UNITED STATES
SECURITIES AND EXCHANGE COMMISSION
Washington, D.C. 20549
FORM N-CSR
CERTIFIED SHAREHOLDER REPORT OF REGISTERED
MANAGEMENT INVESTMENT COMPANIES
Investment Company Act file number: 811-07852
USAA Mutual Funds Trust
(Exact name of registrant as specified in charter)
| 15935 La Cantera Pkwy, Building Two, San Antonio, Texas | 78256 |
| (Address of principal executive offices) | (Zip code) |
Citi Fund Services Ohio, Inc., 4400 Easton Commons, Suite 200, Columbus, Ohio 43219
(Name and address of agent for service)
Registrant’s telephone number, including area code: 800-235-8396
Date of fiscal year end: July 31
Date of reporting period: July 31, 2020
Item 1. Reports to Stockholders.

JULY 31, 2020
Annual Report
USAA Aggressive Growth Fund
Beginning January 1, 2021, as permitted by regulations adopted by the Securities and Exchange Commission, paper copies of the Fund's shareholder reports like this one will no longer be sent by mail, unless you specifically request paper copies of the reports from the Fund or from your financial intermediary, such as a broker-dealer or bank. Instead, the reports will be made available on VictoryFunds.com, and you will be notified by mail each time a report is posted and provided with a website link to access the report. If you already elected to receive shareholder reports electronically, you will not be affected by this change and you need not take any action.
You may elect to receive shareholder reports and other communications from the Fund or your financial intermediary electronically by notifying your financial intermediary directly, or if you are a direct investor, by calling (800) 235-8396 or logging on to usaa.com. Effective on or about November 6, 2020, a shareholder who has an account directly with the Fund will need to submit their request via email to TA.Processing@FISGlobal.com.
You may elect to receive all future reports in paper free of charge. You can inform the Fund or your financial intermediary that you wish to continue receiving paper copies of your shareholder reports by notifying your financial intermediary directly, or if you are a direct investor, by calling (800) 235-8396 or logging on to usaa.com. Effective on or about November 6, 2020, a shareholder who has an account directly with the Fund will need to submit their request via email to TA.Processing@FISGlobal.com. Your election to receive reports in paper will apply to all funds held with the USAA Mutual Funds or your financial intermediary.
Victory Capital means Victory Capital Management Inc., the investment adviser of the USAA Mutual Funds. USAA Mutual Funds are distributed by Victory Capital Services, Inc., member FINRA, an affiliate of Victory Capital. Victory Capital and its affiliates are not affiliated with United Services Automobile Association or its affiliates. USAA and the USAA logo are registered trademarks and the USAA Mutual Funds and USAA Investments logos are trademarks of United Services Automobile Association and are being used by Victory Capital and its affiliates under license.
USAA Mutual Funds Trust
TABLE OF CONTENTS
Shareholder Letter (Unaudited) | 2 | ||||||
Managers' Commentary (Unaudited) | 3 | ||||||
Investment Overview (Unaudited) | 5 | ||||||
| Investment Objective & Portfolio Holdings (Unaudited) | 6 | ||||||
Financial Statements | |||||||
Schedule of Portfolio Investments | 7 | ||||||
Statement of Assets and Liabilities | 10 | ||||||
Statement of Operations | 11 | ||||||
Statements of Changes in Net Assets | 12 | ||||||
Financial Highlights | 14 | ||||||
Notes to Financial Statements | 16 | ||||||
| Report of Independent Registered Public Accounting Firm | 26 | ||||||
Supplemental Information | 27 | ||||||
Trustees' and Officers' Information | 27 | ||||||
Proxy Voting and Portfolio Holdings Information | 33 | ||||||
Expense Examples | 33 | ||||||
Additional Federal Income Tax Information | 34 | ||||||
Liquidity Risk Management Program | 35 | ||||||
Privacy Policy (inside back cover) | |||||||
This report is for the information of the shareholders and others who have received a copy of the currently effective prospectus of the Fund, managed by Victory Capital Management Inc. It may be used as sales literature only when preceded or accompanied by a current prospectus, which provides further details about the Fund.
IRA DISTRIBUTION WITHHOLDING DISCLOSURE
We generally must withhold federal income tax at a rate of 10% of the taxable portion of your distribution and, if you live in a state that requires state income tax withholding, at your state's tax rate. However, you may elect not to have withholding apply or to have income tax withheld at a higher rate. Any withholding election that you make will apply to any subsequent distribution unless and until you change or revoke the election. If you wish to make a withholding election, or change or revoke a prior withholding election, call (800) 235-8396.
If you do not have a withholding election in place by the date of a distribution, federal income tax will be withheld from the taxable portion of your distribution at a rate of 10%. If you must pay estimated taxes, you may be subject to estimated tax penalties if your estimated tax payments are not sufficient and sufficient tax is not withheld from your distribution.
For more specific information, please consult your tax adviser.
1
(Unaudited)
Dear Shareholder,
The previous decade ended with the longest-ever bull market in U.S. equities still intact, even as investors wrestled with issues like softening global economic data, Brexit, and U.S.-China trade relations. In retrospect, those worries seem pedestrian given what we would experience.
A new and unexpected threat—a global pandemic, the novel coronavirus ("COVID-19")—first emerged in Asia and then began spreading globally and throughout the United States during the first quarter of 2020. This unprecedented and unanticipated event not only rendered all existing economic forecasts moot, but it also roiled stock and bond markets everywhere. It also brought the economy to a near halt. The historic bull market in stocks ended virtually overnight.
After an initial severe sell-off in March, equity markets recovered sharply. As our annual reporting period drew to a close on July 31, 2020, many of the broad market indexes had recovered and volatility had returned to more palatable levels. In fact, despite all the chaos, the S&P 500® Index, one of the most popular measures of large U.S. stocks, finished the fiscal year (July 31, 2020) at approximately 3,271, which was up 8.9% from one year ago. Quite the impressive reversal.
The market turmoil of early 2020 was not limited to equities. Fixed income volatility spiked when liquidity evaporated in late March as investors struggled to understand the ramifications of sheltering in place. Fortunately, the U.S. Federal Reserve (the "Fed") (as well as other global central banks) leapt into action—cutting interest rates, (re)starting quantitative easing and, in the case of the Fed, launching an array of programs to stabilize markets.
The new lending facilities and programs had their intended effect of improving fixed income liquidity and trading. Credit spreads across corporate, high yield, structured, and municipal markets were coaxed down from their highs. In addition, Congress came through with substantial fiscal stimulus that also was applauded by investors and markets. Although fixed income markets regained their footing, the yield on 10-Year Treasurys, a benchmark for low-risk investments, declined steadily during our fiscal year—from 2.02% at the beginning of our reporting period to approximately 0.55% as of July 31, 2020. This suggests that investors remain a little wary.
While the past year has been unprecedented for all of us, both personally and professionally, our portfolio managers continue to analyze the financial markets, economic conditions, and the trajectory of the pandemic, which will likely be a guiding factor on Fed policy and the markets.
No matter what happens in the near term, we believe that the massive monetary and fiscal policies introduced earlier this year will have longer-term ramifications. Despite this uncertainty, it's important to remain focused on your long-term investment goals and avoid making emotional decisions. If you invest with us directly, our Member Service Representatives are available to help. Call us at (800) 235-8396.
Sincerely,

Christopher K. Dyer, CFA
President,
USAA Mutual Funds
2
USAA Mutual Funds Trust
USAA Aggressive Growth Fund
Managers' Commentary
(Unaudited)
Victory Solutions
Mannik S. Dhillon, CFA, CAIA Wasif A. Latif
NewBridge Asset Management, A Victory Capital Investment Franchise
Eric F. Maronak Jason E. Dahl, CFA
Scott R. Kefer, CFA Michael B. Koskuba
RS Investments Growth, A Victory Capital Investment Franchise
Scott Tracy, CFA Stephen J. Bishop
Melissa Chadwick-Dunn Christopher Clark, CFA
Paul Leung, CFA
• What were the market conditions over the reporting period?
The U.S. stock market generated solid gains for the reporting period overall. Growth stocks significantly outperformed value stocks, while large-cap stocks outpaced small-cap stocks.
Global financial market performance varied widely over the period driven by optimism of continued economic recovery followed by the novel coronavirus ("COVID-19") shock and uncertainty related to the duration and economic impact of the COVID-19 pandemic. These fears generally led to a "risk-off" environment as investors flocked to safe haven assets such as U.S. Treasurys and gold. Global equities turned mostly lower with the exception of a small breadth of mega-cap securities well positioned for an extended economic slowdown and the new stay-at-home paradigm. The final month and a half of the reporting period saw a rebound in risky assets as economies began a phased reopening. The U.S. large-cap growth space, led by information technology and communication services continued to outperform in the face of the economic threat as they were perceived as "stay-at-home stocks" that would further benefit from economic activity from homes.
Within the United States, the S&P 500® Index dropped nearly 34% at the end of the reporting period from its 2020 high, before beginning to recoup losses with the support of comprehensive monetary and fiscal stimulus, along with optimism that a COVID-19 treatment will eventually emerge. Over the reporting period, the S&P 500 Index retuned 11.96%, with large-cap growth stocks leading the way, up to a return of 29.84% as represented by the Russell 1000 Growth Index. Value stocks and small-cap stocks significantly underperformed growth stocks over the period. U.S. large-cap value stocks were down to a return of -6.01% over the reporting period as gauged by the Russell 1000 Value Index, while U.S. small-cap stocks, returned -4.59% as represented by the Russell 2000 Index.
Developed-market international and emerging market equities followed a path similar to U.S. equities. Markets led investors on a rollercoaster ride that saw both the MSCI
3
USAA Mutual Funds Trust
USAA Aggressive Growth Fund (continued)
Managers' Commentary (continued)
EAFE Index and MSCI Emerging Markets Index drop approximately 34% from their highs in the year. The market drawdown hit bottom on March 23rd and then started a steady ascent, erasing most of the year's losses as European Central Bank quantitative easing and talks of a 750-billion euros fiscal stimulus helped bolster momentum in the market's recovery. Over the reporting period, developed international equities, represented by the MSCI EAFE Index, were down to a return of -1.67%, while the MSCI Emerging Markets Index returned 6.55%.
• How did the USAA Aggressive Growth Fund (the "Fund") perform during the reporting period?
The Fund has two share classes: Fund Shares and Institutional Shares. For the reporting period ended July 31, 2020, the Fund Shares and Institutional Shares had total returns of 26.30% and 26.33%, respectively. This compares to returns of 29.84% for the Russell 1000® Growth Index (the "Index") and 28.44% for the Lipper Large-Cap Growth Funds Index.
• What strategies did you employ during the reporting period?
For the reporting period, the Fund underperformed the benchmark index as stock selection detracted from performance while sector allocation added to performance versus the Index. In terms of allocation, an overweight to the consumer discretionary and underweight to consumer staples, materials, real estate and financials helped performance. Stock selection within the healthcare, communication services, consumer discretionary, and staples detracted from performance. On the positive side, stock selection in financials and industrials added to the Fund's performance.
Thank you for allowing us to assist you with your investment needs.
4
USAA Mutual Funds Trust
USAA Aggressive Growth Fund
Investment Overview
(Unaudited)
Average Annual Total Return
Year Ended July 31, 2020
Fund Shares | Institutional Shares | ||||||||||||||||||
INCEPTION DATE | 10/19/81 | 8/1/08 | |||||||||||||||||
Net Asset Value | Net Asset Value | Russell 1000® Growth Index1 | Lipper Large-Cap Growth Funds Index2 | ||||||||||||||||
One Year | 26.30 | % | 26.33 | % | 29.84 | % | 28.44 | % | |||||||||||
Five Year | 13.91 | % | 13.95 | % | 16.82 | % | 15.38 | % | |||||||||||
Ten Year | 15.01 | % | 15.22 | % | 17.28 | % | 15.94 | % | |||||||||||
Past performance is not indicative of future results. The performance data quoted represents past performance and current returns may be lower or higher. The investment return and principal value will fluctuate so that an investor's shares, when redeemed, may be worth more or less than the original cost. To obtain performance information current to the most recent month's end, please visit www.vcm.com.
Total return measures the price change in a share assuming the reinvestment of all net investment income and realized capital gain distributions, if any. The total returns quoted do not reflect adjustments made to the enclosed financial statements in accordance with U.S. generally accepted accounting principles or the deduction of taxes that a shareholder would pay on net investment income and realized capital gain distributions, including reinvested distributions, or redemptions of shares. The total return figures set forth above include all waivers of fees for various periods since inception. Without such fee waivers, the total returns would have been lower.
USAA Aggressive Growth Fund — Growth of $10,000
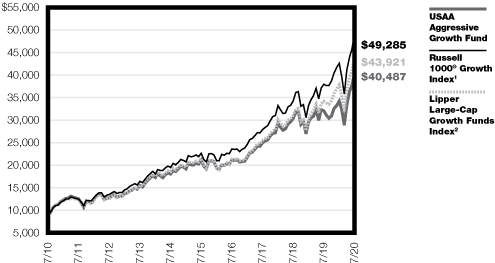
1The unmanaged Russell 1000® Growth Index measures the performance of those Russell 1000 companies with higher price-to-book ratios and higher forecasted growth values.
2The unmanaged Lipper Large-Cap Growth Funds Index tracks the total return performance of funds within the Lipper Large-Cap Growth Funds category.
The graph reflects investment of growth of a hypothetical $10,000 investment in the Fund. Past performance is no guarantee of future results.
The graph and table do not reflect the deduction of taxes that a shareholder would pay on Fund distributions or the redemption of Fund shares.
5
| USAA Mutual Funds Trust USAA Aggressive Growth Fund | July 31, 2020 | ||||||
(Unaudited)
Investment Objective & Portfolio Holdings:
The USAA Aggressive Growth Fund seeks capital appreciation.
Sector Allocation*:
July 31, 2020
(% of Net Assets)
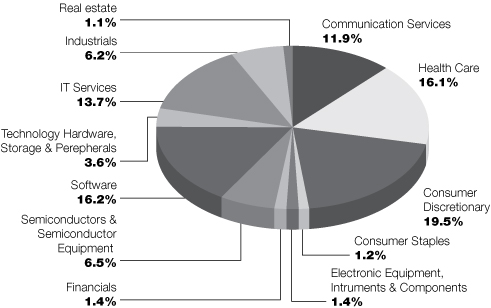
* Does not include futures, money market instruments, and short-term investments purchased with cash collateral from securities loaned.
Percentage are of the net assets of the Fund and may not equal 100%.
6
| USAA Mutual Funds Trust USAA Aggressive Growth Fund | Schedule of Portfolio Investments July 31, 2020 | ||||||
(Amounts in Thousands, Except for Shares)
Security Description | Shares | Value | |||||||||
Common Stocks (98.8%) | |||||||||||
Communication Services (11.9%): | |||||||||||
Activision Blizzard, Inc. | 522,572 | $ | 43,180 | ||||||||
Alphabet, Inc. Class C (a) | 57,830 | 85,760 | |||||||||
Facebook, Inc. Class A (a) | 232,373 | 58,946 | |||||||||
Netflix, Inc. (a) | 34,113 | 16,677 | |||||||||
Twitter, Inc. (a) | 510,988 | 18,600 | |||||||||
223,163 | |||||||||||
Consumer Discretionary (19.5%): | |||||||||||
Alibaba Group Holding Ltd., ADR (a) | 120,001 | 30,123 | |||||||||
Amazon.com, Inc. (a) | 49,616 | 157,019 | |||||||||
Booking Holdings, Inc. (a) | 6,019 | 10,004 | |||||||||
Burlington Stores, Inc. (a) | 141,912 | 26,679 | |||||||||
Chipotle Mexican Grill, Inc. (a) | 11,780 | 13,608 | |||||||||
Lululemon Athletica, Inc. (a) | 123,082 | 40,074 | |||||||||
Nike, Inc. Class B | 194,709 | 19,006 | |||||||||
Starbucks Corp. | 63,872 | 4,888 | |||||||||
Target Corp. | 103,480 | 13,026 | |||||||||
Tesla, Inc. (a) | 11,690 | 16,726 | |||||||||
The Home Depot, Inc. | 68,849 | 18,279 | |||||||||
The TJX Cos., Inc. | 288,656 | 15,007 | |||||||||
364,439 | |||||||||||
Consumer Staples (1.2%): | |||||||||||
Church & Dwight Co., Inc. | 76,934 | 7,411 | |||||||||
Constellation Brands, Inc. Class A | 84,888 | 15,127 | |||||||||
22,538 | |||||||||||
Electronic Equipment, Instruments & Components (1.4%): | |||||||||||
Amphenol Corp. Class A | 91,716 | 9,700 | |||||||||
Keysight Technologies, Inc. (a) | 168,245 | 16,806 | |||||||||
26,506 | |||||||||||
Financials (1.4%): | |||||||||||
MSCI, Inc. | 71,483 | 26,876 | |||||||||
Health Care (16.1%): | |||||||||||
Align Technology, Inc. (a) | 33,097 | 9,725 | |||||||||
bluebird bio, Inc. (a) | 109,839 | 6,667 | |||||||||
Bristol-Myers Squibb Co. | 286,666 | 16,816 | |||||||||
Charles River Laboratories International, Inc. (a) | 75,282 | 14,980 | |||||||||
Edwards Lifesciences Corp. (a) | 349,014 | 27,366 | |||||||||
Eli Lilly & Co. | 92,780 | 13,944 | |||||||||
Masimo Corp. (a) | 126,823 | 27,916 | |||||||||
Royalty Pharma PLC Class A (a) | 414,854 | 17,859 | |||||||||
Sage Therapeutics, Inc. (a) | 74,643 | 3,401 | |||||||||
UnitedHealth Group, Inc. | 150,774 | 45,651 | |||||||||
Veeva Systems, Inc. Class A (a) | 129,130 | 34,164 | |||||||||
Vertex Pharmaceuticals, Inc. (a) | 143,451 | 39,019 | |||||||||
See notes to financial statements.
7
| USAA Mutual Funds Trust USAA Aggressive Growth Fund | Schedule of Portfolio Investments — continued July 31, 2020 | ||||||
(Amounts in Thousands, Except for Shares)
Security Description | Shares | Value | |||||||||
West Pharmaceutical Services, Inc. | 50,073 | $ | 13,463 | ||||||||
Zoetis, Inc. | 205,725 | 31,205 | |||||||||
302,176 | |||||||||||
Industrials (6.2%): | |||||||||||
CoStar Group, Inc. (a) | 37,012 | 31,452 | |||||||||
FTI Consulting, Inc. (a) (b) | 78,493 | 9,375 | |||||||||
IDEX Corp. | 75,830 | 12,498 | |||||||||
IHS Markit Ltd. | 125,134 | 10,102 | |||||||||
Old Dominion Freight Line, Inc. | 58,647 | 10,722 | |||||||||
Roper Technologies, Inc. | 33,785 | 14,610 | |||||||||
Trane Technologies PLC | 68,514 | 7,665 | |||||||||
Uber Technologies, Inc. (a) | 647,640 | 19,597 | |||||||||
116,021 | |||||||||||
IT Services (13.7%): | |||||||||||
EPAM Systems, Inc. (a) | 97,411 | 28,257 | |||||||||
Fiserv, Inc. (a) | 162,135 | 16,179 | |||||||||
PayPal Holdings, Inc. (a) | 360,000 | 70,586 | |||||||||
Shopify, Inc. Class A (a) | 21,296 | 21,807 | |||||||||
Twilio, Inc. Class A (a) | 128,162 | 35,555 | |||||||||
Visa, Inc. Class A | 440,578 | 83,886 | |||||||||
256,270 | |||||||||||
Real Estate (1.1%): | |||||||||||
American Tower Corp. | 80,525 | 21,048 | |||||||||
Semiconductors & Semiconductor Equipment (6.5%): | |||||||||||
Lam Research Corp. | 37,075 | 13,983 | |||||||||
Marvell Technology Group Ltd. | 343,838 | 12,540 | |||||||||
NVIDIA Corp. | 149,856 | 63,628 | |||||||||
QUALCOMM, Inc. | 178,045 | 18,803 | |||||||||
STMicroelectronics NV, NYS | 494,061 | 13,804 | |||||||||
122,758 | |||||||||||
Software (16.2%): | |||||||||||
Adobe, Inc. (a) | 64,185 | 28,519 | |||||||||
Fair Isaac Corp. (a) | 37,492 | 16,466 | |||||||||
Microsoft Corp. | 436,852 | 89,560 | |||||||||
Proofpoint, Inc. (a) | 134,437 | 15,550 | |||||||||
RingCentral, Inc. Class A (a) | 83,525 | 24,245 | |||||||||
Salesforce.com, Inc. (a) | 185,536 | 36,151 | |||||||||
ServiceNow, Inc. (a) | 118,621 | 52,099 | |||||||||
Synopsys, Inc. (a) | 49,497 | 9,861 | |||||||||
The Trade Desk, Inc. Class A (a) | 39,877 | 17,997 | |||||||||
Workday, Inc. Class A (a) | 62,068 | 11,229 | |||||||||
301,677 | |||||||||||
Technology Hardware, Storage & Peripherals (3.6%): | |||||||||||
Apple, Inc. | 157,051 | 66,753 | |||||||||
Total Common Stocks (Cost $1,117,623) | 1,850,225 | ||||||||||
See notes to financial statements.
8
| USAA Mutual Funds Trust USAA Aggressive Growth Fund | Schedule of Portfolio Investments — continued July 31, 2020 | ||||||
(Amounts in Thousands, Except for Shares)
Security Description | Shares | Value | |||||||||
Collateral for Securities Loaned^ (0.0%) (c) | |||||||||||
| Goldman Sachs Financial Square Government Fund Institutional Shares, 0.13% (d) | 2,200 | $ | 2 | ||||||||
HSBC U.S. Government Money Market Fund I Shares, 0.08% (d) | 22,700 | 23 | |||||||||
Total Collateral for Securities Loaned (Cost $25) | 25 | ||||||||||
Total Investments (Cost $1,117,648) — 98.8% | 1,850,250 | ||||||||||
Other assets in excess of liabilities — 1.2% | 23,319 | ||||||||||
NET ASSETS — 100.00% | $ | 1,873,569 | |||||||||
At July 31, 2020 the Fund's investments in foreign securities were 8.2% of net assets.
^ Purchased with cash collateral from securities on loan.
(a) Non-income producing security.
(b) All or a portion of this security is on loan.
(c) Amount represents less than 0.05% of net assets.
(d) Rate disclosed is the daily yield on July 31, 2020.
ADR — American Depositary Receipt
NYS — New York Registered Shares
PLC — Public Limited Company
See notes to financial statements.
9
USAA Mutual Funds Trust | Statement of Assets and Liabilities July 31, 2020 | ||||||
(Amounts in Thousands, Except Per Share Amounts)
| USAA Aggressive Growth Fund | |||||||
Assets: | |||||||
Investments, at value (Cost $1,117,648) | $ | 1,850,250 | (a) | ||||
Cash and cash equivalents | 19,714 | ||||||
Receivables: | |||||||
Interest and dividends | 208 | ||||||
Capital shares issued | 634 | ||||||
Investments sold | 10,218 | ||||||
From Adviser | 2 | ||||||
Prepaid expenses | 39 | ||||||
Total assets | 1,881,065 | ||||||
Liabilities: | |||||||
Payables: | |||||||
Collateral received on loaned securities | 25 | ||||||
Investments purchased | 5,882 | ||||||
Capital shares redeemed | 561 | ||||||
Accrued expenses and other payables: | |||||||
Investment advisory fees | 595 | ||||||
Administration fees | 232 | ||||||
Custodian fees | 14 | ||||||
Transfer agent fees | 139 | ||||||
Compliance fees | 1 | ||||||
Other accrued expenses | 47 | ||||||
Total liabilities | 7,496 | ||||||
Net Assets: | |||||||
Capital | 1,188,251 | ||||||
Total accumulated earnings/(loss) | 685,318 | ||||||
Net assets | $ | 1,873,569 | |||||
Net Assets: | |||||||
Fund Shares | $ | 1,861,282 | |||||
Institutional Shares | 12,287 | ||||||
Total | $ | 1,873,569 | |||||
Shares (unlimited number of shares authorized with no par value): | |||||||
Fund Shares | 40,449 | ||||||
Institutional Shares | 262 | ||||||
Total | 40,711 | ||||||
Net asset value, offering and redemption price per share: (b) | |||||||
Fund Shares | $ | 46.02 | |||||
Institutional Shares | $ | 46.82 | |||||
(a) Includes $24 of securities on loan.
(b) Per share amount may not recalculate due to rounding of net assets and/or shares outstanding.
See notes to financial statements.
10
USAA Mutual Funds Trust | Statement of Operations For the Year Ended July 31, 2020 | ||||||
(Amounts in Thousands)
| USAA Aggressive Growth Fund | |||||||
Investment Income: | |||||||
Dividends | $ | 8,539 | |||||
Interest | 363 | ||||||
Securities lending (net of fees) | 90 | ||||||
Total income | 8,992 | ||||||
Expenses: | |||||||
Investment advisory fees | 7,056 | ||||||
Administration fees — Fund Shares | 2,405 | ||||||
Administration fees — Institutional Shares | 11 | ||||||
Sub-Administration fees | 52 | ||||||
Custodian fees | 114 | ||||||
Transfer agent fees — Fund Shares | 1,742 | ||||||
Transfer agent fees — Institutional Shares | 11 | ||||||
Trustees' fees | 46 | ||||||
Compliance fees | 11 | ||||||
Legal and audit fees | 87 | ||||||
State registration and filing fees | 43 | ||||||
Other expenses | 95 | ||||||
Total expenses | 11,673 | ||||||
Expenses waived/reimbursed by Adviser | (13 | ) | |||||
Net expenses | 11,660 | ||||||
Net Investment Income (Loss) | (2,668 | ) | |||||
Realized/Unrealized Gains (Losses) from Investments: | |||||||
Net realized gains (losses) from investment securities | (42,542 | ) | |||||
Net change in unrealized appreciation/depreciation on investment securities | 440,177 | ||||||
Net realized/unrealized gains (losses) on investments | 397,635 | ||||||
Change in net assets resulting from operations | $ | 394,967 | |||||
See notes to financial statements.
11
USAA Mutual Funds Trust | Statements of Changes in Net Assets | ||||||
(Amounts in Thousands)
USAA Aggressive Growth Fund | |||||||||||
| Year Ended July 31, 2020 | Year Ended July 31, 2019 | ||||||||||
From Investments: | |||||||||||
Operations: | |||||||||||
Net investment income (loss) | $ | (2,668 | ) | $ | 4,716 | ||||||
Net realized gains (losses) from investments | (42,542 | ) | 294,543 | ||||||||
| Net change in unrealized appreciation/depreciation on investments | 440,177 | (213,886 | ) | ||||||||
Change in net assets resulting from operations | 394,967 | 85,373 | |||||||||
Distributions to Shareholders: | |||||||||||
Fund Shares | (273,925 | ) | (223,656 | ) | |||||||
Institutional Shares | (2,048 | ) | (1,695 | ) | |||||||
Change in net assets resulting from distributions to shareholders | (275,973 | ) | (225,351 | ) | |||||||
Change in net assets resulting from capital transactions | 118,415 | 171,815 | |||||||||
Change in net assets | 237,409 | 31,837 | |||||||||
Net Assets: | |||||||||||
Beginning of period | 1,636,160 | 1,604,323 | |||||||||
End of period | $ | 1,873,569 | $ | 1,636,160 | |||||||
Capital Transactions: | |||||||||||
Fund Shares | |||||||||||
Proceeds from shares issued | $ | 115,595 | $ | 147,097 | |||||||
Distributions reinvested | 270,045 | 220,904 | |||||||||
Cost of shares redeemed | (267,501 | ) | (197,789 | ) | |||||||
Total Fund Shares | $ | 118,139 | $ | 170,212 | |||||||
Institutional Shares | |||||||||||
Proceeds from shares issued | $ | 3,528 | $ | 10,190 | |||||||
Distributions reinvested | 2,005 | 1,661 | |||||||||
Cost of shares redeemed | (5,257 | ) | (10,248 | ) | |||||||
Total Institutional Shares | $ | 276 | $ | 1,603 | |||||||
Change in net assets resulting from capital transactions | $ | 118,415 | $ | 171,815 | |||||||
Share Transactions: | |||||||||||
Fund Shares | |||||||||||
Issued | 2,965 | 3,315 | |||||||||
Reinvested | 7,237 | 5,648 | |||||||||
Redeemed | (6,745 | ) | (4,535 | ) | |||||||
Total Fund Shares | 3,457 | 4,428 | |||||||||
Institutional Shares | |||||||||||
Issued | 85 | 224 | |||||||||
Reinvested | 53 | 42 | |||||||||
Redeemed | (142 | ) | (230 | ) | |||||||
Total Institutional Shares | (4 | ) | 36 | ||||||||
Change in Shares | 3,453 | 4,464 | |||||||||
See notes to financial statements.
12
This page is intentionally left blank.
13
USAA Mutual Funds Trust | Financial Highlights | ||||||
For a Share Outstanding Throughout Each Period
Investment Activities | Distributions to Shareholders From | ||||||||||||||||||||||||||
| Net Asset Value, Beginning of Period | Net Investment Income (Loss) | Net Realized and Unrealized Gains (Losses) on Investments | Total from Investment Activities | Net Investment Income | Net Realized Gains from Investments | ||||||||||||||||||||||
USAA Aggressive Growth Fund | |||||||||||||||||||||||||||
Fund Shares | |||||||||||||||||||||||||||
| Year Ended July 31, 2020 | $ | 43.91 | (0.07 | )(b) | 9.82 | 9.75 | (0.04 | ) | (7.60 | ) | |||||||||||||||||
| Year Ended July 31, 2019 | $ | 48.92 | 0.13 | 1.72 | 1.85 | (0.08 | ) | (6.78 | ) | ||||||||||||||||||
| Year Ended July 31, 2018 | $ | 43.96 | 0.19 | 8.79 | 8.98 | (0.19 | ) | (3.83 | ) | ||||||||||||||||||
| Year Ended July 31, 2017 | $ | 40.02 | 0.36 | 6.30 | 6.66 | (0.33 | ) | (2.39 | ) | ||||||||||||||||||
| Year Ended July 31, 2016 | $ | 42.55 | 0.33 | (0.20 | ) | 0.13 | (0.33 | ) | (2.33 | ) | |||||||||||||||||
Institutional Shares | |||||||||||||||||||||||||||
| Year Ended July 31, 2020 | $ | 44.54 | (0.05 | )(b) | 9.98 | 9.93 | (0.05 | ) | (7.60 | ) | |||||||||||||||||
| Year Ended July 31, 2019 | $ | 49.55 | 0.14 | (b) | 1.75 | 1.89 | (0.12 | ) | (6.78 | ) | |||||||||||||||||
| Year Ended July 31, 2018 | $ | 44.36 | 0.14 | (b) | 8.93 | 9.07 | (0.05 | ) | (3.83 | ) | |||||||||||||||||
| Year Ended July 31, 2017 | $ | 40.39 | 0.21 | (b) | 6.52 | 6.73 | (0.37 | ) | (2.39 | ) | |||||||||||||||||
| Year Ended July 31, 2016 | $ | 42.92 | 0.44 | (0.24 | ) | 0.20 | (0.40 | ) | (2.33 | ) | |||||||||||||||||
* Assumes reinvestment of all net investment income and realized capital gain distributions, if any, during the period. Includes adjustments in accordance with U.S. generally accepted accounting principles and could differ from the Lipper reported return.
^ The net expense ratio may not correlate to the applicable expense limits in place during the period since the current contractual expense limitation is applied for a two year period beginning July 1, 2019 and in effect through June 30, 2021, instead of coinciding with the Fund's fiscal year end. Details of the current contractual expense limitation in effect can be found in Note 5 of the accompanying Notes to Financial Statements.
(a) Portfolio turnover is calculated on the basis of the Fund as a whole without distinguishing between the classes of shares issued.
(b) Per share net investment income (loss) has been calculated using the average daily shares method.
(c) Reflects total annual operating expenses of the shares before reductions of any expenses paid indirectly. The shares' expenses paid indirectly decreased the expense ratio by less than 0.01%.
(d) Prior to December 1, 2017, USAA Asset Management Company ("AMCO") (previous Investment Adviser) had voluntarily agreed to limit the annual expenses of the Institutional Shares to 0.70% of the Institutional Shares' average daily net assets.
See notes to financial statements.
14
USAA Mutual Funds Trust | Financial Highlights — continued | ||||||
For a Share Outstanding Throughout Each Period
Ratios to Average Net Assets | Supplemental Data | ||||||||||||||||||||||||||||||||||
| Total Distributions | Net Asset Value, End of Period | Total Return* | Net Expenses^ | Net Investment Income (Loss) | Gross Expenses | Net Assets, End of Period (000's) | Portfolio Turnover(a) | ||||||||||||||||||||||||||||
USAA Aggressive Growth Fund | |||||||||||||||||||||||||||||||||||
Fund Shares | |||||||||||||||||||||||||||||||||||
| Year Ended July 31, 2020 | (7.64 | ) | $ | 46.02 | 26.30 | % | 0.72 | % | (0.17 | )% | 0.72 | % | $ | 1,861,282 | 64 | % | |||||||||||||||||||
| Year Ended July 31, 2019 | (6.86 | ) | $ | 43.91 | 5.53 | % | 0.72 | % | 0.30 | % | 0.72 | % | $ | 1,624,319 | 78 | % | |||||||||||||||||||
| Year Ended July 31, 2018 | (4.02 | ) | $ | 48.92 | 21.57 | % | 0.75 | %(c) | 0.32 | % | 0.75 | %(c) | $ | 1,592,944 | 57 | % | |||||||||||||||||||
| Year Ended July 31, 2017 | (2.72 | ) | $ | 43.96 | 17.92 | % | 0.81 | %(c) | 0.57 | % | 0.81 | %(c) | $ | 1,340,385 | 51 | % | |||||||||||||||||||
| Year Ended July 31, 2016 | (2.66 | ) | $ | 40.02 | 0.36 | % | 0.85 | %(c) | 0.30 | % | 0.85 | %(c) | $ | 1,208,124 | 70 | % | |||||||||||||||||||
Institutional Shares | |||||||||||||||||||||||||||||||||||
| Year Ended July 31, 2020 | (7.65 | ) | $ | 46.82 | 26.33 | % | 0.70 | % | (0.13 | )% | 0.81 | % | $ | 12,287 | 64 | % | |||||||||||||||||||
| Year Ended July 31, 2019 | (6.90 | ) | $ | 44.54 | 5.56 | % | 0.70 | % | 0.32 | % | 0.83 | % | $ | 11,841 | 78 | % | |||||||||||||||||||
| Year Ended July 31, 2018 | (3.88 | ) | $ | 49.55 | 21.54 | % | 0.75 | %(c)(d) | 0.30 | % | 0.94 | %(c) | $ | 11,379 | 57 | % | |||||||||||||||||||
| Year Ended July 31, 2017 | (2.76 | ) | $ | 44.36 | 17.94 | % | 0.73 | %(c) | 0.54 | % | 0.73 | %(c) | $ | 5,587 | 51 | % | |||||||||||||||||||
| Year Ended July 31, 2016 | (2.73 | ) | $ | 40.39 | 0.51 | % | 0.70 | %(c) | 0.45 | % | 0.70 | %(c) | $ | 136,361 | 70 | % | |||||||||||||||||||
See notes to financial statements.
15
USAA Mutual Funds Trust | Notes to Financial Statements July 31, 2020 | ||||||
1. Organization:
USAA Mutual Funds Trust (the "Trust") is organized as a Delaware statutory trust and is registered under the Investment Company Act of 1940, as amended (the "1940 Act"), as an open-end investment company. The Trust is comprised of 47 funds and is authorized to issue an unlimited number of shares, which are units of beneficial interest with no par value.
The accompanying financial statements are those of the USAA Aggressive Growth Fund (the "Fund"). The Fund offers two classes of shares: Fund Shares and Institutional Shares. The Fund is classified as diversified under the 1940 Act.
Each class of shares of the Fund has substantially identical rights and privileges except with respect to fees paid under distribution plans, expenses allocable exclusively to each class of shares, voting rights on matters solely affecting a single class of shares, and the exchange privilege of each class of shares. Under the Trust's organizational documents, its officers and trustees are indemnified against certain liabilities arising out of the performance of their duties to the Fund. In addition, in the normal course of business, the Fund enters into contracts with its vendors and others that provide for general indemnifications. The Fund's maximum exposure under these arrangements is unknown, as this would involve future claims that may be made against the Fund. However, based on experience, the Fund expects that risk of loss to be remote.
2. Significant Accounting Policies:
The following is a summary of significant accounting policies followed by the Trust in the preparation of its financial statements. The policies are in conformity with generally accepted accounting principles in the United States of America ("GAAP"). The preparation of financial statements in accordance with GAAP requires management to make estimates and assumptions that affect the reported amounts of assets and liabilities and disclosure of contingent assets and liabilities at the date of the financial statements and the reported amounts of income and expenses for the period. Actual results could differ from those estimates. The Fund follows the specialized accounting and reporting requirements under GAAP that are applicable to investment companies under Accounting Standards Codification Topic 946.
Investment Valuation:
The Fund records investments at fair value. Fair value is defined as the price that would be received to sell an asset or paid to transfer a liability in an orderly transaction between market participants at the measurement date.
The valuation techniques described below maximize the use of observable inputs and minimize the use of unobservable inputs in determining fair value. The inputs used for valuing the Fund's investments are summarized in the three broad levels listed below:
• Level 1 — quoted prices in active markets for identical securities
• Level 2 — other significant observable inputs (including quoted prices for similar securities or interest rates applicable to those securities, etc.)
• Level 3 — significant unobservable inputs (including the Fund's own assumptions in determining the fair value of investments)
Changes in valuation techniques may result in transfers in or out of an assigned level within the disclosure hierarchy. The inputs or methodologies used for valuation techniques are not necessarily an indication of the risk associated with entering into those investments.
The Adviser has established the Pricing and Liquidity Committee (the "Committee"), and subject to Trust's Board of Trustees (the "Board") oversight, the Committee administers and oversees the Fund's valuation policies and procedures, which are approved by the Board.
Portfolio securities listed or traded on securities exchanges, including exchange-traded funds ("ETFs"), American Depositary Receipts ("ADRs") and Rights, are valued at the closing price on the exchange or system where the security is principally traded, if available, or at the Nasdaq Official Closing Price. If there have been no sales for that day on the exchange or system, then a security is valued at the last
16
USAA Mutual Funds Trust | Notes to Financial Statements — continued July 31, 2020 | ||||||
available bid quotation on the exchange or system where the security is principally traded. In each of these situations, valuations are typically categorized as Level 1 in the fair value hierarchy.
Investments in open-end investment companies are valued at net asset value ("NAV"). These valuations are typically categorized as Level 1 in the fair value hierarchy.
In the event that price quotations or valuations are not readily available, are not reflective of market value, or a significant event has been recognized in relation to a security or class of securities, the securities are valued in good faith by the Committee in accordance with valuation procedures approved by the Board. These valuations are typically categorized as Level 2 or Level 3 in the fair value hierarchy, based on the observability of inputs used to determine the fair value. The effect of fair value pricing is that securities may not be priced on the basis of quotations from the primary market in which they are traded and the actual price realized from the sale of a security may differ materially from the fair value price. Valuing these securities at fair value is intended to cause the Fund's NAV to be more reliable than it otherwise would be.
A summary of the valuations as of July 31, 2020, based upon the three levels defined above, is included in the table below while the breakdown, by category, of investments is disclosed in the Schedule of Portfolio Investments (amounts in thousands):
Level 1 | Level 2 | Level 3 | Total | ||||||||||||||||
Common Stocks | $ | 1,850,225 | $ | — | $ | — | $ | 1,850,225 | |||||||||||
Collateral for Securities Loaned | 25 | — | — | 25 | |||||||||||||||
Total | $ | 1,850,250 | $ | — | $ | — | $ | 1,850,250 | |||||||||||
For the year ended July 31, 2020, there were no transfers in or out of the Level 3 fair value hierarchy.
Investment Companies:
Exchange-Traded Funds:
The Fund may invest in ETFs, the shares of which are bought and sold on a securities exchange. An ETF trades like common stock and represents a fixed portfolio of securities designed to track the performance and dividend yield of a particular domestic or foreign market index. The Fund may purchase shares of an ETF to temporarily gain exposure to a portion of the U.S. or a foreign market while awaiting purchase of underlying securities. The risks of owning an ETF generally reflect the risks of owning the underlying securities they are designed to track, although the lack of liquidity of an ETF could result in it being more volatile. Additionally, ETFs have fees and expenses that reduce their value.
Open-End Funds:
The Fund may invest in portfolios of open-end investment companies. These investment companies value securities in their portfolios for which market quotations are readily available at their market values (generally the last reported sale price) and all other securities and assets at their fair value by the methods established by the board of directors of the underlying funds.
Foreign Exchange Currency Contracts:
The Fund may enter into foreign exchange currency contracts to convert U.S. dollars to and from various foreign currencies. A foreign exchange currency contract is an obligation by the Fund to purchase or sell a specific currency at a future date at a price (in U.S. dollars) set at the time of the contract. The Fund does not engage in "cross-currency" foreign exchange contracts (i.e., contracts to purchase or sell one foreign currency in exchange for another foreign currency). The Fund's foreign exchange currency contracts might be considered spot contracts (typically a contract of one week or less) or forward contracts (typically a contract term over one week). A spot contract is entered into for purposes of hedging against foreign currency fluctuations relating to a specific portfolio transaction,
17
USAA Mutual Funds Trust | Notes to Financial Statements — continued July 31, 2020 | ||||||
such as the delay between a security transaction trade date and settlement date. Forward contracts are entered into for purposes of hedging portfolio holdings or concentrations of such holdings. Each foreign exchange currency contract is adjusted daily by the prevailing spot or forward rate of the underlying currency, and any appreciation or depreciation is recorded for financial statement purposes as unrealized until the contract settlement date, at which time the Fund records realized gains or losses equal to the difference between the value of a contract at the time it was opened and the value at the time it was closed. The Fund could be exposed to risk if a counterparty is unable to meet the terms of a foreign exchange currency contract or if the value of the foreign currency changes unfavorably. In addition, the use of foreign exchange currency contracts does not eliminate fluctuations in the underlying prices of the securities. As of July 31, 2020, the Fund had no open forward foreign exchange currency contracts.
Investment Transactions and Related Income:
Changes in holdings of investments are accounted for no later than one business day following the trade date. For financial reporting purposes, however, investment transactions are accounted for on trade date on the last business day of the reporting period. Interest income is determined on the basis of coupon interest accrued using the effective interest method which adjusts, where applicable, the amortization of premiums or accretion of discount. Gains or losses realized on sales of securities are determined by comparing the identified cost of the security lot sold with the net sales proceeds.
Withholding taxes on interest, dividends, and gains as a result of certain investments in ADRs by the Fund has been provided for in accordance with each investment's applicable country's tax rules and rates.
Securities Lending:
The Fund, through a securities lending agreement with Citibank, N.A. ("Citibank"), may lend its securities to qualified financial institutions, such as certain broker-dealers, to earn additional income, net of income retained by Citibank. Borrowers are required to secure their loans for collateral in the amount of at least 102% of the value of U.S. securities loaned or at least 105% of the value of non-U.S. securities loaned, marked-to-market daily. Any collateral shortfalls associated with increases in the valuation of the securities loaned are cured the next business day once the shortfall exceeds $100 thousand. Collateral may be cash, U.S. government securities, or other securities as permitted by SEC guidelines. Cash collateral may be invested in high-quality short-term investments, primarily open-end investment companies. Collateral requirements are determined daily based on the value of the Fund's securities on loan as of the end of the prior business day. During the time portfolio securities are on loan, the borrower will pay the Fund any dividends or interest paid on such securities plus any fee negotiated between the parties to the lending agreement. The Fund also earns a return from the collateral. The Fund pays Citibank various fees in connection with the investment of cash collateral and fees based on the investment income received from securities lending activities. Securities lending income (net of these fees) is disclosed on the Statement of Operations. Loans are terminable upon demand and the borrower must return the loaned securities within the lesser of one standard settlement period or five business days. Risks relating to securities-lending transactions include that the borrower may not provide additional collateral when required or return the securities when due, and that the value of the short-term investments will be less than the amount of cash collateral required to be returned to the borrower. The Fund's agreement with Citibank does not include master netting provisions. Non- cash collateral received by the Fund may not be sold or re-pledged except to satisfy borrower default.
Cash collateral is listed on the Fund's Schedule of Portfolio of Investments and Financial Statements while non-cash collateral is not included. The following table (amounts in thousands) is a summary of the Fund's securities lending transactions as of July 31, 2020.
18
USAA Mutual Funds Trust | Notes to Financial Statements — continued July 31, 2020 | ||||||
| Value of Securities on Loan | Non-Cash Collateral | Cash Collateral | |||||||||
| $ | 24 | $ | — | $ | 25 | ||||||
Foreign Currency Translations:
The accounting records of the Fund are maintained in U.S. dollars. Investment securities and other assets and liabilities of the Fund denominated in a foreign currency are translated into U.S. dollars at current exchange rates. Purchases and sales of securities, income receipts, and expense payments are translated into U.S. dollars at the exchange rates on the date of the transactions. The Fund does not isolate the portion of the results of operations resulting from changes in foreign exchange rates on investments from fluctuations arising from changes in market prices of securities held. Such fluctuations are disclosed as net change in unrealized appreciation/depreciation on investments and foreign currency translations on the Statement of Operations. Any realized gains or losses from these fluctuations, including foreign currency arising from in-kind redemptions, are disclosed as net realized gains or losses from investment transactions and foreign currency translations on the Statement of Operations.
Foreign Taxes:
The Fund may be subject to foreign taxes related to foreign income received (a portion of which may be reclaimable), capital gains on the sale of securities, and certain foreign currency transactions. All foreign taxes are recorded in accordance with the applicable regulations and rates that exist in the foreign jurisdictions in which the Fund invests.
Federal Income Taxes:
It is the Fund's policy to continue to qualify as a regulated investment company by complying with the provisions available to certain investment companies, as defined in applicable sections of the Internal Revenue Code, and to make distributions of net investment income and net realized gains sufficient to relieve it from all, or substantially all, federal income taxes. Accordingly, no provision for federal income taxes is required in the financial statements. The Fund has a tax year-end of July 31.
Management of the Fund has reviewed tax positions taken in tax years that remain subject to examination by all major tax jurisdictions, including federal (i.e., the last four tax years, which includes the current fiscal tax year end). Management believes that there is no tax liability resulting from unrecognized tax benefits related to uncertain tax positions taken.
Allocations:
Expenses directly attributable to the Fund are charged to the Fund, while expenses that are attributable to more than one fund in the Trust, or jointly with an affiliated trust, are allocated among the respective funds in the Trust and/or affiliated trust based upon net assets or another appropriate basis.
Income, expenses (other than class-specific expenses such as transfer agent fees, state registration fees, and printing fees), and realized and unrealized gains or losses on investments are allocated to each class of shares based on its relative net assets on the date income is earned or expenses and realized and unrealized gains and losses are incurred.
19
USAA Mutual Funds Trust | Notes to Financial Statements — continued July 31, 2020 | ||||||
3. Purchases and Sales:
Cost of purchases and proceeds from sales/maturities of securities (excluding securities maturing less than one year from acquisition) for the year ended July 31, 2020, were as follows for the Fund (amounts in thousands):
| Excluding U.S. Government Securities | |||||||||||
Purchases | Sales | ||||||||||
$ | 1,015,736 | $ | 1,155,458 | ||||||||
There were no purchases and sales of U.S. government securities during the year ended July 31, 2020.
4. Affiliated Fund Ownership:
The Fund offers its shares for investment by other USAA Mutual Funds. The fund-of-funds do not invest in the underlying funds for the purpose of exercising management or control, and the affiliated fund- of-funds' annual and semi-annual reports may be viewed at usaa.com. As of July 31, 2020, certain fund-of-funds owned total outstanding shares of the Fund as follows:
USAA Cornerstone Conservative Fund | 0.1 | % | |||||
USAA Cornerstone Equity Fund | 0.5 | % | |||||
5. Fees and Transactions with Affiliates and Related Parties:
Investment Advisory Fees:
Investment advisory services are provided to the Fund by Victory Capital Management Inc. ("VCM" or "Adviser"), a New York corporation registered as an investment adviser with the Securities and Exchange Commission ("SEC"). The Adviser is a wholly-owned indirect subsidiary of Victory Capital Holdings, Inc., a publicly traded Delaware corporation, and a wholly-owned direct subsidiary of Victory Capital Operating, LLC. Under the terms of the Investment Advisory Agreement, the Adviser is entitled to receive a base fee and a performance adjustment. The Fund's base fee is accrued daily and paid monthly at an annualized rates of 0.50% of the first $750 million of the Fund's average daily net assets, 0.40% of that portion of the Fund's average daily net assets over $750 million but not over $1.5 billion, and 0.33% of that portion of the Fund's average daily net assets over $1.5 billion. Amounts incurred and paid to VCM for the year ended July 31, 2020, are reflected on the Statement of Operations as Investment Advisory fees.
Effective July 1, 2019, no performance adjustments were made for the period beginning July 1, 2019 through June 30, 2020. Only performance beginning as of July 1, 2019, and thereafter is utilized in calculating future performance adjustments.
The performance adjustment for each share class is accrued daily and calculated monthly by comparing each class' performance to that of the Lipper Large-Cap Growth Funds Index. The Lipper Large-Cap Growth Funds Index tracks the total return performance of each class within the Lipper Large-Cap Growth Funds category.
The performance period for each share class consists of the current month plus the previous 35 months (or the number of months beginning July 1, 2019, if fewer). The following table is utilized to determine the extent of the performance adjustment:
| Over/Under Performance Relative to Index (in basis points)(a) | Annual Adjustment Rate (in basis points)(a) | ||||||
+/- 100 to 400 | +/- 4 | ||||||
+/- 401 to 700 | +/- 5 | ||||||
+/- 701 and greater | +/- 6 | ||||||
20
USAA Mutual Funds Trust | Notes to Financial Statements — continued July 31, 2020 | ||||||
(a) Based on the difference between average annual performance of the relevant share class of the Fund and its relevant Lipper index, rounded to the nearest basis point. Average daily net assets of the share class are calculated over a rolling 36-month period.
Each class' annual performance adjustment rate is multiplied by the average daily net assets of the class over the entire performance period, which is then multiplied by a fraction, the numerator of which is the number of days in the month and the denominator of which is 365 (366 in leap years). The resulting amount is then added to (in the case of overperformance), or subtracted from (in the case of underperformance) the base fee.
Under the performance fee arrangement, each class pays a positive performance fee adjustment for a performance period whenever the class outperforms the Lipper Large-Cap Growth Funds Index over that period, even if the class has overall negative returns during the performance period.
For the period July 1, 2020 through July 31, 2020, performance adjustments for Fund Shares, and Institutional Shares were $(68) and less than $(1) thousand, respectively. For the Fund Shares, and Institutional Shares, the performance adjustments were less than 0.01% of net assets for both classes.
The Trust relies on an exemptive order granted to VCM and its affiliated funds by the SEC in March 2019 permitting the use of a "manager-of-managers" structure for certain funds. Under a manager-of- managers structure, the investment adviser may select (with approval of the Board and without shareholder approval) one or more subadvisers to manage the day-to-day investment of a fund's assets. For the year ended July 31, 2020, the Fund had no subadvisors.
Administration and Servicing Fees:
VCM serves as the Fund's administrator and fund accountant. Under the Fund Administration, Servicing and Accounting Agreement, VCM is paid for its services an annual fee at a rate of 0.15% and 0.10% of average daily net assets of the Fund Shares and Institutional Shares, respectively. Amounts incurred for the year ended July 31, 2020, are reflected on the Statement of Operations as Administration fees.
The Fund (as part of the Trust) has entered into an agreement to provide compliance services with the Adviser, pursuant to which the Adviser furnishes its compliance personnel, including the services of the Chief Compliance Officer ("CCO"), and other resources reasonably necessary to provide the Trust with compliance oversight services related to the design, administration and oversight of a compliance program for the Trust in accordance with Rule 38a-1 under the 1940 Act. The CCO is an employee of the Adviser, which pays the compensation of the CCO and support staff. Funds in the Trust, Victory Variable Insurance Funds, Victory Portfolios, and Victory Portfolios II (collectively, the "Victory Funds Complex") in the aggregate, compensates the Adviser for these services. Amounts incurred for the year ended July 31, 2020, are reflected on the Statement of Operations as Compliance fees.
Citi Fund Services Ohio, Inc. ("Citi"), an affiliate of Citibank, acts as sub-administrator and sub-fund accountant to the Fund pursuant to a Sub-Administration and Sub-Fund Accounting Services Agreement between VCM and Citi. VCM pays Citi a fee for providing these services. The Fund reimburses VCM and Citi for reasonable out-of-pocket expenses incurred in providing these services and certain other expenses specifically allocated to the Funds, under the Fund Administration, Servicing, and Accounting Agreement. Amounts incurred for the year ended July 31, 2020, are reflected on the Statement of Operations as Sub-Administration fees.
Transfer Agency Fees:
Victory Capital Transfer Agency, Inc. ("VCTA"), provides transfer agency services to the Fund. VCTA, an affiliate of the Adviser, provides transfer agent services to the Fund Shares based on an annual charge of $23 per shareholder account plus out-of-pocket expenses. VCTA pays a portion of these fees to certain intermediaries for the administration and servicing of accounts that are held with such intermediaries. Transfer agent's fees for Institutional Shares are paid monthly based on a fee accrued daily at an annualized rate of 0.10% of average daily net assets, plus out-of-pocket expenses. Amounts incurred and paid to VCTA for the year ended July 31, 2020, are reflected on the Statement of Operations as Transfer Agent fees.
21
USAA Mutual Funds Trust | Notes to Financial Statements — continued July 31, 2020 | ||||||
FIS Investor Services LLC serves as sub-transfer agent and dividend disbursing agent for the Fund pursuant to a Sub-Transfer Agent agreement between VCTA and FIS Investor Services LLC. VCTA provides FIS Investor Services LLC a fee for providing these services.
Distributor/Underwriting Services:
Victory Capital Services, Inc. (the "Distributor"), an affiliate of the Adviser, serves as distributor for the continuous offering of the shares of the Fund pursuant to a Distribution Agreement between the Distributor and the Trust. The Distributor received no fees or other compensation for such distribution services. Effective June 30, 2020, the Distributor's name was changed from Victory Capital Advisers, Inc.
Other Fees:
Citibank serves as the Fund's custodian.
K&L Gates LLP provides legal services to the Trust.
The Adviser has entered into an expense limitation agreement with the Fund until at least June 30, 2021. Under the terms of the agreement, the Adviser has agreed to waive fees or reimburse certain expenses to the extent that ordinary operating expenses incurred by certain classes of the Fund in any fiscal year exceed the expense limit for such classes of the Fund. Such excess amounts will be the liability of the Adviser. Interest, taxes, brokerage commissions, other expenditures, which are capitalized in accordance with GAAP, and other extraordinary expenses not incurred in the ordinary course of the Fund's business are excluded from the expense limits. As of July 31, 2020, the expense limits (excluding voluntary waivers) are 0.75% and 0.70% for Fund Shares and Institutional Shares, respectively.
Under this expense limitation agreement, the Fund has agreed to repay fees and expenses that were waived or reimbursed by the Adviser for a period up to three years after the fiscal year in which the waiver or reimbursement took place, subject to the lesser of any operating expense limits in effect at the time of: (a) the original waiver or expense reimbursement; or (b) the recoupment, after giving effect to the recoupment amount. As of July 31, 2020, the following amounts are available to be repaid to the Adviser (amounts in thousands). The Fund has not recorded any amounts available to be repaid as a liability due to an assessment that such repayment is not probable at July 31, 2020.
| Expires July 31, 2022 | Expires July 31, 2023 | Total | |||||||||
| $ | 3 | $ | 13 | $ | 16 | ||||||
The Adviser may voluntarily waive or reimburse additional fees to assist the Fund in maintaining competitive expense ratios. Voluntary waivers and reimbursements applicable to the Fund are not available to be recouped at a future time. There were no voluntary waivers or reimbursements for the year ended July 31, 2020.
Certain officers and/or interested trustees of the Fund are also officers and/or employees of the Adviser, Administrator, Sub-Administrator, Sub-Fund Accountant, and Legal.
6. Risks:
The Fund may be subject to other risks in addition to these identified risks.
Global economies and financial markets are increasingly interconnected, which increases the possibilities that conditions in one country or region might adversely affect issuers in another country or region. Geopolitical and other risks, including war, terrorism, trade disputes, political or economic dysfunction within some nations, public health crises and related geopolitical events, as well as environmental disasters such as earthquakes, fires, and floods, may add to instability in world economies and markets generally. Changes in trade policies and international trade agreements could affect the economies of many countries in unpredictable ways. Epidemics and/or pandemics, such as the coronavirus (or COVID-19), may result in, among other things, closing borders, disruptions to healthcare service preparation and delivery, quarantines, cancellations, disruptions to supply chains and consumer activity, as well as general concern and uncertainty. The impact may be short-term or may last for extended periods.
22
USAA Mutual Funds Trust | Notes to Financial Statements — continued July 31, 2020 | ||||||
The COVID-19 pandemic, which has spread rapidly across the world, has led and will continue to lead for an unknown period of time to disruptions in local, regional, national and global markets and economies. Among other things, the outbreak has resulted in, and until fully resolved is likely to continue to result in, among other things (1) government imposition of various forms of "stay at home" orders and the closing of "non-essential" businesses, resulting in significant disruption to the businesses of many issuers as well as lay-offs of employees: (2) increased requests by issuers of debt instruments for amendments and waivers of agreements to avoid default and increased defaults: (3) volatility and disruption of markets, including greater volatility in pricing and spreads; and (4) rapidly evolving proposals and/or actions by state and federal governments to address problems being experienced by the markets and by businesses and the economy in general.
The Fund invests in large-capitalization companies. Such investments may go in and out of favor based on market and economic conditions and may underperform other market segments. Some large- capitalization companies may be unable to respond quickly to new competitive challenges and attain the high growth rate of successful smaller companies, especially during extended periods of economic expansion. As such, returns on investments in stocks of large-capitalization companies could trail the returns on investments in stocks of small- and mid-capitalization companies.
Overall stock market risks may affect the value of the Fund. Factors such as domestic and international economic growth and market conditions, interest rate levels, and political events affect the securities market.
The value of the equity securities in which the Fund invests may decline in response to developments affecting individual companies and/or general economic conditions. A company's earnings or dividends may not increase as expected. Price changes may be temporary or last for extended periods.
7. Borrowing and Interfund Lending:
Line of Credit:
For the year ended July 31, 2020, the Victory Funds Complex participated in a short-term demand note "Line of Credit" agreement with Citibank. The Line of Credit agreement with Citibank was renewed on June 29, 2020 with a termination date of June 28, 2021. Under the agreement with Citibank, the Victory Funds Complex may borrow up to $600 million, of which $300 million is committed and $300 million is uncommitted. $40 million of the Line of Credit is reserved for use by the Victory Floating Rate Fund (herein, the "Fund"), another series of the Victory Funds Complex, with that Fund paying the related commitment fees for that amount. The purpose of the agreement is to meet temporary or emergency cash needs. For the year ended July 31, 2020, Citibank received an annual commitment fee of 0.15% on $300 million for providing the Line of Credit. Each fund in the Victory Funds Complex pays a pro-rata portion of the commitment fees plus any interest (one month LIBOR plus one percent) on amounts borrowed. Effective June 29, 2020, under an amended Line of Credit agreement, Citibank will also receive an annual upfront fee of 0.10% on the $300 million committed line of credit. Each fund in the Victory Funds Complex will pay a pro-rata portion of the upfront fee. Interest charged to each Fund during the period, if applicable, is reflected on the Statements of Operations under Line of credit fees.
The Fund had no borrowings under the Line of Credit agreement during the year ended July 31, 2020.
Interfund Lending:
The Trust and Adviser rely on an exemptive order granted by the SEC in March 2017 (the "Order"), permitting the establishment and operation of an Interfund Lending Facility (the "Facility"). The Facility allows the Fund to directly lend and borrow money to or from any other Fund in the Victory Funds Complex relying upon the Order at rates beneficial to both the borrowing and lending funds. Advances under the Facility are allowed for temporary or emergency purposes. The interfund loan rate is determined, as specified in the Order, by averaging the current repurchase agreement rate and the current bank loan rate. As a Borrower, interest charged to the Fund, if any, during the period is reflected
23
USAA Mutual Funds Trust | Notes to Financial Statements — continued July 31, 2020 | ||||||
on the Statement of Operations under Interfund lending fees. As a Lender, interest earned by the Fund, if any, during the period is reflected on the Statement of Operations under Income on Interfund lending.
The Fund did not utilize or participate in the Facility during the year ended July 31, 2020.
8. Federal Income Tax Information:
The Fund intends to distribute any net investment income annually. Distributable net realized gains, if any, are declared and paid at least annually.
The amounts of dividends from net investment income and distributions from net realized gains (collectively distributions to shareholders) are determined in accordance with federal income tax regulations, which may differ from GAAP. To the extent these "book/tax" differences are permanent in nature (e.g., net operating loss and distribution reclassification), such amounts are reclassified within the components of net assets based on their federal tax-basis treatment; temporary differences (e.g., wash sales) do not require reclassification. To the extent dividends and distributions exceed net investment income and net realized gains for tax purposes, they are reported as distributions of capital. Net investment losses incurred by the Fund may be reclassified as an offset to capital on the accompanying Statement of Assets and Liabilities.
As of July 31, 2020, on the Statement of Assets and Liabilities, there were no permanent book-to-tax difference reclassification adjustments.
The tax character of distributions paid during the tax years ended as noted below, were as follows (total distributions paid may differ from the Statements of Changes in Net Assets because, for tax purposes, dividends are recognized when actually paid) (amounts in thousands).
Year Ended July 31, 2020 | Year Ended July 31, 2019 | ||||||||||||||||||||||||||
Distributions paid from | Distributions paid from | ||||||||||||||||||||||||||
Ordinary Income | Net Long-Term Capital Gains | Total Distributions Paid | Ordinary Income* | Net Long-Term Capital Gains | Total Distributions Paid | ||||||||||||||||||||||
$ | 9,588 | $ | 266,385 | $ | 275,973 | $ | 23,144 | $ | 202,207 | $ | 225,351 | ||||||||||||||||
* Includes short-term realized capital gains, if any, which are taxable as ordinary income.
As of July 31, 2020, the components of accumulated earnings (loss) on a tax basis were as follows (amounts in thousands):
| Accumulated Capital and Other Losses | Qualified Late-Year Losses* | Unrealized Appreciation (Depreciation)** | Total Accumulated Earnings (Loss) | ||||||||||||
| $ | (38,270 | ) | $ | (633 | ) | $ | 724,221 | $ | 685,318 | ||||||
* Qualified late-year losses are comprised of post-October capital losses incurred after October 31 and certain late-year ordinary losses. Late-year ordinary losses represent ordinary losses incurred after December 31 and specified losses incurred after October 31. These losses are deemed to arise on the first day of the Fund's next taxable year.
** The difference between the book-basis and tax-basis of unrealized appreciation/depreciation is attributable primarily to tax deferral of losses on wash sales and passive foreign investment company adjustments.
24
USAA Mutual Funds Trust | Notes to Financial Statements — continued July 31, 2020 | ||||||
At July 31, 2020, the Fund had net capital loss carryforwards as shown in the table below (amounts in thousands). It is unlikely that the Board will authorize a distribution of capital gains realized in the future until the capital loss carryforwards have been used.
| Short-Term Amount | Total | ||||||
| $ | 38,270 | $ | 38,270 | ||||
As of July 31, 2020, the cost basis for federal income tax purposes, gross unrealized appreciation, gross unrealized depreciation, and net unrealized appreciation (depreciation) for investments were as follows (amounts in thousands):
| Cost of Investments for Federal Tax Purposes | Gross Unrealized Appreciation | Gross Unrealized Depreciation | Net Unrealized Appreciation (Depreciation) | ||||||||||||
| $ | 1,126,029 | $ | 752,858 | $ | (28,637 | ) | $ | 724,221 | |||||||
25
REPORT OF INDEPENDENT REGISTERED PUBLIC ACCOUNTING FIRM
To the Shareholders and the Board of Trustees of USAA Aggressive Growth Fund
Opinion on the Financial Statements
We have audited the accompanying statement of assets and liabilities of USAA Aggressive Growth Fund (the "Fund") (one of the funds constituting USAA Mutual Funds Trust (the "Trust")), including the schedule of portfolio investments, as of July 31, 2020, and the related statement of operations for the year then ended, the statements of changes in net assets for each of the two years in the period then ended, the financial highlights for each of the five years in the period then ended and the related notes (collectively referred to as the "financial statements"). In our opinion, the financial statements present fairly, in all material respects, the financial position of the Fund (one of the funds constituting USAA Mutual Funds Trust) at July 31, 2020, the results of its operations for the year then ended, the changes in its net assets for each of the two years in the period then ended and its financial highlights for each of the five years in the period then ended, in conformity with U.S. generally accepted accounting principles.
Basis for Opinion
These financial statements are the responsibility of the Trust's management. Our responsibility is to express an opinion on the Fund's financial statements based on our audits. We are a public accounting firm registered with the Public Company Accounting Oversight Board (United States) ("PCAOB") and are required to be independent with respect to the Trust in accordance with the U.S. federal securities laws and the applicable rules and regulations of the Securities and Exchange Commission and the PCAOB.
We conducted our audits in accordance with the standards of the PCAOB. Those standards require that we plan and perform the audit to obtain reasonable assurance about whether the financial statements are free of material misstatement, whether due to error or fraud. The Trust is not required to have, nor were we engaged to perform, an audit of the Trust's internal control over financial reporting. As part of our audits we are required to obtain an understanding of internal control over financial reporting, but not for the purpose of expressing an opinion on the effectiveness of the Trust's internal control over financial reporting. Accordingly, we express no such opinion.
Our audits included performing procedures to assess the risks of material misstatement of the financial statements, whether due to error or fraud, and performing procedures that respond to those risks. Such procedures included examining, on a test basis, evidence regarding the amounts and disclosures in the financial statements. Our procedures included confirmation of securities owned as of July 31, 2020, by correspondence with the custodian and brokers or by other appropriate auditing procedures where replies from brokers were not received. Our audits also included evaluating the accounting principles used and significant estimates made by management, as well as evaluating the overall presentation of the financial statements. We believe that our audits provide a reasonable basis for our opinion.

We have served as the auditor of one or more Victory Capital investment companies since 1995.
San Antonio, Texas
September 29, 2020
26
USAA Mutual Funds Trust | Supplemental Information July 31, 2020 | ||||||
(Unaudited)
Trustee and Officer Information
Board of Trustees:
Overall responsibility for management of the Trust rests with the Board. The Trust is managed by the Board in accordance with the laws of the state of Delaware. There are currently 10 Trustees, eight of whom are not "interested persons" of the Trust within the meaning of that term under the 1940 Act ("Independent Trustees") and two of whom is an "interested person" of the Trust within the meaning of that term under the 1940 Act ("Interested Trustee"). The Trustees, in turn, elect the officers of the Trust to actively supervise its day-to-day operations.
The following tables list the Trustees, their ages, position with the Trust, commencement of service, principal occupations during the past five years and any directorships of other investment companies or companies whose securities are registered under the Securities Exchange Act of 1934, as amended, or who file reports under that Act. Each Trustee oversees 47 portfolios in the Trust. Each Trustee's address is 15935 La Cantera Pkwy, Building Two, San Antonio, TX, 78256. Pursuant to a policy adopted by the Board, the term of office for each Trustee shall be until the Independent Trustee reaches age 75 or an Interested Trustee reaches age 75. The Board may change or grant exceptions from this policy at any time without shareholder approval. A Trustee may resign or be removed by a vote of the other Trustees or the holders of a majority of the outstanding shares of the Trust at any time. Vacancies on the Board can be filled by the action of a majority of the Trustees, provided that after filling such vacancy at least two-thirds of the Trustees have been elected by the shareholders.
Name and Date of Birth | Position Held with the Trust | Year Commenced Service | Principal Occupation During Past 5 Years | Other Directorships Held During Past 5 Years | |||||||||||||||
Independent Trustees. | |||||||||||||||||||
| Jefferson C. Boyce, Born September 1957 | Lead Independent Trustee, and Vice Chairman | 2013 | Senior Managing Director, New York Life Investments, LLC (1992-2012) | Westhab, Inc. | |||||||||||||||
| John C. Walters, Born February 1962 | Trustee | 2019 | Retired. Mr. Walters brings significant Board experience including active involvement with the board of a Fortune 500 company, and a proven record of leading large, complex financial organizations. He has a demonstrated record of success in distribution, manufacturing, investment brokerage, and investment management in both the retail and institutional investment businesses. He has substantial experience in the investment management business with a demonstrated ability to develop and drive strategy while managing operation, financial, and investment risk. | Guardian Variable Products Trust (16 series), Lead Independent Director; Amerilife Holdings LLC, Director; Stadion Money Management; Director; University of North Carolina (Chapel Hill), Member Board of Governors. | |||||||||||||||
27
USAA Mutual Funds Trust | Supplemental Information — continued July 31, 2020 | ||||||
(Unaudited)
Name and Date of Birth | Position Held with the Trust | Year Commenced Service | Principal Occupation During Past 5 Years | Other Directorships Held During Past 5 Years | |||||||||||||||
| Robert L. Mason, Ph.D., Born July 1946 | Trustee | 1997 | Adjunct Professor in the Department of Management Science and Statistics in the College of Business at the University of Texas at San Antonio (since 2001); Institute Analyst, Southwest Research Institute (March 2002-January 2016) | None | |||||||||||||||
| Dawn M. Hawley, Born February 1954 | Trustee | 2014 | Manager of Finance, Menil Foundation, Inc. (May 2007-June 2011), which is a private foundation that oversees the assemblage of sculptures, prints, drawings, photographs, and rare books. Director of Financial Planning and Analysis and Chief Financial Officer, AIM Management Group, Inc. (October 1987-January 2006) | None | |||||||||||||||
| Paul L. McNamara, Born July 1948 | Trustee | 2012 | Director, Cantor Opportunistic Alternatives Fund, LLC (March 2010-February 2014) , which is a closed-end fund of funds by Cantor Fitzgerald Investment Advisors, LLC | None | |||||||||||||||
28
USAA Mutual Funds Trust | Supplemental Information — continued July 31, 2020 | ||||||
(Unaudited)
Name and Date of Birth | Position Held with the Trust | Year Commenced Service | Principal Occupation During Past 5 Years | Other Directorships Held During Past 5 Years | |||||||||||||||
| Richard Y. Newton III, Born January 1956 | Trustee | 2017 | Director, Elta North America (01/18-present), which is a global leader in the design, manufacture, and support of innovative electronic systems in the ground, maritime, airborne, and security domains for the nation's warfighters, security personnel, and first responders; Managing Partner, Pioneer Partnership Development Group (December 2015-present)); Executive Director, The Union League Club of New York (June 2014-November 2015): Executive Vice President, Air Force Association (August 2012-May 2014); Lieutenant General, United States Air Force (January 2008-June 2012) | None | |||||||||||||||
| Barbara B. Ostdiek, Ph.D., Born March 1964 | Trustee | 2008 | Senior Associate Dean of Degree Programs at Jesse H. Jones Graduate School of Business at Rice University (since 2013); Associate Professor of Finance at Jessie H. Jones Graduate School of Business at Rice University (since 2001) | None | |||||||||||||||
| Michael F. Reimherr, Born August 1945 | Trustee | 2000 | President of Reimherr Business Consulting (May 1995-December 2017); St. Mary's University Investment Committee overseeing University Endowment (since 2014) | None | |||||||||||||||
29
USAA Mutual Funds Trust | Supplemental Information — continued July 31, 2020 | ||||||
(Unaudited)
Name and Date of Birth | Position Held with the Trust | Year Commenced Service | Principal Occupation During Past 5 Years | Other Directorships Held During Past 5 Years | |||||||||||||||
Interested Trustees. | |||||||||||||||||||
| David C. Brown, ** Born May 1972 | Trustee | 2019 | Chairman and Chief Executive Officer (since 2013), Co-Chief Executive Officer (2011-2013), Victory Capital Management Inc.; Chairman and Chief Executive Officer, Victory Capital Holdings, Inc. (since 2013). Mr. Brown brings to the Board extensive business, finance and leadership skills gained and developed through years of experience in the financial services industry, including his tenure overseeing the strategic direction as CEO of Victory Capital. These skills, combined with Mr. Brown's extensive knowledge of the financial services industry and demonstrated success in the development and distribution of investment strategies and products, enable him to provide valuable insights to the Board and strategic direction for the Funds | Trustee, Victory Portfolios (42 series), Victory Portfolios II (26 series), Victory Variable Insurance Funds (9 series) | |||||||||||||||
30
USAA Mutual Funds Trust | Supplemental Information — continued July 31, 2020 | ||||||
(Unaudited)
Name and Date of Birth | Position Held with the Trust | Year Commenced Service | Principal Occupation During Past 5 Years | Other Directorships Held During Past 5 Years | |||||||||||||||
| Daniel S. McNamara, ** Born June 1966 | Trustee and Chair of the Board of Trustees | 2012 | Trustee, President, and Vice Chairman of USAA ETF Trust (June 2017-June 2019); President of Financial Advice & Solutions Group (FASG), USAA (since 2013); Director, Investment Management Company (IMCO) (September 2009-April 2014); President, Asset Management Company (AMCO) (August, 2011-April 2013); Senior Vice President of USAA Financial Planning Services Insurance Agency, Inc. (FPS) (since 2011); Director of USAA IMCO (since 2009); Chairman of Board of IMCO (since 2013); Director of AMCO (August 2011-June 2019); President and Director of USAA Shareholder Account Services (SAS) (October 2009-June 2019); Director and Vice Chairman of FPS (since 2013); President and Director of USAA Investment Corporation (ICORP) (since 2010); Chairman of Board of ICORP (since 2013); Director of USAA Financial Advisors, Inc. (FAI) (since 2013); Chairman of Board of FAI (since 2015). Mr. McNamara brings to the Board extensive experience in the financial services industry, including experience as an officer of the Trust. | None | |||||||||||||||
** Mr. Dan McNamara, the Chairman of the Board, is deemed an "interested person" due to his previous position as Director of AMCO, the former investment adviser of the Funds. Mr. Brown is deemed an "interested person" due to his position as Chief Executive Officer of Victory Capital, investment adviser to the Funds.
The Statement of Additional Information includes additional information about the Trustees of the Trust and is available, without charge, on the SEC's website at www.sec.gov and/or by calling (800)-539-3863.
31
USAA Mutual Funds Trust | Supplemental Information — continued July 31, 2020 | ||||||
(Unaudited)
Officers:
The officers of the Trust, their ages, commencement of service and their principal occupations during the past five years, are detailed in the following table. Each officer serves until the earlier of his or her resignation, removal, retirement, death, or the election of a successor. The mailing address of each officer of the Trust is 15935 La Cantera Pkwy, Building Two, San Antonio, TX, 78256. The officers of the Trust receive no compensation directly from the Trust for performing the duties of their offices.
Name and Date of Birth | Position with the Trust | Year Commenced Service | Principal Occupation During Past 5 Years | ||||||||||||
Interested Officers. | |||||||||||||||
| Christopher K. Dyer, Born February 1962 | President | 2019 | Director of Fund Administration, Victory Capital (2004-present) | ||||||||||||
| Scott A Stahorsky, Born July 1969 | Vice President | 2019 | Manager, Fund Administration, Victory Capital (since 2015); Senior Analyst, Fund Administration, Victory Capital (prior to 2015) | ||||||||||||
| James K. De Vries, Born April 1969 | Treasurer, Principal Financial Officer | 2018 | Executive Director, Victory Capital Management Inc. (since 2019); Treasurer, USAA ETF Trust (September 2018-June 2019); Executive Director, Investment and Financial Administration, USAA (April 2012-June 2019); Assistant Treasurer, USAA ETF Trust (June 2017-September 2018); Assistant Treasurer, USAA Mutual Funds Trust (December 2013-February 2018) | ||||||||||||
| Allan Shaer, Born March 1965 | Assistant Treasurer | 2019 | Senior Vice President, Financial Administration, Citi Fund Services Ohio, Inc. (since 2016); Vice President, Mutual Fund Administration, JP Morgan Chase (2011-2016) | ||||||||||||
| Carol D. Trevino, Born October 1965 | Assistant Treasurer | 2018 | Director, Accounting and Finance, Victory Capital Management Inc. (since 2019); Accounting/Financial Director, USAA (December 2013-June 2019); Assistant Treasurer, USAA ETF Trust (September 2018-June 2019). | ||||||||||||
| Erin G. Wagner, Born February 1974 | Secretary | 2019 | Deputy General Counsel, the Adviser (since 2013) | ||||||||||||
| Charles Booth, Born April 1960 | Anti-Money Laundering Compliance Officer and Identity Theft Officer | 2019 | Director, Regulatory Administration and CCO Support Services, Citi Fund Services Ohio, Inc. (2007-present) | ||||||||||||
| Amy Campos, Born July 1976 | Chief Compliance Officer | 2019 | Chief Compliance Officer, USAA Mutual Funds Trust (since 2019); Executive Director, Deputy Chief Compliance Officer, USAA Mutual Funds Trust and USAA ETF Trust (July 2017-June 2019); Compliance Director, USAA Mutual Funds Trust (2014-July 2017) | ||||||||||||
32
USAA Mutual Funds Trust | Supplemental Information — continued July 31, 2020 | ||||||
(Unaudited)
Proxy Voting and Portfolio Holdings Information
Proxy Voting:
Information regarding the policies and procedures the Fund uses to determine how to vote proxies relating to portfolio securities is available without charge, upon request, by calling (800) 539-3863. The information is also included in the Fund's Statement of Additional Information, which is available on the SEC's website at www.sec.gov.
Information relating to how the Fund voted proxies relating to portfolio securities held during the most recent 12 months ended June 30 is available on the SEC's website at www.sec.gov.
Availability of Schedules of Portfolio Investments:
The Trust files a complete list of Schedules of Portfolio Investments with the SEC for the first and third quarter of each fiscal year on Form N-PORT. Forms N-PORT are available on the SEC's website at www.sec.gov.
Expense Examples
As a shareholder of the Fund, you may incur two types of costs: (1) transaction costs, and (2) ongoing costs, including management fees and other Fund expenses. These examples are intended to help you understand your ongoing costs (in dollars) of investing in the Fund and to compare these costs with the ongoing costs of investing in other mutual funds.
These examples are based on an investment of $1,000 invested at the beginning of the period and held for the entire period from February 1, 2020 through July 31, 2020.
The Actual Expense figures in the table below provide information about actual account values and actual expenses. You may use the information below, together with the amount you invested, to estimate the expenses that you paid over the period. Simply divide your account value by $1,000 (for example, an $8,600 account value divided by $1,000 = 8.6), then multiply the result by the number in the table under the heading entitled "Actual Expenses Paid During Period" to estimate the expenses you paid on your account during this period.
The Hypothetical Expense figures in the table below provide information about hypothetical account values and hypothetical expenses based on the Fund's actual expense ratio and an assumed rate of return of 5% per year before expenses, which is not the Fund's actual return. The hypothetical account values and expenses may not be used to estimate the actual ending account balance or expenses you paid for the period. You may use this information to compare this 5% hypothetical example with the 5% hypothetical examples that appear in shareholder reports of other funds.
Please note the expenses shown in the table below are meant to highlight your ongoing costs only and do not reflect any transactional costs. If these transactional costs were included, your costs would have been higher.
| Beginning Account Value 2/1/20 | Actual Ending Account Value 7/31/20 | Hypothetical Ending Account Value 7/31/20 | Actual Expenses Paid During Period 2/1/20- 7/31/20* | Hypothetical Expenses Paid During Period 2/1/20- 7/31/20* | Annualized Expense Ratio During Period 2/1/20- 7/31/20 | ||||||||||||||||||||||
Fund Shares | $ | 1,000.00 | $ | 1,183.60 | $ | 1,021.43 | $ | 3.75 | $ | 3.47 | 0.69 | % | |||||||||||||||
Institutional Shares | 1,000.00 | 1,183.80 | 1,021.48 | 3.69 | 3.42 | 0.68 | % | ||||||||||||||||||||
* Expenses are equal to the average account value multiplied by the Fund's annualized expense ratio multiplied by 182/366 (the number of days in the most recent fiscal half-year divided by the number of days in the fiscal year).
33
USAA Mutual Funds Trust | Supplemental Information — continued July 31, 2020 | ||||||
(Unaudited)
Additional Federal Income Tax Information
The following federal tax information related to the Fund's fiscal year ended July 31, 2020, is provided for information purposes only and should not be used for reporting to federal or state revenue agencies. Federal tax information for the calendar year will be reported to you on Form 1099-DIV in January 2021.
With respect to distributions paid, the Fund designates the following amounts (or, if subsequently determined to be different, the maximum amount allowable) for the fiscal year ended July 31, 2020 (amounts in thousands):
| Dividend Received Deduction (corporate shareholders)* | Short-Term Capital Gains Distributions | Long-Term Capital Gains Distributions(a) | |||||||||||||
94.99 | % | $ | 7,765 | $ | 266,385 | ||||||||||
* Presented as a percentage of net investment income and excludes short-term capital gain distributions paid, if any. All or a portion of these amounts may be exempt from taxation at the state level.
(a) Pursuant to Section 852 of the Internal Revenue Code.
34
USAA Mutual Funds Trust | Supplemental Information — continued July 31, 2020 | ||||||
(Unaudited)
Liquidity Risk Management Program
The USAA Mutual Funds have adopted and implemented a written liquidity risk management program (the "LRMP") as required by Rule 22e-4 under the Investment Company Act of 1940, as amended. The LRMP is reasonably designed to assess and manage the Fund's liquidity risk, taking into consideration the Fund's investment strategy and the liquidity of its portfolio investments during normal and reasonably foreseeable stressed market conditions; its short and long-term cash flow projections; and its cash holdings and access to other liquidity management tools such as available funding sources including the Victory Funds Complex Interfund Lending Facility and Line of Credit (discussed in the Notes to Financial Statements). The USAA Mutual Funds' Board of Trustees approved the appointment of the Fund's investment adviser, Victory Capital Management Inc. ("Victory Capital"), as the administrator of the LRMP. At an in-person meeting held on February 26, 2020, Victory Capital provided an oral and written report to the Trustees on the operation and effectiveness of the LRMP during the previous year.
Victory Capital manages liquidity risks associated with the Fund's investments by monitoring, among other things, cash and cash equivalents, any use of derivatives, the concentration of investments, the appropriateness of the Fund's investment strategy, and by classifying every fund investment as either highly liquid, moderately liquid, less liquid or illiquid on at least a monthly basis. To assist with the classification of Fund investments, Victory Capital has retained a third-party provider of liquidity evaluation services. This provider determines preliminary liquidity classifications for all portfolio holdings based upon portfolio-level data and certain assumptions provided by Victory Capital. Victory Capital reviews the preliminary liquidity classifications, and, when appropriate, considers other information including input from the Fund's portfolio managers (including the portfolio managers employed by any investment sub-advisers) in determining final liquidity classifications.
The report from Victory Capital concluded that the Fund did not experience any significant liquidity challenges during the covered period, and the Fund's LRMP is reasonably designed to assess and manage its liquidity risk. The report also concluded that the LRMP continues to operate adequately and effectively to enable Victory Capital to oversee and manage liquidity risk and ensure the Fund is able to meet redemption requests without significant dilution to the remaining investors' interest in the Fund. During the review period, the Fund's portfolio consisted primarily of highly liquid investments, which are defined as cash and any investments reasonably expected to be converted to cash in current market conditions in three business days or less without significantly changing the market value of the investment. Therefore, the Fund has not adopted a Highly Liquid Investment Minimum. The Fund's investments were below the limitation on illiquid investments during the review period. Additionally, Victory Capital indicated that no events occurred that would require the filing of Form N-LIQUID and recommended no material changes to the LRMP.
35
Privacy Policy
Protecting the Privacy of Information
The Trust respects your right to privacy. We also know that you expect us to conduct and process your business in an accurate and efficient manner. To do so, we must collect and maintain certain personal information about you. This is the information we collect from you on applications or other forms, and from the transactions you make with us or third parties. It may include your name, address, social security number, account transactions and balances, and information about investment goals and risk tolerance.
We do not disclose any information about you or about former customers to anyone except as permitted or required by law. Specifically, we may disclose the information we collect to companies that perform services on our behalf, such as the transfer agent that processes shareholder accounts and printers and mailers that assist us in the distribution of investor materials. We may also disclose this information to companies that perform marketing services on our behalf. This allows us to continue to offer you Victory investment products and services that meet your investing needs, and to effect transactions that you request or authorize. These companies will use this information only in connection with the services for which we hired them. They are not permitted to use or share this information for any other purpose.
To protect your personal information internally, we permit access only by authorized employees and maintain physical, electronic and procedural safeguards to guard your personal information.*
* You may have received communications regarding information about privacy policies from other financial institutions which gave you the opportunity to "opt-out" of certain information sharing with companies which are not affiliated with that financial institution. The Trust does not share information with other companies for purposes of marketing solicitations for products other than the Trust. Therefore, the Trust does not provide opt-out options to their shareholders.
P.O. Box 182593
Columbus, Ohio 43218-2593

Visit our website at: | Call | ||||||
vcm.com | (800) 235-8396 | ||||||
23417-0920

JULY 31, 2020
Annual Report
USAA Capital Growth Fund
Beginning January 1, 2021, as permitted by regulations adopted by the Securities and Exchange Commission, paper copies of the Fund's shareholder reports like this one will no longer be sent by mail, unless you specifically request paper copies of the reports from the Fund or from your financial intermediary, such as a broker-dealer or bank. Instead, the reports will be made available on VictoryFunds.com, and you will be notified by mail each time a report is posted and provided with a website link to access the report. If you already elected to receive shareholder reports electronically, you will not be affected by this change and you need not take any action.
You may elect to receive shareholder reports and other communications from the Fund or your financial intermediary electronically by notifying your financial intermediary directly, or if you are a direct investor, by calling (800) 235-8396 or logging on to usaa.com. Effective on or about November 6, 2020, a shareholder who has an account directly with the Fund will need to submit their request via email to TA.Processing@FISGlobal.com.
You may elect to receive all future reports in paper free of charge. You can inform the Fund or your financial intermediary that you wish to continue receiving paper copies of your shareholder reports by notifying your financial intermediary directly, or if you are a direct investor, by calling (800) 235-8396 or logging on to usaa.com. Effective on or about November 6, 2020, a shareholder who has an account directly with the Fund will need to submit their request via email to TA.Processing@FISGlobal.com. Your election to receive reports in paper will apply to all funds held with the USAA Mutual Funds or your financial intermediary.
Victory Capital means Victory Capital Management Inc., the investment adviser of the USAA Mutual Funds. USAA Mutual Funds are distributed by Victory Capital Services, Inc., member FINRA, an affiliate of Victory Capital. Victory Capital and its affiliates are not affiliated with United Services Automobile Association or its affiliates. USAA and the USAA logo are registered trademarks and the USAA Mutual Funds and USAA Investments logos are trademarks of United Services Automobile Association and are being used by Victory Capital and its affiliates under license.
USAA Mutual Funds Trust
TABLE OF CONTENTS
Shareholder Letter (Unaudited) | 2 | ||||||
Managers' Commentary (Unaudited) | 3 | ||||||
Investment Overview (Unaudited) | 5 | ||||||
| Investment Objective & Portfolio Holdings (Unaudited) | 6 | ||||||
Financial Statements | |||||||
Schedule of Portfolio Investments | 7 | ||||||
Statement of Assets and Liabilities | 19 | ||||||
Statement of Operations | 20 | ||||||
Statements of Changes in Net Assets | 21 | ||||||
Financial Highlights | 22 | ||||||
Notes to Financial Statements | 24 | ||||||
| Report of Independent Registered Public Accounting Firm | 34 | ||||||
Supplemental Information | 35 | ||||||
Trustees' and Officers' Information | 35 | ||||||
Proxy Voting and Portfolio Holdings Information | 41 | ||||||
Expense Examples | 41 | ||||||
Additional Federal Income Tax Information | 42 | ||||||
Liquidity Risk Management Program | 43 | ||||||
Privacy Policy (inside back cover) | |||||||
This report is for the information of the shareholders and others who have received a copy of the currently effective prospectus of the Fund, managed by Victory Capital Management Inc. It may be used as sales literature only when preceded or accompanied by a current prospectus, which provides further details about the Fund.
IRA DISTRIBUTION WITHHOLDING DISCLOSURE
We generally must withhold federal income tax at a rate of 10% of the taxable portion of your distribution and, if you live in a state that requires state income tax withholding, at your state's tax rate. However, you may elect not to have withholding apply or to have income tax withheld at a higher rate. Any withholding election that you make will apply to any subsequent distribution unless and until you change or revoke the election. If you wish to make a withholding election, or change or revoke a prior withholding election, call (800) 235-8396.
If you do not have a withholding election in place by the date of a distribution, federal income tax will be withheld from the taxable portion of your distribution at a rate of 10%. If you must pay estimated taxes, you may be subject to estimated tax penalties if your estimated tax payments are not sufficient and sufficient tax is not withheld from your distribution.
For more specific information, please consult your tax adviser.
1
(Unaudited)
Dear Shareholder,
The previous decade ended with the longest-ever bull market in U.S. equities still intact, even as investors wrestled with issues like softening global economic data, Brexit, and U.S.-China trade relations. In retrospect, those worries seem pedestrian given what we would experience.
A new and unexpected threat—a global pandemic, the novel coronavirus ("COVID-19")—first emerged in Asia and then began spreading globally and throughout the United States during the first quarter of 2020. This unprecedented and unanticipated event not only rendered all existing economic forecasts moot, but it also roiled stock and bond markets everywhere. It also brought the economy to a near halt. The historic bull market in stocks ended virtually overnight.
After an initial severe sell-off in March, equity markets recovered sharply. As our annual reporting period drew to a close on July 31, 2020, many of the broad market indexes had recovered and volatility had returned to more palatable levels. In fact, despite all the chaos, the S&P 500® Index, one of the most popular measures of large U.S. stocks, finished the fiscal year (July 31, 2020) at approximately 3,271, which was up 8.9% from one year ago. Quite the impressive reversal.
The market turmoil of early 2020 was not limited to equities. Fixed income volatility spiked when liquidity evaporated in late March as investors struggled to understand the ramifications of sheltering in place. Fortunately, the U.S. Federal Reserve (the "Fed") (as well as other global central banks) leapt into action—cutting interest rates, (re)starting quantitative easing and, in the case of the Fed, launching an array of programs to stabilize markets.
The new lending facilities and programs had their intended effect of improving fixed income liquidity and trading. Credit spreads across corporate, high yield, structured, and municipal markets were coaxed down from their highs. In addition, Congress came through with substantial fiscal stimulus that also was applauded by investors and markets. Although fixed income markets regained their footing, the yield on 10-Year Treasurys, a benchmark for low-risk investments, declined steadily during our fiscal year—from 2.02% at the beginning of our reporting period to approximately 0.55% as of July 31, 2020. This suggests that investors remain a little wary.
While the past year has been unprecedented for all of us, both personally and professionally, our portfolio managers continue to analyze the financial markets, economic conditions, and the trajectory of the pandemic, which will likely be a guiding factor on Fed policy and the markets.
No matter what happens in the near term, we believe that the massive monetary and fiscal policies introduced earlier this year will have longer-term ramifications. Despite this uncertainty, it's important to remain focused on your long-term investment goals and avoid making emotional decisions. If you invest with us directly, our Member Service Representatives are available to help. Call us at (800) 235-8396.
Sincerely,

Christopher K. Dyer, CFA
President,
USAA Mutual Funds
2
USAA Mutual Funds Trust
USAA Capital Growth Fund
Managers' Commentary
(Unaudited)
Victory Solutions
Mannik S. Dhillon, CFA, CAIA Wasif A. Latif
RS Investments Developed Markets, A Victory Capital Investment Franchise
U-Wen Kok, CFA Adam Mezan, CFA
Sophus Capital, A Victory Capital Investment Franchise
Michael Reynal, CFA Michael Ade, CFA*
Maria Freund, CFA
Trivalent Investments, A Victory Capital Investment Franchise
Peter S. Carpenter, CFA Jeffrey R. Sullivan, CFA
• What were the market conditions over the reporting period?
The U.S. stock market generated solid gains for the reporting period overall. Growth stocks significantly outperformed value stocks, while large-cap stocks outpaced small-cap stocks.
Global financial market performance varied widely over the period driven by optimism of continued economic recovery followed by the novel coronavirus ("COVID-19") shock and uncertainty related to the duration and economic impact of the COVID-19 pandemic. These fears generally led to a "risk-off" environment as investors flocked to safe haven assets such as U.S. Treasurys and gold. Global equities turned mostly lower with the exception of a small breadth of mega-cap securities well positioned for an extended economic slowdown and the new stay-at-home paradigm. The final month and a half of the reporting period saw a rebound in risky assets as economies began a phased reopening. The U.S. large-cap growth space, led by information technology and communication services, continued to outperform in the face of the economic threat as they were perceived as "stay-at-home stocks" that would further benefit from economic activity from homes.
Within the United States, the S&P 500® Index dropped nearly 34% at the end of the reporting period from its 2020 high, before beginning to recoup losses with the support of comprehensive monetary and fiscal stimulus, along with optimism that a COVID-19 treatment will eventually emerge. Over the reporting period, the S&P 500 Index retuned 11.96%, with large-cap growth stocks leading the way, up to a return of 29.84% as represented by the Russell 1000 Growth Index. Value stocks and small-cap stocks significantly underperformed growth stocks over the period. U.S. large-cap value stocks were down to a return of -6.01% over the reporting period as gauged by the Russell 1000 Value Index, while U.S. small-cap stocks, returned -4.59% as represented by the Russell 2000 Index.
* *Effective May 1, 2020, Michael Ade no longer manages the Fund.
3
USAA Mutual Funds Trust
USAA Capital Growth Fund
Managers' Commentary (continued)
Developed-market international and emerging market equities followed a path similar to U.S. equities. Markets led investors on a rollercoaster ride that saw both the MSCI EAFE Index and MSCI Emerging Markets Index drop approximately 34% from their highs in the year. The market drawdown hit bottom on March 23rd and then started a steady ascent, erasing most of the year's losses as European Central Bank quantitative easing and talks of a 750-billion euros fiscal stimulus helped bolster momentum in the market's recovery. Over the reporting period, developed international equities, represented by the MSCI EAFE Index, were down to a return of -1.67%, while the MSCI Emerging Markets Index returned 6.55%.
• How did the USAA Capital Growth Fund (the "Fund") perform during the reporting period?
The Fund has two share classes: Fund Shares and Institutional Shares. For the reporting period ended July 31, 2020, the Fund Shares and Institutional Shares had total returns of 2.14% and 2.20%, respectively. This compares to returns of 7.23% for the MSCI World Index, 7.20% for the MSCI All-Country World Index (the "Index") and 7.33% for the Lipper Global Funds Index.
• What strategies did you employ during the reporting period?
For the reporting period, stock selection was the principal detractor from the Fund's performance relative to the Index, while sector allocation had a slightly negative effect overall. Stock selection within the consumer discretionary, communication services, industrials, and information technology sectors detracted performance, while the Fund's selection within consumer staples helped performance. In terms of allocation, an overweight position to the healthcare sector and an underweight position in financials helped performance, while underweight positions in consumer discretionary and staples harmed Fund returns.
Thank you for allowing us to assist you with your investment needs.
4
USAA Mutual Funds Trust
USAA Capital Growth Fund
Investment Overview
(Unaudited)
Average Annual Total Return
Year Ended July 31, 2020
Fund Shares | Institutional Shares | ||||||||||||||||||||||
INCEPTION DATE | 10/27/00 | 8/7/15 | |||||||||||||||||||||
Net Asset Value | Net Asset Value | MSCI All-Country World Index1 | MSCI World Index2 | Lipper Global Funds Index3 | |||||||||||||||||||
One Year | 2.14 | % | 2.20 | % | 7.20 | % | 7.23 | % | 7.33 | % | |||||||||||||
Five Year | 5.72 | % | N/A | 7.37 | % | 7.52 | % | 6.52 | % | ||||||||||||||
Ten Year | 9.25 | % | N/A | 8.86 | % | 9.61 | % | 8.46 | % | ||||||||||||||
Since Inception | N/A | 5.75 | % | N/A | N/A | N/A | |||||||||||||||||
Past performance is not indicative of future results. The performance data quoted represents past performance and current returns may be lower or higher. The investment return and principal value will fluctuate so that an investor's shares, when redeemed, may be worth more or less than the original cost. To obtain performance information current to the most recent month's end, please visit www.vcm.com.
Total return measures the price change in a share assuming the reinvestment of all net investment income and realized capital gain distributions, if any. The total returns quoted do not reflect adjustments made to the enclosed financial statements in accordance with U.S. generally accepted accounting principles or the deduction of taxes that a shareholder would pay on net investment income and realized capital gain distributions, including reinvested distributions, or redemptions of shares. The total return figures set forth above include all waivers of fees for various periods since inception. Without such fee waivers, the total returns would have been lower.
USAA Capital Growth Fund — Growth of $10,000

1The unmanaged MSCI All-Country World Index is a free float-adjusted market capitalization weighted index that is designed to measure the equity market performance of developed and emerging markets. There are no expenses associated with the index, while there are expenses associated with the Fund.
2The unmanaged MSCI World Index reflects the movements of world stock markets by representing a broad selection of domestically listed companies within each market.
3The unmanaged Lipper Global Funds Index tracks the total return performance of funds within the Lipper Global Funds category. This category includes funds that invest at least 25% of their portfolio in securities traded outside of the United States and that may own U.S. securities as well.
The Fund has selected the MSCI All-Country World Index as the Fund's principal benchmark index in replacement of the MSCI World Index because it believes the MSCI All-Country World Index is more representative of the Fund's investment universe.
The graph reflects investment of growth of a hypothetical $10,000 investment in the Fund. Past performance is no guarantee of future results.
The graph and table do not reflect the deduction of taxes that a shareholder would pay on Fund distributions or the redemption of Fund shares.
5
| USAA Mutual Funds Trust USAA Capital Growth Fund | July 31, 2020 | ||||||
(Unaudited)
Investment Objective & Portfolio Holdings:
The USAA Capital Growth Fund seeks capital appreciation.
Sector Allocation*:
July 31, 2020
(% of Net Assets)
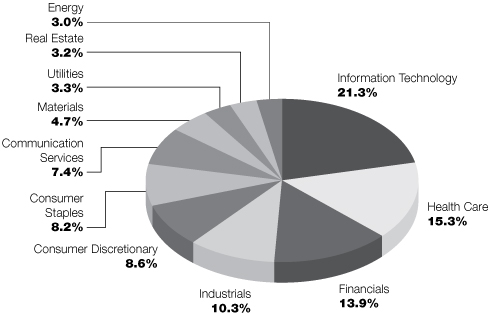
* Does not include futures, money market instruments, and short-term investments purchased with cash collateral from securities loaned.
Percentages are of the net assets of the Fund and may not equal 100%.
6
| USAA Mutual Funds Trust USAA Capital Growth Fund | Schedule of Portfolio Investments July 31, 2020 | ||||||
(Amounts in Thousands, Except for Shares)
Security Description | Shares | Value | |||||||||
Common Stocks (99.0%) | |||||||||||
Communication Services (7.4%): | |||||||||||
Activision Blizzard, Inc. | 30,195 | $ | 2,495 | ||||||||
Alphabet, Inc. Class C (a) | 4,806 | 7,127 | |||||||||
AT&T, Inc. | 118,246 | 3,498 | |||||||||
Cathay Media & Education Group, Inc. (a) (b) | 443,003 | 333 | |||||||||
Charter Communications, Inc. Class A (a) | 4,590 | 2,662 | |||||||||
Comcast Corp. Class A | 88,819 | 3,801 | |||||||||
Deutsche Telekom AG | 30,150 | 503 | |||||||||
DISH Network Corp. Class A (a) | 98,403 | 3,160 | |||||||||
Electronic Arts, Inc. (a) | 17,899 | 2,535 | |||||||||
Facebook, Inc. Class A (a) | 22,239 | 5,641 | |||||||||
Fox Corp. Class A | 92,147 | 2,375 | |||||||||
HKT Trust & HKT Ltd. | 234,000 | 345 | |||||||||
International Games System Co. Ltd. | 12,000 | 308 | |||||||||
Kakaku.com, Inc. | 44,600 | 1,077 | |||||||||
KDDI Corp. | 21,900 | 697 | |||||||||
Koninklijke KPN NV (c) | 718,043 | 1,891 | |||||||||
Match Group, Inc. (a) | 21,573 | 2,216 | |||||||||
Nexon Co. Ltd. | 23,400 | 601 | |||||||||
Nintendo Co. Ltd. | 1,100 | 484 | |||||||||
Nippon Telegraph & Telephone Corp. | 92,100 | 2,138 | |||||||||
NOS SGPS SA | 45,973 | 203 | |||||||||
Sirius XM Holdings, Inc. | 329,019 | 1,935 | |||||||||
Take-Two Interactive Software, Inc. (a) | 15,268 | 2,504 | |||||||||
Telefonica SA | 427,078 | 1,788 | |||||||||
Tencent Holdings Ltd. | 29,700 | 2,037 | |||||||||
Turk Telekomunikasyon A/S | 217,537 | 226 | |||||||||
Verizon Communications, Inc. | 62,957 | 3,619 | |||||||||
Vivendi SA | 15,538 | 412 | |||||||||
Vodafone Group PLC | 197,704 | 297 | |||||||||
56,908 | |||||||||||
Consumer Discretionary (8.5%): | |||||||||||
Afya Ltd. Class A (a) | 11,367 | 297 | |||||||||
Aristocrat Leisure Ltd. | 15,566 | 292 | |||||||||
AutoZone, Inc. (a) | 1,877 | 2,266 | |||||||||
Barratt Developments PLC | 52,087 | 346 | |||||||||
boohoo Group PLC (a) | 56,622 | 192 | |||||||||
Booking Holdings, Inc. (a) | 1,571 | 2,611 | |||||||||
China East Education Holdings Ltd. (b) | 110,000 | 259 | |||||||||
China Kepei Education Group Ltd. | 394,000 | 303 | |||||||||
China Yongda Automobiles Services Holdings Ltd. | 235,000 | 243 | |||||||||
Cie Generale des Etablissements Michelin SCA | 13,200 | 1,367 | |||||||||
Dollar General Corp. | 12,161 | 2,316 | |||||||||
Domino's Pizza, Inc. | 5,060 | 1,956 | |||||||||
F&F Co. Ltd. | 2,850 | 196 | |||||||||
Faurecia SE (a) | 45,924 | 1,773 | |||||||||
Fiat Chrysler Automobiles NV (a) | 23,258 | 236 | |||||||||
Grupo SBF SA (a) | 46,000 | 257 | |||||||||
See notes to financial statements.
7
| USAA Mutual Funds Trust USAA Capital Growth Fund | Schedule of Portfolio Investments — continued July 31, 2020 | ||||||
(Amounts in Thousands, Except for Shares)
Security Description | Shares | Value | |||||||||
Hangzhou Robam Appliances Co. Ltd. Class A | 48,100 | $ | 264 | ||||||||
HelloFresh SE (a) | 9,890 | 537 | |||||||||
Hikari Tsushin, Inc. | 5,900 | 1,279 | |||||||||
Hyosung TNC Co. Ltd. | 2,795 | 267 | |||||||||
Industria de Diseno Textil SA | 9,939 | 263 | |||||||||
Kering SA | 631 | 358 | |||||||||
Leejam Sports Co. JSC | 16,649 | 254 | |||||||||
Lowe's Cos., Inc. | 20,854 | 3,105 | |||||||||
Lululemon Athletica, Inc. (a) | 9,071 | 2,954 | |||||||||
LVMH Moet Hennessy Louis Vuitton SE | 9,904 | 4,306 | |||||||||
Next PLC | 17,348 | 1,224 | |||||||||
Nike, Inc. Class B | 55,630 | 5,430 | |||||||||
O'Reilly Automotive, Inc. (a) | 4,959 | 2,367 | |||||||||
Poya International Co. Ltd. | 21,000 | 441 | |||||||||
Prosus NV (a) | 8,706 | 847 | |||||||||
Q Technology Group Co. Ltd. | 203,000 | 277 | |||||||||
Sony Corp. | 25,000 | 1,943 | |||||||||
Target Corp. | 19,346 | 2,435 | |||||||||
Tesla, Inc. (a) | 3,287 | 4,703 | |||||||||
The Home Depot, Inc. | 28,793 | 7,644 | |||||||||
Tofas Turk Otomobil Fabrikasi A/S | 70,646 | 257 | |||||||||
Tong Yang Industry Co. Ltd. | 196,000 | 232 | |||||||||
Tongcheng-Elong Holdings Ltd. (a) | 144,800 | 266 | |||||||||
Topkey Corp. | 60,000 | 328 | |||||||||
Toyo Tire Corp. | 21,200 | 282 | |||||||||
Toyota Motor Corp. | 75,300 | 4,471 | |||||||||
Tupy SA (a) | 86,600 | 302 | |||||||||
Wynn Macau Ltd. | 667,200 | 1,170 | |||||||||
Yum! Brands, Inc. | 23,482 | 2,138 | |||||||||
65,254 | |||||||||||
Consumer Staples (8.2%): | |||||||||||
Ausnutria Dairy Corp. Ltd. | 128,000 | 214 | |||||||||
British American Tobacco PLC | 15,548 | 514 | |||||||||
Carlsberg A/S Class B | 4,311 | 637 | |||||||||
Coca-Cola HBC AG | 9,254 | 241 | |||||||||
Colgate-Palmolive Co. | 31,119 | 2,402 | |||||||||
Costco Wholesale Corp. | 8,559 | 2,786 | |||||||||
Diageo PLC | 39,952 | 1,462 | |||||||||
Essity AB Class B (a) | 12,820 | 423 | |||||||||
GS Retail Co. Ltd. | 4,873 | 141 | |||||||||
Imperial Brands PLC | 73,561 | 1,225 | |||||||||
Jonjee Hi-Tech Industrial and Commercial Holding Co. Ltd. Class A | 26,600 | 268 | |||||||||
Kimberly-Clark Corp. | 15,234 | 2,316 | |||||||||
Kobe Bussan Co. Ltd. | 19,800 | 1,229 | |||||||||
Koninklijke Ahold Delhaize NV | 29,667 | 854 | |||||||||
Lion Corp. | 17,200 | 447 | |||||||||
Nestle SA Registered Shares | 70,070 | 8,335 | |||||||||
Newtree Co. Ltd. | 11,962 | 253 | |||||||||
Nippon Suisan Kaisha Ltd. | 70,000 | 294 | |||||||||
Orion Corp. | 2,100 | 236 | |||||||||
See notes to financial statements.
8
| USAA Mutual Funds Trust USAA Capital Growth Fund | Schedule of Portfolio Investments — continued July 31, 2020 | ||||||
(Amounts in Thousands, Except for Shares)
Security Description | Shares | Value | |||||||||
Philip Morris International, Inc. | 73,438 | $ | 5,641 | ||||||||
Royal Unibrew A/S (a) | 22,105 | 2,237 | |||||||||
Swedish Match AB | 9,453 | 729 | |||||||||
Sysco Corp. | 37,891 | 2,003 | |||||||||
Tate & Lyle PLC | 44,135 | 376 | |||||||||
Tesco PLC | 261,965 | 739 | |||||||||
The Clorox Co. | 19,734 | 4,667 | |||||||||
The Kroger Co. | 132,510 | 4,610 | |||||||||
The Procter & Gamble Co. | 60,766 | 7,968 | |||||||||
Toyo Suisan Kaisha Ltd. | 36,300 | 2,207 | |||||||||
Tyson Foods, Inc. Class A | 42,042 | 2,583 | |||||||||
Unilever PLC | 29,092 | 1,732 | |||||||||
Varun Beverages Ltd. | 36,933 | 349 | |||||||||
Walgreens Boots Alliance, Inc. | 58,038 | 2,363 | |||||||||
WH Group Ltd. (b) | 522,500 | 465 | |||||||||
62,946 | |||||||||||
Energy (3.0%): | |||||||||||
Aker BP ASA (c) | 36,939 | 704 | |||||||||
Beach Energy Ltd. | 546,066 | 547 | |||||||||
| BP PLC | 506,708 | 1,835 | |||||||||
Cairn Energy PLC (a) | 160,076 | 249 | |||||||||
Chevron Corp. | 35,258 | 2,960 | |||||||||
China Suntien Green Energy Corp. Ltd. Class H (a) | 989,000 | 287 | |||||||||
ConocoPhillips | 112,170 | 4,194 | |||||||||
Galp Energia SGPS SA | 33,532 | 351 | |||||||||
Gaztransport Et Technigaz SA | 12,248 | 1,139 | |||||||||
Parex Resources, Inc. (a) | 98,368 | 1,190 | |||||||||
Petronet LNG Ltd. | 85,296 | 282 | |||||||||
Phillips 66 | 61,997 | 3,845 | |||||||||
Royal Dutch Shell PLC Class A | 115,113 | 1,682 | |||||||||
TOTAL SA | 56,986 | 2,156 | |||||||||
Valero Energy Corp. | 33,500 | 1,884 | |||||||||
23,305 | |||||||||||
Financials (13.9%): | |||||||||||
| 3i Group PLC | 50,562 | 582 | |||||||||
AGNC Investment Corp. | 9,471 | 129 | |||||||||
AIA Group Ltd. | 162,400 | 1,464 | |||||||||
Allianz SE | 17,474 | 3,625 | |||||||||
Amundi SA (b) | 3,934 | 299 | |||||||||
Annaly Capital Management, Inc. | 25,012 | 185 | |||||||||
Aon PLC Class A | 11,587 | 2,378 | |||||||||
Australia & New Zealand Banking Group Ltd. | 19,255 | 244 | |||||||||
AXA SA (c) | 22,769 | 457 | |||||||||
Banca Generali SpA (a) | 53,777 | 1,609 | |||||||||
Banco Santander SA | 95,896 | 206 | |||||||||
Barclays PLC | 153,390 | 199 | |||||||||
BNP Paribas SA (a) | 9,983 | 403 | |||||||||
BOC Hong Kong Holdings Ltd. | 111,500 | 311 | |||||||||
Brown & Brown, Inc. | 54,357 | 2,472 | |||||||||
See notes to financial statements.
9
| USAA Mutual Funds Trust USAA Capital Growth Fund | Schedule of Portfolio Investments — continued July 31, 2020 | ||||||
(Amounts in Thousands, Except for Shares)
Security Description | Shares | Value | |||||||||
Capital One Financial Corp. | 40,870 | $ | 2,607 | ||||||||
Cembra Money Bank AG | 10,758 | 1,175 | |||||||||
Chailease Holding Co. Ltd. | 52,800 | 221 | |||||||||
China Merchants Bank Co. Ltd. Class H | 148,500 | 693 | |||||||||
Cholamandalam Investment and Finance Co. Ltd. | 99,787 | 269 | |||||||||
Close Brothers Group PLC | 49,787 | 713 | |||||||||
DB Insurance Co. Ltd. | 5,821 | 230 | |||||||||
DBS Group Holdings Ltd. | 20,100 | 290 | |||||||||
Euronext NV (b) | 4,789 | 553 | |||||||||
Fifth Third Bancorp | 136,644 | 2,714 | |||||||||
First Republic Bank | 20,026 | 2,253 | |||||||||
Gentera SAB de CV (a) | 659,238 | 230 | |||||||||
Hannover Rueck SE | 3,562 | 603 | |||||||||
HSBC Holdings PLC | 215,392 | 970 | |||||||||
ING Groep NV | 270,490 | 1,886 | |||||||||
Intercontinental Exchange, Inc. | 23,614 | 2,285 | |||||||||
Intercorp Financial Services, Inc. | 7,515 | 190 | |||||||||
Jafco Co. Ltd. | 23,600 | 834 | |||||||||
JPMorgan Chase & Co. | 38,898 | 3,759 | |||||||||
Julius Baer Group Ltd. | 8,898 | 391 | |||||||||
KBC Group NV | 5,318 | 303 | |||||||||
Kiatnakin Bank PCL Class F | 166,600 | 208 | |||||||||
KIWOOM Securities Co. Ltd. | 4,580 | 370 | |||||||||
Legal & General Group PLC | 704,002 | 1,949 | |||||||||
Macquarie Group Ltd. | 24,826 | 2,181 | |||||||||
Manappuram Finance Ltd. | 155,908 | 330 | |||||||||
Manulife Financial Corp. | 173,137 | 2,320 | |||||||||
MarketAxess Holdings, Inc. | 4,227 | 2,184 | |||||||||
MetLife, Inc. | 72,084 | 2,728 | |||||||||
Metropolitan Bank & Trust Co. | 298,130 | 208 | |||||||||
Mitsubishi UFJ Financial Group, Inc. | 424,100 | 1,589 | |||||||||
Mizuho Financial Group, Inc. | 207,600 | 253 | |||||||||
Morgan Stanley | 66,480 | 3,250 | |||||||||
MSCI, Inc. | 12,111 | 4,553 | |||||||||
Multi Commodity Exchange of India Ltd. | 16,334 | 368 | |||||||||
National Bank of Greece SA (a) | 195,453 | 259 | |||||||||
NN Group NV | 10,576 | 387 | |||||||||
Nomura Holdings, Inc. | 64,500 | 304 | |||||||||
ORIX Corp. | 52,200 | 565 | |||||||||
PT Bank Danamon Indonesia Tbk | 1,235,300 | 234 | |||||||||
Raiffeisen Bank International AG (a) | 9,832 | 169 | |||||||||
Regions Financial Corp. | 235,127 | 2,553 | |||||||||
S&P Global, Inc. | 15,573 | 5,454 | |||||||||
Shinsei Bank Ltd. | 19,300 | 218 | |||||||||
Singapore Exchange Ltd. | 63,500 | 379 | |||||||||
Skandinaviska Enskilda Banken AB Class A (a) | 39,930 | 387 | |||||||||
SpareBank 1 SMN | 210,807 | 1,817 | |||||||||
State Street Corp. | 41,433 | 2,643 | |||||||||
Sumitomo Mitsui Financial Group, Inc. | 12,800 | 341 | |||||||||
Sumitomo Mitsui Trust Holdings, Inc. | 7,600 | 195 | |||||||||
See notes to financial statements.
10
| USAA Mutual Funds Trust USAA Capital Growth Fund | Schedule of Portfolio Investments — continued July 31, 2020 | ||||||
(Amounts in Thousands, Except for Shares)
Security Description | Shares | Value | |||||||||
SVB Financial Group (a) | 10,446 | $ | 2,343 | ||||||||
Swiss Life Holding AG | 2,424 | 886 | |||||||||
Synchrony Financial | 132,442 | 2,931 | |||||||||
T. Rowe Price Group, Inc. | 18,184 | 2,511 | |||||||||
The Allstate Corp. | 40,281 | 3,802 | |||||||||
The Goldman Sachs Group, Inc. | 14,349 | 2,841 | |||||||||
The PNC Financial Services Group, Inc. | 21,712 | 2,316 | |||||||||
The Progressive Corp. | 54,915 | 4,961 | |||||||||
The Toronto-Dominion Bank | 38,681 | 1,712 | |||||||||
Tokio Marine Holdings, Inc. | 28,400 | 1,199 | |||||||||
Transaction Capital Ltd. | 204,447 | 219 | |||||||||
U.S. Bancorp | 63,338 | 2,333 | |||||||||
UBS Group AG Registered Shares | 149,487 | 1,762 | |||||||||
Woori Financial Group, Inc. | 33,075 | 237 | |||||||||
106,181 | |||||||||||
Health Care (15.3%): | |||||||||||
AbbVie, Inc. | 63,318 | 6,010 | |||||||||
Alkem Laboratories Ltd. | 7,024 | 250 | |||||||||
Amgen, Inc. | 23,602 | 5,775 | |||||||||
Anthem, Inc. | 9,560 | 2,618 | |||||||||
Astellas Pharma, Inc. | 36,600 | 571 | |||||||||
AstraZeneca PLC | 6,030 | 666 | |||||||||
Biogen, Inc. (a) | 15,061 | 4,137 | |||||||||
Bristol-Myers Squibb Co. | 92,658 | 5,435 | |||||||||
Cerner Corp. | 28,884 | 2,006 | |||||||||
Cigna Corp. | 14,067 | 2,429 | |||||||||
Classys, Inc. | 19,691 | 241 | |||||||||
Cleopatra Hospital (a) | 922,084 | 289 | |||||||||
CSL Ltd. | 10,807 | 2,102 | |||||||||
CVS Health Corp. | 43,541 | 2,741 | |||||||||
Daewon Pharmaceutical Co. Ltd. | 15,557 | 278 | |||||||||
DaVita, Inc. (a) | 23,369 | 2,042 | |||||||||
DexCom, Inc. (a) | 5,634 | 2,454 | |||||||||
Dong-A ST Co. Ltd. | 3,865 | 301 | |||||||||
Eli Lilly & Co. | 33,019 | 4,962 | |||||||||
Fisher & Paykel Healthcare Corp. Ltd. | 75,536 | 1,809 | |||||||||
Fresenius Medical Care AG & Co. KGaA (a) | 6,306 | 556 | |||||||||
Genmab A/S (a) | 834 | 287 | |||||||||
HCA Healthcare, Inc. | 23,707 | 3,002 | |||||||||
Hikma Pharmaceuticals PLC | 17,621 | 494 | |||||||||
Hoya Corp. | 19,900 | 1,963 | |||||||||
ICON PLC (a) | 3,873 | 718 | |||||||||
IDEXX Laboratories, Inc. (a) | 6,904 | 2,746 | |||||||||
I-Sens, Inc. | 15,786 | 380 | |||||||||
Johnson & Johnson | 56,777 | 8,276 | |||||||||
Lonza Group AG Registered Shares | 894 | 559 | |||||||||
Merck & Co., Inc. | 37,597 | 3,017 | |||||||||
Mettler-Toledo International, Inc. (a) | 2,666 | 2,493 | |||||||||
Novartis AG Registered Shares | 61,080 | 5,032 | |||||||||
Novo Nordisk A/S Class B | 4,540 | 298 | |||||||||
See notes to financial statements.
11
| USAA Mutual Funds Trust USAA Capital Growth Fund | Schedule of Portfolio Investments — continued July 31, 2020 | ||||||
(Amounts in Thousands, Except for Shares)
Security Description | Shares | Value | |||||||||
Ono Pharmaceutical Co. Ltd. | 9,900 | $ | 278 | ||||||||
Pfizer, Inc. | 88,271 | 3,397 | |||||||||
Recordati SpA | 30,527 | 1,639 | |||||||||
Regeneron Pharmaceuticals, Inc. (a) | 3,886 | 2,456 | |||||||||
ResMed, Inc. | 12,597 | 2,551 | |||||||||
Roche Holding AG | 19,367 | 6,710 | |||||||||
Samjin Pharmaceutical Co. Ltd. | 10,638 | 256 | |||||||||
Sanofi | 7,086 | 744 | |||||||||
Sanofi India Ltd. | 2,434 | 253 | |||||||||
Sartorius Stedim Biotech | 1,130 | 353 | |||||||||
Seegene, Inc. | 3,440 | 751 | |||||||||
Sequent Scientific Ltd. | 197,190 | 323 | |||||||||
Shionogi & Co. Ltd. | 39,400 | 2,344 | |||||||||
Smith & Nephew PLC | 55,699 | 1,099 | |||||||||
Sonic Healthcare Ltd. | 12,895 | 295 | |||||||||
Supermax Corp. Bhd (a) | 101,800 | 447 | |||||||||
TaiDoc Technology Corp. (a) | 29,000 | 250 | |||||||||
Tonghua Dongbao Pharmaceutical Co. Ltd. Class A | 108,100 | 213 | |||||||||
UCB SA | 5,513 | 708 | |||||||||
UnitedHealth Group, Inc. | 24,696 | 7,477 | |||||||||
Universal Vision Biotechnology Co. Ltd. | 55,000 | 331 | |||||||||
Vertex Pharmaceuticals, Inc. (a) | 8,390 | 2,282 | |||||||||
Waters Corp. (a) | 10,166 | 2,167 | |||||||||
West Pharmaceutical Services, Inc. | 9,975 | 2,682 | |||||||||
116,943 | |||||||||||
Industrials (10.2%): | |||||||||||
3M Co. | 15,650 | 2,355 | |||||||||
ACS Actividades de Construccion y Servicios SA | 19,816 | 460 | |||||||||
Alstom SA (a) | 6,426 | 358 | |||||||||
Ashtead Group PLC | 15,212 | 484 | |||||||||
Atlas Copco AB Class B | 56,832 | 2,201 | |||||||||
Aurizon Holdings Ltd. | 89,434 | 285 | |||||||||
BAE Systems PLC | 80,375 | 515 | |||||||||
Binjiang Service Group Co. Ltd. | 118,000 | 280 | |||||||||
Canadian Pacific Railway Ltd. | 10,049 | 2,764 | |||||||||
Carrier Global Corp. | 259,046 | 7,056 | |||||||||
Chicony Power Technology Co. Ltd. | 116,000 | 268 | |||||||||
Cia de Locacao das Americas | 81,100 | 297 | |||||||||
Cie de Saint-Gobain | 9,080 | 336 | |||||||||
CK Hutchison Holdings Ltd. | 79,500 | 519 | |||||||||
Controladora Vuela Cia de Aviacion SAB de CV, ADR (a) | 47,766 | 264 | |||||||||
Cummins, Inc. | 15,453 | 2,986 | |||||||||
Deutsche Post AG Registered Shares (a) | 15,975 | 648 | |||||||||
Eaton Corp. PLC | 29,980 | 2,792 | |||||||||
Engineers India Ltd. | 323,086 | 277 | |||||||||
en-japan, Inc. | 24,600 | 592 | |||||||||
Experian PLC | 42,459 | 1,483 | |||||||||
FedEx Corp. | 20,579 | 3,466 | |||||||||
Fuji Electric Co. Ltd. | 48,300 | 1,317 | |||||||||
General Dynamics Corp. | 19,462 | 2,856 | |||||||||
See notes to financial statements.
12
| USAA Mutual Funds Trust USAA Capital Growth Fund | Schedule of Portfolio Investments — continued July 31, 2020 | ||||||
(Amounts in Thousands, Except for Shares)
Security Description | Shares | Value | |||||||||
Grupo Aeroportuario del Centro Norte SAB de CV, ADR (a) | 9,278 | $ | 309 | ||||||||
Grupo Traxion SAB de CV (a) (b) (c) | 413,818 | 293 | |||||||||
Gunkul Engineering PCL | 3,497,900 | 301 | |||||||||
Hitachi Construction Machinery Co. Ltd. | 25,000 | 725 | |||||||||
IHS Markit Ltd. | 31,033 | 2,505 | |||||||||
Illinois Tool Works, Inc. | 13,301 | 2,461 | |||||||||
ITOCHU Corp. | 107,000 | 2,346 | |||||||||
JSL SA | 65,600 | 362 | |||||||||
Korea Line Corp. (a) | 19,532 | 268 | |||||||||
Leonardo SpA | 42,887 | 275 | |||||||||
Lockheed Martin Corp. | 12,635 | 4,788 | |||||||||
Metso Outotec Oyj | 70,219 | 453 | |||||||||
Mitsubishi Electric Corp. | 28,100 | 367 | |||||||||
Mitsui & Co. Ltd. | 28,400 | 425 | |||||||||
Neles Oyj | 8,673 | 124 | |||||||||
NICE Information Service Co. Ltd. | 16,984 | 289 | |||||||||
Northrop Grumman Corp. | 6,716 | 2,183 | |||||||||
Obayashi Corp. | 35,500 | 317 | |||||||||
OKUMA Corp. | 21,800 | 842 | |||||||||
Old Dominion Freight Line, Inc. | 12,903 | 2,359 | |||||||||
Otis Worldwide Corp. | 39,927 | 2,505 | |||||||||
PNC Infratech Ltd. | 182,417 | 325 | |||||||||
RELX PLC | 79,571 | 1,675 | |||||||||
Rockwell Automation, Inc. | 10,249 | 2,236 | |||||||||
Samsung Engineering Co. Ltd. (a) | 21,536 | 216 | |||||||||
Sandvik AB (a) | 17,573 | 329 | |||||||||
Sanwa Holdings Corp. | 127,400 | 1,092 | |||||||||
Saudi Industrial Services Co. | 51,987 | 300 | |||||||||
Secom Co. Ltd. | 5,200 | 450 | |||||||||
| SKF AB B Shares | 17,400 | 322 | |||||||||
Sunonwealth Electric Machine Industry Co. Ltd. | 169,000 | 320 | |||||||||
Taisei Corp. | 7,900 | 271 | |||||||||
Taiwan Secom Co. Ltd. | 115,000 | 338 | |||||||||
Teledyne Technologies, Inc. (a) | 6,193 | 1,899 | |||||||||
Teleperformance | 2,020 | 591 | |||||||||
Verisk Analytics, Inc. | 13,013 | 2,456 | |||||||||
Volvo AB Class B | 23,004 | 398 | |||||||||
W.W. Grainger, Inc. | 6,711 | 2,292 | |||||||||
Wolters Kluwer NV | 31,855 | 2,514 | |||||||||
Yamato Holdings Co. Ltd. | 11,500 | 297 | |||||||||
Zoomlion Heavy Industry Science and Technology Co. Ltd. Class H (a) | 322,600 | 333 | |||||||||
78,010 | |||||||||||
Information Technology (21.3%): | |||||||||||
21vianet Group, Inc., ADR (a) | 14,950 | 325 | |||||||||
Accenture PLC Class A | 13,607 | 3,059 | |||||||||
Adobe, Inc. (a) | 15,599 | 6,931 | |||||||||
Advantest Corp. | 10,000 | 546 | |||||||||
Anritsu Corp. (c) | 12,800 | 309 | |||||||||
Apple, Inc. | 96,179 | 40,880 | |||||||||
Applied Materials, Inc. | 49,507 | 3,185 | |||||||||
See notes to financial statements.
13
| USAA Mutual Funds Trust USAA Capital Growth Fund | Schedule of Portfolio Investments — continued July 31, 2020 | ||||||
(Amounts in Thousands, Except for Shares)
Security Description | Shares | Value | |||||||||
| ASML Holding NV | 895 | $ | 318 | ||||||||
Beijing Sinnet Technology Co. Ltd. Class A | 53,300 | 200 | |||||||||
Beijing Thunisoft Corp. Ltd. Class A | 48,900 | 186 | |||||||||
Broadcom, Inc. | 10,581 | 3,352 | |||||||||
Capgemini SE | 25,638 | 3,325 | |||||||||
CDW Corp. | 17,762 | 2,065 | |||||||||
Cisco Systems, Inc. | 77,355 | 3,643 | |||||||||
Citrix Systems, Inc. | 13,405 | 1,914 | |||||||||
Cognizant Technology Solutions Corp. Class A | 41,360 | 2,826 | |||||||||
Compeq Manufacturing Co. Ltd. | 225,000 | 373 | |||||||||
Constellation Software, Inc. | 1,967 | 2,327 | |||||||||
DocuSign, Inc. (a) | 17,250 | 3,740 | |||||||||
Flat Glass Group Co. Ltd. Class H (c) | 268,000 | 418 | |||||||||
FLEXium Interconnect, Inc. | 107,000 | 518 | |||||||||
Formosa Sumco Technology Corp. | 62,000 | 275 | |||||||||
Foxsemicon Integrated Technology, Inc. | 56,000 | 395 | |||||||||
Fujitsu Ltd. | 21,900 | 2,933 | |||||||||
General Interface Solution Holding Ltd. (a) | 66,000 | 310 | |||||||||
Hanmi Semiconductor Co. Ltd. | 38,665 | 387 | |||||||||
Hitachi Ltd. | 11,300 | 339 | |||||||||
HP, Inc. | 293,020 | 5,151 | |||||||||
HyVision System, Inc. | 40,529 | 406 | |||||||||
Intel Corp. | 60,870 | 2,905 | |||||||||
Intuit, Inc. | 8,029 | 2,460 | |||||||||
Kingboard Laminates Holdings Ltd. | 229,000 | 258 | |||||||||
KLA Corp. | 12,468 | 2,491 | |||||||||
Lam Research Corp. | 26,815 | 10,114 | |||||||||
Leidos Holdings, Inc. | 20,101 | 1,913 | |||||||||
Lelon Electronics Corp. | 263,000 | 418 | |||||||||
Logitech International SA Class R | 10,173 | 742 | |||||||||
Macronix International | 318,000 | 344 | |||||||||
Mastercard, Inc. Class A | 11,752 | 3,626 | |||||||||
Melexis NV | 16,058 | 1,376 | |||||||||
Micron Technology, Inc. (a) | 54,469 | 2,726 | |||||||||
Microsoft Corp. | 51,562 | 10,571 | |||||||||
Mphasis Ltd. | 32,308 | 500 | |||||||||
Murata Manufacturing Co. Ltd. | 9,500 | 610 | |||||||||
NVIDIA Corp. | 19,042 | 8,085 | |||||||||
Obic Co. Ltd. | 2,400 | 430 | |||||||||
Oracle Corp. | 16,000 | 1,928 | |||||||||
Oracle Corp. | 55,172 | 3,059 | |||||||||
Powertech Technology, Inc. | 69,000 | 231 | |||||||||
SAP SE | 29,478 | 4,653 | |||||||||
Seagate Technology PLC | 47,968 | 2,169 | |||||||||
SFA Engineering Corp. | 9,182 | 272 | |||||||||
Sino-American Silicon Products, Inc. | 105,000 | 351 | |||||||||
STMicroelectronics NV | 18,629 | 523 | |||||||||
TeamViewer AG (a) (b) | 7,781 | 421 | |||||||||
Telefonaktiebolaget LM Ericsson Class B | 38,184 | 444 | |||||||||
TES Co. Ltd. | 14,764 | 318 | |||||||||
See notes to financial statements.
14
| USAA Mutual Funds Trust USAA Capital Growth Fund | Schedule of Portfolio Investments — continued July 31, 2020 | ||||||
(Amounts in Thousands, Except for Shares)
Security Description | Shares | Value | |||||||||
Texas Instruments, Inc. | 21,464 | $ | 2,738 | ||||||||
Tripod Technology Corp. | 80,000 | 347 | |||||||||
Ulvac, Inc. | 14,400 | 427 | |||||||||
Unitest, Inc. | 22,255 | 282 | |||||||||
VeriSign, Inc. (a) | 9,154 | 1,938 | |||||||||
VMware, Inc. Class A (a) (c) | 17,848 | 2,502 | |||||||||
Worldline SA (a) (b) | 5,022 | 432 | |||||||||
163,240 | |||||||||||
Materials (4.7%): | |||||||||||
Air Products & Chemicals, Inc. | 9,635 | 2,762 | |||||||||
Anglo American PLC | 37,390 | 905 | |||||||||
Arkema SA | 22,291 | 2,319 | |||||||||
BHP Group Ltd. | 110,066 | 2,897 | |||||||||
Boliden AB | 14,996 | 410 | |||||||||
Centamin PLC | 144,912 | 388 | |||||||||
Evraz PLC | 315,863 | 1,169 | |||||||||
Gold Fields Ltd., ADR | 29,735 | 389 | |||||||||
Hansol Chemical Co. Ltd. | 5,232 | 666 | |||||||||
HeidelbergCement AG | 3,831 | 213 | |||||||||
Impala Platinum Holdings Ltd. | 34,720 | 310 | |||||||||
JK Lakshmi Cement Ltd. | 76,939 | 302 | |||||||||
Kirkland Lake Gold Ltd. | 32,025 | 1,749 | |||||||||
Linde PLC | 13,661 | 3,348 | |||||||||
LyondellBasell Industries NV Class A | 81,270 | 5,081 | |||||||||
Mishra Dhatu Nigam Ltd. (b) | 86,223 | 231 | |||||||||
Newmont Corp. | 34,693 | 2,401 | |||||||||
PT Merdeka Copper Gold Tbk (a) | 3,308,000 | 408 | |||||||||
Rengo Co. Ltd. | 38,400 | 289 | |||||||||
Rio Tinto Ltd. | 23,948 | 1,752 | |||||||||
Rio Tinto PLC | 54,148 | 3,296 | |||||||||
Shin-Etsu Chemical Co. Ltd. | 2,600 | 304 | |||||||||
SK Materials Co. Ltd. | 1,427 | 294 | |||||||||
Taiwan Hon Chuan Enterprise Co. Ltd. | 157,000 | 287 | |||||||||
The Sherwin-Williams Co. | 3,919 | 2,539 | |||||||||
Titan Cement International SA | 21,754 | 289 | |||||||||
Tosoh Corp. | 20,800 | 279 | |||||||||
Tung Ho Steel Enterprise Corp. | 323,000 | 260 | |||||||||
West China Cement Ltd. | 1,546,000 | 330 | |||||||||
35,867 | |||||||||||
Real Estate (3.2%): | |||||||||||
Alexandria Real Estate Equities, Inc. | 2,055 | 365 | |||||||||
alstria office REIT-AG (a) | 15,079 | 226 | |||||||||
American Tower Corp. | 7,829 | 2,046 | |||||||||
Ascendas India Trust | 278,800 | 285 | |||||||||
AvalonBay Communities, Inc. | 2,489 | 381 | |||||||||
Boston Properties, Inc. | 2,737 | 244 | |||||||||
Camden Property Trust | 1,725 | 157 | |||||||||
CBRE Group, Inc. Class A (a) | 5,635 | 247 | |||||||||
Charter Hall Group | 41,552 | 310 | |||||||||
China SCE Group Holdings Ltd. | 581,134 | 268 | |||||||||
See notes to financial statements.
15
| USAA Mutual Funds Trust USAA Capital Growth Fund | Schedule of Portfolio Investments — continued July 31, 2020 | ||||||
(Amounts in Thousands, Except for Shares)
Security Description | Shares | Value | |||||||||
CK Asset Holdings Ltd. | 280,000 | $ | 1,555 | ||||||||
Concentradora Fibra Danhos SA de CV | 257,266 | 247 | |||||||||
Crown Castle International Corp. | 7,408 | 1,235 | |||||||||
Daiwa House Industry Co. Ltd. | 11,700 | 258 | |||||||||
Digital Realty Trust, Inc. | 4,618 | 741 | |||||||||
Duke Realty Corp. | 6,509 | 262 | |||||||||
Equinix, Inc. | 1,497 | 1,176 | |||||||||
Equity LifeStyle Properties, Inc. | 3,057 | 209 | |||||||||
Equity Residential | 6,613 | 355 | |||||||||
Essex Property Trust, Inc. | 1,152 | 254 | |||||||||
Extra Space Storage, Inc. | 2,298 | 238 | |||||||||
Fastighets AB Balder Class B (a) | 7,085 | 294 | |||||||||
Federal Realty Investment Trust | 1,341 | 102 | |||||||||
Healthpeak Properties, Inc. | 8,802 | 240 | |||||||||
Host Hotels & Resorts, Inc. | 12,801 | 138 | |||||||||
Invitation Homes, Inc. | 9,527 | 284 | |||||||||
Iron Mountain, Inc. (c) | 5,101 | 144 | |||||||||
Jones Lang LaSalle, Inc. | 921 | 91 | |||||||||
Kimco Realty Corp. | 7,627 | 85 | |||||||||
LEG Immobilien AG | 3,104 | 433 | |||||||||
Medical Properties Trust, Inc. | 9,192 | 185 | |||||||||
Mid-America Apartment Communities, Inc. | 2,032 | 242 | |||||||||
National Retail Properties, Inc. | 3,056 | 108 | |||||||||
NEPI Rockcastle PLC | 47,062 | 244 | |||||||||
New World Development Co. Ltd. (a) | 59,829 | 292 | |||||||||
Omega Healthcare Investors, Inc. | 3,905 | 126 | |||||||||
Open House Co. Ltd. | 8,700 | 246 | |||||||||
Powerlong Real Estate Holdings Ltd. | 359,000 | 219 | |||||||||
Prologis, Inc. | 13,122 | 1,383 | |||||||||
Public Storage | 2,793 | 558 | |||||||||
Realty Income Corp. | 5,793 | 348 | |||||||||
Regency Centers Corp. | 2,941 | 121 | |||||||||
SBA Communications Corp. | 2,003 | 624 | |||||||||
Scentre Group | 765,794 | 1,110 | |||||||||
Simon Property Group, Inc. | 5,379 | 335 | |||||||||
SL Green Realty Corp. | 1,434 | 67 | |||||||||
Stockland | 116,143 | 262 | |||||||||
Sumitomo Realty & Development Co. Ltd. | 38,400 | 979 | |||||||||
Sun Communities, Inc. | 1,645 | 247 | |||||||||
Times China Holdings Ltd. | 169,000 | 300 | |||||||||
UDR, Inc. | 5,219 | 189 | |||||||||
Ventas, Inc. | 6,652 | 255 | |||||||||
VEREIT, Inc. | 18,991 | 124 | |||||||||
VICI Properties, Inc. | 8,220 | 178 | |||||||||
Vonovia SE | 28,643 | 1,851 | |||||||||
Vornado Realty Trust | 3,081 | 106 | |||||||||
W.P. Carey, Inc. | 3,065 | 219 | |||||||||
Welltower, Inc. | 7,244 | 388 | |||||||||
Weyerhaeuser Co. | 13,333 | 371 | |||||||||
Yuzhou Properties Co. Ltd. | 530,000 | 238 | |||||||||
24,785 | |||||||||||
See notes to financial statements.
16
| USAA Mutual Funds Trust USAA Capital Growth Fund | Schedule of Portfolio Investments — continued July 31, 2020 | ||||||
(Amounts in Thousands, Except for Shares)
Security Description | Shares | Value | |||||||||
Utilities (3.3%): | |||||||||||
ACEA SpA | 19,878 | $ | 407 | ||||||||
Atlantica Sustainable Infrastructure PLC | 13,940 | 418 | |||||||||
CESC Ltd. | 42,450 | 311 | |||||||||
Chubu Electric Power Co., Inc. | 101,300 | 1,205 | |||||||||
Cia de Saneamento do Parana | 53,400 | 314 | |||||||||
Duke Energy Corp. | 31,061 | 2,632 | |||||||||
E.ON SE | 57,744 | 678 | |||||||||
Enel SpA | 466,257 | 4,271 | |||||||||
Enerjisa Enerji A/S (b) | 220,009 | 261 | |||||||||
Eversource Energy | 26,646 | 2,400 | |||||||||
Exelon Corp. | 69,343 | 2,677 | |||||||||
Neoenergia SA | 65,500 | 266 | |||||||||
NextEra Energy, Inc. | 11,183 | 3,139 | |||||||||
Orsted A/S (b) | 4,952 | 708 | |||||||||
Rubis SCA | 4,989 | 235 | |||||||||
Terna Energy SA | 44,092 | 579 | |||||||||
The Kansai Electric Power Co., Inc. | 29,900 | 284 | |||||||||
The Southern Co. | 40,827 | 2,229 | |||||||||
WEC Energy Group, Inc. | 23,928 | 2,279 | |||||||||
25,293 | |||||||||||
Total Common Stocks (Cost $656,724) | 758,732 | ||||||||||
Preferred Stocks (0.2%) | |||||||||||
Consumer Discretionary (0.1%): | |||||||||||
Volkswagen AG (a) | 5,798 | 849 | |||||||||
Financials (0.0%): (d) | |||||||||||
Banco do Estado do Rio Grande do Sul SA | 96,900 | 265 | |||||||||
Industrials (0.1%): | |||||||||||
Randon SA Implementos e Participacoes | 127,200 | 286 | |||||||||
Total Preferred Stocks (Cost $1,642) | 1,400 | ||||||||||
Exchange-Traded Funds (0.1%) | |||||||||||
iShares Core MSCI EAFE ETF | 12,119 | 707 | |||||||||
iShares MSCI EAFE ETF | 2,615 | 162 | |||||||||
Total Exchange-Traded Funds (Cost $891) | 869 | ||||||||||
Collateral for Securities Loaned^ (0.8%) | |||||||||||
HSBC U.S. Government Money Market Fund I Shares, 0.08% (e) | 3,532,318 | 3,532 | |||||||||
Invesco Government & Agency Portfolio Institutional Shares, 0.06% (e) | 2,571,405 | 2,572 | |||||||||
Total Collateral for Securities Loaned (Cost $6,104) | 6,104 | ||||||||||
Total Investments (Cost $665,361) — 100.1% | 767,105 | ||||||||||
Liabilities in excess of other assets — (0.1)% | (444 | ) | |||||||||
NET ASSETS — 100.00% | $ | 766,661 | |||||||||
See notes to financial statements.
17
| USAA Mutual Funds Trust USAA Capital Growth Fund | Schedule of Portfolio Investments — continued July 31, 2020 | ||||||
At July 31, 2020 the Fund's investments in foreign securities were 35.7% of net assets.
^ Purchased with cash collateral from securities on loan.
(a) Non-income producing security.
(b) Rule 144A security or other security that is restricted as to resale to institutional investors. The Fund's Adviser has deemed this security to be liquid based upon procedures approved by the Board of Trustees. As of July 31, 2020, the fair value of these securities was $4,255 (thousands) and amounted to 0.6% of net assets.
(c) All or a portion of this security is on loan.
(d) Amount represents less than 0.05% of net assets.
(e) Rate disclosed is the daily yield on July 31, 2020.
ADR — American Depositary Receipt
ETF — Exchange-Traded Fund
PCL — Public Company Limited
PLC — Public Limited Company
REIT — Real Estate Investment Trust
See notes to financial statements.
18
USAA Mutual Funds Trust | Statement of Assets and Liabilities July 31, 2020 | ||||||
(Amounts in Thousands, Except Per Share Amounts)
| USAA Capital Growth Fund | |||||||
Assets: | |||||||
Investments, at value (Cost $665,361) | $ | 767,105 | (a) | ||||
Cash and cash equivalents | 5,343 | ||||||
Receivables: | |||||||
Interest and dividends | 950 | ||||||
Capital shares issued | 363 | ||||||
Investments sold | 623 | ||||||
Reclaims | 680 | ||||||
From Adviser | 23 | ||||||
Prepaid expenses | 29 | ||||||
Total Assets | 775,116 | ||||||
Liabilities: | |||||||
Payables: | |||||||
To Custodian for foreign currency, at value (Cost $193) | 191 | ||||||
Collateral received on loaned securities | 6,104 | ||||||
Investments purchased | 571 | ||||||
Capital shares redeemed | 855 | ||||||
Accrued expenses and other payables: | |||||||
Investment advisory fees | 447 | ||||||
Administration fees | 96 | ||||||
Custodian fees | 34 | ||||||
Transfer agent fees | 106 | ||||||
Compliance fees | — | (b) | |||||
Other accrued expenses | 51 | ||||||
Total Liabilities | 8,455 | ||||||
Net Assets: | |||||||
Capital | 660,637 | ||||||
Total accumulated earnings/(loss) | 106,024 | ||||||
Net Assets | $ | 766,661 | |||||
Net Assets: | |||||||
Fund Shares | $ | 755,102 | |||||
Institutional Shares | 11,559 | ||||||
Total | $ | 766,661 | |||||
Shares (unlimited number of shares authorized with no par value): | |||||||
Fund Shares | 71,118 | ||||||
Institutional Shares | 1,084 | ||||||
Total | 72,202 | ||||||
Net asset value, offering and redemption price per share: (c) | |||||||
Fund Shares | $ | 10.62 | |||||
Institutional Shares | $ | 10.66 | |||||
(a) Includes $5,789 of securities on loan.
(b) Rounds to less than $1 thousand.
(c) Per share amount may not recalculate due to rounding of net assets and/or shares outstanding.
See notes to financial statements.
19
USAA Mutual Funds Trust | Statement of Operations For the Year Ended July 31, 2020 | ||||||
(Amounts in Thousands)
| USAA Capital Growth Fund | |||||||
Investment Income: | |||||||
Dividends | $ | 20,857 | |||||
Interest | 31 | ||||||
Securities lending (net of fees) | 177 | ||||||
Foreign tax withholding | (915 | ) | |||||
Total Income | 20,150 | ||||||
Expenses: | |||||||
Investment advisory fees | 6,134 | ||||||
Administration fees — Fund Shares | 1,153 | ||||||
Administration fees — Institutional Shares | 54 | ||||||
Sub-Administration fees | 62 | ||||||
Custodian fees | 195 | ||||||
Transfer agent fees — Fund Shares | 1,324 | ||||||
Transfer agent fees — Institutional Shares | 54 | ||||||
Trustees' fees | 46 | ||||||
Compliance fees | 6 | ||||||
Legal and audit fees | 91 | ||||||
State registration and filing fees | 31 | ||||||
Line of credit fees | — | (a) | |||||
Interfund lending fees | — | (a) | |||||
Other expenses | 88 | ||||||
Total Expenses | 9,238 | ||||||
Expenses waived/reimbursed by Adviser | (133 | ) | |||||
Net Expenses | 9,105 | ||||||
Net Investment Income (Loss) | 11,045 | ||||||
Realized/Unrealized Gains (Losses) from Investments: | |||||||
Net realized gains (losses) from investment securities and foreign currency translations | 26,146 | ||||||
Foreign taxes on realized gains | (41 | ) | |||||
| Net change in unrealized appreciation/depreciation on investment securities and foreign currency translations | (19,968 | ) | |||||
Net realized/unrealized gains (losses) on investments | 6,137 | ||||||
Change in net assets resulting from operations | $ | 17,182 | |||||
(a) Amount is less than $1 thousand.
See notes to financial statements.
20
USAA Mutual Funds Trust | Statements of Changes in Net Assets | ||||||
(Amounts in Thousands)
USAA Capital Growth Fund | |||||||||||
| Year Ended July 31, 2020 | Year Ended July 31, 2019 | ||||||||||
From Investments: | |||||||||||
Operations: | |||||||||||
Net investment income (loss) | $ | 11,045 | $ | 13,162 | |||||||
Net realized gains (losses) from investments | 26,105 | 62,784 | |||||||||
Net change in unrealized appreciation/depreciation on investments | (19,968 | ) | (90,256 | ) | |||||||
Change in net assets resulting from operations | 17,182 | (14,310 | ) | ||||||||
Distributions to Shareholders: | |||||||||||
Fund Shares | (72,350 | ) | (66,864 | ) | |||||||
Institutional Shares | (6,085 | ) | (620 | ) | |||||||
Change in net assets resulting from distributions to shareholders | (78,435 | ) | (67,484 | ) | |||||||
Change in net assets resulting from capital transactions | (108,841 | ) | 107,918 | ||||||||
Change in net assets | (170,094 | ) | 26,124 | ||||||||
Net Assets: | |||||||||||
Beginning of period | 936,755 | 910,631 | |||||||||
End of period | $ | 766,661 | $ | 936,755 | |||||||
Capital Transactions: | |||||||||||
Fund Shares | |||||||||||
Proceeds from shares issued | $ | 35,630 | $ | 45,444 | |||||||
Distributions reinvested | 71,922 | 66,499 | |||||||||
Cost of shares redeemed | (118,356 | ) | (104,140 | ) | |||||||
Total Fund Shares | $ | (10,804 | ) | $ | 7,803 | ||||||
Institutional Shares | |||||||||||
Proceeds from shares issued | $ | 750 | $ | 100,957 | |||||||
Distributions reinvested | 5,585 | 148 | |||||||||
Cost of shares redeemed | (104,372 | ) | (990 | ) | |||||||
Total Institutional Shares | $ | (98,037 | ) | $ | 100,115 | ||||||
Change in net assets resulting from capital transactions | $ | (108,841 | ) | $ | 107,918 | ||||||
Share Transactions: | |||||||||||
Fund Shares | |||||||||||
Issued | 3,485 | 3,952 | |||||||||
Reinvested | 6,484 | 6,365 | |||||||||
Redeemed | (11,563 | ) | (9,094 | ) | |||||||
Total Fund Shares | (1,594 | ) | 1,223 | ||||||||
Institutional Shares | |||||||||||
Issued | 73 | 9,136 | |||||||||
Reinvested | 502 | 14 | |||||||||
Redeemed | (9,183 | ) | (87 | ) | |||||||
Total Institutional Shares | (8,608 | ) | 9,063 | ||||||||
Change in Shares | (10,202 | ) | 10,286 | ||||||||
See notes to financial statements.
21
USAA Mutual Funds Trust | Financial Highlights | ||||||
For a Share Outstanding Throughout Each Period
Investment Activities | Distributions to Shareholders From | ||||||||||||||||||||||||||
| Net Asset Value, Beginning of Period | Net Investment Income (Loss) | Net Realized and Unrealized Gains (Losses) on Investments | Total from Investment Activities | Net Investment Income | Net Realized Gains from Investments | ||||||||||||||||||||||
USAA Capital Growth Fund | |||||||||||||||||||||||||||
Fund Shares | |||||||||||||||||||||||||||
Year Ended July 31, 2020 | $ | 11.36 | 0.14 | (d) | 0.13 | 0.27 | (0.17 | ) | (0.84 | ) | |||||||||||||||||
Year Ended July 31, 2019 | $ | 12.63 | 0.16 | (0.48 | ) | (0.32 | ) | (0.17 | ) | (0.78 | ) | ||||||||||||||||
Year Ended July 31, 2018 | $ | 11.67 | 0.15 | 1.21 | 1.36 | (0.12 | ) | (0.28 | ) | ||||||||||||||||||
Year Ended July 31, 2017 | $ | 9.97 | 0.14 | 1.71 | 1.85 | (0.15 | ) | — | |||||||||||||||||||
Year Ended July 31, 2016 | $ | 10.16 | 0.13 | (0.21 | ) | (0.08 | ) | (0.11 | ) | — | |||||||||||||||||
Institutional Shares | |||||||||||||||||||||||||||
Year Ended July 31, 2020 | $ | 11.39 | 0.14 | (d) | 0.14 | 0.28 | (0.17 | ) | (0.84 | ) | |||||||||||||||||
Year Ended July 31, 2019 | $ | 12.66 | 0.23 | (d) | (0.55 | ) | (0.32 | ) | (0.17 | ) | (0.78 | ) | |||||||||||||||
Year Ended July 31, 2018 | $ | 11.70 | 0.17 | 1.20 | 1.37 | (0.13 | ) | (0.28 | ) | ||||||||||||||||||
Year Ended July 31, 2017 | $ | 9.98 | 0.15 | 1.71 | 1.86 | (0.14 | ) | — | |||||||||||||||||||
| August 7, 2015 (h) through July 31, 2016 | $ | 10.20 | 0.14 | (0.24 | ) | (0.10 | ) | (0.12 | ) | — | |||||||||||||||||
* Assumes reinvestment of all net investment income and realized capital gain distributions, if any, during the period. Includes adjustments in accordance with U.S. generally accepted accounting principles and could differ from the Lipper reported return.
^ The net expense ratio may not correlate to the applicable expense limits in place during the period since the current contractual expense limitation is applied for a two year period beginning July 1, 2019 and in effect through June 30, 2021, instead of coinciding with the Fund's fiscal year end. Details of the current contractual expense limitation in effect can be found in Note 5 of the accompanying Notes to Financial Statements.
(a) Not annualized for periods less than one year.
(b) Annualized for periods less than one year.
(c) Portfolio turnover is calculated on the basis of the Fund as a whole without distinguishing between the classes of shares issued.
(d) Per share net investment income (loss) has been calculated using the average daily shares method.
(e) Reflects increased trading activity due to current year transition or asset allocation shift.
(f) Reflects overall increase in purchases and sales of securities.
(g) Reflects overall decrease in purchases and sales of securities.
(h) Commencement of operations.
See notes to financial statements.
22
USAA Mutual Funds Trust | Financial Highlights — continued | ||||||
For a Share Outstanding Throughout Each Period
Ratios to Average Net Assets | Supplemental Data | ||||||||||||||||||||||||||||||||||
Total Distributions | Net Asset Value, End of Period | Total Return*(a) | Net Expenses^(b) | Net Investment Income (Loss)(b) | Gross Expenses(b) | Net Assets, End of Period (000's) | Portfolio Turnover(a)(c) | ||||||||||||||||||||||||||||
USAA Capital Growth Fund | |||||||||||||||||||||||||||||||||||
Fund Shares | |||||||||||||||||||||||||||||||||||
Year Ended July 31, 2020 | (1.01 | ) | $ | 10.62 | 2.14 | % | 1.12 | % | 1.35 | % | 1.13 | % | $ | 755,102 | 152 | %(e) | |||||||||||||||||||
Year Ended July 31, 2019 | (0.95 | ) | $ | 11.36 | (1.82 | )% | 1.13 | % | 1.43 | % | 1.13 | % | $ | 826,325 | 54 | %(f) | |||||||||||||||||||
Year Ended July 31, 2018 | (0.40 | ) | $ | 12.63 | 11.76 | % | 1.15 | % | 1.25 | % | 1.15 | % | $ | 902,670 | 22 | %(g) | |||||||||||||||||||
Year Ended July 31, 2017 | (0.15 | ) | $ | 11.67 | 18.75 | % | 1.21 | % | 1.27 | % | 1.21 | % | $ | 836,515 | 55 | %(f) | |||||||||||||||||||
Year Ended July 31, 2016 | (0.11 | ) | $ | 9.97 | (0.76 | )% | 1.24 | % | 1.39 | % | 1.24 | % | $ | 721,357 | 24 | % | |||||||||||||||||||
Institutional Shares | |||||||||||||||||||||||||||||||||||
Year Ended July 31, 2020 | (1.01 | ) | $ | 10.66 | 2.20 | % | 1.01 | % | 1.31 | % | 1.01 | % | $ | 11,559 | 152 | %(e) | |||||||||||||||||||
Year Ended July 31, 2019 | (0.95 | ) | $ | 11.39 | (1.77 | )% | 1.03 | % | 2.04 | % | 1.03 | % | $ | 110,430 | 54 | %(f) | |||||||||||||||||||
Year Ended July 31, 2018 | (0.41 | ) | $ | 12.66 | 11.84 | % | 1.10 | % | 1.38 | % | 1.21 | % | $ | 7,961 | 22 | %(g) | |||||||||||||||||||
Year Ended July 31, 2017 | (0.14 | ) | $ | 11.70 | 18.79 | % | 1.10 | % | 1.38 | % | 1.47 | % | $ | 5,762 | 55 | %(f) | |||||||||||||||||||
| August 7, 2015 (h) through July 31, 2016 | (0.12 | ) | $ | 9.98 | (0.99 | )% | 1.10 | % | 1.57 | % | 1.48 | % | $ | 4,891 | 24 | % | |||||||||||||||||||
See notes to financial statements.
23
USAA Mutual Funds Trust | Notes to Financial Statements July 31, 2020 | ||||||
1. Organization:
USAA Mutual Funds Trust (the "Trust") is organized as a Delaware statutory trust and is registered under the Investment Company Act of 1940, as amended (the "1940 Act"), as an open-end investment company. The Trust is comprised of 47 funds and is authorized to issue an unlimited number of shares, which are units of beneficial interest with no par value.
The accompanying financial statements are those of the USAA Capital Growth Fund (the "Fund"). The Fund offers two classes of shares: Fund Shares and Institutional Shares. The Fund is classified as diversified under the 1940 Act.
Each class of shares of the Fund has substantially identical rights and privileges except with respect to fees paid under distribution plans, expenses allocable exclusively to each class of shares, voting rights on matters solely affecting a single class of shares, and the exchange privilege of each class of shares.
Under the Trust's organizational documents, its officers and trustees are indemnified against certain liabilities arising out of the performance of their duties to the Fund. In addition, in the normal course of business, the Fund enters into contracts with its vendors and others that provide for general indemnifications. The Fund's maximum exposure under these arrangements is unknown, as this would involve future claims that may be made against the Fund. However, based on experience, the Fund expects that risk of loss to be remote.
2. Significant Accounting Policies:
The following is a summary of significant accounting policies followed by the Trust in the preparation of its financial statements. The policies are in conformity with generally accepted accounting principles in the United States of America ("GAAP"). The preparation of financial statements in accordance with GAAP requires management to make estimates and assumptions that affect the reported amounts of assets and liabilities and disclosure of contingent assets and liabilities at the date of the financial statements and the reported amounts of income and expenses for the period. Actual results could differ from those estimates. The Fund follows the specialized accounting and reporting requirements under GAAP that are applicable to investment companies under Accounting Standards Codification Topic 946.
Investment Valuation:
The Fund records investments at fair value. Fair value is defined as the price that would be received to sell an asset or paid to transfer a liability in an orderly transaction between market participants at the measurement date.
The valuation techniques described below maximize the use of observable inputs and minimize the use of unobservable inputs in determining fair value. The inputs used for valuing the Fund's investments are summarized in the three broad levels listed below:
• Level 1 — quoted prices in active markets for identical securities
• Level 2 — other significant observable inputs (including quoted prices for similar securities or interest rates applicable to those securities, etc.)
• Level 3 — significant unobservable inputs (including the Fund's own assumptions in determining the fair value of investments)
Changes in valuation techniques may result in transfers in or out of an assigned level within the disclosure hierarchy. The inputs or methodologies used for valuation techniques are not necessarily an indication of the risk associated with entering into those investments.
The Adviser has established the Pricing and Liquidity Committee (the "Committee"), and subject to Trust's Board of Trustees (the "Board") oversight, the Committee administers and oversees the Fund's valuation policies and procedures, which are approved by the Board.
Portfolio securities listed or traded on securities exchanges, including exchange-traded funds ("ETFs"), American Depositary Receipts ("ADRs") and Rights, are valued at the closing price on the exchange or system where the security is principally traded, if available, or at the Nasdaq Official Closing Price. If there have been no sales for that day on the exchange or system, then a security is valued at the last
24
USAA Mutual Funds Trust | Notes to Financial Statements — continued July 31, 2020 | ||||||
available bid quotation on the exchange or system where the security is principally traded. In each of these situations, valuations are typically categorized as Level 1 in the fair value hierarchy.
Investments in open-end investment companies are valued at net asset value ("NAV"). These valuations are typically categorized as Level 1 in the fair value hierarchy.
In the event that price quotations or valuations are not readily available, are not reflective of market value, or a significant event has been recognized in relation to a security or class of securities, the securities are valued in good faith by the Committee in accordance with valuation procedures approved by the Board. These valuations are typically categorized as Level 2 or Level 3 in the fair value hierarchy, based on the observability of inputs used to determine the fair value. The effect of fair value pricing is that securities may not be priced on the basis of quotations from the primary market in which they are traded and the actual price realized from the sale of a security may differ materially from the fair value price. Valuing these securities at fair value is intended to cause the Fund's NAV to be more reliable than it otherwise would be.
In accordance with procedures adopted by the Board, fair value pricing may be used if events materially affecting the value of foreign securities occur between the time the exchange on which they are traded closes and the time the Fund's NAV is calculated. The Fund uses a systematic valuation model, provided daily by an independent third party to fair value its international equity securities. These valuations are considered as Level 2 in the fair value hierarchy.
A summary of the valuations as of July 31, 2020, based upon the three levels defined above, is included in the table below while the breakdown, by category, of investments is disclosed in the Schedule of Portfolio Investments (amounts in thousands):
Level 1 | Level 2 | Level 3 | Total | ||||||||||||||||
Common Stocks | $ | 528,823 | $ | 229,909 | $ | — | $ | 758,732 | |||||||||||
Preferred Stocks | 551 | 849 | — | 1,400 | |||||||||||||||
Exchnange-Traded Funds | 869 | — | — | 869 | |||||||||||||||
Collateral for Securities Loaned | 6,104 | — | — | 6,104 | |||||||||||||||
Total | $ | 536,347 | $ | 230,758 | $ | — | $ | 767,105 | |||||||||||
For the year ended July 31, 2020, there were no transfers in or out of the Level 3 fair value hierarchy.
Real Estate Investment Trusts ("REITs"):
The Fund may invest in REITs, which report information on the source of their distributions annually. REITs are pooled investment vehicles that invest primarily in income producing real estate or real estate related loans or interests (such as mortgages). Certain distributions received from REITs during the year are recorded as realized gains or return of capital as estimated by the Fund or when such information becomes known.
Investment Companies:
Exchange-Traded Funds:
The Fund may invest in ETFs, the shares of which are bought and sold on a securities exchange. An ETF trades like common stock and represents a fixed portfolio of securities designed to track the performance and dividend yield of a particular domestic or foreign market index. The Fund may purchase shares of an ETF to temporarily gain exposure to a portion of the U.S. or a foreign market while awaiting purchase of underlying securities. The risks of owning an ETF generally reflect the risks of owning the underlying securities they are designed to track, although the lack of liquidity of an ETF could result in it being more volatile. Additionally, ETFs have fees and expenses that reduce their value.
Open-End Funds:
The Fund may invest in portfolios of open-end investment companies. These investment companies value securities in their portfolios for which market quotations are readily available at their market
25
USAA Mutual Funds Trust | Notes to Financial Statements — continued July 31, 2020 | ||||||
values (generally the last reported sale price) and all other securities and assets at their fair value by the methods established by the board of directors of the underlying funds.
Foreign Exchange Currency Contracts:
The Fund may enter into foreign exchange currency contracts to convert U.S. dollars to and from various foreign currencies. A foreign exchange currency contract is an obligation by the Fund to purchase or sell a specific currency at a future date at a price (in U.S. dollars) set at the time of the contract. The Fund does not engage in "cross-currency" foreign exchange contracts (i.e., contracts to purchase or sell one foreign currency in exchange for another foreign currency). The Fund's foreign exchange currency contracts might be considered spot contracts (typically a contract of one week or less) or forward contracts (typically a contract term over one week). A spot contract is entered into for purposes of hedging against foreign currency fluctuations relating to a specific portfolio transaction, such as the delay between a security transaction trade date and settlement date. Forward contracts are entered into for purposes of hedging portfolio holdings or concentrations of such holdings. Each foreign exchange currency contract is adjusted daily by the prevailing spot or forward rate of the underlying currency, and any appreciation or depreciation is recorded for financial statement purposes as unrealized until the contract settlement date, at which time the Fund records realized gains or losses equal to the difference between the value of a contract at the time it was opened and the value at the time it was closed. The Fund could be exposed to risk if a counterparty is unable to meet the terms of a foreign exchange currency contract or if the value of the foreign currency changes unfavorably. In addition, the use of foreign exchange currency contracts does not eliminate fluctuations in the underlying prices of the securities. As of July 31, 2020, the Fund had no open forward foreign exchange currency contracts.
Investment Transactions and Related Income:
Changes in holdings of investments are accounted for no later than one business day following the trade date. For financial reporting purposes, however, investment transactions are accounted for on trade date on the last business day of the reporting period. Interest income is determined on the basis of coupon interest accrued using the effective interest method which adjusts, where applicable, the amortization of premiums or accretion of discount. Gains or losses realized on sales of securities are determined by comparing the identified cost of the security lot sold with the net sales proceeds.
Withholding taxes on interest, dividends, and gains as a result of certain investments in ADRs by the Fund has been provided for in accordance with each investment's applicable country's tax rules and rates.
Securities Lending:
The Fund, through a securities lending agreement with Citibank, N.A. ("Citibank"), may lend its securities to qualified financial institutions, such as certain broker-dealers, to earn additional income, net of income retained by Citibank. Borrowers are required to secure their loans for collateral in the amount of at least 102% of the value of U.S. securities loaned or at least 105% of the value of non-U.S. securities loaned, marked-to-market daily. Any collateral shortfalls associated with increases in the valuation of the securities loaned are cured the next business day once the shortfall exceeds $100 thousand. Collateral may be cash, U.S. government securities, or other securities as permitted by SEC guidelines. Cash collateral may be invested in high-quality short-term investments, primarily open-end investment companies. Collateral requirements are determined daily based on the value of the Fund's securities on loan as of the end of the prior business day. During the time portfolio securities are on loan, the borrower will pay the Fund any dividends or interest paid on such securities plus any fee negotiated between the parties to the lending agreement. The Fund also earns a return from the collateral. The Fund pays Citibank various fees in connection with the investment of cash collateral and fees based on the investment income received from securities lending activities. Securities lending income (net of these fees) is disclosed on the Statement of Operations. Loans are terminable upon demand and the borrower must return the loaned securities within the lesser of one standard settlement period or five
26
USAA Mutual Funds Trust | Notes to Financial Statements — continued July 31, 2020 | ||||||
business days. Risks relating to securities-lending transactions include that the borrower may not provide additional collateral when required or return the securities when due, and that the value of the short-term investments will be less than the amount of cash collateral required to be returned to the borrower. The Fund's agreement with Citibank does not include master netting provisions. Non- cash collateral received by the Fund may not be sold or re-pledged except to satisfy borrower default. Cash collateral is listed on the Fund's Schedule of Portfolio of Investments and Financial Statements while non-cash collateral is not included. The following table (amounts in thousands) is a summary of the Fund's securities lending transactions as of July 31, 2020.
| Value of Securities on Loan | Non-Cash Collateral | Cash Collateral | |||||||||
| $ | 5,789 | $ | — | $ | 6,104 | ||||||
Foreign Currency Translations:
The accounting records of the Fund are maintained in U.S. dollars. Investment securities and other assets and liabilities of the Fund denominated in a foreign currency are translated into U.S. dollars at current exchange rates. Purchases and sales of securities, income receipts, and expense payments are translated into U.S. dollars at the exchange rates on the date of the transactions. The Fund does not isolate the portion of the results of operations resulting from changes in foreign exchange rates on investments from fluctuations arising from changes in market prices of securities held. Such fluctuations are disclosed as net change in unrealized appreciation/depreciation on investments and foreign currency translations on the Statement of Operations. Any realized gains or losses from these fluctuations, including foreign currency arising from in-kind redemptions, are disclosed as net realized gains or losses from investment transactions and foreign currency translations on the Statement of Operations.
Foreign Taxes:
The Fund may be subject to foreign taxes related to foreign income received (a portion of which may be reclaimable), capital gains on the sale of securities, and certain foreign currency transactions. All foreign taxes are recorded in accordance with the applicable regulations and rates that exist in the foreign jurisdictions in which the Fund invests.
Federal Income Taxes:
It is the Fund's policy to continue to qualify as a regulated investment company by complying with the provisions available to certain investment companies, as defined in applicable sections of the Internal Revenue Code, and to make distributions of net investment income and net realized gains sufficient to relieve it from all, or substantially all, federal income taxes. Accordingly, no provision for federal income taxes is required in the financial statements. The Fund has a tax year-end of July 31.
Management of the Fund has reviewed tax positions taken in tax years that remain subject to examination by all major tax jurisdictions, including federal (i.e., the last four tax years, which includes the current fiscal tax year end). Management believes that there is no tax liability resulting from unrecognized tax benefits related to uncertain tax positions taken.
Allocations:
Expenses directly attributable to the Fund are charged to the Fund, while expenses that are attributable to more than one fund in the Trust, or jointly with an affiliated trust, are allocated among the respective funds in the Trust and/or affiliated trust based upon net assets or another appropriate basis.
Income, expenses (other than class-specific expenses such as transfer agent fees, state registration fees, and printing fees), and realized and unrealized gains or losses on investments are allocated to each class of shares based on its relative net assets on the date income is earned or expenses and realized and unrealized gains and losses are incurred.
27
USAA Mutual Funds Trust | Notes to Financial Statements — continued July 31, 2020 | ||||||
3. Purchases and Sales:
Cost of purchases and proceeds from sales/maturities of securities (excluding securities maturing less than one year from acquisition) for the year ended July 31, 2020, were as follows for the Fund (amounts in thousands):
| Excluding U.S. Government Securities | |||||||||||
Purchases | Sales | ||||||||||
$ | 1,237,899 | $ | 1,416,255 | ||||||||
There were no purchases and sales of U.S. government securities during the year ended July 31, 2020.
4. Affiliated Fund Ownership:
The Fund offers its shares for investment by other USAA Mutual Funds. The fund-of-funds do not invest in the underlying funds for the purpose of exercising management or control, and the affiliated fund-of-funds' annual and semi-annual reports may be viewed at usaa.com. As of July 31, 2020, certain fund-of-funds owned total outstanding shares of the Fund as follows:
USAA Cornerstone Conservative Fund | 0.2 | % | |||||
USAA Cornerstone Equity Fund | 0.5 | % | |||||
USAA Target Retirement Income Fund | 0.0 | %* | |||||
* Amount is less than 0.05%.
5. Fees and Transactions with Affiliates and Related Parties:
Investment Advisory Fees:
Investment advisory services are provided to the Fund by Victory Capital Management Inc. ("VCM" or the "Adviser"), a New York corporation registered as an investment adviser with the Securities and Exchange Commission ("SEC"). The Adviser is a wholly-owned indirect subsidiary of Victory Capital Holdings, Inc., a publicly traded Delaware corporation, and a wholly-owned direct subsidiary of Victory Capital Operating, LLC. Under the terms of the Investment Advisory Agreement, the Adviser is entitled to receive a base fee and a performance adjustment. The Fund's base fee is accrued daily and paid monthly at an annualized rate of 0.75% of the Fund's average daily net assets. Amounts incurred and paid to VCM for the year ended July 31, 2020, are reflected on the Statement of Operations as Investment Advisory fees.
Effective July 1, 2019, no performance adjustments were made for the period beginning July 1, 2019, through June 30, 2020. Only performance beginning as of July 1, 2019, and thereafter is utilized in calculating future performance adjustments.
The performance adjustment for each share class is accrued daily and calculated monthly by comparing each class' performance to that of the Lipper Global Funds Index. The Lipper Global Funds Index tracks the total return performance of each class within the Lipper Global Funds category.
The performance period for each share class consists of the current month plus the previous 35 months (or the number of months beginning July 1, 2019, if fewer). The following table is utilized to determine the extent of the performance adjustment:
| Over/Under Performance Relative to Index (in basis points)(a) | Annual Adjustment Rate (in basis points)(a) | ||||||
+/- 100 to 400 | +/- 4 | ||||||
+/- 401 to 700 | +/- 5 | ||||||
+/- 701 and greater | +/- 6 | ||||||
28
USAA Mutual Funds Trust | Notes to Financial Statements — continued July 31, 2020 | ||||||
(a) Based on the difference between average annual performance of the relevant share class of the Fund and its relevant Lipper index, rounded to the nearest basis point. Average daily net assets of the share class are calculated over a rolling 36-month period.
Each class' annual performance adjustment rate is multiplied by the average daily net assets of the class over the entire performance period, which is then multiplied by a fraction, the numerator of which is the number of days in the month and the denominator of which is 365 (366 in leap years). The resulting amount is then added to (in the case of overperformance), or subtracted from (in the case of underperformance) the base fee.
Under the performance fee arrangement, each class pays a positive performance fee adjustment for a performance period whenever the class outperforms the Lipper Global Funds Index over that period, even if the class has overall negative returns during the performance period.
For the period July 1, 2020 through July 31, 2020, performance adjustments for Fund Shares, and Institutional Shares were $(33) and $(2) thousand, respectively. For the Fund Shares, and Institutional Shares, the performance adjustments were less than 0.01% of net assets for both classes.
The Trust relies on an exemptive order granted to VCM and its affiliated funds by the SEC in March 2019 permitting the use of a "manager-of-managers" structure for certain funds. Under a manager-of- managers structure, the investment adviser may select (with approval of the Board and without shareholder approval) one or more subadvisers to manage the day-to-day investment of a fund's assets. For the year ended July 31, 2020, the Fund had no subadvisors.
Administration and Servicing Fees:
VCM serves as the Fund's administrator and fund accountant. Under the Fund Administration, Servicing and Accounting Agreement, VCM is paid for its services an annual fee at a rate of 0.15% and 0.10% of average daily net assets of the Fund Shares and Institutional Shares, respectively. Amounts incurred for the year ended July 31, 2020, are reflected on the Statement of Operations as Administration fees.
The Fund (as part of the Trust) has entered into an agreement to provide compliance services with the Adviser, pursuant to which the Adviser furnishes its compliance personnel, including the services of the Chief Compliance Officer ("CCO"), and other resources reasonably necessary to provide the Trust with compliance oversight services related to the design, administration and oversight of a compliance program for the Trust in accordance with Rule 38a-1 under the 1940 Act. The CCO is an employee of the Adviser, which pays the compensation of the CCO and support staff. Funds in the Trust, Victory Variable Insurance Funds, Victory Portfolios, and Victory Portfolios II (collectively, the "Victory Funds Complex") in the aggregate, compensates the Adviser for these services. Amounts incurred for the year ended July 31, 2020, are reflected on the Statement of Operations as Compliance fees.
Citi Fund Services Ohio, Inc. ("Citi"), an affiliate of Citibank, acts as sub-administrator and sub-fund accountant to the Fund pursuant to a Sub-Administration and Sub-Fund Accounting Services Agreement between VCM and Citi. VCM pays Citi a fee for providing these services. The Fund reimburses VCM and Citi for reasonable out-of-pocket expenses incurred in providing these services and certain other expenses specifically allocated to the Funds, under the Fund Administration, Servicing, and Accounting Agreement. Amounts incurred for the year ended July 31, 2020, are reflected on the Statement of Operations as Sub-Administration fees.
Transfer Agency Fees:
Victory Capital Transfer Agency, Inc. ("VCTA"), provides transfer agency services to the Fund. VCTA, an affiliate of the Adviser, provides transfer agent services to the Fund Shares based on an annual charge of $23 per shareholder account plus out-of-pocket expenses. VCTA pays a portion of these fees to certain intermediaries for the administration and servicing of accounts that are held with such intermediaries. Transfer agent's fees for Institutional Shares are paid monthly based on a fee accrued daily at an annualized rate of 0.10% of average daily net assets, plus out-of-pocket expenses. Amounts incurred and paid to VCTA for the year ended July 31, 2020, are reflected on the Statement of Operations as Transfer Agent fees.
29
USAA Mutual Funds Trust | Notes to Financial Statements — continued July 31, 2020 | ||||||
FIS Investor Services LLC serves as sub-transfer agent and dividend disbursing agent for the Fund pursuant to a Sub-Transfer Agent agreement between VCTA and FIS Investor Services LLC. VCTA provides FIS Investor Services LLC a fee for providing these services.
Distributor/Underwriting Services:
Victory Capital Services, Inc. (the "Distributor"), an affiliate of the Adviser, serves as distributor for the continuous offering of the shares of the Fund pursuant to a Distribution Agreement between the Distributor and the Trust. The Distributor received no fees or other compensation for such distribution services. Effective June 30, 2020, the Distributor's name was changed from Victory Capital Advisers, Inc.
Other Fees:
Citibank serves as the Fund's custodian.
K&L Gates LLP provides legal services to the Trust.
The Adviser has entered into an expense limitation agreement with the Fund until at least June 30, 2021. Under the terms of the agreement, the Adviser has agreed to waive fees or reimburse certain expenses to the extent that ordinary operating expenses incurred by certain classes of the Fund in any fiscal year exceed the expense limit for such classes of the Fund. Such excess amounts will be the liability of the Adviser. Interest, taxes, brokerage commissions, other expenditures, which are capitalized in accordance with GAAP, and other extraordinary expenses not incurred in the ordinary course of the Fund's business are excluded from the expense limits. As of July 31, 2020, the expense limits (excluding voluntary waivers) are 1.12% and 1.10% for Fund Shares and Institutional Shares, respectively.
Under this expense limitation agreement, the Fund has agreed to repay fees and expenses that were waived or reimbursed by the Adviser for a period up to three years after the fiscal year in which the waiver or reimbursement took place, subject to the lesser of any operating expense limits in effect at the time of: (a) the original waiver or expense reimbursement; or (b) the recoupment, after giving effect to the recoupment amount. As of July 31, 2020, the following amounts are available to be repaid to the Adviser (amounts in thousands). The Fund has not recorded any amounts available to be repaid as a liability due to an assessment that such repayment is not probable at July 31, 2020.
| Expires July 31, 2023 | |||
| $ | 133 | ||
The Adviser may voluntarily waive or reimburse additional fees to assist the Fund in maintaining competitive expense ratios. Voluntary waivers and reimbursements applicable to the Fund are not available to be recouped at a future time. There were no voluntary waivers or reimbursements for the year ended July 31, 2020.
Certain officers and/or interested trustees of the Fund are also officers and/or employees of the Adviser, Administrator, Sub-Administrator, Sub-Fund Accountant, and Legal.
6. Risks:
The Fund may be subject to other risks in addition to these identified risks.
Global economies and financial markets are increasingly interconnected, which increases the possibilities that conditions in one country or region might adversely affect issuers in another country or region. Geopolitical and other risks, including war, terrorism, trade disputes, political or economic dysfunction within some nations, public health crises and related geopolitical events, as well as environmental disasters such as earthquakes, fires, and floods, may add to instability in world economies and markets generally. Changes in trade policies and international trade agreements could affect the economies of many countries in unpredictable ways. Epidemics and/or pandemics, such as the coronavirus (or COVID-19), may result in, among other things, closing borders, disruptions to healthcare service preparation and delivery, quarantines, cancellations, disruptions to supply chains and consumer activity, as well as general concern and uncertainty. The impact may be short-term or may last for extended periods.
30
USAA Mutual Funds Trust | Notes to Financial Statements — continued July 31, 2020 | ||||||
The COVID-19 pandemic, which has spread rapidly across the world, has led and will continue to lead for an unknown period of time to disruptions in local, regional, national and global markets and economies. Among other things, the outbreak has resulted in, and until fully resolved is likely to continue to result in, among other things (1) government imposition of various forms of "stay at home" orders and the closing of "non-essential" businesses, resulting in significant disruption to the businesses of many issuers as well as lay-offs of employees: (2) increased requests by issuers of debt instruments for amendments and waivers of agreements to avoid default and increased defaults: (3) volatility and disruption of markets, including greater volatility in pricing and spreads; and (4) rapidly evolving proposals and/or actions by state and federal governments to address problems being experienced by the markets and by businesses and the economy in general.
Overall stock market risks may affect the value of the Fund. Factors such as domestic and international economic growth and market conditions, interest rate levels, and political events affect the securities market.
The value of the equity securities in which the Fund invests may decline in response to developments affecting individual companies and/or general economic conditions. A company's earnings or dividends may not increase as expected. Price changes may be temporary or last for extended periods.
Foreign markets can be more volatile than the U.S. market due to increased risks of adverse issuer, political, regulatory, market, or economic developments and can perform differently from the U.S. market.
7. Borrowing and Interfund Lending:
Line of Credit:
For the year ended July 31, 2020, the Victory Funds Complex participated in a short-term demand note "Line of Credit" agreement with Citibank. The Line of Credit agreement with Citibank was renewed on June 29, 2020 with a termination date of June 28, 2021. Under the agreement with Citibank, the Victory Funds Complex may borrow up to $600 million, of which $300 million is committed and $300 million is uncommitted. $40 million of the Line of Credit is reserved for use by the Victory Floating Rate Fund (herein, the "Fund"), another series of the Victory Funds Complex, with that Fund paying the related commitment fees for that amount. The purpose of the agreement is to meet temporary or emergency cash needs. For the year ended July 31, 2020, Citibank received an annual commitment fee of 0.15% on $300 million for providing the Line of Credit. Each fund in the Victory Funds Complex pays a pro-rata portion of the commitment fees plus any interest (one month LIBOR plus one percent) on amounts borrowed. Effective June 29, 2020, under an amended Line of Credit agreement, Citibank will also receive an annual upfront fee of 0.10% on the $300 million committed line of credit. Each fund in the Victory Funds Complex will pay a pro-rata portion of the upfront fee. Interest charged to each Fund during the period, if applicable, is reflected on the Statements of Operations under Line of credit fees.
The average borrowing for the days outstanding and average interest rate for the Fund during the year ended July 31, 2020 were as follows (amounts in thousands):
| Amount Outstanding at July 31, 2020 | Average Borrowing* | Days Borrowing Outstanding | Average Interest Rate* | Maximum Borrowing During the Period | |||||||||||||||
| $ | — | $ | 4,000 | 1 | 3.15 | % | $ | 4,000 | |||||||||||
* For the year ended July 31,2020, based on the number of days borrowings were outstanding.
Interfund Lending:
The Trust and Adviser rely on an exemptive order granted by the SEC in March 2017 (the "Order"), permitting the establishment and operation of an Interfund Lending Facility (the "Facility"). The Facility allows the Fund to directly lend and borrow money to or from any other Fund in the Victory Funds Complex relying upon the Order at rates beneficial to both the borrowing and lending funds. Advances under the Facility are allowed for temporary or emergency purposes. The interfund loan rate is determined, as specified in the Order, by averaging the current repurchase agreement rate and the
31
USAA Mutual Funds Trust | Notes to Financial Statements — continued July 31, 2020 | ||||||
current bank loan rate. As a Borrower, interest charged to the Fund, if any, during the period is reflected on the Statement of Operations under Interfund lending fees. As a Lender, interest earned by the Fund, if any, during the period is reflected on the Statement of Operations under Income on Interfund lending.
The average borrowing or lending for the days outstanding and average interest rate for the Fund during the year ended July 31, 2020 were as follows (amounts in thousands):
| Borrower or Lender | Amount Outstanding at July 31, 2020 | Average Borrowing* | Days Borrowing Outstanding | Average Interest Rate* | Maximum Borrowing During the Period | ||||||||||||||||||
Borrower | $ | — | $ | 1,480 | 2 | 2.13 | % | $ | 1,600 | ||||||||||||||
* For the year ended July 31, 2020, based on the number of days borrowings were outstanding.
8. Federal Income Tax Information:
The Fund intends to distribute any net investment income annually. Distributable net realized gains, if any, are declared and paid at least annually.
The amounts of dividends from net investment income and distributions from net realized gains (collectively distributions to shareholders) are determined in accordance with federal income tax regulations, which may differ from GAAP. To the extent these "book/tax" differences are permanent in nature (e.g., net operating loss and distribution reclassification), such amounts are reclassified within the components of net assets based on their federal tax-basis treatment; temporary differences (e.g., wash sales) do not require reclassification. To the extent dividends and distributions exceed net investment income and net realized gains for tax purposes, they are reported as distributions of capital. Net investment losses incurred by the Fund may be reclassified as an offset to capital on the accompanying Statement of Assets and Liabilities.
The following permanent reclassifications were made between capital accounts to reflect the portion of the payments made to redeeming shareholders that was claimed as a distribution for income tax purposes during the year ended July 31, 2020 (amounts in thousands):
| Total accumulated earnings/(loss) | Capital | ||||||
| $ | (4,748 | ) | $ | 4,748 | |||
The tax character of distributions paid during the tax years ended as noted below, were as follows (total distributions paid may differ from the Statements of Changes in Net Assets because, for tax purposes, dividends are recognized when actually paid) (amounts in thousands).
Year Ended July 31, 2020 | Year Ended July 31, 2019 | ||||||||||||||||||||||||||
Distributions paid from | Distributions paid from | ||||||||||||||||||||||||||
Ordinary Income | Net Long-Term Capital Gains | Total Distributions Paid | Ordinary Income* | Net Long-Term Capital Gains | Total Distributions Paid | ||||||||||||||||||||||
$ | 13,664 | $ | 64,771 | $ | 78,435 | $ | 19,850 | $ | 47,634 | $ | 67,484 | ||||||||||||||||
* Includes short-term realized capital gains, if any, which are taxable as ordinary income.
32
USAA Mutual Funds Trust | Notes to Financial Statements — continued July 31, 2020 | ||||||
As of July 31, 2020, the components of accumulated earnings (loss) on a tax basis were as follows (amounts in thousands):
| Undistributed Ordinary Income | Undistributed Long Term Capital Gains | Accumulated Earnings | Unrealized Appreciation (Depreciation)* | Total Accumulated Earnings (Loss) | |||||||||||||||
| $ | 6,041 | $ | 2,570 | $ | 8,611 | $ | 97,413 | $ | 106,024 | ||||||||||
* The difference between the book-basis and tax-basis of unrealized appreciation/depreciation is attributable to the tax deferral of losses on wash sales.
As of July 31, 2020, the cost basis for federal income tax purposes, gross unrealized appreciation, gross unrealized depreciation, and net unrealized appreciation (depreciation) for investments were as follows (amounts in thousands):
| Cost of Investments for Federal Tax Purposes | Gross Unrealized Appreciation | Gross Unrealized Depreciation | Net Unrealized Appreciation (Depreciation) | ||||||||||||
| $ | 669,721 | $ | 141,355 | $ | (43,971 | ) | $ | 97,384 | |||||||
33
REPORT OF INDEPENDENT REGISTERED PUBLIC ACCOUNTING FIRM
To the Shareholders and the Board of Trustees of USAA Capital Growth Fund
Opinion on the Financial Statements
We have audited the accompanying statement of assets and liabilities of USAA Capital Growth Fund (the "Fund") (one of the funds constituting USAA Mutual Funds Trust (the "Trust")), including the portfolio of investments, as of July 31, 2020, and the related statement of operations for the year then ended, the statements of changes in net assets for each of the two years in the period then ended, the financial highlights for each of the five years in the period then ended and the related notes (collectively referred to as the "financial statements"). In our opinion, the financial statements present fairly, in all material respects, the financial position of the Fund (one of the funds constituting USAA Mutual Funds Trust) at July 31, 2020, the results of its operations for the year then ended, the changes in its net assets for each of the two years in the period then ended and its financial highlights for each of the five years in the period then ended, in conformity with U.S. generally accepted accounting principles.
Basis for Opinion
These financial statements are the responsibility of the Trust's management. Our responsibility is to express an opinion on the Fund's financial statements based on our audits. We are a public accounting firm registered with the Public Company Accounting Oversight Board (United States) ("PCAOB") and are required to be independent with respect to the Trust in accordance with the U.S. federal securities laws and the applicable rules and regulations of the Securities and Exchange Commission and the PCAOB.
We conducted our audits in accordance with the standards of the PCAOB. Those standards require that we plan and perform the audit to obtain reasonable assurance about whether the financial statements are free of material misstatement, whether due to error or fraud. The Trust is not required to have, nor were we engaged to perform, an audit of the Trust's internal control over financial reporting. As part of our audits we are required to obtain an understanding of internal control over financial reporting, but not for the purpose of expressing an opinion on the effectiveness of the Trust's internal control over financial reporting. Accordingly, we express no such opinion.
Our audits included performing procedures to assess the risks of material misstatement of the financial statements, whether due to error or fraud, and performing procedures that respond to those risks. Such procedures included examining, on a test basis, evidence regarding the amounts and disclosures in the financial statements. Our procedures included confirmation of securities owned as of July 31, 2020, by correspondence with the custodian and brokers or by other appropriate auditing procedures where replies from brokers were not received. Our audits also included evaluating the accounting principles used and significant estimates made by management, as well as evaluating the overall presentation of the financial statements. We believe that our audits provide a reasonable basis for our opinion.

We have served as the auditor of one or more Victory Capital investment companies since 1995.
San Antonio, Texas
September 29, 2020
34
USAA Mutual Funds Trust | Supplemental Information July 31, 2020 | ||||||
(Unaudited)
Trustee and Officer Information
Board of Trustees:
Overall responsibility for management of the Trust rests with the Board. The Trust is managed by the Board in accordance with the laws of the state of Delaware. There are currently 10 Trustees, eight of whom are not "interested persons" of the Trust within the meaning of that term under the 1940 Act ("Independent Trustees") and two of whom is an "interested person" of the Trust within the meaning of that term under the 1940 Act ("Interested Trustee"). The Trustees, in turn, elect the officers of the Trust to actively supervise its day-to-day operations.
The following tables list the Trustees, their ages, position with the Trust, commencement of service, principal occupations during the past five years and any directorships of other investment companies or companies whose securities are registered under the Securities Exchange Act of 1934, as amended, or who file reports under that Act. Each Trustee oversees 47 portfolios in the Trust. Each Trustee's address is 15935 La Cantera Pkwy, Building Two, San Antonio, TX, 78256. Pursuant to a policy adopted by the Board, the term of office for each Trustee shall be until the Independent Trustee reaches age 75 or an Interested Trustee reaches age 75. The Board may change or grant exceptions from this policy at any time without shareholder approval. A Trustee may resign or be removed by a vote of the other Trustees or the holders of a majority of the outstanding shares of the Trust at any time. Vacancies on the Board can be filled by the action of a majority of the Trustees, provided that after filling such vacancy at least two-thirds of the Trustees have been elected by the shareholders.
Name and Date of Birth | Position Held with the Trust | Year Commenced Service | Principal Occupation During Past 5 Years | Other Directorships Held During Past 5 Years | |||||||||||||||
Independent Trustees. | |||||||||||||||||||
| Jefferson C. Boyce, Born September 1957 | Lead Independent Trustee, and Vice Chairman | 2013 | Senior Managing Director, New York Life Investments, LLC (1992-2012) | Westhab, Inc. | |||||||||||||||
| John C. Walters, Born February 1962 | Trustee | 2019 | Retired. Mr. Walters brings significant Board experience including active involvement with the board of a Fortune 500 company, and a proven record of leading large, complex financial organizations. He has a demonstrated record of success in distribution, manufacturing, investment brokerage, and investment management in both the retail and institutional investment businesses. He has substantial experience in the investment management business with a demonstrated ability to develop and drive strategy while managing operation, financial, and investment risk. | Guardian Variable Products Trust (16 series), Lead Independent Director; Amerilife Holdings LLC, Director; Stadion Money Management; Director; University of North Carolina (Chapel Hill), Member Board of Governors. | |||||||||||||||
35
USAA Mutual Funds Trust | Supplemental Information — continued July 31, 2020 | ||||||
(Unaudited)
Name and Date of Birth | Position Held with the Trust | Year Commenced Service | Principal Occupation During Past 5 Years | Other Directorships Held During Past 5 Years | |||||||||||||||
| Robert L. Mason, Ph.D., Born July 1946 | Trustee | 1997 | Adjunct Professor in the Department of Management Science and Statistics in the College of Business at the University of Texas at San Antonio (since 2001); Institute Analyst, Southwest Research Institute (March 2002-January 2016) | None | |||||||||||||||
| Dawn M. Hawley, Born February 1954 | Trustee | 2014 | Manager of Finance, Menil Foundation, Inc. (May 2007-June 2011), which is a private foundation that oversees the assemblage of sculptures, prints, drawings, photographs, and rare books. Director of Financial Planning and Analysis and Chief Financial Officer, AIM Management Group, Inc. (October 1987-January 2006) | None | |||||||||||||||
| Paul L. McNamara, Born July 1948 | Trustee | 2012 | Director, Cantor Opportunistic Alternatives Fund, LLC (March 2010-February 2014) , which is a closed-end fund of funds by Cantor Fitzgerald Investment Advisors, LLC | None | |||||||||||||||
36
USAA Mutual Funds Trust | Supplemental Information — continued July 31, 2020 | ||||||
(Unaudited)
Name and Date of Birth | Position Held with the Trust | Year Commenced Service | Principal Occupation During Past 5 Years | Other Directorships Held During Past 5 Years | |||||||||||||||
| Richard Y. Newton III, Born January 1956 | Trustee | 2017 | Director, Elta North America (01/18-present), which is a global leader in the design, manufacture, and support of innovative electronic systems in the ground, maritime, airborne, and security domains for the nation's warfighters, security personnel, and first responders; Managing Partner, Pioneer Partnership Development Group (December 2015-present)); Executive Director, The Union League Club of New York (June 2014-November 2015): Executive Vice President, Air Force Association (August 2012-May 2014); Lieutenant General, United States Air Force (January 2008-June 2012) | None | |||||||||||||||
| Barbara B. Ostdiek, Ph.D., Born March 1964 | Trustee | 2008 | Senior Associate Dean of Degree Programs at Jesse H. Jones Graduate School of Business at Rice University (since 2013); Associate Professor of Finance at Jessie H. Jones Graduate School of Business at Rice University (since 2001) | None | |||||||||||||||
| Michael F. Reimherr, Born August 1945 | Trustee | 2000 | President of Reimherr Business Consulting (May 1995-December 2017); St. Mary's University Investment Committee overseeing University Endowment (since 2014) | None | |||||||||||||||
37
USAA Mutual Funds Trust | Supplemental Information — continued July 31, 2020 | ||||||
(Unaudited)
Name and Date of Birth | Position Held with the Trust | Year Commenced Service | Principal Occupation During Past 5 Years | Other Directorships Held During Past 5 Years | |||||||||||||||
Interested Trustees. | |||||||||||||||||||
| David C. Brown, ** Born May 1972 | Trustee | 2019 | Chairman and Chief Executive Officer (since 2013), Co-Chief Executive Officer (2011-2013), Victory Capital Management Inc.; Chairman and Chief Executive Officer, Victory Capital Holdings, Inc. (since 2013). Mr. Brown brings to the Board extensive business, finance and leadership skills gained and developed through years of experience in the financial services industry, including his tenure overseeing the strategic direction as CEO of Victory Capital. These skills, combined with Mr. Brown's extensive knowledge of the financial services industry and demonstrated success in the development and distribution of investment strategies and products, enable him to provide valuable insights to the Board and strategic direction for the Funds | Trustee, Victory Portfolios (42 series), Victory Portfolios II (26 series), Victory Variable Insurance Funds (9 series) | |||||||||||||||
38
USAA Mutual Funds Trust | Supplemental Information — continued July 31, 2020 | ||||||
(Unaudited)
Name and Date of Birth | Position Held with the Trust | Year Commenced Service | Principal Occupation During Past 5 Years | Other Directorships Held During Past 5 Years | |||||||||||||||
| Daniel S. McNamara, ** Born June 1966 | Trustee and Chair of the Board of Trustees | 2012 | Trustee, President, and Vice Chairman of USAA ETF Trust (June 2017-June 2019); President of Financial Advice & Solutions Group (FASG), USAA (since 2013); Director, Investment Management Company (IMCO) (September 2009-April 2014); President, Asset Management Company (AMCO) (August, 2011-April 2013); Senior Vice President of USAA Financial Planning Services Insurance Agency, Inc. (FPS) (since 2011); Director of USAA IMCO (since 2009); Chairman of Board of IMCO (since 2013); Director of AMCO, (August 2011-June 2019); President and Director of USAA Shareholder Account Services (SAS) (October 2009-June 2019); Director and Vice Chairman of FPS (since 2013); President and Director of USAA Investment Corporation (ICORP) (since 2010); Chairman of Board of ICORP (since 2013); Director of USAA Financial Advisors, Inc. (FAI) (since 2013); Chairman of Board of FAI (since 2015). Mr. McNamara brings to the Board extensive experience in the financial services industry, including experience as an officer of the Trust. | None | |||||||||||||||
** Mr. Dan McNamara, the Chairman of the Board, is deemed an "interested person" due to his previous position as Director of AMCO, the former investment adviser of the Funds. Mr. Brown is deemed an "interested person" due to his position as Chief Executive Officer of Victory Capital, investment adviser to the Funds.
The Statement of Additional Information includes additional information about the Trustees of the Trust and is available, without charge, on the SEC's website at www.sec.gov and/or by calling (800)-539-3863.
39
USAA Mutual Funds Trust | Supplemental Information — continued July 31, 2020 | ||||||
(Unaudited)
Officers:
The officers of the Trust, their ages, commencement of service and their principal occupations during the past five years, are detailed in the following table. Each officer serves until the earlier of his or her resignation, removal, retirement, death, or the election of a successor. The mailing address of each officer of the Trust is 15935 La Cantera Pkwy, Building Two, San Antonio, TX, 78256. The officers of the Trust receive no compensation directly from the Trust for performing the duties of their offices.
Name and Date of Birth | Position with the Trust | Year Commenced Service | Principal Occupation During Past 5 Years | ||||||||||||
Interested Officers. | |||||||||||||||
| Christopher K. Dyer, Born February 1962 | President | 2019 | Director of Fund Administration, Victory Capital (2004-present) | ||||||||||||
| Scott A Stahorsky, Born July 1969 | Vice President | 2019 | Manager, Fund Administration, Victory Capital (since 2015); Senior Analyst, Fund Administration, Victory Capital (prior to 2015) | ||||||||||||
| James K. De Vries, Born April 1969 | Treasurer, Principal Financial Officer | 2018 | Executive Director, Victory Capital Management Inc. (since 2019); Treasurer, USAA ETF Trust (September 2018-June 2019); Executive Director, Investment and Financial Administration, USAA (April 2012-June 2019); Assistant Treasurer, USAA ETF Trust (June 2017-September 2018); Assistant Treasurer, USAA Mutual Funds Trust (December 2013-February 2018) | ||||||||||||
| Allan Shaer, Born March 1965 | Assistant Treasurer | 2019 | Senior Vice President, Financial Administration, Citi Fund Services Ohio, Inc. (since 2016); Vice President, Mutual Fund Administration, JP Morgan Chase (2011-2016) | ||||||||||||
| Carol D. Trevino, Born October 1965 | Assistant Treasurer | 2018 | Director, Accounting and Finance, Victory Capital Management Inc. (since 2019); Accounting/Financial Director, USAA (December 2013-June 2019); Assistant Treasurer, USAA ETF Trust (September 2018-June 2019). | ||||||||||||
| Erin G. Wagner, Born February 1974 | Secretary | 2019 | Deputy General Counsel, the Adviser (since 2013) | ||||||||||||
| Charles Booth, Born April 1960 | Anti-Money Laundering Compliance Officer and Identity Theft Officer | 2019 | Director, Regulatory Administration and CCO Support Services, Citi Fund Services Ohio, Inc. (2007-present) | ||||||||||||
| Amy Campos, Born July 1976 | Chief Compliance Officer | 2019 | Chief Compliance Officer, USAA Mutual Funds Trust (since 2019); Executive Director, Deputy Chief Compliance Officer, USAA Mutual Funds Trust and USAA ETF Trust (July 2017-June 2019); Compliance Director, USAA Mutual Funds Trust (2014-July 2017) | ||||||||||||
40
USAA Mutual Funds Trust | Supplemental Information — continued July 31, 2020 | ||||||
(Unaudited)
Proxy Voting and Portfolio Holdings Information
Proxy Voting:
Information regarding the policies and procedures the Fund uses to determine how to vote proxies relating to portfolio securities is available without charge, upon request, by calling (800) 539-3863. The information is also included in the Fund's Statement of Additional Information, which is available on the SEC's website at www.sec.gov.
Information relating to how the Fund voted proxies relating to portfolio securities held during the most recent 12 months ended June 30 is available on the SEC's website at www.sec.gov.
Availability of Schedules of Portfolio Investments:
The Trust files a complete list of Schedules of Portfolio Investments with the SEC for the first and third quarter of each fiscal year on Form N-PORT. Forms N-PORT are available on the SEC's website at www.sec.gov.
Expense Examples
As a shareholder of the Fund, you may incur two types of costs: (1) transaction costs, and (2) ongoing costs, including management fees and other Fund expenses. These examples are intended to help you understand your ongoing costs (in dollars) of investing in the Fund and to compare these costs with the ongoing costs of investing in other mutual funds.
These examples are based on an investment of $1,000 invested at the beginning of the period and held for the entire period from February 1, 2020 through July 31, 2020.
The Actual Expense figures in the table below provide information about actual account values and actual expenses. You may use the information below, together with the amount you invested, to estimate the expenses that you paid over the period. Simply divide your account value by $1,000 (for example, an $8,600 account value divided by $1,000 = 8.6), then multiply the result by the number in the table under the heading entitled "Actual Expenses Paid During Period" to estimate the expenses you paid on your account during this period.
The Hypothetical Expense figures in the table below provide information about hypothetical account values and hypothetical expenses based on the Fund's actual expense ratio and an assumed rate of return of 5% per year before expenses, which is not the Fund's actual return. The hypothetical account values and expenses may not be used to estimate the actual ending account balance or expenses you paid for the period. You may use this information to compare this 5% hypothetical example with the 5% hypothetical examples that appear in shareholder reports of other funds.
Please note the expenses shown in the table below are meant to highlight your ongoing costs only and do not reflect any transactional costs. If these transactional costs were included, your costs would have been higher.
| Beginning Account Value 2/1/20 | Actual Ending Account Value 7/31/20 | Hypothetical Ending Account Value 7/31/20 | Actual Expenses Paid During Period 2/1/20- 7/31/20* | Hypothetical Expenses Paid During Period 2/1/20- 7/31/20* | Annualized Expense Ratio During Period 2/1/20- 7/31/20 | ||||||||||||||||||||||
Fund Shares | $ | 1,000.00 | $ | 984.20 | $ | 1,019.49 | $ | 5.33 | $ | 5.42 | 1.08 | % | |||||||||||||||
Institutional Shares | 1,000.00 | 984.30 | 1,020.14 | 4.69 | 4.77 | 0.95 | % | ||||||||||||||||||||
* Expenses are equal to the average account value multiplied by the Fund's annualized expense ratio multiplied by 182/366 (the number of days in the most recent fiscal half-year divided by the number of days in the fiscal year).
41
USAA Mutual Funds Trust | Supplemental Information — continued July 31, 2020 | ||||||
(Unaudited)
Additional Federal Income Tax Information
The following federal tax information related to the Fund's fiscal year ended July 31, 2020, is provided for information purposes only and should not be used for reporting to federal or state revenue agencies. Federal tax information for the calendar year will be reported to you on Form 1099-DIV in January 2021.
With respect to distributions paid, the Fund designates the following amounts (or, if subsequently determined to be different, the maximum amount allowable) for the fiscal year ended July 31, 2020 (amounts in thousands):
| Dividend Received Deduction (corporate shareholders)* | Qualified Dividend Income (non-corporate shareholders)* | Long-Term Capital Gains Distributions(a) | |||||||||
| 85.92 | % | 36.66 | % | $ | 69,518 | ||||||
* Presented as a percentage of net investment income and excludes short-term capital gain distributions paid, if any. All or a portion of these amounts may be exempt from taxation at the state level.
(a) Pursuant to Section 852 of the Internal Revenue Code.
42
USAA Mutual Funds Trust | Supplemental Information — continued July 31, 2020 | ||||||
(Unaudited)
Liquidity Risk Management Program
The USAA Mutual Funds have adopted and implemented a written liquidity risk management program (the "LRMP") as required by Rule 22e-4 under the Investment Company Act of 1940, as amended. The LRMP is reasonably designed to assess and manage the Fund's liquidity risk, taking into consideration the Fund's investment strategy and the liquidity of its portfolio investments during normal and reasonably foreseeable stressed market conditions; its short and long-term cash flow projections; and its cash holdings and access to other liquidity management tools such as available funding sources including the Victory Funds Complex Interfund Lending Facility and Line of Credit (discussed in the Notes to Financial Statements). The USAA Mutual Funds' Board of Trustees approved the appointment of the Fund's investment adviser, Victory Capital Management Inc. ("Victory Capital"), as the administrator of the LRMP. At an in-person meeting held on February 26, 2020, Victory Capital provided an oral and written report to the Trustees on the operation and effectiveness of the LRMP during the previous year.
Victory Capital manages liquidity risks associated with the Fund's investments by monitoring, among other things, cash and cash equivalents, any use of derivatives, the concentration of investments, the appropriateness of the Fund's investment strategy, and by classifying every fund investment as either highly liquid, moderately liquid, less liquid or illiquid on at least a monthly basis. To assist with the classification of Fund investments, Victory Capital has retained a third-party provider of liquidity evaluation services. This provider determines preliminary liquidity classifications for all portfolio holdings based upon portfolio-level data and certain assumptions provided by Victory Capital. Victory Capital reviews the preliminary liquidity classifications, and, when appropriate, considers other information including input from the Fund's portfolio managers (including the portfolio managers employed by any investment sub-advisers) in determining final liquidity classifications.
The report from Victory Capital concluded that the Fund did not experience any significant liquidity challenges during the covered period, and the Fund's LRMP is reasonably designed to assess and manage its liquidity risk. The report also concluded that the LRMP continues to operate adequately and effectively to enable Victory Capital to oversee and manage liquidity risk and ensure the Fund is able to meet redemption requests without significant dilution to the remaining investors' interest in the Fund. During the review period, the Fund's portfolio consisted primarily of highly liquid investments, which are defined as cash and any investments reasonably expected to be converted to cash in current market conditions in three business days or less without significantly changing the market value of the investment. Therefore, the Fund has not adopted a Highly Liquid Investment Minimum. The Fund's investments were below the limitation on illiquid investments during the review period. Additionally, Victory Capital indicated that no events occurred that would require the filing of Form N-LIQUID and recommended no material changes to the LRMP.
43
Privacy Policy
Protecting the Privacy of Information
The Trust respects your right to privacy. We also know that you expect us to conduct and process your business in an accurate and efficient manner. To do so, we must collect and maintain certain personal information about you. This is the information we collect from you on applications or other forms, and from the transactions you make with us or third parties. It may include your name, address, social security number, account transactions and balances, and information about investment goals and risk tolerance.
We do not disclose any information about you or about former customers to anyone except as permitted or required by law. Specifically, we may disclose the information we collect to companies that perform services on our behalf, such as the transfer agent that processes shareholder accounts and printers and mailers that assist us in the distribution of investor materials. We may also disclose this information to companies that perform marketing services on our behalf. This allows us to continue to offer you Victory investment products and services that meet your investing needs, and to effect transactions that you request or authorize. These companies will use this information only in connection with the services for which we hired them. They are not permitted to use or share this information for any other purpose.
To protect your personal information internally, we permit access only by authorized employees and maintain physical, electronic and procedural safeguards to guard your personal information.*
* You may have received communications regarding information about privacy policies from other financial institutions which gave you the opportunity to "opt-out" of certain information sharing with companies which are not affiliated with that financial institution. The Trust does not share information with other companies for purposes of marketing solicitations for products other than the Trust. Therefore, the Trust does not provide opt-out options to their shareholders.
P.O. Box 182593
Columbus, Ohio 43218-2593

Visit our website at: | Call | ||||||
vcm.com | (800) 235-8396 | ||||||
36844-0920

JULY 31, 2020
Annual Report
USAA Growth & Income Fund
Beginning January 1, 2021, as permitted by regulations adopted by the Securities and Exchange Commission, paper copies of the Fund's shareholder reports like this one will no longer be sent by mail, unless you specifically request paper copies of the reports from the Fund or from your financial intermediary, such as a broker-dealer or bank. Instead, the reports will be made available on VictoryFunds.com, and you will be notified by mail each time a report is posted and provided with a website link to access the report. If you already elected to receive shareholder reports electronically, you will not be affected by this change and you need not take any action.
You may elect to receive shareholder reports and other communications from the Fund or your financial intermediary electronically by notifying your financial intermediary directly, or if you are a direct investor, by calling (800) 235-8396 or logging on to usaa.com. Effective on or about November 6, 2020, a shareholder who has an account directly with the Fund will need to submit their request via email to TA.Processing@FISGlobal.com.
You may elect to receive all future reports in paper free of charge. You can inform the Fund or your financial intermediary that you wish to continue receiving paper copies of your shareholder reports by notifying your financial intermediary directly, or if you are a direct investor, by calling (800) 235-8396 or logging on to usaa.com. Effective on or about November 6, 2020, a shareholder who has an account directly with the Fund will need to submit their request via email to TA.Processing@FISGlobal.com. Your election to receive reports in paper will apply to all funds held with the USAA Mutual Funds or your financial intermediary.
Victory Capital means Victory Capital Management Inc., the investment adviser of the USAA Mutual Funds. USAA Mutual Funds are distributed by Victory Capital Services, Inc., member FINRA, an affiliate of Victory Capital. Victory Capital and its affiliates are not affiliated with United Services Automobile Association or its affiliates. USAA and the USAA logo are registered trademarks and the USAA Mutual Funds and USAA Investments logos are trademarks of United Services Automobile Association and are being used by Victory Capital and its affiliates under license.
TABLE OF CONTENTS
Shareholder Letter (Unaudited) | 2 | ||||||
Managers' Commentary (Unaudited) | 3 | ||||||
Investment Overview (Unaudited) | 5 | ||||||
| Investment Objective & Portfolio Holdings (Unaudited) | 6 | ||||||
Financial Statements | |||||||
Schedule of Portfolio Investments | 7 | ||||||
Statement of Assets and Liabilities | 13 | ||||||
Statement of Operations | 14 | ||||||
Statements of Changes in Net Assets | 15 | ||||||
Financial Highlights | 18 | ||||||
Notes to Financial Statements | 22 | ||||||
| Report of Independent Registered Public Accounting Firm | 32 | ||||||
Supplemental Information | 33 | ||||||
Trustees' and Officers' Information | 33 | ||||||
Proxy Voting and Portfolio Holdings Information | 39 | ||||||
Expense Examples | 39 | ||||||
Additional Federal Income Tax Information | 40 | ||||||
Liquidity Risk Management Program | 41 | ||||||
Privacy Policy (inside back cover) | |||||||
This report is for the information of the shareholders and others who have received a copy of the currently effective prospectus of the Fund, managed by Victory Capital Management Inc. It may be used as sales literature only when preceded or accompanied by a current prospectus, which provides further details about the Fund.
IRA DISTRIBUTION WITHHOLDING DISCLOSURE
We generally must withhold federal income tax at a rate of 10% of the taxable portion of your distribution and, if you live in a state that requires state income tax withholding, at your state's tax rate. However, you may elect not to have withholding apply or to have income tax withheld at a higher rate. Any withholding election that you make will apply to any subsequent distribution unless and until you change or revoke the election. If you wish to make a withholding election, or change or revoke a prior withholding election, call (800) 235-8396.
If you do not have a withholding election in place by the date of a distribution, federal income tax will be withheld from the taxable portion of your distribution at a rate of 10%. If you must pay estimated taxes, you may be subject to estimated tax penalties if your estimated tax payments are not sufficient and sufficient tax is not withheld from your distribution.
For more specific information, please consult your tax adviser.
USAA Mutual Funds Trust
1
(Unaudited)
Dear Shareholder,
The previous decade ended with the longest-ever bull market in U.S. equities still intact, even as investors wrestled with issues like softening global economic data, Brexit, and U.S.-China trade relations. In retrospect, those worries seem pedestrian given what we would experience.
A new and unexpected threat—a global pandemic, the novel coronavirus ("COVID-19")—first emerged in Asia and then began spreading globally and throughout the United States during the first quarter of 2020. This unprecedented and unanticipated event not only rendered all existing economic forecasts moot, but it also roiled stock and bond markets everywhere. It also brought the economy to a near halt. The historic bull market in stocks ended virtually overnight.
After an initial severe sell-off in March, equity markets recovered sharply. As our annual reporting period drew to a close on July 31, 2020, many of the broad market indexes had recovered and volatility had returned to more palatable levels. In fact, despite all the chaos, the S&P 500® Index, one of the most popular measures of large U.S. stocks, finished the fiscal year (July 31, 2020) at approximately 3,271, which was up 8.9% from one year ago. Quite the impressive reversal.
The market turmoil of early 2020 was not limited to equities. Fixed income volatility spiked when liquidity evaporated in late March as investors struggled to understand the ramifications of sheltering in place. Fortunately, the U.S. Federal Reserve (the "Fed") (as well as other global central banks) leapt into action—cutting interest rates, (re)starting quantitative easing and, in the case of the Fed, launching an array of programs to stabilize markets.
The new lending facilities and programs had their intended effect of improving fixed income liquidity and trading. Credit spreads across corporate, high yield, structured, and municipal markets were coaxed down from their highs. In addition, Congress came through with substantial fiscal stimulus that also was applauded by investors and markets. Although fixed income markets regained their footing, the yield on 10-Year Treasurys, a benchmark for low-risk investments, declined steadily during our fiscal year—from 2.02% at the beginning of our reporting period to approximately 0.55% as of July 31, 2020. This suggests that investors remain a little wary.
While the past year has been unprecedented for all of us, both personally and professionally, our portfolio managers continue to analyze the financial markets, economic conditions, and the trajectory of the pandemic, which will likely be a guiding factor on Fed policy and the markets.
No matter what happens in the near term, we believe that the massive monetary and fiscal policies introduced earlier this year will have longer-term ramifications. Despite this uncertainty, it's important to remain focused on your long-term investment goals and avoid making emotional decisions. If you invest with us directly, our Member Service Representatives are available to help. Call us at (800) 235-8396.
Sincerely,

Christopher K. Dyer, CFA
President,
USAA Mutual Funds
2
USAA Mutual Funds Trust
USAA Growth & Income Fund
Managers' Commentary
(Unaudited)
Victory Solutions
Mannik S. Dhillon, CFA, CAIA Wasif A. Latif
RS Investment Growth, A Victory Capital Investment Franchise
Scott Tracy, CFA Stephen J. Bishop
Melissa Chadwick-Dunn Christopher Clark, CFA
Paul Leung, CFA
• What were the market conditions over the reporting period?
The U.S. stock market generated solid gains for the reporting period overall. Growth stocks significantly outperformed value stocks, while large-cap stocks outpaced small-cap stocks.
Global financial market performance varied widely over the period driven by optimism of continued economic recovery followed by the novel coronavirus ("COVID-19") shock and uncertainty related to the duration and economic impact of the COVID-19 pandemic. These fears generally led to a "risk-off" environment as investors flocked to safe haven assets such as U.S. Treasurys and gold. Global equities turned mostly lower with the exception of a small breadth of mega-cap securities well positioned for an extended economic slowdown and the new stay-at-home paradigm. The final month and a half of the reporting period saw a rebound in risky assets as economies began a phased reopening. The U.S. large-cap growth space, led by information technology and communication services continued to outperform in the face of the economic threat as they were perceived as "stay-at-home stocks" that would further benefit from economic activity from homes.
Within the United States, the S&P 500® Index dropped nearly 34% at the end of the reporting period from its 2020 high, before beginning to recoup losses with the support of comprehensive monetary and fiscal stimulus, along with optimism that a COVID-19 treatment will eventually emerge. Over the reporting period, the S&P 500 Index retuned 11.96%, with large-cap growth stocks leading the way, up to a return of 29.84% as represented by the Russell 1000 Growth Index. Value stocks and small-cap stocks significantly underperformed growth stocks over the period. U.S. large-cap value stocks were down to a return of -6.01% over the reporting period as gauged by the Russell 1000 Value Index, while U.S. small-cap stocks, returned -4.59% as represented by the Russell 2000 Index.
Developed-market international and emerging market equities followed a path similar to U.S. equities. Markets led investors on a rollercoaster ride that saw both the MSCI EAFE Index and MSCI Emerging Markets Index drop approximately 34% from their highs in the year. The market drawdown hit bottom on March 23rd and then started a steady ascent, erasing most of the year's losses as European Central Bank quantitative easing and talks of a 750-billion euros fiscal stimulus helped bolster momentum in the market's
3
USAA Mutual Funds Trust
USAA Growth & Income Fund (continued)
Managers' Commentary (continued)
recovery. Over the reporting period, developed international equities, represented by the MSCI EAFE Index, were down to a return of -1.67%, while the MSCI Emerging Markets Index returned 6.55%.
• How did the USAA Growth & Income Fund (the "Fund") perform during the reporting period?
The Fund has three share classes: Fund Shares, Institutional Shares, and Class A shares (redesignated from Adviser Shares). For the reporting period ended July 31, 2020, the Fund Shares, Institutional Shares, and Class A shares had total returns of 7.81%, 7.86%, and 7.52%, respectively. This compares to returns of 10.93% for the Russell 3000® Index (the "Index") and 9.69% for the Lipper Multi-Cap Core Funds Index.
• What strategies did you employ during the reporting period?
During the reporting period, the Fund recorded a positive return but underperformed the Index. Security selection detracted most from relative returns, while sector allocations aided performance. In terms of stock selection, the Fund was harmed most by its holdings in the healthcare, communication services, real estate, and financials sectors. On the other hand, stock selection in industrials and utilities helped Fund performance.
Regarding sector allocations, the Fund's underweight in energy and financials, which lagged the index, helped relative performance. Additional help came from overweight positions in information technology and consumer discretionary sectors.
Thank you for allowing us to assist you with your investment needs.
4
USAA Mutual Funds Trust
USAA Growth & Income Fund
Investment Overview
(Unaudited)
Average Annual Total Return
Year Ended July 31, 2020
Fund Shares | Institutional Shares | Class A Shares | |||||||||||||||||||||||||
INCEPTION DATE | 6/1/93 | 8/7/15 | 8/1/10 | ||||||||||||||||||||||||
Net Asset Value | Net Asset Value | Net Asset Value | Maxiumum Offering Price | Russell 3000® Index1 | Lipper Multi-Cap Core Funds Index2 | ||||||||||||||||||||||
One Year | 7.81 | % | 7.86 | % | 7.52 | % | 1.34 | % | 10.93 | % | 9.69 | % | |||||||||||||||
Five Year | 7.96 | % | N/A | 7.66 | % | 6.39 | % | 10.87 | % | 9.35 | % | ||||||||||||||||
Ten Year | 11.30 | % | N/A | N/A | N/A | 13.58 | % | 11.93 | % | ||||||||||||||||||
Since Inception | N/A | 7.94 | % | 10.74 | % | 10.09 | % | N/A | N/A | ||||||||||||||||||
Past performance is not indicative of future results. The performance data quoted represents past performance and current returns may be lower or higher. The investment return and principal value will fluctuate so that an investor's shares, when redeemed, may be worth more or less than the original cost. To obtain performance information current to the most recent month's end, please visit www.vcm.com.
Total return measures the price change in a share assuming the reinvestment of all net investment income and realized capital gain distributions, if any. The total returns quoted do not reflect adjustments made to the enclosed financial statements in accordance with U.S. generally accepted accounting principles or the deduction of taxes that a shareholder would pay on net investment income and realized capital gain distributions, including reinvested distributions, or redemptions of shares. The total return figures set forth above include all waivers of fees for various periods since inception. Without such fee waivers, the total returns would have been lower.
USAA Growth & Income Fund — Growth of $10,000
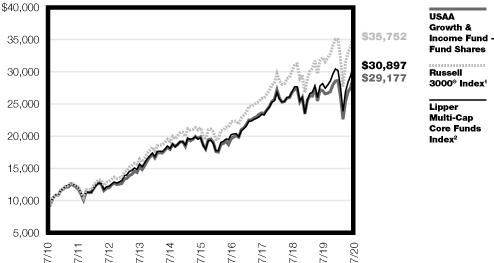
1The unmanaged Russell 3000® Index measures the performance of the 3,000 largest U.S. companies based on total market capitalization, which represents approximately 98% of the investable U.S. equity market.
2The unmanaged Lipper Multi-Cap Core Funds Index tracks the total return performance of funds within the Lipper Multi-Cap Core Funds category.
The graph reflects investment of growth of a hypothetical $10,000 investment in the Fund. Past performance is no guarantee of future results.
The graph and table do not reflect the deduction of taxes that a shareholder would pay on Fund distributions or the redemption of Fund shares.
5
| USAA Mutual Funds Trust USAA Growth & Income Fund | July 31, 2020 | ||||||
(Unaudited)
Investment Objective & Portfolio Holdings:
The USAA Growth & Income Fund seeks capital growth with a secondary investment objective of current income.
Sector Allocation*:
July 31, 2020
(% of Net Assets)
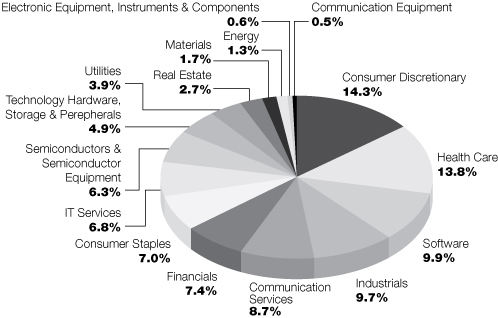
* Does not include futures, money market instruments, and short-term investments purchased with cash collateral from securities loaned.
Percentages are of the net assets of the Fund and may not equal 100%.
6
| USAA Mutual Funds Trust USAA Growth & Income Fund | Schedule of Portfolio Investments July 31, 2020 | ||||||
(Amounts in Thousands, Except for Shares)
Security Description | Shares | Value | |||||||||
Common Stocks (99.5%) | |||||||||||
Communication Services (8.7%): | |||||||||||
Activision Blizzard, Inc. | 213,262 | $ | 17,622 | ||||||||
Alphabet, Inc. Class C (a) | 30,803 | 45,680 | |||||||||
AT&T, Inc. | 375,727 | 11,114 | |||||||||
Facebook, Inc. Class A (a) | 64,922 | 16,469 | |||||||||
Netflix, Inc. (a) | 35,339 | 17,277 | |||||||||
Omnicom Group, Inc. | 130,002 | 6,985 | |||||||||
Sirius XM Holdings, Inc. | 406,108 | 2,388 | |||||||||
Twitter, Inc. (a) | 529,952 | 19,290 | |||||||||
Verizon Communications, Inc. | 316,135 | 18,171 | |||||||||
World Wrestling Entertainment, Inc. Class A | 15,967 | 744 | |||||||||
155,740 | |||||||||||
Communications Equipment (0.5%): | |||||||||||
Cisco Systems, Inc. | 148,494 | 6,994 | |||||||||
Juniper Networks, Inc. | 64,625 | 1,640 | |||||||||
8,634 | |||||||||||
Consumer Discretionary (14.3%): | |||||||||||
Amazon.com, Inc. (a) | 25,208 | 79,775 | |||||||||
Best Buy Co., Inc. | 104,056 | 10,363 | |||||||||
Booking Holdings, Inc. (a) | 6,251 | 10,390 | |||||||||
Chipotle Mexican Grill, Inc. (a) | 12,238 | 14,137 | |||||||||
Dollar General Corp. | 13,553 | 2,580 | |||||||||
Domino's Pizza, Inc. | 16,456 | 6,362 | |||||||||
Foot Locker, Inc. | 31,871 | 937 | |||||||||
Genuine Parts Co. | 41,953 | 3,782 | |||||||||
H&R Block, Inc. | 46,721 | 677 | |||||||||
Lowe's Cos., Inc. | 42,871 | 6,384 | |||||||||
Nike, Inc. Class B | 258,957 | 25,277 | |||||||||
Starbucks Corp. | 66,186 | 5,065 | |||||||||
Target Corp. | 196,438 | 24,728 | |||||||||
Tesla, Inc. (a) | 12,172 | 17,415 | |||||||||
The Home Depot, Inc. | 128,424 | 34,095 | |||||||||
The TJX Cos., Inc. | 299,484 | 15,570 | |||||||||
257,537 | |||||||||||
Consumer Staples (7.0%): | |||||||||||
Campbell Soup Co. | 93,972 | 4,658 | |||||||||
Church & Dwight Co., Inc. | 80,036 | 7,710 | |||||||||
Colgate-Palmolive Co. | 105,474 | 8,143 | |||||||||
Constellation Brands, Inc. Class A | 88,376 | 15,749 | |||||||||
General Mills, Inc. | 97,569 | 6,173 | |||||||||
Ingredion, Inc. | 24,822 | 2,147 | |||||||||
Kimberly-Clark Corp. | 51,111 | 7,771 | |||||||||
Philip Morris International, Inc. | 190,038 | 14,597 | |||||||||
Sysco Corp. | 101,951 | 5,388 | |||||||||
The Hershey Co. | 28,848 | 4,195 | |||||||||
The J.M. Smucker Co. | 22,634 | 2,475 | |||||||||
The Kroger Co. | 126,391 | 4,397 | |||||||||
See notes to financial statements.
7
| USAA Mutual Funds Trust USAA Growth & Income Fund | Schedule of Portfolio Investments — continued July 31, 2020 | ||||||
(Amounts in Thousands, Except for Shares)
Security Description | Shares | Value | |||||||||
The Procter & Gamble Co. | 174,471 | $ | 22,876 | ||||||||
Tyson Foods, Inc. Class A | 42,672 | 2,622 | |||||||||
Walgreens Boots Alliance, Inc. | 114,614 | 4,666 | |||||||||
Walmart, Inc. | 99,299 | 12,849 | |||||||||
126,416 | |||||||||||
Electronic Equipment, Instruments & Components (0.6%): | |||||||||||
Amphenol Corp. Class A | 97,883 | 10,352 | |||||||||
Avnet, Inc. | 12,002 | 321 | |||||||||
10,673 | |||||||||||
Energy (1.3%): | |||||||||||
Cabot Oil & Gas Corp. | 90,615 | 1,695 | |||||||||
Chevron Corp. | 54,132 | 4,544 | |||||||||
EOG Resources, Inc. | 97,373 | 4,562 | |||||||||
Exxon Mobil Corp. | 108,905 | 4,583 | |||||||||
Phillips 66 | 77,878 | 4,829 | |||||||||
Valero Energy Corp. | 49,602 | 2,789 | |||||||||
23,002 | |||||||||||
Financials (7.4%): | |||||||||||
Aflac, Inc. | 75,630 | 2,690 | |||||||||
American Financial Group, Inc. | 32,647 | 1,984 | |||||||||
Ameriprise Financial, Inc. | 22,864 | 3,513 | |||||||||
Annaly Capital Management, Inc. | 229,797 | 1,703 | |||||||||
Bank of America Corp. | 445,349 | 11,080 | |||||||||
Brown & Brown, Inc. | 21,024 | 956 | |||||||||
Comerica, Inc. | 70,979 | 2,734 | |||||||||
Commerce Bancshares, Inc. | 6,766 | 387 | |||||||||
Everest Re Group Ltd. | 8,158 | 1,785 | |||||||||
FactSet Research Systems, Inc. | 11,562 | 4,004 | |||||||||
Fidelity National Financial, Inc. | 76,774 | 2,484 | |||||||||
Fifth Third Bancorp | 141,374 | 2,808 | |||||||||
First Republic Bank | 14,576 | 1,640 | |||||||||
Huntington Bancshares, Inc. | 597,593 | 5,540 | |||||||||
Intercontinental Exchange, Inc. | 37,021 | 3,583 | |||||||||
JPMorgan Chase & Co. | 80,536 | 7,783 | |||||||||
M&T Bank Corp. | 39,153 | 4,148 | |||||||||
MarketAxess Holdings, Inc. | 4,854 | 2,508 | |||||||||
Marsh & McLennan Cos., Inc. | 23,897 | 2,786 | |||||||||
Nasdaq, Inc. | 26,941 | 3,538 | |||||||||
People's United Financial, Inc. | 248,211 | 2,678 | |||||||||
Prudential Financial, Inc. | 47,302 | 2,998 | |||||||||
Regions Financial Corp. | 159,953 | 1,737 | |||||||||
RenaissanceRe Holdings Ltd. | 23,239 | 4,192 | |||||||||
S&P Global, Inc. | 29,249 | 10,243 | |||||||||
SEI Investments Co. | 11,678 | 611 | |||||||||
State Street Corp. | 37,365 | 2,384 | |||||||||
T. Rowe Price Group, Inc. | 43,901 | 6,063 | |||||||||
The Allstate Corp. | 96,420 | 9,102 | |||||||||
The Bank of New York Mellon Corp. | 13,657 | 490 | |||||||||
See notes to financial statements.
8
| USAA Mutual Funds Trust USAA Growth & Income Fund | Schedule of Portfolio Investments — continued July 31, 2020 | ||||||
(Amounts in Thousands, Except for Shares)
Security Description | Shares | Value | |||||||||
The Hanover Insurance Group, Inc. | 18,949 | $ | 1,931 | ||||||||
The Hartford Financial Services Group, Inc. | 71,508 | 3,026 | |||||||||
The PNC Financial Services Group, Inc. | 30,288 | 3,231 | |||||||||
The Progressive Corp. | 90,816 | 8,204 | |||||||||
The Travelers Cos., Inc. | 27,630 | 3,161 | |||||||||
Wells Fargo & Co. | 79,267 | 1,923 | |||||||||
Western Alliance Bancorp | 14,359 | 516 | |||||||||
Zions Bancorp NA | 44,372 | 1,441 | |||||||||
131,585 | |||||||||||
Health Care (13.8%): | |||||||||||
Align Technology, Inc. (a) | 34,451 | 10,122 | |||||||||
AmerisourceBergen Corp. | 19,060 | 1,910 | |||||||||
Amgen, Inc. | 47,256 | 11,562 | |||||||||
Anthem, Inc. | 11,295 | 3,093 | |||||||||
bluebird bio, Inc. (a) | 115,712 | 7,024 | |||||||||
Bristol-Myers Squibb Co. | 411,922 | 24,164 | |||||||||
Cardinal Health, Inc. | 93,270 | 5,094 | |||||||||
Charles River Laboratories International, Inc. (a) | 78,359 | 15,593 | |||||||||
Chemed Corp. | 1,603 | 789 | |||||||||
Danaher Corp. | 25,269 | 5,150 | |||||||||
Eli Lilly & Co. | 138,920 | 20,878 | |||||||||
Gilead Sciences, Inc. | 49,999 | 3,476 | |||||||||
Johnson & Johnson | 169,686 | 24,733 | |||||||||
Masimo Corp. (a) | 45,350 | 9,982 | |||||||||
McKesson Corp. | 31,110 | 4,671 | |||||||||
Medtronic PLC | 28,091 | 2,710 | |||||||||
Merck & Co., Inc. | 106,363 | 8,535 | |||||||||
Pfizer, Inc. | 158,009 | 6,080 | |||||||||
ResMed, Inc. | 8,839 | 1,790 | |||||||||
Royalty Pharma PLC Class A (a) | 431,032 | 18,556 | |||||||||
Sage Therapeutics, Inc. (a) | 79,490 | 3,622 | |||||||||
UnitedHealth Group, Inc. | 80,839 | 24,476 | |||||||||
Vertex Pharmaceuticals, Inc. (a) | 64,706 | 17,601 | |||||||||
West Pharmaceutical Services, Inc. | 58,634 | 15,766 | |||||||||
247,377 | |||||||||||
Industrials (9.7%): | |||||||||||
3M Co. | 54,311 | 8,172 | |||||||||
Acuity Brands, Inc. | 5,664 | 561 | |||||||||
Allegion PLC | 33,816 | 3,364 | |||||||||
Allison Transmission Holdings, Inc. | 71,159 | 2,659 | |||||||||
BWX Technologies, Inc. | 7,975 | 435 | |||||||||
C.H. Robinson Worldwide, Inc. | 55,400 | 5,192 | |||||||||
Cummins, Inc. | 46,350 | 8,958 | |||||||||
Eaton Corp. PLC | 35,760 | 3,330 | |||||||||
Fastenal Co. | 58,281 | 2,741 | |||||||||
FTI Consulting, Inc. (a) | 81,769 | 9,766 | |||||||||
Graco, Inc. | 10,630 | 566 | |||||||||
Honeywell International, Inc. | 6,827 | 1,020 | |||||||||
IDEX Corp. | 78,764 | 12,981 | |||||||||
See notes to financial statements.
9
| USAA Mutual Funds Trust USAA Growth & Income Fund | Schedule of Portfolio Investments — continued July 31, 2020 | ||||||
(Amounts in Thousands, Except for Shares)
Security Description | Shares | Value | |||||||||
IHS Markit Ltd. | 157,480 | $ | 12,713 | ||||||||
Illinois Tool Works, Inc. | 44,729 | 8,274 | |||||||||
Johnson Controls International PLC | 88,571 | 3,408 | |||||||||
Lennox International, Inc. | 18,886 | 5,064 | |||||||||
Lockheed Martin Corp. | 20,358 | 7,715 | |||||||||
ManpowerGroup, Inc. | 7,776 | 535 | |||||||||
Old Dominion Freight Line, Inc. | 72,259 | 13,210 | |||||||||
PACCAR, Inc. | 25,721 | 2,188 | |||||||||
Republic Services, Inc. | 51,022 | 4,452 | |||||||||
Robert Half International, Inc. | 63,787 | 3,245 | |||||||||
Rockwell Automation, Inc. | 28,816 | 6,286 | |||||||||
Rollins, Inc. (b) | 22,061 | 1,156 | |||||||||
Roper Technologies, Inc. | 35,975 | 15,557 | |||||||||
Snap-on, Inc. | 13,715 | 2,001 | |||||||||
Southwest Airlines Co. | 78,317 | 2,419 | |||||||||
The Toro Co. | 33,469 | 2,388 | |||||||||
Trane Technologies PLC | 71,269 | 7,973 | |||||||||
United Parcel Service, Inc. Class B | 48,715 | 6,955 | |||||||||
Verisk Analytics, Inc. | 11,197 | 2,113 | |||||||||
W.W. Grainger, Inc. | 4,365 | 1,491 | |||||||||
Waste Management, Inc. | 46,622 | 5,109 | |||||||||
173,997 | |||||||||||
IT Services (6.8%): | |||||||||||
Cognizant Technology Solutions Corp. Class A | 46,177 | 3,155 | |||||||||
Fiserv, Inc. (a) | 167,959 | 16,761 | |||||||||
International Business Machines Corp. | 18,842 | 2,316 | |||||||||
Jack Henry & Associates, Inc. | 6,658 | 1,187 | |||||||||
Mastercard, Inc. Class A | 15,837 | 4,886 | |||||||||
PayPal Holdings, Inc. (a) | 105,623 | 20,710 | |||||||||
Twilio, Inc. Class A (a) | 134,143 | 37,214 | |||||||||
Visa, Inc. Class A | 184,735 | 35,174 | |||||||||
121,403 | |||||||||||
Materials (1.7%): | |||||||||||
Air Products & Chemicals, Inc. | 22,670 | 6,498 | |||||||||
Avery Dennison Corp. | 6,647 | 753 | |||||||||
International Paper Co. | 48,117 | 1,674 | |||||||||
LyondellBasell Industries NV Class A | 98,062 | 6,131 | |||||||||
Newmont Corp. | 50,388 | 3,487 | |||||||||
Nucor Corp. | 61,449 | 2,578 | |||||||||
Packaging Corp. of America | 24,357 | 2,341 | |||||||||
Royal Gold, Inc. | 10,435 | 1,460 | |||||||||
RPM International, Inc. | 9,477 | 773 | |||||||||
Steel Dynamics, Inc. | 69,822 | 1,914 | |||||||||
The Scotts Miracle-Gro Co. | 6,386 | 1,013 | |||||||||
Westrock Co. | 76,759 | 2,062 | |||||||||
30,684 | |||||||||||
See notes to financial statements.
10
| USAA Mutual Funds Trust USAA Growth & Income Fund | Schedule of Portfolio Investments — continued July 31, 2020 | ||||||
(Amounts in Thousands, Except for Shares)
Security Description | Shares | Value | |||||||||
Real Estate (2.7%): | |||||||||||
Alexandria Real Estate Equities, Inc. | 17,859 | $ | 3,171 | ||||||||
AvalonBay Communities, Inc. | 20,961 | 3,210 | |||||||||
Boston Properties, Inc. | 22,812 | 2,032 | |||||||||
Digital Realty Trust, Inc. | 24,139 | 3,874 | |||||||||
Equity Residential | 45,637 | 2,448 | |||||||||
Essex Property Trust, Inc. | 8,634 | 1,906 | |||||||||
Healthpeak Properties, Inc. | 67,131 | 1,832 | |||||||||
Host Hotels & Resorts, Inc. | 117,529 | 1,267 | |||||||||
Invitation Homes, Inc. | 59,813 | 1,784 | |||||||||
Jones Lang LaSalle, Inc. | 27,629 | 2,733 | |||||||||
National Retail Properties, Inc. | 26,740 | 948 | |||||||||
Park Hotels & Resorts, Inc. | 117,703 | 973 | |||||||||
Prologis, Inc. | 61,379 | 6,470 | |||||||||
Public Storage | 11,190 | 2,237 | |||||||||
Realty Income Corp. | 43,249 | 2,597 | |||||||||
Regency Centers Corp. | 35,201 | 1,444 | |||||||||
Ventas, Inc. | 48,610 | 1,865 | |||||||||
VICI Properties, Inc. | 85,359 | 1,853 | |||||||||
Welltower, Inc. | 44,337 | 2,375 | |||||||||
Weyerhaeuser Co. | 100,037 | 2,782 | |||||||||
47,801 | |||||||||||
Semiconductors & Semiconductor Equipment (6.3%): | |||||||||||
Applied Materials, Inc. | 42,039 | 2,704 | |||||||||
Broadcom, Inc. | 7,232 | 2,291 | |||||||||
Intel Corp. | 197,346 | 9,419 | |||||||||
KLA Corp. | 11,771 | 2,352 | |||||||||
Lam Research Corp. | 47,410 | 17,881 | |||||||||
Marvell Technology Group Ltd. | 358,869 | 13,088 | |||||||||
NVIDIA Corp. | 41,347 | 17,556 | |||||||||
QUALCOMM, Inc. | 239,564 | 25,301 | |||||||||
STMicroelectronics NV, NYS | 512,399 | 14,316 | |||||||||
Texas Instruments, Inc. | 57,436 | 7,326 | |||||||||
112,234 | |||||||||||
Software (9.9%): | |||||||||||
CDK Global, Inc. | 10,407 | 473 | |||||||||
Citrix Systems, Inc. | 15,435 | 2,204 | |||||||||
Fair Isaac Corp. (a) | 38,991 | 17,124 | |||||||||
Intuit, Inc. | 14,159 | 4,338 | |||||||||
Microsoft Corp. | 464,855 | 95,300 | |||||||||
Oracle Corp. | 38,099 | 2,113 | |||||||||
RingCentral, Inc. Class A (a) | 86,536 | 25,119 | |||||||||
Salesforce.com, Inc. (a) | 32,765 | 6,384 | |||||||||
Synopsys, Inc. (a) | 51,338 | 10,228 | |||||||||
Workday, Inc. Class A (a) | 64,352 | 11,643 | |||||||||
174,926 | |||||||||||
See notes to financial statements.
11
| USAA Mutual Funds Trust USAA Growth & Income Fund | Schedule of Portfolio Investments — continued July 31, 2020 | ||||||
(Amounts in Thousands, Except for Shares)
Security Description | Shares | Value | |||||||||
Technology Hardware, Storage & Peripherals (4.9%): | |||||||||||
Apple, Inc. | 195,048 | $ | 82,902 | ||||||||
HP, Inc. | 155,322 | 2,731 | |||||||||
NetApp, Inc. | 23,602 | 1,046 | |||||||||
86,679 | |||||||||||
Utilities (3.9%): | |||||||||||
Alliant Energy Corp. | 14,336 | 772 | |||||||||
Ameren Corp. | 23,562 | 1,891 | |||||||||
CMS Energy Corp. | 70,981 | 4,556 | |||||||||
Consolidated Edison, Inc. | 32,707 | 2,513 | |||||||||
Dominion Energy, Inc. | 31,384 | 2,543 | |||||||||
DTE Energy Co. | 43,182 | 4,993 | |||||||||
Duke Energy Corp. | 59,538 | 5,045 | |||||||||
Evergy, Inc. | 70,115 | 4,546 | |||||||||
Eversource Energy | 35,540 | 3,201 | |||||||||
Exelon Corp. | 78,716 | 3,039 | |||||||||
National Fuel Gas Co. | 10,861 | 441 | |||||||||
NextEra Energy, Inc. | 18,733 | 5,258 | |||||||||
Pinnacle West Capital Corp. | 33,333 | 2,769 | |||||||||
PPL Corp. | 79,655 | 2,120 | |||||||||
The AES Corp. | 57,115 | 870 | |||||||||
The Southern Co. | 61,467 | 3,357 | |||||||||
UGI Corp. | 21,195 | 706 | |||||||||
Vistra Corp. | 51,713 | 965 | |||||||||
WEC Energy Group, Inc. | 105,118 | 10,013 | |||||||||
Xcel Energy, Inc. | 132,712 | 9,163 | |||||||||
68,761 | |||||||||||
Total Common Stocks (Cost $1,434,050) | 1,777,449 | ||||||||||
Collateral for Securities Loaned^ (0.0%) (c) | |||||||||||
HSBC U.S. Government Money Market Fund I Shares, 0.08% (d) | 83,755 | 84 | |||||||||
Invesco Government & Agency Portfolio Institutional Shares, 0.06% (d) | 705,945 | 706 | |||||||||
Total Collateral for Securities Loaned (Cost $790) | 790 | ||||||||||
Total Investments (Cost $1,434,840) — 99.5% | 1,778,239 | ||||||||||
Other assets in excess of liabilities — 0.5% | 8,082 | ||||||||||
NET ASSETS — 100.00% | $ | 1,786,321 | |||||||||
At July 31, 2020 the Fund's investments in foreign securities were 5.1% of net assets.
^ Purchased with cash collateral from securities on loan.
(a) Non-income producing security.
(b) All or a portion of this security is on loan.
(c) Amount represents less than 0.05% of net assets.
(d) Rate disclosed is the daily yield on July 31, 2020.
NYS — New York Registered Shares
PLC — Public Limited Company
See notes to financial statements.
12
USAA Mutual Funds Trust | Statement of Assets and Liabilities July 31, 2020 | ||||||
(Amounts in Thousands, Except Per Share Amounts)
| USAA Growth & Income Fund | |||||||
Assets: | |||||||
Investments, at value (Cost $1,434,840) | $ | 1,778,239 | (a) | ||||
Cash and cash equivalents | 5,263 | ||||||
Receivables: | |||||||
Interest and dividends | 1,268 | ||||||
Capital shares issued | 296 | ||||||
Investments sold | 10,834 | ||||||
Prepaid expenses | 50 | ||||||
Total assets | 1,795,950 | ||||||
Liabilities: | |||||||
Payables: | |||||||
Collateral received on loaned securities | 790 | ||||||
Investments purchased | 6,119 | ||||||
Capital shares redeemed | 1,429 | ||||||
Accrued expenses and other payables: | |||||||
Investment advisory fees | 853 | ||||||
Administration fees | 216 | ||||||
Custodian fees | 21 | ||||||
Transfer agent fees | 147 | ||||||
Compliance fees | 1 | ||||||
| 12b-1 fees | 1 | ||||||
Other accrued expenses | 52 | ||||||
Total liabilities | 9,629 | ||||||
Net Assets: | |||||||
Capital | 1,489,400 | ||||||
Total accumulated earnings/(loss) | 296,921 | ||||||
Net assets | $ | 1,786,321 | |||||
Net Assets: | |||||||
Fund Shares | $ | 1,605,020 | |||||
Institutional Shares | 172,787 | ||||||
Class A shares | 8,514 | ||||||
Total | $ | 1,786,321 | |||||
Shares (unlimited number of shares authorized with no par value): | |||||||
Fund Shares | 78,648 | ||||||
Institutional Shares | 8,477 | ||||||
Class A shares | 419 | ||||||
Total | 87,544 | ||||||
Net asset value, offering and redemption price per share: (b) | |||||||
Fund Shares | $ | 20.41 | |||||
Institutional Shares | $ | 20.38 | |||||
Class A shares | $ | 20.31 | |||||
Maximum Sales Charge — Class A shares | 5.75 | % | |||||
Maximum offering price: | |||||||
| (100%/(100%-maximum sales charge) of net asset value adjusted to the nearest cent) per share — Class A shares | $ | 21.55 | |||||
(a) Includes $781 of securities on loan.
(b) Per share amount may not recalculate due to rounding of net assets and/or shares outstanding.
See notes to financial statements.
13
USAA Mutual Funds Trust | Statement of Operations For the Year Ended July 31, 2020 | ||||||
(Amounts in Thousands)
| USAA Growth & Income Fund | |||||||
Investment Income: | |||||||
Dividends | $ | 33,560 | |||||
Interest | 142 | ||||||
Securities lending (net of fees) | 33 | ||||||
Total income | 33,735 | ||||||
Expenses: | |||||||
Investment advisory fees | 10,476 | ||||||
Administration fees — Fund Shares | 2,375 | ||||||
Administration fees — Institutional Shares | 164 | ||||||
Administration fees — Class A shares | 13 | ||||||
Sub-Administration fees | 40 | ||||||
12b-1 fees — Class A shares | 22 | ||||||
Custodian fees | 118 | ||||||
Transfer agent fees — Fund Shares | 1,592 | ||||||
Transfer agent fees — Institutional Shares | 164 | ||||||
Transfer agent fees — Class A shares | 2 | ||||||
Trustees' fees | 46 | ||||||
Compliance fees | 12 | ||||||
Legal and audit fees | 89 | ||||||
State registration and filing fees | 35 | ||||||
Interfund lending fees | — | (a) | |||||
Other expenses | 120 | ||||||
Total expenses | 15,268 | ||||||
Net Investment Income (Loss) | 18,467 | ||||||
Realized/Unrealized Gains (Losses) from Investments: | |||||||
Net realized gains (losses) from investment securities | (45,325 | ) | |||||
Net change in unrealized appreciation/depreciation on investment securities | 154,924 | ||||||
Net realized/unrealized gains (losses) on investments | 109,599 | ||||||
Change in net assets resulting from operations | $ | 128,066 | |||||
(a) Rounds to less than $1 thousand.
See notes to financial statements.
14
USAA Mutual Funds Trust | Statements of Changes in Net Assets | ||||||
(Amounts in Thousands)
USAA Growth & Income Fund | |||||||||||
| Year Ended July 31, 2020 | Year Ended July 31, 2019 | ||||||||||
From Investments: | |||||||||||
Operations: | |||||||||||
Net investment income (loss) | $ | 18,467 | $ | 19,191 | |||||||
Net realized gains (losses) from investments | (45,325 | ) | 394,988 | ||||||||
| Net change in unrealized appreciation/depreciation on investments | 154,924 | (399,883 | ) | ||||||||
Change in net assets resulting from operations | 128,066 | 14,296 | |||||||||
Distributions to Shareholders: | |||||||||||
Fund Shares | (343,128 | ) | (166,142 | ) | |||||||
Institutional Shares | (35,438 | ) | (15,193 | ) | |||||||
Class A shares | (2,079 | ) | (1,013 | ) | |||||||
Change in net assets resulting from distributions to shareholders | (380,645 | ) | (182,348 | ) | |||||||
Change in net assets resulting from capital transactions | 190,818 | 89,869 | |||||||||
Change in net assets | (61,761 | ) | (78,183 | ) | |||||||
Net Assets: | |||||||||||
Beginning of period | 1,848,082 | 1,926,265 | |||||||||
End of period | $ | 1,786,321 | $ | 1,848,082 | |||||||
Capital Transactions: | |||||||||||
Fund Shares | |||||||||||
Proceeds from shares issued | $ | 68,003 | $ | 90,122 | |||||||
Distributions reinvested | 337,401 | 163,732 | |||||||||
Cost of shares redeemed | (244,637 | ) | (182,952 | ) | |||||||
Total Fund Shares | $ | 160,767 | $ | 70,902 | |||||||
Institutional Shares | |||||||||||
Proceeds from shares issued | $ | 6,128 | $ | 14,447 | |||||||
Distributions reinvested | 35,435 | 15,189 | |||||||||
Cost of shares redeemed | (11,532 | ) | (10,756 | ) | |||||||
Total Institutional Shares | $ | 30,031 | $ | 18,880 | |||||||
Class A shares | |||||||||||
Proceeds from shares issued | $ | 142 | $ | 219 | |||||||
Distributions reinvested | 104 | 36 | |||||||||
Cost of shares redeemed | (226 | ) | (168 | ) | |||||||
Total Class A shares | $ | 20 | $ | 87 | |||||||
Change in net assets resulting from capital transactions | $ | 190,818 | $ | 89,869 | |||||||
(continues on next page)
See notes to financial statements.
15
USAA Mutual Funds Trust | Statements of Changes in Net Assets | ||||||
(Amounts in Thousands) (continued)
USAA Growth & Income Fund | |||||||||||
| Year Ended July 31, 2020 | Year Ended July 31, 2019 | ||||||||||
Share Transactions: | |||||||||||
Fund Shares | |||||||||||
Issued | 3,423 | 3,781 | |||||||||
Reinvested | 16,949 | 7,465 | |||||||||
Redeemed | (12,322 | ) | (7,709 | ) | |||||||
Total Fund Shares | 8,050 | 3,537 | |||||||||
Institutional Shares | |||||||||||
Issued | 281 | 625 | |||||||||
Reinvested | 1,782 | 693 | |||||||||
Redeemed | (561 | ) | (425 | ) | |||||||
Total Institutional Shares | 1,502 | 893 | |||||||||
Class A shares | |||||||||||
Issued | 7 | 9 | |||||||||
Reinvested | 5 | 2 | |||||||||
Redeemed | (13 | ) | (7 | ) | |||||||
Total Class A shares | (1 | ) | 4 | ||||||||
Change in Shares | 9,551 | 4,434 | |||||||||
See notes to financial statements.
16
This page is intentionally left blank.
17
USAA Mutual Funds Trust | Financial Highlights | ||||||
For a Share Outstanding Throughout Each Period
Investment Activities | Distributions to Shareholders From | ||||||||||||||||||||||||||
| Net Asset Value, Beginning of Period | Net Investment Income (Loss) | Net Realized and Unrealized Gains (Losses) on Investments | Total from Investment Activities | Net Investment Income | Net Realized Gains from Investments | ||||||||||||||||||||||
USAA Growth & Income Fund | |||||||||||||||||||||||||||
Fund Shares | |||||||||||||||||||||||||||
| Year Ended July 31, 2020 | $ | 23.70 | 0.22 | (d) | 1.45 | 1.67 | (0.23 | ) | (4.73 | ) | |||||||||||||||||
| Year Ended July 31, 2019 | $ | 26.19 | 0.25 | (0.24 | ) | 0.01 | (0.24 | ) | (2.26 | ) | |||||||||||||||||
| Year Ended July 31, 2018 | $ | 24.25 | 0.19 | 3.03 | 3.22 | (0.18 | ) | (1.10 | ) | ||||||||||||||||||
| Year Ended July 31, 2017 | $ | 20.39 | 0.21 | 3.94 | 4.15 | (0.22 | ) | (0.07 | ) | ||||||||||||||||||
| Year Ended July 31, 2016 | $ | 22.00 | 0.15 | (0.51 | ) | (0.36 | ) | (0.14 | ) | (1.11 | ) | ||||||||||||||||
Institutional Shares | |||||||||||||||||||||||||||
| Year Ended July 31, 2020 | $ | 23.68 | 0.23 | (d) | 1.44 | 1.67 | (0.24 | ) | (4.73 | ) | |||||||||||||||||
| Year Ended July 31, 2019 | $ | 26.17 | 0.26 | (0.24 | ) | 0.02 | (0.25 | ) | (2.26 | ) | |||||||||||||||||
| Year Ended July 31, 2018 | $ | 24.23 | 0.20 | 3.03 | 3.23 | (0.19 | ) | (1.10 | ) | ||||||||||||||||||
| Year Ended July 31, 2017 | $ | 20.38 | 0.22 | 3.94 | 4.16 | (0.24 | ) | (0.07 | ) | ||||||||||||||||||
| August 7, 2015 (g) through July 31, 2016 | $ | 22.10 | 0.16 | (0.60 | ) | (0.44 | ) | (0.17 | ) | (1.11 | ) | ||||||||||||||||
* Assumes reinvestment of all net investment income and realized capital gain distributions, if any, during the period. Includes adjustments in accordance with U.S. generally accepted accounting principles and could differ from the Lipper reported return.
^ The net expense ratio may not correlate to the applicable expense limits in place during the period since the current contractual expense limitation is applied for a two year period beginning July 1, 2019 and in effect through June 30, 2021, instead of coinciding with the Fund's fiscal year end. Details of the current contractual expense limitation in effect can be found in Note 4 of the accompanying Notes to Financial Statements.
(a) Not annualized for periods less than one year.
(b) Annualized for periods less than one year.
(c) Portfolio turnover is calculated on the basis of the Fund as a whole without distinguishing between the classes of shares issued.
(d) Per share net investment income (loss) has been calculated using the average daily shares method.
(e) Reflects increased trading activity due to current year transition or asset allocation shift.
(f) Prior to December 1, 2018, USAA Asset Management Company ("AMCO") (previous Investment Adviser) voluntarily agreed to limit the annual expenses of the Institutional Shares to 0.85% of the Institutional Shares' average daily net assets.
(g) Commencement of operations.
(h) Prior to December 1, 2017, AMCO voluntarily agreed to limit the annual expenses of the Class A shares to 1.20% of the Class A shares' average daily net assets.
See notes to financial statements.
18
USAA Mutual Funds Trust | Financial Highlights — continued | ||||||
For a Share Outstanding Throughout Each Period
Ratios to Average Net Assets | Supplemental Data | ||||||||||||||||||||||||||||||||||
| Total Distributions | Net Asset Value, End of Period | Total Return (Excludes Sales Charge)*(a) | Net Expenses^(b) | Net Investment Income (Loss)(b) | Gross Expenses(b) | Net Assets, End of Period (000's) | Portfolio Turnover(a)(c) | ||||||||||||||||||||||||||||
USAA Growth & Income Fund | |||||||||||||||||||||||||||||||||||
Fund Shares | |||||||||||||||||||||||||||||||||||
| Year Ended July 31, 2020 | (4.96 | ) | $ | 20.41 | 7.81 | % | 0.87 | % | 1.05 | % | 0.87 | % | $ | 1,605,020 | 74 | % | |||||||||||||||||||
| Year Ended July 31, 2019 | (2.50 | ) | $ | 23.70 | 0.89 | % | 0.88 | % | 1.04 | % | 0.88 | % | $ | 1,673,033 | 93 | %(e) | |||||||||||||||||||
| Year Ended July 31, 2018 | (1.28 | ) | $ | 26.19 | 13.59 | % | 0.88 | % | 0.80 | % | 0.88 | % | $ | 1,756,259 | 23 | % | |||||||||||||||||||
| Year Ended July 31, 2017 | (0.29 | ) | $ | 24.25 | 20.49 | % | 0.91 | % | 0.89 | % | 0.91 | % | $ | 1,605,220 | 21 | % | |||||||||||||||||||
| Year Ended July 31, 2016 | (1.25 | ) | $ | 20.39 | (1.49 | )% | 0.95 | % | 0.78 | % | 0.95 | % | $ | 1,380,560 | 22 | % | |||||||||||||||||||
Institutional Shares | |||||||||||||||||||||||||||||||||||
| Year Ended July 31, 2020 | (4.97 | ) | $ | 20.38 | 7.86 | % | 0.83 | % | 1.09 | % | 0.83 | % | $ | 172,787 | 74 | % | |||||||||||||||||||
| Year Ended July 31, 2019 | (2.51 | ) | $ | 23.68 | 0.94 | % | 0.83 | %(f) | 1.09 | % | 0.83 | % | $ | 165,137 | 93 | %(e) | |||||||||||||||||||
| Year Ended July 31, 2018 | (1.29 | ) | $ | 26.17 | 13.66 | % | 0.84 | % | 0.85 | % | 0.84 | % | $ | 159,148 | 23 | % | |||||||||||||||||||
| Year Ended July 31, 2017 | (0.31 | ) | $ | 24.23 | 20.54 | % | 0.85 | % | 0.95 | % | 0.85 | % | $ | 139,866 | 21 | % | |||||||||||||||||||
| August 7, 2015 (g) through July 31, 2016 | (1.28 | ) | $ | 20.38 | (1.87 | )% | 0.85 | % | 0.83 | % | 0.87 | % | $ | 117,512 | 22 | % | |||||||||||||||||||
(continues on next page)
See notes to financial statements.
19
USAA Mutual Funds Trust | Financial Highlights — continued | ||||||
For a Share Outstanding Throughout Each Period
Investment Activities | Distributions to Shareholders From | ||||||||||||||||||||||||||
| Net Asset Value, Beginning of Period | Net Investment Income (Loss) | Net Realized and Unrealized Gains (Losses) on Investments | Total from Investment Activities | Net Investment Income | Net Realized Gains from Investments | ||||||||||||||||||||||
USAA Growth & Income Fund | |||||||||||||||||||||||||||
Class A shares | |||||||||||||||||||||||||||
| Year Ended July 31, 2020 | $ | 23.61 | 0.16 | (b) | 1.45 | 1.61 | (0.18 | ) | (4.73 | ) | |||||||||||||||||
| Year Ended July 31, 2019 | $ | 26.10 | 0.19 | (0.25 | ) | (0.06 | ) | (0.17 | ) | (2.26 | ) | ||||||||||||||||
| Year Ended July 31, 2018 | $ | 24.17 | 0.12 | 3.02 | 3.14 | (0.11 | ) | (1.10 | ) | ||||||||||||||||||
| Year Ended July 31, 2017 | $ | 20.32 | 0.15 | 3.91 | 4.06 | (0.14 | ) | (0.07 | ) | ||||||||||||||||||
| Year Ended July 31, 2016 | $ | 21.93 | 0.10 | (0.50 | ) | (0.40 | ) | (0.10 | ) | (1.11 | ) | ||||||||||||||||
* Assumes reinvestment of all net investment income and realized capital gain distributions, if any, during the period. Includes adjustments in accordance with U.S. generally accepted accounting principles and could differ from the Lipper reported return.
^ The net expense ratio may not correlate to the applicable expense limits in place during the period since the current contractual expense limitation is applied for a two year period beginning July 1, 2019 and in effect through June 30, 2021, instead of coinciding with the Fund's fiscal year end. Details of the current contractual expense limitation in effect can be found in Note 4 of the accompanying Notes to Financial Statements.
(a) Portfolio turnover is calculated on the basis of the Fund as a whole without distinguishing between the classes of shares issued.
(b) Per share net investment income (loss) has been calculated using the average daily shares method.
(c) Reflects increased trading activity due to current year transition or asset allocation shift.
(d) Prior to December 1, 2017, AMCO (previous Investment Adviser) voluntarily agreed to limit the annual expenses of the Class A shares to 1.20% of the Class A shares' average daily net assets.
See notes to financial statements.
20
USAA Mutual Funds Trust | Financial Highlights — continued | ||||||
For a Share Outstanding Throughout Each Period (continued)
Ratios to Average Net Assets | Supplemental Data | ||||||||||||||||||||||||||||||||||
| Total Distributions | Net Asset Value, End of Period | Total Return (Excludes Sales Charge)* | Net Expenses^ | Net Investment Income (Loss) | Gross Expenses | Net Assets, End of Period (000's) | Portfolio Turnover(a) | ||||||||||||||||||||||||||||
USAA Growth & Income Fund | |||||||||||||||||||||||||||||||||||
Class A shares | |||||||||||||||||||||||||||||||||||
| Year Ended July 31, 2020 | (4.91 | ) | $ | 20.31 | 7.52 | % | 1.14 | % | 0.79 | % | 1.14 | % | $ | 8,514 | 74 | % | |||||||||||||||||||
| Year Ended July 31, 2019 | (2.43 | ) | $ | 23.61 | 0.62 | % | 1.15 | % | 0.77 | % | 1.23 | % | $ | 9,912 | 93 | %(c) | |||||||||||||||||||
| Year Ended July 31, 2018 | (1.21 | ) | $ | 26.10 | 13.28 | % | 1.17 | %(d) | 0.52 | % | 1.20 | % | $ | 10,858 | 23 | % | |||||||||||||||||||
| Year Ended July 31, 2017 | (0.21 | ) | $ | 24.17 | 20.10 | % | 1.20 | % | 0.60 | % | 1.24 | % | $ | 9,987 | 21 | % | |||||||||||||||||||
| Year Ended July 31, 2016 | (1.21 | ) | $ | 20.32 | (1.72 | )% | 1.20 | % | 0.53 | % | 1.28 | % | $ | 8,332 | 22 | % | |||||||||||||||||||
See notes to financial statements.
21
USAA Mutual Funds Trust | Notes to Financial Statements July 31, 2020 | ||||||
1. Organization:
USAA Mutual Funds Trust (the "Trust") is organized as a Delaware statutory trust and is registered under the Investment Company Act of 1940, as amended (the "1940 Act"), as an open-end investment company. The Trust is comprised of 47 funds and is authorized to issue an unlimited number of shares, which are units of beneficial interest with no par value.
The accompanying financial statements are those of the USAA Growth & Income Fund (the "Fund"). The Fund offers three classes of shares: Fund Shares, Institutional Shares, and Class A shares. The Fund is classified as diversified under the 1940 Act.
Effective June 29, 2020, the Fund's Adviser Shares were redesignated Class A shares and became subject to a front-end sales charge.
Each class of shares of the Fund has substantially identical rights and privileges except with respect to fees paid under distribution plans, expenses allocable exclusively to each class of shares, voting rights on matters solely affecting a single class of shares, and the exchange privilege of each class of shares.
Under the Trust's organizational documents, its officers and trustees are indemnified against certain liabilities arising out of the performance of their duties to the Fund. In addition, in the normal course of business, the Fund enters into contracts with its vendors and others that provide for general indemnifications. The Fund's maximum exposure under these arrangements is unknown, as this would involve future claims that may be made against the Fund. However, based on experience, the Fund expects that risk of loss to be remote.
2. Significant Accounting Policies:
The following is a summary of significant accounting policies followed by the Trust in the preparation of its financial statements. The policies are in conformity with generally accepted accounting principles in the United States of America ("GAAP"). The preparation of financial statements in accordance with GAAP requires management to make estimates and assumptions that affect the reported amounts of assets and liabilities and disclosure of contingent assets and liabilities at the date of the financial statements and the reported amounts of income and expenses for the period. Actual results could differ from those estimates. The Fund follows the specialized accounting and reporting requirements under GAAP that are applicable to investment companies under Accounting Standards Codification Topic 946.
Investment Valuation:
The Fund records investments at fair value. Fair value is defined as the price that would be received to sell an asset or paid to transfer a liability in an orderly transaction between market participants at the measurement date.
The valuation techniques described below maximize the use of observable inputs and minimize the use of unobservable inputs in determining fair value. The inputs used for valuing the Fund's investments are summarized in the three broad levels listed below:
• Level 1 — quoted prices in active markets for identical securities
• Level 2 — other significant observable inputs (including quoted prices for similar securities or interest rates applicable to those securities, etc.)
• Level 3 — significant unobservable inputs (including the Fund's own assumptions in determining the fair value of investments)
Changes in valuation techniques may result in transfers in or out of an assigned level within the disclosure hierarchy. The inputs or methodologies used for valuation techniques are not necessarily an indication of the risk associated with entering into those investments.
The Adviser has established the Pricing and Liquidity Committee (the "Committee"), and, subject to Trust's Board of Trustees (the "Board") oversight, the Committee administers and oversees the Fund's valuation policies and procedures, which are approved by the Board.
22
USAA Mutual Funds Trust | Notes to Financial Statements — continued July 31, 2020 | ||||||
Portfolio securities listed or traded on securities exchanges, including exchange-traded funds ("ETFs"), American Depositary Receipts ("ADRs") and Rights, are valued at the closing price on the exchange or system where the security is principally traded, if available, or at the Nasdaq Official Closing Price. If there have been no sales for that day on the exchange or system, then a security is valued at the last available bid quotation on the exchange or system where the security is principally traded. In each of these situations, valuations are typically categorized as Level 1 in the fair value hierarchy.
Investments in open-end investment companies are valued at net asset value, ("NAV"). These valuations are typically categorized as Level 1 in the fair value hierarchy.
In the event that price quotations or valuations are not readily available, are not reflective of market value, or a significant event has been recognized in relation to a security or class of securities, the securities are valued in good faith by the Committee in accordance with valuation procedures approved by the Board. These valuations are typically categorized as Level 2 or Level 3 in the fair value hierarchy, based on the observability of inputs used to determine the fair value. The effect of fair value pricing is that securities may not be priced on the basis of quotations from the primary market in which they are traded and the actual price realized from the sale of a security may differ materially from the fair value price. Valuing these securities at fair value is intended to cause the Fund's NAV to be more reliable than it otherwise would be.
A summary of the valuations as of July 31, 2020, based upon the three levels defined above, is included in the table below while the breakdown, by category, of investments is disclosed in the Schedule of Portfolio Investments (amounts in thousands):
Level 1 | Level 2 | Level 3 | Total | ||||||||||||||||
Common Stocks | $ | 1,777,449 | $ | — | $ | — | $ | 1,777,449 | |||||||||||
Collateral for Securities Loaned | 790 | — | — | 790 | |||||||||||||||
Total | $ | 1,778,239 | $ | — | $ | — | $ | 1,778,239 | |||||||||||
For the year ended July 31, 2020, there were no transfers in or out of the Level 3 fair value hierarchy.
Real Estate Investment Trusts ("REITs"):
The Fund may invest in REITs, which report information on the source of their distributions annually. REITs are pooled investment vehicles that invest primarily in income producing real estate or real estate related loans or interests (such as mortgages). Certain distributions received from REITs during the year are recorded as realized gains or return of capital as estimated by the Fund or when such information becomes known.
Investment Companies:
Exchange-Traded Funds:
The Fund may invest in ETFs, the shares of which are bought and sold on a securities exchange. An ETF trades like common stock and represents a fixed portfolio of securities designed to track the performance and dividend yield of a particular domestic or foreign market index. The Fund may purchase shares of an ETF to temporarily gain exposure to a portion of the U.S. or a foreign market while awaiting purchase of underlying securities. The risks of owning an ETF generally reflect the risks of owning the underlying securities they are designed to track, although the lack of liquidity of an ETF could result in it being more volatile. Additionally, ETFs have fees and expenses that reduce their value.
Open-End Funds:
The Fund may invest in portfolios of open-end investment companies. These investment companies value securities in their portfolios for which market quotations are readily available at their market
23
USAA Mutual Funds Trust | Notes to Financial Statements — continued July 31, 2020 | ||||||
values (generally the last reported sale price) and all other securities and assets at their fair value by the methods established by the board of directors of the underlying funds.
Foreign Exchange Currency Contracts:
The Fund may enter into foreign exchange currency contracts to convert U.S. dollars to and from various foreign currencies. A foreign exchange currency contract is an obligation by the Fund to purchase or sell a specific currency at a future date at a price (in U.S. dollars) set at the time of the contract. The Fund does not engage in "cross-currency" foreign exchange contracts (i.e., contracts to purchase or sell one foreign currency in exchange for another foreign currency). The Fund's foreign exchange currency contracts might be considered spot contracts (typically a contract of one week or less) or forward contracts (typically a contract term over one week). A spot contract is entered into for purposes of hedging against foreign currency fluctuations relating to a specific portfolio transaction, such as the delay between a security transaction trade date and settlement date. Forward contracts are entered into for purposes of hedging portfolio holdings or concentrations of such holdings. Each foreign exchange currency contract is adjusted daily by the prevailing spot or forward rate of the underlying currency, and any appreciation or depreciation is recorded for financial statement purposes as unrealized until the contract settlement date, at which time the Fund records realized gains or losses equal to the difference between the value of a contract at the time it was opened and the value at the time it was closed. The Fund could be exposed to risk if a counterparty is unable to meet the terms of a foreign exchange currency contract or if the value of the foreign currency changes unfavorably. In addition, the use of foreign exchange currency contracts does not eliminate fluctuations in the underlying prices of the securities. As of July 31, 2020, the Fund had no open forward foreign exchange currency contracts.
Investment Transactions and Related Income:
Changes in holdings of investments are accounted for no later than one business day following the trade date. For financial reporting purposes, however, investment transactions are accounted for on trade date on the last business day of the reporting period. Interest income is determined on the basis of coupon interest accrued using the effective interest method which adjusts, where applicable, the amortization of premiums or accretion of discount. Gains or losses realized on sales of securities are determined by comparing the identified cost of the security lot sold with the net sales proceeds.
Withholding taxes on interest, dividends, and gains as a result of certain investments in ADRs by the Fund has been provided for in accordance with each investment's applicable country's tax rules and rates.
Securities Lending:
The Fund, through a securities lending agreement with Citibank, N.A. ("Citibank"), may lend its securities to qualified financial institutions, such as certain broker-dealers, to earn additional income, net of income retained by Citibank. Borrowers are required to secure their loans for collateral in the amount of at least 102% of the value of U.S. securities loaned or at least 105% of the value of non-U.S. securities loaned, marked-to-market daily. Any collateral shortfalls associated with increases in the valuation of the securities loaned are cured the next business day once the shortfall exceeds $100 thousand. Collateral may be cash, U.S. government securities, or other securities as permitted by SEC guidelines. Cash collateral may be invested in high-quality short-term investments, primarily open-end investment companies. Collateral requirements are determined daily based on the value of the Fund's securities on loan as of the end of the prior business day. During the time portfolio securities are on loan, the borrower will pay the Fund any dividends or interest paid on such securities plus any fee negotiated between the parties to the lending agreement. The Fund also earns a return from the collateral. The Fund pays Citibank various fees in connection with the investment of cash collateral and fees based on the investment income received from securities lending activities. Securities lending income (net of these fees) is disclosed on the Statement of Operations. Loans are terminable upon demand and the borrower must return the loaned securities within the lesser of one standard settlement period or five
24
USAA Mutual Funds Trust | Notes to Financial Statements — continued July 31, 2020 | ||||||
business days. Risks relating to securities-lending transactions include that the borrower may not provide additional collateral when required or return the securities when due, and that the value of the short-term investments will be less than the amount of cash collateral required to be returned to the borrower. The Fund's agreement with Citibank does not include master netting provisions. Non- cash collateral received by the Fund may not be sold or re-pledged except to satisfy borrower default. Cash collateral is listed on the Fund's Schedule of Portfolio of Investments and Financial Statements while non-cash collateral is not included. The following table (amounts in thousands) is a summary of the Fund's securities lending transactions as of July 31, 2020.
| Value of Securities on Loan | Non-Cash Collateral | Cash Collateral | |||||||||
| $ | 781 | $ | — | $ | 790 | ||||||
Foreign Currency Translations:
The accounting records of the Fund are maintained in U.S. dollars. Investment securities and other assets and liabilities of the Fund denominated in a foreign currency are translated into U.S. dollars at current exchange rates. Purchases and sales of securities, income receipts, and expense payments are translated into U.S. dollars at the exchange rates on the date of the transactions. The Fund does not isolate the portion of the results of operations resulting from changes in foreign exchange rates on investments from fluctuations arising from changes in market prices of securities held. Such fluctuations are disclosed as net change in unrealized appreciation/depreciation on investments and foreign currency translations on the Statement of Operations. Any realized gains or losses from these fluctuations, including foreign currency arising from in-kind redemptions, are disclosed as net realized gains or losses from investment transactions and foreign currency translations on the Statement of Operations.
Foreign Taxes:
The Fund may be subject to foreign taxes related to foreign income received (a portion of which may be reclaimable), capital gains on the sale of securities, and certain foreign currency transactions. All foreign taxes are recorded in accordance with the applicable regulations and rates that exist in the foreign jurisdictions in which the Fund invests.
Federal Income Taxes:
It is the Fund's policy to continue to qualify as a regulated investment company by complying with the provisions available to certain investment companies, as defined in applicable sections of the Internal Revenue Code, and to make distributions of net investment income and net realized gains sufficient to relieve it from all, or substantially all, federal income taxes. Accordingly, no provision for federal income taxes is required in the financial statements. The Fund has a tax year-end of July 31.
Management of the Fund has reviewed tax positions taken in tax years that remain subject to examination by all major tax jurisdictions, including federal (i.e., the last four tax years, which includes the current fiscal tax year end). Management believes that there is no tax liability resulting from unrecognized tax benefits related to uncertain tax positions taken.
Allocations:
Expenses directly attributable to the Fund are charged to the Fund, while expenses that are attributable to more than one fund in the Trust, or jointly with an affiliated trust, are allocated among the respective funds in the Trust and/or affiliated trust based upon net assets or another appropriate basis.
Income, expenses (other than class-specific expenses such as transfer agent fees, state registration fees, 12b-1 fees and printing fees), and realized and unrealized gains or losses on investments are allocated to each class of shares based on its relative net assets on the date income is earned or expenses and realized and unrealized gains and losses are incurred.
25
USAA Mutual Funds Trust | Notes to Financial Statements — continued July 31, 2020 | ||||||
3. Purchases and Sales:
Cost of purchases and proceeds from sales/maturities of securities (excluding securities maturing less than one year from acquisition) for the year ended July 31, 2020, were as follows for the Fund (amounts in thousands):
| Excluding U.S. Government Securities | |||||||||||
Purchases | Sales | ||||||||||
$ | 1,294,684 | $ | 1,442,937 | ||||||||
There were no purchases and sales of U.S. government securities during the year ended July 31, 2020.
4. Fees and Transactions with Affiliates and Related Parties:
Investment Advisory Fees:
Investment advisory services are provided to the Fund by Victory Capital Management Inc. ("VCM" or the "Adviser"), a New York corporation registered as an investment adviser with the Securities and Exchange Commission ("SEC"). The Adviser is a wholly-owned indirect subsidiary of Victory Capital Holdings, Inc., a publicly traded Delaware corporation, and a wholly-owned direct subsidiary of Victory Capital Operating, LLC. Under the terms of the Investment Advisory Agreement, the Adviser is entitled to receive a base fee and a performance adjustment. The Fund's base fee is accrued daily and paid monthly at an annualized rate of 0.60% of the Fund's average daily net assets. Amounts incurred and paid to VCM for the year ended July 31, 2020, are reflected on the Statement of Operations as Investment Advisory fees.
Effective July 1, 2019, no performance adjustments were made for the period beginning July 1, 2019, through June 30, 2020. Only performance beginning as of July 1, 2019, and thereafter is utilized in calculating future performance adjustments.
The performance adjustment for each share class is accrued daily and calculated monthly by comparing each class' performance to that of the Lipper Multi-Cap Core Funds Index. The Lipper Multi-Cap Core Funds Index tracks the total return performance of each class within the Lipper Multi-Cap Core Funds category.
The performance period for each share class consists of the current month plus the previous 35 months (or the number of months beginning July 1, 2019, if fewer). The following table is utilized to determine the extent of the performance adjustment:
| Over/Under Performance Relative to Index (in basis points)(a) | Annual Adjustment Rate (in basis points)(a) | ||||||
+/- 100 to 400 | +/- 4 | ||||||
+/- 401 to 700 | +/- 5 | ||||||
+/- 701 and greater | +/- 6 | ||||||
(a) Based on the difference between average annual performance of the relevant share class of the Fund and its relevant Lipper index, rounded to the nearest basis point. Average daily net assets of the share class are calculated over a rolling 36-month period.
Each class' annual performance adjustment rate is multiplied by the average daily net assets of the class over the entire performance period, which is then multiplied by a fraction, the numerator of which is the number of days in the month and the denominator of which is 365 (366 in leap years). The resulting amount is then added to (in the case of overperformance), or subtracted from (in the case of underperformance) the base fee.
26
USAA Mutual Funds Trust | Notes to Financial Statements — continued July 31, 2020 | ||||||
Under the performance fee arrangement, each class pays a positive performance fee adjustment for a performance period whenever the class outperforms the Lipper Multi-Cap Core Funds Index over that period, even if the class has overall negative returns during the performance period.
For the period July 1, 2020 through July 31, 2020, performance adjustments for Fund Shares, Institutional Shares, and Class A shares were $(54), $(6), and less than $(1) thousand, respectively. For the Fund Shares, Institutional Shares and Class A shares, the performance adjustments were less than 0.01% of net assets for all classes.
The Trust relies on an exemptive order granted to VCM and its affiliated funds by the SEC in March 2019 permitting the use of a "manager-of-managers" structure for certain funds. Under a manager-of- managers structure, the investment adviser may select (with approval of the Board and without shareholder approval) one or more subadvisers to manage the day-to-day investment of a fund's assets. For the year ended July 31, 2020, the Fund had no subadvisors.
Administration and Servicing Fees:
VCM serves as the Fund's administrator and fund accountant. Under the Fund Administration, Servicing and Accounting Agreement, VCM is paid for its services an annual fee at a rate of 0.15% of average daily net assets of the Fund Shares and Class A shares, and 0.10% of average daily net assets of the Institutional Shares. Amounts incurred for the year ended July 31, 2020, are reflected on the Statement of Operations as Administration fees.
The Fund (as part of the Trust) has entered into an agreement to provide compliance services with the Adviser, pursuant to which the Adviser furnishes its compliance personnel, including the services of the Chief Compliance Officer ("CCO"), and other resources reasonably necessary to provide the Trust with compliance oversight services related to the design, administration and oversight of a compliance program for the Trust in accordance with Rule 38a-1 under the 1940 Act. The CCO is an employee of the Adviser, which pays the compensation of the CCO and support staff. Funds in the Trust, Victory Variable Insurance Funds, Victory Portfolios, and Victory Portfolios II (collectively, the "Victory Funds Complex") in the aggregate, compensates the Adviser for these services. Amounts incurred for the year ended July 31, 2020, are reflected on the Statement of Operations as Compliance fees.
Citi Fund Services Ohio, Inc. ("Citi"), an affiliate of Citibank, acts as sub-administrator and sub-fund accountant to the Fund pursuant to a Sub-Administration and Sub-Fund Accounting Services Agreement between VCM and Citi. VCM pays Citi a fee for providing these services. The Fund reimburses VCM and Citi for reasonable out-of-pocket expenses incurred in providing these services and certain other expenses specifically allocated to the Funds, under the Fund Administration, Servicing, and Accounting Agreement. Amounts incurred for the year ended July 31, 2020, are reflected on the Statement of Operations as Sub-Administration fees.
Transfer Agency Fees:
Victory Capital Transfer Agency, Inc. ("VCTA"), provides transfer agency services to the Fund. VCTA, an affiliate of the Adviser, provides transfer agent services to the Fund Shares based on an annual charge of $23 per shareholder account plus out-of-pocket expenses. VCTA pays a portion of these fees to certain intermediaries for the administration and servicing of accounts that are held with such intermediaries. Transfer agent's fees for Institutional Shares and Class A shares are paid monthly based on a fee accrued daily at an annualized rate of 0.10% of average daily net assets, plus out-of-pocket expenses. Amounts incurred and paid to VCTA for the year ended July 31, 2020, are reflected on the Statement of Operations as Transfer Agent fees.
FIS Investor Services LLC serves as sub-transfer agent and dividend disbursing agent for the Fund pursuant to a Sub-Transfer Agent agreement between VCTA and FIS Investor Services LLC. VCTA provides FIS Investor Services LLC a fee for providing these services.
27
USAA Mutual Funds Trust | Notes to Financial Statements — continued July 31, 2020 | ||||||
Distributor/Underwriting Services:
Victory Capital Services, Inc. (the "Distributor"), an affiliate of the Adviser, serves as distributor for the continuous offering of shares of the Fund pursuant to a Distribution Agreement between the Distributor and the Trust. Effective June 30, 2020, the Distributor's name was changed from Victory Capital Advisers, Inc. Pursuant to the Distribution and Service Plans adopted in accordance with Rule 12b-1 under the 1940 Act, the Distributor may receive a monthly distribution and service fee, at an annual rate of up to 0.25% of the average daily net assets of Class A shares. The distribution and service fees paid to the Distributor may be used by the Distributor to pay for activity primarily intended to result in the sale of Class A shares of the Fund. Amounts incurred and paid to the Distributor for the year ended July 31, 2020, are reflected on the Statement of Operations as 12b-1 fees
In addition, the Distributor is entitled to receive commission on sales of the Class A shares of the Fund. For the fiscal year ended July 31, 2020, the Distributor didn't receive any commissions.
Other Fees:
Citibank serves as the Fund's custodian.
K&L Gates LLP provides legal services to the Trust.
The Adviser has entered into an expense limitation agreement with the Fund until at least June 30, 2021. Under the terms of the agreement, the Adviser has agreed to waive fees or reimburse certain expenses to the extent that ordinary operating expenses incurred by certain classes of the Fund in any fiscal year exceed the expense limit for such classes of the Fund. Such excess amounts will be the liability of the Adviser. Interest, taxes, brokerage commissions, other expenditures, which are capitalized in accordance with GAAP, and other extraordinary expenses not incurred in the ordinary course of the Fund's business are excluded from the expense limits. As of July 31, 2020, the expense limits (excluding voluntary waivers) are 0.88%, 0.84%, and 1.15% for Fund Shares, Institutional Shares, and Class A shares, respectively.
Under this expense limitation agreement, the Fund has agreed to repay fees and expenses that were waived or reimbursed by the Adviser for a period up to three years after the fiscal year in which the waiver or reimbursement took place, subject to the lesser of any operating expense limits in effect at the time of: (a) the original waiver or expense reimbursement; or (b) the recoupment, after giving effect to the recoupment amount. As of July 31, 2020, the following amounts are available to be repaid to the Adviser (amounts in thousands). The Fund has not recorded any amounts available to be repaid as a liability due to an assessment that such repayment is not probable at July 31, 2020.
| Expires July 31, 2022 | |||
| $ | 4 | ||
*Rounds to less than $1 thousand.
The Adviser may voluntarily waive or reimburse additional fees to assist the Fund in maintaining competitive expense ratios. Voluntary waivers and reimbursements applicable to the Fund are not available to be recouped at a future time. There were no voluntary waivers or reimbursements for the year ended July 31, 2020.
Certain officers and/or interested trustees of the Fund are also officers and/or employees of the Adviser, Administrator, Sub-Administrator, Sub-Fund Accountant, and Legal.
5. Risks:
The Fund may be subject to other risks in addition to these identified risks.
Global economies and financial markets are increasingly interconnected, which increases the possibilities that conditions in one country or region might adversely affect issuers in another country or region. Geopolitical and other risks, including war, terrorism, trade disputes, political or economic dysfunction within some nations, public health crises and related geopolitical events, as well as
28
USAA Mutual Funds Trust | Notes to Financial Statements — continued July 31, 2020 | ||||||
environmental disasters such as earthquakes, fires, and floods, may add to instability in world economies and markets generally. Changes in trade policies and international trade agreements could affect the economies of many countries in unpredictable ways. Epidemics and/or pandemics, such as the coronavirus (or COVID-19), may result in, among other things, closing borders, disruptions to healthcare service preparation and delivery, quarantines, cancellations, disruptions to supply chains and consumer activity, as well as general concern and uncertainty. The impact may be short-term or may last for extended periods.
The COVID-19 pandemic, which has spread rapidly across the world, has led and will continue to lead for an unknown period of time to disruptions in local, regional, national and global markets and economies. Among other things, the outbreak has resulted in, and until fully resolved is likely to continue to result in, among other things (1) government imposition of various forms of "stay at home" orders and the closing of "non-essential" businesses, resulting in significant disruption to the businesses of many issuers as well as lay-offs of employees: (2) increased requests by issuers of debt instruments for amendments and waivers of agreements to avoid default and increased defaults: (3) volatility and disruption of markets, including greater volatility in pricing and spreads; and (4) rapidly evolving proposals and/or actions by state and federal governments to address problems being experienced by the markets and by businesses and the economy in general.
Overall stock market risks may affect the value of the Fund. Domestic and international factors such as political events, war, trade disputes, interest rate levels and other fiscal and monetary policy changes, pandemics and other public health crises, and related geopolitical events, as well as environmental disasters such as earthquakes, fires, and floods, may add to instability in world economies and markets generally. The impact of these and other factors may be short-term or may last for extended periods.
The value of the equity securities in which the Fund invests may decline in response to developments affecting individual companies and/or general economic conditions. A company's earnings or dividends may not increase as expected due to poor management decisions, competitive pressures, breakthroughs in technology, reliance on suppliers, labor problems or shortages, corporate restructurings, fraudulent disclosures, natural disasters, military confrontations, war, terrorism, public health crises, or other events, conditions, and factors. Price changes may be temporary or last for extended periods.
Foreign markets can be more volatile than the U.S. market due to increased risks of adverse issuer, political, regulatory, market, or economic developments and can perform differently from the U.S. market.
6. Borrowing and Interfund Lending:
Line of Credit:
For the year ended July 31, 2020, the Victory Funds Complex participated in a short-term demand note "Line of Credit" agreement with Citibank. The Line of Credit agreement with Citibank was renewed on June 29, 2020 with a termination date of June 28, 2021. Under the agreement with Citibank, the Victory Funds Complex may borrow up to $600 million, of which $300 million is committed and $300 million is uncommitted. $40 million of the Line of Credit is reserved for use by the Victory Floating Rate Fund (herein, the "Fund"), another series of the Victory Funds Complex, with that Fund paying the related commitment fees for that amount. The purpose of the agreement is to meet temporary or emergency cash needs. For the year ended July 31, 2020, Citibank received an annual commitment fee of 0.15% on $300 million for providing the Line of Credit. Each fund in the Victory Funds Complex pays a pro-rata portion of the commitment fees plus any interest (one month LIBOR plus one percent) on amounts borrowed. Effective June 29, 2020, under an amended Line of Credit agreement, Citibank will also receive an annual upfront fee of 0.10% on the $300 million committed line of credit. Each fund in the Victory Funds Complex will pay a pro-rata portion of the upfront fee. Interest charged to each Fund during the period, if applicable, is reflected on the Statements of Operations under Line of credit fees.
The Fund had no borrowings under the Line of Credit agreement during the year ended July 31, 2020.
29
USAA Mutual Funds Trust | Notes to Financial Statements — continued July 31, 2020 | ||||||
Interfund Lending:
The Trust and Adviser rely on an exemptive order granted by the SEC in March 2017 (the "Order"), permitting the establishment and operation of an Interfund Lending Facility (the "Facility"). The Facility allows the Fund to directly lend and borrow money to or from any other Fund in the Victory Funds Complex relying upon the Order at rates beneficial to both the borrowing and lending funds. Advances under the Facility are allowed for temporary or emergency purposes. The interfund loan rate is determined, as specified in the Order, by averaging the current repurchase agreement rate and the current bank loan rate. As a Borrower, interest charged to the Fund, if any, during the period is reflected on the Statement of Operations under Interfund lending fees. As a Lender, interest earned by the Fund, if any, during the period is reflected on the Statement of Operations under Income on Interfund lending.
The average borrowing or lending for the days outstanding and average interest rate for the Fund during the year ended July 31, 2020 were as follows (amounts in thousands):
| Borrower or Lender | Amount Outstanding at July 31, 2020 | Average Borrowing* | Days Borrowing Outstanding | Average Interest Rate* | Maximum Borrowing During the Period | ||||||||||||||||||||||
Borrower | $ | — | $ | 1,281 | 3 | 2.15 | % | $ | 1,721 | ||||||||||||||||||
* For the year ended July 31, 2020, based on the number of days borrowings were outstanding.
7. Federal Income Tax Information:
The Fund intends to declare daily and distribute any net investment income quarterly. Distributable net realized gains if any, are declared and paid at least annually.
The amounts of dividends from net investment income and distributions from net realized gains (collectively distributions to shareholders) are determined in accordance with federal income tax regulations, which may differ from GAAP. To the extent these "book/tax" differences are permanent in nature (e.g., net operating loss and distribution reclassification), such amounts are reclassified within the components of net assets based on their federal tax-basis treatment; temporary differences (e.g., wash sales) do not require reclassification. To the extent dividends and distributions exceed net investment income and net realized gains for tax purposes, they are reported as distributions of capital. Net investment losses incurred by the Fund may be reclassified as an offset to capital on the accompanying Statement of Assets and Liabilities.
The following permanent reclassifications were made between capital accounts to reflect the portion of the payments made to redeeming shareholders that was claimed as a distribution for income tax purposes during the year ended July 31, 2020 (amounts in thousands):
| Total accumulated earnings/(loss) | Capital | ||||||
| $ | 1 | $ | (1 | ) | |||
The tax character of distributions paid during the tax years ended as noted below, were as follows (total distributions paid may differ from the Statements of Changes in Net Assets because, for tax purposes, dividends are recognized when actually paid) (amounts in thousands).
Year Ended July 31, 2020 | Year Ended July 31, 2019 | ||||||||||||||||||||||||||
Distributions paid from | Distributions paid from | ||||||||||||||||||||||||||
| Ordinary Income | Net Long-Term Capital Gains | Total Distributions Paid | Ordinary Income* | Net Long-Term Capital Gains | Total Distributions Paid | ||||||||||||||||||||||
$ | 21,852 | $ | 358,793 | $ | 380,645 | $ | 18,971 | $ | 163,377 | $ | 182,348 | ||||||||||||||||
* Includes short-term realized capital gains, if any, which are taxable as ordinary income.
30
USAA Mutual Funds Trust | Notes to Financial Statements — continued July 31, 2020 | ||||||
As of July 31, 2020, the components of accumulated earnings (loss) on a tax basis were as follows (amounts in thousands):
| Undistributed Ordinary Income | Accumulated Earnings | Accumulated Capital and Other Losses | Unrealized Appreciation (Depreciation)* | Total Accumulated Earnings (Loss) | |||||||||||||||
| $ | 3,299 | $ | 3,299 | $ | (39,007 | ) | $ | 332,629 | $ | 296,921 | |||||||||
* The difference between the book-basis and tax-basis of unrealized appreciation/depreciation is attributable primarily to tax deferral of losses on wash sales and passive foreign investment company adjustments.
At July 31, 2020, the Fund had net capital loss carryforwards as shown in the table below (amounts in thousands). It is unlikely that the Board will authorize a distribution of capital gains realized in the future until the capital loss carryforwards have been used.
| Short-Term Amount | Total | ||||||
| $ | 39,007 | $ | 39,007 | ||||
As of July 31, 2020, the cost basis for federal income tax purposes, gross unrealized appreciation, gross unrealized depreciation, and net unrealized appreciation (depreciation) for investments were as follows (amounts in thousands):
| Cost of Investments for Federal Tax Purposes | Gross Unrealized Appreciation | Gross Unrealized Depreciation | Net Unrealized Appreciation (Depreciation) | ||||||||||||
| $ | 1,445,610 | $ | 412,911 | $ | (80,282 | ) | $ | 332,629 | |||||||
31
REPORT OF INDEPENDENT REGISTERED PUBLIC ACCOUNTING FIRM
To the Shareholders and the Board of Trustees of USAA Growth & Income Fund
Opinion on the Financial Statements
We have audited the accompanying statement of assets and liabilities of USAA Growth & Income Fund (the "Fund") (one of the funds constituting USAA Mutual Funds Trust (the "Trust")), including the schedule of portfolio investments, as of July 31, 2020, and the related statement of operations for the year then ended, the statements of changes in net assets for each of the two years in the period then ended, the financial highlights for each of the five years in the period then ended and the related notes (collectively referred to as the "financial statements"). In our opinion, the financial statements present fairly, in all material respects, the financial position of the Fund (one of the funds constituting USAA Mutual Funds Trust) at July 31, 2020, the results of its operations for the year then ended, the changes in its net assets for each of the two years in the period then ended and its financial highlights for each of the five years in the period then ended, in conformity with U.S. generally accepted accounting principles.
Basis for Opinion
These financial statements are the responsibility of the Trust's management. Our responsibility is to express an opinion on the Fund's financial statements based on our audits. We are a public accounting firm registered with the Public Company Accounting Oversight Board (United States) ("PCAOB") and are required to be independent with respect to the Trust in accordance with the U.S. federal securities laws and the applicable rules and regulations of the Securities and Exchange Commission and the PCAOB.
We conducted our audits in accordance with the standards of the PCAOB. Those standards require that we plan and perform the audit to obtain reasonable assurance about whether the financial statements are free of material misstatement, whether due to error or fraud. The Trust is not required to have, nor were we engaged to perform, an audit of the Trust's internal control over financial reporting. As part of our audits we are required to obtain an understanding of internal control over financial reporting, but not for the purpose of expressing an opinion on the effectiveness of the Trust's internal control over financial reporting. Accordingly, we express no such opinion.
Our audits included performing procedures to assess the risks of material misstatement of the financial statements, whether due to error or fraud, and performing procedures that respond to those risks. Such procedures included examining, on a test basis, evidence regarding the amounts and disclosures in the financial statements. Our procedures included confirmation of securities owned as of July 31, 2020, by correspondence with the custodian and brokers or by other appropriate auditing procedures where replies from brokers were not received. Our audits also included evaluating the accounting principles used and significant estimates made by management, as well as evaluating the overall presentation of the financial statements. We believe that our audits provide a reasonable basis for our opinion.

We have served as the auditor of one or more Victory Capital investment companies since 1995.
San Antonio, Texas
September 29, 2020
32
USAA Mutual Funds Trust | Supplemental Information July 31, 2020 | ||||||
(Unaudited)
Trustee and Officer Information
Board of Trustees:
Overall responsibility for management of the Trust rests with the Board. The Trust is managed by the Board in accordance with the laws of the state of Delaware. There are currently 10 Trustees, eight of whom are not "interested persons" of the Trust within the meaning of that term under the 1940 Act ("Independent Trustees") and two of whom is an "interested person" of the Trust within the meaning of that term under the 1940 Act ("Interested Trustee"). The Trustees, in turn, elect the officers of the Trust to actively supervise its day-to-day operations.
The following tables list the Trustees, their ages, position with the Trust, commencement of service, principal occupations during the past five years and any directorships of other investment companies or companies whose securities are registered under the Securities Exchange Act of 1934, as amended, or who file reports under that Act. Each Trustee oversees 47 portfolios in the Trust. Each Trustee's address is 15935 La Cantera Pkwy, Building Two, San Antonio, TX, 78256. Pursuant to a policy adopted by the Board, the term of office for each Trustee shall be until the Independent Trustee reaches age 75 or an Interested Trustee reaches age 75. The Board may change or grant exceptions from this policy at any time without shareholder approval. A Trustee may resign or be removed by a vote of the other Trustees or the holders of a majority of the outstanding shares of the Trust at any time. Vacancies on the Board can be filled by the action of a majority of the Trustees, provided that after filling such vacancy at least two-thirds of the Trustees have been elected by the shareholders.
Name and Date of Birth | Position Held with the Trust | Year Commenced Service | Principal Occupation During Past 5 Years | Other Directorships Held During Past 5 Years | |||||||||||||||
Independent Trustees. | |||||||||||||||||||
| Jefferson C. Boyce, Born September 1957 | Lead Independent Trustee, and Vice Chairman | 2013 | Senior Managing Director, New York Life Investments, LLC (1992-2012) | Westhab, Inc. | |||||||||||||||
| John C. Walters, Born February 1962 | Trustee | 2019 | Retired. Mr. Walters brings significant Board experience including active involvement with the board of a Fortune 500 company, and a proven record of leading large, complex financial organizations. He has a demonstrated record of success in distribution, manufacturing, investment brokerage, and investment management in both the retail and institutional investment businesses. He has substantial experience in the investment management business with a demonstrated ability to develop and drive strategy while managing operation, financial, and investment risk. | Guardian Variable Products Trust (16 series), Lead Independent Director; Amerilife Holdings LLC, Director; Stadion Money Management; Director; University of North Carolina (Chapel Hill), Member Board of Governors. | |||||||||||||||
33
USAA Mutual Funds Trust | Supplemental Information — continued July 31, 2020 | ||||||
(Unaudited)
Name and Date of Birth | Position Held with the Trust | Year Commenced Service | Principal Occupation During Past 5 Years | Other Directorships Held During Past 5 Years | |||||||||||||||
| Robert L. Mason, Ph.D., Born July 1946 | Trustee | 1997 | Adjunct Professor in the Department of Management Science and Statistics in the College of Business at the University of Texas at San Antonio (since 2001); Institute Analyst, Southwest Research Institute (March 2002-January 2016) | None | |||||||||||||||
| Dawn M. Hawley, Born February 1954 | Trustee | 2014 | Manager of Finance, Menil Foundation, Inc. (May 2007-June 2011), which is a private foundation that oversees the assemblage of sculptures, prints, drawings, photographs, and rare books. Director of Financial Planning and Analysis and Chief Financial Officer, AIM Management Group, Inc. (October 1987-January 2006) | None | |||||||||||||||
| Paul L. McNamara, Born July 1948 | Trustee | 2012 | Director, Cantor Opportunistic Alternatives Fund, LLC (March 2010-February 2014) , which is a closed-end fund of funds by Cantor Fitzgerald Investment Advisors, LLC | None | |||||||||||||||
34
USAA Mutual Funds Trust | Supplemental Information — continued July 31, 2020 | ||||||
(Unaudited)
Name and Date of Birth | Position Held with the Trust | Year Commenced Service | Principal Occupation During Past 5 Years | Other Directorships Held During Past 5 Years | |||||||||||||||
| Richard Y. Newton III, Born January 1956 | Trustee | 2017 | Director, Elta North America (01/18-present), which is a global leader in the design, manufacture, and support of innovative electronic systems in the ground, maritime, airborne, and security domains for the nation's warfighters, security personnel, and first responders; Managing Partner, Pioneer Partnership Development Group (December 2015-present)); Executive Director, The Union League Club of New York (June 2014-November 2015): Executive Vice President, Air Force Association (August 2012-May 2014); Lieutenant General, United States Air Force (January 2008-June 2012) | None | |||||||||||||||
| Barbara B. Ostdiek, Ph.D., Born March 1964 | Trustee | 2008 | Senior Associate Dean of Degree Programs at Jesse H. Jones Graduate School of Business at Rice University (since 2013); Associate Professor of Finance at Jessie H. Jones Graduate School of Business at Rice University (since 2001) | None | |||||||||||||||
| Michael F. Reimherr, Born August 1945 | Trustee | 2000 | President of Reimherr Business Consulting (May 1995-December 2017); St. Mary's University Investment Committee overseeing University Endowment (since 2014) | None | |||||||||||||||
35
USAA Mutual Funds Trust | Supplemental Information — continued July 31, 2020 | ||||||
(Unaudited)
Name and Date of Birth | Position Held with the Trust | Year Commenced Service | Principal Occupation During Past 5 Years | Other Directorships Held During Past 5 Years | |||||||||||||||
Interested Trustees. | |||||||||||||||||||
| David C. Brown, ** Born May 1972 | Trustee | 2019 | Chairman and Chief Executive Officer (since 2013), Co-Chief Executive Officer (2011-2013), Victory Capital Management Inc.; Chairman and Chief Executive Officer, Victory Capital Holdings, Inc. (since 2013). Mr. Brown brings to the Board extensive business, finance and leadership skills gained and developed through years of experience in the financial services industry, including his tenure overseeing the strategic direction as CEO of Victory Capital. These skills, combined with Mr. Brown's extensive knowledge of the financial services industry and demonstrated success in the development and distribution of investment strategies and products, enable him to provide valuable insights to the Board and strategic direction for the Funds | Trustee, Victory Portfolios (42 series), Victory Portfolios II (26 series), Victory Variable Insurance Funds (9 series) | |||||||||||||||
36
USAA Mutual Funds Trust | Supplemental Information — continued July 31, 2020 | ||||||
(Unaudited)
Name and Date of Birth | Position Held with the Trust | Year Commenced Service | Principal Occupation During Past 5 Years | Other Directorships Held During Past 5 Years | |||||||||||||||
| Daniel S. McNamara, ** Born June 1966 | Trustee and Chair of the Board of Trustees | 2012 | Trustee, President, and Vice Chairman of USAA ETF Trust (June 2017-June 2019); President of Financial Advice & Solutions Group (FASG), USAA (since 2013); Director, Investment Management Company (IMCO) (September 2009-April 2014); President, Asset Management Company (AMCO) (August, 2011-April 2013); Senior Vice President of USAA Financial Planning Services Insurance Agency, Inc. (FPS) (since 2011); Director of USAA IMCO (since 2009); Chairman of Board of IMCO (since 2013); Director of AMCO (August 2011-June 2019); President and Director of USAA Shareholder Account Services (SAS) (October 2009-June 2019); Director and Vice Chairman of FPS (since 2013); President and Director of USAA Investment Corporation (ICORP) (since 2010); Chairman of Board of ICORP (since 2013); Director of USAA Financial Advisors, Inc. (FAI) (since 2013); Chairman of Board of FAI (since 2015). Mr. McNamara brings to the Board extensive experience in the financial services industry, including experience as an officer of the Trust. | None | |||||||||||||||
** Mr. Dan McNamara, the Chairman of the Board, is deemed an "interested person" due to his previous position as Director of AMCO, the former investment adviser of the Funds. Mr. Brown is deemed an "interested person" due to his position as Chief Executive Officer of Victory Capital, investment adviser to the Funds.
The Statement of Additional Information includes additional information about the Trustees of the Trust and is available, without charge, on the SEC's website at www.sec.gov and/or by calling (800)-539-3863.
37
USAA Mutual Funds Trust | Supplemental Information — continued July 31, 2020 | ||||||
(Unaudited)
Officers:
The officers of the Trust, their ages, commencement of service and their principal occupations during the past five years, are detailed in the following table. Each officer serves until the earlier of his or her resignation, removal, retirement, death, or the election of a successor. The mailing address of each officer of the Trust is 15935 La Cantera Pkwy, Building Two, San Antonio, TX, 78256. The officers of the Trust receive no compensation directly from the Trust for performing the duties of their offices.
Name and Date of Birth | Position with the Trust | Year Commenced Service | Principal Occupation During Past 5 Years | ||||||||||||
Interested Officers. | |||||||||||||||
| Christopher K. Dyer, Born February 1962 | President | 2019 | Director of Fund Administration, Victory Capital (2004-present) | ||||||||||||
| Scott A Stahorsky, Born July 1969 | Vice President | 2019 | Manager, Fund Administration, Victory Capital (since 2015); Senior Analyst, Fund Administration, Victory Capital (prior to 2015) | ||||||||||||
| James K. De Vries, Born April 1969 | Treasurer, Principal Financial Officer | 2018 | Executive Director, Victory Capital Management Inc. (since 2019); Treasurer, USAA ETF Trust (September 2018-June 2019); Executive Director, Investment and Financial Administration, USAA (April 2012-June 2019); Assistant Treasurer, USAA ETF Trust (June 2017-September 2018); Assistant Treasurer, USAA Mutual Funds Trust (December 2013-February 2018) | ||||||||||||
| Allan Shaer, Born March 1965 | Assistant Treasurer | 2019 | Senior Vice President, Financial Administration, Citi Fund Services Ohio, Inc. (since 2016); Vice President, Mutual Fund Administration, JP Morgan Chase (2011-2016) | ||||||||||||
| Carol D. Trevino, Born October 1965 | Assistant Treasurer | 2018 | Director, Accounting and Finance, Victory Capital Management Inc. (since 2019); Accounting/Financial Director, USAA (December 2013-June 2019); Assistant Treasurer, USAA ETF Trust (September 2018-June 2019). | ||||||||||||
| Erin G. Wagner, Born February 1974 | Secretary | 2019 | Deputy General Counsel, the Adviser (since 2013) | ||||||||||||
| Charles Booth, Born April 1960 | Anti-Money Laundering Compliance Officer and Identity Theft Officer | 2019 | Director, Regulatory Administration and CCO Support Services, Citi Fund Services Ohio, Inc. (2007-present) | ||||||||||||
| Amy Campos, Born July 1976 | Chief Compliance Officer | 2019 | Chief Compliance Officer, USAA Mutual Funds Trust (since 2019); Executive Director, Deputy Chief Compliance Officer, USAA Mutual Funds Trust and USAA ETF Trust (July 2017-June 2019); Compliance Director, USAA Mutual Funds Trust (2014-July 2017) | ||||||||||||
38
USAA Mutual Funds Trust | Supplemental Information — continued July 31, 2020 | ||||||
(Unaudited)
Proxy Voting and Portfolio Holdings Information
Proxy Voting:
Information regarding the policies and procedures the Fund uses to determine how to vote proxies relating to portfolio securities is available without charge, upon request, by calling (800) 539-3863. The information is also included in the Fund's Statement of Additional Information, which is available on the SEC's website at www.sec.gov.
Information relating to how the Fund voted proxies relating to portfolio securities held during the most recent 12 months ended June 30 is available on the SEC's website at www.sec.gov.
Availability of Schedules of Portfolio Investments:
The Trust files a complete list of Schedules of Portfolio Investments with the SEC for the first and third quarter of each fiscal year on Form N-PORT. Forms N-PORT are available on the SEC's website at www.sec.gov.
Expense Examples
As a shareholder of the Fund, you may incur two types of costs: (1) transaction costs, and (2) ongoing costs, including management fees and other Fund expenses. These examples are intended to help you understand your ongoing costs (in dollars) of investing in the Fund and to compare these costs with the ongoing costs of investing in other mutual funds.
These examples are based on an investment of $1,000 invested at the beginning of the period and held for the entire period from February 1, 2020 through July 31, 2020.
The Actual Expense figures in the table below provide information about actual account values and actual expenses. You may use the information below, together with the amount you invested, to estimate the expenses that you paid over the period. Simply divide your account value by $1,000 (for example, an $8,600 account value divided by $1,000 = 8.6), then multiply the result by the number in the table under the heading entitled "Actual Expenses Paid During Period" to estimate the expenses you paid on your account during this period.
The Hypothetical Expense figures in the table below provide information about hypothetical account values and hypothetical expenses based on the Fund's actual expense ratio and an assumed rate of return of 5% per year before expenses, which is not the Fund's actual return. The hypothetical account values and expenses may not be used to estimate the actual ending account balance or expenses you paid for the period. You may use this information to compare this 5% hypothetical example with the 5% hypothetical examples that appear in shareholder reports of other funds.
Please note the expenses shown in the table below are meant to highlight your ongoing costs only and do not reflect any transactional costs. If these transactional costs were included, your costs would have been higher.
| Beginning Account Value 2/1/20 | Actual Ending Account Value 7/31/20 | Hypothetical Ending Account Value 7/31/20 | Actual Expenses Paid During Period 2/1/20- 7/31/20* | Hypothetical Expenses Paid During Period 2/1/20- 7/31/20* | Annualized Expense Ratio During Period 2/1/20- 7/31/20 | ||||||||||||||||||||||
Fund Shares | $ | 1,000.00 | $ | 1,018.50 | $ | 1,020.64 | $ | 4.27 | $ | 4.27 | 0.85 | % | |||||||||||||||
Institutional Shares | 1,000.00 | 1,018.30 | 1,020.89 | 4.01 | 4.02 | 0.80 | % | ||||||||||||||||||||
Class A shares | 1,000.00 | 1,017.30 | 1,019.29 | 5.62 | 5.62 | 1.12 | % | ||||||||||||||||||||
* Expenses are equal to the average account value multiplied by the Fund's annualized expense ratio multiplied by 182/366 (the number of days in the most recent fiscal half-year divided by the number of days in the fiscal year).
39
USAA Mutual Funds Trust | Supplemental Information — continued July 31, 2020 | ||||||
(Unaudited)
Additional Federal Income Tax Information
The following federal tax information related to the Fund's fiscal year ended July 31, 2020, is provided for information purposes only and should not be used for reporting to federal or state revenue agencies. Federal tax information for the calendar year will be reported to you on Form 1099-DIV in January 2021.
With respect to distributions paid, the Fund designates the following amounts (or, if subsequently determined to be different, the maximum amount allowable) for the fiscal year ended July 31, 2020 (amounts in thousands):
| Dividend Received Deduction (corporate shareholders)* | Qualified Dividend Income (non-corporate shareholders)* | Short-Term Capital Gain Distributions | Long-Term Capital Gain Distributions(a) | ||||||||||||||||
100.00 | % | 79.14 | % | $ | 2,897 | $ | 358,792 | ||||||||||||
* Presented as a percentage of net investment income and excludes short-term capital gain distributions paid, if any. All or a portion of these amounts may be exempt from taxation at the state level.
(a) Pursuant to Section 852 of the Internal Revenue Code.
40
USAA Mutual Funds Trust | Supplemental Information — continued July 31, 2020 | ||||||
(Unaudited)
Liquidity Risk Management Program
The USAA Mutual Funds have adopted and implemented a written liquidity risk management program (the "LRMP") as required by Rule 22e-4 under the Investment Company Act of 1940, as amended. The LRMP is reasonably designed to assess and manage the Fund's liquidity risk, taking into consideration the Fund's investment strategy and the liquidity of its portfolio investments during normal and reasonably foreseeable stressed market conditions; its short and long-term cash flow projections; and its cash holdings and access to other liquidity management tools such as available funding sources including the Victory Funds Complex Interfund Lending Facility and Line of Credit (discussed in the Notes to Financial Statements). The USAA Mutual Funds' Board of Trustees approved the appointment of the Fund's investment adviser, Victory Capital Management Inc. ("Victory Capital"), as the administrator of the LRMP. At an in-person meeting held on February 26, 2020, Victory Capital provided an oral and written report to the Trustees on the operation and effectiveness of the LRMP during the previous year.
Victory Capital manages liquidity risks associated with the Fund's investments by monitoring, among other things, cash and cash equivalents, any use of derivatives, the concentration of investments, the appropriateness of the Fund's investment strategy, and by classifying every fund investment as either highly liquid, moderately liquid, less liquid or illiquid on at least a monthly basis. To assist with the classification of Fund investments, Victory Capital has retained a third-party provider of liquidity evaluation services. This provider determines preliminary liquidity classifications for all portfolio holdings based upon portfolio-level data and certain assumptions provided by Victory Capital. Victory Capital reviews the preliminary liquidity classifications, and, when appropriate, considers other information including input from the Fund's portfolio managers (including the portfolio managers employed by any investment sub-advisers) in determining final liquidity classifications.
The report from Victory Capital concluded that the Fund did not experience any significant liquidity challenges during the covered period, and the Fund's LRMP is reasonably designed to assess and manage its liquidity risk. The report also concluded that the LRMP continues to operate adequately and effectively to enable Victory Capital to oversee and manage liquidity risk and ensure the Fund is able to meet redemption requests without significant dilution to the remaining investors' interest in the Fund. During the review period, the Fund's portfolio consisted primarily of highly liquid investments, which are defined as cash and any investments reasonably expected to be converted to cash in current market conditions in three business days or less without significantly changing the market value of the investment. Therefore, the Fund has not adopted a Highly Liquid Investment Minimum. The Fund's investments were below the limitation on illiquid investments during the review period. Additionally, Victory Capital indicated that no events occurred that would require the filing of Form N-LIQUID and recommended no material changes to the LRMP.
41
Privacy Policy
Protecting the Privacy of Information
The Trust respects your right to privacy. We also know that you expect us to conduct and process your business in an accurate and efficient manner. To do so, we must collect and maintain certain personal information about you. This is the information we collect from you on applications or other forms, and from the transactions you make with us or third parties. It may include your name, address, social security number, account transactions and balances, and information about investment goals and risk tolerance.
We do not disclose any information about you or about former customers to anyone except as permitted or required by law. Specifically, we may disclose the information we collect to companies that perform services on our behalf, such as the transfer agent that processes shareholder accounts and printers and mailers that assist us in the distribution of investor materials. We may also disclose this information to companies that perform marketing services on our behalf. This allows us to continue to offer you Victory investment products and services that meet your investing needs, and to effect transactions that you request or authorize. These companies will use this information only in connection with the services for which we hired them. They are not permitted to use or share this information for any other purpose.
To protect your personal information internally, we permit access only by authorized employees and maintain physical, electronic and procedural safeguards to guard your personal information.*
* You may have received communications regarding information about privacy policies from other financial institutions which gave you the opportunity to "opt-out" of certain information sharing with companies which are not affiliated with that financial institution. The Trust does not share information with other companies for purposes of marketing solicitations for products other than the Trust. Therefore, the Trust does not provide opt-out options to their shareholders.
P.O. Box 182593
Columbus, Ohio 43218-2593

Visit our website at: | Call | ||||||
vcm.com | (800) 235-8396 | ||||||
23431-0920

JULY 31, 2020
Annual Report
USAA Growth Fund
Beginning January 1, 2021, as permitted by regulations adopted by the Securities and Exchange Commission, paper copies of the Fund's shareholder reports like this one will no longer be sent by mail, unless you specifically request paper copies of the reports from the Fund or from your financial intermediary, such as a broker-dealer or bank. Instead, the reports will be made available on VictoryFunds.com, and you will be notified by mail each time a report is posted and provided with a website link to access the report. If you already elected to receive shareholder reports electronically, you will not be affected by this change and you need not take any action.
You may elect to receive shareholder reports and other communications from the Fund or your financial intermediary electronically by notifying your financial intermediary directly, or if you are a direct investor, by calling (800) 235-8396 or logging on to usaa.com. Effective on or about November 6, 2020, a shareholder who has an account directly with the Fund will need to submit their request via email to TA.Processing@FISGlobal.com.
You may elect to receive all future reports in paper free of charge. You can inform the Fund or your financial intermediary that you wish to continue receiving paper copies of your shareholder reports by notifying your financial intermediary directly, or if you are a direct investor, by calling (800) 235-8396 or logging on to usaa.com. Effective on or about November 6, 2020, a shareholder who has an account directly with the Fund will need to submit their request via email to TA.Processing@FISGlobal.com. Your election to receive reports in paper will apply to all funds held with the USAA Mutual Funds or your financial intermediary.
Victory Capital means Victory Capital Management Inc., the investment adviser of the USAA Mutual Funds. USAA Mutual Funds are distributed by Victory Capital Services, Inc., member FINRA, an affiliate of Victory Capital. Victory Capital and its affiliates are not affiliated with United Services Automobile Association or its affiliates. USAA and the USAA logo are registered trademarks and the USAA Mutual Funds and USAA Investments logos are trademarks of United Services Automobile Association and are being used by Victory Capital and its affiliates under license.
USAA Mutual Funds Trust
TABLE OF CONTENTS
Shareholder Letter (Unaudited) | 2 | ||||||
Managers' Commentary (Unaudited) | 3 | ||||||
Investment Overview (Unaudited) | 5 | ||||||
| Investment Objective & Portfolio Holdings (Unaudited) | 6 | ||||||
Financial Statements | |||||||
Schedule of Portfolio Investments | 7 | ||||||
Statement of Assets and Liabilities | 10 | ||||||
Statement of Operations | 11 | ||||||
Statements of Changes in Net Assets | 12 | ||||||
Financial Highlights | 14 | ||||||
Notes to Financial Statements | 16 | ||||||
| Report of Independent Registered Public Accounting Firm | 25 | ||||||
Supplemental Information | 26 | ||||||
Trustees' and Officers' Information | 26 | ||||||
Proxy Voting and Portfolio Holdings Information | 32 | ||||||
Expense Examples | 32 | ||||||
Additional Federal Income Tax Information | 33 | ||||||
Liquidity Risk Management Program | 34 | ||||||
Privacy Policy (inside back cover) | |||||||
This report is for the information of the shareholders and others who have received a copy of the currently effective prospectus of the Fund, managed by Victory Capital Management Inc. It may be used as sales literature only when preceded or accompanied by a current prospectus, which provides further details about the Fund.
IRA DISTRIBUTION WITHHOLDING DISCLOSURE
We generally must withhold federal income tax at a rate of 10% of the taxable portion of your distribution and, if you live in a state that requires state income tax withholding, at your state's tax rate. However, you may elect not to have withholding apply or to have income tax withheld at a higher rate. Any withholding election that you make will apply to any subsequent distribution unless and until you change or revoke the election. If you wish to make a withholding election, or change or revoke a prior withholding election, call (800) 235-8396.
If you do not have a withholding election in place by the date of a distribution, federal income tax will be withheld from the taxable portion of your distribution at a rate of 10%. If you must pay estimated taxes, you may be subject to estimated tax penalties if your estimated tax payments are not sufficient and sufficient tax is not withheld from your distribution.
For more specific information, please consult your tax adviser.
1
(Unaudited)
Dear Shareholder,
The previous decade ended with the longest-ever bull market in U.S. equities still intact, even as investors wrestled with issues like softening global economic data, Brexit, and U.S.-China trade relations. In retrospect, those worries seem pedestrian given what we would experience.
A new and unexpected threat—a global pandemic, the novel coronavirus ("COVID-19")—first emerged in Asia and then began spreading globally and throughout the United States during the first quarter of 2020. This unprecedented and unanticipated event not only rendered all existing economic forecasts moot, but it also roiled stock and bond markets everywhere. It also brought the economy to a near halt. The historic bull market in stocks ended virtually overnight.
After an initial severe sell-off in March, equity markets recovered sharply. As our annual reporting period drew to a close on July 31, 2020, many of the broad market indexes had recovered and volatility had returned to more palatable levels. In fact, despite all the chaos, the S&P 500® Index, one of the most popular measures of large U.S. stocks, finished the fiscal year (July 31, 2020) at approximately 3,271, which was up 8.9% from one year ago. Quite the impressive reversal.
The market turmoil of early 2020 was not limited to equities. Fixed income volatility spiked when liquidity evaporated in late March as investors struggled to understand the ramifications of sheltering in place. Fortunately, the U.S. Federal Reserve (the "Fed") (as well as other global central banks) leapt into action—cutting interest rates, (re)starting quantitative easing and, in the case of the Fed, launching an array of programs to stabilize markets.
The new lending facilities and programs had their intended effect of improving fixed income liquidity and trading. Credit spreads across corporate, high yield, structured, and municipal markets were coaxed down from their highs. In addition, Congress came through with substantial fiscal stimulus that also was applauded by investors and markets. Although fixed income markets regained their footing, the yield on 10-Year Treasurys, a benchmark for low-risk investments, declined steadily during our fiscal year—from 2.02% at the beginning of our reporting period to approximately 0.55% as of July 31, 2020. This suggests that investors remain a little wary.
While the past year has been unprecedented for all of us, both personally and professionally, our portfolio managers continue to analyze the financial markets, economic conditions, and the trajectory of the pandemic, which will likely be a guiding factor on Fed policy and the markets.
No matter what happens in the near term, we believe that the massive monetary and fiscal policies introduced earlier this year will have longer-term ramifications. Despite this uncertainty, it's important to remain focused on your long-term investment goals and avoid making emotional decisions. If you invest with us directly, our Member Service Representatives are available to help. Call us at (800) 235-8396.
Sincerely,

Christopher K. Dyer, CFA
President,
USAA Mutual Funds
2
USAA Mutual Funds Trust
USAA Growth Fund
Managers' Commentary
(Unaudited)
Victory Solutions
Mannik S. Dhillon, CFA, CAIA Wasif A. Latif
NewBridge Asset Management, A Victory Capital Investment Franchise
Eric F. Maronak Jason E. Dahl, CFA
Scott R. Kefer, CFA Michael B. Koskuba
RS Investments Growth, A Victory Capital Investment Franchise
Scott Tracy, CFA Stephen J. Bishop
Melissa Chadwick-Dunn Christopher Clark, CFA
Paul Leung, CFA
Loomis, Sayles & Company, L.P.
Aziz V. Hamzaogullari, CFA
Renaissance Investment Management*
Michael E. Schroer, CFA Andy Eng, CFA
• What were the market conditions over the reporting period?
The U.S. stock market generated solid gains for the reporting period overall. Growth stocks significantly outperformed value stocks, while large-cap stocks outpaced small-cap stocks.
Global financial market performance varied widely over the period driven by optimism of continued economic recovery followed by the novel coronavirus ("COVID-19") shock and uncertainty related to the duration and economic impact of the COVID-19 pandemic. These fears generally led to a "risk-off" environment as investors flocked to safe haven assets such as U.S. Treasurys and gold. Global equities turned mostly lower with the exception of a small breadth of mega-cap securities well positioned for an extended economic slowdown and the new stay-at-home paradigm. The final month and a half of the reporting period saw a rebound in risky assets as economies began a phased reopening. The U.S. large-cap growth space, led by information technology and communication services, continued to outperform in the face of the economic threat as they were perceived as "stay-at-home stocks" that would further benefit from economic activity from homes.
Within the United States, the S&P 500® Index dropped nearly 34% at the end of the reporting period from its 2020 high, before beginning to recoup losses with the support of comprehensive monetary and fiscal stimulus, along with optimism that a COVID-19 treatment will eventually emerge. Over the reporting period, the S&P 500 Index retuned 11.96%, with large-cap growth stocks leading the way, up to a return of 29.84% as represented by the Russell 1000 Growth Index. Value stocks and small-cap stocks
*Effective June 30, 2020, Renaissance Investment Management is no longer a subadviser to the Fund.
3
USAA Mutual Funds Trust
USAA Growth Fund (continued)
Managers' Commentary (continued)
significantly underperformed growth stocks over the period. U.S. large-cap value stocks were down to a return of -6.01% over the reporting period as gauged by the Russell 1000 Value Index, while U.S. small-cap stocks, returned -4.59% as represented by the Russell 2000 Index.
Developed-market international and emerging market equities followed a path similar to U.S. equities. Markets led investors on a rollercoaster ride that saw both the MSCI EAFE Index and MSCI Emerging Markets Index drop approximately 34% from their highs in the year. The market drawdown hit bottom on March 23rd and then started a steady ascent, erasing most of the year's losses as European Central Bank quantitative easing and talks of a 750-billion euros fiscal stimulus helped bolster momentum in the market's recovery. Over the reporting period, developed international equities, represented by the MSCI EAFE Index, were down to a return of -1.67%, while the MSCI Emerging Markets Index returned 6.55%.
• How did the USAA Growth Fund (the "Fund") perform during the reporting period?
The Fund has two share classes: Fund Shares and Institutional Shares. For the reporting period ended July 31, 2020, the Fund Shares and Institutional Shares had total returns of 23.71% and 23.75%, respectively. This compares to returns of 29.84% for the Russell 1000® Growth Index (the "Index") and 28.44% for the Lipper Large-Cap Growth Funds Index.
Victory Capital Management Inc. is the Fund's investment adviser. and employs dedicated resources to support the research, selection, and monitoring of the Fund's subadviser. Loomis, Sayles & Company, L.P. ("Loomis Sayles") is the subadviser to the Fund. The subadviser provides day-to-day discretionary management for a portion of the Fund's assets.
• What strategies did you employ during the reporting period?
For the reporting period, the Fund underperformed the benchmark index as stock selection detracted from performance while sector allocation added to performance versus the Index. In terms of allocation, overweight positions in the consumer discretionary and underweight positions in consumer staples, materials, real estate and financials helped Fund performance.
Stock selection within the healthcare, information technology, communication services, consumer discretionary, and staples detracted from Fund performance. On the positive side, stock selection in industrials and financials added to Fund performance.
Thank you for allowing us to assist you with your investment needs.
4
USAA Mutual Funds Trust
USAA Growth Fund
Investment Overview
(Unaudited)
Average Annual Total Return
Year Ended July 31, 2020
Fund Shares | Institutional Shares | ||||||||||||||||||
INCEPTION DATE | 4/5/71 | 8/1/08 | |||||||||||||||||
Net Asset Value | Net Asset Value | Russell 1000® Growth Index1 | Lipper Large-Cap Growth Funds Index2 | ||||||||||||||||
One Year | 23.71 | % | 23.75 | % | 29.84 | % | 28.44 | % | |||||||||||
Five Year | 14.40 | % | 14.47 | % | 16.82 | % | 15.38 | % | |||||||||||
Ten Year | 16.00 | % | 16.06 | % | 17.28 | % | 15.94 | % | |||||||||||
Past performance is not indicative of future results. The performance data quoted represents past performance and current returns may be lower or higher. The investment return and principal value will fluctuate so that an investor's shares, when redeemed, may be worth more or less than the original cost. To obtain performance information current to the most recent month's end, please visit www.vcm.com.
Total return measures the price change in a share assuming the reinvestment of all net investment income and realized capital gain distributions, if any. The total returns quoted do not reflect adjustments made to the enclosed financial statements in accordance with U.S. generally accepted accounting principles or the deduction of taxes that a shareholder would pay on net investment income and realized capital gain distributions, including reinvested distributions, or redemptions of shares. The total return figures set forth above include all waivers of fees for various periods since inception. Without such fee waivers, the total returns would have been lower.
USAA Growth Fund — Growth of $10,000
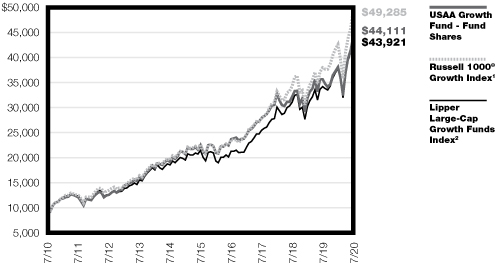
1The unmanaged Russell 1000® Growth Index measures the performance of those Russell 1000 companies with higher price-to-book ratios and higher forecasted growth values.
2The unmanaged Lipper Large-Cap Growth Funds Index tracks the total return performance of funds within the Lipper Large-Cap Growth Funds category.
The graph reflects investment of growth of a hypothetical $10,000 investment in the Fund. Past performance is no guarantee of future results.
The graph and table do not reflect the deduction of taxes that a shareholder would pay on Fund distributions or the redemption of Fund shares.
5
| USAA Mutual Funds Trust USAA Growth Fund | July 31, 2020 | ||||||
(Unaudited)
Investment Objective & Portfolio Holdings:
The USAA Growth Fund seeks long-term growth of capital.
Sector Allocation*:
July 31, 2020
(% of Net Assets)

* Does not include futures, money market instruments, and short-term investments purchased with cash collateral from securities loaned.
Percentages are of the net assets of the Fund and may not equal 100%.
6
| USAA Mutual Funds Trust USAA Growth Fund | Schedule of Portfolio Investments July 31, 2020 | ||||||
(Amounts in Thousands, Except for Shares)
Security Description | Shares | Value | |||||||||
Common Stocks (99.0%) | |||||||||||
Communication Services (12.4%): | |||||||||||
Activision Blizzard, Inc. | 508,037 | $ | 41,979 | ||||||||
Alphabet, Inc. Class A (a) | 19,054 | 28,351 | |||||||||
Alphabet, Inc. Class C (a) | 79,979 | 118,606 | |||||||||
Facebook, Inc. Class A (a) | 473,982 | 120,235 | |||||||||
Netflix, Inc. (a) | 43,058 | 21,050 | |||||||||
The Walt Disney Co. | 175,086 | 20,475 | |||||||||
Twitter, Inc. (a) | 640,899 | 23,329 | |||||||||
374,025 | |||||||||||
Communications Equipment (0.7%): | |||||||||||
Cisco Systems, Inc. | 469,252 | 22,102 | |||||||||
Consumer Discretionary (18.8%): | |||||||||||
Alibaba Group Holding Ltd., ADR (a) | 346,283 | 86,924 | |||||||||
Amazon.com, Inc. (a) | 78,104 | 247,174 | |||||||||
Booking Holdings, Inc. (a) | 7,577 | 12,594 | |||||||||
Burlington Stores, Inc. (a) | 119,702 | 22,504 | |||||||||
Chipotle Mexican Grill, Inc. (a) | 14,807 | 17,104 | |||||||||
Lululemon Athletica, Inc. (a) | 103,790 | 33,792 | |||||||||
Nike, Inc. Class B | 241,712 | 23,594 | |||||||||
Starbucks Corp. | 304,220 | 23,283 | |||||||||
Target Corp. | 130,453 | 16,421 | |||||||||
Tesla, Inc. (a) | 14,697 | 21,028 | |||||||||
The Home Depot, Inc. | 86,747 | 23,030 | |||||||||
The TJX Cos., Inc. | 363,657 | 18,907 | |||||||||
Yum China Holdings, Inc. | 194,759 | 9,979 | |||||||||
Yum! Brands, Inc. | 148,668 | 13,536 | |||||||||
569,870 | |||||||||||
Consumer Staples (2.8%): | |||||||||||
Church & Dwight Co., Inc. | 96,965 | 9,341 | |||||||||
Colgate-Palmolive Co. | 221,292 | 17,083 | |||||||||
Constellation Brands, Inc. Class A | 106,715 | 19,017 | |||||||||
Monster Beverage Corp. (a) | 492,603 | 38,659 | |||||||||
84,100 | |||||||||||
Electronic Equipment, Instruments & Components (0.9%): | |||||||||||
Amphenol Corp. Class A | 116,862 | 12,359 | |||||||||
Keysight Technologies, Inc. (a) | 141,910 | 14,176 | |||||||||
26,535 | |||||||||||
Energy (0.2%): | |||||||||||
Schlumberger Ltd. | 379,036 | 6,876 | |||||||||
Financials (1.9%): | |||||||||||
FactSet Research Systems, Inc. | 56,479 | 19,559 | |||||||||
MSCI, Inc. | 60,296 | 22,670 | |||||||||
SEI Investments Co. | 316,155 | 16,544 | |||||||||
58,773 | |||||||||||
See notes to financial statements.
7
| USAA Mutual Funds Trust USAA Growth Fund | Schedule of Portfolio Investments — continued July 31, 2020 | ||||||
(Amounts in Thousands, Except for Shares)
Security Description | Shares | Value | |||||||||
Health Care (15.6%): | |||||||||||
Align Technology, Inc. (a) | 41,942 | $ | 12,323 | ||||||||
bluebird bio, Inc. (a) | 140,017 | 8,499 | |||||||||
Bristol-Myers Squibb Co. | 365,992 | 21,469 | |||||||||
Cerner Corp. | 257,159 | 17,860 | |||||||||
Charles River Laboratories International, Inc. (a) | 95,404 | 18,985 | |||||||||
Edwards Lifesciences Corp. (a) | 294,396 | 23,085 | |||||||||
Eli Lilly & Co. | 116,940 | 17,575 | |||||||||
Illumina, Inc. (a) | 47,800 | 18,267 | |||||||||
Intuitive Surgical, Inc. (a) | 21,343 | 14,629 | |||||||||
Masimo Corp. (a) | 125,076 | 27,531 | |||||||||
Novartis AG, ADR | 215,514 | 17,702 | |||||||||
NOVO Nordisk A/S, ADR | 155,629 | 10,167 | |||||||||
Regeneron Pharmaceuticals, Inc. (a) | 66,671 | 42,141 | |||||||||
Roche Holdings Ltd., ADR | 773,919 | 33,356 | |||||||||
Royalty Pharma PLC Class A (a) | 527,918 | 22,727 | |||||||||
Sage Therapeutics, Inc. (a) | 95,232 | 4,340 | |||||||||
UnitedHealth Group, Inc. | 151,463 | 45,860 | |||||||||
Varian Medical Systems, Inc. (a) | 53,452 | 7,629 | |||||||||
Veeva Systems, Inc. Class A (a) | 108,914 | 28,815 | |||||||||
Vertex Pharmaceuticals, Inc. (a) | 147,007 | 39,985 | |||||||||
West Pharmaceutical Services, Inc. | 62,238 | 16,734 | |||||||||
Zoetis, Inc. | 173,520 | 26,319 | |||||||||
475,998 | |||||||||||
Industrials (7.1%): | |||||||||||
CoStar Group, Inc. (a) | 31,133 | 26,455 | |||||||||
Deere & Co. | 186,788 | 32,932 | |||||||||
Expeditors International of Washington, Inc. | 304,829 | 25,761 | |||||||||
FTI Consulting, Inc. (a) | 98,673 | 11,786 | |||||||||
IDEX Corp. | 95,520 | 15,744 | |||||||||
IHS Markit Ltd. | 157,847 | 12,743 | |||||||||
Old Dominion Freight Line, Inc. | 73,744 | 13,482 | |||||||||
Roper Technologies, Inc. | 43,182 | 18,674 | |||||||||
The Boeing Co. | 197,338 | 31,179 | |||||||||
Trane Technologies PLC | 86,348 | 9,660 | |||||||||
Uber Technologies, Inc. (a) | 546,287 | 16,531 | |||||||||
214,947 | |||||||||||
IT Services (11.0%): | |||||||||||
Automatic Data Processing, Inc. | 50,742 | 6,744 | |||||||||
EPAM Systems, Inc. (a) | 82,166 | 23,835 | |||||||||
Fiserv, Inc. (a) | 204,684 | 20,425 | |||||||||
PayPal Holdings, Inc. (a) | 346,121 | 67,864 | |||||||||
Shopify, Inc. Class A (a) | 17,927 | 18,357 | |||||||||
Twilio, Inc. Class A (a) | 161,862 | 44,904 | |||||||||
Visa, Inc. Class A | 764,363 | 145,535 | |||||||||
327,664 | |||||||||||
See notes to financial statements.
8
| USAA Mutual Funds Trust USAA Growth Fund | Schedule of Portfolio Investments — continued July 31, 2020 | ||||||
(Amounts in Thousands, Except for Shares)
Security Description | Shares | Value | |||||||||
Real Estate (0.6%): | |||||||||||
American Tower Corp. | 67,916 | $ | 17,753 | ||||||||
Semiconductors & Semiconductor Equipment (6.8%): | |||||||||||
Lam Research Corp. | 47,287 | 17,835 | |||||||||
Marvell Technology Group Ltd. | 434,349 | 15,841 | |||||||||
NVIDIA Corp. | 253,914 | 107,809 | |||||||||
QUALCOMM, Inc. | 436,114 | 46,058 | |||||||||
STMicroelectronics NV, NYS (b) | 619,669 | 17,314 | |||||||||
204,857 | |||||||||||
Software (17.3%): | |||||||||||
Adobe, Inc. (a) | 54,138 | 24,055 | |||||||||
Autodesk, Inc. (a) | 217,730 | 51,477 | |||||||||
Fair Isaac Corp. (a) | 47,250 | 20,752 | |||||||||
Microsoft Corp. | 781,716 | 160,259 | |||||||||
Oracle Corp. | 748,249 | 41,490 | |||||||||
Proofpoint, Inc. (a) | 113,402 | 13,117 | |||||||||
RingCentral, Inc. Class A (a) | 105,086 | 30,503 | |||||||||
Salesforce.com, Inc. (a) | 392,673 | 76,512 | |||||||||
ServiceNow, Inc. (a) | 100,054 | 43,944 | |||||||||
Synopsys, Inc. (a) | 62,371 | 12,426 | |||||||||
The Trade Desk, Inc. Class A (a) | 33,638 | 15,182 | |||||||||
Workday, Inc. Class A (a) | 159,420 | 28,843 | |||||||||
518,560 | |||||||||||
Technology Hardware, Storage & Peripherals (2.9%): | |||||||||||
Apple, Inc. | 202,837 | 86,214 | |||||||||
Total Common Stocks (Cost $1,676,680) | 2,988,274 | ||||||||||
Collateral for Securities Loaned^ (0.4%) | |||||||||||
| Goldman Sachs Financial Square Government Fund Institutional Shares, 0.13% (c) | 11,034,123 | 11,034 | |||||||||
Total Collateral for Securities Loaned (Cost $11,034) | 11,034 | ||||||||||
Total Investments (Cost $1,687,714) — 99.4% | 2,999,308 | ||||||||||
Other assets in excess of liabilities — 0.6% | 17,550 | ||||||||||
NET ASSETS — 100.00% | $ | 3,016,858 | |||||||||
At July 31, 2020 the Fund's investments in foreign securities were 9.5% of net assets.
^ Purchased with cash collateral from securities on loan.
(a) Non-income producing security.
(b) All or a portion of this security is on loan.
(c) Rate disclosed is the daily yield on July 31, 2020.
ADR — American Depositary Receipt
NYS — New York Registered Shares
PLC — Public Limited Company
See notes to financial statements.
9
USAA Mutual Funds Trust | Statement of Assets and Liabilities July 31, 2020 | ||||||
(Amounts in Thousands, Except Per Share Amounts)
| USAA Growth Fund | |||||||
Assets: | |||||||
Investments, at value (Cost $1,687,714) | $ | 2,999,308 | (a) | ||||
Cash and cash equivalents | 23,798 | ||||||
Receivables: | |||||||
Interest and dividends | 491 | ||||||
Capital shares issued | 494 | ||||||
Investments sold | 14,076 | ||||||
Reclaims | 982 | ||||||
Prepaid expenses | 49 | ||||||
Total assets | 3,039,198 | ||||||
Liabilities: | |||||||
Payables: | |||||||
Collateral received on loaned securities | 11,034 | ||||||
Investments purchased | 7,453 | ||||||
Capital shares redeemed | 1,682 | ||||||
Accrued expenses and other payables: | |||||||
Investment advisory fees | 1,488 | ||||||
Administration fees | 323 | ||||||
Custodian fees | 43 | ||||||
Transfer agent fees | 254 | ||||||
Compliance fees | 2 | ||||||
Other accrued expenses | 61 | ||||||
Total liabilities | 22,340 | ||||||
Net Assets: | |||||||
Capital | 1,671,374 | ||||||
Total accumulated earnings/(loss) | 1,345,484 | ||||||
Net assets | $ | 3,016,858 | |||||
Net Assets: | |||||||
Fund Shares | $ | 1,841,547 | |||||
Institutional Shares | 1,175,311 | ||||||
Total | $ | 3,016,858 | |||||
Shares (unlimited number of shares authorized with no par value): | |||||||
Fund Shares | 59,698 | ||||||
Institutional Shares | 38,194 | ||||||
Total | 97,892 | ||||||
Net asset value, offering and redemption price per share: (b) | |||||||
Fund Shares | $ | 30.85 | |||||
Institutional Shares | $ | 30.77 | |||||
(a) Includes $10,631 of securities on loan.
(b) Per share amount may not recalculate due to rounding of net assets and/or shares outstanding.
See notes to financial statements.
10
USAA Mutual Funds Trust | Statement of Operations For the Year Ended July 31, 2020 | ||||||
(Amounts in Thousands)
| USAA Growth Fund | |||||||
Investment Income: | |||||||
Dividends | $ | 19,448 | |||||
Interest | 505 | ||||||
Securities lending (net of fees) | 119 | ||||||
Total income | 20,072 | ||||||
Expenses: | |||||||
Investment advisory fees | 17,415 | ||||||
Administration fees — Fund Shares | 2,468 | ||||||
Administration fees — Institutional Shares | 1,051 | ||||||
Sub-Administration fees | 59 | ||||||
Custodian fees | 187 | ||||||
Transfer agent fees — Fund Shares | 1,497 | ||||||
Transfer agent fees — Institutional Shares | 1,051 | ||||||
Trustees' fees | 46 | ||||||
Compliance fees | 18 | ||||||
Legal and audit fees | 86 | ||||||
State registration and filing fees | 45 | ||||||
Interfund lending fees | 1 | ||||||
Other expenses | 202 | ||||||
Total expenses | 24,126 | ||||||
Net Investment Income (Loss) | (4,054 | ) | |||||
Realized/Unrealized Gains (Losses) from Investments: | |||||||
Net realized gains (losses) from investment securities | 41,547 | ||||||
Net change in unrealized appreciation/depreciation on investment securities | 535,104 | ||||||
Net realized/unrealized gains (losses) on investments | 576,651 | ||||||
Change in net assets resulting from operations | $ | 572,597 | |||||
See notes to financial statements.
11
USAA Mutual Funds Trust | Statements of Changes in Net Assets | ||||||
(Amounts in Thousands)
USAA Growth Fund | |||||||||||
| Year Ended July 31, 2020 | Year Ended July 31, 2019 | ||||||||||
From Investments: | |||||||||||
Operations: | |||||||||||
Net investment income (loss) | $ | (4,054 | ) | $ | 11,844 | ||||||
Net realized gains (losses) from investments | 41,547 | 697,328 | |||||||||
| Net change in unrealized appreciation/depreciation on investments | 535,104 | (420,992 | ) | ||||||||
Change in net assets resulting from operations | 572,597 | 288,180 | |||||||||
Distributions to Shareholders: | |||||||||||
Fund Shares | (353,429 | ) | (172,418 | ) | |||||||
Institutional Shares | (238,249 | ) | (126,833 | ) | |||||||
Change in net assets resulting from distributions to shareholders | (591,678 | ) | (299,251 | ) | |||||||
Change in net assets resulting from capital transactions | 275,670 | (134,407 | ) | ||||||||
Change in net assets | 256,589 | (145,478 | ) | ||||||||
Net Assets: | |||||||||||
Beginning of period | 2,760,269 | 2,905,747 | |||||||||
End of period | $ | 3,016,858 | $ | 2,760,269 | |||||||
Capital Transactions: | |||||||||||
Fund Shares | |||||||||||
Proceeds from shares issued | $ | 145,301 | $ | 154,373 | |||||||
Distributions reinvested | 347,843 | 170,170 | |||||||||
Cost of shares redeemed | (334,706 | ) | (221,811 | ) | |||||||
Total Fund Shares | $ | 158,438 | $ | 102,732 | |||||||
Institutional Shares | |||||||||||
Proceeds from shares issued | $ | 191,549 | $ | 73,455 | |||||||
Distributions reinvested | 238,149 | 126,793 | |||||||||
Cost of shares redeemed | (312,466 | ) | (437,387 | ) | |||||||
Total Institutional Shares | $ | 117,232 | $ | (237,139 | ) | ||||||
Change in net assets resulting from capital transactions | $ | 275,670 | $ | (134,407 | ) | ||||||
Share Transactions: | |||||||||||
Fund Shares | |||||||||||
Issued | 5,347 | 5,086 | |||||||||
Reinvested | 13,475 | 6,270 | |||||||||
Redeemed | (12,283 | ) | (7,389 | ) | |||||||
Total Fund Shares | 6,539 | 3,967 | |||||||||
Institutional Shares | |||||||||||
Issued | 6,323 | 2,430 | |||||||||
Reinvested | 9,247 | 4,682 | |||||||||
Redeemed | (11,815 | ) | (13,944 | ) | |||||||
Total Institutional Shares | 3,755 | (6,832 | ) | ||||||||
Change in Shares | 10,294 | (2,865 | ) | ||||||||
See notes to financial statements.
12
This page is intentionally left blank.
13
USAA Mutual Funds Trust | Financial Highlights | ||||||
For a Share Outstanding Throughout Each Period
Investment Activities | Distributions to Shareholders From | ||||||||||||||||||||||||||
| Net Asset Value, Beginning of Period | Net Investment Income (Loss) | Net Realized and Unrealized Gains (Losses) on Investments | Total from Investment Activities | Net Investment Income | Net Realized Gains from Investments | ||||||||||||||||||||||
USAA Growth Fund | |||||||||||||||||||||||||||
Fund Shares | |||||||||||||||||||||||||||
| Year Ended July 31, 2020 | $ | 31.54 | (0.05 | )(b) | 6.18 | 6.13 | (0.08 | ) | (6.74 | ) | |||||||||||||||||
| Year Ended July 31, 2019 | $ | 32.15 | 0.12 | 2.80 | 2.92 | (0.09 | ) | (3.44 | ) | ||||||||||||||||||
| Year Ended July 31, 2018 | $ | 28.65 | 0.07 | 4.18 | 4.25 | (0.05 | ) | (0.70 | ) | ||||||||||||||||||
| Year Ended July 31, 2017 | $ | 25.53 | 0.09 | 4.31 | 4.40 | (0.05 | ) | (1.23 | ) | ||||||||||||||||||
| Year Ended July 31, 2016 | $ | 25.91 | 0.10 | 1.19 | 1.29 | (0.11 | ) | (1.56 | ) | ||||||||||||||||||
Institutional Shares | |||||||||||||||||||||||||||
| Year Ended July 31, 2020 | $ | 31.47 | (0.04 | )(b) | 6.16 | 6.12 | (0.08 | ) | (6.74 | ) | |||||||||||||||||
| Year Ended July 31, 2019 | $ | 32.08 | 0.15 | 2.78 | 2.93 | (0.10 | ) | (3.44 | ) | ||||||||||||||||||
| Year Ended July 31, 2018 | $ | 28.59 | 0.09 | 4.18 | 4.27 | (0.08 | ) | (0.70 | ) | ||||||||||||||||||
| Year Ended July 31, 2017 | $ | 25.48 | 0.12 | 4.30 | 4.42 | (0.08 | ) | (1.23 | ) | ||||||||||||||||||
| Year Ended July 31, 2016 | $ | 25.86 | 0.15 | 1.16 | 1.31 | (0.13 | ) | (1.56 | ) | ||||||||||||||||||
* Assumes reinvestment of all net investment income and realized capital gain distributions, if any, during the period. Includes adjustments in accordance with U.S. generally accepted accounting principles and could differ from the Lipper reported return.
^ The net expense ratio may not correlate to the applicable expense limits in place during the period since the current contractual expense limitation is applied for a two year period beginning July 1, 2019 and in effect through June 30, 2021, instead of coinciding with the Fund's fiscal year end. Details of the current contractual expense limitation in effect can be found in Note 5 of the accompanying Notes to Financial Statements.
(a) Portfolio turnover is calculated on the basis of the Fund as a whole without distinguishing between the classes of shares issued.
(b) Per share net investment income (loss) has been calculated using the average daily shares method.
(c) Reflects total annual operating expenses of the shares before reductions of any expenses paid indirectly. The shares' expenses paid indirectly decreased the expense ratio by less than 0.01%.
(d) Reflects increased trading activity due to current year transition or asset allocation shift.
See notes to financial statements.
14
USAA Mutual Funds Trust | Financial Highlights — continued | ||||||
For a Share Outstanding Throughout Each Period
Ratios to Average Net Assets | Supplemental Data | ||||||||||||||||||||||||||||||||||
| Total Distributions | Net Asset Value, End of Period | Total Return* | Net Expenses^ | Net Investment Income (Loss) | Gross Expenses | Net Assets, End of Period (000's) | Portfolio Turnover(a) | ||||||||||||||||||||||||||||
USAA Growth Fund | |||||||||||||||||||||||||||||||||||
Fund Shares | |||||||||||||||||||||||||||||||||||
| Year Ended July 31, 2020 | (6.82 | ) | $ | 30.85 | 23.71 | % | 0.91 | % | (0.16 | )% | 0.91 | % | $ | 1,841,547 | 59 | % | |||||||||||||||||||
| Year Ended July 31, 2019 | (3.53 | ) | $ | 31.54 | 10.90 | % | 0.90 | %(c) | 0.41 | % | 0.90 | %(c) | $ | 1,676,470 | 70 | %(d) | |||||||||||||||||||
| Year Ended July 31, 2018 | (0.75 | ) | $ | 32.15 | 14.99 | % | 0.97 | %(c) | 0.33 | % | 0.97 | %(c) | $ | 1,581,693 | 19 | % | |||||||||||||||||||
| Year Ended July 31, 2017 | (1.28 | ) | $ | 28.65 | 18.04 | % | 1.09 | %(c) | 0.36 | % | 1.09 | %(c) | $ | 1,375,305 | 17 | % | |||||||||||||||||||
| Year Ended July 31, 2016 | (1.67 | ) | $ | 25.53 | 5.25 | % | 1.11 | %(c) | 0.36 | % | 1.11 | %(c) | $ | 1,143,344 | 18 | % | |||||||||||||||||||
Institutional Shares | |||||||||||||||||||||||||||||||||||
| Year Ended July 31, 2020 | (6.82 | ) | $ | 30.77 | 23.75 | % | 0.87 | % | (0.13 | )% | 0.87 | % | $ | 1,175,311 | 59 | % | |||||||||||||||||||
| Year Ended July 31, 2019 | (3.54 | ) | $ | 31.47 | 10.94 | % | 0.85 | %(c) | 0.47 | % | 0.85 | %(c) | $ | 1,083,799 | 70 | %(d) | |||||||||||||||||||
| Year Ended July 31, 2018 | (0.78 | ) | $ | 32.08 | 15.07 | % | 0.92 | %(c) | 0.39 | % | 0.92 | %(c) | $ | 1,324,054 | 19 | % | |||||||||||||||||||
| Year Ended July 31, 2017 | (1.31 | ) | $ | 28.59 | 18.14 | % | 1.01 | %(c) | 0.43 | % | 1.01 | %(c) | $ | 1,299,751 | 17 | % | |||||||||||||||||||
| Year Ended July 31, 2016 | (1.69 | ) | $ | 25.48 | 5.34 | % | 1.02 | %(c) | 0.47 | % | 1.02 | %(c) | $ | 1,012,360 | 18 | % | |||||||||||||||||||
See notes to financial statements.
15
USAA Mutual Funds Trust | Notes to Financial Statements July 31, 2020 | ||||||
1. Organization:
USAA Mutual Funds Trust (the "Trust") is organized as a Delaware statutory trust and is registered under the Investment Company Act of 1940, as amended (the "1940 Act"), as an open-end investment company. The Trust is comprised of 47 funds and is authorized to issue an unlimited number of shares, which are units of beneficial interest with no par value.
The accompanying financial statements are those of the USAA Growth Fund (the "Fund"). The Fund offers two classes of shares: Fund Shares and Institutional Shares. The Fund is classified as diversified under the 1940 Act.
Each class of shares of the Fund has substantially identical rights and privileges except with respect to fees paid under distribution plans, expenses allocable exclusively to each class of shares, voting rights on matters solely affecting a single class of shares, and the exchange privilege of each class of shares.
Under the Trust's organizational documents, its officers and trustees are indemnified against certain liabilities arising out of the performance of their duties to the Fund. In addition, in the normal course of business, the Fund enters into contracts with its vendors and others that provide for general indemnifications. The Fund's maximum exposure under these arrangements is unknown, as this would involve future claims that may be made against the Fund. However, based on experience, the Fund expects that risk of loss to be remote.
2. Significant Accounting Policies:
The following is a summary of significant accounting policies followed by the Trust in the preparation of its financial statements. The policies are in conformity with generally accepted accounting principles in the United States of America ("GAAP"). The preparation of financial statements in accordance with GAAP requires management to make estimates and assumptions that affect the reported amounts of assets and liabilities and disclosure of contingent assets and liabilities at the date of the financial statements and the reported amounts of income and expenses for the period. Actual results could differ from those estimates. The Fund follows the specialized accounting and reporting requirements under GAAP that are applicable to investment companies under Accounting Standards Codification Topic 946.
Investment Valuation:
The Fund records investments at fair value. Fair value is defined as the price that would be received to sell an asset or paid to transfer a liability in an orderly transaction between market participants at the measurement date.
The valuation techniques described below maximize the use of observable inputs and minimize the use of unobservable inputs in determining fair value. The inputs used for valuing the Fund's investments are summarized in the three broad levels listed below:
• Level 1 — quoted prices in active markets for identical securities
• Level 2 — other significant observable inputs (including quoted prices for similar securities or interest rates applicable to those securities, etc.)
• Level 3 — significant unobservable inputs (including the Fund's own assumptions in determining the fair value of investments)
Changes in valuation techniques may result in transfers in or out of an assigned level within the disclosure hierarchy. The inputs or methodologies used for valuation techniques are not necessarily an indication of the risk associated with entering into those investments.
The Adviser has established the Pricing and Liquidity Committee (the "Committee"), and subject to Trust's Board of Trustees (the "Board") oversight, the Committee administers and oversees the Fund's valuation policies and procedures, which are approved by the Board.
Portfolio securities listed or traded on securities exchanges, including exchange-traded funds ("ETFs"), American Depositary Receipts ("ADRs") and Rights, are valued at the closing price on the exchange or system where the security is principally traded, if available, or at the Nasdaq Official Closing Price. If
16
USAA Mutual Funds Trust | Notes to Financial Statements — continued July 31, 2020 | ||||||
there have been no sales for that day on the exchange or system, then a security is valued at the last available bid quotation on the exchange or system where the security is principally traded. In each of these situations, valuations are typically categorized as Level 1 in the fair value hierarchy.
Investments in open-end investment companies are valued at net asset value ("NAV"). These valuations are typically categorized as Level 1 in the fair value hierarchy.
In the event that price quotations or valuations are not readily available, are not reflective of market value, or a significant event has been recognized in relation to a security or class of securities, the securities are valued in good faith by the Committee in accordance with valuation procedures approved by the Board. These valuations are typically categorized as Level 2 or Level 3 in the fair value hierarchy, based on the observability of inputs used to determine the fair value. The effect of fair value pricing is that securities may not be priced on the basis of quotations from the primary market in which they are traded and the actual price realized from the sale of a security may differ materially from the fair value price. Valuing these securities at fair value is intended to cause the Fund's NAV to be more reliable than it otherwise would be.
A summary of the valuations as of July 31, 2020, based upon the three levels defined above, is included in the table below while the breakdown, by category, of investments is disclosed in the Schedule of Portfolio Investments (amounts in thousands):
Level 1 | Level 2 | Level 3 | Total | ||||||||||||||||
Common Stocks | $ | 2,988,274 | $ | — | $ | — | $ | 2,988,274 | |||||||||||
Collateral for Securities Loaned | 11,034 | — | — | 11,034 | |||||||||||||||
Total | $ | 2,999,308 | $ | — | $ | — | $ | 2,999,308 | |||||||||||
For the year ended July 31, 2020, there were no transfers in or out of the Level 3 fair value hierarchy.
Investment Companies:
Exchange-Traded Funds:
The Fund may invest in ETFs, the shares of which are bought and sold on a securities exchange. An ETF trades like common stock and represents a fixed portfolio of securities designed to track the performance and dividend yield of a particular domestic or foreign market index. The Fund may purchase shares of an ETF to temporarily gain exposure to a portion of the U.S. or a foreign market while awaiting purchase of underlying securities. The risks of owning an ETF generally reflect the risks of owning the underlying securities they are designed to track, although the lack of liquidity of an ETF could result in it being more volatile. Additionally, ETFs have fees and expenses that reduce their value.
Open-End Funds:
The Fund may invest in portfolios of open-end investment companies. These investment companies value securities in their portfolios for which market quotations are readily available at their market values (generally the last reported sale price) and all other securities and assets at their fair value by the methods established by the board of directors of the underlying funds.
Investment Transactions and Related Income:
Changes in holdings of investments are accounted for no later than one business day following the trade date. For financial reporting purposes, however, investment transactions are accounted for on trade date on the last business day of the reporting period. Interest income is determined on the basis of coupon interest accrued using the effective interest method which adjusts, where applicable, the amortization of premiums or accretion of discount. Gains or losses realized on sales of securities are determined by comparing the identified cost of the security lot sold with the net sales proceeds.
17
USAA Mutual Funds Trust | Notes to Financial Statements — continued July 31, 2020 | ||||||
Withholding taxes on interest, dividends, and gains as a result of certain investments in ADRs by the Fund has been provided for in accordance with each investment's applicable country's tax rules and rates.
Securities Lending:
The Fund, through a securities lending agreement with Citibank, N.A. ("Citibank"), may lend its securities to qualified financial institutions, such as certain broker-dealers, to earn additional income, net of income retained by Citibank. Borrowers are required to secure their loans for collateral in the amount of at least 102% of the value of U.S. securities loaned or at least 105% of the value of non-U.S. securities loaned, marked-to-market daily. Any collateral shortfalls associated with increases in the valuation of the securities loaned are cured the next business day once the shortfall exceeds $100 thousand. Collateral may be cash, U.S. government securities, or other securities as permitted by SEC guidelines. Cash collateral may be invested in high-quality short-term investments, primarily open-end investment companies. Collateral requirements are determined daily based on the value of the Fund's securities on loan as of the end of the prior business day. During the time portfolio securities are on loan, the borrower will pay the Fund any dividends or interest paid on such securities plus any fee negotiated between the parties to the lending agreement. The Fund also earns a return from the collateral. The Fund pays Citibank various fees in connection with the investment of cash collateral and fees based on the investment income received from securities lending activities. Securities lending income (net of these fees) is disclosed on the Statement of Operations. Loans are terminable upon demand and the borrower must return the loaned securities within the lesser of one standard settlement period or five business days. Risks relating to securities-lending transactions include that the borrower may not provide additional collateral when required or return the securities when due, and that the value of the short-term investments will be less than the amount of cash collateral required to be returned to the borrower. The Fund's agreement with Citibank does not include master netting provisions. Non- cash collateral received by the Fund may not be sold or re-pledged except to satisfy borrower default. Cash collateral is listed on the Fund's Schedule of Portfolio of Investments and Financial Statements while non-cash collateral is not included. The following table (amounts in thousands) is a summary of the Fund's securities lending transactions as of July 31, 2020.
| Value of Securities on Loan | Non-Cash Collateral | Cash Collateral | |||||||||
| $ | 10,631 | $ | — | $ | 11,034 | ||||||
Federal Income Taxes:
It is the Fund's policy to continue to qualify as a regulated investment company by complying with the provisions available to certain investment companies, as defined in applicable sections of the Internal Revenue Code, and to make distributions of net investment income and net realized gains sufficient to relieve it from all, or substantially all, federal income taxes. Accordingly, no provision for federal income taxes is required in the financial statements. The Fund has a tax year-end of July 31.
Management of the Fund has reviewed tax positions taken in tax years that remain subject to examination by all major tax jurisdictions, including federal (i.e., the last four tax years, which includes the current fiscal tax year end). Management believes that there is no tax liability resulting from unrecognized tax benefits related to uncertain tax positions taken.
Allocations:
Expenses directly attributable to the Fund are charged to the Fund, while expenses that are attributable to more than one fund in the Trust, or jointly with an affiliated trust, are allocated among the respective funds in the Trust and/or affiliated trust based upon net assets or another appropriate basis.
Income, expenses (other than class-specific expenses such as transfer agent fees, state registration fees, and printing fees), and realized and unrealized gains or losses on investments are allocated to
18
USAA Mutual Funds Trust | Notes to Financial Statements — continued July 31, 2020 | ||||||
each class of shares based on its relative net assets on the date income is earned or expenses and realized and unrealized gains and losses are incurred.
3. Purchases and Sales:
Cost of purchases and proceeds from sales/maturities of securities (excluding securities maturing less than one year from acquisition) for the year ended July 31, 2020, were as follows for the Fund (amounts in thousands):
| Excluding U.S. Government Securities | |||||||||||
Purchases | Sales | ||||||||||
$ | 1,577,936 | $ | 1,863,896 | ||||||||
There were no purchases and sales of U.S. government securities during the year ended July 31, 2020.
4. Affiliated Fund Ownership:
The Fund offers its shares for investment by other USAA Mutual Funds. The fund-of-funds do not invest in the underlying funds for the purpose of exercising management or control, and the affiliated fund-of-funds' annual and semi-annual reports may be viewed at usaa.com. As of July 31, 2020, certain fund-of-funds owned total outstanding shares of the Fund as follows:
USAA Cornerstone Conservative Fund | 0.1 | % | |||||
USAA Cornerstone Equity Fund | 0.3 | % | |||||
USAA Target Retirement Income Fund | 0.1 | % | |||||
USAA Target Retirement 2020 Fund | 0.3 | % | |||||
USAA Target Retirement 2030 Fund | 1.5 | % | |||||
USAA Target Retirement 2040 Fund | 2.3 | % | |||||
USAA Target Retirement 2050 Fund | 1.5 | % | |||||
USAA Target Retirement 2060 Fund | 0.2 | % | |||||
5. Fees and Transactions with Affiliates and Related Parties:
Investment Advisory Fees:
Investment advisory services are provided to the Fund by Victory Capital Management Inc. ("VCM" or the "Adviser"), a New York corporation registered as an investment adviser with the Securities and Exchange Commission ("SEC"). The Adviser is a wholly-owned indirect subsidiary of Victory Capital Holdings, Inc., a publicly traded Delaware corporation, and a wholly-owned direct subsidiary of Victory Capital Operating, LLC. Under the terms of the Investment Advisory Agreement, the Adviser is entitled to receive a base fee and a performance adjustment. The Fund's base fee is accrued daily and paid monthly at an annualized rate of 0.65% of the Fund's average daily net assets. Amounts incurred and paid to VCM for the year ended July 31, 2020, are reflected on the Statement of Operations as Investment Advisory fees.
Effective July 1, 2019, no performance adjustments were made for the period beginning July 1, 2019, through June 30, 2020. Only performance beginning as of July 1, 2019, and thereafter is utilized in calculating future performance adjustments.
The performance adjustment for each share class is accrued daily and calculated monthly by comparing each class' performance to that of the Lipper Large-Cap Growth Funds Index. The Lipper Large-Cap Growth Funds Index tracks the total return performance of each class within the Lipper Large-Cap Growth Funds category.
19
USAA Mutual Funds Trust | Notes to Financial Statements — continued July 31, 2020 | ||||||
The performance period for each share class consists of the current month plus the previous 35 months (or the number of months beginning July 1, 2019, if fewer). The following table is utilized to determine the extent of the performance adjustment:
| Over/Under Performance Relative to Index (in basis points)(a) | Annual Adjustment Rate (in basis points)(a) | ||||||
+/- 100 to 400 | +/- 4 | ||||||
+/- 401 to 700 | +/- 5 | ||||||
+/- 701 and greater | +/- 6 | ||||||
(a) Based on the difference between average annual performance of the relevant share class of the Fund and its relevant Lipper index, rounded to the nearest basis point. Average daily net assets of the share class are calculated over a rolling 36-month period.
Each class' annual performance adjustment rate is multiplied by the average daily net assets of the class over the entire performance period, which is then multiplied by a fraction, the numerator of which is the number of days in the month and the denominator of which is 365 (366 in leap years). The resulting amount is then added to (in the case of overperformance), or subtracted from (in the case of underperformance) the base fee.
Under the performance fee arrangement, each class pays a positive performance fee adjustment for a performance period whenever the class outperforms the Lipper Large-Cap Growth Funds Index over that period, even if the class has overall negative returns during the performance period.
For the period July 1, 2020 through July 31, 2020, performance adjustments for Fund Shares, and Institutional Shares were $(70), and $(45), respectively. For the Fund Shares and Institutional Shares, the performance adjustments were less than 0.01% of net assets for both classes.
The Trust relies on an exemptive order granted to VCM and its affiliated funds by the SEC in March 2019 permitting the use of a "manager-of-managers" structure for certain funds. Under a manager-of- managers structure, the investment adviser may select (with approval of the Board and without shareholder approval) one or more subadvisers to manage the day-to-day investment of a fund's assets.
VCM has entered into a Subadvisory Agreement with Loomis, Sayles & Company, L.P. ("Loomis Sayles") and Renaissance Investment Management ("Renaissance"), under which Loomis Sayles and Renaissance each direct the investment and reinvestment of a portion of the Fund's assets (as allocated from time to time by VCM). These arrangements provide for monthly fees that are paid by VCM. VCM (not the Fund) pays the subadviser fees.
Effective June 30, 2020, Renaissance is no longer a subadviser to the Fund.
Administration and Servicing Fees:
VCM serves as the Fund's administrator and fund accountant. Under the Fund Administration, Servicing and Accounting Agreement, VCM is paid for its services an annual fee at a rate of 0.15% and 0.10% of average daily net assets of the Fund Shares and Institutional Shares, respectively. Amounts incurred for the year ended July 31, 2020, are reflected on the Statement of Operations as Administration fees.
The Fund (as part of the Trust) has entered into an agreement to provide compliance services with the Adviser, pursuant to which the Adviser furnishes its compliance personnel, including the services of the Chief Compliance Officer ("CCO"), and other resources reasonably necessary to provide the Trust with compliance oversight services related to the design, administration and oversight of a compliance program for the Trust in accordance with Rule 38a-1 under the 1940 Act. The CCO is an employee of the Adviser, which pays the compensation of the CCO and support staff. Funds in the Trust, Victory Variable Insurance Funds, Victory Portfolios, and Victory Portfolios II (collectively, the "Victory Funds Complex") in the aggregate, compensates the Adviser for these services. Amounts incurred for the year ended July 31, 2020, are reflected on the Statement of Operations as Compliance fees.
Citi Fund Services Ohio, Inc. ("Citi"), an affiliate of Citibank, acts as sub-administrator and sub-fund accountant to the Fund pursuant to a Sub-Administration and Sub-Fund Accounting Services Agreement
20
USAA Mutual Funds Trust | Notes to Financial Statements — continued July 31, 2020 | ||||||
between VCM and Citi. VCM pays Citi a fee for providing these services. The Fund reimburses VCM and Citi for reasonable out-of-pocket expenses incurred in providing these services and certain other expenses specifically allocated to the Funds, under the Fund Administration, Servicing, and Accounting Agreement. Amounts incurred for the year ended July 31, 2020, are reflected on the Statement of Operations as Sub-Administration fees.
Transfer Agency Fees:
Victory Capital Transfer Agency, Inc. ("VCTA"), provides transfer agency services to the Fund. VCTA, an affiliate of the Adviser, provides transfer agent services to the Fund Shares based on an annual charge of $23 per shareholder account plus out-of-pocket expenses. VCTA pays a portion of these fees to certain intermediaries for the administration and servicing of accounts that are held with such intermediaries. Transfer agent's fees for Institutional Shares are paid monthly based on a fee accrued daily at an annualized rate of 0.10% of average daily net assets, plus out-of-pocket expenses. Amounts incurred and paid to VCTA for the year ended July 31, 2020, are reflected on the Statement of Operations as Transfer Agent fees.
FIS Investor Services LLC serves as sub-transfer agent and dividend disbursing agent for the Fund pursuant to a Sub-Transfer Agent agreement between VCTA and FIS Investor Services LLC. VCTA provides FIS Investor Services LLC a fee for providing these services.
Distributor/Underwriting Services:
Victory Capital Services, Inc. (the "Distributor"), an affiliate of the Adviser, serves as distributor for the continuous offering of the shares of the Fund pursuant to a Distribution Agreement between the Distributor and the Trust. The Distributor received no fees or other compensation for such distribution services. Effective June 30, 2020, the Distributor's name was changed from Victory Capital Advisers, Inc.
Other Fees:
Citibank serves as the Fund's custodian.
K&L Gates LLP provides legal services to the Trust.
The Adviser has entered into an expense limitation agreement with the Fund until at least June 30, 2021. Under the terms of the agreement, the Adviser has agreed to waive fees or reimburse certain expenses to the extent that ordinary operating expenses incurred by certain classes of the Fund in any fiscal year exceed the expense limit for such classes of the Fund. Such excess amounts will be the liability of the Adviser. Interest, taxes, brokerage commissions, other expenditures, which are capitalized in accordance with GAAP, and other extraordinary expenses not incurred in the ordinary course of the Fund's business are excluded from the expense limits. As of July 31, 2020, the expense limits (excluding voluntary waivers) are 0.92% and 0.88% for Fund Shares and Institutional Shares, respectively.
Under this expense limitation agreement, the Fund has agreed to repay fees and expenses that were waived or reimbursed by the Adviser for a period up to three years after the fiscal year in which the waiver or reimbursement took place, subject to the lesser of any operating expense limits in effect at the time of: (a) the original waiver or expense reimbursement; or (b) the recoupment, after giving effect to the recoupment amount. As of July 31, 2020, the Fund had no amounts available to be repaid to the Adviser.
The Adviser may voluntarily waive or reimburse additional fees to assist the Fund in maintaining competitive expense ratios. Voluntary waivers and reimbursements applicable to the Fund are not available to be recouped at a future time. There were no voluntary waivers or reimbursements for the year ended July 31, 2020.
Certain officers and/or interested trustees of the Fund are also officers and/or employees of the Adviser, Administrator, Sub-Administrator, Sub-Fund Accountant, and Legal.
6. Risks:
The Fund may be subject to other risks in addition to these identified risks.
21
USAA Mutual Funds Trust | Notes to Financial Statements — continued July 31, 2020 | ||||||
Global economies and financial markets are increasingly interconnected, which increases the possibilities that conditions in one country or region might adversely affect issuers in another country or region. Geopolitical and other risks, including war, terrorism, trade disputes, political or economic dysfunction within some nations, public health crises and related geopolitical events, as well as environmental disasters such as earthquakes, fires, and floods, may add to instability in world economies and markets generally. Changes in trade policies and international trade agreements could affect the economies of many countries in unpredictable ways. Epidemics and/or pandemics, such as the coronavirus (or COVID-19), may result in, among other things, closing borders, disruptions to healthcare service preparation and delivery, quarantines, cancellations, disruptions to supply chains and consumer activity, as well as general concern and uncertainty. The impact may be short-term or may last for extended periods.
The COVID-19 pandemic, which has spread rapidly across the world, has led and will continue to lead for an unknown period of time to disruptions in local, regional, national and global markets and economies. Among other things, the outbreak has resulted in, and until fully resolved is likely to continue to result in, among other things (1) government imposition of various forms of "stay at home" orders and the closing of "non-essential" businesses, resulting in significant disruption to the businesses of many issuers as well as lay-offs of employees: (2) increased requests by issuers of debt instruments for amendments and waivers of agreements to avoid default and increased defaults: (3) volatility and disruption of markets, including greater volatility in pricing and spreads; and (4) rapidly evolving proposals and/or actions by state and federal governments to address problems being experienced by the markets and by businesses and the economy in general.
Overall stock market risks may affect the value of the Fund. Factors such as domestic and international economic growth and market conditions, interest rate levels, and political events affect the securities market.
The value of the equity securities in which the Fund invests may decline in response to developments affecting individual companies and/or general economic conditions. A company's earnings or dividends may not increase as expected. Price changes may be temporary or last for extended periods.
Foreign markets can be more volatile than the U.S. market due to increased risks of adverse issuer, political, regulatory, market, or economic developments and can perform differently from the U.S. market.
7. Borrowing and Interfund Lending:
Line of Credit:
For the year ended July 31, 2020, the Victory Funds Complex participated in a short-term demand note "Line of Credit" agreement with Citibank. The Line of Credit agreement with Citibank was renewed on June 29, 2020 with a termination date of June 28, 2021. Under the agreement with Citibank, the Victory Funds Complex may borrow up to $600 million, of which $300 million is committed and $300 million is uncommitted. $40 million of the Line of Credit is reserved for use by the Victory Floating Rate Fund (herein, the "Fund"), another series of the Victory Funds Complex, with that Fund paying the related commitment fees for that amount. The purpose of the agreement is to meet temporary or emergency cash needs. For the year ended July 31, 2020, Citibank received an annual commitment fee of 0.15% on $300 million for providing the Line of Credit. Each fund in the Victory Funds Complex pays a pro-rata portion of the commitment fees plus any interest (one month LIBOR plus one percent) on amounts borrowed. Effective June 29, 2020, under an amended Line of Credit agreement, Citibank will also receive an annual upfront fee of 0.10% on the $300 million committed line of credit. Each fund in the Victory Funds Complex will pay a pro-rata portion of the upfront fee. Interest charged to each Fund during the period, if applicable, is reflected on the Statements of Operations under Line of credit fees.
The Fund had no borrowings under the Line of Credit agreement during the year ended July 31, 2020.
22
USAA Mutual Funds Trust | Notes to Financial Statements — continued July 31, 2020 | ||||||
Interfund Lending:
The Trust and Adviser rely on an exemptive order granted by the SEC in March 2017 (the "Order"), permitting the establishment and operation of an Interfund Lending Facility (the "Facility"). The Facility allows the Fund to directly lend and borrow money to or from any other Fund in the Victory Funds Complex relying upon the Order at rates beneficial to both the borrowing and lending funds. Advances under the Facility are allowed for temporary or emergency purposes. The interfund loan rate is determined, as specified in the Order, by averaging the current repurchase agreement rate and the current bank loan rate. As a Borrower, interest charged to the Fund, if any, during the period is reflected on the Statement of Operations under Interfund lending fees. As a Lender, interest earned by the Fund, if any, during the period is reflected on the Statement of Operations under Income on Interfund lending.
The average borrowing or lending for the days outstanding and average interest rate for the Fund during the year ended July 31, 2020 were as follows (amounts in thousands):
| Borrower or Lender | Amount Outstanding at July 31, 2020 | Average Borrowing* | Days Borrowing Outstanding | Average Interest Rate* | Maximum Borrowing During the Period | ||||||||||||||||||
| Borrower | $ | — | $ | 4,681 | 9 | 1.52 | % | $ | 20,708 | ||||||||||||||
* For the year ended July 31, 2020, based on the number of days borrowings were outstanding.
8. Federal Income Tax Information:
The Fund intends to distribute any net investment income annually. Distributable net realized gains, if any, are declared and paid at least annually.
The amounts of dividends from net investment income and distributions from net realized gains (collectively distributions to shareholders) are determined in accordance with federal income tax regulations, which may differ from GAAP. To the extent these "book/tax" differences are permanent in nature (e.g., net operating loss and distribution reclassification), such amounts are reclassified within the components of net assets based on their federal tax-basis treatment; temporary differences (e.g., wash sales) do not require reclassification. To the extent dividends and distributions exceed net investment income and net realized gains for tax purposes, they are reported as distributions of capital. Net investment losses incurred by the Fund may be reclassified as an offset to capital on the accompanying Statement of Assets and Liabilities.
The following permanent reclassifications were made between capital accounts to reflect the portion of the payments made to redeeming shareholders that was claimed as a distribution for income tax purposes during the year ended July 31, 2020 (amounts in thousands):
| Total accumulated earnings/(loss) | Capital | ||||||
| $ | (1,084 | ) | $ | 1,084 | |||
The tax character of distributions paid during the tax years ended as noted below, were as follows (total distributions paid may differ from the Statements of Changes in Net Assets because, for tax purposes, dividends are recognized when actually paid) (amounts in thousands).
Year Ended July 31, 2020 | Year Ended July 31, 2019 | ||||||||||||||||||||||||||
Distributions paid from | Distributions paid from | ||||||||||||||||||||||||||
| Ordinary Income | Net Long-Term Capital Gains | Total Distributions Paid | Ordinary Income* | Net Long-Term Capital Gains | Total Distributions Paid | ||||||||||||||||||||||
$ | 35,629 | $ | 556,049 | $ | 591,678 | $ | 21,804 | $ | 277,447 | $ | 299,251 | ||||||||||||||||
* Includes short-term realized capital gains, if any, which are taxable as ordinary income.
23
USAA Mutual Funds Trust | Notes to Financial Statements — continued July 31, 2020 | ||||||
As of July 31, 2020, the components of accumulated earnings (loss) on a tax basis were as follows (amounts in thousands):
| Undistributed Long Term Capital Gains | Accumulated Earnings | Qualified Late-Year Losses* | Unrealized Appreciation (Depreciation)** | Total Accumulated Earnings (Loss) | |||||||||||||||
| $ | 68,933 | $ | 68,933 | $ | (1,404 | ) | $ | 1,277,955 | $ | 1,345,484 | |||||||||
* Qualified late-year losses are comprised of post-October capital losses incurred after October 31 and certain late-year ordinary losses. Late-year ordinary losses represent ordinary losses incurred after December 31 and specified losses incurred after October 31. These losses are deemed to arise on the first day of the Fund's next taxable year.
** The difference between the book-basis and tax-basis of unrealized appreciation/depreciation is attributable to the tax deferral of losses on wash sales.
As of July 31, 2020, the cost basis for federal income tax purposes, gross unrealized appreciation, gross unrealized depreciation, and net unrealized appreciation (depreciation) for investments were as follows (amounts in thousands):
| Cost of Investments for Federal Tax Purposes | Gross Unrealized Appreciation | Gross Unrealized Depreciation | Net Unrealized Appreciation (Depreciation) | ||||||||||||
| $ | 1,721,353 | $ | 1,345,842 | $ | (67,887 | ) | $ | 1,277,955 | |||||||
24
REPORT OF INDEPENDENT REGISTERED PUBLIC ACCOUNTING FIRM
To the Shareholders and the Board of Trustees of USAA Growth Fund
Opinion on the Financial Statements
We have audited the accompanying statement of assets and liabilities of USAA Growth Fund (the "Fund") (one of the funds constituting USAA Mutual Funds Trust (the "Trust")), including the schedule of portfolio investments, as of July 31, 2020, and the related statement of operations for the year then ended, the statements of changes in net assets for each of the two years in the period then ended, the financial highlights for each of the five years in the period then ended and the related notes (collectively referred to as the "financial statements"). In our opinion, the financial statements present fairly, in all material respects, the financial position of the Fund (one of the funds constituting USAA Mutual Funds Trust) at July 31, 2020, the results of its operations for the year then ended, the changes in its net assets for each of the two years in the period then ended and its financial highlights for each of the five years in the period then ended, in conformity with U.S. generally accepted accounting principles.
Basis for Opinion
These financial statements are the responsibility of the Trust's management. Our responsibility is to express an opinion on the Fund's financial statements based on our audits. We are a public accounting firm registered with the Public Company Accounting Oversight Board (United States) ("PCAOB") and are required to be independent with respect to the Trust in accordance with the U.S. federal securities laws and the applicable rules and regulations of the Securities and Exchange Commission and the PCAOB.
We conducted our audits in accordance with the standards of the PCAOB. Those standards require that we plan and perform the audit to obtain reasonable assurance about whether the financial statements are free of material misstatement, whether due to error or fraud. The Trust is not required to have, nor were we engaged to perform, an audit of the Trust's internal control over financial reporting. As part of our audits we are required to obtain an understanding of internal control over financial reporting, but not for the purpose of expressing an opinion on the effectiveness of the Trust's internal control over financial reporting. Accordingly, we express no such opinion.
Our audits included performing procedures to assess the risks of material misstatement of the financial statements, whether due to error or fraud, and performing procedures that respond to those risks. Such procedures included examining, on a test basis, evidence regarding the amounts and disclosures in the financial statements. Our procedures included confirmation of securities owned as of July 31, 2020, by correspondence with the custodian and brokers or by other appropriate auditing procedures where replies from brokers were not received. Our audits also included evaluating the accounting principles used and significant estimates made by management, as well as evaluating the overall presentation of the financial statements. We believe that our audits provide a reasonable basis for our opinion.

We have served as the auditor of one or more Victory Capital investment companies since 1995.
San Antonio, Texas
September 29, 2020
25
USAA Mutual Funds Trust | Supplemental Information July 31, 2020 | ||||||
(Unaudited)
Trustee and Officer Information
Board of Trustees:
Overall responsibility for management of the Trust rests with the Board. The Trust is managed by the Board in accordance with the laws of the state of Delaware. There are currently 10 Trustees, eight of whom are not "interested persons" of the Trust within the meaning of that term under the 1940 Act ("Independent Trustees") and two of whom is an "interested person" of the Trust within the meaning of that term under the 1940 Act ("Interested Trustee"). The Trustees, in turn, elect the officers of the Trust to actively supervise its day-to-day operations.
The following tables list the Trustees, their ages, position with the Trust, commencement of service, principal occupations during the past five years and any directorships of other investment companies or companies whose securities are registered under the Securities Exchange Act of 1934, as amended, or who file reports under that Act. Each Trustee oversees 47 portfolios in the Trust. Each Trustee's address is 15935 La Cantera Pkwy, Building Two, San Antonio, TX, 78256. Pursuant to a policy adopted by the Board, the term of office for each Trustee shall be until the Independent Trustee reaches age 75 or an Interested Trustee reaches age 75. The Board may change or grant exceptions from this policy at any time without shareholder approval. A Trustee may resign or be removed by a vote of the other Trustees or the holders of a majority of the outstanding shares of the Trust at any time. Vacancies on the Board can be filled by the action of a majority of the Trustees, provided that after filling such vacancy at least two-thirds of the Trustees have been elected by the shareholders.
Name and Date of Birth | Position Held with the Trust | Year Commenced Service | Principal Occupation During Past 5 Years | Other Directorships Held During Past 5 Years | |||||||||||||||
Independent Trustees. | |||||||||||||||||||
| Jefferson C. Boyce, Born September 1957 | Lead Independent Trustee, and Vice Chairman | 2013 | Senior Managing Director, New York Life Investments, LLC (1992-2012) | Westhab, Inc. | |||||||||||||||
| John C. Walters, Born February 1962 | Trustee | 2019 | Retired. Mr. Walters brings significant Board experience including active involvement with the board of a Fortune 500 company, and a proven record of leading large, complex financial organizations. He has a demonstrated record of success in distribution, manufacturing, investment brokerage, and investment management in both the retail and institutional investment businesses. He has substantial experience in the investment management business with a demonstrated ability to develop and drive strategy while managing operation, financial, and investment risk. | Guardian Variable Products Trust (16 series), Lead Independent Director; Amerilife Holdings LLC, Director; Stadion Money Management; Director; University of North Carolina (Chapel Hill), Member Board of Governors. | |||||||||||||||
26
USAA Mutual Funds Trust | Supplemental Information — continued July 31, 2020 | ||||||
(Unaudited)
Name and Date of Birth | Position Held with the Trust | Year Commenced Service | Principal Occupation During Past 5 Years | Other Directorships Held During Past 5 Years | |||||||||||||||
| Robert L. Mason, Ph.D., Born July 1946 | Trustee | 1997 | Adjunct Professor in the Department of Management Science and Statistics in the College of Business at the University of Texas at San Antonio (since 2001); Institute Analyst, Southwest Research Institute (March 2002-January 2016) | None | |||||||||||||||
| Dawn M. Hawley, Born February 1954 | Trustee | 2014 | Manager of Finance, Menil Foundation, Inc. (May 2007-June 2011), which is a private foundation that oversees the assemblage of sculptures, prints, drawings, photographs, and rare books. Director of Financial Planning and Analysis and Chief Financial Officer, AIM Management Group, Inc. (October 1987-January 2006) | None | |||||||||||||||
| Paul L. McNamara, Born July 1948 | Trustee | 2012 | Director, Cantor Opportunistic Alternatives Fund, LLC (March 2010-February 2014) , which is a closed-end fund of funds by Cantor Fitzgerald Investment Advisors, LLC | None | |||||||||||||||
27
USAA Mutual Funds Trust | Supplemental Information — continued July 31, 2020 | ||||||
(Unaudited)
Name and Date of Birth | Position Held with the Trust | Year Commenced Service | Principal Occupation During Past 5 Years | Other Directorships Held During Past 5 Years | |||||||||||||||
| Richard Y. Newton III, Born January 1956 | Trustee | 2017 | Director, Elta North America (01/18-present), which is a global leader in the design, manufacture, and support of innovative electronic systems in the ground, maritime, airborne, and security domains for the nation's warfighters, security personnel, and first responders; Managing Partner, Pioneer Partnership Development Group (December 2015-present)); Executive Director, The Union League Club of New York (June 2014-November 2015): Executive Vice President, Air Force Association (August 2012-May 2014); Lieutenant General, United States Air Force (January 2008-June 2012) | None | |||||||||||||||
| Barbara B. Ostdiek, Ph.D., Born March 1964 | Trustee | 2008 | Senior Associate Dean of Degree Programs at Jesse H. Jones Graduate School of Business at Rice University (since 2013); Associate Professor of Finance at Jessie H. Jones Graduate School of Business at Rice University (since 2001) | None | |||||||||||||||
| Michael F. Reimherr, Born August 1945 | Trustee | 2000 | President of Reimherr Business Consulting (May 1995-December 2017); St. Mary's University Investment Committee overseeing University Endowment (since 2014) | None | |||||||||||||||
28
USAA Mutual Funds Trust | Supplemental Information — continued July 31, 2020 | ||||||
(Unaudited)
Name and Date of Birth | Position Held with the Trust | Year Commenced Service | Principal Occupation During Past 5 Years | Other Directorships Held During Past 5 Years | |||||||||||||||
Interested Trustees. | |||||||||||||||||||
| David C. Brown, ** Born May 1972 | Trustee | 2019 | Chairman and Chief Executive Officer (since 2013), Co-Chief Executive Officer (2011-2013), Victory Capital Management Inc.; Chairman and Chief Executive Officer, Victory Capital Holdings, Inc. (since 2013). Mr. Brown brings to the Board extensive business, finance and leadership skills gained and developed through years of experience in the financial services industry, including his tenure overseeing the strategic direction as CEO of Victory Capital. These skills, combined with Mr. Brown's extensive knowledge of the financial services industry and demonstrated success in the development and distribution of investment strategies and products, enable him to provide valuable insights to the Board and strategic direction for the Funds | Trustee, Victory Portfolios (42 series), Victory Portfolios II (26 series), Victory Variable Insurance Funds (9 series) | |||||||||||||||
29
USAA Mutual Funds Trust | Supplemental Information — continued July 31, 2020 | ||||||
(Unaudited)
Name and Date of Birth | Position Held with the Trust | Year Commenced Service | Principal Occupation During Past 5 Years | Other Directorships Held During Past 5 Years | |||||||||||||||
| Daniel S. McNamara, ** Born June 1966 | Trustee and Chair of the Board of Trustees | 2012 | Trustee, President, and Vice Chairman of USAA ETF Trust (June 2017-June 2019); President of Financial Advice & Solutions Group (FASG), USAA (since 2013); Director, Investment Management Company (IMCO) (September 2009-April 2014); President, Asset Management Company (AMCO) (August, 2011-April 2013); Senior Vice President of USAA Financial Planning Services Insurance Agency, Inc. (FPS) (since 2011); Director of USAA IMCO (since 2009); Chairman of Board of IMCO (since 2013); Director of AMCO (August 2011-June 2019); President and Director of USAA Shareholder Account Services (SAS) (October 2009-June 2019); Director and Vice Chairman of FPS (since 2013); President and Director of USAA Investment Corporation (ICORP) (since 2010); Chairman of Board of ICORP (since 2013); Director of USAA Financial Advisors, Inc. (FAI) (since 2013); Chairman of Board of FAI (since 2015). Mr. McNamara brings to the Board extensive experience in the financial services industry, including experience as an officer of the Trust. | None | |||||||||||||||
** Mr. Dan McNamara, the Chairman of the Board, is deemed an "interested person" due to his previous position as Director of AMCO, the former investment adviser of the Funds. Mr. Brown is deemed an "interested person" due to his position as Chief Executive Officer of Victory Capital, investment adviser to the Funds.
The Statement of Additional Information includes additional information about the Trustees of the Trust and is available, without charge, on the SEC's website at www.sec.gov and/or by calling (800)-539-3863.
30
USAA Mutual Funds Trust | Supplemental Information — continued July 31, 2020 | ||||||
(Unaudited)
Officers:
The officers of the Trust, their ages, commencement of service and their principal occupations during the past five years, are detailed in the following table. Each officer serves until the earlier of his or her resignation, removal, retirement, death, or the election of a successor. The mailing address of each officer of the Trust is 15935 La Cantera Pkwy, Building Two, San Antonio, TX, 78256. The officers of the Trust receive no compensation directly from the Trust for performing the duties of their offices.
Name and Date of Birth | Position with the Trust | Year Commenced Service | Principal Occupation During Past 5 Years | ||||||||||||
Interested Officers. | |||||||||||||||
| Christopher K. Dyer, Born February 1962 | President | 2019 | Director of Fund Administration, Victory Capital (2004-present) | ||||||||||||
| Scott A Stahorsky, Born July 1969 | Vice President | 2019 | Manager, Fund Administration, Victory Capital (since 2015); Senior Analyst, Fund Administration, Victory Capital (prior to 2015) | ||||||||||||
| James K. De Vries, Born April 1969 | Treasurer, Principal Financial Officer | 2018 | Executive Director, Victory Capital Management Inc. (since 2019); Treasurer, USAA ETF Trust (September 2018-June 2019); Executive Director, Investment and Financial Administration, USAA (April 2012-June 2019); Assistant Treasurer, USAA ETF Trust (June 2017-September 2018); Assistant Treasurer, USAA Mutual Funds Trust (December 2013-February 2018) | ||||||||||||
| Allan Shaer, Born March 1965 | Assistant Treasurer | 2019 | Senior Vice President, Financial Administration, Citi Fund Services Ohio, Inc. (since 2016); Vice President, Mutual Fund Administration, JP Morgan Chase (2011-2016) | ||||||||||||
| Carol D. Trevino, Born October 1965 | Assistant Treasurer | 2018 | Director, Accounting and Finance, Victory Capital Management Inc. (since 2019); Accounting/Financial Director, USAA (December 2013-June 2019); Assistant Treasurer, USAA ETF Trust (September 2018-June 2019). | ||||||||||||
| Erin G. Wagner, Born February 1974 | Secretary | 2019 | Deputy General Counsel, the Adviser (since 2013) | ||||||||||||
| Charles Booth, Born April 1960 | Anti-Money Laundering Compliance Officer and Identity Theft Officer | 2019 | Director, Regulatory Administration and CCO Support Services, Citi Fund Services Ohio, Inc. (2007-present) | ||||||||||||
| Amy Campos, Born July 1976 | Chief Compliance Officer | 2019 | Chief Compliance Officer, USAA Mutual Funds Trust (since 2019); Executive Director, Deputy Chief Compliance Officer, USAA Mutual Funds Trust and USAA ETF Trust (July 2017-June 2019); Compliance Director, USAA Mutual Funds Trust (2014-July 2017) | ||||||||||||
31
USAA Mutual Funds Trust | Supplemental Information — continued July 31, 2020 | ||||||
(Unaudited)
Proxy Voting and Portfolio Holdings Information
Proxy Voting:
Information regarding the policies and procedures the Fund uses to determine how to vote proxies relating to portfolio securities is available without charge, upon request, by calling (800) 539-3863. The information is also included in the Fund's Statement of Additional Information, which is available on the SEC's website at www.sec.gov.
Information relating to how the Fund voted proxies relating to portfolio securities held during the most recent 12 months ended June 30 is available on the SEC's website at www.sec.gov.
Availability of Schedules of Portfolio Investments:
The Trust files a complete list of Schedules of Portfolio Investments with the SEC for the first and third quarter of each fiscal year on Form N-PORT. Forms N-PORT are available on the SEC's website at www.sec.gov.
Expense Examples
As a shareholder of the Fund, you may incur two types of costs: (1) transaction costs, and (2) ongoing costs, including management fees and other Fund expenses. These examples are intended to help you understand your ongoing costs (in dollars) of investing in the Fund and to compare these costs with the ongoing costs of investing in other mutual funds.
These examples are based on an investment of $1,000 invested at the beginning of the period and held for the entire period from February 1, 2020 through July 31, 2020.
The Actual Expense figures in the table below provide information about actual account values and actual expenses. You may use the information below, together with the amount you invested, to estimate the expenses that you paid over the period. Simply divide your account value by $1,000 (for example, an $8,600 account value divided by $1,000 = 8.6), then multiply the result by the number in the table under the heading entitled "Actual Expenses Paid During Period" to estimate the expenses you paid on your account during this period.
The Hypothetical Expense figures in the table below provide information about hypothetical account values and hypothetical expenses based on the Fund's actual expense ratio and an assumed rate of return of 5% per year before expenses, which is not the Fund's actual return. The hypothetical account values and expenses may not be used to estimate the actual ending account balance or expenses you paid for the period. You may use this information to compare this 5% hypothetical example with the 5% hypothetical examples that appear in shareholder reports of other funds.
Please note the expenses shown in the table below are meant to highlight your ongoing costs only and do not reflect any transactional costs. If these transactional costs were included, your costs would have been higher.
| Beginning Account Value 2/1/20 | Actual Ending Account Value 7/31/20 | Hypothetical Ending Account Value 7/31/20 | Actual Expenses Paid During Period 2/1/20- 7/31/20* | Hypothetical Expenses Paid During Period 2/1/20- 7/31/20* | Annualized Expense Ratio During Period 2/1/20- 7/31/20 | ||||||||||||||||||||||
Fund Shares | $ | 1,000.00 | $ | 1,158.00 | $ | 1,020.49 | $ | 4.72 | $ | 4.42 | 0.88 | % | |||||||||||||||
Institutional Shares | 1,000.00 | 1,158.10 | 1,020.64 | 4.56 | 4.27 | 0.85 | % | ||||||||||||||||||||
* Expenses are equal to the average account value multiplied by the Fund's annualized expense ratio multiplied by 182/366 (the number of days in the most recent fiscal half-year divided by the number of days in the fiscal year).
32
USAA Mutual Funds Trust | Supplemental Information — continued July 31, 2020 | ||||||
(Unaudited)
Additional Federal Income Tax Information
The following federal tax information related to the Fund's fiscal year ended July 31, 2020, is provided for information purposes only and should not be used for reporting to federal or state revenue agencies. Federal tax information for the calendar year will be reported to you on Form 1099-DIV in January 2021.
With respect to distributions paid, the Fund designates the following amounts (or, if subsequently determined to be different, the maximum amount allowable) for the fiscal year ended July 31, 2020 (amounts in thousands):
| Dividend Received Deduction (corporate shareholders)* | Short-Term Capital Gains Distributions | Long-Term Capital Gain Distributions(a) | |||||||||||||
68.41 | % | $ | 27,116 | $ | 557,132 | ||||||||||
* Presented as a percentage of net investment income and excludes short-term capital gain distributions paid, if any. All or a portion of these amounts may be exempt from taxation at the state level.
(a) Pursuant to Section 852 of the Internal Revenue Code.
33
USAA Mutual Funds Trust | Supplemental Information — continued July 31, 2020 | ||||||
(Unaudited)
Liquidity Risk Management Program
The USAA Mutual Funds have adopted and implemented a written liquidity risk management program (the "LRMP") as required by Rule 22e-4 under the Investment Company Act of 1940, as amended. The LRMP is reasonably designed to assess and manage the Fund's liquidity risk, taking into consideration the Fund's investment strategy and the liquidity of its portfolio investments during normal and reasonably foreseeable stressed market conditions; its short and long-term cash flow projections; and its cash holdings and access to other liquidity management tools such as available funding sources including the Victory Funds Complex Interfund Lending Facility and Line of Credit (discussed in the Notes to Financial Statements). The USAA Mutual Funds' Board of Trustees approved the appointment of the Fund's investment adviser, Victory Capital Management Inc. ("Victory Capital"), as the administrator of the LRMP. At an in-person meeting held on February 26, 2020, Victory Capital provided an oral and written report to the Trustees on the operation and effectiveness of the LRMP during the previous year.
Victory Capital manages liquidity risks associated with the Fund's investments by monitoring, among other things, cash and cash equivalents, any use of derivatives, the concentration of investments, the appropriateness of the Fund's investment strategy, and by classifying every fund investment as either highly liquid, moderately liquid, less liquid or illiquid on at least a monthly basis. To assist with the classification of Fund investments, Victory Capital has retained a third-party provider of liquidity evaluation services. This provider determines preliminary liquidity classifications for all portfolio holdings based upon portfolio-level data and certain assumptions provided by Victory Capital. Victory Capital reviews the preliminary liquidity classifications, and, when appropriate, considers other information including input from the Fund's portfolio managers (including the portfolio managers employed by any investment sub-advisers) in determining final liquidity classifications.
The report from Victory Capital concluded that the Fund did not experience any significant liquidity challenges during the covered period, and the Fund's LRMP is reasonably designed to assess and manage its liquidity risk. The report also concluded that the LRMP continues to operate adequately and effectively to enable Victory Capital to oversee and manage liquidity risk and ensure the Fund is able to meet redemption requests without significant dilution to the remaining investors' interest in the Fund. During the review period, the Fund's portfolio consisted primarily of highly liquid investments, which are defined as cash and any investments reasonably expected to be converted to cash in current market conditions in three business days or less without significantly changing the market value of the investment. Therefore, the Fund has not adopted a Highly Liquid Investment Minimum. The Fund's investments were below the limitation on illiquid investments during the review period. Additionally, Victory Capital indicated that no events occurred that would require the filing of Form N-LIQUID and recommended no material changes to the LRMP.
34
Privacy Policy
Protecting the Privacy of Information
The Trust respects your right to privacy. We also know that you expect us to conduct and process your business in an accurate and efficient manner. To do so, we must collect and maintain certain personal information about you. This is the information we collect from you on applications or other forms, and from the transactions you make with us or third parties. It may include your name, address, social security number, account transactions and balances, and information about investment goals and risk tolerance.
We do not disclose any information about you or about former customers to anyone except as permitted or required by law. Specifically, we may disclose the information we collect to companies that perform services on our behalf, such as the transfer agent that processes shareholder accounts and printers and mailers that assist us in the distribution of investor materials. We may also disclose this information to companies that perform marketing services on our behalf. This allows us to continue to offer you Victory investment products and services that meet your investing needs, and to effect transactions that you request or authorize. These companies will use this information only in connection with the services for which we hired them. They are not permitted to use or share this information for any other purpose.
To protect your personal information internally, we permit access only by authorized employees and maintain physical, electronic and procedural safeguards to guard your personal information.*
* You may have received communications regarding information about privacy policies from other financial institutions which gave you the opportunity to "opt-out" of certain information sharing with companies which are not affiliated with that financial institution. The Trust does not share information with other companies for purposes of marketing solicitations for products other than the Trust. Therefore, the Trust does not provide opt-out options to their shareholders.
P.O. Box 182593
Columbus, Ohio 43218-2593

Visit our website at: | Call | ||||||
vcm.com | (800 | ) 235-8396 | |||||
23419-0920

JULY 31, 2020
Annual Report
USAA High Income Fund
Beginning January 1, 2021, as permitted by regulations adopted by the Securities and Exchange Commission, paper copies of the Fund's shareholder reports like this one will no longer be sent by mail, unless you specifically request paper copies of the reports from the Fund or from your financial intermediary, such as a broker-dealer or bank. Instead, the reports will be made available on VictoryFunds.com, and you will be notified by mail each time a report is posted and provided with a website link to access the report. If you already elected to receive shareholder reports electronically, you will not be affected by this change and you need not take any action.
You may elect to receive shareholder reports and other communications from the Fund or your financial intermediary electronically by notifying your financial intermediary directly, or if you are a direct investor, by calling (800) 235-8396 or logging on to usaa.com. Effective on or about November 6, 2020, a shareholder who has an account directly with the Fund will need to submit their request via email to TA.Processing@FISGlobal.com.
You may elect to receive all future reports in paper free of charge. You can inform the Fund or your financial intermediary that you wish to continue receiving paper copies of your shareholder reports by notifying your financial intermediary directly, or if you are a direct investor, by calling (800) 235-8396 or logging on to usaa.com. Effective on or about November 6, 2020, a shareholder who has an account directly with the Fund will need to submit their request via email to TA.Processing@FISGlobal.com. Your election to receive reports in paper will apply to all funds held with the USAA Mutual Funds or your financial intermediary.
Victory Capital means Victory Capital Management Inc., the investment adviser of the USAA Mutual Funds. USAA Mutual Funds are distributed by Victory Capital Services, Inc., member FINRA, an affiliate of Victory Capital. Victory Capital and its affiliates are not affiliated with United Services Automobile Association or its affiliates. USAA and the USAA logo are registered trademarks and the USAA Mutual Funds and USAA Investments logos are trademarks of United Services Automobile Association and are being used by Victory Capital and its affiliates under license.
USAA Mutual Funds Trust
TABLE OF CONTENTS
Shareholder Letter (Unaudited) | 2 | ||||||
Managers' Commentary (Unaudited) | 3 | ||||||
Investment Overview (Unaudited) | 6 | ||||||
| Investment Objective & Portfolio Holdings (Unaudited) | 7 | ||||||
Financial Statements | |||||||
Schedule of Portfolio Investments | 9 | ||||||
Statement of Assets and Liabilities | 26 | ||||||
Statement of Operations | 27 | ||||||
Statements of Changes in Net Assets | 28 | ||||||
Financial Highlights | 30 | ||||||
Notes to Financial Statements | 34 | ||||||
| Report of Independent Registered Public Accounting Firm | 45 | ||||||
Supplemental Information | 46 | ||||||
Trustees' and Officers' Information | 46 | ||||||
Proxy Voting and Portfolio Holdings Information | 52 | ||||||
Expense Examples | 52 | ||||||
Additional Federal Income Tax Information | 53 | ||||||
Liquidity Risk Management Program | 54 | ||||||
Privacy Policy (inside back cover) | |||||||
This report is for the information of the shareholders and others who have received a copy of the currently effective prospectus of the Fund, managed by Victory Capital Management Inc. It may be used as sales literature only when preceded or accompanied by a current prospectus, which provides further details about the Fund.
IRA DISTRIBUTION WITHHOLDING DISCLOSURE
We generally must withhold federal income tax at a rate of 10% of the taxable portion of your distribution and, if you live in a state that requires state income tax withholding, at your state's tax rate. However, you may elect not to have withholding apply or to have income tax withheld at a higher rate. Any withholding election that you make will apply to any subsequent distribution unless and until you change or revoke the election. If you wish to make a withholding election, or change or revoke a prior withholding election, call (800) 235-8396.
If you do not have a withholding election in place by the date of a distribution, federal income tax will be withheld from the taxable portion of your distribution at a rate of 10%. If you must pay estimated taxes, you may be subject to estimated tax penalties if your estimated tax payments are not sufficient and sufficient tax is not withheld from your distribution.
For more specific information, please consult your tax adviser.
1
(Unaudited)
Dear Shareholder,
The previous decade ended with the longest-ever bull market in U.S. equities still intact, even as investors wrestled with issues like softening global economic data, Brexit, and U.S.-China trade relations. In retrospect, those worries seem pedestrian given what we would experience.
A new and unexpected threat—a global pandemic, the novel coronavirus ("COVID-19")—first emerged in Asia and then began spreading globally and throughout the United States during the first quarter of 2020. This unprecedented and unanticipated event not only rendered all existing economic forecasts moot, but it also roiled stock and bond markets everywhere. It also brought the economy to a near halt. The historic bull market in stocks ended virtually overnight.
After an initial severe sell-off in March, equity markets recovered sharply. As our annual reporting period drew to a close on July 31, 2020, many of the broad market indexes had recovered and volatility had returned to more palatable levels. In fact, despite all the chaos, the S&P 500® Index, one of the most popular measures of large U.S. stocks, finished the fiscal year (July 31, 2020) at approximately 3,271, which was up 8.9% from one year ago. Quite the impressive reversal.
The market turmoil of early 2020 was not limited to equities. Fixed income volatility spiked when liquidity evaporated in late March as investors struggled to understand the ramifications of sheltering in place. Fortunately, the U.S. Federal Reserve (the "Fed") (as well as other global central banks) leapt into action—cutting interest rates, (re)starting quantitative easing and, in the case of the Fed, launching an array of programs to stabilize markets.
The new lending facilities and programs had their intended effect of improving fixed income liquidity and trading. Credit spreads across corporate, high yield, structured, and municipal markets were coaxed down from their highs. In addition, Congress came through with substantial fiscal stimulus that also was applauded by investors and markets. Although fixed income markets regained their footing, the yield on 10-Year Treasurys, a benchmark for low-risk investments, declined steadily during our fiscal year—from 2.02% at the beginning of our reporting period to approximately 0.55% as of July 31, 2020. This suggests that investors remain a little wary.
While the past year has been unprecedented for all of us, both personally and professionally, our portfolio managers continue to analyze the financial markets, economic conditions, and the trajectory of the pandemic, which will likely be a guiding factor on Fed policy and the markets.
No matter what happens in the near term, we believe that the massive monetary and fiscal policies introduced earlier this year will have longer-term ramifications. Despite this uncertainty, it's important to remain focused on your long-term investment goals and avoid making emotional decisions. If you invest with us directly, our Member Service Representatives are available to help. Call us at (800) 235-8396.
Sincerely,

Christopher K. Dyer, CFA
President,
USAA Mutual Funds
2
USAA Mutual Funds Trust
USAA High Income Fund
Managers' Commentary
(Unaudited)
USAA Investments, A Victory Capital Investment Franchise
Julianne Bass, CFA | John Spear, CFA | ||||||
Kurt Daum, JD | James F. Jackson Jr., CFA | ||||||
R. Neal Graves, CFA, CPA |
| ||||||
• What were market conditions during the reporting period?
High-yield corporate bonds earned a positive return during the reporting period, as investors favored them for the added interest income they earn.
When the reporting period began in August 2019, investor sentiment was dominated by the U.S.-China trade dispute, the impeachment of President Donald Trump, and uncertainty surrounding Brexit. High-yield bonds posted particularly strong returns in December as investors reacted positively to a "phase-one" trade deal with China.
When the first quarter of 2020 began, high-yield corporate bonds continued to generate positive returns, adding to their 2019 gains. However, in the second half of the quarter, the emergence of the novel coronavirus ("COVID-19") altered economic and market conditions. The expanding pandemic led to the shutdown of major parts of the U.S. economy, and investors' growth expectations plunged. Market volatility surged, surpassing levels seen during the 2008-2009 financial crisis. Investors sought sanctuary in cash and U.S. Treasury securities. Credit spreads, which had been tightening since October widened significantly amid worries about the spread of COVID-19, falling crude oil prices, driven by a conflict between Saudi Arabia and Russia, and fears about a potential U.S economic slowdown.
In the second quarter and through the end of the reporting period, high-yield bonds staged a dramatic recovery, leading a rally in the fixed income market. The asset class benefitted from increased investor appetite, which was supported by substantial monetary and fiscal stimulus from the federal government as well as a reopening of parts of the US economy. To counter the economic fallout of COVID-19, and to keep credit markets functioning, the U.S. Federal Reserve (the "Fed") instituted a series of supportive facilities for commercial paper, corporate bonds, and asset-backed securities. The Fed also began buying high-yield bond exchange-traded funds ("ETF's") under its secondary market corporate credit facility, putting upward pressure on prices of the ETF's underlying bonds.
During the fiscal year, unprecedented became an everyday word, as life in the United States became unlike anything we have ever seen. With many businesses being forced to temporarily close, many people were put out of work. Monthly payrolls, which had been growing at an average of roughly 216 thousand per month since August 2019, plummeted to a loss of 1.4 million jobs in March, and an unprecedented loss of 21 million jobs in April. The unemployment rate, which was at a record low of 3.5% in February, jumped to 14.7% in April. Real GDP fell 5% in first quarter of 2020 and a record 32.9% in the second quarter of 2020, thus officially marking the economy as being in recession. Due to demand dropping precipitously from people not driving, coupled with a strong supply, the price of
3
USAA Mutual Funds Trust
USAA High Income Fund (continued)
Managers' Commentary (continued)
West Texas Intermediate (WTI) crude oil, an indicating benchmark, actually went negative in April. This was due to investors in WTI futures contracts, which requires physical settlement, having to pay to not take delivery, forcing the price into unprecedented negative territory.
In response, federal and state governments stepped up stimulus efforts to help those out of work. Congress passed an unprecedented $1 trillion stimulus package, with unemployment benefits to temporarily supplement state payments, as well as grants/loans to businesses. The Fed significantly increased its balance sheet again, and in an unprecedented move, increased the types of bonds it can buy, to include corporate bonds.
Although U.S. Treasury rates had already begun to fall by August 2019, in response to worries over the trade war with China and the economy beginning to slow, the unprecedented worldwide economic shutdown drove interest rates much lower, as investors bought U.S. Treasurys in a flight to quality. Given the Fed moving the Fed Funds rate to effectively zero and the economy only slowly beginning to reopen, U.S. Treasury rates remain at their lows. Although interest rates were already low, year over year decreases were dramatic. The two-year U.S. Treasury yield dropped 177 basis points, while 10-year and 30-year U.S. Treasury yields dropped 149 and 133 basis points, respectively. (A basis point is 1/100th of a percent.)
High-yield credit spreads widened for the reporting period. Credit spreads based on the Bloomberg Barclays U.S. High Yield 2% Issuer Capped Bond Index began the period at 388 basis points, then widened to 1,100 basis points in response to COVID-19, and ended the reporting period at 490 basis points due to stimulus from the Fed and Treasury and improving economic outlook. (A basis point is 1/100th of a percentage point.) Higher-rated BB bonds had strong total returns for the period. Single B-rated bonds had more modest but still positive returns. Lower-rated CCC bonds, which are most susceptible to debt restructurings, had negative returns during the period.
In this environment, high-yield bonds underperformed both the S&P 500® Index and 10-year U.S. Treasury securities — a departure from their long-term historical performance. Historically, high-yield securities tend to perform between stocks and high-quality bonds, generally with less volatility, which can potentially provide long-term investors with a significant diversification advantage. During the reporting period, the S&P 500® Index produced a return of almost 11.96%, while the total return for intermediate-term U.S. Treasurys was over 14%. The Bloomberg Barclays 2% Issuer Capped Bond Index had a total return of 4.07% during the period.
High-yield bond issuance surged after the initial sell-off in May, as companies raised cash for their balance sheets to maintain adequate liquidity during the economic downturn. Other companies refinanced debt to take advantage of low interest rates. High-yield leverage has increased to levels above the 10 year average.
High-yield bond default expectations rose to well above historical averages at the end of the reporting period. According to JP Morgan, U.S. high-yield default rate was 6.22% in July 2020 which was a 10-year high. Energy, retailing, and consumer products
4
USAA Mutual Funds Trust
USAA High Income Fund (continued)
Managers' Commentary (continued)
had the most defaults. Some of the companies that defaulted during the period were Hertz, J.C. Penney, Neiman Marcus, and Chesapeake Energy.
• How did the USAA High Income Fund (the "Fund") perform during the reporting period?
The Fund has four share classes: Fund Shares, Institutional Shares, Class A shares (redesignated from Adviser Shares), and R6 Shares. For the reporting period ended July 31, 2020, the Fund Shares, Institutional Shares, Class A shares, and R6 Shares had total returns of -0.27%, -0.19%, -0.44%, and -0.12%, respectively. This compares to returns of 4.07% for the Bloomberg Barclays U.S. High Yield 2% Issuer Capped Bond Index (the "Index") and 1.24% for the Lipper High Yield Bond Funds Index. At the same time, the Fund Shares, Institutional Shares, A Shares, and R6 Shares provided a one-year dividend yield of 5.87%, 5.96%, 5.69%, and 6.04%, respectively, compared to 5.21% for the Lipper High Yield Bond Funds Index Average.
• What strategies did you employ during the reporting period?
The Fund produced a negative total return during the reporting period ended July 31, 2020, and underperformed the Index, which had a positive total return. Although the portfolio benefited from the income generated by its holdings, it was hurt by a drop in prices during the reporting period.
Relative to the Index, the Fund's selection of high-yield corporate bonds detracted from performance. In particular, the Fund was hampered by its investments in the energy sector, consumer cyclicals, and communications sectors. Holdings of bank loans also diminished relative returns. On the positive side, the Fund was helped by its positioning in cash and high-yield ETFs.
During the period, we were able to purchase higher-quality bonds at attractive yields, particularly in March and April. We focused on adding higher-quality names to enhance performance during times of economic uncertainty and volatility. Additionally, we have reduced our holdings in off-index segments including equites, preferred equity, and bank loans.
We continued to build the portfolio bond by bond, looking for relative value opportunities within the high-yield bond market while continuing to maintain a diversified, liquid portfolio. We seek ideas where our fundamental understanding of the credit risk is different than that of the market, working with our team of analysts to evaluate each potential investment individually, rather than on the basis of thematic trends. Our analysts continued to analyze and monitor every holding in the portfolio.
Thank you for allowing us to assist you with your investment needs.
* Information on individual companies is provided strictly as an illustration of broader themes and should not be deemed a recommendation to buy or sell any security. There is no guarantee that the securities mentioned remain(ed) in or out of the Fund's portfolio at any time.
5
USAA Mutual Funds Trust
USAA High Income Fund
Investment Overview
(Unaudited)
Average Annual Total Return
Year Ended July 31, 2020
Fund Shares | Institutional Shares | Class A shares | Class R6 Shares | ||||||||||||||||||||||||||||
INCEPTION DATE | 8/2/99 | 8/1/08 | 8/2/10 | 12/1/16 | |||||||||||||||||||||||||||
Net Asset Value | Net Asset Value | Net Asset Value | Maxiumum Offering Price | Net Asset Value | Bloomberg Barclays U.S. High Yield 2% Issuer Capped Bond Index1 | Lipper High Yield Bond Funds Index2 | |||||||||||||||||||||||||
One Year | –0.27 | % | –0.19 | % | –0.44 | % | –2.65 | % | –0.12 | % | 4.07 | % | 1.24 | % | |||||||||||||||||
Five Year | 4.16 | % | 4.22 | % | 3.92 | % | 3.44 | % | N/A | 5.87 | % | 4.47 | % | ||||||||||||||||||
Ten Year | 5.84 | % | 5.97 | % | N/A | N/A | N/A | 6.78 | % | 5.91 | % | ||||||||||||||||||||
Since Inception | N/A | N/A | 5.60 | % | 5.36 | % | 4.17 | % | N/A | N/A | |||||||||||||||||||||
Past performance is not indicative of future results. The performance data quoted represents past performance and current returns may be lower or higher. The investment return and principal value will fluctuate so that an investor's shares, when redeemed, may be worth more or less than the original cost. To obtain performance information current to the most recent month's end, please visit www.vcm.com.
Total return measures the price change in a share assuming the reinvestment of all net investment income and realized capital gain distributions, if any. The total returns quoted do not reflect adjustments made to the enclosed financial statements in accordance with U.S. generally accepted accounting principles or the deduction of taxes that a shareholder would pay on net investment income and realized capital gain distributions, including reinvested distributions, or redemptions of shares. The total return figures set forth above include all waivers of fees for various periods since inception. Without such fee waivers, the total returns would have been lower.
USAA High Income Fund — Growth of $10,000
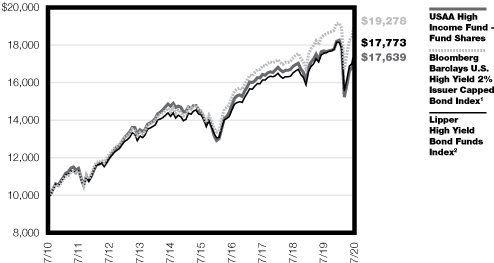
1The unmanaged Bloomberg Barclays U.S. High Yield 2% Issuer Capped Bond Index is an index comprised of fixed rate, non-investment grade debt securities that are dollar denominated and nonconvertible. The index limits the maximum exposure to any one issuer to 2%.
2The unmanaged Lipper High Yield Bond Funds Index tracks the total return performance of the funds within the Lipper High Yield Funds category.
The graph reflects investment of growth of a hypothetical $10,000 investment in the Fund. Past performance is no guarantee of future results.
The graph and table do not reflect the deduction of taxes that a shareholder would pay on Fund distributions or the redemption of Fund shares.
6
| USAA Mutual Funds Trust USAA High Income Fund | July 31, 2020 | ||||||
(Unaudited)
Investment Objective & Portfolio Holdings:
The USAA High Income Fund seeks to provide an attractive total return primarily through high current income and secondarily through capital appreciation.
Sector Allocation*:
July 31, 2020
(% of Net Assets)

*Does not include futures, money market instruments, and short term investments purchased with cash collateral from securities loaned.
Percentages are of the net assets of the Fund and may not equal 100%.
7
| USAA Mutual Funds Trust USAA High Income Fund (continued) | July 31, 2020 | ||||||
(Unaudited)
Portfolio Ratings Mix*:
July 31, 2020
(% of Net Assets)
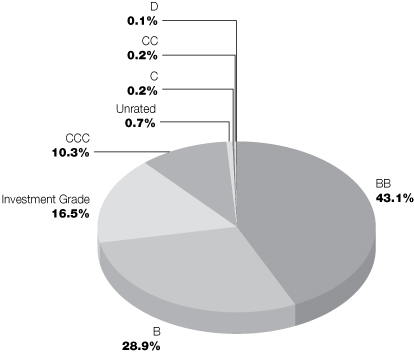
This chart reflects the highest long-term rating from a Nationally Recognized Statistical Rating Organization ("NRSRO"), with the four highest long-term credit ratings labeled, in descending order of credit quality, AAA, AA, A, and BBB. These categories represent investment-grade quality. NRSRO ratings are shown because they provide independent analysis of the credit quality of the Fund's investments. Victory Capital Management, Inc. ("Adviser") also performs its own fundamental credit analysis of each security. As part of its fundamental credit analysis, the Adviser considers various criteria, including industry specific actions, peer comparisons, payment ranking, and structure specific characteristics. Any of the Fund's securities that are not rated by an NRSRO appear in the chart above as "Unrated," but these securities are analyzed and monitored by the Adviser on an ongoing basis. Government securities that are issued or guaranteed as to principal and interest by the U.S. government and pre-refunded and escrowed-to-maturity municipal bonds that are not rated are treated as AAA for credit quality purposes.
8
| USAA Mutual Funds Trust USAA High Income Fund | Schedule of Portfolio Investments July 31, 2020 | ||||||
(Amounts in Thousands, Except for Shares)
Security Description | Shares or | Value | |||||||||
Asset-Backed Securities (0.2%) | |||||||||||
NP SPE II LLC, Series 2019-2A, Class C1, 6.44%, 11/19/49 (a) | $ | 2,786 | $ | 2,763 | |||||||
Total Asset-Backed Securities (Cost $2,786) | 2,763 | ||||||||||
Collateralized Mortgage Obligations (0.2%) | |||||||||||
Banc of America Commercial Mortgage Trust, Series 2008-1, Class AJ, | 163 | 166 | |||||||||
Bear Stearns Commercial Mortgage Securities Trust, Series 2007-T26, | 5,000 | 3,786 | |||||||||
CHL Mortgage Pass-Through Trust, Series 2004-25, Class 1A6, | 2,004 | 277 | |||||||||
Credit Suisse Commercial Mortgage Trust, Series 2007-C1, Class AMFL, | 50 | 47 | |||||||||
Credit Suisse First Boston Mortgage Securities Corp., Series 1998-C1, | 45 | 1 | |||||||||
4,277 | |||||||||||
Total Collateralized Mortgage Obligations (Cost $6,210) | 4,277 | ||||||||||
Common Stocks (1.5%) | |||||||||||
Communication Services (0.3%): | |||||||||||
AT&T, Inc. | 33,780 | 999 | |||||||||
CenturyLink, Inc. | 63,000 | 608 | |||||||||
Clear Channel Outdoor Holdings, Inc. (d) (e) | 163,905 | 150 | |||||||||
Comcast Corp. Class A | 52,422 | 2,244 | |||||||||
iHeartMedia, Inc. Class A (d) (e) | 69,703 | 583 | |||||||||
Verizon Communications, Inc. | 19,653 | 1,130 | |||||||||
5,714 | |||||||||||
Consumer Discretionary (0.0%): (f) | |||||||||||
Las Vegas Sands Corp. (g) | 13,500 | 589 | |||||||||
Energy (0.4%): | |||||||||||
| BP PL C, ADR | 53,764 | 1,185 | |||||||||
GenOn Energy, Inc. (d) (h) (i) | 16,168 | 2,910 | |||||||||
Nine Point Energy (d) (h) (i) | 21,663 | — | (j) | ||||||||
Nine Point Energy Holdings, Inc. (d) (h) (i) | 464 | — | (j) | ||||||||
Paragon Litigation (d) (i) (k) | 2,542 | — | (j) | ||||||||
Paragon Litigation (d) (i) (k) | 3,813 | 24 | |||||||||
Royal Dutch Shell PLC, ADR | 32,263 | 962 | |||||||||
Sabine Oil & Gas Holdings, Inc. (h) (i) | 2,824 | 38 | |||||||||
Thunderbird Resources (d) (h) (i) | 22,883 | 1 | |||||||||
5,120 | |||||||||||
Financials (0.3%): | |||||||||||
CME Group, Inc. | 13,217 | 2,196 | |||||||||
JPMorgan Chase & Co. | 18,507 | 1,789 | |||||||||
KeyCorp | 111,918 | 1,344 | |||||||||
Regions Financial Corp. | 109,207 | 1,186 | |||||||||
6,515 | |||||||||||
See notes to financial statements.
9
| USAA Mutual Funds Trust USAA High Income Fund | Schedule of Portfolio Investments — continued July 31, 2020 | ||||||
(Amounts in Thousands, Except for Shares)
Security Description | Shares or Principal Amount | Value | |||||||||
Health Care (0.3%): | |||||||||||
AbbVie, Inc. | 22,300 | $ | 2,116 | ||||||||
CVS Health Corp. | 18,400 | 1,158 | |||||||||
Merck & Co., Inc. | 30,900 | 2,479 | |||||||||
5,753 | |||||||||||
Information Technology (0.1%): | |||||||||||
Microsoft Corp. (g) | 7,174 | 1,471 | |||||||||
Materials (0.0%): (f) | |||||||||||
LyondellBasell Industries NV Class A | 19,215 | 1,201 | |||||||||
Real Estate (0.1%): | |||||||||||
Crown Castle International Corp. | 12,489 | 2,082 | |||||||||
Total Common Stocks (Cost $29,218) | 28,445 | ||||||||||
Preferred Stocks (3.3%) | |||||||||||
Communication Services (0.3%): | |||||||||||
Qwest Corp., 6.50%, 9/1/56 | 192,291 | 4,711 | |||||||||
Consumer Staples (1.8%): | |||||||||||
CHS, Inc., cumulative redeemable, Series 1, 7.88% (l) | 180,612 | 4,949 | |||||||||
| CHS, Inc., cumulative redeemable, Series 2, 7.10% (LIBOR03M+429bps) (c) (l) | 371,899 | 9,372 | |||||||||
Dairy Farmers of America, Inc., cumulative redeemable, 7.88% (a) (l) | 200,000 | 17,599 | |||||||||
31,920 | |||||||||||
Energy (0.9%): | |||||||||||
NuStar Logistics LP, 7.01% (LIBOR03M+673bps), 1/15/43 (g) | 858,521 | 17,291 | |||||||||
Financials (0.1%): | |||||||||||
| American Overseas Group Ltd., non-cumulative, Series A (LIBOR03M+356bps), 12/15/66 (c) (h) (i) | 3,000 | 750 | |||||||||
U.S. Bancorp, non-cumulative, Series A, 3.50% (LIBOR03M+102bps) (l) | 3,099 | 2,597 | |||||||||
3,347 | |||||||||||
Real Estate (0.2%): | |||||||||||
Equity Residential, cumulative redeemable, Series K, 8.29% (l) | 45,314 | 2,877 | |||||||||
Prologis, Inc., cumulative redeemable, Series Q, 8.54% (l) | 5,310 | 392 | |||||||||
3,269 | |||||||||||
Total Preferred Stocks (Cost $67,531) | 60,538 | ||||||||||
Senior Secured Loans (2.4%) | |||||||||||
| Abe Investment Holdings, Inc., 1st Lien Term Loan B, 4.69% (LIBOR01M+450bps), 2/19/26 (c) | $ | 2,927 | 2,634 | ||||||||
Avaya, Inc., 1st Lien Term Loan B, 4.42% (LIBOR01M+425bps), 12/15/24 (c) | 2,691 | 2,539 | |||||||||
Bass Pro Group LLC, Term Loan B, 6.07% (LIBOR06M+500bps), 12/16/23 (c) | 4,926 | 4,893 | |||||||||
| Cengage Learning, Inc., 1st Lien Term Loan B, 5.25% (LIBOR06M+425bps), 6/7/23 (c) | 2,873 | 2,325 | |||||||||
Chesapeake Energy Corp., 6/9/24 (c) (m) (n) (u) | 3,000 | 1,468 | |||||||||
CITGO Petroleum Corp., 6.00% (LIBOR06M+500bps), 3/22/24 (c) | 2,161 | 2,084 | |||||||||
| Envision Healthcare Corp., 1st Lien Term Loan B, 3.93% (LIBOR01M+375bps), 10/11/25 (c) | 2,925 | 1,918 | |||||||||
See notes to financial statements.
10
| USAA Mutual Funds Trust USAA High Income Fund | Schedule of Portfolio Investments — continued July 31, 2020 | ||||||
(Amounts in Thousands, Except for Shares)
Security Description | Principal Amount | Value | |||||||||
| H-Food Holdings LLC, 1st Lien Term Loan, 3.87% (LIBOR01M+369bps), 5/31/25 (c) | $ | 1,990 | $ | 1,918 | |||||||
| Lealand Finance Co. BV, 1st Lien Term Loan, 3.17% (LIBOR01M+300bps), 6/30/24 (c) | 39 | 35 | |||||||||
| Lucid Energy Group II Borrower LLC, 1st Lien Term Loan, 4.00% (LIBOR01M+300bps), 2/18/25 (c) | 1,940 | 1,644 | |||||||||
| Mallinckrodt International Finance SA, 1st Lien Term Loan B, 3.50% (LIBOR06M+275bps), 9/24/24 (c) | 2,295 | 1,912 | |||||||||
| McDermott Technology Americas, Inc., 1st Lien Term Loan B, 9.25% (Prime+600bps), 5/10/25 (c) (i) | 1,987 | 716 | |||||||||
Mitchell International, Inc., 7.43% (LIBOR01M+725bps), 12/1/25 (c) | 5,000 | 4,500 | |||||||||
| PFC Acquisition Corp., 1st Lien Term Loan B, 6.67% (LIBOR01M+650bps), 3/1/26 (c) | 2,963 | 1,955 | |||||||||
| Pregis TopCo Corp., 1st Lien Term Loan B, 4.18% (LIBOR01M+400bps), 7/25/26 (c) | 1,493 | 1,462 | |||||||||
Quicksilver Resources, Inc., 6/21/19 (c) (h) (i) (u) | 3,993 | 6 | |||||||||
| Team Health Holdings, Inc., 1st Lien Term Loan B, 3.75% (LIBOR01M+275bps), 2/6/24 (c) | 5,939 | 4,692 | |||||||||
Veritas US, Inc., 1st Lien Term Loan B, 5.50% (LIBOR03M+450bps), 1/27/23 (c) | 1,593 | 1,521 | |||||||||
| Versant Health Holdco, Inc., 2nd Lien Term Loan, 7.75% (LIBOR01M+675bps), 12/1/25 (c) | 4,500 | 4,312 | |||||||||
| WaterBridge Midstream Operating LLC, 1st Lien Term Loan B, 6.75% (LIBOR06M+575bps), 6/21/26 (c) | 1,983 | 1,643 | |||||||||
44,177 | |||||||||||
Total Senior Secured Loans (Cost $55,366) | 44,177 | ||||||||||
Corporate Bonds (68.9%) | |||||||||||
Communication Services (12.6%): | |||||||||||
| CCO Holdings LLC/CCO Holdings Capital Corp. 4.75%, 3/1/30, Callable 9/1/24 @ 102.38 (a) | 30,000 | 32,056 | |||||||||
4.50%, 8/15/30, Callable 2/15/25 @ 102.25 (a) | 5,000 | 5,304 | |||||||||
| CenturyLink, Inc. 7.50%, 4/1/24, Callable 1/1/24 @ 100 | 5,000 | 5,652 | |||||||||
7.65%, 3/15/42 | 6,621 | 7,560 | |||||||||
| Cincinnati Bell, Inc. 7.00%, 7/15/24, Callable 9/10/20 @ 105.25 (a) | 6,000 | 6,199 | |||||||||
8.00%, 10/15/25, Callable 10/15/20 @ 106 (a) | 4,000 | 4,240 | |||||||||
| Clear Channel Worldwide Holdings, Inc., 5.13%, 8/15/27, Callable 8/15/22 @ 102.56 (a) | 1,667 | 1,641 | |||||||||
| CSC Holdings LLC 5.38%, 2/1/28, Callable 2/1/23 @ 102.69 (a) | 1,000 | 1,085 | |||||||||
7.50%, 4/1/28, Callable 4/1/23 @ 103.75 (a) | 3,000 | 3,454 | |||||||||
6.50%, 2/1/29, Callable 2/1/24 @ 103.25 (a) | 4,500 | 5,151 | |||||||||
5.75%, 1/15/30, Callable 1/15/25 @ 102.88 (a) | 11,000 | 12,204 | |||||||||
| Dish DBS Corp. 5.00%, 3/15/23 | 5,000 | 5,219 | |||||||||
5.88%, 11/15/24 | 4,000 | 4,185 | |||||||||
See notes to financial statements.
11
| USAA Mutual Funds Trust USAA High Income Fund | Schedule of Portfolio Investments — continued July 31, 2020 | ||||||
(Amounts in Thousands, Except for Shares)
Security Description | Principal Amount | Value | |||||||||
7.75%, 7/1/26 | $ | 7,000 | $ | 7,856 | |||||||
7.38%, 7/1/28, Callable 7/1/23 @ 103.69 (a) | 2,000 | 2,121 | |||||||||
Embarq Corp., 8.00%, 6/1/36 | 5,000 | 5,917 | |||||||||
| Frontier Communications Corp. 11.00%, 9/15/25, Callable 6/15/25 @ 100 (m) (n) | 4,500 | 1,574 | |||||||||
8.50%, 4/1/26, Callable 4/1/21 @ 106.38 (a) (e) (m) (n) | 4,000 | 3,943 | |||||||||
9.00%, 8/15/31 (m) (n) | 8,500 | 2,618 | |||||||||
Getty Images, Inc., 9.75%, 3/1/27, Callable 3/1/22 @ 104.88 (a) (e) | 1,500 | 1,406 | |||||||||
| Iheartcommunications, Inc. 6.38%, 5/1/26, Callable 5/1/22 @ 103.19 (e) | 394 | 417 | |||||||||
8.38%, 5/1/27, Callable 5/1/22 @ 104.19 | 3,714 | 3,706 | |||||||||
Lamar Media Corp., 4.88%, 1/15/29, Callable 1/15/24 @ 102.44 (a) | 1,000 | 1,052 | |||||||||
Match Group Holdings II LLC, 4.63%, 6/1/28, Callable 6/1/23 @ 102.31 (a) | 2,000 | 2,112 | |||||||||
Meredith Corp., 6.88%, 2/1/26, Callable 2/1/21 @ 103.44 | 5,000 | 4,347 | |||||||||
National CineMedia LLC, 5.75%, 8/15/26, Callable 8/15/21 @ 102.88 | 2,000 | 1,298 | |||||||||
| Netflix, Inc. 3.63%, 6/15/25, Callable 3/15/25 @ 100 (a) | 3,000 | 3,188 | |||||||||
4.88%, 4/15/28 | 5,000 | 5,813 | |||||||||
4.88%, 6/15/30, Callable 3/15/30 @ 100 (a) | 5,500 | 6,468 | |||||||||
Nexstar Escrow, Inc., 5.63%, 7/15/27, Callable 7/15/22 @ 104.22 (a) | 4,000 | 4,284 | |||||||||
| Radiate Holdco LLC/Radiate Finance, Inc., 6.88%, 2/15/23, Callable 9/10/20 @ 103.44 (a) | 3,000 | 3,036 | |||||||||
Salem Media Group, Inc., 6.75%, 6/1/24, Callable 9/10/20 @ 103.38 (a) (e) | 4,500 | 3,885 | |||||||||
Scripps Escrow, Inc., 5.88%, 7/15/27, Callable 7/15/22 @ 104.41 (a) | 1,000 | 1,004 | |||||||||
| Sinclair Television Group, Inc., 5.50%, 3/1/30, Callable 12/1/24 @ 102.75 (a) (e) | 8,000 | 7,998 | |||||||||
| Sprint Corp. 7.63%, 2/15/25, Callable 11/15/24 @ 100 (g) | 15,000 | 18,229 | |||||||||
7.63%, 3/1/26, Callable 11/1/25 @ 100 | 10,000 | 12,510 | |||||||||
| T-Mobile USA, Inc. 6.00%, 4/15/24, Callable 8/21/20 @ 102.25 | 5,000 | 5,114 | |||||||||
4.75%, 2/1/28, Callable 2/1/23 @ 102.38 | 10,000 | 10,842 | |||||||||
| Trilogy International Partners LLC/Trilogy International Finance, Inc., 8.88%, 5/1/22, Callable 9/10/20 @ 102.22 (a) (e) | 2,500 | 2,311 | |||||||||
Univision Communications, Inc., 9.50%, 5/1/25, Callable 5/1/22 @ 104.75 (a) | 3,000 | 3,274 | |||||||||
| Zayo Group Holdings, Inc. 4.00%, 3/1/27, Callable 3/1/21 @ 102 (a) | 1,500 | 1,502 | |||||||||
6.13%, 3/1/28, Callable 3/1/23 @ 103.06 (a) | 5,000 | 5,163 | |||||||||
| Zayo Group LLC/Zayo Capital, Inc. 6.38%, 5/15/25, Callable 9/10/20 @ 103.19 (e) | 5,000 | 4,850 | |||||||||
5.75%, 1/15/27, Callable 1/15/22 @ 102.88 (a) | 500 | 492 | |||||||||
232,280 | |||||||||||
Consumer Discretionary (7.8%): | |||||||||||
Asbury Automotive Group, Inc., 4.75%, 3/1/30, Callable 3/1/25 @ 102.38 (a) | 54 | 55 | |||||||||
| Ashton Woods USA LLC/Ashton Woods Finance Co. 6.75%, 8/1/25, Callable 9/10/20 @ 105.06 (a) | 4,000 | 4,078 | |||||||||
9.88%, 4/1/27, Callable 4/1/22 @ 107.41 (a) | 2,000 | 2,146 | |||||||||
Beazer Homes USA, Inc., 7.25%, 10/15/29, Callable 10/15/24 @ 103.63 | 6,300 | 6,785 | |||||||||
Boyd Gaming Corp., 4.75%, 12/1/27, Callable 12/1/22 @ 102.38 (a) | 2,175 | 2,088 | |||||||||
See notes to financial statements.
12
| USAA Mutual Funds Trust USAA High Income Fund | Schedule of Portfolio Investments — continued July 31, 2020 | ||||||
(Amounts in Thousands, Except for Shares)
Security Description | Principal Amount | Value | |||||||||
| Caesars Resort Collection LLC/CRC Finco, Inc., 5.25%, 10/15/25, Callable 10/15/20 @ 102.63 (a) | $ | 3,000 | $ | 2,702 | |||||||
| Clarios Global LP/Clarios US Finance Co., 8.50%, 5/15/27, Callable 5/15/22 @ 104.25 (a) | 7,500 | 7,895 | |||||||||
Cooper-Standard Automotive, Inc., 13.00%, 6/1/24, Callable 6/1/22 @ 106.5 (a) | 500 | 533 | |||||||||
| Ford Motor Co. 8.50%, 4/21/23 (g) | 3,000 | 3,331 | |||||||||
9.00%, 4/22/25, Callable 3/22/25 @ 100 (g) | 3,000 | 3,534 | |||||||||
6.63%, 10/1/28 | 13,000 | 14,181 | |||||||||
Golden Nugget, Inc., 8.75%, 10/1/25, Callable 10/1/20 @ 104.38 (a) (g) | 2,000 | 1,048 | |||||||||
GPC Merger Sub, Inc., 7.13%, 8/15/28, Callable 8/15/23 @ 103.56 (a) (o) | 3,500 | 3,646 | |||||||||
| Hilton Domestic Operating Co., Inc., 5.38%, 5/1/25, Callable 5/1/22 @ 102.69 (a) | 100 | 105 | |||||||||
Hyatt Hotels Corp., 5.75%, 4/23/30, Callable 1/23/30 @ 100 | 3,000 | 3,405 | |||||||||
L Brands, Inc., 6.95%, 3/1/33 | 3,000 | 2,604 | |||||||||
LGI Homes, Inc., 6.88%, 7/15/26, Callable 7/15/21 @ 103.44 (a) (g) | 2,500 | 2,663 | |||||||||
M/I Homes, Inc., 4.95%, 2/1/28, Callable 2/1/23 @ 103.71 | 4,500 | 4,643 | |||||||||
Marriott International, Inc., 5.75%, 5/1/25, Callable 4/1/25 @ 100 (g) | 1,227 | 1,364 | |||||||||
| Marriott Ownership Resorts, Inc., 4.75%, 1/15/28, Callable 9/15/22 @ 102.38 (a) | 2,000 | 1,845 | |||||||||
Mattel, Inc., 6.75%, 12/31/25, Callable 12/31/20 @ 105.06 (a) | 5,185 | 5,534 | |||||||||
MGM Resorts International, 6.75%, 5/1/25, Callable 5/1/22 @ 103.38 | 5,000 | 5,187 | |||||||||
| Midas Intermediate Holdco II LLC/Midas Intermediate Holdco II Finance, Inc., 7.88%, 10/1/22, Callable 8/26/20 @ 100 (a) (e) | 4,283 | 3,349 | |||||||||
| NCL Corp. Ltd. 12.25%, 5/15/24, Callable 2/15/24 @ 100 (a) | 1,000 | 1,088 | |||||||||
3.63%, 12/15/24, Callable 12/15/21 @ 101.81 (a) | 1,000 | 659 | |||||||||
10.25%, 2/1/26, Callable 8/1/23 @ 105.13 (a) | 1,000 | 995 | |||||||||
Newell Brands, Inc., 5.62%, 4/1/36, Callable 10/1/35 @ 100 (p) | 3,500 | 3,944 | |||||||||
| Northwest Fiber LLC/Northwest Fiber Finance Sub, Inc., 10.75%, 6/1/28, Callable 6/1/23 @ 105.38 (a) | 1,000 | 1,087 | |||||||||
| PetSmart, Inc. 7.13%, 3/15/23, Callable 9/10/20 @ 101.78 (a) | 3,000 | 3,029 | |||||||||
8.88%, 6/1/25, Callable 8/21/20 @ 104.44 (a) (e) | 3,000 | 3,126 | |||||||||
| Scientific Games International, Inc., 8.25%, 3/15/26, Callable 3/15/22 @ 104.13 (a) | 5,000 | 4,992 | |||||||||
Service Corp. International, 5.13%, 6/1/29, Callable 6/1/24 @ 102.56 (g) | 3,500 | 3,886 | |||||||||
| Taylor Morrison Communities, Inc., 5.75%, 1/15/28, Callable 10/15/27 @ 100 (a) | 5,000 | 5,613 | |||||||||
Tesla, Inc., 5.30%, 8/15/25, Callable 9/10/20 @ 103.98 (a) | 7,000 | 7,241 | |||||||||
Trident TPI Holdings, Inc., 6.63%, 11/1/25, Callable 11/1/20 @ 103.31 (a) | 3,000 | 2,946 | |||||||||
| USA Compression Partners LP/USA Compression Finance Corp., 6.88%, 9/1/27, Callable 9/1/22 @ 105.16 | 3,000 | 3,044 | |||||||||
Vail Resorts, Inc., 6.25%, 5/15/25, Callable 5/15/22 @ 103.13 (a) | 500 | 538 | |||||||||
| Weekley Homes LLC/Weekley Finance Corp., 6.63%, 8/15/25, Callable 9/10/20 @ 104.97 | 5,000 | 5,199 | |||||||||
| Williams Scotsman International, Inc., 6.88%, 8/15/23, Callable 9/10/20 @ 103.44 (a) | 3,000 | 3,109 | |||||||||
Wolverine World Wide, Inc., 6.38%, 5/15/25, Callable 5/15/22 @ 103.19 (a) | 2,500 | 2,642 | |||||||||
| Wynn Resorts Finance LLC/Wynn Resorts Capital Corp., 5.13%, 10/1/29, Callable 7/1/29 @ 100 (a) | 3,000 | 2,889 | |||||||||
Yum! Brands, Inc., 4.75%, 1/15/30, Callable 10/15/29 @ 100 (a) | 4,000 | 4,338 | |||||||||
143,086 | |||||||||||
See notes to financial statements.
13
| USAA Mutual Funds Trust USAA High Income Fund | Schedule of Portfolio Investments — continued July 31, 2020 | ||||||
(Amounts in Thousands, Except for Shares)
Security Description | Principal Amount | Value | |||||||||
Consumer Staples (4.3%): | |||||||||||
| Albertsons Cos., Inc./Safeway, Inc./New Albertsons LP/Albertsons LLC, 5.75%, 3/15/25, Callable 9/10/20 @ 104.31 | $ | 12,000 | $ | 12,397 | |||||||
Coty, Inc., 6.50%, 4/15/26, Callable 4/15/21 @ 104.88 (a) | 5,000 | 3,894 | |||||||||
Edgewell Personal Care Co., 5.50%, 6/1/28, Callable 6/1/23 @ 102.75 (a) | 1,000 | 1,082 | |||||||||
| Energizer Holdings, Inc. 6.38%, 7/15/26, Callable 7/15/21 @ 103.19 (a) | 500 | 533 | |||||||||
7.75%, 1/15/27, Callable 1/15/22 @ 103.88 (a) | 3,000 | 3,335 | |||||||||
4.75%, 6/15/28, Callable 6/15/23 @ 102.38 (a) | 250 | 268 | |||||||||
| H-Food Holdings LLC/Hearthside Finance Co., Inc., 8.50%, 6/1/26, Callable 6/1/21 @ 104.25 (a) | 4,000 | 3,798 | |||||||||
JBS Investments II GMBH, 5.75%, 1/15/28, Callable 7/15/22 @ 102.88 (a) | 1,500 | 1,594 | |||||||||
| JBS USA LUX SA/JBS USA Finance, Inc., 5.88%, 7/15/24, Callable 9/10/20 @ 101.96 (a) | 3,000 | 3,063 | |||||||||
| Kraft Heinz Foods Co. 4.63%, 1/30/29, Callable 10/30/28 @ 100 | 15,000 | 17,076 | |||||||||
4.25%, 3/1/31, Callable 12/1/30 @ 100 (a) | 1,500 | 1,653 | |||||||||
4.38%, 6/1/46, Callable 12/1/45 @ 100 | 10,000 | 10,409 | |||||||||
Lamb Weston Holdings, Inc., 4.88%, 5/15/28, Callable 11/15/27 @ 100 (a) | 500 | 560 | |||||||||
NBM US Holdings, Inc., 6.63%, 8/6/29, Callable 8/6/24 @ 103.31 (a) (e) | 3,000 | 3,273 | |||||||||
Pilgrim's Pride Corp., 5.88%, 9/30/27, Callable 9/30/22 @ 102.94 (a) | 3,000 | 3,175 | |||||||||
| Post Holdings, Inc. 5.75%, 3/1/27, Callable 3/1/22 @ 102.88 (a) | 3,000 | 3,195 | |||||||||
5.50%, 12/15/29, Callable 12/15/24 @ 102.75 (a) | 2,500 | 2,744 | |||||||||
4.63%, 4/15/30, Callable 4/15/25 @ 102.31 (a) | 3,000 | 3,156 | |||||||||
Spectrum Brands, Inc., 5.50%, 7/15/30, Callable 7/15/25 @ 102.75 (a) | 500 | 520 | |||||||||
U.S. Foods, Inc., 6.25%, 4/15/25, Callable 4/15/22 @ 103.13 (a) | 3,000 | 3,218 | |||||||||
78,943 | |||||||||||
Energy (8.0%): | |||||||||||
| Alliance Resource Operating Partners LP/Alliance Resource Finance Corp., 7.50%, 5/1/25, Callable 9/10/20 @ 105.63 (a) (e) | 3,000 | 2,099 | |||||||||
Apache Corp., 4.38%, 10/15/28, Callable 7/15/28 @ 100 (e) | 10,000 | 9,985 | |||||||||
| Blue Racer Midstream LLC/Blue Racer Finance Corp., 6.13%, 11/15/22, Callable 9/10/20 @ 101.53 (a) | 3,000 | 2,977 | |||||||||
Buckeye Partners LP, 5.60%, 10/15/44, Callable 4/15/44 @ 100 | 10,754 | 9,627 | |||||||||
Carrizo Oil & Gas, Inc., 8.25%, 7/15/25, Callable 9/10/20 @ 106.19 | 3,000 | 921 | |||||||||
Citgo Holding, Inc., 9.25%, 8/1/24, Callable 8/1/21 @ 104.63 (a) | 1,000 | 1,003 | |||||||||
Citgo Petroleum Corp., 6.25%, 8/15/22, Callable 9/10/20 @ 100 (a) | 1,875 | 1,883 | |||||||||
CONSOL Energy, Inc., 11.00%, 11/15/25, Callable 11/15/21 @ 105.5 (a) | 5,000 | 2,073 | |||||||||
| CSI Compressco LP/CSI Compressco Finance, Inc., 7.50%, 4/1/25, Callable 4/1/21 @ 105.63 (a) | 1,163 | 998 | |||||||||
| CSI Compressco LP/CSI Compressco Finance, Inc. PIK, 10.00%, 4/1/26, Callable 4/1/23 @ 107.5 (a) (q) | 3,614 | 2,223 | |||||||||
| Endeavor Energy Resources LP/EER Finance, Inc., 6.63%, 7/15/25, Callable 7/15/22 @ 103.31 (a) | 2,000 | 2,102 | |||||||||
| Energy Transfer Operating LP 7.12% (H15T5Y+531bps), Callable 5/15/30 @ 100 (c) (l) | 3,000 | 2,491 | |||||||||
3.70% (LIBOR03M+302bps), 11/1/66, Callable 9/10/20 @ 100 (c) | 3,000 | 1,452 | |||||||||
| Enlink Midstream Partners LP, 6.00% (LIBOR03M+411bps), Callable 12/15/22 @ 100 (c) (l) | 6,500 | 2,472 | |||||||||
See notes to financial statements.
14
| USAA Mutual Funds Trust USAA High Income Fund | Schedule of Portfolio Investments — continued July 31, 2020 | ||||||
(Amounts in Thousands, Except for Shares)
Security Description | Principal Amount | Value | |||||||||
| Enterprise Products Operating LLC, 3.13% (LIBOR03M+278bps), 6/1/67, Callable 9/10/20 @ 100 (c) | $ | 3,000 | $ | 2,260 | |||||||
| Enterprise TE Partners LP, 3.13% (LIBOR03M+278bps), 6/1/67, Callable 9/10/20 @ 100 (c) | 3,000 | 2,190 | |||||||||
EQT Corp., 7.00%, 2/1/30, Callable 11/1/29 @ 100 | 1,000 | 1,159 | |||||||||
GenOn Energy, Inc., 9.88%, 10/15/20 (h) (i) (m) | 7,000 | — | |||||||||
Hess Midstream Partners LP, 5.13%, 6/15/28, Callable 6/15/23 @ 102.56 (a) | 3,000 | 3,050 | |||||||||
Highpoint Operating Corp., 7.00%, 10/15/22, Callable 9/10/20 @ 101.17 | 3,000 | 755 | |||||||||
| Hilcorp Energy I LP/Hilcorp Finance Co., 6.25%, 11/1/28, Callable 11/1/23 @ 103.13 (a) | 3,000 | 2,783 | |||||||||
Laredo Petroleum, Inc., 10.13%, 1/15/28, Callable 1/15/23 @ 107.59 (e) | 1,500 | 1,062 | |||||||||
| Martin Midstream Partners LP/Martin Midstream Finance Corp., 7.25%, 2/15/21, Callable 9/10/20 @ 100 | 3,500 | 2,783 | |||||||||
MPLX LP, 6.87% (LIBOR03M+465bps), Callable 2/15/23 @ 100 (c) (e) (l) | 5,000 | 4,376 | |||||||||
| Murphy Oil Corp. 6.88%, 8/15/24, Callable 9/10/20 @ 103.44 | 4,000 | 4,011 | |||||||||
5.75%, 8/15/25, Callable 9/10/20 @ 104.31 | 3,000 | 2,825 | |||||||||
Newfield Exploration Co., 5.63%, 7/1/24 | 2,000 | 1,996 | |||||||||
Noble Energy, Inc., 7.25%, 10/15/23 | 2,000 | 2,357 | |||||||||
| Occidental Petroleum Corp. 2.90%, 8/15/24, Callable 7/15/24 @ 100 | 6,000 | 5,646 | |||||||||
8.50%, 7/15/27, Callable 1/15/27 @ 100 | 5,000 | 5,567 | |||||||||
8.88%, 7/15/30, Callable 1/15/30 @ 100 | 5,000 | 5,631 | |||||||||
5.25%, 10/10/36 (r) | 3,500 | 1,529 | |||||||||
Ovintiv, Inc., 6.63%, 8/15/37 | 2,000 | 1,820 | |||||||||
| PBF Holding Co. LLC/PBF Finance Corp., 7.25%, 6/15/25, Callable 9/10/20 @ 105.44 | 4,000 | 3,619 | |||||||||
PDC Energy, Inc., 5.75%, 5/15/26, Callable 5/15/21 @ 104.31 (e) | 1,500 | 1,503 | |||||||||
Petroleos Mexicanos, 6.63%, 6/15/35 | 15,000 | 12,835 | |||||||||
Range Resources Corp., 4.88%, 5/15/25, Callable 2/15/25 @ 100 | 2,000 | 1,673 | |||||||||
Rex Energy Corp., 8.00%, 10/1/20 (i) (m) | 2,408 | 18 | |||||||||
| Southern Union Co., 3.70% (LIBOR03M+302bps), 11/1/66, Callable 9/10/20 @ 100 (c) | 2,000 | 901 | |||||||||
| Southwestern Energy Co. 6.20%, 1/23/25, Callable 10/23/24 @ 100 (p) | 2,000 | 1,859 | |||||||||
7.75%, 10/1/27, Callable 10/1/22 @ 103.88 (e) | 1,000 | 941 | |||||||||
SRC Energy, Inc., 6.25%, 12/1/25, Callable 12/1/20 @ 104.69 | 7,000 | 6,090 | |||||||||
| Tallgrass Energy Partners LP/Tallgras Energy Finance Corp., 6.00%, 3/1/27, Callable 3/1/23 @ 103 (a) | 3,000 | 2,718 | |||||||||
| Targa Resources Partners LP/Targa Resources Partners Finance Corp., 5.00%, 1/15/28, Callable 1/15/23 @ 102.5 | 10,000 | 10,203 | |||||||||
| Teekay Offshore Partners LP/Teekay Offshore Finance Corp., 8.50%, 7/15/23, Callable 8/26/20 @ 104.25 (a) | 1,500 | 1,312 | |||||||||
Western Midstream Operating LP, 5.25%, 2/1/50, Callable 8/1/49 @ 100 (p) | 7,000 | 6,895 | |||||||||
WPX Energy, Inc., 5.88%, 6/15/28, Callable 6/15/23 @ 102.94 | 3,000 | 3,057 | |||||||||
147,730 | |||||||||||
Financials (9.2%): | |||||||||||
Adient Global Holdings Corp., 4.88%, 8/15/26, Callable 8/15/21 @ 102.44 (a) | 10,000 | 9,356 | |||||||||
AmTrust Financial Services, Inc., 6.13%, 8/15/23 | 10,000 | 9,020 | |||||||||
AmWINS Group, Inc., 7.75%, 7/1/26, Callable 7/1/21 @ 105.81 (a) | 4,000 | 4,404 | |||||||||
See notes to financial statements.
15
| USAA Mutual Funds Trust USAA High Income Fund | Schedule of Portfolio Investments — continued July 31, 2020 | ||||||
(Amounts in Thousands, Except for Shares)
Security Description | Principal Amount | Value | |||||||||
Ares Capital Corp., 3.88%, 1/15/26, Callable 12/15/25 @ 100 | $ | 2,000 | $ | 2,026 | |||||||
Banc of California, Inc., 5.25%, 4/15/25, Callable 1/15/25 @ 100 | 5,000 | 5,187 | |||||||||
| Cadence Bancorp, 4.75% (LIBOR03M+303bps), 6/30/29, Callable 6/30/24 @ 100 (c) | 2,000 | 1,693 | |||||||||
| Credit Acceptance Corp. 5.13%, 12/31/24, Callable 12/31/21 @ 102.56 (a) | 4,000 | 4,070 | |||||||||
6.63%, 3/15/26, Callable 3/15/22 @ 103.31 | 9,750 | 10,245 | |||||||||
First Midwest Bancorp, Inc., 5.88%, 9/29/26, Callable 8/29/26 @ 100 | 5,000 | 5,459 | |||||||||
| Flex Acquisition Co., Inc. 6.88%, 1/15/25, Callable 9/10/20 @ 103.44 (a) | 3,150 | 3,205 | |||||||||
7.88%, 7/15/26, Callable 7/15/21 @ 103.94 (a) | 2,000 | 2,077 | |||||||||
Ford Motor Credit Co. LLC, 5.11%, 5/3/29, Callable 2/3/29 @ 100 | 15,000 | 16,055 | |||||||||
FS KKR Capital Corp. II, 4.25%, 2/14/25, Callable 1/14/25 @ 100 (a) | 3,000 | 2,712 | |||||||||
| Genworth Holdings, Inc., 2.39% (LIBOR03M+200bps), 11/15/66, Callable 8/26/20 @ 100 (c) | 3,000 | 1,012 | |||||||||
HUB International Ltd., 7.00%, 5/1/26, Callable 5/1/21 @ 103.5 (a) | 5,000 | 5,314 | |||||||||
ILFC E-Capital Trust II, 3.27%, 12/21/65, Callable 9/10/20 @ 100 (a) (p) | 5,362 | 2,735 | |||||||||
| LABL Escrow Issuer LLC 6.75%, 7/15/26, Callable 7/15/22 @ 103.38 (a) | 1,000 | 1,080 | |||||||||
10.50%, 7/15/27, Callable 7/15/22 @ 105.25 (a) (g) | 3,000 | 3,271 | |||||||||
Lehman Brothers Holdings, 5.75%, 4/25/11, MTN (i) (m) | 1,000 | 12 | |||||||||
Lehman Brothers Treasury Co. BV, MTN (l) (s) | 1,447 | 15 | |||||||||
Level 3 Financing, Inc., 4.25%, 7/1/28, Callable 7/1/23 @ 102.13 (a) | 2,917 | 3,045 | |||||||||
MetLife, Inc., 10.75%, 8/1/69, Callable 8/1/34 @ 100 | 2,000 | 3,202 | |||||||||
MUFG Americas Holdings Corp., 3.00%, 2/10/25, Callable 1/10/25 @ 100 | 1,000 | 1,086 | |||||||||
| Navient Corp. 6.75%, 6/25/25 | 7,000 | 7,323 | |||||||||
6.75%, 6/15/26 | 5,000 | 5,178 | |||||||||
5.63%, 8/1/33, MTN | 10,000 | 8,487 | |||||||||
| New York Community Bancorp, Inc., 5.90% (LIBOR03M+278bps), 11/6/28, Callable 11/6/23 @ 100 (c) (e) | 1,000 | 980 | |||||||||
| OneMain Finance Corp. 8.88%, 6/1/25, Callable 6/1/22 @ 104.44 | 1,500 | 1,696 | |||||||||
7.13%, 3/15/26 | 9,000 | 10,562 | |||||||||
6.63%, 1/15/28, Callable 7/15/27 @ 100 | 1,000 | 1,145 | |||||||||
5.38%, 11/15/29, Callable 5/15/29 @ 100 | 3,500 | 3,717 | |||||||||
| PPL Capital Funding, Inc., 2.97% (LIBOR03M+267bps), 3/30/67, Callable 9/10/20 @ 100 (c) | 5,000 | 3,763 | |||||||||
Resideo Funding, Inc., 6.13%, 11/1/26, Callable 11/1/21 @ 104.59 (a) | 1,500 | 1,522 | |||||||||
| Sally Holdings LLC / Sally Capital, Inc., 8.75%, 4/30/25, Callable 4/30/22 @ 104.38 (a) (e) | 3,000 | 3,395 | |||||||||
SBL Holdings, Inc., 5.13%, 11/13/26, Callable 9/13/26 @ 100 (a) | 5,000 | 4,729 | |||||||||
| Synovus Financial Corp., 5.90% (USSW5+338bps), 2/7/29, Callable 2/7/24 @ 100 (c) | 10,000 | 10,061 | |||||||||
The Hanover Insurance Group, Inc., 8.21%, 2/3/27 | 3,780 | 4,609 | |||||||||
| The Hartford Financial Services Group, Inc., 2.52% (LIBOR03M+213bps), 2/12/67, Callable 9/10/20 @ 100 (a) (c) | 2,000 | 1,637 | |||||||||
Zenith National Insurance Capital Trust I, 8.55%, 8/1/28 (a) | 2,000 | 2,532 | |||||||||
167,617 | |||||||||||
See notes to financial statements.
16
| USAA Mutual Funds Trust USAA High Income Fund | Schedule of Portfolio Investments — continued July 31, 2020 | ||||||
(Amounts in Thousands, Except for Shares)
Security Description | Principal Amount | Value | |||||||||
Health Care (7.2%): | |||||||||||
| Bausch Health Cos., Inc. 5.00%, 1/30/28, Callable 1/30/23 @ 102.5 (a) | $ | 4,633 | $ | 4,653 | |||||||
5.25%, 1/30/30, Callable 1/30/25 @ 102.63 (a) | 13,370 | 13,652 | |||||||||
| Centene Corp. 4.63%, 12/15/29, Callable 12/15/24 @ 102.31 | 5,000 | 5,584 | |||||||||
3.38%, 2/15/30, Callable 2/15/25 @ 101.69 | 3,000 | 3,175 | |||||||||
| CHS, Inc. 6.88%, 2/1/22, Callable 9/10/20 @ 100 (e) | 1,239 | 954 | |||||||||
8.00%, 3/15/26, Callable 3/15/22 @ 104 (a) | 20,000 | 20,463 | |||||||||
CHS/Community Health System, 6.63%, 2/15/25, Callable 2/15/22 @ 103.31 (a) | 6,000 | 6,066 | |||||||||
DaVita, Inc., 5.00%, 5/1/25, Callable 8/21/20 @ 102.5 | 5,000 | 5,146 | |||||||||
Eastern Maine Healthcare Systems, 5.02%, 7/1/36 | 3,000 | 3,263 | |||||||||
Encompass Health Corp., 5.75%, 9/15/25, Callable 9/15/20 @ 102.88 | 2,000 | 2,068 | |||||||||
| HCA, Inc. 5.63%, 9/1/28, Callable 3/1/28 @ 100 | 14,500 | 17,301 | |||||||||
3.50%, 9/1/30, Callable 3/1/30 @ 100 | 3,000 | 3,161 | |||||||||
Mednax, Inc., 6.25%, 1/15/27, Callable 1/15/22 @ 104.69 (a) | 5,000 | 5,276 | |||||||||
Molina Healthcare, Inc., 4.38%, 6/15/28, Callable 6/15/23 @ 102.19 (a) | 1,000 | 1,062 | |||||||||
| Ortho-Clinical Diagnostics, Inc./Ortho-Clinical Diagnostics SA 7.38%, 6/1/25, Callable 6/1/22 @ 103.69 (a) (g) | 1,000 | 1,070 | |||||||||
7.25%, 2/1/28, Callable 2/1/23 @ 103.63 (a) | 3,000 | 3,145 | |||||||||
Par Pharmaceutical, Inc., 7.50%, 4/1/27, Callable 4/1/22 @ 105.63 (a) | 5,250 | 5,587 | |||||||||
Select Medical Corp., 6.25%, 8/15/26, Callable 8/15/22 @ 103.13 (a) | 5,000 | 5,386 | |||||||||
| Tenet Healthcare Corp. 6.75%, 6/15/23 | 12,000 | 12,662 | |||||||||
7.00%, 8/1/25, Callable 9/10/20 @ 103.5 (e) | 6,425 | 6,648 | |||||||||
5.13%, 11/1/27, Callable 11/1/22 @ 102.56 (a) | 3,000 | 3,182 | |||||||||
6.88%, 11/15/31 | 3,000 | 2,879 | |||||||||
132,383 | |||||||||||
Industrials (6.3%): | |||||||||||
ADT Security Corp., 4.88%, 7/15/32 (a) (e) | 3,500 | 3,518 | |||||||||
Advanced Drainage Systems, Inc., 5.00%, 9/30/27, Callable 9/30/22 @ 102.5 (a) | 1,000 | 1,029 | |||||||||
Alaska Airlines Pass Through Trust, 4.80%, 2/15/29 (a) | 2,000 | 2,070 | |||||||||
| Avis Budget Car Rental LLC/Avis Budget Finance, Inc., 10.50%, 5/15/25, Callable 5/15/22 @ 107.88 (a) (e) | 2,000 | 2,313 | |||||||||
| Brand Energy & Infrastructure Services, Inc., 8.50%, 7/15/25, Callable 9/10/20 @ 106.34 (a) | 4,000 | 3,700 | |||||||||
Builders FirstSource, Inc., 6.75%, 6/1/27, Callable 6/1/22 @ 103.38 (a) | 3,099 | 3,422 | |||||||||
Clark Equipment Co., 5.88%, 6/1/25, Callable 6/1/22 @ 102.94 (a) | 750 | 786 | |||||||||
Covanta Holding Corp., 5.88%, 7/1/25, Callable 9/10/20 @ 104.41 | 3,000 | 3,136 | |||||||||
| Delta Air Lines, Inc. 7.00%, 5/1/25 (a) | 3,000 | 3,199 | |||||||||
7.38%, 1/15/26, Callable 12/15/25 @ 100 | 2,000 | 1,983 | |||||||||
Gates Global LLC/Gates Corp., 6.25%, 1/15/26, Callable 1/15/22 @ 103.13 (a) | 3,000 | 3,143 | |||||||||
H&E Equipment Services, Inc., 5.63%, 9/1/25, Callable 9/10/20 @ 104.22 | 2,000 | 2,080 | |||||||||
Hillenbrand, Inc., 5.75%, 6/15/25, Callable 6/15/22 @ 102.88 | 1,000 | 1,078 | |||||||||
| Howmet Aerospace, Inc. 6.88%, 5/1/25, Callable 4/1/25 @ 100 (g) | 5,000 | 5,669 | |||||||||
5.95%, 2/1/37 | 5,000 | 5,636 | |||||||||
See notes to financial statements.
17
| USAA Mutual Funds Trust USAA High Income Fund | Schedule of Portfolio Investments — continued July 31, 2020 | ||||||
(Amounts in Thousands, Except for Shares)
Security Description | Principal Amount | Value | |||||||||
IAA, Inc., 5.50%, 6/15/27, Callable 6/15/22 @ 102.75 (a) | $ | 2,250 | $ | 2,398 | |||||||
| Icahn Enterprises LP/Icahn Enterprises Finance Corp., 5.25%, 5/15/27, Callable 11/15/26 @ 100 | 4,000 | 4,211 | |||||||||
JB Poindexter & Co., Inc., 7.13%, 4/15/26, Callable 4/15/21 @ 105.34 (a) | 3,000 | 3,136 | |||||||||
Matthews International Corp., 5.25%, 12/1/25, Callable 12/1/20 @ 103.94 (a) | 3,500 | 3,227 | |||||||||
| Prime Security Services Borrower LLC/Prime Finance, Inc., 6.25%, 1/15/28, Callable 1/15/23 @ 103.13 (a) | 10,000 | 10,425 | |||||||||
RR Donnelley & Sons Co., 8.25%, 7/1/27, Callable 7/1/23 @ 106.19 (e) | 2,850 | 2,817 | |||||||||
Southwest Airlines Co., 5.13%, 6/15/27, Callable 4/15/27 @ 100 | 5,000 | 5,259 | |||||||||
Spirit Airlines Pass Through Trust, 4.10%, 10/1/29 | 2,197 | 1,867 | |||||||||
| Textron Financial Corp., 2.13% (LIBOR03M+174bps), 2/15/42, Callable 8/26/20 @ 100 (a) (c) | 5,000 | 3,318 | |||||||||
Titan International, Inc., 6.50%, 11/30/23, Callable 9/10/20 @ 104.88 | 3,000 | 1,997 | |||||||||
| TransDigm, Inc. 8.00%, 12/15/25, Callable 4/8/22 @ 104 (a) | 500 | 543 | |||||||||
7.50%, 3/15/27, Callable 3/15/22 @ 103.75 | 5,000 | 5,100 | |||||||||
5.50%, 11/15/27, Callable 11/15/22 @ 102.75 | 9,000 | 8,535 | |||||||||
| United Rentals North America, Inc. 5.50%, 5/15/27, Callable 5/15/22 @ 102.75 | 5,000 | 5,382 | |||||||||
4.00%, 7/15/30, Callable 7/15/25 @ 102 (e) | 3,000 | 3,100 | |||||||||
Waste Pro USA, Inc., 5.50%, 2/15/26, Callable 2/15/21 @ 104.13 (a) | 3,000 | 3,058 | |||||||||
WESCO Distribution, Inc., 7.25%, 6/15/28, Callable 6/15/23 @ 103.63 (a) | 1,000 | 1,093 | |||||||||
| XPO Logistics, Inc. 6.75%, 8/15/24, Callable 8/15/21 @ 103.38 (a) | 5,333 | 5,734 | |||||||||
6.25%, 5/1/25, Callable 5/1/22 @ 103.13 (a) | 2,000 | 2,164 | |||||||||
116,126 | |||||||||||
Information Technology (3.1%): | |||||||||||
Boxer Parent Co., Inc., 7.13%, 10/2/25, Callable 6/1/22 @ 103.56 (a) | 3,000 | 3,309 | |||||||||
CDW LLC / CDW Finance Corp., 4.13%, 5/1/25, Callable 5/1/22 @ 102.06 | 2,000 | 2,116 | |||||||||
| Colt Merger Sub, Inc. 6.25%, 7/1/25, Callable 7/1/22 @ 103.13 (a) | 2,000 | 2,086 | |||||||||
5.75%, 7/1/25, Callable 7/1/22 @ 102.88 (a) | 1,000 | 1,044 | |||||||||
| CommScope Technologies LLC 6.00%, 6/15/25, Callable 8/21/20 @ 103 (a) | 6,000 | 6,133 | |||||||||
5.00%, 3/15/27, Callable 3/15/22 @ 102.5 (a) | 12,000 | 11,610 | |||||||||
Dell, Inc., 7.10%, 4/15/28 (e) | 3,000 | 3,631 | |||||||||
Gartner, Inc., 4.50%, 7/1/28, Callable 7/1/23 @ 102.25 (a) | 1,500 | 1,580 | |||||||||
GTT Communications, Inc., 7.88%, 12/31/24, Callable 9/10/20 @ 105.91 (a) | 1,000 | 557 | |||||||||
Itron, Inc., 5.00%, 1/15/26, Callable 1/15/21 @ 102.5 (a) | 1,500 | 1,549 | |||||||||
Microchip Technology, Inc., 4.25%, 9/1/25, Callable 9/1/22 @ 102.13 (a) | 3,000 | 3,142 | |||||||||
NCR Corp., 6.13%, 9/1/29, Callable 9/1/24 @ 103.06 (a) | 3,000 | 3,288 | |||||||||
Solera LLC/Solera Finance, Inc., 10.50%, 3/1/24, Callable 9/10/20 @ 105.25 (a) | 3,500 | 3,703 | |||||||||
Sophia LP/Sophia Finance, Inc., 9.00%, 9/30/23, Callable 9/10/20 @ 102.25 (a) | 6,000 | 6,094 | |||||||||
Western Digital Corp., 4.75%, 2/15/26, Callable 11/15/25 @ 100 (e) | 5,000 | 5,430 | |||||||||
55,272 | |||||||||||
Materials (6.8%): | |||||||||||
Allegheny Ludlum LLC, 6.95%, 12/15/25 | 6,456 | 6,233 | |||||||||
Allegheny Technologies, Inc., 5.88%, 12/1/27, Callable 12/1/22 @ 102.94 (e) | 500 | 475 | |||||||||
| Arconic Corp. 6.00%, 5/15/25, Callable 5/15/22 @ 103 (a) | 2,000 | 2,158 | |||||||||
6.13%, 2/15/28, Callable 2/15/23 @ 103.06 (a) | 1,200 | 1,277 | |||||||||
See notes to financial statements.
18
| USAA Mutual Funds Trust USAA High Income Fund | Schedule of Portfolio Investments — continued July 31, 2020 | ||||||
(Amounts in Thousands, Except for Shares)
Security Description | Principal Amount | Value | |||||||||
| Ardagh Packaging Finance PLC/Ardagh Holdings USA, Inc., 5.25%, 8/15/27, Callable 8/15/22 @ 102.63 (a) | $ | 3,000 | $ | 3,118 | |||||||
| Ardagh Packaging Finance PLC/Holdings USA, Inc., 5.25%, 4/30/25, Callable 4/30/22 @ 102.63 (a) | 700 | 743 | |||||||||
| Axalta Coating Systems LLC/Axalta Coating Systems Dutch Holding B BV, 4.75%, 6/15/27, Callable 6/15/23 @ 102.38 (a) | 1,500 | 1,569 | |||||||||
Berry Global, Inc., 4.88%, 7/15/26, Callable 7/15/22 @ 102.44 (a) (g) | 3,000 | 3,168 | |||||||||
Bway Holding Co., 7.25%, 4/15/25, Callable 9/10/20 @ 103.63 (a) (e) | 9,000 | 8,639 | |||||||||
| Cleveland Cliffs, Inc. 6.38%, 10/15/25, Callable 10/15/20 @ 103.19 (a) (e) | 7,417 | 5,957 | |||||||||
6.75%, 3/15/26, Callable 3/15/22 @ 105.06 (a) | 3,000 | 3,012 | |||||||||
| Compass Minerals International, Inc., 6.75%, 12/1/27, Callable 12/1/22 @ 103.38 (a) | 4,000 | 4,343 | |||||||||
| Freeport-McMoRan, Inc. 4.25%, 3/1/30, Callable 3/1/25 @ 102.13 | 10,000 | 10,453 | |||||||||
5.45%, 3/15/43, Callable 9/15/42 @ 100 | 10,000 | 11,115 | |||||||||
Kaiser Aluminum Corp., 6.50%, 5/1/25, Callable 5/1/22 @ 103.25 (a) | 3,000 | 3,188 | |||||||||
| Kraton Polymers LLC/Kraton Polymers Capital Corp., 7.00%, 4/15/25, Callable 9/10/20 @ 105.25 (a) | 3,000 | 3,113 | |||||||||
| Kronos Acquisition Holdings, Inc., 9.00%, 8/15/23, Callable 9/10/20 @ 102.25 (a) | 7,000 | 7,122 | |||||||||
| New Enterprise Stone & Lime Co., Inc., 6.25%, 3/15/26, Callable 3/15/21 @ 103.13 (a) | 1,000 | 1,030 | |||||||||
Novelis Corp., 4.75%, 1/30/30, Callable 1/30/25 @ 102.38 (a) | 3,000 | 3,133 | |||||||||
Olin Corp., 5.00%, 2/1/30, Callable 2/1/24 @ 102.5 | 5,000 | 4,687 | |||||||||
| Owens-Brockway Glass Container, Inc., 6.63%, 5/13/27, Callable 5/15/23 @ 103.31 (a) | 1,000 | 1,098 | |||||||||
Plastipak Holdings, Inc., 6.25%, 10/15/25, Callable 10/15/20 @ 103.13 (a) | 4,000 | 3,995 | |||||||||
PolyOne Corp., 5.75%, 5/15/25, Callable 5/15/22 @ 102.88 (a) | 3,000 | 3,261 | |||||||||
Reynolds Group Issuer, Inc., 7.00%, 7/15/24, Callable 9/10/20 @ 101.75 (a) | 3,250 | 3,335 | |||||||||
Sealed Air Corp., 6.88%, 7/15/33 (a) | 3,000 | 3,648 | |||||||||
| SunCoke Energy Partners LP/SunCoke Energy Partners Finance Corp., 7.50%, 6/15/25, Callable 9/10/20 @ 105.63 (a) | 5,000 | 4,625 | |||||||||
The Chemours Co., 5.38%, 5/15/27, Callable 2/15/27 @ 100 | 3,000 | 2,939 | |||||||||
Tronox, Inc., 6.50%, 5/1/25, Callable 5/1/22 @ 103.25 (a) | 3,000 | 3,201 | |||||||||
United States Steel Corp., 6.25%, 3/15/26, Callable 3/15/21 @ 103.13 (e) | 7,500 | 5,025 | |||||||||
| Venator Finance SARL/Venator Materials LLC, 5.75%, 7/15/25, Callable 9/10/20 @ 104.31 (a) | 2,000 | 1,489 | |||||||||
Warrior Met Coal LLC, 8.00%, 11/1/24, Callable 11/1/20 @ 104 (a) | 7,000 | 7,182 | |||||||||
124,331 | |||||||||||
Real Estate (1.0%): | |||||||||||
Diversified Healthcare Trust, 9.75%, 6/15/25, Callable 6/15/22 @ 104.88 | 3,000 | 3,311 | |||||||||
| MPT Operating Partnership LP / MPT Finance Corp., 5.00%, 10/15/27, Callable 10/15/22 @ 102.5 | 5,000 | 5,364 | |||||||||
| Outfront Media Capital LLC/Outfront Media Capital Corp. 6.25%, 6/15/25, Callable 6/15/22 @ 103.13 (a) | 2,000 | 2,039 | |||||||||
4.63%, 3/15/30, Callable 3/15/25 @ 102.31 (a) | 1,000 | 937 | |||||||||
Sabra Health Care LP, 5.13%, 8/15/26, Callable 5/15/26 @ 100 | 3,000 | 3,196 | |||||||||
Vertical US Newco, Inc., 5.25%, 7/15/27, Callable 7/15/23 @ 102.63 (a) | 2,000 | 2,103 | |||||||||
See notes to financial statements.
19
| USAA Mutual Funds Trust USAA High Income Fund | Schedule of Portfolio Investments — continued July 31, 2020 | ||||||
(Amounts in Thousands, Except for Shares)
Security Description | Principal Amount | Value | |||||||||
| VICI Properties LP/VICI Note Co., Inc., 4.13%, 8/15/30, Callable 2/15/25 @ 102.06 (a) | $ | 750 | $ | 758 | |||||||
Washington Prime Group LP, 6.45%, 8/15/24, Callable 6/15/24 @ 100 (e) | 2,000 | 781 | |||||||||
18,489 | |||||||||||
Utilities (2.6%): | |||||||||||
| Calpine Corp. 5.75%, 1/15/25, Callable 8/26/20 @ 102.88 | 10,000 | 10,285 | |||||||||
4.50%, 2/15/28, Callable 2/15/23 @ 102.25 (a) | 3,000 | 3,122 | |||||||||
4.63%, 2/1/29, Callable 2/1/24 @ 102.31 (a) (o) | 10,000 | 10,100 | |||||||||
DPL, Inc., 4.13%, 7/1/25, Callable 4/1/25 @ 100 (a) | 1,000 | 1,053 | |||||||||
Genesis Energy LP, 6.50%, 10/1/25, Callable 10/1/20 @ 104.88 | 4,000 | 3,705 | |||||||||
| Genesis Energy LP/Genesis Energy Finance Corp., 7.75%, 2/1/28, Callable 2/1/23 @ 105.81 | 3,500 | 3,374 | |||||||||
| NRG Energy, Inc. 7.25%, 5/15/26, Callable 5/15/21 @ 103.63 | 1,500 | 1,615 | |||||||||
5.75%, 1/15/28, Callable 1/15/23 @ 102.88 | 3,000 | 3,302 | |||||||||
| PG&E Corp. 5.00%, 7/1/28, Callable 7/1/23 @ 102.5 | 1,000 | 1,030 | |||||||||
5.25%, 7/1/30, Callable 7/1/25 @ 102.63 | 2,000 | 2,082 | |||||||||
Talen Energy Supply LLC, 7.25%, 5/15/27, Callable 5/15/22 @ 103.63 (a) | 3,000 | 3,117 | |||||||||
Vistra Operations Co. LLC, 5.00%, 7/31/27, Callable 7/31/22 @ 102.5 (a) | 5,000 | 5,318 | |||||||||
48,103 | |||||||||||
Total Corporate Bonds (Cost $1,227,433) | 1,264,360 | ||||||||||
Yankee Dollar (16.4%) | |||||||||||
Communication Services (2.2%): | |||||||||||
Altice France Holding SA, 6.00%, 2/15/28, Callable 2/15/23 @ 103 (a) | 10,000 | 9,973 | |||||||||
| Altice France SA 7.38%, 5/1/26, Callable 5/1/21 @ 103.69 (a) | 10,000 | 10,657 | |||||||||
8.13%, 2/1/27, Callable 2/1/22 @ 106.09 (a) | 6,000 | 6,702 | |||||||||
| Colombia Telecomunicaciones SA ESP, 4.95%, 7/17/30, Callable 4/17/30 @ 100 (a) | 1,000 | 1,028 | |||||||||
| Digicel International Finance Ltd./Digicel Holdings Bermuda Ltd. 8.75%, 5/25/24, Callable 5/25/21 @ 104.38 (a) (e) | 5,000 | 5,050 | |||||||||
8.75%, 5/25/24, Callable 5/25/21 @ 104.38 (a) (e) | 1,695 | 1,714 | |||||||||
Telecom Italia Capital SA, 7.20%, 7/18/36 | 5,000 | 6,564 | |||||||||
41,688 | |||||||||||
Consumer Discretionary (1.3%): | |||||||||||
| Brookfield Residential Properties, Inc., 6.38%, 5/15/25, Callable 9/10/20 @ 103.19 (a) | 3,000 | 3,049 | |||||||||
| Cirsa Finance International S.A.R.L, 7.88%, 12/20/23, Callable 8/21/20 @ 103.94 (a) | 2,000 | 1,887 | |||||||||
IHO Verwaltungs GmbH PIK, 6.38%, 5/15/29, Callable 5/15/24 @ 103.19 (a) (q) | 3,524 | 3,636 | |||||||||
| International Game Technology PLC 6.50%, 2/15/25, Callable 8/15/24 @ 100 (a) | 3,000 | 3,225 | |||||||||
6.25%, 1/15/27, Callable 7/15/26 @ 100 (a) | 3,000 | 3,194 | |||||||||
Mattamy Group Corp., 4.63%, 3/1/30, Callable 3/1/25 @ 102.31 (a) | 3,000 | 3,055 | |||||||||
Melco Reosrts Finance Ltd., 5.38%, 12/4/29, Callable 12/4/24 @ 102.69 (a) | 3,000 | 2,987 | |||||||||
Wynn Macau Ltd., 5.13%, 12/15/29, Callable 12/15/24 @ 102.56 (a) (e) | 3,000 | 2,929 | |||||||||
23,962 | |||||||||||
See notes to financial statements.
20
| USAA Mutual Funds Trust USAA High Income Fund | Schedule of Portfolio Investments — continued July 31, 2020 | ||||||
(Amounts in Thousands, Except for Shares)
Security Description | Principal Amount | Value | |||||||||
Consumer Staples (1.0%): | |||||||||||
Avon International Capital PLC, 6.50%, 8/15/22, Callable 9/10/20 @ 101.97 (a) | $ | 7,000 | $ | 6,960 | |||||||
| JBS USA LUX SA/JBS USA Finance, Inc., 6.75%, 2/15/28, Callable 2/15/23 @ 103.38 (a) | 6,000 | 6,705 | |||||||||
Minerva Luxembourg SA, 5.88%, 1/19/28, Callable 1/19/23 @ 102.94 (a) | 3,000 | 3,131 | |||||||||
NBM U.S. Holdings, Inc., 7.00%, 5/14/26, Callable 5/14/22 @ 103.5 | 800 | 863 | |||||||||
17,659 | |||||||||||
Energy (1.6%): | |||||||||||
Baytex Energy Corp., 8.75%, 4/1/27, Callable 4/1/23 @ 106.56 (a) | 3,000 | 1,552 | |||||||||
Cenovus Energy, Inc., 5.38%, 7/15/25, Callable 4/15/25 @ 100 (e) | 3,000 | 3,000 | |||||||||
Hunt Oil Co. of Peru LLC Sucursal Del Peru, 6.38%, 6/1/28 (a) (e) | 3,060 | 3,005 | |||||||||
Meg Energy Corp., 7.00%, 3/31/24, Callable 9/10/20 @ 102.33 (a) | 2,000 | 1,905 | |||||||||
Petrobras Global Finance BV, 5.75%, 2/1/29 | 4,093 | 4,427 | |||||||||
Petroleos Maxicanos, 5.95%, 1/28/31, Callable 10/28/30 @ 100 (a) | 3,000 | 2,580 | |||||||||
Petroleos Mexicanos, 6.84%, 1/23/30, Callable 10/23/29 @ 100 (a) | 5,000 | 4,643 | |||||||||
Tecpetrol SA, 4.88%, 12/12/22, Callable 12/12/20 @ 102.44 (a) (e) | 3,000 | 2,917 | |||||||||
Transocean, Inc., 7.50%, 1/15/26, Callable 1/15/21 @ 105.63 (a) | 4,000 | 1,953 | |||||||||
| Transportadora de Gas del Sur SA, 6.75%, 5/2/25, Callable 5/2/22 @ 103.38 (a) (e) | 2,415 | 2,107 | |||||||||
28,089 | |||||||||||
Financials (3.2%): | |||||||||||
Altice Financing SA, 5.00%, 1/15/28, Callable 1/15/23 @ 102.5 (a) | 5,000 | 5,135 | |||||||||
| Banco Santander Mexico SA Institucion de Banca Multiple Grupo Financiero Santand, 5.38%, 4/17/25 (a) | 2,143 | 2,381 | |||||||||
| BBVA Bancomer SA, 5.87% (H15T5Y+431bps), 9/13/34, Callable 9/13/29 @ 100 (a) (c) | 4,500 | 4,424 | |||||||||
| Deutsche Bank AG 4.30% (USSW5+225bps), 5/24/28, Callable 5/24/23 @ 100 (c) | 2,000 | 1,950 | |||||||||
5.88% (SOFR+544bps), 7/8/31, Callable 4/8/30 @ 100 (c) | 4,000 | 4,185 | |||||||||
4.87% (USISDA05+255bps), 12/1/32, Callable 12/1/27 @ 100 (c) | 14,000 | 13,506 | |||||||||
| Intelsat Jackson Holdings SA 5.50%, 8/1/23, Callable 9/10/20 @ 100.92 (e) (m) (n) | 2,000 | 1,253 | |||||||||
8.50%, 10/15/24, Callable 10/15/20 @ 106.38 (a) (m) (n) | 2,000 | 1,319 | |||||||||
Intesa Sanpaolo SpA, 5.71%, 1/15/26 (a) | 5,000 | 5,440 | |||||||||
| Natwest Group PLC, 2.63% (LIBOR03M+232bps), Callable 9/30/27 @ 100 (c) (l) | 5,000 | 4,726 | |||||||||
Rede D'or Finance S.A.R.L, 4.50%, 1/22/30, Callable 10/22/29 @ 100 (a) | 3,000 | 2,687 | |||||||||
| UniCredit SpA, 7.30% (USISDA05+491bps), 4/2/34, Callable 4/2/29 @ 100 (a) (c) | 10,000 | 11,640 | |||||||||
58,646 | |||||||||||
Health Care (1.2%): | |||||||||||
| Bausch Health Cos., Inc. 6.13%, 4/15/25, Callable 9/10/20 @ 103.06 (a) | 5,000 | 5,166 | |||||||||
7.25%, 5/30/29, Callable 5/30/24 @ 103.63 (a) | 5,000 | 5,534 | |||||||||
| Teva Pharmaceutical Finance Netherlands III BV 6.75%, 3/1/28, Callable 12/1/27 @ 100 (e) | 5,000 | 5,550 | |||||||||
4.10%, 10/1/46 | 5,000 | 4,252 | |||||||||
20,502 | |||||||||||
See notes to financial statements.
21
| USAA Mutual Funds Trust USAA High Income Fund | Schedule of Portfolio Investments — continued July 31, 2020 | ||||||
(Amounts in Thousands, Except for Shares)
Security Description | Principal Amount | Value | |||||||||
Industrials (1.3%): | |||||||||||
| AerCap Ireland Capital DAC/AerCap Global Aviation Trust, 3.65%, 7/21/27, Callable 4/21/27 @ 100 | $ | 5,000 | $ | 4,543 | |||||||
Air Canada Pass Through Trust, 4.13%, 11/15/26 (a) | 5,485 | 4,959 | |||||||||
| Bombardier, Inc. 7.50%, 3/15/25, Callable 9/10/20 @ 103.75 (a) | 7,000 | 5,659 | |||||||||
7.88%, 4/15/27, Callable 4/15/22 @ 103.94 (a) | 8,000 | 6,364 | |||||||||
Latam Airlines Pass Through Trust B, 4.50%, 8/15/25 | 2,931 | 1,638 | |||||||||
Norwegian Air Shuttle Pass Through Trust, 7.50%, 5/10/25 (a) | 3,476 | 2,727 | |||||||||
25,890 | |||||||||||
Materials (3.5%): | |||||||||||
Alcoa Nederland Holding, 6.13%, 5/15/28, Callable 5/15/23 @ 103.06 (a) | 4,000 | 4,351 | |||||||||
ArcelorMittal, 7.00%, 10/15/39 | 8,000 | 10,633 | |||||||||
| Ardagh Packaging Finance PLC/Holdings USA, Inc., 6.00%, 2/15/25, Callable 8/21/20 @ 104.5 (a) | 826 | 863 | |||||||||
| Cemex SAB de CV 7.38%, 6/5/27, Callable 6/5/23 @ 103.69 (a) | 1,000 | 1,063 | |||||||||
5.45%, 11/19/29, Callable 11/19/24 @ 102.73 (a) | 3,000 | 2,902 | |||||||||
Eldorado Gold Corp., 9.50%, 6/1/24, Callable 12/1/21 @ 107.13 (a) | 3,000 | 3,281 | |||||||||
| First Quantum Minerals Ltd. 7.50%, 4/1/25, Callable 9/10/20 @ 105.63 (a) | 10,000 | 10,102 | |||||||||
6.88%, 3/1/26, Callable 3/1/21 @ 105.16 (a) | 3,000 | 3,006 | |||||||||
Infrabuild Australia Pty Ltd., 12.00%, 10/1/24, Callable 10/1/21 @ 109 (a) (e) | 3,000 | 2,827 | |||||||||
Methanex Corp., 5.25%, 12/15/29, Callable 9/15/29 @ 100 | 5,000 | 4,836 | |||||||||
Mineral Resources Ltd., 8.13%, 5/1/27, Callable 5/1/22 @ 106.09 (a) | 3,000 | 3,314 | |||||||||
Smurfit Kappa Treasury Funding DAC, 7.50%, 11/20/25 | 3,200 | 3,864 | |||||||||
| Starfruit Finco BV/Starfruit US Holdco LLC, 8.00%, 10/1/26, Callable 10/1/21 @ 104 (a) (e) | 4,000 | 4,270 | |||||||||
Teck Resources Ltd., 6.13%, 10/1/35 | 3,000 | 3,515 | |||||||||
| Vedanta Resources Ltd. 8.25%, 6/7/21 (a) (e) | 5,000 | 4,305 | |||||||||
6.38%, 7/30/22 (a) | 3,000 | 2,142 | |||||||||
65,274 | |||||||||||
Real Estate (0.1%): | |||||||||||
Vertical Holdco GmbH, 7.63%, 7/15/28, Callable 7/15/23 @ 103.81 (a) (e) | 1,000 | 1,063 | |||||||||
Sovereign Bond (0.1%): | |||||||||||
| Bahamas Government International Bond, 6.00%, 11/21/28, Callable 8/21/28 @ 100 (a) (e) | 3,000 | 2,726 | |||||||||
Utilities (0.9%): | |||||||||||
AES Gener SA, 7.12% (USSW5+464bps), 3/26/79, Callable 4/7/24 @ 100 (a) (c) | 5,000 | 5,102 | |||||||||
| Electricite de France SA, 5.25% (USSW10+371bps), Callable 1/29/23 @ 100 (a) (c) (l) | 3,000 | 3,131 | |||||||||
Empresa Electrica Cochrane SpA, 5.50%, 5/14/27 (a) | 2,873 | 2,944 | |||||||||
ENEL SpA, 8.75% (USSW5+588bps), 9/24/73, Callable 9/24/23 @ 100 (a) (c) | 4,975 | 5,774 | |||||||||
16,951 | |||||||||||
Total Yankee Dollar (Cost $293,265) | 302,450 | ||||||||||
See notes to financial statements.
22
| USAA Mutual Funds Trust USAA High Income Fund | Schedule of Portfolio Investments — continued July 31, 2020 | ||||||
(Amounts in Thousands, Except for Shares)
Security Description | Shares or Principal Amount | Value | |||||||||
Municipal Bonds (0.2%) | |||||||||||
Illinois (0.1%): | |||||||||||
City of Chicago, GO, Series B, 7.05%, 1/1/29 | $ | 2,000 | $ | 2,153 | |||||||
New Jersey (0.1%): | |||||||||||
South Jersey Transportation Authority Revenue, Series B, 3.36%, 11/1/28 | 1,375 | 1,422 | |||||||||
Total Municipal Bonds (Cost $3,375) | 3,575 | ||||||||||
Commercial Paper (2.9%) | |||||||||||
Canadian Natural Resources Ltd., 0.19%, 8/4/20 (r) | 9,000 | 9,000 | |||||||||
Energy Transfer Part LP, 0.17%, 8/4/20 (r) | 12,000 | 12,000 | |||||||||
Glencore Funding LLC, 0.39%, 8/7/20 (r) | 10,000 | 9,999 | |||||||||
Hyundai Capital America, Inc., 0.60%, 8/25/20 (r) | 5,000 | 4,998 | |||||||||
Jabil, Inc., 2.67%, 8/3/20 (r) | 18,000 | 17,996 | |||||||||
53,993 | |||||||||||
Total Commercial Paper (Cost $53,997) | 53,993 | ||||||||||
Exchange-Traded Funds (1.9%) | |||||||||||
iShares iBoxx High Yield Corporate Bond ETF | 207,295 | 17,701 | |||||||||
SPDR Bloomberg Barclays High Yield Bond ETF | 159,197 | 16,891 | |||||||||
Total Exchange-Traded Funds (Cost $33,265) | 34,592 | ||||||||||
Warrants (0.0%) (f) | |||||||||||
Energy (0.0%): | |||||||||||
Sabine Oil & Gas Holdings, Inc. (i) (k) | 8,791 | 144 | |||||||||
SandRidge Energy, Inc. (i) | 13,764 | — | (j) | ||||||||
SandRidge Energy, Inc. | 5,795 | — | (j) | ||||||||
144 | |||||||||||
Total Warrants (Cost $—) | 144 | ||||||||||
Collateral for Securities Loaned^ (2.4%) | |||||||||||
| Goldman Sachs Financial Square Government Fund Institutional Shares, 0.13% (t) | 35,544,458 | 35,544 | |||||||||
HSBC U.S. Government Money Market Fund I Shares, 0.08% (t) | 9,178,818 | 9,179 | |||||||||
Total Collateral for Securities Loaned (Cost $44,723) | 44,723 | ||||||||||
Total Investments (Cost $1,817,169) — 100.3% | 1,844,037 | ||||||||||
Liabilities in excess of other assets — (0.3)% | (5,332 | ) | |||||||||
NET ASSETS — 100.00% | $ | 1,838,705 | |||||||||
At July 31, 2020 the Fund's investments in foreign securities were 16.5% of net assets.
^ Purchased with cash collateral from securities on loan.
(a) Rule 144A security or other security that is restricted as to resale to institutional investors. The Fund's Adviser has deemed this security to be liquid based upon procedures approved by the Board of Trustees.
See notes to financial statements.
23
| USAA Mutual Funds Trust USAA High Income Fund | Schedule of Portfolio Investments — continued July 31, 2020 | ||||||
As of July 31, 2020, the fair value of these securities was $853,289 (thousands) and amounted to 46.4% of net assets.
(b) The rate for certain asset-backed and mortgage-backed securities may vary based on factors relating to the pool of assets underlying the security. The rate disclosed is the rate in effect at July 31, 2020.
(c) Variable or Floating-Rate Security. Rate disclosed is as of July 31, 2020.
(d) Non-income producing security.
(e) All or a portion of this security is on loan.
(f) Amount represents less than 0.05% of net assets.
(g) All or a portion of this security has been segregated as collateral for securities purchased on a when-issued basis.
(h) Security was fair valued based upon procedures approved by the Board of Trustees and the total of these securities represents 0.2% of the Fund's net assets as of July 31, 2020. This security is classified as Level 3 within the fair value hierarchy. (See Note 2)
(i) The Fund's Adviser has deemed this security to be illiquid based upon procedures approved by the Board of Trustees. As of July 31, 2020, illiquid securities were 0.3% of the Fund's net assets.
(j) Rounds to less than $1 thousand.
(k) Security was fair valued based upon procedures approved by the Board of Trustees and represents less than 0.05% of the Fund's net assets as of July 31, 2020. (See Note 2)
(l) Security is perpetual and has no final maturity date but may be subject to calls at various dates in the future.
(m) Defaulted security
(n) At July 31, 2020, the issuer was in bankruptcy.
(o) Security purchased on a when-issued basis.
(p) Variable Rate Demand Notes that provide the rights to sell the security at face value on either that day or within the rate-reset period. The interest rate is reset on the put date at a stipulated daily, weekly, monthly, quarterly, or other specified time interval to reflect current market conditions. These securities do not indicate a reference rate and spread in their description.
(q) All of the coupon is paid in kind.
(r) Rate represents the effective yield at July 31, 2020.
(s) Zero-coupon bond.
(t) Rate disclosed is the daily yield on July 31, 2020.
(u) The rate for this senior secured loan will be known on settlement date of the loan, subsequent to this report date. Senior secured loans have rates that will fluctuate over time in line with prevailing interest rates.
ADR — American Depositary Receipt
bps — Basis points
ETF — Exchange-Traded Fund
GO — General Obligation
See notes to financial statements.
24
| USAA Mutual Funds Trust USAA High Income Fund | Schedule of Portfolio Investments — continued July 31, 2020 | ||||||
H15T5Y — 5 Year Treasury Constant Maturity Rate
LIBOR — London InterBank Offered Rate
LIBOR01M — 1 Month US Dollar LIBOR, rate disclosed as of July 31, 2020, based on the last reset date of the security
LIBOR02M — 2 Month US Dollar LIBOR, rate disclosed as of July 31, 2020, based on the last reset date of the security
LIBOR03M — 3 Month US Dollar LIBOR, rate disclosed as of July 31, 2020, based on the last reset date of the security
LIBOR06M — 6 Month US Dollar LIBOR, rate disclosed as of July 31, 2020, based on the last reset date of the security
LLC — Limited Liability Company
LP — Limited Partnership
MTN — Medium Term Note
PIK — Payment-in-kind
PLC — Public Limited Company
SOFR — Secured Overnight Financing Rate
USISDA05 — 5 Year ICE Swap Rate, rate disclosed as of July 31, 2020.
USSW10 — USD 10 Year Swap Rate, rate disclosed as of July 31, 2020
USSW5 — USD 5 Year Swap Rate, rate disclosed as of July 31, 2020.
See notes to financial statements.
25
USAA Mutual Funds Trust | Statement of Assets and Liabilities July 31, 2020 | ||||||
(Amounts in Thousands, Except Per Share Amounts)
| USAA High Income Fund | |||||||
Assets: | |||||||
Investments, at value (Cost $1,817,169) | $ | 1,844,037 | (a) | ||||
Cash and cash equivalents | 25,940 | ||||||
Deposits with brokers for futures contracts | 90 | ||||||
Receivables: | |||||||
Interest and dividends | 25,774 | ||||||
Capital shares issued | 751 | ||||||
Investments sold | 15,986 | ||||||
From Adviser | 4 | ||||||
Prepaid expenses | 54 | ||||||
Total assets | 1,912,636 | ||||||
Liabilities: | |||||||
Payables: | |||||||
Collateral received on loaned securities | 44,723 | ||||||
Investments purchased | 26,658 | ||||||
Capital shares redeemed | 1,394 | ||||||
Accrued expenses and other payables: | |||||||
Investment advisory fees | 670 | ||||||
Administration fees | 196 | ||||||
Custodian fees | 29 | ||||||
Transfer agent fees | 196 | ||||||
Compliance fees | 1 | ||||||
| 12b-1 fees | 1 | ||||||
Other accrued expenses | 63 | ||||||
Total liabilities | 73,931 | ||||||
Net Assets: | |||||||
Capital | 2,045,809 | ||||||
Total accumulated earnings/(loss) | (207,104 | ) | |||||
Net assets | $ | 1,838,705 | |||||
Net Assets: | |||||||
Fund Shares | $ | 1,027,510 | |||||
Institutional Shares | 798,688 | ||||||
Class A shares | 7,184 | ||||||
Class R6 Shares | 5,323 | ||||||
Total | $ | 1,838,705 | |||||
Shares (unlimited number of shares authorized with no par value): | |||||||
Fund Shares | 138,095 | ||||||
Institutional Shares | 107,474 | ||||||
Class A shares | 963 | ||||||
Class R6 Shares | 716 | ||||||
Total | 247,248 | ||||||
Net asset value, offering and redemption price per share: (b) | |||||||
Fund Shares | $ | 7.44 | |||||
Institutional Shares | $ | 7.43 | |||||
Class A shares | $ | 7.46 | |||||
Class R6 Shares | $ | 7.43 | |||||
Maximum Sales Charge — Class A shares | 2.25 | % | |||||
Maximum offering price | |||||||
| (100%/(100%-maximum sales charge) of net asset value adjusted to the nearest cent) per share — Class A shares | $ | 7.63 | |||||
(a) Includes $42,940 of securities on loan.
(b) Per share amount may not recalculate due to rounding of net assets and/or shares outstanding.
See notes to financial statements.
26
USAA Mutual Funds Trust | Statement of Operations For the Year Ended July 31, 2020 | ||||||
(Amounts in Thousands)
| USAA High Income Fund | |||||||
Investment Income: | |||||||
Dividends | $ | 13,098 | |||||
Interest | 113,344 | ||||||
Foreign tax withholding | (1 | ) | |||||
Securities lending (net of fees) | 622 | ||||||
Total income | 127,063 | ||||||
Expenses: | |||||||
Investment advisory fees | 9,494 | ||||||
Administration fees — Fund Shares | 1,679 | ||||||
Administration fees — Institutional Shares | 785 | ||||||
Administration fees — Class A shares | 14 | ||||||
Administration fees — Class R6 Shares | 3 | ||||||
Sub-Administration fees | 20 | ||||||
12b-1 fees — Class A shares | 23 | ||||||
Custodian fees | 200 | ||||||
Transfer agent fees — Fund Shares | 1,530 | ||||||
Transfer agent fees — Institutional Shares | 785 | ||||||
Transfer agent fees — Class A shares | 7 | ||||||
Transfer agent fees — Class R6 Shares | 1 | ||||||
Trustees' fees | 46 | ||||||
Compliance fees | 13 | ||||||
Legal and audit fees | 112 | ||||||
State registration and filing fees | 59 | ||||||
Interfund lending fees | 1 | ||||||
Other expenses | 197 | ||||||
Total expenses | 14,969 | ||||||
Expenses waived/reimbursed by Adviser | (69 | ) | |||||
Net expenses | 14,900 | ||||||
Net Investment Income (Loss) | 112,163 | ||||||
Realized/Unrealized Gains (Losses) from Investments: | |||||||
Net realized gains (losses) from investment securities | (149,455 | ) | |||||
Net change in unrealized appreciation/depreciation on investment securities | 28,915 | ||||||
Net realized/unrealized gains (losses) on investments | (120,540 | ) | |||||
Change in net assets resulting from operations | $ | (8,377 | ) | ||||
See notes to financial statements.
27
USAA Mutual Funds Trust | Statements of Changes in Net Assets | ||||||
(Amounts in Thousands)
USAA High Income Fund | |||||||||||
| Year Ended July 31, 2020 | Year Ended July 31, 2019 | ||||||||||
From Investments: | |||||||||||
Operations: | |||||||||||
Net investment income (loss) | $ | 112,163 | $ | 126,090 | |||||||
Net realized gains (losses) from investments | (149,455 | ) | (7,451 | ) | |||||||
| Net change in unrealized appreciation/depreciation on investments | 28,915 | (20,776 | ) | ||||||||
Change in net assets resulting from operations | (8,377 | ) | 97,863 | ||||||||
Distributions to Shareholders: | |||||||||||
Fund Shares | (64,546 | ) | (71,053 | ) | |||||||
Institutional Shares | (45,706 | ) | (55,401 | ) | |||||||
Class A shares | (507 | ) | (574 | ) | |||||||
Class R6 Shares | (310 | ) | (315 | ) | |||||||
Change in net assets resulting from distributions to shareholders | (111,069 | ) | (127,343 | ) | |||||||
Change in net assets resulting from capital transactions | (183,394 | ) | (17,963 | ) | |||||||
Change in net assets | (302,840 | ) | (47,443 | ) | |||||||
Net Assets: | |||||||||||
Beginning of period | 2,141,545 | 2,188,988 | |||||||||
End of period | $ | 1,838,705 | $ | 2,141,545 | |||||||
Capital Transactions: | |||||||||||
Fund Shares | |||||||||||
Proceeds from shares issued | $ | 170,453 | $ | 205,681 | |||||||
Distributions reinvested | 59,873 | 66,013 | |||||||||
Cost of shares redeemed | (338,042 | ) | (250,114 | ) | |||||||
Total Fund Shares | $ | (107,716 | ) | $ | 21,580 | ||||||
Institutional Shares | |||||||||||
Proceeds from shares issued | $ | 153,393 | $ | 76,300 | |||||||
Distributions reinvested | 44,791 | 53,355 | |||||||||
Cost of shares redeemed | (272,137 | ) | (169,564 | ) | |||||||
Total Institutional Shares | $ | (73,953 | ) | $ | (39,909 | ) | |||||
Class A shares | |||||||||||
Proceeds from shares issued | $ | 957 | $ | 926 | |||||||
Distributions reinvested | 216 | 255 | |||||||||
Cost of shares redeemed | (3,341 | ) | (1,036 | ) | |||||||
Total Class A shares | $ | (2,168 | ) | $ | 145 | ||||||
Class R6 Shares | |||||||||||
Proceeds from shares issued | $ | 858 | $ | 243 | |||||||
Distributions reinvested | 29 | 9 | |||||||||
Cost of shares redeemed | (444 | ) | (31 | ) | |||||||
Total Class R6 Shares | $ | 443 | $ | 221 | |||||||
Change in net assets resulting from capital transactions | $ | (183,394 | ) | $ | (17,963 | ) | |||||
(continues on next page)
See notes to financial statements.
28
USAA Mutual Funds Trust | Statements of Changes in Net Assets | ||||||
(Amounts in Thousands) (continued)
USAA High Income Fund | |||||||||||
| Year Ended July 31, 2020 | Year Ended July 31, 2019 | ||||||||||
Share Transactions: | |||||||||||
Fund Shares | |||||||||||
Issued | 22,775 | 26,154 | |||||||||
Reinvested | 8,026 | 8,428 | |||||||||
Redeemed | (46,089 | ) | (31,952 | ) | |||||||
Total Fund Shares | (15,288 | ) | 2,630 | ||||||||
Institutional Shares | |||||||||||
Issued | 21,816 | 9,714 | |||||||||
Reinvested | 6,030 | 6,820 | |||||||||
Redeemed | (36,069 | ) | (21,566 | ) | |||||||
Total Institutional Shares | (8,223 | ) | (5,032 | ) | |||||||
Class A shares | |||||||||||
Issued | 126 | 118 | |||||||||
Reinvested | 29 | 32 | |||||||||
Redeemed | (457 | ) | (133 | ) | |||||||
Total Class A shares | (302 | ) | 17 | ||||||||
Class R6 Shares | |||||||||||
Issued | 113 | 31 | |||||||||
Reinvested | 4 | 1 | |||||||||
Redeemed | (61 | ) | (4 | ) | |||||||
Total Class R6 Shares | 56 | 28 | |||||||||
Change in Shares | (23,757 | ) | (2,357 | ) | |||||||
See notes to financial statements.
29
USAA Mutual Funds Trust | Financial Highlights | ||||||
For a Share Outstanding Throughout Each Period
Investment Activities | Distributions to Shareholders From | ||||||||||||||||||||||||||
| Net Asset Value, Beginning of Period | Net Investment Income (Loss) | Net Realized and Unrealized Gains (Losses) on Investments | Total from Investment Activities | Net Investment Income | Total Distributions | ||||||||||||||||||||||
USAA High Income Fund | |||||||||||||||||||||||||||
Fund Shares | |||||||||||||||||||||||||||
| Year Ended July 31, 2020 | $ | 7.91 | 0.44 | (d) | (0.47 | ) | (0.03 | ) | (0.44 | ) | (0.44 | ) | |||||||||||||||
| Year Ended July 31, 2019 | $ | 8.01 | 0.47 | (0.10 | ) | 0.37 | (0.47 | ) | (0.47 | ) | |||||||||||||||||
| Year Ended July 31, 2018 | $ | 8.27 | 0.47 | (0.26 | ) | 0.21 | (0.47 | ) | (0.47 | ) | |||||||||||||||||
| Year Ended July 31, 2017 | $ | 7.90 | 0.47 | 0.37 | 0.84 | (0.47 | ) | (0.47 | ) | ||||||||||||||||||
| Year Ended July 31, 2016 | $ | 8.17 | 0.48 | (0.28 | ) | 0.20 | (0.47 | ) | (0.47 | ) | |||||||||||||||||
Institutional Shares | |||||||||||||||||||||||||||
| Year Ended July 31, 2020 | $ | 7.90 | 0.44 | (d) | (0.47 | ) | (0.03 | ) | (0.44 | ) | (0.44 | ) | |||||||||||||||
| Year Ended July 31, 2019 | $ | 8.00 | 0.47 | (0.09 | ) | 0.38 | (0.48 | ) | (0.48 | ) | |||||||||||||||||
| Year Ended July 31, 2018 | $ | 8.26 | 0.48 | (0.26 | ) | 0.22 | (0.48 | ) | (0.48 | ) | |||||||||||||||||
| Year Ended July 31, 2017 | $ | 7.90 | 0.48 | 0.36 | 0.84 | (0.48 | ) | (0.48 | ) | ||||||||||||||||||
| Year Ended July 31, 2016 | $ | 8.16 | 0.48 | (0.26 | ) | 0.22 | (0.48 | ) | (0.48 | ) | |||||||||||||||||
* Assumes reinvestment of all net investment income and realized capital gain distributions, if any, during the period. Includes adjustments in accordance with U.S. generally accepted accounting principles and could differ from the Lipper reported return.
^ The net expense ratio may not correlate to the applicable expense limits in place during the period since the current contractual expense limitation is applied for a two year period beginning July 1, 2019 and in effect through June 30, 2021, instead of coinciding with the Fund's fiscal year end. Details of the current contractual expense limitation in effect can be found in Note 5 of the accompanying Notes to Financial Statements.
(a) Not annualized for periods less than one year.
(b) Annualized for periods less than one year.
(c) Portfolio turnover is calculated on the basis of the Fund as a whole without distinguishing between the classes of shares issued.
(d) Per share net investment income (loss) has been calculated using the average daily shares method.
(e) Amount is less than $0.005.
See notes to financial statements.
30
USAA Mutual Funds Trust | Financial Highlights — continued | ||||||
For a Share Outstanding Throughout Each Period
Ratios to Average Net Assets | Supplemental Data | ||||||||||||||||||||||||||||||||||
| Redemption Fees Added to Beneficial Interests | Net Asset Value, End of Period | Total Return (Excludes Sales Charge)*(a) | Net Expenses^(b) | Net Investment Income (Loss)(b) | Gross Expenses(b) | Net Assets, End of Period (000's) | Portfolio Turnover(a)(c) | ||||||||||||||||||||||||||||
USAA High Income Fund | |||||||||||||||||||||||||||||||||||
Fund Shares | |||||||||||||||||||||||||||||||||||
| Year Ended July 31, 2020 | — | $ | 7.44 | (0.27 | )% | 0.81 | % | 5.82 | % | 0.81 | % | $ | 1,027,510 | 48 | % | ||||||||||||||||||||
| Year Ended July 31, 2019 | — | (e) | $ | 7.91 | 4.85 | % | 0.85 | % | 5.93 | % | 0.85 | % | $ | 1,212,711 | 31 | % | |||||||||||||||||||
| Year Ended July 31, 2018 | — | (e) | $ | 8.01 | 2.65 | % | 0.81 | % | 5.79 | % | 0.81 | % | $ | 1,207,790 | 22 | % | |||||||||||||||||||
| Year Ended July 31, 2017 | — | (e) | $ | 8.27 | 10.92 | % | 0.83 | % | 5.80 | % | 0.83 | % | $ | 1,225,990 | 21 | % | |||||||||||||||||||
| Year Ended July 31, 2016 | — | (e) | $ | 7.90 | 2.95 | % | 0.82 | % | 6.22 | % | 0.82 | % | $ | 1,105,081 | 36 | % | |||||||||||||||||||
Institutional Shares | |||||||||||||||||||||||||||||||||||
| Year Ended July 31, 2020 | — | $ | 7.43 | (0.19 | )% | 0.72 | % | 5.91 | % | 0.73 | % | $ | 798,688 | 48 | % | ||||||||||||||||||||
| Year Ended July 31, 2019 | — | (e) | $ | 7.90 | 4.94 | % | 0.78 | % | 6.00 | % | 0.78 | % | $ | 913,599 | 31 | % | |||||||||||||||||||
| Year Ended July 31, 2018 | — | (e) | $ | 8.00 | 2.74 | % | 0.72 | % | 5.88 | % | 0.72 | % | $ | 966,124 | 22 | % | |||||||||||||||||||
| Year Ended July 31, 2017 | — | (e) | $ | 8.26 | 10.89 | % | 0.75 | % | 5.89 | % | 0.75 | % | $ | 970,767 | 21 | % | |||||||||||||||||||
| Year Ended July 31, 2016 | — | (e) | $ | 7.90 | 3.19 | % | 0.71 | % | 6.32 | % | 0.71 | % | $ | 990,980 | 36 | % | |||||||||||||||||||
(continues on next page)
See notes to financial statements.
31
USAA Mutual Funds Trust | Financial Highlights — continued | ||||||
For a Share Outstanding Throughout Each Period
Investment Activities | Distributions to Shareholders From | ||||||||||||||||||||||||||
| Net Asset Value, Beginning of Period | Net Investment Income (Loss) | Net Realized and Unrealized Gains (Losses) on Investments | Total from Investment Activities | Net Investment Income | Total Distributions | ||||||||||||||||||||||
USAA High Income Fund | |||||||||||||||||||||||||||
Class A shares | |||||||||||||||||||||||||||
| Year Ended July 31, 2020 | $ | 7.93 | 0.43 | (d) | (0.48 | ) | (0.05 | ) | (0.42 | ) | (0.42 | ) | |||||||||||||||
| Year Ended July 31, 2019 | $ | 8.03 | 0.46 | (0.10 | ) | 0.36 | (0.46 | ) | (0.46 | ) | |||||||||||||||||
| Year Ended July 31, 2018 | $ | 8.28 | 0.46 | (0.26 | ) | 0.20 | (0.45 | ) | (0.45 | ) | |||||||||||||||||
| Year Ended July 31, 2017 | $ | 7.92 | 0.46 | 0.35 | 0.81 | (0.45 | ) | (0.45 | ) | ||||||||||||||||||
| Year Ended July 31, 2016 | $ | 8.18 | 0.44 | (0.25 | ) | 0.19 | (0.45 | ) | (0.45 | ) | |||||||||||||||||
Class R6 Shares | |||||||||||||||||||||||||||
| Year Ended July 31, 2020 | $ | 7.90 | 0.45 | (d) | (0.47 | ) | (0.02 | ) | (0.45 | ) | (0.45 | ) | |||||||||||||||
| Year Ended July 31, 2019 | $ | 8.01 | 0.48 | (0.10 | ) | 0.38 | (0.49 | ) | (0.49 | ) | |||||||||||||||||
| Year Ended July 31, 2018 | $ | 8.26 | 0.48 | (0.25 | ) | 0.23 | (0.48 | ) | (0.48 | ) | |||||||||||||||||
| December 1, 2016 (h) through July 31, 2017 | $ | 7.98 | 0.32 | 0.28 | 0.60 | (0.32 | ) | (0.32 | ) | ||||||||||||||||||
* Assumes reinvestment of all net investment income and realized capital gain distributions, if any, during the period. Includes adjustments in accordance with U.S. generally accepted accounting principles and could differ from the Lipper reported return.
^ The net expense ratio may not correlate to the applicable expense limits in place during the period since the current contractual expense limitation is applied for a two year period beginning July 1, 2019 and in effect through June 30, 2021, instead of coinciding with the Fund's fiscal year end. Details of the current contractual expense limitation in effect can be found in Note 5 of the accompanying Notes to Financial Statements.
(a) Not annualized for periods less than one year.
(b) Annualized for periods less than one year.
(c) Portfolio turnover is calculated on the basis of the Fund as a whole without distinguishing between the classes of shares issued.
(d) Per share net investment income (loss) has been calculated using the average daily shares method.
(e) Amount is less than $0.005.
See notes to financial statements.
32
USAA Mutual Funds Trust | Financial Highlights — continued | ||||||
For a Share Outstanding Throughout Each Period (continued)
Ratios to Average Net Assets | Supplemental Data | ||||||||||||||||||||||||||||||||||
| Redemption Fees Added to Beneficial Interests | Net Asset Value, End of Period | Total Return (Excludes Sales Charge)*(a) | Net Expenses^(b) | Net Investment Income (Loss)(b) | Gross Expenses(b) | Net Assets, End of Period (000's) | Portfolio Turnover(a)(c) | ||||||||||||||||||||||||||||
USAA High Income Fund | |||||||||||||||||||||||||||||||||||
Class A shares | |||||||||||||||||||||||||||||||||||
| Year Ended July 31, 2020 | — | $ | 7.46 | (0.44 | )% | 0.98 | % | 5.63 | % | 1.09 | % | $ | 7,184 | 48 | % | ||||||||||||||||||||
| Year Ended July 31, 2019 | — | (e) | $ | 7.93 | 4.69 | % | 1.00 | % | 5.78 | % | 1.21 | % | $ | 10,021 | 31 | % | |||||||||||||||||||
| Year Ended July 31, 2018 | — | (e) | $ | 8.03 | 2.55 | % | 1.02 | %(f) | 5.58 | % | 1.13 | % | $ | 10,019 | 22 | % | |||||||||||||||||||
| Year Ended July 31, 2017 | — | (e) | $ | 8.28 | 10.49 | % | 1.08 | %(g) | 5.55 | % | 1.15 | % | $ | 10,096 | 21 | % | |||||||||||||||||||
| Year Ended July 31, 2016 | — | (e) | $ | 7.92 | 2.73 | % | 1.15 | % | 5.88 | % | 1.19 | % | $ | 9,183 | 36 | % | |||||||||||||||||||
Class R6 Shares | |||||||||||||||||||||||||||||||||||
| Year Ended July 31, 2020 | — | $ | 7.43 | (0.12 | )% | 0.64 | % | 5.98 | % | 0.82 | % | $ | 5,323 | 48 | % | ||||||||||||||||||||
| Year Ended July 31, 2019 | — | $ | 7.90 | 4.95 | % | 0.65 | % | 6.13 | % | 0.96 | % | $ | 5,214 | 31 | % | ||||||||||||||||||||
| Year Ended July 31, 2018 | — | $ | 8.01 | 2.94 | % | 0.65 | % | 5.95 | % | 0.92 | % | $ | 5,055 | 22 | % | ||||||||||||||||||||
| December 1, 2016 (h) through July 31, 2017 | — | $ | 8.26 | 7.64 | % | 0.65 | % | 5.88 | % | 1.26 | % | $ | 5,177 | 21 | % | ||||||||||||||||||||
(f) Prior to December 1, 2017, USAA Asset Management Company ("AMCO") (previous Investment Adviser) voluntarily agreed to limit the annual expenses of the Class A shares to 1.05% of the Class A shares' average daily net assets.
(g) Prior to December 1, 2016, AMCO voluntarily agreed to limit the annual expenses of the Class A shares to 1.15% of the Class A shares' average daily net assets.
(h) Commencement of operations.
See notes to financial statements.
33
USAA Mutual Funds Trust | Notes to Financial Statements July 31, 2020 | ||||||
1. Organization:
USAA Mutual Funds Trust (the "Trust") is organized as a Delaware statutory trust and is registered under the Investment Company Act of 1940, as amended (the "1940 Act"), as an open-end investment company. The Trust is comprised of 47 funds and is authorized to issue an unlimited number of shares, which are units of beneficial interest with no par value.
The accompanying financial statements are those of the USAA High Income Fund (the "Fund"). The Fund offers four classes of shares: Fund Shares, Institutional Shares, Class A shares*, and R6 Shares. The Fund is classified as diversified under the 1940 Act.
*Effective June 29, 2020, the Fund's Adviser Shares were redesignated Class A shares and became subject to a front-end sales charge.
Each class of shares of the Fund has substantially identical rights and privileges except with respect to fees paid under distribution plans, expenses allocable exclusively to each class of shares, voting rights on matters solely affecting a single class of shares, and the exchange privilege of each class of shares.
Under the Trust's organizational documents, its officers and trustees are indemnified against certain liabilities arising out of the performance of their duties to the Fund. In addition, in the normal course of business, the Fund enters into contracts with its vendors and others that provide for general indemnifications. The Fund's maximum exposure under these arrangements is unknown, as this would involve future claims that may be made against the Fund. However, based on experience, the Fund expects that risk of loss to be remote.
2. Significant Accounting Policies:
The following is a summary of significant accounting policies followed by the Trust in the preparation of its financial statements. The policies are in conformity with generally accepted accounting principles in the United States of America ("GAAP"). The preparation of financial statements in accordance with GAAP requires management to make estimates and assumptions that affect the reported amounts of assets and liabilities and disclosure of contingent assets and liabilities at the date of the financial statements and the reported amounts of income and expenses for the period. Actual results could differ from those estimates. The Fund follows the specialized accounting and reporting requirements under GAAP that are applicable to investment companies under Accounting Standards Codification Topic 946.
Investment Valuation:
The Fund records investments at fair value. Fair value is defined as the price that would be received to sell an asset or paid to transfer a liability in an orderly transaction between market participants at the measurement date.
The valuation techniques described below maximize the use of observable inputs and minimize the use of unobservable inputs in determining fair value. The inputs used for valuing the Fund's investments are summarized in the three broad levels listed below:
• Level 1 — quoted prices in active markets for identical securities
• Level 2 — other significant observable inputs (including quoted prices for similar securities or interest rates applicable to those securities, etc.)
• Level 3 — significant unobservable inputs (including the Fund's own assumptions in determining the fair value of investments)
Changes in valuation techniques may result in transfers in or out of an assigned level within the disclosure hierarchy. The inputs or methodologies used for valuation techniques are not necessarily an indication of the risk associated with entering into those investments.
The Adviser has established the Pricing and Liquidity Committee (the "Committee"), and subject to Trust's Board of Trustees (the "Board") oversight, the Committee administers and oversees the Fund's valuation policies and procedures, which are approved by the Board.
34
USAA Mutual Funds Trust | Notes to Financial Statements — continued July 31, 2020 | ||||||
Portfolio securities listed or traded on securities exchanges, including exchange-traded funds ("ETFs"), American Depositary Receipts ("ADRs") and Rights, are valued at the closing price on the exchange or system where the security is principally traded, if available, or at the Nasdaq Official Closing Price. If there have been no sales for that day on the exchange or system, then a security is valued at the last available bid quotation on the exchange or system where the security is principally traded. In each of these situations, valuations are typically categorized as Level 1 in the fair value hierarchy.
Investments in open-end investment companies are valued at net asset value ("NAV"). These valuations are typically categorized as Level 1 in the fair value hierarchy.
Debt securities of United States ("U.S.") issuers, along with corporate and municipal securities, including short-term investments maturing in 60 days or less, may be valued using evaluated bid or the last sales price to price securities by dealers or an independent pricing service approved by the Board. These valuations are typically categorized as Level 2 in the fair value hierarchy.
Futures contracts are valued at the settlement price established each day by the board of trade or an exchange on which they are traded. These valuations are typically categorized as Level 1 in the fair value hierarchy.
In the event that price quotations or valuations are not readily available, are not reflective of market value, or a significant event has been recognized in relation to a security or class of securities, the securities are valued in good faith by the Committee in accordance with valuation procedures approved by the Board. These valuations are typically categorized as Level 2 or Level 3 in the fair value hierarchy, based on the observability of inputs used to determine the fair value. The effect of fair value pricing is that securities may not be priced on the basis of quotations from the primary market in which they are traded and the actual price realized from the sale of a security may differ materially from the fair value price. Valuing these securities at fair value is intended to cause the Fund's NAV to be more reliable than it otherwise would be.
A summary of the valuations as of July 31, 2020, based upon the three levels defined above, is included in the table below while the breakdown, by category, of investments is disclosed on the Schedule of Portfolio Investments (amounts in thousands):
Level 1 | Level 2 | Level 3 | Total | ||||||||||||||||
Asset-Backed Securities | $ | — | $ | 2,763 | $ | — | $ | 2,763 | |||||||||||
| Collateralized Mortgage Obligations | — | 4,277 | — | 4,277 | |||||||||||||||
Common Stocks | 25,510 | 24 | 2,911 | 28,445 | |||||||||||||||
Preferred Stocks | 39,311 | 20,477 | 750 | 60,538 | |||||||||||||||
Senior Secured Loans | — | 44,171 | 6 | 44,177 | |||||||||||||||
Corporate Bonds | — | 1,264,360 | — | 1,264,360 | |||||||||||||||
Yankee Dollars | — | 302,450 | — | 302,450 | |||||||||||||||
Municipal Bonds | — | 3,575 | — | 3,575 | |||||||||||||||
Commercial Paper | — | 53,993 | — | 53,993 | |||||||||||||||
Exchange-Traded Funds | 34,592 | — | — | 34,592 | |||||||||||||||
Warrants | — | 144 | — | 144 | |||||||||||||||
Collateral for Securities Loaned | 44,723 | — | — | 44,723 | |||||||||||||||
Total | $ | 144,136 | $ | 1,696,234 | $ | 3,667 | $ | 1,844,037 | |||||||||||
For the year ended July 31, 2020, the Fund had transfers into/out of Level 3 that were less than 0.50% of net assets.
Real Estate Investment Trusts ("REITs"):
The Fund may invest in REITs, which report information on the source of their distributions annually. REITs are pooled investment vehicles that invest primarily in income producing real estate or real estate related loans or interests (such as mortgages). Certain distributions received from REITs during the year are recorded as realized gains or return of capital as estimated by the Fund or when such information becomes known.
35
USAA Mutual Funds Trust | Notes to Financial Statements — continued July 31, 2020 | ||||||
Investment Companies:
Exchange-Traded Funds:
The Fund may invest in ETFs, the shares of which are bought and sold on a securities exchange. An ETF trades like common stock and represents a fixed portfolio of securities designed to track the performance and dividend yield of a particular domestic or foreign market index. The Fund may purchase shares of an ETF to temporarily gain exposure to a portion of the U.S. or a foreign market while awaiting purchase of underlying securities. The risks of owning an ETF generally reflect the risks of owning the underlying securities they are designed to track, although the lack of liquidity of an ETF could result in it being more volatile. Additionally, ETFs have fees and expenses that reduce their value.
Open-End Funds:
The Fund may invest in portfolios of open-end investment companies. These investment companies value securities in their portfolios for which market quotations are readily available at their market values (generally the last reported sale price) and all other securities and assets at their fair value by the methods established by the board of directors of the underlying funds.
Securities Purchased on a Delayed-Delivery or When-Issued Basis:
The Fund may purchase securities on a delayed-delivery or when-issued basis. Delivery and payment for securities that have been purchased by the Fund on a delayed-delivery, or when-issued basis, or for delayed draws on loans can take place a month or more after the trade date. At the time the Fund makes the commitment to purchase a security on a delayed-delivery or when-issued basis, the Fund records the transaction and reflects the value of the security in determining NAV. No interest accrues to the Fund until the transaction settles and payment takes place. A segregated account is established and the Fund maintains cash and/or marketable securities at least equal in value to commitments for delayed-delivery or when-issued securities. If the Fund owns delayed-delivery or when-issued securities, these values are included in Payable for investments purchased on the accompanying Statement of Assets and Liabilities and the segregated assets are identified on the Schedule of Portfolio Investments.
Municipal Obligations:
The values of municipal obligations can fluctuate and may be affected by adverse tax, legislative, or political changes, and by financial developments affecting municipal issuers. Payment of municipal obligations may depend on a relatively limited source of revenue, resulting in greater credit risk. Future changes in federal tax laws or the activity of an issuer may adversely affect the tax-exempt status of municipal obligations.
Mortgage- and Asset-Backed Securities:
The values of some mortgage-related or asset-backed securities may be particularly sensitive to changes in prevailing interest rates. Early repayment of principal on some mortgage-related securities may expose the Fund to a lower rate of return upon reinvestment of principal. The values of mortgage- and asset-backed securities depend in part on the credit quality and adequacy of the underlying assets or collateral and may fluctuate in response to the market's perception of these factors as well as current and future repayment rates. Some mortgage-backed securities are backed by the full faith and credit of the U.S. government (e.g., mortgage-backed securities issued by the Government National Mortgage Association, commonly known as "Ginnie Mae"), while other mortgage-backed securities (e.g., mortgage- backed securities issued by the Federal National Mortgage Association and the Federal Home Loan Mortgage Corporation, commonly known as "Fannie Mae" and "Freddie Mac", respectively), are backed only by the credit of the government entity issuing them. In addition, some mortgage-backed securities are issued by private entities and, as such, are not guaranteed by the U.S. government or any agency or instrumentality of the U.S. government.
36
USAA Mutual Funds Trust | Notes to Financial Statements — continued July 31, 2020 | ||||||
Leveraged Loans:
The Fund may invest in leveraged loans, a type of bank loan. Leveraged loans are adjustable-rate bank loans made to companies rated below investment grade. The interest rates on leveraged loans are reset periodically based upon the fluctuations of a base interest rate such as LIBOR and a "spread" above that base interest rate that represents a risk premium to the lending banks and/or other participating investors. Many bank loans bear an adjustable rate of interest; however, leveraged loans provide for a greater "spread" over the base interest rate than other bank loans because they are considered to represent a greater credit risk. Because they are perceived to represent a greater credit risk, leveraged loans possess certain attributes that are similar to high-yield securities. However, because they are often secured by collateral of the borrower, leveraged loans possess certain attributes that are similar to other bank loans.
Below Investment Grade Securities:
The Fund may invest in below investment grade securities (i.e. lower-quality, "junk" debt), which are subject to various risks. Lower-quality debt is considered to be speculative because it is less certain that the issuer will be able to pay interest or repay the principal than in the case of investment grade debt. These securities can involve a substantially greater risk of default than higher-rated securities, and their values can decline significantly over short periods of time. Lower-quality debt securities tend to be more sensitive to adverse news about their issuers, the market and the economy in general, than higher-quality debt securities. The market for these securities can be less liquid, especially during periods of recession or general market decline.
Investment Transactions and Related Income:
Changes in holdings of investments are accounted for no later than one business day following the trade date. For financial reporting purposes, however, investment transactions are accounted for on trade date on the last business day of the reporting period. Interest income is determined on the basis of coupon interest accrued using the effective interest method which adjusts, where applicable, the amortization of premiums or accretion of discount. Gains or losses realized on sales of securities are determined by comparing the identified cost of the security lot sold with the net sales proceeds.
Withholding taxes on interest, dividends, and gains as a result of certain investments in ADRs by the Fund has been provided for in accordance with each investment's applicable country's tax rules and rates.
Securities Lending:
The Fund, through a securities lending agreement with Citibank, N.A. ("Citibank"), may lend its securities to qualified financial institutions, such as certain broker-dealers, to earn additional income, net of income retained by Citibank. Borrowers are required to secure their loans for collateral in the amount of at least 102% of the value of U.S. securities loaned or at least 105% of the value of non-U.S. securities loaned, marked-to-market daily. Any collateral shortfalls associated with increases in the valuation of the securities loaned are cured the next business day once the shortfall exceeds $100 thousand. Collateral may be cash, U.S. government securities, or other securities as permitted by SEC guidelines. Cash collateral may be invested in high-quality short-term investments, primarily open-end investment companies. Collateral requirements are determined daily based on the value of the Fund's securities on loan as of the end of the prior business day. During the time portfolio securities are on loan, the borrower will pay the Fund any dividends or interest paid on such securities plus any fee negotiated between the parties to the lending agreement. The Fund also earns a return from the collateral. The Fund pays Citibank various fees in connection with the investment of cash collateral and fees based on the investment income received from securities lending activities. Securities lending income (net of these fees) is disclosed on the Statement of Operations. Loans are terminable upon demand and the borrower must return the loaned securities within the lesser of one standard settlement period or five business days. Risks relating to securities-lending transactions include that the borrower may not provide additional collateral when required or return the securities when due, and that the value of the short-term investments will be less than the amount of cash collateral required to be returned to
37
USAA Mutual Funds Trust | Notes to Financial Statements — continued July 31, 2020 | ||||||
the borrower. The Fund's agreement with Citibank does not include master netting provisions. Non- cash collateral received by the Fund may not be sold or re-pledged except to satisfy borrower default. Cash collateral is listed on the Fund's Schedule of Portfolio of Investments and Financial Statements while non-cash collateral is not included. The following table (amounts in thousands) is a summary of the Fund's securities lending transactions as of July 31, 2020:
| Value of Securities on Loan | Non-Cash Collateral | Cash Collateral | |||||||||
| $ | 42,940 | $ | — | $ | 44,723 | ||||||
Federal Income Taxes:
It is the Fund's policy to continue to qualify as a regulated investment company by complying with the provisions available to certain investment companies, as defined in applicable sections of the Internal Revenue Code, and to make distributions of net investment income and net realized gains sufficient to relieve it from all, or substantially all, federal income taxes. Accordingly, no provision for federal income taxes is required in the financial statements. The Fund has a tax year end of July 31.
Management of the Fund has reviewed tax positions taken in tax years that remain subject to examination by all major tax jurisdictions, including federal (i.e., the last four tax years, which includes the current fiscal tax year end). Management believes that there is no tax liability resulting from unrecognized tax benefits related to uncertain tax positions taken.
Allocations:
Expenses directly attributable to the Fund are charged to the Fund, while expenses that are attributable to more than one fund in the Trust, or jointly with an affiliated trust, are allocated among the respective funds in the Trust and/or affiliated trust based upon net assets or another appropriate basis.
Income, expenses (other than class-specific expenses such as transfer agent fees, state registration fees, 12b-1 fees and printing fees), and realized and unrealized gains or losses on investments are allocated to each class of shares based on its relative net assets on the date income is earned or expenses and realized and unrealized gains and losses are incurred.
Cross-Trade Transactions:
Pursuant to Rule 17a-7 under the 1940 Act, the Fund may engage in cross-trades, which are securities transactions with affiliated investment companies and advisory accounts managed by the Adviser and any applicable sub-adviser. Any such purchase or sale transaction must be effected without brokerage commission or other remuneration, except for customary transfer fees. The transaction must be effected at the current market price, which is either the security's last sale price on an exchange or, if there are no transactions in the security that day, at the average of the highest bid and lowest asked price. For the year ended July 31, 2020, the Fund engaged in the following securities transactions with affiliated funds, which resulted in the following net realized gains (losses) (amounts in thousands):
| Purchases | Sales | Net Realized Gains (Losses) | |||||||||
| $ | — | $ | 5,041 | $ | 41 | ||||||
3. Purchases and Sales:
Cost of purchases and proceeds from sales/maturities of securities (excluding securities maturing less than one year from acquisition) for the year ended July 31, 2020, were as follows for the Fund (amounts in thousands):
| Excluding U.S. Government Securities | U.S. Government Securities | ||||||||||||||
Purchases | Sales | Purchases | Sales | ||||||||||||
$ | 859,707 | $ | 991,716 | $ | — | $ | 8,558 | ||||||||
38
USAA Mutual Funds Trust | Notes to Financial Statements — continued July 31, 2020 | ||||||
4. Affiliated Fund Ownership:
The Fund offers its shares for investment by other USAA Mutual Funds. The fund-of-funds do not invest in the underlying funds for the purpose of exercising management or control, and the affiliated fund-of-funds' annual and semi-annual reports may be viewed at usaa.com. As of July 31, 2020, certain fund-of-funds owned total outstanding shares of the Fund as follows:
USAA Cornerstone Conservative Fund | 0.4 | % | |||||
USAA Target Retirement Income Fund | 0.7 | % | |||||
USAA Target Retirement 2020 Fund | 1.1 | % | |||||
USAA Target Retirement 2030 Fund | 3.0 | % | |||||
USAA Target Retirement 2040 Fund | 2.7 | % | |||||
USAA Target Retirement 2050 Fund | 1.0 | % | |||||
USAA Target Retirement 2060 Fund | 0.2 | % | |||||
5. Fees and Transactions with Affiliates and Related Parties:
Investment Advisory Fees:
Investment advisory services are provided to the Fund by Victory Capital Management Inc. ("VCM" or the "Adviser"), a New York corporation registered as an investment adviser with the Securities and Exchange Commission ("SEC"). The Adviser is a wholly-owned indirect subsidiary of Victory Capital Holdings, Inc., a publicly traded Delaware corporation, and a wholly-owned direct subsidiary of Victory Capital Operating, LLC. Under the terms of the Investment Advisory Agreement, the Adviser is entitled to receive a base fee and a performance adjustment. The Fund's base fee is accrued daily and paid monthly at an annualized rate of 0.50% of the Fund's average daily net assets. Amounts incurred and paid to VCM for the year ended July 31, 2020, are reflected on the Statement of Operations as Investment Advisory fees.
Effective July 1, 2019, no performance adjustments were made for the period beginning July 1, 2019, through June 30, 2020. Only performance beginning as of July 1, 2019, and thereafter is utilized in calculating future performance adjustments.
The performance adjustment for each share class is accrued daily and calculated monthly by comparing each class' performance to that of the Lipper High Yield Bond Funds Index. The Lipper High Yield Bond Funds Index tracks the total return performance of each class within the Lipper High Yield Bond Funds category.
The performance period for each share class consists of the current month plus the previous 35 months (or the number of months beginning July 1, 2019, if fewer). The following table is utilized to determine the extent of the performance adjustment:
| Over/Under Performance Relative to Index (in basis points)(a) | Annual Adjustment Rate (in basis points)(a) | ||||||
+/- 20 to 50 | +/- 4 | ||||||
+/- 51 to 100 | +/- 5 | ||||||
+/- 101 and greater | +/- 6 | ||||||
(a) Based on the difference between average annual performance of the relevant share class of the Fund and its relevant Lipper index, rounded to the nearest basis point. Average daily net assets of the share class are calculated over a rolling 36-month period.
Each class' annual performance adjustment rate is multiplied by the average daily net assets of the class over the entire performance period, which is then multiplied by a fraction, the numerator of which is the number of days in the month and the denominator of which is 365 (366 in leap years). The resulting amount is then added to (in the case of overperformance), or subtracted from (in the case of underperformance) the base fee.
39
USAA Mutual Funds Trust | Notes to Financial Statements — continued July 31, 2020 | ||||||
Under the performance fee arrangement, each class pays a positive performance fee adjustment for a performance period whenever the class outperforms the Lipper High Yield Bond Funds Index over that period, even if the class has overall negative returns during the performance period.
For the period July 1, 2020 through July 31, 2020, performance adjustments for Fund Shares, Institutional Shares, Class A shares, and R6 Shares were $(57), $(40), less than $(1) thousand, and less than $(1) thousand, respectively. For the Fund Shares, Institutional Shares, Class A shares, and R6 Shares, the performance adjustments were less than 0.01% of net assets for all classes.
The Trust relies on an exemptive order granted to VCM and its affiliated funds by the SEC in March 2019 permitting the use of a "manager-of-managers" structure for certain funds. Under a manager-of- managers structure, the investment adviser may select (with approval of the Board and without shareholder approval) one or more subadvisers to manage the day-to-day investment of a fund's assets. For the year ended July 31, 2020, the Fund had no subadvisors.
Administration and Servicing Fees:
VCM serves as the Fund's administrator and fund accountant. Under the Fund Administration, Servicing and Accounting Agreement, VCM is paid for its services an annual fee at a rate of 0.15% of average daily net assets of the Fund Shares and Class A shares, 0.10% of average daily net assets of the Institutional Shares, and 0.05% of average daily net assets of the R6 Shares. Amounts incurred for the year ended July 31, 2020, are reflected on the Statement of Operations as Administration fees.
The Fund (as part of the Trust) has entered into an agreement to provide compliance services with the Adviser, pursuant to which the Adviser furnishes its compliance personnel, including the services of the Chief Compliance Officer ("CCO"), and other resources reasonably necessary to provide the Trust with compliance oversight services related to the design, administration and oversight of a compliance program for the Trust in accordance with Rule 38a-1 under the 1940 Act. The CCO is an employee of the Adviser, which pays the compensation of the CCO and support staff. Funds in the Trust, Victory Variable Insurance Funds, Victory Portfolios, and Victory Portfolios II (collectively, the "Victory Funds Complex") in the aggregate, compensates the Adviser for these services. Amounts incurred for the year ended July 31, 2020, are reflected on the Statement of Operations as Compliance fees.
Citi Fund Services Ohio, Inc. ("Citi"), an affiliate of Citibank, acts as sub-administrator and sub-fund accountant to the Fund pursuant to a Sub-Administration and Sub-Fund Accounting Services Agreement between VCM and Citi. VCM pays Citi a fee for providing these services. The Fund reimburses VCM and Citi for reasonable out-of-pocket expenses incurred in providing these services and certain other expenses specifically allocated to the Funds, under the Fund Administration, Servicing, and Accounting Agreement. Amounts incurred for the year ended July 31, 2020, are reflected on the Statement of Operations as Sub-Administration fees.
Transfer Agency Fees:
Victory Capital Transfer Agency, Inc. ("VCTA"), provides transfer agency services to the Fund. VCTA, an affiliate of the Adviser, provides transfer agent services to the Fund Shares based on an annual charge of $25.50 per shareholder account plus out-of-pocket expenses. VCTA pays a portion of these fees to certain intermediaries for the administration and servicing of accounts that are held with such intermediaries. Transfer agent's fees for Institutional Shares, Class A shares, and R6 Shares are paid monthly based on a fee accrued daily at an annualized rate of 0.10%, 0.10%, and 0.01%, respectively, of average daily net assets, plus out-of-pocket expenses. Amounts incurred and paid to VCTA are reflected on the Statement of Operations as Transfer Agent fees.
FIS Investor Services LLC serves as sub-transfer agent and dividend disbursing agent for the Fund pursuant to a Sub-Transfer Agent Agreement between VCTA and FIS Investor Services LLC. VCTA provides FIS Investor Services LLC a fee for providing these services.
40
USAA Mutual Funds Trust | Notes to Financial Statements — continued July 31, 2020 | ||||||
Distributor/Underwriting Services:
Victory Capital Services, Inc. (the "Distributor"), an affiliate of the Adviser, serves as distributor for the continuous offering of shares of the Fund pursuant to a Distribution Agreement between the Distributor and the Trust. Effective June 30, 2020, the Distributor's name was changed from Victory Capital Advisers, Inc. Pursuant to the Distribution and Service Plans adopted in accordance with Rule 12b-1 under the1940 Act, the Distributor may receive a monthly distribution and service fee, at an annual rate of up to 0.25% of the average daily net assets of Class A shares. The distribution and service fees paid to the Distributor may be used by the Distributor to pay for activity primarily intended to result in the sale of Class A shares of the Fund. Amounts incurred and paid to VCTA for the year ended July 31, 2020, are reflected on the Statement of Operations as 12b-1 fees.
In addition, the Distributor is entitled to receive commission on sales of the Class A shares of the Fund. For the fiscal year ended July 31, 2020, the Distributor did not receive any commissions.
Other Fees:
Citibank serves as the Fund's custodian.
K&L Gates LLP provides legal services to the Trust.
The Adviser has entered into an expense limitation agreement with the Fund until at least June 30, 2021. Under the terms of the agreement, the Adviser has agreed to waive fees or reimburse certain expenses to the extent that ordinary operating expenses incurred by certain classes of the Fund in any fiscal year exceed the expense limit for such classes of the Fund. Such excess amounts will be the liability of the Adviser. Interest, taxes, brokerage commissions, other expenditures, which are capitalized in accordance with GAAP, and other extraordinary expenses not incurred in the ordinary course of the Fund's business are excluded from the expense limits. As of July 31, 2020, the expense limits (excluding voluntary waivers) are 0.83%, 0.73%, 1.00%, and 0.65% for Fund Shares, Institutional Shares, Class A shares, and R6 Shares, respectively.
Under this expense limitation agreement, the Fund has agreed to repay fees and expenses that were waived or reimbursed by the Adviser for a period up to three years after the fiscal year in which the waiver or reimbursement took place, subject to the lesser of any operating expense limits in effect at the time of: (a) the original waiver or expense reimbursement; or (b) the recoupment, after giving effect to the recoupment amount. As of July 31, 2020, the following amounts are available to be repaid to the Adviser (amounts in thousands). The Fund has not recorded any amounts available to be repaid as a liability due to an assessment that such repayment is not probable at July 31, 2020.
| Expires July 31, 2022 | Expires July 31, 2023 | Total | |||||||||
| $ | 10 | $ | 69 | $ | 79 | ||||||
The Adviser, may voluntarily waive or reimburse additional fees to assist the Fund in maintaining competitive expense ratios. Voluntary waivers and reimbursements applicable to the Fund are not available to be recouped at a future time. There were no voluntary waivers or reimbursements for the year ended July 31, 2020.
Certain officers and/or interested trustees of the Fund are also officers and/or employees of the Adviser, Administrator, Sub-Administrator, Sub-Fund Accountant, and Legal.
6. Risks:
The Fund may be subject to other risks in addition to these identified risks.
Global economies and financial markets are increasingly interconnected, which increases the possibilities that conditions in one country or region might adversely affect issuers in another country or region. Geopolitical and other risks, including war, terrorism, trade disputes, political or economic dysfunction within some nations, public health crises and related geopolitical events, as well as environmental disasters such as earthquakes, fires, and floods, may add to instability in world economies and markets generally. Changes in trade policies and international trade agreements could affect the economies of many countries in unpredictable ways. Epidemics and/or pandemics, such as the
41
USAA Mutual Funds Trust | Notes to Financial Statements — continued July 31, 2020 | ||||||
coronavirus (or COVID-19), may result in, among other things, closing borders, disruptions to healthcare service preparation and delivery, quarantines, cancellations, disruptions to supply chains and consumer activity, as well as general concern and uncertainty. The impact may be short-term or may last for extended periods.
The COVID-19 pandemic, which has spread rapidly across the world, has led and will continue to lead for an unknown period of time to disruptions in local, regional, national and global markets and economies. Among other things, the outbreak has resulted in, and until fully resolved is likely to continue to result in, among other things (1) government imposition of various forms of "stay at home" orders and the closing of "non-essential" businesses, resulting in significant disruption to the businesses of many issuers as well as lay-offs of employees: (2) increased requests by issuers of debt instruments for amendments and waivers of agreements to avoid default and increased defaults: (3) volatility and disruption of markets, including greater volatility in pricing and spreads; and (4) rapidly evolving proposals and/or actions by state and federal governments to address problems being experienced by the markets and by businesses and the economy in general.
The value of a debt security or other income-producing security changes in response to various factors, including, for example, market-related factors (such as changes in interest rates or changes in the risk appetite of investors generally) and changes in the actual or perceived ability of the issuer (or of issuers generally) to meet its (or their) obligations.
Other factors that may affect the value of debt securities, include, among others, public health crises and responses by governments and companies to such crises. These and other events may affect the creditworthiness of the issuer of a debt security and may impair an issuers ability to timely meet its debt obligations as they come due.
The fixed-income securities in the Fund's portfolio are subject to credit risk, which is the possibility that an issuer of a fixed-income security will fail to make timely interest and/or principal payments on its securities or that negative market perceptions of the issuer's ability to make such payments will cause the price of that security to decline. The Fund accepts some credit risk as a recognized means to enhance an investor's return. All fixed-income securities, varying from the highest quality to the very speculative, have some degree of credit risk.
Fixed-income securities rated below investment grade, also known as "junk" or high-yield bonds, generally entail greater economic, credit, and liquidity risk than investment-grade securities. Their prices may be more volatile, especially during economic downturns, financial setbacks, or liquidity events. High-yield securities also can involve a substantially greater risk of default than higher quality debt securities, and their values can decline significantly over short and longer periods of time.
Many debt securities, derivatives and other financial instruments, including some of the Fund's investments, use the London Interbank Offered Rate ("LIBOR") as the reference or benchmark rate for variable interest rate calculations. However, the use of LIBOR started to come under pressure following manipulation allegations in 2012. Despite increased regulation and other corrective actions since that time, concerns have arisen regarding its viability as a benchmark, due largely to reduced activity in the financial markets that it measures. In June 2017, the Alternative Reference Rates Committee, a group of large U.S. banks working with the Federal Reserve, announced its selection of a new Secured Overnight Funding Rate ("SOFR"), which is intended to be a broad measure of secured overnight U.S. Treasury repo rates, as an appropriate replacement for LIBOR. The Federal Reserve Bank of New York began publishing the SOFR in 2018, expecting that it could be used on a voluntary basis in new instruments and transactions. Bank working groups and regulators in other countries have suggested other alternatives for their markets, including the Sterling Overnight Interbank Average Rate ("SONIA") in England. In July 2017, the Financial Conduct Authority (the "FCA"), the United Kingdom financial regulatory body, announced that after 2021 it will cease its active encouragement of UK banks to provide the quotations needed to sustain LIBOR. That announcement suggests that LIBOR may cease to be published after that time. The roughly three-year period until the end of 2021 is expected to be enough time for market participants to transition to the use of a different benchmark for both new and existing securities and transactions. Various financial industry groups have begun planning for that
42
USAA Mutual Funds Trust | Notes to Financial Statements — continued July 31, 2020 | ||||||
transition, but there are obstacles to converting certain longer-term securities and transactions to a new benchmark. Transition planning is at an early stage, and neither the effect of the transition process nor its ultimate success can yet be known. The transition process might lead to increased volatility and illiquidity in markets that currently rely on the LIBOR to determine interest rates. It could also lead to a reduction in the value of some LIBOR-based investments and reduce the effectiveness of new hedges placed against existing LIBOR-based instruments. Since the usefulness of LIBOR as a benchmark could deteriorate during the transition period, these effects could occur before the end of 2021.
7. Borrowing and Interfund Lending:
Line of Credit:
For the year ended July 31, 2020, the Victory Funds Complex participated in a short-term demand note "Line of Credit" agreement with Citibank. The Line of Credit agreement with Citibank was renewed on June 29, 2020 with a termination date of June 28, 2021. Under the agreement with Citibank, the Victory Funds Complex may borrow up to $600 million, of which $300 million is committed and $300 million is uncommitted. $40 million of the Line of Credit is reserved for use by the Victory Floating Rate Fund (herein, the "Fund"), another series of the Victory Funds Complex, with that Fund paying the related commitment fees for that amount. The purpose of the agreement is to meet temporary or emergency cash needs. For the year ended July 31, 2020, Citibank received an annual commitment fee of 0.15% on $300 million for providing the Line of Credit. Each fund in the Victory Funds Complex pays a pro-rata portion of the commitment fees plus any interest (one month LIBOR plus one percent) on amounts borrowed. Effective June 29, 2020, under an amended Line of Credit agreement, Citibank will also receive an annual upfront fee of 0.10% on the $300 million committed line of credit. Each fund in the Victory Funds Complex will pay a pro-rata portion of the upfront fee. Interest charged to each Fund during the period, if applicable, is reflected on the Statements of Operations under Line of credit fees.
The Fund had no borrowings under the Line of Credit agreement during the year ended July 31, 2020.
Interfund Lending:
The Trust and Adviser rely on an exemptive order granted by the SEC in March 2017 (the "Order"), permitting the establishment and operation of an Interfund Lending Facility (the "Facility"). The Facility allows the Fund to directly lend and borrow money to or from any other Fund in the Victory Funds Complex relying upon the Order at rates beneficial to both the borrowing and lending funds. Advances under the Facility are allowed for temporary or emergency purposes. The interfund loan rate is determined, as specified in the Order, by averaging the current repurchase agreement rate and the current bank loan rate. As a Borrower, interest charged to the Fund, if any, during the period is reflected on the Statement of Operations under Interfund lending fees. As a Lender, interest earned by the Fund, if any, during the period is reflected on the Statement of Operations under Income on Interfund lending.
The average borrowing or lending for the days outstanding and average interest rate for the Fund during the year ended July 31, 2020 were as follows (amounts in thousands):
| Borrower or Lender | Amount Outstanding at July 31, 2020 | Average Borrowing* | Days Borrowing Outstanding | Average Interest Rate* | Maximum Borrowing During the Period | ||||||||||||||||||||||
Borrower | $ | — | $ | 3,642 | 8 | 1.93 | % | $ | 5,765 | ||||||||||||||||||
* For the year ended July 31, 2020, based on the number of days borrowings were outstanding.
8. Federal Income Tax Information:
The Fund intends to declare daily and distribute any net investment income monthly. Distributable net realized gains, if any, are declared and paid at least annually.
43
USAA Mutual Funds Trust | Notes to Financial Statements — continued July 31, 2020 | ||||||
The amounts of dividends from net investment income and distributions from net realized gains (collectively distributions to shareholders) are determined in accordance with federal income tax regulations, which may differ from GAAP. To the extent these "book/tax" differences are permanent in nature (e.g., net operating loss and distribution reclassification), such amounts are reclassified within the components of net assets based on their federal tax-basis treatment; temporary differences (e.g., wash sales) do not require reclassification. To the extent dividends and distributions exceed net investment income and net realized gains for tax purposes, they are reported as distributions of capital. Net investment losses incurred by the Fund may be reclassified as an offset to capital on the accompanying Statement of Assets and Liabilities.
As of July 31, 2020, on the Statement of Assets and Liabilities, there were no permanent book-to-tax difference reclassification adjustments.
The tax character of distributions paid during the tax years ended as noted below, were as follows (total distributions paid may differ from the Statements of Changes in Net Assets because, for tax purposes, dividends are recognized when actually paid) (amounts in thousands).
Year Ended July 31, 2020 | Year Ended July 31, 2019 | ||||||||||||||||||
| Distributions paid from | Distributions paid from | ||||||||||||||||||
Ordinary Income | Total Distributions Paid | Ordinary Income* | Total Distributions Paid | ||||||||||||||||
$ | 111,069 | $ | 111,069 | $ | 127,343 | $ | 127,343 | ||||||||||||
* Includes short-term realized capital gains, if any, which are taxable as ordinary income.
As of July 31, 2020, the components of accumulated earnings (loss) on a tax basis were as follows (amounts in thousands):
| Undistributed Ordinary Income | Accumulated Earnings | Accumulated Capital and Other Losses | Other Earnings (Loss) | Unrealized Appreciation (Depreciation)* | Total Accumulated Earnings (Loss) | ||||||||||||||||||
| $ | 2,651 | $ | 2,651 | $ | (236,418 | ) | $ | (167 | ) | $ | 26,830 | $ | (207,104 | ) | |||||||||
* The difference between the book-basis and tax-basis of unrealized appreciation/depreciation is attributable primarily to tax deferral of losses on wash sales and passive foreign investment company adjustments.
At July 31, 2020, the Fund had net capital loss carryforwards as shown in the table below (amounts in thousands). It is unlikely that the Board will authorize a distribution of capital gains realized in the future until the capital loss carryforwards have been used.
| Short-Term Amount | Long-Term Amount | Total | |||||||||
| $ | 44,065 | $ | 192,353 | $ | 236,418 | ||||||
As of July 31, 2020, the cost basis for federal income tax purposes, gross unrealized appreciation, gross unrealized depreciation, and net unrealized appreciation (depreciation) for investments were as follows (amounts in thousands):
| Cost of Investments for Federal Tax Purposes | Gross Unrealized Appreciation | Gross Unrealized Depreciation | Net Unrealized Appreciation (Depreciation) | ||||||||||||
| $ | 1,817,207 | $ | 119,659 | $ | (92,829 | ) | $ | 26,830 | |||||||
44
REPORT OF INDEPENDENT REGISTERED PUBLIC ACCOUNTING FIRM
To the Shareholders and the Board of Trustees of USAA High Income Fund
Opinion on the Financial Statements
We have audited the accompanying statement of assets and liabilities of USAA High Income Fund (the "Fund") (one of the funds constituting USAA Mutual Funds Trust (the "Trust")), including the schedule of portfolio investments, as of July 31, 2020, and the related statement of operations for the year then ended, the statements of changes in net assets for each of the two years in the period then ended, the financial highlights for each of the five years in the period then ended and the related notes (collectively referred to as the "financial statements"). In our opinion, the financial statements present fairly, in all material respects, the financial position of the Fund (one of the funds constituting USAA Mutual Funds Trust) at July 31, 2020, the results of its operations for the year then ended, the changes in its net assets for each of the two years in the period then ended and its financial highlights for each of the five years in the period then ended, in conformity with U.S. generally accepted accounting principles.
Basis for Opinion
These financial statements are the responsibility of the Trust's management. Our responsibility is to express an opinion on the Fund's financial statements based on our audits. We are a public accounting firm registered with the Public Company Accounting Oversight Board (United States) ("PCAOB") and are required to be independent with respect to the Trust in accordance with the U.S. federal securities laws and the applicable rules and regulations of the Securities and Exchange Commission and the PCAOB.
We conducted our audits in accordance with the standards of the PCAOB. Those standards require that we plan and perform the audit to obtain reasonable assurance about whether the financial statements are free of material misstatement, whether due to error or fraud. The Trust is not required to have, nor were we engaged to perform, an audit of the Trust's internal control over financial reporting. As part of our audits we are required to obtain an understanding of internal control over financial reporting, but not for the purpose of expressing an opinion on the effectiveness of the Trust's internal control over financial reporting. Accordingly, we express no such opinion.
Our audits included performing procedures to assess the risks of material misstatement of the financial statements, whether due to error or fraud, and performing procedures that respond to those risks. Such procedures included examining, on a test basis, evidence regarding the amounts and disclosures in the financial statements. Our procedures included confirmation of securities owned as of July 31, 2020, by correspondence with the custodian, brokers and agent banks or by other appropriate auditing procedures where replies from brokers or agent banks were not received. Our audits also included evaluating the accounting principles used and significant estimates made by management, as well as evaluating the overall presentation of the financial statements. We believe that our audits provide a reasonable basis for our opinion.

We have served as the auditor of one or more Victory Capital investment companies since 1995.
San Antonio, Texas
September 29, 2020
45
USAA Mutual Funds Trust | Supplemental Information July 31, 2020 | ||||||
(Unaudited)
Trustee and Officer Information
Board of Trustees:
Overall responsibility for management of the Trust rests with the Board. The Trust is managed by the Board in accordance with the laws of the state of Delaware. There are currently 10 Trustees, eight of whom are not "interested persons" of the Trust within the meaning of that term under the 1940 Act ("Independent Trustees") and two of whom is an "interested person" of the Trust within the meaning of that term under the 1940 Act ("Interested Trustee"). The Trustees, in turn, elect the officers of the Trust to actively supervise its day-to-day operations.
The following tables list the Trustees, their ages, position with the Trust, commencement of service, principal occupations during the past five years and any directorships of other investment companies or companies whose securities are registered under the Securities Exchange Act of 1934, as amended, or who file reports under that Act. Each Trustee oversees 47 portfolios in the Trust. Each Trustee's address is 15935 La Cantera Pkwy, Building Two, San Antonio, TX, 78256. Pursuant to a policy adopted by the Board, the term of office for each Trustee shall be until the Independent Trustee reaches age 75 or an Interested Trustee reaches age 75. The Board may change or grant exceptions from this policy at any time without shareholder approval. A Trustee may resign or be removed by a vote of the other Trustees or the holders of a majority of the outstanding shares of the Trust at any time. Vacancies on the Board can be filled by the action of a majority of the Trustees, provided that after filling such vacancy at least two-thirds of the Trustees have been elected by the shareholders.
Name and Date of Birth | Position Held with the Trust | Year Commenced Service | Principal Occupation During Past 5 Years | Other Directorships Held During Past 5 Years | |||||||||||||||
Independent Trustees. | |||||||||||||||||||
| Jefferson C. Boyce, Born September 1957 | Lead Independent Trustee, and Vice Chairman | 2013 | Senior Managing Director, New York Life Investments, LLC (1992-2012) | Westhab, Inc. | |||||||||||||||
| John C. Walters, Born February 1962 | Trustee | 2019 | Retired. Mr. Walters brings significant Board experience including active involvement with the board of a Fortune 500 company, and a proven record of leading large, complex financial organizations. He has a demonstrated record of success in distribution, manufacturing, investment brokerage, and investment management in both the retail and institutional investment businesses. He has substantial experience in the investment management business with a demonstrated ability to develop and drive strategy while managing operation, financial, and investment risk. | Guardian Variable Products Trust (16 series), Lead Independent Director; Amerilife Holdings LLC, Director; Stadion Money Management; Director; University of North Carolina (Chapel Hill), Member Board of Governors. | |||||||||||||||
46
USAA Mutual Funds Trust | Supplemental Information — continued July 31, 2020 | ||||||
(Unaudited)
Name and Date of Birth | Position Held with the Trust | Year Commenced Service | Principal Occupation During Past 5 Years | Other Directorships Held During Past 5 Years | |||||||||||||||
| Robert L. Mason, Ph.D., Born July 1946 | Trustee | 1997 | Adjunct Professor in the Department of Management Science and Statistics in the College of Business at the University of Texas at San Antonio (since 2001); Institute Analyst, Southwest Research Institute (March 2002-January 2016) | None | |||||||||||||||
| Dawn M. Hawley, Born February 1954 | Trustee | 2014 | Manager of Finance, Menil Foundation, Inc. (May 2007-June 2011), which is a private foundation that oversees the assemblage of sculptures, prints, drawings, photographs, and rare books. Director of Financial Planning and Analysis and Chief Financial Officer, AIM Management Group, Inc. (October 1987-January 2006) | None | |||||||||||||||
| Paul L. McNamara, Born July 1948 | Trustee | 2012 | Director, Cantor Opportunistic Alternatives Fund, LLC (March 2010-February 2014) , which is a closed-end fund of funds by Cantor Fitzgerald Investment Advisors, LLC | None | |||||||||||||||
47
USAA Mutual Funds Trust | Supplemental Information — continued July 31, 2020 | ||||||
(Unaudited)
Name and Date of Birth | Position Held with the Trust | Year Commenced Service | Principal Occupation During Past 5 Years | Other Directorships Held During Past 5 Years | |||||||||||||||
| Richard Y. Newton III, Born January 1956 | Trustee | 2017 | Director, Elta North America (01/18-present), which is a global leader in the design, manufacture, and support of innovative electronic systems in the ground, maritime, airborne, and security domains for the nation's warfighters, security personnel, and first responders; Managing Partner, Pioneer Partnership Development Group (December 2015-present)); Executive Director, The Union League Club of New York (June 2014-November 2015): Executive Vice President, Air Force Association (August 2012-May 2014); Lieutenant General, United States Air Force (January 2008-June 2012) | None | |||||||||||||||
| Barbara B. Ostdiek, Ph.D., Born March 1964 | Trustee | 2008 | Senior Associate Dean of Degree Programs at Jesse H. Jones Graduate School of Business at Rice University (since 2013); Associate Professor of Finance at Jessie H. Jones Graduate School of Business at Rice University (since 2001) | None | |||||||||||||||
| Michael F. Reimherr, Born August 1945 | Trustee | 2000 | President of Reimherr Business Consulting (May 1995-December 2017); St. Mary's University Investment Committee overseeing University Endowment (since 2014) | None | |||||||||||||||
48
USAA Mutual Funds Trust | Supplemental Information — continued July 31, 2020 | ||||||
(Unaudited)
Name and Date of Birth | Position Held with the Trust | Year Commenced Service | Principal Occupation During Past 5 Years | Other Directorships Held During Past 5 Years | |||||||||||||||
Interested Trustees. | |||||||||||||||||||
| David C. Brown, ** Born May 1972 | Trustee | 2019 | Chairman and Chief Executive Officer (since 2013), Co-Chief Executive Officer (2011-2013), Victory Capital Management Inc.; Chairman and Chief Executive Officer, Victory Capital Holdings, Inc. (since 2013). Mr. Brown brings to the Board extensive business, finance and leadership skills gained and developed through years of experience in the financial services industry, including his tenure overseeing the strategic direction as CEO of Victory Capital. These skills, combined with Mr. Brown's extensive knowledge of the financial services industry and demonstrated success in the development and distribution of investment strategies and products, enable him to provide valuable insights to the Board and strategic direction for the Funds | Trustee, Victory Portfolios (42 series), Victory Portfolios II (26 series), Victory Variable Insurance Funds (9 series) | |||||||||||||||
49
USAA Mutual Funds Trust | Supplemental Information — continued July 31, 2020 | ||||||
(Unaudited)
Name and Date of Birth | Position Held with the Trust | Year Commenced Service | Principal Occupation During Past 5 Years | Other Directorships Held During Past 5 Years | |||||||||||||||
| Daniel S. McNamara, ** Born June 1966 | Trustee and Chair of the Board of Trustees | 2012 | Trustee, President, and Vice Chairman of USAA ETF Trust (June 2017-June 2019); President of Financial Advice & Solutions Group (FASG), USAA (since 2013); Director, Investment Management Company (IMCO) (September 2009-April 2014); President, Asset Management Company (AMCO) (August, 2011-April 2013); Senior Vice President of USAA Financial Planning Services Insurance Agency, Inc. (FPS) (since 2011); Director of USAA IMCO (since 2009); Chairman of Board of IMCO (since 2013); Director of AMCO, (August 2011-June 2019); President and Director of USAA Shareholder Account Services (SAS) (October 2009-June 2019); Director and Vice Chairman of FPS (since 2013); President and Director of USAA Investment Corporation (ICORP) (since 2010); Chairman of Board of ICORP (since 2013); Director of USAA Financial Advisors, Inc. (FAI) (since 2013); Chairman of Board of FAI (since 2015). Mr. McNamara brings to the Board extensive experience in the financial services industry, including experience as an officer of the Trust. | None | |||||||||||||||
** Mr. Dan McNamara, the Chairman of the Board, is deemed an "interested person" due to his previous position as Director of AMCO, the former investment adviser of the Funds. Mr. Brown is deemed an "interested person" due to his position as Chief Executive Officer of Victory Capital, investment adviser to the Funds.
The Statement of Additional Information includes additional information about the Trustees of the Trust and is available, without charge, on the SEC's website at www.sec.gov and/or by calling (800)-539-3863.
50
USAA Mutual Funds Trust | Supplemental Information — continued July 31, 2020 | ||||||
(Unaudited)
Officers:
The officers of the Trust, their ages, commencement of service and their principal occupations during the past five years, are detailed in the following table. Each officer serves until the earlier of his or her resignation, removal, retirement, death, or the election of a successor. The mailing address of each officer of the Trust is 15935 La Cantera Pkwy, Building Two, San Antonio, TX, 78256. The officers of the Trust receive no compensation directly from the Trust for performing the duties of their offices.
Name and Date of Birth | Position with the Trust | Year Commenced Service | Principal Occupation During Past 5 Years | ||||||||||||
Interested Officers. | |||||||||||||||
| Christopher K. Dyer, Born February 1962 | President | 2019 | Director of Fund Administration, Victory Capital (2004-present) | ||||||||||||
| Scott A Stahorsky, Born July 1969 | Vice President | 2019 | Manager, Fund Administration, Victory Capital (since 2015); Senior Analyst, Fund Administration, Victory Capital (prior to 2015) | ||||||||||||
| James K. De Vries, Born April 1969 | Treasurer, Principal Financial Officer | 2018 | Executive Director, Victory Capital Management Inc. (since 2019); Treasurer, USAA ETF Trust (September 2018-June 2019); Executive Director, Investment and Financial Administration, USAA (April 2012-June 2019); Assistant Treasurer, USAA ETF Trust (June 2017-September 2018); Assistant Treasurer, USAA Mutual Funds Trust (December 2013-February 2018) | ||||||||||||
| Allan Shaer, Born March 1965 | Assistant Treasurer | 2019 | Senior Vice President, Financial Administration, Citi Fund Services Ohio, Inc. (since 2016); Vice President, Mutual Fund Administration, JP Morgan Chase (2011-2016) | ||||||||||||
| Carol D. Trevino, Born October 1965 | Assistant Treasurer | 2018 | Director, Accounting and Finance, Victory Capital Management Inc. (since 2019); Accounting/Financial Director, USAA (December 2013-June 2019); Assistant Treasurer, USAA ETF Trust (September 2018-June 2019). | ||||||||||||
| Erin G. Wagner, Born February 1974 | Secretary | 2019 | Deputy General Counsel, the Adviser (since 2013) | ||||||||||||
| Charles Booth, Born April 1960 | Anti-Money Laundering Compliance Officer and Identity Theft Officer | 2019 | Director, Regulatory Administration and CCO Support Services, Citi Fund Services Ohio, Inc. (2007-present) | ||||||||||||
| Amy Campos, Born July 1976 | Chief Compliance Officer | 2019 | Chief Compliance Officer, USAA Mutual Funds Trust (since 2019); Executive Director, Deputy Chief Compliance Officer, USAA Mutual Funds Trust and USAA ETF Trust (July 2017-June 2019); Compliance Director, USAA Mutual Funds Trust (2014-July 2017) | ||||||||||||
51
USAA Mutual Funds Trust | Supplemental Information — continued July 31, 2020 | ||||||
(Unaudited)
Proxy Voting and Portfolio Holdings Information
Proxy Voting:
Information regarding the policies and procedures the Fund uses to determine how to vote proxies relating to portfolio securities is available without charge, upon request, by calling (800) 539-3863. The information is also included in the Fund's Statement of Additional Information, which is available on the SEC's website at www.sec.gov.
Information relating to how the Fund voted proxies relating to portfolio securities held during the most recent 12 months ended June 30 is available on the SEC's website at www.sec.gov.
Availability of Schedules of Portfolio Investments:
The Trust files a complete list of Schedules of Portfolio Investments with the SEC for the first and third quarter of each fiscal year on Form N-PORT. Forms N-PORT are available on the SEC's website at www.sec.gov.
Expense Examples
As a shareholder of the Fund, you may incur two types of costs: (1) transaction costs, and (2) ongoing costs, including management fees and other Fund expenses. These examples are intended to help you understand your ongoing costs (in dollars) of investing in the Fund and to compare these costs with the ongoing costs of investing in other mutual funds.
These examples are based on an investment of $1,000 invested at the beginning of the period and held for the entire period from February 1, 2020 through July 31, 2020.
The Actual Expense figures in the table below provide information about actual account values and actual expenses. You may use the information below, together with the amount you invested, to estimate the expenses that you paid over the period. Simply divide your account value by $1,000 (for example, an $8,600 account value divided by $1,000 = 8.6), then multiply the result by the number in the table under the heading entitled "Actual Expenses Paid During Period" to estimate the expenses you paid on your account during this period.
The Hypothetical Expense figures in the table below provide information about hypothetical account values and hypothetical expenses based on the Fund's actual expense ratio and an assumed rate of return of 5% per year before expenses, which is not the Fund's actual return. The hypothetical account values and expenses may not be used to estimate the actual ending account balance or expenses you paid for the period. You may use this information to compare this 5% hypothetical example with the 5% hypothetical examples that appear in shareholder reports of other funds.
Please note the expenses shown in the table below are meant to highlight your ongoing costs only and do not reflect any transactional costs. If these transactional costs were included, your costs would have been higher.
| Beginning Account Value 2/1/20 | Actual Ending Account Value 7/31/20 | Hypothetical Ending Account Value 7/31/20 | Actual Expenses Paid During Period 2/1/20- 7/31/20* | Hypothetical Expenses Paid During Period 2/1/20- 7/31/20* | Annualized Expense Ratio During Period 2/1/20- 7/31/20 | ||||||||||||||||||||||
Fund Shares | $ | 1,000.00 | $ | 966.40 | $ | 1,020.89 | $ | 3.91 | $ | 4.02 | 0.80 | % | |||||||||||||||
Institutional Shares | 1,000.00 | 966.80 | 1,021.33 | 3.47 | 3.57 | 0.71 | % | ||||||||||||||||||||
Class A shares | 1,000.00 | 966.90 | 1,019.94 | 4.84 | 4.97 | 0.99 | % | ||||||||||||||||||||
Class R6 Shares | 1,000.00 | 967.20 | 1,021.68 | 3.13 | 3.22 | 0.64 | % | ||||||||||||||||||||
* Expenses are equal to the average account value multiplied by the Fund's annualized expense ratio multiplied by 182/366 (the number of days in the most recent fiscal half-year divided by the number of days in the fiscal year).
52
USAA Mutual Funds Trust | Supplemental Information — continued July 31, 2020 | ||||||
(Unaudited)
Additional Federal Income Tax Information
The following federal tax information related to the Fund's fiscal year ended July 31, 2020, is provided for information purposes only and should not be used for reporting to federal or state revenue agencies. Federal tax information for the calendar year will be reported to you on Form 1099-DIV in January 2021.
With respect to distributions paid, the Fund designates the following amounts (or, if subsequently determined to be different, the maximum amount allowable) for the fiscal year ended July 31, 2020 (amounts in thousands):
| Dividend Received Deduction (corporate shareholders)* | Qualified Dividend Income (non-corporate shareholders)* | ||||||
| 2.04 | % | 3.60 | % | ||||
* Presented as a percentage of net investment income and excludes short-term capital gain distributions paid, if any. All or a portion of these amounts may be exempt from taxation at the state level.
53
USAA Mutual Funds Trust | Supplemental Information — continued July 31, 2020 | ||||||
(Unaudited)
Liquidity Risk Management Program
The USAA Mutual Funds have adopted and implemented a written liquidity risk management program (the "LRMP") as required by Rule 22e-4 under the 1940 Act, as amended. The LRMP is reasonably designed to assess and manage the Fund's liquidity risk, taking into consideration the Fund's investment strategy and the liquidity of its portfolio investments during normal and reasonably foreseeable stressed market conditions; its short and long-term cash flow projections; and its cash holdings and access to other liquidity management tools such as available funding sources including the Victory Funds Complex Interfund Lending Facility and Line of Credit (discussed in the Notes to Financial Statements). The USAA Mutual Funds' Board of Trustees approved the appointment of the Fund's investment adviser, Victory Capital Management Inc. ("Victory Capital") as the administrator of the LRMP. At an in-person meeting held on February 26, 2020, Victory Capital provided an oral and written report to the Trustees on the operation and effectiveness of the LRMP during the previous year.
Victory Capital manages liquidity risks associated with the Fund's investments by monitoring, among other things, cash and cash equivalents, any use of derivatives, the concentration of investments, the appropriateness of the Fund's investment strategy, and by classifying every fund investment as either highly liquid, moderately liquid, less liquid or illiquid on at least a monthly basis. To assist with the classification of Fund investments, Victory Capital has retained a third-party provider of liquidity evaluation services. This provider determines preliminary liquidity classifications for all portfolio holdings based upon portfolio-level data and certain assumptions provided by Victory Capital. Victory Capital reviews the preliminary liquidity classifications, and, when appropriate, considers other information including input from the Fund's portfolio managers (including the portfolio managers employed by any investment sub-advisers) in determining final liquidity classifications.
The report from Victory Capital concluded that the Fund did not experience any significant liquidity challenges during the covered period, and the Fund's LRMP is reasonably designed to assess and manage its liquidity risk. The report also concluded that the LRMP continues to operate adequately and effectively to enable Victory Capital to oversee and manage liquidity risk and ensure the Fund is able to meet redemption requests without significant dilution to the remaining investors' interest in the Fund. During the review period, the Fund's portfolio consisted primarily of highly liquid investments, which are defined as cash and any investments reasonably expected to be converted to cash in current market conditions in three business days or less without significantly changing the market value of the investment. Therefore, the Fund has not adopted a Highly Liquid Investment Minimum. The Fund's investments were below the limitation on illiquid investments during the review period. Additionally, Victory Capital indicated that no events occurred that would require the filing of Form N-LIQUID and recommended no material changes to the LRMP.
54
Privacy Policy
Protecting the Privacy of Information
The Trust respects your right to privacy. We also know that you expect us to conduct and process your business in an accurate and efficient manner. To do so, we must collect and maintain certain personal information about you. This is the information we collect from you on applications or other forms, and from the transactions you make with us or third parties. It may include your name, address, social security number, account transactions and balances, and information about investment goals and risk tolerance.
We do not disclose any information about you or about former customers to anyone except as permitted or required by law. Specifically, we may disclose the information we collect to companies that perform services on our behalf, such as the transfer agent that processes shareholder accounts and printers and mailers that assist us in the distribution of investor materials. We may also disclose this information to companies that perform marketing services on our behalf. This allows us to continue to offer you Victory investment products and services that meet your investing needs, and to effect transactions that you request or authorize. These companies will use this information only in connection with the services for which we hired them. They are not permitted to use or share this information for any other purpose.
To protect your personal information internally, we permit access only by authorized employees and maintain physical, electronic and procedural safeguards to guard your personal information.*
* You may have received communications regarding information about privacy policies from other financial institutions which gave you the opportunity to "opt-out" of certain information sharing with companies which are not affiliated with that financial institution. The Trust does not share information with other companies for purposes of marketing solicitations for products other than the Trust. Therefore, the Trust does not provide opt-out options to their shareholders.
P.O. Box 182593
Columbus, Ohio 43218-2593

Visit our website at: | Call | ||||||
vcm.com | (800) 235-8396 | ||||||
40052-0920

JULY 31, 2020
Annual Report
USAA Income Fund
Beginning January 1, 2021, as permitted by regulations adopted by the Securities and Exchange Commission, paper copies of the Fund's shareholder reports like this one will no longer be sent by mail, unless you specifically request paper copies of the reports from the Fund or from your financial intermediary, such as a broker-dealer or bank. Instead, the reports will be made available on VictoryFunds.com, and you will be notified by mail each time a report is posted and provided with a website link to access the report. If you already elected to receive shareholder reports electronically, you will not be affected by this change and you need not take any action.
You may elect to receive shareholder reports and other communications from the Fund or your financial intermediary electronically by notifying your financial intermediary directly, or if you are a direct investor, by calling (800) 235-8396 or logging on to usaa.com. Effective on or about November 6, 2020, a shareholder who has an account directly with the Fund will need to submit their request via email to TA.Processing@FISGlobal.com.
You may elect to receive all future reports in paper free of charge. You can inform the Fund or your financial intermediary that you wish to continue receiving paper copies of your shareholder reports by notifying your financial intermediary directly, or if you are a direct investor, by calling (800) 235-8396 or logging on to usaa.com. Effective on or about November 6, 2020, a shareholder who has an account directly with the Fund will need to submit their request via email to TA.Processing@FISGlobal.com. Your election to receive reports in paper will apply to all funds held with the USAA Mutual Funds or your financial intermediary.
Victory Capital means Victory Capital Management Inc., the investment adviser of the USAA Mutual Funds. USAA Mutual Funds are distributed by Victory Capital Services, Inc., member FINRA, an affiliate of Victory Capital. Victory Capital and its affiliates are not affiliated with United Services Automobile Association or its affiliates. USAA and the USAA logo are registered trademarks and the USAA Mutual Funds and USAA Investments logos are trademarks of United Services Automobile Association and are being used by Victory Capital and its affiliates under license.
USAA Mutual Funds Trust
TABLE OF CONTENTS
Shareholder Letter (Unaudited) | 2 | ||||||
Managers' Commentary (Unaudited) | 3 | ||||||
Investment Overview (Unaudited) | 6 | ||||||
| Investment Objective & Portfolio Holdings (Unaudited) | 8 | ||||||
Financial Statements | |||||||
Schedule of Portfolio Investments | 10 | ||||||
Statement of Assets and Liabilities | 42 | ||||||
Statement of Operations | 43 | ||||||
Statements of Changes in Net Assets | 44 | ||||||
Financial Highlights | 46 | ||||||
Notes to Financial Statements | 48 | ||||||
| Report of Independent Registered Public Accounting Firm | 61 | ||||||
Supplemental Information | 62 | ||||||
Trustees' and Officers' Information | 62 | ||||||
Proxy Voting and Portfolio Holdings Information | 68 | ||||||
Expense Examples | 68 | ||||||
Additional Federal Income Tax Information | 69 | ||||||
Liquidity Risk Management Program | 70 | ||||||
Privacy Policy (inside back cover) | |||||||
This report is for the information of the shareholders and others who have received a copy of the currently effective prospectus of the Fund, managed by Victory Capital Management Inc. It may be used as sales literature only when preceded or accompanied by a current prospectus, which provides further details about the Fund.
IRA DISTRIBUTION WITHHOLDING DISCLOSURE
We generally must withhold federal income tax at a rate of 10% of the taxable portion of your distribution and, if you live in a state that requires state income tax withholding, at your state's tax rate. However, you may elect not to have withholding apply or to have income tax withheld at a higher rate. Any withholding election that you make will apply to any subsequent distribution unless and until you change or revoke the election. If you wish to make a withholding election, or change or revoke a prior withholding election, call (800) 235-8396.
If you do not have a withholding election in place by the date of a distribution, federal income tax will be withheld from the taxable portion of your distribution at a rate of 10%. If you must pay estimated taxes, you may be subject to estimated tax penalties if your estimated tax payments are not sufficient and sufficient tax is not withheld from your distribution.
For more specific information, please consult your tax adviser.
1
(Unaudited)
Dear Shareholder,
The previous decade ended with the longest-ever bull market in U.S. equities still intact, even as investors wrestled with issues like softening global economic data, Brexit, and U.S.-China trade relations. In retrospect, those worries seem pedestrian given what we would experience.
A new and unexpected threat—a global pandemic, the novel coronavirus ("COVID-19")—first emerged in Asia and then began spreading globally and throughout the United States during the first quarter of 2020. This unprecedented and unanticipated event not only rendered all existing economic forecasts moot, but it also roiled stock and bond markets everywhere. It also brought the economy to a near halt. The historic bull market in stocks ended virtually overnight.
After an initial severe sell-off in March, equity markets recovered sharply. As our annual reporting period drew to a close on July 31, 2020, many of the broad market indexes had recovered and volatility had returned to more palatable levels. In fact, despite all the chaos, the S&P 500® Index, one of the most popular measures of large U.S. stocks, finished the fiscal year (July 31, 2020) at approximately 3,271, which was up 8.9% from one year ago. Quite the impressive reversal.
The market turmoil of early 2020 was not limited to equities. Fixed income volatility spiked when liquidity evaporated in late March as investors struggled to understand the ramifications of sheltering in place. Fortunately, the U.S. Federal Reserve (the "Fed") (as well as other global central banks) leapt into action—cutting interest rates, (re)starting quantitative easing and, in the case of the Fed, launching an array of programs to stabilize markets.
The new lending facilities and programs had their intended effect of improving fixed income liquidity and trading. Credit spreads across corporate, high yield, structured, and municipal markets were coaxed down from their highs. In addition, Congress came through with substantial fiscal stimulus that also was applauded by investors and markets. Although fixed income markets regained their footing, the yield on 10-Year Treasurys, a benchmark for low-risk investments, declined steadily during our fiscal year—from 2.02% at the beginning of our reporting period to approximately 0.55% as of July 31, 2020. This suggests that investors remain a little wary.
While the past year has been unprecedented for all of us, both personally and professionally, our portfolio managers continue to analyze the financial markets, economic conditions, and the trajectory of the pandemic, which will likely be a guiding factor on Fed policy and the markets.
No matter what happens in the near term, we believe that the massive monetary and fiscal policies introduced earlier this year will have longer-term ramifications. Despite this uncertainty, it's important to remain focused on your long-term investment goals and avoid making emotional decisions. If you invest with us directly, our Member Service Representatives are available to help. Call us at (800) 235-8396.
Sincerely,

Christopher K. Dyer, CFA
President,
USAA Mutual Funds
2
USAA Mutual Funds Trust
USAA Income Fund
Managers' Commentary
(Unaudited)
USAA Investments, A Victory Capital Investment Franchise
Julianne Bass, CFA | Brian Smith, CFA, CPA | ||||||
John Spear, CFA | Kurt Daum, JD | ||||||
James F. Jackson Jr., CFA | R. Neal Graves, CFA, CPA | ||||||
• What were the market conditions over the reporting period?
Seems like eons ago, but just a year and a half ago, the U.S. Federal Reserve (the "Fed") had actually increased the Fed Funds rate to a range of 2.25%-2.50%. This turned out to be the highest the Fed Funds rate would go. Six-months later, the Fed began lowering interest rates, bringing the Fed Funds rate down to a range of 2.00%-2.25% when the reporting period started in August 2019. The Fed also stopped shrinking its balance sheet, all in an effort to keep the economy humming, as the effects of the trade war with China were starting to be felt here in the United States. While real GDP was somewhat weak in the second quarter of 2019 at 1.50%, the rest of the year posted a respectable growth rate of 2.50%. However, the world was about to change in a way almost no one imagined.
Sometime in late 2019, reports were surfacing of a virus in Wuhan, China. The virus, a novel coronavirus ("COVID-19"), started spreading rapidly in Wuhan, and was soon beginning to show up in other countries. Ultimately, COVID-19 became a pandemic, and many countries around the world, including the United States, began "locking down" their economies in an effort to contain the virus. In the United States, the lockdowns began in earnest in March, and significantly affected almost every area of the economy.
Unprecedented became an everyday word, as life in the United States became unlike anything we have ever seen. With many businesses being forced to temporarily close, many people were put out of work. Monthly payrolls, which had been growing at an average of roughly 216 thousand per month since August 2019, plummeted to a loss of 1.4 million jobs in March, and an unprecedented loss of 21 million jobs in April. The unemployment rate, which was at a record low of 3.5% in February, jumped to 14.7% in April. Real GDP fell 5% in first quarter of 2020 and a record 32.9% in the second quarter of 2020, thus officially marking the economy as being in recession. Due to demand dropping precipitously from people not driving, coupled with a strong supply, the price of West Texas Intermediate ("WTI") crude oil, an indicating benchmark, actually went negative in April. This was due to investors in WTI futures contracts, which requires physical settlement, having to pay to not take delivery, forcing the price into unprecedented negative territory.
In response, federal and state governments stepped up stimulus efforts to help those out of work. Congress passed an unprecedented $1 trillion stimulus package, with unemployment benefits to temporarily supplement state payments, as well as grants/loans to businesses. The Fed significantly increased its balance sheet again, and in an unprecedented move, increased the types of bonds it can buy, to include corporate bonds.
3
USAA Mutual Funds Trust
USAA Income Fund (continued)
Managers' Commentary (continued)
Although U.S. Treasury rates had already begun to fall by August 2019, in response to worries over the trade war with China and the economy beginning to slow, the unprecedented worldwide economic shutdown drove interest rates much lower, as investors bought U.S. Treasurys in a flight to quality. Given the Fed moving the Fed Funds rate to effectively zero and the economy only slowly beginning to reopen, U.S. Treasury rates remain at their lows. Although interest rates were already low, year over year decreases were dramatic. The two-year U.S. Treasury yield dropped 177 basis points, while 10-year and 30-year U.S. Treasury yields dropped 149 and 133 basis points, respectively. (A basis point is 1/100th of a percent.)
Given the pandemic, credit spreads (yield differentials between corporate bonds and U.S. Treasury securities of comparable maturity) significantly increased. Although they did not increase as much as in 2008, they increased much more rapidly. From a relatively low level in mid-February, spreads peaked in late March, which resulted in a very rapid increase. AAA, AA, A and BBB spreads widened by 10, 24, 18, and 33 basis points, respectively. High-yield spreads widened by 119 basis points. (Spreads are generally considered an indication of risk; the wider the spread, the greater the perceived risk.) Although spreads have continued to fall, they remain higher than pre-COVID-19 levels.
• How did the USAA Income Fund (the "Fund") perform during the reporting period?
The Fund has five share classes: Fund Shares, Institutional Shares, Class A shares (redesignated from Adviser Shares), Class C shares, and R6 Shares. For the reporting period ended July 31, 2020, the Fund Shares, Institutional Shares, Class A shares, and R6 Shares had total returns of 8.64%, 8.78%, 8.40%, and 8.86%, respectively. The Class C shares commenced operations on June 29, 2020, and from that time through July 31, 2020, had a total return of 2.15%. This compares to returns of 10.12% for the Bloomberg Barclays U.S. Aggregate Bond Index (the "Index") and 13.47% for the Lipper A Rated Bond Funds Index. At the same time, the Fund Shares, Institutional Shares, Class A shares, and R6 Shares provided a one- year dividend yield of 2.92%, 2.98%, 2.70%, and 3.04%, respectively, compared to 2.43% for the Lipper Corporate Debt Funds A Rated Average.
• What strategies did you employ during the reporting period?
The Fund produced a positive total return but underperformed the Index, as bond prices appreciated during the reporting period and spreads widened. Relative to the Index, the Fund was helped slightly by its allocation to and security selection within corporate bonds. The Fund benefited from overweight positions in financial sectors such as banking and insurance. The Fund also benefited from allocations to midstream energy, metals and mining, chemicals and utilities. The Fund's holdings of agency commercial mortgage-backed securities and taxable municipal bonds also added to performance. An underweight position in U.S. Treasury securities, which generated greater returns than the Index, hindered relative performance; however, this was somewhat offset by our overweighting longer-maturity U.S. Treasurys in the portfolio. We were also underweight
4
USAA Mutual Funds Trust
USAA Income Fund (continued)
Managers' Commentary (continued)
agency residential mortgage-backed securities which detracted from performance. Finally, our income orientation had a positive impact on results. Over time, the income generated by the Fund accounts for the majority of its long-term return. As of July 31, 2020, the Fund's SEC yield was 2.20%.
In keeping with our investment process, we continued to build the portfolio bond by bond. We work with our team of analysts to seek ideas where our fundamental understanding of the credit risk is different than that of the market. During the reporting period, we found a number of attractive opportunities as we continued to seek relative values across the fixed income market. We took advantage of periods of volatility to add or reduce select investments in corporate credit, commercial mortgage-backed securities, asset backed securities and taxable municipals. Our analysts continued to analyze and monitor every holding in the portfolio. We are committed to building a portfolio diversified among multiple asset classes and across a large number of issuers.
Thank you for allowing us to assist you with your investment needs.
5
USAA Mutual Funds Trust
USAA Income Fund
Investment Overview
(Unaudited)
Average Annual Total Return
Year Ended July 31, 2020
| Fund Shares | Institutional Shares | Class A shares | Class C shares | Class R6 Shares | |||||||||||||||||||||||||||||||||||
INCEPTION DATE | 3/4/74 | 8/1/08 | 8/2/10 | 6/29/20 | 12/1/16 | ||||||||||||||||||||||||||||||||||
| Net Asset Value | Net Asset Value | Net Asset Value | Maxiumum Offering Price | Net Asset Value | Contingent Deferred Charges | Net Asset Value | Bloomberg Barclays U.S. Aggregate Bond Index1 | Lipper A Rated Bond Funds Index2 | |||||||||||||||||||||||||||||||
One Year | 8.64 | % | 8.78 | % | 8.40 | % | 6.00 | % | N/A | N/A | 8.86 | % | 10.12 | % | 13.47 | % | |||||||||||||||||||||||
Five Year | 5.02 | % | 5.08 | % | 4.77 | % | 4.30 | % | N/A | N/A | N/A | 4.46 | % | 6.28 | % | ||||||||||||||||||||||||
Ten Year | 4.63 | % | 4.73 | % | N/A | N/A | N/A | N/A | N/A | 3.87 | % | 5.30 | % | ||||||||||||||||||||||||||
| Since Inception | N/A | N/A | 4.37 | % | 4.13 | % | 2.15 | % | 1.15 | % | 6.07 | % | N/A | N/A | |||||||||||||||||||||||||
Past performance is not indicative of future results. The performance data quoted represents past performance and current returns may be lower or higher. The investment return and principal value will fluctuate so that an investor's shares, when redeemed, may be worth more or less than the original cost. To obtain performance information current to the most recent month's end, please visit www.vcm.com.
Total return measures the price change in a share assuming the reinvestment of all net investment income and realized capital gain distributions, if any. The total returns quoted do not reflect adjustments made to the enclosed financial statements in accordance with U.S. generally accepted accounting principles or the deduction of taxes that a shareholder would pay on net investment income and realized capital gain distributions, including reinvested distributions, or redemptions of shares.
The total return figures set forth above include all waivers of fees for various periods since inception. Without such fee waivers, the total returns would have been lower.
USAA Income Fund — Growth of $10,000
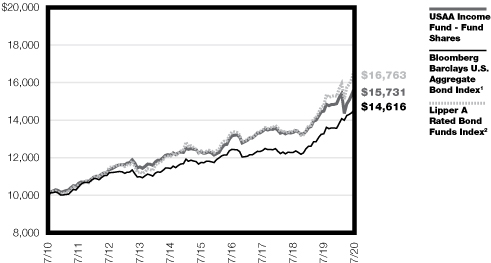
1The unmanaged Bloomberg Barclays U.S. Aggregate Bond Index covers the U.S. investment-grade rated bond market, including government and credit securities, agency mortgage pass-through securities, asset-backed securities, and commercial mortgage-backed securities that have remaining maturities of more than one year.
2The unmanaged Lipper A Rated Bond Funds Index tracks the total return performance of funds within the Lipper Corporate Debt Funds A Rated category.
There are no expenses associated with the index, while there are expenses associated with the Fund. It is not possible to invest in an index.
The graph reflects investment of growth of a hypothetical $10,000 investment in the Fund. Past performance is no guarantee of future results.
The graph and table do not reflect the deduction of taxes that a shareholder would pay on Fund distributions or the redemption of Fund shares.
6
USAA Mutual Funds Trust
USAA Income Fund (continued)
12-MONTH DIVIDEND YIELD COMPARISON
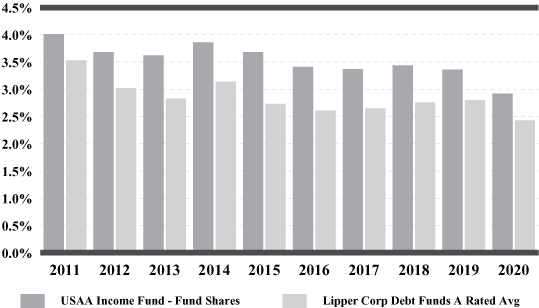
The 12-month dividend yield is computed by dividing net investment income dividends paid during the previous 12 months by the latest adjusted month-end net asset value. The yields quoted do not reflect adjustments made to the enclosed financial statements in accordance with U.S. generally accepted accounting principles. The net asset value is adjusted for a portion of the capital gains, if any, distributed during the previous nine months. The graph represents data for periods ending 7/31/11 through 7/31/20.
The Lipper Corporate Debt Funds A Rated Average is the average performance level of all corporate A rated debt funds, reported by Lipper Inc., an independent organization that monitors the performance of mutual funds.
7
| USAA Mutual Funds Trust USAA Income Fund | July 31, 2020 | ||||||
(Unaudited)
Investment Objective & Portfolio Holdings:
The USAA Income Fund seeks maximum current income without undue risk to principal.
Asset Allocation*:
July 31, 2020
(% of Net Assets)
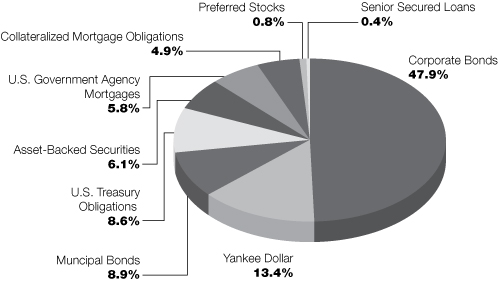
* Does not include futures, money market instruments, and short-term investments purchased with cash collateral from securities loaned.
Percentages are of the net assets of the Fund and may not equal 100%.
8
| USAA Mutual Funds Trust USAA Income Fund (continued) | July 31, 2020 | ||||||
(Unaudited)
Portfolio Ratings Mix:
July 31, 2020
(% of Net Assets)
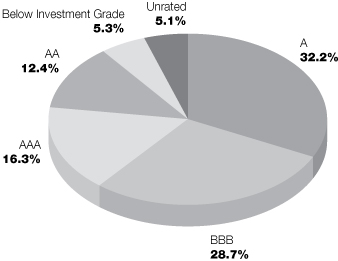
This chart reflects the highest long-term rating from a Nationally Recognized Statistical Rating Organization ("NRSRO"), with the four highest long-term credit ratings labeled, in descending order of credit quality, AAA, AA, A, and BBB. These categories represent investment-grade quality. NRSRO ratings are shown because they provide independent analysis of the credit quality of the Fund's investments. Victory Capital Management, Inc. ("Adviser") also performs its own fundamental credit analysis of each security. As part of its fundamental credit analysis, the Adviser considers various criteria, including industry specific actions, peer comparisons, payment ranking, and structure specific characteristics. Any of the Fund's securities that are not rated by an NRSRO appear in the chart above as "Unrated," but these securities are analyzed and monitored by the Adviser on an ongoing basis. Government securities that are issued or guaranteed as to principal and interest by the U.S. government and pre-refunded and escrowed-to-maturity municipal bonds that are not rated are treated as AAA for credit quality purposes.
9
| USAA Mutual Funds Trust USAA Income Fund | Schedule of Portfolio Investments July 31, 2020 | ||||||
(Amounts in Thousands, Except for Shares)
Security Description | Principal Amount | Value | |||||||||
Asset-Backed Securities (6.1%) | |||||||||||
| AmeriCredit Automobile Receivables Trust, Series 2016-2, Class D, 3.65%, 5/9/22, Callable 10/8/20 @ 100 | $ | 5,000 | $ | 5,023 | |||||||
| AmeriCredit Automobile Receivables Trust, Series 2017-4, Class D, 3.08%, 12/18/23, Callable 5/18/22 @ 100 | 1,921 | 1,975 | |||||||||
| AmeriCredit Automobile Receivables Trust, Series 2018-2, Class C, 3.59%, 6/18/24, Callable 2/18/23 @ 100 | 4,000 | 4,190 | |||||||||
| AmeriCredit Automobile Receivables Trust, Series 2017-4, Class C, 2.60%, 9/18/23, Callable 5/18/22 @ 100 | 5,000 | 5,112 | |||||||||
| AmeriCredit Automobile Receivables Trust, Series 2016-3, Class D, 2.71%, 9/8/22, Callable 3/8/21 @ 100 | 9,650 | 9,753 | |||||||||
| ARI Fleet Lease Trust, Series 2020-A, Class A3, 1.80%, 8/15/28, Callable 4/15/23 @ 100 (a) | 4,500 | 4,576 | |||||||||
| Avis Budget Rental Car Funding AESOP LLC, Series 2018-2A, Class B, 4.27%, 3/20/25 (a) | 5,250 | 5,414 | |||||||||
| Avis Budget Rental Car Funding AESOP LLC, Series 2019-2A, Class B, 3.55%, 9/22/25 (a) | 7,500 | 7,505 | |||||||||
| Avis Budget Rental Car Funding AESOP LLC, Series 2016-2A, Class B, 3.36%, 11/20/22 (a) | 6,000 | 6,003 | |||||||||
| Avis Budget Rental Car Funding AESOP LLC, Series 2019-3A, Class B, 2.65%, 3/20/26 (a) | 12,500 | 12,186 | |||||||||
| Avis Budget Rental Car Funding AESOP LLC, Series 2016-1A, Class C, 4.94%, 6/20/22 (a) | 2,827 | 2,830 | |||||||||
| BCC Funding Corp. XVI LLC, Series 2019-1A, Class A2, 2.46%, 8/20/24, Callable 3/20/23 @ 100 (a) | 10,000 | 10,039 | |||||||||
| California Republic Auto Receivables Trust, Series 2018-1, Class D, 4.33%, 4/15/25, Callable 8/15/22 @ 100 | 2,300 | 2,407 | |||||||||
| California Republic Auto Receivables Trust, Series 2017-1, Class C, 3.76%, 12/15/23, Callable 6/15/21 @ 100 | 2,309 | 2,357 | |||||||||
| California Republic Auto Receivables Trust, Series 2017-1, Class B, 2.91%, 12/15/22, Callable 6/15/21 @ 100 | 6,500 | 6,588 | |||||||||
| Canadian Pacer Auto Receivables Trust, Series 2020-1A, Class A4, 1.89%, 3/19/25, Callable 8/19/23 @ 100 (a) | 6,067 | 6,126 | |||||||||
| Canadian Pacer Auto Receivables Trust, Series 2020-1A, Class B, 2.00%, 7/21/25, Callable 8/19/23 @ 100 (a) | 2,000 | 2,023 | |||||||||
| Canadian Pacer Auto Receivables Trust, Series 2018-2A, Class C, 4.07%, 3/19/25, Callable 2/19/22 @ 100 (a) | 1,590 | 1,623 | |||||||||
| Canadian Pacer Auto Receivables Trust, Series 2018-2A, Class B, 3.63%, 1/19/24, Callable 2/19/22 @ 100 (a) | 1,250 | 1,296 | |||||||||
| CarMax Auto Owner Trust, Series 2020-1, Class B, 2.21%, 9/15/25, Callable 9/15/23 @ 100 | 6,375 | 6,637 | |||||||||
| CarMax Auto Owner Trust, Series 2019-1, Class B, 3.45%, 11/15/24, Callable 2/15/23 @ 100 | 1,924 | 2,039 | |||||||||
| CarMax Auto Owner Trust, Series 2020-2, Class B, 2.90%, 8/15/25, Callable 7/15/23 @ 100 | 3,611 | 3,834 | |||||||||
| CarMax Auto Owner Trust, Series 2017-3, Class D, 3.46%, 10/16/23, Callable 9/15/21 @ 100 | 2,000 | 2,045 | |||||||||
Chesapeake Funding LLC, Series 2018-3A, Class C, 3.81%, 1/15/31 (a) | 6,000 | 6,212 | |||||||||
| Chesapeake Funding LLC, Series 2018-2A, Class B, 3.52%, 8/15/30, Callable 8/15/21 @ 100 (a) | 6,000 | 6,146 | |||||||||
See notes to financial statements.
10
| USAA Mutual Funds Trust USAA Income Fund | Schedule of Portfolio Investments — continued July 31, 2020 | ||||||
(Amounts in Thousands, Except for Shares)
Security Description | Principal Amount | Value | |||||||||
| CIT Education Loan Trust, Series 2007-1, Class B, 0.60% (LIBOR03M+30bps), 6/25/42, Callable 3/25/31 @ 100 (a) (b) | $ | 4,505 | $ | 3,661 | |||||||
| CNH Equipment Trust, Series 2020-A, Class B, 2.30%, 10/15/27, Callable 7/15/24 @ 100 | 1,100 | 1,107 | |||||||||
| CPS Auto Receivables Trust, Series 2019-C, Class C, 2.84%, 6/16/25, Callable 4/15/23 @ 100 (a) | 2,500 | 2,548 | |||||||||
| Credit Acceptance Auto Loan Trust, Series 2020-1A, Class B, 2.39%, 4/16/29, Callable 1/15/24 @ 100 (a) | 4,118 | 4,221 | |||||||||
Credit Acceptance Auto Loan Trust, Series 2017-2, Class C, 3.35%, 6/15/26 (a) | 4,850 | 4,878 | |||||||||
| Dell Equipment Finance Trust, Series 2020-1, Class B, 2.98%, 4/24/23, Callable 10/22/22 @ 100 (a) | 1,550 | 1,605 | |||||||||
| Dell Equipment Finance Trust, Series 2020-1, Class A3, 2.24%, 2/22/23, Callable 10/22/22 @ 100 (a) | 3,000 | 3,060 | |||||||||
Element Rail Leasing I LLC, Series 2014-1A, Class A2, 3.67%, 4/19/44 (a) | 25,000 | 25,139 | |||||||||
Enterprise Fleet Financing LLC, Series 2020-1, Class A3, 1.86%, 12/22/25 (a) | 6,150 | 6,299 | |||||||||
| Exeter Automobile Receivables Trust, Series 2017-3A, Class D, 5.28%, 10/15/24, Callable 5/15/22 @ 100 (a) | 8,000 | 8,268 | |||||||||
| Exeter Automobile Receivables Trust, Series 2020-1A, Class B, 2.26%, 4/15/24, Callable 4/15/24 @ 100 (a) | 5,132 | 5,199 | |||||||||
| Exeter Automobile Receivables Trust, Series 2020-2A, Class B, 2.08%, 7/15/24, Callable 4/15/24 @ 100 (a) | 3,594 | 3,636 | |||||||||
| ExteNet LLC, Series 2019-1A, Class A2, 3.20%, 7/26/49, Callable 1/25/23 @ 100 (a) | 5,625 | 5,638 | |||||||||
| Flagship Credit Auto Trust, Series 2016-4, Class D, 3.89%, 11/15/22, Callable 10/15/21 @ 100 (a) | 6,795 | 6,958 | |||||||||
| Ford Credit Auto Owner Trust, Series 2020-1, Class A, 2.04%, 8/15/31, Callable 2/15/25 @ 100 (a) | 5,333 | 5,511 | |||||||||
| Ford Credit Auto Owner Trust, Series 2020-1, Class C, 2.54%, 8/15/31, Callable 2/15/25 @ 100 (a) | 4,000 | 4,020 | |||||||||
| Ford Credit Auto Owner Trust, Series 2020-1, Class B, 2.29%, 8/15/31, Callable 2/15/25 @ 100 (a) | 12,314 | 12,500 | |||||||||
| GM Financial Consumer Automobile Receivables Trust, Series 2020-2, Class B, 2.54%, 8/18/25, Callable 7/16/23 @ 100 | 1,500 | 1,569 | |||||||||
| GM Financial Consumer Automobile Receivables Trust, Series 2020-1, Class A4, 1.90%, 3/17/25, Callable 5/16/23 @ 100 | 4,500 | 4,682 | |||||||||
| GM Financial Consumer Automobile Receivables Trust, Series 2020-2, Class A4, 1.74%, 8/18/25, Callable 7/16/23 @ 100 | 1,250 | 1,302 | |||||||||
Hertz Vehicle Financing LLC, Series 2018-3, Class A, 4.03%, 7/25/24 (a) | 3,414 | 3,420 | |||||||||
Hertz Vehicle Financing LP, Series 2019-1A, Class B, 4.10%, 3/25/23 (a) | 6,250 | 6,259 | |||||||||
Hertz Vehicle Financing LP, Series 2017-2A, Class A, 3.29%, 10/25/23 (a) | 5,918 | 5,927 | |||||||||
Hertz Vehicle Financing LP, Series 2016-4A, Class A, 2.65%, 7/25/22 (a) | 2,025 | 2,028 | |||||||||
Hertz Vehicle Financing LP, Series 2019-3A, Class A, 2.67%, 12/26/25 (a) | 6,079 | 6,084 | |||||||||
| HPEFS Equipment Trust, Series 2019-1A, Class C, 2.49%, 9/20/29, Callable 4/20/22 @ 100 (a) | 2,700 | 2,736 | |||||||||
| HPEFS Equipment Trust, Series 2020-2A, Class B, 1.20%, 7/22/30, Callable 5/20/23 @ 100 (a) | 8,333 | 8,340 | |||||||||
| HPEFS Equipment Trust, Series 2020-1A, Class B, 1.89%, 2/20/30, Callable 12/20/22 @ 100 (a) | 3,846 | 3,903 | |||||||||
| InSite Issuer LLC, Series 2018-1A, Class A, 4.10%, 12/15/48, Callable 7/15/24 @ 100 (a) | 8,000 | 8,477 | |||||||||
See notes to financial statements.
11
| USAA Mutual Funds Trust USAA Income Fund | Schedule of Portfolio Investments — continued July 31, 2020 | ||||||
(Amounts in Thousands, Except for Shares)
Security Description | Principal Amount | Value | |||||||||
| John Deere Owner Trust, Series 2020-A, Class A4, 1.21%, 11/16/26, Callable 8/15/23 @ 100 | $ | 10,000 | $ | 10,163 | |||||||
| Kubota Credit Owner Trust, Series 2020-1A, Class A4, 2.26%, 7/15/26, Callable 10/15/23 @ 100 (a) | 5,769 | 6,035 | |||||||||
Master Credit Card Trust, Series 2020-1A, Class B, 2.27%, 9/23/24 (a) | 834 | 857 | |||||||||
| MMAF Equipment Finance LLC, Series 2015-A, Class A5, 2.49%, 2/19/36, Callable 11/16/23 @ 100 (a) | 6,135 | 6,231 | |||||||||
| MMAF Equipment Finance LLC, Series 2017-A, Class A5, 2.68%, 7/16/27, Callable 5/16/26 @ 100 (a) | 2,750 | 2,883 | |||||||||
| Navient Student Loan Trust, Series 2015-2, Class B, 1.67% (LIBOR01M+150bps), 8/25/50, Callable 12/25/28 @ 100 (b) | 3,000 | 2,608 | |||||||||
| Navient Student Loan Trust, Series 2018-2A, Class B, 1.32% (LIBOR01M+115bps), 3/25/67, Callable 6/25/33 @ 100 (a) (b) | 3,500 | 3,149 | |||||||||
| Nelnet Student Loan Trust, Series 2005-4, Class B, 0.59% (LIBOR03M+28bps), 9/22/35, Callable 6/22/28 @ 100 (b) | 1,128 | 920 | |||||||||
| NP SPE II LLC, Series 2017-1A, Class A2, 4.22%, 10/21/47, Callable 10/20/27 @ 100 (a) | 15,625 | 15,798 | |||||||||
NP SPE II LLC, Series 2019-2A, Class C1, 6.44%, 11/19/49 (a) | 6,500 | 6,446 | |||||||||
| OneMain Direct Auto Receivables Trust, Series 2017-2, Class C, 2.82%, 7/15/24, Callable 9/14/20 @ 100 (a) | 8,500 | 8,517 | |||||||||
OSCAR US Funding Trust IX LLC, Series 2018-2A, Class A4, 3.63%, 9/10/25 (a) | 12,000 | 12,487 | |||||||||
OSCAR US Funding Trust LLC, Series 2018-1A, Class A4, 3.50%, 5/12/25 (a) | 4,760 | 4,920 | |||||||||
PSNH Funding LLC, Series 2018-1, Class A3, 3.81%, 2/1/35 | 15,545 | 17,852 | |||||||||
Renew, Series 2018-1, Class A, 3.95%, 9/20/53, Callable 12/20/28 @ 100 (a) | 4,755 | 5,118 | |||||||||
Renew, Series 2017-2, Class A, 3.22%, 9/22/53, Callable 12/20/28 @ 100 (a) | 1,205 | 1,191 | |||||||||
| Santander Drive Auto Receivables Trust, Series 2016-2, Class D, 3.39%, 4/15/22, Callable 11/15/20 @ 100 | 11,409 | 11,477 | |||||||||
| Santander Drive Auto Receivables Trust, Series 2020-1, Class A3, 2.03%, 2/15/24, Callable 12/15/24 @ 100 | 3,188 | 3,256 | |||||||||
| SCF Equipment Leasing LLC, Series 2017-2A, Class A, 3.41%, 12/20/23, Callable 8/20/20 @ 100 (a) | 1,947 | 1,951 | |||||||||
| SCF Equipment Leasing LLC, Series 2019-1A, Class B, 3.49%, 1/20/26, Callable 8/20/20 @ 100 (a) | 6,000 | 6,068 | |||||||||
| SCF Equipment Leasing LLC, Series 2019-1A, Class A2, 3.23%, 10/20/24, Callable 8/20/20 @ 100 (a) | 1,000 | 1,019 | |||||||||
| SLM Student Loan Trust, Series 2006-9, Class B, 0.47% (LIBOR03M+23bps), 1/25/41, Callable 4/25/32 @ 100 (b) | 4,723 | 3,976 | |||||||||
| SLM Student Loan Trust, Series 2006-10, Class B, 0.46% (LIBOR03M+22bps), 3/25/44, Callable 1/25/32 @ 100 (b) | 1,984 | 1,660 | |||||||||
| SLM Student Loan Trust, Series 2012-6, Class B, 1.17% (LIBOR01M+100bps), 4/27/43, Callable 10/25/27 @ 100 (b) | 20,862 | 18,271 | |||||||||
| SLM Student Loan Trust, Series 2005-9, Class B, 0.54% (LIBOR03M+30bps), 1/25/41, Callable 10/25/30 @ 100 (b) | 1,481 | 1,280 | |||||||||
| SLM Student Loan Trust, Series 2007-1, Class B, 0.46% (LIBOR03M+22bps), 1/27/42, Callable 1/25/29 @ 100 (b) | 6,864 | 5,964 | |||||||||
| SLM Student Loan Trust, Series 2003-14, Class B, 0.79% (LIBOR03M+55bps), 10/25/65, Callable 1/25/29 @ 100 (b) | 1,650 | 1,448 | |||||||||
| SLM Student Loan Trust, Series 2007-7, Class B, 0.99% (LIBOR03M+75bps), 10/27/70, Callable 4/25/23 @ 100 (b) | 5,740 | 5,253 | |||||||||
Start Ltd., Series 2018-1, Class A, 4.09%, 5/15/43, Callable 5/15/25 @ 100 (a) | 7,267 | 6,585 | |||||||||
See notes to financial statements.
12
| USAA Mutual Funds Trust USAA Income Fund | Schedule of Portfolio Investments — continued July 31, 2020 | ||||||
(Amounts in Thousands, Except for Shares)
Security Description | Principal Amount | Value | |||||||||
| Synchrony Credit Card Master Note Trust, Series 2018-2, Class C, 3.87%, 5/15/26 | $ | 18,417 | $ | 19,024 | |||||||
| Tesla Auto Lease Trust, Series 2020-A, Class B, 1.18%, 1/22/24, Callable 4/20/23 @ 100 (a) (c) | 5,500 | 5,499 | |||||||||
| Transportation Finance Equipment Trust, Series 2019-1, Class B, 2.06%, 5/23/24, Callable 9/23/23 @ 100 (a) | 1,095 | 1,118 | |||||||||
| TRIP Rail Master Funding LLC, Series 2017-1A, Class A2, 3.74%, 8/15/47, Callable 4/15/24 @ 100 (a) | 3,334 | 3,413 | |||||||||
| TRIP Rail Master Funding LLC, Series 2014-1A, Class A2, 4.09%, 4/15/44, Callable 7/15/21 @ 100 (a) | 10,000 | 10,112 | |||||||||
| VB-S1 Issuer LLC, Series 2018-1A, Class C, 3.41%, 2/15/48, Callable 2/15/22 @ 100 (a) | 7,850 | 8,084 | |||||||||
| VB-S1 Issuer LLC, Series 2020-1A, Class C2, 3.03%, 6/15/50, Callable 6/15/24 @ 100 (a) | 1,400 | 1,421 | |||||||||
| Westlake Automobile Receivables Trust, Series 2019-1A, Class C, 3.45%, 3/15/24, Callable 7/15/22 @ 100 (a) | 2,340 | 2,387 | |||||||||
| Westlake Automobile Receivables Trust, Series 2018-2A, Class D, 4.00%, 1/16/24, Callable 12/15/21 @ 100 (a) | 4,000 | 4,089 | |||||||||
| World Omni Auto Receivables Trust, Series 2018-D, Class C, 3.87%, 8/15/25, Callable 10/15/22 @ 100 | 4,000 | 4,250 | |||||||||
515,694 | |||||||||||
Total Asset-Backed Securities (Cost $510,398) | 515,694 | ||||||||||
Collateralized Mortgage Obligations (4.9%) | |||||||||||
| BAMLL Commercial Mortgage Securities Trust, Series 2015-200P, Class B, 3.49%, 4/14/33 (a) | 9,027 | 9,602 | |||||||||
| Banc of America Commercial Mortgage Trust, Series 2006-3, Class AM, 5.66%, 7/10/44 (d) | 1,937 | 387 | |||||||||
Bank, Series 2017-BNK4, Class B, 4.00%, 5/15/50 | 5,600 | 5,866 | |||||||||
Bank, Series 2019-BN24, Class ASB, 2.93%, 11/15/62 | 7,123 | 7,795 | |||||||||
Benchmark Mortgage Trust, Series 2020-B17, Class ASB, 2.18%, 3/15/53 | 9,900 | 10,362 | |||||||||
| BX Commercial Mortgage Trust, Series 2019-XL, Class B, 1.25% (LIBOR01M+108bps), 10/15/36 (a) (b) | 5,859 | 5,847 | |||||||||
BX Trust, Series 2019-OC11, Class A, 3.20%, 12/9/41 (a) | 9,231 | 9,781 | |||||||||
| Cantor Commercial Real Estate Lending, Series 2019-CF3, Class ASB, 2.94%, 1/15/53 | 6,000 | 6,538 | |||||||||
| Citigroup Commercial Mortgage Trust, Series 2019-GC41, Class AS, 3.02%, 8/10/56 | 10,339 | 11,261 | |||||||||
| Citigroup Commercial Mortgage Trust, Series 2014-GC23, Class AS, 3.86%, 7/10/47 | 4,000 | 4,360 | |||||||||
| Citigroup Commercial Mortgage Trust, Series 2014-GC23, Class A3, 3.36%, 7/10/47 | 7,833 | 8,399 | |||||||||
| Citigroup Commercial Mortgage Trust, Series 2019-SMRT, Class C, 4.68%, 1/10/24 (a) | 8,100 | 8,495 | |||||||||
| Citigroup Commercial Mortgage Trust, Series 2017-P8, Class AS, 3.79%, 9/15/50 (d) | 9,500 | 10,600 | |||||||||
| Citigroup Commercial Mortgage Trust, Series 2020-GC46, Class AAB, 2.61%, 1/15/53 | 10,000 | 10,746 | |||||||||
See notes to financial statements.
13
| USAA Mutual Funds Trust USAA Income Fund | Schedule of Portfolio Investments — continued July 31, 2020 | ||||||
(Amounts in Thousands, Except for Shares)
Security Description | Principal Amount | Value | |||||||||
| Citigroup Commercial Mortgage Trust, Series 2020-555, Class A, 2.65%, 12/10/41 (a) | $ | 10,000 | $ | 10,397 | |||||||
| Citigroup Commercial Mortgage Trust, Series 2014-GC23, Class A4, 3.62%, 7/10/47 | 2,500 | 2,717 | |||||||||
COMM Mortgage Trust, Series 2015-LC23, Class AM, 4.16%, 10/10/48 (d) | 6,300 | 6,859 | |||||||||
COMM Mortgage Trust, Series 2015-PC1, Class B, 4.36%, 7/10/50 (d) | 2,500 | 2,602 | |||||||||
COMM Mortgage Trust, Series 2014-277P, Class A, 3.61%, 8/10/49 (a) (d) | 10,500 | 11,316 | |||||||||
COMM Mortgage Trust, Series 2014-CCRE19, Class A5, 3.80%, 8/10/47 | 5,000 | 5,479 | |||||||||
COMM Mortgage Trust, Series 2015-PC1, Class A5, 3.90%, 7/10/50 (e) | 15,000 | 16,718 | |||||||||
COMM Mortgage Trust, Series 2012-CCRE4, Class XA, 1.69%, 10/15/45 (d) (f) | 53,780 | 1,720 | |||||||||
COMM Mortgage Trust, Series 2012-CCRE3, Class AM, 3.42%, 10/15/45 (a) | 5,925 | 6,128 | |||||||||
COMM Mortgage Trust, Series 2012-CCRE1, Class XA, 1.85%, 5/15/45 (d) | 34,061 | 850 | |||||||||
COMM Mortgage Trust, Series 2015-PC1, Class AM, 4.29%, 7/10/50 (d) | 2,000 | 2,154 | |||||||||
COMM Mortgage Trust, Series 2012-CCRE4, Class AM, 3.25%, 10/15/45 | 8,600 | 8,719 | |||||||||
COMM Mortgage Trust, Series 2014-CCRE19, Class AM, 4.08%, 8/10/47 | 7,500 | 8,219 | |||||||||
CSMC Trust, Series 2020-West, Class A, 3.04%, 2/15/35 (a) | 2,500 | 2,392 | |||||||||
DBJPM Mortgage Trust, Series 2016-SFC, Class B, 3.24%, 8/10/36 (a) | 2,500 | 2,288 | |||||||||
DBJPM Mortgage Trust, Series 2016-SFC, Class A, 2.83%, 8/10/36 (a) | 4,750 | 4,479 | |||||||||
FREMF Mortgage Trust, Series 2019-K99, Class B, 3.65%, 9/25/29 (a) (d) | 10,000 | 11,069 | |||||||||
GE Commercial Mortgage Corp., Series 2007-C1, Class AM, 5.61%, 12/10/49 (d) | 628 | 454 | |||||||||
GS Mortgage Securities Corp., Series 2013-GC10, Class AS, 3.28%, 2/10/46 | 5,000 | 5,179 | |||||||||
| GS Mortgage Securities Corp., Series 2005-ROCK, Class X1, 0.21%, 5/3/32 (a) (d) (f) | 190,667 | 2,386 | |||||||||
GS Mortgage Securities Corp., Series 2013-GC10, Class B, 3.68%, 2/10/46 (a) | 10,000 | 10,285 | |||||||||
GS Mortgage Securities Trust, Series 2012-GCJ7, Class XA, 2.16%, 5/10/45 (d) | 21,681 | 376 | |||||||||
GS Mortgage Securities Trust, Series 2013-GC14, Class A5, 4.24%, 8/10/46 | 5,000 | 5,420 | |||||||||
GS Mortgage Securities Trust, Series 2015-GC32, Class A4, 3.76%, 7/10/48 | 6,000 | 6,682 | |||||||||
GS Mortgage Securities Trust, Series 2020-GC45, Class AAB, 2.84%, 2/13/53 | 3,571 | 3,888 | |||||||||
GS Mortgage Securities Trust, Series 2020-GC45, Class A5, 2.91%, 2/13/53 | 4,231 | 4,700 | |||||||||
GS Mortgage Securities Trust, Series 2012-ALOH, Class A, 3.55%, 4/10/34 (a) | 3,534 | 3,564 | |||||||||
GS Mortgage Securities Trust, Series 2012-GCJ7, Class A4, 3.38%, 5/10/45 (e) | 3,793 | 3,863 | |||||||||
| JP Morgan Chase Commercial Mortgage Securities Trust, Series 2010-C2, Class C, 5.65%, 11/15/43 (a) (d) | 15,000 | 15,082 | |||||||||
| JP Morgan Chase Commercial Mortgage Securities Trust, Series 2012-C6, Class B, 4.82%, 5/15/45 (d) | 10,697 | 10,907 | |||||||||
| JP Morgan Chase Commercial Mortgage Securities Trust, Series 2012-CIBX, Class AS, 4.27%, 6/15/45 | 11,745 | 12,281 | |||||||||
| JPMBB Commercial Mortgage Securities Trust, Series 2014-C18, Class AS, 4.44%, 2/15/47, Callable 2/11/24 @ 100 (d) | 9,000 | 9,918 | |||||||||
| Morgan Stanley Bank of America Merrill Lynch Trust, Series C9, Class AS, 3.46%, 5/15/46 | 3,200 | 3,347 | |||||||||
Morgan Stanley Capital Trust, Series 2011-C2, Class B, 5.20%, 6/15/44 (a) (d) | 2,750 | 2,794 | |||||||||
Morgan Stanley Capital Trust, Series 2012-C4, Class AS, 3.77%, 3/15/45 | 3,000 | 2,952 | |||||||||
Morgan Stanley Capital Trust, Series 2015-MS1, Class AS, 4.03%, 5/15/48 (d) | 7,000 | 7,590 | |||||||||
UBS Commercial Mortgage Trust, Series 2012-C1, Class B, 4.82%, 5/10/45 | 15,000 | 14,957 | |||||||||
UBS Commercial Mortgage Trust, Series 2012-C1, Class AS, 4.17%, 5/10/45 | 9,375 | 9,773 | |||||||||
| UBS Commercial Mortgage Trust, Series 2012-C1, Class XA, 2.07%, 5/10/45 (a) (d) (f) | 45,632 | 1,123 | |||||||||
| UBS-Barclays Commercial Mortgage Trust, Series 2012-C2, Class ASEC, 4.18%, 5/10/63 (a) | 2,313 | 2,411 | |||||||||
See notes to financial statements.
14
| USAA Mutual Funds Trust USAA Income Fund | Schedule of Portfolio Investments — continued July 31, 2020 | ||||||
(Amounts in Thousands, Except for Shares)
Security Description | Shares or Principal Amount | Value | |||||||||
| Wells Fargo Commercial Mortgage Trust, Series 2012-LC5, Class XA, 1.75%, 10/15/45 (a) (d) (f) | $ | 23,150 | $ | 706 | |||||||
| Wells Fargo Commercial Mortgage Trust, Series 2015-C28, Class A4, 3.54%, 5/15/48 | 7,000 | 7,680 | |||||||||
| WFRBS Commercial Mortgage Trust, Series 2013-C18, Class A3, 3.65%, 12/15/46 | 20,000 | 20,080 | |||||||||
| WFRBS Commercial Mortgage Trust, Series 2012-C10, Class A5, 3.24%, 12/15/45 | 5,000 | 4,807 | |||||||||
| WFRBS Commercial Mortgage Trust, Series 2012-C7, Class AS, 4.09%, 6/15/45 (d) | 10,000 | 10,345 | |||||||||
| WFRBS Commercial Mortgage Trust, Series 2011-C4, Class B, 5.22%, 6/15/44 (a) (d) | 6,500 | 6,647 | |||||||||
| WFRBS Commercial Mortgage Trust, Series 2013-C13, Class AS, 3.35%, 5/15/45 | 5,000 | 5,227 | |||||||||
409,569 | |||||||||||
Total Collateralized Mortgage Obligations (Cost $394,205) | 409,569 | ||||||||||
Common Stocks (0.0%) (g) | |||||||||||
Financials (0.0%): (g) | |||||||||||
MFA Financial, Inc. | 199,850 | 526 | |||||||||
Total Common Stocks (Cost $1,438) | 526 | ||||||||||
Preferred Stocks (0.8%) | |||||||||||
Consumer Staples (0.3%): | |||||||||||
CHS, Inc., cumulative redeemable, Series 1, 7.88% (h) | 200,000 | 5,480 | |||||||||
Dairy Farmers of America, Inc., cumulative redeemable, 7.88% (a) (h) | 172,520 | 15,182 | |||||||||
20,662 | |||||||||||
Financials (0.0%): (g) | |||||||||||
Citigroup Capital, cumulative redeemable, 6.64% (LIBOR03M+637bps), 10/30/40 (b) | 40,000 | 1,080 | |||||||||
Real Estate (0.5%): | |||||||||||
Equity Residential, cumulative redeemable, Series K, 8.29% (h) | 111,611 | 7,087 | |||||||||
| Mid-America Apartment Communities, Inc., cumulative redeemable, Series I, 8.50% (h) | 219,731 | 14,009 | |||||||||
Prologis, Inc., cumulative redeemable, Series Q, 8.54% (h) (i) | 284,623 | 21,002 | |||||||||
42,098 | |||||||||||
Utilities (0.0%): (g) | |||||||||||
Entergy Texas, Inc., 5.63%, 6/1/64 | 104,000 | 2,732 | |||||||||
Total Preferred Stocks (Cost $55,590) | 66,572 | ||||||||||
Senior Secured Loans (0.4%) | |||||||||||
CSC Holdings LLC, 1st Lien Term Loan, 2.42% (LIBOR01M+225bps), 7/17/25 (b) | $ | 2,381 | 2,296 | ||||||||
| Harbor Freight Tools USA, Inc., 1st Lien Term Loan, 3.25% (LIBOR01M+250bps), 8/16/23 (b) | 7,376 | 7,215 | |||||||||
| McGraw-Hill Global Education Holdings LLC, 1st Lien Term Loan B, 5.00% (LIBOR03M+400bps), 5/4/22 (b) | 3,241 | 2,808 | |||||||||
| Reynolds Group Holdings, Inc., 1st Lien Term Loan B, 2.93% (LIBOR01M+275bps), 2/5/23 (b) | 8,497 | 8,315 | |||||||||
See notes to financial statements.
15
| USAA Mutual Funds Trust USAA Income Fund | Schedule of Portfolio Investments — continued July 31, 2020 | ||||||
(Amounts in Thousands, Except for Shares)
Security Description | Principal Amount | Value | |||||||||
Solera LLC, 1st Lien Term Loan B, 2.93% (LIBOR01M+275bps), 3/3/23 (b) | $ | 7,146 | $ | 7,014 | |||||||
Terex Corp. 1st Lien Term Loan, 2.75% (LIBOR03M+200bps), 1/31/24 (b) | 4,753 | 4,598 | |||||||||
32,246 | |||||||||||
Total Senior Secured Loans (Cost $33,308) | 32,246 | ||||||||||
Corporate Bonds (47.9%) | |||||||||||
Communication Services (2.7%): | |||||||||||
Activision Blizzard, Inc., 3.40%, 9/15/26, Callable 6/15/26 @ 100 | 5,000 | 5,728 | |||||||||
| AT&T, Inc. 2.30%, 6/1/27, Callable 4/1/27 @ 100 | 12,000 | 12,716 | |||||||||
4.50%, 5/15/35, Callable 11/15/34 @ 100 | 10,000 | 11,999 | |||||||||
3.10%, 2/1/43, Callable 8/1/42 @ 100 (c) | 10,000 | 10,296 | |||||||||
CBS Corp., 4.20%, 6/1/29, Callable 3/1/29 @ 100 | 3,000 | 3,459 | |||||||||
| CCO Holdings LLC/CCO Holdings Capital Corp., 5.75%, 2/15/26, Callable 2/15/21 @ 102.88 (a) | 5,000 | 5,232 | |||||||||
| CenturyLink, Inc. 5.80%, 3/15/22 | 10,000 | 10,537 | |||||||||
6.75%, 12/1/23 | 2,000 | 2,220 | |||||||||
| Charter Communications Operating LLC, 6.38%, 10/23/35, Callable 4/23/35 @ 100 | 12,000 | 16,442 | |||||||||
Comcast Corp., 3.90%, 3/1/38, Callable 9/1/37 @ 100 | 15,000 | 18,786 | |||||||||
Crown Castle Towers LLC, 3.22%, 5/15/42, Callable 5/15/21 @ 100 (a) | 10,000 | 10,153 | |||||||||
CSC Holdings LLC, 5.50%, 4/15/27, Callable 4/15/22 @ 102.75 (a) | 3,000 | 3,213 | |||||||||
Discovery Communications LLC, 3.95%, 3/20/28, Callable 12/20/27 @ 100 | 10,000 | 11,440 | |||||||||
| Fox Corp. 3.05%, 4/7/25, Callable 3/7/25 @ 100 | 3,571 | 3,913 | |||||||||
4.71%, 1/25/29, Callable 10/25/28 @ 100 | 7,600 | 9,246 | |||||||||
Qwest Corp., 6.75%, 12/1/21 | 5,000 | 5,333 | |||||||||
Sprint Corp., 7.25%, 9/15/21 | 2,250 | 2,378 | |||||||||
Sprint Spectrum Co. LLC/Sprint Spectrum Co. II LLC, 4.74%, 9/20/29 (a) | 19,500 | 21,261 | |||||||||
The Walt Disney Co., 2.20%, 1/13/28 | 8,000 | 8,449 | |||||||||
| T-Mobile USA, Inc. 4.75%, 2/1/28, Callable 2/1/23 @ 102.38 | 2,857 | 3,097 | |||||||||
3.88%, 4/15/30, Callable 1/15/30 @ 100 (a) (e) | 15,333 | 17,570 | |||||||||
2.55%, 2/15/31, Callable 11/15/30 @ 100 (a) | 10,000 | 10,371 | |||||||||
| Verizon Communications, Inc. 3.15%, 3/22/30, Callable 12/22/29 @ 100 | 1,800 | 2,067 | |||||||||
4.40%, 11/1/34, Callable 5/1/34 @ 100 | 5,000 | 6,442 | |||||||||
4.13%, 8/15/46 | 5,000 | 6,586 | |||||||||
ViacomCBS, Inc., 3.38%, 2/15/28, Callable 11/15/27 @ 100 | 7,000 | 7,644 | |||||||||
226,578 | |||||||||||
Consumer Discretionary (1.5%): | |||||||||||
Advance Auto Parts, Inc., 4.50%, 12/1/23, Callable 9/1/23 @ 100 | 10,000 | 10,998 | |||||||||
Amazon.com, Inc., 3.88%, 8/22/37, Callable 2/22/37 @ 100 | 12,000 | 15,571 | |||||||||
AutoNation, Inc., 4.75%, 6/1/30, Callable 3/1/30 @ 100 | 7,200 | 8,374 | |||||||||
Ford Motor Co., 9.63%, 4/22/30, Callable 1/22/30 @ 100 | 1,875 | 2,467 | |||||||||
General Motors Co., 6.80%, 10/1/27, Callable 8/1/27 @ 100 | 8,000 | 9,792 | |||||||||
Hasbro, Inc., 3.55%, 11/19/26, Callable 9/19/26 @ 100 | 12,000 | 12,697 | |||||||||
Horace Mann School, 3.27%, 7/1/27 | 2,500 | 2,767 | |||||||||
See notes to financial statements.
16
| USAA Mutual Funds Trust USAA Income Fund | Schedule of Portfolio Investments — continued July 31, 2020 | ||||||
(Amounts in Thousands, Except for Shares)
Security Description | Principal Amount | Value | |||||||||
| Marriott International, Inc. 5.75%, 5/1/25, Callable 4/1/25 @ 100 (e) | $ | 1,840 | $ | 2,045 | |||||||
4.63%, 6/15/30, Callable 3/15/30 @ 100 | 2,333 | 2,496 | |||||||||
Murphy Oil USA, Inc., 4.75%, 9/15/29, Callable 9/15/24 @ 102.38 | 2,000 | 2,117 | |||||||||
NCL Corp. Ltd., 12.25%, 5/15/24, Callable 2/15/24 @ 100 (a) | 2,353 | 2,559 | |||||||||
O'Reilly Automotive, Inc., 4.20%, 4/1/30, Callable 1/1/30 @ 100 | 7,500 | 9,100 | |||||||||
Princeton Theological Seminary, 4.11%, 7/1/23 | 6,080 | 6,583 | |||||||||
| Smithsonian Institution 1.51%, 9/1/26 | 1,250 | 1,285 | |||||||||
1.61%, 9/1/27 | 1,150 | 1,185 | |||||||||
2.65%, 9/1/39 | 2,000 | 2,112 | |||||||||
The Art Institute of Chicago, 3.23%, 3/1/22 | 2,750 | 2,847 | |||||||||
University of Notre Dame du Lac, 3.44%, 2/15/45 | 5,000 | 6,131 | |||||||||
Vanderbilt University Medical Center, 4.17%, 7/1/37, Callable 1/1/37 @ 100 | 1,000 | 1,268 | |||||||||
VF Corp., 2.95%, 4/23/30, Callable 1/23/30 @ 100 | 8,000 | 8,799 | |||||||||
| Volkswagen Group of America Finance LLC 3.35%, 5/13/25 (a) | 5,000 | 5,459 | |||||||||
3.20%, 9/26/26, Callable 7/26/26 @ 100 (a) | 7,105 | 7,780 | |||||||||
124,432 | |||||||||||
Consumer Staples (2.2%): | |||||||||||
Altria Group, Inc., 3.40%, 5/6/30, Callable 2/6/30 @ 100 | 5,133 | 5,761 | |||||||||
| Anheuser-Busch Cos. LLC/Anheuser-Busch InBev Worldwide, Inc., 4.70%, 2/1/36, Callable 8/1/35 @ 100 | 20,000 | 24,467 | |||||||||
Anheuser-Busch InBev Worldwide, Inc., 4.38%, 4/15/38, Callable 10/15/37 @ 100 | 6,500 | 7,760 | |||||||||
BAT Capital Corp., 4.39%, 8/15/37, Callable 2/15/37 @ 100 | 5,000 | 5,716 | |||||||||
Bunge Ltd. Finance Corp., 3.25%, 8/15/26, Callable 5/15/26 @ 100 | 3,000 | 3,203 | |||||||||
Flowers Foods, Inc., 3.50%, 10/1/26, Callable 7/1/26 @ 100 | 10,000 | 10,793 | |||||||||
General Mills, Inc., 4.55%, 4/17/38, Callable 10/17/37 @ 100 | 4,667 | 6,273 | |||||||||
| Keurig Dr Pepper, Inc. 4.60%, 5/25/28, Callable 2/25/28 @ 100 | 7,143 | 8,783 | |||||||||
4.99%, 5/25/38, Callable 11/25/37 @ 100 | 4,667 | 6,326 | |||||||||
| Kraft Heinz Foods Co. 3.95%, 7/15/25, Callable 4/15/25 @ 100 | 10,000 | 10,999 | |||||||||
3.75%, 4/1/30, Callable 1/1/30 @ 100 (a) | 3,750 | 4,054 | |||||||||
Mars, Inc., 3.88%, 4/1/39, Callable 10/1/38 @ 100 (a) | 14,000 | 17,420 | |||||||||
McCormick & Co., Inc., 2.50%, 4/15/30, Callable 1/15/30 @ 100 | 5,000 | 5,435 | |||||||||
Mead Johnson Nutrition Co., 4.13%, 11/15/25, Callable 8/15/25 @ 100 | 3,500 | 4,100 | |||||||||
Mondelez International, Inc., 2.75%, 4/13/30, Callable 1/13/30 @ 100 | 4,000 | 4,440 | |||||||||
| PepsiCo, Inc. 2.75%, 3/19/30, Callable 12/19/29 @ 100 | 18,000 | 20,550 | |||||||||
4.25%, 10/22/44, Callable 4/22/44 @ 100 | 5,000 | 6,789 | |||||||||
SC Johnson & Son, Inc., 4.35%, 9/30/44, Callable 3/30/44 @ 100 (a) | 10,000 | 12,800 | |||||||||
| Smithfield Foods, Inc. 4.25%, 2/1/27, Callable 11/1/26 @ 100 (a) | 5,000 | 5,200 | |||||||||
5.20%, 4/1/29, Callable 1/1/29 @ 100 (a) | 10,000 | 11,128 | |||||||||
Sysco Corp., 5.95%, 4/1/30, Callable 1/1/30 @ 100 | 4,304 | 5,465 | |||||||||
187,462 | |||||||||||
See notes to financial statements.
17
| USAA Mutual Funds Trust USAA Income Fund | Schedule of Portfolio Investments — continued July 31, 2020 | ||||||
(Amounts in Thousands, Except for Shares)
Security Description | Principal Amount | Value | |||||||||
Energy (6.0%): | |||||||||||
| Boardwalk Pipelines LP 4.95%, 12/15/24, Callable 9/15/24 @ 100 | $ | 15,000 | $ | 16,357 | |||||||
4.45%, 7/15/27, Callable 4/15/27 @ 100 | 10,000 | 10,658 | |||||||||
| Buckeye Partners LP 4.13%, 12/1/27, Callable 9/1/27 @ 100 | 9,167 | 9,036 | |||||||||
5.60%, 10/15/44, Callable 4/15/44 @ 100 | 15,000 | 13,428 | |||||||||
Cameron LNG LLC, 3.30%, 1/15/35, Callable 9/15/34 @ 100 (a) | 22,364 | 25,348 | |||||||||
Chevron Phillips Chemical Co. LLC, 3.40%, 12/1/26, Callable 9/1/26 @ 100 (a) | 10,000 | 10,916 | |||||||||
Columbia Pipeline Group, Inc., 4.50%, 6/1/25, Callable 3/1/25 @ 100 | 15,000 | 17,477 | |||||||||
ConocoPhillips Co., 4.15%, 11/15/34, Callable 5/15/34 @ 100 (j) | 10,000 | 11,674 | |||||||||
Continental Resources, Inc., 4.50%, 4/15/23, Callable 1/15/23 @ 100 (e) | 4,042 | 4,042 | |||||||||
| DCP Midstream Operating LP, 5.85% (LIBOR03M+385bps), 5/21/43, Callable 5/21/23 @ 100 (a) (b) | 15,000 | 11,499 | |||||||||
Enable Midstream Partners LP, 4.15%, 9/15/29, Callable 6/15/29 @ 100 | 10,000 | 9,028 | |||||||||
| Energy Transfer Operating LP 4.75%, 1/15/26, Callable 10/15/25 @ 100 | 5,000 | 5,430 | |||||||||
3.70% (LIBOR03M+302bps), 11/1/66, Callable 9/10/20 @ 100 (b) | 15,010 | 7,263 | |||||||||
| Energy Transfer Partners LP/Regency Energy Finance, 4.50%, 11/1/23, Callable 8/1/23 @ 100 | 7,000 | 7,447 | |||||||||
| EnLink Midstream Partners LP 4.15%, 6/1/25, Callable 3/1/25 @ 100 | 14,000 | 11,214 | |||||||||
4.85%, 7/15/26, Callable 4/15/26 @ 100 | 10,000 | 7,753 | |||||||||
Enterprise Products Operating LLC, 2.80%, 1/31/30, Callable 10/31/29 @ 100 | 10,000 | 10,732 | |||||||||
| EOG Resources, Inc. 4.38%, 4/15/30, Callable 1/15/30 @ 100 | 1,154 | 1,404 | |||||||||
3.90%, 4/1/35, Callable 10/1/34 @ 100 | 10,000 | 11,989 | |||||||||
EQM Midstream Partners LP, 4.00%, 8/1/24, Callable 5/1/24 @ 100 | 6,437 | 6,417 | |||||||||
EQT Corp., 7.00%, 2/1/30, Callable 11/1/29 @ 100 | 9,569 | 11,090 | |||||||||
EQT Midstream Partners LP, 4.13%, 12/1/26, Callable 9/1/26 @ 100 | 14,000 | 13,622 | |||||||||
Exxon Mobil Corp., 2.61%, 10/15/30, Callable 7/15/30 @ 100 | 8,500 | 9,395 | |||||||||
Florida Gas Transmission Co. LLC, 2.55%, 7/1/30, Callable 4/1/30 @ 100 (a) | 8,000 | 8,405 | |||||||||
Hess Corp., 4.30%, 4/1/27, Callable 1/1/27 @ 100 | 7,500 | 7,899 | |||||||||
| Marathon Petroleum Corp. 4.70%, 5/1/25, Callable 4/1/25 @ 100 | 1,875 | 2,129 | |||||||||
4.75%, 9/15/44, Callable 3/15/44 @ 100 | 10,000 | 11,376 | |||||||||
Midwest Connector Capital Co. LLC, 4.63%, 4/1/29, Callable 1/1/29 @ 100 (a) | 25,000 | 25,076 | |||||||||
MPLX LP, 4.00%, 2/15/25, Callable 11/15/24 @ 100 | 7,500 | 8,148 | |||||||||
Murphy Oil Corp., 5.75%, 8/15/25, Callable 9/10/20 @ 104.31 | 5,000 | 4,709 | |||||||||
| Newfield Exploration Co. 5.63%, 7/1/24 | 6,730 | 6,717 | |||||||||
5.38%, 1/1/26, Callable 10/1/25 @ 100 | 9,500 | 9,119 | |||||||||
Northwest Pipeline LLC, 4.00%, 4/1/27, Callable 1/1/27 @ 100 | 6,067 | 6,788 | |||||||||
NuStar Logistics LP, 6.00%, 6/1/26, Callable 3/1/26 @ 100 | 3,500 | 3,587 | |||||||||
| Occidental Petroleum Corp. 3.40%, 4/15/26, Callable 1/15/26 @ 100 | 10,000 | 9,064 | |||||||||
3.00%, 2/15/27, Callable 11/15/26 @ 100 | 5,000 | 4,419 | |||||||||
3.50%, 8/15/29, Callable 5/15/29 @ 100 | 6,279 | 5,577 | |||||||||
4.40%, 8/15/49, Callable 2/15/49 @ 100 | 7,500 | 6,108 | |||||||||
ONEOK Partners LP, 4.90%, 3/15/25, Callable 12/15/24 @ 100 | 5,000 | 5,446 | |||||||||
See notes to financial statements.
18
| USAA Mutual Funds Trust USAA Income Fund | Schedule of Portfolio Investments — continued July 31, 2020 | ||||||
(Amounts in Thousands, Except for Shares)
Security Description | Principal Amount | Value | |||||||||
ONEOK, Inc., 6.35%, 1/15/31, Callable 10/15/30 @ 100 | $ | 2,500 | $ | 2,904 | |||||||
Phillips 66, 4.65%, 11/15/34, Callable 5/15/34 @ 100 | 10,000 | 12,632 | |||||||||
| Plains All American Pipeline LP/PAA Finance Corp., 3.55%, 12/15/29, Callable 9/15/29 @ 100 | 13,750 | 13,548 | |||||||||
| Rockies Express Pipeline LLC 4.95%, 7/15/29, Callable 4/15/29 @ 100 (a) | 13,730 | 13,404 | |||||||||
4.80%, 5/15/30, Callable 2/15/30 @ 100 (a) | 3,000 | 2,876 | |||||||||
Sabal Trail Transmission LLC, 4.68%, 5/1/38, Callable 11/1/37 @ 100 (a) | 15,000 | 17,299 | |||||||||
| Schlumberger Holdings Corp. 4.00%, 12/21/25, Callable 9/21/25 @ 100 (a) | 961 | 1,067 | |||||||||
3.90%, 5/17/28, Callable 2/17/28 @ 100 (a) | 14,669 | 16,166 | |||||||||
| Southwestern Energy Co. 6.20%, 1/23/25, Callable 10/23/24 @ 100 | 2,000 | 1,859 | |||||||||
7.50%, 4/1/26, Callable 4/1/21 @ 105.63 (j) | 5,000 | 4,695 | |||||||||
Spectra Energy Partners LP, 3.38%, 10/15/26, Callable 7/15/26 @ 100 | 5,000 | 5,510 | |||||||||
| Targa Resources Partners LP/Targa Resources Partners Finance Corp., 5.50%, 3/1/30, Callable 3/1/25 @ 102.75 (a) | 5,000 | 5,288 | |||||||||
The Williams Cos., Inc., 4.55%, 6/24/24, Callable 3/24/24 @ 100 | 10,000 | 11,133 | |||||||||
| TransCanada PipeLines Ltd., 2.60% (LIBOR03M+221bps), 5/15/67, Callable 9/10/20 @ 100 (b) | 12,124 | 8,192 | |||||||||
Transcontinental Gas Pipe Line Co. LLC, 7.85%, 2/1/26, Callable 11/1/25 @ 100 | 3,000 | 3,925 | |||||||||
Transocean Pontus Ltd., 6.13%, 8/1/25, Callable 8/1/21 @ 104.59 (a) | 1,948 | 1,825 | |||||||||
| Western Midstream Operating LP 5.38%, 6/1/21, Callable 3/1/21 @ 100 | 10,000 | 10,129 | |||||||||
3.10%, 2/1/25, Callable 1/1/25 @ 100 | 4,211 | 4,175 | |||||||||
Whiting Petroleum Corp., 6.63%, 1/15/26, Callable 10/15/25 @ 100 (k) (l) | 5,000 | 924 | |||||||||
505,337 | |||||||||||
Financials (15.4%): | |||||||||||
Amcor Finance USA, Inc., 3.63%, 4/28/26, Callable 1/28/26 @ 100 | 4,750 | 5,233 | |||||||||
| American Equity Investment Life Holding Co., 5.00%, 6/15/27, Callable 3/15/27 @ 100 | 5,000 | 5,481 | |||||||||
American International Group, Inc., 3.88%, 1/15/35, Callable 7/15/34 @ 100 | 10,000 | 11,849 | |||||||||
AmSouth Bancorp, 6.75%, 11/1/25 | 5,000 | 6,061 | |||||||||
AmTrust Financial Services, Inc., 6.13%, 8/15/23 | 10,000 | 9,020 | |||||||||
| Ares Capital Corp. 3.50%, 2/10/23, Callable 1/10/23 @ 100 | 10,000 | 10,141 | |||||||||
4.20%, 6/10/24, Callable 5/10/24 @ 100 | 5,000 | 5,135 | |||||||||
4.25%, 3/1/25, Callable 1/1/25 @ 100 | 5,000 | 5,127 | |||||||||
| Assurant, Inc. 4.90%, 3/27/28, Callable 12/27/27 @ 100 (j) | 5,000 | 5,513 | |||||||||
3.70%, 2/22/30, Callable 11/22/29 @ 100 | 3,846 | 3,958 | |||||||||
Athene Global Funding, 2.80%, 5/26/23 (a) | 9,000 | 9,345 | |||||||||
| Atlantic Union Bankshares Corp., 5.00% (LIBOR03M+318bps), 12/15/26, Callable 12/15/21 @ 100 (b) | 10,000 | 9,950 | |||||||||
AXA Equitable Holdings, Inc., 4.35%, 4/20/28, Callable 1/20/28 @ 100 | 15,000 | 17,304 | |||||||||
Banc of California, Inc., 5.25%, 4/15/25, Callable 1/15/25 @ 100 | 15,000 | 15,562 | |||||||||
| BancorpSouth Bank, 4.13% (LIBOR03M+247bps), 11/20/29, Callable 11/20/24 @ 100 (b) | 8,572 | 8,545 | |||||||||
See notes to financial statements.
19
| USAA Mutual Funds Trust USAA Income Fund | Schedule of Portfolio Investments — continued July 31, 2020 | ||||||
(Amounts in Thousands, Except for Shares)
Security Description | Principal Amount | Value | |||||||||
| Bank of America Corp. 4.20%, 8/26/24, MTN (e) | $ | 10,000 | $ | 11,195 | |||||||
3.95%, 4/21/25, MTN | 5,000 | 5,604 | |||||||||
3.71% (LIBOR03M+151bps), 4/24/28, Callable 4/24/27 @ 100 (b) | 8,000 | 9,130 | |||||||||
3.42% (LIBOR03M+104bps), 12/20/28, Callable 12/20/27 @ 100 (b) | 4,383 | 4,953 | |||||||||
BankUnited, Inc., 4.88%, 11/17/25, Callable 8/17/25 @ 100 | 10,000 | 11,237 | |||||||||
BBVA USA, 3.88%, 4/10/25, Callable 3/10/25 @ 100 | 20,000 | 21,484 | |||||||||
BMW US Capital LLC, 4.15%, 4/9/30, Callable 1/9/30 @ 100 (a) | 10,000 | 11,915 | |||||||||
| BOKF Merger Corp., 5.62% (LIBOR03M+317bps), 6/25/30, Callable 6/25/25 @ 100 (b) | 8,000 | 8,433 | |||||||||
BP Capital Markets America, Inc., 3.59%, 4/14/27, Callable 1/14/27 @ 100 | 10,000 | 11,310 | |||||||||
| Cadence Bancorp, 4.75% (LIBOR03M+303bps), 6/30/29, Callable 6/30/24 @ 100 (b) | 7,833 | 6,631 | |||||||||
| Capital One Financial Corp. 3.75%, 4/24/24, Callable 3/24/24 @ 100 | 10,000 | 10,939 | |||||||||
3.75%, 3/9/27, Callable 2/9/27 @ 100 | 15,000 | 16,854 | |||||||||
| CIT Group, Inc. 5.25%, 3/7/25, Callable 12/7/24 @ 100 | 5,000 | 5,351 | |||||||||
4.13% (H15T5Y+237bps), 11/13/29, Callable 11/13/24 @ 100 (b) | 15,000 | 13,167 | |||||||||
| Citigroup, Inc. 4.40%, 6/10/25 | 20,000 | 22,745 | |||||||||
3.67% (LIBOR03M+139bps), 7/24/28, Callable 7/24/27 @ 100 (b) | 10,000 | 11,381 | |||||||||
| Citizens Financial Group, Inc. 4.15%, 9/28/22 (a) | 15,000 | 15,787 | |||||||||
3.75%, 7/1/24 | 5,500 | 5,942 | |||||||||
Credit Acceptance Corp., 6.63%, 3/15/26, Callable 3/15/22 @ 103.31 | 4,875 | 5,123 | |||||||||
Cullen/Frost Bankers, Inc., 4.50%, 3/17/27, Callable 2/17/27 @ 100 (j) | 3,500 | 3,820 | |||||||||
| Cullen/Frost Capital Trust II, 1.90% (LIBOR03M+155bps), 3/1/34, Callable 9/10/20 @ 100 (b) | 10,000 | 7,892 | |||||||||
DAE Funding LLC, 5.00%, 8/1/24, Callable 9/10/20 @ 103.75 (a) | 3,000 | 2,775 | |||||||||
| Dime Community Bancshares, Inc., 4.50% (LIBOR03M+266bps), 6/15/27, Callable 6/15/22 @ 100 (b) (j) | 3,750 | 3,740 | |||||||||
Discover Bank, 4.68% (USSW5+173bps), 8/9/28, Callable 8/9/23 @ 100 (b) | 10,000 | 10,269 | |||||||||
| Eagle Bancorp, Inc., 5.00% (LIBOR03M+385bps), 8/1/26, Callable 8/1/21 @ 100 (b) | 10,000 | 10,028 | |||||||||
Fifth Third Bancorp, 2.55%, 5/5/27, Callable 4/5/27 @ 100 | 3,000 | 3,259 | |||||||||
Fifth Third Bank, 3.85%, 3/15/26, Callable 2/15/26 @ 100 | 10,000 | 11,447 | |||||||||
| First Citizens Bancshare, Inc., 3.37% (SOFR+247bps), 3/15/30, Callable 3/15/25 @ 100 (b) | 12,097 | 11,818 | |||||||||
First Horizon Bank, 5.75%, 5/1/30, Callable 2/1/30 @ 100 | 8,000 | 8,894 | |||||||||
| First Maryland Capital I, 1.28% (LIBOR03M+100bps), 1/15/27, Callable 9/10/20 @ 100 (b) | 3,500 | 3,076 | |||||||||
FirstMerit Bank NA, 4.27%, 11/25/26 | 5,000 | 5,693 | |||||||||
Flagstar Bancorp, Inc., 6.13%, 7/15/21, Callable 6/15/21 @ 100 | 10,000 | 9,945 | |||||||||
| Ford Motor Credit Co. LLC 4.06%, 11/1/24, Callable 10/1/24 @ 100 | 10,000 | 10,222 | |||||||||
4.54%, 8/1/26, Callable 6/1/26 @ 100 | 10,000 | 10,282 | |||||||||
| Fulton Financial Corp. 3.60%, 3/16/22 | 3,250 | 3,315 | |||||||||
4.50%, 11/15/24 (j) | 5,000 | 5,392 | |||||||||
3.25%(SOFR+230bps), 3/15/30, Callable 3/15/25 @ 100 (b) | 10,000 | 9,994 | |||||||||
See notes to financial statements.
20
| USAA Mutual Funds Trust USAA Income Fund | Schedule of Portfolio Investments — continued July 31, 2020 | ||||||
(Amounts in Thousands, Except for Shares)
Security Description | Principal Amount | Value | |||||||||
GlaxoSmithKline Capital, Inc., 4.20%, 3/18/43 | $ | 10,000 | $ | 13,626 | |||||||
| Glencore Funding LLC 4.13%, 5/30/23 (a) | 5,000 | 5,368 | |||||||||
4.00%, 3/27/27, Callable 12/27/26 @ 100 (a) | 10,000 | 11,014 | |||||||||
4.88%, 3/12/29, Callable 12/12/28 @ 100 (a) | 3,700 | 4,375 | |||||||||
| Global Atlantic Financial Co. 8.63%, 4/15/21 (a) | 10,000 | 10,399 | |||||||||
4.40%, 10/15/29, Callable 7/15/29 @ 100 (a) | 17,143 | 17,816 | |||||||||
| Home Bancshares, Inc., 5.62% (LIBOR03M+358bps), 4/15/27, Callable 4/15/22 @ 100 (b) | 5,000 | 5,109 | |||||||||
Huntington Bancshares, Inc., 4.35%, 2/4/23 | 10,000 | 10,768 | |||||||||
| Hyundai Capital America 3.25%, 9/20/22 (a) | 10,000 | 10,357 | |||||||||
3.50%, 11/2/26, Callable 9/2/26 @ 100 (a) | 10,000 | 10,620 | |||||||||
ILFC E-Capital Trust I, 3.02%, 12/21/65, Callable 9/10/20 @ 100 (a) | 10,000 | 4,984 | |||||||||
Intercontinental Exchange, Inc., 3.10%, 9/15/27, Callable 6/15/27 @ 100 | 15,000 | 17,160 | |||||||||
| JPMorgan Chase & Co. 2.95%, 10/1/26, Callable 7/1/26 @ 100 | 20,000 | 22,191 | |||||||||
1.19% (LIBOR03M+50bps), 2/1/27, Callable 9/10/20 @ 100 (b) | 4,000 | 3,655 | |||||||||
4.25%, 10/1/27 | 5,000 | 5,880 | |||||||||
KeyBank NA, 3.40%, 5/20/26, MTN | 20,000 | 22,297 | |||||||||
KeyCorp, 2.25%, 4/6/27, MTN | 6,500 | 6,937 | |||||||||
| LegacyTexas Financial Group, Inc., 5.50% (LIBOR03M+389bps), 12/1/25, Callable 12/1/20 @ 100 (b) | 5,000 | 4,890 | |||||||||
Level 3 Financing, Inc., 3.88%, 11/15/29, Callable 8/15/29 @ 100 (a) | 20,000 | 21,686 | |||||||||
| Lincoln National Corp. 4.20%, 3/15/22 | 10,000 | 10,592 | |||||||||
2.74% (LIBOR03M+236bps), 5/17/66, Callable 8/26/20 @ 100 (b) | 15,000 | 10,703 | |||||||||
| Loews Corp. 3.75%, 4/1/26, Callable 1/1/26 @ 100 | 5,000 | 5,714 | |||||||||
3.20%, 5/15/30, Callable 2/15/30 @ 100 | 8,000 | 9,007 | |||||||||
| Main Street Capital Corp. 4.50%, 12/1/22 | 4,500 | 4,629 | |||||||||
5.20%, 5/1/24 | 3,000 | 3,092 | |||||||||
Manufacturers & Traders Trust Co., 3.40%, 8/17/27 | 5,000 | 5,614 | |||||||||
| MB Financial Bank NA, 4.00% (LIBOR03M+187bps), 12/1/27, Callable 12/1/22 @ 100 (b) | 10,417 | 10,493 | |||||||||
Mercury General Corp., 4.40%, 3/15/27, Callable 12/15/26 @ 100 | 15,000 | 16,145 | |||||||||
MetLife, Inc., 4.13%, 8/13/42 | 10,000 | 13,010 | |||||||||
MUFG Americas Holdings Corp., 3.00%, 2/10/25, Callable 1/10/25 @ 100 | 18,026 | 19,580 | |||||||||
| National Rural Utilities Cooperative Finance Corp., 4.75% (LIBOR03M+291bps), 4/30/43, Callable 4/30/23 @ 100 (b) | 9,500 | 9,500 | |||||||||
| Nationwide Mutual Insurance Co., 2.60% (LIBOR03M+229bps), 12/15/24, Callable 9/10/20 @ 100 (a) (b) | 24,505 | 24,289 | |||||||||
| New York Community Bancorp, Inc., 5.90% (LIBOR03M+278bps), 11/6/28, Callable 11/6/23 @ 100 (b) | 10,000 | 9,804 | |||||||||
Nuveen Finance LLC, 4.13%, 11/1/24 (a) | 5,000 | 5,678 | |||||||||
Old Republic International Corp., 3.88%, 8/26/26, Callable 7/26/26 @ 100 | 20,000 | 21,939 | |||||||||
Pine Street Trust I, 4.57%, 2/15/29, Callable 11/15/28 @ 100 (a) | 15,000 | 17,344 | |||||||||
| Pinnacle Financial Partners, Inc., 4.13% (LIBOR03M+278bps), 9/15/29, Callable 9/15/24 @ 100 (b) | 5,000 | 4,914 | |||||||||
See notes to financial statements.
21
| USAA Mutual Funds Trust USAA Income Fund | Schedule of Portfolio Investments — continued July 31, 2020 | ||||||
(Amounts in Thousands, Except for Shares)
Security Description | Principal Amount | Value | |||||||||
PNC Bank NA, 2.70%, 10/22/29 | $ | 10,000 | $ | 10,998 | |||||||
| PPL Capital Funding, Inc. 4.13%, 4/15/30, Callable 1/15/30 @ 100 | 5,000 | 5,868 | |||||||||
2.97% (LIBOR03M+267bps), 3/30/67, Callable 9/10/20 @ 100 (b) | 21,130 | 15,901 | |||||||||
Primerica, Inc., 4.75%, 7/15/22 | 7,145 | 7,584 | |||||||||
ProAssurance Corp., 5.30%, 11/15/23 | 9,864 | 10,331 | |||||||||
| Prudential Financial, Inc. 5.62% (LIBOR03M+392bps), 6/15/43, Callable 6/15/23 @ 100 (b) | 10,000 | 10,829 | |||||||||
4.35%, 2/25/50, Callable 8/25/49 @ 100 | 5,000 | 6,524 | |||||||||
Regions Bank, 6.45%, 6/26/37 | 10,409 | 14,783 | |||||||||
S&P Global, Inc., 4.00%, 6/15/25, Callable 3/15/25 @ 100 | 10,000 | 11,486 | |||||||||
Santander Holdings USA, Inc., 4.40%, 7/13/27, Callable 4/14/27 @ 100 | 5,818 | 6,474 | |||||||||
Signature Bank, 4.13% (LIBOR03M+256bps), 11/1/29, Callable 11/1/24 @ 100 (b) | 10,000 | 10,094 | |||||||||
StanCorp Financial Group, Inc., 5.00%, 8/15/22 | 17,050 | 18,075 | |||||||||
Starwood Property Trust, Inc., 3.63%, 2/1/21, Callable 11/1/20 @ 100 | 5,450 | 5,415 | |||||||||
Sterling Bancorp, 4.00% (SOFR+253bps), 12/30/29, Callable 12/30/24 @ 100 (b) | 8,750 | 8,433 | |||||||||
| Sterling National Bank, 5.25% (LIBOR03M+394bps), 4/1/26, Callable 4/1/21 @ 100 (b) | 5,000 | 5,069 | |||||||||
Susquehanna Bancshares, Inc., 5.38%, 8/15/22 | 6,021 | 6,471 | |||||||||
| Synchrony Financial 3.95%, 12/1/27, Callable 9/1/27 @ 100 | 13,500 | 14,205 | |||||||||
5.15%, 3/19/29, Callable 12/19/28 @ 100 | 9,250 | 10,547 | |||||||||
| Synovus Financial Corp., 5.90% (USSW5+338bps), 2/7/29, Callable 2/7/24 @ 100 (b) | 10,000 | 10,060 | |||||||||
| TCF National Bank 6.25%, 6/8/22 | 10,000 | 10,546 | |||||||||
4.12% (LIBOR03M+238bps), 7/2/29, Callable 7/2/24 @ 100 (b) | 4,000 | 3,873 | |||||||||
Texas Capital Bank NA, 5.25%, 1/31/26 | 12,335 | 12,906 | |||||||||
| The Allstate Corp., 5.75% (LIBOR03M+294bps), 8/15/53, Callable 8/15/23 @ 100 (b) | 5,000 | 5,283 | |||||||||
The Hanover Insurance Group, Inc., 4.50%, 4/15/26, Callable 1/15/26 @ 100 | 13,086 | 14,398 | |||||||||
| The Hartford Financial Services Group, Inc., 2.52% (LIBOR03M+213bps), 2/12/67, Callable 9/10/20 @ 100 (a) (b) | 14,000 | 11,459 | |||||||||
| The PNC Financial Services Group, Inc. 2.85%, 11/9/22 (m) | 10,000 | 10,543 | |||||||||
2.55%, 1/22/30, Callable 10/24/29 @ 100 | 15,000 | 16,594 | |||||||||
The Progressive Corp., 3.20%, 3/26/30, Callable 12/26/29 @ 100 (j) | 4,000 | 4,694 | |||||||||
TIAA FSB Holdings, Inc., 5.75%, 7/2/25, Callable 6/2/25 @ 100 | 10,000 | 10,352 | |||||||||
Torchmark Corp., 4.55%, 9/15/28, Callable 6/15/28 @ 100 | 7,670 | 9,101 | |||||||||
Towne Bank, 4.50% (LIBOR03M+255bps), 7/30/27, Callable 7/30/22 @ 100 (b) | 11,062 | 11,178 | |||||||||
Toyota Motor Credit Corp., 3.38%, 4/1/30, MTN | 4,821 | 5,722 | |||||||||
Truist Bank, 2.25%, 3/11/30, Callable 12/11/29 @ 100 | 2,450 | 2,582 | |||||||||
U.S. Bancorp, 3.10%, 4/27/26, MTN, Callable 3/27/26 @ 100 | 5,000 | 5,597 | |||||||||
United Financial Bancorp, Inc., 5.75%, 10/1/24 | 2,500 | 2,694 | |||||||||
USB Realty Corp., 1.42% (LIBOR03M+115bps), Callable 1/15/22 @ 100 (a) (b) (h) | 16,800 | 13,272 | |||||||||
| WEA Finance LLC/Westfield UK & Europe Finance PLC, 3.75%, 9/17/24, Callable 6/17/24 @ 100 (a) | 20,000 | 20,718 | |||||||||
Wells Fargo & Co., 3.00%, 10/23/26 | 20,000 | 21,930 | |||||||||
Zions Bancorp NA, 3.25%, 10/29/29, Callable 7/29/29 @ 100 | 25,000 | 25,045 | |||||||||
1,288,079 | |||||||||||
See notes to financial statements.
22
| USAA Mutual Funds Trust USAA Income Fund | Schedule of Portfolio Investments — continued July 31, 2020 | ||||||
(Amounts in Thousands, Except for Shares)
Security Description | Principal Amount | Value | |||||||||
Health Care (3.2%): | |||||||||||
| AbbVie, Inc. 3.20%, 11/6/22, Callable 9/6/22 @ 100 | $ | 5,000 | $ | 5,269 | |||||||
3.80%, 3/15/25, Callable 12/15/24 @ 100 (a) | 15,000 | 16,820 | |||||||||
3.60%, 5/14/25, Callable 2/14/25 @ 100 | 5,000 | 5,593 | |||||||||
3.20%, 11/21/29, Callable 8/21/29 @ 100 (a) (e) | 10,000 | 11,257 | |||||||||
Anthem, Inc., 2.88%, 9/15/29, Callable 6/15/29 @ 100 | 9,677 | 10,700 | |||||||||
| Baylor Scott & White Holdings 3.10%, 11/15/25, Callable 8/15/25 @ 100 | 7,000 | 7,322 | |||||||||
2.65%, 11/15/26, Callable 8/15/26 @ 100 | 20,000 | 20,664 | |||||||||
Bon Secours Charity Health System, Inc., 5.25%, 11/1/25 | 3,000 | 3,383 | |||||||||
Boston Medical Center Corp., 4.52%, 7/1/26 | 4,250 | 4,913 | |||||||||
Cigna Corp., 3.40%, 3/1/27, Callable 12/1/26 @ 100 | 15,000 | 16,921 | |||||||||
Community Health Network, Inc., 4.24%, 5/1/25 | 10,000 | 11,071 | |||||||||
| CVS Health Corp. 4.30%, 3/25/28, Callable 12/25/27 @ 100 | 11,700 | 13,873 | |||||||||
3.25%, 8/15/29, Callable 5/15/29 @ 100 (e) | 8,966 | 10,094 | |||||||||
| CVS Pass-Through Trust 6.04%, 12/10/28 | 5,372 | 6,078 | |||||||||
5.93%, 1/10/34 (a) | 3,777 | 4,352 | |||||||||
DENTSPLY SIRONA, Inc., 3.25%, 6/1/30, Callable 3/1/30 @ 100 | 12,000 | 13,161 | |||||||||
Eastern Maine Healthcare Systems, 5.02%, 7/1/36 | 17,000 | 18,488 | |||||||||
| HCA, Inc. 5.00%, 3/15/24 | 5,000 | 5,631 | |||||||||
5.25%, 4/15/25 | 15,000 | 17,465 | |||||||||
4.50%, 2/15/27, Callable 8/15/26 @ 100 | 2,500 | 2,872 | |||||||||
| Mercy Health 3.38%, 11/1/25 | 15,000 | 16,028 | |||||||||
4.30%, 7/1/28 | 3,720 | 4,269 | |||||||||
Mylan, Inc., 4.55%, 4/15/28, Callable 1/15/28 @ 100 | 5,555 | 6,578 | |||||||||
Northwell Healthcare, Inc., 3.39%, 11/1/27, Callable 8/1/27 @ 100 | 3,900 | 4,067 | |||||||||
NYU Langone Hospitals, 4.17%, 7/1/37 | 6,500 | 7,342 | |||||||||
Premier Health Partners, 2.91%, 11/15/26, Callable 5/15/26 @ 100 | 10,000 | 9,816 | |||||||||
SSM Health Care Corp., 3.82%, 6/1/27, Callable 3/1/27 @ 100 | 8,500 | 9,383 | |||||||||
Upjohn, Inc., 2.30%, 6/22/27, Callable 4/22/27 @ 100 (a) | 4,000 | 4,213 | |||||||||
267,623 | |||||||||||
Industrials (5.9%): | |||||||||||
Air Lease Corp., 3.63%, 4/1/27, Callable 1/1/27 @ 100 | 10,000 | 9,871 | |||||||||
| American Airlines Pass Through Trust 3.70%, 4/1/28 | 7,016 | 5,808 | |||||||||
4.00%, 3/22/29 | 8,106 | 6,715 | |||||||||
4.00%, 8/15/30 | 4,263 | 3,580 | |||||||||
3.60%, 4/15/31 | 8,918 | 7,131 | |||||||||
Arconic, Inc., 5.13%, 10/1/24, Callable 7/1/24 @ 100 | 17,750 | 19,067 | |||||||||
Ashtead Capital, Inc., 4.25%, 11/1/29, Callable 11/1/24 @ 102.13 (a) | 1,786 | 1,870 | |||||||||
| British Airways Pass Through Trust 4.63%, 12/20/25 (a) | 13,693 | 13,008 | |||||||||
3.35%, 12/15/30 (a) | 6,971 | 5,785 | |||||||||
3.80%, 3/20/33 (a) | 3,711 | 3,532 | |||||||||
See notes to financial statements.
23
| USAA Mutual Funds Trust USAA Income Fund | Schedule of Portfolio Investments — continued July 31, 2020 | ||||||
(Amounts in Thousands, Except for Shares)
Security Description | Principal Amount | Value | |||||||||
| Burlington Northern Santa Fe LLC 3.75%, 4/1/24, Callable 1/1/24 @ 100 | $ | 8,000 | $ | 8,855 | |||||||
3.65%, 9/1/25, Callable 6/1/25 @ 100 | 10,000 | 11,400 | |||||||||
3.90%, 8/1/46, Callable 2/1/46 @ 100 | 7,000 | 9,179 | |||||||||
Carlisle Cos., Inc., 2.75%, 3/1/30, Callable 12/1/29 @ 100 | 14,127 | 14,927 | |||||||||
Carrier Global Corp., 3.38%, 4/5/40, Callable 10/5/39 @ 100 (a) | 7,500 | 8,092 | |||||||||
Caterpillar, Inc., 2.60%, 4/9/30, Callable 1/9/30 @ 100 | 8,000 | 8,945 | |||||||||
| Continental Airlines Pass Through Trust 5.50%, 4/29/22 | 1,230 | 1,208 | |||||||||
4.15%, 10/11/25 | 6,555 | 6,114 | |||||||||
4.00%, 4/29/26 | 3,373 | 3,131 | |||||||||
Delta Air Lines Pass Through Trust, 3.88%, 1/30/29 | 7,047 | 6,114 | |||||||||
| Eaton Corp. 2.75%, 11/2/22 | 5,000 | 5,261 | |||||||||
3.10%, 9/15/27, Callable 6/15/27 @ 100 | 10,000 | 11,252 | |||||||||
| FedEx Corp. 4.25%, 5/15/30, Callable 2/15/30 @ 100 | 8,000 | 9,572 | |||||||||
3.90%, 2/1/35 | 10,000 | 11,537 | |||||||||
Ferguson Finance PLC, 3.25%, 6/2/30, Callable 3/2/30 @ 100 (a) | 7,200 | 7,551 | |||||||||
| General Electric Co., 5.00% (LIBOR03M+333bps), Callable 1/21/21 @ 100 (b) (h) | 11,842 | 9,377 | |||||||||
| Hawaiian Airlines Pass Through Certificates 4.95%, 7/15/23 | 12,408 | 10,925 | |||||||||
3.90%, 7/15/27 | 11,468 | 9,621 | |||||||||
Hillenbrand, Inc., 4.50%, 9/15/26, Callable 7/15/26 @ 100 | 15,000 | 16,122 | |||||||||
Howmet Aerospace, Inc., 6.88%, 5/1/25, Callable 4/1/25 @ 100 (e) | 1,613 | 1,829 | |||||||||
Hubbell, Inc., 3.50%, 2/15/28, Callable 11/15/27 @ 100 | 5,000 | 5,369 | |||||||||
Ingersoll-Rand Co., 9.00%, 8/15/21 | 1,500 | 1,588 | |||||||||
JetBlue Pass Through Trust, 2.95%, 11/15/29 | 9,637 | 8,480 | |||||||||
Kennametal, Inc., 4.63%, 6/15/28, Callable 3/15/28 @ 100 | 8,295 | 9,086 | |||||||||
Molex Electronic Technologies LLC, 3.90%, 4/15/25, Callable 1/15/25 @ 100 (a) | 10,000 | 10,375 | |||||||||
Otis Worldwide Corp., 3.11%, 2/15/40, Callable 8/15/39 @ 100 (a) | 12,000 | 13,314 | |||||||||
| Penske Truck Leasing Co. LP / PTL Finance Corp. 3.95%, 3/10/25, Callable 1/10/25 @ 100 (a) | 5,000 | 5,514 | |||||||||
4.00%, 7/15/25, Callable 6/15/25 @ 100 (a) | 8,000 | 8,945 | |||||||||
Raytheon Technologies Corp., 4.20%, 12/15/44, Callable 6/15/44 @ 100 (a) | 10,000 | 12,188 | |||||||||
Ryder System, Inc., 3.35%, 9/1/25, MTN, Callable 8/1/25 @ 100 | 8,000 | 8,702 | |||||||||
Snap-on, Inc., 3.25%, 3/1/27, Callable 12/1/26 @ 100 | 10,000 | 11,137 | |||||||||
Southwest Airlines Co., 5.13%, 6/15/27, Callable 4/15/27 @ 100 | 9,600 | 10,099 | |||||||||
| Spirit Airlines Pass Through Trust 4.45%, 10/1/25 | 2,528 | 1,866 | |||||||||
4.10%, 10/1/29 | 10,984 | 9,336 | |||||||||
3.38%, 8/15/31 | 8,959 | 8,360 | |||||||||
The Boeing Co., 5.71%, 5/1/40, Callable 11/1/39 @ 100 | 21,000 | 24,088 | |||||||||
| The Conservation Fund A Nonprofit Corp., 3.47%, 12/15/29, Callable 9/15/29 @ 100 | 2,900 | 3,169 | |||||||||
| Totem Ocean Trailer Express, Inc,Title XI. (NBGA — United States Government), 6.37%, 4/15/28 | 7,024 | 8,265 | |||||||||
| TTX Co. 4.15%, 1/15/24 (a) | 5,000 | 5,419 | |||||||||
3.60%, 1/15/25 (a) | 10,000 | 11,083 | |||||||||
See notes to financial statements.
24
| USAA Mutual Funds Trust USAA Income Fund | Schedule of Portfolio Investments — continued July 31, 2020 | ||||||
(Amounts in Thousands, Except for Shares)
Security Description | Principal Amount | Value | |||||||||
| U.S. Airways Pass Through Trust 6.25%, 10/22/24 | $ | 2,095 | $ | 1,755 | |||||||
3.95%, 5/15/27 | 6,168 | 5,011 | |||||||||
| Union Pacific Corp. 3.38%, 2/1/35, Callable 8/1/34 @ 100 | 10,000 | 11,778 | |||||||||
4.25%, 4/15/43, Callable 10/15/42 @ 100 | 10,000 | 12,768 | |||||||||
| United Airlines Pass Through Trust 3.70%, 6/1/24 | 7,000 | 6,355 | |||||||||
4.30%, 2/15/27 | 3,639 | 3,369 | |||||||||
3.75%, 3/3/28 | 14,916 | 13,466 | |||||||||
Wabtec Corp., 3.45%, 11/15/26, Callable 8/15/26 @ 100 | 14,050 | 14,841 | |||||||||
| Westinghouse Air Brake Technologies Corp., 3.20%, 6/15/25, Callable 5/15/25 @ 100 | 3,295 | 3,438 | |||||||||
496,543 | |||||||||||
Information Technology (1.9%): | |||||||||||
| Analog Devices, Inc. 2.95%, 4/1/25, Callable 3/1/25 @ 100 | 4,000 | 4,383 | |||||||||
4.50%, 12/5/36, Callable 6/5/36 @ 100 | 5,000 | 6,002 | |||||||||
Applied Materials, Inc., 3.30%, 4/1/27, Callable 1/1/27 @ 100 | 10,000 | 11,581 | |||||||||
| Broadcom, Inc. 3.63%, 10/15/24, Callable 9/15/24 @ 100 (a) | 5,000 | 5,476 | |||||||||
5.00%, 4/15/30, Callable 1/15/30 @ 100 (a) | 5,000 | 5,939 | |||||||||
Hewlett Packard Enterprise Co., 4.65%, 10/1/24, Callable 9/1/24 @ 100 | 12,500 | 14,053 | |||||||||
HP, Inc., 3.40%, 6/17/30, Callable 3/17/30 @ 100 | 12,000 | 12,914 | |||||||||
| Keysight Technologies, Inc. 4.60%, 4/6/27, Callable 1/6/27 @ 100 | 2,604 | 3,077 | |||||||||
3.00%, 10/30/29, Callable 7/30/29 @ 100 | 5,263 | 5,877 | |||||||||
Micron Technology, Inc., 4.66%, 2/15/30, Callable 11/15/29 @ 100 | 10,000 | 12,032 | |||||||||
| Microsoft Corp. 3.30%, 2/6/27, Callable 11/6/26 @ 100 | 10,000 | 11,579 | |||||||||
4.20%, 11/3/35, Callable 5/3/35 @ 100 | 10,000 | 13,467 | |||||||||
3.45%, 8/8/36, Callable 2/8/36 @ 100 | 10,000 | 12,522 | |||||||||
Motorola Solutions, Inc., 4.60%, 2/23/28, Callable 11/23/27 @ 100 | 10,000 | 11,608 | |||||||||
| Qualcomm, Inc. 3.25%, 5/20/27, Callable 2/20/27 @ 100 | 5,000 | 5,735 | |||||||||
4.65%, 5/20/35, Callable 11/20/34 @ 100 | 5,000 | 6,911 | |||||||||
Total System Services, Inc., 4.80%, 4/1/26, Callable 1/1/26 @ 100 | 5,000 | 5,947 | |||||||||
Trimble, Inc., 4.15%, 6/15/23, Callable 5/15/23 @ 100 | 3,000 | 3,226 | |||||||||
VeriSign, Inc., 5.25%, 4/1/25, Callable 1/1/25 @ 100 | 4,250 | 4,844 | |||||||||
157,173 | |||||||||||
Materials (1.7%): | |||||||||||
Allegheny Ludlum LLC, 6.95%, 12/15/25 (j) | 5,000 | 4,828 | |||||||||
Avery Dennison Corp., 2.65%, 4/30/30, Callable 2/1/30 @ 100 | 6,000 | 6,372 | |||||||||
Colonial Enterprises, Inc., 3.25%, 5/15/30, Callable 2/15/30 @ 100 (a) | 4,000 | 4,421 | |||||||||
| Crown Americas LLC/Crown Americas Capital Corp., 4.25%, 9/30/26, Callable 3/31/26 @ 100 | 5,000 | 5,313 | |||||||||
Eagle Materials, Inc., 4.50%, 8/1/26, Callable 8/1/21 @ 102.25 | 3,000 | 3,124 | |||||||||
Freeport-McMoRan, Inc., 5.45%, 3/15/43, Callable 9/15/42 @ 100 | 10,000 | 11,116 | |||||||||
LYB International Finance III LLC, 3.38%, 5/1/30, Callable 2/1/30 @ 100 | 9,500 | 10,505 | |||||||||
See notes to financial statements.
25
| USAA Mutual Funds Trust USAA Income Fund | Schedule of Portfolio Investments — continued July 31, 2020 | ||||||
(Amounts in Thousands, Except for Shares)
Security Description | Principal Amount | Value | |||||||||
| Monsanto Co. 3.38%, 7/15/24, Callable 4/15/24 @ 100 | $ | 5,000 | $ | 5,246 | |||||||
3.95%, 4/15/45, Callable 10/15/44 @ 100 | 5,000 | 4,452 | |||||||||
| Reynolds Group Issuer, Inc. 5.13%, 7/15/23, Callable 9/10/20 @ 101.28 (a) | 2,500 | 2,541 | |||||||||
7.00%, 7/15/24, Callable 9/10/20 @ 101.75 (a) | 5,000 | 5,131 | |||||||||
Sasol Financing USA LLC, 5.88%, 3/27/24, Callable 2/27/24 @ 100 | 8,000 | 7,502 | |||||||||
Sonoco Products Co., 3.13%, 5/1/30, Callable 2/1/30 @ 100 | 12,000 | 13,182 | |||||||||
The Dow Chemical Co., 4.25%, 10/1/34, Callable 4/1/34 @ 100 | 10,000 | 11,805 | |||||||||
The Mosaic Co., 4.05%, 11/15/27, Callable 8/15/27 @ 100 (j) | 5,000 | 5,407 | |||||||||
Vulcan Materials Co., 3.50%, 6/1/30, Callable 3/1/30 @ 100 | 12,000 | 13,492 | |||||||||
Westlake Chemical Corp., 3.60%, 8/15/26, Callable 5/15/26 @ 100 | 10,000 | 10,897 | |||||||||
Worthington Industries, Inc., 4.30%, 8/1/32, Callable 5/1/32 @ 100 | 8,890 | 10,300 | |||||||||
WRKCo, Inc., 3.00%, 6/15/33, Callable 3/15/33 @ 100 | 6,000 | 6,514 | |||||||||
142,148 | |||||||||||
Real Estate (2.1%): | |||||||||||
Alexandria Real Estate Equities, Inc., 4.50%, 7/30/29, Callable 4/30/29 @ 100 | 5,000 | 6,161 | |||||||||
| AvalonBay Communities, Inc. 3.45%, 6/1/25, Callable 3/3/25 @ 100 | 5,000 | 5,628 | |||||||||
3.20%, 1/15/28, Callable 10/15/27 @ 100, MTN | 2,679 | 3,020 | |||||||||
2.45%, 1/15/31, Callable 10/15/30 @ 100, MTN | 2,000 | 2,173 | |||||||||
| Boston Properties LP 3.85%, 2/1/23, Callable 11/1/22 @ 100 | 10,000 | 10,715 | |||||||||
3.25%, 1/30/31, Callable 10/30/30 @ 100 | 3,938 | 4,385 | |||||||||
| Columbia Property Trust Operating Partnership, 3.65%, 8/15/26, Callable 5/15/26 @ 100 | 7,500 | 7,831 | |||||||||
EPR Properties, 3.75%, 8/15/29, Callable 5/15/29 @ 100 | 10,000 | 8,895 | |||||||||
ERP Operating LP, 2.85%, 11/1/26, Callable 8/1/26 @ 100 | 9,000 | 9,978 | |||||||||
Essex Portfolio LP, 2.65%, 3/15/32, Callable 12/15/31 @ 100 | 5,000 | 5,406 | |||||||||
| Federal Realty Investment Trust 3.00%, 8/1/22, Callable 5/1/22 @ 100 | 7,000 | 7,144 | |||||||||
2.75%, 6/1/23, Callable 3/1/23 @ 100 | 10,000 | 10,219 | |||||||||
3.25%, 7/15/27, Callable 4/15/27 @ 100 | 1,852 | 1,974 | |||||||||
Hospitality Properties Trust, 4.95%, 2/15/27, Callable 8/15/26 @ 100 | 5,000 | 4,532 | |||||||||
| Hudson Pacific Properties LP 3.95%, 11/1/27, Callable 8/1/27 @ 100 | 5,000 | 5,341 | |||||||||
4.65%, 4/1/29, Callable 1/1/29 @ 100 | 1,979 | 2,233 | |||||||||
| MPT Operating Partnership LP/MPT Finance Corp. 5.25%, 8/1/26, Callable 8/1/21 @ 102.63 | 4,901 | 5,168 | |||||||||
4.63%, 8/1/29, Callable 8/1/24 @ 102.31 | 1,000 | 1,057 | |||||||||
Physicians Realty LP, 4.30%, 3/15/27, Callable 12/15/26 @ 100 | 7,500 | 7,985 | |||||||||
Realty Income Corp., 3.00%, 1/15/27, Callable 10/15/26 @ 100 | 6,000 | 6,562 | |||||||||
Sabra Health Care LP, 5.13%, 8/15/26, Callable 5/15/26 @ 100 | 4,000 | 4,262 | |||||||||
SBA Tower Trust, 3.45%, 3/15/48 (a) | 30,000 | 31,500 | |||||||||
Spirit Realty LP, 4.45%, 9/15/26, Callable 6/15/26 @ 100 | 7,500 | 8,016 | |||||||||
| Washington Real Estate Investment Trust, 3.95%, 10/15/22, Callable 7/15/22 @ 100 | 14,000 | 14,301 | |||||||||
174,486 | |||||||||||
See notes to financial statements.
26
| USAA Mutual Funds Trust USAA Income Fund | Schedule of Portfolio Investments — continued July 31, 2020 | ||||||
(Amounts in Thousands, Except for Shares)
Security Description | Principal Amount | Value | |||||||||
Utilities (5.3%): | |||||||||||
AES Corp., 5.50%, 4/15/25, Callable 9/10/20 @ 102.75 | $ | 10,000 | $ | 10,316 | |||||||
Ameren Corp., 3.50%, 1/15/31, Callable 10/15/30 @ 100 | 4,250 | 4,920 | |||||||||
American Water Capital Corp., 2.95%, 9/1/27, Callable 6/1/27 @ 100 | 5,000 | 5,619 | |||||||||
Atlantic City Electric Co., 3.38%, 9/1/24, Callable 6/1/24 @ 100 | 5,000 | 5,291 | |||||||||
Atmos Energy Corp., 4.13%, 10/15/44, Callable 4/15/44 @ 100 | 10,000 | 13,042 | |||||||||
Berkshire Hathaway Energy Co., 4.50%, 2/1/45, Callable 8/1/44 @ 100 | 15,000 | 20,562 | |||||||||
Black Hills Corp., 3.88%, 10/15/49, Callable 4/15/49 @ 100 | 20,000 | 23,944 | |||||||||
| Cleco Corporate Holdings LLC 3.74%, 5/1/26, Callable 2/1/26 @ 100 | 15,000 | 16,008 | |||||||||
3.38%, 9/15/29, Callable 6/15/29 @ 100 | 7,333 | 7,512 | |||||||||
Delmarva Power & Light Co., 4.15%, 5/15/45, Callable 11/15/44 @ 100 | 5,000 | 6,427 | |||||||||
Dominion Energy South Carolina, Inc., 4.10%, 6/15/46, Callable 12/15/45 @ 100 | 5,000 | 6,359 | |||||||||
DTE Electric Co., 2.25%, 3/1/30, Callable 12/1/29 @ 100 | 10,000 | 10,842 | |||||||||
Duke Energy Carolinas LLC, 3.88%, 3/15/46, Callable 9/15/45 @ 100 | 7,000 | 9,082 | |||||||||
Duke Energy Indiana LLC, 3.75%, 5/15/46, Callable 11/15/45 @ 100 | 10,000 | 12,603 | |||||||||
Duke Energy Progress LLC, 4.15%, 12/1/44, Callable 6/1/44 @ 100 | 10,000 | 13,212 | |||||||||
Duquesne Light Holdings, Inc., 5.90%, 12/1/21 (a) | 3,500 | 3,696 | |||||||||
Entergy Arkansas LLC, 3.05%, 6/1/23, Callable 3/1/23 @ 100 | 4,000 | 4,241 | |||||||||
Entergy Louisiana LLC, 4.95%, 1/15/45, Callable 1/15/25 @ 100 | 7,000 | 7,769 | |||||||||
Entergy Mississippi LLC, 3.25%, 12/1/27, Callable 9/1/27 @ 100 | 5,000 | 5,565 | |||||||||
| Entergy Texas, Inc. 2.55%, 6/1/21, Callable 5/1/21 @ 100 | 10,000 | 10,159 | |||||||||
3.45%, 12/1/27, Callable 9/1/27 @ 100 | 15,000 | 16,619 | |||||||||
3.55%, 9/30/49, Callable 3/30/49 @ 100 | 5,000 | 6,078 | |||||||||
Florida Power & Light Co., 3.15%, 10/1/49, Callable 4/1/49 @ 100 | 5,000 | 6,131 | |||||||||
Georgia Power Co., 3.25%, 4/1/26, Callable 1/1/26 @ 100 | 5,000 | 5,567 | |||||||||
Gulf Power Co., 3.30%, 5/30/27, Callable 2/28/27 @ 100 | 10,000 | 11,319 | |||||||||
IPALCO Enterprises, Inc., 4.25%, 5/1/30, Callable 2/1/30 @ 100 (a) | 4,200 | 4,680 | |||||||||
ITC Holdings Corp., 3.35%, 11/15/27, Callable 8/15/27 @ 100 | 7,500 | 8,428 | |||||||||
MidAmerican Energy Co., 3.15%, 4/15/50, Callable 10/15/49 @ 100 | 7,000 | 8,479 | |||||||||
Mississippi Power Co., 4.25%, 3/15/42 | 3,168 | 3,872 | |||||||||
| Monongahela Power Co. 4.10%, 4/15/24, Callable 1/15/24 @ 100 (a) | 10,000 | 10,989 | |||||||||
5.40%, 12/15/43, Callable 6/15/43 @ 100 (a) | 5,000 | 7,255 | |||||||||
| National Fuel Gas Co. 4.90%, 12/1/21, Callable 9/1/21 @ 100 | 5,000 | 5,169 | |||||||||
5.20%, 7/15/25, Callable 4/15/25 @ 100 | 5,000 | 5,405 | |||||||||
3.95%, 9/15/27, Callable 6/15/27 @ 100 | 10,000 | 10,016 | |||||||||
Northern States Power Co., 3.60%, 5/15/46, Callable 11/15/45 @ 100 | 20,000 | 25,175 | |||||||||
Oncor Electric Delivery Co. LLC, 3.75%, 4/1/45, Callable 10/1/44 @ 100 | 5,000 | 6,366 | |||||||||
PECO Energy Co., 3.00%, 9/15/49, Callable 3/15/49 @ 100 | 7,000 | 8,160 | |||||||||
Pedernales Electric Cooperative, Inc., 5.95%, 11/15/22 (a) | 2,733 | 2,911 | |||||||||
Potomac Electric Power Co., 4.15%, 3/15/43, Callable 9/15/42 @ 100 | 5,000 | 6,410 | |||||||||
Public Service Co. of Colorado, 2.70%, 1/15/51, Callable 7/15/50 @ 100 | 7,000 | 7,771 | |||||||||
Public Service Electric & Gas Co., 3.80%, 3/1/46, MTN, Callable 9/1/45 @ 100 | 10,000 | 12,941 | |||||||||
Southern Co. Gas Capital Corp., 3.25%, 6/15/26, Callable 3/15/26 @ 100 | 7,000 | 7,602 | |||||||||
Southwestern Public Service Co., 3.15%, 5/1/50, Callable 11/1/49 @ 100 | 10,000 | 11,683 | |||||||||
Spire, Inc., 3.54%, 2/27/24, Callable 12/27/23 @ 100 | 11,880 | 12,529 | |||||||||
The Narragansett Electric Co., 3.40%, 4/9/30, Callable 1/9/30 @ 100 (a) | 8,000 | 9,330 | |||||||||
See notes to financial statements.
27
| USAA Mutual Funds Trust USAA Income Fund | Schedule of Portfolio Investments — continued July 31, 2020 | ||||||
(Amounts in Thousands, Except for Shares)
Security Description | Principal Amount | Value | |||||||||
| Tri-State Generation & Transmission Association, Inc. 4.70%, 11/1/44, Callable 5/1/44 @ 100 | $ | 5,000 | $ | 6,347 | |||||||
4.25%, 6/1/46, Callable 12/1/45 @ 100 | 10,000 | 11,989 | |||||||||
| WEC Energy Group, Inc., 3.80% (LIBOR03M+211bps), 5/15/67, Callable 9/10/20 @ 100 (b) | 15,000 | 11,531 | |||||||||
447,921 | |||||||||||
Total Corporate Bonds (Cost $3,726,646) | 4,017,782 | ||||||||||
Yankee Dollar (13.4%) | |||||||||||
Communication Services (0.7%): | |||||||||||
British Telecommunications PLC, 3.25%, 11/8/29, Callable 8/8/29 @ 100 (a) | 14,000 | 15,538 | |||||||||
| Deutsche Telekom International Finance BV, 3.60%, 1/19/27, Callable 10/19/26 @ 100 (a) | 15,000 | 16,946 | |||||||||
Pearson Funding Four PLC, 3.75%, 5/8/22 (a) | 5,000 | 5,111 | |||||||||
| Vodafone Group PLC 5.00%, 5/30/38 | 6,667 | 8,677 | |||||||||
4.25%, 9/17/50 | 10,000 | 12,335 | |||||||||
58,607 | |||||||||||
Consumer Discretionary (0.0% (g)): | |||||||||||
International Game Technology PLC, 6.50%, 2/15/25, Callable 8/15/24 @ 100 (a) | 3,000 | 3,225 | |||||||||
Consumer Staples (0.9%): | |||||||||||
Alimentation Couche-Tard, Inc., 2.95%, 1/25/30, Callable 10/25/29 @ 100 (a) | 7,333 | 7,841 | |||||||||
Bacardi Ltd., 4.70%, 5/15/28, Callable 2/15/28 @ 100 (a) (e) | 10,000 | 11,741 | |||||||||
Becle SAB de CV, 3.75%, 5/13/25 (a) | 7,500 | 7,995 | |||||||||
| Hutchison Whampoa International Ltd. 4.63%, 1/13/22 (a) | 5,000 | 5,244 | |||||||||
3.63%, 10/31/24 (a) | 10,000 | 10,930 | |||||||||
| Imperial Brands Finance PLC 4.25%, 7/21/25, Callable 4/21/25 @ 100 (a) | 20,000 | 22,300 | |||||||||
3.88%, 7/26/29, Callable 4/26/29 @ 100 (a) (j) | 10,000 | 10,942 | |||||||||
76,993 | |||||||||||
Energy (0.3%): | |||||||||||
Aker BP ASA, 5.88%, 3/31/25, Callable 3/31/21 @ 102.94 (a) | 4,500 | 4,726 | |||||||||
APT Pipelines Ltd., 4.25%, 7/15/27, Callable 4/15/27 @ 100 (a) | 6,000 | 6,803 | |||||||||
Petroleos Maxicanos, 5.95%, 1/28/31, Callable 10/28/30 @ 100 (a) | 6,667 | 5,735 | |||||||||
Petroleos Mexicanos, 6.84%, 1/23/30, Callable 10/23/29 @ 100 (a) | 6,000 | 5,572 | |||||||||
Transocean, Inc., 8.38%, 12/15/21 (j) | 2,250 | 1,546 | |||||||||
24,382 | |||||||||||
Financials (7.4%): | |||||||||||
| ABN AMRO Bank NV 4.75%, 7/28/25 (a) | 15,000 | 16,893 | |||||||||
4.80%, 4/18/26 (a) (j) | 10,000 | 11,380 | |||||||||
| Banco Santander Mexico SA Institucion de Banca Multiple Groupo Financiero Santand, 5.95%(H15T5Y+300bps), 10/1/28, Callable 10/1/23 @ 100 (a) (b) | 1,000 | 1,033 | |||||||||
| Banco Santander Mexico SA Institucion de Banca Multiple Grupo Financiero Santand, 5.38%, 4/17/25 (a) | 1,786 | 1,984 | |||||||||
See notes to financial statements.
28
| USAA Mutual Funds Trust USAA Income Fund | Schedule of Portfolio Investments — continued July 31, 2020 | ||||||
(Amounts in Thousands, Except for Shares)
Security Description | Principal Amount | Value | |||||||||
Bank of Montreal, 3.80% (USSW5+143bps), 12/15/32, Callable 12/15/27 @ 100 (b) | $ | 7,500 | $ | 8,325 | |||||||
Banque Federative du Credit Mutuel SA, 2.70%, 7/20/22 (a) | 5,000 | 5,204 | |||||||||
BAT International Finance PLC, 3.95%, 6/15/25 (a) | 20,000 | 22,334 | |||||||||
| BNP Paribas SA 4.71% (LIBOR03M+224bps), 1/10/25, Callable 1/10/24 @ 100 (a) (b) | 10,000 | 11,170 | |||||||||
4.38%, 9/28/25 (a) | 5,000 | 5,590 | |||||||||
4.38%, 5/12/26 (a) | 10,000 | 11,281 | |||||||||
4.63%, 3/13/27 (a) | 4,000 | 4,605 | |||||||||
| BP Capital Markets PLC 3.28%, 9/19/27, Callable 6/19/27 @ 100 | 5,000 | 5,619 | |||||||||
3.72%, 11/28/28, Callable 8/28/28 @ 100 | 5,000 | 5,867 | |||||||||
| BPCE SA 3.00%, 5/22/22 (a) | 5,000 | 5,191 | |||||||||
4.00%, 9/12/23 (a) | 5,000 | 5,428 | |||||||||
3.50%, 10/23/27 (a) | 5,000 | 5,573 | |||||||||
3.25%, 1/11/28 (a) (j) | 10,000 | 11,115 | |||||||||
Brookfield Finance, Inc., 4.85%, 3/29/29, Callable 12/29/28 @ 100 | 10,000 | 12,061 | |||||||||
Canadian Imperial Bank of Commerce, 7.26%, 4/10/32 (a) | 2,917 | 3,387 | |||||||||
Commonwealth Bank of Australia, 3.25%, 7/20/23 (a) | 10,000 | 10,810 | |||||||||
| Co-operatieve Rabobank UA 3.88%, 2/8/22 | 10,000 | 10,521 | |||||||||
3.95%, 11/9/22 | 10,000 | 10,644 | |||||||||
4.00% (USSW5+189bps), 4/10/29, Callable 4/10/24 @ 100, MTN (b) | 5,000 | 5,328 | |||||||||
| Credit Agricole SA 3.25%, 10/4/24 (a) | 14,286 | 15,537 | |||||||||
4.13%, 1/10/27 (a) | 15,000 | 17,257 | |||||||||
| Credit Suisse Group AG 3.57%, 1/9/23, Callable 1/9/22 @ 100 (a) | 11,400 | 11,822 | |||||||||
3.87% (LIBOR03M+141bps), 1/12/29, Callable 1/12/28 @ 100 (a) (b) (e) | 4,445 | 5,002 | |||||||||
Credit Suisse Group Funding Guernsey Ltd., 4.55%, 4/17/26 | 10,000 | 11,667 | |||||||||
| Deutsche Bank AG, 4.87% (USISDA05+255bps), 12/1/32, Callable 12/1/27 @ 100 (b) | 10,000 | 9,648 | |||||||||
| Enel Finance International NV 4.63%, 9/14/25 (a) | 5,000 | 5,778 | |||||||||
3.63%, 5/25/27 (a) | 5,000 | 5,565 | |||||||||
HSBC Bank PLC, 0.75% (LIBOR06M+25bps), Callable 12/31/20 @ 100 (b) (h) | 15,000 | 11,726 | |||||||||
| HSBC Holdings PLC 3.90%, 5/25/26 | 10,000 | 11,243 | |||||||||
4.38%, 11/23/26 | 5,000 | 5,639 | |||||||||
ING Groep NV, 3.95%, 3/29/27 | 14,100 | 16,425 | |||||||||
| Lloyds Banking Group PLC 3.75%, 1/11/27 | 25,000 | 28,355 | |||||||||
3.57% (LIBOR03M+121bps), 11/7/28, Callable 11/7/27 @ 100 (b) | 5,000 | 5,613 | |||||||||
Mizuho Financial Group, Inc., 3.17%, 9/11/27 | 20,000 | 22,019 | |||||||||
National Australia Bank Ltd., 3.00%, 1/20/23 | 5,000 | 5,310 | |||||||||
| Nationwide Building Society 4.00%, 9/14/26 (a) | 20,000 | 21,984 | |||||||||
4.12% (USISDA05+185bps), 10/18/32, Callable 10/18/27 @ 100 (a) (b) | 12,000 | 13,218 | |||||||||
Nordea Bank Abp, 4.88%, 5/13/21 (a) | 11,000 | 11,352 | |||||||||
| QBE Capital Funding III Ltd., 7.25% (USSW10+405bps), 5/24/41, Callable 5/24/21 @ 100 (a) (b) | 20,000 | 20,711 | |||||||||
See notes to financial statements.
29
| USAA Mutual Funds Trust USAA Income Fund | Schedule of Portfolio Investments — continued July 31, 2020 | ||||||
(Amounts in Thousands, Except for Shares)
Security Description | Principal Amount | Value | |||||||||
Royal Bank of Canada, 4.65%, 1/27/26 | $ | 20,000 | $ | 23,769 | |||||||
| Royal Bank of Scotland Group PLC 3.88%, 9/12/23 | 7,000 | 7,603 | |||||||||
4.27% (LIBOR03M+176bps), 3/22/25, Callable 3/22/24 @ 100 (b) | 4,000 | 4,400 | |||||||||
4.80%, 4/5/26 | 5,000 | 5,896 | |||||||||
5.08% (LIBOR03M+191bps), 1/27/30, Callable 1/27/29 @ 100 (b) | 10,000 | 12,277 | |||||||||
Santander UK Group Holdings PLC, 3.57%, 1/10/23, Callable 1/10/22 @ 100 | 5,000 | 5,188 | |||||||||
| Santander UK PLC 5.00%, 11/7/23 (a) | 7,034 | 7,748 | |||||||||
4.00%, 3/13/24 | 5,000 | 5,554 | |||||||||
Shell International Finance BV, 3.63%, 8/21/42 | 10,000 | 11,775 | |||||||||
| Siemens Financieringsmaatschappij NV 3.25%, 5/27/25 (a) | 10,000 | 11,243 | |||||||||
3.40%, 3/16/27 (a) | 10,000 | 11,361 | |||||||||
Silversea Cruise Finance Ltd., 7.25%, 2/1/25, Callable 8/21/20 @ 105.44 (a) (e) | 10,000 | 9,553 | |||||||||
| Standard Chartered PLC, 4.87% (LIBOR03M+197bps), 3/15/33, Callable 3/15/28 @ 100 (a) (b) (j) | 7,500 | 8,225 | |||||||||
Swedbank AB, 2.65%, 3/10/21 (a) (j) | 7,500 | 7,605 | |||||||||
The Bank of Nova Scotia, 4.50%, 12/16/25 | 10,000 | 11,617 | |||||||||
| The Toronto-Dominion Bank, 3.62% (USSW5+221bps), 9/15/31, Callable 9/15/26 @ 100 (b) | 10,000 | 11,397 | |||||||||
| Washington Aircraft 1 Co. DAC, Title XI (NBGA — United States Government), 2.64%, 9/15/26 | 3,750 | 3,968 | |||||||||
| Westpac Banking Corp., 4.32% (USISDA05+224bps), 11/23/31, Callable 11/23/26 @ 100 (b) | 10,000 | 11,266 | |||||||||
617,659 | |||||||||||
Health Care (0.1%): | |||||||||||
Mylan NV, 3.95%, 6/15/26, Callable 3/15/26 @ 100 | 5,000 | 5,703 | |||||||||
Teva Pharmaceutical Finance Netherlands BV, 3.15%, 10/1/26 | 5,000 | 4,565 | |||||||||
10,268 | |||||||||||
Industrials (1.7%): | |||||||||||
| Air Canada Pass Through Trust 5.38%, 11/15/22 (a) | 2,967 | 2,643 | |||||||||
4.13%, 11/15/26 (a) | 17,605 | 15,914 | |||||||||
3.60%, 9/15/28 (a) | 7,914 | 7,230 | |||||||||
3.75%, 6/15/29 (a) | 4,843 | 4,605 | |||||||||
BAE Systems PLC, 3.40%, 4/15/30, Callable 1/15/30 @ 100 (a) | 12,000 | 13,560 | |||||||||
Canadian National Railway Co., 2.75%, 3/1/26, Callable 12/1/25 @ 100 | 12,000 | 13,213 | |||||||||
| CK Hutchison International Ltd. 2.75%, 10/3/26 (a) | 5,000 | 5,367 | |||||||||
3.50%, 4/5/27 (a) | 10,000 | 11,044 | |||||||||
3.25%, 9/29/27 (a) | 10,000 | 10,960 | |||||||||
CNH Industrial NV, 3.85%, 11/15/27, MTN, Callable 8/15/27 @ 100 | 5,000 | 5,414 | |||||||||
Heathrow Funding Ltd., 4.88%, 7/15/21 (a) | 11,802 | 12,143 | |||||||||
Latam Airlines Pass Through Trust, 4.20%, 8/15/29 | 11,032 | 9,497 | |||||||||
Rolls-Royce PLC, 3.63%, 10/14/25, Callable 7/14/25 @ 100 (a) | 5,000 | 5,167 | |||||||||
Smiths Group PLC, 3.63%, 10/12/22 (a) | 12,250 | 12,628 | |||||||||
Sydney Airport Finance Co. Pty Ltd., 3.63%, 4/28/26, Callable 1/28/26 @ 100 (a) | 10,000 | 10,752 | |||||||||
Turkish Airlines Pass Through Trust, 4.20%, 9/15/28 (a) | 6,912 | 5,307 | |||||||||
145,444 | |||||||||||
See notes to financial statements.
30
| USAA Mutual Funds Trust USAA Income Fund | Schedule of Portfolio Investments — continued July 31, 2020 | ||||||
(Amounts in Thousands, Except for Shares)
Security Description | Principal Amount | Value | |||||||||
Information Technology (0.1%): | |||||||||||
Tyco Electronics Group SA, 3.13%, 8/15/27, Callable 5/15/27 @ 100 | $ | 4,800 | $ | 5,293 | |||||||
Materials (1.5%): | |||||||||||
Air Liquide Finance SA, 3.50%, 9/27/46, Callable 3/27/46 @ 100 (a) | 10,000 | 12,327 | |||||||||
| Anglo American Capital PLC 4.88%, 5/14/25 (a) | 5,000 | 5,642 | |||||||||
4.00%, 9/11/27 (a) | 6,667 | 7,396 | |||||||||
5.63%, 4/1/30, Callable 1/1/30 @ 100 (a) | 3,125 | 3,907 | |||||||||
ArcelorMittal, 7.00%, 10/15/39 | 8,000 | 10,633 | |||||||||
Boral Finance Pty Ltd., 3.75%, 5/1/28, Callable 2/1/28 @ 100 (a) | 3,462 | 3,821 | |||||||||
Braskem Netherlands Finance BV, 4.50%, 1/31/30 (a) | 25,000 | 23,212 | |||||||||
| CCL Industries, Inc. 3.25%, 10/1/26, Callable 7/1/26 @ 100 (a) | 4,000 | 4,274 | |||||||||
3.05%, 6/1/30, Callable 3/1/30 @ 100 (a) | 5,000 | 5,243 | |||||||||
Cemex SAB de CV, 7.75%, 4/16/26, Callable 4/16/21 @ 103.88 (a) | 9,250 | 9,738 | |||||||||
Fresnillo PLC, 5.50%, 11/13/23 (a) | 15,000 | 16,526 | |||||||||
| Kinross Gold Corp. 5.95%, 3/15/24, Callable 12/15/23 @ 100 | 5,000 | 5,681 | |||||||||
4.50%, 7/15/27, Callable 4/15/27 @ 100 | 2,000 | 2,279 | |||||||||
Teck Resources Ltd., 6.13%, 10/1/35 | 12,334 | 14,453 | |||||||||
125,132 | |||||||||||
Real Estate (0.1%): | |||||||||||
| Scentre Group Trust 1/Scentre Group Trust 2, 3.25%, 10/28/25, Callable 7/30/25 @ 100 (a) | 10,000 | 10,489 | |||||||||
Sovereign Bond (0.1%): | |||||||||||
Caribbean Development Bank, 4.38%, 11/9/27 (a) | 5,000 | 5,710 | |||||||||
Utilities (0.5%): | |||||||||||
Comision Federal de Electricidad, 4.75%, 2/23/27 (a) | 5,000 | 5,302 | |||||||||
| Electricite de France SA, 5.25% (USSW10+371bps), Callable 1/29/23 @ 100 (a) (b) (h) (j) | 10,000 | 10,437 | |||||||||
ENEL Chile SA, 4.88%, 6/12/28, Callable 3/12/28 @ 100 | 10,000 | 11,679 | |||||||||
Fortis, Inc., 3.06%, 10/4/26, Callable 7/4/26 @ 100 | 10,000 | 10,954 | |||||||||
38,372 | |||||||||||
Total Yankee Dollar (Cost $1,026,282) | 1,121,574 | ||||||||||
Government National Mortgage Association (0.0%) (g) | |||||||||||
Pass-throughs (0.0%): | |||||||||||
| Government National Mortgage Assoc. 7.50%, 12/15/28-8/15/29 | 112 | 129 | |||||||||
129 | |||||||||||
Total Government National Mortgage Association (Cost $113) | 129 | ||||||||||
Municipal Bonds (8.9%) | |||||||||||
Alabama (0.1%): | |||||||||||
| The Water Works Board of the City of Birmingham Revenue 2.70%, 1/1/29 | 3,000 | 3,299 | |||||||||
2.80%, 1/1/30, Continuously Callable @ 100 | 3,000 | 3,294 | |||||||||
6,593 | |||||||||||
See notes to financial statements.
31
| USAA Mutual Funds Trust USAA Income Fund | Schedule of Portfolio Investments — continued July 31, 2020 | ||||||
(Amounts in Thousands, Except for Shares)
Security Description | Principal Amount | Value | |||||||||
California (0.9%): | |||||||||||
| City of Riverside CA Revenue Series A, 2.49%, 6/1/26 | $ | 1,800 | $ | 1,864 | |||||||
Series A, 2.64%, 6/1/27 | 1,400 | 1,453 | |||||||||
| Industry Public Facilities Authority Tax Allocation (INS — Assured Guaranty Municipal Corp.) Series A, 3.47%, 1/1/21 | 5,000 | 5,058 | |||||||||
Series A, 3.82%, 1/1/22 | 5,000 | 5,226 | |||||||||
Las Virgenes Unified School District, GO, Series C1, 5.54%, 8/1/25 | 1,250 | 1,466 | |||||||||
Placentia-Yorba Linda Unified School District, GO, 5.40%, 8/1/21 | 850 | 892 | |||||||||
| Port of Oakland Revenue 4.50%, 5/1/32, Pre-refunded 5/1/22 @ 100 | 75 | 80 | |||||||||
4.50%, 5/1/32, Continuously Callable @ 100 | 11,625 | 12,287 | |||||||||
Series P, 4.50%, 5/1/30, Continuously Callable @ 100 | 5,000 | 5,291 | |||||||||
| Riverside Community College District, GO Series B, 3.49%, 8/1/23 | 4,250 | 4,626 | |||||||||
Series B, 3.61%, 8/1/24 | 3,000 | 3,350 | |||||||||
| San Jose Redevelopment Agency Successor Agency Tax Allocation, Series A-T, 3.13%, 8/1/28, Continuously Callable @ 100 | 10,000 | 10,967 | |||||||||
| San Marcos Redevelopment Agency Successor Agency Tax Allocation Series B, 4.02%, 10/1/25 | 5,250 | 6,003 | |||||||||
Series B, 4.47%, 10/1/29 | 6,500 | 7,912 | |||||||||
Torrance Unified School District, GO, Series B, 5.52%, 8/1/21 | 2,000 | 2,102 | |||||||||
| Vista Redevelopment Agency Successor Agency Tax Allocation (INS — Assured Guaranty Municipal Corp.), Series A, 4.13%, 9/1/30, Continuously Callable @ 100 | 2,590 | 2,818 | |||||||||
71,395 | |||||||||||
Colorado (0.1%): | |||||||||||
County of El Paso Co. Revenue, 4.47%, 10/1/35 | 5,000 | 6,278 | |||||||||
Connecticut (0.7%): | |||||||||||
| City of Bridgeport, GO Series A, 4.03%, 8/15/28 | 10,000 | 11,428 | |||||||||
Series A, 4.08%, 8/15/29, Continuously Callable @ 100 | 7,380 | 8,401 | |||||||||
City of New Haven, GO, Series B, 4.68%, 8/1/31, Continuously Callable @ 100 | 10,000 | 11,304 | |||||||||
| State of Connecticut, GO Series A, 3.23%, 1/15/25 | 5,000 | 5,459 | |||||||||
Series A, 2.35%, 7/1/26 | 2,415 | 2,558 | |||||||||
Series A, 3.43%, 4/15/28 | 1,500 | 1,703 | |||||||||
Series A, 3.90%, 9/15/28 | 2,500 | 2,936 | |||||||||
Town of Hamden, GO, 4.93%, 8/15/30, Continuously Callable @ 100 | 3,845 | 4,336 | |||||||||
Town of Stratford, GO, 5.75%, 8/15/30, Continuously Callable @ 100 | 10,000 | 11,265 | |||||||||
59,390 | |||||||||||
Florida (0.6%): | |||||||||||
City of Jacksonville Florida Revenue, 2.37%, 10/1/20 | 3,000 | 3,008 | |||||||||
| County of Broward Florida Airport System Revenue, Series C, 2.91%, 10/1/32, Continuously Callable @ 100 | 9,500 | 9,312 | |||||||||
| County of Miami-Dade Aviation Revenue Series B, 2.70%, 10/1/26 | 8,250 | 8,477 | |||||||||
Series B, 3.38%, 10/1/30, Continuously Callable @ 100 | 2,500 | 2,658 | |||||||||
See notes to financial statements.
32
| USAA Mutual Funds Trust USAA Income Fund | Schedule of Portfolio Investments — continued July 31, 2020 | ||||||
(Amounts in Thousands, Except for Shares)
Security Description | Principal Amount | Value | |||||||||
| Hillsborough County School Board Certificate participation, Series B, 1.92%, 7/1/25 | $ | 8,000 | $ | 8,225 | |||||||
Palm Beach County School District Certificate participation, 5.40%, 8/1/25 | 6,000 | 7,142 | |||||||||
| The School Board of Miami-Dade County Certificate participation (INS — Assured Guaranty Municipal Corp.), Series B, 5.38%, 5/1/31, Continuously Callable @ 100 | 10,000 | 10,290 | |||||||||
49,112 | |||||||||||
Georgia (0.3%): | |||||||||||
| Athens Housing Authority Revenue 2.54%, 12/1/27 | 3,405 | 3,654 | |||||||||
2.59%, 12/1/28 | 4,585 | 4,935 | |||||||||
2.69%, 12/1/29 | 4,740 | 5,133 | |||||||||
| Atlanta & Fulton County Recreation Authority Revenue 3.80%, 12/15/37 | 2,000 | 2,276 | |||||||||
4.00%, 12/15/46 | 1,500 | 1,690 | |||||||||
Savannah Hospital Authority Revenue, 3.99%, 7/1/38 | 5,000 | 5,638 | |||||||||
23,326 | |||||||||||
Hawaii (0.5%): | |||||||||||
| City & County of Honolulu, GO 2.81%, 11/1/23, Pre-refunded 11/1/22 @ 100 | 900 | 943 | |||||||||
3.06%, 11/1/25, Pre-refunded 11/1/22 @ 100 | 680 | 716 | |||||||||
3.16%, 11/1/26, Pre-refunded 11/1/22 @ 100 | 775 | 818 | |||||||||
3.26%, 11/1/27, Pre-refunded 11/1/22 @ 100 | 625 | 661 | |||||||||
3.36%, 11/1/28, Pre-refunded 11/1/22 @ 100 | 690 | 732 | |||||||||
| State of Hawaii Department of Budget & Finance Revenue 3.25%, 1/1/25 | 3,000 | 3,245 | |||||||||
3.10%, 5/1/26 | 7,235 | 7,939 | |||||||||
| State of Hawaii Department of Business Economic Development & Tourism Revenue, Series A2, 3.24%, 1/1/31 | 14,618 | 15,755 | |||||||||
State of Hawaii, GO, 2.80%, 10/1/27, Continuously Callable @ 100 | 7,000 | 7,619 | |||||||||
38,428 | |||||||||||
Idaho (0.1%): | |||||||||||
| Idaho State Building Authority Revenue 3.78%, 9/1/30, Continuously Callable @ 100 | 2,500 | 2,873 | |||||||||
3.93%, 9/1/31, Continuously Callable @ 100 | 2,120 | 2,451 | |||||||||
3.98%, 9/1/32, Continuously Callable @ 100 | 2,000 | 2,312 | |||||||||
7,636 | |||||||||||
Illinois (0.5%): | |||||||||||
| Chicago Midway International Airport Revenue Series A, 5.00%, 1/1/25, Continuously Callable @ 100 | 6,500 | 7,332 | |||||||||
Series A, 5.00%, 1/1/26, Continuously Callable @ 100 | 8,000 | 9,012 | |||||||||
Chicago O'Hare International Airport Revenue, Series B, 5.00%, 1/1/21 | 5,000 | 5,082 | |||||||||
City of Chicago Wastewater Transmission Revenue, 5.84%, 1/1/35 | 6,500 | 8,749 | |||||||||
| Illinois Finance Authority Revenue 3.55%, 8/15/29 | 2,025 | 2,264 | |||||||||
3.60%, 8/15/30 | 3,000 | 3,374 | |||||||||
| Winnebago & Boone Counties School District No 205 Rockford, GO, 3.80%, 12/1/26, Continuously Callable @ 100 | 4,500 | 5,049 | |||||||||
40,862 | |||||||||||
See notes to financial statements.
33
| USAA Mutual Funds Trust USAA Income Fund | Schedule of Portfolio Investments — continued July 31, 2020 | ||||||
(Amounts in Thousands, Except for Shares)
Security Description | Principal Amount | Value | |||||||||
Indiana (0.2%): | |||||||||||
| Indiana Finance Authority Revenue Series A, 3.62%, 7/1/36 | $ | 1,500 | $ | 1,790 | |||||||
Series B, 3.43%, 9/15/32, Continuously Callable @ 100 | 4,500 | 4,377 | |||||||||
Series C, 4.36%, 7/15/29 | 4,955 | 6,056 | |||||||||
Series C, 4.53%, 7/15/31 | 4,260 | 5,374 | |||||||||
17,597 | |||||||||||
Kansas (0.1%): | |||||||||||
Kansas Development Finance Authority Revenue, Series H, 4.73%, 4/15/37 | 10,000 | 12,551 | |||||||||
Kentucky (0.1%): | |||||||||||
| Kentucky Economic Development Finance Authority Revenue 3.72%, 12/1/26 | 2,335 | 2,499 | |||||||||
3.82%, 12/1/27 | 1,985 | 2,149 | |||||||||
3.92%, 12/1/28, Continuously Callable @ 100 | 1,000 | 1,086 | |||||||||
4.02%, 12/1/29, Continuously Callable @ 100 | 1,500 | 1,635 | |||||||||
4.12%, 12/1/30, Continuously Callable @ 100 | 1,300 | 1,423 | |||||||||
| Kentucky Economic Development Finance Authority Revenue (INS — Assured Guaranty Municipal Corp.), 3.62%, 12/1/25 | 1,000 | 1,059 | |||||||||
9,851 | |||||||||||
Lousiana (0.3%): | |||||||||||
| Louisiana Local Government Environmental Facilities & Community Development Authority Revenue 1.74%, 2/1/28 (c) | 4,500 | 4,501 | |||||||||
3.24%, 8/1/28 | 18,912 | 19,814 | |||||||||
Louisiana Public Facilities Authority Revenue, 2.28%, 6/1/30 (c) | 3,500 | 3,578 | |||||||||
27,893 | |||||||||||
Maine (0.1%): | |||||||||||
Maine Municipal Bond Bank Revenue, 4.25%, 6/1/23 | 5,000 | 5,465 | |||||||||
Maryland (0.3%): | |||||||||||
| Maryland Economic Development Corp. Revenue Series B, 4.05%, 6/1/27 | 2,290 | 2,456 | |||||||||
Series B, 4.15%, 6/1/28 | 2,390 | 2,595 | |||||||||
Series B, 4.25%, 6/1/29 | 2,495 | 2,746 | |||||||||
Series B, 4.35%, 6/1/30 | 1,325 | 1,480 | |||||||||
Series B, 4.40%, 6/1/31 | 1,385 | 1,567 | |||||||||
| Maryland Stadium Authority Revenue Series C, 2.33%, 5/1/34 | 3,010 | 3,027 | |||||||||
Series C, 2.36%, 5/1/35 | 3,050 | 3,061 | |||||||||
Series C, 2.81%, 5/1/40 | 7,000 | 7,212 | |||||||||
24,144 | |||||||||||
Massachusetts (0.1%): | |||||||||||
| Massachusetts School Building Authority Revenue, Series B, 2.97%, 10/15/32, Continuously Callable @ 100 | 6,500 | 7,038 | |||||||||
Michigan (0.1%): | |||||||||||
Michigan Finance Authority Revenue, 3.08%, 12/1/34 | 10,000 | 10,971 | |||||||||
See notes to financial statements.
34
| USAA Mutual Funds Trust USAA Income Fund | Schedule of Portfolio Investments — continued July 31, 2020 | ||||||
(Amounts in Thousands, Except for Shares)
Security Description | Principal Amount | Value | |||||||||
Mississippi (0.2%): | |||||||||||
| State of Mississippi, GO Series D, 3.73%, 10/1/32 | $ | 10,000 | $ | 12,362 | |||||||
Series E, 2.83%, 12/1/24 | 1,800 | 1,978 | |||||||||
Series E, 3.03%, 12/1/25 | 2,000 | 2,245 | |||||||||
16,585 | |||||||||||
Missouri (0.0%): (g) | |||||||||||
University of Missouri Revenue, 2.01%, 11/1/27, Continuously Callable @ 100 | 3,000 | 3,188 | |||||||||
New Jersey (0.5%): | |||||||||||
| City of Atlantic, GO Series A, 4.23%, 9/1/25 | 2,525 | 2,782 | |||||||||
Series A, 4.29%, 9/1/26 | 2,415 | 2,699 | |||||||||
| New Jersey Economic Development Authority Revenue 5.25%, 9/1/22, Continuously Callable @ 100 | 2,700 | 2,768 | |||||||||
Series C, 5.71%, 6/15/30 | 2,500 | 3,086 | |||||||||
Series NNN, 3.77%, 6/15/31 | 10,000 | 10,083 | |||||||||
New Jersey Educational Facilities Authority Revenue, Series E, 4.02%, 7/1/39 | 3,000 | 3,344 | |||||||||
| New Jersey Transportation Trust Fund Authority Revenue 5.50%, 12/15/22 | 3,320 | 3,662 | |||||||||
4.08%, 6/15/39 | 3,845 | 3,826 | |||||||||
| New Jersey Transportation Trust Fund Authority Revenue (INS — AMBAC Assurance Corp.), Series B, 5.25%, 12/15/22 | 5,000 | 5,486 | |||||||||
| New Jersey Transportation Trust Fund Authority Revenue, Build America Bond, Series C, 5.75%, 12/15/28 | 1,810 | 1,979 | |||||||||
| South Jersey Port Corp. Revenue Series B, 5.00%, 1/1/25 | 500 | 553 | |||||||||
Series B, 5.00%, 1/1/26 | 1,000 | 1,124 | |||||||||
Series B, 5.00%, 1/1/27 | 1,000 | 1,141 | |||||||||
Series B, 5.00%, 1/1/28 | 500 | 579 | |||||||||
43,112 | |||||||||||
New York (0.7%): | |||||||||||
| Long Island Power Authority Revenue Series B, 3.98%, 9/1/25 | 2,500 | 2,750 | |||||||||
Series B, 4.13%, 9/1/26 | 2,500 | 2,793 | |||||||||
Long Island Power Authority Revenue, Build America Bond, 5.25%, 5/1/22 | 10,000 | 10,634 | |||||||||
| New York City Transitional Finance Authority Future Tax Secured Revenue, 5.00%, 2/1/35, Continuously Callable @ 100 | 5,000 | 5,110 | |||||||||
| New York State Dormitory Authority Revenue 5.10%, 8/1/34 | 11,400 | 13,680 | |||||||||
Series A, 2.46%, 7/1/32 | 7,000 | 7,077 | |||||||||
Series A, 2.51%, 7/1/33 | 5,000 | 5,066 | |||||||||
New York State Thruway Authority Revenue, Series M, 2.55%, 1/1/28 | 3,846 | 4,034 | |||||||||
| New York State Urban Development Corp. Revenue 1.88%, 3/15/30 | 2,600 | 2,607 | |||||||||
2.03%, 3/15/31, Continuously Callable @ 100 | 3,500 | 3,528 | |||||||||
Town of Oyster Bay, GO, 3.95%, 2/1/21 | 1,500 | 1,500 | |||||||||
58,779 | |||||||||||
See notes to financial statements.
35
| USAA Mutual Funds Trust USAA Income Fund | Schedule of Portfolio Investments — continued July 31, 2020 | ||||||
(Amounts in Thousands, Except for Shares)
Security Description | Principal Amount | Value | |||||||||
Ohio (0.4%): | |||||||||||
| City of Cleveland Airport System Revenue Series A, 2.88%, 1/1/31 | $ | 1,230 | $ | 1,313 | |||||||
Series A, 2.93%, 1/1/32 | 2,990 | 3,223 | |||||||||
Series A, 2.98%, 1/1/33 | 3,190 | 3,457 | |||||||||
| Cleveland Department of Public Utilities Division of Public Power Revenue, 5.50%, 11/15/38, Pre-refunded 11/15/24 @ 100 | 10,000 | 12,115 | |||||||||
| State of Ohio, GO Series A, 1.73%, 8/1/31 | 5,000 | 5,134 | |||||||||
Series A, 1.78%, 8/1/32 | 7,000 | 7,230 | |||||||||
32,472 | |||||||||||
Oklahoma (0.1%): | |||||||||||
Oklahoma Development Finance Authority Revenue, Series C, 5.45%, 8/15/28 | 10,250 | 12,064 | |||||||||
Other Territories (0.0%): (g) | |||||||||||
| Federal Home Loan Mortgage Corp. Revenue, Series A, 1.60%, 8/15/51, (Put Date 6/15/22) (n) | 2,821 | 2,874 | |||||||||
Pennsylvania (0.5%): | |||||||||||
Commonwealth Financing Authority Revenue, Series A, 3.86%, 6/1/38 | 5,045 | 6,007 | |||||||||
| Pennsylvania Economic Development Financing Authority Revenue, Series B, 3.20%, 11/15/27 | 1,375 | 1,491 | |||||||||
Pennsylvania IDA Revenue, 3.56%, 7/1/24 (a) | 10,000 | 10,719 | |||||||||
| Scranton School District, GO Series A, 3.15%, 6/15/34, (Put Date 6/15/24) (a) (n) | 2,805 | 3,005 | |||||||||
Series B, 3.15%, 6/15/34, (Put Date 6/15/24) (a) (n) | 1,415 | 1,516 | |||||||||
State Public School Building Authority Revenue, 3.15%, 4/1/30 | 6,460 | 6,736 | |||||||||
| State Public School Building Authority Revenue (INS — Build America Mutual Assurance Co.), Series B-1, 4.08%, 12/1/23 | 1,300 | 1,415 | |||||||||
The School District of Philadelphia, GO, 5.06%, 9/1/42 | 10,000 | 12,066 | |||||||||
42,955 | |||||||||||
Tennessee (0.2%): | |||||||||||
| Jackson Energy Authority Revenue 2.90%, 4/1/22 | 2,000 | 2,081 | |||||||||
3.05%, 4/1/23 | 2,745 | 2,927 | |||||||||
Series E, 3.20%, 4/1/24, Continuously Callable @ 100 | 3,915 | 4,180 | |||||||||
| Metropolitan Government Nashville & Davidson County Health & Educational Facilities Board Revenue, Series B, 4.05%, 7/1/26, Continuously Callable @ 100 | 8,000 | 8,782 | |||||||||
17,970 | |||||||||||
Texas (1.1%): | |||||||||||
| Austin Community College District Public Facility Corp. Revenue, Build America Bond Series A, 6.76%, 8/1/30, Pre-refunded 8/1/20 @ 100 | 1,550 | 1,550 | |||||||||
Series A, 6.91%, 8/1/35, Pre-refunded 8/1/20 @ 100 | 2,000 | 2,000 | |||||||||
| City of Corpus Christi Tx Utility System Revenue Series B, 1.49%, 7/15/27 | 2,000 | 2,025 | |||||||||
Series B, 1.71%, 7/15/28 | 2,220 | 2,267 | |||||||||
City of Dallas Tx Waterworks & Sewer System Revenue, Series D, 1.68%, 10/1/28 | 1,500 | 1,552 | |||||||||
See notes to financial statements.
36
| USAA Mutual Funds Trust USAA Income Fund | Schedule of Portfolio Investments — continued July 31, 2020 | ||||||
(Amounts in Thousands, Except for Shares)
Security Description | Principal Amount | Value | |||||||||
| City of Houston Combined Utility System Revenue, 5.00%, 11/15/33, Continuously Callable @ 100 | $ | 5,000 | $ | 5,065 | |||||||
City of Houston Tx Combined Utility System Revenue, Series D, 1.62%, 11/15/30 | 2,250 | 2,247 | |||||||||
City of San Antonio Tx, GO, 1.76%, 2/1/31, Continuously Callable @ 100 | 11,400 | 11,756 | |||||||||
| Colony Local Development Corp. Revenue (INS — Berkshire Hathaway Assurance Corp.), Series A, 4.38%, 10/1/33 | 9,000 | 10,951 | |||||||||
| Dallas/Fort Worth International Airport Revenue 4.00%, 11/1/21, Pre-refunded 11/1/20 @ 100 | 12,570 | 12,682 | |||||||||
Series A, 4.44%, 11/1/21 | 2,265 | 2,369 | |||||||||
Series C, 1.65%, 11/1/26 (c) | 1,500 | 1,504 | |||||||||
Series C, 1.95%, 11/1/28 (c) | 1,000 | 1,002 | |||||||||
Series C, 2.05%, 11/1/29 (c) | 1,250 | 1,252 | |||||||||
Series C, 2.10%, 11/1/30 (c) | 1,000 | 1,000 | |||||||||
| Ector County Hospital District Revenue, Build America Bond, Series B, 7.18%, 9/15/35, Continuously Callable @ 100 | 9,700 | 9,729 | |||||||||
| Granbury Independent School District, GO, Series A, 1.87%, 8/1/31, Continuously Callable @ 100 | 1,000 | 1,035 | |||||||||
| Harris County Cultural Education Facilities Finance Corp. Revenue Series B, 2.10%, 5/15/22 | 875 | 896 | |||||||||
Series B, 2.17%, 5/15/23 | 1,000 | 1,035 | |||||||||
Series B, 2.57%, 5/15/26 | 1,000 | 1,062 | |||||||||
Series B, 2.28%, 7/1/34 (c) | 6,785 | 6,803 | |||||||||
| McLennan County Public Facility Corp. Revenue, 3.90%, 6/1/29, Continuously Callable @ 100 | 2,000 | 2,167 | |||||||||
Port of Corpus Christi Authority of Nueces County Revenue, 3.49%, 12/1/25 | 1,000 | 1,116 | |||||||||
State of Texas, GO, 3.00%, 4/1/28 | 3,850 | 4,373 | |||||||||
| Texas Tech University System Revenue 1.55%, 2/15/28 | 2,000 | 2,023 | |||||||||
1.65%, 2/15/29 | 1,250 | 1,264 | |||||||||
1.75%, 2/15/30, Continuously Callable @ 100 | 2,500 | 2,526 | |||||||||
93,251 | |||||||||||
Wisconsin (0.1%): | |||||||||||
State of Wisconsin Revenue, Series A, 2.40%, 5/1/30 | 4,000 | 4,300 | |||||||||
Total Municipal Bonds (Cost $683,794) | 746,080 | ||||||||||
U.S. Government Agency Mortgages (5.8%) | |||||||||||
| Federal Home Loan Mortgage Corp. 5.50%, 11/1/20-4/1/36 | 798 | 928 | |||||||||
5.00%, 1/1/21 | 33 | 33 | |||||||||
Series K018, Class X1, 1.29%, 1/25/22 (d) (f) | 49,999 | 639 | |||||||||
Series K020, Class X1, 1.36%, 5/25/22 (d) (f) | 84,497 | 1,496 | |||||||||
Series K021, Class X1, 1.41%, 6/25/22 (d) (f) | 65,726 | 1,286 | |||||||||
Series K025, Class X1, 0.81%, 10/25/22 (d) (f) | 63,166 | 876 | |||||||||
Series K026, Class X1, 0.97%, 11/25/22 (d) (f) | 88,020 | 1,499 | |||||||||
Series K028, Class A2, 3.11%, 2/25/23 | 4,000 | 4,229 | |||||||||
Series K045, Class A2, 3.02%, 1/25/25 | 10,000 | 10,992 | |||||||||
Series KPLB, Class A, 2.77%, 5/25/25 | 17,000 | 18,637 | |||||||||
Series K049, Class A2, 3.01%, 7/25/25 | 8,000 | 8,840 | |||||||||
Series KC02, Class A2, 3.37%, 7/25/25 (e) | 10,000 | 11,174 | |||||||||
See notes to financial statements.
37
| USAA Mutual Funds Trust USAA Income Fund | Schedule of Portfolio Investments — continued July 31, 2020 | ||||||
(Amounts in Thousands, Except for Shares)
Security Description | Principal Amount | Value | |||||||||
Series KIR1, Class A2, 2.85%, 3/25/26 (e) | $ | 12,000 | $ | 13,242 | |||||||
Series K056, Class AM, 2.59%, 5/25/26 | 10,000 | 10,890 | |||||||||
Series K062, Class A2, 3.41%, 12/25/26 (e) | 10,000 | 11,502 | |||||||||
Series K063, Class A2, 3.43%, 1/25/27 (d) | 9,000 | 10,358 | |||||||||
Series S8FX, Class A1, 3.02%, 3/25/27 | 11,911 | 13,241 | |||||||||
Series KIR2, Class A2, 3.17%, 3/25/27 | 9,500 | 10,781 | |||||||||
Series K064, Class AM, 3.33%, 3/25/27 (d) | 8,420 | 9,587 | |||||||||
Series K068, Class A2, 3.24%, 8/25/27 | 4,533 | 5,216 | |||||||||
Series K075, Class A2, 3.65%, 2/25/28 (d) | 3,000 | 3,546 | |||||||||
Series K153, Class A2, 3.29%, 3/25/29 (d) | 7,500 | 8,788 | |||||||||
Series 4818, Class VD, 4.00%, 6/15/29 | 8,195 | 8,221 | |||||||||
Series K095, Class A2, 2.79%, 6/25/29 | 8,750 | 9,979 | |||||||||
Series K097, Class AM, 2.22%, 7/25/29 | 5,000 | 5,415 | |||||||||
Series K097, Class A2, 2.51%, 7/25/29 | 8,000 | 8,972 | |||||||||
Series K096, Class A2, 2.52%, 7/25/29 | 9,000 | 10,097 | |||||||||
Series KG02, Class A2, 2.41%, 8/25/29 | 9,091 | 10,081 | |||||||||
Series K100, Class A2, 2.67%, 9/25/29 | 5,455 | 6,190 | |||||||||
Series K151, Class A3, 3.51%, 4/25/30 | 15,500 | 18,165 | |||||||||
Series K158, Class A2, 3.90%, 12/25/30-10/25/33 (d) | 12,000 | 14,991 | |||||||||
Series K153, Class A3, 3.12%, 10/25/31 (d) | 4,855 | 5,674 | |||||||||
Series K-1510, Class A3, 3.79%, 1/25/34 | 19,200 | 23,964 | |||||||||
Series K-1512, Class A3, 3.06%, 4/25/34 | 5,500 | 6,521 | |||||||||
3.50%, 5/1/42-5/1/47 | 22,361 | 23,994 | |||||||||
310,044 | |||||||||||
| Federal National Mortgage Association 5.50%, 7/1/21-5/1/38 | 4,914 | 5,739 | |||||||||
7.00%, 10/1/22-3/1/23 | 6 | 6 | |||||||||
Series 2016-M2, Class AV2, 2.15%, 1/25/23 | 6,897 | 7,112 | |||||||||
Series 2017-M15, Class AV2, 2.63%, 11/25/24 (d) | 4,834 | 5,209 | |||||||||
Series 2017-M2, Class A2, 2.80%, 2/25/27 (d) | 3,500 | 3,882 | |||||||||
Series M7, Class A2, 2.96%, 2/25/27 (d) | 2,500 | 2,796 | |||||||||
2.50%, 2/1/28-11/1/34 (e) | 13,737 | 14,416 | |||||||||
Series M4, Class A2, 3.05%, 3/25/28 (d) | 7,105 | 8,114 | |||||||||
Series 2019-M12, Class A2, 2.89%, 5/25/29 (d) | 8,000 | 9,116 | |||||||||
6.50%, 4/1/31-3/1/32 | 415 | 491 | |||||||||
5.00%, 6/1/33 | 993 | 1,140 | |||||||||
6.00%, 5/1/36-8/1/37 | 1,649 | 1,960 | |||||||||
4.00%, 4/1/48-2/1/50 | 48,206 | 51,143 | |||||||||
3.50%, 9/1/49-2/1/50 (e) | 34,119 | 35,926 | |||||||||
3.00%, 2/1/50 | 18,570 | 19,630 | |||||||||
166,680 | |||||||||||
| Government National Mortgage Association 7.00%, 5/15/23-7/15/32 | 554 | 618 | |||||||||
6.50%, 6/15/23-10/15/31 | 857 | 961 | |||||||||
7.50%, 7/15/23-2/15/28 | 316 | 344 | |||||||||
6.00%, 8/15/28-1/15/33 | 1,674 | 1,875 | |||||||||
5.50%, 4/20/33 | 328 | 378 | |||||||||
5.00%, 8/15/33 | 1,954 | 2,231 | |||||||||
6,407 | |||||||||||
See notes to financial statements.
38
| USAA Mutual Funds Trust USAA Income Fund | Schedule of Portfolio Investments — continued July 31, 2020 | ||||||
(Amounts in Thousands, Except for Shares)
Security Description | Principal Amount | Value | |||||||||
| Government National Mortgage Assoc. 6.00%, 8/20/32 | $ | 305 | $ | 353 | |||||||
Total U.S. Government Agency Mortgages (Cost $442,333) | 483,484 | ||||||||||
U.S. Treasury Obligations (8.6%) | |||||||||||
| U.S. Treasury Bonds 2.38%, 1/15/25 | 40,000 | 63,314 | |||||||||
1.13%, 5/15/40 | 10,000 | 10,267 | |||||||||
3.88%, 8/15/40 | 15,000 | 22,994 | |||||||||
2.75%, 8/15/42 (e) | 15,000 | 19,971 | |||||||||
2.75%, 11/15/42 | 10,000 | 13,309 | |||||||||
3.38%, 5/15/44 | 5,000 | 7,352 | |||||||||
3.00%, 11/15/44 | 25,000 | 34,859 | |||||||||
2.50%, 2/15/45 (e) | 55,000 | 70,761 | |||||||||
2.50%, 2/15/46 | 15,000 | 19,402 | |||||||||
2.25%, 8/15/46 (e) | 42,950 | 53,278 | |||||||||
2.88%, 11/15/46 (e) | 10,000 | 13,872 | |||||||||
2.75%, 11/15/47 (e) | 12,000 | 16,416 | |||||||||
3.00%, 2/15/49 | 10,000 | 14,430 | |||||||||
1.25%, 5/15/50 | 10,000 | 10,133 | |||||||||
| U.S. Treasury Notes 2.63%, 11/15/20 | 50,000 | 50,355 | |||||||||
1.50%, 8/31/21 (e) | 40,000 | 40,589 | |||||||||
2.00%, 2/15/22 | 15,000 | 15,429 | |||||||||
2.00%, 7/31/22 | 30,000 | 31,120 | |||||||||
2.38%, 1/31/23 (e) | 5,000 | 5,280 | |||||||||
2.00%, 2/15/23 | 10,000 | 10,475 | |||||||||
0.13%, 7/15/23 | 20,000 | 20,002 | |||||||||
2.50%, 5/15/24 | 5,000 | 5,442 | |||||||||
2.50%, 1/31/25 (e) | 5,000 | 5,516 | |||||||||
2.00%, 2/15/25 | 70,000 | 75,693 | |||||||||
1.63%, 2/15/26 | 40,000 | 42,966 | |||||||||
2.38%, 5/15/27 (e) | 10,000 | 11,341 | |||||||||
2.25%, 8/15/27 | 10,000 | 11,292 | |||||||||
2.25%, 11/15/27 | 10,000 | 11,325 | |||||||||
0.88%, 1/15/29 | 10,000 | 11,842 | |||||||||
Total U.S. Treasury Obligations (Cost $617,599) | 719,025 | ||||||||||
Commercial Paper (1.9%) | |||||||||||
Canadian Natural Resources Ltd., 0.19%, 8/4/20 (a) (o) | 25,000 | 24,999 | |||||||||
Canadian Pacific Railway, 0.17%, 8/13/20 (a) (o) | 10,000 | 9,999 | |||||||||
Enbridge Gas Distribution, 0.19%, 8/7/20 (a) (o) | 13,000 | 13,000 | |||||||||
Glencore Funding LLC, 0.39%, 8/6/20 (a) (o) | 25,000 | 24,998 | |||||||||
Hannover Funding Co. LLC, 0.33%, 8/7/20 (a) (o) | 8,000 | 7,999 | |||||||||
Hyundai Capital America, Inc., 0.59%, 8/11/20 (a) (o) | 25,000 | 24,998 | |||||||||
Kentucky Utilities Co., 0.19%, 8/3/20 (a) (o) | 25,000 | 25,000 | |||||||||
PPL Electric Utilities, 0.19%, 8/3/20 (a) (o) | 25,000 | 25,000 | |||||||||
Total Commercial Paper (Cost $155,994) | 155,993 | ||||||||||
See notes to financial statements.
39
| USAA Mutual Funds Trust USAA Income Fund | Schedule of Portfolio Investments — continued July 31, 2020 | ||||||
(Amounts in Thousands, Except for Shares)
Security Description | Shares | Value | |||||||||
Collateral for Securities Loaned^ (0.1%) | |||||||||||
| Goldman Sachs Financial Square Government Fund Institutional Shares, 0.13% (p) | 634,738 | $ | 635 | ||||||||
HSBC U.S. Government Money Market Fund I Shares, 0.08% (p) | 27,084 | 27 | |||||||||
Invesco Government & Agency Portfolio Institutional Shares, 0.06% (p) | 7,544,566 | 7,544 | |||||||||
Total Collateral for Securities Loaned (Cost $8,206) | 8,206 | ||||||||||
Total Investments (Cost $7,655,906) — 98.8% | 8,276,880 | ||||||||||
Other assets in excess of liabilities — 1.2% | 103,211 | ||||||||||
NET ASSETS — 100.00% | $ | 8,380,091 | |||||||||
At July 31, 2020 the Fund's investments in foreign securities were 13.4% of net assets.
^ Purchased with cash collateral from securities on loan.
(a) Rule 144A security or other security that is restricted as to resale to institutional investors. The Fund's Adviser has deemed this security to be liquid based upon procedures approved by the Board of Trustees. As of July 31, 2020, the fair value of these securities was $1,943,575 (thousands) and amounted to 23.2% of net assets.
(b) Variable or Floating-Rate Security. Rate disclosed is as of July 31, 2020.
(c) Security purchased on a when-issued basis.
(d) The rate for certain asset-backed and mortgage backed securities may vary based on factors relating to the pool of assets underlying the security. The rate disclosed is the rate in effect at July 31, 2020.
(e) All or a portion of this security has been segregated as collateral for securities purchased on a when-issued basis.
(f) Security is interest only.
(g) Amount represents less than 0.05% of net assets.
(h) Security is perpetual and has no final maturity date but may be subject to calls at various dates in the future.
(i) The Fund's Adviser has deemed this security to be illiquid based upon procedures approved by the Board of Trustees. As of July 31, 2020, illiquid securities were 0.3% of the Fund's net assets.
(j) All or a portion of this security is on loan.
(k) Defaulted security
(l) At July 31, 2020, the issuer was in bankruptcy.
(m) Stepped-coupon security converts to coupon form on 11/09/22 with a rate of 2.85%.
(n) Put Bond.
(o) Rate represents the effective yield at July 31, 2020.
(p) Rate disclosed is the daily yield on July 31, 2020.
AMBAC — American Municipal Bond Assurance Corporation
See notes to financial statements.
40
| USAA Mutual Funds Trust USAA Income Fund | Schedule of Portfolio Investments — continued July 31, 2020 | ||||||
bps — Basis points
GO — General Obligation
H15T5Y — 5 Year Treasury Constant Maturity Rate
IDA — Industrial Development Authority
LIBOR — London InterBank Offered Rate
LIBOR01M — 1 Month US Dollar LIBOR, rate disclosed as of July 31, 2020, based on the last reset date of the security
LIBOR03M — 3 Month US Dollar LIBOR, rate disclosed as of July 31, 2020, based on the last reset date of the security
LIBOR06M — 6 Month US Dollar LIBOR, rate disclosed as of July 31, 2020, based on the last reset date of the security
LLC — Limited Liability Company
LP — Limited Partnership
MTN — Medium-Term Note
PLC — Public Limited Company
SOFR — Secured Overnight Financing Rate
Title XI — The Title XI Guarantee Program provides a guarantee of payment of principal and interest of debt obligations issued by U.S. merchant marine and U.S. shipyards by enabling owners of eligible vessels and shipyards to obtain financing at attractive terms. The guarantee carries the full faith and credit of the U.S. government.
USISDA05 — 5 Year ICE Swap Rate, rate disclosed as of July 31, 2020.
USSW10 — USD 10 Year Swap Rate, rate disclosed as of July 31, 2020
USSW5 — USD 5 Year Swap Rate, rate disclosed as of July 31, 2020.
Credit Enhancements — Adds the financial strength of the provider of the enhancement to support the issuer's ability to repay the principal and interest payments when due. The enhancement may be provided by a high-quality bank, insurance company or other corporation, or a collateral trust. The enhancements do not guarantee the market values of the securities.
INS Principal and interest payments are insured by the name listed. Although bond insurance reduces the risk of loss due to default by an issuer, such bonds remain subject to the risk that value may fluctuate for other reasons, and there is no assurance that the insurance company will meet its obligations.
NBGA Principal and interest payments or, under certain circumstances, underlying mortgages, are guaranteed by a nonbank guarantee agreement from the name listed.
See notes to financial statements.
41
USAA Mutual Funds Trust | Statement of Assets and Liabilities July 31, 2020 | ||||||
(Amounts in Thousands, Except Per Share Amounts)
| USAA Income Fund | |||||||
Assets: | |||||||
Investments, at value (Cost $7,655,906) | $ | 8,276,880 | (a) | ||||
Cash and cash equivalents | 87,014 | ||||||
Deposits with brokers for futures contracts | 2,007 | ||||||
Receivables: | |||||||
Interest and dividends | 65,142 | ||||||
Capital shares issued | 2,614 | ||||||
Investments sold | 3,354 | ||||||
From Adviser | 1 | ||||||
Prepaid expenses | 140 | ||||||
Total assets | 8,437,152 | ||||||
Liabilities: | |||||||
Payables: | |||||||
Collateral received on loaned securities | 8,206 | ||||||
Investments purchased | 38,602 | ||||||
Capital shares redeemed | 7,194 | ||||||
Accrued expenses and other payables: | |||||||
Investment advisory fees | 1,261 | ||||||
Administration fees | 846 | ||||||
Custodian fees | 73 | ||||||
Transfer agent fees | 727 | ||||||
Compliance fees | 5 | ||||||
| 12b-1 fees | 10 | ||||||
Other accrued expenses | 137 | ||||||
Total liabilities | 57,061 | ||||||
Net Assets: | |||||||
| Capital | 7,660,475 | ||||||
Total accumulated earnings/(loss) | 719,616 | ||||||
Net assets | $ | 8,380,091 | |||||
Net Assets: | |||||||
Fund Shares | $ | 3,292,322 | |||||
Institutional Shares | 4,978,740 | ||||||
Class A shares | 87,216 | ||||||
Class C shares | 19 | ||||||
Class R6 Shares | 21,794 | ||||||
Total | $ | 8,380,091 | |||||
Shares (unlimited number of shares authorized with no par value): | |||||||
Fund Shares | 235,958 | ||||||
Institutional Shares | 357,058 | ||||||
Class A shares | 6,269 | ||||||
Class C shares | 1 | ||||||
Class R6 Shares | 1,563 | ||||||
Total | 600,849 | ||||||
Net asset value, offering and redemption price per share: (b) | |||||||
Fund Shares | $ | 13.95 | |||||
Institutional Shares | $ | 13.94 | |||||
Class A shares | $ | 13.91 | |||||
Class C shares (c) | $ | 13.92 | |||||
Class R6 Shares | $ | 13.95 | |||||
Maximum Sales Charge — Class A shares | 2.25 | % | |||||
| Maximum offering price (100%/(100%-maximum sales charge) of net asset value adjusted to the nearest cent) per share — Class A shares | $ | 14.23 | |||||
(a) Includes $8,039 of securities on loan.
(b) Per share amount may not recalculate due to rounding of net assets and/or shares outstanding.
(c) Redemption price per share varies by the length of time shares are held.
See notes to financial statements.
42
USAA Mutual Funds Trust | Statement of Operations For the Year Ended July 31, 2020 | ||||||
(Amounts in Thousands)
| USAA Income Fund | |||||||
Investment Income: | |||||||
Dividends | $ | 5,642 | |||||
Interest | 310,319 | ||||||
Interfund lending | 1 | ||||||
Securities lending (net of fees) | 238 | ||||||
Foreign tax withholding | (32 | ) | |||||
Total income | 316,168 | ||||||
Expenses*: | |||||||
Investment advisory fees | 19,965 | ||||||
Administration fees — Fund Shares | 4,944 | ||||||
Administration fees — Institutional Shares | 5,089 | ||||||
Administration fees — Class A shares | 136 | ||||||
Administration fees — Class C shares | — | (a) | |||||
Administration fees — R6 Shares | 11 | ||||||
Sub-Administration fees | 24 | ||||||
12b-1 fees — Class A shares | 227 | ||||||
12b-1 fees — Class C Shares | — | (a) | |||||
Custodian fees | 439 | ||||||
Transfer agent fees — Fund Shares | 3,449 | ||||||
Transfer agent fees — Institutional Shares | 5,089 | ||||||
Transfer agent fees — Class A shares | 84 | ||||||
Transfer agent fees — Class C shares | — | (a) | |||||
Transfer agent fees — Class R6 Shares | 2 | ||||||
Trustees' fees | 48 | ||||||
Compliance fees | 56 | ||||||
Legal and audit fees | 111 | ||||||
State registration and filing fees | 134 | ||||||
Interfund lending fees | 5 | ||||||
Other expenses | 426 | ||||||
Total expenses | 40,239 | ||||||
Expenses waived/reimbursed by Adviser | (3 | ) | |||||
Net expenses | 40,236 | ||||||
Net Investment Income (Loss) | 275,932 | ||||||
Realized/Unrealized Gains (Losses) from Investments: | |||||||
| Net realized gains (losses) from investment securities and foreign currency translations | 100,028 | ||||||
Net realized gains (losses) from futures contracts | 6,543 | ||||||
| Net change in unrealized appreciation/depreciation on investment securities and foreign currency translations | 313,133 | ||||||
Net change in unrealized appreciation/depreciation on futures contracts | (2,329 | ) | |||||
Net realized/unrealized gains (losses) on investments | 417,375 | ||||||
Change in net assets resulting from operations | $ | 693,307 | |||||
(a) Rounds to less than $1 thousand.
* Class C activity is for the period June 29, 2020 (commencement of operations) to July 31, 2020.
See notes to financial statements.
43
USAA Mutual Funds Trust | Statements of Changes in Net Assets | ||||||
(Amounts in Thousands)
USAA Income Fund | |||||||||||
| Year Ended July 31, 2020 | Year Ended July 31, 2019 | ||||||||||
From Investments: | |||||||||||
Operations: | |||||||||||
Net investment income (loss) | $ | 275,932 | $ | 280,012 | |||||||
Net realized gains (losses) from investments | 106,571 | 16,111 | |||||||||
| Net change in unrealized appreciation/depreciation on investments | 310,804 | 358,780 | |||||||||
Change in net assets resulting from operations | 693,307 | 654,903 | |||||||||
Distributions to Shareholders: | |||||||||||
Fund Shares | (110,589 | ) | (107,662 | ) | |||||||
Institutional Shares | (173,849 | ) | (171,913 | ) | |||||||
Class A shares | (2,835 | ) | (3,223 | ) | |||||||
Class C shares (a) | — | (b) | — | ||||||||
Class R6 Shares | (792 | ) | (702 | ) | |||||||
Change in net assets resulting from distributions to shareholders | (288,065 | ) | (283,500 | ) | |||||||
Change in net assets resulting from capital transactions | (403,727 | ) | 197,775 | ||||||||
Change in net assets | 1,515 | 569,178 | |||||||||
Net Assets: | |||||||||||
Beginning of period | 8,378,576 | 7,809,398 | |||||||||
End of period | $ | 8,380,091 | $ | 8,378,576 | |||||||
Capital Transactions: | |||||||||||
Fund Shares | |||||||||||
Proceeds from shares issued | $ | 701,830 | $ | 615,756 | |||||||
Distributions reinvested | 105,951 | 102,735 | |||||||||
Cost of shares redeemed | (886,140 | ) | (701,564 | ) | |||||||
Total Fund Shares | $ | (78,359 | ) | $ | 16,927 | ||||||
Institutional Shares | |||||||||||
Proceeds from shares issued | $ | 814,499 | $ | 949,163 | |||||||
Distributions reinvested | 172,774 | 168,534 | |||||||||
Cost of shares redeemed | (1,300,445 | ) | (923,600 | ) | |||||||
Total Institutional Shares | $ | (313,172 | ) | $ | 194,097 | ||||||
Class A shares | |||||||||||
Proceeds from shares issued | $ | 3,777 | $ | 3,771 | |||||||
Distributions reinvested | 2,779 | 3,180 | |||||||||
Cost of shares redeemed | (18,634 | ) | (21,284 | ) | |||||||
Total Class A shares | $ | (12,078 | ) | $ | (14,333 | ) | |||||
Class C shares (a) | |||||||||||
Proceeds from shares issued | $ | 18 | $ | — | |||||||
Distributions reinvested | — | (b) | — | ||||||||
Total Class C shares | $ | 18 | $ | — | |||||||
Class R6 Shares | |||||||||||
Proceeds from shares issued | $ | 6,753 | $ | 4,116 | |||||||
Distributions reinvested | 609 | 518 | |||||||||
Cost of shares redeemed | (7,498 | ) | (3,550 | ) | |||||||
Total Class R6 Shares | $ | (136 | ) | $ | 1,084 | ||||||
Change in net assets resulting from capital transactions | $ | (403,727 | ) | $ | 197,775 | ||||||
(a) Class C activity is for the period June 29, 2020 (commencement of operations) to July 31, 2020.
(b) Rounds to less than $1 thousand.
(continues on next page)
See notes to financial statements.
44
USAA Mutual Funds Trust | Statements of Changes in Net Assets | ||||||
(Amounts in Thousands) (continued)
USAA Income Fund | |||||||||||
| Year Ended July 31, 2020 | Year Ended July 31, 2019 | ||||||||||
Share Transactions: | |||||||||||
Fund Shares | |||||||||||
Issued | 52,125 | 48,140 | |||||||||
Reinvested | 7,872 | 8,039 | |||||||||
Redeemed | (66,180 | ) | (55,041 | ) | |||||||
Total Fund Shares | (6,183 | ) | 1,138 | ||||||||
Institutional Shares | |||||||||||
Issued | 60,462 | 74,103 | |||||||||
Reinvested | 12,844 | 13,197 | |||||||||
Redeemed | (96,812 | ) | (72,144 | ) | |||||||
Total Institutional Shares | (23,506 | ) | 15,156 | ||||||||
Class A shares | |||||||||||
Issued | 282 | 292 | |||||||||
Reinvested | 207 | 250 | |||||||||
Redeemed | (1,397 | ) | (1,673 | ) | |||||||
Total Class A shares | (908 | ) | (1,131 | ) | |||||||
Class C shares (a) | |||||||||||
Issued | 1 | — | |||||||||
Reinvested | — | (c) | — | ||||||||
Total Class C Shares | 1 | — | |||||||||
Class R6 Shares | |||||||||||
Issued | 501 | 321 | |||||||||
Reinvested | 45 | 40 | |||||||||
Redeemed | (554 | ) | (280 | ) | |||||||
Total Class R6 Shares | (8 | ) | 81 | ||||||||
Change in Shares | (30,604 | ) | 15,244 | ||||||||
(a) Class C activity is for the period June 29, 2020 (commencement of operations) to July 31, 2020.
(b) Rounds to less than $1 thousand.
(c) Rounds to less than 500 shares.
See notes to financial statements.
45
USAA Mutual Funds Trust | Financial Highlights | ||||||
For a Share Outstanding Throughout Each Period
Investment Activities | Distributions to Shareholders From | ||||||||||||||||||||||||||
| Net Asset Value, Beginning of Period | Net Investment Income (Loss) | Net Realized and Unrealized Gains (Losses) on Investments | Total from Investment Activities | Net Investment Income | Net Realized Gains From Investments | ||||||||||||||||||||||
USAA Income Fund | |||||||||||||||||||||||||||
Fund Shares | |||||||||||||||||||||||||||
Year Ended July 31, 2020 | $ | 13.28 | 0.43 | (d) | 0.69 | 1.12 | (0.41 | ) | (0.04 | ) | |||||||||||||||||
Year Ended July 31, 2019 | $ | 12.68 | 0.45 | 0.60 | 1.05 | (0.45 | ) | — | (e) | ||||||||||||||||||
Year Ended July 31, 2018 | $ | 13.20 | 0.45 | (0.51 | ) | (0.06 | ) | (0.44 | ) | (0.02 | ) | ||||||||||||||||
Year Ended July 31, 2017 | $ | 13.40 | 0.44 | (0.20 | ) | 0.24 | (0.44 | ) | — | ||||||||||||||||||
Year Ended July 31, 2016 | $ | 12.99 | 0.47 | 0.40 | 0.87 | (0.46 | ) | — | |||||||||||||||||||
Institutional Shares | |||||||||||||||||||||||||||
Year Ended July 31, 2020 | $ | 13.27 | 0.44 | (d) | 0.69 | 1.13 | (0.42 | ) | (0.04 | ) | |||||||||||||||||
Year Ended July 31, 2019 | $ | 12.67 | 0.45 | 0.61 | 1.06 | (0.46 | ) | — | (e) | ||||||||||||||||||
Year Ended July 31, 2018 | $ | 13.19 | 0.44 | (0.50 | ) | (0.06 | ) | (0.44 | ) | (0.02 | ) | ||||||||||||||||
Year Ended July 31, 2017 | $ | 13.39 | 0.45 | (0.20 | ) | 0.25 | (0.45 | ) | — | ||||||||||||||||||
Year Ended July 31, 2016 | $ | 12.99 | 0.48 | 0.39 | 0.87 | (0.47 | ) | — | |||||||||||||||||||
Class A shares | |||||||||||||||||||||||||||
Year Ended July 31, 2020 | $ | 13.24 | 0.40 | (d) | 0.69 | 1.09 | (0.38 | ) | (0.04 | ) | |||||||||||||||||
Year Ended July 31, 2019 | $ | 12.65 | 0.42 | 0.59 | 1.01 | (0.42 | ) | — | (e) | ||||||||||||||||||
Year Ended July 31, 2018 | $ | 13.16 | 0.41 | (0.49 | ) | (0.08 | ) | (0.41 | ) | (0.02 | ) | ||||||||||||||||
Year Ended July 31, 2017 | $ | 13.36 | 0.42 | (0.21 | ) | 0.21 | (0.41 | ) | — | ||||||||||||||||||
Year Ended July 31, 2016 | $ | 12.96 | 0.44 | 0.38 | 0.82 | (0.42 | ) | — | |||||||||||||||||||
Class C shares | |||||||||||||||||||||||||||
| June 29, 2020 (f) through July 31, 2020 | $ | 13.64 | 0.02 | (d) | 0.27 | 0.29 | (0.01 | ) | — | ||||||||||||||||||
Class R6 Shares | |||||||||||||||||||||||||||
Year Ended July 31, 2020 | $ | 13.27 | 0.45 | (d) | 0.70 | 1.15 | (0.43 | ) | (0.04 | ) | |||||||||||||||||
Year Ended July 31, 2019 | $ | 12.67 | 0.47 | 0.60 | 1.07 | (0.47 | ) | — | (e) | ||||||||||||||||||
Year Ended July 31, 2018 | $ | 13.19 | 0.45 | (0.49 | ) | (0.04 | ) | (0.46 | ) | (0.02 | ) | ||||||||||||||||
| December 1, 2016 (f) through July 31, 2017 | $ | 12.83 | 0.30 | 0.36 | 0.66 | (0.30 | ) | — | |||||||||||||||||||
* Assumes reinvestment of all net investment income and realized capital gain distributions, if any, during the period. Includes adjustments in accordance with U.S. generally accepted accounting principles and could differ from the Lipper reported return.
^ The net expense ratio may not correlate to the applicable expense limits in place during the period since the current contractual expense limitation is applied for a two year period beginning July 1, 2019 and in effect through June 30, 2021, instead of coinciding with the Fund's fiscal year end. Details of the current contractual expense limitation in effect can be found in Note 5 of the accompanying Notes to Financial Statements.
(a) Not annualized for periods less than one year.
(b) Annualized for periods less than one year.
(c) Portfolio turnover is calculated on the basis of the Fund as a whole without distinguishing between the classes of shares issued.
See notes to financial statements.
46
USAA Mutual Funds Trust | Financial Highlights — continued | ||||||
For a Share Outstanding Throughout Each Period
Ratios to Average Net Assets | Supplemental Data | ||||||||||||||||||||||||||||||||||
| Total Distributions | Net Asset Value, End of Period | Total Return (Excludes Sales Charge)*(a) | Net Expenses^(b) | Net Investment Income (Loss)(b) | Gross Expenses(b) | Net Assets, End of Period (000's) | Portfolio Turnover(a)(c) | ||||||||||||||||||||||||||||
USAA Income Fund | |||||||||||||||||||||||||||||||||||
Fund Shares | |||||||||||||||||||||||||||||||||||
Year Ended July 31, 2020 | (0.45 | ) | $ | 13.95 | 8.64 | % | 0.50 | % | 3.22 | % | 0.50 | % | $ | 3,292,322 | 25 | % | |||||||||||||||||||
Year Ended July 31, 2019 | (0.45 | ) | $ | 13.28 | 8.50 | % | 0.55 | % | 3.49 | % | 0.55 | % | $ | 3,214,507 | 13 | % | |||||||||||||||||||
Year Ended July 31, 2018 | (0.46 | ) | $ | 12.68 | (0.47 | )% | 0.52 | % | 3.40 | % | 0.52 | % | $ | 3,055,739 | 8 | % | |||||||||||||||||||
Year Ended July 31, 2017 | (0.44 | ) | $ | 13.20 | 1.91 | % | 0.49 | % | 3.40 | % | 0.49 | % | $ | 3,617,550 | 9 | % | |||||||||||||||||||
Year Ended July 31, 2016 | (0.46 | ) | $ | 13.40 | 6.88 | % | 0.51 | % | 3.61 | % | 0.51 | % | $ | 3,394,088 | 11 | % | |||||||||||||||||||
Institutional Shares | |||||||||||||||||||||||||||||||||||
Year Ended July 31, 2020 | (0.46 | ) | $ | 13.94 | 8.78 | % | 0.45 | % | 3.28 | % | 0.45 | % | $ | 4,978,740 | 25 | % | |||||||||||||||||||
Year Ended July 31, 2019 | (0.46 | ) | $ | 13.27 | 8.58 | % | 0.48 | % | 3.56 | % | 0.48 | % | $ | 5,048,203 | 13 | % | |||||||||||||||||||
Year Ended July 31, 2018 | (0.46 | ) | $ | 12.67 | (0.41 | )% | 0.47 | % | 3.46 | % | 0.47 | % | $ | 4,629,713 | 8 | % | |||||||||||||||||||
Year Ended July 31, 2017 | (0.45 | ) | $ | 13.19 | 1.97 | % | 0.43 | % | 3.45 | % | 0.43 | % | $ | 3,644,795 | 9 | % | |||||||||||||||||||
Year Ended July 31, 2016 | (0.47 | ) | $ | 13.39 | 6.89 | % | 0.44 | % | 3.66 | % | 0.44 | % | $ | 3,114,810 | 11 | % | |||||||||||||||||||
Class A shares | |||||||||||||||||||||||||||||||||||
Year Ended July 31, 2020 | (0.42 | ) | $ | 13.91 | 8.40 | % | 0.77 | % | 2.96 | % | 0.77 | % | $ | 87,216 | 25 | % | |||||||||||||||||||
Year Ended July 31, 2019 | (0.42 | ) | $ | 13.24 | 8.20 | % | 0.77 | % | 3.28 | % | 0.77 | % | $ | 95,026 | 13 | % | |||||||||||||||||||
Year Ended July 31, 2018 | (0.43 | ) | $ | 12.65 | (0.61 | )% | 0.74 | % | 3.18 | % | 0.74 | % | $ | 105,072 | 8 | % | |||||||||||||||||||
Year Ended July 31, 2017 | (0.41 | ) | $ | 13.16 | 1.67 | % | 0.72 | % | 3.17 | % | 0.72 | % | $ | 130,912 | 9 | % | |||||||||||||||||||
Year Ended July 31, 2016 | (0.42 | ) | $ | 13.36 | 6.53 | % | 0.77 | % | 3.36 | % | 0.77 | % | $ | 171,518 | 11 | % | |||||||||||||||||||
Class C shares | |||||||||||||||||||||||||||||||||||
| June 29, 2020 (f) through July 31, 2020 | (0.01 | ) | $ | 13.92 | 2.15 | % | 1.43 | % | 1.93 | % | 175.42 | % | $ | 19 | 25 | % | |||||||||||||||||||
Class R6 Shares | |||||||||||||||||||||||||||||||||||
Year Ended July 31, 2020 | (0.47 | ) | $ | 13.95 | 8.86 | % | 0.37 | % | 3.35 | % | 0.37 | % | $ | 21,794 | 25 | % | |||||||||||||||||||
Year Ended July 31, 2019 | (0.47 | ) | $ | 13.27 | 8.68 | % | 0.39 | % | 3.65 | % | 0.43 | % | $ | 20,840 | 13 | % | |||||||||||||||||||
Year Ended July 31, 2018 | (0.48 | ) | $ | 12.67 | (0.32 | )% | 0.39 | % | 3.56 | % | 0.58 | % | $ | 18,874 | 8 | % | |||||||||||||||||||
| December 1, 2016 (f) through July 31, 2017 | (0.30 | ) | $ | 13.19 | 5.22 | % | 0.39 | % | 3.50 | % | 0.99 | % | $ | 5,142 | 9 | % | |||||||||||||||||||
(d) Per share net investment income (loss) has been calculated using the average daily shares method.
(e) Amount is less than $0.005.
(f) Commencement of operations.
See notes to financial statements.
47
USAA Mutual Funds Trust | Notes to Financial Statements July 31, 2020 | ||||||
1. Organization:
USAA Mutual Funds Trust (the "Trust") is organized as a Delaware statutory trust and is registered under the Investment Company Act of 1940, as amended (the "1940 Act"), as an open-end investment company. The Trust is comprised of 47 funds and is authorized to issue an unlimited number of shares, which are units of beneficial interest with no par value.
The accompanying financial statements are those of the USAA Income Fund (the "Fund"). The Fund offers five classes of shares: Fund Shares, Institutional Shares, Class A* shares, Class C** shares, and R6 Shares. The Fund is classified as diversified under the 1940 Act.
* Effective June 29, 2020, the Fund's Adviser Shares were redesignated Class A shares and became subject to a front-end sales charge.
** Class C shares commenced operations on June 29, 2020.
Each class of shares of the Fund has substantially identical rights and privileges except with respect to fees paid under distribution plans, expenses allocable exclusively to each class of shares, voting rights on matters solely affecting a single class of shares, and the exchange privilege of each class of shares.
Under the Trust's organizational documents, its officers and trustees are indemnified against certain liabilities arising out of the performance of their duties to the Fund. In addition, in the normal course of business, the Fund enters into contracts with its vendors and others that provide for general indemnifications. The Fund's maximum exposure under these arrangements is unknown, as this would involve future claims that may be made against the Fund. However, based on experience, the Fund expects that risk of loss to be remote.
2. Significant Accounting Policies:
The following is a summary of significant accounting policies followed by the Trust in the preparation of its financial statements. The policies are in conformity with generally accepted accounting principles in the United States of America ("GAAP"). The preparation of financial statements in accordance with GAAP requires management to make estimates and assumptions that affect the reported amounts of assets and liabilities and disclosure of contingent assets and liabilities at the date of the financial statements and the reported amounts of income and expenses for the period. Actual results could differ from those estimates. The Fund follows the specialized accounting and reporting requirements under GAAP that are applicable to investment companies under Accounting Standards Codification Topic 946.
Investment Valuation:
The Fund records investments at fair value. Fair value is defined as the price that would be received to sell an asset or paid to transfer a liability in an orderly transaction between market participants at the measurement date.
The valuation techniques described below maximize the use of observable inputs and minimize the use of unobservable inputs in determining fair value. The inputs used for valuing the Fund's investments are summarized in the three broad levels listed below:
• Level 1 — quoted prices in active markets for identical securities
• Level 2 — other significant observable inputs (including quoted prices for similar securities or interest rates applicable to those securities, etc.)
• Level 3 — significant unobservable inputs (including the Fund's own assumptions in determining the fair value of investments)
Changes in valuation techniques may result in transfers in or out of an assigned level within the disclosure hierarchy. The inputs or methodologies used for valuation techniques are not necessarily an indication of the risk associated with entering into those investments.
The Adviser has established the Pricing and Liquidity Committee (the "Committee"), and subject to Trust's Board of Trustees (the "Board") oversight, the Committee administers and oversees the Fund's valuation policies and procedures, which are approved by the Board.
48
USAA Mutual Funds Trust | Notes to Financial Statements — continued July 31, 2020 | ||||||
Portfolio securities listed or traded on securities exchanges, including exchange-traded funds ("ETFs"), American Depositary Receipts ("ADRs") and Rights, are valued at the closing price on the exchange or system where the security is principally traded, if available, or at the Nasdaq Official Closing Price. If there have been no sales for that day on the exchange or system, then a security is valued at the last available bid quotation on the exchange or system where the security is principally traded. In each of these situations, valuations are typically categorized as Level 1 in the fair value hierarchy.
Investments in open-end investment companies are valued at net asset value ("NAV"). These valuations are typically categorized as Level 1 in the fair value hierarchy.
Debt securities of United States ("U.S.") issuers, along with corporate and municipal securities, including short-term investments maturing in 60 days or less, may be valued using evaluated bid or the last sales price to price securities by dealers or an independent pricing service approved by the Board. These valuations are typically categorized as Level 2 in the fair value hierarchy.
Futures contracts are valued at the settlement price established each day by the board of trade or an exchange on which they are traded. These valuations are typically categorized as Level 1 in the fair value hierarchy
In the event that price quotations or valuations are not readily available, are not reflective of market value, or a significant event has been recognized in relation to a security or class of securities, the securities are valued in good faith by the Committee in accordance with valuation procedures approved by the Board. These valuations are typically categorized as Level 2 or Level 3 in the fair value hierarchy, based on the observability of inputs used to determine the fair value. The effect of fair value pricing is that securities may not be priced on the basis of quotations from the primary market in which they are traded and the actual price realized from the sale of a security may differ materially from the fair value price. Valuing these securities at fair value is intended to cause the Fund's NAV to be more reliable than it otherwise would be.
A summary of the valuations as of July 31, 2020, based upon the three levels defined above, is included in the table below while the breakdown, by category, of investments is disclosed on the Schedule of Portfolio Investments (amounts in thousands):
Level 1 | Level 2 | Level 3 | Total | ||||||||||||||||
Asset-Backed Securities | $ | — | $ | 515,694 | $ | — | $ | 515,694 | |||||||||||
| Collateralized Mortgage Obligations | — | 409,569 | — | 409,569 | |||||||||||||||
Common Stocks | 526 | — | — | 526 | |||||||||||||||
Preferred Stocks | 44,303 | 22,269 |
| 66,572 | |||||||||||||||
Senior Secured Loans | — | 32,246 | — | 32,246 | |||||||||||||||
Corporate Bonds | — | 4,017,782 | — | 4,017,782 | |||||||||||||||
Yankee Dollar | — | 1,121,574 | — | 1,121,574 | |||||||||||||||
| Government National Mortgage Association | — | 129 | — | 129 | |||||||||||||||
Municipal Bonds | — | 746,080 | — | 746,080 | |||||||||||||||
| U.S. Government Agency Mortgages | — | 483,484 | — | 483,484 | |||||||||||||||
U.S. Treasury Obligations | — | 719,025 | — | 719,025 | |||||||||||||||
Commercial Paper | — | 155,993 | — | 155,993 | |||||||||||||||
Collateral for Securities Loaned | 8,206 | — | — | 8,206 | |||||||||||||||
Total | $ | 53,035 | $ | 8,223,845 | $ | — | $ | 8,276,880 | |||||||||||
For the year ended July 31, 2020, there were no transfers in or out of the Level 3 fair value hierarchy.
Real Estate Investment Trusts ("REITs"):
The Fund may invest in REITs, which report information on the source of their distributions annually. REITs are pooled investment vehicles that invest primarily in income producing real estate or real estate related loans or interests (such as mortgages). Certain distributions received from REITs during
49
USAA Mutual Funds Trust | Notes to Financial Statements — continued July 31, 2020 | ||||||
the year are recorded as realized gains or return of capital as estimated by the Fund or when such information becomes known.
Investment Companies:
Open-End Funds:
The Fund may invest in portfolios of open-end investment companies. These investment companies value securities in their portfolios for which market quotations are readily available at their market values (generally the last reported sale price) and all other securities and assets at their fair value by the methods established by the board of directors of the underlying funds.
Securities Purchased on a Delayed-Delivery or When-Issued Basis:
The Fund may purchase securities on a delayed-delivery or when-issued basis. Delivery and payment for securities that have been purchased by the Fund on a delayed-delivery, or when-issued basis, or for delayed draws on loans can take place a month or more after the trade date. At the time the Fund makes the commitment to purchase a security on a delayed-delivery or when-issued basis, the Fund records the transaction and reflects the value of the security in determining NAV. No interest accrues to the Fund until the transaction settles and payment takes place. A segregated account is established and the Fund maintains cash and/or marketable securities at least equal in value to commitments for delayed-delivery or when-issued securities. If the Fund owns delayed-delivery or when-issued securities, these values are included in Payable for investments purchased on the accompanying Statement of Assets and Liabilities and the segregated assets are identified on the Schedule of Portfolio Investments.
Mortgage- and Asset-Backed Securities:
The values of some mortgage-related or asset-backed securities may be particularly sensitive to changes in prevailing interest rates. Early repayment of principal on some mortgage-related securities may expose the Fund to a lower rate of return upon reinvestment of principal. The values of mortgage and asset-backed securities depend in part on the credit quality and adequacy of the underlying assets or collateral and may fluctuate in response to the market's perception of these factors as well as current and future repayment rates. Some mortgage-backed securities are backed by the full faith and credit of the U.S. government (e.g., mortgage-backed securities issued by the Government National Mortgage Association, commonly known as "Ginnie Mae"), while other mortgage-backed securities (e.g., mortgage- backed securities issued by the Federal National Mortgage Association and the Federal Home Loan Mortgage Corporation, commonly known as "Fannie Mae" and "Freddie Mac", respectively), are backed only by the credit of the government entity issuing them. In addition, some mortgage-backed securities are issued by private entities and, as such, are not guaranteed by the U.S. government or any agency or instrumentality of the U.S. government.
Leveraged Loans:
The Fund may invest in leveraged loans, a type of bank loan. Leveraged loans are adjustable-rate bank loans made to companies rated below investment grade. The interest rates on leveraged loans are reset periodically based upon the fluctuations of a base interest rate such as LIBOR and a "spread" above that base interest rate that represents a risk premium to the lending banks and/or other participating investors. Many bank loans bear an adjustable rate of interest; however, leveraged loans provide for a greater "spread" over the base interest rate than other bank loans because they are considered to represent a greater credit risk. Because they are perceived to represent a greater credit risk, leveraged loans possess certain attributes that are similar to high-yield securities. However, because they are often secured by collateral of the borrower, leveraged loans possess certain attributes that are similar to other bank loans.
50
USAA Mutual Funds Trust | Notes to Financial Statements — continued July 31, 2020 | ||||||
Derivative Instruments:
Futures Contracts:
The Fund may enter into contracts for the future delivery of securities or foreign currencies and futures contracts based on a specific security, class of securities, foreign currency or an index, and purchase or sell options on any such futures contracts. A futures contract on a securities index is an agreement obligating either party to pay, and entitling the other party to receive, while the contract is outstanding, cash payments based on the level of a specified securities index. No physical delivery of the underlying asset is made. The Fund may enter into futures contracts in an effort to hedge market risks. The acquisition of put and call options on futures contracts will give the Fund the right (but not the obligation), for a specified price, to sell or to purchase the underlying futures contract, upon exercise of the option, at any time during the option period. Futures transactions involve brokerage costs and require the Fund to segregate assets to cover contracts that would require it to purchase securities or currencies. A good faith margin deposit, known as initial margin, of cash or government securities with a broker or custodian is required to initiate and maintain open positions in futures contracts. Subsequent payments, known as variation margin, are made or received by the Fund based on the change in the market value of the position and are recorded as unrealized appreciation or depreciation until the contract is closed out, at which time the gain or loss is realized. The Fund may lose the expected benefit of futures transactions if interest rates, exchange rates or securities prices change in an unanticipated manner. Such unanticipated changes may also result in lower overall performance than if the Fund had not entered into any futures transactions. In addition, the value of the Fund's futures positions may not prove to be perfectly or even highly correlated with the value of its portfolio securities or foreign currencies, limiting the Fund's ability to hedge effectively against interest rate, exchange rate and/or market risk and giving rise to additional risks. There is no assurance of liquidity in the secondary market for purposes of closing out futures positions. The collateral held by the Fund is reflected on the Statement of Assets and Liabilities under Deposit with broker for futures contracts.
During the year ended July 31, 2020, the Fund held futures contracts primarily for the strategy of hedging or other purposes, including but not limited to, providing liquidity and equitizing cash. The Fund held no futures contracts at July 31, 2020.
Summary of Derivative Instruments:
The following table presents the effect of derivative instruments on the Statement of Operations, categorized by risk exposure, for the year ended July 31, 2020 (amounts in thousands):
| Net Realized Gains (Losses) on Derivatives Recognized as a Result from Operations | Net Change in Unrealized Appreciation/Depreciation on Derivatives Recognized as a Result of Operations | ||||||||||
| Net Realized Gains (Losses) from Futures Contracts | Net Change in Unrealized Appreciation/Depreciation on Futures Contracts | ||||||||||
Interest Rate Risk Exposure: | $ | 6,543 | $ | (2,329 | ) | ||||||
All open derivative positions at period end are reflected in the Fund's Schedule of Portfolio Investments. The underlying face value of open derivative positions relative to the Fund's net assets at period end is generally representative of the notional amount of open positions to net assets throughout the period.
Investment Transactions and Related Income:
Changes in holdings of investments are accounted for no later than one business day following the trade date. For financial reporting purposes, however, investment transactions are accounted for on trade date on the last business day of the reporting period. Interest income is determined on the basis of coupon interest accrued using the effective interest method which adjusts, where applicable, the
51
USAA Mutual Funds Trust | Notes to Financial Statements — continued July 31, 2020 | ||||||
amortization of premiums or accretion of discount. Gains or losses realized on sales of securities are determined by comparing the identified cost of the security lot sold with the net sales proceeds.
Withholding taxes on interest, dividends, and gains as a result of certain investments in ADRs by the Fund has been provided for in accordance with each investment's applicable country's tax rules and rates.
Securities Lending:
The Fund, through a securities lending agreement with Citibank, N.A. ("Citibank"), may lend its securities to qualified financial institutions, such as certain broker-dealers, to earn additional income, net of income retained by Citibank. Borrowers are required to secure their loans for collateral in the amount of at least 102% of the value of U.S. securities loaned or at least 105% of the value of non-U.S. securities loaned, marked-to-market daily. Any collateral shortfalls associated with increases in the valuation of the securities loaned are cured the next business day once the shortfall exceeds $100 thousand. Collateral may be cash, U.S. government securities, or other securities as permitted by SEC guidelines. Cash collateral may be invested in high-quality short-term investments, primarily open-end investment companies. Collateral requirements are determined daily based on the value of the Fund's securities on loan as of the end of the prior business day. During the time portfolio securities are on loan, the borrower will pay the Fund any dividends or interest paid on such securities plus any fee negotiated between the parties to the lending agreement. The Fund also earns a return from the collateral. The Fund pays Citibank various fees in connection with the investment of cash collateral and fees based on the investment income received from securities lending activities. Securities lending income (net of these fees) is disclosed on the Statement of Operations. Loans are terminable upon demand and the borrower must return the loaned securities within the lesser of one standard settlement period or five business days. Risks relating to securities-lending transactions include that the borrower may not provide additional collateral when required or return the securities when due, and that the value of the short-term investments will be less than the amount of cash collateral required to be returned to the borrower. The Fund's agreement with Citibank does not include master netting provisions. Non- cash collateral received by the Fund may not be sold or re-pledged except to satisfy borrower default. Cash collateral is listed on the Fund's Schedule Portfolio of Investments and Financial Statements while non-cash collateral is not included. The following table (amounts in thousands) is a summary of the Fund's securities lending transactions as of July 31, 2020.
| Value of Securities on Loan | Non-Cash Collateral | Cash Collateral | |||||||||
| $ | 8,039 | $ | — | $ | 8,206 | ||||||
Foreign Currency Translations:
The accounting records of the Fund are maintained in U.S. dollars. Investment securities and other assets and liabilities of the Fund denominated in a foreign currency are translated into U.S. dollars at current exchange rates. Purchases and sales of securities, income receipts, and expense payments are translated into U.S. dollars at the exchange rates on the date of the transactions. The Fund does not isolate the portion of the results of operations resulting from changes in foreign exchange rates on investments from fluctuations arising from changes in market prices of securities held. Such fluctuations are disclosed as net change in unrealized appreciation/depreciation on investments and foreign currency translations on the Statement of Operations. Any realized gains or losses from these fluctuations, including foreign currency arising from in-kind redemptions, are disclosed as net realized gains or losses from investment transactions and foreign currency translations on the Statement of Operations.
Foreign Taxes:
The Fund may be subject to foreign taxes related to foreign income received (a portion of which may be reclaimable), capital gains on the sale of securities, and certain foreign currency transactions. All foreign taxes are recorded in accordance with the applicable regulations and rates that exist in the foreign jurisdictions in which the Fund invests.
52
USAA Mutual Funds Trust | Notes to Financial Statements — continued July 31, 2020 | ||||||
Federal Income Taxes:
It is the Fund's policy to continue to qualify as a regulated investment company by complying with the provisions available to certain investment companies, as defined in applicable sections of the Internal Revenue Code, and to make distributions of net investment income and net realized gains sufficient to relieve it from all, or substantially all, federal income taxes. Accordingly, no provision for federal income taxes is required in the financial statements. The Fund has a tax year end of July 31.
Management of the Fund has reviewed tax positions taken in tax years that remain subject to examination by all major tax jurisdictions, including federal (i.e., the last four tax years, which includes the current fiscal tax year end). Management believes that there is no tax liability resulting from unrecognized tax benefits related to uncertain tax positions taken.
Allocations:
Expenses directly attributable to the Fund are charged to the Fund, while expenses that are attributable to more than one fund in the Trust, or jointly with an affiliated trust, are allocated among the respective funds in the Trust and/or affiliated trust based upon net assets or another appropriate basis.
Income, expenses (other than class-specific expenses such as transfer agent fees, state registration fees, 12b-1 fees and printing fees), and realized and unrealized gains or losses on investments are allocated to each class of shares based on its relative net assets on the date income is earned or expenses and realized and unrealized gains and losses are incurred.
Cross-Trade Transactions:
Pursuant to Rule 17a-7 under the 1940 Act, the Fund may engage in cross-trades, which are securities transactions with affiliated investment companies and advisory accounts managed by the Adviser and any applicable sub-adviser. Any such purchase or sale transaction must be effected without brokerage commission or other remuneration, except for customary transfer fees. The transaction must be effected at the current market price, which is either the security's last sale price on an exchange or, if there are no transactions in the security that day, at the average of the highest bid and lowest asked price. For the year ended July 31, 2020, the Fund engaged in the following securities transactions with affiliated funds, which resulted in the following net realized gains (losses) (amounts in thousands):
| Purchases | Sales | Net Realized Gains (Losses) | |||||||||
| $ | — | $ | 5,162 | $ | 61 | ||||||
3. Purchases and Sales:
Cost of purchases and proceeds from sales/maturities of securities (excluding securities maturing less than one year from acquisition) for the year ended July 31, 2020, were as follows for the Fund (amounts in thousands):
| Excluding U.S. Government Securities | U.S. Government Securities | ||||||||||||||
Purchases | Sales | Purchases | Sales | ||||||||||||
$ | 1,770,981 | $ | 2,117,474 | $ | 326,820 | $ | 491,893 | ||||||||
53
USAA Mutual Funds Trust | Notes to Financial Statements — continued July 31, 2020 | ||||||
4. Affiliated Fund Ownership:
The Fund offers its shares for investment by other USAA Mutual Funds. The fund-of-funds do not invest in the underlying funds for the purpose of exercising management or control, and the affiliated fund- of-funds' annual and semi-annual reports may be viewed at usaa.com. As of July 31, 2020, certain fund-of-funds owned total outstanding shares of the Fund as follows:
USAA Cornerstone Conservative Fund | 0.7 | % | |||||
USAA Target Retirement Income Fund | 0.6 | % | |||||
USAA Target Retirement 2020 Fund | 0.9 | % | |||||
USAA Target Retirement 2030 Fund | 1.1 | % | |||||
USAA Target Retirement 2040 Fund | 0.6 | % | |||||
USAA Target Retirement 2050 Fund | 0.2 | % | |||||
USAA Target Retirement 2060 Fund | 0.0 | %* | |||||
* Amount is less than 0.05%.
5. Fees and Transactions with Affiliates and Related Parties:
Investment Advisory Fees:
Investment advisory services are provided to the Fund by Victory Capital Management Inc. ("VCM" or the "Adviser"), a New York corporation registered as an investment adviser with the Securities and Exchange Commission ("SEC"). The Adviser is a wholly-owned indirect subsidiary of Victory Capital Holdings, Inc., a publicly traded Delaware corporation, and a wholly-owned direct subsidiary of Victory Capital Operating, LLC. Under the terms of the Investment Advisory Agreement, the Adviser is entitled to receive a base fee and a performance adjustment. The Fund's base fee is accrued daily and paid monthly at an annualized rate of 0.24% of the Fund's average daily net assets. Amounts incurred and paid to VCM for the year ended July 31, 2020, are reflected on the Statement of Operations as Investment Advisory fees.
Effective July 1, 2019, no performance adjustments were made for the period beginning July 1, 2019, through June 30, 2020. Only performance beginning as of July 1, 2019, and thereafter is utilized in calculating future performance adjustments.
The performance adjustment for each share class is accrued daily and calculated monthly by comparing each class' performance to that of the Lipper A Rated Bond Funds Index. The Lipper A Rated Bond Funds Index tracks the total return performance of each class within the Lipper A Rated Bond Funds category.
The performance period for each share class consists of the current month plus the previous 35 months (or the number of months beginning July 1, 2019, if fewer). The following table is utilized to determine the extent of the performance adjustment:
| Over/Under Performance Relative to Index (in basis points)(a) | Annual Adjustment Rate (in basis points)(a) | ||||||
+/- 20 to 50 | +/- 4 | ||||||
+/- 51 to 100 | +/- 5 | ||||||
+/- 101 and greater | +/- 6 | ||||||
(a) Based on the difference between average annual performance of the relevant share class of the Fund and its relevant Lipper index, rounded to the nearest basis point. Average daily net assets of the share class are calculated over a rolling 36-month period.
Each class' annual performance adjustment rate is multiplied by the average daily net assets of the class over the entire performance period, which is then multiplied by a fraction, the numerator of which is the number of days in the month and the denominator of which is 365 (366 in leap years). The
54
USAA Mutual Funds Trust | Notes to Financial Statements — continued July 31, 2020 | ||||||
resulting amount is then added to (in the case of overperformance), or subtracted from (in the case of underperformance) the base fee.
Under the performance fee arrangement, each class pays a positive performance fee adjustment for a performance period whenever the class outperforms the Lipper A Rated Bond Funds Index over that period, even if the class has overall negative returns during the performance period.
For the period July 1, 2020 through July 31, 2020, performance adjustments for Fund Shares, Institutional Shares, Class A shares, Class C shares, and R6 Shares were $(167), $(258), $(5), less than $(1) thousand, and $(1), respectively. For the Fund Shares, Institutional Shares, Class A shares, Class C shares, and R6 Shares, the performance adjustments were less than 0.01% of net assets for all classes.
The Trust relies on an exemptive order granted to VCM and its affiliated funds by the SEC in March 2019 permitting the use of a "manager-of-managers" structure for certain funds. Under a manager-of-managers structure, the investment adviser may select (with approval of the Board and without shareholder approval) one or more subadvisers to manage the day-to-day investment of a fund's assets. For the year ended July 31, 2020, the Fund had no subadvisors.
Administration and Servicing Fees:
VCM serves as the Fund's administrator and fund accountant. Under the Fund Administration, Servicing and Accounting Agreement, VCM is paid for its services an annual fee at a rate of 0.15% of average daily net assets of the Fund Shares, Class A shares, and Class C shares, 0.10% of average daily net assets of the Institutional Shares, and 0.05% of average daily net assets of the R6 Shares, respectively. Amounts incurred for the year ended July 31, 2020, are reflected on the Statement of Operations as Administration fees.
The Fund (as part of the Trust) has entered into an agreement to provide compliance services with the Adviser, pursuant to which the Adviser furnishes its compliance personnel, including the services of the Chief Compliance Officer ("CCO"), and other resources reasonably necessary to provide the Trust with compliance oversight services related to the design, administration and oversight of a compliance program for the Trust in accordance with Rule 38a-1 under the 1940 Act. The CCO is an employee of the Adviser, which pays the compensation of the CCO and support staff. Funds in the Trust, Victory Variable Insurance Funds, Victory Portfolios, and Victory Portfolios II (collectively, the "Victory Funds Complex") in the aggregate, compensates the Adviser for these services. Amounts incurred for the year ended July 31, 2020, are reflected on the Statement of Operations as Compliance fees.
Citi Fund Services Ohio, Inc. ("Citi"), an affiliate of Citibank, acts as sub-administrator and sub-fund accountant to the Fund pursuant to a Sub-Administration and Sub-Fund Accounting Services Agreement between VCM and Citi. VCM pays Citi a fee for providing these services. The Fund reimburses VCM and Citi for reasonable out-of-pocket expenses incurred in providing these services and certain other expenses specifically allocated to the Funds, under the Fund Administration, Servicing, and Accounting Agreement. Amounts incurred for the year ended July 31, 2020, are reflected on the Statement of Operations as Sub-Administration fees.
Transfer Agency Fees:
Victory Capital Transfer Agency, Inc. ("VCTA"), provides transfer agency services to the Fund. VCTA, an affiliate of the Adviser, provides transfer agent services to the Fund Shares based on an annual charge of $25.50 per shareholder account plus out-of-pocket expenses. VCTA pays a portion of these fees to certain intermediaries for the administration and servicing of accounts that are held with such intermediaries. Transfer agent's fees for Institutional Shares, Class A shares, and Class C shares are paid monthly based on a fee accrued daily at an annualized rate of 0.10% and R6 Shares at an annualized rate of 0.01%, of average daily net assets, respectively, plus out-of-pocket expenses. Amounts incurred and paid to VCTA for the year ended July 31, 2020, are reflected on the Statement of Operations as Transfer Agent fees.
FIS Investor Services LLC serves as sub-transfer agent and dividend disbursing agent for the Fund pursuant to a Sub-Transfer Agent Agreement between VCTA and FIS Investor Services LLC. VCTA provides FIS Investor Services LLC a fee for providing these services.
55
USAA Mutual Funds Trust | Notes to Financial Statements — continued July 31, 2020 | ||||||
Distributor/Underwriting Services:
Victory Capital Services, Inc. (the "Distributor"), an affiliate of the Adviser, serves as distributor for the continuous offering of shares of the Fund pursuant to a Distribution Agreement between the Distributor and the Trust. Effective June 30, 2020, the Distributor's name was changed from Victory Capital Advisers, Inc. Pursuant to the Distribution and Service Plans adopted in accordance with Rule 12b-1 under the1940 Act, the Distributor may receive a monthly distribution and service fee, at an annual rate of up to 0.25% of the average daily net assets of Class A shares and 1.00% of the average daily net assets of Class C shares. The distribution and service fees paid to the Distributor may be used by the Distributor to pay for activity primarily intended to result in the sale of Class A shares or Class C shares of the Fund. Amounts incurred and paid to VCTA for the year ended July 31, 2020, are reflected on the Statement of Operations as 12b-1 fees.
In addition, the Distributor is entitled to receive commission on sales of the Class A shares of the Fund. For the fiscal year ended July 31, 2020, the Distributor did not receive any commissions.
Other Fees:
Citibank serves as the Fund's custodian.
K&L Gates LLP provides legal services to the Trust.
The Adviser has entered into an expense limitation agreement with the Fund until at least June 30, 2021. Under the terms of the agreement, the Adviser has agreed to waive fees or reimburse certain expenses to the extent that ordinary operating expenses incurred by certain classes of the Fund in any fiscal year exceed the expense limit for such classes of the Fund. Such excess amounts will be the liability of the Adviser. Interest, taxes, brokerage commissions, other expenditures, which are capitalized in accordance with GAAP, and other extraordinary expenses not incurred in the ordinary course of the Fund's business are excluded from the expense limits. As of July 31, 2020, the expense limits (excluding voluntary waivers) are 0.52%, 0.46%, 0.77%, 1.43%, and 0.39% for Fund Shares, Institutional Shares, Class A shares, Class C shares, and R6 Shares, respectively.
Under this expense limitation agreement, the Fund has agreed to repay fees and expenses that were waived or reimbursed by the Adviser for a period up to three years after the fiscal year in which the waiver or reimbursement took place, subject to the lesser of any operating expense limits in effect at the time of: (a) the original waiver or expense reimbursement; or (b) the recoupment, after giving effect to the recoupment amount. As of July 31, 2020, the following amounts are available to be repaid to the Adviser (amounts in thousands). The Fund has not recorded any amounts available to be repaid as a liability due to an assessment that such repayment is not probable at July 31, 2020.
| Expires July 31, 2022 | Expires July 31, 2023 | Total | |||||||||
| $ | 2 | $ | 3 | $ | 5 | ||||||
The Adviser, may voluntarily waive or reimburse additional fees to assist the Fund in maintaining competitive expense ratios. Voluntary waivers and reimbursements applicable to the Fund are not available to be recouped at a future time. There were no voluntary waivers or reimbursements for the year ended July 31, 2020.
Certain officers and/or interested trustees of the Fund are also officers and/or employees of the Adviser, Administrator, Sub-Administrator, Sub-Fund Accountant, and Legal.
6. Risks:
The Fund may be subject to other risks in addition to these identified risks.
Global economies and financial markets are increasingly interconnected, which increases the possibilities that conditions in one country or region might adversely affect issuers in another country or region. Geopolitical and other risks, including war, terrorism, trade disputes, political or economic dysfunction within some nations, public health crises and related geopolitical events, as well as environmental disasters such as earthquakes, fires, and floods, may add to instability in world economies
56
USAA Mutual Funds Trust | Notes to Financial Statements — continued July 31, 2020 | ||||||
and markets generally. Changes in trade policies and international trade agreements could affect the economies of many countries in unpredictable ways. Epidemics and/or pandemics, such as the coronavirus (or COVID-19), may result in, among other things, closing borders, disruptions to healthcare service preparation and delivery, quarantines, cancellations, disruptions to supply chains and consumer activity, as well as general concern and uncertainty. The impact may be short-term or may last for extended periods.
The COVID-19 pandemic, which has spread rapidly across the world, has led and will continue to lead for an unknown period of time to disruptions in local, regional, national and global markets and economies. Among other things, the outbreak has resulted in, and until fully resolved is likely to continue to result in, among other things (1) government imposition of various forms of "stay at home" orders and the closing of "non-essential" businesses, resulting in significant disruption to the businesses of many issuers as well as lay-offs of employees: (2) increased requests by issuers of debt instruments for amendments and waivers of agreements to avoid default and increased defaults: (3) volatility and disruption of markets, including greater volatility in pricing and spreads; and (4) rapidly evolving proposals and/or actions by state and federal governments to address problems being experienced by the markets and by businesses and the economy in general.
Overall stock market risks may affect the value of the Fund. Domestic and international factors such as political events, war, trade disputes, interest rate levels and other fiscal and monetary policy changes, pandemics and other public health crises, and related geopolitical events, as well as environmental disasters such as earthquakes, fires, and floods, may add to instability in world economies and markets generally. The impact of these and other factors may be short-term or may last for extended periods.
The value of a debt security or other income-producing security changes in response to various factors, including, for example, market-related factors (such as changes in interest rates or changes in the risk appetite of investors generally) and changes in the actual or perceived ability of the issuer (or of issuers generally) to meet its (or their) obligations.
Other factors that may affect the value of debt securities, include, among others, public health crises and responses by governments and companies to such crises. These and other events may affect the creditworthiness of the issuer of a debt security and may impair an issuers ability to timely meet its debt obligations as they come due.
The Fund is subject to the risk that the market value of the bonds in its portfolio will fluctuate because of changes in interest rates, changes in the supply of and demand for debt securities, and other market factors. Bond prices generally are linked to the prevailing market interest rates. In general, when interest rates rise, bond prices fall; conversely, when interest rates fall, bond prices rise. The price volatility of a bond also depends on its duration. Generally, the longer the duration of a bond, the greater is its sensitivity to interest rates. To compensate investors for this higher interest rate risk, bonds with longer durations generally offer higher yields than bonds with shorter durations. The ability of an issuer of a debt security to repay principal prior to a security's maturity can increase the security's sensitivity to interest rate changes.
Decisions by the U.S. Federal Reserve (also known as the "Fed") regarding interest rate and monetary policy, which can be difficult to predict and sometimes change direction suddenly in response to economic and market events, can have a significant effect on the value of fixed income securities as well as the overall strength of the U.S. economy. Precise interest rate predictions are difficult to make, and interest rates may change unexpectedly and dramatically in response to extreme changes in market or economic conditions. As a result, the value of fixed income securities may vary widely under certain market conditions.
Many debt securities, derivatives and other financial instruments, including some of the Fund's investments, use the London Interbank Offered Rate ("LIBOR") as the reference or benchmark rate for variable interest rate calculations. However, the use of LIBOR started to come under pressure following manipulation allegations in 2012. Despite increased regulation and other corrective actions since that time, concerns have arisen regarding its viability as a benchmark, due largely to reduced activity in the financial markets that it measures. In June 2017, the Alternative Reference Rates Committee, a
57
USAA Mutual Funds Trust | Notes to Financial Statements — continued July 31, 2020 | ||||||
group of large U.S. banks working with the Federal Reserve, announced its selection of a new Secured Overnight Funding Rate ("SOFR"), which is intended to be a broad measure of secured overnight U.S. Treasury repo rates, as an appropriate replacement for LIBOR. The Federal Reserve Bank of New York began publishing the SOFR in 2018, expecting that it could be used on a voluntary basis in new instruments and transactions. Bank working groups and regulators in other countries have suggested other alternatives for their markets, including the Sterling Overnight Interbank Average Rate ("SONIA") in England. In July 2017, the Financial Conduct Authority (the "FCA"), the United Kingdom financial regulatory body, announced that after 2021 it will cease its active encouragement of UK banks to provide the quotations needed to sustain LIBOR. That announcement suggests that LIBOR may cease to be published after that time. The roughly three-year period until the end of 2021 is expected to be enough time for market participants to transition to the use of a different benchmark for both new and existing securities and transactions. Various financial industry groups have begun planning for that transition, but there are obstacles to converting certain longer-term securities and transactions to a new benchmark. Transition planning is at an early stage, and neither the effect of the transition process nor its ultimate success can yet be known. The transition process might lead to increased volatility and illiquidity in markets that currently rely on the LIBOR to determine interest rates. It could also lead to a reduction in the value of some LIBOR-based investments and reduce the effectiveness of new hedges placed against existing LIBOR-based instruments. Since the usefulness of LIBOR as a benchmark could deteriorate during the transition period, these effects could occur before the end of 2021.
7. Borrowing and Interfund Lending:
Line of Credit:
For the year ended July 31, 2020, the Victory Funds Complex participated in a short-term demand note "Line of Credit" agreement with Citibank. The Line of Credit agreement with Citibank was renewed on June 29, 2020 with a termination date of June 28, 2021. Under the agreement with Citibank, the Victory Funds Complex may borrow up to $600 million, of which $300 million is committed and $300 million is uncommitted. $40 million of the Line of Credit is reserved for use by the Victory Floating Rate Fund (herein, the "Fund"), another series of the Victory Funds Complex, with that Fund paying the related commitment fees for that amount. The purpose of the agreement is to meet temporary or emergency cash needs. For the year ended July 31, 2020, Citibank received an annual commitment fee of 0.15% on $300 million for providing the Line of Credit. Each fund in the Victory Funds Complex pays a pro-rata portion of the commitment fees plus any interest (one month LIBOR plus one percent) on amounts borrowed. Effective June 29, 2020, under an amended Line of Credit agreement, Citibank will also receive an annual upfront fee of 0.10% on the $300 million committed line of credit. Each fund in the Victory Funds Complex will pay a pro-rata portion of the upfront fee. Interest charged to each Fund during the period, if applicable, is reflected on the Statements of Operations under Line of credit fees.
The Fund had no borrowings under the Line of Credit agreement during the year ended July 31, 2020.
Interfund Lending:
The Trust and Adviser rely on an exemptive order granted by the SEC in March 2017 (the "Order"), permitting the establishment and operation of an Interfund Lending Facility (the "Facility"). The Facility allows the Fund to directly lend and borrow money to or from any other Fund in the Victory Funds Complex relying upon the Order at rates beneficial to both the borrowing and lending funds. Advances under the Facility are allowed for temporary or emergency purposes. The interfund loan rate is determined, as specified in the Order, by averaging the current repurchase agreement rate and the current bank loan rate. As a Borrower, interest charged to the Fund, if any, during the period is reflected on the Statement of Operations under Interfund lending fees. As a Lender, interest earned by the Fund, if any, during the period is reflected on the Statement of Operations under Income on Interfund lending.
58
USAA Mutual Funds Trust | Notes to Financial Statements — continued July 31, 2020 | ||||||
The average borrowing or lending for the days outstanding and average interest rate for the Fund during the year ended July 31, 2020 were as follows (amounts in thousands):
| Borrower or Lender | Amount Outstanding at July 31, 2020 | Average Borrowing* | Days Borrowing Outstanding | Average Interest Rate* | Maximum Borrowing During the Period | ||||||||||||||||||||||
Borrower | $ | — | $ | 6,207 | 14 | 2.21 | % | $ | 11,087 | ||||||||||||||||||
Lender | — | 4,102 | 16 | 0.68 | % | 21,671 | |||||||||||||||||||||
*For the year ended July 31, 2020, based on the number of days borrowings were outstanding.
8. Federal Income Tax Information:
The Fund intends to distribute any net investment income monthly. Distributable net realized gains, if any, are declared and paid at least annually.
The amounts of dividends from net investment income and distributions from net realized gains (collectively distributions to shareholders) are determined in accordance with federal income tax regulations, which may differ from GAAP. To the extent these "book/tax" differences are permanent in nature (e.g., net operating loss and distribution reclassification), such amounts are reclassified within the components of net assets based on their federal tax-basis treatment; temporary differences (e.g., wash sales) do not require reclassification. To the extent dividends and distributions exceed net investment income and net realized gains for tax purposes, they are reported as distributions of capital. Net investment losses incurred by the Fund may be reclassified as an offset to capital on the accompanying Statement of Assets and Liabilities.
The following permanent reclassifications were made between capital accounts to reflect the portion of the payments made to redeeming shareholders that was claimed as a distribution for income tax purposes during the year ended July 31, 2020 (amounts in thousands):
| Total accumulated earnings/(loss) | Capital | ||||||
| $ | (5,711 | ) | $ | 5,711 | |||
The tax character of distributions paid during the tax years ended as noted below, were as follows (total distributions paid may differ from the Statements of Changes in Net Assets because, for tax purposes, dividends are recognized when actually paid) (amounts in thousands).
Year Ended July 31, 2020 | Year Ended July 31, 2019 | ||||||||||||||||||||||||||
Distributions paid from | Distributions paid from | ||||||||||||||||||||||||||
Ordinary Income | Net Long-Term Capital Gains | Total Distributions Paid | Ordinary Income* | Net Long-Term Capital Gains | Total Distributions Paid | ||||||||||||||||||||||
$ | 267,356 | $ | 20,709 | $ | 288,065 | $ | 281,461 | $ | 2,039 | $ | 283,500 | ||||||||||||||||
* Includes short-term realized capital gains, if any, which are taxable as ordinary income.
As of July 31, 2020, the components of accumulated earnings (loss) on a tax basis were as follows (amounts in thousands):
| Undistributed Ordinary Income | Accumulated Undistributed Long-Term Capital Gains | Accumulated Earnings | Other Earnings (Loss) | Unrealized Appreciation (Depreciation)* | Total Accumulated Earnings (Loss) | ||||||||||||||||||||||
$ | 19,223 | $ | 79,967 | $ | 99,190 | $ | (25 | ) | $ | 620,451 | $ | 719,616 | |||||||||||||||
* The difference between the book-basis and tax-basis of unrealized appreciation/depreciation is attributable to the tax deferral of losses on wash sales.
59
USAA Mutual Funds Trust | Notes to Financial Statements — continued July 31, 2020 | ||||||
As of July 31, 2020, the cost basis for federal income tax purposes, gross unrealized appreciation, gross unrealized depreciation, and net unrealized appreciation (depreciation) for investments were as follows (amounts in thousands):
| Cost of Investments for Federal Tax Purposes | Gross Unrealized Appreciation | Gross Unrealized Depreciation | Net Unrealized Appreciation (Depreciation) | ||||||||||||
| $ | 7,656,429 | $ | 724,668 | $ | (104,217 | ) | $ | 620,451 | |||||||
60
REPORT OF INDEPENDENT REGISTERED PUBLIC ACCOUNTING FIRM
To the Shareholders and the Board of Trustees of USAA Income Fund
Opinion on the Financial Statements
We have audited the accompanying statement of assets and liabilities of USAA Income Fund (the "Fund") (one of the funds constituting USAA Mutual Funds Trust (the "Trust")), including the schedule of portfolio investments, as of July 31, 2020, and the related statement of operations for the year then ended, the statements of changes in net assets for each of the two years in the period then ended, the financial highlights for each of the five years in the period then ended and the related notes (collectively referred to as the "financial statements"). In our opinion, the financial statements present fairly, in all material respects, the financial position of the Fund (one of the funds constituting USAA Mutual Funds Trust) at July 31, 2020, the results of its operations for the year then ended, the changes in its net assets for each of the two years in the period then ended and its financial highlights for each of the five years in the period then ended, in conformity with U.S. generally accepted accounting principles.
Basis for Opinion
These financial statements are the responsibility of the Trust's management. Our responsibility is to express an opinion on the Fund's financial statements based on our audits. We are a public accounting firm registered with the Public Company Accounting Oversight Board (United States) ("PCAOB") and are required to be independent with respect to the Trust in accordance with the U.S. federal securities laws and the applicable rules and regulations of the Securities and Exchange Commission and the PCAOB.
We conducted our audits in accordance with the standards of the PCAOB. Those standards require that we plan and perform the audit to obtain reasonable assurance about whether the financial statements are free of material misstatement, whether due to error or fraud. The Trust is not required to have, nor were we engaged to perform, an audit of the Trust's internal control over financial reporting. As part of our audits we are required to obtain an understanding of internal control over financial reporting, but not for the purpose of expressing an opinion on the effectiveness of the Trust's internal control over financial reporting. Accordingly, we express no such opinion.
Our audits included performing procedures to assess the risks of material misstatement of the financial statements, whether due to error or fraud, and performing procedures that respond to those risks. Such procedures included examining, on a test basis, evidence regarding the amounts and disclosures in the financial statements. Our procedures included confirmation of securities owned as of July 31, 2020, by correspondence with the custodian, brokers and agent banks or by other appropriate auditing procedures where replies from brokers or agent banks were not received. Our audits also included evaluating the accounting principles used and significant estimates made by management, as well as evaluating the overall presentation of the financial statements. We believe that our audits provide a reasonable basis for our opinion.

We have served as the auditor of one or more Victory Capital investment companies since 1995.
San Antonio, Texas
September 29, 2020
61
USAA Mutual Funds Trust | Supplemental Information July 31, 2020 | ||||||
(Unaudited)
Trustee and Officer Information
Board of Trustees:
Overall responsibility for management of the Trust rests with the Board. The Trust is managed by the Board in accordance with the laws of the state of Delaware. There are currently 10 Trustees, eight of whom are not "interested persons" of the Trust within the meaning of that term under the 1940 Act ("Independent Trustees") and two of whom is an "interested person" of the Trust within the meaning of that term under the 1940 Act ("Interested Trustee"). The Trustees, in turn, elect the officers of the Trust to actively supervise its day-to-day operations.
The following tables list the Trustees, their ages, position with the Trust, commencement of service, principal occupations during the past five years and any directorships of other investment companies or companies whose securities are registered under the Securities Exchange Act of 1934, as amended, or who file reports under that Act. Each Trustee oversees 47 portfolios in the Trust. Each Trustee's address is 15935 La Cantera Pkwy, Building Two, San Antonio, TX, 78256. Pursuant to a policy adopted by the Board, the term of office for each Trustee shall be until the Independent Trustee reaches age 75 or an Interested Trustee reaches age 75. The Board may change or grant exceptions from this policy at any time without shareholder approval. A Trustee may resign or be removed by a vote of the other Trustees or the holders of a majority of the outstanding shares of the Trust at any time. Vacancies on the Board can be filled by the action of a majority of the Trustees, provided that after filling such vacancy at least two-thirds of the Trustees have been elected by the shareholders.
Name and Date of Birth | Position Held with the Trust | Year Commenced Service | Principal Occupation During Past 5 Years | Other Directorships Held During Past 5 Years | |||||||||||||||
Independent Trustees. | |||||||||||||||||||
| Jefferson C. Boyce, Born September 1957 | Lead Independent Trustee, and Vice Chairman | 2013 | Senior Managing Director, New York Life Investments, LLC (1992-2012) | Westhab, Inc. | |||||||||||||||
| John C. Walters, Born February 1962 | Trustee | 2019 | Retired. Mr. Walters brings significant Board experience including active involvement with the board of a Fortune 500 company, and a proven record of leading large, complex financial organizations. He has a demonstrated record of success in distribution, manufacturing, investment brokerage, and investment management in both the retail and institutional investment businesses. He has substantial experience in the investment management business with a demonstrated ability to develop and drive strategy while managing operation, financial, and investment risk. | Guardian Variable Products Trust (16 series), Lead Independent Director; Amerilife Holdings LLC, Director; Stadion Money Management; Director; University of North Carolina (Chapel Hill), Member Board of Governors. | |||||||||||||||
62
USAA Mutual Funds Trust | Supplemental Information — continued July 31, 2020 | ||||||
(Unaudited)
Name and Date of Birth | Position Held with the Trust | Year Commenced Service | Principal Occupation During Past 5 Years | Other Directorships Held During Past 5 Years | |||||||||||||||
| Robert L. Mason, Ph.D., Born July 1946 | Trustee | 1997 | Adjunct Professor in the Department of Management Science and Statistics in the College of Business at the University of Texas at San Antonio (since 2001); Institute Analyst, Southwest Research Institute (March 2002-January 2016) | None | |||||||||||||||
| Dawn M. Hawley, Born February 1954 | Trustee | 2014 | Manager of Finance, Menil Foundation, Inc. (May 2007-June 2011), which is a private foundation that oversees the assemblage of sculptures, prints, drawings, photographs, and rare books. Director of Financial Planning and Analysis and Chief Financial Officer, AIM Management Group, Inc. (October 1987-January 2006) | None | |||||||||||||||
| Paul L. McNamara, Born July 1948 | Trustee | 2012 | Director, Cantor Opportunistic Alternatives Fund, LLC (March 2010-February 2014) , which is a closed-end fund of funds by Cantor Fitzgerald Investment Advisors, LLC | None | |||||||||||||||
63
USAA Mutual Funds Trust | Supplemental Information — continued July 31, 2020 | ||||||
(Unaudited)
Name and Date of Birth | Position Held with the Trust | Year Commenced Service | Principal Occupation During Past 5 Years | Other Directorships Held During Past 5 Years | |||||||||||||||
| Richard Y. Newton III, Born January 1956 | Trustee | 2017 | Director, Elta North America (01/18-present), which is a global leader in the design, manufacture, and support of innovative electronic systems in the ground, maritime, airborne, and security domains for the nation's warfighters, security personnel, and first responders; Managing Partner, Pioneer Partnership Development Group (December 2015-present)); Executive Director, The Union League Club of New York (June 2014-November 2015): Executive Vice President, Air Force Association (August 2012-May 2014); Lieutenant General, United States Air Force (January 2008-June 2012) | None | |||||||||||||||
| Barbara B. Ostdiek, Ph.D., Born March 1964 | Trustee | 2008 | Senior Associate Dean of Degree Programs at Jesse H. Jones Graduate School of Business at Rice University (since 2013); Associate Professor of Finance at Jessie H. Jones Graduate School of Business at Rice University (since 2001) | None | |||||||||||||||
| Michael F. Reimherr, Born August 1945 | Trustee | 2000 | President of Reimherr Business Consulting (May 1995-December 2017); St. Mary's University Investment Committee overseeing University Endowment (since 2014) | None | |||||||||||||||
64
USAA Mutual Funds Trust | Supplemental Information — continued July 31, 2020 | ||||||
(Unaudited)
Name and Date of Birth | Position Held with the Trust | Year Commenced Service | Principal Occupation During Past 5 Years | Other Directorships Held During Past 5 Years | |||||||||||||||
Interested Trustees. | |||||||||||||||||||
| David C. Brown, ** Born May 1972 | Trustee | 2019 | Chairman and Chief Executive Officer (since 2013), Co-Chief Executive Officer (2011-2013), Victory Capital Management Inc.; Chairman and Chief Executive Officer, Victory Capital Holdings, Inc. (since 2013). Mr. Brown brings to the Board extensive business, finance and leadership skills gained and developed through years of experience in the financial services industry, including his tenure overseeing the strategic direction as CEO of Victory Capital. These skills, combined with Mr. Brown's extensive knowledge of the financial services industry and demonstrated success in the development and distribution of investment strategies and products, enable him to provide valuable insights to the Board and strategic direction for the Funds | Trustee, Victory Portfolios (42 series), Victory Portfolios II (26 series), Victory Variable Insurance Funds (9 series) | |||||||||||||||
65
USAA Mutual Funds Trust | Supplemental Information — continued July 31, 2020 | ||||||
(Unaudited)
Name and Date of Birth | Position Held with the Trust | Year Commenced Service | Principal Occupation During Past 5 Years | Other Directorships Held During Past 5 Years | |||||||||||||||
| Daniel S. McNamara, ** Born June 1966 | Trustee and Chair of the Board of Trustees | 2012 | Trustee, President, and Vice Chairman of USAA ETF Trust (June 2017-June 2019); President of Financial Advice & Solutions Group (FASG), USAA (since 2013); Director, Investment Management Company (IMCO) (September 2009-April 2014); President, Asset Management Company (AMCO) (August, 2011-April 2013); Senior Vice President of USAA Financial Planning Services Insurance Agency, Inc. (FPS) (since 2011); Director of USAA IMCO (since 2009); Chairman of Board of IMCO (since 2013); Director of AMCO, (August 2011-June 2019); President and Director of USAA Shareholder Account Services (SAS) (October 2009-June 2019); Director and Vice Chairman of FPS (since 2013); President and Director of USAA Investment Corporation (ICORP) (since 2010); Chairman of Board of ICORP (since 2013); Director of USAA Financial Advisors, Inc. (FAI) (since 2013); Chairman of Board of FAI (since 2015). Mr. McNamara brings to the Board extensive experience in the financial services industry, including experience as an officer of the Trust. | None | |||||||||||||||
** Mr. Dan McNamara, the Chairman of the Board, is deemed an "interested person" due to his previous position as Director of AMCO, the former investment adviser of the Funds. Mr. Brown is deemed an "interested person" due to his position as Chief Executive Officer of Victory Capital, investment adviser to the Funds.
The Statement of Additional Information includes additional information about the Trustees of the Trust and is available, without charge, on the SEC's website at www.sec.gov and/or by calling (800)-539-3863.
66
USAA Mutual Funds Trust | Supplemental Information — continued July 31, 2020 | ||||||
(Unaudited)
Officers:
The officers of the Trust, their ages, commencement of service and their principal occupations during the past five years, are detailed in the following table. Each officer serves until the earlier of his or her resignation, removal, retirement, death, or the election of a successor. The mailing address of each officer of the Trust is 15935 La Cantera Pkwy, Building Two, San Antonio, TX, 78256. The officers of the Trust receive no compensation directly from the Trust for performing the duties of their offices.
Name and Date of Birth | Position with the Trust | Year Commenced Service | Principal Occupation During Past 5 Years | ||||||||||||
Interested Officers. | |||||||||||||||
| Christopher K. Dyer, Born February 1962 | President | 2019 | Director of Fund Administration, Victory Capital (2004-present) | ||||||||||||
| Scott A Stahorsky, Born July 1969 | Vice President | 2019 | Manager, Fund Administration, Victory Capital (since 2015); Senior Analyst, Fund Administration, Victory Capital (prior to 2015) | ||||||||||||
| James K. De Vries, Born April 1969 | Treasurer, Principal Financial Officer | 2018 | Executive Director, Victory Capital Management Inc. (since 2019); Treasurer, USAA ETF Trust (September 2018-June 2019); Executive Director, Investment and Financial Administration, USAA (April 2012-June 2019); Assistant Treasurer, USAA ETF Trust (June 2017-September 2018); Assistant Treasurer, USAA Mutual Funds Trust (December 2013-February 2018) | ||||||||||||
| Allan Shaer, Born March 1965 | Assistant Treasurer | 2019 | Senior Vice President, Financial Administration, Citi Fund Services Ohio, Inc. (since 2016); Vice President, Mutual Fund Administration, JP Morgan Chase (2011-2016) | ||||||||||||
| Carol D. Trevino, Born October 1965 | Assistant Treasurer | 2018 | Director, Accounting and Finance, Victory Capital Management Inc. (since 2019); Accounting/Financial Director, USAA (December 2013-June 2019); Assistant Treasurer, USAA ETF Trust (September 2018-June 2019). | ||||||||||||
| Erin G. Wagner, Born February 1974 | Secretary | 2019 | Deputy General Counsel, the Adviser (since 2013) | ||||||||||||
| Charles Booth, Born April 1960 | Anti-Money Laundering Compliance Officer and Identity Theft Officer | 2019 | Director, Regulatory Administration and CCO Support Services, Citi Fund Services Ohio, Inc. (2007-present) | ||||||||||||
| Amy Campos, Born July 1976 | Chief Compliance Officer | 2019 | Chief Compliance Officer, USAA Mutual Funds Trust (since 2019); Executive Director, Deputy Chief Compliance Officer, USAA Mutual Funds Trust and USAA ETF Trust (July 2017-June 2019); Compliance Director, USAA Mutual Funds Trust (2014-July 2017) | ||||||||||||
67
USAA Mutual Funds Trust | Supplemental Information — continued July 31, 2020 | ||||||
(Unaudited)
Proxy Voting and Portfolio Holdings Information
Proxy Voting:
Information regarding the policies and procedures the Fund uses to determine how to vote proxies relating to portfolio securities is available without charge, upon request, by calling (800) 539-3863. The information is also included in the Fund's Statement of Additional Information, which is available on the SEC's website at www.sec.gov.
Information relating to how the Fund voted proxies relating to portfolio securities held during the most recent 12 months ended June 30 is available on the SEC's website at www.sec.gov.
Availability of Schedules of Portfolio Investments:
The Trust files a complete list of Schedules of Portfolio Investments with the SEC for the first and third quarter of each fiscal year on Form N-PORT. Forms N-PORT are available on the SEC's website at www.sec.gov.
Expense Examples
As a shareholder of the Fund, you may incur two types of costs: (1) transaction costs, and (2) ongoing costs, including management fees and other Fund expenses. These examples are intended to help you understand your ongoing costs (in dollars) of investing in the Fund and to compare these costs with the ongoing costs of investing in other mutual funds.
These examples are based on an investment of $1,000 invested at the beginning of the period and held for the entire period from February 1, 2020 through July 31, 2020 (unless noted otherwise).
The Actual Expense figures in the table below provide information about actual account values and actual expenses. You may use the information below, together with the amount you invested, to estimate the expenses that you paid over the period. Simply divide your account value by $1,000 (for example, an $8,600 account value divided by $1,000 = 8.6), then multiply the result by the number in the table under the heading entitled "Actual Expenses Paid During Period" to estimate the expenses you paid on your account during this period.
The Hypothetical Expense figures in the table below provide information about hypothetical account values and hypothetical expenses based on the Fund's actual expense ratio and an assumed rate of return of 5% per year before expenses, which is not the Fund's actual return. The hypothetical account values and expenses may not be used to estimate the actual ending account balance or expenses you paid for the period. You may use this information to compare this 5% hypothetical example with the 5% hypothetical examples that appear in shareholder reports of other funds.
Please note the expenses shown in the table below are meant to highlight your ongoing costs only and do not reflect any transactional costs. If these transactional costs were included, your costs would have been higher.
| Beginning Account Value 2/1/20 | Actual Ending Account Value 7/31/20 | Hypothetical Ending Account Value 7/31/20 | Actual Expenses Paid During Period 2/1/20- 7/31/20* | Hypothetical Expenses Paid During Period 2/1/20- 7/31/20* | Annualized Expense Ratio During Period 2/1/20- 7/31/20 | ||||||||||||||||||||||
Fund Shares | $ | 1,000.00 | $ | 1,034.70 | $ | 1,022.43 | $ | 2.48 | $ | 2.46 | 0.49 | % | |||||||||||||||
Institutional Shares | 1,000.00 | 1,035.00 | 1,022.68 | 2.23 | 2.21 | 0.44 | % | ||||||||||||||||||||
Class A shares | 1,000.00 | 1,033.50 | 1,021.13 | 3.79 | 3.77 | 0.75 | % | ||||||||||||||||||||
Class C shares** | 1,000.00 | 1,021.50 | 1,017.75 | 1.26 | 7.17 | 1.43 | % | ||||||||||||||||||||
Class R6 Shares | 1,000.00 | 1,036.20 | 1,023.12 | 1.77 | 1.76 | 0.35 | % | ||||||||||||||||||||
* Expenses are equal to the average account value multiplied by the Fund's annualized expense ratio multiplied by 182/366 (the number of days in the most recent fiscal half-year divided by the number of days in the fiscal year).
** Actual Expenses Paid are equal to the average account value multiplied by the Fund's annualized expense ratio multiplied by 32/366 to reflect the stub period from commencement of operations June 29, 2020 through July 31, 2020.
68
USAA Mutual Funds Trust | Supplemental Information — continued July 31, 2020 | ||||||
(Unaudited)
Additional Federal Income Tax Information
The following federal tax information related to the Fund's fiscal year ended July 31, 2020, is provided for information purposes only and should not be used for reporting to federal or state revenue agencies. Federal tax information for the calendar year will be reported to you on Form 1099-DIV in January 2021.
With respect to distributions paid, the Fund designates the following amounts (or, if subsequently determined to be different, the maximum amount allowable) for the fiscal year ended July 31, 2020 (amounts in thousands):
| Dividend Received Deduction (corporate shareholders)* | Qualified Dividend Income (non-corporate shareholders)* | Short-Term Capital Gains Distributions | Long-Term Capital Gains Distributions(a) | ||||||||||||||||
0.28 | % | 0.89 | % | $ | 8,114 | $ | 26,420 | ||||||||||||
* Presented as a percentage of net investment income and excludes short-term capital gain distributions paid, if any. All or a portion of these amounts may be exempt from taxation at the state level.
(a) Pursuant to Section 852 of the Internal Revenue Code.
69
USAA Mutual Funds Trust | Supplemental Information — continued July 31, 2020 | ||||||
(Unaudited)
Liquidity Risk Management Program
The USAA Mutual Funds have adopted and implemented a written liquidity risk management program (the "LRMP") as required by Rule 22e-4 under the 1940 Act, as amended. The LRMP is reasonably designed to assess and manage the Fund's liquidity risk, taking into consideration the Fund's investment strategy and the liquidity of its portfolio investments during normal and reasonably foreseeable stressed market conditions; its short and long-term cash flow projections; and its cash holdings and access to other liquidity management tools such as available funding sources including the Victory Funds Complex Interfund Lending Facility and Line of Credit (discussed in the Notes to Financial Statements). The USAA Mutual Funds' Board of Trustees approved the appointment of the Fund's investment adviser, Victory Capital Management Inc. ("Victory Capital"), as the administrator of the LRMP. At an in-person meeting held on February 26, 2020, Victory Capital provided an oral and written report to the Trustees on the operation and effectiveness of the LRMP during the previous year.
Victory Capital manages liquidity risks associated with the Fund's investments by monitoring, among other things, cash and cash equivalents, any use of derivatives, the concentration of investments, the appropriateness of the Fund's investment strategy, and by classifying every fund investment as either highly liquid, moderately liquid, less liquid or illiquid on at least a monthly basis. To assist with the classification of Fund investments, Victory Capital has retained a third-party provider of liquidity evaluation services. This provider determines preliminary liquidity classifications for all portfolio holdings based upon portfolio-level data and certain assumptions provided by Victory Capital. Victory Capital reviews the preliminary liquidity classifications, and, when appropriate, considers other information including input from the Fund's portfolio managers (including the portfolio managers employed by any investment sub-advisers) in determining final liquidity classifications.
The report from Victory Capital concluded that the Fund did not experience any significant liquidity challenges during the covered period, and the Fund's LRMP is reasonably designed to assess and manage its liquidity risk. The report also concluded that the LRMP continues to operate adequately and effectively to enable Victory Capital to oversee and manage liquidity risk and ensure the Fund is able to meet redemption requests without significant dilution to the remaining investors' interest in the Fund. During the review period, the Fund's portfolio consisted primarily of highly liquid investments, which are defined as cash and any investments reasonably expected to be converted to cash in current market conditions in three business days or less without significantly changing the market value of the investment. Therefore, the Fund has not adopted a Highly Liquid Investment Minimum. The Fund's investments were below the limitation on illiquid investments during the review period. Additionally, Victory Capital indicated that no events occurred that would require the filing of Form N-LIQUID and recommended no material changes to the LRMP.
70
Privacy Policy
Protecting the Privacy of Information
The Trust respects your right to privacy. We also know that you expect us to conduct and process your business in an accurate and efficient manner. To do so, we must collect and maintain certain personal information about you. This is the information we collect from you on applications or other forms, and from the transactions you make with us or third parties. It may include your name, address, social security number, account transactions and balances, and information about investment goals and risk tolerance.
We do not disclose any information about you or about former customers to anyone except as permitted or required by law. Specifically, we may disclose the information we collect to companies that perform services on our behalf, such as the transfer agent that processes shareholder accounts and printers and mailers that assist us in the distribution of investor materials. We may also disclose this information to companies that perform marketing services on our behalf. This allows us to continue to offer you Victory investment products and services that meet your investing needs, and to effect transactions that you request or authorize. These companies will use this information only in connection with the services for which we hired them. They are not permitted to use or share this information for any other purpose.
To protect your personal information internally, we permit access only by authorized employees and maintain physical, electronic and procedural safeguards to guard your personal information.*
* You may have received communications regarding information about privacy policies from other financial institutions which gave you the opportunity to "opt-out" of certain information sharing with companies which are not affiliated with that financial institution. The Trust does not share information with other companies for purposes of marketing solicitations for products other than the Trust. Therefore, the Trust does not provide opt-out options to their shareholders.
P.O. Box 182593
Columbus, Ohio 43218-2593

Visit our website at: | Call | ||||||
vcm.com | (800) 235-8396 | ||||||
23423-0920

JULY 31, 2020
Annual Report
USAA Income Stock Fund
Beginning January 1, 2021, as permitted by regulations adopted by the Securities and Exchange Commission, paper copies of the Fund's shareholder reports like this one will no longer be sent by mail, unless you specifically request paper copies of the reports from the Fund or from your financial intermediary, such as a broker-dealer or bank. Instead, the reports will be made available on VictoryFunds.com, and you will be notified by mail each time a report is posted and provided with a website link to access the report. If you already elected to receive shareholder reports electronically, you will not be affected by this change and you need not take any action.
You may elect to receive shareholder reports and other communications from the Fund or your financial intermediary electronically by notifying your financial intermediary directly, or if you are a direct investor, by calling (800) 235-8396 or logging on to usaa.com. Effective on or about November 6, 2020, a shareholder who has an account directly with the Fund will need to submit their request via email to TA.Processing@FISGlobal.com.
You may elect to receive all future reports in paper free of charge. You can inform the Fund or your financial intermediary that you wish to continue receiving paper copies of your shareholder reports by notifying your financial intermediary directly, or if you are a direct investor, by calling (800) 235-8396 or logging on to usaa.com. Effective on or about November 6, 2020, a shareholder who has an account directly with the Fund will need to submit their request via email to TA.Processing@FISGlobal.com. Your election to receive reports in paper will apply to all funds held with the USAA Mutual Funds or your financial intermediary.
Victory Capital means Victory Capital Management Inc., the investment adviser of the USAA Mutual Funds. USAA Mutual Funds are distributed by Victory Capital Services, Inc., member FINRA, an affiliate of Victory Capital. Victory Capital and its affiliates are not affiliated with United Services Automobile Association or its affiliates. USAA and the USAA logo are registered trademarks and the USAA Mutual Funds and USAA Investments logos are trademarks of United Services Automobile Association and are being used by Victory Capital and its affiliates under license.
USAA Mutual Funds Trust
TABLE OF CONTENTS
Shareholder Letter (Unaudited) | 2 | ||||||
Managers' Commentary (Unaudited) | 3 | ||||||
Investment Overview (Unaudited) | 5 | ||||||
| Investment Objective & Portfolio Holdings (Unaudited) | 6 | ||||||
Financial Statements | |||||||
Schedule of Portfolio Investments | 7 | ||||||
Statement of Assets and Liabilities | 12 | ||||||
Statement of Operations | 13 | ||||||
Statements of Changes in Net Assets | 14 | ||||||
Financial Highlights | 16 | ||||||
Notes to Financial Statements | 18 | ||||||
| Report of Independent Registered Public Accounting Firm | 28 | ||||||
Supplemental Information | 29 | ||||||
Trustees' and Officers' Information | 29 | ||||||
Proxy Voting and Portfolio Holdings Information | 35 | ||||||
Expense Examples | 35 | ||||||
Additional Federal Income Tax Information | 36 | ||||||
Liquidity Risk Management Program | 37 | ||||||
Privacy Policy (inside back cover) | |||||||
This report is for the information of the shareholders and others who have received a copy of the currently effective prospectus of the Fund, managed by Victory Capital Management Inc. It may be used as sales literature only when preceded or accompanied by a current prospectus, which provides further details about the Fund.
IRA DISTRIBUTION WITHHOLDING DISCLOSURE
We generally must withhold federal income tax at a rate of 10% of the taxable portion of your distribution and, if you live in a state that requires state income tax withholding, at your state's tax rate. However, you may elect not to have withholding apply or to have income tax withheld at a higher rate. Any withholding election that you make will apply to any subsequent distribution unless and until you change or revoke the election. If you wish to make a withholding election, or change or revoke a prior withholding election, call (800) 235-8396.
If you do not have a withholding election in place by the date of a distribution, federal income tax will be withheld from the taxable portion of your distribution at a rate of 10%. If you must pay estimated taxes, you may be subject to estimated tax penalties if your estimated tax payments are not sufficient and sufficient tax is not withheld from your distribution.
For more specific information, please consult your tax adviser.
1
(Unaudited)
Dear Shareholder,
The previous decade ended with the longest-ever bull market in U.S. equities still intact, even as investors wrestled with issues like softening global economic data, Brexit, and U.S.-China trade relations. In retrospect, those worries seem pedestrian given what we would experience.
A new and unexpected threat—a global pandemic, the novel coronavirus ("COVID-19")—first emerged in Asia and then began spreading globally and throughout the United States during the first quarter of 2020. This unprecedented and unanticipated event not only rendered all existing economic forecasts moot, but it also roiled stock and bond markets everywhere. It also brought the economy to a near halt. The historic bull market in stocks ended virtually overnight.
After an initial severe sell-off in March, equity markets recovered sharply. As our annual reporting period drew to a close on July 31, 2020, many of the broad market indexes had recovered and volatility had returned to more palatable levels. In fact, despite all the chaos, the S&P 500® Index, one of the most popular measures of large U.S. stocks, finished the fiscal year (July 31, 2020) at approximately 3,271, which was up 8.9% from one year ago. Quite the impressive reversal.
The market turmoil of early 2020 was not limited to equities. Fixed income volatility spiked when liquidity evaporated in late March as investors struggled to understand the ramifications of sheltering in place. Fortunately, the U.S. Federal Reserve (the "Fed") (as well as other global central banks) leapt into action—cutting interest rates, (re)starting quantitative easing and, in the case of the Fed, launching an array of programs to stabilize markets.
The new lending facilities and programs had their intended effect of improving fixed income liquidity and trading. Credit spreads across corporate, high yield, structured, and municipal markets were coaxed down from their highs. In addition, Congress came through with substantial fiscal stimulus that also was applauded by investors and markets. Although fixed income markets regained their footing, the yield on 10-Year Treasurys, a benchmark for low-risk investments, declined steadily during our fiscal year—from 2.02% at the beginning of our reporting period to approximately 0.55% as of July 31, 2020. This suggests that investors remain a little wary.
While the past year has been unprecedented for all of us, both personally and professionally, our portfolio managers continue to analyze the financial markets, economic conditions, and the trajectory of the pandemic, which will likely be a guiding factor on Fed policy and the markets.
No matter what happens in the near term, we believe that the massive monetary and fiscal policies introduced earlier this year will have longer-term ramifications. Despite this uncertainty, it's important to remain focused on your long-term investment goals and avoid making emotional decisions. If you invest with us directly, our Member Service Representatives are available to help. Call us at (800) 235-8396.
Sincerely,

Christopher K. Dyer, CFA
President,
USAA Mutual Funds
2
USAA Mutual Funds Trust
USAA Income Stock Fund
Managers' Commentary
(Unaudited)
Victory Solutions
Mannik S. Dhillon, CFA, CAIA
Wasif A. Latif
• What were the market conditions over the reporting period?
The U.S. stock market generated solid gains for the reporting period overall. Growth stocks significantly outperformed value stocks, while large-cap stocks outpaced small-cap stocks.
Global financial market performance varied widely over the period driven by optimism of continued economic recovery followed by the novel coronavirus ("COVID-19") shock and uncertainty related to the duration and economic impact of the COVID-19 pandemic. These fears generally led to a "risk-off" environment as investors flocked to safe haven assets such as U.S. Treasurys and gold. Global equities turned mostly lower with the exception of a small breadth of mega-cap securities well positioned for an extended economic slowdown and the new stay-at-home paradigm. The final month and a half of the reporting period saw a rebound in risky assets as economies began a phased reopening. The U.S. large-cap growth space, led by information technology and communication services continued to outperform in the face of the economic threat as they were perceived as "stay-at-home stocks" that would further benefit from economic activity from homes.
Within the United States, the S&P 500® Index dropped nearly 34% at the end of the reporting period from its 2020 high, before beginning to recoup losses with the support of comprehensive monetary and fiscal stimulus, along with optimism that a COVID-19 treatment will eventually emerge. Over the reporting period, the S&P 500 Index retuned 11.96%, with large-cap growth stocks leading the way, up to a return of 29.84% as represented by the Russell 1000 Growth Index. Value stocks and small-cap stocks significantly underperformed growth stocks over the period. U.S. large-cap value stocks were down to a return of -6.01% over the reporting period as gauged by the Russell 1000 Value Index, while U.S. small-cap stocks, returned -4.59% as represented by the Russell 2000 Index.
Developed-market international and emerging market equities followed a path similar to U.S. equities. Markets led investors on a rollercoaster ride that saw both the MSCI EAFE Index and MSCI Emerging Markets Index drop approximately 34% from their highs in the year. The market drawdown hit bottom on March 23rd and then started a steady ascent, erasing most of the year's losses as European Central Bank quantitative easing and talks of a 750-billion euros fiscal stimulus helped bolster momentum in the market's recovery. Over the reporting period, developed international equities, represented by the MSCI EAFE Index, were down to a return of -1.67%, while the MSCI Emerging Markets Index returned 6.55%.
3
USAA Mutual Funds Trust
USAA Income Stock Fund (continued)
Managers' Commentary (continued)
• How did the USAA Income Stock Fund (the "Fund") perform during the reporting period?
The Fund has three share classes: Fund Shares, Institutional Shares, and R6 Shares. For the reporting period ended July 31, 2020, the Fund Shares, Institutional Shares, and R6 Shares had a total return of -3.84%, -3.81, and -3.77%, respectively. This compares to returns of -6.01% for the Russell 1000® Value Index (the "Index") and -1.38% for the Lipper Equity Income Funds Index.
• What strategies did you employ during the reporting period?
The Fund outperformed the Index during the reporting period ended July 31, 2020. Relative to the Index, the Fund was helped primarily by sector allocation, followed by security selection. Leading performance was the Fund's strong stock selection in and overweight positions to information technology, consumer discretionary, and consumer staples sectors. An underweight allocation to the energy sector was also a strong contributor to Fund performance.
On the detractor side, the Fund was harmed by security selection in the real estate and materials sectors as well as an underweight position to healthcare.
Thank you for allowing us to assist you with your investment needs.
4
USAA Mutual Funds Trust
USAA Income Stock Fund
Investment Overview
(Unaudited)
Average Annual Total Return
Year Ended July 31, 2020
Fund Shares | Institutional Shares | Class R6 Shares | |||||||||||||||||||||
INCEPTION DATE | 5/4/87 | 8/1/08 | 12/1/16 | ||||||||||||||||||||
Net Asset Value | Net Asset Value | Net Asset Value | Russell 1000® Value Index1 | Lipper Equity Income Funds Index2 | |||||||||||||||||||
One Year | –3.84 | % | –3.81 | % | –3.77 | % | –6.01 | % | –1.38 | % | |||||||||||||
Five Year | 6.38 | % | 6.42 | % | N/A | 5.36 | % | 6.70 | % | ||||||||||||||
Ten Year | 10.22 | % | 10.31 | % | N/A | 10.11 | % | 10.16 | % | ||||||||||||||
Since Inception | N/A | N/A | 6.45 | % | N/A | N/A | |||||||||||||||||
Past performance is not indicative of future results. The performance data quoted represents past performance and current returns may be lower or higher. The investment return and principal value will fluctuate so that an investor's shares, when redeemed, may be worth more or less than the original cost. To obtain performance information current to the most recent month's end, please visit www.vcm.com.
Total return measures the price change in a share assuming the reinvestment of all net investment income and realized capital gain distributions, if any. The total returns quoted do not reflect adjustments made to the enclosed financial statements in accordance with U.S. generally accepted accounting principles or the deduction of taxes that a shareholder would pay on net investment income and realized capital gain distributions, including reinvested distributions, or redemptions of shares. The total return figures set forth above include all waivers of fees for various periods since inception. Without such fee waivers, the total returns would have been lower.
USAA Income Stock Fund — Growth of $10,000
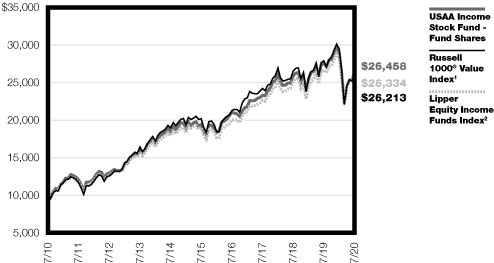
1The unmanaged Russell 1000® Value Index measures the performance of those Russell 1000 companies with lower price-to-book ratios and lower forecasted growth values.
2The unmanaged Lipper Equity Income Funds Index tracks the total return performance of funds within the Lipper Equity Income Funds category.
The graph reflects investment of growth of a hypothetical $10,000 investment in the Fund. Past performance is no guarantee of future results.
The graph and table do not reflect the deduction of taxes that a shareholder would pay on Fund distributions or the redemption of Fund shares.
5
| USAA Mutual Funds Trust USAA Income Stock Fund | July 31, 2020 | ||||||
(Unaudited)
Investment Objective & Portfolio Holdings:
The USAA Income Stock Fund seeks current income with the prospect of increasing dividend income and the potential for capital appreciation.
Sector Allocation*:
July 31, 2020
(% of Net Assets)

* Does not include futures, money market instruments, and short-term investments purchased with cash collateral from securities loaned.
Percentages are of the net assets of the Fund and may not equal 100%.
6
| USAA Mutual Funds Trust USAA Income Stock Fund | Schedule of Portfolio Investments July 31, 2020 | ||||||
(Amounts in Thousands, Except for Shares)
Security Description | Shares | Value | |||||||||
Common Stocks (99.7%) | |||||||||||
Communication Services (6.0%): | |||||||||||
Activision Blizzard, Inc. | 363,932 | $ | 30,072 | ||||||||
AT&T, Inc. | 1,200,730 | 35,518 | |||||||||
Omnicom Group, Inc. | 388,715 | 20,886 | |||||||||
Sirius XM Holdings, Inc. (a) | 1,214,287 | 7,140 | |||||||||
Verizon Communications, Inc. | 967,500 | 55,611 | |||||||||
World Wrestling Entertainment, Inc. Class A | 47,743 | 2,225 | |||||||||
151,452 | |||||||||||
Consumer Discretionary (7.9%): | |||||||||||
Best Buy Co., Inc. | 311,134 | 30,986 | |||||||||
Dollar General Corp. | 40,524 | 7,716 | |||||||||
Domino's Pizza, Inc. | 71,993 | 27,833 | |||||||||
Foot Locker, Inc. | 95,297 | 2,801 | |||||||||
Genuine Parts Co. | 125,444 | 11,309 | |||||||||
H&R Block, Inc. | 139,699 | 2,026 | |||||||||
Lowe's Cos., Inc. | 137,007 | 20,402 | |||||||||
Nike, Inc. Class B | 215,288 | 21,014 | |||||||||
Target Corp. | 266,068 | 33,492 | |||||||||
The Home Depot, Inc. | 170,648 | 45,305 | |||||||||
202,884 | |||||||||||
Consumer Staples (12.3%): | |||||||||||
Campbell Soup Co. | 280,984 | 13,928 | |||||||||
Colgate-Palmolive Co. | 315,373 | 24,347 | |||||||||
General Mills, Inc. | 291,738 | 18,458 | |||||||||
Ingredion, Inc. | 74,221 | 6,420 | |||||||||
Kimberly-Clark Corp. | 152,825 | 23,236 | |||||||||
Philip Morris International, Inc. | 568,226 | 43,645 | |||||||||
Sysco Corp. | 304,839 | 16,111 | |||||||||
The Hershey Co. | 86,257 | 12,543 | |||||||||
The J.M. Smucker Co. | 67,678 | 7,401 | |||||||||
The Kroger Co. | 410,507 | 14,282 | |||||||||
The Procter & Gamble Co. | 538,241 | 70,573 | |||||||||
Tyson Foods, Inc. Class A | 127,593 | 7,841 | |||||||||
Walgreens Boots Alliance, Inc. | 342,692 | 13,951 | |||||||||
Walmart, Inc. | 297,511 | 38,497 | |||||||||
311,233 | |||||||||||
Energy (2.8%): | |||||||||||
Cabot Oil & Gas Corp. | 270,945 | 5,067 | |||||||||
Chevron Corp. | 161,890 | 13,589 | |||||||||
EOG Resources, Inc. | 291,152 | 13,640 | |||||||||
Exxon Mobil Corp. | 350,939 | 14,767 | |||||||||
Phillips 66 | 232,859 | 14,442 | |||||||||
Valero Energy Corp. | 148,313 | 8,340 | |||||||||
69,845 | |||||||||||
Financials (16.1%): | |||||||||||
Aflac, Inc. | 226,138 | 8,044 | |||||||||
American Financial Group, Inc. | 97,618 | 5,932 | |||||||||
See notes to financial statements.
7
| USAA Mutual Funds Trust USAA Income Stock Fund | Schedule of Portfolio Investments — continued July 31, 2020 | ||||||
(Amounts in Thousands, Except for Shares)
Security Description | Shares | Value | |||||||||
Ameriprise Financial, Inc. | 68,367 | $ | 10,503 | ||||||||
Annaly Capital Management, Inc. | 687,106 | 5,091 | |||||||||
Bank of America Corp. | 1,377,112 | 34,263 | |||||||||
Brown & Brown, Inc. | 62,863 | 2,858 | |||||||||
Comerica, Inc. | 212,233 | 8,175 | |||||||||
Commerce Bancshares, Inc. | 20,232 | 1,158 | |||||||||
Everest Re Group Ltd. | 24,393 | 5,337 | |||||||||
FactSet Research Systems, Inc. | 34,571 | 11,972 | |||||||||
Fidelity National Financial, Inc. | 229,559 | 7,429 | |||||||||
Fifth Third Bancorp | 422,717 | 8,395 | |||||||||
First Republic Bank | 43,585 | 4,902 | |||||||||
Franklin Resources, Inc. | 307,007 | 6,462 | |||||||||
Huntington Bancshares, Inc. | 1,786,839 | 16,564 | |||||||||
Intercontinental Exchange, Inc. | 110,695 | 10,713 | |||||||||
JPMorgan Chase & Co. | 240,809 | 23,272 | |||||||||
M&T Bank Corp. | 117,070 | 12,404 | |||||||||
MarketAxess Holdings, Inc. | 14,516 | 7,500 | |||||||||
Marsh & McLennan Cos., Inc. | 71,456 | 8,332 | |||||||||
Nasdaq, Inc. | 80,556 | 10,578 | |||||||||
People's United Financial, Inc. | 742,165 | 8,008 | |||||||||
Prudential Financial, Inc. | 141,435 | 8,963 | |||||||||
Regions Financial Corp. | 478,269 | 5,194 | |||||||||
RenaissanceRe Holdings Ltd. | 69,488 | 12,534 | |||||||||
S&P Global, Inc. | 87,459 | 30,634 | |||||||||
SEI Investments Co. | 34,918 | 1,827 | |||||||||
State Street Corp. | 111,725 | 7,127 | |||||||||
T. Rowe Price Group, Inc. | 131,269 | 18,128 | |||||||||
The Allstate Corp. | 288,301 | 27,212 | |||||||||
The Bank of New York Mellon Corp. | 40,836 | 1,464 | |||||||||
The Hanover Insurance Group, Inc. | 56,661 | 5,773 | |||||||||
The Hartford Financial Services Group, Inc. | 213,812 | 9,049 | |||||||||
The PNC Financial Services Group, Inc. | 90,564 | 9,660 | |||||||||
The Progressive Corp. | 271,546 | 24,531 | |||||||||
The Travelers Cos., Inc. | 82,616 | 9,453 | |||||||||
Wells Fargo & Co. | 325,940 | 7,907 | |||||||||
Western Alliance Bancorp | 42,935 | 1,544 | |||||||||
Zions Bancorp NA | 132,674 | 4,308 | |||||||||
403,200 | |||||||||||
Health Care (13.1%): | |||||||||||
AbbVie, Inc. | 235,981 | 22,397 | |||||||||
AmerisourceBergen Corp. | 56,990 | 5,710 | |||||||||
Amgen, Inc. | 141,300 | 34,572 | |||||||||
Anthem, Inc. | 33,774 | 9,247 | |||||||||
Bristol-Myers Squibb Co. | 326,726 | 19,166 | |||||||||
Cardinal Health, Inc. | 278,885 | 15,233 | |||||||||
Chemed Corp. | 4,794 | 2,360 | |||||||||
Danaher Corp. | 75,556 | 15,397 | |||||||||
Eli Lilly & Co. | 127,688 | 19,190 | |||||||||
Gilead Sciences, Inc. | 149,501 | 10,395 | |||||||||
Johnson & Johnson | 507,864 | 74,027 | |||||||||
See notes to financial statements.
8
| USAA Mutual Funds Trust USAA Income Stock Fund | Schedule of Portfolio Investments — continued July 31, 2020 | ||||||
(Amounts in Thousands, Except for Shares)
Security Description | Shares | Value | |||||||||
McKesson Corp. | 93,020 | $ | 13,968 | ||||||||
Medtronic PLC | 83,994 | 8,104 | |||||||||
Merck & Co., Inc. | 318,032 | 25,519 | |||||||||
Pfizer, Inc. | 472,456 | 18,180 | |||||||||
ResMed, Inc. | 26,431 | 5,353 | |||||||||
UnitedHealth Group, Inc. | 55,656 | 16,851 | |||||||||
West Pharmaceutical Services, Inc. | 41,680 | 11,207 | |||||||||
326,876 | |||||||||||
Industrials (12.6%): | |||||||||||
3M Co. | 162,390 | 24,435 | |||||||||
Acuity Brands, Inc. | 16,936 | 1,678 | |||||||||
Allegion PLC | 101,112 | 10,057 | |||||||||
Allison Transmission Holdings, Inc. | 212,769 | 7,949 | |||||||||
BWX Technologies, Inc. | 23,845 | 1,300 | |||||||||
C.H. Robinson Worldwide, Inc. | 165,650 | 15,525 | |||||||||
Cummins, Inc. | 138,590 | 26,785 | |||||||||
Eaton Corp. PLC | 106,926 | 9,958 | |||||||||
Fastenal Co. | 174,266 | 8,197 | |||||||||
Graco, Inc. | 31,786 | 1,692 | |||||||||
Honeywell International, Inc. | 20,413 | 3,049 | |||||||||
IHS Markit Ltd. | 82,847 | 6,688 | |||||||||
Illinois Tool Works, Inc. | 133,742 | 24,741 | |||||||||
Johnson Controls International PLC | 264,833 | 10,191 | |||||||||
Lennox International, Inc. | 56,472 | 15,142 | |||||||||
Lockheed Martin Corp. | 60,874 | 23,069 | |||||||||
ManpowerGroup, Inc. | 23,251 | 1,599 | |||||||||
Old Dominion Freight Line, Inc. | 34,071 | 6,229 | |||||||||
PACCAR, Inc. | 76,907 | 6,543 | |||||||||
Republic Services, Inc. | 152,559 | 13,311 | |||||||||
Robert Half International, Inc. | 190,727 | 9,703 | |||||||||
Rockwell Automation, Inc. | 86,161 | 18,796 | |||||||||
Rollins, Inc. | 65,964 | 3,457 | |||||||||
Snap-on, Inc. | 41,009 | 5,982 | |||||||||
Southwest Airlines Co. | 234,173 | 7,234 | |||||||||
The Toro Co. | 100,076 | 7,140 | |||||||||
United Parcel Service, Inc. Class B | 146,917 | 20,974 | |||||||||
Verisk Analytics, Inc. | 33,482 | 6,318 | |||||||||
W.W. Grainger, Inc. | 13,053 | 4,458 | |||||||||
Waste Management, Inc. | 139,400 | 15,278 | |||||||||
317,478 | |||||||||||
Information Technology (11.5%): | |||||||||||
Apple, Inc. | 82,817 | 35,200 | |||||||||
Applied Materials, Inc. | 125,700 | 8,086 | |||||||||
Avnet, Inc. | 35,887 | 959 | |||||||||
Broadcom, Inc. | 21,624 | 6,849 | |||||||||
CDK Global, Inc. | 31,118 | 1,415 | |||||||||
Cisco Systems, Inc. | 444,007 | 20,913 | |||||||||
Citrix Systems, Inc. | 114,361 | 16,325 | |||||||||
Cognizant Technology Solutions Corp. Class A | 138,072 | 9,433 | |||||||||
HP, Inc. | 464,422 | 8,165 | |||||||||
See notes to financial statements.
9
| USAA Mutual Funds Trust USAA Income Stock Fund | Schedule of Portfolio Investments — continued July 31, 2020 | ||||||
(Amounts in Thousands, Except for Shares)
Security Description | Shares | Value | |||||||||
Intel Corp. | 590,078 | $ | 28,164 | ||||||||
International Business Machines Corp. | 65,827 | 8,093 | |||||||||
Intuit, Inc. | 42,337 | 12,971 | |||||||||
Jack Henry & Associates, Inc. | 19,909 | 3,550 | |||||||||
Juniper Networks, Inc. | 193,234 | 4,904 | |||||||||
KLA Corp. | 35,196 | 7,033 | |||||||||
Lam Research Corp. | 23,905 | 9,016 | |||||||||
Mastercard, Inc. Class A | 47,353 | 14,609 | |||||||||
Microsoft Corp. | 33,728 | 6,915 | |||||||||
NetApp, Inc. | 70,572 | 3,126 | |||||||||
NortonLifeLock, Inc. | 269,267 | 5,776 | |||||||||
NVIDIA Corp. | 79,342 | 33,689 | |||||||||
Oracle Corp. | 113,920 | 6,317 | |||||||||
QUALCOMM, Inc. | 162,501 | 17,162 | |||||||||
Texas Instruments, Inc. | 171,737 | 21,905 | |||||||||
290,575 | |||||||||||
Materials (3.6%): | |||||||||||
Air Products & Chemicals, Inc. | 67,786 | 19,430 | |||||||||
Avery Dennison Corp. | 19,875 | 2,253 | |||||||||
International Paper Co. | 143,875 | 5,005 | |||||||||
LyondellBasell Industries NV Class A | 293,211 | 18,332 | |||||||||
Newmont Corp. | 150,664 | 10,426 | |||||||||
Nucor Corp. | 183,736 | 7,708 | |||||||||
Packaging Corp. of America | 72,829 | 7,000 | |||||||||
Royal Gold, Inc. | 31,202 | 4,366 | |||||||||
RPM International, Inc. | 28,338 | 2,312 | |||||||||
Steel Dynamics, Inc. | 208,772 | 5,722 | |||||||||
The Scotts Miracle-Gro Co. | 19,096 | 3,028 | |||||||||
Westrock Co. | 229,515 | 6,165 | |||||||||
91,747 | |||||||||||
Real Estate (5.7%): | |||||||||||
Alexandria Real Estate Equities, Inc. | 53,401 | 9,481 | |||||||||
AvalonBay Communities, Inc. | 62,674 | 9,597 | |||||||||
Boston Properties, Inc. | 68,210 | 6,077 | |||||||||
Digital Realty Trust, Inc. | 72,179 | 11,588 | |||||||||
Equity Residential | 136,459 | 7,318 | |||||||||
Essex Property Trust, Inc. | 25,817 | 5,699 | |||||||||
Healthpeak Properties, Inc. | 200,728 | 5,478 | |||||||||
Host Hotels & Resorts, Inc. | 352,560 | 3,801 | |||||||||
Invitation Homes, Inc. | 178,844 | 5,333 | |||||||||
Jones Lang LaSalle, Inc. | 82,614 | 8,171 | |||||||||
National Retail Properties, Inc. | 79,956 | 2,834 | |||||||||
Park Hotels & Resorts, Inc. | 351,940 | 2,911 | |||||||||
Prologis, Inc. | 183,527 | 19,346 | |||||||||
Public Storage | 33,460 | 6,688 | |||||||||
Realty Income Corp. | 129,317 | 7,765 | |||||||||
Regency Centers Corp. | 105,253 | 4,319 | |||||||||
Ventas, Inc. | 145,349 | 5,576 | |||||||||
See notes to financial statements.
10
| USAA Mutual Funds Trust USAA Income Stock Fund | Schedule of Portfolio Investments — continued July 31, 2020 | ||||||
(Amounts in Thousands, Except for Shares)
Security Description | Shares | Value | |||||||||
VICI Properties, Inc. | 255,230 | $ | 5,541 | ||||||||
Welltower, Inc. | 132,572 | 7,101 | |||||||||
Weyerhaeuser Co. | 299,117 | 8,318 | |||||||||
142,942 | |||||||||||
Utilities (8.1%): | |||||||||||
Alliant Energy Corp. | 42,868 | 2,308 | |||||||||
Ameren Corp. | 70,452 | 5,653 | |||||||||
CMS Energy Corp. | 212,239 | 13,621 | |||||||||
Consolidated Edison, Inc. | 81,414 | 6,255 | |||||||||
Dominion Energy, Inc. | 93,839 | 7,604 | |||||||||
DTE Energy Co. | 129,117 | 14,930 | |||||||||
Duke Energy Corp. | 178,024 | 15,086 | |||||||||
Evergy, Inc. | 209,650 | 13,592 | |||||||||
Eversource Energy | 106,266 | 9,571 | |||||||||
Exelon Corp. | 235,365 | 9,087 | |||||||||
National Fuel Gas Co. | 32,477 | 1,318 | |||||||||
NextEra Energy, Inc. | 56,014 | 15,723 | |||||||||
Pinnacle West Capital Corp. | 99,668 | 8,280 | |||||||||
PPL Corp. | 238,174 | 6,340 | |||||||||
The AES Corp. | 170,779 | 2,601 | |||||||||
The Southern Co. | 183,790 | 10,037 | |||||||||
UGI Corp. | 63,377 | 2,113 | |||||||||
Vistra Corp. | 154,626 | 2,885 | |||||||||
WEC Energy Group, Inc. | 314,308 | 29,941 | |||||||||
Xcel Energy, Inc. | 396,818 | 27,397 | |||||||||
204,342 | |||||||||||
Total Common Stocks (Cost $2,258,996) | 2,512,574 | ||||||||||
Collateral for Securities Loaned (0.1%)^ | |||||||||||
HSBC U.S. Government Money Market Fund I Shares, 0.08% (b) | 241,623 | 242 | |||||||||
Invesco Government & Agency Portfolio Institutional Shares, 0.06% (b) | 1,408,377 | 1,408 | |||||||||
Total Collateral for Securities Loaned (Cost $1,650) | 1,650 | ||||||||||
Total Investments (Cost $2,260,646) — 99.8% | 2,514,224 | ||||||||||
Other assets in excess of liabilities — 0.2% | 5,835 | ||||||||||
NET ASSETS — 100.00% | $ | 2,520,059 | |||||||||
^ Purchased with cash collateral from securities on loan.
(a) All or a portion of this security is on loan.
(b) Rate disclosed is the daily yield on July 31, 2020.
PLC — Public Limited Company
See notes to financial statements.
11
USAA Mutual Funds Trust | Statement of Assets and Liabilities July 31, 2020 | ||||||
(Amounts in Thousands, Except Per Share Amounts)
| USAA Income Stock Fund | |||||||
Assets: | |||||||
Investments, at value (Cost $2,260,646) | $ | 2,514,224 | (a) | ||||
Cash and cash equivalents | 6,477 | ||||||
Receivables: | |||||||
Interest and dividends | 3,323 | ||||||
Capital shares issued | 308 | ||||||
Reclaims | 454 | ||||||
From Adviser | 3 | ||||||
Prepaid expenses | 48 | ||||||
Total assets | 2,524,837 | ||||||
Liabilities: | |||||||
Payables: | |||||||
Collateral received on loaned securities | 1,650 | ||||||
Capital shares redeemed | 1,658 | ||||||
Accrued expenses and other payables: | |||||||
Investment advisory fees | 929 | ||||||
Administration fees | 265 | ||||||
Custodian fees | 26 | ||||||
Transfer agent fees | 182 | ||||||
Compliance fees | 1 | ||||||
Other accrued expenses | 67 | ||||||
Total liabilities | 4,778 | ||||||
Net Assets: | |||||||
Capital | 2,349,372 | ||||||
Total accumulated earnings/(loss) | 170,687 | ||||||
Net assets | $ | 2,520,059 | |||||
Net Assets: | |||||||
Fund Shares | $ | 1,482,959 | |||||
Institutional Shares | 1,028,803 | ||||||
R6 Shares | 8,297 | ||||||
Total | $ | 2,520,059 | |||||
Shares (unlimited number of shares authorized with no par value): | |||||||
Fund Shares | 94,289 | ||||||
Institutional Shares | 65,507 | ||||||
R6 Shares | 528 | ||||||
Total | 160,324 | ||||||
Net asset value, offering and redemption price per share: (b) | |||||||
Fund Shares | $ | 15.73 | |||||
Institutional Shares | 15.71 | ||||||
R6 Shares | 15.72 | ||||||
(a) Includes $1,617 of securities on loan.
(b) Per share amount may not recalculate due to rounding of net assets and/or shares outstanding.
See notes to financial statements.
12
USAA Mutual Funds Trust | Statement of Operations For the Year Ended July 31, 2020 | ||||||
(Amounts in Thousands)
| USAA Income Stock Fund | |||||||
Investment Income: | |||||||
Dividends | $ | 79,342 | |||||
Interest | 58 | ||||||
Securities lending (net of fees) | 31 | ||||||
Total income | 79,431 | ||||||
Expenses: | |||||||
Investment advisory fees | 12,930 | ||||||
Administration fees — Fund Shares | 2,394 | ||||||
Administration fees — Institutional Shares | 998 | ||||||
Administration fees — R6 Shares | 5 | ||||||
Sub-Administration fees | 46 | ||||||
Custodian fees | 136 | ||||||
Transfer agent fees — Fund Shares | 1,227 | ||||||
Transfer agent fees — Institutional Shares | 998 | ||||||
Transfer agent fees — R6 Shares | 1 | ||||||
Trustees' fees | 46 | ||||||
Compliance fees | 17 | ||||||
Legal and audit fees | 85 | ||||||
State registration and filing fees | 52 | ||||||
Interfund lending fees | 1 | ||||||
Other expenses | 137 | ||||||
Total expenses | 19,073 | ||||||
Expenses waived/reimbursed by Adviser | (21 | ) | |||||
Net expenses | 19,052 | ||||||
Net Investment Income (Loss) | 60,379 | ||||||
Realized/Unrealized Gains (Losses) from Investments: | |||||||
Net realized gains (losses) from investment securities | (87,706 | ) | |||||
Net change in unrealized appreciation/depreciation on investment securities | (77,836 | ) | |||||
Net realized/unrealized gains (losses) on investments | (165,542 | ) | |||||
Change in net assets resulting from operations | $ | (105,163 | ) | ||||
See notes to financial statements.
13
USAA Mutual Funds Trust | Statements of Changes in Net Assets | ||||||
(Amounts in Thousands)
USAA Income Stock Fund | |||||||||||
| Year Ended July 31, 2020 | Year Ended July 31, 2019 | ||||||||||
From Investments: | |||||||||||
Operations: | |||||||||||
Net investment income (loss) | $ | 60,379 | $ | 68,012 | |||||||
Net realized gains (losses) from investments | (87,706 | ) | 486,567 | ||||||||
| Net change in unrealized appreciation/depreciation on investments | (77,836 | ) | (375,906 | ) | |||||||
Change in net assets resulting from operations | (105,163 | ) | 178,673 | ||||||||
Distributions to Shareholders: | |||||||||||
Fund Shares | (306,762 | ) | (133,413 | ) | |||||||
Institutional Shares | (189,116 | ) | (86,990 | ) | |||||||
R6 Shares | (1,853 | ) | (991 | ) | |||||||
Change in net assets resulting from distributions to shareholders | (497,731 | ) | (221,394 | ) | |||||||
Change in net assets resulting from capital transactions | 315,435 | 89,093 | |||||||||
Change in net assets | (287,459 | ) | 46,372 | ||||||||
Net Assets: | |||||||||||
Beginning of period | 2,807,518 | 2,761,146 | |||||||||
End of period | $ | 2,520,059 | $ | 2,807,518 | |||||||
See notes to financial statements.
14
USAA Mutual Funds Trust | Statements of Changes in Net Assets — continued | ||||||
(Amounts in Thousands)
USAA Income Stock Fund | |||||||||||
| Year Ended July 31, 2020 | Year Ended July 31, 2019 | ||||||||||
Capital Transactions: | |||||||||||
Fund Shares | |||||||||||
Proceeds from shares issued | $ | 121,878 | $ | 93,141 | |||||||
Distributions reinvested | 295,305 | 128,119 | |||||||||
Cost of shares redeemed | (268,091 | ) | (195,299 | ) | |||||||
Total Fund Shares | $ | 149,092 | $ | 25,961 | |||||||
Institutional Shares | |||||||||||
Proceeds from shares issued | $ | 189,037 | $ | 216,857 | |||||||
Distributions reinvested | 189,099 | 86,971 | |||||||||
Cost of shares redeemed | (210,127 | ) | (240,262 | ) | |||||||
Total Institutional Shares | $ | 168,009 | $ | 63,566 | |||||||
R6 Shares | |||||||||||
Proceeds from shares issued | $ | 972 | $ | 625 | |||||||
Distributions reinvested | 864 | 550 | |||||||||
Cost of shares redeemed | (3,502 | ) | (1,609 | ) | |||||||
Total R6 Shares | $ | (1,666 | ) | $ | (434 | ) | |||||
Change in net assets resulting from capital transactions | $ | 315,435 | $ | 89,093 | |||||||
Share Transactions: | |||||||||||
Fund Shares | |||||||||||
Issued | 7,293 | 4,818 | |||||||||
Reinvested | 16,913 | 6,925 | |||||||||
Redeemed | (16,208 | ) | (10,114 | ) | |||||||
Total Fund Shares | 7,998 | 1,629 | |||||||||
Institutional Shares | |||||||||||
Issued | 12,032 | 11,479 | |||||||||
Reinvested | 10,855 | �� | 4,705 | ||||||||
Redeemed | (12,464 | ) | (12,280 | ) | |||||||
Total Institutional Shares | 10,423 | 3,904 | |||||||||
R6 Shares | |||||||||||
Issued | 57 | 32 | |||||||||
Reinvested | 49 | 30 | |||||||||
Redeemed | (187 | ) | (83 | ) | |||||||
Total R6 Shares | (81 | ) | (21 | ) | |||||||
Change in Shares | 18,340 | 5,512 | |||||||||
See notes to financial statements.
15
USAA Mutual Funds Trust | Financial Highlights | ||||||
For a Share Outstanding Throughout Each Period
Investment Activities | Distributions to Shareholders From | ||||||||||||||||||||||||||
| Net Asset Value, Beginning of Period | Net Investment Income (Loss) | Net Realized and Unrealized Gains (Losses) on Investments | Total from Investment Activities | Net Investment Income | Net Realized Gains from Investments | ||||||||||||||||||||||
USAA Income Stock Fund | |||||||||||||||||||||||||||
Fund Shares | |||||||||||||||||||||||||||
| Year Ended July 31, 2020 | $ | 19.78 | 0.40 | (d) | (0.87 | ) | (0.47 | ) | (0.36 | ) | (3.22 | ) | |||||||||||||||
| Year Ended July 31, 2019 | $ | 20.24 | 0.43 | 0.70 | 1.13 | (0.44 | ) | (1.15 | ) | ||||||||||||||||||
| Year Ended July 31, 2018 | $ | 19.68 | 0.40 | 1.74 | 2.14 | (0.40 | ) | (1.18 | ) | ||||||||||||||||||
| Year Ended July 31, 2017 | $ | 18.18 | 0.42 | 1.51 | 1.93 | (0.43 | ) | — | |||||||||||||||||||
| Year Ended July 31, 2016 | $ | 17.79 | 0.40 | 0.97 | 1.37 | (0.40 | ) | (0.58 | ) | ||||||||||||||||||
Institutional Shares | |||||||||||||||||||||||||||
| Year Ended July 31, 2020 | $ | 19.76 | 0.40 | (d) | (0.86 | ) | (0.46 | ) | (0.37 | ) | (3.22 | ) | |||||||||||||||
| Year Ended July 31, 2019 | $ | 20.22 | 0.43 | 0.70 | 1.13 | (0.44 | ) | (1.15 | ) | ||||||||||||||||||
| Year Ended July 31, 2018 | $ | 19.66 | 0.41 | 1.73 | 2.14 | (0.40 | ) | (1.18 | ) | ||||||||||||||||||
| Year Ended July 31, 2017 | $ | 18.16 | 0.43 | 1.50 | 1.93 | (0.43 | ) | — | |||||||||||||||||||
| Year Ended July 31, 2016 | $ | 17.77 | 0.40 | 0.98 | 1.38 | (0.41 | ) | (0.58 | ) | ||||||||||||||||||
R6 Shares | |||||||||||||||||||||||||||
| Year Ended July 31, 2020 | $ | 19.77 | 0.42 | (d) | (0.87 | ) | (0.45 | ) | (0.38 | ) | (3.22 | ) | |||||||||||||||
| Year Ended July 31, 2019 | $ | 20.23 | 0.45 | 0.69 | 1.14 | (0.45 | ) | (1.15 | ) | ||||||||||||||||||
| Year Ended July 31, 2018 | $ | 19.67 | 0.47 | 1.69 | 2.16 | (0.42 | ) | (1.18 | ) | ||||||||||||||||||
| December 1, 2016 (g) through July 31, 2017 | $ | 18.17 | 0.27 | 1.60 | 1.87 | (0.37 | ) | — | |||||||||||||||||||
* Assumes reinvestment of all net investment income and realized capital gain distributions, if any, during the period. Includes adjustments in accordance with U.S. generally accepted accounting principles and could differ from the Lipper reported return.
^ The net expense ratio may not correlate to the applicable expense limits in place during the period since the current contractual expense limitation is applied for a two year period beginning July 1, 2019 and in effect through June 30, 2021, instead of coinciding with the Fund's fiscal year end. Details of the current contractual expense limitation in effect can be found in Note 5 of the accompanying Notes to Financial Statements.
(a) Not annualized for periods less than one year.
(b) Annualized for periods less than one year.
(c) Portfolio turnover is calculated on the basis of the Fund as a whole without distinguishing between the classes of shares issued.
(d) Per share net investment income (loss) has been calculated using the average daily shares method.
(e) Reflects increased trading activity due to current year transition or asset allocation shift.
See notes to financial statements.
16
USAA Mutual Funds Trust | Financial Highlights — continued | ||||||
For a Share Outstanding Throughout Each Period
Ratios to Average Net Assets | Supplemental Data | ||||||||||||||||||||||||||||||||||
| Total Distributions | Net Asset Value, End of Period | Total Return*(a) | Net Expenses^(b) | Net Investment Income (Loss)(b) | Gross Expenses(b) | Net Assets, End of Period (000's) | Portfolio Turnover(a)(c) | ||||||||||||||||||||||||||||
USAA Income Stock Fund | |||||||||||||||||||||||||||||||||||
Fund Shares | |||||||||||||||||||||||||||||||||||
| Year Ended July 31, 2020 | (3.58 | ) | $ | 15.73 | (3.84 | )% | 0.74 | % | 2.31 | % | 0.74 | % | $ | 1,482,959 | 64 | % | |||||||||||||||||||
| Year Ended July 31, 2019 | (1.59 | ) | $ | 19.78 | 6.26 | % | 0.75 | % | 2.44 | % | 0.75 | % | $ | 1,707,034 | 86 | %(e) | |||||||||||||||||||
| Year Ended July 31, 2018 | (1.58 | ) | $ | 20.24 | 11.16 | % | 0.76 | %(f) | 2.19 | % | 0.76 | %(f) | $ | 1,713,558 | 23 | % | |||||||||||||||||||
| Year Ended July 31, 2017 | (0.43 | ) | $ | 19.68 | 10.71 | % | 0.77 | %(f) | 2.24 | % | 0.77 | %(f) | $ | 1,651,374 | 23 | % | |||||||||||||||||||
| Year Ended July 31, 2016 | (0.98 | ) | $ | 18.18 | 8.29 | % | 0.80 | %(f) | 2.42 | % | 0.80 | %(f) | $ | 1,564,900 | 19 | % | |||||||||||||||||||
Institutional Shares | |||||||||||||||||||||||||||||||||||
| Year Ended July 31, 2020 | (3.59 | ) | $ | 15.71 | (3.81 | )% | 0.72 | % | 2.34 | % | 0.72 | % | $ | 1,028,803 | 64 | % | |||||||||||||||||||
| Year Ended July 31, 2019 | (1.59 | ) | $ | 19.76 | 6.30 | % | 0.73 | % | 2.47 | % | 0.73 | % | $ | 1,088,446 | 86 | %(e) | |||||||||||||||||||
| Year Ended July 31, 2018 | (1.58 | ) | $ | 20.22 | 11.21 | % | 0.72 | %(f) | 2.22 | % | 0.72 | %(f) | $ | 1,034,842 | 23 | % | |||||||||||||||||||
| Year Ended July 31, 2017 | (0.43 | ) | $ | 19.66 | 10.76 | % | 0.73 | %(f) | 2.30 | % | 0.73 | %(f) | $ | 1,097,164 | 23 | % | |||||||||||||||||||
| Year Ended July 31, 2016 | (0.99 | ) | $ | 18.16 | 8.36 | % | 0.75 | %(f) | 2.47 | % | 0.75 | %(f) | $ | 1,158,385 | 19 | % | |||||||||||||||||||
R6 Shares | |||||||||||||||||||||||||||||||||||
| Year Ended July 31, 2020 | (3.60 | ) | $ | 15.72 | (3.77 | )% | 0.65 | % | 2.40 | % | 0.72 | % | $ | 8,297 | 64 | % | |||||||||||||||||||
| Year Ended July 31, 2019 | (1.60 | ) | $ | 19.77 | 6.37 | % | 0.65 | % | 2.54 | % | 0.73 | % | $ | 12,038 | 86 | %(e) | |||||||||||||||||||
| Year Ended July 31, 2018 | (1.60 | ) | $ | 20.23 | 11.31 | % | 0.65 | %(f) | 2.33 | % | 0.90 | %(f) | $ | 12,746 | 23 | % | |||||||||||||||||||
| December 1, 2016 (g) through July 31, 2017 | (0.37 | ) | $ | 19.67 | 10.36 | % | 0.65 | %(f) | 2.13 | % | 1.24 | %(f) | $ | 5,412 | 23 | % | |||||||||||||||||||
(f) Reflects total annual operating expenses of the shares before reductions of any expenses paid indirectly. The shares' expenses paid indirectly decreased the expense ratio by less than 0.01%.
(g) Commencement of operations.
See notes to financial statements.
17
USAA Mutual Funds Trust | Notes to Financial Statements July 31, 2020 | ||||||
1. Organization:
USAA Mutual Funds Trust (the "Trust") is organized as a Delaware statutory trust and is registered under the Investment Company Act of 1940, as amended (the "1940 Act"), as an open-end investment company. The Trust is comprised of 47 funds and is authorized to issue an unlimited number of shares, which are units of beneficial interest with no par value.
The accompanying financial statements are those of the USAA Income Stock Fund (the "Fund"). The Fund offers three classes of shares: Fund Shares, Institutional Shares, and R6 Shares. The Fund is classified as diversified under the 1940 Act.
Each class of shares of the Fund has substantially identical rights and privileges except with respect to fees paid under distribution plans, expenses allocable exclusively to each class of shares, voting rights on matters solely affecting a single class of shares, and the exchange privilege of each class of shares.
Under the Trust's organizational documents, its officers and trustees are indemnified against certain liabilities arising out of the performance of their duties to the Fund. In addition, in the normal course of business, the Fund enters into contracts with its vendors and others that provide for general indemnifications. The Fund's maximum exposure under these arrangements is unknown, as this would involve future claims that may be made against the Fund. However, based on experience, the Fund expects that risk of loss to be remote.
2. Significant Accounting Policies:
The following is a summary of significant accounting policies followed by the Trust in the preparation of its financial statements. The policies are in conformity with generally accepted accounting principles in the United States of America ("GAAP"). The preparation of financial statements in accordance with GAAP requires management to make estimates and assumptions that affect the reported amounts of assets and liabilities and disclosure of contingent assets and liabilities at the date of the financial statements and the reported amounts of income and expenses for the period. Actual results could differ from those estimates. The Fund follows the specialized accounting and reporting requirements under GAAP that are applicable to investment companies under Accounting Standards Codification Topic 946.
Investment Valuation:
The Fund records investments at fair value. Fair value is defined as the price that would be received to sell an asset or paid to transfer a liability in an orderly transaction between market participants at the measurement date.
The valuation techniques described below maximize the use of observable inputs and minimize the use of unobservable inputs in determining fair value. The inputs used for valuing the Fund's investments are summarized in the three broad levels listed below:
• Level 1 — quoted prices in active markets for identical securities
• Level 2 — other significant observable inputs (including quoted prices for similar securities or interest rates applicable to those securities, etc.)
• Level 3 — significant unobservable inputs (including the Fund's own assumptions in determining the fair value of investments)
Changes in valuation techniques may result in transfers in or out of an assigned level within the disclosure hierarchy. The inputs or methodologies used for valuation techniques are not necessarily an indication of the risk associated with entering into those investments.
The Adviser has established the Pricing and Liquidity Committee (the "Committee"), and subject to Trust's Board of Trustees (the "Board") oversight, the Committee administers and oversees the Fund's valuation policies and procedures, which are approved by the Board.
Portfolio securities listed or traded on securities exchanges, including exchange-traded funds ("ETFs"), American Depositary Receipts ("ADRs") and Rights, are valued at the closing price on the exchange or
18
USAA Mutual Funds Trust | Notes to Financial Statements — continued July 31, 2020 | ||||||
system where the security is principally traded, if available, or at the Nasdaq Official Closing Price. If there have been no sales for that day on the exchange or system, then a security is valued at the last available bid quotation on the exchange or system where the security is principally traded. In each of these situations, valuations are typically categorized as Level 1 in the fair value hierarchy.
Investments in open-end investment companies are valued at net asset value ("NAV"). These valuations are typically categorized as Level 1 in the fair value hierarchy.
In the event that price quotations or valuations are not readily available, are not reflective of market value, or a significant event has been recognized in relation to a security or class of securities, the securities are valued in good faith by the Committee in accordance with valuation procedures approved by the Board. These valuations are typically categorized as Level 2 or Level 3 in the fair value hierarchy, based on the observability of inputs used to determine the fair value. The effect of fair value pricing is that securities may not be priced on the basis of quotations from the primary market in which they are traded and the actual price realized from the sale of a security may differ materially from the fair value price. Valuing these securities at fair value is intended to cause the Fund's NAV to be more reliable than it otherwise would be.
A summary of the valuations as of July 31, 2020, based upon the three levels defined above, is included in the table below while the breakdown, by category, of investments is disclosed in the Schedule of Portfolio Investments (amounts in thousands):
Level 1 | Level 2 | Level 3 | Total | ||||||||||||||||
Common Stocks | $ | 2,512,574 | $ | — | $ | — | $ | 2,512,574 | |||||||||||
Collateral for Securities Loaned | 1,650 | — | — | 1,650 | |||||||||||||||
Total | $ | 2,514,224 | $ | — | $ | — | $ | 2,514,224 | |||||||||||
For the year ended July 31, 2020, there were no transfers in or out of the Level 3 fair value hierarchy.
Real Estate Investment Trusts ("REITs"):
The Fund may invest in REITs, which report information on the source of their distributions annually. REITs are pooled investment vehicles that invest primarily in income producing real estate or real estate related loans or interests (such as mortgages). Certain distributions received from REITs during the year are recorded as realized gains or return of capital as estimated by the Fund or when such information becomes known.
Investment Companies:
Exchange-Traded Funds:
The Fund may invest in ETFs, the shares of which are bought and sold on a securities exchange. An ETF trades like common stock and represents a fixed portfolio of securities designed to track the performance and dividend yield of a particular domestic or foreign market index. The Fund may purchase shares of an ETF to temporarily gain exposure to a portion of the U.S. or a foreign market while awaiting purchase of underlying securities. The risks of owning an ETF generally reflect the risks of owning the underlying securities they are designed to track, although the lack of liquidity of an ETF could result in it being more volatile. Additionally, ETFs have fees and expenses that reduce their value.
Open-End Funds:
The Fund may invest in portfolios of open-end investment companies. These investment companies value securities in their portfolios for which market quotations are readily available at their market values (generally the last reported sale price) and all other securities and assets at their fair value by the methods established by the board of directors of the underlying funds.
19
USAA Mutual Funds Trust | Notes to Financial Statements — continued July 31, 2020 | ||||||
Investment Transactions and Related Income:
Changes in holdings of investments are accounted for no later than one business day following the trade date. For financial reporting purposes, however, investment transactions are accounted for on trade date on the last business day of the reporting period. Interest income is determined on the basis of coupon interest accrued using the effective interest method which adjusts, where applicable, the amortization of premiums or accretion of discount. Gains or losses realized on sales of securities are determined by comparing the identified cost of the security lot sold with the net sales proceeds.
Withholding taxes on interest, dividends, and gains as a result of certain investments in ADRs by the Fund has been provided for in accordance with each investment's applicable country's tax rules and rates.
Securities Lending:
The Fund, through a securities lending agreement with Citibank, N.A. ("Citibank"), may lend its securities to qualified financial institutions, such as certain broker-dealers, to earn additional income, net of income retained by Citibank. Borrowers are required to secure their loans for collateral in the amount of at least 102% of the value of U.S. securities loaned or at least 105% of the value of non-U.S. securities loaned, marked-to-market daily. Any collateral shortfalls associated with increases in the valuation of the securities loaned are cured the next business day once the shortfall exceeds $100 thousand. Collateral may be cash, U.S. government securities, or other securities as permitted by SEC guidelines. Cash collateral may be invested in high-quality short-term investments, primarily open-end investment companies. Collateral requirements are determined daily based on the value of the Fund's securities on loan as of the end of the prior business day. During the time portfolio securities are on loan, the borrower will pay the Fund any dividends or interest paid on such securities plus any fee negotiated between the parties to the lending agreement. The Fund also earns a return from the collateral. The Fund pays Citibank various fees in connection with the investment of cash collateral and fees based on the investment income received from securities lending activities. Securities lending income (net of these fees) is disclosed on the Statement of Operations. Loans are terminable upon demand and the borrower must return the loaned securities within the lesser of one standard settlement period or five business days. Risks relating to securities-lending transactions include that the borrower may not provide additional collateral when required or return the securities when due, and that the value of the short-term investments will be less than the amount of cash collateral required to be returned to the borrower. The Fund's agreement with Citibank does not include master netting provisions. Non- cash collateral received by the Fund may not be sold or re-pledged except to satisfy borrower default. Cash collateral is listed on the Fund's Schedule of Portfolio of Investments and Financial Statements while non-cash collateral is not included. The following table (amounts in thousands) is a summary of the Fund's securities lending transactions as of July 31, 2020.
| Value of Securities on Loan | Non-Cash Collateral | Cash Collateral | |||||||||
| $ | 1,617 | $ | — | $ | 1,650 | ||||||
Foreign Currency Translations:
The accounting records of the Fund are maintained in U.S. dollars. Investment securities and other assets and liabilities of the Fund denominated in a foreign currency are translated into U.S. dollars at current exchange rates. Purchases and sales of securities, income receipts, and expense payments are translated into U.S. dollars at the exchange rates on the date of the transactions. The Fund does not isolate the portion of the results of operations resulting from changes in foreign exchange rates on investments from fluctuations arising from changes in market prices of securities held. Such fluctuations are disclosed as net change in unrealized appreciation/depreciation on investments and foreign currency translations on the Statement of Operations. Any realized gains or losses from these fluctuations, including foreign currency arising from in-kind redemptions, are disclosed as net realized gains or losses from investment transactions and foreign currency translations on the Statement of Operations.
20
USAA Mutual Funds Trust | Notes to Financial Statements — continued July 31, 2020 | ||||||
Foreign Taxes:
The Fund may be subject to foreign taxes related to foreign income received (a portion of which may be reclaimable), capital gains on the sale of securities, and certain foreign currency transactions. All foreign taxes are recorded in accordance with the applicable regulations and rates that exist in the foreign jurisdictions in which the Fund invests.
Federal Income Taxes:
It is the Fund's policy to continue to qualify as a regulated investment company by complying with the provisions available to certain investment companies, as defined in applicable sections of the Internal Revenue Code, and to make distributions of net investment income and net realized gains sufficient to relieve it from all, or substantially all, federal income taxes. Accordingly, no provision for federal income taxes is required in the financial statements. The Fund has a tax year-end of July 31.
Management of the Fund has reviewed tax positions taken in tax years that remain subject to examination by all major tax jurisdictions, including federal (i.e., the last four tax years, which includes the current fiscal tax year end). Management believes that there is no tax liability resulting from unrecognized tax benefits related to uncertain tax positions taken.
Allocations:
Expenses directly attributable to the Fund are charged to the Fund, while expenses that are attributable to more than one fund in the Trust, or jointly with an affiliated trust, are allocated among the respective funds in the Trust and/or affiliated trust based upon net assets or another appropriate basis.
Income, expenses (other than class-specific expenses such as transfer agent fees, state registration fees, and printing fees), and realized and unrealized gains or losses on investments are allocated to each class of shares based on its relative net assets on the date income is earned or expenses and realized and unrealized gains and losses are incurred.
3. Purchases and Sales:
Cost of purchases and proceeds from sales/maturities of securities (excluding securities maturing less than one year from acquisition) for the year ended July 31, 2020, were as follows for the Fund (amounts in thousands):
| Excluding U.S. Government Securities | |||||||||||
Purchases | Sales | ||||||||||
$ | 1,671,579 | $ | 1,789,691 | ||||||||
There were no purchases and sales of U.S. government securities during the year ended July 31, 2020.
4. Affiliated Fund Ownership:
The Fund offers its shares for investment by other USAA Mutual Funds. The fund-of-funds do not invest in the underlying funds for the purpose of exercising management or control, and the affiliated fund- of-funds' annual and semi-annual reports may be viewed at usaa.com. As of July 31, 2020, certain fund-of-funds owned total outstanding shares of the Fund as follows:
USAA Cornerstone Conservative Fund | 0.1 | % | |||||
USAA Cornerstone Equity Fund | 0.4 | % | |||||
USAA Target Retirement Income Fund | 0.2 | % | |||||
USAA Target Retirement 2020 Fund | 0.2 | % | |||||
USAA Target Retirement 2030 Fund | 1.0 | % | |||||
USAA Target Retirement 2040 Fund | 1.5 | % | |||||
USAA Target Retirement 2050 Fund | 1.0 | % | |||||
USAA Target Retirement 2060 Fund | 0.2 | % | |||||
21
USAA Mutual Funds Trust | Notes to Financial Statements — continued July 31, 2020 | ||||||
5. Fees and Transactions with Affiliates and Related Parties:
Investment Advisory Fees:
Investment advisory services are provided to the Fund by Victory Capital Management Inc. ("VCM" or the "Adviser"), a New York corporation registered as an investment adviser with the Securities and Exchange Commission ("SEC"). The Adviser is a wholly-owned indirect subsidiary of Victory Capital Holdings, Inc., a publicly traded Delaware corporation, and a wholly-owned direct subsidiary of Victory Capital Operating, LLC. Under the terms of the Investment Advisory Agreement, the Adviser is entitled to receive a base fee and a performance adjustment. The Fund's base fee is accrued daily and paid monthly at an annualized rate of 0.50% of the Fund's average daily net assets. Amounts incurred and paid to VCM for the year ended July 31, 2020, are reflected on the Statement of Operations as Investment Advisory fees.
Effective July 1, 2019, no performance adjustments were made for the period beginning July 1, 2019, through June 30, 2020. Only performance beginning as of July 1, 2019, and thereafter is utilized in calculating future performance adjustments.
The performance adjustment for each share class is accrued daily and calculated monthly by comparing each class' performance to that of the Lipper Equity Income Funds Index. The Lipper Equity Income Funds Index tracks the total return performance of each class within the Lipper Equity Income Funds category.
The performance period for each share class consists of the current month plus the previous 35 months (or the number of months beginning July 1, 2019, if fewer). The following table is utilized to determine the extent of the performance adjustment:
| Over/Under Performance Relative to Index (in basis points)(a) | Annual Adjustment Rate (in basis points)(a) | ||||||
+/- 100 to 400 | +/- 4 | ||||||
+/- 401 to 700 | +/- 5 | ||||||
+/- 701 and greater | +/- 6 | ||||||
(a) Based on the difference between average annual performance of the relevant share class of the Fund and its relevant Lipper index, rounded to the nearest basis point. Average daily net assets of the share class are calculated over a rolling 36-month period.
Each class' annual performance adjustment rate is multiplied by the average daily net assets of the class over the entire performance period, which is then multiplied by a fraction, the numerator of which is the number of days in the month and the denominator of which is 365 (366 in leap years). The resulting amount is then added to (in the case of overperformance), or subtracted from (in the case of underperformance) the base fee.
Under the performance fee arrangement, each class pays a positive performance fee adjustment for a performance period whenever the class outperforms the Lipper Equity Income Funds Index over that period, even if the class has overall negative returns during the performance period.
For the period July 1, 2020 through July 31, 2020, performance adjustments for Fund Shares, Institutional Shares, and Class R6 were $(54), $(34), and less than $(1) thousand, respectively. For the Fund Shares, Institutional Shares and Class R6, the performance adjustments were less than 0.01% of net assets for all classes.
The Trust relies on an exemptive order granted to VCM and its affiliated funds by the SEC in March 2019 permitting the use of a "manager-of-managers" structure for certain funds. Under a manager-of-managers structure, the investment adviser may select (with approval of the Board and without shareholder approval) one or more subadvisers to manage the day-to-day investment of a fund's assets.
22
USAA Mutual Funds Trust | Notes to Financial Statements — continued July 31, 2020 | ||||||
VCM has entered into a Subadvisory Agreement with Epoch Investment Partners, Inc ("Epoch"), under which Epoch directs the investment and reinvestment of a portion of the Fund's assets (as allocated from time to time by VCM). This arrangement provides for monthly fees that are paid by VCM. VCM (not the Fund) pays the subadviser fees.
Administration and Servicing Fees:
VCM serves as the Fund's administrator and fund accountant. Under the Fund Administration, Servicing and Accounting Agreement, VCM is paid for its services an annual fee at a rate of 0.15%, 0.10%, and 0.05% of average daily net assets of Fund Shares, Institutional Shares, and R6 Shares, respectively. Amounts incurred for the year ended July 31, 2020, are reflected on the Statement of Operations as Administration fees.
The Fund (as part of the Trust) has entered into an agreement to provide compliance services with the Adviser, pursuant to which the Adviser furnishes its compliance personnel, including the services of the Chief Compliance Officer ("CCO"), and other resources reasonably necessary to provide the Trust with compliance oversight services related to the design, administration and oversight of a compliance program for the Trust in accordance with Rule 38a-1 under the 1940 Act. The CCO is an employee of the Adviser, which pays the compensation of the CCO and support staff. Funds in the Trust, Victory Variable Insurance Funds, Victory Portfolios, and Victory Portfolios II (collectively, the "Victory Funds Complex") in the aggregate, compensates the Adviser for these services. Amounts incurred for the year ended July 31, 2020, are reflected on the Statement of Operations as Compliance fees.
Citi Fund Services Ohio, Inc. ("Citi"), an affiliate of Citibank, acts as sub-administrator and sub-fund accountant to the Fund pursuant to a Sub-Administration and Sub-Fund Accounting Services Agreement between VCM and Citi. VCM pays Citi a fee for providing these services. The Fund reimburses VCM and Citi for reasonable out-of-pocket expenses incurred in providing these services and certain other expenses specifically allocated to the Funds, under the Fund Administration, Servicing, and Accounting Agreement. Amounts incurred for the year ended July 31, 2020, are reflected on the Statement of Operations as Sub-Administration fees.
Transfer Agency Fees:
Victory Capital Transfer Agency, Inc. ("VCTA"), provides transfer agency services to the Fund. VCTA, an affiliate of the Adviser, provides transfer agent services to the Fund Shares based on an annual charge of $23 per shareholder account plus out-of-pocket expenses. VCTA pays a portion of these fees to certain intermediaries for the administration and servicing of accounts that are held with such intermediaries. Transfer agent's fees for Institutional Shares and R6 Shares are paid monthly based on a fee accrued daily at an annualized rate of 0.10% and 0.01% of average daily net assets, plus out-of- pocket expenses, respectively. Amounts incurred and paid to VCTA for the year ended July 31, 2020, are reflected on the Statement of Operations as Transfer Agent fees.
FIS Investor Services LLC serves as sub-transfer agent and dividend disbursing agent for the Fund pursuant to a Sub-Transfer Agent agreement between VCTA and FIS Investor Services LLC. VCTA provides FIS Investor Services LLC a fee for providing these services.
Distributor/Underwriting Services:
Victory Capital Services, Inc. (the "Distributor"), an affiliate of the Adviser, serves as distributor for the continuous offering of the shares of the Fund pursuant to a Distribution Agreement between the Distributor and the Trust. The Distributor received no fees or other compensation for such distribution services. Effective June 30, 2020, the Distributor's name was changed from Victory Capital Advisers, Inc.
Other Fees:
Citibank serves as the Fund's custodian.
K&L Gates LLP provides legal services to the Trust.
23
USAA Mutual Funds Trust | Notes to Financial Statements — continued July 31, 2020 | ||||||
The Adviser has entered into an expense limitation agreement with the Fund until at least June 30, 2021. Under the terms of the agreement, the Adviser has agreed to waive fees or reimburse certain expenses to the extent that ordinary operating expenses incurred by certain classes of the Fund in any fiscal year exceed the expense limit for such classes of the Fund. Such excess amounts will be the liability of the Adviser. Interest, taxes, brokerage commissions, other expenditures, which are capitalized in accordance with GAAP, and other extraordinary expenses not incurred in the ordinary course of the Fund's business are excluded from the expense limits. As of July 31, 2020, the expense limits (excluding voluntary waivers) are 0.76%, 0.72%, and 0.65% for Fund Shares, Institutional Shares, and R6 Shares, respectively.
Under this expense limitation agreement, the Fund has agreed to repay fees and expenses that were waived or reimbursed by the Adviser for a period up to three years after the fiscal year in which the waiver or reimbursement took place, subject to the lesser of any operating expense limits in effect at the time of: (a) the original waiver or expense reimbursement; or (b) the recoupment, after giving effect to the recoupment amount. As of July 31, 2020, the following amounts are available to be repaid to the Adviser (amounts in thousands). The Fund has not recorded any amounts available to be repaid as a liability due to an assessment that such repayment is not probable at July 31, 2020.
| Expires July 31, 2022 | Expires July 31, 2023 | Total | |||||||||
| $ | 4 | $ | 21 | $ | 25 | ||||||
The Adviser may voluntarily waive or reimburse additional fees to assist the Fund in maintaining competitive expense ratios. Voluntary waivers and reimbursements applicable to the Fund are not available to be recouped at a future time. There were no voluntary waivers or reimbursements for the year ended July 31, 2020.
Certain officers and/or interested trustees of the Fund are also officers and/or employees of the Adviser, Administrator, Sub-Administrator, Sub-Fund Accountant, and Legal.
6. Risks:
The Fund may be subject to other risks in addition to these identified risks.
Global economies and financial markets are increasingly interconnected, which increases the possibilities that conditions in one country or region might adversely affect issuers in another country or region. Geopolitical and other risks, including war, terrorism, trade disputes, political or economic dysfunction within some nations, public health crises and related geopolitical events, as well as environmental disasters such as earthquakes, fires, and floods, may add to instability in world economies and markets generally. Changes in trade policies and international trade agreements could affect the economies of many countries in unpredictable ways. Epidemics and/or pandemics, such as the coronavirus (or COVID-19), may result in, among other things, closing borders, disruptions to healthcare service preparation and delivery, quarantines, cancellations, disruptions to supply chains and consumer activity, as well as general concern and uncertainty. The impact may be short-term or may last for extended periods.
The COVID-19 pandemic, which has spread rapidly across the world, has led and will continue to lead for an unknown period of time to disruptions in local, regional, national and global markets and economies. Among other things, the outbreak has resulted in, and until fully resolved is likely to continue to result in, among other things (1) government imposition of various forms of "stay at home" orders and the closing of "non-essential" businesses, resulting in significant disruption to the businesses of many issuers as well as lay-offs of employees: (2) increased requests by issuers of debt instruments for amendments and waivers of agreements to avoid default and increased defaults: (3) volatility and disruption of markets, including greater volatility in pricing and spreads; and (4) rapidly evolving proposals and/or actions by state and federal governments to address problems being experienced by the markets and by businesses and the economy in general.
24
USAA Mutual Funds Trust | Notes to Financial Statements — continued July 31, 2020 | ||||||
Overall stock market risks may affect the value of the Fund. Factors such as domestic and international economic growth and market conditions, interest rate levels, and political events affect the securities market.
The value of the equity securities in which the Fund invests may decline in response to developments affecting individual companies and/or general economic conditions. A company's earnings or dividends may not increase as expected. Price changes may be temporary or last for extended periods.
Foreign markets can be more volatile than the U.S. market due to increased risks of adverse issuer, political, regulatory, market, or economic developments and can perform differently from the U.S. market.
7. Borrowing and Interfund Lending:
Line of Credit:
For the year ended July 31, 2020, the Victory Funds Complex participated in a short-term demand note "Line of Credit" agreement with Citibank. The Line of Credit agreement with Citibank was renewed on June 29, 2020 with a termination date of June 28, 2021. Under the agreement with Citibank, the Victory Funds Complex may borrow up to $600 million, of which $300 million is committed and $300 million is uncommitted. $40 million of the Line of Credit is reserved for use by the Victory Floating Rate Fund (herein, the "Fund"), another series of the Victory Funds Complex, with that Fund paying the related commitment fees for that amount. The purpose of the agreement is to meet temporary or emergency cash needs. For the year ended July 31, 2020, Citibank received an annual commitment fee of 0.15% on $300 million for providing the Line of Credit. Each fund in the Victory Funds Complex pays a pro-rata portion of the commitment fees plus any interest (one month LIBOR plus one percent) on amounts borrowed. Effective June 29, 2020, under an amended Line of Credit agreement, Citibank will also receive an annual upfront fee of 0.10% on the $300 million committed line of credit. Each fund in the Victory Funds Complex will pay a pro-rata portion of the upfront fee. Interest charged to each Fund during the period, if applicable, is reflected on the Statements of Operations under Line of credit fees.
The Fund had no borrowings under the Line of Credit agreement during the year ended July 31, 2020.
Interfund Lending:
The Trust and Adviser rely on an exemptive order granted by the SEC in March 2017 (the "Order"), permitting the establishment and operation of an Interfund Lending Facility (the "Facility"). The Facility allows the Fund to directly lend and borrow money to or from any other Fund in the Victory Funds Complex relying upon the Order at rates beneficial to both the borrowing and lending funds. Advances under the Facility are allowed for temporary or emergency purposes. The interfund loan rate is determined, as specified in the Order, by averaging the current repurchase agreement rate and the current bank loan rate. As a Borrower, interest charged to the Fund, if any, during the period is reflected on the Statement of Operations under Interfund lending fees. As a Lender, interest earned by the Fund, if any, during the period is reflected on the Statement of Operations under Income on Interfund lending.
The average borrowing or lending for the days outstanding and average interest rate for the Fund during the year ended July 31, 2020 were as follows (amounts in thousands):
Borrower or Lender | Amount Outstanding at July 31, 2020 | Average Borrowing* | Days Borrowing Outstanding | Average Interest Rate* | Maximum Borrowing During the Period | ||||||||||||||||||||||
Borrower | $ | — | $ | 2,304 | 4 | 2.49 | % | $ | 2,500 | ||||||||||||||||||
* For the year ended July 31, 2020, based on the number of days borrowings were outstanding.
25
USAA Mutual Funds Trust | Notes to Financial Statements — continued July 31, 2020 | ||||||
8. Federal Income Tax Information:
The Fund intends to distribute any net investment income quarterly. Distributable net realized gains, if any, are declared and paid at least annually.
The amounts of dividends from net investment income and distributions from net realized gains (collectively distributions to shareholders) are determined in accordance with federal income tax regulations, which may differ from GAAP. To the extent these "book/tax" differences are permanent in nature (e.g., net operating loss and distribution reclassification), such amounts are reclassified within the components of net assets based on their federal tax-basis treatment; temporary differences (e.g., wash sales) do not require reclassification. To the extent dividends and distributions exceed net investment income and net realized gains for tax purposes, they are reported as distributions of capital. Net investment losses incurred by the Fund may be reclassified as an offset to capital on the accompanying Statement of Assets and Liabilities.
The following permanent reclassifications were made between capital accounts to reflect the portion of the payments made to redeeming shareholders that was claimed as a distribution for income tax purposes during the year ended July 31, 2020 (amounts in thousands):
| Total accumulated earning/(loss) | Capital | ||||||
| $ | 79 | $ | (79 | ) | |||
The tax character of distributions paid during the tax years ended as noted below, were as follows (total distributions paid may differ from the Statements of Changes in Net Assets because, for tax purposes, dividends are recognized when actually paid) (amounts in thousands).
Year Ended July 31, 2020 | Year Ended July 31, 2019 | ||||||||||||||||||||||||||
Distributions paid from | Distributions paid from | ||||||||||||||||||||||||||
| Ordinary Income | Net Long-Term Capital Gains | Total Distributions Paid | Ordinary Income* | Net Long-Term Capital Gains | Total Distributions Paid | ||||||||||||||||||||||
$ | 63,972 | $ | 433,759 | $ | 497,731 | $ | 64,890 | $ | 156,504 | $ | 221,394 | ||||||||||||||||
* Includes short-term realized capital gains, if any, which are taxable as ordinary income.
As of July 31, 2020, the components of accumulated earnings (loss) on a tax basis were as follows (amounts in thousands):
| Undistributed Ordinary Income | Accumulated Earnings | Accumulated Capital and Other Losses | Unrealized Appreciation (Depreciation)* | Total Accumulated Earnings (Loss) | |||||||||||||||
| $ | 4,066 | $ | 4,066 | $ | (85,236 | ) | $ | 251,857 | $ | 170,687 | |||||||||
* The difference between the book-basis and tax-basis of unrealized appreciation/depreciation is attributable to the tax deferral of losses on wash sales.
At July 31, 2020, the Fund had net capital loss carryforwards as shown in the table below (amounts in thousands). It is unlikely that the Board will authorize a distribution of capital gains realized in the future until the capital loss carryforwards have been used.
| Short-Term Amount | Total | ||||||
| $ | 85,236 | $ | 85,236 | ||||
26
USAA Mutual Funds Trust | Notes to Financial Statements — continued July 31, 2020 | ||||||
As of July 31, 2020, the cost basis for federal income tax purposes, gross unrealized appreciation, gross unrealized depreciation, and net unrealized appreciation (depreciation) for investments were as follows (amounts in thousands):
| Cost of Investments for Federal Tax Purposes | Gross Unrealized Appreciation | Gross Unrealized Depreciation | Net Unrealized Appreciation (Depreciation) | ||||||||||||
| $ | 2,262,367 | $ | 417,028 | $ | (165,171 | ) | $ | 251,857 | |||||||
27
REPORT OF INDEPENDENT REGISTERED PUBLIC ACCOUNTING FIRM
To the Shareholders and the Board of Trustees of USAA Income Stock Fund
Opinion on the Financial Statements
We have audited the accompanying statement of assets and liabilities of USAA Income Stock Fund (the "Fund") (one of the funds constituting USAA Mutual Funds Trust (the "Trust")), including the schedule of portfolio investments, as of July 31, 2020, and the related statement of operations for the year then ended, the statements of changes in net assets for each of the two years in the period then ended, the financial highlights for each of the five years in the period then ended and the related notes (collectively referred to as the "financial statements"). In our opinion, the financial statements present fairly, in all material respects, the financial position of the Fund (one of the funds constituting USAA Mutual Funds Trust) at July 31, 2020, the results of its operations for the year then ended, the changes in its net assets for each of the two years in the period then ended and its financial highlights for each of the five years in the period then ended, in conformity with U.S. generally accepted accounting principles.
Basis for Opinion
These financial statements are the responsibility of the Trust's management. Our responsibility is to express an opinion on the Fund's financial statements based on our audits. We are a public accounting firm registered with the Public Company Accounting Oversight Board (United States) ("PCAOB") and are required to be independent with respect to the Trust in accordance with the U.S. federal securities laws and the applicable rules and regulations of the Securities and Exchange Commission and the PCAOB.
We conducted our audits in accordance with the standards of the PCAOB. Those standards require that we plan and perform the audit to obtain reasonable assurance about whether the financial statements are free of material misstatement, whether due to error or fraud. The Trust is not required to have, nor were we engaged to perform, an audit of the Trust's internal control over financial reporting. As part of our audits we are required to obtain an understanding of internal control over financial reporting, but not for the purpose of expressing an opinion on the effectiveness of the Trust's internal control over financial reporting. Accordingly, we express no such opinion.
Our audits included performing procedures to assess the risks of material misstatement of the financial statements, whether due to error or fraud, and performing procedures that respond to those risks. Such procedures included examining, on a test basis, evidence regarding the amounts and disclosures in the financial statements. Our procedures included confirmation of securities owned as of July 31, 2020, by correspondence with the custodian. Our audits also included evaluating the accounting principles used and significant estimates made by management, as well as evaluating the overall presentation of the financial statements. We believe that our audits provide a reasonable basis for our opinion.

We have served as the auditor of one or more Victory Capital investment companies since 1995.
San Antonio, Texas
September 29, 2020
28
USAA Mutual Funds Trust | Supplemental Information July 31, 2020 | ||||||
(Unaudited)
Trustee and Officer Information
Board of Trustees:
Overall responsibility for management of the Trust rests with the Board. The Trust is managed by the Board in accordance with the laws of the state of Delaware. There are currently 10 Trustees, eight of whom are not "interested persons" of the Trust within the meaning of that term under the 1940 Act ("Independent Trustees") and two of whom is an "interested person" of the Trust within the meaning of that term under the 1940 Act ("Interested Trustee"). The Trustees, in turn, elect the officers of the Trust to actively supervise its day-to-day operations.
The following tables list the Trustees, their ages, position with the Trust, commencement of service, principal occupations during the past five years and any directorships of other investment companies or companies whose securities are registered under the Securities Exchange Act of 1934, as amended, or who file reports under that Act. Each Trustee oversees 47 portfolios in the Trust. Each Trustee's address is 15935 La Cantera Pkwy, Building Two, San Antonio, TX, 78256. Pursuant to a policy adopted by the Board, the term of office for each Trustee shall be until the Independent Trustee reaches age 75 or an Interested Trustee reaches age 75. The Board may change or grant exceptions from this policy at any time without shareholder approval. A Trustee may resign or be removed by a vote of the other Trustees or the holders of a majority of the outstanding shares of the Trust at any time. Vacancies on the Board can be filled by the action of a majority of the Trustees, provided that after filling such vacancy at least two-thirds of the Trustees have been elected by the shareholders.
Name and Date of Birth | Position Held with the Trust | Year Commenced Service | Principal Occupation During Past 5 Years | Other Directorships Held During Past 5 Years | |||||||||||||||
Independent Trustees. | |||||||||||||||||||
| Jefferson C. Boyce, Born September 1957 | Lead Independent Trustee, and Vice Chairman | 2013 | Senior Managing Director, New York Life Investments, LLC (1992-2012) | Westhab, Inc. | |||||||||||||||
| John C. Walters, Born February 1962 | Trustee | 2019 | Retired. Mr. Walters brings significant Board experience including active involvement with the board of a Fortune 500 company, and a proven record of leading large, complex financial organizations. He has a demonstrated record of success in distribution, manufacturing, investment brokerage, and investment management in both the retail and institutional investment businesses. He has substantial experience in the investment management business with a demonstrated ability to develop and drive strategy while managing operation, financial, and investment risk. | Guardian Variable Products Trust (16 series), Lead Independent Director; Amerilife Holdings LLC, Director; Stadion Money Management; Director; University of North Carolina (Chapel Hill), Member Board of Governors. | |||||||||||||||
29
USAA Mutual Funds Trust | Supplemental Information — continued July 31, 2020 | ||||||
(Unaudited)
Name and Date of Birth | Position Held with the Trust | Year Commenced Service | Principal Occupation During Past 5 Years | Other Directorships Held During Past 5 Years | |||||||||||||||
| Robert L. Mason, Ph.D., Born July 1946 | Trustee | 1997 | Adjunct Professor in the Department of Management Science and Statistics in the College of Business at the University of Texas at San Antonio (since 2001); Institute Analyst, Southwest Research Institute (March 2002-January 2016) | None | |||||||||||||||
| Dawn M. Hawley, Born February 1954 | Trustee | 2014 | Manager of Finance, Menil Foundation, Inc. (May 2007-June 2011), which is a private foundation that oversees the assemblage of sculptures, prints, drawings, photographs, and rare books. Director of Financial Planning and Analysis and Chief Financial Officer, AIM Management Group, Inc. (October 1987-January 2006) | None | |||||||||||||||
| Paul L. McNamara, Born July 1948 | Trustee | 2012 | Director, Cantor Opportunistic Alternatives Fund, LLC (March 2010-February 2014) , which is a closed-end fund of funds by Cantor Fitzgerald Investment Advisors, LLC | None | |||||||||||||||
30
USAA Mutual Funds Trust | Supplemental Information — continued July 31, 2020 | ||||||
(Unaudited)
Name and Date of Birth | Position Held with the Trust | Year Commenced Service | Principal Occupation During Past 5 Years | Other Directorships Held During Past 5 Years | |||||||||||||||
| Richard Y. Newton III, Born January 1956 | Trustee | 2017 | Director, Elta North America (01/18-present), which is a global leader in the design, manufacture, and support of innovative electronic systems in the ground, maritime, airborne, and security domains for the nation's warfighters, security personnel, and first responders; Managing Partner, Pioneer Partnership Development Group (December 2015-present)); Executive Director, The Union League Club of New York (June 2014-November 2015): Executive Vice President, Air Force Association (August 2012-May 2014); Lieutenant General, United States Air Force (January 2008-June 2012) | None | |||||||||||||||
| Barbara B. Ostdiek, Ph.D., Born March 1964 | Trustee | 2008 | Senior Associate Dean of Degree Programs at Jesse H. Jones Graduate School of Business at Rice University (since 2013); Associate Professor of Finance at Jessie H. Jones Graduate School of Business at Rice University (since 2001) | None | |||||||||||||||
| Michael F. Reimherr, Born August 1945 | Trustee | 2000 | President of Reimherr Business Consulting (May 1995-December 2017); St. Mary's University Investment Committee overseeing University Endowment (since 2014) | None | |||||||||||||||
31
USAA Mutual Funds Trust | Supplemental Information — continued July 31, 2020 | ||||||
(Unaudited)
Name and Date of Birth | Position Held with the Trust | Year Commenced Service | Principal Occupation During Past 5 Years | Other Directorships Held During Past 5 Years | |||||||||||||||
Interested Trustees. | |||||||||||||||||||
| David C. Brown, ** Born May 1972 | Trustee | 2019 | Chairman and Chief Executive Officer (since 2013), Co-Chief Executive Officer (2011-2013), Victory Capital Management Inc.; Chairman and Chief Executive Officer, Victory Capital Holdings, Inc. (since 2013). Mr. Brown brings to the Board extensive business, finance and leadership skills gained and developed through years of experience in the financial services industry, including his tenure overseeing the strategic direction as CEO of Victory Capital. These skills, combined with Mr. Brown's extensive knowledge of the financial services industry and demonstrated success in the development and distribution of investment strategies and products, enable him to provide valuable insights to the Board and strategic direction for the Funds | Trustee, Victory Portfolios (42 series), Victory Portfolios II (26 series), Victory Variable Insurance Funds (9 series) | |||||||||||||||
32
USAA Mutual Funds Trust | Supplemental Information — continued July 31, 2020 | ||||||
(Unaudited)
Name and Date of Birth | Position Held with the Trust | Year Commenced Service | Principal Occupation During Past 5 Years | Other Directorships Held During Past 5 Years | |||||||||||||||
| Daniel S. McNamara, ** Born June 1966 | Trustee and Chair of the Board of Trustees | 2012 | Trustee, President, and Vice Chairman of USAA ETF Trust (June 2017-June 2019); President of Financial Advice & Solutions Group (FASG), USAA (since 2013); Director, Investment Management Company (IMCO) (September 2009-April 2014); President, Asset Management Company (AMCO) (August, 2011-April 2013); Senior Vice President of USAA Financial Planning Services Insurance Agency, Inc. (FPS) (since 2011); Director of USAA IMCO (since 2009); Chairman of Board of IMCO (since 2013); Director of AMCO, (August 2011-June 2019); President and Director of USAA Shareholder Account Services (SAS) (October 2009-June 2019); Director and Vice Chairman of FPS (since 2013); President and Director of USAA Investment Corporation (ICORP) (since 2010); Chairman of Board of ICORP (since 2013); Director of USAA Financial Advisors, Inc. (FAI) (since 2013); Chairman of Board of FAI (since 2015). Mr. McNamara brings to the Board extensive experience in the financial services industry, including experience as an officer of the Trust. | None | |||||||||||||||
** Mr. Dan McNamara, the Chairman of the Board, is deemed an "interested person" due to his previous position as Director of AMCO, the former investment adviser of the Funds. Mr. Brown is deemed an "interested person" due to his position as Chief Executive Officer of Victory Capital, investment adviser to the Funds.
The Statement of Additional Information includes additional information about the Trustees of the Trust and is available, without charge, on the SEC's website at www.sec.gov and/or by calling (800)-539-3863.
33
USAA Mutual Funds Trust | Supplemental Information — continued July 31, 2020 | ||||||
(Unaudited)
Officers:
The officers of the Trust, their ages, commencement of service and their principal occupations during the past five years, are detailed in the following table. Each officer serves until the earlier of his or her resignation, removal, retirement, death, or the election of a successor. The mailing address of each officer of the Trust is 15935 La Cantera Pkwy, Building Two, San Antonio, TX, 78256. The officers of the Trust receive no compensation directly from the Trust for performing the duties of their offices.
Name and Date of Birth | Position with the Trust | Year Commenced Service | Principal Occupation During Past 5 Years | ||||||||||||
Interested Officers. | |||||||||||||||
| Christopher K. Dyer, Born February 1962 | President | 2019 | Director of Fund Administration, Victory Capital (2004-present) | ||||||||||||
| Scott A Stahorsky, Born July 1969 | Vice President | 2019 | Manager, Fund Administration, Victory Capital (since 2015); Senior Analyst, Fund Administration, Victory Capital (prior to 2015) | ||||||||||||
| James K. De Vries, Born April 1969 | Treasurer, Principal Financial Officer | 2018 | Executive Director, Victory Capital Management Inc. (since 2019); Treasurer, USAA ETF Trust (September 2018-June 2019); Executive Director, Investment and Financial Administration, USAA (April 2012-June 2019); Assistant Treasurer, USAA ETF Trust (June 2017-September 2018); Assistant Treasurer, USAA Mutual Funds Trust (December 2013-February 2018) | ||||||||||||
| Allan Shaer, Born March 1965 | Assistant Treasurer | 2019 | Senior Vice President, Financial Administration, Citi Fund Services Ohio, Inc. (since 2016); Vice President, Mutual Fund Administration, JP Morgan Chase (2011-2016) | ||||||||||||
| Carol D. Trevino, Born October 1965 | Assistant Treasurer | 2018 | Director, Accounting and Finance, Victory Capital Management Inc. (since 2019); Accounting/Financial Director, USAA (December 2013-June 2019); Assistant Treasurer, USAA ETF Trust (September 2018-June 2019). | ||||||||||||
| Erin G. Wagner, Born February 1974 | Secretary | 2019 | Deputy General Counsel, the Adviser (since 2013) | ||||||||||||
| Charles Booth, Born April 1960 | Anti-Money Laundering Compliance Officer and Identity Theft Officer | 2019 | Director, Regulatory Administration and CCO Support Services, Citi Fund Services Ohio, Inc. (2007-present) | ||||||||||||
| Amy Campos, Born July 1976 | Chief Compliance Officer | 2019 | Chief Compliance Officer, USAA Mutual Funds Trust (since 2019); Executive Director, Deputy Chief Compliance Officer, USAA Mutual Funds Trust and USAA ETF Trust (July 2017-June 2019); Compliance Director, USAA Mutual Funds Trust (2014-July 2017) | ||||||||||||
34
USAA Mutual Funds Trust | Supplemental Information — continued July 31, 2020 | ||||||
(Unaudited)
Proxy Voting and Portfolio Holdings Information
Proxy Voting:
Information regarding the policies and procedures the Fund uses to determine how to vote proxies relating to portfolio securities is available without charge, upon request, by calling (800) 539-3863. The information is also included in the Fund's Statement of Additional Information, which is available on the SEC's website at www.sec.gov.
Information relating to how the Fund voted proxies relating to portfolio securities held during the most recent 12 months ended June 30 is available on the SEC's website at www.sec.gov.
Availability of Schedules of Portfolio Investments:
The Trust files a complete list of Schedules of Portfolio Investments with the SEC for the first and third quarter of each fiscal year on Form N-PORT. Forms N-PORT are available on the SEC's website at www.sec.gov.
Expense Examples
As a shareholder of the Fund, you may incur two types of costs: (1) transaction costs, and (2) ongoing costs, including management fees and other Fund expenses. These examples are intended to help you understand your ongoing costs (in dollars) of investing in the Fund and to compare these costs with the ongoing costs of investing in other mutual funds.
These examples are based on an investment of $1,000 invested at the beginning of the period and held for the entire period from February 1, 2020 through July 31, 2020.
The Actual Expense figures in the table below provide information about actual account values and actual expenses. You may use the information below, together with the amount you invested, to estimate the expenses that you paid over the period. Simply divide your account value by $1,000 (for example, an $8,600 account value divided by $1,000 = 8.6), then multiply the result by the number in the table under the heading entitled "Actual Expenses Paid During Period" to estimate the expenses you paid on your account during this period.
The Hypothetical Expense figures in the table below provide information about hypothetical account values and hypothetical expenses based on the Fund's actual expense ratio and an assumed rate of return of 5% per year before expenses, which is not the Fund's actual return. The hypothetical account values and expenses may not be used to estimate the actual ending account balance or expenses you paid for the period. You may use this information to compare this 5% hypothetical example with the 5% hypothetical examples that appear in shareholder reports of other funds.
Please note the expenses shown in the table below are meant to highlight your ongoing costs only and do not reflect any transactional costs. If these transactional costs were included, your costs would have been higher.
| Beginning Account Value 2/1/20 | Actual Ending Account Value 7/31/20 | Hypothetical Ending Account Value 7/31/20 | Actual Expenses Paid During Period 2/1/20- 7/31/20* | Hypothetical Expenses Paid During Period 2/1/20- 7/31/20* | Annualized Expense Ratio During Period 2/1/20- 7/31/20 | ||||||||||||||||||||||
Fund Shares | $ | 1,000.00 | $ | 914.10 | $ | 1,021.28 | $ | 3.43 | $ | 3.62 | 0.72 | % | |||||||||||||||
Institutional Shares | 1,000.00 | 914.20 | 1,021.38 | 3.33 | 3.52 | 0.70 | % | ||||||||||||||||||||
Class R6 Shares | 1,000.00 | 914.10 | 1,021.73 | 3.00 | 3.17 | 0.63 | % | ||||||||||||||||||||
* Expenses are equal to the average account value multiplied by the Fund's annualized expense ratio multiplied by 182/366 (the number of days in the most recent fiscal half-year divided by the number of days in the fiscal year).
35
USAA Mutual Funds Trust | Supplemental Information — continued July 31, 2020 | ||||||
(Unaudited)
Additional Federal Income Tax Information
The following federal tax information related to the Fund's fiscal year ended July 31, 2020, is provided for information purposes only and should not be used for reporting to federal or state revenue agencies. Federal tax information for the calendar year will be reported to you on Form 1099-DIV in January 2021.
With respect to distributions paid, the Fund designates the following amounts (or, if subsequently determined to be different, the maximum amount allowable) for the fiscal year ended July 31, 2020 (amounts in thousands):
| Dividend Received Deduction (corporate shareholders)* | Qualified Dividend Income (non-corporate shareholders)* | Short-Term Capital Gains Distributions | Long-Term Capital Gains Distributions(a) | ||||||||||||||||
100.00 | % | 88.03 | % | $ | 5,735 | $ | 433,759 | ||||||||||||
* Presented as a percentage of net investment income and excludes short-term capital gain distributions paid, if any. All or a portion of these amounts may be exempt from taxation at the state level.
(a) Pursuant to Section 852 of the Internal Revenue Code.
36
USAA Mutual Funds Trust | Supplemental Information — continued July 31, 2020 | ||||||
(Unaudited)
Liquidity Risk Management Program
The USAA Mutual Funds have adopted and implemented a written liquidity risk management program (the "LRMP") as required by Rule 22e-4 under the Investment Company Act of 1940, as amended. The LRMP is reasonably designed to assess and manage the Fund's liquidity risk, taking into consideration the Fund's investment strategy and the liquidity of its portfolio investments during normal and reasonably foreseeable stressed market conditions; its short and long-term cash flow projections; and its cash holdings and access to other liquidity management tools such as available funding sources including the Victory Funds Complex Interfund Lending Facility and Line of Credit (discussed in the Notes to Financial Statements). The USAA Mutual Funds' Board of Trustees approved the appointment of the Fund's investment adviser, Victory Capital Management Inc. ("Victory Capital"), as the administrator of the LRMP. At an in-person meeting held on February 26, 2020, Victory Capital provided an oral and written report to the Trustees on the operation and effectiveness of the LRMP during the previous year.
Victory Capital manages liquidity risks associated with the Fund's investments by monitoring, among other things, cash and cash equivalents, any use of derivatives, the concentration of investments, the appropriateness of the Fund's investment strategy, and by classifying every fund investment as either highly liquid, moderately liquid, less liquid or illiquid on at least a monthly basis. To assist with the classification of Fund investments, Victory Capital has retained a third-party provider of liquidity evaluation services. This provider determines preliminary liquidity classifications for all portfolio holdings based upon portfolio-level data and certain assumptions provided by Victory Capital. Victory Capital reviews the preliminary liquidity classifications, and, when appropriate, considers other information including input from the Fund's portfolio managers (including the portfolio managers employed by any investment sub-advisers) in determining final liquidity classifications.
The report from Victory Capital concluded that the Fund did not experience any significant liquidity challenges during the covered period, and the Fund's LRMP is reasonably designed to assess and manage its liquidity risk. The report also concluded that the LRMP continues to operate adequately and effectively to enable Victory Capital to oversee and manage liquidity risk and ensure the Fund is able to meet redemption requests without significant dilution to the remaining investors' interest in the Fund. During the review period, the Fund's portfolio consisted primarily of highly liquid investments, which are defined as cash and any investments reasonably expected to be converted to cash in current market conditions in three business days or less without significantly changing the market value of the investment. Therefore, the Fund has not adopted a Highly Liquid Investment Minimum. The Fund's investments were below the limitation on illiquid investments during the review period. Additionally, Victory Capital indicated that no events occurred that would require the filing of Form N-LIQUID and recommended no material changes to the LRMP.
37
Privacy Policy
Protecting the Privacy of Information
The Trust respects your right to privacy. We also know that you expect us to conduct and process your business in an accurate and efficient manner. To do so, we must collect and maintain certain personal information about you. This is the information we collect from you on applications or other forms, and from the transactions you make with us or third parties. It may include your name, address, social security number, account transactions and balances, and information about investment goals and risk tolerance.
We do not disclose any information about you or about former customers to anyone except as permitted or required by law. Specifically, we may disclose the information we collect to companies that perform services on our behalf, such as the transfer agent that processes shareholder accounts and printers and mailers that assist us in the distribution of investor materials. We may also disclose this information to companies that perform marketing services on our behalf. This allows us to continue to offer you Victory investment products and services that meet your investing needs, and to effect transactions that you request or authorize. These companies will use this information only in connection with the services for which we hired them. They are not permitted to use or share this information for any other purpose.
To protect your personal information internally, we permit access only by authorized employees and maintain physical, electronic and procedural safeguards to guard your personal information.*
* You may have received communications regarding information about privacy policies from other financial institutions which gave you the opportunity to "opt-out" of certain information sharing with companies which are not affiliated with that financial institution. The Trust does not share information with other companies for purposes of marketing solicitations for products other than the Trust. Therefore, the Trust does not provide opt-out options to their shareholders.
P.O. Box 182593
Columbus, Ohio 43218-2593

Visit our website at: | Call | ||||||
vcm.com | (800 | ) 235-8396 | |||||
23421-0920

JULY 31, 2020
Annual Report
USAA Intermediate-Term Bond Fund
Beginning January 1, 2021, as permitted by regulations adopted by the Securities and Exchange Commission, paper copies of the Fund's shareholder reports like this one will no longer be sent by mail, unless you specifically request paper copies of the reports from the Fund or from your financial intermediary, such as a broker-dealer or bank. Instead, the reports will be made available on VictoryFunds.com, and you will be notified by mail each time a report is posted and provided with a website link to access the report. If you already elected to receive shareholder reports electronically, you will not be affected by this change and you need not take any action.
You may elect to receive shareholder reports and other communications from the Fund or your financial intermediary electronically by notifying your financial intermediary directly, or if you are a direct investor, by calling (800) 235-8396 or logging on to usaa.com. Effective on or about November 6, 2020, a shareholder who has an account directly with the Fund will need to submit their request via email to TA.Processing@FISGlobal.com.
You may elect to receive all future reports in paper free of charge. You can inform the Fund or your financial intermediary that you wish to continue receiving paper copies of your shareholder reports by notifying your financial intermediary directly, or if you are a direct investor, by calling (800) 235-8396 or logging on to usaa.com. Effective on or about November 6, 2020, a shareholder who has an account directly with the Fund will need to submit their request via email to TA.Processing@FISGlobal.com. Your election to receive reports in paper will apply to all funds held with the USAA Mutual Funds or your financial intermediary.
Victory Capital means Victory Capital Management Inc., the investment adviser of the USAA Mutual Funds. USAA Mutual Funds are distributed by Victory Capital Services, Inc., member FINRA, an affiliate of Victory Capital. Victory Capital and its affiliates are not affiliated with United Services Automobile Association or its affiliates. USAA and the USAA logo are registered trademarks and the USAA Mutual Funds and USAA Investments logos are trademarks of United Services Automobile Association and are being used by Victory Capital and its affiliates under license.
USAA Mutual Funds Trust
TABLE OF CONTENTS
Shareholder Letter (Unaudited) | 2 | ||||||
Managers' Commentary (Unaudited) | 3 | ||||||
Investment Overview (Unaudited) | 6 | ||||||
| Investment Objective & Portfolio Holdings (Unaudited) | 8 | ||||||
Financial Statements | |||||||
Schedule of Portfolio Investments | 10 | ||||||
Statement of Assets and Liabilities | 38 | ||||||
Statement of Operations | 40 | ||||||
Statements of Changes in Net Assets | 41 | ||||||
Financial Highlights | 44 | ||||||
Notes to Financial Statements | 46 | ||||||
| Report of Independent Registered Public Accounting Firm | 59 | ||||||
Supplemental Information | 60 | ||||||
Trustees' and Officers' Information | 60 | ||||||
Proxy Voting and Portfolio Holdings Information | 66 | ||||||
Expense Examples | 66 | ||||||
Additional Federal Income Tax Information | 67 | ||||||
Liquidity Risk Management Program | 68 | ||||||
Privacy Policy (inside back cover) | |||||||
This report is for the information of the shareholders and others who have received a copy of the currently effective prospectus of the Fund, managed by Victory Capital Management Inc. It may be used as sales literature only when preceded or accompanied by a current prospectus, which provides further details about the Fund.
IRA DISTRIBUTION WITHHOLDING DISCLOSURE
We generally must withhold federal income tax at a rate of 10% of the taxable portion of your distribution and, if you live in a state that requires state income tax withholding, at your state's tax rate. However, you may elect not to have withholding apply or to have income tax withheld at a higher rate. Any withholding election that you make will apply to any subsequent distribution unless and until you change or revoke the election. If you wish to make a withholding election, or change or revoke a prior withholding election, call (800) 235-8396.
If you do not have a withholding election in place by the date of a distribution, federal income tax will be withheld from the taxable portion of your distribution at a rate of 10%. If you must pay estimated taxes, you may be subject to estimated tax penalties if your estimated tax payments are not sufficient and sufficient tax is not withheld from your distribution.
For more specific information, please consult your tax adviser.
1
(Unaudited)
Dear Shareholder,
The previous decade ended with the longest-ever bull market in U.S. equities still intact, even as investors wrestled with issues like softening global economic data, Brexit, and U.S.-China trade relations. In retrospect, those worries seem pedestrian given what we would experience.
A new and unexpected threat—a global pandemic, the novel coronavirus ("COVID-19")—first emerged in Asia and then began spreading globally and throughout the United States during the first quarter of 2020. This unprecedented and unanticipated event not only rendered all existing economic forecasts moot, but it also roiled stock and bond markets everywhere. It also brought the economy to a near halt. The historic bull market in stocks ended virtually overnight.
After an initial severe sell-off in March, equity markets recovered sharply. As our annual reporting period drew to a close on July 31, 2020, many of the broad market indexes had recovered and volatility had returned to more palatable levels. In fact, despite all the chaos, the S&P 500® Index, one of the most popular measures of large U.S. stocks, finished the fiscal year (July 31, 2020) at approximately 3,271, which was up 8.9% from one year ago. Quite the impressive reversal.
The market turmoil of early 2020 was not limited to equities. Fixed income volatility spiked when liquidity evaporated in late March as investors struggled to understand the ramifications of sheltering in place. Fortunately, the U.S. Federal Reserve (the "Fed") (as well as other global central banks) leapt into action—cutting interest rates, (re)starting quantitative easing and, in the case of the Fed, launching an array of programs to stabilize markets.
The new lending facilities and programs had their intended effect of improving fixed income liquidity and trading. Credit spreads across corporate, high yield, structured, and municipal markets were coaxed down from their highs. In addition, Congress came through with substantial fiscal stimulus that also was applauded by investors and markets. Although fixed income markets regained their footing, the yield on 10-Year Treasurys, a benchmark for low-risk investments, declined steadily during our fiscal year—from 2.02% at the beginning of our reporting period to approximately 0.55% as of July 31, 2020. This suggests that investors remain a little wary.
While the past year has been unprecedented for all of us, both personally and professionally, our portfolio managers continue to analyze the financial markets, economic conditions, and the trajectory of the pandemic, which will likely be a guiding factor on Fed policy and the markets.
No matter what happens in the near term, we believe that the massive monetary and fiscal policies introduced earlier this year will have longer-term ramifications. Despite this uncertainty, it's important to remain focused on your long-term investment goals and avoid making emotional decisions. If you invest with us directly, our Member Service Representatives are available to help. Call us at (800) 235-8396.
Sincerely,

Christopher K. Dyer, CFA
President,
USAA Mutual Funds
2
USAA Mutual Funds Trust
USAA Intermediate-Term Bond Fund
Managers' Commentary
(Unaudited)
USAA Investments, A Victory Capital Investment Franchise
Julianne Bass, CFA | Brian Smith, CFA, CPA | ||||||
John Spear, CFA | Kurt Daum, JD | ||||||
James F. Jackson Jr., CFA | R. Neal Graves, CFA, CPA | ||||||
• What were the market conditions over the reporting period?
Seems like eons ago, but just a year and a half ago, the U.S. Federal Reserve (the "Fed") had actually increased the Fed Funds rate to a range of 2.25%-2.50%. This turned out to be the highest the Fed Funds rate would go. Six-months later, the Fed began lowering interest rates, bringing the Fed Funds rate down to a range of 2.00%-2.25% when the reporting period started in August 2019. The Fed also stopped shrinking its balance sheet, all in an effort to keep the economy humming, as the effects of the trade war with China were starting to be felt here in the United States. While real GDP was somewhat weak in in the second quarter of 2019 at 1.50%, the rest of the year posted a respectable growth rate of 2.50%. However, the world was about to change in a way almost no one imagined.
Sometime in late 2019, reports were surfacing of a virus in Wuhan, China. The virus, a novel coronavirus ("COVID-19"), started spreading rapidly in Wuhan, and was soon beginning to show up in other countries. Ultimately, COVID-19 became a pandemic, and many countries around the world, including the United States, began "locking down" their economies in an effort to contain the virus. In the United States, the lockdowns began in earnest in March, and significantly affected almost every area of the economy.
Unprecedented became an everyday word, as life in the United States became unlike anything we have ever seen. With many businesses being forced to temporarily close, many people were put out of work. Monthly payrolls, which had been growing at an average of roughly 216 thousand per month since August 2019, plummeted to a loss of 1.4 million jobs in March, and an unprecedented loss of 21 million jobs in April. The unemployment rate, which was at a record low of 3.5% in February, jumped to 14.7% in April. Real GDP fell 5% in first quarter of 2020 and a record 32.9% in the second quarter of 2020, thus officially marking the economy as being in recession. Due to demand dropping precipitously from people not driving, coupled with a strong supply, the price of West Texas Intermediate ("WTI") crude oil, an indicating benchmark, actually went negative in April. This was due to investors in WTI futures contracts, which requires physical settlement, having to pay to not take delivery, forcing the price into unprecedented negative territory.
In response, federal and state governments stepped up stimulus efforts to help those out of work. Congress passed an unprecedented $1 trillion stimulus package, with unemployment benefits to temporarily supplement state payments, as well as grants/loans to businesses. The Fed significantly increased its balance sheet again, and in an unprecedented move, increased the types of bonds it can buy, to include corporate bonds.
3
USAA Mutual Funds Trust
USAA Intermediate-Term Bond Fund (continued)
Managers' Commentary (continued)
Although U.S. Treasury rates had already begun to fall by August 2019, in response to worries over the trade war with China and the economy beginning to slow, the unprecedented worldwide economic shutdown drove interest rates much lower, as investors bought U.S. Treasurys in a flight to quality. Given the Fed moving the Fed Funds rate to effectively zero and the economy only slowly beginning to reopen, U.S. Treasury rates remain at their lows. Although interest rates were already low, year over year decreases were dramatic. The two-year U.S. Treasury yield dropped 177 basis points, while 10-year and 30-year U.S. Treasury yields dropped 149 and 133 basis points, respectively. (A basis point is 1/100th of a percent.)
Given the pandemic, credit spreads (yield differentials between corporate bonds and U.S. Treasury securities of comparable maturity) significantly increased. Although they did not increase as much as in 2008, they increased much more rapidly. From a relatively low level in mid-February, spreads peaked in late March, which resulted in a very rapid increase. AAA, AA, A and BBB spreads widened by 10, 24, 18, and 33 basis points, respectively. High-yield spreads widened by 119 basis points. (Spreads are generally considered an indication of risk; the wider the spread, the greater the perceived risk.) Although spreads have continued to fall, they remain higher than pre-COVID-19 levels.
• How did the USAA Intermediate-Term Bond Fund (the "Fund") perform during the reporting period?
The Fund has five share classes: Fund Shares, Institutional Shares, Class A shares (redesignated from Adviser Shares), Class C shares, and R6 Shares. For the reporting period ended July 31, 2020, the Fund Shares, Institutional Shares, Class A shares, and R6 Shares had total returns of 8.94%, 9.11%, 8.66%, and 9.14%, respectively. The Class C shares commenced operations on June 29, 2020, and from that time through July 31, 2020, had a total return of 2.09%. This compares to returns of 10.12% for the Bloomberg Barclays U.S. Aggregate Bond Index (the "Index") and 9.07% for the Lipper Core Plus Bond Funds Index. At the same time, the Fund Shares, Institutional Shares, Class A shares, and R6 Shares provided a one-year dividend yield of 3.20%, 3.25%, 2.94%, and 3.37%, respectively, compared to 2.44% for the Lipper Core Plus Bond Funds Average.
• What strategies did you employ during the reporting period?
The Fund produced a positive total return during the reporting period ended July 31, 2020, and underperfomed the Index, as bond prices appreciated during the reporting period and spreads widened. Relative to the Index, the Fund was helped slightly by its allocation to and, to a greater extent, our issue selection of corporate bonds. The Fund benefited from overweight positions in financial sectors, such as property and casualty, life insurance and banking. The Fund also benefitted from allocations to independent energy producers, healthcare companies, automotive, food and beverage and building materials issuers. Bond selection, especially within energy producers (independent and integrated), leisure, technology, home construction, airlines, and gaming, also added to
4
USAA Mutual Funds Trust
USAA Intermediate-Term Bond Fund (continued)
Managers' Commentary (continued)
relative returns. An underweight position in U.S. Treasury securities, which generated greater returns than the Index, hindered relative performance, which was somewhat offset by our positioning of overweighting longer-maturity U.S. Treasuries in the portfolio. Finally, our income orientation contributed positively to results. Over time, the income generated by the Fund accounts for the majority of its long-term return. As of July 31, 2020, the Fund's SEC yield was 2.63%. This compares to an SEC yield of 3.19% on July 31, 2019.
In keeping with our investment process, we continued to build the portfolio bond by bond. We seek ideas where our fundamental understanding of the credit risk is different than that of the market, working with our team of analysts to evaluate each potential investment individually. During the reporting period, we found a number of attractive opportunities as we continued to seek relative values across the fixed income market. We took advantage of periods of volatility to add or reduce select investments in corporate credit, commercial mortgage-backed securities, asset backed securities and taxable municipals.
Our analysts continued to analyze and monitor every holding in the portfolio. We are committed to building a portfolio diversified among multiple asset classes and across a large number of issuers. To minimize the Fund's exposure to potential surprises, we limit the positions we take in any one issuer.
Thank you for allowing us to assist you with your investment needs.
5
USAA Mutual Funds Trust
USAA Intermediate-Term Bond Fund
Investment Overview
(Unaudited)
Average Annual Total Return
Year Ended July 31, 2020
| Fund Shares | Institutional Shares | Class A shares | Class C shares | Class R6 Shares | |||||||||||||||||||||||||||||||||||
INCEPTION DATE | 8/2/99 | 8/1/08 | 8/2/10 | 6/29/20 | 12/1/16 | ||||||||||||||||||||||||||||||||||
| Net Asset Value | Net Asset Value | Net Asset Value | Maxiumum Offering Price | Net Asset Value | Contingent Deferred Charges | Net Asset Value | Bloomberg Barclays U.S. Aggregate Bond Index1 | Lipper Core Plus Bond Funds Index2 | |||||||||||||||||||||||||||||||
One Year | 8.94 | % | 9.11 | % | 8.66 | % | 6.19 | % | N/A | N/A | 9.14 | % | 10.12 | % | 9.07 | % | |||||||||||||||||||||||
Five Year | 5.20 | % | 5.29 | % | 4.91 | % | 4.44 | % | N/A | N/A | N/A | 4.46 | % | 4.55 | % | ||||||||||||||||||||||||
Ten Year | 5.45 | % | 5.56 | % | N/A | N/A | N/A | N/A | N/A | 3.87 | % | 4.42 | % | ||||||||||||||||||||||||||
| Since Inception | N/A | N/A | 5.17 | % | 4.93 | % | 2.09 | % | 1.09 | % | 6.42 | % | N/A | N/A | |||||||||||||||||||||||||
Past performance is not indicative of future results. The performance data quoted represents past performance and current returns may be lower or higher. The investment return and principal value will fluctuate so that an investor's shares, when redeemed, may be worth more or less than the original cost. To obtain performance information current to the most recent month's end, please visit www.vcm.com.
Total return measures the price change in a share assuming the reinvestment of all net investment income and realized capital gain distributions, if any. The total returns quoted do not reflect adjustments made to the enclosed financial statements in accordance with U.S. generally accepted accounting principles or the deduction of taxes that a shareholder would pay on net investment income and realized capital gain distributions, including reinvested distributions, or redemptions of shares.
The total return figures set forth above include all waivers of fees for various periods since inception. Without such fee waivers, the total returns would have been lower.
USAA Intermediate-Term Bond Fund — Growth of $10,000
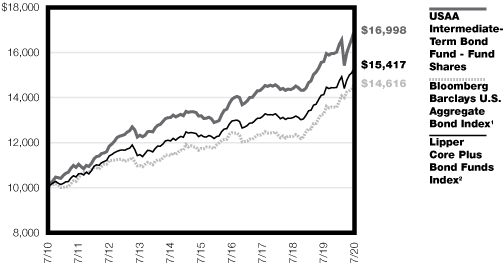
1The unmanaged Bloomberg Barclays U.S. Aggregate Bond Index covers the U.S. investment-grade rated bond market, including government and credit securities, agency mortgage pass-through securities, asset-backed securities, and commercial mortgage-backed securities that have remaining maturities of more than one year.
2The Lipper Core Plus Bond Funds Index measures performance of funds primarily invested in domestic investment-grade debt issues (rated in the top four grades), with any remaining investment in non-benchmark sectors such as high-yield, global and emerging market, and with dollar-weighted average maturities of five to ten years.
The graph reflects investment of growth of a hypothetical $10,000 investment in the Fund. Past performance is no guarantee of future results.
The graph and table do not reflect the deduction of taxes that a shareholder would pay on Fund distributions or the redemption of Fund shares.
6
USAA Mutual Funds Trust
USAA Intermediate-Term Bond Fund (continued)
12-MONTH DIVIDEND YIELD COMPARISON
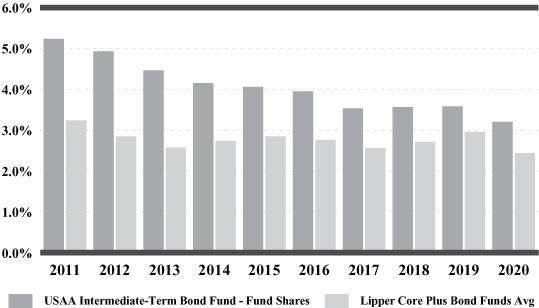
7
| USAA Mutual Funds Trust USAA Intermediate-Term Bond Fund | July 31, 2020 | ||||||
(Unaudited)
Investment Objective & Portfolio Holdings:
The USAA Intermediate-Term Bond Fund seeks high current income without undue risk to principal.
Asset Allocation*:
7/31/20
(% of Net Assets)
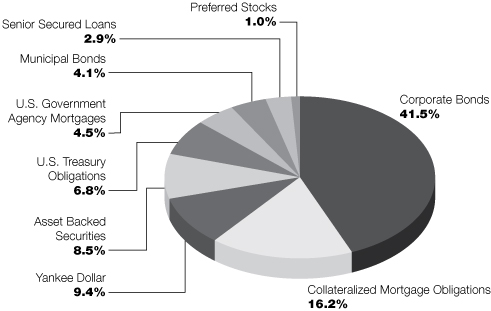
* Does not include futures, money market instruments, and short term investments purchased with cash collateral from securities loaned.
Percentages are of the net assets of the Fund and may not equal 100%.
8
| USAA Mutual Funds Trust USAA Intermediate-Term Bond Fund | July 31, 2020 | ||||||
(Unaudited)
Investment Objective & Portfolio Holdings:
Portfolio Ratings Mix
7/31/20
(% of Net Assets)
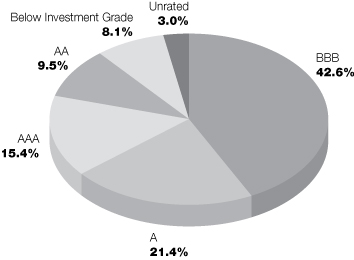
9
| USAA Mutual Funds Trust USAA Intermediate-Term Bond Fund | Schedule of Portfolio Investments July 31, 2020 | ||||||
(Amounts in Thousands, Except for Shares)
| Security Description | Principal Amount | Value | |||||||||
Asset-Backed Securities (8.5%) | |||||||||||
| AccessLex Institute, Series 2004-2, Class A3, 0.43%(LIBOR03M+19bps), 10/25/24, Callable 7/25/31 @ 100 (a) | $ | 2,550 | $ | 2,418 | |||||||
| Americredit Automobile Receivables Trust, Series 2018-1, Class D, 3.82%, 3/18/24, Callable 9/18/22 @ 100 | 6,360 | 6,633 | |||||||||
| ARI Fleet Lease Trust, Series 2020-A, Class B, 2.06%, 11/15/28, Callable 4/15/23 @ 100 (b) | 1,470 | 1,496 | |||||||||
| Ascentium Equipment Receivables Trust, Series 2017-1A, Class D, 3.80%, 1/10/24, Callable 7/10/21 @ 100 (b) | 767 | 776 | |||||||||
| Ascentium Equipment Receivables Trust, Series 2017-2A, Class D, 3.56%, 10/10/25, Callable 1/10/22 @ 100 (b) | 608 | 616 | |||||||||
| Avis Budget Rental Car Funding AESOP LLC, Series 2020- 1A, Class B, 2.68%, 8/20/26 (b) | 4,000 | 3,909 | |||||||||
| Bank of The West Auto Trust, Series 2019-1, Class C, 2.90%, 4/15/25, Callable 3/15/23 @ 100 (b) | 3,790 | 3,935 | |||||||||
| California Republic Auto Receivables Trust, Series 2018-1, Class D, 4.33%, 4/15/25, Callable 8/15/22 @ 100 | 3,533 | 3,697 | |||||||||
| Canadian Pacer Auto Receivables Trust, Series 2020-1A, Class C, 2.49%, 5/19/26, Callable 8/19/23 @ 100 (b) | 2,000 | 2,012 | |||||||||
| Canadian Pacer Auto Receivables Trust, Series 2019-1, Class C, 3.75%, 7/21/25, Callable 9/19/22 @ 100 (b) | 3,000 | 3,102 | |||||||||
| CarMax Auto Owner Trust, Series 2020-3, Class C, 1.69%, 4/15/26, Callable 6/15/24 @ 100 | 2,500 | 2,505 | |||||||||
| CarMax Auto Owner Trust, Series 2019-4, Class C, 2.60%, 9/15/25, Callable 7/15/23 @ 100 | 5,162 | 5,336 | |||||||||
| CarMax Auto Owner Trust, Series 2020-2, Class B, 2.90%, 8/15/25, Callable 7/15/23 @ 100 | 1,083 | 1,150 | |||||||||
| CarMax Auto Owner Trust, Series 2019-1, Class B, 3.45%, 11/15/24, Callable 2/15/23 @ 100 | 1,923 | 2,038 | |||||||||
| CarMax Auto Owner Trust, Series 2020-1, Class C, 2.34%, 11/17/25, Callable 9/15/23 @ 100 | 4,230 | 4,336 | |||||||||
| CarMax Auto Owner Trust, Series 2018-1, Class D, 3.37%, 7/15/24, Callable 2/15/22 @ 100 | 500 | 509 | |||||||||
| CarMax Auto Owner Trust, Series 2018-4, Class C, 3.85%, 7/15/24, Callable 11/15/22 @ 100 | 420 | 442 | |||||||||
| CCG Receivables Trust, Seies 2019-1, Class B, 3.22%, 9/14/26, Callable 11/14/22 @ 100 (b) | 1,040 | 1,068 | |||||||||
| CNH Equipment Trust, Series 2020-A, Class B, 2.30%, 10/15/27, Callable 7/15/24 @ 100 | 1,100 | 1,107 | |||||||||
| Credit Acceptance Auto Loan Trust, Series 2018-2, Class C, 4.16%, 9/15/27, Callable 3/15/21 @ 100 (b) | 8,720 | 9,084 | |||||||||
| Credit Acceptance Auto Loan Trust, Series 2018-1A, Class B, 3.60%, 4/15/27, Callable 6/15/21 @ 100 (b) | 3,325 | 3,400 | |||||||||
| Credit Acceptance Auto Loan Trust, Series 2020-1A, Class C, 2.59%, 6/15/29, Callable 1/15/24 @ 100 (b) | 5,000 | 5,083 | |||||||||
| Credit Acceptance Auto Loan Trust, Series 2018-1, Class C, 3.77%, 6/15/27, Callable 7/15/21 @ 100 (b) | 2,000 | 2,027 | |||||||||
| Credit Acceptance Auto Loan Trust, Series 2017-3, Class C, 3.48%, 10/15/26, Callable 11/15/21 @ 100 (b) | 9,665 | 9,795 | |||||||||
See notes to financial statements.
10
| USAA Mutual Funds Trust USAA Intermediate-Term Bond Fund | Schedule of Portfolio Investments — continued July 31, 2020 | ||||||
(Amounts in Thousands, Except for Shares)
| Security Description | Principal Amount | Value | |||||||||
| Credit Acceptance Auto Loan Trust, Series 2019- 3A, Class A, 2.38%, 11/15/28 (b) | $ | 5,000 | $ | 5,102 | |||||||
| Dell Equipment Finance Trust, Series 2017-2, Class D, 3.27%, 10/23/23, Callable 8/22/20 @ 100 (b) | 3,250 | 3,252 | |||||||||
| Dell Equipment Finance Trust, Series 2020-1, Class B, 2.98%, 4/24/23, Callable 10/22/22 @ 100 (b) | 775 | 802 | |||||||||
| Dell Equipment Finance Trust, Series 2020-1, Class C, 4.26%, 6/22/23, Callable 10/22/22 @ 100 (b) | 1,750 | 1,838 | |||||||||
| Drive Auto Receivables Trust, Series 2017-AA, Class D, 4.16%, 5/15/24, Callable 6/15/21 @ 100 (b) | 725 | 738 | |||||||||
| Drive Auto Receivables Trust, Series 2018-1, Class D, 3.81%, 5/15/24, Callable 4/15/22 @ 100 | 5,000 | 5,113 | |||||||||
| Drive Auto Receivables Trust, Series 2020-2, Class C, 2.28%, 8/17/26, Callable 7/15/25 @ 100 | 1,680 | 1,714 | |||||||||
Element Rail Leasing I LLC, Series 2014-1A, Class A2, 3.67%, 4/19/44 (b) | 5,000 | 5,028 | |||||||||
Enterprise Fleet Financing LLC, Series 2019-3, Class A2, 2.06%, 5/20/25 (b) | 2,500 | 2,534 | |||||||||
Evergreen Credit Card Trust, Series 2019-2, Class C, 2.62%, 9/15/24 (b) | 2,096 | 2,110 | |||||||||
Evergreen Credit Card Trust, Series 2019-3, Class C, 2.71%, 10/16/23 (b) | 4,000 | 4,073 | |||||||||
| Exeter Automobile Receivables Trust, Series 2018-1, Class C, 3.03%, 1/17/23, Callable 7/15/22 @ 100 (b) | 1,309 | 1,317 | |||||||||
| Exeter Automobile Receivables Trust, Series 2020-2A, Class B, 2.08%, 7/15/24, Callable 4/15/24 @ 100 (b) | 2,156 | 2,181 | |||||||||
| Exeter Automobile Receivables Trust, Series 2017-3A, Class D, 5.28%, 10/15/24, Callable 5/15/22 @ 100 (b) | 3,000 | 3,101 | |||||||||
| Exeter Automobile Receivables Trust, Series 2019-2A, Class C, 3.30%, 3/15/24, Callable 8/15/23 @ 100 (b) | 3,731 | 3,827 | |||||||||
| Exeter Automobile Receivables Trust, Series 2020-1A, Class C, 2.49%, 1/15/25, Callable 4/15/24 @ 100 (b) | 2,273 | 2,301 | |||||||||
| Exeter Automobile Receivables Trust, Series 2019-1A, Class C, 3.82%, 12/16/24, Callable 5/15/23 @ 100 (b) | 5,550 | 5,666 | |||||||||
| ExteNet LLC, Series 2019-1A, Class A2, 3.20%, 7/26/49, Callable 1/25/23 @ 100 (b) | 1,875 | 1,879 | |||||||||
| Flagship Credit Auto Trust, Series 2018-4, Class C, 4.11%, 10/15/24, Callable 12/15/23 @ 100 (b) | 1,210 | 1,268 | |||||||||
| Flagship Credit Auto Trust, Series 2017-4, Class B, 2.66%, 10/17/22, Callable 8/15/22 @ 100 (b) | 2,261 | 2,273 | |||||||||
| GM Financial Automobile Leasing Trust, Series 2020-2, Class C, 2.56%, 7/22/24, Callable 3/20/23 @ 100 | 1,625 | 1,681 | |||||||||
| GMF Floorplan Owner Revolving Trust, Series 2018-3, Class C, 3.68%, 9/15/22 (b) | 1,923 | 1,928 | |||||||||
| Goal Capital Funding Trust, Series 2005-2, Class A4, 0.56%(LIBOR03M+20bps), 8/25/44, Callable 8/25/20 @ 100 (a) | 9,037 | 8,718 | |||||||||
Hertz Vehicle Financing II LP, Series 2017-1A, Class A, 2.96%, 10/25/21 (b) | 6,828 | 6,834 | |||||||||
Hertz Vehicle Financing LP, Series 2019-3A, Class B, 3.03%, 12/26/25 (b) | 7,000 | 6,995 | |||||||||
Hertz Vehicle Financing LP, Series 2019-1A, Class B, 4.10%, 3/25/23 (b) | 7,120 | 7,130 | |||||||||
Hertz Vehicle Financing LP, Series 2017-2A, Class A, 3.29%, 10/25/23 (b) | 2,959 | 2,963 | |||||||||
Hertz Vehicle Financing LP, Series 2016-4A, Class A, 2.65%, 7/25/22 (b) | 675 | 676 | |||||||||
| HPEFS Equipment Trust, Series 2019-1A, Class B, 2.32%, 9/20/29, Callable 4/20/22 @ 100 (b) | 1,750 | 1,781 | |||||||||
See notes to financial statements.
11
| USAA Mutual Funds Trust USAA Intermediate-Term Bond Fund | Schedule of Portfolio Investments — continued July 31, 2020 | ||||||
(Amounts in Thousands, Except for Shares)
| Security Description | Principal Amount | Value | |||||||||
| HPEFS Equipment Trust, Series 2019-1A, Class C, 2.49%, 9/20/29, Callable 4/20/22 @ 100 (b) | $ | 1,350 | $ | 1,368 | |||||||
| HPEFS Equipment Trust, Series 2020-2A, Class C, 2.00%, 7/22/30, Callable 5/20/23 @ 100 (b) | 3,400 | 3,404 | |||||||||
| HPEFS Equipment Trust, Series 2020-1A, Class C, 2.03%, 2/20/30, Callable 12/20/22 @ 100 (b) | 2,851 | 2,851 | |||||||||
Master Credit Card Trust, Series 2020-1A, Class C, 2.59%, 9/23/24 (b) | 2,125 | 2,184 | |||||||||
Master Credit Card Trust, Series 2020-1A, Class B, 2.27%, 9/23/24 (b) | 833 | 856 | |||||||||
| MVW Owner Trust, Series 2013-1A, Class B, 2.74%, 4/22/30, Callable 8/20/20 @ 100 (b) | 687 | 687 | |||||||||
| NextGear Floorplan Master Owner Trust, Series 2017-2A, Class B, 3.02%, 10/17/22 (b) | 3,400 | 3,399 | |||||||||
NP SPE II LLC, Series 2019-2A, Class A2, 3.10%, 11/19/49 (b) | 9,283 | 9,244 | |||||||||
| NP SPE II LLC, Series 2017-1A, Class A2, 4.22%, 10/21/47, Callable 10/20/27 @ 100 (b) | 5,875 | 5,940 | |||||||||
NP SPE II LLC, Series 2019-2A, Class A1, 2.86%, 11/19/49 (b) | 12,171 | 12,171 | |||||||||
| Prestige Auto Receivables Trust, Series 2019-1A, Class D, 3.01%, 8/15/25, Callable 1/15/23 @ 100 (b) | 5,750 | 5,836 | |||||||||
| Santander Drive Auto Receivables Trust, Series 2017-3, Class D, 3.20%, 11/15/23, Callable 12/15/21 @ 100 | 1,450 | 1,476 | |||||||||
| Santander Drive Auto Receivables Trust, Series 2018-5, Class D, 4.19%, 12/16/24, Callable 9/15/22 @ 100 | 4,275 | 4,422 | |||||||||
| Santander Drive Auto Receivables Trust, Series 2018-2, Class D, 3.88%, 2/15/24, Callable 5/15/22 @ 100 | 1,665 | 1,710 | |||||||||
| Santander Drive Auto Receivables Trust, Series 2020-1, Class A3, 2.03%, 2/15/24, Callable 12/15/24 @ 100 | 1,063 | 1,085 | |||||||||
| Santander Retail Auto Lease Trust, Series 2019-B, Class C, 2.77%, 8/21/23, Callable 11/20/22 @ 100 (b) | 1,460 | 1,477 | |||||||||
| Santander Retail Auto Lease Trust, Series 2019-C, Class C, 2.39%, 11/20/23, Callable 1/20/23 @ 100 (b) | 1,782 | 1,789 | |||||||||
Sapphire Aviation Finance Ltd., Series 2018-1A, Class A, 4.25%, 3/15/40 (b) | 1,877 | 1,684 | |||||||||
| SCF Equipment Leasing LLC, Series 2017-2A, Class A, 3.41%, 12/20/23, Callable 8/20/20 @ 100 (b) | 4,775 | 4,786 | |||||||||
| SCF Equipment Leasing LLC, Series 2019-2, Class C, 3.11%, 6/21/27, Callable 10/20/24 @ 100 (b) | 5,500 | 5,490 | |||||||||
| SCF Equipment Leasing LLC, Series 2018-1, Class B, 3.97%, 12/20/25, Callable 8/20/20 @ 100 (b) | 1,000 | 1,023 | |||||||||
| Securitized Term Auto Receivables Trust, Series 2017-2A, Class A4, 2.29%, 3/25/22, Callable 1/25/21 @ 100 (b) | 3,266 | 3,283 | |||||||||
| SLM Student Loan Trust, Series 2006-2, Class B, 0.46%(LIBOR03M+22bps), 1/25/41, Callable 4/25/32 @ 100 (a) | 1,853 | 1,563 | |||||||||
| SLM Student Loan Trust, Series 2012-6, Class B, 1.17%(LIBOR01M+100bps), 4/27/43, Callable 10/25/27 @ 100 (a) | 2,500 | 2,190 | |||||||||
| SLM Student Loan Trust, Series 2003-14, Class B, 0.79%(LIBOR03M+55bps), 10/25/65, Callable 1/25/29 @ 100 (a) | 660 | 579 | |||||||||
| Stack Infrastructure Issuer LLC, Series 2019-2A, Class A2, 3.08%, 10/25/44, Callable 4/25/23 @ 100 (b) | 2,000 | 1,964 | |||||||||
| Synchrony Credit Card Master Note Trust, Series 2018-2, Class C, 3.87%, 5/15/26 | 7,583 | 7,833 | |||||||||
| TCF Auto Receivables Owner Trust, Series 2015-2A, Class D, 4.24%, 8/15/22, Callable 8/15/20 @ 100 (b) | 1,242 | 1,252 | |||||||||
See notes to financial statements.
12
| USAA Mutual Funds Trust USAA Intermediate-Term Bond Fund | Schedule of Portfolio Investments — continued July 31, 2020 | ||||||
(Amounts in Thousands, Except for Shares)
| Security Description | Principal Amount | Value | |||||||||
| Tesla Auto Lease Trust, Series 2020-A, Class C, 1.68%, 2/20/24, Callable 4/20/23 @ 100 (b) (c) | $ | 2,000 | $ | 2,000 | |||||||
| Tesla Auto Lease Trust, Series 2019-A, Class B, 2.41%, 12/20/22, Callable 11/20/22 @ 100 (b) | 5,000 | 5,125 | |||||||||
| Transportation Finance Equipment Trust, Series 2019-1, Class C, 2.19%, 8/23/24, Callable 9/23/23 @ 100 (b) | 1,250 | 1,258 | |||||||||
Trillium Credit Card Trust II, Series 2020-1A, Class C, 2.63%, 12/27/24 (b) | 4,900 | 4,863 | |||||||||
Trillium Credit Card Trust II, Series 2020-1A, Class B, 2.33%, 12/27/24 (b) | 2,912 | 2,947 | |||||||||
| Trinity Rail Leasing LLC, Series 2019-1, Class A, 3.82%, 4/17/49, Callable 8/17/20 @ 100 (b) | 3,749 | 3,819 | |||||||||
| TRIP Rail Master Funding LLC, Series 2017-1A, Class A2, 3.74%, 8/15/47, Callable 4/15/24 @ 100 (b) | 3,333 | 3,412 | |||||||||
| VB-S1 Issuer LLC, Series 2020-1A, Class C2, 3.03%, 6/15/50, Callable 6/15/24 @ 100 (b) | 600 | 609 | |||||||||
| VB-S1 Issuer LLC, Series 2020-1A, Class D, 4.09%, 6/15/50, Callable 6/15/24 @ 100 (b) | 750 | 759 | |||||||||
| Verizon Owner Trust, Series 2020-A, Class C, 2.06%, 7/22/24, Callable 3/20/23 @ 100 | 5,000 | 5,022 | |||||||||
| Volvo Financial Equipment LLC, Series 2019-2A, Class A4, 2.14%, 9/16/24, Callable 7/15/23 @ 100 (b) | 2,500 | 2,595 | |||||||||
| Westlake Automobile Receivables Trust, Series 2018-3A, Class D, 4.00%, 10/16/23, Callable 4/15/22 @ 100 (b) | 5,000 | 5,154 | |||||||||
| Westlake Automobile Receivables Trust, Series 2018-3, Class C, 3.61%, 10/16/23, Callable 4/15/22 @ 100 (b) | 7,686 | 7,820 | |||||||||
| Westlake Automobile Receivables Trust, Series 2019-2A, Class D, 3.20%, 11/15/24, Callable 11/15/22 @ 100 (b) | 2,550 | 2,611 | |||||||||
| Westlake Automobile Receivables Trust, Series 2018-2A, Class D, 4.00%, 1/16/24, Callable 12/15/21 @ 100 (b) | 9,625 | 9,839 | |||||||||
| World Omni Select Auto Trust, Series 2018-1A, Class D, 4.13%, 1/15/25, Callable 8/15/22 @ 100 (b) | 2,500 | 2,586 | |||||||||
323,262 | |||||||||||
Total Asset-Backed Securities (Cost $321,178) | 323,262 | ||||||||||
Collateralized Mortgage Obligations (16.2%) | |||||||||||
| Annisa CLO Ltd., Series 2016-2, Class BR, 1.92%(LIBOR03M+165bps), 7/20/31, Callable 10/20/20 @ 100 (a) (b) | 10,000 | 9,664 | |||||||||
| Arbor Multifamily Mortgage Securities Trust, Series 2020-MF1, Class C, 3.72%, 5/15/53 (b) (d) | 1,500 | 1,554 | |||||||||
| ARES LII CLO Ltd., Series 2019-52A, Class B, 2.11%(LIBOR03M+185bps), 4/22/31, Callable 4/22/21 @ 100 (a) (b) | 5,000 | 4,902 | |||||||||
| Austin Fairmont Hotel Trust, Series 2019-FAIR, Class D, 1.97%(LIBOR01M+180bps), 9/15/32 (a) (b) | 3,585 | 3,245 | |||||||||
| Austin Fairmont Hotel Trust, Series 2019-FAIR, Class A, 1.22%(LIBOR01M+105bps), 9/15/32 (a) (b) | 5,000 | 4,794 | |||||||||
Aventura Mall Trust, Series 2018-AVM, Class D, 4.11%, 7/5/40 (b) (d) | 2,420 | 2,140 | |||||||||
| Ballyrock CLO Ltd., Series 2020-1A, Class A2, 2.69%(LIBOR03M+240bps), 7/20/30, Callable 7/20/21 @ 100 (a) (b) | 2,500 | 2,500 | |||||||||
| Ballyrock CLO Ltd., Series 2020-1A, Class X, 1.29%(LIBOR03M+100bps), 7/20/30, Callable 7/20/21 @ 100 (a) (b) | 2,300 | 2,300 | |||||||||
See notes to financial statements.
13
| USAA Mutual Funds Trust USAA Intermediate-Term Bond Fund | Schedule of Portfolio Investments — continued July 31, 2020 | ||||||
(Amounts in Thousands, Except for Shares)
| Security Description | Principal Amount | Value | |||||||||
| BAMLL Commercial Mortgage Securities Trust, Series 2015-200P, Class C, 3.60%, 4/14/33 (b) (d) | $ | 6,450 | $ | 6,834 | |||||||
| BAMLL Commercial Mortgage Securities Trust, Series 2020-BOC, Class C, 3.03%, 1/15/32 (b) | 5,000 | 5,138 | |||||||||
| BAMLL Commercial Mortgage Securities Trust, Series 2015-200P, Class D, 3.60%(LIBOR01M+105bps), 4/14/33 (a) (b) | 11,735 | 12,130 | |||||||||
| BAMLL Commercial Mortgage Securities Trust, Series 2015-200P, Class B, 3.49%, 4/14/33 (b) | 13,485 | 14,345 | |||||||||
Bank, Series 2019-BNK22, Class AS, 3.21%, 11/15/62 | 9,000 | 9,747 | |||||||||
Bank, Series 2019-BN23, Class AS, 3.20%, 11/15/29 | 5,000 | 5,502 | |||||||||
Bank, Series 2017-BNK8, Class AS, 3.73%, 11/15/50 | 7,000 | 7,737 | |||||||||
Bank, Series 2020-BN27, Class XA, 1.16%, 4/15/63 (d) (e) | 37,962 | 3,546 | |||||||||
Bank, Series 2017-BNK4, Class AS, 3.78%, 5/15/50 | 5,000 | 5,608 | |||||||||
| Barclays Commercial Mortgage Trust, Series 2019-C5, Class AS, 3.37%, 11/15/52 | 5,000 | 5,537 | |||||||||
BBCMS Mortgage Trust, Series 2020-C7, Class XA, 1.63%, 4/15/53 (d) (e) | 17,795 | 1,996 | |||||||||
BBCMS Trust, Series 2013-TYSN, Class B, 4.04%, 9/5/32 (b) | 3,500 | 3,496 | |||||||||
BBCMS Trust, Series 2013-TYSN, Class A2, 3.76%, 9/5/32 (b) | 9,584 | 9,583 | |||||||||
BBCRE Trust, Series 2015-GTP, Class A, 3.97%, 8/10/33 (b) | 5,935 | 6,536 | |||||||||
| Bear Stearns Commercial Mortgage Securities Trust, Series 2005-PWR7, Class B, 5.21%, 2/11/41 (d) | 579 | 554 | |||||||||
Benchmark Mortgage Trust, Series 2019-B12, Class AS, 3.42%, 8/15/52 | 3,828 | 4,317 | |||||||||
| Benchmark Mortgage Trust, Series 2020-B18, Class A5, 1.93%, 7/15/53, Callable 7/11/30 @ 100 | 4,000 | 4,139 | |||||||||
Benchmark Mortgage Trust, Series 2020-B18, Class XA, 1.92%, 7/15/53 (d) | 40,138 | 5,011 | |||||||||
Benchmark Mortgage Trust, Series 2019-B14, Class AS, 3.35%, 12/15/61 | 5,000 | 5,521 | |||||||||
| BX Commercial Mortgage Trust, Series 2019-XL, Class D, 1.62%(LIBOR01M+145bps), 10/15/36 (a) (b) | 3,797 | 3,775 | |||||||||
| BX Commercial Mortgage Trust, Series 2019-XL, Class C, 1.42%(LIBOR01M+125bps), 10/15/36 (a) (b) | 7,594 | 7,535 | |||||||||
| BX Commercial Mortgage Trust, Series 2020-VIV2, Class C, 3.66%, 3/9/44 (b) (d) | 10,000 | 9,606 | |||||||||
| BX Commercial Mortgage Trust, Series 2020-BXLP, Class D, 1.42%(LIBOR01M+125bps), 12/15/29 (a) (b) | 2,997 | 2,944 | |||||||||
| BX Commercial Mortgage Trust, Series 2019-XL, Class B, 1.25%(LIBOR01M+108bps), 10/15/36 (a) (b) | 2,441 | 2,435 | |||||||||
| CFCRE Commercial Mortgage Trust, Series 2011-C2, Class AJ, 5.74%, 12/15/47 (b) (d) | 7,000 | 7,260 | |||||||||
| CGMS Commercial Mortgage Trust, Series 2017-B1, Class A4, 3.46%, 8/15/50 (f) | 8,050 | 9,070 | |||||||||
| CIFC Funding Ltd., Series 2017-I, Class B, 1.97%(LIBOR03M+170bps), 4/23/29, Callable 1/21/21 @ 100 (a) (b) | 3,500 | 3,397 | |||||||||
| CIFC Funding Ltd., Series 2017-III, Class A1, 1.49%(LIBOR03M+122bps), 7/20/30, Callable 10/20/20 @ 100 (a) (b) | 5,000 | 4,926 | |||||||||
| Citigroup Commercial Mortgage Trust, Series 2016-C2, Class A4, 2.83%, 8/10/49 | 8,293 | 8,937 | |||||||||
| Citigroup Commercial Mortgage Trust, Series 2020-555, Class D, 3.23%, 12/10/41 (b) | 5,000 | 4,953 | |||||||||
| Citigroup Commercial Mortgage Trust, Series 2020-555, Class B, 2.83%, 12/10/41 (b) | 4,000 | 4,142 | |||||||||
See notes to financial statements.
14
| USAA Mutual Funds Trust USAA Intermediate-Term Bond Fund | Schedule of Portfolio Investments — continued July 31, 2020 | ||||||
(Amounts in Thousands, Except for Shares)
| Security Description | Principal Amount | Value | |||||||||
| Citigroup Commercial Mortgage Trust, Series 2019-PRM, Class A, 3.34%, 5/10/36 (b) | $ | 3,750 | $ | 3,995 | |||||||
| Citigroup Commercial Mortgage Trust, Series 2019-PRM, Class D, 4.35%, 5/10/36 (b) | 1,850 | 1,866 | |||||||||
COMM Mortgage Trust, Series 2015-PC1, Class B, 4.36%, 7/10/50 (d) | 3,399 | 3,537 | |||||||||
COMM Mortgage Trust, Series 2013-CCRE11, Class AM, 4.72%, 8/10/50 (d) | 5,000 | 5,491 | |||||||||
COMM Mortgage Trust, Series 2020-CBM, Class C, 3.40%, 11/13/39 (b) | 2,625 | 2,529 | |||||||||
COMM Mortgage Trust, Series 2019-GC44, Class AM, 3.26%, 8/15/57 | 5,000 | 5,507 | |||||||||
COMM Mortgage Trust, Series 2015-PC1, Class AM, 4.29%, 7/10/50 (d) | 3,000 | 3,231 | |||||||||
COMM Mortgage Trust, Series 2014-277P, Class A, 3.61%, 8/10/49 (b) (d) | 9,500 | 10,238 | |||||||||
| COSMO Mortgage Trust, Series 2017-CSMO, Class C, 1.67%(LIBOR01M+150bps), 11/15/36 (a) (b) | 7,000 | 6,694 | |||||||||
CSMC Trust, Series 2020-West, Class A, 3.04%, 2/15/35 (b) | 2,500 | 2,392 | |||||||||
CSMC Trust, Series 2019-UVIL, Class C, 3.39%, 12/15/41 (b) (d) | 5,000 | 4,239 | |||||||||
| DBCG Mortgage Trust, Series 2017-BBG, Class A, 0.87%(LIBOR01M+70bps), 6/15/34 (a) (b) | 7,000 | 6,908 | |||||||||
DBJPM Mortgage Trust, Series 2016-SFC, Class A, 2.83%, 8/10/36 (b) | 5,000 | 4,714 | |||||||||
DBJPM Mortgage Trust, Series 2016-C1, Class A4, 3.28%, 5/10/49 | 5,228 | 5,761 | |||||||||
DBJPM Mortgage Trust, Series 2016-SFC, Class B, 3.24%, 8/10/36 (b) | 2,500 | 2,288 | |||||||||
DBUBS Mortgage Trust, Series 2011-LC3, Class B, 5.33%, 8/10/44 (b) (d) | 1,950 | 1,983 | |||||||||
| Dryden Senior Loan Fund, Series 2016-42A, Class BR, 1.82%(LIBOR03M+155bps), 7/15/30, Callable 10/15/20 @ 100 (a) (b) | 5,000 | 4,778 | |||||||||
| Dryden Senior Loan Fund, Series 2016-43A, Class BR, 2.02%(LIBOR03M+175bps), 7/20/29, Callable 10/20/20 @ 100 (a) (b) | 4,000 | 3,918 | |||||||||
| Flatiron CLO 18 Ltd., Series 2018-1A, Class A, 1.22%(LIBOR03M+95bps), 4/17/31, Callable 10/17/20 @ 100 (a) (b) | 3,500 | 3,404 | |||||||||
FREMF Mortgage Trust, Series 2019-K99, Class B, 3.65%, 9/25/29 (b) (d) | 10,000 | 11,069 | |||||||||
FREMF Mortgage Trust, Series 2017-K724, Class B, 3.48%, 11/25/23 (b) (d) | 7,000 | 7,339 | |||||||||
| Goldentree Loan Management U.S. CLO 8 Ltd., Series 2020-8A, Class B1(LIBOR03M+210bps), 7/20/31 (a) (b) (c) | 5,000 | 5,000 | |||||||||
| Golub Capital Partners 48 LP, Series 2020-48A, Class B1, 2.07%(LIBOR03M+180bps), 4/17/33, Callable 4/17/24 @ 100 (a) (b) | 4,350 | 4,202 | |||||||||
| GS Mortgage Securities Corp. Trust, Series 2020-UPTN, Class B, 2.95%, 12/10/39 (b) | 1,735 | 1,726 | |||||||||
| GS Mortgage Securities Trust, Series 2012-ALOH, Class A, 3.55%, 4/10/34 (b) | 3,534 | 3,564 | |||||||||
| GS Mortgage Securities Trust, Series 2012-GC6, Class AS, 4.95%, 1/10/45 (b) | 3,000 | 3,108 | |||||||||
| GS Mortgage Securities Trust, Series 2019-GSA1, Class AS, 3.34%, 11/10/52 | 10,000 | 10,938 | |||||||||
| GS Mortgage Securities Trust, Series 2019-GSA1, Class A4, 3.05%, 11/10/52 | 7,000 | 7,828 | |||||||||
| GS Mortgage Securities Trust, Series 2020-GC45, Class AS, 3.17%, 2/13/53 | 3,750 | 4,037 | |||||||||
| Houston Galleria Mall Trust, Series 2015-HGLR, Class A1A2, 3.09%, 3/5/37 (b) | 5,100 | 5,177 | |||||||||
| Hudson Yards Mortgage Trust, Series 2019-30HY, Class D, 3.44%, 7/10/39 (b) (d) | 8,187 | 8,382 | |||||||||
See notes to financial statements.
15
| USAA Mutual Funds Trust USAA Intermediate-Term Bond Fund | Schedule of Portfolio Investments — continued July 31, 2020 | ||||||
(Amounts in Thousands, Except for Shares)
| Security Description | Principal Amount | Value | |||||||||
| Hudson Yards Mortgage Trust, Series 2016-10HY, Class A, 2.84%, 8/10/38 (b) | $ | 8,020 | $ | 8,650 | |||||||
| Hudson Yards Mortgage Trust, Series 2019-55HY, Class D, 2.94%, 12/10/41 (b) (d) | 10,672 | 10,467 | |||||||||
Jackson Park Trust, Series 2019-LIC, Class C, 3.13%, 10/14/39 (b) (d) | 5,000 | 5,178 | |||||||||
Jackson Park Trust, Series 2019-LIC, Class A, 2.77%, 10/14/39 (b) | 5,000 | 5,375 | |||||||||
| JP Morgan Chase Commercial Mortgage Securities Trust, Series 2006-LDP7, Class AJ, 6.07%, 4/17/45 (d) | 1,002 | 381 | |||||||||
| JP Morgan Chase Commercial Mortgage Securities Trust, Series 2010-C2, Class C, 5.65%, 11/15/43 (b) (d) | 4,000 | 4,022 | |||||||||
| JP Morgan Chase Commercial Mortgage Securities Trust, Series 2012-C8, Class XA, 1.77%, 10/15/45 (d) (e) | 19,007 | 578 | |||||||||
| JP Morgan Chase Commercial Mortgage Securities Trust, Series 2019-OSB, Class D, 3.78%, 6/5/39 (b) (d) | 2,000 | 2,000 | |||||||||
| JP Morgan Chase Commercial Mortgage Securities Trust, Series 2019-OSB, Class C, 3.75%, 6/5/39 (b) (d) | 1,614 | 1,677 | |||||||||
| JP Morgan Chase Commercial Mortgage Securities Trust, Series 2011-C5, Class AS, 5.42%, 8/15/46 (b) (d) | 6,100 | 6,309 | |||||||||
| JPMorgan Chase Commercial Mortgage Securities Trust, Series 2013-C10, Class C, 4.11%, 12/15/47 (d) | 3,045 | 3,059 | |||||||||
| KNDL Mortgage Trust, Series 2019-KNSQ, Class E, 1.97%(LIBOR01M+180bps), 5/15/36 (a) (b) | 2,500 | 2,406 | |||||||||
| LCM LP, Series 18A, Class A1R, 1.29%(LIBOR03M+102bps), 4/20/31, Callable 10/20/20 @ 100 (a) (b) | 1,000 | 975 | |||||||||
| Magnetite Ltd., Series 2015-12A, Class BRRA, 1.87%(LIBOR03M+160bps), 10/15/31, Callable 10/15/20 @ 100 (a) (b) | 3,240 | 3,141 | |||||||||
| Morgan Stanley Bank of America Merrill Lynch Trust, Series 2012-C6, Class XA, 1.61%, 11/15/45 (b) (d) (e) | 18,876 | 500 | |||||||||
| Morgan Stanley Bank of America Merrill Lynch Trust, Series C17, Class A5, 3.74%, 8/15/47, Callable 7/11/24 @ 100 | 5,000 | 5,438 | |||||||||
| Morgan Stanley Capital I Trust, Series 2017-CLS, Class E, 2.12%(LIBOR01M+195bps), 11/15/34 (a) (b) | 1,140 | 1,110 | |||||||||
| Morgan Stanley Capital I Trust, Series 2017-CLS, Class A, 0.87%(LIBOR01M+70bps), 11/15/34 (a) (b) | 2,105 | 2,094 | |||||||||
| Morgan Stanley Capital I Trust, Series 2017-CLS, Class B, 1.02%(LIBOR01M+85bps), 11/15/34 (a) (b) | 1,100 | 1,085 | |||||||||
| Morgan Stanley Capital I Trust, Series 2017-CLS, Class C, 1.17%(LIBOR01M+100bps), 11/15/34 (a) (b) | 2,745 | 2,693 | |||||||||
| Morgan Stanley Capital I Trust, Series 2020-CNP, Class A, 2.51%, 4/5/42 (b) (d) | 1,000 | 1,057 | |||||||||
| Neuberger Berman CLO XIV Ltd., Series 2013-14A, Class BR2, 1.75%(LIBOR03M+150bps), 1/28/30, Callable 1/28/21 @ 100 (a) (b) | 5,000 | 4,836 | |||||||||
| Neuberger Berman Loan Advisers CLO Ltd., Series 2018-29A, Class B1, 1.97%(LIBOR03M+170bps), 10/19/31, Callable 10/19/20 @ 100 (a) (b) | 4,000 | 3,879 | |||||||||
| Neuberger Berman Loan Advisers CLO Ltd., Series 2018-29A, Class B2, 4.60%, 10/19/31, Callable 10/19/20 @ 100 (b) | 5,000 | 4,994 | |||||||||
| Oaktree EIF Ltd., Series 2016-IIIA, Class B, 2.27%(LIBOR03M+200bps), 10/20/27, Callable 10/20/20 @ 100 (a) (b) | 10,000 | 9,864 | |||||||||
| Octagon Investment Partners 42 Ltd., Series 2019-3A, Class B1, 2.23%(LIBOR03M+195bps), 4/15/31, Callable 4/15/21 @ 100 (a) (b) | 5,000 | 4,921 | |||||||||
See notes to financial statements.
16
| USAA Mutual Funds Trust USAA Intermediate-Term Bond Fund | Schedule of Portfolio Investments — continued July 31, 2020 | ||||||
(Amounts in Thousands, Except for Shares)
| Security Description | Principal Amount | Value | |||||||||
| Octagon Investment Partners 47 Ltd., Series 2020-1A, Class B, 2.85%(LIBOR03M+260bps), 4/20/31, Callable 7/20/21 @ 100 (a) (b) | $ | 3,000 | $ | 3,010 | |||||||
| Octagon Investment Partners XVII Ltd., Series 2013-1A, Class CR2, 1.94%(LIBOR03M+170bps), 1/25/31, Callable 10/25/20 @ 100 (a) (b) | 2,750 | 2,561 | |||||||||
One Bryant Park Trust, Series 2019-OBP, Class A, 2.52%, 9/13/49 (b) | 11,040 | 11,910 | |||||||||
| Palmer Square Loan Funding Ltd., Series 2020-1A, Class B, 2.28%(LIBOR03M+190bps), 2/20/28, Callable 2/20/21 @ 100 (a) (b) | 2,000 | 1,916 | |||||||||
| Palmer Square Loan Funding Ltd., Series 2019-3, Class B, 2.48%(LIBOR03M+210bps), 8/20/27, Callable 8/20/20 @ 100 (a) (b) | 5,000 | 4,874 | |||||||||
| Palmer Square Loan Funding Ltd., Series 2020-3A, Class B, 3.61%(LIBOR03M+330bps), 7/20/28, Callable 7/20/21 @ 100 (a) (b) | 2,800 | 2,790 | |||||||||
| Palmer Square Loan Funding Ltd., Series 2019-4, Class A2, 1.86%(LIBOR03M+160bps), 10/24/27, Callable 10/24/20 @ 100 (a) (b) | 4,500 | 4,399 | |||||||||
| Palmer Square Loan Funding Ltd., Series 2019-2, Class B, 2.52%(LIBOR03M+225bps), 4/20/27, Callable 10/20/20 @ 100 (a) (b) | 5,000 | 4,833 | |||||||||
| Palmer Square Loan Funding Ltd., Series 2019-4, Class B, 2.36%(LIBOR03M+210bps), 10/24/27, Callable 10/24/20 @ 100 (a) (b) | 5,000 | 4,894 | |||||||||
| Race Point CLO Ltd., Series 2016-10A, Class B1R, 1.89%(LIBOR03M+165bps), 7/25/31, Callable 10/25/20 @ 100 (a) (b) | 5,000 | 4,775 | |||||||||
| Sound Point CLO VII-R Ltd., Series 2014-3RA, Class C, 2.51%(LIBOR03M+225bps), 10/23/31, Callable 10/23/20 @ 100 (a) (b) | 5,000 | 4,752 | |||||||||
| Sound Point CLO XVIII Ltd., Series 2017-4A, Class B, 2.07%(LIBOR03M+180bps), 1/21/31, Callable 10/20/20 @ 100 (a) (b) | 1,000 | 933 | |||||||||
| Stewart Park CLO Ltd., Series 2015-1A, Class A2R, 1.53%(LIBOR03M+125bps), 1/15/30, Callable 10/15/20 @ 100 (a) (b) | 2,000 | 1,912 | |||||||||
| Stratus CLO Ltd., Series 2020-1A, Class A, 3.29%(LIBOR03M+198bps), 4/30/28, Callable 4/20/21 @ 100 (a) (b) | 3,000 | 3,004 | |||||||||
| Structured Asset Mortgage Investments II Trust, Series 2005-AR5, Class B1, 0.69%(LIBOR01M+50bps), 7/19/35, Callable 8/19/20 @ 100 (a) | 1,258 | 1,138 | |||||||||
| TIAA CLO I Ltd., Series 2016-1A, Class B2R, 4.59%, 7/20/31, Callable 10/20/20 @ 100 (b) | 2,500 | 2,496 | |||||||||
| TIAA CLO I Ltd., Series 2016-1A, Class B1R, 2.02%(LIBOR03M+175bps), 7/20/31, Callable 10/20/20 @ 100 (a) (b) | 2,500 | 2,408 | |||||||||
| TIAA CLO IV Ltd., Series 2018-1A, Class A2, 1.97%(LIBOR03M+170bps), 1/20/32, Callable 1/20/21 @ 100 (a) (b) | 5,000 | 4,804 | |||||||||
| Trinitas CLO Ltd., Series 2019-11A, Class B1, 2.58%(LIBOR03M+230bps), 7/15/32, Callable 7/15/21 @ 100 (a) (b) | 5,000 | 4,977 | |||||||||
| Trinitas CLO Ltd., Series 2019-11A, Class A2, 2.23%(LIBOR03M+195bps), 7/15/32, Callable 7/15/21 @ 100 (a) (b) | 5,610 | 5,395 | |||||||||
| Tryon Park CLO Ltd., Series 2013-1A, Class A1SR, 1.17%(LIBOR03M+89bps), 4/15/29, Callable 10/15/20 @ 100 (a) (b) | 5,000 | 4,936 | |||||||||
| UBS Commercial Mortgage Trust, Series 2012-C1, Class XA, 2.07%, 5/10/45 (b) (d) | 23,209 | 571 | |||||||||
| UBS-Citigroup Commercial Mortgage Trust, Series 2011-C1, Class AS, 5.15%, 1/10/45 (b) | 4,756 | 4,946 | |||||||||
| Venture CLO Ltd., Series 2014-16A, Class ARR, 1.13%(LIBOR03M+85bps), 1/15/28, Callable 10/15/20 @ 100 (a) (b) | 4,231 | 4,180 | |||||||||
| Voya CLO Ltd., Series 2013-2A, Class A1R, 1.21%(LIBOR03M+97bps), 4/25/31, Callable 10/25/20 @ 100 (a) (b) | 8,750 | 8,476 | |||||||||
See notes to financial statements.
17
| USAA Mutual Funds Trust USAA Intermediate-Term Bond Fund | Schedule of Portfolio Investments — continued July 31, 2020 | ||||||
(Amounts in Thousands, Except for Shares)
| Security Description | Principal Amount | Value | |||||||||
| Voya CLO Ltd., Series 2019-4A, Class A1, 1.62%(LIBOR03M+134bps), 1/15/33, Callable 1/15/22 @ 100 (a) (b) | $ | 5,000 | $ | 4,920 | |||||||
| Voya CLO Ltd., Series 2019-4A, Class B, 2.27%(LIBOR03M+200bps), 1/15/33, Callable 1/15/22 @ 100 (a) (b) | 4,500 | 4,411 | |||||||||
| Voya CLO Ltd., Series 2018-3, Class B, 1.92%(LIBOR03M+165bps), 10/15/31, Callable 10/15/20 @ 100 (a) (b) | 2,500 | 2,406 | |||||||||
| Voya CLO Ltd., Series 2017-1, Class A2, 1.87%(LIBOR03M+160bps), 4/17/30, Callable 10/17/20 @ 100 (a) (b) | 3,000 | 2,900 | |||||||||
| Voya CLO Ltd., Series 2015-3A, Class BR, 2.47%(LIBOR03M+220bps), 10/20/31, Callable 10/20/20 @ 100 (a) (b) | 1,250 | 1,176 | |||||||||
| Voya CLO Ltd., Series 2020-1A, Class B1, 2.50%(LIBOR03M+220bps), 7/16/31, Callable 7/16/21 @ 100 (a) (b) | 2,000 | 2,000 | |||||||||
| Wells Fargo Commercial Mortgage Trust, Series 2015-NXS3, Class B, 4.55%, 9/15/57 (d) | 2,000 | 1,952 | |||||||||
| Wells Fargo Commercial Mortgage Trust, Series 2015-NXS4, Class B, 4.22%, 12/15/48 (d) | 5,000 | 5,234 | |||||||||
| Wells Fargo Commercial Mortgage Trust, Series 2015-NXS4, Class AS, 3.97%, 12/15/48 | 3,500 | 3,763 | |||||||||
| Wells Fargo Commercial Mortgage Trust, Series 2010-C1, Class B, 5.28%, 11/15/43 (b) (d) | 3,000 | 3,007 | |||||||||
| Wells Fargo Commercial Mortgage Trust, Series 2020-C56, Class AS, 3.11%, 6/15/53 | 2,000 | 2,163 | |||||||||
| Wells Fargo Commercial Mortgage Trust, Series 2018-AUS, Class A, 4.06%, 7/17/36 (b) (d) | 4,200 | 4,657 | |||||||||
| WFRBS Commercial Mortgage Trust, Series 2012-C10, Class XA, 1.53%, 12/15/45 (b) (d) (e) | 58,811 | 1,762 | |||||||||
| WFRBS Commercial Mortgage Trust, Series 2011-C2, Class B, 5.17%, 2/15/44 (b) (d) | 6,000 | 6,007 | |||||||||
| WFRBS Commercial Mortgage Trust, Series 2011-C5, Class B, 5.66%, 11/15/44 (b) (d) | 5,348 | 5,525 | |||||||||
622,661 | |||||||||||
Total Collateralized Mortgage Obligations (Cost $615,371) | 622,661 | ||||||||||
Preferred Stocks (1.0%) | |||||||||||
Consumer Staples (0.6%): | |||||||||||
CHS, Inc., cumulative redeemable, Series 2, 7.10%(LIBOR03M+429bps) (a) (g) | 400,000 | 10,080 | |||||||||
Dairy Farmers of America, Inc., cumulative redeemable, 7.88% (b) (g) | 150,000 | 13,200 | |||||||||
23,280 | |||||||||||
Financials (0.4%): | |||||||||||
| American Overseas Group Ltd., non-cumulative, Series A(LIBOR03M+356bps), 12/15/66 (a) (h) (i) | 2,000 | 500 | |||||||||
| Citigroup Capital, cumulative redeemable, 6.64%(LIBOR03M+637bps), 10/30/40 (a) | 87,500 | 2,363 | |||||||||
CoBank ACB, 1.45% (b) (g) | 2,000 | 1,220 | |||||||||
Delphi Financial Group, Inc., 3.58%(LIBOR03M+319bps), 5/15/37 (a) (i) | 369,987 | 7,770 | |||||||||
U.S. Bancorp, non-cumulative, Series A, 3.50%(LIBOR03M+102bps) (g) | 5,000 | 4,189 | |||||||||
16,042 | |||||||||||
Total Preferred Stocks (Cost $42,416) | 39,322 | ||||||||||
See notes to financial statements.
18
| USAA Mutual Funds Trust USAA Intermediate-Term Bond Fund | Schedule of Portfolio Investments — continued July 31, 2020 | ||||||
(Amounts in Thousands, Except for Shares)
| Security Description | Principal Amount | Value | |||||||||
Convertible Corporate Bonds (0.0%) (j) | |||||||||||
Energy (0.0% (j)): | |||||||||||
Whiting Petroleum Corp., 1.25%, 12/1/20 (k) (l) | $ | 2,500 | $ | 472 | |||||||
Total Convertible Corporate Bonds (Cost $2,500) | 472 | ||||||||||
Senior Secured Loans (2.9%) | |||||||||||
Allen Media LLC, 5.81%(LIBOR03M+550bps), 2/10/27 (a) | 997 | 962 | |||||||||
| Alterra Mountain Co., 1st Lien Term Loan B, 5.50%(LIBOR01M+450bps), 5/13/26 (a) (c) | 4,988 | 4,950 | |||||||||
| AssuredPartners, Inc., 1st Lien Term Loan B, 5.50%(LIBOR01M+450bps), 2/13/27 (a) | 1,496 | 1,481 | |||||||||
Bass Pro Group LLC, Term Loan B, 6.07%(LIBOR06M+500bps), 12/16/23 (a) | 2,992 | 2,972 | |||||||||
| Blackstone CQP Holdco LP, 1st Lien Term Loan B, 3.81%(LIBOR03M+350bps), 6/20/24 (a) | 9,410 | 9,136 | |||||||||
| Buckeye Partners LP, 1st Lien Term Loan, 2.92%(LIBOR01M+275bps), 12/16/26 (a) | 1,995 | 1,947 | |||||||||
California Resources Corp., 5.75%(LIBOR03M+475bps), 12/31/22 (a) (k) | 5,000 | 1,811 | |||||||||
CenturyLink, Inc., 2.43%(LIBOR01M+225bps), 3/15/27 (a) (c) | 4,985 | 4,793 | |||||||||
CITGO Petroleum Corp., 6.00%(LIBOR06M+500bps), 3/22/24 (a) | 1,440 | 1,390 | |||||||||
| Clear Channel Outdoor Holdings, Inc., 4.26%(LIBOR03M+350bps), 11/25/26 (a) | 4,965 | 4,407 | |||||||||
| ClubCorp Holdings, Inc., 1st Lien Term Loan B, 3.06%(LIBOR03M+275bps), 9/18/24 (a) | 2 | 2 | |||||||||
Delta Air Lines, Inc., 5.75%(LIBOR03M+475bps), 4/27/23 (a) | 2,500 | 2,457 | |||||||||
Elanco Animal Health, Inc., 1.91%(LIBOR01M+175bps), 2/4/27 (a) (c) | 4,000 | 3,895 | |||||||||
| Endo International PLC, 1st Lien Term Loan B, 5.00%(LIBOR03M+425bps), 4/29/24 (a) | 4,912 | 4,689 | |||||||||
Epic Crude Services, LP, 5.37%(LIBOR03M+500bps), 3/1/26 (a) | 4,000 | 3,117 | |||||||||
Graham Packaging Co., Inc., 4.50%(LIBOR01M+375bps), 7/28/27 (a) (c) | 1,500 | 1,495 | |||||||||
| H-Food Holdings LLC, 1st Lien Term Loan, 3.87%(LIBOR01M+369bps), 5/31/25 (a) | 4,962 | 4,782 | |||||||||
| H-Food Holdings LLC, 1st Lien Term Loan B3, 6.00%(LIBOR01M+500bps), 5/31/25 (a) | 500 | 493 | |||||||||
| HUB International Ltd., 1st Lien Term Loan B, 5.00%(LIBOR03M+400bps), 4/25/25 (a) | 3,965 | 3,967 | |||||||||
| iHeartCommunications, InC., 1st Lien Term Loan B, 4.75%(LIBOR01M+400bps), 5/1/26 (a) | 1,000 | 970 | |||||||||
| Mauser Packaging Solutions Holding Co., 1st Lien Term Loan B, 3.52%(LIBOR03M+325bps), 4/3/24 (a) | 4,288 | 3,996 | |||||||||
| Mileage Plus Holdings LLC/Mileage Plus Intellectual Property Assets Ltd., 6.25%(LIBOR03M+525bps), 6/25/27 (a) | 3,000 | 2,991 | |||||||||
Sally Holdings LLC, 1st Lien Term Loan B2, 4.50%(LIBOR+450bps), 7/5/24 (a) | 4,000 | 3,980 | |||||||||
| Serta Simmons Bedding LLC, 1st Lien Term Loan B, 4.50%(LIBOR03M+350bps), 11/8/23 (a) | 9,300 | 2,200 | |||||||||
Solera LLC, 1st Lien Term Loan B, 2.93%(LIBOR01M+275bps), 3/3/23 (a) | 6,404 | 6,285 | |||||||||
| Sunshine Luxembourg VII S.A.R.L, 1st Lien Term Loan B, 5.32%(LIBOR06M+425bps), 10/2/26 (a) | 5,970 | 5,936 | |||||||||
See notes to financial statements.
19
| USAA Mutual Funds Trust USAA Intermediate-Term Bond Fund | Schedule of Portfolio Investments — continued July 31, 2020 | ||||||
(Amounts in Thousands, Except for Shares)
| Security Description | Principal Amount | Value | |||||||||
| The Ultimate Software Group, Inc., 1st Lien Term Loan, 4.75%(LIBOR03M+400bps), 5/3/26 (a) | $ | 500 | $ | 500 | |||||||
| T-Mobile USA, Inc., 1st Lien Tem Loan B, 3.18%(LIBOR01M+300bps), 4/1/27 (a) (c) | 4,000 | 4,013 | |||||||||
Vertical US Newco, Inc., 6/30/27 (a) (c) (r) | 3,500 | 3,449 | |||||||||
Western Digital Corp., 1.67%(LIBOR01M+150bps), 2/27/23 (a) | 2,433 | 2,383 | |||||||||
Whatabrands LLC, 2.92%(LIBOR01M+275bps), 8/3/26 (a) | 12,384 | 11,914 | |||||||||
Zayo Group Holdings, Inc., 3.18%(LIBOR01M+300bps), 2/21/27 (a) | 2,494 | 2,419 | |||||||||
109,782 | |||||||||||
Total Senior Secured Loans (Cost $118,697) | 109,782 | ||||||||||
Corporate Bonds (41.5%) | |||||||||||
Communication Services (1.7%): | |||||||||||
| AT&T, Inc. 2.75%, 6/1/31, Callable 3/1/31 @ 100 | 5,000 | 5,360 | |||||||||
4.50%, 5/15/35, Callable 11/15/34 @ 100 | 10,000 | 11,999 | |||||||||
3.65%, 6/1/51, Callable 12/1/50 @ 100 | 3,000 | 3,288 | |||||||||
3.30%, 2/1/52, Callable 8/1/51 @ 100 (c) | 5,000 | 5,172 | |||||||||
| CCO Holdings LLC/CCO Holdings Capital Corp., 4.25%, 2/1/31, Callable 7/1/25 @ 102.13 (b) | 1,000 | 1,044 | |||||||||
Comcast Corp., 4.20%, 8/15/34, Callable 2/15/34 @ 100 | 5,000 | 6,428 | |||||||||
iHeartCommunications, Inc., 4.75%, 1/15/28, Callable 1/15/23 @ 102.38 (b) | 1,000 | 994 | |||||||||
Lamar Media Corp., 4.00%, 2/15/30, Callable 2/15/25 @ 102 (b) | 500 | 505 | |||||||||
Live Nation Entertainment, Inc., 6.50%, 5/15/27, Callable 5/15/23 @ 104.88 (b) | 500 | 538 | |||||||||
Qwest Corp., 6.75%, 12/1/21 | 6,000 | 6,400 | |||||||||
Sprint Spectrum, 3.36%, 3/20/23 (b) | 1,875 | 1,901 | |||||||||
Sprint Spectrum Co. LLC, 5.15%, 9/20/29 (b) | 5,000 | 5,848 | |||||||||
T-Mobile USA, Inc., 2.55%, 2/15/31, Callable 11/15/30 @ 100 (b) | 5,000 | 5,185 | |||||||||
TripAdvisor, Inc., 7.00%, 7/15/25, Callable 7/15/22 @ 103.5 (b) | 1,000 | 1,048 | |||||||||
Verizon Communications, Inc., 4.50%, 8/10/33 | 10,000 | 13,029 | |||||||||
Zayo Group Holdings, Inc., 4.00%, 3/1/27, Callable 3/1/21 @ 102 (b) | 500 | 501 | |||||||||
69,240 | |||||||||||
Consumer Discretionary (2.2%): | |||||||||||
Asbury Automotive Group, Inc. | |||||||||||
4.50%, 3/1/28, Callable 3/1/23 @ 102.25 (b) | 1,000 | 1,025 | |||||||||
4.75%, 3/1/30, Callable 3/1/25 @ 102.38 (b) | 2,000 | 2,055 | |||||||||
AutoNation, Inc., 4.75%, 6/1/30, Callable 3/1/30 @ 100 | 11,000 | 12,794 | |||||||||
Booking Holdings, Inc., 4.63%, 4/13/30, Callable 1/13/30 @ 100 | 5,000 | 6,097 | |||||||||
Choice Hotels International, Inc., 3.70%, 1/15/31, Callable 10/15/30 @ 100 | 8,000 | 8,301 | |||||||||
Dollar General Corp., 3.50%, 4/3/30, Callable 1/3/30 @ 100 | 3,000 | 3,468 | |||||||||
Ford Motor Co., 9.63%, 4/22/30, Callable 1/22/30 @ 100 | 125 | 164 | |||||||||
Hasbro, Inc., 3.90%, 11/19/29, Callable 8/19/29 @ 100 (f) | 5,000 | 5,306 | |||||||||
Hyatt Hotels Corp., 5.75%, 4/23/30, Callable 1/23/30 @ 100 | 1,000 | 1,135 | |||||||||
| International Game Technology PLC, 5.25%, 1/15/29, Callable 1/15/24 @ 102.63 (b) | 2,500 | 2,551 | |||||||||
Lear Corp., 3.50%, 5/30/30, Callable 2/28/30 @ 100 | 5,000 | 5,074 | |||||||||
Lithia Motors, Inc., 4.63%, 12/15/27, Callable 12/15/22 @ 103.47 (b) | 325 | 346 | |||||||||
Lowe's Cos., Inc., 4.50%, 4/15/30, Callable 1/15/30 @ 100 | 3,000 | 3,752 | |||||||||
See notes to financial statements.
20
| USAA Mutual Funds Trust USAA Intermediate-Term Bond Fund | Schedule of Portfolio Investments — continued July 31, 2020 | ||||||
(Amounts in Thousands, Except for Shares)
| Security Description | Principal Amount | Value | |||||||||
M/I Homes, Inc., 4.95%, 2/1/28, Callable 2/1/23 @ 103.71 | $ | 2,737 | $ | 2,824 | |||||||
| Marriott International, Inc. 5.75%, 5/1/25, Callable 4/1/25 @ 100 (f) | 1,227 | 1,364 | |||||||||
4.63%, 6/15/30, Callable 3/15/30 @ 100 | 7,000 | 7,488 | |||||||||
| NCL Corp. Ltd. 12.25%, 5/15/24, Callable 2/15/24 @ 100 (b) | 4,000 | 4,351 | |||||||||
3.63%, 12/15/24, Callable 12/15/21 @ 101.81 (b) | 2,000 | 1,319 | |||||||||
10.25%, 2/1/26, Callable 8/1/23 @ 105.13 (b) | 2,000 | 1,990 | |||||||||
Newell Brands, Inc., 4.20%, 4/1/26, Callable 1/1/26 @ 100 | 1,000 | 1,084 | |||||||||
NVR, Inc., 3.00%, 5/15/30, Callable 11/15/29 @ 100 | 3,000 | 3,251 | |||||||||
Royal Caribbean Cruises Ltd., 3.70%, 3/15/28, Callable 12/15/27 @ 100 | 3,050 | 2,136 | |||||||||
Starbucks Corp., 2.55%, 11/15/30, Callable 8/15/30 @ 100 | 3,000 | 3,214 | |||||||||
Vanderbilt University Medical Center, 4.17%, 7/1/37, Callable 1/1/37 @ 100 | 1,445 | 1,832 | |||||||||
| Volkswagen Group of America Finance LLC 3.20%, 9/26/26, Callable 7/26/26 @ 100 (b) | 1,184 | 1,297 | |||||||||
3.75%, 5/13/30 (b) | 3,000 | 3,419 | |||||||||
87,637 | |||||||||||
Consumer Staples (1.2%): | |||||||||||
| Albertsons Cos., Inc./ Safeway, Inc. /New Albertsons LP/Albertsons LLC, 6.63%, 6/15/24, Callable 9/10/20 @ 103.31 | 3,000 | 3,120 | |||||||||
| Anheuser-Busch InBev Worldwide, Inc., 4.38%, 4/15/38, Callable 10/15/37 @ 100 | 5,000 | 5,969 | |||||||||
BAT Capital Corp., 4.39%, 8/15/37, Callable 2/15/37 @ 100 | 2,000 | 2,286 | |||||||||
Bunge Ltd. Finance Corp., 3.25%, 8/15/26, Callable 5/15/26 @ 100 | 5,000 | 5,338 | |||||||||
Kraft Heinz Foods Co., 4.63%, 10/1/39, Callable 4/1/39 @ 100 (b) | 5,000 | 5,242 | |||||||||
| Smithfield Foods, Inc. 4.25%, 2/1/27, Callable 11/1/26 @ 100 (b) | 5,000 | 5,201 | |||||||||
5.20%, 4/1/29, Callable 1/1/29 @ 100 (b) | 5,167 | 5,749 | |||||||||
Sysco Corp., 5.95%, 4/1/30, Callable 1/1/30 @ 100 | 3,131 | 3,976 | |||||||||
The J.M. Smucker Co., 2.38%, 3/15/30, Callable 12/15/29 @ 100 | 5,000 | 5,288 | |||||||||
U.S. Foods, Inc., 6.25%, 4/15/25, Callable 4/15/22 @ 103.13 (b) | 500 | 536 | |||||||||
42,705 | |||||||||||
Energy (6.5%): | |||||||||||
| Alliance Resource Operating Partners LP/Alliance Resource Finance Corp., 7.50%, 5/1/25, Callable 9/10/20 @ 105.63 (b) | 3,000 | 2,099 | |||||||||
| Boardwalk Pipelines LP 4.95%, 12/15/24, Callable 9/15/24 @ 100 | 4,000 | 4,362 | |||||||||
4.45%, 7/15/27, Callable 4/15/27 @ 100 | 17,000 | 18,119 | |||||||||
| Buckeye Partners LP 4.35%, 10/15/24, Callable 7/15/24 @ 100 (m) | 2,500 | 2,504 | |||||||||
3.95%, 12/1/26, Callable 9/1/26 @ 100 | 8,000 | 8,018 | |||||||||
Cameron LNG LLC, 3.30%, 1/15/35, Callable 9/15/34 @ 100 (b) | 7,727 | 8,758 | |||||||||
| Cheniere Corpus Christi Holdings LLC, 3.70%, 11/15/29, Callable 5/18/29 @ 100 (b) | 5,000 | 5,280 | |||||||||
Cheniere Energy Partners LP, 4.50%, 10/1/29, Callable 10/1/24 @ 102.25 | 1,000 | 1,059 | |||||||||
Chevron Phillips Chemical Co. LLC, 3.40%, 12/1/26, Callable 9/1/26 @ 100 (b) | 5,000 | 5,458 | |||||||||
Continental Resources, Inc., 4.50%, 4/15/23, Callable 1/15/23 @ 100 (f) | 1,500 | 1,500 | |||||||||
| DCP Midstream Operating LP, 5.85%(LIBOR03M+385bps), 5/21/43, Callable 5/21/23 @ 100 (a) (b) | 5,000 | 3,833 | |||||||||
See notes to financial statements.
21
| USAA Mutual Funds Trust USAA Intermediate-Term Bond Fund | Schedule of Portfolio Investments — continued July 31, 2020 | ||||||
(Amounts in Thousands, Except for Shares)
| Security Description | Principal Amount | Value | |||||||||
Diamondback Energy, Inc., 3.50%, 12/1/29, Callable 9/1/29 @ 100 | $ | 4,500 | $ | 4,501 | |||||||
Enable Midstream Partners LP, 4.15%, 9/15/29, Callable 6/15/29 @ 100 | 5,000 | 4,514 | |||||||||
| Energy Transfer Operating LP 7.12%(H15T5Y+531bps), Callable 5/15/30 @ 100 (a) (g) | 7,010 | 5,820 | |||||||||
2.90%, 5/15/25, Callable 4/15/25 @ 100 | 5,000 | 5,054 | |||||||||
3.70%(LIBOR03M+302bps), 11/1/66, Callable 9/10/20 @ 100 (a) | 5,000 | 2,419 | |||||||||
EnLink Midstream LLC, 5.38%, 6/1/29, Callable 3/1/29 @ 100 | 4,000 | 3,180 | |||||||||
| Enterprise Products Operating LLC, 3.20%, 2/15/52, Callable 8/15/51 @ 100 (c) | 7,000 | 6,959 | |||||||||
| EQT Corp. 3.00%, 10/1/22, Callable 9/1/22 @ 100 (m) | 3,000 | 2,980 | |||||||||
7.00%, 2/1/30, Callable 11/1/29 @ 100 | 4,071 | 4,718 | |||||||||
| EQT Midstream Partners LP 4.13%, 12/1/26, Callable 9/1/26 @ 100 | 9,000 | 8,757 | |||||||||
5.50%, 7/15/28, Callable 4/15/28 @ 100 | 5,000 | 5,188 | |||||||||
Hess Corp., 4.30%, 4/1/27, Callable 1/1/27 @ 100 | 4,305 | 4,534 | |||||||||
| Hilcorp Energy I LP/Hilcorp Finance Co., 6.25%, 11/1/28, Callable 11/1/23 @ 103.13 (b) | 10,000 | 9,276 | |||||||||
Marathon Petroleum Corp., 4.75%, 9/15/44, Callable 3/15/44 @ 100 | 5,000 | 5,688 | |||||||||
Midwest Connector Capital Co. LLC, 4.63%, 4/1/29, Callable 1/1/29 @ 100 (b) | 15,000 | 15,046 | |||||||||
MPLX LP, 4.00%, 2/15/25, Callable 11/15/24 @ 100 (m) | 7,500 | 8,148 | |||||||||
Northwest Pipeline LLC, 4.00%, 4/1/27, Callable 1/1/27 @ 100 | 6,955 | 7,781 | |||||||||
| NuStar Logistics LP 4.80%, 9/1/20 | 5,000 | 4,992 | |||||||||
4.75%, 2/1/22, Callable 11/1/21 @ 100 (m) | 3,000 | 2,990 | |||||||||
| Occidental Petroleum Corp. 8.00%, 7/15/25, Callable 4/15/25 @ 100 (m) | 2,000 | 2,189 | |||||||||
3.50%, 8/15/29, Callable 5/15/29 @ 100 | 2,093 | 1,859 | |||||||||
| ONEOK, Inc. 4.35%, 3/15/29, Callable 12/15/28 @ 100 | 4,917 | 5,057 | |||||||||
3.10%, 3/15/30, Callable 12/15/29 @ 100 | 5,000 | 4,711 | |||||||||
6.35%, 1/15/31, Callable 10/15/30 @ 100 | 3,000 | 3,485 | |||||||||
Phillips 66 Partners LP, 3.55%, 10/1/26, Callable 7/1/26 @ 100 | 5,000 | 5,415 | |||||||||
Rockies Express Pipeline LLC, 4.95%, 7/15/29, Callable 4/15/29 @ 100 (b) | 19,960 | 19,485 | |||||||||
Sabal Trail Transmission LLC, 4.68%, 5/1/38, Callable 11/1/37 @ 100 (b) | 5,000 | 5,766 | |||||||||
Sabine Pass Liquefaction LLC, 4.50%, 5/15/30, Callable 11/15/29 @ 100 (b) | 3,000 | 3,457 | |||||||||
Southwestern Energy Co., 6.20%, 1/23/25, Callable 10/23/24 @ 100 (m) (n) | 5,000 | 4,648 | |||||||||
Spectra Energy Partners LP, 3.38%, 10/15/26, Callable 7/15/26 @ 100 | 5,000 | 5,510 | |||||||||
| Tallgrass Energy Partners LP/Tallgrass Energy Finance, 5.50%, 1/15/28, Callable 1/15/23 @ 102.75 (b) | 2,936 | 2,613 | |||||||||
Transocean Pontus Ltd., 6.13%, 8/1/25, Callable 8/1/21 @ 104.59 (b) | 557 | 522 | |||||||||
Valero Energy Corp., 4.00%, 4/1/29, Callable 1/1/29 @ 100 (f) | 3,000 | 3,426 | |||||||||
Viper Energy Partners LP, 5.38%, 11/1/27, Callable 11/1/22 @ 102.69 (b) | 4,000 | 4,206 | |||||||||
Western Midstream Operating LP, 3.10%, 2/1/25, Callable 1/1/25 @ 100 | 3,865 | 3,833 | |||||||||
249,717 | |||||||||||
Financials (13.6%): | |||||||||||
Amcor Finance USA, Inc., 3.63%, 4/28/26, Callable 1/28/26 @ 100 | 5,000 | 5,509 | |||||||||
| American Equity Investment Life Holding Co., 5.00%, 6/15/27, Callable 3/15/27 @ 100 | 5,000 | 5,481 | |||||||||
See notes to financial statements.
22
| USAA Mutual Funds Trust USAA Intermediate-Term Bond Fund | Schedule of Portfolio Investments — continued July 31, 2020 | ||||||
(Amounts in Thousands, Except for Shares)
| Security Description | Principal Amount | Value | |||||||||
| American International Group, Inc., 8.17%(LIBOR03M+420bps), 5/15/68, Callable 5/15/38 @ 100 (a) | $ | 2,000 | $ | 2,776 | |||||||
Apollo Management Holdings LP, 2.65%, 6/5/30, Callable 3/5/30 @ 100 (b) | 10,000 | 10,188 | |||||||||
Ares Capital Corp., 4.20%, 6/10/24, Callable 5/10/24 @ 100 | 2,000 | 2,054 | |||||||||
Associated Bancorp, 4.25%, 1/15/25, Callable 10/15/24 @ 100 | 10,000 | 10,555 | |||||||||
| Assurant, Inc. 4.90%, 3/27/28, Callable 12/27/27 @ 100 | 2,500 | 2,756 | |||||||||
3.70%, 2/22/30, Callable 11/22/29 @ 100 | 5,000 | 5,146 | |||||||||
Athene Holding Ltd., 6.15%, 4/3/30, Callable 1/3/30 @ 100 | 3,000 | 3,581 | |||||||||
AXA Equitable Holdings, Inc., 4.35%, 4/20/28, Callable 1/20/28 @ 100 | 8,500 | 9,806 | |||||||||
Banc of California, Inc., 5.25%, 4/15/25, Callable 1/15/25 @ 100 | 10,000 | 10,375 | |||||||||
| BancorpSouth Bank, 4.13%(LIBOR03M+247bps), 11/20/29, Callable 11/20/24 @ 100 (a) | 4,286 | 4,273 | |||||||||
| BankUnited, Inc. 4.88%, 11/17/25, Callable 8/17/25 @ 100 | 5,000 | 5,619 | |||||||||
5.13%, 6/11/30, Callable 3/11/30 @ 100 | 2,000 | 2,132 | |||||||||
| BOKF Merger Corp., 5.62%(LIBOR03M+317bps), 6/25/30, Callable 6/25/25 @ 100 (a) | 4,750 | 5,007 | |||||||||
Cantor Fitzgerald LP, 4.88%, 5/1/24, Callable 4/1/24 @ 100 (b) | 3,000 | 3,250 | |||||||||
| Capital One Financial Corp. 3.75%, 3/9/27, Callable 2/9/27 @ 100 | 7,000 | 7,865 | |||||||||
3.65%, 5/11/27, Callable 4/11/27 @ 100 | 3,000 | 3,344 | |||||||||
| Citizens Financial Group, Inc. 4.15%, 9/28/22 (b) | 15,000 | 15,787 | |||||||||
3.75%, 7/1/24 | 5,500 | 5,942 | |||||||||
Cullen/Frost Bankers, Inc., 4.50%, 3/17/27, Callable 2/17/27 @ 100 | 2,000 | 2,183 | |||||||||
DAE Funding LLC, 4.50%, 8/1/22, Callable 9/10/20 @ 101.13 (b) | 2,898 | 2,847 | |||||||||
Discover Bank, 4.68%(USSW5+173bps), 8/9/28, Callable 8/9/23 @ 100 (a) | 5,000 | 5,134 | |||||||||
| Eagle Bancorp, Inc., 5.00%(LIBOR03M+385bps), 8/1/26, Callable 8/1/21 @ 100 (a) | 10,000 | 10,028 | |||||||||
First Financial Bancorp, 5.13%, 8/25/25 | 5,000 | 5,048 | |||||||||
First Horizon Bank, 5.75%, 5/1/30, Callable 2/1/30 @ 100 | 3,000 | 3,335 | |||||||||
First Midwest Bancorp, Inc., 5.88%, 9/29/26, Callable 8/29/26 @ 100 | 5,000 | 5,459 | |||||||||
FirstMerit Bank NA, 4.27%, 11/25/26 | 5,000 | 5,693 | |||||||||
Five Corners Funding Trust II, 2.85%, 5/15/30, Callable 2/15/30 @ 100 (b) | 3,000 | 3,244 | |||||||||
FNB Corp., 2.20%, 2/24/23, Callable 1/24/23 @ 100 | 3,175 | 3,174 | |||||||||
| Ford Motor Credit Co. LLC 5.09%, 1/7/21 | 2,000 | 2,015 | |||||||||
5.11%, 5/3/29, Callable 2/3/29 @ 100 | 9,555 | 10,228 | |||||||||
Fulton Financial Corp., 4.50%, 11/15/24 | 10,000 | 10,783 | |||||||||
General Motors Financial Co., Inc., 4.35%, 1/17/27, Callable 10/17/26 @ 100 | 5,000 | 5,471 | |||||||||
| Glencore Funding LLC 4.00%, 3/27/27, Callable 12/27/26 @ 100 (b) | 10,000 | 11,014 | |||||||||
4.88%, 3/12/29, Callable 12/12/28 @ 100 (b) | 5,000 | 5,912 | |||||||||
Global Atlantic Financial Co., 4.40%, 10/15/29, Callable 7/15/29 @ 100 (b) | 8,572 | 8,908 | |||||||||
| Harley-Davidson Financial Services, Inc., 3.35%, 6/8/25, Callable 5/8/25 @ 100 (b) | 3,000 | 3,150 | |||||||||
Hilltop Holdings, Inc., 5.00%, 4/15/25, Callable 1/15/25 @ 100 | 5,000 | 5,335 | |||||||||
ILFC E-Capital Trust I, 3.02%, 12/21/65, Callable 9/10/20 @ 100 (b) (n) | 6,225 | 3,103 | |||||||||
See notes to financial statements.
23
| USAA Mutual Funds Trust USAA Intermediate-Term Bond Fund | Schedule of Portfolio Investments — continued July 31, 2020 | ||||||
(Amounts in Thousands, Except for Shares)
| Security Description | Principal Amount | Value | |||||||||
| JPMorgan Chase & Co. 4.60%(SOFR+313bps), Callable 2/1/25 @ 100 (a) (g) | $ | 3,333 | $ | 3,237 | |||||||
2.96%(SOFR+252bps), 5/13/31, Callable 5/13/30 @ 100 (a) (f) | 3,000 | 3,260 | |||||||||
Kemper Corp., 4.35%, 2/15/25, Callable 11/15/24 @ 100 | 5,000 | 5,450 | |||||||||
KeyBank NA, 3.90%, 4/13/29 | 5,000 | 5,743 | |||||||||
KeyCorp, 2.25%, 4/6/27, MTN | 5,000 | 5,336 | |||||||||
KeyCorp Capital II, 6.88%, 3/17/29 (m) | 750 | 849 | |||||||||
| LegacyTexas Financial Group, Inc., 5.50%(LIBOR03M+389bps), 12/1/25, Callable 12/1/20 @ 100 (a) | 5,000 | 4,890 | |||||||||
Level 3 Financing, Inc., 3.88%, 11/15/29, Callable 8/15/29 @ 100 (b) | 7,500 | 8,132 | |||||||||
| Lincoln National Corp., 2.74%(LIBOR03M+236bps), 5/17/66, Callable 8/26/20 @ 100 (a) | 5,018 | 3,581 | |||||||||
Main Street Capital Corp., 4.50%, 12/1/22 (m) | 5,000 | 5,144 | |||||||||
| MB Financial Bank NA, 4.00%(LIBOR03M+187bps), 12/1/27, Callable 12/1/22 @ 100 (a) | 7,717 | 7,773 | |||||||||
Mercury General Corp., 4.40%, 3/15/27, Callable 12/15/26 @ 100 | 5,350 | 5,758 | |||||||||
| MetLife, Inc. 6.40%, 12/15/66, Callable 12/15/31 @ 100 | 8,000 | 9,867 | |||||||||
9.25%, 4/8/68, Callable 4/8/33 @ 100 (b) | 5,000 | 7,445 | |||||||||
| Nationwide Mutual Insurance Co., 2.60%(LIBOR03M+229bps), 12/15/24, Callable 9/10/20 @ 100 (a) (b) | 10,235 | 10,145 | |||||||||
| New York Community Bancorp, Inc., 5.90%(LIBOR03M+278bps), 11/6/28, Callable 11/6/23 @ 100 (a) | 4,000 | 3,922 | |||||||||
Old Republic International Corp., 3.88%, 8/26/26, Callable 7/26/26 @ 100 | 6,000 | 6,582 | |||||||||
OneBeacon U.S. Holdings, Inc., 4.60%, 11/9/22 | 10,025 | 10,507 | |||||||||
People's United Bank NA, 4.00%, 7/15/24, Callable 4/16/24 @ 100 | 10,000 | 10,598 | |||||||||
Pine Street Trust I, 4.57%, 2/15/29, Callable 11/15/28 @ 100 (b) | 5,000 | 5,781 | |||||||||
PNC Bank NA, 2.70%, 10/22/29 | 6,500 | 7,149 | |||||||||
| PPL Capital Funding, Inc., 2.97%(LIBOR03M+267bps), 3/30/67, Callable 9/10/20 @ 100 (a) | 4,000 | 3,010 | |||||||||
Primerica, Inc., 4.75%, 7/15/22 | 5,000 | 5,307 | |||||||||
| Principal Financial Global Funding LLC, 0.79%(LIBOR03M+52bps), 1/10/31 (a) | 3,000 | 2,732 | |||||||||
ProAssurance Corp., 5.30%, 11/15/23 | 9,864 | 10,331 | |||||||||
| Prudential Financial, Inc., 5.87%(LIBOR03M+418bps), 9/15/42, Callable 9/15/22 @ 100 (a) | 5,000 | 5,348 | |||||||||
| Regions Financial Corp., 5.75%(H15T5Y+543bps), Callable 6/15/25 @ 100 (a) (g) (m) | 2,000 | 2,139 | |||||||||
RLI Corp., 4.88%, 9/15/23 | 5,000 | 5,382 | |||||||||
| Santander Holdings USA, Inc. 3.45%, 6/2/25, Callable 5/2/25 @ 100 | 3,000 | 3,214 | |||||||||
4.40%, 7/13/27, Callable 4/14/27 @ 100 | 12,818 | 14,264 | |||||||||
SL Green Operating Partnership LP, 3.25%, 10/15/22, Callable 9/15/22 @ 100 | 4,444 | 4,541 | |||||||||
| Sterling National Bank, 5.25%(LIBOR03M+394bps), 4/1/26, Callable 4/1/21 @ 100 (a) | 5,000 | 5,069 | |||||||||
SunTrust Capital, 1.06%(LIBOR03M+67bps), 5/15/27, Callable 9/10/20 @ 100 (a) | 5,000 | 4,523 | |||||||||
| TCF National Bank 4.60%, 2/27/25 | 5,000 | 5,176 | |||||||||
4.12%(LIBOR03M+238bps), 7/2/29, Callable 7/2/24 @ 100 (a) | 5,000 | 4,841 | |||||||||
Texas Capital Bank NA, 5.25%, 1/31/26 | 10,225 | 10,698 | |||||||||
See notes to financial statements.
24
| USAA Mutual Funds Trust USAA Intermediate-Term Bond Fund | Schedule of Portfolio Investments — continued July 31, 2020 | ||||||
(Amounts in Thousands, Except for Shares)
| Security Description | Principal Amount | Value | |||||||||
| The Allstate Corp., 5.75%(LIBOR03M+294bps), 8/15/53, Callable 8/15/23 @ 100 (a) | $ | 10,000 | $ | 10,566 | |||||||
The Hanover Insurance Group, Inc., 4.50%, 4/15/26, Callable 1/15/26 @ 100 | 7,000 | 7,702 | |||||||||
| The Hartford Financial Services Group, Inc., 2.52%(LIBOR03M+213bps), 2/12/67, Callable 9/10/20 @ 100 (a) (b) | 10,000 | 8,185 | |||||||||
TIAA FSB Holdings, Inc., 5.75%, 7/2/25, Callable 6/2/25 @ 100 | 10,000 | 10,352 | |||||||||
Towne Bank, 4.50%(LIBOR03M+255bps), 7/30/27, Callable 7/30/22 @ 100 (a) | 4,643 | 4,692 | |||||||||
Truist Bank, 2.25%, 3/11/30, Callable 12/11/29 @ 100 | 8,500 | 8,957 | |||||||||
Truist Financial Corp., 5.10%(H15T10Y+435bps), Callable 3/1/30 @ 100 (a) (g) | 7,000 | 7,573 | |||||||||
| Wells Fargo & Co., 2.57%(LIBOR03M+100bps), 2/11/31, MTN, Callable 2/11/30 @ 100 (a) | 5,000 | 5,307 | |||||||||
Wintrust Financial Corp., 5.00%, 6/13/24 | 3,500 | 3,759 | |||||||||
518,327 | |||||||||||
Health Care (3.5%): | |||||||||||
AbbVie, Inc., 3.20%, 11/21/29, Callable 8/21/29 @ 100 (b) (f) | 10,000 | 11,257 | |||||||||
Bausch Health Cos., Inc., 6.25%, 2/15/29, Callable 2/15/24 @ 103.13 (b) | 1,500 | 1,595 | |||||||||
Baxter International, Inc., 3.95%, 4/1/30, Callable 1/10/30 @ 100 (b) | 3,000 | 3,641 | |||||||||
| Bayer U.S. Finance II LLC 2.85%, 4/15/25, Callable 1/15/25 @ 100 (b) | 5,405 | 5,719 | |||||||||
4.63%, 6/25/38, Callable 12/25/37 @ 100 (b) | 5,000 | 6,257 | |||||||||
Baylor Scott & White Holdings, 2.65%, 11/15/26, Callable 8/15/26 @ 100 | 5,000 | 5,166 | |||||||||
Bon Secours Charity Health System, Inc., 5.25%, 11/1/25 | 5,000 | 5,638 | |||||||||
Boston Medical Center Corp., 3.91%, 7/1/28 | 3,000 | 3,405 | |||||||||
CIGNA Corp., 2.40%, 3/15/30, Callable 12/15/29 @ 100 | 5,000 | 5,332 | |||||||||
| CVS Health Corp. 3.25%, 8/15/29, Callable 5/15/29 @ 100 (f) | 2,500 | 2,815 | |||||||||
4.88%, 7/20/35, Callable 1/20/35 @ 100 | 5,000 | 6,513 | |||||||||
CVS Pass-Through Trust, 5.93%, 1/10/34 (b) | 7,554 | 8,703 | |||||||||
DENTSPLY SIRONA, Inc., 3.25%, 6/1/30, Callable 3/1/30 @ 100 | 8,000 | 8,774 | |||||||||
Eastern Maine Healthcare Systems, 3.71%, 7/1/26 | 13,720 | 14,126 | |||||||||
| Fresenius Medical Care U.S. Finance III, Inc., 3.75%, 6/15/29, Callable 3/15/29 @ 100 (b) | 7,000 | 7,852 | |||||||||
HCA, Inc., 4.50%, 2/15/27, Callable 8/15/26 @ 100 | 6,000 | 6,893 | |||||||||
Mednax, Inc., 6.25%, 1/15/27, Callable 1/15/22 @ 104.69 (b) | 1,000 | 1,055 | |||||||||
Mylan, Inc., 4.55%, 4/15/28, Callable 1/15/28 @ 100 | 7,778 | 9,210 | |||||||||
Premier Health Partners, 2.91%, 11/15/26, Callable 5/15/26 @ 100 | 6,595 | 6,474 | |||||||||
Quest Diagnostics, Inc., 2.95%, 6/30/30, Callable 3/30/30 @ 100 | 5,000 | 5,541 | |||||||||
SSM Health Care Corp., 3.82%, 6/1/27, Callable 3/1/27 @ 100 | 4,000 | 4,416 | |||||||||
Tenet Healthcare Corp., 4.63%, 6/15/28, Callable 6/15/23 @ 102.31 (b) | 2,000 | 2,102 | |||||||||
132,484 | |||||||||||
Industrials (5.1%): | |||||||||||
Air Lease Corp., 3.63%, 12/1/27, Callable 9/1/27 @ 100 | 5,000 | 4,915 | |||||||||
Aircastle Ltd., 4.25%, 6/15/26, Callable 4/15/26 @ 100 | 5,000 | 4,705 | |||||||||
Alaska Airlines Pass Through Trust, 4.80%, 2/15/29 (b) | 6,000 | 6,210 | |||||||||
| American Airlines Pass Through Trust 4.00%, 1/15/27 | 5,447 | 4,328 | |||||||||
3.60%, 4/15/31 | 1,784 | 1,426 | |||||||||
Aramark Services, Inc., 6.38%, 5/1/25, Callable 5/1/22 @ 103.19 (b) | 500 | 527 | |||||||||
See notes to financial statements.
25
| USAA Mutual Funds Trust USAA Intermediate-Term Bond Fund | Schedule of Portfolio Investments — continued July 31, 2020 | ||||||
(Amounts in Thousands, Except for Shares)
| Security Description | Principal Amount | Value | |||||||||
Ashtead Capital, Inc., 5.25%, 8/1/26, Callable 8/1/21 @ 103.94 (b) | $ | 2,500 | $ | 2,661 | |||||||
Aviation Capital Group LLC, 5.50%, 12/15/24, Callable 11/15/24 @ 100 (b) | 5,000 | 5,120 | |||||||||
| British Airways Pass Through Trust 4.63%, 12/20/25 (b) | 10,270 | 9,756 | |||||||||
3.35%, 12/15/30 (b) | 2,490 | 2,066 | |||||||||
Continental Airlines Pass Through Trust, 4.15%, 10/11/25 | 7,210 | 6,725 | |||||||||
CoStar Group, Inc., 2.80%, 7/15/30, Callable 4/15/30 @ 100 (b) | 5,000 | 5,274 | |||||||||
Delta Air Lines Pass Through Trust, 2.50%, 12/10/29 | 5,000 | 4,458 | |||||||||
| Delta Air Lines, Inc. 7.00%, 5/1/25 (b) | 4,000 | 4,265 | |||||||||
7.38%, 1/15/26, Callable 12/15/25 @ 100 | 2,071 | 2,053 | |||||||||
FedEx Corp., 3.90%, 2/1/35 | 5,000 | 5,768 | |||||||||
Ferguson Finance PLC, 3.25%, 6/2/30, Callable 3/2/30 @ 100 (b) | 6,000 | 6,292 | |||||||||
Fluor Corp., 3.50%, 12/15/24, Callable 9/15/24 @ 100 | 3,000 | 2,471 | |||||||||
GATX Corp., 4.00%, 6/30/30, Callable 3/30/30 @ 100 | 3,000 | 3,365 | |||||||||
Hawaiian Airlines Pass Through Certificates, 3.90%, 7/15/27 (m) | 6,547 | 5,493 | |||||||||
Howmet Aerospace, Inc., 6.88%, 5/1/25, Callable 4/1/25 @ 100 (f) | 806 | 914 | |||||||||
Kennametal, Inc., 4.63%, 6/15/28, Callable 3/15/28 @ 100 | 5,400 | 5,915 | |||||||||
Korn Ferry, 4.63%, 12/15/27, Callable 12/15/22 @ 102.31 (b) | 2,000 | 2,051 | |||||||||
Molex Electronic Technologies LLC, 3.90%, 4/15/25, Callable 1/15/25 @ 100 (b) | 5,000 | 5,187 | |||||||||
Pentair Finance S.A.R.L, 4.50%, 7/1/29, Callable 4/1/29 @ 100 | 5,606 | 6,307 | |||||||||
Southwest Airlines Co., 5.13%, 6/15/27, Callable 4/15/27 @ 100 | 10,000 | 10,521 | |||||||||
| Spirit Aerosystems, Inc. 3.85%, 6/15/26, Callable 3/15/26 @ 100 | 5,000 | 4,659 | |||||||||
4.60%, 6/15/28, Callable 3/15/28 @ 100 (m) | 4,000 | 3,120 | |||||||||
Spirit Aerosysytems, Inc., 7.50%, 4/15/25, Callable 4/15/22 @ 103.75 (b) | 4,187 | 4,121 | |||||||||
| Stanley Black & Decker, Inc., 4.00%(H15T5Y+266bps), 3/15/60, Callable 3/15/25 @ 100 (a) | 3,000 | 3,131 | |||||||||
| The Boeing Co. 5.15%, 5/1/30, Callable 2/1/30 @ 100 | 17,500 | 19,167 | |||||||||
5.81%, 5/1/50, Callable 11/1/49 @ 100 | 5,000 | 5,878 | |||||||||
5.93%, 5/1/60, Callable 11/1/59 @ 100 | 3,000 | 3,615 | |||||||||
The Timken Co., 4.50%, 12/15/28, Callable 9/15/28 @ 100 | 5,658 | 6,218 | |||||||||
U.S. Airways (INS — MBIA Insurance Corp.), 7.08%, 9/20/22 | 261 | 258 | |||||||||
| U.S. Airways Pass Through Trust 6.25%, 10/22/24 | 2,095 | 1,755 | |||||||||
7.13%, 4/22/25 | 1,385 | 1,151 | |||||||||
3.95%, 5/15/27 | 6,168 | 5,010 | |||||||||
| United Airlines Pass Through Trust 4.63%, 3/3/24 | 4,066 | 3,638 | |||||||||
4.30%, 2/15/27 | 3,639 | 3,369 | |||||||||
3.50%, 11/1/29 | 5,000 | 3,501 | |||||||||
Waste Pro USA, Inc., 5.50%, 2/15/26, Callable 2/15/21 @ 104.13 (b) | 3,000 | 3,058 | |||||||||
WESCO Distribution, Inc., 7.13%, 6/15/25, Callable 6/15/22 @ 103.56 (b) | 1,000 | 1,098 | |||||||||
191,520 | |||||||||||
Information Technology (1.6%): | |||||||||||
Amphenol Corp., 2.80%, 2/15/30, Callable 11/15/29 @ 100 | 4,000 | 4,420 | |||||||||
| Broadcom Corp./Broadcom Cayman Finance Ltd., 3.50%, 1/15/28, Callable 10/15/27 @ 100 | 2,000 | 2,170 | |||||||||
See notes to financial statements.
26
| USAA Mutual Funds Trust USAA Intermediate-Term Bond Fund | Schedule of Portfolio Investments — continued July 31, 2020 | ||||||
(Amounts in Thousands, Except for Shares)
| Security Description | Principal Amount | Value | |||||||||
| Broadcom, Inc. 5.00%, 4/15/30, Callable 1/15/30 @ 100 (b) | $ | 5,000 | $ | 5,939 | |||||||
4.30%, 11/15/32, Callable 8/15/32 @ 100 (b) | 3,000 | 3,445 | |||||||||
Dell International LLC/EMC Corp., 5.30%, 10/1/29, Callable 7/1/29 @ 100 (b) | 3,000 | 3,442 | |||||||||
Fiserv, Inc., 3.50%, 7/1/29, Callable 4/1/29 @ 100 (f) | 4,500 | 5,221 | |||||||||
Global Payments, Inc., 3.20%, 8/15/29, Callable 5/15/29 @ 100 | 7,000 | 7,814 | |||||||||
HP, Inc., 3.40%, 6/17/30, Callable 3/17/30 @ 100 | 5,000 | 5,381 | |||||||||
Jabil, Inc., 3.95%, 1/12/28, Callable 10/12/27 @ 100 | 5,000 | 5,479 | |||||||||
| Keysight Technologies, Inc. 4.60%, 4/6/27, Callable 1/6/27 @ 100 | 2,604 | 3,077 | |||||||||
3.00%, 10/30/29, Callable 7/30/29 @ 100 | 2,632 | 2,939 | |||||||||
NVIDIA Corp., 3.50%, 4/1/50, Callable 10/1/49 @ 100 | 3,000 | 3,579 | |||||||||
Sabre GLBL, Inc., 9.25%, 4/15/25, Callable 3/16/25 @ 100 (b) | 500 | 550 | |||||||||
| VMware, Inc. 3.90%, 8/21/27, Callable 5/21/27 @ 100 | 5,000 | 5,507 | |||||||||
4.70%, 5/15/30, Callable 2/15/30 @ 100 | 3,000 | 3,520 | |||||||||
62,483 | |||||||||||
Materials (2.0%): | |||||||||||
Avery Dennison Corp., 2.65%, 4/30/30, Callable 2/1/30 @ 100 | 7,000 | 7,434 | |||||||||
Cabot Corp., 4.00%, 7/1/29, Callable 4/1/29 @ 100 | 4,000 | 4,268 | |||||||||
Carpenter Technology Corp., 5.20%, 7/15/21 | 2,000 | 2,061 | |||||||||
CF Industries, Inc., 4.50%, 12/1/26 (b) | 5,000 | 5,650 | |||||||||
Huntsman International LLC, 4.50%, 5/1/29, Callable 2/1/29 @ 100 | 5,000 | 5,461 | |||||||||
LYB International Finance III LLC, 3.38%, 5/1/30, Callable 2/1/30 @ 100 | 5,000 | 5,529 | |||||||||
Mosaic Co., 5.45%, 11/15/33, Callable 5/15/33 @ 100 (f) | 1,500 | 1,688 | |||||||||
Reliance Steel & Aluminum Co., 2.15%, 8/15/30, Callable 5/15/30 @ 100 (c) | 3,000 | 3,014 | |||||||||
Sonoco Products Co., 3.13%, 5/1/30, Callable 2/1/30 @ 100 | 3,000 | 3,295 | |||||||||
Southern Copper Corp., 3.88%, 4/23/25 | 3,000 | 3,332 | |||||||||
The Mosaic Co., 4.05%, 11/15/27, Callable 8/15/27 @ 100 | 5,000 | 5,407 | |||||||||
| Vulcan Materials Co. 3.90%, 4/1/27, Callable 1/1/27 @ 100 | 1,000 | 1,119 | |||||||||
3.50%, 6/1/30, Callable 3/1/30 @ 100 | 13,500 | 15,178 | |||||||||
Westlake Chemical Corp., 3.60%, 8/15/26, Callable 5/15/26 @ 100 | 5,000 | 5,449 | |||||||||
| WRKCo, Inc. 4.20%, 6/1/32, Callable 3/1/32 @ 100 | 2,000 | 2,410 | |||||||||
3.00%, 6/15/33, Callable 3/15/33 @ 100 | 5,000 | 5,429 | |||||||||
76,724 | |||||||||||
Real Estate (2.3%): | |||||||||||
Alexandria Real Estate Equities, Inc., 2.75%, 12/15/29, Callable 9/15/29 @ 100 | 5,000 | 5,458 | |||||||||
American Tower Corp., 3.95%, 3/15/29, Callable 12/15/28 @ 100 | 3,000 | 3,529 | |||||||||
| Boston Properties LP 2.90%, 3/15/30, Callable 12/15/29 @ 100 | 10,000 | 10,714 | |||||||||
3.25%, 1/30/31, Callable 10/30/30 @ 100 | 1,313 | 1,462 | |||||||||
| Columbia Property Trust Operating Partnership, 3.65%, 8/15/26, Callable 5/15/26 @ 100 | 7,500 | 7,831 | |||||||||
| Crown Castle International Corp. 4.30%, 2/15/29, Callable 11/15/28 @ 100 | 4,000 | 4,805 | |||||||||
3.30%, 7/1/30, Callable 4/1/30 @ 100 | 2,000 | 2,276 | |||||||||
See notes to financial statements.
27
| USAA Mutual Funds Trust USAA Intermediate-Term Bond Fund | Schedule of Portfolio Investments — continued July 31, 2020 | ||||||
(Amounts in Thousands, Except for Shares)
| Security Description | Principal Amount | Value | |||||||||
Equinix, Inc., 5.38%, 5/15/27, Callable 5/15/22 @ 102.69 | $ | 5,000 | $ | 5,507 | |||||||
Federal Realty Investment Trust, 3.50%, 6/1/30, Callable 3/1/30 @ 100 | 3,000 | 3,272 | |||||||||
GLP Capital LP/GLP Financing II, Inc., 4.00%, 1/15/30, Callable 10/15/29 @ 100 | 8,476 | 8,782 | |||||||||
Hudson Pacific Properties LP, 3.95%, 11/1/27, Callable 8/1/27 @ 100 | 5,000 | 5,342 | |||||||||
| Keenan Development Associates of Tennessee LLC (INS — XL Capital Assurance), 5.02%, 7/15/28 (b) | 351 | 389 | |||||||||
| MGM Growth Properties Operating Partnership LP/MGP Finance Co-Issuer, Inc., 4.63%, 6/15/25, Callable 3/15/25 @ 100 (b) | 500 | 526 | |||||||||
Nationwide Health Properties, Inc., 6.90%, 10/1/37, MTN | 2,000 | 2,419 | |||||||||
Physicians Realty LP, 4.30%, 3/15/27, Callable 12/15/26 @ 100 | 6,500 | 6,921 | |||||||||
Realty Income Corp., 3.00%, 1/15/27, Callable 10/15/26 @ 100 | 3,000 | 3,281 | |||||||||
Sabra Health Care LP, 5.13%, 8/15/26, Callable 5/15/26 @ 100 | 4,000 | 4,262 | |||||||||
SBA Tower Trust, 2.33%, 7/15/52 (b) | 3,000 | 2,977 | |||||||||
| VICI Properties LP/VICI Note Co., Inc. 4.63%, 12/1/29, Callable 12/1/24 @ 102.31 (b) | 2,000 | 2,104 | |||||||||
4.13%, 8/15/30, Callable 2/15/25 @ 102.06 (b) | 1,250 | 1,264 | |||||||||
| Washington Real Estate Investment Trust, 3.95%, 10/15/22, Callable 7/15/22 @ 100 | 5,000 | 5,107 | |||||||||
88,228 | |||||||||||
Utilities (1.8%): | |||||||||||
Ameren Corp., 3.50%, 1/15/31, Callable 10/15/30 @ 100 | 1,500 | 1,737 | |||||||||
Cleco Corporate Holdings LLC, 3.74%, 5/1/26, Callable 2/1/26 @ 100 | 10,000 | 10,672 | |||||||||
| Duquesne Light Holdings, Inc. 5.90%, 12/1/21 (b) | 3,500 | 3,696 | |||||||||
3.62%, 8/1/27, Callable 5/1/27 @ 100 (b) | 13,000 | 13,634 | |||||||||
Entergy Corp., 2.80%, 6/15/30, Callable 3/15/30 @ 100 (m) | 3,000 | 3,318 | |||||||||
ITC Holdings Corp., 3.35%, 11/15/27, Callable 8/15/27 @ 100 | 3,750 | 4,214 | |||||||||
| National Fuel Gas Co. 3.75%, 3/1/23, Callable 12/1/22 @ 100 | 10,000 | 10,290 | |||||||||
3.95%, 9/15/27, Callable 6/15/27 @ 100 | 4,000 | 4,007 | |||||||||
Spire, Inc., 3.54%, 2/27/24, Callable 12/27/23 @ 100 | 2,270 | 2,394 | |||||||||
Vistra Operations Co. LLC, 4.30%, 7/15/29, Callable 4/15/29 @ 100 (b) | 12,000 | 12,949 | |||||||||
| WEC Energy Group, Inc., 3.80%(LIBOR03M+211bps), 5/15/67, Callable 9/10/20 @ 100 (a) | 4,500 | 3,459 | |||||||||
70,370 | |||||||||||
Total Corporate Bonds (Cost $1,487,534) | 1,589,435 | ||||||||||
Yankee Dollar (9.4%) | |||||||||||
Consumer Discretionary (0.2%): | |||||||||||
IHO Verwaltungs GmbH PIK, 6.38%, 5/15/29, Callable 5/15/24 @ 103.19 (b) (o) | 3,785 | 3,905 | |||||||||
International Game Technology PLC, 6.25%, 1/15/27, Callable 7/15/26 @ 100 (b) | 4,000 | 4,259 | |||||||||
8,164 | |||||||||||
Consumer Staples (1.0%): | |||||||||||
Alimentation Couche-Tard, Inc., 3.55%, 7/26/27, Callable 4/26/27 @ 100 (b) | 3,334 | 3,679 | |||||||||
Anheuser-Busch InBev Worldwide, Inc., 3.75%, 7/15/42 | 5,000 | 5,513 | |||||||||
Bacardi Ltd., 2.75%, 7/15/26, Callable 4/15/26 @ 100 (b) | 5,000 | 5,189 | |||||||||
Becle SAB de CV, 3.75%, 5/13/25 (b) | 10,000 | 10,660 | |||||||||
See notes to financial statements.
28
| USAA Mutual Funds Trust USAA Intermediate-Term Bond Fund | Schedule of Portfolio Investments — continued July 31, 2020 | ||||||
(Amounts in Thousands, Except for Shares)
| Security Description | Principal Amount | Value | |||||||||
| Imperial Brands Finance PLC 4.25%, 7/21/25, Callable 4/21/25 @ 100 (b) | $ | 6,000 | $ | 6,690 | |||||||
3.50%, 7/26/26, Callable 5/26/26 @ 100 (b) | 5,000 | 5,439 | |||||||||
37,170 | |||||||||||
Energy (0.6%): | |||||||||||
Aker BP ASA | |||||||||||
6.00%, 7/1/22, Callable 9/10/20 @ 101.5 (b) (m) | 2,750 | 2,803 | |||||||||
4.75%, 6/15/24, Callable 6/15/21 @ 102.38 (b) | 2,494 | 2,508 | |||||||||
Canadian National Resources, 3.85%, 6/1/27, Callable 3/1/27 @ 100 | 5,000 | 5,412 | |||||||||
Equinor ASA, 3.13%, 4/6/30, Callable 1/6/30 @ 100 | 3,000 | 3,424 | |||||||||
Saudi Arabian Oil Co., 3.50%, 4/16/29 (b) | 3,000 | 3,350 | |||||||||
Transocean Guardian Ltd., 5.88%, 1/15/24, Callable 7/15/21 @ 102.94 (b) | 780 | 691 | |||||||||
Transocean Poseidon Ltd., 6.88%, 2/1/27, Callable 2/1/22 @ 105.16 (b) | 1,500 | 1,353 | |||||||||
Transocean Sentry Ltd., 5.38%, 5/15/23, Callable 5/16/21 @ 102.67 (b) | 1,500 | 1,315 | |||||||||
Transocean, Inc., 7.25%, 11/1/25, Callable 11/1/21 @ 103.63 (b) | 1,000 | 489 | |||||||||
Woodside Finance Ltd., 4.60%, 5/10/21, Callable 2/10/21 @ 100 (b) | 2,000 | 2,034 | |||||||||
23,379 | |||||||||||
Financials (4.5%): | |||||||||||
ABN AMRO Bank NV, 4.75%, 7/28/25 (b) | 5,000 | 5,630 | |||||||||
| Allied World Assurance Co. Holdings Ltd., 4.35%, 10/29/25, Callable 7/29/25 @ 100 (m) | 5,000 | 5,298 | |||||||||
Athene Holding Ltd., 4.13%, 1/12/28, Callable 10/12/27 @ 100 | 5,000 | 5,366 | |||||||||
| Banco Santander Mexico SA Institucion de Banca Multiple Grupo Financiero Santand, 5.38%, 4/17/25 (b) | 2,143 | 2,381 | |||||||||
| Bank of Montreal, 3.80%(USSW5+143bps), 12/15/32, Callable 12/15/27 @ 100 (a) | 3,750 | 4,163 | |||||||||
Barclays PLC, 2.85%(LIBOR03M+245bps), 5/7/26, Callable 5/7/25 @ 100 (a) | 3,000 | 3,180 | |||||||||
| BNP Paribas SA 4.38%, 5/12/26 (b) | 5,000 | 5,641 | |||||||||
4.63%, 3/13/27 (b) | 3,000 | 3,454 | |||||||||
BP Capital Markets PLC, 4.38%(H15T5Y+404bps), Callable 6/22/25 @ 100 (a) (g) | 5,000 | 5,220 | |||||||||
Brookfield Finance, Inc., 4.35%, 4/15/30, Callable 1/15/30 @ 100 | 8,500 | 9,992 | |||||||||
| Credit Suisse Group AG 2.59%(SOFR+156bps), 9/11/25, Callable 9/11/24 @ 100 (a) (b) | 3,000 | 3,140 | |||||||||
4.19%(SOFR+373bps), 4/1/31, Callable 4/1/30 @ 100 (a) (b) | 2,000 | 2,342 | |||||||||
| Danske Bank A/S, 3.24%(LIBOR03M+159bps), 12/20/25, Callable 12/20/24 @ 100 (a) (b) | 3,500 | 3,733 | |||||||||
Deutsche Bank AG, 5.88%(SOFR+544bps), 7/8/31, Callable 4/8/30 @ 100 (a) | 3,000 | 3,139 | |||||||||
Element Fleet Management Corp., 3.85%, 6/15/25, Callable 5/15/25 @ 100 (b) | 3,000 | 3,161 | |||||||||
Enel Finance International NV, 3.63%, 5/25/27 (b) (m) | 5,000 | 5,565 | |||||||||
HSBC Holdings PLC, 3.90%, 5/25/26 | 3,000 | 3,373 | |||||||||
ING Groep NV, 3.95%, 3/29/27 | 3,000 | 3,495 | |||||||||
| Lloyds Banking Group PLC, 3.57%(LIBOR03M+121bps), 11/7/28, Callable 11/7/27 @ 100 (a) | 5,000 | 5,613 | |||||||||
Nationwide Building Society, 4.00%, 9/14/26 (b) | 5,000 | 5,496 | |||||||||
Natwest Group PLC, 3.07%(H15T1Y+255bps), 5/22/28, Callable 5/22/27 @ 100 (a) | 3,000 | 3,223 | |||||||||
Nordea Bank Abp, 4.25%, 9/21/22 (b) | 3,000 | 3,191 | |||||||||
| NXP BV / NXP Funding LLC / NXP USA, Inc., 3.15%, 5/1/27, Callable 3/1/27 @ 100 (b) | 2,000 | 2,173 | |||||||||
See notes to financial statements.
29
| USAA Mutual Funds Trust USAA Intermediate-Term Bond Fund | Schedule of Portfolio Investments — continued July 31, 2020 | ||||||
(Amounts in Thousands, Except for Shares)
| Security Description | Principal Amount | Value | |||||||||
| QBE Capital Funding III Ltd., 7.25%(USSW10+405bps), 5/24/41, Callable 5/24/21 @ 100 (a) (b) | $ | 10,056 | $ | 10,414 | |||||||
| Royal Bank of Scotland Group PLC 6.13%, 12/15/22 | 10,000 | 10,943 | |||||||||
5.08%(LIBOR03M+191bps), 1/27/30, Callable 1/27/29 @ 100 (a) | 2,000 | 2,455 | |||||||||
Santander UK PLC, 5.00%, 11/7/23 (b) | 4,221 | 4,649 | |||||||||
Silversea Cruise Finance Ltd., 7.25%, 2/1/25, Callable 8/21/20 @ 105.44 (b) (f) | 15,000 | 14,330 | |||||||||
Societe Generale SA, 3.88%, 3/28/24 (b) | 5,000 | 5,391 | |||||||||
| Standard Chartered PLC, 4.87%(LIBOR03M+197bps), 3/15/33, Callable 3/15/28 @ 100 (a) (b) (m) | 7,500 | 8,225 | |||||||||
| Westpac Banking Corp., 4.11%(H15T5Y+200bps), 7/24/34, Callable 7/24/29 @ 100 (a) | 10,000 | 11,308 | |||||||||
165,684 | |||||||||||
Health Care (0.0% (j)): | |||||||||||
Mylan NV, 3.75%, 12/15/20, Callable 11/15/20 @ 100 | 514 | 517 | |||||||||
| Teva Pharmaceutical Finance Netherlands III BV, 6.75%, 3/1/28, Callable 12/1/27 @ 100 (m) | 500 | 555 | |||||||||
1,072 | |||||||||||
Industrials (1.5%): | |||||||||||
| Air Canada Pass Through Trust 5.38%, 11/15/22 (b) | 2,503 | 2,230 | |||||||||
3.88%, 9/15/24 (b) | 6,626 | 5,548 | |||||||||
4.13%, 11/15/26 (b) | 6,900 | 6,236 | |||||||||
3.75%, 6/15/29 (b) | 4,843 | 4,605 | |||||||||
Ashtead Capital, Inc., 4.13%, 8/15/25, Callable 8/26/20 @ 103.09 (b) | 2,500 | 2,565 | |||||||||
Avolon Holdings Funding Ltd., 3.25%, 2/15/27, Callable 12/15/26 @ 100 (b) | 2,550 | 2,139 | |||||||||
BAE Systems PLC, 3.40%, 4/15/30, Callable 1/15/30 @ 100 (b) | 5,000 | 5,650 | |||||||||
CK Hutchison International Ltd., 2.75%, 9/6/29, Callable 6/6/29 @ 100 (b) | 5,000 | 5,375 | |||||||||
Experian Finance PLC, 2.75%, 3/8/30, Callable 12/8/29 @ 100 (b) | 5,000 | 5,485 | |||||||||
Heathrow Funding Ltd., 4.88%, 7/15/21 (b) | 12,254 | 12,608 | |||||||||
Latam Airlines Pass Through Trust, 4.20%, 8/15/29 | 2,615 | 2,251 | |||||||||
Sydney Airport Finance Co. Pty Ltd., 3.63%, 4/28/26, Callable 1/28/26 @ 100 (b) | 2,000 | 2,150 | |||||||||
56,842 | |||||||||||
Information Technology (0.0% (j)): | |||||||||||
Open Text Holdings, Inc., 4.13%, 2/15/30, Callable 2/15/25 @ 102.06 (b) | 1,000 | 1,059 | |||||||||
Materials (1.2%): | |||||||||||
| Anglo American Capital PLC 3.75%, 4/10/22 (b) | 2,500 | 2,591 | |||||||||
5.38%, 4/1/25, Callable 3/1/25 @ 100 (b) | 2,000 | 2,305 | |||||||||
4.00%, 9/11/27 (b) | 4,000 | 4,437 | |||||||||
CCL Industries, Inc., 3.25%, 10/1/26, Callable 7/1/26 @ 100 (b) | 7,500 | 8,014 | |||||||||
Fresnillo PLC, 5.50%, 11/13/23 (b) | 10,000 | 11,018 | |||||||||
Kinross Gold Corp., 4.50%, 7/15/27, Callable 4/15/27 @ 100 (m) | 3,000 | 3,419 | |||||||||
| Teck Resources Ltd. 3.75%, 2/1/23, Callable 11/1/22 @ 100 | 5,000 | 5,088 | |||||||||
6.13%, 10/1/35 | 3,000 | 3,515 | |||||||||
Yara International ASA, 3.80%, 6/6/26, Callable 3/6/26 @ 100 (b) | 4,000 | 4,437 | |||||||||
44,824 | |||||||||||
See notes to financial statements.
30
| USAA Mutual Funds Trust USAA Intermediate-Term Bond Fund | Schedule of Portfolio Investments — continued July 31, 2020 | ||||||
(Amounts in Thousands, Except for Shares)
| Security Description | Principal Amount | Value | |||||||||
Real Estate (0.1%): | |||||||||||
| Ontario Teachers' Cadillac Fairview Properties Trust, 4.13%, 2/1/29, Callable 11/1/28 @ 100 (b) | $ | 4,167 | $ | 4,699 | |||||||
Utilities (0.3%): | |||||||||||
Comision Federal de Electricidad, 4.75%, 2/23/27 (b) | 5,000 | 5,302 | |||||||||
Empresa Electrica Cochrane SpA, 5.50%, 5/14/27 (b) | 2,395 | 2,453 | |||||||||
Fortis, Inc., 3.06%, 10/4/26, Callable 7/4/26 @ 100 | 3,192 | 3,496 | |||||||||
Infraestructura Energetica Nova SAB de CV, 3.75%, 1/14/28 (b) | 5,000 | 5,028 | |||||||||
16,279 | |||||||||||
Total Yankee Dollar (Cost $337,091) | 359,172 | ||||||||||
Municipal Bonds (4.1%) | |||||||||||
Alabama (0.1%): | |||||||||||
| Auburn University Revenue, Series C, 1.85%, 6/1/31, Continuously Callable @100 | 750 | 754 | |||||||||
| The Water Works Board of The City of Birmingham Revenue, 2.60%, 1/1/27 | 2,000 | 2,177 | |||||||||
2,931 | |||||||||||
Arizona (0.0%): (j) | |||||||||||
City of Phoenix Civic Improvement Corp. Revenue, 2.37%, 7/1/25 | 1,500 | 1,578 | |||||||||
California (0.2%): | |||||||||||
| San Jose Redevelopment Agency Successor Agency Tax Allocation, Series A-T, 3.23%, 8/1/27 | 5,000 | 5,552 | |||||||||
Colorado (0.0%): (j) | |||||||||||
| Park Creek Metropolitan District Revenue Series B, 2.89%, 12/1/27 | 660 | 713 | |||||||||
Series B, 2.99%, 12/1/28 | 1,000 | 1,088 | |||||||||
1,801 | |||||||||||
Connecticut (0.1%): | |||||||||||
City of New Haven, GO, Series A, 4.43%, 8/1/28 | 1,250 | 1,421 | |||||||||
Connecticut State Development Authority Revenue, 5.50%, 4/1/21 | 3,000 | 3,085 | |||||||||
State of Connecticut, GO, Series A, 2.42%, 7/1/27 | 1,000 | 1,063 | |||||||||
5,569 | |||||||||||
District of Columbia (0.0%): (j) | |||||||||||
| District of Columbia Revenue 2.25%, 4/1/27 | 800 | 800 | |||||||||
2.68%, 4/1/31 | 1,500 | 1,528 | |||||||||
2,328 | |||||||||||
Florida (0.1%): | |||||||||||
| County of Miami-Dade Florida Transit System Revenue, Build America Bond, Series B, 4.59%, 7/1/21 | 3,300 | 3,415 | |||||||||
Hawaii (0.5%): | |||||||||||
| State of Hawaii Department of Business Economic Development & Tourism Revenue, Series A2, 3.24%, 1/1/31 | 14,618 | 15,756 | |||||||||
See notes to financial statements.
31
| USAA Mutual Funds Trust USAA Intermediate-Term Bond Fund | Schedule of Portfolio Investments — continued July 31, 2020 | ||||||
(Amounts in Thousands, Except for Shares)
| Security Description | Principal Amount | Value | |||||||||
Illinois (0.0%): (j) | |||||||||||
Illinois Finance Authority Revenue, 5.45%, 8/1/38 | $ | 1,500 | $ | 1,636 | |||||||
Indiana (0.0%): (j) | |||||||||||
| Indiana Finance Authority Revenue 3.08%, 9/15/27 | 1,130 | 1,093 | |||||||||
3.18%, 9/15/28 | 1,000 | 966 | |||||||||
2,059 | |||||||||||
Lousiana (0.0%): (j) | |||||||||||
Louisiana Public Facilities Authority Revenue, 2.28%, 6/1/30 (c) | 1,750 | 1,789 | |||||||||
Maryland (0.4%): | |||||||||||
| Maryland Economic Development Corp. Revenue Series B, 4.05%, 6/1/27 | 2,295 | 2,461 | |||||||||
Series B, 4.15%, 6/1/28 | 2,390 | 2,595 | |||||||||
Series B, 4.25%, 6/1/29 | 2,490 | 2,740 | |||||||||
Series B, 4.35%, 6/1/30 | 1,330 | 1,486 | |||||||||
Series B, 4.40%, 6/1/31 | 1,385 | 1,567 | |||||||||
| Maryland Stadium Authority Revenue Series C, 1.76%, 5/1/27 | 1,715 | 1,723 | |||||||||
Series C, 1.91%, 5/1/28 | 4,770 | 4,805 | |||||||||
17,377 | |||||||||||
Massachusetts (0.1%): | |||||||||||
Massachusetts Development Finance Agency Revenue, Series B, 4.00%, 6/1/24 | 610 | 630 | |||||||||
| Massachusetts State College Building Authority Revenue, Series A, 1.80%, 5/1/29 | 3,000 | 3,071 | |||||||||
3,701 | |||||||||||
Michigan (0.1%): | |||||||||||
Michigan Finance Authority Revenue, 2.95%, 12/1/30 | 2,500 | 2,709 | |||||||||
New Jersey (0.6%): | |||||||||||
City of Atlantic, GO | |||||||||||
Series A, 4.23%, 9/1/25 | 2,525 | 2,782 | |||||||||
Series A, 4.29%, 9/1/26 | 2,410 | 2,693 | |||||||||
| New Jersey Economic Development Authority Revenue Series C, 5.71%, 6/15/30 | 2,500 | 3,086 | |||||||||
Series NNN, 3.47%, 6/15/27 | 5,000 | 4,968 | |||||||||
New Jersey Transportation Trust Fund Authority Revenue, 2.63%, 6/15/24 | 1,100 | 1,086 | |||||||||
| New Jersey Transportation Trust Fund Authority Revenue, Build America Bond, Series C, 5.75%, 12/15/28 | 3,000 | 3,280 | |||||||||
| South Jersey Transportation Authority Revenue Series B, 3.12%, 11/1/26 | 450 | 459 | |||||||||
Series B, 3.36%, 11/1/28 | 1,375 | 1,422 | |||||||||
19,776 | |||||||||||
New York (0.4%): | |||||||||||
| Metropolitan Transportation Authority Revenue, Build America Bond, 6.73%, 11/15/30 | 5,000 | 5,771 | |||||||||
New York State Dormitory Authority Revenue, Series A, 2.01%, 7/1/28 | 750 | 754 | |||||||||
New York State Thruway Authority Revenue, 2.50%, 1/1/27 | 1,200 | 1,260 | |||||||||
See notes to financial statements.
32
| USAA Mutual Funds Trust USAA Intermediate-Term Bond Fund | Schedule of Portfolio Investments — continued July 31, 2020 | ||||||
(Amounts in Thousands, Except for Shares)
| Security Description | Principal Amount | Value | |||||||||
| State of New York Mortgage Agency Revenue, 4.20%, 10/1/27, Continuously Callable @100 | $ | 2,920 | $ | 3,002 | |||||||
Town of Oyster Bay, GO, 3.95%, 2/1/21 | 1,500 | 1,500 | |||||||||
12,287 | |||||||||||
North Carolina (0.0%): (j) | |||||||||||
City of Winston-Salem NC Revenue, Series B, 2.64%, 6/1/29 | 1,140 | 1,227 | |||||||||
Ohio (0.2%): | |||||||||||
City of Cleveland Airport System Revenue, Series A, 2.69%, 1/1/27 | 5,000 | 5,212 | |||||||||
Oklahoma (0.3%): | |||||||||||
Oklahoma Development Finance Authority Revenue, Series C, 5.45%, 8/15/28 | 7,951 | 9,359 | |||||||||
Oregon (0.0%): (j) | |||||||||||
Medford Hospital Facilities Authority Revenue, Series B, 1.88%, 8/15/25 | 500 | 501 | |||||||||
Pennsylvania (0.2%): | |||||||||||
| City of Bethlehem, GO (NBGA — Federal Agricultural Mortgage Corporation) Series A, 2.46%, 10/1/26 | 2,570 | 2,728 | |||||||||
Series A, 2.55%, 10/1/27 | 2,655 | 2,830 | |||||||||
| City of Philadelphia PA Water & Wastewater Revenue Series B, 1.73%, 11/1/28 (c) | 1,000 | 1,010 | |||||||||
Series B, 1.88%, 11/1/29 (c) | 1,000 | 1,006 | |||||||||
City of Philadelphia, GO, Series A, 2.71%, 7/15/29 | 1,000 | 1,048 | |||||||||
| Pennsylvania Economic Development Financing Authority Revenue 2.62%, 3/1/29 | 1,855 | 1,907 | |||||||||
Series B, 3.20%, 11/15/27 | 1,000 | 1,084 | |||||||||
11,613 | |||||||||||
South Dakota (0.1%): | |||||||||||
| South Dakota Health & Educational Facilities Authority Revenue Series B, 2.59%, 7/1/25 | 1,000 | 1,037 | |||||||||
Series B, 2.80%, 7/1/26 | 2,735 | 2,860 | |||||||||
3,897 | |||||||||||
Texas (0.4%): | |||||||||||
City of Dallas Tx Waterworks & Sewer System Revenue, 1.50%, 10/1/27 | 850 | 873 | |||||||||
| Dallas/Fort Worth International Airport Revenue, 2.25%, 11/1/31, Continuously Callable @100 (c) | 2,585 | 2,583 | |||||||||
| Ector County Hospital District Revenue, Build America Bond, 6.80%, 9/15/25, Continuously Callable @100 | 4,350 | 4,362 | |||||||||
Gainesville Hospital District, GO, 4.56%, 8/15/21 | 1,480 | 1,500 | |||||||||
| Harris County Cultural Education Facilities Finance Corp. Revenue Series B, 1.27%, 7/1/25 (c) | 850 | 852 | |||||||||
Series B, 2.71%, 5/15/27 | 1,600 | 1,711 | |||||||||
Series B, 2.76%, 5/15/28 | 2,000 | 2,144 | |||||||||
Series B, 2.30%, 7/1/35 (c) | 500 | 505 | |||||||||
Texas State University System Revenue, Series B, 2.54%, 3/15/28 | 2,775 | 2,982 | |||||||||
17,512 | |||||||||||
Wisconsin (0.3%): | |||||||||||
State of Wisconsin Revenue, Series A, 2.35%, 5/1/29 | 6,000 | 6,439 | |||||||||
Total Municipal Bonds (Cost $146,612) | 156,024 | ||||||||||
See notes to financial statements.
33
| USAA Mutual Funds Trust USAA Intermediate-Term Bond Fund | Schedule of Portfolio Investments — continued July 31, 2020 | ||||||
(Amounts in Thousands, Except for Shares)
| Security Description | Principal Amount | Value | |||||||||
U.S. Government Agency Mortgages (4.5%) | |||||||||||
| Federal Home Loan Mortgage Corp. 5.00%, 9/1/20 | $ | 3 | $ | 3 | |||||||
Series K017, Class X1, 1.29%, 12/25/21 (d) (e) | 34,625 | 413 | |||||||||
Series K019, Class X1, 1.59%, 3/25/22 (d) (e) | 19,554 | 362 | |||||||||
Series K023, Class X1, 1.23%, 8/25/22 (d) (e) | 64,900 | 1,256 | |||||||||
Series K025, Class X1, 0.81%, 10/25/22 (d) (e) | 63,166 | 876 | |||||||||
Series KC02, Class A2, 3.37%, 7/25/25 (f) | 5,000 | 5,587 | |||||||||
Series K063, Class A2, 3.43%, 1/25/27 (d) | 5,000 | 5,755 | |||||||||
Series K095, Class A2, 2.79%, 6/25/29 | 5,000 | 5,702 | |||||||||
Series K099, Class A2, 2.60%, 9/25/29 | 20,000 | 22,569 | |||||||||
Series K102, Class A2, 2.54%, 10/25/29 | 14,000 | 15,746 | |||||||||
Series K103, Class A2, 2.65%, 11/25/29 | 5,000 | 5,682 | |||||||||
Series K110, Class X1, 1.70%, 4/25/30 (d) (e) | 15,300 | 2,039 | |||||||||
Series K111, Class X1, 1.68%, 5/25/30 (d) (e) | 11,610 | 1,480 | |||||||||
Series K113, Class X1, 1.49%, 6/25/30 (c) (d) (e) | 26,800 | 3,104 | |||||||||
Series K154, Class A3, 3.46%, 11/25/32 | 891 | 1,072 | |||||||||
5.50%, 4/1/36 | 46 | 53 | |||||||||
71,699 | |||||||||||
| Federal National Mortgage Association Series 2012-M4, Class X1, 0.42%, 4/25/22 (d) (e) | 53,570 | 160 | |||||||||
Series 2017-M2, Class A2, 2.80%, 2/25/27 (d) | 3,500 | 3,882 | |||||||||
Series M7, Class A2, 2.96%, 2/25/27 (d) | 2,500 | 2,796 | |||||||||
2.50%, 7/1/27 — 11/1/34 (f) | 21,114 | 22,152 | |||||||||
Series M4, Class A2, 3.05%, 3/25/28 (d) | 3,553 | 4,057 | |||||||||
4.00%, 8/1/49 — 2/1/50 (f) | 33,962 | 36,033 | |||||||||
3.50%, 9/1/49 — 2/1/50 (f) | 28,663 | 30,182 | |||||||||
99,262 | |||||||||||
Total U.S. Government Agency Mortgages (Cost $161,577) | 170,961 | ||||||||||
U.S. Treasury Obligations (6.8%) | |||||||||||
| U.S. Treasury Bonds 1.13%, 5/15/40 | 18,000 | 18,481 | |||||||||
2.50%, 2/15/45 (f) | 30,000 | 38,597 | |||||||||
3.38%, 11/15/48 (f) | 30,000 | 45,998 | |||||||||
1.25%, 5/15/50 | 50,000 | 50,664 | |||||||||
| U.S. Treasury Notes 2.38%, 5/15/27 (f) | 29,000 | 32,888 | |||||||||
0.38%, 7/31/27 | 7,000 | 6,992 | |||||||||
1.63%, 8/15/29 (f) | 60,000 | 66,000 | |||||||||
Total U.S. Treasury Obligations (Cost $225,519) | 259,620 | ||||||||||
Commercial Paper (4.9%) | |||||||||||
| Cabot Corp. 0.17%, 8/12/20 (b) (p) | 1,000 | 1,000 | |||||||||
0.17%, 8/13/20 (p) | 15,840 | 15,839 | |||||||||
Canadian Natural Resources Ltd., 0.19%, 8/4/20 (b) (p) | 31,500 | 31,499 | |||||||||
Energy Transfer Part LP, 0.17%, 8/4/20 (b) (p) | 21,000 | 21,000 | |||||||||
See notes to financial statements.
34
| USAA Mutual Funds Trust USAA Intermediate-Term Bond Fund | Schedule of Portfolio Investments — continued July 31, 2020 | ||||||
(Amounts in Thousands, Except for Shares)
Security Description | Shares or Principal Amount | Value | |||||||||
FMC Corp., 0.67%, 9/1/20 (b) (p) | $ | 17,500 | $ | 17,490 | |||||||
Glencore Funding LLC, 0.39%, 8/7/20 (b) (p) | 20,000 | 19,998 | |||||||||
| Hyundai Capital America, Inc. 0.19%, 8/5/20 (b) (p) | 7,000 | 7,000 | |||||||||
0.59%, 8/11/20 (b) (p) | 10,000 | 9,999 | |||||||||
0.45%, 8/18/20 (b) (p) | 10,000 | 9,998 | |||||||||
0.60%, 8/25/20 (b) (p) | 11,000 | 10,995 | |||||||||
| Jabil, Inc. 2.67%, 8/3/20 (b) (p) | 18,000 | 17,996 | |||||||||
2.65%, 8/4/20 (b) (p) | 15,000 | 14,996 | |||||||||
Kentucky Utilities Co., 0.19%, 8/3/20 (b) (p) | 10,000 | 10,000 | |||||||||
187,810 | |||||||||||
Total Commercial Paper (Cost $187,815) | 187,810 | ||||||||||
Collateral for Securities Loaned^ (0.3%) | |||||||||||
| Goldman Sachs Financial Square Government Fund Institutional Shares, 0.13% (q) | 10,017,632 | 10,017 | |||||||||
HSBC U.S. Government Money Market Fund I Shares, 0.08% (q) | 1,758,661 | 1,759 | |||||||||
Total Collateral for Securities Loaned (Cost $11,776) | 11,776 | ||||||||||
Total Investments (Cost $3,658,086) — 100.1% | 3,830,297 | ||||||||||
Liabilities in excess of other assets — (0.1)% | (5,707 | ) | |||||||||
NET ASSETS — 100.00% | $ | 3,824,590 | |||||||||
At July 31, 2020 the Fund's investments in foreign securities were 9.2% of net assets.
^ Purchased with cash collateral from securities on loan.
(a) Variable or Floating-Rate Security. Rate disclosed is as of July 31, 2020.
(b) Rule 144A security or other security that is restricted as to resale to institutional investors. The Fund's Adviser has deemed this security to be liquid based upon procedures approved by the Board of Trustees. As of July 31, 2020, the fair value of these securities was $1,396,989 (thousands) and amounted to 36.6% of net assets.
(c) Security purchased on a when-issued basis.
(d) The rate for certain asset-backed and mortgage backed securities may vary based on factors relating to the pool of assets underlying the security. The rate disclosed is the rate in effect at July 31, 2020.
(e) Security is interest only.
(f) All or a portion of this security has been segregated as collateral for derivative instruments and/or when-issued securities.
(g) Security is perpetual and has no final maturity date but may be subject to calls at various dates in the future.
(h) Security was fair valued based upon procedures approved by the Board of Trustees and represents less than 0.05% of the Fund's net assets as of July 31, 2020. This security is classified as Level 3 within the fair value hierarchy. (See Note 2)
See notes to financial statements.
35
| USAA Mutual Funds Trust USAA Intermediate-Term Bond Fund | Schedule of Portfolio Investments — continued July 31, 2020 | ||||||
(i) The Fund's Adviser has deemed this security to be illiquid based upon procedures approved by the Board of Trustees. As of July 31, 2020, illiquid securities were 0.2% of the Fund's net assets.
(j) Amount represents less than 0.05% of net assets.
(k) Defaulted security
(l) At July 31, 2020, the issuer was in bankruptcy.
(m) All or a portion of this security is on loan.
(n) Variable Rate Demand Notes that provide the rights to sell the security at face value on either that day or within the rate-reset period. The interest rate is reset on the put date at a stipulated daily, weekly, monthly, quarterly, or other specified time interval to reflect current market conditions. These securities do not indicate a reference rate and spread in their description.
(o) All of the coupon is paid in kind.
(p) Rate represents the effective yield at July 31, 2020.
(q) Rate disclosed is the daily yield on July 31, 2020.
(r) The rate for this senior secured loan will be known on settlement date of the loan, subsequent to this report date. Senior secured loans have rates that will fluctuate over time in line with prevailing interest rates.
bps — Basis points
GO — General Obligation
H15T1Y — 1 Year Treasury Constant Maturity Rate
H15T5Y — 5 Year Treasury Constant Maturity Rate
LIBOR — London InterBank Offered Rate
LIBOR01M — 1 Month US Dollar LIBOR, rate disclosed as of July 31, 2020, based on the last reset date of the security
LIBOR03M — 3 Month US Dollar LIBOR, rate disclosed as of July 31, 2020, based on the last reset date of the security
LIBOR06M — 6 Month US Dollar LIBOR, rate disclosed as of July 31, 2020, based on the last reset date of the security
LLC — Limited Liability Company
LP — Limited Partnership
MBIA — Municipal Bond Insurance Association
MTN — Medium Term Note
PIK — Payment-in-kind
PLC — Public Limited Company
SOFR — Secured Overnight Financing Rate
USSW10 — USD 10 Year Swap Rate, rate disclosed as of July 31, 2020
USSW5 — USD 5 Year Swap Rate, rate disclosed as of July 31, 2020.
See notes to financial statements.
36
| USAA Mutual Funds Trust USAA Intermediate-Term Bond Fund | Schedule of Portfolio Investments — continued July 31, 2020 | ||||||
Credit Enhancements — Adds the financial strength of the provider of the enhancement to support the issuer's ability to repay the principal and interest payments when due. The enhancement may be provided by a high-quality bank, insurance company or other corporation, or a collateral trust. The enhancements do not guarantee the market values of the securities.
INS Principal and interest payments are insured by the name listed. Although bond insurance reduces the risk of loss due to default by an issuer, such bonds remain subject to the risk that value may fluctuate for other reasons, and there is no assurance that the insurance company will meet its obligations.
NBGA Principal and interest payments or, under certain circumstances, underlying mortgages, are guaranteed by a nonbank guarantee agreement from the name listed.
Futures Contracts Purchased
(Amounts not in thousands)
| Number of Contracts | Expiration Date | Notional Amount | Value | Unrealized Appreciation (Depreciation) | |||||||||||||||||||
10-Year U.S. Treasury Note Future | 100 | 9/21/20 | $ | 13,836,424 | $ | 14,007,812 | $ | 171,388 | |||||||||||||||
2-Year U.S. Treasury Note Future | 80 | 9/30/20 | 17,665,190 | 17,678,750 | 13,560 | ||||||||||||||||||
30-Year U.S. Treasury Bond Future | 220 | 9/21/20 | 38,999,359 | 40,101,875 | 1,102,516 | ||||||||||||||||||
5-Year U.S. Treasury Note Future | 5 | 9/30/20 | 628,879 | 630,625 | 1,746 | ||||||||||||||||||
$ | 1,289,210 | ||||||||||||||||||||||
| Total unrealized appreciation | $ | 1,289,210 | ||||||||||||||||||||
| Total unrealized depreciation | — | |||||||||||||||||||||
| Total net unrealized appreciation(depreciation) | $ | 1,289,210 | ||||||||||||||||||||
See notes to financial statements.
37
USAA Mutual Funds Trust | Statement of Assets and Liabilities July 31, 2020 | ||||||
(Amounts in Thousands, Except Per Share Amounts)
| USAA Intermediate- Term Bond Fund | |||||||
Assets: | |||||||
Investments, at value (Cost $3,658,086) | $ | 3,830,297 | (a) | ||||
Cash and cash equivalents | 35,153 | ||||||
Deposits with brokers for futures contracts | 4,892 | ||||||
Receivables: | |||||||
Interest and dividends | 24,786 | ||||||
Capital shares issued | 1,326 | ||||||
Investments sold | 25,483 | ||||||
Variation margin on open futures contracts | 32 | ||||||
From Adviser | 19 | ||||||
Prepaid expenses | 96 | ||||||
Total assets | 3,922,084 | ||||||
Liabilities: | |||||||
Payables: | |||||||
Collateral received on loaned securities | 11,776 | ||||||
Distributions | 316 | ||||||
Investments purchased | 76,857 | ||||||
Capital shares redeemed | 6,758 | ||||||
Accrued expenses and other payables: | |||||||
Investment advisory fees | 975 | ||||||
Administration fees | 405 | ||||||
Custodian fees | 23 | ||||||
Transfer agent fees | 293 | ||||||
Compliance fees | 2 | ||||||
| 12b-1 fees | 5 | ||||||
Other accrued expenses | 84 | ||||||
Total liabilities | 97,494 | ||||||
(continues on next page)
See notes to financial statements.
38
USAA Mutual Funds Trust | Statement of Assets and Liabilities July 31, 2020 | ||||||
(Amounts in Thousands, Except Per Share Amounts) (continued)
| USAA Intermediate- Term Bond Fund | |||||||
Net Assets: | |||||||
Capital | 3,545,825 | ||||||
Total accumulated earnings/(loss) | 278,765 | ||||||
Net assets | $ | 3,824,590 | |||||
Net Assets: | |||||||
Fund Shares | $ | 1,960,334 | |||||
Institutional Shares | 1,791,887 | ||||||
Class A shares | 45,991 | ||||||
Class C shares | 19 | ||||||
Class R6 Shares | 26,359 | ||||||
Total | $ | 3,824,590 | |||||
Shares (unlimited number of shares authorized with no par value): | |||||||
Fund Shares | 174,817 | ||||||
Institutional Shares | 159,764 | ||||||
Class A shares | 4,106 | ||||||
Class C shares | 2 | ||||||
Class R6 Shares | 2,350 | ||||||
Total | 341,039 | ||||||
Net asset value, offering and redemption price per share: (b) | |||||||
Fund Shares | $ | 11.21 | |||||
Institutional Shares | $ | 11.22 | |||||
Class A shares | $ | 11.20 | |||||
Class C shares (c) | $ | 11.20 | |||||
Class R6 Shares | $ | 11.22 | |||||
Maximum Sales Charge — Class A shares | 2.25 | % | |||||
| Maximum offering price (100%/(100%-maximum sales charge) of net asset value adjusted to the nearest cent) per share — Class A shares | $ | 11.46 | |||||
(a) Includes $11,405 of securities on loan.
(b) Per share amount may not recalculate due to rounding of net assets and/or shares outstanding.
(c) Redemption price per share varies by the length of time shares are held.
See notes to financial statements.
39
USAA Mutual Funds Trust | Statement of Operations For the Year Ended July 31, 2020 | ||||||
(Amounts in Thousands)
| USAA Intermediate- Term Bond Fund | |||||||
Investment Income: | |||||||
Dividends | $ | 3,713 | |||||
Interest | 145,815 | ||||||
Interfund lending | — | (a) | |||||
Securities lending (net of fees) | 174 | ||||||
Foreign tax withholding | 4 | ||||||
Total income | 149,706 | ||||||
Expenses*: | |||||||
Investment advisory fees | 11,665 | ||||||
Administration fees — Fund Shares | 2,950 | ||||||
Administration fees — Institutional Shares | 1,807 | ||||||
Administration fees — Class A shares | 72 | ||||||
Administration fees — Class C shares | — | (a) | |||||
Administration fees — Class R6 Shares | 9 | ||||||
Sub-Administration fees | 24 | ||||||
12b-1 fees — Class A shares | 119 | ||||||
12b-1 fees — Class C shares | — | (a) | |||||
Custodian fees | 323 | ||||||
Transfer agent fees — Fund Shares | 2,081 | ||||||
Transfer agent fees — Institutional Shares | 1,807 | ||||||
Transfer agent fees — Class A shares | 53 | ||||||
Transfer agent fees — Class C shares | — | (a) | |||||
Transfer agent fees — Class R6 Shares | 2 | ||||||
Trustees' fees | 47 | ||||||
Compliance fees | 25 | ||||||
Legal and audit fees | 130 | ||||||
State registration and filing fees | 84 | ||||||
Interfund lending fees | 10 | ||||||
Other expenses | 231 | ||||||
Total expenses | 21,439 | ||||||
Expenses waived/reimbursed by Adviser | (200 | ) | |||||
Net expenses | 21,239 | ||||||
Net Investment Income (Loss) | 128,467 | ||||||
Realized/Unrealized Gains (Losses) from Investments: | |||||||
Net realized gains (losses) from investment securities | 151,756 | ||||||
Net realized gains (losses) from futures contracts | 5,515 | ||||||
Net change in unrealized appreciation/depreciation on investment securities | 37,622 | ||||||
Net change in unrealized appreciation/depreciation on futures contracts | (96 | ) | |||||
Net realized/unrealized gains (losses) on investments | 194,797 | ||||||
Change in net assets resulting from operations | $ | 323,264 | |||||
(a) Amount is less than $1 thousand.
* Class C activity is for the period June 29, 2020 (commencement of operations) to July 31, 2020.
See notes to financial statements.
40
USAA Mutual Funds Trust | Statements of Changes in Net Assets | ||||||
(Amounts in Thousands)
| USAA Intermediate- Term Bond Fund | |||||||||||
| Year Ended July 31, 2020 | Year Ended July 31, 2019 | ||||||||||
From Investments: | |||||||||||
Operations: | |||||||||||
Net investment income (loss) | $ | 128,467 | $ | 140,180 | |||||||
Net realized gains (losses) from investments | 157,271 | 9,486 | |||||||||
| Net change in unrealized appreciation/depreciation on investments | 37,526 | 150,446 | |||||||||
Change in net assets resulting from operations | 323,264 | 300,112 | |||||||||
Distributions to Shareholders: | |||||||||||
Fund Shares | (91,800 | ) | (69,671 | ) | |||||||
Institutional Shares | (85,458 | ) | (68,783 | ) | |||||||
Class A shares | (2,102 | ) | (1,653 | ) | |||||||
Class C shares (a) | — | (b) | — | ||||||||
Class R6 Shares | (699 | ) | (205 | ) | |||||||
Change in net assets resulting from distributions to shareholders | (180,059 | ) | (140,312 | ) | |||||||
Change in net assets resulting from capital transactions | (123,163 | ) | (285,872 | ) | |||||||
Change in net assets | 20,042 | (126,072 | ) | ||||||||
Net Assets: | |||||||||||
Beginning of period | 3,804,548 | 3,930,620 | |||||||||
End of period | $ | 3,824,590 | $ | 3,804,548 | |||||||
Capital Transactions: | |||||||||||
Fund Shares | |||||||||||
Proceeds from shares issued | $ | 370,884 | $ | 341,437 | |||||||
Distributions reinvested | 88,555 | 66,889 | |||||||||
Cost of shares redeemed | (522,396 | ) | (446,353 | ) | |||||||
Total Fund Shares | $ | (62,957 | ) | $ | (38,027 | ) | |||||
Institutional Shares | |||||||||||
Proceeds from shares issued | $ | 305,352 | $ | 482,475 | |||||||
Distributions reinvested | 83,607 | 65,556 | |||||||||
Cost of shares redeemed | (462,347 | ) | (791,794 | ) | |||||||
Total Institutional Shares | $ | (73,388 | ) | $ | (243,763 | ) | |||||
Class A shares | |||||||||||
Proceeds from shares issued | $ | 5,417 | $ | 6,834 | |||||||
Distributions reinvested | 2,069 | 1,624 | |||||||||
Cost of shares redeemed | (14,102 | ) | (12,828 | ) | |||||||
Total Class A shares | $ | (6,616 | ) | $ | (4,370 | ) | |||||
Class C shares (a) | |||||||||||
Proceeds from shares issued | $ | 18 | $ | — | |||||||
Distributions reinvested | — | (b) | — | ||||||||
Total Class C shares | $ | 18 | $ | — | |||||||
Class R6 Shares | |||||||||||
Proceeds from shares issued | $ | 20,274 | $ | 316 | |||||||
Distributions reinvested | 83 | — | (b) | ||||||||
Cost of shares redeemed | (577 | ) | (28 | ) | |||||||
Total Class R6 Shares | $ | 19,780 | $ | 288 | |||||||
Change in net assets resulting from capital transactions | $ | (123,163 | ) | $ | (285,872 | ) | |||||
(a) Class C activity is for the period June 29, 2020 (commencement of operations) to July 31, 2020.
(b) Amount is less than $1 thousand.
(continues on next page)
See notes to financial statements.
41
USAA Mutual Funds Trust | Statements of Changes in Net Assets | ||||||
(Amounts in Thousands) (continued)
| USAA Intermediate- Term Bond Fund | |||||||||||
| Year Ended July 31, 2020 | Year Ended July 31, 2019 | ||||||||||
Share Transactions: | |||||||||||
Fund Shares | |||||||||||
Issued | 34,243 | 32,829 | |||||||||
Reinvested | 8,176 | 6,420 | |||||||||
Redeemed | (48,491 | ) | (43,105 | ) | |||||||
Total Fund Shares | (6,072 | ) | (3,856 | ) | |||||||
Institutional Shares | |||||||||||
Issued | 28,134 | 45,934 | |||||||||
Reinvested | 7,719 | 6,291 | |||||||||
Redeemed | (42,872 | ) | (75,621 | ) | |||||||
Total Institutional Shares | (7,019 | ) | (23,396 | ) | |||||||
Class A shares | |||||||||||
Issued | 498 | 644 | |||||||||
Reinvested | 191 | 156 | |||||||||
Redeemed | (1,309 | ) | (1,242 | ) | |||||||
Total Class A shares | (620 | ) | (442 | ) | |||||||
Class C shares (a) | |||||||||||
Issued | 2 | — | |||||||||
Reinvested | — | — | |||||||||
Total Class C shares | 2 | — | |||||||||
Class R6 Shares | |||||||||||
Issued | 1,884 | 31 | |||||||||
Reinvested | 8 | — | (c) | ||||||||
Redeemed | (53 | ) | (3 | ) | |||||||
Total Class R6 Shares | 1,839 | 28 | |||||||||
Change in Shares | (11,870 | ) | (27,666 | ) | |||||||
(a) Class C activity is for the period June 29, 2020 (commencement of operations) to July 31, 2020.
(c) Amount is less than 500 shares.
See notes to financial statements.
42
This page is intentionally left blank.
43
USAA Mutual Funds Trust | Financial Highlights | ||||||
For a Share Outstanding Throughout Each Period
Investment Activities | Distributions to Shareholders From | ||||||||||||||||||||||||||
| Net Asset Value, Beginning of Period | Net Investment Income (Loss) | Net Realized and Unrealized Gains (Losses) on Investments | Total from Investment Activities | Net Investment Income | Net Realized Gains From Investments | ||||||||||||||||||||||
USAA Intermediate-Term Bond Fund | |||||||||||||||||||||||||||
Fund Shares | |||||||||||||||||||||||||||
Year Ended July 31, 2020 | $ | 10.78 | 0.36 | (d) | 0.58 | 0.94 | (0.36 | ) | (0.15 | ) | |||||||||||||||||
Year Ended July 31, 2019 | $ | 10.33 | 0.38 | 0.46 | 0.84 | (0.39 | ) | — | |||||||||||||||||||
Year Ended July 31, 2018 | $ | 10.70 | 0.37 | (0.37 | ) | — | (0.37 | ) | — | ||||||||||||||||||
Year Ended July 31, 2017 | $ | 10.71 | 0.38 | (0.01 | ) | 0.37 | (0.38 | ) | — | ||||||||||||||||||
Year Ended July 31, 2016 | $ | 10.58 | 0.42 | 0.14 | 0.56 | (0.42 | ) | (0.01 | ) | ||||||||||||||||||
Institutional Shares | |||||||||||||||||||||||||||
Year Ended July 31, 2020 | $ | 10.78 | 0.37 | (d) | 0.59 | 0.96 | (0.37 | ) | (0.15 | ) | |||||||||||||||||
Year Ended July 31, 2019 | $ | 10.33 | 0.39 | 0.45 | 0.84 | (0.39 | ) | — | |||||||||||||||||||
Year Ended July 31, 2018 | $ | 10.70 | 0.38 | (0.37 | ) | 0.01 | (0.38 | ) | — | ||||||||||||||||||
Year Ended July 31, 2017 | $ | 10.72 | 0.39 | (0.02 | ) | 0.37 | (0.39 | ) | — | ||||||||||||||||||
Year Ended July 31, 2016 | $ | 10.58 | 0.43 | 0.15 | 0.58 | (0.43 | ) | (0.01 | ) | ||||||||||||||||||
Class A shares | |||||||||||||||||||||||||||
Year Ended July 31, 2020 | $ | 10.77 | 0.33 | (d) | 0.58 | 0.91 | (0.33 | ) | (0.15 | ) | |||||||||||||||||
Year Ended July 31, 2019 | $ | 10.32 | 0.35 | 0.45 | 0.80 | (0.35 | ) | — | |||||||||||||||||||
Year Ended July 31, 2018 | $ | 10.69 | 0.34 | (0.37 | ) | (0.03 | ) | (0.34 | ) | — | |||||||||||||||||
Year Ended July 31, 2017 | $ | 10.70 | 0.35 | (0.01 | ) | 0.34 | (0.35 | ) | — | ||||||||||||||||||
Year Ended July 31, 2016 | $ | 10.58 | 0.40 | 0.13 | 0.53 | (0.40 | ) | (0.01 | ) | ||||||||||||||||||
Class C shares | |||||||||||||||||||||||||||
| June 29, 2020 (f) through July 31, 2020 | $ | 10.99 | 0.02 | (d) | 0.21 | 0.23 | (0.02 | ) | — | ||||||||||||||||||
Class R6 Shares | |||||||||||||||||||||||||||
Year Ended July 31, 2020 | $ | 10.79 | 0.37 | (d) | 0.59 | 0.96 | (0.38 | ) | (0.15 | ) | |||||||||||||||||
Year Ended July 31, 2019 | $ | 10.33 | 0.41 | 0.46 | 0.87 | (0.41 | ) | — | |||||||||||||||||||
Year Ended July 31, 2018 | $ | 10.71 | 0.39 | (0.38 | ) | 0.01 | (0.39 | ) | — | ||||||||||||||||||
| December 1, 2016 (f) through July 31, 2017 | $ | 10.38 | 0.26 | 0.33 | 0.59 | (0.26 | ) | — | |||||||||||||||||||
* Assumes reinvestment of all net investment income and realized capital gain distributions, if any, during the period. Includes adjustments in accordance with U.S. generally accepted accounting principles and could differ from the Lipper reported return.
^ The net expense ratio may not correlate to the applicable expense limits in place during the period since the current contractual expense limitation is applied for a two year period beginning July 1, 2019 and in effect through June 30, 2021, instead of coinciding with the Fund's fiscal year end. Details of the current contractual expense limitation in effect can be found in Note 4 of the accompanying Notes to Financial Statements.
(a) Not annualized for periods less than one year.
(b) Annualized for periods less than one year.
(c) Portfolio turnover is calculated on the basis of the Fund as a whole without distinguishing between the classes of shares issued.
See notes to financial statements.
44
USAA Mutual Funds Trust | Financial Highlights — continued | ||||||
For a Share Outstanding Throughout Each Period
Ratios to Average Net Assets | Supplemental Data | ||||||||||||||||||||||||||||||||||
| Total Distributions | Net Asset Value, End of Period | Total Return (Excludes Sales Charge)*(a) | Net Expenses^(b) | Net Investment Income (Loss)(b) | Gross Expenses(b) | Net Assets, End of Period (000's) | Portfolio Turnover(a)(c) | ||||||||||||||||||||||||||||
USAA Intermediate-Term Bond Fund | |||||||||||||||||||||||||||||||||||
Fund Shares | |||||||||||||||||||||||||||||||||||
Year Ended July 31, 2020 | (0.51 | ) | $ | 11.21 | 8.94 | % | 0.58 | % | 3.32 | % | 0.58 | % | $ | 1,960,334 | 73 | %(e) | |||||||||||||||||||
Year Ended July 31, 2019 | (0.39 | ) | $ | 10.78 | 8.28 | % | 0.64 | % | 3.71 | % | 0.64 | % | $ | 1,949,989 | 35 | % | |||||||||||||||||||
Year Ended July 31, 2018 | (0.37 | ) | $ | 10.33 | (0.03 | )% | 0.63 | % | 3.50 | % | 0.63 | % | $ | 1,907,941 | 15 | % | |||||||||||||||||||
Year Ended July 31, 2017 | (0.38 | ) | $ | 10.70 | 3.52 | % | 0.63 | % | 3.57 | % | 0.63 | % | $ | 1,949,102 | 13 | % | |||||||||||||||||||
Year Ended July 31, 2016 | (0.43 | ) | $ | 10.71 | 5.55 | % | 0.62 | % | 4.08 | % | 0.62 | % | $ | 1,812,716 | 18 | % | |||||||||||||||||||
Institutional Shares | |||||||||||||||||||||||||||||||||||
Year Ended July 31, 2020 | (0.52 | ) | $ | 11.22 | 9.11 | % | 0.51 | % | 3.39 | % | 0.52 | % | $ | 1,791,887 | 73 | %(e) | |||||||||||||||||||
Year Ended July 31, 2019 | (0.39 | ) | $ | 10.78 | 8.35 | % | 0.58 | % | 3.77 | % | 0.58 | % | $ | 1,798,154 | 35 | % | |||||||||||||||||||
Year Ended July 31, 2018 | (0.38 | ) | $ | 10.33 | 0.04 | % | 0.56 | % | 3.57 | % | 0.56 | % | $ | 1,964,377 | 15 | % | |||||||||||||||||||
Year Ended July 31, 2017 | (0.39 | ) | $ | 10.70 | 3.51 | % | 0.56 | % | 3.64 | % | 0.56 | % | $ | 2,049,723 | 13 | % | |||||||||||||||||||
Year Ended July 31, 2016 | (0.44 | ) | $ | 10.72 | 5.72 | % | 0.54 | % | 4.13 | % | 0.54 | % | $ | 1,771,357 | 18 | % | |||||||||||||||||||
Class A shares | |||||||||||||||||||||||||||||||||||
Year Ended July 31, 2020 | (0.48 | ) | $ | 11.20 | 8.66 | % | 0.86 | % | 3.06 | % | 0.86 | % | $ | 45,991 | 73 | %(e) | |||||||||||||||||||
Year Ended July 31, 2019 | (0.35 | ) | $ | 10.77 | 7.97 | % | 0.93 | % | 3.42 | % | 0.93 | % | $ | 50,892 | 35 | % | |||||||||||||||||||
Year Ended July 31, 2018 | (0.34 | ) | $ | 10.32 | (0.31 | )% | 0.90 | % | 3.22 | % | 0.90 | % | $ | 53,308 | 15 | % | |||||||||||||||||||
Year Ended July 31, 2017 | (0.35 | ) | $ | 10.69 | 3.28 | % | 0.87 | % | 3.44 | % | 0.87 | % | $ | 74,377 | 13 | % | |||||||||||||||||||
Year Ended July 31, 2016 | (0.41 | ) | $ | 10.70 | 5.19 | % | 0.86 | % | 3.85 | % | 0.86 | % | $ | 98,835 | 18 | % | |||||||||||||||||||
Class C shares | |||||||||||||||||||||||||||||||||||
| June 29, 2020 (f) through July 31, 2020 | (0.02 | ) | $ | 11.20 | 2.09 | % | 1.53 | % | 2.06 | % | 175.78 | % | $ | 19 | 73 | %(e) | |||||||||||||||||||
Class R6 Shares | |||||||||||||||||||||||||||||||||||
Year Ended July 31, 2020 | (0.53 | ) | $ | 11.22 | 9.14 | % | 0.39 | % | 3.45 | % | 0.46 | % | $ | 26,359 | 73 | %(e) | |||||||||||||||||||
Year Ended July 31, 2019 | (0.41 | ) | $ | 10.79 | 8.66 | % | 0.39 | % | 3.96 | % | 0.74 | % | $ | 5,513 | 35 | % | |||||||||||||||||||
Year Ended July 31, 2018 | (0.39 | ) | $ | 10.33 | 0.12 | % | 0.39 | % | 3.74 | % | 0.80 | % | $ | 4,994 | 15 | % | |||||||||||||||||||
| December 1, 2016 (f) through July 31, 2017 | (0.26 | ) | $ | 10.71 | 5.79 | % | 0.39 | % | 3.78 | % | 1.07 | % | $ | 5,158 | 13 | % | |||||||||||||||||||
(d) Per share net investment income (loss) has been calculated using the average daily shares method.
(e) Reflects increased trading activity due to current year transition or asset allocation shift.
(f) Commencement of operations.
See notes to financial statements.
45
USAA Mutual Funds Trust | Notes to Financial Statements July 31, 2020 | ||||||
1. Organization:
USAA Mutual Funds Trust (the "Trust") is organized as a Delaware statutory trust and is registered under the Investment Company Act of 1940, as amended (the "1940 Act"), as an open-end investment company. The Trust is comprised of 47 funds and is authorized to issue an unlimited number of shares, which are units of beneficial interest with no par value.
The accompanying financial statements are those of the USAA Intermediate-Term Bond Fund (the "Fund"). The Fund offers five classes of shares: Fund Shares, Institutional Shares, Class A* shares, Class C** shares, and R6 Shares. The Fund is classified as diversified under the 1940 Act.
* Effective June 29, 2020, the Fund's Adviser Shares were redesignated Class A shares and became subject to a front-end sales charge.
** Class C shares commenced operations on June 29, 2020.
Each class of shares of the Fund has substantially identical rights and privileges except with respect to fees paid under distribution plans, expenses allocable exclusively to each class of shares, voting rights on matters solely affecting a single class of shares, and the exchange privilege of each class of shares.
Under the Trust's organizational documents, its officers and trustees are indemnified against certain liabilities arising out of the performance of their duties to the Fund. In addition, in the normal course of business, the Fund enters into contracts with its vendors and others that provide for general indemnifications. The Fund's maximum exposure under these arrangements is unknown, as this would involve future claims that may be made against the Fund. However, based on experience, the Fund expects that risk of loss to be remote.
2. Significant Accounting Policies:
The following is a summary of significant accounting policies followed by the Trust in the preparation of its financial statements. The policies are in conformity with generally accepted accounting principles in the United States of America ("GAAP"). The preparation of financial statements in accordance with GAAP requires management to make estimates and assumptions that affect the reported amounts of assets and liabilities and disclosure of contingent assets and liabilities at the date of the financial statements and the reported amounts of income and expenses for the period. Actual results could differ from those estimates. The Fund follows the specialized accounting and reporting requirements under GAAP that are applicable to investment companies under Accounting Standards Codification Topic 946.
Investment Valuation:
The Fund records investments at fair value. Fair value is defined as the price that would be received to sell an asset or paid to transfer a liability in an orderly transaction between market participants at the measurement date.
The valuation techniques described below maximize the use of observable inputs and minimize the use of unobservable inputs in determining fair value. The inputs used for valuing the Fund's investments are summarized in the three broad levels listed below:
• Level 1 — quoted prices in active markets for identical securities
• Level 2 — other significant observable inputs (including quoted prices for similar securities or interest rates applicable to those securities, etc.)
• Level 3 — significant unobservable inputs (including the Fund's own assumptions in determining the fair value of investments)
Changes in valuation techniques may result in transfers in or out of an assigned level within the disclosure hierarchy. The inputs or methodologies used for valuation techniques are not necessarily an indication of the risk associated with entering into those investments.
The Adviser has established the Pricing and Liquidity Committee (the "Committee"), and subject to Trust's Board of Trustees (the "Board") oversight, the Committee administers and oversees the Fund's valuation policies and procedures, which are approved by the Board.
46
USAA Mutual Funds Trust | Notes to Financial Statements — continued July 31, 2020 | ||||||
Portfolio securities listed or traded on securities exchanges, including exchange-traded funds ("ETFs"), American Depositary Receipts ("ADRs") and Rights, are valued at the closing price on the exchange or system where the security is principally traded, if available, or at the Nasdaq Official Closing Price. If there have been no sales for that day on the exchange or system, then a security is valued at the last available bid quotation on the exchange or system where the security is principally traded. In each of these situations, valuations are typically categorized as Level 1 in the fair value hierarchy.
Investments in open-end investment companies are valued at net asset value ("NAV"). These valuations are typically categorized as Level 1 in the fair value hierarchy.
Debt securities of United States ("U.S.") issuers, along with corporate and municipal securities, including short-term investments maturing in 60 days or less, may be valued using evaluated bid or the last sales price to price securities by dealers or an independent pricing service approved by the Board. These valuations are typically categorized as Level 2 in the fair value hierarchy.
Futures contracts are valued at the settlement price established each day by the board of trade or an exchange on which they are traded. These valuations are typically categorized as Level 1 in the fair value hierarchy.
In the event that price quotations or valuations are not readily available, are not reflective of market value, or a significant event has been recognized in relation to a security or class of securities, the securities are valued in good faith by the Committee in accordance with valuation procedures approved by the Board. These valuations are typically categorized as Level 2 or Level 3 in the fair value hierarchy, based on the observability of inputs used to determine the fair value. The effect of fair value pricing is that securities may not be priced on the basis of quotations from the primary market in which they are traded and the actual price realized from the sale of a security may differ materially from the fair value price. Valuing these securities at fair value is intended to cause the Fund's NAV to be more reliable than it otherwise would be.
A summary of the valuations as of July 31, 2020, based upon the three levels defined above, is included in the table below while the breakdown, by category, of investments is disclosed on the Schedule of Portfolio Investments (amounts in thousands):
Level 1 | Level 2 | Level 3 | Total | ||||||||||||||||
Asset-Backed Securities | $ | — | $ | 323,262 | $ | — | $ | 323,262 | |||||||||||
Collateralized Mortgage Obligations | — | 622,661 | — | 622,661 | |||||||||||||||
Preferred Stocks | 17,852 | 20,970 | 500 | 39,322 | |||||||||||||||
Convertible Corporate Bond | — | 472 | — | 472 | |||||||||||||||
Senior Secured Loans | — | 109,782 | — | 109,782 | |||||||||||||||
Corporate Bonds | — | 1,589,435 | — | 1,589,435 | |||||||||||||||
Yankee Dollars | — | 359,172 | — | 359,172 | |||||||||||||||
Municipal Bonds | — | 156,024 | — | 156,024 | |||||||||||||||
U.S. Government Agency Mortgages | — | 170,961 | — | 170,961 | |||||||||||||||
U.S. Treasury Obligations | — | 259,620 | — | 259,620 | |||||||||||||||
Commercial Paper | — | 187,810 | — | 187,810 | |||||||||||||||
Collateral for Securities Loaned | 11,776 | — | — | 11,776 | |||||||||||||||
Total | $ | 29,628 | $ | 3,800,169 | $ | 500 | $ | 3,830,297 | |||||||||||
Other Financial Investments ^: | |||||||||||||||||||
Assets: | |||||||||||||||||||
Future Contracts | $ | 1,289 | $ | — | $ | — | $ | 1,289 | |||||||||||
| Total | $ | 1,289 | $ | — | $ | — | $ | 1,289 | |||||||||||
^ Futures Contracts are valued at the unrealized appreciation (depreciation) on the investment.
For the year ended July 31, 2020, there were no transfers in or out of the Level 3 fair value hierarchy.
47
USAA Mutual Funds Trust | Notes to Financial Statements — continued July 31, 2020 | ||||||
Real Estate Investment Trusts ("REITs"):
The Fund may invest in REITs, which report information on the source of their distributions annually. REITs are pooled investment vehicles that invest primarily in income producing real estate or real estate related loans or interests (such as mortgages). Certain distributions received from REITs during the year are recorded as realized gains or return of capital as estimated by the Fund or when such information becomes known.
Investment Companies:
Open-End Funds:
The Fund may invest in portfolios of open-end investment companies. These investment companies value securities in their portfolios for which market quotations are readily available at their market values (generally the last reported sale price) and all other securities and assets at their fair value by the methods established by the board of directors of the underlying funds.
Securities Purchased on a Delayed-Delivery or When-Issued Basis:
The Fund may purchase securities on a delayed-delivery or when-issued basis. Delivery and payment for securities that have been purchased by the Fund on a delayed-delivery or when-issued basis or for delayed draws on loans can take place a month or more after the trade date. At the time the Fund makes the commitment to purchase a security on a delayed-delivery, or when-issued basis, the Fund records the transaction and reflects the value of the security in determining NAV. No interest accrues to the Fund until the transaction settles and payment takes place. A segregated account is established and the Fund maintains cash and/or marketable securities at least equal in value to commitments for delayed-delivery or when-issued securities. If the Fund owns delayed-delivery or when-issued securities, these values are included in Payable for investments purchased on the accompanying Statement of Assets and Liabilities and the segregated assets are identified on the Schedule of Portfolio Investments.
Municipal Obligations:
The values of municipal obligations can fluctuate and may be affected by adverse tax, legislative, or political changes, and by financial developments affecting municipal issuers. Payment of municipal obligations may depend on a relatively limited source of revenue, resulting in greater credit risk. Future changes in federal tax laws or the activity of an issuer may adversely affect the tax-exempt status of municipal obligations.
Mortgage- and Asset-Backed Securities:
The values of some mortgage-related or asset-backed securities may be particularly sensitive to changes in prevailing interest rates. Early repayment of principal on some mortgage-related securities may expose the Fund to a lower rate of return upon reinvestment of principal. The values of mortgage- and asset-backed securities depend in part on the credit quality and adequacy of the underlying assets or collateral and may fluctuate in response to the market's perception of these factors as well as current
and future repayment rates. Some mortgage-backed securities are backed by the full faith and credit of the U.S. government (e.g., mortgage-backed securities issued by the Government National Mortgage Association, commonly known as "Ginnie Mae"), while other mortgage-backed securities (e.g., mortgage- backed securities issued by the Federal National Mortgage Association and the Federal Home Loan Mortgage Corporation, commonly known as "Fannie Mae" and "Freddie Mac", respectively), are backed only by the credit of the government entity issuing them. In addition, some mortgage-backed securities are issued by private entities and, as such, are not guaranteed by the U.S. government or any agency or instrumentality of the U.S. government.
48
USAA Mutual Funds Trust | Notes to Financial Statements — continued July 31, 2020 | ||||||
Leveraged Loans:
The Fund may invest in leveraged loans, a type of bank loan. Leveraged loans are adjustable-rate bank loans made to companies rated below investment grade. The interest rates on leveraged loans are reset periodically based upon the fluctuations of a base interest rate such as LIBOR and a "spread" above that base interest rate that represents a risk premium to the lending banks and/or other participating investors. Many bank loans bear an adjustable rate of interest; however, leveraged loans provide for a greater "spread" over the base interest rate than other bank loans because they are considered to represent a greater credit risk. Because they are perceived to represent a greater credit risk, leveraged loans possess certain attributes that are similar to high-yield securities. However, because they are often secured by collateral of the borrower, leveraged loans possess certain attributes that are similar to other bank loans.
Below Investment Grade Securities:
The Fund may invest in below investment grade securities (i.e. lower-quality, "junk" debt), which are subject to various risks. Lower-quality debt is considered to be speculative because it is less certain that the issuer will be able to pay interest or repay the principal than in the case of investment grade debt. These securities can involve a substantially greater risk of default than higher-rated securities, and their values can decline significantly over short periods of time. Lower-quality debt securities tend to be more sensitive to adverse news about their issuers, the market and the economy in general, than higher-quality debt securities. The market for these securities can be less liquid, especially during periods of recession or general market decline.
Derivative Instruments:
Futures Contracts:
The Fund may enter into contracts for the future delivery of securities or foreign currencies and futures contracts based on a specific security, class of securities, foreign currency or an index, and purchase or sell options on any such futures contracts. A futures contract on a securities index is an agreement obligating either party to pay, and entitling the other party to receive, while the contract is outstanding, cash payments based on the level of a specified securities index. No physical delivery of the underlying asset is made. The Fund may enter into futures contracts in an effort to hedge against market risks. The acquisition of put and call options on futures contracts will give the Fund the right (but not the obligation), for a specified price, to sell or to purchase the underlying futures contract, upon exercise of the option, at any time during the option period. Futures transactions involve brokerage costs and require the Fund to segregate assets to cover contracts that would require it to purchase securities or currencies. A good faith margin deposit, known as initial margin, of cash or government securities with a broker or custodian is required to initiate and maintain open positions in futures contracts. Subsequent payments, known as variation margin, are made or received by the Fund based on the change in the market value of the position and are recorded as unrealized appreciation or depreciation until the contract is closed out, at which time the gain or loss is realized. The Fund may lose the expected benefit of futures transactions if interest rates, exchange rates or securities prices change in an unanticipated manner. Such unanticipated changes may also result in lower overall performance than if the Fund had not entered into any futures transactions. In addition, the value of the Fund's futures positions may not prove to be perfectly or even highly correlated with the value of its portfolio securities or foreign currencies, limiting the Fund's ability to hedge effectively against interest rate, exchange rate and/or market risk and giving rise to additional risks. There is no assurance of liquidity in the secondary market for purposes of closing out futures positions. The collateral held by the Fund is reflected on the Statement of Assets and Liabilities under Deposit with broker for futures contracts.
49
USAA Mutual Funds Trust | Notes to Financial Statements — continued July 31, 2020 | ||||||
Summary of Derivative Instruments:
The following table summarizes the fair values of derivative instruments on the Statement of Assets and Liabilities, categorized by risk exposure, as of July 31, 2020 (amounts in thousands):
Assets | |||||||
| Variation Margin Receivable on Open Futures Contracts* | |||||||
Interest Rate Risk Exposure: | $ | 1,289 | |||||
* Includes cumulative appreciation/depreciation of futures contracts as reported on the Schedule of Portfolio Investments. Only current day's variation margin for futures contracts are reported within the Statement of Assets and Liabilities.
The following table presents the effect of derivative instruments on the Statement of Operations, categorized by risk exposure, for the year ended July 31, 2020 (amounts in thousands):
| Net Realized Gains (Losses) on Derivatives Recognized as a Result from Operations | Net Change in Unrealized Appreciation/Depreciation on Derivatives Recognized as a Result of Operations | ||||||||||
| Net Realized Gains (Losses) from Futures Contracts | Net Change in Unrealized Appreciation/Depreciation on Futures Contracts | ||||||||||
Interest Rate Risk Exposure: | $ | 5,515 | $ | (96 | ) | ||||||
All open derivative positions at period end are reflected in the Fund's Schedule of Portfolio Investments. The underlying face value of open derivative positions relative to the Fund's net assets at period end is generally representative of the notional amount of open positions to net assets throughout the period.
Investment Transactions and Related Income:
Changes in holdings of investments are accounted for no later than one business day following the trade date. For financial reporting purposes, however, investment transactions are accounted for on trade date on the last business day of the reporting period. Interest income is determined on the basis of coupon interest accrued using the effective interest method which adjusts, where applicable, the amortization of premiums or accretion of discount. Gains or losses realized on sales of securities are determined by comparing the identified cost of the security lot sold with the net sales proceeds.
Securities Lending:
The Fund, through a securities lending agreement with Citibank, N.A. ("Citibank"), may lend its securities to qualified financial institutions, such as certain broker-dealers, to earn additional income, net of income retained by Citibank. Borrowers are required to secure their loans for collateral in the amount of at least 102% of the value of U.S. securities loaned or at least 105% of the value of non-U.S. securities loaned, marked-to-market daily. Any collateral shortfalls associated with increases in the valuation of the securities loaned are cured the next business day once the shortfall exceeds $100 thousand. Collateral may be cash, U.S. government securities, or other securities as permitted by SEC guidelines. Cash collateral may be invested in high-quality short-term investments, primarily open-end investment companies. Collateral requirements are determined daily based on the value of the Fund's securities on loan as of the end of the prior business day. During the time portfolio securities are on loan, the borrower will pay the Fund any dividends or interest paid on such securities plus any fee negotiated between the parties to the lending agreement. The Fund also earns a return from the collateral. The Fund pays Citibank various fees in connection with the investment of cash collateral and fees based on the investment income received from securities lending activities. Securities lending income (net of these fees) is disclosed on the Statement of Operations. Loans are terminable upon demand and the borrower must return the loaned securities within the lesser of one standard settlement period or five business days. Risks relating to securities-lending transactions include that the borrower may not
50
USAA Mutual Funds Trust | Notes to Financial Statements — continued July 31, 2020 | ||||||
provide additional collateral when required or return the securities when due, and that the value of the short-term investments will be less than the amount of cash collateral required to be returned to the borrower. The Fund's agreement with Citibank does not include master netting provisions. Non- cash collateral received by the Fund may not be sold or re-pledged except to satisfy borrower default. Cash collateral is listed on the Fund's Schedule of Portfolio of Investments and Financial Statements while non-cash collateral is not included.
The following table (amounts in thousands) is a summary of the Fund's securities lending transactions as of July 31, 2020:
| Value of Securities on Loan | Non-Cash Collateral | Cash Collateral | |||||||||
| $ | 11,405 | $ | — | $ | 11,776 | ||||||
Foreign Currency Translations:
The accounting records of the Fund are maintained in U.S. dollars. Investment securities and other assets and liabilities of the Fund denominated in a foreign currency are translated into U.S. dollars at current exchange rates. Purchases and sales of securities, income receipts, and expense payments are translated into U.S. dollars at the exchange rates on the date of the transactions. The Fund does not isolate the portion of the results of operations resulting from changes in foreign exchange rates on investments from fluctuations arising from changes in market prices of securities held. Such fluctuations are disclosed as net change in unrealized appreciation/depreciation on investments and foreign currency translations on the Statement of Operations. Any realized gains or losses from these fluctuations, including foreign currency arising from in-kind redemptions, are disclosed as net realized gains or losses from investment transactions and foreign currency translations on the Statement of Operations.
Foreign Taxes:
The Fund may be subject to foreign taxes related to foreign income received (a portion of which may be reclaimable), capital gains on the sale of securities, and certain foreign currency transactions. All foreign taxes are recorded in accordance with the applicable regulations and rates that exist in the foreign jurisdictions in which the Fund invests.
Federal Income Taxes:
It is the Fund's policy to continue to qualify as a regulated investment company by complying with the provisions available to certain investment companies, as defined in applicable sections of the Internal Revenue Code, and to make distributions of net investment income and net realized gains sufficient to relieve it from all, or substantially all, federal income taxes. Accordingly, no provision for federal income taxes is required in the financial statements. The Fund has a tax year end of July 31.
Management of the Fund has reviewed tax positions taken in tax years that remain subject to examination by all major tax jurisdictions, including federal (i.e., the last four tax years, which includes the current fiscal tax year end). Management believes that there is no tax liability resulting from unrecognized tax benefits related to uncertain tax positions taken.
Allocations:
Expenses directly attributable to the Fund are charged to the Fund, while expenses that are attributable to more than one fund in the Trust, or jointly with an affiliated trust, are allocated among the respective funds in the Trust and/or affiliated trust based upon net assets or another appropriate basis.
Income, expenses (other than class-specific expenses such as transfer agent fees, state registration fees, 12b-1 fees and printing fees), and realized and unrealized gains or losses on investments are allocated to each class of shares based on its relative net assets on the date income is earned or expenses and realized and unrealized gains and losses are incurred.
51
USAA Mutual Funds Trust | Notes to Financial Statements — continued July 31, 2020 | ||||||
3. Purchases and Sales:
Cost of purchases and proceeds from sales/maturities of securities (excluding securities maturing less than one year from acquisition) for the year ended July 31, 2020, were as follows for the Fund (amounts in thousands):
| Excluding U.S. Government Securities | U.S. Government Securities | ||||||||||||||
Purchases | Sales | Purchases | Sales | ||||||||||||
$ | 2,175,693 | $ | 2,344,421 | $ | 519,329 | $ | 560,382 | ||||||||
4. Affiliated Fund Ownership:
The Fund offers its shares for investment by other USAA Mutual Funds. The fund-of-funds do not invest in the underlying funds for the purpose of exercising management or control, and the affiliated fund-of-funds' annual and semi-annual reports may be viewed at usaa.com. As of July 31, 2020, certain fund-of-funds owned total outstanding shares of the Fund as follows:
USAA Cornerstone Conservative Fund | 0.9 | % | |||||
USAA Target Retirement 2020 Fund | 0.0 | %* | |||||
USAA Target Retirement 2030 Fund | 0.0 | %* | |||||
USAA Target Retirement 2040 Fund | 0.0 | %* | |||||
USAA Target Retirement 2050 Fund | 0.0 | %* | |||||
USAA Target Retirement 2060 Fund | 0.0 | %* | |||||
* Amount is less than 0.05%.
5. Fees and Transactions with Affiliates and Related Parties:
Investment Advisory Fees:
Investment advisory services are provided to the Fund by Victory Capital Management Inc. ("VCM" or the "Adviser"), a New York corporation registered as an investment adviser with the Securities and Exchange Commission ("SEC"). The Adviser is a wholly-owned indirect subsidiary of Victory Capital Holdings, Inc., a publicly traded Delaware corporation, and a wholly-owned direct subsidiary of Victory Capital Operating, LLC. Under the terms of the Investment Advisory Agreement, the Adviser is entitled to receive a base fee and a performance adjustment. The Fund's base fee is accrued daily and paid monthly at an annualized rates of 0.50% of the first $50 million of the Fund's average daily net assets, 0.40% of that portion of average daily net assets over $50 million but not over $100 million, and 0.30% of that portion of the Fund's average daily net assets over $100 million. Amounts incurred and paid to VCM for the year ended July 31, 2020, are reflected on the Statement of Operations as Investment Advisory fees.
Effective July 1, 2019, no performance adjustments were made for the period beginning July 1, 2019, through June 30, 2020. Only performance beginning as of July 1, 2019, and thereafter is utilized in calculating future performance adjustments.
The performance adjustment for each share class is accrued daily and calculated monthly by comparing each class' performance to that of the Lipper Core Plus Bond Funds Index. The Lipper Core Plus Bond Funds Index tracks the total return performance of each class within the Lipper Core Plus Bond Funds category.
52
USAA Mutual Funds Trust | Notes to Financial Statements — continued July 31, 2020 | ||||||
The performance period for each share class consists of the current month plus the previous 35 months (or the number of months beginning July 1, 2019, if fewer). The following table is utilized to determine the extent of the performance adjustment:
| Over/Under Performance Relative to Index (in basis points)(a) | Annual Adjustment Rate (in basis points)(a) | ||||||
+/- 20 to 50 | +/- 4 | ||||||
+/- 51 to 100 | +/- 5 | ||||||
+/- 101 and greater | +/- 6 | ||||||
(a) Based on the difference between average annual performance of the relevant share class of the Fund and its relevant Lipper index, rounded to the nearest basis point. Average daily net assets of the share class are calculated over a rolling 36-month period.
Each class' annual performance adjustment rate is multiplied by the average daily net assets of the class over the entire performance period, which is then multiplied by a fraction, the numerator of which is the number of days in the month and the denominator of which is 365 (366 in leap years). The resulting amount is then added to (in the case of overperformance), or subtracted from (in the case of underperformance) the base fee.
Under the performance fee arrangement, each class pays a positive performance fee adjustment for a performance period whenever the class outperforms the Lipper Core Plus Bond Funds Index over that period, even if the class has overall negative returns during the performance period.
For the period July 1, 2020 through July 31, 2020, performance adjustments for Class A shares, and Class C shares, were $(2), and less than $(1) thousand, respectively. For the Class A shares, and Class C shares, the performance adjustments were less than 0.01% of net assets. There were no performance adjustments for Fund Shares, Institutional Shares, and R6 Shares for the period July 1, 2020 through July 31, 2020.
The Trust relies on an exemptive order granted to VCM and its affiliated funds by the SEC in March 2019 permitting the use of a "manager-of-managers" structure for certain funds. Under a manager-of- managers structure, the investment adviser may select (with approval of the Board and without shareholder approval) one or more subadvisers to manage the day-to-day investment of a fund's assets. For the year ended July 31, 2020, the Fund had no subadvisors.
Administration and Servicing Fees:
VCM serves as the Fund's administrator and fund accountant. Under the Fund Administration, Servicing and Accounting Agreement, VCM is paid for its services an annual fee at a rate of 0.15% of average daily net assets of the Fund Shares, Class A shares, and Class C shares, 0.10% of average daily net assets of the Institutional Shares, and 0.05% of average daily net assets of the R6 Shares. Amounts incurred for the year ended July 31, 2020, are reflected on the Statement of Operations as Administration fees.
The Fund (as part of the Trust) has entered into an agreement to provide compliance services with the Adviser, pursuant to which the Adviser furnishes its compliance personnel, including the services of the Chief Compliance Officer ("CCO"), and other resources reasonably necessary to provide the Trust with compliance oversight services related to the design, administration and oversight of a compliance program for the Trust in accordance with Rule 38a-1 under the 1940 Act. The CCO is an employee of the Adviser, which pays the compensation of the CCO and support staff. Funds in the Trust, Victory Variable Insurance Funds, Victory Portfolios, and Victory Portfolios II (collectively, the "Victory Funds Complex") in the aggregate, compensates the Adviser for these services. Amounts incurred for the year ended July 31, 2020, are reflected on the Statement of Operations as Compliance fees.
Citi Fund Services Ohio, Inc. ("Citi"), an affiliate of Citibank, acts as sub-administrator and sub-fund accountant to the Fund pursuant to a Sub-Administration and Sub-Fund Accounting Services Agreement
53
USAA Mutual Funds Trust | Notes to Financial Statements — continued July 31, 2020 | ||||||
between VCM and Citi. VCM pays Citi a fee for providing these services. The Fund reimburses VCM and Citi for reasonable out-of-pocket expenses incurred in providing these services and certain other expenses specifically allocated to the Funds, under the Fund Administration, Servicing, and Accounting Agreement. Amounts incurred for the year ended July 31, 2020, are reflected on the Statement of Operations as Sub-Administration fees.
Transfer Agency Fees:
Victory Capital Transfer Agency, Inc. ("VCTA"), provides transfer agency services to the Fund. VCTA, an affiliate of the Adviser, provides transfer agent services to the Fund Shares based on an annual charge of $25.50 per shareholder account plus out-of-pocket expenses. VCTA pays a portion of these fees to certain intermediaries for the administration and servicing of accounts that are held with such intermediaries. Transfer agent's fees for Institutional Shares, Class A shares, and Class C shares are paid monthly based on a fee accrued daily at an annualized rate of 0.10% and R6 Shares at an annualized rate of 0.01%, of average daily net assets, respectively, plus out-of-pocket expenses. Amounts incurred and paid to VCTA for the year ended July 31, 2020, are reflected on the Statement of Operations as Transfer Agent fees.
FIS Investor Services LLC serves as sub-transfer agent and dividend disbursing agent for the Fund pursuant to a Sub-Transfer Agent Agreement between VCTA and FIS Investor Services LLC. VCTA provides FIS Investor Services LLC a fee for providing these services.
Distributor/Underwriting Services:
Victory Capital Services, Inc. (the "Distributor"), an affiliate of the Adviser, serves as distributor for the continuous offering of shares of the Fund pursuant to a Distribution Agreement between the Distributor and the Trust. Effective June 30, 2020, the Distributor's name was changed from Victory Capital Advisers, Inc. Pursuant to the Distribution and Service Plans adopted in accordance with Rule 12b-1 under the1940 Act, the Distributor may receive a monthly distribution and service fee, at an annual rate of up to 0.25% of the average daily net assets of Class A shares and 1.00% of the average daily net assets of Class C shares. The distribution and service fees paid to the Distributor may be used by the Distributor to pay for activity primarily intended to result in the sale of Class A shares or Class C shares of the Fund. Amounts incurred and paid to VCTA for the year ended July 31, 2020, are reflected on the Statement of Operations as 12b-1 fees.
In addition, the Distributor is entitled to receive commission on sales of the Class A shares of the Fund. For the fiscal year ended July 31, 2020, the Distributor received approximately less than $1 thousand from commissions earned on sales of Class A shares of the Fund.
Other Fees:
Citibank serves as the Fund's custodian.
K&L Gates LLP provides legal services to the Trust.
The Adviser has entered into an expense limitation agreement with the Fund until at least June 30, 2021. Under the terms of the agreement, the Adviser has agreed to waive fees or reimburse certain expenses to the extent that ordinary operating expenses incurred by certain classes of the Fund in any fiscal year exceed the expense limit for such classes of the Fund. Such excess amounts will be the liability of the Adviser. Interest, taxes, brokerage commissions, other expenditures, which are capitalized in accordance with GAAP, and other extraordinary expenses not incurred in the ordinary course of the Fund's business are excluded from the expense limits. As of July 31, 2020, the expense limits (excluding voluntary waivers) are 0.59%, 0.52%, 0.87%, 1.53%, and 0.39% for Fund Shares, Institutional Shares, Class A shares, Class C shares, and R6 Shares, respectively.
Under this expense limitation agreement, the Fund has agreed to repay fees and expenses that were waived or reimbursed by the Adviser for a period up to three years after the fiscal year in which the waiver or reimbursement took place, subject to the lesser of any operating expense limits in effect at the time of: (a) the original waiver or expense reimbursement; or (b) the recoupment, after giving effect
54
USAA Mutual Funds Trust | Notes to Financial Statements — continued July 31, 2020 | ||||||
to the recoupment amount. As of July 31, 2020, the following amounts are available to be repaid to the Adviser (amounts in thousands). The Fund has not recorded any amounts available to be repaid as a liability due to an assessment that such repayment is not probable at July 31, 2020.
| Expires July 31, 2022 | Expires July 31, 2023 | Total | |||||||||
| $ | 4 | $ | 200 | $ | 204 | ||||||
The Adviser, may voluntarily waive or reimburse additional fees to assist the Fund in maintaining competitive expense ratios. Voluntary waivers and reimbursements applicable to the Fund are not available to be recouped at a future time. There were no voluntary waivers or reimbursements for the year ended July 31, 2020.
Certain officers and/or interested trustees of the Fund are also officers and/or employees of the Adviser, Administrator, Sub-Administrator, Sub-Fund Accountant, and Legal.
6. Risks:
The Fund may be subject to other risks in addition to these identified risks.
Global economies and financial markets are increasingly interconnected, which increases the possibilities that conditions in one country or region might adversely affect issuers in another country or region. Geopolitical and other risks, including war, terrorism, trade disputes, political or economic dysfunction within some nations, public health crises and related geopolitical events, as well as environmental disasters such as earthquakes, fires, and floods, may add to instability in world economies and markets generally. Changes in trade policies and international trade agreements could affect the economies of many countries in unpredictable ways. Epidemics and/or pandemics, such as the coronavirus (or COVID-19), may result in, among other things, closing borders, disruptions to healthcare service preparation and delivery, quarantines, cancellations, disruptions to supply chains and consumer activity, as well as general concern and uncertainty. The impact may be short-term or may last for extended periods.
The COVID-19 pandemic, which has spread rapidly across the world, has led and will continue to lead for an unknown period of time to disruptions in local, regional, national and global markets and economies. Among other things, the outbreak has resulted in, and until fully resolved is likely to continue to result in, among other things (1) government imposition of various forms of "stay at home" orders and the closing of "non-essential" businesses, resulting in significant disruption to the businesses of many issuers as well as lay-offs of employees: (2) increased requests by issuers of debt instruments for amendments and waivers of agreements to avoid default and increased defaults: (3) volatility and disruption of markets, including greater volatility in pricing and spreads; and (4) rapidly evolving proposals and/or actions by state and federal governments to address problems being experienced by the markets and by businesses and the economy in general.
The value of a debt security or other income-producing security changes in response to various factors, including, for example, market-related factors (such as changes in interest rates or changes in the risk appetite of investors generally) and changes in the actual or perceived ability of the issuer (or of issuers generally) to meet its (or their) obligations.
Other factors that may affect the value of debt securities, include, among others, public health crises and responses by governments and companies to such crises. These and other events may affect the creditworthiness of the issuer of a debt security and may impair an issuers ability to timely meet its debt obligations as they come due.
The Fund is subject to the risk that the market value of the bonds in its portfolio will fluctuate because of changes in interest rates, changes in the supply of and demand for debt securities, and other market factors. Bond prices generally are linked to the prevailing market interest rates. In general, when interest rates rise, bond prices fall; conversely, when interest rates fall, bond prices rise. The price volatility of a bond also depends on its duration. Generally, the longer the duration of a bond, the greater is its sensitivity to interest rates. To compensate investors for this higher interest rate risk,
55
USAA Mutual Funds Trust | Notes to Financial Statements — continued July 31, 2020 | ||||||
bonds with longer durations generally offer higher yields than bonds with shorter durations. The ability of an issuer of a debt security to repay principal prior to a security's maturity can increase the security's sensitivity to interest rate changes.
Decisions by the U.S. Federal Reserve (also known as the "Fed") regarding interest rate and monetary policy, which can be difficult to predict and sometimes change direction suddenly in response to economic and market events, can have a significant effect on the value of fixed income securities as well as the overall strength of the U.S. economy. Precise interest rate predictions are difficult to make, and interest rates may change unexpectedly and dramatically in response to extreme changes in market or economic conditions. As a result, the value of fixed income securities may vary widely under certain market conditions.
The fixed-income securities in the Fund's portfolio are subject to credit risk, which is the possibility that an issuer of a fixed-income security will fail to make timely interest and/or principal payments on its securities or that negative market perceptions of the issuer's ability to make such payments will cause the price of that security to decline. The Fund accepts some credit risk as a recognized means to enhance an investor's return. All fixed-income securities, varying from the highest quality to the very speculative, have some degree of credit risk.
Many debt securities, derivatives and other financial instruments, including some of the Fund's investments, use the London Interbank Offered Rate ("LIBOR") as the reference or benchmark rate for variable interest rate calculations. However, the use of LIBOR started to come under pressure following manipulation allegations in 2012. Despite increased regulation and other corrective actions since that time, concerns have arisen regarding its viability as a benchmark, due largely to reduced activity in the financial markets that it measures. In June 2017, the Alternative Reference Rates Committee, a group of large U.S. banks working with the Federal Reserve, announced its selection of a new Secured Overnight Funding Rate ("SOFR"), which is intended to be a broad measure of secured overnight U.S. Treasury repo rates, as an appropriate replacement for LIBOR. The Federal Reserve Bank of New York began publishing the SOFR in 2018, expecting that it could be used on a voluntary basis in new instruments and transactions. Bank working groups and regulators in other countries have suggested other alternatives for their markets, including the Sterling Overnight Interbank Average Rate ("SONIA") in England. In July 2017, the Financial Conduct Authority (the "FCA"), the United Kingdom financial regulatory body, announced that after 2021 it will cease its active encouragement of UK banks to provide the quotations needed to sustain LIBOR. That announcement suggests that LIBOR may cease to be published after that time. The roughly three-year period until the end of 2021 is expected to be enough time for market participants to transition to the use of a different benchmark for both new and existing securities and transactions. Various financial industry groups have begun planning for that transition, but there are obstacles to converting certain longer-term securities and transactions to a new benchmark. Transition planning is at an early stage, and neither the effect of the transition process nor its ultimate success can yet be known. The transition process might lead to increased volatility and illiquidity in markets that currently rely on the LIBOR to determine interest rates. It could also lead to a reduction in the value of some LIBOR-based investments and reduce the effectiveness of new hedges placed against existing LIBOR-based instruments. Since the usefulness of LIBOR as a benchmark could deteriorate during the transition period, these effects could occur before the end of 2021.
7. Borrowing and Interfund Lending:
Line of Credit:
For the year ended July 31, 2020, the Victory Funds Complex participated in a short-term demand note "Line of Credit" agreement with Citibank. The Line of Credit agreement with Citibank was renewed on June 29, 2020 with a termination date of June 28, 2021. Under the agreement with Citibank, the Victory Funds Complex may borrow up to $600 million, of which $300 million is committed and $300 million is uncommitted. $40 million of the Line of Credit is reserved for use by the Victory Floating Rate Fund (herein, the "Fund"), another series of the Victory Funds Complex, with that Fund paying the related commitment fees for that amount. The purpose of the agreement is to meet temporary or emergency
56
USAA Mutual Funds Trust | Notes to Financial Statements — continued July 31, 2020 | ||||||
cash needs. For the year ended July 31, 2020, Citibank received an annual commitment fee of 0.15% on $300 million for providing the Line of Credit. Each fund in the Victory Funds Complex pays a pro-rata portion of the commitment fees plus any interest (one month LIBOR plus one percent) on amounts borrowed. Effective June 29, 2020, under an amended Line of Credit agreement, Citibank will also receive an annual upfront fee of 0.10% on the $300 million committed line of credit. Each fund in the Victory Funds Complex will pay a pro-rata portion of the upfront fee. Interest charged to each Fund during the period, if applicable, is reflected on the Statements of Operations under Line of credit fees.
The Fund had no borrowings under the Line of Credit agreement during the year ended July 31, 2020.
Interfund Lending:
The Trust and Adviser rely on an exemptive order granted by the SEC in March 2017 (the "Order"), permitting the establishment and operation of an Interfund Lending Facility (the "Facility"). The Facility allows the Fund to directly lend and borrow money to or from any other Fund in the Victory Funds Complex relying upon the Order at rates beneficial to both the borrowing and lending funds. Advances under the Facility are allowed for temporary or emergency purposes. The interfund loan rate is determined, as specified in the Order, by averaging the current repurchase agreement rate and the current bank loan rate. As a Borrower, interest charged to the Fund, if any, during the period is reflected on the Statement of Operations under Interfund lending fees. As a Lender, interest earned by the Fund, if any, during the period is reflected on the Statement of Operations under Income on Interfund lending.
The average borrowing or lending for the days outstanding and average interest rate for the Fund during the year ended July 31, 2020 were as follows (amounts in thousands):
| Borrower or Lender | Amount Outstanding at July 31, 2020 | Average Borrowing* | Days Borrowing Outstanding | Average Interest Rate* | Maximum Borrowing During the Period | ||||||||||||||||||||||
Borrower | — | $ | 5,703 | 33 | 2.01 | % | $ | 14,136 | |||||||||||||||||||
Lender | — | 3,288 | 1 | 0.64 | 3,288 | ||||||||||||||||||||||
*For the year ended July 31, 2020, based on the number of days borrowings were outstanding.
8. Federal Income Tax Information:
The Fund intends to declare daily and distribute monthly any net investment income. Distributable net realized gains, if any, are declared and paid at least annually.
The amounts of dividends from net investment income and distributions from net realized gains (collectively distributions to shareholders) are determined in accordance with federal income tax regulations, which may differ from GAAP. To the extent these "book/tax" differences are permanent in nature (e.g., net operating loss and distribution reclassification), such amounts are reclassified within the components of net assets based on their federal tax-basis treatment; temporary differences (e.g., wash sales) do not require reclassification. To the extent dividends and distributions exceed net investment income and net realized gains for tax purposes, they are reported as distributions of capital. Net investment losses incurred by the Fund may be reclassified as an offset to capital on the accompanying Statement of Assets and Liabilities.
The following permanent reclassifications were made between capital accounts to reflect the portion of the payments made to redeeming shareholders that was claimed as a distribution for income tax purposes during the year ended July 31, 2020 (amounts in thousands):
| Total accumulated earnings/(loss) | Capital | ||||||
| $ | (7,158 | ) | $ | 7,158 | |||
57
USAA Mutual Funds Trust | Notes to Financial Statements — continued July 31, 2020 | ||||||
The tax character of distributions paid during the tax years ended as noted below, were as follows (total distributions paid may differ from the Statements of Changes in Net Assets because, for tax purposes, dividends are recognized when actually paid) (amounts in thousands):
Year Ended July 31, 2020 | Year Ended July 31, 2019 | ||||||||||||||||||||||
Distributions paid from | Distributions paid from | ||||||||||||||||||||||
Ordinary Income | Net Long-Term Capital Gains | Total Distributions Paid | Ordinary Income* | Total Distributions Paid | |||||||||||||||||||
$ | 148,509 | $ | 31,550 | $ | 180,059 | $ | 140,312 | $ | 140,312 | ||||||||||||||
* Includes short-term realized capital gains, if any, which are taxable as ordinary income.
As of July 31, 2020, the components of accumulated earnings (loss) on a tax basis were as follows (amounts in thousands):
| Undistributed Ordinary Income | Undistributed Long-Term Capital Gains | Distributions Payable | Accumulated Earnings | Other Earinngs (Loss) | Unrealized Appreciation (Depreciation)* | Total Accumulated Earnings (Loss) | |||||||||||||||||||||||||
$ | 43,846 | $ | 63,767 | $ | (316 | ) | $ | 107,297 | $ | (94 | ) | $ | 171,562 | $ | 278,765 | ||||||||||||||||
* The difference between the book-basis and tax-basis of unrealized appreciation/depreciation is attributable to the tax deferral of losses on wash sales.
As of July 31, 2020, the cost basis for federal income tax purposes, gross unrealized appreciation, gross unrealized depreciation, and net unrealized appreciation (depreciation) for investments were as follows (amounts in thousands):
| Cost of Investments for Federal Tax Purposes | Gross Unrealized Appreciation | Gross Unrealized Depreciation | Net Unrealized Appreciation (Depreciation) | ||||||||||||||||
$ | 3,658,735 | $ | 227,368 | $ | (55,806 | ) | $ | 171,562 | |||||||||||
58
REPORT OF INDEPENDENT REGISTERED PUBLIC ACCOUNTING FIRM
To the Shareholders and the Board of Trustees of USAA Intermediate-Term Bond Fund
Opinion on the Financial Statements
We have audited the accompanying statement of assets and liabilities of USAA Intermediate-Term Bond Fund (the "Fund") (one of the funds constituting USAA Mutual Funds Trust (the "Trust")), including the schedule of portfolio investments, as of July 31, 2020, and the related statement of operations for the year then ended, the statements of changes in net assets for each of the two years in the period then ended, the financial highlights for each of the five years in the period then ended and the related notes (collectively referred to as the "financial statements"). In our opinion, the financial statements present fairly, in all material respects, the financial position of the Fund (one of the funds constituting USAA Mutual Funds Trust) at July 31, 2020, the results of its operations for the year then ended, the changes in its net assets for each of the two years in the period then ended and its financial highlights for each of the five years in the period then ended, in conformity with U.S. generally accepted accounting principles.
Basis for Opinion
These financial statements are the responsibility of the Trust's management. Our responsibility is to express an opinion on the Fund's financial statements based on our audits. We are a public accounting firm registered with the Public Company Accounting Oversight Board (United States) ("PCAOB") and are required to be independent with respect to the Trust in accordance with the U.S. federal securities laws and the applicable rules and regulations of the Securities and Exchange Commission and the PCAOB.
We conducted our audits in accordance with the standards of the PCAOB. Those standards require that we plan and perform the audit to obtain reasonable assurance about whether the financial statements are free of material misstatement, whether due to error or fraud. The Trust is not required to have, nor were we engaged to perform, an audit of the Trust's internal control over financial reporting. As part of our audits we are required to obtain an understanding of internal control over financial reporting, but not for the purpose of expressing an opinion on the effectiveness of the Trust's internal control over financial reporting. Accordingly, we express no such opinion.
Our audits included performing procedures to assess the risks of material misstatement of the financial statements, whether due to error or fraud, and performing procedures that respond to those risks. Such procedures included examining, on a test basis, evidence regarding the amounts and disclosures in the financial statements. Our procedures included confirmation of securities owned as of July 31, 2020, by correspondence with the custodian, brokers and agent banks or by other appropriate auditing procedures where replies from brokers or agent banks were not received. Our audits also included evaluating the accounting principles used and significant estimates made by management, as well as evaluating the overall presentation of the financial statements. We believe that our audits provide a reasonable basis for our opinion.

We have served as the auditor of one or more Victory Capital investment companies since 1995.
San Antonio, Texas
September 29, 2020
59
USAA Mutual Funds Trust | Supplemental Information July 31, 2020 | ||||||
(Unaudited)
Trustee and Officer Information
Board of Trustees:
Overall responsibility for management of the Trust rests with the Board. The Trust is managed by the Board in accordance with the laws of the state of Delaware. There are currently 10 Trustees, eight of whom are not "interested persons" of the Trust within the meaning of that term under the 1940 Act ("Independent Trustees") and two of whom is an "interested person" of the Trust within the meaning of that term under the 1940 Act ("Interested Trustee"). The Trustees, in turn, elect the officers of the Trust to actively supervise its day-to-day operations.
The following tables list the Trustees, their ages, position with the Trust, commencement of service, principal occupations during the past five years and any directorships of other investment companies or companies whose securities are registered under the Securities Exchange Act of 1934, as amended, or who file reports under that Act. Each Trustee oversees 47 portfolios in the Trust. Each Trustee's address is 15935 La Cantera Pkwy, Building Two, San Antonio, TX, 78256. Pursuant to a policy adopted by the Board, the term of office for each Trustee shall be until the Independent Trustee reaches age 75 or an Interested Trustee reaches age 75. The Board may change or grant exceptions from this policy at any time without shareholder approval. A Trustee may resign or be removed by a vote of the other Trustees or the holders of a majority of the outstanding shares of the Trust at any time. Vacancies on the Board can be filled by the action of a majority of the Trustees, provided that after filling such vacancy at least two-thirds of the Trustees have been elected by the shareholders.
Name and Date of Birth | Position Held with the Trust | Year Commenced Service | Principal Occupation During Past 5 Years | Other Directorships Held During Past 5 Years | |||||||||||||||
Independent Trustees. | |||||||||||||||||||
| Jefferson C. Boyce, Born September 1957 | Lead Independent Trustee, and Vice Chairman | 2013 | Senior Managing Director, New York Life Investments, LLC (1992-2012) | Westhab, Inc. | |||||||||||||||
| John C. Walters, Born February 1962 | Trustee | 2019 | Retired. Mr. Walters brings significant Board experience including active involvement with the board of a Fortune 500 company, and a proven record of leading large, complex financial organizations. He has a demonstrated record of success in distribution, manufacturing, investment brokerage, and investment management in both the retail and institutional investment businesses. He has substantial experience in the investment management business with a demonstrated ability to develop and drive strategy while managing operation, financial, and investment risk. | Guardian Variable Products Trust (16 series), Lead Independent Director; Amerilife Holdings LLC, Director; Stadion Money Management; Director; University of North Carolina (Chapel Hill), Member Board of Governors. | |||||||||||||||
60
USAA Mutual Funds Trust | Supplemental Information — continued July 31, 2020 | ||||||
(Unaudited)
Name and Date of Birth | Position Held with the Trust | Year Commenced Service | Principal Occupation During Past 5 Years | Other Directorships Held During Past 5 Years | |||||||||||||||
| Robert L. Mason, Ph.D., Born July 1946 | Trustee | 1997 | Adjunct Professor in the Department of Management Science and Statistics in the College of Business at the University of Texas at San Antonio (since 2001); Institute Analyst, Southwest Research Institute (March 2002-January 2016) | None | |||||||||||||||
| Dawn M. Hawley, Born February 1954 | Trustee | 2014 | Manager of Finance, Menil Foundation, Inc. (May 2007-June 2011), which is a private foundation that oversees the assemblage of sculptures, prints, drawings, photographs, and rare books. Director of Financial Planning and Analysis and Chief Financial Officer, AIM Management Group, Inc. (October 1987-January 2006) | None | |||||||||||||||
| Paul L. McNamara, Born July 1948 | Trustee | 2012 | Director, Cantor Opportunistic Alternatives Fund, LLC (March 2010-February 2014) , which is a closed-end fund of funds by Cantor Fitzgerald Investment Advisors, LLC | None | |||||||||||||||
61
USAA Mutual Funds Trust | Supplemental Information — continued July 31, 2020 | ||||||
(Unaudited)
Name and Date of Birth | Position Held with the Trust | Year Commenced Service | Principal Occupation During Past 5 Years | Other Directorships Held During Past 5 Years | |||||||||||||||
| Richard Y. Newton III, Born January 1956 | Trustee | 2017 | Director, Elta North America (01/18-present), which is a global leader in the design, manufacture, and support of innovative electronic systems in the ground, maritime, airborne, and security domains for the nation's warfighters, security personnel, and first responders; Managing Partner, Pioneer Partnership Development Group (December 2015-present)); Executive Director, The Union League Club of New York (June 2014-November 2015): Executive Vice President, Air Force Association (August 2012-May 2014); Lieutenant General, United States Air Force (January 2008-June 2012) | None | |||||||||||||||
| Barbara B. Ostdiek, Ph.D., Born March 1964 | Trustee | 2008 | Senior Associate Dean of Degree Programs at Jesse H. Jones Graduate School of Business at Rice University (since 2013); Associate Professor of Finance at Jessie H. Jones Graduate School of Business at Rice University (since 2001) | None | |||||||||||||||
| Michael F. Reimherr, Born August 1945 | Trustee | 2000 | President of Reimherr Business Consulting (May 1995-December 2017); St. Mary's University Investment Committee overseeing University Endowment (since 2014) | None | |||||||||||||||
62
USAA Mutual Funds Trust | Supplemental Information — continued July 31, 2020 | ||||||
(Unaudited)
Name and Date of Birth | Position Held with the Trust | Year Commenced Service | Principal Occupation During Past 5 Years | Other Directorships Held During Past 5 Years | |||||||||||||||
Interested Trustees. | |||||||||||||||||||
| David C. Brown, ** Born May 1972 | Trustee | 2019 | Chairman and Chief Executive Officer (since 2013), Co-Chief Executive Officer (2011-2013), Victory Capital Management Inc.; Chairman and Chief Executive Officer, Victory Capital Holdings, Inc. (since 2013). Mr. Brown brings to the Board extensive business, finance and leadership skills gained and developed through years of experience in the financial services industry, including his tenure overseeing the strategic direction as CEO of Victory Capital. These skills, combined with Mr. Brown's extensive knowledge of the financial services industry and demonstrated success in the development and distribution of investment strategies and products, enable him to provide valuable insights to the Board and strategic direction for the Funds | Trustee, Victory Portfolios (42 series), Victory Portfolios II (26 series), Victory Variable Insurance Funds (9 series) | |||||||||||||||
63
USAA Mutual Funds Trust | Supplemental Information — continued July 31, 2020 | ||||||
(Unaudited)
Name and Date of Birth | Position Held with the Trust | Year Commenced Service | Principal Occupation During Past 5 Years | Other Directorships Held During Past 5 Years | |||||||||||||||
| Daniel S. McNamara, ** Born June 1966 | Trustee and Chair of the Board of Trustees | 2012 | Trustee, President, and Vice Chairman of USAA ETF Trust (June 2017-June 2019); President of Financial Advice & Solutions Group (FASG), USAA (since 2013); Director, Investment Management Company (IMCO) (September 2009-April 2014); President, Asset Management Company (AMCO) (August, 2011-April 2013); Senior Vice President of USAA Financial Planning Services Insurance Agency, Inc. (FPS) (since 2011); Director of USAA IMCO (since 2009); Chairman of Board of IMCO (since 2013); Director of AMCO, (August 2011-June 2019); President and Director of USAA Shareholder Account Services (SAS) (October 2009-June 2019); Director and Vice Chairman of FPS (since 2013); President and Director of USAA Investment Corporation (ICORP) (since 2010); Chairman of Board of ICORP (since 2013); Director of USAA Financial Advisors, Inc. (FAI) (since 2013); Chairman of Board of FAI (since 2015). Mr. McNamara brings to the Board extensive experience in the financial services industry, including experience as an officer of the Trust. | None | |||||||||||||||
** Mr. Dan McNamara, the Chairman of the Board, is deemed an "interested person" due to his previous position as Director of AMCO, the former investment adviser of the Funds. Mr. Brown is deemed an "interested person" due to his position as Chief Executive Officer of Victory Capital, investment adviser to the Funds.
The Statement of Additional Information includes additional information about the Trustees of the Trust and is available, without charge, on the SEC's website at www.sec.gov and/or by calling (800)-539-3863.
64
USAA Mutual Funds Trust | Supplemental Information — continued July 31, 2020 | ||||||
(Unaudited)
Officers:
The officers of the Trust, their ages, commencement of service and their principal occupations during the past five years, are detailed in the following table. Each officer serves until the earlier of his or her resignation, removal, retirement, death, or the election of a successor. The mailing address of each officer of the Trust is 15935 La Cantera Pkwy, Building Two, San Antonio, TX, 78256. The officers of the Trust receive no compensation directly from the Trust for performing the duties of their offices.
Name and Date of Birth | Position with the Trust | Year Commenced Service | Principal Occupation During Past 5 Years | ||||||||||||
Interested Officers. | |||||||||||||||
| Christopher K. Dyer, Born February 1962 | President | 2019 | Director of Fund Administration, Victory Capital (2004-present) | ||||||||||||
| Scott A Stahorsky, Born July 1969 | Vice President | 2019 | Manager, Fund Administration, Victory Capital (since 2015); Senior Analyst, Fund Administration, Victory Capital (prior to 2015) | ||||||||||||
| James K. De Vries, Born April 1969 | Treasurer, Principal Financial Officer | 2018 | Executive Director, Victory Capital Management Inc. (since 2019); Treasurer, USAA ETF Trust (September 2018-June 2019); Executive Director, Investment and Financial Administration, USAA (April 2012-June 2019); Assistant Treasurer, USAA ETF Trust (June 2017-September 2018); Assistant Treasurer, USAA Mutual Funds Trust (December 2013-February 2018) | ||||||||||||
| Allan Shaer, Born March 1965 | Assistant Treasurer | 2019 | Senior Vice President, Financial Administration, Citi Fund Services Ohio, Inc. (since 2016); Vice President, Mutual Fund Administration, JP Morgan Chase (2011-2016) | ||||||||||||
| Carol D. Trevino, Born October 1965 | Assistant Treasurer | 2018 | Director, Accounting and Finance, Victory Capital Management Inc. (since 2019); Accounting/Financial Director, USAA (December 2013-June 2019); Assistant Treasurer, USAA ETF Trust (September 2018-June 2019). | ||||||||||||
| Erin G. Wagner, Born February 1974 | Secretary | 2019 | Deputy General Counsel, the Adviser (since 2013) | ||||||||||||
| Charles Booth, Born April 1960 | Anti-Money Laundering Compliance Officer and Identity Theft Officer | 2019 | Director, Regulatory Administration and CCO Support Services, Citi Fund Services Ohio, Inc. (2007-present) | ||||||||||||
| Amy Campos, Born July 1976 | Chief Compliance Officer | 2019 | Chief Compliance Officer, USAA Mutual Funds Trust (since 2019); Executive Director, Deputy Chief Compliance Officer, USAA Mutual Funds Trust and USAA ETF Trust (July 2017-June 2019); Compliance Director, USAA Mutual Funds Trust (2014-July 2017) | ||||||||||||
65
USAA Mutual Funds Trust | Supplemental Information — continued July 31, 2020 | ||||||
(Unaudited)
Proxy Voting and Portfolio Holdings Information
Proxy Voting:
Information regarding the policies and procedures the Fund uses to determine how to vote proxies relating to portfolio securities is available without charge, upon request, by calling (800) 539-3863. The information is also included in the Fund's Statement of Additional Information, which is available on the SEC's website at www.sec.gov.
Information relating to how the Fund voted proxies relating to portfolio securities held during the most recent 12 months ended June 30 is available on the SEC's website at www.sec.gov.
Availability of Schedules of Portfolio Investments:
The Trust files a complete list of Schedules of Portfolio Investments with the SEC for the first and third quarter of each fiscal year on Form N-PORT. Forms N-PORT are available on the SEC's website at www.sec.gov.
Expense Examples
As a shareholder of the Fund, you may incur two types of costs: (1) transaction costs, and (2) ongoing costs, including management fees and other Fund expenses. These examples are intended to help you understand your ongoing costs (in dollars) of investing in the Fund and to compare these costs with the ongoing costs of investing in other mutual funds.
These examples are based on an investment of $1,000 invested at the beginning of the period and held for the entire period from February 1, 2020 through July 31, 2020 (unless noted otherwise).
The Actual Expense figures in the table below provide information about actual account values and actual expenses. You may use the information below, together with the amount you invested, to estimate the expenses that you paid over the period. Simply divide your account value by $1,000 (for example, an $8,600 account value divided by $1,000 = 8.6), then multiply the result by the number in the table under the heading entitled "Actual Expenses Paid During Period" to estimate the expenses you paid on your account during this period.
The Hypothetical Expense figures in the table below provide information about hypothetical account values and hypothetical expenses based on the Fund's actual expense ratio and an assumed rate of return of 5% per year before expenses, which is not the Fund's actual return. The hypothetical account values and expenses may not be used to estimate the actual ending account balance or expenses you paid for the period. You may use this information to compare this 5% hypothetical example with the 5% hypothetical examples that appear in shareholder reports of other funds.
Please note the expenses shown in the table below are meant to highlight your ongoing costs only and do not reflect any transactional costs. If these transactional costs were included, your costs would have been higher.
| Beginning Account Value 2/1/20 | Actual Ending Account Value 7/31/20 | Hypothetical Ending Account Value 7/31/20 | Actual Expenses Paid During Period 2/1/20- 7/31/20* | Hypothetical Expenses Paid During Period 2/1/20- 7/31/20* | Annualized Expense Ratio During Period 2/1/20- 7/31/20 | ||||||||||||||||||||||
Fund Shares | $ | 1,000.00 | $ | 1,039.30 | $ | 1,021.98 | $ | 2.94 | $ | 2.92 | 0.58 | % | |||||||||||||||
Institutional Shares | 1,000.00 | 1,040.50 | 1,022.28 | 2.64 | 2.61 | 0.52 | % | ||||||||||||||||||||
Class A shares | 1,000.00 | 1,038.00 | 1,020.64 | 4.31 | 4.27 | 0.85 | % | ||||||||||||||||||||
Class C shares** | 1,000.00 | 1,020.90 | 1,017.26 | 1.35 | 7.67 | 1.53 | % | ||||||||||||||||||||
Class R6 Shares | 1,000.00 | 1,041.20 | 1,022.92 | 1.98 | 1.96 | 0.39 | % | ||||||||||||||||||||
* Expenses are equal to the average account value multiplied by the Fund's annualized expense ratio multiplied by 182/366 (the number of days in the most recent fiscal half-year divided by the number of days in the fiscal year).
** Actual Expenses Paid are equal to the average account value multiplied by the Fund's annualized expense ratio multiplied by 32/366 to reflect the stub period from commencement of operations June 29, 2020 through July 31, 2020.
66
USAA Mutual Funds Trust | Supplemental Information — continued July 31, 2020 | ||||||
(Unaudited)
Additional Federal Income Tax Information
The following federal tax information related to the Fund's fiscal year ended July 31, 2020, is provided for information purposes only and should not be used for reporting to federal or state revenue agencies. Federal tax information for the calendar year will be reported to you on Form 1099-DIV in January 2021.
With respect to distributions paid, the Fund designates the following amounts (or, if subsequently determined to be different, the maximum amount allowable) for the fiscal year ended July 31, 2020 (amounts in thousands):
| Dividend Received Deduction (corporate shareholders)* | Qualified Dividend Income (non-corporate shareholders)* | Short-Term Capital Gains Distributions | Long-Term Capital Gains Distributions(a) | ||||||||||||
| 0.56 | % | 1.21 | % | $ | 20,417 | $ | 38,710 | ||||||||
* Presented as a percentage of net investment income and excludes short-term capital gain distributions paid, if any. All or a portion of these amounts may be exempt from taxation at the state level.
(a) Pursuant to Section 852 of the Internal Revenue Code.
67
USAA Mutual Funds Trust | Supplemental Information — continued July 31, 2020 | ||||||
(Unaudited)
Liquidity Risk Management Program
The USAA Mutual Funds have adopted and implemented a written liquidity risk management program (the "LRMP") as required by Rule 22e-4 under the 1940 Act, as amended. The LRMP is reasonably designed to assess and manage the Fund's liquidity risk, taking into consideration the Fund's investment strategy and the liquidity of its portfolio investments during normal and reasonably foreseeable stressed market conditions; its short and long-term cash flow projections; and its cash holdings and access to other liquidity management tools such as available funding sources including the Victory Funds Complex Interfund Lending Facility and Line of Credit (discussed in the Notes to Financial Statements). The USAA Mutual Funds' Board of Trustees approved the appointment of the Fund's investment adviser, Victory Capital Management Inc. ("Victory Capital") as the administrator of the LRMP. At an in-person meeting held on February 26, 2020, Victory Capital provided an oral and written report to the Trustees on the operation and effectiveness of the LRMP during the previous year.
Victory Capital manages liquidity risks associated with the Fund's investments by monitoring, among other things, cash and cash equivalents, any use of derivatives, the concentration of investments, the appropriateness of the Fund's investment strategy, and by classifying every fund investment as either highly liquid, moderately liquid, less liquid or illiquid on at least a monthly basis. To assist with the classification of Fund investments, Victory Capital has retained a third-party provider of liquidity evaluation services. This provider determines preliminary liquidity classifications for all portfolio holdings based upon portfolio-level data and certain assumptions provided by Victory Capital. Victory Capital reviews the preliminary liquidity classifications, and, when appropriate, considers other information including input from the Fund's portfolio managers (including the portfolio managers employed by any investment sub-advisers) in determining final liquidity classifications.
The report from Victory Capital concluded that the Fund did not experience any significant liquidity challenges during the covered period, and the Fund's LRMP is reasonably designed to assess and manage its liquidity risk. The report also concluded that the LRMP continues to operate adequately and effectively to enable Victory Capital to oversee and manage liquidity risk and ensure the Fund is able to meet redemption requests without significant dilution to the remaining investors' interest in the Fund. During the review period, the Fund's portfolio consisted primarily of highly liquid investments, which are defined as cash and any investments reasonably expected to be converted to cash in current market conditions in three business days or less without significantly changing the market value of the investment. Therefore, the Fund has not adopted a Highly Liquid Investment Minimum. The Fund's investments were below the limitation on illiquid investments during the review period. Additionally, Victory Capital indicated that no events occurred that would require the filing of Form N-LIQUID and recommended no material changes to the LRMP.
68
Privacy Policy
Protecting the Privacy of Information
The Trust respects your right to privacy. We also know that you expect us to conduct and process your business in an accurate and efficient manner. To do so, we must collect and maintain certain personal information about you. This is the information we collect from you on applications or other forms, and from the transactions you make with us or third parties. It may include your name, address, social security number, account transactions and balances, and information about investment goals and risk tolerance.
We do not disclose any information about you or about former customers to anyone except as permitted or required by law. Specifically, we may disclose the information we collect to companies that perform services on our behalf, such as the transfer agent that processes shareholder accounts and printers and mailers that assist us in the distribution of investor materials. We may also disclose this information to companies that perform marketing services on our behalf. This allows us to continue to offer you Victory investment products and services that meet your investing needs, and to effect transactions that you request or authorize. These companies will use this information only in connection with the services for which we hired them. They are not permitted to use or share this information for any other purpose.
To protect your personal information internally, we permit access only by authorized employees and maintain physical, electronic and procedural safeguards to guard your personal information.*
* You may have received communications regarding information about privacy policies from other financial institutions which gave you the opportunity to "opt-out" of certain information sharing with companies which are not affiliated with that financial institution. The Trust does not share information with other companies for purposes of marketing solicitations for products other than the Trust. Therefore, the Trust does not provide opt-out options to their shareholders.
P.O. Box 182593
Columbus, Ohio 43218-2593

Visit our website at: | Call | ||||||
vcm.com | (800) 235-8396 | ||||||
40050-0920

JULY 31, 2020
Annual Report
USAA Money Market Fund
Beginning January 1, 2021, as permitted by regulations adopted by the Securities and Exchange Commission, paper copies of the Fund's shareholder reports like this one will no longer be sent by mail, unless you specifically request paper copies of the reports from the Fund or from your financial intermediary, such as a broker-dealer or bank. Instead, the reports will be made available on VictoryFunds.com, and you will be notified by mail each time a report is posted and provided with a website link to access the report. If you already elected to receive shareholder reports electronically, you will not be affected by this change and you need not take any action.
You may elect to receive shareholder reports and other communications from the Fund or your financial intermediary electronically by notifying your financial intermediary directly, or if you are a direct investor, by calling (800) 235-8396 or logging on to usaa.com. Effective on or about November 6, 2020, a shareholder who has an account directly with the Fund will need to submit their request via email to TA.Processing@FISGlobal.com.
You may elect to receive all future reports in paper free of charge. You can inform the Fund or your financial intermediary that you wish to continue receiving paper copies of your shareholder reports by notifying your financial intermediary directly, or if you are a direct investor, by calling (800) 235-8396 or logging on to usaa.com. Effective on or about November 6, 2020, a shareholder who has an account directly with the Fund will need to submit their request via email to TA.Processing@FISGlobal.com. Your election to receive reports in paper will apply to all funds held with the USAA Mutual Funds or your financial intermediary.
Victory Capital means Victory Capital Management Inc., the investment adviser of the USAA Mutual Funds. USAA Mutual Funds are distributed by Victory Capital Services, Inc., member FINRA, an affiliate of Victory Capital. Victory Capital and its affiliates are not affiliated with United Services Automobile Association or its affiliates. USAA and the USAA logo are registered trademarks and the USAA Mutual Funds and USAA Investments logos are trademarks of United Services Automobile Association and are being used by Victory Capital and its affiliates under license.
USAA Mutual Funds Trust
TABLE OF CONTENTS
Shareholder Letter (Unaudited) | 2 | ||||||
Managers' Commentary (Unaudited) | 3 | ||||||
Investment Overview (Unaudited) | 5 | ||||||
| Investment Objective & Portfolio Holdings (Unaudited) | 6 | ||||||
Financial Statements | |||||||
Schedule of Portfolio Investments | 7 | ||||||
Statement of Assets and Liabilities | 13 | ||||||
Statement of Operations | 14 | ||||||
Statements of Changes in Net Assets | 15 | ||||||
Financial Highlights | 16 | ||||||
Notes to Financial Statements | 18 | ||||||
| Report of Independent Registered Public Accounting Firm | 25 | ||||||
Supplemental Information | 26 | ||||||
Trustees' and Officers' Information | 26 | ||||||
Proxy Voting and Portfolio Holdings Information | 32 | ||||||
Expense Examples | 32 | ||||||
Additional Federal Income Tax Information | 33 | ||||||
Privacy Policy (inside back cover) | |||||||
This report is for the information of the shareholders and others who have received a copy of the currently effective prospectus of the Fund, managed by Victory Capital Management Inc. It may be used as sales literature only when preceded or accompanied by a current prospectus, which provides further details about the Fund.
IRA DISTRIBUTION WITHHOLDING DISCLOSURE
We generally must withhold federal income tax at a rate of 10% of the taxable portion of your distribution and, if you live in a state that requires state income tax withholding, at your state's tax rate. However, you may elect not to have withholding apply or to have income tax withheld at a higher rate. Any withholding election that you make will apply to any subsequent distribution unless and until you change or revoke the election. If you wish to make a withholding election, or change or revoke a prior withholding election, call (800) 235-8396.
If you do not have a withholding election in place by the date of a distribution, federal income tax will be withheld from the taxable portion of your distribution at a rate of 10%. If you must pay estimated taxes, you may be subject to estimated tax penalties if your estimated tax payments are not sufficient and sufficient tax is not withheld from your distribution.
For more specific information, please consult your tax adviser.
1
(Unaudited)
Dear Shareholder,
The previous decade ended with the longest-ever bull market in U.S. equities still intact, even as investors wrestled with issues like softening global economic data, Brexit, and U.S.-China trade relations. In retrospect, those worries seem pedestrian given what we would experience.
A new and unexpected threat—a global pandemic, the novel coronavirus ("COVID-19")—first emerged in Asia and then began spreading globally and throughout the United States during the first quarter of 2020. This unprecedented and unanticipated event not only rendered all existing economic forecasts moot, but it also roiled stock and bond markets everywhere. It also brought the economy to a near halt. The historic bull market in stocks ended virtually overnight.
After an initial severe sell-off in March, equity markets recovered sharply. As our annual reporting period drew to a close on July 31, 2020, many of the broad market indexes had recovered and volatility had returned to more palatable levels. In fact, despite all the chaos, the S&P 500® Index, one of the most popular measures of large U.S. stocks, finished the fiscal year (July 31, 2020) at approximately 3,271, which was up 8.9% from one year ago. Quite the impressive reversal.
The market turmoil of early 2020 was not limited to equities. Fixed income volatility spiked when liquidity evaporated in late March as investors struggled to understand the ramifications of sheltering in place. Fortunately, the U.S. Federal Reserve (the "Fed") (as well as other global central banks) leapt into action—cutting interest rates, (re)starting quantitative easing and, in the case of the Fed, launching an array of programs to stabilize markets.
The new lending facilities and programs had their intended effect of improving fixed income liquidity and trading. Credit spreads across corporate, high yield, structured, and municipal markets were coaxed down from their highs. In addition, Congress came through with substantial fiscal stimulus that also was applauded by investors and markets. Although fixed income markets regained their footing, the yield on 10-Year Treasurys, a benchmark for low-risk investments, declined steadily during our fiscal year—from 2.02% at the beginning of our reporting period to approximately 0.55% as of July 31, 2020. This suggests that investors remain a little wary.
While the past year has been unprecedented for all of us, both personally and professionally, our portfolio managers continue to analyze the financial markets, economic conditions, and the trajectory of the pandemic, which will likely be a guiding factor on Fed policy and the markets.
No matter what happens in the near term, we believe that the massive monetary and fiscal policies introduced earlier this year will have longer-term ramifications. Despite this uncertainty, it's important to remain focused on your long-term investment goals and avoid making emotional decisions. If you invest with us directly, our Member Service Representatives are available to help. Call us at (800) 235-8396.
Sincerely,

Christopher K. Dyer, CFA
President,
USAA Mutual Funds
2
USAA Mutual Funds Trust
USAA Money Market Fund
Managers' Commentary
(Unaudited)
AA Investments, A Victory Capital Investment Franchise
Cody Perkins, CFA
Andrew Hattman, CFA, CAIA
• What were market conditions during the reporting period?
The U.S. Federal Reserve (the "Fed") shifted its monetary policy stance during the reporting period ending July 31, 2020. On August 1, 2019, when the reporting period began, the target range for the federal funds ("fed funds") rate was between 2.00% and 2.25%. Immediately prior, at the July 31 policy meeting, the Fed officials eased monetary policy in response to global economic weakness and rising trade tensions, cutting the fed funds target rate by 0.25%. Citing global developments for the economic outlook and muted inflation, the Fed then cut its target range for fed funds by 0.25% twice more in 2019 to a range of 1.50% to 1.75%.
At the beginning of 2020, the Fed policymakers maintained their monetary policy stance—holding short-term interest rates steady—and said that they were evaluating the economic impact of their three 2019 rate cuts. In February, as the emergence of a novel coronavirus ("COVID-19") raised concerns about a global economic slowdown, Fed Chair Jerome Powell said the U.S. central bank would "act as appropriate" to support the U.S. economy. In March, amid rising recession risks, the Fed implemented an emergency 0.50% cut to the target fed funds rate. Just two weeks later, as the pandemic spread and major parts of the U.S. economy shut down, Fed officials made another emergency rate cut, slashing the fed funds rate by 1% to a range between 0% and 0.25%. The Fed also said it would keep the rate at that level "until it is confident that the economy has weathered recent events and is on track" to achieve its goals of stable prices and strong employment. At their April policy meeting, Fed officials left the fed funds rate unchanged, with the minutes from the meeting indicating concern that COVID-19 related lockdowns could lead to corporate bankruptcies and longer-term unemployment. Fed policymakers said they would use their "full range of tools" to support the U.S. economy. During June and July, the Fed continued to hold the fed funds rate in a range between 0% and 0.25% and projected no rate hikes through 2022.
Interest rates on money market instruments were low at the end of the reporting period as the Fed kept the fed funds rate near zero. As a result, yields on money market mutual funds were also low. However, investors continued to rely on the perceived risk profile of money market funds.
Money market funds are not insured or guaranteed by the Federal Deposit Insurance Corporation (FDIC) or any other government agency. Although money market funds seek to preserve the value of investors' shares at $1.00 per share, it is possible to lose money by investing in a money market fund.
3
USAA Mutual Funds Trust
USAA Money Market Fund (continued)
Managers' Commentary (continued)
• How did the USAA Money Market Fund (the "Fund") perform during the reporting period?
For the reporting period ended July 31, 2020, the seven-day yield for the Fund was 0.02%. The total return for the same period was 1.04%, compared to an average of 1.01% for all money market funds ranked by iMoneyNet, Inc.
• What strategies did you employ during the period?
During the reporting period ending July 31, 2020, we continued to invest in floating-rate certificates of deposit ("CDs") and floating-rate notes, as well as commercial paper, fixed-rate Yankee CDs, Treasury securities, and corporate notes. We moderated the Fund's investments in variable rate Yankee CDs as interest rates moved lower while increasing our exposure to variable rate demand notes ("VRDNs"). The VRDNs owned by the Fund give us flexibility because they can be sold at par (100% of face value) upon notice of seven days or less. Furthermore, most of these VRDNs are guaranteed by a bank letter of credit for the payment of both principal and interest, providing the Fund with a degree of safety and liquidity.
As always, we relied on our team of analysts to help us identify securities that represented relative value. These specialists also continue to analyze and monitor every holding in the portfolio.
Thank you for allowing us to assist in your investment needs.
4
USAA Mutual Funds Trust
USAA Money Market Fund
Investment Overview
(Unaudited)
Average Annual Total Return
Year Ended July 31, 2020
Fund Shares | |||||||
INCEPTION DATE | 1/30/81 | ||||||
Net Asset Value | |||||||
One Year | 1.04 | % | |||||
Five Year | 0.89 | % | |||||
Ten Year | 0.45 | % | |||||
Past performance is not indicative of future results. The performance data quoted represents past performance and current returns may be lower or higher. The investment return and principal value will fluctuate so that an investor's shares, when redeemed, may be worth more or less than the original cost. To obtain performance information current to the most recent month's end, please visit www.vcm.com.
You could lose money by investing in the Fund. Although the Fund seeks to preserve the value of your investment at $1 per share, it cannot guarantee it will do so. The Fund may impose a fee upon the sale of your shares or may temporarily suspend your ability to sell shares if the Fund's liquidity falls below required minimums because of market conditions or other factors. An investment in the Fund is not a deposit in USAA Federal Savings Bank, or any other bank, and is not insured or guaranteed by the Federal Deposit Insurance Corporation or any other government agency. The Fund's sponsor has no legal obligation to provide financial support to the Fund, and you should not expect that the sponsor will provide financial support to the Fund at any time.
Total return measures the price change in a share assuming the reinvestment of all net investment income and realized capital gain distributions, if any. The total returns quoted do not reflect adjustments made to the enclosed financial statements in accordance with U.S. generally accepted accounting principles or the deduction of taxes that a shareholder would pay on net investment income and realized capital gain distributions, including reinvested distributions, or redemptions of shares.
The total return figures set forth above include all waivers of fees for various periods since inception. Without such fee waivers, the total returns would have been lower.
USAA Money Market Fund — Growth of $10,000
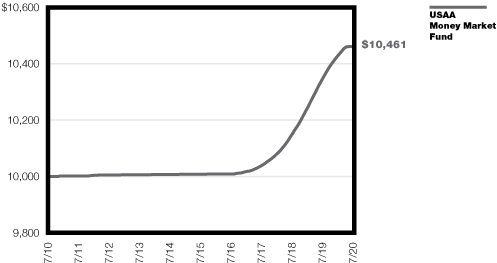
The graph reflects investment of growth of a hypothetical $10,000 investment in the Fund. Past performance is no guarantee of future results.
The graph and table do not reflect the deduction of taxes that a shareholder would pay on Fund distributions or the redemption of Fund shares.
5
| USAA Mutual Funds Trust USAA Money Market Fund | July 31, 2020 | ||||||
(Unaudited)
Investment Objective & Portfolio Holdings:
The USAA Money Market Fund seeks the highest income consistent with preservation of capital and the maintenance of liquidity.
Portfolio Mix*:
July 31, 2020
(% of Net Assets)

* Percentages are of the net assets of the Fund and may not equal 100%.
6
| USAA Mutual Funds Trust USAA Money Market Fund | Schedule of Portfolio Investments July 31, 2020 | ||||||
(Amounts in Thousands, Except for Shares)
Security Description | Principal Amount | Value | |||||||||
Corporate Bonds (11.8%) | |||||||||||
Consumer Discretionary (0.1%): | |||||||||||
| Cattail Creek Country Club, Inc. (LOC-Manufacturers & Traders Trust Co.), 0.51%, 3/1/31 (a) | $ | 3,070 | $ | 3,070 | |||||||
Consumer Staples (1.3%): | |||||||||||
| Altoona-Blair County Development Corp. (LOC-PNC Financial Services Group), 0.22%, 4/1/35, Callable 8/18/20 @ 100 (a) (b) | 20,000 | 20,000 | |||||||||
| Harvest Time Tabernacle, Inc. (LOC-Federal Home Loan Bank of Dallas), 0.28%, 8/1/37 (a) | 4,235 | 4,235 | |||||||||
Labcon North America (LOC-BNP Paribas), 0.30%, 6/1/44 (a) | 7,120 | 7,120 | |||||||||
Tallahassee Orthopedic Center LC (LOC-Wells Fargo & Co.), 0.32%, 4/3/34 (a) | 30 | 30 | |||||||||
31,385 | |||||||||||
Financials (10.4%): | |||||||||||
| Bass Pro Rossford Development Co. LLC (LOC-Fifth Third Bank), 0.32%, 11/1/27 (a) | 23,090 | 23,090 | |||||||||
| Carol Allen Family Liquidity Trust (LOC-Comerica Bank, N.A.), 0.22%, 3/1/48, Callable 9/10/20 @ 100 (a) | 25,000 | 25,000 | |||||||||
| Chad J Himmel Irrevocable Trust (LOC-Federal Home Loan Bank of Dallas), 0.22%, 7/1/48, Callable 9/10/20 @ 100 (a) | 5,290 | 5,290 | |||||||||
| Columbus Hotel Investment One LLC (LOC-Federal Home Loan Bank of New York), 0.22%, 10/1/48, Callable 9/10/20 @ 100 (a) | 6,535 | 6,535 | |||||||||
| David S Pearl II Irrevocable Trust (LOC-Federal Home Loan Bank of Dallas), 0.32%, 11/1/36, Callable 9/10/20 @ 100 (a) | 2,670 | 2,670 | |||||||||
Delos LLC (LOC-Wells Fargo & Co.), 0.35%, 3/1/37 (a) | 9,205 | 9,205 | |||||||||
Elsinore Properties LP (LOC-Fifth Third Bank), 0.27%, 2/1/37 (a) | 4,125 | 4,125 | |||||||||
Fiore Capital LLC (LOC-Wells Fargo & Co.), 0.45%, 8/1/45 (a) | 25,000 | 25,000 | |||||||||
| Gerald J Rubin Special Trust No 1 (LOC-Goldman Sachs Bank USA), 0.22%, 12/1/48, Callable 9/10/20 @ 100 (a) | 14,215 | 14,215 | |||||||||
| Gillean Family Trust (LOC-Federal Home Loan Bank of Dallas), 0.22%, 12/1/39, Callable 9/10/20 @ 100 (a) | 6,140 | 6,140 | |||||||||
| Herman & Kittle Capital LLC (LOC-Federal Home Loan Bank of Cincinnati), 0.22%, 2/1/37 (a) | 3,595 | 3,595 | |||||||||
| Lamar Avenue Trust (LOC-Federal Home Loan Bank of Dallas), 0.22%, 12/1/37, Callable 9/10/20 @ 100 (a) | 4,445 | 4,445 | |||||||||
| Lavonia O Frick Family Trust (LOC-Federal Home Loan Bank of Atlanta), 0.22%, 8/1/48, Callable 9/10/20 @ 100 (a) | 6,000 | 6,000 | |||||||||
| Mark E Potteiger Irrevocable Life Insurance Trust (LOC-Federal Home Loan Bank of Dallas), 0.22%, 6/1/48, Callable 9/10/20 @ 100 (a) | 4,025 | 4,025 | |||||||||
| Medilucent MOB I LP (LOC-PNC Financial Services Group), 0.22%, 8/1/30 (a) | 6,255 | 6,255 | |||||||||
| NLS Irrevocable Trust (LOC-Bank of Oklahoma, N.A.), 0.25%, 12/1/39, Callable 9/10/20 @ 100 (a) | 11,260 | 11,260 | |||||||||
| Opler Irrevocable Trust (LOC-Bank of Oklahoma, N.A.), 0.25%, 11/1/39, Callable 9/10/20 @ 100 (a) | 9,280 | 9,280 | |||||||||
OSF Finance Co. LLC (LOC-PNC Financial Services Group), 0.22%, 12/1/37 (a) | 21,565 | 21,565 | |||||||||
| Pinnacle Properties Development Group LLC (LOC-Federal Home Loan Bank of Cincinnati), 0.22%, 6/15/41 (a) | 10,859 | 10,859 | |||||||||
See notes to financial statements.
7
| USAA Mutual Funds Trust USAA Money Market Fund | Schedule of Portfolio Investments — continued July 31, 2020 | ||||||
(Amounts in Thousands, Except for Shares)
Security Description | Principal Amount | Value | |||||||||
| Stivers Realty LC (LOC-Federal Home Loan Bank of Dallas), 0.22%, 7/1/43, Callable 9/10/20 @ 100 (a) | $ | 6,470 | $ | 6,470 | |||||||
Stobro Co. LP (LOC-Federal Home Loan Bank of Pittsburgh), 0.38%, 1/1/32 (a) | 10,305 | 10,305 | |||||||||
| The Debra B Kennedy Irrevocable Trust (LOC-Federal Home Loan Bank of Dallas), 0.22%, 5/1/48, Callable 9/10/20 @ 100 (a) | 4,420 | 4,420 | |||||||||
| The Dennis Wesley Co., Inc. (LOC-Federal Home Loan Bank of Indianapolis) 0.22%, 6/15/34, Callable 9/10/20 @ 100 (a) | 2,075 | 2,075 | |||||||||
0.22%, 11/15/39, Callable 9/10/20 @ 100 (a) | 10,125 | 10,125 | |||||||||
| The Jacob Rosenstein Irrevocable Life Insurance Trust (LOC-Bank of Oklahoma, N.A.), 0.25%, 8/1/37, Callable 9/10/20 @ 100 (a) | 5,800 | 5,800 | |||||||||
| The Linda E Krejsek Life Insurance Trust (LOC-Federal Home Loan Bank of Dallas), 0.22%, 9/1/37 (a) | 5,490 | 5,490 | |||||||||
243,239 | |||||||||||
Total Corporate Bonds (Cost $277,694) | 277,694 | ||||||||||
Yankee Dollar (2.6%) | |||||||||||
Financials (1.1%): | |||||||||||
Westpac Banking Corp., 0.45%(FEDL01+35bps), 9/21/20 (c) | 25,000 | 25,000 | |||||||||
Materials (1.5%): | |||||||||||
| SSAB AB (LOC-Credit Agricole Corp. Inv. Bank), 0.22%, 5/1/34, Callable 9/10/20 @ 100 (a) | 15,000 | 15,000 | |||||||||
SSAB AB (LOC-Swedbank AB), 0.22%, 4/1/34 (a) | 20,000 | 20,000 | |||||||||
35,000 | |||||||||||
Total Yankee Dollar (Cost $60,000) | 60,000 | ||||||||||
Municipal Bonds (21.9%) | |||||||||||
Alabama (0.3%): | |||||||||||
| Columbia Industrial Development Board Revenue (NBGA-Southern Co.), Series A, 0.20%, 12/1/37, Continuously Callable @ 100 (a) | 7,550 | 7,550 | |||||||||
Arizona (1.1%): | |||||||||||
| Yavapai County IDA Revenue (LOC-Bank of Nova Scotia), 0.30%, 9/1/35, Continuously Callable @ 100 (a) | 26,625 | 26,625 | |||||||||
Arkansas (1.2%): | |||||||||||
| County of Union Revenue (LOC-Bank of America Corp.), Series R, 0.28%, 10/1/27, Callable 9/1/20 @ 100 (a) | 29,000 | 29,000 | |||||||||
Colorado (0.4%): | |||||||||||
| Traer Creek Metropolitan District Revenue (LOC-BNP Paribas), 0.31%, 10/1/30, Continuously Callable @ 100 (a) | 8,976 | 8,976 | |||||||||
Connecticut (0.2%): | |||||||||||
| Connecticut State Development Authority Revenue (LOC-Toronto-Dominion Bank), 0.34%, 12/1/28, Continuously Callable @ 100 (a) | 4,330 | 4,330 | |||||||||
Georgia (2.9%): | |||||||||||
| Appling County Development Authority Revenue (NBGA-Southern Co.), 0.24%, 9/1/41, Continuously Callable @ 100 (a) | 15,900 | 15,900 | |||||||||
See notes to financial statements.
8
| USAA Mutual Funds Trust USAA Money Market Fund | Schedule of Portfolio Investments — continued July 31, 2020 | ||||||
(Amounts in Thousands, Except for Shares)
Security Description | Principal Amount | Value | |||||||||
| The Burke County Development Authority Revenue, Series 1, 0.22%, 7/1/49, Continuously Callable @ 100 (a) | $ | 15,000 | $ | 15,000 | |||||||
| The Burke County Development Authority Revenue (NBGA-Southern Co.), 0.23%, 11/1/52, Continuously Callable @ 100 (a) | 36,480 | 36,480 | |||||||||
67,380 | |||||||||||
Illinois (0.1%): | |||||||||||
| Illinois Finance Authority Revenue (LOC-Federal Home Loan Bank of Chicago), 0.24%, 7/1/40, Continuously Callable @ 100 (a) | 2,740 | 2,740 | |||||||||
Indiana (0.7%): | |||||||||||
| City of Knox Revenue (LOC-SunTrust Bank), 0.28%, 2/1/46, Continuously Callable @ 100 (a) | 11,300 | 11,300 | |||||||||
| City of Marion Revenue (LOC-Key Bank, N.A.), Series A, 0.33%, 2/1/35, Continuously Callable @ 100 (a) | 3,845 | 3,845 | |||||||||
15,145 | |||||||||||
Louisiana (4.4%): | |||||||||||
| Parish of St. Charles Revenue (LOC-Federal Home Loan Bank of Atlanta), 0.30%, 9/1/24, Continuously Callable @ 100 (a) | 2,975 | 2,975 | |||||||||
| Parish of St. James Revenue (NBGA-Nucor Corp.), Series B-1, 0.34%, 11/1/40, Continuously Callable @ 100 (a) | 100,970 | 100,970 | |||||||||
103,945 | |||||||||||
Missouri (0.8%): | |||||||||||
Palmyra IDA Revenue, 0.57%, 12/1/37, Callable 9/1/20 @ 100 (a) | 18,000 | 18,000 | |||||||||
New York (4.5%): | |||||||||||
Broadalbin-Perth Central School District, GO, 1.25%, 6/24/21 | 13,000 | 13,081 | |||||||||
Hannibal Central School District, GO, 1.25%, 6/30/21 | 27,000 | 27,171 | |||||||||
Minisink Valley Central School District, GO, 1.25%, 6/25/21 | 17,939 | 18,011 | |||||||||
| New York State Housing Finance Agency Revenue (LOC-Landesbank Hessen-Thuringen), Series B, 0.21%, 11/1/44 (a) | 100 | 100 | |||||||||
| Saratoga County IDA Revenue (LOC-JPMorgan Chase & Co.), 0.23%, 11/1/21, Continuously Callable @ 100 (a) | 13,755 | 13,755 | |||||||||
Schuylerville Central School District, GO, 1.50%, 6/25/21 | 18,730 | 18,813 | |||||||||
Stillwater Central School District, GO, 1.50%, 6/25/21 | 12,183 | 12,243 | |||||||||
103,174 | |||||||||||
Oklahoma (1.4%): | |||||||||||
| Muskogee Industrial Trust Revenue, Series A, 0.40%, 1/1/25, Callable 9/2/20 @ 100 (a) | 32,400 | 32,400 | |||||||||
Pennsylvania (0.3%): | |||||||||||
| Allegheny County IDA Revenue (LOC-PNC Financial Services Group), 0.24%, 11/1/27, Callable 9/1/20 @ 100 (a) | 4,736 | 4,736 | |||||||||
| Pennsylvania Economic Development Financing Authority Revenue (LOC-PNC Financial Services Group), 0.22%, 4/1/35 (a) | 3,095 | 3,095 | |||||||||
7,831 | |||||||||||
Texas (3.6%): | |||||||||||
| Brazos Harbor Industrial Development Corp. Revenue 0.57%, 10/1/36, Callable 9/1/20 @ 100 (a) | 45,000 | 45,000 | |||||||||
0.57%, 5/1/38, Callable 9/1/20 @ 100 (a) | 25,000 | 25,000 | |||||||||
See notes to financial statements.
9
| USAA Mutual Funds Trust USAA Money Market Fund | Schedule of Portfolio Investments — continued July 31, 2020 | ||||||
(Amounts in Thousands, Except for Shares)
Security Description | Principal Amount | Value | |||||||||
| Port of Port Arthur Navigation District Revenue (NBGA-BASF S.E.), Series A, 0.57%, 5/1/38, Callable 9/1/20 @ 100 (a) | $ | 15,000 | $ | 15,000 | |||||||
85,000 | |||||||||||
Total Municipal Bonds (Cost $512,096) | 512,096 | ||||||||||
U.S. Treasury Obligations (4.3%) | |||||||||||
U.S. Treasury Bills, 0.18%, 11/24/20 (d) | 100,000 | 99,941 | |||||||||
Total U.S. Treasury Obligations (Cost $99,941) | 99,941 | ||||||||||
Commercial Paper (36.3%) | |||||||||||
| American Honda Finance 0.36%, 8/5/20 (d) | 20,000 | 19,999 | |||||||||
0.34%, 9/25/20 (d) | 10,000 | 9,995 | |||||||||
| Barton Capital Corp. 0.25%, 10/13/20 (d) | 25,000 | 24,987 | |||||||||
0.35%, 1/19/21 (d) | 25,000 | 24,958 | |||||||||
CenterPoint Energy Resources Corp., 0.10%, 8/3/20 (d) | 72,000 | 72,000 | |||||||||
Commonwealth Edison Co., 0.12%, 8/5/20 (d) | 50,000 | 49,999 | |||||||||
| Crown Point Capital Co. LLC 0.30%, 11/12/20 (d) | 20,000 | 19,983 | |||||||||
0.35%, 1/13/21 (d) | 20,000 | 19,968 | |||||||||
0.41%, 4/13/21 (d) | 40,000 | 40,000 | |||||||||
| Dairy Farmers of America 0.15%, 8/3/20 (d) | 50,000 | 49,999 | |||||||||
0.24%, 8/7/20 (d) | 20,000 | 19,999 | |||||||||
0.26%, 8/14/20 (d) | 20,000 | 19,998 | |||||||||
| Duke Energy Corp. 0.07%, 8/3/20 (d) | 51,000 | 51,001 | |||||||||
0.18%, 8/11/20 (d) | 20,000 | 19,999 | |||||||||
| Glencore Funding LLC 0.45%, 8/10/20 (d) | 20,000 | 19,998 | |||||||||
0.46%, 8/14/20 (d) | 20,000 | 19,996 | |||||||||
0.48%, 8/24/20 (d) | 21,000 | 20,993 | |||||||||
| Great Bridge Capital Co. LLC 0.31%, 9/2/20 (d) | 20,000 | 19,994 | |||||||||
0.40%, 10/19/20 (d) | 20,000 | 19,982 | |||||||||
0.35%, 1/15/21 (d) | 20,000 | 19,968 | |||||||||
| Hannover Funding Co. LLC 0.20%, 8/3/20 (d) | 20,000 | 20,000 | |||||||||
0.28%, 8/17/20 (d) | 20,000 | 19,997 | |||||||||
0.27%, 8/24/20 (d) | 20,000 | 19,996 | |||||||||
| Harley-Davidson Funding 0.27%, 8/7/20 (d) | 20,000 | 19,999 | |||||||||
0.34%, 9/9/20 (d) | 15,000 | 14,994 | |||||||||
| Hyundai Capital America, Inc. 0.50%, 8/3/20 (d) | 20,000 | 19,999 | |||||||||
0.59%, 8/11/20 (d) | 20,000 | 19,996 | |||||||||
Landesbank Baden-Wurttemberg, 0.30%, 1/11/21 (d) | 20,000 | 19,973 | |||||||||
See notes to financial statements.
10
| USAA Mutual Funds Trust USAA Money Market Fund | Schedule of Portfolio Investments — continued July 31, 2020 | ||||||
(Amounts in Thousands, Except for Shares)
Security Description | Principal Amount | Value | |||||||||
LMA Americas LLC, 0.35%, 12/2/20 (d) | $ | 20,000 | $ | 19,976 | |||||||
| Manhattan Asset Funding Co. 0.21%, 10/7/20 (d) | 12,000 | 11,995 | |||||||||
0.33%, 11/30/20 (d) | 30,000 | 29,967 | |||||||||
| Ridgefield Funding Co. LLC 0.25%, 10/13/20 (d) | 25,000 | 24,987 | |||||||||
0.34%, 11/2/20 (d) | 20,000 | 19,982 | |||||||||
Sheffield Receivables, 0.29%, 11/10/20 (d) | 25,000 | 24,980 | |||||||||
850,657 | |||||||||||
Total Commercial Paper (Cost $850,657) | 850,657 | ||||||||||
Certificates of Deposit (21.3%) | |||||||||||
| Bank of Montreal 0.36%, 8/3/20 (SOFR+26bps) (c) | 40,000 | 40,000 | |||||||||
0.45%, 8/3/20 (FEDL01+35bps) (c) | 40,000 | 40,000 | |||||||||
Bank of Nova Scotia, 0.55% (FEDL01+45bps), 10/23/20 (c) | 25,000 | 25,000 | |||||||||
Bayerische Landesbank, 0.38%, 10/1/20 | 50,000 | 50,007 | |||||||||
Credit Suisse, 0.38%, 4/12/21 | 20,000 | 20,000 | |||||||||
Credit Suisse AG, 1.27%, 10/6/20 | 50,000 | 50,000 | |||||||||
Mizuho Bank Ltd., 0.35% (LIBOR01M+17bps), 1/25/21 (c) | 25,000 | 25,000 | |||||||||
Norinchukin Bank, 0.34% (LIBOR01M+17bps), 1/29/21 (c) | 25,000 | 25,000 | |||||||||
| Societe Generale 0.54%, 8/17/20 (FEDL01+44bps) (c) | 40,000 | 40,000 | |||||||||
0.59%, 9/8/20 (FEDL01+49bps) (c) | 40,000 | 40,000 | |||||||||
Toronto Dominion Bank, 0.45% (FEDL01+35bps), 8/7/20 (c) | 40,000 | 40,000 | |||||||||
Toronto-Dominion Bank, 0.52% (SOFR+42bps), 9/30/20 (c) | 25,000 | 25,000 | |||||||||
Wells Fargo Bank NA, 0.44% (FEDL01+34bps), 8/14/20 (c) | 40,000 | 40,000 | |||||||||
Westpac Banking Corp., 0.50% (FEDL01+40bps), 11/2/20 (c) | 40,000 | 40,000 | |||||||||
Total Certificates of Deposit (Cost $500,007) | 500,007 | ||||||||||
Total Investments (Cost $2,300,395) — 98.2% | 2,300,395 | ||||||||||
Other assets in excess of liabilities — 1.8% | 44,224 | ||||||||||
NET ASSETS — 100.00% | $ | 2,344,619 | |||||||||
(a) Variable Rate Demand Notes that provide the rights to sell the security at face value on either that day or within the rate-reset period. The interest rate is reset on the put date at a stipulated daily, weekly, monthly, quarterly, or other specified time interval to reflect current market conditions. These securities do not indicate a reference rate and spread in their description.
(b) Rule 144A security or other security that is restricted as to resale to institutional investors. The Fund's Adviser has deemed this security to be liquid based upon procedures approved by the Board of Trustees. As of July 31, 2020, the fair value of these securities was $20,000 (thousands) and amounted to 0.9% of net assets.
(c) Variable or Floating-Rate Security. Rate disclosed is as of July 31, 2020.
(d) Rate represents the effective yield at July 31, 2020.
bps — Basis points
FEDL01 — Effective Federal Fund Rate
See notes to financial statements.
11
| USAA Mutual Funds Trust USAA Money Market Fund | Schedule of Portfolio Investments — continued July 31, 2020 | ||||||
GO — General Obligation
IDA — Industrial Development Authority
LIBOR — London InterBank Offered Rate
LIBOR01M — 1 Month US Dollar LIBOR, rate disclosed as of July 31, 2020, based on the last reset date of the security
LLC — Limited Liability Company
LOC — Letter of Credit
LP — Limited Partnership
SOFR — Secured Overnight Financing Rate
Credit Enhancements — Adds the financial strength of the provider of the enhancement to support the issuer's ability to repay the principal and interest payments when due. The enhancement may be provided by a high-quality bank, insurance company or other corporation, or a collateral trust. The enhancements do not guarantee the market values of the securities.
LOC Principal and interest payments are guaranteed by a bank letter of credit or other bank credit agreement.
NBGA Principal and interest payments or, under certain circumstances, underlying mortgages, are guaranteed by a nonbank guarantee agreement from the name listed.
See notes to financial statements.
12
USAA Mutual Funds Trust | Statement of Assets and Liabilities July 31, 2020 | ||||||
(Amounts in Thousands, Except Per Share Amounts)
| USAA Money Market Fund | |||||||
Assets: | |||||||
Investments, at value (Cost $2,300,395) | $ | 2,300,395 | |||||
Cash and cash equivalents | 359 | ||||||
Receivables: | |||||||
Interest and dividends | 820 | ||||||
Capital shares issued | 5,118 | ||||||
Investments sold | 42,300 | ||||||
From Adviser | 917 | ||||||
Prepaid expenses | 47 | ||||||
Total Assets | 2,349,956 | ||||||
Liabilities: | |||||||
Payables: | |||||||
Capital shares redeemed | 4,057 | ||||||
Accrued expenses and other payables: | |||||||
Investment advisory fees | 481 | ||||||
Administration fees | 200 | ||||||
Transfer agent fees | 504 | ||||||
Compliance fees | 1 | ||||||
Other accrued expenses | 94 | ||||||
Total Liabilities | 5,337 | ||||||
Net Assets: | |||||||
Capital | 2,344,511 | ||||||
Total accumulated earnings | 108 | ||||||
Net Assets | $ | 2,344,619 | |||||
Shares (unlimited number of shares authorized with no par value): | 2,345,031 | ||||||
Net asset value, offering and redemption price per share: (a) | $ | 1.00 | |||||
(a) Per share amount may not recalculate due to rounding of net assets and/or shares outstanding.
See notes to financial statements.
13
USAA Mutual Funds Trust | Statement of Operations For the Year Ended July 31, 2020 | ||||||
(Amounts in Thousands)
| USAA Money Market Fund | |||||||
Investment Income: | |||||||
Interest | $ | 73,810 | |||||
Total Income | 73,810 | ||||||
Expenses: | |||||||
Investment advisory fees | 10,269 | ||||||
Administration fees | 4,279 | ||||||
Sub-Administration fees | 27 | ||||||
Custodian fees | 257 | ||||||
Transfer agent fees | 10,702 | ||||||
Trustees' fees | 47 | ||||||
Compliance fees | 29 | ||||||
Legal and audit fees | 84 | ||||||
State registration and filing fees | 51 | ||||||
Other expenses | 388 | ||||||
Total Expenses | 26,133 | ||||||
Expenses waived/reimbursed by Adviser | (1,305 | ) | |||||
Net Expenses | 24,828 | ||||||
Net Investment Income | 48,982 | ||||||
Realized/Unrealized Gains from Investments: | |||||||
Net realized gains from investment securities | 106 | ||||||
Net realized/unrealized gains on investments | 106 | ||||||
Change in net assets resulting from operations | $ | 49,088 | |||||
See notes to financial statements.
14
USAA Mutual Funds Trust | Statements of Changes in Net Assets | ||||||
(Amounts in Thousands)
USAA Money Market Fund | |||||||||||
| Year Ended July 31, 2020 | Year Ended July 31, 2019 | ||||||||||
From Investments: | |||||||||||
Operations: | |||||||||||
Net investment income | $ | 48,982 | $ | 94,412 | |||||||
Net realized gains from investments | 106 | 6 | |||||||||
Change in net assets resulting from operations | 49,088 | 94,418 | |||||||||
Change in net assets resulting from distributions to shareholders | (48,976 | ) | (94,412 | ) | |||||||
Change in net assets resulting from capital transactions | (2,534,136 | ) | 255,027 | ||||||||
Change in net assets | (2,534,024 | ) | 255,033 | ||||||||
Net Assets: | |||||||||||
Beginning of period | 4,878,643 | 4,623,610 | |||||||||
End of period | $ | 2,344,619 | $ | 4,878,643 | |||||||
Capital Transactions: | |||||||||||
Proceeds from shares issued | $ | 4,964,491 | $ | 6,144,694 | |||||||
Distributions reinvested | 48,704 | 93,847 | |||||||||
Cost of shares redeemed | (7,547,331 | ) | (5,983,514 | ) | |||||||
Change in net assets resulting from capital transactions | $ | (2,534,136 | ) | $ | 255,027 | ||||||
Share Transactions: | |||||||||||
Issued | 4,964,491 | 6,144,694 | |||||||||
Reinvested | 48,704 | 93,847 | |||||||||
Redeemed | (7,547,331 | ) | (5,983,514 | ) | |||||||
Change in Shares | (2,534,136 | ) | 255,027 | ||||||||
See notes to financial statements.
15
USAA Mutual Funds Trust | Financial Highlights | ||||||
For a Share Outstanding Throughout Each Period
Investment Activities | Distributions to Shareholders From | ||||||||||||||||||||||||||
| Net Asset Value, Beginning of Period | Net Investment Income | Net Realized and Unrealized Gains on Investments | Total from Investment Activities | Net Investment Income | Net Realized Gains From Investments | ||||||||||||||||||||||
USAA Money Market Fund | |||||||||||||||||||||||||||
Year Ended July 31, 2020 | $ | 1.00 | 0.01 | (a) | — | (b) | 0.01 | (0.01 | ) | — | |||||||||||||||||
Year Ended July 31, 2019 | $ | 1.00 | 0.02 | — | (b) | 0.02 | (0.02 | ) | — | ||||||||||||||||||
Year Ended July 31, 2018 | $ | 1.00 | 0.01 | — | (b) | 0.01 | (0.01 | ) | — | ||||||||||||||||||
Year Ended July 31, 2017 | $ | 1.00 | — | (b) | — | (b) | — | (b) | — | — | (b) | ||||||||||||||||
Year Ended July 31, 2016 | $ | 1.00 | — | (b) | — | (b) | — | (b) | — | — | (b) | ||||||||||||||||
* Assumes reinvestment of all net investment income and realized capital gain distributions, if any, during the period. Includes adjustments in accordance with U.S. generally accepted accounting principles and could differ from the Lipper reported return.
^ The net expense ratio may not correlate to the applicable expense limits in place during the period since the current contractual expense limitation is applied for a two year period beginning July 1, 2019 and in effect through June 30, 2021, instead of coinciding with the Fund's fiscal year end. Details of the current contractual expense limitation in effect can be found in Note 4 of the accompanying Notes to Financial Statements.
(a) Per share net investment income (loss) has been calculated using the average daily shares method.
(b) Amount is less than $0.005.
(c) USAA Asset Management Company ("AMCO") (previous Investment Adviser) voluntarily agreed, on a temporary basis, to reimburse management, administrative, or other fees to limit the Fund's expenses and attempt to prevent a negative yield.
(d) Reflects total annual operating expenses of the Fund before reductions of any expenses paid indirectly. The Fund's expenses paid indirectly decreased the expense ratios by less than 0.01%.
See notes to financial statements.
16
USAA Mutual Funds Trust | Financial Highlights — continued | ||||||
For a Share Outstanding Throughout Each Period
Ratios to Average Net Assets | Supplemental Data | ||||||||||||||||||||||||||||||
| Total Distributions | Net Asset Value, End of Period | Total Return* | Net Expenses^ | Net Investment Income | Gross Expenses | Net Assets, End of Period (000's) | |||||||||||||||||||||||||
USAA Money Market Fund | |||||||||||||||||||||||||||||||
Year Ended July 31, 2020 | (0.01 | ) | $ | 1.00 | 1.04 | % | 0.58 | % | 1.15 | % | 0.61 | % | $ | 2,344,619 | |||||||||||||||||
Year Ended July 31, 2019 | (0.02 | ) | $ | 1.00 | 1.97 | % | 0.62 | % | 1.95 | % | 0.62 | % | $ | 4,878,643 | |||||||||||||||||
Year Ended July 31, 2018 | (0.01 | ) | $ | 1.00 | 1.13 | % | 0.62 | % | 1.12 | % | 0.62 | % | $ | 4,623,610 | |||||||||||||||||
Year Ended July 31, 2017 | — | (b) | $ | 1.00 | 0.31 | %(c) | 0.63 | %(c)(d) | 0.29 | % | 0.63 | %(d) | $ | 4,513,270 | |||||||||||||||||
Year Ended July 31, 2016 | — | (b) | $ | 1.00 | 0.01 | %(c) | 0.41 | %(c)(d) | 0.01 | % | 0.67 | %(d) | $ | 5,606,434 | |||||||||||||||||
See notes to financial statements.
17
USAA Mutual Funds Trust | Notes to Financial Statements July 31, 2020 | ||||||
1. Organization:
USAA Mutual Funds Trust (the "Trust") is organized as a Delaware statutory trust and is registered under the Investment Company Act of 1940, as amended (the "1940 Act"), as an open-end investment company. The Trust is comprised of 47 funds and is authorized to issue an unlimited number of shares, which are units of beneficial interest with no par value.
The accompanying financial statements are those of the USAA Money Market Fund (the "Fund"). The Fund is classified as diversified under the 1940 Act.
The Fund operates as a retail money market fund in compliance with the requirements of Rule 2a-7 under the 1940 Act; and as a retail money market fund, shares of the Fund are available for sale only to accounts that are beneficially owned by natural persons.
Under the Trust's organizational documents, its officers and trustees are indemnified against certain liabilities arising out of the performance of their duties to the Fund. In addition, in the normal course of business, the Fund enters into contracts with its vendors and others that provide for general indemnifications. The Fund's maximum exposure under these arrangements is unknown, as this would involve future claims that may be made against the Fund. However, based on experience, the Fund expects that risk of loss to be remote.
2. Significant Accounting Policies:
The following is a summary of significant accounting policies followed by the Trust in the preparation of its financial statements. The policies are in conformity with generally accepted accounting principles in the United States of America ("GAAP"). The preparation of financial statements in accordance with GAAP requires management to make estimates and assumptions that affect the reported amounts of assets and liabilities and disclosure of contingent assets and liabilities at the date of the financial statements and the reported amounts of income and expenses for the period. Actual results could differ from those estimates. The Fund follows the specialized accounting and reporting requirements under GAAP that are applicable to investment companies under Accounting Standards Codification Topic 946.
Investment Valuation:
The inputs or methodologies used for valuing securities are not necessarily an indication of the risks associated with investing in those securities. For example, money market securities are valued using amortized cost, in accordance with rules under the 1940 Act. Generally, amortized cost approximates the current fair value of a security, but since the value is not obtained from a quoted price in an active market, such securities are reflected as Level 2.
The Fund records investments at fair value. Fair value is defined as the price that would be received to sell an asset or paid to transfer a liability in an orderly transaction between market participants at the measurement date.
The valuation techniques described below maximize the use of observable inputs and minimize the use of unobservable inputs in determining fair value. The inputs used for valuing the Fund's investments are summarized in the three broad levels listed below:
• Level 1 — quoted prices in active markets for identical securities
• Level 2 — other significant observable inputs (including quoted prices for similar securities or interest rates applicable to those securities, etc.)
• Level 3 — significant unobservable inputs (including the Fund's own assumptions in determining the fair value of investments)
The Adviser has established the Pricing and Liquidity Committee (the "Committee"), and subject to Trust's Board of Trustees (the "Board") oversight, the Committee administers and oversees the Fund's valuation policies and procedures, which are approved by the Board.
18
USAA Mutual Funds Trust | Notes to Financial Statements — continued July 31, 2020 | ||||||
Repurchase agreements are valued at cost.
All securities held in the Fund are short-term debt securities, which are valued pursuant to Rule 2a-7 under the 1940 Act. This method values a security at its purchase price, and thereafter, assumes a constant amortization to maturity of any premiums or discounts. Securities for which amortized cost valuations are considered unreliable or whose values have been materially affected by a significant event are valued in good faith, at fair value, using methods determined by the Committee, under procedures to stabilize net assets and valuation procedures approved by the Board.
Repurchase Agreements:
The Fund may enter into repurchase agreements with commercial banks or recognized security dealers pursuant to the terms of a Master Repurchase Agreement. A repurchase agreement is an arrangement wherein the Fund purchases securities and the seller agrees to repurchase the securities at an agreed upon time and at an agreed upon price. The purchased securities are marked-to-market daily to ensure their value is equal to or in excess of the purchase price plus accrued interest and are held by the Fund, either through its regular custodian or through a special "tri-party" custodian that maintains separate accounts for both the Fund and its counterparty, until maturity of the repurchase agreement. Master Repurchase Agreements typically contain netting provisions, which provide for the net settlement of all transactions and collateral with the Fund through a single payment in the event of default or termination. Repurchase agreements are subject to credit risk, and the Fund's Manager monitors the creditworthiness of sellers with which the Fund may enter into repurchase agreements.
Investments in repurchase agreements as reflected on the Schedule of Portfolio of Investments are not net settlement amounts but gross. At July 31, 2020, the value of the related collateral exceeded the value of the repurchase agreements, reducing the net settlement amount to zero. Details on the collateral are included on the Schedule of Portfolio of Investments. At July 31, 2020, the Fund did not hold any repurchase agreements.
Securities Purchased on a Delayed-Delivery or When-Issued Basis:
The Fund may purchase securities on a delayed-delivery or when-issued basis. Delivery and payment for securities that have been purchased by the Fund on a delayed-delivery, or when-issued basis, or for delayed draws on loans can take place a month or more after the trade date. At the time the Fund makes the commitment to purchase a security on a delayed-delivery or when-issued basis, the Fund records the transaction and reflects the value of the security in determining net asset value ("NAV"). No interest accrues to the Fund until the transaction settles and payment takes place. A segregated account is established and the Fund maintains cash and/or marketable securities at least equal in value to commitments for delayed-delivery or when-issued securities. If the Fund owns delayed-delivery or when-issued securities, these values are included in Payable for investments purchased on the accompanying Statement of Assets and Liabilities and the segregated assets are identified on the Schedule of Portfolio Investments.
Municipal Obligations:
The values of municipal obligations can fluctuate and may be affected by adverse tax, legislative, or political changes, and by financial developments affecting municipal issuers. Payment of municipal obligations may depend on a relatively limited source of revenue, resulting in greater credit risk. Future changes in federal tax laws or the activity of an issuer may adversely affect the tax-exempt status of municipal obligations.
Investment Transactions and Related Income:
Changes in holdings of investments are accounted for no later than one business day following the trade date. For financial reporting purposes, however, investment transactions are accounted for on trade date on the last business day of the reporting period. Interest income is determined on the basis of coupon interest accrued using the effective interest method which adjusts, where applicable, the
19
USAA Mutual Funds Trust | Notes to Financial Statements — continued July 31, 2020 | ||||||
amortization of premiums or accretion of discount. Gains or losses realized on sales of securities are determined by comparing the identified cost of the security lot sold with the net sales proceeds.
Federal Income Taxes:
It is the Fund's policy to continue to qualify as a regulated investment company by complying with the provisions available to certain investment companies, as defined in applicable sections of the Internal Revenue Code, and to make distributions of net investment income and net realized gains sufficient to relieve it from all, or substantially all, federal income taxes. Accordingly, no provision for federal income taxes is required in the financial statements. The Fund has a tax year end of July 31.
Management of the Fund has reviewed tax positions taken in tax years that remain subject to examination by all major tax jurisdictions, including federal (i.e., the last four tax years, which includes the current fiscal tax year end). Management believes that there is no tax liability resulting from unrecognized tax benefits related to uncertain tax positions taken.
Allocations:
Expenses directly attributable to the Fund are charged to the Fund, while expenses that are attributable to more than one fund in the Trust, or jointly with an affiliated trust, are allocated among the respective funds in the Trust and/or affiliated trust based upon net assets or another appropriate basis.
Cross-Trade Transactions:
Pursuant to Rule 17a-7 under the 1940 Act, the Fund may engage in cross-trades which are securities transactions with affiliated investment companies and advisory accounts managed by the Adviser and any applicable sub-adviser. Any such purchase or sale transaction must be effected without brokerage commission or other remuneration, except for customary transfer fees. The transaction must be effected at the current market price, which is either the security's last sale price on an exchange or, if there are no transactions in the security that day, at the average of the highest bid and lowest asked price. For the year ended July 31, 2020, the Fund engaged in the following securities transactions with affiliated funds, which resulted in the following net realized gains (losses) (amounts in thousands):
| Purchases | Sales | Net Realized Gains (Losses) | |||||||||
| $ | 39,500 | $ | 33,800 | $ | — | ||||||
Fees Paid Indirectly:
Expense offsets to custody fees that arise from credits on cash balances maintained on deposit are reflected on the Statement of Operations, as applicable, as Fees paid indirectly.
3. Fees and Transactions with Affiliates and Related Parties:
Investment Advisory Fees:
Investment advisory services are provided to the Fund by Victory Capital Management Inc. ("VCM" or the "Adviser"), a New York corporation registered as an investment adviser with the Securities and Exchange Commission ("SEC"). The Adviser is a wholly-owned indirect subsidiary of Victory Capital Holdings, Inc., a publicly traded Delaware corporation, and a wholly-owned direct subsidiary of Victory Capital Operating, LLC. The Fund's Investment Adviser fee is accrued daily and paid monthly at an annualized rate of 0.24% of the Fund's average daily net assets. Amounts incurred and paid to VCM for the year ended July 31, 2020, are reflected on the Statement of Operations as Investment Advisory fees.
The Trust relies on an exemptive order granted to VCM and its affiliated funds by the SEC in March 2019 permitting the use of a "manager-of-managers" structure for certain funds. Under a manager-of- managers structure, the investment adviser may select (with approval of the Board and without
20
USAA Mutual Funds Trust | Notes to Financial Statements — continued July 31, 2020 | ||||||
shareholder approval) one or more subadvisers to manage the day-to-day investment of a fund's assets. For the year ended July 31, 2020, the Fund had no subadvisors.
Administration and Servicing Fees:
VCM serves as the Fund's administrator and fund accountant. Under the Fund Administration, Servicing and Accounting Agreement, VCM is paid for its services an annual fee at a rate of 0.10% of average daily net assets of the Fund. Amounts incurred for the year ended July 31, 2020, are reflected on the Statement of Operations as Administration fees.
The Fund (as part of the Trust) has entered into an agreement to provide compliance services with the Adviser, pursuant to which the Adviser furnishes its compliance personnel, including the services of the Chief Compliance Officer ("CCO"), and other resources reasonably necessary to provide the Trust with compliance oversight services related to the design, administration and oversight of a compliance program for the Trust in accordance with Rule 38a-1 under the 1940 Act. The CCO is an employee of the Adviser, which pays the compensation of the CCO and support staff. Funds in the Trust, Victory Variable Insurance Funds, Victory Portfolios, and Victory Portfolios II (collectively, the "Victory Funds Complex") in the aggregate, compensate the Adviser for these services. Amounts incurred for the year ended July 31, 2020, are reflected on the Statement of Operations as Compliance fees.
Citi Fund Services Ohio, Inc. ("Citi"), an affiliate of Citibank, acts as sub-administrator and sub-fund accountant to the Fund pursuant to a Sub-Administration and Sub-Fund Accounting Services Agreement between VCM and Citi. VCM pays Citi a fee for providing these services. The Fund reimburses VCM and Citi for reasonable out-of-pocket expenses incurred in providing these services and certain other expenses specifically allocated to the Funds, under the Fund Administration, Servicing, and Accounting Agreement. Amounts incurred for the year ended July 31, 2020, are reflected on the Statement of Operations as Sub-Administration fees.
Transfer Agency Fees:
Victory Capital Transfer Agency, Inc. ("VCTA"), provides transfer agency services to the Fund. Transfer agent's fees for the Fund are paid monthly based on a fee accrued daily at an annualized rate of 0.25% of average daily net assets, plus out-of-pocket expenses. Amounts incurred and paid to VCTA for the year ended July 31, 2020, are reflected on the Statement of Operations as Transfer Agent fees.
FIS Investor Services LLC serves as sub-transfer agent and dividend disbursing agent for the Fund pursuant to a Sub-Transfer Agent Agreement between VCTA and FIS Investor Services LLC. VCTA provides FIS Investor Services LLC a fee for providing these services.
Distributor/Underwriting Services:
Victory Capital Services, Inc. (the "Distributor"), an affiliate of the Adviser, serves as distributor for the continuous offering of the shares of the Fund pursuant to a Distribution Agreement between the Distributor and the Trust. The Distributor received no fees or other compensation for such distribution services. Effective June 30, 2020, the Distributor's name was changed from Victory Capital Advisers, Inc.
Other Fees:
Citibank serves as the Fund's custodian.
K&L Gates LLP provides legal services to the Trust.
The Adviser has entered into an expense limitation agreement with the Fund until at least June 30, 2021. Under the terms of the agreement, the Adviser has agreed to waive fees or reimburse certain expenses to the extent that ordinary operating expenses incurred by the Fund in any fiscal year exceed the expense limit. Such excess amounts will be the liability of the Adviser. Interest, taxes, brokerage commissions, other expenditures which are capitalized in accordance with GAAP, and other extraordinary expenses not incurred in the ordinary course of the Fund's business are excluded from the expense limits. As of July 31, 2020, the expense limit (excluding voluntary waivers) is 0.62%.
21
USAA Mutual Funds Trust | Notes to Financial Statements — continued July 31, 2020 | ||||||
Under this expense limitation agreement, the Fund has agreed to repay fees and expenses that were waived or reimbursed by the Adviser for a period up to three years after the fiscal year in which the waiver or reimbursement took place, subject to the lesser of any operating expense limits in effect at the time of: (a) the original waiver or expense reimbursement; or (b) the recoupment, after giving effect to the recoupment amount.
Amendment #1 to the expense limitation agreement was effective March 23, 2020. Under this amendment, the Adviser agreed to further reimburse fees in excess of the Fund's expense limit agreement of 0.62% dated July 1, 2019. These voluntary reductions, to the extent necessary, are to maintain a certain minimum net yield of the Fund. Under this agreement to reimburse additional fees, the Fund has agreed to repay fees and expenses that were waived or reimbursed by the Adviser for a period up to three years after the fiscal year in which the waiver or reimbursement took place, to the extent any repayments would not cause the Fund's net yield to fall below the Fund's minimum yield at the time of: (a) the original waiver or expense reimbursement; or (b) the expense limit in effect at the time of the extra waiver. As of July 31, 2020, the following amounts are available to be repaid to the Adviser (amounts in thousands). The Fund has not recorded any amounts available to be repaid as a liability due to an assessment that such repayment is not probable at July 31, 2020.
Expires July 31, 2023 | |||||||
$ | 1,305 | ||||||
Certain officers and/or interested trustees of the Fund are also officers and/or employees of the Adviser, Administrator, Sub-Administrator, Sub-Fund Accountant, and Legal.
4. Risks:
The Fund may be subject to other risks in addition to these identified risks.
Global economies and financial markets are increasingly interconnected, which increases the possibilities that conditions in one country or region might adversely affect issuers in another country or region. Geopolitical and other risks, including war, terrorism, trade disputes, political or economic dysfunction within some nations, public health crises and related geopolitical events, as well as environmental disasters such as earthquakes, fires, and floods, may add to instability in world economies and markets generally. Changes in trade policies and international trade agreements could affect the economies of many countries in unpredictable ways. Epidemics and/or pandemics, such as the coronavirus (or COVID-19), may result in, among other things, closing borders, disruptions to healthcare service preparation and delivery, quarantines, cancellations, disruptions to supply chains and consumer activity, as well as general concern and uncertainty. The impact may be short-term or may last for extended periods.
The COVID-19 pandemic, which has spread rapidly across the world, has led and will continue to lead for an unknown period of time to disruptions in local, regional, national and global markets and economies. Among other things, the outbreak has resulted in, and until fully resolved is likely to continue to result in, among other things (1) government imposition of various forms of "stay at home" orders and the closing of "non-essential" businesses, resulting in significant disruption to the businesses of many issuers as well as lay-offs of employees: (2) increased requests by issuers of debt instruments for amendments and waivers of agreements to avoid default and increased defaults: (3) volatility and disruption of markets, including greater volatility in pricing and spreads; and (4) rapidly evolving proposals and/or actions by state and federal governments to address problems being experienced by the markets and by businesses and the economy in general.
When interest rates rise, debt security prices generally fall. The opposite also generally is true: debt security prices rise when interest rates fall. Interest rate changes are influenced by a number of factors including government policy, monetary policy, inflation expectations, perceptions of risk, and supply and demand of debt securities. The Fund's yield will vary. A sharp and unexpected rise in interest rates could cause the Fund's share price to drop below a dollar. A low interest rate environment may prevent
22
USAA Mutual Funds Trust | Notes to Financial Statements — continued July 31, 2020 | ||||||
the Fund from providing a positive yield and could also impair the Fund's ability to maintain a stable net asset value ("NAV").
Credit risk is expected to be low for the Fund because it invests primarily in securities that are considered to be of high quality. However, there is the possibility that an issuer will fail to make timely interest and principal payments on its securities or that negative perceptions of the issuer's ability to make such payments will cause the price of that security to decline.
The Fund is actively managed, and the investment techniques and risk analyses used by the Fund's portfolio managers may not produce the desired results.
Many debt securities, derivatives and other financial instruments, including some of the Fund's investments, use the London Interbank Offered Rate ("LIBOR") as the reference or benchmark rate for variable interest rate calculations. However, the use of LIBOR started to come under pressure following manipulation allegations in 2012. Despite increased regulation and other corrective actions since that time, concerns have arisen regarding its viability as a benchmark, due largely to reduced activity in the financial markets that it measures. In June 2017, the Alternative Reference Rates Committee, a group of large U.S. banks working with the Federal Reserve, announced its selection of a new Secured Overnight Funding Rate ("SOFR"), which is intended to be a broad measure of secured overnight U.S. Treasury repo rates, as an appropriate replacement for LIBOR. The Federal Reserve Bank of New York began publishing the SOFR in 2018, expecting that it could be used on a voluntary basis in new instruments and transactions. Bank working groups and regulators in other countries have suggested other alternatives for their markets, including the Sterling Overnight Interbank Average Rate ("SONIA") in England. In July 2017, the Financial Conduct Authority (the "FCA"), the United Kingdom financial regulatory body, announced that after 2021 it will cease its active encouragement of UK banks to provide the quotations needed to sustain LIBOR. That announcement suggests that LIBOR may cease to be published after that time. The roughly three-year period until the end of 2021 is expected to be enough time for market participants to transition to the use of a different benchmark for both new and existing securities and transactions. Various financial industry groups have begun planning for that transition, but there are obstacles to converting certain longer-term securities and transactions to a new benchmark. Transition planning is at an early stage, and neither the effect of the transition process nor its ultimate success can yet be known. The transition process might lead to increased volatility and illiquidity in markets that currently rely on the LIBOR to determine interest rates. It could also lead to a reduction in the value of some LIBOR-based investments and reduce the effectiveness of new hedges placed against existing LIBOR-based instruments. Since the usefulness of LIBOR as a benchmark could deteriorate during the transition period, these effects could occur before the end of 2021.
5. Borrowing:
Line of Credit:
For the year ended July 31, 2020, the Victory Funds Complex participated in a short-term demand note "Line of Credit" agreement with Citibank. The Line of Credit agreement with Citibank was renewed on June 29, 2020 with a termination date of June 28, 2021. Under the agreement with Citibank, the Victory Funds Complex, may borrow up to $600 million, of which $300 million is committed and $300 million is uncommitted. $40 million of the Line of Credit is reserved for use by the Victory Floating Rate Fund (herein, the "Fund"), another series of the Victory Funds Complex, with that Fund paying the related commitment fees for that amount. The purpose of the agreement is to meet temporary or emergency cash needs. For the year ended July 31, 2020, Citibank received an annual commitment fee of 0.15% on $300 million for providing the Line of Credit. Each fund in the Victory Funds Complex pays a pro-rata portion of the commitment fees plus any interest (one month LIBOR plus one percent) on amounts borrowed. Effective June 29, 2020, under an amended Line of Credit agreement, Citibank will also receive an annual upfront fee of 0.10% on the $300 million committed line of credit. Each fund in the Victory Funds Complex will pay a pro-rata portion of the upfront fee. Interest charged to each Fund during the period, if applicable, is reflected on the Statements of Operations under Line of credit fees.
23
USAA Mutual Funds Trust | Notes to Financial Statements — continued July 31, 2020 | ||||||
The average loans under the line of credit agreement with Citibank for the days outstanding and average interest rate for each Fund during the year ended June 30, 2020 were as follows:
| Amount Outstanding at July 31, 2020 | Average Borrowings* | Days Outstanding | Average Rate* | Maximum Borrowing During the Period | |||||||||||||||
| $ | — | $ | 25,900 | 1 | 2.18 | % | $ | 25,900 | |||||||||||
* For the year ended July 31, 2020, based on the number of days borrowings were outstanding.
6. Federal Income Tax Information:
The Fund intends to declare daily and distribute monthly any net investment income. Distributable net realized gains, if any, are declared and paid at least annually.
The amounts of dividends from net investment income and distributions from net realized gains (collectively distributions to shareholders) are determined in accordance with federal income tax regulations, which may differ from GAAP. To the extent these "book/tax" differences are permanent in nature (e.g., net operating loss and distribution reclassification), such amounts are reclassified within the components of net assets based on their federal tax-basis treatment; temporary differences (e.g., wash sales) do not require reclassification. To the extent dividends and distributions exceed net investment income and net realized gains for tax purposes, they are reported as distributions of capital. Net investment losses incurred by the Fund may be reclassified as an offset to capital on the accompanying Statement of Assets and Liabilities.
As of July 31, 2020, on the Statement of Assets and Liabilities, there were no permanent book-to-tax difference reclassification adjustments.
The tax character of distributions paid during the tax years ended as noted below, were as follows (total distributions paid may differ from the Statements of Changes in Net Assets because, for tax purposes, dividends are recognized when actually paid) (amounts in thousands).
Year Ended July 31, 2020 | Year Ended July 31, 2019 | ||||||||||||||||||
| Distributions paid from | Distributions paid from | ||||||||||||||||||
Ordinary Income | Total Distributions Paid | Ordinary Income* | Total Distributions Paid | ||||||||||||||||
$ | 49,089 | $ | 49,089 | $ | 94,412 | $ | 94,412 | ||||||||||||
* Includes short-term realized capital gains, if any, which are taxable as ordinary income.
As of July 31, 2020, the components of accumulated earnings (loss) on a tax basis were as follows (amounts in thousands):
| Undistributed Ordinary Income | Total Accumulated Earnings (Loss) | ||||||
| $ | 108 | $ | 108 | ||||
At July 31, 2020, the Fund had no net capital loss carryforwards for federal income tax purposes.
As of July 31, 2020, the cost basis for federal income tax purposes, gross unrealized appreciation,gross unrealized depreciation, and net unrealized appreciation (depreciation) for investments were as follows (amounts in thousands):
| Cost of Investments for Federal Tax Purposes | Gross Unrealized Appreciation | Gross Unrealized Depreciation | Net Unrealized Appreciation (Depreciation) | ||||||||||||||||
$ | 2,300,395 | $ | — | $ | — | $ | — | ||||||||||||
24
REPORT OF INDEPENDENT REGISTERED PUBLIC ACCOUNTING FIRM
To the Shareholders and the Board of Trustees of USAA Money Market Fund
Opinion on the Financial Statements
We have audited the accompanying statement of assets and liabilities of USAA Money Market Fund (the "Fund") (one of the funds constituting USAA Mutual Funds Trust (the "Trust")), including the schedule of portfolio investments, as of July 31, 2020, and the related statement of operations for the year then ended, the statements of changes in net assets for each of the two years in the period then ended, the financial highlights for each of the five years in the period then ended and the related notes (collectively referred to as the "financial statements"). In our opinion, the financial statements present fairly, in all material respects, the financial position of the Fund (one of the funds constituting USAA Mutual Funds Trust) at July 31, 2020, the results of its operations for the year then ended, the changes in its net assets for each of the two years in the period then ended and its financial highlights for each of the five years in the period then ended, in conformity with U.S. generally accepted accounting principles.
Basis for Opinion
These financial statements are the responsibility of the Trust's management. Our responsibility is to express an opinion on the Fund's financial statements based on our audits. We are a public accounting firm registered with the Public Company Accounting Oversight Board (United States) ("PCAOB") and are required to be independent with respect to the Trust in accordance with the U.S. federal securities laws and the applicable rules and regulations of the Securities and Exchange Commission and the PCAOB.
We conducted our audits in accordance with the standards of the PCAOB. Those standards require that we plan and perform the audit to obtain reasonable assurance about whether the financial statements are free of material misstatement, whether due to error or fraud. The Trust is not required to have, nor were we engaged to perform, an audit of the Trust's internal control over financial reporting. As part of our audits we are required to obtain an understanding of internal control over financial reporting, but not for the purpose of expressing an opinion on the effectiveness of the Trust's internal control over financial reporting. Accordingly, we express no such opinion.
Our audits included performing procedures to assess the risks of material misstatement of the financial statements, whether due to error or fraud, and performing procedures that respond to those risks. Such procedures included examining, on a test basis, evidence regarding the amounts and disclosures in the financial statements. Our procedures included confirmation of securities owned as of July 31, 2020, by correspondence with the custodian. Our audits also included evaluating the accounting principles used and significant estimates made by management, as well as evaluating the overall presentation of the financial statements. We believe that our audits provide a reasonable basis for our opinion.

We have served as the auditor of one or more Victory Capital investment companies since 1995.
San Antonio, Texas
September 29, 2020
25
USAA Mutual Funds Trust | Supplemental Information July 31, 2020 | ||||||
(Unaudited)
Trustee and Officer Information
Board of Trustees:
Overall responsibility for management of the Trust rests with the Board. The Trust is managed by the Board in accordance with the laws of the state of Delaware. There are currently 10 Trustees, eight of whom are not "interested persons" of the Trust within the meaning of that term under the 1940 Act ("Independent Trustees") and two of whom is an "interested person" of the Trust within the meaning of that term under the 1940 Act ("Interested Trustee"). The Trustees, in turn, elect the officers of the Trust to actively supervise its day-to-day operations.
The following tables list the Trustees, their ages, position with the Trust, commencement of service, principal occupations during the past five years and any directorships of other investment companies or companies whose securities are registered under the Securities Exchange Act of 1934, as amended, or who file reports under that Act. Each Trustee oversees 47 portfolios in the Trust. Each Trustee's address is 15935 La Cantera Pkwy, Building Two, San Antonio, TX, 78256. Pursuant to a policy adopted by the Board, the term of office for each Trustee shall be until the Independent Trustee reaches age 75 or an Interested Trustee reaches age 75. The Board may change or grant exceptions from this policy at any time without shareholder approval. A Trustee may resign or be removed by a vote of the other Trustees or the holders of a majority of the outstanding shares of the Trust at any time. Vacancies on the Board can be filled by the action of a majority of the Trustees, provided that after filling such vacancy at least two-thirds of the Trustees have been elected by the shareholders.
Name and Date of Birth | Position Held with the Trust | Year Commenced Service | Principal Occupation During Past 5 Years | Other Directorships Held During Past 5 Years | |||||||||||||||
Independent Trustees. | |||||||||||||||||||
| Jefferson C. Boyce, Born September 1957 | Lead Independent Trustee, and Vice Chairman | 2013 | Senior Managing Director, New York Life Investments, LLC (1992-2012) | Westhab, Inc. | |||||||||||||||
| John C. Walters, Born February 1962 | Trustee | 2019 | Retired. Mr. Walters brings significant Board experience including active involvement with the board of a Fortune 500 company, and a proven record of leading large, complex financial organizations. He has a demonstrated record of success in distribution, manufacturing, investment brokerage, and investment management in both the retail and institutional investment businesses. He has substantial experience in the investment management business with a demonstrated ability to develop and drive strategy while managing operation, financial, and investment risk. | Guardian Variable Products Trust (16 series), Lead Independent Director; Amerilife Holdings LLC, Director; Stadion Money Management; Director; University of North Carolina (Chapel Hill), Member Board of Governors. | |||||||||||||||
26
USAA Mutual Funds Trust | Supplemental Information — continued July 31, 2020 | ||||||
(Unaudited)
Name and Date of Birth | Position Held with the Trust | Year Commenced Service | Principal Occupation During Past 5 Years | Other Directorships Held During Past 5 Years | |||||||||||||||
| Robert L. Mason, Ph.D., Born July 1946 | Trustee | 1997 | Adjunct Professor in the Department of Management Science and Statistics in the College of Business at the University of Texas at San Antonio (since 2001); Institute Analyst, Southwest Research Institute (March 2002-January 2016) | None | |||||||||||||||
| Dawn M. Hawley, Born February 1954 | Trustee | 2014 | Manager of Finance, Menil Foundation, Inc. (May 2007-June 2011), which is a private foundation that oversees the assemblage of sculptures, prints, drawings, photographs, and rare books. Director of Financial Planning and Analysis and Chief Financial Officer, AIM Management Group, Inc. (October 1987-January 2006) | None | |||||||||||||||
| Paul L. McNamara, Born July 1948 | Trustee | 2012 | Director, Cantor Opportunistic Alternatives Fund, LLC (March 2010-February 2014) , which is a closed-end fund of funds by Cantor Fitzgerald Investment Advisors, LLC | None | |||||||||||||||
27
USAA Mutual Funds Trust | Supplemental Information — continued July 31, 2020 | ||||||
(Unaudited)
Name and Date of Birth | Position Held with the Trust | Year Commenced Service | Principal Occupation During Past 5 Years | Other Directorships Held During Past 5 Years | |||||||||||||||
| Richard Y. Newton III, Born January 1956 | Trustee | 2017 | Director, Elta North America (01/18-present), which is a global leader in the design, manufacture, and support of innovative electronic systems in the ground, maritime, airborne, and security domains for the nation's warfighters, security personnel, and first responders; Managing Partner, Pioneer Partnership Development Group (December 2015-present)); Executive Director, The Union League Club of New York (June 2014-November 2015): Executive Vice President, Air Force Association (August 2012-May 2014); Lieutenant General, United States Air Force (January 2008-June 2012) | None | |||||||||||||||
| Barbara B. Ostdiek, Ph.D., Born March 1964 | Trustee | 2008 | Senior Associate Dean of Degree Programs at Jesse H. Jones Graduate School of Business at Rice University (since 2013); Associate Professor of Finance at Jessie H. Jones Graduate School of Business at Rice University (since 2001) | None | |||||||||||||||
| Michael F. Reimherr, Born August 1945 | Trustee | 2000 | President of Reimherr Business Consulting (May 1995-December 2017); St. Mary's University Investment Committee overseeing University Endowment (since 2014) | None | |||||||||||||||
28
USAA Mutual Funds Trust | Supplemental Information — continued July 31, 2020 | ||||||
(Unaudited)
Name and Date of Birth | Position Held with the Trust | Year Commenced Service | Principal Occupation During Past 5 Years | Other Directorships Held During Past 5 Years | |||||||||||||||
Interested Trustees. | |||||||||||||||||||
| David C. Brown, ** Born May 1972 | Trustee | 2019 | Chairman and Chief Executive Officer (since 2013), Co-Chief Executive Officer (2011-2013), Victory Capital Management Inc.; Chairman and Chief Executive Officer, Victory Capital Holdings, Inc. (since 2013). Mr. Brown brings to the Board extensive business, finance and leadership skills gained and developed through years of experience in the financial services industry, including his tenure overseeing the strategic direction as CEO of Victory Capital. These skills, combined with Mr. Brown's extensive knowledge of the financial services industry and demonstrated success in the development and distribution of investment strategies and products, enable him to provide valuable insights to the Board and strategic direction for the Funds | Trustee, Victory Portfolios (42 series), Victory Portfolios II (26 series), Victory Variable Insurance Funds (9 series) | |||||||||||||||
29
USAA Mutual Funds Trust | Supplemental Information — continued July 31, 2020 | ||||||
(Unaudited)
Name and Date of Birth | Position Held with the Trust | Year Commenced Service | Principal Occupation During Past 5 Years | Other Directorships Held During Past 5 Years | |||||||||||||||
| Daniel S. McNamara, ** Born June 1966 | Trustee and Chair of the Board of Trustees | 2012 | Trustee, President, and Vice Chairman of USAA ETF Trust (June 2017-June 2019); President of Financial Advice & Solutions Group (FASG), USAA (since 2013); Director, Investment Management Company (IMCO) (September 2009-April 2014); President, Asset Management Company (AMCO) (August, 2011-April 2013); Senior Vice President of USAA Financial Planning Services Insurance Agency, Inc. (FPS) (since 2011); Director of USAA IMCO (since 2009); Chairman of Board of IMCO (since 2013); Director of AMCO (August 2011-June 2019); President and Director of USAA Shareholder Account Services (SAS) (October 2009-June 2019); Director and Vice Chairman of FPS (since 2013); President and Director of USAA Investment Corporation (ICORP) (since 2010); Chairman of Board of ICORP (since 2013); Director of USAA Financial Advisors, Inc. (FAI) (since 2013); Chairman of Board of FAI (since 2015). Mr. McNamara brings to the Board extensive experience in the financial services industry, including experience as an officer of the Trust. | None | |||||||||||||||
** Mr. Dan McNamara, the Chairman of the Board, is deemed an "interested person" due to his previous position as Director of AMCO, the former investment adviser of the Funds. Mr. Brown is deemed an "interested person" due to his position as Chief Executive Officer of Victory Capital, investment adviser to the Funds.
The Statement of Additional Information includes additional information about the Trustees of the Trust and is available, without charge, on the SEC's website at www.sec.gov and/or by calling (800)-539-3863.
30
USAA Mutual Funds Trust | Supplemental Information — continued July 31, 2020 | ||||||
(Unaudited)
Officers:
The officers of the Trust, their ages, commencement of service and their principal occupations during the past five years, are detailed in the following table. Each officer serves until the earlier of his or her resignation, removal, retirement, death, or the election of a successor. The mailing address of each officer of the Trust is 15935 La Cantera Pkwy, Building Two, San Antonio, TX, 78256. The officers of the Trust receive no compensation directly from the Trust for performing the duties of their offices.
Name and Date of Birth | Position with the Trust | Year Commenced Service | Principal Occupation During Past 5 Years | ||||||||||||
Interested Officers. | |||||||||||||||
| Christopher K. Dyer, Born February 1962 | President | 2019 | Director of Fund Administration, Victory Capital (2004-present) | ||||||||||||
| Scott A Stahorsky, Born July 1969 | Vice President | 2019 | Manager, Fund Administration, Victory Capital (since 2015); Senior Analyst, Fund Administration, Victory Capital (prior to 2015) | ||||||||||||
| James K. De Vries, Born April 1969 | Treasurer, Principal Financial Officer | 2018 | Executive Director, Victory Capital Management Inc. (since 2019); Treasurer, USAA ETF Trust (September 2018-June 2019); Executive Director, Investment and Financial Administration, USAA (April 2012-June 2019); Assistant Treasurer, USAA ETF Trust (June 2017-September 2018); Assistant Treasurer, USAA Mutual Funds Trust (December 2013-February 2018) | ||||||||||||
| Allan Shaer, Born March 1965 | Assistant Treasurer | 2019 | Senior Vice President, Financial Administration, Citi Fund Services Ohio, Inc. (since 2016); Vice President, Mutual Fund Administration, JP Morgan Chase (2011-2016) | ||||||||||||
| Carol D. Trevino, Born October 1965 | Assistant Treasurer | 2018 | Director, Accounting and Finance, Victory Capital Management Inc. (since 2019); Accounting/Financial Director, USAA (December 2013-June 2019); Assistant Treasurer, USAA ETF Trust (September 2018-June 2019). | ||||||||||||
| Erin G. Wagner, Born February 1974 | Secretary | 2019 | Deputy General Counsel, the Adviser (since 2013) | ||||||||||||
| Charles Booth, Born April 1960 | Anti-Money Laundering Compliance Officer and Identity Theft Officer | 2019 | Director, Regulatory Administration and CCO Support Services, Citi Fund Services Ohio, Inc. (2007-present) | ||||||||||||
| Amy Campos, Born July 1976 | Chief Compliance Officer | 2019 | Chief Compliance Officer, USAA Mutual Funds Trust (since 2019); Executive Director, Deputy Chief Compliance Officer, USAA Mutual Funds Trust and USAA ETF Trust (July 2017-June 2019); Compliance Director, USAA Mutual Funds Trust (2014-July 2017) | ||||||||||||
31
USAA Mutual Funds Trust | Supplemental Information — continued July 31, 2020 | ||||||
(Unaudited)
Proxy Voting and Portfolio Holdings Information
Proxy Voting:
Information regarding the policies and procedures the Fund uses to determine how to vote proxies relating to portfolio securities is available without charge, upon request, by calling (800) 539-3863. The information is also included in the Fund's Statement of Additional Information, which is available on the SEC's website at www.sec.gov.
Information relating to how the Fund voted proxies relating to portfolio securities held during the most recent 12 months ended June 30 is available on the SEC's website at www.sec.gov.
Availability of Schedules of Portfolio Investments:
The Trust files a complete list of Schedules of Portfolio Investments with the SEC for the first and third quarter of each fiscal year on Form N-PORT.
Forms N-PORT are available on the SEC's website at www.sec.gov.
Expense Examples
As a shareholder of the Fund, you may incur two types of costs: (1) transaction costs, and (2) ongoing costs, including management fees and other Fund expenses. These examples are intended to help you understand your ongoing costs (in dollars) of investing in the Fund and to compare these costs with the ongoing costs of investing in other mutual funds.
These examples are based on an investment of $1,000 invested at the beginning of the period and held for the entire period from February 1, 2020 through July 31, 2020.
The Actual Expense figures in the table below provide information about actual account values and actual expenses. You may use the information below, together with the amount you invested, to estimate the expenses that you paid over the period. Simply divide your account value by $1,000 (for example, an $8,600 account value divided by $1,000 = 8.6), then multiply the result by the number in the table under the heading entitled "Actual Expenses Paid During Period" to estimate the expenses you paid on your account during this period.
The Hypothetical Expense figures in the table below provide information about hypothetical account values and hypothetical expenses based on the Fund's actual expense ratio and an assumed rate of return of 5% per year before expenses, which is not the Fund's actual return. The hypothetical account values and expenses may not be used to estimate the actual ending account balance or expenses you paid for the period. You may use this information to compare this 5% hypothetical example with the 5% hypothetical examples that appear in shareholder reports of other funds.
Please note the expenses shown in the table below are meant to highlight your ongoing costs only and do not reflect any transactional costs. If these transactional costs were included, your costs would have been higher.
| Beginning Account Value 2/1/20 | Actual Ending Account Value 7/31/20 | Hypothetical Ending Account Value 7/31/20 | Actual Expenses Paid During Period 2/1/20- 7/31/20* | Hypothetical Expenses Paid During Period 2/1/20- 7/31/20* | Annualized Expense Ratio During Period 2/1/20- 7/31/20 | ||||||||||||||||||
| $ | 1,000.00 | $ | 1,002.60 | $ | 1,022.23 | $ | 2.64 | $ | 2.66 | 0.53 | % | ||||||||||||
* Expenses are equal to the average account value multiplied by the Fund's annualized expense ratio multiplied by 182/366 (the number of days in the most recent fiscal half-year divided by the number of days in the fiscal year).
32
USAA Mutual Funds Trust | Supplemental Information — continued July 31, 2020 | ||||||
(Unaudited)
Additional Federal Income Tax Information
The following federal tax information related to the Fund's fiscal year ended July 31, 2020, is provided for information purposes only and should not be used for reporting to federal or state revenue agencies. Federal tax information for the calendar year will be reported to you on Form 1099-DIV in January 2021.
With respect to distributions paid, the Fund designates the following amounts (or, if subsequently determined to be different, the maximum amount allowable) for the fiscal year ended July 31, 2020 (amounts in thousands):
| Short-Term Capital Gains Distributions | |||||||
$ | 4 | ||||||
33
Privacy Policy
Protecting the Privacy of Information
The Trust respects your right to privacy. We also know that you expect us to conduct and process your business in an accurate and efficient manner. To do so, we must collect and maintain certain personal information about you. This is the information we collect from you on applications or other forms, and from the transactions you make with us or third parties. It may include your name, address, social security number, account transactions and balances, and information about investment goals and risk tolerance.
We do not disclose any information about you or about former customers to anyone except as permitted or required by law. Specifically, we may disclose the information we collect to companies that perform services on our behalf, such as the transfer agent that processes shareholder accounts and printers and mailers that assist us in the distribution of investor materials. We may also disclose this information to companies that perform marketing services on our behalf. This allows us to continue to offer you Victory investment products and services that meet your investing needs, and to effect transactions that you request or authorize. These companies will use this information only in connection with the services for which we hired them. They are not permitted to use or share this information for any other purpose.
To protect your personal information internally, we permit access only by authorized employees and maintain physical, electronic and procedural safeguards to guard your personal information.*
* You may have received communications regarding information about privacy policies from other financial institutions which gave you the opportunity to "opt-out" of certain information sharing with companies which are not affiliated with that financial institution. The Trust does not share information with other companies for purposes of marketing solicitations for products other than the Trust. Therefore, the Trust does not provide opt-out options to their shareholders.
P.O. Box 182593
Columbus, Ohio 43218-2593

Visit our website at: | Call | ||||||
vcm.com | (800 | ) 235-8396 | |||||
23427-0920

JULY 31, 2020
Annual Report
USAA Science & Technology Fund
Beginning January 1, 2021, as permitted by regulations adopted by the Securities and Exchange Commission, paper copies of the Fund's shareholder reports like this one will no longer be sent by mail, unless you specifically request paper copies of the reports from the Fund or from your financial intermediary, such as a broker-dealer or bank. Instead, the reports will be made available on VictoryFunds.com, and you will be notified by mail each time a report is posted and provided with a website link to access the report. If you already elected to receive shareholder reports electronically, you will not be affected by this change and you need not take any action.
You may elect to receive shareholder reports and other communications from the Fund or your financial intermediary electronically by notifying your financial intermediary directly, or if you are a direct investor, by calling (800) 235-8396 or logging on to usaa.com. Effective on or about November 6, 2020, a shareholder who has an account directly with the Fund will need to submit their request via email to TA.Processing@FISGlobal.com.
You may elect to receive all future reports in paper free of charge. You can inform the Fund or your financial intermediary that you wish to continue receiving paper copies of your shareholder reports by notifying your financial intermediary directly, or if you are a direct investor, by calling (800) 235-8396 or logging on to usaa.com. Effective on or about November 6, 2020, a shareholder who has an account directly with the Fund will need to submit their request via email to TA.Processing@FISGlobal.com. Your election to receive reports in paper will apply to all funds held with the USAA Mutual Funds or your financial intermediary.
Victory Capital means Victory Capital Management Inc., the investment adviser of the USAA Mutual Funds. USAA Mutual Funds are distributed by Victory Capital Services, Inc., member FINRA, an affiliate of Victory Capital. Victory Capital and its affiliates are not affiliated with United Services Automobile Association or its affiliates. USAA and the USAA logo are registered trademarks and the USAA Mutual Funds and USAA Investments logos are trademarks of United Services Automobile Association and are being used by Victory Capital and its affiliates under license.
USAA Mutual Funds Trust
TABLE OF CONTENTS
Shareholder Letter (Unaudited) | 2 | ||||||
Managers' Commentary (Unaudited) | 3 | ||||||
Investment Overview (Unaudited) | 5 | ||||||
| Investment Objective & Portfolio Holdings (Unaudited) | 6 | ||||||
Financial Statements | |||||||
Schedule of Portfolio Investments | 7 | ||||||
Statement of Assets and Liabilities | 14 | ||||||
Statement of Operations | 15 | ||||||
Statements of Changes in Net Assets | 16 | ||||||
Financial Highlights | 18 | ||||||
Notes to Financial Statements | 20 | ||||||
| Report of Independent Registered Public Accounting Firm | 30 | ||||||
Supplemental Information | 31 | ||||||
Trustees' and Officers' Information | 31 | ||||||
Proxy Voting and Portfolio Holdings Information | 37 | ||||||
Expense Examples | 37 | ||||||
Additional Federal Income Tax Information | 38 | ||||||
Liquidity Risk Management Program | 39 | ||||||
Privacy Policy (inside back cover) | |||||||
This report is for the information of the shareholders and others who have received a copy of the currently effective prospectus of the Fund, managed by Victory Capital Management Inc. It may be used as sales literature only when preceded or accompanied by a current prospectus, which provides further details about the Fund.
IRA DISTRIBUTION WITHHOLDING DISCLOSURE
We generally must withhold federal income tax at a rate of 10% of the taxable portion of your distribution and, if you live in a state that requires state income tax withholding, at your state's tax rate. However, you may elect not to have withholding apply or to have income tax withheld at a higher rate. Any withholding election that you make will apply to any subsequent distribution unless and until you change or revoke the election. If you wish to make a withholding election, or change or revoke a prior withholding election, call (800) 235-8396.
If you do not have a withholding election in place by the date of a distribution, federal income tax will be withheld from the taxable portion of your distribution at a rate of 10%. If you must pay estimated taxes, you may be subject to estimated tax penalties if your estimated tax payments are not sufficient and sufficient tax is not withheld from your distribution.
For more specific information, please consult your tax adviser.
1
(Unaudited)
Dear Shareholder,
The previous decade ended with the longest-ever bull market in U.S. equities still intact, even as investors wrestled with issues like softening global economic data, Brexit, and U.S.-China trade relations. In retrospect, those worries seem pedestrian given what we would experience.
A new and unexpected threat—a global pandemic, the novel coronavirus ("COVID-19")—first emerged in Asia and then began spreading globally and throughout the United States during the first quarter of 2020. This unprecedented and unanticipated event not only rendered all existing economic forecasts moot, but it also roiled stock and bond markets everywhere. It also brought the economy to a near halt. The historic bull market in stocks ended virtually overnight.
After an initial severe sell-off in March, equity markets recovered sharply. As our annual reporting period drew to a close on July 31, 2020, many of the broad market indexes had recovered and volatility had returned to more palatable levels. In fact, despite all the chaos, the S&P 500® Index, one of the most popular measures of large U.S. stocks, finished the fiscal year (July 31, 2020) at approximately 3,271, which was up 8.9% from one year ago. Quite the impressive reversal.
The market turmoil of early 2020 was not limited to equities. Fixed income volatility spiked when liquidity evaporated in late March as investors struggled to understand the ramifications of sheltering in place. Fortunately, the U.S. Federal Reserve (the "Fed") (as well as other global central banks) leapt into action—cutting interest rates, (re)starting quantitative easing and, in the case of the Fed, launching an array of programs to stabilize markets.
The new lending facilities and programs had their intended effect of improving fixed income liquidity and trading. Credit spreads across corporate, high yield, structured, and municipal markets were coaxed down from their highs. In addition, Congress came through with substantial fiscal stimulus that also was applauded by investors and markets. Although fixed income markets regained their footing, the yield on 10-Year Treasurys, a benchmark for low-risk investments, declined steadily during our fiscal year—from 2.02% at the beginning of our reporting period to approximately 0.55% as of July 31, 2020. This suggests that investors remain a little wary.
While the past year has been unprecedented for all of us, both personally and professionally, our portfolio managers continue to analyze the financial markets, economic conditions, and the trajectory of the pandemic, which will likely be a guiding factor on Fed policy and the markets.
No matter what happens in the near term, we believe that the massive monetary and fiscal policies introduced earlier this year will have longer-term ramifications. Despite this uncertainty, it's important to remain focused on your long-term investment goals and avoid making emotional decisions. If you invest with us directly, our Member Service Representatives are available to help. Call us at (800) 235-8396.
Sincerely,

Christopher K. Dyer, CFA
President,
USAA Mutual Funds
2
USAA Mutual Funds Trust
USAA Science & Technology Fund
Managers' Commentary
(Unaudited)
Victory Solutions
Mannik S. Dhillon, CFA, CAIA Wasif A. Latif
RS Investments Growth, A Victory Capital Investment Franchise
Stephen J. Bishop Christopher Clark, CFA
Paul Leung, CFA
Wellington Management Company LLP
Robert L. Deresiewicz John F. Averill, CFA
Ann C. Gallo Eunhak Bae
Brian Barbetta Jeffrey S. Wantman
• What were the market conditions over the reporting period?
The U.S. stock market generated solid gains for the reporting period overall. Growth stocks significantly outperformed value stocks, while large-cap stocks outpaced small-cap stocks.
Global financial market performance varied widely over the period driven by optimism of continued economic recovery followed by the novel coronavirus ("COVID-19") shock and uncertainty related to the duration and economic impact of the COVID-19 pandemic. These fears generally led to a "risk-off" environment as investors flocked to safe haven assets such as U.S. Treasurys and gold. Global equities turned mostly lower with the exception of a small breadth of mega-cap securities well positioned for an extended economic slowdown and the new stay-at-home paradigm. The final month and a half of the reporting period saw a rebound in risky assets as economies began a phased reopening. The U.S. large growth space led by information technology and communication services continued to outperform in the face of the economic threat as they were perceived as "stay-at-home stocks" that would further benefit from economic activity from homes.
Within the United States, the S&P 500® Index dropped nearly 34% at the end of the reporting period from its 2020 high, before beginning to recoup losses with the support of comprehensive monetary and fiscal stimulus, along with optimism that a COVID-19 treatment will eventually emerge. Over the reporting period, the S&P 500 Index retuned 11.96%, with large-cap growth stocks leading the way, up to a return of 29.84% as represented by the Russell 1000 Growth Index. Value stocks and small-cap stocks significantly underperformed growth stocks over the period. U.S. large-cap value stocks were down to a return of -6.01% over the reporting period as gauged by the Russell 1000 Value Index, while U.S. small-caps stocks, returned -4.59% as represented by the Russell 2000 Index.
Developed-market international and emerging market equities followed a path similar to U.S. equities. Markets led investors on a rollercoaster ride that saw both the MSCI
3
USAA Mutual Funds Trust
USAA Science & Technology Fund (continued)
Managers' Commentary (continued)
EAFE Index and MSCI Emerging Markets Index drop approximately 34% from their highs in the year.
The market drawdown hit bottom on March 23rd and then started a steady ascent, erasing most of the year's losses as European Central Bank quantitative easing and talks of a 750-billion euros fiscal stimulus helped bolster momentum in the market's recovery. Over the reporting period, developed international equities, represented by the MSCI EAFE Index, were down to a return of -1.67%, while the MSCI Emerging Markets Index returned 6.55%.
• How did the USAA Science & Technology Fund (the "Fund") perform during the reporting period?
The Fund has two share classes: Fund Shares and Class A shares (redesignated from Adviser Shares). For the reporting period ended July 31, 2020, the Fund Shares and Class A shares had total returns of 30.85% and 30.47%, respectively. This compares to returns of 11.96% for the S&P 500® Index (the "Index"), 34.60% for the S&P North American Technology Index, 18.52% for the S&P Composite 1500 Health Care Index, and 28.33% for the Lipper Science & Technology Funds Index.
Victory Capital Management Inc. is the Fund's investment adviser and employs dedicated resources to support the research, selection, and monitoring of the Fund's subadviser. Wellington Management Company LLP ("Wellington Management") is the subadviser to the Fund. The subadviser provides day-to-day discretionary management for the Fund's assets.
• What strategies did you employ during the reporting period?
The Fund had very strong positive returns for the reporting period ended July 31, 2020. Overall, stock selection in information technology had by far the largest positive effect on relative performance, while stock selection within health care detracted from Fund performance. Allocation across industries within information technology and healthcare detracted from relative performance.
Thank you for allowing us to assist you with your investment needs.
4
USAA Mutual Funds Trust
USAA Science & Technology Fund
Investment Overview
(Unaudited)
Average Annual Total Return
Year Ended July 31, 2020
Fund Shares | Class A Shares | ||||||||||||||||||||||||||||||
INCEPTION DATE | 8/1/97 | 8/2/10 | |||||||||||||||||||||||||||||
Net Asset Value | Net Asset Value | Maxiumum Offering Price | S&P 500® Index1 | S&P North American Technology Index2 | S&P Composite 1500 Health Care Index3 | Lipper Science & Technology Funds Index4 | |||||||||||||||||||||||||
One Year | 30.85 | % | 30.47 | % | 22.96 | % | 11.96 | % | 34.60 | % | 18.52 | % | 28.33 | % | |||||||||||||||||
Five Year | 17.53 | % | 17.22 | % | 15.84 | % | 11.47 | % | 23.91 | % | 8.98 | % | 19.24 | % | |||||||||||||||||
Ten Year | 19.45 | % | N/A | N/A | 13.82 | % | 20.46 | % | 16.47 | % | 17.56 | % | |||||||||||||||||||
Since Inception | N/A | 18.95 | % | 18.25 | % | N/A | N/A | N/A | N/A | ||||||||||||||||||||||
Past performance is not indicative of future results. The performance data quoted represents past performance and current returns may be lower or higher. The investment return and principal value will fluctuate so that an investor's shares, when redeemed, may be worth more or less than the original cost. To obtain performance information current to the most recent month's end, please visit www.vcm.com.
Total return measures the price change in a share assuming the reinvestment of all net investment income and realized capital gain distributions, if any. The total returns quoted do not reflect adjustments made to the enclosed financial statements in accordance with U.S. generally accepted accounting principles or the deduction of taxes that a shareholder would pay on net investment income and realized capital gain distributions, including reinvested distributions, or redemptions of shares. The total return figures set forth above include all waivers of fees for various periods since inception. Without such fee waivers, the total returns would have been lower.
USAA Science & Technology Fund — Growth of $10,000

1The unmanaged, broad-based composite S&P 500® Index represents the weighted average performance of a group of 500 widely held, publicly traded stocks.
2The unmanaged S&P North American Technology Index provides investors with a benchmark that represents U.S. securities classified under the Global Industry Classification System (GICS®) technology sector and internet retail sub-industry.
3The unmanaged S&P Composite 1500 Health Care Index comprises U.S. traded stocks that are members of either the S&P Total Market Index (TMI) or the S&P/TSX Composite Index, and are classified within the health care sector of the GICS®.
4The unmanaged Lipper Science & Technology Funds Index tracks the total return performance of funds within the Lipper Science & Technology Funds category.
The graph reflects investment of growth of a hypothetical $10,000 investment in the Fund. Past performance is no guarantee of future results.
The graph and table do not reflect the deduction of taxes that a shareholder would pay on Fund distributions or the redemption of Fund shares.
5
| USAA Mutual Funds Trust USAA Science & Technology Fund | July 31, 2020 | ||||||
(Unaudited)
Investment Objective & Portfolio Holdings:
The USAA Science & Technology Fund seeks long-term capital appreciation.
Sector Allocation*:
July 31, 2020
(% of Net Assets)
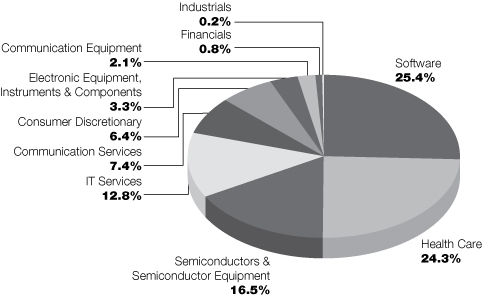
* Does not include futures, money market instruments, and short-term investments purchased with cash collateral from securities loaned.
Percentages are of the net assets of the Fund and may not equal 100%.
6
| USAA Mutual Funds Trust USAA Science & Technology Fund | Schedule of Portfolio Investments July 31, 2020 | ||||||
(Amounts in Thousands, Except for Shares)
Security Description | Shares | Value | |||||||||
Common Stocks (99.2%) | |||||||||||
Communication Services (7.4%): | |||||||||||
Alphabet, Inc. Class A (a) | 12,553 | $ | 18,678 | ||||||||
Boingo Wireless, Inc. (a) | 1,075,101 | 15,535 | |||||||||
Facebook, Inc. Class A (a) | 157,896 | 40,054 | |||||||||
Match Group, Inc. (a) | 183,405 | 18,835 | |||||||||
Nexon Co. Ltd. | 128,400 | 3,299 | |||||||||
Snap, Inc. Class A (a) | 403,303 | 9,042 | |||||||||
Take-Two Interactive Software, Inc. (a) | 82,534 | 13,537 | |||||||||
Tencent Holdings Ltd. | 59,860 | 4,106 | |||||||||
Tencent Music Entertainment Group, ADR (a) | 133,630 | 2,157 | |||||||||
ZoomInfo Technologies, Inc. Class A (a) | 3,620 | 148 | |||||||||
125,391 | |||||||||||
Communications Equipment (2.1%): | |||||||||||
Lumentum Holdings, Inc. (a) | 253,860 | 23,565 | |||||||||
Viavi Solutions, Inc. (a) | 826,221 | 11,427 | |||||||||
34,992 | |||||||||||
Consumer Discretionary (6.4%): | |||||||||||
Alibaba Group Holding Ltd. (a) | 171,208 | 5,372 | |||||||||
Amazon.com, Inc. (a) | 22,471 | 71,114 | |||||||||
Arco Platform Ltd. Class A (a) | 206,677 | 9,001 | |||||||||
Booking Holdings, Inc. (a) | 7,697 | 12,793 | |||||||||
Etsy, Inc. (a) | 29,877 | 3,537 | |||||||||
Trainline PLC (a) (b) | 394,862 | 2,123 | |||||||||
103,940 | |||||||||||
Electronic Equipment, Instruments & Components (3.3%): | |||||||||||
Airgain, Inc. (a) | 23,485 | 301 | |||||||||
Corning, Inc. | 159,442 | 4,943 | |||||||||
Dolby Laboratories, Inc. Class A | 125,753 | 8,752 | |||||||||
Fabrinet (a) | 219,861 | 15,969 | |||||||||
Flex Ltd. (a) | 443,130 | 5,092 | |||||||||
Hon Hai Precision Industry Co. Ltd. | 632,000 | 1,689 | |||||||||
Keysight Technologies, Inc. (a) | 93,064 | 9,296 | |||||||||
Rogers Corp. (a) | 70,257 | 8,374 | |||||||||
54,416 | |||||||||||
Financials (0.8%): | |||||||||||
LendingTree, Inc. (a) (c) | 25,238 | 8,740 | |||||||||
Panacea Acquisition Corp. (a) | 518,825 | 5,603 | |||||||||
14,343 | |||||||||||
Health Care (24.3%): | |||||||||||
10X Genomics, Inc. Class A (a) | 85,329 | 8,394 | |||||||||
89bio, Inc. (a) | 3,866 | 117 | |||||||||
Abbott Laboratories | 12,128 | 1,221 | |||||||||
Acadia Healthcare Co., Inc. (a) | 7,827 | 233 | |||||||||
Accolade, Inc. (a) (c) | 400 | 13 | |||||||||
See notes to financial statements.
7
| USAA Mutual Funds Trust USAA Science & Technology Fund | Schedule of Portfolio Investments — continued July 31, 2020 | ||||||
(Amounts in Thousands, Except for Shares)
Security Description | Shares | Value | |||||||||
Adaptimmune Therapeutics PLC, ADR (a) | 492,007 | $ | 4,600 | ||||||||
Adaptive Biotechnologies Corp. (a) | 65,212 | 2,434 | |||||||||
Adverum Biotechnologies, Inc. (a) | 228,519 | 3,832 | |||||||||
Aimmune Therapeutics, Inc. (a) (c) | 302,467 | 3,995 | |||||||||
Akero Therapeutics, Inc. (a) | 2,500 | 88 | |||||||||
Akouos, Inc. (a) | 121,982 | 2,385 | |||||||||
Albireo Pharma, Inc. (a) | 82,225 | 2,324 | |||||||||
Alkermes PLC (a) | 18,204 | 328 | |||||||||
Allogene Therapeutics, Inc. (a) (c) | 119,557 | 4,384 | |||||||||
Alnylam Pharmaceuticals, Inc. (a) | 2,776 | 405 | |||||||||
ALX Oncology Holdings, Inc. (a) | 700 | 23 | |||||||||
Amedisys, Inc. (a) | 1,022 | 239 | |||||||||
Amicus Therapeutics, Inc. (a) | 231,472 | 3,345 | |||||||||
Amneal Pharmaceuticals, Inc. (a) | 12,583 | 54 | |||||||||
Apellis Pharmaceuticals, Inc. (a) | 257,691 | 6,672 | |||||||||
Arcus Biosciences, Inc. (a) | 171,235 | 3,370 | |||||||||
Arena Pharmaceuticals, Inc. (a) | 64,526 | 3,961 | |||||||||
Argenx SE, ADR (a) | 525 | 121 | |||||||||
Ascendis Pharma A/S, ADR (a) | 46,224 | 6,362 | |||||||||
Assembly Biosciences, Inc. (a) | 282,321 | 6,268 | |||||||||
AstraZeneca PLC, ADR | 19,810 | 1,105 | |||||||||
Atreca, Inc. Class A (a) | 314,372 | 4,071 | |||||||||
Autolus Therapeutics PLC, ADR (a) | 203,751 | 2,690 | |||||||||
Avidity Biosciences, Inc. (a) | 164,922 | 4,650 | |||||||||
Avrobio, Inc. (a) | 227,610 | 3,858 | |||||||||
Baxter International, Inc. | 7,858 | 679 | |||||||||
Beam Therapeutics, Inc. (a) (c) | 126,392 | 2,444 | |||||||||
Becton, Dickinson & Co. | 1,218 | 343 | |||||||||
BeiGene Ltd., ADR (a) (c) | 21,630 | 4,521 | |||||||||
Berkeley Lights, Inc. (a) | 67,267 | 4,034 | |||||||||
Bicycle Therapeutics PLC, ADR (a) | 280,815 | 4,437 | |||||||||
Biohaven Pharmaceutical Holding Co. Ltd. (a) | 3,541 | 227 | |||||||||
BioLife Solutions, Inc. (a) | 208,495 | 4,030 | |||||||||
Bio-Techne Corp. | 852 | 234 | |||||||||
Bioxcel Therapeutics, Inc. (a) | 89,490 | 4,059 | |||||||||
Black Diamond Therapeutics, Inc. (a) | 1,117 | 31 | |||||||||
bluebird bio, Inc. (a) | 266,915 | 16,201 | |||||||||
Blueprint Medicines Corp. (a) (c) | 88,950 | 6,509 | |||||||||
Boston Scientific Corp. (a) | 26,434 | 1,020 | |||||||||
Bristol-Myers Squibb Co. | 23,805 | 1,396 | |||||||||
Celyad SA, ADR (a) (c) | 190,193 | 1,794 | |||||||||
Centene Corp. (a) | 6,305 | 411 | |||||||||
Centogene NV (a) | 271,884 | 3,453 | |||||||||
Chugai Pharmaceutical Co. Ltd. | 4,290 | 194 | |||||||||
Coherus Biosciences, Inc. (a) (c) | 6,669 | 117 | |||||||||
Constellation Pharmaceuticals, Inc. (a) | 97,140 | 2,612 | |||||||||
ConvaTec Group PLC (b) | 78,416 | 208 | |||||||||
Crinetics Pharmaceuticals, Inc. (a) | 119,932 | 1,665 | |||||||||
CryoPort, Inc. (a) (c) | 363,936 | 12,061 | |||||||||
Cytokinetics, Inc. (a) (c) | 5,734 | 124 | |||||||||
See notes to financial statements.
8
| USAA Mutual Funds Trust USAA Science & Technology Fund | Schedule of Portfolio Investments — continued July 31, 2020 | ||||||
(Amounts in Thousands, Except for Shares)
Security Description | Shares | Value | |||||||||
CytomX Therapeutics, Inc. (a) | 459,836 | $ | 3,223 | ||||||||
Daiichi Sankyo Co. Ltd. | 4,750 | 420 | |||||||||
Danaher Corp. | 6,594 | 1,344 | |||||||||
Dermtech, Inc. (a) | 120,260 | 1,274 | |||||||||
Dermtech, Inc. PIPE (a) | 464,762 | 4,922 | |||||||||
Editas Medicine, Inc. (a) (c) | 94,637 | 2,779 | |||||||||
Edwards Lifesciences Corp. (a) | 12,771 | 1,001 | |||||||||
Eidos Therapeutics, Inc. (a) (c) | 93,647 | 3,755 | |||||||||
Eisai Co. Ltd. | 5,515 | 445 | |||||||||
Elanco Animal Health, Inc. (a) | 6,955 | 164 | |||||||||
Eli Lilly & Co. | 9,336 | 1,403 | |||||||||
Encompass Health Corp. | 4,632 | 315 | |||||||||
Epizyme, Inc. (a) | 399,083 | 5,523 | |||||||||
Equillium, Inc. (a) | 412,996 | 3,985 | |||||||||
Exact Sciences Corp. (a) | 72,276 | 6,848 | |||||||||
Exagen, Inc. (a) | 264,134 | 3,288 | |||||||||
Fate Therapeutics, Inc. (a) | 509,579 | 15,935 | |||||||||
Forma Therapeutics Holdings, Inc. (a) (c) | 1,500 | 52 | |||||||||
Fresenius SE & Co. KGaA (a) | 3,924 | 196 | |||||||||
Fusion Pharmaceuticals, Inc. (a) (c) | 169,297 | 2,330 | |||||||||
G1 Therapeutics, Inc. (a) | 8,911 | 131 | |||||||||
Galapagos NV (a) | 910 | 169 | |||||||||
Generation Bio Co. (a) | 155,200 | 3,048 | |||||||||
Genmab A/S (a) | 524 | 180 | |||||||||
Genus PLC | 3,959 | 177 | |||||||||
Global Blood Therapeutics, Inc. (a) | 5,233 | 353 | |||||||||
GlycoMimetics, Inc. (a) | 10,451 | 41 | |||||||||
Gossamer Bio, Inc. (a) | 275,209 | 3,280 | |||||||||
Gritstone Oncology, Inc. (a) (c) | 78,368 | 251 | |||||||||
GW Pharmaceuticals PLC, ADR (a) (c) | 56,598 | 7,223 | |||||||||
HCA Healthcare, Inc. | 4,855 | 615 | |||||||||
Hikma Pharmaceuticals PLC | 1,311 | 37 | |||||||||
Hill-Rom Holdings, Inc. | 1,494 | 145 | |||||||||
HMS Holdings Corp. (a) | 8,275 | 269 | |||||||||
Hologic, Inc. (a) | 6,016 | 420 | |||||||||
Homology Medicines, Inc. (a) | 184,697 | 2,429 | |||||||||
Humana, Inc. | 1,602 | 629 | |||||||||
Hutchison China Meditech Ltd., ADR (a) | 2,598 | 70 | |||||||||
iCAD, Inc. (a) (c) | 59,086 | 545 | |||||||||
ICON PLC (a) | 2,041 | 378 | |||||||||
Illumina, Inc. (a) | 24,424 | 9,334 | |||||||||
ImmunoGen, Inc. (a) | 25,083 | 103 | |||||||||
Immunomedics, Inc. (a) | 126,522 | 5,343 | |||||||||
Integer Holdings Corp. (a) | 1,041 | 68 | |||||||||
Intuitive Surgical, Inc. (a) | 960 | 658 | |||||||||
Invitae Corp. (a) (c) | 194,938 | 5,692 | |||||||||
Iovance Biotherapeutics, Inc. (a) | 208,827 | 6,071 | |||||||||
Ironwood Pharmaceuticals, Inc. (a) | 22,704 | 208 | |||||||||
KalVista Pharmaceuticals, Inc. (a) | 103,665 | 1,019 | |||||||||
Kangji Medical Holdings Ltd. (a) | 2,600 | 10 | |||||||||
See notes to financial statements.
9
| USAA Mutual Funds Trust USAA Science & Technology Fund | Schedule of Portfolio Investments — continued July 31, 2020 | ||||||
(Amounts in Thousands, Except for Shares)
Security Description | Shares | Value | |||||||||
Kezar Life Sciences, Inc. (a) | 1,101,187 | $ | 4,812 | ||||||||
Kodiak Sciences, Inc. (a) (c) | 2,567 | 119 | |||||||||
Krystal Biotech, Inc. (a) | 42,357 | 1,749 | |||||||||
Kura Oncology, Inc. (a) | 356,319 | 5,858 | |||||||||
Laboratorios Farmaceuticos Rovi SA (a) | 3,163 | 109 | |||||||||
Legend Biotech Corp., ADR (a) | 849 | 30 | |||||||||
LHC Group, Inc. (a) | 1,228 | 240 | |||||||||
Lyra Therapeutics, Inc. (a) | 98,217 | 1,316 | |||||||||
MacroGenics, Inc. (a) (c) | 170,541 | 4,332 | |||||||||
Madrigal Pharmaceuticals, Inc. (a) | 2,233 | 229 | |||||||||
Marinus Pharmaceuticals, Inc. (a) | 857,428 | 1,440 | |||||||||
Masimo Corp. (a) | 505 | 111 | |||||||||
Matinas BioPharma Holdings, Inc. (a) (c) | 2,267,383 | 1,773 | |||||||||
Mirati Therapeutics, Inc. (a) (c) | 47,978 | 5,820 | |||||||||
Molina Healthcare, Inc. (a) | 1,093 | 202 | |||||||||
Momenta Pharmaceuticals, Inc. (a) | 14,561 | 429 | |||||||||
Mylan NV (a) | 15,031 | 242 | |||||||||
MyoKardia, Inc. (a) | 46,680 | 4,209 | |||||||||
Myovant Sciences Ltd. (a) | 223,759 | 3,401 | |||||||||
NanoString Technologies, Inc. (a) | 5,339 | 193 | |||||||||
NeoGenomics, Inc. (a) | 207,933 | 7,949 | |||||||||
Neurocrine Biosciences, Inc. (a) | 20,139 | 2,424 | |||||||||
Notre Dame Intermedica Participacoes SA | 13,300 | 170 | |||||||||
Novartis AG Registered Shares | 2,453 | 202 | |||||||||
Nurix Therapeutics, Inc. (a) (d) | 13,119 | 254 | |||||||||
NuVasive, Inc. (a) (c) | 3,288 | 188 | |||||||||
Odonate Therapeutics, Inc. (a) | 6,842 | 249 | |||||||||
Omnicell, Inc. (a) | 4,580 | 322 | |||||||||
Ono Pharmaceutical Co. Ltd. | 7,530 | 212 | |||||||||
ORIC Pharmaceuticals, Inc. (a) | 126,635 | 2,542 | |||||||||
Oyster Point Pharma, Inc. (a) | 4,763 | 107 | |||||||||
Pandion Therapeutics, Inc. (a) (c) | 243,340 | 4,142 | |||||||||
Passage Bio, Inc. (a) (c) | 71,686 | 1,121 | |||||||||
Pfizer, Inc. | 62,305 | 2,397 | |||||||||
PhaseBio Pharmaceuticals, Inc. (a) (c) | 11,759 | 47 | |||||||||
PPD, Inc. (a) | 14,200 | 417 | |||||||||
PRA Health Sciences, Inc. (a) | 3,453 | 368 | |||||||||
Precision BioSciences, Inc. (a) (c) | 185,850 | 1,182 | |||||||||
Provention Bio, Inc. (a) (c) | 234,220 | 2,434 | |||||||||
Quotient Ltd. (a) (c) | 400,710 | 3,142 | |||||||||
R1 RCM, Inc. (a) | 10,731 | 147 | |||||||||
Radius Health, Inc. (a) | 3,571 | 45 | |||||||||
RAPT Therapeutics, Inc. (a) (c) | 70,061 | 1,513 | |||||||||
Regeneron Pharmaceuticals, Inc. (a) | 427 | 270 | |||||||||
Relay Therapeutics, Inc. (a) | 700 | 25 | |||||||||
Repligen Corp. (a) | 1,056 | 159 | |||||||||
Replimune Group, Inc. (a) | 297,476 | 5,941 | |||||||||
Revance Therapeutics, Inc. (a) | 7,108 | 167 | |||||||||
REVOLUTION Medicines, Inc. (a) | 32,068 | 773 | |||||||||
Rigel Pharmaceuticals, Inc. (a) | 33,825 | 78 | |||||||||
See notes to financial statements.
10
| USAA Mutual Funds Trust USAA Science & Technology Fund | Schedule of Portfolio Investments — continued July 31, 2020 | ||||||
(Amounts in Thousands, Except for Shares)
Security Description | Shares | Value | |||||||||
Royalty Pharma PLC Class A (a) | 3,529 | $ | 152 | ||||||||
Sage Therapeutics, Inc. (a) | 68,165 | 3,106 | |||||||||
Satsuma Pharmaceuticals, Inc. (a) | 3,180 | 75 | |||||||||
Scholar Rock Holding Corp. (a) (c) | 168,112 | 1,898 | |||||||||
Seattle Genetics, Inc. (a) | 3,193 | 531 | |||||||||
Shockwave Medical, Inc. (a) | 3,860 | 190 | |||||||||
Smith & Nephew PLC | 22,295 | 440 | |||||||||
SpringWorks Therapeutics, Inc. (a) | 85,124 | 3,629 | |||||||||
Stoke Therapeutics, Inc. (a) (c) | 103,329 | 2,603 | |||||||||
Surface Oncology, Inc. (a) | 1,057,296 | 5,509 | |||||||||
Sutro Biopharma, Inc. (a) | 213,334 | 1,658 | |||||||||
Syndax Pharmaceuticals, Inc. (a) | 14,947 | 211 | |||||||||
Takeda Pharmaceutical Co. Ltd. | 2,365 | 86 | |||||||||
TCR2 Therapeutics, Inc. (a) | 174,200 | 2,918 | |||||||||
Tecan Group AG | 655 | 275 | |||||||||
Teladoc Health, Inc. (a) | 455 | 108 | |||||||||
Teleflex, Inc. | 1,659 | 619 | |||||||||
Therapeutics Acquisition Corp. Class A (a) | 2,000 | 28 | |||||||||
Theravance BioPharma, Inc. (a) | 4,761 | 92 | |||||||||
Thermo Fisher Scientific, Inc. | 3,895 | 1,612 | |||||||||
Tricida, Inc. (a) | 6,523 | 87 | |||||||||
Turning Point Therapeutics, Inc. (a) | 58,452 | 3,462 | |||||||||
Twist Bioscience Corp. (a) | 186,945 | 10,476 | |||||||||
UCB SA | 3,052 | 392 | |||||||||
UnitedHealth Group, Inc. | 9,824 | 2,975 | |||||||||
UroGen Pharma Ltd. (a) (c) | 5,879 | 130 | |||||||||
Veeva Systems, Inc. Class A (a) | 60,006 | 15,876 | |||||||||
Vertex Pharmaceuticals, Inc. (a) | 1,745 | 475 | |||||||||
Wave Life Sciences Ltd. (a) | 5,415 | 48 | |||||||||
Wuxi Apptec Co. Ltd. (b) (c) | 16,264 | 245 | |||||||||
Wuxi Biologics Cayman, Inc. (a) (b) | 7,500 | 155 | |||||||||
Zai Lab Ltd., ADR (a) | 5,364 | 408 | |||||||||
Zealand Pharma A/S, ADR (a) (c) | 1,617 | 52 | |||||||||
Zymeworks, Inc. (a) | 144,468 | 4,410 | |||||||||
402,976 | |||||||||||
Industrials (0.2%): | |||||||||||
Equifax, Inc. | 9,271 | 1,507 | |||||||||
Uber Technologies, Inc. (a) | 53,345 | 1,614 | |||||||||
3,121 | |||||||||||
IT Services (12.8%): | |||||||||||
FleetCor Technologies, Inc. (a) | 31,210 | 8,070 | |||||||||
Genpact Ltd. | 179,639 | 7,153 | |||||||||
Global Payments, Inc. | 177,797 | 31,651 | |||||||||
GoDaddy, Inc. Class A (a) | 179,100 | 12,587 | |||||||||
PayPal Holdings, Inc. (a) | 82,633 | 16,202 | |||||||||
Square, Inc. Class A (a) | 27,304 | 3,545 | |||||||||
Twilio, Inc. Class A (a) | 164,094 | 45,524 | |||||||||
Visa, Inc. Class A | 212,063 | 40,377 | |||||||||
See notes to financial statements.
11
| USAA Mutual Funds Trust USAA Science & Technology Fund | Schedule of Portfolio Investments — continued July 31, 2020 | ||||||
(Amounts in Thousands, Except for Shares)
Security Description | Shares | Value | |||||||||
WEX, Inc. (a) | 35,482 | $ | 5,619 | ||||||||
Wix.com Ltd. (a) | 143,262 | 41,615 | |||||||||
212,343 | |||||||||||
Semiconductors & Semiconductor Equipment (16.5%): | |||||||||||
Advanced Micro Devices, Inc. (a) | 250,279 | 19,379 | |||||||||
ASM Pacific Technology Ltd. | 157,800 | 1,782 | |||||||||
BE Semiconductor Industries NV | 86,363 | 3,861 | |||||||||
Cohu, Inc. | 871,044 | 16,402 | |||||||||
FormFactor, Inc. (a) | 125,375 | 3,616 | |||||||||
Globalwafers Co. Ltd. | 203,000 | 2,907 | |||||||||
KLA Corp. | 59,811 | 11,952 | |||||||||
Koh Young Technology, Inc. | 31,080 | 2,566 | |||||||||
Lam Research Corp. | 70,594 | 26,625 | |||||||||
Lattice Semiconductor Corp. (a) | 943,472 | 29,332 | |||||||||
MACOM Technology Solutions Holdings, Inc. (a) | 820,694 | 34,682 | |||||||||
Marvell Technology Group Ltd. | 836,298 | 30,500 | |||||||||
Micron Technology, Inc. (a) | 153,722 | 7,695 | |||||||||
MKS Instruments, Inc. | 140,220 | 17,870 | |||||||||
Monolithic Power Systems, Inc. | 47,563 | 12,605 | |||||||||
NVIDIA Corp. | 38,262 | 16,246 | |||||||||
SK Hynix, Inc. | 65,932 | 4,617 | |||||||||
STMicroelectronics NV, NYS (c) | 723,055 | 20,202 | |||||||||
Teradyne, Inc. | 50,556 | 4,497 | |||||||||
Tokyo Electron Ltd. | 13,800 | 3,819 | |||||||||
271,155 | |||||||||||
Software (25.4%): | |||||||||||
Adobe, Inc. (a) | 13,156 | 5,845 | |||||||||
Avaya Holdings Corp. (a) (c) | 638,425 | 8,082 | |||||||||
Coupa Software, Inc. (a) | 95,908 | 29,391 | |||||||||
DocuSign, Inc. (a) | 158,742 | 34,420 | |||||||||
Domo, Inc. Class B (a) (c) | 407,980 | 13,129 | |||||||||
Dropbox, Inc. Class A (a) | 565,926 | 12,875 | |||||||||
Fair Isaac Corp. (a) | 29,720 | 13,053 | |||||||||
Guidewire Software, Inc. (a) | 60,321 | 7,097 | |||||||||
Microsoft Corp. | 444,216 | 91,069 | |||||||||
Paycom Software, Inc. (a) | 50,889 | 14,471 | |||||||||
Proofpoint, Inc. (a) | 111,280 | 12,872 | |||||||||
RingCentral, Inc. Class A (a) | 235,144 | 68,255 | |||||||||
Salesforce.com, Inc. (a) | 79,419 | 15,475 | |||||||||
ServiceNow, Inc. (a) | 88,240 | 38,755 | |||||||||
Slack Technologies, Inc. Class A (a) | 128,311 | 3,792 | |||||||||
Splunk, Inc. (a) | 46,605 | 9,779 | |||||||||
SVMK, Inc. (a) | 139,763 | 3,352 | |||||||||
Varonis Systems, Inc. (a) | 152,970 | 16,574 | |||||||||
Workday, Inc. Class A (a) | 57,949 | 10,484 | |||||||||
Zendesk, Inc. (a) | 97,799 | 8,914 | |||||||||
417,684 | |||||||||||
Total Common Stocks (Cost $1,046,149) | 1,640,361 | ||||||||||
See notes to financial statements.
12
| USAA Mutual Funds Trust USAA Science & Technology Fund | Schedule of Portfolio Investments — continued July 31, 2020 | ||||||
(Amounts in Thousands, Except for Shares)
Security Description | Shares | Value | |||||||||
Rights (0.0%) (e) | |||||||||||
Health Care (0.0%): (e) | |||||||||||
Contra Clementia Pharmaceuticals (d) (f) | 14,251 | $ | 15 | ||||||||
Total Rights (Cost $19) | 15 | ||||||||||
Collateral for Securities Loaned^ (3.5%) | |||||||||||
| Goldman Sachs Financial Square Government Fund Institutional Shares, 0.13% (g) | 50,208,727 | 50,208 | |||||||||
HSBC U.S. Government Money Market Fund I Shares, 0.08% (g) | 6,308,858 | 6,309 | |||||||||
Invesco Government & Agency Portfolio Institutional Shares, 0.06% (g) | 834,521 | 835 | |||||||||
Total Collateral for Securities Loaned (Cost $57,352) | 57,352 | ||||||||||
Total Investments (Cost $1,103,520) — 102.7% | 1,697,728 | ||||||||||
Liabilities in excess of other assets — (2.7)% | (44,693 | ) | |||||||||
NET ASSETS — 100.00% | $ | 1,653,035 | |||||||||
At July 31, 2020 the Fund's investments in foreign securities were 13.5% of net assets.
^ Purchased with cash collateral from securities on loan.
(a) Non-income producing security.
(b) Rule 144A security or other security that is restricted as to resale to institutional investors. The Fund's Adviser has deemed this security to be liquid based upon procedures approved by the Board of Trustees. As of July 31, 2020, the fair value of these securities was $2,731 (thousands) and amounted to 0.2% of net assets.
(c) All or a portion of this security is on loan.
(d) The Fund's Adviser has deemed this security to be illiquid based upon procedures approved by the Board of Trustees. As of July 31, 2020, illiquid securities were less than 0.05% of the Fund's net assets.
(e) Amount represents less than 0.05% of net assets.
(f) Security was fair valued based upon procedures approved by the Board of Trustees and represents less than 0.05% of the Fund's net assets as of July 31, 2020. This security is classified as Level 3 within the fair value hierarchy. (See Note 2)
(g) Rate disclosed is the daily yield on July 31, 2020.
ADR — American Depositary Receipt
NYS — New York Registered Shares
PIPE — Private Investment in Public Equity
PLC — Public Limited Company
See notes to financial statements.
13
USAA Mutual Funds Trust | Statement of Assets and Liabilities July 31, 2020 | ||||||
(Amounts in Thousands, Except Per Share Amounts)
| USAA Science & Technology Fund | |||||||
Assets: | |||||||
Investments, at value (Cost $1,103,520) | $ | 1,697,728 | (a) | ||||
Cash and cash equivalents | 13,370 | ||||||
Receivables: | |||||||
Interest and dividends | 409 | ||||||
Capital shares issued | 443 | ||||||
Investments sold | 1,386 | ||||||
Reclaims | 23 | ||||||
From Adviser | 1 | ||||||
Prepaid expenses | 52 | ||||||
Total Assets | 1,713,412 | ||||||
Liabilities: | |||||||
Payables: | |||||||
Collateral received on loaned securities | 57,352 | ||||||
Investments purchased | 569 | ||||||
Capital shares redeemed | 953 | ||||||
Accrued expenses and other payables: | |||||||
Investment advisory fees | 1,087 | ||||||
Administration fees | 208 | ||||||
Custodian fees | 22 | ||||||
Transfer agent fees | 132 | ||||||
Compliance fees | 1 | ||||||
| 12b-1 fees | 10 | ||||||
Other accrued expenses | 43 | ||||||
Total Liabilities | 60,377 | ||||||
Net Assets: | |||||||
Capital | 1,022,250 | ||||||
Total accumulated earnings/(loss) | 630,785 | ||||||
Net Assets | $ | 1,653,035 | |||||
Net Assets: | |||||||
Fund Shares | $ | 1,559,222 | |||||
Class A shares | 93,813 | ||||||
Total | $ | 1,653,035 | |||||
Shares (unlimited number of shares authorized with no par value): | |||||||
Fund Shares | 53,897 | ||||||
Class A shares | 3,386 | ||||||
Total | 57,283 | ||||||
Net asset value, offering and redemption price per share: (b) | |||||||
Fund Shares | $ | 28.93 | |||||
Class A shares | $ | 27.71 | |||||
Maximum Sales Charge — Class A shares | 5.75 | % | |||||
Maximum offering price: | |||||||
| (100%/(100%-maximum sales charge) of net asset value adjusted to the nearest cent) per share — Class A shares | $ | 29.40 | |||||
(a) Includes $54,465 of securities on loan.
(b) Per share amount may not recalculate due to rounding of net assets and/or shares outstanding.
See notes to financial statements.
14
USAA Mutual Funds Trust | Statement of Operations For the Year Ended July 31, 2020 | ||||||
(Amounts in Thousands)
| USAA Science & Technology Fund | |||||||
Investment Income: | |||||||
Dividends | $ | 4,250 | |||||
Interest | 268 | ||||||
Securities lending (net of fees) | 1,090 | ||||||
Foreign tax withholding | (96 | ) | |||||
Total Income | 5,512 | ||||||
Expenses: | |||||||
Investment advisory fees | 10,789 | ||||||
Administration fees — Fund Shares | 2,011 | ||||||
Administration fees — Class A shares | 137 | ||||||
Sub-Administration fees | 38 | ||||||
12b-1 fees — Class A shares | 228 | ||||||
Custodian fees | 141 | ||||||
Transfer agent fees — Fund Shares | 1,400 | ||||||
Transfer agent fees — Class A shares | 112 | ||||||
Trustees' fees | 46 | ||||||
Compliance fees | 9 | ||||||
Legal and audit fees | 138 | ||||||
State registration and filing fees | 33 | ||||||
Interfund lending fees | 1 | ||||||
Other expenses | 109 | ||||||
Total Expenses | 15,192 | ||||||
Net Investment Income (Loss) | (9,680 | ) | |||||
Realized/Unrealized Gains (Losses) from Investments: | |||||||
| Net realized gains (losses) from investment securities and foreign currency translations | 60,290 | ||||||
| Net change in unrealized appreciation/depreciation on investment securities and foreign currency translations | 343,518 | ||||||
Net realized/unrealized gains (losses) on investments | 403,808 | ||||||
Change in net assets resulting from operations | $ | 394,128 | |||||
See notes to financial statements.
15
USAA Mutual Funds Trust | Statements of Changes in Net Assets | ||||||
(Amounts in Thousands)
USAA Science & Technology Fund | |||||||||||
| Year Ended July 31, 2020 | Year Ended July 31, 2019 | ||||||||||
From Investments: | |||||||||||
Operations: | |||||||||||
Net investment income (loss) | $ | (9,680 | ) | $ | (5,689 | ) | |||||
Net realized gains (losses) from investments | 60,290 | 369,112 | |||||||||
| Net change in unrealized appreciation/depreciation on investments | 343,518 | (199,041 | ) | ||||||||
Change in net assets resulting from operations | 394,128 | 164,382 | |||||||||
Distributions to Shareholders: | |||||||||||
Fund Shares | (301,846 | ) | (162,096 | ) | |||||||
Class A shares | (22,502 | ) | (13,848 | ) | |||||||
Change in net assets resulting from distributions to shareholders | (324,348 | ) | (175,944 | ) | |||||||
Change in net assets resulting from capital transactions | 94,526 | 56,982 | |||||||||
Change in net assets | 164,306 | 45,420 | |||||||||
Net Assets: | |||||||||||
Beginning of period | 1,488,729 | 1,443,309 | |||||||||
End of period | $ | 1,653,035 | $ | 1,488,729 | |||||||
Capital Transactions: | |||||||||||
Fund Shares | |||||||||||
Proceeds from shares issued | $ | 135,503 | $ | 123,560 | |||||||
Distributions reinvested | 296,794 | 159,454 | |||||||||
Cost of shares redeemed | (326,335 | ) | (218,810 | ) | |||||||
Total Fund Shares | $ | 105,962 | $ | 64,204 | |||||||
Class A shares | |||||||||||
Proceeds from shares issued | $ | 8,302 | $ | 10,908 | |||||||
Distributions reinvested | 21,872 | 13,485 | |||||||||
Cost of shares redeemed | (41,610 | ) | (31,615 | ) | |||||||
Total Class A shares | $ | (11,436 | ) | $ | (7,222 | ) | |||||
Change in net assets resulting from capital transactions | $ | 94,526 | $ | 56,982 | |||||||
Share Transactions: | |||||||||||
Fund Shares | |||||||||||
Issued | 5,609 | 4,641 | |||||||||
Reinvested | 12,870 | 6,997 | |||||||||
Redeemed | (13,323 | ) | (8,391 | ) | |||||||
Total Fund Shares | 5,156 | 3,247 | |||||||||
Class A shares | |||||||||||
Issued | 357 | 425 | |||||||||
Reinvested | 989 | 609 | |||||||||
Redeemed | (1,766 | ) | (1,272 | ) | |||||||
Total Class A shares | (420 | ) | (238 | ) | |||||||
Change in Shares | 4,736 | 3,009 | |||||||||
See notes to financial statements.
16
This page is intentionally left blank.
17
USAA Mutual Funds Trust | Financial Highlights | ||||||
For a Share Outstanding Throughout Each Period
Investment Activities | Distributions to Shareholders From | ||||||||||||||||||||||||||
| Net Asset Value, Beginning of Period | Net Investment Income (Loss) | Net Realized and Unrealized Gains (Losses) on Investments | Total from Investment Activities | Net Investment Income | Net Realized Gains from Investments | ||||||||||||||||||||||
USAA Science & Technology Fund | |||||||||||||||||||||||||||
Fund Shares | |||||||||||||||||||||||||||
Year Ended July 31, 2020 | $ | 28.39 | (0.17 | )(b) | 7.26 | 7.09 | — | (6.55 | ) | ||||||||||||||||||
Year Ended July 31, 2019 | $ | 29.19 | 0.01 | 2.83 | 2.84 | — | (3.64 | ) | |||||||||||||||||||
Year Ended July 31, 2018 | $ | 26.89 | — | (e) | 4.50 | 4.50 | — | (2.20 | ) | ||||||||||||||||||
Year Ended July 31, 2017 | $ | 22.03 | 0.05 | 5.68 | 5.73 | — | (0.87 | ) | |||||||||||||||||||
Year Ended July 31, 2016 | $ | 23.07 | (0.01 | ) | 0.37 | 0.36 | — | (1.40 | ) | ||||||||||||||||||
Class A shares | |||||||||||||||||||||||||||
Year Ended July 31, 2020 | $ | 27.53 | (0.23 | )(b) | 6.96 | 6.73 | — | (6.55 | ) | ||||||||||||||||||
Year Ended July 31, 2019 | $ | 28.49 | (0.07 | ) | 2.75 | 2.68 | — | (3.64 | ) | ||||||||||||||||||
Year Ended July 31, 2018 | $ | 26.36 | (0.08 | ) | 4.41 | 4.33 | — | (2.20 | ) | ||||||||||||||||||
Year Ended July 31, 2017 | $ | 21.67 | (0.02 | ) | 5.58 | 5.56 | — | (0.87 | ) | ||||||||||||||||||
Year Ended July 31, 2016 | $ | 22.77 | (0.07 | ) | 0.37 | 0.30 | — | (1.40 | ) | ||||||||||||||||||
* Assumes reinvestment of all net investment income and realized capital gain distributions, if any, during the period. Includes adjustments in accordance with U.S. generally accepted accounting principles and could differ from the Lipper reported return.
^ The net expense ratio may not correlate to the applicable expense limits in place during the period since the current contractual expense limitation is applied for a two year period beginning July 1, 2019 and in effect through June 30, 2021, instead of coinciding with the Fund's fiscal year end. Details of the current contractual expense limitation in effect can be found in Note 4 of the accompanying Notes to Financial Statements.
(a) Portfolio turnover is calculated on the basis of the Fund as a whole without distinguishing between the classes of shares issued.
(b) Per share net investment income (loss) has been calculated using the average daily shares method.
(c) Reflects total annual operating expenses of the shares before reductions of any expenses paid indirectly. The shares' expenses paid indirectly decreased the expense ratio by less than 0.01%.
(d) Reflects increased trading activity due to current year transition or asset allocation shift.
(e) Amount is less than $0.01 per share.
(f) Prior to December 1, 2018, USAA Asset Management Company ("AMCO") (previous Investment Adviser) voluntarily agreed to limit the annual expenses of the Class A shares to 1.35% of the Class A shares' average daily net assets.
(g) Prior to December 1, 2017, AMCO (previous Investment Adviser) voluntarily agreed to limit the annual expenses of the Class A shares to 1.35% of the Class A shares' average daily net assets.
(h) Prior to December 1, 2016, AMCO (previous Investment Adviser) voluntarily agreed to limit the annual expenses of the Class A shares to 1.40% of the Class A shares' average daily net assets.
See notes to financial statements.
18
USAA Mutual Funds Trust | Financial Highlights — continued | ||||||
For a Share Outstanding Throughout Each Period
Ratios to Average Net Assets | Supplemental Data | ||||||||||||||||||||||||||||||||||
| Total Distributions | Net Asset Value, End of Period | Total Return (Excludes Sales Charge)* | Net Expenses^ | Net Investment Income (Loss) | Gross Expenses | Net Assets, End of Period (000's) | Portfolio Turnover(a) | ||||||||||||||||||||||||||||
USAA Science & Technology Fund | |||||||||||||||||||||||||||||||||||
Fund Shares | |||||||||||||||||||||||||||||||||||
Year Ended July 31, 2020 | (6.55 | ) | $ | 28.93 | 30.85 | % | 1.04 | % | (0.66 | )% | 1.04 | % | $ | 1,559,222 | 44 | % | |||||||||||||||||||
Year Ended July 31, 2019 | (3.64 | ) | $ | 28.39 | 12.79 | % | 1.02 | %(c) | (0.39 | )% | 1.02 | %(c) | $ | 1,383,956 | 109 | %(d) | |||||||||||||||||||
Year Ended July 31, 2018 | (2.20 | ) | $ | 29.19 | 17.55 | % | 1.04 | %(c) | (0.31 | )% | 1.04 | %(c) | $ | 1,328,080 | 56 | % | |||||||||||||||||||
Year Ended July 31, 2017 | (0.87 | ) | $ | 26.89 | 27.05 | % | 1.14 | %(c) | (0.28 | )% | 1.14 | %(c) | $ | 1,137,256 | 75 | % | |||||||||||||||||||
Year Ended July 31, 2016 | (1.40 | ) | $ | 22.03 | 1.74 | % | 1.17 | %(c) | (0.24 | )% | 1.17 | %(c) | $ | 901,629 | 83 | % | |||||||||||||||||||
Class A shares | |||||||||||||||||||||||||||||||||||
Year Ended July 31, 2020 | (6.55 | ) | $ | 27.71 | 30.47 | % | 1.33 | % | (0.94 | )% | 1.33 | % | $ | 93,813 | 44 | % | |||||||||||||||||||
Year Ended July 31, 2019 | (3.64 | ) | $ | 27.53 | 12.52 | % | 1.29 | %(c)(f) | (0.65 | )% | 1.29 | %(c) | $ | 104,773 | 109 | %(d) | |||||||||||||||||||
Year Ended July 31, 2018 | (2.20 | ) | $ | 28.49 | 17.24 | % | 1.31 | %(c)(g) | (0.57 | )% | 1.31 | %(c) | $ | 115,229 | 56 | % | |||||||||||||||||||
Year Ended July 31, 2017 | (0.87 | ) | $ | 26.36 | 26.71 | % | 1.41 | %(c)(h) | (0.55 | )% | 1.42 | %(c) | $ | 115,559 | 75 | % | |||||||||||||||||||
Year Ended July 31, 2016 | (1.40 | ) | $ | 21.67 | 1.48 | % | 1.42 | %(c) | (0.50 | )% | 1.42 | %(c) | $ | 122,430 | 83 | % | |||||||||||||||||||
See notes to financial statements.
19
USAA Mutual Funds Trust | Notes to Financial Statements July 31, 2020 | ||||||
1. Organization:
USAA Mutual Funds Trust (the "Trust") is organized as a Delaware statutory trust and is registered under the Investment Company Act of 1940, as amended (the "1940 Act"), as an open-end investment company. The Trust is comprised of 47 funds and is authorized to issue an unlimited number of shares, which are units of beneficial interest with no par value.
The accompanying financial statements are those of the USAA Science & Technology Fund (the "Fund"). The Fund offers two classes of shares: Fund Shares and Class A shares. The Fund is classified as diversified under the 1940 Act.
Effective June 29, 2020, the Fund's Adviser Shares were redesignated Class A shares and became subject to a front-end sales charge.
Each class of shares of the Fund has substantially identical rights and privileges except with respect to fees paid under distribution plans, expenses allocable exclusively to each class of shares, voting rights on matters solely affecting a single class of shares, and the exchange privilege of each class of shares.
Under the Trust's organizational documents, its officers and trustees are indemnified against certain liabilities arising out of the performance of their duties to the Fund. In addition, in the normal course of business, the Fund enters into contracts with its vendors and others that provide for general indemnifications. The Fund's maximum exposure under these arrangements is unknown, as this would involve future claims that may be made against the Fund. However, based on experience, the Fund expects that risk of loss to be remote.
2. Significant Accounting Policies:
The following is a summary of significant accounting policies followed by the Trust in the preparation of its financial statements. The policies are in conformity with generally accepted accounting principles in the United States of America ("GAAP"). The preparation of financial statements in accordance with GAAP requires management to make estimates and assumptions that affect the reported amounts of assets and liabilities and disclosure of contingent assets and liabilities at the date of the financial statements and the reported amounts of income and expenses for the period. Actual results could differ from those estimates. The Fund follows the specialized accounting and reporting requirements under GAAP that are applicable to investment companies under Accounting Standards Codification Topic 946.
Investment Valuation:
The Fund records investments at fair value. Fair value is defined as the price that would be received to sell an asset or paid to transfer a liability in an orderly transaction between market participants at the measurement date.
The valuation techniques described below maximize the use of observable inputs and minimize the use of unobservable inputs in determining fair value. The inputs used for valuing the Fund's investments are summarized in the three broad levels listed below:
• Level 1 — quoted prices in active markets for identical securities
• Level 2 — other significant observable inputs (including quoted prices for similar securities or interest rates applicable to those securities, etc.)
• Level 3 — significant unobservable inputs (including the Fund's own assumptions in determining the fair value of investments)
Changes in valuation techniques may result in transfers in or out of an assigned level within the disclosure hierarchy. The inputs or methodologies used for valuation techniques are not necessarily an indication of the risk associated with entering into those investments.
The Adviser has established the Pricing and Liquidity Committee (the "Committee"), and subject to Trust's Board of Trustees (the "Board") oversight, the Committee administers and oversees the Fund's valuation policies and procedures, which are approved by the Board.
20
USAA Mutual Funds Trust | Notes to Financial Statements — continued July 31, 2020 | ||||||
Portfolio securities listed or traded on securities exchanges, including exchange-traded funds ("ETFs"), American Depositary Receipts ("ADRs") and Rights, are valued at the closing price on the exchange or system where the security is principally traded, if available, or at the Nasdaq Official Closing Price. If there have been no sales for that day on the exchange or system, then a security is valued at the last available bid quotation on the exchange or system where the security is principally traded. In each of these situations, valuations are typically categorized as Level 1 in the fair value hierarchy.
Investments in open-end investment companies are valued at net asset value ("NAV"). These valuations are typically categorized as Level 1 in the fair value hierarchy.
In the event that price quotations or valuations are not readily available, are not reflective of market value, or a significant event has been recognized in relation to a security or class of securities, the securities are valued in good faith by the Committee in accordance with valuation procedures approved by the Board. These valuations are typically categorized as Level 2 or Level 3 in the fair value hierarchy, based on the observability of inputs used to determine the fair value. The effect of fair value pricing is that securities may not be priced on the basis of quotations from the primary market in which they are traded and the actual price realized from the sale of a security may differ materially from the fair value price. Valuing these securities at fair value is intended to cause the Fund's NAV to be more reliable than it otherwise would be.
In accordance with procedures adopted by the Board, fair value pricing may be used if events materially affecting the value of foreign securities occur between the time the exchange on which they are traded closes and the time the Fund's NAV is calculated. The Fund uses a systematic valuation model, provided daily by an independent third party to fair value its international equity securities. These valuations are considered as Level 2 in the fair value hierarchy.
A summary of the valuations as of July 31, 2020, based upon the three levels defined above, is included in the table below while the breakdown, by category, of investments is disclosed in the Schedule of Portfolio Investments (amounts in thousands):
Level 1 | Level 2 | Level 3 | Total | ||||||||||||||||
Common Stocks | $ | 1,595,156 | $ | 45,205 | $ | — | $ | 1,640,361 | |||||||||||
Rights | — | — | 15 | 15 | |||||||||||||||
Collateral for Securities Loaned | 57,352 | — | — | 57,352 | |||||||||||||||
Total | $ | 1,652,508 | $ | 45,205 | $ | 15 | $ | 1,697,728 | |||||||||||
For the year ended July 31, 2020, there were no transfers in or out of the Level 3 fair value hierarchy.
Investment Companies:
Exchange-Traded Funds:
The Fund may invest in ETFs, the shares of which are bought and sold on a securities exchange. An ETF trades like common stock and represents a fixed portfolio of securities designed to track the performance and dividend yield of a particular domestic or foreign market index. The Fund may purchase shares of an ETF to temporarily gain exposure to a portion of the U.S. or a foreign market while awaiting purchase of underlying securities. The risks of owning an ETF generally reflect the risks of owning the underlying securities they are designed to track, although the lack of liquidity of an ETF could result in it being more volatile. Additionally, ETFs have fees and expenses that reduce their value.
Open-End Funds:
The Fund may invest in portfolios of open-end investment companies. These investment companies value securities in their portfolios for which market quotations are readily available at their market values (generally the last reported sale price) and all other securities and assets at their fair value by the methods established by the board of directors of the underlying funds.
21
USAA Mutual Funds Trust | Notes to Financial Statements — continued July 31, 2020 | ||||||
Foreign Exchange Currency Contracts:
The Fund may enter into foreign exchange currency contracts to convert U.S. dollars to and from various foreign currencies. A foreign exchange currency contract is an obligation by the Fund to purchase or sell a specific currency at a future date at a price (in U.S. dollars) set at the time of the contract. The Fund does not engage in "cross-currency" foreign exchange contracts (i.e., contracts to purchase or sell one foreign currency in exchange for another foreign currency). The Fund's foreign exchange currency contracts might be considered spot contracts (typically a contract of one week or less) or forward contracts (typically a contract term over one week). A spot contract is entered into for purposes of hedging against foreign currency fluctuations relating to a specific portfolio transaction, such as the delay between a security transaction trade date and settlement date. Forward contracts are entered into for purposes of hedging portfolio holdings or concentrations of such holdings. Each foreign exchange currency contract is adjusted daily by the prevailing spot or forward rate of the underlying currency, and any appreciation or depreciation is recorded for financial statement purposes as unrealized until the contract settlement date, at which time the Fund records realized gains or losses equal to the difference between the value of a contract at the time it was opened and the value at the time it was closed. The Fund could be exposed to risk if a counterparty is unable to meet the terms of a foreign exchange currency contract or if the value of the foreign currency changes unfavorably. In addition, the use of foreign exchange currency contracts does not eliminate fluctuations in the underlying prices of the securities. As of July 31, 2020, the Fund had no open forward foreign exchange currency contracts.
Investment Transactions and Related Income:
Changes in holdings of investments are accounted for no later than one business day following the trade date. For financial reporting purposes, however, investment transactions are accounted for on trade date on the last business day of the reporting period. Interest income is determined on the basis of coupon interest accrued using the effective interest method which adjusts, where applicable, the amortization of premiums or accretion of discount. Gains or losses realized on sales of securities are determined by comparing the identified cost of the security lot sold with the net sales proceeds.
Withholding taxes on interest, dividends, and gains as a result of certain investments in ADRs by the Fund has been provided for in accordance with each investment's applicable country's tax rules and rates.
Securities Lending:
The Fund, through a securities lending agreement with Citibank, N.A. ("Citibank"), may lend its securities to qualified financial institutions, such as certain broker-dealers, to earn additional income, net of income retained by Citibank. Borrowers are required to secure their loans for collateral in the amount of at least 102% of the value of U.S. securities loaned or at least 105% of the value of non-U.S. securities loaned, marked-to-market daily. Any collateral shortfalls associated with increases in the valuation of the securities loaned are cured the next business day once the shortfall exceeds $100 thousand. Collateral may be cash, U.S. government securities, or other securities as permitted by SEC guidelines. Cash collateral may be invested in high-quality short-term investments, primarily open-end investment companies. Collateral requirements are determined daily based on the value of the Fund's securities on loan as of the end of the prior business day. During the time portfolio securities are on loan, the borrower will pay the Fund any dividends or interest paid on such securities plus any fee negotiated between the parties to the lending agreement. The Fund also earns a return from the collateral. The Fund pays Citibank various fees in connection with the investment of cash collateral and fees based on the investment income received from securities lending activities. Securities lending income (net of these fees) is disclosed on the Statement of Operations. Loans are terminable upon demand and the borrower must return the loaned securities within the lesser of one standard settlement period or five business days. Risks relating to securities-lending transactions include that the borrower may not provide additional collateral when required or return the securities when due, and that the value of the short-term investments will be less than the amount of cash collateral required to be returned to the borrower. The Fund's agreement with Citibank does not include master netting provisions. Non-
22
USAA Mutual Funds Trust | Notes to Financial Statements — continued July 31, 2020 | ||||||
cash collateral received by the Fund may not be sold or re-pledged except to satisfy borrower default. Cash collateral is listed on the Fund's Schedule of Portfolio of Investments and Financial Statements while non-cash collateral is not included. The following table (amounts in thousands) is a summary of the Fund's securities lending transactions as of July 31, 2020.
| Value of Securities on Loan | Non-Cash Collateral | Cash Collateral | |||||||||
| $ | 54,465 | $ | — | $ | 57,352 | ||||||
Foreign Currency Translations:
The accounting records of the Fund are maintained in U.S. dollars. Investment securities and other assets and liabilities of the Fund denominated in a foreign currency are translated into U.S. dollars at current exchange rates. Purchases and sales of securities, income receipts, and expense payments are translated into U.S. dollars at the exchange rates on the date of the transactions. The Fund does not isolate the portion of the results of operations resulting from changes in foreign exchange rates on investments from fluctuations arising from changes in market prices of securities held. Such fluctuations are disclosed as net change in unrealized appreciation/depreciation on investments and foreign currency translations on the Statement of Operations. Any realized gains or losses from these fluctuations, including foreign currency arising from in-kind redemptions, are disclosed as net realized gains or losses from investment transactions and foreign currency translations on the Statement of Operations.
Foreign Taxes:
The Fund may be subject to foreign taxes related to foreign income received (a portion of which may be reclaimable), capital gains on the sale of securities, and certain foreign currency transactions. All foreign taxes are recorded in accordance with the applicable regulations and rates that exist in the foreign jurisdictions in which the Fund invests.
Federal Income Taxes:
It is the Fund's policy to continue to qualify as a regulated investment company by complying with the provisions available to certain investment companies, as defined in applicable sections of the Internal Revenue Code, and to make distributions of net investment income and net realized gains sufficient to relieve it from all, or substantially all, federal income taxes. Accordingly, no provision for federal income taxes is required in the financial statements. The Fund has a tax year-end of July 31.
Management of the Fund has reviewed tax positions taken in tax years that remain subject to examination by all major tax jurisdictions, including federal (i.e., the last four tax years, which includes the current fiscal tax year end). Management believes that there is no tax liability resulting from unrecognized tax benefits related to uncertain tax positions taken.
Allocations:
Expenses directly attributable to the Fund are charged to the Fund, while expenses that are attributable to more than one fund in the Trust, or jointly with an affiliated trust, are allocated among the respective funds in the Trust and/or affiliated trust based upon net assets or another appropriate basis.
Income, expenses (other than class-specific expenses such as transfer agent fees, state registration fees, 12b-1 fees and printing fees), and realized and unrealized gains or losses on investments are allocated to each class of shares based on its relative net assets on the date income is earned or expenses and realized and unrealized gains and losses are incurred.
23
USAA Mutual Funds Trust | Notes to Financial Statements — continued July 31, 2020 | ||||||
3. Purchases and Sales:
Cost of purchases and proceeds from sales/maturities of securities (excluding securities maturing less than one year from acquisition) for the year ended July 31, 2020, were as follows for the Fund (amounts in thousands):
| Excluding U.S. Government Securities | |||||||||||
Purchases | Sales | ||||||||||
$ | 616,831 | $ | 821,277 | ||||||||
There were no purchases and sales of U.S. government securities during the year ended July 31, 2020.
4. Fees and Transactions with Affiliates and Related Parties:
Investment Advisory Fees:
Investment advisory services are provided to the Fund by Victory Capital Management Inc. ("VCM" or the "Adviser"), a New York corporation registered as an investment adviser with the Securities and Exchange Commission ("SEC"). The Adviser is a wholly-owned indirect subsidiary of Victory Capital Holdings, Inc., a publicly traded Delaware corporation, and a wholly-owned direct subsidiary of Victory Capital Operating, LLC. Under the terms of the Investment Advisory Agreement, the Adviser is entitled to receive a base fee and a performance adjustment. The Fund's base fee is accrued daily and paid monthly at an annualized rate of 0.75% of the Fund's average daily net assets. Amounts incurred and paid to VCM for the year ended July 31, 2020, are reflected on the Statement of Operations as Investment Advisory fees.
Effective July 1, 2019, no performance adjustments were made for the period beginning July 1, 2019, through June 30, 2020. Only performance beginning as of July 1, 2019, and thereafter is utilized in calculating future performance adjustments.
The performance adjustment for each share class is accrued daily and calculated monthly by comparing each class' performance to that of the Lipper Science & Technology Funds Index. The Lipper Science & Technology Funds Index tracks the total return performance of each class within the Lipper Science & Technology Funds category.
The performance period for each share class consists of the current month plus the previous 35 months (or the number of months beginning July 1, 2019, if fewer). The following table is utilized to determine the extent of the performance adjustment:
| Over/Under Performance Relative to Index (in basis points)(a) | Annual Adjustment Rate (in basis points)(a) | ||||||
+/- 100 to 400 | +/- 4 | ||||||
+/- 401 to 700 | +/- 5 | ||||||
+/- 701 and greater | +/- 6 | ||||||
(a) Based on the difference between average annual performance of the relevant share class of the Fund and its relevant Lipper index, rounded to the nearest basis point. Average daily net assets of the share class are calculated over a rolling 36-month period.
Each class' annual performance adjustment rate is multiplied by the average daily net assets of the class over the entire performance period, which is then multiplied by a fraction, the numerator of which is the number of days in the month and the denominator of which is 365 (366 in leap years). The resulting amount is then added to (in the case of overperformance), or subtracted from (in the case of underperformance) the base fee.
Under the performance fee arrangement, each class pays a positive performance fee adjustment for a performance period whenever the class outperforms the Lipper Science & Technology Funds Index over that period, even if the class has overall negative returns during the performance period.
24
USAA Mutual Funds Trust | Notes to Financial Statements — continued July 31, 2020 | ||||||
For the period July 1, 2020 through July 31, 2020, performance adjustments for Fund Shares, and Class A shares were $46 and $3 thousand, respectively. For the Fund Shares, and Class A shares, the performance adjustments were less than 0.01% of net assets for both classes.
The Trust relies on an exemptive order granted to VCM and its affiliated funds by the SEC in March 2019 permitting the use of a "manager-of-managers" structure for certain funds. Under a manager-of-managers structure, the investment adviser may select (with approval of the Board and without shareholder approval) one or more subadvisers to manage the day-to-day investment of a fund's assets.
VCM has entered into a Subadvisory Agreement with Wellington Management Company LLP ("Wellington Management"). Under which Wellington directs the investment and reinvestment of a portion of the Fund's assets (as allocated from time to time by VCM). This arrangement provides for monthly fees that are paid by VCM. VCM (not the Fund) pays the subadviser fees.
Administration and Servicing Fees:
VCM serves as the Fund's administrator and fund accountant. Under the Fund Administration, Servicing and Accounting Agreement, VCM is paid for its services an annual fee at a rate of 0.15% of average daily net assets of the Fund Shares and Class A shares, respectively. Amounts incurred for the year ended July 31, 2020, are reflected on the Statement of Operations as Administration fees.
The Fund (as part of the Trust) has entered into an agreement to provide compliance services with the Adviser, pursuant to which the Adviser furnishes its compliance personnel, including the services of the Chief Compliance Officer ("CCO"), and other resources reasonably necessary to provide the Trust with compliance oversight services related to the design, administration and oversight of a compliance program for the Trust in accordance with Rule 38a-1 under the 1940 Act. The CCO is an employee of the Adviser, which pays the compensation of the CCO and support staff. Funds in the Trust, Victory Variable Insurance Funds, Victory Portfolios, and Victory Portfolios II (collectively, the "Victory Funds Complex") in the aggregate, compensates the Adviser for these services. Amounts incurred for the year ended July 31, 2020, are reflected on the Statement of Operations as Compliance fees.
Citi Fund Services Ohio, Inc. ("Citi"), an affiliate of Citibank, acts as sub-administrator and sub-fund accountant to the Fund pursuant to a Sub-Administration and Sub-Fund Accounting Services Agreement between VCM and Citi. VCM pays Citi a fee for providing these services. The Fund reimburses VCM and Citi for reasonable out-of-pocket expenses incurred in providing these services and certain other expenses specifically allocated to the Funds, under the Fund Administration, Servicing, and Accounting Agreement. Amounts incurred for the year ended July 31, 2020, are reflected on the Statement of Operations as Sub-Administration fees.
Transfer Agency Fees:
Victory Capital Transfer Agency, Inc. ("VCTA"), provides transfer agency services to the Fund. VCTA, an affiliate of the Adviser, provides transfer agent services to the Fund Shares based on an annual charge of $23 per shareholder account plus out-of-pocket expenses. VCTA pays a portion of these fees to certain intermediaries for the administration and servicing of accounts that are held with such intermediaries. Transfer agent's fees for Class A shares are paid monthly based on a fee accrued daily at an annualized rate of 0.10% of average daily net assets, plus out-of-pocket expenses. Amounts incurred and paid to VCTA for the year ended July 31, 2020, are reflected on the Statement of Operations as Transfer Agent fees.
FIS Investor Services LLC serves as sub-transfer agent and dividend disbursing agent for the Fund pursuant to a Sub-Transfer Agent agreement between VCTA and FIS Investor Services LLC. VCTA provides FIS Investor Services LLC a fee for providing these services.
Distributor/Underwriting Services:
Victory Capital Services, Inc. (the "Distributor"), an affiliate of the Adviser, serves as distributor for the continuous offering of shares of the Fund pursuant to a Distribution Agreement between the Distributor and the Trust. Effective June 30, 2020, the Distributor's name was changed from Victory Capital Advisers, Inc. Pursuant to the Distribution and Service Plans adopted in accordance with Rule 12b-1 under
25
USAA Mutual Funds Trust | Notes to Financial Statements — continued July 31, 2020 | ||||||
the1940 Act, the Distributor may receive a monthly distribution and service fee, at an annual rate of up to 0.25% of the average daily net assets of Class A shares. The distribution and service fees paid to the Distributor may be used by the Distributor to pay for activity primarily intended to result in the sale of Class A shares of the Fund. Amounts incurred and paid to the Distributor for the year ended July 31, 2020, are reflected on the Statement of Operations as 12b-1 fees.
In addition, the Distributor is entitled to receive commission on sales of the Class A shares of the Fund. For the fiscal year ended July 31, 2020, the Distributor received less than $1 thousand from commissions earned on sales of Class A shares of the Fund.
Other Fees:
Citibank serves as the Fund's custodian.
K&L Gates LLP provides legal services to the Trust.
The Adviser has entered into an expense limitation agreement with the Fund until at least June 30, 2021. Under the terms of the agreement, the Adviser has agreed to waive fees or reimburse certain expenses to the extent that ordinary operating expenses incurred by certain classes of the Fund in any fiscal year exceed the expense limit for such classes of the Fund. Such excess amounts will be the liability of the Adviser. Interest, taxes, brokerage commissions, other expenditures, which are capitalized in accordance with GAAP, and other extraordinary expenses not incurred in the ordinary course of the Fund's business are excluded from the expense limits. As of July 31, 2020, the expense limits (excluding voluntary waivers) are 1.06% and 1.34% for Fund Shares and Class A shares, respectively.
Under this expense limitation agreement, the Fund has agreed to repay fees and expenses that were waived or reimbursed by the Adviser for a period up to three years after the fiscal year in which the waiver or reimbursement took place, subject to the lesser of any operating expense limits in effect at the time of: (a) the original waiver or expense reimbursement; or (b) the recoupment, after giving effect to the recoupment amount. As of July 31, 2020, the Fund had no amounts available to be repaid to the Adviser.
The Adviser may voluntarily waive or reimburse additional fees to assist the Fund in maintaining competitive expense ratios. Voluntary waivers and reimbursements applicable to the Fund are not available to be recouped at a future time. There were no voluntary waivers or reimbursements for the year ended July 31, 2020.
Certain officers and/or interested trustees of the Fund are also officers and/or employees of the Adviser, Administrator, Sub-Administrator, Sub-Fund Accountant, and Legal.
5. Risks:
The Fund may be subject to other risks in addition to these identified risks.
Global economies and financial markets are increasingly interconnected, which increases the possibilities that conditions in one country or region might adversely affect issuers in another country or region. Geopolitical and other risks, including war, terrorism, trade disputes, political or economic dysfunction within some nations, public health crises and related geopolitical events, as well as environmental disasters such as earthquakes, fires, and floods, may add to instability in world economies and markets generally. Changes in trade policies and international trade agreements could affect the economies of many countries in unpredictable ways. Epidemics and/or pandemics, such as the coronavirus (or COVID-19), may result in, among other things, closing borders, disruptions to healthcare service preparation and delivery, quarantines, cancellations, disruptions to supply chains and consumer activity, as well as general concern and uncertainty. The impact may be short-term or may last for extended periods.
The COVID-19 pandemic, which has spread rapidly across the world, has led and will continue to lead for an unknown period of time to disruptions in local, regional, national and global markets and economies. Among other things, the outbreak has resulted in, and until fully resolved is likely to continue to result in, among other things (1) government imposition of various forms of "stay at home" orders and the closing of "non-essential" businesses, resulting in significant disruption to the businesses of
26
USAA Mutual Funds Trust | Notes to Financial Statements — continued July 31, 2020 | ||||||
many issuers as well as lay-offs of employees: (2) increased requests by issuers of debt instruments for amendments and waivers of agreements to avoid default and increased defaults: (3) volatility and disruption of markets, including greater volatility in pricing and spreads; and (4) rapidly evolving proposals and/or actions by state and federal governments to address problems being experienced by the markets and by businesses and the economy in general.
Overall stock market risks may affect the value of the Fund. Factors such as domestic and international economic growth and market conditions, interest rate levels, and political events affect the securities market.
The value of the equity securities in which the Fund invests may decline in response to developments affecting individual companies and/or general economic conditions. A company's earnings or dividends may not increase as expected. Price changes may be temporary or last for extended periods.
Foreign markets can be more volatile than the U.S. market due to increased risks of adverse issuer, political, regulatory, market, or economic developments and can perform differently from the U.S. market.
6. Borrowing and Interfund Lending:
Line of Credit:
For the year ended July 31, 2020, the Victory Funds Complex participated in a short-term demand note "Line of Credit" agreement with Citibank. The Line of Credit agreement with Citibank was renewed on June 29, 2020 with a termination date of June 28, 2021. Under the agreement with Citibank, the Victory Funds Complex may borrow up to $600 million, of which $300 million is committed and $300 million is uncommitted. $40 million of the Line of Credit is reserved for use by the Victory Floating Rate Fund (herein, the "Fund"), another series of the Victory Funds Complex, with that Fund paying the related commitment fees for that amount. The purpose of the agreement is to meet temporary or emergency cash needs. For the year ended July 31, 2020, Citibank received an annual commitment fee of 0.15% on $300 million for providing the Line of Credit. Each fund in the Victory Funds Complex pays a pro-rata portion of the commitment fees plus any interest (one month LIBOR plus one percent) on amounts borrowed. Effective June 29, 2020, under an amended Line of Credit agreement, Citibank will also receive an annual upfront fee of 0.10% on the $300 million committed line of credit. Each fund in the Victory Funds Complex will pay a pro-rata portion of the upfront fee. Interest charged to each Fund during the period, if applicable, is reflected on the Statements of Operations under Line of credit fees.
The Fund had no borrowings under the Line of Credit agreement during the year ended July 31, 2020.
Interfund Lending:
The Trust and Adviser rely on an exemptive order granted by the SEC in March 2017 (the "Order"), permitting the establishment and operation of an Interfund Lending Facility (the "Facility"). The Facility allows the Fund to directly lend and borrow money to or from any other Fund in the Victory Funds Complex relying upon the Order at rates beneficial to both the borrowing and lending funds. Advances under the Facility are allowed for temporary or emergency purposes. The interfund loan rate is determined, as specified in the Order, by averaging the current repurchase agreement rate and the current bank loan rate. As a Borrower, interest charged to the Fund, if any, during the period is reflected on the Statement of Operations under Interfund lending fees. As a Lender, interest earned by the Fund, if any, during the period is reflected on the Statement of Operations under Income on Interfund lending.
The average borrowing or lending for the days outstanding and average interest rate for the Fund during the year ended July 31, 2020 were as follows (amounts in thousands):
Borrower | Amount | Average | Days | Average | Maximum | ||||||||||||||||||
Borrower | $ | — | $ | 2,913 | 5 | 1.72 | % | $ | 4,757 | ||||||||||||||
*For the year ended July 31, 2020, based on the number of days borrowings were outstanding.
27
USAA Mutual Funds Trust | Notes to Financial Statements — continued July 31, 2020 | ||||||
7. Federal Income Tax Information:
The Fund intends to distribute any net investment income annually. Distributable net realized gains, if any, are declared and paid at least annually.
The amounts of dividends from net investment income and distributions from net realized gains (collectively distributions to shareholders) are determined in accordance with federal income tax regulations, which may differ from GAAP. To the extent these "book/tax" differences are permanent in nature (e.g., net operating loss and distribution reclassification), such amounts are reclassified within the components of net assets based on their federal tax-basis treatment; temporary differences (e.g., wash sales) do not require reclassification. To the extent dividends and distributions exceed net investment income and net realized gains for tax purposes, they are reported as distributions of capital. Net investment losses incurred by the Fund, if any, may be reclassified as an offset to capital on the accompanying Statement of Assets and Liabilities.
The following permanent reclassifications were made between capital accounts to reflect the portion of the payments made to redeeming shareholders that was claimed as a distribution for income tax purposes during the year ended July 31, 2020 (amounts in thousands):
| Total accumulated earnings/(loss) | Capital | ||||||
| $ | (858 | ) | $ | 858 | |||
The tax character of distributions paid during the tax years ended as noted below, were as follows (total distributions paid may differ from the Statements of Changes in Net Assets because, for tax purposes, dividends are recognized when actually paid) (amounts in thousands).
Year Ended July 31, 2020 | Year Ended July 31, 2019 | ||||||||||||||||||||||||||
Distributions paid from | Distributions paid from | ||||||||||||||||||||||||||
| Ordinary Income | Net Long-Term Capital Gains | Total Distributions Paid | Ordinary Income* | Net Long-Term Capital Gains | Total Distributions Paid | ||||||||||||||||||||||
$ | 5,194 | $ | 319,154 | $ | 324,348 | $ | 14,583 | $ | 161,361 | $ | 175,944 | ||||||||||||||||
* Includes short-term realized capital gains, if any, which are taxable as ordinary income.
As of July 31, 2020, the components of accumulated earnings (loss) on a tax basis were as follows (amounts in thousands):
| Undistributed Long Term Capital Gains | Accumulated Earnings | Qualified Late-Year Losses* | Unrealized Appreciation (Depreciation)** | Total Accumulated Earnings (Loss) | |||||||||||||||||||
$ | 48,739 | $ | 48,739 | $ | (5,722 | ) | $ | 587,768 | $ | 630,785 | |||||||||||||
* Qualified late-year losses are comprised of post-October capital losses incurred after October 31 and certain late-year ordinary losses. Late-year ordinary losses represent ordinary losses incurred after December 31 and specified losses incurred after October 31. These losses are deemed to arise on the first day of the Fund's next taxable year.
** The difference between the book-basis and tax-basis of unrealized appreciation/depreciation is attributable to the tax deferral of losses on wash sales.
28
USAA Mutual Funds Trust | Notes to Financial Statements — continued July 31, 2020 | ||||||
As of July 31, 2020, the cost basis for federal income tax purposes, gross unrealized appreciation, gross unrealized depreciation, and net unrealized appreciation (depreciation) for investments were as follows (amounts in thousands):
| Cost of Investments for Federal Tax Purposes | Gross Unrealized Appreciation | Gross Unrealized Depreciation | Net Unrealized Appreciation (Depreciation) | ||||||||||||||||
$ | 1,109,963 | $ | 648,293 | $ | (60,528 | ) | $ | 587,765 | |||||||||||
29
REPORT OF INDEPENDENT REGISTERED PUBLIC ACCOUNTING FIRM
To the Shareholders and the Board of Trustees of USAA Science & Technology Fund
Opinion on the Financial Statements
We have audited the accompanying statement of assets and liabilities of USAA Science & Technology Fund (the "Fund") (one of the funds constituting USAA Mutual Funds Trust (the "Trust")), including the schedule of portfolio investments, as of July 31, 2020, and the related statement of operations for the year then ended, the statements of changes in net assets for each of the two years in the period then ended, the financial highlights for each of the five years in the period then ended and the related notes (collectively referred to as the "financial statements"). In our opinion, the financial statements present fairly, in all material respects, the financial position of the Fund (one of the funds constituting USAA Mutual Funds Trust) at July 31, 2020, the results of its operations for the year then ended, the changes in its net assets for each of the two years in the period then ended and its financial highlights for each of the five years in the period then ended, in conformity with U.S. generally accepted accounting principles.
Basis for Opinion
These financial statements are the responsibility of the Trust's management. Our responsibility is to express an opinion on the Fund's financial statements based on our audits. We are a public accounting firm registered with the Public Company Accounting Oversight Board (United States) ("PCAOB") and are required to be independent with respect to the Trust in accordance with the U.S. federal securities laws and the applicable rules and regulations of the Securities and Exchange Commission and the PCAOB.
We conducted our audits in accordance with the standards of the PCAOB. Those standards require that we plan and perform the audit to obtain reasonable assurance about whether the financial statements are free of material misstatement, whether due to error or fraud. The Trust is not required to have, nor were we engaged to perform, an audit of the Trust's internal control over financial reporting. As part of our audits we are required to obtain an understanding of internal control over financial reporting, but not for the purpose of expressing an opinion on the effectiveness of the Trust's internal control over financial reporting. Accordingly, we express no such opinion.
Our audits included performing procedures to assess the risks of material misstatement of the financial statements, whether due to error or fraud, and performing procedures that respond to those risks. Such procedures included examining, on a test basis, evidence regarding the amounts and disclosures in the financial statements. Our procedures included confirmation of securities owned as of July 31, 2020, by correspondence with the custodian and brokers or by other appropriate auditing procedures where replies from brokers were not received. Our audits also included evaluating the accounting principles used and significant estimates made by management, as well as evaluating the overall presentation of the financial statements. We believe that our audits provide a reasonable basis for our opinion.

We have served as the auditor of one or more Victory Capital investment companies since 1995.
San Antonio, Texas
September 29, 2020
30
USAA Mutual Funds Trust | Supplemental Information July 31, 2020 | ||||||
(Unaudited)
Trustee and Officer Information
Board of Trustees:
Overall responsibility for management of the Trust rests with the Board. The Trust is managed by the Board in accordance with the laws of the state of Delaware. There are currently 10 Trustees, eight of whom are not "interested persons" of the Trust within the meaning of that term under the 1940 Act ("Independent Trustees") and two of whom is an "interested person" of the Trust within the meaning of that term under the 1940 Act ("Interested Trustee"). The Trustees, in turn, elect the officers of the Trust to actively supervise its day-to-day operations.
The following tables list the Trustees, their ages, position with the Trust, commencement of service, principal occupations during the past five years and any directorships of other investment companies or companies whose securities are registered under the Securities Exchange Act of 1934, as amended, or who file reports under that Act. Each Trustee oversees 47 portfolios in the Trust. Each Trustee's address is 15935 La Cantera Pkwy, Building Two, San Antonio, TX, 78256. Pursuant to a policy adopted by the Board, the term of office for each Trustee shall be until the Independent Trustee reaches age 75 or an Interested Trustee reaches age 75. The Board may change or grant exceptions from this policy at any time without shareholder approval. A Trustee may resign or be removed by a vote of the other Trustees or the holders of a majority of the outstanding shares of the Trust at any time. Vacancies on the Board can be filled by the action of a majority of the Trustees, provided that after filling such vacancy at least two-thirds of the Trustees have been elected by the shareholders.
Name and Date of Birth | Position Held with the Trust | Year Commenced Service | Principal Occupation During Past 5 Years | Other Directorships Held During Past 5 Years | |||||||||||||||
Independent Trustees. | |||||||||||||||||||
| Jefferson C. Boyce, Born September 1957 | Lead Independent Trustee, and Vice Chairman | 2013 | Senior Managing Director, New York Life Investments, LLC (1992-2012) | Westhab, Inc. | |||||||||||||||
| John C. Walters, Born February 1962 | Trustee | 2019 | Retired. Mr. Walters brings significant Board experience including active involvement with the board of a Fortune 500 company, and a proven record of leading large, complex financial organizations. He has a demonstrated record of success in distribution, manufacturing, investment brokerage, and investment management in both the retail and institutional investment businesses. He has substantial experience in the investment management business with a demonstrated ability to develop and drive strategy while managing operation, financial, and investment risk. | Guardian Variable Products Trust (16 series), Lead Independent Director; Amerilife Holdings LLC, Director; Stadion Money Management; Director; University of North Carolina (Chapel Hill), Member Board of Governors. | |||||||||||||||
31
USAA Mutual Funds Trust | Supplemental Information — continued July 31, 2020 | ||||||
(Unaudited)
Name and Date of Birth | Position Held with the Trust | Year Commenced Service | Principal Occupation During Past 5 Years | Other Directorships Held During Past 5 Years | |||||||||||||||
| Robert L. Mason, Ph.D., Born July 1946 | Trustee | 1997 | Adjunct Professor in the Department of Management Science and Statistics in the College of Business at the University of Texas at San Antonio (since 2001); Institute Analyst, Southwest Research Institute (March 2002-January 2016) | None | |||||||||||||||
| Dawn M. Hawley, Born February 1954 | Trustee | 2014 | Manager of Finance, Menil Foundation, Inc. (May 2007-June 2011), which is a private foundation that oversees the assemblage of sculptures, prints, drawings, photographs, and rare books. Director of Financial Planning and Analysis and Chief Financial Officer, AIM Management Group, Inc. (October 1987-January 2006) | None | |||||||||||||||
| Paul L. McNamara, Born July 1948 | Trustee | 2012 | Director, Cantor Opportunistic Alternatives Fund, LLC (March 2010-February 2014) , which is a closed-end fund of funds by Cantor Fitzgerald Investment Advisors, LLC | None | |||||||||||||||
32
USAA Mutual Funds Trust | Supplemental Information — continued July 31, 2020 | ||||||
(Unaudited)
Name and Date of Birth | Position Held with the Trust | Year Commenced Service | Principal Occupation During Past 5 Years | Other Directorships Held During Past 5 Years | |||||||||||||||
| Richard Y. Newton III, Born January 1956 | Trustee | 2017 | Director, Elta North America (01/18-present), which is a global leader in the design, manufacture, and support of innovative electronic systems in the ground, maritime, airborne, and security domains for the nation's warfighters, security personnel, and first responders; Managing Partner, Pioneer Partnership Development Group (December 2015-present)); Executive Director, The Union League Club of New York (June 2014-November 2015): Executive Vice President, Air Force Association (August 2012-May 2014); Lieutenant General, United States Air Force (January 2008-June 2012) | None | |||||||||||||||
| Barbara B. Ostdiek, Ph.D., Born March 1964 | Trustee | 2008 | Senior Associate Dean of Degree Programs at Jesse H. Jones Graduate School of Business at Rice University (since 2013); Associate Professor of Finance at Jessie H. Jones Graduate School of Business at Rice University (since 2001) | None | |||||||||||||||
| Michael F. Reimherr, Born August 1945 | Trustee | 2000 | President of Reimherr Business Consulting (May 1995-December 2017); St. Mary's University Investment Committee overseeing University Endowment (since 2014) | None | |||||||||||||||
33
USAA Mutual Funds Trust | Supplemental Information — continued July 31, 2020 | ||||||
(Unaudited)
Name and Date of Birth | Position Held with the Trust | Year Commenced Service | Principal Occupation During Past 5 Years | Other Directorships Held During Past 5 Years | |||||||||||||||
Interested Trustees. | |||||||||||||||||||
| David C. Brown, ** Born May 1972 | Trustee | 2019 | Chairman and Chief Executive Officer (since 2013), Co-Chief Executive Officer (2011-2013), Victory Capital Management Inc.; Chairman and Chief Executive Officer, Victory Capital Holdings, Inc. (since 2013). Mr. Brown brings to the Board extensive business, finance and leadership skills gained and developed through years of experience in the financial services industry, including his tenure overseeing the strategic direction as CEO of Victory Capital. These skills, combined with Mr. Brown's extensive knowledge of the financial services industry and demonstrated success in the development and distribution of investment strategies and products, enable him to provide valuable insights to the Board and strategic direction for the Funds | Trustee, Victory Portfolios (42 series), Victory Portfolios II (26 series), Victory Variable Insurance Funds (9 series) | |||||||||||||||
34
USAA Mutual Funds Trust | Supplemental Information — continued July 31, 2020 | ||||||
(Unaudited)
Name and Date of Birth | Position Held with the Trust | Year Commenced Service | Principal Occupation During Past 5 Years | Other Directorships Held During Past 5 Years | |||||||||||||||
| Daniel S. McNamara, ** Born June 1966 | Trustee and Chair of the Board of Trustees | 2012 | Trustee, President, and Vice Chairman of USAA ETF Trust (June 2017-June 2019); President of Financial Advice & Solutions Group (FASG), USAA (since 2013); Director, Investment Management Company (IMCO) (September 2009-April 2014); President, Asset Management Company (AMCO) (August, 2011-April 2013); Senior Vice President of USAA Financial Planning Services Insurance Agency, Inc. (FPS) (since 2011); Director of USAA IMCO (since 2009); Chairman of Board of IMCO (since 2013); Director of AMCO (August 2011-June 2019); President and Director of USAA Shareholder Account Services (SAS) (October 2009-June 2019); Director and Vice Chairman of FPS (since 2013); President and Director of USAA Investment Corporation (ICORP) (since 2010); Chairman of Board of ICORP (since 2013); Director of USAA Financial Advisors, Inc. (FAI) (since 2013); Chairman of Board of FAI (since 2015). Mr. McNamara brings to the Board extensive experience in the financial services industry, including experience as an officer of the Trust. | None | |||||||||||||||
** Mr. Dan McNamara, the Chairman of the Board, is deemed an "interested person" due to his previous position as Director of AMCO, the former investment adviser of the Funds. Mr. Brown is deemed an "interested person" due to his position as Chief Executive Officer of Victory Capital, investment adviser to the Funds.
The Statement of Additional Information includes additional information about the Trustees of the Trust and is available, without charge, on the SEC's website at www.sec.gov and/or by calling (800)-539-3863.
35
USAA Mutual Funds Trust | Supplemental Information — continued July 31, 2020 | ||||||
(Unaudited)
Officers:
The officers of the Trust, their ages, commencement of service and their principal occupations during the past five years, are detailed in the following table. Each officer serves until the earlier of his or her resignation, removal, retirement, death, or the election of a successor. The mailing address of each officer of the Trust is 15935 La Cantera Pkwy, Building Two, San Antonio, TX, 78256. The officers of the Trust receive no compensation directly from the Trust for performing the duties of their offices.
Name and Date of Birth | Position with the Trust | Year Commenced Service | Principal Occupation During Past 5 Years | ||||||||||||
Interested Officers. | |||||||||||||||
| Christopher K. Dyer, Born February 1962 | President | 2019 | Director of Fund Administration, Victory Capital (2004-present) | ||||||||||||
| Scott A Stahorsky, Born July 1969 | Vice President | 2019 | Manager, Fund Administration, Victory Capital (since 2015); Senior Analyst, Fund Administration, Victory Capital (prior to 2015) | ||||||||||||
| James K. De Vries, Born April 1969 | Treasurer, Principal Financial Officer | 2018 | Executive Director, Victory Capital Management Inc. (since 2019); Treasurer, USAA ETF Trust (September 2018-June 2019); Executive Director, Investment and Financial Administration, USAA (April 2012-June 2019); Assistant Treasurer, USAA ETF Trust (June 2017-September 2018); Assistant Treasurer, USAA Mutual Funds Trust (December 2013-February 2018) | ||||||||||||
| Allan Shaer, Born March 1965 | Assistant Treasurer | 2019 | Senior Vice President, Financial Administration, Citi Fund Services Ohio, Inc. (since 2016); Vice President, Mutual Fund Administration, JP Morgan Chase (2011-2016) | ||||||||||||
| Carol D. Trevino, Born October 1965 | Assistant Treasurer | 2018 | Director, Accounting and Finance, Victory Capital Management Inc. (since 2019); Accounting/Financial Director, USAA (December 2013-June 2019); Assistant Treasurer, USAA ETF Trust (September 2018-June 2019). | ||||||||||||
| Erin G. Wagner, Born February 1974 | Secretary | 2019 | Deputy General Counsel, the Adviser (since 2013) | ||||||||||||
| Charles Booth, Born April 1960 | Anti-Money Laundering Compliance Officer and Identity Theft Officer | 2019 | Director, Regulatory Administration and CCO Support Services, Citi Fund Services Ohio, Inc. (2007-present) | ||||||||||||
| Amy Campos, Born July 1976 | Chief Compliance Officer | 2019 | Chief Compliance Officer, USAA Mutual Funds Trust (since 2019); Executive Director, Deputy Chief Compliance Officer, USAA Mutual Funds Trust and USAA ETF Trust (July 2017-June 2019); Compliance Director, USAA Mutual Funds Trust (2014-July 2017) | ||||||||||||
36
USAA Mutual Funds Trust | Supplemental Information — continued July 31, 2020 | ||||||
(Unaudited)
Proxy Voting and Portfolio Holdings Information
Proxy Voting:
Information regarding the policies and procedures the Fund uses to determine how to vote proxies relating to portfolio securities is available without charge, upon request, by calling (800) 539-3863. The information is also included in the Fund's Statement of Additional Information, which is available on the SEC's website at www.sec.gov.
Information relating to how the Fund voted proxies relating to portfolio securities held during the most recent 12 months ended June 30 is available on the SEC's website at www.sec.gov.
Availability of Schedules of Portfolio Investments:
The Trust files a complete list of Schedules of Portfolio Investments with the SEC for the first and third quarter of each fiscal year on Form N-PORT. Forms N-PORT are available on the SEC's website at www.sec.gov.
Expense Examples
As a shareholder of the Fund, you may incur two types of costs: (1) transaction costs, and (2) ongoing costs, including management fees and other Fund expenses. These examples are intended to help you understand your ongoing costs (in dollars) of investing in the Fund and to compare these costs with the ongoing costs of investing in other mutual funds.
These examples are based on an investment of $1,000 invested at the beginning of the period and held for the entire period from February 1, 2020 through July 31, 2020.
The Actual Expense figures in the table below provide information about actual account values and actual expenses. You may use the information below, together with the amount you invested, to estimate the expenses that you paid over the period. Simply divide your account value by $1,000 (for example, an $8,600 account value divided by $1,000 = 8.6), then multiply the result by the number in the table under the heading entitled "Actual Expenses Paid During Period" to estimate the expenses you paid on your account during this period.
The Hypothetical Expense figures in the table below provide information about hypothetical account values and hypothetical expenses based on the Fund's actual expense ratio and an assumed rate of return of 5% per year before expenses, which is not the Fund's actual return. The hypothetical account values and expenses may not be used to estimate the actual ending account balance or expenses you paid for the period. You may use this information to compare this 5% hypothetical example with the 5% hypothetical examples that appear in shareholder reports of other funds.
Please note the expenses shown in the table below are meant to highlight your ongoing costs only and do not reflect any transactional costs. If these transactional costs were included, your costs would have been higher.
| Beginning Account Value 2/1/20 | Actual Ending Account Value 7/31/20 | Hypothetical Ending Account Value 7/31/20 | Actual Expenses Paid During Period 2/1/20- 7/31/20* | Hypothetical Expenses Paid During Period 2/1/20- 7/31/20* | Annualized Expense Ratio During Period 2/1/20- 7/31/20 | ||||||||||||||||||||||
Fund Shares | $ | 1,000.00 | $ | 1,208.90 | $ | 1,019.79 | $ | 5.60 | $ | 5.12 | 1.02 | % | |||||||||||||||
Class A shares | 1,000.00 | 1,207.40 | 1,018.45 | 7.08 | 6.47 | 1.29 | % | ||||||||||||||||||||
* Expenses are equal to the average account value multiplied by the Fund's annualized expense ratio multiplied by 182/366 (the number of days in the most recent fiscal half-year divided by the number of days in the fiscal year).
37
USAA Mutual Funds Trust | Supplemental Information — continued July 31, 2020 | ||||||
(Unaudited)
Additional Federal Income Tax Information
The following federal tax information related to the Fund's fiscal year ended July 31, 2020, is provided for information purposes only and should not be used for reporting to federal or state revenue agencies. Federal tax information for the calendar year will be reported to you on Form 1099-DIV in January 2021.
With respect to distributions paid, the Fund designates the following amounts (or, if subsequently determined to be different, the maximum amount allowable) for the fiscal year ended July 31, 2020 (amounts in thousands):
| Dividend Received Deduction (corporate shareholders)* | Short-Term Capital Gains Distributions | Long-Term Capital Gains Distributions(a) | |||||||||||||
20.36 | % | $ | 5,194 | $ | 322,697 | ||||||||||
* Presented as a percentage of net investment income and excludes short-term capital gain distributions paid, if any. All or a portion of these amounts may be exempt from taxation at the state level.
(a) Pursuant to Section 852 of the Internal Revenue Code.
38
USAA Mutual Funds Trust | Supplemental Information — continued July 31, 2020 | ||||||
(Unaudited)
Liquidity Risk Management Program
The USAA Mutual Funds have adopted and implemented a written liquidity risk management program (the "LRMP") as required by Rule 22e-4 under the Investment Company Act of 1940, as amended. The LRMP is reasonably designed to assess and manage the Fund's liquidity risk, taking into consideration the Fund's investment strategy and the liquidity of its portfolio investments during normal and reasonably foreseeable stressed market conditions; its short and long-term cash flow projections; and its cash holdings and access to other liquidity management tools such as available funding sources including the Victory Funds Complex Interfund Lending Facility and Line of Credit (discussed in the Notes to Financial Statements). The USAA Mutual Funds' Board of Trustees approved the appointment of the Fund's investment adviser, Victory Capital Management Inc. ("Victory Capital"), as the administrator of the LRMP. At an in-person meeting held on February 26, 2020, Victory Capital provided an oral and written report to the Trustees on the operation and effectiveness of the LRMP during the previous year.
Victory Capital manages liquidity risks associated with the Fund's investments by monitoring, among other things, cash and cash equivalents, any use of derivatives, the concentration of investments, the appropriateness of the Fund's investment strategy, and by classifying every fund investment as either highly liquid, moderately liquid, less liquid or illiquid on at least a monthly basis. To assist with the classification of Fund investments, Victory Capital has retained a third-party provider of liquidity evaluation services. This provider determines preliminary liquidity classifications for all portfolio holdings based upon portfolio-level data and certain assumptions provided by Victory Capital. Victory Capital reviews the preliminary liquidity classifications, and, when appropriate, considers other information including input from the Fund's portfolio managers (including the portfolio managers employed by any investment sub-advisers) in determining final liquidity classifications.
The report from Victory Capital concluded that the Fund did not experience any significant liquidity challenges during the covered period, and the Fund's LRMP is reasonably designed to assess and manage its liquidity risk. The report also concluded that the LRMP continues to operate adequately and effectively to enable Victory Capital to oversee and manage liquidity risk and ensure the Fund is able to meet redemption requests without significant dilution to the remaining investors' interest in the Fund. During the review period, the Fund's portfolio consisted primarily of highly liquid investments, which are defined as cash and any investments reasonably expected to be converted to cash in current market conditions in three business days or less without significantly changing the market value of the investment. Therefore, the Fund has not adopted a Highly Liquid Investment Minimum. The Fund's investments were below the limitation on illiquid investments during the review period. Additionally, Victory Capital indicated that no events occurred that would require the filing of Form N-LIQUID and recommended no material changes to the LRMP.
39
Privacy Policy
Protecting the Privacy of Information
The Trust respects your right to privacy. We also know that you expect us to conduct and process your business in an accurate and efficient manner. To do so, we must collect and maintain certain personal information about you. This is the information we collect from you on applications or other forms, and from the transactions you make with us or third parties. It may include your name, address, social security number, account transactions and balances, and information about investment goals and risk tolerance.
We do not disclose any information about you or about former customers to anyone except as permitted or required by law. Specifically, we may disclose the information we collect to companies that perform services on our behalf, such as the transfer agent that processes shareholder accounts and printers and mailers that assist us in the distribution of investor materials. We may also disclose this information to companies that perform marketing services on our behalf. This allows us to continue to offer you Victory investment products and services that meet your investing needs, and to effect transactions that you request or authorize. These companies will use this information only in connection with the services for which we hired them. They are not permitted to use or share this information for any other purpose.
To protect your personal information internally, we permit access only by authorized employees and maintain physical, electronic and procedural safeguards to guard your personal information.*
* You may have received communications regarding information about privacy policies from other financial institutions which gave you the opportunity to "opt-out" of certain information sharing with companies which are not affiliated with that financial institution. The Trust does not share information with other companies for purposes of marketing solicitations for products other than the Trust. Therefore, the Trust does not provide opt-out options to their shareholders.
P.O. Box 182593
Columbus, Ohio 43218-2593

Visit our website at: | Call | ||||||
vcm.com | (800) 235-8396 | ||||||
31712-0920

JULY 31, 2020
Annual Report
USAA Short-Term Bond Fund
Beginning January 1, 2021, as permitted by regulations adopted by the Securities and Exchange Commission, paper copies of the Fund's shareholder reports like this one will no longer be sent by mail, unless you specifically request paper copies of the reports from the Fund or from your financial intermediary, such as a broker-dealer or bank. Instead, the reports will be made available on VictoryFunds.com, and you will be notified by mail each time a report is posted and provided with a website link to access the report. If you already elected to receive shareholder reports electronically, you will not be affected by this change and you need not take any action.
You may elect to receive shareholder reports and other communications from the Fund or your financial intermediary electronically by notifying your financial intermediary directly, or if you are a direct investor, by calling (800) 235-8396 or logging on to usaa.com. Effective on or about November 6, 2020, a shareholder who has an account directly with the Fund will need to submit their request via email to TA.Processing@FISGlobal.com.
You may elect to receive all future reports in paper free of charge. You can inform the Fund or your financial intermediary that you wish to continue receiving paper copies of your shareholder reports by notifying your financial intermediary directly, or if you are a direct investor, by calling (800) 235-8396 or logging on to usaa.com. Effective on or about November 6, 2020, a shareholder who has an account directly with the Fund will need to submit their request via email to TA.Processing@FISGlobal.com. Your election to receive reports in paper will apply to all funds held with the USAA Mutual Funds or your financial intermediary.
Victory Capital means Victory Capital Management Inc., the investment adviser of the USAA Mutual Funds. USAA Mutual Funds are distributed by Victory Capital Services, Inc., member FINRA, an affiliate of Victory Capital. Victory Capital and its affiliates are not affiliated with United Services Automobile Association or its affiliates. USAA and the USAA logo are registered trademarks and the USAA Mutual Funds and USAA Investments logos are trademarks of United Services Automobile Association and are being used by Victory Capital and its affiliates under license.
USAA Mutual Funds Trust
TABLE OF CONTENTS
Shareholder Letter (Unaudited) | 2 | ||||||
Managers' Commentary (Unaudited) | 3 | ||||||
Investment Overview (Unaudited) | 6 | ||||||
| Investment Objective & Portfolio Holdings (Unaudited) | 8 | ||||||
Financial Statements | |||||||
Schedule of Portfolio Investments | 10 | ||||||
Statement of Assets and Liabilities | 36 | ||||||
Statement of Operations | 37 | ||||||
Statements of Changes in Net Assets | 38 | ||||||
Financial Highlights | 40 | ||||||
Notes to Financial Statements | 44 | ||||||
| Report of Independent Registered Public Accounting Firm | 57 | ||||||
Supplemental Information | 58 | ||||||
Trustees' and Officers' Information | 58 | ||||||
Proxy Voting and Portfolio Holdings Information | 64 | ||||||
Expense Examples | 64 | ||||||
Additional Federal Income Tax Information | 65 | ||||||
Liquidity Risk Management Program | 66 | ||||||
Privacy Policy (inside back cover) | |||||||
This report is for the information of the shareholders and others who have received a copy of the currently effective prospectus of the Fund, managed by Victory Capital Management Inc. It may be used as sales literature only when preceded or accompanied by a current prospectus, which provides further details about the Fund.
IRA DISTRIBUTION WITHHOLDING DISCLOSURE
We generally must withhold federal income tax at a rate of 10% of the taxable portion of your distribution and, if you live in a state that requires state income tax withholding, at your state's tax rate. However, you may elect not to have withholding apply or to have income tax withheld at a higher rate. Any withholding election that you make will apply to any subsequent distribution unless and until you change or revoke the election. If you wish to make a withholding election, or change or revoke a prior withholding election, call (800) 235-8396.
If you do not have a withholding election in place by the date of a distribution, federal income tax will be withheld from the taxable portion of your distribution at a rate of 10%. If you must pay estimated taxes, you may be subject to estimated tax penalties if your estimated tax payments are not sufficient and sufficient tax is not withheld from your distribution.
For more specific information, please consult your tax adviser.
1
(Unaudited)
Dear Shareholder,
The previous decade ended with the longest-ever bull market in U.S. equities still intact, even as investors wrestled with issues like softening global economic data, Brexit, and U.S.-China trade relations. In retrospect, those worries seem pedestrian given what we would experience.
A new and unexpected threat—a global pandemic, the novel coronavirus ("COVID-19")—first emerged in Asia and then began spreading globally and throughout the United States during the first quarter of 2020. This unprecedented and unanticipated event not only rendered all existing economic forecasts moot, but it also roiled stock and bond markets everywhere. It also brought the economy to a near halt. The historic bull market in stocks ended virtually overnight.
After an initial severe sell-off in March, equity markets recovered sharply. As our annual reporting period drew to a close on July 31, 2020, many of the broad market indexes had recovered and volatility had returned to more palatable levels. In fact, despite all the chaos, the S&P 500® Index, one of the most popular measures of large U.S. stocks, finished the fiscal year (July 31, 2020) at approximately 3,271, which was up 8.9% from one year ago. Quite the impressive reversal.
The market turmoil of early 2020 was not limited to equities. Fixed income volatility spiked when liquidity evaporated in late March as investors struggled to understand the ramifications of sheltering in place. Fortunately, the U.S. Federal Reserve (the "Fed") (as well as other global central banks) leapt into action—cutting interest rates, (re)starting quantitative easing and, in the case of the Fed, launching an array of programs to stabilize markets.
The new lending facilities and programs had their intended effect of improving fixed income liquidity and trading. Credit spreads across corporate, high yield, structured, and municipal markets were coaxed down from their highs. In addition, Congress came through with substantial fiscal stimulus that also was applauded by investors and markets. Although fixed income markets regained their footing, the yield on 10-Year Treasurys, a benchmark for low-risk investments, declined steadily during our fiscal year—from 2.02% at the beginning of our reporting period to approximately 0.55% as of July 31, 2020. This suggests that investors remain a little wary.
While the past year has been unprecedented for all of us, both personally and professionally, our portfolio managers continue to analyze the financial markets, economic conditions, and the trajectory of the pandemic, which will likely be a guiding factor on Fed policy and the markets.
No matter what happens in the near term, we believe that the massive monetary and fiscal policies introduced earlier this year will have longer-term ramifications. Despite this uncertainty, it's important to remain focused on your long-term investment goals and avoid making emotional decisions. If you invest with us directly, our Member Service Representatives are available to help. Call us at (800) 235-8396.
Sincerely,

Christopher K. Dyer, CFA
President,
USAA Mutual Funds
2
USAA Mutual Funds Trust
USAA Short-Term Bond Fund
Managers' Commentary
(Unaudited)
USAA Investments, A Victory Capital Investment Franchise
| Brian Smith, CFA, CPA | Julianne Bass, CFA |
| John Spear, CFA | Kurt Daum, JD |
| James F. Jackson Jr., CFA | R. Neal Graves, CFA, CPA |
| Douglas J. Rollwitz, CFA, CPA |
• What were the market conditions over the reporting period?
Seems like eons ago, but just a year and a half ago, the U.S. Federal Reserve (the "Fed") had actually increased the Fed Funds rate to a range of 2.25%-2.50%. This turned out to be the highest the Fed Funds rate would go. Six-months later, the Fed began lowering interest rates, bringing the Fed Funds rate down to a range of 2.00%-2.25% when the reporting period started in August 2019. The Fed also stopped shrinking its balance sheet, all in an effort to keep the economy humming, as the effects of the trade war with China were starting to be felt here in the United States. While real GDP was somewhat weak in the second quarter of 2019 at 1.50%, the rest of the year posted a respectable growth rate of 2.50%. However, the world was about to change in a way almost no one imagined.
Sometime in late 2019, reports were surfacing of a virus in Wuhan, China. The virus, a novel coronavirus ("COVID-19"), started spreading rapidly in Wuhan, and was soon beginning to show up in other countries. Ultimately, COVID-19 became a pandemic, and many countries around the world, including the United States, began "locking down" their economies in an effort to contain the virus. In the United States, the lockdowns began in earnest in March, and significantly affected almost every area of the economy.
Unprecedented became an everyday word, as life in the United States became unlike anything we have ever seen. With many businesses being forced to temporarily close, many people were put out of work. Monthly payrolls, which had been growing at an average of roughly 216 thousand per month since August 2019, plummeted to a loss of 1.4 million jobs in March, and an unprecedented loss of 21 million jobs in April. The unemployment rate, which was at a record low of 3.5% in February, jumped to 14.7% in April. Real GDP fell 5% in first quarter of 2020 and a record 32.9% in the second quarter of 2020, thus officially marking the economy as being in recession. Due to demand dropping precipitously from people not driving, coupled with a strong supply, the price of West Texas Intermediate ("WTI") crude oil, an indicating benchmark, actually went negative in April. This was due to investors in WTI futures contracts, which requires physical settlement, having to pay to not take delivery, forcing the price into unprecedented negative territory.
In response, federal and state governments stepped up stimulus efforts to help those out of work. Congress passed an unprecedented $1 trillion stimulus package, with unemployment benefits to temporarily supplement state payments, as well as grants/loans to businesses. The Fed significantly increased its balance sheet again, and in an unprecedented move, increased the types of bonds it can buy, to include corporate bonds.
3
USAA Mutual Funds Trust
USAA Short-Term Bond Fund (continued)
Managers' Commentary (continued)
Although U.S. Treasury rates had already begun to fall by August 2019, in response to worries over the trade war with China and the economy beginning to slow, the unprecedented worldwide economic shutdown drove interest rates much lower, as investors bought U.S. Treasurys in a flight to quality. Given the Fed moving the Fed Funds rate to effectively zero and the economy only slowly beginning to reopen, U.S. Treasury rates remain at their lows. Although interest rates were already low, year over year decreases were dramatic. The two-year U.S. Treasury yield dropped 177 basis points, while 10-year and 30-year U.S. Treasury yields dropped 149 and 133 basis points, respectively. (A basis point is 1/100th of a percent.)
Given the pandemic, credit spreads (yield differentials between corporate bonds and U.S. Treasury securities of comparable maturity) significantly increased. Although they did not increase as much as in 2008, they increased much more rapidly. From a relatively low level in mid-February, spreads peaked in late March, which resulted in a very rapid increase. AAA, AA, A and BBB spreads widened by 10, 24, 18, and 33 basis points, respectively. High-yield spreads widened by 119 basis points. (Spreads generally are considered an indication of risk; the wider the spread, the greater the perceived risk.) Although spreads have continued to fall, they remain higher than pre-COVID-19 levels.
• How did the USAA Short-Term Bond Fund (the "Fund") perform during the reporting period?
The Fund has four share classes: Fund Shares, Institutional Shares, Class A shares (redesignated from Adviser Shares), and R6 Shares. For the reporting period ended July 31, 2020, the Fund Shares, Institutional Shares, Class A shares, and R6 Shares had total returns of 3.79%, 4.01%, 3.58%, and 4.04%, respectively. This compares to returns of 4.67% for the Bloomberg Barclays 1-3 Year Credit Index (the "Index") and 4.06% for the Lipper Short Investment Grade Debt Funds Index. At the same time, the Fund Shares, Institutional Shares, Class A shares, and R6 Shares provided a one-year dividend yield of 2.80%, 2.90%, 2.60%, and 2.93%, respectively, compared to 2.29% for the Lipper Short Investment Grade Debt Funds Index.
• What strategies did you employ during the reporting period?
The Fund earned a positive total return during the reporting period ended July 31, 2020, driven primarily by coupon income and the decline in U.S. Treasury yields, but underperformed the Index.
Reflecting the portfolio's diversification, the Fund's results were spread among a variety of sectors. Within corporate bonds, the Fund benefited from investments in Pharmaceuticals, Healthcare, Technology, Insurance, Municipal Bonds and Utilities. Certain other market segments weighed on relative performance, although they generally produced positive returns. These included Airlines, Finance Companies, Leisure, Energy, as well U.S. Treasury securities. In addition, the Fund's cash position was a drag on performance as bond prices rose during the reporting period. We continued to adhere to
4
USAA Mutual Funds Trust
USAA Short-Term Bond Fund (continued)
Managers' Commentary (continued)
our disciplined investment approach, which is to maintain an attractive yield with an acceptable level of risk. From a credit risk perspective, investment-grade bonds outperformed for the period, with high-yield bonds underperforming.
To identify attractive investment opportunities, we worked with our in-house team of credit analysts, continuing to build the portfolio bond-by-bond, through fundamental bottom-up analysis. We seek ideas where our fundamental understanding of the credit risk is different than the market. This approach, we believe, can generate total returns that may outperform our Lipper peers over the long run, with less volatility. Our credit analysts review all securities considered for purchase and assign their own independent credit rating. As always, they continuously monitor every holding in the Fund. We are committed to building a portfolio diversified among multiple asset classes and across a large number of issuers. To minimize the Fund's exposure to potential surprises, we limit the positions we take in any one issuer.
Thank you for allowing us to assist you with your investment needs.
5
USAA Mutual Funds Trust
USAA Short-Term Bond Fund
Investment Overview
(Unaudited)
Average Annual Total Return
Year Ended July 31, 2020
Fund Shares | Institutional Shares | Class A shares | Class R6 Shares | ||||||||||||||||||||||||||||
INCEPTION DATE | 6/1/93 | 8/1/08 | 8/2/10 | 12/1/16 | |||||||||||||||||||||||||||
Net Asset Value | Net Asset Value | Net Asset Value | Maxiumum Offering Price | Net Asset Value | Bloomberg Barclays 1-3 Year Credit Index1 | Lipper Short Investment Grade Debt Funds Index2 | |||||||||||||||||||||||||
One Year | 3.79 | % | 4.01 | % | 3.58 | % | 1.27 | % | 4.04 | % | 4.67 | % | 4.06 | % | |||||||||||||||||
Five Year | 2.61 | % | 2.72 | % | 2.39 | % | 1.93 | % | N/A | 2.66 | % | 2.39 | % | ||||||||||||||||||
Ten Year | 2.38 | % | 2.52 | % | N/A | N/A | N/A | 2.32 | % | 2.08 | % | ||||||||||||||||||||
Since Inception | N/A | N/A | 2.15 | % | 1.92 | % | 3.22 | % | N/A | N/A | |||||||||||||||||||||
Past performance is not indicative of future results. The performance data quoted represents past performance and current returns may be lower or higher. The investment return and principal value will fluctuate so that an investor's shares, when redeemed, may be worth more or less than the original cost. To obtain performance information current to the most recent month's end, please visit www.vcm.com.
Total return measures the price change in a share assuming the reinvestment of all net investment income and realized capital gain distributions, if any. The total returns quoted do not reflect adjustments made to the enclosed financial statements in accordance with U.S. generally accepted accounting principles or the deduction of taxes that a shareholder would pay on net investment income and realized capital gain distributions, including reinvested distributions, or redemptions of shares.
The total return figures set forth above include all waivers of fees for various periods since inception. Without such fee waivers, the total returns would have been lower.
USAA Short-Term Bond Fund — Growth of $10,000

1The unmanaged broad-based Bloomberg Barclays 1–3 Year Credit Index measures the performance of investment grade corporate debt and sovereign, supranational, local authority, and non-U.S. agency bonds that have a remaining maturity of at least one year and less than three years.
2The unmanaged Lipper Short Investment Grade Debt Funds Index tracks the total return performance of funds in the Lipper Short Investment Grade Debt Funds category.
The graph reflects investment of growth of a hypothetical $10,000 investment in the Fund. Past performance is no guarantee of future results.
The graph and table do not reflect the deduction of taxes that a shareholder would pay on Fund distributions or the redemption of Fund shares.
6
USAA Mutual Funds Trust
USAA Short-Term Bond Fund (continued)
12-MONTH DIVIDEND YIELD COMPARISON
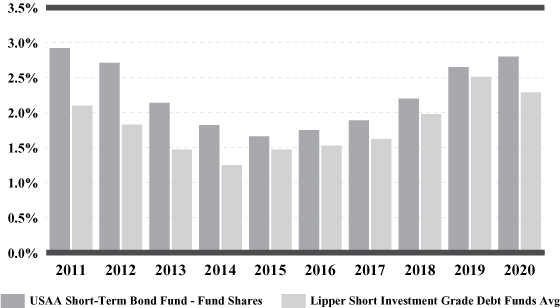
The 12-month dividend yield is computed by dividing net investment income dividends paid during the previous 12 months by the latest adjusted month-end net asset value. The yields quoted do not reflect adjustments made to the enclosed financial statements in accordance with U.S. generally accepted accounting principles. The net asset value is adjusted for a portion of the capital gains, if any, distributed during the previous nine months. The graph represents data for periods ending 7/31/11 through 7/31/20.
The Lipper Corporate Debt Funds A Rated Average is the average performance level of all corporate A rated debt funds, reported by Lipper Inc., an independent organization that monitors the performance of mutual funds.
7
| USAA Mutual Funds Trust USAA Short-Term Bond Fund | July 31, 2020 | ||||||
(Unaudited)
Investment Objective & Portfolio Holdings:
The USAA Short-Term Bond Fund seeks high current income consistent with preservation of principal.
Asset Allocation*:
July 31, 2020
(% of Net Assets)
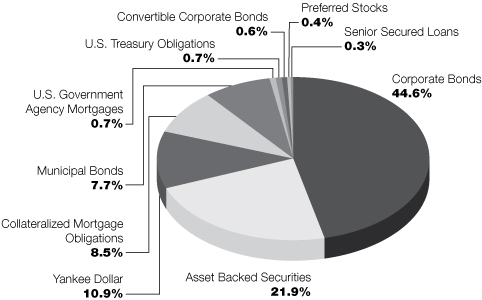
* Does not include futures, money market instruments, and short-term investments purchased with cash collateral from securities loaned.
Percentages are of the net assets of the Fund and may not equal 100%.
8
| USAA Mutual Funds Trust USAA Short-Term Bond Fund | July 31, 2020 | ||||||
(Unaudited)
Portfolio Ratings Mix:
July 31, 2020
(% of Net Assets)
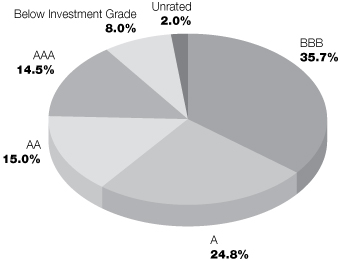
This chart reflects the highest long-term rating from a Nationally Recognized Statistical Rating Organization ("NRSRO"), with the four highest long-term credit ratings labeled, in descending order of credit quality, AAA, AA, A, and BBB. These categories represent investment-grade quality. NRSRO ratings are shown because they provide independent analysis of the credit quality of the Fund's investments. Victory Capital Management, Inc. ("Adviser") also performs its own fundamental credit analysis of each security. As part of its fundamental credit analysis, the Adviser considers various criteria, including industry specific actions, peer comparisons, payment ranking, and structure specific characteristics. Any of the Fund's securities that are not rated by an NRSRO appear in the chart above as "Unrated," but these securities are analyzed and monitored by the Adviser on an ongoing basis. Government securities that are issued or guaranteed as to principal and interest by the U.S. government and pre-refunded and escrowed-to-maturity municipal bonds that are not rated are treated as AAA for credit quality purposes.
9
| USAA Mutual Funds Trust USAA Short-Term Bond Fund | Schedule of Portfolio Investments July 31, 2020 | ||||||
(Amounts in Thousands, Except for Shares)
Security Description | Principal Amount | Value | |||||||||
Asset-Backed Securities (21.9%) | |||||||||||
| Americredit Automobile Receivables Trust, Series 2018-2, Class A3, 3.15%, 3/20/23, Callable 2/18/23 @ 100 | $ | 2,306 | $ | 2,338 | |||||||
| AmeriCredit Automobile Receivables Trust, Series 2017-4, Class D, 3.08%, 12/18/23, Callable 5/18/22 @ 100 | 1,921 | 1,975 | |||||||||
| AmeriCredit Automobile Receivables Trust, Series 2017-4, Class C, 2.60%, 9/18/23, Callable 5/18/22 @ 100 | 5,000 | 5,112 | |||||||||
| AmeriCredit Automobile Receivables Trust, Series 2016-2, Class D, 3.65%, 5/9/22, Callable 10/8/20 @ 100 | 5,000 | 5,023 | |||||||||
| AmeriCredit Automobile Receivables Trust, Series 2016-3, Class C, 2.24%, 4/8/22, Callable 3/8/21 @ 100 (a) | 5,367 | 5,383 | |||||||||
| ARI Fleet Lease Trust, Series 2018-A, Class A2, 2.55%, 10/15/26, Callable 11/15/21 @ 100 (b) | 704 | 707 | |||||||||
| ARI Fleet Lease Trust, Series 2018-A, Class A3, 2.84%, 10/15/26, Callable 11/15/21 @ 100 (b) | 6,063 | 6,174 | |||||||||
| ARI Fleet Lease Trust, Series 2019-A, Class A3, 2.53%, 11/15/27, Callable 12/15/22 @ 100 (b) | 5,000 | 5,170 | |||||||||
| ARI Fleet Lease Trust, Series 2020-A, Class A3, 1.80%, 8/15/28, Callable 4/15/23 @ 100 (b) | 2,250 | 2,288 | |||||||||
| ARI Fleet Lease Trust, Series 2020-A, Class B, 2.06%, 11/15/28, Callable 4/15/23 @ 100 (b) | 1,470 | 1,496 | |||||||||
| ARL Second LLC, Series 2014-1A, Class A1, 2.92%, 6/15/44, Callable 6/15/24 @ 100 (b) | 438 | 437 | |||||||||
| Ascentium Equipment Receivables Trust, Series 2017-2A, Class D, 3.56%, 10/10/25, Callable 1/10/22 @ 100 (b) | 608 | 616 | |||||||||
| Ascentium Equipment Receivables Trust, Series 2017-1A, Class B, 2.85%, 10/10/21, Callable 7/10/21 @ 100 (b) | 7,764 | 7,853 | |||||||||
| Ascentium Equipment Receivables Trust, Series 2017-1A, Class D, 3.80%, 1/10/24, Callable 7/10/21 @ 100 (b) | 767 | 776 | |||||||||
| Avis Budget Rental Car Funding AESOP LLC, Series 2019-1A, Class B, 3.70%, 3/20/23 (b) | 2,200 | 2,212 | |||||||||
| Avis Budget Rental Car Funding AESOP LLC, Series 2019-2A, Class A, 3.35%, 9/22/25 (b) | 3,300 | 3,315 | |||||||||
| Avis Budget Rental Car Funding AESOP LLC, Series 2019-3A, Class A, 2.36%, 3/20/26 (b) | 5,000 | 4,877 | |||||||||
| Avis Budget Rental Car Funding AESOP LLC, Series 2016-1A, Class C, 4.94%, 6/20/22 (b) | 2,827 | 2,830 | |||||||||
| Avis Budget Rental Car Funding AESOP LLC, Series 2016-2A, Class B, 3.36%, 11/20/22 (b) | 5,000 | 5,002 | |||||||||
| Avis Budget Rental Car Funding AESOP LLC, Series 2020- 1A, Class B, 2.68%, 8/20/26 (b) | 4,000 | 3,909 | |||||||||
| Avis Budget Rental Car Funding AESOP LLC, Series 2019-1A, Class A, 3.45%, 3/20/23 (b) | 4,967 | 5,007 | |||||||||
| Bank of The West Auto Trust, Series 2017-1, Class A4, 2.33%, 9/15/23, Callable 1/15/22 @ 100 (b) | 5,455 | 5,580 | |||||||||
| Bank of The West Auto Trust, Series 2019-1, Class A4, 2.51%, 10/15/24, Callable 3/15/23 @ 100 (b) | 7,500 | 7,849 | |||||||||
| Bank of The West Auto Trust, Series 2018-1, Class A4, 3.59%, 12/15/23, Callable 2/15/22 @ 100 (b) | 5,000 | 5,202 | |||||||||
See notes to financial statements.
10
| USAA Mutual Funds Trust USAA Short-Term Bond Fund | Schedule of Portfolio Investments — continued July 31, 2020 | ||||||
(Amounts in Thousands, Except for Shares)
Security Description | Principal Amount | Value | |||||||||
| Bank of The West Auto Trust, Series 2019-1, Class B, 2.76%, 1/15/25, Callable 3/15/23 @ 100 (b) | $ | 3,300 | $ | 3,460 | |||||||
| Bank of The West Auto Trust, Series 2019-1, Class C, 2.90%, 4/15/25, Callable 3/15/23 @ 100 (b) | 1,400 | 1,454 | |||||||||
| Bank of The West Auto Trust, Series 2017-1, Class C, 2.96%, 2/15/24, Callable 1/15/22 @ 100 (b) | 5,000 | 5,135 | |||||||||
| BCC Funding Corp. XVI LLC, Series 2019-1A, Class A2, 2.46%, 8/20/24, Callable 3/20/23 @ 100 (b) | 6,460 | 6,485 | |||||||||
| BCC Funding LLC, Series 2018-1A, Class A2, 2.96%, 6/20/23, Callable 10/20/21 @ 100 (b) | 1,704 | 1,708 | |||||||||
| California Republic Auto Receivables Trust, Series 2018-1, Class D, 4.33%, 4/15/25, Callable 8/15/22 @ 100 | 3,531 | 3,695 | |||||||||
| Canadian Pacer Auto Receivables Trust, Series 2018-1A, Class C, 3.82%, 4/19/24, Callable 4/19/21 @ 100 (b) | 10,000 | 10,203 | |||||||||
| Canadian Pacer Auto Receivables Trust, Series 2018-1, Class B, 3.47%, 2/19/23, Callable 4/19/21 @ 100 (b) | 5,000 | 5,102 | |||||||||
| Canadian Pacer Auto Receivables Trust, Series 2018-2A, Class B, 3.63%, 1/19/24, Callable 2/19/22 @ 100 (b) | 1,250 | 1,296 | |||||||||
| Canadian Pacer Auto Receivables Trust, Series 2018-2A, Class C, 4.07%, 3/19/25, Callable 2/19/22 @ 100 (b) | 5,000 | 5,105 | |||||||||
| Canadian Pacer Auto Receivables Trust, Series 2018-2A, Class A4, 3.44%, 8/21/23, Callable 2/19/22 @ 100 (b) | 5,135 | 5,303 | |||||||||
| Canadian Pacer Auto Receivables Trust, Series 2020-1A, Class C, 2.49%, 5/19/26, Callable 8/19/23 @ 100 (b) | 2,000 | 2,012 | |||||||||
| Canadian Pacer Auto Receivables Trust, Series 2020-1A, Class B, 2.00%, 7/21/25, Callable 8/19/23 @ 100 (b) | 2,000 | 2,023 | |||||||||
| CarMax Auto Owner Trust, Series 2019-4, Class C, 2.60%, 9/15/25, Callable 7/15/23 @ 100 | 5,163 | 5,337 | |||||||||
| CarMax Auto Owner Trust, Series 2018-1, Class D, 3.37%, 7/15/24, Callable 2/15/22 @ 100 | 500 | 509 | |||||||||
| CarMax Auto Owner Trust, Series 2020-1, Class C, 2.34%, 11/17/25, Callable 9/15/23 @ 100 | 3,270 | 3,352 | |||||||||
| CarMax Auto Owner Trust, Series 2020-2, Class B, 2.90%, 8/15/25, Callable 7/15/23 @ 100 | 1,806 | 1,918 | |||||||||
| CarMax Auto Owner Trust, Series 2019-1, Class B, 3.45%, 11/15/24, Callable 2/15/23 @ 100 | 1,923 | 2,038 | |||||||||
| CarMax Auto Owner Trust, Series 2020-1, Class B, 2.21%, 9/15/25, Callable 9/15/23 @ 100 | 3,188 | 3,319 | |||||||||
| CARS LP, Series 2020-1A, Class A1, 2.69%, 2/15/50 (b) | 4,257 | 4,330 | |||||||||
| CCG Receivables Trust, Seies 2019-1, Class B, 3.22%, 9/14/26, Callable 11/14/22 @ 100 (b) | 1,040 | 1,068 | |||||||||
| CCG Receivables Trust, Series 2019-2, Class B, 2.55%, 3/15/27, Callable 2/14/22 @ 100 (b) | 3,500 | 3,559 | |||||||||
| Chesapeake Funding LLC, Series 2018-A1, Class A1, 3.04%, 4/15/30 (b) | 1,345 | 1,369 | |||||||||
| Chesapeake Funding LLC, Series 2019-1A, Class B, 3.11%, 4/15/31, Callable 6/15/22 @ 100 (b) | 6,000 | 6,213 | |||||||||
| Chesapeake Funding LLC, Series 2018-2A, Class A1, 3.23%, 8/15/30, Callable 8/15/21 @ 100 (b) | 2,714 | 2,755 | |||||||||
See notes to financial statements.
11
| USAA Mutual Funds Trust USAA Short-Term Bond Fund | Schedule of Portfolio Investments — continued July 31, 2020 | ||||||
(Amounts in Thousands, Except for Shares)
Security Description | Principal Amount | Value | |||||||||
| CNH Equipment Trust, Series 2017-B, Class B, 2.47%, 12/16/24, Callable 9/15/21 @ 100 | $ | 1,200 | $ | 1,218 | |||||||
| College Loan Corp. Trust, Series 2005-2, Class B, 0.77% (LIBOR03M+49bps), 1/15/37, Callable 4/15/28 @ 100 (c) | 1,326 | 1,148 | |||||||||
| Conn's Receivables Funding LLC, Series 2019-B, Class A, 2.66%, 6/17/24, Callable 11/15/21 @ 100 (b) | 1,308 | 1,305 | |||||||||
| Credit Acceptance Auto Loan Trust, Series 2017-2, Class C, 3.35%, 6/15/26 (b) | 4,850 | 4,878 | |||||||||
| Credit Acceptance Auto Loan Trust, Series 2017-3, Class B, 3.21%, 8/17/26 (b) | 1,500 | 1,513 | |||||||||
| Credit Acceptance Auto Loan Trust, Series 2019- 3A, Class A, 2.38%, 11/15/28 (b) | 2,250 | 2,296 | |||||||||
| Credit Acceptance Auto Loan Trust, Series 2018-1, Class A, 3.01%, 2/16/27 (b) | 1,496 | 1,505 | |||||||||
| Credit Acceptance Auto Loan Trust, Series 2020-1A, Class B, 2.39%, 4/16/29, Callable 1/15/24 @ 100 (b) | 2,059 | 2,110 | |||||||||
| Credit Acceptance Auto Loan Trust, Series 2020-1A, Class C, 2.59%, 6/15/29, Callable 1/15/24 @ 100 (b) | 4,000 | 4,066 | |||||||||
| Credit Acceptance Auto Loan Trust, Series 2019-3A, Class B, 2.86%, 1/16/29 (b) | 7,330 | 7,568 | |||||||||
| Credit Acceptance Auto Loan Trust, Series 2018-3A, Class A, 3.55%, 8/15/27, Callable 10/15/21 @ 100 (b) | 2,348 | 2,388 | |||||||||
| Credit Acceptance Auto Loan Trust, Series 2018-1A, Class B, 3.60%, 4/15/27, Callable 6/15/21 @ 100 (b) | 16,000 | 16,362 | |||||||||
| Dell Equipment Finance Trust, Series 2020-1, Class A3, 2.24%, 2/22/23, Callable 10/22/22 @ 100 (b) | 2,813 | 2,869 | |||||||||
| Dell Equipment Finance Trust, Series 2020-1, Class B, 2.98%, 4/24/23, Callable 10/22/22 @ 100 (b) | 775 | 802 | |||||||||
| Dell Equipment Finance Trust, Series 2017-2, Class D, 3.27%, 10/23/23, Callable 8/22/20 @ 100 (b) | 2,536 | 2,537 | |||||||||
| Dell Equipment Finance Trust, Series 2020-1, Class A2, 2.26%, 6/22/22, Callable 10/22/22 @ 100 (b) | 2,000 | 2,030 | |||||||||
| Dell Equipment Finance Trust, Series 2017-2, Class C, 2.73%, 10/24/22, Callable 8/22/20 @ 100 (b) | 1,750 | 1,751 | |||||||||
| Dell Equipment Finance Trust, Series 2019-2, Class C, 2.18%, 10/22/24, Callable 7/22/22 @ 100 (b) | 2,700 | 2,713 | |||||||||
| Drive Auto Receivables Trust, Series 2018-1, Class D, 3.81%, 5/15/24, Callable 4/15/22 @ 100 | 6,000 | 6,135 | |||||||||
| Drive Auto Receivables Trust, Series 2018-2, Class D, 4.14%, 8/15/24, Callable 9/15/22 @ 100 | 5,000 | 5,180 | |||||||||
| Drive Auto Receivables Trust, Series 2018-1, Class C, 3.22%, 3/15/23, Callable 4/15/22 @ 100 | 167 | 167 | |||||||||
| Drive Auto Receivables Trust, Series 2018-3, Class D, 4.30%, 9/16/24, Callable 9/15/22 @ 100 | 2,805 | 2,885 | |||||||||
| Drive Auto Receivables Trust, Series 2018-5, Class B, 3.68%, 7/15/23, Callable 12/15/22 @ 100 | 3,505 | 3,521 | |||||||||
| Drive Auto Receivables Trust, Series 2018-4, Class C, 3.66%, 11/15/24, Callable 8/15/22 @ 100 | 2,711 | 2,745 | |||||||||
| DT Auto Owner Trust, Series 2018-2A, Class C, 3.67%, 3/15/24, Callable 6/15/22 @ 100 (b) | 3,278 | 3,301 | |||||||||
See notes to financial statements.
12
| USAA Mutual Funds Trust USAA Short-Term Bond Fund | Schedule of Portfolio Investments — continued July 31, 2020 | ||||||
(Amounts in Thousands, Except for Shares)
Security Description | Principal Amount | Value | |||||||||
| Element Rail Leasing I LLC, Series 2014-1A, Class A1, 2.30%, 4/19/44 (b) | $ | 529 | $ | 527 | |||||||
| Element Rail Leasing I LLC, Series 2014-1A, Class A2, 3.67%, 4/19/44 (b) | 12,000 | 12,067 | |||||||||
| Enterprise Fleet Financing LLC, Series 2017-1, Class A3, 2.60%, 7/20/22, Callable 8/20/20 @ 100 (b) | 5,053 | 5,057 | |||||||||
| Enterprise Fleet Financing LLC, Series 2017-3, Class A3, 2.36%, 5/20/23 (b) | 2,344 | 2,374 | |||||||||
| Enterprise Fleet Financing LLC, Series 2019-1, Class A3, 3.07%, 10/20/24 (b) | 1,000 | 1,047 | |||||||||
| Enterprise Fleet Financing LLC, Series 2020-1, Class A3, 1.86%, 12/22/25 (b) | 2,050 | 2,100 | |||||||||
| Evergreen Credit Card Trust, Series 2019-2, Class B, 2.27%, 9/15/24 (b) | 3,562 | 3,591 | |||||||||
| Evergreen Credit Card Trust, Series 2019-1, Class B, 3.59%, 1/15/23 (b) | 3,740 | 3,781 | |||||||||
| Evergreen Credit Card Trust, Series 2019-1, Class C, 3.98%, 1/15/23 (b) | 4,000 | 4,023 | |||||||||
| Exeter Automobile Receivables Trust, Series 2019-3, Class C, 2.79%, 5/15/24, Callable 10/15/23 @ 100 (b) | 3,490 | 3,546 | |||||||||
| Exeter Automobile Receivables Trust, Series 2020-1A, Class B, 2.26%, 4/15/24, Callable 4/15/24 @ 100 (b) | 2,566 | 2,599 | |||||||||
| Exeter Automobile Receivables Trust, Series 2019-4, Class C, 2.44%, 9/16/24, Callable 9/15/23 @ 100 (b) | 4,000 | 4,047 | |||||||||
| Exeter Automobile Receivables Trust, Series 2020-1A, Class C, 2.49%, 1/15/25, Callable 4/15/24 @ 100 (b) | 4,545 | 4,602 | |||||||||
| Exeter Automobile Receivables Trust, Series 2018-3, Class D, 4.35%, 6/17/24, Callable 1/15/23 @ 100 (b) | 2,500 | 2,600 | |||||||||
| Exeter Automobile Receivables Trust, Series 2019-2A, Class C, 3.30%, 3/15/24, Callable 8/15/23 @ 100 (b) | 6,496 | 6,663 | |||||||||
| Exeter Automobile Receivables Trust, Series 2018-4, Class C, 3.97%, 9/15/23, Callable 1/15/23 @ 100 (b) | 4,000 | 4,085 | |||||||||
| Exeter Automobile Receivables Trust, Series 2018-3A, Class B, 3.46%, 10/17/22, Callable 1/15/23 @ 100 (b) | 183 | 183 | |||||||||
| First Investors Auto Owner Trust, Series 2019-2A, Class C, 2.71%, 12/15/25, Callable 4/15/23 @ 100 (b) | 7,403 | 7,547 | |||||||||
| First Investors Auto Owner Trust, Series 2020-1A, Class C, 2.55%, 2/17/26, Callable 11/15/23 @ 100 (b) | 5,000 | 5,083 | |||||||||
| First Investors Auto Owner Trust, Series 2017-2, Class D, 3.56%, 9/15/23, Callable 2/15/22 @ 100 (b) | 5,695 | 5,846 | |||||||||
| First Investors Auto Owner Trust, Series 2019-2, Class B, 2.47%, 1/15/25, Callable 4/15/23 @ 100 (b) | 3,640 | 3,714 | |||||||||
| Flagship Credit Auto Trust, Series 2017-4, Class B, 2.66%, 10/17/22, Callable 8/15/22 @ 100 (b) | 2,261 | 2,273 | |||||||||
| Flagship Credit Auto Trust, Series 2017-1, Class D, 4.23%, 5/15/23, Callable 1/15/22 @ 100 (b) | 5,760 | 5,925 | |||||||||
| Ford Credit Auto Lease Trust, Series 2020-A, Class B, 2.05%, 6/15/23, Callable 8/15/22 @ 100 | 5,000 | 5,098 | |||||||||
| Ford Credit Auto Owner Trust, Series 2020-1, Class B, 2.29%, 8/15/31, Callable 2/15/25 @ 100 (b) | 5,000 | 5,076 | |||||||||
See notes to financial statements.
13
| USAA Mutual Funds Trust USAA Short-Term Bond Fund | Schedule of Portfolio Investments — continued July 31, 2020 | ||||||
(Amounts in Thousands, Except for Shares)
Security Description | Principal Amount | Value | |||||||||
| Ford Credit Auto Owner Trust, Series 2020-1, Class C, 2.54%, 8/15/31, Callable 2/15/25 @ 100 (b) | $ | 5,000 | $ | 5,025 | |||||||
| Ford Credit Auto Owner Trust, Series 2020-1, Class A, 2.04%, 8/15/31, Callable 2/15/25 @ 100 (b) | 2,667 | 2,756 | |||||||||
| GM Financial Automobile Leasing Trust, Series 2020-1, Class B, 1.84%, 12/20/23, Callable 8/20/22 @ 100 | 3,261 | 3,315 | |||||||||
| GM Financial Automobile Leasing Trust, Series 2020-2, Class C, 2.56%, 7/22/24, Callable 3/20/23 @ 100 | 1,625 | 1,681 | |||||||||
| GM Financial Consumer Automobile Receivables Trust, Series 2020-2, Class B, 2.54%, 8/18/25, Callable 7/16/23 @ 100 | 1,500 | 1,569 | |||||||||
| GM Financial Consumer Automobile Receivables Trust, Series 2019-2, Class C, 3.07%, 11/18/24, Callable 11/16/22 @ 100 | 2,000 | 2,091 | |||||||||
| GMF Floorplan Owner Revolving Trust, Series 2018-3, Class B, 3.49%, 9/15/22 (b) | 4,546 | 4,557 | |||||||||
| GMF Floorplan Owner Revolving Trust, Series 2018-3, Class C, 3.68%, 9/15/22 (b) | 1,922 | 1,927 | |||||||||
| Goal Capital Funding Trust, Series 2005-2, Class A4, 0.56% (LIBOR03M+20bps), 8/25/44, Callable 8/25/20 @ 100 (c) | 4,518 | 4,359 | |||||||||
| Great American Auto Leasing, Inc., Series 2019-1, Class A4, 3.21%, 2/18/25, Callable 12/15/22 @ 100 (b) | 1,000 | 1,040 | |||||||||
| GreatAmerica Leasing Receivables Funding LLC, Series 2018-1, Class A4, 2.83%, 6/17/24, Callable 11/15/21 @ 100 (b) | 5,000 | 5,099 | |||||||||
| Hertz Vehicle Financing LP, Series 2016-4A, Class A, 2.65%, 7/25/22 (b) | 1,350 | 1,352 | |||||||||
| Hertz Vehicle Financing LP, Series 2019-1A, Class B, 4.10%, 3/25/23 (b) | 870 | 871 | |||||||||
| Hertz Vehicle Financing LP, Series 2019-1A, Class A, 3.71%, 3/25/23 (b) | 3,416 | 3,413 | |||||||||
| HPEFS Equipment Trust, Series 2020-1A, Class C, 2.03%, 2/20/30, Callable 12/20/22 @ 100 (b) | 2,851 | 2,851 | |||||||||
| HPEFS Equipment Trust, Series 2019-1A, Class B, 2.32%, 9/20/29, Callable 4/20/22 @ 100 (b) | 1,750 | 1,781 | |||||||||
| HPEFS Equipment Trust, Series 2019-1A, Class C, 2.49%, 9/20/29, Callable 4/20/22 @ 100 (b) | 1,350 | 1,368 | |||||||||
| HPEFS Equipment Trust, Series 2020-2A, Class C, 2.00%, 7/22/30, Callable 5/20/23 @ 100 (b) | 3,400 | 3,404 | |||||||||
| HPEFS Equipment Trust, Series 2020-2A, Class B, 1.20%, 7/22/30, Callable 5/20/23 @ 100 (b) | 4,167 | 4,170 | |||||||||
| Iowa Student Loan Liquidity Corp., Series 2005-1, Class B, 0.65% (LIBOR03M+35bps), 9/25/37, Callable 12/25/21 @ 100 (c) | 1,927 | 1,649 | |||||||||
| Kubota Credit Owner Trust, Series 2020-1A, Class A3, 1.96%, 3/15/24, Callable 10/15/23 @ 100 (b) | 3,750 | 3,854 | |||||||||
| Kubota Credit Owner Trust, Series 2020-1A, Class A2, 1.92%, 12/15/22, Callable 10/15/23 @ 100 (b) | 5,000 | 5,059 | |||||||||
| Master Credit Card Trust, Series 2020-1A, Class C, 2.59%, 9/23/24 (b) | 2,125 | 2,184 | |||||||||
| Master Credit Card Trust, Series 2019-2A, Class C, 2.83%, 7/21/21 (b) | 2,750 | 2,769 | |||||||||
| Master Credit Card Trust, Series 2019-2A, Class B, 2.39%, 7/21/21 (b) | 5,000 | 5,046 | |||||||||
See notes to financial statements.
14
| USAA Mutual Funds Trust USAA Short-Term Bond Fund | Schedule of Portfolio Investments — continued July 31, 2020 | ||||||
(Amounts in Thousands, Except for Shares)
Security Description | Principal Amount | Value | |||||||||
| Master Credit Card Trust, Series 2020-1A, Class B, 2.27%, 9/23/24 (b) | $ | 833 | $ | 856 | |||||||
| MMAF Equipment Finance LLC, Series 2017-A, Class A4, 2.41%, 8/16/24, Callable 5/16/26 @ 100 (b) | 2,900 | 2,950 | |||||||||
| Nelnet Student Loan Trust, Series 2005-3, Class B, 0.59% (LIBOR03M+28bps), 9/22/37, Callable 9/22/20 @ 100 (c) | 1,048 | 1,012 | |||||||||
| NextGear Floorplan Master Owner Trust, Series 2017-2A, Class B, 3.02%, 10/17/22 (b) | 3,400 | 3,399 | |||||||||
| NP SPE II LLC, Series 2017-1A, Class A1, 3.37%, 10/21/47, Callable 10/20/27 @ 100 (b) | 2,181 | 2,152 | |||||||||
| NP SPE II LLC, Series 2019-2A, Class A1, 2.86%, 11/19/49 (b) | 4,057 | 4,057 | |||||||||
| OneMain Direct Auto Receivables Trust, Series 2017-2, Class B, 2.55%, 11/14/23, Callable 9/14/20 @ 100 (b) | 741 | 741 | |||||||||
| OSCAR US Funding Trust LLC, Series 2018-2A, Class A3, 3.39%, 9/12/22 (b) | 4,840 | 4,880 | |||||||||
| OSCAR US Funding Trust LLC, Series 2017-1A, Class A4, 3.30%, 5/10/24 (b) | 3,268 | 3,318 | |||||||||
| OSCAR US Funding Trust LLC, Series 2018-1A, Class A3, 3.23%, 5/10/22 (b) | 3,328 | 3,353 | |||||||||
| OSCAR US Funding Trust LLC, Series 2017-2A, Class A3, 2.45%, 12/10/21 (b) | 924 | 926 | |||||||||
| Pawnee Equipment Receivables Series 1 LLC, Series 2019-1, Class A2, 2.29%, 10/15/24, Callable 3/15/23 @ 100 (b) | 4,990 | 5,053 | |||||||||
| Prestige Auto Receivables Trust, Series 2018-1A, Class C, 3.75%, 10/15/24, Callable 6/15/22 @ 100 (b) | 5,500 | 5,633 | |||||||||
| Prestige Auto Receivables Trust, Series 2019-1A, Class D, 3.01%, 8/15/25, Callable 1/15/23 @ 100 (b) | 5,000 | 5,075 | |||||||||
| Prestige Auto Receivables Trust, Series 2019-1A, Class B, 2.53%, 1/16/24, Callable 1/15/23 @ 100 (b) | 5,000 | 5,082 | |||||||||
| Prestige Auto Receivables Trust, Series 2016-2, Class C, 2.88%, 11/15/22, Callable 1/15/21 @ 100 (b) | 934 | 937 | |||||||||
| Prestige Auto Receivables Trust, Series 2017-1, Class B, 2.39%, 5/16/22, Callable 7/15/21 @ 100 (b) | 309 | 309 | |||||||||
| Santander Drive Auto Receivables Trust, Series 2018-5, Class B, 3.52%, 12/15/22, Callable 9/15/22 @ 100 | 1,751 | 1,757 | |||||||||
| Santander Retail Auto Lease Trust, Series 2020-A, Class B, 1.88%, 3/20/24, Callable 5/20/23 @ 100 (b) | 5,500 | 5,480 | |||||||||
| Santander Retail Auto Lease Trust, Series 2019-C, Class C, 2.39%, 11/20/23, Callable 1/20/23 @ 100 (b) | 1,783 | 1,790 | |||||||||
| SCF Equipment Leasing LLC, Series 2019-1A, Class B, 3.49%, 1/20/26, Callable 8/20/20 @ 100 (b) | 5,500 | 5,562 | |||||||||
| SCF Equipment Leasing LLC, Series 2019-2, Class B, 2.76%, 8/20/26, Callable 10/20/24 @ 100 (b) | 2,000 | 1,975 | |||||||||
| SCF Equipment Leasing LLC, Series 2019-1A, Class A2, 3.23%, 10/20/24, Callable 8/20/20 @ 100 (b) | 4,550 | 4,638 | |||||||||
| SCF Equipment Leasing LLC, Series 2017-2A, Class A, 3.41%, 12/20/23, Callable 8/20/20 @ 100 (b) | 1,569 | 1,573 | |||||||||
| SCF Equipment Leasing LLC, Series 2017-1, Class A, 3.77%, 1/20/23, Callable 7/20/21 @ 100 (b) | 2,980 | 3,000 | |||||||||
See notes to financial statements.
15
| USAA Mutual Funds Trust USAA Short-Term Bond Fund | Schedule of Portfolio Investments — continued July 31, 2020 | ||||||
(Amounts in Thousands, Except for Shares)
Security Description | Principal Amount | Value | |||||||||
| Securitized Term Auto Receivables Trust, Series 2017-2A, Class A4, 2.29%, 3/25/22, Callable 1/25/21 @ 100 (b) | $ | 3,447 | $ | 3,465 | |||||||
| Securitized Term Auto Receivables Trust, Series 2019-CRTA, Class B, 2.45%, 3/25/26, Callable 2/25/23 @ 100 (b) | 1,261 | 1,287 | |||||||||
| Securitized Term Auto Receivables Trust, Series 2019-CRTA, Class C, 2.85%, 3/25/26, Callable 2/25/23 @ 100 (b) | 1,802 | 1,843 | |||||||||
| Synchrony Card Funding LLC, Series 2019-A1, Class A, 2.95%, 3/15/25 | 1,000 | 1,033 | |||||||||
| Synchrony Credit Card Master Note Trust, Series 2016-2, Class C, 2.95%, 5/15/24 | 4,565 | 4,580 | |||||||||
| Synchrony Credit Card Master Note Trust, Series 2018-2, Class C, 3.87%, 5/15/26 | 5,000 | 5,165 | |||||||||
| TCF Auto Receivables Owner Trust, Series 2016-PT1, Class B, 2.92%, 10/17/22, Callable 1/15/21 @ 100 (b) | 5,000 | 5,052 | |||||||||
| TCF Auto Receivables Owner Trust, Series 2015-2A, Class D, 4.24%, 8/15/22, Callable 8/15/20 @ 100 (b) | 1,242 | 1,252 | |||||||||
| Tesla Auto Lease Trust, Series 2020-A, Class B, 1.18%, 1/22/24, Callable 4/20/23 @ 100 (b) (d) | 2,750 | 2,750 | |||||||||
| Transportation Finance Equipment Trust, Series 2019-1, Class A4, 1.88%, 3/25/24, Callable 9/23/23 @ 100 (b) | 3,000 | 3,011 | |||||||||
| Trillium Credit Card Trust II, Series 2019-2A, Class A, 3.04%, 1/26/24 (b) | 10,000 | 10,121 | |||||||||
| Trillium Credit Card Trust II, Series 2020-1A, Class B, 2.33%, 12/27/24 (b) | 3,708 | 3,752 | |||||||||
| Trinity Rail Leasing LLC, Series 2019-2A, Class A1, 2.39%, 10/18/49, Callable 10/17/20 @ 100 (b) | 2,259 | 2,212 | |||||||||
| Trinity Rail Leasing LP, Series 2012-1A, Class A1, 2.27%, 1/15/43, Callable 1/15/23 @ 100 (b) | 1,612 | 1,596 | |||||||||
| United Auto Credit Securitization Trust, Series 2019-1, Class B, 3.03%, 4/10/24, Callable 11/10/21 @ 100 (b) | 4,250 | 4,266 | |||||||||
| United Auto Credit Securitization Trust, Series 2018-1, Class D, 3.52%, 11/10/22, Callable 10/10/20 @ 100 (b) | 732 | 732 | |||||||||
| United Auto Credit Securitization Trust, Series 2020-1, Class C, 2.15%, 2/10/25, Callable 12/10/22 @ 100 (b) | 3,250 | 3,260 | |||||||||
| VB-S1 Issuer LLC, Series 2020-1A, Class C2, 3.03%, 6/15/50, Callable 6/15/24 @ 100 (b) | 1,000 | 1,015 | |||||||||
| Westlake Automobile Receivables Trust, Series 2018-1, Class E, 4.53%, 5/15/23, Callable 7/15/21 @ 100 (b) | 5,000 | 5,129 | |||||||||
| Westlake Automobile Receivables Trust, Series 2017-2, Class D, 3.28%, 12/15/22, Callable 2/15/21 @ 100 (b) | 2,000 | 2,017 | |||||||||
| Westlake Automobile Receivables Trust, Series 2018-3, Class C, 3.61%, 10/16/23, Callable 4/15/22 @ 100 (b) | 3,000 | 3,052 | |||||||||
| Westlake Automobile Receivables Trust, Series 2018-2A, Class D, 4.00%, 1/16/24, Callable 12/15/21 @ 100 (b) | 14,450 | 14,769 | |||||||||
| Westlake Automobile Receivables Trust, Series 2018-3A, Class D, 4.00%, 10/16/23, Callable 4/15/22 @ 100 (b) | 3,900 | 4,020 | |||||||||
| Westlake Automobile Receivables Trust, Series 2019-1A, Class C, 3.45%, 3/15/24, Callable 7/15/22 @ 100 (b) | 1,000 | 1,020 | |||||||||
| Westlake Automobile Receivables Trust, Series 2020-1A, Class C, 2.52%, 4/15/25, Callable 10/15/23 @ 100 (b) | 5,000 | 5,073 | |||||||||
See notes to financial statements.
16
| USAA Mutual Funds Trust USAA Short-Term Bond Fund | Schedule of Portfolio Investments — continued July 31, 2020 | ||||||
(Amounts in Thousands, Except for Shares)
Security Description | Principal Amount | Value | |||||||||
| World Omni Auto Receivables Trust, Series 2018-D, Class C, 3.87%, 8/15/25, Callable 10/15/22 @ 100 | $ | 4,000 | $ | 4,250 | |||||||
| World Omni Auto Receivables Trust, Series 2018-D, Class B, 3.67%, 12/16/24, Callable 10/15/22 @ 100 | 2,000 | 2,121 | |||||||||
| World Omni Select Auto Trust, Series 2018-1A, Class D, 4.13%, 1/15/25, Callable 8/15/22 @ 100 (b) | 2,500 | 2,586 | |||||||||
| World Omni Select Auto Trust, Series 2018-1, Class B, 3.68%, 7/15/23, Callable 8/15/22 @ 100 (b) | 5,000 | 5,110 | |||||||||
620,563 | |||||||||||
Total Asset-Backed Securities (Cost $612,832) | 620,563 | ||||||||||
Collateralized Mortgage Obligations (8.5%) | |||||||||||
| American Money Management Corp., Series 2016-19A, Class AR, 1.42% (LIBOR03M+114bps), 10/16/28, Callable 10/15/20 @ 100 (b) (c) | 1,500 | 1,486 | |||||||||
| Annisa CLO Ltd., Series 2016-2, Class AR, 1.37% (LIBOR03M+110bps), 7/20/31, Callable 10/20/20 @ 100 (b) (c) | 3,000 | 2,927 | |||||||||
| BBCMS Trust, Series 2013-TYSN, Class B, 4.04%, 9/5/32 (b) | 3,500 | 3,496 | |||||||||
| BBCMS Trust, Series 2013-TYSN, Class A2, 3.76%, 9/5/32 (b) | 10,000 | 9,999 | |||||||||
| BTH Mortgage-Backed Securities Trust, Series 2018-21, Class A, 2.50% (LIBOR01M+250bps), 10/7/21 (b) (c) | 4,000 | 3,961 | |||||||||
| Citigroup Commercial Mortgage Trust, Series 2019-PRM, Class A, 3.34%, 5/10/36 (b) | 7,338 | 7,818 | |||||||||
| Citigroup Commercial Mortgage Trust, Series 2019-SMRT, Class B, 4.38%, 1/10/36 (b) | 7,600 | 8,150 | |||||||||
| COMM Mortgage Trust, Series 2015-PC1, Class B, 4.36%, 7/10/50 (e) | 3,366 | 3,503 | |||||||||
| COMM Mortgage Trust, Series 2020-CBM, Class A2, 2.90%, 11/13/39 (b) | 5,620 | 5,602 | |||||||||
| COMM Mortgage Trust, Series 2020-CBM, Class C, 3.40%, 11/13/39 (b) | 2,625 | 2,529 | |||||||||
| COMM Mortgage Trust, Series 2020-CBM, Class B, 3.10%, 11/13/39 (b) | 5,000 | 5,017 | |||||||||
| COMM Mortgage Trust, Series 2012-CCRE4, Class XA, 1.69%, 10/15/45 (e) (f) | 53,780 | 1,720 | |||||||||
| COMM Mortgage Trust, Series 2012-CCRE2, Class XA, 1.63%, 8/15/45 (e) (f) | 58,455 | 1,450 | |||||||||
| COMM Mortgage Trust, Series 2014-277P, Class A, 3.61%, 8/10/49 (b) (e) | 5,000 | 5,388 | |||||||||
| COSMO Mortgage Trust, Series 2017-CSMO, Class C, 1.67% (LIBOR01M+150bps), 11/15/36 (b) (c) | 9,500 | 9,085 | |||||||||
| FREMF Mortgage Trust, Series 2016-K504, Class B, 3.18%, 9/25/20 (b) (e) | 5,655 | 5,645 | |||||||||
| FREMF Mortgage Trust, Series 2014-K717, Class B, 3.63%, 11/25/47 (b) (e) | 5,500 | 5,622 | |||||||||
| FREMF Mortgage Trust, Series 2014-K715, Class B, 3.98%, 2/25/46 (b) (e) | 10,000 | 10,106 | |||||||||
See notes to financial statements.
17
| USAA Mutual Funds Trust USAA Short-Term Bond Fund | Schedule of Portfolio Investments — continued July 31, 2020 | ||||||
(Amounts in Thousands, Except for Shares)
Security Description | Principal Amount | Value | |||||||||
| FREMF Mortgage Trust, Series 2017-K724, Class B, 3.48%, 11/25/23 (b) (e) | $ | 4,935 | $ | 5,174 | |||||||
| FREMF Mortgage Trust, Series 2012- K17, Class B, 4.32%, 12/25/44 (b) (e) | 9,335 | 9,705 | |||||||||
| FREMF Mortgage Trust, Series 2011-K12, Class B, 4.34%, 1/25/46 (b) (e) | 4,500 | 4,546 | |||||||||
| GS Mortgage Securities Corp. Trust, Series 2017-GPTX, Class A, 2.86%, 5/10/34 (b) | 10,000 | 9,917 | |||||||||
| GS Mortgage Securities Corp. Trust, Series 2017-SLP, Class A, 3.42%, 10/10/32 (b) | 4,730 | 4,797 | |||||||||
| GS Mortgage Securities Corp. Trust, Series 2020-UPTN, Class A, 2.75%, 12/10/39 (b) | 2,000 | 2,010 | |||||||||
| GS Mortgage Securities Trust, Series 2012-GCJ7, Class XA, 2.16%, 5/10/45 (e) | 21,681 | 376 | |||||||||
| GS Mortgage Securities Trust, Series 2012-ALOH, Class A, 3.55%, 4/10/34 (b) | 5,000 | 5,043 | |||||||||
| GS Mortgage Securities Trust, Series 2012-GCJ9, Class XA, 1.94%, 11/10/45 (e) (f) | 22,280 | 778 | |||||||||
| GS Mortgage Securities Trust, Series 2012-GC6, Class AS, 4.95%, 1/10/45 (b) | 5,297 | 5,487 | |||||||||
| Houston Galleria Mall Trust, Series 2015-HGLR, Class A1A2, 3.09%, 3/5/37 (b) | 7,000 | 7,106 | |||||||||
| JP Morgan Chase Commercial Mortgage Securities Trust, Series 2012-C8, Class XA, 1.77%, 10/15/45 (e) | 19,007 | 578 | |||||||||
| Madison Park Funding Ltd., Series 2013-11A, Class AR, 1.42% (LIBOR03M+116bps), 7/23/29, Callable 10/23/20 @ 100 (b) (c) | 6,750 | 6,653 | |||||||||
| Morgan Stanley Bank of America Merrill Lynch Trust, Series 2012-C6, Class XA, 1.61%, 11/15/45 (b) (e) | 18,876 | 500 | |||||||||
| Morgan Stanley Capital I Trust, Series 2019-NUGS, Class B, 2.80% (LIBOR01M+130bps), 12/15/21 (b) (c) | 3,846 | 3,896 | |||||||||
| Oaktree EIF Ltd., Series 2016-IIIA, Class B, 2.27% ( LIBOR03M+200bps), 10/20/27, Callable 10/20/20 @ 100 (b) (c) | 10,500 | 10,357 | |||||||||
| Palmer Square Loan Funding Ltd., Series 2020-1A, Class A2, 1.73% (LIBOR03M+135bps), 2/20/28, Callable 2/20/21 @ 100 (b) (c) | 4,600 | 4,442 | |||||||||
| Palmer Square Loan Funding Ltd., Series 2018-2A, Class A2, 1.33% (LIBOR03M+105bps), 7/15/26, Callable 10/15/20 @ 100 (b) (c) | 1,970 | 1,900 | |||||||||
| Palmer Square Loan Funding Ltd., Series 2018-2A, Class A1, 0.92% (LIBOR03M+65bps), 7/15/26, Callable 10/15/20 @ 100 (b) (c) | 2,137 | 2,105 | |||||||||
| Palmer Square Loan Funding Ltd., Series 2019-2, Class A1, 1.24% (LIBOR03M+97bps), 4/20/27, Callable 10/20/20 @ 100 (b) (c) | 2,206 | 2,190 | |||||||||
| Palmer Square Loan Funding Ltd., Series 2019-3, Class A1, 1.23% (LIBOR03M+85bps), 8/20/27, Callable 8/20/20 @ 100 (b) (c) | 4,118 | 4,084 | |||||||||
| Palmer Square Loan Funding Ltd., Series 2020-1A, Class A1, 1.18% (LIBOR03M+80bps), 2/20/28, Callable 2/20/21 @ 100 (b) (c) | 4,921 | 4,874 | |||||||||
| Palmer Square Loan Funding Ltd., Series 2018-5A, Class A1, 1.12% (LIBOR03M+85bps), 1/20/27, Callable 10/20/20 @ 100 (b) (c) | 3,202 | 3,154 | |||||||||
| Race Point CLO Ltd., Series 2016-10A, Class A1R, 1.34% (LIBOR03M+110bps), 7/25/31, Callable 10/25/20 @ 100 (b) (c) | 4,437 | 4,329 | |||||||||
| Sequoia Mortgage Trust, Series 2013-5, Class A2, 3.00%, 5/25/43, Callable 8/25/23 @ 100 (b) (e) | 1,965 | 2,046 | |||||||||
See notes to financial statements.
18
| USAA Mutual Funds Trust USAA Short-Term Bond Fund | Schedule of Portfolio Investments — continued July 31, 2020 | ||||||
(Amounts in Thousands, Except for Shares)
Security Description | Shares or Principal Amount | Value | |||||||||
| TIAA CLO Ltd., Series 2017-1A, Class A, 1.55% (LIBOR03M+128bps), 4/20/29, Callable 10/20/20 @ 100 (b) (c) | $ | 2,500 | $ | 2,474 | |||||||
| Trinitas CLO Ltd., Series 2016-5A, Class AR, 1.63% (LIBOR03M+139bps), 10/25/28, Callable 10/25/20 @ 100 (b) (c) | 3,250 | 3,220 | |||||||||
| Trinitas CLO Ltd., Series 2017-6A, Class AR, 1.41% (LIBOR03M+117bps), 7/25/29, Callable 10/25/20 @ 100 (b) (c) | 5,000 | 4,931 | |||||||||
| UBS Commercial Mortgage Trust, Series 2012-C1, Class XA, 2.07%, 5/10/45 (b) (e) | 46,449 | 1,143 | |||||||||
| UBS Commercial Mortgage Trust, Series 2012-C1, Class XA, 2.07%, 5/10/45 (b) (e) (f) | 35,263 | 868 | |||||||||
| UBS-Barclays Commercial Mortgage Trust, Series 2012-C3, Class XA, 1.82%, 8/10/49 (b) (e) (f) | 23,163 | 723 | |||||||||
| Wells Fargo Commercial Mortgage Trust, Series 2012-LC5, Class XA, 1.75%, 10/15/45 (b) (e) (f) | 23,150 | 706 | |||||||||
| Wells Fargo Commercial Mortgage Trust, Series 2015-NXS3, Class A2, 2.85%, 9/15/57 | 2,799 | 2,800 | |||||||||
| WFRBS Commercial Mortgage Trust, Series 2011-C5, Class A4, 3.67%, 11/15/44 | 2,137 | 2,177 | |||||||||
| WFRBS Commercial Mortgage Trust, Series 2011-C5, Class B, 5.66%, 11/15/44 (b) (e) | 5,348 | 5,525 | |||||||||
| WFRBS Commercial Mortgage Trust, Series 2011-C4, Class A4, 4.90%, 6/15/44 (b) (e) | 15,000 | 15,356 | |||||||||
| WFRBS Commercial Mortgage Trust, Series 2013-C18, Class A3, 3.65%, 12/15/46 | 1,689 | 1,696 | |||||||||
241,170 | |||||||||||
Total Collateralized Mortgage Obligations (Cost $234,762) | 241,170 | ||||||||||
Preferred Stocks (0.4%) | |||||||||||
Financials (0.2%): | |||||||||||
| Citigroup Capital, cumulative redeemable, 6.64% (LIBOR03M+637bps), 10/30/40 (c) | 200,000 | 5,400 | |||||||||
Real Estate (0.2%): | |||||||||||
SunTrust Real Estate Investment Corp., non-cumulative, 9.00% (g) (h) (i) | 50 | 5,250 | |||||||||
Total Preferred Stocks (Cost $10,920) | 10,650 | ||||||||||
Convertible Corporate Bonds (0.6%) | |||||||||||
Energy (0.2%): | |||||||||||
PDC Energy, Inc., 1.13%, 9/15/21 (j) | 5,000 | 4,756 | |||||||||
Whiting Petroleum Corp., 1.25%, 12/1/20 (k) (l) | 9,006 | 1,702 | |||||||||
6,458 | |||||||||||
Health Care (0.4%): | |||||||||||
Teva Pharmaceutical Finance LLC, 0.25%, 2/1/26, Callable 8/31/20 @ 100 | 10,105 | 9,935 | |||||||||
Total Convertible Corporate Bonds (Cost $23,071) | 16,393 | ||||||||||
Senior Secured Loans (0.3%) | |||||||||||
GLP Capital LP, Term Loan A1, 1.66% (LIBOR01M+150bps), 4/28/21 (c) | 8,552 | 8,510 | |||||||||
Total Senior Secured Loans (Cost $8,546) | 8,510 | ||||||||||
See notes to financial statements.
19
| USAA Mutual Funds Trust USAA Short-Term Bond Fund | Schedule of Portfolio Investments — continued July 31, 2020 | ||||||
(Amounts in Thousands, Except for Shares)
Security Description | Principal Amount | Value | |||||||||
Corporate Bonds (44.6%) | |||||||||||
Communication Services (0.6%): | |||||||||||
AMC Networks, Inc., 4.75%, 12/15/22, Callable 9/10/20 @ 100.79 | $ | 3,088 | $ | 3,126 | |||||||
CenturyLink, Inc., 6.45%, 6/15/21 | 3,600 | 3,730 | |||||||||
Sprint Spectrum, 3.36%, 3/20/23 (b) | 4,875 | 4,941 | |||||||||
The Walt Disney Co., 1.75%, 1/13/26 | 5,000 | 5,223 | |||||||||
17,020 | |||||||||||
Consumer Discretionary (3.5%): | |||||||||||
| Association of American Medical Colleges 2.27%, 10/1/25 | 4,145 | 4,204 | |||||||||
2.39%, 10/1/26 | 4,275 | 4,364 | |||||||||
Carnival Corp., 3.95%, 10/15/20 (j) | 8,500 | 8,491 | |||||||||
Duke University Health System, Inc., 2.26%, 6/1/26 | 700 | 736 | |||||||||
| Expedia Group, Inc. 3.60%, 12/15/23, Callable 11/15/23 @ 100 (b) | 5,000 | 5,056 | |||||||||
6.25%, 5/1/25, Callable 2/1/25 @ 100 (b) | 5,000 | 5,462 | |||||||||
Ford Motor Co., 8.50%, 4/21/23 (a) | 5,692 | 6,320 | |||||||||
General Motors Co., 1.27% (LIBOR03M+80bps), 8/7/20 (c) | 4,341 | 4,340 | |||||||||
Horace Mann School, 2.48%, 7/1/22 | 2,500 | 2,586 | |||||||||
| Howard University 2.64%, 10/1/21 | 500 | 510 | |||||||||
2.80%, 10/1/23 | 1,000 | 1,053 | |||||||||
2.42%, 10/1/24 | 1,350 | 1,436 | |||||||||
2.52%, 10/1/25 | 1,000 | 1,067 | |||||||||
Hyatt Hotels Corp., 5.38%, 4/23/25, Callable 3/23/25 @ 100 (a) | 3,000 | 3,209 | |||||||||
| International Game Technology PLC, 6.25%, 2/15/22, Callable 8/15/21 @ 100 (b) | 1,293 | 1,351 | |||||||||
Lennar Corp., 2.95%, 11/29/20, Callable 9/29/20 @ 100 (j) | 10,000 | 10,010 | |||||||||
Macys Retail Holdings, Inc., 3.45%, 1/15/21, Callable 12/15/20 @ 100 (j) | 4,994 | 4,921 | |||||||||
| Nissan Motor Acceptance Corp. 0.70% (LIBOR03M+39bps), 9/28/20 (b) (c) | 1,000 | 996 | |||||||||
0.94% (LIBOR03M+63bps), 9/21/21 (b) (c) | 5,000 | 4,861 | |||||||||
Pultegroup, Inc., 4.25%, 3/1/21, Callable 2/1/21 @ 100 | 2,000 | 2,023 | |||||||||
QVC, Inc., 4.38%, 3/15/23 | 6,770 | 7,067 | |||||||||
Smithsonian Institution, 0.97%, 9/1/23 | 1,400 | 1,415 | |||||||||
Toll Brothers Finance Corp., 5.88%, 2/15/22, Callable 11/15/21 @ 100 | 2,800 | 2,941 | |||||||||
| Volkswagen Group of America Finance LLC 2.50%, 9/24/21 (b) | 5,000 | 5,099 | |||||||||
2.70%, 9/26/22 (b) | 5,000 | 5,194 | |||||||||
3.13%, 5/12/23 (b) | 5,000 | 5,300 | |||||||||
| YMCA of Greater New York 2.21%, 8/1/20 | 325 | 325 | |||||||||
2.26%, 8/1/21 | 300 | 304 | |||||||||
100,641 | |||||||||||
Consumer Staples (2.3%): | |||||||||||
| Anheuser-Busch InBev Worldwide, Inc., 4.15%, 1/23/25, Callable 12/23/24 @ 100 | 5,000 | 5,706 | |||||||||
BAT Capital Corp., 2.76%, 8/15/22, Callable 7/15/22 @ 100 | 10,000 | 10,391 | |||||||||
See notes to financial statements.
20
| USAA Mutual Funds Trust USAA Short-Term Bond Fund | Schedule of Portfolio Investments — continued July 31, 2020 | ||||||
(Amounts in Thousands, Except for Shares)
Security Description | Principal Amount | Value | |||||||||
Cargill, Inc., 3.25%, 3/1/23 (b) | $ | 2,500 | $ | 2,672 | |||||||
Constellation Brands, Inc., 2.65%, 11/7/22, Callable 10/7/22 @ 100 | 7,896 | 8,242 | |||||||||
McCormick & Co., Inc., 2.70%, 8/15/22, Callable 7/15/22 @ 100 | 5,000 | 5,206 | |||||||||
Philip Morris International, Inc., 2.63%, 2/18/22, Callable 1/18/22 @ 100 | 10,000 | 10,323 | |||||||||
Smithfield Foods, Inc., 2.65%, 10/3/21, Callable 9/3/21 @ 100 (b) | 13,425 | 13,392 | |||||||||
| Walmart, Inc. 2.85%, 7/8/24, Callable 6/8/24 @ 100 | 5,000 | 5,452 | |||||||||
3.55%, 6/26/25, Callable 4/26/25 @ 100 | 5,000 | 5,703 | |||||||||
67,087 | |||||||||||
Energy (8.3%): | |||||||||||
Antero Resources Corp., 5.13%, 12/1/22, Callable 9/10/20 @ 100 | 2,582 | 2,064 | |||||||||
Apache Corp., 3.63%, 2/1/21, Callable 11/1/20 @ 100 | 10,113 | 10,121 | |||||||||
| Buckeye Partners LP 4.88%, 2/1/21, Callable 11/1/20 @ 100 (j) | 12,364 | 12,385 | |||||||||
4.15%, 7/1/23, Callable 4/1/23 @ 100 | 5,000 | 5,089 | |||||||||
Continental Resources, Inc., 4.50%, 4/15/23, Callable 1/15/23 @ 100 (a) | 10,252 | 10,253 | |||||||||
DCP Midstream Operating LP, 4.75%, 9/30/21, Callable 6/30/21 @ 100 (b) (j) | 6,645 | 6,755 | |||||||||
Enable Midstream Partners LP, 3.90%, 5/15/24, Callable 2/15/24 @ 100 | 10,000 | 9,809 | |||||||||
Energy Transfer Operating LP, 4.20%, 9/15/23, Callable 8/15/23 @ 100 | 5,000 | 5,277 | |||||||||
| EQM Midstream Partners LP 4.75%, 7/15/23, Callable 6/15/23 @ 100 (a) | 5,000 | 5,077 | |||||||||
4.00%, 8/1/24, Callable 5/1/24 @ 100 | 9,645 | 9,615 | |||||||||
| EQT Corp. 3.00%, 10/1/22, Callable 9/1/22 @ 100 (j) | 15,000 | 14,899 | |||||||||
6.13%, 2/1/25, Callable 1/1/25 @ 100 (j) | 7,000 | 7,688 | |||||||||
Exxon Mobil Corp., 2.99%, 3/19/25, Callable 2/19/25 @ 100 (a) | 10,000 | 11,007 | |||||||||
Kinder Morgan, Inc., 5.00%, 2/15/21, Callable 1/15/21 @ 100 (b) | 2,300 | 2,345 | |||||||||
| Marathon Petroleum Corp. 5.38%, 10/1/22, Callable 9/10/20 @ 100.9 (j) | 5,105 | 5,147 | |||||||||
4.50%, 5/1/23, Callable 4/1/23 @ 100 (a) | 5,000 | 5,420 | |||||||||
4.75%, 12/15/23, Callable 10/15/23 @ 100 | 1,494 | 1,649 | |||||||||
5.13%, 4/1/24, Callable 9/10/20 @ 101.71 | 5,000 | 5,095 | |||||||||
Midwest Connector Capital Co. LLC, 3.63%, 4/1/22, Callable 3/1/22 @ 100 (b) | 20,000 | 20,008 | |||||||||
| MPLX LP 1.21% (LIBOR03M+90bps), 9/9/21, Callable 9/10/20 @ 100 (c) | 5,000 | 4,970 | |||||||||
6.25%, 10/15/22, Callable 8/26/20 @ 101.56 | 4,607 | 4,645 | |||||||||
3.50%, 12/1/22, Callable 11/1/22 @ 100 | 5,691 | 5,934 | |||||||||
| NuStar Logistics LP 4.80%, 9/1/20 | 5,113 | 5,105 | |||||||||
6.75%, 2/1/21 | 1,700 | 1,724 | |||||||||
| Occidental Petroleum Corp. 4.10%, 2/1/21, Callable 11/1/20 @ 100 | 5,000 | 5,000 | |||||||||
4.85%, 3/15/21, Callable 2/15/21 @ 100 (j) | 2,025 | 2,036 | |||||||||
1.68% (LIBOR03M+125bps), 8/13/21, Callable 8/21/20 @ 100 (c) | 4,000 | 3,883 | |||||||||
2.70%, 8/15/22 | 5,000 | 4,836 | |||||||||
2.90%, 8/15/24, Callable 7/15/24 @ 100 | 9,000 | 8,470 | |||||||||
ONEOK, Inc., 5.85%, 1/15/26, Callable 12/15/25 @ 100 | 5,000 | 5,694 | |||||||||
| Plains All American Pipeline LP / PAA Finance Corp., 5.00%, 2/1/21, Callable 11/1/20 @ 100 | 4,602 | 4,639 | |||||||||
See notes to financial statements.
21
| USAA Mutual Funds Trust USAA Short-Term Bond Fund | Schedule of Portfolio Investments — continued July 31, 2020 | ||||||
(Amounts in Thousands, Except for Shares)
Security Description | Principal Amount | Value | |||||||||
| Sunoco Logistics Partners Operations LP, 4.40%, 4/1/21, Callable 3/1/21 @ 100 | $ | 5,032 | $ | 5,125 | |||||||
| Targa Resources Partners LP/Targa Resources Partners Finance Corp., 5.25%, 5/1/23, Callable 9/10/20 @ 100.88 | 4,000 | 4,026 | |||||||||
Texas Eastern Transmission LP, 4.13%, 12/1/20, Callable 9/10/20 @ 100 (a) (b) | 500 | 501 | |||||||||
Valero Energy Corp., 2.70%, 4/15/23 (a) | 9,302 | 9,697 | |||||||||
| Western Midstream Operating LP 4.00%, 7/1/22, Callable 4/1/22 @ 100 | 5,000 | 5,164 | |||||||||
3.10%, 2/1/25, Callable 1/1/25 @ 100 | 8,421 | 8,350 | |||||||||
239,502 | |||||||||||
Financials (14.4%): | |||||||||||
Alleghany Corp., 4.95%, 6/27/22 | 1,250 | 1,344 | |||||||||
Ares Capital Corp., 3.25%, 7/15/25, Callable 6/15/25 @ 100 | 5,000 | 4,961 | |||||||||
Associated Bank NA, 3.50%, 8/13/21, Callable 7/13/21 @ 100 | 5,000 | 5,116 | |||||||||
| Assurant, Inc. 1.53% (LIBOR03M+125bps), 3/26/21, Callable 8/26/20 @ 100 (c) | 834 | 833 | |||||||||
4.20%, 9/27/23, Callable 8/27/23 @ 100 | 5,000 | 5,350 | |||||||||
Athene Global Funding, 2.80%, 5/26/23 (b) | 5,000 | 5,192 | |||||||||
| BancorpSouth Bank, 4.13% (LIBOR03M+247bps), 11/20/29, Callable 11/20/24 @ 100 (c) | 8,571 | 8,544 | |||||||||
| Bank of America Corp. 2.33% (LIBOR03M+63bps), 10/1/21, Callable 10/1/20 @ 100 (a) (c) | 5,000 | 5,015 | |||||||||
3.12% (LIBOR03M+116bps), 1/20/23, Callable 1/20/22 @ 100, MTN (c) | 5,000 | 5,176 | |||||||||
BB&T Corp., 4.25%, 9/30/24 | 1,955 | 2,201 | |||||||||
BBVA USA, 2.88%, 6/29/22, Callable 5/29/22 @ 100 | 3,750 | 3,838 | |||||||||
| Cadence Bancorp, 4.75% (LIBOR03M+303bps), 6/30/29, Callable 6/30/24 @ 100 (c) | 9,667 | 8,184 | |||||||||
Capital One Financial Corp., 3.05%, 3/9/22, Callable 2/9/22 @ 100 | 5,000 | 5,184 | |||||||||
CIT Group, Inc., 4.13%, 3/9/21, Callable 2/9/21 @ 100 | 6,311 | 6,360 | |||||||||
Citigroup, Inc., 3.14% (LIBOR03M+72bps), 1/24/23, Callable 1/24/22 @ 100 (c) | 5,000 | 5,177 | |||||||||
Citizens Financial Group, Inc., 4.15%, 9/28/22 (b) | 1,283 | 1,350 | |||||||||
City National Bank, 5.38%, 7/15/22 | 2,000 | 2,184 | |||||||||
| DAE Funding LLC 4.00%, 8/1/20 (b) | 11,612 | 11,612 | |||||||||
5.25%, 11/15/21, Callable 10/15/21 @ 100 (b) | 5,000 | 4,992 | |||||||||
4.50%, 8/1/22, Callable 9/10/20 @ 101.13 (b) | 2,370 | 2,328 | |||||||||
| Dime Community Bancshares, Inc., 4.50% (LIBOR03M+266bps), 6/15/27, Callable 6/15/22 @ 100 (c) | 3,750 | 3,740 | |||||||||
| First Citizens Bancshare, Inc., 3.37% (SOFR+247bps), 3/15/30, Callable 3/15/25 @ 100 (c) (j) | 8,065 | 7,879 | |||||||||
First Horizon National Corp., 3.55%, 5/26/23, Callable 4/26/23 @ 100 | 5,000 | 5,238 | |||||||||
Flagstar Bancorp, Inc., 6.13%, 7/15/21, Callable 6/15/21 @ 100 | 500 | 497 | |||||||||
FNB Corp., 2.20%, 2/24/23, Callable 1/24/23 @ 100 | 6,349 | 6,347 | |||||||||
| Ford Motor Credit Co. LLC 3.16%, 8/4/20 | 1,500 | 1,500 | |||||||||
3.20%, 1/15/21 | 4,000 | 4,008 | |||||||||
| Fulton Financial Corp. 3.60%, 3/16/22 | 9,750 | 9,946 | |||||||||
3.25% (SOFR+230bps), 3/15/30, Callable 3/15/25 @ 100 (c) | 10,000 | 9,994 | |||||||||
See notes to financial statements.
22
| USAA Mutual Funds Trust USAA Short-Term Bond Fund | Schedule of Portfolio Investments — continued July 31, 2020 | ||||||
(Amounts in Thousands, Except for Shares)
Security Description | Principal Amount | Value | |||||||||
| Hilltop Holdings, Inc., 5.75% (SOFR+568bps), 5/15/30, Callable 5/15/25 @ 100 (c) | $ | 5,000 | $ | 5,064 | |||||||
HSBC Finance Corp., 6.68%, 1/15/21 | 14,646 | 14,972 | |||||||||
Hyundai Capital America, 2.75%, 9/18/20 (b) | 5,000 | 5,008 | |||||||||
Infinity Property & Casualty Corp., 5.00%, 9/19/22 | 21,955 | 23,256 | |||||||||
| JPMorgan Chase & Co., 2.78% (LIBOR03M+94bps), 4/25/23, Callable 4/25/22 @ 100 (c) | 5,000 | 5,190 | |||||||||
KeyBank NA, 2.30%, 9/14/22 | 5,000 | 5,186 | |||||||||
| Ladder Capital Finance Holdings LLLP/Ladder Capital Finance Corp., 5.88%, 8/1/21, Callable 9/10/20 @ 100 (b) | 4,993 | 4,927 | |||||||||
Main Street Capital Corp., 5.20%, 5/1/24 | 5,200 | 5,359 | |||||||||
| MB Financial Bank NA, 4.00% (LIBOR03M+187bps), 12/1/27, Callable 12/1/22 @ 100 (c) | 3,000 | 3,022 | |||||||||
Mobr-04 LLC (LOC — Compass Bank), 1.21%, 9/1/24 (a) | 3,350 | 3,350 | |||||||||
National Securities Clearing Corp., 1.20%, 4/23/23 (b) | 5,000 | 5,101 | |||||||||
| New York Community Bancorp, Inc., 5.90% (LIBOR03M+278bps), 11/6/28, Callable 11/6/23 @ 100 (c) (j) | 8,242 | 8,081 | |||||||||
People's United Financial, Inc., 3.65%, 12/6/22, Callable 9/6/22 @ 100 | 9,500 | 10,110 | |||||||||
| Pinnacle Bank/Nashville, 3.40% (LIBOR03M+313bps), 7/30/25, Callable 10/30/20 @ 100 (c) | 5,000 | 4,983 | |||||||||
| Pinnacle Financial Partners, Inc., 5.25% (LIBOR03M+388bps), 11/16/26, Callable 11/16/21 @ 100 (b) (c) | 3,800 | 3,791 | |||||||||
Protective Life Global Funding, 3.10%, 4/15/24 (b) | 5,000 | 5,420 | |||||||||
| Reliance Standard Life Global Funding II 3.85%, 9/19/23 (b) | 5,000 | 5,400 | |||||||||
2.75%, 5/7/25 (b) | 5,000 | 5,193 | |||||||||
| Santander Holdings USA, Inc. 4.45%, 12/3/21, Callable 11/3/21 @ 100 | 5,000 | 5,204 | |||||||||
3.70%, 3/28/22, Callable 2/28/22 @ 100 | 15,000 | 15,558 | |||||||||
3.45%, 6/2/25, Callable 5/2/25 @ 100 | 4,179 | 4,477 | |||||||||
| Signature Bank, 4.13% (LIBOR03M+256bps), 11/1/29, Callable 11/1/24 @ 100 (c) | 11,650 | 11,759 | |||||||||
| SL Green Operating Partnership LP, 3.25%, 10/15/22, Callable 9/15/22 @ 100 | 2,612 | 2,669 | |||||||||
StanCorp Financial Group, Inc., 5.00%, 8/15/22 | 5,366 | 5,688 | |||||||||
| Starwood Property Trust, Inc., 3.63%, 2/1/21, Callable 11/1/20 @ 100 | 6,250 | 6,210 | |||||||||
| State Street Corp., 2.83% (SOFR+269bps), 3/30/23, Callable 3/30/22 @ 100 (b) (c) | 5,000 | 5,192 | |||||||||
| Sterling Bancorp, 4.00% (SOFR+253bps), 12/30/29, Callable 12/30/24 @ 100 (c) | 8,750 | 8,433 | |||||||||
| Sterling National Bank, 5.25% (LIBOR03M+394bps), 4/1/26, Callable 4/1/21 @ 100 (c) | 3,750 | 3,802 | |||||||||
SunTrust Bank, 3.00%, 2/2/23, Callable 1/2/23 @ 100 (j) | 10,000 | 10,591 | |||||||||
Synovus Bank, 2.29% (SOFR+95bps), 2/10/23, Callable 2/10/22 @ 100 (c) (j) | 4,776 | 4,854 | |||||||||
| TCF National Bank 4.12% (LIBOR03M+238bps), 7/2/29, Callable 7/2/24 @ 100 (c) | 5,000 | 4,841 | |||||||||
5.50% (LIBOR03M+509bps), 5/6/30, Callable 5/6/25 @ 100 (c) | 10,000 | 10,382 | |||||||||
| TIAA FSB Holdings, Inc., 6.00% (LIBOR03M+470bps), 3/15/26, Callable 3/15/21 @ 100 (c) | 5,718 | 5,719 | |||||||||
See notes to financial statements.
23
| USAA Mutual Funds Trust USAA Short-Term Bond Fund | Schedule of Portfolio Investments — continued July 31, 2020 | ||||||
(Amounts in Thousands, Except for Shares)
Security Description | Principal Amount | Value | |||||||||
United Financial Bancorp, Inc., 5.75%, 10/1/24 | $ | 4,120 | $ | 4,439 | |||||||
WEA Finance LLC, 3.15%, 4/5/22, Callable 3/5/22 @ 100 (b) | 5,000 | 5,072 | |||||||||
| Wells Fargo & Co. 3.07%, 1/24/23, Callable 1/24/22 @ 100 | 10,000 | 10,352 | |||||||||
2.16% (LIBOR03M+75bps), 2/11/26, Callable 2/11/25 @ 100, MTN (c) | 5,000 | 5,213 | |||||||||
Wells Fargo Bank NA, 2.60%, 1/15/21 | 5,000 | 5,052 | |||||||||
Zions Bancorp NA, 3.35%, 3/4/22, Callable 2/4/22 @ 100 (a) (j) | 3,900 | 4,029 | |||||||||
407,039 | |||||||||||
Health Care (1.7%): | |||||||||||
| Bristol-Myers Squibb Co. 2.75%, 2/15/23, Callable 1/15/23 @ 100 | 10,000 | 10,573 | |||||||||
3.25%, 2/20/23, Callable 1/20/23 @ 100 | 5,000 | 5,349 | |||||||||
| Centene Corp. 4.75%, 5/15/22, Callable 9/10/20 @ 101.19 | 2,000 | 2,038 | |||||||||
4.75%, 1/15/25, Callable 9/10/20 @ 103.56 | 930 | 965 | |||||||||
Cigna Corp., 3.00%, 7/15/23, Callable 5/16/23 @ 100 | 5,000 | 5,339 | |||||||||
Fresenius Medical Care U.S. Finance, Inc., 5.75%, 2/15/21 (b) | 5,000 | 5,119 | |||||||||
Fresenius U.S. Finance II, Inc., 4.50%, 1/15/23, Callable 10/17/22 @ 100 (b) (j) | 4,000 | 4,252 | |||||||||
Laboratory Corp. of America Holdings, 3.20%, 2/1/22 | 8,200 | 8,518 | |||||||||
SSM Health Care Corp., 3.69%, 6/1/23, Callable 3/1/23 @ 100 | 4,330 | 4,679 | |||||||||
46,832 | |||||||||||
Industrials (4.8%): | |||||||||||
| Air Lease Corp. 2.50%, 3/1/21 | 8,438 | 8,460 | |||||||||
3.88%, 4/1/21, Callable 3/1/21 @ 100 | 3,000 | 3,032 | |||||||||
1.01% (LIBOR03M+67bps), 6/3/21, MTN (c) | 5,000 | 4,899 | |||||||||
3.50%, 1/15/22 | 5,500 | 5,565 | |||||||||
2.25%, 1/15/23 | 5,000 | 4,942 | |||||||||
Aircastle Ltd., 4.25%, 6/15/26, Callable 4/15/26 @ 100 | 5,000 | 4,705 | |||||||||
| American Airlines Pass Through Trust 4.38%, 4/1/24 | 3,567 | 2,497 | |||||||||
4.40%, 3/22/25 | 7,006 | 4,976 | |||||||||
4.38%, 12/15/25 (b) | 5,823 | 3,762 | |||||||||
Aviation Capital Group LLC, 5.50%, 12/15/24, Callable 11/15/24 @ 100 (b) | 5,000 | 5,121 | |||||||||
| Continental Airlines Pass Through Trust 5.50%, 4/29/22 | 5,760 | 5,660 | |||||||||
4.75%, 7/12/22 | 4,794 | 4,623 | |||||||||
Delta Air Lines Pass Through Trust, 2.00%, 12/10/29 | 5,000 | 4,769 | |||||||||
Fluor Corp., 3.50%, 12/15/24, Callable 9/15/24 @ 100 | 6,000 | 4,942 | |||||||||
Howmet Aerospace, Inc., 6.88%, 5/1/25, Callable 4/1/25 @ 100 (a) | 5,000 | �� | 5,668 | ||||||||
PACCAR Financial Corp., 2.65%, 4/6/23, MTN | 5,000 | 5,287 | |||||||||
| Ryder System, Inc. 3.50%, 6/1/21, MTN (a) | 1,000 | 1,023 | |||||||||
2.80%, 3/1/22, Callable 2/1/22 @ 100, MTN | 5,000 | 5,159 | |||||||||
2.50%, 9/1/22, Callable 8/1/22 @ 100, MTN | 5,000 | 5,145 | |||||||||
3.40%, 3/1/23, Callable 2/1/23 @ 100, MTN | 4,706 | 4,980 | |||||||||
| Southwest Airlines Co. 2.65%, 11/5/20, Callable 10/5/20 @ 100 | 4,500 | 4,505 | |||||||||
See notes to financial statements.
24
| USAA Mutual Funds Trust USAA Short-Term Bond Fund | Schedule of Portfolio Investments — continued July 31, 2020 | ||||||
(Amounts in Thousands, Except for Shares)
Security Description | Principal Amount | Value | |||||||||
4.75%, 5/4/23 | $ | 5,000 | $ | 5,222 | |||||||
5.25%, 5/4/25, Callable 4/4/25 @ 100 | 15,000 | 15,984 | |||||||||
Spirit AeroSystems, Inc., 3.95%, 6/15/23, Callable 5/15/23 @ 100 | 1,181 | 996 | |||||||||
The Boeing Co., 1.65%, 10/30/20, Callable 9/30/20 @ 100 (j) | 2,000 | 2,002 | |||||||||
U.S. Airways, 5.38%, 5/15/23 | 10,429 | 8,407 | |||||||||
U.S. Airways (INS — MBIA Insurance Corp.), 7.08%, 9/20/22 | 261 | 258 | |||||||||
| United Airlines Pass Through Trust 5.38%, 2/15/23 | 2,474 | 2,325 | |||||||||
4.63%, 3/3/24 | 912 | 816 | |||||||||
| Westinghouse Air Brake Technologies Corp., 3.20%, 6/15/25, Callable 5/15/25 @ 100 | 1,129 | 1,178 | |||||||||
136,908 | |||||||||||
Information Technology (1.8%): | |||||||||||
Broadcom, Inc., 3.13%, 4/15/21 (b) | 5,000 | 5,076 | |||||||||
FLIR Systems, Inc., 3.13%, 6/15/21 (a) | 5,000 | 5,101 | |||||||||
HP, Inc., 2.20%, 6/17/25, Callable 5/17/25 @ 100 | 5,000 | 5,251 | |||||||||
Jabil, Inc., 5.63%, 12/15/20 | 1,700 | 1,731 | |||||||||
Leidos Holdings, Inc., 4.45%, 12/1/20, Callable 9/2/20 @ 100 | 9,260 | 9,278 | |||||||||
Leidos, Inc., 2.95%, 5/15/23, Callable 4/15/23 @ 100 (b) | 9,302 | 9,811 | |||||||||
Microchip Technology, Inc., 3.92%, 6/1/21 | 2,000 | 2,037 | |||||||||
Oracle Corp., 2.40%, 9/15/23, Callable 7/15/23 @ 100 | 10,000 | 10,568 | |||||||||
48,853 | |||||||||||
Materials (1.2%): | |||||||||||
| Albemarle Corp., 1.44% (LIBOR03M+105bps), 11/15/22, Callable 11/15/20 @ 100 (c) | 6,364 | 6,233 | |||||||||
Carpenter Technology Corp., 5.20%, 7/15/21 | 9,350 | 9,636 | |||||||||
Huntsman International LLC, 5.13%, 11/15/22, Callable 8/15/22 @ 100 | 3,000 | 3,185 | |||||||||
Reliance Steel & Aluminum Co., 4.50%, 4/15/23, Callable 1/15/23 @ 100 | 8,403 | 9,054 | |||||||||
The Mosaic Co., 3.25%, 11/15/22, Callable 10/15/22 @ 100 | 5,000 | 5,159 | |||||||||
33,267 | |||||||||||
Real Estate (2.6%): | |||||||||||
American Tower Trust #1, 3.07%, 3/15/48, Callable 9/15/21 @ 100 (b) | 3,760 | 3,831 | |||||||||
Boston Properties LP, 4.13%, 5/15/21, Callable 2/15/21 @ 100 | 5,398 | 5,497 | |||||||||
CoreCivic, Inc., 5.00%, 10/15/22, Callable 7/15/22 @ 100 | 12,437 | 12,195 | |||||||||
Federal Realty Investment Trust, 2.55%, 1/15/21, Callable 12/15/20 @ 100 | 1,125 | 1,128 | |||||||||
| Nationwide Health Properties, Inc., 6.90%, 10/1/37, (Put Date 10/1/17), MTN (n) | 2,950 | 3,568 | |||||||||
Realty Income Corp., 3.25%, 10/15/22, Callable 7/15/22 @ 100 | 10,000 | 10,502 | |||||||||
| SBA Tower Trust 2.84%, 1/15/25 (b) | 6,923 | 7,192 | |||||||||
3.45%, 3/15/48 (b) | 10,000 | 10,500 | |||||||||
1.88%, 7/15/50 (b) | 3,500 | 3,465 | |||||||||
Senior Housing Properties Trust, 6.75%, 12/15/21, Callable 6/15/21 @ 100 | 6,890 | 6,959 | |||||||||
SL Green Realty Corp., 4.50%, 12/1/22, Callable 9/1/22 @ 100 (j) | 5,000 | 5,158 | |||||||||
| VICI Properties LP/VICI Note Co., Inc., 3.50%, 2/15/25, Callable 2/15/22 @ 101.75 (b) | 3,636 | 3,690 | |||||||||
73,685 | |||||||||||
See notes to financial statements.
25
| USAA Mutual Funds Trust USAA Short-Term Bond Fund | Schedule of Portfolio Investments — continued July 31, 2020 | ||||||
(Amounts in Thousands, Except for Shares)
Security Description | Principal Amount | Value | |||||||||
Utilities (3.4%): | |||||||||||
Alliant Energy Finance LLC, 3.75%, 6/15/23, Callable 5/15/23 @ 100 (b) | $ | 5,000 | $ | 5,379 | |||||||
CenterPoint Energy, Inc., 2.50%, 9/1/22, Callable 8/1/22 @ 100 | 3,000 | 3,112 | |||||||||
Delmarva Power & Light Co., 3.50%, 11/15/23, Callable 8/15/23 @ 100 | 5,858 | 6,389 | |||||||||
Dominion Energy, Inc., 2.72%, 8/15/21 (o) | 5,000 | 5,107 | |||||||||
Duke Energy Corp., 2.40%, 8/15/22, Callable 7/15/22 @ 100 | 5,000 | 5,181 | |||||||||
Exelon Generation Co. LLC, 3.25%, 6/1/25, Callable 5/1/25 @ 100 | 5,000 | 5,523 | |||||||||
| National Fuel Gas Co. 4.90%, 12/1/21, Callable 9/1/21 @ 100 | 5,000 | 5,169 | |||||||||
5.50%, 1/15/26, Callable 12/15/25 @ 100 | 5,000 | 5,415 | |||||||||
National Grid North America, Inc., 2.38%, 9/30/20 | 3,400 | 3,406 | |||||||||
NextEra Energy Capital Holdings, Inc., 3.34%, 9/1/20 | 3,333 | 3,341 | |||||||||
Public Service Electric & Gas Co., 3.25%, 9/1/23, MTN, Callable 8/1/23 @ 100 | 5,000 | 5,405 | |||||||||
Sierra Pacific Power Co., 3.38%, 8/15/23, Callable 5/15/23 @ 100 | 4,299 | 4,649 | |||||||||
Southern Co. Gas Capital Corp., 2.45%, 10/1/23, Callable 8/1/23 @ 100 | 10,000 | 10,517 | |||||||||
Southern Power Co., 2.75%, 9/20/23, Callable 7/20/23 @ 100 | 9,500 | 10,079 | |||||||||
Southern Star Central Corp., 5.13%, 7/15/22, Callable 9/10/20 @ 100 (b) | 10,537 | 10,570 | |||||||||
System Energy Resources, Inc., 4.10%, 4/1/23, Callable 1/1/23 @ 100 | 3,630 | 3,919 | |||||||||
Virginia Electric & Power Co., 2.75%, 3/15/23, Callable 12/15/22 @ 100 | 5,000 | 5,256 | |||||||||
98,417 | |||||||||||
Total Corporate Bonds (Cost $1,246,505) | 1,269,251 | ||||||||||
Yankee Dollar (10.9%) | |||||||||||
Communication Services (0.5%): | |||||||||||
| Deutsche Telekom International Finance BV, 2.82%, 1/19/22, Callable 12/19/21 @ 100 (b) (j) | 5,000 | 5,123 | |||||||||
Pearson Funding Four PLC, 3.75%, 5/8/22 (b) | 7,250 | 7,411 | |||||||||
12,534 | |||||||||||
Consumer Staples (1.8%): | |||||||||||
Alimentation Couche-Tard, Inc., 2.70%, 7/26/22, Callable 6/26/22 @ 100 (b) | 5,000 | 5,152 | |||||||||
Avon International Capital PLC, 6.50%, 8/15/22, Callable 9/10/20 @ 101.97 (b) | 11,995 | 11,925 | |||||||||
Grupo Bimbo Sab de CV, 4.50%, 1/25/22 (b) | 18,588 | 19,529 | |||||||||
| Reckitt Benckiser Treasury Services PLC, 2.38%, 6/24/22, Callable 5/24/22 @ 100 (b) | 15,000 | 15,501 | |||||||||
52,107 | |||||||||||
Energy (0.7%): | |||||||||||
| Aker BP ASA 6.00%, 7/1/22, Callable 9/10/20 @ 101.5 (b) (j) | 8,300 | 8,460 | |||||||||
5.88%, 3/31/25, Callable 3/31/21 @ 102.94 (b) | 4,406 | 4,628 | |||||||||
Suncor Energy, Inc., 2.80%, 5/15/23 | 5,000 | 5,262 | |||||||||
18,350 | |||||||||||
Financials (3.5%): | |||||||||||
| BBVA Bancomer SA 6.50%, 3/10/21 | 3,000 | 3,075 | |||||||||
6.50%, 3/10/21 (b) | 15,000 | 15,377 | |||||||||
| Lloyds Banking Group PLC, 2.91% (LIBOR03M+81bps), 11/7/23, Callable 11/7/22 @ 100 (c) | 10,000 | 10,447 | |||||||||
See notes to financial statements.
26
| USAA Mutual Funds Trust USAA Short-Term Bond Fund | Schedule of Portfolio Investments — continued July 31, 2020 | ||||||
(Amounts in Thousands, Except for Shares)
Security Description | Principal Amount | Value | |||||||||
ORIX Corp., 2.90%, 7/18/22 | $ | 10,000 | $ | 10,400 | |||||||
| Park Aerospace Holdings Ltd. 3.63%, 3/15/21, Callable 2/15/21 @ 100 (b) | 2,000 | 1,952 | |||||||||
5.25%, 8/15/22, Callable 7/15/22 @ 100 (b) | 8,000 | 7,688 | |||||||||
Royal Bank of Scotland Group PLC, 6.13%, 12/15/22 | 13,000 | 14,224 | |||||||||
| Santander UK Group Holdings PLC 3.57%, 1/10/23, Callable 1/10/22 @ 100 | 5,000 | 5,188 | |||||||||
3.37% (LIBOR03M+108bps), 1/5/24, Callable 1/5/23 @ 100 (c) | 5,000 | 5,267 | |||||||||
| Silversea Cruise Finance Ltd., 7.25%, 2/1/25, Callable 8/21/20 @ 105.44 (a) (b) | 22,790 | 21,771 | |||||||||
95,389 | |||||||||||
Industrials (2.6%): | |||||||||||
AerCap Ireland Capital DAC/AerCap Global Aviation Trust, 4.63%, 10/30/20 (a) | 11,815 | 11,911 | |||||||||
| Air Canada Pass Through Trust 5.38%, 11/15/22 (b) | 2,503 | 2,230 | |||||||||
4.13%, 11/15/26 (b) | 5,002 | 4,522 | |||||||||
Aircastle Ltd., 4.40%, 9/25/23, Callable 8/25/23 @ 100 | 5,000 | 4,930 | |||||||||
| Avolon Holdings Funding Ltd. 3.95%, 7/1/24, Callable 6/1/24 @ 100 (b) | 5,000 | 4,522 | |||||||||
2.88%, 2/15/25, Callable 1/15/25 @ 100 (b) | 10,000 | 8,597 | |||||||||
CK Hutchison International 16 Ltd., 1.88%, 10/3/21 (b) | 10,000 | 10,077 | |||||||||
CK Hutchison International 17 II Ltd., 2.75%, 9/29/23 | 4,907 | 5,104 | |||||||||
CK Hutchison International 17 Ltd., 2.88%, 4/5/22 (b) | 5,000 | 5,137 | |||||||||
CK Hutchison International Ltd., 2.25%, 9/29/20 (b) (j) | 5,000 | 5,010 | |||||||||
Heathrow Funding Ltd., 4.88%, 7/15/21 (b) | 9,624 | 9,902 | |||||||||
Rolls-Royce PLC, 2.38%, 10/14/20, Callable 9/14/20 @ 100 (b) | 1,000 | 997 | |||||||||
Smiths Group PLC, 3.63%, 10/12/22 (b) | 7,306 | 7,531 | |||||||||
80,470 | |||||||||||
Materials (0.6%): | |||||||||||
Braskem Netherlands Finance BV, 3.50%, 1/10/23, Callable 12/10/22 @ 100 (b) | 5,000 | 5,054 | |||||||||
Fresnillo PLC, 5.50%, 11/13/23 (b) | 5,000 | 5,509 | |||||||||
POSCO, 2.38%, 1/17/23 (b) | 5,000 | 5,120 | |||||||||
15,683 | |||||||||||
Real Estate (0.3%): | |||||||||||
| Scentre Group Trust 1/Scentre Group Trust 2, 2.38%, 4/28/21, Callable 3/29/21 @ 100 (b) (j) | 7,995 | 8,027 | |||||||||
Sovereign Bond (0.4%): | |||||||||||
Province of Alberta Canada, 3.35%, 11/1/23 | 5,000 | 5,457 | |||||||||
Province of Canada, 2.45%, 6/29/22 | 5,000 | 5,203 | |||||||||
10,660 | |||||||||||
Utilities (0.5%): | |||||||||||
| Comision Federal de Electricidad 4.88%, 5/26/21 | 10,000 | 10,227 | |||||||||
4.88%, 5/26/21 (b) | 5,000 | 5,113 | |||||||||
15,340 | |||||||||||
Total Yankee Dollar (Cost $307,093) | 308,560 | ||||||||||
See notes to financial statements.
27
| USAA Mutual Funds Trust USAA Short-Term Bond Fund | Schedule of Portfolio Investments — continued July 31, 2020 | ||||||
(Amounts in Thousands, Except for Shares)
Security Description | Principal Amount | Value | |||||||||
Municipal Bonds (7.7%) | |||||||||||
Alabama (0.2%): | |||||||||||
Auburn University Revenue, Series C, 0.82%, 6/1/24 | $ | 2,760 | $ | 2,768 | |||||||
| The Water Works Board of The City of Birmingham Revenue 2.20%, 1/1/24 | 1,000 | 1,053 | |||||||||
2.36%, 1/1/25 | 2,000 | 2,136 | |||||||||
5,957 | |||||||||||
Alaska (0.0%): (p) | |||||||||||
| University of Alaska Revenue, Build America Bond Series W, 1.70%, 10/1/22 | 900 | 899 | |||||||||
Series W, 1.83%, 10/1/23 | 1,000 | 1,001 | |||||||||
1,900 | |||||||||||
Arizona (0.1%): | |||||||||||
City of Flagstaff AZ Certificate participation, Series A, 0.97%, 5/1/23 (d) | 1,000 | 1,000 | |||||||||
City of Phoenix Civic Improvement Corp. Revenue, 2.37%, 7/1/25 | 1,500 | 1,578 | |||||||||
2,578 | |||||||||||
California (0.2%): | |||||||||||
City of Riverside CA Revenue, Series A, 1.75%, 6/1/22 | 670 | 677 | |||||||||
| San Jose Redevelopment Agency Successor Agency Tax Allocation, Series A-T, 2.63%, 8/1/22 | 4,750 | 4,930 | |||||||||
Sequoia Union High School District, GO, 1.74%, 7/1/25 | 1,250 | 1,300 | |||||||||
6,907 | |||||||||||
Colorado (0.4%): | |||||||||||
| City of Loveland Electric & Communications Enterprise Revenue, 2.97%, 12/1/24 | 2,280 | 2,465 | |||||||||
| Colorado Health Facilities Authority Revenue Series B, 2.24%, 11/1/22 | 530 | 538 | |||||||||
Series B, 2.40%, 11/1/23 | 1,250 | 1,275 | |||||||||
Series B, 2.50%, 11/1/24 | 1,250 | 1,280 | |||||||||
| Denver City & County Housing Authority Revenue 2.15%, 12/1/24 | 3,850 | 4,054 | |||||||||
2.30%, 12/1/25 | 2,000 | 2,128 | |||||||||
Park Creek Metropolitan District Revenue, Series B, 2.53%, 12/1/24 | 500 | 528 | |||||||||
University of Colorado Revenue, Series A, 2.35%, 6/1/25 | 2,500 | 2,683 | |||||||||
14,951 | |||||||||||
District of Columbia (0.0%): (p) | |||||||||||
| District of Columbia Revenue 1.44%, 4/1/22 | 350 | 349 | |||||||||
1.56%, 4/1/23 | 520 | 522 | |||||||||
1.67%, 4/1/24 | 550 | 548 | |||||||||
1,419 | |||||||||||
Florida (0.3%): | |||||||||||
County of Lee Florida Water & Sewer Revenue, 2.01%, 10/1/24 | 1,360 | 1,429 | |||||||||
| Florida Development Finance Corp. Revenue 1.65%, 4/1/21 | 720 | 717 | |||||||||
1.80%, 4/1/22 | 1,180 | 1,172 | |||||||||
1.98%, 4/1/23 | 1,750 | 1,738 | |||||||||
See notes to financial statements.
28
| USAA Mutual Funds Trust USAA Short-Term Bond Fund | Schedule of Portfolio Investments — continued July 31, 2020 | ||||||
(Amounts in Thousands, Except for Shares)
Security Description | Principal Amount | Value | |||||||||
| Florida Municipal Power Agency Revenue Series B, 2.20%, 10/1/20 | $ | 1,375 | $ | 1,376 | |||||||
Series B, 2.38%, 10/1/21 | 2,500 | 2,522 | |||||||||
8,954 | |||||||||||
Georgia (0.2%): | |||||||||||
| Athens Housing Authority Revenue 2.13%, 12/1/24 | 1,850 | 1,943 | |||||||||
2.32%, 12/1/25 | 3,215 | 3,413 | |||||||||
5,356 | |||||||||||
Illinois (0.1%): | |||||||||||
City of Chicago Wastewater Transmission Revenue, 4.31%, 1/1/21 | 2,520 | 2,546 | |||||||||
Indiana (0.2%): | |||||||||||
| Indiana Finance Authority Revenue 2.66%, 3/1/25 | 1,675 | 1,750 | |||||||||
2.76%, 3/1/26 | 1,850 | 1,940 | |||||||||
3,690 | |||||||||||
Kentucky (0.0%): (p) | |||||||||||
| Kentucky State Property & Building Commission Revenue Series C, 2.56%, 5/1/21 | 1,060 | 1,073 | |||||||||
Series C, 2.76%, 5/1/22 | 250 | 258 | |||||||||
1,331 | |||||||||||
Maryland (0.3%): | |||||||||||
| County of Howard, GO Series C, 1.22%, 8/15/22 | 1,000 | 1,011 | |||||||||
Series C, 1.34%, 8/15/23 | 1,000 | 1,016 | |||||||||
| Maryland Economic Development Corp. Revenue Series B, 3.05%, 6/1/21 | 3,670 | 3,684 | |||||||||
Series B, 3.30%, 6/1/22 | 3,795 | 3,843 | |||||||||
| Maryland Stadium Authority Revenue Series C, 1.13%, 5/1/23 | 1,535 | 1,538 | |||||||||
Series C, 1.32%, 5/1/24 | 1,000 | 1,005 | |||||||||
12,097 | |||||||||||
Massachusetts (0.0%): (p) | |||||||||||
Massachusetts Development Finance Agency Revenue, Series B, 4.00%, 6/1/24 | 615 | 635 | |||||||||
Michigan (0.9%): | |||||||||||
| Clintondale Community Schools, GO 2.61%, 5/1/21 | 5,395 | 5,470 | |||||||||
2.84%, 5/1/22 | 4,000 | 4,141 | |||||||||
| Ecorse Public School District, GO 2.00%, 5/1/24 | 1,250 | 1,290 | |||||||||
2.09%, 5/1/25 | 2,200 | 2,284 | |||||||||
| Great Lakes Water Authority Sewage Disposal System Revenue Series B, 1.44%, 7/1/21 | 400 | 400 | |||||||||
Series B, 1.49%, 7/1/22 | 670 | 671 | |||||||||
| Michigan Finance Authority Revenue 2.21%, 12/1/23 | 1,565 | 1,616 | |||||||||
2.31%, 12/1/24 | 895 | 932 | |||||||||
2.37%, 9/1/49, (Put Date 9/1/23) (n) | 5,944 | 6,208 | |||||||||
See notes to financial statements.
29
| USAA Mutual Funds Trust USAA Short-Term Bond Fund | Schedule of Portfolio Investments — continued July 31, 2020 | ||||||
(Amounts in Thousands, Except for Shares)
Security Description | Principal Amount | Value | |||||||||
Ypsilanti School District, GO, 2.02%, 5/1/25 | $ | 575 | $ | 593 | |||||||
23,605 | |||||||||||
Minnesota (0.0%): (p) | |||||||||||
| Western Minnesota Municipal Power Agency Revenue Series A, 2.28%, 1/1/25 | 1,000 | 1,069 | |||||||||
Series A, 2.38%, 1/1/26 | 1,000 | 1,079 | |||||||||
2,148 | |||||||||||
Mississippi (0.2%): | |||||||||||
| Mississippi Development Bank Revenue 2.31%, 1/1/25 | 2,235 | 2,376 | |||||||||
2.36%, 1/1/26 | 2,000 | 2,142 | |||||||||
4,518 | |||||||||||
Missouri (0.2%): | |||||||||||
| Bi-State Development Agency of the Missouri-Illinois Metropolitan District Revenue Series B, 1.02%, 10/1/23 | 2,000 | 2,006 | |||||||||
Series B, 1.22%, 10/1/24 | 1,250 | 1,256 | |||||||||
University of Missouri Revenue, 1.47%, 11/1/23 | 2,000 | 2,064 | |||||||||
5,326 | |||||||||||
Nebraska (0.0%): (p) | |||||||||||
| Papio-Missouri River Natural Resource District Special Tax, 2.09%, 12/15/24, Continuously Callable @100 | 1,000 | 1,037 | |||||||||
New Jersey (0.9%): | |||||||||||
City of Newark, GO, 2.25%, 2/24/21 | 5,500 | 5,447 | |||||||||
| New Jersey Economic Development Authority Revenue 3.70%, 6/15/21 | 550 | 555 | |||||||||
Series B, 3.65%, 7/1/21 | 495 | 500 | |||||||||
Series NNN, 2.78%, 6/15/23 | 2,042 | 2,015 | |||||||||
| New Jersey Educational Facilities Authority Revenue 2.25%, 9/1/20 | 2,615 | 2,616 | |||||||||
2.47%, 9/1/21 | 7,450 | 7,503 | |||||||||
| North Hudson Sewerage Authority Revenue 2.43%, 6/1/24 | 1,200 | 1,262 | |||||||||
2.59%, 6/1/25 | 1,000 | 1,070 | |||||||||
20,968 | |||||||||||
New York (0.4%): | |||||||||||
| Madison County Capital Resource Corp. Revenue 2.23%, 7/1/24 | 1,200 | 1,266 | |||||||||
2.39%, 7/1/25 | 2,670 | 2,851 | |||||||||
2.52%, 7/1/26 | 3,050 | 3,281 | |||||||||
| New York State Dormitory Authority Revenue 2.44%, 7/1/21 | 1,550 | 1,561 | |||||||||
Series B, 3.18%, 3/15/22 | 2,000 | 2,082 | |||||||||
New York State Thruway Authority Revenue, Series M, 2.26%, 1/1/25 | 1,000 | 1,040 | |||||||||
12,081 | |||||||||||
See notes to financial statements.
30
| USAA Mutual Funds Trust USAA Short-Term Bond Fund | Schedule of Portfolio Investments — continued July 31, 2020 | ||||||
(Amounts in Thousands, Except for Shares)
Security Description | Principal Amount | Value | |||||||||
North Carolina (0.0%): (p) | |||||||||||
City of Winston-Salem NC Revenue, Series B, 2.33%, 6/1/26 | $ | 500 | $ | 528 | |||||||
Ohio (0.2%): | |||||||||||
| City of Cleveland Airport System Revenue 2.49%, 1/1/25 | 2,000 | 2,068 | |||||||||
2.59%, 1/1/26 | 2,000 | 2,078 | |||||||||
4,146 | |||||||||||
Oregon (0.1%): | |||||||||||
| Medford Hospital Facilities Authority Revenue Series B, 1.65%, 8/15/22 | 500 | 501 | |||||||||
Series B, 1.73%, 8/15/23 | 1,400 | 1,404 | |||||||||
Series B, 1.83%, 8/15/24 | 1,700 | 1,706 | |||||||||
3,611 | |||||||||||
Pennsylvania (0.9%): | |||||||||||
County of Allegheny PA, GO, Series C, 0.69%, 11/1/23 (d) | 2,200 | 2,204 | |||||||||
County of Bucks PA, GO, 0.98%, 6/1/24 | 2,025 | 2,042 | |||||||||
| Montgomery County Industrial Development Authority Revenue Series D, 2.45%, 11/15/23 | 1,250 | 1,253 | |||||||||
Series D, 2.60%, 11/15/24 | 4,050 | 4,065 | |||||||||
Pennsylvania IDA Revenue, 2.97%, 7/1/21 (b) | 2,279 | 2,326 | |||||||||
| Scranton School District, GO Series A, 3.15%, 6/15/34, (Put Date 6/15/24) (b) (n) | 2,805 | 3,005 | |||||||||
Series B, 3.15%, 6/15/34, (Put Date 6/15/24) (b) (n) | 1,415 | 1,516 | |||||||||
| Scranton School District, GO (INS — Build America Mutual Assurance Co.) 2.50%, 4/1/23 | 1,815 | 1,894 | |||||||||
2.60%, 4/1/24 | 1,730 | 1,833 | |||||||||
2.72%, 4/1/25 | 900 | 967 | |||||||||
2.82%, 4/1/26 | 1,000 | 1,085 | |||||||||
State Public School Building Authority Revenue, 2.75%, 4/1/25 | 1,500 | 1,536 | |||||||||
23,726 | |||||||||||
Rhode Island (0.1%): | |||||||||||
Rhode Island Commerce Corp. Revenue, 2.86%, 5/1/24 | 2,065 | 2,187 | |||||||||
South Dakota (0.1%): | |||||||||||
| South Dakota Health & Educational Facilities Authority Revenue Series B, 2.31%, 7/1/23 | 1,500 | 1,533 | |||||||||
Series B, 2.38%, 7/1/24 | 1,350 | 1,386 | |||||||||
2,919 | |||||||||||
Texas (0.8%): | |||||||||||
| City of Houston, GO 2.77%, 3/1/22 | 1,240 | 1,275 | |||||||||
2.98%, 3/1/23 | 1,900 | 1,994 | |||||||||
City of Lubbock Water & Wastewater System Revenue, 2.06%, 2/15/25 | 5,000 | 5,291 | |||||||||
| Dallas/Fort Worth International Airport Revenue Series C, 1.04%, 11/1/23 (d) | 500 | 500 | |||||||||
Series C, 1.23%, 11/1/24 (d) | 750 | 751 | |||||||||
See notes to financial statements.
31
| USAA Mutual Funds Trust USAA Short-Term Bond Fund | Schedule of Portfolio Investments — continued July 31, 2020 | ||||||
(Amounts in Thousands, Except for Shares)
Security Description | Principal Amount | Value | |||||||||
| Harris County Cultural Education Facilities Finance Corp. Revenue, Series B, 2.47%, 5/15/25 | $ | 1,000 | $ | 1,056 | |||||||
| Port of Port Arthur Navigation District Revenue, 1.30%, 11/1/40, Continuously Callable @100 (m) | 10,000 | 10,000 | |||||||||
Texas A&M University Revenue, Series A, 2.95%, 5/15/23 | 1,585 | 1,696 | |||||||||
22,563 | |||||||||||
Virginia (0.5%): | |||||||||||
| Virginia Small Business Financing Authority Revenue, 3.00%, 7/1/50, (Put Date 12/31/20) (b) (n) | 10,000 | 10,009 | |||||||||
Wisconsin (0.4%): | |||||||||||
| Public Finance Authority Revenue (LOC — Citizens Financial Group), 3.75%, 2/1/22, Continuously Callable @100 | 6,500 | 6,507 | |||||||||
| State of Wisconsin Revenue Series A, 1.90%, 5/1/25 | 2,000 | 2,103 | |||||||||
Series A, 2.10%, 5/1/26 | 1,000 | 1,061 | |||||||||
9,671 | |||||||||||
Total Municipal Bonds (Cost $211,495) | 217,364 | ||||||||||
U.S. Government Agency Mortgages (0.7%) | |||||||||||
| Federal Home Loan Mortgage Corp. 5.00%, 9/1/20 | 3 | 3 | |||||||||
5.50%, 4/1/21 | 26 | 26 | |||||||||
Series K023, Class X1, 1.23%, 8/25/22 (e) (f) | 64,900 | 1,256 | |||||||||
3.62% (LIBOR12M+163bps), 4/1/35 (c) | 384 | 399 | |||||||||
1,684 | |||||||||||
| Federal National Mortgage Association 5.50%, 12/1/20-6/1/24 | 442 | 461 | |||||||||
5.00%, 12/1/21-2/1/24 | 168 | 176 | |||||||||
Series 2012-M8, Class X2, 0.65%, 5/25/22 (e) (f) | 49,963 | 382 | |||||||||
Series 2013-M1, Class X2, 0.54%, 8/25/22 (e) (f) | 43,314 | 306 | |||||||||
6.00%, 10/1/22-7/1/23 | 347 | 360 | |||||||||
4.50%, 5/1/23-2/1/24 | 78 | 81 | |||||||||
2.50%, 4/1/27-8/1/27 | 14,471 | 15,201 | |||||||||
Series 2012-104, Class HC, 1.25%, 9/25/27 | 2,173 | 2,156 | |||||||||
19,123 | |||||||||||
Total U.S. Government Agency Mortgages (Cost $19,470) | 20,807 | ||||||||||
U.S. Treasury Obligations (0.7%) | |||||||||||
| U.S. Treasury Notes 1.38%, 9/30/20 (a) | 10,000 | 10,019 | |||||||||
1.63%, 11/30/20 (a) | 8,000 | 8,039 | |||||||||
1.38%, 1/31/21 | 2,750 | 2,767 | |||||||||
Total U.S. Treasury Obligations (Cost $20,740) | 20,825 | ||||||||||
See notes to financial statements.
32
| USAA Mutual Funds Trust USAA Short-Term Bond Fund | Schedule of Portfolio Investments — continued July 31, 2020 | ||||||
(Amounts in Thousands, Except for Shares)
Security Description | Shares or Principal Amount | Value | |||||||||
Commercial Paper (3.3%) | |||||||||||
(3.1%): | |||||||||||
Enbridge Gas Distribution, 0.19%, 8/7/20 (b) (q) | $ | 2,050 | $ | 2,050 | |||||||
Energy Transfer Part LP, 2.67%, 8/3/20 (b) (q) | 17,000 | 16,996 | |||||||||
| Glencore Funding LLC 0.39%, 8/6/20 (b) (q) | 17,500 | 17,499 | |||||||||
0.39%, 8/7/20 (b) (q) | 10,000 | 9,999 | |||||||||
Hyundai Capital America, Inc., 0.60%, 8/25/20 (b) (q) | 10,000 | 9,996 | |||||||||
| Jabil, Inc. 2.67%, 8/3/20 (b) (q) | 12,000 | 11,997 | |||||||||
2.65%, 8/4/20 (b) (q) | 10,000 | 9,997 | |||||||||
| Nissan Motor Acceptance Corp. 2.26%, 8/10/20 (b) (q) | 5,000 | 4,997 | |||||||||
3.59%, 1/29/21 (b) (q) | 5,500 | 5,402 | |||||||||
88,933 | |||||||||||
Texas (0.2%): | |||||||||||
Dallas/Fort Worth International Airport, 0.65%, 8/28/20 (b) (q) | 5,000 | 5,000 | |||||||||
Total Commercial Paper (Cost $93,848) | 93,933 | ||||||||||
Collateral for Securities Loaned^ (1.5%) | |||||||||||
HSBC U.S. Government Money Market Fund I Shares, 0.08% (r) | 42,051,664 | 42,052 | |||||||||
Invesco Government & Agency Portfolio Institutional Shares, 0.06% (r) | 297,000 | 297 | |||||||||
Total Collateral for Securities Loaned (Cost $42,349) | 42,349 | ||||||||||
Total Investments (Cost $2,831,631) — 101.1% | 2,870,375 | ||||||||||
Liabilities in excess of other assets — (1.1)% | (32,585) | ||||||||||
NET ASSETS — 100.00% | $ | 2,837,790 | |||||||||
At July 31, 2020 the Fund's investments in foreign securities were 10.7% of net assets.
^ Purchased with cash collateral from securities on loan.
(a) All or a portion of this security has been segregated as collateral for derivative instruments and/or when-issued securities.
(b) Rule 144A security or other security that is restricted as to resale to institutional investors. The Fund's Adviser has deemed this security to be liquid based upon procedures approved by the Board of Trustees. As of July 31, 2020, the fair value of these securities was $1,210,227 (thousands) and amounted to 42.6% of net assets.
(c) Variable or Floating-Rate Security. Rate disclosed is as of July 31, 2020.
(d) Security purchased on a when-issued basis.
(e) The rate for certain asset-backed and mortgage-backed securities may vary based on factors relating to the pool of assets underlying the security. The rate disclosed is the rate in effect at July 31, 2020.
(f) Security is interest only.
See notes to financial statements.
33
| USAA Mutual Funds Trust USAA Short-Term Bond Fund | Schedule of Portfolio Investments — continued July 31, 2020 | ||||||
(g) Security is perpetual and has no final maturity date but may be subject to calls at various dates in the future.
(h) Security was fair valued based upon procedures approved by the Board of Trustees and represents 0.2% of the Fund's net assets as of July 31, 2020. This security is classified as Level 3 within the fair value hierarchy. (See Note 2 in the Notes to Financial Statements)
(i) Rule 144A security or other security that is restricted as to resale to institutional investors. The Fund's Adviser has deemed this security to be illiquid based upon procedures approved by the Board of Trustees. At July 31, 2020, illiquid securities were 0.2% of the Fund's net assets.
(j) All or a portion of this security is on loan.
(k) Defaulted security
(l) At July 31, 2020, the issuer was in bankruptcy.
(m) Variable Rate Demand Notes that provide the right to sell the security at face value on either that day or within the rate-reset period. The interest rate is reset on the put date at a stipulated daily, weekly, monthly, quarterly, or other specified time interval to reflect current market conditions. These securities do not indicate a reference rate and spread in their description.
(n) Put Bond.
(o) Stepped-coupon security converts to coupon form on 08/15/21 with a rate of 2.715%.
(p) Amount represents less than 0.05% of net assets.
(q) Rate represents the effective yield at July 31, 2020.
(r) Rate disclosed is the daily yield on July 31, 2020.
bps — Basis points
GO — General Obligation
IDA — Industrial Development Authority
LIBOR — London InterBank Offered Rate
LIBOR01M — 1 Month US Dollar LIBOR, rate disclosed as of July 31, 2020, based on the last reset date of the security
LIBOR03M — 3 Month US Dollar LIBOR, rate disclosed as of July 31, 2020, based on the last reset date of the security
LIBOR12M — 12 Month US Dollar LIBOR, rate disclosed as of July 31, 2020, based on the last reset date of the security
LLC — Limited Liability Company
LOC — Letter of Credit
LP — Limited Partnership
MBIA — Municipal Bond Insurance Association
MTN — Medium Term Note
PLC — Public Limited Company
SOFR — Secured Overnight Financing Rate
See notes to financial statements.
34
| USAA Mutual Funds Trust USAA Short-Term Bond Fund | Schedule of Portfolio Investments — continued July 31, 2020 | ||||||
Credit Enhancements — Adds the financial strength of the provider of the enhancement to support the issuer's ability to repay the principal and interest payments when due. The enhancement may be provided by a high-quality bank, insurance company or other corporation, or a collateral trust. The enhancements do not guarantee the market values of the securities.
INS Principal and interest payments are insured by the name listed. Although bond insurance reduces the risk of loss due to default by an issuer, such bonds remain subject to the risk that value may fluctuate for other reasons, and there is no assurance that the insurance company will meet its obligations.
LOC Principal and interest payments are guaranteed by a bank letter of credit or other bank credit agreement.
Futures Contracts Purchased
(Amounts not in thousands)
| Number of Contracts | Expiration Date | Notional Amount | Value | Unrealized Appreciation (Depreciation) | |||||||||||||||||||
5-Year U.S. Treasury Note Future | 300 | 9/30/20 | $ | 37,617,914 | $ | 37,837,500 | $ | 219,587 | |||||||||||||||
Total unrealized appreciation | $ | 219,587 | |||||||||||||||||||||
Total unrealized depreciation | — | ||||||||||||||||||||||
Total net unrealized appreciation (depreciation) | $ | 219,587 | |||||||||||||||||||||
See notes to financial statements.
35
USAA Mutual Funds Trust | Statement of Assets and Liabilities July 31, 2020 | ||||||
(Amounts in Thousands, Except Per Share Amounts)
| USAA Short-Term Bond Fund | |||||||
Assets: | |||||||
Investments, at value (Cost $2,831,631) | $ | 2,870,375 | (a) | ||||
Cash and cash equivalents | 216 | ||||||
Deposits with brokers for futures contracts | 2,450 | ||||||
Receivables: | |||||||
Interest and dividends | 19,491 | ||||||
Capital shares issued | 940 | ||||||
Investments sold | 4,306 | ||||||
Variation margin on open futures contracts | 23 | ||||||
Prepaid expenses | 64 | ||||||
Total Assets | 2,897,865 | ||||||
Liabilities: | |||||||
Payables: | |||||||
Collateral received on loaned securities | 42,349 | ||||||
Distributions | 127 | ||||||
Investments purchased | 12,255 | ||||||
Capital shares redeemed | 4,163 | ||||||
Accrued expenses and other payables: | |||||||
Investment advisory fees | 444 | ||||||
Administration fees | 284 | ||||||
Custodian fees | 38 | ||||||
Transfer agent fees | 294 | ||||||
Compliance fees | 2 | ||||||
| 12b-1 fees | 1 | ||||||
Other accrued expenses | 118 | ||||||
Total Liabilities | 60,075 | ||||||
Net Assets: | |||||||
Capital | 2,787,890 | ||||||
Total accumulated earnings/(loss) | 49,900 | ||||||
Net Assets | $ | 2,837,790 | |||||
Net Assets: | |||||||
Fund Shares | $ | 1,040,688 | |||||
Institutional Shares | 1,777,916 | ||||||
Class A shares | 11,236 | ||||||
Class R6 Shares | 7,950 | ||||||
Total | $ | 2,837,790 | |||||
Shares (unlimited number of shares authorized with no par value): | |||||||
Fund Shares | 111,977 | ||||||
Institutional Shares | 191,402 | ||||||
Class A shares | 1,209 | ||||||
Class R6 Shares | 855 | ||||||
Total | 305,443 | ||||||
Net asset value, offering and redemption price per share: (b) | |||||||
Fund Shares | $ | 9.29 | |||||
Institutional Shares | $ | 9.29 | |||||
Class A shares | $ | 9.29 | |||||
Class R6 Shares | $ | 9.30 | |||||
Maximum Sales Charge — Class A shares | 2.25 | % | |||||
Maximum offering price | |||||||
| (100%/(100%-maximum sales charge) of net asset value adjusted to the nearest cent) per share — Class A shares | $ | 9.50 | |||||
(a) Includes $41,124 of securities on loan.
(b) Per share amount may not recalculate due to rounding of net assets and/or shares outstanding.
See notes to financial statements.
36
USAA Mutual Funds Trust | Statement of Operations For the Year Ended July 31, 2020 | ||||||
(Amounts in Thousands)
| USAA Short-Term Bond Fund | |||||||
Investment Income: | |||||||
Dividends | $ | 2,682 | |||||
Interest | 95,665 | ||||||
Securities lending (net of fees) | 85 | ||||||
Total Income | 98,432 | ||||||
Expenses: | |||||||
Investment advisory fees | 5,861 | ||||||
Administration fees — Fund Shares | 1,679 | ||||||
Administration fees — Institutional Shares | 1,811 | ||||||
Administration fees — Class A shares | 18 | ||||||
Administration fees — R6 Shares | 4 | ||||||
Sub-Administration fees | 24 | ||||||
12b-1 fees — Class A shares | 31 | ||||||
Custodian fees | 172 | ||||||
Transfer agent fees — Fund Shares | 1,642 | ||||||
Transfer agent fees — Institutional Shares | 1,811 | ||||||
Transfer agent fees — Class A shares | 6 | ||||||
Transfer agent fees — Class R6 Shares | 1 | ||||||
Trustees' fees | 47 | ||||||
Compliance fees | 20 | ||||||
Legal and audit fees | 94 | ||||||
State registration and filing fees | 65 | ||||||
Interfund lending fees | — | (a) | |||||
Other expenses | 262 | ||||||
Total Expenses | 13,548 | ||||||
Expenses waived/reimbursed by Adviser | (6 | ) | |||||
Net Expenses | 13,542 | ||||||
Net Investment Income (Loss) | 84,890 | ||||||
Realized/Unrealized Gains (Losses) from Investments: | |||||||
Net realized gains (losses) from investment securities | 11,356 | ||||||
Net realized gains (losses) from futures contracts | 1,619 | ||||||
Net change in unrealized appreciation/depreciation on investment securities | 9,255 | ||||||
Net change in unrealized appreciation/depreciation on futures contracts | 220 | ||||||
Net realized/unrealized gains (losses) on investments | 22,450 | ||||||
Change in net assets resulting from operations | $ | 107,340 | |||||
(a) Amount is less than $1 thousand.
See notes to financial statements.
37
USAA Mutual Funds Trust | Statements of Changes in Net Assets | ||||||
(Amounts in Thousands)
USAA Short-Term Bond Fund | |||||||||||
| Year Ended July 31, 2020 | Year Ended July 31, 2019 | ||||||||||
From Investments: | |||||||||||
Operations: | |||||||||||
Net investment income (loss) | $ | 84,890 | $ | 88,630 | |||||||
Net realized gains (losses) from investments | 12,975 | (354 | ) | ||||||||
| Net change in unrealized appreciation/depreciation on investments | 9,475 | 51,945 | |||||||||
Change in net assets resulting from operations | 107,340 | 140,221 | |||||||||
Distributions to Shareholders: | |||||||||||
Fund Shares | (31,970 | ) | (31,432 | ) | |||||||
Institutional Shares | (53,509 | ) | (57,077 | ) | |||||||
Class A shares | (325 | ) | (417 | ) | |||||||
Class R6 Shares | (221 | ) | (150 | ) | |||||||
Change in net assets resulting from distributions to shareholders | (86,025 | ) | (89,076 | ) | |||||||
Change in net assets resulting from capital transactions | (194,932 | ) | (281,820 | ) | |||||||
Change in net assets | (173,617 | ) | (230,675 | ) | |||||||
Net Assets: | |||||||||||
Beginning of period | 3,011,407 | 3,242,082 | |||||||||
End of period | $ | 2,837,790 | $ | 3,011,407 | |||||||
Capital Transactions: | |||||||||||
Fund Shares | |||||||||||
Proceeds from shares issued | $ | 196,309 | $ | 231,270 | |||||||
Distributions reinvested | 31,095 | 30,563 | |||||||||
Cost of shares redeemed | (362,515 | ) | (300,518 | ) | |||||||
Total Fund Shares | $ | (135,111 | ) | $ | (38,685 | ) | |||||
Institutional Shares | |||||||||||
Proceeds from shares issued | $ | 325,565 | $ | 419,712 | |||||||
Distributions reinvested | 52,823 | 53,713 | |||||||||
Cost of shares redeemed | (436,571 | ) | (708,728 | ) | |||||||
Total Institutional Shares | $ | (58,183 | ) | $ | (235,303 | ) | |||||
Class A shares | |||||||||||
Proceeds from shares issued | $ | 2,198 | $ | 2,697 | |||||||
Distributions reinvested | 166 | 212 | |||||||||
Cost of shares redeemed | (6,436 | ) | (10,972 | ) | |||||||
Total Class A shares | $ | (4,072 | ) | $ | (8,063 | ) | |||||
Class R6 Shares | |||||||||||
Proceeds from shares issued | $ | 3,296 | $ | 226 | |||||||
Distributions reinvested | 71 | 6 | |||||||||
Cost of shares redeemed | (933 | ) | (1 | ) | |||||||
Total Class R6 Shares | $ | 2,434 | $ | 231 | |||||||
Change in net assets resulting from capital transactions | $ | (194,932 | ) | $ | (281,820 | ) | |||||
(continues on next page)
See notes to financial statements.
38
USAA Mutual Funds Trust | Statements of Changes in Net Assets | ||||||
(Amounts in Thousands) (continued)
USAA Short-Term Bond Fund | |||||||||||
| Year Ended July 31, 2020 | Year Ended July 31, 2019 | ||||||||||
Share Transactions: | |||||||||||
Fund Shares | |||||||||||
Issued | 21,376 | 25,391 | |||||||||
Reinvested | 3,383 | 3,351 | |||||||||
Redeemed | (39,623 | ) | (33,004 | ) | |||||||
Total Fund Shares | (14,864 | ) | (4,262 | ) | |||||||
Institutional Shares | |||||||||||
Issued | 35,367 | 46,093 | |||||||||
Reinvested | 5,752 | 5,894 | |||||||||
Redeemed | (47,767 | ) | (77,547 | ) | |||||||
Total Institutional Shares | (6,648 | ) | (25,560 | ) | |||||||
Class A shares | |||||||||||
Issued | 238 | 296 | |||||||||
Reinvested | 18 | 23 | |||||||||
Redeemed | (700 | ) | (1,207 | ) | |||||||
Total Class A shares | (444 | ) | (888 | ) | |||||||
Class R6 Shares | |||||||||||
Issued | 357 | 24 | |||||||||
Reinvested | 8 | 1 | |||||||||
Redeemed | (102 | ) | — | (a) | |||||||
Total Class R6 Shares | 263 | 25 | |||||||||
Change in Shares | (21,693 | ) | (30,685 | ) | |||||||
(a) Represents less than 500 shares.
See notes to financial statements.
39
USAA Mutual Funds Trust | Financial Highlights | ||||||
For a Share Outstanding Throughout Each Period
Investment Activities | Distributions to Shareholders From | ||||||||||||||||||||||||||
| Net Asset Value, Beginning of Period | Net Investment Income (Loss) | Net Realized and Unrealized Gains (Losses) on Investments | Total from Investment Activities | Net Investment Income | Net Realized Gains from Investments | ||||||||||||||||||||||
USAA Short-Term Bond Fund | |||||||||||||||||||||||||||
Fund Shares | |||||||||||||||||||||||||||
| Year Ended July 31, 2020 | $ | 9.21 | 0.26 | (d) | 0.08 | 0.34 | (0.26 | ) | — | (e) | |||||||||||||||||
| Year Ended July 31, 2019 | $ | 9.06 | 0.24 | 0.15 | 0.39 | (0.24 | ) | — | (e) | ||||||||||||||||||
| Year Ended July 31, 2018 | $ | 9.21 | 0.20 | (0.15 | ) | 0.05 | (0.20 | ) | — | (e) | |||||||||||||||||
| Year Ended July 31, 2017 | $ | 9.20 | 0.17 | 0.01 | 0.18 | (0.17 | ) | — | |||||||||||||||||||
| Year Ended July 31, 2016 | $ | 9.15 | 0.16 | 0.05 | 0.21 | (0.16 | ) | — | |||||||||||||||||||
Institutional Shares | |||||||||||||||||||||||||||
| Year Ended July 31, 2020 | $ | 9.20 | 0.27 | (d) | 0.09 | 0.36 | (0.27 | ) | — | (e) | |||||||||||||||||
| Year Ended July 31, 2019 | $ | 9.06 | 0.25 | 0.14 | 0.39 | (0.25 | ) | — | (e) | ||||||||||||||||||
| Year Ended July 31, 2018 | $ | 9.21 | 0.21 | (0.15 | ) | 0.06 | (0.21 | ) | — | (e) | |||||||||||||||||
| Year Ended July 31, 2017 | $ | 9.20 | 0.18 | 0.01 | 0.19 | (0.18 | ) | — | |||||||||||||||||||
| Year Ended July 31, 2016 | $ | 9.15 | 0.17 | 0.05 | 0.22 | (0.17 | ) | — | |||||||||||||||||||
* Assumes reinvestment of all net investment income and realized capital gain distributions, if any, during the period. Includes adjustments in accordance with U.S. generally accepted accounting principles and could differ from the Lipper reported return.
^ The net expense ratio may not correlate to the applicable expense limits in place during the period since the current contractual expense limitation is applied for a two year period beginning July 1, 2019 and in effect through June 30, 2021, instead of coinciding with the Fund's fiscal year end. Details of the current contractual expense limitation in effect can be found in Note 5 of the accompanying Notes to Financial Statements.
(a) Not annualized for periods less than one year.
(b) Annualized for periods less than one year.
(c) Portfolio turnover is calculated on the basis of the Fund as a whole without distinguishing between the classes of shares issued.
(d) Per share net investment income (loss) has been calculated using the average daily shares method.
(e) Amount is less than $0.005 per share.
See notes to financial statements.
40
USAA Mutual Funds Trust | Financial Highlights — continued | ||||||
For a Share Outstanding Throughout Each Period
Ratios to Average Net Assets | Supplemental Data | ||||||||||||||||||||||||||||||||||
| Total Distributions | Net Asset Value, End of Period | Total Return (Excludes Sales Charge)*,(a) | Net Expenses^(b) | Net Investment Income (Loss)(b) | Gross Expenses(b) | Net Assets, End of Period (000's) | Portfolio Turnover(a)(c) | ||||||||||||||||||||||||||||
USAA Short-Term Bond Fund | |||||||||||||||||||||||||||||||||||
Fund Shares | |||||||||||||||||||||||||||||||||||
| Year Ended July 31, 2020 | (0.26 | ) | $ | 9.29 | 3.79 | % | 0.52 | % | 2.82 | % | 0.52 | % | $ | 1,040,688 | 66 | % | |||||||||||||||||||
| Year Ended July 31, 2019 | (0.24 | ) | $ | 9.21 | 4.43 | % | 0.57 | % | 2.68 | % | 0.57 | % | $ | 1,167,973 | 48 | % | |||||||||||||||||||
| Year Ended July 31, 2018 | (0.20 | ) | $ | 9.06 | 0.54 | % | 0.59 | % | 2.18 | % | 0.59 | % | $ | 1,188,259 | 39 | % | |||||||||||||||||||
| Year Ended July 31, 2017 | (0.17 | ) | $ | 9.21 | 2.02 | % | 0.63 | % | 1.90 | % | 0.63 | % | $ | 1,301,428 | 31 | % | |||||||||||||||||||
| Year Ended July 31, 2016 | (0.16 | ) | $ | 9.20 | 2.34 | % | 0.61 | % | 1.76 | % | 0.61 | % | $ | 1,400,054 | 22 | % | |||||||||||||||||||
Institutional Shares | |||||||||||||||||||||||||||||||||||
| Year Ended July 31, 2020 | (0.27 | ) | $ | 9.29 | 4.01 | % | 0.42 | % | 2.92 | % | 0.42 | % | $ | 1,777,916 | 66 | % | |||||||||||||||||||
| Year Ended July 31, 2019 | (0.25 | ) | $ | 9.20 | 4.42 | % | 0.47 | % | 2.78 | % | 0.47 | % | $ | 1,822,756 | 48 | % | |||||||||||||||||||
| Year Ended July 31, 2018 | (0.21 | ) | $ | 9.06 | 0.65 | % | 0.48 | % | 2.29 | % | 0.48 | % | $ | 2,025,651 | 39 | % | |||||||||||||||||||
| Year Ended July 31, 2017 | (0.18 | ) | $ | 9.21 | 2.13 | % | 0.53 | % | 2.00 | % | 0.53 | % | $ | 1,954,307 | 31 | % | |||||||||||||||||||
| Year Ended July 31, 2016 | (0.17 | ) | $ | 9.20 | 2.44 | % | 0.51 | % | 1.87 | % | 0.51 | % | $ | 1,942,385 | 22 | % | |||||||||||||||||||
(continues on next page)
See notes to financial statements.
41
USAA Mutual Funds Trust | Financial Highlights — continued | ||||||
For a Share Outstanding Throughout Each Period (continued)
Investment Activities | Distributions to Shareholders From | ||||||||||||||||||||||||||
| Net Asset Value, Beginning of Period | Net Investment Income (Loss) | Net Realized and Unrealized Gains (Losses) on Investments | Total from Investment Activities | Net Investment Income | Net Realized Gains from Investments | ||||||||||||||||||||||
USAA Short-Term Bond Fund | |||||||||||||||||||||||||||
Class A shares | |||||||||||||||||||||||||||
| Year Ended July 31, 2020 | $ | 9.21 | 0.24 | (d) | 0.08 | 0.32 | (0.24 | ) | — | (e) | |||||||||||||||||
| Year Ended July 31, 2019 | $ | 9.06 | 0.22 | 0.15 | 0.37 | (0.22 | ) | — | (e) | ||||||||||||||||||
| Year Ended July 31, 2018 | $ | 9.21 | 0.18 | (0.15 | ) | 0.03 | (0.18 | ) | — | (e) | |||||||||||||||||
| Year Ended July 31, 2017 | $ | 9.20 | 0.16 | 0.01 | 0.17 | (0.16 | ) | — | |||||||||||||||||||
| Year Ended July 31, 2016 | $ | 9.15 | 0.14 | 0.05 | 0.19 | (0.14 | ) | — | |||||||||||||||||||
Class R6 Shares | |||||||||||||||||||||||||||
| Year Ended July 31, 2020 | $ | 9.21 | 0.27 | (d) | 0.09 | 0.36 | (0.27 | ) | — | (e) | |||||||||||||||||
| Year Ended July 31, 2019 | $ | 9.07 | 0.26 | 0.14 | 0.40 | (0.26 | ) | — | (e) | ||||||||||||||||||
| Year Ended July 31, 2018 | $ | 9.21 | 0.22 | (0.14 | ) | 0.08 | (0.22 | ) | — | (e) | |||||||||||||||||
| December 1, 2016 (f) through July 31, 2017 | $ | 9.12 | 0.13 | 0.09 | 0.22 | (0.13 | ) | — | |||||||||||||||||||
* Assumes reinvestment of all net investment income and realized capital gain distributions, if any, during the period. Includes adjustments in accordance with U.S. generally accepted accounting principles and could differ from the Lipper reported return.
^ The net expense ratio may not correlate to the applicable expense limits in place during the period since the current contractual expense limitation is applied for a two year period beginning July 1, 2019 and in effect through June 30, 2021, instead of coinciding with the Fund's fiscal year end. Details of the current contractual expense limitation in effect can be found in Note 5 of the accompanying Notes to Financial Statements.
(a) Not annualized for periods less than one year.
(b) Annualized for periods less than one year.
(c) Portfolio turnover is calculated on the basis of the Fund as a whole without distinguishing between the classes of shares issued.
(d) Per share net investment income (loss) has been calculated using the average daily shares method.
(e) Amount is less than $0.005 per share.
(f) Commencement of operations.
See notes to financial statements.
42
USAA Mutual Funds Trust | Financial Highlights — continued | ||||||
For a Share Outstanding Throughout Each Period
Ratios to Average Net Assets | Supplemental Data | ||||||||||||||||||||||||||||||||||
| Total Distributions | Net Asset Value, End of Period | Total Return (Excludes Sales Charge)*,(a) | Net Expenses^(b) | Net Investment Income (Loss)(b) | Gross Expenses(b) | Net Assets, End of Period (000's) | Portfolio Turnover(a)(c) | ||||||||||||||||||||||||||||
USAA Short-Term Bond Fund | |||||||||||||||||||||||||||||||||||
Class A shares | |||||||||||||||||||||||||||||||||||
| Year Ended July 31, 2020 | (0.24 | ) | $ | 9.29 | 3.58 | % | 0.73 | % | 2.61 | % | 0.74 | % | $ | 11,236 | 66 | % | |||||||||||||||||||
| Year Ended July 31, 2019 | (0.22 | ) | $ | 9.21 | 4.17 | % | 0.82 | % | 2.43 | % | 0.82 | % | $ | 15,222 | 48 | % | |||||||||||||||||||
| Year Ended July 31, 2018 | (0.18 | ) | $ | 9.06 | 0.38 | % | 0.74 | % | 2.02 | % | 0.74 | % | $ | 23,030 | 39 | % | |||||||||||||||||||
| Year Ended July 31, 2017 | (0.16 | ) | $ | 9.21 | 1.82 | % | 0.82 | % | 1.70 | % | 0.82 | % | $ | 21,532 | 31 | % | |||||||||||||||||||
| Year Ended July 31, 2016 | (0.14 | ) | $ | 9.20 | 2.08 | % | 0.86 | % | 1.52 | % | 0.86 | % | $ | 12,747 | 22 | % | |||||||||||||||||||
Class R6 Shares | |||||||||||||||||||||||||||||||||||
| Year Ended July 31, 2020 | (0.27 | ) | $ | 9.30 | 4.04 | % | 0.39 | % | 2.96 | % | 0.45 | % | $ | 7,950 | 66 | % | |||||||||||||||||||
| Year Ended July 31, 2019 | (0.26 | ) | $ | 9.21 | 4.50 | % | 0.39 | % | 2.86 | % | 0.71 | % | $ | 5,456 | 48 | % | |||||||||||||||||||
| Year Ended July 31, 2018 | (0.22 | ) | $ | 9.07 | 0.85 | % | 0.39 | % | 2.38 | % | 0.67 | % | $ | 5,142 | 39 | % | |||||||||||||||||||
| December 1, 2016 (f) through July 31, 2017 | (0.13 | ) | $ | 9.21 | 2.43 | % | 0.39 | % | 2.14 | % | 1.02 | % | $ | 5,129 | 31 | % | |||||||||||||||||||
See notes to financial statements.
43
USAA Mutual Funds Trust | Notes to Financial Statements July 31, 2020 | ||||||
1. Organization:
USAA Mutual Funds Trust (the "Trust") is organized as a Delaware statutory trust and is registered under the Investment Company Act of 1940, as amended (the "1940 Act"), as an open-end investment company. The Trust is comprised of 47 funds and is authorized to issue an unlimited number of shares, which are units of beneficial interest with no par value.
The accompanying financial statements are those of the USAA Short-Term Bond Fund (the "Fund"). The Fund offers four classes of shares: Fund Shares, Institutional Shares, Class A* shares, and R6 Shares. The Fund is classified as diversified under the 1940 Act.
* Effective June 29, 2020, the Fund's Adviser Shares were redesignated Class A shares and became subject to a front-end sales charge.
Each class of shares of the Fund has substantially identical rights and privileges except with respect to fees paid under distribution plans, expenses allocable exclusively to each class of shares, voting rights on matters solely affecting a single class of shares, and the exchange privilege of each class of shares.
Under the Trust's organizational documents, its officers and trustees are indemnified against certain liabilities arising out of the performance of their duties to the Fund. In addition, in the normal course of business, the Fund enters into contracts with its vendors and others that provide for general indemnifications. The Fund's maximum exposure under these arrangements is unknown, as this would involve future claims that may be made against the Fund. However, based on experience, the Fund expects that risk of loss to be remote.
2. Significant Accounting Policies:
The following is a summary of significant accounting policies followed by the Trust in the preparation of its financial statements. The policies are in conformity with generally accepted accounting principles in the United States of America ("GAAP"). The preparation of financial statements in accordance with GAAP requires management to make estimates and assumptions that affect the reported amounts of assets and liabilities and disclosure of contingent assets and liabilities at the date of the financial statements and the reported amounts of income and expenses for the period. Actual results could differ from those estimates. The Fund follows the specialized accounting and reporting requirements under GAAP that are applicable to investment companies under Accounting Standards Codification Topic 946.
Investment Valuation:
The Fund records investments at fair value. Fair value is defined as the price that would be received to sell an asset or paid to transfer a liability in an orderly transaction between market participants at the measurement date.
The valuation techniques described below maximize the use of observable inputs and minimize the use of unobservable inputs in determining fair value. The inputs used for valuing the Fund's investments are summarized in the three broad levels listed below:
• Level 1 — quoted prices in active markets for identical securities
• Level 2 — other significant observable inputs (including quoted prices for similar securities or interest rates applicable to those securities, etc.)
• Level 3 — significant unobservable inputs (including the Fund's own assumptions in determining the fair value of investments)
Changes in valuation techniques may result in transfers in or out of an assigned level within the disclosure hierarchy. The inputs or methodologies used for valuation techniques are not necessarily an indication of the risk associated with entering into those investments.
The Adviser has established the Pricing and Liquidity Committee (the "Committee"), and subject to Trust's Board of Trustees (the "Board") oversight, the Committee administers and oversees the Fund's valuation policies and procedures, which are approved by the Board.
44
USAA Mutual Funds Trust | Notes to Financial Statements — continued July 31, 2020 | ||||||
Portfolio securities listed or traded on securities exchanges, including exchange-traded funds ("ETFs"), American Depositary Receipts ("ADRs") and Rights, are valued at the closing price on the exchange or system where the security is principally traded, if available, or at the Nasdaq Official Closing Price. If there have been no sales for that day on the exchange or system, then a security is valued at the last available bid quotation on the exchange or system where the security is principally traded. In each of these situations, valuations are typically categorized as Level 1 in the fair value hierarchy.
Investments in open-end investment companies are valued at net asset value ("NAV"). These valuations are typically categorized as Level 1 in the fair value hierarchy.
Debt securities of United States ("U.S.") issuers, along with corporate and municipal securities, including short-term investments maturing in 60 days or less, may be valued using evaluated bid or the last sales price to price securities by dealers or an independent pricing service approved by the Board. These valuations are typically categorized as Level 2 in the fair value hierarchy.
Futures contracts are valued at the settlement price established each day by the board of trade or an exchange on which they are traded. These valuations are typically categorized as Level 1 in the fair value hierarchy.
In the event that price quotations or valuations are not readily available, are not reflective of market value, or a significant event has been recognized in relation to a security or class of securities, the securities are valued in good faith by the Committee in accordance with valuation procedures approved by the Board. These valuations are typically categorized as Level 2 or Level 3 in the fair value hierarchy, based on the observability of inputs used to determine the fair value. The effect of fair value pricing is that securities may not be priced on the basis of quotations from the primary market in which they are traded and the actual price realized from the sale of a security may differ materially from the fair value price. Valuing these securities at fair value is intended to cause the Fund's NAV to be more reliable than it otherwise would be.
A summary of the valuations as of July 31, 2020, based upon the three levels defined above, is included in the table below while the breakdown, by category, of investments is disclosed on the Schedule of Portfolio Investments (amounts in thousands):
Level 1 | Level 2 | Level 3 | Total | ||||||||||||||||
Asset-Backed Securities | $ | — | $ | 620,563 | $ | — | $ | 620,563 | |||||||||||
| Collateralized Mortgage Obligations | — | 241,170 | — | 241,170 | |||||||||||||||
Preferred Stocks | 5,400 | — | 5,250 | 10,650 | |||||||||||||||
Convertible Corporate Bond | — | 16,393 | — | 16,393 | |||||||||||||||
Senior Secured Loans | — | 8,510 | — | 8,510 | |||||||||||||||
Corporate Bonds | — | 1,269,251 | — | 1,269,251 | |||||||||||||||
Yankee Dollars | — | 308,560 | — | 308,560 | |||||||||||||||
Municipal Bonds | — | 217,364 | — | 217,364 | |||||||||||||||
| U.S. Government Agency Mortgages | — | 20,807 | — | 20,807 | |||||||||||||||
U.S. Treasury Obligations | — | 20,825 | — | 20,825 | |||||||||||||||
Commercial Paper | — | 93,933 | — | 93,933 | |||||||||||||||
Collateral for Securities Loaned | 42,349 | — | — | 42,349 | |||||||||||||||
Total | $ | 47,749 | $ | 2,817,376 | $ | 5,250 | $ | 2,870,375 | |||||||||||
Other Financial Investments^: | |||||||||||||||||||
Assets: | |||||||||||||||||||
Future Contracts | $ | 220 | $ | — | $ | — | $ | 220 | |||||||||||
| Total | $ | 220 | $ | — | $ | — | $ | 220 | |||||||||||
^ Futures Contracts are valued at the unrealized appreciation (depreciation) on the investment.
For the year ended July 31, 2020, there were no transfers in or out of the Level 3 fair value hierarchy.
45
USAA Mutual Funds Trust | Notes to Financial Statements — continued July 31, 2020 | ||||||
Real Estate Investment Trusts ("REITs"):
The Fund may invest in REITs, which report information on the source of their distributions annually. REITs are pooled investment vehicles that invest primarily in income producing real estate or real estate related loans or interests (such as mortgages). Certain distributions received from REITs during the year are recorded as realized gains or return of capital as estimated by the Fund or when such information becomes known.
Investment Companies:
Open-End Funds:
The Fund may invest in portfolios of open-end investment companies. These investment companies value securities in their portfolios for which market quotations are readily available at their market values (generally the last reported sale price) and all other securities and assets at their fair value by the methods established by the board of directors of the underlying funds.
Securities Purchased on a Delayed-Delivery or When-Issued Basis:
The Fund may purchase securities on a delayed-delivery or when-issued basis. Delivery and payment for securities that have been purchased by the Fund on a delayed-delivery, or when-issued basis, or for delayed draws on loans can take place a month or more after the trade date. At the time the Fund makes the commitment to purchase a security on a delayed-delivery or when-issued basis, the Fund records the transaction and reflects the value of the security in determining NAV. No interest accrues to the Fund until the transaction settles and payment takes place. A segregated account is established and the Fund maintains cash and/or marketable securities at least equal in value to commitments for delayed-delivery or when-issued securities. If the Fund owns delayed-delivery or when-issued securities, these values are included in Payable for investments purchased on the accompanying Statement of Assets and Liabilities and the segregated assets are identified on the Schedule of Portfolio Investments.
Municipal Obligations:
The values of municipal obligations can fluctuate and may be affected by adverse tax, legislative, or political changes, and by financial developments affecting municipal issuers. Payment of municipal obligations may depend on a relatively limited source of revenue, resulting in greater credit risk. Future changes in federal tax laws or the activity of an issuer may adversely affect the tax-exempt status of municipal obligations.
Mortgage- and Asset-Backed Securities:
The values of some mortgage-related or asset-backed securities may be particularly sensitive to changes in prevailing interest rates. Early repayment of principal on some mortgage-related securities may expose the Fund to a lower rate of return upon reinvestment of principal. The values of mortgage- and asset-backed securities depend in part on the credit quality and adequacy of the underlying assets or collateral and may fluctuate in response to the market's perception of these factors as well as current and future repayment rates. Some mortgage-backed securities are backed by the full faith and credit of the U.S. government (e.g., mortgage-backed securities issued by the Government National Mortgage Association, commonly known as "Ginnie Mae"), while other mortgage-backed securities (e.g., mortgage- backed securities issued by the Federal National Mortgage Association and the Federal Home Loan Mortgage Corporation, commonly known as "Fannie Mae" and "Freddie Mac", respectively), are backed only by the credit of the government entity issuing them. In addition, some mortgage-backed securities are issued by private entities and, as such, are not guaranteed by the U.S. government or any agency or instrumentality of the U.S. government.
46
USAA Mutual Funds Trust | Notes to Financial Statements — continued July 31, 2020 | ||||||
Leveraged Loans:
The Fund may invest in leveraged loans, a type of bank loan. Leveraged loans are adjustable-rate bank loans made to companies rated below investment grade. The interest rates on leveraged loans are reset periodically based upon the fluctuations of a base interest rate such as LIBOR and a "spread" above that base interest rate that represents a risk premium to the lending banks and/or other participating investors. Many bank loans bear an adjustable rate of interest; however, leveraged loans provide for a greater "spread" over the base interest rate than other bank loans because they are considered to represent a greater credit risk. Because they are perceived to represent a greater credit risk, leveraged loans possess certain attributes that are similar to high-yield securities. However, because they are often secured by collateral of the borrower, leveraged loans possess certain attributes that are similar to other bank loans.
Below Investment Grade Securities:
The Fund may invest in below investment grade securities (i.e. lower-quality, "junk" debt), which are subject to various risks. Lower-quality debt is considered to be speculative because it is less certain that the issuer will be able to pay interest or repay the principal than in the case of investment grade debt. These securities can involve a substantially greater risk of default than higher-rated securities, and their values can decline significantly over short periods of time. Lower-quality debt securities tend to be more sensitive to adverse news about their issuers, the market and the economy in general, than higher-quality debt securities. The market for these securities can be less liquid, especially during periods of recession or general market decline.
Derivative Instruments:
Futures Contracts:
The Fund may enter into contracts for the future delivery of securities or foreign currencies and futures contracts based on a specific security, class of securities, foreign currency or an index, and purchase or sell options on any such futures contracts. A futures contract on a securities index is an agreement obligating either party to pay, and entitling the other party to receive, while the contract is outstanding, cash payments based on the level of a specified securities index. No physical delivery of the underlying asset is made. The Fund may enter into futures contracts in an effort to hedge against market risks. The acquisition of put and call options on futures contracts will give the Fund the right (but not the obligation), for a specified price, to sell or to purchase the underlying futures contract, upon exercise of the option, at any time during the option period. Futures transactions involve brokerage costs and require the Fund to segregate assets to cover contracts that would require it to purchase securities or currencies. A good faith margin deposit, known as initial margin, of cash or government securities with a broker or custodian is required to initiate and maintain open positions in futures contracts. Subsequent payments, known as variation margin, are made or received by the Fund based on the change in the market value of the position and are recorded as unrealized appreciation or depreciation until the contract is closed out, at which time the gain or loss is realized. The Fund may lose the expected benefit of futures transactions if interest rates, exchange rates or securities prices change in an unanticipated manner. Such unanticipated changes may also result in lower overall performance than if the Fund had not entered into any futures transactions. In addition, the value of the Fund's futures positions may not prove to be perfectly or even highly correlated with the value of its portfolio securities or foreign currencies, limiting the Fund's ability to hedge effectively against interest rate, exchange rate and/or market risk and giving rise to additional risks. There is no assurance of liquidity in the secondary market for purposes of closing out futures positions. The collateral held by the Fund is reflected on the Statement of Assets and Liabilities under Deposit with broker for futures contracts During the period ended July 30, 2020, the Fund held futures contracts primarily for managing duration.
47
USAA Mutual Funds Trust | Notes to Financial Statements — continued July 31, 2020 | ||||||
Summary of Derivative Instruments:
The following table summarizes the fair values of derivative instruments on the Statement of Assets and Liabilities, categorized by risk exposure, as of July 31, 2020 (amounts in thousands):
Assets | |||||||
| Variation Margin Receivable on Open Futures Contracts* | |||||||
Interest Rate Risk Exposure: | $ | 220 | |||||
* Includes cumulative appreciation/depreciation of futures contracts as reported on the Schedule of Portfolio Investments. Only current day's variation margin for futures contracts are reported within the Statement of Assets and Liabilities.
The following table presents the effect of derivative instruments on the Statement of Operations, categorized by risk exposure, for the year ended July 31, 2020 (amounts in thousands):
| Net Realized Gains (Losses) on Derivatives Recognized as a Result from Operations | Net Change in Unrealized Appreciation/Depreciation on Derivatives Recognized as a Result of Operations | ||||||||||
| Net Realized Gains (Losses) from Futures Contracts | Net Change in Unrealized Appreciation/Depreciation on Futures Contracts | ||||||||||
Interest Rate Risk Exposure: | $ | 1,619 | $ | 220 | |||||||
All open derivative positions at period end are reflected in the Fund's Schedule of Portfolio Investments. The underlying face value of open derivative positions relative to the Fund's net assets at period end is generally representative of the notional amount of open positions to net assets throughout the period.
Investment Transactions and Related Income:
Changes in holdings of investments are accounted for no later than one business day following the trade date. For financial reporting purposes, however, investment transactions are accounted for on trade date on the last business day of the reporting period. Interest income is determined on the basis of coupon interest accrued using the effective interest method which adjusts, where applicable, the amortization of premiums or accretion of discount. Gains or losses realized on sales of securities are determined by comparing the identified cost of the security lot sold with the net sales proceeds.
Securities Lending:
The Fund, through a securities lending agreement with Citibank, N.A. ("Citibank"), may lend its securities to qualified financial institutions, such as certain broker-dealers, to earn additional income, net of income retained by Citibank. Borrowers are required to secure their loans for collateral in the amount of at least 102% of the value of U.S. securities loaned or at least 105% of the value of non-U.S. securities loaned, marked-to-market daily. Any collateral shortfalls associated with increases in the valuation of the securities loaned are cured the next business day once the shortfall exceeds $100 thousand.
Collateral may be cash, U.S. government securities, or other securities as permitted by SEC guidelines. Cash collateral may be invested in high-quality short-term investments, primarily open-end investment companies. Collateral requirements are determined daily based on the value of the Fund's securities on loan as of the end of the prior business day. During the time portfolio securities are on loan, the borrower will pay the Fund any dividends or interest paid on such securities plus any fee negotiated between the parties to the lending agreement. The Fund also earns a return from the collateral. The Fund pays Citibank various fees in connection with the investment of cash collateral and fees based on the investment income received from securities lending activities. Securities lending income (net of these fees) is disclosed on the Statement of Operations. Loans are terminable upon demand and the borrower must return the loaned securities within the lesser of one standard settlement period or five
48
USAA Mutual Funds Trust | Notes to Financial Statements — continued July 31, 2020 | ||||||
business days. Risks relating to securities-lending transactions include that the borrower may not provide additional collateral when required or return the securities when due, and that the value of the short-term investments will be less than the amount of cash collateral required to be returned to the borrower. The Fund's agreement with Citibank does not include master netting provisions. Non- cash collateral received by the Fund may not be sold or re-pledged except to satisfy borrower default. Cash collateral is listed on the Fund's Schedule of Portfolio of Investments and Financial Statements while non-cash collateral is not included. The following table (amounts in thousands) is a summary of the Fund's securities lending transactions as of July 31, 2020:
| Value of Securities on Loan | Non-Cash Collateral | Cash Collateral | |||||||||
| $ | 41,124 | $ | — | $ | 42,349 | ||||||
Federal Income Taxes:
It is the Fund's policy to continue to qualify as a regulated investment company by complying with the provisions available to certain investment companies, as defined in applicable sections of the Internal Revenue Code, and to make distributions of net investment income and net realized gains sufficient to relieve it from all, or substantially all, federal income taxes. Accordingly, no provision for federal income taxes is required in the financial statements. The Fund has a tax year end of July 31.
Management of the Fund has reviewed tax positions taken in tax years that remain subject to examination by all major tax jurisdictions, including federal (i.e., the last four tax years, which includes the current fiscal tax year end). Management believes that there is no tax liability resulting from unrecognized tax benefits related to uncertain tax positions taken.
Allocations:
Expenses directly attributable to the Fund are charged to the Fund, while expenses that are attributable to more than one fund in the Trust, or jointly with an affiliated trust, are allocated among the respective funds in the Trust and/or affiliated trust based upon net assets or another appropriate basis.
Income, expenses (other than class-specific expenses such as transfer agent fees, state registration fees, 12b-1 fees and printing fees), and realized and unrealized gains or losses on investments are allocated to each class of shares based on its relative net assets on the date income is earned or expenses and realized and unrealized gains and losses are incurred.
Cross-Trade Transactions:
Pursuant to Rule 17a-7 under the 1940 Act, the Fund may engage in cross-trades, which are securities transactions with affiliated investment companies and advisory accounts managed by the Adviser and any applicable sub-adviser. Any such purchase or sale transaction must be effected without brokerage commission or other remuneration, except for customary transfer fees. The transaction must be effected at the current market price, which is either the security's last sale price on an exchange or, if there are no transactions in the security that day, at the average of the highest bid and lowest asked price. For the year ended July 31, 2020, the Fund engaged in the following securities transactions with affiliated funds, which resulted in the following net realized gains (losses) (amounts in thousands):
| Purchases | Sales | Net Realized Gains (Losses) | |||||||||
| $ | 16,053 | $ | 4,298 | $ | 12 | ||||||
49
USAA Mutual Funds Trust | Notes to Financial Statements — continued July 31, 2020 | ||||||
3. Purchases and Sales:
Cost of purchases and proceeds from sales/maturities of securities (excluding securities maturing less than one year from acquisition) for the year ended July 31, 2020, were as follows for the Fund (amounts in thousands):
| Excluding U.S. Government Securities | U.S. Government Securities | ||||||||||||||||||
Purchases | Sales | Purchases | Sales | ||||||||||||||||
$ | 1,797,926 | $ | 1,859,571 | $ | 31,335 | $ | 197,114 | ||||||||||||
4. Affiliated Fund Ownership:
The Fund offers its shares for investment by other USAA Mutual Funds. The fund-of-funds do not invest in the underlying funds for the purpose of exercising management or control, and the affiliated fund-of- funds' annual and semi-annual reports may be viewed at usaa.com. As of July 31, 2020, certain fund-of-funds owned total outstanding shares of the Fund as follows:
USAA Cornerstone Conservative Fund | 0.2 | % | |||||
USAA Target Retirement Income Fund | 1.6 | % | |||||
USAA Target Retirement 2020 Fund | 2.7 | % | |||||
USAA Target Retirement 2030 Fund | 2.1 | % | |||||
USAA Target Retirement 2040 Fund | 0.8 | % | |||||
USAA Target Retirement 2050 Fund | 0.1 | % | |||||
USAA Target Retirement 2060 Fund | 0.0 | %* | |||||
* Amount is less than 0.05%.
5. Fees and Transactions with Affiliates and Related Parties:
Investment Advisory Fees:
Investment advisory services are provided to the Fund by Victory Capital Management Inc. ("VCM" or the "Adviser"), a New York corporation registered as an investment adviser with the Securities and Exchange Commission ("SEC"). The Adviser is a wholly-owned indirect subsidiary of Victory Capital Holdings, Inc., a publicly traded Delaware corporation, and a wholly-owned direct subsidiary of Victory Capital Operating, LLC. Under the terms of the Investment Advisory Agreement, the Adviser is entitled to receive a base fee and a performance adjustment. The Fund's base fee is accrued daily and paid monthly at an annualized rate of 0.20% of the Fund's average daily net assets. Amounts incurred and paid to VCM for the year ended July 31, 2020, are reflected on the Statement of Operations as Investment Advisory fees.
Effective July 1, 2019, no performance adjustments were made for the period beginning July 1, 2019, through June 30, 2020. Only performance beginning as of July 1, 2019, and thereafter is utilized in calculating future performance adjustments.
The performance adjustment for each share class is accrued daily and calculated monthly by comparing each class' performance to that of the Lipper Short Investment Grade Debt Funds Index. The Lipper Short Investment Grade Debt Funds Index tracks the total return performance of each class within the Lipper Short Investment Grade Debt Funds category.
50
USAA Mutual Funds Trust | Notes to Financial Statements — continued July 31, 2020 | ||||||
The performance period for each share class consists of the current month plus the previous 35 months (or the number of months beginning July 1, 2019, if fewer). The following table is utilized to determine the extent of the performance adjustment:
| Over/Under Performance Relative to Index (in basis points)(a) | Annual Adjustment Rate (in basis points)(a) | ||||||
+/- 20 to 50 | +/- 4 | ||||||
+/- 51 to 100 | +/- 5 | ||||||
+/- 101 and greater | +/- 6 | ||||||
(a) Based on the difference between average annual performance of the relevant share class of the Fund and its relevant Lipper index, rounded to the nearest basis point. Average daily net assets of the share class are calculated over a rolling 36-month period.
Each class' annual performance adjustment rate is multiplied by the average daily net assets of the class over the entire performance period, which is then multiplied by a fraction, the numerator of which is the number of days in the month and the denominator of which is 365 (366 in leap years). The resulting amount is then added to (in the case of overperformance), or subtracted from (in the case of underperformance) the base fee.
Under the performance fee arrangement, each class pays a positive performance fee adjustment for a performance period whenever the class outperforms the Lipper Short Investment Grade Debt Funds Index over that period, even if the class has overall negative returns during the performance period.
For the period July 1, 2020 through July 31, 2020, performance adjustments for Fund Shares, Institutional Shares, Class A shares, and R6 Shares were $(38), $0, $(1), and $0, respectively. For the Fund Shares, Institutional Shares, Class A shares, and R6 Shares, the performance adjustments were less than 0.01% of net assets for all classes.
The Trust relies on an exemptive order granted to VCM and its affiliated funds by the SEC in March 2019 permitting the use of a "manager-of-managers" structure for certain funds. Under a manager-of- managers structure, the investment adviser may select (with approval of the Board and without shareholder approval) one or more subadvisers to manage the day-to-day investment of a fund's assets. For the year ended July 31, 2020, the Fund had no subadvisors.
Administration and Servicing Fees:
VCM serves as the Fund's administrator and fund accountant. Under the Fund Administration, Servicing and Accounting Agreement, VCM is paid for its services an annual fee at a rate of 0.15% of average daily net assets of the Fund Shares and Class A shares, 0.10% of average daily net assets of the Institutional Shares, and 0.05% of average daily net assets of the R6 Shares. Amounts incurred for the year ended July 31, 2020, are reflected on the Statement of Operations as Administration fees.
The Fund (as part of the Trust) has entered into an agreement to provide compliance services with the Adviser, pursuant to which the Adviser furnishes its compliance personnel, including the services of the Chief Compliance Officer ("CCO"), and other resources reasonably necessary to provide the Trust with compliance oversight services related to the design, administration and oversight of a compliance program for the Trust in accordance with Rule 38a-1 under the 1940 Act. The CCO is an employee of the Adviser, which pays the compensation of the CCO and support staff. Funds in the Trust, Victory Variable Insurance Funds, Victory Portfolios, and Victory Portfolios II (collectively, the "Victory Funds Complex") in the aggregate, compensates the Adviser for these services. Amounts incurred for the year ended July 31, 2020, are reflected on the Statement of Operations as Compliance fees.
Citi Fund Services Ohio, Inc. ("Citi"), an affiliate of Citibank, acts as sub-administrator and sub-fund accountant to the Fund pursuant to a Sub-Administration and Sub-Fund Accounting Services Agreement between VCM and Citi. VCM pays Citi a fee for providing these services. The Fund reimburses VCM and Citi for reasonable out-of-pocket expenses incurred in providing these services and certain other expenses specifically allocated to the Funds, under the Fund Administration, Servicing, and Accounting
51
USAA Mutual Funds Trust | Notes to Financial Statements — continued July 31, 2020 | ||||||
Agreement. Amounts incurred for the year ended July 31, 2020, are reflected on the Statement of Operations as Sub-Administration fees.
Transfer Agency Fees:
Victory Capital Transfer Agency, Inc. ("VCTA"), provides transfer agency services to the Fund. VCTA, an affiliate of the Adviser, provides transfer agent services to the Fund Shares based on an annual charge of $25.50 per shareholder account plus out-of-pocket expenses. VCTA pays a portion of these fees to certain intermediaries for the administration and servicing of accounts that are held with such intermediaries. Transfer agent's fees for Institutional Shares, Class A shares, and R6 Shares are paid monthly based on a fee accrued daily at an annualized rate of 0.10%, 0.10%, and 0.01%, respectively, of average daily net assets, plus out-of-pocket expenses. Amounts incurred and paid to VCTA for the year ended July 31, 2020, are reflected on the Statement of Operations as Transfer Agent fees.
FIS Investor Services LLC serves as sub-transfer agent and dividend disbursing agent for the Fund pursuant to a Sub-Transfer Agent Agreement between VCTA and FIS Investor Services LLC. VCTA provides FIS Investor Services LLC a fee for providing these services.
Distributor/Underwriting Services:
Victory Capital Services, Inc. (the "Distributor"), an affiliate of the Adviser, serves as distributor for the continuous offering of shares of the Fund pursuant to a Distribution Agreement between the Distributor and the Trust. Effective June 30, 2020, the Distributor's name was changed from Victory Capital Advisers, Inc. Pursuant to the Distribution and Service Plans adopted in accordance with Rule 12b-1 under the1940 Act, the Distributor may receive a monthly distribution and service fee, at an annual rate of up to 0.25% of the average daily net assets of Class A shares. The distribution and service fees paid to the Distributor may be used by the Distributor to pay for activity primarily intended to result in the sale of Class A shares of the Fund. Amounts incurred and paid to VCTA for the year ended July 31, 2020, are reflected on the Statement of Operations as 12b-1 fees
In addition, the Distributor is entitled to receive commission on sales of the Class A shares of the Fund. For the fiscal year ended July 31, 2020, the Distributor did not receive any commissions.
Other Fees:
Citibank serves as the Fund's custodian.
K&L Gates LLP provides legal services to the Trust.
The Adviser has entered into an expense limitation agreement with the Fund until at least June 30, 2021. Under the terms of the agreement, the Adviser has agreed to waive fees or reimburse certain expenses to the extent that ordinary operating expenses incurred by certain classes of the Fund in any fiscal year exceed the expense limit for such classes of the Fund. Such excess amounts will be the liability of the Adviser. Interest, taxes, brokerage commissions, other expenditures, which are capitalized in accordance with GAAP, and other extraordinary expenses not incurred in the ordinary course of the Fund's business are excluded from the expense limits. As of July 31, 2020, the expense limits (excluding voluntary waivers) are 0.53%, 0.43%, 0.73%, and 0.39% for Fund Shares, Institutional Shares, Class A shares, and R6 Shares, respectively.
Under this expense limitation agreement, the Fund has agreed to repay fees and expenses that were waived or reimbursed by the Adviser for a period up to three years after the fiscal year in which the waiver or reimbursement took place, subject to the lesser of any operating expense limits in effect at the time of: (a) the original waiver or expense reimbursement; or (b) the recoupment, after giving effect to the recoupment amount. As of July 31, 2020, the following amounts are available to be repaid to the Adviser (amounts in thousands). The Fund has not recorded any amounts available to be repaid as a liability due to an assessment that such repayment is not probable at July 31, 2020.
| Expires July 31, 2022 | Expires July 31, 2023 | Total | |||||||||
| $ | 6 | $ | 6 | $ | 12 | ||||||
52
USAA Mutual Funds Trust | Notes to Financial Statements — continued July 31, 2020 | ||||||
The Adviser, may voluntarily waive or reimburse additional fees to assist the Fund in maintaining competitive expense ratios. Voluntary waivers and reimbursements applicable to the Fund are not available to be recouped at a future time. There were no voluntary waivers or reimbursements for the year ended July 31, 2020.
Certain officers and/or interested trustees of the Fund are also officers and/or employees of the Adviser, Administrator, Sub-Administrator, Sub-Fund Accountant, and Legal.
6. Risks:
The Fund may be subject to other risks in addition to these identified risks.
Global economies and financial markets are increasingly interconnected, which increases the possibilities that conditions in one country or region might adversely affect issuers in another country or region. Geopolitical and other risks, including war, terrorism, trade disputes, political or economic dysfunction within some nations, public health crises and related geopolitical events, as well as environmental disasters such as earthquakes, fires, and floods, may add to instability in world economies and markets generally. Changes in trade policies and international trade agreements could affect the economies of many countries in unpredictable ways. Epidemics and/or pandemics, such as the coronavirus (or COVID-19), may result in, among other things, closing borders, disruptions to healthcare service preparation and delivery, quarantines, cancellations, disruptions to supply chains and consumer activity, as well as general concern and uncertainty. The impact may be short-term or may last for extended periods.
The COVID-19 pandemic, which has spread rapidly across the world, has led and will continue to lead for an unknown period of time to disruptions in local, regional, national and global markets and economies. Among other things, the outbreak has resulted in, and until fully resolved is likely to continue to result in, among other things (1) government imposition of various forms of "stay at home" orders and the closing of "non-essential" businesses, resulting in significant disruption to the businesses of many issuers as well as lay-offs of employees: (2) increased requests by issuers of debt instruments for amendments and waivers of agreements to avoid default and increased defaults: (3) volatility and disruption of markets, including greater volatility in pricing and spreads; and (4) rapidly evolving proposals and/or actions by state and federal governments to address problems being experienced by the markets and by businesses and the economy in general.
The value of a debt security or other income-producing security changes in response to various factors, including, for example, market-related factors (such as changes in interest rates or changes in the risk appetite of investors generally) and changes in the actual or perceived ability of the issuer (or of issuers generally) to meet its (or their) obligations.
Other factors that may affect the value of debt securities, include, among others, public health crises and responses by governments and companies to such crises. These and other events may affect the creditworthiness of the issuer of a debt security and may impair an issuers ability to timely meet its debt obligations as they come due.
The Fund is subject to the risk that the market value of the bonds in its portfolio will fluctuate because of changes in interest rates, changes in the supply of and demand for debt securities, and other market factors. Bond prices generally are linked to the prevailing market interest rates. In general, when interest rates rise, bond prices fall; conversely, when interest rates fall, bond prices rise. The price volatility of a bond also depends on its duration. Generally, the longer the duration of a bond, the greater is its sensitivity to interest rates. To compensate investors for this higher interest rate risk, bonds with longer durations generally offer higher yields than bonds with shorter durations. The ability of an issuer of a debt security to repay principal prior to a security's maturity can increase the security's sensitivity to interest rate changes.
Decisions by the U.S. Federal Reserve (also known as the "Fed") regarding interest rate and monetary policy, which can be difficult to predict and sometimes change direction suddenly in response to economic and market events, can have a significant effect on the value of fixed income securities as well as the overall strength of the U.S. economy. Precise interest rate predictions are difficult to make,
53
USAA Mutual Funds Trust | Notes to Financial Statements — continued July 31, 2020 | ||||||
and interest rates may change unexpectedly and dramatically in response to extreme changes in market or economic conditions. As a result, the value of fixed income securities may vary widely under certain market conditions.
The fixed-income securities in the Fund's portfolio are subject to credit risk, which is the possibility that an issuer of a fixed-income security will fail to make timely interest and/or principal payments on its securities or that negative market perceptions of the issuer's ability to make such payments will cause the price of that security to decline. The Fund accepts some credit risk as a recognized means to enhance an investor's return. All fixed-income securities, varying from the highest quality to the very speculative, have some degree of credit risk.
Many debt securities, derivatives and other financial instruments, including some of the Fund's investments, use the London Interbank Offered Rate ("LIBOR") as the reference or benchmark rate for variable interest rate calculations. However, the use of LIBOR started to come under pressure following manipulation allegations in 2012. Despite increased regulation and other corrective actions since that time, concerns have arisen regarding its viability as a benchmark, due largely to reduced activity in the financial markets that it measures. In June 2017, the Alternative Reference Rates Committee, a group of large U.S. banks working with the Federal Reserve, announced its selection of a new Secured Overnight Funding Rate ("SOFR"), which is intended to be a broad measure of secured overnight U.S. Treasury repo rates, as an appropriate replacement for LIBOR. The Federal Reserve Bank of New York began publishing the SOFR in 2018, expecting that it could be used on a voluntary basis in new instruments and transactions. Bank working groups and regulators in other countries have suggested other alternatives for their markets, including the Sterling Overnight Interbank Average Rate ("SONIA") in England. In July 2017, the Financial Conduct Authority (the "FCA"), the United Kingdom financial regulatory body, announced that after 2021 it will cease its active encouragement of UK banks to provide the quotations needed to sustain LIBOR. That announcement suggests that LIBOR may cease to be published after that time. The roughly three-year period until the end of 2021 is expected to be enough time for market participants to transition to the use of a different benchmark for both new and existing securities and transactions. Various financial industry groups have begun planning for that transition, but there are obstacles to converting certain longer-term securities and transactions to a new benchmark. Transition planning is at an early stage, and neither the effect of the transition process nor its ultimate success can yet be known. The transition process might lead to increased volatility and illiquidity in markets that currently rely on the LIBOR to determine interest rates. It could also lead to a reduction in the value of some LIBOR-based investments and reduce the effectiveness of new hedges placed against existing LIBOR-based instruments. Since the usefulness of LIBOR as a benchmark could deteriorate during the transition period, these effects could occur before the end of 2021.
7. Borrowing and Interfund Lending:
Line of Credit:
For the year ended July 31, 2020, the Victory Funds Complex participated in a short-term demand note "Line of Credit" agreement with Citibank. The Line of Credit agreement with Citibank was renewed on June 29, 2020 with a termination date of June 28, 2021. Under the agreement with Citibank, the Victory Funds Complex may borrow up to $600 million, of which $300 million is committed and $300 million is uncommitted. $40 million of the Line of Credit is reserved for use by the Victory Floating Rate Fund (herein, the "Fund"), another series of the Victory Funds Complex, with that Fund paying the related commitment fees for that amount. The purpose of the agreement is to meet temporary or emergency cash needs. For the year ended July 31, 2020, Citibank received an annual commitment fee of 0.15% on $300 million for providing the Line of Credit. Each fund in the Victory Funds Complex pays a pro-rata portion of the commitment fees plus any interest (one month LIBOR plus one percent) on amounts borrowed. Effective June 29, 2020, under an amended Line of Credit agreement, Citibank will also receive an annual upfront fee of 0.10% on the $300 million committed line of credit. Each fund in the Victory Funds Complex will pay a pro-rata portion of the upfront fee. Interest charged to each Fund during the period, if applicable, is reflected on the Statements of Operations under Line of credit fees.
The Fund had no borrowings under the Line of Credit agreement during the year ended July 31, 2020.
54
USAA Mutual Funds Trust | Notes to Financial Statements — continued July 31, 2020 | ||||||
Interfund Lending:
The Trust and Adviser rely on an exemptive order granted by the SEC in March 2017 (the "Order"), permitting the establishment and operation of an Interfund Lending Facility (the "Facility"). The Facility allows the Fund to directly lend and borrow money to or from any other Fund in the Victory Funds Complex relying upon the Order at rates beneficial to both the borrowing and lending funds. Advances under the Facility are allowed for temporary or emergency purposes. The interfund loan rate is determined, as specified in the Order, by averaging the current repurchase agreement rate and the current bank loan rate. As a Borrower, interest charged to the Fund, if any, during the period is reflected on the Statement of Operations under Interfund lending fees. As a Lender, interest earned by the Fund, if any, during the period is reflected on the Statement of Operations under Income on Interfund lending.
The average borrowing or lending for the days outstanding and average interest rate for the Fund during the year ended July 31, 2020 were as follows (amounts in thousands):
| Borrower or Lender | Amount Outstanding at July 31, 2020 | Average Borrowing* | Days Borrowing Outstanding | Average Interest Rate* | Maximum Borrowing During the Period | ||||||||||||||||||||||
Borrower | $ | — | $ | 4,780 | 2 | 1.65 | % | $ | 5,136 | ||||||||||||||||||
* For the year ended July 31, 2020, based on the number of days borrowings were outstanding.
8. Federal Income Tax Information:
The Fund intends to declare daily and distribute monthly any net investment income. Distributable net realized gains, if any, are declared and paid at least annually.
The amounts of dividends from net investment income and distributions from net realized gains (collectively distributions to shareholders) are determined in accordance with federal income tax regulations, which may differ from GAAP. To the extent these "book/tax" differences are permanent in nature (e.g., net operating loss and distribution reclassification), such amounts are reclassified within the components of net assets based on their federal tax-basis treatment; temporary differences (e.g., wash sales) do not require reclassification. To the extent dividends and distributions exceed net investment income and net realized gains for tax purposes, they are reported as distributions of capital. Net investment losses incurred by the Fund may be reclassified as an offset to capital on the accompanying Statement of Assets and Liabilities.
The following permanent reclassifications were made between capital accounts to reflect the portion of the payments made to redeeming shareholders that was claimed as a distribution for income tax purposes during the year ended July 31, 2020 (amounts in thousands):
| Total accumulated earnings/(loss) | Capital | ||||||
| $ | (602 | ) | $ | 602 | |||
The tax character of distributions paid during the tax years ended as noted below, were as follows (total distributions paid may differ from the Statements of Changes in Net Assets because, for tax purposes, dividends are recognized when actually paid) (amounts in thousands).
Year Ended July 31, 2020 | Year Ended July 31, 2019 | ||||||||||||||||||||||||||
Distributions paid from | Distributions paid from | ||||||||||||||||||||||||||
| Ordinary Income | Net Long-Term Capital Gains | Total Distributions Paid | Ordinary Income* | Net Long-Term Capital Gains | Total Distributions Paid | ||||||||||||||||||||||
$ | 86,025 | $ | — | (a) | $ | 86,025 | $ | 88,600 | $ | 476 | $ | 89,076 | |||||||||||||||
(a) Less than $1 thousand.
* Includes short-term realized capital gains, if any, which are taxable as ordinary income.
55
USAA Mutual Funds Trust | Notes to Financial Statements — continued July 31, 2020 | ||||||
As of July 31, 2020, the components of accumulated earnings (loss) on a tax basis were as follows (amounts in thousands):
| Undistributed Ordinary Income | Undistributed Long-Term Capital Gains | Distributions Payable | Accumulated Earnings | Other Earnings/ (Loss) | Total Unrealized Appreciation (Depreciation)* | Accumulated Earnings (Loss) | |||||||||||||||||||||
$ | 8,144 | $ | 4,032 | $ | (127 | ) | $ | 12,049 | $ | 14 | $ | 37,837 | $ | 49,900 | |||||||||||||
* The difference between the book-basis and tax-basis of unrealized appreciation/depreciation is attributable to the tax deferral of losses on wash sales.
During the tax year ended July 31, 2020, the Fund utilized $336 (in thousands) of long-term capital loss carryforwards.
As of July 31, 2020, the cost basis for federal income tax purposes, gross unrealized appreciation, gross unrealized depreciation, and net unrealized appreciation (depreciation) for investments were as follows (amounts in thousands):
| Cost of Investments for Federal Tax Purposes | Gross Unrealized Appreciation | Gross Unrealized Depreciation | Net Unrealized Appreciation (Depreciation) | ||||||||||||
| $ | 2,832,538 | $ | 68,637 | $ | (30,800 | ) | $ | 37,837 | |||||||
56
REPORT OF INDEPENDENT REGISTERED PUBLIC ACCOUNTING FIRM
To the Shareholders and the Board of Trustees of USAA Short-Term Bond Fund
Opinion on the Financial Statements
We have audited the accompanying statement of assets and liabilities of USAA Short-Term Bond Fund (the "Fund") (one of the funds constituting USAA Mutual Funds Trust (the "Trust")), including the schedule of portfolio investments, as of July 31, 2020, and the related statement of operations for the year then ended, the statements of changes in net assets for each of the two years in the period then ended, the financial highlights for each of the five years in the period then ended and the related notes (collectively referred to as the "financial statements"). In our opinion, the financial statements present fairly, in all material respects, the financial position of the Fund (one of the funds constituting USAA Mutual Funds Trust) at July 31, 2020, the results of its operations for the year then ended, the changes in its net assets for each of the two years in the period then ended and its financial highlights for each of the five years in the period then ended, in conformity with U.S. generally accepted accounting principles.
Basis for Opinion
These financial statements are the responsibility of the Trust's management. Our responsibility is to express an opinion on the Fund's financial statements based on our audits. We are a public accounting firm registered with the Public Company Accounting Oversight Board (United States) ("PCAOB") and are required to be independent with respect to the Trust in accordance with the U.S. federal securities laws and the applicable rules and regulations of the Securities and Exchange Commission and the PCAOB.
We conducted our audits in accordance with the standards of the PCAOB. Those standards require that we plan and perform the audit to obtain reasonable assurance about whether the financial statements are free of material misstatement, whether due to error or fraud. The Trust is not required to have, nor were we engaged to perform, an audit of the Trust's internal control over financial reporting. As part of our audits we are required to obtain an understanding of internal control over financial reporting, but not for the purpose of expressing an opinion on the effectiveness of the Trust's internal control over financial reporting. Accordingly, we express no such opinion.
Our audits included performing procedures to assess the risks of material misstatement of the financial statements, whether due to error or fraud, and performing procedures that respond to those risks. Such procedures included examining, on a test basis, evidence regarding the amounts and disclosures in the financial statements. Our procedures included confirmation of securities owned as of July 31, 2020, by correspondence with the custodian, brokers and agent banks or by other appropriate auditing procedures where replies from brokers or agent banks were not received. Our audits also included evaluating the accounting principles used and significant estimates made by management, as well as evaluating the overall presentation of the financial statements. We believe that our audits provide a reasonable basis for our opinion.

We have served as the auditor of one or more Victory Capital investment companies since 1995.
San Antonio, Texas
September 29, 2020
57
USAA Mutual Funds Trust | Supplemental Information July 31, 2020 | ||||||
(Unaudited)
Trustee and Officer Information
Board of Trustees:
Overall responsibility for management of the Trust rests with the Board. The Trust is managed by the Board in accordance with the laws of the state of Delaware. There are currently 10 Trustees, eight of whom are not "interested persons" of the Trust within the meaning of that term under the 1940 Act ("Independent Trustees") and two of whom is an "interested person" of the Trust within the meaning of that term under the 1940 Act ("Interested Trustee"). The Trustees, in turn, elect the officers of the Trust to actively supervise its day-to-day operations.
The following tables list the Trustees, their ages, position with the Trust, commencement of service, principal occupations during the past five years and any directorships of other investment companies or companies whose securities are registered under the Securities Exchange Act of 1934, as amended, or who file reports under that Act. Each Trustee oversees 47 portfolios in the Trust. Each Trustee's address is 15935 La Cantera Pkwy, Building Two, San Antonio, TX, 78256. Pursuant to a policy adopted by the Board, the term of office for each Trustee shall be until the Independent Trustee reaches age 75 or an Interested Trustee reaches age 75. The Board may change or grant exceptions from this policy at any time without shareholder approval. A Trustee may resign or be removed by a vote of the other Trustees or the holders of a majority of the outstanding shares of the Trust at any time. Vacancies on the Board can be filled by the action of a majority of the Trustees, provided that after filling such vacancy at least two-thirds of the Trustees have been elected by the shareholders.
Name and Date of Birth | Position Held with the Trust | Year Commenced Service | Principal Occupation During Past 5 Years | Other Directorships Held During Past 5 Years | |||||||||||||||
Independent Trustees. | |||||||||||||||||||
| Jefferson C. Boyce, Born September 1957 | Lead Independent Trustee, and Vice Chairman | 2013 | Senior Managing Director, New York Life Investments, LLC (1992-2012) | Westhab, Inc. | |||||||||||||||
| John C. Walters, Born February 1962 | Trustee | 2019 | Retired. Mr. Walters brings significant Board experience including active involvement with the board of a Fortune 500 company, and a proven record of leading large, complex financial organizations. He has a demonstrated record of success in distribution, manufacturing, investment brokerage, and investment management in both the retail and institutional investment businesses. He has substantial experience in the investment management business with a demonstrated ability to develop and drive strategy while managing operation, financial, and investment risk. | Guardian Variable Products Trust (16 series), Lead Independent Director; Amerilife Holdings LLC, Director; Stadion Money Management; Director; University of North Carolina (Chapel Hill), Member Board of Governors. | |||||||||||||||
58
USAA Mutual Funds Trust | Supplemental Information — continued July 31, 2020 | ||||||
(Unaudited)
Name and Date of Birth | Position Held with the Trust | Year Commenced Service | Principal Occupation During Past 5 Years | Other Directorships Held During Past 5 Years | |||||||||||||||
| Robert L. Mason, Ph.D., Born July 1946 | Trustee | 1997 | Adjunct Professor in the Department of Management Science and Statistics in the College of Business at the University of Texas at San Antonio (since 2001); Institute Analyst, Southwest Research Institute (March 2002-January 2016) | None | |||||||||||||||
| Dawn M. Hawley, Born February 1954 | Trustee | 2014 | Manager of Finance, Menil Foundation, Inc. (May 2007-June 2011), which is a private foundation that oversees the assemblage of sculptures, prints, drawings, photographs, and rare books. Director of Financial Planning and Analysis and Chief Financial Officer, AIM Management Group, Inc. (October 1987-January 2006) | None | |||||||||||||||
| Paul L. McNamara, Born July 1948 | Trustee | 2012 | Director, Cantor Opportunistic Alternatives Fund, LLC (March 2010-February 2014) , which is a closed-end fund of funds by Cantor Fitzgerald Investment Advisors, LLC | None | |||||||||||||||
59
USAA Mutual Funds Trust | Supplemental Information — continued July 31, 2020 | ||||||
(Unaudited)
Name and Date of Birth | Position Held with the Trust | Year Commenced Service | Principal Occupation During Past 5 Years | Other Directorships Held During Past 5 Years | |||||||||||||||
| Richard Y. Newton III, Born January 1956 | Trustee | 2017 | Director, Elta North America (01/18-present), which is a global leader in the design, manufacture, and support of innovative electronic systems in the ground, maritime, airborne, and security domains for the nation's warfighters, security personnel, and first responders; Managing Partner, Pioneer Partnership Development Group (December 2015-present)); Executive Director, The Union League Club of New York (June 2014-November 2015): Executive Vice President, Air Force Association (August 2012-May 2014); Lieutenant General, United States Air Force (January 2008-June 2012) | None | |||||||||||||||
| Barbara B. Ostdiek, Ph.D., Born March 1964 | Trustee | 2008 | Senior Associate Dean of Degree Programs at Jesse H. Jones Graduate School of Business at Rice University (since 2013); Associate Professor of Finance at Jessie H. Jones Graduate School of Business at Rice University (since 2001) | None | |||||||||||||||
| Michael F. Reimherr, Born August 1945 | Trustee | 2000 | President of Reimherr Business Consulting (May 1995-December 2017); St. Mary's University Investment Committee overseeing University Endowment (since 2014) | None | |||||||||||||||
60
USAA Mutual Funds Trust | Supplemental Information — continued July 31, 2020 | ||||||
(Unaudited)
Name and Date of Birth | Position Held with the Trust | Year Commenced Service | Principal Occupation During Past 5 Years | Other Directorships Held During Past 5 Years | |||||||||||||||
Interested Trustees. | |||||||||||||||||||
| David C. Brown, ** Born May 1972 | Trustee | 2019 | Chairman and Chief Executive Officer (since 2013), Co-Chief Executive Officer (2011-2013), Victory Capital Management Inc.; Chairman and Chief Executive Officer, Victory Capital Holdings, Inc. (since 2013). Mr. Brown brings to the Board extensive business, finance and leadership skills gained and developed through years of experience in the financial services industry, including his tenure overseeing the strategic direction as CEO of Victory Capital. These skills, combined with Mr. Brown's extensive knowledge of the financial services industry and demonstrated success in the development and distribution of investment strategies and products, enable him to provide valuable insights to the Board and strategic direction for the Funds | Trustee, Victory Portfolios (42 series), Victory Portfolios II (26 series), Victory Variable Insurance Funds (9 series) | |||||||||||||||
61
USAA Mutual Funds Trust | Supplemental Information — continued July 31, 2020 | ||||||
(Unaudited)
Name and Date of Birth | Position Held with the Trust | Year Commenced Service | Principal Occupation During Past 5 Years | Other Directorships Held During Past 5 Years | |||||||||||||||
| Daniel S. McNamara, ** Born June 1966 | Trustee and Chair of the Board of Trustees | 2012 | Trustee, President, and Vice Chairman of USAA ETF Trust (June 2017-June 2019); President of Financial Advice & Solutions Group (FASG), USAA (since 2013); Director, Investment Management Company (IMCO) (September 2009-April 2014); President, Asset Management Company (AMCO) (August, 2011-April 2013); Senior Vice President of USAA Financial Planning Services Insurance Agency, Inc. (FPS) (since 2011); Director of USAA IMCO (since 2009); Chairman of Board of IMCO (since 2013); Director of AMCO (August 2011-June 2019); President and Director of USAA Shareholder Account Services (SAS) (October 2009-June 2019); Director and Vice Chairman of FPS (since 2013); President and Director of USAA Investment Corporation (ICORP) (since 2010); Chairman of Board of ICORP (since 2013); Director of USAA Financial Advisors, Inc. (FAI) (since 2013); Chairman of Board of FAI (since 2015). Mr. McNamara brings to the Board extensive experience in the financial services industry, including experience as an officer of the Trust. | None | |||||||||||||||
** Mr. Dan McNamara, the Chairman of the Board, is deemed an "interested person" due to his previous position as Director of AMCO, the former investment adviser of the Funds. Mr. Brown is deemed an "interested person" due to his position as Chief Executive Officer of Victory Capital, investment adviser to the Funds.
The Statement of Additional Information includes additional information about the Trustees of the Trust and is available, without charge, on the SEC's website at www.sec.gov and/or by calling (800)-539-3863.
62
USAA Mutual Funds Trust | Supplemental Information — continued July 31, 2020 | ||||||
(Unaudited)
Officers:
The officers of the Trust, their ages, commencement of service and their principal occupations during the past five years, are detailed in the following table. Each officer serves until the earlier of his or her resignation, removal, retirement, death, or the election of a successor. The mailing address of each officer of the Trust is 15935 La Cantera Pkwy, Building Two, San Antonio, TX, 78256. The officers of the Trust receive no compensation directly from the Trust for performing the duties of their offices.
Name and Date of Birth | Position with the Trust | Year Commenced Service | Principal Occupation During Past 5 Years | ||||||||||||
Interested Officers. | |||||||||||||||
| Christopher K. Dyer, Born February 1962 | President | 2019 | Director of Fund Administration, Victory Capital (2004-present) | ||||||||||||
| Scott A Stahorsky, Born July 1969 | Vice President | 2019 | Manager, Fund Administration, Victory Capital (since 2015); Senior Analyst, Fund Administration, Victory Capital (prior to 2015) | ||||||||||||
| James K. De Vries, Born April 1969 | Treasurer, Principal Financial Officer | 2018 | Executive Director, Victory Capital Management Inc. (since 2019); Treasurer, USAA ETF Trust (September 2018-June 2019); Executive Director, Investment and Financial Administration, USAA (April 2012-June 2019); Assistant Treasurer, USAA ETF Trust (June 2017-September 2018); Assistant Treasurer, USAA Mutual Funds Trust (December 2013-February 2018) | ||||||||||||
| Allan Shaer, Born March 1965 | Assistant Treasurer | 2019 | Senior Vice President, Financial Administration, Citi Fund Services Ohio, Inc. (since 2016); Vice President, Mutual Fund Administration, JP Morgan Chase (2011-2016) | ||||||||||||
| Carol D. Trevino, Born October 1965 | Assistant Treasurer | 2018 | Director, Accounting and Finance, Victory Capital Management Inc. (since 2019); Accounting/Financial Director, USAA (December 2013-June 2019); Assistant Treasurer, USAA ETF Trust (September 2018-June 2019). | ||||||||||||
| Erin G. Wagner, Born February 1974 | Secretary | 2019 | Deputy General Counsel, the Adviser (since 2013) | ||||||||||||
| Charles Booth, Born April 1960 | Anti-Money Laundering Compliance Officer and Identity Theft Officer | 2019 | Director, Regulatory Administration and CCO Support Services, Citi Fund Services Ohio, Inc. (2007-present) | ||||||||||||
| Amy Campos, Born July 1976 | Chief Compliance Officer | 2019 | Chief Compliance Officer, USAA Mutual Funds Trust (since 2019); Executive Director, Deputy Chief Compliance Officer, USAA Mutual Funds Trust and USAA ETF Trust (July 2017-June 2019); Compliance Director, USAA Mutual Funds Trust (2014-July 2017) | ||||||||||||
63
USAA Mutual Funds Trust | Supplemental Information — continued July 31, 2020 | ||||||
(Unaudited)
Proxy Voting and Portfolio Holdings Information
Proxy Voting:
Information regarding the policies and procedures the Fund uses to determine how to vote proxies relating to portfolio securities is available without charge, upon request, by calling (800) 539-3863. The information is also included in the Fund's Statement of Additional Information, which is available on the SEC's website at www.sec.gov.
Information relating to how the Fund voted proxies relating to portfolio securities held during the most recent 12 months ended June 30 is available on the SEC's website at www.sec.gov.
Availability of Schedules of Portfolio Investments:
The Trust files a complete list of Schedules of Portfolio Investments with the SEC for the first and third quarter of each fiscal year on Form N-PORT. Forms N-PORT are available on the SEC's website at www.sec.gov.
Expense Examples
As a shareholder of the Fund, you may incur two types of costs: (1) transaction costs, and (2) ongoing costs, including management fees and other Fund expenses. These examples are intended to help you understand your ongoing costs (in dollars) of investing in the Fund and to compare these costs with the ongoing costs of investing in other mutual funds.
These examples are based on an investment of $1,000 invested at the beginning of the period and held for the entire period from February 1, 2020 through July 31, 2020.
The Actual Expense figures in the table below provide information about actual account values and actual expenses. You may use the information below, together with the amount you invested, to estimate the expenses that you paid over the period. Simply divide your account value by $1,000 (for example, an $8,600 account value divided by $1,000 = 8.6), then multiply the result by the number in the table under the heading entitled "Actual Expenses Paid During Period" to estimate the expenses you paid on your account during this period.
The Hypothetical Expense figures in the table below provide information about hypothetical account values and hypothetical expenses based on the Fund's actual expense ratio and an assumed rate of return of 5% per year before expenses, which is not the Fund's actual return. The hypothetical account values and expenses may not be used to estimate the actual ending account balance or expenses you paid for the period. You may use this information to compare this 5% hypothetical example with the 5% hypothetical examples that appear in shareholder reports of other funds.
Please note the expenses shown in the table below are meant to highlight your ongoing costs only and do not reflect any transactional costs. If these transactional costs were included, your costs would have been higher.
| Beginning Account Value 2/1/20 | Actual Ending Account Value 7/31/20 | Hypothetical Ending Account Value 7/31/20 | Actual Expenses Paid During Period 2/1/20- 7/31/20* | Hypothetical Expenses Paid During Period 2/1/20- 7/31/20* | Annualized Expense Ratio During Period 2/1/20- 7/31/20 | ||||||||||||||||||||||
Fund Shares | $ | 1,000.00 | $ | 1,015.50 | $ | 1,022.38 | $ | 2.51 | $ | 2.51 | 0.50 | % | |||||||||||||||
Institutional Shares | 1,000.00 | 1,017.10 | 1,022.77 | 2.11 | 2.11 | 0.42 | % | ||||||||||||||||||||
Class A shares | 1,000.00 | 1,014.50 | 1,021.28 | 3.61 | 3.62 | 0.72 | % | ||||||||||||||||||||
Class R6 Shares | 1,000.00 | 1,017.20 | 1,022.92 | 1.96 | 1.96 | 0.39 | % | ||||||||||||||||||||
* Expenses are equal to the average account value multiplied by the Fund's annualized expense ratio multiplied by 182/366 (the number of days in the most recent fiscal half-year divided by the number of days in the fiscal year).
64
USAA Mutual Funds Trust | Supplemental Information — continued July 31, 2020 | ||||||
(Unaudited)
Additional Federal Income Tax Information
The following federal tax information related to the Fund's fiscal year ended July 31, 2020, is provided for information purposes only and should not be used for reporting to federal or state revenue agencies. Federal tax information for the calendar year will be reported to you on Form 1099-DIV in January 2021.
With respect to distributions paid, the Fund designates the following amounts (or, if subsequently determined to be different, the maximum amount allowable) for the fiscal year ended July 31, 2020 (amounts in thousands):
| Short-Term Capital Gains Distributions | Long-Term Capital Gains Distributions(a) | ||||||
| $ | 813 | $ | 603 | ||||
(a) Pursuant to Section 852 of the Internal Revenue Code.
65
USAA Mutual Funds Trust | Supplemental Information — continued July 31, 2020 | ||||||
(Unaudited)
Liquidity Risk Management Program
The USAA Mutual Funds have adopted and implemented a written liquidity risk management program (the "LRMP") as required by Rule 22e-4 under the 1940 Act, as amended. The LRMP is reasonably designed to assess and manage the Fund's liquidity risk, taking into consideration the Fund's investment strategy and the liquidity of its portfolio investments during normal and reasonably foreseeable stressed market conditions; its short and long-term cash flow projections; and its cash holdings and access to other liquidity management tools such as available funding sources including the Victory Funds Complex Interfund Lending Facility and Line of Credit (discussed in the Notes to Financial Statements). The USAA Mutual Funds' Board of Trustees approved the appointment of the Fund's investment adviser, Victory Capital Management Inc. ("Victory Capital") as the administrator of the LRMP. At an in-person meeting held on February 26, 2020, Victory Capital provided an oral and written report to the Trustees on the operation and effectiveness of the LRMP during the previous year.
Victory Capital manages liquidity risks associated with the Fund's investments by monitoring, among other things, cash and cash equivalents, any use of derivatives, the concentration of investments, the appropriateness of the Fund's investment strategy, and by classifying every fund investment as either highly liquid, moderately liquid, less liquid or illiquid on at least a monthly basis. To assist with the classification of Fund investments, Victory Capital has retained a third-party provider of liquidity evaluation services. This provider determines preliminary liquidity classifications for all portfolio holdings based upon portfolio-level data and certain assumptions provided by Victory Capital. Victory Capital reviews the preliminary liquidity classifications, and, when appropriate, considers other information including input from the Fund's portfolio managers (including the portfolio managers employed by any investment sub-advisers) in determining final liquidity classifications.
The report from Victory Capital concluded that the Fund did not experience any significant liquidity challenges during the covered period, and the Fund's LRMP is reasonably designed to assess and manage its liquidity risk. The report also concluded that the LRMP continues to operate adequately and effectively to enable Victory Capital to oversee and manage liquidity risk and ensure the Fund is able to meet redemption requests without significant dilution to the remaining investors' interest in the Fund. During the review period, the Fund's portfolio consisted primarily of highly liquid investments, which are defined as cash and any investments reasonably expected to be converted to cash in current market conditions in three business days or less without significantly changing the market value of the investment. Therefore, the Fund has not adopted a Highly Liquid Investment Minimum. The Fund's investments were below the limitation on illiquid investments during the review period. Additionally, Victory Capital indicated that no events occurred that would require the filing of Form N-LIQUID and recommended no material changes to the LRMP.
66
Privacy Policy
Protecting the Privacy of Information
The Trust respects your right to privacy. We also know that you expect us to conduct and process your business in an accurate and efficient manner. To do so, we must collect and maintain certain personal information about you. This is the information we collect from you on applications or other forms, and from the transactions you make with us or third parties. It may include your name, address, social security number, account transactions and balances, and information about investment goals and risk tolerance.
We do not disclose any information about you or about former customers to anyone except as permitted or required by law. Specifically, we may disclose the information we collect to companies that perform services on our behalf, such as the transfer agent that processes shareholder accounts and printers and mailers that assist us in the distribution of investor materials. We may also disclose this information to companies that perform marketing services on our behalf. This allows us to continue to offer you Victory investment products and services that meet your investing needs, and to effect transactions that you request or authorize. These companies will use this information only in connection with the services for which we hired them. They are not permitted to use or share this information for any other purpose.
To protect your personal information internally, we permit access only by authorized employees and maintain physical, electronic and procedural safeguards to guard your personal information.*
* You may have received communications regarding information about privacy policies from other financial institutions which gave you the opportunity to "opt-out" of certain information sharing with companies which are not affiliated with that financial institution. The Trust does not share information with other companies for purposes of marketing solicitations for products other than the Trust. Therefore, the Trust does not provide opt-out options to their shareholders.
P.O. Box 182593
Columbus, Ohio 43218-2593

Visit our website at: | Call | ||||||
vcm.com | (800) 235-8396 | ||||||
23425-0920

JULY 31, 2020
Annual Report
USAA Small Cap Stock Fund
Beginning January 1, 2021, as permitted by regulations adopted by the Securities and Exchange Commission, paper copies of the Fund's shareholder reports like this one will no longer be sent by mail, unless you specifically request paper copies of the reports from the Fund or from your financial intermediary, such as a broker-dealer or bank. Instead, the reports will be made available on VictoryFunds.com, and you will be notified by mail each time a report is posted and provided with a website link to access the report. If you already elected to receive shareholder reports electronically, you will not be affected by this change and you need not take any action.
You may elect to receive shareholder reports and other communications from the Fund or your financial intermediary electronically by notifying your financial intermediary directly, or if you are a direct investor, by calling (800) 235-8396 or logging on to usaa.com. Effective on or about November 6, 2020, a shareholder who has an account directly with the Fund will need to submit their request via email to TA.Processing@FISGlobal.com.
You may elect to receive all future reports in paper free of charge. You can inform the Fund or your financial intermediary that you wish to continue receiving paper copies of your shareholder reports by notifying your financial intermediary directly, or if you are a direct investor, by calling (800) 235-8396 or logging on to usaa.com. Effective on or about November 6, 2020, a shareholder who has an account directly with the Fund will need to submit their request via email to TA.Processing@FISGlobal.com. Your election to receive reports in paper will apply to all funds held with the USAA Mutual Funds or your financial intermediary.
Victory Capital means Victory Capital Management Inc., the investment adviser of the USAA Mutual Funds. USAA Mutual Funds are distributed by Victory Capital Services, Inc., member FINRA, an affiliate of Victory Capital. Victory Capital and its affiliates are not affiliated with United Services Automobile Association or its affiliates. USAA and the USAA logo are registered trademarks and the USAA Mutual Funds and USAA Investments logos are trademarks of United Services Automobile Association and are being used by Victory Capital and its affiliates under license.
USAA Mutual Funds Trust
TABLE OF CONTENTS
Shareholder Letter (Unaudited) | 2 | ||||||
Managers' Commentary (Unaudited) | 3 | ||||||
Investment Overview (Unaudited) | 6 | ||||||
| Investment Objective & Portfolio Holdings (Unaudited) | 7 | ||||||
Financial Statements | |||||||
Schedule of Portfolio Investments | 8 | ||||||
Statement of Assets and Liabilities | 21 | ||||||
Statement of Operations | 22 | ||||||
Statements of Changes in Net Assets | 23 | ||||||
Financial Highlights | 24 | ||||||
Notes to Financial Statements | 26 | ||||||
| Report of Independent Registered Public Accounting Firm | 36 | ||||||
Supplemental Information | 37 | ||||||
Trustees' and Officers' Information | 37 | ||||||
Proxy Voting and Portfolio Holdings Information | 43 | ||||||
Expense Examples | 43 | ||||||
Additional Federal Income Tax Information | 44 | ||||||
Liquidity Risk Management Program | 45 | ||||||
Privacy Policy (inside back cover) | |||||||
This report is for the information of the shareholders and others who have received a copy of the currently effective prospectus of the Fund, managed by Victory Capital Management Inc. It may be used as sales literature only when preceded or accompanied by a current prospectus, which provides further details about the Fund.
IRA DISTRIBUTION WITHHOLDING DISCLOSURE
We generally must withhold federal income tax at a rate of 10% of the taxable portion of your distribution and, if you live in a state that requires state income tax withholding, at your state's tax rate. However, you may elect not to have withholding apply or to have income tax withheld at a higher rate. Any withholding election that you make will apply to any subsequent distribution unless and until you change or revoke the election. If you wish to make a withholding election, or change or revoke a prior withholding election, call (800) 235-8396.
If you do not have a withholding election in place by the date of a distribution, federal income tax will be withheld from the taxable portion of your distribution at a rate of 10%. If you must pay estimated taxes, you may be subject to estimated tax penalties if your estimated tax payments are not sufficient and sufficient tax is not withheld from your distribution.
For more specific information, please consult your tax adviser.
1
(Unaudited)
Dear Shareholder,
The previous decade ended with the longest-ever bull market in U.S. equities still intact, even as investors wrestled with issues like softening global economic data, Brexit, and U.S.-China trade relations. In retrospect, those worries seem pedestrian given what we would experience.
A new and unexpected threat—a global pandemic, the novel coronavirus ("COVID-19")—first emerged in Asia and then began spreading globally and throughout the United States during the first quarter of 2020. This unprecedented and unanticipated event not only rendered all existing economic forecasts moot, but it also roiled stock and bond markets everywhere. It also brought the economy to a near halt. The historic bull market in stocks ended virtually overnight.
After an initial severe sell-off in March, equity markets recovered sharply. As our annual reporting period drew to a close on July 31, 2020, many of the broad market indexes had recovered and volatility had returned to more palatable levels. In fact, despite all the chaos, the S&P 500® Index, one of the most popular measures of large U.S. stocks, finished the fiscal year (July 31, 2020) at approximately 3,271, which was up 8.9% from one year ago. Quite the impressive reversal.
The market turmoil of early 2020 was not limited to equities. Fixed income volatility spiked when liquidity evaporated in late March as investors struggled to understand the ramifications of sheltering in place. Fortunately, the U.S. Federal Reserve (the "Fed") (as well as other global central banks) leapt into action—cutting interest rates, (re)starting quantitative easing and, in the case of the Fed, launching an array of programs to stabilize markets.
The new lending facilities and programs had their intended effect of improving fixed income liquidity and trading. Credit spreads across corporate, high yield, structured, and municipal markets were coaxed down from their highs. In addition, Congress came through with substantial fiscal stimulus that also was applauded by investors and markets. Although fixed income markets regained their footing, the yield on 10-Year Treasurys, a benchmark for low-risk investments, declined steadily during our fiscal year—from 2.02% at the beginning of our reporting period to approximately 0.55% as of July 31, 2020. This suggests that investors remain a little wary.
While the past year has been unprecedented for all of us, both personally and professionally, our portfolio managers continue to analyze the financial markets, economic conditions, and the trajectory of the pandemic, which will likely be a guiding factor on Fed policy and the markets.
No matter what happens in the near term, we believe that the massive monetary and fiscal policies introduced earlier this year will have longer-term ramifications. Despite this uncertainty, it's important to remain focused on your long-term investment goals and avoid making emotional decisions. If you invest with us directly, our Member Service Representatives are available to help. Call us at (800) 235-8396.
Sincerely,

Christopher K. Dyer, CFA
President,
USAA Mutual Funds
2
USAA Mutual Funds Trust
USAA Small Cap Stock Fund
Managers' Commentary
(Unaudited)
Victory Solutions
Mannik S. Dhillon, CFA, CAIA Wasif A. Latif
Munder Capital Management, A Victory Capital Investment Franchise
Tony Y. Dong, CFA Robert E. Crosby
Robert Glise, CFA Gavin Hayman, CFA
Brian S. Matuszak, CFA Sean D. Wright, CFA
RS Investments Value, A Victory Capital Investment Franchise
Robert J. Harris Tyler Dan II, CFA
Joseph Mainelli
Wellington Management Company LLP
Timothy J. McCormack, CFA Shaun F. Pedersen
Edmond C. Griffin, CFA
Granahan Investment Management, Inc.
Gary C. Hatton, CFA Jennifer M. Pawloski
Andrew L. Beja, CFA David M. Rose, CFA
Jeffrey A. Harrison, CFA
ClariVest Asset Management LLC*
Todd Wolter, CFA Michael Waterman, CFA
• What were the market conditions over the reporting period?
The U.S. stock market generated solid gains for the reporting period overall. Growth stocks significantly outperformed value stocks, while large-cap stocks outpaced small-cap stocks.
Global financial market performance varied widely over the period driven by optimism of continued economic recovery followed by the novel coronavirus ("COVID-19") shock and uncertainty related to the duration and economic impact of the COVID-19 pandemic. These fears generally led to a "risk-off" environment as investors flocked to safe haven assets such as U.S. Treasurys and gold. Global equities turned mostly lower with the exception of a small breadth of mega-cap securities well positioned for an extended economic slowdown and the new stay-at-home paradigm. The final month and a half of the reporting period saw a rebound in risky assets as economies began a phased reopening. The U.S. large-cap growth space, led by information technology and communication services continued to outperform in the face of the economic threat as they were perceived as "stay-at-home stocks" that would further benefit from economic activity from homes.
*Effective June 30, 2020, ClariVest Asset Management LLC is no longer a subadviser to the Fund and has been replaced by RS Investments Value.
3
USAA Mutual Funds Trust
USAA Small Cap Stock Fund (continued)
Managers' Commentary (continued)
Within the United States, the S&P 500® Index dropped nearly 34% at the end of the reporting period from its 2020 high, before beginning to recoup losses with the support of comprehensive monetary and fiscal stimulus, along with optimism that a COVID-19 treatment will eventually emerge. Over the reporting period, the S&P 500 Index retuned 11.96%, with large-cap growth stocks leading the way, up to a return of 29.84% as represented by the Russell 1000 Growth Index. Value stocks and small-cap stocks significantly underperformed growth stocks over the period. U.S. large-cap value stocks were down to a return of -6.01% over the reporting period as gauged by the Russell 1000 Value Index, while U.S. small-cap stocks, returned -4.59% as represented by the Russell 2000 Index.
Developed-market international and emerging market equities followed a path similar to U.S. equities. Markets led investors on a rollercoaster ride that saw both the MSCI EAFE Index and MSCI Emerging Markets Index drop approximately 34% from their highs in the year. The market drawdown hit bottom on March 23rd and then started a steady ascent, erasing most of the year's losses as European Central Bank quantitative easing and talks of a 750-billion euros fiscal stimulus helped bolster momentum in the market's recovery. Over the reporting period, developed international equities, represented by the MSCI EAFE Index, were down to a return of -1.67%, while the MSCI Emerging Markets Index returned 6.55%.
• How did the USAA Small Cap Stock Fund (the "Fund") perform during the reporting period?
The Fund has two share classes: Fund Shares and Institutional Shares. For the reporting period ended July 31, 2020, the Fund Shares and Institutional Shares had total returns of -2.21% and -2.08%, respectively. This compares to returns of -4.59% for the Russell 2000® Index (the "Index"), -8.68% for the S&P SmallCap 600® Index, and -9.44% for the Lipper Small-Cap Core Funds Index.
Victory Capital Management Inc. is the Fund's investment adviser and employs dedicated resources to support the research, selection, and monitoring of the Fund's subadvisers. Wellington Management Company LLP ("Wellington Management"), Granahan Investment Management, Inc., ("GIMI"), and ClariVest Asset Management LLC ("ClariVest") are subadvisers to the Fund. The subadvisers each provide day-to-day discretionary management for a portion of the Fund's assets.
• What strategies did you employ during the reporting period?
For the reporting period end July 31, 2020, the Fund outperformed the Index as stock selection significantly contributed to performance while sector allocation was a detractor from performance versus the Russell 2000 Growth Index. In terms of allocation, the Fund's overweight positions to the information technology and underweight positions to real estate helped performance. On the other hand, the Fund's underweight positions in
4
USAA Mutual Funds Trust
USAA Small Cap Stock Fund (continued)
Managers' Commentary (continued)
healthcare and consumer discretionary as well as overweight allocations to energy and financials detracted from Fund performance.
Stock selection within the healthcare, information technology, communication services and energy contributed to fund performance, whereas it was a detractor in industrials, utilities and consumer staples.
Thank you for allowing us to assist you with your investment needs.
5
USAA Mutual Funds Trust
USAA Small Cap Stock Fund
Investment Overview
(Unaudited)
Average Annual Total Return
Year Ended July 31, 2020
Fund Shares | Institutional Shares | ||||||||||||||||||||||
INCEPTION DATE | 8/2/99 | 8/1/08 | |||||||||||||||||||||
Net Asset Value | Net Asset Value | Russell 2000® Index1 | S&P SmallCap 600 Index2 | Lipper Small-Cap Core Funds Index3 | |||||||||||||||||||
One Year | –2.21 | % | –2.08 | % | –4.59 | % | –8.68 | % | –9.44 | % | |||||||||||||
Five Year | 5.04 | % | 5.17 | % | 5.10 | % | 5.50 | % | 4.33 | % | |||||||||||||
Ten Year | 9.59 | % | 9.82 | % | 10.06 | % | 11.00 | % | 9.22 | % | |||||||||||||
Past performance is not indicative of future results. The performance data quoted represents past performance and current returns may be lower or higher. The investment return and principal value will fluctuate so that an investor's shares, when redeemed, may be worth more or less than the original cost. To obtain performance information current to the most recent month's end, please visit www.vcm.com.
Total return measures the price change in a share assuming the reinvestment of all net investment income and realized capital gain distributions, if any. The total returns quoted do not reflect adjustments made to the enclosed financial statements in accordance with U.S. generally accepted accounting principles or the deduction of taxes that a shareholder would pay on net investment income and realized capital gain distributions, including reinvested distributions, or redemptions of shares. The total return figures set forth above include all waivers of fees for various periods since inception. Without such fee waivers, the total returns would have been lower.
USAA Small Cap Stock Fund — Growth of $10,000
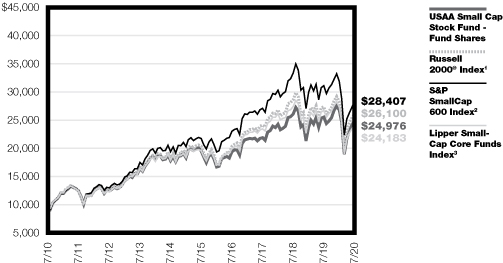
1 The unmanaged Russell 2000® Index measures the performance of the 2,000 smallest companies in the Russell 3000® Index, which represents approximately 10% of the total market capitalization of the Russell 3000 Index.
2 The unmanaged S&P SmallCap 600® Index is a market-value-weighted index consisting of 600 domestic stocks chosen for market size, liquidity, and industry group representation.
3 The unmanaged Lipper Small-Cap Core Funds Index tracks the total return performance of funds within the Lipper Small-Cap Core Funds category.
The graph reflects investment of growth of a hypothetical $10,000 investment in the Fund. Past performance is no guarantee of future results.
The graph and table do not reflect the deduction of taxes that a shareholder would pay on Fund distributions or the redemption of Fund shares.
6
| USAA Mutual Funds Trust USAA Small Cap Stock Fund | July 31, 2020 | ||||||
(Unaudited)
Investment Objective & Portfolio Holdings:
The USAA Small Cap Stock Fund seeks long-term growth of capital.
Sector Allocation*:
July 31, 2020
(% of Net Assets)
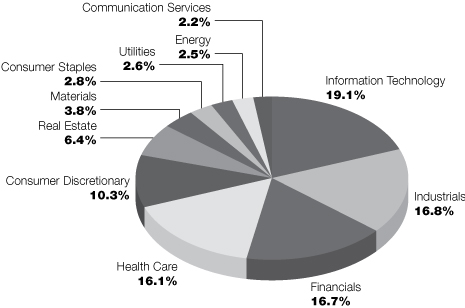
*Does not include futures, money market instruments, and short-term investments purchased with cash collateral from securities loaned.
Percentages are of the net assets of the Fund and may not equal 100%.
7
| USAA Mutual Funds Trust USAA Small Cap Stock Fund | Schedule of Portfolio Investments July 31, 2020 | ||||||
(Amounts in Thousands, Except for Shares)
Security Description | Shares | Value | |||||||||
Common Stocks (99.3%) | |||||||||||
Communication Services (2.2%): | |||||||||||
ANGI Homeservices, Inc. Class A (a) (b) | 12,600 | $ | 199 | ||||||||
Cogent Communications Holdings, Inc. | 9,035 | 814 | |||||||||
EverQuote, Inc. Class A (a) | 10,615 | 577 | |||||||||
Gray Television, Inc. (a) | 204,314 | 2,931 | |||||||||
IAC/Interactive Corp. (a) | 2,700 | 358 | |||||||||
Iridium Communications, Inc. (a) | 46,360 | 1,270 | |||||||||
Madison Square Garden Sports Corp. (a) | 2,010 | 309 | |||||||||
Meredith Corp. (b) | 96,060 | 1,379 | |||||||||
MSG Networks, Inc. Class A (a) (b) | 33,836 | 322 | |||||||||
Sinclair Broadcast Group, Inc. Class A (b) | 82,605 | 1,702 | |||||||||
TechTarget, Inc. (a) | 71,400 | 2,591 | |||||||||
TEGNA, Inc. | 210,527 | 2,480 | |||||||||
Vonage Holdings Corp. (a) | 674,164 | 8,056 | |||||||||
World Wrestling Entertainment, Inc. Class A | 41,820 | 1,949 | |||||||||
24,937 | |||||||||||
Consumer Discretionary (10.3%): | |||||||||||
Aaron's, Inc. | 150,053 | 7,829 | |||||||||
Afya Ltd. Class A (a) | 89,210 | 2,333 | |||||||||
Bright Horizons Family Solutions, Inc. (a) | 30,405 | 3,261 | |||||||||
Burlington Stores, Inc. (a) | 8,132 | 1,529 | |||||||||
Carter's, Inc. | 5,870 | 462 | |||||||||
Cavco Industries, Inc. (a) | 8,881 | 1,779 | |||||||||
Chegg, Inc. (a) | 65,650 | 5,315 | |||||||||
Chewy, Inc. Class A (a) (b) | 27,782 | 1,458 | |||||||||
Cooper Tire & Rubber Co. | 79,814 | 2,479 | |||||||||
Cracker Barrel Old Country Store, Inc. | 21,401 | 2,364 | |||||||||
Dana, Inc. | 246,145 | 2,813 | |||||||||
Deckers Outdoor Corp. (a) | 17,792 | 3,723 | |||||||||
Designer Brands, Inc. Class A | 218,483 | 1,291 | |||||||||
Etsy, Inc. (a) | 37,831 | 4,478 | |||||||||
Five Below, Inc. (a) (b) | 15,949 | 1,737 | |||||||||
GAN Ltd. (a) | 30,369 | 588 | |||||||||
Gentherm, Inc. (a) | 36,550 | 1,417 | |||||||||
G-III Apparel Group Ltd. (a) | 72,248 | 715 | |||||||||
Group 1 Automotive, Inc. | 24,058 | 2,021 | |||||||||
Helen of Troy Ltd. (a) | 6,393 | 1,203 | |||||||||
Johnson Outdoors, Inc. Class A | 4,002 | 350 | |||||||||
KB Home | 102,307 | 3,442 | |||||||||
Kontoor Brands, Inc. | 65,820 | 1,261 | |||||||||
Levi Strauss & Co. Class A (b) | 143,805 | 1,749 | |||||||||
Lithia Motors, Inc. Class A (b) | 15,301 | 3,506 | |||||||||
Magnite, Inc. (a) | 1,162,492 | 6,982 | |||||||||
Marine Products Corp. | 70,790 | 909 | |||||||||
MarineMax, Inc. (a) | 12,028 | 334 | |||||||||
Monro, Inc. (b) | 14,090 | 793 | |||||||||
Motorcar Parts of America, Inc. (a) | 29,069 | 484 | |||||||||
Murphy USA, Inc. (a) | 42,026 | 5,565 | |||||||||
See notes to financial statements.
8
| USAA Mutual Funds Trust USAA Small Cap Stock Fund | Schedule of Portfolio Investments — continued July 31, 2020 | ||||||
(Amounts in Thousands, Except for Shares)
Security Description | Shares | Value | |||||||||
Nordstrom, Inc. (b) | 80,958 | $ | 1,108 | ||||||||
OneSpaWorld Holdings Ltd. (b) | 54,937 | 305 | |||||||||
Penn National Gaming, Inc. (a) (b) | 124,544 | 4,216 | |||||||||
Penske Automotive Group, Inc. | 42,490 | 1,904 | |||||||||
Purple Innovation, Inc. (a) | 104,590 | 2,549 | |||||||||
RumbleON, Inc. Class B (a) | 4,880 | 106 | |||||||||
Ruth's Hospitality Group, Inc. | 188,953 | 1,265 | |||||||||
ServiceMaster Global Holdings, Inc. (a) | 15,060 | 616 | |||||||||
Skyline Champion Corp. (a) | 73,707 | 2,081 | |||||||||
Sonic Automotive, Inc. Class A | 107,097 | 4,083 | |||||||||
Steven Madden Ltd. | 158,739 | 3,362 | |||||||||
Strategic Education, Inc. | 5,451 | 688 | |||||||||
Taylor Morrison Home Corp. Class A (a) | 40,410 | 948 | |||||||||
The Children's Place, Inc. (b) | 41,502 | 1,013 | |||||||||
The Michaels Cos., Inc. (a) (b) | 321,003 | 2,305 | |||||||||
The ODP Corp. | 71,615 | 1,581 | |||||||||
TopBuild Corp. (a) (b) | 27,656 | 3,648 | |||||||||
Tractor Supply Co. | 11,750 | 1,677 | |||||||||
TRI Pointe Group, Inc. (a) | 382,067 | 6,387 | |||||||||
Vail Resorts, Inc. | 15,500 | 2,976 | |||||||||
Wolverine World Wide, Inc. | 32,420 | 779 | |||||||||
Wyndham Hotels & Resorts, Inc. | 16,010 | 707 | |||||||||
Zumiez, Inc. (a) | 20,950 | 484 | |||||||||
118,958 | |||||||||||
Consumer Staples (2.8%): | |||||||||||
Albertsons Cos., Inc. Class A (a) (b) | 69,402 | 1,031 | |||||||||
B&G Foods, Inc. (b) | 42,146 | 1,218 | |||||||||
C&C Group PLC | 389,134 | 1,176 | |||||||||
Cal-Maine Foods, Inc. (a) | 29,126 | 1,280 | |||||||||
Cranswick PLC | 40,365 | 1,880 | |||||||||
Edgewell Personal Care Co. (a) | 57,956 | 1,732 | |||||||||
Grocery Outlet Holding Corp. (a) | 49,078 | 2,159 | |||||||||
Hostess Brands, Inc. (a) | 262,772 | 3,333 | |||||||||
J&J Snack Foods Corp. | 12,939 | 1,593 | |||||||||
Medifast, Inc. | 14,297 | 2,390 | |||||||||
Nomad Foods Ltd. (a) | 61,850 | 1,426 | |||||||||
Performance Food Group Co. (a) | 67,928 | 1,903 | |||||||||
Spectrum Brands Holdings, Inc. | 48,240 | 2,613 | |||||||||
TreeHouse Foods, Inc. (a) | 35,200 | 1,542 | |||||||||
United Natural Foods, Inc. (a) | 87,083 | 1,729 | |||||||||
Universal Corp. | 40,301 | 1,699 | |||||||||
WD-40 Co. (b) | 14,709 | 2,891 | |||||||||
31,595 | |||||||||||
Energy (2.5%): | |||||||||||
Arch Resources, Inc. (a) | 31,001 | 962 | |||||||||
Bristow Group, Inc. (a) | 99,692 | 1,596 | |||||||||
Cactus, Inc. Class A | 40,610 | 919 | |||||||||
CONSOL Energy, Inc. (a) | 42,792 | 252 | |||||||||
See notes to financial statements.
9
| USAA Mutual Funds Trust USAA Small Cap Stock Fund | Schedule of Portfolio Investments — continued July 31, 2020 | ||||||
(Amounts in Thousands, Except for Shares)
Security Description | Shares | Value | |||||||||
CVR Energy, Inc. | 87,822 | $ | 1,686 | ||||||||
Delek U.S. Holdings, Inc. | 163,866 | 2,864 | |||||||||
Dorian LPG Ltd. (a) | 134,385 | 1,148 | |||||||||
Dril-Quip, Inc. (a) (b) | 20,968 | 698 | |||||||||
Helmerich & Payne, Inc. | 20,950 | 374 | |||||||||
Kosmos Energy Ltd. | 380,670 | 613 | |||||||||
Magnolia Oil & Gas Corp. Class A (a) | 503,986 | 3,014 | |||||||||
Parsley Energy, Inc. Class A | 91,386 | 1,003 | |||||||||
Peabody Energy Corp. | 211,377 | 659 | |||||||||
Renewable Energy Group, Inc. (a) (b) | 63,353 | 1,747 | |||||||||
REX American Resources Corp. (a) | 17,559 | 1,197 | |||||||||
Ring Energy, Inc. (a) (b) | 230,373 | 253 | |||||||||
Scorpio Tankers, Inc. (b) | 104,049 | 1,376 | |||||||||
SEACOR Holdings, Inc. (a) | 93,198 | 2,709 | |||||||||
SEACOR Marine Holdings, Inc. (a) (b) | 124,365 | 306 | |||||||||
Southwestern Energy Co. (a) (b) | 1,535,487 | 3,732 | |||||||||
Talos Energy, Inc. (a) (b) | 53,709 | 366 | |||||||||
World Fuel Services Corp. | 35,335 | 831 | |||||||||
28,305 | |||||||||||
Financials (16.7%): | |||||||||||
1st Source Corp. | 124,846 | 4,135 | |||||||||
Alleghany Corp. | 4,040 | 2,110 | |||||||||
Amerant Bancorp, Inc. (a) | 48,586 | 649 | |||||||||
American Equity Investment Life Holding Co. | 82,982 | 2,112 | |||||||||
Ameris Bancorp | 15,180 | 350 | |||||||||
AMERISAFE, Inc. | 19,472 | 1,236 | |||||||||
Apollo Commercial Real Estate Finance, Inc. | 116,908 | 1,087 | |||||||||
Argo Group International Holdings Ltd. | 29,772 | 998 | |||||||||
Associated Bancorp | 59,060 | 758 | |||||||||
Atlantic Union Bankshares Corp. | 64,760 | 1,462 | |||||||||
Banc of California, Inc. | 140,104 | 1,502 | |||||||||
Banco Latinoamericano Comercio Exterior SA Class E | 31,517 | 368 | |||||||||
BGC Partners, Inc. Class A | 442,808 | 1,227 | |||||||||
Blackstone Mortgage Trust, Inc. Class A (b) | 77,448 | 1,864 | |||||||||
Boston Private Financial Holdings, Inc. | 143,304 | 843 | |||||||||
Brightsphere Investment Group | 180,526 | 2,426 | |||||||||
Cathay General Bancorp | 275,722 | 6,668 | |||||||||
Central Pacific Financial Corp. | 77,910 | 1,212 | |||||||||
Chimera Investment Corp. | 107,907 | 970 | |||||||||
CNO Financial Group, Inc. | 250,600 | 3,783 | |||||||||
Columbia Banking System, Inc. | 35,060 | 1,014 | |||||||||
Community Bank System, Inc. | 57,554 | 3,236 | |||||||||
ConnectOne Bancorp, Inc. Class A | 41,442 | 571 | |||||||||
Customers Bancorp, Inc. Class A (a) | 62,748 | 744 | |||||||||
eHealth, Inc. (a) | 12,968 | 897 | |||||||||
Encore Capital Group, Inc. (a) (b) | 64,103 | 2,341 | |||||||||
Enova International, Inc. (a) | 87,670 | 1,411 | |||||||||
FBL Financial Group, Inc. Class A | 3,164 | 110 | |||||||||
First Bancorp, Inc. | 326,683 | 1,777 | |||||||||
First Busey Corp. | 181,331 | 3,101 | |||||||||
See notes to financial statements.
10
| USAA Mutual Funds Trust USAA Small Cap Stock Fund | Schedule of Portfolio Investments — continued July 31, 2020 | ||||||
(Amounts in Thousands, Except for Shares)
Security Description | Shares | Value | |||||||||
First Financial Corp. Class A | 22,984 | $ | 768 | ||||||||
First Midwest Bancorp, Inc. | 136,854 | 1,661 | |||||||||
Flushing Financial Corp. | 266,647 | 2,954 | |||||||||
FNB Corp. | 66,500 | 493 | |||||||||
Fulton Financial Corp. (b) | 379,533 | 3,681 | |||||||||
Globe Life, Inc. | 21,030 | 1,674 | |||||||||
Gohealth, Inc. Class A (a) (b) | 17,625 | 313 | |||||||||
Great Western Bancorp, Inc. | 193,635 | 2,517 | |||||||||
Hancock Whitney Corp. | 157,325 | 2,998 | |||||||||
Hanmi Financial Corp. | 67,519 | 623 | |||||||||
HBT Financial, Inc. | 82,275 | 989 | |||||||||
Hope Bancorp, Inc. | 275,468 | 2,322 | |||||||||
Independent Bank Corp. | 11,490 | 741 | |||||||||
International Bancshares Corp. | 256,214 | 7,795 | |||||||||
Invesco Mortgage Capital, Inc. | 4,536 | 14 | |||||||||
Investors Bancorp, Inc. | 140,350 | 1,140 | |||||||||
James River Group Holdings Ltd. | 97,120 | 4,499 | |||||||||
Kemper Corp. | 44,833 | 3,520 | |||||||||
Kinsale Capital Group, Inc. (b) | 13,666 | 2,664 | |||||||||
Lakeland Financial Corp. | 47,429 | 2,099 | |||||||||
Lemonade, Inc. (a) | 4,754 | 277 | |||||||||
Meridian Bancorp, Inc. | 77,370 | 882 | |||||||||
MFA Financial, Inc. | 255,117 | 671 | |||||||||
Morningstar, Inc. | 14,746 | 2,478 | |||||||||
National General Holdings Corp. | 103,559 | 3,520 | |||||||||
NBT Bancorp, Inc. | 68,353 | 2,036 | |||||||||
Northwest Bancshares, Inc. | 266,829 | 2,628 | |||||||||
OFG Bancorp | 109,912 | 1,438 | |||||||||
Oppenheimer Holdings, Inc. Class A | 39,223 | 831 | |||||||||
Park National Corp. | 26,966 | 2,313 | |||||||||
PCSB Financial Corp. | 32,310 | 359 | |||||||||
Pennymac Mortgage Investment Trust (b) | 116,475 | 2,196 | |||||||||
Pinnacle Financial Partners, Inc. | 24,490 | 970 | |||||||||
Piper Sandler Cos. | 32,571 | 2,016 | |||||||||
Preferred Bank | 59,800 | 2,228 | |||||||||
Primerica, Inc. | 19,751 | 2,364 | |||||||||
ProAssurance Corp. | 51,906 | 763 | |||||||||
Provident Financial Services, Inc. | 132,123 | 1,803 | |||||||||
Radian Group, Inc. | 468,327 | 6,988 | |||||||||
Redwood Trust, Inc. (b) | 205,565 | 1,466 | |||||||||
S&T Bancorp, Inc. | 61,483 | 1,322 | |||||||||
Safety Insurance Group, Inc. | 25,190 | 1,906 | |||||||||
Selective Insurance Group, Inc. | 47,640 | 2,589 | |||||||||
Selectquote, Inc. (a) | 8,077 | 144 | |||||||||
ServisFirst Bancshares, Inc. | 98,145 | 3,591 | |||||||||
SLM Corp. | 132,906 | 900 | |||||||||
Solar Capital Ltd. | 194,024 | 3,137 | |||||||||
South State Corp. | 15,434 | 736 | |||||||||
Southside Bancshares, Inc. | 45,942 | 1,273 | |||||||||
Stewart Information Services Corp. | 55,690 | 2,336 | |||||||||
See notes to financial statements.
11
| USAA Mutual Funds Trust USAA Small Cap Stock Fund | Schedule of Portfolio Investments — continued July 31, 2020 | ||||||
(Amounts in Thousands, Except for Shares)
Security Description | Shares | Value | |||||||||
Stifel Financial Corp. | 75,845 | $ | 3,678 | ||||||||
Stock Yards Bancorp, Inc. | 8,718 | 341 | |||||||||
Synovus Financial Corp. | 108,854 | 2,194 | |||||||||
TCF Financial Corp. | 29,090 | 800 | |||||||||
Texas Capital Bancshares, Inc. (a) | 102,017 | 3,389 | |||||||||
TFS Financial Corp. | 66,370 | 961 | |||||||||
The Bank of NT Butterfield & Son Ltd. | 163,088 | 4,245 | |||||||||
The Hanover Insurance Group, Inc. | 24,320 | 2,478 | |||||||||
Tompkins Financial Corp. (c) | 29,576 | 1,909 | |||||||||
Tradeweb Markets, Inc. Class A | 40,859 | 2,209 | |||||||||
TrustCo Bank Corp. | 184,318 | 1,067 | |||||||||
Trustmark Corp. (b) | 89,750 | 2,021 | |||||||||
Two Harbors Investment Corp. (b) | 154,010 | 836 | |||||||||
UMB Financial Corp. | 56,151 | 2,796 | |||||||||
Umpqua Holdings Corp. | 35,510 | 385 | |||||||||
Universal Insurance Holdings, Inc. | 77,298 | 1,353 | |||||||||
Waddell & Reed Financial, Inc. Class A (b) | 71,700 | 1,046 | |||||||||
Walker & Dunlop, Inc. | 101,364 | 5,110 | |||||||||
Washington Federal, Inc. | 153,709 | 3,588 | |||||||||
White Mountains Insurance Group Ltd. | 1,580 | 1,391 | |||||||||
World Acceptance Corp. (a) (b) | 9,176 | 682 | |||||||||
193,067 | |||||||||||
Health Care (16.1%): | |||||||||||
1Life Healthcare, Inc. (a) (b) | 7,270 | 215 | |||||||||
ABIOMED, Inc. (a) | 4,662 | 1,398 | |||||||||
Acceleron Pharma, Inc. (a) | 17,465 | 1,732 | |||||||||
Adaptive Biotechnologies Corp. (a) | 16,725 | 624 | |||||||||
ADC Therapeutics SA (a) (b) | 18,458 | 858 | |||||||||
Aerie Pharmaceuticals, Inc. (a) (b) | 90,225 | 1,043 | |||||||||
Akero Therapeutics, Inc. (a) | 22,234 | 781 | |||||||||
Akouos, Inc. (a) | 10,660 | 208 | |||||||||
Allscripts Healthcare Solutions, Inc. (a) | 230,535 | 2,075 | |||||||||
Amedisys, Inc. (a) | 21,230 | 4,971 | |||||||||
AMN Healthcare Services, Inc. (a) | 9,733 | 535 | |||||||||
Annexon, Inc. (a) (b) (c) | 9,561 | 174 | |||||||||
Aprea Therapeutics, Inc. (a) (b) | 14,160 | 388 | |||||||||
Argenx SE, ADR (a) | 16,447 | 3,785 | |||||||||
Arrowhead Pharmaceuticals, Inc. (a) | 30,378 | 1,308 | |||||||||
Athenex, Inc. (a) | 29,336 | 311 | |||||||||
Athersys, Inc. (a) (b) | 161,011 | 412 | |||||||||
Atreca, Inc. Class A (a) (b) | 25,419 | 329 | |||||||||
AtriCure, Inc. (a) | 21,600 | 881 | |||||||||
Aurinia Pharmaceuticals, Inc. (a) | 134,872 | 1,907 | |||||||||
Autolus Therapeutics PLC, ADR (a) | 43,800 | 578 | |||||||||
Avidity Biosciences, Inc. (a) | 19,782 | 558 | |||||||||
Beam Therapeutics, Inc. (a) (b) | 46,622 | 901 | |||||||||
Berkeley Lights, Inc. (a) | 13,374 | 802 | |||||||||
Bicycle Therapeutics PLC, ADR (a) (b) | 40,058 | 633 | |||||||||
BioCryst Pharmaceuticals, Inc. (a) | 182,297 | 742 | |||||||||
BioMarin Pharmaceutical, Inc. (a) | 4,448 | 533 | |||||||||
See notes to financial statements.
12
| USAA Mutual Funds Trust USAA Small Cap Stock Fund | Schedule of Portfolio Investments — continued July 31, 2020 | ||||||
(Amounts in Thousands, Except for Shares)
Security Description | Shares | Value | |||||||||
Biomerica, Inc. (a) (b) | 37,500 | $ | 342 | ||||||||
Black Diamond Therapeutics, Inc. (a) (b) | 6,994 | 195 | |||||||||
bluebird bio, Inc. (a) | 10,997 | 668 | |||||||||
Blueprint Medicines Corp. (a) | 32,550 | 2,382 | |||||||||
Cabaletta Bio, Inc. (a) | 49,374 | 564 | |||||||||
Cara Therapeutics, Inc. (a) (b) | 34,545 | 568 | |||||||||
Cardiovascular Systems, Inc. (a) | 37,976 | 1,158 | |||||||||
Castle Biosciences, Inc. (a) (b) | 98,587 | 3,817 | |||||||||
Cellectis SA, ADR (a) (b) | 10,154 | 159 | |||||||||
Centogene NV (a) | 57,630 | 732 | |||||||||
Cerus Corp. (a) | 110,632 | 789 | |||||||||
Collegium Pharmaceutical, Inc. (a) | 25,773 | 407 | |||||||||
CONMED Corp. (b) | 18,298 | 1,510 | |||||||||
Cortexyme, Inc. (a) | 6,738 | 269 | |||||||||
CRISPR Therapeutics AG (a) | 10,912 | 933 | |||||||||
CryoPort, Inc. (a) (b) | 102,450 | 3,395 | |||||||||
Cymabay Therapeutics, Inc. (a) (b) | 51,885 | 184 | |||||||||
CytomX Therapeutics, Inc. (a) | 29,523 | 207 | |||||||||
CytoSorbents Corp. (a) (b) | 301,543 | 2,887 | |||||||||
Deciphera Pharmaceuticals, Inc. (a) | 21,454 | 995 | |||||||||
Dicerna Pharmaceuticals, Inc. (a) | 35,333 | 760 | |||||||||
Dynavax Technologies Corp. (a) (b) | 101,166 | 820 | |||||||||
Editas Medicine, Inc. (a) | 16,200 | 476 | |||||||||
Emergent BioSolutions, Inc. (a) | 30,273 | 3,368 | |||||||||
Enanta Pharmaceuticals, Inc. (a) | 24,804 | 1,137 | |||||||||
Epizyme, Inc. (a) | 39,100 | 541 | |||||||||
Esperion Therapeutics, Inc. (a) (b) | 61,807 | 2,326 | |||||||||
Evolent Health, Inc. Class A (a) (b) | 352,111 | 4,102 | |||||||||
Exact Sciences Corp. (a) | 20,950 | 1,985 | |||||||||
Fennec Pharmaceuticals, Inc. (a) (b) | 103,113 | 871 | |||||||||
Flexion Therapeutics, Inc. (a) (b) | 145,908 | 1,980 | |||||||||
Fusion Pharmaceuticals, Inc. (a) (b) | 68,552 | 943 | |||||||||
Gamida Cell Ltd. (a) (b) | 135,337 | 543 | |||||||||
Generation Bio Co. (a) | 18,731 | 368 | |||||||||
Genetron Holdings Ltd., ADR (a) | 86,776 | 1,241 | |||||||||
Guardant Health, Inc. (a) | 16,199 | 1,380 | |||||||||
Haemonetics Corp. (a) | 24,896 | 2,182 | |||||||||
Halozyme Therapeutics, Inc. (a) | 95,103 | 2,586 | |||||||||
Health Catalyst, Inc. (a) (b) | 38,900 | 1,358 | |||||||||
HealthEquity, Inc. (a) | 75,861 | 3,911 | |||||||||
HMS Holdings Corp. (a) | 35,570 | 1,156 | |||||||||
Horizon Therapeutics PLC (a) | 15,604 | 955 | |||||||||
Immunomedics, Inc. (a) | 73,179 | 3,090 | |||||||||
Inari Medical, Inc. (a) | 695 | 39 | |||||||||
Insmed, Inc. (a) | 100,576 | 2,627 | |||||||||
Insulet Corp. (a) | 11,293 | 2,297 | |||||||||
Intellia Therapeutics, Inc. (a) (b) | 7,900 | 141 | |||||||||
Intercept Pharmaceuticals, Inc. (a) | 5,717 | 261 | |||||||||
Iovance Biotherapeutics, Inc. (a) | 39,481 | 1,148 | |||||||||
Jounce Therapeutics, Inc. (a) | 45,112 | 207 | |||||||||
See notes to financial statements.
13
| USAA Mutual Funds Trust USAA Small Cap Stock Fund | Schedule of Portfolio Investments — continued July 31, 2020 | ||||||
(Amounts in Thousands, Except for Shares)
Security Description | Shares | Value | |||||||||
Karyopharm Therapeutics, Inc. (a) | 146,200 | $ | 2,347 | ||||||||
Lantheus Holdings, Inc. (a) | 82,650 | 1,114 | |||||||||
Ligand Pharmaceuticals, Inc. (a) (b) | 13,537 | 1,586 | |||||||||
LivaNova PLC (a) | 52,033 | 2,422 | |||||||||
MacroGenics, Inc. (a) | 19,868 | 505 | |||||||||
Medpace Holdings, Inc. (a) (b) | 27,388 | 3,269 | |||||||||
Merit Medical Systems, Inc. (a) | 33,206 | 1,485 | |||||||||
NanoString Technologies, Inc. (a) (b) | 26,878 | 971 | |||||||||
Natera, Inc. (a) | 37,758 | 1,813 | |||||||||
Natus Medical, Inc. (a) | 34,755 | 646 | |||||||||
Neogen Corp. (a) | 18,337 | 1,408 | |||||||||
NeoGenomics, Inc. (a) | 58,788 | 2,247 | |||||||||
Neurocrine Biosciences, Inc. (a) | 5,310 | 639 | |||||||||
NextCure, Inc. (a) | 33,211 | 296 | |||||||||
Novavax, Inc. (a) | 7,350 | 1,052 | |||||||||
Novocure Ltd. (a) | 17,631 | 1,336 | |||||||||
Nupathe, Inc. (a) (c) (d) | 133,709 | — | |||||||||
Nurix Therapeutics, Inc. (a) (c) | 9,561 | 185 | |||||||||
Omnicell, Inc. (a) | 27,387 | 1,925 | |||||||||
Orchard Therapeutics PLC, ADR (a) | 88,862 | 457 | |||||||||
Organogenesis Holdings, Inc. (a) | 306,146 | 1,127 | |||||||||
Orthopediatrics Corp. (a) | 87,613 | 3,696 | |||||||||
Oxford Immunotec Global PLC (a) | 67,367 | 881 | |||||||||
Oyster Point Pharma, Inc. (a) | 6,583 | 147 | |||||||||
Pacira BioSciences, Inc. (a) | 92,776 | 4,881 | |||||||||
Passage Bio, Inc. (a) | 20,592 | 322 | |||||||||
PolyPid Ltd. (a) (b) | 117,985 | 1,649 | |||||||||
Quanterix Corp. (a) | 97,874 | 3,162 | |||||||||
Quidel Corp. (a) | 20,950 | 5,918 | |||||||||
RadNet, Inc. (a) | 52,036 | 827 | |||||||||
Reata Pharmaceuticals, Inc. Class A (a) (b) | 11,564 | 1,708 | |||||||||
Relay Therapeutics, Inc. (a) | 693 | 25 | |||||||||
Repligen Corp. (a) | 53,894 | 8,133 | |||||||||
Sangamo Therapeutics, Inc. (a) (b) | 10,800 | 117 | |||||||||
Schrodinger, Inc. (a) (b) | 3,469 | 251 | |||||||||
SI-BONE, Inc. (a) | 82,117 | 1,404 | |||||||||
Silk Road Medical, Inc. (a) | 44,937 | 2,088 | |||||||||
Stoke Therapeutics, Inc. (a) | 19,050 | 480 | |||||||||
Sutro Biopharma, Inc. (a) | 39,095 | 304 | |||||||||
Syneos Health, Inc. (a) | 61,467 | 3,835 | |||||||||
TCR2 Therapeutics, Inc. (a) | 51,703 | 866 | |||||||||
Tenet Healthcare Corp. (a) | 120,530 | 3,187 | |||||||||
TG Therapeutics, Inc. (a) | 37,356 | 731 | |||||||||
Turning Point Therapeutics, Inc. (a) | 24,334 | 1,441 | |||||||||
Vapotherm, Inc. (a) | 5,534 | 289 | |||||||||
Vaxcyte, Inc. (a) | 2,082 | 65 | |||||||||
Veracyte, Inc. (a) (b) | 207,584 | 7,405 | |||||||||
Vericel Corp. (a) | 382,248 | 6,303 | |||||||||
Viking Therapeutics, Inc. (a) (b) | 97,264 | 683 | |||||||||
Xencor, Inc. (a) | 29,654 | 892 | |||||||||
See notes to financial statements.
14
| USAA Mutual Funds Trust USAA Small Cap Stock Fund | Schedule of Portfolio Investments — continued July 31, 2020 | ||||||
(Amounts in Thousands, Except for Shares)
Security Description | Shares | Value | |||||||||
Xenon Pharmaceuticals, Inc. (a) | 88,219 | $ | 964 | ||||||||
Zai Lab Ltd., ADR (a) | 18,027 | 1,372 | |||||||||
186,498 | |||||||||||
Industrials (16.8%): | |||||||||||
ACCO Brands Corp. | 488,808 | 3,187 | |||||||||
Albany International Corp. | 14,569 | 700 | |||||||||
Altra Industrial Motion Corp. | 19,860 | 680 | |||||||||
American Woodmark Corp. (a) | 44,650 | 3,599 | |||||||||
Apogee Enterprises, Inc. | 74,373 | 1,606 | |||||||||
Applied Industrial Technologies, Inc. | 7,480 | 472 | |||||||||
Argan, Inc. | 4,750 | 204 | |||||||||
ASGN, Inc. (a) | 97,284 | 6,661 | |||||||||
Atkore International Group, Inc. (a) | 135,301 | 3,609 | |||||||||
Atlas Air Worldwide Holdings, Inc. (a) (b) | 75,164 | 3,914 | |||||||||
Avis Budget Group, Inc. (a) | 90,868 | 2,353 | |||||||||
Axon Enterprise, Inc. (a) | 42,574 | 3,538 | |||||||||
Beacon Roofing Supply, Inc. (a) | 72,401 | 2,256 | |||||||||
Brady Corp. Class A | 43,403 | 1,995 | |||||||||
Brightview Holdings, Inc. (a) | 99,164 | 1,202 | |||||||||
BWX Technologies, Inc. | 23,236 | 1,267 | |||||||||
Casella Waste Systems, Inc. (a) | 111,515 | 6,179 | |||||||||
CBIZ, Inc. (a) (b) | 41,930 | 1,014 | |||||||||
Chart Industries, Inc. (a) | 72,212 | 4,949 | |||||||||
Cimpress PLC (a) | 16,895 | 1,690 | |||||||||
Columbus McKinnon Corp. | 97,601 | 3,234 | |||||||||
Comfort Systems USA, Inc. | 45,255 | 2,250 | |||||||||
Construction Partners, Inc. Class A (a) (b) | 98,692 | 1,633 | |||||||||
Crane Co. | 14,050 | 795 | |||||||||
Deluxe Corp. | 65,106 | 1,838 | |||||||||
Douglas Dynamics, Inc. | 35,251 | 1,246 | |||||||||
EMCOR Group, Inc. | 62,673 | 4,293 | |||||||||
Enphase Energy, Inc. (a) | 150,636 | 9,091 | |||||||||
EnPro Industries, Inc. | 34,086 | 1,627 | |||||||||
ESCO Technologies, Inc. | 29,782 | 2,559 | |||||||||
Finning International, Inc. | 55,130 | 786 | |||||||||
Forrester Research, Inc. (a) | 95,987 | 3,370 | |||||||||
Forward Air Corp. (b) | 55,253 | 2,873 | |||||||||
Franklin Electric Co., Inc. (b) | 38,081 | 2,058 | |||||||||
GATX Corp. (b) | 28,768 | 1,755 | |||||||||
GMS, Inc. (a) | 136,509 | 3,198 | |||||||||
Hexcel Corp. | 29,290 | 1,093 | |||||||||
Hillenbrand, Inc. | 66,378 | 1,940 | |||||||||
Hudson Technologies, Inc. (a) | 229,272 | 245 | |||||||||
Huron Consulting Group, Inc. (a) | 47,933 | 2,287 | |||||||||
ICF International, Inc. | 23,899 | 1,616 | |||||||||
Insperity, Inc. | 16,438 | 1,099 | |||||||||
Kaman Corp. | 26,065 | 1,029 | |||||||||
Kelly Services, Inc. Class A | 88,000 | 1,303 | |||||||||
Kornit Digital Ltd. (a) | 137,351 | 7,361 | |||||||||
Kratos Defense & Security Solutions, Inc. (a) | 103,548 | 1,865 | |||||||||
See notes to financial statements.
15
| USAA Mutual Funds Trust USAA Small Cap Stock Fund | Schedule of Portfolio Investments — continued July 31, 2020 | ||||||
(Amounts in Thousands, Except for Shares)
Security Description | Shares | Value | |||||||||
Luxfer Holdings PLC | 305,686 | $ | 3,882 | ||||||||
Marten Transport Ltd. | 20,962 | 558 | |||||||||
Masonite International Corp. (a) | 48,397 | 4,083 | |||||||||
MasTec, Inc. (a) | 115,373 | 4,590 | |||||||||
Matthews International Corp. Class A | 49,438 | 1,068 | |||||||||
McGrath RentCorp | 16,420 | 953 | |||||||||
Meritor, Inc. (a) | 176,758 | 4,022 | |||||||||
Mistras Group, Inc. (a) | 111,630 | 394 | |||||||||
Mueller Industries, Inc. | 131,506 | 3,677 | |||||||||
Owens Corning, Inc. | 26,047 | 1,575 | |||||||||
Parsons Corp. (a) | 37,777 | 1,316 | |||||||||
PGT Innovations, Inc. (a) | 85,753 | 1,464 | |||||||||
Primoris Services Corp. | 192,355 | 3,084 | |||||||||
Proto Labs, Inc. (a) (b) | 15,300 | 1,838 | |||||||||
RBC Bearings, Inc. (a) | 33,519 | 4,103 | |||||||||
Regal Beloit Corp. | 9,000 | 828 | |||||||||
Rexnord Corp. | 25,041 | 725 | |||||||||
Rush Enterprises, Inc. Class A | 81,575 | 3,882 | |||||||||
Saia, Inc. (a) | 11,510 | 1,375 | |||||||||
Simpson Manufacturing Co., Inc. | 36,349 | 3,510 | |||||||||
SP Plus Corp. (a) | 99,642 | 1,583 | |||||||||
Spirit Airlines, Inc. (a) (b) | 88,139 | 1,393 | |||||||||
Steelcase, Inc. Class A | 79,676 | 855 | |||||||||
TFI International, Inc. | 37,500 | 1,627 | |||||||||
The AZEK Co., Inc. (a) | 41,661 | 1,437 | |||||||||
The Greenbrier Cos., Inc. | 34,045 | 876 | |||||||||
The Timken Co. | 35,360 | 1,615 | |||||||||
Thermon Group Holdings, Inc. (a) | 105,210 | 1,426 | |||||||||
Titan Machinery, Inc. (a) | 67,078 | 729 | |||||||||
TriMas Corp. (a) | 109,960 | 2,573 | |||||||||
TrueBlue, Inc. (a) | 108,192 | 1,669 | |||||||||
Tyman PLC | 740,978 | 1,703 | |||||||||
UniFirst Corp. | 4,450 | 830 | |||||||||
Valmont Industries, Inc. | 16,720 | 2,026 | |||||||||
Vicor Corp. (a) | 14,479 | 1,180 | |||||||||
VSE Corp. | 10,615 | 299 | |||||||||
Wabash National Corp. | 133,018 | 1,515 | |||||||||
WESCO International, Inc. (a) | 77,096 | 2,996 | |||||||||
WillScot Mobile Mini Holdings Corp. (a) | 395,494 | 5,955 | |||||||||
192,733 | |||||||||||
Information Technology (19.1%): | |||||||||||
2u, Inc. (a) (b) | 63,832 | 3,006 | |||||||||
Airgain, Inc. (a) (b) | 166,850 | 2,136 | |||||||||
Akoustis Technologies, Inc. (a) (b) | 127,100 | 1,009 | |||||||||
Alteryx, Inc. Class A (a) (b) | 8,673 | 1,522 | |||||||||
Amkor Technology, Inc. (a) (b) | 178,250 | 2,423 | |||||||||
Badger Meter, Inc. | 28,091 | 1,758 | |||||||||
Belden, Inc. | 142,036 | 4,488 | |||||||||
Benchmark Electronics, Inc. | 67,662 | 1,378 | |||||||||
Blackline, Inc. (a) | 29,528 | 2,625 | |||||||||
See notes to financial statements.
16
| USAA Mutual Funds Trust USAA Small Cap Stock Fund | Schedule of Portfolio Investments — continued July 31, 2020 | ||||||
(Amounts in Thousands, Except for Shares)
Security Description | Shares | Value | |||||||||
Box, Inc. Class A (a) | 41,868 | $ | 752 | ||||||||
Brooks Automation, Inc. | 100,501 | 5,472 | |||||||||
Ciena Corp. (a) | 63,600 | 3,784 | |||||||||
Cirrus Logic, Inc. (a) | 90,759 | 6,220 | |||||||||
Cloudera, Inc. (a) | 518,386 | 5,843 | |||||||||
Cloudflare, Inc. Class A (a) | 52,523 | 2,186 | |||||||||
Coherent, Inc. (a) | 9,360 | 1,299 | |||||||||
Coupa Software, Inc. (a) | 2,087 | 640 | |||||||||
CSG Systems International, Inc. | 54,009 | 2,275 | |||||||||
CTS Corp. | 159,091 | 3,160 | |||||||||
CyberArk Software Ltd. (a) | 13,820 | 1,628 | |||||||||
Datadog, Inc. Class A (a) | 13,557 | 1,272 | |||||||||
Digital Turbine, Inc. (a) | 522,740 | 7,257 | |||||||||
Dropbox, Inc. Class A (a) | 60,679 | 1,380 | |||||||||
Ebix, Inc. (b) | 64,404 | 1,420 | |||||||||
Elastic NV (a) | 22,132 | 2,129 | |||||||||
Endava PLC, ADR (a) | 23,222 | 1,199 | |||||||||
EPAM Systems, Inc. (a) | 4,938 | 1,432 | |||||||||
Euronet Worldwide, Inc. (a) | 82,249 | 7,907 | |||||||||
EVERTEC, Inc. | 16,620 | 516 | |||||||||
ExlService Holdings, Inc. (a) | 12,880 | 825 | |||||||||
Globant SA (a) | 20,645 | 3,571 | |||||||||
Inphi Corp. (a) | 19,300 | 2,522 | |||||||||
InterDigital, Inc. | 46,843 | 2,812 | |||||||||
KBR, Inc. | 166,907 | 3,712 | |||||||||
Limelight Networks, Inc. (a) | 1,033,413 | 6,480 | |||||||||
LivePerson, Inc. (a) | 63,646 | 2,736 | |||||||||
Lumentum Holdings, Inc. (a) | 15,148 | 1,406 | |||||||||
Marvell Technology Group Ltd. | 26,389 | 962 | |||||||||
MAXIMUS, Inc. | 14,509 | 1,077 | |||||||||
Mimecast Ltd. (a) (b) | 11,907 | 559 | |||||||||
Monolithic Power Systems, Inc. | 7,040 | 1,866 | |||||||||
Napco Security Technologies, Inc. (a) | 105,118 | 2,773 | |||||||||
NCR Corp. (a) | 67,300 | 1,240 | |||||||||
NeoPhotonics Corp. (a) | 119,642 | 1,090 | |||||||||
NetScout Systems, Inc. (a) | 91,120 | 2,320 | |||||||||
New Relic, Inc. (a) | 38,625 | 2,739 | |||||||||
Nutanix, Inc. Class A (a) | 86,179 | 1,912 | |||||||||
Okta, Inc. (a) (b) | 8,420 | 1,861 | |||||||||
ON Semiconductor Corp. (a) | 85,093 | 1,753 | |||||||||
OneSpan, Inc. (a) | 103,150 | 3,212 | |||||||||
Onto Innovation, Inc. (a) | 113,129 | 4,278 | |||||||||
OSI Systems, Inc. (a) | 28,411 | 2,016 | |||||||||
PagerDuty, Inc. (a) | 61,168 | 1,864 | |||||||||
Paycom Software, Inc. (a) | 2,821 | 802 | |||||||||
Paylocity Holding Corp. (a) | 8,388 | 1,117 | |||||||||
Perficient, Inc. (a) | 62,000 | 2,431 | |||||||||
Perspecta, Inc. | 46,746 | 1,000 | |||||||||
Ping Identity Holding Corp. (a) | 87,801 | 3,017 | |||||||||
Plexus Corp. (a) | 13,849 | 1,029 | |||||||||
See notes to financial statements.
17
| USAA Mutual Funds Trust USAA Small Cap Stock Fund | Schedule of Portfolio Investments — continued July 31, 2020 | ||||||
(Amounts in Thousands, Except for Shares)
Security Description | Shares | Value | |||||||||
Pluralsight, Inc. Class A (a) (b) | 155,950 | $ | 3,301 | ||||||||
Power Integrations, Inc. | 13,700 | 1,672 | |||||||||
Proofpoint, Inc. (a) | 12,800 | 1,481 | |||||||||
PROS Holdings, Inc. (a) | 43,900 | 1,432 | |||||||||
PTC, Inc. (a) | 22,800 | 1,951 | |||||||||
Pure Storage, Inc. Class A (a) | 238,168 | 4,254 | |||||||||
QAD, Inc. Class A | 9,735 | 385 | |||||||||
Qualys, Inc. (a) | 21,300 | 2,630 | |||||||||
Radware Ltd. (a) | 85,100 | 2,174 | |||||||||
Rambus, Inc. (a) | 39,134 | 578 | |||||||||
Rapid7, Inc. (a) | 50,100 | 2,984 | |||||||||
RealPage, Inc. (a) | 18,215 | 1,148 | |||||||||
Rogers Corp. (a) | 4,300 | 513 | |||||||||
Sanmina Corp. (a) | 99,103 | 2,942 | |||||||||
Sapiens International Corp. NV (b) | 49,496 | 1,513 | |||||||||
Semtech Corp. (a) (b) | 60,604 | 3,377 | |||||||||
SharpSpring, Inc. (a) (b) | 153,656 | 1,240 | |||||||||
ShotSpotter, Inc. (a) (b) | 15,314 | 353 | |||||||||
Silicon Laboratories, Inc. (a) | 14,400 | 1,447 | |||||||||
Smartsheet, Inc. Class A (a) | 54,356 | 2,595 | |||||||||
Sprout Social, Inc. Class A (a) | 15,589 | 450 | |||||||||
SPS Commerce, Inc. (a) | 13,011 | 978 | |||||||||
Sykes Enterprises, Inc. (a) | 33,456 | 919 | |||||||||
Synaptics, Inc. (a) | 53,886 | 4,312 | |||||||||
Talend SA, ADR (a) | 76,760 | 2,713 | |||||||||
Teradyne, Inc. | 20,300 | 1,806 | |||||||||
The Hackett Group, Inc. | 45,621 | 629 | |||||||||
The Trade Desk, Inc. Class A (a) (b) | 1,000 | 451 | |||||||||
TransAct Technologies, Inc. | 52,174 | 183 | |||||||||
Varonis Systems, Inc. (a) (b) | 12,083 | 1,309 | |||||||||
Verint Systems, Inc. (a) | 76,730 | 3,444 | |||||||||
Virtusa Corp. (a) | 88,022 | 3,574 | |||||||||
Vishay Intertechnology, Inc. | 173,198 | 2,717 | |||||||||
Western Digital Corp. | 39,050 | 1,683 | |||||||||
WNS Holdings Ltd., ADR (a) | 109,881 | 7,028 | |||||||||
Workiva, Inc. (a) | 8,550 | 478 | |||||||||
Zix Corp. (a) | 458,904 | 3,265 | |||||||||
Zscaler, Inc. (a) | 20,190 | 2,622 | |||||||||
219,629 | |||||||||||
Materials (3.8%): | |||||||||||
Avient Corp. | 119,221 | 2,849 | |||||||||
Commercial Metals Co. | 80,561 | 1,666 | |||||||||
Element Solutions, Inc. (a) | 138,500 | 1,504 | |||||||||
Ferro Corp. (a) | 64,914 | 759 | |||||||||
Graphic Packaging Holding Co. | 222,640 | 3,104 | |||||||||
Hecla Mining Co. | 125,810 | 694 | |||||||||
Ingevity Corp. (a) | 9,900 | 579 | |||||||||
Louisiana-Pacific Corp. | 172,539 | 5,464 | |||||||||
Materion Corp. | 24,158 | 1,387 | |||||||||
Minerals Technologies, Inc. | 68,089 | 3,193 | |||||||||
See notes to financial statements.
18
| USAA Mutual Funds Trust USAA Small Cap Stock Fund | Schedule of Portfolio Investments — continued July 31, 2020 | ||||||
(Amounts in Thousands, Except for Shares)
Security Description | Shares | Value | |||||||||
Neenah, Inc. | 37,566 | $ | 1,676 | ||||||||
Orion Engineered Carbons SA (b) | 144,226 | 1,471 | |||||||||
Quaker Chemical Corp. (b) | 10,097 | 1,959 | |||||||||
Schweitzer-Mauduit International, Inc. | 41,081 | 1,336 | |||||||||
Stepan Co. | 20,918 | 2,284 | |||||||||
Summit Materials, Inc. Class A (a) | 203,147 | 2,990 | |||||||||
Trinseo SA | 111,538 | 2,420 | |||||||||
Verso Corp. Class A | 107,529 | 1,313 | |||||||||
Warrior Met Coal, Inc. | 207,300 | 3,300 | |||||||||
Worthington Industries, Inc. | 105,733 | 3,957 | |||||||||
43,905 | |||||||||||
Real Estate (6.4%): | |||||||||||
Agree Realty Corp. | 14,903 | 998 | |||||||||
Alexander & Baldwin, Inc. | 125,590 | 1,484 | |||||||||
Alexander's, Inc. | 5,000 | 1,259 | |||||||||
American Assets Trust, Inc. | 18,896 | 510 | |||||||||
Brandywine Realty Trust | 160,790 | 1,741 | |||||||||
Chatham Lodging Trust | 147,658 | 769 | |||||||||
CoreCivic, Inc. | 219,245 | 1,953 | |||||||||
CorEnergy Infrastructure Trust, Inc. (b) | 58,992 | 517 | |||||||||
Corporate Office Properties Trust | 81,645 | 2,162 | |||||||||
DiamondRock Hospitality Co. | 313,934 | 1,450 | |||||||||
Easterly Government Properties, Inc. | 95,996 | 2,347 | |||||||||
Equity Commonwealth | 55,840 | 1,763 | |||||||||
FirstService Corp. | 14,273 | 1,706 | |||||||||
Four Corners Property Trust, Inc. | 67,170 | 1,693 | |||||||||
Global Medical REIT, Inc. | 88,353 | 1,051 | |||||||||
Healthcare Realty Trust, Inc. | 43,715 | 1,281 | |||||||||
Industrial Logistics Properties Trust | 118,633 | 2,504 | |||||||||
Innovative Industrial Properties, Inc. (b) | 9,450 | 985 | |||||||||
Jones Lang LaSalle, Inc. | 9,940 | 983 | |||||||||
Kennedy-Wilson Holdings, Inc. | 51,940 | 771 | |||||||||
Lexington Realty Trust | 581,468 | 6,745 | |||||||||
National Health Investors, Inc. | 41,930 | 2,600 | |||||||||
Newmark Group, Inc. Class A | 154,544 | 629 | |||||||||
Physicians Realty Trust | 188,432 | 3,400 | |||||||||
Piedmont Office Realty Trust, Inc. Class A | 121,857 | 1,975 | |||||||||
PotlatchDeltic Corp. | 66,297 | 2,838 | |||||||||
QTS Realty Trust, Inc. Class A (b) | 27,404 | 1,972 | |||||||||
Retail Opportunity Investments Corp. | 220,607 | 2,398 | |||||||||
Rexford Industrial Realty, Inc. | 74,241 | 3,484 | |||||||||
| RPT Realty | 236,977 | 1,474 | |||||||||
Sabra Health Care REIT, Inc. | 234,540 | 3,457 | |||||||||
STAG Industrial, Inc. | 99,050 | 3,229 | |||||||||
Summit Hotel Properties, Inc. | 262,660 | 1,361 | |||||||||
Terreno Realty Corp. | 20,186 | 1,227 | |||||||||
The Macerich Co. (b) | 445,631 | 3,400 | |||||||||
UMH Properties, Inc. | 104,662 | 1,287 | |||||||||
Universal Health Realty Income Trust | 17,141 | 1,193 | |||||||||
Urban Edge Properties | 179,135 | 1,877 | |||||||||
See notes to financial statements.
19
| USAA Mutual Funds Trust USAA Small Cap Stock Fund | Schedule of Portfolio Investments — continued July 31, 2020 | ||||||
(Amounts in Thousands, Except for Shares)
Security Description | Shares | Value | |||||||||
Washington Real Estate Investment Trust | 27,440 | $ | 614 | ||||||||
Xenia Hotels & Resorts, Inc. | 225,653 | 1,796 | |||||||||
74,883 | |||||||||||
Utilities (2.6%): | |||||||||||
ALLETE, Inc. | 50,413 | 2,989 | |||||||||
American States Water Co. | 41,474 | 3,189 | |||||||||
Avista Corp. | 72,109 | 2,677 | |||||||||
Black Hills Corp. | 24,390 | 1,411 | |||||||||
New Jersey Resources Corp. | 29,668 | 921 | |||||||||
NorthWestern Corp. | 175,932 | 9,899 | |||||||||
Otter Tail Corp. | 67,043 | 2,564 | |||||||||
Portland General Electric Co. | 81,826 | 3,612 | |||||||||
South Jersey Industries, Inc. | 32,710 | 763 | |||||||||
Spire, Inc. | 26,356 | 1,626 | |||||||||
29,651 | |||||||||||
Total Common Stocks (Cost $1,017,594) | 1,144,161 | ||||||||||
Collateral for Securities Loaned^ (5.8%) | |||||||||||
| Goldman Sachs Financial Square Government Fund Institutional Shares, 0.13% (e) | 53,545,954 | 53,545 | |||||||||
HSBC U.S. Government Money Market Fund I Shares, 0.08% (e) | 12,017,988 | 12,018 | |||||||||
Invesco Government & Agency Portfolio Institutional Shares, 0.06% (e) | 1,140,518 | 1,141 | |||||||||
Total Collateral for Securities Loaned (Cost $66,704) | 66,704 | ||||||||||
Total Investments (Cost $1,084,298) — 105.1% | 1,210,865 | ||||||||||
Liabilities in excess of other assets — (5.1)% | (58,673 | ) | |||||||||
NET ASSETS — 100.00% | $ | 1,152,192 | |||||||||
At July 31, 2020 the Fund's investments in foreign securities were 8.4% of net assets.
^ Purchased with cash collateral from securities on loan.
(a) Non-income producing security.
(b) All or a portion of this security is on loan.
(c) The Fund's Adviser has deemed this security to be illiquid based upon procedures approved by the Board of Trustees. As of July 31, 2020, illiquid securities were 0.2% of the Fund's net assets.
(d) Security was fair valued based upon procedures approved by the Board of Trustees and represents 0.0% of the Fund's net assets as of July 31, 2020. This security is classified as Level 3 within the fair value hierarchy. (See Note 2 in the Notes to Financial Statements)
(e) Rate disclosed is the daily yield on July 31, 2020.
ADR — American Depositary Receipt
PLC — Public Limited Company
REIT — Real Estate Investment Trust
See notes to financial statements.
20
USAA Mutual Funds Trust | Statement of Assets and Liabilities July 31, 2020 | ||||||
(Amounts in Thousands, Except Per Share Amounts)
| USAA Small Cap Stock Fund | |||||||
Assets: | |||||||
Investments, at value (Cost $1,084,298) | $ | 1,210,865 | (a) | ||||
Cash and cash equivalents | 7.156 | ||||||
Receivables: | |||||||
Interest and dividends | 464 | ||||||
Capital shares issued | 183 | ||||||
Investments sold | 4,712 | ||||||
Reclaims | — | (b) | |||||
From Adviser | 19 | ||||||
Prepaid expenses | 30 | ||||||
Total assets | 1,223,429 | ||||||
Liabilities: | |||||||
Payables: | |||||||
Collateral received on loaned securities | 66,704 | ||||||
Investments purchased | 2,571 | ||||||
Capital shares redeemed | 744 | ||||||
Accrued expenses and other payables: | |||||||
Investment advisory fees | 872 | ||||||
Administration fees | 133 | ||||||
Custodian fees | 18 | ||||||
Transfer agent fees | 136 | ||||||
Compliance fees | 1 | ||||||
Other accrued expenses | 58 | ||||||
Total liabilities | 71,237 | ||||||
Net Assets: | |||||||
Capital | 1,002,372 | ||||||
Total accumulated earnings/loss | 149,820 | ||||||
Net assets | $ | 1,152,192 | |||||
Net Assets: | |||||||
Fund Shares | $ | 595,019 | |||||
Institutional Shares | 557,173 | ||||||
Total | $ | 1,152,192 | |||||
Shares (unlimited number of shares authorized with no par value): | |||||||
Fund Shares | 39,988 | ||||||
Institutional Shares | 37,002 | ||||||
Total | 76,990 | ||||||
Net asset value, offering and redemption price per share: (c) | |||||||
Fund Shares | $ | 14.88 | |||||
Institutional Shares | $ | 15.06 | |||||
(a) Includes $63,885 of securities on loan.
(b) Rounds to less than $1 thousand.
(c) Per share amount may not recalculate due to rounding of net assets and/or shares outstanding.
See notes to financial statements.
21
USAA Mutual Funds Trust | Statement of Operations For the Year Ended July 31, 2020 | ||||||
(Amounts in Thousands)
| USAA Small Cap Stock Fund | |||||||
Investment Income: | |||||||
Dividends | $ | 19,092 | |||||
Interest | 171 | ||||||
Securities lending (net of fees) | 1,146 | ||||||
Foreign tax withholding | (40 | ) | |||||
Total Income | 20,369 | ||||||
Expenses: | |||||||
Investment advisory fees | 10,744 | ||||||
Administration fees — Fund Shares | 947 | ||||||
Administration fees — Institutional Shares | 793 | ||||||
Sub-Administration fees | 92 | ||||||
Custodian fees | 141 | ||||||
Transfer agent fees — Fund Shares | 978 | ||||||
Transfer agent fees — Institutional Shares | 793 | ||||||
Trustees' fees | 46 | ||||||
Compliance fees | 10 | ||||||
Legal and audit fees | 79 | ||||||
State registration and filing fees | 33 | ||||||
Interfund lending fees | 1 | ||||||
Other expenses | 121 | ||||||
Total Expenses | 14,778 | ||||||
Expenses waived/reimbursed by Adviser | (64 | ) | |||||
Net Expenses | 14,714 | ||||||
Net Investment Income (Loss) | 5,655 | ||||||
Realized/Unrealized Gains (Losses) from Investments: | |||||||
| Net realized gains (losses) from investment securities and foreign currency translations | 74,639 | ||||||
| Net change in unrealized appreciation/depreciation on investment securities and foreign currency translations | (101,502 | ) | |||||
Net realized/unrealized gains (losses) on investments | (26,863 | ) | |||||
Change in net assets resulting from operations | $ | (21,208 | ) | ||||
See notes to financial statements.
22
USAA Mutual Funds Trust | Statements of Changes in Net Assets | ||||||
(Amounts in Thousands)
USAA Small Cap Stock Fund | |||||||||||
| Year Ended July 31, 2020 | Year Ended July 31, 2019 | ||||||||||
From Investments: | |||||||||||
Operations: | |||||||||||
Net investment income (loss) | $ | 5,655 | $ | 10,051 | |||||||
Net realized gains (losses) from investments | 74,639 | 137,832 | |||||||||
| Net change in unrealized appreciation/depreciation on investments | (101,502 | ) | (184,256 | ) | |||||||
Change in net assets resulting from operations | (21,208 | ) | (36,373 | ) | |||||||
Distributions to Shareholders: | |||||||||||
Fund Shares | (65,538 | ) | (75,659 | ) | |||||||
Institutional Shares | (82,906 | ) | (95,199 | ) | |||||||
Change in net assets resulting from distributions to shareholders | (148,444 | ) | (170,858 | ) | |||||||
Change in net assets resulting from capital transactions | (277,152 | ) | 51,769 | ||||||||
Change in net assets | (446,804 | ) | (155,462 | ) | |||||||
Net Assets: | |||||||||||
Beginning of period | 1,598,996 | 1,754,458 | |||||||||
End of period | $ | 1,152,192 | $ | 1,598,996 | |||||||
Capital Transactions: | |||||||||||
Fund Shares | |||||||||||
Proceeds from shares issued | $ | 71,874 | $ | 79,969 | |||||||
Distributions reinvested | 64,623 | 74,755 | |||||||||
Cost of shares redeemed | (151,659 | ) | (124,566 | ) | |||||||
Total Fund Shares | $ | (15,162 | ) | $ | 30,158 | ||||||
Institutional Shares | |||||||||||
Proceeds from shares issued | $ | 87,006 | $ | 111,029 | |||||||
Distributions reinvested | 82,899 | 95,182 | |||||||||
Cost of shares redeemed | (431,895 | ) | (184,600 | ) | |||||||
Total Institutional Shares | $ | (261,990 | ) | $ | 21,611 | ||||||
Change in net assets resulting from capital transactions | $ | (277,152 | ) | $ | 51,769 | ||||||
Share Transactions: | |||||||||||
Fund Shares | |||||||||||
Issued | 4,956 | 4,681 | |||||||||
Reinvested | 3,974 | 5,005 | |||||||||
Redeemed | (10,400 | ) | (7,448 | ) | |||||||
Total Fund Shares | (1,470 | ) | 2,238 | ||||||||
Institutional Shares | |||||||||||
Issued | 6,588 | 6,605 | |||||||||
Reinvested | 5,038 | 6,312 | |||||||||
Redeemed | (28,139 | ) | (10,506 | ) | |||||||
Total Institutional Shares | (16,513 | ) | 2,411 | ||||||||
Change in Shares | (17,983 | ) | 4,649 | ||||||||
See notes to financial statements.
23
USAA Mutual Funds Trust | Financial Highlights | ||||||
For a Share Outstanding Throughout Each Period
Investment Activities | Distributions to Shareholders From | ||||||||||||||||||||||||||
Net Asset Value, Beginning of Period | Net Investment Income (Loss) | Net Realized and Unrealized Gains (Losses) on Investments | Total from Investment Activities | Net Investment Income | Net Realized Gains from Investments | ||||||||||||||||||||||
USAA Small Cap Stock Fund | |||||||||||||||||||||||||||
Fund Shares | |||||||||||||||||||||||||||
Year Ended July 31, 2020 | $ | 16.74 | 0.05 | (b) | (0.28 | ) | (0.23 | ) | (0.03 | ) | (1.60 | ) | |||||||||||||||
Year Ended July 31, 2019 | $ | 19.33 | 0.07 | (0.71 | ) | (0.64 | ) | (0.04 | ) | (1.91 | ) | ||||||||||||||||
Year Ended July 31, 2018 | $ | 18.02 | 0.05 | 3.19 | 3.24 | (0.07 | ) | (1.86 | ) | ||||||||||||||||||
Year Ended July 31, 2017 | $ | 16.17 | 0.08 | 1.99 | 2.07 | (0.03 | ) | (0.19 | ) | ||||||||||||||||||
Year Ended July 31, 2016 | $ | 17.77 | 0.02 | (0.22 | ) | (0.20 | ) | (0.05 | ) | (1.35 | ) | ||||||||||||||||
Institutional Shares | |||||||||||||||||||||||||||
Year Ended July 31, 2020 | $ | 16.91 | 0.07 | (b) | (0.28 | ) | (0.21 | ) | (0.04 | ) | (1.60 | ) | |||||||||||||||
Year Ended July 31, 2019 | $ | 19.50 | 0.08 | (0.71 | ) | (0.63 | ) | (0.05 | ) | (1.91 | ) | ||||||||||||||||
Year Ended July 31, 2018 | $ | 18.16 | 0.07 | 3.22 | 3.29 | (0.09 | ) | (1.86 | ) | ||||||||||||||||||
Year Ended July 31, 2017 | $ | 16.30 | 0.09 | 2.02 | 2.11 | (0.06 | ) | (0.19 | ) | ||||||||||||||||||
Year Ended July 31, 2016 | $ | 17.89 | 0.07 | (0.24 | ) | (0.17 | ) | (0.07 | ) | (1.35 | ) | ||||||||||||||||
* Assumes reinvestment of all net investment income and realized capital gain distributions, if any, during the period. Includes adjustments in accordance with U.S. generally accepted accounting principles and could differ from the Lipper reported return.
^ The net expense ratio may not correlate to the applicable expense limits in place during the period since the current contractual expense limitation is applied for a two year period beginning July 1, 2019 and in effect through June 30, 2021, instead of coinciding with the Fund's fiscal year end. Details of the current contractual expense limitation in effect can be found in Note 5 of the accompanying Notes to Financial Statements.
(a) Portfolio turnover is calculated on the basis of the Fund as a whole without distinguishing between the classes of shares issued.
(b) Per share net investment income (loss) has been calculated using the average daily shares method.
(c) Reflects total annual operating expenses of the shares before reductions of any expenses paid indirectly. The Fund's expenses paid indirectly decreased the expense ratios by less than 0.01%.
See notes to financial statements.
24
USAA Mutual Funds Trust | Financial Highlights — continued | ||||||
For a Share Outstanding Throughout Each Period
Ratios to Average Net Assets | Supplemental Data | ||||||||||||||||||||||||||||||||||
| Total Distributions | Net Asset Value, End of Period | Total Return* | Net Expenses^ | Net Investment Income (Loss) | Gross Expenses | Net Assets, End of Period (000's) | Portfolio Turnover(a) | ||||||||||||||||||||||||||||
USAA Small Cap Stock Fund | |||||||||||||||||||||||||||||||||||
Fund Shares | |||||||||||||||||||||||||||||||||||
Year Ended July 31, 2020 | (1.63 | ) | $ | 14.88 | (2.21 | )% | 1.10 | % | 0.33 | % | 1.10 | % | $ | 595,019 | 71 | % | |||||||||||||||||||
Year Ended July 31, 2019 | (1.95 | ) | $ | 16.74 | (2.07 | )% | 1.06 | %(c) | 0.58 | % | 1.06 | %(c) | $ | 694,015 | 84 | % | |||||||||||||||||||
Year Ended July 31, 2018 | (1.93 | ) | $ | 19.33 | 19.21 | % | 1.06 | %(c) | 0.31 | % | 1.06 | %(c) | $ | 758,065 | 68 | % | |||||||||||||||||||
Year Ended July 31, 2017 | (0.22 | ) | $ | 18.02 | 12.81 | % | 1.09 | %(c) | 0.42 | % | 1.09 | %(c) | $ | 658,038 | 53 | % | |||||||||||||||||||
Year Ended July 31, 2016 | (1.40 | ) | $ | 16.17 | (0.75 | )% | 1.15 | %(c) | 0.18 | % | 1.15 | %(c) | $ | 586,438 | 52 | % | |||||||||||||||||||
Institutional Shares | |||||||||||||||||||||||||||||||||||
Year Ended July 31, 2020 | (1.64 | ) | $ | 15.06 | (2.08 | )% | 0.98 | % | 0.45 | % | 0.99 | % | $ | 557,173 | 71 | % | |||||||||||||||||||
Year Ended July 31, 2019 | (1.96 | ) | $ | 16.91 | (1.98 | )% | 0.96 | %(c) | 0.67 | % | 0.96 | %(c) | $ | 904,981 | 84 | % | |||||||||||||||||||
Year Ended July 31, 2018 | (1.95 | ) | $ | 19.50 | 19.36 | % | 0.95 | %(c) | 0.42 | % | 0.95 | %(c) | $ | 996,393 | 68 | % | |||||||||||||||||||
Year Ended July 31, 2017 | (0.25 | ) | $ | 18.16 | 12.92 | % | 0.97 | %(c) | 0.52 | % | 0.97 | %(c) | $ | 892,691 | 53 | % | |||||||||||||||||||
Year Ended July 31, 2016 | (1.42 | ) | $ | 16.30 | (0.55 | )% | 0.99 | %(c) | 0.35 | % | 0.99 | %(c) | $ | 884,187 | 52 | % | |||||||||||||||||||
See notes to financial statements.
25
USAA Mutual Funds Trust | Notes to Financial Statements July 31, 2020 | ||||||
1. Organization:
USAA Mutual Funds Trust (the "Trust") is organized as a Delaware statutory trust and is registered under the Investment Company Act of 1940, as amended (the "1940 Act"), as an open-end investment company. The Trust is comprised of 47 funds and is authorized to issue an unlimited number of shares, which are units of beneficial interest with no par value.
The accompanying financial statements are those of the USAA Small Cap Stock Fund (the "Fund"). The Fund offers two classes of shares: Fund Shares and Institutional Shares. The Fund is classified as diversified under the 1940 Act.
Each class of shares of the Fund has substantially identical rights and privileges except with respect to fees paid under distribution plans, expenses allocable exclusively to each class of shares, voting rights on matters solely affecting a single class of shares, and the exchange privilege of each class of shares.
Under the Trust's organizational documents, its officers and trustees are indemnified against certain liabilities arising out of the performance of their duties to the Fund. In addition, in the normal course of business, the Fund enters into contracts with its vendors and others that provide for general indemnifications. The Fund's maximum exposure under these arrangements is unknown, as this would involve future claims that may be made against the Fund. However, based on experience, the Fund expects that risk of loss to be remote.
2. Significant Accounting Policies:
The following is a summary of significant accounting policies followed by the Trust in the preparation of its financial statements. The policies are in conformity with generally accepted accounting principles in the United States of America ("GAAP"). The preparation of financial statements in accordance with GAAP requires management to make estimates and assumptions that affect the reported amounts of assets and liabilities and disclosure of contingent assets and liabilities at the date of the financial statements and the reported amounts of income and expenses for the period. Actual results could differ from those estimates. The Fund follows the specialized accounting and reporting requirements under GAAP that are applicable to investment companies under Accounting Standards Codification Topic 946.
Investment Valuation:
The Fund records investments at fair value. Fair value is defined as the price that would be received to sell an asset or paid to transfer a liability in an orderly transaction between market participants at the measurement date.
The valuation techniques described below maximize the use of observable inputs and minimize the use of unobservable inputs in determining fair value. The inputs used for valuing the Fund's investments are summarized in the three broad levels listed below:
• Level 1 — quoted prices in active markets for identical securities
• Level 2 — other significant observable inputs (including quoted prices for similar securities or interest rates applicable to those securities, etc.)
• Level 3 — significant unobservable inputs (including the Fund's own assumptions in determining the fair value of investments)
Changes in valuation techniques may result in transfers in or out of an assigned level within the disclosure hierarchy. The inputs or methodologies used for valuation techniques are not necessarily an indication of the risk associated with entering into those investments.
The Adviser has established the Pricing and Liquidity Committee (the "Committee"), and subject to Trust's Board of Trustees (the "Board") oversight, the Committee administers and oversees the Fund's valuation policies and procedures, which are approved by the Board.
Portfolio securities listed or traded on securities exchanges, including exchange-traded funds ("ETFs"), American Depositary Receipts ("ADRs") and Rights, are valued at the closing price on the exchange or system where the security is principally traded, if available, or at the Nasdaq Official Closing Price. If there have been no sales for that day on the exchange or system, then a security is valued at the last
26
USAA Mutual Funds Trust | Notes to Financial Statements — continued July 31, 2020 | ||||||
available bid quotation on the exchange or system where the security is principally traded. In each of these situations, valuations are typically categorized as Level 1 in the fair value hierarchy.
Investments in open-end investment companies are valued at net asset value ("NAV"). These valuations are typically categorized as Level 1 in the fair value hierarchy.
In the event that price quotations or valuations are not readily available, are not reflective of market value, or a significant event has been recognized in relation to a security or class of securities, the securities are valued in good faith by the Committee in accordance with valuation procedures approved by the Board. These valuations are typically categorized as Level 2 or Level 3 in the fair value hierarchy, based on the observability of inputs used to determine the fair value. The effect of fair value pricing is that securities may not be priced on the basis of quotations from the primary market in which they are traded and the actual price realized from the sale of a security may differ materially from the fair value price. Valuing these securities at fair value is intended to cause the Fund's NAV to be more reliable than it otherwise would be.
In accordance with procedures adopted by the Board, fair value pricing may be used if events materially affecting the value of foreign securities occur between the time the exchange on which they are traded closes and the time the Fund's NAV is calculated. The Fund uses a systematic valuation model, provided daily by an independent third party to fair value its international equity securities. These valuations are considered as Level 2 in the fair value hierarchy.
A summary of the valuations as of July 31, 2020, based upon the three levels defined above, is included in the table below while the breakdown, by category, of investments is disclosed in the Schedule of Portfolio Investments (amounts in thousands):
Level 1 | Level 2 | Level 3 | Total | ||||||||||||||||
Common Stocks | $ | 1,139,402 | $ | 4,759 | $ | — | (a) | $ | 1,144,161 | ||||||||||
Collateral for Securities Loaned | 66,704 | — | — | 66,704 | |||||||||||||||
Total | $ | 1,206,106 | $ | 4,759 | $ | — | $ | 1,210,865 | |||||||||||
(a) Nupathe, Inc. is categorized as Level 3 in the fair value hierarchy and is valued at zero as of July 31, 2020.
For the year ended July 31, 2020, there were no transfers in or out of the Level 3 fair value hierarchy.
Real Estate Investment Trusts ("REITs"):
The Fund may invest in REITs, which report information on the source of their distributions annually. REITs are pooled investment vehicles that invest primarily in income producing real estate or real estate related loans or interests (such as mortgages). Certain distributions received from REITs during the year are recorded as realized gains or return of capital as estimated by the Fund or when such information becomes known.
Investment Companies:
Exchange-Traded Funds:
The Fund may invest in ETFs, the shares of which are bought and sold on a securities exchange. An ETF trades like common stock and represents a fixed portfolio of securities designed to track the performance and dividend yield of a particular domestic or foreign market index. The Fund may purchase shares of an ETF to temporarily gain exposure to a portion of the U.S. or a foreign market while awaiting purchase of underlying securities. The risks of owning an ETF generally reflect the risks of owning the underlying securities they are designed to track, although the lack of liquidity of an ETF could result in it being more volatile. Additionally, ETFs have fees and expenses that reduce their value.
27
USAA Mutual Funds Trust | Notes to Financial Statements — continued July 31, 2020 | ||||||
Open-End Funds:
The Fund may invest in portfolios of open-end investment companies. These investment companies value securities in their portfolios for which market quotations are readily available at their market values (generally the last reported sale price) and all other securities and assets at their fair value by the methods established by the board of directors of the underlying funds.
Foreign Exchange Currency Contracts:
The Fund may enter into foreign exchange currency contracts to convert U.S. dollars to and from various foreign currencies. A foreign exchange currency contract is an obligation by the Fund to purchase or sell a specific currency at a future date at a price (in U.S. dollars) set at the time of the contract. The Fund does not engage in "cross-currency" foreign exchange contracts (i.e., contracts to purchase or sell one foreign currency in exchange for another foreign currency). The Fund's foreign exchange currency contracts might be considered spot contracts (typically a contract of one week or less) or forward contracts (typically a contract term over one week). A spot contract is entered into for purposes of hedging against foreign currency fluctuations relating to a specific portfolio transaction, such as the delay between a security transaction trade date and settlement date. Forward contracts are entered into for purposes of hedging portfolio holdings or concentrations of such holdings. Each foreign exchange currency contract is adjusted daily by the prevailing spot or forward rate of the underlying currency, and any appreciation or depreciation is recorded for financial statement purposes as unrealized until the contract settlement date, at which time the Fund records realized gains or losses equal to the difference between the value of a contract at the time it was opened and the value at the time it was closed. The Fund could be exposed to risk if a counterparty is unable to meet the terms of a foreign exchange currency contract or if the value of the foreign currency changes unfavorably. In addition, the use of foreign exchange currency contracts does not eliminate fluctuations in the underlying prices of the securities. As of July 31, 2020, the Fund had no open forward foreign exchange currency contracts.
Investment Transactions and Related Income:
Changes in holdings of investments are accounted for no later than one business day following the trade date. For financial reporting purposes, however, investment transactions are accounted for on trade date on the last business day of the reporting period. Interest income is determined on the basis of coupon interest accrued using the effective interest method which adjusts, where applicable, the amortization of premiums or accretion of discount. Gains or losses realized on sales of securities are determined by comparing the identified cost of the security lot sold with the net sales proceeds.
Withholding taxes on interest, dividends, and gains as a result of certain investments in ADRs by the Fund has been provided for in accordance with each investment's applicable country's tax rules and rates.
Securities Lending:
The Fund, through a securities lending agreement with Citibank, N.A. ("Citibank"), may lend its securities to qualified financial institutions, such as certain broker-dealers, to earn additional income, net of income retained by Citibank. Borrowers are required to secure their loans for collateral in the amount of at least 102% of the value of U.S. securities loaned or at least 105% of the value of non-U.S. securities loaned, marked-to-market daily. Any collateral shortfalls associated with increases in the valuation of the securities loaned are cured the next business day once the shortfall exceeds $100 thousand. Collateral may be cash, U.S. government securities, or other securities as permitted by SEC guidelines. Cash collateral may be invested in high-quality short-term investments, primarily open-end investment companies. Collateral requirements are determined daily based on the value of the Fund's securities on loan as of the end of the prior business day. During the time portfolio securities are on loan, the borrower will pay the Fund any dividends or interest paid on such securities plus any fee negotiated between the parties to the lending agreement. The Fund also earns a return from the collateral. The
28
USAA Mutual Funds Trust | Notes to Financial Statements — continued July 31, 2020 | ||||||
Fund pays Citibank various fees in connection with the investment of cash collateral and fees based on the investment income received from securities lending activities. Securities lending income (net of these fees) is disclosed on the Statement of Operations. Loans are terminable upon demand and the borrower must return the loaned securities within the lesser of one standard settlement period or five business days. Risks relating to securities-lending transactions include that the borrower may not provide additional collateral when required or return the securities when due, and that the value of the short-term investments will be less than the amount of cash collateral required to be returned to the borrower. The Fund's agreement with Citibank does not include master netting provisions. Non- cash collateral received by the Fund may not be sold or re-pledged except to satisfy borrower default. Cash collateral is listed on the Fund's Schedule of Portfolio of Investments and Financial Statements while non-cash collateral is not included. The following table (amounts in thousands) is a summary of the Fund's securities lending transactions as of July 31, 2020.
| Value of Securities on Loan | Non-Cash Collateral | Cash Collateral | |||||||||
| $ | 64,546 | * | $ | — | $ | 66,704 | |||||
* Includes $661 of securities on loan that were sold prior to July 31, 2020.
Foreign Currency Translations:
The accounting records of the Fund are maintained in U.S. dollars. Investment securities and other assets and liabilities of the Fund denominated in a foreign currency are translated into U.S. dollars at current exchange rates. Purchases and sales of securities, income receipts, and expense payments are translated into U.S. dollars at the exchange rates on the date of the transactions. The Fund does not isolate the portion of the results of operations resulting from changes in foreign exchange rates on investments from fluctuations arising from changes in market prices of securities held. Such fluctuations are disclosed as net change in unrealized appreciation/depreciation on investments and foreign currency translations on the Statement of Operations. Any realized gains or losses from these fluctuations, including foreign currency arising from in-kind redemptions, are disclosed as net realized gains or losses from investment transactions and foreign currency translations on the Statement of Operations.
Foreign Taxes:
The Fund may be subject to foreign taxes related to foreign income received (a portion of which may be reclaimable), capital gains on the sale of securities, and certain foreign currency transactions. All foreign taxes are recorded in accordance with the applicable regulations and rates that exist in the foreign jurisdictions in which the Fund invests.
Federal Income Taxes:
It is the Fund's policy to continue to qualify as a regulated investment company by complying with the provisions available to certain investment companies, as defined in applicable sections of the Internal Revenue Code, and to make distributions of net investment income and net realized gains sufficient to relieve it from all, or substantially all, federal income taxes. Accordingly, no provision for federal income taxes is required in the financial statements. The Fund has a tax year-end of July 31.
Management of the Fund has reviewed tax positions taken in tax years that remain subject to examination by all major tax jurisdictions, including federal (i.e., the last four tax years, which includes the current fiscal tax year end). Management believes that there is no tax liability resulting from unrecognized tax benefits related to uncertain tax positions taken.
Allocations:
Expenses directly attributable to the Fund are charged to the Fund, while expenses that are attributable to more than one fund in the Trust, or jointly with an affiliated trust, are allocated among the respective funds in the Trust and/or affiliated trust based upon net assets or another appropriate basis.
29
USAA Mutual Funds Trust | Notes to Financial Statements — continued July 31, 2020 | ||||||
Income, expenses (other than class-specific expenses such as transfer agent fees, state registration fees, and printing fees), and realized and unrealized gains or losses on investments are allocated to each class of shares based on its relative net assets on the date income is earned or expenses and realized and unrealized gains and losses are incurred.
3. Purchases and Sales:
Cost of purchases and proceeds from sales/maturities of securities (excluding securities maturing less than one year from acquisition) for the year ended July 31, 2020, were as follows for the Fund (amounts in thousands):
| Excluding U.S. Government Securities | |||||||||||
Purchases | Sales | ||||||||||
$ | 991,570 | $ | 1,388,045 | ||||||||
There were no purchases and sales of U.S. government securities during the year ended July 31, 2020.
4. Affiliated Fund Ownership:
The Fund offers its shares for investment by other USAA Mutual Funds. The fund-of-funds do not invest in the underlying funds for the purpose of exercising management or control, and the affiliated fund-of-funds' annual and semi-annual reports may be viewed at usaa.com. As of July 31, 2020, certain fund-of-funds owned total outstanding shares of the Fund as follows:
USAA Cornerstone Conservative Fund | 0.2 | % | |||||
USAA Cornerstone Equity Fund | 0.6 | % | |||||
USAA Target Retirement Income Fund | 0.2 | % | |||||
USAA Target Retirement 2020 Fund | 0.4 | % | |||||
USAA Target Retirement 2030 Fund | 1.8 | % | |||||
USAA Target Retirement 2040 Fund | 1.9 | % | |||||
USAA Target Retirement 2050 Fund | 1.4 | % | |||||
USAA Target Retirement 2060 Fund | 0.2 | % | |||||
5. Fees and Transactions with Affiliates and Related Parties:
Investment Advisory Fees:
Investment advisory services are provided to the Fund by Victory Capital Management Inc. ("VCM" or the "Adviser"), a New York corporation registered as an investment adviser with the Securities and Exchange Commission ("SEC"). The Adviser is a wholly-owned indirect subsidiary of Victory Capital Holdings, Inc., a publicly traded Delaware corporation, and a wholly-owned direct subsidiary of Victory Capital Operating, LLC. Under the terms of the Investment Advisory Agreement, the Adviser is entitled to receive a base fee and a performance adjustment. The Fund's base fee is accrued daily and paid monthly at an annualized rate of 0.75% of the Fund's average daily net assets. Amounts incurred and paid to VCM for the year ended July 31, 2020, are reflected on the Statement of Operations as Investment Advisory fees.
Effective July 1, 2019, no performance adjustments were made for the period beginning July 1, 2019 through June 30, 2020. Only performance beginning as of July 1, 2019, and thereafter is utilized in calculating future performance adjustments.
The performance adjustment for each share class is accrued daily and calculated monthly by comparing each class' performance to that of the Lipper Small-Cap Core Funds Index. The Lipper Small-Cap Core Funds Index tracks the total return performance of each class within the Lipper Small-Cap Core Funds category.
30
USAA Mutual Funds Trust | Notes to Financial Statements — continued July 31, 2020 | ||||||
The performance period for each share class consists of the current month plus the previous 35 months (or the number of months beginning July 1, 2019, if fewer). The following table is utilized to determine the extent of the performance adjustment:
| Over/Under Performance Relative to Index (in basis points)(a) | Annual Adjustment Rate (in basis points)(a) | ||||||
+/- 100 to 400 | +/- 4 | ||||||
+/- 401 to 700 | +/- 5 | ||||||
+/- 701 and greater | +/- 6 | ||||||
(a) Based on the difference between average annual performance of the relevant share class of the Fund and its relevant Lipper index, rounded to the nearest basis point. Average daily net assets of the share class are calculated over a rolling 36-month period.
Each class' annual performance adjustment rate is multiplied by the average daily net assets of the class over the entire performance period, which is then multiplied by a fraction, the numerator of which is the number of days in the month and the denominator of which is 365 (366 in leap years). The resulting amount is then added to (in the case of overperformance), or subtracted from (in the case of underperformance) the base fee.
Under the performance fee arrangement, each class pays a positive performance fee adjustment for a performance period whenever the class outperforms the Lipper Small-Cap Core Funds Index over that period, even if the class has overall negative returns during the performance period.
For the period July 1, 2020 through July 31, 2020, performance adjustments for Fund Shares, and Institutional Shares were $27 and $34 thousand, respectively. For the Fund Shares, and Institutional Shares, the performance adjustments were less than 0.01% of net assets for both classes.
The Trust relies on an exemptive order granted to VCM and its affiliated funds by the SEC in March 2019 permitting the use of a "manager-of-managers" structure for certain funds. Under a manager-of- managers structure, the investment adviser may select (with approval of the Board and without shareholder approval) one or more subadvisers to manage the day-to-day investment of a fund's assets.
VCM has entered into a Subadvisory Agreement with Wellington Management Company LLP ("Wellington Management"), Granahan Investment Management, Inc. ("GIMI"), and ClariVest Asset Management LLC ("ClariVest"), under which GIMI, ClariVest and Wellington Management each direct the investment and reinvestment of a portion of the Fund's assets (as allocated from time to time by VCM). These arrangements provide for monthly fees that are paid by VCM. VCM (not the Fund) pays the subadviser fees. Effective June 30, 2020, ClariVest is no longer a subadviser to the Fund.
Administration and Servicing Fees:
VCM serves as the Fund's administrator and fund accountant. Under the Fund Administration, Servicing and Accounting Agreement, VCM is paid for its services an annual fee at a rate of 0.15% and 0.10% of average daily net assets of the Fund Shares and Institutional Shares, respectively. Amounts incurred for the year ended July 31, 2020, are reflected on the Statement of Operations as Administration fees.
The Fund (as part of the Trust) has entered into an agreement to provide compliance services with the Adviser, pursuant to which the Adviser furnishes its compliance personnel, including the services of the Chief Compliance Officer ("CCO"), and other resources reasonably necessary to provide the Trust with compliance oversight services related to the design, administration and oversight of a compliance program for the Trust in accordance with Rule 38a-1 under the 1940 Act. The CCO is an employee of the Adviser, which pays the compensation of the CCO and support staff. Funds in the Trust, Victory Variable Insurance Funds, Victory Portfolios, and Victory Portfolios II (collectively, the "Victory Funds Complex") in the aggregate, compensates the Adviser for these services. Amounts incurred for the year ended July 31, 2020, are reflected on the Statement of Operations as Compliance fees.
31
USAA Mutual Funds Trust | Notes to Financial Statements — continued July 31, 2020 | ||||||
Citi Fund Services Ohio, Inc. ("Citi"), an affiliate of Citibank, acts as sub-administrator and sub-fund accountant to the Fund pursuant to a Sub-Administration and Sub-Fund Accounting Services Agreement between VCM and Citi. VCM pays Citi a fee for providing these services. The Fund reimburses VCM and Citi for reasonable out-of-pocket expenses incurred in providing these services and certain other expenses specifically allocated to the Funds, under the Fund Administration, Servicing, and Accounting Agreement. Amounts incurred for the year ended July 31, 2020, are reflected on the Statement of Operations as Sub-Administration fees.
Transfer Agency Fees:
Victory Capital Transfer Agency, Inc. ("VCTA"), provides transfer agency services to the Fund. VCTA, an affiliate of the Adviser, provides transfer agent services to the Fund Shares based on an annual charge of $23 per shareholder account plus out-of-pocket expenses. VCTA pays a portion of these fees to certain intermediaries for the administration and servicing of accounts that are held with such intermediaries. Transfer agent's fees for Institutional Shares are paid monthly based on a fee accrued daily at an annualized rate of 0.10% of average daily net assets, plus out-of-pocket expenses. Amounts incurred and paid to VCTA for the year ended July 31, 2020, are reflected on the Statement of Operations as Transfer Agent fees.
FIS Investor Services LLC serves as sub-transfer agent and dividend disbursing agent for the Fund pursuant to a Sub-Transfer Agent agreement between VCTA and FIS Investor Services LLC. VCTA provides FIS Investor Services LLC a fee for providing these services.
Distributor/Underwriting Services:
Victory Capital Services, Inc. (the "Distributor"), an affiliate of the Adviser, serves as distributor for the continuous offering of the shares of the Fund pursuant to a Distribution Agreement between the Distributor and the Trust. The Distributor received no fees or other compensation for such distribution services. Effective June 30, 2020, the Distributor's name was changed from Victory Capital Advisers, Inc.
Other Fees:
Citibank serves as the Fund's custodian.
K&L Gates LLP provides legal services to the Trust.
The Adviser has entered into an expense limitation agreement with the Fund until at least June 30, 2021. Under the terms of the agreement, the Adviser has agreed to waive fees or reimburse certain expenses to the extent that ordinary operating expenses incurred by certain classes of the Fund in any fiscal year exceed the expense limit for such classes of the Fund. Such excess amounts will be the liability of the Adviser. Interest, taxes, brokerage commissions, other expenditures, which are capitalized in accordance with GAAP, and other extraordinary expenses not incurred in the ordinary course of the Fund's business are excluded from the expense limits. As of July 31, 2020, the expense limits (excluding voluntary waivers) are 1.10% and 0.98% for Fund Shares and Institutional Shares, respectively.
Under this expense limitation agreement, the Fund has agreed to repay fees and expenses that were waived or reimbursed by the Adviser for a period up to three years after the fiscal year in which the waiver or reimbursement took place, subject to the lesser of any operating expense limits in effect at the time of: (a) the original waiver or expense reimbursement; or (b) the recoupment, after giving effect to the recoupment amount. As of July 31, 2020, the following amounts are available to be repaid to the Adviser (amounts in thousands). The Fund has not recorded any amounts available to be repaid as a liability due to an assessment that such repayment is not probable at July 31, 2020.
Expires July 31, 2023 | |||||||
$ | 64 | ||||||
32
USAA Mutual Funds Trust | Notes to Financial Statements — continued July 31, 2020 | ||||||
The Adviser, may voluntarily waive or reimburse additional fees to assist the Fund in maintaining competitive expense ratios. Voluntary waivers and reimbursements applicable to the Fund are not available to be recouped at a future time. There were no voluntary waivers or reimbursements for the year ended July 31, 2020.
Certain officers and/or interested trustees of the Fund are also officers and/or employees of the Adviser, Administrator, Sub-Administrator, Sub-Fund Accountant, and Legal.
6. Risks:
The Fund may be subject to other risks in addition to these identified risks.
Global economies and financial markets are increasingly interconnected, which increases the possibilities that conditions in one country or region might adversely affect issuers in another country or region. Geopolitical and other risks, including war, terrorism, trade disputes, political or economic dysfunction within some nations, public health crises and related geopolitical events, as well as environmental disasters such as earthquakes, fires, and floods, may add to instability in world economies and markets generally. Changes in trade policies and international trade agreements could affect the economies of many countries in unpredictable ways. Epidemics and/or pandemics, such as the coronavirus (or COVID-19), may result in, among other things, closing borders, disruptions to healthcare service preparation and delivery, quarantines, cancellations, disruptions to supply chains and consumer activity, as well as general concern and uncertainty. The impact may be short-term or may last for extended periods.
The COVID-19 pandemic, which has spread rapidly across the world, has led and will continue to lead for an unknown period of time to disruptions in local, regional, national and global markets and economies. Among other things, the outbreak has resulted in, and until fully resolved is likely to continue to result in, among other things (1) government imposition of various forms of "stay at home" orders and the closing of "non-essential" businesses, resulting in significant disruption to the businesses of many issuers as well as lay-offs of employees: (2) increased requests by issuers of debt instruments for amendments and waivers of agreements to avoid default and increased defaults: (3) volatility and disruption of markets, including greater volatility in pricing and spreads; and (4) rapidly evolving proposals and/or actions by state and federal governments to address problems being experienced by the markets and by businesses and the economy in general.
The Fund is subject to small-cap company risk, which is the greater risk of investing in smaller, less well-known companies, as opposed to investing in established companies with proven track records. Small-cap companies also may have limited product lines, markets, or financial resources. Securities of such companies may be less liquid and more volatile than securities of larger companies or the market in general and, therefore, may involve greater risk than investing in the securities of larger companies.
Overall stock market risks may affect the value of the Fund. Factors such as domestic and international economic growth and market conditions, interest rate levels, and political events affect the securities market.
The value of the equity securities in which the Fund invests may decline in response to developments affecting individual companies and/or general economic conditions. A company's earnings or dividends may not increase as expected. Price changes may be temporary or last for extended periods.
7. Borrowing and Interfund Lending:
Line of Credit:
For the year ended July 31, 2020, the Victory Funds Complex participated in a short-term demand note "Line of Credit" agreement with Citibank. The Line of Credit agreement with Citibank was renewed on June 29, 2020 with a termination date of June 28, 2021. Under the agreement with Citibank, the Victory
33
USAA Mutual Funds Trust | Notes to Financial Statements — continued July 31, 2020 | ||||||
Funds Complex may borrow up to $600 million, of which $300 million is committed and $300 million is uncommitted. $40 million of the Line of Credit is reserved for use by the Victory Floating Rate Fund (herein, the "Fund"), another series of the Victory Funds Complex, with that Fund paying the related commitment fees for that amount. The purpose of the agreement is to meet temporary or emergency cash needs. For the year ended July 31, 2020, Citibank received an annual commitment fee of 0.15% on $300 million for providing the Line of Credit. Each fund in the Victory Funds Complex pays a pro-rata portion of the commitment fees plus any interest (one month LIBOR plus one percent) on amounts borrowed. Effective June 29, 2020, under an amended Line of Credit agreement, Citibank will also receive an annual upfront fee of 0.10% on the $300 million committed line of credit. Each fund in the Victory Funds Complex will pay a pro-rata portion of the upfront fee. Interest charged to each Fund during the period, if applicable, is reflected on the Statements of Operations under Line of credit fees.
The Fund had no borrowings under the Line of Credit agreement during the year ended July 31, 2020.
Interfund Lending:
The Trust and Adviser rely on an exemptive order granted by the SEC in March 2017 (the "Order"), permitting the establishment and operation of an Interfund Lending Facility (the "Facility"). The Facility allows the Fund to directly lend and borrow money to or from any other Fund in the Victory Funds Complex relying upon the Order at rates beneficial to both the borrowing and lending funds. Advances under the Facility are allowed for temporary or emergency purposes. The interfund loan rate is determined, as specified in the Order, by averaging the current repurchase agreement rate and the current bank loan rate. As a Borrower, interest charged to the Fund, if any, during the period is reflected on the Statement of Operations under Interfund lending fees. As a Lender, interest earned by the Fund, if any, during the period is reflected on the Statement of Operations under Income on Interfund lending.
The average borrowing or lending for the days outstanding and average interest rate for the Fund during the year ended July 31, 2020 were as follows (amounts in thousands):
Borrower or Lender | Amount Outstanding at June 31, 2020 | Average Borrowing* | Days Borrowing Outstanding | Average Interest Rate* | Maximum Borrowing During the Period | ||||||||||||||||||
Borrower | $ | — | $ | 4,778 | 9 | 1.06 | % | $ | 20,223 | ||||||||||||||
* For the year ended July 31, 2020, based on the number of days borrowings were outstanding.
8. Federal Income Tax Information:
The Fund intends to distribute any net investment income annually. Distributable net realized gains, if any, are declared and paid at least annually.
The amounts of dividends from net investment income and distributions from net realized gains (collectively distributions to shareholders) are determined in accordance with federal income tax regulations, which may differ from GAAP. To the extent these "book/tax" differences are permanent in nature (e.g., net operating loss and distribution reclassification), such amounts are reclassified within the components of net assets based on their federal tax-basis treatment; temporary differences (e.g., wash sales) do not require reclassification. To the extent dividends and distributions exceed net investment income and net realized gains for tax purposes, they are reported as distributions of capital. Net investment losses incurred by the Fund may be reclassified as an offset to capital on the accompanying Statement of Assets and Liabilities.
The following permanent reclassifications were made between capital accounts to reflect the portion of the payments made to redeeming shareholders that was claimed as a distribution for income tax purposes during the year ended July 31, 2020 (amounts in thousands):
| Total accumulated earnings/(loss) | Capital | ||||||
| $ | (9,741 | ) | $ | 9,741 | |||
34
USAA Mutual Funds Trust | Notes to Financial Statements — continued July 31, 2020 | ||||||
The tax character of distributions paid during the tax years ended as noted below, were as follows (total distributions paid may differ from the Statements of Changes in Net Assets because, for tax purposes, dividends are recognized when actually paid) (amounts in thousands).
| Year Ended July 31, 2020 | Year Ended July 31, 2019 | ||||||||||||||||||||||
| Distributions paid from | Distributions paid from | ||||||||||||||||||||||
| Ordinary Income | Net Long-Term Capital Gains | Total Distributions Paid | Ordinary Income* | Net Long-Term Capital Gains | Total Distributions Paid | ||||||||||||||||||
| $ | 3,429 | $ | 145,015 | $ | 148,444 | $ | 38,548 | $ | 132,310 | $ | 170,858 | ||||||||||||
* Includes short-term realized capital gains, if any, which are taxable as ordinary income.
As of July 31, 2020, the components of accumulated earnings (loss) on a tax basis were as follows (amounts in thousands):
| Undistributed Ordinary Income | Undistributed Long Term Capital Gains | Accumulated Earnings | Unrealized Appreciation (Depreciation)* | Total Accumulated Earnings (Loss) | |||||||||||||||
| $ | 7,468 | $ | 46,275 | $ | 53,743 | $ | 96,077 | $ | 149,820 | ||||||||||
* The difference between the book-basis and tax-basis of unrealized appreciation/depreciation is attributable primarily to tax deferral of losses on wash sales and passive foreign investment company adjustments.
As of May 31, 2020, the cost basis for federal income tax purposes, gross unrealized appreciation, gross unrealized depreciation, and net unrealized appreciation (depreciation) for investments were as follows (amounts in thousands):
| Cost of Investments for Federal Tax Purposes | Gross Unrealized Appreciation | Gross Unrealized Depreciation | Net Unrealized Appreciation (Depreciation) | ||||||||||||
| $ | 1,114,789 | $ | 254,761 | $ | (158,685 | ) | $ | 96,076 | |||||||
35
REPORT OF INDEPENDENT REGISTERED PUBLIC ACCOUNTING FIRM
To the Shareholders and the Board of Trustees of USAA Small Cap Stock Fund
Opinion on the Financial Statements
We have audited the accompanying statement of assets and liabilities of USAA Small Cap Stock Fund (the "Fund") (one of the funds constituting USAA Mutual Funds Trust (the "Trust")), including the schedule of portfolio investments, as of July 31, 2020, and the related statement of operations for the year then ended, the statements of changes in net assets for each of the two years in the period then ended, the financial highlights for each of the five years in the period then ended and the related notes (collectively referred to as the "financial statements"). In our opinion, the financial statements present fairly, in all material respects, the financial position of the Fund (one of the funds constituting USAA Mutual Funds Trust) at July 31, 2020, the results of its operations for the year then ended, the changes in its net assets for each of the two years in the period then ended and its financial highlights for each of the five years in the period then ended, in conformity with U.S. generally accepted accounting principles.
Basis for Opinion
These financial statements are the responsibility of the Trust's management. Our responsibility is to express an opinion on the Fund's financial statements based on our audits. We are a public accounting firm registered with the Public Company Accounting Oversight Board (United States) ("PCAOB") and are required to be independent with respect to the Trust in accordance with the U.S. federal securities laws and the applicable rules and regulations of the Securities and Exchange Commission and the PCAOB.
We conducted our audits in accordance with the standards of the PCAOB. Those standards require that we plan and perform the audit to obtain reasonable assurance about whether the financial statements are free of material misstatement, whether due to error or fraud. The Trust is not required to have, nor were we engaged to perform, an audit of the Trust's internal control over financial reporting. As part of our audits we are required to obtain an understanding of internal control over financial reporting, but not for the purpose of expressing an opinion on the effectiveness of the Trust's internal control over financial reporting. Accordingly, we express no such opinion.
Our audits included performing procedures to assess the risks of material misstatement of the financial statements, whether due to error or fraud, and performing procedures that respond to those risks. Such procedures included examining, on a test basis, evidence regarding the amounts and disclosures in the financial statements. Our procedures included confirmation of securities owned as of July 31, 2020, by correspondence with the custodian and brokers or by other appropriate auditing procedures where replies from brokers were not received. Our audits also included evaluating the accounting principles used and significant estimates made by management, as well as evaluating the overall presentation of the financial statements. We believe that our audits provide a reasonable basis for our opinion.

We have served as the auditor of one or more Victory Capital investment companies since 1995.
San Antonio, Texas
September 29, 2020
36
USAA Mutual Funds Trust | Supplemental Information July 31, 2020 | ||||||
(Unaudited)
Trustee and Officer Information
Board of Trustees:
Overall responsibility for management of the Trust rests with the Board. The Trust is managed by the Board in accordance with the laws of the state of Delaware. There are currently 10 Trustees, eight of whom are not "interested persons" of the Trust within the meaning of that term under the 1940 Act ("Independent Trustees") and two of whom is an "interested person" of the Trust within the meaning of that term under the 1940 Act ("Interested Trustee"). The Trustees, in turn, elect the officers of the Trust to actively supervise its day-to-day operations.
The following tables list the Trustees, their ages, position with the Trust, commencement of service, principal occupations during the past five years and any directorships of other investment companies or companies whose securities are registered under the Securities Exchange Act of 1934, as amended, or who file reports under that Act. Each Trustee oversees 47 portfolios in the Trust. Each Trustee's address is 15935 La Cantera Pkwy, Building Two, San Antonio, TX, 78256. Pursuant to a policy adopted by the Board, the term of office for each Trustee shall be until the Independent Trustee reaches age 75 or an Interested Trustee reaches age 75. The Board may change or grant exceptions from this policy at any time without shareholder approval. A Trustee may resign or be removed by a vote of the other Trustees or the holders of a majority of the outstanding shares of the Trust at any time. Vacancies on the Board can be filled by the action of a majority of the Trustees, provided that after filling such vacancy at least two-thirds of the Trustees have been elected by the shareholders.
Name and Date of Birth | Position Held with the Trust | Year Commenced Service | Principal Occupation During Past 5 Years | Other Directorships Held During Past 5 Years | |||||||||||||||
Independent Trustees. | |||||||||||||||||||
| Jefferson C. Boyce, Born September 1957 | Lead Independent Trustee, and Vice Chairman | 2013 | Senior Managing Director, New York Life Investments, LLC (1992-2012) | Westhab, Inc. | |||||||||||||||
| John C. Walters, Born February 1962 | Trustee | 2019 | Retired. Mr. Walters brings significant Board experience including active involvement with the board of a Fortune 500 company, and a proven record of leading large, complex financial organizations. He has a demonstrated record of success in distribution, manufacturing, investment brokerage, and investment management in both the retail and institutional investment businesses. He has substantial experience in the investment management business with a demonstrated ability to develop and drive strategy while managing operation, financial, and investment risk. | Guardian Variable Products Trust (16 series), Lead Independent Director; Amerilife Holdings LLC, Director; Stadion Money Management; Director; University of North Carolina (Chapel Hill), Member Board of Governors. | |||||||||||||||
37
USAA Mutual Funds Trust | Supplemental Information — continued July 31, 2020 | ||||||
(Unaudited)
Name and Date of Birth | Position Held with the Trust | Year Commenced Service | Principal Occupation During Past 5 Years | Other Directorships Held During Past 5 Years | |||||||||||||||
| Robert L. Mason, Ph.D., Born July 1946 | Trustee | 1997 | Adjunct Professor in the Department of Management Science and Statistics in the College of Business at the University of Texas at San Antonio (since 2001); Institute Analyst, Southwest Research Institute (March 2002-January 2016) | None | |||||||||||||||
| Dawn M. Hawley, Born February 1954 | Trustee | 2014 | Manager of Finance, Menil Foundation, Inc. (May 2007-June 2011), which is a private foundation that oversees the assemblage of sculptures, prints, drawings, photographs, and rare books. Director of Financial Planning and Analysis and Chief Financial Officer, AIM Management Group, Inc. (October 1987-January 2006) | None | |||||||||||||||
| Paul L. McNamara, Born July 1948 | Trustee | 2012 | Director, Cantor Opportunistic Alternatives Fund, LLC (March 2010-February 2014) , which is a closed-end fund of funds by Cantor Fitzgerald Investment Advisors, LLC | None | |||||||||||||||
38
USAA Mutual Funds Trust | Supplemental Information — continued July 31, 2020 | ||||||
(Unaudited)
Name and Date of Birth | Position Held with the Trust | Year Commenced Service | Principal Occupation During Past 5 Years | Other Directorships Held During Past 5 Years | |||||||||||||||
| Richard Y. Newton III, Born January 1956 | Trustee | 2017 | Director, Elta North America (01/18-present), which is a global leader in the design, manufacture, and support of innovative electronic systems in the ground, maritime, airborne, and security domains for the nation's warfighters, security personnel, and first responders; Managing Partner, Pioneer Partnership Development Group (December 2015-present)); Executive Director, The Union League Club of New York (June 2014-November 2015): Executive Vice President, Air Force Association (August 2012-May 2014); Lieutenant General, United States Air Force (January 2008-June 2012) | None | |||||||||||||||
| Barbara B. Ostdiek, Ph.D., Born March 1964 | Trustee | 2008 | Senior Associate Dean of Degree Programs at Jesse H. Jones Graduate School of Business at Rice University (since 2013); Associate Professor of Finance at Jessie H. Jones Graduate School of Business at Rice University (since 2001) | None | |||||||||||||||
| Michael F. Reimherr, Born August 1945 | Trustee | 2000 | President of Reimherr Business Consulting (May 1995-December 2017); St. Mary's University Investment Committee overseeing University Endowment (since 2014) | None | |||||||||||||||
39
USAA Mutual Funds Trust | Supplemental Information — continued July 31, 2020 | ||||||
(Unaudited)
Name and Date of Birth | Position Held with the Trust | Year Commenced Service | Principal Occupation During Past 5 Years | Other Directorships Held During Past 5 Years | |||||||||||||||
Interested Trustees. | |||||||||||||||||||
| David C. Brown, ** Born May 1972 | Trustee | 2019 | Chairman and Chief Executive Officer (since 2013), Co-Chief Executive Officer (2011-2013), Victory Capital Management Inc.; Chairman and Chief Executive Officer, Victory Capital Holdings, Inc. (since 2013). Mr. Brown brings to the Board extensive business, finance and leadership skills gained and developed through years of experience in the financial services industry, including his tenure overseeing the strategic direction as CEO of Victory Capital. These skills, combined with Mr. Brown's extensive knowledge of the financial services industry and demonstrated success in the development and distribution of investment strategies and products, enable him to provide valuable insights to the Board and strategic direction for the Funds | Trustee, Victory Portfolios (42 series), Victory Portfolios II (26 series), Victory Variable Insurance Funds (9 series) | |||||||||||||||
40
USAA Mutual Funds Trust | Supplemental Information — continued July 31, 2020 | ||||||
(Unaudited)
Name and Date of Birth | Position Held with the Trust | Year Commenced Service | Principal Occupation During Past 5 Years | Other Directorships Held During Past 5 Years | |||||||||||||||
| Daniel S. McNamara, ** Born June 1966 | Trustee and Chair of the Board of Trustees | 2012 | Trustee, President, and Vice Chairman of USAA ETF Trust (June 2017-June 2019); President of Financial Advice & Solutions Group (FASG), USAA (since 2013); Director, Investment Management Company (IMCO) (September 2009-April 2014); President, Asset Management Company (AMCO) (August, 2011-April 2013); Senior Vice President of USAA Financial Planning Services Insurance Agency, Inc. (FPS) (since 2011); Director of USAA IMCO (since 2009); Chairman of Board of IMCO (since 2013); Director of AMCO (August 2011-June 2019); President and Director of USAA Shareholder Account Services (SAS) (October 2009-June 2019); Director and Vice Chairman of FPS (since 2013); President and Director of USAA Investment Corporation (ICORP) (since 2010); Chairman of Board of ICORP (since 2013); Director of USAA Financial Advisors, Inc. (FAI) (since 2013); Chairman of Board of FAI (since 2015). Mr. McNamara brings to the Board extensive experience in the financial services industry, including experience as an officer of the Trust. | None | |||||||||||||||
** Mr. Dan McNamara, the Chairman of the Board, is deemed an "interested person" due to his previous position as Director of AMCO, the former investment adviser of the Funds. Mr. Brown is deemed an "interested person" due to his position as Chief Executive Officer of Victory Capital, investment adviser to the Funds.
The Statement of Additional Information includes additional information about the Trustees of the Trust and is available, without charge, on the SEC's website at www.sec.gov and/or by calling (800)-539-3863.
41
USAA Mutual Funds Trust | Supplemental Information — continued July 31, 2020 | ||||||
(Unaudited)
Officers:
The officers of the Trust, their ages, commencement of service and their principal occupations during the past five years, are detailed in the following table. Each officer serves until the earlier of his or her resignation, removal, retirement, death, or the election of a successor. The mailing address of each officer of the Trust is 15935 La Cantera Pkwy, Building Two, San Antonio, TX, 78256. The officers of the Trust receive no compensation directly from the Trust for performing the duties of their offices.
Name and Date of Birth | Position with the Trust | Year Commenced Service | Principal Occupation During Past 5 Years | ||||||||||||
Interested Officers. | |||||||||||||||
| Christopher K. Dyer, Born February 1962 | President | 2019 | Director of Fund Administration, Victory Capital (2004-present) | ||||||||||||
| Scott A Stahorsky, Born July 1969 | Vice President | 2019 | Manager, Fund Administration, Victory Capital (since 2015); Senior Analyst, Fund Administration, Victory Capital (prior to 2015) | ||||||||||||
| James K. De Vries, Born April 1969 | Treasurer, Principal Financial Officer | 2018 | Executive Director, Victory Capital Management Inc. (since 2019); Treasurer, USAA ETF Trust (September 2018-June 2019); Executive Director, Investment and Financial Administration, USAA (April 2012-June 2019); Assistant Treasurer, USAA ETF Trust (June 2017-September 2018); Assistant Treasurer, USAA Mutual Funds Trust (December 2013-February 2018) | ||||||||||||
| Allan Shaer, Born March 1965 | Assistant Treasurer | 2019 | Senior Vice President, Financial Administration, Citi Fund Services Ohio, Inc. (since 2016); Vice President, Mutual Fund Administration, JP Morgan Chase (2011-2016) | ||||||||||||
| Carol D. Trevino, Born October 1965 | Assistant Treasurer | 2018 | Director, Accounting and Finance, Victory Capital Management Inc. (since 2019); Accounting/Financial Director, USAA (December 2013-June 2019); Assistant Treasurer, USAA ETF Trust (September 2018-June 2019). | ||||||||||||
| Erin G. Wagner, Born February 1974 | Secretary | 2019 | Deputy General Counsel, the Adviser (since 2013) | ||||||||||||
| Charles Booth, Born April 1960 | Anti-Money Laundering Compliance Officer and Identity Theft Officer | 2019 | Director, Regulatory Administration and CCO Support Services, Citi Fund Services Ohio, Inc. (2007-present) | ||||||||||||
| Amy Campos, Born July 1976 | Chief Compliance Officer | 2019 | Chief Compliance Officer, USAA Mutual Funds Trust (since 2019); Executive Director, Deputy Chief Compliance Officer, USAA Mutual Funds Trust and USAA ETF Trust (July 2017-June 2019); Compliance Director, USAA Mutual Funds Trust (2014-July 2017) | ||||||||||||
42
USAA Mutual Funds Trust | Supplemental Information — continued July 31, 2020 | ||||||
(Unaudited)
Proxy Voting and Portfolio Holdings Information
Proxy Voting:
Information regarding the policies and procedures the Fund uses to determine how to vote proxies relating to portfolio securities is available without charge, upon request, by calling (800) 539-3863. The information is also included in the Fund's Statement of Additional Information, which is available on the SEC's website at www.sec.gov.
Information relating to how the Fund voted proxies relating to portfolio securities held during the most recent 12 months ended June 30 is available on the SEC's website at www.sec.gov.
Availability of Schedules of Portfolio Investments:
The Trust files a complete list of Schedules of Portfolio Investments with the SEC for the first and third quarter of each fiscal year on Form N-PORT. Forms N-PORT are available on the SEC's website at www.sec.gov.
Expense Examples
As a shareholder of the Fund, you may incur two types of costs: (1) transaction costs, and (2) ongoing costs, including management fees and other Fund expenses. These examples are intended to help you understand your ongoing costs (in dollars) of investing in the Fund and to compare these costs with the ongoing costs of investing in other mutual funds.
These examples are based on an investment of $1,000 invested at the beginning of the period and held for the entire period from February 1, 2020 through July 31, 2020.
The Actual Expense figures in the table below provide information about actual account values and actual expenses. You may use the information below, together with the amount you invested, to estimate the expenses that you paid over the period. Simply divide your account value by $1,000 (for example, an $8,600 account value divided by $1,000 = 8.6), then multiply the result by the number in the table under the heading entitled "Actual Expenses Paid During Period" to estimate the expenses you paid on your account during this period.
The Hypothetical Expense figures in the table below provide information about hypothetical account values and hypothetical expenses based on the Fund's actual expense ratio and an assumed rate of return of 5% per year before expenses, which is not the Fund's actual return. The hypothetical account values and expenses may not be used to estimate the actual ending account balance or expenses you paid for the period. You may use this information to compare this 5% hypothetical example with the 5% hypothetical examples that appear in shareholder reports of other funds.
Please note the expenses shown in the table below are meant to highlight your ongoing costs only and do not reflect any transactional costs. If these transactional costs were included, your costs would have been higher.
| Beginning Account Value 2/1/20 | Actual Ending Account Value 7/31/20 | Hypothetical Ending Account Value 7/31/20 | Actual Expenses Paid During Period 2/1/20- 7/31/20* | Hypothetical Expenses Paid During Period 2/1/20- 7/31/20* | Annualized Expense Ratio During Period 2/1/20- 7/31/20 | ||||||||||||||||||||||
Fund Shares | $ | 1,000.00 | $ | 931.70 | $ | 1,019.44 | $ | 5.24 | $ | 5.47 | 1.09 | % | |||||||||||||||
Institutional Shares | 1,000.00 | 932.50 | 1,020.04 | 4.66 | 4.87 | 0.97 | % | ||||||||||||||||||||
* Expenses are equal to the average account value multiplied by the Fund's annualized expense ratio multiplied by 182/366 (the number of days in the most recent fiscal half-year divided by the number of days in the fiscal year).
43
USAA Mutual Funds Trust | Supplemental Information — continued July 31, 2020 | ||||||
(Unaudited)
Additional Federal Income Tax Information
The following federal tax information related to the Fund's fiscal year ended July 31, 2020, is provided for information purposes only and should not be used for reporting to federal or state revenue agencies. Federal tax information for the calendar year will be reported to you on Form 1099-DIV in January 2021.
With respect to distributions paid, the Fund designates the following amounts (or, if subsequently determined to be different, the maximum amount allowable) for the fiscal year ended July 31, 2020 (amounts in thousands):
| Dividend Received Deduction (corporate shareholders)* | Qualified Dividend Income (non-corporate shareholders)* | Long-Term Capital Gains Distributions(a) | |||||||||||||
48.25 | % | 0.01 | % | $ | 154,715 | ||||||||||
* Presented as a percentage of net investment income and excludes short-term capital gain distributions paid, if any. All or a portion of these amounts may be exempt from taxation at the state level.
(a) Pursuant to Section 852 of the Internal Revenue Code.
44
USAA Mutual Funds Trust | Supplemental Information — continued July 31, 2020 | ||||||
(Unaudited)
Liquidity Risk Management Program
The USAA Mutual Funds have adopted and implemented a written liquidity risk management program (the "LRMP") as required by Rule 22e-4 under the Investment Company Act of 1940, as amended. The LRMP is reasonably designed to assess and manage the Fund's liquidity risk, taking into consideration the Fund's investment strategy and the liquidity of its portfolio investments during normal and reasonably foreseeable stressed market conditions; its short and long-term cash flow projections; and its cash holdings and access to other liquidity management tools such as available funding sources including the Victory Funds Complex Interfund Lending Facility and Line of Credit (discussed in the Notes to Financial Statements). The USAA Mutual Funds' Board of Trustees approved the appointment of the Fund's investment adviser, Victory Capital Management Inc. ("Victory Capital"), as the administrator of the LRMP. At an in-person meeting held on February 26, 2020, Victory Capital provided an oral and written report to the Trustees on the operation and effectiveness of the LRMP during the previous year.
Victory Capital manages liquidity risks associated with the Fund's investments by monitoring, among other things, cash and cash equivalents, any use of derivatives, the concentration of investments, the appropriateness of the Fund's investment strategy, and by classifying every fund investment as either highly liquid, moderately liquid, less liquid or illiquid on at least a monthly basis. To assist with the classification of Fund investments, Victory Capital has retained a third-party provider of liquidity evaluation services. This provider determines preliminary liquidity classifications for all portfolio holdings based upon portfolio-level data and certain assumptions provided by Victory Capital. Victory Capital reviews the preliminary liquidity classifications, and, when appropriate, considers other information including input from the Fund's portfolio managers (including the portfolio managers employed by any investment sub-advisers) in determining final liquidity classifications.
The report from Victory Capital concluded that the Fund did not experience any significant liquidity challenges during the covered period, and the Fund's LRMP is reasonably designed to assess and manage its liquidity risk. The report also concluded that the LRMP continues to operate adequately and effectively to enable Victory Capital to oversee and manage liquidity risk and ensure the Fund is able to meet redemption requests without significant dilution to the remaining investors' interest in the Fund. During the review period, the Fund's portfolio consisted primarily of highly liquid investments, which are defined as cash and any investments reasonably expected to be converted to cash in current market conditions in three business days or less without significantly changing the market value of the investment. Therefore, the Fund has not adopted a Highly Liquid Investment Minimum. The Fund's investments were below the limitation on illiquid investments during the review period. Additionally, Victory Capital indicated that no events occurred that would require the filing of Form N-LIQUID and recommended no material changes to the LRMP.
45
Privacy Policy
Protecting the Privacy of Information
The Trust respects your right to privacy. We also know that you expect us to conduct and process your business in an accurate and efficient manner. To do so, we must collect and maintain certain personal information about you. This is the information we collect from you on applications or other forms, and from the transactions you make with us or third parties. It may include your name, address, social security number, account transactions and balances, and information about investment goals and risk tolerance.
We do not disclose any information about you or about former customers to anyone except as permitted or required by law. Specifically, we may disclose the information we collect to companies that perform services on our behalf, such as the transfer agent that processes shareholder accounts and printers and mailers that assist us in the distribution of investor materials. We may also disclose this information to companies that perform marketing services on our behalf. This allows us to continue to offer you Victory investment products and services that meet your investing needs, and to effect transactions that you request or authorize. These companies will use this information only in connection with the services for which we hired them. They are not permitted to use or share this information for any other purpose.
To protect your personal information internally, we permit access only by authorized employees and maintain physical, electronic and procedural safeguards to guard your personal information.*
* You may have received communications regarding information about privacy policies from other financial institutions which gave you the opportunity to "opt-out" of certain information sharing with companies which are not affiliated with that financial institution. The Trust does not share information with other companies for purposes of marketing solicitations for products other than the Trust. Therefore, the Trust does not provide opt-out options to their shareholders.
P.O. Box 182593
Columbus, Ohio 43218-2593

Visit our website at: | Call | ||||||
vcm.com | (800) 235-8396 | ||||||
40054-0920

JULY 31, 2020
Annual Report
USAA Value Fund
Beginning January 1, 2021, as permitted by regulations adopted by the Securities and Exchange Commission, paper copies of the Fund's shareholder reports like this one will no longer be sent by mail, unless you specifically request paper copies of the reports from the Fund or from your financial intermediary, such as a broker-dealer or bank. Instead, the reports will be made available on VictoryFunds.com, and you will be notified by mail each time a report is posted and provided with a website link to access the report. If you already elected to receive shareholder reports electronically, you will not be affected by this change and you need not take any action.
You may elect to receive shareholder reports and other communications from the Fund or your financial intermediary electronically by notifying your financial intermediary directly, or if you are a direct investor, by calling (800) 235-8396 or logging on to usaa.com. Effective on or about November 6, 2020, a shareholder who has an account directly with the Fund will need to submit their request via email to TA.Processing@FISGlobal.com.
You may elect to receive all future reports in paper free of charge. You can inform the Fund or your financial intermediary that you wish to continue receiving paper copies of your shareholder reports by notifying your financial intermediary directly, or if you are a direct investor, by calling (800) 235-8396 or logging on to usaa.com. Effective on or about November 6, 2020, a shareholder who has an account directly with the Fund will need to submit their request via email to TA.Processing@FISGlobal.com. Your election to receive reports in paper will apply to all funds held with the USAA Mutual Funds or your financial intermediary.
Victory Capital means Victory Capital Management Inc., the investment adviser of the USAA Mutual Funds. USAA Mutual Funds are distributed by Victory Capital Services, Inc., member FINRA, an affiliate of Victory Capital. Victory Capital and its affiliates are not affiliated with United Services Automobile Association or its affiliates. USAA and the USAA logo are registered trademarks and the USAA Mutual Funds and USAA Investments logos are trademarks of United Services Automobile Association and are being used by Victory Capital and its affiliates under license.
USAA Mutual Funds Trust
TABLE OF CONTENTS
Shareholder Letter (Unaudited) | 2 | ||||||
Managers' Commentary (Unaudited) | 3 | ||||||
Investment Overview (Unaudited) | 5 | ||||||
| Investment Objective & Portfolio Holdings (Unaudited) | 6 | ||||||
Financial Statements | |||||||
Schedule of Portfolio Investments | 7 | ||||||
Statement of Assets and Liabilities | 12 | ||||||
Statement of Operations | 13 | ||||||
Statements of Changes in Net Assets | 14 | ||||||
Financial Highlights | 16 | ||||||
Notes to Financial Statements | 18 | ||||||
| Report of Independent Registered Public Accounting Firm | 27 | ||||||
Supplemental Information | 28 | ||||||
Trustees' and Officers' Information | 28 | ||||||
Proxy Voting and Portfolio Holdings Information | 34 | ||||||
Expense Examples | 34 | ||||||
Additional Federal Income Tax Information | 35 | ||||||
Liquidity Risk Management Program | 36 | ||||||
Privacy Policy (inside back cover) | |||||||
This report is for the information of the shareholders and others who have received a copy of the currently effective prospectus of the Fund, managed by Victory Capital Management Inc. It may be used as sales literature only when preceded or accompanied by a current prospectus, which provides further details about the Fund.
IRA DISTRIBUTION WITHHOLDING DISCLOSURE
We generally must withhold federal income tax at a rate of 10% of the taxable portion of your distribution and, if you live in a state that requires state income tax withholding, at your state's tax rate. However, you may elect not to have withholding apply or to have income tax withheld at a higher rate. Any withholding election that you make will apply to any subsequent distribution unless and until you change or revoke the election. If you wish to make a withholding election, or change or revoke a prior withholding election, call (800) 235-8396.
If you do not have a withholding election in place by the date of a distribution, federal income tax will be withheld from the taxable portion of your distribution at a rate of 10%. If you must pay estimated taxes, you may be subject to estimated tax penalties if your estimated tax payments are not sufficient and sufficient tax is not withheld from your distribution.
For more specific information, please consult your tax adviser.
1
(Unaudited)
Dear Shareholder,
The previous decade ended with the longest-ever bull market in U.S. equities still intact, even as investors wrestled with issues like softening global economic data, Brexit, and U.S.-China trade relations. In retrospect, those worries seem pedestrian given what we would experience.
A new and unexpected threat—a global pandemic, the novel coronavirus ("COVID-19")—first emerged in Asia, and then began spreading globally and throughout the United States during the first quarter of 2020. This unprecedented and unanticipated event not only rendered all existing economic forecasts moot, but it also roiled stock and bond markets everywhere. It also brought the economy to a near halt. The historic bull market in stocks ended virtually overnight.
After an initial severe sell-off in March, equity markets recovered sharply. As our annual reporting period drew to a close on July 31, 2020, many of the broad market indexes had recovered and volatility had returned to more palatable levels. In fact, despite all the chaos, the S&P 500® Index, one of the most popular measures of large U.S. stocks, finished the fiscal year (July 31, 2020) at approximately 3,271, which was up 8.9% from one year ago. Quite the impressive reversal.
The market turmoil of early 2020 was not limited to equities. Fixed income volatility spiked when liquidity evaporated in late March as investors struggled to understand the ramifications of sheltering in place. Fortunately, the U.S. Federal Reserve (the "Fed") (as well as other global central banks) leapt into action—cutting interest rates, (re)starting quantitative easing and, in the case of the Fed, launching an array of programs to stabilize markets.
The new lending facilities and programs had their intended effect of improving fixed income liquidity and trading. Credit spreads across corporate, high yield, structured, and municipal markets were coaxed down from their highs. In addition, Congress came through with substantial fiscal stimulus that also was applauded by investors and markets. Although fixed income markets regained their footing, the yield on 10-Year Treasurys, a benchmark for low-risk investments, declined steadily during our fiscal year—from 2.02% at the beginning of our reporting period to approximately 0.55% as of July 31, 2020. This suggests that investors remain a little wary.
While the past year has been unprecedented for all of us, both personally and professionally, our portfolio managers continue to analyze the financial markets, economic conditions, and the trajectory of the pandemic, which will likely be a guiding factor on Fed policy and the markets.
No matter what happens in the near term, we believe that the massive monetary and fiscal policies introduced earlier this year will have longer-term ramifications. Despite this uncertainty, it's important to remain focused on your long-term investment goals and avoid making emotional decisions. If you invest with us directly, our Member Service Representatives are available to help. Call us at (800) 235-8396.
Sincerely,

Christopher K. Dyer, CFA
President,
USAA Mutual Funds
2
USAA Mutual Funds Trust
USAA Value Fund
Managers' Commentary
(Unaudited)
Victory Solutions
Mannik S. Dhillon, CFA, CAIA
Wasif A. Latif
RS Investments Value, A Victory Capital Investment Franchise
Robert J. Harris Tyler Dan II, CFA
Joseph Mainelli
• What were the market conditions over the reporting period?
The U.S. stock market generated solid gains for the reporting period overall. Growth stocks significantly outperformed value stocks, while large-cap stocks outpaced small-cap stocks.
Global financial market performance varied widely over the period driven by optimism of continued economic recovery followed by the novel coronavirus ("COVID-19") shock and uncertainty related to the duration and economic impact of the COVID-19 pandemic. These fears generally led to a "risk off" environment as investors flocked to haven assets such as U.S. Treasurys and gold. Global equities turned mostly lower with the exception of a small breadth of mega-cap securities well positioned for an extended economic slowdown and the new stay-at-home paradigm. The final month and a half of the reporting period saw a rebound in risky assets as economies began a phased reopening. The U.S. large-cap growth space, led by information technology and communication services continued to outperform in the face of the economic threat as they were perceived as "stay-at-home stocks" that would further benefit from economic activity from homes.
Within the United States, the S&P 500® Index dropped nearly 34% at the end of the reporting period from its 2020 high, before beginning to recoup losses with the support of comprehensive monetary and fiscal stimulus, along with optimism a COVID-19 treatment will eventually emerge. Over the reporting period, the S&P 500 Index retuned 11.96%, with large-cap growth stocks leading the way, up to a return of 29.84% as represented by the Russell 1000 Growth Index. Value stocks and small-cap stocks significantly underperformed growth stocks over the period. U.S. large-cap value stocks were down to a return of -6.01% over the reporting period as gauged by the Russell 1000 Value Index, while U.S. small-cap stocks, returned -4.59% as represented by the Russell 2000 Index.
Developed-market international and emerging market equities followed a path similar to U.S. equities. Markets led investors on a rollercoaster ride that saw both the MSCI EAFE Index and MSCI Emerging Markets Index drop approximately 34% from their highs in the year. The market drawdown hit bottom on March 23rd and then started a steady ascent, erasing most of the year's losses as European Central Bank quantitative easing and talks of a 750-billion euros fiscal stimulus helped bolster momentum in the market's
3
USAA Mutual Funds Trust
USAA Value Fund (continued)
Managers' Commentary (continued)
recovery. Over the reporting period, developed international equities, represented by the MSCI EAFE Index, were down to a return of -1.67%, while the MSCI Emerging Markets Index returned 6.55%.
• How did the USAA Value Fund (the "Fund") perform during the reporting period?
The Fund has three share classes: Fund Shares, Institutional Shares, and Class A shares (redesignated from Adviser Shares). For the reporting period end July 31, 2020, the Fund Shares, Institutional Shares, and Class A shares had a total return of -9.43%, -9.40%, and -9.66%, respectively. This compares to returns of -6.01% for the Russell 1000® Value Index* (the "Index"), -6.67% for the Russell 3000® Value Index, and -8.86% for the Lipper Multi-Cap Value Funds Index.
• What were the principal factors in the Fund's performance relative to the Index?
The Fund underperformed the Index during the reporting period. Relative to the Index, the Fund was harmed primarily by security selection, though sector allocations also dampened performance. Stock Selection in the financials, materials, utilities and industrials sectors detracted most from the Fund's relative returns. An overweight position in real estate was a slight drag on performance. The Fund's underweight positions in consumer staples detracted further from results, as these less cyclically sensitive sectors performed well during periods of market volatility.
On the positive side, the Fund benefited from security selection in the communication services, energy, and consumer discretionary sectors. Finally, the Fund's small cash position also added to relative returns.
Thank you for allowing us to assist you with your investment needs.
*The Russell 1000® Value Index replaced the Russell 3000® Value Index as the primary benchmark effective June 29, 2020.
4
USAA Mutual Funds Trust
USAA Value Fund
Investment Overview
(Unaudited)
Average Annual Total Return
Year Ended July 31, 2020
Fund Shares | Institutional Shares | Class A shares | |||||||||||||||||||||||||||||||||
INCEPTION DATE | 8/3/01 | 8/1/08 | 8/2/10 | ||||||||||||||||||||||||||||||||
Net Asset Value | Net Asset Value | Net Asset Value | Maxiumum Offering Price | Russell 1000® Value Index1 | Russell 3000® Value Index2 | Lipper Large-Cap Value Funds Index3 | Lipper Multi-Cap Value Funds Index4 | ||||||||||||||||||||||||||||
One Year | –9.43 | % | –9.40 | % | –9.66 | % | –14.84 | % | –6.01 | % | –6.67 | % | –3.44 | % | –8.86 | % | |||||||||||||||||||
Five Year | 2.78 | % | 2.87 | % | 2.48 | % | 1.27 | % | 5.36 | % | 5.16 | % | 6.15 | % | 3.08 | % | |||||||||||||||||||
Ten Year | 8.45 | % | 8.58 | % | N/A | N/A | 10.11 | % | 9.91 | % | 10.00 | % | 8.45 | % | |||||||||||||||||||||
Since Inception | N/A | N/A | 7.86 | % | 7.22 | % | N/A | N/A | N/A | N/A | |||||||||||||||||||||||||
Past performance is not indicative of future results. The performance data quoted represents past performance and current returns may be lower or higher. The investment return and principal value will fluctuate so that an investor's shares, when redeemed, may be worth more or less than the original cost. To obtain performance information current to the most recent month's end, please visit www.vcm.com.
Total return measures the price change in a share assuming the reinvestment of all net investment income and realized capital gain distributions, if any. The total returns quoted do not reflect adjustments made to the enclosed financial statements in accordance with U.S. generally accepted accounting principles or the deduction of taxes that a shareholder would pay on net investment income and realized capital gain distributions, including reinvested distributions, or redemptions of shares.
The total return figures set forth above include all waivers of fees for various periods since inception. Without such fee waivers, the total returns would have been lower.
USAA Value Fund — Growth of $10,000

1The unmanaged Russell 1000® Value Index is made of about 1,000 of the largest companies in the U.S. equity market. It represents top companies by market capitalization. It's made up of about 90% of the total market capitalization of all U.S. stocks. It is not possible to invest directly in an index.
2The unmanaged Russell 3000 Value Index measures the performance of those Russell 3000 Index companies with lower price-to-book ratios and lower forecasted growth values. The stocks in this index are also members of either the unmanaged Russell 1000® Value or the unmanaged Russell 2000® Value indexes.
3The unmanaged Lipper Large-Cap Value Funds Index tracks the total return performance of funds within the Lipper Large-Cap Value Funds category.
4The unmanaged Lipper Multi-Cap Value Funds Index tracks the total return performance of funds within the Lipper Multi-Cap Value Funds category.
The Fund has selected the Russell 1000 Value Index as its primary benchmark index in replacement of the Russell 3000 Value Index and has added the Lipper Large Cap Value Funds Index as a secondary benchmark because it believes these indexes are more representative of the Fund's investment universe.
The graph reflects investment of growth of a hypothetical $10,000 investment in the Fund. Past performance is no guarantee of future results.
The graph and table do not reflect the deduction of taxes that a shareholder would pay on Fund distributions or the redemption of Fund shares.
5
| USAA Mutual Funds Trust USAA Value Fund | July 31, 2020 | ||||||
(Unaudited)
Investment Objective & Portfolio Holdings:
The USAA Value Fund seeks long-term growth of capital.Sector Allocation*:
Sector Allocation*:
July 31, 2020
(% of Net Assets)

* Does not include futures, money market instruments, and short-term investments purchased with cash collateral from securities
Percentages are of the net assets of the Fund and may not equal 100%.
6
| USAA Mutual Funds Trust USAA Value Fund | Schedule of Portfolio Investments July 31, 2020 | ||||||
(Amounts in Thousands, Except for Shares)
Security Description | Shares | Value | |||||||||
Common Stocks (98.9%) | |||||||||||
Communication Services (8.5%): | |||||||||||
Alphabet, Inc. Class A (a) | 10,839 | $ | 16,128 | ||||||||
AMC Networks, Inc. Class A (a) | 49,474 | 1,143 | |||||||||
AT&T, Inc. | 351,519 | 10,398 | |||||||||
Comcast Corp. Class A | 147,407 | 6,309 | |||||||||
Discovery, Inc. Class A (a) (b) | 75,369 | 1,590 | |||||||||
Facebook, Inc. Class A (a) | 64,500 | 16,362 | |||||||||
Omnicom Group, Inc. | 40,672 | 2,185 | |||||||||
Spotify Technology SA (a) | 16,089 | 4,148 | |||||||||
Take-Two Interactive Software, Inc. (a) | 22,582 | 3,704 | |||||||||
The Walt Disney Co. | 36,398 | 4,256 | |||||||||
Verizon Communications, Inc. | 232,319 | 13,354 | |||||||||
79,577 | |||||||||||
Consumer Discretionary (8.3%): | |||||||||||
AutoZone, Inc. (a) | 3,000 | 3,622 | |||||||||
Best Buy Co., Inc. | 37,038 | 3,689 | |||||||||
Booking Holdings, Inc. (a) | 2,071 | 3,442 | |||||||||
Dick's Sporting Goods, Inc. | 76,600 | 3,494 | |||||||||
Dollar Tree, Inc. (a) | 56,200 | 5,247 | |||||||||
Ford Motor Co. | 514,380 | 3,400 | |||||||||
Las Vegas Sands Corp. | 54,116 | 2,362 | |||||||||
Lennar Corp. Class A | 49,256 | 3,564 | |||||||||
LKQ Corp. (a) | 395,024 | 11,136 | |||||||||
McDonald's Corp. | 22,900 | 4,449 | |||||||||
NVR, Inc. (a) | 458 | 1,800 | |||||||||
O'Reilly Automotive, Inc. (a) | 12,980 | 6,196 | |||||||||
PulteGroup, Inc. | 81,157 | 3,538 | |||||||||
Ross Stores, Inc. | 39,518 | 3,544 | |||||||||
Royal Caribbean Cruises Ltd. | 31,415 | 1,530 | |||||||||
Target Corp. | 42,743 | 5,380 | |||||||||
The Home Depot, Inc. | 12,618 | 3,350 | |||||||||
Tractor Supply Co. | 21,816 | 3,114 | |||||||||
Yum! Brands, Inc. | 45,121 | 4,108 | |||||||||
76,965 | |||||||||||
Consumer Staples (7.7%): | |||||||||||
Campbell Soup Co. | 32,695 | 1,621 | |||||||||
Colgate-Palmolive Co. | 45,469 | 3,510 | |||||||||
Ingredion, Inc. (b) | 8,745 | 756 | |||||||||
Keurig Dr Pepper, Inc. | 549,092 | 16,797 | |||||||||
Mondelez International, Inc. Class A | 259,600 | 14,406 | |||||||||
Nu Skin Enterprises, Inc. Class A | 63,316 | 2,840 | |||||||||
Philip Morris International, Inc. | 82,084 | 6,305 | |||||||||
Pilgrim's Pride Corp. (a) | 87,992 | 1,351 | |||||||||
Spectrum Brands Holdings, Inc. | 34,466 | 1,867 | |||||||||
The Coca-Cola Co. | 40,840 | 1,929 | |||||||||
The J.M. Smucker Co. | 24,143 | 2,640 | |||||||||
The Kroger Co. | 88,849 | 3,091 | |||||||||
See notes to financial statements.
7
| USAA Mutual Funds Trust USAA Value Fund | Schedule of Portfolio Investments — continued July 31, 2020 | ||||||
(Amounts in Thousands, Except for Shares)
Security Description | Shares | Value | |||||||||
The Procter & Gamble Co. | 27,156 | $ | 3,561 | ||||||||
Tyson Foods, Inc. Class A | 48,486 | 2,979 | |||||||||
Walgreens Boots Alliance, Inc. | 83,725 | 3,408 | |||||||||
Walmart, Inc. | 34,777 | 4,501 | |||||||||
71,562 | |||||||||||
Energy (4.8%): | |||||||||||
Chevron Corp. | 143,406 | 12,037 | |||||||||
ConocoPhillips | 136,536 | 5,105 | |||||||||
Enterprise Products Partners LP | 586,824 | 10,329 | |||||||||
EOG Resources, Inc. | 96,622 | 4,527 | |||||||||
Exxon Mobil Corp. | 154,305 | 6,493 | |||||||||
HollyFrontier Corp. | 60,707 | 1,669 | |||||||||
Marathon Petroleum Corp. | 66,538 | 2,542 | |||||||||
Phillips 66 | 40,213 | 2,494 | |||||||||
45,196 | |||||||||||
Financials (19.8%): | |||||||||||
Aflac, Inc. | 232,379 | 8,266 | |||||||||
Annaly Capital Management, Inc. | 261,895 | 1,941 | |||||||||
Bank of America Corp. | 487,941 | 12,140 | |||||||||
Berkshire Hathaway, Inc. Class B (a) | 38,279 | 7,494 | |||||||||
Brown & Brown, Inc. | 257,534 | 11,710 | |||||||||
Capital One Financial Corp. | 70,194 | 4,478 | |||||||||
Cboe Global Markets, Inc. | 66,000 | 5,788 | |||||||||
Chubb Ltd. | 47,600 | 6,057 | |||||||||
Citigroup, Inc. | 185,429 | 9,273 | |||||||||
Citizens Financial Group, Inc. | 129,484 | 3,212 | |||||||||
Discover Financial Services | 53,778 | 2,658 | |||||||||
Everest Re Group Ltd. | 20,074 | 4,392 | |||||||||
Fifth Third Bancorp | 173,406 | 3,444 | |||||||||
First Citizens BancShares, Inc. Class A | 7,971 | 3,395 | |||||||||
Huntington Bancshares, Inc. | 293,786 | 2,723 | |||||||||
JPMorgan Chase & Co. | 137,879 | 13,326 | |||||||||
LPL Financial Holdings, Inc. | 36,269 | 2,866 | |||||||||
M&T Bank Corp. | 35,940 | 3,808 | |||||||||
Marsh & McLennan Cos., Inc. | 56,500 | 6,588 | |||||||||
MetLife, Inc. | 131,945 | 4,994 | |||||||||
MSCI, Inc. | 5,235 | 1,968 | |||||||||
OneMain Holdings, Inc. | 53,509 | 1,536 | |||||||||
Principal Financial Group, Inc. | 65,424 | 2,776 | |||||||||
Prudential Financial, Inc. | 67,538 | 4,280 | |||||||||
Regions Financial Corp. | 331,381 | 3,599 | |||||||||
RenaissanceRe Holdings Ltd. | 91,198 | 16,450 | |||||||||
S&P Global, Inc. | 6,787 | 2,377 | |||||||||
State Street Corp. | 52,963 | 3,379 | |||||||||
SVB Financial Group (a) | 13,671 | 3,066 | |||||||||
Synchrony Financial | 186,613 | 4,130 | |||||||||
The Progressive Corp. | 100,802 | 9,106 | |||||||||
See notes to financial statements.
8
| USAA Mutual Funds Trust USAA Value Fund | Schedule of Portfolio Investments — continued July 31, 2020 | ||||||
(Amounts in Thousands, Except for Shares)
Security Description | Shares | Value | |||||||||
U.S. Bancorp | 250,213 | $ | 9,217 | ||||||||
Voya Financial, Inc. | 88,700 | 4,382 | |||||||||
184,819 | |||||||||||
Health Care (14.5%): | |||||||||||
AbbVie, Inc. | 38,990 | 3,701 | |||||||||
AmerisourceBergen Corp. | 34,459 | 3,452 | |||||||||
Amgen, Inc. | 11,080 | 2,711 | |||||||||
Anthem, Inc. | 12,142 | 3,324 | |||||||||
Biogen, Inc. (a) | 13,761 | 3,779 | |||||||||
Bristol-Myers Squibb Co. | 39,905 | 2,341 | |||||||||
Cardinal Health, Inc. | 30,731 | 1,679 | |||||||||
Cerner Corp. | 49,583 | 3,443 | |||||||||
Cigna Corp. | 62,400 | 10,776 | |||||||||
CVS Health Corp. | 64,183 | 4,040 | |||||||||
Eli Lilly & Co. | 11,604 | 1,744 | |||||||||
Humana, Inc. | 38,738 | 15,202 | |||||||||
Johnson & Johnson | 174,145 | 25,382 | |||||||||
Laboratory Corp. of America Holdings (a) | 14,403 | 2,779 | |||||||||
Medtronic PLC | 42,952 | 4,144 | |||||||||
Merck & Co., Inc. | 40,886 | 3,281 | |||||||||
Pfizer, Inc. | 428,703 | 16,497 | |||||||||
Quest Diagnostics, Inc. | 77,644 | 9,866 | |||||||||
UnitedHealth Group, Inc. | 32,970 | 9,983 | |||||||||
Universal Health Services, Inc. Class B | 19,586 | 2,153 | |||||||||
Veeva Systems, Inc. Class A (a) | 10,412 | 2,755 | |||||||||
West Pharmaceutical Services, Inc. | 10,304 | 2,770 | |||||||||
135,802 | |||||||||||
Industrials (10.6%): | |||||||||||
3M Co. | 23,950 | 3,604 | |||||||||
Caterpillar, Inc. | 17,961 | 2,387 | |||||||||
Cummins, Inc. | 55,928 | 10,809 | |||||||||
Delta Air Lines, Inc. | 86,673 | 2,164 | |||||||||
Dover Corp. | 31,600 | 3,253 | |||||||||
Eaton Corp. PLC | 111,511 | 10,385 | |||||||||
Fastenal Co. | 65,909 | 3,101 | |||||||||
FedEx Corp. | 20,300 | 3,419 | |||||||||
Honeywell International, Inc. | 51,631 | 7,712 | |||||||||
Johnson Controls International PLC | 145,500 | 5,599 | |||||||||
L3Harris Technologies, Inc. | 15,656 | 2,635 | |||||||||
ManpowerGroup, Inc. | 28,216 | 1,941 | |||||||||
Masco Corp. | 139,472 | 7,972 | |||||||||
Old Dominion Freight Line, Inc. | 16,640 | 3,042 | |||||||||
Otis Worldwide Corp. | 58,611 | 3,677 | |||||||||
Parker-Hannifin Corp. | 49,600 | 8,874 | |||||||||
Raytheon Technologies Corp. | 109,467 | 6,205 | |||||||||
Southwest Airlines Co. | 53,991 | 1,668 | |||||||||
Union Pacific Corp. | 47,616 | 8,254 | |||||||||
W.W. Grainger, Inc. | 7,321 | 2,500 | |||||||||
99,201 | |||||||||||
See notes to financial statements.
9
| USAA Mutual Funds Trust USAA Value Fund | Schedule of Portfolio Investments — continued July 31, 2020 | ||||||
(Amounts in Thousands, Except for Shares)
Security Description | Shares | Value | |||||||||
Information Technology (7.9%): | |||||||||||
Adobe, Inc. (a) | 2,869 | $ | 1,275 | ||||||||
Applied Materials, Inc. | 71,722 | 4,614 | |||||||||
Broadridge Financial Solutions, Inc. | 56,500 | 7,590 | |||||||||
CDW Corp. | 24,242 | 2,818 | |||||||||
F5 Networks, Inc. (a) | 10,472 | 1,423 | |||||||||
Fair Isaac Corp. (a) | 4,752 | 2,087 | |||||||||
HP, Inc. | 241,605 | 4,247 | |||||||||
Intel Corp. | 141,332 | 6,746 | |||||||||
International Business Machines Corp. | 21,647 | 2,661 | |||||||||
Intuit, Inc. | 8,890 | 2,723 | |||||||||
Lam Research Corp. | 17,544 | 6,617 | |||||||||
Leidos Holdings, Inc. | 81,500 | 7,756 | |||||||||
Micron Technology, Inc. (a) | 86,189 | 4,314 | |||||||||
NetApp, Inc. | 40,156 | 1,779 | |||||||||
Oracle Corp. | 43,751 | 2,426 | |||||||||
QUALCOMM, Inc. | 26,828 | 2,833 | |||||||||
Texas Instruments, Inc. | 19,611 | 2,501 | |||||||||
Visa, Inc. Class A | 35,171 | 6,697 | |||||||||
Zebra Technologies Corp. (a) | 9,078 | 2,549 | |||||||||
73,656 | |||||||||||
Materials (5.2%): | |||||||||||
Ball Corp. | 49,649 | 3,656 | |||||||||
Celanese Corp. | 22,107 | 2,149 | |||||||||
Dow, Inc. | 71,464 | 2,934 | |||||||||
Eastman Chemical Co. | 23,300 | 1,739 | |||||||||
Ferroglobe PLC (a) (c) (d) | 545,600 | — | (e) | ||||||||
Huntsman Corp. | 197,040 | 3,645 | |||||||||
LyondellBasell Industries NV Class A | 82,684 | 5,169 | |||||||||
Newmont Corp. | 87,200 | 6,034 | |||||||||
Nucor Corp. | 52,425 | 2,199 | |||||||||
PPG Industries, Inc. | 43,568 | 4,690 | |||||||||
Reliance Steel & Aluminum Co. | 11,253 | 1,106 | |||||||||
Sealed Air Corp. | 413,829 | 14,765 | |||||||||
48,086 | |||||||||||
Real Estate (5.1%): | |||||||||||
Alexandria Real Estate Equities, Inc. | 13,419 | 2,383 | |||||||||
AvalonBay Communities, Inc. | 15,565 | 2,383 | |||||||||
Digital Realty Trust, Inc. | 15,757 | 2,530 | |||||||||
Equity Commonwealth | 255,322 | 8,060 | |||||||||
Equity LifeStyle Properties, Inc. | 121,000 | 8,266 | |||||||||
Essex Property Trust, Inc. | 9,353 | 2,065 | |||||||||
Healthpeak Properties, Inc. | 87,234 | 2,381 | |||||||||
Host Hotels & Resorts, Inc. | 131,151 | 1,414 | |||||||||
Invitation Homes, Inc. | 141,773 | 4,228 | |||||||||
Jones Lang LaSalle, Inc. | 10,439 | 1,033 | |||||||||
Prologis, Inc. | 45,552 | 4,802 | |||||||||
Realty Income Corp. | 36,593 | 2,197 | |||||||||
See notes to financial statements.
10
| USAA Mutual Funds Trust USAA Value Fund | Schedule of Portfolio Investments — continued July 31, 2020 | ||||||
(Amounts in Thousands, Except for Shares)
Security Description | Shares | Value | |||||||||
Regency Centers Corp. | 30,446 | $ | 1,249 | ||||||||
Ventas, Inc. | 51,619 | 1,980 | |||||||||
Welltower, Inc. | 44,516 | 2,384 | |||||||||
47,355 | |||||||||||
Utilities (6.5%): | |||||||||||
Dominion Energy, Inc. | 37,941 | 3,074 | |||||||||
Duke Energy Corp. | 74,200 | 6,288 | |||||||||
Evergy, Inc. | 38,715 | 2,510 | |||||||||
Exelon Corp. | 347,341 | 13,410 | |||||||||
FirstEnergy Corp. | 171,860 | 4,984 | |||||||||
NextEra Energy, Inc. | 9,425 | 2,646 | |||||||||
NRG Energy, Inc. | 43,471 | 1,470 | |||||||||
PPL Corp. | 132,334 | 3,523 | |||||||||
UGI Corp. | 33,846 | 1,128 | |||||||||
Vistra Corp. | 853,434 | 15,925 | |||||||||
WEC Energy Group, Inc. | 52,473 | 4,999 | |||||||||
59,957 | |||||||||||
Total Common Stocks (Cost $913,334) | 922,176 | ||||||||||
Collateral for Securities Loaned^ (0.1%) | |||||||||||
Goldman Sachs Financial Square Government Fund Institutional Shares, 0.13% (f) | 5,852 | 6 | |||||||||
HSBC U.S. Government Money Market Fund I Shares, 0.08% (f) | 444,713 | 445 | |||||||||
Invesco Government & Agency Portfolio Institutional Shares, 0.06% (f) | 844,132 | 844 | |||||||||
Total Collateral for Securities Loaned (Cost $1,295) | 1,295 | ||||||||||
Total Investments (Cost $914,629) — 99.0% | 923,471 | ||||||||||
Other assets in excess of liabilities — 1.0% | 9,568 | ||||||||||
NET ASSETS — 100.00% | $ | 933,039 | |||||||||
At July 31, 2020 the Fund's investments in foreign securities were 6.2% of net assets.
^ Purchased with cash collateral from securities on loan.
(a) Non-income producing security.
(b) All or a portion of this security is on loan.
(c) Security was fair valued based upon procedures approved by the Board of Trustees and represents less than 0.05% of the Fund's net assets as of July 31, 2020. This security is classified as Level 3 within the fair value hierarchy. (See Note 2)
(d) The Fund's Adviser has deemed this security to be illiquid based upon procedures approved by the Board of Trustees. As of July 31, 2020, illiquid securities were less than 0.05% of the Fund's net assets.
(e) Rounds to less than $1 thousand.
(f) Rate disclosed is the daily yield on July 31, 2020.
LP — Limited Partnership
PLC — Public Limited Company
See notes to financial statements.
11
USAA Mutual Funds Trust | Statement of Assets and Liabilities July 31, 2020 | ||||||
(Amounts in Thousands, Except Per Share Amounts)
| USAA Value Fund | |||||||
Assets: | |||||||
Investments, at value (Cost $914,629) | $ | 923,471 | (a) | ||||
Cash and cash equivalents | 6,777 | ||||||
Receivables: | |||||||
Interest and dividends | 1,287 | ||||||
Capital shares issued | 1,114 | ||||||
Investments sold | 6,060 | ||||||
From Adviser | 17 | ||||||
Prepaid expenses | 38 | ||||||
Total assets | 938,764 | ||||||
Liabilities: | |||||||
Payables: | |||||||
Collateral received on loaned securities | 1,295 | ||||||
Investments purchased | 2,905 | ||||||
Capital shares redeemed | 780 | ||||||
Accrued expenses and other payables: | |||||||
Investment advisory fees | 473 | ||||||
Administration fees | 109 | ||||||
Custodian fees | 8 | ||||||
Transfer agent fees | 104 | ||||||
Compliance fees | 1 | ||||||
| 12b-1 fees | 1 | ||||||
Other accrued expenses | 49 | ||||||
Total liabilities | 5,725 | ||||||
Net Assets: | |||||||
Capital | 1,006,425 | ||||||
Total accumulated earnings/(loss) | (73,386 | ) | |||||
Net assets | $ | 933,039 | |||||
Net Assets | |||||||
Fund Shares | $ | 711,182 | |||||
Institutional Shares | 215,830 | ||||||
Class A shares | 6,027 | ||||||
Total | $ | 933,039 | |||||
Shares (unlimited number of shares authorized with no par value): | |||||||
Fund Shares | 52,426 | ||||||
Institutional Shares | 15,893 | ||||||
Class A shares | 447 | ||||||
Total | 68,766 | ||||||
Net asset value, offering and redemption price per share: (b) | |||||||
Fund Shares | $ | 13.57 | |||||
Institutional Shares | $ | 13.58 | |||||
Class A shares | $ | 13.48 | |||||
Maximum Sales Charge — Class A shares | 5.75 | % | |||||
Maximum offering price | |||||||
| (100%/(100%-maximum sales charge) of net asset value adjusted to the nearest cent) per share — Class A shares | $ | 14.30 | |||||
(a) Includes $1,265 of securities on loan.
(b) Per share amount may not recalculate due to rounding of net assets and/or shares outstanding.
See notes to financial statements.
12
USAA Mutual Funds Trust | Statement of Operations For the Year Ended July 31, 2020 | ||||||
(Amounts in Thousands)
| USAA Value Fund | |||||||
Investment Income: | |||||||
Dividends | $ | 26,843 | |||||
Interest | 1,229 | ||||||
Securities lending (net of fees) | 23 | ||||||
Foreign tax withholding | (18 | ) | |||||
Total Income | 28,077 | ||||||
Expenses: | |||||||
Investment advisory fees | 6,886 | ||||||
Administration fees — Fund Shares | 1,257 | ||||||
Administration fees — Institutional Shares | 220 | ||||||
Administration fees — Class A shares | 11 | ||||||
Sub-Administration fees | 54 | ||||||
12b-1 fees — Class A shares | 18 | ||||||
Custodian fees | 89 | ||||||
Transfer agent fees — Fund Shares | 1,102 | ||||||
Transfer agent fees — Institutional Shares | 220 | ||||||
Transfer agent fees — Class A shares | 1 | ||||||
Trustees' fees | 46 | ||||||
Compliance fees | 7 | ||||||
Legal and audit fees | 90 | ||||||
State registration and filing fees | 39 | ||||||
Other expenses | 88 | ||||||
Total Expenses | 10,128 | ||||||
Expenses waived/reimbursed by Adviser | (117 | ) | |||||
Net Expenses | 10,011 | ||||||
Net Investment Income (Loss) | 18,066 | ||||||
Realized/Unrealized Gains (Losses) from Investments: | |||||||
Net realized gains (losses) from investment securities and foreign currency translations | (94,069 | ) | |||||
| Net change in unrealized appreciation/depreciation on investment securities and foreign currency translations | (37,230 | ) | |||||
Net realized/unrealized gains (losses) on investments | (131,299 | ) | |||||
Change in net assets resulting from operations | $ | (113,233 | ) | ||||
See notes to financial statements.
13
USAA Mutual Funds Trust | Statements of Changes in Net Assets | ||||||
(Amounts in Thousands)
USAA Value Fund | |||||||||||
| Year Ended July 31, 2020 | Year Ended July 31, 2019 | ||||||||||
From Investments: | |||||||||||
Operations: | |||||||||||
Net investment income (loss) | $ | 18,066 | $ | 18,657 | |||||||
Net realized gains (losses) from investments | (94,069 | ) | 347,939 | ||||||||
| Net change in unrealized appreciation/depreciation on investments | (37,230 | ) | (386,678 | ) | |||||||
Change in net assets resulting from operations | (113,233 | ) | (20,082 | ) | |||||||
Distributions to Shareholders: | |||||||||||
Fund Shares | (220,280 | ) | (109,577 | ) | |||||||
Institutional Shares | (61,101 | ) | (48,387 | ) | |||||||
Class A shares | (2,057 | ) | (1,038 | ) | |||||||
Change in net assets resulting from distributions to shareholders | (283,438 | ) | (159,002 | ) | |||||||
Change in net assets resulting from capital transactions | 157,881 | (306,887 | ) | ||||||||
Change in net assets | (238,790 | ) | (485,971 | ) | |||||||
Net Assets: | |||||||||||
Beginning of period | 1,171,829 | 1,657,800 | |||||||||
End of period | $ | 933,039 | $ | 1,171,829 | |||||||
Capital Transactions: | |||||||||||
Fund Shares | |||||||||||
Proceeds from shares issued | $ | 51,191 | $ | 77,101 | |||||||
Distributions reinvested | 217,411 | 108,344 | |||||||||
Cost of shares redeemed | (192,266 | ) | (138,626 | ) | |||||||
Total Fund Shares | $ | 76,336 | $ | 46,819 | |||||||
Institutional Shares | |||||||||||
Proceeds from shares issued | $ | 64,583 | $ | 39,778 | |||||||
Distributions reinvested | 61,090 | 48,382 | |||||||||
Cost of shares redeemed | (44,124 | ) | (441,867 | ) | |||||||
Total Institutional Shares | $ | 81,549 | $ | (353,707 | ) | ||||||
Class A shares | |||||||||||
Proceeds from shares issued | $ | 32 | $ | 35 | |||||||
Distributions reinvested | 26 | 14 | |||||||||
Cost of shares redeemed | (62 | ) | (48 | ) | |||||||
Total Class A shares | $ | (4 | ) | $ | 1 | ||||||
Change in net assets resulting from capital transactions | $ | 157,881 | $ | (306,887 | ) | ||||||
(continues on next page)
See notes to financial statements.
14
USAA Mutual Funds Trust | Statements of Changes in Net Assets — continued | ||||||
(Amounts in Thousands)
USAA Value Fund | |||||||||||
| Year Ended July 31, 2020 | Year Ended July 31, 2019 | ||||||||||
Share Transactions: | |||||||||||
Fund Shares | |||||||||||
Issued | 3,376 | 3,912 | |||||||||
Reinvested | 13,458 | 6,172 | |||||||||
Redeemed | (13,085 | ) | (7,186 | ) | |||||||
Total Fund Shares | 3,749 | 2,898 | |||||||||
Institutional Shares | |||||||||||
Issued | 3,808 | 2,071 | |||||||||
Reinvested | 3,777 | 2,755 | |||||||||
Redeemed | (3,213 | ) | (22,405 | ) | |||||||
Total Institutional Shares | 4,372 | (17,579 | ) | ||||||||
Class A shares | |||||||||||
Issued | 2 | 2 | |||||||||
Reinvested | 2 | 1 | |||||||||
Redeemed | (5 | ) | (3 | ) | �� | ||||||
Total Class A shares | (1 | ) | — | (a) | |||||||
Change in Shares | 8,120 | (14,681 | ) | ||||||||
(a) Represents less than 500 shares.
See notes to financial statements.
15
USAA Mutual Funds Trust | Financial Highlights | ||||||
For a Share Outstanding Throughout Each Period
Investment Activities | Distributions to Shareholders From | ||||||||||||||||||||||||||
| Net Asset Value, Beginning of Period | Net Investment Income (Loss) | Net Realized and Unrealized Gains (Losses) on Investments | Total from Investment Activities | Net Investment Income | Net Realized Gains from Investments | ||||||||||||||||||||||
USAA Value Fund | |||||||||||||||||||||||||||
Fund Shares | |||||||||||||||||||||||||||
| Year Ended July 31, 2020 | $ | 19.32 | 0.26 | (b) | (1.39 | ) | (1.13 | ) | (0.21 | ) | (4.41 | ) | |||||||||||||||
| Year Ended July 31, 2019 | $ | 22.01 | 0.25 | (0.54 | ) | (0.29 | ) | (0.24 | ) | (2.16 | ) | ||||||||||||||||
| Year Ended July 31, 2018 | $ | 21.55 | 0.21 | 1.84 | 2.05 | (0.21 | ) | (1.38 | ) | ||||||||||||||||||
| Year Ended July 31, 2017 | $ | 19.41 | 0.27 | 2.74 | 3.01 | (0.29 | ) | (0.58 | ) | ||||||||||||||||||
| Year Ended July 31, 2016 | $ | 20.50 | 0.23 | (0.31 | ) | (0.08 | ) | (0.23 | ) | (0.78 | ) | ||||||||||||||||
Institutional Shares | |||||||||||||||||||||||||||
| Year Ended July 31, 2020 | $ | 19.33 | 0.27 | (b) | (1.39 | ) | (1.12 | ) | (0.22 | ) | (4.41 | ) | |||||||||||||||
| Year Ended July 31, 2019 | $ | 22.00 | 0.28 | (b) | (0.55 | ) | (0.27 | ) | (0.24 | ) | (2.16 | ) | |||||||||||||||
| Year Ended July 31, 2018 | $ | 21.54 | 0.23 | 1.84 | 2.07 | (0.23 | ) | (1.38 | ) | ||||||||||||||||||
| Year Ended July 31, 2017 | $ | 19.40 | 0.30 | 2.73 | 3.03 | (0.31 | ) | (0.58 | ) | ||||||||||||||||||
| Year Ended July 31, 2016 | $ | 20.49 | 0.25 | (0.31 | ) | (0.06 | ) | (0.25 | ) | (0.78 | ) | ||||||||||||||||
Class A shares | |||||||||||||||||||||||||||
| Year Ended July 31, 2020 | $ | 19.24 | 0.23 | (b) | (1.39 | ) | (1.16 | ) | (0.19 | ) | (4.41 | ) | |||||||||||||||
| Year Ended July 31, 2019 | $ | 21.91 | 0.20 | (0.55 | ) | (0.35 | ) | (0.16 | ) | (2.16 | ) | ||||||||||||||||
| Year Ended July 31, 2018 | $ | 21.46 | 0.15 | 1.83 | 1.98 | (0.15 | ) | (1.38 | ) | ||||||||||||||||||
| Year Ended July 31, 2017 | $ | 19.32 | 0.23 | 2.72 | 2.95 | (0.23 | ) | (0.58 | ) | ||||||||||||||||||
| Year Ended July 31, 2016 | $ | 20.43 | 0.17 | (0.32 | ) | (0.15 | ) | (0.18 | ) | (0.78 | ) | ||||||||||||||||
* Assumes reinvestment of all net investment income and realized capital gain distributions, if any, during the period. Includes adjustments in accordance with U.S. generally accepted accounting principles and could differ from the Lipper reported return.
^ The net expense ratio may not correlate to the applicable expense limits in place during the period since the current contractual expense limitation is applied for a two year period beginning July 1, 2019 and in effect through June 30, 2021, instead of coinciding with the Fund's fiscal year end. Details of the current contractual expense limitation in effect can be found in Note 5 of the accompanying Notes to Financial Statements.
(a) Portfolio turnover is calculated on the basis of the Fund as a whole without distinguishing between the classes of shares issued.
(b) Per share net investment income (loss) has been calculated using the average daily shares method.
See notes to financial statements.
16
USAA Mutual Funds Trust | Financial Highlights — continued | ||||||
For a Share Outstanding Throughout Each Period
Ratios to Average Net Assets | Supplemental Data | ||||||||||||||||||||||||||||||||||
| Total Distributions | Net Asset Value, End of Period | Total Return (Excludes Sales Charges)* | Net Expenses^ | Net Investment Income (Loss) | Gross Expenses | Net Assets, End of Period (000's) | Portfolio Turnover(a) | ||||||||||||||||||||||||||||
USAA Value Fund | |||||||||||||||||||||||||||||||||||
Fund Shares | |||||||||||||||||||||||||||||||||||
| Year Ended July 31, 2020 | (4.62 | ) | $ | 13.57 | (9.43 | )% | 0.96 | % | 1.69 | % | 0.97 | % | $ | 711,182 | 74 | % | |||||||||||||||||||
| Year Ended July 31, 2019 | (2.40 | ) | $ | 19.32 | (0.11 | )% | 0.96 | % | 1.35 | % | 0.96 | % | $ | 940,515 | 108 | %(d) | |||||||||||||||||||
| Year Ended July 31, 2018 | (1.59 | ) | $ | 22.01 | 9.69 | % | 0.99 | % | 1.10 | % | 0.99 | % | $ | 1,007,712 | 29 | % | |||||||||||||||||||
| Year Ended July 31, 2017 | (0.87 | ) | $ | 21.55 | 15.72 | % | 1.08 | %(c) | 1.37 | % | 1.08 | %(c) | $ | 936,630 | 27 | % | |||||||||||||||||||
| Year Ended July 31, 2016 | (1.01 | ) | $ | 19.41 | (0.14 | )% | 1.11 | %(c) | 1.28 | % | 1.11 | %(c) | $ | 807,052 | 20 | % | |||||||||||||||||||
Institutional Shares | |||||||||||||||||||||||||||||||||||
| Year Ended July 31, 2020 | (4.63 | ) | $ | 13.58 | (9.40 | )% | 0.88 | % | 1.75 | % | 0.89 | % | $ | 215,830 | 74 | % | |||||||||||||||||||
| Year Ended July 31, 2019 | (2.40 | ) | $ | 19.33 | (0.02 | )% | 0.88 | % | 1.42 | % | 0.88 | % | $ | 222,701 | 108 | %(d) | |||||||||||||||||||
| Year Ended July 31, 2018 | (1.61 | ) | $ | 22.00 | 9.79 | % | 0.91 | % | 1.18 | % | 0.91 | % | $ | 640,281 | 29 | % | |||||||||||||||||||
| Year Ended July 31, 2017 | (0.89 | ) | $ | 21.54 | 15.86 | % | 0.98 | %(c) | 1.48 | % | 0.98 | %(c) | $ | 591,384 | 27 | % | |||||||||||||||||||
| Year Ended July 31, 2016 | (1.03 | ) | $ | 19.40 | (0.04 | )% | 0.98 | %(c) | 1.41 | % | 0.98 | %(c) | $ | 522,721 | 20 | % | |||||||||||||||||||
Class A shares | |||||||||||||||||||||||||||||||||||
| Year Ended July 31, 2020 | (4.60 | ) | $ | 13.48 | (9.66 | )% | 1.21 | % | 1.45 | % | 1.21 | % | $ | 6,027 | 74 | % | |||||||||||||||||||
| Year Ended July 31, 2019 | (2.32 | ) | $ | 19.24 | (0.44 | )% | 1.27 | %(e) | 1.03 | % | 1.31 | % | $ | 8,613 | 108 | %(d) | |||||||||||||||||||
| Year Ended July 31, 2018 | (1.53 | ) | $ | 21.91 | 9.41 | % | 1.30 | % | 0.79 | % | 1.30 | % | $ | 9,807 | 29 | % | |||||||||||||||||||
| Year Ended July 31, 2017 | (0.81 | ) | $ | 21.46 | 15.46 | % | 1.33 | %(c)(f) | 1.13 | % | 1.38 | %(c) | $ | 9,626 | 27 | % | |||||||||||||||||||
| Year Ended July 31, 2016 | (0.96 | ) | $ | 19.32 | (0.52 | )% | 1.42 | %(c) | 0.97 | % | 1.42 | %(c) | $ | 8,767 | 20 | % | |||||||||||||||||||
(c) Reflects total annual operating expenses of the shares before reductions of any expenses paid indirectly. The expenses paid indirectly decreased the expense ratio by less than 0.01%.
(d) Reflects increased trading activity due to current year transition or asset allocation shift.
(e) Prior to December 1, 2018, USAA Asset Management Company ("AMCO") (previous Investment Adviser) voluntarily agreed to limit the annual expenses of the Class A shares to 1.30% of the Class A shares average daily net assets.
(f) Effective December 1, 2016, AMCO voluntarily agreed to limit the annual expenses of the Class A shares to 1.30% of the Class A shares average daily net assets.
See notes to financial statements.
17
USAA Mutual Funds Trust | Notes to Financial Statements July 31, 2020 | ||||||
1. Organization:
USAA Mutual Funds Trust (the "Trust") is organized as a Delaware statutory trust and is registered under the Investment Company Act of 1940, as amended (the "1940 Act"), as an open-end investment company. The Trust is comprised of 47 funds and is authorized to issue an unlimited number of shares, which are units of beneficial interest with no par value.
The accompanying financial statements are those of the USAA Value Fund (the "Fund"). The Fund offers three classes of shares: Fund Shares, Institutional Shares, and Class A shares. The Fund is classified as diversified under the 1940 Act.
Effective June 29, 2020, the Fund's Adviser Shares were redesignated Class A shares and became subject to a front-end sales charge.
Each class of shares of the Fund has substantially identical rights and privileges except with respect to fees paid under distribution plans, expenses allocable exclusively to each class of shares, voting rights on matters solely affecting a single class of shares, and the exchange privilege of each class of shares.
Under the Trust's organizational documents, its officers and trustees are indemnified against certain liabilities arising out of the performance of their duties to the Fund. In addition, in the normal course of business, the Fund enters into contracts with its vendors and others that provide for general indemnifications. The Fund's maximum exposure under these arrangements is unknown, as this would involve future claims that may be made against the Fund. However, based on experience, the Fund expects that risk of loss to be remote.
2. Significant Accounting Policies:
The following is a summary of significant accounting policies followed by the Trust in the preparation of its financial statements. The policies are in conformity with generally accepted accounting principles in the United States of America ("GAAP"). The preparation of financial statements in accordance with GAAP requires management to make estimates and assumptions that affect the reported amounts of assets and liabilities and disclosure of contingent assets and liabilities at the date of the financial statements and the reported amounts of income and expenses for the period. Actual results could differ from those estimates. The Fund follows the specialized accounting and reporting requirements under GAAP that are applicable to investment companies under Accounting Standards Codification Topic 946.
Investment Valuation:
The Fund records investments at fair value. Fair value is defined as the price that would be received to sell an asset or paid to transfer a liability in an orderly transaction between market participants at the measurement date.
The valuation techniques described below maximize the use of observable inputs and minimize the use of unobservable inputs in determining fair value. The inputs used for valuing the Fund's investments are summarized in the three broad levels listed below:
• Level 1 — quoted prices in active markets for identical securities
• Level 2 — other significant observable inputs (including quoted prices for similar securities or interest rates applicable to those securities, etc.)
• Level 3 — significant unobservable inputs (including the Fund's own assumptions in determining the fair value of investments)
Changes in valuation techniques may result in transfers in or out of an assigned level within the disclosure hierarchy. The inputs or methodologies used for valuation techniques are not necessarily an indication of the risk associated with entering into those investments.
The Adviser has established the Pricing and Liquidity Committee (the "Committee"), and subject to Trust's Board of Trustees (the "Board") oversight, the Committee administers and oversees the Fund's valuation policies and procedures, which are approved by the Board.
18
USAA Mutual Funds Trust | Notes to Financial Statements — continued July 31, 2020 | ||||||
Portfolio securities listed or traded on securities exchanges, including exchange-traded funds ("ETFs"), American Depositary Receipts ("ADRs") and Rights, are valued at the closing price on the exchange or system where the security is principally traded, if available, or at the Nasdaq Official Closing Price. If there have been no sales for that day on the exchange or system, then a security is valued at the last available bid quotation on the exchange or system where the security is principally traded. In each of these situations, valuations are typically categorized as Level 1 in the fair value hierarchy.
Investments in open-end investment companies are valued at net asset value ("NAV"). These valuations are typically categorized as Level 1 in the fair value hierarchy.
In the event that price quotations or valuations are not readily available, are not reflective of market value, or a significant event has been recognized in relation to a security or class of securities, the securities are valued in good faith by the Committee in accordance with valuation procedures approved by the Board. These valuations are typically categorized as Level 2 or Level 3 in the fair value hierarchy, based on the observability of inputs used to determine the fair value. The effect of fair value pricing is that securities may not be priced on the basis of quotations from the primary market in which they are traded and the actual price realized from the sale of a security may differ materially from the fair value price. Valuing these securities at fair value is intended to cause the Fund's NAV to be more reliable than it otherwise would be.
A summary of the valuations as of July 31, 2020, based upon the three levels defined above, is included in the table below while the breakdown, by category, of investments is disclosed in the Schedule of Portfolio Investments (amounts in thousands):
Level 1 | Level 2 | Level 3 | Total | ||||||||||||||||
Common Stocks | $ | 922,176 | $ | — | $ | — | (a) | $ | 922,176 | ||||||||||
Collateral for Securities Loaned | 1,295 | — | — | 1,295 | |||||||||||||||
Total | $ | 923,471 | $ | — | $ | — | (a) | $ | 923,471 | ||||||||||
(a) Amount less than $1 thousand.
For the year ended July 31, 2020, there were no transfers in or out of the Level 3 fair value hierarchy.
Real Estate Investment Trusts ("REITs"):
The Fund may invest in REITs, which report information on the source of their distributions annually. REITs are pooled investment vehicles that invest primarily in income producing real estate or real estate related loans or interests (such as mortgages). Certain distributions received from REITs during the year are recorded as realized gains or return of capital as estimated by the Fund or when such information becomes known.
Investment Companies:
Exchange-Traded Funds:
The Fund may invest in ETFs, the shares of which are bought and sold on a securities exchange. An ETF trades like common stock and represents a fixed portfolio of securities designed to track the performance and dividend yield of a particular domestic or foreign market index. The Fund may purchase shares of an ETF to temporarily gain exposure to a portion of the U.S. or a foreign market while awaiting purchase of underlying securities. The risks of owning an ETF generally reflect the risks of owning the underlying securities they are designed to track, although the lack of liquidity of an ETF could result in it being more volatile. Additionally, ETFs have fees and expenses that reduce their value.
Open-End Funds:
The Fund may invest in portfolios of open-end investment companies. These investment companies value securities in their portfolios for which market quotations are readily available at their market
19
USAA Mutual Funds Trust | Notes to Financial Statements — continued July 31, 2020 | ||||||
values (generally the last reported sale price) and all other securities and assets at their fair value by the methods established by the board of directors of the underlying funds.
Investment Transactions and Related Income:
Changes in holdings of investments are accounted for no later than one business day following the trade date. For financial reporting purposes, however, investment transactions are accounted for on trade date on the last business day of the reporting period. Interest income is determined on the basis of coupon interest accrued using the effective interest method which adjusts, where applicable, the amortization of premiums or accretion of discount. Gains or losses realized on sales of securities are determined by comparing the identified cost of the security lot sold with the net sales proceeds.
Withholding taxes on interest, dividends, and gains as a result of certain investments in ADRs by the Fund has been provided for in accordance with each investment's applicable country's tax rules and rates.
Securities Lending:
The Fund, through a securities lending agreement with Citibank, N.A. ("Citibank"), may lend its securities to qualified financial institutions, such as certain broker-dealers, to earn additional income, net of income retained by Citibank. Borrowers are required to secure their loans for collateral in the amount of at least 102% of the value of U.S. securities loaned or at least 105% of the value of non-U.S. securities loaned, marked-to-market daily. Any collateral shortfalls associated with increases in the valuation of the securities loaned are cured the next business day once the shortfall exceeds $100 thousand. Collateral may be cash, U.S. government securities, or other securities as permitted by SEC guidelines. Cash collateral may be invested in high-quality short-term investments, primarily open-end investment companies. Collateral requirements are determined daily based on the value of the Fund's securities on loan as of the end of the prior business day. During the time portfolio securities are on loan, the borrower will pay the Fund any dividends or interest paid on such securities plus any fee negotiated between the parties to the lending agreement. The Fund also earns a return from the collateral. The Fund pays Citibank various fees in connection with the investment of cash collateral and fees based on the investment income received from securities lending activities. Securities lending income (net of these fees) is disclosed on the Statement of Operations. Loans are terminable upon demand and the borrower must return the loaned securities within the lesser of one standard settlement period or five business days. Risks relating to securities-lending transactions include that the borrower may not provide additional collateral when required or return the securities when due, and that the value of the short-term investments will be less than the amount of cash collateral required to be returned to the borrower. The Fund's agreement with Citibank does not include master netting provisions. Non-cash collateral received by the Fund may not be sold or re-pledged except to satisfy borrower default. Cash collateral is listed on the Fund's Schedule of Portfolio of Investments and Financial Statements while non-cash collateral is not included. The following table (amounts in thousands) is a summary of the Fund's securities lending transactions as of July 31, 2020.
| Value of Securities on Loan | Non-Cash Collateral | Cash Collateral | |||||||||
| $ | 1,265 | $ | — | $ | 1,295 | ||||||
Foreign Currency Translations:
The accounting records of the Fund are maintained in U.S. dollars. Investment securities and other assets and liabilities of the Fund denominated in a foreign currency are translated into U.S. dollars at current exchange rates. Purchases and sales of securities, income receipts, and expense payments are translated into U.S. dollars at the exchange rates on the date of the transactions. The Fund does not isolate the portion of the results of operations resulting from changes in foreign exchange rates on investments from fluctuations arising from changes in market prices of securities held. Such fluctuations are disclosed as net change in unrealized appreciation/depreciation on investments and foreign currency translations on the Statement of Operations. Any realized gains or losses from these fluctuations,
20
USAA Mutual Funds Trust | Notes to Financial Statements — continued July 31, 2020 | ||||||
including foreign currency arising from in-kind redemptions, are disclosed as net realized gains or losses from investment transactions and foreign currency translations on the Statement of Operations.
Foreign Taxes:
The Fund may be subject to foreign taxes related to foreign income received (a portion of which may be reclaimable), capital gains on the sale of securities, and certain foreign currency transactions. All foreign taxes are recorded in accordance with the applicable regulations and rates that exist in the foreign jurisdictions in which the Fund invests.
Federal Income Taxes:
It is the Fund's policy to continue to qualify as a regulated investment company by complying with the provisions available to certain investment companies, as defined in applicable sections of the Internal Revenue Code, and to make distributions of net investment income and net realized gains sufficient to relieve it from all, or substantially all, federal income taxes. Accordingly, no provision for federal income taxes is required in the financial statements. The Fund has a tax year end of July 31.
Management of the Fund has reviewed tax positions taken in tax years that remain subject to examination by all major tax jurisdictions, including federal (i.e., the last four tax years, which includes the current fiscal tax year end). Management believes that there is no tax liability resulting from unrecognized tax benefits related to uncertain tax positions taken.
Allocations:
Expenses directly attributable to the Fund are charged to the Fund, while expenses that are attributable to more than one fund in the Trust, or jointly with an affiliated trust, are allocated among the respective funds in the Trust and/or affiliated trust based upon net assets or another appropriate basis.
Income, expenses (other than class-specific expenses such as transfer agent fees, state registration fees, 12b-1 fees and printing fees), and realized and unrealized gains or losses on investments are allocated to each class of shares based on its relative net assets on the date income is earned or expenses and realized and unrealized gains and losses are incurred.
3. Purchases and Sales:
Cost of purchases and proceeds from sales/maturities of securities (excluding securities maturing less than one year from acquisition) for the year ended July 31, 2020, were as follows for the Fund (amounts in thousands):
| Excluding U.S. Government Securities | |||||||||||
Purchases | Sales | ||||||||||
$ | 774,118 | $ | 869,220 | ||||||||
There were no purchases and sales of U.S. government securities during the year ended July 31, 2020.
4. Affiliated Fund Ownership:
The Fund offers its shares for investment by other USAA Mutual Funds. The fund-of-funds do not invest in the underlying funds for the purpose of exercising management or control, and the affiliated fund-of-funds' annual and semi-annual reports may be viewed at usaa.com. As of July 31, 2020, certain fund-of-funds owned total outstanding shares of the Fund as follows:
USAA Cornerstone Conservative Fund | 0.2 | % | |||||
USAA Cornerstone Equity Fund | 0.9 | % | |||||
21
USAA Mutual Funds Trust | Notes to Financial Statements — continued July 31, 2020 | ||||||
5. Fees and Transactions with Affiliates and Related Parties:
Investment Advisory Fees:
Investment advisory services are provided to the Fund by Victory Capital Management Inc. ("VCM" or the "Adviser"), a New York corporation registered as an investment adviser with the Securities and Exchange Commission ("SEC"). The Adviser is a wholly-owned indirect subsidiary of Victory Capital Holdings, Inc., a publicly traded Delaware corporation, and a wholly-owned direct subsidiary of Victory Capital Operating, LLC. Under the terms of the Investment Advisory Agreement, the Adviser is entitled to receive a base fee and a performance adjustment. The Fund's base fee is accrued daily and paid monthly at an annualized rate of 0.65% of the Fund's average daily net assets. Amounts incurred and paid to VCM for the year ended July 31, 2020, are reflected on the Statement of Operations as Investment Advisory fees.
Effective July 1, 2019, no performance adjustments were made for the period beginning July 1, 2019, through June 30, 2020. Only performance beginning as of July 1, 2019, and thereafter is utilized in calculating future performance adjustments.
The performance adjustment for each share class is accrued daily and calculated monthly by comparing each class' performance to that of the Lipper Multi-Cap Value Funds Index. The Lipper Multi-Cap Value Funds Index tracks the total return performance of each class within the Lipper Multi-Cap Value Funds category.
The performance period for each share class consists of the current month plus the previous 35 months (or the number of months beginning July 1, 2019, if fewer). The following table is utilized to determine the extent of the performance adjustment:
| Over/Under Performance Relative to Index (in basis points)(a) | Annual Adjustment Rate (in basis points)(a) | ||||||
+/- 100 to 400 | +/- 4 | ||||||
+/- 401 to 700 | +/- 5 | ||||||
+/- 701 and greater | +/- 6 | ||||||
(a) Based on the difference between average annual performance of the relevant share class of the Fund and its relevant Lipper index, rounded to the nearest basis point. Average daily net assets of the share class are calculated over a rolling 36-month period.
Each class' annual performance adjustment rate is multiplied by the average daily net assets of the class over the entire performance period, which is then multiplied by a fraction, the numerator of which is the number of days in the month and the denominator of which is 365 (366 in leap years). The resulting amount is then added to (in the case of overperformance), or subtracted from (in the case of underperformance) the base fee.
Under the performance fee arrangement, each class pays a positive performance fee adjustment for a performance period whenever the class outperforms the Lipper Multi-Cap Value Funds Index over that period, even if the class has overall negative returns during the performance period.
For the period July 1, 2020 through July 31, 2020, performance adjustments for Fund Shares, Institutional Shares and Class A shares were $(29), $(8), and less than $(1) thousand, respectively. For the Fund Shares, Institutional Shares and Class A shares, the performance adjustments were less than 0.01% of net assets for all classes.
The Trust relies on an exemptive order granted to VCM and its affiliated funds by the SEC in March 2019 permitting the use of a "manager-of-managers" structure for certain funds. Under a manager-of- managers structure, the investment adviser may select (with approval of the Board and without shareholder approval) one or more subadvisers to manage the day-to-day investment of a fund's assets. For the year ended July 31, 2020, the Fund had no subadvisors.
22
USAA Mutual Funds Trust | Notes to Financial Statements — continued July 31, 2020 | ||||||
Administration and Servicing Fees:
VCM serves as the Fund's administrator and fund accountant. Under the Fund Administration, Servicing and Accounting Agreement, VCM is paid for its services an annual fee at a rate of 0.15% of average daily net assets of the Fund Shares and Class A shares and 0.10% of average daily net assets of Institutional Shares, respectively. Amounts incurred for the year ended July 31, 2020, are reflected on the Statement of Operations as Administration fees.
The Fund (as part of the Trust) has entered into an agreement to provide compliance services with the Adviser, pursuant to which the Adviser furnishes its compliance personnel, including the services of the Chief Compliance Officer ("CCO"), and other resources reasonably necessary to provide the Trust with compliance oversight services related to the design, administration and oversight of a compliance program for the Trust in accordance with Rule 38a-1 under the 1940 Act. The CCO is an employee of the Adviser, which pays the compensation of the CCO and support staff. Funds in the Trust, Victory Variable Insurance Funds, Victory Portfolios, and Victory Portfolios II (collectively, the "Victory Funds Complex") in the aggregate, compensates the Adviser for these services. Amounts incurred for the year ended July 31, 2020, are reflected on the Statement of Operations as Compliance fees.
Citi Fund Services Ohio, Inc. ("Citi"), an affiliate of Citibank, acts as sub-administrator and sub-fund accountant to the Fund pursuant to a Sub-Administration and Sub-Fund Accounting Services Agreement between VCM and Citi. VCM pays Citi a fee for providing these services. The Fund reimburses VCM and Citi for reasonable out-of-pocket expenses incurred in providing these services and certain other expenses specifically allocated to the Funds, under the Fund Administration, Servicing, and Accounting Agreement. Amounts incurred for the year ended July 31, 2020, are reflected on the Statement of Operations as Sub-Administration fees.
Transfer Agency Fees:
Victory Capital Transfer Agency, Inc. ("VCTA"), provides transfer agency services to the Fund. VCTA, an affiliate of the Adviser, provides transfer agent services to the Fund Shares based on an annual charge of $23 per shareholder account plus out-of-pocket expenses. VCTA pays a portion of these fees to certain intermediaries for the administration and servicing of accounts that are held with such intermediaries. Transfer agent's fees for Institutional Shares and Class A shares are paid monthly based on a fee accrued daily at an annualized rate of 0.10% of average daily net assets, plus out-of-pocket expenses. Amounts incurred and paid to VCTA for the year ended July 31, 2020, are reflected on the Statement of Operations as Transfer Agent fees.
FIS Investor Services LLC serves as sub-transfer agent and dividend disbursing agent for the Fund pursuant to a Sub-Transfer Agent Agreement between VCTA and FIS Investor Services LLC. VCTA provides FIS Investor Services LLC a fee for providing these services.
Distributor/Underwriting Services:
Victory Capital Services, Inc. (the "Distributor"), an affiliate of the Adviser, serves as distributor for the continuous offering of shares of the Fund pursuant to a Distribution Agreement between the Distributor and the Trust. Effective June 30, 2020, the Distributor's name was changed from Victory Capital Advisers, Inc. Pursuant to the Distribution and Service Plans adopted in accordance with Rule 12b-1 under the1940 Act, the Distributor may receive a monthly distribution and service fee, at an annual rate of up to 0.25% of the average daily net assets of Class A shares. The distribution and service fees paid to the Distributor may be used by the Distributor to pay for activity primarily intended to result in the sale of Class A shares of the Fund. Amounts incurred and paid to VCTA for the year ended July 31, 2020, are reflected on the Statement of Operations as 12b-1 fees.
In addition, the Distributor is entitled to receive commission on sales of the Class A shares of the Fund. For the fiscal year ended July 31, 2020, the Distributor didn't receive any commissions.
Other Fees:
Citibank serves as the Fund's custodian.
K&L Gates LLP provides legal services to the Trust.
23
USAA Mutual Funds Trust | Notes to Financial Statements — continued July 31, 2020 | ||||||
The Adviser has entered into an expense limitation agreement with the Fund until at least June 30, 2021. Under the terms of the agreement, the Adviser has agreed to waive fees or reimburse certain expenses to the extent that ordinary operating expenses incurred by certain classes of the Fund in any fiscal year exceed the expense limit for such classes of the Fund. Such excess amounts will be the liability of the Adviser. Interest, taxes, brokerage commissions, other expenditures, which are capitalized in accordance with GAAP, and other extraordinary expenses not incurred in the ordinary course of the Fund's business are excluded from the expense limits. As of July 31, 2020, the expense limits (excluding voluntary waivers) are 0.96%, 0.88%, and 1.27% for Fund Shares, Institutional Shares, and Class A shares, respectively.
Under this expense limitation agreement, the Fund has agreed to repay fees and expenses that were waived or reimbursed by the Adviser for a period up to three years after the fiscal year in which the waiver or reimbursement took place, subject to the lesser of any operating expense limits in effect at the time of: (a) the original waiver or expense reimbursement; or (b) the recoupment, after giving effect to the recoupment amount. As of July 31, 2020, the following amounts are available to be repaid to the Adviser (amounts in thousands). The Fund has not recorded any amounts available to be repaid as a liability due to an assessment that such repayment is not probable at July 31, 2020.
| Expires July 21, 2022 | Expires July 21, 2023 | Total | |||||||||
| $ | 3 | $ | 117 | $ | 120 | ||||||
The Adviser, may voluntarily waive or reimburse additional fees to assist the Fund in maintaining competitive expense ratios. Voluntary waivers and reimbursements applicable to the Fund are not available to be recouped at a future time. There were no voluntary waivers or reimbursements for the year ended July 31, 2020.
Certain officers and/or interested trustees of the Fund are also officers and/or employees of the Adviser, Administrator, Sub-Administrator, Sub-Fund Accountant, and Legal.
6. Risks:
The Fund may be subject to other risks in addition to these identified risks.
Global economies and financial markets are increasingly interconnected, which increases the possibilities that conditions in one country or region might adversely affect issuers in another country or region. Geopolitical and other risks, including war, terrorism, trade disputes, political or economic dysfunction within some nations, public health crises and related geopolitical events, as well as environmental disasters such as earthquakes, fires, and floods, may add to instability in world economies and markets generally. Changes in trade policies and international trade agreements could affect the economies of many countries in unpredictable ways. Epidemics and/or pandemics, such as the coronavirus (or COVID-19), may result in, among other things, closing borders, disruptions to healthcare service preparation and delivery, quarantines, cancellations, disruptions to supply chains and consumer activity, as well as general concern and uncertainty. The impact may be short-term or may last for extended periods.
The COVID-19 pandemic, which has spread rapidly across the world, has led and will continue to lead for an unknown period of time to disruptions in local, regional, national and global markets and economies. Among other things, the outbreak has resulted in, and until fully resolved is likely to continue to result in, among other things (1) government imposition of various forms of "stay at home" orders and the closing of "non-essential" businesses, resulting in significant disruption to the businesses of many issuers as well as lay-offs of employees: (2) increased requests by issuers of debt instruments for amendments and waivers of agreements to avoid default and increased defaults: (3) volatility and disruption of markets, including greater volatility in pricing and spreads; and (4) rapidly evolving proposals and/or actions by state and federal governments to address problems being experienced by the markets and by businesses and the economy in general.
Overall stock market risks may affect the value of the Fund. Domestic and international factors such as political events, war, trade disputes, interest rate levels and other fiscal and monetary policy changes,
24
USAA Mutual Funds Trust | Notes to Financial Statements — continued July 31, 2020 | ||||||
pandemics and other public health crises, and related geopolitical events, as well as environmental disasters such as earthquakes, fires, and floods, may add to instability in world economies and markets generally. The impact of these and other factors may be short-term or may last for extended periods.
The value of the equity securities in which the Fund invests may decline in response to developments affecting individual companies and/or general economic conditions. A company's earnings or dividends may not increase as expected due to poor management decisions, competitive pressures, breakthroughs in technology, reliance on suppliers, labor problems or shortages, corporate restructurings, fraudulent disclosures, natural disasters, military confrontations, war, terrorism, public health crises, or other events, conditions, and factors. Price changes may be temporary or last for extended periods.
Foreign markets can be more volatile than the U.S. market due to increased risks of adverse issuer, political, regulatory, market, or economic developments and can perform differently from the U.S. market.
7. Borrowing and Interfund Lending:
Line of Credit:
For the year ended July 31, 2020, the Victory Funds Complex participated in a short-term demand note "Line of Credit" agreement with Citibank. The Line of Credit agreement with Citibank was renewed on June 29, 2020 with a termination date of June 28, 2021. Under the agreement with Citibank, the Victory Funds Complex may borrow up to $600 million, of which $300 million is committed and $300 million is uncommitted. $40 million of the Line of Credit is reserved for use by the Victory Floating Rate Fund (herein, the "Fund"), another series of the Victory Funds Complex, with that Fund paying the related commitment fees for that amount. The purpose of the agreement is to meet temporary or emergency cash needs. For the year ended July 31, 2020, Citibank received an annual commitment fee of 0.15% on $300 million for providing the Line of Credit. Each fund in the Victory Funds Complex pays a pro-rata portion of the commitment fees plus any interest (one month LIBOR plus one percent) on amounts borrowed. Effective June 29, 2020, under an amended Line of Credit agreement, Citibank will also receive an annual upfront fee of 0.10% on the $300 million committed line of credit. Each fund in the Victory Funds Complex will pay a pro-rata portion of the upfront fee. Interest charged to each Fund during the period, if applicable, is reflected on the Statements of Operations under Line of credit fees.
The Fund had no borrowings under the Line of Credit agreement during the year ended July 31, 2020.
Interfund Lending:
The Trust and Adviser rely on an exemptive order granted by the SEC in March 2017 (the "Order"), permitting the establishment and operation of an Interfund Lending Facility (the "Facility"). The Facility allows the Fund to directly lend and borrow money to or from any other Fund in the Victory Funds Complex relying upon the Order at rates beneficial to both the borrowing and lending funds. Advances under the Facility are allowed for temporary or emergency purposes. The interfund loan rate is determined, as specified in the Order, by averaging the current repurchase agreement rate and the current bank loan rate. As a Borrower, interest charged to the Fund, if any, during the period is reflected on the Statement of Operations under Interfund lending fees. As a Lender, interest earned by the Fund, if any, during the period is reflected on the Statement of Operations under Income on Interfund lending.
The Fund did not utilize or participate in the Facility during the year ended July 31, 2020.
8. Federal Income Tax Information:
The Fund intends to distribute any net investment income annually. Distributable net realized gains, if any, are declared and paid at least annually.
The amounts of dividends from net investment income and distributions from net realized gains (collectively distributions to shareholders) are determined in accordance with federal income tax regulations, which may differ from GAAP. To the extent these "book/tax" differences are permanent in
25
USAA Mutual Funds Trust | Notes to Financial Statements — continued July 31, 2020 | ||||||
nature (e.g., net operating loss and distribution reclassification), such amounts are reclassified within the components of net assets based on their federal tax-basis treatment; temporary differences (e.g., wash sales) do not require reclassification. To the extent dividends and distributions exceed net investment income and net realized gains for tax purposes, they are reported as distributions of capital. Net investment losses incurred by the Fund may be reclassified as an offset to capital on the accompanying Statement of Assets and Liabilities.
The following permanent reclassifications were made between capital accounts to reflect the portion of the payments made to redeeming shareholders that was claimed as a distribution for income tax purposes during the year ended July 31, 2020 (amounts in thousands):
| Total accumulated earnings/(loss) | Capital | ||||||
| $ | 1 | $ | (1 | ) | |||
The tax character of distributions paid during the tax years ended as noted below, were as follows (total distributions paid may differ from the Statements of Changes in Net Assets because, for tax purposes, dividends are recognized when actually paid) (amounts in thousands).
Year Ended July 31, 2020 | Year Ended July 31, 2019 | ||||||||||||||||||||||||||
Distributions paid from | Distributions paid from | ||||||||||||||||||||||||||
Ordinary Income | Net Long-Term Capital Gains | Total Distributions Paid | Ordinary Income* | Net Long-Term Capital Gains | Total Distributions Paid | ||||||||||||||||||||||
| $ | 18,889 | $ | 264,549 | $ | 283,438 | $ | 17,180 | $ | 141,822 | $ | 159,002 | ||||||||||||||||
* Includes short-term realized capital gains, if any, which are taxable as ordinary income.
As of July 31, 2020, the components of accumulated earnings (loss) on a tax basis were as follows (amounts in thousands):
| Undistributed Ordinary Income | Accumulated Earnings | Accumulated Capital and Other Losses | Unrealized Appreciation (Depreciation)* | Total Accumulated Earnings (Loss) | |||||||||||||||
| $ | 11,694 | $ | 11,694 | $ | (80,719 | ) | $ | (4,361 | ) | $ | (73,386 | ) | |||||||
* The difference between the book-basis and tax-basis of unrealized appreciation/depreciation is attributable primarily to tax deferral of losses on wash sales and passive foreign investment company adjustments.
At July 31, 2020, the Fund had net capital loss carryforwards as shown in the table below (amounts in thousands). It is unlikely that the Board will authorize a distribution of capital gains realized in the future until the capital loss carryforwards have been used.
| Short-Term Amount | Total | ||||||
| $ | 80,719 | $ | 80,719 | ||||
As of July 31, 2020, the cost basis for federal income tax purposes, gross unrealized appreciation, gross unrealized depreciation, and net unrealized appreciation (depreciation) for investments were as follows (amounts in thousands):
| Cost of Investments for Federal Tax Purposes | Gross Unrealized Appreciation | Gross Unrealized Depreciation | Net Unrealized Appreciation (Depreciation) | ||||||||||||
| $ | 927,832 | $ | 88,046 | $ | (92,407 | ) | $ | (4,361 | ) | ||||||
26
REPORT OF INDEPENDENT REGISTERED PUBLIC ACCOUNTING FIRM
To the Shareholders and the Board of Trustees of USAA Value Fund
Opinion on the Financial Statements
We have audited the accompanying statement of assets and liabilities of USAA Value Fund (the "Fund") (one of the funds constituting USAA Mutual Funds Trust (the "Trust")), including the schedule of portfolio investments, as of July 31, 2020, and the related statement of operations for the year then ended, the statements of changes in net assets for each of the two years in the period then ended, the financial highlights for each of the five years in the period then ended and the related notes (collectively referred to as the "financial statements"). In our opinion, the financial statements present fairly, in all material respects, the financial position of the Fund (one of the funds constituting USAA Mutual Funds Trust) at July 31, 2020, the results of its operations for the year then ended, the changes in its net assets for each of the two years in the period then ended and its financial highlights for each of the five years in the period then ended, in conformity with U.S. generally accepted accounting principles.
Basis for Opinion
These financial statements are the responsibility of the Trust's management. Our responsibility is to express an opinion on the Fund's financial statements based on our audits. We are a public accounting firm registered with the Public Company Accounting Oversight Board (United States) ("PCAOB") and are required to be independent with respect to the Trust in accordance with the U.S. federal securities laws and the applicable rules and regulations of the Securities and Exchange Commission and the PCAOB.
We conducted our audits in accordance with the standards of the PCAOB. Those standards require that we plan and perform the audit to obtain reasonable assurance about whether the financial statements are free of material misstatement, whether due to error or fraud. The Trust is not required to have, nor were we engaged to perform, an audit of the Trust's internal control over financial reporting. As part of our audits we are required to obtain an understanding of internal control over financial reporting, but not for the purpose of expressing an opinion on the effectiveness of the Trust's internal control over financial reporting. Accordingly, we express no such opinion.
Our audits included performing procedures to assess the risks of material misstatement of the financial statements, whether due to error or fraud, and performing procedures that respond to those risks. Such procedures included examining, on a test basis, evidence regarding the amounts and disclosures in the financial statements. Our procedures included confirmation of securities owned as of July 31, 2020, by correspondence with the custodian and brokers or by other appropriate auditing procedures where replies from brokers were not received. Our audits also included evaluating the accounting principles used and significant estimates made by management, as well as evaluating the overall presentation of the financial statements. We believe that our audits provide a reasonable basis for our opinion.

We have served as the auditor of one or more Victory Capital investment companies since 1995.
San Antonio, Texas
September 29, 2020
27
USAA Mutual Funds Trust | Supplemental Information July 31, 2020 | ||||||
(Unaudited)
Trustee and Officer Information
Board of Trustees:
Overall responsibility for management of the Trust rests with the Board. The Trust is managed by the Board in accordance with the laws of the state of Delaware. There are currently 10 Trustees, eight of whom are not "interested persons" of the Trust within the meaning of that term under the 1940 Act ("Independent Trustees") and two of whom is an "interested person" of the Trust within the meaning of that term under the 1940 Act ("Interested Trustee"). The Trustees, in turn, elect the officers of the Trust to actively supervise its day-to-day operations.
The following tables list the Trustees, their ages, position with the Trust, commencement of service, principal occupations during the past five years and any directorships of other investment companies or companies whose securities are registered under the Securities Exchange Act of 1934, as amended, or who file reports under that Act. Each Trustee oversees 47 portfolios in the Trust. Each Trustee's address is 15935 La Cantera Pkwy, Building Two, San Antonio, TX, 78256. Pursuant to a policy adopted by the Board, the term of office for each Trustee shall be until the Independent Trustee reaches age 75 or an Interested Trustee reaches age 75. The Board may change or grant exceptions from this policy at any time without shareholder approval. A Trustee may resign or be removed by a vote of the other Trustees or the holders of a majority of the outstanding shares of the Trust at any time. Vacancies on the Board can be filled by the action of a majority of the Trustees, provided that after filling such vacancy at least two-thirds of the Trustees have been elected by the shareholders.
Name and Date of Birth | Position Held with the Trust | Year Commenced Service | Principal Occupation During Past 5 Years | Other Directorships Held During Past 5 Years | |||||||||||||||
Independent Trustees. | |||||||||||||||||||
| Jefferson C. Boyce, Born September 1957 | Lead Independent Trustee, and Vice Chairman | 2013 | Senior Managing Director, New York Life Investments, LLC (1992-2012) | Westhab, Inc. | |||||||||||||||
| John C. Walters, Born February 1962 | Trustee | 2019 | Retired. Mr. Walters brings significant Board experience including active involvement with the board of a Fortune 500 company, and a proven record of leading large, complex financial organizations. He has a demonstrated record of success in distribution, manufacturing, investment brokerage, and investment management in both the retail and institutional investment businesses. He has substantial experience in the investment management business with a demonstrated ability to develop and drive strategy while managing operation, financial, and investment risk. | Guardian Variable Products Trust (16 series), Lead Independent Director; Amerilife Holdings LLC, Director; Stadion Money Management; Director; University of North Carolina (Chapel Hill), Member Board of Governors. | |||||||||||||||
28
USAA Mutual Funds Trust | Supplemental Information — continued July 31, 2020 | ||||||
(Unaudited)
Name and Date of Birth | Position Held with the Trust | Year Commenced Service | Principal Occupation During Past 5 Years | Other Directorships Held During Past 5 Years | |||||||||||||||
| Robert L. Mason, Ph.D., Born July 1946 | Trustee | 1997 | Adjunct Professor in the Department of Management Science and Statistics in the College of Business at the University of Texas at San Antonio (since 2001); Institute Analyst, Southwest Research Institute (March 2002-January 2016) | None | |||||||||||||||
| Dawn M. Hawley, Born February 1954 | Trustee | 2014 | Manager of Finance, Menil Foundation, Inc. (May 2007-June 2011), which is a private foundation that oversees the assemblage of sculptures, prints, drawings, photographs, and rare books. Director of Financial Planning and Analysis and Chief Financial Officer, AIM Management Group, Inc. (October 1987-January 2006) | None | |||||||||||||||
| Paul L. McNamara, Born July 1948 | Trustee | 2012 | Director, Cantor Opportunistic Alternatives Fund, LLC (March 2010-February 2014) , which is a closed-end fund of funds by Cantor Fitzgerald Investment Advisors, LLC | None | |||||||||||||||
29
USAA Mutual Funds Trust | Supplemental Information — continued July 31, 2020 | ||||||
(Unaudited)
Name and Date of Birth | Position Held with the Trust | Year Commenced Service | Principal Occupation During Past 5 Years | Other Directorships Held During Past 5 Years | |||||||||||||||
| Richard Y. Newton III, Born January 1956 | Trustee | 2017 | Director, Elta North America (01/18-present), which is a global leader in the design, manufacture, and support of innovative electronic systems in the ground, maritime, airborne, and security domains for the nation's warfighters, security personnel, and first responders; Managing Partner, Pioneer Partnership Development Group (December 2015-present)); Executive Director, The Union League Club of New York (June 2014-November 2015): Executive Vice President, Air Force Association (August 2012-May 2014); Lieutenant General, United States Air Force (January 2008-June 2012) | None | |||||||||||||||
| Barbara B. Ostdiek, Ph.D., Born March 1964 | Trustee | 2008 | Senior Associate Dean of Degree Programs at Jesse H. Jones Graduate School of Business at Rice University (since 2013); Associate Professor of Finance at Jessie H. Jones Graduate School of Business at Rice University (since 2001) | None | |||||||||||||||
| Michael F. Reimherr, Born August 1945 | Trustee | 2000 | President of Reimherr Business Consulting (May 1995-December 2017); St. Mary's University Investment Committee overseeing University Endowment (since 2014) | None | |||||||||||||||
30
USAA Mutual Funds Trust | Supplemental Information — continued July 31, 2020 | ||||||
(Unaudited)
Name and Date of Birth | Position Held with the Trust | Year Commenced Service | Principal Occupation During Past 5 Years | Other Directorships Held During Past 5 Years | |||||||||||||||
Interested Trustees. | |||||||||||||||||||
| David C. Brown, ** Born May 1972 | Trustee | 2019 | Chairman and Chief Executive Officer (since 2013), Co-Chief Executive Officer (2011-2013), Victory Capital Management Inc.; Chairman and Chief Executive Officer, Victory Capital Holdings, Inc. (since 2013). Mr. Brown brings to the Board extensive business, finance and leadership skills gained and developed through years of experience in the financial services industry, including his tenure overseeing the strategic direction as CEO of Victory Capital. These skills, combined with Mr. Brown's extensive knowledge of the financial services industry and demonstrated success in the development and distribution of investment strategies and products, enable him to provide valuable insights to the Board and strategic direction for the Funds | Trustee, Victory Portfolios (42 series), Victory Portfolios II (26 series), Victory Variable Insurance Funds (9 series) | |||||||||||||||
31
USAA Mutual Funds Trust | Supplemental Information — continued July 31, 2020 | ||||||
(Unaudited)
Name and Date of Birth | Position Held with the Trust | Year Commenced Service | Principal Occupation During Past 5 Years | Other Directorships Held During Past 5 Years | |||||||||||||||
| Daniel S. McNamara, ** Born June 1966 | Trustee and Chair of the Board of Trustees | 2012 | Trustee, President, and Vice Chairman of USAA ETF Trust (June 2017-June 2019); President of Financial Advice & Solutions Group (FASG), USAA (since 2013); Director, Investment Management Company (IMCO) (September 2009-April 2014); President, Asset Management Company (AMCO) (August, 2011-April 2013); Senior Vice President of USAA Financial Planning Services Insurance Agency, Inc. (FPS) (since 2011); Director of USAA IMCO (since 2009); Chairman of Board of IMCO (since 2013); Director of AMCO (August 2011-June 2019); President and Director of USAA Shareholder Account Services (SAS) (October 2009-June 2019); Director and Vice Chairman of FPS (since 2013); President and Director of USAA Investment Corporation (ICORP) (since 2010); Chairman of Board of ICORP (since 2013); Director of USAA Financial Advisors, Inc. (FAI) (since 2013); Chairman of Board of FAI (since 2015). Mr. McNamara brings to the Board extensive experience in the financial services industry, including experience as an officer of the Trust. | None | |||||||||||||||
** Mr. Dan McNamara, the Chairman of the Board, is deemed an "interested person" due to his previous position as Director of AMCO, the former investment adviser of the Funds. Mr. Brown is deemed an "interested person" due to his position as Chief Executive Officer of Victory Capital, investment adviser to the Funds.
The Statement of Additional Information includes additional information about the Trustees of the Trust and is available, without charge, on the SEC's website at www.sec.gov and/or by calling (800)-539-3863.
32
USAA Mutual Funds Trust | Supplemental Information — continued July 31, 2020 | ||||||
(Unaudited)
Officers:
The officers of the Trust, their ages, commencement of service and their principal occupations during the past five years, are detailed in the following table. Each officer serves until the earlier of his or her resignation, removal, retirement, death, or the election of a successor. The mailing address of each officer of the Trust is 15935 La Cantera Pkwy, Building Two, San Antonio, TX, 78256. The officers of the Trust receive no compensation directly from the Trust for performing the duties of their offices.
Name and Date of Birth | Position with the Trust | Year Commenced Service | Principal Occupation During Past 5 Years | ||||||||||||
Interested Officers.
| Christopher K. Dyer, Born February 1962 | President | 2019 | Director of Fund Administration, Victory Capital (2004-present) | ||||||||||||
| Scott A Stahorsky, Born July 1969 | Vice President | 2019 | Manager, Fund Administration, Victory Capital (since 2015); Senior Analyst, Fund Administration, Victory Capital (prior to 2015) | ||||||||||||
| James K. De Vries, Born April 1969 | Treasurer, Principal Financial Officer | 2018 | Executive Director, Victory Capital Management Inc. (since 2019); Treasurer, USAA ETF Trust (September 2018-June 2019); Executive Director, Investment and Financial Administration, USAA (April 2012-June 2019); Assistant Treasurer, USAA ETF Trust (June 2017-September 2018); Assistant Treasurer, USAA Mutual Funds Trust (December 2013-February 2018) | ||||||||||||
| Allan Shaer, Born March 1965 | Assistant Treasurer | 2019 | Senior Vice President, Financial Administration, Citi Fund Services Ohio, Inc. (since 2016); Vice President, Mutual Fund Administration, JP Morgan Chase (2011-2016) | ||||||||||||
| Carol D. Trevino, Born October 1965 | Assistant Treasurer | 2018 | Director, Accounting and Finance, Victory Capital Management Inc. (since 2019); Accounting/Financial Director, USAA (December 2013-June 2019); Assistant Treasurer, USAA ETF Trust (September 2018-June 2019). | ||||||||||||
| Erin G. Wagner, Born February 1974 | Secretary | 2019 | Deputy General Counsel, the Adviser (since 2013) | ||||||||||||
| Charles Booth, Born April 1960 | Anti-Money Laundering Compliance Officer and Identity Theft Officer | 2019 | Director, Regulatory Administration and CCO Support Services, Citi Fund Services Ohio, Inc. (2007-present) | ||||||||||||
| Amy Campos, Born July 1976 | Chief Compliance Officer | 2019 | Chief Compliance Officer, USAA Mutual Funds Trust (since 2019); Executive Director, Deputy Chief Compliance Officer, USAA Mutual Funds Trust and USAA ETF Trust (July 2017-June 2019); Compliance Director, USAA Mutual Funds Trust (2014-July 2017) | ||||||||||||
33
USAA Mutual Funds Trust | Supplemental Information — continued July 31, 2020 | ||||||
(Unaudited)
Proxy Voting and Portfolio Holdings Information
Proxy Voting:
Information regarding the policies and procedures the Fund uses to determine how to vote proxies relating to portfolio securities is available without charge, upon request, by calling (800) 539-3863. The information is also included in the Fund's Statement of Additional Information, which is available on the SEC's website at www.sec.gov.
Information relating to how the Fund voted proxies relating to portfolio securities held during the most recent 12 months ended June 30 is available on the SEC's website at www.sec.gov.
Availability of Schedules of Portfolio Investments:
The Trust files a complete list of Schedules of Portfolio Investments with the SEC for the first and third quarter of each fiscal year on Form N-PORT. Forms N-PORT are available on the SEC's website at www.sec.gov.
Expense Examples
As a shareholder of the Fund, you may incur two types of costs: (1) transaction costs, and (2) ongoing costs, including management fees and other Fund expenses. These examples are intended to help you understand your ongoing costs (in dollars) of investing in the Fund and to compare these costs with the ongoing costs of investing in other mutual funds.
These examples are based on an investment of $1,000 invested at the beginning of the period and held for the entire period from February 1, 2020 through July 31, 2020.
The Actual Expense figures in the table below provide information about actual account values and actual expenses. You may use the information below, together with the amount you invested, to estimate the expenses that you paid over the period. Simply divide your account value by $1,000 (for example, an $8,600 account value divided by $1,000 = 8.6), then multiply the result by the number in the table under the heading entitled "Actual Expenses Paid During Period" to estimate the expenses you paid on your account during this period.
The Hypothetical Expense figures in the table below provide information about hypothetical account values and hypothetical expenses based on the Fund's actual expense ratio and an assumed rate of return of 5% per year before expenses, which is not the Fund's actual return. The hypothetical account values and expenses may not be used to estimate the actual ending account balance or expenses you paid for the period. You may use this information to compare this 5% hypothetical example with the 5% hypothetical examples that appear in shareholder reports of other funds.
Please note the expenses shown in the table below are meant to highlight your ongoing costs only and do not reflect any transactional costs. If these transactional costs were included, your costs would have been higher.
| Beginning Account Value 2/1/20 | Actual Ending Account Value 7/31/20 | Hypothetical Ending Account Value 7/31/20 | Actual Expenses Paid During Period 2/1/20- 7/31/20* | Hypothetical Expenses Paid During Period 2/1/20- 7/31/20* | Annualized Expense Ratio During Period 2/1/20- 7/31/20 | ||||||||||||||||||||||
Fund Shares | $ | 1,000.00 | $ | 872.10 | $ | 1,020.24 | $ | 4.33 | $ | 4.67 | 0.93 | % | |||||||||||||||
Institutional Shares | 1,000.00 | 872.20 | 1,020.64 | 3.96 | 4.27 | 0.85 | % | ||||||||||||||||||||
| Class A shares | 1,000.00 | 871.40 | 1,019.19 | 5.30 | 5.72 | 1.14 | % | ||||||||||||||||||||
* Expenses are equal to the average account value multiplied by the Fund's annualized expense ratio multiplied by 182/366 (the number of days in the most recent fiscal half-year divided by the number of days in the fiscal year).
34
USAA Mutual Funds Trust | Supplemental Information — continued July 31, 2020 | ||||||
(Unaudited)
Additional Federal Income Tax Information
The following federal tax information related to the Fund's fiscal year ended July 31, 2020, is provided for information purposes only and should not be used for reporting to federal or state revenue agencies. Federal tax information for the calendar year will be reported to you on Form 1099-DIV in January 2021.
With respect to distributions paid, the Fund designates the following amounts (or, if subsequently determined to be different, the maximum amount allowable) for the fiscal year ended July 31, 2020 (amounts in thousands):
| Dividend Received Deduction (corporate shareholders)* | Qualified Dividend Income (non-corporate shareholders)* | Short-Term Capital Gains Distributions | Long-Term Capital Gains Distributions(a) | ||||||||||||||||
100.00 | % | 31.66 | % | $ | 2,793 | $ | 264,549 | ||||||||||||
* Presented as a percentage of net investment income and excludes short-term capital gain distributions paid, if any. All or a portion of these amounts may be exempt from taxation at the state level.
(a) Pursuant to Section 852 of the Internal Revenue Code.
35
USAA Mutual Funds Trust | Supplemental Information — continued July 31, 2020 | ||||||
(Unaudited)
Liquidity Risk Management Program
The USAA Mutual Funds have adopted and implemented a written liquidity risk management program (the "LRMP") as required by Rule 22e-4 under the 1940 Act, as amended. The LRMP is reasonably designed to assess and manage the Fund's liquidity risk, taking into consideration the Fund's investment strategy and the liquidity of its portfolio investments during normal and reasonably foreseeable stressed market conditions; its short and long-term cash flow projections; and its cash holdings and access to other liquidity management tools such as available funding sources including the Victory Funds Complex Interfund Lending Facility and Line of Credit (discussed in the Notes to Financial Statements). The USAA Mutual Funds' Board of Trustees approved the appointment of the Fund's investment adviser, Victory Capital Management Inc. ("Victory Capital") as the administrator of the LRMP. At an in-person meeting held on February 26, 2020, Victory Capital provided an oral and written report to the Trustees on the operation and effectiveness of the LRMP during the previous year.
Victory Capital manages liquidity risks associated with the Fund's investments by monitoring, among other things, cash and cash equivalents, any use of derivatives, the concentration of investments, the appropriateness of the Fund's investment strategy, and by classifying every fund investment as either highly liquid, moderately liquid, less liquid or illiquid on at least a monthly basis. To assist with the classification of Fund investments, Victory Capital has retained a third-party provider of liquidity evaluation services. This provider determines preliminary liquidity classifications for all portfolio holdings based upon portfolio-level data and certain assumptions provided by Victory Capital. Victory Capital reviews the preliminary liquidity classifications, and, when appropriate, considers other information including input from the Fund's portfolio managers (including the portfolio managers employed by any investment sub-advisers) in determining final liquidity classifications.
The report from Victory Capital concluded that the Fund did not experience any significant liquidity challenges during the covered period, and the Fund's LRMP is reasonably designed to assess and manage its liquidity risk. The report also concluded that the LRMP continues to operate adequately and effectively to enable Victory Capital to oversee and manage liquidity risk and ensure the Fund is able to meet redemption requests without significant dilution to the remaining investors' interest in the Fund. During the review period, the Fund's portfolio consisted primarily of highly liquid investments, which are defined as cash and any investments reasonably expected to be converted to cash in current market conditions in three business days or less without significantly changing the market value of the investment. Therefore, the Fund has not adopted a Highly Liquid Investment Minimum. The Fund's investments were below the limitation on illiquid investments during the review period. Additionally, Victory Capital indicated that no events occurred that would require the filing of Form N-LIQUID and recommended no material changes to the LRMP.
36
Privacy Policy
Protecting the Privacy of Information
The Trust respects your right to privacy. We also know that you expect us to conduct and process your business in an accurate and efficient manner. To do so, we must collect and maintain certain personal information about you. This is the information we collect from you on applications or other forms, and from the transactions you make with us or third parties. It may include your name, address, social security number, account transactions and balances, and information about investment goals and risk tolerance.
We do not disclose any information about you or about former customers to anyone except as permitted or required by law. Specifically, we may disclose the information we collect to companies that perform services on our behalf, such as the transfer agent that processes shareholder accounts and printers and mailers that assist us in the distribution of investor materials. We may also disclose this information to companies that perform marketing services on our behalf. This allows us to continue to offer you Victory investment products and services that meet your investing needs, and to effect transactions that you request or authorize. These companies will use this information only in connection with the services for which we hired them. They are not permitted to use or share this information for any other purpose.
To protect your personal information internally, we permit access only by authorized employees and maintain physical, electronic and procedural safeguards to guard your personal information.*
* You may have received communications regarding information about privacy policies from other financial institutions which gave you the opportunity to "opt-out" of certain information sharing with companies which are not affiliated with that financial institution. The Trust does not share information with other companies for purposes of marketing solicitations for products other than the Trust. Therefore, the Trust does not provide opt-out options to their shareholders.
P.O. Box 182593
Columbus, Ohio 43218-2593

Visit our website at: | Call | ||||||
vcm.com | (800 | ) 235-8396 | |||||
40846-0920
Item 2. Code of Ethics.
| (a) | The registrant has adopted a code of ethics that applies to the registrant’s principal executive officer, principal financial officer, principal accounting officer or controller, or persons performing similar functions. This code of ethics in included as an Exhibit. |
| (b) | During the period covered by the report, with respect to the registrant’s code of ethics that applies to its principal executive officer, principal financial officer, principal accounting officer or controller, or persons performing similar functions; on July 1, 2019, the Board of Trustees of USAA Mutual Funds Trust approved a Code of Ethics ("Sarbanes Code") applicable solely to its senior financial officers, including its principal executive officer (President), as defined under the Sarbanes-Oxley Act of 2002 and implementing regulations of the Securities and Exchange Commission. A copy of the Sarbanes Code is attached as an Exhibit to this Form N-CSR. |
No waivers (explicit or implicit) have been granted from a provision of the Sarbanes Code.
Item 3. Audit Committee Financial Expert.
(a)(1) The registrant’s board of trustees has determined that the registrant has at least one audit committee financial expert serving on its audit committee.
(a)(2) The audit committee financial experts are Dr. Barbara B. Ostdiek, Ph.D. and Dawn M. Hawley, who are “independent” for purposes of this Item 3 of Form N-CSR.
Dr. Ostdiek has served as an Associate Professor of Management at Rice University since 2001. Dr. Ostdiek also has served as an Academic Director at El Paso Corporation Finance Center since 2002. Ms. Hawley was Chief Financial Officer, Director of Financial Planning and Analysis for AIM Management Group Inc. from October 1987 through January 2006 and was Manager of Finance at Menil Foundation, Inc. from May 2007 through June 2011. Each of Dr. Ostdiek and Ms. Hawley is an independent trustee who serves as a member of the Audit and Compliance Committee, Investments Committee, Product Management and Distribution Committee, and the Corporate Governance Committee of the Board of Trustees of USAA Mutual Funds Trust.
Item 4. Principal Accountant Fees and Services.
| 2020 | 2019 | |||||||
| (a) Audit Fees (1) | $ | 373,405 | $ | 463,500 | ||||
| (b) Audit-Related Fees (2) | - | - | ||||||
| (c) Tax Fees (3) | 45,401 | 37,733 | ||||||
| (d) All Other Fees (4) | - | - | ||||||
(1) Audit fees include amounts related to the audit of the Registrant’s annual financial statements and services normally provided by the accountant in connection with statutory and regulatory filings. Audit fees billed were for professional services provided by Ernst & Young LLP for statutory and regulatory filings.
(2) For the fiscal years ended July 31, 2020 and July 31, 2019, there were no audit-related fees billed by Ernst & Young LLP to the Registrant.
(3) Represents the aggregate tax fee billed for professional services rendered by Ernst & Young LLP for assistance with PFIC Analyzer Service and tax consulting services.
(4) For the fiscal years ended July 31, 2020 and July 31, 2019, there were no other fees billed by Ernst & Young LLP to the Registrant.
(e)(1) All audit and non-audit services to be performed for the Registrant by Ernst & Young LLP must be pre-approved by the Audit and Compliance Committee. The Audit and Compliance Committee Charter also permits the Chair of the Audit and Compliance Committee to pre-approve any permissible non-audit service that must be commenced prior to a scheduled meeting of the Audit and Compliance Committee. All non-audit services were pre-approved by the Audit and Compliance Committee or its Chair, consistent with the Audit and Compliance Committee's preapproval procedures.
(e)(2) There were no services performed under Rule 2.01 (c)(7)(i)(C).
(f) Not applicable.
(g) Aggregate non-audit fees for services rendered to the:
| Registrant | Adviser | |||||||
| 2020 | $ | 45,401 | $ | 129,964 | ||||
| 2019 | $ | 37,733 | $ | 151,735 | ||||
(h) The aggregate non-audit fees related to fees billed by Ernst & Young LLP for services rendered to the Registrant; the investment adviser, USAA Asset Management Company (AMCO) and its affiliate, USAA Investment Management Company (IMCO); and the Funds' transfer agent, Victory Capital Transfer Agency Inc. and prior transfer agent, USAA Shareholder Account Services (SAS), which includes aggregate fees accrued or paid to Ernst & Young, LLP for professional services rendered related to the annual study of internal controls of the transfer agent for fiscal years listed above. All services were preapproved by the Audit Committee.
Effective July 1, 2019, AMCO, the prior investment adviser to the Funds, and SAS, the prior transfer agent to the Funds, were acquired by Victory Capital Holdings, Inc. Effective July 1, 2019, Victory Capital Management Inc. is the new investment adviser and administrator to the Funds; SAS was renamed Victory Capital Transfer Agency, Inc. and is the new transfer agent to the Funds.
Ernst & Young LLP provided non-audit services to AMCO and IMCO in 2020 and 2019 and also provided certain tax services to Victory Capital Holdings, Inc. in 2019 that were not required to be pre-approved by the Registrant's Audit and Compliance Committee because the services were not directly related to the operations of the Registrant's Funds. The Board of Trustees will consider Ernst & Young LLP's independence and will consider whether the provision of these non-audit services to AMCO is compatible with maintaining Ernst & Young LLP's independence.
| Item 5. | Audit Committee of Listed Registrants. |
Not applicable.
| Item 6. | Investments. |
(a) Not applicable.
(b) Not applicable.
Item 7. Disclosure of Proxy Voting Policies and Procedures for Closed-End Management Investment Companies.
Not applicable.
Item 8. Portfolio Managers of Closed-End Management Investment Companies.
Not applicable.
Item 9. Purchases of Equity Securities by Closed-End Management Investment Company and Affiliated Purchasers.
Not applicable.
Item 10. Submission of Matters to a Vote of Security Holders.
The Corporate Governance Committee selects and nominates candidates for membership on the Board as independent trustees. The Corporate Governance Committee has adopted procedures to consider Board candidates suggested by shareholders. The procedures are initiated by the receipt of nominations submitted by a fund shareholder sent to Board member(s) at the address specified in fund disclosure documents or as received by the Adviser or a fund officer. Any recommendations for a nomination by a shareholder, to be considered by the Board, must include at least the following information: name; date of birth; contact information; education; business profession and other expertise; affiliations; experience relating to serving on the Board; and references. The Corporate Governance Committee gives shareholder recommendations the same consideration as any other candidate.
Item 11. Controls and Procedures.
(a)The registrant’s principal executive officer and principal financial officer have concluded, based on their evaluation of the registrant's disclosure controls and procedures as conducted within 90 days of the filing date of this report, that these disclosure controls and procedures are adequately designed and are operating effectively to ensure that information required to be disclosed by the registrant on Form N-CSR is recorded, processed, summarized and reported within the time periods specified in the Securities and Exchange Commission's rules and forms.
(b)There were no changes in the registrant’s internal control over financial reporting (as defined in Rule 30a-3(d) under the Investment Company Act of 1940 (17 CFR 270.30a-3(d)) that occurred during the period covered by this report that have materially affected or are reasonably likely to materially affect, the registrant’s internal control over financial reporting.
Item 12. Disclosure of Securities Lending Activities for Closed-End Management Investment Companies.
(a)(1) Not applicable.
(a)(2) Not applicable.
(a)(3) Not applicable.
(a)(4) Not applicable.
(b) Not applicable.
Item 13. Exhibits.
(a)(2) Certifications pursuant to Rule 30a-2(a) are attached hereto.
(a)(3) Not applicable.
(a)(4) Not applicable.
(b) Certifications pursuant to Rule 30a-2(b) are attached hereto.
SIGNATURES
Pursuant to the requirements of the Securities Exchange Act of 1934 and the Investment Company Act of 1940, the registrant has duly caused this report to be signed on its behalf by the undersigned, thereunto duly authorized.
(Registrant) USAA Mutual Fund Trust
By (Signature and Title)* /s/ James K. De Vries
James K. De Vries, Principal Financial Officer
Date October 8, 2020
Pursuant to the requirements of the Securities Exchange Act of 1934 and the Investment Company Act of 1940, this report has been signed below by the following persons on behalf of the registrant and in the capacities and on the dates indicated.
By (Signature and Title)* /s/ Christopher K. Dyer
Christopher K. Dyer, Principal Executive Officer
Date October 8, 2020
By (Signature and Title)* /s/ James K. De Vries
James K. De Vries, Principal Financial Officer
Date October 8, 2020