UNITED STATES
SECURITIES AND EXCHANGE COMMISSION
Washington, D.C. 20549
FORM N-CSR
CERTIFIED SHAREHOLDER REPORT OF REGISTERED
MANAGEMENT INVESTMENT COMPANIES
Investment Company Act file number: 811-07852
USAA Mutual Funds Trust
(Exact name of registrant as specified in charter)
| 15935 La Cantera Pkwy, Building Two, San Antonio, Texas | 78256 | ||
| (Address of principal executive offices) | (Zip code) |
Citi Fund Services Ohio, Inc., 4400 Easton Commons, Suite 200, Columbus, OH 43219
(Name and address of agent for service)
Registrant’s telephone number, including area code: 800-235-8396
Date of fiscal year end: May 31
Date of reporting period: November 30, 2020
Item 1. Reports to Stockholders.

NOVEMBER 30, 2020
Semi Annual Report
USAA Cornerstone Aggressive Fund
Beginning January 1, 2021, as permitted by regulations adopted by the Securities and Exchange Commission, paper copies of the Fund's shareholder reports may no longer be sent by mail, unless you specifically request paper copies of the reports from the Fund or from your financial intermediary, such as a broker-dealer or bank. Instead, the reports will be made available on VictoryFunds.com, and you will be notified by mail each time a report is posted and provided with a website link to access the report. If you already elected to receive shareholder reports electronically, you will not be affected by this change and you need not take any action.
You may elect to receive shareholder reports and other communications from the Fund or your financial intermediary electronically by notifying your financial intermediary directly, or if you are a shareholder who has an account directly with the Fund, by calling (800) 235-8396 or by submitting your request via email to TA.Processing@FISGlobal.com.
You may elect to receive all future reports in paper free of charge. You can inform the Fund or your financial intermediary that you wish to continue receiving paper copies of your shareholder reports by notifying your financial intermediary directly, or if you are a shareholder who has an account directly with the Fund, by calling (800) 235-8396 or submitting your request via email to TA.Processing@FISGlobal.com.
Your election to receive reports in paper will apply to all funds held with the USAA Mutual Funds or your financial intermediary.
Victory Capital means Victory Capital Management Inc., the investment adviser of the USAA Mutual Funds. USAA Mutual Funds are distributed by Victory Capital Services, Inc., member of FINRA, an affiliate of Victory Capital. Victory Capital and its affiliates are not affiliated with United Services Automobile Association or its affiliates. USAA and the USAA logo are registered trademarks and the USAA Mutual Funds and USAA Investments logos are trademarks of United Services Automobile Association and are being used by Victory Capital and its affiliates under license.
USAA Mutual Funds Trust
TABLE OF CONTENTS
Investment Objective & Portfolio Holdings | 2 | ||||||
Schedule of Portfolio Investments | 3 | ||||||
Financial Statements | |||||||
Statement of Assets and Liabilities | 22 | ||||||
Statement of Operations | 23 | ||||||
Statements of Changes in Net Assets | 24 | ||||||
Financial Highlights | 26 | ||||||
Notes to Financial Statements | 28 | ||||||
Supplemental Information | 40 | ||||||
Proxy Voting and Portfolio Holdings Information | 40 | ||||||
Expense Example | 40 | ||||||
Privacy Policy (inside back cover) | |||||||
This report is for the information of the shareholders and others who have received a copy of the currently effective prospectus of the Fund, managed by Victory Capital Management Inc. It may be used as sales literature only when preceded or accompanied by a current prospectus, which provides further details about the Fund.
IRA DISTRIBUTION WITHHOLDING DISCLOSURE
We generally must withhold federal income tax at a rate of 10% of the taxable portion of your distribution and, if you live in a state that requires state income tax withholding, at your state's tax rate. However, you may elect not to have withholding apply or to have income tax withheld at a higher rate. Any withholding election that you make will apply to any subsequent distribution unless and until you change or revoke the election. If you wish to make a withholding election, or change or revoke a prior withholding election, call (800) 235-8396, and form W-4P (OMB No. 1545-0074 withholding certificate for pension or annuity payments) will be electronically sent.
If you do not have a withholding election in place by the date of a distribution, federal income tax will be withheld from the taxable portion of your distribution at a rate of 10%. If you must pay estimated taxes, you may be subject to estimated tax penalties if your estimated tax payments are not sufficient and sufficient tax is not withheld from your distribution.
For more specific information, please consult your tax adviser.
1
| USAA Mutual Funds Trust USAA Cornerstone Aggressive Fund | November 30, 2020 | ||||||
(Unaudited)
Investment Objective & Portfolio Holdings:
The Fund's investment objective is to seek capital appreciation over the long term and also considers the potential for current income.
Asset Allocation*:
November 30, 2020
(% of Net Assets)
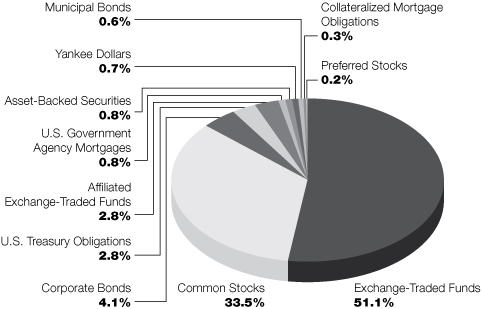
* Does not include futures, money market instruments, and short-term investments purchased with cash collateral from securities loaned.
Percentages are of the net assets of the Fund and may not equal 100%.
2
| USAA Mutual Funds Trust USAA Cornerstone Aggressive Fund | Schedule of Portfolio Investments November 30, 2020 | ||||||
(Amounts in Thousands, Except for Shares) (Unaudited)
Security Description | Principal Amount | Value | |||||||||
Asset-Backed Securities (0.8%) | |||||||||||
| American Express Credit Account Master Trust, Series 2019-2, Class B, 2.86%, 11/15/24 | $ | 187 | $ | 193 | |||||||
| Americredit Automobile Receivables Trust, Series 2018-1, Class C, 3.50%, 1/18/24, Callable 7/18/22 @ 100 | 240 | 249 | |||||||||
| Americredit Automobile Receivables Trust, Series 2018-2, Class A3, 3.15%, 3/20/23, Callable 10/18/22 @ 100 | 45 | 46 | |||||||||
| ARI Fleet Lease Trust, Series 2020-A, Class A3, 1.80%, 8/15/28, Callable 3/15/23 @ 100 (a) | 50 | 51 | |||||||||
| Canadian Pacer Auto Receivables Trust, Series 2018-1A, Class C, 3.82%, 4/19/24, Callable 5/19/21 @ 100 (a) | 137 | 139 | |||||||||
| CarMax Auto Owner Trust, Series 2020-1, Class B, 2.21%, 9/15/25, Callable 8/15/23 @ 100 | 71 | 74 | |||||||||
| Credit Acceptance Auto Loan Trust, Series 2018-3A, Class A, 3.55%, 8/15/27, Callable 10/15/21 @ 100 (a) | 110 | 111 | |||||||||
| Dell Equipment Finance Trust, Series 2020-1, Class A3, 2.24%, 2/22/23, Callable 8/22/22 @ 100 (a) | 35 | 36 | |||||||||
| Drive Auto Receivables Trust, Series 2019-1, Class C, 3.78%, 4/15/25, Callable 9/15/22 @ 100 | 82 | 84 | |||||||||
| Drive Auto Receivables Trust, Series 2018-4, Class D, 4.09%, 1/15/26, Callable 7/15/22 @ 100 | 62 | 64 | |||||||||
Enterprise Fleet Financing LLC, Series 2020-1, Class A3, 1.86%, 12/22/25 (a) | 46 | 48 | |||||||||
Evergreen Credit Card Trust, Series 2019-2, Class A, 1.90%, 9/15/24 (a) | 127 | 131 | |||||||||
| Exeter Automobile Receivables Trust, Series 2020-1A, Class B, 2.26%, 4/15/24, Callable 5/15/23 @ 100 (a) | 57 | 58 | |||||||||
| Exeter Automobile Receivables Trust, Series 2017-3A, Class D, 5.28%, 10/15/24, Callable 4/15/22 @ 100 (a) | 50 | 52 | |||||||||
| Exeter Automobile Receivables Trust, Series 2019-2A, Class C, 3.30%, 3/15/24, Callable 12/15/22 @ 100 (a) | 110 | 112 | |||||||||
| Ford Credit Auto Owner Trust, Series 2019-A, Class A3, 2.78%, 9/15/23, Callable 12/15/22 @ 100 | 40 | 41 | |||||||||
| Ford Credit Auto Owner Trust, Series 2020-1, Class B, 2.29%, 8/15/31, Callable 2/15/25 @ 100 (a) | 75 | 78 | |||||||||
| Great American Auto Leasing, Inc., Series 2019-1, Class A3, 3.05%, 9/15/22, Callable 12/15/22 @ 100 (a) | 51 | 52 | |||||||||
Hertz Vehicle Financing II LP, Series 2019-3A, Class A, 2.67%, 12/26/25 (a) | 24 | 24 | |||||||||
| HPEFS Equipment Trust, Series 2019-1A, Class C, 2.49%, 9/20/29, Callable 5/20/22 @ 100 (a) | 50 | 51 | |||||||||
| HPEFS Equipment Trust, Series 2020-1A, Class B, 1.89%, 2/20/30, Callable 12/20/22 @ 100 (a) | 29 | 29 | |||||||||
| MMAF Equipment Finance LLC, Series 2017-B, Class A4, 2.41%, 11/15/24, Callable 6/15/22 @ 100 (a) | 112 | 114 | |||||||||
| Navient Student Loan Trust, Series 2015-2, Class B, 1.65% (LIBOR01M+150bps), 8/25/50, Callable 1/25/29 @ 100 (b) | 50 | 47 | |||||||||
| NP SPE II LLC, Series 2017-1A, Class A1, 3.37%, 10/21/47, Callable 10/20/27 @ 100 (a) | 31 | 32 | |||||||||
OSCAR US Funding Trust IX LLC, Series 2018-2A, Class A4, 3.63%, 9/10/25 (a) | 280 | 292 | |||||||||
| SCF Equipment Leasing LLC, Series 2017-2A, Class A, 3.41%, 12/20/23, Callable 12/20/20 @ 100 (a) | 20 | 20 | |||||||||
See notes to financial statements.
3
| USAA Mutual Funds Trust USAA Cornerstone Aggressive Fund | Schedule of Portfolio Investments — continued November 30, 2020 | ||||||
(Amounts in Thousands, Except for Shares) (Unaudited)
Security Description | Principal Amount | Value | |||||||||
| SCF Equipment Leasing LLC, Series 2020-1A, Class B, 2.02%, 3/20/28, Callable 7/20/25 @ 100 (a) | $ | 47 | $ | 47 | |||||||
| Synchrony Credit Card Master Note Trust, Series 2016-2, Class C, 2.95%, 5/15/24 | 137 | 138 | |||||||||
| Synchrony Credit Card Master Note Trust, Series 2018-2, Class A, 3.47%, 5/15/26 | 199 | 213 | |||||||||
| Transportation Finance Equipment Trust, Series 2019-1, Class A4, 1.88%, 3/25/24, Callable 6/23/23 @ 100 (a) | 112 | 115 | |||||||||
| Westlake Automobile Receivables Trust, Series 2020-1A, Class B, 1.94%, 4/15/25, Callable 7/15/23 @ 100 (a) | 188 | 191 | |||||||||
| Westlake Automobile Receivables Trust, Series 2018-2A, Class D, 4.00%, 1/16/24, Callable 1/15/22 @ 100 (a) | 150 | 153 | |||||||||
Total Asset-Backed Securities (Cost $3,020) | 3,085 | ||||||||||
Collateralized Mortgage Obligations (0.3%) | |||||||||||
| Banc of America Commercial Mortgage Trust, Series 2008-1, Class AJ, 6.79%, 2/10/51 (c) | 7 | 7 | |||||||||
| Banc of America Commercial Mortgage Trust, Series 2006-3, Class AM, 5.86%, 7/10/44 (c) | 39 | 8 | |||||||||
| Barclays Commercial Mortgage Trust, Series 2019-C5, Class ASB, 2.99%, 11/15/52 | 87 | 96 | |||||||||
| Benchmark Mortgage Trust, Series 2020-B17, Class ASB, 2.18%, 3/15/53, Callable 11/15/29 @ 100 | 75 | 79 | |||||||||
Benchmark Mortgage Trust, Series 2019-B14, Class A5, 3.05%, 12/15/61 | 150 | 168 | |||||||||
| BTH Mortgage-Backed Securities Trust, Series 2018-21, Class A, 2.65% (LIBOR01M+250bps), 10/7/21 (a) (b) | 160 | 159 | |||||||||
BX Trust, Series 2019-OC11, Class A, 3.20%, 12/9/41 (a) | 69 | 74 | |||||||||
| Citigroup Commercial Mortgage Trust, Series 2020-GC46, Class AAB, 2.61%, 1/15/53 | 75 | 81 | |||||||||
| Citigroup Commercial Mortgage Trust, Series 2020-555, Class A, 2.65%, 12/10/41 (a) | 112 | 117 | |||||||||
| COMM Mortgage Trust, Series 2014-277P, Class A, 3.73%, 8/10/49, Callable 8/10/24 @ 100 (a) (c) | 61 | 66 | |||||||||
COMM Mortgage Trust, Series 2019-GC44, Class ASB, 2.87%, 8/15/57 | 112 | 123 | |||||||||
| Credit Suisse Commercial Mortgage Trust, Series 2007-C1, Class AMFL, 0.33% (LIBOR01M+19bps), 2/15/40 (b) | 1 | 1 | |||||||||
| CSAIL Commercial Mortgage Trust, Series 2016-C6, Class XA, 2.06%, 1/15/49, Callable 11/15/25 @ 100 (c) (d) | 572 | 43 | |||||||||
GE Commercial Mortgage Corp., Series 2007-C1, Class AM, 5.61%, 12/10/49 (c) | 12 | 6 | |||||||||
GS Mortgage Securities Trust, Series 2020-GC45, Class AAB, 2.84%, 2/13/53 | 40 | 44 | |||||||||
GS Mortgage Securities Trust, Series 2020-GC45, Class A5, 2.91%, 2/13/53 | 47 | 52 | |||||||||
Manhattan West, Series 2020-1MW, Class A, 2.13%, 9/10/40 (a) | 39 | 40 | |||||||||
| UBS Commercial Mortgage Trust, Series 2012-C1, Class XA, 2.25%, 5/10/45, Callable 4/10/22 @ 100 (a) (c) (d) | 767 | 14 | |||||||||
Total Collateralized Mortgage Obligations (Cost $1,165) | 1,178 | ||||||||||
See notes to financial statements.
4
| USAA Mutual Funds Trust USAA Cornerstone Aggressive Fund | Schedule of Portfolio Investments — continued November 30, 2020 | ||||||
(Amounts in Thousands, Except for Shares) (Unaudited)
Security Description | Shares | Value | |||||||||
Common Stocks (33.5%) | |||||||||||
Communication Services (2.3%): | |||||||||||
Activision Blizzard, Inc. | 7,071 | $ | 562 | ||||||||
Alphabet, Inc. Class C (e) | 922 | 1,623 | |||||||||
AMC Networks, Inc. Class A (e) (f) | 3,170 | 105 | |||||||||
AT&T, Inc. | 24,840 | 714 | |||||||||
Cargurus, Inc. (e) | 3,017 | 76 | |||||||||
Charter Communications, Inc. Class A (e) | 891 | 581 | |||||||||
Comcast Corp. Class A | 14,953 | 751 | |||||||||
Facebook, Inc. Class A (e) | 4,324 | 1,198 | |||||||||
Gray Television, Inc. (e) | 4,853 | 86 | |||||||||
Match Group, Inc. (e) | 3,946 | 549 | |||||||||
Sinclair Broadcast Group, Inc. Class A (f) | 1,372 | 37 | |||||||||
Sirius XM Holdings, Inc. (f) | 76,635 | 497 | |||||||||
T-Mobile U.S., Inc. (e) | 4,208 | 559 | |||||||||
Verizon Communications, Inc. | 12,632 | 763 | |||||||||
Zillow Group, Inc. Class C (e) | 4,624 | 499 | |||||||||
8,600 | |||||||||||
Consumer Discretionary (3.4%): | |||||||||||
Amazon.com, Inc. (e) | 610 | 1,932 | |||||||||
AutoNation, Inc. (e) | 1,382 | 85 | |||||||||
AutoZone, Inc. (e) | 445 | 506 | |||||||||
Big Lots, Inc. | 1,866 | 96 | |||||||||
Booking Holdings, Inc. (e) | 280 | 568 | |||||||||
Cracker Barrel Old Country Store, Inc. | 521 | 73 | |||||||||
Crocs, Inc. (e) | 1,318 | 78 | |||||||||
Deckers Outdoor Corp. (e) | 345 | 88 | |||||||||
Dick's Sporting Goods, Inc. | 1,413 | 80 | |||||||||
Dollar General Corp. | 2,520 | 551 | |||||||||
Domino's Pizza, Inc. | 1,285 | 504 | |||||||||
eBay, Inc. | 10,933 | 551 | |||||||||
Foot Locker, Inc. | 2,462 | 92 | |||||||||
Ford Motor Co. | 58,948 | 535 | |||||||||
General Motors Co. | 12,752 | 559 | |||||||||
Gentex Corp. | 2,105 | 69 | |||||||||
Group 1 Automotive, Inc. | 831 | 99 | |||||||||
H&R Block, Inc. | 3,312 | 62 | |||||||||
Hanesbrands, Inc. | 5,985 | 85 | |||||||||
Harley-Davidson, Inc. | 2,434 | 98 | |||||||||
KB Home | 1,505 | 53 | |||||||||
Kontoor Brands, Inc. | 2,163 | 90 | |||||||||
La-Z-Boy, Inc. | 1,429 | 53 | |||||||||
Lennar Corp. Class A | 6,748 | 512 | |||||||||
Lowe's Cos., Inc. | 4,095 | 638 | |||||||||
O'Reilly Automotive, Inc. (e) | 1,129 | 499 | |||||||||
Peloton Interactive, Inc. Class A (e) | 4,599 | 535 | |||||||||
Penske Automotive Group, Inc. | 703 | 39 | |||||||||
Pool Corp. | 276 | 96 | |||||||||
Qurate Retail, Inc. Class A | 6,577 | 69 | |||||||||
See notes to financial statements.
5
| USAA Mutual Funds Trust USAA Cornerstone Aggressive Fund | Schedule of Portfolio Investments — continued November 30, 2020 | ||||||
(Amounts in Thousands, Except for Shares) (Unaudited)
Security Description | Shares | Value | |||||||||
RH (e) | 201 | $ | 91 | ||||||||
Sally Beauty Holdings, Inc. (e) | 3,022 | 35 | |||||||||
Sleep Number Corp. (e) | 833 | 58 | |||||||||
Steven Madden Ltd. | 1,399 | 44 | |||||||||
Tesla, Inc. (e) | 1,780 | 1,010 | |||||||||
Texas Roadhouse, Inc. | 912 | 69 | |||||||||
The Home Depot, Inc. | 5,831 | 1,618 | |||||||||
The ODP Corp. (e) | 735 | 21 | |||||||||
Toll Brothers, Inc. | 1,755 | 83 | |||||||||
Williams-Sonoma, Inc. | 927 | 101 | |||||||||
Wingstop, Inc. | 390 | 50 | |||||||||
12,475 | |||||||||||
Consumer Staples (1.8%): | |||||||||||
Altria Group, Inc. | 13,890 | 553 | |||||||||
Cal-Maine Foods, Inc. (e) | 959 | 37 | |||||||||
Colgate-Palmolive Co. | 6,567 | 562 | |||||||||
Flowers Foods, Inc. | 2,727 | 60 | |||||||||
Hostess Brands, Inc. (e) | 3,715 | 50 | |||||||||
Ingles Markets, Inc. Class A | 1,775 | 67 | |||||||||
Kimberly-Clark Corp. | 3,739 | 521 | |||||||||
Monster Beverage Corp. (e) | 5,994 | 508 | |||||||||
Philip Morris International, Inc. | 15,759 | 1,194 | |||||||||
Pilgrim's Pride Corp. (e) | 3,528 | 67 | |||||||||
Sprouts Farmers Market, Inc. (e) | 2,988 | 63 | |||||||||
The Clorox Co. | 4,881 | 991 | |||||||||
The Kroger Co. | 15,563 | 514 | |||||||||
The Procter & Gamble Co. | 6,028 | 837 | |||||||||
U.S. Foods Holding Corp. (e) | 2,364 | 74 | |||||||||
Walgreens Boots Alliance, Inc. | 13,521 | 514 | |||||||||
WD-40 Co. | 274 | 70 | |||||||||
Weis Markets, Inc. (g) | 999 | 48 | |||||||||
6,730 | |||||||||||
Energy (1.0%): | |||||||||||
Arch Resources, Inc. (e) | 3,038 | 102 | |||||||||
Cabot Oil & Gas Corp. | 28,058 | 492 | |||||||||
Cactus, Inc. Class A | 2,188 | 51 | |||||||||
Chevron Corp. | 7,920 | 690 | |||||||||
ConocoPhillips | 26,872 | 1,063 | |||||||||
Continental Resources, Inc. (f) | 3,640 | 56 | |||||||||
Halliburton Co. | 30,727 | 510 | |||||||||
HollyFrontier Corp. | 1,692 | 39 | |||||||||
Phillips 66 | 8,531 | 517 | |||||||||
Renewable Energy Group, Inc. (e) | 2,210 | 128 | |||||||||
3,648 | |||||||||||
Financials (4.3%): | |||||||||||
Affiliated Managers Group, Inc. | 954 | 83 | |||||||||
AGNC Investment Corp. | 1,826 | 28 | |||||||||
Annaly Capital Management, Inc. | 4,844 | 39 | |||||||||
See notes to financial statements.
6
| USAA Mutual Funds Trust USAA Cornerstone Aggressive Fund | Schedule of Portfolio Investments — continued November 30, 2020 | ||||||
(Amounts in Thousands, Except for Shares) (Unaudited)
Security Description | Shares | Value | |||||||||
Aon PLC Class A | 2,594 | $ | 532 | ||||||||
Artisan Partners Asset Management, Inc. Class A | 1,028 | 46 | |||||||||
BancFirst Corp. | 790 | 43 | |||||||||
Bank of Hawaii Corp. | 1,639 | 123 | |||||||||
BankUnited, Inc. | 2,281 | 65 | |||||||||
Berkshire Hathaway, Inc. Class B (e) | 3,634 | 832 | |||||||||
Brown & Brown, Inc. | 10,266 | 462 | |||||||||
Capital One Financial Corp. | 6,096 | 522 | |||||||||
Cathay General Bancorp | 3,043 | 86 | |||||||||
Cohen & Steers, Inc. | 1,247 | 88 | |||||||||
Cullen/Frost Bankers, Inc. | 1,158 | 97 | |||||||||
Employers Holdings, Inc. | 1,465 | 45 | |||||||||
Essent Group Ltd. | 2,326 | 102 | |||||||||
First Republic Bank | 3,705 | 480 | |||||||||
Flagstar Bancorp, Inc. | 3,469 | 122 | |||||||||
Goosehead Insurance, Inc. Class A | 523 | 64 | |||||||||
Great Western Bancorp, Inc. | 2,507 | 41 | |||||||||
Hamilton Lane, Inc. Class A | 893 | 62 | |||||||||
International Bancshares Corp. | 4,914 | 159 | |||||||||
KeyCorp | 31,454 | 486 | |||||||||
LPL Financial Holdings, Inc. | 638 | 58 | |||||||||
MarketAxess Holdings, Inc. | 957 | 516 | |||||||||
Marsh & McLennan Cos., Inc. | 4,712 | 540 | |||||||||
MetLife, Inc. | 11,581 | 535 | |||||||||
MGIC Investment Corp. | 4,529 | 54 | |||||||||
Moody's Corp. | 1,894 | 535 | |||||||||
Morgan Stanley | 9,783 | 605 | |||||||||
Mr. Cooper Group, Inc. (e) | 4,926 | 131 | |||||||||
MSCI, Inc. | 2,529 | 1,035 | |||||||||
National General Holdings Corp. | 2,178 | 74 | |||||||||
Nelnet, Inc. Class A | 701 | 48 | |||||||||
NMI Holdings, Inc. Class A (e) | 3,443 | 76 | |||||||||
OneMain Holdings, Inc. | 1,915 | 75 | |||||||||
Preferred Bank | 823 | 30 | |||||||||
Primerica, Inc. | 542 | 71 | |||||||||
Prudential Financial, Inc. | 6,784 | 513 | |||||||||
Radian Group, Inc. | 7,423 | 140 | |||||||||
S&P Global, Inc. | 3,321 | 1,168 | |||||||||
ServisFirst Bancshares, Inc. | 1,295 | 49 | |||||||||
State Street Corp. | 7,437 | 524 | |||||||||
SVB Financial Group (e) | 2,793 | 963 | |||||||||
Synovus Financial Corp. | 1,391 | 44 | |||||||||
T. Rowe Price Group, Inc. | 3,630 | 521 | |||||||||
The Allstate Corp. | 5,044 | 516 | |||||||||
The Goldman Sachs Group, Inc. | 2,539 | 586 | |||||||||
The Progressive Corp. | 11,312 | 985 | |||||||||
TPG RE Finance Trust, Inc. | 2,805 | 29 | |||||||||
Universal Insurance Holdings, Inc. | 3,969 | 55 | |||||||||
Webster Financial Corp. | 1,576 | 60 | |||||||||
Wells Fargo & Co. | 23,092 | 632 | |||||||||
See notes to financial statements.
7
| USAA Mutual Funds Trust USAA Cornerstone Aggressive Fund | Schedule of Portfolio Investments — continued November 30, 2020 | ||||||
(Amounts in Thousands, Except for Shares) (Unaudited)
Security Description | Shares | Value | |||||||||
Western Alliance Bancorp | 2,437 | $ | 125 | ||||||||
15,900 | |||||||||||
Health Care (5.6%): | |||||||||||
AbbVie, Inc. | 6,914 | 723 | |||||||||
Acadia Healthcare Co., Inc. (e) | 1,187 | 50 | |||||||||
Amedisys, Inc. (e) | 380 | 93 | |||||||||
Amgen, Inc. | 5,537 | 1,229 | |||||||||
AMN Healthcare Services, Inc. (e) | 1,843 | 120 | |||||||||
Amneal Pharmaceuticals, Inc. (e) | 14,634 | 58 | |||||||||
Anthem, Inc. | 1,819 | 567 | |||||||||
Biogen, Inc. (e) | 4,388 | 1,054 | |||||||||
Bio-Rad Laboratories, Inc. Class A (e) | 847 | 456 | |||||||||
Bristol-Myers Squibb Co. | 10,322 | 644 | |||||||||
Bruker Corp. | 1,863 | 94 | |||||||||
Cerner Corp. | 6,842 | 512 | |||||||||
Chemed Corp. | 229 | 110 | |||||||||
Cigna Corp. | 2,742 | 573 | |||||||||
Corcept Therapeutics, Inc. (e) | 5,233 | 118 | |||||||||
CVS Health Corp. | 8,809 | 597 | |||||||||
Danaher Corp. | 2,742 | 616 | |||||||||
DexCom, Inc. (e) | 1,521 | 486 | |||||||||
Eli Lilly & Co. | 4,296 | 626 | |||||||||
Emergent BioSolutions, Inc. (e) | 765 | 63 | |||||||||
Encompass Health Corp. | 1,208 | 97 | |||||||||
Exelixis, Inc. (e) | 6,734 | 129 | |||||||||
Gilead Sciences, Inc. (g) | 9,283 | 563 | |||||||||
HCA Healthcare, Inc. | 3,523 | 529 | |||||||||
Hill-Rom Holdings, Inc. | 1,071 | 102 | |||||||||
IDEXX Laboratories, Inc. (e) | 1,159 | 534 | |||||||||
Innoviva, Inc. (e) | 9,256 | 97 | |||||||||
Johnson & Johnson (g) | 12,222 | 1,768 | |||||||||
Ligand Pharmaceuticals, Inc. (e) (f) | 738 | 62 | |||||||||
MEDNAX, Inc. (e) | 4,273 | 86 | |||||||||
Medpace Holdings, Inc. (e) | 557 | 72 | |||||||||
Merck & Co., Inc. | 8,641 | 695 | |||||||||
Meridian Bioscience, Inc. (e) | 3,230 | 61 | |||||||||
Mettler-Toledo International, Inc. (e) | 443 | 509 | |||||||||
NuVasive, Inc. (e) | 1,525 | 71 | |||||||||
Owens & Minor, Inc. | 4,080 | 105 | |||||||||
PerkinElmer, Inc. | 944 | 126 | |||||||||
Pfizer, Inc. | 19,556 | 749 | |||||||||
PRA Health Sciences, Inc. (e) | 734 | 82 | |||||||||
Premier, Inc. Class A | 3,020 | 107 | |||||||||
Prestige Consumer Healthcare, Inc. (e) | 3,047 | 108 | |||||||||
Quidel Corp. (e) | 303 | 59 | |||||||||
ResMed, Inc. | 2,384 | 500 | |||||||||
Select Medical Holdings Corp. (e) | 4,246 | 102 | |||||||||
Simulations Plus, Inc. | 795 | 45 | |||||||||
Supernus Pharmaceuticals, Inc. (e) | 4,355 | 93 | |||||||||
Tenet Healthcare Corp. (e) | 3,643 | 115 | |||||||||
See notes to financial statements.
8
| USAA Mutual Funds Trust USAA Cornerstone Aggressive Fund | Schedule of Portfolio Investments — continued November 30, 2020 | ||||||
(Amounts in Thousands, Except for Shares) (Unaudited)
Security Description | Shares | Value | |||||||||
The Ensign Group, Inc. | 1,788 | $ | 129 | ||||||||
Thermo Fisher Scientific, Inc. | 1,437 | 668 | |||||||||
United Therapeutics Corp. (e) | 883 | 117 | |||||||||
UnitedHealth Group, Inc. | 4,896 | 1,647 | |||||||||
Veeva Systems, Inc. Class A (e) | 1,882 | 521 | |||||||||
Waters Corp. (e) | 2,189 | 508 | |||||||||
West Pharmaceutical Services, Inc. | 1,748 | 481 | |||||||||
20,426 | |||||||||||
Industrials (3.4%): | |||||||||||
3M Co. | 6,803 | 1,175 | |||||||||
AAON, Inc. | 707 | 46 | |||||||||
ACCO Brands Corp. | 5,030 | 39 | |||||||||
AECOM (e) | 1,830 | 95 | |||||||||
Allison Transmission Holdings, Inc. | 2,333 | 96 | |||||||||
Apogee Enterprises, Inc. | 2,012 | 53 | |||||||||
ArcBest Corp. | 1,447 | 61 | |||||||||
Atkore International Group, Inc. (e) | 1,866 | 73 | |||||||||
Carrier Global Corp. | 12,788 | 487 | |||||||||
Cimpress PLC (e) | 614 | 55 | |||||||||
Crane Co. | 1,221 | 85 | |||||||||
CSW Industrials, Inc. | 676 | 72 | |||||||||
CSX Corp. | 6,196 | 558 | |||||||||
Cummins, Inc. | 2,263 | 523 | |||||||||
Eaton Corp. PLC | 4,638 | 562 | |||||||||
EnPro Industries, Inc. | 636 | 45 | |||||||||
Equifax, Inc. | 2,784 | 465 | |||||||||
FedEx Corp. | 1,891 | 542 | |||||||||
Fortune Brands Home & Security, Inc. | 5,734 | 479 | |||||||||
General Dynamics Corp. | 3,474 | 519 | |||||||||
Graco, Inc. | 680 | 46 | |||||||||
GrafTech International Ltd. | 10,397 | 82 | |||||||||
Herman Miller, Inc. | 3,035 | 108 | |||||||||
Hillenbrand, Inc. | 1,521 | 57 | |||||||||
HNI Corp. | 2,058 | 75 | |||||||||
Illinois Tool Works, Inc. | 2,612 | 551 | |||||||||
Insperity, Inc. | 1,137 | 97 | |||||||||
Kforce, Inc. | 1,183 | 49 | |||||||||
Lockheed Martin Corp. | 1,531 | 559 | |||||||||
ManpowerGroup, Inc. | 552 | 48 | |||||||||
Masonite International Corp. (e) | 708 | 71 | |||||||||
MasTec, Inc. (e) | 1,971 | 112 | |||||||||
MSC Industrial Direct Co., Inc. | 1,157 | 96 | |||||||||
Northrop Grumman Corp. | 1,735 | 524 | |||||||||
nVent Electric PLC | 2,218 | 51 | |||||||||
Old Dominion Freight Line, Inc. | 2,391 | 486 | |||||||||
Oshkosh Corp. | 1,142 | 92 | |||||||||
Otis Worldwide Corp. | 7,606 | 509 | |||||||||
Regal Beloit Corp. | 1,144 | 136 | |||||||||
Rockwell Automation, Inc. | 2,066 | 528 | |||||||||
Rollins, Inc. | 8,284 | 474 | |||||||||
See notes to financial statements.
9
| USAA Mutual Funds Trust USAA Cornerstone Aggressive Fund | Schedule of Portfolio Investments — continued November 30, 2020 | ||||||
(Amounts in Thousands, Except for Shares) (Unaudited)
Security Description | Shares | Value | |||||||||
Rush Enterprises, Inc. Class A | 2,697 | $ | 103 | ||||||||
Simpson Manufacturing Co., Inc. | 458 | 42 | |||||||||
Steelcase, Inc. Class A | 8,435 | 102 | |||||||||
The Timken Co. | 1,550 | 114 | |||||||||
The Toro Co. | 550 | 50 | |||||||||
TriNet Group, Inc. (e) | 1,133 | 85 | |||||||||
Triton International Ltd. | 1,399 | 63 | |||||||||
Verisk Analytics, Inc. | 2,461 | 488 | |||||||||
W.W. Grainger, Inc. | 1,193 | 499 | |||||||||
Werner Enterprises, Inc. | 1,408 | 56 | |||||||||
WESCO International, Inc. (e) | 1,718 | 112 | |||||||||
12,495 | |||||||||||
Information Technology (8.4%): | |||||||||||
Accenture PLC Class A | 2,668 | 665 | |||||||||
Adobe, Inc. (e) | 3,106 | 1,486 | |||||||||
Apple, Inc. | 68,236 | 8,124 | |||||||||
Applied Materials, Inc. | 7,421 | 612 | |||||||||
Aspen Technology, Inc. (e) | 656 | 88 | |||||||||
Badger Meter, Inc. | 1,029 | 85 | |||||||||
Broadcom, Inc. | 1,702 | 684 | |||||||||
CACI International, Inc. Class A (e) | 368 | 87 | |||||||||
Cadence Design Systems, Inc. (e) | 4,513 | 525 | |||||||||
Cardtronics PLC Class A (e) | 1,636 | 40 | |||||||||
CDW Corp. | 3,669 | 479 | |||||||||
Cirrus Logic, Inc. (e) | 1,303 | 104 | |||||||||
Cisco Systems, Inc. | 16,419 | 706 | |||||||||
Cognizant Technology Solutions Corp. Class A | 7,164 | 560 | |||||||||
CoreLogic, Inc. | 665 | 52 | |||||||||
Coupa Software, Inc. (e) | 1,636 | 538 | |||||||||
CSG Systems International, Inc. | 1,619 | 70 | |||||||||
Digital Turbine, Inc. (e) | 1,620 | 73 | |||||||||
DocuSign, Inc. (e) | 2,392 | 545 | |||||||||
DXC Technology Co. | 2,093 | 46 | |||||||||
Fair Isaac Corp. (e) | 166 | 79 | |||||||||
HP, Inc. | 49,785 | 1,092 | |||||||||
Insight Enterprises, Inc. (e) | 2,239 | 160 | |||||||||
Intel Corp. | 15,633 | 756 | |||||||||
InterDigital, Inc. | 656 | 39 | |||||||||
International Business Machines Corp. | 5,077 | 627 | |||||||||
Intuit, Inc. | 1,621 | 571 | |||||||||
J2 Global, Inc. (e) | 1,351 | 121 | |||||||||
Jabil, Inc. | 2,460 | 94 | |||||||||
KBR, Inc. | 3,255 | 90 | |||||||||
Lam Research Corp. | 2,530 | 1,145 | |||||||||
Manhattan Associates, Inc. (e) | 888 | 91 | |||||||||
Mastercard, Inc. Class A | 2,411 | 811 | |||||||||
MAXIMUS, Inc. | 1,701 | 122 | |||||||||
Methode Electronics, Inc. | 1,551 | 54 | |||||||||
Micron Technology, Inc. (e) | 9,254 | 593 | |||||||||
Microsoft Corp. (g) | 10,030 | 2,147 | |||||||||
See notes to financial statements.
10
| USAA Mutual Funds Trust USAA Cornerstone Aggressive Fund | Schedule of Portfolio Investments — continued November 30, 2020 | ||||||
(Amounts in Thousands, Except for Shares) (Unaudited)
Security Description | Shares | Value | |||||||||
Monolithic Power Systems, Inc. | 455 | $ | 146 | ||||||||
NCR Corp. (e) | 3,623 | 100 | |||||||||
NIC, Inc. | 3,603 | 84 | |||||||||
NVIDIA Corp. | 3,096 | 1,660 | |||||||||
Oracle Corp. | 10,951 | 632 | |||||||||
Perspecta, Inc. | 2,489 | 56 | |||||||||
SMART Global Holdings, Inc. (e) (f) | 3,180 | 98 | |||||||||
SolarEdge Technologies, Inc. (e) | 330 | 92 | |||||||||
Square, Inc. Class A (e) | 2,903 | 612 | |||||||||
Super Micro Computer, Inc. (e) | 2,522 | 71 | |||||||||
SYNNEX Corp. | 466 | 75 | |||||||||
Teradyne, Inc. | 673 | 74 | |||||||||
Texas Instruments, Inc. | 4,077 | 657 | |||||||||
The Hackett Group, Inc. | 5,610 | 79 | |||||||||
The Trade Desk, Inc. Class A (e) | 639 | 576 | |||||||||
TTEC Holdings, Inc. | 1,268 | 86 | |||||||||
VeriSign, Inc. (e) | 2,565 | 515 | |||||||||
Vishay Intertechnology, Inc. | 5,235 | 101 | |||||||||
VMware, Inc. Class A (e) (f) | 3,434 | 480 | |||||||||
Vontier Corp. (e) | 3,994 | 132 | |||||||||
Zoom Video Communications, Inc. Class A (e) | 1,288 | 616 | |||||||||
31,103 | |||||||||||
Materials (1.0%): | |||||||||||
Air Products & Chemicals, Inc. | 1,997 | 560 | |||||||||
Ball Corp. | 5,136 | 493 | |||||||||
Berry Global Group, Inc. (e) | 1,033 | 55 | |||||||||
Huntsman Corp. | 3,629 | 90 | |||||||||
Hycroft Mining Holding Corp. (e) | 997 | 8 | |||||||||
LyondellBasell Industries NV Class A | 12,230 | 1,041 | |||||||||
Newmont Corp. | 8,447 | 497 | |||||||||
Reliance Steel & Aluminum Co. | 1,090 | 128 | |||||||||
Schweitzer-Mauduit International, Inc. | 1,824 | 63 | |||||||||
Silgan Holdings, Inc. | 2,727 | 92 | |||||||||
The Chemours Co. | 4,055 | 99 | |||||||||
The Sherwin-Williams Co. | 757 | 566 | |||||||||
Warrior Met Coal, Inc. | 4,847 | 84 | |||||||||
3,776 | |||||||||||
Real Estate (1.2%): | |||||||||||
Alexandria Real Estate Equities, Inc. | 422 | 69 | |||||||||
American Tower Corp. | 1,479 | 342 | |||||||||
AvalonBay Communities, Inc. | 485 | 81 | |||||||||
Boston Properties, Inc. | 507 | 50 | |||||||||
Brixmor Property Group, Inc. | 4,106 | 63 | |||||||||
Camden Property Trust | 336 | 33 | |||||||||
CBRE Group, Inc. Class A (e) | 1,144 | 70 | |||||||||
Crown Castle International Corp. | 1,439 | 241 | |||||||||
CubeSmart | 3,602 | 117 | |||||||||
Digital Realty Trust, Inc. | 917 | 124 | |||||||||
Duke Realty Corp. | 1,268 | 48 | |||||||||
See notes to financial statements.
11
| USAA Mutual Funds Trust USAA Cornerstone Aggressive Fund | Schedule of Portfolio Investments — continued November 30, 2020 | ||||||
(Amounts in Thousands, Except for Shares) (Unaudited)
Security Description | Shares | Value | |||||||||
Equinix, Inc. | 293 | $ | 204 | ||||||||
Equity LifeStyle Properties, Inc. | 596 | 35 | |||||||||
Equity Residential | 1,290 | 75 | |||||||||
Essex Property Trust, Inc. | 233 | 57 | |||||||||
Extra Space Storage, Inc. | 452 | 51 | |||||||||
Federal Realty Investment Trust | 250 | 22 | |||||||||
First Industrial Realty Trust, Inc. | 3,943 | 165 | |||||||||
Gaming and Leisure Properties, Inc. | 2,867 | 119 | |||||||||
Healthpeak Properties, Inc. | 1,758 | 51 | |||||||||
Host Hotels & Resorts, Inc. | 2,391 | 33 | |||||||||
Invitation Homes, Inc. | 1,873 | 53 | |||||||||
Iron Mountain, Inc. | 974 | 27 | |||||||||
iStar, Inc. | 3,536 | 50 | |||||||||
Jones Lang LaSalle, Inc. (e) | 583 | 77 | |||||||||
Kimco Realty Corp. | 4,728 | 68 | |||||||||
Lamar Advertising Co. Class A | 987 | 79 | |||||||||
LTC Properties, Inc. | 2,923 | 108 | |||||||||
Medical Properties Trust, Inc. | 6,483 | 126 | |||||||||
Mid-America Apartment Communities, Inc. | 397 | 50 | |||||||||
National Health Investors, Inc. | 818 | 53 | |||||||||
National Retail Properties, Inc. | 607 | 23 | |||||||||
Omega Healthcare Investors, Inc. | 2,131 | 75 | |||||||||
Outfront Media, Inc. | 4,162 | 79 | |||||||||
PotlatchDeltic Corp. | 2,112 | 98 | |||||||||
Prologis, Inc. | 2,552 | 255 | |||||||||
Public Storage | 543 | 122 | |||||||||
Realty Income Corp. | 1,160 | 70 | |||||||||
Regency Centers Corp. | 591 | 27 | |||||||||
SBA Communications Corp. | 391 | 112 | |||||||||
Simon Property Group, Inc. | 1,061 | 88 | |||||||||
Sun Communities, Inc. | 322 | 45 | |||||||||
Terreno Realty Corp. | 2,670 | 155 | |||||||||
UDR, Inc. | 1,028 | 39 | |||||||||
Ventas, Inc. | 1,276 | 61 | |||||||||
VEREIT, Inc. | 3,748 | 27 | |||||||||
VICI Properties, Inc. | 1,580 | 40 | |||||||||
Vornado Realty Trust | 558 | 22 | |||||||||
Welltower, Inc. | 1,417 | 89 | |||||||||
Weyerhaeuser Co. | 2,520 | 73 | |||||||||
WP Carey, Inc. | 602 | 42 | |||||||||
4,283 | |||||||||||
Utilities (1.1%): | |||||||||||
ALLETE, Inc. | 1,096 | 62 | |||||||||
Clearway Energy, Inc. Class C | 1,763 | 52 | |||||||||
Duke Energy Corp. (g) | 6,169 | 572 | |||||||||
Eversource Energy (g) | 5,593 | 489 | |||||||||
Exelon Corp. | 12,572 | 516 | |||||||||
IDACORP, Inc. | 1,083 | 98 | |||||||||
New Jersey Resources Corp. | 1,986 | 66 | |||||||||
See notes to financial statements.
12
| USAA Mutual Funds Trust USAA Cornerstone Aggressive Fund | Schedule of Portfolio Investments — continued November 30, 2020 | ||||||
(Amounts in Thousands, Except for Shares) (Unaudited)
Security Description | Shares or Principal Amount | Value | |||||||||
NextEra Energy, Inc. (g) | 8,224 | $ | 605 | ||||||||
NorthWestern Corp. | 930 | 54 | |||||||||
NRG Energy, Inc. | 15,388 | 504 | |||||||||
Southwest Gas Holdings, Inc. | 1,223 | 78 | |||||||||
The AES Corp. | 23,109 | 472 | |||||||||
WEC Energy Group, Inc. (g) | 5,183 | 492 | |||||||||
4,060 | |||||||||||
Total Common Stocks (Cost $102,293) | 123,496 | ||||||||||
Preferred Stocks (0.2%) | |||||||||||
Communication Services (0.0%): (h) | |||||||||||
Qwest Corp., 6.50%, 9/1/56 | 8,000 | 204 | |||||||||
Consumer Staples (0.1%): | |||||||||||
CHS, Inc., cumulative redeemable, Series 1, 7.88% (f) (i) | 8,000 | 230 | |||||||||
Dairy Farmers of America, Inc., cumulative redeemable, 7.88% (a) (i) | 2,000 | 187 | |||||||||
417 | |||||||||||
Financials (0.1%): | |||||||||||
Delphi Financial Group, Inc., 3.41% (LIBOR03M+319bps), 5/15/37 (b) (j) | 12,000 | 237 | |||||||||
Total Preferred Stocks (Cost $914) | 858 | ||||||||||
Corporate Bonds (4.1%) | |||||||||||
Communication Services (0.2%): | |||||||||||
AT&T, Inc., 2.30%, 6/1/27, Callable 4/1/27 @ 100 | $ | 95 | 101 | ||||||||
Fox Corp., 3.05%, 4/7/25, Callable 3/7/25 @ 100 | 53 | 58 | |||||||||
The Walt Disney Co., 2.20%, 1/13/28 | 45 | 48 | |||||||||
T-Mobile USA, Inc., 3.88%, 4/15/30, Callable 1/15/30 @ 100 (a) (g) | 133 | 152 | |||||||||
Verizon Communications, Inc., 4.50%, 8/10/33 | 224 | 285 | |||||||||
644 | |||||||||||
Consumer Discretionary (0.1%): | |||||||||||
AutoNation, Inc., 4.75%, 6/1/30, Callable 3/1/30 @ 100 | 38 | 46 | |||||||||
General Motors Co., 6.80%, 10/1/27, Callable 8/1/27 @ 100 (g) | 42 | 54 | |||||||||
Hasbro, Inc., 3.55%, 11/19/26, Callable 9/19/26 @ 100 | 90 | 100 | |||||||||
Nordstrom, Inc., 4.38%, 4/1/30, Callable 1/1/30 @ 100 | 75 | 72 | |||||||||
VF Corp., 2.95%, 4/23/30, Callable 1/23/30 @ 100 | 53 | 58 | |||||||||
330 | |||||||||||
Consumer Staples (0.4%): | |||||||||||
Altria Group, Inc., 3.40%, 5/6/30, Callable 2/6/30 @ 100 | 49 | 54 | |||||||||
| Anheuser-Busch Cos. LLC/Anheuser-Busch InBev Worldwide, Inc., 4.70%, 2/1/36, Callable 8/1/35 @ 100 | 187 | 238 | |||||||||
BAT Capital Corp., 2.79%, 9/6/24, Callable 8/6/24 @ 100 | 200 | 214 | |||||||||
Kraft Heinz Foods Co., 3.75%, 4/1/30, Callable 1/1/30 @ 100 (a) | 84 | 91 | |||||||||
McCormick & Co., Inc., 2.50%, 4/15/30, Callable 1/15/30 @ 100 | 32 | 34 | |||||||||
PepsiCo, Inc., 2.25%, 3/19/25, Callable 2/19/25 @ 100 | 175 | 187 | |||||||||
Sysco Corp., 5.95%, 4/1/30, Callable 1/1/30 @ 100 | 44 | 58 | |||||||||
The Coca-Cola Co., 3.45%, 3/25/30 | 250 | 295 | |||||||||
See notes to financial statements.
13
| USAA Mutual Funds Trust USAA Cornerstone Aggressive Fund | Schedule of Portfolio Investments — continued November 30, 2020 | ||||||
(Amounts in Thousands, Except for Shares) (Unaudited)
Security Description | Principal Amount | Value | |||||||||
The Procter & Gamble Co., 3.00%, 3/25/30 | $ | 74 | $ | 86 | |||||||
Unilever Capital Corp., 2.60%, 5/5/24, Callable 3/5/24 @ 100 | 150 | 160 | |||||||||
1,417 | |||||||||||
Energy (0.6%): | |||||||||||
Cameron LNG LLC, 3.30%, 1/15/35, Callable 9/15/34 @ 100 (a) | 143 | 161 | |||||||||
Cheniere Corpus Christi Holdings LLC, 3.70%, 11/15/29, Callable 5/18/29 @ 100 | 187 | 205 | |||||||||
Enable Midstream Partners LP, 4.15%, 9/15/29, Callable 6/15/29 @ 100 | 150 | 139 | |||||||||
Enbridge Energy Partners LP, 7.38%, 10/15/45, Callable 4/15/45 @ 100 (g) | 100 | 150 | |||||||||
Enterprise Products Operating LLC, 2.80%, 1/31/30, Callable 10/31/29 @ 100 | 112 | 121 | |||||||||
EOG Resources, Inc., 4.38%, 4/15/30, Callable 1/15/30 @ 100 | 34 | 41 | |||||||||
EQM Midstream Partners LP, 4.75%, 7/15/23, Callable 6/15/23 @ 100 (g) | 400 | 408 | |||||||||
EQT Corp., 8.75%, 2/1/30, Callable 11/1/29 @ 100 | 77 | 97 | |||||||||
Exxon Mobil Corp., 2.99%, 3/19/25, Callable 2/19/25 @ 100 (g) | 188 | 206 | |||||||||
Florida Gas Transmission Co. LLC, 2.55%, 7/1/30, Callable 4/1/30 @ 100 (a) | 38 | 40 | |||||||||
Marathon Petroleum Corp., 4.70%, 5/1/25, Callable 4/1/25 @ 100 | 49 | 56 | |||||||||
Midwest Connector Capital Co. LLC, 4.63%, 4/1/29, Callable 1/1/29 @ 100 (a) | 92 | 93 | |||||||||
National Oilwell Varco, Inc., 3.60%, 12/1/29, Callable 9/1/29 @ 100 | 150 | 152 | |||||||||
Occidental Petroleum Corp., 4.40%, 8/15/49, Callable 2/15/49 @ 100 | 75 | 61 | |||||||||
ONEOK, Inc., 6.35%, 1/15/31, Callable 10/15/30 @ 100 | 46 | 57 | |||||||||
Rockies Express Pipeline LLC, 4.80%, 5/15/30, Callable 2/15/30 @ 100 (a) | 75 | 73 | |||||||||
| Targa Resources Partners LP/Targa Resources Partners Finance Corp., 5.50%, 3/1/30 | 75 | 82 | |||||||||
Western Midstream Operating LP, 3.10%, 2/1/25, Callable 1/1/25 @ 100 | 78 | 78 | |||||||||
2,220 | |||||||||||
Financials (1.1%): | |||||||||||
Ares Capital Corp., 3.63%, 1/19/22, Callable 12/19/21 @ 100 (g) | 100 | 103 | |||||||||
| BancorpSouth Bank, 4.13% (LIBOR03M+247bps), 11/20/29, Callable 11/20/24 @ 100 (b) | 96 | 97 | |||||||||
BBVA USA, 3.88%, 4/10/25, Callable 3/10/25 @ 100 | 200 | 222 | |||||||||
Belrose Funding Trust, 2.33%, 8/15/30, Callable 5/15/30 @ 100 (a) | 93 | 95 | |||||||||
Capital One NA, 2.15%, 9/6/22, Callable 8/6/22 @ 100 | 150 | 154 | |||||||||
Citizens Financial Group, Inc., 2.50%, 2/6/30, Callable 11/6/29 @ 100 | 112 | 119 | |||||||||
| Cullen/Frost Capital Trust II, 1.80% (LIBOR03M+155bps), 3/1/34, Callable 1/8/21 @ 100 (b) | 175 | 135 | |||||||||
First Horizon Bank, 5.75%, 5/1/30, Callable 2/1/30 @ 100 | 53 | 62 | |||||||||
| First Maryland Capital I, 1.24% (LIBOR03M+100bps), 1/15/27, Callable 1/8/21 @ 100 (b) | 50 | 46 | |||||||||
Ford Motor Credit Co. LLC, 4.06%, 11/1/24, Callable 10/1/24 @ 100 | 250 | 260 | |||||||||
Glencore Funding LLC, 2.50%, 9/1/30, Callable 6/1/30 @ 100 (a) | 108 | 108 | |||||||||
Global Atlantic Financial Co., 4.40%, 10/15/29, Callable 7/15/29 @ 100 (a) | 96 | 103 | |||||||||
HSB Group, Inc., 1.15% (LIBOR03M+91bps), 7/15/27, Callable 1/8/21 @ 100 (b) | 200 | 176 | |||||||||
Hyundai Capital America, 3.75%, 7/8/21 (a) (g) | 350 | 356 | |||||||||
| JPMorgan Chase & Co., 2.52% (SOFR+204bps), 4/22/31, Callable 4/22/30 @ 100 (b) | 62 | 66 | |||||||||
KeyCorp, 2.25%, 4/6/27, MTN | 112 | 119 | |||||||||
Level 3 Financing, Inc., 3.88%, 11/15/29, Callable 8/15/29 @ 100 (a) | 150 | 166 | |||||||||
Loews Corp., 3.20%, 5/15/30, Callable 2/15/30 @ 100 | 68 | 77 | |||||||||
| Nationwide Mutual Insurance Co., 2.54% (LIBOR03M+229bps), 12/15/24, Callable 1/8/21 @ 100 (a) (b) | 300 | 299 | |||||||||
See notes to financial statements.
14
| USAA Mutual Funds Trust USAA Cornerstone Aggressive Fund | Schedule of Portfolio Investments — continued November 30, 2020 | ||||||
(Amounts in Thousands, Except for Shares) (Unaudited)
Security Description | Principal Amount | Value | |||||||||
| New York Community Bancorp, Inc., 5.90% (LIBOR03M+278bps), 11/6/28, Callable 11/6/23 @ 100 (b) | $ | 23 | $ | 24 | |||||||
PPL Capital Funding, Inc., 4.13%, 4/15/30, Callable 1/15/30 @ 100 | 74 | 88 | |||||||||
| Prudential Financial, Inc., 5.62% (LIBOR03M+392bps), 6/15/43, Callable 6/15/23 @ 100 (b) | 200 | 215 | |||||||||
Regions Financial Corp., 2.25%, 5/18/25, Callable 4/18/25 @ 100 | 74 | 78 | |||||||||
Santander Holdings USA, Inc., 3.45%, 6/2/25, Callable 5/2/25 @ 100 | 39 | 42 | |||||||||
| Signature Bank, 4.13% (LIBOR03M+256bps), 11/1/29, Callable 11/1/24 @ 100 (b) | 150 | 152 | |||||||||
Texas Capital Bank NA, 5.25%, 1/31/26 | 75 | 79 | |||||||||
| The Allstate Corp., 5.75% (LIBOR03M+294bps), 8/15/53, Callable 8/15/23 @ 100 (b) | 40 | 43 | |||||||||
The Progressive Corp., 3.20%, 3/26/30, Callable 12/26/29 @ 100 | 23 | 27 | |||||||||
Truist Bank, 0.89% (LIBOR03M+67bps), 5/15/27, Callable 1/8/21 @ 100 (b) | 200 | 189 | |||||||||
Wells Fargo & Co., 2.19% (SOFR+200bps), 4/30/26, Callable 4/30/25 @ 100 (b) | 79 | 83 | |||||||||
Zions Bancorp NA, 3.25%, 10/29/29, Callable 7/29/29 @ 100 | 150 | 154 | |||||||||
3,937 | |||||||||||
Health Care (0.3%): | |||||||||||
AbbVie, Inc., 3.20%, 11/21/29, Callable 8/21/29 @ 100 (a) (g) | 150 | 170 | |||||||||
CVS Health Corp., 3.25%, 8/15/29, Callable 5/15/29 @ 100 (g) | 290 | 323 | |||||||||
DENTSPLY SIRONA, Inc., 3.25%, 6/1/30, Callable 3/1/30 @ 100 | 72 | 80 | |||||||||
Duke University Health System, Inc., 2.60%, 6/1/30 | 60 | 64 | |||||||||
HCA, Inc., 5.13%, 6/15/39, Callable 12/15/38 @ 100 | 187 | 240 | |||||||||
Laboratory Corp. of America Holdings, 2.95%, 12/1/29, Callable 9/1/29 @ 100 | 112 | 124 | |||||||||
Thermo Fisher Scientific, Inc., 4.13%, 3/25/25, Callable 2/25/25 @ 100 | 74 | 84 | |||||||||
Upjohn, Inc., 2.30%, 6/22/27, Callable 4/22/27 @ 100 (a) | 23 | 24 | |||||||||
1,109 | |||||||||||
Industrials (0.6%): | |||||||||||
Ashtead Capital, Inc., 4.00%, 5/1/28, Callable 5/1/23 @ 102 (a) | 27 | 28 | |||||||||
Carlisle Cos., Inc., 2.75%, 3/1/30, Callable 12/1/29 @ 100 | 112 | 120 | |||||||||
Carrier Global Corp., 3.38%, 4/5/40, Callable 10/5/39 @ 100 (a) | 56 | 62 | |||||||||
Caterpillar, Inc., 2.60%, 4/9/30, Callable 1/9/30 @ 100 | 55 | 61 | |||||||||
CoStar Group, Inc., 2.80%, 7/15/30, Callable 4/15/30 @ 100 (a) | 21 | 22 | |||||||||
Dover Corp., 2.95%, 11/4/29, Callable 8/4/29 @ 100 | 112 | 122 | |||||||||
General Dynamics Corp., 3.50%, 4/1/27, Callable 2/1/27 @ 100 | 74 | 85 | |||||||||
Georgia-Pacific LLC, 2.10%, 4/30/27, Callable 2/28/27 @ 100 (a) | 122 | 129 | |||||||||
IDEX Corp., 3.00%, 5/1/30, Callable 2/1/30 @ 100 | 122 | 135 | |||||||||
Otis Worldwide Corp., 3.11%, 2/15/40, Callable 8/15/39 @ 100 | 75 | 82 | |||||||||
| Penske Truck Leasing Co. LP/PTL Finance Corp., 4.00%, 7/15/25, Callable 6/15/25 @ 100 (a) | 74 | 84 | |||||||||
Ryder System, Inc. | |||||||||||
3.50%0, 6/1/210, MTN (g) | 350 | 356 | |||||||||
2.90%0, 12/1/26, Callable 10/1/26 @ 100, MTN | 187 | 204 | |||||||||
Southwest Airlines Co., 5.13%, 6/15/27, Callable 4/15/27 @ 100 | 48 | 56 | |||||||||
The Boeing Co., 5.71%, 5/1/40, Callable 11/1/39 @ 100 | 103 | 130 | |||||||||
| The Conservation Fund A Nonprofit Corp., 3.47%, 12/15/29, Callable 9/15/29 @ 100 | 175 | 190 | |||||||||
United Airlines Pass Through Trust, 2.90%, 11/1/29 | 196 | 170 | |||||||||
See notes to financial statements.
15
| USAA Mutual Funds Trust USAA Cornerstone Aggressive Fund | Schedule of Portfolio Investments — continued November 30, 2020 | ||||||
(Amounts in Thousands, Except for Shares) (Unaudited)
Security Description | Principal Amount | Value | |||||||||
| Westinghouse Air Brake Technologies Corp., 3.20%, 6/15/25, Callable 5/15/25 @ 100 | $ | 16 | $ | 17 | |||||||
2,053 | |||||||||||
Information Technology (0.2%): | |||||||||||
Amphenol Corp., 2.80%, 2/15/30, Callable 11/15/29 @ 100 | 200 | 218 | |||||||||
Analog Devices, Inc., 2.95%, 4/1/25, Callable 3/1/25 @ 100 | 27 | 29 | |||||||||
Broadcom, Inc., 4.30%, 11/15/32, Callable 8/15/32 @ 100 | 43 | 51 | |||||||||
Hewlett Packard Enterprise Co., 4.65%, 10/1/24, Callable 9/1/24 @ 100 | 73 | 83 | |||||||||
HP, Inc., 3.40%, 6/17/30, Callable 3/17/30 @ 100 | 68 | 75 | |||||||||
Jabil, Inc., 3.00%, 1/15/31, Callable 10/15/30 @ 100 | 21 | 22 | |||||||||
Microsoft Corp., 3.45%, 8/8/36, Callable 2/8/36 @ 100 | 243 | 301 | |||||||||
779 | |||||||||||
Materials (0.1%): | |||||||||||
Avery Dennison Corp., 2.65%, 4/30/30, Callable 2/1/30 @ 100 | 45 | 48 | |||||||||
Colonial Enterprises, Inc., 3.25%, 5/15/30, Callable 2/15/30 @ 100 (a) | 21 | 24 | |||||||||
LYB International Finance III LLC, 3.38%, 5/1/30, Callable 2/1/30 @ 100 | 63 | 70 | |||||||||
Packaging Corp. of America, 3.00%, 12/15/29, Callable 9/15/29 @ 100 | 187 | 207 | |||||||||
Sonoco Products Co., 3.13%, 5/1/30, Callable 2/1/30 @ 100 | 82 | 91 | |||||||||
Vulcan Materials Co., 3.50%, 6/1/30, Callable 3/1/30 @ 100 | 68 | 78 | |||||||||
WRKCo, Inc., 3.00%, 6/15/33, Callable 3/15/33 @ 100 (g) | 35 | 38 | |||||||||
556 | |||||||||||
Real Estate (0.2%): | |||||||||||
AvalonBay Communities, Inc., 2.45%, 1/15/31, MTN, Callable 10/15/30 @ 100 | 101 | 108 | |||||||||
Boston Properties LP, 3.25%, 1/30/31, Callable 10/30/30 @ 100 | 45 | 49 | |||||||||
Essex Portfolio LP, 2.65%, 3/15/32, Callable 12/15/31 @ 100 | 131 | 139 | |||||||||
GLP Capital LP/GLP Financing II, Inc., 4.00%, 1/15/31, Callable 10/15/30 @ 100 | 23 | 25 | |||||||||
Host Hotels & Resorts LP, 3.50%, 9/15/30, Callable 6/15/30 @ 100 | 19 | 20 | |||||||||
Mid-America Apartments LP, 2.75%, 3/15/30, Callable 12/15/29 @ 100 | 187 | 204 | |||||||||
SBA Tower Trust, 2.84%, 1/15/25 (a) | 87 | 92 | |||||||||
| VICI Properties LP/VICI Note Co., Inc., 4.63%, 12/1/29, Callable 12/1/24 @ 102.31 (a) | 17 | 18 | |||||||||
655 | |||||||||||
Utilities (0.3%): | |||||||||||
AEP Texas, Inc., 3.45%, 1/15/50, Callable 7/15/49 @ 100 | 131 | 149 | |||||||||
Alabama Power Co., 3.85%, 12/1/42 | 112 | 138 | |||||||||
Ameren Corp., 3.50%, 1/15/31, Callable 10/15/30 @ 100 | 37 | 43 | |||||||||
Cleco Corporate Holdings LLC, 3.38%, 9/15/29, Callable 6/15/29 @ 100 | 183 | 189 | |||||||||
Duke Energy Florida LLC, 3.85%, 11/15/42, Callable 5/15/42 @ 100 | 112 | 135 | |||||||||
Exelon Generation Co. LLC, 3.25%, 6/1/25, Callable 5/1/25 @ 100 | 74 | 80 | |||||||||
IPALCO Enterprises, Inc., 4.25%, 5/1/30, Callable 2/1/30 @ 100 (a) | 82 | 95 | |||||||||
ITC Holdings Corp., 2.95%, 5/14/30, Callable 2/14/30 @ 100 (a) | 76 | 83 | |||||||||
National Fuel Gas Co., 5.50%, 1/15/26, Callable 12/15/25 @ 100 | 96 | 108 | |||||||||
The Narragansett Electric Co., 3.40%, 4/9/30, Callable 1/9/30 @ 100 (a) | 55 | 63 | |||||||||
Union Electric Co., 2.95%, 3/15/30, Callable 12/15/29 @ 100 | 188 | 211 | |||||||||
1,294 | |||||||||||
Total Corporate Bonds (Cost $13,881) | 14,994 | ||||||||||
See notes to financial statements.
16
| USAA Mutual Funds Trust USAA Cornerstone Aggressive Fund | Schedule of Portfolio Investments — continued November 30, 2020 | ||||||
(Amounts in Thousands, Except for Shares) (Unaudited)
Security Description | Principal Amount | Value | |||||||||
Yankee Dollars (0.7%) | |||||||||||
Consumer Staples (0.0%): (h) | |||||||||||
Alimentation Couche-Tard, Inc., 2.95%, 1/25/30, Callable 10/25/29 @ 100 (a) | $ | 75 | $ | 82 | |||||||
Energy (0.0%): (h) | |||||||||||
Petroleos Mexicanos, 6.49%, 1/23/27, Callable 11/23/26 @ 100 | 64 | 64 | |||||||||
Petronas Capital Ltd., 3.50%, 4/21/30, Callable 1/21/30 @ 100 (a) | 5 | 6 | |||||||||
70 | |||||||||||
Financials (0.5%): | |||||||||||
Athene Holding Ltd., 4.13%, 1/12/28, Callable 10/12/27 @ 100 | 350 | 387 | |||||||||
| Banco Santander Mexico SA Institucion de Banca Multiple Grupo Financiero Santand, 5.38%, 4/17/25 (a) | 51 | 58 | |||||||||
Barclays PLC, 2.85% (LIBOR03M+245bps), 5/7/26, Callable 5/7/25 @ 100 (b) | 103 | 110 | |||||||||
| Deutsche Bank AG, 3.96% (SOFR+258bps), 11/26/25, Callable 11/26/24 @ 100 (b) | 112 | 121 | |||||||||
Diageo Capital PLC, 2.13%, 4/29/32, Callable 1/29/32 @ 100 | 122 | 129 | |||||||||
| QBE Capital Funding III Ltd., 7.25% (USSW10+405bps), 5/24/41, Callable 5/24/21 @ 100 (a) (b) | 200 | 205 | |||||||||
Royal Bank of Canada, 1.60%, 4/17/23, MTN | 125 | 129 | |||||||||
Sumitomo Mitsui Financial Group, Inc., 2.45%, 9/27/24 | 400 | 424 | |||||||||
1,563 | |||||||||||
Health Care (0.0%): (h) | |||||||||||
Royalty Pharma PLC, 2.20%, 9/2/30, Callable 6/2/30 @ 100 (a) | 26 | 26 | |||||||||
Industrials (0.1%): | |||||||||||
CK Hutchison International 19 II Ltd., 2.75%, 9/6/29, Callable 6/6/29 @ 100 (a) | 200 | 214 | |||||||||
Ferguson Finance PLC, 3.25%, 6/2/30, Callable 3/2/30 @ 100 (a) | 42 | 46 | |||||||||
Heathrow Funding Ltd., 4.88%, 7/15/21 (a) | 71 | 73 | |||||||||
333 | |||||||||||
Materials (0.1%): | |||||||||||
Anglo American Capital PLC, 5.63%, 4/1/30, Callable 1/1/30 @ 100 (a) | 69 | 87 | |||||||||
Braskem Netherlands Finance BV, 4.50%, 1/31/30 (a) | 113 | 114 | |||||||||
CCL Industries, Inc., 3.05%, 6/1/30, Callable 3/1/30 @ 100 (a) | 71 | 77 | |||||||||
Teck Resources Ltd., 6.13%, 10/1/35 | 120 | 151 | |||||||||
429 | |||||||||||
Total Yankee Dollars (Cost $2,308) | 2,503 | ||||||||||
Municipal Bonds (0.6%) | |||||||||||
Florida (0.0%): (h) | |||||||||||
County of Broward Florida Airport System Revenue, Series C, 2.50%, 10/1/28 | 75 | 76 | |||||||||
| Hillsborough County School Board Certificate of Participation, Series B, 1.92%, 7/1/25 | 40 | 41 | |||||||||
117 | |||||||||||
Georgia (0.1%): | |||||||||||
Athens Housing Authority Revenue, 2.42%, 12/1/26 | 160 | 171 | |||||||||
See notes to financial statements.
17
| USAA Mutual Funds Trust USAA Cornerstone Aggressive Fund | Schedule of Portfolio Investments — continued November 30, 2020 | ||||||
(Amounts in Thousands, Except for Shares) (Unaudited)
Security Description | Principal Amount | Value | |||||||||
Louisiana (0.0%): (h) | |||||||||||
| Louisiana Local Government Environmental Facilities & Community Development Authority Revenue, 1.55%, 2/1/27 | $ | 60 | $ | 61 | |||||||
Michigan (0.0%): (h) | |||||||||||
Michigan Finance Authority Revenue, 3.08%, 12/1/34 | 115 | 127 | |||||||||
New Jersey (0.1%): | |||||||||||
| New Jersey Economic Development Authority Revenue, Series NNN, 2.88%, 6/15/24 | 72 | 73 | |||||||||
New Jersey Transportation Trust Fund Authority Revenue, 4.08%, 6/15/39 | 30 | 30 | |||||||||
North Hudson Sewerage Authority Revenue, 2.88%, 6/1/28 | 37 | 40 | |||||||||
Rutgers The State University of New Jersey Revenue, Series S, 2.01%, 5/1/32 | 40 | 39 | |||||||||
182 | |||||||||||
New York (0.1%): | |||||||||||
New York State Dormitory Authority Revenue | |||||||||||
Series A, 2.46%, 7/1/32 | 70 | 71 | |||||||||
Series B, 2.83%, 7/1/31 | 185 | 195 | |||||||||
New York State Thruway Authority Revenue, Series M, 2.55%, 1/1/28 | 43 | 46 | |||||||||
312 | |||||||||||
Pennsylvania (0.2%): | |||||||||||
| Scranton School District, GO (INS-Build America Mutual Assurance Co.), 3.10%, 4/1/30 | 371 | 401 | |||||||||
State Public School Building Authority Revenue, 3.05%, 4/1/28 | 75 | 78 | |||||||||
| University of Pittsburgh-of The Commonwealth System of Higher Education Revenue Series C, 2.53%, 9/15/31 | 75 | 80 | |||||||||
Series C, 2.58%, 9/15/32 | 40 | 43 | |||||||||
Series C, 2.63%, 9/15/33 | 75 | 80 | |||||||||
682 | |||||||||||
Texas (0.1%): | |||||||||||
City of Houston Texas Combined Utility System Revenue, 3.72%, 11/15/28 | 95 | 112 | |||||||||
City of San Antonio, GO, 1.76%, 2/1/31, Continuously Callable @100 | 55 | 56 | |||||||||
Dallas/Fort Worth International Airport Revenue, Series C, 1.75%, 11/1/27 | 40 | 40 | |||||||||
| Harris County Cultural Education Facilities Finance Corp. Revenue, Series B, 2.81%, 5/15/29 | 75 | 80 | |||||||||
State of Texas, GO, 3.00%, 4/1/28 | 112 | 127 | |||||||||
415 | |||||||||||
Total Municipal Bonds (Cost $1,953) | 2,067 | ||||||||||
U.S. Government Agency Mortgages (0.8%) | |||||||||||
Federal Home Loan Mortgage Corporation | |||||||||||
Series K047, Class A2, 3.33%, 5/25/25 (c) | 300 | 333 | |||||||||
3.00%, 10/1/46 — 10/1/47 | 1,939 | 2,037 | |||||||||
3.50%, 4/1/48 | 234 | 247 | |||||||||
2,617 | |||||||||||
See notes to financial statements.
18
| USAA Mutual Funds Trust USAA Cornerstone Aggressive Fund | Schedule of Portfolio Investments — continued November 30, 2020 | ||||||
(Amounts in Thousands, Except for Shares) (Unaudited)
Security Description | Shares or Principal Amount | Value | |||||||||
Federal National Mortgage Association | |||||||||||
Series 2016-M2, Class AV2, 2.15%, 1/25/23 | $ | 149 | $ | 151 | |||||||
4.00%, 4/1/49 | 376 | 401 | |||||||||
552 | |||||||||||
Total U.S. Government Agency Mortgages (Cost $3,014) | 3,169 | ||||||||||
U.S. Treasury Obligations (2.8%) | |||||||||||
U.S. Treasury Bonds | |||||||||||
3.00%, 8/15/48 (g) | 1,000 | 1,335 | |||||||||
3.38%, 11/15/48 (g) | 500 | 712 | |||||||||
U.S. Treasury Inflation Indexed Bonds, 0.13%, 7/15/26 | 1,000 | 1,177 | |||||||||
U.S. Treasury Notes | |||||||||||
1.63%, 11/15/22 | 1,000 | 1,029 | |||||||||
1.63%, 4/30/23 (g) | 1,567 | 1,622 | |||||||||
1.63%, 2/15/26 | 2,250 | 2,393 | |||||||||
2.25%, 2/15/27 | 2,000 | 2,213 | |||||||||
Total U.S. Treasury Obligations (Cost $9,392) | 10,481 | ||||||||||
Exchange-Traded Funds (51.1%) | |||||||||||
Invesco DB Commodity Index Tracking Fund (f) | 28,600 | 399 | |||||||||
Invesco FTSE RAFI Developed Markets ex-US ETF | 70,202 | 2,834 | |||||||||
Invesco FTSE RAFI Emerging Markets ETF | 269,013 | 5,324 | |||||||||
iShares Core MSCI EAFE ETF | 145,494 | 9,638 | |||||||||
iShares Core MSCI Emerging Markets ETF (f) | 271,700 | 15,927 | |||||||||
iShares Core S&P 500 ETF | 65,488 | 23,793 | |||||||||
iShares Core US Aggregate Bond ETF | 14,093 | 1,669 | |||||||||
iShares MSCI Canada ETF (f) | 111,723 | 3,383 | |||||||||
iShares MSCI International Momentum Factor ETF | 120,883 | 4,329 | |||||||||
iShares MSCI International Quality Factor ETF | 130,029 | 4,431 | |||||||||
iShares Russell 2000 ETF | 30,265 | 5,479 | |||||||||
Schwab Fundamental Emerging Markets Large Co. Index ETF | 430,014 | 11,537 | |||||||||
Schwab Fundamental International Large Co. Index ETF | 829,619 | 23,337 | |||||||||
Schwab Fundamental International Small Co. Index ETF | 91,800 | 3,051 | |||||||||
SPDR Gold Shares (e) | 19,890 | 3,315 | |||||||||
SPDR S&P Emerging Markets Smallcap ETF | 14,790 | 731 | |||||||||
VanEck Vectors Gold Miners ETF | 56,060 | 1,944 | |||||||||
VanEck Vectors Junior Gold Miners ETF | 12,000 | 600 | |||||||||
Vanguard FTSE All-World ex-US ETF | 47,754 | 2,657 | |||||||||
Vanguard FTSE Developed Markets ETF | 496,882 | 22,404 | |||||||||
Vanguard FTSE Emerging Markets ETF (g) | 151,693 | 7,215 | |||||||||
Vanguard Real Estate ETF | 72,546 | 6,094 | |||||||||
Vanguard S&P 500 ETF (g) | 48,529 | 16,143 | |||||||||
Vanguard Short-Term Bond ETF | 51,286 | 4,252 | |||||||||
Vanguard Total Bond Market ETF | 78,203 | 6,920 | |||||||||
WisdomTree Emerging Markets SmallCap Dividend Fund | 16,645 | 761 | |||||||||
Total Exchange-Traded Funds (Cost $165,513) | 188,167 | ||||||||||
See notes to financial statements.
19
| USAA Mutual Funds Trust USAA Cornerstone Aggressive Fund | Schedule of Portfolio Investments — continued November 30, 2020 | ||||||
(Amounts in Thousands, Except for Shares) (Unaudited)
Security Description | Shares | Value | |||||||||
Affiliated Exchange-Traded Funds (2.8%) | |||||||||||
VictoryShares USAA Core Intermediate-Term Bond ETF | 85,500 | $ | 4,666 | ||||||||
VictoryShares USAA Core Short-Term Bond ETF (f) | 93,145 | 4,837 | |||||||||
VictoryShares USAA MSCI Emerging Markets Value Momentum ETF (g) | 16,000 | 688 | |||||||||
Total Affiliated Exchange-Traded Funds (Cost $10,236) | 10,191 | ||||||||||
Collateral for Securities Loaned^ (3.4%) | |||||||||||
| Goldman Sachs Financial Square Government Fund Institutional Shares, 0.02% (k) | 8,182,442 | 8,182 | |||||||||
HSBC U.S. Government Money Market Fund I Shares, 0.03% (k) | 4,258,849 | 4,259 | |||||||||
Total Collateral for Securities Loaned (Cost $12,441) | 12,441 | ||||||||||
Total Investments (Cost $326,130) — 101.1% | 372,630 | ||||||||||
Liabilities in excess of other assets — (1.1)% | (4,112 | ) | |||||||||
NET ASSETS — 100.00% | $ | 368,518 | |||||||||
At November 30, 2020 the Fund's investments in foreign securities were 25.6% of net assets.
^ Purchased with cash collateral from securities on loan.
(a) Rule 144A security or other security that is restricted as to resale to institutional investors. The Fund's Adviser has deemed this security to be liquid based upon procedures approved by the Board of Trustees. As of November 30, 2020, the fair value of these securities was $6,212 (thousands) and amounted to 1.7% of net assets.
(b) Variable or Floating-Rate Security. Rate disclosed is as of November 30, 2020.
(c) The rate for certain asset-backed and mortgage-backed securities may vary based on factors relating to the pool of assets underlying the security. The rate disclosed is the rate in effect at November 30, 2020.
(d) Security is interest only.
(e) Non-income producing security.
(f) All or a portion of this security is on loan.
(g) All or a portion of this security has been segregated as collateral for derivative instruments.
(h) Amount represents less than 0.05% of net assets.
(i) Security is perpetual and has no final maturity date but may be subject to calls at various dates in the future.
(j) The Fund's Adviser has deemed this security to be illiquid based upon procedures approved by the Board of Trustees. As of November 30, 2020, illiquid securities were 0.1% of the Fund's net assets.
(k) Rate disclosed is the daily yield on November 30, 2020.
bps — Basis points
Continuously callable — Investment is continuously callable or will be continuously callable on any date after the first call date until its maturity.
ETF — Exchange-Traded Fund
GO — General Obligation
See notes to financial statements.
20
| USAA Mutual Funds Trust USAA Cornerstone Aggressive Fund | Schedule of Portfolio Investments — continued November 30, 2020 | ||||||
(Unaudited)
LIBOR — London InterBank Offered Rate
LIBOR01M — 1 Month US Dollar LIBOR, rate disclosed as of November 30, 2020, based on the last reset date of the security
LIBOR03M — 3 Month US Dollar LIBOR, rate disclosed as of November 30, 2020, based on the last reset date of the security
LLC — Limited Liability Company
LP — Limited Partnership
MTN — Medium Term Note
PLC — Public Limited Company
SOFR — Secured Overnight Financing Rate
USSW10 — USD 10 Year Swap Rate, rate disclosed as of November 30, 2020
Credit Enhancements — Adds the financial strength of the provider of the enhancement to support the issuer's ability to repay the principal and interest payments when due. The enhancement may be provided by a high-quality bank, insurance company or other corporation, or a collateral trust. The enhancements do not guarantee the market values of the securities.
INS Principal and interest payments are insured by the name listed. Although bond insurance reduces the risk of loss due to default by an issuer, such bonds remain subject to the risk that value may fluctuate for other reasons, and there is no assurance that the insurance company will meet its obligations.
Futures Contracts Purchased
(Amounts not in thousands)
| Number of Contracts | Expiration Date | Notional Amount | Value | Unrealized Appreciation/ (Depreciation) | |||||||||||||||||||
S&P/Toronto Stock Exchange 60 Index Futures | 17 | 12/17/20 | $ | 2,489,635 | $ | 2,678,891 | $ | 147,601 | |||||||||||||||
Swiss Market Index Futures | 33 | 12/18/20 | 3,781,058 | 3,816,159 | 35,049 | ||||||||||||||||||
$ | 182,650 | ||||||||||||||||||||||
Futures Contracts Sold
(Amounts not in thousands)
| Number of Contracts | Expiration Date | Notional Amount | Value | Unrealized Appreciation/ (Depreciation) | |||||||||||||||||||
Euro Stoxx 50 Futures | 30 | 12/18/20 | 1,227,034 | 1,254,130 | (21,069 | ) | |||||||||||||||||
Russell 2000 E-Mini Index Futures | 25 | 12/18/20 | 1,957,505 | 2,275,125 | (317,620 | ) | |||||||||||||||||
Tokyo Price Index Futures | 15 | 12/10/20 | 2,316,484 | 2,522,753 | (176,835 | ) | |||||||||||||||||
(515,524 | ) | ||||||||||||||||||||||
Total unrealized appreciation | $ | 182,650 | |||||||||||||||||||||
Total unrealized depreciation | (515,524 | ) | |||||||||||||||||||||
Total net unrealized appreciation (depreciation) | $ | (332,874 | ) | ||||||||||||||||||||
See notes to financial statements.
21
USAA Mutual Funds Trust | Statement of Assets and Liabilities November 30, 2020 | ||||||
(Amounts in Thousands, Except Per Share Amounts) (Unaudited)
| USAA Cornerstone Aggressive Fund | |||||||
Assets: | |||||||
Affiliated investments, at value(Cost $10,236) | $ | 10,191 | |||||
Unaffiliated investments, at value (Cost $315,894) | 362,439 | (a) | |||||
Cash and cash equivalents | 7,811 | ||||||
Deposits with brokers for futures contracts | 533 | ||||||
Receivables: | |||||||
Interest and dividends | 432 | ||||||
Capital shares issued | 265 | ||||||
Variation margin on open futures contracts | 94 | ||||||
From Adviser | 103 | ||||||
Prepaid expenses | 11 | ||||||
Total Assets | 381,879 | ||||||
Liabilities: | |||||||
Payables: | |||||||
Collateral received on loaned securities | 12,441 | ||||||
Collateral received from brokers for futures contract | 281 | ||||||
Payable for foreign currency | 10 | ||||||
Capital shares redeemed | 270 | ||||||
Variation margin on open futures contracts | 36 | ||||||
Accrued expenses and other payables: | |||||||
Investment advisory fees | 178 | ||||||
Administration fees | 45 | ||||||
Transfer agent fees | 50 | ||||||
Compliance fees | — | (b) | |||||
Other accrued expenses | 50 | ||||||
Total Liabilities | 13,361 | ||||||
Net Assets: | |||||||
Capital | 315,706 | ||||||
Total accumulated earnings/(loss) | 52,812 | ||||||
Net Assets | $ | 368,518 | |||||
Shares (unlimited number of shares authorized with no par value): | 27,082 | ||||||
Net asset value, offering and redemption price per share: (c) | $ | 13.61 | |||||
(a) Includes $11,782 of securities on loan.
(b) Rounds to less than $1 thousand.
(c) Per share amount may not recalculate due to rounding of net assets and/or shares outstanding.
See notes to financial statements.
22
USAA Mutual Funds Trust | Statement of Operations For the Six Months Ended November 30, 2020 | ||||||
(Amounts in Thousands) (Unaudited)
| USAA Cornerstone Aggressive Fund | |||||||
Investment Income: | |||||||
Income distributions from affiliated funds | $ | 35 | |||||
Dividends | 3,107 | ||||||
Interest | 517 | ||||||
Securities lending (net of fees) | 41 | ||||||
Foreign tax withholding | (2 | ) | |||||
Total Income | 3,698 | ||||||
Expenses: | |||||||
Investment advisory fees | 1,064 | ||||||
Administration fees | 266 | ||||||
Sub-Administration fees | 46 | ||||||
Custodian fees | 18 | ||||||
Transfer agent fees | 605 | ||||||
Trustees' fees | 26 | ||||||
Compliance fees | 1 | ||||||
Legal and audit fees | 41 | ||||||
State registration and filing fees | 16 | ||||||
Interfund lending fees | — | (a) | |||||
Other expenses | 43 | ||||||
Total Expenses | 2,126 | ||||||
Expenses waived/reimbursed by Adviser | (171 | ) | |||||
Net Expenses | 1,955 | ||||||
Net Investment Income (Loss) | 1,743 | ||||||
Realized/Unrealized Gains (Losses) from Investments: | |||||||
| Net realized gains (losses) from unaffiliated investment securities and foreign currency translations | 7,591 | ||||||
Net realized gains (losses) from futures contracts | 114 | ||||||
| Net change in unrealized appreciation/depreciation on unaffiliated investment securities and foreign currency translations | 43,245 | ||||||
Net change in unrealized appreciation/depreciation on affiliated funds | 136 | ||||||
Net change in unrealized appreciation/depreciation on futures contracts | (333 | ) | |||||
Net realized/unrealized gains (losses) on investments | 50,753 | ||||||
Change in net assets resulting from operations | $ | 52,496 | |||||
(a) Rounds to less than $1 thousand.
See notes to financial statements.
23
USAA Mutual Funds Trust | Statements of Changes in Net Assets | ||||||
(Amounts in Thousands)
USAA Cornerstone Aggressive Fund | |||||||||||
| Six Months Ended November 30, 2020 (unaudited) | Year Ended May 31, 2020 | ||||||||||
From Investments: | |||||||||||
Operations: | |||||||||||
Net investment income (loss) | $ | 1,743 | $ | 6,090 | |||||||
Net realized gains (losses) from investments | 7,705 | (3,584 | ) | ||||||||
| Net change in unrealized appreciation/depreciation on investments | 43,048 | 3,241 | |||||||||
Change in net assets resulting from operations | 52,496 | 5,747 | |||||||||
Change in net assets resulting from distributions to shareholders | — | (6,470 | ) | ||||||||
Change in net assets resulting from capital transactions | (27,538 | ) | (7,127 | ) | |||||||
Change in net assets | 24,958 | (7,850 | ) | ||||||||
Net Assets: | |||||||||||
Beginning of period | 343,560 | 351,410 | |||||||||
End of period | $ | 368,518 | $ | 343,560 | |||||||
Capital Transactions: | |||||||||||
Proceeds from shares issued | $ | 14,263 | $ | 54,179 | |||||||
Distributions reinvested | — | 6,219 | |||||||||
Cost of shares redeemed | (41,801 | ) | (67,525 | ) | |||||||
Change in net assets resulting from capital transactions | $ | (27,538 | ) | $ | (7,127 | ) | |||||
Share Transactions: | |||||||||||
Issued | 1,124 | 4,491 | |||||||||
Reinvested | — | 480 | |||||||||
Redeemed | (3,316 | ) | (5,660 | ) | |||||||
Change in Shares | (2,192 | ) | (689 | ) | |||||||
See notes to financial statements.
24
This page is intentionally left blank.
25
USAA Mutual Funds Trust | Financial Highlights | ||||||
For a Share Outstanding Throughout Each Period
Investment Activities | Distributions to Shareholders From | ||||||||||||||||||||||||||
| Net Asset Value, Beginning of Period | Net Investment Income (Loss) | Net Realized and Unrealized Gains (Losses) on Investments | Total from Investment Activities | Net Investment Income | Net Realized Gains from Investments | ||||||||||||||||||||||
USAA Cornerstone Aggressive Fund | |||||||||||||||||||||||||||
| Six Months Ended November 30, 2020 (unaudited) | $ | 11.74 | 0.06 | (d) | 1.81 | 1.87 | — | — | |||||||||||||||||||
| Year Ended May 31, 2020 | $ | 11.73 | 0.20 | (d) | 0.03 | (e) | 0.23 | (0.15 | ) | (0.07 | ) | ||||||||||||||||
| Year Ended May 31, 2019 | $ | 12.81 | 0.15 | (0.57 | ) | (0.42 | ) | (0.18 | ) | (0.48 | ) | ||||||||||||||||
| Year Ended May 31, 2018 | $ | 12.57 | 0.16 | 0.94 | 1.10 | (0.14 | ) | (0.72 | ) | ||||||||||||||||||
| Year Ended May 31, 2017 | $ | 11.33 | 0.15 | 1.26 | 1.41 | (0.17 | ) | — | |||||||||||||||||||
| Year Ended May 31, 2016 | $ | 12.35 | 0.17 | (0.95 | ) | (0.78 | ) | (0.16 | ) | (0.08 | ) | ||||||||||||||||
* Assumes reinvestment of all net investment income and realized capital gain distributions, if any, during the period. Includes adjustments in accordance with U.S. generally accepted accounting principles and could differ from the Lipper reported return.
^ The net expense ratio may not correlate to the applicable expense limits in place during the period since the current contractual expense limitation is applied for a two year period beginning July 1, 2019 and in effect through September 30, 2021, instead of coinciding with the Fund's fiscal year end. Details of the current contractual expense limitation in effect can be found in Note 4 of the accompanying Notes to Financial Statements.
(a) Not annualized for periods less than one year.
(b) Annualized for periods less than one year.
(c) The expense ratios exclude the impact of expenses paid by each underlying fund.
(d) Per share net investment income (loss) has been calculated using the average daily shares method.
(e) The amount shown for a share outstanding throughout the period does not accord with the change in aggregate gains and losses in the portfolio of securities during the period because of timing of sales and purchases of fund shares in relation to fluctuating market values during the period.
(f) Reflects increased trading activity due to usage of quantitative investment strategies.
See notes to financial statements.
26
USAA Mutual Funds Trust | Financial Highlights | ||||||
For a Share Outstanding Throughout Each Period
Ratios to Average Net Assets | Supplemental Data | ||||||||||||||||||||||||||||||||||
| Total Distributions | Net Asset Value, End of Period | Total Return*(a) | Net Expenses^(b)(c) | Net Investment Income (Loss)(b) | Gross Expenses(b)(c) | Net Assets, End of Period (000's) | Portfolio Turnover(a) | ||||||||||||||||||||||||||||
USAA Cornerstone Aggressive Fund | |||||||||||||||||||||||||||||||||||
| Six Months Ended November 30, 2020 (unaudited) | — | $ | 13.61 | 15.93 | % | 1.10 | % | 0.98 | % | 1.20 | % | $ | 368,518 | 32 | % | ||||||||||||||||||||
| Year Ended May 31, 2020 | (0.22 | ) | $ | 11.74 | 1.78 | % | 1.10 | % | 1.68 | % | 1.18 | % | $ | 343,560 | 90 | % | |||||||||||||||||||
| Year Ended May 31, 2019 | (0.66 | ) | $ | 11.73 | (3.04 | )% | 1.10 | % | 1.54 | % | 1.24 | % | $ | 351,410 | 95 | %(f) | |||||||||||||||||||
| Year Ended May 31, 2018 | (0.86 | ) | $ | 12.81 | 8.85 | % | 1.10 | % | 1.18 | % | 1.25 | % | $ | 344,768 | 65 | % | |||||||||||||||||||
| Year Ended May 31, 2017 | (0.17 | ) | $ | 12.57 | 12.59 | % | 1.10 | % | 1.32 | % | 1.36 | % | $ | 283,867 | 70 | % | |||||||||||||||||||
| Year Ended May 31, 2016 | (0.24 | ) | $ | 11.33 | (6.26 | )% | 1.10 | % | 1.57 | % | 1.46 | % | $ | 222,224 | 81 | % | |||||||||||||||||||
See notes to financial statements.
27
USAA Mutual Funds Trust | Notes to Financial Statements November 30, 2020 | ||||||
(Unaudited)
1. Organization:
USAA Mutual Funds Trust (the "Trust") is organized as a Delaware statutory trust and is registered under the Investment Company Act of 1940, as amended (the "1940 Act"), as an open-end investment company. The Trust is comprised of 46 funds and is authorized to issue an unlimited number of shares, which are units of beneficial interest with no par value.
The accompanying financial statements are those of the USAA Cornerstone Aggressive Fund (the "Fund"). The Fund is classified as diversified under the 1940 Act.
Under the Trust's organizational documents, its officers and trustees are indemnified against certain liabilities arising out of the performance of their duties to the Fund. In addition, in the normal course of business, the Fund enters into contracts with its vendors and others that provide for general indemnifications. The Fund's maximum exposure under these arrangements is unknown, as this would involve future claims that may be made against the Fund. However, based on experience, the Fund expects that risk of loss to be remote.
2. Significant Accounting Policies:
The following is a summary of significant accounting policies followed by the Trust in the preparation of its financial statements. The policies are in conformity with Generally Accepted Accounting Principles in the United States of America ("GAAP"). The preparation of financial statements in accordance with GAAP requires management to make estimates and assumptions that affect the reported amounts of assets and liabilities and disclosure of contingent assets and liabilities at the date of the financial statements and the reported amounts of income and expenses for the period. Actual results could differ from those estimates. The Fund follows the specialized accounting and reporting requirements under GAAP that are applicable to investment companies under Accounting Standards Codification Topic 946.
Investment Valuation:
The Fund records investments at fair value. Fair value is defined as the price that would be received to sell an asset or paid to transfer a liability in an orderly transaction between market participants at the measurement date.
The valuation techniques described below maximize the use of observable inputs and minimize the use of unobservable inputs in determining fair value. The inputs used for valuing the Fund's investments are summarized in the three broad levels listed below:
• Level 1 — quoted prices in active markets for identical securities
• Level 2 — other significant observable inputs (including quoted prices for similar securities or interest rates applicable to those securities, etc.)
• Level 3 — significant unobservable inputs (including the Fund's own assumptions in determining the fair value of investments)
Changes in valuation techniques may result in transfers in or out of an assigned level within the disclosure hierarchy. The inputs or methodologies used for valuation techniques are not necessarily an indication of the risk associated with entering into those investments.
Victory Capital Management Inc. ("VCM" or the "Adviser") has established the Pricing and Liquidity Committee (the "Committee"), and subject to the Trust's Board of Trustees (the "Board") oversight, the Committee administers and oversees the Fund's valuation policies and procedures, which are approved by the Board.
Portfolio securities listed or traded on securities exchanges, including exchange-traded funds ("ETFs"), American Depositary Receipts ("ADRs") and Rights, are valued at the closing price on the exchange or system where the security is principally traded, if available, or at the Nasdaq Official Closing Price. If there have been no sales for that day on the exchange or system, then a security is valued at the last available bid quotation on the exchange or system where the security is principally traded. In each of these situations, valuations are typically categorized as Level 1 in the fair value hierarchy.
28
USAA Mutual Funds Trust | Notes to Financial Statements — continued November 30, 2020 | ||||||
(Unaudited)
Investments in open-end investment companies are valued at their net asset value ("NAV"). These valuations are typically categorized as Level 1 in the fair value hierarchy.
Futures contracts are valued at the settlement price established each day by the board of trade or an exchange on which they are traded. These valuations are typically categorized as Level 1 in the fair value hierarchy.
Debt securities of United States ("U.S.") issuers, along with corporate and municipal securities, including short-term investments maturing in 60 days or less, may be valued using evaluated bid or the last sales price to price securities by dealers or an independent pricing service approved by the Board. These valuations are typically categorized as Level 2 in the fair value hierarchy.
In the event that price quotations or valuations are not readily available, are not reflective of market value, or a significant event has been recognized in relation to a security or class of securities, the securities are valued in good faith by the Committee in accordance with valuation procedures approved by the Board. These valuations are typically categorized as Level 2 or Level 3 in the fair value hierarchy, based on the observability of inputs used to determine the fair value. The effect of fair value pricing is that securities may not be priced on the basis of quotations from the primary market in which they are traded and the actual price realized from the sale of a security may differ materially from the fair value price. Valuing these securities at fair value is intended to cause the Fund's NAV to be more reliable than it otherwise would be.
In accordance with procedures adopted by the Board, fair value pricing may be used if events materially affecting the value of foreign securities occur between the time the exchange on which they are traded closes and the time the Fund's NAV is calculated. The Fund uses a systematic valuation model, provided daily by an independent third party to fair value its international equity securities. The valuations are considered as Level 2 in the fair value hierarchy.
A summary of the valuations as of November 30, 2020, based upon the three levels defined above, is included in the table below while the breakdown, by category, of investments is disclosed on the Schedule of Portfolio Investments (amounts in thousands):
Level 1 | Level 2 | Level 3 | Total | ||||||||||||||||
Asset-Backed Securities | $ | — | $ | 3,085 | $ | — | $ | 3,085 | |||||||||||
| Collateralized Mortgage Obligations | — | 1,178 | — | 1,178 | |||||||||||||||
Common Stocks | 123,496 | — | — | 123,496 | |||||||||||||||
Preferred Stocks | 858 | — | — | 858 | |||||||||||||||
Corporate Bonds | — | 14,994 | — | 14,994 | |||||||||||||||
Yankee Dollars | — | 2,503 | — | 2,503 | |||||||||||||||
Municipal Bonds | — | 2,067 | — | 2,067 | |||||||||||||||
| U.S. Government Agency Mortgages | — | 3,169 | — | 3,169 | |||||||||||||||
U.S. Treasury Obligations | — | 10,481 | — | 10,481 | |||||||||||||||
Exchange-Traded Funds | 188,167 | — | — | 188,167 | |||||||||||||||
| Affiliated Exchange-Traded Funds | 10,191 | — | — | 10,191 | |||||||||||||||
Collateral for Securities Loaned | 12,441 | — | — | 12,441 | |||||||||||||||
Total | $ | 335,153 | $ | 37,477 | $ | — | $ | 372,630 | |||||||||||
Other Financial Investments^: | |||||||||||||||||||
Assets: | |||||||||||||||||||
Futures Contracts | $ | 183 | $ | — | $ | — | $ | 183 | |||||||||||
Liabilities: | |||||||||||||||||||
Futures Contracts | (516 | ) | — | — | (516 | ) | |||||||||||||
Total | $ | (333 | ) | $ | — | $ | — | $ | (333 | ) | |||||||||
^ Futures Contracts are valued at the unrealized appreciation (depreciation) on the investment.
29
USAA Mutual Funds Trust | Notes to Financial Statements — continued November 30, 2020 | ||||||
(Unaudited)
For the six months ended November 30, 2020, there were no transfers in or out of the Level 3 fair value hierarchy.
Real Estate Investment Trusts ("REITs"):
The Fund may invest in REITs, which report information on the source of their distributions annually. REITs are pooled investment vehicles that invest primarily in income producing real estate or real estate related loans or interests (such as mortgages). Certain distributions received from REITs during the year are recorded as realized gains or return of capital as estimated by the Fund or when such information becomes known.
Investment Companies:
Exchange-Traded Funds:
The Fund may invest in ETFs, the shares of which are bought and sold on a securities exchange. An ETF trades like common stock and represents a portfolio of securities designed to track the performance and dividend yield of a particular domestic or foreign market index. The Fund may purchase shares of an ETF to temporarily gain exposure to a portion of the U.S. or a foreign market while awaiting purchase of underlying securities. The risks of owning an ETF generally reflect the risks of owning the underlying securities they are designed to track, although the lack of liquidity of an ETF could result in it being more volatile. Additionally, ETFs have fees and expenses that reduce their value.
Open-End Funds:
The Fund may invest in portfolios of open-end investment companies. These investment companies value securities in their portfolios for which market quotations are readily available at their market values (generally the last reported sale price) and all other securities and assets at their fair value by the methods established by the board of directors of the underlying funds.
Securities Purchased on a Delayed-Delivery or When-Issued Basis:
The Fund may purchase securities on a delayed-delivery or when-issued basis. Delivery and payment for securities that have been purchased by the Fund on a delayed-delivery or when-issued basis or for delayed draws on loans can take place a month or more after the trade date. At the time the Fund makes the commitment to purchase a security on a delayed-delivery or when-issued basis, the Fund records the transaction and reflects the value of the security in determining NAV. No interest accrues to the Fund until the transaction settles and payment takes place. A segregated account is established and the Fund maintains cash and/or marketable securities at least equal in value to commitments for delayed-delivery or when-issued securities. If the Fund owns delayed-delivery or when-issued securities, these values are included in Payable for investments purchased on the accompanying Statement of Assets and Liabilities and the segregated assets are identified on the Schedule of Portfolio Investments.
Municipal Obligations:
The values of municipal obligations can fluctuate and may be affected by adverse tax, legislative, or political changes, and by financial developments affecting municipal issuers. Payment of municipal obligations may depend on a relatively limited source of revenue, resulting in greater credit risk. Future changes in federal tax laws or the activity of an issuer may adversely affect the tax-exempt status of municipal obligations.
Mortgage- and Asset-Backed Securities:
The values of some mortgage-related or asset-backed securities may be particularly sensitive to changes in prevailing interest rates. Early repayment of principal on some mortgage-related securities may expose the Fund to a lower rate of return upon reinvestment of principal. The values of mortgage and asset-backed securities depend in part on the credit quality and adequacy of the underlying assets or
30
USAA Mutual Funds Trust | Notes to Financial Statements — continued November 30, 2020 | ||||||
(Unaudited)
collateral and may fluctuate in response to the market's perception of these factors as well as current and future repayment rates. Some mortgage-backed securities are backed by the full faith and credit of the U.S. government (e.g., mortgage-backed securities issued by the Government National Mortgage Association, commonly known as "Ginnie Mae"), while other mortgage-backed securities (e.g., mortgage-backed securities issued by the Federal National Mortgage Association and the Federal Home Loan Mortgage Corporation, commonly known as "Fannie Mae" and "Freddie Mac", respectively), are backed only by the credit of the government entity issuing them. In addition, some mortgage-backed securities are issued by private entities and, as such, are not guaranteed by the U.S. government or any agency or instrumentality of the U.S. government.
Derivative Instruments:
Futures Contracts:
The Fund may enter into contracts for the future delivery of securities or foreign currencies and futures contracts based on a specific security, class of securities, foreign currency or an index, and purchase or sell options on any such futures contracts. A futures contract on a securities index is an agreement obligating either party to pay, and entitling the other party to receive, while the contract is outstanding, cash payments based on the level of a specified securities index. No physical delivery of the underlying asset is made. The Fund may enter into futures contracts in an effort to hedge against market risks. The acquisition of put and call options on futures contracts will give the Fund the right (but not the obligation), for a specified price, to sell or to purchase the underlying futures contract, upon exercise of the option, at any time during the option period. Futures transactions involve brokerage costs and require the Fund to segregate assets to cover contracts that would require it to purchase securities or currencies. A good faith margin deposit, known as initial margin, of cash or government securities with a broker or custodian is required to initiate and maintain open positions in futures contracts. Subsequent payments, known as variation margin, are made or received by the Fund based on the change in the market value of the position and are recorded as unrealized appreciation or depreciation until the contract is closed out, at which time the gain or loss is realized. The Fund may lose the expected benefit of futures transactions if interest rates, exchange rates or securities prices change in an unanticipated manner. Such unanticipated changes may also result in lower overall performance than if the Fund had not entered into any futures transactions. In addition, the value of the Fund's futures positions may not prove to be perfectly or even highly correlated with the value of its portfolio securities or foreign currencies, limiting the Fund's ability to hedge effectively against interest rate, exchange rate and/or market risk and giving rise to additional risks. There is no assurance of liquidity in the secondary market for purposes of closing out futures positions. The collateral held by the Fund is reflected on the Statement of Assets and Liabilities under Collateral received from brokers for futures contract. During the six months ended November 30, 2020, the Fund held futures contracts primarily for the strategy of gaining exposure to a particular asset class or securities market.
Summary of Derivative Instruments:
The following table summarizes the fair values of derivative instruments on the Statement of Assets and Liabilities, categorized by risk exposure, as of November 30, 2020 (amounts in thousands):
Assets | Liabilities | ||||||||||
| Variation Margin Receivable on Open Futures Contracts* | Variation Margin Payable on Open Futures Contracts* | ||||||||||
Equity Risk Exposure | $ | 183 | $ | 516 | |||||||
* Includes cumulative appreciation (depreciation) of futures contracts as reported on the Schedule of Portfolio Investments. Only current day's variation margin for futures contracts is reported within the Statement of Assets and Liabilities.
31
USAA Mutual Funds Trust | Notes to Financial Statements — continued November 30, 2020 | ||||||
(Unaudited)
The following table presents the effect of derivative instruments on the Statement of Operations, categorized by risk exposure, for the six-months ended November 30, 2020 (amounts in thousands):
| Net Realized Gains (Losses) on Derivatives Recognized as a Result of Operations | Net Change in Unrealized Appreciation/Depreciation on Derivatives Recognized as a Result of Operations | ||||||||||
| Net Realized Gains (Losses) from Futures Contracts | Net Change in Unrealized Appreciation/Depreciation on Futures Contracts | ||||||||||
Equity Risk Exposure | $ | 114 | $ | (333 | ) | ||||||
All open derivative positions at period end are reflected on the Fund's Schedule of Portfolio Investments. The underlying face value of open derivative positions relative to the Fund's net assets at period end is generally representative of the notional amount of open positions to net assets throughout the period.
Investment Transactions and Related Income:
Changes in holdings of investments are accounted for no later than one business day following the trade date. For financial reporting purposes, however, investment transactions are accounted for on trade date on the last business day of the reporting period. Interest income is determined on the basis of coupon interest accrued using the effective interest method which adjusts, where applicable, the amortization of premiums or accretion of discount. Gains or losses realized on sales of securities are determined by comparing the identified cost of the security lot sold with the net sales proceeds.
Withholding taxes on interest, dividends, and gains as a result of certain investments in ADRs by the Fund has been provided for in accordance with each investment's applicable country's tax rules and rates.
Securities Lending:
The Fund, through a securities lending agreement with Citibank, N.A. ("Citibank"), may lend its securities to qualified financial institutions, such as certain broker-dealers, to earn additional income, net of income retained by Citibank. Borrowers are required to secure their loans for collateral in the amount of at least 102% of the value of U.S. securities loaned or at least 105% of the value of non-U.S. securities loaned, marked-to-market daily. Any collateral shortfalls associated with increases in the valuation of the securities loaned are cured the next business day once the shortfall exceeds $100 thousand. Collateral may be cash, U.S. government securities, or other securities as permitted by Securities and Exchange Commission ("SEC") guidelines. Cash collateral may be invested in high-quality short-term investments, primarily open-end investment companies. Collateral requirements are determined daily based on the value of the Fund's securities on loan as of the end of the prior business day. During the time portfolio securities are on loan, the borrower will pay the Fund any dividends or interest paid on such securities plus any fee negotiated between the parties to the lending agreement. The Fund also earns a return from the collateral. The Fund pays Citibank various fees in connection with the investment of cash collateral and fees based on the investment income received from securities lending activities. Securities lending income (net of these fees) is disclosed on the Statement of Operations. Loans are terminable upon demand and the borrower must return the loaned securities within the lesser of one standard settlement period or five business days. Risks relating to securities-lending transactions include that the borrower may not provide additional collateral when required or return the securities when due, and that the value of the short-term investments will be less than the amount of cash collateral required to be returned to the borrower. The Fund's agreement with Citibank does not include master netting provisions. Noncash collateral received by the Fund may not be sold or re-pledged, except to satisfy borrower default. Cash collateral is listed on the Fund's Schedule of Portfolio Investments and Financial Statements while non-cash collateral is not included.
32
USAA Mutual Funds Trust | Notes to Financial Statements — continued November 30, 2020 | ||||||
(Unaudited)
The following table (amounts in thousands) is a summary of the Fund's securities lending transactions as of November 30, 2020.
| Value of Securities on Loan | Non-Cash Collateral | Cash Collateral | |||||||||
| $ | 11,782 | $ | — | $ | 12,441 | ||||||
Foreign Currency Translations:
The accounting records of the Fund are maintained in U.S. dollars. Investment securities and other assets and liabilities of the Fund denominated in a foreign currency are translated into U.S. dollars at current exchange rates. Purchases and sales of securities, income receipts and expense payments are translated into U.S. dollars at the exchange rates on the date of the transactions. The Fund does not isolate the portion of the results of operations resulting from changes in foreign exchange rates on investments from fluctuations arising from changes in market prices of securities held. Such fluctuations are disclosed as net change in unrealized appreciation/depreciation on investments and foreign currency translations on the Statement of Operations. Any realized gains or losses from these fluctuations, including foreign currency arising from in-kind redemptions, are disclosed as net realized gains or losses from investment transactions and foreign currency translations on the Statement of Operations.
Foreign Taxes:
The Fund may be subject to foreign taxes related to foreign income received (a portion of which may be reclaimable), capital gains on the sale of securities, and certain foreign currency transactions. All foreign taxes are recorded in accordance with the applicable regulations and rates that exist in the foreign jurisdictions in which the Fund invests.
Federal Income Taxes:
It is the Fund's policy to continue to qualify as a regulated investment company by complying with the provisions available to certain investment companies, as defined in applicable sections of the Internal Revenue Code, and to make distributions of net investment income and net realized gains sufficient to relieve it from all, or substantially all, federal income taxes. Accordingly, no provision for federal income taxes is required in the financial statements. The Fund has a tax year end of May 31.
Management of the Fund has reviewed tax positions taken in tax years that remain subject to examination by all major tax jurisdictions, including federal (i.e., the last four tax years, which includes the current fiscal tax year end). Management believes that there is no tax liability resulting from unrecognized tax benefits related to uncertain tax positions taken.
Allocations:
Expenses directly attributable to the Fund are charged to the Fund, while expenses that are attributable to more than one fund in the Trust, or jointly with an affiliated trust, are allocated among the respective funds in the Trust and/or affiliated trust based upon net assets or another appropriate basis.
Cross-Trade Transactions:
Pursuant to Rule 17a-7 under the 1940 Act, the Fund may engage in cross-trades, which are securities transactions with affiliated investment companies and advisory accounts managed by the Adviser and any applicable sub-adviser. Any such purchase or sale transaction must be effected without brokerage commission or other remuneration, except for customary transfer fees. The transaction must be effected at the current market price, which is either the security's last sale price on an exchange or, if there are no transactions in the security that day, at the average of the highest bid and lowest asked price. For the six months ended November 30, 2020, the Fund engaged in the following securities transactions with affiliated funds, which resulted in the following net realized gains (losses) (amounts in thousands):
| Purchases | Sales | Net Realized Gains (Losses) | |||||||||
| $ | — | $ | 133 | $ | 1 | ||||||
33
USAA Mutual Funds Trust | Notes to Financial Statements — continued November 30, 2020 | ||||||
(Unaudited)
3. Purchases and Sales:
Cost of purchases and proceeds from sales/maturities of securities (excluding securities maturing less than one year from acquisition) for the six months ended November 30, 2020, were as follows for the Fund (amounts in thousands):
| Purchases (excluding U.S. Government Securities) | Sales (excluding U.S. Government Securities) | Purchases of U.S. Government Securities | Sales of U.S. Government Securities | ||||||||||||||||
$ | 110,428 | $ | 137,269 | $ | 798 | $ | 1,443 | ||||||||||||
4. Fees and Transactions with Affiliates and Related Parties:
Investment Advisory Fees:
Investment advisory services are provided to the Fund by the Adviser, which is a New York corporation registered as an investment adviser with the SEC. The Adviser is a wholly-owned indirect subsidiary of Victory Capital Holdings, Inc., a publicly traded Delaware corporation, and a wholly-owned direct subsidiary of Victory Capital Operating, LLC. Under the terms of the Investment Advisory Agreement, the Adviser is entitled to receive fees accrued daily and paid monthly at an annualized rate of 0.60% of the Fund's average daily net assets. Amounts incurred and paid to VCM for the six months ended November 30, 2020, are reflected on the Statement of Operations as Investment Advisory fees.
In addition, the Fund invests in affiliated VCM exchange-traded fund(s) ("affiliated ETFs"). The Fund's Adviser fee is reimbursed by VCM to the extent of the indirect Adviser fee incurred through the Fund's proportional investment in the affiliated ETF(s). As of November 30, 2020, the Fund's Adviser fee was reimbursed by VCM in an amount of $5 thousand, of which $4 thousand is receivable from VCM. These reimbursements are not available for recoupment and are reflected on the Statement of Operations as Expenses waived/reimbursed by Adviser.
The Trust relies on an exemptive order granted to VCM and its affiliated funds by the SEC in March 2019 permitting the use of a "manager-of-managers" structure for certain funds. Under a manager-of-managers structure, the investment adviser may select (with approval of the Board and without shareholder approval) one or more subadvisers to manage the day-to-day investment of a fund's assets. For the six months ended November 30, 2020, the Fund had no subadvisors.
Administration and Servicing Fees:
VCM serves as the Fund's administrator and fund accountant. Under the Administration, Servicing and Accounting Agreement, VCM is paid for its services an annual fee at a rate of 0.15% of average daily net assets of the Fund. Amounts incurred for the six months ended November 30, 2020, are reflected on the Statement of Operations as Administration fees.
The Fund (as part of the Trust) has entered into an agreement to provide compliance services with the Adviser, pursuant to which the Adviser furnishes its compliance personnel, including the services of the Chief Compliance Officer ("CCO"), and other resources reasonably necessary to provide the Trust with compliance oversight services related to the design, administration and oversight of a compliance program for the Trust in accordance with Rule 38a-1 under the 1940 Act. The CCO is an employee of the Adviser, which pays the compensation of the CCO and support staff. Funds in the Trust, Victory Variable Insurance Funds, Victory Portfolios, and Victory Portfolios II (collectively, the "Victory Funds Complex") in the aggregate, compensate the Adviser for these services. Amounts incurred for the six months ended November 30, 2020, are reflected on the Statement of Operations as Compliance fees.
Citi Fund Services Ohio, Inc. ("Citi"), an affiliate of Citibank, acts as sub-administrator and sub-fund accountant to the Fund pursuant to a Sub-Administration and Sub-Fund Accounting Services Agreement between VCM and Citi. VCM pays Citi a fee for providing these services. The Trust reimburses VCM and Citi for out-of-pocket expenses incurred in providing these services and certain other expenses specifically allocated to the Funds. Amounts incurred for the six months ended November 30, 2020, are reflected on the Statement of Operations as Sub-Administration fees.
34
USAA Mutual Funds Trust | Notes to Financial Statements — continued November 30, 2020 | ||||||
(Unaudited)
Transfer Agency Fees:
Victory Capital Transfer Agency, Inc. ("VCTA") provides transfer agency services to the Fund. VCTA, an affiliate of the Adviser, provides transfer agent services based on an annual charge of $23 per shareholder account plus out-of-pocket expenses. VCTA pays a portion of these fees to certain intermediaries for the administration and servicing of accounts that are held with such intermediaries. Amounts incurred and paid to VCTA for the six months ended November 30, 2020, are reflected on the Statement of Operations as Transfer Agent fees.
FIS Investor Services LLC serves as sub-transfer agent and dividend disbursing agent for the Fund pursuant to a Sub-Transfer Agent agreement between VCTA and FIS Investor Services LLC. VCTA provides FIS Investor Services LLC a fee for providing these services.
Distributor/Underwriting Services:
Victory Capital Services, Inc. (the "Distributor"), an affiliate of the Adviser, serves as distributor for the continuous offering of the shares of the Fund pursuant to a Distribution Agreement between the Distributor and the Trust. Effective June 30, 2020, the Distributor's name was changed from Victory Capital Advisers, Inc.
Other Fees:
Citibank serves as the Fund's custodian. The Fund pays Citibank a fee for providing these services. Amounts incurred for the six months ended November 30, 2020, are reflected on the Statement of Operations as Custodian fees.
K&L Gates LLP provides legal services to the Trust.
The Adviser has entered into an expense limitation agreement with the Fund until at least September 30, 2021. Under the terms of the agreement, the Adviser has agreed to waive fees or reimburse certain expenses to the extent that ordinary operating expenses incurred in any fiscal year exceed the expense limit for the Fund. Such excess amounts will be the liability of the Adviser. Interest, taxes, brokerage commissions, other expenditures, which are capitalized in accordance with GAAP, and other extraordinary expenses not incurred in the ordinary course of the Fund's business are excluded from the expense limits. As of November 30, 2020, the expense limit (excluding voluntary waivers) is 1.10%.
Under this expense limitation agreement, the Fund has agreed to repay fees and expenses that were waived or reimbursed by the Adviser for a period up to three years after the fiscal year in which the waiver or reimbursement took place, subject to the lesser of any operating expense limits in effect at the time of: (a) the original waiver or expense reimbursement; or (b) the recoupment, after giving effect to the recoupment amount.
As of November 30, 2020, the following amounts are available to be repaid to the Adviser (amounts in thousands). The Fund has not recorded any amounts available to be repaid as a liability due to an assessment that such repayment is not probable at November 30, 2020.
| Expires May 31, 2023 | Expires May 31, 2024 | Total | |||||||||
| $ | 267 | $ | 166 | $ | 433 | ||||||
The Adviser may voluntarily waive or reimburse additional fees to assist the Fund in maintaining competitive expense ratios. Voluntary waivers and reimbursements applicable to the Fund are not available to be recouped at a future time. There were no voluntary waivers or reimbursements for the six months ended November 30, 2020.
Certain officers and/or interested trustees of the Fund are also officers and/or employees of the Adviser, Administrator, Sub-Administrator, Sub-Fund Accountant, and Legal.
5. Risks:
The Fund may be subject to other risks in addition to these identified risks.
35
USAA Mutual Funds Trust | Notes to Financial Statements — continued November 30, 2020 | ||||||
(Unaudited)
Geopolitical/Natural Disaster Risk — Global economies and financial markets are increasingly interconnected, which increases the possibilities that conditions in one country or region might adversely affect issuers in another country or region. Geopolitical and other risks, including war, terrorism, trade disputes, political or economic dysfunction within some nations, public health crises and related geopolitical events, as well as environmental disasters such as earthquakes, fires, and floods, may add to instability in world economies and markets generally. Changes in trade policies and international trade agreements could affect the economies of many countries in unpredictable ways. Likewise, systemic market dislocations of the kind that occurred during the financial crisis that began in 2008, if repeated, would be highly disruptive to economies and markets, adversely affecting individual companies and industries, securities markets, interest rates, credit ratings, inflation, investor sentiment, and other factors affecting the value of a Fund's investments. Some countries, including the United States, are adopting more protectionist trade policies and moving away from the tighter financial industry regulations that followed the 2008 financial crisis, which may also affect the value of a Fund's investments.
Political events within the United States at times have resulted, and may in the future result, in a shutdown of government services, which could negatively affect the U.S. economy, decrease the value of a Fund's investments, increase uncertainty in or impair the operation of the U.S. or other securities markets and degrade investor and consumer confidence, perhaps suddenly and to a significant degree.
An outbreak of disease called COVID-19 has spread internationally. The transmission of COVID-19 and efforts to contain its spread have resulted in international, national and local border closings and other significant travel restrictions and disruptions, significant disruptions to business operations, supply chains and consumer activity, significant challenges in healthcare service preparation and delivery, quarantines and general concern and uncertainty. These negative impacts have caused significant volatility and declines in global financial markets, which have caused losses for Fund investors during and subsequent to period end. The impact of the COVID-19 pandemic last for an extended period of time, and could result in a substantial economic downturn or recession. Public health crises may exacerbate other pre-existing political, social, economic, market and financial risks. The extent of the impact to the financial performance of the Funds' investments will depend on future developments, including (i) the duration and spread of the outbreak, (ii) the restrictions and advisories, (iii) the effects on the financial markets, and (iv) the effects on the economy overall, all of which are highly uncertain and cannot be predicted.
Tactical Allocation Risk — The Fund has a targeted risk tolerance and a corresponding asset allocation target; however, mere asset allocation and volatility are not the sole determination of risk. The Fund's managers will tactically allocate away from the target allocation as market conditions and the perceived risks warrant. The Fund bears the risk that the managers' tactical allocation will not be successful.
Affiliated Funds Risk — The risks of the Fund directly correspond to the risks of the underlying affiliated funds in which the Fund invests. By investing in the underlying affiliated funds, the Fund has exposure to the risk of many different areas of the market. The degree to which the risks described below apply to the Fund varies according to the Fund's asset allocation. For instance, the more the Fund is allocated to stock funds, the greater the risk associated with equity securities. The Fund also is subject to asset allocation risk (i.e., the risk that allocations will not produce the intended results) and to management risk (i.e., the risk that the selection of underlying affiliated funds will not produce the intended results).
Conflict of Interest Risk — In managing a Fund that invests in underlying affiliated funds, the Adviser may have conflicts of interest in allocating the Fund's assets among the various underlying affiliated funds. This is because the fees payable by some of the underlying affiliated funds to the Adviser and/or its affiliates are higher than the fees payable by other underlying affiliated funds, and because the Adviser also manages and administers the underlying affiliated funds.
LIBOR Discontinuation Risk — Many debt securities, derivatives and other financial instruments, including some of the Fund's investments, use the London Interbank Offered Rate ("LIBOR") as the reference or benchmark rate for variable interest rate calculations. However, the use of LIBOR started to come under pressure following manipulation allegations in 2012. Despite increased regulation and
36
USAA Mutual Funds Trust | Notes to Financial Statements — continued November 30, 2020 | ||||||
(Unaudited)
other corrective actions since that time, concerns have arisen regarding its viability as a benchmark, due largely to reduced activity in the financial markets that it measures. In June 2017, the Alternative Reference Rates Committee, a group of large U.S. banks working with the Federal Reserve, announced its selection of a new Secured Overnight Funding Rate ("SOFR"), which is intended to be a broad measure of secured overnight U.S. Treasury repo rates, as an appropriate replacement for LIBOR. The Federal Reserve Bank of New York began publishing the SOFR in 2018, expecting that it could be used on a voluntary basis in new instruments and transactions. Bank working groups and regulators in other countries have suggested other alternatives for their markets, including the Sterling Overnight Interbank Average Rate ("SONIA") in England. In July 2017, the Financial Conduct Authority (the "FCA"), the United Kingdom financial regulatory body, announced that after 2021 it will cease its active encouragement of UK banks to provide the quotations needed to sustain LIBOR. That announcement suggests that LIBOR may cease to be published after that time. For U.S. dollar LIBOR, however, the relevant date may be deferred to June 30, 2023 for the most common tenors (overnight and one, three, six and 12 months). As to those tenors, the LIBOR administrator has published a consultation regarding its intention to cease publication of U.S. dollar LIBOR as of June 30, 2023 (instead of December 31, 2021, as previously expected), apparently based on continued rate submissions from banks. It is expected that there will be enough for market participants to transition to the use of a different benchmark for both new and existing securities and transactions. Various financial industry groups have begun planning for that transition, but there are obstacles to converting certain longer-term securities and transactions to a new benchmark. Transition planning is at an early stage, and neither the effect of the transition process nor its ultimate success can yet be known. Although the foregoing may provide some sense of timing, there is no assurance that LIBOR, or any particular currency and tenor, will continue to be published until any particular date, and it appears highly likely that LIBOR will be discontinued or modified after December 31, 2021 or June 30, 2023, depending on the currency and tenor. The transition process might lead to increased volatility and illiquidity in markets that currently rely on the LIBOR to determine interest rates. It could also lead to a reduction in the value of some LIBOR-based investments and reduce the effectiveness of new hedges placed against existing LIBOR-based instruments. Since the usefulness of LIBOR as a benchmark could deteriorate during the transition period, these effects could occur before the end of 2021
6. Borrowing and Interfund Lending:
Line of Credit:
For the six months ended November 30, 2020, the Victory Funds Complex participated in a short-term demand note "Line of Credit" agreement with Citibank. The Line of Credit agreement with Citibank was renewed on June 29, 2020 with a termination date of June 28, 2021. Under the agreement with Citibank, the Victory Funds Complex may borrow up to $600 million, of which $300 million is committed and $300 million is uncommitted. $40 million of the Line of Credit is reserved for use by the Victory Floating Rate Fund, another series of the Victory Funds Complex, with Victory Floating Rate Fund paying the related commitment fees for that amount. The purpose of the agreement is to meet temporary or emergency cash needs. For the six months ended November 30, 2020, Citibank received an annual commitment fee of 0.15% on $300 million for providing the Line of Credit. Each fund in the Victory Funds Complex pays a pro- rata portion of the commitment fees plus any interest (one month LIBOR plus one percent) on amounts borrowed. Effective June 29, 2020, under an amended Line of Credit agreement, Citibank will also receive an annual upfront fee of 0.10% on the $300 million committed line of credit. Each fund in the Victory Funds Complex will pay a pro-rata portion of the upfront fee. Interest charged to each Fund during the period, if applicable, is reflected on the Statements of Operations under Line of credit fees.
The Fund had no borrowings under the Line of Credit agreement during the six months ended November 30, 2020.
37
USAA Mutual Funds Trust | Notes to Financial Statements — continued November 30, 2020 | ||||||
(Unaudited)
Interfund Lending:
The Trust and Adviser rely on an exemptive order granted by the SEC in March 2017 (the "Order"), permitting the establishment and operation of an Interfund Lending Facility (the "Facility"). The Facility allows the Fund to directly lend and borrow money to or from any other Fund, that is permitted to participate in the Facility, in the Victory Funds Complex relying upon the Order at rates beneficial to both the borrowing and lending funds. Advances under the Facility are allowed for temporary or emergency purposes. The interfund loan rate is determined, as specified in the Order, by averaging the current repurchase agreement rate and the current bank loan rate. As a Borrower, interest charged to the Fund, if any, during the period is reflected on the Statement of Operations under Interfund lending fees. As a Lender, interest earned by the Fund, if any, during the period is reflected on the Statement of Operations under Income on Interfund lending.
The average borrowing or lending for the days outstanding and average interest rate for the Fund during the six months ended November 30, 2020 were as follows (amounts in thousands):
| Borrower or Lender | Amount Outstanding at November 30, 2020 | Average Borrowing* | Days Borrowing Outstanding | Average Interest Rate* | Maximum Borrowing During the Period | ||||||||||||||||||
| Borrower | $ | — | $ | 2,843 | 2 | 0.62 | % | $ | 2,890 | ||||||||||||||
* For the six months ended November 30, 2020, based on the number of days borrowings were outstanding.
7. Federal Income Tax Information:
The Fund intends to declare and distribute any net investment income annually. Distributable net realized gains, if any, are declared and paid at least annually.
The amounts of dividends from net investment income and distributions from net realized gains (collectively; distributions to shareholders) are determined in accordance with federal income tax regulations, which may differ from GAAP. To the extent these "book/tax" differences are permanent in nature (e.g., net operating loss and distribution reclassification), such amounts are reclassified within the components of net assets based on their federal tax-basis treatment; temporary differences (e.g., wash sales) do not require reclassification. To the extent dividends and distributions exceed net investment income and net realized gains for tax purposes, they are reported as distributions of capital.
Net investment losses incurred by the Fund may be reclassified as an offset to capital on the accompanying Statement of Assets and Liabilities.
The tax character of current year distributions paid and the tax basis of the current components of accumulated earnings (deficit) will be determined at the end of the current tax year ending May 31, 2021.
At May 31, 2020, the Fund had net capital loss carryforwards as shown in the table below (amounts in thousands).
| Short-Term Amount | Long-Term Amount | Total | |||||||||
| $ | 3,213 | $ | — | $ | 3,213 | ||||||
8. Affiliated Securities:
An affiliated security is a security in which the Fund has ownership of at least 5% of the security's outstanding voting shares or an investment company managed by VCM. The Fund does not invest in affiliated underlying funds for the purpose of exercising management or control. These underlying funds' are noted as affiliated on the Fund's Schedule of Portfolio Investments. The affiliated underlying
38
USAA Mutual Funds Trust | Notes to Financial Statements — continued November 30, 2020 | ||||||
(Unaudited)
funds' annual or semiannual reports may be viewed at vcm.com. Transactions in affiliated securities during the six months ended November 30, 2020, were as follows (amount in thousands):
| Fair Value 5/31/2020 | Purchases at Cost | Proceeds from Sales | Realized Gains (Losses) | Capital Gain Distribution | Net Change in Unrealized Appreciation/ Depreciation | Fair Value 11/30/2020 | Dividend Income | ||||||||||||||||||||||||||||
| VictoryShares USAA Core Intermediate-Term Bond ETF | $ | — | $ | 4,642 | $ | — | $ | — | $ | — | $ | 24 | $ | 4,666 | $ | 12 | |||||||||||||||||||
| VictoryShares USAA Core Short-Term Bond ETF | — | 4,824 | — | — | — | 13 | 4,837 | 10 | |||||||||||||||||||||||||||
| VictoryShares USAA MSCI Emerging Markets Value Momentum ETF | 589 | — | — | — | — | 99 | 688 | 13 | |||||||||||||||||||||||||||
$ | 589 | $ | 9,466 | $ | — | $ | — | $ | — | $ | 136 | $ | 10,191 | $ | 35 | ||||||||||||||||||||
39
USAA Mutual Funds Trust | Supplemental Information November 30, 2020 | ||||||
(Unaudited)
Proxy Voting and Portfolio Holdings Information
Proxy Voting:
Information regarding the policies and procedures the Fund uses to determine how to vote proxies relating to portfolio securities is available without charge, upon request, by calling (800) 539-3863. The information is also included in the Fund's Statement of Additional Information, which is available on the SEC's website at www.sec.gov.
Information relating to how the Fund voted proxies relating to portfolio securities held during the most recent 12 months ended June 30 is available on the SEC's website at www.sec.gov.
Availability of Schedules of Portfolio Investments:
The Trust files a complete list of Schedules of Portfolio Investments with the SEC for the first and third quarter of each fiscal year on Form N-PORT. Form N-PORT is available on the SEC's website at www.sec.gov.
Expense Example
As a shareholder of the Fund, you may incur two types of costs: (1) transaction costs, and (2) ongoing costs, including management fees and other Fund expenses. These examples are intended to help you understand your ongoing costs (in dollars) of investing in the Fund and to compare these costs with the ongoing costs of investing in other mutual funds.
These examples are based on an investment of $1,000 invested at the beginning of the period and held for the entire period from June 1, 2020 through November 30, 2020.
The Actual Expense figures in the table below provide information about actual account values and actual expenses. You may use the information below, together with the amount you invested, to estimate the expenses that you paid over the period. Simply divide your account value by $1,000 (for example, an $8,600 account value divided by $1,000 = 8.6), then multiply the result by the number in the table under the heading entitled "Actual Expenses Paid During Period" to estimate the expenses you paid on your account during this period.
The Hypothetical Expense figures in the table below provide information about hypothetical account values and hypothetical expenses based on the Fund's actual expense ratio and an assumed rate of return of 5% per year before expenses, which is not the Fund's actual return. The hypothetical account values and expenses may not be used to estimate the actual ending account balance or expenses you paid for the period. You may use this information to compare this 5% hypothetical example with the 5% hypothetical examples that appear in shareholder reports of other funds.
Please note the expenses shown in the table below are meant to highlight your ongoing costs only and do not reflect any transactional costs. If these transactional costs were included, your costs would have been higher.
| Beginning Account Value 6/1/20 | Actual Ending Account Value 11/30/20 | Hypothetical Ending Account Value 11/30/20 | Actual Expenses Paid During Period 6/1/20- 11/30/20* | Hypothetical Expenses Paid During Period 6/1/20- 11/30/20* | Annualized Expense Ratio During Period 6/1/20- 11/30/20 | ||||||||||||||||||
| $ | 1,000.00 | $ | 1,159.30 | $ | 1,019.55 | $ | 5.95 | $ | 5.57 | 1.10 | % | ||||||||||||
* Expenses are equal to the average account value multiplied by the Fund's annualized expense ratio multiplied by 183/365 (the number of days in the most recent fiscal half-year divided by the number of days in the fiscal year).
40
Privacy Policy
Protecting the Privacy of Information
The Trust respects your right to privacy. We also know that you expect us to conduct and process your business in an accurate and efficient manner. To do so, we must collect and maintain certain personal information about you. This is the information we collect from you on applications or other forms, and from the transactions you make with us or third parties. It may include your name, address, social security number, account transactions and balances, and information about investment goals and risk tolerance.
We do not disclose any information about you or about former customers to anyone except as permitted or required by law. Specifically, we may disclose the information we collect to companies that perform services on our behalf, such as the transfer agent that processes shareholder accounts and printers and mailers that assist us in the distribution of investor materials. We may also disclose this information to companies that perform marketing services on our behalf. This allows us to continue to offer you Victory investment products and services that meet your investing needs, and to effect transactions that you request or authorize. These companies will use this information only in connection with the services for which we hired them. They are not permitted to use or share this information for any other purpose.
To protect your personal information internally, we permit access only by authorized employees and maintain physical, electronic and procedural safeguards to guard your personal information.*
* You may have received communications regarding information about privacy policies from other financial institutions which gave you the opportunity to "opt-out" of certain information sharing with companies which are not affiliated with that financial institution. The Trust does not share information with other companies for purposes of marketing solicitations for products other than the Trust. Therefore, the Trust does not provide opt-out options to their shareholders.
P.O. Box 182593
Columbus, Ohio 43218-2593

Visit our website at: | Call | ||||||
vcm.com | (800) 235-8396 | ||||||
97452-0121

NOVEMBER 30, 2020
Semi Annual Report
USAA Cornerstone Conservative Fund
Beginning January 1, 2021, as permitted by regulations adopted by the Securities and Exchange Commission, paper copies of the Fund's shareholder reports may no longer be sent by mail, unless you specifically request paper copies of the reports from the Fund or from your financial intermediary, such as a broker-dealer or bank. Instead, the reports will be made available on VictoryFunds.com, and you will be notified by mail each time a report is posted and provided with a website link to access the report. If you already elected to receive shareholder reports electronically, you will not be affected by this change and you need not take any action.
You may elect to receive shareholder reports and other communications from the Fund or your financial intermediary electronically by notifying your financial intermediary directly, or if you are a shareholder who has an account directly with the Fund, by calling (800) 235-8396 or by submitting your request via email to TA.Processing@FISGlobal.com.
You may elect to receive all future reports in paper free of charge. You can inform the Fund or your financial intermediary that you wish to continue receiving paper copies of your shareholder reports by notifying your financial intermediary directly, or if you are a shareholder who has an account directly with the Fund, by calling (800) 235-8396 or submitting your request via email to TA.Processing@FISGlobal.com.
Your election to receive reports in paper will apply to all funds held with the USAA Mutual Funds or your financial intermediary.
Victory Capital means Victory Capital Management Inc., the investment adviser of the USAA Mutual Funds. USAA Mutual Funds are distributed by Victory Capital Services, Inc., member of FINRA, an affiliate of Victory Capital. Victory Capital and its affiliates are not affiliated with United Services Automobile Association or its affiliates. USAA and the USAA logo are registered trademarks and the USAA Mutual Funds and USAA Investments logos are trademarks of United Services Automobile Association and are being used by Victory Capital and its affiliates under license.
USAA Mutual Funds Trust
TABLE OF CONTENTS
Investment Objective & Portfolio Holdings | 2 | ||||||
Schedule of Portfolio Investments | 4 | ||||||
Financial Statements | |||||||
Statement of Assets and Liabilities | 5 | ||||||
Statement of Operations | 6 | ||||||
Statements of Changes in Net Assets | 7 | ||||||
Financial Highlights | 8 | ||||||
Notes to Financial Statements | 10 | ||||||
Supplemental Information | 19 | ||||||
Proxy Voting and Portfolio Holdings Information | 19 | ||||||
Expense Example | 19 | ||||||
Privacy Policy (inside back cover) | |||||||
This report is for the information of the shareholders and others who have received a copy of the currently effective prospectus of the Fund, managed by Victory Capital Management Inc. It may be used as sales literature only when preceded or accompanied by a current prospectus, which provides further details about the Fund.
IRA DISTRIBUTION WITHHOLDING DISCLOSURE
We generally must withhold federal income tax at a rate of 10% of the taxable portion of your distribution and, if you live in a state that requires state income tax withholding, at your state's tax rate. However, you may elect not to have withholding apply or to have income tax withheld at a higher rate. Any withholding election that you make will apply to any subsequent distribution unless and until you change or revoke the election. If you wish to make a withholding election, or change or revoke a prior withholding election, call (800) 235-8396, and form W-4P (OMB No. 1545-0074 withholding certificate for pension or annuity payments) will be electronically sent.
If you do not have a withholding election in place by the date of a distribution, federal income tax will be withheld from the taxable portion of your distribution at a rate of 10%. If you must pay estimated taxes, you may be subject to estimated tax penalties if your estimated tax payments are not sufficient and sufficient tax is not withheld from your distribution.
For more specific information, please consult your tax adviser.
1
| USAA Mutual Funds Trust USAA Cornerstone Conservative Fund | November 30, 2020 | ||||||
(Unaudited)
Investment Objective & Portfolio Holdings:
The Fund's investment objective is to seek current income. The Fund also considers the potential for capital appreciation.
Top 10 Holdings*:
November 30, 2020
(% of Net Assets)
USAA Government Securities Fund Institutional Shares | 18.9 | % | |||||
USAA Income Fund Institutional Shares | 16.7 | % | |||||
USAA Intermediate-Term Bond Fund Institutional Shares | 15.7 | % | |||||
VictoryShares USAA Core Short-Term Bond ETF | 11.0 | % | |||||
VictoryShares USAA Core Intermediate-Term Bond ETF | 8.2 | % | |||||
USAA 500 Index Fund Reward Shares | 3.5 | % | |||||
USAA International Fund Institutional Shares | 3.3 | % | |||||
USAA High Income Fund Institutional Shares | 3.2 | % | |||||
USAA Short-Term Bond Fund Institutional Shares | 3.0 | % | |||||
VictoryShares USAA MSCI USA Value Momentum ETF | 2.6 | % | |||||
* Does not include futures, money market instruments, and short-term investments purchased with cash collateral from securities loaned.
Refer to the Schedule of Portfolio Investments for a complete list of securities.
2
| USAA Mutual Funds Trust USAA Cornerstone Conservative Fund (continued) | November 30, 2020 | ||||||
(Unaudited)
Asset Allocation*:
November 30, 2020
(% of Net Assets)
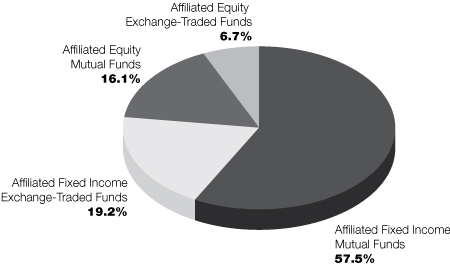
* Does not include futures, money market instruments, and short-term investments purchased with cash collateral from securities loaned.
Percentages are of the net assets of the Fund and may not equal 100%.
3
| USAA Mutual Funds Trust USAA Cornerstone Conservative Fund | Schedule of Portfolio Investments November 30, 2020 | ||||||
(Amounts in Thousands, Except for Shares) (Unaudited)
Security Description | Shares | Value | |||||||||
Affiliated Exchange-Traded Funds (25.9%) | |||||||||||
VictoryShares USAA Core Intermediate-Term Bond ETF | 334,133 | $ | 18,235 | ||||||||
VictoryShares USAA Core Short-Term Bond ETF | 475,200 | 24,676 | |||||||||
VictoryShares USAA MSCI Emerging Markets Value Momentum ETF | 67,940 | 2,921 | |||||||||
VictoryShares USAA MSCI International Value Momentum ETF | 113,561 | 4,934 | |||||||||
VictoryShares USAA MSCI USA Small Cap Value Momentum ETF | 23,660 | 1,323 | |||||||||
VictoryShares USAA MSCI USA Value Momentum ETF | 108,778 | 5,798 | |||||||||
Total Affiliated Exchange-Traded Funds (Cost $55,536) | 57,887 | ||||||||||
Affiliated Mutual Funds (73.6%) | |||||||||||
USAA 500 Index Fund Reward Shares | 155,454 | 7,861 | |||||||||
USAA Aggressive Growth Fund Institutional Shares | 33,519 | 1,759 | |||||||||
USAA Capital Growth Fund Institutional Shares | 47,101 | 551 | |||||||||
USAA Emerging Markets Fund Institutional Shares | 125,373 | 2,627 | |||||||||
USAA Government Securities Fund Institutional Shares | 4,165,331 | 42,361 | |||||||||
USAA Growth Fund Institutional Shares | 56,850 | 1,955 | |||||||||
USAA High Income Fund Institutional Shares | 930,242 | 7,126 | |||||||||
USAA Income Fund Institutional Shares | 2,668,075 | 37,380 | |||||||||
USAA Income Stock Fund Institutional Shares | 185,704 | 3,168 | |||||||||
USAA Intermediate-Term Bond Fund Institutional Shares | 3,092,412 | 35,068 | |||||||||
USAA International Fund Institutional Shares | 292,509 | 7,406 | |||||||||
USAA Precious Metals and Minerals Fund Institutional Shares(a) | 60,961 | 1,240 | |||||||||
USAA Short-Term Bond Fund Institutional Shares | 708,298 | 6,623 | |||||||||
USAA Small Cap Stock Fund Institutional Shares | 115,158 | 2,130 | |||||||||
USAA Target Managed Allocation Fund | 477,124 | 5,625 | |||||||||
USAA Value Fund Institutional Shares | 115,081 | 1,771 | |||||||||
Total Affiliated Mutual Funds (Cost $149,752) | 164,651 | ||||||||||
Total Investments (Cost $205,288) — 99.5% | 222,538 | ||||||||||
Other assets in excess of liabilities — 0.5% | 1,052 | ||||||||||
NET ASSETS — 100.00% | $ | 223,590 | |||||||||
At November 30, 2020 the Fund's investments in foreign securities were 11.2% of net assets.
(a) Non-income producing security.
ETF — Exchange-Traded Fund
See notes to financial statements.
4
USAA Mutual Funds Trust | Statement of Assets and Liabilities November 30, 2020 | ||||||
(Amounts in Thousands, Except Per Share Amounts) (Unaudited)
| USAA Cornerstone Conservative Fund | |||||||
Assets: | |||||||
Affiliated investments, at value(Cost $205,288) | $ | 222,538 | |||||
Cash and cash equivalents | 893 | ||||||
Receivables: | |||||||
Interest and dividends | 171 | ||||||
Capital shares issued | 331 | ||||||
From Adviser | 1 | ||||||
Prepaid expenses | 11 | ||||||
Total assets | 223,945 | ||||||
Liabilities: | |||||||
Payables: | |||||||
Capital shares redeemed | 329 | ||||||
Accrued expenses and other payables: | |||||||
Custodian fees | 2 | ||||||
Transfer agent fees | — | (a) | |||||
Compliance fees | — | (a) | |||||
Trustees' fees | — | (a) | |||||
Other accrued expenses | 24 | ||||||
Total liabilities | 355 | ||||||
Net Assets: | |||||||
Capital | 203,827 | ||||||
Total accumulated earnings/(loss) | 19,763 | ||||||
Net assets | $ | 223,590 | |||||
Shares (unlimited number of shares authorized with no par value): | 19,197 | ||||||
Net asset value, offering and redemption price per share: (b) | $ | 11.65 | |||||
(a) Rounds to less than $1 thousand.
(b) Per share amount may not recalculate due to rounding of net assets and/or shares outstanding.
See notes to financial statements.
5
USAA Mutual Funds Trust | Statements of Operations For the Six Months Ended November 30, 2020 | ||||||
(Amounts in Thousands) (Unaudited)
| USAA Cornerstone Conservative Fund | |||||||
Investment Income: | |||||||
Income distributions from affiliated funds | $ | 2,553 | |||||
Securities lending (net of fees) | — | (a) | |||||
Total income | 2,553 | ||||||
Expenses: | |||||||
Sub-Administration fees | 9 | ||||||
Custodian fees | 3 | ||||||
Trustees' fees | 26 | ||||||
Compliance fees | 1 | ||||||
Printing fees | 19 | ||||||
Legal and audit fees | 35 | ||||||
State registration and filing fees | 16 | ||||||
Other expenses | 1 | ||||||
Total expenses | 110 | ||||||
Expenses waived/reimbursed by Adviser | (2 | ) | |||||
Net expenses | 108 | ||||||
Net Investment Income (Loss) | 2,445 | ||||||
Realized/Unrealized Gains (Losses) from Investments: | |||||||
Net realized gains (losses) from sales of affiliated funds | 1,011 | ||||||
Net change in unrealized appreciation/depreciation on affiliated funds | 12,015 | ||||||
Net change in unrealized appreciation/depreciation on unaffiliated investments | — | ||||||
Net realized/unrealized gains (losses) on investments | 13,026 | ||||||
Change in net assets resulting from operations | $ | 15,471 | |||||
(a) Rounds to less than $1 thousand.
See notes to financial statements.
6
USAA Mutual Funds Trust | Statements of Changes in Net Assets | ||||||
(Amounts in Thousands)
| USAA Cornerstone Conservative Fund | |||||||||||
| Six Months Ended November 30, 2020 (Unaudited) | Year Ended May 31, 2020 | ||||||||||
From Investments: | |||||||||||
Operations: | |||||||||||
Net investment income (loss) | $ | 2,445 | $ | 6,048 | |||||||
Net realized gains (losses) from investments | 1,011 | 3,426 | |||||||||
| Net change in unrealized appreciation/depreciation on investments | 12,015 | 564 | |||||||||
Change in net assets resulting from operations | 15,471 | 10,038 | |||||||||
Change in net assets resulting from distributions to shareholders | (2,516 | ) | (6,280 | ) | |||||||
Change in net assets resulting from capital transactions | 4,685 | 8,927 | |||||||||
Change in net assets | 17,640 | 12,685 | |||||||||
Net Assets: | |||||||||||
Beginning of period | 205,950 | 193,265 | |||||||||
End of period | $ | 223,590 | $ | 205,950 | |||||||
Capital Transactions: | |||||||||||
Proceeds from shares issued | $ | 24,691 | $ | 58,872 | |||||||
Distributions reinvested | 2,504 | 6,254 | |||||||||
Cost of shares redeemed | (22,510 | ) | (56,199 | ) | |||||||
Change in net assets resulting from capital transactions | $ | 4,685 | $ | 8,927 | |||||||
Share Transactions: | |||||||||||
Issued | 2,176 | 5,373 | |||||||||
Reinvested | 225 | 581 | |||||||||
Redeemed | (1,987 | ) | (5,191 | ) | |||||||
Change in Shares | 414 | 763 | |||||||||
See notes to financial statements.
7
USAA Mutual Funds Trust | Financial Highlights | ||||||
For a Share Outstanding Throughout Each Period
Investment Activities | Distributions to Shareholders From | ||||||||||||||||||||||||||
| Net Asset Value, Beginning of Period | Net Investment Income (Loss) | Net Realized and Unrealized Gains (Losses) on Investments | Total from Investment Activities | Net Investment Income | Net Realized Gains from Investments | ||||||||||||||||||||||
USAA Cornerstone Conservative Fund | |||||||||||||||||||||||||||
| Six Months Ended November 30, 2020 (unaudited) | $ | 10.96 | 0.13 | (d) | 0.69 | 0.82 | (0.13 | ) | — | ||||||||||||||||||
Year Ended May 31, 2020 | $ | 10.72 | 0.32 | (d) | 0.25 | 0.57 | (0.33 | ) | — | ||||||||||||||||||
Year Ended May 31, 2019 | $ | 10.64 | 0.32 | 0.08 | 0.40 | (0.32 | ) | — | |||||||||||||||||||
Year Ended May 31, 2018 | $ | 10.76 | 0.30 | (0.11 | ) | 0.19 | (0.31 | ) | — | ||||||||||||||||||
Year Ended May 31, 2017 | $ | 10.27 | 0.31 | 0.49 | 0.80 | (0.31 | ) | — | |||||||||||||||||||
Year Ended May 31, 2016 | $ | 10.68 | 0.35 | (0.37 | ) | (0.02 | ) | (0.34 | ) | (0.05 | ) | ||||||||||||||||
* Assumes reinvestment of all net investment income and realized capital gain distributions, if any, during the period. Includes adjustments in accordance with U.S. generally accepted accounting principles and could differ from the Lipper reported return.
^ The net expense ratio may not correlate to the applicable expense limits in place during the period since the current contractual expense limitation is applied for a two year period beginning July 1, 2019 and in effect through September 30, 2021, instead of coinciding with the Fund's fiscal year end. Details of the current contractual expense limitation in effect can be found in Note 4 of the accompanying Notes to Financial Statements.
(a) Not annualized for periods less than one year.
(b) Annualized for periods less than one year.
(c) The expense ratios exclude the impact of expenses paid by each underlying fund.
(d) Per share net investment income (loss) has been calculated using the average daily shares method.
(e) Reflects a return to normal trading levels after a prior year transition or allocation shift.
See notes to financial statements.
8
USAA Mutual Funds Trust | Financial Highlights — continued | ||||||
For a Share Outstanding Throughout Each Period
Ratios to Average Net Assets | Supplemental Data | ||||||||||||||||||||||||||||||||||
| Total Distributions | Net Asset Value, End of Period | Total Return*(a) | Net Expenses^(b)(c) | Net Investment Income (Loss)(b) | Gross Expenses(b)(c) | Net Assets, End of Period (000's) | Portfolio Turnover(a) | ||||||||||||||||||||||||||||
USAA Cornerstone Conservative Fund | |||||||||||||||||||||||||||||||||||
| Six Months Ended November 30, 2020 (unaudited) | (0.13 | ) | $ | 11.65 | 7.57 | % | 0.10 | % | 2.26 | % | 0.10 | % | $ | 223,590 | 14 | % | |||||||||||||||||||
Year Ended May 31, 2020 | (0.33 | ) | $ | 10.96 | 5.45 | % | 0.09 | % | 2.92 | % | 0.10 | % | $ | 205,950 | 8 | % | |||||||||||||||||||
Year Ended May 31, 2019 | (0.32 | ) | $ | 10.72 | 3.84 | % | 0.10 | % | 2.99 | % | 0.12 | % | $ | 193,265 | 22 | % | |||||||||||||||||||
Year Ended May 31, 2018 | (0.31 | ) | $ | 10.64 | 1.79 | % | 0.10 | % | 2.87 | % | 0.12 | % | $ | 196,292 | 5 | % | |||||||||||||||||||
Year Ended May 31, 2017 | (0.31 | ) | $ | 10.76 | 7.93 | % | 0.10 | % | 3.02 | % | 0.15 | % | $ | 174,754 | 7 | %(e) | |||||||||||||||||||
Year Ended May 31, 2016 | (0.39 | ) | $ | 10.27 | (0.05 | )% | 0.10 | % | 3.38 | % | 0.15 | % | $ | 137,705 | 43 | % | |||||||||||||||||||
See notes to financial statements.
9
USAA Mutual Funds Trust | Notes to Financial Statements November 30, 2020 | ||||||
(Unaudited)
1. Organization:
USAA Mutual Funds Trust (the "Trust") is organized as a Delaware statutory trust and is registered under the Investment Company Act of 1940, as amended (the "1940 Act"), as an open-end investment company. The Trust is comprised of 46 funds and is authorized to issue an unlimited number of shares, which are units of beneficial interest with no par value.
The accompanying financial statements are those of the USAA Cornerstone Conservative Fund (the "Fund"). The Fund is classified as diversified under the 1940 Act.
The Fund is a "fund of funds" in that it invests in a selection of affiliated mutual funds and exchange-traded funds managed by the Fund's Adviser, Victory Capital Management Inc., an affiliate of the Fund.
Under the Trust's organizational documents, its officers and trustees are indemnified against certain liabilities arising out of the performance of their duties to the Fund. In addition, in the normal course of business, the Fund enters into contracts with its vendors and others that provide for general indemnifications. The Fund's maximum exposure under these arrangements is unknown, as this would involve future claims that may be made against the Fund. However, based on experience, the Fund expects that risk of loss to be remote.
2. Significant Accounting Policies:
The following is a summary of significant accounting policies followed by the Trust in the preparation of its financial statements. The policies are in conformity with Generally Accepted Accounting Principles in the United States of America ("GAAP"). The preparation of financial statements in accordance with GAAP requires management to make estimates and assumptions that affect the reported amounts of assets and liabilities and disclosure of contingent assets and liabilities at the date of the financial statements and the reported amounts of income and expenses for the period. Actual results could differ from those estimates. The Fund follows the specialized accounting and reporting requirements under GAAP that are applicable to investment companies under Accounting Standards Codification Topic 946.
Investment Valuation:
The Fund records investments at fair value. Fair value is defined as the price that would be received to sell an asset or paid to transfer a liability in an orderly transaction between market participants at the measurement date.
The valuation techniques described below maximize the use of observable inputs and minimize the use of unobservable inputs in determining fair value. The inputs used for valuing the Fund's investments are summarized in the three broad levels listed below:
• Level 1 — quoted prices in active markets for identical securities
• Level 2 — other significant observable inputs (including quoted prices for similar securities or interest rates applicable to those securities, etc.)
• Level 3 — significant unobservable inputs (including the Fund's own assumptions in determining the fair value of investments)
Changes in valuation techniques may result in transfers in or out of an assigned level within the disclosure hierarchy. The inputs or methodologies used for valuation techniques are not necessarily an indication of the risk associated with entering into those investments.
The Adviser has established the Pricing and Liquidity Committee (the "Committee"), and subject to the Trust's Board of Trustees (the "Board") oversight, the Committee administers and oversees the Fund's valuation policies and procedures, which are approved by the Board.
Portfolio securities listed or traded on securities exchanges, including exchange-traded funds ("ETFs") are valued at the closing price on the exchange or system where the security is principally traded, if available, or at the Nasdaq Official Closing Price. If there have been no sales for that day on the exchange or system, then a security is valued at the last available bid quotation on the exchange or system where
10
USAA Mutual Funds Trust | Notes to Financial Statements — continued November 30, 2020 | ||||||
(Unaudited)
the security is principally traded. In each of these situations, valuations are typically categorized as Level 1 in the fair value hierarchy.
Investments in open-end investment companies, including underlying funds, are valued at their net asset value ("NAV"). These valuations are typically categorized as Level 1 in the fair value hierarchy.
In the event that price quotations or valuations are not readily available, are not reflective of market value, or a significant event has been recognized in relation to a security or class of securities, the securities are valued in good faith by the Committee in accordance with valuation procedures approved by the Board. These valuations are typically categorized as Level 2 or Level 3 in the fair value hierarchy, based on the observability of inputs used to determine the fair value. The effect of fair value pricing is that securities may not be priced on the basis of quotations from the primary market in which they are traded and the actual price realized from the sale of a security may differ materially from the fair value price. Valuing these securities at fair value is intended to cause the Fund's NAV to be more reliable than it otherwise would be.
A summary of the valuations as of November 30, 2020, based upon the three levels defined above, is included in the table below while the breakdown, by category, of investments is disclosed on the Schedule of Portfolio Investments (amounts in thousands):
Level 1 | Level 2 | Level 3 | Total | ||||||||||||||||
Affiliated Exchange-Traded Funds | $ | 57,887 | $ | — | $ | — | $ | 57,887 | |||||||||||
Affiliated Mutual Funds | 164,651 | — | — | 164,651 | |||||||||||||||
Total | $ | 222,538 | $ | — | $ | — | $ | 222,538 | |||||||||||
For the six months ended November 30, 2020, there were no transfers in or out of the Level 3 fair value hierarchy.
Investment Companies:
Exchange-Traded Funds:
The Fund may invest in ETFs, the shares of which are bought and sold on a securities exchange. An ETF trades like common stock and represents a portfolio of securities designed to track the performance and dividend yield of a particular domestic or foreign market index. The Fund may purchase shares of an ETF to temporarily gain exposure to a portion of the U.S. or a foreign market while awaiting purchase of underlying securities. The risks of owning an ETF generally reflect the risks of owning the underlying securities they are designed to track, although the lack of liquidity of an ETF could result in it being more volatile. Additionally, ETFs have fees and expenses that reduce their value.
Open-End Funds:
The Fund may invest in portfolios of open-end investment companies. These investment companies value securities in their portfolios for which market quotations are readily available at their market values (generally the last reported sale price) and all other securities and assets at their fair value by the methods established by the board of directors of the underlying funds.
Investment Transactions and Related Income:
Changes in holdings of investments are accounted for no later than one business day following the trade date. For financial reporting purposes, however, investment transactions are accounted for on trade date on the last business day of the reporting period. Interest income is determined on the basis of coupon interest accrued using the effective interest method which adjusts, where applicable, the amortization of premiums or accretion of discount. Gains or losses realized on sales of securities are determined by comparing the identified cost of the security lot sold with the net sales proceeds.
11
USAA Mutual Funds Trust | Notes to Financial Statements — continued November 30, 2020 | ||||||
(Unaudited)
Securities Lending:
The Fund, through a securities lending agreement with Citibank, N.A. ("Citibank"), may lend its securities to qualified financial institutions, such as certain broker-dealers, to earn additional income, net of income retained by Citibank. Borrowers are required to secure their loans for collateral in the amount of at least 102% of the value of U.S. securities loaned or at least 105% of the value of non-U.S. securities loaned, marked-to-market daily. Any collateral shortfalls associated with increases in the valuation of the securities loaned are cured the next business day once the shortfall exceeds $100 thousand. Collateral may be cash, U.S. government securities, or other securities as permitted by Securities and Exchange Commission ("SEC") guidelines. Cash collateral may be invested in high-quality short-term investments, primarily open-end investment companies. Collateral requirements are determined daily based on the value of the Fund's securities on loan as of the end of the prior business day. During the time portfolio securities are on loan, the borrower will pay the Fund any dividends or interest paid on such securities plus any fee negotiated between the parties to the lending agreement. The Fund also earns a return from the collateral. The Fund pays Citibank various fees in connection with the investment of cash collateral and fees based on the investment income received from securities lending activities. Securities lending income (net of these fees) is disclosed on the Statement of Operations. Loans are terminable upon demand and the borrower must return the loaned securities within the lesser of one standard settlement period or five business days. Risks relating to securities-lending transactions include that the borrower may not provide additional collateral when required or return the securities when due, and that the value of the short-term investments will be less than the amount of cash collateral required to be returned to the borrower. The Fund's agreement with Citibank does not include master netting provisions. Noncash collateral received by the Fund may not be sold or re-pledged, except to satisfy borrower default.
As of November 30, 2020, the Fund did not have any securities on loan.
Federal Income Taxes:
It is the Fund's policy to continue to qualify as a regulated investment company by complying with the provisions available to certain investment companies, as defined in applicable sections of the Internal Revenue Code, and to make distributions of net investment income and net realized gains sufficient to relieve it from all, or substantially all, federal income taxes. Accordingly, no provision for federal income taxes is required in the financial statements. The Fund has a tax year end of May 31.
Management of the Fund has reviewed tax positions taken in tax years that remain subject to examination by all major tax jurisdictions, including federal (i.e., the last four tax years, which includes the current fiscal tax year end). Management believes that there is no tax liability resulting from unrecognized tax benefits related to uncertain tax positions taken.
Allocations:
Expenses directly attributable to the Fund are charged to the Fund, while expenses that are attributable to more than one fund in the Trust, or jointly with an affiliated trust, are allocated among the respective funds in the Trust and/or affiliated trust based upon net assets or another appropriate basis.
3. Purchases and Sales:
Cost of purchases and proceeds from sales/maturities of securities (excluding securities maturing less than one year from acquisition) for the six months ended November 30, 2020, were as follows for the Fund (amounts in thousands):
| Purchases (excluding U.S. Government Securities) | Sales (excluding U.S. Government Securities) | ||||||||||
$ | 32,798 | $ | 29,008 | ||||||||
12
USAA Mutual Funds Trust | Notes to Financial Statements — continued November 30, 2020 | ||||||
(Unaudited)
There were no purchases and sales of U.S. government securities during the six months ended November 30, 2020
4. Fees and Transactions with Affiliates and Related Parties:
Investment Advisory Fees:
Investment advisory services are provided to the Fund by the Adviser, which is a New York corporation registered as an investment adviser with the SEC. The Adviser is a wholly-owned indirect subsidiary of Victory Capital Holdings, Inc., a publicly traded Delaware corporation, and a wholly-owned direct subsidiary of Victory Capital Operating, LLC. The Adviser does not receive any fees from the Fund for these services.
Administration and Servicing Fees:
VCM serves as the Fund's administrator and fund accountant. Under the Administration, Servicing and Accounting Agreement, VCM does not receive any fees from the Fund for these services.
The Fund (as part of the Trust) has entered into an agreement to provide compliance services with the Adviser, pursuant to which the Adviser furnishes its compliance personnel, including the services of the Chief Compliance Officer ("CCO"), and other resources reasonably necessary to provide the Trust with compliance oversight services related to the design, administration and oversight of a compliance program for the Trust in accordance with Rule 38a-1 under the 1940 Act. The CCO is an employee of the Adviser, which pays the compensation of the CCO and support staff. Funds in the Trust, Victory Variable Insurance Funds, Victory Portfolios, and Victory Portfolios II (collectively, the "Victory Funds Complex") in the aggregate, compensate the Adviser for these services. Amounts incurred for the six months ended November 30, 2020, are reflected on the Statement of Operations as Compliance fees.
Citi Fund Services Ohio, Inc. ("Citi"), an affiliate of Citibank, acts as sub-administrator and sub-fund accountant to the Fund pursuant to a Sub-Administration and Sub-Fund Accounting Services Agreement between VCM and Citi. VCM pays Citi a fee for providing these services. The Trust reimburses VCM and Citi for out-of-pocket expenses incurred in providing these services and certain other expenses specifically allocated to the Funds. Amounts incurred for the six months ended November 30, 2020, are reflected on the Statement of Operations as Sub-Administration fees.
Transfer Agency Fees:
Victory Capital Transfer Agency, Inc. ("VCTA"), an affiliate of the Adviser provides transfer agency services to the Fund. VCTA received no fees from the Fund for these services.
FIS Investor Services LLC serves as sub-transfer agent and dividend disbursing agent for the Fund pursuant to a Sub-Transfer Agent agreement between VCTA and FIS Investor Services LLC. VCTA provides FIS Investor Services LLC a fee for providing these services.
Distributor/Underwriting Services:
Victory Capital Services, Inc. (the "Distributor"), an affiliate of the Adviser, serves as distributor for the continuous offering of the shares of the Fund pursuant to a Distribution Agreement between the Distributor and the Trust. Effective June 30, 2020, the Distributor's name was changed from Victory Capital Advisers, Inc.
Other Fees:
Citibank serves as the Fund's custodian. The Fund pays Citibank a fee for providing these services. Amounts incurred for the six months ended November 30, 2020, are reflected on the Statement of Operations as Custodian fees.
K&L Gates LLP provides legal services to the Trust.
13
USAA Mutual Funds Trust | Notes to Financial Statements — continued November 30, 2020 | ||||||
(Unaudited)
The Adviser has entered into an expense limitation agreement with the Fund until at least September 30, 2021. Under the terms of the agreement, the Adviser has agreed to waive fees or reimburse certain expenses to the extent that ordinary operating expenses incurred in any fiscal year exceed the expense limit for the Fund. Such excess amounts will be the liability of the Adviser. Interest, taxes, brokerage commissions, other expenditures, which are capitalized in accordance with GAAP, and other extraordinary expenses not incurred in the ordinary course of the Fund's business are excluded from the expense limits. As of November 30, 2020, the expense limit (excluding voluntary waivers) is 0.10%.
Under this expense limitation agreement, the Fund has agreed to repay fees and expenses that were waived or reimbursed by the Adviser for a period up to three years after the fiscal year in which the waiver or reimbursement took place, subject to the lesser of any operating expense limits in effect at the time of: (a) the original waiver or expense reimbursement; or (b) the recoupment, after giving effect to the recoupment amount.
As of November 30, 2020, the following amounts are available to be repaid to the Adviser (amounts in thousands). The Fund has not recorded any amounts available to be repaid as a liability due to an assessment that such repayment is not probable at November 30, 2020.
| Expires May 31, 2024 | Total | ||||||
| $ | 2 | $ | 2 | ||||
The Adviser may voluntarily waive or reimburse additional fees to assist the Fund in maintaining competitive expense ratios. Voluntary waivers and reimbursements applicable to the Fund are not available to be recouped at a future time. There were no voluntary waivers or reimbursements for the six months ended November 30, 2020.
Certain officers and/or interested trustees of the Fund are also officers and/or employees of the Adviser, Administrator, Sub-Administrator, Sub-Fund Accountant, and Legal.
5. Risks:
The Fund may be subject to other risks in addition to these identified risks.
Geopolitical/Natural Disaster Risk — Global economies and financial markets are increasingly interconnected, which increases the possibilities that conditions in one country or region might adversely affect issuers in another country or region. Geopolitical and other risks, including war, terrorism, trade disputes, political or economic dysfunction within some nations, public health crises and related geopolitical events, as well as environmental disasters such as earthquakes, fires, and floods, may add to instability in world economies and markets generally. Changes in trade policies and international trade agreements could affect the economies of many countries in unpredictable ways. Likewise, systemic market dislocations of the kind that occurred during the financial crisis that began in 2008, if repeated, would be highly disruptive to economies and markets, adversely affecting individual companies and industries, securities markets, interest rates, credit ratings, inflation, investor sentiment, and other factors affecting the value of a Fund's investments. Some countries, including the United States, are adopting more protectionist trade policies and moving away from the tighter financial industry regulations that followed the 2008 financial crisis, which may also affect the value of a Fund's investments.
Political events within the United States at times have resulted, and may in the future result, in a shutdown of government services, which could negatively affect the U.S. economy, decrease the value of a Fund's investments, increase uncertainty in or impair the operation of the U.S. or other securities markets and degrade investor and consumer confidence, perhaps suddenly and to a significant degree.
An outbreak of disease called COVID-19 has spread internationally. The transmission of COVID-19 and efforts to contain its spread have resulted in international, national and local border closings and other significant travel restrictions and disruptions, significant disruptions to business operations, supply chains and consumer activity, significant challenges in healthcare service preparation and delivery, quarantines and general concern and uncertainty. These negative impacts have caused significant volatility and declines in global financial markets, which have caused losses for Fund investors during
14
USAA Mutual Funds Trust | Notes to Financial Statements — continued November 30, 2020 | ||||||
(Unaudited)
and subsequent to period end. The impact of the COVID-19 pandemic last for an extended period of time, and could result in a substantial economic downturn or recession. Public health crises may exacerbate other pre-existing political, social, economic, market and financial risks. The extent of the impact to the financial performance of the Funds' investments will depend on future developments, including (i) the duration and spread of the outbreak, (ii) the restrictions and advisories, (iii) the effects on the financial markets, and (iv) the effects on the economy overall, all of which are highly uncertain and cannot be predicted.
Tactical Allocation Risk — The Fund has a targeted risk tolerance and a corresponding asset allocation target; however, mere asset allocation and volatility are not the sole determination of risk. The Fund's managers will tactically allocate away from the target allocation as market conditions and the perceived risks warrant. The Fund bears the risk that the managers' tactical allocation will not be successful.
Affiliated Funds Risk — The risks of the Fund directly correspond to the risks of the underlying affiliated funds in which the Fund invests. By investing in the underlying affiliated funds, the Fund has exposure to the risk of many different areas of the market. The degree to which the risks described below apply to the Fund varies according to the Fund's asset allocation. For instance, the more the Fund is allocated to stock funds, the greater the risk associated with equity securities. The Fund also is subject to asset allocation risk (i.e., the risk that allocations will not produce the intended results) and to management risk (i.e., the risk that the selection of underlying affiliated funds will not produce the intended results).
Conflict of Interest Risk — In managing a Fund that invests in underlying affiliated funds, the Adviser may have conflicts of interest in allocating the Fund's assets among the various underlying affiliated funds. This is because the fees payable by some of the underlying affiliated funds to the Adviser and/or its affiliates are higher than the fees payable by other underlying affiliated funds, and because the Adviser also manages and administers the underlying affiliated funds.
Equity Risk — The Fund may invest in underlying affiliated funds that invest in equity securities, which are subject to stock market risk. Stock prices in general may decline over short or even extended periods, regardless of the success or failure of a company's operations. Equity securities tend to be more volatile than bonds. In addition, to the degree an underlying affiliated fund invests in foreign securities, there is a possibility that the value of the Fund's investments in foreign securities will decrease because of unique risks, such as currency exchange-rate fluctuations; foreign market illiquidity; emerging-market risk; increased price volatility; uncertain political conditions; exchange control regulations; foreign ownership limits; different accounting, reporting, and disclosure requirements; difficulties in obtaining legal judgments; and foreign withholding taxes.
6. Borrowing and Interfund Lending:
Line of Credit:
For the six months ended November 30, 2020, the Victory Funds Complex participated in a short-term demand note "Line of Credit" agreement with Citibank. The Line of Credit agreement with Citibank was renewed on June 29, 2020 with a termination date of June 28, 2021. Under the agreement with Citibank, the Victory Funds Complex may borrow up to $600 million, of which $300 million is committed and $300 million is uncommitted. $40 million of the Line of Credit is reserved for use by the Victory Floating Rate Fund, another series of the Victory Funds Complex, with Victory Floating Rate Fund paying the related commitment fees for that amount. The purpose of the agreement is to meet temporary or emergency cash needs. For the six months ended November 30, 2020, Citibank received an annual commitment fee of 0.15% on $300 million for providing the Line of Credit. Each fund in the Victory Funds Complex pays a pro- rata portion of the commitment fees plus any interest (one month LIBOR plus one percent) on amounts borrowed. Effective June 29, 2020, under an amended Line of Credit agreement, Citibank will also receive an annual upfront fee of 0.10% on the $300 million committed line of credit. Each fund in the Victory Funds Complex will pay a pro-rata portion of the upfront fee. Interest charged to each Fund during the period, if applicable, is reflected on the Statements of Operations under Line of credit fees.
The Fund had no borrowings under the Line of Credit agreement during the six months ended November 30, 2020.
15
USAA Mutual Funds Trust | Notes to Financial Statements — continued November 30, 2020 | ||||||
(Unaudited)
Interfund Lending:
The Trust and Adviser rely on an exemptive order granted by the SEC in March 2017 (the "Order"), permitting the establishment and operation of an Interfund Lending Facility (the "Facility"). The Facility allows the Fund to directly lend and borrow money to or from any other Fund, that is permitted to participate in the Facility, in the Victory Funds Complex relying upon the Order at rates beneficial to both the borrowing and lending funds. Advances under the Facility are allowed for temporary or emergency purposes. The interfund loan rate is determined, as specified in the Order, by averaging the current repurchase agreement rate and the current bank loan rate. As a Borrower, interest charged to the Fund, if any, during the period is reflected on the Statement of Operations under Interfund lending fees. As a Lender, interest earned by the Fund, if any, during the period is reflected on the Statement of Operations under Income on Interfund lending.
The Fund did not utilize or participate in the Facility during the six months ended November 30, 2020.
7. Federal Income Tax Information:
The Fund intends to declare and distribute quarterly any net investment income. Distributable net realized gains, if any, are declared and paid at least annually.
The amounts of dividends from net investment income and distributions from net realized gains (collectively distributions to shareholders) are determined in accordance with federal income tax regulations, which may differ from GAAP. To the extent these "book/tax" differences are permanent in nature (e.g., net operating loss and distribution reclassification), such amounts are reclassified within the components of net assets based on their federal tax-basis treatment; temporary differences (e.g., wash sales) do not require reclassification. To the extent dividends and distributions exceed net investment income and net realized gains for tax purposes, they are reported as distributions of capital.
Net investment losses incurred by the Fund may be reclassified as an offset to capital on the accompanying Statement of Assets and Liabilities.
The tax character of current year distributions paid and the tax basis of the current components of accumulated earnings (deficit) will be determined at the end of the current tax year ending May 31, 2021.
At May 31, 2020, the Fund had no capital loss carryforwards, for the federal income tax purposes.
8. Affiliated Securities:
An affiliated security is a security in which the Fund has ownership of at least 5% of the security's outstanding voting shares or an investment company managed by VCM. The Fund does not invest in affiliated underlying funds for the purpose of exercising management or control. These underlying funds' are noted as affiliated on each Fund's Schedule of Portfolio Investments. The affiliated underlying fund's annual or semiannual reports may be viewed at vcm.com. Transactions in affiliated securities during the six months ended November 30, 2020 were as follows (amount in thousands):
| Fair Value 5/31/2020 | Purchases at Cost | Proceeds from Sales | Realized Gains (Losses) | Capital Gain Distribution | Net Change in Unrealized Appreciation/ Depreciation | Fair Value 11/30/2020 | Dividend Income | ||||||||||||||||||||||||||||
USAA Cornerstone Conservative Fund | |||||||||||||||||||||||||||||||||||
| USAA 500 Index Fund Reward Shares | $ | 6,523 | $ | 927 | $ | (855 | ) | $ | 134 | $ | — | $ | 1,132 | $ | 7,861 | $ | 50 | ||||||||||||||||||
| USAA Aggressive Growth Fund Institutional Shares | 1,406 | — | — | — | — | 353 | 1,759 | — | |||||||||||||||||||||||||||
| USAA Capital Growth Fund Institutional Shares | 1,858 | — | (1,526 | ) | 6 | — | 213 | 551 | — | ||||||||||||||||||||||||||
16
USAA Mutual Funds Trust | Notes to Financial Statements — continued November 30, 2020 | ||||||
(Unaudited)
| Fair Value 5/31/2020 | Purchases at Cost | Proceeds from Sales | Realized Gains (Losses) | Capital Gain Distribution | Net Change in Unrealized Appreciation/ Depreciation | Fair Value 11/30/2020 | Dividend Income | ||||||||||||||||||||||||||||
| USAA Emerging Markets Fund Institutional Shares | $ | 2,368 | $ | 417 | $ | (872 | ) | $ | 88 | $ | — | $ | 626 | $ | 2,627 | $ | — | ||||||||||||||||||
| USAA Government Securities Fund Institutional Shares | 41,565 | 1,046 | — | — | — | (250 | ) | 42,361 | 500 | ||||||||||||||||||||||||||
| USAA Growth Fund Institutional Shares | 1,963 | — | (436 | ) | 82 | — | 346 | 1,955 | — | ||||||||||||||||||||||||||
| USAA High Income Fund Institutional Shares | 6,397 | 188 | — | — | — | 541 | 7,126 | 188 | |||||||||||||||||||||||||||
| USAA Income Fund Institutional Shares | 56,887 | 791 | (22,479 | ) | 1,029 | — | 1,152 | 37,380 | 792 | ||||||||||||||||||||||||||
| USAA Income Stock Fund Institutional Shares | 3,177 | 33 | (431 | ) | (75 | ) | — | 464 | 3,168 | 34 | |||||||||||||||||||||||||
| USAA Intermediate-Term Bond Fund Institutional Shares | 33,040 | 433 | — | — | — | 1,595 | 35,068 | 511 | |||||||||||||||||||||||||||
| USAA International Fund Institutional Shares | 6,859 | 417 | (1,094 | ) | (189 | ) | — | 1,413 | 7,406 | — | |||||||||||||||||||||||||
| USAA Precious Metals and Minerals Fund Institutional Shares | 1,385 | — | (228 | ) | 93 | — | (10 | ) | 1,240 | — | |||||||||||||||||||||||||
| USAA Short-Term Bond Fund Institutional Shares | 6,382 | 79 | — | — | — | 162 | 6,623 | 93 | |||||||||||||||||||||||||||
| USAA Small Cap Stock Fund Institutional Shares | 2,385 | — | (874 | ) | (54 | ) | — | 673 | 2,130 | — | |||||||||||||||||||||||||
| USAA Target Managed Allocation Fund | 4,074 | 866 | — | — | — | 685 | 5,625 | — | |||||||||||||||||||||||||||
| USAA Value Fund Institutional Shares | 1,730 | — | (210 | ) | (103 | ) | — | 354 | 1,771 | — | |||||||||||||||||||||||||
| VictoryShares USAA Core Intermediate-Term Bond ETF | 17,709 | — | — | — | — | 526 | 18,235 | 214 | |||||||||||||||||||||||||||
| VictoryShares USAA Core Short-Term Bond ETF | 229 | 24,375 | — | — | — | 72 | 24,676 | 60 | |||||||||||||||||||||||||||
| VictoryShares USAA MSCI Emerging Markets Value Momentum ETF | 879 | 1,746 | — | — | — | 296 | 2,921 | 22 | |||||||||||||||||||||||||||
| VictoryShares USAA MSCI International Value Momentum ETF | 2,694 | 1,733 | — | — | — | 507 | 4,934 | 38 | |||||||||||||||||||||||||||
17
USAA Mutual Funds Trust | Notes to Financial Statements — continued November 30, 2020 | ||||||
(Unaudited)
| Fair Value 5/31/2020 | Purchases at Cost | Proceeds from Sales | Realized Gains (Losses) | Capital Gain Distribution | Net Change in Unrealized Appreciation/ Depreciation | Fair Value 11/30/2020 | Dividend Income | ||||||||||||||||||||||||||||
| VictoryShares USAA MSCI USA Small Cap Value Momentum ETF | $ | 1,049 | $ | — | $ | — | $ | — | $ | — | $ | 274 | $ | 1,323 | $ | 8 | |||||||||||||||||||
| VictoryShares USAA MSCI USA Value Momentum ETF | 4,907 | — | — | — | — | 891 | 5,798 | 43 | |||||||||||||||||||||||||||
$ | 205,466 | $ | 33,051 | $ | (29,005 | ) | $ | 1,011 | $ | — | $ | 12,015 | $ | 222,538 | $ | 2,553 | |||||||||||||||||||
18
USAA Mutual Funds Trust | Supplemental Information November 30, 2020 | ||||||
(Unaudited)
Proxy Voting and Portfolio Holdings Information
Proxy Voting:
Information regarding the policies and procedures the Fund uses to determine how to vote proxies relating to portfolio securities is available without charge, upon request, by calling (800) 539-3863. The information is also included in the Fund's Statement of Additional Information, which is available on the SEC's website at www.sec.gov.
Information relating to how the Fund voted proxies relating to portfolio securities held during the most recent 12 months ended June 30 is available on the SEC's website at www.sec.gov.
Availability of Schedules of Portfolio Investments:
The Trust files a complete list of Schedules of Portfolio Investments with the SEC for the first and third quarter of each fiscal year on Form N-PORT. Form N-PORT is available on the SEC's website at www.sec.gov.
Expense Example
As a shareholder of the Fund, you may incur two types of costs: (1) transaction costs, and (2) ongoing costs, including management fees and other Fund expenses. These examples are intended to help you understand your ongoing costs (in dollars) of investing in the Fund and to compare these costs with the ongoing costs of investing in other mutual funds.
These examples are based on an investment of $1,000 invested at the beginning of the period and held for the entire period from June 1, 2020 through November 30, 2020.
The Actual Expense figures in the table below provide information about actual account values and actual expenses. You may use the information below, together with the amount you invested, to estimate the expenses that you paid over the period. Simply divide your account value by $1,000 (for example, an $8,600 account value divided by $1,000 = 8.6), then multiply the result by the number in the table under the heading entitled "Actual Expenses Paid During Period" to estimate the expenses you paid on your account during this period.
The Hypothetical Expense figures in the table below provide information about hypothetical account values and hypothetical expenses based on the Fund's actual expense ratio and an assumed rate of return of 5% per year before expenses, which is not the Fund's actual return. The hypothetical account values and expenses may not be used to estimate the actual ending account balance or expenses you paid for the period. You may use this information to compare this 5% hypothetical example with the 5% hypothetical examples that appear in shareholder reports of other funds.
Please note the expenses shown in the table below are meant to highlight your ongoing costs only and do not reflect any transactional costs. If these transactional costs were included, your costs would have been higher.
| Beginning Account Value 6/1/20 | Actual Ending Account Value 11/30/20 | Hypothetical Ending Account Value 11/30/20 | Actual Expenses Paid During Period 6/1/20- 11/30/20* | Hypothetical Expenses Paid During Period 6/1/20- 11/30/20* | Annualized Expense Ratio During Period 6/1/20- 11/30/20 | ||||||||||||||||||
| $ | 1,000.00 | $ | 1,075.70 | $ | 1,024.57 | $ | 0.52 | $ | 0.51 | 0.10 | % | ||||||||||||
* Expenses are equal to the average account value multiplied by the Fund's annualized expense ratio multiplied by 183/365 (the number of days in the most recent fiscal half-year divided by the number of days in the fiscal year).
19
Privacy Policy
Protecting the Privacy of Information
The Trust respects your right to privacy. We also know that you expect us to conduct and process your business in an accurate and efficient manner. To do so, we must collect and maintain certain personal information about you. This is the information we collect from you on applications or other forms, and from the transactions you make with us or third parties. It may include your name, address, social security number, account transactions and balances, and information about investment goals and risk tolerance.
We do not disclose any information about you or about former customers to anyone except as permitted or required by law. Specifically, we may disclose the information we collect to companies that perform services on our behalf, such as the transfer agent that processes shareholder accounts and printers and mailers that assist us in the distribution of investor materials. We may also disclose this information to companies that perform marketing services on our behalf. This allows us to continue to offer you Victory investment products and services that meet your investing needs, and to effect transactions that you request or authorize. These companies will use this information only in connection with the services for which we hired them. They are not permitted to use or share this information for any other purpose.
To protect your personal information internally, we permit access only by authorized employees and maintain physical, electronic and procedural safeguards to guard your personal information.*
* You may have received communications regarding information about privacy policies from other financial institutions which gave you the opportunity to "opt-out" of certain information sharing with companies which are not affiliated with that financial institution. The Trust does not share information with other companies for purposes of marketing solicitations for products other than the Trust. Therefore, the Trust does not provide opt-out options to their shareholders.
P.O. Box 182593
Columbus, Ohio 43218-2593

Visit our website at: | Call | ||||||
vcm.com | (800) 235-8396 | ||||||
97450-0121

NOVEMBER 30, 2020
Semi Annual Report
USAA Cornerstone Equity Fund
Beginning January 1, 2021, as permitted by regulations adopted by the Securities and Exchange Commission, paper copies of the Fund's shareholder reports may no longer be sent by mail, unless you specifically request paper copies of the reports from the Fund or from your financial intermediary, such as a broker-dealer or bank. Instead, the reports will be made available on VictoryFunds.com, and you will be notified by mail each time a report is posted and provided with a website link to access the report. If you already elected to receive shareholder reports electronically, you will not be affected by this change and you need not take any action.
You may elect to receive shareholder reports and other communications from the Fund or your financial intermediary electronically by notifying your financial intermediary directly, or if you are a shareholder who has an account directly with the Fund, by calling (800) 235-8396 or by submitting your request via email to TA.Processing@FISGlobal.com.
You may elect to receive all future reports in paper free of charge. You can inform the Fund or your financial intermediary that you wish to continue receiving paper copies of your shareholder reports by notifying your financial intermediary directly, or if you are a shareholder who has an account directly with the Fund, by calling (800) 235-8396 or submitting your request via email to TA.Processing@FISGlobal.com.
Your election to receive reports in paper will apply to all funds held with the USAA Mutual Funds or your financial intermediary.
Victory Capital means Victory Capital Management Inc., the investment adviser of the USAA Mutual Funds. USAA Mutual Funds are distributed by Victory Capital Services, Inc., member of FINRA, an affiliate of Victory Capital. Victory Capital and its affiliates are not affiliated with United Services Automobile Association or its affiliates. USAA and the USAA logo are registered trademarks and the USAA Mutual Funds and USAA Investments logos are trademarks of United Services Automobile Association and are being used by Victory Capital and its affiliates under license.
USAA Mutual Funds Trust
TABLE OF CONTENTS
Investment Objective & Portfolio Holdings | 2 | ||||||
Schedule of Portfolio Investments | 4 | ||||||
Financial Statements | |||||||
Statement of Assets and Liabilities | 5 | ||||||
Statement of Operations | 6 | ||||||
Statements of Changes in Net Assets | 7 | ||||||
Financial Highlights | 8 | ||||||
Notes to Financial Statements | 10 | ||||||
Supplemental Information | 18 | ||||||
Proxy Voting and Portfolio Holdings Information | 18 | ||||||
Expense Example | 18 | ||||||
Privacy Policy (inside back cover) | |||||||
This report is for the information of the shareholders and others who have received a copy of the currently effective prospectus of the Fund, managed by Victory Capital Management Inc. It may be used as sales literature only when preceded or accompanied by a current prospectus, which provides further details about the Fund.
IRA DISTRIBUTION WITHHOLDING DISCLOSURE
We generally must withhold federal income tax at a rate of 10% of the taxable portion of your distribution and, if you live in a state that requires state income tax withholding, at your state's tax rate. However, you may elect not to have withholding apply or to have income tax withheld at a higher rate. Any withholding election that you make will apply to any subsequent distribution unless and until you change or revoke the election. If you wish to make a withholding election, or change or revoke a prior withholding election, call (800) 235-8396, and form W-4P (OMB No. 1545-0074 withholding certificate for pension or annuity payments) will be electronically sent.
If you do not have a withholding election in place by the date of a distribution, federal income tax will be withheld from the taxable portion of your distribution at a rate of 10%. If you must pay estimated taxes, you may be subject to estimated tax penalties if your estimated tax payments are not sufficient and sufficient tax is not withheld from your distribution.
For more specific information, please consult your tax adviser.
1
| USAA Mutual Funds Trust USAA Cornerstone Equity Fund | November 30, 2020 | ||||||
(Unaudited)
Investment Objective & Portfolio Holdings:
The Fund's investment objective is to seek capital appreciation over the long term.
Top 10 Holdings*:
November 30, 2020
(% of Net Assets)
VictoryShares USAA MSCI USA Value Momentum ETF | 16.4 | % | |||||
USAA 500 Index Fund Reward Shares | 14.7 | % | |||||
USAA International Fund Institutional Shares | 13.5 | % | |||||
VictoryShares USAA MSCI International Value Momentum ETF | 12.5 | % | |||||
USAA Target Managed Allocation Fund | 6.5 | % | |||||
VictoryShares USAA MSCI Emerging Markets Value Momentum ETF | 6.4 | % | |||||
USAA Income Stock Fund Institutional Shares | 5.0 | % | |||||
USAA Growth Fund Institutional Shares | 4.9 | % | |||||
USAA Aggressive Growth Fund Institutional Shares | 4.7 | % | |||||
USAA Value Fund Institutional Shares | 4.6 | % | |||||
* Does not include futures, money market instruments, and short-term investments purchased with cash collateral from securities loaned.
Refer to the Schedule of Portfolio Investments for a complete list of securities.
2
| USAA Mutual Funds Trust USAA Cornerstone Equity Fund (continued) | November 30, 2020 | ||||||
(Unaudited)
Asset Allocation*:
November 30, 2020
(% of Net Assets)
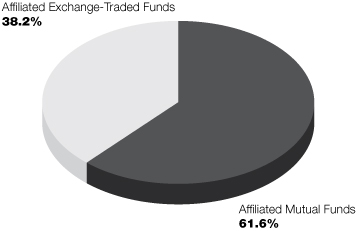
* Does not include futures, money market instruments, and short-term investments purchased with cash collateral from securities loaned.
Percentages are of the net assets of the Fund and may not equal 100%.
3
| USAA Mutual Funds Trust USAA Cornerstone Equity Fund | Schedule of Portfolio Investments November 30, 2020 | ||||||
(Amounts in Thousands, Except for Shares) (Unaudited)
Security Description | Shares | Value | |||||||||
Affiliated Exchange-Traded Funds (38.2%) | |||||||||||
VictoryShares USAA MSCI Emerging Markets Value Momentum ETF | 305,765 | $ | 13,145 | ||||||||
VictoryShares USAA MSCI International Value Momentum ETF (a) | 589,400 | 25,607 | |||||||||
VictoryShares USAA MSCI USA Small Cap Value Momentum ETF | 104,048 | 5,817 | |||||||||
VictoryShares USAA MSCI USA Value Momentum ETF | 630,222 | 33,592 | |||||||||
Total Affiliated Exchange-Traded Funds (Cost $81,365) | 78,161 | ||||||||||
Affiliated Mutual Funds (61.6%) | |||||||||||
USAA 500 Index Fund Reward Shares | 593,244 | 30,000 | |||||||||
USAA Aggressive Growth Fund Institutional Shares | 184,056 | 9,661 | |||||||||
USAA Emerging Markets Fund Institutional Shares | 427,229 | 8,950 | |||||||||
USAA Growth Fund Institutional Shares | 293,654 | 10,096 | |||||||||
USAA Income Stock Fund Institutional Shares | 604,387 | 10,311 | |||||||||
USAA International Fund Institutional Shares | 1,088,754 | 27,567 | |||||||||
USAA Precious Metals and Minerals Fund Institutional Shares (b) | 43,791 | 891 | |||||||||
USAA Small Cap Stock Fund Institutional Shares | 320,055 | 5,921 | |||||||||
USAA Target Managed Allocation Fund | 1,122,105 | 13,230 | |||||||||
USAA Value Fund Institutional Shares | 609,234 | 9,376 | |||||||||
Total Affiliated Mutual Funds (Cost $101,018) | 126,003 | ||||||||||
Collateral for Securities Loaned^ (3.8%) | |||||||||||
HSBC U.S. Government Money Market Fund I Shares, 0.03% (c) | 7,785,000 | 7,785 | |||||||||
Total Collateral for Securities Loaned (Cost $7,785) | 7,785 | ||||||||||
Total Investments (Cost $190,168) — 103.6% | 211,949 | ||||||||||
Liabilities in excess of other assets — (3.6)% | (7,313 | ) | |||||||||
NET ASSETS — 100.00% | $ | 204,636 | |||||||||
At November 30, 2020 the Fund's investments in foreign securities were 56.0% of net assets.
^ Purchased with cash collateral from securities on loan.
(a) All or a portion of this security is on loan.
(b) Non-income producing security.
(c) Rate disclosed is the daily yield on November 30, 2020.
ETF — Exchange-Traded Fund
See notes to financial statements.
4
USAA Mutual Funds Trust | Statement of Assets and Liabilities November 30, 2020 | ||||||
(Amounts in Thousands, Except Per Share Amounts) (Unaudited)
| USAA Cornerstone Equity Fund | |||||||
Assets: | |||||||
Affiliated investments, at value (Cost $182,383) | $ | 204,164 | |||||
Unaffiliated investments, at value (Cost $7,785) | 7,785 | (a) | |||||
Cash and cash equivalents | 534 | ||||||
Receivables: | |||||||
Interest | — | (b) | |||||
Capital shares issued | 97 | ||||||
From Adviser | 6 | ||||||
Prepaid expenses | 9 | ||||||
Total assets | 212,595 | ||||||
Liabilities: | |||||||
Payables: | |||||||
Collateral received on loaned securities | 7,785 | ||||||
Capital shares redeemed | 144 | ||||||
Accrued expenses and other payables: | |||||||
Custodian fees | 2 | ||||||
Transfer agent fees | — | (b) | |||||
Compliance fees | — | (b) | |||||
Other accrued expenses | 28 | ||||||
Total liabilities | 7,959 | ||||||
Net Assets: | |||||||
Capital | 168,622 | ||||||
Total accumulated earnings/(loss) | 36,014 | ||||||
Net assets | $ | 204,636 | |||||
Shares (unlimited number of shares authorized with no par value): | 12,862 | ||||||
Net asset value, offering and redemption price per share: (c) | $ | 15.91 | |||||
(a) Includes $ 7,516 of securities on loan.
(b) Rounds to less than $1 thousand.
(c) Per share amount may not recalculate due to rounding of net assets and/or shares outstanding.
See notes to financial statements.
5
USAA Mutual Funds Trust | Statement of Operations For the Six Months Ended November 30, 2020 | ||||||
(Amounts in Thousands) (Unaudited)
| USAA Cornerstone Equity Fund | |||||||
Investment Income: | |||||||
Income distributions from affiliated funds | $ | 1,072 | |||||
Interest | — | (a) | |||||
Securities lending (net of fees) | — | (a) | |||||
Total income | 1,072 | ||||||
Expenses: | |||||||
Sub-Administration fees | 9 | ||||||
Custodian fees | 4 | ||||||
Trustees' fees | 26 | ||||||
Compliance fees | 1 | ||||||
Printing fees | 24 | ||||||
Legal and audit fees | 33 | ||||||
State registration and filing fees | 13 | ||||||
Interfund lending fees | — | (a) | |||||
Other expenses | 2 | ||||||
Total expenses | 112 | ||||||
Expenses waived/reimbursed by Adviser | (14 | ) | |||||
Net expenses | 98 | ||||||
Net Investment Income (Loss) | 974 | ||||||
Realized/Unrealized Gains (Losses) from Investments: | |||||||
Net realized gains (losses) from sales of affiliated funds | (584 | ) | |||||
Net change in unrealized appreciation/depreciation on affiliated funds | 35,282 | ||||||
Net realized/unrealized gains (losses) on investments | 34,698 | ||||||
Change in net assets resulting from operations | $ | 35,672 | |||||
(a) Rounds to less than $1 thousand.
See notes to financial statements.
6
USAA Mutual Funds Trust | Statements of Changes in Net Assets | ||||||
(Amounts in Thousands)
USAA Cornerstone Equity Fund | |||||||||||
| Six Months Ended November 30, 2020 (unaudited) | Year Ended May 31, 2020 | ||||||||||
From Investments: | |||||||||||
Operations: | |||||||||||
Net investment income (loss) | $ | 974 | $ | 4,906 | |||||||
Net realized gains (losses) from investments | (584 | ) | 13,841 | ||||||||
| Net change in unrealized appreciation/depreciation on investments | 35,282 | (18,537 | ) | ||||||||
Change in net assets resulting from operations | 35,672 | 210 | |||||||||
Change in net assets resulting from distributions to shareholders | — | (10,384 | ) | ||||||||
Change in net assets resulting from capital transactions | (22,049 | ) | (1,101 | ) | |||||||
Change in net assets | 13,623 | (11,275 | ) | ||||||||
Net Assets: | |||||||||||
Beginning of period | 191,013 | 202,288 | |||||||||
End of period | $ | 204,636 | $ | 191,013 | |||||||
Capital Transactions: | |||||||||||
Proceeds from shares issued | 8,214 | 39,178 | |||||||||
Distributions reinvested | — | 10,364 | |||||||||
Cost of shares redeemed | (30,263 | ) | (50,643 | ) | |||||||
Change in net assets resulting from capital transactions | $ | (22,049 | ) | $ | (1,101 | ) | |||||
Share Transactions: | |||||||||||
Issued | 564 | 2,815 | |||||||||
Reinvested | — | 684 | |||||||||
Redeemed | (2,087 | ) | (3,666 | ) | |||||||
Change in Shares | (1,523 | ) | (167 | ) | |||||||
See notes to financial statements.
7
USAA Mutual Funds Trust | Financial Highlights | ||||||
For a Share Outstanding Throughout Each Period
Investment Activities | Distributions to Shareholders From | ||||||||||||||||||||||||||
| Net Asset Value, Beginning of Period | Net Investment Income (Loss) | Net Realized and Unrealized Gains (Losses) on Investments | Total from Investment Activities | Net Investment Income | Net Realized Gains from Investments | ||||||||||||||||||||||
USAA Cornerstone Equity Fund | |||||||||||||||||||||||||||
| Six Months Ended November 30, 2020 (unaudited) | $ | 13.28 | 0.07 | (d) | 2.56 | 2.63 | — | — | |||||||||||||||||||
| Year Ended May 31, 2020 | $ | 13.90 | 0.34 | (d) | (0.24 | ) | 0.10 | (0.32 | ) | (0.40 | ) | ||||||||||||||||
| Year Ended May 31, 2019 | $ | 15.49 | 0.26 | (0.99 | ) | (0.73 | ) | (0.25 | ) | (0.61 | ) | ||||||||||||||||
| Year Ended May 31, 2018 | $ | 14.31 | 0.22 | 1.26 | 1.48 | (0.22 | ) | (0.08 | ) | ||||||||||||||||||
| Year Ended May 31, 2017 | $ | 12.51 | 0.19 | 2.02 | 2.21 | (0.19 | ) | (0.22 | ) | ||||||||||||||||||
| Year Ended May 31, 2016 | $ | 13.61 | 0.16 | (0.82 | ) | (0.66 | ) | (0.15 | ) | (0.29 | ) | ||||||||||||||||
* Assumes reinvestment of all net investment income and realized capital gain distributions, if any, during the period. Includes adjustments in accordance with U.S. generally accepted accounting principles and could differ from the Lipper reported return.
^ The net expense ratio may not correlate to the applicable expense limits in place during the period since the current contractual expense limitation is applied for a two year period beginning July 1, 2019 and in effect through September 30, 2021, instead of coinciding with the Fund's fiscal year end. Details of the current contractual expense limitation in effect can be found in Note 4 of the accompanying Notes to Financial Statements.
(a) Not annualized for periods less than one year.
(b) Annualized for periods less than one year.
(c) The expense ratios exclude the impact of expenses paid by each underlying fund.
(d) Per share net investment income (loss) has been calculated using the average daily shares method.
(e) Reflects increased usage of quantitative investment strategies.
(f) Reflects an increase in trading activity due to asset allocation shifts.
See notes to financial statements.
8
USAA Mutual Funds Trust | Financial Highlights — continued | ||||||
For a Share Outstanding Throughout Each Period
Ratios to Average Net Assets | Supplemental Data | ||||||||||||||||||||||||||||||||||
| Total Distributions | Net Asset Value, End of Period | Total Return*(a) | Net Expenses^(b)(c) | Net Investment Income (Loss)(b) | Gross Expenses(b)(c) | Net Assets, End of Period (000's) | Portfolio Turnover(a) | ||||||||||||||||||||||||||||
USAA Cornerstone Equity Fund | |||||||||||||||||||||||||||||||||||
| Six Months Ended November 30, 2020 (unaudited) | — | $ | 15.91 | 19.80 | % | 0.10 | % | 0.99 | % | 0.11 | % | $ | 204,636 | 2 | % | ||||||||||||||||||||
| Year Ended May 31, 2020 | (0.72 | ) | $ | 13.28 | 0.14 | % | 0.10 | % | 2.38 | % | 0.10 | % | $ | 191,013 | 6 | % | |||||||||||||||||||
| Year Ended May 31, 2019 | (0.86 | ) | $ | 13.90 | (4.35 | )% | 0.10 | % | 1.79 | % | 0.13 | % | $ | 202,288 | 11 | %(e) | |||||||||||||||||||
| Year Ended May 31, 2018 | (0.30 | ) | $ | 15.49 | 10.32 | % | 0.10 | % | 1.46 | % | 0.13 | % | $ | 200,186 | 38 | %(f) | |||||||||||||||||||
| Year Ended May 31, 2017 | (0.41 | ) | $ | 14.31 | 17.99 | % | 0.10 | % | 1.39 | % | 0.20 | % | $ | 143,657 | 7 | % | |||||||||||||||||||
| Year Ended May 31, 2016 | (0.44 | ) | $ | 12.51 | (4.77 | )% | 0.10 | % | 1.36 | % | 0.22 | % | $ | 99,974 | 15 | % | |||||||||||||||||||
See notes to financial statements.
9
USAA Mutual Funds Trust | Notes to Financial Statements November 30, 2020 | ||||||
(Unaudited)
1. Organization:
USAA Mutual Funds Trust (the "Trust") is organized as a Delaware statutory trust and is registered under the Investment Company Act of 1940, as amended (the "1940 Act"), as an open-end investment company. The Trust is comprised of 46 funds and is authorized to issue an unlimited number of shares, which are units of beneficial interest with no par value.
The accompanying financial statements are those of the USAA Cornerstone Equity Fund (the "Fund"). The Fund is classified as diversified under the 1940 Act.
The Fund is a "fund of funds" in that it invests in a selection of affiliated mutual funds and exchange-traded funds managed by the Fund's Adviser, Victory Capital Management Inc., an affiliate of the Fund.
Under the Trust's organizational documents, its officers and trustees are indemnified against certain liabilities arising out of the performance of their duties to the Fund. In addition, in the normal course of business, the Fund enters into contracts with its vendors and others that provide for general indemnifications. The Fund's maximum exposure under these arrangements is unknown, as this would involve future claims that may be made against the Fund. However, based on experience, the Fund expects that risk of loss to be remote.
2. Significant Accounting Policies:
The following is a summary of significant accounting policies followed by the Trust in the preparation of its financial statements. The policies are in conformity with Generally Accepted Accounting Principles in the United States of America ("GAAP"). The preparation of financial statements in accordance with GAAP requires management to make estimates and assumptions that affect the reported amounts of assets and liabilities and disclosure of contingent assets and liabilities at the date of the financial statements and the reported amounts of income and expenses for the period. Actual results could differ from those estimates. The Fund follows the specialized accounting and reporting requirements under GAAP that are applicable to investment companies under Accounting Standards Codification Topic 946.
Investment Valuation:
The Fund records investments at fair value. Fair value is defined as the price that would be received to sell an asset or paid to transfer a liability in an orderly transaction between market participants at the measurement date.
The valuation techniques described below maximize the use of observable inputs and minimize the use of unobservable inputs in determining fair value. The inputs used for valuing the Fund's investments are summarized in the three broad levels listed below:
• Level 1 — quoted prices in active markets for identical securities
• Level 2 — other significant observable inputs (including quoted prices for similar securities or interest rates applicable to those securities, etc.)
• Level 3 — significant unobservable inputs (including the Fund's own assumptions in determining the fair value of investments)
Changes in valuation techniques may result in transfers in or out of an assigned level within the disclosure hierarchy. The inputs or methodologies used for valuation techniques are not necessarily an indication of the risk associated with entering into those investments.
The Adviser has established the Pricing and Liquidity Committee (the "Committee"), and subject to the Trust's Board of Trustees (the "Board") oversight, the Committee administers and oversees the Fund's valuation policies and procedures, which are approved by the Board.
Portfolio securities listed or traded on securities exchanges, including exchange-traded funds ("ETFs"), are valued at the closing price on the exchange or system where the security is principally traded, if available, or at the Nasdaq Official Closing Price. If there have been no sales for that day on the exchange or system, then a security is valued at the last available bid quotation on the exchange or system where the security is principally traded. In each of these situations, valuations are typically categorized as Level 1 in the fair value hierarchy.
10
USAA Mutual Funds Trust | Notes to Financial Statements — continued November 30, 2020 | ||||||
(Unaudited)
Investments in the underlying affiliated Funds and other open-end investment companies, other than ETFs, are valued at their net asset value ("NAV") at the end of each business day and are typically categorized in Level 1 of the fair value hierarchy.
In the event that price quotations or valuations are not readily available, are not reflective of market value, or a significant event has been recognized in relation to a security or class of securities, the securities are valued in good faith by the Committee in accordance with valuation procedures approved by the Board. These valuations are typically categorized as Level 2 or Level 3 in the fair value hierarchy, based on the observability of inputs used to determine the fair value. The effect of fair value pricing is that securities may not be priced on the basis of quotations from the primary market in which they are traded and the actual price realized from the sale of a security may differ materially from the fair value price. Valuing these securities at fair value is intended to cause the Fund's NAV to be more reliable than it otherwise would be.
A summary of the valuations as of November 30, 2020, based upon the three levels defined above, is included in the table below while the breakdown, by category, of investments is disclosed on the Schedule of Portfolio Investments (amounts in thousands):
Level 1 | Level 2 | Level 3 | Total | ||||||||||||||||
Affiliated Exchange-Traded Funds | $ | 78,161 | $ | — | $ | — | $ | 78,161 | |||||||||||
Affiliated Mutual Funds | 126,003 | — | — | 126,003 | |||||||||||||||
Collateral for Securities Loaned | 7,785 | — | — | 7,785 | |||||||||||||||
Total | $ | 211,949 | $ | — | $ | — | $ | 211,949 | |||||||||||
For the six months ended November 30, 2020, there were no transfers in or out of the Level 3 fair value hierarchy.
Investment Companies:
Exchange-Traded Funds:
The Fund may invest in ETFs, the shares of which are bought and sold on a securities exchange. An ETF trades like common stock and represents a portfolio of securities designed to track the performance and dividend yield of a particular domestic or foreign market index. The Fund may purchase shares of an ETF to temporarily gain exposure to a portion of the U.S. or a foreign market while awaiting purchase of underlying securities. The risks of owning an ETF generally reflect the risks of owning the underlying securities they are designed to track, although the lack of liquidity of an ETF could result in it being more volatile. Additionally, ETFs have fees and expenses that reduce their value.
Open-End Funds:
The Fund may invest in portfolios of open-end investment companies. These investment companies value securities in their portfolios for which market quotations are readily available at their market values (generally the last reported sale price) and all other securities and assets at their fair value by the methods established by the board of directors of the underlying funds.
Investment Transactions and Related Income:
Changes in holdings of investments are accounted for no later than one business day following the trade date. For financial reporting purposes, however, investment transactions are accounted for on trade date on the last business day of the reporting period. Dividend income and capital gain distributions from the underlying affiliated funds are recorded on the ex-dividend date. Interest income is determined on the basis of coupon interest accrued using the effective interest method which adjusts, where applicable, the amortization of premiums or accretion of discount. Gains or losses realized on sales of securities are determined by comparing the identified cost of the security lot sold with the net sales proceeds.
Securities Lending:
The Fund, through a securities lending agreement with Citibank, N.A. ("Citibank"), may lend its securities to qualified financial institutions, such as certain broker-dealers, to earn additional income, net of
11
USAA Mutual Funds Trust | Notes to Financial Statements — continued November 30, 2020 | ||||||
(Unaudited)
income retained by Citibank. Borrowers are required to secure their loans for collateral in the amount of at least 102% of the value of U.S. securities loaned or at least 105% of the value of non-U.S. securities loaned, marked-to-market daily. Any collateral shortfalls associated with increases in the valuation of the securities loaned are cured the next business day once the shortfall exceeds $100 thousand. Collateral may be cash, U.S. government securities, or other securities as permitted by Securities and Exchange Commission ("SEC") guidelines. Cash collateral may be invested in high-quality short-term investments, primarily open-end investment companies. Collateral requirements are determined daily based on the value of the Fund's securities on loan as of the end of the prior business day. During the time portfolio securities are on loan, the borrower will pay the Fund any dividends or interest paid on such securities plus any fee negotiated between the parties to the lending agreement. The Fund also earns a return from the collateral. The Fund pays Citibank various fees in connection with the investment of cash collateral and fees based on the investment income received from securities lending activities. Securities lending income (net of these fees) is disclosed on the Statement of Operations. Loans are terminable upon demand and the borrower must return the loaned securities within the lesser of one standard settlement period or five business days. Risks relating to securities-lending transactions include that the borrower may not provide additional collateral when required or return the securities when due, and that the value of the short-term investments will be less than the amount of cash collateral required to be returned to the borrower. The Fund's agreement with Citibank does not include master netting provisions. Noncash collateral received by the Fund may not be sold or re-pledged, except to satisfy borrower default. Cash collateral is listed on the Fund's Schedule of Portfolio Investments and Financial Statements while non-cash collateral is not included.
The following table (amounts in thousands) is a summary of the Fund's securities lending transactions as of November 30, 2020.
| Value of Securities on Loan | Non-Cash Collateral | Cash Collateral | |||||||||
| $ | 7,516 | $ | — | $ | 7,785 | ||||||
Federal Income Taxes:
It is the Fund's policy to continue to qualify as a regulated investment company by complying with the provisions available to certain investment companies, as defined in applicable sections of the Internal Revenue Code, and to make distributions of net investment income and net realized gains sufficient to relieve it from all, or substantially all, federal income taxes. Accordingly, no provision for federal income taxes is required in the financial statements. The Fund has a tax year end of May 31.
Management of the Fund has reviewed tax positions taken in tax years that remain subject to examination by all major tax jurisdictions, including federal (i.e., the last four tax years, which includes the current fiscal tax year end). Management believes that there is no tax liability resulting from unrecognized tax benefits related to uncertain tax positions taken.
Allocations:
Expenses directly attributable to the Fund are charged to the Fund, while expenses that are attributable to more than one fund in the Trust, or jointly with an affiliated trust, are allocated among the respective funds in the Trust and/or affiliated trust based upon net assets or another appropriate basis.
3. Purchases and Sales:
Cost of purchases and proceeds from sales/maturities of securities (excluding securities maturing less than one year from acquisition) for the six months ended November 30, 2020, were as follows for the Fund (amounts in thousands):
| Purchases (excluding U.S. Government Securities) | Sales (excluding U.S. Government Securities) | ||||||
$ | 3,271 | $ | 24,596 | ||||
12
USAA Mutual Funds Trust | Notes to Financial Statements — continued November 30, 2020 | ||||||
(Unaudited)
There were no purchases and sales of U.S. government securities during the six months ended November 30, 2020
4. Fees and Transactions with Affiliates and Related Parties:
Investment Advisory Fees:
Investment advisory services are provided to the Fund by the Adviser, which is a New York corporation registered as an investment adviser with the SEC. The Adviser is a wholly-owned indirect subsidiary of Victory Capital Holdings, Inc., a publicly traded Delaware corporation, and a wholly-owned direct subsidiary of Victory Capital Operating, LLC. The Adviser does not receive any fees from the Fund for these services.
Administration and Servicing Fees:
VCM serves as the Fund's administrator and fund accountant. Under the Administration, Servicing and Accounting Agreement, VCM does not receive any fees from the Fund for these services.
The Fund (as part of the Trust) has entered into an agreement to provide compliance services with the Adviser, pursuant to which the Adviser furnishes its compliance personnel, including the services of the Chief Compliance Officer ("CCO"), and other resources reasonably necessary to provide the Trust with compliance oversight services related to the design, administration and oversight of a compliance program for the Trust in accordance with Rule 38a-1 under the 1940 Act. The CCO is an employee of the Adviser, which pays the compensation of the CCO and support staff. Funds in the Trust, Victory Variable Insurance Funds, Victory Portfolios, and Victory Portfolios II (collectively, the "Victory Funds Complex") in the aggregate, compensate the Adviser for these services. Amounts incurred for the six-months ended November 30, 2020, are reflected on the Statement of Operations as Compliance fees.
Citi Fund Services Ohio, Inc. ("Citi"), an affiliate of Citibank, acts as sub-administrator and sub-fund accountant to the Fund pursuant to a Sub-Administration and Sub-Fund Accounting Services Agreement between VCM and Citi. VCM pays Citi a fee for providing these services. The Trust reimburses VCM and Citi for out-of-pocket expenses incurred in providing these services and certain other expenses specifically allocated to the Funds. Amounts incurred for the six months ended November 30, 2020, are reflected on the Statement of Operations as Sub-Administration fees.
Transfer Agency Fees:
Victory Capital Transfer Agency, Inc. ("VCTA"), an affiliate of the Adviser provides transfer agency services to the Fund. VCTA received no fees from the Fund for these services.
FIS Investor Services LLC serves as sub-transfer agent and dividend disbursing agent for the Fund pursuant to a Sub-Transfer Agent agreement between VCTA and FIS Investor Services LLC. VCTA provides FIS Investor Services LLC a fee for providing these services.
Distributor/Underwriting Services:
Victory Capital Services, Inc. (the "Distributor"), an affiliate of the Adviser, serves as distributor for the continuous offering of the shares of the Fund pursuant to a Distribution Agreement between the Distributor and the Trust. Effective June 30, 2020, the Distributor's name was changed from Victory Capital Advisers, Inc. The Distributor received no fees or other compensation for such distribution services.
Other Fees:
Citibank serves as the Fund's custodian. The Fund pays Citibank a fee for providing these services. Amounts incurred for the six months ended November 30, 2020, are reflected on the Statement of Operations as Custodian fees.
13
USAA Mutual Funds Trust | Notes to Financial Statements — continued November 30, 2020 | ||||||
(Unaudited)
K&L Gates LLP provides legal services to the Trust.
The Adviser has entered into an expense limitation agreement with the Fund until at least September 30, 2021. Under the terms of the agreement, the Adviser has agreed to waive fees or reimburse certain expenses to the extent that ordinary operating expenses incurred in any fiscal year exceed the expense limit for the Fund. Such excess amounts will be the liability of the Adviser. Interest, taxes, brokerage commissions, other expenditures, which are capitalized in accordance with GAAP, and other extraordinary expenses not incurred in the ordinary course of the Fund's business are excluded from the expense limits. As of November 30, 2020, the expense limit (excluding voluntary waivers) is 0.10% for Fund Shares.
Under this expense limitation agreement, the Fund has agreed to repay fees and expenses that were waived or reimbursed by the Adviser for a period up to three years after the fiscal year in which the waiver or reimbursement took place, subject to the lesser of any operating expense limits in effect at the time of: (a) the original waiver or expense reimbursement; or (b) the recoupment, after giving effect to the recoupment amount. As of November 30, 2020, the following amounts are available to be repaid to the Adviser (amounts in thousands). The Fund has not recorded any amounts available to be repaid as a liability due to an assessment that such repayment is not probable at November 30, 2020.
Expires May 31,2024 | Total | ||||||
$ | 14 | $ | 14 | ||||
The Adviser may voluntarily waive or reimburse additional fees to assist the Fund in maintaining competitive expense ratios. Voluntary waivers and reimbursements applicable to the Fund are not available to be recouped at a future time. There were no voluntary waivers or reimbursements for the six months ended November 30, 2020.
Certain officers and/or interested trustees of the Fund are also officers and/or employees of the Adviser, Administrator, Sub-Administrator, Sub-Fund Accountant, and Legal.
5. Risks:
The Fund may be subject to other risks in addition to these identified risks.
Geopolitical/Natural Disaster Risk — Global economies and financial markets are increasingly interconnected, which increases the possibilities that conditions in one country or region might adversely affect issuers in another country or region. Geopolitical and other risks, including war, terrorism, trade disputes, political or economic dysfunction within some nations, public health crises and related geopolitical events, as well as environmental disasters such as earthquakes, fires, and floods, may add to instability in world economies and markets generally. Changes in trade policies and international trade agreements could affect the economies of many countries in unpredictable ways. Likewise, systemic market dislocations of the kind that occurred during the financial crisis that began in 2008, if repeated, would be highly disruptive to economies and markets, adversely affecting individual companies and industries, securities markets, interest rates, credit ratings, inflation, investor sentiment, and other factors affecting the value of a Fund's investments. Some countries, including the United States, are adopting more protectionist trade policies and moving away from the tighter financial industry regulations that followed the 2008 financial crisis, which may also affect the value of a Fund's investments.
Political events within the United States at times have resulted, and may in the future result, in a shutdown of government services, which could negatively affect the U.S. economy, decrease the value of a Fund's investments, increase uncertainty in or impair the operation of the U.S. or other securities markets and degrade investor and consumer confidence, perhaps suddenly and to a significant degree.
An outbreak of disease called COVID-19 has spread internationally. The transmission of COVID-19 and efforts to contain its spread have resulted in international, national and local border closings and other significant travel restrictions and disruptions, significant disruptions to business operations, supply chains and consumer activity, significant challenges in healthcare service preparation and delivery, quarantines and general concern and uncertainty. These negative impacts have caused significant volatility and declines in global financial markets, which have caused losses for Fund investors during and subsequent to period end. The impact of the COVID-19 pandemic last for an extended period of
14
USAA Mutual Funds Trust | Notes to Financial Statements — continued November 30, 2020 | ||||||
(Unaudited)
time, and could result in a substantial economic downturn or recession. Public health crises may exacerbate other pre-existing political, social, economic, market and financial risks. The extent of the impact to the financial performance of the Funds' investments will depend on future developments, including (i) the duration and spread of the outbreak, (ii) the restrictions and advisories, (iii) the effects on the financial markets, and (iv) the effects on the economy overall, all of which are highly uncertain and cannot be predicted.
Affiliated Funds Risk — The risks of the Fund directly correspond to the risks of the underlying affiliated funds in which the Fund invests. By investing in the underlying affiliated funds, the Fund has exposure to the risk of many different areas of the market. The degree to which the risks described below apply to the Fund varies according to the Fund's asset allocation. For instance, the more the Fund is allocated to stock funds, the greater the risk associated with equity securities. The Fund also is subject to asset allocation risk (i.e., the risk that allocations will not produce the intended results) and to management risk (i.e., the risk that the selection of underlying affiliated funds will not produce the intended results).
Conflict of Interest Risk — In managing a Fund that invests in underlying affiliated funds, the Adviser may have conflicts of interest in allocating the Fund's assets among the various underlying affiliated funds. This is because the fees payable by some of the underlying affiliated funds to the Adviser and/or its affiliates are higher than the fees payable by other underlying affiliated funds, and because the Adviser also manages and administers the underlying affiliated funds.
Equity Risk — The Fund may invest in underlying affiliated funds that invest in equity securities. The value of the equity securities in which the Fund invests may decline in response to developments affecting individual companies and/or general economic conditions. A company's earnings or dividends may not increase as expected due to poor management decisions, competitive pressures, breakthroughs in technology, reliance on suppliers, labor problems or shortages, corporate restructurings, fraudulent disclosures, natural disasters, military confrontations, war, terrorism, public health crises, or other events, conditions, and factors. Price changes may be temporary or last for extended periods.
6. Borrowing and Interfund Lending:
Line of Credit:
For the six months ended November 30, 2020, the Victory Funds Complex participated in a short-term demand note "Line of Credit" agreement with Citibank. The Line of Credit agreement with Citibank was renewed on June 29, 2020 with a termination date of June 28, 2021. Under the agreement with Citibank, the Victory Funds Complex may borrow up to $600 million, of which $300 million is committed and $300 million is uncommitted. $40 million of the Line of Credit is reserved for use by the Victory Floating Rate Fund, another series of the Victory Funds Complex, with Victory Floating Rate Fund paying the related commitment fees for that amount. The purpose of the agreement is to meet temporary or emergency cash needs. For the six months ended November 30, 2020, Citibank received an annual commitment fee of 0.15% on $300 million for providing the Line of Credit. Each fund in the Victory Funds Complex pays a pro-rata portion of the commitment fees plus any interest (one month LIBOR plus one percent) on amounts borrowed. Effective June 29, 2020, under an amended Line of Credit agreement, Citibank will also receive an annual upfront fee of 0.10% on the $300 million committed line of credit. Each fund in the Victory Funds Complex will pay a pro-rata portion of the upfront fee. Interest charged to each Fund during the period, if applicable, is reflected on the Statements of Operations under Line of credit fees.
The Fund had no borrowings under the Line of Credit agreement during the six months ended November 30, 2020.
Interfund Lending:
The Trust and Adviser rely on an exemptive order granted by the SEC in March 2017 (the "Order"), permitting the establishment and operation of an Interfund Lending Facility (the "Facility"). The Facility allows the Fund to directly lend and borrow money to or from any other Fund, that is permitted to participate in the Facility, in the Victory Funds Complex relying upon the Order at rates beneficial to both the borrowing and lending funds. Advances under the Facility are allowed for temporary or emergency purposes. The interfund loan rate is determined, as specified in the Order, by averaging the
15
USAA Mutual Funds Trust | Notes to Financial Statements — continued November 30, 2020 | ||||||
(Unaudited)
current repurchase agreement rate and the current bank loan rate. As a Borrower, interest charged to the Fund, if any, during the period is reflected on the Statement of Operations under Interfund lending fees. As a Lender, interest earned by the Fund, if any, during the period is reflected on the Statement of Operations under Income on Interfund lending.
The average borrowing or lending for the days outstanding and average interest rate for the Fund during the period ended November 30, 2020 were as follows (amounts in thousands):
| Borrower or Lender | Amount Outstanding at November 30, 2020 | Average Borrowing* | Days Borrowing Outstanding | Average Interest Rate* | Maximum Borrowing During the Period | ||||||||||||||||||
| Borrower | $ | — | $ | 908 | 1 | 0.62 | % | $ | 908 | ||||||||||||||
* For the six months ended November 30, 2020, based on the number of days borrowings were outstanding.
7. Federal Income Tax Information:
The Fund intends to declare and distribute any net investment income annually. Distributable net realized gains, if any, are declared and paid at least annually.
The amounts of dividends from net investment income and distributions from net realized gains (collectively distributions to shareholders) are determined in accordance with federal income tax regulations, which may differ from GAAP. To the extent these "book/tax" differences are permanent in nature (e.g., net operating loss and distribution reclassification), such amounts are reclassified within the components of net assets based on their federal tax-basis treatment; temporary differences (e.g., wash sales) do not require reclassification. To the extent dividends and distributions exceed net investment income and net realized gains for tax purposes, they are reported as distributions of capital.
Net investment losses incurred by the Fund may be reclassified as an offset to capital on the accompanying Statement of Assets and Liabilities.
The tax character of current year distributions paid and the tax basis of the current components of accumulated earnings (deficit) will be determined at the end of the current tax year ending May 31, 2021.
At May 31, 2020, the Fund had no capital loss carryforwards, for federal income tax purposes.
8. Affiliated Securities:
An affiliated security is a security in which the Fund has ownership of at least 5% of the security's outstanding voting shares or an investment company managed by VCM. The Fund does not invest in affiliated underlying funds for the purpose of exercising management or control. These underlying funds are noted as affiliated on the Fund's Schedule of Portfolio Investments. The affiliated underlying funds' annual or semiannual reports may be viewed at vcm.com. Transactions in affiliated securities during the six months ended November 30, 2020 were as follows (amount in thousands):
| Fair Value 5/31/2020 | Purchases at Cost | Proceeds from Sales | Realized Gains (Losses) | Capital Gain Distribution | Net Change in Unrealized Appreciation/ Depreciation | Fair Value 11/30/2020 | Dividend Income | ||||||||||||||||||||||||||||
| USAA 500 Index Fund Reward Shares | $ | 26,240 | $ | 406 | $ | (1,757 | ) | $ | 185 | $ | — | $ | 4,926 | $ | 30,000 | $ | 208 | ||||||||||||||||||
| USAA Aggressive Growth Fund Institutional Shares | 8,071 | — | (401 | ) | 7 | — | 1,984 | 9,661 | — | ||||||||||||||||||||||||||
16
USAA Mutual Funds Trust | Notes to Financial Statements — continued November 30, 2020 | ||||||
(Unaudited)
| Fair Value 5/31/2020 | Purchases at Cost | Proceeds from Sales | Realized Gains (Losses) | Capital Gain Distribution | Net Change in Unrealized Appreciation/ Depreciation | Fair Value 11/30/2020 | Dividend Income | ||||||||||||||||||||||||||||
| USAA Capital Growth Fund Institutional Shares | $ | 5,444 | $ | — | $ | (5,996 | ) | $ | 75 | $ | — | $ | 477 | $ | — | $ | — | ||||||||||||||||||
| USAA Emerging Markets Fund Institutional Shares | 8,232 | 195 | (1,761 | ) | 220 | — | 2,064 | 8,950 | — | ||||||||||||||||||||||||||
| USAA Growth Fund Institutional Shares | 9,479 | — | (1,390 | ) | 185 | — | 1,822 | 10,096 | — | ||||||||||||||||||||||||||
| USAA Income Stock Fund Institutional Shares | 8,495 | 691 | — | — | — | 1,125 | 10,311 | 96 | |||||||||||||||||||||||||||
| USAA International Fund Institutional Shares | 27,920 | — | (5,037 | ) | (925 | ) | — | 5,609 | 27,567 | — | |||||||||||||||||||||||||
| USAA Precious Metals and Minerals Fund Institutional Shares | 1,332 | — | (491 | ) | 241 | — | (191 | ) | 891 | — | |||||||||||||||||||||||||
| USAA Small Cap Stock Fund Institutional Shares | 6,667 | — | (2,505 | ) | (273 | ) | — | 2,032 | 5,921 | — | |||||||||||||||||||||||||
| USAA Target Managed Allocation Fund | 12,716 | 200 | (1,552 | ) | 123 | — | 1,743 | 13,230 | — | ||||||||||||||||||||||||||
| USAA Value Fund Institutional Shares | 8,228 | — | (191 | ) | (94 | ) | — | 1,433 | 9,376 | — | |||||||||||||||||||||||||
| VictoryShares USAA MSCI Emerging Markets Value Momentum ETF | 9,618 | 1,780 | — | — | — | 1,747 | 13,145 | 207 | |||||||||||||||||||||||||||
| VictoryShares USAA MSCI International Value Momentum ETF | 22,189 | — | — | — | — | 3,418 | 25,607 | 259 | |||||||||||||||||||||||||||
| VictoryShares USAA MSCI USA Small Cap Value Momentum ETF | 6,791 | — | (2,520 | ) | (184 | ) | — | 1,730 | 5,817 | 51 | |||||||||||||||||||||||||
| VictoryShares USAA MSCI USA Value Momentum ETF | 29,369 | — | (996 | ) | (144 | ) | — | 5,363 | 33,592 | 251 | |||||||||||||||||||||||||
$ | 190,791 | $ | 3,272 | $ | (24,597 | ) | $ | (584 | ) | $ | — | $ | 35,282 | $ | 204,164 | $ | 1,072 | ||||||||||||||||||
17
USAA Mutual Funds Trust | Supplemental Information November 30, 2020 | ||||||
(Unaudited)
Proxy Voting and Portfolio Holdings Information
Proxy Voting:
Information regarding the policies and procedures the Fund uses to determine how to vote proxies relating to portfolio securities is available without charge, upon request, by calling (800) 539-3863. The information is also included in the Fund's Statement of Additional Information, which is available on the SEC's website at www.sec.gov.
Information relating to how the Fund voted proxies relating to portfolio securities held during the most recent 12 months ended June 30 is available on the SEC's website at www.sec.gov.
Availability of Schedules of Portfolio Investments:
The Trust files a complete list of Schedules of Portfolio Investments with the SEC for the first and third quarter of each fiscal year on Form N-PORT. Form N-PORT is available on the SEC's website at www.sec.gov.
Expense Example
As a shareholder of the Fund, you may incur two types of costs: (1) transaction costs, and (2) ongoing costs, including management fees and other Fund expenses. These examples are intended to help you understand your ongoing costs (in dollars) of investing in the Fund and to compare these costs with the ongoing costs of investing in other mutual funds.
These examples are based on an investment of $1,000 invested at the beginning of the period and held for the entire period from June 1, 2020 through November 30, 2020.
The Actual Expense figures in the table below provide information about actual account values and actual expenses. You may use the information below, together with the amount you invested, to estimate the expenses that you paid over the period. Simply divide your account value by $1,000 (for example, an $8,600 account value divided by $1,000 = 8.6), then multiply the result by the number in the table under the heading entitled "Actual Expenses Paid During Period" to estimate the expenses you paid on your account during this period.
The Hypothetical Expense figures in the table below provide information about hypothetical account values and hypothetical expenses based on the Fund's actual expense ratio and an assumed rate of return of 5% per year before expenses, which is not the Fund's actual return. The hypothetical account values and expenses may not be used to estimate the actual ending account balance or expenses you paid for the period. You may use this information to compare this 5% hypothetical example with the 5% hypothetical examples that appear in shareholder reports of other funds.
Please note the expenses shown in the table below are meant to highlight your ongoing costs only and do not reflect any transactional costs. If these transactional costs were included, your costs would have been higher.
| Beginning Account Value 6/1/20 | Actual Ending Account Value 11/30/20 | Hypothetical Ending Account Value 11/30/20 | Actual Expenses Paid During Period 6/1/20- 11/30/20* | Hypothetical Expenses Paid During Period 6/1/20- 11/30/20* | Annualized Expense Ratio During Period 6/1/20 11/30/20 | ||||||||||||||||||
| $ | 1,000.00 | $ | 1,198.00 | $ | 1,024.57 | $ | 0.55 | $ | 0.51 | 0.10 | % | ||||||||||||
* Expenses are equal to the average account value multiplied by the Fund's annualized expense ratio multiplied by 183/365 (the number of days in the most recent fiscal half-year divided by the number of days in the fiscal year).
18
Privacy Policy
Protecting the Privacy of Information
The Trust respects your right to privacy. We also know that you expect us to conduct and process your business in an accurate and efficient manner. To do so, we must collect and maintain certain personal information about you. This is the information we collect from you on applications or other forms, and from the transactions you make with us or third parties. It may include your name, address, social security number, account transactions and balances, and information about investment goals and risk tolerance.
We do not disclose any information about you or about former customers to anyone except as permitted or required by law. Specifically, we may disclose the information we collect to companies that perform services on our behalf, such as the transfer agent that processes shareholder accounts and printers and mailers that assist us in the distribution of investor materials. We may also disclose this information to companies that perform marketing services on our behalf. This allows us to continue to offer you Victory investment products and services that meet your investing needs, and to effect transactions that you request or authorize. These companies will use this information only in connection with the services for which we hired them. They are not permitted to use or share this information for any other purpose.
To protect your personal information internally, we permit access only by authorized employees and maintain physical, electronic and procedural safeguards to guard your personal information.*
* You may have received communications regarding information about privacy policies from other financial institutions which gave you the opportunity to "opt-out" of certain information sharing with companies which are not affiliated with that financial institution. The Trust does not share information with other companies for purposes of marketing solicitations for products other than the Trust. Therefore, the Trust does not provide opt-out options to their shareholders.
P.O. Box 182593
Columbus, Ohio 43218-2593

Visit our website at: | Call | ||||||
vcm.com | (800) 235-8396 | ||||||
97453-0121

NOVEMBER 30, 2020
Semi Annual Report
USAA Cornerstone Moderate Fund
Beginning January 1, 2021, as permitted by regulations adopted by the Securities and Exchange Commission, paper copies of the Fund's shareholder reports may no longer be sent by mail, unless you specifically request paper copies of the reports from the Fund or from your financial intermediary, such as a broker-dealer or bank. Instead, the reports will be made available on VictoryFunds.com, and you will be notified by mail each time a report is posted and provided with a website link to access the report. If you already elected to receive shareholder reports electronically, you will not be affected by this change and you need not take any action.
You may elect to receive shareholder reports and other communications from the Fund or your financial intermediary electronically by notifying your financial intermediary directly, or if you are a shareholder who has an account directly with the Fund, by calling (800) 235-8396 or by submitting your request via email to TA.Processing@FISGlobal.com.
You may elect to receive all future reports in paper free of charge. You can inform the Fund or your financial intermediary that you wish to continue receiving paper copies of your shareholder reports by notifying your financial intermediary directly, or if you are a shareholder who has an account directly with the Fund, by calling (800) 235-8396 or submitting your request via email to TA.Processing@FISGlobal.com.
Your election to receive reports in paper will apply to all funds held with the USAA Mutual Funds or your financial intermediary.
Victory Capital means Victory Capital Management Inc., the investment adviser of the USAA Mutual Funds. USAA Mutual Funds are distributed by Victory Capital Services, Inc., member of FINRA, an affiliate of Victory Capital. Victory Capital and its affiliates are not affiliated with United Services Automobile Association or its affiliates. USAA and the USAA logo are registered trademarks and the USAA Mutual Funds and USAA Investments logos are trademarks of United Services Automobile Association and are being used by Victory Capital and its affiliates under license.
TABLE OF CONTENTS
Investment Objective & Portfolio Holdings | 2 | ||||||
Schedule of Portfolio Investments | 3 | ||||||
Financial Statements | |||||||
Statement of Assets and Liabilities | 20 | ||||||
Statement of Operations | 21 | ||||||
Statements of Changes in Net Assets | 22 | ||||||
Financial Highlights | 24 | ||||||
Notes to Financial Statements | 26 | ||||||
Supplemental Information | 37 | ||||||
Proxy Voting and Portfolio Holdings Information | 37 | ||||||
Expense Example | 37 | ||||||
Privacy Policy (inside back cover) | |||||||
This report is for the information of the shareholders and others who have received a copy of the currently effective prospectus of the Fund, managed by Victory Capital Management Inc. It may be used as sales literature only when preceded or accompanied by a current prospectus, which provides further details about the Fund.
IRA DISTRIBUTION WITHHOLDING DISCLOSURE
We generally must withhold federal income tax at a rate of 10% of the taxable portion of your distribution and, if you live in a state that requires state income tax withholding, at your state's tax rate. However, you may elect not to have withholding apply or to have income tax withheld at a higher rate. Any withholding election that you make will apply to any subsequent distribution unless and until you change or revoke the election. If you wish to make a withholding election, or change or revoke a prior withholding election, call (800) 235-8396, and form W-4P (OMB No. 1545-0074 withholding certificate for pension or annuity payments) will be electronically sent.
If you do not have a withholding election in place by the date of a distribution, federal income tax will be withheld from the taxable portion of your distribution at a rate of 10%. If you must pay estimated taxes, you may be subject to estimated tax penalties if your estimated tax payments are not sufficient and sufficient tax is not withheld from your distribution.
For more specific information, please consult your tax adviser.
USAA Mutual Funds Trust
1
| USAA Mutual Funds Trust USAA Cornerstone Moderate Fund | November 30, 2020 | ||||||
(Unaudited)
Investment Objective & Portfolio Holdings:
The Fund's investment objective is to seek a high total return.
Asset Allocation*:
November 30, 2020
(% of Net Assets)
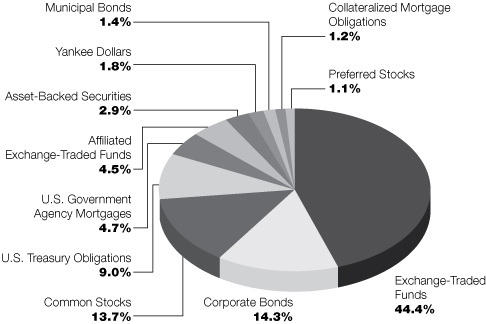
* Does not include futures, money market instruments, and short-term investments purchased with cash collateral from securities loaned.
Percentages are of the net assets of the Fund and may not equal 100%.
2
| USAA Mutual Funds Trust USAA Cornerstone Moderate Fund | Schedule of Portfolio Investments November 30, 2020 | ||||||
(Amounts in Thousands, Except for Shares) (Unaudited)
Security Description | Principal Amount | Value | |||||||||
Asset-Backed Securities (2.9%) | |||||||||||
| American Express Credit Account Master Trust, Series 2019-2, Class B, 2.86%, 11/15/24 | $ | 1,619 | $ | 1,671 | |||||||
| Americredit Automobile Receivables Trust, Series 2018-2, Class A3, 3.15%, 3/20/23, Callable 10/18/22 @ 100 | 181 | 183 | |||||||||
| Americredit Automobile Receivables Trust, Series 2018-1, Class C, 3.50%, 1/18/24, Callable 7/18/22 @ 100 | 2,640 | 2,735 | |||||||||
| ARI Fleet Lease Trust, Series 2020-A, Class A3, 1.80%, 8/15/28, Callable 3/15/23 @ 100 (a) | 438 | 449 | |||||||||
| BCC Funding Corp. XVI LLC, Series 2019-1A, Class A2, 2.46%, 8/20/24, Callable 4/20/23 @ 100 (a) | 1,987 | 2,011 | |||||||||
| Canadian Pacer Auto Receivables Trust, Series 2018-1A, Class C, 3.82%, 4/19/24, Callable 5/19/21 @ 100 (a) | 1,190 | 1,208 | |||||||||
| CarMax Auto Owner Trust, Series 2020-1, Class B, 2.21%, 9/15/25, Callable 8/15/23 @ 100 | 620 | 644 | |||||||||
| Credit Acceptance Auto Loan Trust, Series 2018-3A, Class A, 3.55%, 8/15/27, Callable 10/15/21 @ 100 (a) | 1,001 | 1,013 | |||||||||
| Dell Equipment Finance Trust, Series 2020-1, Class A3, 2.24%, 2/22/23, Callable 8/22/22 @ 100 (a) | 325 | 334 | |||||||||
| Drive Auto Receivables Trust, Series 2019-1, Class C, 3.78%, 4/15/25, Callable 9/15/22 @ 100 | 712 | 727 | |||||||||
| Drive Auto Receivables Trust, Series 2018-4, Class D, 4.09%, 1/15/26, Callable 7/15/22 @ 100 | 662 | 684 | |||||||||
Enterprise Fleet Financing LLC, Series 2020-1, Class A3, 1.86%, 12/22/25 (a) | 399 | 414 | |||||||||
Evergreen Credit Card Trust, Series 2019-2, Class A, 1.90%, 9/15/24 (a) | 1,577 | 1,621 | |||||||||
| Exeter Automobile Receivables Trust, Series 2017-3A, Class D, 5.28%, 10/15/24, Callable 4/15/22 @ 100 (a) | 490 | 513 | |||||||||
| Exeter Automobile Receivables Trust, Series 2019-2A, Class C, 3.30%, 3/15/24, Callable 12/15/22 @ 100 (a) | 970 | 991 | |||||||||
| Exeter Automobile Receivables Trust, Series 2020-1A, Class B, 2.26%, 4/15/24, Callable 5/15/23 @ 100 (a) | 499 | 505 | |||||||||
| Ford Credit Auto Owner Trust, Series 2019-A, Class A3, 2.78%, 9/15/23, Callable 12/15/22 @ 100 | 350 | 357 | |||||||||
| Ford Credit Auto Owner Trust, Series 2020-1, Class B, 2.29%, 8/15/31, Callable 2/15/25 @ 100 (a) | 648 | 672 | |||||||||
| Great American Auto Leasing, Inc., Series 2019-1, Class A3, 3.05%, 9/15/22, Callable 12/15/22 @ 100 (a) | 444 | 451 | |||||||||
Hertz Vehicle Financing II LP, Series 2019-3A, Class A, 2.67%, 12/26/25 (a) | 210 | 210 | |||||||||
| HPEFS Equipment Trust, Series 2019-1A, Class C, 2.49%, 9/20/29, Callable 5/20/22 @ 100 (a) | 437 | 447 | |||||||||
| HPEFS Equipment Trust, Series 2020-1A, Class B, 1.89%, 2/20/30, Callable 12/20/22 @ 100 (a) | 249 | 253 | |||||||||
| MMAF Equipment Finance LLC, Series 2017-B, Class A4, 2.41%, 11/15/24, Callable 6/15/22 @ 100 (a) | 972 | 990 | |||||||||
| Navient Student Loan Trust, Series 2015-2, Class B, 1.65% (LIBOR01M+150bps), 8/25/50, Callable 1/25/29 @ 100 (b) | 950 | 903 | |||||||||
| NP SPE II LLC, Series 2017-1A, Class A1, 3.37%, 10/21/47, Callable 10/20/27 @ 100 (a) | 334 | 341 | |||||||||
OSCAR US Funding Trust IX LLC, Series 2018-2A, Class A4, 3.63%, 9/10/25 (a) | 2,560 | 2,669 | |||||||||
See notes to financial statements.
3
| USAA Mutual Funds Trust USAA Cornerstone Moderate Fund | Schedule of Portfolio Investments — continued November 30, 2020 | ||||||
(Amounts in Thousands, Except for Shares) (Unaudited)
Security Description | Principal Amount | Value | |||||||||
| SCF Equipment Leasing LLC, Series 2017-2A, Class A, 3.41%, 12/20/23, Callable 12/20/20 @ 100 (a) | $ | 218 | $ | 219 | |||||||
| SCF Equipment Leasing LLC, Series 2020-1A, Class B, 2.02%, 3/20/28, Callable 7/20/25 @ 100 (a) | 506 | 511 | |||||||||
| SLM Student Loan Trust, Series 2003-14, Class B, 0.76% (LIBOR03M+55bps), 10/25/65, Callable 4/25/29 @ 100 (b) | 320 | 299 | |||||||||
| Synchrony Credit Card Master Note Trust, Series 2016-2, Class C, 2.95%, 5/15/24 | 1,461 | 1,471 | |||||||||
| Synchrony Credit Card Master Note Trust, Series 2018-2, Class A, 3.47%, 5/15/26 | 1,721 | 1,840 | |||||||||
| Transportation Finance Equipment Trust, Series 2019-1, Class B, 2.06%, 5/23/24, Callable 6/23/23 @ 100 (a) | 900 | 928 | |||||||||
| Transportation Finance Equipment Trust, Series 2019-1, Class A4, 1.88%, 3/25/24, Callable 6/23/23 @ 100 (a) | 972 | 1,000 | |||||||||
| Trinity Rail Leasing LLC, Series 2019-2A, Class A1, 2.39%, 10/18/49, Callable 12/17/20 @ 100 (a) | 428 | 428 | |||||||||
| Trinity Rail Leasing LLC, Series 2019-2A, Class A2, 3.10%, 10/18/49, Callable 12/17/20 @ 100 (a) | 2,000 | 2,069 | |||||||||
| Westlake Automobile Receivables Trust, Series 2018-2A, Class D, 4.00%, 1/16/24, Callable 1/15/22 @ 100 (a) | 1,000 | 1,021 | |||||||||
| Westlake Automobile Receivables Trust, Series 2020-1A, Class B, 1.94%, 4/15/25, Callable 7/15/23 @ 100 (a) | 1,618 | 1,641 | |||||||||
Total Asset-Backed Securities (Cost $33,685) | 34,423 | ||||||||||
Collateralized Mortgage Obligations (1.2%) | |||||||||||
| Banc of America Commercial Mortgage Trust, Series 2008-1, Class AJ, 6.79%, 2/10/51 (c) | 130 | 136 | |||||||||
| Banc of America Commercial Mortgage Trust, Series 2006-3, Class AM, 5.86%, 7/10/44 (c) | 1,254 | 250 | |||||||||
BANK, Series 2019-BNK20, Class A3, 3.01%, 9/15/61 | 1,000 | 1,116 | |||||||||
| Barclays Commercial Mortgage Trust, Series 2019-C5, Class ASB, 2.99%, 11/15/52 | 754 | 831 | |||||||||
Benchmark Mortgage Trust, Series 2019-B14, Class A5, 3.05%, 12/15/61 | 1,295 | 1,454 | |||||||||
| Benchmark Mortgage Trust, Series 2020-B17, Class ASB, 2.18%, 3/15/53, Callable 11/15/29 @ 100 | 648 | 683 | |||||||||
| BTH Mortgage-Backed Securities Trust, Series 2018-21, Class A, 2.65% (LIBOR01M+250bps), 10/7/21 (a) (b) | 1,200 | 1,194 | |||||||||
BX Trust, Series 2019-OC11, Class A, 3.20%, 12/9/41 (a) | 598 | 638 | |||||||||
| Citigroup Commercial Mortgage Trust, Series 2019-PRM, Class A, 3.34%, 5/10/36 (a) | 1,000 | 1,058 | |||||||||
| Citigroup Commercial Mortgage Trust, Series 2020-555, Class A, 2.65%, 12/10/41 (a) | 972 | 1,019 | |||||||||
| Citigroup Commercial Mortgage Trust, Series 2020-GC46, Class AAB, 2.61%, 1/15/53 | 648 | 702 | |||||||||
COMM Mortgage Trust, Series 2019-GC44, Class ASB, 2.87%, 8/15/57 | 971 | 1,067 | |||||||||
| COMM Mortgage Trust, Series 2014-277P, Class A, 3.73%, 8/10/49, Callable 8/10/24 @ 100 (a) (c) | 661 | 712 | |||||||||
See notes to financial statements.
4
| USAA Mutual Funds Trust USAA Cornerstone Moderate Fund | Schedule of Portfolio Investments — continued November 30, 2020 | ||||||
(Amounts in Thousands, Except for Shares) (Unaudited)
Security Description | Shares or Principal Amount | Value | |||||||||
| Credit Suisse Commercial Mortgage Trust, Series 2007-C1, Class AMFL, 0.33% (LIBOR01M+19bps), 2/15/40 (b) | $ | 25 | $ | 23 | |||||||
| CSAIL Commercial Mortgage Trust, Series 2016-C6, Class XA, 2.06%, 1/15/49, Callable 11/15/25 @ 100 (c) (d) | 10,774 | 816 | |||||||||
DBJPM Mortgage Trust, Series 2016-SFC, Class A, 2.83%, 8/10/36 (a) | 1,500 | 1,469 | |||||||||
| GE Commercial Mortgage Corp., Series 2007-C1, Class AM, 5.61%, 12/10/49 (c) | 66 | 31 | |||||||||
| GS Mortgage Securities Trust, Series 2020-GC45, Class AAB, 2.84%, 2/13/53 | 347 | 381 | |||||||||
| GS Mortgage Securities Trust, Series 2020-GC45, Class A5, 2.91%, 2/13/53 | 411 | 456 | |||||||||
Manhattan West, Series 2020-1MW, Class A, 2.13%, 9/10/40 (a) | 414 | 429 | |||||||||
| UBS Commercial Mortgage Trust, Series 2012-C1, Class XA, 2.25%, 5/10/45, Callable 4/10/22 @ 100 (a) (c) | 11,259 | 197 | |||||||||
Total Collateralized Mortgage Obligations (Cost $15,237) | 14,662 | ||||||||||
Common Stocks (13.7%) | |||||||||||
Communication Services (1.1%): | |||||||||||
Activision Blizzard, Inc. | 10,769 | 856 | |||||||||
Alphabet, Inc. Class C (e) | 1,400 | 2,465 | |||||||||
AT&T, Inc. | 37,727 | 1,085 | |||||||||
Charter Communications, Inc. Class A (e) | 1,309 | 854 | |||||||||
Comcast Corp. Class A | 22,711 | 1,141 | |||||||||
Facebook, Inc. Class A (e) | 6,567 | 1,819 | |||||||||
Match Group, Inc. (e) | 5,994 | 834 | |||||||||
Sirius XM Holdings, Inc. (f) | 116,389 | 755 | |||||||||
T-Mobile U.S., Inc. (e) | 6,515 | 866 | |||||||||
Verizon Communications, Inc. | 19,186 | 1,159 | |||||||||
Zillow Group, Inc. Class C (e) | 7,159 | 772 | |||||||||
12,606 | |||||||||||
Consumer Discretionary (1.3%): | |||||||||||
Amazon.com, Inc. (e) | 927 | 2,937 | |||||||||
AutoZone, Inc. (e) | 678 | 771 | |||||||||
Booking Holdings, Inc. (e) | 425 | 862 | |||||||||
Dollar General Corp. | 3,831 | 837 | |||||||||
Domino's Pizza, Inc. | 1,952 | 766 | |||||||||
eBay, Inc. | 16,633 | 839 | |||||||||
Ford Motor Co. | 91,257 | 829 | |||||||||
General Motors Co. | 19,741 | 865 | |||||||||
Lennar Corp. Class A | 10,249 | 778 | |||||||||
Lowe's Cos., Inc. | 6,233 | 971 | |||||||||
O'Reilly Automotive, Inc. (e) | 1,717 | 760 | |||||||||
Peloton Interactive, Inc. Class A (e) | 7,119 | 828 | |||||||||
Tesla, Inc. (e) | 2,703 | 1,534 | |||||||||
The Home Depot, Inc. | 8,867 | 2,460 | |||||||||
16,037 | |||||||||||
See notes to financial statements.
5
| USAA Mutual Funds Trust USAA Cornerstone Moderate Fund | Schedule of Portfolio Investments — continued November 30, 2020 | ||||||
(Amounts in Thousands, Except for Shares) (Unaudited)
Security Description | Shares | Value | |||||||||
Consumer Staples (0.8%): | |||||||||||
Altria Group, Inc. | 21,503 | $ | 856 | ||||||||
Colgate-Palmolive Co. | 9,973 | 854 | |||||||||
Kimberly-Clark Corp. | 5,695 | 793 | |||||||||
Monster Beverage Corp. (e) | 9,115 | 773 | |||||||||
Philip Morris International, Inc. | 23,934 | 1,813 | |||||||||
The Clorox Co. | 7,436 | 1,509 | |||||||||
The Kroger Co. | 23,638 | 780 | |||||||||
The Procter & Gamble Co. | 8,934 | 1,241 | |||||||||
Walgreens Boots Alliance, Inc. | 20,536 | 781 | |||||||||
9,400 | |||||||||||
Energy (0.4%): | |||||||||||
Cabot Oil & Gas Corp. | 42,799 | 750 | |||||||||
Chevron Corp. | 12,029 | 1,049 | |||||||||
ConocoPhillips | 40,811 | 1,614 | |||||||||
Halliburton Co. | 46,779 | 776 | |||||||||
Phillips 66 | 12,956 | 785 | |||||||||
4,974 | |||||||||||
Financials (1.7%): | |||||||||||
AGNC Investment Corp. | 2,774 | 42 | |||||||||
Annaly Capital Management, Inc. | 7,356 | 59 | |||||||||
Aon PLC Class A | 3,786 | 776 | |||||||||
Berkshire Hathaway, Inc. Class B (e) | 5,520 | 1,264 | |||||||||
Brown & Brown, Inc. | 15,612 | 703 | |||||||||
Capital One Financial Corp. | 9,438 | 808 | |||||||||
First Republic Bank | 5,628 | 729 | |||||||||
KeyCorp | 47,773 | 738 | |||||||||
MarketAxess Holdings, Inc. | 1,456 | 785 | |||||||||
Marsh & McLennan Cos., Inc. | 7,170 | 822 | |||||||||
MetLife, Inc. | 17,590 | 812 | |||||||||
Moody's Corp. | 2,882 | 814 | |||||||||
Morgan Stanley | 14,858 | 919 | |||||||||
MSCI, Inc. | 3,841 | 1,573 | |||||||||
Prudential Financial, Inc. | 10,503 | 794 | |||||||||
S&P Global, Inc. | 5,054 | 1,778 | |||||||||
State Street Corp. | 11,295 | 796 | |||||||||
SVB Financial Group (e) | 4,269 | 1,472 | |||||||||
T. Rowe Price Group, Inc. | 5,296 | 759 | |||||||||
The Allstate Corp. | 7,661 | 784 | |||||||||
The Goldman Sachs Group, Inc. | 3,856 | 889 | |||||||||
The Progressive Corp. | 17,192 | 1,498 | |||||||||
Wells Fargo & Co. | 35,749 | 978 | |||||||||
20,592 | |||||||||||
Health Care (2.2%): | |||||||||||
AbbVie, Inc. | 10,501 | 1,098 | |||||||||
Amgen, Inc. | 8,415 | 1,868 | |||||||||
Anthem, Inc. | 2,763 | 861 | |||||||||
Biogen, Inc. (e) | 6,680 | 1,604 | |||||||||
See notes to financial statements.
6
| USAA Mutual Funds Trust USAA Cornerstone Moderate Fund | Schedule of Portfolio Investments — continued November 30, 2020 | ||||||
(Amounts in Thousands, Except for Shares) (Unaudited)
Security Description | Shares | Value | |||||||||
Bio-Rad Laboratories, Inc. Class A (e) | 1,287 | $ | 693 | ||||||||
Bristol-Myers Squibb Co. | 15,677 | 978 | |||||||||
Cerner Corp. | 10,403 | 779 | |||||||||
Cigna Corp. | 4,165 | 871 | |||||||||
CVS Health Corp. | 13,379 | 907 | |||||||||
Danaher Corp. | 4,246 | 954 | |||||||||
DexCom, Inc. (e) | 2,323 | 743 | |||||||||
Eli Lilly & Co. | 6,537 | 952 | |||||||||
Gilead Sciences, Inc. (g) | 14,371 | 872 | |||||||||
HCA Healthcare, Inc. | 5,351 | 803 | |||||||||
IDEXX Laboratories, Inc. (e) | 1,760 | 811 | |||||||||
Johnson & Johnson (g) | 18,562 | 2,685 | |||||||||
Merck & Co., Inc. | 13,144 | 1,057 | |||||||||
Mettler-Toledo International, Inc. (e) | 673 | 774 | |||||||||
Pfizer, Inc. | 29,702 | 1,138 | |||||||||
ResMed, Inc. | 3,621 | 759 | |||||||||
Thermo Fisher Scientific, Inc. | 2,224 | 1,034 | |||||||||
UnitedHealth Group, Inc. | 7,436 | 2,501 | |||||||||
Veeva Systems, Inc. Class A (e) | 2,914 | 807 | |||||||||
Waters Corp. (e) | 3,201 | 743 | |||||||||
West Pharmaceutical Services, Inc. | 2,659 | 732 | |||||||||
27,024 | |||||||||||
Industrials (1.3%): | |||||||||||
3M Co. | 10,435 | 1,803 | |||||||||
Carrier Global Corp. | 19,422 | 739 | |||||||||
CSX Corp. | 9,410 | 847 | |||||||||
Cummins, Inc. | 3,437 | 795 | |||||||||
Eaton Corp. PLC | 7,044 | 853 | |||||||||
Equifax, Inc. | 4,228 | 706 | |||||||||
FedEx Corp. | 2,927 | 839 | |||||||||
Fortune Brands Home & Security, Inc. | 8,722 | 728 | |||||||||
General Dynamics Corp. | 5,276 | 788 | |||||||||
Illinois Tool Works, Inc. | 3,967 | 837 | |||||||||
Lockheed Martin Corp. | 2,329 | 850 | |||||||||
Northrop Grumman Corp. | 2,634 | 796 | |||||||||
Old Dominion Freight Line, Inc. | 3,634 | 739 | |||||||||
Otis Worldwide Corp. | 11,552 | 773 | |||||||||
Rockwell Automation, Inc. | �� | 3,137 | 802 | ||||||||
Rollins, Inc. | 12,221 | 699 | |||||||||
Verisk Analytics, Inc. | 3,737 | 741 | |||||||||
W.W. Grainger, Inc. | 1,812 | 758 | |||||||||
15,093 | |||||||||||
Information Technology (3.6%): | |||||||||||
Accenture PLC Class A | 4,055 | 1,010 | |||||||||
Adobe, Inc. (e) | 4,723 | 2,260 | |||||||||
Apple, Inc. | 103,636 | 12,338 | |||||||||
Applied Materials, Inc. | 11,271 | 930 | |||||||||
Broadcom, Inc. | 2,585 | 1,038 | |||||||||
Cadence Design Systems, Inc. (e) | 6,862 | 798 | |||||||||
See notes to financial statements.
7
| USAA Mutual Funds Trust USAA Cornerstone Moderate Fund | Schedule of Portfolio Investments — continued November 30, 2020 | ||||||
(Amounts in Thousands, Except for Shares) (Unaudited)
Security Description | Shares | Value | |||||||||
CDW Corp. | 5,573 | $ | 727 | ||||||||
Cisco Systems, Inc. | 24,937 | 1,073 | |||||||||
Cognizant Technology Solutions Corp. Class A | 10,881 | 850 | |||||||||
Coupa Software, Inc. (e) | 2,489 | 819 | |||||||||
DocuSign, Inc. (e) | 3,638 | 829 | |||||||||
HP, Inc. | 76,310 | 1,673 | |||||||||
Intel Corp. | 23,742 | 1,148 | |||||||||
International Business Machines Corp. | 7,859 | 971 | |||||||||
Intuit, Inc. | 2,463 | 867 | |||||||||
Lam Research Corp. | 3,843 | 1,740 | |||||||||
Mastercard, Inc. Class A | 3,666 | 1,234 | |||||||||
Micron Technology, Inc. (e) | 14,055 | 901 | |||||||||
Microsoft Corp. (g) | 15,233 | 3,261 | |||||||||
NVIDIA Corp. | 4,703 | 2,521 | |||||||||
Oracle Corp. | 16,632 | 960 | |||||||||
Square, Inc. Class A (e) | 4,495 | 948 | |||||||||
Texas Instruments, Inc. | 6,192 | 998 | |||||||||
The Trade Desk, Inc. Class A (e) | 989 | 891 | |||||||||
VeriSign, Inc. (e) | 3,905 | 784 | |||||||||
VMware, Inc. Class A (e) (f) | 5,215 | 729 | |||||||||
Zoom Video Communications, Inc. Class A (e) | 1,994 | 954 | |||||||||
43,252 | |||||||||||
Materials (0.4%): | |||||||||||
Air Products & Chemicals, Inc. | 3,042 | 852 | |||||||||
Ball Corp. | 7,951 | 763 | |||||||||
Hycroft Mining Holding Corp. (e) | 44,822 | 350 | |||||||||
LyondellBasell Industries NV Class A | 18,575 | 1,581 | |||||||||
Newmont Corp. | 12,860 | 756 | |||||||||
The Sherwin-Williams Co. | 1,150 | 860 | |||||||||
5,162 | |||||||||||
Real Estate (0.4%): | |||||||||||
Alexandria Real Estate Equities, Inc. | 641 | 105 | |||||||||
American Tower Corp. | 2,247 | 519 | |||||||||
AvalonBay Communities, Inc. | 736 | 123 | |||||||||
Boston Properties, Inc. | 770 | 76 | |||||||||
Camden Property Trust | 510 | 50 | |||||||||
CBRE Group, Inc. Class A (e) | 1,738 | 106 | |||||||||
Crown Castle International Corp. | 2,185 | 366 | |||||||||
Digital Realty Trust, Inc. | 1,393 | 188 | |||||||||
Duke Realty Corp. | 1,926 | 73 | |||||||||
Equinix, Inc. | 445 | 310 | |||||||||
Equity LifeStyle Properties, Inc. | 905 | 53 | |||||||||
Equity Residential | 1,959 | 113 | |||||||||
Essex Property Trust, Inc. | 354 | 87 | |||||||||
Extra Space Storage, Inc. | 686 | 77 | |||||||||
Federal Realty Investment Trust | 380 | 33 | |||||||||
Healthpeak Properties, Inc. | 2,669 | 77 | |||||||||
Host Hotels & Resorts, Inc. | 3,632 | 51 | |||||||||
Invitation Homes, Inc. | 2,845 | 81 | |||||||||
See notes to financial statements.
8
| USAA Mutual Funds Trust USAA Cornerstone Moderate Fund | Schedule of Portfolio Investments — continued November 30, 2020 | ||||||
(Amounts in Thousands, Except for Shares) (Unaudited)
| Security Description | Shares or Principal Amount | Value | |||||||||
Iron Mountain, Inc. (f) | 1,480 | $ | 41 | ||||||||
Jones Lang LaSalle, Inc. (e) | 266 | 35 | |||||||||
Medical Properties Trust, Inc. | 2,775 | 54 | |||||||||
Mid-America Apartment Communities, Inc. | 603 | 76 | |||||||||
National Retail Properties, Inc. | 922 | 35 | |||||||||
Omega Healthcare Investors, Inc. | 1,208 | 43 | |||||||||
Prologis, Inc. | 3,876 | 388 | |||||||||
Public Storage | 824 | 185 | |||||||||
Realty Income Corp. | 1,762 | 106 | |||||||||
Regency Centers Corp. | 898 | 41 | |||||||||
SBA Communications Corp. | 594 | 171 | |||||||||
Simon Property Group, Inc. | 1,611 | 133 | |||||||||
Sun Communities, Inc. | 489 | 68 | |||||||||
UDR, Inc. | 1,562 | 60 | |||||||||
Ventas, Inc. | 1,938 | 93 | |||||||||
VEREIT, Inc. | 5,693 | 40 | |||||||||
VICI Properties, Inc. | 2,399 | 61 | |||||||||
Vornado Realty Trust | 847 | 33 | |||||||||
Welltower, Inc. | 2,152 | 136 | |||||||||
Weyerhaeuser Co. | 3,827 | 111 | |||||||||
WP Carey, Inc. | 914 | 63 | |||||||||
4,461 | |||||||||||
Utilities (0.5%): | |||||||||||
Duke Energy Corp. (g) | 9,369 | 868 | |||||||||
Eversource Energy (g) | 8,502 | 744 | |||||||||
Exelon Corp. | 19,094 | 784 | |||||||||
NextEra Energy, Inc. (g) | 12,492 | 919 | |||||||||
NRG Energy, Inc. | 23,449 | 768 | |||||||||
The AES Corp. | 35,098 | 718 | |||||||||
WEC Energy Group, Inc. (g) | 7,624 | 724 | |||||||||
5,525 | |||||||||||
Total Common Stocks (Cost $134,774) | 164,126 | ||||||||||
Preferred Stocks (1.1%) | |||||||||||
Communication Services (0.2%): | |||||||||||
Qwest Corp., 6.50%, 9/1/56 | $ | 112,000 | 2,857 | ||||||||
Consumer Staples (0.6%): | |||||||||||
CHS, Inc., cumulative redeemable, Series 1, 7.88% (h) | 161,682 | 4,640 | |||||||||
Dairy Farmers of America, Inc., cumulative redeemable, 7.88% (a) (h) | 28,000 | 2,618 | |||||||||
7,258 | |||||||||||
Financials (0.3%): | |||||||||||
Delphi Financial Group, Inc., 3.41% (LIBOR03M+319bps), 5/15/37 (i) | 167,198 | 3,302 | |||||||||
Total Preferred Stocks (Cost $13,012) | 13,417 | ||||||||||
See notes to financial statements.
9
| USAA Mutual Funds Trust USAA Cornerstone Moderate Fund | Schedule of Portfolio Investments — continued November 30, 2020 | ||||||
(Amounts in Thousands, Except for Shares) (Unaudited)
Security Description | Principal Amount | Value | |||||||||
Corporate Bonds (14.3%) | |||||||||||
Communication Services (0.5%): | |||||||||||
AT&T, Inc., 2.30%, 6/1/27, Callable 4/1/27 @ 100 | $ | 985 | $ | 1,046 | |||||||
Fox Corp., 3.05%, 4/7/25, Callable 3/7/25 @ 100 | 462 | 505 | |||||||||
The Walt Disney Co., 2.20%, 1/13/28 | 437 | 464 | |||||||||
T-Mobile USA, Inc., 3.88%, 4/15/30, Callable 1/15/30 @ 100 (a) (g) | 1,174 | 1,347 | |||||||||
Verizon Communications, Inc., 4.50%, 8/10/33 | 1,943 | 2,470 | |||||||||
5,832 | |||||||||||
Consumer Discretionary (0.3%): | |||||||||||
AutoNation, Inc., 4.75%, 6/1/30, Callable 3/1/30 @ 100 | 394 | 475 | |||||||||
General Motors Co., 6.80%, 10/1/27, Callable 8/1/27 @ 100 (g) | 409 | 526 | |||||||||
Hasbro, Inc., 3.55%, 11/19/26, Callable 9/19/26 @ 100 | 777 | 857 | |||||||||
Nordstrom, Inc., 4.38%, 4/1/30, Callable 1/1/30 @ 100 (f) | 648 | 624 | |||||||||
O'Reilly Automotive, Inc., 4.20%, 4/1/30, Callable 1/1/30 @ 100 | 500 | 601 | |||||||||
VF Corp., 2.95%, 4/23/30, Callable 1/23/30 @ 100 | 488 | 536 | |||||||||
3,619 | |||||||||||
Consumer Staples (0.9%): | |||||||||||
Altria Group, Inc., 3.40%, 5/6/30, Callable 2/6/30 @ 100 | 468 | 520 | |||||||||
| Anheuser-Busch Cos. LLC/Anheuser-Busch InBev Worldwide, Inc., 4.70%, 2/1/36, Callable 8/1/35 @ 100 | 1,619 | 2,062 | |||||||||
BAT Capital Corp., 2.79%, 9/6/24, Callable 8/6/24 @ 100 | 1,500 | 1,604 | |||||||||
Kraft Heinz Foods Co., 3.75%, 4/1/30, Callable 1/1/30 @ 100 (a) | 728 | 785 | |||||||||
McCormick & Co., Inc., 2.50%, 4/15/30, Callable 1/15/30 @ 100 | 284 | 304 | |||||||||
Mondelez International, Inc., 2.75%, 4/13/30, Callable 1/13/30 @ 100 | 250 | 274 | |||||||||
PepsiCo, Inc., 2.25%, 3/19/25, Callable 2/19/25 @ 100 | 1,505 | 1,609 | |||||||||
Sysco Corp., 5.95%, 4/1/30, Callable 1/1/30 @ 100 | 379 | 501 | |||||||||
The Coca-Cola Co., 3.45%, 3/25/30 | 500 | 590 | |||||||||
The Procter & Gamble Co., 3.00%, 3/25/30 | 646 | 749 | |||||||||
Unilever Capital Corp., 2.60%, 5/5/24, Callable 3/5/24 @ 100 | 1,500 | 1,598 | |||||||||
10,596 | |||||||||||
Energy (2.1%): | |||||||||||
Cameron LNG LLC, 3.30%, 1/15/35, Callable 9/15/34 @ 100 (a) | 1,237 | 1,393 | |||||||||
Cheniere Corpus Christi Holdings LLC, 3.70%, 11/15/29, Callable 5/18/29 @ 100 | 1,618 | 1,771 | |||||||||
Enable Midstream Partners LP, 4.15%, 9/15/29, Callable 6/15/29 @ 100 | 1,500 | 1,394 | |||||||||
Enbridge Energy Partners LP, 7.38%, 10/15/45, Callable 4/15/45 @ 100 (g) | 2,950 | 4,424 | |||||||||
Enterprise Products Operating LLC, 2.80%, 1/31/30, Callable 10/31/29 @ 100 | 972 | 1,051 | |||||||||
| Enterprise TE Partners LP, 3.02% (LIBOR03M+278bps), 6/1/67, Callable 1/8/21 @ 100 (b) | 2,500 | 2,015 | |||||||||
EOG Resources, Inc., 4.38%, 4/15/30, Callable 1/15/30 @ 100 | 299 | 364 | |||||||||
EQM Midstream Partners LP, 4.75%, 7/15/23, Callable 6/15/23 @ 100 (g) | 3,300 | 3,366 | |||||||||
EQT Corp., 8.75%, 2/1/30, Callable 11/1/29 @ 100 | 655 | 829 | |||||||||
Exxon Mobil Corp., 2.99%, 3/19/25, Callable 2/19/25 @ 100 (g) | 1,618 | 1,768 | |||||||||
Florida Gas Transmission Co. LLC, 2.55%, 7/1/30, Callable 4/1/30 @ 100 (a) | 412 | 433 | |||||||||
Marathon Petroleum Corp., 4.70%, 5/1/25, Callable 4/1/25 @ 100 | 458 | 520 | |||||||||
Midwest Connector Capital Co. LLC, 4.63%, 4/1/29, Callable 1/1/29 @ 100 (a) | 991 | 1,003 | |||||||||
National Oilwell Varco, Inc., 3.60%, 12/1/29, Callable 9/1/29 @ 100 | 1,295 | 1,315 | |||||||||
See notes to financial statements.
10
| USAA Mutual Funds Trust USAA Cornerstone Moderate Fund | Schedule of Portfolio Investments — continued November 30, 2020 | ||||||
(Amounts in Thousands, Except for Shares) (Unaudited)
Security Description | Principal Amount | Value | |||||||||
| Occidental Petroleum Corp. 3.50%0, 8/15/29, Callable 5/15/29 @ 100 | $ | 209 | $ | 183 | |||||||
4.40%0, 8/15/49, Callable 2/15/49 @ 100 | 648 | 530 | |||||||||
ONEOK, Inc., 6.35%, 1/15/31, Callable 10/15/30 @ 100 | 404 | 500 | |||||||||
Pioneer Natural Resources Co., 1.90%, 8/15/30, Callable 5/15/30 @ 100 | 500 | 493 | |||||||||
Rockies Express Pipeline LLC, 4.80%, 5/15/30, Callable 2/15/30 @ 100 (a) | 648 | 634 | |||||||||
| Targa Resources Partners LP/Targa Resources Partners Finance Corp., 5.50%, 3/1/30 | 648 | 705 | |||||||||
Western Midstream Operating LP, 3.10%, 2/1/25, Callable 1/1/25 @ 100 | 682 | 680 | |||||||||
25,371 | |||||||||||
Financials (4.6%): | |||||||||||
AmTrust Financial Services, Inc., 6.13%, 8/15/23 | 1,921 | 1,858 | |||||||||
Ares Capital Corp., 3.63%, 1/19/22, Callable 12/19/21 @ 100 (g) | 1,600 | 1,643 | |||||||||
Assurant, Inc., 3.70%, 2/22/30, Callable 11/22/29 @ 100 | 1,154 | 1,240 | |||||||||
| BancorpSouth Bank, 4.13% (LIBOR03M+247bps), 11/20/29, Callable 11/20/24 @ 100 (b) | 833 | 845 | |||||||||
BBVA USA, 3.88%, 4/10/25, Callable 3/10/25 @ 100 | 2,000 | 2,224 | |||||||||
Belrose Funding Trust, 2.33%, 8/15/30, Callable 5/15/30 @ 100 (a) | 994 | 1,013 | |||||||||
| Cadence Bancorp, 4.75% (LIBOR03M+303bps), 6/30/29, Callable 6/30/24 @ 100 (b) | 250 | 231 | |||||||||
Citizens Financial Group, Inc., 2.50%, 2/6/30, Callable 11/6/29 @ 100 | 972 | 1,032 | |||||||||
| Cullen/Frost Capital Trust II, 1.80% (LIBOR03M+155bps), 3/1/34, Callable 1/8/21 @ 100 (b) | 4,000 | 3,076 | |||||||||
First Horizon Bank, 5.75%, 5/1/30, Callable 2/1/30 @ 100 | 488 | 568 | |||||||||
| First Maryland Capital I, 1.24% (LIBOR03M+100bps), 1/15/27, Callable 1/8/21 @ 100 (b) | 2,850 | 2,636 | |||||||||
Ford Motor Credit Co. LLC, 4.06%, 11/1/24, Callable 10/1/24 @ 100 | 1,250 | 1,299 | |||||||||
Glencore Funding LLC, 2.50%, 9/1/30, Callable 6/1/30 @ 100 (a) | 1,159 | 1,156 | |||||||||
Global Atlantic Financial Co., 4.40%, 10/15/29, Callable 7/15/29 @ 100 (a) | 832 | 894 | |||||||||
| HSB Group, Inc., 1.15% (LIBOR03M+91bps), 7/15/27, Callable 1/8/21 @ 100 (b) | 2,575 | 2,266 | |||||||||
Hyundai Capital America, 3.75%, 7/8/21 (a) (g) | 3,250 | 3,306 | |||||||||
| JPMorgan Chase & Co., 2.52% (SOFR+204bps), 4/22/31, Callable 4/22/30 @ 100 (b) | 569 | 608 | |||||||||
KeyCorp, 2.25%, 4/6/27, MTN | 972 | 1,036 | |||||||||
Level 3 Financing, Inc., 3.88%, 11/15/29, Callable 8/15/29 @ 100 (a) | 1,295 | 1,428 | |||||||||
Loews Corp., 3.20%, 5/15/30, Callable 2/15/30 @ 100 | 654 | 741 | |||||||||
| Manufactures & Traders Trust Co., 0.89% (LIBOR03M+64bps), 12/1/21, Callable 1/8/21 @ 100 (b) (g) | 2,000 | 1,992 | |||||||||
| Nationwide Mutual Insurance Co., 2.54% (LIBOR03M+229bps), 12/15/24, Callable 1/8/21 @ 100 (a) (b) | 5,670 | 5,656 | |||||||||
| New York Community Bancorp, Inc., 5.90% (LIBOR03M+278bps), 11/6/28, Callable 11/6/23 @ 100 (b) | 249 | 255 | |||||||||
| Pinnacle Financial Partners, Inc., 4.13% (LIBOR03M+278bps), 9/15/29, Callable 9/15/24 @ 100 (b) | 1,000 | 995 | |||||||||
PPL Capital Funding, Inc., 4.13%, 4/15/30, Callable 1/15/30 @ 100 | 647 | 768 | |||||||||
| Prudential Financial, Inc., 5.62% (LIBOR03M+392bps), 6/15/43, Callable 6/15/23 @ 100 (b) | 2,800 | 3,015 | |||||||||
Regions Financial Corp., 2.25%, 5/18/25, Callable 4/18/25 @ 100 | 737 | 781 | |||||||||
Santander Holdings USA, Inc., 3.45%, 6/2/25, Callable 5/2/25 @ 100 | 412 | 447 | |||||||||
See notes to financial statements.
11
| USAA Mutual Funds Trust USAA Cornerstone Moderate Fund | Schedule of Portfolio Investments — continued November 30, 2020 | ||||||
(Amounts in Thousands, Except for Shares) (Unaudited)
Security Description | Principal Amount | Value | |||||||||
| Signature Bank, 4.13% (LIBOR03M+256bps), 11/1/29, Callable 11/1/24 @ 100 (b) | $ | 2,600 | $ | 2,632 | |||||||
Texas Capital Bank NA, 5.25%, 1/31/26 | 647 | 684 | |||||||||
| The Allstate Corp., 5.75% (LIBOR03M+294bps), 8/15/53, Callable 8/15/23 @ 100 (b) | 640 | 686 | |||||||||
The Progressive Corp., 3.20%, 3/26/30, Callable 12/26/29 @ 100 | 194 | 224 | |||||||||
Toyota Motor Credit Corp., 3.38%, 4/1/30, MTN | 714 | 834 | |||||||||
Truist Bank, 0.89% (LIBOR03M+67bps), 5/15/27, Callable 1/8/21 @ 100 (b) | 6,000 | 5,664 | |||||||||
| Wells Fargo & Co., 2.19% (SOFR+200bps), 4/30/26, Callable 4/30/25 @ 100 (b) | 733 | 768 | |||||||||
Zions Bancorp NA, 3.25%, 10/29/29, Callable 7/29/29 @ 100 | 1,295 | 1,332 | |||||||||
55,833 | |||||||||||
Health Care (0.9%): | |||||||||||
AbbVie, Inc., 3.20%, 11/21/29, Callable 8/21/29 @ 100 (a) (g) | 1,295 | 1,466 | |||||||||
Commonspirit Health, 3.35%, 10/1/29, Callable 4/1/29 @ 100 | 1,000 | 1,084 | |||||||||
CVS Health Corp., 3.25%, 8/15/29, Callable 5/15/29 @ 100 (g) | 1,998 | 2,228 | |||||||||
DENTSPLY SIRONA, Inc., 3.25%, 6/1/30, Callable 3/1/30 @ 100 | 738 | 814 | |||||||||
Duke University Health System, Inc., 2.60%, 6/1/30 | 485 | 514 | |||||||||
HCA, Inc., 5.13%, 6/15/39, Callable 12/15/38 @ 100 | 1,619 | 2,078 | |||||||||
Laboratory Corp. of America Holdings, 2.95%, 12/1/29, Callable 9/1/29 @ 100 | 971 | 1,073 | |||||||||
Thermo Fisher Scientific, Inc., 4.13%, 3/25/25, Callable 2/25/25 @ 100 | 646 | 735 | |||||||||
Upjohn, Inc., 2.30%, 6/22/27, Callable 4/22/27 @ 100 (a) | 248 | 262 | |||||||||
10,254 | |||||||||||
Industrials (2.1%): | |||||||||||
Ashtead Capital, Inc., 4.00%, 5/1/28, Callable 5/1/23 @ 102 (a) | 1,017 | 1,068 | |||||||||
| BNSF Funding Trust, 6.61% (LIBOR03M+235bps), 12/15/55, Callable 1/15/26 @ 100 (b) | 3,000 | 3,415 | |||||||||
Carlisle Cos., Inc., 2.75%, 3/1/30, Callable 12/1/29 @ 100 | 972 | 1,046 | |||||||||
Carrier Global Corp., 3.38%, 4/5/40, Callable 10/5/39 @ 100 (a) | 486 | 536 | |||||||||
Caterpillar, Inc., 2.60%, 4/9/30, Callable 1/9/30 @ 100 | 486 | 536 | |||||||||
CoStar Group, Inc., 2.80%, 7/15/30, Callable 4/15/30 @ 100 (a) | 222 | 233 | |||||||||
Dover Corp., 2.95%, 11/4/29, Callable 8/4/29 @ 100 | 971 | 1,058 | |||||||||
FedEx Corp., 4.25%, 5/15/30, Callable 2/15/30 @ 100 | 750 | 913 | |||||||||
General Dynamics Corp., 3.50%, 4/1/27, Callable 2/1/27 @ 100 | 646 | 744 | |||||||||
Georgia-Pacific LLC, 2.10%, 4/30/27, Callable 2/28/27 @ 100 (a) | 1,140 | 1,203 | |||||||||
Hillenbrand, Inc., 4.50%, 9/15/26, Callable 7/15/26 @ 100 | 1,500 | 1,648 | |||||||||
IDEX Corp., 3.00%, 5/1/30, Callable 2/1/30 @ 100 | 1,140 | 1,263 | |||||||||
Otis Worldwide Corp., 3.11%, 2/15/40, Callable 8/15/39 @ 100 | 648 | 712 | |||||||||
| Penske Truck Leasing Co. LP/PTL Finance Corp., 4.00%, 7/15/25, Callable 6/15/25 @ 100 (a) | 647 | 733 | |||||||||
| Ryder System, Inc. 3.50%0, 6/1/210, MTN (g) | 3,200 | 3,252 | |||||||||
2.90%0, 12/1/26, Callable 10/1/26 @ 100, MTN | 1,618 | 1,766 | |||||||||
Southwest Airlines Co., 5.13%, 6/15/27, Callable 4/15/27 @ 100 | 526 | 611 | |||||||||
The Boeing Co., 5.71%, 5/1/40, Callable 11/1/39 @ 100 | 979 | 1,234 | |||||||||
| The Conservation Fund A Nonprofit Corp., 3.47%, 12/15/29, Callable 9/15/29 @ 100 | 1,300 | 1,412 | |||||||||
See notes to financial statements.
12
| USAA Mutual Funds Trust USAA Cornerstone Moderate Fund | Schedule of Portfolio Investments — continued November 30, 2020 | ||||||
(Amounts in Thousands, Except for Shares) (Unaudited)
Security Description | Principal Amount | Value | |||||||||
United Airlines Pass Through Trust, 2.90%, 11/1/29 | $ | 1,472 | $ | 1,275 | |||||||
| Westinghouse Air Brake Technologies Corp., 3.20%, 6/15/25, Callable 5/15/25 @ 100 | 177 | 190 | |||||||||
24,848 | |||||||||||
Information Technology (0.7%): | |||||||||||
Amphenol Corp., 2.80%, 2/15/30, Callable 11/15/29 @ 100 | 1,500 | 1,639 | |||||||||
Analog Devices, Inc., 2.95%, 4/1/25, Callable 3/1/25 @ 100 | 243 | 265 | |||||||||
Broadcom, Inc., 4.30%, 11/15/32, Callable 8/15/32 @ 100 | 408 | 485 | |||||||||
Hewlett Packard Enterprise Co., 4.65%, 10/1/24, Callable 9/1/24 @ 100 | 648 | 735 | |||||||||
HP, Inc., 3.40%, 6/17/30, Callable 3/17/30 @ 100 | 743 | 818 | |||||||||
Jabil, Inc., 3.00%, 1/15/31, Callable 10/15/30 @ 100 | 222 | 232 | |||||||||
Keysight Technologies, Inc., 3.00%, 10/30/29, Callable 7/30/29 @ 100 | 1,803 | 1,980 | |||||||||
Microsoft Corp., 3.45%, 8/8/36, Callable 2/8/36 @ 100 | 2,105 | 2,605 | |||||||||
8,759 | |||||||||||
Materials (0.4%): | |||||||||||
Avery Dennison Corp., 2.65%, 4/30/30, Callable 2/1/30 @ 100 | 389 | 418 | |||||||||
Colonial Enterprises, Inc., 3.25%, 5/15/30, Callable 2/15/30 @ 100 (a) | 204 | 230 | |||||||||
LYB International Finance III LLC, 3.38%, 5/1/30, Callable 2/1/30 @ 100 | 569 | 636 | |||||||||
Packaging Corp. of America, 3.00%, 12/15/29, Callable 9/15/29 @ 100 | 1,619 | 1,791 | |||||||||
Sonoco Products Co., 3.13%, 5/1/30, Callable 2/1/30 @ 100 | 752 | 833 | |||||||||
Vulcan Materials Co., 3.50%, 6/1/30, Callable 3/1/30 @ 100 | 654 | 746 | |||||||||
WRKCo, Inc., 3.00%, 6/15/33, Callable 3/15/33 @ 100 (g) | 373 | 411 | |||||||||
5,065 | |||||||||||
Real Estate (0.7%): | |||||||||||
AvalonBay Communities, Inc., 2.45%, 1/15/31, MTN, Callable 10/15/30 @ 100 | 983 | 1,053 | |||||||||
Boston Properties LP, 3.25%, 1/30/31, Callable 10/30/30 @ 100 | 428 | 467 | |||||||||
Essex Portfolio LP, 2.65%, 3/15/32, Callable 12/15/31 @ 100 | 1,134 | 1,205 | |||||||||
| GLP Capital LP/GLP Financing II, Inc., 4.00%, 1/15/31, Callable 10/15/30 @ 100 | 249 | 270 | |||||||||
Host Hotels & Resorts LP, 3.50%, 9/15/30, Callable 6/15/30 @ 100 | 206 | 211 | |||||||||
Lexington Realty Trust, 4.25%, 6/15/23, Callable 3/15/23 @ 100 | 1,400 | 1,489 | |||||||||
Mid-America Apartments LP, 2.75%, 3/15/30, Callable 12/15/29 @ 100 | 1,619 | 1,764 | |||||||||
Sabra Health Care LP, 5.13%, 8/15/26, Callable 5/15/26 @ 100 | 1,000 | 1,104 | |||||||||
SBA Tower Trust, 2.84%, 1/15/25 (a) | 692 | 731 | |||||||||
| VICI Properties LP/VICI Note Co., Inc., 4.63%, 12/1/29, Callable 12/1/24 @ 102.31 (a) | 149 | 159 | |||||||||
8,453 | |||||||||||
Utilities (1.1%): | |||||||||||
AEP Texas, Inc., 3.45%, 1/15/50, Callable 7/15/49 @ 100 | 1,133 | 1,291 | |||||||||
Alabama Power Co., 3.85%, 12/1/42 | 971 | 1,197 | |||||||||
Ameren Corp., 3.50%, 1/15/31, Callable 10/15/30 @ 100 | 323 | 374 | |||||||||
CenterPoint Energy, Inc., 2.50%, 9/1/24, Callable 8/1/24 @ 100 | 2,000 | 2,123 | |||||||||
Cleco Corporate Holdings LLC, 3.38%, 9/15/29, Callable 6/15/29 @ 100 | 1,467 | 1,511 | |||||||||
Duke Energy Florida LLC, 3.85%, 11/15/42, Callable 5/15/42 @ 100 | 971 | 1,170 | |||||||||
Exelon Generation Co. LLC, 3.25%, 6/1/25, Callable 5/1/25 @ 100 | 737 | 795 | |||||||||
IPALCO Enterprises, Inc., 4.25%, 5/1/30, Callable 2/1/30 @ 100 (a) | 738 | 854 | |||||||||
ITC Holdings Corp., 2.95%, 5/14/30, Callable 2/14/30 @ 100 (a) | 737 | 809 | |||||||||
National Fuel Gas Co., 5.50%, 1/15/26, Callable 12/15/25 @ 100 | 984 | 1,104 | |||||||||
See notes to financial statements.
13
| USAA Mutual Funds Trust USAA Cornerstone Moderate Fund | Schedule of Portfolio Investments — continued November 30, 2020 | ||||||
(Amounts in Thousands, Except for Shares) (Unaudited)
Security Description | Principal Amount | Value | |||||||||
The Narragansett Electric Co., 3.40%, 4/9/30, Callable 1/9/30 @ 100 (a) | $ | 486 | $ | 554 | |||||||
Union Electric Co., 2.95%, 3/15/30, Callable 12/15/29 @ 100 | 1,618 | 1,819 | |||||||||
13,601 | |||||||||||
Total Corporate Bonds (Cost $160,389) | 172,231 | ||||||||||
Yankee Dollars (1.8%) | |||||||||||
Consumer Staples (0.1%): | |||||||||||
Alimentation Couche-Tard, Inc., 2.95%, 1/25/30, Callable 10/25/29 @ 100 (a) | 648 | 705 | |||||||||
Energy (0.0%): (j) | |||||||||||
Petroleos Mexicanos, 6.49%, 1/23/27, Callable 11/23/26 @ 100 | 554 | 556 | |||||||||
Petronas Capital Ltd., 3.50%, 4/21/30, Callable 1/21/30 @ 100 (a) | 49 | 56 | |||||||||
612 | |||||||||||
Financials (1.1%): | |||||||||||
Athene Holding Ltd., 4.13%, 1/12/28, Callable 10/12/27 @ 100 | 3,200 | 3,540 | |||||||||
| Banco Santander Mexico SA Institucion de Banca Multiple Grupo Financiero Santand, 5.38%, 4/17/25 (a) | 464 | 525 | |||||||||
Barclays PLC, 2.85% (LIBOR03M+245bps), 5/7/26, Callable 5/7/25 @ 100 (b) | 979 | 1,039 | |||||||||
| Deutsche Bank AG, 3.96% (SOFR+258bps), 11/26/25, Callable 11/26/24 @ 100 (b) | 972 | 1,052 | |||||||||
Diageo Capital PLC, 2.13%, 4/29/32, Callable 1/29/32 @ 100 | 1,140 | 1,207 | |||||||||
| QBE Capital Funding III Ltd., 7.25% (USSW10+405bps), 5/24/41, Callable 5/24/21 @ 100 (a) (b) | 3,430 | 3,518 | |||||||||
Royal Bank of Canada, 1.60%, 4/17/23, MTN | 1,138 | 1,170 | |||||||||
Sumitomo Mitsui Financial Group, Inc., 2.45%, 9/27/24 | 1,000 | 1,061 | |||||||||
13,112 | |||||||||||
Health Care (0.0%): (j) | |||||||||||
Royalty Pharma PLC, 2.20%, 9/2/30, Callable 6/2/30 @ 100 (a) | 276 | 280 | |||||||||
Industrials (0.3%): | |||||||||||
BAE Systems PLC, 3.40%, 4/15/30, Callable 1/15/30 @ 100 (a) | 750 | 849 | |||||||||
CK Hutchison International 19 II Ltd., 2.75%, 9/6/29, Callable 6/6/29 @ 100 (a) | 1,500 | 1,604 | |||||||||
Ferguson Finance PLC, 3.25%, 6/2/30, Callable 3/2/30 @ 100 (a) | 444 | 491 | |||||||||
Heathrow Funding Ltd., 4.88%, 7/15/21 (a) | 650 | 665 | |||||||||
3,609 | |||||||||||
Materials (0.3%): | |||||||||||
Anglo American Capital PLC, 5.63%, 4/1/30, Callable 1/1/30 @ 100 (a) | 606 | 762 | |||||||||
Braskem Netherlands Finance BV, 4.50%, 1/31/30 (a) | 971 | 980 | |||||||||
CCL Industries, Inc., 3.05%, 6/1/30, Callable 3/1/30 @ 100 (a) | 739 | 804 | |||||||||
Teck Resources Ltd., 6.13%, 10/1/35 | 1,038 | 1,309 | |||||||||
3,855 | |||||||||||
Total Yankee Dollars (Cost $20,530) | 22,173 | ||||||||||
Municipal Bonds (1.4%) | |||||||||||
Arizona (0.1%): | |||||||||||
City of Phoenix Civic Improvement Corp. Revenue, 1.26%, 7/1/27 | 500 | 497 | |||||||||
See notes to financial statements.
14
| USAA Mutual Funds Trust USAA Cornerstone Moderate Fund | Schedule of Portfolio Investments — continued November 30, 2020 | ||||||
(Amounts in Thousands, Except for Shares) (Unaudited)
Security Description | Principal Amount | Value | |||||||||
Florida (0.1%): | |||||||||||
| County of Broward Florida Airport System Revenue, Series C, 2.50%, 10/1/28 | $ | 648 | $ | 662 | |||||||
| Hillsborough County School Board Certificate of Participation, Series B, 1.92%, 7/1/25 | 410 | 418 | |||||||||
1,080 | |||||||||||
Georgia (0.1%): | |||||||||||
Athens Housing Authority Revenue, 2.42%, 12/1/26 | 1,380 | 1,477 | |||||||||
Louisiana (0.1%): | |||||||||||
| Louisiana Local Government Environmental Facilities & Community Development Authority Revenue, 1.55%, 2/1/27 | 665 | 672 | |||||||||
Michigan (0.1%): | |||||||||||
Michigan Finance Authority Revenue, 3.08%, 12/1/34 | 970 | 1,071 | |||||||||
New Jersey (0.1%): | |||||||||||
| New Jersey Economic Development Authority Revenue, Series NNN, 2.88%, 6/15/24 | 624 | 633 | |||||||||
New Jersey Transportation Trust Fund Authority Revenue, 4.08%, 6/15/39 | 250 | 248 | |||||||||
North Hudson Sewerage Authority Revenue, 2.88%, 6/1/28 | 324 | 354 | |||||||||
Rutgers The State University of New Jersey Revenue, Series S, 2.01%, 5/1/32 | 415 | 402 | |||||||||
1,637 | |||||||||||
New York (0.2%): | |||||||||||
| New York State Dormitory Authority Revenue Series A, 2.46%, 7/1/32 | 745 | 756 | |||||||||
Series B, 2.83%, 7/1/31 | 1,620 | 1,712 | |||||||||
New York State Thruway Authority Revenue, Series M, 2.55%, 1/1/28 | 373 | 395 | |||||||||
2,863 | |||||||||||
Pennsylvania (0.2%): | |||||||||||
| Scranton School District, GO (INS-Build America Mutual Assurance Co.), 3.15%, 4/1/31 | 250 | 270 | |||||||||
State Public School Building Authority Revenue, 3.05%, 4/1/28 | 647 | 671 | |||||||||
| University of Pittsburgh-of The Commonwealth System of Higher Education Revenue Series C, 2.53%, 9/15/31 | 645 | 688 | |||||||||
Series C, 2.58%, 9/15/32 | 325 | 347 | |||||||||
Series C, 2.63%, 9/15/33 | 645 | 690 | |||||||||
2,666 | |||||||||||
Texas (0.4%): | |||||||||||
City of Houston Texas Combined Utility System Revenue, 3.72%, 11/15/28 | 810 | 953 | |||||||||
City of San Antonio, GO, 1.76%, 2/1/31, Continuously Callable @100 | 620 | 628 | |||||||||
Dallas/Fort Worth International Airport Revenue, Series C, 1.75%, 11/1/27 | 415 | 418 | |||||||||
| Harris County Cultural Education Facilities Finance Corp. Revenue, Series B, 2.81%, 5/15/29 | 645 | 691 | |||||||||
State of Texas, GO, 3.00%, 4/1/28 | 972 | 1,103 | |||||||||
Waco Educational Finance Corp. Revenue, 1.38%, 3/1/26 | 575 | 577 | |||||||||
4,370 | |||||||||||
Total Municipal Bonds (Cost $15,580) | 16,333 | ||||||||||
See notes to financial statements.
15
| USAA Mutual Funds Trust USAA Cornerstone Moderate Fund | Schedule of Portfolio Investments — continued November 30, 2020 | ||||||
(Amounts in Thousands, Except for Shares) (Unaudited)
Security Description | Shares or Principal Amount | Value | |||||||||
U.S. Government Agency Mortgages (4.7%) | |||||||||||
| Federal Home Loan Mortgage Corporation Series K047, Class A2, 3.33%, 5/25/25 (c) | $ | 5,200 | $ | 5,778 | |||||||
Series K151, Class A3, 3.51%, 4/25/30 | 5,000 | 5,859 | |||||||||
Series K156, Class A2, 3.70%, 1/25/33 (c) | 2,679 | 3,231 | |||||||||
3.50%, 4/1/46 - 4/1/48 | 7,630 | 8,079 | |||||||||
3.00%, 6/1/46 - 8/1/47 | 31,146 | 32,754 | |||||||||
55,701 | |||||||||||
| Federal National Mortgage Association Series 2016-M2, Class AV2, 2.15%, 1/25/23 | 1,331 | 1,357 | |||||||||
Total U.S. Government Agency Mortgages (Cost $53,484) | 57,058 | ||||||||||
U.S. Treasury Obligations (9.0%) | |||||||||||
| U.S. Treasury Bonds 3.13%, 8/15/44 | 8,600 | 11,493 | |||||||||
3.00%, 11/15/44 | 6,000 | 7,869 | |||||||||
2.38%, 11/15/49 | 5,000 | 5,967 | |||||||||
| U.S. Treasury Notes 2.50%, 1/31/21 (g) | 2,000 | 2,008 | |||||||||
1.13%, 2/28/21 | 15,664 | 15,703 | |||||||||
1.63%, 11/15/22 | 10,000 | 10,288 | |||||||||
1.63%, 4/30/23 (g) | 14,658 | 15,173 | |||||||||
2.25%, 11/15/25 | 5,000 | 5,463 | |||||||||
1.63%, 2/15/26 | 20,000 | 21,277 | |||||||||
2.25%, 2/15/27 | 3,500 | 3,872 | |||||||||
2.38%, 5/15/29 | 7,850 | 8,906 | |||||||||
Total U.S. Treasury Obligations (Cost $98,340) | 108,019 | ||||||||||
Exchange-Traded Funds (44.4%) | |||||||||||
Invesco DB Commodity Index Tracking Fund (f) | 114,500 | 1,596 | |||||||||
Invesco FTSE RAFI Developed Markets ex-US ETF (f) | 335,920 | 13,561 | |||||||||
Invesco FTSE RAFI Emerging Markets ETF (f) | 686,690 | 13,590 | |||||||||
iShares Core MSCI EAFE ETF | 261,048 | 17,292 | |||||||||
iShares Core MSCI Emerging Markets ETF | 569,005 | 33,355 | |||||||||
iShares Core S&P 500 ETF | 268,016 | 97,376 | |||||||||
iShares Core S&P Small-Cap ETF | 357,238 | 30,415 | |||||||||
iShares Core US Aggregate Bond ETF | 303,812 | 35,977 | |||||||||
iShares MSCI Canada ETF (f) | 300,292 | 9,093 | |||||||||
iShares MSCI International Momentum Factor ETF | 314,978 | 11,279 | |||||||||
iShares MSCI International Quality Factor ETF | 338,816 | 11,547 | |||||||||
iShares Russell 2000 ETF (f) | 49,293 | 8,923 | |||||||||
Schwab Fundamental Emerging Markets Large Co. Index ETF | 920,892 | 24,707 | |||||||||
Schwab Fundamental International Large Co. Index ETF | 1,549,839 | 43,597 | |||||||||
Schwab Fundamental International Small Co. Index ETF | 266,700 | 8,865 | |||||||||
SPDR Bloomberg Barclays High Yield Bond ETF (g) | 19,724 | 2,121 | |||||||||
SPDR Gold Shares (e) | 51,540 | 8,590 | |||||||||
SPDR S&P Emerging Markets Smallcap ETF | 34,497 | 1,705 | |||||||||
VanEck Vectors Gold Miners ETF | 131,844 | 4,572 | |||||||||
See notes to financial statements.
16
| USAA Mutual Funds Trust USAA Cornerstone Moderate Fund | Schedule of Portfolio Investments — continued November 30, 2020 | ||||||
(Amounts in Thousands, Except for Shares) (Unaudited)
Security Description | Shares | Value | |||||||||
VanEck Vectors Junior Gold Miners ETF | 24,379 | $ | 1,220 | ||||||||
Vanguard FTSE All-World ex-US ETF (f) | 257,493 | 14,327 | |||||||||
Vanguard FTSE Developed Markets ETF | 1,205,068 | 54,336 | |||||||||
Vanguard FTSE Emerging Markets ETF (g) | 278,173 | 13,230 | |||||||||
Vanguard Real Estate ETF | 101,145 | 8,496 | |||||||||
Vanguard S&P 500 ETF (g) | 91,404 | 30,405 | |||||||||
Vanguard Short-Term Bond ETF | 78,165 | 6,481 | |||||||||
Vanguard Total Bond Market ETF | 175,441 | 15,525 | |||||||||
Vanguard Total Stock Market ETF (g) | 28,750 | 5,368 | |||||||||
WisdomTree Emerging Markets SmallCap Dividend Fund | 59,797 | 2,734 | |||||||||
Xtrackers USD High Yield Corporate Bond ETF | 78,169 | 3,871 | |||||||||
Total Exchange-Traded Funds (Cost $467,566) | 534,154 | ||||||||||
Affiliated Exchange-Traded Funds (4.5%) | |||||||||||
VictoryShares USAA Core Intermediate-Term Bond ETF | 718,500 | 39,211 | |||||||||
VictoryShares USAA Core Short-Term Bond ETF | 244,851 | 12,715 | |||||||||
VictoryShares USAA MSCI Emerging Markets Value Momentum ETF (g) | 51,500 | 2,214 | |||||||||
Total Affiliated Exchange-Traded Funds (Cost $54,284) | 54,140 | ||||||||||
Collateral for Securities Loaned^ (2.1%) | |||||||||||
| Goldman Sachs Financial Square Government Fund Institutional Shares, 0.02% (k) | 1,474,935 | 1,475 | |||||||||
HSBC U.S. Government Money Market Fund I Shares, 0.03% (k) | 24,121,778 | 24,122 | |||||||||
Total Collateral for Securities Loaned (Cost $25,597) | 25,597 | ||||||||||
Total Investments (Cost $1,092,478) — 101.1% | 1,216,333 | ||||||||||
Liabilities in excess of other assets — (1.1)% | (13,780 | ) | |||||||||
NET ASSETS — 100.00% | $ | 1,202,553 | |||||||||
At November 30, 2020, the Fund's investments in foreign securities were 18.5% of net assets.
^ Purchased with cash collateral from securities on loan.
(a) Rule 144A security or other security that is restricted as to resale to institutional investors. The Fund's Adviser has deemed this security to be liquid based upon procedures approved by the Board of Trustees. As of November 30, 2020, the fair value of these securities was $71,368 (thousands) and amounted to 5.9% of net assets.
(b) Variable or Floating-Rate Security. Rate disclosed is as of November 30, 2020.
(c) The rate for certain asset-backed and mortgage-backed securities may vary based on factors relating to the pool of assets underlying the security. The rate disclosed is the rate in effect at November 30, 2020.
(d) Security is interest only.
(e) Non-income producing security.
(f) All or a portion of this security is on loan.
(g) All or a portion of this security has been segregated as collateral for derivative instruments.
See notes to financial statements.
17
| USAA Mutual Funds Trust USAA Cornerstone Moderate Fund | Schedule of Portfolio Investments — continued November 30, 2020 | ||||||
(Unaudited)
(h) Security is perpetual and has no final maturity date but may be subject to calls at various dates in the future.
(i) The Fund's Adviser has deemed this security to be illiquid based upon procedures approved by the Board of Trustees. As of November 30, 2020, illiquid securities were 0.3% of the Fund's net assets.
(j) Amount represents less than 0.05% of net assets.
(k) Rate disclosed is the daily yield on November 30, 2020.
bps — Basis points
Continuously callable — Investment is continuously callable or will be continuously callable on any date after the first call date until its maturity.
ETF — Exchange-Traded Fund
GO — General Obligation
LIBOR — London InterBank Offered Rate
LIBOR01M — 1 Month US Dollar LIBOR, rate disclosed as of November 30, 2020, based on the last reset date of the security
LIBOR03M — 3 Month US Dollar LIBOR, rate disclosed as of November 30, 2020, based on the last reset date of the security
LLC — Limited Liability Company
LP — Limited Partnership
MTN — Medium Term Note
PLC — Public Limited Company
SOFR — Secured Overnight Financing Rate
USSW10 — USD 10 Year Swap Rate, rate disclosed as of November 30, 2020
Credit Enhancements — Adds the financial strength of the provider of the enhancement to support the issuer's ability to repay the principal and interest payments when due. The enhancement may be provided by a high-quality bank, insurance company or other corporation, or a collateral trust. The enhancements do not guarantee the market values of the securities.
INS Principal and interest payments are insured by the name listed. Although bond insurance reduces the risk of loss due to default by an issuer, such bonds remain subject to the risk that value may fluctuate for other reasons, and there is no assurance that the insurance company will meet its obligations.
See notes to financial statements.
18
| USAA Mutual Funds Trust USAA Cornerstone Moderate Fund | Schedule of Portfolio Investments — continued November 30, 2020 | ||||||
(Unaudited)
Futures Contracts Purchased
(Amounts not in thousands)
| Number of Contracts | Expiration Date | Notional Amount | Value | Unrealized Appreciation/ (Depreciation) | |||||||||||||||||||
| S&P/Toronto Stock Exchange 60 Index Futures | 47 | 12/17/20 | $ | 6,888,920 | $ | 7,406,346 | $ | 403,006 | |||||||||||||||
Swiss Market Index Futures | 109 | 12/18/20 | 12,486,522 | 12,604,887 | 117,848 | ||||||||||||||||||
$ | 520,854 | ||||||||||||||||||||||
Futures Contracts Sold
(Amounts not in thousands)
| Number of Contracts | Expiration Date | Notional Amount | Value | Unrealized Appreciation/ (Depreciation) | |||||||||||||||||||
Euro Stoxx 50 Futures | 205 | 12/18/20 | $ | 8,408,219 | $ | 8,569,886 | $ | (114,329 | ) | ||||||||||||||
Russell 2000 E-Mini Index Futures | 75 | 12/18/20 | 5,888,311 | 6,825,375 | (937,063 | ) | |||||||||||||||||
Tokyo Price Index Futures | 78 | 12/10/20 | 12,045,715 | 13,118,318 | (919,542 | ) | |||||||||||||||||
$ | (1,970,934 | ) | |||||||||||||||||||||
Total unrealized appreciation | $ | 520,854 | |||||||||||||||||||||
Total unrealized depreciation | (1,970,934 | ) | |||||||||||||||||||||
Total net unrealized appreciation (depreciation) | $ | (1,450,080 | ) | ||||||||||||||||||||
See notes to financial statements.
19
USAA Mutual Funds Trust | Statement of Assets and Liabilities November 30, 2020 | ||||||
(Amounts in Thousands, Except Per Share Amounts) (Unaudited)
| USAA Cornerstone Moderate Fund | |||||||
Assets: | |||||||
Affiliated investments, at value(Cost 54,284) | $ | 54,140 | |||||
Unaffiliated investments, at value (Cost $1,038,194) | 1,162,193 | (a) | |||||
Cash and cash equivalents | 10,173 | ||||||
Deposits with brokers for futures contracts | 1,106 | ||||||
Receivables: | |||||||
Interest and dividends | 2,623 | ||||||
Capital shares issued | 660 | ||||||
Investments sold | 957 | ||||||
Variation margin on open futures contracts | 394 | ||||||
From Adviser | 21 | ||||||
Prepaid expenses | 16 | ||||||
Total assets | 1,232,283 | ||||||
Liabilities: | |||||||
Payables: | |||||||
Collateral received on loaned securities | 25,597 | ||||||
Collateral received from brokers for futures contract | 1,970 | ||||||
Payable for foreign currency | 34 | ||||||
Capital shares redeemed | 1,079 | ||||||
Variation margin on open futures contracts | 101 | ||||||
Accrued expenses and other payables: | |||||||
Investment advisory fees | 574 | ||||||
Administration fees | 146 | ||||||
Custodian fees | 7 | ||||||
Transfer agent fees | 151 | ||||||
Compliance fees | 1 | ||||||
Other accrued expenses | 70 | ||||||
Total liabilities | 29,730 | ||||||
Net Assets: | |||||||
Capital | 1,070,695 | ||||||
Total accumulated earnings/(loss) | 131,858 | ||||||
Net assets | $ | 1,202,553 | |||||
Shares (unlimited number of shares authorized with no par value): | 76,471 | ||||||
Net asset value, offering and redemption price per share: (b) | $ | 15.73 | |||||
(a) Includes $24,371 of securities on loan.
(b) Per share amount may not recalculate due to rounding of net assets and/or shares outstanding.
See notes to financial statements.
20
USAA Mutual Funds Trust | Statement of Operations For the Six Months Ended November 30, 2020 | ||||||
(Amounts in Thousands) (Unaudited)
| USAA Cornerstone Moderate Fund | |||||||
Investment Income: | |||||||
Income distributions from affiliated funds | $ | 146 | |||||
Dividends | 7,193 | ||||||
Interest | 6,417 | ||||||
Securities lending (net of fees) | 80 | ||||||
Foreign tax withholding | (3 | ) | |||||
Total income | 13,833 | ||||||
Expenses: | |||||||
Investment advisory fees | 3,448 | ||||||
Administration fees | 877 | ||||||
Sub-Administration fees | 54 | ||||||
Custodian fees | 39 | ||||||
Transfer agent fees | 1,238 | ||||||
Trustees' fees | 26 | ||||||
Compliance fees | 4 | ||||||
Legal and audit fees | 47 | ||||||
State registration and filing fees | 17 | ||||||
Other expenses | 77 | ||||||
Total expenses | 5,827 | ||||||
Expenses waived/reimbursed by Adviser | (23 | ) | |||||
Net expenses | 5,804 | ||||||
Net Investment Income (Loss) | 8,029 | ||||||
Realized/Unrealized Gains (Losses) from Investments: | |||||||
| Net realized gains (losses) from unaffiliated investment securities and foreign currency translations | 12,776 | ||||||
Net realized gains (losses) from futures contracts | 267 | ||||||
| Net change in unrealized appreciation/depreciation on unaffiliated investment securities and foreign currency translations | 103,281 | ||||||
Net change in unrealized appreciation/depreciation on affiliated funds | 594 | ||||||
Net change in unrealized appreciation/depreciation on futures contracts | (1,450 | ) | |||||
Net realized/unrealized gains (losses) on investments | 115,468 | ||||||
Change in net assets resulting from operations | $ | 123,497 | |||||
See notes to financial statements.
21
USAA Mutual Funds Trust | Statements of Changes in Net Assets | ||||||
(Amounts in Thousands)
USAA Cornerstone Moderate Fund | |||||||||||
| Six Months Ended November 30, 2020 (Unaudited) | Year Ended May 31, 2020 | ||||||||||
From Investments: | |||||||||||
Operations: | |||||||||||
Net investment income (loss) | $ | 8,029 | $ | 23,702 | |||||||
Net realized gains (losses) from investments | 13,043 | 1,856 | |||||||||
| Net change in unrealized appreciation/depreciation on investments | 102,425 | 8,743 | |||||||||
Change in net assets resulting from operations | 123,497 | 34,301 | |||||||||
Change in net assets resulting from distributions to shareholders | (7,812 | ) | (23,992 | ) | |||||||
Change in net assets resulting from capital transactions | (44,590 | ) | (42,225 | ) | |||||||
Change in net assets | 71,095 | (31,916 | ) | ||||||||
Net Assets: | |||||||||||
Beginning of period | 1,131,458 | 1,163,374 | |||||||||
End of period | $ | 1,202,553 | $ | 1,131,458 | |||||||
Capital Transactions: | |||||||||||
Proceeds from shares issued | $ | 30,692 | $ | 90,971 | |||||||
Distributions reinvested | 7,774 | 23,878 | |||||||||
Cost of shares redeemed | (83,056 | ) | (157,074 | ) | |||||||
Change in net assets resulting from capital transactions | $ | (44,590 | ) | $ | (42,225 | ) | |||||
Share Transactions: | |||||||||||
Issued | 2,042 | 6,302 | |||||||||
Reinvested | 535 | 1,646 | |||||||||
Redeemed | (5,539 | ) | (10,983 | ) | |||||||
Change in Shares | (2,962 | ) | (3,035 | ) | |||||||
See notes to financial statements.
22
This page is intentionally left blank.
23
USAA Mutual Funds Trust | Financial Highlights | ||||||
For a Share Outstanding Throughout Each Period
Investment Activities | Distributions to Shareholders From | ||||||||||||||||||||||||||
| Net Asset Value, Beginning of Period | Net Investment Income (Loss) | Net Realized and Unrealized Gains (Losses) on Investments | Total from Investment Activities | Net Investment Income | Net Realized Gains from Investments | ||||||||||||||||||||||
USAA Cornerstone Moderate Fund | |||||||||||||||||||||||||||
| Six Months Ended November 30, 2020 (unaudited) | $ | 14.24 | 0.10 | (d) | 1.49 | 1.59 | (0.10 | ) | — | ||||||||||||||||||
| Year Ended May 31, 2020 | $ | 14.11 | 0.29 | (d) | 0.13 | 0.42 | (0.29 | ) | — | ||||||||||||||||||
| Year Ended May 31, 2019 | $ | 14.83 | 0.30 | (0.31 | ) | (0.01 | ) | (0.29 | ) | (0.42 | ) | ||||||||||||||||
| Year Ended May 31, 2018 | $ | 15.05 | 0.26 | 0.55 | 0.81 | (0.26 | ) | (0.77 | ) | ||||||||||||||||||
| Year Ended May 31, 2017 | $ | 14.01 | 0.31 | 1.06 | 1.37 | (0.33 | ) | — | |||||||||||||||||||
| Year Ended May 31, 2016 | $ | 15.43 | 0.39 | (1.15 | ) | (0.76 | ) | (0.38 | ) | (0.28 | ) | ||||||||||||||||
* Assumes reinvestment of all net investment income and realized capital gain distributions, if any, during the period. Includes adjustments in accordance with U.S. generally accepted accounting principles and could differ from the Lipper reported return.
^ The net expense ratio may not correlate to the applicable expense limits in place during the period since the current contractual expense limitation is applied for a two year period beginning July 1, 2019 and in effect through September 30, 2021, instead of coinciding with the Fund's fiscal year end. Details of the current contractual expense limitation in effect can be found in Note 4 of the accompanying Notes to Financial Statements.
(a) Not annualized for periods less than one year.
(b) Annualized for periods less than one year.
(c) The expense ratios exclude the impact of expenses paid by each underlying fund.
(d) Per share net investment income (loss) has been calculated using the average daily shares method.
(e) Reflects increased trading activity due to usage of quantitative investment strategies.
See notes to financial statements.
24
USAA Mutual Funds Trust | Financial Highlights — continued | ||||||
For a Share Outstanding Throughout Each Period
Ratios to Average Net Assets | Supplemental Data | ||||||||||||||||||||||||||||||||||
| Total Distributions | Net Asset Value, End of Period | Total Return*(a) | Net Expenses^(b)(c) | Net Investment Income (Loss)(b) | Gross Expenses(b)(c) | Net Assets, End of Period (000's) | Portfolio Turnover(a) | ||||||||||||||||||||||||||||
USAA Cornerstone Moderate Fund | |||||||||||||||||||||||||||||||||||
| Six Months Ended November 30, 2020 (unaudited) | (0.10 | ) | $ | 15.73 | 11.22 | % | 0.99 | % | 1.37 | % | 0.99 | % | $ | 1,202,553 | 30 | % | |||||||||||||||||||
| Year Ended May 31, 2020 | (0.29 | ) | $ | 14.24 | 2.98 | % | 1.00 | % | 2.01 | % | 1.00 | % | $ | 1,131,458 | 87 | % | |||||||||||||||||||
| Year Ended May 31, 2019 | (0.71 | ) | $ | 14.11 | 0.13 | % | 1.00 | % | 2.10 | % | 1.02 | % | $ | 1,163,374 | 81 | %(e) | |||||||||||||||||||
| Year Ended May 31, 2018 | (1.03 | ) | $ | 14.83 | 5.42 | % | 1.00 | % | 1.73 | % | 1.03 | % | $ | 1,184,032 | 51 | % | |||||||||||||||||||
| Year Ended May 31, 2017 | (0.33 | ) | $ | 15.05 | 9.91 | % | 1.00 | % | 2.14 | % | 1.10 | % | $ | 1,119,494 | 66 | % | |||||||||||||||||||
| Year Ended May 31, 2016 | (0.66 | ) | $ | 14.01 | (4.89 | )% | 1.00 | % | 2.72 | % | 1.16 | % | $ | 1,057,659 | 70 | % | |||||||||||||||||||
See notes to financial statements.
25
USAA Mutual Funds Trust | Notes to Financial Statements November 30, 2020 | ||||||
(Unaudited)
1. Organization:
USAA Mutual Funds Trust (the "Trust") is organized as a Delaware statutory trust and is registered under the Investment Company Act of 1940, as amended (the "1940 Act"), as an open-end investment company. The Trust is comprised of 46 funds and is authorized to issue an unlimited number of shares, which are units of beneficial interest with no par value.
The accompanying financial statements are those of the USAA Cornerstone Moderate Fund (the "Fund"). The Fund is classified as diversified under the 1940 Act.
Under the Trust's organizational documents, its officers and trustees are indemnified against certain liabilities arising out of the performance of their duties to the Fund. In addition, in the normal course of business, the Fund enters into contracts with its vendors and others that provide for general indemnifications. The Fund's maximum exposure under these arrangements is unknown, as this would involve future claims that may be made against the Fund. However, based on experience, the Fund expects that risk of loss to be remote.
2. Significant Accounting Policies:
The following is a summary of significant accounting policies followed by the Trust in the preparation of its financial statements. The policies are in conformity with Generally Accepted Accounting Principles in the United States of America ("GAAP"). The preparation of financial statements in accordance with GAAP requires management to make estimates and assumptions that affect the reported amounts of assets and liabilities and disclosure of contingent assets and liabilities at the date of the financial statements and the reported amounts of income and expenses for the period. Actual results could differ from those estimates. The Fund follows the specialized accounting and reporting requirements under GAAP that are applicable to investment companies under Accounting Standards Codification Topic 946.
Investment Valuation:
The Fund records investments at fair value. Fair value is defined as the price that would be received to sell an asset or paid to transfer a liability in an orderly transaction between market participants at the measurement date.
The valuation techniques described below maximize the use of observable inputs and minimize the use of unobservable inputs in determining fair value. The inputs used for valuing the Fund's investments are summarized in the three broad levels listed below:
• Level 1 — quoted prices in active markets for identical securities
• Level 2 — other significant observable inputs (including quoted prices for similar securities or interest rates applicable to those securities, etc.)
• Level 3 — significant unobservable inputs (including the Fund's own assumptions in determining the fair value of investments)
Changes in valuation techniques may result in transfers in or out of an assigned level within the disclosure hierarchy. The inputs or methodologies used for valuation techniques are not necessarily an indication of the risk associated with entering into those investments.
Victory Capital Management Inc. ("VCM" or the "Adviser") has established the Pricing and Liquidity Committee (the "Committee"), and subject to the Trust's Board of Trustees (the "Board") oversight, the Committee administers and oversees the Fund's valuation policies and procedures, which are approved by the Board.
Portfolio securities listed or traded on securities exchanges, including exchange-traded funds ("ETFs"), American Depositary Receipts ("ADRs") and Rights, are valued at the closing price on the exchange or system where the security is principally traded, if available, or at the Nasdaq Official Closing Price. If there have been no sales for that day on the exchange or system, then a security is valued at the last available bid quotation on the exchange or system where the security is principally traded. In each of these situations, valuations are typically categorized as Level 1 in the fair value hierarchy.
26
USAA Mutual Funds Trust | Notes to Financial Statements — continued November 30, 2020 | ||||||
(Unaudited)
Investments in open-end investment companies are valued at their net asset value ("NAV"). These valuations are typically categorized as Level 1 in the fair value hierarchy.
Futures contracts are valued at the settlement price established each day by the board of trade or an exchange on which they are traded. These valuations are typically categorized as Level 1 in the fair value hierarchy.
Debt securities of United States ("U.S.") issuers, along with corporate and municipal securities, including short-term investments maturing in 60 days or less, may be valued using evaluated bid or the last sales price to price securities by dealers or an independent pricing service approved by the Board. These valuations are typically categorized as Level 2 in the fair value hierarchy.
In the event that price quotations or valuations are not readily available, are not reflective of market value, or a significant event has been recognized in relation to a security or class of securities, the securities are valued in good faith by the Committee in accordance with valuation procedures approved by the Board. These valuations are typically categorized as Level 2 or Level 3 in the fair value hierarchy, based on the observability of inputs used to determine the fair value. The effect of fair value pricing is that securities may not be priced on the basis of quotations from the primary market in which they are traded and the actual price realized from the sale of a security may differ materially from the fair value price. Valuing these securities at fair value is intended to cause the Fund's NAV to be more reliable than it otherwise would be.
In accordance with procedures adopted by the Board, fair value pricing may be used if events materially affecting the value of foreign securities occur between the time the exchange on which they are traded closes and the time the Fund's NAV is calculated. The Fund uses a systematic valuation model, provided daily by an independent third party to fair value its international equity securities. The valuations are considered as Level 2 in the fair value hierarchy.
A summary of the valuations as of November 30, 2020, based upon the three levels defined above, is included in the table below while the breakdown, by category, of investments is disclosed on the Schedule of Portfolio Investments (amounts in thousands):
Level 1 | Level 2 | Level 3 | Total | ||||||||||||||||
Asset-Backed Securities | $ | — | $ | 34,423 | $ | — | $ | 34,423 | |||||||||||
Collateralized Mortgage Obligations | — | 14,662 | — | 14,662 | |||||||||||||||
Common Stocks | 164,126 | — | — | 164,126 | |||||||||||||||
Preferred Stocks | 13,417 | — | — | 13,417 | |||||||||||||||
Corporate Bonds | — | 172,231 | — | 172,231 | |||||||||||||||
Yankee Dollars | — | 22,173 | — | 22,173 | |||||||||||||||
Municipal Bonds | — | 16,333 | — | 16,333 | |||||||||||||||
U.S. Government Agency Mortgages | — | 57,058 | — | 57,058 | |||||||||||||||
U.S. Treasury Obligations | — | 108,019 | — | 108,019 | |||||||||||||||
Exchange-Traded Funds | 534,154 | — | — | 534,154 | |||||||||||||||
Affiliated Exchange-Traded Funds | 54,140 | — | — | 54,140 | |||||||||||||||
Collateral for Securities Loaned | 25,597 | — | — | 25,597 | |||||||||||||||
Total | $ | 791,434 | $ | 424,899 | $ | — | $ | 1,216,333 | |||||||||||
Other Financial Investments^: | |||||||||||||||||||
Assets: | |||||||||||||||||||
Futures Contracts | $ | 521 | $ | — | $ | — | $ | 521 | |||||||||||
Liabilities: | |||||||||||||||||||
Futures Contracts | (1,971 | ) | — | — | (1,971 | ) | |||||||||||||
Total | $ | (1,450 | ) | $ | — | $ | — | $ | (1,450 | ) | |||||||||
^ Futures Contracts are valued at the unrealized appreciation (depreciation) on the investment.
27
USAA Mutual Funds Trust | Notes to Financial Statements — continued November 30, 2020 | ||||||
(Unaudited)
For the six months ended November 30, 2020, there were no transfers in or out of the Level 3 fair value hierarchy.
Real Estate Investment Trusts ("REITs"):
The Fund may invest in REITs, which report information on the source of their distributions annually. REITs are pooled investment vehicles that invest primarily in income producing real estate or real estate related loans or interests (such as mortgages). Certain distributions received from REITs during the year are recorded as realized gains or return of capital as estimated by the Fund or when such information becomes known.
Investment Companies:
Exchange-Traded Funds:
The Fund may invest in ETFs, the shares of which are bought and sold on a securities exchange. An ETF trades like common stock and represents a portfolio of securities designed to track the performance and dividend yield of a particular domestic or foreign market index. The Fund may purchase shares of an ETF to temporarily gain exposure to a portion of the U.S. or a foreign market while awaiting purchase of underlying securities. The risks of owning an ETF generally reflect the risks of owning the underlying securities they are designed to track, although the lack of liquidity of an ETF could result in it being more volatile. Additionally, ETFs have fees and expenses that reduce their value.
Open-End Funds:
The Fund may invest in portfolios of open-end investment companies. These investment companies value securities in their portfolios for which market quotations are readily available at their market values (generally the last reported sale price) and all other securities and assets at their fair value by the methods established by the board of directors of the underlying funds.
Municipal Obligations:
The values of municipal obligations can fluctuate and may be affected by adverse tax, legislative, or political changes, and by financial developments affecting municipal issuers. Payment of municipal obligations may depend on a relatively limited source of revenue, resulting in greater credit risk. Future changes in federal tax laws or the activity of an issuer may adversely affect the tax-exempt status of municipal obligations.
Mortgage- and Asset-Backed Securities:
The values of some mortgage-related or asset-backed securities may be particularly sensitive to changes in prevailing interest rates. Early repayment of principal on some mortgage-related securities may expose the Fund to a lower rate of return upon reinvestment of principal. The values of mortgage and asset-backed securities depend in part on the credit quality and adequacy of the underlying assets or collateral and may fluctuate in response to the market's perception of these factors as well as current and future repayment rates. Some mortgage-backed securities are backed by the full faith and credit of the U.S. government (e.g., mortgage-backed securities issued by the Government National Mortgage Association, commonly known as "Ginnie Mae"), while other mortgage-backed securities (e.g., mortgage-backed securities issued by the Federal National Mortgage Association and the Federal Home Loan Mortgage Corporation, commonly known as "Fannie Mae" and "Freddie Mac", respectively), are backed only by the credit of the government entity issuing them. In addition, some mortgage-backed securities are issued by private entities and, as such, are not guaranteed by the U.S. government or any agency or instrumentality of the U.S. government.
28
USAA Mutual Funds Trust | Notes to Financial Statements — continued November 30, 2020 | ||||||
(Unaudited)
Derivative Instruments:
Futures Contracts:
The Fund may enter into contracts for the future delivery of securities or foreign currencies and futures contracts based on a specific security, class of securities, foreign currency or an index, and purchase or sell options on any such futures contracts. A futures contract on a securities index is an agreement obligating either party to pay, and entitling the other party to receive, while the contract is outstanding, cash payments based on the level of a specified securities index. No physical delivery of the underlying asset is made. The Fund may enter into futures contracts in an effort to hedge against market risks. The acquisition of put and call options on futures contracts will give the Fund the right (but not the obligation), for a specified price, to sell or to purchase the underlying futures contract, upon exercise of the option, at any time during the option period. Futures transactions involve brokerage costs and require the Fund to segregate assets to cover contracts that would require it to purchase securities or currencies. A good faith margin deposit, known as initial margin, of cash or government securities with a broker or custodian is required to initiate and maintain open positions in futures contracts. Subsequent payments, known as variation margin, are made or received by the Fund based on the change in the market value of the position and are recorded as unrealized appreciation or depreciation until the contract is closed out, at which time the gain or loss is realized. The Fund may lose the expected benefit of futures transactions if interest rates, exchange rates or securities prices change in an unanticipated manner. Such unanticipated changes may also result in lower overall performance than if the Fund had not entered into any futures transactions. In addition, the value of the Fund's futures positions may not prove to be perfectly or even highly correlated with the value of its portfolio securities or foreign currencies, limiting the Fund's ability to hedge effectively against interest rate, exchange rate and/or market risk and giving rise to additional risks. There is no assurance of liquidity in the secondary market for purposes of closing out futures positions. The collateral held by the Fund is reflected on the Statement of Assets and Liabilities under Collateral received from brokers for futures contract. During the period ended November 30, 2020, the Fund held futures contracts primarily for gaining exposure to a particular asset class or securities market.
Summary of Derivative Instruments:
The following table summarizes the fair values of derivative instruments on the Statement of Assets and Liabilities, categorized by risk exposure, as of November 30, 2020 (amounts in thousands):
Assets | Liabilities | ||||||||||
| Variation Margin Receivable on Open Futures Contracts* | Variation Margin Payable on Open Futures Contracts* | ||||||||||
Equity Risk Exposure | $ | 521 | $ | 1,971 | |||||||
* Includes cumulative appreciation (depreciation) of futures contracts as reported on the Schedule of Portfolio Investments. Only current day's variation margin for futures contracts is reported within the Statement of Assets and Liabilities.
The following table presents the effect of derivative instruments on the Statement of Operations, categorized by risk exposure, for the six months ended November 30, 2020 (amounts in thousands):
| Net Realized Gains (Losses) on Derivatives Recognized as a Result of Operations | Net Change in Unrealized Appreciation/Depreciation on Derivatives Recognized as a Result of Operations | ||||||||||
| Net Realized Gains (Losses) from Futures Contracts | Net Change in Unrealized Appreciation/Depreciation on Futures Contracts | ||||||||||
Equity Risk Exposure | $ | 267 | $ | (1,450 | ) | ||||||
29
USAA Mutual Funds Trust | Notes to Financial Statements — continued November 30, 2020 | ||||||
(Unaudited)
All open derivative positions at period end are reflected on the Fund's Schedule of Portfolio Investments. The underlying face value of open derivative positions relative to the Fund's net assets at period end is generally representative of the notional amount of open positions to net assets throughout the period.
Investment Transactions and Related Income:
Changes in holdings of investments are accounted for no later than one business day following the trade date. For financial reporting purposes, however, investment transactions are accounted for on trade date on the last business day of the reporting period. Interest income is determined on the basis of coupon interest accrued using the effective interest method which adjusts, where applicable, the amortization of premiums or accretion of discount. Gains or losses realized on sales of securities are determined by comparing the identified cost of the security lot sold with the net sales proceeds.
Withholding taxes on interest, dividends, and gains as a result of certain investments in ADRs by the Fund has been provided for in accordance with each investment's applicable country's tax rules and rates.
Securities Lending:
The Fund, through a securities lending agreement with Citibank, N.A. ("Citibank"), may lend its securities to qualified financial institutions, such as certain broker-dealers, to earn additional income, net of income retained by Citibank. Borrowers are required to secure their loans for collateral in the amount of at least 102% of the value of U.S. securities loaned or at least 105% of the value of non-U.S. securities loaned, marked-to-market daily. Any collateral shortfalls associated with increases in the valuation of the securities loaned are cured the next business day once the shortfall exceeds $100 thousand. Collateral may be cash, U.S. government securities, or other securities as permitted by Securities and Exchange Commission ("SEC") guidelines. Cash collateral may be invested in high-quality short-term investments, primarily open-end investment companies. Collateral requirements are determined daily based on the value of the Fund's securities on loan as of the end of the prior business day. During the time portfolio securities are on loan, the borrower will pay the Fund any dividends or interest paid on such securities plus any fee negotiated between the parties to the lending agreement. The Fund also earns a return from the collateral. The Fund pays Citibank various fees in connection with the investment of cash collateral and fees based on the investment income received from securities lending activities. Securities lending income (net of these fees) is disclosed on the Statement of Operations. Loans are terminable upon demand and the borrower must return the loaned securities within the lesser of one standard settlement period or five business days. Risks relating to securities-lending transactions include that the borrower may not provide additional collateral when required or return the securities when due, and that the value of the short-term investments will be less than the amount of cash collateral required to be returned to the borrower. The Fund's agreement with Citibank does not include master netting provisions. Noncash collateral received by the Fund may not be sold or re-pledged, except to satisfy borrower default. Cash collateral is listed on the Fund's Schedule of Portfolio Investments and Financial Statements while non-cash collateral is not included.
The following table (amounts in thousands) is a summary of the Fund's securities lending transactions as of November 30, 2020.
| Value of Securities on Loan | Non-Cash Collateral | Cash Collateral | |||||||||
| $ | 24,371 | $ | — | $ | 25,597 | ||||||
Foreign Currency Translations:
The accounting records of the Fund are maintained in U.S. dollars. Investment securities and other assets and liabilities of the Fund denominated in a foreign currency are translated into U.S. dollars at current exchange rates. Purchases and sales of securities, income receipts, and expense payments are translated into U.S. dollars at the exchange rates on the date of the transactions. The Fund does not isolate the portion of the results of operations resulting from changes in foreign exchange rates on investments from fluctuations arising from changes in market prices of securities held. Such fluctuations
30
USAA Mutual Funds Trust | Notes to Financial Statements — continued November 30, 2020 | ||||||
(Unaudited)
are disclosed as net change in unrealized appreciation/depreciation on investments and foreign currency translations on the Statement of Operations. Any realized gains or losses from these fluctuations, including foreign currency arising from in-kind redemptions, are disclosed as net realized gains or losses from investment transactions and foreign currency translations on the Statement of Operations.
Foreign Taxes:
The Fund may be subject to foreign taxes related to foreign income received (a portion of which may be reclaimable), capital gains on the sale of securities, and certain foreign currency transactions. All foreign taxes are recorded in accordance with the applicable regulations and rates that exist in the foreign jurisdictions in which the Fund invests.
Federal Income Taxes:
It is the Fund's policy to continue to qualify as a regulated investment company by complying with the provisions available to certain investment companies, as defined in applicable sections of the Internal Revenue Code, and to make distributions of net investment income and net realized gains sufficient to relieve it from all, or substantially all, federal income taxes. Accordingly, no provision for federal income taxes is required in the financial statements. The Fund has a tax year end of May 31.
Management of the Fund has reviewed tax positions taken in tax years that remain subject to examination by all major tax jurisdictions, including federal (i.e., the last four tax years, which includes the current fiscal tax year end). Management believes that there is no tax liability resulting from unrecognized tax benefits related to uncertain tax positions taken.
Allocations:
Expenses directly attributable to the Fund are charged to the Fund, while expenses that are attributable to more than one fund in the Trust, or jointly with an affiliated trust, are allocated among the respective funds in the Trust and/or affiliated trust based upon net assets or another appropriate basis.
Cross-Trade Transactions:
Pursuant to Rule 17a-7 under the 1940 Act, the Fund may engage in cross-trades, which are securities transactions with affiliated investment companies and advisory accounts managed by the Adviser and any applicable sub-adviser. Any such purchase or sale transaction must be effected without brokerage commission or other remuneration, except for customary transfer fees. The transaction must be effected at the current market price, which is either the security's last sale price on an exchange or, if there are no transactions in the security that day, at the average of the highest bid and lowest asked price. For the six months ended November 30, 2020, the Fund engaged in the following securities transactions with affiliated funds, which resulted in the following net realized gains (losses) (amounts in thousands):
| Purchases | Sales | Net Realized Gains (Losses) | |||||||||
| $ | — | $ | 1,156 | $ | 13 | ||||||
3. Purchases and Sales:
Cost of purchases and proceeds from sales/maturities of securities (excluding securities maturing less than one year from acquisition) for the six months ended November 30, 2020, were as follows for the Fund (amounts in thousands):
| Purchases (excluding U.S. Government Securities) | Sales (excluding U.S. Government Securities) | Purchases of U.S. Government Securities | Sales of U.S. Government Securities | ||||||||||||
| $ | 346,505 | $ | 354,642 | $ | — | $ | 29,410 | ||||||||
31
USAA Mutual Funds Trust | Notes to Financial Statements — continued November 30, 2020 | ||||||
(Unaudited)
4. Fees and Transactions with Affiliates and Related Parties:
Investment Advisory Fees:
Investment advisory services are provided to the Fund by the Adviser, which is a New York corporation registered as an investment adviser with the SEC. The Adviser is a wholly-owned indirect subsidiary of Victory Capital Holdings, Inc., a publicly traded Delaware corporation, and a wholly-owned direct subsidiary of Victory Capital Operating, LLC.
Under the terms of the Investment Advisory Agreement, the Adviser is entitled to receive fees accrued daily and paid monthly at an annualized rate of 0.59% of the Fund's average daily net assets. Amounts incurred and paid to VCM for the six months ended November 30, 2020, are reflected on the Statement of Operations as Investment Advisory fees.
In addition, the Fund invests in affiliated VCM exchange-traded fund(s) ("affiliated ETFs"). The Fund's Adviser fee is reimbursed by VCM to the extent of the indirect Adviser fee incurred through the Fund's proportional investment in the affiliated ETF(s). As of November 30, 2020, the Fund's Adviser fee was reimbursed by VCM in an amount of $23 thousand, of which $21 thousand is receivable from VCM. These reimbursements are not available for recoupment and are reflected on the Statement of Operations as Expenses waived/reimbursed by Adviser.
The Trust relies on an exemptive order granted to VCM and its affiliated funds by the SEC in March 2019 permitting the use of a "manager-of-managers" structure for certain funds. Under a manager-of-managers structure, the investment adviser may select (with approval of the Board and without shareholder approval) one or more subadvisers to manage the day-to-day investment of a fund's assets. For the six months ended November 30, 2020, the Fund had no subadvisors.
Administration and Servicing Fees:
VCM serves as the Fund's administrator and fund accountant. Under the Administration, Servicing and Accounting Agreement, VCM is paid for its services an annual fee at a rate of 0.15% of average daily net assets of the Fund. Amounts incurred for the six months ended November 30, 2020, are reflected on the Statement of Operations as Administration fees.
The Fund (as part of the Trust) has entered into an agreement to provide compliance services with the Adviser, pursuant to which the Adviser furnishes its compliance personnel, including the services of the Chief Compliance Officer ("CCO"), and other resources reasonably necessary to provide the Trust with compliance oversight services related to the design, administration and oversight of a compliance program for the Trust in accordance with Rule 38a-1 under the 1940 Act. The CCO is an employee of the Adviser, which pays the compensation of the CCO and support staff. Funds in the Trust, Victory Variable Insurance Funds, Victory Portfolios, and Victory Portfolios II (collectively, the "Victory Funds Complex") in the aggregate, compensate the Adviser for these services. Amounts incurred for the six months ended November 30, 2020, are reflected on the Statement of Operations as Compliance fees.
Citi Fund Services Ohio, Inc. ("Citi"), an affiliate of Citibank, acts as sub-administrator and sub-fund accountant to the Fund pursuant to a Sub-Administration and Sub-Fund Accounting Services Agreement between VCM and Citi. VCM pays Citi a fee for providing these services. The Trust reimburses VCM and Citi for out-of-pocket expenses incurred in providing these services and certain other expenses specifically allocated to the Fund. Amounts incurred for the six months ended November 30, 2020, are reflected on the Statement of Operations as Sub-Administration fees.
Transfer Agency Fees:
Victory Capital Transfer Agency, Inc. ("VCTA"), an affiliate of the Adviser provides transfer agency services to the Fund. VCTA provides transfer agent services based on an annual charge of $23 per shareholder account plus out-of-pocket expenses. VCTA pays a portion of these fees to certain intermediaries for the administration and servicing of accounts that are held with such intermediaries. Amounts incurred and paid to VCTA for the six months ended November 30, 2020, are reflected on the Statement of Operations as Transfer Agent fees.
32
USAA Mutual Funds Trust | Notes to Financial Statements — continued November 30, 2020 | ||||||
(Unaudited)
FIS Investor Services LLC serves as sub-transfer agent and dividend disbursing agent for the Fund pursuant to a Sub-Transfer Agent agreement between VCTA and FIS Investor Services LLC. VCTA provides FIS Investor Services LLC a fee for providing these services.
Distributor/Underwriting Services:
Victory Capital Services, Inc. (the "Distributor"), an affiliate of the Adviser, serves as distributor for the continuous offering of the shares of the Fund pursuant to a Distribution Agreement between the Distributor and the Trust. Effective June 30, 2020, the Distributor's name was changed from Victory Capital Advisers, Inc.
Other Fees:
Citibank serves as the Fund's custodian. The Fund pays Citibank a fee for providing these services. Amounts incurred for the six months ended November 30, 2020, are reflected on the Statement of Operations as Custodian fees.
K&L Gates LLP provides legal services to the Trust.
The Adviser has entered into an expense limitation agreement with the Fund until at least September 30, 2021. Under the terms of the agreement, the Adviser has agreed to waive fees or reimburse certain expenses to the extent that ordinary operating expenses incurred in any fiscal year exceed the expense limit for the Fund. Such excess amounts will be the liability of the Adviser. Interest, taxes, brokerage commissions, other expenditures, which are capitalized in accordance with GAAP, and other extraordinary expenses not incurred in the ordinary course of the Fund's business are excluded from the expense limits. As of November 30, 2020, the expense limit (excluding voluntary waivers) is 1.00%.
Under this expense limitation agreement, the Fund has agreed to repay fees and expenses that were waived or reimbursed by the Adviser for a period up to three years after the fiscal year in which the waiver or reimbursement took place, subject to the lesser of any operating expense limits in effect at the time of: (a) the original waiver or expense reimbursement; or (b) the recoupment, after giving effect to the recoupment amount.
As of November 30, 2020, the following amounts are available to be repaid to the Adviser (amounts in thousands). The Fund has not recorded any amounts available to be repaid as a liability due to an assessment that such repayment is not probable at November 30, 2020.
| Expires May 31, 2023 | Total | ||||||
| $ | 5 | $ | 5 | ||||
The Adviser may voluntarily waive or reimburse additional fees to assist the Fund in maintaining competitive expense ratios. Voluntary waivers and reimbursements applicable to the Fund are not available to be recouped at a future time. There were no voluntary waivers or reimbursements for the six months ended November 30, 2020.
Certain officers and/or interested trustees of the Fund are also officers and/or employees of the Adviser, Administrator, Sub-Administrator, Sub-Fund Accountant, and Legal.
5. Risks:
The Fund may be subject to other risks in addition to these identified risks.
Geopolitical/Natural Disaster Risk — Global economies and financial markets are increasingly interconnected, which increases the possibilities that conditions in one country or region might adversely affect issuers in another country or region. Geopolitical and other risks, including war, terrorism, trade disputes, political or economic dysfunction within some nations, public health crises and related geopolitical events, as well as environmental disasters such as earthquakes, fires, and floods, may add to instability in world economies and markets generally. Changes in trade policies and international trade agreements could affect the economies of many countries in unpredictable ways. Likewise, systemic market dislocations of the kind that occurred during the financial crisis that began in 2008, if repeated, would be highly disruptive to economies and markets, adversely affecting individual
33
USAA Mutual Funds Trust | Notes to Financial Statements — continued November 30, 2020 | ||||||
(Unaudited)
companies and industries, securities markets, interest rates, credit ratings, inflation, investor sentiment, and other factors affecting the value of a Fund's investments. Some countries, including the United States, are adopting more protectionist trade policies and moving away from the tighter financial industry regulations that followed the 2008 financial crisis, which may also affect the value of a Fund's investments.
Political events within the United States at times have resulted, and may in the future result, in a shutdown of government services, which could negatively affect the U.S. economy, decrease the value of a Fund's investments, increase uncertainty in or impair the operation of the U.S. or other securities markets and degrade investor and consumer confidence, perhaps suddenly and to a significant degree.
An outbreak of disease called COVID-19 has spread internationally. The transmission of COVID-19 and efforts to contain its spread have resulted in international, national and local border closings and other significant travel restrictions and disruptions, significant disruptions to business operations, supply chains and consumer activity, significant challenges in healthcare service preparation and delivery, quarantines and general concern and uncertainty. These negative impacts have caused significant volatility and declines in global financial markets, which have caused losses for Fund investors during and subsequent to period end. The impact of the COVID-19 pandemic last for an extended period of time, and could result in a substantial economic downturn or recession. Public health crises may exacerbate other pre-existing political, social, economic, market and financial risks. The extent of the impact to the financial performance of the Funds' investments will depend on future developments, including (i) the duration and spread of the outbreak, (ii) the restrictions and advisories, (iii) the effects on the financial markets, and (iv) the effects on the economy overall, all of which are highly uncertain and cannot be predicted.
Tactical Allocation Risk — The Fund has a targeted risk tolerance and a corresponding asset allocation target; however, mere asset allocation and volatility are not the sole determination of risk. The Fund's managers will tactically allocate away from the target allocation as market conditions and the perceived risks warrant. The Fund bears the risk that the managers' tactical allocation will not be successful.
Affiliated Funds Risk — The risks of the Fund directly correspond to the risks of the underlying affiliated funds in which the Fund invests. By investing in the underlying affiliated funds, the Fund has exposure to the risk of many different areas of the market. The degree to which the risks described below apply to the Fund varies according to the Fund's asset allocation. For instance, the more the Fund is allocated to stock funds, the greater the risk associated with equity securities. The Fund also is subject to asset allocation risk (i.e., the risk that allocations will not produce the intended results) and to management risk (i.e., the risk that the selection of underlying affiliated funds will not produce the intended results).
Conflict of Interest Risk — In managing a Fund that invests in underlying affiliated funds, the Adviser may have conflicts of interest in allocating the Fund's assets among the various underlying affiliated funds. This is because the fees payable by some of the underlying affiliated funds to the Adviser and/or its affiliates are higher than the fees payable by other underlying affiliated funds, and because the Adviser also manages and administers the underlying affiliated funds.
LIBOR Discontinuation Risk — Many debt securities, derivatives and other financial instruments, including some of the Fund's investments, use the London Interbank Offered Rate ("LIBOR") as the reference or benchmark rate for variable interest rate calculations. However, the use of LIBOR started to come under pressure following manipulation allegations in 2012. Despite increased regulation and other corrective actions since that time, concerns have arisen regarding its viability as a benchmark, due largely to reduced activity in the financial markets that it measures. In June 2017, the Alternative Reference Rates Committee, a group of large U.S. banks working with the Federal Reserve, announced its selection of a new Secured Overnight Funding Rate ("SOFR"), which is intended to be a broad measure of secured overnight U.S. Treasury repo rates, as an appropriate replacement for LIBOR. The Federal Reserve Bank of New York began publishing the SOFR in 2018, expecting that it could be used on a voluntary basis in new instruments and transactions. Bank working groups and regulators in other countries have suggested other alternatives for their markets, including the Sterling Overnight Interbank Average Rate ("SONIA") in England. In July 2017, the Financial Conduct Authority (the "FCA"),
34
USAA Mutual Funds Trust | Notes to Financial Statements — continued November 30, 2020 | ||||||
(Unaudited)
the United Kingdom financial regulatory body, announced that after 2021 it will cease its active encouragement of UK banks to provide the quotations needed to sustain LIBOR. That announcement suggests that LIBOR may cease to be published after that time. It is expected that there will be enough for market participants to transition to the use of a different benchmark for both new and existing securities and transactions. Various financial industry groups have begun planning for that transition, but there are obstacles to converting certain longer-term securities and transactions to a new benchmark. Transition planning is at an early stage, and neither the effect of the transition process nor its ultimate success can yet be known. Although the foregoing may provide some sense of timing, there is no assurance that LIBOR, or any particular currency and tenor, will continue to be published until any particular date, and it appears highly likely that LIBOR will be discontinued or modified after December 31, 2021 or June 30, 2023, depending on the currency and tenor. The transition process might lead to increased volatility and illiquidity in markets that currently rely on the LIBOR to determine interest rates. It could also lead to a reduction in the value of some LIBOR-based investments and reduce the effectiveness of new hedges placed against existing LIBOR-based instruments. Since the usefulness of LIBOR as a benchmark could deteriorate during the transition period, these effects could occur before the end of 2021.
6. Borrowing and Interfund Lending:
Line of Credit:
For the six months ended November 30, 2020, the Victory Funds Complex participated in a short-term demand note "Line of Credit" agreement with Citibank. The Line of Credit agreement with Citibank was renewed on June 29, 2020 with a termination date of June 28, 2021. Under the agreement with Citibank, the Victory Funds Complex may borrow up to $600 million, of which $300 million is committed and $300 million is uncommitted. $40 million of the Line of Credit is reserved for use by the Victory Floating Rate Fund, another series of the Victory Funds Complex, with Victory Floating Rate Fund paying the related commitment fees for that amount. The purpose of the agreement is to meet temporary or emergency cash needs. For the six months ended November 30, 2020, Citibank received an annual commitment fee of 0.15% on $300 million for providing the Line of Credit. Each fund in the Victory Funds Complex pays a pro-rata portion of the commitment fees plus any interest (one month LIBOR plus one percent) on amounts borrowed. Effective June 29, 2020, under an amended Line of Credit agreement, Citibank will also receive an annual upfront fee of 0.10% on the $300 million committed line of credit. Each fund in the Victory Funds Complex will pay a pro-rata portion of the upfront fee. Interest charged to each Fund during the period, if applicable, is reflected on the Statements of Operations under Line of credit fees.
The Fund had no borrowings under the Line of Credit agreement during the six months ended November 30, 2020.
Interfund Lending:
The Trust and Adviser rely on an exemptive order granted by the SEC in March 2017 (the "Order"), permitting the establishment and operation of an Interfund Lending Facility (the "Facility"). The Facility allows the Fund to directly lend and borrow money to or from any other Fund, that is permitted to participate in the Facility, in the Victory Funds Complex relying upon the Order at rates beneficial to both the borrowing and lending funds. Advances under the Facility are allowed for temporary or emergency purposes. The interfund loan rate is determined, as specified in the Order, by averaging the current repurchase agreement rate and the current bank loan rate. As a Borrower, interest charged to the Fund, if any, during the period is reflected on the Statement of Operations under Interfund lending fees. As a Lender, interest earned by the Fund, if any, during the period is reflected on the Statement of Operations under Income on Interfund lending.
The Fund did not utilize or participate in the Facility during the six months ended November 30, 2020.
35
USAA Mutual Funds Trust | Notes to Financial Statements — continued November 30, 2020 | ||||||
(Unaudited)
7. Federal Income Tax Information:
The Fund intends to declare and distribute any net investment income quarterly. Distributable net realized gains, if any, are declared and paid at least annually.
The amounts of dividends from net investment income and distributions from net realized gains (collectively distributions to shareholders) are determined in accordance with federal income tax regulations, which may differ from GAAP. To the extent these "book/tax" differences are permanent in nature (e.g., net operating loss and distribution reclassification), such amounts are reclassified within the components of net assets based on their federal tax-basis treatment; temporary differences (e.g., wash sales) do not require reclassification. To the extent dividends and distributions exceed net investment income and net realized gains for tax purposes, they are reported as distributions of capital.
Net investment losses incurred by the Fund may be reclassified as an offset to capital on the accompanying Statement of Assets and Liabilities.
The tax character of current year distributions paid and the tax basis of the current components of accumulated earnings (deficit) will be determined at the end of the current tax year ending May 31, 2021.
At May 31, 2020, the Fund had net capital loss carryforwards as shown in the table below (amounts in thousands).
| Short-Term Amount | Long-Term Amount | Total | |||||||||
| $ | 2,079 | $ | — | $ | 2,079 | ||||||
8. Affiliated Securities:
An affiliated security is a security in which the Fund has ownership of at least 5% of the security's outstanding voting shares or an investment company managed by VCM. The Fund does not invest in affiliated underlying funds for the purpose of exercising management or control. These underlying funds' are noted as affiliated in the Fund's Schedule of Portfolio Investments. The affiliated underlying funds' annual or semiannual reports may be viewed at vcm.com. Transactions in affiliated securities during the six months ended November, 2020, were as follows (amount in thousands):
| Fair Value 5/31/2020 | Purchases at Cost | Proceeds from Sales | Realized Gains (Losses) | Capital Gain Distribution | Net Change in Unrealized Appreciation/ Depreciation | Fair Value 11/30/2020 | Dividend Income | ||||||||||||||||||||||||||||
| VictoryShares USAA Core Intermediate-Term Bond ETF | $ | — | $ | 38,968 | $ | — | $ | — | $ | — | $ | 243 | $ | 39,211 | $ | 79 | |||||||||||||||||||
| VictoryShares USAA Core Short-Term Bond ETF | — | 12,681 | — | — | — | 34 | 12,715 | 26 | |||||||||||||||||||||||||||
| VictoryShares USAA MSCI Emerging Markets Value Momentum ETF | 1,897 | — | — | — | — | 317 | 2,214 | 41 | |||||||||||||||||||||||||||
$ | 1,897 | $ | 51,649 | $ | — | $ | — | $ | — | $ | 594 | $ | 54,140 | $ | 146 | ||||||||||||||||||||
36
USAA Mutual Funds Trust | Supplemental Information November 30, 2020 | ||||||
(Unaudited)
Proxy Voting and Portfolio Holdings Information
Proxy Voting:
Information regarding the policies and procedures the Fund uses to determine how to vote proxies relating to portfolio securities is available without charge, upon request, by calling (800) 539-3863. The information is also included in the Fund's Statement of Additional Information, which is available on the SEC's website at www.sec.gov.
Information relating to how the Fund voted proxies relating to portfolio securities held during the most recent 12 months ended June 30 is available on the SEC's website at www.sec.gov.
Availability of Schedules of Portfolio Investments:
The Trust files a complete list of Schedules of Portfolio Investments with the SEC for the first and third quarter of each fiscal year on Form N-PORT. Form N-PORT is available on the SEC's website at www.sec.gov.
Expense Example
As a shareholder of the Fund, you may incur two types of costs: (1) transaction costs, and (2) ongoing costs, including management fees and other Fund expenses. These examples are intended to help you understand your ongoing costs (in dollars) of investing in the Fund and to compare these costs with the ongoing costs of investing in other mutual funds.
These examples are based on an investment of $1,000 invested at the beginning of the period and held for the entire period from June 1, 2020 through November 30, 2020.
The Actual Expense figures in the table below provide information about actual account values and actual expenses. You may use the information below, together with the amount you invested, to estimate the expenses that you paid over the period. Simply divide your account value by $1,000 (for example, an $8,600 account value divided by $1,000 = 8.6), then multiply the result by the number in the table under the heading entitled "Actual Expenses Paid During Period" to estimate the expenses you paid on your account during this period.
The Hypothetical Expense figures in the table below provide information about hypothetical account values and hypothetical expenses based on the Fund's actual expense ratio and an assumed rate of return of 5% per year before expenses, which is not the Fund's actual return. The hypothetical account values and expenses may not be used to estimate the actual ending account balance or expenses you paid for the period. You may use this information to compare this 5% hypothetical example with the 5% hypothetical examples that appear in shareholder reports of other funds.
Please note the expenses shown in the table below are meant to highlight your ongoing costs only and do not reflect any transactional costs. If these transactional costs were included, your costs would have been higher.
| Beginning Account Value 6/1/20 | Actual Ending Account Value 11/30/20 | Hypothetical Ending Account Value 11/30/20 | Actual Expenses Paid During Period 6/1/20- 11/30/20* | Hypothetical Expenses Paid During Period 6/1/20- 11/30/20* | Annualized Expense Ratio During Period 6/1/20- 11/30/20 | ||||||||||||||||||
$ | 1,000.00 | $ | 1,112.20 | $ | 1,020.10 | $ | 5.24 | $ | 5.01 | 0.99 | % | ||||||||||||
* Expenses are equal to the average account value multiplied by the Fund's annualized expense ratio multiplied by 183/365 (the number of days in the most recent fiscal half-year divided by the number of days in the fiscal year).
37
Privacy Policy
Protecting the Privacy of Information
The Trust respects your right to privacy. We also know that you expect us to conduct and process your business in an accurate and efficient manner. To do so, we must collect and maintain certain personal information about you. This is the information we collect from you on applications or other forms, and from the transactions you make with us or third parties. It may include your name, address, social security number, account transactions and balances, and information about investment goals and risk tolerance.
We do not disclose any information about you or about former customers to anyone except as permitted or required by law. Specifically, we may disclose the information we collect to companies that perform services on our behalf, such as the transfer agent that processes shareholder accounts and printers and mailers that assist us in the distribution of investor materials. We may also disclose this information to companies that perform marketing services on our behalf. This allows us to continue to offer you Victory investment products and services that meet your investing needs, and to effect transactions that you request or authorize. These companies will use this information only in connection with the services for which we hired them. They are not permitted to use or share this information for any other purpose.
To protect your personal information internally, we permit access only by authorized employees and maintain physical, electronic and procedural safeguards to guard your personal information.*
* You may have received communications regarding information about privacy policies from other financial institutions which gave you the opportunity to "opt-out" of certain information sharing with companies which are not affiliated with that financial institution. The Trust does not share information with other companies for purposes of marketing solicitations for products other than the Trust. Therefore, the Trust does not provide opt-out options to their shareholders.
P.O. Box 182593
Columbus, Ohio 43218-2593

Visit our website at: | Call | ||||||
vcm.com | (800) 235-8396 | ||||||
27804-0121

NOVEMBER 30, 2020
Semi Annual Report
USAA Cornerstone Moderately Aggressive Fund
Beginning January 1, 2021, as permitted by regulations adopted by the Securities and Exchange Commission, paper copies of the Fund's shareholder reports may no longer be sent by mail, unless you specifically request paper copies of the reports from the Fund or from your financial intermediary, such as a broker-dealer or bank. Instead, the reports will be made available on VictoryFunds.com, and you will be notified by mail each time a report is posted and provided with a website link to access the report. If you already elected to receive shareholder reports electronically, you will not be affected by this change and you need not take any action.
You may elect to receive shareholder reports and other communications from the Fund or your financial intermediary electronically by notifying your financial intermediary directly, or if you are a shareholder who has an account directly with the Fund, by calling (800) 235-8396 or by submitting your request via email to TA.Processing@FISGlobal.com.
You may elect to receive all future reports in paper free of charge. You can inform the Fund or your financial intermediary that you wish to continue receiving paper copies of your shareholder reports by notifying your financial intermediary directly, or if you are a shareholder who has an account directly with the Fund, by calling (800) 235-8396 or submitting your request via email to TA.Processing@FISGlobal.com.
Your election to receive reports in paper will apply to all funds held with the USAA Mutual Funds or your financial intermediary.
Victory Capital means Victory Capital Management Inc., the investment adviser of the USAA Mutual Funds. USAA Mutual Funds are distributed by Victory Capital Services, Inc., member of FINRA, an affiliate of Victory Capital. Victory Capital and its affiliates are not affiliated with United Services Automobile Association or its affiliates. USAA and the USAA logo are registered trademarks and the USAA Mutual Funds and USAA Investments logos are trademarks of United Services Automobile Association and are being used by Victory Capital and its affiliates under license.
TABLE OF CONTENTS
Investment Objective & Portfolio Holdings | 2 | ||||||
Schedule of Portfolio Investments | 3 | ||||||
Financial Statements | |||||||
Statement of Assets and Liabilities | 20 | ||||||
Statement of Operations | 21 | ||||||
Statements of Changes in Net Assets | 22 | ||||||
Financial Highlights | 24 | ||||||
Notes to Financial Statements | 26 | ||||||
Supplemental Information | 38 | ||||||
Proxy Voting and Portfolio Holdings Information | 38 | ||||||
Expense Example | 38 | ||||||
Privacy Policy (inside back cover) | |||||||
This report is for the information of the shareholders and others who have received a copy of the currently effective prospectus of the Fund, managed by Victory Capital Management Inc. It may be used as sales literature only when preceded or accompanied by a current prospectus, which provides further details about the Fund.
IRA DISTRIBUTION WITHHOLDING DISCLOSURE
We generally must withhold federal income tax at a rate of 10% of the taxable portion of your distribution and, if you live in a state that requires state income tax withholding, at your state's tax rate. However, you may elect not to have withholding apply or to have income tax withheld at a higher rate. Any withholding election that you make will apply to any subsequent distribution unless and until you change or revoke the election. If you wish to make a withholding election, or change or revoke a prior withholding election, call (800) 235-8396, and form W-4P (OMB No. 1545-0074 withholding certificate for pension or annuity payments) will be electronically sent.
If you do not have a withholding election in place by the date of a distribution, federal income tax will be withheld from the taxable portion of your distribution at a rate of 10%. If you must pay estimated taxes, you may be subject to estimated tax penalties if your estimated tax payments are not sufficient and sufficient tax is not withheld from your distribution.
For more specific information, please consult your tax adviser.
USAA Mutual Funds Trust
1
| USAA Mutual Funds Trust USAA Cornerstone Moderately Aggressive Fund | November 30, 2020 | ||||||
(Unaudited)
Investment Objective & Portfolio Holdings:
The Fund's investment objective is to seek capital appreciation with a secondary focus on current income.
Asset Allocation*:
November 30, 2020
(% of Net Assets)
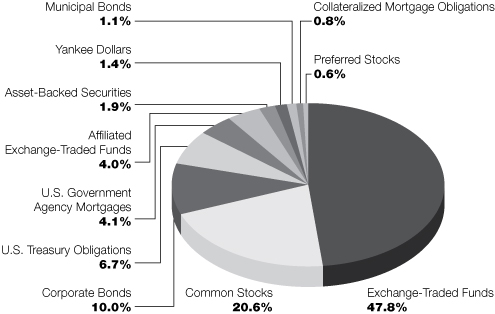
* Does not include futures, money market instruments, and short-term investments purchased with cash collateral from securities loaned.
Percentages are of the net assets of the Fund and may not equal 100%.
2
| USAA Mutual Funds Trust USAA Cornerstone Moderately Aggressive Fund | Schedule of Portfolio Investments November 30, 2020 | ||||||
(Amounts in Thousands, Except for Shares) (Unaudited)
Security Description | Principal Amount | Value | |||||||||
Asset-Backed Securities (1.9%) | |||||||||||
| American Express Credit Account Master Trust, Series 2019-2, Class B, 2.86%, 11/15/24 | $ | 2,836 | $ | 2,927 | |||||||
| Americredit Automobile Receivables Trust, Series 2018-2, Class A3, 3.15%, 3/20/23, Callable 10/18/22 @ 100 | 301 | 304 | |||||||||
| Americredit Automobile Receivables Trust, Series 2018-1, Class C, 3.50%, 1/18/24, Callable 7/18/22 @ 100 | 4,640 | 4,807 | |||||||||
| ARI Fleet Lease Trust, Series 2020-A, Class A3, 1.80%, 8/15/28, Callable 3/15/23 @ 100 (a) | 766 | 785 | |||||||||
| Canadian Pacer Auto Receivables Trust, Series 2018-1A, Class C, 3.82%, 4/19/24, Callable 5/19/21 @ 100 (a) | 2,084 | 2,115 | |||||||||
| CarMax Auto Owner Trust, Series 2020-1, Class B, 2.21%, 9/15/25, Callable 8/15/23 @ 100 | 1,084 | 1,127 | |||||||||
| Credit Acceptance Auto Loan Trust, Series 2018-3A, Class A, 3.55%, 8/15/27, Callable 10/15/21 @ 100 (a) | 1,799 | 1,820 | |||||||||
| Dell Equipment Finance Trust, Series 2020-1, Class A3, 2.24%, 2/22/23, Callable 8/22/22 @ 100 (a) | 569 | 584 | |||||||||
| Drive Auto Receivables Trust, Series 2018-4, Class D, 4.09%, 1/15/26, Callable 7/15/22 @ 100 | 1,137 | 1,175 | |||||||||
| Drive Auto Receivables Trust, Series 2019-1, Class C, 3.78%, 4/15/25, Callable 9/15/22 @ 100 | 1,247 | 1,273 | |||||||||
| Enterprise Fleet Financing LLC, Series 2020-1, Class A3, 1.86%, 12/22/25 (a) | 697 | 723 | |||||||||
Evergreen Credit Card Trust, Series 2019-2, Class A, 1.90%, 9/15/24 (a) | 1,916 | 1,970 | |||||||||
| Exeter Automobile Receivables Trust, Series 2020-1A, Class B, 2.26%, 4/15/24, Callable 5/15/23 @ 100 (a) | 873 | 884 | |||||||||
| Exeter Automobile Receivables Trust, Series 2019-2A, Class C, 3.30%, 3/15/24, Callable 12/15/22 @ 100 (a) | 1,705 | 1,742 | |||||||||
| Exeter Automobile Receivables Trust, Series 2017-3A, Class D, 5.28%, 10/15/24, Callable 4/15/22 @ 100 (a) | 850 | 890 | |||||||||
| Ford Credit Auto Owner Trust, Series 2019-A, Class A3, 2.78%, 9/15/23, Callable 12/15/22 @ 100 | 612 | 624 | |||||||||
| Ford Credit Auto Owner Trust, Series 2020-1, Class B, 2.29%, 8/15/31, Callable 2/15/25 @ 100 (a) | 1,134 | 1,175 | |||||||||
| Great American Auto Leasing, Inc., Series 2019-1, Class A3, 3.05%, 9/15/22, Callable 12/15/22 @ 100 (a) | 777 | 789 | |||||||||
Hertz Vehicle Financing II LP, Series 2019-3A, Class A, 2.67%, 12/26/25 (a) | 367 | 368 | |||||||||
| HPEFS Equipment Trust, Series 2019-1A, Class C, 2.49%, 9/20/29, Callable 5/20/22 @ 100 (a) | 766 | 784 | |||||||||
| HPEFS Equipment Trust, Series 2020-1A, Class B, 1.89%, 2/20/30, Callable 12/20/22 @ 100 (a) | 436 | 444 | |||||||||
| MMAF Equipment Finance LLC, Series 2017-B, Class A4, 2.41%, 11/15/24, Callable 6/15/22 @ 100 (a) | 1,701 | 1,734 | |||||||||
| Navient Student Loan Trust, Series 2015-2, Class B, 1.65% (LIBOR01M+150bps), 8/25/50, Callable 1/25/29 @ 100 (b) | 1,800 | 1,710 | |||||||||
| NP SPE II LLC, Series 2017-1A, Class A1, 3.37%, 10/21/47, Callable 10/20/27 @ 100 (a) | 605 | 619 | |||||||||
| OSCAR US Funding Trust IX LLC, Series 2018-2A, Class A4, 3.63%, 9/10/25 (a) | 4,600 | 4,796 | |||||||||
See notes to financial statements.
3
| USAA Mutual Funds Trust USAA Cornerstone Moderately Aggressive Fund | Schedule of Portfolio Investments — continued November 30, 2020 | ||||||
(Amounts in Thousands, Except for Shares) (Unaudited)
Security Description | Principal Amount | Value | |||||||||
| SCF Equipment Leasing LLC, Series 2020-1A, Class B, 2.02%, 3/20/28, Callable 7/20/25 @ 100 (a) | $ | 869 | $ | 877 | |||||||
| SCF Equipment Leasing LLC, Series 2017-2A, Class A, 3.41%, 12/20/23, Callable 12/20/20 @ 100 (a) | 386 | 388 | |||||||||
| SLM Student Loan Trust, Series 2006-2, Class B, 0.43% (LIBOR03M+22bps), 1/25/41, Callable 7/25/32 @ 100 (b) | 1,804 | 1,604 | |||||||||
| SLM Student Loan Trust, Series 2003-14, Class B, 0.76% (LIBOR03M+55bps), 10/25/65, Callable 4/25/29 @ 100 (b) | 639 | 598 | |||||||||
| Synchrony Credit Card Master Note Trust, Series 2018-2, Class A, 3.47%, 5/15/26 | 3,015 | 3,223 | |||||||||
| Synchrony Credit Card Master Note Trust, Series 2016-2, Class C, 2.95%, 5/15/24 | 2,648 | 2,667 | |||||||||
| Transportation Finance Equipment Trust, Series 2019-1, Class A4, 1.88%, 3/25/24, Callable 6/23/23 @ 100 (a) | 1,701 | 1,750 | |||||||||
| Transportation Finance Equipment Trust, Series 2019-1, Class B, 2.06%, 5/23/24, Callable 6/23/23 @ 100 (a) | 600 | 619 | |||||||||
| Trinity Rail Leasing LLC, Series 2019-2A, Class A2, 3.10%, 10/18/49, Callable 12/17/20 @ 100 (a) | 1,000 | 1,034 | |||||||||
| Westlake Automobile Receivables Trust, Series 2018-2A, Class D, 4.00%, 1/16/24, Callable 1/15/22 @ 100 (a) | 1,500 | 1,532 | |||||||||
| Westlake Automobile Receivables Trust, Series 2020-1A, Class B, 1.94%, 4/15/25, Callable 7/15/23 @ 100 (a) | 2,836 | 2,876 | |||||||||
Total Asset-Backed Securities (Cost $52,236) | 53,337 | ||||||||||
Collateralized Mortgage Obligations (0.8%) | |||||||||||
| Banc of America Commercial Mortgage Trust, Series 2006-3, Class AM, 5.86%, 7/10/44 (c) | 3,874 | 771 | |||||||||
| Banc of America Commercial Mortgage Trust, Series 2008-1, Class AJ, 6.79%, 2/10/51 (c) | 130 | 136 | |||||||||
BANK, Series 2019-BNK20, Class A3, 3.01%, 9/15/61 | 1,750 | 1,953 | |||||||||
| Barclays Commercial Mortgage Trust, Series 2019-C5, Class ASB, 2.99%, 11/15/52 | 1,322 | 1,457 | |||||||||
| Benchmark Mortgage Trust, Series 2020-B17, Class ASB, 2.18%, 3/15/53, Callable 11/15/29 @ 100 | 1,134 | 1,196 | |||||||||
Benchmark Mortgage Trust, Series 2019-B14, Class A5, 3.05%, 12/15/61 | 2,269 | 2,548 | |||||||||
| BTH Mortgage-Backed Securities Trust, Series 2018-21, Class A, 2.65% (LIBOR01M+250bps), 10/7/21 (a) (b) | 2,320 | 2,309 | |||||||||
BX Trust, Series 2019-OC11, Class A, 3.20%, 12/9/41 (a) | 1,047 | 1,118 | |||||||||
| Citigroup Commercial Mortgage Trust, Series 2020-555, Class A, 2.65%, 12/10/41 (a) | 1,701 | 1,783 | |||||||||
| Citigroup Commercial Mortgage Trust, Series 2020-GC46, Class AAB, 2.61%, 1/15/53 | 1,134 | 1,228 | |||||||||
COMM Mortgage Trust, Series 2019-GC44, Class ASB, 2.87%, 8/15/57 | 1,701 | 1,868 | |||||||||
| COMM Mortgage Trust, Series 2014-277P, Class A, 3.73%, 8/10/49, Callable 8/10/24 @ 100 (a) (c) | 1,138 | 1,226 | |||||||||
| Credit Suisse Commercial Mortgage Trust, Series 2007-C1, Class AMFL, 0.33% (LIBOR01M+19bps), 2/15/40 (b) | 55 | 51 | |||||||||
See notes to financial statements.
4
| USAA Mutual Funds Trust USAA Cornerstone Moderately Aggressive Fund | Schedule of Portfolio Investments — continued November 30, 2020 | ||||||
(Amounts in Thousands, Except for Shares) (Unaudited)
Security Description | Shares or Principal Amount | Value | |||||||||
| CSAIL Commercial Mortgage Trust, Series 2016-C6, Class XA, 2.06%, 1/15/49, Callable 11/15/25 @ 100 (c) (d) | $ | 20,394 | $ | 1,545 | |||||||
DBJPM Mortgage Trust, Series 2016-SFC, Class A, 2.83%, 8/10/36 (a) | 1,000 | 979 | |||||||||
| GE Commercial Mortgage Corp., Series 2007-C1, Class AM, 5.61%, 12/10/49 (c) | 549 | 258 | |||||||||
GS Mortgage Securities Trust, Series 2020-GC45, Class A5, 2.91%, 2/13/53 | 720 | 799 | |||||||||
GS Mortgage Securities Trust, Series 2020-GC45, Class AAB, 2.84%, 2/13/53 | 608 | 667 | |||||||||
Manhattan West, Series 2020-1MW, Class A, 2.13%, 9/10/40 (a) | 711 | 737 | |||||||||
| UBS Commercial Mortgage Trust, Series 2012-C1, Class XA, 2.25%, 5/10/45, Callable 4/10/22 @ 100 (a) (c) (d) | 20,761 | 364 | |||||||||
Total Collateralized Mortgage Obligations (Cost $25,486) | 22,993 | ||||||||||
Common Stocks (20.6%) | |||||||||||
Communication Services (1.6%): | |||||||||||
Activision Blizzard, Inc. | 38,552 | 3,064 | |||||||||
Alphabet, Inc. Class C (e) | 4,988 | 8,783 | |||||||||
AT&T, Inc. | 134,381 | 3,864 | |||||||||
Charter Communications, Inc. Class A (e) | 4,827 | 3,147 | |||||||||
Comcast Corp. Class A | 80,895 | 4,064 | |||||||||
Facebook, Inc. Class A (e) | 23,529 | 6,517 | |||||||||
Match Group, Inc. (e) | 21,351 | 2,972 | |||||||||
Sirius XM Holdings, Inc. (f) | 414,195 | 2,688 | |||||||||
T-Mobile U.S., Inc. (e) | 23,207 | 3,085 | |||||||||
Verizon Communications, Inc. | 68,340 | 4,129 | |||||||||
Zillow Group, Inc. Class C (e) | 25,501 | 2,749 | |||||||||
45,062 | |||||||||||
Consumer Discretionary (2.0%): | |||||||||||
Amazon.com, Inc. (e) | 3,302 | 10,461 | |||||||||
AutoZone, Inc. (e) | 2,416 | 2,749 | |||||||||
Booking Holdings, Inc. (e) | 1,515 | 3,073 | |||||||||
Dollar General Corp. | 13,648 | 2,983 | |||||||||
Domino's Pizza, Inc. | 6,954 | 2,730 | |||||||||
eBay, Inc. | 59,246 | 2,988 | |||||||||
Ford Motor Co. | 325,048 | 2,951 | |||||||||
General Motors Co. | 70,317 | 3,083 | |||||||||
Lennar Corp. Class A | 36,508 | 2,769 | |||||||||
Lowe's Cos., Inc. | 22,202 | 3,459 | |||||||||
O'Reilly Automotive, Inc. (e) | 6,117 | 2,706 | |||||||||
Peloton Interactive, Inc. Class A (e) | 25,360 | 2,951 | |||||||||
Tesla, Inc. (e) | 9,630 | 5,466 | |||||||||
The Home Depot, Inc. | 31,584 | 8,762 | |||||||||
57,131 | |||||||||||
Consumer Staples (1.2%): | |||||||||||
Altria Group, Inc. | 76,592 | 3,051 | |||||||||
Colgate-Palmolive Co. | 35,156 | 3,011 | |||||||||
Kimberly-Clark Corp. | 20,210 | 2,815 | |||||||||
Monster Beverage Corp. (e) | 32,468 | 2,753 | |||||||||
See notes to financial statements.
5
| USAA Mutual Funds Trust USAA Cornerstone Moderately Aggressive Fund | Schedule of Portfolio Investments — continued November 30, 2020 | ||||||
(Amounts in Thousands, Except for Shares) (Unaudited)
Security Description | Shares | Value | |||||||||
Philip Morris International, Inc. | 85,290 | $ | 6,461 | ||||||||
The Clorox Co. | 26,487 | 5,376 | |||||||||
The Kroger Co. | 84,197 | 2,778 | |||||||||
The Procter & Gamble Co. | 32,628 | 4,531 | |||||||||
Walgreens Boots Alliance, Inc. | 73,147 | 2,780 | |||||||||
33,556 | |||||||||||
Energy (0.6%): | |||||||||||
Cabot Oil & Gas Corp. | 152,446 | 2,671 | |||||||||
Chevron Corp. | 42,849 | 3,735 | |||||||||
ConocoPhillips | 146,308 | 5,788 | |||||||||
Halliburton Co. | 170,821 | 2,834 | |||||||||
Phillips 66 | 46,151 | 2,796 | |||||||||
17,824 | |||||||||||
Financials (2.6%): | |||||||||||
AGNC Investment Corp. | 11,575 | 177 | |||||||||
Annaly Capital Management, Inc. | 30,696 | 245 | |||||||||
Aon PLC Class A | 14,046 | 2,878 | |||||||||
Berkshire Hathaway, Inc. Class B (e) | 19,662 | 4,501 | |||||||||
Brown & Brown, Inc. | 55,610 | 2,504 | |||||||||
Capital One Financial Corp. | 33,618 | 2,879 | |||||||||
First Republic Bank | 20,047 | 2,597 | |||||||||
KeyCorp | 170,162 | 2,631 | |||||||||
MarketAxess Holdings, Inc. | 5,186 | 2,796 | |||||||||
Marsh & McLennan Cos., Inc. | 25,540 | 2,928 | |||||||||
MetLife, Inc. | 62,654 | 2,893 | |||||||||
Moody's Corp. | 10,267 | 2,899 | |||||||||
Morgan Stanley | 52,926 | 3,272 | |||||||||
MSCI, Inc. | 13,699 | 5,609 | |||||||||
Prudential Financial, Inc. | 37,412 | 2,829 | |||||||||
S&P Global, Inc. | 18,002 | 6,333 | |||||||||
State Street Corp. | 40,232 | 2,835 | |||||||||
SVB Financial Group (e) | 15,205 | 5,244 | |||||||||
T. Rowe Price Group, Inc. | 19,654 | 2,819 | |||||||||
The Allstate Corp. | 27,417 | 2,806 | |||||||||
The Goldman Sachs Group, Inc. | 13,737 | 3,167 | |||||||||
The Progressive Corp. | 61,238 | 5,334 | |||||||||
Wells Fargo & Co. | 127,336 | 3,483 | |||||||||
73,659 | |||||||||||
Health Care (3.4%): | |||||||||||
AbbVie, Inc. | 37,404 | 3,912 | |||||||||
Amgen, Inc. | 29,976 | 6,656 | |||||||||
Anthem, Inc. | 9,844 | 3,067 | |||||||||
Biogen, Inc. (e) | 23,793 | 5,714 | |||||||||
Bio-Rad Laboratories, Inc. Class A (e) | 4,538 | 2,444 | |||||||||
Bristol-Myers Squibb Co. | 55,841 | 3,484 | |||||||||
Cerner Corp. | 37,056 | 2,773 | |||||||||
Cigna Corp. | 14,838 | 3,103 | |||||||||
CVS Health Corp. | 47,656 | 3,231 | |||||||||
See notes to financial statements.
6
| USAA Mutual Funds Trust USAA Cornerstone Moderately Aggressive Fund | Schedule of Portfolio Investments — continued November 30, 2020 | ||||||
(Amounts in Thousands, Except for Shares) (Unaudited)
Security Description | Shares | Value | |||||||||
Danaher Corp. | 15,124 | $ | 3,397 | ||||||||
DexCom, Inc. (e) | 8,277 | 2,646 | |||||||||
Eli Lilly & Co. | 23,286 | 3,392 | |||||||||
Gilead Sciences, Inc. (g) | 51,189 | 3,106 | |||||||||
HCA Healthcare, Inc. | 19,061 | 2,861 | |||||||||
IDEXX Laboratories, Inc. (e) | 6,270 | 2,890 | |||||||||
Johnson & Johnson (g) | 66,280 | 9,589 | |||||||||
Merck & Co., Inc. | 46,818 | 3,764 | |||||||||
Mettler-Toledo International, Inc. (e) | 2,399 | 2,759 | |||||||||
Pfizer, Inc. | 105,796 | 4,053 | |||||||||
ResMed, Inc. | 12,899 | 2,704 | |||||||||
Thermo Fisher Scientific, Inc. | 7,924 | 3,685 | |||||||||
UnitedHealth Group, Inc. | 26,488 | 8,909 | |||||||||
Veeva Systems, Inc. Class A (e) | 10,382 | 2,874 | |||||||||
Waters Corp. (e) | 11,852 | 2,750 | |||||||||
West Pharmaceutical Services, Inc. | 9,472 | 2,606 | |||||||||
96,369 | |||||||||||
Industrials (1.9%): | |||||||||||
3M Co. | 37,168 | 6,420 | |||||||||
Carrier Global Corp. | 69,181 | 2,634 | |||||||||
CSX Corp. | 33,520 | 3,019 | |||||||||
Cummins, Inc. | 12,244 | 2,830 | |||||||||
Eaton Corp. PLC | 25,091 | 3,039 | |||||||||
Equifax, Inc. | 15,393 | 2,569 | |||||||||
FedEx Corp. | 10,428 | 2,988 | |||||||||
Fortune Brands Home & Security, Inc. | 31,067 | 2,594 | |||||||||
General Dynamics Corp. | 18,795 | 2,807 | |||||||||
Illinois Tool Works, Inc. | 14,315 | 3,022 | |||||||||
Lockheed Martin Corp. | 8,297 | 3,028 | |||||||||
Northrop Grumman Corp. | 9,501 | 2,872 | |||||||||
Old Dominion Freight Line, Inc. | 12,945 | 2,633 | |||||||||
Otis Worldwide Corp. | 41,147 | 2,754 | |||||||||
Rockwell Automation, Inc. | 11,125 | 2,843 | |||||||||
Rollins, Inc. | 44,843 | 2,564 | |||||||||
Verisk Analytics, Inc. | 13,383 | 2,654 | |||||||||
W.W. Grainger, Inc. | 6,454 | 2,700 | |||||||||
53,970 | |||||||||||
Information Technology (5.4%): | |||||||||||
Accenture PLC Class A | 14,446 | 3,598 | |||||||||
Adobe, Inc. (e) | 16,824 | 8,050 | |||||||||
Apple, Inc. | 369,142 | 43,946 | |||||||||
Applied Materials, Inc. | 40,148 | 3,311 | |||||||||
Broadcom, Inc. | 9,209 | 3,698 | |||||||||
Cadence Design Systems, Inc. (e) | 24,442 | 2,843 | |||||||||
CDW Corp. | 19,852 | 2,591 | |||||||||
Cisco Systems, Inc. | 88,825 | 3,821 | |||||||||
Cognizant Technology Solutions Corp. Class A | 38,757 | 3,028 | |||||||||
Coupa Software, Inc. (e) | 8,867 | 2,916 | |||||||||
DocuSign, Inc. (e) | 12,958 | 2,953 | |||||||||
See notes to financial statements.
7
| USAA Mutual Funds Trust USAA Cornerstone Moderately Aggressive Fund | Schedule of Portfolio Investments — continued November 30, 2020 | ||||||
(Amounts in Thousands, Except for Shares) (Unaudited)
Security Description | Shares | Value | |||||||||
HP, Inc. | 271,811 | $ | 5,961 | ||||||||
Intel Corp. | 83,450 | 4,035 | |||||||||
International Business Machines Corp. | 27,995 | 3,458 | |||||||||
Intuit, Inc. | 8,772 | 3,088 | |||||||||
Lam Research Corp. | 13,690 | 6,197 | |||||||||
Mastercard, Inc. Class A | 13,058 | 4,394 | |||||||||
Micron Technology, Inc. (e) | 50,062 | 3,208 | |||||||||
Microsoft Corp. (g) | 54,261 | 11,616 | |||||||||
NVIDIA Corp. | 16,752 | 8,980 | |||||||||
Oracle Corp. | 59,242 | 3,419 | |||||||||
Square, Inc. Class A (e) | 16,011 | 3,378 | |||||||||
Texas Instruments, Inc. | 22,058 | 3,557 | |||||||||
The Trade Desk, Inc. Class A (e) | 3,523 | 3,174 | |||||||||
VeriSign, Inc. (e) | 13,909 | 2,792 | |||||||||
VMware, Inc. Class A (e) (f) | 18,577 | 2,599 | |||||||||
Zoom Video Communications, Inc. Class A (e) | 7,103 | 3,398 | |||||||||
154,009 | |||||||||||
Materials (0.6%): | |||||||||||
Air Products & Chemicals, Inc. | 10,998 | 3,081 | |||||||||
Ball Corp. | 28,322 | 2,719 | |||||||||
Hycroft Mining Holding Corp. (e) (h) | 116,092 | 906 | |||||||||
LyondellBasell Industries NV Class A | 66,164 | 5,631 | |||||||||
Newmont Corp. | 45,807 | 2,694 | |||||||||
The Sherwin-Williams Co. | 4,050 | 3,028 | |||||||||
18,059 | |||||||||||
Real Estate (0.6%): | |||||||||||
Alexandria Real Estate Equities, Inc. | 2,673 | 438 | |||||||||
American Tower Corp. | 8,004 | 1,850 | |||||||||
AvalonBay Communities, Inc. | 2,524 | 420 | |||||||||
Boston Properties, Inc. | 3,215 | 316 | |||||||||
Camden Property Trust | 2,128 | 210 | |||||||||
CBRE Group, Inc. Class A (e) | 6,014 | 368 | |||||||||
Crown Castle International Corp. | 7,583 | 1,271 | |||||||||
Digital Realty Trust, Inc. | 4,853 | 654 | |||||||||
Duke Realty Corp. | 8,037 | 306 | |||||||||
Equinix, Inc. | 1,606 | 1,121 | |||||||||
Equity LifeStyle Properties, Inc. | 3,775 | 221 | |||||||||
Equity Residential | 6,660 | 386 | |||||||||
Essex Property Trust, Inc. | 1,171 | 288 | |||||||||
Extra Space Storage, Inc. | 2,864 | 323 | |||||||||
Federal Realty Investment Trust | 1,587 | 138 | |||||||||
Healthpeak Properties, Inc. | 11,139 | 321 | |||||||||
Host Hotels & Resorts, Inc. | 15,155 | 213 | |||||||||
Invitation Homes, Inc. | 11,872 | 339 | |||||||||
Iron Mountain, Inc. | 6,174 | 170 | |||||||||
Jones Lang LaSalle, Inc. (e) | 1,111 | 147 | |||||||||
Medical Properties Trust, Inc. | 11,579 | 225 | |||||||||
Mid-America Apartment Communities, Inc. | 2,516 | 317 | |||||||||
National Retail Properties, Inc. | 3,848 | 145 | |||||||||
See notes to financial statements.
8
| USAA Mutual Funds Trust USAA Cornerstone Moderately Aggressive Fund | Schedule of Portfolio Investments — continued November 30, 2020 | ||||||
(Amounts in Thousands, Except for Shares) (Unaudited)
Security Description | Shares or Principal Amount | Value | |||||||||
Omega Healthcare Investors, Inc. | 5,042 | $ | 177 | ||||||||
Prologis, Inc. | 13,391 | 1,340 | |||||||||
Public Storage | 2,846 | 639 | |||||||||
Realty Income Corp. | 6,223 | 373 | |||||||||
Regency Centers Corp. | 3,746 | 171 | |||||||||
SBA Communications Corp. | 2,027 | 582 | |||||||||
Simon Property Group, Inc. | 5,526 | 456 | |||||||||
Sun Communities, Inc. | 2,042 | 284 | |||||||||
UDR, Inc. | 6,517 | 251 | |||||||||
Ventas, Inc. | 8,086 | 387 | |||||||||
VEREIT, Inc. | 23,754 | 168 | |||||||||
VICI Properties, Inc. | 10,011 | 253 | |||||||||
Vornado Realty Trust | 3,536 | 138 | |||||||||
Welltower, Inc. | 7,507 | 473 | |||||||||
Weyerhaeuser Co. | 13,436 | 390 | |||||||||
WP Carey, Inc. | 3,813 | 264 | |||||||||
16,533 | |||||||||||
Utilities (0.7%): | |||||||||||
Duke Energy Corp. (g) | 33,373 | 3,093 | |||||||||
Eversource Energy (g) | 30,286 | 2,650 | |||||||||
Exelon Corp. | 68,013 | 2,793 | |||||||||
NextEra Energy, Inc. (g) | 44,994 | 3,311 | |||||||||
NRG Energy, Inc. | 83,523 | 2,736 | |||||||||
The AES Corp. | 125,016 | 2,555 | |||||||||
WEC Energy Group, Inc. (g) | 28,056 | 2,663 | |||||||||
19,801 | |||||||||||
Total Common Stocks (Cost $472,461) | 585,973 | ||||||||||
Preferred Stocks (0.6%) | |||||||||||
Communication Services (0.2%): | |||||||||||
Qwest Corp., 6.50%, 9/1/56 | 220,000 | 5,612 | |||||||||
Consumer Staples (0.2%): | |||||||||||
CHS, Inc., cumulative redeemable, Series 1, 7.88% (i) | 30,000 | 861 | |||||||||
Dairy Farmers of America, Inc., cumulative redeemable, 7.88% (a) (i) | 45,000 | 4,207 | |||||||||
5,068 | |||||||||||
Financials (0.2%): | |||||||||||
Delphi Financial Group, Inc., 3.41% (LIBOR03M+319bps), 5/15/37 (b) (j) | 309,253 | 6,108 | |||||||||
Total Preferred Stocks (Cost $16,519) | 16,788 | ||||||||||
Corporate Bonds (10.0%) | |||||||||||
Communication Services (0.4%): | |||||||||||
AT&T, Inc., 2.30%, 6/1/27, Callable 4/1/27 @ 100 | $ | 1,709 | 1,815 | ||||||||
Fox Corp., 3.05%, 4/7/25, Callable 3/7/25 @ 100 | 812 | 888 | |||||||||
The Walt Disney Co., 2.20%, 1/13/28 | 758 | 805 | |||||||||
T-Mobile USA, Inc., 3.88%, 4/15/30, Callable 1/15/30 @ 100 (a) (g) | 2,064 | 2,367 | |||||||||
Verizon Communications, Inc., 4.50%, 8/10/33 | 3,403 | 4,326 | |||||||||
10,201 | |||||||||||
See notes to financial statements.
9
| USAA Mutual Funds Trust USAA Cornerstone Moderately Aggressive Fund | Schedule of Portfolio Investments — continued November 30, 2020 | ||||||
(Amounts in Thousands, Except for Shares) (Unaudited)
Security Description | Principal Amount | Value | |||||||||
Consumer Discretionary (0.3%): | |||||||||||
AutoNation, Inc., 4.75%, 6/1/30, Callable 3/1/30 @ 100 | $ | 683 | $ | 823 | |||||||
General Motors Co., 6.80%, 10/1/27, Callable 8/1/27 @ 100 (g) | 711 | 915 | |||||||||
Hasbro, Inc., 3.55%, 11/19/26, Callable 9/19/26 @ 100 | 1,361 | 1,501 | |||||||||
Nordstrom, Inc., 4.38%, 4/1/30, Callable 1/1/30 @ 100 (f) | 1,134 | 1,092 | |||||||||
O'Reilly Automotive, Inc., 4.20%, 4/1/30, Callable 1/1/30 @ 100 | 1,500 | 1,802 | |||||||||
VF Corp., 2.95%, 4/23/30, Callable 1/23/30 @ 100 | 853 | 938 | |||||||||
| Volkswagen Group of America Finance LLC, 3.20%, 9/26/26, Callable 7/26/26 @ 100 (a) | 711 | 785 | |||||||||
7,856 | |||||||||||
Consumer Staples (0.7%): | |||||||||||
Altria Group, Inc., 3.40%, 5/6/30, Callable 2/6/30 @ 100 | 814 | 904 | |||||||||
| Anheuser-Busch Cos. LLC/Anheuser-Busch InBev Worldwide, Inc., 4.70%, 2/1/36, Callable 8/1/35 @ 100 | 2,836 | 3,612 | |||||||||
BAT Capital Corp., 2.79%, 9/6/24, Callable 8/6/24 @ 100 | 3,000 | 3,208 | |||||||||
Kraft Heinz Foods Co., 3.75%, 4/1/30, Callable 1/1/30 @ 100 (a) | 1,277 | 1,377 | |||||||||
McCormick & Co., Inc., 2.50%, 4/15/30, Callable 1/15/30 @ 100 | 497 | 532 | |||||||||
Mondelez International, Inc., 2.75%, 4/13/30, Callable 1/13/30 @ 100 | 375 | 411 | |||||||||
PepsiCo, Inc., 2.25%, 3/19/25, Callable 2/19/25 @ 100 | 2,639 | 2,821 | |||||||||
Sysco Corp., 5.95%, 4/1/30, Callable 1/1/30 @ 100 | 668 | 883 | |||||||||
The Coca-Cola Co., 3.45%, 3/25/30 | 1,750 | 2,063 | |||||||||
The Procter & Gamble Co., 3.00%, 3/25/30 | 1,138 | 1,320 | |||||||||
Unilever Capital Corp., 2.60%, 5/5/24, Callable 3/5/24 @ 100 | 3,000 | 3,197 | |||||||||
20,328 | |||||||||||
Energy (1.3%): | |||||||||||
Cameron LNG LLC, 3.30%, 1/15/35, Callable 9/15/34 @ 100 (a) | 2,165 | 2,439 | |||||||||
| Cheniere Corpus Christi Holdings LLC, 3.70%, 11/15/29, Callable 5/18/29 @ 100 | 2,837 | 3,105 | |||||||||
Enable Midstream Partners LP, 4.15%, 9/15/29, Callable 6/15/29 @ 100 | 3,000 | 2,787 | |||||||||
Enbridge Energy Partners LP, 7.38%, 10/15/45, Callable 4/15/45 @ 100 (g) | 1,300 | 1,950 | |||||||||
Enterprise Products Operating LLC, 2.80%, 1/31/30, Callable 10/31/29 @ 100 | 1,701 | 1,840 | |||||||||
| Enterprise TE Partners LP, 3.02% (LIBOR03M+278bps), 6/1/67, Callable 1/8/21 @ 100 (b) | 500 | 403 | |||||||||
EOG Resources, Inc., 4.38%, 4/15/30, Callable 1/15/30 @ 100 | 525 | 639 | |||||||||
EQM Midstream Partners LP, 4.75%, 7/15/23, Callable 6/15/23 @ 100 (g) | 5,600 | 5,712 | |||||||||
EQT Corp., 8.75%, 2/1/30, Callable 11/1/29 @ 100 | 1,148 | 1,452 | |||||||||
Exxon Mobil Corp., 2.99%, 3/19/25, Callable 2/19/25 @ 100 (g) | 2,837 | 3,100 | |||||||||
Florida Gas Transmission Co. LLC, 2.55%, 7/1/30, Callable 4/1/30 @ 100 (a) | 711 | 748 | |||||||||
Marathon Petroleum Corp., 4.70%, 5/1/25, Callable 4/1/25 @ 100 | 800 | 908 | |||||||||
Midwest Connector Capital Co. LLC, 4.63%, 4/1/29, Callable 1/1/29 @ 100 (a) | 1,708 | 1,729 | |||||||||
National Oilwell Varco, Inc., 3.60%, 12/1/29, Callable 9/1/29 @ 100 | 2,269 | 2,303 | |||||||||
| Occidental Petroleum Corp. 3.50%, 8/15/29, Callable 5/15/29 @ 100 | 419 | 367 | |||||||||
4.40%, 8/15/49, Callable 2/15/49 @ 100 | 1,134 | 927 | |||||||||
ONEOK, Inc., 6.35%, 1/15/31, Callable 10/15/30 @ 100 | 711 | 880 | |||||||||
Pioneer Natural Resources Co., 1.90%, 8/15/30, Callable 5/15/30 @ 100 | 750 | 740 | |||||||||
Rockies Express Pipeline LLC, 4.80%, 5/15/30, Callable 2/15/30 @ 100 (a) | 1,134 | 1,110 | |||||||||
| Targa Resources Partners LP/Targa Resources Partners Finance Corp., 5.50%, 3/1/30 | 1,134 | 1,233 | |||||||||
See notes to financial statements.
10
| USAA Mutual Funds Trust USAA Cornerstone Moderately Aggressive Fund | Schedule of Portfolio Investments — continued November 30, 2020 | ||||||
(Amounts in Thousands, Except for Shares) (Unaudited)
Security Description | Principal Amount | Value | |||||||||
Western Midstream Operating LP, 3.10%, 2/1/25, Callable 1/1/25 @ 100 | $ | 1,194 | $ | 1,191 | |||||||
35,563 | |||||||||||
Financials (3.3%): | |||||||||||
AmTrust Financial Services, Inc., 6.13%, 8/15/23 | 3,607 | 3,488 | |||||||||
Ares Capital Corp., 3.63%, 1/19/22, Callable 12/19/21 @ 100 (g) | 5,950 | 6,111 | |||||||||
Assurant, Inc., 3.70%, 2/22/30, Callable 11/22/29 @ 100 (f) | 1,154 | 1,240 | |||||||||
| BancorpSouth Bank, 4.13% (LIBOR03M+247bps), 11/20/29, Callable 11/20/24 @ 100 (b) | 1,458 | 1,479 | |||||||||
BBVA USA, 3.88%, 4/10/25, Callable 3/10/25 @ 100 | 2,700 | 3,002 | |||||||||
Belrose Funding Trust, 2.33%, 8/15/30, Callable 5/15/30 @ 100 (a) | 1,704 | 1,736 | |||||||||
| Cadence Bancorp, 4.75% (LIBOR03M+303bps), 6/30/29, Callable 6/30/24 @ 100 (b) | 500 | 463 | |||||||||
Citizens Financial Group, Inc., 2.50%, 2/6/30, Callable 11/6/29 @ 100 | 1,701 | 1,807 | |||||||||
| Cullen/Frost Capital Trust II, 1.80% (LIBOR03M+155bps), 3/1/34, Callable 1/8/21 @ 100 (b) | 9,000 | 6,922 | |||||||||
First Horizon Bank, 5.75%, 5/1/30, Callable 2/1/30 @ 100 | 853 | 993 | |||||||||
| First Maryland Capital I, 1.24% (LIBOR03M+100bps), 1/15/27, Callable 1/8/21 @ 100 (b) | 4,000 | 3,700 | |||||||||
Ford Motor Credit Co. LLC, 4.06%, 11/1/24, Callable 10/1/24 @ 100 | 2,000 | 2,078 | |||||||||
Glencore Funding LLC, 2.50%, 9/1/30, Callable 6/1/30 @ 100 (a) | 1,989 | 1,983 | |||||||||
Global Atlantic Financial Co., 4.40%, 10/15/29, Callable 7/15/29 @ 100 (a) | 1,459 | 1,568 | |||||||||
HSB Group, Inc., 1.15% (LIBOR03M+91bps), 7/15/27, Callable 1/8/21 @ 100 (b) | 4,550 | 4,004 | |||||||||
Hyundai Capital America, 3.75%, 7/8/21 (a) (g) | 5,700 | 5,798 | |||||||||
| JPMorgan Chase & Co., 2.52% (SOFR+204bps), 4/22/31, Callable 4/22/30 @ 100 (b) | 995 | 1,063 | |||||||||
KeyCorp, 2.25%, 4/6/27, MTN | 1,701 | 1,813 | |||||||||
Level 3 Financing, Inc., 3.88%, 11/15/29, Callable 8/15/29 @ 100 (a) | 2,268 | 2,501 | |||||||||
Loews Corp., 3.20%, 5/15/30, Callable 2/15/30 @ 100 | 1,138 | 1,289 | |||||||||
| Manufactures & Traders Trust Co., 0.89% (LIBOR03M+64bps), 12/1/21, Callable 1/8/21 @ 100 (b) (g) | 6,039 | 6,014 | |||||||||
| Nationwide Mutual Insurance Co., 2.54% (LIBOR03M+229bps), 12/15/24, Callable 1/8/21 @ 100 (a) (b) | 11,510 | 11,482 | |||||||||
| New York Community Bancorp, Inc., 5.90% (LIBOR03M+278bps), 11/6/28, Callable 11/6/23 @ 100 (b) | 426 | 436 | |||||||||
| Pinnacle Financial Partners, Inc., 4.13% (LIBOR03M+278bps), 9/15/29, Callable 9/15/24 @ 100 (b) | 2,000 | 1,990 | |||||||||
PPL Capital Funding, Inc., 4.13%, 4/15/30, Callable 1/15/30 @ 100 | 1,138 | 1,351 | |||||||||
| Prudential Financial, Inc., 5.62% (LIBOR03M+392bps), 6/15/43, Callable 6/15/23 @ 100 (b) | 5,400 | 5,814 | |||||||||
Regions Financial Corp., 2.25%, 5/18/25, Callable 4/18/25 @ 100 | 1,281 | 1,357 | |||||||||
Santander Holdings USA, Inc., 3.45%, 6/2/25, Callable 5/2/25 @ 100 | 714 | 774 | |||||||||
| Signature Bank, 4.13% (LIBOR03M+256bps), 11/1/29, Callable 11/1/24 @ 100 (b) | 2,000 | 2,025 | |||||||||
Texas Capital Bank NA, 5.25%, 1/31/26 | 1,135 | 1,200 | |||||||||
| The Allstate Corp., 5.75% (LIBOR03M+294bps), 8/15/53, Callable 8/15/23 @ 100 (b) | 1,180 | 1,265 | |||||||||
The Progressive Corp., 3.20%, 3/26/30, Callable 12/26/29 @ 100 | 340 | 393 | |||||||||
Toyota Motor Credit Corp., 3.38%, 4/1/30, MTN | 1,071 | 1,252 | |||||||||
Truist Bank, 0.89% (LIBOR03M+67bps), 5/15/27, Callable 1/8/21 @ 100 (b) | 1,000 | 944 | |||||||||
See notes to financial statements.
11
| USAA Mutual Funds Trust USAA Cornerstone Moderately Aggressive Fund | Schedule of Portfolio Investments — continued November 30, 2020 | ||||||
(Amounts in Thousands, Except for Shares) (Unaudited)
Security Description | Principal Amount | Value | |||||||||
Wells Fargo & Co., 2.19% (SOFR+200bps), 4/30/26, Callable 4/30/25 @ 100 (b) | $ | 1,279 | $ | 1,340 | |||||||
Zions Bancorp NA, 3.25%, 10/29/29, Callable 7/29/29 @ 100 | 2,269 | 2,333 | |||||||||
93,008 | |||||||||||
Health Care (0.6%): | |||||||||||
AbbVie, Inc., 3.20%, 11/21/29, Callable 8/21/29 @ 100 (a) (g) | 2,268 | 2,567 | |||||||||
Commonspirit Health, 3.35%, 10/1/29, Callable 4/1/29 @ 100 | 1,500 | 1,626 | |||||||||
CVS Health Corp., 3.25%, 8/15/29, Callable 5/15/29 @ 100 (g) | 3,747 | 4,179 | |||||||||
DENTSPLY SIRONA, Inc., 3.25%, 6/1/30, Callable 3/1/30 @ 100 | 1,282 | 1,414 | |||||||||
Duke University Health System, Inc., 2.60%, 6/1/30 | 850 | 902 | |||||||||
HCA, Inc., 5.13%, 6/15/39, Callable 12/15/38 @ 100 | 2,836 | 3,641 | |||||||||
Laboratory Corp. of America Holdings, 2.95%, 12/1/29, Callable 9/1/29 @ 100 | 1,702 | 1,880 | |||||||||
Thermo Fisher Scientific, Inc., 4.13%, 3/25/25, Callable 2/25/25 @ 100 | 1,138 | 1,294 | |||||||||
Upjohn, Inc., 2.30%, 6/22/27, Callable 4/22/27 @ 100 (a) | 427 | 451 | |||||||||
17,954 | |||||||||||
Industrials (1.5%): | |||||||||||
Ashtead Capital, Inc., 4.00%, 5/1/28, Callable 5/1/23 @ 102 (a) | 1,405 | 1,475 | |||||||||
| BNSF Funding Trust, 6.61% (LIBOR03M+235bps), 12/15/55, Callable 1/15/26 @ 100 (b) | 5,325 | 6,061 | |||||||||
Carlisle Cos., Inc., 2.75%, 3/1/30, Callable 12/1/29 @ 100 | 1,701 | 1,830 | |||||||||
Carrier Global Corp., 3.38%, 4/5/40, Callable 10/5/39 @ 100 (a) | 851 | 939 | |||||||||
Caterpillar, Inc., 2.60%, 4/9/30, Callable 1/9/30 @ 100 | 853 | 941 | |||||||||
CoStar Group, Inc., 2.80%, 7/15/30, Callable 4/15/30 @ 100 (a) | 382 | 401 | |||||||||
Dover Corp., 2.95%, 11/4/29, Callable 8/4/29 @ 100 | 1,702 | 1,854 | |||||||||
FedEx Corp., 4.25%, 5/15/30, Callable 2/15/30 @ 100 | 1,250 | 1,522 | |||||||||
General Dynamics Corp., 3.50%, 4/1/27, Callable 2/1/27 @ 100 | 1,138 | 1,311 | |||||||||
Georgia-Pacific LLC, 2.10%, 4/30/27, Callable 2/28/27 @ 100 (a) | 1,990 | 2,100 | |||||||||
Hillenbrand, Inc., 4.50%, 9/15/26, Callable 7/15/26 @ 100 | 1,500 | 1,649 | |||||||||
IDEX Corp., 3.00%, 5/1/30, Callable 2/1/30 @ 100 | 1,990 | 2,204 | |||||||||
Otis Worldwide Corp., 3.11%, 2/15/40, Callable 8/15/39 @ 100 | 1,134 | 1,246 | |||||||||
| Penske Truck Leasing Co. LP/PTL Finance Corp., 4.00%, 7/15/25, Callable 6/15/25 @ 100 (a) | 1,138 | 1,289 | |||||||||
Ryder System, Inc. | |||||||||||
3.50%, 6/1/21, MTN (g) | 5,750 | 5,842 | |||||||||
2.90%, 12/1/26, Callable 10/1/26 @ 100, MTN | 2,837 | 3,097 | |||||||||
Southwest Airlines Co., 5.13%, 6/15/27, Callable 4/15/27 @ 100 | 912 | 1,060 | |||||||||
The Boeing Co., 5.71%, 5/1/40, Callable 11/1/39 @ 100 | 1,706 | 2,150 | |||||||||
| The Conservation Fund A Nonprofit Corp., 3.47%, 12/15/29, Callable 9/15/29 @ 100 | 2,300 | 2,499 | |||||||||
United Airlines Pass Through Trust, 2.90%, 11/1/29 | 2,944 | 2,550 | |||||||||
| Westinghouse Air Brake Technologies Corp., 3.20%, 6/15/25, Callable 5/15/25 @ 100 | 304 | 326 | |||||||||
42,346 | |||||||||||
Information Technology (0.5%): | |||||||||||
Amphenol Corp., 2.80%, 2/15/30, Callable 11/15/29 @ 100 | 3,000 | 3,279 | |||||||||
Analog Devices, Inc., 2.95%, 4/1/25, Callable 3/1/25 @ 100 | 427 | 467 | |||||||||
Broadcom, Inc., 4.30%, 11/15/32, Callable 8/15/32 @ 100 | 711 | 845 | |||||||||
Hewlett Packard Enterprise Co., 4.65%, 10/1/24, Callable 9/1/24 @ 100 | 1,138 | 1,290 | |||||||||
HP, Inc., 3.40%, 6/17/30, Callable 3/17/30 @ 100 | 1,285 | 1,414 | |||||||||
See notes to financial statements.
12
| USAA Mutual Funds Trust USAA Cornerstone Moderately Aggressive Fund | Schedule of Portfolio Investments — continued November 30, 2020 | ||||||
(Amounts in Thousands, Except for Shares) (Unaudited)
Security Description | Principal Amount | Value | |||||||||
Jabil, Inc., 3.00%, 1/15/31, Callable 10/15/30 @ 100 | $ | 382 | $ | 399 | |||||||
Keysight Technologies, Inc., 3.00%, 10/30/29, Callable 7/30/29 @ 100 | 2,039 | 2,239 | |||||||||
Microsoft Corp., 3.45%, 8/8/36, Callable 2/8/36 @ 100 | 3,686 | 4,561 | |||||||||
14,494 | |||||||||||
Materials (0.3%): | |||||||||||
Avery Dennison Corp., 2.65%, 4/30/30, Callable 2/1/30 @ 100 | 680 | 731 | |||||||||
Colonial Enterprises, Inc., 3.25%, 5/15/30, Callable 2/15/30 @ 100 (a) | 356 | 401 | |||||||||
LYB International Finance III LLC, 3.38%, 5/1/30, Callable 2/1/30 @ 100 | 994 | 1,111 | |||||||||
Packaging Corp. of America, 3.00%, 12/15/29, Callable 9/15/29 @ 100 | 2,836 | 3,138 | |||||||||
Sonoco Products Co., 3.13%, 5/1/30, Callable 2/1/30 @ 100 | 1,316 | 1,458 | |||||||||
Vulcan Materials Co., 3.50%, 6/1/30, Callable 3/1/30 @ 100 | 1,137 | 1,297 | |||||||||
WRKCo, Inc., 3.00%, 6/15/33, Callable 3/15/33 @ 100 (g) | 647 | 712 | |||||||||
8,848 | |||||||||||
Real Estate (0.4%): | |||||||||||
AvalonBay Communities, Inc., 2.45%, 1/15/31, MTN, Callable 10/15/30 @ 100 | 1,705 | 1,826 | |||||||||
Boston Properties LP, 3.25%, 1/30/31, Callable 10/30/30 @ 100 | 746 | 814 | |||||||||
Essex Portfolio LP, 2.65%, 3/15/32, Callable 12/15/31 @ 100 | 1,985 | 2,110 | |||||||||
GLP Capital LP/GLP Financing II, Inc., 4.00%, 1/15/31, Callable 10/15/30 @ 100 | 426 | 461 | |||||||||
Host Hotels & Resorts LP, 3.50%, 9/15/30, Callable 6/15/30 @ 100 | 354 | 363 | |||||||||
Lexington Realty Trust, 4.25%, 6/15/23, Callable 3/15/23 @ 100 | 1,400 | 1,489 | |||||||||
Mid-America Apartments LP, 2.75%, 3/15/30, Callable 12/15/29 @ 100 | 2,836 | 3,090 | |||||||||
Sabra Health Care LP, 5.13%, 8/15/26, Callable 5/15/26 @ 100 | 1,000 | 1,105 | |||||||||
SBA Tower Trust, 2.84%, 1/15/25 (a) | 1,125 | 1,188 | |||||||||
| VICI Properties LP/VICI Note Co., Inc., 4.63%, 12/1/29, Callable 12/1/24 @ 102.31 (a) | 262 | 279 | |||||||||
12,725 | |||||||||||
Utilities (0.7%): | |||||||||||
AEP Texas, Inc., 3.45%, 1/15/50, Callable 7/15/49 @ 100 | 1,985 | 2,262 | |||||||||
Alabama Power Co., 3.85%, 12/1/42 | 1,702 | 2,099 | |||||||||
Ameren Corp., 3.50%, 1/15/31, Callable 10/15/30 @ 100 | 569 | 659 | |||||||||
CenterPoint Energy, Inc., 2.50%, 9/1/24, Callable 8/1/24 @ 100 | 2,000 | 2,123 | |||||||||
Cleco Corporate Holdings LLC, 3.38%, 9/15/29, Callable 6/15/29 @ 100 | 1,650 | 1,699 | |||||||||
Duke Energy Florida LLC, 3.85%, 11/15/42, Callable 5/15/42 @ 100 | 1,702 | 2,051 | |||||||||
Exelon Generation Co. LLC, 3.25%, 6/1/25, Callable 5/1/25 @ 100 | 1,281 | 1,381 | |||||||||
IPALCO Enterprises, Inc., 4.25%, 5/1/30, Callable 2/1/30 @ 100 (a) | 1,294 | 1,497 | |||||||||
ITC Holdings Corp., 2.95%, 5/14/30, Callable 2/14/30 @ 100 (a) | 1,279 | 1,404 | |||||||||
National Fuel Gas Co., 5.50%, 1/15/26, Callable 12/15/25 @ 100 | 1,709 | 1,917 | |||||||||
The Narragansett Electric Co., 3.40%, 4/9/30, Callable 1/9/30 @ 100 (a) | 853 | 973 | |||||||||
Union Electric Co., 2.95%, 3/15/30, Callable 12/15/29 @ 100 | 2,837 | 3,190 | |||||||||
21,255 | |||||||||||
Total Corporate Bonds (Cost $265,350) | 284,578 | ||||||||||
Yankee Dollars (1.4%) | |||||||||||
Consumer Staples (0.1%): | |||||||||||
Alimentation Couche-Tard, Inc., 2.95%, 1/25/30, Callable 10/25/29 @ 100 (a) | 1,134 | 1,235 | |||||||||
See notes to financial statements.
13
| USAA Mutual Funds Trust USAA Cornerstone Moderately Aggressive Fund | Schedule of Portfolio Investments — continued November 30, 2020 | ||||||
(Amounts in Thousands, Except for Shares) (Unaudited)
Security Description | Principal Amount | Value | |||||||||
Energy (0.0%): (k) | |||||||||||
Petroleos Mexicanos, 6.49%, 1/23/27, Callable 11/23/26 @ 100 | $ | 973 | $ | 977 | |||||||
Petronas Capital Ltd., 3.50%, 4/21/30, Callable 1/21/30 @ 100 (a) | 85 | 97 | |||||||||
1,074 | |||||||||||
Financials (0.8%): | |||||||||||
Athene Holding Ltd., 4.13%, 1/12/28, Callable 10/12/27 @ 100 | 5,750 | 6,361 | |||||||||
| Banco Santander Mexico SA Institucion de Banca Multiple Grupo Financiero Santand, 5.38%, 4/17/25 (a) | 812 | 918 | |||||||||
Barclays PLC, 2.85% (LIBOR03M+245bps), 5/7/26, Callable 5/7/25 @ 100 (b) | 1,706 | 1,812 | |||||||||
| Deutsche Bank AG, 3.96% (SOFR+258bps), 11/26/25, Callable 11/26/24 @ 100 (b) | 1,701 | 1,840 | |||||||||
Diageo Capital PLC, 2.13%, 4/29/32, Callable 1/29/32 @ 100 | 1,990 | 2,108 | |||||||||
| QBE Capital Funding III Ltd., 7.25% (USSW10+405bps), 5/24/41, Callable 5/24/21 @ 100 (a) (b) | 5,900 | 6,051 | |||||||||
Royal Bank of Canada, 1.60%, 4/17/23, MTN | 1,989 | 2,045 | |||||||||
Sumitomo Mitsui Financial Group, Inc., 2.45%, 9/27/24 | 1,600 | 1,697 | |||||||||
22,832 | |||||||||||
Health Care (0.0%): (k) | |||||||||||
Royalty Pharma PLC, 2.20%, 9/2/30, Callable 6/2/30 @ 100 (a) | 474 | 480 | |||||||||
Industrials (0.2%): | |||||||||||
BAE Systems PLC, 3.40%, 4/15/30, Callable 1/15/30 @ 100 (a) | 1,500 | 1,698 | |||||||||
CK Hutchison International 19 II Ltd., 2.75%, 9/6/29, Callable 6/6/29 @ 100 (a) | 3,000 | 3,208 | |||||||||
Ferguson Finance PLC, 3.25%, 6/2/30, Callable 3/2/30 @ 100 (a) | 769 | 849 | |||||||||
Heathrow Funding Ltd., 4.88%, 7/15/21 (a) | 1,137 | 1,164 | |||||||||
6,919 | |||||||||||
Materials (0.3%): | |||||||||||
Anglo American Capital PLC, 5.63%, 4/1/30, Callable 1/1/30 @ 100 (a) | 1,067 | 1,342 | |||||||||
Braskem Finance Ltd., 6.45%, 2/3/24 | 500 | 548 | |||||||||
Braskem Netherlands Finance BV, 4.50%, 1/31/30 (a) | 1,702 | 1,719 | |||||||||
CCL Industries, Inc., 3.05%, 6/1/30, Callable 3/1/30 @ 100 (a) | 1,281 | 1,393 | |||||||||
Teck Resources Ltd., 6.13%, 10/1/35 | 1,818 | 2,292 | |||||||||
7,294 | |||||||||||
Total Yankee Dollars (Cost $36,840) | 39,834 | ||||||||||
Municipal Bonds (1.1%) | |||||||||||
Arizona (0.0%): (k) | |||||||||||
City of Phoenix Civic Improvement Corp. Revenue, 1.26%, 7/1/27 | 1,000 | 995 | |||||||||
Florida (0.1%): | |||||||||||
| County of Broward Florida Airport System Revenue, Series C, 2.50%, 10/1/28 | 1,134 | 1,158 | |||||||||
| Hillsborough County School Board Certificate of Participation, Series B, 1.92%, 7/1/25 | 710 | 725 | |||||||||
1,883 | |||||||||||
Georgia (0.1%): | |||||||||||
Athens Housing Authority Revenue, 2.42%, 12/1/26 | 2,420 | 2,590 | |||||||||
See notes to financial statements.
14
| USAA Mutual Funds Trust USAA Cornerstone Moderately Aggressive Fund | Schedule of Portfolio Investments — continued November 30, 2020 | ||||||
(Amounts in Thousands, Except for Shares) (Unaudited)
Security Description | Principal Amount | Value | |||||||||
Louisiana (0.0%): (k) | |||||||||||
| Louisiana Local Government Environmental Facilities & Community Development Authority Revenue, 1.55%, 2/1/27 | $ | 1,140 | $ | 1,151 | |||||||
Michigan (0.1%): | |||||||||||
Michigan Finance Authority Revenue, 3.08%, 12/1/34 | 1,700 | 1,877 | |||||||||
New Jersey (0.1%): | |||||||||||
| New Jersey Economic Development Authority Revenue, Series NNN, 2.88%, 6/15/24 | 1,094 | 1,110 | |||||||||
New Jersey Transportation Trust Fund Authority Revenue, 4.08%, 6/15/39 | 435 | 431 | |||||||||
North Hudson Sewerage Authority Revenue, 2.88%, 6/1/28 | 567 | 620 | |||||||||
Rutgers The State University of New Jersey Revenue, Series S, 2.01%, 5/1/32 | 710 | 687 | |||||||||
2,848 | |||||||||||
New York (0.2%): | |||||||||||
New York State Dormitory Authority Revenue | |||||||||||
Series A, 2.46%, 7/1/32 | 1,280 | 1,299 | |||||||||
Series B, 2.83%, 7/1/31 | 2,835 | 2,996 | |||||||||
New York State Thruway Authority Revenue, Series M, 2.55%, 1/1/28 | 655 | 694 | |||||||||
4,989 | |||||||||||
Pennsylvania (0.2%): | |||||||||||
Scranton School District, GO (INS-Build America Mutual Assurance Co.) | |||||||||||
3.05%, 4/1/29 | 800 | 863 | |||||||||
3.10%, 4/1/30 | 579 | 626 | |||||||||
State Public School Building Authority Revenue, 3.05%, 4/1/28 | 1,135 | 1,177 | |||||||||
| University of Pittsburgh-of The Commonwealth System of Higher Education Revenue | |||||||||||
Series C, 2.53%, 9/15/31 | 1,135 | 1,210 | |||||||||
Series C, 2.58%, 9/15/32 | 565 | 603 | |||||||||
Series C, 2.63%, 9/15/33 | 1,135 | 1,215 | |||||||||
5,694 | |||||||||||
Texas (0.3%): | |||||||||||
City of Houston Texas Combined Utility System Revenue, 3.72%, 11/15/28 | 1,415 | 1,664 | |||||||||
City of San Antonio, GO, 1.76%, 2/1/31, Continuously Callable @100 | 1,065 | 1,078 | |||||||||
Dallas/Fort Worth International Airport Revenue, Series C, 1.75%, 11/1/27 | 710 | 714 | |||||||||
| Harris County Cultural Education Facilities Finance Corp. Revenue, Series B, 2.81%, 5/15/29 | 1,135 | 1,217 | |||||||||
State of Texas, GO, 3.00%, 4/1/28 | 1,701 | 1,931 | |||||||||
Waco Educational Finance Corp. Revenue, 1.38%, 3/1/26 | 800 | 803 | |||||||||
7,407 | |||||||||||
Total Municipal Bonds (Cost $28,042) | 29,434 | ||||||||||
U.S. Government Agency Mortgages (4.1%) | |||||||||||
Federal Home Loan Mortgage Corporation | |||||||||||
Series K047, Class A2, 3.33%, 5/25/25 (c) | 8,400 | 9,334 | |||||||||
Series K053, Class A2, 3.00%, 12/25/25 | 14,000 | 15,418 | |||||||||
Series K151, Class A3, 3.51%, 4/25/30 | 9,000 | 10,546 | |||||||||
Series K156, Class A2, 3.70%, 1/25/33 (c) | 4,285 | 5,167 | |||||||||
3.50%, 4/1/46-4/1/48 | 13,088 | 13,875 | |||||||||
See notes to financial statements.
15
| USAA Mutual Funds Trust USAA Cornerstone Moderately Aggressive Fund | Schedule of Portfolio Investments — continued November 30, 2020 | ||||||
(Amounts in Thousands, Except for Shares) (Unaudited)
Security Description | Shares or Principal Amount | Value | |||||||||
3.00%, 6/1/46-6/1/47 | $ | 52,856 | $ | 55,586 | |||||||
4.00%, 7/1/48 | 3,314 | 3,531 | |||||||||
113,457 | |||||||||||
Federal National Mortgage Association | |||||||||||
Series 2016-M2, Class AV2, 2.15%, 1/25/23 | 2,219 | 2,262 | |||||||||
Government National Mortgage Association | |||||||||||
6.50%, 4/15/24 | 3 | 3 | |||||||||
Total U.S. Government Agency Mortgages (Cost $108,388) | 115,722 | ||||||||||
U.S. Treasury Obligations (6.7%) | |||||||||||
U.S. Treasury Bonds | |||||||||||
3.13%, 8/15/44 | 19,200 | 25,659 | |||||||||
2.38%, 11/15/49 | 10,000 | 11,934 | |||||||||
U.S. Treasury Notes | |||||||||||
1.13%, 2/28/21 | 36,125 | 36,214 | |||||||||
1.88%, 7/31/22 (g) | 3,382 | 3,479 | |||||||||
1.63%, 8/15/22 | 10,000 | 10,252 | |||||||||
1.63%, 11/15/22 | 20,000 | 20,576 | |||||||||
1.63%, 4/30/23 (g) | 29,000 | 30,019 | |||||||||
2.75%, 11/15/23 | 1,000 | 1,076 | |||||||||
2.25%, 11/15/25 | 5,000 | 5,463 | |||||||||
1.63%, 2/15/26 | 37,000 | 39,362 | |||||||||
2.38%, 5/15/27 (g) | 6,100 | 6,812 | |||||||||
Total U.S. Treasury Obligations (Cost $175,862) | 190,846 | ||||||||||
Exchange-Traded Funds (47.8%) | |||||||||||
Invesco DB Commodity Index Tracking Fund | 256,100 | 3,570 | |||||||||
Invesco FTSE RAFI Developed Markets ex-US ETF | 653,206 | 26,370 | |||||||||
Invesco FTSE RAFI Emerging Markets ETF | 1,539,501 | 30,467 | |||||||||
iShares Core MSCI EAFE ETF | 391,974 | 25,964 | |||||||||
iShares Core MSCI Emerging Markets ETF (f) | 1,981,119 | 116,133 | |||||||||
iShares Core S&P 500 ETF | 428,105 | 155,539 | |||||||||
iShares Core S&P Small-Cap ETF | 749,825 | 63,840 | |||||||||
iShares Core US Aggregate Bond ETF | 542,578 | 64,252 | |||||||||
iShares MSCI Canada ETF (f) | 710,921 | 21,527 | |||||||||
iShares MSCI International Momentum Factor ETF (f) | 952,016 | 34,092 | |||||||||
iShares MSCI International Quality Factor ETF | 1,024,048 | 34,900 | |||||||||
iShares Russell 2000 ETF (f) | 151,762 | 27,472 | |||||||||
Schwab Fundamental Emerging Markets Large Co. Index ETF | 2,206,197 | 59,192 | |||||||||
Schwab Fundamental International Large Co. Index ETF | 3,168,339 | 89,125 | |||||||||
Schwab Fundamental International Small Co. Index ETF | 593,600 | 19,731 | |||||||||
SPDR Gold Shares (e) | 165,956 | 27,660 | |||||||||
SPDR S&P Emerging Markets Smallcap ETF | 107,983 | 5,337 | |||||||||
VanEck Vectors Gold Miners ETF | 532,415 | 18,464 | |||||||||
VanEck Vectors Junior Gold Miners ETF | 101,000 | 5,053 | |||||||||
Vanguard FTSE All-World ex-US ETF | 689,576 | 38,368 | |||||||||
Vanguard FTSE Developed Markets ETF | 4,811,274 | 216,940 | |||||||||
Vanguard FTSE Emerging Markets ETF (g) | 701,453 | 33,361 | |||||||||
Vanguard Mid-Capital ETF (f) | 30,077 | 6,006 | |||||||||
See notes to financial statements.
16
| USAA Mutual Funds Trust USAA Cornerstone Moderately Aggressive Fund | Schedule of Portfolio Investments — continued November 30, 2020 | ||||||
(Amounts in Thousands, Except for Shares) (Unaudited)
Security Description | Shares | Value | |||||||||
Vanguard Mortgage-Backed Securities ETF | 104,857 | $ | 5,675 | ||||||||
Vanguard Real Estate ETF | 350,311 | 29,426 | |||||||||
Vanguard S&P 500 ETF (g) | 316,114 | 105,152 | |||||||||
Vanguard Short-Term Bond ETF | 325,167 | 26,960 | |||||||||
Vanguard Small-Cap Value ETF (g) | 96,209 | 12,890 | |||||||||
Vanguard Total Bond Market ETF | 424,389 | 37,554 | |||||||||
WisdomTree Emerging Markets SmallCap Dividend Fund (f) | 202,622 | 9,264 | |||||||||
Xtrackers USD High Yield Corporate Bond ETF | 190,204 | 9,418 | |||||||||
Total Exchange-Traded Funds (Cost $1,201,106) | 1,359,702 | ||||||||||
Affiliated Exchange-Traded Funds (4.0%) | |||||||||||
VictoryShares USAA Core Intermediate-Term Bond ETF | 1,494,000 | 81,534 | |||||||||
VictoryShares USAA Core Short-Term Bond ETF | 583,710 | 30,312 | |||||||||
VictoryShares USAA MSCI Emerging Markets Value Momentum ETF (g) | 68,000 | 2,923 | |||||||||
Total Affiliated Exchange-Traded Funds (Cost $114,713) | 114,769 | ||||||||||
Collateral for Securities Loaned^ (3.9%) | |||||||||||
| Goldman Sachs Financial Square Government Fund Institutional Shares, 0.02% (l) | 15,413,028 | 15,413 | |||||||||
HSBC U.S. Government Money Market Fund I Shares, 0.03% (l) | 96,796,039 | 96,796 | |||||||||
Total Collateral for Securities Loaned (Cost $112,209) | 112,209 | ||||||||||
Total Investments (Cost $2,609,212) — 102.8% | 2,926,185 | ||||||||||
Liabilities in excess of other assets — (2.9)% | (79,966 | ) | |||||||||
NET ASSETS — 100.00% | $ | 2,846,219 | |||||||||
At November 30, 2020, the Fund's investments in foreign securities were 19.0% of net assets.
^ Purchased with cash collateral from securities on loan.
(a) Rule 144A security or other security that is restricted as to resale to institutional investors. The Fund's Adviser has deemed this security to be liquid based upon procedures approved by the Board of Trustees. As of November 30, 2020, the fair value of these securities was $114,762 (thousands) and amounted to 4.0% of net assets.
(b) Variable or Floating-Rate Security. Rate disclosed is as of November 30, 2020.
(c) The rate for certain asset-backed and mortgage-backed securities may vary based on factors relating to the pool of assets underlying the security. The rate disclosed is the rate in effect at November 30, 2020.
(d) Security is interest only.
(e) Non-income producing security.
(f) All or a portion of this security is on loan.
(g) All or a portion of this security has been segregated as collateral for derivative instruments.
(h) Security was fair valued based upon procedures approved by the Board of Trustees and represents less than 0.05% of the Fund's net assets as of November 30, 2020. (See Note 2)
See notes to financial statements.
17
| USAA Mutual Funds Trust USAA Cornerstone Moderately Aggressive Fund | Schedule of Portfolio Investments — continued November 30, 2020 | ||||||
(Unaudited)
(i) Security is perpetual and has no final maturity date but may be subject to calls at various dates in the future.
(j) The Fund's Adviser has deemed this security to be illiquid based upon procedures approved by the Board of Trustees. As of November 30, 2020, illiquid securities were 0.2% of the Fund's net assets.
(k) Amount represents less than 0.05% of net assets.
(l) Rate disclosed is the daily yield on November 30, 2020.
bps — Basis points
Continuously callable — Investment is continuously callable or will be continuously callable on any date after the first call date until its maturity.
ETF — Exchange-Traded Fund
GO — General Obligation
LIBOR — London InterBank Offered Rate
LIBOR01M — 1 Month US Dollar LIBOR, rate disclosed as of November 30, 2020, based on the last reset date of the security
LIBOR03M — 3 Month US Dollar LIBOR, rate disclosed as of November 30, 2020, based on the last reset date of the security
LLC — Limited Liability Company
LP — Limited Partnership
MTN — Medium Term Note
PLC — Public Limited Company
SOFR — Secured Overnight Financing Rate
USSW10 — USD 10 Year Swap Rate, rate disclosed as of November 30, 2020
Credit Enhancements — Adds the financial strength of the provider of the enhancement to support the issuer's ability to repay the principal and interest payments when due. The enhancement may be provided by a high-quality bank, insurance company or other corporation, or a collateral trust. The enhancements do not guarantee the market values of the securities.
INS Principal and interest payments are insured by the name listed. Although bond insurance reduces the risk of loss due to default by an issuer, such bonds remain subject to the risk that value may fluctuate for other reasons, and there is no assurance that the insurance company will meet its obligations.
See notes to financial statements.
18
| USAA Mutual Funds Trust USAA Cornerstone Moderately Aggressive Fund | Schedule of Portfolio Investments — continued November 30, 2020 | ||||||
(Unaudited)
Futures Contracts Purchased
(Amounts not in thousands)
| Number of Contracts | Expiration Date | Notional Amount | Value | Unrealized Appreciation/ (Depreciation) | |||||||||||||||||||
| S&P/Toronto Stock Exchange 60 Index Futures | 111 | 12/17/20 | $ | 16,273,143 | $ | 17,491,583 | $ | 946,858 | |||||||||||||||
Swiss Market Index Futures | 247 | 12/18/20 | 28,311,945 | 28,563,368 | 248,482 | ||||||||||||||||||
$ | 1,195,340 | ||||||||||||||||||||||
Futures Contracts Sold
(Amounts not in thousands)
| Number of Contracts | Expiration Date | Notional Amount | Value | Unrealized Appreciation/ (Depreciation) | |||||||||||||||||||
Euro Stoxx 50 Futures | 484 | 12/18/20 | $ | 19,851,636 | $ | 20,233,293 | $ | (269,914 | ) | ||||||||||||||
Russell 2000 E-Mini Index Futures | 111 | 12/18/20 | 8,619,866 | 10,101,555 | (1,481,688 | ) | |||||||||||||||||
Tokyo Price Index Futures | 169 | 12/10/20 | 26,099,050 | 28,423,022 | (1,992,340 | ) | |||||||||||||||||
$ | (3,743,942 | ) | |||||||||||||||||||||
Total unrealized appreciation | $ | 1,195,340 | |||||||||||||||||||||
Total unrealized depreciation | (3,743,942 | ) | |||||||||||||||||||||
Total net unrealized appreciation (depreciation) | $ | (2,548,602 | ) | ||||||||||||||||||||
See notes to financial statements.
19
USAA Mutual Funds Trust | Statement of Assets and Liabilities November 30, 2020 | ||||||
(Amounts in Thousands, Except Per Share Amounts) (Unaudited)
| USAA Cornerstone Moderately Aggressive Fund | |||||||
Assets: | |||||||
Affiliated investments, at value(Cost $114,713) | $ | 114,769 | |||||
Unaffiliated investments, at value (Cost $2,494,499) | 2,811,416 | (a) | |||||
Cash and cash equivalents | 31,116 | ||||||
Deposits with brokers for futures contracts | 2,516 | ||||||
Receivables: | |||||||
Interest and dividends | 5,283 | ||||||
Capital shares issued | 745 | ||||||
Variation margin on open futures contracts | 784 | ||||||
Reclaims | 10 | ||||||
From Adviser | 46 | ||||||
Prepaid expenses | 28 | ||||||
Total Assets | 2,966,713 | ||||||
Liabilities: | |||||||
Payables: | |||||||
Collateral received on loaned securities | 112,209 | ||||||
Collateral received from brokers for futures contract | 3,771 | ||||||
Payable for foreign currency | 78 | ||||||
Capital shares redeemed | 2,020 | ||||||
Variation margin on open futures contracts | 238 | ||||||
Accrued expenses and other payables: | |||||||
Investment advisory fees | 1,359 | ||||||
Administration fees | 346 | ||||||
Custodian fees | 14 | ||||||
Transfer agent fees | 384 | ||||||
Compliance fees | 2 | ||||||
Other accrued expenses | 73 | ||||||
Total Liabilities | 120,494 | ||||||
Net Assets: | |||||||
Capital | 2,450,879 | ||||||
Total accumulated earnings/(loss) | 395,340 | ||||||
Net Assets | $ | 2,846,219 | |||||
Shares (unlimited number of shares authorized with no par value): | 104,890 | ||||||
Net asset value, offering and redemption price per share: (b) | $ | 27.14 | |||||
(a) Includes $107,461 of securities on loan.
(b) Per share amount may not recalculate due to rounding of net assets and/or shares outstanding.
See notes to financial statements.
20
USAA Mutual Funds Trust | Statement of Operations For the Six Months Ended November 30, 2020 | ||||||
(Amounts in Thousands) (Unaudited)
| USAA Cornerstone Moderately Aggressive Fund | |||||||
Investment Income: | |||||||
Income distributions from affiliated funds | $ | 301 | |||||
Dividends | 19,282 | ||||||
Interest | 11,157 | ||||||
Securities lending (net of fees) | 249 | ||||||
Foreign tax withholding | (4 | ) | |||||
Total Income | 30,985 | ||||||
Expenses: | |||||||
Investment advisory fees | 8,151 | ||||||
Administration fees | 2,072 | ||||||
Sub-Administration fees | 54 | ||||||
Custodian fees | 78 | ||||||
Transfer agent fees | 2,973 | ||||||
Trustees' fees | 26 | ||||||
Compliance fees | 9 | ||||||
Legal and audit fees | 47 | ||||||
State registration and filing fees | 21 | ||||||
Interfund lending fees | 1 | ||||||
Other expenses | 145 | ||||||
Total Expenses | 13,577 | ||||||
Expenses waived/reimbursed by Adviser | (48 | ) | |||||
Net Expenses | 13,529 | ||||||
Net Investment Income (Loss) | 17,456 | ||||||
Realized/Unrealized Gains (Losses) from Investments: | |||||||
| Net realized gains (losses) from investment securities and foreign currency translations | 61,836 | ||||||
Net realized gains (losses) from futures contracts | 610 | ||||||
Net change in unrealized appreciation/depreciation on affiliated funds | 1,015 | ||||||
Net change in unrealized appreciation/depreciation on unaffiliated investments | 249,268 | ||||||
Net change in unrealized appreciation/depreciation on futures contracts | (2,549 | ) | |||||
Net realized/unrealized gains (losses) on investments | 310,180 | ||||||
Change in net assets resulting from operations | $ | 327,636 | |||||
See notes to financial statements.
21
USAA Mutual Funds Trust | Statements of Changes in Net Assets | ||||||
(Amounts in Thousands)
| USAA Cornerstone Moderately Aggressive Fund | |||||||||||
| Six Months Ended November 30, 2020 (unaudited) | Year Ended May 31, 2020 | ||||||||||
Operations: | |||||||||||
Net investment income (loss) | $ | 17,456 | $ | 54,303 | |||||||
Net realized gains (losses) from investments | 62,446 | (16,457 | ) | ||||||||
| Net change in unrealized appreciation/depreciation on investments | 247,734 | 33,755 | |||||||||
Change in net assets resulting from operations | 327,636 | 71,601 | |||||||||
Change in net assets resulting from distributions to shareholders | — | (59,152 | ) | ||||||||
Change in net assets resulting from capital transactions | (143,771 | ) | (127,133 | ) | |||||||
Change in net assets | 183,865 | (114,684 | ) | ||||||||
Net Assets: | |||||||||||
Beginning of period | 2,662,354 | 2,777,038 | |||||||||
End of period | $ | 2,846,219 | $ | 2,662,354 | |||||||
Capital Transactions: | |||||||||||
Proceeds from shares issued | $ | 58,570 | $ | 170,755 | |||||||
Distributions reinvested | — | 58,672 | |||||||||
Cost of shares redeemed | (202,341 | ) | (356,560 | ) | |||||||
Change in net assets resulting from capital transactions | $ | (143,771 | ) | $ | (127,133 | ) | |||||
Share Transactions: | |||||||||||
Issued | 2,280 | 6,942 | |||||||||
Reinvested | — | 2,273 | |||||||||
Redeemed | (7,874 | ) | (14,578 | ) | |||||||
Change in Shares | (5,594 | ) | (5,363 | ) | |||||||
See notes to financial statements.
22
This page is intentionally left blank.
23
USAA Mutual Funds Trust | Financial Highlights | ||||||
For a Share Outstanding Throughout Each Period
Investment Activities | Distributions to Shareholders From | ||||||||||||||||||||||||||
| Net Asset Value, Beginning of Period | Net Investment Income (Loss) | Net Realized and Unrealized Gains (Losses) on Investments | Total from Investment Activities | Net Investment Income | Net Realized Gains from Investments | ||||||||||||||||||||||
USAA Cornerstone Moderately Aggressive Fund | |||||||||||||||||||||||||||
| Six Months Ended November 30, 2020 (unaudited) | $ | 24.10 | 0.16 | (d) | 2.88 | 3.04 | — | — | |||||||||||||||||||
| Year Ended May 31, 2020 | $ | 23.97 | 0.48 | (d) | 0.18 | 0.66 | (0.39 | ) | (0.14 | ) | |||||||||||||||||
| Year Ended May 31, 2019 | $ | 25.78 | 0.46 | (0.79 | ) | (0.33 | ) | (0.39 | ) | (1.09 | ) | ||||||||||||||||
| Year Ended May 31, 2018 | $ | 26.09 | 0.42 | 1.28 | 1.70 | (0.44 | ) | (1.57 | ) | ||||||||||||||||||
| Year Ended May 31, 2017 | $ | 24.08 | 0.45 | 2.06 | 2.51 | (0.50 | ) | — | |||||||||||||||||||
| Year Ended May 31, 2016 | $ | 26.27 | 0.55 | (2.06 | ) | (1.51 | ) | (0.56 | ) | (0.12 | ) | ||||||||||||||||
* Assumes reinvestment of all net investment income and realized capital gain distributions, if any, during the period. Includes adjustments in accordance with U.S. generally accepted accounting principles and could differ from the Lipper reported return.
^ The net expense ratio may not correlate to the applicable expense limits in place during the period since the current contractual expense limitation is applied for a two year period beginning July 1, 2019 and in effect through September 30, 2021, instead of coinciding with the Fund's fiscal year end. Details of the current contractual expense limitation in effect can be found in Note 4 of the accompanying Notes to Financial Statements.
(a) Not annualized for periods less than one year.
(b) Annualized for periods less than one year.
(c) The expense ratios exclude the impact of expenses paid by each underlying fund.
(d) Per share net investment income (loss) has been calculated using the average daily shares method.
See notes to financial statements.
24
USAA Mutual Funds Trust | Financial Highlights | ||||||
For a Share Outstanding Throughout Each Period
Ratios to Average Net Assets | Supplemental Data | ||||||||||||||||||||||||||||||||||
| Total Distributions | Net Asset Value, End of Period | Total Return*(a) | Net Expenses^(b)(c) | Net Investment Income (Loss)(b) | Gross Expenses(b)(c) | Net Assets, End of Period (000's) | Portfolio Turnover(a) | ||||||||||||||||||||||||||||
USAA Cornerstone Moderately Aggressive Fund | |||||||||||||||||||||||||||||||||||
| Six Months Ended November 30, 2020 (unaudited) | — | $ | 27.14 | 12.61 | % | 0.98 | % | 1.26 | % | 0.98 | % | $ | 2,846,219 | 36 | % | ||||||||||||||||||||
| Year Ended May 31, 2020 | (0.53 | ) | $ | 24.10 | 2.59 | % | 0.98 | % | 1.94 | % | 0.99 | % | $ | 2,662,354 | 92 | % | |||||||||||||||||||
| Year Ended May 31, 2019 | (1.48 | ) | $ | 23.97 | (1.20 | )% | 0.98 | %(e) | 1.91 | % | 1.01 | % | $ | 2,777,038 | 95 | %(f) | |||||||||||||||||||
| Year Ended May 31, 2018 | (2.01 | ) | $ | 25.78 | 6.52 | % | 0.97 | % | 1.64 | % | 0.97 | % | $ | 2,493,883 | 56 | % | |||||||||||||||||||
| Year Ended May 31, 2017 | (0.50 | ) | $ | 26.09 | 10.59 | % | 1.06 | % | 1.78 | % | 1.06 | % | $ | 2,398,407 | 69 | % | |||||||||||||||||||
| Year Ended May 31, 2016 | (0.68 | ) | $ | 24.08 | (5.73 | )% | 1.13 | % | 2.18 | % | 1.13 | % | $ | 2,278,762 | 87 | % | |||||||||||||||||||
(e) Effective June 22, 2018 USAA Asset Management Company ("AMCO") (previous Investment Adviser) has voluntarily agreed to limit the annual expenses of the Fund to 0.98% of the Fund's average daily net assets.
(f) For the year ended May 31, 2019, the portfolio turnover calculation excludes the value of securities purchased of $370,785 thousand and sold of $3,096 thousand after the Fund's acquisition of First Start Growth Fund. Reflects increased trading activity due to usage of quantitative investment strategies.
See notes to financial statements.
25
USAA Mutual Funds Trust | Notes to Financial Statements November 30, 2020 | ||||||
(Unaudited)
1. Organization:
USAA Mutual Funds Trust (the "Trust") is organized as a Delaware statutory trust and is registered under the Investment Company Act of 1940, as amended (the "1940 Act"), as an open-end investment company. The Trust is comprised of 46 funds and is authorized to issue an unlimited number of shares, which are units of beneficial interest with no par value.
The accompanying financial statements are those of the USAA Cornerstone Moderately Aggressive Fund (the "Fund"). The Fund is classified as diversified under the 1940 Act.
Under the Trust's organizational documents, its officers and trustees are indemnified against certain liabilities arising out of the performance of their duties to the Fund. In addition, in the normal course of business, the Fund enters into contracts with its vendors and others that provide for general indemnifications. The Fund's maximum exposure under these arrangements is unknown, as this would involve future claims that may be made against the Fund. However, based on experience, the Fund expects that risk of loss to be remote.
2. Significant Accounting Policies:
The following is a summary of significant accounting policies followed by the Trust in the preparation of its financial statements. The policies are in conformity with Generally Accepted Accounting Principles in the United States of America ("GAAP"). The preparation of financial statements in accordance with GAAP requires management to make estimates and assumptions that affect the reported amounts of assets and liabilities and disclosure of contingent assets and liabilities at the date of the financial statements and the reported amounts of income and expenses for the period. Actual results could differ from those estimates. The Fund follows the specialized accounting and reporting requirements under GAAP that are applicable to investment companies under Accounting Standards Codification Topic 946.
Investment Valuation:
The Fund records investments at fair value. Fair value is defined as the price that would be received to sell an asset or paid to transfer a liability in an orderly transaction between market participants at the measurement date.
The valuation techniques described below maximize the use of observable inputs and minimize the use of unobservable inputs in determining fair value. The inputs used for valuing the Fund's investments are summarized in the three broad levels listed below:
• Level 1 — quoted prices in active markets for identical securities
• Level 2 — other significant observable inputs (including quoted prices for similar securities or interest rates applicable to those securities, etc.)
• Level 3 — significant unobservable inputs (including the Fund's own assumptions in determining the fair value of investments)
Changes in valuation techniques may result in transfers in or out of an assigned level within the disclosure hierarchy. The inputs or methodologies used for valuation techniques are not necessarily an indication of the risk associated with entering into those investments.
Victory Capital Management Inc. ("VCM" or the "Adviser") has established the Pricing and Liquidity Committee (the "Committee"), and subject to the Trust's Board of Trustees (the "Board") oversight, the Committee administers and oversees the Fund's valuation policies and procedures, which are approved by the Board.
Portfolio securities listed or traded on securities exchanges, including exchange-traded funds ("ETFs"), American Depositary Receipts ("ADRs") and Rights, are valued at the closing price on the exchange or system where the security is principally traded, if available, or at the Nasdaq Official Closing Price. If there have been no sales for that day on the exchange or system, then a security is valued at the last available bid quotation on the exchange or system where the security is principally traded. In each of these situations, valuations are typically categorized as Level 1 in the fair value hierarchy.
26
USAA Mutual Funds Trust | Notes to Financial Statements November 30, 2020 | ||||||
(Unaudited)
Investments in open-end investment companies are valued at their net asset value ("NAV"). These valuations are typically categorized as Level 1 in the fair value hierarchy.
Futures contracts are valued at the settlement price established each day by the board of trade or an exchange on which they are traded. These valuations are typically categorized as Level 1 in the fair value hierarchy.
Debt securities of United States ("U.S.") issuers, along with corporate and municipal securities, including short-term investments maturing in 60 days or less, may be valued using evaluated bid or the last sales price to price securities by dealers or an independent pricing service approved by the Board. These valuations are typically categorized as Level 2 in the fair value hierarchy.
In the event that price quotations or valuations are not readily available, are not reflective of market value, or a significant event has been recognized in relation to a security or class of securities, the securities are valued in good faith by the Committee in accordance with valuation procedures approved by the Board. These valuations are typically categorized as Level 2 or Level 3 in the fair value hierarchy, based on the observability of inputs used to determine the fair value. The effect of fair value pricing is that securities may not be priced on the basis of quotations from the primary market in which they are traded and the actual price realized from the sale of a security may differ materially from the fair value price. Valuing these securities at fair value is intended to cause the Fund's NAV to be more reliable than it otherwise would be.
In accordance with procedures adopted by the Board, fair value pricing may be used if events materially affecting the value of foreign securities occur between the time the exchange on which they are traded closes and the time the Fund's NAV is calculated. The Fund uses a systematic valuation model, provided daily by an independent third party to fair value its international equity securities. The valuations are considered as Level 2 in the fair value hierarchy.
A summary of the valuations as of November 30, 2020, based upon the three levels defined above, is included in the table below while the breakdown, by category, of investments is disclosed on the Schedule of Portfolio Investments (amounts in thousands):
Level 1 | Level 2 | Level 3 | Total | ||||||||||||||||
Asset-Backed Securities | $ | — | $ | 53,337 | $ | — | $ | 53,337 | |||||||||||
Collateralized Mortgage Obligations | — | 22,993 | — | 22,993 | |||||||||||||||
Common Stocks | 585,973 | — | — | 585,973 | |||||||||||||||
Preferred Stocks | 16,788 | — | — | 16,788 | |||||||||||||||
Corporate Bonds | — | 284,578 | — | 284,578 | |||||||||||||||
Yankee Dollars | — | 39,834 | — | 39,834 | |||||||||||||||
Municipal Bonds | — | 29,434 | — | 29,434 | |||||||||||||||
U.S. Government Agency Mortgages | — | 115,722 | — | 115,722 | |||||||||||||||
U.S. Treasury Obligations | — | 190,846 | — | 190,846 | |||||||||||||||
Exchange-Traded Funds | 1,359,702 | — | — | 1,359,702 | |||||||||||||||
Affiliated Exchange-Traded Funds | 114,769 | — | — | 114,769 | |||||||||||||||
Collateral for Securities Loaned | 112,209 | — | — | 112,209 | |||||||||||||||
Total | $ | 2,189,441 | $ | 736,744 | $ | — | $ | 2,926,185 | |||||||||||
Other Financial Investments^: | |||||||||||||||||||
Assets: | |||||||||||||||||||
Futures Contracts | $ | 1,195 | $ | — | $ | — | $ | 1,195 | |||||||||||
Liabilities: | |||||||||||||||||||
Futures Contracts | (3,744 | ) | — | — | (3,744 | ) | |||||||||||||
Total | $ | (2,549 | ) | $ | — | $ | — | $ | (2,549 | ) | |||||||||
^ Futures Contracts are valued at the unrealized appreciation (depreciation) on the investment.
27
USAA Mutual Funds Trust | Notes to Financial Statements November 30, 2020 | ||||||
(Unaudited)
For the six months ended November 30, 2020, there were no transfers in or out of the Level 3 fair value hierarchy.
Real Estate Investment Trusts ("REITs"):
The Fund may invest in REITs, which report information on the source of their distributions annually. REITs are pooled investment vehicles that invest primarily in income producing real estate or real estate related loans or interests (such as mortgages). Certain distributions received from REITs during the year are recorded as realized gains or return of capital as estimated by the Fund or when such information becomes known.
Investment Companies:
Exchange-Traded Funds:
The Fund may invest in ETFs, the shares of which are bought and sold on a securities exchange. An ETF trades like common stock and represents a portfolio of securities designed to track the performance and dividend yield of a particular domestic or foreign market index. The Fund may purchase shares of an ETF to temporarily gain exposure to a portion of the U.S. or a foreign market while awaiting purchase of underlying securities. The risks of owning an ETF generally reflect the risks of owning the underlying securities they are designed to track, although the lack of liquidity of an ETF could result in it being more volatile. Additionally, ETFs have fees and expenses that reduce their value.
Open-End Funds:
The Fund may invest in portfolios of open-end investment companies. These investment companies value securities in their portfolios for which market quotations are readily available at their market values (generally the last reported sale price) and all other securities and assets at their fair value by the methods established by the board of directors of the underlying funds.
Municipal Obligations:
The values of municipal obligations can fluctuate and may be affected by adverse tax, legislative, or political changes, and by financial developments affecting municipal issuers. Payment of municipal obligations may depend on a relatively limited source of revenue, resulting in greater credit risk. Future changes in federal tax laws or the activity of an issuer may adversely affect the tax-exempt status of municipal obligations.
Mortgage- and Asset-Backed Securities:
The values of some mortgage-related or asset-backed securities may be particularly sensitive to changes in prevailing interest rates. Early repayment of principal on some mortgage-related securities may expose the Fund to a lower rate of return upon reinvestment of principal. The values of mortgage- and asset-backed securities depend in part on the credit quality and adequacy of the underlying assets or collateral and may fluctuate in response to the market's perception of these factors as well as current and future repayment rates. Some mortgage-backed securities are backed by the full faith and credit of the U.S. government (e.g., mortgage-backed securities issued by the Government National Mortgage Association, commonly known as "Ginnie Mae"), while other mortgage-backed securities (e.g., mortgage-backed securities issued by the Federal National Mortgage Association and the Federal Home Loan Mortgage Corporation, commonly known as "Fannie Mae" and "Freddie Mac", respectively), are backed only by the credit of the government entity issuing them. In addition, some mortgage-backed securities are issued by private entities and, as such, are not guaranteed by the U.S. government or any agency or instrumentality of the U.S. government.
28
USAA Mutual Funds Trust | Notes to Financial Statements November 30, 2020 | ||||||
(Unaudited)
Derivative Instruments:
Futures Contracts:
The Fund may enter into contracts for the future delivery of securities or foreign currencies and futures contracts based on a specific security, class of securities, foreign currency or an index, and purchase or sell options on any such futures contracts. A futures contract on a securities index is an agreement obligating either party to pay, and entitling the other party to receive, while the contract is outstanding, cash payments based on the level of a specified securities index. No physical delivery of the underlying asset is made. The Fund may enter into futures contracts in an effort to hedge against market risks. The acquisition of put and call options on futures contracts will give the Fund the right (but not the obligation), for a specified price, to sell or to purchase the underlying futures contract, upon exercise of the option, at any time during the option period. Futures transactions involve brokerage costs and require the Fund to segregate assets to cover contracts that would require it to purchase securities or currencies. A good faith margin deposit, known as initial margin, of cash or government securities with a broker or custodian is required to initiate and maintain open positions in futures contracts. Subsequent payments, known as variation margin, are made or received by the Fund based on the change in the market value of the position and are recorded as unrealized appreciation or depreciation until the contract is closed out, at which time the gain or loss is realized. The Fund may lose the expected benefit of futures transactions if interest rates, exchange rates or securities prices change in an unanticipated manner. Such unanticipated changes may also result in lower overall performance than if the Fund had not entered into any futures transactions. In addition, the value of the Fund's futures positions may not prove to be perfectly or even highly correlated with the value of its portfolio securities or foreign currencies, limiting the Fund's ability to hedge effectively against interest rate, exchange rate and/or market risk and giving rise to additional risks. There is no assurance of liquidity in the secondary market for purposes of closing out futures positions. The collateral held by the Fund is reflected on the Statement of Assets and Liabilities under Collateral received from brokers for futures contract. During the period ended November 30, 2020, the Fund held futures contracts primarily for gaining exposure to a particular asset class or securities market.
Summary of Derivative Instruments:
The following table summarizes the fair values of derivative instruments on the Statement of Assets and Liabilities, categorized by risk exposure, as of November 30, 2020 (amounts in thousands):
Assets | Liabilities | ||||||||||
| Variation Margin Receivable on Open Futures Contracts* | Variation Margin Payable on Open Futures Contracts* | ||||||||||
Equity Risk Exposure | $ | 1,201 | $ | 3,750 | |||||||
* Includes cumulative appreciation (depreciation) of futures contracts as reported on the Schedule of Portfolio Investments. Only current day's variation margin for futures contracts are reported within the Statement of Assets and Liabilities.
The following table presents the effect of derivative instruments on the Statement of Operations, categorized by risk exposure, for the six months ended November 30, 2020 (amounts in thousands):
| Net Realized Gains (Losses) on on Derivatives Recognized as a Result of Operations | Net Change in Unrealized Appreciation/Depreciation on Derivatives Recognized as a Result of Operations | ||||||||||
| Net Realized Gains (Losses) from Futures Contracts | Net Change in Unrealized Appreciation/Depreciation on Futures Contracts | ||||||||||
Equity Risk Exposure | $ | 610 | $ | (2,549 | ) | ||||||
29
USAA Mutual Funds Trust | Notes to Financial Statements November 30, 2020 | ||||||
(Unaudited)
All open derivative positions at period end are reflected on the Fund's Schedule of Portfolio Investments. The underlying face value of open derivative positions relative to the Fund's net assets at period end is generally representative of the notional amount of open positions to net assets throughout the period.
Investment Transactions and Related Income:
Changes in holdings of investments are accounted for no later than one business day following the trade date. For financial reporting purposes, however, investment transactions are accounted for on trade date on the last business day of the reporting period. Interest income is determined on the basis of coupon interest accrued using the effective interest method which adjusts, where applicable, the amortization of premiums or accretion of discount. Gains or losses realized on sales of securities are determined by comparing the identified cost of the security lot sold with the net sales proceeds.
Withholding taxes on interest, dividends, and gains as a result of certain investments in ADRs by the Fund has been provided for in accordance with each investment's applicable country's tax rules and rates.
Securities Lending:
The Fund, through a securities lending agreement with Citibank, N.A. ("Citibank"), may lend its securities to qualified financial institutions, such as certain broker-dealers, to earn additional income, net of income retained by Citibank. Borrowers are required to secure their loans for collateral in the amount of at least 102% of the value of U.S. securities loaned or at least 105% of the value of non-U.S. securities loaned, marked-to-market daily. Any collateral shortfalls associated with increases in the valuation of the securities loaned are cured the next business day once the shortfall exceeds $100 thousand. Collateral may be cash, U.S. government securities, or other securities as permitted by Securities and Exchange Commission ("SEC") guidelines. Cash collateral may be invested in high-quality short-term investments, primarily open-end investment companies. Collateral requirements are determined daily based on the value of the Fund's securities on loan as of the end of the prior business day. During the time portfolio securities are on loan, the borrower will pay the Fund any dividends or interest paid on such securities plus any fee negotiated between the parties to the lending agreement. The Fund also earns a return from the collateral. The Fund pays Citibank various fees in connection with the investment of cash collateral and fees based on the investment income received from securities lending activities. Securities lending income (net of these fees) is disclosed on the Statement of Operations. Loans are terminable upon demand and the borrower must return the loaned securities within the lesser of one standard settlement period or five business days. Risks relating to securities-lending transactions include that the borrower may not provide additional collateral when required or return the securities when due, and that the value of the short-term investments will be less than the amount of cash collateral required to be returned to the borrower. The Fund's agreement with Citibank does not include master netting provisions. Noncash collateral received by the Fund may not be sold or re-pledged, except to satisfy borrower default. Cash collateral is listed on the Fund's Schedule of Portfolio Investments and Financial Statements while non-cash collateral is not included.
The following table (amounts in thousands) is a summary of the Fund's securities lending transactions as of November 30, 2020.
| Value of Securities on Loan | Non-Cash Collateral | Cash Collateral | |||||||||
$ | 107,461 | $ | — | $ | 112,209 | ||||||
Foreign Currency Translations:
The accounting records of the Fund are maintained in U.S. dollars. Investment securities and other assets and liabilities of the Fund denominated in a foreign currency are translated into U.S. dollars at current exchange rates. Purchases and sales of securities, income receipts and expense payments are translated into U.S. dollars at the exchange rates on the date of the transactions. The Fund does not isolate the portion of the results of operations resulting from changes in foreign exchange rates on
30
USAA Mutual Funds Trust | Notes to Financial Statements November 30, 2020 | ||||||
(Unaudited)
investments from fluctuations arising from changes in market prices of securities held. Such fluctuations are disclosed as net change in unrealized appreciation/depreciation on investments and foreign currency translations on the Statement of Operations. Any realized gains or losses from these fluctuations, including foreign currency arising from in-kind redemptions, are disclosed as net realized gains or losses from investment transactions and foreign currency translations on the Statement of Operations.
Foreign Taxes:
The Fund may be subject to foreign taxes related to foreign income received (a portion of which may be reclaimable), capital gains on the sale of securities, and certain foreign currency transactions. All foreign taxes are recorded in accordance with the applicable regulations and rates that exist in the foreign jurisdictions in which the Fund invests.
Federal Income Taxes:
It is the Fund's policy to continue to qualify as a regulated investment company by complying with the provisions available to certain investment companies, as defined in applicable sections of the Internal Revenue Code, and to make distributions of net investment income and net realized gains sufficient to relieve it from all, or substantially all, federal income taxes. Accordingly, no provision for federal income taxes is required in the financial statements. The Fund has a tax year end of May 31.
Management of the Fund has reviewed tax positions taken in tax years that remain subject to examination by all major tax jurisdictions, including federal (i.e., the last four tax years, which includes the current fiscal tax year end). Management believes that there is no tax liability resulting from unrecognized tax benefits related to uncertain tax positions taken.
Allocations:
Expenses directly attributable to the Fund are charged to the Fund, while expenses that are attributable to more than one fund in the Trust, or jointly with an affiliated trust, are allocated among the respective funds in the Trust and/or affiliated trust based upon net assets or another appropriate basis.
Cross-Trade Transactions:
Pursuant to Rule 17a-7 under the 1940 Act, the Fund may engage in cross-trades which are securities transactions with affiliated investment companies and advisory accounts managed by the Adviser and any applicable sub-adviser. Any such purchase or sale transaction must be effected without brokerage commission or other remuneration, except for customary transfer fees. The transaction must be effected at the current market price, which is either the security's last sale price on an exchange or, if there are no transactions in the security that day, at the average of the highest bid and lowest asked price. For the six months ended November 30, 2020, the Fund engaged in the following securities transactions with affiliated funds, which resulted in the following net realized gains (losses) (amounts in thousands):
| Purchases | Sales | Net Realized Gains (Losses) | |||||||||
| $ | — | $ | 2,027 | $ | 23 | ||||||
31
USAA Mutual Funds Trust | Notes to Financial Statements November 30, 2020 | ||||||
(Unaudited)
3. Purchases and Sales:
Cost of purchases and proceeds from sales/maturities of securities (excluding securities maturing less than one year from acquisition) for the six months ended November 30, 2020, were as follows for the Fund (amounts in thousands):
| Purchases (excluding U.S. Government Securities) | Sales (excluding U.S. Government Securities) | Purchases of U.S. Government Securities | Sales of U.S. Government Securities | ||||||||||||||||
| USAA Cornerstone Mod Aggressive Fund | $ | 969,797 | $ | 1,021,391 | $ | — | $ | 73,505 | |||||||||||
4. Fees and Transactions with Affiliates and Related Parties:
Investment Advisory Fees:
Investment advisory services are provided to the Fund by the Adviser, which is a New York corporation registered as an investment adviser with the SEC. The Adviser is a wholly-owned indirect subsidiary of Victory Capital Holdings, Inc., a publicly traded Delaware corporation, and a wholly-owned direct subsidiary of Victory Capital Operating, LLC. Under the terms of the Investment Advisory Agreement, the Adviser is entitled to receive fees accrued daily and paid monthly at an annualized rate of 0.59% of the Fund's average daily net assets. Amounts incurred and paid to VCM for the six months ended November 30, 2020, are reflected on the Statement of Operations as Investment Advisory fees.
In addition, the Fund invests in affiliated VCM exchange-traded fund(s) ("affiliated ETFs"). The Fund's Adviser fee is reimbursed by VCM to the extent of the indirect Adviser fee incurred through the Fund's proportional investment in the affiliated ETF(s). As of November 30, 2020, the Fund's Adviser fee was reimbursed by VCM in an amount of $48 thousand, of which $46 thousand is receivable from VCM. These reimbursements are not available for recoupment and are reflected on the Statement of Operations as Expenses waived/reimbursed by Adviser.
The Trust relies on an exemptive order granted to VCM and its affiliated funds by the SEC in March 2019 permitting the use of a "manager-of-managers" structure for certain funds. Under a manager-of-managers structure, the investment adviser may select (with approval of the Board and without shareholder approval) one or more subadvisers to manage the day-to-day investment of a fund's assets. For the six months ended November 30, 2020, the Fund had no subadvisors.
Administration and Servicing Fees:
VCM serves as the Fund's administrator and fund accountant. Under the Administration, Servicing and Accounting Agreement, VCM is paid for its services an annual fee at a rate of 0.15% of average daily net assets of the Fund. Amounts incurred for the six months ended November 30, 2020, are reflected on the Statement of Operations as Administration fees.
The Fund (as part of the Trust) has entered into an agreement to provide compliance services with the Adviser, pursuant to which the Adviser furnishes its compliance personnel, including the services of the Chief Compliance Officer ("CCO"), and other resources reasonably necessary to provide the Trust with compliance oversight services related to the design, administration and oversight of a compliance program for the Trust in accordance with Rule 38a-1 under the 1940 Act. The CCO is an employee of the Adviser, which pays the compensation of the CCO and support staff. Funds in the Trust, Victory Variable Insurance Funds, Victory Portfolios, and Victory Portfolios II (collectively, the "Victory Funds Complex") in the aggregate, compensate the Adviser for these services. Amounts incurred for the six-months ended November 30, 2020, are reflected on the Statement of Operations as Compliance fees.
Citi Fund Services Ohio, Inc. ("Citi"), an affiliate of Citibank, acts as sub-administrator and sub-fund accountant to the Fund pursuant to a Sub-Administration and Sub-Fund Accounting Services Agreement between VCM and Citi. VCM pays Citi a fee for providing these services. The Trust reimburses VCM and Citi for out-of-pocket expenses incurred in providing these services and certain other expenses
32
USAA Mutual Funds Trust | Notes to Financial Statements November 30, 2020 | ||||||
(Unaudited)
specifically allocated to the Funds. Amounts incurred for the six months ended November 30, 2020, are reflected on the Statement of Operations as Sub-Administration fees.
Transfer Agency Fees:
Victory Capital Transfer Agency, Inc. ("VCTA") provides transfer agency services to the Fund. VCTA, an affiliate of the Adviser, provides transfer agent services based on an annual charge of $23 per shareholder account plus out-of-pocket expenses. VCTA pays a portion of these fees to certain intermediaries for the administration and servicing of accounts that are held with such intermediaries. Amounts incurred and paid to VCTA for the six months ended November 30, 2020, are reflected on the Statement of Operations as Transfer Agent fees.
FIS Investor Services LLC serves as sub-transfer agent and dividend disbursing agent for the Fund pursuant to a Sub-Transfer Agent agreement between VCTA and FIS Investor Services LLC. VCTA provides FIS Investor Services LLC a fee for providing these services.
Distributor/Underwriting Services:
Victory Capital Services, Inc. (the "Distributor"), an affiliate of the Adviser, serves as distributor for the continuous offering of the shares of the Fund pursuant to a Distribution Agreement between the Distributor and the Trust. Effective June 30, 2020, the Distributor's name was changed from Victory Capital Advisers, Inc.
Other Fees:
Citibank serves as the Fund's custodian. The Fund pays Citibank a fee for providing these services. Amounts incurred for the six months ended November 30, 2020, are reflected on the Statement of Operations as Custodian fees.
K&L Gates LLP provides legal services to the Trust.
The Adviser has entered into an expense limitation agreement with the Fund until at least September 30, 2021. Under the terms of the agreement, the Adviser has agreed to waive fees or reimburse certain expenses to the extent that ordinary operating expenses incurred in any fiscal year exceed the expense limit for the Fund. Such excess amounts will be the liability of the Adviser. Interest, taxes, brokerage commissions, other expenditures, which are capitalized in accordance with GAAP, and other extraordinary expenses not incurred in the ordinary course of the Fund's business are excluded from the expense limits. As of November 30, 2020, the expense limit (excluding voluntary waivers) is 0.98% for Fund Shares.
Under this expense limitation agreement, the Fund has agreed to repay fees and expenses that were waived or reimbursed by the Adviser for a period up to three years after the fiscal year in which the waiver or reimbursement took place, subject to the lesser of any operating expense limits in effect at the time of: (a) the original waiver or expense reimbursement; or (b) the recoupment, after giving effect to the recoupment amount. As of November 30, 2020, the following amounts are available to be repaid to the Adviser (amounts in thousands). The Fund has not recorded any amounts available to be repaid as a liability due to an assessment that such repayment is not probable at November 30, 2020.
Expires 05/31/2023 | Total | ||||||
$ | 127 | $ | 127 | ||||
The Adviser may voluntarily waive or reimburse additional fees to assist the Funds in maintaining competitive expense ratios. Voluntary waivers and reimbursements applicable to the Fund are not available to be recouped at a future time. There were no voluntary waivers or reimbursements for the six months ended November 30, 2020.
Certain officers and/or interested trustees of the Funds are also officers and/or employees of the Adviser, Administrator, Sub-Administrator, Sub-Fund Accountant, and Legal.
33
USAA Mutual Funds Trust | Notes to Financial Statements November 30, 2020 | ||||||
(Unaudited)
5. Risks:
The Fund may be subject to other risks in addition to these identified risks.
Geopolitical/Natural Disaster Risk — Global economies and financial markets are increasingly interconnected, which increases the possibilities that conditions in one country or region might adversely affect issuers in another country or region. Geopolitical and other risks, including war, terrorism, trade disputes, political or economic dysfunction within some nations, public health crises and related geopolitical events, as well as environmental disasters such as earthquakes, fires, and floods, may add to instability in world economies and markets generally. Changes in trade policies and international trade agreements could affect the economies of many countries in unpredictable ways. Likewise, systemic market dislocations of the kind that occurred during the financial crisis that began in 2008, if repeated, would be highly disruptive to economies and markets, adversely affecting individual companies and industries, securities markets, interest rates, credit ratings, inflation, investor sentiment, and other factors affecting the value of a Fund's investments. Some countries, including the United States, are adopting more protectionist trade policies and moving away from the tighter financial industry regulations that followed the 2008 financial crisis, which may also affect the value of a Fund's investments.
Political events within the United States at times have resulted, and may in the future result, in a shutdown of government services, which could negatively affect the U.S. economy, decrease the value of a Fund's investments, increase uncertainty in or impair the operation of the U.S. or other securities markets and degrade investor and consumer confidence, perhaps suddenly and to a significant degree.
An outbreak of disease called COVID-19 has spread internationally. The transmission of COVID-19 and efforts to contain its spread have resulted in international, national and local border closings and other significant travel restrictions and disruptions, significant disruptions to business operations, supply chains and consumer activity, significant challenges in healthcare service preparation and delivery, quarantines and general concern and uncertainty. These negative impacts have caused significant volatility and declines in global financial markets, which have caused losses for Fund investors during and subsequent to period end. The impact of the COVID-19 pandemic last for an extended period of time, and could result in a substantial economic downturn or recession. Public health crises may exacerbate other pre-existing political, social, economic, market and financial risks. The extent of the impact to the financial performance of the Funds' investments will depend on future developments, including (i) the duration and spread of the outbreak, (ii) the restrictions and advisories, (iii) the effects on the financial markets, and (iv) the effects on the economy overall, all of which are highly uncertain and cannot be predicted.
Tactical Allocation Risk — The Fund has a targeted risk tolerance and a corresponding asset allocation target; however, mere asset allocation and volatility are not the sole determination of risk. The Fund's managers will tactically allocate away from the target allocation as market conditions and the perceived risks warrant. The Fund bears the risk that the managers' tactical allocation will not be successful.
Affiliated Funds Risk — The risks of the Fund directly correspond to the risks of the underlying affiliated funds in which the Fund invests. By investing in the underlying affiliated funds, the Fund has exposure to the risk of many different areas of the market. The degree to which the risks described below apply to the Fund varies according to the Fund's asset allocation. For instance, the more the Fund is allocated to stock funds, the greater the risk associated with equity securities. The Fund also is subject to asset allocation risk (i.e., the risk that allocations will not produce the intended results) and to management risk (i.e., the risk that the selection of underlying affiliated funds will not produce the intended results).
Conflict of Interest Risk — In managing a Fund that invests in underlying affiliated funds, the Adviser may have conflicts of interest in allocating the Fund's assets among the various underlying affiliated funds. This is because the fees payable by some of the underlying affiliated funds to the Adviser and/or its affiliates are higher than the fees payable by other underlying affiliated funds, and because the Adviser also manages and administers the underlying affiliated funds.
34
USAA Mutual Funds Trust | Notes to Financial Statements November 30, 2020 | ||||||
(Unaudited)
LIBOR Discontinuation Risk — Many debt securities, derivatives and other financial instruments, including some of the Fund's investments, use the London Interbank Offered Rate ("LIBOR") as the reference or benchmark rate for variable interest rate calculations. However, the use of LIBOR started to come under pressure following manipulation allegations in 2012. Despite increased regulation and other corrective actions since that time, concerns have arisen regarding its viability as a benchmark, due largely to reduced activity in the financial markets that it measures. In June 2017, the Alternative Reference Rates Committee, a group of large U.S. banks working with the Federal Reserve, announced its selection of a new Secured Overnight Funding Rate ("SOFR"), which is intended to be a broad measure of secured overnight U.S. Treasury repo rates, as an appropriate replacement for LIBOR. The Federal Reserve Bank of New York began publishing the SOFR in 2018, expecting that it could be used on a voluntary basis in new instruments and transactions. Bank working groups and regulators in other countries have suggested other alternatives for their markets, including the Sterling Overnight Interbank Average Rate ("SONIA") in England. In July 2017, the Financial Conduct Authority (the "FCA"), the United Kingdom financial regulatory body, announced that after 2021 it will cease its active encouragement of UK banks to provide the quotations needed to sustain LIBOR. That announcement suggests that LIBOR may cease to be published after that time. For U.S. dollar LIBOR, however, the relevant date may be deferred to June 30, 2023 for the most common tenors (overnight and one, three, six and 12 months). As to those tenors, the LIBOR administrator has published a consultation regarding its intention to cease publication of U.S. dollar LIBOR as of June 30, 2023 (instead of December 31, 2021, as previously expected), apparently based on continued rate submissions from banks. It is expected that there will be enough for market participants to transition to the use of a different benchmark for both new and existing securities and transactions. Various financial industry groups have begun planning for that transition, but there are obstacles to converting certain longer-term securities and transactions to a new benchmark. Transition planning is at an early stage, and neither the effect of the transition process nor its ultimate success can yet be known. Although the foregoing may provide some sense of timing, there is no assurance that LIBOR, or any particular currency and tenor, will continue to be published until any particular date, and it appears highly likely that LIBOR will be discontinued or modified after December 31, 2021 or June 30, 2023, depending on the currency and tenor. The transition process might lead to increased volatility and illiquidity in markets that currently rely on the LIBOR to determine interest rates. It could also lead to a reduction in the value of some LIBOR-based investments and reduce the effectiveness of new hedges placed against existing LIBOR-based instruments. Since the usefulness of LIBOR as a benchmark could deteriorate during the transition period, these effects could occur before the end of 2021.
Small-Capitalization and Mid-Capitalization Stock Risk — The Fund invests in small- and mid-capitalization companies, which may be more vulnerable than larger companies to adverse business or economic conditions. Securities of small- and mid-capitalization companies may be less liquid and more volatile than securities of larger companies or the market in general and, therefore, may involve greater risk than investing in securities of larger companies.
6. Borrowing and Interfund Lending:
Line of Credit:
For the six months ended November 30, 2020, the Victory Funds Complex participated in a short-term demand note "Line of Credit" agreement with Citibank. The Line of Credit agreement with Citibank was renewed on June 29, 2020 with a termination date of June 28, 2021. Under the agreement with Citibank, the Victory Funds Complex may borrow up to $600 million, of which $300 million is committed and $300 million is uncommitted. $40 million of the Line of Credit is reserved for use by the Victory Floating Rate Fund, another series of the Victory Funds Complex, with Victory Floating Rate Fund paying the related commitment fees for that amount. The purpose of the agreement is to meet temporary or emergency cash needs. For the six months ended November 30, 2020, Citibank received an annual commitment fee of 0.15% on $300 million for providing the Line of Credit. Each fund in the Victory Funds Complex pays a pro- rata portion of the commitment fees plus any interest (one month LIBOR plus one percent) on amounts borrowed. Effective June 29, 2020, under an amended Line of Credit
35
USAA Mutual Funds Trust | Notes to Financial Statements November 30, 2020 | ||||||
(Unaudited)
agreement, Citibank will also receive an annual upfront fee of 0.10% on the $300 million committed line of credit. Each fund in the Victory Funds Complex will pay a pro-rata portion of the upfront fee. Interest charged to each Fund during the period, if applicable, is reflected on the Statements of Operations under Line of credit fees.
The Fund had no borrowings under the Line of Credit agreement during the six months ended November 30, 2020.
Interfund Lending:
The Trust and Adviser rely on an exemptive order granted by the SEC in March 2017 (the "Order"), permitting the establishment and operation of an Interfund Lending Facility (the "Facility"). The Facility allows the Fund to directly lend and borrow money to or from any other Fund, that is permitted to participate in the Facility, in the Victory Funds Complex relying upon the Order at rates beneficial to both the borrowing and lending funds. Advances under the Facility are allowed for temporary or emergency purposes. The interfund loan rate is determined, as specified in the Order, by averaging the current repurchase agreement rate and the current bank loan rate. As a Borrower, interest charged to the Fund, if any, during the period is reflected on the Statement of Operations under Interfund lending fees. As a Lender, interest earned by the Fund, if any, during the period is reflected on the Statement of Operations under Income on Interfund lending.
The average borrowing or lending for the days outstanding and average interest rate for the Fund during the six months ended November 30, 2020 were as follows (amounts in thousands):
| Borrower or Lender | Amount Outstanding at November 30, 2020 | Average Borrowing* | Days Borrowing Outstanding | Average Interest Rate* | Maximum Borrowing During the Period | ||||||||||||||||||
| Borrower | $ | — | $ | 14,193 | 4 | 0.61 | % | $ | 14,193 | ||||||||||||||
* For the six months ended November 30, 2020, based on the number of days borrowings were outstanding.
7. Federal Income Tax Information:
The Fund intends to declare and distribute any net investment income annually. Distributable net realized gains, if any, are declared and paid at least annually.
The amounts of dividends from net investment income and distributions from net realized gains (collectively distributions to shareholders) are determined in accordance with federal income tax regulations, which may differ from GAAP. To the extent these "book/tax" differences are permanent in nature (e.g., net operating loss and distribution reclassification), such amounts are reclassified within the components of net assets based on their federal tax-basis treatment; temporary differences (e.g., wash sales) do not require reclassification. To the extent dividends and distributions exceed net investment income and net realized gains for tax purposes, they are reported as distributions of capital.
Net investment losses incurred by the Fund may be reclassified as an offset to capital on the accompanying Statement of Assets and Liabilities.
The tax character of current year distributions paid and the tax basis of the current components of accumulated earnings (deficit) will be determined at the end of the current tax year ending May 31, 2021.
At May 31, 2020, the Funds had net capital loss carryforwards as shown in the table below (amounts in thousands).
| Short-Term Amount | Long-Term Amount | Total | |||||||||
| $ | 13,350 | $ | — | $ | 13,350 | ||||||
36
USAA Mutual Funds Trust | Notes to Financial Statements November 30, 2020 | ||||||
(Unaudited)
8. Affiliated Securities:
An affiliated security is a security in which the Fund has ownership of at least 5% of the security's outstanding voting shares or an investment company managed by VCM. The Fund does not invest in affiliated underlying funds for the purpose of exercising management or control. These underlying funds' are noted as affiliated on the Fund's Schedule of Portfolio Investments. The affiliated underlying funds' annual or semiannual reports may be viewed at vcm.com. Transactions in affiliated securities during the six months ended November, 2020, were as follows (amount in thousands):
| Fair Value 5/31/2020 | Purchases at Cost | Proceeds from Sales | Realized Gains (Losses) | Capital Gain Distribution | Net Change in Unrealized Appreciation/ Depreciation | Fair Value 11/30/2020 | Dividend Income | ||||||||||||||||||||||||||||
| VictoryShares USAA Core Intermediate-Term Bond ETF | $ | — | $ | 81,018 | $ | — | $ | — | $ | — | $ | 516 | $ | 81,534 | $ | 186 | |||||||||||||||||||
| VictoryShares USAA Core Short-Term Bond ETF | — | 30,231 | — | — | — | 81 | 30,312 | 61 | |||||||||||||||||||||||||||
| VictoryShares USAA MSCI Emerging Markets Value Momentum ETF | 2,505 | — | — | — | — | 418 | 2,923 | 54 | |||||||||||||||||||||||||||
$ | 2,505 | $ | 111,249 | $ | — | $ | — | $ | — | $ | 1,015 | $ | 114,769 | $ | 301 | ||||||||||||||||||||
37
USAA Mutual Funds Trust | Supplemental Information November 30, 2020 | ||||||
(Unaudited)
Proxy Voting and Portfolio Holdings Information
Proxy Voting:
Information regarding the policies and procedures the Fund uses to determine how to vote proxies relating to portfolio securities is available without charge, upon request, by calling (800) 539-3863. The information is also included in the Fund's Statement of Additional Information, which is available on the SEC's website at www.sec.gov.
Information relating to how the Fund voted proxies relating to portfolio securities held during the most recent 12 months ended June 30 is available on the SEC's website at www.sec.gov.
Availability of Schedules of Portfolio Investments:
The Trust files a complete list of Schedules of Portfolio Investments with the SEC for the first and third quarter of each fiscal year on Form N-PORT. Form N-PORT is available on the SEC's website at www.sec.gov.
Expense Example
As a shareholder of the Fund, you may incur two types of costs: (1) transaction costs, and (2) ongoing costs, including management fees and other Fund expenses. These examples are intended to help you understand your ongoing costs (in dollars) of investing in the Fund and to compare these costs with the ongoing costs of investing in other mutual funds.
These examples are based on an investment of $1,000 invested at the beginning of the period and held for the entire period from June 1, 2020 through November 30, 2020.
The Actual Expense figures in the table below provide information about actual account values and actual expenses. You may use the information below, together with the amount you invested, to estimate the expenses that you paid over the period. Simply divide your account value by $1,000 (for example, an $8,600 account value divided by $1,000 = 8.6), then multiply the result by the number in the table under the heading entitled "Actual Expenses Paid During Period" to estimate the expenses you paid on your account during this period.
The Hypothetical Expense figures in the table below provide information about hypothetical account values and hypothetical expenses based on the Fund's actual expense ratio and an assumed rate of return of 5% per year before expenses, which is not the Fund's actual return. The hypothetical account values and expenses may not be used to estimate the actual ending account balance or expenses you paid for the period. You may use this information to compare this 5% hypothetical example with the 5% hypothetical examples that appear in shareholder reports of other funds.
Please note the expenses shown in the table below are meant to highlight your ongoing costs only and do not reflect any transactional costs. If these transactional costs were included, your costs would have been higher.
| Beginning Account Value 6/1/20 | Actual Ending Account Value 11/30/20 | Hypothetical Ending Account Value 11/30/20 | Actual Expenses Paid During Period 6/1/20- 11/30/20* | Hypothetical Expenses Paid During Period 6/1/20- 11/30/20* | Annualized Expense Ratio During Period 6/1/20- 11/30/20 | ||||||||||||||||||
| $ | 1,000.00 | $ | 1,126.10 | $ | 1,020.16 | $ | 5.22 | $ | 4.96 | 0.98 | % | ||||||||||||
* Expenses are equal to the average account value multiplied by the Fund's annualized expense ratio multiplied by 183/365 (the number of days in the most recent fiscal half-year divided by the number of days in the fiscal year).
38
Privacy Policy
Protecting the Privacy of Information
The Trust respects your right to privacy. We also know that you expect us to conduct and process your business in an accurate and efficient manner. To do so, we must collect and maintain certain personal information about you. This is the information we collect from you on applications or other forms, and from the transactions you make with us or third parties. It may include your name, address, social security number, account transactions and balances, and information about investment goals and risk tolerance.
We do not disclose any information about you or about former customers to anyone except as permitted or required by law. Specifically, we may disclose the information we collect to companies that perform services on our behalf, such as the transfer agent that processes shareholder accounts and printers and mailers that assist us in the distribution of investor materials. We may also disclose this information to companies that perform marketing services on our behalf. This allows us to continue to offer you Victory investment products and services that meet your investing needs, and to effect transactions that you request or authorize. These companies will use this information only in connection with the services for which we hired them. They are not permitted to use or share this information for any other purpose.
To protect your personal information internally, we permit access only by authorized employees and maintain physical, electronic and procedural safeguards to guard your personal information.*
* You may have received communications regarding information about privacy policies from other financial institutions which gave you the opportunity to "opt-out" of certain information sharing with companies which are not affiliated with that financial institution. The Trust does not share information with other companies for purposes of marketing solicitations for products other than the Trust. Therefore, the Trust does not provide opt-out options to their shareholders.
P.O. Box 182593
Columbus, Ohio 43218-2593

Visit our website at: | Call | ||||||
vcm.com | (800) 235-8396 | ||||||
27800-0121

NOVEMBER 30, 2020
Semi Annual Report
USAA Cornerstone Moderately Conservative Fund
Beginning January 1, 2021, as permitted by regulations adopted by the Securities and Exchange Commission, paper copies of the Fund's shareholder reports may no longer be sent by mail, unless you specifically request paper copies of the reports from the Fund or from your financial intermediary, such as a broker-dealer or bank. Instead, the reports will be made available on VictoryFunds.com, and you will be notified by mail each time a report is posted and provided with a website link to access the report. If you already elected to receive shareholder reports electronically, you will not be affected by this change and you need not take any action.
You may elect to receive shareholder reports and other communications from the Fund or your financial intermediary electronically by notifying your financial intermediary directly, or if you are a shareholder who has an account directly with the Fund, by calling (800) 235-8396 or by submitting your request via email to TA.Processing@FISGlobal.com.
You may elect to receive all future reports in paper free of charge. You can inform the Fund or your financial intermediary that you wish to continue receiving paper copies of your shareholder reports by notifying your financial intermediary directly, or if you are a shareholder who has an account directly with the Fund, by calling (800) 235-8396 or submitting your request via email to TA.Processing@FISGlobal.com.
Your election to receive reports in paper will apply to all funds held with the USAA Mutual Funds or your financial intermediary.
Victory Capital means Victory Capital Management Inc., the investment adviser of the USAA Mutual Funds. USAA Mutual Funds are distributed by Victory Capital Services, Inc., member of FINRA, an affiliate of Victory Capital. Victory Capital and its affiliates are not affiliated with United Services Automobile Association or its affiliates. USAA and the USAA logo are registered trademarks and the USAA Mutual Funds and USAA Investments logos are trademarks of United Services Automobile Association and are being used by Victory Capital and its affiliates under license.
USAA Mutual Funds Trust
TABLE OF CONTENTS
Investment Objective & Portfolio Holdings | 2 | ||||||
Schedule of Portfolio Investments | 3 | ||||||
Financial Statements | |||||||
Statement of Assets and Liabilities | 19 | ||||||
Statement of Operations | 20 | ||||||
Statements of Changes in Net Assets | 21 | ||||||
Financial Highlights | 22 | ||||||
Notes to Financial Statements | 24 | ||||||
Supplemental Information | 35 | ||||||
Proxy Voting and Portfolio Holdings Information | 35 | ||||||
Expense Example | 35 | ||||||
Privacy Policy (inside back cover) | |||||||
This report is for the information of the shareholders and others who have received a copy of the currently effective prospectus of the Fund, managed by Victory Capital Management Inc. It may be used as sales literature only when preceded or accompanied by a current prospectus, which provides further details about the Fund.
IRA DISTRIBUTION WITHHOLDING DISCLOSURE
We generally must withhold federal income tax at a rate of 10% of the taxable portion of your distribution and, if you live in a state that requires state income tax withholding, at your state's tax rate. However, you may elect not to have withholding apply or to have income tax withheld at a higher rate. Any withholding election that you make will apply to any subsequent distribution unless and until you change or revoke the election. If you wish to make a withholding election, or change or revoke a prior withholding election, call (800) 235-8396, and form W-4P (OMB No. 1545-0074 withholding certificate for pension or annuity payments) will be electronically sent.
If you do not have a withholding election in place by the date of a distribution, federal income tax will be withheld from the taxable portion of your distribution at a rate of 10%. If you must pay estimated taxes, you may be subject to estimated tax penalties if your estimated tax payments are not sufficient and sufficient tax is not withheld from your distribution.
For more specific information, please consult your tax adviser.
1
| USAA Mutual Funds Trust USAA Cornerstone Moderately Conservative Fund | November 30, 2020 | ||||||
(Unaudited)
Investment Objective & Portfolio Holdings:
The Fund's investment objective is to seek current income with a secondary focus on capital appreciation.
Asset Allocation*:
November 30, 2020
(% of Net Assets)
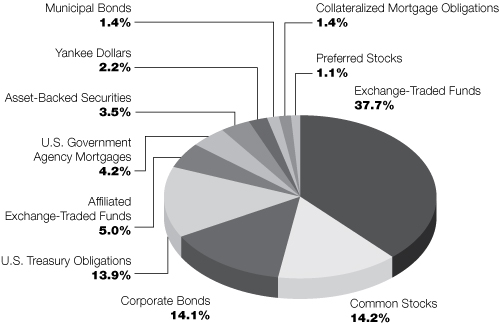
* Does not include futures, money market instruments, and short-term investments purchased with cash collateral from securities loaned.
Percentages are of the net assets of the Fund and may not equal 100%.
2
| USAA Mutual Funds Trust USAA Cornerstone Moderately Conservative Fund | Schedule of Portfolio Investments November 30, 2020 | ||||||
(Amounts in Thousands, Except for Shares) (Unaudited)
Security Description | Principal Amount | Value | |||||||||
Asset-Backed Securities (3.5%) | |||||||||||
| American Express Credit Account Master Trust, Series 2019-2, Class B, 2.86%, 11/15/24 | $ | 358 | $ | 370 | |||||||
| Americredit Automobile Receivables Trust, Series 2018-2, Class A3, 3.15%, 3/20/23, Callable 10/18/22 @ 100 | 75 | 76 | |||||||||
| Americredit Automobile Receivables Trust, Series 2018-1, Class C, 3.50%, 1/18/24, Callable 7/18/22 @ 100 | 480 | 497 | |||||||||
| ARI Fleet Lease Trust, Series 2020-A, Class A3, 1.80%, 8/15/28, Callable 3/15/23 @ 100 (a) | 96 | 98 | |||||||||
| BCC Funding Corp. XVI LLC, Series 2019-1A, Class A2, 2.46%, 8/20/24, Callable 4/20/23 @ 100 (a) | 1,192 | 1,207 | |||||||||
| Canadian Pacer Auto Receivables Trust, Series 2018-1A, Class C, 3.82%, 4/19/24, Callable 5/19/21 @ 100 (a) | 263 | 267 | |||||||||
| CarMax Auto Owner Trust, Series 2020-1, Class B, 2.21%, 9/15/25, Callable 8/15/23 @ 100 | 137 | 142 | |||||||||
| Credit Acceptance Auto Loan Trust, Series 2018-3A, Class A, 3.55%, 8/15/27, Callable 10/15/21 @ 100 (a) | 219 | 222 | |||||||||
| Dell Equipment Finance Trust, Series 2020-1, Class A3, 2.24%, 2/22/23, Callable 8/22/22 @ 100 (a) | 71 | 73 | |||||||||
| Drive Auto Receivables Trust, Series 2019-1, Class C, 3.78%, 4/15/25, Callable 9/15/22 @ 100 | 158 | 161 | |||||||||
| Drive Auto Receivables Trust, Series 2018-4, Class D, 4.09%, 1/15/26, Callable 7/15/22 @ 100 | 139 | 144 | |||||||||
Enterprise Fleet Financing LLC, Series 2020-1, Class A3, 1.86%, 12/22/25 (a) | 88 | 91 | |||||||||
Evergreen Credit Card Trust, Series 2019-2, Class A, 1.90%, 9/15/24 (a) | 275 | 283 | |||||||||
| Exeter Automobile Receivables Trust, Series 2019-2A, Class C, 3.30%, 3/15/24, Callable 12/15/22 @ 100 (a) | 215 | 220 | |||||||||
| Exeter Automobile Receivables Trust, Series 2017-3A, Class D, 5.28%, 10/15/24, Callable 4/15/22 @ 100 (a) | 110 | 115 | |||||||||
| Exeter Automobile Receivables Trust, Series 2020-1A, Class B, 2.26%, 4/15/24, Callable 5/15/23 @ 100 (a) | 110 | 111 | |||||||||
| Ford Credit Auto Owner Trust, Series 2019-A, Class A3, 2.78%, 9/15/23, Callable 12/15/22 @ 100 | 78 | 80 | |||||||||
| Ford Credit Auto Owner Trust, Series 2020-1, Class B, 2.29%, 8/15/31, Callable 2/15/25 @ 100 (a) | 143 | 148 | |||||||||
| Great American Auto Leasing, Inc., Series 2019-1, Class A3, 3.05%, 9/15/22, Callable 12/15/22 @ 100 (a) | 98 | 100 | |||||||||
Hertz Vehicle Financing II LP, Series 2019-3A, Class A, 2.67%, 12/26/25 (a) | 46 | 46 | |||||||||
| HPEFS Equipment Trust, Series 2019-1A, Class C, 2.49%, 9/20/29, Callable 5/20/22 @ 100 (a) | 97 | 99 | |||||||||
| HPEFS Equipment Trust, Series 2020-1A, Class B, 1.89%, 2/20/30, Callable 12/20/22 @ 100 (a) | 55 | 56 | |||||||||
| MMAF Equipment Finance LLC, Series 2017-B, Class A4, 2.41%, 11/15/24, Callable 6/15/22 @ 100 (a) | 215 | 219 | |||||||||
| Navient Student Loan Trust, Series 2015-2, Class B, 1.65% (LIBOR01M+150bps), 8/25/50, Callable 1/25/29 @ 100 (b) | 200 | 190 | |||||||||
| NP SPE II LLC, Series 2017-1A, Class A1, 3.37%, 10/21/47, Callable 10/20/27 @ 100 (a) | 73 | 75 | |||||||||
| OSCAR US Funding Trust IX LLC, Series 2018-2A, Class A4, 3.63%, 9/10/25 (a) | 560 | 584 | |||||||||
See notes to financial statements.
3
| USAA Mutual Funds Trust USAA Cornerstone Moderately Conservative Fund | Schedule of Portfolio Investments — continued November 30, 2020 | ||||||
(Amounts in Thousands, Except for Shares) (Unaudited)
Security Description | Principal Amount | Value | |||||||||
| SCF Equipment Leasing LLC, Series 2017-2A, Class A, 3.41%, 12/20/23, Callable 12/20/20 @ 100 (a) | $ | 45 | $ | 45 | |||||||
| SCF Equipment Leasing LLC, Series 2020-1A, Class B, 2.02%, 3/20/28, Callable 7/20/25 @ 100 (a) | 107 | 108 | |||||||||
| Synchrony Credit Card Master Note Trust, Series 2016-2, Class C, 2.95%, 5/15/24 | 320 | 322 | |||||||||
| Synchrony Credit Card Master Note Trust, Series 2018-2, Class A, 3.47%, 5/15/26 | 381 | 407 | |||||||||
| Transportation Finance Equipment Trust, Series 2019-1, Class A4, 1.88%, 3/25/24, Callable 6/23/23 @ 100 (a) | 215 | 221 | |||||||||
| Trinity Rail Leasing LLC, Series 2019-2A, Class A1, 2.39%, 10/18/49, Callable 12/17/20 @ 100 (a) | 428 | 428 | |||||||||
| Westlake Automobile Receivables Trust, Series 2018-2A, Class D, 4.00%, 1/16/24, Callable 1/15/22 @ 100 (a) | 350 | 358 | |||||||||
| Westlake Automobile Receivables Trust, Series 2020-1A, Class B, 1.94%, 4/15/25, Callable 7/15/23 @ 100 (a) | 358 | 363 | |||||||||
Total Asset-Backed Securities (Cost $7,776) | 7,926 | ||||||||||
Collateralized Mortgage Obligations (1.4%) | |||||||||||
| Banc of America Commercial Mortgage Trust, Series 2006-3, Class AM, 5.86%, 7/10/44 (c) | 155 | 31 | |||||||||
| Banc of America Commercial Mortgage Trust, Series 2008-1, Class AJ, 6.79%, 2/10/51 (c) | 26 | 27 | |||||||||
BANK, Series 2019-BNK20, Class A3, 3.01%, 9/15/61 | 250 | 279 | |||||||||
| Barclays Commercial Mortgage Trust, Series 2019-C5, Class ASB, 2.99%, 11/15/52 | 167 | 184 | |||||||||
Benchmark Mortgage Trust, Series 2019-B14, Class A5, 3.05%, 12/15/61 | 286 | 322 | |||||||||
| Benchmark Mortgage Trust, Series 2020-B17, Class ASB, 2.18%, 3/15/53, Callable 11/15/29 @ 100 | 143 | 151 | |||||||||
| BTH Mortgage-Backed Securities Trust, Series 2018-21, Class A, 2.65% (LIBOR01M+250bps), 10/7/21 (a) (b) | 320 | 318 | |||||||||
BX Trust, Series 2019-OC11, Class A, 3.20%, 12/9/41 (a) | 132 | 141 | |||||||||
| Citigroup Commercial Mortgage Trust, Series 2020-GC46, Class AAB, 2.61%, 1/15/53 | 143 | 155 | |||||||||
| Citigroup Commercial Mortgage Trust, Series 2020-555, Class A, 2.65%, 12/10/41 (a) | 215 | 225 | |||||||||
COMM Mortgage Trust, Series 2019-GC44, Class ASB, 2.87%, 8/15/57 | 215 | 236 | |||||||||
| COMM Mortgage Trust, Series 2014-277P, Class A, 3.73%, 8/10/49, Callable 8/10/24 @ 100 (a) (c) | 140 | 150 | |||||||||
| Credit Suisse Commercial Mortgage Trust, Series 2007-C1, Class AMFL, 0.33% (LIBOR01M+19bps), 2/15/40 (b) | 3 | 3 | |||||||||
| CSAIL Commercial Mortgage Trust, Series 2016-C6, Class XA, 2.06%, 1/15/49, Callable 11/15/25 @ 100 (c) (d) | 2,274 | 172 | |||||||||
DBJPM Mortgage Trust, Series 2016-SFC, Class A, 2.83%, 8/10/36 (a) | 500 | 490 | |||||||||
GE Commercial Mortgage Corp., Series 2007-C1, Class AM, 5.61%, 12/10/49 (c) | 54 | 25 | |||||||||
GS Mortgage Securities Trust, Series 2020-GC45, Class A5, 2.91%, 2/13/53 | 91 | 101 | |||||||||
GS Mortgage Securities Trust, Series 2020-GC45, Class AAB, 2.84%, 2/13/53 | 77 | 85 | |||||||||
See notes to financial statements.
4
| USAA Mutual Funds Trust USAA Cornerstone Moderately Conservative Fund | Schedule of Portfolio Investments — continued November 30, 2020 | ||||||
(Amounts in Thousands, Except for Shares) (Unaudited)
Security Description | Shares or Principal Amount | Value | |||||||||
Manhattan West, Series 2020-1MW, Class A, 2.13%, 9/10/40 (a) | $ | 87 | $ | 90 | |||||||
| UBS Commercial Mortgage Trust, Series 2012-C1, Class XA, 2.25%, 5/10/45, Callable 4/10/22 @ 100 (a) (c) (d) | 2,421 | 42 | |||||||||
Total Collateralized Mortgage Obligations (Cost $3,284) | 3,227 | ||||||||||
Common Stocks (14.2%) | |||||||||||
Communication Services (1.1%): | |||||||||||
Activision Blizzard, Inc. | 2,079 | 165 | |||||||||
Alphabet, Inc. Class C (e) | 271 | 477 | |||||||||
AT&T, Inc. | 7,304 | 210 | |||||||||
Charter Communications, Inc. Class A (e) | 262 | 171 | |||||||||
Comcast Corp. Class A | 4,397 | 221 | |||||||||
Facebook, Inc. Class A (e) | 1,272 | 352 | |||||||||
Match Group, Inc. (e) | 1,160 | 162 | |||||||||
Sirius XM Holdings, Inc. (f) | 22,534 | 146 | |||||||||
T-Mobile U.S., Inc. (e) | 1,238 | 165 | |||||||||
Verizon Communications, Inc. | 3,714 | 224 | |||||||||
Zillow Group, Inc. Class C (e) | 1,361 | 147 | |||||||||
2,440 | |||||||||||
Consumer Discretionary (1.4%): | |||||||||||
Amazon.com, Inc. (e) | 179 | 567 | |||||||||
AutoZone, Inc. (e) | 131 | 149 | |||||||||
Booking Holdings, Inc. (e) | 82 | 166 | |||||||||
Dollar General Corp. | 741 | 162 | |||||||||
Domino's Pizza, Inc. | 378 | 148 | |||||||||
eBay, Inc. | 3,215 | 162 | |||||||||
Ford Motor Co. | 17,353 | 158 | |||||||||
General Motors Co. | 3,753 | 165 | |||||||||
Lennar Corp. Class A | 1,984 | 151 | |||||||||
Lowe's Cos., Inc. | 1,204 | 188 | |||||||||
O'Reilly Automotive, Inc. (e) | 332 | 147 | |||||||||
Peloton Interactive, Inc. Class A (e) | 1,353 | 157 | |||||||||
Tesla, Inc. (e) | 523 | 297 | |||||||||
The Home Depot, Inc. | 1,714 | 475 | |||||||||
3,092 | |||||||||||
Consumer Staples (0.8%): | |||||||||||
Altria Group, Inc. | 4,088 | 163 | |||||||||
Colgate-Palmolive Co. | 1,931 | 165 | |||||||||
Kimberly-Clark Corp. | 1,099 | 153 | |||||||||
Monster Beverage Corp. (e) | 1,762 | 150 | |||||||||
Philip Morris International, Inc. | 4,634 | 351 | |||||||||
The Clorox Co. | 1,435 | 291 | |||||||||
The Kroger Co. | 4,576 | 151 | |||||||||
The Procter & Gamble Co. | 1,772 | 246 | |||||||||
Walgreens Boots Alliance, Inc. | 3,975 | 151 | |||||||||
1,821 | |||||||||||
See notes to financial statements.
5
| USAA Mutual Funds Trust USAA Cornerstone Moderately Conservative Fund | Schedule of Portfolio Investments — continued November 30, 2020 | ||||||
(Amounts in Thousands, Except for Shares) (Unaudited)
Security Description | Shares | Value | |||||||||
Energy (0.4%): | |||||||||||
Cabot Oil & Gas Corp. | 8,252 | $ | 145 | ||||||||
Chevron Corp. | 2,329 | 203 | |||||||||
ConocoPhillips | 7,901 | 312 | |||||||||
Halliburton Co. | 9,036 | 150 | |||||||||
Phillips 66 | 2,508 | 152 | |||||||||
962 | |||||||||||
Financials (1.7%): | |||||||||||
AGNC Investment Corp. | 537 | 8 | |||||||||
Annaly Capital Management, Inc. | 1,424 | 11 | |||||||||
Aon PLC Class A | 762 | 156 | |||||||||
Berkshire Hathaway, Inc. Class B (e) | 1,068 | 244 | |||||||||
Brown & Brown, Inc. | 3,019 | 136 | |||||||||
Capital One Financial Corp. | 1,794 | 154 | |||||||||
First Republic Bank | 1,089 | 141 | |||||||||
KeyCorp | 9,249 | 143 | |||||||||
MarketAxess Holdings, Inc. | 281 | 152 | |||||||||
Marsh & McLennan Cos., Inc. | 1,385 | 159 | |||||||||
MetLife, Inc. | 3,405 | 157 | |||||||||
Moody's Corp. | 557 | 157 | |||||||||
Morgan Stanley | 2,876 | 178 | |||||||||
MSCI, Inc. | 744 | 305 | |||||||||
Prudential Financial, Inc. | 1,997 | 151 | |||||||||
S&P Global, Inc. | 976 | 343 | |||||||||
State Street Corp. | 2,186 | 154 | |||||||||
SVB Financial Group (e) | 821 | 283 | |||||||||
T. Rowe Price Group, Inc. | 1,067 | 153 | |||||||||
The Allstate Corp. | 1,483 | 152 | |||||||||
The Goldman Sachs Group, Inc. | 746 | 172 | |||||||||
The Progressive Corp. | 3,326 | 290 | |||||||||
Wells Fargo & Co. | 6,797 | 186 | |||||||||
3,985 | |||||||||||
Health Care (2.3%): | |||||||||||
AbbVie, Inc. | 2,033 | 213 | |||||||||
Amgen, Inc. | 1,628 | 361 | |||||||||
Anthem, Inc. | 535 | 167 | |||||||||
Biogen, Inc. (e) | 1,290 | 310 | |||||||||
Bio-Rad Laboratories, Inc. Class A (e) | 249 | 134 | |||||||||
Bristol-Myers Squibb Co. | 3,035 | 189 | |||||||||
Cerner Corp. | 2,012 | 151 | |||||||||
Cigna Corp. | 806 | 169 | |||||||||
CVS Health Corp. | 2,590 | 176 | |||||||||
Danaher Corp. | 807 | 181 | |||||||||
DexCom, Inc. (e) | 447 | 143 | |||||||||
Eli Lilly & Co. | 1,263 | 184 | |||||||||
Gilead Sciences, Inc. (g) | 2,732 | 166 | |||||||||
HCA Healthcare, Inc. | 1,036 | 156 | |||||||||
IDEXX Laboratories, Inc. (e) | 340 | 157 | |||||||||
Johnson & Johnson (g) | 3,594 | 520 | |||||||||
See notes to financial statements.
6
| USAA Mutual Funds Trust USAA Cornerstone Moderately Conservative Fund | Schedule of Portfolio Investments — continued November 30, 2020 | ||||||
(Amounts in Thousands, Except for Shares) (Unaudited)
Security Description | Shares | Value | |||||||||
Merck & Co., Inc. | 2,541 | $ | 204 | ||||||||
Mettler-Toledo International, Inc. (e) | 130 | 149 | |||||||||
Pfizer, Inc. | 5,750 | 220 | |||||||||
ResMed, Inc. | 701 | 147 | |||||||||
Thermo Fisher Scientific, Inc. | 423 | 197 | |||||||||
UnitedHealth Group, Inc. | 1,439 | 484 | |||||||||
Veeva Systems, Inc. Class A (e) | 554 | 153 | |||||||||
Waters Corp. (e) | 643 | 149 | |||||||||
West Pharmaceutical Services, Inc. | 514 | 141 | |||||||||
5,221 | |||||||||||
Industrials (1.3%): | |||||||||||
3M Co. | 2,001 | 346 | |||||||||
Carrier Global Corp. | 3,760 | 143 | |||||||||
CSX Corp. | 1,822 | 164 | |||||||||
Cummins, Inc. | 665 | 154 | |||||||||
Eaton Corp. PLC | 1,363 | 165 | |||||||||
Equifax, Inc. | 819 | 137 | |||||||||
FedEx Corp. | 556 | 159 | |||||||||
Fortune Brands Home & Security, Inc. | 1,686 | 141 | |||||||||
General Dynamics Corp. | 1,021 | 152 | |||||||||
Illinois Tool Works, Inc. | 768 | 162 | |||||||||
Lockheed Martin Corp. | 450 | 164 | |||||||||
Northrop Grumman Corp. | 510 | 154 | |||||||||
Old Dominion Freight Line, Inc. | 703 | 143 | |||||||||
Otis Worldwide Corp. | 2,236 | 150 | |||||||||
Rockwell Automation, Inc. | 607 | 155 | |||||||||
Rollins, Inc. | 2,436 | 139 | |||||||||
Verisk Analytics, Inc. | 724 | 144 | |||||||||
W.W. Grainger, Inc. | 350 | 146 | |||||||||
2,918 | |||||||||||
Information Technology (3.7%): | |||||||||||
Accenture PLC Class A | 784 | 195 | |||||||||
Adobe, Inc. (e) | 913 | 437 | |||||||||
Apple, Inc. | 20,064 | 2,389 | |||||||||
Applied Materials, Inc. | 2,182 | 180 | |||||||||
Broadcom, Inc. | 500 | 201 | |||||||||
Cadence Design Systems, Inc. (e) | 1,327 | 154 | |||||||||
CDW Corp. | 1,079 | 141 | |||||||||
Cisco Systems, Inc. | 4,828 | 208 | |||||||||
Cognizant Technology Solutions Corp. Class A | 2,106 | 165 | |||||||||
Coupa Software, Inc. (e) | 481 | 158 | |||||||||
DocuSign, Inc. (e) | 703 | 160 | |||||||||
HP, Inc. | 14,647 | 321 | |||||||||
Intel Corp. | 4,597 | 222 | |||||||||
International Business Machines Corp. | 1,494 | 185 | |||||||||
Intuit, Inc. | 476 | 168 | |||||||||
Lam Research Corp. | 744 | 337 | |||||||||
Mastercard, Inc. Class A | 709 | 239 | |||||||||
Micron Technology, Inc. (e) | 2,721 | 174 | |||||||||
See notes to financial statements.
7
| USAA Mutual Funds Trust USAA Cornerstone Moderately Conservative Fund | Schedule of Portfolio Investments — continued November 30, 2020 | ||||||
(Amounts in Thousands, Except for Shares) (Unaudited)
Security Description | Shares | Value | |||||||||
Microsoft Corp. (g) | 2,949 | $ | 631 | ||||||||
NVIDIA Corp. | 910 | 488 | |||||||||
Oracle Corp. | 3,220 | 186 | |||||||||
Square, Inc. Class A (e) | 854 | 180 | |||||||||
Texas Instruments, Inc. | 1,199 | 193 | |||||||||
The Trade Desk, Inc. Class A (e) | 188 | 169 | |||||||||
VeriSign, Inc. (e) | 754 | 151 | |||||||||
VMware, Inc. Class A (e) (f) | 1,009 | 141 | |||||||||
Zoom Video Communications, Inc. Class A (e) | 379 | 181 | |||||||||
8,354 | |||||||||||
Materials (0.6%): | |||||||||||
Air Products & Chemicals, Inc. | 587 | 164 | |||||||||
Ball Corp. | 1,512 | 145 | |||||||||
Hycroft Mining Holding Corp. (e) | 62,784 | 490 | |||||||||
LyondellBasell Industries NV Class A | 3,596 | 306 | |||||||||
Newmont Corp. | 2,484 | 146 | |||||||||
The Sherwin-Williams Co. | 223 | 167 | |||||||||
1,418 | |||||||||||
Real Estate (0.4%): | |||||||||||
Alexandria Real Estate Equities, Inc. | 124 | 20 | |||||||||
American Tower Corp. | 435 | 101 | |||||||||
AvalonBay Communities, Inc. | 143 | 24 | |||||||||
Boston Properties, Inc. | 149 | 15 | |||||||||
Camden Property Trust | 99 | 10 | |||||||||
CBRE Group, Inc. Class A (e) | 336 | 21 | |||||||||
Crown Castle International Corp. | 423 | 71 | |||||||||
Digital Realty Trust, Inc. | 270 | 36 | |||||||||
Duke Realty Corp. | 373 | 14 | |||||||||
Equinix, Inc. | 86 | 60 | |||||||||
Equity LifeStyle Properties, Inc. | 175 | 10 | |||||||||
Equity Residential | 379 | 22 | |||||||||
Essex Property Trust, Inc. | 68 | 17 | |||||||||
Extra Space Storage, Inc. | 133 | 15 | |||||||||
Federal Realty Investment Trust | 74 | 6 | |||||||||
Healthpeak Properties, Inc. | 517 | 15 | |||||||||
Host Hotels & Resorts, Inc. | 703 | 10 | |||||||||
Invitation Homes, Inc. | 551 | 16 | |||||||||
Iron Mountain, Inc. | 286 | 8 | |||||||||
Jones Lang LaSalle, Inc. (e) | 52 | 7 | |||||||||
Medical Properties Trust, Inc. | 537 | 10 | |||||||||
Mid-America Apartment Communities, Inc. | 117 | 15 | |||||||||
National Retail Properties, Inc. | 179 | 7 | |||||||||
Omega Healthcare Investors, Inc. | 234 | 8 | |||||||||
Prologis, Inc. | 750 | 75 | |||||||||
Public Storage | 160 | 36 | |||||||||
Realty Income Corp. | 341 | 20 | |||||||||
Regency Centers Corp. | 174 | 8 | |||||||||
SBA Communications Corp. | 115 | 33 | |||||||||
Simon Property Group, Inc. | 312 | 26 | |||||||||
See notes to financial statements.
8
| USAA Mutual Funds Trust USAA Cornerstone Moderately Conservative Fund | Schedule of Portfolio Investments — continued November 30, 2020 | ||||||
(Amounts in Thousands, Except for Shares) (Unaudited)
Security Description | Shares or Principal Amount | Value | |||||||||
Sun Communities, Inc. | 95 | $ | 13 | ||||||||
UDR, Inc. | 302 | 12 | |||||||||
Ventas, Inc. | 375 | 18 | |||||||||
VEREIT, Inc. | 1,102 | 8 | |||||||||
VICI Properties, Inc. | 464 | 12 | |||||||||
Vornado Realty Trust | 164 | 6 | |||||||||
Welltower, Inc. | 417 | 26 | |||||||||
Weyerhaeuser Co. | 741 | 21 | |||||||||
WP Carey, Inc. | 177 | 12 | |||||||||
864 | |||||||||||
Utilities (0.5%): | |||||||||||
Duke Energy Corp. (g) | 1,814 | 168 | |||||||||
Eversource Energy (g) | 1,644 | 144 | |||||||||
Exelon Corp. | 3,696 | 152 | |||||||||
NextEra Energy, Inc. (g) | 2,420 | 178 | |||||||||
NRG Energy, Inc. | 4,525 | 148 | |||||||||
The AES Corp. | 6,795 | 139 | |||||||||
WEC Energy Group, Inc. (g) | 1,524 | 145 | |||||||||
1,074 | |||||||||||
Total Common Stocks (Cost $26,644) | 32,149 | ||||||||||
Preferred Stocks (1.1%) | |||||||||||
Communication Services (0.2%): | |||||||||||
Qwest Corp., 6.50%, 9/1/56 | 20,000 | 510 | |||||||||
Consumer Staples (0.6%): | |||||||||||
CHS, Inc., cumulative redeemable, Series 1, 7.88% (h) | 32,000 | 918 | |||||||||
Dairy Farmers of America, Inc., cumulative redeemable, 7.88% (a) (h) | 5,000 | 468 | |||||||||
1,386 | |||||||||||
Financials (0.3%): | |||||||||||
Delphi Financial Group, Inc., 3.41% (LIBOR03M+319bps), 5/15/37 (b) (i) | 27,414 | 542 | |||||||||
Total Preferred Stocks (Cost $2,517) | 2,438 | ||||||||||
Corporate Bonds (14.1%) | |||||||||||
Communication Services (0.6%): | |||||||||||
AT&T, Inc., 2.30%, 6/1/27, Callable 4/1/27 @ 100 | $ | 211 | 224 | ||||||||
Fox Corp., 3.05%, 4/7/25, Callable 3/7/25 @ 100 | 102 | 111 | |||||||||
The Walt Disney Co., 2.20%, 1/13/28 | 94 | 100 | |||||||||
T-Mobile USA, Inc., 3.88%, 4/15/30, Callable 1/15/30 @ 100 (a) (g) | 257 | 295 | |||||||||
Verizon Communications, Inc., 4.50%, 8/10/33 | 430 | 547 | |||||||||
1,277 | |||||||||||
Consumer Discretionary (0.3%): | |||||||||||
AutoNation, Inc., 4.75%, 6/1/30, Callable 3/1/30 @ 100 | 85 | 102 | |||||||||
General Motors Co., 6.80%, 10/1/27, Callable 8/1/27 @ 100 (g) | 88 | 113 | |||||||||
Hasbro, Inc., 3.55%, 11/19/26, Callable 9/19/26 @ 100 | 172 | 190 | |||||||||
Nordstrom, Inc., 4.38%, 4/1/30, Callable 1/1/30 @ 100 (f) | 143 | 138 | |||||||||
VF Corp., 2.95%, 4/23/30, Callable 1/23/30 @ 100 | 106 | 117 | |||||||||
660 | |||||||||||
See notes to financial statements.
9
| USAA Mutual Funds Trust USAA Cornerstone Moderately Conservative Fund | Schedule of Portfolio Investments — continued November 30, 2020 | ||||||
(Amounts in Thousands, Except for Shares) (Unaudited)
Security Description | Principal Amount | Value | |||||||||
Consumer Staples (1.2%): | |||||||||||
Altria Group, Inc., 3.40%, 5/6/30, Callable 2/6/30 @ 100 | $ | 101 | $ | 112 | |||||||
| Anheuser-Busch Cos. LLC/Anheuser-Busch InBev Worldwide, Inc., 4.70%, 2/1/36, Callable 8/1/35 @ 100 | 358 | 456 | |||||||||
BAT Capital Corp., 2.79%, 9/6/24, Callable 8/6/24 @ 100 | 300 | 321 | |||||||||
Kraft Heinz Foods Co., 3.75%, 4/1/30, Callable 1/1/30 @ 100 (a) | 161 | 174 | |||||||||
McCormick & Co., Inc., 2.50%, 4/15/30, Callable 1/15/30 @ 100 | 62 | 66 | |||||||||
PepsiCo, Inc., 2.25%, 3/19/25, Callable 2/19/25 @ 100 | 332 | 355 | |||||||||
Sysco Corp., 5.95%, 4/1/30, Callable 1/1/30 @ 100 | 83 | 110 | |||||||||
The Coca-Cola Co., 3.45%, 3/25/30 | 500 | 589 | |||||||||
The Procter & Gamble Co., 3.00%, 3/25/30 | 142 | 165 | |||||||||
Unilever Capital Corp., 2.60%, 5/5/24, Callable 3/5/24 @ 100 | 350 | 373 | |||||||||
2,721 | |||||||||||
Energy (2.2%): | |||||||||||
Cameron LNG LLC, 3.30%, 1/15/35, Callable 9/15/34 @ 100 (a) | 273 | 308 | |||||||||
Cheniere Corpus Christi Holdings LLC, 3.70%, 11/15/29, Callable 5/18/29 @ 100 | 358 | 392 | |||||||||
Enable Midstream Partners LP, 4.15%, 9/15/29, Callable 6/15/29 @ 100 | 350 | 325 | |||||||||
Enbridge Energy Partners LP, 7.38%, 10/15/45, Callable 4/15/45 @ 100 (g) | 650 | 975 | |||||||||
Enterprise Products Operating LLC, 2.80%, 1/31/30, Callable 10/31/29 @ 100 | 215 | 233 | |||||||||
EOG Resources, Inc., 4.38%, 4/15/30, Callable 1/15/30 @ 100 | 65 | 79 | |||||||||
EQM Midstream Partners LP, 4.75%, 7/15/23, Callable 6/15/23 @ 100 (g) | 700 | 714 | |||||||||
EQT Corp., 8.75%, 2/1/30, Callable 11/1/29 @ 100 | 145 | 183 | |||||||||
Exxon Mobil Corp., 2.99%, 3/19/25, Callable 2/19/25 @ 100 (g) | 357 | 390 | |||||||||
Florida Gas Transmission Co. LLC, 2.55%, 7/1/30, Callable 4/1/30 @ 100 (a) | 89 | 94 | |||||||||
Marathon Petroleum Corp., 4.70%, 5/1/25, Callable 4/1/25 @ 100 | 99 | 112 | |||||||||
Midwest Connector Capital Co. LLC, 4.63%, 4/1/29, Callable 1/1/29 @ 100 (a) | 209 | 212 | |||||||||
National Oilwell Varco, Inc., 3.60%, 12/1/29, Callable 9/1/29 @ 100 | 286 | 290 | |||||||||
Occidental Petroleum Corp., 4.40%, 8/15/49, Callable 2/15/49 @ 100 | 143 | 117 | |||||||||
ONEOK, Inc., 6.35%, 1/15/31, Callable 10/15/30 @ 100 | 89 | 110 | |||||||||
Rockies Express Pipeline LLC, 4.80%, 5/15/30, Callable 2/15/30 @ 100 (a) | 143 | 140 | |||||||||
| Targa Resources Partners LP/Targa Resources Partners Finance Corp., 5.50%, 3/1/30 | 143 | 155 | |||||||||
Western Midstream Operating LP, 3.10%, 2/1/25, Callable 1/1/25 @ 100 | 151 | 151 | |||||||||
4,980 | |||||||||||
Financials (4.2%): | |||||||||||
AmTrust Financial Services, Inc., 6.13%, 8/15/23 | 332 | 321 | |||||||||
Ares Capital Corp., 3.63%, 1/19/22, Callable 12/19/21 @ 100 (g) | 350 | 359 | |||||||||
| BancorpSouth Bank, 4.13% (LIBOR03M+247bps), 11/20/29, Callable 11/20/24 @ 100 (b) | 184 | 187 | |||||||||
BBVA USA, 3.88%, 4/10/25, Callable 3/10/25 @ 100 | 100 | 111 | |||||||||
Belrose Funding Trust, 2.33%, 8/15/30, Callable 5/15/30 @ 100 (a) | 209 | 213 | |||||||||
Citizens Financial Group, Inc., 2.50%, 2/6/30, Callable 11/6/29 @ 100 | 215 | 228 | |||||||||
| Cullen/Frost Capital Trust II, 1.80% (LIBOR03M+155bps), 3/1/34, Callable 1/8/21 @ 100 (b) | 1,000 | 769 | |||||||||
First Horizon Bank, 5.75%, 5/1/30, Callable 2/1/30 @ 100 | 106 | 123 | |||||||||
| First Maryland Capital I, 1.24% (LIBOR03M+100bps), 1/15/27, Callable 1/8/21 @ 100 (b) | 100 | 93 | |||||||||
Ford Motor Credit Co. LLC, 4.06%, 11/1/24, Callable 10/1/24 @ 100 | 500 | 520 | |||||||||
Glencore Funding LLC, 2.50%, 9/1/30, Callable 6/1/30 @ 100 (a) | 244 | 243 | |||||||||
See notes to financial statements.
10
| USAA Mutual Funds Trust USAA Cornerstone Moderately Conservative Fund | Schedule of Portfolio Investments — continued November 30, 2020 | ||||||
(Amounts in Thousands, Except for Shares) (Unaudited)
Security Description | Principal Amount | Value | |||||||||
Global Atlantic Financial Co., 4.40%, 10/15/29, Callable 7/15/29 @ 100 (a) | $ | 184 | $ | 198 | |||||||
HSB Group, Inc., 1.15% (LIBOR03M+91bps), 7/15/27, Callable 1/8/21 @ 100 (b) | 550 | 484 | |||||||||
Hyundai Capital America, 3.75%, 7/8/21 (a) (g) | 700 | 712 | |||||||||
| JPMorgan Chase & Co., 2.52% (SOFR+204bps), 4/22/31, Callable 4/22/30 @ 100 (b) | 124 | 133 | |||||||||
KeyCorp, 2.25%, 4/6/27, MTN | 215 | 229 | |||||||||
Level 3 Financing, Inc., 3.88%, 11/15/29, Callable 8/15/29 @ 100 (a) | 287 | 317 | |||||||||
Loews Corp., 3.20%, 5/15/30, Callable 2/15/30 @ 100 | 140 | 159 | |||||||||
| Nationwide Mutual Insurance Co., 2.54% (LIBOR03M+229bps), 12/15/24, Callable 1/8/21 @ 100 (a) (b) | 1,100 | 1,097 | |||||||||
| New York Community Bancorp, Inc., 5.90% (LIBOR03M+278bps), 11/6/28, Callable 11/6/23 @ 100 (b) | 52 | 53 | |||||||||
PPL Capital Funding, Inc., 4.13%, 4/15/30, Callable 1/15/30 @ 100 | 141 | 167 | |||||||||
| Prudential Financial, Inc., 5.62% (LIBOR03M+392bps), 6/15/43, Callable 6/15/23 @ 100 (b) | 600 | 646 | |||||||||
Regions Financial Corp., 2.25%, 5/18/25, Callable 4/18/25 @ 100 | 158 | 167 | |||||||||
Santander Holdings USA, Inc., 3.45%, 6/2/25, Callable 5/2/25 @ 100 | 88 | 95 | |||||||||
| Signature Bank, 4.13% (LIBOR03M+256bps), 11/1/29, Callable 11/1/24 @ 100 (b) | 250 | 253 | |||||||||
Texas Capital Bank NA, 5.25%, 1/31/26 | 143 | 151 | |||||||||
| The Allstate Corp., 5.75% (LIBOR03M+294bps), 8/15/53, Callable 8/15/23 @ 100 (b) | 140 | 150 | |||||||||
The Progressive Corp., 3.20%, 3/26/30, Callable 12/26/29 @ 100 | 43 | 50 | |||||||||
Truist Bank, 0.89% (LIBOR03M+67bps), 5/15/27, Callable 1/8/21 @ 100 (b) | 1,000 | 944 | |||||||||
Wells Fargo & Co., 2.19% (SOFR+200bps), 4/30/26, Callable 4/30/25 @ 100 (b) | 159 | 167 | |||||||||
Zions Bancorp NA, 3.25%, 10/29/29, Callable 7/29/29 @ 100 | 286 | 294 | |||||||||
9,633 | |||||||||||
Health Care (0.9%): | |||||||||||
AbbVie, Inc., 3.20%, 11/21/29, Callable 8/21/29 @ 100 (a) (g) | 287 | 325 | |||||||||
CVS Health Corp., 3.25%, 8/15/29, Callable 5/15/29 @ 100 (g) | 534 | 596 | |||||||||
Dentsply Sirona, Inc., 3.25%, 6/1/30, Callable 3/1/30 @ 100 | 158 | 174 | |||||||||
Duke University Health System, Inc., 2.60%, 6/1/30 | 105 | 111 | |||||||||
HCA, Inc., 5.13%, 6/15/39, Callable 12/15/38 @ 100 | 358 | 460 | |||||||||
Laboratory Corp. of America Holdings, 2.95%, 12/1/29, Callable 9/1/29 @ 100 | 215 | 237 | |||||||||
Thermo Fisher Scientific, Inc., 4.13%, 3/25/25, Callable 2/25/25 @ 100 | 142 | 161 | |||||||||
Upjohn, Inc., 2.30%, 6/22/27, Callable 4/22/27 @ 100 (a) | 52 | 55 | |||||||||
2,119 | |||||||||||
Industrials (1.7%): | |||||||||||
Ashtead Capital, Inc., 4.00%, 5/1/28, Callable 5/1/23 @ 102 (a) | 51 | 54 | |||||||||
Carlisle Cos., Inc., 2.75%, 3/1/30, Callable 12/1/29 @ 100 | 215 | 231 | |||||||||
Carrier Global Corp., 3.38%, 4/5/40, Callable 10/5/39 @ 100 (a) | 107 | 118 | |||||||||
Caterpillar, Inc., 2.60%, 4/9/30, Callable 1/9/30 @ 100 | 106 | 117 | |||||||||
CoStar Group, Inc., 2.80%, 7/15/30, Callable 4/15/30 @ 100 (a) | 47 | 49 | |||||||||
Dover Corp., 2.95%, 11/4/29, Callable 8/4/29 @ 100 | 215 | 234 | |||||||||
General Dynamics Corp., 3.50%, 4/1/27, Callable 2/1/27 @ 100 | 142 | 164 | |||||||||
Georgia-Pacific LLC, 2.10%, 4/30/27, Callable 2/28/27 @ 100 (a) | 248 | 262 | |||||||||
IDEX Corp., 3.00%, 5/1/30, Callable 2/1/30 @ 100 | 248 | 275 | |||||||||
Otis Worldwide Corp., 3.11%, 2/15/40, Callable 8/15/39 @ 100 | 143 | 157 | |||||||||
See notes to financial statements.
11
| USAA Mutual Funds Trust USAA Cornerstone Moderately Conservative Fund | Schedule of Portfolio Investments — continued November 30, 2020 | ||||||
(Amounts in Thousands, Except for Shares) (Unaudited)
Security Description | Principal Amount | Value | |||||||||
| Penske Truck Leasing Co. LP/PTL Finance Corp., 4.00%, 7/15/25, Callable 6/15/25 @ 100 (a) | $ | 141 | $ | 160 | |||||||
Ryder System, Inc. | |||||||||||
3.50%, 6/1/21, MTN (g) | 700 | 711 | |||||||||
2.90%, 12/1/26, Callable 10/1/26 @ 100, MTN | 358 | 391 | |||||||||
Southwest Airlines Co., 5.13%, 6/15/27, Callable 4/15/27 @ 100 | 114 | 132 | |||||||||
The Boeing Co., 5.71%, 5/1/40, Callable 11/1/39 @ 100 | 212 | 267 | |||||||||
| The Conservation Fund A Nonprofit Corp., 3.47%, 12/15/29, Callable 9/15/29 @ 100 | 325 | 353 | |||||||||
United Airlines Pass Through Trust, 2.90%, 11/1/29 | 294 | 255 | |||||||||
| Westinghouse Air Brake Technologies Corp., 3.20%, 6/15/25, Callable 5/15/25 @ 100 | 37 | 40 | |||||||||
3,970 | |||||||||||
Information Technology (0.8%): | |||||||||||
Amphenol Corp., 2.80%, 2/15/30, Callable 11/15/29 @ 100 | 300 | 328 | |||||||||
Analog Devices, Inc., 2.95%, 4/1/25, Callable 3/1/25 @ 100 | 53 | 58 | |||||||||
Broadcom, Inc., 4.30%, 11/15/32, Callable 8/15/32 @ 100 | 88 | 104 | |||||||||
Hewlett Packard Enterprise Co., 4.65%, 10/1/24, Callable 9/1/24 @ 100 | 141 | 160 | |||||||||
HP, Inc., 3.40%, 6/17/30, Callable 3/17/30 @ 100 | 161 | 177 | |||||||||
Jabil, Inc., 3.00%, 1/15/31, Callable 10/15/30 @ 100 | 47 | 49 | |||||||||
Keysight Technologies, Inc., 3.00%, 10/30/29, Callable 7/30/29 @ 100 | 263 | 289 | |||||||||
Microsoft Corp., 3.45%, 8/8/36, Callable 2/8/36 @ 100 | 466 | 577 | |||||||||
1,742 | |||||||||||
Materials (0.5%): | |||||||||||
Avery Dennison Corp., 2.65%, 4/30/30, Callable 2/1/30 @ 100 | 86 | 92 | |||||||||
Colonial Enterprises, Inc., 3.25%, 5/15/30, Callable 2/15/30 @ 100 (a) | 44 | 49 | |||||||||
LYB International Finance III LLC, 3.38%, 5/1/30, Callable 2/1/30 @ 100 | 124 | 139 | |||||||||
Packaging Corp. of America, 3.00%, 12/15/29, Callable 9/15/29 @ 100 | 358 | 396 | |||||||||
Sonoco Products Co., 3.13%, 5/1/30, Callable 2/1/30 @ 100 | 164 | 182 | |||||||||
Vulcan Materials Co., 3.50%, 6/1/30, Callable 3/1/30 @ 100 | 141 | 161 | |||||||||
WRKCo, Inc., 3.00%, 6/15/33, Callable 3/15/33 @ 100 (g) | 80 | 88 | |||||||||
1,107 | |||||||||||
Real Estate (0.6%): | |||||||||||
AvalonBay Communities, Inc., 2.45%, 1/15/31, MTN, Callable 10/15/30 @ 100 | 211 | 226 | |||||||||
Boston Properties LP, 3.25%, 1/30/31, Callable 10/30/30 @ 100 | 93 | 102 | |||||||||
Essex Portfolio LP, 2.65%, 3/15/32, Callable 12/15/31 @ 100 | 250 | 266 | |||||||||
GLP Capital LP/GLP Financing II, Inc., 4.00%, 1/15/31, Callable 10/15/30 @ 100 | 52 | 56 | |||||||||
Host Hotels & Resorts LP, 3.50%, 9/15/30, Callable 6/15/30 @ 100 | 44 | 45 | |||||||||
Mid-America Apartments LP, 2.75%, 3/15/30, Callable 12/15/29 @ 100 | 358 | 390 | |||||||||
SBA Tower Trust, 2.84%, 1/15/25 (a) | 173 | 183 | |||||||||
| VICI Properties LP/VICI Note Co., Inc., 4.63%, 12/1/29, Callable 12/1/24 @ 102.31 (a) | 33 | 35 | |||||||||
1,303 | |||||||||||
Utilities (1.1%): | |||||||||||
AEP Texas, Inc., 3.45%, 1/15/50, Callable 7/15/49 @ 100 | 251 | 286 | |||||||||
Alabama Power Co., 3.85%, 12/1/42 | 215 | 265 | |||||||||
Ameren Corp., 3.50%, 1/15/31, Callable 10/15/30 @ 100 | 71 | 82 | |||||||||
Cleco Corporate Holdings LLC, 3.38%, 9/15/29, Callable 6/15/29 @ 100 | 367 | 378 | |||||||||
See notes to financial statements.
12
| USAA Mutual Funds Trust USAA Cornerstone Moderately Conservative Fund | Schedule of Portfolio Investments — continued November 30, 2020 | ||||||
(Amounts in Thousands, Except for Shares) (Unaudited)
Security Description | Principal Amount | Value | |||||||||
Duke Energy Florida LLC, 3.85%, 11/15/42, Callable 5/15/42 @ 100 | $ | 215 | $ | 259 | |||||||
Exelon Generation Co. LLC, 3.25%, 6/1/25, Callable 5/1/25 @ 100 | 158 | 170 | |||||||||
IPALCO Enterprises, Inc., 4.25%, 5/1/30, Callable 2/1/30 @ 100 (a) | 161 | 186 | |||||||||
ITC Holdings Corp., 2.95%, 5/14/30, Callable 2/14/30 @ 100 (a) | 158 | 173 | |||||||||
National Fuel Gas Co., 5.50%, 1/15/26, Callable 12/15/25 @ 100 | 211 | 237 | |||||||||
The Narragansett Electric Co., 3.40%, 4/9/30, Callable 1/9/30 @ 100 (a) | 106 | 121 | |||||||||
Union Electric Co., 2.95%, 3/15/30, Callable 12/15/29 @ 100 | 357 | 402 | |||||||||
2,559 | |||||||||||
Total Corporate Bonds (Cost $29,723) | 32,071 | ||||||||||
Yankee Dollars (2.2%) | |||||||||||
Consumer Staples (0.1%): | |||||||||||
Alimentation Couche-Tard, Inc., 2.95%, 1/25/30, Callable 10/25/29 @ 100 (a) | 143 | 156 | |||||||||
Energy (0.1%): | |||||||||||
Petroleos Mexicanos, 6.49%, 1/23/27, Callable 11/23/26 @ 100 | 123 | 123 | |||||||||
Petronas Capital Ltd., 3.50%, 4/21/30, Callable 1/21/30 @ 100 (a) | 11 | 13 | |||||||||
136 | |||||||||||
Financials (1.4%): | |||||||||||
Athene Holding Ltd., 4.13%, 1/12/28, Callable 10/12/27 @ 100 | 700 | 774 | |||||||||
| Banco Santander Mexico SA Institucion de Banca Multiple Grupo Financiero Santand, 5.38%, 4/17/25 (a) | 101 | 114 | |||||||||
Barclays PLC, 2.85% (LIBOR03M+245bps), 5/7/26, Callable 5/7/25 @ 100 (b) | 212 | 225 | |||||||||
| Deutsche Bank AG, 3.96% (SOFR+258bps), 11/26/25, Callable 11/26/24 @ 100 (b) | 215 | 233 | |||||||||
Diageo Capital PLC, 2.13%, 4/29/32, Callable 1/29/32 @ 100 | 248 | 263 | |||||||||
| QBE Capital Funding III Ltd., 7.25% (USSW10+405bps), 5/24/41, Callable 5/24/21 @ 100 (a) (b) | 250 | 256 | |||||||||
Royal Bank of Canada, 1.60%, 4/17/23, MTN | 248 | 255 | |||||||||
Sumitomo Mitsui Financial Group, Inc., 2.45%, 9/27/24 | 1,000 | 1,061 | |||||||||
3,181 | |||||||||||
Health Care (0.0%) (j) | |||||||||||
Royalty Pharma PLC, 2.20%, 9/2/30, Callable 6/2/30 @ 100 (a) | 58 | 59 | |||||||||
Industrials (0.2%): | |||||||||||
CK Hutchison International 19 II Ltd., 2.75%, 9/6/29, Callable 6/6/29 @ 100 (a) | 300 | 321 | |||||||||
Ferguson Finance PLC, 3.25%, 6/2/30, Callable 3/2/30 @ 100 (a) | 95 | 105 | |||||||||
Heathrow Funding Ltd., 4.88%, 7/15/21 (a) | 142 | 145 | |||||||||
571 | |||||||||||
Materials (0.4%): | |||||||||||
Anglo American Capital PLC, 5.63%, 4/1/30, Callable 1/1/30 @ 100 (a) | 133 | 167 | |||||||||
Braskem Netherlands Finance BV, 4.50%, 1/31/30 (a) | 214 | 216 | |||||||||
CCL Industries, Inc., 3.05%, 6/1/30, Callable 3/1/30 @ 100 (a) | 159 | 173 | |||||||||
Teck Resources Ltd., 6.13%, 10/1/35 | 230 | 290 | |||||||||
846 | |||||||||||
Total Yankee Dollars (Cost $4,554) | 4,949 | ||||||||||
See notes to financial statements.
13
| USAA Mutual Funds Trust USAA Cornerstone Moderately Conservative Fund | Schedule of Portfolio Investments — continued November 30, 2020 | ||||||
(Amounts in Thousands, Except for Shares) (Unaudited)
Security Description | Principal Amount | Value | |||||||||
Municipal Bonds (1.4%) | |||||||||||
Florida (0.1%): | |||||||||||
County of Broward Florida Airport System Revenue, Series C, 2.50%, 10/1/28 | $ | 143 | $ | 146 | |||||||
| Hillsborough County School Board Certificate of Participation, Series B, 1.92%, 7/1/25 | 90 | 92 | |||||||||
238 | |||||||||||
Georgia (0.1%): | |||||||||||
Athens Housing Authority Revenue, 2.42%, 12/1/26 | 305 | 326 | |||||||||
Louisiana (0.1%): | |||||||||||
| Louisiana Local Government Environmental Facilities & Community Development Authority Revenue, 1.55%, 2/1/27 | 140 | 141 | |||||||||
Michigan (0.1%): | |||||||||||
Michigan Finance Authority Revenue, 3.08%, 12/1/34 | 215 | 237 | |||||||||
New Jersey (0.1%): | |||||||||||
| New Jersey Economic Development Authority Revenue, Series NNN, 2.88%, 6/15/24 | 138 | 140 | |||||||||
New Jersey Transportation Trust Fund Authority Revenue, 4.08%, 6/15/39 | 55 | 55 | |||||||||
North Hudson Sewerage Authority Revenue, 2.88%, 6/1/28 | 72 | 79 | |||||||||
Rutgers The State University of New Jersey Revenue, Series S, 2.01%, 5/1/32 | 85 | 82 | |||||||||
356 | |||||||||||
New York (0.3%): | |||||||||||
| New York State Dormitory Authority Revenue Series A, 2.46%, 7/1/32 | 155 | 157 | |||||||||
Series B, 2.83%, 7/1/31 | 360 | 381 | |||||||||
New York State Thruway Authority Revenue, Series M, 2.55%, 1/1/28 | 83 | 88 | |||||||||
626 | |||||||||||
Pennsylvania (0.2%): | |||||||||||
State Public School Building Authority Revenue, 3.05%, 4/1/28 | 143 | 148 | |||||||||
| University of Pittsburgh-of The Commonwealth System of Higher Education Revenue Series C, 2.53%, 9/15/31 | 145 | 155 | |||||||||
Series C, 2.58%, 9/15/32 | 70 | 75 | |||||||||
Series C, 2.63%, 9/15/33 | 145 | 155 | |||||||||
533 | |||||||||||
Texas (0.4%): | |||||||||||
City of Houston Texas Combined Utility System Revenue, 3.72%, 11/15/28 | 180 | 212 | |||||||||
City of San Antonio, GO, 1.76%, 2/1/31, Continuously Callable @100 | 130 | 132 | |||||||||
Dallas/Fort Worth International Airport Revenue, Series C, 1.75%, 11/1/27 | 85 | 85 | |||||||||
| Harris County Cultural Education Facilities Finance Corp. Revenue, Series B, 2.81%, 5/15/29 | 145 | 155 | |||||||||
State of Texas, GO, 3.00%, 4/1/28 | 215 | 244 | |||||||||
828 | |||||||||||
Total Municipal Bonds (Cost $3,123) | 3,285 | ||||||||||
See notes to financial statements.
14
| USAA Mutual Funds Trust USAA Cornerstone Moderately Conservative Fund | Schedule of Portfolio Investments — continued November 30, 2020 | ||||||
(Amounts in Thousands, Except for Shares) (Unaudited)
Security Description | Shares or Principal Amount | Value | |||||||||
U.S. Government Agency Mortgages (4.2%) | |||||||||||
| Federal Home Loan Mortgage Corporation Series K047, Class A2, 3.33%, 5/25/25 (c) | $ | 1,100 | $ | 1,222 | |||||||
3.50%, 4/1/46 - 4/1/48 | 2,825 | 2,994 | |||||||||
3.00%, 10/1/46 - 3/1/47 | 4,698 | 4,946 | |||||||||
9,162 | |||||||||||
| Federal National Mortgage Association Series 2016-M2, Class AV2, 2.15%, 1/25/23 | 296 | 302 | |||||||||
Total U.S. Government Agency Mortgages (Cost $9,034) | 9,464 | ||||||||||
U.S. Treasury Obligations (13.9%) | |||||||||||
| U.S. Treasury Bonds 3.13%, 8/15/44 | 700 | 936 | |||||||||
3.00%, 8/15/48 (g) | 1,000 | 1,335 | |||||||||
2.38%, 11/15/49 | 1,000 | 1,193 | |||||||||
| U.S. Treasury Notes 1.13%, 2/28/21 | 6,802 | 6,819 | |||||||||
1.63%, 11/15/22 | 2,600 | 2,675 | |||||||||
2.00%, 2/15/23 | 618 | 642 | |||||||||
1.63%, 4/30/23 (g) | 3,800 | 3,934 | |||||||||
2.50%, 5/15/24 | 1,500 | 1,617 | |||||||||
2.25%, 11/15/25 | 6,200 | 6,774 | |||||||||
1.63%, 2/15/26 | 2,000 | 2,128 | |||||||||
2.25%, 2/15/27 | 1,000 | 1,106 | |||||||||
2.38%, 5/15/27 (g) | 2,000 | 2,234 | |||||||||
Total U.S. Treasury Obligations (Cost $29,207) | 31,393 | ||||||||||
Exchange-Traded Funds (37.7%) | |||||||||||
Invesco DB Commodity Index Tracking Fund | 22,900 | 319 | |||||||||
Invesco FTSE RAFI Developed Markets ex-US ETF | 45,661 | 1,843 | |||||||||
Invesco FTSE RAFI Emerging Markets ETF | 99,400 | 1,967 | |||||||||
iShares Core MSCI Emerging Markets ETF (f) | 91,984 | 5,392 | |||||||||
iShares Core S&P 500 ETF | 19,682 | 7,151 | |||||||||
iShares Core S&P Small-Cap ETF | 7,474 | 636 | |||||||||
iShares Core US Aggregate Bond ETF | 73,296 | 8,680 | |||||||||
iShares MSCI Canada ETF (f) | 43,295 | 1,311 | |||||||||
iShares MSCI International Momentum Factor ETF | 57,626 | 2,064 | |||||||||
iShares MSCI International Quality Factor ETF | 61,990 | 2,113 | |||||||||
iShares Russell 2000 ETF (f) | 7,747 | 1,402 | |||||||||
Schwab Fundamental Emerging Markets Large Co. Index ETF | 160,268 | 4,300 | |||||||||
Schwab Fundamental International Large Co. Index ETF | 237,343 | 6,677 | |||||||||
Schwab Fundamental International Small Co. Index ETF | 50,100 | 1,665 | |||||||||
SPDR Bloomberg Barclays High Yield Bond ETF (g) | 5,106 | 549 | |||||||||
SPDR Gold Shares (e) | 9,038 | 1,506 | |||||||||
SPDR S&P Emerging Markets Smallcap ETF | 7,496 | 371 | |||||||||
VanEck Vectors Gold Miners ETF | 21,830 | 757 | |||||||||
VanEck Vectors Junior Gold Miners ETF | 4,503 | 225 | |||||||||
Vanguard FTSE All-World ex-US ETF | 41,597 | 2,315 | |||||||||
See notes to financial statements.
15
| USAA Mutual Funds Trust USAA Cornerstone Moderately Conservative Fund | Schedule of Portfolio Investments — continued November 30, 2020 | ||||||
(Amounts in Thousands, Except for Shares) (Unaudited)
Security Description | Shares or Principal Amount | Value | |||||||||
Vanguard FTSE Developed Markets ETF | $ | 209,603 | $ | 9,451 | |||||||
Vanguard FTSE Emerging Markets ETF (g) | 36,415 | 1,732 | |||||||||
Vanguard Mortgage-Backed Securities ETF | 42,318 | 2,290 | |||||||||
Vanguard Real Estate ETF | 12,000 | 1,008 | |||||||||
Vanguard S&P 500 ETF (g) | 13,158 | 4,377 | |||||||||
Vanguard Short-Term Bond ETF | 18,009 | 1,493 | |||||||||
Vanguard Small-Cap Value ETF (g) | 18,747 | 2,512 | |||||||||
Vanguard Total Bond Market ETF | 98,542 | 8,720 | |||||||||
Vanguard Total Stock Market ETF (g) | 6,619 | 1,236 | |||||||||
WisdomTree Emerging Markets SmallCap Dividend Fund | 5,259 | 240 | |||||||||
Xtrackers USD High Yield Corporate Bond ETF | 22,440 | 1,111 | |||||||||
Total Exchange-Traded Funds (Cost $76,028) | 85,413 | ||||||||||
Affiliated Exchange-Traded Funds (5.0%) | |||||||||||
VictoryShares USAA Core Intermediate-Term Bond ETF | 159,000 | 8,677 | |||||||||
VictoryShares USAA Core Short-Term Bond ETF | 44,683 | 2,321 | |||||||||
VictoryShares USAA MSCI Emerging Markets Value Momentum ETF (g) | 9,770 | 420 | |||||||||
Total Affiliated Exchange-Traded Funds (Cost $11,411) | 11,418 | ||||||||||
Collateral for Securities Loaned^ (3.9%) | |||||||||||
| Goldman Sachs Financial Square Government Fund Institutional Shares, 0.02% (k) | 1,113,813 | 1,114 | |||||||||
HSBC U.S. Government Money Market Fund I Shares, 0.03% (k) | 7,705,308 | 7,705 | |||||||||
Total Collateral for Securities Loaned (Cost $8,819) | 8,819 | ||||||||||
Total Investments (Cost $212,120) — 102.6% | 232,552 | ||||||||||
Liabilities in excess of other assets — (2.6)% | (5,924 | ) | |||||||||
NET ASSETS — 100.00% | $ | 226,628 | |||||||||
At November 30, 2020, the Fund's investments in foreign securities were 15.1% of net assets.
^ Purchased with cash collateral from securities on loan.
(a) Rule 144A security or other security that is restricted as to resale to institutional investors. The Fund's Adviser has deemed this security to be liquid based upon procedures approved by the Board of Trustees. As of November 30, 2020, the fair value of these securities was $14,959 (thousands) and amounted to 6.6% of net assets.
(b) Variable or Floating-Rate Security. Rate disclosed is as of November 30, 2020.
(c) The rate for certain asset-backed and mortgage-backed securities may vary based on factors relating to the pool of assets underlying the security. The rate disclosed is the rate in effect at November 30, 2020.
(d) Security is interest only.
(e) Non-income producing security.
(f) All or a portion of this security is on loan.
See notes to financial statements.
16
| USAA Mutual Funds Trust USAA Cornerstone Moderately Conservative Fund | Schedule of Portfolio Investments — continued November 30, 2020 | ||||||
(Unaudited)
(g) All or a portion of this security has been segregated as collateral for derivative instruments.
(h) Security is perpetual and has no final maturity date but may be subject to calls at various dates in the future.
(i) The Fund's Adviser has deemed this security to be illiquid based upon procedures approved by the Board of Trustees. As of November 30, 2020, illiquid securities were 0.2% of the Fund's net assets.
(j) Amount represents less than 0.05% of net assets.
(k) Rate disclosed is the daily yield on November 30, 2020.
bps — Basis points
Continuously callable — Investment is continuously callable or will be continuously callable on any date after the first call date until its maturity.
ETF — Exchange-Traded Fund
GO — General Obligation
LIBOR — London InterBank Offered Rate
LIBOR01M — 1 Month US Dollar LIBOR, rate disclosed as of November 30, 2020, based on the last reset date of the security
LIBOR03M — 3 Month US Dollar LIBOR, rate disclosed as of November 30, 2020, based on the last reset date of the security
LLC — Limited Liability Company
LP — Limited Partnership
MTN — Medium Term Note
PLC — Public Limited Company
SOFR — Secured Overnight Financing Rate
USSW10 — USD 10 Year Swap Rate, rate disclosed as of November 30, 2020
Futures Contracts Purchased
(Amounts not in thousands)
| Number of Contracts | Expiration Date | Notional Amount | Value | Unrealized Appreciation/ (Depreciation) | |||||||||||||||||||
| S&P/Toronto Stock Exchange 60 Index Futures | 9 | 12/17/20 | $ | 1,316,926 | $ | 1,418,237 | $ | 79,591 | |||||||||||||||
Swiss Market Index Futures | 18 | 12/18/20 | 2,052,637 | 2,081,541 | 28,950 | ||||||||||||||||||
$ | 108,541 | ||||||||||||||||||||||
See notes to financial statements.
17
| USAA Mutual Funds Trust USAA Cornerstone Moderately Conservative Fund | Schedule of Portfolio Investments — continued November 30, 2020 | ||||||
(Unaudited)
Futures Contracts Sold
(Amounts not in thousands)
| Number of Contracts | Expiration Date | Notional Amount | Value | Unrealized Appreciation/ (Depreciation) | |||||||||||||||||||
Euro Stoxx 50 Futures | 34 | 12/18/20 | $ | 1,394,122 | $ | 1,421,347 | $ | (19,485 | ) | ||||||||||||||
Russell 2000 E-Mini Index Futures | 9 | 12/21/20 | 701,492 | 819,045 | (117,553 | ) | |||||||||||||||||
Tokyo Price Index Futures | 14 | 12/10/20 | 2,162,051 | 2,354,570 | (165,046 | ) | |||||||||||||||||
(302,084 | ) | ||||||||||||||||||||||
Total unrealized appreciation | $ | 108,541 | |||||||||||||||||||||
Total unrealized depreciation | (302,084 | ) | |||||||||||||||||||||
Total net unrealized appreciation (depreciation) | $ | (193,543 | ) | ||||||||||||||||||||
See notes to financial statements.
18
USAA Mutual Funds Trust | Statement of Assets and Liabilities November 30, 2020 | ||||||
(Amounts in Thousands, Except Per Share Amounts) (Unaudited)
| USAA Cornerstone Moderately Conservative Fund | |||||||
Assets: | |||||||
Affiliated investments, at value (Cost $11,411) | $ | 11,418 | |||||
Unaffiliated investments, at value (Cost $200,709) | 221,134 | (a) | |||||
Cash and cash equivalents | 2,602 | ||||||
Deposits with brokers for futures contracts | 215 | ||||||
Receivables: | |||||||
Interest and dividends | 513 | ||||||
Capital shares issued | 127 | ||||||
Variation margin on open futures contracts | 62 | ||||||
From Adviser | 59 | ||||||
Prepaid expenses | 11 | ||||||
Total assets | 236,141 | ||||||
Liabilities: | |||||||
Payables: | |||||||
Collateral received on loaned securities | 8,819 | ||||||
Collateral received from brokers for futures contract | 265 | ||||||
Foreign currency | 6 | ||||||
Capital shares redeemed | 209 | ||||||
Variation margin on open futures contracts | 19 | ||||||
Accrued expenses and other payables: | |||||||
Investment advisory fees | 92 | ||||||
Administration fees | 28 | ||||||
Custodian fees | 1 | ||||||
Transfer agent fees | 24 | ||||||
Compliance fees | — | (b) | |||||
Other accrued expenses | 50 | ||||||
Total liabilities | 9,513 | ||||||
Net Assets: | |||||||
Capital | 204,581 | ||||||
Total accumulated earnings/(loss) | 22,047 | ||||||
Net assets | $ | 226,628 | |||||
Shares (unlimited number of shares authorized with no par value): | 18,802 | ||||||
Net asset value, offering and redemption price per share: (c) | $ | 12.05 | |||||
(a) Includes $8,444 of securities on loan.
(b) Rounds to less than $1 thousand.
(c) Per share amount may not recalculate due to rounding of net assets and/or shares outstanding.
See notes to financial statements.
19
USAA Mutual Funds Trust | Statement of Operations For the Six Months Ended November 30, 2020 | ||||||
(Amounts in Thousands) (Unaudited)
| USAA Cornerstone Moderately Conservative Fund | |||||||
Investment Income: | |||||||
Income distributions from affiliated funds | $ | 33 | |||||
Dividends | 1,250 | ||||||
Interest | 1,278 | ||||||
Securities lending (net of fees) | 33 | ||||||
Foreign tax withholding | (1 | ) | |||||
Total income | 2,593 | ||||||
Expenses: | |||||||
Investment advisory fees | 558 | ||||||
Administration fees | 167 | ||||||
Sub-Administration fees | 36 | ||||||
Custodian fees | 14 | ||||||
Transfer agent fees | 275 | ||||||
Trustees' fees | 26 | ||||||
Compliance fees | 1 | ||||||
Legal and audit fees | 41 | ||||||
State registration and filing fees | 13 | ||||||
Other expenses | 31 | ||||||
Total expenses | 1,162 | ||||||
Expenses waived/reimbursed by Adviser | (157 | ) | |||||
Net expenses | 1,005 | ||||||
Net Investment Income (Loss) | 1,588 | ||||||
Realized/Unrealized Gains (Losses) from Investments: | |||||||
| Net realized gains (losses) from unaffiliated investment securities and foreign currency translations | 2,332 | ||||||
Net realized gains (losses) from futures contracts | 64 | ||||||
Net change in unrealized appreciation/depreciation on affiliated funds | 116 | ||||||
| Net change in unrealized appreciation/depreciation on unaffiliated investment securities | 15,385 | ||||||
Net change in unrealized appreciation/depreciation on futures contracts | (194 | ) | |||||
Net realized/unrealized gains (losses) on investments | 17,703 | ||||||
Change in net assets resulting from operations | $ | 19,291 | |||||
See notes to financial statements.
20
USAA Mutual Funds Trust | Statements of Changes in Net Assets | ||||||
(Amounts in Thousands)
| USAA Cornerstone Moderately Conservative Fund | |||||||||||
| Six Months Ended November 30, 2020 (unaudited) | Year Ended May 31, 2020 | ||||||||||
From Investments: | |||||||||||
Operations: | |||||||||||
Net investment income (loss) | $ | 1,588 | $ | 4,698 | |||||||
Net realized gains (losses) from investments | 2,396 | 450 | |||||||||
| Net change in unrealized appreciation/depreciation on investments | 15,307 | 3,478 | |||||||||
Change in net assets resulting from operations | 19,291 | 8,626 | |||||||||
Change in net assets resulting from distributions to shareholders | (1,574 | ) | (5,060 | ) | |||||||
Change in net assets resulting from capital transactions | (11,876 | ) | (9,263 | ) | |||||||
Change in net assets | 5,841 | (5,697 | ) | ||||||||
Net Assets: | |||||||||||
Beginning of period | 220,787 | 226,484 | |||||||||
End of period | $ | 226,628 | $ | 220,787 | |||||||
Capital Transactions: | |||||||||||
Proceeds from shares issued | $ | 8,891 | $ | 32,147 | |||||||
Distributions reinvested | 1,493 | 4,808 | |||||||||
Cost of shares redeemed | (22,260 | ) | (46,218 | ) | |||||||
Change in net assets resulting from capital transactions | $ | (11,876 | ) | $ | (9,263 | ) | |||||
Share Transactions: | |||||||||||
Issued | 761 | 2,879 | |||||||||
Reinvested | 132 | 429 | |||||||||
Redeemed | (1,918 | ) | (4,182 | ) | |||||||
Change in Shares | (1,025 | ) | (874 | ) | |||||||
See notes to financial statements.
21
USAA Mutual Funds Trust | Financial Highlights | ||||||
For a Share Outstanding Throughout Each Period
Investment Activities | Distributions to Shareholders From | ||||||||||||||||||||||||||
| Net Asset Value, Beginning of Period | Net Investment Income (Loss) | Net Realized and Unrealized Gains (Losses) on Investments | Total from Investment Activities | Net Investment Income | Net Realized Gains From Investments | ||||||||||||||||||||||
USAA Cornerstone Moderately Conservative Fund | |||||||||||||||||||||||||||
| Six Months Ended November 30, 2020 (unaudited) | $ | 11.14 | 0.08 | (d) | 0.91 | 0.99 | (0.08 | ) | — | ||||||||||||||||||
| Year Ended May 31, 2020 | $ | 10.94 | 0.23 | (d) | 0.22 | 0.45 | (0.23 | ) | (0.02 | ) | |||||||||||||||||
| Year Ended May 31, 2019 | $ | 11.29 | 0.24 | (0.14 | ) | 0.10 | (0.24 | ) | (0.21 | ) | |||||||||||||||||
| Year Ended May 31, 2018 | $ | 11.34 | 0.21 | 0.23 | 0.44 | (0.21 | ) | (0.28 | ) | ||||||||||||||||||
| Year Ended May 31, 2017 | $ | 10.67 | 0.23 | 0.68 | 0.91 | (0.24 | ) | — | |||||||||||||||||||
| Year Ended May 31, 2016 | $ | 11.42 | 0.28 | (0.68 | ) | (0.40 | ) | (0.26 | ) | (0.09 | ) | ||||||||||||||||
* Assumes reinvestment of all net investment income and realized capital gain distributions, if any, during the period. Includes adjustments in accordance with U.S. generally accepted accounting principles and could differ from the Lipper reported return.
^ The net expense ratio may not correlate to the applicable expense limits in place during the period since the current contractual expense limitation is applied for a two year period beginning July 1, 2019 and in effect through September 30, 2021, instead of coinciding with the Fund's fiscal year end. Details of the current contractual expense limitation in effect can be found in Note 4 of the accompanying Notes to Financial Statements.
(a) Not annualized for periods less than one year.
(b) Annualized for periods less than one year.
(c) The expense ratios exclude the impact of expenses paid by each underlying fund.
(d) Per share net investment income (loss) has been calculated using the average daily shares method.
(e) Reflects increased usage of quantitative investment strategies.
See notes to financial statements.
22
USAA Mutual Funds Trust | Financial Highlights — continued | ||||||
For a Share Outstanding Throughout Each Period
Ratios to Average Net Assets | Supplemental Data | ||||||||||||||||||||||||||||||||||
| Total Distributions | Net Asset Value, End of Period | Total Return*(a) | Net Expenses^(b)(c) | Net Investment Income (Loss)(b) | Gross Expenses(b)(c) | Net Assets, End of Period (000's) | Portfolio Turnover(a) | ||||||||||||||||||||||||||||
USAA Cornerstone Moderately Conservative Fund | |||||||||||||||||||||||||||||||||||
| Six Months Ended November 30, 2020 (unaudited) | (0.08 | ) | $ | 12.05 | 8.95 | % | 0.90 | % | 1.42 | % | 1.04 | % | $ | 226,628 | 29 | % | |||||||||||||||||||
| Year Ended May 31, 2020 | (0.25 | ) | $ | 11.14 | 4.09 | % | 0.90 | % | 2.05 | % | 1.02 | % | $ | 220,787 | 84 | % | |||||||||||||||||||
| Year Ended May 31, 2019 | (0.45 | ) | $ | 10.94 | 0.99 | % | 0.90 | % | 2.22 | % | 1.08 | % | $ | 226,484 | 77 | %(e) | |||||||||||||||||||
| Year Ended May 31, 2018 | (0.49 | ) | $ | 11.29 | 3.89 | % | 0.90 | % | 1.84 | % | 1.07 | % | $ | 221,721 | 45 | % | |||||||||||||||||||
| Year Ended May 31, 2017 | (0.24 | ) | $ | 11.34 | 8.65 | % | 0.90 | % | 2.12 | % | 1.09 | % | $ | 209,270 | 55 | % | |||||||||||||||||||
| Year Ended May 31, 2016 | (0.35 | ) | $ | 10.67 | (3.50 | )% | 0.90 | % | 2.56 | % | 1.09 | % | $ | 194,376 | 70 | % | |||||||||||||||||||
See notes to financial statements.
23
USAA Mutual Funds Trust | Notes to Financial Statements November 30, 2020 | ||||||
(Unaudited)
1. Organization:
USAA Mutual Funds Trust (the "Trust") is organized as a Delaware statutory trust and is registered under the Investment Company Act of 1940, as amended (the "1940 Act"), as an open-end investment company. The Trust is comprised of 46 funds and is authorized to issue an unlimited number of shares, which are units of beneficial interest with no par value.
The accompanying financial statements are those of the USAA Cornerstone Moderately Conservative Fund (the "Fund"). The Fund is classified as diversified under the 1940 Act.
Under the Trust's organizational documents, its officers and trustees are indemnified against certain liabilities arising out of the performance of their duties to the Fund. In addition, in the normal course of business, the Fund enters into contracts with its vendors and others that provide for general indemnifications. The Fund's maximum exposure under these arrangements is unknown, as this would involve future claims that may be made against the Fund. However, based on experience, the Fund expects that risk of loss to be remote.
2. Significant Accounting Policies:
The following is a summary of significant accounting policies followed by the Trust in the preparation of its financial statements. The policies are in conformity with Generally Accepted Accounting Principles in the United States of America ("GAAP"). The preparation of financial statements in accordance with GAAP requires management to make estimates and assumptions that affect the reported amounts of assets and liabilities and disclosure of contingent assets and liabilities at the date of the financial statements and the reported amounts of income and expenses for the period. Actual results could differ from those estimates. The Fund follows the specialized accounting and reporting requirements under GAAP that are applicable to investment companies under Accounting Standards Codification Topic 946.
Investment Valuation:
The Fund records investments at fair value. Fair value is defined as the price that would be received to sell an asset or paid to transfer a liability in an orderly transaction between market participants at the measurement date.
The valuation techniques described below maximize the use of observable inputs and minimize the use of unobservable inputs in determining fair value. The inputs used for valuing the Fund's investments are summarized in the three broad levels listed below:
• Level 1 — quoted prices in active markets for identical securities
• Level 2 — other significant observable inputs (including quoted prices for similar securities or interest rates applicable to those securities, etc.)
• Level 3 — significant unobservable inputs (including the Fund's own assumptions in determining the fair value of investments)
Changes in valuation techniques may result in transfers in or out of an assigned level within the disclosure hierarchy. The inputs or methodologies used for valuation techniques are not necessarily an indication of the risk associated with entering into those investments.
Victory Capital Management Inc. ("VCM" or the "Adviser") has established the Pricing and Liquidity Committee (the "Committee"), and subject to the Trust's Board of Trustees (the "Board") oversight, the Committee administers and oversees the Fund's valuation policies and procedures, which are approved by the Board.
Portfolio securities listed or traded on securities exchanges, including exchange-traded funds ("ETFs"), American Depositary Receipts ("ADRs") and Rights, are valued at the closing price on the exchange or system where the security is principally traded, if available, or at the Nasdaq Official Closing Price. If there have been no sales for that day on the exchange or system, then a security is valued at the last available bid quotation on the exchange or system where the security is principally traded. In each of these situations, valuations are typically categorized as Level 1 in the fair value hierarchy.
24
USAA Mutual Funds Trust | Notes to Financial Statements — continued November 30, 2020 | ||||||
(Unaudited)
Investments in open-end investment companies are valued at their net asset value ("NAV"). These valuations are typically categorized as Level 1 in the fair value hierarchy.
Futures contracts are valued at the settlement price established each day by the board of trade or an exchange on which they are traded. These valuations are typically categorized as Level 1 in the fair value hierarchy.
Debt securities of United States ("U.S.") issuers, along with corporate and municipal securities, including short-term investments maturing in 60 days or less, may be valued using evaluated bid or the last sales price to price securities by dealers or an independent pricing service approved by the Board. These valuations are typically categorized as Level 2 in the fair value hierarchy.
In the event that price quotations or valuations are not readily available, are not reflective of market value, or a significant event has been recognized in relation to a security or class of securities, the securities are valued in good faith by the Committee in accordance with valuation procedures approved by the Board. These valuations are typically categorized as Level 2 or Level 3 in the fair value hierarchy, based on the observability of inputs used to determine the fair value. The effect of fair value pricing is that securities may not be priced on the basis of quotations from the primary market in which they are traded and the actual price realized from the sale of a security may differ materially from the fair value price. Valuing these securities at fair value is intended to cause the Fund's NAV to be more reliable than it otherwise would be.
In accordance with procedures adopted by the Board, fair value pricing may be used if events materially affecting the value of foreign securities occur between the time the exchange on which they are traded closes and the time the Fund's NAV is calculated. The Fund uses a systematic valuation model, provided daily by an independent third party to fair value its international equity securities. The valuations are considered as Level 2 in the fair value hierarchy.
A summary of the valuations as of November 30, 2020, based upon the three levels defined above, is included in the table below while the breakdown, by category, of investments is disclosed on the Schedule of Portfolio Investments (amounts in thousands):
Level 1 | Level 2 | Level 3 | Total | ||||||||||||||||
Asset-Backed Securities | $ | — | $ | 7,926 | $ | — | $ | 7,926 | |||||||||||
Collateralized Mortgage Obligations | — | 3,227 | — | 3,227 | |||||||||||||||
Common Stocks | 32,149 | — | — | 32,149 | |||||||||||||||
Preferred Stocks | 2,438 | — | — | 2,438 | |||||||||||||||
Corporate Bonds | — | 32,071 | — | 32,071 | |||||||||||||||
Yankee Dollars | — | 4,949 | — | 4,949 | |||||||||||||||
Municipal Bonds | — | 3,285 | — | 3,285 | |||||||||||||||
U.S. Government Agency Mortgages | — | 9,464 | — | 9,464 | |||||||||||||||
U.S. Treasury Obligations | — | 31,393 | — | 31,393 | |||||||||||||||
Exchange-Traded Funds | 85,413 | — | — | 85,413 | |||||||||||||||
Affiliated Exchange-Traded Funds | 11,418 | — | — | 11,418 | |||||||||||||||
Collateral for Securities Loaned | 8,819 | — | — | 8,819 | |||||||||||||||
Total | $ | 140,237 | $ | 92,315 | $ | — | $ | 232,552 | |||||||||||
Other Financial Investments^: | |||||||||||||||||||
Assets: | |||||||||||||||||||
Futures Contracts | $ | 109 | $ | — | $ | — | $ | 109 | |||||||||||
Liabilities: | |||||||||||||||||||
Futures Contracts | (302 | ) | — | — | (302 | ) | |||||||||||||
Total | $ | (193 | ) | $ | — | $ | — | $ | (193 | ) | |||||||||
^ Futures Contracts are valued at the unrealized appreciation (depreciation) on the investment.
25
USAA Mutual Funds Trust | Notes to Financial Statements — continued November 30, 2020 | ||||||
(Unaudited)
For the six months ended November 30, 2020, there were no transfers in or out of the Level 3 fair value hierarchy.
Real Estate Investment Trusts ("REITs"):
The Fund may invest in REITs, which report information on the source of their distributions annually. REITs are pooled investment vehicles that invest primarily in income producing real estate or real estate related loans or interests (such as mortgages). Certain distributions received from REITs during the year are recorded as realized gains or return of capital as estimated by the Fund or when such information becomes known.
Investment Companies:
Exchange-Traded Funds:
The Fund may invest in ETFs, the shares of which are bought and sold on a securities exchange. An ETF trades like common stock and represents a portfolio of securities designed to track the performance and dividend yield of a particular domestic or foreign market index. The Fund may purchase shares of an ETF to temporarily gain exposure to a portion of the U.S. or a foreign market while awaiting purchase of underlying securities. The risks of owning an ETF generally reflect the risks of owning the underlying securities they are designed to track, although the lack of liquidity of an ETF could result in it being more volatile. Additionally, ETFs have fees and expenses that reduce their value.
Open-End Funds:
The Fund may invest in portfolios of open-end investment companies. These investment companies value securities in their portfolios for which market quotations are readily available at their market values (generally the last reported sale price) and all other securities and assets at their fair value by the methods established by the board of directors of the underlying funds.
Securities Purchased on a Delayed-Delivery or When-Issued Basis:
The Fund may purchase securities on a delayed-delivery or when-issued basis. Delivery and payment for securities that have been purchased by the Fund on a delayed-delivery or when-issued basis or for delayed draws on loans can take place a month or more after the trade date. At the time the Fund makes the commitment to purchase a security on a delayed-delivery or when-issued basis, the Fund records the transaction and reflects the value of the security in determining NAV. No interest accrues to the Fund until the transaction settles and payment takes place. A segregated account is established and the Fund maintains cash and/or marketable securities at least equal in value to commitments for delayed-delivery or when-issued securities. If the Fund owns delayed-delivery or when-issued securities, these values are included in Payable for investments purchased on the accompanying Statement of Assets and Liabilities and the segregated assets are identified on the Schedule of Portfolio Investments.
Municipal Obligations:
The values of municipal obligations can fluctuate and may be affected by adverse tax, legislative, or political changes, and by financial developments affecting municipal issuers. Payment of municipal obligations may depend on a relatively limited source of revenue, resulting in greater credit risk. Future changes in federal tax laws or the activity of an issuer may adversely affect the tax-exempt status of municipal obligations.
Mortgage- and Asset-Backed Securities:
The values of some mortgage-related or asset-backed securities may be particularly sensitive to changes in prevailing interest rates. Early repayment of principal on some mortgage-related securities may expose the Fund to a lower rate of return upon reinvestment of principal. The values of mortgage and asset-backed securities depend in part on the credit quality and adequacy of the underlying assets or collateral and may fluctuate in response to the market's perception of these factors as well as current
26
USAA Mutual Funds Trust | Notes to Financial Statements — continued November 30, 2020 | ||||||
(Unaudited)
and future repayment rates. Some mortgage-backed securities are backed by the full faith and credit of the U.S. government (e.g., mortgage-backed securities issued by the Government National Mortgage Association, commonly known as "Ginnie Mae"), while other mortgage-backed securities (e.g., mortgage-backed securities issued by the Federal National Mortgage Association and the Federal Home Loan Mortgage Corporation, commonly known as "Fannie Mae" and "Freddie Mac", respectively), are backed only by the credit of the government entity issuing them. In addition, some mortgage-backed securities are issued by private entities and, as such, are not guaranteed by the U.S. government or any agency or instrumentality of the U.S. government.
Derivative Instruments:
Futures Contracts:
The Fund may enter into contracts for the future delivery of securities or foreign currencies and futures contracts based on a specific security, class of securities, foreign currency or an index, and purchase or sell options on any such futures contracts. A futures contract on a securities index is an agreement obligating either party to pay, and entitling the other party to receive, while the contract is outstanding, cash payments based on the level of a specified securities index. No physical delivery of the underlying asset is made. The Fund may enter into futures contracts in an effort to hedge against market risks. The acquisition of put and call options on futures contracts will give the Fund the right (but not the obligation), for a specified price, to sell or to purchase the underlying futures contract, upon exercise of the option, at any time during the option period. Futures transactions involve brokerage costs and require the Fund to segregate assets to cover contracts that would require it to purchase securities or currencies. A good faith margin deposit, known as initial margin, of cash or government securities with a broker or custodian is required to initiate and maintain open positions in futures contracts. Subsequent payments, known as variation margin, are made or received by the Fund based on the change in the market value of the position and are recorded as unrealized appreciation or depreciation until the contract is closed out, at which time the gain or loss is realized. The Fund may lose the expected benefit of futures transactions if interest rates, exchange rates or securities prices change in an unanticipated manner. Such unanticipated changes may also result in lower overall performance than if the Fund had not entered into any futures transactions. In addition, the value of the Fund's futures positions may not prove to be perfectly or even highly correlated with the value of its portfolio securities or foreign currencies, limiting the Fund's ability to hedge effectively against interest rate, exchange rate and/or market risk and giving rise to additional risks. There is no assurance of liquidity in the secondary market for purposes of closing out futures positions. The collateral held by the Fund is reflected on the Statement of Assets and Liabilities under Collateral received from brokers for futures contract. During the six months ended November 30, 2020, the Fund held futures contracts primarily for the strategy of gaining exposure to a particular asset class or securities market.
Summary of Derivative Instruments:
The following table summarizes the fair values of derivative instruments on the Statement of Assets and Liabilities, categorized by risk exposure, as of November 30, 2020 (amounts in thousands):
Assets | Liabilities | ||||||||||
| Variation Margin Receivable on Open Futures Contracts* | Variation Margin Payable on Open Futures Contracts* | ||||||||||
Equity Risk Exposure | $ | 109 | $ | 302 | |||||||
* Includes cumulative appreciation (depreciation) of futures contracts as reported on the Schedule of Portfolio Investments. Only current day's variation margin for futures contracts is reported within the Statement of Assets and Liabilities.
27
USAA Mutual Funds Trust | Notes to Financial Statements — continued November 30, 2020 | ||||||
(Unaudited)
The following table presents the effect of derivative instruments on the Statement of Operations, categorized by risk exposure, for the six-months ended November 30, 2020 (amounts in thousands):
| Net Realized Gains (Losses) on on Derivatives Recognized as a Result of Operations | Net Change in Unrealized Appreciation/Depreciation on Derivatives Recognized as a Result of Operations | ||||||||||
| Net Realized Gains (Losses) from Futures Contracts | Net Change in Unrealized Appreciation/Depreciation on Futures Contracts | ||||||||||
Equity Risk Exposure | $ | 64 | $ | (194 | ) | ||||||
All open derivative positions at period end are reflected on the Fund's Schedule of Portfolio Investments. The underlying face value of open derivative positions relative to the Fund's net assets at period end is generally representative of the notional amount of open positions to net assets throughout the period.
Investment Transactions and Related Income:
Changes in holdings of investments are accounted for no later than one business day following the trade date. For financial reporting purposes, however, investment transactions are accounted for on trade date on the last business day of the reporting period. Interest income is determined on the basis of coupon interest accrued using the effective interest method which adjusts, where applicable, the amortization of premiums or accretion of discount. Gains or losses realized on sales of securities are determined by comparing the identified cost of the security lot sold with the net sales proceeds.
Withholding taxes on interest, dividends, and gains as a result of certain investments in ADRs by the Fund has been provided for in accordance with each investment's applicable country's tax rules and rates.
Securities Lending:
The Fund, through a securities lending agreement with Citibank, N.A. ("Citibank"), may lend its securities to qualified financial institutions, such as certain broker-dealers, to earn additional income, net of income retained by Citibank. Borrowers are required to secure their loans for collateral in the amount of at least 102% of the value of U.S. securities loaned or at least 105% of the value of non-U.S. securities loaned, marked-to-market daily. Any collateral shortfalls associated with increases in the valuation of the securities loaned are cured the next business day once the shortfall exceeds $100 thousand. Collateral may be cash, U.S. government securities, or other securities as permitted by Securities and Exchange Commission ("SEC") guidelines. Cash collateral may be invested in high-quality short-term investments, primarily open-end investment companies. Collateral requirements are determined daily based on the value of the Fund's securities on loan as of the end of the prior business day. During the time portfolio securities are on loan, the borrower will pay the Fund any dividends or interest paid on such securities plus any fee negotiated between the parties to the lending agreement. The Fund also earns a return from the collateral. The Fund pays Citibank various fees in connection with the investment of cash collateral and fees based on the investment income received from securities lending activities. Securities lending income (net of these fees) is disclosed on the Statement of Operations. Loans are terminable upon demand and the borrower must return the loaned securities within the lesser of one standard settlement period or five business days. Risks relating to securities-lending transactions include that the borrower may not provide additional collateral when required or return the securities when due, and that the value of the short-term investments will be less than the amount of cash collateral required to be returned to the borrower. The Fund's agreement with Citibank does not include master netting provisions. Noncash collateral received by the Fund may not be sold or re-pledged, except to satisfy borrower default. Cash collateral is listed on the Fund's Schedule of Portfolio Investments and Financial Statements while non-cash collateral is not included.
28
USAA Mutual Funds Trust | Notes to Financial Statements — continued November 30, 2020 | ||||||
(Unaudited)
The following table (amounts in thousands) is a summary of the Fund's securities lending transactions as of November 30, 2020.
| Value of Securities on Loan | Non-Cash Collateral | Cash Collateral | |||||||||
| $ | 8,444 | $ | — | $ | 8,819 | ||||||
Foreign Currency Translations:
The accounting records of the Fund are maintained in U.S. dollars. Investment securities and other assets and liabilities of the Fund denominated in a foreign currency are translated into U.S. dollars at current exchange rates. Purchases and sales of securities, income receipts and expense payments are translated into U.S. dollars at the exchange rates on the date of the transactions. The Fund does not isolate the portion of the results of operations resulting from changes in foreign exchange rates on investments from fluctuations arising from changes in market prices of securities held. Such fluctuations are disclosed as net change in unrealized appreciation/depreciation on investments and foreign currency translations on the Statement of Operations. Any realized gains or losses from these fluctuations, including foreign currency arising from in-kind redemptions, are disclosed as net realized gains or losses from investment transactions and foreign currency translations on the Statement of Operations.
Foreign Taxes:
The Fund may be subject to foreign taxes related to foreign income received (a portion of which may be reclaimable), capital gains on the sale of securities, and certain foreign currency transactions. All foreign taxes are recorded in accordance with the applicable regulations and rates that exist in the foreign jurisdictions in which the Fund invests.
Federal Income Taxes:
It is the Fund's policy to continue to qualify as a regulated investment company by complying with the provisions available to certain investment companies, as defined in applicable sections of the Internal Revenue Code, and to make distributions of net investment income and net realized gains sufficient to relieve it from all, or substantially all, federal income taxes. Accordingly, no provision for federal income taxes is required in the financial statements. The Fund has a tax year end of May 31.
Management of the Fund has reviewed tax positions taken in tax years that remain subject to examination by all major tax jurisdictions, including federal (i.e., the last four tax years, which includes the current fiscal tax year end). Management believes that there is no tax liability resulting from unrecognized tax benefits related to uncertain tax positions taken.
Allocations:
Expenses directly attributable to the Fund are charged to the Fund, while expenses that are attributable to more than one fund in the Trust, or jointly with an affiliated trust, are allocated among the respective funds in the Trust and/or affiliated trust based upon net assets or another appropriate basis.
Cross-Trade Transactions:
Pursuant to Rule 17a-7 under the 1940 Act, the Fund may engage in cross-trades, which are securities transactions with affiliated investment companies and advisory accounts managed by the Adviser and any applicable sub-adviser. Any such purchase or sale transaction must be effected without brokerage commission or other remuneration, except for customary transfer fees. The transaction must be effected at the current market price, which is either the security's last sale price on an exchange or, if there are no transactions in the security that day, at the average of the highest bid and lowest asked price. For the six months ended November 30, 2020, the Fund engaged in the following securities transactions with affiliated funds, which resulted in the following net realized gains (losses) (amounts in thousands):
Purchases | Sales | Net Realized Gains (Losses) | |||||||||||||
$ | — | $ | 256 | $ | 3 | ||||||||||
29
USAA Mutual Funds Trust | Notes to Financial Statements — continued November 30, 2020 | ||||||
(Unaudited)
3. Purchases and Sales:
Cost of purchases and proceeds from sales/maturities of securities (excluding securities maturing less than one year from acquisition) for the six months ended November 30, 2020, were as follows for the Fund (amounts in thousands):
| Purchases (excluding U.S. Government Securities) | Sales (excluding U.S. Government Securities) | Purchases of U.S. Government Securities | Sales of U.S. Government Securities | ||||||||||||
| $ | 63,028 | $ | 65,299 | $ | — | $ | 7,555 | ||||||||
4. Fees and Transactions with Affiliates and Related Parties:
Investment Advisory Fees:
Investment advisory services are provided to the Fund by the Adviser, which is a New York corporation registered as an investment adviser with the SEC. The Adviser is a wholly-owned indirect subsidiary of Victory Capital Holdings, Inc., a publicly traded Delaware corporation, and a wholly-owned direct subsidiary of Victory Capital Operating, LLC. Under the terms of the Investment Advisory Agreement, the Adviser is entitled to receive fees accrued daily and paid monthly at an annualized rate of 0.50% of the Fund's average daily net assets. Amounts incurred and paid to VCM for the six months ended November 30, 2020, are reflected on the Statement of Operations as Investment Advisory fees.
In addition, the Fund invests in affiliated VCM exchange-traded fund(s) ("affiliated ETFs"). The Fund's Adviser fee is reimbursed by VCM to the extent of the indirect Adviser fee incurred through the Fund's proportional investment in the affiliated ETF(s). As of November 30, 2020, the Fund's Adviser fee was reimbursed by VCM in an amount of $5 thousand, of which $5 thousand is receivable from VCM. These reimbursements are not available for recoupment and are reflected on the Statement of Operations as Expenses waived/reimbursed by Adviser.
The Trust relies on an exemptive order granted to VCM and its affiliated funds by the SEC in March 2019 permitting the use of a "manager-of-managers" structure for certain funds. Under a manager-of-managers structure, the investment adviser may select (with approval of the Board and without shareholder approval) one or more subadvisers to manage the day-to-day investment of a fund's assets. For the six months ended November 30, 2020, the Fund had no subadvisors.
Administration and Servicing Fees:
VCM serves as the Fund's administrator and fund accountant. Under the Administration, Servicing and Accounting Agreement, VCM is paid for its services an annual fee at a rate of 0.15% of average daily net assets of the Fund. Amounts incurred for the six months ended November 30, 2020, are reflected on the Statement of Operations as Administration fees.
The Fund (as part of the Trust) has entered into an agreement to provide compliance services with the Adviser, pursuant to which the Adviser furnishes its compliance personnel, including the services of the Chief Compliance Officer ("CCO"), and other resources reasonably necessary to provide the Trust with compliance oversight services related to the design, administration and oversight of a compliance program for the Trust in accordance with Rule 38a-1 under the 1940 Act. The CCO is an employee of the Adviser, which pays the compensation of the CCO and support staff. Funds in the Trust, Victory Variable Insurance Funds, Victory Portfolios, and Victory Portfolios II (collectively, the "Victory Funds Complex") in the aggregate, compensate the Adviser for these services. Amounts incurred for the six months ended November 30, 2020, are reflected on the Statement of Operations as Compliance fees.
Citi Fund Services Ohio, Inc. ("Citi"), an affiliate of Citibank, acts as sub-administrator and sub-fund accountant to the Fund pursuant to a Sub-Administration and Sub-Fund Accounting Services Agreement between VCM and Citi. VCM pays Citi a fee for providing these services. The Trust reimburses VCM and Citi for out-of-pocket expenses incurred in providing these services and certain other expenses
30
USAA Mutual Funds Trust | Notes to Financial Statements — continued November 30, 2020 | ||||||
(Unaudited)
specifically allocated to the Fund. Amounts incurred for the six months ended November 30, 2020, are reflected on the Statement of Operations as Sub-Administration fees.
Transfer Agency Fees:
Victory Capital Transfer Agency, Inc. ("VCTA"), (formerly, provides transfer agency services to the Fund. VCTA, an affiliate of the Adviser, provides transfer agent services based on an annual charge of $23 per shareholder account plus out-of-pocket expenses. VCTA pays a portion of these fees to certain intermediaries for the administration and servicing of accounts that are held with such intermediaries. Amounts incurred and paid to VCTA for the six months ended November 30, 2020, are reflected on the Statement of Operations as Transfer Agent fees.
FIS Investor Services LLC serves as sub-transfer agent and dividend disbursing agent for the Fund pursuant to a Sub-Transfer Agent agreement between VCTA and FIS Investor Services LLC. VCTA provides FIS Investor Services LLC a fee for providing these services.
Distributor/Underwriting Services:
Victory Capital Services, Inc. (the "Distributor"), an affiliate of the Adviser, serves as distributor for the continuous offering of the shares of the Fund pursuant to a Distribution Agreement between the Distributor and the Trust. Effective June 30, 2020, the Distributor's name was changed from Victory Capital Advisers, Inc.
Other Fees:
Citibank serves as the Fund's custodian. The Fund pays Citibank a fee for providing these services. Amounts incurred for the six months ended November 30, 2020, are reflected on the Statement of Operations as Custodian fees.
K&L Gates LLP provides legal services to the Trust.
The Adviser has entered into an expense limitation agreement with the Fund until at least September 30, 2021. Under the terms of the agreement, the Adviser has agreed to waive fees or reimburse certain expenses to the extent that ordinary operating expenses incurred in any fiscal year exceed the expense limit for the Fund. Such excess amounts will be the liability of the Adviser. Interest, taxes, brokerage commissions, other expenditures, which are capitalized in accordance with GAAP, and other extraordinary expenses not incurred in the ordinary course of the Fund's business are excluded from the expense limits. As of November 30, 2020, the expense limit (excluding voluntary waivers) is 0.90%.
Under this expense limitation agreement, the Fund has agreed to repay fees and expenses that were waived or reimbursed by the Adviser for a period up to three years after the fiscal year in which the waiver or reimbursement took place, subject to the lesser of any operating expense limits in effect at the time of: (a) the original waiver or expense reimbursement; or (b) the recoupment, after giving effect to the recoupment amount.
As of November 30, 2020, the following amounts are available to be repaid to the Adviser (amounts in thousands). The Fund has not recorded any amounts available to be repaid as a liability due to an assessment that such repayment is not probable at November 30, 2020.
| Expires May 31, 2023 | Expires May 31, 2024 | Total | |||||||||
| $ | 252 | $ | 152 | $ | 404 | ||||||
The Adviser may voluntarily waive or reimburse additional fees to assist the Fund in maintaining competitive expense ratios. Voluntary waivers and reimbursements applicable to the Fund are not available to be recouped at a future time. There were no voluntary waivers or reimbursements for the six months ended November 30, 2020.
Certain officers and/or interested trustees of the Fund are also officers and/or employees of the Adviser, Administrator, Sub-Administrator, Sub-Fund Accountant, and Legal.
31
USAA Mutual Funds Trust | Notes to Financial Statements — continued November 30, 2020 | ||||||
(Unaudited)
5. Risks:
The Fund may be subject to other risks in addition to these identified risks.
Geopolitical/Natural Disaster Risk — Global economies and financial markets are increasingly interconnected, which increases the possibilities that conditions in one country or region might adversely affect issuers in another country or region. Geopolitical and other risks, including war, terrorism, trade disputes, political or economic dysfunction within some nations, public health crises and related geopolitical events, as well as environmental disasters such as earthquakes, fires, and floods, may add to instability in world economies and markets generally. Changes in trade policies and international trade agreements could affect the economies of many countries in unpredictable ways. Likewise, systemic market dislocations of the kind that occurred during the financial crisis that began in 2008, if repeated, would be highly disruptive to economies and markets, adversely affecting individual companies and industries, securities markets, interest rates, credit ratings, inflation, investor sentiment, and other factors affecting the value of a Fund's investments. Some countries, including the United States, are adopting more protectionist trade policies and moving away from the tighter financial industry regulations that followed the 2008 financial crisis, which may also affect the value of a Fund's investments.
Political events within the United States at times have resulted, and may in the future result, in a shutdown of government services, which could negatively affect the U.S. economy, decrease the value of a Fund's investments, increase uncertainty in or impair the operation of the U.S. or other securities markets and degrade investor and consumer confidence, perhaps suddenly and to a significant degree.
An outbreak of disease called COVID-19 has spread internationally. The transmission of COVID-19 and efforts to contain its spread have resulted in international, national and local border closings and other significant travel restrictions and disruptions, significant disruptions to business operations, supply chains and consumer activity, significant challenges in healthcare service preparation and delivery, quarantines and general concern and uncertainty. These negative impacts have caused significant volatility and declines in global financial markets, which have caused losses for Fund investors during and subsequent to period end. The impact of the COVID-19 pandemic last for an extended period of time, and could result in a substantial economic downturn or recession. Public health crises may exacerbate other pre-existing political, social, economic, market and financial risks. The extent of the impact to the financial performance of the Funds' investments will depend on future developments, including (i) the duration and spread of the outbreak, (ii) the restrictions and advisories, (iii) the effects on the financial markets, and (iv) the effects on the economy overall, all of which are highly uncertain and cannot be predicted.
Tactical Allocation Risk — The Fund has a targeted risk tolerance and a corresponding asset allocation target; however, mere asset allocation and volatility are not the sole determination of risk. The Fund's managers will tactically allocate away from the target allocation as market conditions and the perceived risks warrant. The Fund bears the risk that the managers' tactical allocation will not be successful.
Affiliated Funds Risk — The risks of the Fund directly correspond to the risks of the underlying affiliated funds in which the Fund invests. By investing in the underlying affiliated funds, the Fund has exposure to the risk of many different areas of the market. The degree to which the risks described below apply to the Fund varies according to the Fund's asset allocation. For instance, the more the Fund is allocated to stock funds, the greater the risk associated with equity securities. The Fund also is subject to asset allocation risk (i.e., the risk that allocations will not produce the intended results) and to management risk (i.e., the risk that the selection of underlying affiliated funds will not produce the intended results).
Conflict of Interest Risk — In managing a Fund that invests in underlying affiliated funds, the Adviser may have conflicts of interest in allocating the Fund's assets among the various underlying affiliated funds. This is because the fees payable by some of the underlying affiliated funds to the Adviser and/or its affiliates are higher than the fees payable by other underlying affiliated funds, and because the Adviser also manages and administers the underlying affiliated funds.
32
USAA Mutual Funds Trust | Notes to Financial Statements — continued November 30, 2020 | ||||||
(Unaudited)
LIBOR Discontinuation Risk — Many debt securities, derivatives and other financial instruments, including some of the Fund's investments, use the London Interbank Offered Rate ("LIBOR") as the reference or benchmark rate for variable interest rate calculations. However, the use of LIBOR started to come under pressure following manipulation allegations in 2012. Despite increased regulation and other corrective actions since that time, concerns have arisen regarding its viability as a benchmark, due largely to reduced activity in the financial markets that it measures. In June 2017, the Alternative Reference Rates Committee, a group of large U.S. banks working with the Federal Reserve, announced its selection of a new Secured Overnight Funding Rate ("SOFR"), which is intended to be a broad measure of secured overnight U.S. Treasury repo rates, as an appropriate replacement for LIBOR. The Federal Reserve Bank of New York began publishing the SOFR in 2018, expecting that it could be used on a voluntary basis in new instruments and transactions. Bank working groups and regulators in other countries have suggested other alternatives for their markets, including the Sterling Overnight Interbank Average Rate ("SONIA") in England. In July 2017, the Financial Conduct Authority (the "FCA"), the United Kingdom financial regulatory body, announced that after 2021 it will cease its active encouragement of UK banks to provide the quotations needed to sustain LIBOR. That announcement suggests that LIBOR may cease to be published after that time. For U.S. dollar LIBOR, however, the relevant date may be deferred to June 30, 2023 for the most common tenors (overnight and one, three, six and 12 months). As to those tenors, the LIBOR administrator has published a consultation regarding its intention to cease publication of U.S. dollar LIBOR as of June 30, 2023 (instead of December 31, 2021, as previously expected), apparently based on continued rate submissions from banks. It is expected that there will be enough for market participants to transition to the use of a different benchmark for both new and existing securities and transactions. Various financial industry groups have begun planning for that transition, but there are obstacles to converting certain longer-term securities and transactions to a new benchmark. Transition planning is at an early stage, and neither the effect of the transition process nor its ultimate success can yet be known. Although the foregoing may provide some sense of timing, there is no assurance that LIBOR, or any particular currency and tenor, will continue to be published until any particular date, and it appears highly likely that LIBOR will be discontinued or modified after December 31, 2021 or June 30, 2023, depending on the currency and tenor. The transition process might lead to increased volatility and illiquidity in markets that currently rely on the LIBOR to determine interest rates. It could also lead to a reduction in the value of some LIBOR-based investments and reduce the effectiveness of new hedges placed against existing LIBOR-based instruments. Since the usefulness of LIBOR as a benchmark could deteriorate during the transition period, these effects could occur before the end of 2021.
6. Borrowing and Interfund Lending:
Line of Credit:
For the six months ended November 30, 2020, the Victory Funds Complex participated in a short-term demand note "Line of Credit" agreement with Citibank. The Line of Credit agreement with Citibank was renewed on June 29, 2020 with a termination date of June 28, 2021. Under the agreement with Citibank, the Victory Funds Complex may borrow up to $600 million, of which $300 million is committed and $300 million is uncommitted. $40 million of the Line of Credit is reserved for use by the Victory Floating Rate Fund, another series of the Victory Funds Complex, with Victory Floating Rate Fund paying the related commitment fees for that amount. The purpose of the agreement is to meet temporary or emergency cash needs. For the six months ended November 30, 2020, Citibank received an annual commitment fee of 0.15% on $300 million for providing the Line of Credit. Each fund in the Victory Funds Complex pays a pro- rata portion of the commitment fees plus any interest (one month LIBOR plus one percent) on amounts borrowed. Effective June 29, 2020, under an amended Line of Credit agreement, Citibank will also receive an annual upfront fee of 0.10% on the $300 million committed line of credit. Each fund in the Victory Funds Complex will pay a pro-rata portion of the upfront fee. Interest charged to each Fund during the period, if applicable, is reflected on the Statements of Operations under Line of credit fees.
The Fund had no borrowings under the Line of Credit agreement during the six months ended November 30, 2020.
33
USAA Mutual Funds Trust | Notes to Financial Statements — continued November 30, 2020 | ||||||
(Unaudited)
Interfund Lending:
The Trust and Adviser rely on an exemptive order granted by the SEC in March 2017 (the "Order"), permitting the establishment and operation of an Interfund Lending Facility (the "Facility"). The Facility allows the Fund to directly lend and borrow money to or from any other Fund, that is permitted to participate in the Facility, in the Victory Funds Complex relying upon the Order at rates beneficial to both the borrowing and lending funds. Advances under the Facility are allowed for temporary or emergency purposes. The interfund loan rate is determined, as specified in the Order, by averaging the current repurchase agreement rate and the current bank loan rate. As a Borrower, interest charged to the Fund, if any, during the period is reflected on the Statement of Operations under Interfund lending fees. As a Lender, interest earned by the Fund, if any, during the period is reflected on the Statement of Operations under Income on Interfund lending.
The Fund did not utilize or participate in the Facility during the six months ended November 30, 2020.
7. Federal Income Tax Information:
The Fund intends to declare and distribute any net investment income quarterly. Distributable net realized gains, if any, are declared and paid at least annually.
The amounts of dividends from net investment income and distributions from net realized gains (collectively distributions to shareholders) are determined in accordance with federal income tax regulations, which may differ from GAAP. To the extent these "book/tax" differences are permanent in nature (e.g., net operating loss and distribution reclassification), such amounts are reclassified within the components of net assets based on their federal tax-basis treatment; temporary differences (e.g., wash sales) do not require reclassification. To the extent dividends and distributions exceed net investment income and net realized gains for tax purposes, they are reported as distributions of capital.
Net investment losses incurred by the Fund may be reclassified as an offset to capital on the accompanying Statement of Assets and Liabilities.
The tax character of current year distributions paid and the tax basis of the current components of accumulated earnings (deficit) will be determined at the end of the current tax year ending May 31, 2021.
At May 31, 2020, the Fund had no capital loss carryforwards, for federal income tax purposes.
8. Affiliated Securities:
An affiliated security is a security in which the Fund has ownership of at least 5% of the security's outstanding voting shares or an investment company managed by VCM. The Fund does not invest in affiliated underlying funds for the purpose of exercising management or control. These underlying funds are noted as affiliated on the Fund's Schedule of Portfolio Investments. The affiliated underlying funds' annual or semiannual reports may be viewed at vcm.com. Transactions in affiliated securities during the six months ended November 30, 2020, were as follows (amount in thousands):
| Fair Value 5/31/2020 | Purchases at Cost | Proceeds from Sales | Realized Gains (Losses) | Capital Gain Distribution | Net Change in Unrealized Appreciation/ Depreciation | Fair Value 11/30/2020 | Dividend Income | ||||||||||||||||||||||||||||
| VictoryShares USAA Core Intermediate-Term Bond ETF | $ | — | $ | 8,627 | $ | — | $ | — | $ | — | $ | 50 | $ | 8,677 | $ | 20 | |||||||||||||||||||
| VictoryShares USAA Core Short-Term Bond ETF | — | 2,315 | — | — | — | 6 | 2,321 | 5 | |||||||||||||||||||||||||||
| VictoryShares USAA MSCI Emerging Markets Value Momentum ETF | 360 | — | — | — | — | 60 | 420 | 8 | |||||||||||||||||||||||||||
$ | 360 | $ | 10,942 | $ | — | $ | — | $ | — | $ | 116 | $ | 11,418 | $ | 33 | ||||||||||||||||||||
34
USAA Mutual Funds Trust | Supplemental Information November 30, 2020 | ||||||
(Unaudited)
Proxy Voting and Portfolio Holdings Information
Proxy Voting:
Information regarding the policies and procedures the Fund uses to determine how to vote proxies relating to portfolio securities is available without charge, upon request, by calling (800) 539-3863. The information is also included in the Fund's Statement of Additional Information, which is available on the SEC's website at www.sec.gov.
Information relating to how the Fund voted proxies relating to portfolio securities held during the most recent 12 months ended June 30 is available on the SEC's website at www.sec.gov.
Availability of Schedules of Portfolio Investments:
The Trust files a complete list of Schedules of Portfolio Investments with the SEC for the first and third quarter of each fiscal year on Form N-PORT. Form N-PORT is available on the SEC's website at www.sec.gov.
Expense Example
As a shareholder of the Fund, you may incur two types of costs: (1) transaction costs, and (2) ongoing costs, including management fees and other Fund expenses. These examples are intended to help you understand your ongoing costs (in dollars) of investing in the Fund and to compare these costs with the ongoing costs of investing in other mutual funds.
These examples are based on an investment of $1,000 invested at the beginning of the period and held for the entire period from June 1, 2020 through November 30, 2020.
The Actual Expense figures in the table below provide information about actual account values and actual expenses. You may use the information below, together with the amount you invested, to estimate the expenses that you paid over the period. Simply divide your account value by $1,000 (for example, an $8,600 account value divided by $1,000 = 8.6), then multiply the result by the number in the table under the heading entitled "Actual Expenses Paid During Period" to estimate the expenses you paid on your account during this period.
The Hypothetical Expense figures in the table below provide information about hypothetical account values and hypothetical expenses based on the Fund's actual expense ratio and an assumed rate of return of 5% per year before expenses, which is not the Fund's actual return. The hypothetical account values and expenses may not be used to estimate the actual ending account balance or expenses you paid for the period. You may use this information to compare this 5% hypothetical example with the 5% hypothetical examples that appear in shareholder reports of other funds.
Please note the expenses shown in the table below are meant to highlight your ongoing costs only and do not reflect any transactional costs. If these transactional costs were included, your costs would have been higher.
| Beginning Account Value 6/1/20 | Actual Ending Account Value 11/30/20 | Hypothetical Ending Account Value 11/30/20 | Actual Expenses Paid During Period 6/1/20- 11/30/20* | Hypothetical Expenses Paid During Period 6/1/20- 11/30/20* | Annualized Expense Ratio During Period 6/1/20- 11/30/20 | ||||||||||||||||||
| $ | 1,000.00 | $ | 1,089.50 | $ | 1,020.56 | $ | 4.71 | $ | 4.56 | 0.90 | % | ||||||||||||
* Expenses are equal to the average account value multiplied by the Fund's annualized expense ratio multiplied by 183/365 (the number of days in the most recent fiscal half-year divided by the number of days in the fiscal year).
35
Privacy Policy
Protecting the Privacy of Information
The Trust respects your right to privacy. We also know that you expect us to conduct and process your business in an accurate and efficient manner. To do so, we must collect and maintain certain personal information about you. This is the information we collect from you on applications or other forms, and from the transactions you make with us or third parties. It may include your name, address, social security number, account transactions and balances, and information about investment goals and risk tolerance.
We do not disclose any information about you or about former customers to anyone except as permitted or required by law. Specifically, we may disclose the information we collect to companies that perform services on our behalf, such as the transfer agent that processes shareholder accounts and printers and mailers that assist us in the distribution of investor materials. We may also disclose this information to companies that perform marketing services on our behalf. This allows us to continue to offer you Victory investment products and services that meet your investing needs, and to effect transactions that you request or authorize. These companies will use this information only in connection with the services for which we hired them. They are not permitted to use or share this information for any other purpose.
To protect your personal information internally, we permit access only by authorized employees and maintain physical, electronic and procedural safeguards to guard your personal information.*
* You may have received communications regarding information about privacy policies from other financial institutions which gave you the opportunity to "opt-out" of certain information sharing with companies which are not affiliated with that financial institution. The Trust does not share information with other companies for purposes of marketing solicitations for products other than the Trust. Therefore, the Trust does not provide opt-out options to their shareholders.
P.O. Box 182593
Columbus, Ohio 43218-2593

Visit our website at: | Call | ||||||
vcm.com | (800) 235-8396 | ||||||
97451-0121

NOVEMBER 30, 2020
Semi Annual Report
USAA Emerging Markets Fund
Beginning January 1, 2021, as permitted by regulations adopted by the Securities and Exchange Commission, paper copies of the Fund's shareholder reports may no longer be sent by mail, unless you specifically request paper copies of the reports from the Fund or from your financial intermediary, such as a broker-dealer or bank. Instead, the reports will be made available on VictoryFunds.com, and you will be notified by mail each time a report is posted and provided with a website link to access the report. If you already elected to receive shareholder reports electronically, you will not be affected by this change and you need not take any action.
You may elect to receive shareholder reports and other communications from the Fund or your financial intermediary electronically by notifying your financial intermediary directly, or if you are a shareholder who has an account directly with the Fund, by calling (800) 235-8396 or by submitting your request via email to TA.Processing@FISGlobal.com.
You may elect to receive all future reports in paper free of charge. You can inform the Fund or your financial intermediary that you wish to continue receiving paper copies of your shareholder reports by notifying your financial intermediary directly, or if you are a shareholder who has an account directly with the Fund, by calling (800) 235-8396 or by submitting your request via email to TA.Processing@FISGlobal.com.
Your election to receive reports in paper will apply to all funds held with the USAA Mutual Funds or your financial intermediary.
Victory Capital means Victory Capital Management Inc., the investment adviser of the USAA Mutual Funds. USAA Mutual Funds are distributed by Victory Capital Services, Inc., member of FINRA, an affiliate of Victory Capital. Victory Capital and its affiliates are not affiliated with United Services Automobile Association or its affiliates. USAA and the USAA logo are registered trademarks and the USAA Mutual Funds and USAA Investments logos are trademarks of United Services Automobile Association and are being used by Victory Capital and its affiliates under license.
USAA Mutual Funds Trust
TABLE OF CONTENTS
Investment Objective & Portfolio Holdings | 2 | ||||||
Schedule of Portfolio Investments | 4 | ||||||
Financial Statements | |||||||
Statement of Assets and Liabilities | 17 | ||||||
Statement of Operations | 18 | ||||||
Statements of Changes in Net Assets | 19 | ||||||
Financial Highlights | 22 | ||||||
Notes to Financial Statements | 26 | ||||||
Supplemental Information | 36 | ||||||
Proxy Voting and Portfolio Holdings Information | 36 | ||||||
Expense Examples | 36 | ||||||
Privacy Policy (inside back cover) | |||||||
This report is for the information of the shareholders and others who have received a copy of the currently effective prospectus of the Fund, managed by Victory Capital Management Inc. It may be used as sales literature only when preceded or accompanied by a current prospectus, which provides further details about the Fund.
IRA DISTRIBUTION WITHHOLDING DISCLOSURE
We generally must withhold federal income tax at a rate of 10% of the taxable portion of your distribution and, if you live in a state that requires state income tax withholding, at your state's tax rate. However, you may elect not to have withholding apply or to have income tax withheld at a higher rate. Any withholding election that you make will apply to any subsequent distribution unless and until you change or revoke the election. If you wish to make a withholding election, or change or revoke a prior withholding election, call (800) 235-8396, and form W-4P (OMB No. 1545-0074 withholding certificate for pension or annuity payments) will be electronically sent.
If you do not have a withholding election in place by the date of a distribution, federal income tax will be withheld from the taxable portion of your distribution at a rate of 10%. If you must pay estimated taxes, you may be subject to estimated tax penalties if your estimated tax payments are not sufficient and sufficient tax is not withheld from your distribution.
For more specific information, please consult your tax adviser.
1
| USAA Mutual Funds Trust USAA Emerging Markets Fund | November 30, 2020 | ||||||
(Unaudited)
Investment Objective & Portfolio Holdings:
The Fund's investment objective is to seek capital appreciation.
Top 10 Sectors
November 30, 2020
(% of Net Assets)
Information Technology | 22.2 | % | |||||
Financials | 21.2 | % | |||||
Consumer Discretionary | 16.0 | % | |||||
Communication Services | 12.5 | % | |||||
Industrials | 6.6 | % | |||||
Materials | 6.3 | % | |||||
Energy | 4.8 | % | |||||
Consumer Staples | 3.0 | % | |||||
Health Care | 2.7 | % | |||||
Real Estate | 1.7 | % | |||||
Refer to the Schedule of Portfolio Investments for a complete list of securities.
2
| USAA Mutual Funds Trust USAA Emerging Markets Fund (continued) | November 30, 2020 | ||||||
(Unaudited)
Country Allocation*:
November 30, 2020
(% of Net Assets)
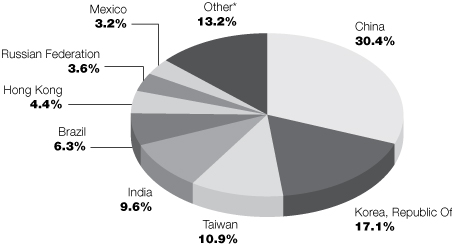
* Includes countries with less than 3.0% of portfolio and short-term investments purchased with cash collateral from securities loaned.
Percentages are of the net assets of the Fund and may not equal 100%
Refer to the Schedule of Portfolio Investments for a complete list of securities.
3
| USAA Mutual Funds Trust USAA Emerging Markets Fund | Schedule of Portfolio Investments November 30, 2020 | ||||||
(Amounts in Thousands, Except for Shares) (Unaudited)
Security Description | Shares | Value | |||||||||
Common Stocks (98.2%) | |||||||||||
Brazil (6.3%): | |||||||||||
Communication Services (0.4%): | |||||||||||
TIM SA | 1,046,679 | $ | 2,636 | ||||||||
Consumer Discretionary (0.9%): | |||||||||||
Afya Ltd. Class A (a) | 112,075 | 2,972 | |||||||||
Lojas Americanas SA Preference Shares | 337,800 | 1,446 | |||||||||
MRV Engenharia e Participacoes SA | 161,000 | 569 | |||||||||
Petrobras Distribuidora SA | 403,500 | 1,547 | |||||||||
6,534 | |||||||||||
Consumer Staples (0.1%): | |||||||||||
SLC Agricola SA | 91,400 | 459 | |||||||||
Energy (0.6%): | |||||||||||
Enauta Participacoes SA | 174,900 | 338 | |||||||||
Petroleo Brasileiro SA, ADR | 434,943 | 4,162 | |||||||||
4,500 | |||||||||||
Financials (2.0%): | |||||||||||
Banco Bradesco SA, ADR | 1,392,090 | 6,320 | |||||||||
Banco do Brasil SA | 946,995 | 5,986 | |||||||||
Banco do Estado do Rio Grande do Sul SA Preference Shares | 126,900 | 313 | |||||||||
Porto Seguro SA | 39,000 | 345 | |||||||||
XP, Inc. Class A (a) | 40,541 | 1,663 | |||||||||
14,627 | |||||||||||
Industrials (0.8%): | |||||||||||
CCR SA | 780,020 | 1,899 | |||||||||
Cia de Locacao das Americas | 109,400 | 556 | |||||||||
Randon SA Implementos e Participacoes Preference Shares | 872,300 | 2,394 | |||||||||
SIMPAR SA (a) | 212,900 | 1,178 | |||||||||
6,027 | |||||||||||
Information Technology (0.6%): | |||||||||||
Pagseguro Digital Ltd. Class A (a) | 83,824 | 3,970 | |||||||||
Materials (0.5%): | |||||||||||
Vale SA | 251,800 | 3,666 | |||||||||
Utilities (0.4%): | |||||||||||
Cia de Saneamento do Parana | 82,500 | 385 | |||||||||
Neoenergia SA | 530,600 | 1,804 | |||||||||
Omega Geracao SA (a) | 53,100 | 365 | |||||||||
2,554 | |||||||||||
44,973 | |||||||||||
Canada (0.9%): | |||||||||||
Materials (0.9%): | |||||||||||
First Quantum Minerals Ltd. | 463,619 | 6,580 | |||||||||
See notes to financial statements.
4
| USAA Mutual Funds Trust USAA Emerging Markets Fund | Schedule of Portfolio Investments — continued November 30, 2020 | ||||||
(Amounts in Thousands, Except for Shares) (Unaudited)
Security Description | Shares | Value | |||||||||
China (30.4%): | |||||||||||
Communication Services (6.9%): | |||||||||||
Baidu, Inc., ADR (a) | 29,206 | $ | 4,060 | ||||||||
NetEase, Inc., ADR | 44,219 | 3,996 | |||||||||
Tencent Holdings Ltd. | 564,363 | 41,142 | |||||||||
49,198 | |||||||||||
Consumer Discretionary (9.4%): | |||||||||||
Alibaba Group Holding Ltd., ADR (a) | 147,377 | 38,813 | |||||||||
China East Education Holdings Ltd. (b) | 823,000 | 1,831 | |||||||||
China New Higher Education Group Ltd. (b) | 810,000 | 513 | |||||||||
China Yongda Automobiles Services Holdings Ltd. | 1,505,500 | 2,572 | |||||||||
Hisense Home Appliances Group Co. Ltd. Class A | 1,173,600 | 2,664 | |||||||||
JD.com, Inc., ADR (a) | 62,621 | 5,345 | |||||||||
Jiumaojiu International Holdings Ltd. (a) (b) | 695,000 | 1,582 | |||||||||
Meituan Dianping Class B (a) | 255,600 | 9,559 | |||||||||
Minth Group Ltd. | 310,000 | 1,539 | |||||||||
Tianneng Power International Ltd. (c) | 236,000 | 495 | |||||||||
Tongcheng-Elong Holdings Ltd. (a) | 1,455,600 | 2,712 | |||||||||
67,625 | |||||||||||
Consumer Staples (0.9%): | |||||||||||
China Feihe Ltd. (b) | 1,457,000 | 3,480 | |||||||||
China Modern Dairy Holdings Ltd. (a) | 2,099,000 | 358 | |||||||||
Wuliangye Yibin Co. Ltd. Class A | 73,095 | 2,819 | |||||||||
6,657 | |||||||||||
Energy (1.2%): | |||||||||||
China Oilfield Services Ltd. Class H | 3,360,000 | 2,538 | |||||||||
China Shenhua Energy Co. Ltd. Class H | 1,679,500 | 3,239 | |||||||||
CNOOC Ltd., ADR | 28,113 | 2,776 | |||||||||
8,553 | |||||||||||
Financials (5.0%): | |||||||||||
China Construction Bank Corp. Class H | 6,870,000 | 5,370 | |||||||||
China Merchants Bank Co. Ltd. Class H | 1,786,500 | 11,324 | |||||||||
CSC Financial Co. Ltd. Class H (b) | 2,114,500 | 2,899 | |||||||||
Ping An Insurance Group Co. of China Ltd. | 1,377,000 | 16,196 | |||||||||
35,789 | |||||||||||
Health Care (0.8%): | |||||||||||
China Animal Healthcare Ltd. (a) (d) (e) | 1,673,000 | — | |||||||||
Shandong Weigao Group Medical Polymer Co. Ltd. Class H | 164,000 | 340 | |||||||||
Sinopharm Group Co. Ltd. Class H | 825,599 | 2,043 | |||||||||
Wuxi Biologics Cayman, Inc. (a) | 339,000 | 3,311 | |||||||||
5,694 | |||||||||||
Industrials (2.2%): | |||||||||||
Airtac International Group | 153,000 | 4,461 | |||||||||
China Lesso Group Holdings Ltd. | 402,000 | 719 | |||||||||
Hangcha Group Co. Ltd. Class A | 661,700 | 2,012 | |||||||||
Sany Heavy Industry Co. Ltd. Class A | 663,900 | 3,100 | |||||||||
See notes to financial statements.
5
| USAA Mutual Funds Trust USAA Emerging Markets Fund | Schedule of Portfolio Investments — continued November 30, 2020 | ||||||
(Amounts in Thousands, Except for Shares) (Unaudited)
Security Description | Shares | Value | |||||||||
Zhejiang Expressway Co. Ltd. Class H | 448,000 | $ | 320 | ||||||||
Zoomlion Heavy Industry Science and Technology Co. Ltd. Class H | 3,423,800 | 3,574 | |||||||||
ZTO Express Cayman, Inc., ADR | 51,460 | 1,453 | |||||||||
15,639 | |||||||||||
Information Technology (2.1%): | |||||||||||
Chinasoft International Ltd. | 2,796,000 | 2,961 | |||||||||
GDS Holdings Ltd., ADR (a) (c) | 19,597 | 1,764 | |||||||||
Kingdee International Software Group Co. Ltd. | 663,000 | 2,302 | |||||||||
Shengyi Technology Co. Ltd. Class A | 626,000 | 2,660 | |||||||||
Weimob, Inc. (a) (b) | 1,224,000 | 1,680 | |||||||||
Xinyi Solar Holdings Ltd. | 2,090,000 | 3,828 | |||||||||
15,195 | |||||||||||
Materials (0.8%): | |||||||||||
Anhui Conch Cement Co. Ltd. Class H | 455,500 | 2,911 | |||||||||
China Hongqiao Group Ltd. | 2,960,000 | 2,585 | |||||||||
5,496 | |||||||||||
Real Estate (0.7%): | |||||||||||
China SCE Group Holdings Ltd. | 6,807,132 | 3,117 | |||||||||
Shimao Services Holdings Ltd. (a) (b) | 886,886 | 1,584 | |||||||||
Times Neighborhood Holdings Ltd. | 320,806 | 320 | |||||||||
5,021 | |||||||||||
Utilities (0.4%): | |||||||||||
China Longyuan Power Group Corp. Ltd. Class H | 3,414,000 | 2,885 | |||||||||
China Tian Lun Gas Holdings Ltd. (c) | 379,500 | 327 | |||||||||
3,212 | |||||||||||
218,079 | |||||||||||
Colombia (0.7%): | |||||||||||
Financials (0.7%): | |||||||||||
Bancolombia SA, ADR | 175,040 | 5,330 | |||||||||
5,330 | |||||||||||
Cyprus (0.1%): | |||||||||||
Financials (0.1%): | |||||||||||
TCS Group Holding PLC, GDR | 16,299 | 500 | |||||||||
Egypt (0.4%): | |||||||||||
Communication Services (0.1%): | |||||||||||
Telecom Egypt Co. | 555,868 | 446 | |||||||||
Financials (0.3%): | |||||||||||
Commercial International Bank Egypt SAE Registered Shares, GDR | 521,721 | 2,030 | |||||||||
Credit Agricole Egypt SAE | 158,451 | 261 | |||||||||
2,291 | |||||||||||
2,737 | |||||||||||
Greece (0.6%): | |||||||||||
Financials (0.4%): | |||||||||||
National Bank of Greece SA (a) | 1,409,213 | 2,532 | |||||||||
See notes to financial statements.
6
| USAA Mutual Funds Trust USAA Emerging Markets Fund | Schedule of Portfolio Investments — continued November 30, 2020 | ||||||
(Amounts in Thousands, Except for Shares) (Unaudited)
Security Description | Shares | Value | |||||||||
Industrials (0.1%): | |||||||||||
Mytilineos SA | 55,408 | $ | 721 | ||||||||
Utilities (0.1%): | |||||||||||
Terna Energy SA | 53,096 | 822 | |||||||||
4,075 | |||||||||||
Hong Kong (4.4%): | |||||||||||
Communication Services (0.4%): | |||||||||||
China Mobile Ltd., ADR | 81,960 | 2,447 | |||||||||
NetDragon Websoft Holdings Ltd. | 159,500 | 349 | |||||||||
2,796 | |||||||||||
Consumer Discretionary (1.4%): | |||||||||||
Geely Automobile Holdings Ltd. | 1,088,000 | 3,010 | |||||||||
TCL Electronics Holdings Ltd. | 531,000 | 418 | |||||||||
Techtronic Industries Co. Ltd. | 514,000 | 6,562 | |||||||||
9,990 | |||||||||||
Energy (1.1%): | |||||||||||
CNOOC Ltd. | 5,099,719 | 5,075 | |||||||||
Kunlun Energy Co. Ltd. | 3,454,000 | 2,606 | |||||||||
7,681 | |||||||||||
Financials (0.0%): (f) | |||||||||||
Far East Horizon Ltd. | 319,000 | 340 | |||||||||
Health Care (0.3%): | |||||||||||
Sino Biopharmaceutical Ltd. | 1,570,500 | 1,576 | |||||||||
The United Laboratories International Holdings Ltd. | 418,000 | 313 | |||||||||
1,889 | |||||||||||
Industrials (0.1%): | |||||||||||
Sinotruk Hong Kong Ltd. | 194,500 | 485 | |||||||||
Information Technology (0.4%): | |||||||||||
Lenovo Group Ltd. | 3,928,000 | 2,798 | |||||||||
Materials (0.1%): | |||||||||||
China Resources Cement Holdings Ltd. | 408,000 | 507 | |||||||||
Nine Dragons Paper Holdings Ltd. | 379,000 | 498 | |||||||||
1,005 | |||||||||||
Real Estate (0.5%): | |||||||||||
China Overseas Grand Oceans Group Ltd. | 1,113,000 | 664 | |||||||||
Shimao Group Holdings Ltd. (d) | 796,000 | 2,967 | |||||||||
3,631 | |||||||||||
Utilities (0.1%): | |||||||||||
Canvest Environmental Protection Group Co. Ltd. | 769,000 | 325 | |||||||||
China Water Affairs Group Ltd. (c) | 484,000 | 381 | |||||||||
706 | |||||||||||
31,321 | |||||||||||
See notes to financial statements.
7
| USAA Mutual Funds Trust USAA Emerging Markets Fund | Schedule of Portfolio Investments — continued November 30, 2020 | ||||||
(Amounts in Thousands, Except for Shares) (Unaudited)
Security Description | Shares | Value | |||||||||
Hungary (0.6%): | |||||||||||
Financials (0.5%): | |||||||||||
OTP Bank Nyrt (a) | 100,323 | $ | 3,999 | ||||||||
Health Care (0.1%): | |||||||||||
Richter Gedeon Nyrt | 21,718 | 515 | |||||||||
4,514 | |||||||||||
India (9.6%): | |||||||||||
Communication Services (0.1%): | |||||||||||
Tata Communications Ltd. | 40,349 | 577 | |||||||||
Consumer Discretionary (0.4%): | |||||||||||
Bajaj Auto Ltd. | 67,150 | 2,869 | |||||||||
Crompton Greaves Consumer Electricals Ltd. | 79,777 | 328 | |||||||||
3,197 | |||||||||||
Consumer Staples (0.1%): | |||||||||||
Kaveri Seed Co. Ltd. | 66,393 | 437 | |||||||||
Energy (0.7%): | |||||||||||
Hindustan Petroleum Corp. Ltd. | 109,373 | 306 | |||||||||
Petronet LNG Ltd. | 700,159 | 2,370 | |||||||||
Reliance Industries Ltd. | 90,817 | 2,348 | |||||||||
5,024 | |||||||||||
Financials (4.2%): | |||||||||||
Axis Bank Ltd. (a) | 121,830 | 985 | |||||||||
Axis Bank Ltd., GDR (a) | 113,749 | 4,456 | |||||||||
Bandhan Bank Ltd. (a) (b) | 573,600 | 2,827 | |||||||||
Cholamandalam Investment and Finance Co. Ltd. | 527,008 | 2,740 | |||||||||
HDFC Bank Ltd., ADR (a) | 37,809 | 2,609 | |||||||||
Housing Development Finance Corp. Ltd. | 188,106 | 5,706 | |||||||||
ICICI Bank Ltd., ADR (a) | 596,621 | 7,673 | |||||||||
Multi Commodity Exchange of India Ltd. | 97,496 | 2,117 | |||||||||
Muthoot Finance Ltd. | 44,507 | 691 | |||||||||
Power Finance Corp. Ltd. | 282,885 | 412 | |||||||||
30,216 | |||||||||||
Health Care (0.6%): | |||||||||||
Alembic Pharmaceuticals Ltd. | 45,379 | 609 | |||||||||
Dr. Reddy's Laboratories Ltd. | 32,335 | 2,101 | |||||||||
Granules India Ltd. | 113,732 | 626 | |||||||||
Ipca Laboratories Ltd. | 25,584 | 745 | |||||||||
Sanofi India Ltd. | 3,282 | 365 | |||||||||
4,446 | |||||||||||
Industrials (0.5%): | |||||||||||
Engineers India Ltd. | 254,385 | 254 | |||||||||
Escorts Ltd. | 159,845 | 3,018 | |||||||||
3,272 | |||||||||||
Information Technology (1.9%): | |||||||||||
HCL Technologies Ltd. | 188,244 | 2,078 | |||||||||
Infosys Technologies Ltd., ADR | 582,677 | 8,868 | |||||||||
See notes to financial statements.
8
| USAA Mutual Funds Trust USAA Emerging Markets Fund | Schedule of Portfolio Investments — continued November 30, 2020 | ||||||
(Amounts in Thousands, Except for Shares) (Unaudited)
Security Description | Shares | Value | |||||||||
Mphasis Ltd. | 24,076 | $ | 428 | ||||||||
Tata Consultancy Services Ltd. | 67,207 | 2,415 | |||||||||
13,789 | |||||||||||
Materials (1.0%): | |||||||||||
Asian Paints Ltd. | 59,141 | 1,762 | |||||||||
Birla Corp. Ltd. | 44,156 | 421 | |||||||||
Coromandel International Ltd. | 41,857 | 466 | |||||||||
HeidelbergCement India Ltd. | 197,822 | 554 | |||||||||
Hindalco Industries Ltd. | 1,290,222 | 3,904 | |||||||||
7,107 | |||||||||||
Utilities (0.1%): | |||||||||||
CESC Ltd. | 39,189 | 306 | |||||||||
Gujarat Gas Ltd. | 117,638 | 553 | |||||||||
859 | |||||||||||
68,924 | |||||||||||
Indonesia (2.3%): | |||||||||||
Communication Services (0.4%): | |||||||||||
PT Media Nusantara Citra Tbk (a) | 5,533,400 | 398 | |||||||||
PT Telekomunikasi Indonesia Persero Tbk, ADR | 114,387 | 2,568 | |||||||||
2,966 | |||||||||||
Consumer Discretionary (0.3%): | |||||||||||
PT Astra International Tbk | 5,297,400 | 1,988 | |||||||||
Financials (1.6%): | |||||||||||
PT Bank Mandiri Persero Tbk | 7,417,690 | 3,334 | |||||||||
PT Bank Negara Indonesia Persero Tbk | 8,104,400 | 3,444 | |||||||||
PT Bank Rakyat Indonesia Persero Tbk | 16,800,664 | 4,870 | |||||||||
11,648 | |||||||||||
16,602 | |||||||||||
Jersey (0.1%): | |||||||||||
Information Technology (0.1%): | |||||||||||
WNS Holdings Ltd., ADR (a) | 6,371 | 449 | |||||||||
Korea, Republic Of (17.1%): | |||||||||||
Communication Services (1.8%): | |||||||||||
AfreecaTV Co. Ltd. | 7,739 | 404 | |||||||||
Echo Marketing, Inc. | 16,825 | 383 | |||||||||
NAVER Corp. | 14,523 | 3,657 | |||||||||
NCSoft Corp. | 11,120 | 8,173 | |||||||||
Neowiz (a) | 17,612 | 370 | |||||||||
12,987 | |||||||||||
Consumer Discretionary (1.9%): | |||||||||||
Coway Co. Ltd. (a) | 5,802 | 365 | |||||||||
Danawa Co. Ltd. | 12,670 | 336 | |||||||||
DoubleUGames Co. Ltd. | 7,184 | 381 | |||||||||
GS Home Shopping, Inc. | 2,848 | 354 | |||||||||
Hyundai Mobis Co. Ltd. | 15,696 | 3,466 | |||||||||
See notes to financial statements.
9
| USAA Mutual Funds Trust USAA Emerging Markets Fund | Schedule of Portfolio Investments — continued November 30, 2020 | ||||||
(Amounts in Thousands, Except for Shares) (Unaudited)
Security Description | Shares | Value | |||||||||
Kia Motors Corp. | 100,276 | $ | 5,246 | ||||||||
LG Electronics, Inc. | 32,231 | 2,492 | |||||||||
S&T Motiv Co. Ltd. | 9,670 | 434 | |||||||||
SL Corp. | 27,821 | 415 | |||||||||
Youngone Corp. | 12,878 | 348 | |||||||||
13,837 | |||||||||||
Consumer Staples (0.9%): | |||||||||||
Cosmax, Inc. | 21,124 | 1,824 | |||||||||
Hite Jinro Co. Ltd. | 10,469 | 303 | |||||||||
KT&G Corp. | 21,042 | 1,570 | |||||||||
Maeil Dairies Co. Ltd. | 10,010 | 633 | |||||||||
Orion Corp. | 15,739 | 1,685 | |||||||||
6,015 | |||||||||||
Financials (1.5%): | |||||||||||
DB Insurance Co. Ltd. | 57,231 | 2,276 | |||||||||
Hana Financial Group, Inc. | 77,797 | 2,365 | |||||||||
KIWOOM Securities Co. Ltd. | 6,031 | 675 | |||||||||
Samsung Securities Co. Ltd. | 78,854 | 2,807 | |||||||||
Shinhan Financial Group Co. Ltd. | 97,081 | 2,860 | |||||||||
10,983 | |||||||||||
Health Care (0.5%): | |||||||||||
Chong Kun Dang Pharmaceutical Corp. | 3,464 | 545 | |||||||||
Dongkook Pharmaceutical Co. Ltd. | 16,431 | 382 | |||||||||
Hugel, Inc. (a) | 9,242 | 1,649 | |||||||||
Osstem Implant Co. Ltd. (a) | 8,598 | 409 | |||||||||
Seegene, Inc. | 3,140 | 538 | |||||||||
3,523 | |||||||||||
Industrials (1.0%): | |||||||||||
CJ Logistics Corp. (a) | 8,699 | 1,305 | |||||||||
CS Wind Corp. (a) | 21,803 | 2,540 | |||||||||
Daelim Industrial Co. Ltd. | 7,238 | 524 | |||||||||
Hyundai Glovis Co. Ltd. | 3,053 | 492 | |||||||||
LG Corp. | 31,490 | 2,009 | |||||||||
Samsung Engineering Co. Ltd. (a) | 45,665 | 563 | |||||||||
7,433 | |||||||||||
Information Technology (8.9%): | |||||||||||
Douzone Bizon Co. Ltd. | 8,289 | 792 | |||||||||
LG Innotek Co. Ltd. | 17,740 | 2,492 | |||||||||
NHN KCP Corp. | 15,671 | 948 | |||||||||
Partron Co. Ltd. | 40,694 | 368 | |||||||||
Samsung Electronics Co. Ltd. | 673,057 | 40,581 | |||||||||
SFA Engineering Corp. | 14,603 | 496 | |||||||||
Silicon Works Co. Ltd. | 10,072 | 429 | |||||||||
SK Hynix, Inc. | 198,912 | 17,532 | |||||||||
63,638 | |||||||||||
See notes to financial statements.
10
| USAA Mutual Funds Trust USAA Emerging Markets Fund | Schedule of Portfolio Investments — continued November 30, 2020 | ||||||
(Amounts in Thousands, Except for Shares) (Unaudited)
Security Description | Shares | Value | |||||||||
Materials (0.6%): | |||||||||||
Korea Petrochemical Ind Co. Ltd. | 4,258 | $ | 940 | ||||||||
LG Chem Ltd. | 3,523 | 2,560 | |||||||||
Soulbrain Co. Ltd. (a) | 3,020 | 697 | |||||||||
4,197 | |||||||||||
122,613 | |||||||||||
Luxembourg (0.3%): | |||||||||||
Materials (0.3%): | |||||||||||
Ternium SA, ADR (a) | 72,968 | 2,022 | |||||||||
Malaysia (0.4%): | |||||||||||
Communication Services (0.1%): | |||||||||||
TIME dotCom Bhd | 178,900 | 601 | |||||||||
Energy (0.1%): | |||||||||||
Serba Dinamik Holdings Bhd | 974,090 | 387 | |||||||||
Health Care (0.1%): | |||||||||||
Supermax Corp. Bhd (a) | 328,300 | 740 | |||||||||
Information Technology (0.1%): | |||||||||||
V.S. Industry Bhd | 1,402,400 | 808 | |||||||||
Materials (0.0%): (f) | |||||||||||
Scientex Bhd | 131,600 | 383 | |||||||||
Real Estate (0.0%): (f) | |||||||||||
Eco World Development Group Bhd (a) | 3,234,300 | 302 | |||||||||
3,221 | |||||||||||
Mexico (3.2%): | |||||||||||
Communication Services (0.5%): | |||||||||||
America Movil SAB de CV, Series L, ADR | 232,810 | 3,466 | |||||||||
Consumer Staples (0.4%): | |||||||||||
Kimberly-Clark de Mexico SAB de CV Class A | 1,176,600 | 1,867 | |||||||||
La Comer SAB de CV | 334,534 | 691 | |||||||||
2,558 | |||||||||||
Energy (0.0%): (f) | |||||||||||
Vista Oil & Gas SAB de CV, ADR (a) | 108,136 | 287 | |||||||||
Financials (0.7%): | |||||||||||
Banco del Bajio SA (a) (b) (c) | 259,784 | 324 | |||||||||
Grupo Financiero Banorte SAB de CV Class O (a) | 933,408 | 4,674 | |||||||||
4,998 | |||||||||||
Health Care (0.0%): (f) | |||||||||||
Genomma Lab Internacional SAB de CV Class B (a) | 386,754 | 378 | |||||||||
Industrials (0.6%): | |||||||||||
Controladora Vuela Cia de Aviacion SAB de CV, ADR (a) | 201,873 | 2,112 | |||||||||
Grupo Aeroportuario del Centro Norte SAB de CV, ADR (a) (c) | 44,508 | 2,072 | |||||||||
4,184 | |||||||||||
See notes to financial statements.
11
| USAA Mutual Funds Trust USAA Emerging Markets Fund | Schedule of Portfolio Investments — continued November 30, 2020 | ||||||
(Amounts in Thousands, Except for Shares) (Unaudited)
Security Description | Shares | Value | |||||||||
Materials (0.7%): | |||||||||||
Grupo Cementos de Chihuahua SAB de CV | 146,340 | $ | 768 | ||||||||
Grupo Mexico SAB de CV Class B | 1,124,009 | 4,080 | |||||||||
4,848 | |||||||||||
Real Estate (0.3%): | |||||||||||
Corp Inmobiliaria Vesta SAB de CV | 908,707 | 1,626 | |||||||||
PLA Administradora Industrial S de RL de CV | 257,638 | 368 | |||||||||
Prologis Property Mexico SA de CV | 208,080 | 450 | |||||||||
2,444 | |||||||||||
23,163 | |||||||||||
Netherlands (0.3%): | |||||||||||
Communication Services (0.3%): | |||||||||||
Yandex NV Class A (a) | 28,709 | 1,980 | |||||||||
Philippines (0.3%): | |||||||||||
Financials (0.3%): | |||||||||||
BDO Unibank, Inc. | 1,162,610 | 2,501 | |||||||||
Poland (0.6%): | |||||||||||
Communication Services (0.3%): | |||||||||||
CD Projekt SA (a) | 19,212 | 1,996 | |||||||||
TEN Square Games SA | 2,499 | 381 | |||||||||
2,377 | |||||||||||
Financials (0.3%): | |||||||||||
Bank Pekao SA (a) | 139,704 | 2,115 | |||||||||
4,492 | |||||||||||
Qatar (0.1%): | |||||||||||
Energy (0.1%): | |||||||||||
Qatar Gas Transport Co. Ltd. | 533,763 | 474 | |||||||||
Russian Federation (3.6%): | |||||||||||
Communication Services (0.4%): | |||||||||||
Mobile TeleSystems PJSC, ADR | 319,720 | 2,759 | |||||||||
Consumer Discretionary (0.4%): | |||||||||||
Detsky Mir PJSC (b) | 1,480,490 | 2,724 | |||||||||
Energy (0.9%): | |||||||||||
LUKOIL PJSC, ADR | 53,199 | 3,511 | |||||||||
Rosneft Oil Co. PJSC, GDR | 560,208 | 3,241 | |||||||||
6,752 | |||||||||||
Financials (1.8%): | |||||||||||
Moscow Exchange MICEX PJSC | 174,030 | 350 | |||||||||
Sberbank of Russia PJSC, ADR | 329,191 | 4,388 | |||||||||
Sberbank of Russia PJSC | 2,644,992 | 8,615 | |||||||||
13,353 | |||||||||||
See notes to financial statements.
12
| USAA Mutual Funds Trust USAA Emerging Markets Fund | Schedule of Portfolio Investments — continued November 30, 2020 | ||||||
(Amounts in Thousands, Except for Shares) (Unaudited)
Security Description | Shares | Value | |||||||||
Materials (0.1%): | |||||||||||
Polymetal International PLC | 31,259 | $ | 651 | ||||||||
26,239 | |||||||||||
Saudi Arabia (0.3%): | |||||||||||
Health Care (0.0%): (f) | |||||||||||
Mouwasat Medical Services Co. | 10,306 | 354 | |||||||||
Industrials (0.3%): | |||||||||||
Saudi Industrial Services Co. | 263,794 | 2,123 | |||||||||
2,477 | |||||||||||
Singapore (0.4%): | |||||||||||
Communication Services (0.4%): | |||||||||||
Sea Ltd., ADR (a) | 15,549 | 2,805 | |||||||||
South Africa (1.5%): | |||||||||||
Communication Services (0.4%): | |||||||||||
MTN Group Ltd. | 612,787 | 2,633 | |||||||||
Consumer Discretionary (0.2%): | |||||||||||
Mr. Price Group Ltd. | 163,546 | 1,711 | |||||||||
Energy (0.1%): | |||||||||||
Exxaro Resources Ltd. | 45,396 | 348 | |||||||||
Financials (0.3%): | |||||||||||
Standard Bank Group Ltd. | 285,131 | 2,229 | |||||||||
Industrials (0.0%): (f) | |||||||||||
Barloworld Ltd. | 72,243 | 325 | |||||||||
Materials (0.5%): | |||||||||||
African Rainbow Minerals Ltd. | 59,059 | 914 | |||||||||
Impala Platinum Holdings Ltd. | 221,767 | 2,321 | |||||||||
3,235 | |||||||||||
10,481 | |||||||||||
Taiwan (10.9%): | |||||||||||
Communication Services (0.1%): | |||||||||||
International Games System Co. Ltd. | 20,000 | 477 | |||||||||
Consumer Discretionary (0.9%): | |||||||||||
Gourmet Master Co. Ltd. | 103,000 | 518 | |||||||||
Makalot Industrial Co. Ltd. | 406,000 | 2,631 | |||||||||
Merida Industry Co. Ltd. | 98,000 | 858 | |||||||||
Nien Made Enterprise Co. Ltd. | 28,000 | 330 | |||||||||
Poya International Co. Ltd. | 19,000 | 399 | |||||||||
Topkey Corp. | 277,000 | 1,625 | |||||||||
6,361 | |||||||||||
Financials (0.9%): | |||||||||||
Chailease Holding Co. Ltd. | 531,444 | 2,916 | |||||||||
King's Town Bank Co. Ltd. | 404,000 | 542 | |||||||||
Yuanta Financial Holding Co. Ltd. | 4,824,640 | 3,236 | |||||||||
6,694 | |||||||||||
See notes to financial statements.
13
| USAA Mutual Funds Trust USAA Emerging Markets Fund | Schedule of Portfolio Investments — continued November 30, 2020 | ||||||
(Amounts in Thousands, Except for Shares) (Unaudited)
Security Description | Shares | Value | |||||||||
Health Care (0.3%): | |||||||||||
Ginko International Co. Ltd. | 64,000 | $ | 335 | ||||||||
Universal Vision Biotechnology Co. Ltd. | 190,000 | 1,980 | |||||||||
2,315 | |||||||||||
Industrials (0.5%): | |||||||||||
Chicony Power Technology Co. Ltd. | 246,000 | 581 | |||||||||
Evergreen Marine Corp. Ltd. (a) | 642,000 | 556 | |||||||||
Kung Long Batteries Industrial Co. Ltd. | 72,000 | 354 | |||||||||
Sunonwealth Electric Machine Industry Co. Ltd. | 975,000 | 1,927 | |||||||||
3,418 | |||||||||||
Information Technology (8.1%): | |||||||||||
Chipbond Technology Corp. | 329,000 | 743 | |||||||||
Elan Microelectronics Corp. | 170,000 | 788 | |||||||||
Elite Material Co. Ltd. | 64,000 | 350 | |||||||||
Gigabyte Technology Co. Ltd. | 165,000 | 455 | |||||||||
Globalwafers Co. Ltd. | 166,000 | 3,247 | |||||||||
Hon Hai Precision Industry Co. Ltd., GDR | 379,771 | 2,213 | |||||||||
Largan Precision Co. Ltd. | 17,406 | 1,969 | |||||||||
Lite-On Technology Corp. | 277,000 | 467 | |||||||||
MediaTek, Inc. | 283,000 | 6,989 | |||||||||
Nanya Technology Corp. | 1,436,000 | 3,645 | |||||||||
Parade Technologies Ltd. | 21,000 | 763 | |||||||||
Radiant Opto-Electronics Corp. | 185,000 | 754 | |||||||||
Silicon Motion Technology Corp., ADR | 81,687 | 3,241 | |||||||||
Simplo Technology Co. Ltd. | 48,000 | 558 | |||||||||
Sinbon Electronics Co. Ltd. | 141,000 | 965 | |||||||||
Taiwan Semiconductor Manufacturing Co. Ltd., ADR | 78,148 | 7,582 | |||||||||
Taiwan Semiconductor Manufacturing Co. Ltd. | 1,157,000 | 19,696 | |||||||||
Tripod Technology Corp. | 154,000 | 662 | |||||||||
Unimicron Technology Corp. | 210,000 | 663 | |||||||||
Wistron Corp. | 412,000 | 431 | |||||||||
Zhen Ding Technology Holding Ltd. | 498,000 | 2,158 | |||||||||
58,339 | |||||||||||
Real Estate (0.1%): | |||||||||||
Chong Hong Construction Co. Ltd. | 168,000 | 489 | |||||||||
78,093 | |||||||||||
Thailand (0.7%): | |||||||||||
Consumer Discretionary (0.1%): | |||||||||||
Sri Trang Agro-Industry PCL | 402,800 | 356 | |||||||||
Financials (0.4%): | |||||||||||
Siam Commercial Bank PCL Class R | 918,100 | 2,591 | |||||||||
Thanachart Capital PCL | 314,500 | 353 | |||||||||
2,944 | |||||||||||
Industrials (0.0%): (f) | |||||||||||
Gunkul Engineering PCL | 3,617,700 | 299 | |||||||||
See notes to financial statements.
14
| USAA Mutual Funds Trust USAA Emerging Markets Fund | Schedule of Portfolio Investments — continued November 30, 2020 | ||||||
(Amounts in Thousands, Except for Shares) (Unaudited)
Security Description | Shares | Value | |||||||||
Information Technology (0.1%): | |||||||||||
Hana Microelectronics PCL Class R | 424,200 | $ | 599 | ||||||||
Real Estate (0.1%): | |||||||||||
AP Thailand PCL | 2,569,500 | 594 | |||||||||
Origin Property PCL | 1,800,500 | 462 | |||||||||
1,056 | |||||||||||
5,254 | |||||||||||
Turkey (0.4%): | |||||||||||
Consumer Discretionary (0.1%): | |||||||||||
Arcelik A/S (a) (c) | 172,713 | 603 | |||||||||
Consumer Staples (0.1%): | |||||||||||
Coca-Cola Icecek A/S | 60,535 | 434 | |||||||||
Industrials (0.0%): (f) | |||||||||||
Tekfen Holding A/S (c) | 117,716 | 219 | |||||||||
Utilities (0.2%): | |||||||||||
Enerjisa Enerji A/S (b) | 1,256,538 | 1,738 | |||||||||
1,738 | |||||||||||
2,994 | |||||||||||
United Arab Emirates (0.1%): | |||||||||||
Industrials (0.1%): | |||||||||||
Aramex PJSC | 449,110 | 490 | |||||||||
United Kingdom (1.2%): | |||||||||||
Consumer Staples (0.4%): | |||||||||||
Unilever PLC | 55,219 | 3,347 | |||||||||
Materials (0.8%): | |||||||||||
Anglo American PLC | 101,663 | 2,960 | |||||||||
Antofagasta PLC | 165,276 | 2,729 | |||||||||
5,689 | |||||||||||
9,036 | |||||||||||
United States (0.4%): | |||||||||||
Industrials (0.4%): | |||||||||||
Bizlink Holding, Inc. | 328,000 | 2,819 | |||||||||
2,819 | |||||||||||
Total Common Stocks (Cost $503,433) | 705,238 | ||||||||||
Rights (0.0%) (f) | |||||||||||
Taiwan (0.0%): | |||||||||||
Information Technology (0.0%): | |||||||||||
Simplo Technology Co. Ltd. , Expires 03/26/21 (a) (d) (e) | 1,757 | — | |||||||||
Total Rights (Cost $—) | — | ||||||||||
See notes to financial statements.
15
| USAA Mutual Funds Trust USAA Emerging Markets Fund | Schedule of Portfolio Investments — continued November 30, 2020 | ||||||
(Amounts in Thousands, Except for Shares) (Unaudited)
Security Description | Shares | Value | |||||||||
Exchange-Traded Funds (0.0%) (f) | |||||||||||
United States (0.0%): | |||||||||||
iShares MSCI Emerging Markets Small-Cap ETF | 2,824 | $ | 141 | ||||||||
Total Exchange-Traded Funds (Cost $138) | 141 | ||||||||||
Collateral for Securities Loaned^ (0.4%) | |||||||||||
United States (0.4%): | |||||||||||
| Goldman Sachs Financial Square Government Fund Institutional Shares, 0.02% (g) | 1,080,656 | 1,081 | |||||||||
HSBC U.S. Government Money Market Fund I Shares, 0.03% (g) | 1,953,751 | 1,954 | |||||||||
Total Collateral for Securities Loaned (Cost $3,035) | 3,035 | ||||||||||
Total Investments (Cost $506,606) — 98.6% | 708,414 | ||||||||||
Other assets in excess of liabilities — 1.4% | 9,707 | ||||||||||
NET ASSETS — 100.00% | $ | 718,121 | |||||||||
^ Purchased with cash collateral from securities on loan.
(a) Non-income producing security.
(b) Rule 144A security or other security that is restricted as to resale to institutional investors. The Fund's Adviser has deemed this security to be liquid based upon procedures approved by the Board of Trustees. As of November 30, 2020, the fair value of these securities was $21,182 (thousands) and amounted to 2.9% of net assets.
(c) All or a portion of this security is on loan.
(d) The Fund's Adviser has deemed this security to be illiquid based upon procedures approved by the Board of Trustees. As of November 30, 2020, illiquid securities were 0.4% of the Fund's net assets.
(e) Security was fair valued based upon procedures approved by the Board of Trustees and represents 0.0% of the Fund's net assets as of November 30, 2020. This security is classified as Level 3 within the fair value hierarchy. (See Note 2)
(f) Amount represents less than 0.05% of net assets.
(g) Rate disclosed is the daily yield on November 30, 2020.
ADR — American Depositary Receipt
ETF — Exchange-Traded Fund
GDR — Global Depositary Receipt
PCL — Public Company Limited
PLC — Public Limited Company
See notes to financial statements.
16
USAA Mutual Funds Trust | Statement of Assets and Liabilities November 30, 2020 | ||||||
(Amounts in Thousands, Except Per Share Amounts) (Unaudited)
| USAA Emerging Markets Fund | |||||||
Assets: | |||||||
Investments, at value (Cost $506,606) | $ | 708,414 | (a) | ||||
Foreign currency, at value (Cost $471) | 475 | ||||||
Cash and cash equivalents | 13,451 | ||||||
Receivables: | |||||||
Interest and dividends | 234 | ||||||
Capital shares issued | 245 | ||||||
Investments sold | 3,675 | ||||||
Reclaims | 18 | ||||||
From Adviser | 46 | ||||||
Prepaid expenses | 31 | ||||||
Total assets | 726,589 | ||||||
Liabilities: | |||||||
Payables: | |||||||
Collateral received on loaned securities | 3,035 | ||||||
Investments purchased | 2,177 | ||||||
Capital shares redeemed | 935 | ||||||
Accrued foreign capital gains taxes | 1,458 | ||||||
Accrued expenses and other payables: | |||||||
Investment advisory fees | 561 | ||||||
Administration fees | 72 | ||||||
Custodian fees | 58 | ||||||
Transfer agent fees | 81 | ||||||
Compliance fees | — | (b) | |||||
| 12b-1 fees | 1 | ||||||
Other accrued expenses | 90 | ||||||
Total liabilities | 8,468 | ||||||
Net Assets: | |||||||
Capital | 631,489 | ||||||
Total accumulated earnings/(loss) | 86,632 | ||||||
Net assets | $ | 718,121 | |||||
Net Assets | |||||||
Fund Shares | $ | 330,969 | |||||
Institutional Shares | 381,373 | ||||||
Class A shares | 5,779 | ||||||
Total | $ | 718,121 | |||||
Shares (unlimited number of shares authorized with no par value): | |||||||
Fund Shares | 15,785 | ||||||
Institutional Shares | 18,202 | ||||||
Class A shares | 277 | ||||||
Total | 34,264 | ||||||
Net asset value, offering and redemption price per share: (c) | |||||||
Fund Shares | $ | 20.97 | |||||
Institutional Shares | $ | 20.95 | |||||
Class A shares | $ | 20.83 | |||||
Maximum Sales Charge — Class A shares | 5.75 | % | |||||
Maximum offering price | |||||||
| (100%/(100%-maximum sales charge) of net asset value adjusted to the nearest cent) per share — Class A shares | $ | 22.10 | |||||
(a) Includes $2,907 of securities on loan.
(b) Rounds to less than $1 thousand.
(c) Per share amount may not recalculate due to rounding of net assets and/or shares outstanding.
See notes to financial statements.
17
USAA Mutual Funds Trust | Statement of Operations For the Six Months Ended November 30, 2020 | ||||||
(Amounts in Thousands) (Unaudited)
| USAA Emerging Markets Fund | |||||||
Investment Income: | |||||||
Dividends | $ | 9,337 | |||||
Interest | 2 | ||||||
Securities lending (net of fees) | 37 | ||||||
Foreign tax withholding | (1,002 | ) | |||||
Total income | 8,374 | ||||||
Expenses: | |||||||
Investment advisory fees | 3,302 | ||||||
Administration fees — Fund Shares | 235 | ||||||
Administration fees — Institutional Shares | 183 | ||||||
Administration fees — Class A shares | 4 | ||||||
Sub-Administration fees | 38 | ||||||
12b-1 fees — Class A shares | 7 | ||||||
Custodian fees | 213 | ||||||
Transfer agent fees — Fund Shares | 404 | ||||||
Transfer agent fees — Institutional Shares | 183 | ||||||
Transfer agent fees — Class A shares | 2 | ||||||
Trustees' fees | 26 | ||||||
Compliance fees | 2 | ||||||
Legal and audit fees | 64 | ||||||
State registration and filing fees | 30 | ||||||
Interfund lending fees | — | (a) | |||||
Other expenses | 65 | ||||||
Total expenses | 4,758 | ||||||
Expenses waived/reimbursed by Adviser | (135 | ) | |||||
Net expenses | 4,623 | ||||||
Net Investment Income (Loss) | 3,751 | ||||||
Realized/Unrealized Gains (Losses) from Investments: | |||||||
| Net realized gains (losses) from investment securities and foreign currency translations | 32,657 | ||||||
Foreign taxes on realized gains | (29 | ) | |||||
| Net change in unrealized appreciation/depreciation on investment securities and foreign currency translations | 140,585 | ||||||
Net change in accrued foreign taxes on unrealized gains | (1,407 | ) | |||||
Net realized/unrealized gains (losses) on investments | 171,806 | ||||||
Change in net assets resulting from operations | $ | 175,557 | |||||
(a) Rounds to less than $1 thousand.
See notes to financial statements.
18
USAA Mutual Funds Trust | Statements of Changes in Net Assets | ||||||
(Amounts in Thousands)
| USAA Emerging Markets Fund | |||||||||||
| Six Months Ended November 30, 2020 (unaudited) | Year Ended May 31, 2020 | ||||||||||
From Investments: | |||||||||||
Operations: | |||||||||||
Net investment income (loss) | $ | 3,751 | $ | 11,331 | |||||||
Net realized gains (losses) from investments | 32,628 | 2,277 | |||||||||
| Net change in unrealized appreciation/depreciation on investments | 139,178 | (43,928 | ) | ||||||||
Change in net assets resulting from operations | 175,557 | (30,320 | ) | ||||||||
Distributions to Shareholders: | |||||||||||
Fund Shares | — | (1,181 | ) | ||||||||
Institutional Shares | — | (1,681 | ) | ||||||||
Class A shares | — | (12 | ) | ||||||||
Change in net assets resulting from distributions to shareholders | — | (2,874 | ) | ||||||||
Change in net assets resulting from capital transactions | (71,007 | ) | (190,423 | ) | |||||||
Change in net assets | 104,550 | (223,617 | ) | ||||||||
Net Assets: | |||||||||||
Beginning of period | 613,571 | 837,188 | |||||||||
End of period | $ | 718,121 | $ | 613,571 | |||||||
Capital Transactions: | |||||||||||
Fund Shares | |||||||||||
Proceeds from shares issued | $ | 8,242 | $ | 35,895 | |||||||
Distributions reinvested | — | 1,167 | |||||||||
Cost of shares redeemed | (39,511 | ) | (78,125 | ) | |||||||
Total Fund Shares | $ | (31,269 | ) | $ | (41,063 | ) | |||||
Institutional Shares | |||||||||||
Proceeds from shares issued | $ | 4,062 | $ | 28,712 | |||||||
Distributions reinvested | — | 1,680 | |||||||||
Cost of shares redeemed | (43,779 | ) | (179,763 | ) | |||||||
Total Institutional Shares | $ | (39,717 | ) | $ | (149,371 | ) | |||||
Class A shares | |||||||||||
Proceeds from shares issued | $ | 4,790 | $ | 18 | |||||||
Distributions reinvested | — | — | (a) | ||||||||
Cost of shares redeemed | (4,811 | ) | (7 | ) | |||||||
Total Class A shares | $ | (21 | ) | $ | 11 | ||||||
Change in net assets resulting from capital transactions | $ | (71,007 | ) | $ | (190,423 | ) | |||||
(a) Rounds to less than $1 thousand.
See notes to financial statements.
19
USAA Mutual Funds Trust | Statements of Changes in Net Assets — continued | ||||||
(Amounts in Thousands)
| USAA Emerging Markets Fund | |||||||||||
| Six Months Ended November 30, 2020 (unaudited) | Year Ended May 31, 2020 | ||||||||||
Share Transactions: | |||||||||||
Fund Shares | |||||||||||
Issued | 432 | 2,094 | |||||||||
Reinvested | — | 61 | |||||||||
Redeemed | (2,089 | ) | (4,572 | ) | |||||||
Total Fund Shares | (1,657 | ) | (2,417 | ) | |||||||
Institutional Shares | |||||||||||
Issued | 218 | 1,679 | |||||||||
Reinvested | — | 88 | |||||||||
Redeemed | (2,289 | ) | (10,272 | ) | |||||||
Total Institutional Shares | (2,071 | ) | (8,505 | ) | |||||||
Class A shares | |||||||||||
Issued | 278 | 1 | |||||||||
Reinvested | — | — | (a) | ||||||||
Redeemed | (280 | ) | — | (a) | |||||||
Total Class A shares | (2 | ) | 1 | ||||||||
Change in Shares | (3,730 | ) | (10,921 | ) | |||||||
(a) Rounds to less than 1 thousand.
See notes to financial statements.
20
This page is intentionally left blank.
21
USAA Mutual Funds Trust | Financial Highlights | ||||||
For a Share Outstanding Throughout Each Period
Investment Activities | Distributions to Shareholders From | ||||||||||||||||||||||||||
| Net Asset Value, Beginning of Period | Net Investment Income (Loss) | Net Realized and Unrealized Gains (Losses) on Investments | Total from Investment Activities | Net Investment Income | Total Distributions | ||||||||||||||||||||||
USAA Emerging Markets Fund | |||||||||||||||||||||||||||
Fund Shares | |||||||||||||||||||||||||||
| Six Months Ended November 30, 2020 (unaudited) | $ | 16.16 | 0.09 | (e) | 4.72 | 4.81 | — | — | |||||||||||||||||||
| Year Ended May 31, 2020 | $ | 17.14 | 0.25 | (e) | (1.17 | ) | (0.92 | ) | (0.06 | ) | (0.06 | ) | |||||||||||||||
| Year Ended May 31, 2019 | $ | 18.84 | 0.17 | (1.67 | ) | (1.50 | ) | (0.20 | ) | (0.20 | ) | ||||||||||||||||
| Year Ended May 31, 2018 | $ | 17.60 | 0.16 | 1.15 | 1.31 | (0.07 | ) | (0.07 | ) | ||||||||||||||||||
| Year Ended May 31, 2017 | $ | 14.24 | 0.07 | 3.43 | 3.50 | (0.14 | ) | (0.14 | ) | ||||||||||||||||||
| Year Ended May 31, 2016 | $ | 16.46 | 0.11 | (e) | (2.22 | ) | (2.11 | ) | (0.11 | ) | (0.11 | ) | |||||||||||||||
Institutional Shares | |||||||||||||||||||||||||||
| Six Months Ended November 30, 2020 (unaudited) | $ | 16.14 | 0.11 | (e) | 4.70 | 4.81 | — | — | |||||||||||||||||||
| Year Ended May 31, 2020 | $ | 17.10 | 0.29 | (e) | (1.17 | ) | (0.88 | ) | (0.08 | ) | (0.08 | ) | |||||||||||||||
| Year Ended May 31, 2019 | $ | 18.79 | 0.18 | (1.62 | ) | (1.44 | ) | (0.25 | ) | (0.25 | ) | ||||||||||||||||
| Year Ended May 31, 2018 | $ | 17.55 | 0.20 | 1.14 | 1.34 | (0.10 | ) | (0.10 | ) | ||||||||||||||||||
| Year Ended May 31, 2017 | $ | 14.21 | 0.12 | (e) | 3.40 | 3.52 | (0.18 | ) | (0.18 | ) | |||||||||||||||||
| Year Ended May 31, 2016 | $ | 16.42 | 0.18 | (2.25 | ) | (2.07 | ) | (0.14 | ) | (0.14 | ) | ||||||||||||||||
* Assumes reinvestment of all net investment income and realized capital gain distributions, if any, during the period. Includes adjustments in accordance with U.S. generally accepted accounting principles and could differ from the Lipper reported return.
^ The net expense ratio may not correlate to the applicable expense limits in place during the period since the current contractual expense limitation is applied for a two year period beginning July 1, 2019 and in effect through September 30, 2021, instead of coinciding with the Fund's fiscal year end. Details of the current contractual expense limitation in effect can be found in Note 5 of the accompanying Notes to Financial Statements.
(a) Not annualized for periods less than one year.
(b) Annualized for periods less than one year.
(c) Reflects total annual operating expenses for reductions of expenses paid indirectly for the May 31 fiscal years ended 2019, 2018, 2017 and 2016. Expenses paid indirectly decreased the expense ratio for each of these respective years by less than 0.01%.
(d) Portfolio turnover is calculated on the basis of the Fund as a whole without distinguishing between the classes of shares issued.
(e) Per share net investment income (loss) has been calculated using the average daily shares method.
See notes to financial statements.
22
USAA Mutual Funds Trust | Financial Highlights — continued | ||||||
For a Share Outstanding Throughout Each Period
Ratios to Average Net Assets | Supplemental Data | ||||||||||||||||||||||||||||||
| Net Asset Value, End of Period | Total Return (Excludes Sales Charges)*(a) | Net Expenses^(b)(c) | Net Investment Income (Loss)(b) | Gross Expenses(b)(c) | Net Assets, End of Period (000's) | Portfolio Turnover(a)(d) | |||||||||||||||||||||||||
USAA Emerging Markets Fund | |||||||||||||||||||||||||||||||
Fund Shares | |||||||||||||||||||||||||||||||
| Six Months Ended November 30, 2020 (unaudited) | $ | 20.97 | 29.68 | % | 1.45 | % | 0.99 | % | 1.49 | % | $ | 330,969 | 36 | % | |||||||||||||||||
| Year Ended May 31, 2020 | $ | 16.16 | (5.41 | )% | 1.48 | % | 1.44 | % | 1.54 | % | $ | 281,937 | 124 | %(f) | |||||||||||||||||
| Year Ended May 31, 2019 | $ | 17.14 | (7.86 | )% | 1.48 | % | 1.02 | % | 1.48 | % | $ | 340,465 | 68 | % | |||||||||||||||||
| Year Ended May 31, 2018 | $ | 18.84 | 7.41 | % | 1.46 | % | 0.86 | % | 1.46 | % | $ | 402,401 | 59 | % | |||||||||||||||||
| Year Ended May 31, 2017 | $ | 17.60 | 24.70 | % | 1.51 | % | 0.50 | % | 1.51 | % | $ | 374,130 | 45 | % | |||||||||||||||||
| Year Ended May 31, 2016 | $ | 14.24 | (12.77 | )% | 1.58 | % | 0.73 | % | 1.58 | % | $ | 302,012 | 47 | % | |||||||||||||||||
Institutional Shares | |||||||||||||||||||||||||||||||
| Six Months Ended November 30, 2020 (unaudited) | $ | 20.95 | 29.80 | % | 1.26 | % | 1.19 | % | 1.29 | % | $ | 381,373 | 36 | % | |||||||||||||||||
| Year Ended May 31, 2020 | $ | 16.14 | (5.17 | )% | 1.29 | % | 1.67 | % | 1.33 | % | $ | 327,156 | 124 | %(f) | |||||||||||||||||
| Year Ended May 31, 2019 | $ | 17.10 | (7.58 | )% | 1.25 | % | 1.24 | % | 1.25 | % | $ | 491,978 | 68 | % | |||||||||||||||||
| Year Ended May 31, 2018 | $ | 18.79 | 7.62 | % | 1.28 | % | 1.09 | % | 1.28 | % | $ | 596,185 | 59 | % | |||||||||||||||||
| Year Ended May 31, 2017 | $ | 17.55 | 24.93 | % | 1.29 | % | 0.75 | % | 1.29 | % | $ | 585,468 | 45 | % | |||||||||||||||||
| Year Ended May 31, 2016 | $ | 14.21 | (12.53 | )% | 1.30 | % | 1.11 | % | 1.30 | % | $ | 603,981 | 47 | % | |||||||||||||||||
(f) Reflects increased trading activity due to current year transition or asset allocation shift.
(continues on next page)
See notes to financial statements.
23
USAA Mutual Funds Trust | Financial Highlights — continued | ||||||
For a Share Outstanding Throughout Each Period
Investment Activities | Distributions to Shareholders From | ||||||||||||||||||||||||||
| Net Asset Value, Beginning of Period | Net Investment Income (Loss) | Net Realized and Unrealized Gains (Losses) on Investments | Total from Investment Activities | Net Investment Income | Total Distributions | ||||||||||||||||||||||
USAA Emerging Markets Fund | |||||||||||||||||||||||||||
Class A shares | |||||||||||||||||||||||||||
| Six Months Ended November 30, 2020 (unaudited) | $ | 16.08 | 0.06 | (e) | 4.69 | 4.75 | — | — | |||||||||||||||||||
| Year Ended May 31, 2020 | $ | 17.08 | 0.20 | (e) | (1.16 | ) | (0.96 | ) | (0.04 | ) | (0.04 | ) | |||||||||||||||
| Year Ended May 31, 2019 | $ | 18.76 | 0.10 | (1.62 | ) | (1.52 | ) | (0.16 | ) | (0.16 | ) | ||||||||||||||||
| Year Ended May 31, 2018 | $ | 17.55 | 0.12 | 1.13 | 1.25 | (0.04 | ) | (0.04 | ) | ||||||||||||||||||
| Year Ended May 31, 2017 | $ | 14.20 | 0.05 | 3.42 | 3.47 | (0.12 | ) | (0.12 | ) | ||||||||||||||||||
| Year Ended May 31, 2016 | $ | 16.40 | 0.09 | (2.21 | ) | (2.12 | ) | (0.08 | ) | (0.08 | ) | ||||||||||||||||
* Assumes reinvestment of all net investment income and realized capital gain distributions, if any, during the period. Includes adjustments in accordance with U.S. generally accepted accounting principles and could differ from the Lipper reported return.
^ The net expense ratio may not correlate to the applicable expense limits in place during the period since the current contractual expense limitation is applied for a two year period beginning July 1, 2019 and in effect through September 30, 2021, instead of coinciding with the Fund's fiscal year end. Details of the current contractual expense limitation in effect can be found in Note 5 of the accompanying Notes to Financial Statements.
(a) Not annualized for periods less than one year.
(b) Annualized for periods less than one year.
(c) Reflects total annual operating expenses for reductions of expenses paid indirectly for the May 31 fiscal years ended 2019, 2018, 2017 and 2016. Expenses paid indirectly decreased the expense ratio for each of these respective years by less than 0.01%.
(d) Portfolio turnover is calculated on the basis of the Fund as a whole without distinguishing between the classes of shares issued.
(e) Per share net investment income (loss) has been calculated using the average daily shares method.
See notes to financial statements.
24
USAA Mutual Funds Trust | Financial Highlights — continued | ||||||
For a Share Outstanding Throughout Each Period
Ratios to Average Net Assets | Supplemental Data | ||||||||||||||||||||||||||||||
| Net Asset Value, End of Period | Total Return (Excludes Sales Charges)*(a) | Net Expenses^(b)(c) | Net Investment Income (Loss)(b) | Gross Expenses(b)(c) | Net Assets, End of Period (000's) | Portfolio Turnover(a)(d) | |||||||||||||||||||||||||
USAA Emerging Markets Fund | |||||||||||||||||||||||||||||||
Class A shares | |||||||||||||||||||||||||||||||
| Six Months Ended November 30, 2020 (unaudited) | $ | 20.83 | 29.54 | % | 1.72 | % | 0.66 | % | 1.98 | % | $ | 5,779 | 36 | % | |||||||||||||||||
| Year Ended May 31, 2020 | $ | 16.08 | (5.65 | )% | 1.75 | % | 1.13 | % | 1.76 | % | $ | 4,478 | 124 | %(h) | |||||||||||||||||
| Year Ended May 31, 2019 | $ | 17.08 | (8.07 | )% | 1.75 | % | 0.73 | % | 1.79 | % | $ | 4,745 | 68 | % | |||||||||||||||||
| Year Ended May 31, 2018 | $ | 18.76 | 7.09 | % | 1.72 | %(f) | 0.61 | % | 1.81 | % | $ | 5,186 | 59 | % | |||||||||||||||||
| Year Ended May 31, 2017 | $ | 17.55 | 24.53 | % | 1.66 | %(g) | 0.35 | % | 1.87 | % | $ | 4,864 | 45 | % | |||||||||||||||||
| Year Ended May 31, 2016 | $ | 14.20 | (12.93 | )% | 1.75 | % | 0.60 | % | 1.92 | % | $ | 3,931 | 47 | % | |||||||||||||||||
(f) Prior to October 1, 2017, USAA Asset Management Company ("AMCO") (previous Investment Adviser) voluntarily agreed to limit the annual expenses of the Class A shares to 1.65% of the Class A shares' average daily net assets.
(g) Prior to October 1, 2016, AMCO voluntarily agreed to limit the annual expenses of the Class A shares to 1.75% of the Class A shares' average daily net assets.
(h) Reflects increased trading activity due to current year transition or asset allocation shift.
See notes to financial statements.
25
USAA Mutual Funds Trust | Notes to Financial Statements November 30, 2020 | ||||||
(Unaudited)
1. Organization:
USAA Mutual Funds Trust (the "Trust") is organized as a Delaware statutory trust and is registered under the Investment Company Act of 1940, as amended (the "1940 Act"), as an open-end investment company. The Trust is comprised of 46 funds and is authorized to issue an unlimited number of shares, which are units of beneficial interest with no par value.
The accompanying financial statements are those of the USAA Emerging Markets Fund (the "Fund"). The Fund offers three classes of shares: Fund Shares, Institutional Shares and Class A shares. The Fund is classified as diversified under the 1940 Act.
Effective June 29, 2020, the Fund's Adviser Shares were redesignated Class A shares and became subject to a front-end sales charge.
Each class of shares of the Fund has substantially identical rights and privileges except with respect to sales charges, fees paid under distribution plans, expenses allocable exclusively to each class of shares, voting rights on matters solely affecting a single class of shares, and the exchange privilege of each class of shares.
Under the Trust's organizational documents, its officers and trustees are indemnified against certain liabilities arising out of the performance of their duties to the Fund. In addition, in the normal course of business, the Fund enters into contracts with its vendors and others that provide for general indemnifications. The Fund's maximum exposure under these arrangements is unknown, as this would involve future claims that may be made against the Fund. However, based on experience, the Fund expects that risk of loss to be remote.
2. Significant Accounting Policies:
The following is a summary of significant accounting policies followed by the Trust in the preparation of its financial statements. The policies are in conformity with Generally Accepted Accounting Principles in the United States of America ("GAAP"). The preparation of financial statements in accordance with GAAP requires management to make estimates and assumptions that affect the reported amounts of assets and liabilities and disclosure of contingent assets and liabilities at the date of the financial statements and the reported amounts of income and expenses for the period. Actual results could differ from those estimates. The Fund follows the specialized accounting and reporting requirements under GAAP that are applicable to investment companies under Accounting Standards Codification Topic 946.
Investment Valuation:
The Fund records investments at fair value. Fair value is defined as the price that would be received to sell an asset or paid to transfer a liability in an orderly transaction between market participants at the measurement date.
The valuation techniques described below maximize the use of observable inputs and minimize the use of unobservable inputs in determining fair value. The inputs used for valuing the Fund's investments are summarized in the three broad levels listed below:
• Level 1 — quoted prices in active markets for identical securities
• Level 2 — other significant observable inputs (including quoted prices for similar securities or interest rates applicable to those securities, etc.)
• Level 3 — significant unobservable inputs (including the Fund's own assumptions in determining the fair value of investments)
Changes in valuation techniques may result in transfers in or out of an assigned level within the disclosure hierarchy. The inputs or methodologies used for valuation techniques are not necessarily an indication of the risk associated with entering into those investments.
26
USAA Mutual Funds Trust | Notes to Financial Statements — continued November 30, 2020 | ||||||
(Unaudited)
Victory Capital Management Inc. ("VCM" or the "Adviser") has established the Pricing and Liquidity Committee (the "Committee"), and subject to the Trust's Board of Trustees (the "Board") oversight, the Committee administers and oversees the Fund's valuation policies and procedures, which are approved by the Board.
Portfolio securities listed or traded on securities exchanges, including exchange-traded funds ("ETFs"), American Depositary Receipts ("ADRs") and Rights, are valued at the closing price on the exchange or system where the security is principally traded, if available, or at the Nasdaq Official Closing Price. If there have been no sales for that day on the exchange or system, then a security is valued at the last available bid quotation on the exchange or system where the security is principally traded. In each of these situations, valuations are typically categorized as Level 1 in the fair value hierarchy.
Investments in open-end investment companies are valued at their net asset value ("NAV"). These valuations are typically categorized as Level 1 in the fair value hierarchy.
In the event that price quotations or valuations are not readily available, are not reflective of market value, or a significant event has been recognized in relation to a security or class of securities, the securities are valued in good faith by the Committee in accordance with valuation procedures approved by the Board. These valuations are typically categorized as Level 2 or Level 3 in the fair value hierarchy, based on the observability of inputs used to determine the fair value. The effect of fair value pricing is that securities may not be priced on the basis of quotations from the primary market in which they are traded and the actual price realized from the sale of a security may differ materially from the fair value price. Valuing these securities at fair value is intended to cause the Fund's NAV to be more reliable than it otherwise would be.
In accordance with procedures adopted by the Board, fair value pricing may be used if events materially affecting the value of foreign securities occur between the time the exchange on which they are traded closes and the time the Fund's NAV is calculated. The Fund uses a systematic valuation model, provided daily by an independent third party to fair value its international equity securities. The valuations are considered as Level 2 in the fair value hierarchy.
A summary of the valuations as of November 30, 2020, based upon the three levels defined above, is included in the table below while the breakdown, by category, of investments is disclosed on the Schedule of Portfolio Investments (amounts in thousands):
Level 1 | Level 2 | Level 3 | Total | ||||||||||||||||
Common Stocks | $ | 199,395 | $ | 505,843 | $ | — | (a) | $ | 705,238 | ||||||||||
Rights | — | — | — | (a) | — | ||||||||||||||
Exchange-Traded Funds | 141 | — | — | 141 | |||||||||||||||
Collateral for Securities Loaned | 3,035 | — | — | 3,035 | |||||||||||||||
Total | $ | 202,571 | $ | 505,843 | $ | — | (a) | $ | 708,414 | ||||||||||
(a) Amount rounds to less than $1 thousand.
For the six months ended November 30, 2020, there were no transfers in or out of the Level 3 fair value hierarchy.
Real Estate Investment Trusts ("REITs"):
The Fund may invest in REITs, which report information on the source of their distributions annually. REITs are pooled investment vehicles that invest primarily in income producing real estate or real estate related loans or interests (such as mortgages). Certain distributions received from REITs during the year are recorded as realized gains or return of capital as estimated by the Fund or when such information becomes known.
27
USAA Mutual Funds Trust | Notes to Financial Statements — continued November 30, 2020 | ||||||
(Unaudited)
Investment Companies:
Exchange-Traded Funds:
The Fund may invest in ETFs, the shares of which are bought and sold on a securities exchange. An ETF trades like common stock and represents a portfolio of securities designed to track the performance and dividend yield of a particular domestic or foreign market index. The Fund may purchase shares of an ETF to temporarily gain exposure to a portion of the U.S. or a foreign market while awaiting purchase of underlying securities. The risks of owning an ETF generally reflect the risks of owning the underlying securities they are designed to track, although the lack of liquidity of an ETF could result in it being more volatile. Additionally, ETFs have fees and expenses that reduce their value.
Open-End Funds:
The Fund may invest in portfolios of open-end investment companies. These investment companies value securities in their portfolios for which market quotations are readily available at their market values (generally the last reported sale price) and all other securities and assets at their fair value by the methods established by the board of directors of the underlying funds.
Foreign Exchange Currency Contracts:
The Fund may enter into foreign exchange currency contracts to convert U.S. dollars to and from various foreign currencies. A foreign exchange currency contract is an obligation by the Fund to purchase or sell a specific currency at a future date at a price (in U.S. dollars) set at the time of the contract. The Fund does not engage in "cross-currency" foreign exchange contracts (i.e., contracts to purchase or sell one foreign currency in exchange for another foreign currency). The Fund's foreign exchange currency contracts might be considered spot contracts (typically a contract of one week or less) or forward contracts (typically a contract term over one week). A spot contract is entered into for purposes of hedging against foreign currency fluctuations relating to a specific portfolio transaction, such as the delay between a security transaction trade date and settlement date. Forward contracts are entered into for purposes of hedging portfolio holdings or concentrations of such holdings. Each foreign exchange currency contract is adjusted daily by the prevailing spot or forward rate of the underlying currency, and any appreciation or depreciation is recorded for financial statement purposes as unrealized until the contract settlement date, at which time the Fund records realized gains or losses equal to the difference between the value of a contract at the time it was opened and the value at the time it was closed. The Fund could be exposed to risk if a counterparty is unable to meet the terms of a foreign exchange currency contract or if the value of the foreign currency changes unfavorably. In addition, the use of foreign exchange currency contracts does not eliminate fluctuations in the underlying prices of the securities. As of November 30, 2020, the Fund had no open forward foreign exchange currency contracts.
Investment Transactions and Related Income:
Changes in holdings of investments are accounted for no later than one business day following the trade date. For financial reporting purposes, however, investment transactions are accounted for on trade date on the last business day of the reporting period. Interest income is determined on the basis of coupon interest accrued using the effective interest method which adjusts, where applicable, the amortization of premiums or accretion of discount. Gains or losses realized on sales of securities are determined by comparing the identified cost of the security lot sold with the net sales proceeds.
Withholding taxes on interest, dividends, and gains as a result of certain investments in ADRs by the Fund has been provided for in accordance with each investment's applicable country's tax rules and rates.
28
USAA Mutual Funds Trust | Notes to Financial Statements — continued November 30, 2020 | ||||||
(Unaudited)
Securities Lending:
The Fund, through a securities lending agreement with Citibank, N.A. ("Citibank"), may lend its securities to qualified financial institutions, such as certain broker-dealers, to earn additional income, net of income retained by Citibank. Borrowers are required to secure their loans for collateral in the amount of at least 102% of the value of U.S. securities loaned or at least 105% of the value of non-U.S. securities loaned, marked-to-market daily. Any collateral shortfalls associated with increases in the valuation of the securities loaned are cured the next business day once the shortfall exceeds $100 thousand. Collateral may be cash, U.S. government securities, or other securities as permitted by Securities and Exchange Commission ("SEC") guidelines. Cash collateral may be invested in high-quality short-term investments, primarily open-end investment companies. Collateral requirements are determined daily based on the value of the Fund's securities on loan as of the end of the prior business day. During the time portfolio securities are on loan, the borrower will pay the Fund any dividends or interest paid on such securities plus any fee negotiated between the parties to the lending agreement. The Fund also earns a return from the collateral. The Fund pays Citibank various fees in connection with the investment of cash collateral and fees based on the investment income received from securities lending activities. Securities lending income (net of these fees) is disclosed on the Statement of Operations. Loans are terminable upon demand and the borrower must return the loaned securities within the lesser of one standard settlement period or five business days. Risks relating to securities-lending transactions include that the borrower may not provide additional collateral when required or return the securities when due, and that the value of the short-term investments will be less than the amount of cash collateral required to be returned to the borrower. The Fund's agreement with Citibank does not include master netting provisions. Noncash collateral received by the Fund may not be sold or re-pledged, except to satisfy borrower default. Cash collateral is listed on the Fund's Schedule of Portfolio Investments and Financial Statements while non-cash collateral is not included.
The following table (amounts in thousands) is a summary of the Fund's securities lending transactions as of November 30, 2020.
| Value of Securities on Loan | Non-Cash Collateral | Cash Collateral | |||||||||
| $ | 2,907 | $ | — | $ | 3,035 | ||||||
Foreign Currency Translations:
The accounting records of the Fund are maintained in U.S. dollars. Investment securities and other assets and liabilities of the Fund denominated in a foreign currency are translated into U.S. dollars at current exchange rates. Purchases and sales of securities, income receipts, and expense payments are translated into U.S. dollars at the exchange rates on the date of the transactions. The Fund does not isolate the portion of the results of operations resulting from changes in foreign exchange rates on investments from fluctuations arising from changes in market prices of securities held. Such fluctuations are disclosed as net change in unrealized appreciation/depreciation on investments and foreign currency translations on the Statement of Operations. Any realized gains or losses from these fluctuations, including foreign currency arising from in-kind redemptions, are disclosed as net realized gains or losses from investment transactions and foreign currency translations on the Statement of Operations.
Foreign Taxes:
The Fund may be subject to foreign taxes related to foreign income received (a portion of which may be reclaimable), capital gains on the sale of securities, and certain foreign currency transactions. All foreign taxes are recorded in accordance with the applicable regulations and rates that exist in the foreign jurisdictions in which the Fund invests.
Federal Income Taxes:
It is the Fund's policy to continue to qualify as a regulated investment company by complying with the provisions available to certain investment companies, as defined in applicable sections of the Internal
29
USAA Mutual Funds Trust | Notes to Financial Statements — continued November 30, 2020 | ||||||
(Unaudited)
Revenue Code, and to make distributions of net investment income and net realized gains sufficient to relieve it from all, or substantially all, federal income taxes. Accordingly, no provision for federal income taxes is required in the financial statements. The Fund has a tax year end of May 31.
Management of the Fund has reviewed tax positions taken in tax years that remain subject to examination by all major tax jurisdictions, including federal (i.e., the last four tax years, which includes the current fiscal tax year end). Management believes that there is no tax liability resulting from unrecognized tax benefits related to uncertain tax positions taken.
Allocations:
Expenses directly attributable to the Fund are charged to the Fund, while expenses that are attributable to more than one fund in the Trust, or jointly with an affiliated trust, are allocated among the respective funds in the Trust and/or affiliated trust based upon net assets or another appropriate basis.
Income, expenses (other than class-specific expenses such as transfer agent fees, state registration fees, 12b-1 fees, and printing fees), and realized and unrealized gains or losses on investments are allocated to each class of shares based on its relative net assets on the date income is earned or expenses and realized and unrealized gains and losses are incurred.
3. Purchases and Sales:
Cost of purchases and proceeds from sales/maturities of securities (excluding securities maturing less than one year from acquisition) for the six months ended November 30, 2020, were as follows for the Fund (amounts in thousands):
| Purchases (excluding U.S. Government Securities) | Sales (excluding U.S. Government Securities) | ||||||||||
$ | 236,426 | $ | 310,731 | ||||||||
There were no purchases and sales of U.S. government securities during the six months ended November 30, 2020
4. Affiliated Fund Ownership:
The Fund offers its shares for investment by other USAA Mutual Funds. The fund-of-funds do not invest in the underlying funds for the purpose of exercising management or control, and the affiliated fund-of-funds' annual and semi-annual reports may be viewed at vcm.com. As of November 30, 2020, certain fund-of-funds owned total outstanding shares of the Fund as follows:
Affiliated USAA Mutual Funds | Percent | ||||||
USAA Cornerstone Conservative Fund | 0.4 | % | |||||
USAA Cornerstone Equity Fund | 1.2 | % | |||||
5. Fees and Transactions with Affiliates and Related Parties:
Investment Advisory Fees:
Investment advisory services are provided to the Fund by the Adviser, which is a New York corporation registered as an investment adviser with the SEC. The Adviser is a wholly-owned indirect subsidiary of Victory Capital Holdings, Inc., a publicly traded Delaware corporation, and a wholly-owned direct subsidiary of Victory Capital Operating, LLC. Under the terms of the Investment Advisory Agreement, the Adviser is entitled to receive a base fee and a performance adjustment. The Fund's base fee is accrued daily and paid monthly at an annualized rate of 1.00% of the Fund's average daily net assets. Amounts incurred and paid to VCM for the six months ended November 30, 2020, are reflected on the Statement of Operations as Investment Advisory fees.
30
USAA Mutual Funds Trust | Notes to Financial Statements — continued November 30, 2020 | ||||||
(Unaudited)
On November 6, 2018, United Services Automobile Association ("USAA"), the parent company of USAA Asset Management Company ("AMCO"), the prior investment adviser to the Fund announced that AMCO would be acquired by Victory Capital Holdings Inc. (the "Transaction"). A special shareholder meeting was held on April 18, 2019, at which shareholders of the Fund approved a new investment advisory agreement between the Trust, on behalf of the Fund, and Victory Capital Management Inc. ("Victory Capital"). The Transaction closed on July 1, 2019. Effective July 1, 2019, VCM replaced AMCO as the investment adviser to the Fund and no performance adjustments were made for the periods beginning July 1, 2019, through June 30, 2020. Only performance beginning as of July 1, 2019, and thereafter is utilized in calculating future performance adjustments.
The performance adjustment for each share class is accrued daily and calculated monthly by comparing each class' performance to that of the Lipper Emerging Markets Funds Index. The Lipper Emerging Markets Funds Index tracks the total return performance of each class within the Lipper Emerging Markets Funds category.
The performance period for each share class consists of the current month plus the previous 35 months (or the number of months beginning July 1, 2019, if fewer). The following table is utilized to determine the extent of the performance adjustment:
| Over/Under Performance Relative to Index (in basis points)(a) | Annual Adjustment Rate (in basis points)(a) | ||||||
+/- 100 to 400 | +/- 4 | ||||||
+/- 401 to 700 | +/- 5 | ||||||
+/- 701 and greater | +/- 6 | ||||||
(a) Based on the difference between average annual performance of the relevant share class of the Fund and its relevant Lipper index, rounded to the nearest basis point. Average daily net assets of the share class are calculated over a rolling 36 month period.
Each class' annual performance adjustment rate is multiplied by the average daily net assets of each respective class over the entire performance period, which is then multiplied by a fraction, the numerator of which is the number of days in the month and the denominator of which is 365 (366 in leap years). The resulting amount is then added to (in the case of overperformance), or subtracted from (in the case of underperformance) the base fee.
Under the performance fee arrangement, each class pays a positive performance fee adjustment for a performance period whenever the class outperforms the Lipper Emerging Markets Funds Index over that period, even if the class has overall negative returns during the performance period.
For the period July 1, 2020 through November 30, 2020, performance adjustments for Fund Shares, Institutional Shares and Class A shares were $(54), $(64) and $(1) thousand, respectively. For the Fund Shares, Institutional Shares and Class A shares performance adjustments were (0.03)%, (0.03)% and (0.03)% of average daily net assets, respectively.
The Trust relies on an exemptive order granted to VCM and its affiliated funds by the SEC in March 2019 permitting the use of a "manager-of-managers" structure for certain funds. Under a manager-of-managers structure, the investment adviser may select (with approval of the Board and without shareholder approval) one or more subadvisers to manage the day-to-day investment of a fund's assets.
VCM entered into Investment Subadvisory Agreements with Brandes Investment Partners, L.P. (Effective June 30, 2020 Brandes no longer manages the Fund.) Lazard Asset Management LLC ("Lazard"), under which Brandes and Lazard, each direct the investment and reinvestment of a portion of the Fund's assets (as allocated from time to time by VCM). This arrangement provides for monthly fees that are paid by VCM. VCM (not the Fund) pays the subadviser fees.
31
USAA Mutual Funds Trust | Notes to Financial Statements — continued November 30, 2020 | ||||||
(Unaudited)
Administration and Servicing Fees:
VCM serves as the Fund's administrator and fund accountant. Under the Administration, Servicing and Accounting Agreement, VCM is paid for its services an annual fee at a rate of 0.15% of average daily net assets of the Fund Shares and Class A shares, 0.10% of average daily net assets of the Institutional Shares, respectively. Amounts incurred for the six months ended November 30, 2020, are reflected on the Statement of Operations as Administration fees.
The Fund (as part of the Trust) has entered into an agreement to provide compliance services with the Adviser, pursuant to which the Adviser furnishes its compliance personnel, including the services of the Chief Compliance Officer ("CCO"), and other resources reasonably necessary to provide the Trust with compliance oversight services related to the design, administration and oversight of a compliance program for the Trust in accordance with Rule 38a-1 under the 1940 Act. The CCO is an employee of the Adviser, which pays the compensation of the CCO and support staff. Funds in the Trust, Victory Variable Insurance Funds, Victory Portfolios, and Victory Portfolios II (collectively, the "Victory Funds Complex") in the aggregate, compensate the Adviser for these services. Amounts incurred for the six months ended November 30, 2020, are reflected on the Statement of Operations as Compliance fees.
Citi Fund Services Ohio, Inc. ("Citi"), an affiliate of Citibank, acts as sub-administrator and sub-fund accountant to the Fund pursuant to a Sub-Administration and Sub-Fund Accounting Services Agreement between VCM and Citi. VCM pays Citi a fee for providing these services. The Trust reimburses VCM and Citi for out-of-pocket expenses incurred in providing these services and certain other expenses specifically allocated to the Fund. Amounts incurred for the six months ended November 30, 2020, are reflected on the Statement of Operations as Sub-Administration fees.
Transfer Agency Fees:
Victory Capital Transfer Agency, Inc. ("VCTA"), an affiliate of the Adviser provides transfer agency services to the Fund. VCTA provides transfer agent services to the Fund Shares based on an annual charge of $23 per shareholder account plus out-of-pocket expenses. VCTA pays a portion of these fees to certain intermediaries for the administration and servicing of accounts that are held with such intermediaries. Transfer agent's fees for Institutional Shares and Class A shares are paid monthly based on a fee accrued daily at an annualized rate of 0.10% of average daily net assets, plus out-of-pocket expenses. Amounts incurred and paid to VCTA for the six months ended November 30, 2020, are reflected on the Statement of Operations as Transfer Agent fees.
FIS Investor Services LLC serves as sub-transfer agent and dividend disbursing agent for the Fund pursuant to a Sub-Transfer Agent agreement between VCTA and FIS Investor Services LLC. VCTA provides FIS Investor Services LLC a fee for providing these services.
Distributor/Underwriting Services:
Victory Capital Services, Inc. (the "Distributor"), an affiliate of the Adviser, serves as distributor for the continuous offering of the shares of the Fund pursuant to a Distribution Agreement between the Distributor and the Trust. Effective June 30, 2020, the Distributor's name was changed from Victory Capital Advisers, Inc.
Pursuant to the Distribution and Service Plans adopted in accordance with Rule 12b-1 under the1940 Act, the Distributor may receive a monthly distribution and service fee, at an annual rate of up to 0.25% of the average daily net assets of Class A shares. The distribution and service fees paid to the Distributor may be used by the Distributor to pay for activity primarily intended to result in the sale of Class A shares of the Fund. Amounts incurred and paid to VCTA for the six months ended November 30, 2020, are reflected on the Statement of Operations as 12b-1 fees. In addition, the Distributor is entitled to receive commission on sales of the Class A shares of the Fund. For the six months ended November 30, 2020, the Distributor did not receive any commissions.
32
USAA Mutual Funds Trust | Notes to Financial Statements — continued November 30, 2020 | ||||||
(Unaudited)
Other Fees:
Citibank serves as the Fund's custodian. The Fund pays Citibank a fee for providing these services. Amounts incurred for the six months ended November 30, 2020, are reflected on the Statement of Operations as Custodian fees.
K&L Gates LLP provides legal services to the Trust.
The Adviser has entered into an expense limitation agreement with the Fund until at least September 30, 2021. Under the terms of the agreement, the Adviser has agreed to waive fees or reimburse certain expenses to the extent that ordinary operating expenses incurred by certain classes of the Fund in any fiscal year exceed the expense limit for such classes of the Fund. Such excess amounts will be the liability of the Adviser. Interest, taxes, brokerage commissions, other expenditures, which are capitalized in accordance with GAAP, and other extraordinary expenses not incurred in the ordinary course of the Fund's business are excluded from the expense limits. As of November 30, 2020, the expense limits (excluding voluntary waivers) are 1.48%, 1.29% and 1.75% for the Fund Shares, Institutional Shares, and Class A shares, respectively.
Under this expense limitation agreement, the Fund has agreed to repay fees and expenses that were waived or reimbursed by the Adviser for a period up to three years after the fiscal year in which the waiver or reimbursement took place, subject to the lesser of any operating expense limits in effect at the time of: (a) the original waiver or expense reimbursement; or (b) the recoupment, after giving effect to the recoupment amount.
As of November 30, 2020, the following amounts are available to be repaid to the Adviser (amounts in thousands). The Fund has not recorded any amounts available to be repaid as a liability due to an assessment that such repayment is not probable at November 30, 2020.
| Expires May 31, 2023 | Expires May 31, 2024 | Total | |||||||||
| $ | 345 | $ | 135 | $ | 480 | ||||||
The Adviser may voluntarily waive or reimburse additional fees to assist the Fund in maintaining competitive expense ratios. Voluntary waivers and reimbursements applicable to the Fund are not available to be recouped at a future time. There were no voluntary waivers or reimbursements for the six months ended November 30, 2020.
Certain officers and/or interested trustees of the Fund are also officers and/or employees of the Adviser, Administrator, Sub-Administrator, Sub-Fund Accountant, and Legal.
6. Risks:
The Fund may be subject to other risks in addition to these identified risks.
Geopolitical/Natural Disaster Risk — Global economies and financial markets are increasingly interconnected, which increases the possibilities that conditions in one country or region might adversely affect issuers in another country or region. Geopolitical and other risks, including war, terrorism, trade disputes, political or economic dysfunction within some nations, public health crises and related geopolitical events, as well as environmental disasters such as earthquakes, fires, and floods, may add to instability in world economies and markets generally. Changes in trade policies and international trade agreements could affect the economies of many countries in unpredictable ways. Likewise, systemic market dislocations of the kind that occurred during the financial crisis that began in 2008, if repeated, would be highly disruptive to economies and markets, adversely affecting individual companies and industries, securities markets, interest rates, credit ratings, inflation, investor sentiment, and other factors affecting the value of a Fund's investments. Some countries, including the United States, are adopting more protectionist trade policies and moving away from the tighter financial industry regulations that followed the 2008 financial crisis, which may also affect the value of a Fund's investments.
33
USAA Mutual Funds Trust | Notes to Financial Statements — continued November 30, 2020 | ||||||
(Unaudited)
Political events within the United States at times have resulted, and may in the future result, in a shutdown of government services, which could negatively affect the U.S. economy, decrease the value of a Fund's investments, increase uncertainty in or impair the operation of the U.S. or other securities markets and degrade investor and consumer confidence, perhaps suddenly and to a significant degree.
An outbreak of disease called COVID-19 has spread internationally. The transmission of COVID-19 and efforts to contain its spread have resulted in international, national and local border closings and other significant travel restrictions and disruptions, significant disruptions to business operations, supply chains and consumer activity, significant challenges in healthcare service preparation and delivery, quarantines and general concern and uncertainty. These negative impacts have caused significant volatility and declines in global financial markets, which have caused losses for Fund investors during and subsequent to period end. The impact of the COVID-19 pandemic last for an extended period of time, and could result in a substantial economic downturn or recession. Public health crises may exacerbate other pre-existing political, social, economic, market and financial risks. The extent of the impact to the financial performance of the Funds' investments will depend on future developments, including (i) the duration and spread of the outbreak, (ii) the restrictions and advisories, (iii) the effects on the financial markets, and (iv) the effects on the economy overall, all of which are highly uncertain and cannot be predicted.
Stock Market Risk — Overall stock market risks may affect the value of the Fund. Domestic and international factors such as political events, war, trade disputes, interest rate levels and other fiscal and monetary policy changes, pandemics and other public health crises, and related geopolitical events, as well as environmental disasters such as earthquakes, fires, and floods, may add to instability in world economies and markets generally. The impact of these and other factors may be short-term or may last for extended periods.
Equity Risk — The value of the equity securities in which the Fund invests may decline in response to developments affecting individual companies and/or general economic conditions. A company's earnings or dividends may not increase as expected due to poor management decisions, competitive pressures, breakthroughs in technology, reliance on suppliers, labor problems or shortages, corporate restructurings, fraudulent disclosures, natural disasters, military confrontations, war, terrorism, public health crises, or other events, conditions, and factors. Price changes may be temporary or last for extended periods.
Foreign Securities Risk — Foreign markets can be more volatile than the U.S. market due to increased risks of adverse issuer, political, regulatory, market, or economic developments and can perform differently from the U.S. market.
7. Borrowing and Interfund Lending:
Line of Credit:
For the six months ended November 30, 2020, the Victory Funds Complex participated in a short-term demand note "Line of Credit" agreement with Citibank. The Line of Credit agreement with Citibank was renewed on June 29, 2020 with a termination date of June 28, 2021. Under the agreement with Citibank, the Victory Funds Complex may borrow up to $600 million, of which $300 million is committed and $300 million is uncommitted. $40 million of the Line of Credit is reserved for use by the Victory Floating Rate Fund, another series of the Victory Funds Complex, with Victory Floating Rate Fund paying the related commitment fees for that amount. The purpose of the agreement is to meet temporary or emergency cash needs. For the six months ended November 30, 2020, Citibank received an annual commitment fee of 0.15% on $300 million for providing the Line of Credit. Each fund in the Victory Funds Complex pays a pro-rata portion of the commitment fees plus any interest (one month LIBOR plus one percent) on amounts borrowed. Effective June 29, 2020, under an amended Line of Credit agreement, Citibank will also receive an annual upfront fee of 0.10% on the $300 million committed line of credit. Each fund in the Victory Funds Complex will pay a pro-rata portion of the upfront fee. Interest charged to each Fund during the period, if applicable, is reflected on the Statements of Operations under Line of credit fees.
34
USAA Mutual Funds Trust | Notes to Financial Statements — continued November 30, 2020 | ||||||
(Unaudited)
The Fund had no borrowings under the Line of Credit agreement during the six months ended November 30, 2020.
Interfund Lending:
The Trust and Adviser rely on an exemptive order granted by the SEC in March 2017 (the "Order"), permitting the establishment and operation of an Interfund Lending Facility (the "Facility"). The Facility allows the Fund to directly lend and borrow money to or from any other Fund, that is permitted to participate in the Facility, in the Victory Funds Complex relying upon the Order at rates beneficial to both the borrowing and lending funds. Advances under the Facility are allowed for temporary or emergency purposes. The interfund loan rate is determined, as specified in the Order, by averaging the current repurchase agreement rate and the current bank loan rate. As a Borrower, interest charged to the Fund, if any, during the period is reflected on the Statement of Operations under Interfund lending fees. As a Lender, interest earned by the Fund, if any, during the period is reflected on the Statement of Operations under Income on Interfund lending.
The average borrowing or lending for the days outstanding and average interest rate for the Fund during the six months ended November 30, 2020 were as follows (amounts in thousands):
| Borrower or Lender | Amount Outstanding at November 30, 2020 | Average Borrowing* | Days Borrowing Outstanding | Average Interest Rate* | Maximum Borrowing During the Period | ||||||||||||||||||
| Borrower | $ | — | $ | 4,209 | 4 | 0.63 | % | $ | 4,973 | ||||||||||||||
* For the six months ended November 30, 2020, based on the number of days borrowings were outstanding.
8. Federal Income Tax Information:
The Fund intends to declare and distribute any net investment income annually. Distributable net realized gains, if any, are declared and paid at least annually.
The amounts of dividends from net investment income and distributions from net realized gains (collectively distributions to shareholders) are determined in accordance with federal income tax regulations, which may differ from GAAP. To the extent these "book/tax" differences are permanent in nature (e.g., net operating loss and distribution reclassification), such amounts are reclassified within the components of net assets based on their federal tax-basis treatment; temporary differences (e.g., wash sales) do not require reclassification. To the extent dividends and distributions exceed net investment income and net realized gains for tax purposes, they are reported as distributions of capital.
Net investment losses incurred by the Fund may be reclassified as an offset to capital on the accompanying Statement of Assets and Liabilities.
The tax character of current year distributions paid and the tax basis of the current components of accumulated earnings (deficit) will be determined at the end of the current tax year ending May 31, 2021.
At May 31, 2020, the Fund had net capital loss carryforwards as shown in the table below (amounts in thousands).
| Short-Term Amount | Long-Term Amount | Total | |||||||||
| $ | 124,591 | $ | 20,961 | $ | 145,552 | ||||||
35
USAA Mutual Funds Trust | Supplemental Information November 30, 2020 | ||||||
(Unaudited)
Proxy Voting and Portfolio Holdings Information
Proxy Voting:
Information regarding the policies and procedures the Fund uses to determine how to vote proxies relating to portfolio securities is available without charge, upon request, by calling (800) 539-3863. The information is also included in the Fund's Statement of Additional Information, which is available on the SEC's website at www.sec.gov.
Information relating to how the Fund voted proxies relating to portfolio securities held during the most recent 12 months ended June 30 is available on the SEC's website at www.sec.gov.
Availability of Schedules of Portfolio Investments:
The Trust files a complete list of Schedules of Portfolio Investments with the SEC for the first and third quarter of each fiscal year on Form N-PORT. Form N-PORT is available on the SEC's website at www.sec.gov.
Expense Examples
As a shareholder of the Fund, you may incur two types of costs: (1) transaction costs, including sales charges (loads) on purchases, and (2) ongoing costs, including management fees and other Fund expenses. These examples are intended to help you understand your ongoing costs (in dollars) of investing in the Fund and to compare these costs with the ongoing costs of investing in other mutual funds.
These examples are based on an investment of $1,000 invested at the beginning of the period and held for the entire period from June 1, 2020 through November 30, 2020.
The Actual Expense figures in the table below provide information about actual account values and actual expenses. You may use the information below, together with the amount you invested, to estimate the expenses that you paid over the period. Simply divide your account value by $1,000 (for example, an $8,600 account value divided by $1,000 = 8.6), then multiply the result by the number in the table under the heading entitled "Actual Expenses Paid During Period" to estimate the expenses you paid on your account during this period.
The Hypothetical Expense figures in the table below provide information about hypothetical account values and hypothetical expenses based on the Fund's actual expense ratio and an assumed rate of return of 5% per year before expenses, which is not the Fund's actual return. The hypothetical account values and expenses may not be used to estimate the actual ending account balance or expenses you paid for the period. You may use this information to compare this 5% hypothetical example with the 5% hypothetical examples that appear in shareholder reports of other funds.
Please note the expenses shown in the table below are meant to highlight your ongoing costs only and do not reflect any transactional costs. If these transactional costs were included, your costs would have been higher.
| Beginning Account Value 6/1/20 | Actual Ending Account Value 11/30/20 | Hypothetical Ending Account Value 11/30/20 | Actual Expenses Paid During Period 6/1/20- 11/30/20* | Hypothetical Expenses Paid During Period 6/1/20- 11/30/20* | Annualized Expense Ratio During Period 6/1/20- 11/30/20 | ||||||||||||||||||||||
Fund Shares | $ | 1,000.00 | $ | 1,296.80 | $ | 1,017.80 | $ | 8.35 | $ | 7.33 | 1.45 | % | |||||||||||||||
Institutional Shares | 1,000.00 | 1,298.00 | 1,018.75 | 7.26 | 6.38 | 1.26 | % | ||||||||||||||||||||
Class A shares | 1,000.00 | 1,295.40 | 1,016.44 | 9.90 | 8.69 | 1.72 | % | ||||||||||||||||||||
* Expenses are equal to the average account value multiplied by the Fund's annualized expense ratio multiplied by 183/365 (the number of days in the most recent fiscal half-year divided by the number of days in the fiscal year).
36
Privacy Policy
Protecting the Privacy of Information
The Trust respects your right to privacy. We also know that you expect us to conduct and process your business in an accurate and efficient manner. To do so, we must collect and maintain certain personal information about you. This is the information we collect from you on applications or other forms, and from the transactions you make with us or third parties. It may include your name, address, social security number, account transactions and balances, and information about investment goals and risk tolerance.
We do not disclose any information about you or about former customers to anyone except as permitted or required by law. Specifically, we may disclose the information we collect to companies that perform services on our behalf, such as the transfer agent that processes shareholder accounts and printers and mailers that assist us in the distribution of investor materials. We may also disclose this information to companies that perform marketing services on our behalf. This allows us to continue to offer you Victory investment products and services that meet your investing needs, and to effect transactions that you request or authorize. These companies will use this information only in connection with the services for which we hired them. They are not permitted to use or share this information for any other purpose.
To protect your personal information internally, we permit access only by authorized employees and maintain physical, electronic and procedural safeguards to guard your personal information.*
* You may have received communications regarding information about privacy policies from other financial institutions which gave you the opportunity to "opt-out" of certain information sharing with companies which are not affiliated with that financial institution. The Trust does not share information with other companies for purposes of marketing solicitations for products other than the Trust. Therefore, the Trust does not provide opt-out options to their shareholders.
P.O. Box 182593
Columbus, Ohio 43218-2593

Visit our website at: | Call | ||||||
vcm.com | (800) 235-8396 | ||||||
25559-0121

NOVEMBER 30, 2020
Semi Annual Report
USAA Government Securities Fund
Beginning January 1, 2021, as permitted by regulations adopted by the Securities and Exchange Commission, paper copies of the Fund's shareholder reports may no longer be sent by mail, unless you specifically request paper copies of the reports from the Fund or from your financial intermediary, such as a broker-dealer or bank. Instead, the reports will be made available on VictoryFunds.com, and you will be notified by mail each time a report is posted and provided with a website link to access the report. If you already elected to receive shareholder reports electronically, you will not be affected by this change and you need not take any action.
You may elect to receive shareholder reports and other communications from the Fund or your financial intermediary electronically by notifying your financial intermediary directly, or if you are a shareholder who has an account directly with the Fund, by calling (800) 235-8396 or by submitting your request via email to TA.Processing@FISGlobal.com.
You may elect to receive all future reports in paper free of charge. You can inform the Fund or your financial intermediary that you wish to continue receiving paper copies of your shareholder reports by notifying your financial intermediary directly, or if you are a shareholder who has an account directly with the Fund, by calling (800) 235-8396 or by submitting your request via email to TA.Processing@FISGlobal.com.
Your election to receive reports in paper will apply to all funds held with the USAA Mutual Funds or your financial intermediary.
Victory Capital means Victory Capital Management Inc., the investment adviser of the USAA Mutual Funds. USAA Mutual Funds are distributed by Victory Capital Services, Inc., member of FINRA, an affiliate of Victory Capital. Victory Capital and its affiliates are not affiliated with United Services Automobile Association or its affiliates. USAA and the USAA logo are registered trademarks and the USAA Mutual Funds and USAA Investments logos are trademarks of United Services Automobile Association and are being used by Victory Capital and its affiliates under license.
USAA Mutual Funds Trust
TABLE OF CONTENTS
Investment Objective & Portfolio Holdings | 2 | ||||||
Schedule of Portfolio Investments | 3 | ||||||
Financial Statements | |||||||
Statement of Assets and Liabilities | 8 | ||||||
Statement of Operations | 9 | ||||||
Statements of Changes in Net Assets | 10 | ||||||
Financial Highlights | 12 | ||||||
Notes to Financial Statements | 16 | ||||||
Supplemental Information | 26 | ||||||
Proxy Voting and Portfolio Holdings Information | 26 | ||||||
Expense Examples | 26 | ||||||
Privacy Policy (inside back cover) | |||||||
This report is for the information of the shareholders and others who have received a copy of the currently effective prospectus of the Fund, managed by Victory Capital Management Inc. It may be used as sales literature only when preceded or accompanied by a current prospectus, which provides further details about the Fund.
IRA DISTRIBUTION WITHHOLDING DISCLOSURE
We generally must withhold federal income tax at a rate of 10% of the taxable portion of your distribution and, if you live in a state that requires state income tax withholding, at your state's tax rate. However, you may elect not to have withholding apply or to have income tax withheld at a higher rate. Any withholding election that you make will apply to any subsequent distribution unless and until you change or revoke the election. If you wish to make a withholding election, or change or revoke a prior withholding election, call (800) 235-8396, and form W-4P (OMB No. 1545-0074 withholding certificate for pension or annuity payments) will be electronically sent.
If you do not have a withholding election in place by the date of a distribution, federal income tax will be withheld from the taxable portion of your distribution at a rate of 10%. If you must pay estimated taxes, you may be subject to estimated tax penalties if your estimated tax payments are not sufficient and sufficient tax is not withheld from your distribution.
For more specific information, please consult your tax adviser.
1
| USAA Mutual Funds Trust USAA Government Securities Fund | November 30, 2020 | ||||||
(Unaudited)
Investment Objective & Portfolio Holdings:
The Fund's investment objective is to provide investors with a high level of current income consistent with preservation of principal.
Asset Allocation*:
November 30, 2020
(% of Net Assets)
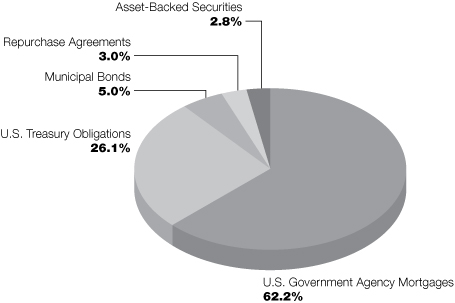
* Percentages are of the net assets of the Fund and may not equal 100%.
Refer to the Schedule of Portfolio Investments for a complete list of securities.
2
| USAA Mutual Funds Trust USAA Government Securities Fund | Schedule of Portfolio Investments November 30, 2020 | ||||||
(Amounts in Thousands, Except for Shares) (Unaudited)
Security Description | Principal Amount | Value | |||||||||
Asset-Backed Securities (2.8%) | |||||||||||
| Montana Higher Education Student Assistance Corp., Series 2012-1, Class A2, 1.15% (LIBOR01M+100bps), 5/20/30, Callable 10/20/30 @ 100 (a) | $ | 5,563 | $ | 5,560 | |||||||
| Navient Student Loan Trust, Series 2014-1, Class A3, 0.66% (LIBOR01M+51bps), 6/25/31, Callable 7/25/31 @ 100 (a) | 2,375 | 2,324 | |||||||||
| Navient Student Loan Trust, Series 2016-2, Class A2, 1.20% (LIBOR01M+105bps), 6/25/65, Callable 6/25/32 @ 100 (a) (b) | 657 | 658 | |||||||||
| Navient Student Loan Trust, Series 2019-1, Class A1, 0.48% (LIBOR01M+33bps), 12/27/67, Callable 2/25/32 @ 100 (a) (b) | 418 | 418 | |||||||||
| Nelnet Student Loan Trust, Series 2006-3, Class B, 0.47% (LIBOR03M+25bps), 6/25/41, Callable 9/25/24 @ 100 (a) | 2,725 | 2,432 | |||||||||
| Nelnet Student Loan Trust, Series 2015-3, Class A2, 0.75% (LIBOR01M+60bps), 2/27/51, Callable 7/25/34 @ 100 (a) (b) | 3,881 | 3,849 | |||||||||
| PHEAA Student Loan Trust, Series 2011-1, Class A1, 1.33% (LIBOR03M+110bps), 6/25/38, Callable 3/25/29 @ 100 (a) (b) | 2,270 | 2,270 | |||||||||
| SLM Student Loan Trust, Series 2006-4, Class B, 0.41% (LIBOR03M+20bps), 1/25/70, Callable 4/25/32 @ 100 (a) | 4,060 | 3,741 | |||||||||
| SLM Student Loan Trust, Series 2013-6, Class A3, 0.80% (LIBOR01M+65bps), 6/25/55, Callable 11/25/28 @ 100 (a) | 3,084 | 3,039 | |||||||||
| SunTrust Student Loan Trust, Series 2006-1A, Class B, 0.49% (LIBOR03M+27bps), 10/28/37, Callable 7/28/26 @ 100 (a) (b) | 1,114 | 994 | |||||||||
Total Asset-Backed Securities (Cost $25,698) | 25,285 | ||||||||||
Municipal Bonds (5.0%) | |||||||||||
Kansas (0.4%): | |||||||||||
Kansas Development Finance Authority Revenue, Series H, 3.94%, 4/15/26 | 3,000 | 3,447 | |||||||||
Louisiana (0.6%): | |||||||||||
State of Louisiana, GO, Series C-1, 0.84%, 6/1/25 | 5,000 | 5,029 | |||||||||
Michigan (0.2%): | |||||||||||
Michigan State Building Authority Revenue, Series II, 0.46%, 10/15/22 | 1,500 | 1,506 | |||||||||
Ohio (0.3%): | |||||||||||
State of Ohio, GO, Series A, 1.78%, 8/1/32 | 3,000 | 3,074 | |||||||||
Texas (2.5%): | |||||||||||
Boerne School District, GO, 1.77%, 2/1/32, Continuously Callable @ 100 (c) | 650 | 656 | |||||||||
| City of Abilene, GO 2.41%, 2/15/26 | 1,715 | 1,832 | |||||||||
2.54%, 2/15/27 | 1,195 | 1,285 | |||||||||
2.64%, 2/15/29 | 1,000 | 1,083 | |||||||||
City of Houston Texas Combined Utility System Revenue, 3.72%, 11/15/28 | 1,530 | 1,799 | |||||||||
| City of Houston, Texas Combined Utility System Revenue, 3.82%, 11/15/29, Continuously Callable @ 100 | 3,000 | 3,528 | |||||||||
| State of Texas, GO 1.61%, 10/1/22 | 1,585 | 1,624 | |||||||||
2.53%, 10/1/31, Continuously Callable @ 100 | 3,500 | 3,828 | |||||||||
See notes to financial statements.
3
| USAA Mutual Funds Trust USAA Government Securities Fund | Schedule of Portfolio Investments — continued November 30, 2020 | ||||||
(Amounts in Thousands, Except for Shares) (Unaudited)
Security Description | Principal Amount | Value | |||||||||
| Texas Public Finance Authority State of Texas, GO Series C, 2.83%, 10/1/25 | $ | 3,000 | $ | 3,313 | |||||||
Series C, 3.01%, 10/1/26, Continuously Callable @ 100 | 4,000 | 4,425 | |||||||||
23,373 | |||||||||||
Virginia (1.0%): | |||||||||||
| Virginia Public Building Authority Revenue Series C, 2.25%, 8/1/26 | 1,370 | 1,445 | |||||||||
Series C, 2.40%, 8/1/27 | 1,475 | 1,561 | |||||||||
Series C, 2.56%, 8/1/29 | 2,700 | 2,865 | |||||||||
Virginia Public School Authority Revenue, Series C, 0.55%, 8/1/23 | 3,000 | 3,005 | |||||||||
8,876 | |||||||||||
Total Municipal Bonds (Cost $42,306) | 45,305 | ||||||||||
U.S. Government Agency Mortgages (62.2%) | |||||||||||
| Federal Home Loan Mortgage Corporation 5.00%, 1/1/21 | 1 | 1 | |||||||||
Series K715, Class A2, 2.86%, 1/25/21 | 3,758 | 3,758 | |||||||||
Series K019, Class A2, 2.27%, 3/25/22 | 2,160 | 2,187 | |||||||||
Series K026, Class A1, 1.69%, 4/25/22 | 1,136 | 1,144 | |||||||||
Series K720, Class A2, 2.72%, 6/25/22 | 4,000 | 4,080 | |||||||||
Series K022, Class A2, 2.36%, 7/25/22 | 3,000 | 3,062 | |||||||||
Series K023, Class A2, 2.31%, 8/25/22 | 10,000 | 10,221 | |||||||||
Series K026, Class A2, 2.51%, 11/25/22 | 5,000 | 5,152 | |||||||||
Series K027, Class A2, 2.64%, 1/25/23 | 5,000 | 5,176 | |||||||||
Series K029, Class A2, 3.32%, 2/25/23 (d) | 3,000 | 3,173 | |||||||||
Series K722, Class A2, 2.41%, 3/25/23 | 3,000 | 3,108 | |||||||||
Series K725, Class A2, 3.00%, 1/25/24 | 5,000 | 5,360 | |||||||||
Series K037, Class A2, 3.49%, 1/25/24 | 10,030 | 10,841 | |||||||||
Series K038, Class A2, 3.39%, 3/25/24 | 3,000 | 3,259 | |||||||||
Series K727, Class A2, 2.95%, 7/25/24 | 20,000 | 21,514 | |||||||||
Series K052, Class A1, 2.60%, 1/25/25 | 2,575 | 2,683 | |||||||||
Series K045, Class A2, 3.02%, 1/25/25 | 3,000 | 3,273 | |||||||||
Series K730, Class A2, 3.59%, 1/25/25 | 5,000 | 5,554 | |||||||||
Series K048, Class A2, 3.28%, 6/25/25 (d) | 10,000 | 11,093 | |||||||||
Series K056, Class A1, 2.20%, 7/25/25 | 4,041 | 4,209 | |||||||||
Series K049, Class A2, 3.01%, 7/25/25 | 4,000 | 4,401 | |||||||||
Series KC02, Class A2, 3.37%, 7/25/25 (e) | 30,000 | 32,235 | |||||||||
Series K733, Class A2, 3.75%, 8/25/25 - 9/25/25 | 20,000 | 22,436 | |||||||||
Series K051, Class A2, 3.31%, 9/25/25 | 20,000 | 22,339 | |||||||||
Series KIR1, Class A2, 2.85%, 3/25/26 (e) | 7,709 | 8,507 | |||||||||
Series K056, Class A2, 2.53%, 5/25/26 | 5,000 | 5,444 | |||||||||
Series K057, Class A2, 2.57%, 7/25/26 | 17,000 | 18,553 | |||||||||
Series K061, Class A1, 3.01%, 8/25/26 | 2,170 | 2,326 | |||||||||
Series 3987, Class A, 2.00%, 9/15/26 | 1,103 | 1,118 | |||||||||
Series K059, Class A2, 3.12%, 9/25/26 (d) | 4,500 | 5,047 | |||||||||
Series K061, Class A2, 3.35%, 11/25/26 (d) | 4,000 | 4,557 | |||||||||
Series K066, Class A2, 3.12%, 6/25/27 | 3,000 | 3,394 | |||||||||
Series K067, Class A2, 3.19%, 7/25/27 | 9,274 | 10,563 | |||||||||
Series K069, Class A2, 3.19%, 9/25/27 (d) | 2,879 | 3,286 | |||||||||
See notes to financial statements.
4
| USAA Mutual Funds Trust USAA Government Securities Fund | Schedule of Portfolio Investments — continued November 30, 2020 | ||||||
(Amounts in Thousands, Except for Shares) (Unaudited)
Security Description | Principal Amount | Value | |||||||||
Series K071, Class A2, 3.29%, 11/25/27 | $ | 5,000 | $ | 5,749 | |||||||
Series K080, Class A2, 3.93%, 7/25/28 (d) | 15,000 | 17,874 | |||||||||
Series K081, Class A2, 3.90%, 8/25/28 (d) | 13,000 | 15,491 | |||||||||
Series K082, Class A2, 3.92%, 9/25/28 (d) | 5,000 | 5,958 | |||||||||
3.00%, 3/1/32 - 6/1/42 | 18,139 | 19,150 | |||||||||
3.50%, 10/1/33 - 8/1/48 | 16,558 | 17,589 | |||||||||
4.00%, 10/1/33 - 8/1/48 | 15,581 | 16,609 | |||||||||
5.50%, 12/1/35 | 430 | 504 | |||||||||
Series 3134, Class FA, 0.44% (LIBOR01M+30bps), 3/15/36 (a) | 609 | 610 | |||||||||
Series 4023, Class PF, 0.69% (LIBOR01M+55bps), 10/15/41 (a) | 809 | 816 | |||||||||
4.50%, 9/1/48 | 2,893 | 3,142 | |||||||||
Series K078, Class A2, 3.85%, 6/25/51 | 12,500 | 14,876 | |||||||||
371,422 | |||||||||||
| Federal National Mortgage Association 3.50%, 5/1/21 - 2/1/50 | 15,924 | 16,958 | |||||||||
2.63%, 9/1/21 | 10,000 | 10,031 | |||||||||
2.42%, 11/1/22 | 19,603 | 19,999 | |||||||||
2.50%, 4/1/23 | 8,265 | 8,502 | |||||||||
Series M1, Class A2, 3.23%, 7/25/23 (d) | 1,051 | 1,115 | |||||||||
Series M7, Class AV2, 2.16%, 10/25/23 | 4,664 | 4,825 | |||||||||
Series M13, Class A2, 2.80%, 6/25/25 (d) | 2,356 | 2,555 | |||||||||
Series M1, Class A1, 2.50%, 9/25/26 (d) | 634 | 648 | |||||||||
3.00%, 2/1/27 - 2/1/50 | 10,346 | 10,826 | |||||||||
Series M8, Class A2, 3.06%, 5/25/27 (d) | 4,000 | 4,506 | |||||||||
Series M12, Class A2, 3.18%, 6/25/27 (d) | 6,250 | 7,067 | |||||||||
Series 73, Class DC, 1.50%, 7/25/27 - 10/25/27 | 4,570 | 4,647 | |||||||||
Series 102, Class GA, 1.38%, 9/25/27 | 1,004 | 1,017 | |||||||||
Series M4, Class A2, 3.15%, 3/25/28 (d) | 2,842 | 3,229 | |||||||||
Series M10, Class A2, 3.48%, 7/25/28 (d) | 8,049 | 9,338 | |||||||||
Series 29, Class FY, 0.45% (LIBOR01M+60bps), 4/25/35 - 8/25/37 (a) | 2,049 | 2,050 | |||||||||
5.00%, 12/1/35 | 608 | 697 | |||||||||
5.50%, 11/1/37 | 175 | 206 | |||||||||
6.00%, 5/1/38 | 342 | 391 | |||||||||
4.00%, 8/1/39 - 2/1/50 | 30,849 | 32,923 | |||||||||
141,530 | |||||||||||
| Government National Mortgage Association 8.50%, 6/15/21 | 1 | 1 | |||||||||
6.00%, 8/15/22 - 12/15/38 | 7,930 | 9,173 | |||||||||
8.00%, 12/20/22 - 9/15/30 | 328 | 376 | |||||||||
4.50%, 4/20/24 - 1/15/41 | 19,406 | 21,655 | |||||||||
7.00%, 5/15/27 - 7/15/32 | 1,014 | 1,152 | |||||||||
7.50%, 2/15/28 - 11/15/31 | 221 | 250 | |||||||||
6.50%, 5/15/28 - 8/20/34 | 2,178 | 2,523 | |||||||||
6.75%, 5/15/28 | 7 | 7 | |||||||||
5.50%, 4/20/33 - 6/15/39 | 12,591 | 14,375 | |||||||||
5.00%, 5/20/33 - 2/15/39 | 3,643 | 4,078 | |||||||||
4.00%, 7/15/40 - 11/20/40 | 4,091 | 4,505 | |||||||||
58,095 | |||||||||||
Total U.S. Government Agency Mortgages (Cost $527,480) | 571,047 | ||||||||||
See notes to financial statements.
5
| USAA Mutual Funds Trust USAA Government Securities Fund | Schedule of Portfolio Investments — continued November 30, 2020 | ||||||
(Amounts in Thousands, Except for Shares) (Unaudited)
Security Description | Shares or Principal Amount | Value | |||||||||
U.S. Treasury Obligations (26.1%) | |||||||||||
| U.S. Treasury Notes 2.63%, 6/15/21 | $ | 20,000 | $ | 20,271 | |||||||
2.13%, 6/30/21 | 3,000 | 3,035 | |||||||||
2.63%, 7/15/21 | 15,000 | 15,235 | |||||||||
2.75%, 8/15/21 | 10,000 | 10,186 | |||||||||
2.75%, 9/15/21 | 35,000 | 35,725 | |||||||||
2.88%, 11/15/21 | 10,000 | 10,263 | |||||||||
2.00%, 2/15/22 | 3,000 | 3,068 | |||||||||
2.13%, 6/30/22 | 20,000 | 20,624 | |||||||||
1.88%, 7/31/22 (e) | 10,000 | 10,287 | |||||||||
1.63%, 8/31/22 | 20,000 | 20,515 | |||||||||
2.00%, 11/30/22 | 11,000 | 11,405 | |||||||||
1.38%, 6/30/23 | 5,000 | 5,155 | |||||||||
2.13%, 11/30/23 | 22,000 | 23,277 | |||||||||
2.00%, 6/30/24 | 20,000 | 21,261 | |||||||||
1.88%, 8/31/24 | 10,000 | 10,606 | |||||||||
2.25%, 11/15/24 | 5,000 | 5,390 | |||||||||
2.13%, 11/30/24 | 4,000 | 4,295 | |||||||||
2.00%, 2/15/25 | 4,000 | 4,285 | |||||||||
2.13%, 5/15/25 | 4,500 | 4,860 | |||||||||
Total U.S. Treasury Obligations (Cost $231,377) | 239,743 | ||||||||||
Investment Companies (0.0%) (f) | |||||||||||
Federated Treasury Obligations Fund Institutional Shares, 0.35% (g) | 176 | 176 | |||||||||
Total Investment Companies (Cost $176) | 176 | ||||||||||
Repurchase Agreements (3.0%) | |||||||||||
| Credit Agricole CIB NY, 0.08%, 12/1/20, purchased on 11/30/20, with maturity date of 12/1/20, with a value of $27,500,061, (collateralized by U.S. Treasury Inflation Bond Index, 2.13%, 2/15/41, with a value of $28,050,079) | 27,500 | 27,500 | |||||||||
Total Repurchase Agreements (Cost $27,500) | 27,500 | ||||||||||
Total Investments (Cost $854,537) — 99.1% | 909,056 | ||||||||||
Other assets in excess of liabilities — 0.9% | 8,571 | ||||||||||
NET ASSETS — 100.00% | $ | 917,627 | |||||||||
(a) Variable or Floating-Rate Security. Rate disclosed is as of November 30, 2020.
(b) Rule 144A security or other security that is restricted as to resale to institutional investors. The Fund's Adviser has deemed this security to be liquid based upon procedures approved by the Board of Trustees. As of November 30, 2020, the fair value of these securities was $8,189 (thousands) and amounted to 0.9% of net assets.
(c) Security or portion of security purchased on a delayed-delivery and/or when-issued basis.
(d) The rate for certain asset-backed and mortgage-backed securities may vary based on factors relating to the pool of assets underlying the security. The rate disclosed is the rate in effect at November 30, 2020.
See notes to financial statements.
6
| USAA Mutual Funds Trust USAA Government Securities Fund | Schedule of Portfolio Investments — continued November 30, 2020 | ||||||
(Unaudited)
(e) All or a portion of this security has been segregated as collateral for securities purchased on a when-issued basis.
(f) Amount represents less than 0.05% of net assets.
(g) Rate disclosed is the daily yield on November 30, 2020.
bps — Basis points
Continuously callable — Investment is continuously callable or will be continuously callable on any date after the first call date until its maturity.
GO — General Obligation
LIBOR — London InterBank Offered Rate
LIBOR01M — 1 Month US Dollar LIBOR, rate disclosed as of November 30, 2020, based on the last reset date of the security
LIBOR03M — 3 Month US Dollar LIBOR, rate disclosed as of November 30, 2020, based on the last reset date of the security
See notes to financial statements.
7
USAA Mutual Funds Trust | Statement of Assets and Liabilities November 30, 2020 | ||||||
(Amounts in Thousands, Except Per Share Amounts) (Unaudited)
| USAA Government Securities Fund | |||||||
Assets: | |||||||
Investments, at value (Cost $827,037) | $ | 881,556 | |||||
Repurchase agreements, at value (Cost $27,500) | 27,500 | ||||||
Cash and cash equivalents | 6,749 | ||||||
Receivables: | |||||||
Interest | 3,007 | ||||||
Capital shares issued | 19 | ||||||
From Adviser | 5 | ||||||
Prepaid expenses | 46 | ||||||
Total assets | 918,882 | ||||||
Liabilities: | |||||||
Payables: | |||||||
Distributions | 55 | ||||||
Investments purchased | 651 | ||||||
Capital shares redeemed | 288 | ||||||
Accrued expenses and other payables: | |||||||
Investment advisory fees | 44 | ||||||
Administration fees | 91 | ||||||
Custodian fees | 9 | ||||||
Transfer agent fees | 73 | ||||||
Compliance fees | 1 | ||||||
| 12b-1 fees | 1 | ||||||
Other accrued expenses | 42 | ||||||
Total liabilities | 1,255 | ||||||
Net Assets: | |||||||
Capital | 855,494 | ||||||
Total accumulated earnings/(loss) | 62,133 | ||||||
Net assets | $ | 917,627 | |||||
Net Assets | |||||||
Fund Shares | $ | 353,450 | |||||
Institutional Shares | 553,588 | ||||||
Class A shares | 5,261 | ||||||
Class R6 Shares | 5,328 | ||||||
Total | $ | 917,627 | |||||
Shares (unlimited number of shares authorized with no par value): | |||||||
Fund Shares | 34,745 | ||||||
Institutional Shares | 54,408 | ||||||
Class A shares | 517 | ||||||
Class R6 Shares | 524 | ||||||
Total | 90,194 | ||||||
Net asset value, offering and redemption price per share: (a) | |||||||
Fund Shares | $ | 10.17 | |||||
Institutional Shares | $ | 10.17 | |||||
Class A shares | $ | 10.17 | |||||
Class R6 Shares | $ | 10.17 | |||||
Maximum Sales Charge — Class A shares | 2.25 | % | |||||
Maximum offering price | |||||||
| (100%/(100%-maximum sales charge) of net asset value adjusted to the nearest cent) per share — Class A shares | $ | 10.40 | |||||
(a) Per share amount may not recalculate due to rounding of net assets and/or shares outstanding.
See notes to financial statements.
8
USAA Mutual Funds Trust | Statement of Operations For the Six Months Ended November 30, 2020 | ||||||
(Amounts in Thousands) (Unaudited)
| USAA Government Securities Fund | |||||||
Investment Income: | |||||||
Interest | $ | 12,219 | |||||
Total income | 12,219 | ||||||
Expenses: | |||||||
Investment advisory fees | 343 | ||||||
Administration fees — Fund Shares | 270 | ||||||
Administration fees — Institutional Shares | 302 | ||||||
Administration fees — Class A shares | 4 | ||||||
Administration fees — R6 Shares | 2 | ||||||
Sub-Administration fees | 11 | ||||||
12b-1 fees — Class A shares | 7 | ||||||
Custodian fees | 27 | ||||||
Transfer agent fees — Fund Shares | 204 | ||||||
Transfer agent fees — Institutional Shares | 302 | ||||||
Transfer agent fees — Class A shares | 2 | ||||||
Transfer agent fees — Class R6 Shares | — | (a) | |||||
Trustees' fees | 26 | ||||||
Compliance fees | 3 | ||||||
Legal and audit fees | 41 | ||||||
State registration and filing fees | 47 | ||||||
Other expenses | 49 | ||||||
Total expenses | 1,640 | ||||||
Expenses waived/reimbursed by Adviser | (11 | ) | |||||
Net expenses | 1,629 | ||||||
Net Investment Income (Loss) | 10,590 | ||||||
Realized/Unrealized Gains (Losses) from Investments: | |||||||
Net realized gains (losses) from investment securities | 5,166 | ||||||
Net change in unrealized appreciation/depreciation on investment securities | (9,386 | ) | |||||
Net realized/unrealized gains (losses) on investments | (4,220 | ) | |||||
Change in net assets resulting from operations | $ | 6,370 | |||||
(a) Rounds to less than $1 thousand.
See notes to financial statements.
9
USAA Mutual Funds Trust | Statements of Changes in Net Assets | ||||||
(Amounts in Thousands)
USAA Government Securities Fund | |||||||||||
| Six Months Ended November 30, 2020 (unaudited) | Year Ended May 31, 2020 | ||||||||||
From Investments: | |||||||||||
Operations: | |||||||||||
Net investment income (loss) | $ | 10,590 | $ | 26,082 | |||||||
Net realized gains (losses) from investments | 5,166 | 6,122 | |||||||||
| Net change in unrealized appreciation/depreciation on investments | (9,386 | ) | 36,218 | ||||||||
Change in net assets resulting from operations | 6,370 | 68,422 | |||||||||
Distributions to Shareholders: | |||||||||||
Fund Shares | (4,106 | ) | (8,215 | ) | |||||||
Institutional Shares | (7,127 | ) | (18,360 | ) | |||||||
Class A shares | (52 | ) | (108 | ) | |||||||
Class R6 Shares | (79 | ) | (169 | ) | |||||||
Change in net assets resulting from distributions to shareholders | (11,364 | ) | (26,852 | ) | |||||||
Change in net assets resulting from capital transactions | (92,957 | ) | (107,815 | ) | |||||||
Change in net assets | (97,951 | ) | (66,245 | ) | |||||||
Net Assets: | |||||||||||
Beginning of period | 1,015,578 | 1,081,823 | |||||||||
End of period | $ | 917,627 | $ | 1,015,578 | |||||||
(continues on next page)
See notes to financial statements.
10
USAA Mutual Funds Trust | Statements of Changes in Net Assets | ||||||
(Amounts in Thousands) (continued)
USAA Government Securities Fund | |||||||||||
| Six Months Ended November 30, 2020 (unaudited) | Year Ended May 31, 2020 | ||||||||||
Capital Transactions: | |||||||||||
Fund Shares | |||||||||||
Proceeds from shares issued | $ | 36,433 | $ | 94,729 | |||||||
Distributions reinvested | 3,851 | 7,575 | |||||||||
Cost of shares redeemed | (49,037 | ) | (79,266 | ) | |||||||
Total Fund Shares | $ | (8,753 | ) | $ | 23,038 | ||||||
Institutional Shares | |||||||||||
Proceeds from shares issued | $ | 4,621 | $ | 34,931 | |||||||
Distributions reinvested | 7,125 | 18,170 | |||||||||
Cost of shares redeemed | (93,397 | ) | (185,234 | ) | |||||||
Total Institutional Shares | $ | (81,651 | ) | $ | (132,133 | ) | |||||
Class A shares | |||||||||||
Proceeds from shares issued | $ | 5,342 | $ | 114 | |||||||
Distributions reinvested | 11 | 4 | |||||||||
Cost of shares redeemed | (5,363 | ) | (58 | ) | |||||||
Total Class A shares | $ | (10 | ) | $ | 60 | ||||||
Class R6 Shares | |||||||||||
Proceeds from shares issued | $ | 158 | $ | 1,713 | |||||||
Distributions reinvested | 18 | 41 | |||||||||
Cost of shares redeemed | (2,719 | ) | (534 | ) | |||||||
Total Class R6 Shares | $ | (2,543 | ) | $ | 1,220 | ||||||
Change in net assets resulting from capital transactions | $ | (92,957 | ) | $ | (107,815 | ) | |||||
Share Transactions: | |||||||||||
Fund Shares | |||||||||||
Issued | 3,566 | 9,416 | |||||||||
Reinvested | 377 | 756 | |||||||||
Redeemed | (4,803 | ) | (7,902 | ) | |||||||
Total Fund Shares | (860 | ) | 2,270 | ||||||||
Institutional Shares | |||||||||||
Issued | 452 | 3,520 | |||||||||
Reinvested | 698 | 1,814 | |||||||||
Redeemed | (9,149 | ) | (18,326 | ) | |||||||
Total Institutional Shares | (7,999 | ) | (12,992 | ) | |||||||
Class A shares | |||||||||||
Issued | 522 | 12 | |||||||||
Reinvested | 1 | — | (a) | ||||||||
Redeemed | (524 | ) | (6 | ) | |||||||
Total Class A shares | (1 | ) | 6 | ||||||||
Class R6 Shares | |||||||||||
Issued | 15 | 169 | |||||||||
Reinvested | 2 | 4 | |||||||||
Redeemed | (266 | ) | (53 | ) | |||||||
Total Class R6 Shares | (249 | ) | 120 | ||||||||
Change in Shares | (9,109 | ) | (10,596 | ) | |||||||
(a) Rounds to less than 1 thousand.
See notes to financial statements.
11
USAA Mutual Funds Trust | Financial Highlights | ||||||
For a Share Outstanding Throughout Each Period
Investment Activities | Distributions to Shareholders From | ||||||||||||||||||||||||||
| Net Asset Value, Beginning of Period | Net Investment Income (Loss) | Net Realized and Unrealized Gains (Losses) on Investments | Total from Investment Activities | Net Investment Income | Total Distributions | ||||||||||||||||||||||
USAA Government Securities Fund | |||||||||||||||||||||||||||
Fund Shares | |||||||||||||||||||||||||||
| Six Months Ended November 30, 2020 (unaudited) | $ | 10.23 | 0.11 | (d) | (0.05 | ) | 0.06 | (0.12 | ) | (0.12 | ) | ||||||||||||||||
| Year Ended May 31, 2020 | $ | 9.84 | 0.24 | (d) | 0.39 | 0.63 | (0.24 | ) | (0.24 | ) | |||||||||||||||||
| Year Ended May 31, 2019 | $ | 9.55 | 0.23 | 0.29 | 0.52 | (0.23 | ) | (0.23 | ) | ||||||||||||||||||
| Year Ended May 31, 2018 | $ | 9.86 | 0.20 | (0.31 | ) | (0.11 | ) | (0.20 | ) | (0.20 | ) | ||||||||||||||||
| Year Ended May 31, 2017 | $ | 10.00 | 0.20 | (0.14 | ) | 0.06 | (0.20 | ) | (0.20 | ) | |||||||||||||||||
| Year Ended May 31, 2016 | $ | 10.04 | 0.22 | (0.04 | ) | 0.18 | (0.22 | ) | (0.22 | ) | |||||||||||||||||
Institutional Shares | |||||||||||||||||||||||||||
| Six Months Ended November 30, 2020 (unaudited) | $ | 10.23 | 0.11 | (d) | (0.05 | ) | 0.06 | (0.12 | ) | (0.12 | ) | ||||||||||||||||
| Year Ended May 31, 2020 | $ | 9.85 | 0.24 | (d) | 0.39 | 0.63 | (0.25 | ) | (0.25 | ) | |||||||||||||||||
| Year Ended May 31, 2019 | $ | 9.55 | 0.24 | 0.30 | 0.54 | (0.24 | ) | (0.24 | ) | ||||||||||||||||||
| Year Ended May 31, 2018 | $ | 9.86 | 0.21 | (0.31 | ) | (0.10 | ) | (0.21 | ) | (0.21 | ) | ||||||||||||||||
| Year Ended May 31, 2017 | $ | 10.00 | 0.21 | (0.14 | ) | 0.07 | (0.21 | ) | (0.21 | ) | |||||||||||||||||
| August 7, 2015 (e) through May 31, 2016 | $ | 9.94 | 0.18 | 0.06 | 0.24 | (0.18 | ) | (0.18 | ) | ||||||||||||||||||
* Assumes reinvestment of all net investment income and realized capital gain distributions, if any, during the period. Includes adjustments in accordance with U.S. generally accepted accounting principles and could differ from the Lipper reported return.
^ The net expense ratio may not correlate to the applicable expense limits in place during the period since the current contractual expense limitation is applied for a two year period beginning July 1, 2019 and in effect through September 30, 2021, instead of coinciding with the Fund's fiscal year end. Details of the current contractual expense limitation in effect can be found in Note 5 of the accompanying Notes to Financial Statements.
(a) Not annualized for periods less than one year.
(b) Annualized for periods less than one year.
(c) Portfolio turnover is calculated on the basis of the Fund as a whole without distinguishing between the classes of shares issued.
(d) Per share net investment income (loss) has been calculated using the average daily shares method.
(e) Commencement of operations.
See notes to financial statements.
12
USAA Mutual Funds Trust | Financial Highlights — continued | ||||||
For a Share Outstanding Throughout Each Period
Ratios to Average Net Assets | Supplemental Data | ||||||||||||||||||||||||||||||||||
| Redemption Fees Added to Beneficial Interests | Net Asset Value, End of Period | Total Return (Excludes Sales Charges)*(a) | Net Expenses^(b) | Net Investment Income (Loss)(b) | Gross Expenses(b) | Net Assets, End of Period (000's) | Portfolio Turnover(a)(c) | ||||||||||||||||||||||||||||
USAA Government Securities Fund | |||||||||||||||||||||||||||||||||||
Fund Shares | |||||||||||||||||||||||||||||||||||
| Six Months Ended November 30, 2020 (unaudited) | — | $ | 10.17 | 0.55 | % | 0.38 | % | 2.11 | % | 0.38 | % | $ | 353,450 | 1 | % | ||||||||||||||||||||
| Year Ended May 31, 2020 | — | $ | 10.23 | 6.49 | % | 0.43 | % | 2.36 | % | 0.43 | % | $ | 364,077 | 11 | % | ||||||||||||||||||||
| Year Ended May 31, 2019 | — | $ | 9.84 | 5.56 | % | 0.47 | % | 2.42 | % | 0.47 | % | $ | 328,123 | 9 | % | ||||||||||||||||||||
| Year Ended May 31, 2018 | — | $ | 9.55 | (1.09 | )% | 0.48 | % | 2.09 | % | 0.48 | % | $ | 333,464 | 15 | % | ||||||||||||||||||||
| Year Ended May 31, 2017 | — | $ | 9.86 | 0.62 | % | 0.48 | % | 2.02 | % | 0.48 | % | $ | 390,897 | 18 | % | ||||||||||||||||||||
| Year Ended May 31, 2016 | — | $ | 10.00 | 1.80 | % | 0.51 | % | 2.17 | % | 0.51 | % | $ | 432,471 | 14 | % | ||||||||||||||||||||
Institutional Shares | |||||||||||||||||||||||||||||||||||
| Six Months Ended November 30, 2020 (unaudited) | — | $ | 10.17 | 0.59 | % | 0.30 | % | 2.20 | % | 0.30 | % | $ | 553,588 | 1 | % | ||||||||||||||||||||
| Year Ended May 31, 2020 | — | $ | 10.23 | 6.45 | % | 0.36 | % | 2.43 | % | 0.36 | % | $ | 638,299 | 11 | % | ||||||||||||||||||||
| Year Ended May 31, 2019 | — | $ | 9.85 | 5.76 | % | 0.38 | % | 2.55 | % | 0.38 | % | $ | 742,233 | 9 | % | ||||||||||||||||||||
| Year Ended May 31, 2018 | — | $ | 9.55 | (1.01 | )% | 0.39 | % | 2.18 | % | 0.39 | % | $ | 251,297 | 15 | % | ||||||||||||||||||||
| Year Ended May 31, 2017 | — | $ | 9.86 | 0.71 | % | 0.40 | % | 2.12 | % | 0.40 | % | $ | 133,607 | 18 | % | ||||||||||||||||||||
| August 7, 2015 (e) through May 31, 2016 | — | $ | 10.00 | 2.39 | % | 0.44 | % | 2.16 | % | 0.44 | % | $ | 106,692 | 14 | % | ||||||||||||||||||||
(continues on next page)
See notes to financial statements.
13
USAA Mutual Funds Trust | Financial Highlights — continued | ||||||
For a Share Outstanding Throughout Each Period
Investment Activities | Distributions to Shareholders From | ||||||||||||||||||||||||||
| Net Asset Value, Beginning of Period | Net Investment Income (Loss) | Net Realized and Unrealized Gains (Losses) on Investments | Total from Investment Activities | Net Investment Income | Total Distributions | ||||||||||||||||||||||
USAA Government Securities Fund | |||||||||||||||||||||||||||
Class A shares | |||||||||||||||||||||||||||
| Six Months Ended November 30, 2020 (unaudited) | $ | 10.22 | 0.09 | (d) | (0.04 | ) | 0.05 | (0.10 | ) | (0.10 | ) | ||||||||||||||||
| Year Ended May 31, 2020 | $ | 9.84 | 0.20 | (d) | 0.39 | 0.59 | (0.21 | ) | (0.21 | ) | |||||||||||||||||
| Year Ended May 31, 2019 | $ | 9.54 | 0.21 | 0.30 | 0.51 | (0.21 | ) | (0.21 | ) | ||||||||||||||||||
| Year Ended May 31, 2018 | $ | 9.85 | 0.18 | (0.31 | ) | (0.13 | ) | (0.18 | ) | (0.18 | ) | ||||||||||||||||
| Year Ended May 31, 2017 | $ | 10.00 | 0.17 | (0.15 | ) | 0.02 | (0.17 | ) | (0.17 | ) | |||||||||||||||||
| Year Ended May 31, 2016 | $ | 10.04 | 0.19 | (0.04 | ) | 0.15 | (0.19 | ) | (0.19 | ) | |||||||||||||||||
Class R6 Shares | |||||||||||||||||||||||||||
| Six Months Ended November 30, 2020 (unaudited) | $ | 10.22 | 0.11 | (d) | (0.04 | ) | 0.07 | (0.12 | ) | (0.12 | ) | ||||||||||||||||
| Year Ended May 31, 2020 | $ | 9.84 | 0.24 | (d) | 0.39 | 0.63 | (0.25 | ) | (0.25 | ) | |||||||||||||||||
| Year Ended May 31, 2019 | $ | 9.55 | 0.24 | 0.29 | 0.53 | (0.24 | ) | (0.24 | ) | ||||||||||||||||||
| Year Ended May 31, 2018 | $ | 9.85 | 0.22 | (0.30 | ) | (0.08 | ) | (0.22 | ) | (0.22 | ) | ||||||||||||||||
| December 1, 2016 (e) through May 31, 2017 | $ | 9.80 | 0.11 | 0.05 | 0.16 | (0.11 | ) | (0.11 | ) | ||||||||||||||||||
* Assumes reinvestment of all net investment income and realized capital gain distributions, if any, during the period. Includes adjustments in accordance with U.S. generally accepted accounting principles and could differ from the Lipper reported return.
^ The net expense ratio may not correlate to the applicable expense limits in place during the period since the current contractual expense limitation is applied for a two year period beginning July 1, 2019 and in effect through September 30, 2021, instead of coinciding with the Fund's fiscal year end. Details of the current contractual expense limitation in effect can be found in Note 5 of the accompanying Notes to Financial Statements.
(a) Not annualized for periods less than one year.
(b) Annualized for periods less than one year.
(c) Portfolio turnover is calculated on the basis of the Fund as a whole without distinguishing between the classes of shares issued.
(d) Per share net investment income (loss) has been calculated using the average daily shares method.
(e) Commencement of operations.
(f) Amount is less than $0.005.
See notes to financial statements.
14
USAA Mutual Funds Trust | Financial Highlights — continued | ||||||
For a Share Outstanding Throughout Each Period (continued)
Ratios to Average Net Assets | Supplemental Data | ||||||||||||||||||||||||||||||||||
| Redemption Fees Added to Beneficial Interests | Net Asset Value, End of Period | Total Return (Excludes Sales Charges)*(a) | Net Expenses^(b) | Net Investment Income (Loss)(b) | Gross Expenses(b) | Net Assets, End of Period (000's) | Portfolio Turnover(a)(c) | ||||||||||||||||||||||||||||
USAA Government Securities Fund | |||||||||||||||||||||||||||||||||||
Class A shares | |||||||||||||||||||||||||||||||||||
| Six Months Ended November 30, 2020 (unaudited) | — | $ | 10.17 | 0.49 | % | 0.70 | % | 1.79 | % | 0.99 | % | $ | 5,261 | 1 | % | ||||||||||||||||||||
| Year Ended May 31, 2020 | — | $ | 10.22 | 6.04 | % | 0.75 | % | 2.03 | % | 0.80 | % | $ | 5,299 | 11 | % | ||||||||||||||||||||
| Year Ended May 31, 2019 | — | $ | 9.84 | 5.37 | % | 0.75 | % | 2.14 | % | 0.87 | % | $ | 5,042 | 9 | % | ||||||||||||||||||||
| Year Ended May 31, 2018 | — | (f) | $ | 9.54 | (1.36 | )% | 0.75 | % | 1.82 | % | 0.87 | % | $ | 4,804 | 15 | % | |||||||||||||||||||
| Year Ended May 31, 2017 | — | $ | 9.85 | 0.25 | % | 0.75 | % | 1.76 | % | 0.93 | % | $ | 6,089 | 18 | % | ||||||||||||||||||||
| Year Ended May 31, 2016 | — | $ | 10.00 | 1.55 | % | 0.75 | % | 1.93 | % | 0.95 | % | $ | 5,088 | 14 | % | ||||||||||||||||||||
Class R6 Shares | |||||||||||||||||||||||||||||||||||
| Six Months Ended November 30, 2020 (unaudited) | — | $ | 10.17 | 0.70 | % | 0.30 | % | 2.23 | % | 0.41 | % | $ | 5,328 | 1 | % | ||||||||||||||||||||
| Year Ended May 31, 2020 | — | $ | 10.22 | 6.46 | % | 0.35 | % | 2.43 | % | 0.39 | % | $ | 7,903 | 11 | % | ||||||||||||||||||||
| Year Ended May 31, 2019 | — | $ | 9.84 | 5.68 | % | 0.35 | % | 2.54 | % | 0.51 | % | $ | 6,425 | 9 | % | ||||||||||||||||||||
| Year Ended May 31, 2018 | — | $ | 9.55 | (0.87 | )% | 0.35 | % | 2.22 | % | 0.64 | % | $ | 6,345 | 15 | % | ||||||||||||||||||||
| December 1, 2016 (e) through May 31, 2017 | — | $ | 9.85 | 1.62 | % | 0.35 | % | 2.22 | % | 1.12 | % | $ | 5,027 | 18 | % | ||||||||||||||||||||
See notes to financial statements.
15
USAA Mutual Funds Trust | Notes to Financial Statements November 30, 2020 | ||||||
(Unaudited)
1. Organization:
USAA Mutual Funds Trust (the "Trust") is organized as a Delaware statutory trust and is registered under the Investment Company Act of 1940, as amended (the "1940 Act"), as an open-end investment company. The Trust is comprised of 46 funds and is authorized to issue an unlimited number of shares, which are units of beneficial interest with no par value.
The accompanying financial statements are those of the USAA Government Securities Fund (the "Fund"). The Fund offers four classes of shares: Fund Shares, Institutional Shares, Class A shares and Class R6 Shares. The Fund is classified as diversified under the 1940 Act.
Effective June 29, 2020, the Fund's Adviser Shares were redesignated Class A shares and became subject to a front-end sales charge.
Each class of shares of the Fund has substantially identical rights and privileges except with respect to sales charges, fees paid under distribution plans, expenses allocable exclusively to each class of shares, voting rights on matters solely affecting a single class of shares, and the exchange privilege of each class of shares.
Under the Trust's organizational documents, its officers and trustees are indemnified against certain liabilities arising out of the performance of their duties to the Fund. In addition, in the normal course of business, the Fund enters into contracts with its vendors and others that provide for general indemnifications. The Fund's maximum exposure under these arrangements is unknown, as this would involve future claims that may be made against the Fund. However, based on experience, the Fund expects that risk of loss to be remote.
2. Significant Accounting Policies:
The following is a summary of significant accounting policies followed by the Trust in the preparation of its financial statements. The policies are in conformity with Generally Accepted Accounting Principles in the United States of America ("GAAP"). The preparation of financial statements in accordance with GAAP requires management to make estimates and assumptions that affect the reported amounts of assets and liabilities and disclosure of contingent assets and liabilities at the date of the financial statements and the reported amounts of income and expenses for the period. Actual results could differ from those estimates. The Fund follows the specialized accounting and reporting requirements under GAAP that are applicable to investment companies under Accounting Standards Codification Topic 946.
Investment Valuation:
The Fund records investments at fair value. Fair value is defined as the price that would be received to sell an asset or paid to transfer a liability in an orderly transaction between market participants at the measurement date.
The valuation techniques described below maximize the use of observable inputs and minimize the use of unobservable inputs in determining fair value. The inputs used for valuing the Fund's investments are summarized in the three broad levels listed below:
• Level 1 — quoted prices in active markets for identical securities
• Level 2 — other significant observable inputs (including quoted prices for similar securities or interest rates applicable to those securities, etc.)
• Level 3 — significant unobservable inputs (including the Fund's own assumptions in determining the fair value of investments)
Changes in valuation techniques may result in transfers in or out of an assigned level within the disclosure hierarchy. The inputs or methodologies used for valuation techniques are not necessarily an indication of the risk associated with entering into those investments.
16
USAA Mutual Funds Trust | Notes to Financial Statements — continued November 30, 2020 | ||||||
(Unaudited)
Victory Capital Management Inc. ("VCM" or the "Adviser") has established the Pricing and Liquidity Committee (the "Committee"), and subject to the Trust's Board of Trustees (the "Board") oversight, the Committee administers and oversees the Fund's valuation policies and procedures, which are approved by the Board.
Investments in open-end investment companies are valued at their net asset value ("NAV"). These valuations are typically categorized as Level 1 in the fair value hierarchy.
Debt securities of United States ("U.S.") issuers, along with corporate and municipal securities, including short-term investments maturing in 60 days or less, may be valued using evaluated bid or the last sales price to price securities by dealers or an independent pricing service approved by the Board. These valuations are typically categorized as Level 2 in the fair value hierarchy.
Repurchase agreements are valued at cost.
In the event that price quotations or valuations are not readily available, are not reflective of market value, or a significant event has been recognized in relation to a security or class of securities, the securities are valued in good faith by the Committee in accordance with valuation procedures approved by the Board. These valuations are typically categorized as Level 2 or Level 3 in the fair value hierarchy, based on the observability of inputs used to determine the fair value. The effect of fair value pricing is that securities may not be priced on the basis of quotations from the primary market in which they are traded and the actual price realized from the sale of a security may differ materially from the fair value price. Valuing these securities at fair value is intended to cause the Fund's NAV to be more reliable than it otherwise would be.
A summary of the valuations as of November 30, 2020, based upon the three levels defined above, is included in the table below while the breakdown, by category, of investments is disclosed on the Schedule of Portfolio Investments (amounts in thousands):
Level 1 | Level 2 | Level 3 | Total | ||||||||||||||||
Asset-Backed Securities | $ | — | $ | 25,285 | $ | — | $ | 25,285 | |||||||||||
Municipal Bonds | — | 45,305 | — | 45,305 | |||||||||||||||
U.S. Government Agency Mortgages | — | 571,047 | — | 571,047 | |||||||||||||||
U.S. Treasury Obligations | — | 239,743 | — | 239,743 | |||||||||||||||
Investment Companies | 176 | — | — | 176 | |||||||||||||||
Repurchase Agreements | — | 27,500 | — | 27,500 | |||||||||||||||
Total | $ | 176 | $ | 908,880 | $ | — | $ | 909,056 | |||||||||||
For the six months ended November 30, 2020, there were no transfers in or out of the Level 3 fair value hierarchy.
Repurchase Agreements:
The Fund may enter into repurchase agreements with commercial banks or recognized security dealers pursuant to the terms of a Master Repurchase Agreement. A repurchase agreement is an arrangement wherein the Fund purchases securities and the seller agrees to repurchase the securities at an agreed upon time and at an agreed upon price. The purchased securities are marked-to-market daily to ensure their value is equal to at least 102% of principal including accrued interest and are held by the Fund, either through its regular custodian or through a special "tri-party" custodian that maintains separate accounts for both the Fund and its counterparty, until maturity of the repurchase agreement. Master Repurchase Agreements typically contain netting provisions, which provide for the net settlement of all transactions and collateral with the Fund through a single payment in the event of default or termination. Repurchase agreements are subject to credit risk, and the Fund's Manager monitors the creditworthiness of sellers with which the Fund may enter into repurchase agreements.
Investments in repurchase agreements as presented on the Portfolio of Investments are not net settlement amounts but gross. At November 30, 2020, the value of the related collateral exceeded the value of the repurchase agreements, reducing the net settlement amount to zero. Details on the collateral are included in the Schedule of Portfolio Investments.
17
USAA Mutual Funds Trust | Notes to Financial Statements — continued November 30, 2020 | ||||||
(Unaudited)
Securities Purchased on a Delayed-Delivery or When-Issued Basis:
The Fund may purchase securities on a delayed-delivery or when-issued basis. Delivery and payment for securities that have been purchased by the Fund on a delayed-delivery or when-issued basis or for delayed draws on loans can take place a month or more after the trade date. At the time the Fund makes the commitment to purchase a security on a delayed-delivery or when-issued basis, the Fund records the transaction and reflects the value of the security in determining NAV. No interest accrues to the Fund until the transaction settles and payment takes place. A segregated account is established and the Fund maintains cash and/or marketable securities at least equal in value to commitments for delayed-delivery or when-issued securities. If the Fund owns delayed-delivery or when-issued securities, these values are included in Payable for investments purchased on the accompanying Statement of Assets and Liabilities and the segregated assets are identified in the Schedule of Portfolio Investments.
Municipal Obligations:
The values of municipal obligations can fluctuate and may be affected by adverse tax, legislative, or political changes, and by financial developments affecting municipal issuers. Payment of municipal obligations may depend on a relatively limited source of revenue, resulting in greater credit risk. Future changes in federal tax laws or the activity of an issuer may adversely affect the tax-exempt status of municipal obligations.
Mortgage- and Asset-Backed Securities:
The values of some mortgage-related or asset-backed securities may be particularly sensitive to changes in prevailing interest rates. Early repayment of principal on some mortgage-related securities may expose the Fund to a lower rate of return upon reinvestment of principal. The values of mortgage and asset-backed securities depend in part on the credit quality and adequacy of the underlying assets or collateral and may fluctuate in response to the market's perception of these factors as well as current and future repayment rates. Some mortgage-backed securities are backed by the full faith and credit of the U.S. government (e.g., mortgage-backed securities issued by the Government National Mortgage Association, commonly known as "Ginnie Mae"), while other mortgage-backed securities (e.g., mortgage-backed securities issued by the Federal National Mortgage Association and the Federal Home Loan Mortgage Corporation, commonly known as "Fannie Mae" and "Freddie Mac", respectively), are backed only by the credit of the government entity issuing them. In addition, some mortgage-backed securities are issued by private entities and, as such, are not guaranteed by the U.S. government or any agency or instrumentality of the U.S. government.
Investment Transactions and Related Income:
Changes in holdings of investments are accounted for no later than one business day following the trade date. For financial reporting purposes, however, investment transactions are accounted for on trade date on the last business day of the reporting period. Interest income is determined on the basis of coupon interest accrued using the effective interest method which adjusts, where applicable, the amortization of premiums or accretion of discount. Gains or losses realized on sales of securities are determined by comparing the identified cost of the security lot sold with the net sales proceeds.
Securities Lending:
The Fund, through a securities lending agreement with Citibank, N.A. ("Citibank"), may lend its securities to qualified financial institutions, such as certain broker-dealers, to earn additional income, net of income retained by Citibank. Borrowers are required to secure their loans for collateral in the amount of at least 102% of the value of U.S. securities loaned or at least 105% of the value of non-U.S. securities loaned, marked-to-market daily. Any collateral shortfalls associated with increases in the valuation of the securities loaned are cured the next business day once the shortfall exceeds $100 thousand. Collateral may be cash, U.S. government securities, or other securities as permitted by Securities and Exchange Commission ("SEC") guidelines. Cash collateral may be invested in high-quality short-term investments, primarily open-end investment companies. Collateral requirements are determined daily
18
USAA Mutual Funds Trust | Notes to Financial Statements — continued November 30, 2020 | ||||||
(Unaudited)
based on the value of the Fund's securities on loan as of the end of the prior business day. During the time portfolio securities are on loan, the borrower will pay the Fund any dividends or interest paid on such securities plus any fee negotiated between the parties to the lending agreement. The Fund also earns a return from the collateral. The Fund pays Citibank various fees in connection with the investment of cash collateral and fees based on the investment income received from securities lending activities. Securities lending income (net of these fees) is disclosed on the Statement of Operations. Loans are terminable upon demand and the borrower must return the loaned securities within the lesser of one standard settlement period or five business days. Risks relating to securities-lending transactions include that the borrower may not provide additional collateral when required or return the securities when due, and that the value of the short-term investments will be less than the amount of cash collateral required to be returned to the borrower. The Fund's agreement with Citibank does not include master netting provisions. Noncash collateral received by the Fund may not be sold or re-pledged, except to satisfy borrower default.
At November 30, 2020, the Fund does not have any securities on loan.
Federal Income Taxes:
It is the Fund's policy to continue to qualify as a regulated investment company by complying with the provisions available to certain investment companies, as defined in applicable sections of the Internal Revenue Code, and to make distributions of net investment income and net realized gains sufficient to relieve it from all, or substantially all, federal income taxes. Accordingly, no provision for federal income taxes is required in the financial statements. The Fund has a tax year end of May 31.
Management of the Fund has reviewed tax positions taken in tax years that remain subject to examination by all major tax jurisdictions, including federal (i.e., the last four tax years, which includes the current fiscal tax year end). Management believes that there is no tax liability resulting from unrecognized tax benefits related to uncertain tax positions taken.
Allocations:
Expenses directly attributable to the Fund are charged to the Fund, while expenses that are attributable to more than one fund in the Trust, or jointly with an affiliated trust, are allocated among the respective funds in the Trust and/or affiliated trust based upon net assets or another appropriate basis.
Income, expenses (other than class-specific expenses such as transfer agent fees, state registration fees, 12b-1 fees, and printing fees), and realized and unrealized gains or losses on investments are allocated to each class of shares based on its relative net assets on the date income is earned or expenses and realized and unrealized gains and losses are incurred.
3. Purchases and Sales:
Cost of purchases and proceeds from sales/maturities of securities (excluding securities maturing less than one year from acquisition) for the six months ended November 30, 2020, were as follows for the Fund (amounts in thousands):
| Purchases (excluding U.S. Government Securities) | Sales (excluding U.S. Government Securities) | Purchases of U.S. Government Securities | Sales of U.S. Government Securities | ||||||||||||
| $ | 13,150 | $ | 28,690 | $ | — | $ | 95,832 | ||||||||
4. Affiliated Fund Ownership:
The Fund offers its shares for investment by other VCM Mutual Funds. The fund-of-funds do not invest in the underlying funds for the purpose of exercising management or control, and the affiliated
19
USAA Mutual Funds Trust | Notes to Financial Statements — continued November 30, 2020 | ||||||
(Unaudited)
fund-of-funds' annual and semi-annual reports may be viewed at vcm.com. As of November 30, 2020, certain fund-of-funds owned total outstanding shares of the Fund as follows:
Affiliated USAA Mutual Funds | Percent | ||||||
Cornerstone Conservative Fund | 4.6 | % | |||||
Target Income | 37.3 | % | |||||
Target 2030 | 19.7 | % | |||||
Target 2040 | 9.8 | % | |||||
Target 2050 | 1.9 | % | |||||
Target 2060 | 0.3 | % | |||||
5. Fees and Transactions with Affiliates and Related Parties:
Investment Advisory Fees:
Investment advisory services are provided to the Fund by the Adviser, which is a New York corporation registered as an investment adviser with the SEC. The Adviser is a wholly-owned indirect subsidiary of Victory Capital Holdings, Inc., a publicly traded Delaware corporation, and a wholly-owned direct subsidiary of Victory Capital Operating, LLC. Under the terms of the Investment Advisory Agreement, the Adviser is entitled to receive a base fee and a performance adjustment. The Fund's base fee is accrued daily and paid monthly at an annualized rate of 0.125% of the Fund's average daily net assets. Amounts incurred and paid to VCM for the six months ended November 30, 2020, are reflected on the Statement of Operations as Investment Advisory fees.
On November 6, 2018, United Services Automobile Association ("USAA"), the parent company of USAA Asset Management Company ("AMCO"), the prior investment adviser to the Fund announced that AMCO would be acquired by Victory Capital Holdings Inc.(the "Transaction"). A special shareholder meeting was held on April 18, 2019, at which shareholders of the Fund approved a new investment advisory agreement between the Trust, on behalf of the Fund, and Victory Capital Management Inc. ("Victory Capital"). The Transaction closed on July 1, 2019. Effective July 1, 2019, VCM replaced AMCO as the investment adviser to the Fund and no performance adjustments were made for the periods beginning July 1, 2019, through June 30, 2020. Only performance beginning as of July 1, 2019, and thereafter is utilized in calculating future performance adjustments.
The performance adjustment for each share class is accrued daily and calculated monthly by comparing each class' performance to that of the Lipper Intermediate U.S. Government Funds Index. The Lipper Intermediate U.S. Government Funds Index tracks the total return performance of each class within the Lipper Intermediate U.S. Government Funds category.
The performance period for each share class consists of the current month plus the previous 35 months (or the number of months beginning July 1, 2019, if fewer). The following table is utilized to determine the extent of the performance adjustment:
| Over/Under Performance Relative to Index (in basis points)(a) | Annual Adjustment Rate (in basis points)(a) | ||||||
+/- 20 to 50 | +/- 4 | ||||||
+/- 51 to 100 | +/- 5 | ||||||
+/- 101 and greater | +/- 6 | ||||||
(a) Based on the difference between average annual performance of the relevant share class of the Fund and its relevant Lipper index, rounded to the nearest basis point. Average daily net assets of the share class are calculated over a rolling 36-month period.
Each class' annual performance adjustment rate is multiplied by the average daily net assets of each respective class over the entire performance period, which is then multiplied by a fraction, the numerator of which is the number of days in the month and the denominator of which is 365 (366 in leap years). The resulting amount is then added to (in the case of overperformance), or subtracted from (in the case of underperformance) the base fee.
20
USAA Mutual Funds Trust | Notes to Financial Statements — continued November 30, 2020 | ||||||
(Unaudited)
Under the performance fee arrangement, each class pays a positive performance fee adjustment for a performance period whenever the class outperforms the Lipper Intermediate U.S. Government Funds Index over that period, even if the class has overall negative returns during the performance period.
For the period July 1, 2020 to November 30, 2020, performance adjustments for Fund Shares, Institutional Shares, Class A shares and Class R6 Shares were $(87), $(176), $(1) and $(2) thousand, respectively. For the Fund Shares, Institutional Shares, Class A shares and Class R6 shares the performance adjustments were (0.05)%, (0.06)%, (0.05)% and (0.05)% of average daily net assets, respectively.
The Trust relies on an exemptive order granted to VCM and its affiliated funds by the SEC in March 2019 permitting the use of a "manager-of-managers" structure for certain funds. Under a manager-of-managers structure, the investment adviser may select (with approval of the Board and without shareholder approval) one or more subadvisers to manage the day-to-day investment of a fund's assets. For the six months ended November 30, 2020, the Fund had no subadvisors.
Administration and Servicing Fees:
VCM serves as the Fund's administrator and fund accountant. Under the Administration, Servicing and Accounting Agreement, VCM is paid for its services an annual fee at a rate of 0.15% of average daily net assets of the Fund Shares and Class A shares, 0.10% of average daily net assets of the Institutional Shares, and 0.05% of average daily net assets of the Class R6 Shares. Amounts incurred for the six months ended November 30, 2020, are reflected on the Statement of Operations as Administration fees.
The Fund (as part of the Trust) has entered into an agreement to provide compliance services with the Adviser, pursuant to which the Adviser furnishes its compliance personnel, including the services of the Chief Compliance Officer ("CCO"), and other resources reasonably necessary to provide the Trust with compliance oversight services related to the design, administration and oversight of a compliance program for the Trust in accordance with Rule 38a-1 under the 1940 Act. The CCO is an employee of the Adviser, which pays the compensation of the CCO and support staff. Funds in the Trust, Victory Variable Insurance Funds, Victory Portfolios, and Victory Portfolios II (collectively, the "Victory Funds Complex") in the aggregate, compensate the Adviser for these services. Amounts incurred for the six months ended November 30, 2020, are reflected on the Statement of Operations as Compliance fees.
Citi Fund Services Ohio, Inc. ("Citi"), an affiliate of Citibank, acts as sub-administrator and sub-fund accountant to the Fund pursuant to a Sub-Administration and Sub-Fund Accounting Services Agreement between VCM and Citi. VCM pays Citi a fee for providing these services. The Trust reimburses VCM and Citi for out-of-pocket expenses incurred in providing these services and certain other expenses specifically allocated to the Fund. Amounts incurred for the six months ended November 30, 2020, are reflected on the Statement of Operations as Sub-Administration fees.
Transfer Agency Fees:
Victory Capital Transfer Agency, Inc. ("VCTA"), an affiliate of the Adviser provides transfer agency services to the Fund. VCTA provides transfer agent services to the Fund Shares based on an annual charge of $25.50 per shareholder account plus out-of-pocket expenses. VCTA pays a portion of these fees to certain intermediaries for the administration and servicing of accounts that are held with such intermediaries. Transfer agent's fees for Institutional Shares and Class R6 Shares are paid monthly based on a fee accrued daily at an annualized rate of 0.10% and 0.01%, average daily net assets, respectively, plus out-of-pocket expenses. Amounts incurred and paid to VCTA for the six months ended November 30, 2020, are reflected on the Statement of Operations as Transfer Agent fees.
FIS Investor Services LLC serves as sub-transfer agent and dividend disbursing agent for the Fund pursuant to a Sub-Transfer Agent agreement between VCTA and FIS Investor Services LLC. VCTA provides FIS Investor Services LLC a fee for providing these services.
21
USAA Mutual Funds Trust | Notes to Financial Statements — continued November 30, 2020 | ||||||
(Unaudited)
Distributor/Underwriting Services:
Victory Capital Services, Inc. (the "Distributor"), an affiliate of the Adviser, serves as distributor for the continuous offering of the shares of the Fund pursuant to a Distribution Agreement between the Distributor and the Trust. Effective June 30, 2020, the Distributor's name was changed from Victory Capital Advisers, Inc.
Pursuant to the Distribution and Service Plans adopted in accordance with Rule 12b-1 under the 1940 Act, the Distributor may receive a monthly distribution and service fee, at an annual rate of up to 0.25% of the average daily net assets of Class A shares. The distribution and service fees paid to the Distributor may be used by the Distributor to pay for activity primarily intended to result in the sale of Class A shares of the Fund. Amounts incurred and paid to VCTA for the period ended November 30, 2020, are reflected on the Statement of Operations as 12b-1 fees.
In addition, the Distributor is entitled to receive commissions on sales of the Class A shares of the Fund. For the six months ended November 30, 2020, the Distributor did not receive any commissions.
Other Fees:
Citibank serves as the Fund's custodian. The Fund pays Citibank a fee for providing these services. Amounts incurred for the six months ended November 30, 2020, are reflected on the Statement of Operations as Custodian fees.
K&L Gates LLP provides legal services to the Trust.
The Adviser has entered into an expense limitation agreement with the Fund until at least September 30, 2021. Under the terms of the agreement, the Adviser has agreed to waive fees or reimburse certain expenses to the extent that ordinary operating expenses incurred by certain classes of the Fund in any fiscal year exceed the expense limit for such classes of the Fund. Such excess amounts will be the liability of the Adviser. Interest, taxes, brokerage commissions, other expenditures, which are capitalized in accordance with GAAP, and other extraordinary expenses not incurred in the ordinary course of the Fund's business are excluded from the expense limits. As of November 30, 2020, the expense limits (excluding voluntary waivers) are 0.48%, 0.39%, 0.75% and 0.35% for the Fund Shares, Institutional Shares, Class A shares, and R6 Shares, respectively.
Under this expense limitation agreement, the Fund has agreed to repay fees and expenses that were waived or reimbursed by the Adviser for a period up to three years after the fiscal year in which the waiver or reimbursement took place, subject to the lesser of any operating expense limits in effect at the time of: (a) the original waiver or expense reimbursement; or (b) the recoupment, after giving effect to the recoupment amount.
As of November 30, 2020, the following amounts are available to be repaid to the Adviser (amounts in thousands). The Fund has not recorded any amounts available to be repaid as a liability due to an assessment that such repayment is not probable at November 30, 2020.
| Expires May 31, 2023 | Expires May 31, 2024 | Total | |||||||||
| $ | 1 | $ | 11 | $ | 12 | ||||||
The Adviser may voluntarily waive or reimburse additional fees to assist the Fund in maintaining competitive expense ratios. Voluntary waivers and reimbursements applicable to the Fund are not available to be recouped at a future time. There were no voluntary waivers or reimbursements for the six months ended November 30, 2020.
Certain officers and/or interested trustees of the Fund are also officers and/or employees of the Adviser, Administrator, Sub-Administrator, Sub-Fund Accountant, and Legal.
6. Risks:
The Fund may be subject to other risks in addition to these identified risks.
Geopolitical/Natural Disaster Risk — Global economies and financial markets are increasingly interconnected, which increases the possibilities that conditions in one country or region might adversely
22
USAA Mutual Funds Trust | Notes to Financial Statements — continued November 30, 2020 | ||||||
(Unaudited)
affect issuers in another country or region. Geopolitical and other risks, including war, terrorism, trade disputes, political or economic dysfunction within some nations, public health crises and related geopolitical events, as well as environmental disasters such as earthquakes, fires, and floods, may add to instability in world economies and markets generally. Changes in trade policies and international trade agreements could affect the economies of many countries in unpredictable ways. Likewise, systemic market dislocations of the kind that occurred during the financial crisis that began in 2008, if repeated, would be highly disruptive to economies and markets, adversely affecting individual companies and industries, securities markets, interest rates, credit ratings, inflation, investor sentiment, and other factors affecting the value of a Fund's investments. Some countries, including the United States, are adopting more protectionist trade policies and moving away from the tighter financial industry regulations that followed the 2008 financial crisis, which may also affect the value of a Fund's investments.
Political events within the United States at times have resulted, and may in the future result, in a shutdown of government services, which could negatively affect the U.S. economy, decrease the value of a Fund's investments, increase uncertainty in or impair the operation of the U.S. or other securities markets and degrade investor and consumer confidence, perhaps suddenly and to a significant degree.
An outbreak of disease called COVID-19 has spread internationally. The transmission of COVID-19 and efforts to contain its spread have resulted in international, national and local border closings and other significant travel restrictions and disruptions, significant disruptions to business operations, supply chains and consumer activity, significant challenges in healthcare service preparation and delivery, quarantines and general concern and uncertainty. These negative impacts have caused significant volatility and declines in global financial markets, which have caused losses for Fund investors during and subsequent to period end. The impact of the COVID-19 pandemic last for an extended period of time, and could result in a substantial economic downturn or recession. Public health crises may exacerbate other pre-existing political, social, economic, market and financial risks. The extent of the impact to the financial performance of the Funds' investments will depend on future developments, including (i) the duration and spread of the outbreak, (ii) the restrictions and advisories, (iii) the effects on the financial markets, and (iv) the effects on the economy overall, all of which are highly uncertain and cannot be predicted.
Interest Rate Risk — The Fund is subject to the risk that the market value of the bonds in its portfolio will fluctuate because of changes in interest rates, changes in the supply of and demand for debt securities, and other market factors. Bond prices generally are linked to the prevailing market interest rates. In general, when interest rates rise, bond prices fall; conversely, when interest rates fall, bond prices rise. The price volatility of a bond also depends on its duration. Generally, the longer the duration of a bond, the greater is its sensitivity to interest rates. To compensate investors for this higher interest rate risk, bonds with longer durations generally offer higher yields than bonds with shorter durations. The ability of an issuer of a debt security to repay principal prior to a security's maturity can increase the security's sensitivity to interest rate changes. Decisions by the U.S. Federal Reserve (also known as the "Fed") regarding interest rate and monetary policy, which can be difficult to predict and sometimes change direction suddenly in response to economic and market events, can have a significant effect on the value of fixed-income securities as well as the overall strength of the U.S. economy. Precise interest rate predictions are difficult to make, and interest rates may change unexpectedly and dramatically in response to extreme changes in market or economic conditions. As a result, the value of fixed income securities may vary widely under certain market conditions.
Decisions by the U.S. Federal Reserve (also known as the "Fed") regarding interest rate and monetary policy, which can be difficult to predict and sometimes change direction suddenly in response to economic and market events, can have a significant effect on the value of fixed-income securities as well as the overall strength of the U.S. economy. Precise interest rate predictions are difficult to make, and interest rates may change unexpectedly and dramatically in response to extreme changes in market or economic conditions. As a result, the value of fixed income securities may vary widely under certain market conditions.
Prepayment and Extension Risk — Mortgage-backed securities make regularly scheduled payments of principal along with interest payments. In addition, mortgagors generally have the option of paying off their mortgages without penalty at any time. For example, when a mortgaged property is sold, the
23
USAA Mutual Funds Trust | Notes to Financial Statements — continued November 30, 2020 | ||||||
(Unaudited)
old mortgage is usually prepaid. Also, when interest rates fall, the mortgagor may refinance the mortgage and prepay the old mortgage. A homeowner's default on the mortgage also may cause a prepayment of the mortgage. This unpredictability of the mortgage's cash flow is called prepayment risk. For the investor, prepayment risk usually means that principal is received at the least opportune time. For example, when interest rates fall, homeowners may find it advantageous to refinance their mortgages and prepay principal. In this case, the investor is forced to reinvest the principal at the current lower rate. On the other hand, when interest rates rise, homeowners generally will not refinance their mortgages and prepayments will fall. This causes the average life of the mortgage to extend and be more sensitive to interest rates, which is called extension risk. In addition, the amount of principal the investor has to invest in these higher interest rates is reduced.
Liquidity Risk — Market developments and other factors, including a general rise in interest rates, have the potential to cause investors to move out of fixed-income securities on a large scale, which may increase redemptions from mutual funds that hold large amounts of fixed-income securities. Such a move, coupled with a reduction in the ability or willingness of dealers and other institutional investors to buy or hold fixed-income securities, may result n decreased liquidity and increased volatility in the fixed-income markets. Heavy redemptions of fixed-income mutual funds and decreased liquidity from fixed-income securities could hurt the Fund's performance.
In addition, significant securities market disruptions related to outbreaks of the coronavirus disease ("COVID-19") have led to dislocation in the market for a variety of fixed-income securities (including municipal obligations), which has decreased liquidity and sharply reduced returns.
LIBOR Discontinuation Risk — Many debt securities, derivatives and other financial instruments, including some of the Fund's investments, use the London Interbank Offered Rate ("LIBOR") as the reference or benchmark rate for variable interest rate calculations. However, the use of LIBOR started to come under pressure following manipulation allegations in 2012. Despite increased regulation and other corrective actions since that time, concerns have arisen regarding its viability as a benchmark, due largely to reduced activity in the financial markets that it measures. In June 2017, the Alternative Reference Rates Committee, a group of large U.S. banks working with the Federal Reserve, announced its selection of a new Secured Overnight Funding Rate ("SOFR"), which is intended to be a broad measure of secured overnight U.S. Treasury repo rates, as an appropriate replacement for LIBOR. The Federal Reserve Bank of New York began publishing the SOFR in 2018, expecting that it could be used on a voluntary basis in new instruments and transactions. Bank working groups and regulators in other countries have suggested other alternatives for their markets, including the Sterling Overnight Interbank Average Rate ("SONIA") in England. In July 2017, the Financial Conduct Authority (the "FCA"), the United Kingdom financial regulatory body, announced that after 2021 it will cease its active encouragement of UK banks to provide the quotations needed to sustain LIBOR. That announcement suggests that LIBOR may cease to be published after that time. For U.S. dollar LIBOR, however, the relevant date may be deferred to June 30, 2023 for the most common tenors (overnight and one, three, six and 12 months). As to those tenors, the LIBOR administrator has published a consultation regarding its intention to cease publication of U.S. dollar LIBOR as of June 30, 2023 (instead of December 31, 2021, as previously expected), apparently based on continued rate submissions from banks. It is expected that there will be enough for market participants to transition to the use of a different benchmark for both new and existing securities and transactions. Various financial industry groups have begun planning for that transition, but there are obstacles to converting certain longer-term securities and transactions to a new benchmark. Transition planning is at an early stage, and neither the effect of the transition process nor its ultimate success can yet be known. Although the foregoing may provide some sense of timing, there is no assurance that LIBOR, or any particular currency and tenor, will continue to be published until any particular date, and it appears highly likely that LIBOR will be discontinued or modified after December 31, 2021 or June 30, 2023, depending on the currency and tenor. The transition process might lead to increased volatility and illiquidity in markets that currently rely on the LIBOR to determine interest rates. It could also lead to a reduction in the value of some LIBOR-based investments and reduce the effectiveness of new hedges placed against existing LIBOR-based instruments. Since the usefulness of LIBOR as a benchmark could deteriorate during the transition period, these effects could occur before the end of 2021.
24
USAA Mutual Funds Trust | Notes to Financial Statements — continued November 30, 2020 | ||||||
(Unaudited)
7. Borrowing and Interfund Lending:
Line of Credit:
For the six months ended November 30, 2020, the Victory Funds Complex participated in a short-term demand note "Line of Credit" agreement with Citibank. The Line of Credit agreement with Citibank was renewed on June 29, 2020 with a termination date of June 28, 2021. Under the agreement with Citibank, the Victory Funds Complex may borrow up to $600 million, of which $300 million is committed and $300 million is uncommitted. $40 million of the Line of Credit is reserved for use by the Victory Floating Rate Fund, another series of the Victory Funds Complex, with Victory Floating Rate Fund paying the related commitment fees for that amount. The purpose of the agreement is to meet temporary or emergency cash needs. For the six months ended November 30, 2020, Citibank received an annual commitment fee of 0.15% on $300 million for providing the Line of Credit. Each fund in the Victory Funds Complex pays a pro-rata portion of the commitment fees plus any interest (one month LIBOR plus one percent) on amounts borrowed. Effective June 29, 2020, under an amended Line of Credit agreement, Citibank will also receive an annual upfront fee of 0.10% on the $300 million committed line of credit. Each fund in the Victory Funds Complex will pay a pro-rata portion of the upfront fee. Interest charged to each Fund during the period, if applicable, is reflected on the Statements of Operations under Line of credit fees.
The Fund had no borrowings under the Line of Credit agreement during the six months ended November 30, 2020.
Interfund Lending:
The Trust and Adviser rely on an exemptive order granted by the SEC in March 2017 (the "Order"), permitting the establishment and operation of an Interfund Lending Facility (the "Facility"). The Facility allows the Fund to directly lend and borrow money to or from any other Fund, that is permitted to participate in the Facility, in the Victory Funds Complex relying upon the Order at rates beneficial to both the borrowing and lending funds. Advances under the Facility are allowed for temporary or emergency purposes. The interfund loan rate is determined, as specified in the Order, by averaging the current repurchase agreement rate and the current bank loan rate. As a Borrower, interest charged to the Fund, if any, during the period is reflected on the Statement of Operations under Interfund lending fees. As a Lender, interest earned by the Fund, if any, during the period is reflected on the Statement of Operations under Income on Interfund lending.
The Fund did not utilize or participate in the Facility during the six months ended November 30, 2020.
8. Federal Income Tax Information:
The Fund intends to declare and distribute any net investment income monthly. Distributable net realized gains, if any, are declared and paid at least annually.
The amounts of dividends from net investment income and distributions from net realized gains (collectively distributions to shareholders) are determined in accordance with federal income tax regulations, which may differ from GAAP. To the extent these "book/tax" differences are permanent in nature (e.g., net operating loss and distribution reclassification), such amounts are reclassified within the components of net assets based on their federal tax-basis treatment; temporary differences (e.g., wash sales) do not require reclassification. To the extent dividends and distributions exceed net investment income and net realized gains for tax purposes, they are reported as distributions of capital.
Net investment losses incurred by the Fund may be reclassified as an offset to capital on the accompanying Statement of Assets and Liabilities.
The tax character of current year distributions paid and the tax basis of the current components of accumulated earnings (deficit) will be determined at the end of the current tax year ending May 31, 2021.
At May 31, 2020, the fund had no capital loss carryforwards, for the federal income tax purposes.
25
USAA Mutual Funds Trust | Supplemental Information November 30, 2020 | ||||||
(Unaudited)
Proxy Voting and Portfolio Holdings Information
Proxy Voting:
Information regarding the policies and procedures the Fund uses to determine how to vote proxies relating to portfolio securities is available without charge, upon request, by calling (800) 539-3863. The information is also included in the Fund's Statement of Additional Information, which is available on the SEC's website at www.sec.gov.
Information relating to how the Fund voted proxies relating to portfolio securities held during the most recent 12 months ended June 30 is available on the SEC's website at www.sec.gov.
Availability of Schedules of Portfolio Investments:
The Trust files a complete list of Schedules of Portfolio Investments with the SEC for the first and third quarter of each fiscal year on Form N-PORT. Form N-PORT is available on the SEC's website at www.sec.gov.
Expense Examples
As a shareholder of the Fund, you may incur two types of costs: (1) transaction costs, including sales charges (loads) on purhcases, and (2) ongoing costs, including management fees and other Fund expenses. These examples are intended to help you understand your ongoing costs (in dollars) of investing in the Fund and to compare these costs with the ongoing costs of investing in other mutual funds.
These examples are based on an investment of $1,000 invested at the beginning of the period and held for the entire period from June 1, 2020 through November 30, 2020.
The Actual Expense figures in the table below provide information about actual account values and actual expenses. You may use the information below, together with the amount you invested, to estimate the expenses that you paid over the period. Simply divide your account value by $1,000 (for example, an $8,600 account value divided by $1,000 = 8.6), then multiply the result by the number in the table under the heading entitled "Actual Expenses Paid During Period" to estimate the expenses you paid on your account during this period.
The Hypothetical Expense figures in the table below provide information about hypothetical account values and hypothetical expenses based on the Fund's actual expense ratio and an assumed rate of return of 5% per year before expenses, which is not the Fund's actual return. The hypothetical account values and expenses may not be used to estimate the actual ending account balance or expenses you paid for the period. You may use this information to compare this 5% hypothetical example with the 5% hypothetical examples that appear in shareholder reports of other funds.
Please note the expenses shown in the table below are meant to highlight your ongoing costs only and do not reflect any transactional costs. If these transactional costs were included, your costs would have been higher.
| Beginning Account Value 6/1/20 | Actual Ending Account Value 11/30/20 | Hypothetical Ending Account Value 11/30/20 | Actual Expenses Paid During Period 6/1/20- 11/30/20* | Hypothetical Expenses Paid During Period 6/1/20- 11/30/20* | Annualized Expense Ratio During Period 6/1/20- 11/30/20 | ||||||||||||||||||||||
Fund Shares | $ | 1,000.00 | $ | 1,005.50 | $ | 1,023.16 | $ | 1.91 | $ | 1.93 | 0.38 | % | |||||||||||||||
Institutional Shares | 1,000.00 | 1,005.90 | 1,023.56 | 1.51 | 1.52 | 0.30 | % | ||||||||||||||||||||
Class A shares | 1,000.00 | 1,004.90 | 1,021.56 | 3.52 | 3.55 | 0.70 | % | ||||||||||||||||||||
Class R6 Shares | 1,000.00 | 1,007.00 | 1,023.56 | 1.51 | 1.52 | 0.30 | % | ||||||||||||||||||||
* Expenses are equal to the average account value multiplied by the Fund's annualized expense ratio multiplied by 183/365 (the number of days in the most recent fiscal half-year divided by the number of days in the fiscal year).
26
Privacy Policy
Protecting the Privacy of Information
The Trust respects your right to privacy. We also know that you expect us to conduct and process your business in an accurate and efficient manner. To do so, we must collect and maintain certain personal information about you. This is the information we collect from you on applications or other forms, and from the transactions you make with us or third parties. It may include your name, address, social security number, account transactions and balances, and information about investment goals and risk tolerance.
We do not disclose any information about you or about former customers to anyone except as permitted or required by law. Specifically, we may disclose the information we collect to companies that perform services on our behalf, such as the transfer agent that processes shareholder accounts and printers and mailers that assist us in the distribution of investor materials. We may also disclose this information to companies that perform marketing services on our behalf. This allows us to continue to offer you Victory investment products and services that meet your investing needs, and to effect transactions that you request or authorize. These companies will use this information only in connection with the services for which we hired them. They are not permitted to use or share this information for any other purpose.
To protect your personal information internally, we permit access only by authorized employees and maintain physical, electronic and procedural safeguards to guard your personal information.*
* You may have received communications regarding information about privacy policies from other financial institutions which gave you the opportunity to "opt-out" of certain information sharing with companies which are not affiliated with that financial institution. The Trust does not share information with other companies for purposes of marketing solicitations for products other than the Trust. Therefore, the Trust does not provide opt-out options to their shareholders.
P.O. Box 182593
Columbus, Ohio 43218-2593

Visit our website at: | Call | ||||||
vcm.com | (800) 235-8396 | ||||||
23414-0121

NOVEMBER 30, 2020
Semi Annual Report
USAA Growth and Tax Strategy Fund
Beginning January 1, 2021, as permitted by regulations adopted by the Securities and Exchange Commission, paper copies of the Fund's shareholder reports may no longer be sent by mail, unless you specifically request paper copies of the reports from the Fund or from your financial intermediary, such as a broker-dealer or bank. Instead, the reports will be made available on VictoryFunds.com, and you will be notified by mail each time a report is posted and provided with a website link to access the report. If you already elected to receive shareholder reports electronically, you will not be affected by this change and you need not take any action.
You may elect to receive shareholder reports and other communications from the Fund or your financial intermediary electronically by notifying your financial intermediary directly, or if you are a shareholder who has an account directly with the Fund, by calling (800) 235-8396 or by submitting your request via email to TA.Processing@FISGlobal.com.
You may elect to receive all future reports in paper free of charge. You can inform the Fund or your financial intermediary that you wish to continue receiving paper copies of your shareholder reports by notifying your financial intermediary directly, or if you are a shareholder who has an account directly with the Fund, by calling (800) 235-8396 or submitting your request via email to TA.Processing@FISGlobal.com.
Your election to receive reports in paper will apply to all funds held with the USAA Mutual Funds or your financial intermediary.
Victory Capital means Victory Capital Management Inc., the investment adviser of the USAA Mutual Funds. USAA Mutual Funds are distributed by Victory Capital Services, Inc., member of FINRA, an affiliate of Victory Capital. Victory Capital and its affiliates are not affiliated with United Services Automobile Association or its affiliates. USAA and the USAA logo are registered trademarks and the USAA Mutual Funds and USAA Investments logos are trademarks of United Services Automobile Association and are being used by Victory Capital and its affiliates under license.
TABLE OF CONTENTS
Investment Objective & Portfolio Holdings | 2 | ||||||
Schedule of Portfolio Investments | 3 | ||||||
Financial Statements | |||||||
Statement of Assets and Liabilities | 26 | ||||||
Statement of Operations | 27 | ||||||
Statements of Changes in Net Assets | 28 | ||||||
Financial Highlights | 30 | ||||||
Notes to Financial Statements | 32 | ||||||
Supplemental Information | 44 | ||||||
Proxy Voting and Portfolio Holdings Information | 44 | ||||||
Expense Examples | 44 | ||||||
Privacy Policy (inside back cover) | |||||||
This report is for the information of the shareholders and others who have received a copy of the currently effective prospectus of the Fund, managed by Victory Capital Management Inc. It may be used as sales literature only when preceded or accompanied by a current prospectus, which provides further details about the Fund.
IRA DISTRIBUTION WITHHOLDING DISCLOSURE
We generally must withhold federal income tax at a rate of 10% of the taxable portion of your distribution and, if you live in a state that requires state income tax withholding, at your state's tax rate. However, you may elect not to have withholding apply or to have income tax withheld at a higher rate. Any withholding election that you make will apply to any subsequent distribution unless and until you change or revoke the election. If you wish to make a withholding election, or change or revoke a prior withholding election, call (800) 235-8396, and form W-4P (OMB No. 1545-0074 withholding certificate for pension or annuity payments) will be electronically sent.
If you do not have a withholding election in place by the date of a distribution, federal income tax will be withheld from the taxable portion of your distribution at a rate of 10%. If you must pay estimated taxes, you may be subject to estimated tax penalties if your estimated tax payments are not sufficient and sufficient tax is not withheld from your distribution.
For more specific information, please consult your tax adviser.
USAA Mutual Funds Trust
1
| USAA Mutual Funds Trust USAA Growth and Tax Strategy Fund | November 30, 2020 | ||||||
(Unaudited)
Investment Objective & Portfolio Holdings:
The Fund's investment objective is to seek a conservative balance for the investor between income, the majority of which is exempt from federal income tax, and the potential for long-term growth of capital to preserve purchasing power.
Top 10 Sectors
November 30, 2020
(% of Net Assets)
Information Technology | 13.1 | % | |||||
Health Care | 6.4 | % | |||||
Consumer Discretionary | 5.5 | % | |||||
Communication Services | 5.2 | % | |||||
Financials | 5.1 | % | |||||
Industrials | 4.3 | % | |||||
Consumer Staples | 3.2 | % | |||||
Utilities | 1.4 | % | |||||
Materials | 1.3 | % | |||||
Real Estate | 1.2 | % | |||||
Top 5 Tax-Exempt Bonds
November 30, 2020
(% of Net Assets)
Illinois Finance Authority Revenue | 1.7 | % | |||||
Massachusetts Development Finance Agency Revenue | 1.6 | % | |||||
Port of Port Arthur Navigation District Revenue | 1.3 | % | |||||
New Jersey Economic Development Authority Revenue | 1.2 | % | |||||
Pennsylvania Turnpike Commission Revenue | 0.7 | % | |||||
Top 5 Blue Chip Stocks
November 30, 2020
(% of Net Assets)
Apple, Inc. | 3.1 | % | |||||
Microsoft Corp. | 2.6 | % | |||||
Amazon.com, Inc. | 2.2 | % | |||||
Facebook, Inc. Class A | 1.0 | % | |||||
Alphabet, Inc. Class A | 0.8 | % | |||||
Refer to the Schedule of Portfolio Investments for a complete list of securities.
2
| USAA Mutual Funds Trust USAA Growth and Tax Strategy Fund | Schedule of Portfolio Investments November 30, 2020 | ||||||
(Amounts in Thousands, Except for Shares) (Unaudited)
Security Description | Shares | Value | |||||||||
Common Stocks (47.8%) | |||||||||||
Blue Chip Stocks (47.8%): | |||||||||||
Communication Services (5.2%): | |||||||||||
Activision Blizzard, Inc. | 9,016 | $ | 717 | ||||||||
Alphabet, Inc. Class A (a) | 3,091 | 5,423 | |||||||||
Alphabet, Inc. Class C (a) | 3,047 | 5,365 | |||||||||
AT&T, Inc. | 66,942 | 1,925 | |||||||||
CenturyLink, Inc. | 3,226 | 34 | |||||||||
Charter Communications, Inc. Class A (a) | 1,764 | 1,150 | |||||||||
Comcast Corp. Class A | 49,729 | 2,498 | |||||||||
Electronic Arts, Inc. (a) | 2,332 | 298 | |||||||||
Facebook, Inc. Class A (a) | 24,703 | 6,842 | |||||||||
Fox Corp. Class A | 4,287 | 124 | |||||||||
Fox Corp. Class B | 1,992 | 56 | |||||||||
Live Nation Entertainment, Inc. (a) | 1,845 | 121 | |||||||||
Netflix, Inc. (a) | 4,641 | 2,277 | |||||||||
News Corp. Class A | 2,721 | 48 | |||||||||
News Corp. Class B | 1,474 | 26 | |||||||||
Omnicom Group, Inc. | 2,667 | 168 | |||||||||
Take-Two Interactive Software, Inc. (a) | 1,508 | 272 | |||||||||
The Interpublic Group of Cos., Inc. | 4,839 | 108 | |||||||||
The Walt Disney Co. | 19,353 | 2,864 | |||||||||
T-Mobile U.S., Inc. (a) | 5,490 | 730 | |||||||||
Twitter, Inc. (a) | 7,251 | 337 | |||||||||
Verizon Communications, Inc. | 45,085 | 2,724 | |||||||||
ViacomCBS, Inc. Class B | 6,762 | 239 | |||||||||
34,346 | |||||||||||
Consumer Discretionary (5.5%): | |||||||||||
Advance Auto Parts, Inc. | 867 | 128 | |||||||||
Amazon.com, Inc. (a) | 4,538 | 14,377 | |||||||||
Aptiv PLC | 2,354 | 279 | |||||||||
AutoZone, Inc. (a) | 255 | 290 | |||||||||
Best Buy Co., Inc. | 2,415 | 263 | |||||||||
Booking Holdings, Inc. (a) | 441 | 895 | |||||||||
BorgWarner, Inc. | 1,420 | 55 | |||||||||
CarMax, Inc. (a) | 2,090 | 195 | |||||||||
Carnival Corp. | 2,980 | 60 | |||||||||
Chipotle Mexican Grill, Inc. (a) | 325 | 419 | |||||||||
D.R. Horton, Inc. | 3,224 | 240 | |||||||||
Darden Restaurants, Inc. | 1,633 | 176 | |||||||||
Dollar General Corp. | 2,615 | 572 | |||||||||
Dollar Tree, Inc. (a) | 2,580 | 282 | |||||||||
eBay, Inc. | 9,005 | 454 | |||||||||
Etsy, Inc. (a) | 754 | 121 | |||||||||
Expedia Group, Inc. | 1,583 | 197 | |||||||||
Ford Motor Co. | 48,980 | 445 | |||||||||
Garmin Ltd. | 1,580 | 184 | |||||||||
General Motors Co. | 13,698 | 601 | |||||||||
Genuine Parts Co. | 1,110 | 109 | |||||||||
Hanesbrands, Inc. | 4,535 | 64 | |||||||||
See notes to financial statements.
3
| USAA Mutual Funds Trust USAA Growth and Tax Strategy Fund | Schedule of Portfolio Investments — continued November 30, 2020 | ||||||
(Amounts in Thousands, Except for Shares) (Unaudited)
Security Description | Shares | Value | |||||||||
Hasbro, Inc. | 1,600 | $ | 149 | ||||||||
Hilton Worldwide Holdings, Inc. | 3,015 | 312 | |||||||||
L Brands, Inc. | 2,727 | 106 | |||||||||
Las Vegas Sands Corp. (b) | 1,042 | 58 | |||||||||
Leggett & Platt, Inc. | 859 | 37 | |||||||||
Lennar Corp. Class A | 3,093 | 235 | |||||||||
Lennar Corp. Class B | 1 | — | (c) | ||||||||
LKQ Corp. (a) | 3,837 | 135 | |||||||||
Lowe's Cos., Inc. | 7,954 | 1,239 | |||||||||
Marriott International, Inc. Class A | 3,292 | 418 | |||||||||
McDonald's Corp. | 7,378 | 1,604 | |||||||||
MGM Resorts International | 6,448 | 182 | |||||||||
Mohawk Industries, Inc. (a) | 618 | 78 | |||||||||
Newell Brands, Inc. | 4,177 | 89 | |||||||||
NIKE, Inc. Class B | 14,322 | 1,929 | |||||||||
Norwegian Cruise Line Holdings Ltd. (a) (d) | 3,415 | 78 | |||||||||
NVR, Inc. (a) | 38 | 152 | |||||||||
O'Reilly Automotive, Inc. (a) | 961 | 425 | |||||||||
PulteGroup, Inc. | 2,649 | 116 | |||||||||
PVH Corp. | 928 | 74 | |||||||||
Ralph Lauren Corp. | 420 | 36 | |||||||||
Ross Stores, Inc. | 3,683 | 396 | |||||||||
Royal Caribbean Cruises Ltd. | 2,147 | 169 | |||||||||
Starbucks Corp. | 13,706 | 1,343 | |||||||||
Tapestry, Inc. | 3,021 | 86 | |||||||||
Target Corp. (b) | 5,779 | 1,037 | |||||||||
The Gap, Inc. | 2,315 | 49 | |||||||||
The Home Depot, Inc. | 11,626 | 3,225 | |||||||||
The TJX Cos., Inc. | 11,818 | 751 | |||||||||
Tiffany & Co. | 1,361 | 179 | |||||||||
Tractor Supply Co. | 1,578 | 222 | |||||||||
Ulta Beauty, Inc. (a) | 550 | 151 | |||||||||
Under Armour, Inc. Class A (a) | 2,357 | 39 | |||||||||
Under Armour, Inc. Class C (a) | 2,104 | 31 | |||||||||
VF Corp. | 3,213 | 268 | |||||||||
Whirlpool Corp. | 792 | 154 | |||||||||
Wynn Resorts Ltd. | 1,047 | 105 | |||||||||
Yum! Brands, Inc. | 3,711 | 393 | |||||||||
36,456 | |||||||||||
Consumer Staples (3.2%): | |||||||||||
Altria Group, Inc. | 18,982 | 756 | |||||||||
Archer-Daniels-Midland Co. | 6,080 | 303 | |||||||||
Brown-Forman Corp. Class B | 2,315 | 187 | |||||||||
Campbell Soup Co. | 2,319 | 116 | |||||||||
Church & Dwight Co., Inc. | 2,959 | 260 | |||||||||
Colgate-Palmolive Co. | 9,374 | 803 | |||||||||
Conagra Brands, Inc. | 6,489 | 237 | |||||||||
Constellation Brands, Inc. Class A | 1,572 | 324 | |||||||||
Costco Wholesale Corp. | 4,892 | 1,917 | |||||||||
General Mills, Inc. | 6,777 | 412 | |||||||||
See notes to financial statements.
4
| USAA Mutual Funds Trust USAA Growth and Tax Strategy Fund | Schedule of Portfolio Investments — continued November 30, 2020 | ||||||
(Amounts in Thousands, Except for Shares) (Unaudited)
Security Description | Shares | Value | |||||||||
Hormel Foods Corp. | 2,891 | $ | 136 | ||||||||
Kellogg Co. | 2,529 | 162 | |||||||||
Kimberly-Clark Corp. | 2,981 | 415 | |||||||||
Lamb Weston Holdings, Inc. | 1,591 | 115 | |||||||||
McCormick & Co., Inc. | 1,570 | 294 | |||||||||
Molson Coors Beverage Co. Class B | 2,045 | 94 | |||||||||
Mondelez International, Inc. Class A | 16,937 | 973 | |||||||||
Monster Beverage Corp. (a) | 3,965 | 336 | |||||||||
PepsiCo, Inc. | 13,946 | 2,011 | |||||||||
Philip Morris International, Inc. | 16,808 | 1,273 | |||||||||
Sysco Corp. | 5,774 | 412 | |||||||||
The Clorox Co. | 1,652 | 335 | |||||||||
The Coca-Cola Co. | 41,477 | 2,140 | |||||||||
The Estee Lauder Cos., Inc. Class A | 2,324 | 570 | |||||||||
The Hershey Co. | 1,885 | 279 | |||||||||
The J.M. Smucker Co. | 1,064 | 125 | |||||||||
The Kraft Heinz Co. | 6,993 | 230 | |||||||||
The Kroger Co. | 8,771 | 289 | |||||||||
The Procter & Gamble Co. | 25,104 | 3,486 | |||||||||
Tyson Foods, Inc. Class A | 2,142 | 140 | |||||||||
Walgreens Boots Alliance, Inc. | 7,770 | 295 | |||||||||
Walmart, Inc. | 14,299 | 2,185 | |||||||||
21,610 | |||||||||||
Energy (1.1%): | |||||||||||
Baker Hughes Co. | 8,513 | 159 | |||||||||
Cabot Oil & Gas Corp. | 4,945 | 87 | |||||||||
Chevron Corp. | 22,344 | 1,948 | |||||||||
Concho Resources, Inc. | 2,441 | 140 | |||||||||
ConocoPhillips | 13,314 | 527 | |||||||||
Devon Energy Corp. | 4,751 | 67 | |||||||||
Diamondback Energy, Inc. | 2,111 | 84 | |||||||||
EOG Resources, Inc. | 3,683 | 173 | |||||||||
Exxon Mobil Corp. | 35,191 | 1,342 | |||||||||
Halliburton Co. | 9,010 | 150 | |||||||||
Hess Corp. | 2,943 | 139 | |||||||||
HollyFrontier Corp. | 1,850 | 43 | |||||||||
Kinder Morgan, Inc. | 24,162 | 347 | |||||||||
Marathon Oil Corp. | 10,479 | 62 | |||||||||
Marathon Petroleum Corp. | 8,076 | 314 | |||||||||
National Oilwell Varco, Inc. | 4,819 | 59 | |||||||||
Occidental Petroleum Corp. | 1,424 | 22 | |||||||||
ONEOK, Inc. | 5,513 | 198 | |||||||||
Phillips 66 | 2,813 | 170 | |||||||||
Pioneer Natural Resources Co. | 2,039 | 205 | |||||||||
Schlumberger Ltd. | 18,134 | 377 | |||||||||
TechnipFMC PLC | 5,504 | 46 | |||||||||
The Williams Cos., Inc. | 15,877 | 333 | |||||||||
Valero Energy Corp. | 2,568 | 138 | |||||||||
7,130 | |||||||||||
See notes to financial statements.
5
| USAA Mutual Funds Trust USAA Growth and Tax Strategy Fund | Schedule of Portfolio Investments — continued November 30, 2020 | ||||||
(Amounts in Thousands, Except for Shares) (Unaudited)
Security Description | Shares | Value | |||||||||
Financials (5.1%): | |||||||||||
Aflac, Inc. | 6,526 | $ | 287 | ||||||||
American Express Co. | 7,305 | 866 | |||||||||
American International Group, Inc. | 10,693 | 411 | |||||||||
Ameriprise Financial, Inc. | 1,259 | 233 | |||||||||
Aon PLC Class A | 2,698 | 553 | |||||||||
Arthur J. Gallagher & Co. | 2,370 | 274 | |||||||||
Assurant, Inc. | 653 | 84 | |||||||||
Bank of America Corp. | 89,376 | 2,517 | |||||||||
Berkshire Hathaway, Inc. Class B (a) | 19,929 | 4,562 | |||||||||
BlackRock, Inc. Class A | 1,662 | 1,161 | |||||||||
Capital One Financial Corp. | 4,854 | 416 | |||||||||
Cboe Global Markets, Inc. | 439 | 40 | |||||||||
Chubb Ltd. | 5,155 | 762 | |||||||||
Cincinnati Financial Corp. | 1,898 | 145 | |||||||||
Citigroup, Inc. | 23,062 | 1,270 | |||||||||
Citizens Financial Group, Inc. | 5,249 | 171 | |||||||||
CME Group, Inc. | 3,155 | 552 | |||||||||
Comerica, Inc. | 1,808 | 89 | |||||||||
Discover Financial Services | 3,983 | 303 | |||||||||
Everest Re Group Ltd. | 440 | 100 | |||||||||
Fifth Third Bancorp | 8,885 | 225 | |||||||||
First Republic Bank | 833 | 108 | |||||||||
Franklin Resources, Inc. | 3,137 | 69 | |||||||||
Globe Life, Inc. | 1,211 | 113 | |||||||||
Huntington Bancshares, Inc. | 12,687 | 153 | |||||||||
Intercontinental Exchange, Inc. | 5,422 | 572 | |||||||||
Invesco Ltd. | 4,735 | 77 | |||||||||
JPMorgan Chase & Co. | 32,894 | 3,878 | |||||||||
KeyCorp | 12,202 | 189 | |||||||||
Lincoln National Corp. | 1,769 | 84 | |||||||||
Loews Corp. | 3,046 | 128 | |||||||||
M&T Bank Corp. | 1,592 | 185 | |||||||||
MarketAxess Holdings, Inc. | 414 | 223 | |||||||||
Marsh & McLennan Cos., Inc. | 5,030 | 577 | |||||||||
MetLife, Inc. | 8,569 | 396 | |||||||||
Moody's Corp. | 1,624 | 459 | |||||||||
Morgan Stanley | 15,971 | 987 | |||||||||
MSCI, Inc. | 992 | 406 | |||||||||
Nasdaq, Inc. | 1,159 | 148 | |||||||||
Northern Trust Corp. (e) | 1,948 | 181 | |||||||||
People's United Financial, Inc. | 5,272 | 65 | |||||||||
Principal Financial Group, Inc. | 2,476 | 123 | |||||||||
Prudential Financial, Inc. | 4,971 | 376 | |||||||||
Raymond James Financial, Inc. | 1,326 | 121 | |||||||||
Regions Financial Corp. | 9,790 | 149 | |||||||||
S&P Global, Inc. | 2,529 | 890 | |||||||||
State Street Corp. | 3,118 | 220 | |||||||||
SVB Financial Group (a) | 645 | 222 | |||||||||
Synchrony Financial | 6,793 | 207 | |||||||||
See notes to financial statements.
6
| USAA Mutual Funds Trust USAA Growth and Tax Strategy Fund | Schedule of Portfolio Investments — continued November 30, 2020 | ||||||
(Amounts in Thousands, Except for Shares) (Unaudited)
Security Description | Shares | Value | |||||||||
T. Rowe Price Group, Inc. | 2,189 | $ | 314 | ||||||||
The Allstate Corp. | 3,329 | 341 | |||||||||
The Bank of New York Mellon Corp. | 8,002 | 313 | |||||||||
The Charles Schwab Corp. | 15,986 | 780 | |||||||||
The Goldman Sachs Group, Inc. | 3,240 | 747 | |||||||||
The Hartford Financial Services Group, Inc. | 2,900 | 128 | |||||||||
The PNC Financial Services Group, Inc. | 5,395 | 745 | |||||||||
The Progressive Corp. | 6,394 | 557 | |||||||||
The Travelers Cos., Inc. | 3,045 | 395 | |||||||||
Truist Financial Corp. | 14,396 | 668 | |||||||||
U.S. Bancorp | 17,014 | 735 | |||||||||
Unum Group | 2,526 | 56 | |||||||||
W.R. Berkley Corp. | 1,826 | 119 | |||||||||
Wells Fargo & Co. | 35,551 | 972 | |||||||||
Willis Towers Watson PLC | 1,546 | 322 | |||||||||
Zions Bancorp NA | 2,017 | 78 | |||||||||
33,597 | |||||||||||
Health Care (6.4%): | |||||||||||
Abbott Laboratories | 19,358 | 2,095 | |||||||||
AbbVie, Inc. | 18,055 | 1,888 | |||||||||
ABIOMED, Inc. (a) | 568 | 156 | |||||||||
Agilent Technologies, Inc. | 4,127 | 482 | |||||||||
Alexion Pharmaceuticals, Inc. (a) | 2,369 | 289 | |||||||||
Align Technology, Inc. (a) | 809 | 389 | |||||||||
AmerisourceBergen Corp. | 1,410 | 145 | |||||||||
Amgen, Inc. | 6,499 | 1,443 | |||||||||
Anthem, Inc. | 2,715 | 846 | |||||||||
Baxter International, Inc. | 4,622 | 352 | |||||||||
Becton Dickinson & Co. | 2,410 | 566 | |||||||||
Biogen, Inc. (a) | 1,644 | 395 | |||||||||
Bio-Rad Laboratories, Inc. Class A (a) | 83 | 45 | |||||||||
Boston Scientific Corp. (a) | 12,299 | 408 | |||||||||
Bristol-Myers Squibb Co. | 23,723 | 1,480 | |||||||||
Cardinal Health, Inc. | 2,538 | 139 | |||||||||
Catalent, Inc. (a) | 1,060 | 102 | |||||||||
Centene Corp. (a) | 5,336 | 329 | |||||||||
Cerner Corp. | 2,787 | 209 | |||||||||
Cigna Corp. | 3,968 | 830 | |||||||||
CVS Health Corp. | 13,876 | 941 | |||||||||
Danaher Corp. | 6,992 | 1,571 | |||||||||
DaVita, Inc. (a) | 972 | 107 | |||||||||
DENTSPLY SIRONA, Inc. | 2,714 | 138 | |||||||||
DexCom, Inc. (a) | 346 | 111 | |||||||||
Edwards Lifesciences Corp. (a) | 6,150 | 516 | |||||||||
Eli Lilly & Co. | 9,241 | 1,346 | |||||||||
Gilead Sciences, Inc. (b) | 9,078 | 551 | |||||||||
HCA Healthcare, Inc. | 2,625 | 394 | |||||||||
Henry Schein, Inc. (a) | 1,136 | 73 | |||||||||
Hologic, Inc. (a) | 2,574 | 178 | |||||||||
Humana, Inc. | 1,448 | 580 | |||||||||
See notes to financial statements.
7
| USAA Mutual Funds Trust USAA Growth and Tax Strategy Fund | Schedule of Portfolio Investments — continued November 30, 2020 | ||||||
(Amounts in Thousands, Except for Shares) (Unaudited)
Security Description | Shares | Value | |||||||||
IDEXX Laboratories, Inc. (a) | 1,090 | $ | 502 | ||||||||
Illumina, Inc. (a) | 1,608 | 518 | |||||||||
Incyte Corp. (a) | 2,342 | 198 | |||||||||
Intuitive Surgical, Inc. (a) | 1,235 | 897 | |||||||||
IQVIA Holdings, Inc. (a) | 1,890 | 319 | |||||||||
Johnson & Johnson (b) | 25,854 | 3,741 | |||||||||
Laboratory Corp. of America Holdings (a) | 1,063 | 212 | |||||||||
McKesson Corp. | 1,766 | 318 | |||||||||
Medtronic PLC | 12,874 | 1,464 | |||||||||
Merck & Co., Inc. | 25,971 | 2,088 | |||||||||
Mettler-Toledo International, Inc. (a) | 250 | 287 | |||||||||
PerkinElmer, Inc. | 1,398 | 186 | |||||||||
Perrigo Co. PLC | 1,463 | 71 | |||||||||
Pfizer, Inc. | 56,318 | 2,157 | |||||||||
Quest Diagnostics, Inc. | 1,463 | 181 | |||||||||
Regeneron Pharmaceuticals, Inc. (a) | 873 | 450 | |||||||||
ResMed, Inc. | 1,423 | 298 | |||||||||
STERIS PLC | 1,110 | 215 | |||||||||
Stryker Corp. | 3,361 | 784 | |||||||||
Teleflex, Inc. | 536 | 205 | |||||||||
The Cooper Cos., Inc. | 445 | 149 | |||||||||
Thermo Fisher Scientific, Inc. | 4,163 | 1,936 | |||||||||
UnitedHealth Group, Inc. | 10,362 | 3,485 | |||||||||
Universal Health Services, Inc. Class B | 844 | 110 | |||||||||
Varian Medical Systems, Inc. (a) | 1,048 | 182 | |||||||||
Vertex Pharmaceuticals, Inc. (a) | 2,828 | 644 | |||||||||
Viatris, Inc. (a) | 14,599 | 246 | |||||||||
Waters Corp. (a) | 690 | 160 | |||||||||
West Pharmaceutical Services, Inc. | 489 | 135 | |||||||||
Zimmer Biomet Holdings, Inc. | 1,629 | 243 | |||||||||
Zoetis, Inc. | 4,796 | 769 | |||||||||
42,244 | |||||||||||
Industrials (4.3%): | |||||||||||
3M Co. | 7,211 | 1,246 | |||||||||
Alaska Air Group, Inc. | 1,550 | 79 | |||||||||
Allegion PLC | 880 | 100 | |||||||||
American Airlines Group, Inc. (d) | 6,217 | 88 | |||||||||
AMETEK, Inc. | 2,905 | 344 | |||||||||
AO Smith Corp. | 1,795 | 101 | |||||||||
C.H. Robinson Worldwide, Inc. | 1,315 | 124 | |||||||||
Carrier Global Corp. | 8,626 | 328 | |||||||||
Caterpillar, Inc. | 6,025 | 1,046 | |||||||||
Cintas Corp. | 1,066 | 379 | |||||||||
Copart, Inc. (a) | 2,286 | 264 | |||||||||
CSX Corp. | 8,013 | 722 | |||||||||
Cummins, Inc. | 1,364 | 315 | |||||||||
Deere & Co. | 3,919 | 1,025 | |||||||||
Delta Air Lines, Inc. | 7,217 | 291 | |||||||||
Dover Corp. | 1,435 | 175 | |||||||||
Eaton Corp. PLC | 4,316 | 523 | |||||||||
See notes to financial statements.
8
| USAA Mutual Funds Trust USAA Growth and Tax Strategy Fund | Schedule of Portfolio Investments — continued November 30, 2020 | ||||||
(Amounts in Thousands, Except for Shares) (Unaudited)
Security Description | Shares | Value | |||||||||
Emerson Electric Co. | 5,920 | $ | 455 | ||||||||
Equifax, Inc. | 1,334 | 223 | |||||||||
Expeditors International of Washington, Inc. | 1,610 | 144 | |||||||||
Fastenal Co. | 7,647 | 378 | |||||||||
FedEx Corp. | 2,126 | 609 | |||||||||
Flowserve Corp. | 1,627 | 55 | |||||||||
Fortive Corp. | 2,506 | 176 | |||||||||
Fortune Brands Home & Security, Inc. | 1,743 | 146 | |||||||||
General Dynamics Corp. | 1,734 | 259 | |||||||||
General Electric Co. | 94,576 | 963 | |||||||||
Honeywell International, Inc. | 7,574 | 1,545 | |||||||||
Howmet Aerospace, Inc. | 4,857 | 114 | |||||||||
Huntington Ingalls Industries, Inc. | 470 | 75 | |||||||||
IDEX Corp. | 757 | 146 | |||||||||
IHS Markit Ltd. | 3,349 | 333 | |||||||||
Illinois Tool Works, Inc. | 3,048 | 643 | |||||||||
Ingersoll Rand, Inc. (a) (b) | 4,166 | 184 | |||||||||
Jacobs Engineering Group, Inc. | 1,348 | 145 | |||||||||
JB Hunt Transport Services, Inc. | 757 | 102 | |||||||||
Johnson Controls International PLC | 6,676 | 307 | |||||||||
Kansas City Southern | 960 | 179 | |||||||||
L3Harris Technologies, Inc. | 2,683 | 515 | |||||||||
Lockheed Martin Corp. | 2,228 | 813 | |||||||||
Masco Corp. | 2,915 | 156 | |||||||||
Nielsen Holdings PLC | 4,460 | 72 | |||||||||
Norfolk Southern Corp. | 2,789 | 661 | |||||||||
Northrop Grumman Corp. | 1,594 | 482 | |||||||||
Old Dominion Freight Line, Inc. | 1,278 | 260 | |||||||||
Otis Worldwide Corp. | 3,056 | 205 | |||||||||
PACCAR, Inc. | 4,366 | 380 | |||||||||
Parker-Hannifin Corp. | 1,216 | 325 | |||||||||
Pentair PLC | 909 | 47 | |||||||||
Quanta Services, Inc. | 1,704 | 117 | |||||||||
Raytheon Technologies Corp. | 14,809 | 1,062 | |||||||||
Republic Services, Inc. (b) | 2,497 | 242 | |||||||||
Robert Half International, Inc. | 1,284 | 82 | |||||||||
Rockwell Automation, Inc. | 1,436 | 367 | |||||||||
Rollins, Inc. | 1,930 | 110 | |||||||||
Roper Technologies, Inc. | 1,322 | 565 | |||||||||
Snap-on, Inc. | 594 | 105 | |||||||||
Southwest Airlines Co. | 6,366 | 295 | |||||||||
Stanley Black & Decker, Inc. | 1,786 | 329 | |||||||||
Teledyne Technologies, Inc. (a) | 398 | 150 | |||||||||
Textron, Inc. | 2,070 | 93 | |||||||||
The Boeing Co. | 5,849 | 1,232 | |||||||||
Trane Technologies PLC | 2,877 | 421 | |||||||||
TransDigm Group, Inc. | 593 | 344 | |||||||||
Union Pacific Corp. | 7,288 | 1,487 | |||||||||
United Airlines Holdings, Inc. (a) | 3,124 | 141 | |||||||||
United Parcel Service, Inc. Class B | 7,664 | 1,311 | |||||||||
See notes to financial statements.
9
| USAA Mutual Funds Trust USAA Growth and Tax Strategy Fund | Schedule of Portfolio Investments — continued November 30, 2020 | ||||||
(Amounts in Thousands, Except for Shares) (Unaudited)
Security Description | Shares | Value | |||||||||
United Rentals, Inc. (a) | 947 | $ | 215 | ||||||||
Verisk Analytics, Inc. | 1,865 | 370 | |||||||||
W.W. Grainger, Inc. | 582 | 243 | |||||||||
Waste Management, Inc. | 3,869 | 461 | |||||||||
Westinghouse Air Brake Technologies Corp. | 1,745 | 128 | |||||||||
Xylem, Inc. | 1,548 | 149 | |||||||||
28,266 | |||||||||||
Information Technology (13.1%): | |||||||||||
Accenture PLC Class A | 7,266 | 1,810 | |||||||||
Adobe, Inc. (a) | 5,049 | 2,416 | |||||||||
Advanced Micro Devices, Inc. (a) | 12,889 | 1,194 | |||||||||
Akamai Technologies, Inc. (a) | 1,627 | 168 | |||||||||
Amphenol Corp. Class A | 2,992 | 391 | |||||||||
Analog Devices, Inc. | 3,989 | 555 | |||||||||
ANSYS, Inc. (a) | 1,058 | 358 | |||||||||
Apple, Inc. | 171,916 | 20,467 | |||||||||
Applied Materials, Inc. | 10,899 | 899 | |||||||||
Arista Networks, Inc. (a) | 591 | 160 | |||||||||
Autodesk, Inc. (a) | 2,385 | 668 | |||||||||
Automatic Data Processing, Inc. | 4,190 | 729 | |||||||||
Broadcom, Inc. | 4,130 | 1,659 | |||||||||
Broadridge Financial Solutions, Inc. | 1,502 | 221 | |||||||||
Cadence Design Systems, Inc. (a) | 2,583 | 300 | |||||||||
CDW Corp. | 1,572 | 205 | |||||||||
Cisco Systems, Inc. | 44,288 | 1,905 | |||||||||
Citrix Systems, Inc. | 1,327 | 164 | |||||||||
Cognizant Technology Solutions Corp. Class A | 5,526 | 432 | |||||||||
Corning, Inc. | 8,056 | 301 | |||||||||
DXC Technology Co. | 3,194 | 70 | |||||||||
F5 Networks, Inc. (a) | 561 | 91 | |||||||||
Fidelity National Information Services, Inc. | 6,687 | 992 | |||||||||
Fiserv, Inc. (a) | 6,247 | 720 | |||||||||
FleetCor Technologies, Inc. (a) | 223 | 59 | |||||||||
FLIR Systems, Inc. | 1,416 | 54 | |||||||||
Fortinet, Inc. (a) | 1,459 | 180 | |||||||||
Gartner, Inc. (a) | 308 | 47 | |||||||||
Global Payments, Inc. | 3,409 | 665 | |||||||||
Hewlett Packard Enterprise Co. | 12,525 | 138 | |||||||||
HP, Inc. | 13,953 | 306 | |||||||||
Intel Corp. | 42,806 | 2,070 | |||||||||
International Business Machines Corp. | 6,781 | 838 | |||||||||
Intuit, Inc. | 2,547 | 897 | |||||||||
IPG Photonics Corp. (a) | 466 | 96 | |||||||||
Jack Henry & Associates, Inc. | 769 | 124 | |||||||||
Juniper Networks, Inc. | 2,447 | 53 | |||||||||
Keysight Technologies, Inc. (a) | 2,383 | 286 | |||||||||
KLA Corp. | 1,555 | 392 | |||||||||
Lam Research Corp. | 1,595 | 722 | |||||||||
Mastercard, Inc. Class A | 9,019 | 3,035 | |||||||||
Maxim Integrated Products, Inc. | 2,767 | 230 | |||||||||
See notes to financial statements.
10
| USAA Mutual Funds Trust USAA Growth and Tax Strategy Fund | Schedule of Portfolio Investments — continued November 30, 2020 | ||||||
(Amounts in Thousands, Except for Shares) (Unaudited)
Security Description | Shares | Value | |||||||||
Microchip Technology, Inc. | 2,724 | $ | 366 | ||||||||
Micron Technology, Inc. (a) | 10,918 | 700 | |||||||||
Microsoft Corp. (b) | 79,841 | 17,092 | |||||||||
Motorola Solutions, Inc. | 1,485 | 255 | |||||||||
NetApp, Inc. | 2,488 | 133 | |||||||||
NortonLifeLock, Inc. | 1,010 | 18 | |||||||||
NVIDIA Corp. | 6,493 | 3,481 | |||||||||
Oracle Corp. | 23,056 | 1,331 | |||||||||
Paychex, Inc. | 3,191 | 297 | |||||||||
Paycom Software, Inc. (a) | 617 | 257 | |||||||||
PayPal Holdings, Inc. (a) | 12,173 | 2,606 | |||||||||
Qorvo, Inc. (a) | 1,188 | 186 | |||||||||
QUALCOMM, Inc. | 13,436 | 1,977 | |||||||||
salesforce.com, Inc. (a) | 9,408 | 2,312 | |||||||||
Seagate Technology PLC | 2,345 | 138 | |||||||||
ServiceNow, Inc. (a) (b) | 2,007 | 1,073 | |||||||||
Skyworks Solutions, Inc. | 1,128 | 159 | |||||||||
Synopsys, Inc. (a) | 1,398 | 318 | |||||||||
TE Connectivity Ltd. | 3,470 | 395 | |||||||||
Teradyne, Inc. | 945 | 104 | |||||||||
Texas Instruments, Inc. | 8,950 | 1,443 | |||||||||
The Western Union Co. | 3,055 | 69 | |||||||||
Tyler Technologies, Inc. (a) | 280 | 120 | |||||||||
VeriSign, Inc. (a) | 1,070 | 215 | |||||||||
Visa, Inc. Class A | 17,570 | 3,696 | |||||||||
Vontier Corp. (a) | 1,002 | 33 | |||||||||
Western Digital Corp. | 3,265 | 147 | |||||||||
Xerox Holdings Corp. | 2,290 | 50 | |||||||||
Xilinx, Inc. | 3,446 | 502 | |||||||||
Zebra Technologies Corp. (a) | 706 | 267 | |||||||||
86,807 | |||||||||||
Materials (1.3%): | |||||||||||
Air Products & Chemicals, Inc. | 2,193 | 614 | |||||||||
Albemarle Corp. | 1,394 | 190 | |||||||||
Amcor PLC | 17,474 | 198 | |||||||||
Avery Dennison Corp. | 906 | 135 | |||||||||
Ball Corp. | 3,726 | 358 | |||||||||
Celanese Corp. | 1,286 | 166 | |||||||||
CF Industries Holdings, Inc. | 2,763 | 103 | |||||||||
Corteva, Inc. | 8,159 | 313 | |||||||||
Dow, Inc. | 9,091 | 482 | |||||||||
DuPont de Nemours, Inc. | 8,076 | 512 | |||||||||
Eastman Chemical Co. | 1,781 | 174 | |||||||||
Ecolab, Inc. | 2,743 | 609 | |||||||||
FMC Corp. | 1,542 | 179 | |||||||||
Freeport-McMoRan, Inc. | 15,889 | 372 | |||||||||
International Flavors & Fragrances, Inc. (d) | 1,154 | 129 | |||||||||
International Paper Co. | 4,916 | 243 | |||||||||
Linde PLC | 5,503 | 1,411 | |||||||||
LyondellBasell Industries NV Class A | 3,036 | 258 | |||||||||
See notes to financial statements.
11
| USAA Mutual Funds Trust USAA Growth and Tax Strategy Fund | Schedule of Portfolio Investments — continued November 30, 2020 | ||||||
(Amounts in Thousands, Except for Shares) (Unaudited)
Security Description | Shares | Value | |||||||||
Martin Marietta Materials, Inc. | 721 | $ | 192 | ||||||||
Newmont Corp. | 9,032 | 531 | |||||||||
Nucor Corp. | 2,642 | 142 | |||||||||
Packaging Corp. of America | 736 | 96 | |||||||||
PPG Industries, Inc. | 2,183 | 320 | |||||||||
Sealed Air Corp. | 1,340 | 60 | |||||||||
The Mosaic Co. | 4,580 | 101 | |||||||||
The Sherwin-Williams Co. | 964 | 721 | |||||||||
Vulcan Materials Co. | 1,213 | 169 | |||||||||
Westrock Co. | 2,863 | 121 | |||||||||
8,899 | |||||||||||
Real Estate (1.2%): | |||||||||||
Alexandria Real Estate Equities, Inc. | 1,101 | 180 | |||||||||
American Tower Corp. | 4,297 | 993 | |||||||||
AvalonBay Communities, Inc. | 740 | 123 | |||||||||
Boston Properties, Inc. | 1,758 | 173 | |||||||||
CBRE Group, Inc. Class A (a) | 3,167 | 194 | |||||||||
Crown Castle International Corp. | 5,001 | 838 | |||||||||
Digital Realty Trust, Inc. | 2,408 | 324 | |||||||||
Duke Realty Corp. | 4,814 | 183 | |||||||||
Equinix, Inc. | 1,002 | 699 | |||||||||
Equity Residential | 2,215 | 128 | |||||||||
Essex Property Trust, Inc. | 290 | 71 | |||||||||
Extra Space Storage, Inc. | 1,147 | 129 | |||||||||
Federal Realty Investment Trust | 884 | 77 | |||||||||
Healthpeak Properties, Inc. | 4,867 | 140 | |||||||||
Host Hotels & Resorts, Inc. | 8,818 | 124 | |||||||||
Iron Mountain, Inc. | 3,600 | 99 | |||||||||
Kimco Realty Corp. | 5,368 | 78 | |||||||||
Mid-America Apartment Communities, Inc. | 1,273 | 161 | |||||||||
Prologis, Inc. | 9,667 | 967 | |||||||||
Public Storage | 1,221 | 274 | |||||||||
Realty Income Corp. | 3,322 | 199 | |||||||||
SBA Communications Corp. | 1,109 | 319 | |||||||||
Simon Property Group, Inc. | 3,796 | 313 | |||||||||
SL Green Realty Corp. | 909 | 53 | |||||||||
UDR, Inc. | 3,662 | 141 | |||||||||
Ventas, Inc. | 4,666 | 224 | |||||||||
Vornado Realty Trust | 1,992 | 78 | |||||||||
Welltower, Inc. | 4,568 | 288 | |||||||||
Weyerhaeuser Co. | 6,892 | 200 | |||||||||
7,770 | |||||||||||
Utilities (1.4%): | |||||||||||
Alliant Energy Corp. | 3,054 | 161 | |||||||||
Ameren Corp. | 2,468 | 192 | |||||||||
American Electric Power Co., Inc. (b) | 4,535 | 385 | |||||||||
American Water Works Co., Inc. | 2,297 | 352 | |||||||||
CenterPoint Energy, Inc. | 6,318 | 146 | |||||||||
CMS Energy Corp. | 3,607 | 222 | |||||||||
See notes to financial statements.
12
| USAA Mutual Funds Trust USAA Growth and Tax Strategy Fund | Schedule of Portfolio Investments — continued November 30, 2020 | ||||||
(Amounts in Thousands, Except for Shares) (Unaudited)
Security Description | Shares or Principal Amount | Value | |||||||||
Consolidated Edison, Inc. (b) | 4,204 | $ | 321 | ||||||||
Dominion Energy, Inc. | 8,021 | 630 | |||||||||
DTE Energy Co. | 2,162 | 272 | |||||||||
Duke Energy Corp. (b) | 6,693 | 620 | |||||||||
Edison International | 4,086 | 251 | |||||||||
Entergy Corp. | 2,505 | 273 | |||||||||
Evergy, Inc. (b) | 2,450 | 136 | |||||||||
Eversource Energy (b) | 3,443 | 301 | |||||||||
Exelon Corp. | 10,875 | 447 | |||||||||
NextEra Energy, Inc. (b) | 21,424 | 1,577 | |||||||||
NiSource, Inc. | 4,189 | 101 | |||||||||
NRG Energy, Inc. | 2,789 | 91 | |||||||||
PPL Corp. | 8,145 | 231 | |||||||||
Public Service Enterprise Group, Inc. | 6,361 | 371 | |||||||||
Sempra Energy | 2,344 | 299 | |||||||||
The AES Corp. | 6,122 | 125 | |||||||||
The Southern Co. (b) | 12,049 | 721 | |||||||||
WEC Energy Group, Inc. (b) | 4,007 | 380 | |||||||||
Xcel Energy, Inc. (b) | 6,662 | 449 | |||||||||
9,054 | |||||||||||
Total Common Stocks (Cost $115,889) | 316,179 | ||||||||||
Municipal Bonds (50.9%) | |||||||||||
Tax-Exempt Securities (50.9%): | |||||||||||
Alabama (0.2%): | |||||||||||
The Lower Alabama Gas District Revenue, Series A, 5.00%, 9/1/46 | $ | 1,000 | 1,489 | ||||||||
Arizona (1.2%): | |||||||||||
Arizona IDA Revenue, 5.00%, 7/1/47, Continuously Callable @100 | 1,000 | 1,149 | |||||||||
City of Phoenix IDA Revenue, 5.00%, 7/1/46, Continuously Callable @100 | 1,300 | 1,402 | |||||||||
| Maricopa County IDA Revenue Series A, 5.00%, 9/1/42, Continuously Callable @100 | 500 | 613 | |||||||||
Series A, 5.00%, 7/1/49, Continuously Callable @100 | 1,000 | 1,195 | |||||||||
Series A, 5.00%, 7/1/54, Continuously Callable @100 | 1,275 | 1,519 | |||||||||
Pima County IDA Revenue, 5.00%, 6/15/47, Continuously Callable @100 (f) | 1,000 | 1,012 | |||||||||
| Student & Academic Services LLC Revenue, 5.00%, 6/1/44, Continuously Callable @100 | 1,000 | 1,117 | |||||||||
8,007 | |||||||||||
Arkansas (0.2%): | |||||||||||
| Arkansas Development Finance Authority Revenue, 4.00%, 12/1/44, Continuously Callable @100 | 1,000 | 1,128 | |||||||||
California (2.2%): | |||||||||||
| California Statewide Communities Development Authority Revenue (INS — Assured Guaranty Municipal Corp.), 5.00%, 11/15/49, Pre-refunded 11/15/24 @ 100 | 1,000 | 1,187 | |||||||||
| Jurupa Public Financing Authority Special Tax, Series A, 5.00%, 9/1/42, Continuously Callable @100 | 1,200 | 1,344 | |||||||||
| Monterey Peninsula Unified School District, GO (INS — Assured Guaranty Municipal Corp.), Series A, 5.50%, 8/1/34, Pre-refunded 8/1/21 @ 100 | 2,000 | 2,071 | |||||||||
See notes to financial statements.
13
| USAA Mutual Funds Trust USAA Growth and Tax Strategy Fund | Schedule of Portfolio Investments — continued November 30, 2020 | ||||||
(Amounts in Thousands, Except for Shares) (Unaudited)
Security Description | Principal Amount | Value | |||||||||
| State of California, GO 5.00%, 2/1/43, Continuously Callable @100 | $ | 1,000 | $ | 1,090 | |||||||
5.00%, 8/1/45, Continuously Callable @100 | 1,000 | 1,181 | |||||||||
| Sutter Butte Flood Agency Special Assessment (INS — Build America Mutual Assurance Co.), 5.00%, 10/1/40, Continuously Callable @100 | 1,000 | 1,177 | |||||||||
| Twin Rivers Unified School District, GO (INS — Build America Mutual Assurance Co.), Series A, 5.00%, 8/1/40, Pre-refunded 2/1/24 @ 100 | 1,500 | 1,722 | |||||||||
| Val Verde Unified School District, GO (INS — Build America Mutual Assurance Co.), Series B, 5.00%, 8/1/44, Continuously Callable @100 | 1,000 | 1,179 | |||||||||
| West Contra Costa Unified School District, GO (INS — National Public Finance Guarantee Corp.), 8/1/34 (g) | 4,435 | 3,482 | |||||||||
14,433 | |||||||||||
Colorado (1.9%): | |||||||||||
| Colorado Educational & Cultural Facilities Authority Revenue 5.00%, 12/1/38, Continuously Callable @100 | 1,000 | 1,205 | |||||||||
5.00%, 4/1/48, Continuously Callable @100 | 710 | 826 | |||||||||
| Colorado Health Facilities Authority Revenue, 4.00%, 12/1/50, Continuously Callable @103 | 1,000 | 1,100 | |||||||||
| Colorado Health Facilities Authority Revenue 5.00%, 12/1/42, Pre-refunded 6/1/22 @ 100 | 1,000 | 1,072 | |||||||||
5.00%, 6/1/45, Pre-refunded 6/1/25 @ 100 | 1,000 | 1,213 | |||||||||
Series A, 4.00%, 9/1/50, Continuously Callable @100 | 1,000 | 1,112 | |||||||||
| Denver Convention Center Hotel Authority Revenue, 5.00%, 12/1/40, Continuously Callable @100 | 1,000 | 1,073 | |||||||||
| Denver Health & Hospital Authority Certificate of Participation, 5.00%, 12/1/48, Continuously Callable @100 | 1,900 | 2,178 | |||||||||
| Park Creek Metropolitan District Revenue 5.00%, 12/1/41, Continuously Callable @100 | 250 | 290 | |||||||||
5.00%, 12/1/45, Continuously Callable @100 | 1,000 | 1,153 | |||||||||
| Rampart Range Metropolitan District No. 1 Revenue (INS — Assured Guaranty Municipal Corp.), 5.00%, 12/1/47, Continuously Callable @100 | 1,000 | 1,204 | |||||||||
12,426 | |||||||||||
Connecticut (0.7%): | |||||||||||
| Connecticut State Health & Educational Facilities Authority Revenue, Series T, 4.00%, 7/1/55, Continuously Callable @100 | 1,000 | 1,126 | |||||||||
Mashantucket Western Pequot Tribe Revenue PIK, 2.05%, 7/1/31 (h) (j) | 4,914 | 172 | |||||||||
| State of Connecticut, GO Series A, 5.00%, 4/15/36, Continuously Callable @100 | 1,500 | 1,905 | |||||||||
Series A, 5.00%, 4/15/37, Continuously Callable @100 | 1,000 | 1,240 | |||||||||
4,443 | |||||||||||
District of Columbia (0.2%): | |||||||||||
District of Columbia Revenue, 5.00%, 7/1/42, Continuously Callable @100 | 1,100 | 1,157 | |||||||||
Florida (3.0%): | |||||||||||
| Capital Trust Agency, Inc. Revenue 5.00%, 8/1/40, Continuously Callable @100 | 300 | 352 | |||||||||
5.00%, 8/1/55, Continuously Callable @100 | 400 | 458 | |||||||||
| City of Atlantic Beach Revenue, Series A, 5.00%, 11/15/53, Continuously Callable @103 | 1,000 | 1,082 | |||||||||
See notes to financial statements.
14
| USAA Mutual Funds Trust USAA Growth and Tax Strategy Fund | Schedule of Portfolio Investments — continued November 30, 2020 | ||||||
(Amounts in Thousands, Except for Shares) (Unaudited)
Security Description | Principal Amount | Value | |||||||||
City of Jacksonville Revenue, 5.00%, 10/1/29, Continuously Callable @100 | $ | 1,000 | $ | 1,081 | |||||||
City of Pompano Beach Revenue, 4.00%, 9/1/50, Continuously Callable @103 | 1,500 | 1,544 | |||||||||
| County of Escambia Revenue 0.15%, 7/1/22 (i) | 1,100 | 1,100 | |||||||||
0.12%, 4/1/39, Continuously Callable @100 (i) | 1,100 | 1,100 | |||||||||
County of Jackson Revenue, 0.15%, 7/1/22, Continuously Callable @100 (i) | 230 | 230 | |||||||||
| County of Polk Florida Utility System Revenue, 4.00%, 10/1/43, Continuously Callable @100 | 2,000 | 2,431 | |||||||||
| Halifax Hospital Medical Center Revenue, 5.00%, 6/1/46, Continuously Callable @100 | 1,000 | 1,124 | |||||||||
Lee County IDA Revenue, 5.50%, 10/1/47, Pre-refunded 10/1/22 @ 102 | 645 | 719 | |||||||||
| Lee Memorial Health System Revenue, Series A-1, 5.00%, 4/1/44, Continuously Callable @100 | 1,450 | 1,759 | |||||||||
| Putnam County Development Authority Revenue, 0.14%, 9/1/24, Continuously Callable @100 (i) | 2,000 | 2,000 | |||||||||
| Sarasota County Health Facilities Authority Revenue, 5.00%, 5/15/38, Continuously Callable @103 | 700 | 763 | |||||||||
| Southeast Overtown Park West Community Redevelopment Agency Tax Allocation, Series A-1, 5.00%, 3/1/30, Continuously Callable @100 (f) | 1,000 | 1,103 | |||||||||
| Tampa-Hillsborough County Expressway Authority Revenue, Series A, 5.00%, 7/1/37, Pre-refunded 7/1/22 @ 100 | 1,505 | 1,617 | |||||||||
| Volusia County Educational Facility Authority Revenue, Series B, 5.00%, 10/15/45, Pre-refunded 4/15/25 @ 100 | 1,000 | 1,202 | |||||||||
19,665 | |||||||||||
Georgia (2.2%): | |||||||||||
| Appling County Development Authority Revenue (NBGA — Southern Co.), 0.17%, 9/1/41, Continuously Callable @100 (i) | 3,900 | 3,900 | |||||||||
| Gainesville & Hall County Hospital Authority Revenue, 4.00%, 2/15/45, Continuously Callable @100 | 2,000 | 2,303 | |||||||||
| Glynn-Brunswick Memorial Hospital Authority Revenue, 5.00%, 8/1/47, Continuously Callable @100 | 1,000 | 1,154 | |||||||||
| The Burke County Development Authority Revenue (NBGA — Southern Co.), 0.18%, 11/1/52, Continuously Callable @100 (i) | 1,600 | 1,600 | |||||||||
The Monroe County Development Authority Revenue, 0.15%, 6/1/49 (i) | 1,625 | 1,625 | |||||||||
| Valdosta Housing Authority Revenue (LIQ — Deutsche Bank A.G.), Series 2020-XF1089, 0.46%, 4/1/60, Callable 4/1/35 @ 100 (f) (i) | 3,900 | 3,900 | |||||||||
14,482 | |||||||||||
Guam (0.3%): | |||||||||||
| Antonio B Won Pat International Airport Authority Revenue (INS — Assured Guaranty Municipal Corp.), 5.50%, 10/1/33, Continuously Callable @100 | 750 | 842 | |||||||||
| Guam Government Waterworks Authority Revenue, 5.50%, 7/1/43, Pre-refunded 7/1/23 @ 100 | 1,000 | 1,134 | |||||||||
1,976 | |||||||||||
Illinois (4.8%): | |||||||||||
| Bureau County Township High School District No. 502, GO (INS — Build America Mutual Assurance Co.), Series A, 5.00%, 12/1/37, Continuously Callable @100 | 1,000 | 1,206 | |||||||||
| Chicago Board of Education, GO (LIQ — Deutsche Bank A.G.), Series 2017-XM0188, 0.41%, 12/1/39, Callable 12/1/21 @ 100 (f) (i) | 1,000 | 1,000 | |||||||||
See notes to financial statements.
15
| USAA Mutual Funds Trust USAA Growth and Tax Strategy Fund | Schedule of Portfolio Investments — continued November 30, 2020 | ||||||
(Amounts in Thousands, Except for Shares) (Unaudited)
Security Description | Principal Amount | Value | |||||||||
| Chicago Midway International Airport Revenue, Series B, 5.00%, 1/1/41, Continuously Callable @100 | $ | 1,000 | $ | 1,153 | |||||||
| Chicago O'Hare International Airport Revenue, Series C, 5.00%, 1/1/41, Continuously Callable @100 | 1,000 | 1,179 | |||||||||
| Chicago O'Hare International Airport Revenue (INS — Assured Guaranty Municipal Corp.), 5.25%, 1/1/33, Continuously Callable @100 | 1,000 | 1,060 | |||||||||
Chicago Park District, GO, Series C, 4.00%, 1/1/42, Continuously Callable @100 | 1,250 | 1,367 | |||||||||
| Chicago Transit Authority Sales Tax Receipts Fund Revenue, Series A, 4.00%, 12/1/55, Continuously Callable @100 | 2,000 | 2,186 | |||||||||
| City of Chicago Wastewater Transmission Revenue 5.00%, 1/1/44, Continuously Callable @100 | 1,000 | 1,091 | |||||||||
Series A, 5.00%, 1/1/47, Continuously Callable @100 | 1,000 | 1,153 | |||||||||
| City of Chicago Waterworks Revenue, 5.00%, 11/1/44, Continuously Callable @100 | 1,000 | 1,137 | |||||||||
| Cook County Community College District No. 508, GO (INS — Build America Mutual Assurance Co.), 5.00%, 12/1/47, Continuously Callable @100 | 1,000 | 1,164 | |||||||||
County of Cook Sales Tax Revenue, 5.00%, 11/15/38, Continuously Callable @100 | 1,000 | 1,185 | |||||||||
| Illinois Educational Facilities Authority Revenue, 4.00%, 11/1/36, Continuously Callable @102 | 1,000 | 1,139 | |||||||||
| Illinois Finance Authority Revenue 3.90%, 3/1/30, Continuously Callable @100 | 1,000 | 1,114 | |||||||||
5.00%, 5/15/37, Continuously Callable @100 | 1,000 | 1,073 | |||||||||
5.00%, 5/15/40, Continuously Callable @100 | 1,275 | 1,351 | |||||||||
5.00%, 8/15/44, Continuously Callable @100 | 1,000 | 1,126 | |||||||||
5.00%, 10/1/44, Continuously Callable @100 | 1,000 | 1,202 | |||||||||
5.00%, 5/15/45, Continuously Callable @100 | 1,000 | 1,050 | |||||||||
Series A, 6.00%, 10/1/32, Pre-refunded 4/1/21 @ 100 | 2,000 | 2,038 | |||||||||
Series A, 4.00%, 10/1/40, Continuously Callable @100 | 1,000 | 1,108 | |||||||||
Series C, 4.00%, 2/15/41, Continuously Callable @100 | 955 | 1,073 | |||||||||
Series C, 4.00%, 2/15/41, Pre-refunded 2/15/27 @ 100 | 45 | 55 | |||||||||
| Northern Illinois Municipal Power Agency Revenue, Series A, 4.00%, 12/1/41, Continuously Callable @100 | 1,000 | 1,119 | |||||||||
| Northern Illinois University Revenue (INS — Build America Mutual Assurance Co.), Series B, 4.00%, 4/1/40, Continuously Callable @100 | 600 | 665 | |||||||||
| Sangamon County Water Reclamation District, GO Series A, 4.00%, 1/1/49, Continuously Callable @100 | 1,000 | 1,144 | |||||||||
Series A, 5.75%, 1/1/53, Continuously Callable @100 | 1,235 | 1,496 | |||||||||
State of Illinois, GO, 5.50%, 5/1/39, Continuously Callable @100 | 225 | 250 | |||||||||
31,884 | |||||||||||
Indiana (0.7%): | |||||||||||
| Evansville Redevelopment Authority Revenue (INS — Build America Mutual Assurance Co.), 4.00%, 2/1/39, Continuously Callable @100 | 1,000 | 1,114 | |||||||||
| Indiana Finance Authority Revenue 5.00%, 2/1/40, Continuously Callable @100 | 1,000 | 1,089 | |||||||||
5.00%, 10/1/44, Pre-refunded 10/1/23 @ 100 | 1,000 | 1,059 | |||||||||
| Richmond Hospital Authority Revenue, 5.00%, 1/1/39, Continuously Callable @100 | 1,500 | 1,700 | |||||||||
4,962 | |||||||||||
See notes to financial statements.
16
| USAA Mutual Funds Trust USAA Growth and Tax Strategy Fund | Schedule of Portfolio Investments — continued November 30, 2020 | ||||||
(Amounts in Thousands, Except for Shares) (Unaudited)
Security Description | Principal Amount | Value | |||||||||
Kansas (1.0%): | |||||||||||
| City of Coffeyville Electric System Revenue (INS — National Public Finance Guarantee Corp.), Series B, 5.00%, 6/1/42, Pre-refunded 6/1/25 @ 100 (f) | $ | 1,000 | $ | 1,210 | |||||||
City of Lawrence Revenue, 5.00%, 7/1/43, Continuously Callable @100 | 1,500 | 1,809 | |||||||||
City of Wichita Revenue, 4.63%, 9/1/33, Continuously Callable @100 | 1,000 | 1,012 | |||||||||
| Wyandotte County-Kansas City Unified Government Utility System Revenue Series A, 5.00%, 9/1/44, Continuously Callable @100 | 1,250 | 1,421 | |||||||||
Series A, 5.00%, 9/1/45, Continuously Callable @100 | 1,000 | 1,162 | |||||||||
6,614 | |||||||||||
Kentucky (0.5%): | |||||||||||
City of Ashland Revenue, 5.00%, 2/1/40, Continuously Callable @100 | 1,000 | 1,093 | |||||||||
| Kentucky Economic Development Finance Authority Revenue, 5.00%, 5/15/46, Continuously Callable @100 | 1,000 | 1,000 | |||||||||
| Kentucky Economic Development Finance Authority Revenue (INS — Assured Guaranty Municipal Corp.), Series A, 5.00%, 12/1/45, Continuously Callable @100 | 1,000 | 1,180 | |||||||||
3,273 | |||||||||||
Louisiana (2.7%): | |||||||||||
| City of Shreveport Water & Sewer Revenue 5.00%, 12/1/40, Continuously Callable @100 | 1,000 | 1,164 | |||||||||
Series B, 4.00%, 12/1/44, Continuously Callable @100 | 500 | 569 | |||||||||
| City of Shreveport Water & Sewer Revenue (INS — Build America Mutual Assurance Co.), Series C, 5.00%, 12/1/39, Continuously Callable @100 | 1,000 | 1,150 | |||||||||
| Jefferson Sales Tax District Revenue, Series B, 4.00%, 12/1/42, Continuously Callable @100 | 1,500 | 1,773 | |||||||||
| Louisiana Local Government Environmental Facilities & Community Development Authority Revenue (INS — Assured Guaranty Municipal Corp.) 5.00%, 10/1/39, Continuously Callable @100 | 1,000 | 1,187 | |||||||||
5.00%, 10/1/43, Continuously Callable @100 | 1,000 | 1,171 | |||||||||
4.00%, 10/1/46, Continuously Callable @100 | 1,000 | 1,086 | |||||||||
| Louisiana Public Facilities Authority Revenue 5.00%, 11/1/45, Pre-refunded 11/1/25 @ 100 | 1,000 | 1,229 | |||||||||
5.00%, 7/1/52, Continuously Callable @100 | 1,000 | 1,146 | |||||||||
4.00%, 1/1/56, Continuously Callable @100 | 1,000 | 1,065 | |||||||||
| Louisiana Public Facilities Authority Revenue (INS — Build America Mutual Assurance Co.), 5.25%, 6/1/51, Continuously Callable @100 | 1,000 | 1,159 | |||||||||
| Parish of East Baton Rouge Capital Improvements District Revenue, 4.00%, 8/1/44, Continuously Callable @100 | 1,400 | 1,647 | |||||||||
| Parish of St. James Revenue, Series A-1, 0.18%, 11/1/40, Continuously Callable @100 (i) | 1,000 | 1,000 | |||||||||
| State of Louisiana Gasoline & Fuels Tax Revenue, Series C, 5.00%, 5/1/45, Continuously Callable @100 | 1,500 | 1,802 | |||||||||
| Tobacco Settlement Financing Corp. Revenue, Series A, 5.25%, 5/15/35, Continuously Callable @100 | 1,000 | 1,094 | |||||||||
18,242 | |||||||||||
Maine (0.1%): | |||||||||||
| Maine Health & Higher Educational Facilities Authority Revenue, Series A, 4.00%, 7/1/46, Continuously Callable @100 | 1,000 | 1,020 | |||||||||
See notes to financial statements.
17
| USAA Mutual Funds Trust USAA Growth and Tax Strategy Fund | Schedule of Portfolio Investments — continued November 30, 2020 | ||||||
(Amounts in Thousands, Except for Shares) (Unaudited)
Security Description | Principal Amount | Value | |||||||||
Maryland (0.2%): | |||||||||||
| Maryland Health & Higher Educational Facilities Authority Revenue, 4.00%, 7/1/45, Continuously Callable @100 | $ | 1,100 | $ | 1,234 | |||||||
Massachusetts (1.6%): | |||||||||||
| Massachusetts Development Finance Agency Revenue 5.00%, 4/15/40, Continuously Callable @100 | 1,000 | 1,086 | |||||||||
5.25%, 11/15/41, Continuously Callable @100 | 1,000 | 1,111 | |||||||||
5.00%, 7/1/46, Continuously Callable @100 | 1,000 | 1,143 | |||||||||
5.00%, 10/1/57, Continuously Callable @105 (f) | 1,000 | 1,042 | |||||||||
Series A, 5.00%, 6/1/39, Continuously Callable @100 | 1,000 | 1,198 | |||||||||
Series A, 5.50%, 7/1/44, Continuously Callable @100 | 1,000 | 935 | |||||||||
Series A, 5.00%, 7/1/44, Continuously Callable @100 | 1,600 | 1,895 | |||||||||
Series D, 5.00%, 7/1/44, Continuously Callable @100 | 1,000 | 1,111 | |||||||||
Series F, 5.75%, 7/15/43, Continuously Callable @100 | 1,000 | 1,037 | |||||||||
10,558 | |||||||||||
Michigan (1.6%): | |||||||||||
| City of Wyandotte Electric System Revenue (INS — Build America Mutual Assurance Co.), Series A, 5.00%, 10/1/44, Continuously Callable @100 | 1,000 | 1,154 | |||||||||
| Detroit Downtown Development Authority Tax Allocation (INS — Assured Guaranty Municipal Corp.), 5.00%, 7/1/43, Continuously Callable @100 | 1,750 | 1,965 | |||||||||
| Jackson Public Schools, GO (NBGA — Michigan School Bond Qualification & Loan Program), 5.00%, 5/1/42, Continuously Callable @100 | 1,000 | 1,239 | |||||||||
| Karegnondi Water Authority Revenue, 5.00%, 11/1/41, Continuously Callable @100 | 1,000 | 1,208 | |||||||||
| Lincoln Consolidated School District, GO (INS — Assured Guaranty Municipal Corp.), Series A, 5.00%, 5/1/40, Continuously Callable @100 | 1,250 | 1,468 | |||||||||
| Livonia Public Schools, GO (INS — Assured Guaranty Municipal Corp.), 5.00%, 5/1/45, Continuously Callable @100 | 1,000 | 1,192 | |||||||||
Michigan Finance Authority Revenue, 4.00%, 9/1/45, Continuously Callable @100 | 1,000 | 1,110 | |||||||||
| Wayne County Airport Authority Revenue, 5.00%, 12/1/44, Continuously Callable @100 | 1,000 | 1,118 | |||||||||
10,454 | |||||||||||
Minnesota (0.4%): | |||||||||||
| Housing & Redevelopment Authority Revenue 5.00%, 11/15/44, Pre-refunded 11/15/25 @ 100 | 1,000 | 1,228 | |||||||||
5.00%, 11/15/47, Continuously Callable @100 | 1,000 | 1,173 | |||||||||
2,401 | |||||||||||
Missouri (0.8%): | |||||||||||
| Health & Educational Facilities Authority of the State of Missouri Revenue, 4.00%, 2/1/48, Continuously Callable @100 | 1,500 | 1,576 | |||||||||
| Health & Educational Facilities Authority Revenue 5.00%, 8/1/45, Continuously Callable @100 | 1,270 | 1,328 | |||||||||
4.00%, 2/15/49, Continuously Callable @100 | 250 | 280 | |||||||||
| St. Louis Municipal Finance Corp. Revenue (INS — Assured Guaranty Municipal Corp.), 5.00%, 10/1/38, Continuously Callable @100 | 1,000 | 1,188 | |||||||||
| St. Louis Municipal Finance Corp. Revenue (INS — Assured Guaranty Municipal Corp.), 5.00%, 10/1/49, Continuously Callable @100 | 1,000 | 1,236 | |||||||||
5,608 | |||||||||||
See notes to financial statements.
18
| USAA Mutual Funds Trust USAA Growth and Tax Strategy Fund | Schedule of Portfolio Investments — continued November 30, 2020 | ||||||
(Amounts in Thousands, Except for Shares) (Unaudited)
Security Description | Principal Amount | Value | |||||||||
Nebraska (0.2%): | |||||||||||
| Douglas County Hospital Authority No. 3 Revenue, 5.00%, 11/1/48, Continuously Callable @100 | $ | 1,000 | $ | 1,121 | |||||||
Nevada (0.7%): | |||||||||||
City of Carson City Revenue, 5.00%, 9/1/42, Continuously Callable @100 | 1,000 | 1,155 | |||||||||
| Las Vegas Convention & Visitors Authority Revenue, Series C, 4.00%, 7/1/41, Continuously Callable @100 | 1,555 | 1,686 | |||||||||
| Las Vegas Redevelopment Agency Tax Allocation, 5.00%, 6/15/45, Continuously Callable @100 | 1,500 | 1,666 | |||||||||
4,507 | |||||||||||
New Jersey (2.6%): | |||||||||||
| New Jersey Economic Development Authority Revenue 5.00%, 6/15/29, Continuously Callable @100 | 1,000 | 1,050 | |||||||||
5.00%, 6/15/42, Continuously Callable @100 | 2,000 | 2,258 | |||||||||
5.00%, 6/15/43, Continuously Callable @100 | 1,000 | 1,154 | |||||||||
Series A, 4.00%, 7/1/34, Continuously Callable @100 | 1,000 | 1,061 | |||||||||
Series A, 5.00%, 6/15/47, Continuously Callable @100 | 1,000 | 1,128 | |||||||||
Series B, 5.00%, 6/15/43, Continuously Callable @100 | 1,000 | 1,153 | |||||||||
| New Jersey Economic Development Authority Revenue (INS — Assured Guaranty Municipal Corp.), 5.00%, 6/1/37, Continuously Callable @100 | 500 | 588 | |||||||||
| New Jersey Educational Facilities Authority Revenue, Series B, 5.00%, 9/1/36, Continuously Callable @100 | 1,000 | 1,132 | |||||||||
| New Jersey Educational Facilities Authority Revenue (INS — Assured Guaranty Municipal Corp.), Series C, 4.00%, 7/1/50, Continuously Callable @100 | 1,000 | 1,118 | |||||||||
| New Jersey Health Care Facilities Financing Authority Revenue, 5.00%, 10/1/37, Continuously Callable @100 | 1,000 | 1,130 | |||||||||
| New Jersey Transportation Trust Fund Authority Revenue Series A, 5.00%, 12/15/35, Continuously Callable @100 | 1,000 | 1,181 | |||||||||
Series AA, 5.00%, 6/15/44, Continuously Callable @100 | 1,000 | 1,088 | |||||||||
| South Jersey Transportation Authority LLC Revenue, Series A, 5.00%, 11/1/39, Continuously Callable @100 | 1,250 | 1,387 | |||||||||
| South Jersey Transportation Authority Revenue, Series A, 4.00%, 11/1/50, Continuously Callable @100 | 1,000 | 1,118 | |||||||||
| Tobacco Settlement Financing Corp. Revenue, Series A, 5.25%, 6/1/46, Continuously Callable @100 | 500 | 601 | |||||||||
17,147 | |||||||||||
New Mexico (0.2%): | |||||||||||
| New Mexico Hospital Equipment Loan Council Revenue, Series LA, 5.00%, 7/1/49, Continuously Callable @102 | 1,000 | 1,048 | |||||||||
New York (1.5%): | |||||||||||
| Metropolitan Transportation Authority Revenue Series B-2A, 5.00%, 5/15/21 | 1,000 | 1,010 | |||||||||
Series C, 5.00%, 11/15/42, Continuously Callable @100 | 1,000 | 1,043 | |||||||||
| New York Liberty Development Corp. Revenue 5.25%, 10/1/35 | 630 | 905 | |||||||||
5.50%, 10/1/37 | 1,500 | 2,250 | |||||||||
2.80%, 9/15/69, Continuously Callable @100 | 1,000 | 1,001 | |||||||||
See notes to financial statements.
19
| USAA Mutual Funds Trust USAA Growth and Tax Strategy Fund | Schedule of Portfolio Investments — continued November 30, 2020 | ||||||
(Amounts in Thousands, Except for Shares) (Unaudited)
Security Description | Principal Amount | Value | |||||||||
| New York State Dormitory Authority Revenue, Series A, 4.00%, 9/1/50, Continuously Callable @100 | $ | 2,000 | $ | 2,186 | |||||||
| New York State Dormitory Authority Revenue (INS — AMBAC Assurance Corp.), Series 1, 5.50%, 7/1/40 | 1,205 | 1,848 | |||||||||
10,243 | |||||||||||
North Carolina (0.4%): | |||||||||||
| North Carolina Medical Care Commission Revenue 5.00%, 10/1/35, Continuously Callable @100 | 1,000 | 1,089 | |||||||||
5.00%, 1/1/49, Continuously Callable @104 | 1,500 | 1,604 | |||||||||
2,693 | |||||||||||
North Dakota (0.2%): | |||||||||||
County of Ward Revenue, Series C, 5.00%, 6/1/43, Continuously Callable @100 | 1,000 | 1,133 | |||||||||
Ohio (0.2%): | |||||||||||
County of Warren Revenue, Series A, 4.00%, 7/1/45, Continuously Callable @100 | 735 | 790 | |||||||||
| Southeastern Ohio Port Authority Revenue, 5.00%, 12/1/43, Continuously Callable @100 | 750 | 756 | |||||||||
1,546 | |||||||||||
Oklahoma (0.5%): | |||||||||||
| Comanche County Hospital Authority Revenue, Series A, 5.00%, 7/1/32, Continuously Callable @100 | 1,315 | 1,361 | |||||||||
| Oklahoma Development Finance Authority Revenue, Series B, 5.50%, 8/15/57, Continuously Callable @100 | 1,000 | 1,183 | |||||||||
| Tulsa County Industrial Authority Revenue, 5.25%, 11/15/37, Continuously Callable @102 | 750 | 814 | |||||||||
3,358 | |||||||||||
Oregon (0.4%): | |||||||||||
| Medford Hospital Facilities Authority Revenue, Series A, 4.00%, 8/15/50, Continuously Callable @100 | 1,000 | 1,148 | |||||||||
| Salem Hospital Facility Authority Revenue, 5.00%, 5/15/53, Continuously Callable @102 | 1,250 | 1,347 | |||||||||
2,495 | |||||||||||
Pennsylvania (5.2%): | |||||||||||
| Adams County General Authority Revenue, 4.00%, 8/15/45, Continuously Callable @100 | 1,455 | 1,638 | |||||||||
| Allegheny County Hospital Development Authority Revenue 4.00%, 7/15/39, Continuously Callable @100 | 1,185 | 1,362 | |||||||||
5.00%, 4/1/47, Continuously Callable @100 | 1,000 | 1,176 | |||||||||
| Altoona Area School District, GO (INS — Build America Mutual Assurance Co.), 5.00%, 12/1/48, Continuously Callable @100 | 1,000 | 1,164 | |||||||||
| Berks County IDA Revenue 5.00%, 5/15/43, Continuously Callable @102 | 350 | 376 | |||||||||
5.00%, 11/1/50, Continuously Callable @100 | 1,500 | 1,568 | |||||||||
Bucks County IDA Revenue, 4.00%, 8/15/44, Continuously Callable @100 | 1,000 | 1,115 | |||||||||
| Butler County Hospital Authority Revenue, 5.00%, 7/1/39, Continuously Callable @100 | 1,125 | 1,264 | |||||||||
Canon Mcmillan School District, GO, 4.00%, 6/1/48, Continuously Callable @100 | 1,500 | 1,681 | |||||||||
See notes to financial statements.
20
| USAA Mutual Funds Trust USAA Growth and Tax Strategy Fund | Schedule of Portfolio Investments — continued November 30, 2020 | ||||||
(Amounts in Thousands, Except for Shares) (Unaudited)
Security Description | Principal Amount | Value | |||||||||
Chester County IDA Revenue, 5.00%, 10/1/44, Continuously Callable @100 | $ | 1,000 | $ | 1,067 | |||||||
| Commonwealth Financing Authority Revenue, 5.00%, 6/1/35, Continuously Callable @100 | 1,000 | 1,239 | |||||||||
| Commonwealth of Pennsylvania Certificate of Participation, Series A, 5.00%, 7/1/43, Continuously Callable @100 | 1,000 | 1,200 | |||||||||
County of Lehigh Revenue, 4.00%, 7/1/49, Continuously Callable @100 | 1,000 | 1,127 | |||||||||
| Indiana County Hospital Authority Revenue, Series A, 6.00%, 6/1/39, Continuously Callable @100 | 1,625 | 1,692 | |||||||||
| Lancaster County Hospital Authority Revenue, 5.00%, 11/1/35, Continuously Callable @100 | 1,000 | 1,128 | |||||||||
| Montgomery County IDA Revenue 5.25%, 1/15/45, Continuously Callable @100 | 1,000 | 1,079 | |||||||||
Series C, 4.00%, 11/15/43, Continuously Callable @103 | 600 | 657 | |||||||||
| Northampton County General Purpose Authority Revenue 4.00%, 8/15/40, Continuously Callable @100 | 1,000 | 1,095 | |||||||||
5.00%, 8/15/43, Continuously Callable @100 | 1,000 | 1,198 | |||||||||
| Pennsylvania Turnpike Commission Revenue Series A-1, 5.00%, 12/1/46, Continuously Callable @100 | 1,000 | 1,147 | |||||||||
Series A-1, 5.00%, 12/1/47, Continuously Callable @100 | 1,000 | 1,192 | |||||||||
Series B, 5.00%, 12/1/39, Continuously Callable @100 | 1,000 | 1,224 | |||||||||
Series B, 5.25%, 12/1/44, Continuously Callable @100 | 1,000 | 1,145 | |||||||||
Philadelphia IDA Revenue, 5.00%, 8/1/50, Continuously Callable @100 | 1,050 | 1,198 | |||||||||
| Philadelphia School District, GO, Series A, 5.00%, 9/1/38, Continuously Callable @100 | 1,000 | 1,216 | |||||||||
| Reading School District, GO (INS — Assured Guaranty Municipal Corp.), 5.00%, 3/1/38, Continuously Callable @100 | 1,500 | 1,820 | |||||||||
| School District of Philadelphia, GO, Series F, 5.00%, 9/1/37, Continuously Callable @100 | 1,000 | 1,175 | |||||||||
| Wilkes-Barre Area School District, GO (INS — Build America Mutual Assurance Co.), 4.00%, 4/15/49, Continuously Callable @100 | 1,500 | 1,734 | |||||||||
34,677 | |||||||||||
Puerto Rico (0.1%): | |||||||||||
| Commonwealth of Puerto Rico, GO (INS — Assured Guaranty Municipal Corp.), Series A, 5.00%, 7/1/35, Continuously Callable @100 | 1,000 | 1,047 | |||||||||
Rhode Island (0.2%): | |||||||||||
| Rhode Island Housing & Mortgage Finance Corp. Revenue, Series 15-A, 6.85%, 10/1/24, Continuously Callable @100 | 40 | 40 | |||||||||
| Rhode Island Turnpike & Bridge Authority Revenue, Series A, 5.00%, 10/1/40, Continuously Callable @100 | 1,000 | 1,211 | |||||||||
1,251 | |||||||||||
South Carolina (0.6%): | |||||||||||
| Piedmont Municipal Power Agency Revenue (INS — Assured Guaranty Municipal Corp.), Series D, 5.75%, 1/1/34, Continuously Callable @100 | 2,000 | 2,060 | |||||||||
| South Carolina Jobs-Economic Development Authority Revenue 5.00%, 11/15/47, Continuously Callable @103 | 1,000 | 1,127 | |||||||||
4.00%, 4/1/49, Continuously Callable @103 | 620 | 617 | |||||||||
3,804 | |||||||||||
See notes to financial statements.
21
| USAA Mutual Funds Trust USAA Growth and Tax Strategy Fund | Schedule of Portfolio Investments — continued November 30, 2020 | ||||||
(Amounts in Thousands, Except for Shares) (Unaudited)
Security Description | Principal Amount | Value | |||||||||
Tennessee (0.8%): | |||||||||||
| Greeneville Health & Educational Facilities Board Revenue, 5.00%, 7/1/37, Continuously Callable @100 | $ | 1,500 | $ | 1,791 | |||||||
| Metropolitan Government Nashville & Davidson County Health & Educational Facilities Board Revenue 5.00%, 10/1/45, Continuously Callable @100 | 1,000 | 1,080 | |||||||||
5.00%, 7/1/46, Continuously Callable @100 | 1,000 | 1,155 | |||||||||
5.00%, 10/1/48, Continuously Callable @100 | 500 | 527 | |||||||||
| The Metropolitan Nashville Airport Authority Revenue, Series A, 4.00%, 7/1/49, Continuously Callable @100 | 1,000 | 1,123 | |||||||||
5,676 | |||||||||||
Texas (8.0%): | |||||||||||
| Arlington Higher Education Finance Corp. Revenue (NBGA — Texas Permanent School Fund), 4.00%, 8/15/44, Continuously Callable @100 | 2,165 | 2,572 | |||||||||
| Austin Convention Enterprises, Inc. Revenue, 5.00%, 1/1/34, Continuously Callable @100 | 1,380 | 1,339 | |||||||||
| Bexar County Health Facilities Development Corp. Revenue, 5.00%, 7/15/37, Continuously Callable @105 | 1,000 | 1,078 | |||||||||
| Central Texas Regional Mobility Authority Revenue 4.00%, 1/1/41, Continuously Callable @100 | 1,000 | 1,080 | |||||||||
Series A, 5.00%, 1/1/45, Continuously Callable @100 | 1,000 | 1,140 | |||||||||
| Central Texas Turnpike System Revenue, Series C, 5.00%, 8/15/42, Continuously Callable @100 | 1,000 | 1,121 | |||||||||
| City of Arlington Special Tax (INS — Assured Guaranty Municipal Corp.), Series A, 5.00%, 2/15/48, Continuously Callable @100 | 1,000 | 1,177 | |||||||||
| City of Houston Hotel Occupancy Tax & Special Revenue 5.00%, 9/1/39, Continuously Callable @100 | 1,000 | 1,051 | |||||||||
5.00%, 9/1/40, Continuously Callable @100 | 1,000 | 1,049 | |||||||||
City of Irving Texas Revenue, 5.00%, 8/15/43, Continuously Callable @100 | 1,000 | 1,030 | |||||||||
| City of Laredo Waterworks & Sewer System Revenue, 4.00%, 3/1/41, Continuously Callable @100 | 1,000 | 1,124 | |||||||||
| City of Lewisville Special Assessment (INS — ACA Financial Guaranty Corp.), 5.80%, 9/1/25 (b) | 3,420 | 3,576 | |||||||||
| Clifton Higher Education Finance Corp. Revenue (NBGA — Texas Permanent School Fund) 5.00%, 8/15/39, Continuously Callable @100 | 1,000 | 1,153 | |||||||||
4.00%, 8/15/44, Continuously Callable @100 | 1,000 | 1,201 | |||||||||
County of Bexar Revenue, 4.00%, 8/15/44, Continuously Callable @100 | 1,500 | 1,602 | |||||||||
| Everman Independent School District, GO (NBGA — Texas Permanent School Fund), 4.00%, 2/15/50, Continuously Callable @100 | 1,500 | 1,810 | |||||||||
| Harris County Cultural Education Facilities Finance Corp. Revenue, 5.00%, 6/1/38, Continuously Callable @100 | 1,000 | 1,048 | |||||||||
| Harris County Hospital District Revenue, 4.00%, 2/15/42, Continuously Callable @100 | 1,000 | 1,098 | |||||||||
| Karnes County Hospital District Revenue, 5.00%, 2/1/44, Continuously Callable @100 | 1,000 | 1,108 | |||||||||
| Matagorda County Navigation District No. 1 Revenue, 4.00%, 6/1/30, Continuously Callable @100 | 1,000 | 1,065 | |||||||||
| Mesquite Health Facilities Development Corp. Revenue, 5.00%, 2/15/35, Continuously Callable @100 | 1,000 | 878 | |||||||||
See notes to financial statements.
22
| USAA Mutual Funds Trust USAA Growth and Tax Strategy Fund | Schedule of Portfolio Investments — continued November 30, 2020 | ||||||
(Amounts in Thousands, Except for Shares) (Unaudited)
Security Description | Principal Amount | Value | |||||||||
| New Hope Cultural Education Facilities Finance Corp. Revenue Series A, 5.00%, 4/1/47, Pre-refunded 4/1/25 @ 100 | $ | 1,600 | $ | 1,920 | |||||||
Series A, 5.00%, 7/1/47, Continuously Callable @100 | 1,000 | 823 | |||||||||
| New Hope Cultural Education Facilities Finance Corp. Revenue (INS — Assured Guaranty Municipal Corp.), Series A1, 5.00%, 7/1/38, Continuously Callable @100 | 225 | 264 | |||||||||
| North Texas Tollway Authority Revenue Series B, 5.00%, 1/1/31, Continuously Callable @100 | 1,500 | 1,700 | |||||||||
Series B, 5.00%, 1/1/45, Continuously Callable @100 | 1,000 | 1,154 | |||||||||
| Port of Arthur Navigation District Industrial Development Corp. Revenue, 0.15%, 3/1/42, Callable 3/1/21 @ 100 (i) | 3,000 | 3,000 | |||||||||
| Port of Port Arthur Navigation District Revenue 0.34%, 11/1/40, Continuously Callable @100 (b) (i) | 4,650 | 4,650 | |||||||||
Series A, 0.20%, 4/1/40, Continuously Callable @100 (i) | 200 | 200 | |||||||||
Series B, 0.20%, 4/1/40, OWN MERIT, Continuously Callable @100 (i) | 275 | 275 | |||||||||
Series C, 0.21%, 4/1/40, Continuously Callable @100 (i) | 3,400 | 3,400 | |||||||||
| Princeton Independent School District, GO (NBGA — Texas Permanent School Fund), 5.00%, 2/15/43, Continuously Callable @100 | 1,000 | 1,256 | |||||||||
| Prosper Independent School District, GO (NBGA — Texas Permanent School Fund), 5.00%, 2/15/48, Continuously Callable @100 | 1,000 | 1,243 | |||||||||
| Tarrant County Cultural Education Facilities Finance Corp. Revenue 5.00%, 11/15/46, Continuously Callable @100 | 1,000 | 1,136 | |||||||||
Series A, 5.00%, 11/15/45, Continuously Callable @100 | 1,000 | 820 | |||||||||
Series B, 5.00%, 11/15/36, Continuously Callable @100 | 1,000 | 876 | |||||||||
Series B, 5.00%, 7/1/48, Continuously Callable @100 | 1,500 | 1,827 | |||||||||
52,844 | |||||||||||
Virginia (0.2%): | |||||||||||
Alexandria IDA Revenue, 5.00%, 10/1/45, Continuously Callable @100 | 1,000 | 1,065 | |||||||||
Washington (0.9%): | |||||||||||
| King County Public Hospital District No 2, GO, Series A, 4.00%, 12/1/41, Continuously Callable @100 | 1,000 | 1,156 | |||||||||
| Washington Health Care Facilities Authority Revenue 4.00%, 7/1/42, Continuously Callable @100 | 1,000 | 1,120 | |||||||||
5.00%, 1/1/47, Continuously Callable @100 | 1,000 | 1,172 | |||||||||
| Washington Higher Education Facilities Authority Revenue, 4.00%, 5/1/45, Continuously Callable @100 | 1,100 | 1,221 | |||||||||
| Washington State Housing Finance Commission Revenue, 5.00%, 1/1/38, Continuously Callable @102 (f) | 1,000 | 1,085 | |||||||||
5,754 | |||||||||||
West Virginia (0.2%): | |||||||||||
| West Virginia Hospital Finance Authority Revenue, 4.00%, 1/1/38, Continuously Callable @100 | 1,500 | 1,677 | |||||||||
Wisconsin (1.1%): | |||||||||||
| Public Finance Authority Revenue 5.00%, 7/1/38, Continuously Callable @100 | 1,000 | 1,244 | |||||||||
Series A, 5.25%, 10/1/48, Continuously Callable @100 | 1,500 | 1,626 | |||||||||
Series A, 4.00%, 10/1/49, Continuously Callable @100 | 1,500 | 1,688 | |||||||||
See notes to financial statements.
23
| USAA Mutual Funds Trust USAA Growth and Tax Strategy Fund | Schedule of Portfolio Investments — continued November 30, 2020 | ||||||
(Amounts in Thousands, Except for Shares) (Unaudited)
Security Description | Shares or Principal Amount | Value | |||||||||
| Public Finance Authority Revenue (INS — Assured Guaranty Municipal Corp.), 5.00%, 7/1/44, Continuously Callable @100 | $ | 600 | $ | 705 | |||||||
| Wisconsin Health & Educational Facilities Authority Revenue 5.25%, 4/15/35, Pre-refunded 4/15/23 @ 100 | 1,000 | 1,118 | |||||||||
5.00%, 9/15/45, Continuously Callable @100 | 1,000 | 1,028 | |||||||||
7,409 | |||||||||||
Wyoming (0.2%): | |||||||||||
County of Laramie Revenue, 5.00%, 5/1/37, Continuously Callable @100 | 1,250 | 1,271 | |||||||||
Total Municipal Bonds (Cost $319,945) | 337,222 | ||||||||||
U.S. Treasury Obligations (0.1%) | |||||||||||
U.S. Treasury Bills, 0.08%, 1/28/21 (b) (k) | 700 | 700 | |||||||||
Total U.S. Treasury Obligations (Cost $700) | 700 | ||||||||||
Collateral for Securities Loaned^ (0.0%) (l) | |||||||||||
| Goldman Sachs Financial Square Government Fund Institutional Shares, 0.02% (m) | 29,281 | 29 | |||||||||
HSBC U.S. Government Money Market Fund I Shares, 0.03% (m) | 284,105 | 284 | |||||||||
Total Collateral for Securities Loaned (Cost $313) | 313 | ||||||||||
Total Investments (Cost $436,847) — 98.8% | 654,414 | ||||||||||
Other assets in excess of liabilities — 1.2% | 7,954 | ||||||||||
NET ASSETS — 100.00% | $ | 662,368 | |||||||||
^ Purchased with cash collateral from securities on loan.
(a) Non-income producing security.
(b) All or a portion of this security has been segregated as collateral for derivative instruments.
(c) Rounds to less than $1 thousand.
(d) All or a portion of this security is on loan.
(e) Northern Trust Corp. is the parent of Northern Trust Investments Inc., which is the sub adviser of the Fund.
(f) Rule 144A security or other security that is restricted as to resale to institutional investors. The Fund's Adviser has deemed this security to be liquid based upon procedures approved by the Board of Trustees. As of November 30, 2020, the fair value of these securities was $10,352 (thousands) and amounted to 1.6% of net assets.
(g) Zero-coupon bond.
(h) The Fund's Adviser has deemed this security to be illiquid based upon procedures approved by the Board of Trustees. As of November 30, 2020, illiquid securities were less than 0.05%% of the Fund's net assets.
(i) Variable Rate Demand Notes that provide the rights to sell the security at face value on either that day or within the rate-reset period. The interest rate is reset on the put date at a stipulated daily, weekly, monthly, quarterly, or other specified time interval to reflect current market conditions. These securities do not indicate a reference rate and spread in their description.
See notes to financial statements.
24
| USAA Mutual Funds Trust USAA Growth and Tax Strategy Fund | Schedule of Portfolio Investments — continued November 30, 2020 | ||||||
(Unaudited)
(j) All of the coupon is paid in kind.
(k) Rate represents the effective yield at November 30, 2020.
(l) Amount represents less than 0.05% of net assets.
(m) Rate disclosed is the daily yield on November 30, 2020.
AMBAC — American Municipal Bond Assurance Corporation
Continuously callable — Investment is continuously callable or will be continuously callable on any date after the first call date until its maturity.
GO — General Obligation
IDA — Industrial Development Authority
LLC — Limited Liability Company
PIK — Payment in-kind
PLC — Public Limited Company
Credit Enhancements — Adds the financial strength of the provider of the enhancement to support the issuer's ability to repay the principal and interest payments when due. The enhancement may be provided by a high-quality bank, insurance company or other corporation, or a collateral trust. The enhancements do not guarantee the market values of the securities.
INS Principal and interest payments are insured by the name listed. Although bond insurance reduces the risk of loss due to default by an issuer, such bonds remain subject to the risk that value may fluctuate for other reasons, and there is no assurance that the insurance company will meet its obligations.
LIQ Liquidity enhancement that may, under certain circumstances, provide for repayment of principal and interest upon demand from the name listed.
NBGA Principal and interest payments or, under certain circumstances, underlying mortgages are guaranteed by a nonbank guarantee agreement from one of the following: Florida General Obligation, Municipal Securities Purchase, Inc., Texas Permanent School Fund, or Utah General Obligation.
Futures Contracts Purchased
(Amounts not in thousands)
| Number of Contracts | Expiration Date | Notional Amount | Value | Unrealized Appreciation/ (Depreciation) | |||||||||||||||||||
E-Mini S&P 500 Futures | 29 | 12/21/20 | $ | 5,008,182 | $ | 5,253,640 | $ | 245,458 | |||||||||||||||
Total unrealized appreciation | $ | 245,458 | |||||||||||||||||||||
Total unrealized depreciation | — | ||||||||||||||||||||||
Total net unrealized appreciation (depreciation) | $ | 245,458 | |||||||||||||||||||||
See notes to financial statements.
25
USAA Mutual Funds Trust | Statement of Assets and Liabilities November 30, 2020 | ||||||
(Amounts in Thousands, Except Per Share Amounts) (Unaudited)
| USAA Growth and Tax Strategy Fund | |||||||
Assets: | |||||||
Investments, at value (Cost $436,847) | $ | 654,414 | (a) | ||||
Cash and cash equivalents | 4,677 | ||||||
Receivables: | |||||||
Interest and dividends | 4,445 | ||||||
Capital shares issued | 217 | ||||||
From Adviser | 7 | ||||||
Prepaid expenses | 54 | ||||||
Total assets | 663,814 | ||||||
Liabilities: | |||||||
Payables: | |||||||
Collateral received on loaned securities | 313 | ||||||
Collateral received from brokers for futures contract | 6 | ||||||
Capital shares redeemed | 762 | ||||||
Variation margin on open futures contracts | 19 | ||||||
Accrued expenses and other payables: | |||||||
Investment advisory fees | 180 | ||||||
Administration fees | 78 | ||||||
Custodian fees | 1 | ||||||
Transfer agent fees | 34 | ||||||
Compliance fees | — | (b) | |||||
| 12b-1 fees | — | (b) | |||||
Other accrued expenses | 53 | ||||||
Total liabilities | 1,446 | ||||||
Net Assets: | |||||||
Capital | 458,448 | ||||||
Total accumulated earnings/(loss) | 203,920 | ||||||
Net assets | $ | 662,368 | |||||
Net Assets | |||||||
Fund Shares | $ | 618,766 | |||||
Institutional Shares | 43,312 | ||||||
Class A shares | 74 | ||||||
Class C shares | 216 | ||||||
Total | $ | 662,368 | |||||
Shares (unlimited number of shares authorized with no par value): | |||||||
Fund Shares | 26,597 | ||||||
Institutional Shares | 1,862 | ||||||
Class A shares | 3 | ||||||
Class C shares | 9 | ||||||
Total | 28,471 | ||||||
Net asset value, offering and redemption price per share: (c) | |||||||
Fund Shares | $ | 23.26 | |||||
Institutional Shares | $ | 23.26 | |||||
Class A shares | $ | 23.25 | |||||
Class C shares (d) | $ | 23.20 | |||||
Maximum Sales Charge — Class A shares | 2.25 | % | |||||
Maximum offering price | |||||||
| (100%/(100%-maximum sales charge) of net asset value adjusted to the nearest cent) per share — Class A shares | $ | 23.79 | |||||
(a) Includes $292 of securities on loan.
(b) Rounds to less than $1 thousand.
(c) Per share amount may not recalculate due to rounding of net assets and/or shares outstanding.
(d) Redemption price per share varies by the length of time shares are held.
See notes to financial statements.
26
USAA Mutual Funds Trust | Statement of Operations For the Six Months Ended November 30, 2020 | ||||||
(Amounts in Thousands) (Unaudited)
| �� | USAA Growth and Tax Strategy Fund | ||||||
Investment Income: | |||||||
Dividends | $ | 2,533 | |||||
Interest | 5,611 | ||||||
Securities lending (net of fees) | 3 | ||||||
Total income | 8,147 | ||||||
Expenses (b): | |||||||
Investment advisory fees | 1,059 | ||||||
Administration fees — Fund Shares | 461 | ||||||
Administration fees — Institutional Shares | 6 | ||||||
Administration fees — Class A shares | — | (a) | |||||
Administration fees — Class C shares | — | (a) | |||||
Sub-Administration fees | 22 | ||||||
12b-1 fees — Class A shares | — | (a) | |||||
12b-1 fees — Class C shares | — | (a) | |||||
Custodian fees | 10 | ||||||
Transfer agent fees — Fund Shares | 206 | ||||||
Transfer agent fees — Institutional Shares | 6 | ||||||
Transfer agent fees — Class A shares | — | (a) | |||||
Transfer agent fees — Class C shares | — | (a) | |||||
Trustees' fees | 26 | ||||||
Compliance fees | 2 | ||||||
Legal and audit fees | 45 | ||||||
State registration and filing fees | 47 | ||||||
Other expenses | 46 | ||||||
Total expenses | 1,936 | ||||||
Expenses waived/reimbursed by Adviser | (20 | ) | |||||
Net expenses | 1,916 | ||||||
Net Investment Income (Loss) | 6,231 | ||||||
Realized/Unrealized Gains (Losses) from Investments: | |||||||
Net realized gains (losses) from investment securities | 931 | ||||||
Net realized gains (losses) from futures contracts | 1,101 | ||||||
Net change in unrealized appreciation/depreciation on investment securities | 63,811 | ||||||
Net change in unrealized appreciation/depreciation on futures contracts | (765 | ) | |||||
Net realized/unrealized gains (losses) on investments | 65,078 | ||||||
Change in net assets resulting from operations | $ | 71,309 | |||||
(a) Rounds to less than $1 thousand.
(b) Activity for each of the Institutional Shares, Class A shares, and Class C shares is for the period June 29, 2020 (commencement of operations) to November 30, 2020.
See notes to financial statements.
27
USAA Mutual Funds Trust | Statements of Changes in Net Assets | ||||||
(Amounts in Thousands)
| USAA Growth and Tax Strategy Fund | |||||||||||
| Six Months Ended November 30, 2020 (unaudited) | Year Ended May 31, 2020 | ||||||||||
From Investments: | |||||||||||
Operations: | |||||||||||
Net investment income (loss) | $ | 6,231 | $ | 13,142 | |||||||
Net realized gains (losses) from investments | 2,032 | (14,260 | ) | ||||||||
| Net change in unrealized appreciation/depreciation on investments | 63,046 | 30,136 | |||||||||
Change in net assets resulting from operations | 71,309 | 29,018 | |||||||||
Distributions to Shareholders: | |||||||||||
Fund Shares | (6,288 | ) | (12,679 | ) | |||||||
Institutional Shares (a) | (50 | ) | — | ||||||||
Class A Shares (a) | — | (b) | — | ||||||||
Class C Shares (a) | — | (b) | — | ||||||||
Change in net assets resulting from distributions to shareholders | (6,338 | ) | (12,679 | ) | |||||||
Change in net assets resulting from capital transactions | 3,818 | 50,920 | |||||||||
Change in net assets | 68,789 | 67,259 | |||||||||
Net Assets: | |||||||||||
Beginning of period | 593,579 | 526,320 | |||||||||
End of period | $ | 662,368 | $ | 593,579 | |||||||
(a) Activity for each of the Institutional Shares, Class A shares, and Class C shares is for the period June 29, 2020 (commencement of operations) to November 30, 2020.
(b) Rounds to less than $1 thousand.
(continues on next page)
See notes to financial statements.
28
USAA Mutual Funds Trust | Statements of Changes in Net Assets | ||||||
(Amounts in Thousands) (continued)
| USAA Growth and Tax Strategy Fund | |||||||||||
| Six Months Ended November 30, 2020 (unaudited) | Year Ended May 31, 2020 | ||||||||||
Capital Transactions: | |||||||||||
Fund Shares | |||||||||||
Proceeds from shares issued | $ | 55,103 | $ | 180,586 | |||||||
Distributions reinvested | 5,693 | 11,553 | |||||||||
Cost of shares redeemed | (98,985 | ) | (141,219 | ) | |||||||
Total Fund Shares | $ | (38,189 | ) | $ | 50,920 | ||||||
Institutional Shares (a) | |||||||||||
Proceeds from shares issued | $ | 42,435 | $ | — | |||||||
Distributions reinvested | 48 | — | |||||||||
Cost of shares redeemed | (754 | ) | — | ||||||||
Total Institutional Shares | $ | 41,729 | $ | — | |||||||
Class A Shares (a) | |||||||||||
Proceeds from shares issued | $ | 71 | $ | — | |||||||
Distributions reinvested | — | (b) | — | ||||||||
Total Class A Shares | $ | 71 | $ | — | |||||||
Class C Shares (a) | |||||||||||
Proceeds from shares issued | $ | 207 | $ | — | |||||||
Distributions reinvested | — | (b) | — | ||||||||
Total Class C Shares | $ | 207 | $ | — | |||||||
Change in net assets resulting from capital transactions | $ | 3,818 | $ | 50,920 | |||||||
Share Transactions: | |||||||||||
Fund Shares | |||||||||||
Issued | 2,483 | 8,571 | |||||||||
Reinvested | 266 | 571 | |||||||||
Redeemed | (4,467 | ) | (6,904 | ) | |||||||
Total Fund Shares | (1,718 | ) | 2,238 | ||||||||
Institutional Shares (a) | |||||||||||
Issued | 1,894 | — | |||||||||
Reinvested | 2 | — | |||||||||
Redeemed | (34 | ) | — | ||||||||
Total Institutional Shares | 1,862 | — | |||||||||
Class A Shares (a) | |||||||||||
Issued | 3 | — | |||||||||
Reinvested | — | (c) | — | ||||||||
Total Class A Shares | 3 | — | |||||||||
Class C Shares (a) | |||||||||||
Issued | 9 | — | |||||||||
Reinvested | — | (c) | — | ||||||||
Total Class C Shares | 9 | — | |||||||||
Change in Shares | 156 | 2,238 | |||||||||
(a) Activity for each of the Institutional Shares, Class A shares, and Class C shares is for the period June 29, 2020 (commencement of operations) to November 30, 2020. Rounds to less than $1 thousand.
(b) Rounds to less than $1 thousand.
(c) Rounds to less than 1 thousand.
See notes to financial statements.
29
USAA Mutual Funds Trust | Financial Highlights | ||||||
For a Share Outstanding Throughout Each Period
Investment Activities | Distributions to Shareholders From | ||||||||||||||||||||||||||
| Net Asset Value, Beginning of Period | Net Investment Income (Loss) | Net Realized and Unrealized Gains (Losses) on Investments | Total from Investment Activities | Net Investment Income | Net Realized Gains from Investments | ||||||||||||||||||||||
USAA Growth and Tax Strategy Fund | |||||||||||||||||||||||||||
Fund Shares | |||||||||||||||||||||||||||
| Six Months Ended November 30, 2020 (unaudited) | $ | 20.96 | 0.22 | (d) | 2.30 | 2.52 | (0.22 | ) | — | ||||||||||||||||||
| Year Ended May 31, 2020 | $ | 20.18 | 0.47 | (d) | 0.77 | 1.24 | (0.46 | ) | — | ||||||||||||||||||
| Year Ended May 31, 2019 | $ | 19.77 | 0.47 | 0.47 | 0.94 | (0.48 | ) | (0.05 | ) | ||||||||||||||||||
| Year Ended May 31, 2018 | $ | 18.76 | 0.44 | 1.01 | 1.45 | (0.44 | ) | — | |||||||||||||||||||
| Year Ended May 31, 2017 | $ | 17.79 | 0.42 | 0.96 | 1.38 | (0.41 | ) | — | |||||||||||||||||||
| Year Ended May 31, 2016 | $ | 17.48 | 0.43 | 0.35 | 0.78 | (0.47 | ) | — | |||||||||||||||||||
Institutional Shares | |||||||||||||||||||||||||||
| June 29, 2020 (f) through November 30, 2020 (unaudited) | $ | 21.05 | 0.20 | (d) | 2.12 | 2.32 | (0.11 | ) | — | ||||||||||||||||||
Class A shares | |||||||||||||||||||||||||||
| June 29, 2020 (f) through November 30, 2020 (unaudited) | $ | 21.05 | 0.16 | (d) | 2.14 | 2.30 | (0.10 | ) | — | ||||||||||||||||||
Class C shares | |||||||||||||||||||||||||||
| June 29, 2020 (f) through November 30, 2020 (unaudited) | $ | 21.05 | 0.09 | (d) | 2.13 | 2.22 | (0.07 | ) | — | ||||||||||||||||||
* Assumes reinvestment of all net investment income and realized capital gain distributions, if any, during the period. Includes adjustments in accordance with U.S. generally accepted accounting principles and could differ from the Lipper reported return.
^ The net expense ratio may not correlate to the applicable expense limits in place during the period since the current contractual expense limitation is applied for a two year period beginning July 1, 2019 and in effect through September 30, 2021, instead of coinciding with the Fund's fiscal year end. Details of the current contractual expense limitation in effect can be found in Note 4 of the accompanying Notes to Financial Statements.
(a) Not annualized for periods less than one year.
(b) Annualized for periods less than one year.
(c) Portfolio turnover is calculated on the basis of the Fund as a whole without distinguishing between the classes of shares.
(d) Per share net investment income (loss) has been calculated using the average daily shares method.
(e) Reflects an overall increase in purchases and sales of securities.
(f) Commencement of operations.
See notes to financial statements.
30
USAA Mutual Funds Trust | Financial Highlights — continued | ||||||
For a Share Outstanding Throughout Each Period
Ratios to Average Net Assets | Supplemental Data | ||||||||||||||||||||||||||||||||||
| Total Distributions | Net Asset Value, End of Period | Total Return (Excludes Sales Charges)*(a) | Net Expenses^(b) | Net Investment Income (Loss)(b) | Gross Expenses(b) | Net Assets, End of Period (000's) | Portfolio Turnover(a)(c) | ||||||||||||||||||||||||||||
USAA Growth and Tax Strategy Fund | |||||||||||||||||||||||||||||||||||
Fund Shares | |||||||||||||||||||||||||||||||||||
| Six Months Ended November 30, 2020 (unaudited) | (0.22 | ) | $ | 23.26 | 12.14 | % | 0.61 | % | 1.98 | % | 0.61 | % | $ | 618,766 | 11 | % | |||||||||||||||||||
| Year Ended May 31, 2020 | (0.46 | ) | $ | 20.96 | 6.25 | % | 0.57 | % | 2.25 | % | 0.57 | % | $ | 593,579 | 34 | %(e) | |||||||||||||||||||
| Year Ended May 31, 2019 | (0.53 | ) | $ | 20.18 | 4.83 | % | 0.60 | % | 2.44 | % | 0.60 | % | $ | 526,320 | 7 | % | |||||||||||||||||||
| Year Ended May 31, 2018 | (0.44 | ) | $ | 19.77 | 7.81 | % | 0.68 | % | 2.32 | % | 0.68 | % | $ | 459,682 | 10 | % | |||||||||||||||||||
| Year Ended May 31, 2017 | (0.41 | ) | $ | 18.76 | 7.88 | % | 0.84 | % | 2.33 | % | 0.84 | % | $ | 391,020 | 4 | % | |||||||||||||||||||
| Year Ended May 31, 2016 | (0.47 | ) | $ | 17.79 | 4.60 | % | 0.87 | % | 2.53 | % | 0.87 | % | $ | 327,334 | 10 | % | |||||||||||||||||||
Institutional Shares | |||||||||||||||||||||||||||||||||||
| June 29, 2020 (f) through November 30, 2020 (unaudited) | (0.11 | ) | $ | 23.26 | 11.07 | % | 0.57 | % | 2.05 | % | 0.65 | % | $ | 43,312 | 11 | % | |||||||||||||||||||
Class A shares | |||||||||||||||||||||||||||||||||||
| June 29, 2020 (f) through November 30, 2020 (unaudited) | (0.10 | ) | $ | 23.25 | 10.95 | % | 0.86 | % | 1.70 | % | 66.63 | % | $ | 74 | 11 | % | |||||||||||||||||||
Class C shares | |||||||||||||||||||||||||||||||||||
| June 29, 2020 (f) through November 30, 2020 (unaudited) | (0.07 | ) | $ | 23.20 | 10.57 | % | 1.61 | % | 0.94 | % | 21.02 | % | $ | 216 | 11 | % | |||||||||||||||||||
See notes to financial statements.
31
USAA Mutual Funds Trust | Notes to Financial Statements November 30, 2020 | ||||||
(Unaudited)
1. Organization:
USAA Mutual Funds Trust (the "Trust") is organized as a Delaware statutory trust and is registered under the Investment Company Act of 1940, as amended (the "1940 Act"), as an open-end investment company. The Trust is comprised of 46 funds and is authorized to issue an unlimited number of shares, which are units of beneficial interest with no par value.
The accompanying financial statements are those of the USAA Growth and Tax Strategy Fund (the "Fund"). The Fund offers four classes of shares: Fund Shares, Institutional Shares*, Class A shares* and Class C shares*. The Fund is classified as diversified under the 1940 Act.
* The Institutional Shares, Class A shares and Class C shares commenced operations on June 29, 2020.
Each class of shares of the Fund has substantially identical rights and privileges except with respect to sales charges, fees paid under distribution plans, expenses allocable exclusively to each class of shares, voting rights on matters solely affecting a single class of shares, and the exchange privilege of each class of shares.
Under the Trust's organizational documents, its officers and trustees are indemnified against certain liabilities arising out of the performance of their duties to the Fund. In addition, in the normal course of business, the Fund enters into contracts with its vendors and others that provide for general indemnifications. The Fund's maximum exposure under these arrangements is unknown, as this would involve future claims that may be made against the Fund. However, based on experience, the Fund expects that risk of loss to be remote.
2. Significant Accounting Policies:
The following is a summary of significant accounting policies followed by the Trust in the preparation of its financial statements. The policies are in conformity with Generally Accepted Accounting Principles in the United States of America ("GAAP"). The preparation of financial statements in accordance with GAAP requires management to make estimates and assumptions that affect the reported amounts of assets and liabilities and disclosure of contingent assets and liabilities at the date of the financial statements and the reported amounts of income and expenses for the period. Actual results could differ from those estimates. The Fund follows the specialized accounting and reporting requirements under GAAP that are applicable to investment companies under Accounting Standards Codification Topic 946.
Investment Valuation:
The Fund records investments at fair value. Fair value is defined as the price that would be received to sell an asset or paid to transfer a liability in an orderly transaction between market participants at the measurement date.
The valuation techniques described below maximize the use of observable inputs and minimize the use of unobservable inputs in determining fair value. The inputs used for valuing the Fund's investments are summarized in the three broad levels listed below:
• Level 1 — quoted prices in active markets for identical securities
• Level 2 — other significant observable inputs (including quoted prices for similar securities or interest rates applicable to those securities, etc.)
• Level 3 — significant unobservable inputs (including the Fund's own assumptions in determining the fair value of investments)
Changes in valuation techniques may result in transfers in or out of an assigned level within the disclosure hierarchy. The inputs or methodologies used for valuation techniques are not necessarily an indication of the risk associated with entering into those investments.
Victory Capital Management Inc. ("VCM" or the "Adviser"), has established the Pricing and Liquidity Committee (the "Committee"), and subject to the Trust's Board of Trustees (the "Board") oversight, the Committee administers and oversees the Fund's valuation policies and procedures, which are approved by the Board.
32
USAA Mutual Funds Trust | Notes to Financial Statements — continued November 30, 2020 | ||||||
(Unaudited)
Portfolio securities listed or traded on securities exchanges, including exchange-traded funds ("ETFs"), American Depositary Receipts ("ADRs") and Rights, are valued at the closing price on the exchange or system where the security is principally traded, if available, or at the Nasdaq Official Closing Price. If there have been no sales for that day on the exchange or system, then a security is valued at the last available bid quotation on the exchange or system where the security is principally traded. In each of these situations, valuations are typically categorized as Level 1 in the fair value hierarchy.
Investments in open-end investment companies are valued at net asset value ("NAV"). These valuations are typically categorized as Level 1 in the fair value hierarchy.
Futures contracts are valued at the settlement price established each day by the board of trade or an exchange on which they are traded. These valuations are typically categorized as Level 1 in the fair value hierarchy.
Debt securities of United States ("U.S.") issuers, along with corporate and municipal securities, including short-term investments maturing in 60 days or less, may be valued using evaluated bid or the last sales price to price securities by dealers or an independent pricing service approved by the Board. These valuations are typically categorized as Level 2 in the fair value hierarchy.
In the event that price quotations or valuations are not readily available, are not reflective of market value, or a significant event has been recognized in relation to a security or class of securities, the securities are valued in good faith by the Committee in accordance with valuation procedures approved by the Board. These valuations are typically categorized as Level 2 or Level 3 in the fair value hierarchy, based on the observability of inputs used to determine the fair value. The effect of fair value pricing is that securities may not be priced on the basis of quotations from the primary market in which they are traded and the actual price realized from the sale of a security may differ materially from the fair value price. Valuing these securities at fair value is intended to cause the Fund's NAV to be more reliable than it otherwise would be.
A summary of the valuations as of November 30, 2020, based upon the three levels defined above, is included in the table below while the breakdown, by category, of investments is disclosed on the Schedule of Portfolio Investments (amounts in thousands):
Level 1 | Level 2 | Level 3 | Total | ||||||||||||||||
Common Stocks | $ | 316,179 | $ | — | $ | — | $ | 316,179 | |||||||||||
Municipal Bonds | — | 337,222 | — | 337,222 | |||||||||||||||
U.S. Treasury Obligations | — | 700 | — | 700 | |||||||||||||||
Collateral for Securities Loaned | 313 | — | — | 313 | |||||||||||||||
Total | $ | 316,492 | $ | 337,922 | $ | — | $ | 654,414 | |||||||||||
Other Financial Investments^: | |||||||||||||||||||
Assets: | |||||||||||||||||||
Futures Contracts | $ | 245 | $ | — | $ | — | $ | 245 | |||||||||||
Total | $ | 245 | $ | — | $ | — | $ | 245 | |||||||||||
^ Futures Contracts are valued at the unrealized appreciation (depreciation) on the investment.
For the six months ended November 30, 2020, there were no transfers in or out of the Level 3 fair value hierarchy.
Real Estate Investment Trusts ("REITs"):
The Fund may invest in REITs, which report information on the source of their distributions annually. REITs are pooled investment vehicles that invest primarily in income producing real estate or real estate related loans or interests (such as mortgages). Certain distributions received from REITs during the year are recorded as realized gains or return of capital as estimated by the Fund or when such information becomes known.
33
USAA Mutual Funds Trust | Notes to Financial Statements — continued November 30, 2020 | ||||||
(Unaudited)
Investment Companies:
Open-End Funds:
The Fund may invest in portfolios of open-end investment companies. These investment companies value securities in their portfolios for which market quotations are readily available at their market values (generally the last reported sale price) and all other securities and assets at their fair value by the methods established by the board of directors of the underlying funds.
Securities Purchased on a Delayed-Delivery or When-Issued Basis:
The Fund may purchase securities on a delayed-delivery or when-issued basis. Delivery and payment for securities that have been purchased by the Fund on a delayed-delivery or when-issued basis or for delayed draws on loans can take place a month or more after the trade date. At the time the Fund makes the commitment to purchase a security on a delayed-delivery or when-issued basis, the Fund records the transaction and reflects the value of the security in determining NAV. No interest accrues to the Fund until the transaction settles and payment takes place. A segregated account is established and the Fund maintains cash and/or marketable securities at least equal in value to commitments for delayed-delivery or when-issued securities. If the Fund owns delayed-delivery or when-issued securities, these values are included in Payable for investments purchased on the accompanying Statement of Assets and Liabilities and the segregated assets are identified on the Schedule of Portfolio Investments.
Municipal Obligations:
The values of municipal obligations can fluctuate and may be affected by adverse tax, legislative, or political changes, and by financial developments affecting municipal issuers. Payment of municipal obligations may depend on a relatively limited source of revenue, resulting in greater credit risk. Future changes in federal tax laws or the activity of an issuer may adversely affect the tax-exempt status of municipal obligations.
Below Investment Grade Securities:
The Fund may invest in below investment grade securities (i.e. lower-quality, "junk" debt), which are subject to various risks. Lower-quality debt is considered to be speculative because it is less certain that the issuer will be able to pay interest or repay the principal than in the case of investment grade debt. These securities can involve a substantially greater risk of default than higher-rated securities, and their values can decline significantly over short periods of time. Lower-quality debt securities tend to be more sensitive to adverse news about their issuers, the market and the economy in general, than higher-quality debt securities. The market for these securities can be less liquid, especially during periods of recession or general market decline.
Derivative Instruments:
Futures Contracts:
The Fund may enter into contracts for the future delivery of securities or foreign currencies and futures contracts based on a specific security, class of securities, foreign currency or an index, and purchase or sell options on any such futures contracts. A futures contract on a securities index is an agreement obligating either party to pay, and entitling the other party to receive, while the contract is outstanding, cash payments based on the level of a specified securities index. No physical delivery of the underlying asset is made. The Fund may enter into futures contracts in an effort to hedge against market risks. The acquisition of put and call options on futures contracts will give the Fund the right (but not the obligation), for a specified price, to sell or to purchase the underlying futures contract, upon exercise of the option, at any time during the option period. Futures transactions involve brokerage costs and require the Fund to segregate assets to cover contracts that would require it to purchase securities or currencies. A good faith margin deposit, known as initial margin, of cash or government securities with a broker or custodian is required to initiate and maintain open positions in futures contracts. Subsequent
34
USAA Mutual Funds Trust | Notes to Financial Statements — continued November 30, 2020 | ||||||
(Unaudited)
payments, known as variation margin, are made or received by the Fund based on the change in the market value of the position and are recorded as unrealized appreciation or depreciation until the contract is closed out, at which time the gain or loss is realized. The Fund may lose the expected benefit of futures transactions if interest rates, exchange rates or securities prices change in an unanticipated manner. Such unanticipated changes may also result in lower overall performance than if the Fund had not entered into any futures transactions. In addition, the value of the Fund's futures positions may not prove to be perfectly or even highly correlated with the value of its portfolio securities or foreign currencies, limiting the Fund's ability to hedge effectively against interest rate, exchange rate and/or market risk and giving rise to additional risks. There is no assurance of liquidity in the secondary market for purposes of closing out futures positions. The collateral held by the Fund is reflected on the Statement of Assets and Liabilities under Collateral received from brokers for futures contracts.
As of November 30, 2020, the Fund entered into futures contracts primarily for the strategy of hedging or other purposes, including but not limited to, providing liquidity and equitizing cash.
Summary of Derivative Instruments:
The following table summarizes the fair values of derivative instruments on the Statement of Assets and Liabilities, categorized by risk exposure, as of November 30, 2020 (amounts in thousands):
Assets | Liabilities | ||||||||||
| Variation Margin Receivable on Open Futures Contracts* | Variation Margin Payable on Open Futures Contracts* | ||||||||||
Equity Risk Exposure | $ | 245 | $ | — | |||||||
* Includes cumulative appreciation (depreciation) of futures contracts as reported on the Schedule of Portfolio Investments. Only current day's variation margin for futures contracts is reported within the Statement of Assets and Liabilities.
The following table presents the effect of derivative instruments on the Statement of Operations, categorized by risk exposure, for the six months ended November 30, 2020 (amounts in thousands):
| Net Realized Gains (Losses) on on Derivatives Recognized as a Result of Operations | Net Change in Unrealized Appreciation/Depreciation on Derivatives Recognized as a Result of Operations | ||||||||||
| Net Realized Gains (Losses) from Futures Contracts | Net Change in Unrealized Appreciation/Depreciation on Futures Contracts | ||||||||||
Equity Risk Exposure | $ | 1,101 | $ | (765 | ) | ||||||
All open derivative positions at period end are reflected on the Fund's Schedule of Portfolio Investments. The underlying face value of open derivative positions relative to the Fund's net assets at period end is generally representative of the notional amount of open positions to net assets throughout the period.
Investment Transactions and Related Income:
Changes in holdings of investments are accounted for no later than one business day following the trade date. For financial reporting purposes, however, investment transactions are accounted for on trade date on the last business day of the reporting period. Interest income is determined on the basis of coupon interest accrued using the effective interest method which adjusts, where applicable, the amortization of premiums or accretion of discount. Gains or losses realized on sales of securities are determined by comparing the identified cost of the security lot sold with the net sales proceeds Investment proceeds.
35
USAA Mutual Funds Trust | Notes to Financial Statements — continued November 30, 2020 | ||||||
(Unaudited)
Securities Lending:
The Fund, through a securities lending agreement with Citibank, N.A. ("Citibank"), may lend its securities to qualified financial institutions, such as certain broker-dealers, to earn additional income, net of income retained by Citibank. Borrowers are required to secure their loans for collateral in the amount of at least 102% of the value of U.S. securities loaned or at least 105% of the value of non-U.S. securities loaned, marked-to-market daily. Any collateral shortfalls associated with increases in the valuation of the securities loaned are cured the next business day once the shortfall exceeds $100 thousand. Collateral may be cash, U.S. government securities, or other securities as permitted by Securities and Exchange Commission ("SEC") guidelines. Cash collateral may be invested in high-quality short-term investments, primarily open-end investment companies. Collateral requirements are determined daily based on the value of the Fund's securities on loan as of the end of the prior business day. During the time portfolio securities are on loan, the borrower will pay the Fund any dividends or interest paid on such securities plus any fee negotiated between the parties to the lending agreement. The Fund also earns a return from the collateral. The Fund pays Citibank various fees in connection with the investment of cash collateral and fees based on the investment income received from securities lending activities. Securities lending income (net of these fees) is disclosed on the Statement of Operations. Loans are terminable upon demand and the borrower must return the loaned securities within the lesser of one standard settlement period or five business days. Risks relating to securities-lending transactions include that the borrower may not provide additional collateral when required or return the securities when due, and that the value of the short-term investments will be less than the amount of cash collateral required to be returned to the borrower. The Fund's agreement with Citibank does not include master netting provisions. Noncash collateral received by the Fund may not be sold or re-pledged, except to satisfy borrower default. Cash collateral is listed on the Fund's Schedule of Portfolio Investments and Financial Statements while non-cash collateral is not included.
The following table (amounts in thousands) is a summary of the Fund's securities lending transactions as of November 30, 2020.
| Value of Securities on Loan | Non-Cash Collateral | Cash Collateral | |||||||||
| $ | 292 | $ | — | $ | 313 | ||||||
Federal Income Taxes:
It is the Fund's policy to continue to qualify as a regulated investment company by complying with the provisions available to certain investment companies, as defined in applicable sections of the Internal Revenue Code, and to make distributions of net investment income and net realized gains sufficient to relieve it from all, or substantially all, federal income taxes. Accordingly, no provision for federal income taxes is required in the financial statements. The Fund has a tax year end of May 31.
Management of the Fund has reviewed tax positions taken in tax years that remain subject to examination by all major tax jurisdictions, including federal (i.e., the last four tax years, which includes the current fiscal tax year end). Management believes that there is no tax liability resulting from unrecognized tax benefits related to uncertain tax positions taken.
Allocations:
Expenses directly attributable to the Fund are charged to the Fund, while expenses that are attributable to more than one fund in the Trust, or jointly with an affiliated trust, are allocated among the respective funds in the Trust and/or affiliated trust based upon net assets or another appropriate basis.
Income, expenses (other than class-specific expenses such as transfer agent fees, state registration fees, 12b-1 fees, and printing fees), and realized and unrealized gains or losses on investments are allocated to each class of shares based on its relative net assets on the date income is earned or expenses and realized and unrealized gains and losses are incurred.
36
USAA Mutual Funds Trust | Notes to Financial Statements — continued November 30, 2020 | ||||||
(Unaudited)
Cross-Trade Transactions:
Pursuant to Rule 17a-7 under the 1940 Act, the Fund may engage in cross-trades, which are securities transactions with affiliated investment companies and advisory accounts managed by the Adviser and any applicable sub-adviser. Any such purchase or sale transaction must be effected without brokerage commission or other remuneration, except for customary transfer fees. The transaction must be effected at the current market price, which is either the security's last sale price on an exchange or, if there are no transactions in the security that day, at the average of the highest bid and lowest asked price. For the six months ended November 30, 2020, the Fund engaged in the following securities transactions with affiliated funds, which resulted in the following net realized gains (losses) (amounts in thousands):
| Purchases | Sales | Net Realized Gains (Losses) | |||||||||
| $ | 11,825 | $ | 17,940 | $ | — | ||||||
Fees Paid Indirectly:
Expense offsets to custody fees that arise from credits on cash balances maintained on deposit are reflected on the Statement of Operations, as applicable, as Fees paid indirectly.
3. Purchases and Sales:
Cost of purchases and proceeds from sales/maturities of securities (excluding securities maturing less than one year from acquisition) for the six months ended November 30, 2020, were as follows for the Fund (amounts in thousands):
| Purchases (excluding U.S. Government Securities) | Sales (excluding U.S. Government Securities) | ||||||
| $ | 73,284 | $ | 69,081 | ||||
There were no purchases and sales of U.S. government securities during the six months ended November 30, 2020.
4. Fees and Transactions with Affiliates and Related Parties:
Investment Advisory Fees:
Investment advisory services are provided to the Fund by the Adviser, which is a New York corporation registered as an investment adviser with the SEC. The Adviser is a wholly-owned indirect subsidiary of Victory Capital Holdings, Inc., a publicly traded Delaware corporation, and a wholly-owned direct subsidiary of Victory Capital Operating, LLC.
Under the terms of the Investment Advisory Agreement, the Adviser is entitled to receive a base fee and a performance adjustment. The Fund's base fee is accrued daily and paid monthly at an annualized rate of 0.30% of the Fund's average daily net assets. Amounts incurred and paid to VCM for the six months ended November 30, 2020, are reflected on the Statement of Operations as Investment Advisory fees.
On November 6, 2018, United Services Automobile Association ("USAA"), the parent company of USAA Asset Management Company ("AMCO"), the prior investment adviser to the Fund announced that AMCO would be acquired by Victory Capital Holdings Inc.(the "Transaction"). A special shareholder meeting was held on April 18, 2019, at which shareholders of the Fund approved a new investment advisory agreement between the Trust, on behalf of the Fund, and Victory Capital Management Inc. ("Victory Capital"). The Transaction closed on July 1, 2019. Effective July 1, 2019, VCM replaced AMCO as the investment adviser to the Fund and no performance adjustments were made for the periods beginning
37
USAA Mutual Funds Trust | Notes to Financial Statements — continued November 30, 2020 | ||||||
(Unaudited)
July 1, 2019, through June 30, 2020. Only performance beginning as of July 1, 2019, and thereafter is utilized in calculating future performance adjustments.
The performance adjustment for each share class is accrued daily and calculated monthly by comparing each class' performance to that of the Lipper Composite Index which is comprised of 51% of the Lipper General & Insured Municipal Bond Funds Index, which measures the total return performance of the largest funds tracked by Lipper that invest at least 65% of their assets in municipal debt issues in the top four credit categories, and 49% of the Lipper Large-Cap Core Funds Index, which measures the total return performance of funds tracked by Lipper that by portfolio practice invest at least 75% of their equity assets in companies with market capitalizations of greater than 300% of the dollar-weighted median market capitalization of the middle 1,000 securities of the S&P 1500 Index.
The performance period for each share class consists of the current month plus the previous 35 months (or the number of months beginning July 1, 2019, if fewer). The following table is utilized to determine the extent of the performance adjustment:
| Over/Under Performance Relative to Index (in basis points)(a) | Annual Adjustment Rate (in basis points)(a) | ||||||
+/- 20 to 50 | +/- 4 | ||||||
+/- 51 to 100 | +/- 5 | ||||||
+/- 101 and greater | +/- 6 | ||||||
(a) Based on the difference between average annual performance of the relevant share class of the Fund and its relevant Lipper index, rounded to the nearest basis point. Average daily net assets of the share class are calculated over a rolling 36-month period.
Each class' annual performance adjustment rate is multiplied by the average daily net assets of each respective class over the entire performance period, which is then multiplied by a fraction, the numerator of which is the number of days in the month and the denominator of which is 365 (366 in leap years). The resulting amount is then added to (in the case of overperformance), or subtracted from (in the case of underperformance) the base fee.
Under the performance fee arrangement, each class pays a positive performance fee adjustment for a performance period whenever the class outperforms the Composite Index over that period, even if the class has overall negative returns during the performance period.
For the period July 1, 2020 to November 30, 2020, performance adjustments for Fund Shares, Institutional Shares, Class A shares and Class C shares were $120 thousand, less than $1 thousand, less than $1 thousand and less than $1 thousand , respectively. For the Fund Shares, Institutional Shares, Class A shares and Class C shares the performance adjustments were 0.04%, less than 0.01%, less than 0.01% and less than 0.01% of average daily net assets, respectively.
The Trust relies on an exemptive order granted to VCM and its affiliated funds by the SEC in March 2019 permitting the use of a "manager-of-managers" structure for certain funds. Under a manager-of-managers structure, the investment adviser may select (with approval of the Board and without shareholder approval) one or more subadvisers to manage the day-to-day investment of a fund's assets.
VCM entered into a Subadvisory Agreement with Northern Trust Investments, Inc. ("NTI") under which NTI directs the investment and reinvestment of the Fund's assets invested in blue chip stocks (as allocated from time to time by VCM). This arrangement provides for monthly fees that are paid by VCM. VCM (not the Fund) pays the subadviser fees.
Administration and Servicing Fees:
VCM serves as the Fund's administrator and fund accountant. Under the Administration, Servicing and Accounting Agreement, VCM is paid for its services an annual fee at a rate of 0.15% of average daily net assets of the Fund Shares, Class A shares and Class C shares, 0.10% of average daily net assets of
38
USAA Mutual Funds Trust | Notes to Financial Statements — continued November 30, 2020 | ||||||
(Unaudited)
the Institutional Shares, respectively. Amounts incurred for the six months ended November 30, 2020, are reflected on the Statement of Operations as Administration fees.
The Fund (as part of the Trust) has entered into an agreement to provide compliance services with the Adviser, pursuant to which the Adviser furnishes its compliance personnel, including the services of the Chief Compliance Officer ("CCO"), and other resources reasonably necessary to provide the Trust with compliance oversight services related to the design, administration and oversight of a compliance program for the Trust in accordance with Rule 38a-1 under the 1940 Act. The CCO is an employee of the Adviser, which pays the compensation of the CCO and support staff. Funds in the Trust, Victory Variable Insurance Funds, Victory Portfolios, and Victory Portfolios II (collectively, the "Victory Funds Complex") in the aggregate, compensate the Adviser for these services. Amounts incurred for the six months ended November 30, 2020, are reflected on the Statement of Operations as Compliance fees.
Citi Fund Services Ohio, Inc. ("Citi"), an affiliate of Citibank, acts as sub-administrator and sub-fund accountant to the Fund pursuant to a Sub-Administration and Sub-Fund Accounting Services Agreement between VCM and Citi. VCM pays Citi a fee for providing these services. The Trust reimburses VCM and Citi for out-of-pocket expenses incurred in providing these services and certain other expenses specifically allocated to the Fund. Amounts incurred for the six months ended November 30, 2020, are reflected on the Statement of Operations as Sub-Administration fees.
Transfer Agency Fees:
Victory Capital Transfer Agency, Inc. ("VCTA"), an affiliate of the Adviser provides transfer agency services to the Fund. VCTA provides transfer agent services to the Fund Shares based on an annual charge of $23 per shareholder account plus out-of-pocket expenses. VCTA pays a portion of these fees to certain intermediaries for the administration and servicing of accounts that are held with such intermediaries. Transfer agent's fees for Institutional Shares, Class A shares and Class C shares are paid monthly based on a fee accrued daily at an annualized rate of 0.10% of average daily net assets, plus out-of-pocket expenses. Amounts incurred and paid to VCTA for the six months ended November 30, 2020, are reflected on the Statement of Operations as Transfer Agent fees.
FIS Investor Services LLC serves as sub-transfer agent and dividend disbursing agent for the Fund pursuant to a Sub-Transfer Agent agreement between VCTA and FIS Investor Services LLC. VCTA provides FIS Investor Services LLC a fee for providing these services.
Distributor/Underwriting Services:
Victory Capital Services, Inc. (the "Distributor"), an affiliate of the Adviser, serves as distributor for the continuous offering of the shares of the Fund pursuant to a Distribution Agreement between the Distributor and the Trust. Effective June 30, 2020, the Distributor's name was changed from Victory Capital Advisers, Inc.
Pursuant to the Distribution and Service Plans adopted in accordance with Rule 12b-1 under the1940 Act, the Distributor may receive a monthly distribution and service fee, at an annual rate of up to 0.25% of the average daily net assets of Class A shares and 1.00% of the average daily net assets of Class C shares. The distribution and service fees paid to the Distributor may be used by the Distributor to pay for activity primarily intended to result in the sale of Class A shares and Class C shares of the Fund. Amounts incurred and paid to VCTA for the period ended November 30, 2020, are reflected on the Statement of Operations as 12b-1 fees.
In addition, the Distributor is entitled to receive commissions on sales of the Class A shares of the Fund. For the six months ended November 30, 2020, the Distributor received approximately less than $1 thousand from commissions earned on sales of Class A shares of the Fund.
Other Fees:
Citibank serves as the Fund's custodian. The Fund pays Citibank a fee for providing these services. Amounts incurred for the six months ended November 30, 2020, are reflected on the Statement of Operations as Custodian fees.
39
USAA Mutual Funds Trust | Notes to Financial Statements — continued November 30, 2020 | ||||||
(Unaudited)
K&L Gates LLP provides legal services to the Trust.
The Adviser has entered into an expense limitation agreement with the Fund until at least September 30, 2021. Under the terms of the agreement, the Adviser has agreed to waive fees or reimburse certain expenses to the extent that ordinary operating expenses incurred by certain classes of the Fund in any fiscal year exceed the expense limit for such classes of the Fund. Such excess amounts will be the liability of the Adviser. Interest, taxes, brokerage commissions, other expenditures, which are capitalized in accordance with GAAP, and other extraordinary expenses not incurred in the ordinary course of the Fund's business are excluded from the expense limits. As of November 30, 2020, the expense limits (excluding voluntary waivers) are 0.61%, 0.57%, 0.86% and 1.61% for Fund Shares, Institutional Shares, Class A shares and Class C shares, respectively.
Under this expense limitation agreement, the Fund has agreed to repay fees and expenses that were waived or reimbursed by the Adviser for a period up to three years after the fiscal year in which the waiver or reimbursement took place, subject to the lesser of any operating expense limits in effect at the time of: (a) the original waiver or expense reimbursement; or (b) the recoupment, after giving effect to the recoupment amount.
As of November 30, 2020, the following amounts are available to be repaid to the Adviser (amounts in thousands). The Fund has not recorded any amounts available to be repaid as a liability due to an assessment that such repayment is not probable at November 30, 2020.
| Expires May 31, 2024 | Total | ||||||
| $ | 20 | $ | 20 | ||||
The Adviser may voluntarily waive or reimburse additional fees to assist the Fund in maintaining competitive expense ratios. Voluntary waivers and reimbursements applicable to the Fund are not available to be recouped at a future time. There were no voluntary waivers or reimbursements for the six months ended November 30, 2020.
Certain officers and/or interested trustees of the Fund are also officers and/or employees of the Adviser, Administrator, Sub-Administrator, Sub-Fund Accountant, and Legal.
5. Risks:
The Fund may be subject to other risks in addition to these identified risks.
Geopolitical/Natural Disaster Risk — Global economies and financial markets are increasingly interconnected, which increases the possibilities that conditions in one country or region might adversely affect issuers in another country or region. Geopolitical and other risks, including war, terrorism, trade disputes, political or economic dysfunction within some nations, public health crises and related geopolitical events, as well as environmental disasters such as earthquakes, fires, and floods, may add to instability in world economies and markets generally. Changes in trade policies and international trade agreements could affect the economies of many countries in unpredictable ways. Likewise, systemic market dislocations of the kind that occurred during the financial crisis that began in 2008, if repeated, would be highly disruptive to economies and markets, adversely affecting individual companies and industries, securities markets, interest rates, credit ratings, inflation, investor sentiment, and other factors affecting the value of a Fund's investments. Some countries, including the United States, are adopting more protectionist trade policies and moving away from the tighter financial industry regulations that followed the 2008 financial crisis, which may also affect the value of a Fund's investments.
Political events within the United States at times have resulted, and may in the future result, in a shutdown of government services, which could negatively affect the U.S. economy, decrease the value of a Fund's investments, increase uncertainty in or impair the operation of the U.S. or other securities markets and degrade investor and consumer confidence, perhaps suddenly and to a significant degree.
An outbreak of disease called COVID-19 has spread internationally. The transmission of COVID-19 and efforts to contain its spread have resulted in international, national and local border closings and other
40
USAA Mutual Funds Trust | Notes to Financial Statements — continued November 30, 2020 | ||||||
(Unaudited)
significant travel restrictions and disruptions, significant disruptions to business operations, supply chains and consumer activity, significant challenges in healthcare service preparation and delivery, quarantines and general concern and uncertainty. These negative impacts have caused significant volatility and declines in global financial markets, which have caused losses for Fund investors during and subsequent to period end. The impact of the COVID-19 pandemic last for an extended period of time, and could result in a substantial economic downturn or recession. Public health crises may exacerbate other pre-existing political, social, economic, market and financial risks. The extent of the impact to the financial performance of the Funds' investments will depend on future developments, including (i) the duration and spread of the outbreak, (ii) the restrictions and advisories, (iii) the effects on the financial markets, and (iv) the effects on the economy overall, all of which are highly uncertain and cannot be predicted.
Debt Securities Risk — The value of a debt security or other income-producing security changes in response to various factors, including, for example, market-related factors (such as changes in interest rates or changes in the risk appetite of investors generally) and changes in the actual or perceived ability of the issuer (or of issuers generally) to meet its (or their) obligations.
Other factors that may affect the value of debt securities, include, among others, public health crises and responses by governments and companies to such crises. These and other events may affect the creditworthiness of the issuer of a debt security and may impair an issuers ability to timely meet its debt obligations as they come due.
Credit Risk — The fixed-income securities in the Fund's portfolio are subject to credit risk, which is the possibility that an issuer of a fixed-income security will fail to make timely interest and/or principal payments on its securities or that negative market perceptions of the issuer's ability to make such payments will cause the price of that security to decline. The Fund accepts some credit risk as a recognized means to enhance an investor's return. All fixed-income securities, varying from the highest quality to the very speculative, have some degree of credit risk. Fixed-income securities rated below investment grade, also known as "junk" or high-yield bonds, generally entail greater economic, credit, and liquidity risk than investment-grade securities. Their prices may be more volatile, especially during economic downturns, financial setbacks, or liquidity events.
Interest Rate Risk — As a mutual fund that has the ability to invest in bonds, the Fund is subject to the risk that the market value of the bonds in its portfolio will fluctuate because of changes in interest rates, changes in the supply of and demand for tax-exempt securities, and other market factors. Bond prices generally are linked to the prevailing market interest rates. In general, when interest rates rise, bond prices fall; conversely, when interest rates fall, bond prices rise. The price volatility of a bond also depends on its duration. Generally, the longer the duration of a bond, the greater is its sensitivity to interest rates. To compensate investors for this higher interest rate risk, bonds with longer durations generally offer higher yields than bonds with shorter durations. The ability of an issuer of a debt security to repay principal prior to a security's maturity can increase the security's sensitivity to interest rate changes.
Decisions by the U.S. Federal Reserve (also known as the "Fed") regarding interest rate and monetary policy, which can be difficult to predict and sometimes change direction suddenly in response to economic and market events, can have a significant effect on the value of fixed-income securities as well as the overall strength of the U.S. economy. Precise interest rate predictions are difficult to make, and interest rates may change unexpectedly and dramatically in response to extreme changes in market or economic conditions. As a result, the value of fixed income securities may vary widely under certain market conditions.
LIBOR Discontinuation Risk — Many debt securities, derivatives and other financial instruments, including some of the Fund's investments, use the London Interbank Offered Rate ("LIBOR") as the reference or benchmark rate for variable interest rate calculations. However, the use of LIBOR started to come under pressure following manipulation allegations in 2012. Despite increased regulation and other corrective actions since that time, concerns have arisen regarding its viability as a benchmark, due largely to reduced activity in the financial markets that it measures. In June 2017, the Alternative
41
USAA Mutual Funds Trust | Notes to Financial Statements — continued November 30, 2020 | ||||||
(Unaudited)
Reference Rates Committee, a group of large U.S. banks working with the Federal Reserve, announced its selection of a new Secured Overnight Funding Rate ("SOFR"), which is intended to be a broad measure of secured overnight U.S. Treasury repo rates, as an appropriate replacement for LIBOR. The Federal Reserve Bank of New York began publishing the SOFR in 2018, expecting that it could be used on a voluntary basis in new instruments and transactions. Bank working groups and regulators in other countries have suggested other alternatives for their markets, including the Sterling Overnight Interbank Average Rate ("SONIA") in England. In July 2017, the Financial Conduct Authority (the "FCA"), the United Kingdom financial regulatory body, announced that after 2021 it will cease its active encouragement of UK banks to provide the quotations needed to sustain LIBOR. That announcement suggests that LIBOR may cease to be published after that time. For U.S. dollar LIBOR, however, the relevant date may be deferred to June 30, 2023 for the most common tenors (overnight and one, three, six and 12 months). As to those tenors, the LIBOR administrator has published a consultation regarding its intention to cease publication of U.S. dollar LIBOR as of June 30, 2023 (instead of December 31, 2021, as previously expected), apparently based on continued rate submissions from banks. It is expected that there will be enough for market participants to transition to the use of a different benchmark for both new and existing securities and transactions. Various financial industry groups have begun planning for that transition, but there are obstacles to converting certain longer-term securities and transactions to a new benchmark. Transition planning is at an early stage, and neither the effect of the transition process nor its ultimate success can yet be known. Although the foregoing may provide some sense of timing, there is no assurance that LIBOR, or any particular currency and tenor, will continue to be published until any particular date, and it appears highly likely that LIBOR will be discontinued or modified after December 31, 2021 or June 30, 2023, depending on the currency and tenor. The transition process might lead to increased volatility and illiquidity in markets that currently rely on the LIBOR to determine interest rates. It could also lead to a reduction in the value of some LIBOR-based investments and reduce the effectiveness of new hedges placed against existing LIBOR-based instruments. Since the usefulness of LIBOR as a benchmark could deteriorate during the transition period, these effects could occur before the end of 2021.
6. Borrowing and Interfund Lending:
Line of Credit:
For the six months ended November 30, 2020, the Victory Funds Complex participated in a short-term demand note "Line of Credit" agreement with Citibank. The Line of Credit agreement with Citibank was renewed on June 29, 2020 with a termination date of June 28, 2021. Under the agreement with Citibank, the Victory Funds Complex may borrow up to $600 million, of which $300 million is committed and $300 million is uncommitted. $40 million of the Line of Credit is reserved for use by the Victory Floating Rate Fund, another series of the Victory Funds Complex, with Victory Floating Rate Fund paying the related commitment fees for that amount. The purpose of the agreement is to meet temporary or emergency cash needs. For the six months ended November 30, 2020, Citibank received an annual commitment fee of 0.15% on $300 million for providing the Line of Credit. Each fund in the Victory Funds Complex pays a pro- rata portion of the commitment fees plus any interest (one month LIBOR plus one percent) on amounts borrowed. Effective June 29, 2020, under an amended Line of Credit agreement, Citibank will also receive an annual upfront fee of 0.10% on the $300 million committed line of credit. Each fund in the Victory Funds Complex will pay a pro-rata portion of the upfront fee. Interest charged to each Fund during the period, if applicable, is reflected on the Statements of Operations under Line of credit fees.
The Fund did not utilize or participate in the Facility during the six months ended November 30, 2020.
Interfund Lending:
The Trust and Adviser rely on an exemptive order granted by the SEC in March 2017 (the "Order"), permitting the establishment and operation of an Interfund Lending Facility (the "Facility"). The Facility allows the Fund to directly lend and borrow money to or from any other Fund, that is permitted to
42
USAA Mutual Funds Trust | Notes to Financial Statements — continued November 30, 2020 | ||||||
(Unaudited)
participate in the Facility, in the Victory Funds Complex relying upon the Order at rates beneficial to both the borrowing and lending funds. Advances under the Facility are allowed for temporary or emergency purposes. The interfund loan rate is determined, as specified in the Order, by averaging the current repurchase agreement rate and the current bank loan rate. As a Borrower, interest charged to the Fund, if any, during the period is reflected on the Statement of Operations under Interfund lending fees. As a Lender, interest earned by the Fund, if any, during the period is reflected on the Statement of Operations under Income on Interfund lending.
The Fund did not utilize or participate in the Facility during the six months ended November 30, 2020.
7. Federal Income Tax Information:
The Fund intends to declare and distribute any net investment income quarterly. Distributable net realized gains, if any, are declared and paid at least annually.
The amounts of dividends from net investment income and distributions from net realized gains (collectively distributions to shareholders) are determined in accordance with federal income tax regulations, which may differ from GAAP. To the extent these "book/tax" differences are permanent in nature (e.g., net operating loss and distribution reclassification), such amounts are reclassified within the components of net assets based on their federal tax-basis treatment; temporary differences (e.g., wash sales) do not require reclassification. To the extent dividends and distributions exceed net investment income and net realized gains for tax purposes, they are reported as distributions of capital. Net investment losses incurred by the Fund may be reclassified as an offset to capital on the accompanying Statement of Assets and Liabilities.
The tax character of current year distributions paid and the tax basis of the current components of accumulated earnings (deficit) will be determined at the end of the current tax year ending May 31, 2021.
At May 31, 2020, the Fund had net capital loss carryforwards as shown in the table below (amounts in thousands).
| Short-Term Amount | Long-Term Amount | Total | |||||||||
| $ | 11,911 | $ | 5,523 | $ | 17,434 | ||||||
43
USAA Mutual Funds Trust | Supplemental Information November 30, 2020 | ||||||
Proxy Voting and Portfolio Holdings Information
Proxy Voting:
Information regarding the policies and procedures the Fund uses to determine how to vote proxies relating to portfolio securities is available without charge, upon request, by calling (800) 539-3863. The information is also included in the Fund's Statement of Additional Information, which is available on the SEC's website at www.sec.gov.
Information relating to how the Fund voted proxies relating to portfolio securities held during the most recent 12 months ended June 30 is available on the SEC's website at www.sec.gov.
Availability of Schedules of Portfolio Investments:
The Trust files a complete list of Schedules of Portfolio Investments with the SEC for the first and third quarter of each fiscal year on Form N-PORT. Form N-PORT is available on the SEC's website at www.sec.gov.
Expense Examples
As a shareholder of the Fund, you may incur two types of costs: (1) transaction costs, including sales charges (loads) on purchases, and (2) ongoing costs, including management fees and other Fund expenses. These examples are intended to help you understand your ongoing costs (in dollars) of investing in the Fund and to compare these costs with the ongoing costs of investing in other mutual funds.
These examples are based on an investment of $1,000 invested at the beginning of the period and held for the entire period from June 1, 2020 through November 30, 2020 (unless noted otherwise).
The Actual Expense figures in the table below provide information about actual account values and actual expenses. You may use the information below, together with the amount you invested, to estimate the expenses that you paid over the period. Simply divide your account value by $1,000 (for example, an $8,600 account value divided by $1,000 = 8.6), then multiply the result by the number in the table under the heading entitled "Actual Expenses Paid During Period" to estimate the expenses you paid on your account during this period.
The Hypothetical Expense figures in the table below provide information about hypothetical account values and hypothetical expenses based on the Fund's actual expense ratio and an assumed rate of return of 5% per year before expenses, which is not the Fund's actual return. The hypothetical account values and expenses may not be used to estimate the actual ending account balance or expenses you paid for the period. You may use this information to compare this 5% hypothetical example with the 5% hypothetical examples that appear in shareholder reports of other funds.
Please note the expenses shown in the table below are meant to highlight your ongoing costs only and do not reflect any transactional costs. If these transactional costs were included, your costs would have been higher.
| Beginning Account Value 6/1/20 | Actual Ending Account Value 11/30/20 | Hypothetical Ending Account Value 11/30/20 | Actual Expenses Paid During Period 6/1/20- 11/30/20* | Hypothetical Expenses Paid During Period 6/1/20- 11/30/20* | Annualized Expense Ratio During Period 6/1/20- 11/30/20 | ||||||||||||||||||||||
Fund Shares | $ | 1,000.00 | $ | 1,121.40 | $ | 1,022.01 | $ | 3.24 | $ | 3.09 | 0.61 | % | |||||||||||||||
Institutional Shares** | 1,000.00 | 1,110.70 | 1,022.21 | 2.54 | 2.89 | 0.57 | % | ||||||||||||||||||||
Class A shares** | 1,000.00 | 1,109.50 | 1,020.76 | 3.83 | 4.36 | 0.86 | % | ||||||||||||||||||||
Class C shares** | 1,000.00 | 1,105.70 | 1,017.00 | 7.15 | 8.14 | 1.61 | % | ||||||||||||||||||||
* Expenses are equal to the average account value multiplied by the Fund's annualized expense ratio multiplied by 183/365 (the number of days in the most recent fiscal half-year divided by the number of days in the fiscal year).
** Actual Expenses Paid are equal to the average account value multiplied by the Fund's annualized expense ratio multiplied by 154/365 to reflect the stub period from commencement of operations June 29, 2020 through November 30, 2020.
44
Privacy Policy
Protecting the Privacy of Information
The Trust respects your right to privacy. We also know that you expect us to conduct and process your business in an accurate and efficient manner. To do so, we must collect and maintain certain personal information about you. This is the information we collect from you on applications or other forms, and from the transactions you make with us or third parties. It may include your name, address, social security number, account transactions and balances, and information about investment goals and risk tolerance.
We do not disclose any information about you or about former customers to anyone except as permitted or required by law. Specifically, we may disclose the information we collect to companies that perform services on our behalf, such as the transfer agent that processes shareholder accounts and printers and mailers that assist us in the distribution of investor materials. We may also disclose this information to companies that perform marketing services on our behalf. This allows us to continue to offer you Victory investment products and services that meet your investing needs, and to effect transactions that you request or authorize. These companies will use this information only in connection with the services for which we hired them. They are not permitted to use or share this information for any other purpose.
To protect your personal information internally, we permit access only by authorized employees and maintain physical, electronic and procedural safeguards to guard your personal information.*
* You may have received communications regarding information about privacy policies from other financial institutions which gave you the opportunity to "opt-out" of certain information sharing with companies which are not affiliated with that financial institution. The Trust does not share information with other companies for purposes of marketing solicitations for products other than the Trust. Therefore, the Trust does not provide opt-out options to their shareholders.
P.O. Box 182593
Columbus, Ohio 43218-2593

Visit our website at: | Call | ||||||
vcm.com | (800) 235-8396 | ||||||
27801-0121

NOVEMBER 30, 2020
Semi Annual Report
USAA International Fund
Beginning January 1, 2021, as permitted by regulations adopted by the Securities and Exchange Commission, paper copies of the Fund's shareholder reports may no longer be sent by mail, unless you specifically request paper copies of the reports from the Fund or from your financial intermediary, such as a broker-dealer or bank. Instead, the reports will be made available on VictoryFunds.com, and you will be notified by mail each time a report is posted and provided with a website link to access the report. If you already elected to receive shareholder reports electronically, you will not be affected by this change and you need not take any action.
You may elect to receive shareholder reports and other communications from the Fund or your financial intermediary electronically by notifying your financial intermediary directly, or if you are a shareholder who has an account directly with the Fund, by calling (800) 235-8396 or by submitting your request via email to TA.Processing@FISGlobal.com.
You may elect to receive all future reports in paper free of charge. You can inform the Fund or your financial intermediary that you wish to continue receiving paper copies of your shareholder reports by notifying your financial intermediary directly, or if you are a shareholder who has an account directly with the Fund, by calling (800) 235-8396 or by submitting your request via email to TA.Processing@FISGlobal.com.
Your election to receive reports in paper will apply to all funds held with the USAA Mutual Funds or your financial intermediary.
Victory Capital means Victory Capital Management Inc., the investment adviser of the USAA Mutual Funds. USAA Mutual Funds are distributed by Victory Capital Services, Inc., member of FINRA, an affiliate of Victory Capital. Victory Capital and its affiliates are not affiliated with United Services Automobile Association or its affiliates. USAA and the USAA logo are registered trademarks and the USAA Mutual Funds and USAA Investments logos are trademarks of United Services Automobile Association and are being used by Victory Capital and its affiliates under license.
TABLE OF CONTENTS
Investment Objective & Portfolio Holdings | 2 | ||||||
Schedule of Portfolio Investments | 3 | ||||||
Financial Statements | |||||||
Statement of Assets and Liabilities | 29 | ||||||
Statement of Operations | 30 | ||||||
Statements of Changes in Net Assets | 31 | ||||||
Financial Highlights | 34 | ||||||
Notes to Financial Statements | 38 | ||||||
Supplemental Information | 48 | ||||||
Proxy Voting and Portfolio Holdings Information | 48 | ||||||
Expense Examples | 48 | ||||||
Privacy Policy (inside back cover) | |||||||
This report is for the information of the shareholders and others who have received a copy of the currently effective prospectus of the Fund, managed by Victory Capital Management Inc. It may be used as sales literature only when preceded or accompanied by a current prospectus, which provides further details about the Fund.
IRA DISTRIBUTION WITHHOLDING DISCLOSURE
We generally must withhold federal income tax at a rate of 10% of the taxable portion of your distribution and, if you live in a state that requires state income tax withholding, at your state's tax rate. However, you may elect not to have withholding apply or to have income tax withheld at a higher rate. Any withholding election that you make will apply to any subsequent distribution unless and until you change or revoke the election. If you wish to make a withholding election, or change or revoke a prior withholding election, call (800) 235-8396, and form W-4P (OMB No. 1545-0074 withholding certificate for pension or annuity payments) will be electronically sent.
If you do not have a withholding election in place by the date of a distribution, federal income tax will be withheld from the taxable portion of your distribution at a rate of 10%. If you must pay estimated taxes, you may be subject to estimated tax penalties if your estimated tax payments are not sufficient and sufficient tax is not withheld from your distribution.
For more specific information, please consult your tax adviser.
USAA Mutual Funds Trust
1
| USAA Mutual Funds Trust USAA International Fund | November 30, 2020 | ||||||
(Unaudited)
Investment Objective & Portfolio Holdings:
The Fund's investment objective is to seek capital appreciation.
Top 10 Sectors
November 30, 2020
(% of Net Assets)
Financials | 17.9 | % | |||||
Industrials | 13.7 | % | |||||
Consumer Discretionary | 11.5 | % | |||||
Health Care | 10.2 | % | |||||
Consumer Staples | 9.1 | % | |||||
Information Technology | 8.4 | % | |||||
Materials | 7.1 | % | |||||
Communication Services | 6.9 | % | |||||
Energy | 5.4 | % | |||||
Real Estate | 5.0 | % | |||||
Refer to the Schedule of Portfolio Investments for a complete list of securities.
Country Allocation*:
November 30, 2020
(% of Net Assets)

* Includes countries with less than 3.0% of portfolio and short-term investments purchased with cash collateral from securities loaned.
Percentages are of the net assets of the Fund and may not equal 100%.
2
| USAA Mutual Funds Trust USAA International Fund | Schedule of Portfolio Investments November 30, 2020 | ||||||
(Amounts in Thousands, Except for Shares) (Unaudited)
Security Description | Shares | Value | |||||||||
Common Stocks (98.5%) | |||||||||||
Argentina (0.0%): (a) | |||||||||||
Energy (0.0%): | |||||||||||
YPF SA, ADR (b) (c) | 179,606 | $ | 903 | ||||||||
Australia (4.8%): | |||||||||||
Communication Services (0.0%): (a) | |||||||||||
Nine Entertainment Co. Holdings Ltd. | 315,798 | 531 | |||||||||
Consumer Discretionary (0.3%): | |||||||||||
ARB Corp. Ltd. | 118,293 | 2,402 | |||||||||
Aristocrat Leisure Ltd. | 84,102 | 1,983 | |||||||||
Collins Foods Ltd. | 339,900 | 2,325 | |||||||||
JB Hi-Fi Ltd. | 42,880 | 1,440 | |||||||||
Kogan.com Ltd. | 96,125 | 1,156 | |||||||||
Temple & Webster Group Ltd. (b) | 89,577 | 648 | |||||||||
9,954 | |||||||||||
Consumer Staples (0.0%): (a) | |||||||||||
Inghams Group Ltd. | 244,753 | 547 | |||||||||
Energy (0.2%): | |||||||||||
Beach Energy Ltd. | 3,783,446 | 4,830 | |||||||||
Financials (0.8%): | |||||||||||
AUB Group Ltd. | 56,067 | 687 | |||||||||
Australia & New Zealand Banking Group Ltd. | 156,883 | 2,595 | |||||||||
Macquarie Group Ltd. | 202,020 | 20,540 | |||||||||
Netwealth Group Ltd. | 149,385 | 1,847 | |||||||||
25,669 | |||||||||||
Health Care (0.9%): | |||||||||||
CSL Ltd. | 106,267 | 23,266 | |||||||||
Healius Ltd. | 437,964 | 1,177 | |||||||||
Sonic Healthcare Ltd. | 84,342 | 2,039 | |||||||||
26,482 | |||||||||||
Industrials (0.0%): (a) | |||||||||||
Austal Ltd. | 292,117 | 626 | |||||||||
Bingo Industries Ltd. | 449,439 | 865 | |||||||||
1,491 | |||||||||||
Information Technology (0.1%): | |||||||||||
Data#3 Ltd. | 296,576 | 1,244 | |||||||||
Hansen Technologies Ltd. | 220,845 | 613 | |||||||||
1,857 | |||||||||||
Materials (1.3%): | |||||||||||
BHP Group Ltd. | 967,066 | 26,963 | |||||||||
Igo Ltd. | 192,298 | 662 | |||||||||
Mineral Resources Ltd. | 60,828 | 1,442 | |||||||||
Ramelius Resources Ltd. | 1,367,947 | 1,694 | |||||||||
See notes to financial statements.
3
| USAA Mutual Funds Trust USAA International Fund | Schedule of Portfolio Investments — continued November 30, 2020 | ||||||
(Amounts in Thousands, Except for Shares) (Unaudited)
Security Description | Shares | Value | |||||||||
Regis Resources Ltd. | 346,958 | $ | 941 | ||||||||
Rio Tinto Ltd. | 88,812 | 6,625 | |||||||||
Westgold Resources Ltd. (b) | 423,650 | 717 | |||||||||
39,044 | |||||||||||
Real Estate (1.2%): | |||||||||||
Abacus Property Group | 415,462 | 952 | |||||||||
Charter Hall Group | 964,494 | 9,665 | |||||||||
Ingenia Communities Group | 645,516 | 2,232 | |||||||||
National Storage REIT | 499,968 | 703 | |||||||||
Scentre Group | 8,446,595 | 17,275 | |||||||||
Stockland | 648,137 | 2,152 | |||||||||
Waypoint REIT Ltd. | 1,894,621 | 3,737 | |||||||||
36,716 | |||||||||||
147,121 | |||||||||||
Austria (0.5%): | |||||||||||
Financials (0.2%): | |||||||||||
BAWAG Group AG (b) (d) | 44,667 | 2,018 | |||||||||
Erste Group Bank AG (b) (c) | 84,189 | 2,415 | |||||||||
Raiffeisen Bank International AG (b) | 72,041 | 1,374 | |||||||||
Vienna Insurance Group AG Wiener Versicherung Gruppe | 20,052 | 478 | |||||||||
6,285 | |||||||||||
Industrials (0.1%): | |||||||||||
Andritz AG | 100,754 | 4,250 | |||||||||
Information Technology (0.1%): | |||||||||||
ams AG (b) | 75,384 | 1,933 | |||||||||
Materials (0.1%): | |||||||||||
Wienerberger AG | 48,048 | 1,334 | |||||||||
13,802 | |||||||||||
Belgium (1.1%): | |||||||||||
Communication Services (0.1%): | |||||||||||
Telenet Group Holding NV | 69,633 | 2,978 | |||||||||
Consumer Staples (0.1%): | |||||||||||
Anheuser-Busch InBev SA/NV | 26,729 | 1,781 | |||||||||
Ontex Group NV (b) | 38,890 | 476 | |||||||||
2,257 | |||||||||||
Financials (0.2%): | |||||||||||
Ageas | 83,985 | 4,112 | |||||||||
KBC Group NV (b) | 27,419 | 1,908 | |||||||||
6,020 | |||||||||||
Health Care (0.1%): | |||||||||||
UCB SA | 31,510 | 3,371 | |||||||||
Industrials (0.0%): (a) | |||||||||||
bpost SA | 125,832 | 1,518 | |||||||||
See notes to financial statements.
4
| USAA Mutual Funds Trust USAA International Fund | Schedule of Portfolio Investments — continued November 30, 2020 | ||||||
(Amounts in Thousands, Except for Shares) (Unaudited)
Security Description | Shares | Value | |||||||||
Information Technology (0.6%): | |||||||||||
Melexis NV | 176,672 | $ | 16,946 | ||||||||
33,090 | |||||||||||
Bermuda (0.0%): (a) | |||||||||||
Energy (0.0%): | |||||||||||
DHT Holdings, Inc. | 104,400 | 534 | |||||||||
Brazil (0.2%): | |||||||||||
Energy (0.1%): | |||||||||||
Petroleo Brasileiro SA Preference Shares | 375,200 | 1,744 | |||||||||
Financials (0.1%): | |||||||||||
Banco Santander Brasil SA | 514,700 | 3,762 | |||||||||
5,506 | |||||||||||
Canada (1.4%): | |||||||||||
Consumer Staples (0.1%): | |||||||||||
Maple Leaf Foods, Inc. | 119,165 | 2,429 | |||||||||
Energy (0.3%): | |||||||||||
ARC Resources Ltd. | 165,435 | 821 | |||||||||
Cameco Corp. (c) | 116,462 | 1,165 | |||||||||
Ovintiv, Inc. (c) | 108,613 | 1,389 | |||||||||
Parex Resources, Inc. (b) | 223,554 | 3,065 | |||||||||
Suncor Energy, Inc. (c) | 93,388 | 1,494 | |||||||||
Tourmaline Oil Corp. | 60,650 | 844 | |||||||||
8,778 | |||||||||||
Financials (0.5%): | |||||||||||
Bank of Montreal | 37,041 | 2,662 | |||||||||
iA Financial Corp., Inc. | 58,922 | 2,581 | |||||||||
IGM Financial, Inc. | 98,890 | 2,616 | |||||||||
National Bank of Canada (c) | 65,355 | 3,621 | |||||||||
Sun Life Financial, Inc. | 80,661 | 3,582 | |||||||||
15,062 | |||||||||||
Industrials (0.1%): | |||||||||||
Canadian Pacific Railway Ltd. | 12,570 | 4,061 | |||||||||
Materials (0.4%): | |||||||||||
Barrick Gold Corp. | 307,470 | 7,059 | |||||||||
Kinross Gold Corp. | 359,850 | 2,569 | |||||||||
Kirkland Lake Gold Ltd. | 52,166 | 2,138 | |||||||||
11,766 | |||||||||||
42,096 | |||||||||||
China (3.8%): | |||||||||||
Communication Services (1.2%): | |||||||||||
Baidu, Inc., ADR (b) | 16,259 | 2,260 | |||||||||
China Telecom Corp. Ltd. Class H | 10,181,335 | 3,064 | |||||||||
NetEase, Inc., ADR | 31,142 | 2,814 | |||||||||
Tencent Holdings Ltd. | 400,900 | 29,226 | |||||||||
37,364 | |||||||||||
See notes to financial statements.
5
| USAA Mutual Funds Trust USAA International Fund | Schedule of Portfolio Investments — continued November 30, 2020 | ||||||
(Amounts in Thousands, Except for Shares) (Unaudited)
Security Description | Shares | Value | |||||||||
Consumer Discretionary (1.4%): | |||||||||||
Alibaba Group Holding Ltd., ADR (b) | 65,500 | $ | 17,250 | ||||||||
BYD Co. Ltd. Class H | 76,500 | 1,753 | |||||||||
China Meidong Auto Holdings Ltd. | 3,242,000 | 14,073 | |||||||||
Dongfeng Motor Group Co. Ltd. Class H | 5,326,444 | 5,480 | |||||||||
JD.com, Inc., ADR (b) | 20,736 | 1,770 | |||||||||
Yum China Holdings, Inc | 37,788 | 2,131 | |||||||||
42,457 | |||||||||||
Consumer Staples (0.1%): | |||||||||||
Tingyi Cayman Islands Holding Corp. | 968,000 | 1,635 | |||||||||
Financials (0.7%): | |||||||||||
Bank of China Ltd. Class H | 6,596,000 | 2,328 | |||||||||
China Merchants Bank Co. Ltd. Class H | 2,320,500 | 14,709 | |||||||||
Huatai Securities Co. Ltd. Class H (d) | 1,578,200 | 2,466 | |||||||||
New China Life Insurance Co. Ltd. Class H | 701,800 | 2,948 | |||||||||
22,451 | |||||||||||
Industrials (0.1%): | |||||||||||
China Railway Group Ltd. Class H | 4,096,000 | 2,022 | |||||||||
S-Enjoy Service Group Co. Ltd. | 562,000 | 1,315 | |||||||||
3,337 | |||||||||||
Materials (0.2%): | |||||||||||
Anhui Conch Cement Co. Ltd. Class H | 777,500 | 4,970 | |||||||||
Real Estate (0.1%): | |||||||||||
Agile Group Holdings Ltd. | 1,680,000 | 2,426 | |||||||||
114,640 | |||||||||||
Denmark (1.7%): | |||||||||||
Consumer Staples (0.8%): | |||||||||||
Carlsberg A/S Class B | 21,152 | 3,151 | |||||||||
Royal Unibrew A/S | 182,551 | 19,059 | |||||||||
Scandinavian Tobacco Group A/S (d) | 97,002 | 1,493 | |||||||||
Schouw & Co. A/S | 13,966 | 1,357 | |||||||||
25,060 | |||||||||||
Energy (0.0%): (a) | |||||||||||
The Drilling Co. of 1972 A/S (b) | 6,339 | 181 | |||||||||
Financials (0.1%): | |||||||||||
Jyske Bank A/S Registered Shares (b) | 46,946 | 1,755 | |||||||||
Ringkjoebing Landbobank A/S | 20,377 | 1,768 | |||||||||
3,523 | |||||||||||
Health Care (0.2%): | |||||||||||
Chemometec A/S (c) | 18,224 | 1,314 | |||||||||
Genmab A/S (b) | 4,747 | 1,826 | |||||||||
GN Store Nord A/S | 25,993 | 2,116 | |||||||||
5,256 | |||||||||||
See notes to financial statements.
6
| USAA Mutual Funds Trust USAA International Fund | Schedule of Portfolio Investments — continued November 30, 2020 | ||||||
(Amounts in Thousands, Except for Shares) (Unaudited)
Security Description | Shares | Value | |||||||||
Industrials (0.4%): | |||||||||||
AP Moller — Maersk A/S Class B (c) | 4,347 | $ | 8,864 | ||||||||
D/S Norden A/S | 117,418 | 2,086 | |||||||||
Per Aarsleff Holding A/S | 50,396 | 2,138 | |||||||||
13,088 | |||||||||||
Information Technology (0.0%): (a) | |||||||||||
Netcompany Group A/S (b) (d) | 15,559 | 1,445 | |||||||||
Utilities (0.2%): | |||||||||||
Orsted A/S (d) | 25,398 | 4,571 | |||||||||
53,124 | |||||||||||
Finland (0.9%): | |||||||||||
Consumer Discretionary (0.0%): (a) | |||||||||||
Tokmanni Group Corp. | 59,858 | 1,089 | |||||||||
Health Care (0.1%): | |||||||||||
Orion Oyj Class B | 27,933 | 1,314 | |||||||||
Industrials (0.4%): | |||||||||||
Cargotec Oyj Class B | 27,742 | 1,106 | |||||||||
Metso Outotec Oyj | 309,078 | 2,764 | |||||||||
Uponor Oyj | 88,356 | 1,796 | |||||||||
Valmet Oyj | 267,645 | 6,754 | |||||||||
12,420 | |||||||||||
Information Technology (0.2%): | |||||||||||
Nokia Oyj (b) | 1,301,986 | 5,192 | |||||||||
Materials (0.2%): | |||||||||||
Huhtamaki Oyj | 65,328 | 3,272 | |||||||||
Kemira Oyj | 165,679 | 2,368 | |||||||||
Metsa Board Oyj | 119,367 | 1,077 | |||||||||
6,717 | |||||||||||
26,732 | |||||||||||
France (7.9%): | |||||||||||
Communication Services (0.1%): | |||||||||||
Publicis Groupe SA | 41,926 | 1,889 | |||||||||
Vivendi SA | 75,393 | 2,260 | |||||||||
4,149 | |||||||||||
Consumer Discretionary (2.7%): | |||||||||||
Cie Generale des Etablissements Michelin SCA | 169,681 | 21,104 | |||||||||
Faurecia SE (b) | 370,503 | 18,351 | |||||||||
Kering SA | 2,486 | 1,794 | |||||||||
LVMH Moet Hennessy Louis Vuitton SE | 63,937 | 36,721 | |||||||||
Renault SA (b) | 93,984 | 3,731 | |||||||||
81,701 | |||||||||||
See notes to financial statements.
7
| USAA Mutual Funds Trust USAA International Fund | Schedule of Portfolio Investments — continued November 30, 2020 | ||||||
(Amounts in Thousands, Except for Shares) (Unaudited)
Security Description | Shares | Value | |||||||||
Energy (1.4%): | |||||||||||
Gaztransport Et Technigaz SA | 105,828 | $ | 10,458 | ||||||||
TOTAL SE | 731,594 | 31,049 | |||||||||
41,507 | |||||||||||
Financials (0.9%): | |||||||||||
Amundi SA (d) | 22,009 | 1,750 | |||||||||
AXA SA | 344,382 | 8,051 | |||||||||
BNP Paribas SA (b) | 197,501 | 10,052 | |||||||||
Coface SA (b) | 90,881 | 916 | |||||||||
SCOR SE (b) | 64,572 | 2,197 | |||||||||
Societe Generale SA | 197,137 | 3,908 | |||||||||
26,874 | |||||||||||
Health Care (0.2%): | |||||||||||
Korian SA (b) | 1 | — | (e) | ||||||||
Sanofi | 23,194 | 2,338 | |||||||||
Sartorius Stedim Biotech | 6,192 | 2,232 | |||||||||
4,570 | |||||||||||
Industrials (0.8%): | |||||||||||
Alstom SA (b) | 31,167 | 1,681 | |||||||||
Cie de Saint-Gobain (b) | 280,278 | 13,276 | |||||||||
Dassault Aviation SA (b) (c) | 1,500 | 1,533 | |||||||||
Elis SA (b) | 36,838 | 599 | |||||||||
Mersen (b) | 20,123 | 586 | |||||||||
Rexel SA (b) | 378,840 | 5,123 | |||||||||
Societe BIC SA | 9,160 | 542 | |||||||||
Teleperformance | 7,018 | 2,333 | |||||||||
25,673 | |||||||||||
Information Technology (0.7%): | |||||||||||
Capgemini SE | 144,227 | 20,063 | |||||||||
Worldline SA (b) (d) | 25,809 | 2,390 | |||||||||
22,453 | |||||||||||
Materials (0.8%): | |||||||||||
Arkema SA | 214,079 | 24,928 | |||||||||
Utilities (0.3%): | |||||||||||
Engie SA | 437,628 | 6,441 | |||||||||
Rubis SCA | 60,809 | 2,580 | |||||||||
9,021 | |||||||||||
240,876 | |||||||||||
Georgia (0.0%): (a) | |||||||||||
Financials (0.0%): | |||||||||||
Bank of Georgia Group PLC (b) | 63,044 | 946 | |||||||||
See notes to financial statements.
8
| USAA Mutual Funds Trust USAA International Fund | Schedule of Portfolio Investments — continued November 30, 2020 | ||||||
(Amounts in Thousands, Except for Shares) (Unaudited)
Security Description | Shares | Value | |||||||||
Germany (5.7%): | |||||||||||
Communication Services (0.2%): | |||||||||||
Deutsche Telekom AG | 245,021 | $ | 4,423 | ||||||||
New Work SE | 2,236 | 686 | |||||||||
ProSiebenSat.1 Media SE (b) | 86,892 | 1,260 | |||||||||
6,369 | |||||||||||
Consumer Discretionary (0.8%): | |||||||||||
Ceconomy AG (b) | 262,508 | 1,293 | |||||||||
Daimler AG Registered Shares | 134,895 | 9,031 | |||||||||
HelloFresh SE (b) | 36,612 | 2,160 | |||||||||
Hornbach Holding AG & Co. KGaA | 43,440 | 4,624 | |||||||||
Schaeffler AG, Preference Shares | 59,533 | 443 | |||||||||
Volkswagen AG Preference Shares | 30,660 | 5,146 | |||||||||
22,697 | |||||||||||
Consumer Staples (0.0%): (a) | |||||||||||
METRO AG | 90,235 | 827 | |||||||||
Energy (0.0%): (a) | |||||||||||
CropEnergies AG | 46,416 | 768 | |||||||||
Financials (1.2%): | |||||||||||
Allianz SE | 144,492 | �� | 33,863 | ||||||||
Hannover Rueck SE | 10,349 | 1,729 | |||||||||
Muenchener Rueckversicherungs-Gesellschaft AG Class R | 6,114 | 1,694 | |||||||||
37,286 | |||||||||||
Health Care (0.3%): | |||||||||||
CompuGroup Medical SE & Co. KgaA | 20,554 | 2,036 | |||||||||
Dermapharm Holding SE | 26,892 | 1,795 | |||||||||
Draegerwerk AG & Co. KGaA, Preference Shares (c) | 16,738 | 1,311 | |||||||||
Fresenius Medical Care AG & Co. KGaA | 22,869 | 1,924 | |||||||||
7,066 | |||||||||||
Industrials (1.3%): | |||||||||||
Cewe Stiftung & Co. KGaA | 4,410 | 477 | |||||||||
Deutsche Post AG Registered Shares | 85,967 | 4,146 | |||||||||
Siemens AG Registered Shares | 259,256 | 34,600 | |||||||||
39,223 | |||||||||||
Information Technology (0.9%): | |||||||||||
Allgeier SE | 20,055 | 1,909 | |||||||||
LPKF Laser & Electronics AG | 27,183 | 741 | |||||||||
SAP SE | 189,846 | 22,915 | |||||||||
TeamViewer AG (b) (d) | 43,785 | 2,087 | |||||||||
27,652 | |||||||||||
Materials (0.1%): | |||||||||||
Aurubis AG | 15,704 | 1,193 | |||||||||
HeidelbergCement AG | 20,066 | 1,419 | |||||||||
Salzgitter AG (b) | 32,457 | 651 | |||||||||
3,263 | |||||||||||
See notes to financial statements.
9
| USAA Mutual Funds Trust USAA International Fund | Schedule of Portfolio Investments — continued November 30, 2020 | ||||||
(Amounts in Thousands, Except for Shares) (Unaudited)
Security Description | Shares | Value | |||||||||
Real Estate (0.8%): | |||||||||||
alstria office REIT-AG | 94,914 | $ | 1,528 | ||||||||
LEG Immobilien AG | 18,543 | 2,637 | |||||||||
Sirius Real Estate Ltd. | 662,047 | 794 | |||||||||
TAG Immobilien AG | 128,855 | 3,852 | |||||||||
Vonovia SE | 239,738 | 16,391 | |||||||||
25,202 | |||||||||||
Utilities (0.1%): | |||||||||||
E.ON SE | 304,801 | 3,298 | |||||||||
173,651 | |||||||||||
Gibraltar (0.0%): (a) | |||||||||||
Consumer Discretionary (0.0%): | |||||||||||
| 888 Holdings PLC | 259,494 | 940 | |||||||||
Hong Kong (2.4%): | |||||||||||
Communication Services (0.2%): | |||||||||||
China Mobile Ltd. | 550,742 | 3,285 | |||||||||
China Unicom Hong Kong Ltd. | 5,459,145 | 3,277 | |||||||||
6,562 | |||||||||||
Consumer Staples (0.1%): | |||||||||||
WH Group Ltd. (d) | 2,720,500 | 2,216 | |||||||||
Energy (0.1%): | |||||||||||
CNOOC Ltd. | 1,748,208 | 1,740 | |||||||||
Kunlun Energy Co. Ltd. | 2,712,000 | 2,046 | |||||||||
3,786 | |||||||||||
Financials (0.7%): | |||||||||||
AIA Group Ltd. | 1,579,600 | 17,336 | |||||||||
BOC Hong Kong Holdings Ltd. | 663,500 | 2,159 | |||||||||
19,495 | |||||||||||
Health Care (0.0%): (a) | |||||||||||
The United Laboratories International Holdings Ltd. | 896,000 | 671 | |||||||||
Industrials (0.2%): | |||||||||||
Johnson Electric Holdings Ltd. | 943,000 | 2,221 | |||||||||
SITC International Holdings Co. Ltd. | 1,846,000 | 3,541 | |||||||||
5,762 | |||||||||||
Information Technology (0.1%): | |||||||||||
Cowell E Holdings, Inc. | 1,043,000 | 644 | |||||||||
Lenovo Group Ltd. | 5,034,000 | 3,587 | |||||||||
4,231 | |||||||||||
Real Estate (0.9%): | |||||||||||
CK Asset Holdings Ltd. | 4,366,604 | 23,861 | |||||||||
Hysan Development Co. Ltd. | 445,000 | 1,791 | |||||||||
K Wah International Holdings Ltd. | 2,000,000 | 995 | |||||||||
New World Development Co. Ltd. | 332,338 | 1,684 | |||||||||
28,331 | |||||||||||
See notes to financial statements.
10
| USAA Mutual Funds Trust USAA International Fund | Schedule of Portfolio Investments — continued November 30, 2020 | ||||||
(Amounts in Thousands, Except for Shares) (Unaudited)
Security Description | Shares | Value | |||||||||
Utilities (0.1%): | |||||||||||
China Water Affairs Group Ltd. (c) | 1,794,000 | $ | 1,412 | ||||||||
72,466 | |||||||||||
Hungary (0.1%): | |||||||||||
Financials (0.1%): | |||||||||||
OTP Bank Nyrt (b) | 71,401 | 2,846 | |||||||||
India (0.7%): | |||||||||||
Communication Services (0.0%): (a) | |||||||||||
Zee Entertainment Enterprises Ltd. | 586,895 | 1,517 | |||||||||
Energy (0.1%): | |||||||||||
Oil & Natural Gas Corp. Ltd. | 1,221,766 | 1,281 | |||||||||
Reliance Industries Ltd. | 126,802 | 3,279 | |||||||||
4,560 | |||||||||||
Financials (0.2%): | |||||||||||
Canara Bank (b) | 730,714 | 1,019 | |||||||||
HDFC Bank Ltd. (b) | 116,126 | 2,243 | |||||||||
Muthoot Finance Ltd. | 138,682 | 2,151 | |||||||||
5,413 | |||||||||||
Health Care (0.2%): | |||||||||||
Ipca Laboratories Ltd. | 156,730 | 4,564 | |||||||||
Information Technology (0.1%): | |||||||||||
HCL Technologies Ltd. | 301,829 | 3,332 | |||||||||
Utilities (0.1%): | |||||||||||
NTPC Ltd. | 269,636 | 343 | |||||||||
Power Grid Corp. of India Ltd. | 781,882 | 2,026 | |||||||||
2,369 | |||||||||||
21,755 | |||||||||||
Indonesia (0.1%): | |||||||||||
Communication Services (0.1%): | |||||||||||
PT Sarana Menara Nusantara Tbk (b) | 37,244,900 | 2,894 | |||||||||
Financials (0.0%): (a) | |||||||||||
PT Bank Mandiri Persero Tbk | 2,799,053 | 1,258 | |||||||||
4,152 | |||||||||||
Ireland (0.8%): | |||||||||||
Financials (0.2%): | |||||||||||
AIB Group PLC | 1,188,171 | 2,133 | |||||||||
Bank of Ireland Group PLC (b) | 865,942 | 2,713 | |||||||||
4,846 | |||||||||||
Health Care (0.1%): | |||||||||||
ICON PLC (b) | 21,702 | 4,229 | |||||||||
See notes to financial statements.
11
| USAA Mutual Funds Trust USAA International Fund | Schedule of Portfolio Investments — continued November 30, 2020 | ||||||
(Amounts in Thousands, Except for Shares) (Unaudited)
Security Description | Shares | Value | |||||||||
Industrials (0.5%): | |||||||||||
DCC PLC | 24,335 | $ | 1,832 | ||||||||
Experian PLC | 335,276 | 11,877 | |||||||||
13,709 | |||||||||||
22,784 | |||||||||||
Isle of Man (0.0%): (a) | |||||||||||
Consumer Discretionary (0.0%): | |||||||||||
Playtech PLC (b) | 212,556 | 1,085 | |||||||||
Israel (0.4%): | |||||||||||
Communication Services (0.1%): | |||||||||||
Bezeq The Israeli Telecommunication Corp. Ltd. (b) | 3,009,923 | 3,259 | |||||||||
Consumer Discretionary (0.1%): | |||||||||||
Maytronics Ltd. | 183,798 | 2,684 | |||||||||
Financials (0.1%): | |||||||||||
Plus500 Ltd. | 194,175 | 3,984 | |||||||||
Industrials (0.1%): | |||||||||||
Ashtrom Group Ltd. | 38,176 | 610 | |||||||||
Danel Adir Yeoshua Ltd. | 10,294 | 1,557 | |||||||||
Elco Ltd. | 15,981 | 653 | |||||||||
Electra Ltd. | 1,064 | 491 | |||||||||
3,311 | |||||||||||
13,238 | |||||||||||
Italy (4.2%): | |||||||||||
Consumer Discretionary (0.0%): (a) | |||||||||||
de' Longhi SpA (b) | 6,452 | 225 | |||||||||
Energy (0.7%): | |||||||||||
Eni SpA | 598,606 | 5,960 | |||||||||
Saipem SpA (c) | 724,632 | 1,779 | |||||||||
Snam SpA | 2,196,898 | 12,407 | |||||||||
20,146 | |||||||||||
Financials (1.2%): | |||||||||||
Anima Holding SpA (d) | 119,845 | 528 | |||||||||
Assicurazioni Generali SpA | 241,981 | 4,136 | |||||||||
Banca Generali SpA (b) | 626,872 | 20,898 | |||||||||
Banco Bpm SpA (b) | 846,901 | 1,881 | |||||||||
| BPER Banca (b) (c) | 779,405 | 1,371 | |||||||||
UniCredit SpA | 496,929 | 5,157 | |||||||||
Unipol Gruppo SpA (b) | 377,884 | 1,822 | |||||||||
35,793 | |||||||||||
Health Care (0.5%): | |||||||||||
Recordati SpA | 314,972 | 16,844 | |||||||||
Industrials (0.1%): | |||||||||||
Leonardo SpA (c) | 239,024 | 1,735 | |||||||||
See notes to financial statements.
12
| USAA Mutual Funds Trust USAA International Fund | Schedule of Portfolio Investments — continued November 30, 2020 | ||||||
(Amounts in Thousands, Except for Shares) (Unaudited)
Security Description | Shares | Value | |||||||||
Information Technology (0.1%): | |||||||||||
Reply SpA | 21,138 | $ | 2,377 | ||||||||
Materials (0.0%): (a) | |||||||||||
Buzzi Unicem SpA | 64,972 | 1,590 | |||||||||
Utilities (1.6%): | |||||||||||
A2A SpA | 363,763 | 556 | |||||||||
ACEA SpA | 107,267 | 2,274 | |||||||||
Enel SpA | 3,919,471 | 39,319 | |||||||||
Hera SpA | 724,117 | 2,639 | |||||||||
Iren SpA | 187,583 | 503 | |||||||||
Italgas SpA | 335,536 | 2,158 | |||||||||
47,449 | |||||||||||
126,159 | |||||||||||
Japan (23.1%): | |||||||||||
Communication Services (1.9%): | |||||||||||
Capcom Co. Ltd. | 244,800 | 13,844 | |||||||||
DeNA Co. Ltd. | 154,350 | 2,705 | |||||||||
Fuji Media Holdings, Inc. | 83,698 | 869 | |||||||||
Gree, Inc. | 354,975 | 1,983 | |||||||||
Imagineer Co. Ltd. | 108,700 | 1,224 | |||||||||
Internet Initiative Japan, Inc. | 15,300 | 728 | |||||||||
Kakaku.com, Inc. | 527,500 | 14,761 | |||||||||
KDDI Corp. | 105,500 | 3,003 | |||||||||
Nexon Co. Ltd. | 91,500 | 2,760 | |||||||||
Nintendo Co. Ltd. | 6,600 | 3,745 | |||||||||
Nippon Telegraph & Telephone Corp. | 134,600 | 3,184 | |||||||||
Nippon Television Holdings, Inc. | 161,314 | 1,755 | |||||||||
SKY Perfect JSAT Holdings, Inc. | 553,900 | 2,506 | |||||||||
TV Asahi Holdings Corp. | 99,600 | 1,601 | |||||||||
Wowow, Inc. | 20,700 | 562 | |||||||||
Z Holdings Corp. | 301,424 | 1,901 | |||||||||
57,131 | |||||||||||
Consumer Discretionary (3.9%): | |||||||||||
Benesse Holdings, Inc. | 14,859 | 312 | |||||||||
DCM Holdings Co. Ltd. | 258,200 | 2,931 | |||||||||
Exedy Corp. | 136,300 | 1,608 | |||||||||
Hikari Tsushin, Inc. | 46,000 | 11,044 | |||||||||
Honda Motor Co. Ltd. | 343,792 | 9,567 | |||||||||
Isuzu Motors Ltd. | 494,774 | 4,810 | |||||||||
Komeri Co. Ltd. | 63,200 | 1,718 | |||||||||
Mitsubishi Motors Corp. (c) | 580,084 | 1,044 | |||||||||
Nafco Co. Ltd. | 85,900 | 1,848 | |||||||||
Nikon Corp. | 264,455 | 1,640 | |||||||||
Nissan Motor Co. Ltd. (b) | 682,693 | 3,232 | |||||||||
Nitori Holdings Co. Ltd. | 8,500 | 1,808 | |||||||||
Nojima Corp. | 19,700 | 514 | |||||||||
Resorttrust, Inc. | 60,100 | 931 | |||||||||
Ride On Express Holdings Co. Ltd. (b) | 52,600 | 1,017 | |||||||||
See notes to financial statements.
13
| USAA Mutual Funds Trust USAA International Fund | Schedule of Portfolio Investments — continued November 30, 2020 | ||||||
(Amounts in Thousands, Except for Shares) (Unaudited)
Security Description | Shares | Value | |||||||||
Shimamura Co. Ltd. | 48,538 | $ | 5,002 | ||||||||
Sony Corp. | 125,100 | 11,660 | |||||||||
Starts Corp., Inc. | 33,200 | 894 | |||||||||
Sumitomo Forestry Co. Ltd. | 39,000 | 706 | |||||||||
Tama Home Co. Ltd. (c) | 133,800 | 1,841 | |||||||||
Tamron Co. Ltd. | 61,200 | 934 | |||||||||
Tokyotokeiba Co. Ltd. | 58,000 | 2,876 | |||||||||
Topre Corp. | 112,900 | 1,406 | |||||||||
Toyo Tire Corp. | 118,100 | 1,859 | |||||||||
Toyota Motor Corp. | 707,600 | 47,765 | |||||||||
118,967 | |||||||||||
Consumer Staples (1.6%): | |||||||||||
Arcs Co. Ltd. | 21,400 | 447 | |||||||||
Cawachi Ltd. | 72,500 | 2,078 | |||||||||
Itoham Yonekyu Holdings, Inc. | 243,000 | 1,521 | |||||||||
Kewpie Corp. | 49,500 | 1,030 | |||||||||
Kobe Bussan Co. Ltd. (c) | 453,600 | 15,894 | |||||||||
Life Corp. | 23,700 | 838 | |||||||||
NH Foods Ltd. | 11,700 | 498 | |||||||||
Niitaka Co. Ltd. (c) | 39,800 | 1,184 | |||||||||
Okuwa Co. Ltd. | 50,600 | 649 | |||||||||
Prima Meat Packers Ltd. | 49,300 | 1,368 | |||||||||
Seven & i Holdings Co. Ltd. | 51,500 | 1,624 | |||||||||
Soiken Holdings, Inc. (c) | 173,100 | 1,139 | |||||||||
The Nisshin Oillio Group Ltd. | 66,200 | 1,847 | |||||||||
Toyo Suisan Kaisha Ltd. | 384,600 | 18,920 | |||||||||
Yokohama Reito Co. Ltd. | 83,600 | 679 | |||||||||
49,716 | |||||||||||
Energy (0.1%): | |||||||||||
Inpex Corp. | 553,714 | 3,067 | |||||||||
Japan Petroleum Exploration Co. Ltd. | 45,700 | 766 | |||||||||
3,833 | |||||||||||
Financials (2.8%): | |||||||||||
Credit Saison Co. Ltd. | 210,800 | 2,410 | |||||||||
Dai-ichi Life Holdings, Inc. | 252,393 | 3,977 | |||||||||
Jaccs Co. Ltd. | 30,300 | 526 | |||||||||
JAFCO Group Co. Ltd. | 197,900 | 8,471 | |||||||||
Mitsubishi UFJ Financial Group, Inc. | 4,090,702 | 17,460 | |||||||||
Mizuho Financial Group, Inc. | 127,650 | 1,618 | |||||||||
Nishi-Nippon Financial Holdings, Inc. | 67,200 | 462 | |||||||||
Nomura Holdings, Inc. | 976,334 | 4,899 | |||||||||
North Pacific Bank Ltd. | 601,200 | 1,341 | |||||||||
ORIX Corp. | 244,100 | 3,614 | |||||||||
Resona Holdings, Inc. | 1,143,686 | 3,987 | |||||||||
Ricoh Leasing Co. Ltd. | 20,300 | 563 | |||||||||
Shinsei Bank Ltd. | 118,600 | 1,402 | |||||||||
Sumitomo Mitsui Financial Group, Inc. | 260,584 | 7,494 | |||||||||
Sumitomo Mitsui Trust Holdings, Inc. | 184,007 | 5,340 | |||||||||
See notes to financial statements.
14
| USAA Mutual Funds Trust USAA International Fund | Schedule of Portfolio Investments — continued November 30, 2020 | ||||||
(Amounts in Thousands, Except for Shares) (Unaudited)
Security Description | Shares | Value | |||||||||
Suruga Bank Ltd. | 131,900 | $ | 424 | ||||||||
T&D Holdings, Inc. | 557,915 | 6,496 | |||||||||
The 77 Bank Ltd. | 52,400 | 731 | |||||||||
The Hyakujushi Bank Ltd. | 28,200 | 437 | |||||||||
The Juroku Bank Ltd. | 63,400 | 1,203 | |||||||||
Tokio Marine Holdings, Inc. | 214,400 | 10,619 | |||||||||
TOMONY Holdings, Inc. | 165,100 | 527 | |||||||||
84,001 | |||||||||||
Health Care (2.4%): | |||||||||||
Astellas Pharma, Inc. | 190,900 | 2,720 | |||||||||
Daito Pharmaceutical Co. Ltd. | 22,800 | 789 | |||||||||
Eisai Co. Ltd. | 26,996 | 2,035 | |||||||||
Hoya Corp. | 243,400 | 32,376 | |||||||||
Nipro Corp. | 201,400 | 2,162 | |||||||||
Ono Pharmaceutical Co. Ltd. | 78,400 | 2,483 | |||||||||
Shionogi & Co. Ltd. | 366,500 | 19,621 | |||||||||
Ship Healthcare Holdings, Inc. | 50,100 | 2,497 | |||||||||
Takeda Pharmaceutical Co. Ltd. | 192,671 | 6,893 | |||||||||
Torii Pharmaceutical Co. Ltd. | 37,300 | 1,129 | |||||||||
Towa Pharmaceutical Co. Ltd. | 82,900 | 1,511 | |||||||||
74,216 | |||||||||||
Industrials (4.7%): | |||||||||||
Bunka Shutter Co. Ltd. | 110,200 | 960 | |||||||||
Chiyoda Corp. (b) | 163,541 | 364 | |||||||||
CTI Engineering Co. Ltd. | 37,200 | 752 | |||||||||
Daihen Corp. | 56,500 | 2,448 | |||||||||
en-japan, Inc. | 438,100 | 13,582 | |||||||||
Fuji Electric Co. Ltd. | 226,200 | 8,011 | |||||||||
Furukawa Co. Ltd. | 43,100 | 467 | |||||||||
Hanwa Co. Ltd. | 102,000 | 2,432 | |||||||||
Hino Motors Ltd. | 489,242 | 4,225 | |||||||||
Hitachi Zosen Corp. | 514,800 | 1,978 | |||||||||
IR Japan Holdings Ltd. | 5,700 | 912 | |||||||||
ITOCHU Corp. | 628,300 | 16,584 | |||||||||
Japan Airlines Co. Ltd. Class C | 82,960 | 1,564 | |||||||||
JGC Holdings Corp. | 303,568 | 2,703 | |||||||||
Kamigumi Co. Ltd. | 46,140 | 796 | |||||||||
Kandenko Co. Ltd. | 295,700 | 2,253 | |||||||||
Kintetsu World Express, Inc. | 46,400 | 962 | |||||||||
Mitsubishi Electric Corp. | 152,800 | 2,239 | |||||||||
Mitsubishi Heavy Industries Ltd. | 64,238 | 1,443 | |||||||||
Mitsui & Co. Ltd. | 133,400 | 2,267 | |||||||||
Mitsui-Soko Holdings Co. Ltd. | 63,100 | 1,357 | |||||||||
Nikkon Holdings Co. Ltd. | 23,500 | 456 | |||||||||
Nippo Corp. | 113,200 | 2,951 | |||||||||
Nippon Yusen | 506,100 | 10,995 | |||||||||
Nishio Rent All Co. Ltd. | 26,200 | 509 | |||||||||
Obayashi Corp. | 184,900 | 1,628 | |||||||||
OKUMA Corp. | 288,000 | 16,555 | |||||||||
See notes to financial statements.
15
| USAA Mutual Funds Trust USAA International Fund | Schedule of Portfolio Investments — continued November 30, 2020 | ||||||
(Amounts in Thousands, Except for Shares) (Unaudited)
Security Description | Shares | Value | |||||||||
Organo Corp. | 29,900 | $ | 1,695 | ||||||||
OSJB Holdings Corp. | 274,200 | 618 | |||||||||
Relia, Inc. | 181,800 | 2,142 | |||||||||
Sanki Engineering Co. Ltd. | 137,500 | 1,512 | |||||||||
Sanwa Holdings Corp. | 1,531,300 | 18,604 | |||||||||
Secom Co. Ltd. | 21,900 | 2,186 | |||||||||
Sintokogio Ltd. | 65,600 | 447 | |||||||||
Sumitomo Heavy Industries Ltd. | 58,610 | 1,267 | |||||||||
Taisei Corp. | 49,900 | 1,756 | |||||||||
Takeei Corp. | 71,800 | 892 | |||||||||
THK Co. Ltd. | 120,356 | 3,715 | |||||||||
Toa Corp. | 29,900 | 568 | |||||||||
Uchida Yoko Co. Ltd. | 12,200 | 597 | |||||||||
Wakita & Co. Ltd. | 59,900 | 656 | |||||||||
Will Group, Inc. | 110,100 | 1,029 | |||||||||
Yamato Holdings Co. Ltd. | 65,300 | 1,647 | |||||||||
Yamazen Corp. | 52,600 | 500 | |||||||||
Yokogawa Bridge Holdings Corp. | 28,500 | 541 | |||||||||
141,765 | |||||||||||
Information Technology (3.3%): | |||||||||||
Anritsu Corp. | 82,200 | 1,876 | |||||||||
Argo Graphics, Inc. | 17,500 | 533 | |||||||||
Canon, Inc. | 87,776 | 1,555 | |||||||||
Citizen Watch Co. Ltd. | 391,992 | 1,027 | |||||||||
Cybernet Systems Co. Ltd. | 172,100 | 1,590 | |||||||||
Digital Information Technologies Corp. | 47,300 | 684 | |||||||||
Eizo Corp. | 20,100 | 696 | |||||||||
Fujitsu Ltd. | 238,744 | 33,034 | |||||||||
Hitachi Ltd. | 59,400 | 2,255 | |||||||||
Itfor, Inc. (b) | 167,500 | 1,471 | |||||||||
Kaga Electronics Co. Ltd. | 31,800 | 656 | |||||||||
Macnica Fuji Electronics Holdings, Inc. | 108,700 | 2,150 | |||||||||
MCJ Co. Ltd. | 243,900 | 2,248 | |||||||||
Mimasu Semiconductor Industry Co. Ltd. | 71,600 | 1,921 | |||||||||
Mitsubishi Research Institute, Inc. | 21,700 | 864 | |||||||||
Murata Manufacturing Co. Ltd. | 51,600 | 4,500 | |||||||||
Nippon Signal Co. Ltd. | 70,300 | 625 | |||||||||
Nohmi Bosai Ltd. | 37,700 | 816 | |||||||||
NSD Co. Ltd. | 28,200 | 538 | |||||||||
Obic Co. Ltd. | 12,700 | 2,856 | |||||||||
Oracle Corp. | 159,100 | 17,648 | |||||||||
PCA Corp. | 10,000 | 433 | |||||||||
Restar Holdings Corp. | 44,900 | 966 | |||||||||
TKC Corp. | 16,900 | 1,122 | |||||||||
Tokyo Electron Device Ltd. | 41,700 | 1,247 | |||||||||
Tokyo Electron Ltd. | 8,700 | 2,957 | |||||||||
Transcosmos, Inc. | 20,000 | 516 | |||||||||
Ulvac, Inc. | 284,300 | 11,480 | |||||||||
United, Inc. | 41,800 | 624 | |||||||||
98,888 | |||||||||||
See notes to financial statements.
16
| USAA Mutual Funds Trust USAA International Fund | Schedule of Portfolio Investments — continued November 30, 2020 | ||||||
(Amounts in Thousands, Except for Shares) (Unaudited)
Security Description | Shares | Value | |||||||||
Materials (0.6%): | |||||||||||
ADEKA Corp. | 61,400 | $ | 971 | ||||||||
Daicel Corp. | 146,300 | 1,024 | |||||||||
Fumakilla Ltd. (b) | 69,100 | 989 | |||||||||
Godo Steel Ltd. | 56,100 | 995 | |||||||||
Hokuetsu Corp. | 117,200 | 393 | |||||||||
Koei Chemical Co. Ltd. (c) | 21,300 | 660 | |||||||||
Kureha Corp. | 31,000 | 1,567 | |||||||||
Kyoei Steel Ltd. | 43,200 | 617 | |||||||||
Nippon Paper Industries Co. Ltd. | 38,400 | 413 | |||||||||
Nippon Pillar Packing Co. Ltd. | 35,100 | 544 | |||||||||
Nitto Denko Corp. | 37,530 | 3,095 | |||||||||
Rengo Co. Ltd. | 194,600 | 1,475 | |||||||||
Shin-Etsu Chemical Co. Ltd. | 14,800 | 2,425 | |||||||||
Tokuyama Corp. | 30,200 | 639 | |||||||||
Tosoh Corp. | 112,500 | 1,762 | |||||||||
Toyo Seikan Group Holdings Ltd. | 135,800 | 1,300 | |||||||||
Toyobo Co. Ltd. | 37,300 | 464 | |||||||||
19,333 | |||||||||||
Real Estate (1.1%): | |||||||||||
Daiwa House Industry Co. Ltd. | 65,100 | 1,990 | |||||||||
Kenedix Retail REIT Corp. | 871 | 1,925 | |||||||||
Kenedix, Inc. | 180,300 | 1,299 | |||||||||
Mirai Corp. | 3,099 | 1,135 | |||||||||
Mitsubishi Estate Co. Ltd. | 239,606 | 4,123 | |||||||||
Nippon Commercial Development Co. Ltd. | 58,700 | 961 | |||||||||
Nomura Real Estate Holdings, Inc. | 207,600 | 4,463 | |||||||||
Open House Co. Ltd. | 92,700 | 3,660 | |||||||||
Shinoken Group Co. Ltd. | 57,600 | 635 | |||||||||
Sumitomo Realty & Development Co. Ltd. | 363,900 | 11,840 | |||||||||
Takara Leben Co. Ltd. | 357,900 | 1,010 | |||||||||
Takara Leben Real Estate Investment Corp. | 1,745 | 1,489 | |||||||||
34,530 | |||||||||||
Utilities (0.7%): | |||||||||||
Chubu Electric Power Co., Inc. | 1,436,700 | 17,275 | |||||||||
Electric Power Development Co. Ltd. | 40,400 | 542 | |||||||||
Hokkaido Electric Power Co., Inc. | 359,500 | 1,345 | |||||||||
The Kansai Electric Power Co., Inc. | 145,500 | 1,328 | |||||||||
20,490 | |||||||||||
702,870 | |||||||||||
Jersey (0.1%): | |||||||||||
Consumer Discretionary (0.1%): | |||||||||||
boohoo Group PLC (b) | 316,437 | 1,328 | |||||||||
Materials (0.0%): (a) | |||||||||||
Centamin PLC | 426,002 | 645 | |||||||||
1,973 | |||||||||||
See notes to financial statements.
17
| USAA Mutual Funds Trust USAA International Fund | Schedule of Portfolio Investments — continued November 30, 2020 | ||||||
(Amounts in Thousands, Except for Shares) (Unaudited)
Security Description | Shares | Value | |||||||||
Korea, Republic Of (1.4%): | |||||||||||
Communication Services (0.2%): | |||||||||||
KT Corp. | 215,235 | $ | 4,715 | ||||||||
Consumer Discretionary (0.2%): | |||||||||||
Hankook Tire & Technology Co. Ltd. | 85,917 | 2,544 | |||||||||
LG Electronics, Inc. | 31,964 | 2,471 | |||||||||
5,015 | |||||||||||
Consumer Staples (0.1%): | |||||||||||
Hite Jinro Co. Ltd. | 58,686 | 1,697 | |||||||||
Orion Corp. | 19,871 | 2,128 | |||||||||
3,825 | |||||||||||
Financials (0.3%): | |||||||||||
KB Financial Group, Inc. | 141,721 | 5,860 | |||||||||
Shinhan Financial Group Co. Ltd. | 161,429 | 4,755 | |||||||||
10,615 | |||||||||||
Health Care (0.1%): | |||||||||||
Seegene, Inc. | 15,587 | 2,672 | |||||||||
Industrials (0.1%): | |||||||||||
Samsung Engineering Co. Ltd. (b) | 200,410 | 2,469 | |||||||||
Information Technology (0.4%): | |||||||||||
LG Innotek Co. Ltd. | 30,508 | 4,286 | |||||||||
Samsung Electronics Co. Ltd. | 136,335 | 8,220 | |||||||||
12,506 | |||||||||||
41,817 | |||||||||||
Luxembourg (0.1%): | |||||||||||
Communication Services (0.1%): | |||||||||||
RTL Group SA (b) (c) | 50,547 | 2,327 | |||||||||
Malaysia (0.2%): | |||||||||||
Communication Services (0.1%): | |||||||||||
Telekom Malaysia Bhd | 1,950,100 | 2,414 | |||||||||
Financials (0.1%): | |||||||||||
CIMB Group Holdings Bhd | 1,783,765 | 1,585 | |||||||||
RHB Bank Bhd | 2,755,500 | 3,475 | |||||||||
5,060 | |||||||||||
7,474 | |||||||||||
Netherlands (4.4%): | |||||||||||
Communication Services (0.7%): | |||||||||||
Koninklijke KPN NV | 6,510,587 | 19,368 | |||||||||
VEON Ltd., ADR | 890,918 | 1,292 | |||||||||
20,660 | |||||||||||
See notes to financial statements.
18
| USAA Mutual Funds Trust USAA International Fund | Schedule of Portfolio Investments — continued November 30, 2020 | ||||||
(Amounts in Thousands, Except for Shares) (Unaudited)
Security Description | Shares | Value | |||||||||
Consumer Discretionary (0.2%): | |||||||||||
Fiat Chrysler Automobiles NV (b) | 197,837 | $ | 3,094 | ||||||||
Prosus NV | 32,746 | 3,549 | |||||||||
6,643 | |||||||||||
Consumer Staples (0.2%): | |||||||||||
Koninklijke Ahold Delhaize NV | 158,588 | 4,533 | |||||||||
X5 Retail Group NV, GDR | 59,206 | 2,119 | |||||||||
6,652 | |||||||||||
Energy (0.4%): | |||||||||||
Royal Dutch Shell PLC Class B | 671,647 | 10,785 | |||||||||
Financials (1.4%): | |||||||||||
ABN AMRO Bank NV (b) (d) | 397,450 | 4,069 | |||||||||
| ASR Nederland NV | 54,792 | 2,030 | |||||||||
Euronext NV (d) | 23,892 | 2,543 | |||||||||
Flow Traders (d) | 21,758 | 700 | |||||||||
ING Groep NV (b) | 3,107,917 | 30,226 | |||||||||
NN Group NV | 58,498 | 2,364 | |||||||||
41,932 | |||||||||||
Health Care (0.1%): | |||||||||||
Pharming Group NV (b) (c) | 550,534 | 779 | |||||||||
QIAGEN NV (b) | 36,087 | 1,739 | |||||||||
2,518 | |||||||||||
Industrials (1.0%): | |||||||||||
Alfen Beheer BV (b) (d) | 33,519 | 2,718 | |||||||||
PostNL NV (b) | 754,559 | 2,569 | |||||||||
Signify NV (b) (d) | 23,792 | 1,003 | |||||||||
Wolters Kluwer NV | 301,458 | 25,235 | |||||||||
31,525 | |||||||||||
Information Technology (0.3%): | |||||||||||
ASM International NV | 19,106 | 3,368 | |||||||||
| ASML Holding NV | 4,897 | 2,127 | |||||||||
STMicroelectronics NV | 104,607 | 4,121 | |||||||||
9,616 | |||||||||||
Materials (0.1%): | |||||||||||
Akzo Nobel NV | 16,726 | 1,771 | |||||||||
Real Estate (0.0%): (a) | |||||||||||
Eurocommercial Properties NV (b) | 52,112 | 899 | |||||||||
133,001 | |||||||||||
New Zealand (0.7%): | |||||||||||
Health Care (0.6%): | |||||||||||
Fisher & Paykel Healthcare Corp. Ltd. | 681,782 | 17,164 | |||||||||
Summerset Group Holdings Ltd. | 113,126 | 840 | |||||||||
18,004 | |||||||||||
See notes to financial statements.
19
| USAA Mutual Funds Trust USAA International Fund | Schedule of Portfolio Investments — continued November 30, 2020 | ||||||
(Amounts in Thousands, Except for Shares) (Unaudited)
Security Description | Shares | Value | |||||||||
Information Technology (0.1%): | |||||||||||
Pushpay Holdings Ltd. (b) | 1,540,336 | $ | 1,911 | ||||||||
Real Estate (0.0%): (a) | |||||||||||
Kiwi Property Group Ltd. | 770,443 | 643 | |||||||||
20,558 | |||||||||||
Norway (1.0%): | |||||||||||
Energy (0.3%): | |||||||||||
Aker BP ASA | 328,744 | 7,386 | |||||||||
Financials (0.5%): | |||||||||||
Norwegian Finans Holding ASA (b) | 98,449 | 783 | |||||||||
SpareBank 1 Nord Norge | 94,359 | 775 | |||||||||
SpareBank 1 SMN | 1,340,632 | 14,359 | |||||||||
15,917 | |||||||||||
Health Care (0.0%): (a) | |||||||||||
ArcticZymes Technologies ASA (b) | 64,177 | 484 | |||||||||
Industrials (0.0%): (a) | |||||||||||
Veidekke ASA (b) | 49,031 | 721 | |||||||||
Materials (0.2%): | |||||||||||
Norsk Hydro ASA (c) | 1,330,256 | 5,389 | |||||||||
Utilities (0.0%): (a) | |||||||||||
Fjordkraft Holding ASA (d) | 133,650 | 1,268 | |||||||||
31,165 | |||||||||||
Portugal (0.1%): | |||||||||||
Communication Services (0.0%): (a) | |||||||||||
NOS SGPS SA | 391,187 | 1,496 | |||||||||
Consumer Staples (0.0%): (a) | |||||||||||
Sonae SGPS SA | 1,358,838 | 1,094 | |||||||||
Energy (0.1%): | |||||||||||
Galp Energia SGPS SA | 167,111 | 1,793 | |||||||||
4,383 | |||||||||||
Russian Federation (0.4%): | |||||||||||
Energy (0.2%): | |||||||||||
Gazprom PJSC, ADR | 572,984 | 2,704 | |||||||||
LUKOIL PJSC, ADR | 55,144 | 3,640 | |||||||||
6,344 | |||||||||||
Financials (0.1%): | |||||||||||
Sberbank of Russia PJSC, ADR | 180,159 | 2,401 | |||||||||
Sberbank of Russia PJSC | 658,600 | 2,145 | |||||||||
4,546 | |||||||||||
See notes to financial statements.
20
| USAA Mutual Funds Trust USAA International Fund | Schedule of Portfolio Investments — continued November 30, 2020 | ||||||
(Amounts in Thousands, Except for Shares) (Unaudited)
Security Description | Shares | Value | |||||||||
Materials (0.1%): | |||||||||||
Petropavlovsk PLC (b) | 2,401,971 | $ | 876 | ||||||||
Polymetal International PLC | 76,086 | 1,585 | |||||||||
2,461 | |||||||||||
13,351 | |||||||||||
Singapore (0.6%): | |||||||||||
Consumer Discretionary (0.1%): | |||||||||||
Genting Singapore Ltd. | 3,103,300 | 1,903 | |||||||||
Consumer Staples (0.1%): | |||||||||||
Sheng Siong Group Ltd. | 1,749,200 | 2,034 | |||||||||
Wilmar International Ltd. | 554,900 | 1,728 | |||||||||
3,762 | |||||||||||
Financials (0.1%): | |||||||||||
DBS Group Holdings Ltd. | 121,600 | 2,269 | |||||||||
Singapore Exchange Ltd. | 331,300 | 2,185 | |||||||||
4,454 | |||||||||||
Industrials (0.0%): (a) | |||||||||||
Frencken Group Ltd. | 1,599,200 | 1,345 | |||||||||
Information Technology (0.1%): | |||||||||||
AEM Holdings Ltd. | 666,600 | 1,742 | |||||||||
Real Estate (0.2%): | |||||||||||
Keppel DC REIT | 1,025,000 | 2,146 | |||||||||
UOL Group Ltd. | 217,300 | 1,183 | |||||||||
Yanlord Land Group Ltd. | 1,500,100 | 1,239 | |||||||||
4,568 | |||||||||||
17,774 | |||||||||||
South Africa (0.4%): | |||||||||||
Communication Services (0.2%): | |||||||||||
MTN Group Ltd. | 346,148 | 1,487 | |||||||||
Naspers Ltd. Class N | 23,585 | 4,744 | |||||||||
6,231 | |||||||||||
Materials (0.2%): | |||||||||||
Gold Fields Ltd. | 231,374 | 2,007 | |||||||||
Impala Platinum Holdings Ltd. | 88,941 | 931 | |||||||||
Kumba Iron Ore Ltd. | 75,297 | 2,561 | |||||||||
5,499 | |||||||||||
11,730 | |||||||||||
Spain (1.3%): | |||||||||||
Communication Services (0.7%): | |||||||||||
Telefonica SA | 4,811,482 | 21,017 | |||||||||
Consumer Discretionary (0.1%): | |||||||||||
Industria de Diseno Textil SA | 58,836 | 1,953 | |||||||||
See notes to financial statements.
21
| USAA Mutual Funds Trust USAA International Fund | Schedule of Portfolio Investments — continued November 30, 2020 | ||||||
(Amounts in Thousands, Except for Shares) (Unaudited)
Security Description | Shares | Value | |||||||||
Consumer Staples (0.1%): | |||||||||||
Viscofan SA | 31,678 | $ | 2,245 | ||||||||
Financials (0.2%): | |||||||||||
CaixaBank SA | 2,019,463 | 5,165 | |||||||||
Liberbank SA (b) | 2,418,635 | 732 | |||||||||
5,897 | |||||||||||
Health Care (0.0%): (a) | |||||||||||
Faes Farma SA | 288,613 | 1,294 | |||||||||
Industrials (0.1%): | |||||||||||
ACS Actividades de Construccion y Servicios SA | 100,236 | 3,166 | |||||||||
Sacyr SA | 608,441 | 1,424 | |||||||||
4,590 | |||||||||||
Utilities (0.1%): | |||||||||||
EDP Renovaveis SA | 129,993 | 2,755 | |||||||||
39,751 | |||||||||||
Sweden (3.0%): | |||||||||||
Communication Services (0.1%): | |||||||||||
G5 Entertainment AB | 24,588 | 1,018 | |||||||||
Paradox Interactive AB | 63,897 | 1,961 | |||||||||
Stillfront Group AB (b) | 7,473 | 857 | |||||||||
3,836 | |||||||||||
Consumer Discretionary (0.2%): | |||||||||||
Betsson AB | 170,725 | 1,473 | |||||||||
Byggmax Group AB (b) | 298,937 | 1,633 | |||||||||
Husqvarna AB B Shares | 131,310 | 1,407 | |||||||||
LeoVegas AB (d) | 346,173 | 1,365 | |||||||||
Thule Group AB (b) (d) | 26,082 | 879 | |||||||||
6,757 | |||||||||||
Consumer Staples (0.1%): | |||||||||||
Swedish Match AB | 46,427 | 3,757 | |||||||||
Energy (0.0%): (a) | |||||||||||
Tethys Oil AB | 153,794 | 790 | |||||||||
Financials (0.1%): | |||||||||||
Skandinaviska Enskilda Banken AB Class A (b) | 215,531 | 2,276 | |||||||||
Health Care (0.2%): | |||||||||||
Biotage AB (b) | 93,532 | 1,559 | |||||||||
Getinge AB Class B | 127,023 | 2,721 | |||||||||
4,280 | |||||||||||
Industrials (1.8%): | |||||||||||
Atlas Copco AB Class B | 495,825 | 21,967 | |||||||||
Bravida Holding AB (d) | 116,137 | 1,409 | |||||||||
Coor Service Management (b) (d) | 129,838 | 1,096 | |||||||||
Epiroc AB Class B | 675,088 | 10,739 | |||||||||
Instalco AB | 54,919 | 1,414 | |||||||||
See notes to financial statements.
22
| USAA Mutual Funds Trust USAA International Fund | Schedule of Portfolio Investments — continued November 30, 2020 | ||||||
(Amounts in Thousands, Except for Shares) (Unaudited)
Security Description | Shares | Value | |||||||||
Inwido AB (b) | 143,131 | $ | 1,755 | ||||||||
Lindab International AB | 116,335 | 2,030 | |||||||||
Loomis AB | 58,607 | 1,679 | |||||||||
NCC AB Class B | 140,328 | 2,412 | |||||||||
Nobina AB (b) (d) | 187,079 | 1,265 | |||||||||
Nolato AB Class B (b) | 26,809 | 2,402 | |||||||||
Sandvik AB (b) | 91,576 | 2,066 | |||||||||
| SKF AB B Shares | 96,354 | 2,380 | |||||||||
Volvo AB Class B | 119,620 | 2,726 | |||||||||
55,340 | |||||||||||
Information Technology (0.2%): | |||||||||||
Fortnox AB | 43,226 | 1,863 | |||||||||
Pricer AB Class B (c) | 247,927 | 1,061 | |||||||||
Telefonaktiebolaget LM Ericsson Class B | 215,139 | 2,642 | |||||||||
5,566 | |||||||||||
Materials (0.1%): | |||||||||||
Boliden AB | 85,246 | 2,949 | |||||||||
Real Estate (0.2%): | |||||||||||
Fastighets AB Balder B Shares (b) | 37,558 | 1,878 | |||||||||
Klovern AB (c) | 308,464 | 511 | |||||||||
Nyfosa AB (b) | 247,194 | 2,437 | |||||||||
4,826 | |||||||||||
90,377 | |||||||||||
Switzerland (10.1%): | |||||||||||
Consumer Staples (2.5%): | |||||||||||
Coca-Cola HBC AG | 50,671 | 1,447 | |||||||||
Nestle SA Registered Shares | 661,340 | 74,100 | |||||||||
75,547 | |||||||||||
Financials (2.2%): | |||||||||||
Cembra Money Bank AG | 106,140 | 12,294 | |||||||||
Julius Baer Group Ltd. | 100,980 | 5,822 | |||||||||
Partners Group Holding AG | 12,306 | 13,272 | |||||||||
Swiss Life Holding AG | 11,712 | 5,228 | |||||||||
UBS Group AG Registered Shares | 2,146,921 | 30,460 | |||||||||
67,076 | |||||||||||
Health Care (3.8%): | |||||||||||
Bachem Holding AG Registered Shares | 4,693 | 1,926 | |||||||||
Lonza Group AG Registered Shares | 5,594 | 3,521 | |||||||||
Novartis AG Registered Shares | 557,001 | 50,442 | |||||||||
Roche Holding AG | 173,976 | 57,158 | |||||||||
Tecan Group AG Class R | 7,940 | 3,492 | |||||||||
116,539 | |||||||||||
See notes to financial statements.
23
| USAA Mutual Funds Trust USAA International Fund | Schedule of Portfolio Investments — continued November 30, 2020 | ||||||
(Amounts in Thousands, Except for Shares) (Unaudited)
Security Description | Shares | Value | |||||||||
Industrials (0.8%): | |||||||||||
Adecco Group AG | 369,182 | $ | 22,324 | ||||||||
Interroll Holding AG Class R | 254 | 727 | |||||||||
23,051 | |||||||||||
Information Technology (0.2%): | |||||||||||
ALSO Holding AG Registered Shares | 10,867 | 2,845 | |||||||||
Logitech International SA Class R | 54,710 | 4,877 | |||||||||
7,722 | |||||||||||
Materials (0.5%): | |||||||||||
Ferrexpo PLC | 317,433 | 890 | |||||||||
Gurit Holding AG Class BR | 530 | 1,334 | |||||||||
LafargeHolcim Ltd. | 199,760 | 10,488 | |||||||||
SIG Combibloc Group AG | 97,162 | 2,245 | |||||||||
Vetropack Holding AG (b) | 8,193 | 535 | |||||||||
15,492 | |||||||||||
Real Estate (0.1%): | |||||||||||
Allreal Holding AG | 9,274 | 1,955 | |||||||||
Utilities (0.0%): (a) | |||||||||||
BKW AG | 9,327 | 965 | |||||||||
308,347 | |||||||||||
Taiwan (1.1%): | |||||||||||
Communication Services (0.1%): | |||||||||||
International Games System Co. Ltd. | 77,000 | 1,836 | |||||||||
Financials (0.2%): | |||||||||||
Chailease Holding Co. Ltd. | 540,520 | 2,966 | |||||||||
Fubon Financial Holding Co. Ltd. | 1,883,000 | 2,927 | |||||||||
Shin Kong Financial Holding Co. Ltd. | 5,353,994 | 1,612 | |||||||||
7,505 | |||||||||||
Information Technology (0.8%): | |||||||||||
Hon Hai Precision Industry Co. Ltd. | 1,184,463 | 3,420 | |||||||||
Innolux Corp. | 5,671,087 | 1,999 | |||||||||
Radiant Opto-Electronics Corp. | 714,000 | 2,908 | |||||||||
Realtek Semiconductor Corp. | 434,000 | 5,642 | |||||||||
Taiwan Semiconductor Manufacturing Co. Ltd. | 547,000 | 9,312 | |||||||||
23,281 | |||||||||||
32,622 | |||||||||||
Thailand (0.2%): | |||||||||||
Consumer Staples (0.1%): | |||||||||||
Charoen Pokphand Foods PCL | 2,029,000 | 1,928 | |||||||||
Financials (0.1%): | |||||||||||
Kasikornbank PCL | 1,162,595 | 4,221 | |||||||||
6,149 | |||||||||||
See notes to financial statements.
24
| USAA Mutual Funds Trust USAA International Fund | Schedule of Portfolio Investments — continued November 30, 2020 | ||||||
(Amounts in Thousands, Except for Shares) (Unaudited)
Security Description | Shares | Value | |||||||||
United Arab Emirates (0.1%): | |||||||||||
Financials (0.1%): | |||||||||||
Emirates NBD Bank PJSC | 719,919 | $ | 2,144 | ||||||||
United Kingdom (13.5%): | |||||||||||
Communication Services (0.8%): | |||||||||||
BT Group PLC | 1,980,301 | 3,065 | |||||||||
Future PLC | 101,941 | 2,270 | |||||||||
ITV PLC | 9,701,214 | 12,071 | |||||||||
S4 Capital PLC (b) | 125,521 | 800 | |||||||||
WPP PLC | 554,608 | 5,343 | |||||||||
23,549 | |||||||||||
Consumer Discretionary (1.4%): | |||||||||||
Barratt Developments PLC (b) | 273,584 | 2,243 | |||||||||
Dunelm Group PLC (b) | 138,676 | 2,230 | |||||||||
Games Workshop Group PLC | 31,706 | 4,151 | |||||||||
Gamesys Group PLC | 120,215 | 1,768 | |||||||||
Halfords Group PLC | 414,804 | 1,472 | |||||||||
Kingfisher PLC (b) | 1,197,490 | 4,348 | |||||||||
Marks & Spencer Group PLC (b) | 1,726,014 | 2,872 | |||||||||
Next PLC | 275,592 | 23,802 | |||||||||
Pets at Home Group PLC | 118,989 | 656 | |||||||||
43,542 | |||||||||||
Consumer Staples (3.1%): | |||||||||||
British American Tobacco PLC | 79,052 | 2,782 | |||||||||
Cranswick PLC | 33,620 | 1,532 | |||||||||
Diageo PLC | 761,670 | 29,316 | |||||||||
Imperial Brands PLC | 1,265,538 | 22,842 | |||||||||
J Sainsbury PLC | 2,395,732 | 6,686 | |||||||||
Nomad Foods Ltd. (b) | 31,000 | 749 | |||||||||
Premier Foods PLC (b) | 1,464,956 | 1,715 | |||||||||
Tate & Lyle PLC | 508,074 | 4,291 | |||||||||
Tesco PLC | 1,414,381 | 4,256 | |||||||||
Unilever PLC | 340,631 | 20,685 | |||||||||
94,854 | |||||||||||
Energy (1.5%): | |||||||||||
| BP PLC | 7,682,012 | 24,938 | |||||||||
Cairn Energy PLC (b) | 797,515 | 1,694 | |||||||||
Royal Dutch Shell PLC Class A | 1,132,781 | 18,987 | |||||||||
45,619 | |||||||||||
Financials (2.3%): | |||||||||||
| 3i Group PLC | 299,610 | 4,235 | |||||||||
Barclays PLC | 1,125,422 | 1,997 | |||||||||
Close Brothers Group PLC | 753,873 | 12,970 | |||||||||
Cmc Markets PLC (d) | 149,063 | 772 | |||||||||
Direct Line Insurance Group PLC | 365,856 | 1,435 | |||||||||
HSBC Holdings PLC | 1,992,991 | 10,253 | |||||||||
IntegraFin Holdings PLC | 180,445 | 1,155 | |||||||||
See notes to financial statements.
25
| USAA Mutual Funds Trust USAA International Fund | Schedule of Portfolio Investments — continued November 30, 2020 | ||||||
(Amounts in Thousands, Except for Shares) (Unaudited)
Security Description | Shares | Value | |||||||||
Investec PLC | 416,513 | $ | 1,025 | ||||||||
Legal & General Group PLC | 7,036,035 | 23,232 | |||||||||
Man Group PLC | 1,622,986 | 2,539 | |||||||||
Ninety One PLC (b) | 319,496 | 898 | |||||||||
Phoenix Group Holdings PLC | 110,896 | 1,050 | |||||||||
Standard Chartered PLC | 1,169,909 | 6,950 | |||||||||
68,511 | |||||||||||
Health Care (0.5%): | |||||||||||
AstraZeneca PLC | 27,526 | 2,880 | |||||||||
Hikma Pharmaceuticals PLC | 100,667 | 3,477 | |||||||||
Smith & Nephew PLC | 490,518 | 9,472 | |||||||||
15,829 | |||||||||||
Industrials (0.9%): | |||||||||||
Aggreko PLC | 313,376 | 2,322 | |||||||||
Ashtead Group PLC | 73,082 | 3,084 | |||||||||
Babcock International Group PLC | 575,762 | 2,577 | |||||||||
BAE Systems PLC | 692,037 | 4,616 | |||||||||
Bodycote PLC | 55,452 | 522 | |||||||||
Capita PLC (b) | 1,056,612 | 593 | |||||||||
G4S PLC (b) | 380,557 | 1,120 | |||||||||
IMI PLC | 342,595 | 5,076 | |||||||||
Morgan Sindall Group PLC | 30,104 | 558 | |||||||||
National Express Group PLC (b) | 264,082 | 778 | |||||||||
Paypoint PLC | 72,547 | 576 | |||||||||
Qinetiq Group PLC | 151,936 | 591 | |||||||||
Redde Northgate PLC | 270,595 | 870 | |||||||||
Rotork PLC | 269,564 | 1,060 | |||||||||
Royal Mail PLC | 220,777 | 895 | |||||||||
Senior PLC (b) | 607,810 | 581 | |||||||||
Tyman PLC (b) | 144,395 | 622 | |||||||||
Ultra Electronics Holdings PLC | 17,587 | 488 | |||||||||
26,929 | |||||||||||
Information Technology (0.2%): | |||||||||||
Computacenter PLC | 84,679 | 2,496 | |||||||||
Dialog Semiconductor PLC (b) | 13,516 | 721 | |||||||||
Kainos Group PLC | 123,518 | 1,993 | |||||||||
Softcat PLC | 34,368 | 518 | |||||||||
Spirent Communications PLC | 467,975 | 1,598 | |||||||||
7,326 | |||||||||||
Materials (2.3%): | |||||||||||
Anglo American PLC | 358,097 | 10,426 | |||||||||
Croda International PLC | 122,103 | 9,613 | |||||||||
Evraz PLC | 2,500,465 | 12,563 | |||||||||
Rio Tinto PLC | 576,630 | 37,635 | |||||||||
70,237 | |||||||||||
See notes to financial statements.
26
| USAA Mutual Funds Trust USAA International Fund | Schedule of Portfolio Investments — continued November 30, 2020 | ||||||
(Amounts in Thousands, Except for Shares) (Unaudited)
Security Description | Shares | Value | |||||||||
Real Estate (0.4%): | |||||||||||
Big Yellow Group PLC | 109,460 | $ | 1,650 | ||||||||
Grainger PLC | 396,374 | 1,487 | |||||||||
Land Securities Group PLC | 224,300 | 1,961 | |||||||||
Safestore Holdings PLC | 194,113 | 1,996 | |||||||||
Savills PLC (b) | 92,379 | 1,122 | |||||||||
St. Modwen Properties PLC | 110,723 | 536 | |||||||||
The British Land Co. PLC | 337,910 | 2,112 | |||||||||
10,864 | |||||||||||
Utilities (0.1%): | |||||||||||
Centrica PLC (b) | 4,037,865 | 2,344 | |||||||||
2,344 | |||||||||||
409,604 | |||||||||||
Total Common Stocks (Cost $2,586,774) | 2,995,863 | ||||||||||
Exchange-Traded Funds (0.1%) | |||||||||||
United States (0.1%): | |||||||||||
iShares Core MSCI EAFE ETF | 46,010 | 3,048 | |||||||||
iShares Core MSCI Emerging Markets ETF (c) | 23,545 | 1,380 | |||||||||
4,428 | |||||||||||
Total Exchange-Traded Funds (Cost $4,347) | 4,428 | ||||||||||
Collateral for Securities Loaned^ (0.9%) | |||||||||||
United States (0.9%): | |||||||||||
| Goldman Sachs Financial Square Government Fund Institutional Shares, 0.02% (f) | 12,958,331 | 12,958 | |||||||||
HSBC U.S. Government Money Market Fund I Shares, 0.03% (f) | 14,014,520 | 14,015 | |||||||||
Total Collateral for Securities Loaned (Cost $26,973) | 26,973 | ||||||||||
Total Investments (Cost $2,618,094) — 99.5% | 3,027,264 | ||||||||||
Other assets in excess of liabilities — 0.5% | 15,094 | ||||||||||
NET ASSETS — 100.00% | $ | 3,042,358 | |||||||||
^ Purchased with cash collateral from securities on loan.
(a) Amount represents less than 0.05% of net assets.
(b) Non-income producing security.
(c) All or a portion of this security is on loan.
(d) Rule 144A security or other security that is restricted as to resale to institutional investors. The Fund's Adviser has deemed this security to be liquid based upon procedures approved by the Board of Trustees. As of November 30, 2020, the fair value of these securities was $40,052 (thousands) and amounted to 1.3% of net assets.
(e) Rounds to less than $1 thousand.
(f) Rate disclosed is the daily yield on November 30, 2020.
See notes to financial statements.
27
| USAA Mutual Funds Trust USAA International Fund | Schedule of Portfolio Investments — continued November 30, 2020 | ||||||
(Unaudited)
ADR — American Depositary Receipt
ETF — Exchange-Traded Fund
GDR — Global Depositary Receipt
PCL — Public Company Limited
PLC — Public Limited Company
REIT — Real Estate Investment Trust
See notes to financial statements.
28
USAA Mutual Funds Trust | Statement of Assets and Liabilities November 30, 2020 | ||||||
(Amounts in Thousands, Except Per Share Amounts) (Unaudited)
| USAA International Fund | |||||||
Assets: | |||||||
Investments, at value (Cost $2,618,094) | $ | 3,027,264 | (a) | ||||
Foreign currency, at value (Cost $9,424) | 9,421 | ||||||
Cash and cash equivalents | 17,544 | ||||||
Receivables: | |||||||
Interest and dividends | 5,149 | ||||||
Capital shares issued | 1,102 | ||||||
Investments sold | 13,278 | ||||||
Reclaims | 7,408 | ||||||
From Adviser | 72 | ||||||
Prepaid expenses | 47 | ||||||
Total assets | 3,081,285 | ||||||
Liabilities: | |||||||
Payables: | |||||||
Collateral received on loaned securities | 26,973 | ||||||
Investments purchased | 5,932 | ||||||
Capital shares redeemed | 3,344 | ||||||
Accrued foreign capital gains taxes | 273 | ||||||
Accrued expenses and other payables: | |||||||
Investment advisory fees | 1,677 | ||||||
Administration fees | 304 | ||||||
Custodian fees | 67 | ||||||
Transfer agent fees | 259 | ||||||
Compliance fees | 2 | ||||||
| 12b-1 fees | 1 | ||||||
Other accrued expenses | 95 | ||||||
Total liabilities | 38,927 | ||||||
Net Assets: | |||||||
Capital | 2,690,289 | ||||||
Total accumulated earnings/(loss) | 352,069 | ||||||
Net assets | $ | 3,042,358 | |||||
Net Assets | |||||||
Fund Shares | $ | 1,477,044 | |||||
Institutional Shares | 1,554,034 | ||||||
Class A shares | 7,308 | ||||||
Class R6 Shares | 3,972 | ||||||
Total | $ | 3,042,358 | |||||
Shares (unlimited number of shares authorized with no par value): | |||||||
Fund Shares | 58,170 | ||||||
Institutional Shares | 61,385 | ||||||
Class A shares | 290 | ||||||
Class R6 Shares | 156 | ||||||
Total | 120,001 | ||||||
Net asset value, offering and redemption price per share: (b) | |||||||
Fund Shares | $ | 25.39 | |||||
Institutional Shares | $ | 25.32 | |||||
Class A shares | $ | 25.18 | |||||
Class R6 Shares | $ | 25.41 | |||||
Maximum Sales Charge — Class A shares | 5.75 | % | |||||
Maximum offering price | |||||||
| (100%/(100%-maximum sales charge) of net asset value adjusted to the nearest cent) per share — Class A shares | $ | 26.72 | |||||
(a) Includes $25,144 of securities on loan.
(b) Per share amount may not recalculate due to rounding of net assets and/or shares outstanding.
See notes to financial statements.
29
USAA Mutual Funds Trust | Statement of Operations For the Six Months Ended November 30, 2020 | ||||||
(Amounts in Thousands) (Unaudited)
| USAA International Fund | |||||||
Investment Income: | |||||||
Dividends | $ | 41,752 | |||||
Interest | — | (a) | |||||
Securities lending (net of fees) | 600 | ||||||
Foreign tax withholding | (3,604 | ) | |||||
Total income | 38,748 | ||||||
Expenses: | |||||||
Investment advisory fees | 10,350 | ||||||
Administration fees — Fund Shares | 1,079 | ||||||
Administration fees — Institutional Shares | 749 | ||||||
Administration fees — Class A shares | 5 | ||||||
Administration fees — R6 Shares | 1 | ||||||
Sub-Administration fees | 46 | ||||||
12b-1 fees — Class A shares | 8 | ||||||
Custodian fees | 359 | ||||||
Transfer agent fees — Fund Shares | 970 | ||||||
Transfer agent fees — Institutional Shares | 749 | ||||||
Transfer agent fees — Class A shares | 3 | ||||||
Transfer agent fees — Class R6 Shares | — | (a) | |||||
Trustees' fees | 26 | ||||||
Compliance fees | 10 | ||||||
Legal and audit fees | 63 | ||||||
State registration and filing fees | 47 | ||||||
Interfund lending fees | — | (a) | |||||
Other expenses | 145 | ||||||
Total expenses | 14,610 | ||||||
Expenses waived/reimbursed by Adviser | (160 | ) | |||||
Net expenses | 14,450 | ||||||
Net Investment Income (Loss) | 24,298 | ||||||
Realized/Unrealized Gains (Losses) from Investments: | |||||||
| Net realized gains (losses) from investment securities and foreign currency translations | 5,311 | ||||||
Foreign taxes on realized gains | (1 | ) | |||||
| Net change in unrealized appreciation/depreciation on investment securities and foreign currency translations | 458,099 | ||||||
Net change in accrued foreign taxes on unrealized gains | (244 | ) | |||||
Net realized/unrealized gains (losses) on investments | 463,165 | ||||||
Change in net assets resulting from operations | $ | 487,463 | |||||
(a) Rounds to less than $1 thousand.
See notes to financial statements.
30
USAA Mutual Funds Trust | Statements of Changes in Net Assets | ||||||
(Amounts in Thousands)
USAA International Fund | |||||||||||
| Six Months Ended November 30, 2020 (unaudited) | Year Ended May 31, 2020 | ||||||||||
From Investments: | |||||||||||
Operations: | |||||||||||
Net investment income (loss) | $ | 24,298 | $ | 58,220 | |||||||
Net realized gains (losses) from investments | 5,310 | 554,267 | |||||||||
| Net change in unrealized appreciation/depreciation on investments | 457,855 | (769,995 | ) | ||||||||
Change in net assets resulting from operations | 487,463 | (157,508 | ) | ||||||||
Distributions to Shareholders: | |||||||||||
Fund Shares | — | (374,850 | ) | ||||||||
Institutional Shares | — | (364,227 | ) | ||||||||
Class A shares | — | (1,941 | ) | ||||||||
Class R6 Shares | — | (1,190 | ) | ||||||||
Change in net assets resulting from distributions to shareholders | — | (742,208 | ) | ||||||||
Change in net assets resulting from capital transactions | (277,258 | ) | 49,137 | ||||||||
Change in net assets | 210,205 | (850,579 | ) | ||||||||
Net Assets: | |||||||||||
Beginning of period | 2,832,153 | 3,682,732 | |||||||||
End of period | $ | 3,042,358 | $ | 2,832,153 | |||||||
(continues on next page)
See notes to financial statements.
31
USAA Mutual Funds Trust | Statements of Changes in Net Assets | ||||||
(Amounts in Thousands) (continued)
USAA International Fund | |||||||||||
| Six Months Ended November 30, 2020 (unaudited) | Year Ended May 31, 2020 | ||||||||||
Capital Transactions: | |||||||||||
Fund Shares | |||||||||||
Proceeds from shares issued | $ | 28,387 | $ | 168,101 | |||||||
Distributions reinvested | — | 367,804 | |||||||||
Cost of shares redeemed | (179,862 | ) | (369,347 | ) | |||||||
Total Fund Shares | $ | (151,475 | ) | $ | 166,558 | ||||||
Institutional Shares | |||||||||||
Proceeds from shares issued | $ | 47,052 | $ | 226,207 | |||||||
Distributions reinvested | — | 363,973 | |||||||||
Cost of shares redeemed | (172,619 | ) | (708,658 | ) | |||||||
Total Institutional Shares | $ | (125,567 | ) | $ | (118,478 | ) | |||||
Class A shares | |||||||||||
Proceeds from shares issued | $ | 6,646 | $ | 1,350 | |||||||
Distributions reinvested | — | 309 | |||||||||
Cost of shares redeemed | (6,862 | ) | (727 | ) | |||||||
Total Class A shares | $ | (216 | ) | $ | 932 | ||||||
Class R6 Shares | |||||||||||
Proceeds from shares issued | $ | — | $ | 938 | |||||||
Distributions reinvested | — | 172 | |||||||||
Cost of shares redeemed | — | (985 | ) | ||||||||
Total Class R6 Shares | $ | — | $ | 125 | |||||||
Change in net assets resulting from capital transactions | $ | (277,258 | ) | $ | 49,137 | ||||||
Share Transactions: | |||||||||||
Fund Shares | |||||||||||
Issued | 1,206 | 6,674 | |||||||||
Reinvested | — | 13,947 | |||||||||
Redeemed | (7,657 | ) | (14,914 | ) | |||||||
Total Fund Shares | (6,451 | ) | 5,707 | ||||||||
Institutional Shares | |||||||||||
Issued | 2,027 | 9,486 | |||||||||
Reinvested | — | 13,849 | |||||||||
Redeemed | (7,334 | ) | (25,837 | ) | |||||||
Total Institutional Shares | (5,307 | ) | (2,502 | ) | |||||||
Class A shares | |||||||||||
Issued | 301 | 47 | |||||||||
Reinvested | — | 12 | |||||||||
Redeemed | (310 | ) | (30 | ) | |||||||
Total Class A shares | (9 | ) | 29 | ||||||||
Class R6 Shares | |||||||||||
Issued | — | 31 | |||||||||
Reinvested | — | 6 | |||||||||
Redeemed | — | (37 | ) | ||||||||
Total Class R6 Shares | — | — | (a) | ||||||||
Change in Shares | (11,767 | ) | 3,234 | ||||||||
(a) Rounds to less than 1 thousand.
See notes to financial statements.
32
This page is intentionally left blank.
33
USAA Mutual Funds Trust | Financial Highlights | ||||||
For a Share Outstanding Throughout Each Period
Investment Activities | Distributions to Shareholders From | ||||||||||||||||||||||||||
| Net Asset Value, Beginning of Period | Net Investment Income (Loss) | Net Realized and Unrealized Gains (Losses) on Investments | Total from Investment Activities | Net Investment Income | Net Realized Gains from Investments | ||||||||||||||||||||||
USAA International Fund | |||||||||||||||||||||||||||
Fund Shares | |||||||||||||||||||||||||||
| Six Months Ended November 30, 2020 (unaudited) | $ | 21.53 | 0.19 | (e) | 3.67 | 3.86 | — | — | |||||||||||||||||||
| Year Ended May 31, 2020 | $ | 28.70 | 0.44 | (e) | (1.12 | ) | (0.68 | ) | (0.73 | ) | (5.76 | ) | |||||||||||||||
| Year Ended May 31, 2019 | $ | 32.82 | 0.53 | (2.41 | ) | (1.88 | ) | (0.44 | ) | (1.80 | ) | ||||||||||||||||
| Year Ended May 31, 2018 | $ | 31.16 | 0.60 | 2.08 | 2.68 | (0.63 | ) | (0.39 | ) | ||||||||||||||||||
| Year Ended May 31, 2017 | $ | 26.40 | 0.42 | 4.76 | 5.18 | (0.42 | ) | — | |||||||||||||||||||
| Year Ended May 31, 2016 | $ | 30.90 | 0.35 | (e) | (3.34 | ) | (2.99 | ) | (0.37 | ) | (1.14 | ) | |||||||||||||||
Institutional Shares | |||||||||||||||||||||||||||
| Six Months Ended November 30, 2020 (unaudited) | $ | 21.46 | 0.20 | (e) | 3.66 | 3.86 | — | — | |||||||||||||||||||
| Year Ended May 31, 2020 | $ | 28.61 | 0.47 | (e) | (1.12 | ) | (0.65 | ) | (0.74 | ) | (5.76 | ) | |||||||||||||||
| Year Ended May 31, 2019 | $ | 32.72 | 0.56 | (2.41 | ) | (1.85 | ) | (0.46 | ) | (1.80 | ) | ||||||||||||||||
| Year Ended May 31, 2018 | $ | 31.07 | 0.64 | 2.06 | 2.70 | (0.66 | ) | (0.39 | ) | ||||||||||||||||||
| Year Ended May 31, 2017 | $ | 26.34 | 0.45 | 4.74 | 5.19 | (0.46 | ) | — | |||||||||||||||||||
| Year Ended May 31, 2016 | $ | 30.82 | 0.47 | (e) | (3.42 | ) | (2.95 | ) | (0.39 | ) | (1.14 | ) | |||||||||||||||
* Assumes reinvestment of all net investment income and realized capital gain distributions, if any, during the period. Includes adjustments in accordance with U.S. generally accepted accounting principles and could differ from the Lipper reported return.
^ The net expense ratio may not correlate to the applicable expense limits in place during the period since the current contractual expense limitation is applied for a two year period beginning July 1, 2019 and in effect through September 30, 2021, instead of coinciding with the Fund's fiscal year end. Details of the current contractual expense limitation in effect can be found in Note 5 of the accompanying Notes to Financial Statements.
(a) Not annualized for periods less than one year.
(b) Annualized for periods less than one year.
(c) Reflects total annual operating expenses for reductions of expenses paid indirectly for the May 31 fiscal years ended 2019, 2018, 2017, and 2016. Expenses paid indirectly decreased the expense ratio for each of these respective years by less than 0.01%.
(d) Portfolio turnover is calculated on the basis of the Fund as a whole without distinguishing between the classes of shares issued.
(e) Per share net investment income (loss) has been calculated using the average daily shares method.
(f) Reflects increased trading activity due to current year transition or asset allocation shift.
See notes to financial statements.
34
USAA Mutual Funds Trust | Financial Highlights — continued | ||||||
For a Share Outstanding Throughout Each Period
Ratios to Average Net Assets | Supplemental Data | ||||||||||||||||||||||||||||||||||||||
| Total Distributions | Redemption Fees Added to Beneficial Interest | Net Asset Value, End of Period | Total Return (Excludes Sales Charges)*(a) | Net Expenses^(b) | Net Investment Income (Loss)(b) | Gross Expenses(b)(c) | Net Assets, End of Period (000's) | Portfolio Turnover(a)(d) | |||||||||||||||||||||||||||||||
USAA International Fund | |||||||||||||||||||||||||||||||||||||||
Fund Shares | |||||||||||||||||||||||||||||||||||||||
| Six Months Ended November 30, 2020 (unaudited) | — | — | $ | 25.39 | 17.93 | % | 1.01 | % | 1.61 | % | 1.03 | % | $ | 1,477,044 | 28 | % | |||||||||||||||||||||||
| Year Ended May 31, 2020 | (6.49 | ) | — | $ | 21.53 | (6.13 | )% | 1.06 | % | 1.68 | % | 1.07 | % | $ | 1,391,279 | 119 | %(f) | ||||||||||||||||||||||
| Year Ended May 31, 2019 | (2.24 | ) | — | $ | 28.70 | (5.14 | )% | 1.08 | % | 1.76 | % | 1.08 | % | $ | 1,690,782 | 30 | % | ||||||||||||||||||||||
| Year Ended May 31, 2018 | (1.02 | ) | — | $ | 32.82 | 8.61 | % | 1.08 | % | 1.58 | % | 1.08 | % | $ | 1,876,020 | 36 | % | ||||||||||||||||||||||
| Year Ended May 31, 2017 | (0.42 | ) | — | $ | 31.16 | 19.87 | % | 1.11 | % | 1.33 | % | 1.11 | % | $ | 1,696,372 | 40 | % | ||||||||||||||||||||||
| Year Ended May 31, 2016 | (1.51 | ) | — | $ | 26.40 | (9.75 | )% | 1.13 | % | 1.27 | % | 1.13 | % | $ | 1,430,667 | 62 | % | ||||||||||||||||||||||
Institutional Shares | |||||||||||||||||||||||||||||||||||||||
| Six Months Ended November 30, 2020 (unaudited) | — | — | $ | 25.32 | 17.99 | % | 0.94 | % | 1.68 | % | 0.94 | % | $ | 1,554,034 | 28 | % | |||||||||||||||||||||||
| Year Ended May 31, 2020 | (6.50 | ) | — | $ | 21.46 | (6.05 | )% | 0.99 | % | 1.77 | % | 0.99 | % | $ | 1,431,107 | 119 | %(f) | ||||||||||||||||||||||
| Year Ended May 31, 2019 | (2.26 | ) | — | $ | 28.61 | (5.06 | )% | 1.00 | % | 1.81 | % | 1.00 | % | $ | 1,979,758 | 30 | % | ||||||||||||||||||||||
| Year Ended May 31, 2018 | (1.05 | ) | — | $ | 32.72 | 8.68 | % | 1.00 | % | 1.62 | % | 1.00 | % | $ | 2,349,281 | 36 | % | ||||||||||||||||||||||
| Year Ended May 31, 2017 | (0.46 | ) | — | $ | 31.07 | 19.97 | % | 1.00 | % | 1.43 | % | 1.00 | % | $ | 2,308,470 | 40 | % | ||||||||||||||||||||||
| Year Ended May 31, 2016 | (1.53 | ) | — | $ | 26.34 | (9.61 | )% | 1.00 | % | 1.74 | % | 1.00 | % | $ | 1,996,349 | 62 | % | ||||||||||||||||||||||
(continues on next page)
See notes to financial statements.
35
USAA Mutual Funds Trust | Financial Highlights — continued | ||||||
For a Share Outstanding Throughout Each Period
Investment Activities | Distributions to Shareholders From | ||||||||||||||||||||||||||
| Net Asset Value, Beginning of Period | Net Investment Income (Loss) | Net Realized and Unrealized Gains (Losses) on Investments | Total from Investment Activities | Net Investment Income | Net Realized Gains from Investments | ||||||||||||||||||||||
USAA International Fund | |||||||||||||||||||||||||||
Class A shares | |||||||||||||||||||||||||||
| Six Months Ended November 30, 2020 (unaudited) | $ | 21.39 | 0.15 | (e) | 3.64 | 3.79 | — | — | |||||||||||||||||||
| Year Ended May 31, 2020 | $ | 28.58 | 0.36 | (e) | (1.10 | ) | (0.74 | ) | (0.69 | ) | (5.76 | ) | |||||||||||||||
| Year Ended May 31, 2019 | $ | 32.67 | 0.47 | (2.41 | ) | (1.94 | ) | (0.35 | ) | (1.80 | ) | ||||||||||||||||
| Year Ended May 31, 2018 | $ | 31.04 | 0.53 | 2.04 | 2.57 | (0.55 | ) | (0.39 | ) | ||||||||||||||||||
| Year Ended May 31, 2017 | $ | 26.31 | 0.35 | 4.74 | 5.09 | (0.36 | ) | — | |||||||||||||||||||
| Year Ended May 31, 2016 | $ | 30.77 | 0.31 | (3.35 | ) | (3.04 | ) | (0.28 | ) | (1.14 | ) | ||||||||||||||||
Class R6 Shares | |||||||||||||||||||||||||||
| Six Months Ended November 30, 2020 (unaudited) | $ | 21.52 | 0.21 | (e) | 3.68 | 3.89 | — | — | |||||||||||||||||||
| Year Ended May 31, 2020 | $ | 28.66 | 0.49 | (e) | (1.12 | ) | (0.63 | ) | (0.75 | ) | (5.76 | ) | |||||||||||||||
| August 17, 2018 (i) through May 31, 2019 | $ | 32.01 | 0.52 | (e) | (1.54 | ) | (1.02 | ) | (0.53 | ) | (1.80 | ) | |||||||||||||||
* Assumes reinvestment of all net investment income and realized capital gain distributions, if any, during the period. Includes adjustments in accordance with U.S. generally accepted accounting principles and could differ from the Lipper reported return.
^ The net expense ratio may not correlate to the applicable expense limits in place during the period since the current contractual expense limitation is applied for a two year period beginning July 1, 2019 and in effect through September 30, 2021, instead of coinciding with the Fund's fiscal year end. Details of the current contractual expense limitation in effect can be found in Note 5 of the accompanying Notes to Financial Statements.
(a) Not annualized for periods less than one year.
(b) Annualized for periods less than one year.
(c) Reflects total annual operating expenses for reductions of expenses paid indirectly for the May 31 fiscal years ended 2019, 2018, 2017, and 2016. Expenses paid indirectly decreased the expense ratio for each of these respective years by less than 0.01%.
(d) Portfolio turnover is calculated on the basis of the Fund as a whole without distinguishing between the classes of shares issued.
(e) Per share net investment income (loss) has been calculated using the average daily shares method.
See notes to financial statements.
36
USAA Mutual Funds Trust | Financial Highlights — continued | ||||||
For a Share Outstanding Throughout Each Period (continued)
Ratios to Average Net Assets | Supplemental Data | ||||||||||||||||||||||||||||||||||||||
| Total Distributions | Redemption Fees Added to Beneficial Interest | Net Asset Value, End of Period | Total Return (Excludes Sales Charges)*(a) | Net Expenses^(b) | Net Investment Income (Loss)(b) | Gross Expenses(b)(c) | Net Assets, End of Period (000's) | Portfolio Turnover(a)(d) | |||||||||||||||||||||||||||||||
USAA International Fund | |||||||||||||||||||||||||||||||||||||||
Class A shares | |||||||||||||||||||||||||||||||||||||||
| Six Months Ended November 30, 2020 (unaudited) | — | — | $ | 25.18 | 17.72 | % | 1.30 | % | 1.30 | % | 1.56 | % | $ | 7,308 | 28 | % | |||||||||||||||||||||||
| Year Ended May 31, 2020 | (6.45 | ) | — | $ | 21.39 | (6.37 | )% | 1.35 | % | 1.37 | % | 1.39 | % | $ | 6,402 | 119 | %(f) | ||||||||||||||||||||||
| Year Ended May 31, 2019 | (2.15 | ) | — | $ | 28.58 | (5.39 | )% | 1.35 | % | 1.52 | % | 1.41 | % | $ | 7,715 | 30 | % | ||||||||||||||||||||||
| Year Ended May 31, 2018 | (0.94 | ) | — | $ | 32.67 | 8.29 | % | 1.35 | % | 1.29 | % | 1.42 | % | $ | 8,101 | 36 | % | ||||||||||||||||||||||
| Year Ended May 31, 2017 | (0.36 | ) | — | $ | 31.04 | 19.58 | % | 1.35 | % | 1.08 | % | 1.51 | % | $ | 7,540 | 40 | % | ||||||||||||||||||||||
| Year Ended May 31, 2016 | (1.42 | ) | — | (g) | $ | 26.31 | (9.94 | )% | 1.37 | %(h) | 1.14 | % | 1.46 | % | $ | 6,362 | 62 | % | |||||||||||||||||||||
Class R6 Shares | |||||||||||||||||||||||||||||||||||||||
| Six Months Ended November 30, 2020 (unaudited) | — | — | $ | 25.41 | 18.08 | % | 0.80 | % | 1.82 | % | 1.27 | % | $ | 3,972 | 28 | % | |||||||||||||||||||||||
| Year Ended May 31, 2020 | (6.51 | ) | — | $ | 21.52 | (5.95 | )% | 0.85 | % | 1.83 | % | 1.18 | % | $ | 3,365 | 119 | %(f) | ||||||||||||||||||||||
| August 17, 2018 (i) through May 31, 2019 | (2.33 | ) | — | $ | 28.66 | (2.55 | )% | 0.85 | % | 2.19 | % | 2.03 | % | $ | 4,477 | 30 | % | ||||||||||||||||||||||
(f) Reflects increased trading activity due to current year transition or asset allocation shift.
(g) Amount is less than $0.005.
(h) Prior to October 1, 2015, USAA Asset Management Company ("AMCO") (previous Adviser) had voluntarily agreed to limit the annual expenses of the Class A shares to 1.40% of the Class A shares' average daily net assets.
(i) Commencement of operations.
See notes to financial statements.
37
USAA Mutual Funds Trust | Notes to Financial Statements November 30, 2020 | ||||||
(Unaudited)
1. Organization:
USAA Mutual Funds Trust (the "Trust") is organized as a Delaware statutory trust and is registered under the Investment Company Act of 1940, as amended (the "1940 Act"), as an open-end investment company. The Trust is comprised of 46 funds and is authorized to issue an unlimited number of shares, which are units of beneficial interest with no par value.
The accompanying financial statements are those of the USAA International Fund (the "Fund"). The Fund offers four classes of shares: Fund Shares, Institutional Shares, Class A shares and R6 Shares. The Fund is classified as diversified under the 1940 Act.
Effective June 29, 2020, the Fund's Adviser Shares were redesignated Class A shares and became subject to a front-end sales charge.
Each class of shares of the Fund has substantially identical rights and privileges except with respect to sales charges, fees paid under distribution plans, expenses allocable exclusively to each class of shares, voting rights on matters solely affecting a single class of shares, and the exchange privilege of each class of shares.
Under the Trust's organizational documents, its officers and trustees are indemnified against certain liabilities arising out of the performance of their duties to the Fund. In addition, in the normal course of business, the Fund enters into contracts with its vendors and others that provide for general indemnifications. The Fund's maximum exposure under these arrangements is unknown, as this would involve future claims that may be made against the Fund. However, based on experience, the Fund expects that risk of loss to be remote.
2. Significant Accounting Policies:
The following is a summary of significant accounting policies followed by the Trust in the preparation of its financial statements. The policies are in conformity with Generally Accepted Accounting Principles in the United States of America ("GAAP"). The preparation of financial statements in accordance with GAAP requires management to make estimates and assumptions that affect the reported amounts of assets and liabilities and disclosure of contingent assets and liabilities at the date of the financial statements and the reported amounts of income and expenses for the period. Actual results could differ from those estimates. The Fund follows the specialized accounting and reporting requirements under GAAP that are applicable to investment companies under Accounting Standards Codification Topic 946.
Investment Valuation:
The Fund records investments at fair value. Fair value is defined as the price that would be received to sell an asset or paid to transfer a liability in an orderly transaction between market participants at the measurement date.
The valuation techniques described below maximize the use of observable inputs and minimize the use of unobservable inputs in determining fair value. The inputs used for valuing the Fund's investments are summarized in the three broad levels listed below:
• Level 1 — quoted prices in active markets for identical securities
• Level 2 — other significant observable inputs (including quoted prices for similar securities or interest rates applicable to those securities, etc.)
• Level 3 — significant unobservable inputs (including the Fund's own assumptions in determining the fair value of investments)
Changes in valuation techniques may result in transfers in or out of an assigned level within the disclosure hierarchy. The inputs or methodologies used for valuation techniques are not necessarily an indication of the risk associated with entering into those investments.
38
USAA Mutual Funds Trust | Notes to Financial Statements — continued November 30, 2020 | ||||||
(Unaudited)
Victory Capital Management Inc. ("VCM" or the "Adviser") has established the Pricing and Liquidity Committee (the "Committee"), and subject to the Trust's Board of Trustees (the "Board") oversight, the Committee administers and oversees the Fund's valuation policies and procedures, which are approved by the Board.
Portfolio securities listed or traded on securities exchanges, including exchange-traded funds ("ETFs"), American Depositary Receipts ("ADRs") and Rights, are valued at the closing price on the exchange or system where the security is principally traded, if available, or at the Nasdaq Official Closing Price. If there have been no sales for that day on the exchange or system, then a security is valued at the last available bid quotation on the exchange or system where the security is principally traded. In each of these situations, valuations are typically categorized as Level 1 in the fair value hierarchy.
Investments in open-end investment companies are valued at their net asset value ("NAV"). These valuations are typically categorized as Level 1 in the fair value hierarchy.
In the event that price quotations or valuations are not readily available, are not reflective of market value, or a significant event has been recognized in relation to a security or class of securities, the securities are valued in good faith by the Committee in accordance with valuation procedures approved by the Board. These valuations are typically categorized as Level 2 or Level 3 in the fair value hierarchy, based on the observability of inputs used to determine the fair value. The effect of fair value pricing is that securities may not be priced on the basis of quotations from the primary market in which they are traded and the actual price realized from the sale of a security may differ materially from the fair value price. Valuing these securities at fair value is intended to cause the Fund's NAV to be more reliable than it otherwise would be.
In accordance with procedures adopted by the Board, fair value pricing may be used if events materially affecting the value of foreign securities occur between the time the exchange on which they are traded closes and the time the Fund's NAV is calculated. The Fund uses a systematic valuation model, provided daily by an independent third party to fair value its international equity securities. The valuations are considered as Level 2 in the fair value hierarchy.
A summary of the valuations as of November 30, 2020, based upon the three levels defined above, is included in the table below while the breakdown, by category, of investments is disclosed on the Schedule of Portfolio Investments (amounts in thousands):
Level 1 | Level 2 | Level 3 | Total | ||||||||||||||||
Common Stocks | $ | 98,583 | $ | 2,897,280 | $ | — | $ | 2,995,863 | |||||||||||
Exchange-Traded Funds | 4,428 | — | — | 4,428 | |||||||||||||||
Collateral for Securities Loaned | 26,973 | — | — | 26,973 | |||||||||||||||
Total | $ | 129,984 | $ | 2,897,280 | $ | — | $ | 3,027,264 | |||||||||||
For the six months ended November 30, 2020, there were no transfers in or out of the Level 3 fair value hierarchy.
Real Estate Investment Trusts ("REITs"):
The Fund may invest in REITs, which report information on the source of their distributions annually. REITs are pooled investment vehicles that invest primarily in income producing real estate or real estate related loans or interests (such as mortgages). Certain distributions received from REITs during the year are recorded as realized gains or return of capital as estimated by the Fund or when such information becomes known.
Investment Companies:
Exchange-Traded Funds:
The Fund may invest in ETFs, the shares of which are bought and sold on a securities exchange. An ETF trades like common stock and represents a portfolio of securities designed to track the performance
39
USAA Mutual Funds Trust | Notes to Financial Statements — continued November 30, 2020 | ||||||
(Unaudited)
and dividend yield of a particular domestic or foreign market index. The Fund may purchase shares of an ETF to temporarily gain exposure to a portion of the U.S. or a foreign market while awaiting purchase of underlying securities. The risks of owning an ETF generally reflect the risks of owning the underlying securities they are designed to track, although the lack of liquidity of an ETF could result in it being more volatile. Additionally, ETFs have fees and expenses that reduce their value.
Open-End Funds:
The Fund may invest in portfolios of open-end investment companies. These investment companies value securities in their portfolios for which market quotations are readily available at their market values (generally the last reported sale price) and all other securities and assets at their fair value by the methods established by the board of directors of the underlying funds.
Foreign Exchange Currency Contracts:
The Fund may enter into foreign exchange currency contracts to convert U.S. dollars to and from various foreign currencies. A foreign exchange currency contract is an obligation by the Fund to purchase or sell a specific currency at a future date at a price (in U.S. dollars) set at the time of the contract. The Fund does not engage in "cross-currency" foreign exchange contracts (i.e., contracts to purchase or sell one foreign currency in exchange for another foreign currency). The Fund's foreign exchange currency contracts might be considered spot contracts (typically a contract of one week or less) or forward contracts (typically a contract term over one week). A spot contract is entered into for purposes of hedging against foreign currency fluctuations relating to a specific portfolio transaction, such as the delay between a security transaction trade date and settlement date. Forward contracts are entered into for purposes of hedging portfolio holdings or concentrations of such holdings. Each foreign exchange currency contract is adjusted daily by the prevailing spot or forward rate of the underlying currency, and any appreciation or depreciation is recorded for financial statement purposes as unrealized until the contract settlement date, at which time the Fund records realized gains or losses equal to the difference between the value of a contract at the time it was opened and the value at the time it was closed. The Fund could be exposed to risk if a counterparty is unable to meet the terms of a foreign exchange currency contract or if the value of the foreign currency changes unfavorably. In addition, the use of foreign exchange currency contracts does not eliminate fluctuations in the underlying prices of the securities. As of November 30, 2020, the Fund had no open forward foreign exchange currency contracts.
Investment Transactions and Related Income:
Changes in holdings of investments are accounted for no later than one business day following the trade date. For financial reporting purposes, however, investment transactions are accounted for on trade date on the last business day of the reporting period. Interest income is determined on the basis of coupon interest accrued using the effective interest method which adjusts, where applicable, the amortization of premiums or accretion of discount. Gains or losses realized on sales of securities are determined by comparing the identified cost of the security lot sold with the net sales proceeds.
Withholding taxes on interest, dividends, and gains as a result of certain investments in ADRs by the Fund has been provided for in accordance with each investment's applicable country's tax rules and rates.
Securities Lending:
The Fund, through a securities lending agreement with Citibank, N.A. ("Citibank"), may lend its securities to qualified financial institutions, such as certain broker-dealers, to earn additional income, net of income retained by Citibank. Borrowers are required to secure their loans for collateral in the amount of at least 102% of the value of U.S. securities loaned or at least 105% of the value of non-U.S. securities loaned, marked-to-market daily. Any collateral shortfalls associated with increases in the valuation of the securities loaned are cured the next business day once the shortfall exceeds $100 thousand. Collateral may be cash, U.S. government securities, or other securities as permitted by Securities and
40
USAA Mutual Funds Trust | Notes to Financial Statements — continued November 30, 2020 | ||||||
(Unaudited)
Exchange Commission ("SEC") guidelines. Cash collateral may be invested in high-quality short-term investments, primarily open-end investment companies. Collateral requirements are determined daily based on the value of the Fund's securities on loan as of the end of the prior business day. During the time portfolio securities are on loan, the borrower will pay the Fund any dividends or interest paid on such securities plus any fee negotiated between the parties to the lending agreement. The Fund also earns a return from the collateral. The Fund pays Citibank various fees in connection with the investment of cash collateral and fees based on the investment income received from securities lending activities. Securities lending income (net of these fees) is disclosed on the Statement of Operations. Loans are terminable upon demand and the borrower must return the loaned securities within the lesser of one standard settlement period or five business days. Risks relating to securities-lending transactions include that the borrower may not provide additional collateral when required or return the securities when due, and that the value of the short-term investments will be less than the amount of cash collateral required to be returned to the borrower. The Fund's agreement with Citibank does not include master netting provisions. Noncash collateral received by the Fund may not be sold or re-pledged, except to satisfy borrower default. Cash collateral is listed on the Fund's Schedule of Portfolio Investments and Financial Statements while non-cash collateral is not included.
The following table (amounts in thousands) is a summary of the Fund's securities lending transactions as of November 30, 2020.
| Value of Securities on Loan | Non-Cash Collateral | Cash Collateral | |||||||||
| $ | 25,144 | $ | — | $ | 26,973 | ||||||
Foreign Currency Translations:
The accounting records of the Fund are maintained in U.S. dollars. Investment securities and other assets and liabilities of the Fund denominated in a foreign currency are translated into U.S. dollars at current exchange rates. Purchases and sales of securities, income receipts, and expense payments are translated into U.S. dollars at the exchange rates on the date of the transactions. The Fund does not isolate the portion of the results of operations resulting from changes in foreign exchange rates on investments from fluctuations arising from changes in market prices of securities held. Such fluctuations are disclosed as net change in unrealized appreciation/depreciation on investments and foreign currency translations on the Statement of Operations. Any realized gains or losses from these fluctuations, including foreign currency arising from in-kind redemptions, are disclosed as net realized gains or losses from investment transactions and foreign currency transactions on the Statement of Operations.
Foreign Taxes:
The Fund may be subject to foreign taxes related to foreign income received (a portion of which may be reclaimable), capital gains on the sale of securities, and certain foreign currency transactions. All foreign taxes are recorded in accordance with the applicable regulations and rates that exist in the foreign jurisdictions in which the Fund invests.
Federal Income Taxes:
It is the Fund's policy to continue to qualify as a regulated investment company by complying with the provisions available to certain investment companies, as defined in applicable sections of the Internal Revenue Code, and to make distributions of net investment income and net realized gains sufficient to relieve it from all, or substantially all, federal income taxes. Accordingly, no provision for federal income taxes is required in the financial statements. The Fund has a tax year end of May 31.
Management of the Fund has reviewed tax positions taken in tax years that remain subject to examination by all major tax jurisdictions, including federal (i.e., the last four tax years, which includes the current fiscal tax year end). Management believes that there is no tax liability resulting from unrecognized tax benefits related to uncertain tax positions taken.
41
USAA Mutual Funds Trust | Notes to Financial Statements — continued November 30, 2020 | ||||||
(Unaudited)
Allocations:
Expenses directly attributable to the Fund are charged to the Fund, while expenses that are attributable to more than one fund in the Trust, or jointly with an affiliated trust, are allocated among the respective funds in the Trust and/or affiliated trust based upon net assets or another appropriate basis.
Income, expenses (other than class-specific expenses such as transfer agent fees, state registration fees, 12b-1 fees, and printing fees), and realized and unrealized gains or losses on investments are allocated to each class of shares based on its relative net assets on the date income is earned or expenses and realized and unrealized gains and losses are incurred.
3. Purchases and Sales:
Cost of purchases and proceeds from sales/maturities of securities (excluding securities maturing less than one year from acquisition) for the six months ended November 30, 2020, were as follows for the Fund (amounts in thousands):
| Purchases (excluding U.S. Government Securities) | Sales (excluding U.S. Government Securities) | ||||||||||
$ | 794,189 | $ | 1,042,669 | ||||||||
There were no purchases and sales of U.S. government securities during the six months ended November 30, 2020.
4. Affiliated Fund Ownership:
The Fund offers its shares for investment by other USAA Mutual Funds. The fund-of-funds do not invest in the underlying funds for the purpose of exercising management or control, and the affiliated fund-of-funds' annual and semi-annual reports may be viewed at vcm.com. As of November 30, 2020, certain fund-of-funds owned total outstanding shares of the Fund as follows:
Affiliated USAA Mutual Funds | Percent | ||||||
USAA Cornerstone Conservative Fund | 0.2 | % | |||||
USAA Cornerstone Equity Fund | 0.9 | % | |||||
5. Fees and Transactions with Affiliates and Related Parties:
Investment Advisory Fees:
Investment advisory services are provided to the Fund by the Adviser, which is a New York corporation registered as an investment adviser with the SEC. The Adviser is a wholly-owned indirect subsidiary of Victory Capital Holdings, Inc., a publicly traded Delaware corporation, and a wholly-owned direct subsidiary of Victory Capital Operating, LLC. Under the terms of the Investment Advisory Agreement, the Adviser is entitled to receive a base fee and a performance adjustment. The Fund's base fee is accrued daily and paid monthly at an annualized rate of 0.75% of the Fund's average daily net assets. Amounts incurred and paid to VCM for the six months ended November 30, 2020, are reflected on the Statement of Operations as Investment Advisory fees.
On November 6, 2018, United Services Automobile Association ("USAA"), the parent company of USAA Asset Management Company ("AMCO"), the prior investment adviser to the Fund announced that AMCO would be acquired by Victory Capital Holdings Inc. (the "Transaction"). A special shareholder meeting was held on April 18, 2019, at which shareholders of the Fund approved a new investment advisory agreement between the Trust, on behalf of the Fund, and Victory Capital Management Inc. ("Victory Capital"). The Transaction closed on July 1, 2019. Effective July 1, 2019, VCM replaced AMCO as the investment adviser to the Fund and no performance adjustments were made for the periods beginning
42
USAA Mutual Funds Trust | Notes to Financial Statements — continued November 30, 2020 | ||||||
(Unaudited)
July 1, 2019, through June 30, 2020. Only performance beginning as of July 1, 2019, and thereafter is utilized in calculating future performance adjustments.
The performance adjustment for each share class is accrued daily and calculated monthly by comparing each class' performance to that of the Lipper International Funds Index. The Lipper International Funds Index tracks the total return performance of each class within the Lipper International Funds category.
The performance period for each share class consists of the current month plus the previous 35 months (or the number of months beginning July 1, 2019, if fewer). The following table is utilized to determine the extent of the performance adjustment:
| Over/Under Performance Relative to Index (in basis points)(a) | Annual Adjustment Rate (in basis points)(a) | ||||||
+/- 100 to 400 | +/- 4 | ||||||
+/- 401 to 700 | +/- 5 | ||||||
+/- 701 and greater | +/- 6 | ||||||
(a) Based on the difference between average annual performance of the relevant share class of the Fund and its relevant Lipper index, rounded to the nearest basis point. Average daily net assets of the share class are calculated over a rolling 36 month period.
Each class' annual performance adjustment rate is multiplied by the average daily net assets of each respective class over the entire performance period, which is then multiplied by a fraction, the numerator of which is the number of days in the month and the denominator of which is 365 (366 in leap years). The resulting amount is then added to (in the case of overperformance), or subtracted from (in the case of underperformance) the base fee.
Under the performance fee arrangement, each class pays a positive performance fee adjustment for a performance period whenever the class outperforms the Lipper International Funds Index over that period, even if the class has overall negative returns during the performance period.
For the period July 1, 2020 to November 30, 2020, performance adjustments for Fund Shares, Institutional Shares, Class A shares and Class R6 Shares were $(343), $(358), $(2), and $(1) thousand, respectively. For the Fund Shares, Institutional Shares, Class A shares and Class R6 Shares the performance adjustments were (0.05)%, (0.05)%, (0.05)%, and (0.05)% of average daily net assets, respectively.
The Trust relies on an exemptive order granted to VCM and its affiliated funds by the SEC in March 2019 permitting the use of a "manager-of-managers" structure for certain funds. Under a manager-of-managers structure, the investment adviser may select (with approval of the Board and without shareholder approval) one or more subadvisers to manage the day-to-day investment of a fund's assets.
VCM entered into Investment Subadvisory Agreements with Lazard Asset Management LLC ("Lazard") and Wellington Management Company LLP ("Wellington Management"). Lazard and Wellington Management each directed the investment and reinvestment of a portion of the Fund's assets (as allocated from time to time by VCM). These arrangements provide for monthly fees that are paid by VCM. VCM (not the Fund) pays the subadviser fees.
Administration and Servicing Fees:
VCM serves as the Fund's administrator and fund accountant. Under the Administration, Servicing and Accounting Agreement, VCM is paid for its services an annual fee at a rate of 0.15% of average daily net assets of the Fund Shares and Class A shares, 0.10% of average daily net assets of the Institutional Shares, and 0.05% of average daily net assets of the Class R6 Shares. Amounts incurred for the six months ended November 30, 2020, are reflected on the Statement of Operations as Administration fees.
43
USAA Mutual Funds Trust | Notes to Financial Statements — continued November 30, 2020 | ||||||
(Unaudited)
The Fund (as part of the Trust) has entered into an agreement to provide compliance services with the Adviser, pursuant to which the Adviser furnishes its compliance personnel, including the services of the Chief Compliance Officer ("CCO"), and other resources reasonably necessary to provide the Trust with compliance oversight services related to the design, administration and oversight of a compliance program for the Trust in accordance with Rule 38a-1 under the 1940 Act. The CCO is an employee of the Adviser, which pays the compensation of the CCO and support staff. Funds in the Trust, Victory Variable Insurance Funds, Victory Portfolios, and Victory Portfolios II (collectively, the "Victory Funds Complex") in the aggregate, compensate the Adviser for these services. Amounts incurred for the six months ended November 30, 2020, are reflected on the Statement of Operations as Compliance fees.
Citi Fund Services Ohio, Inc. ("Citi"), an affiliate of Citibank, acts as sub-administrator and sub-fund accountant to the Fund pursuant to a Sub-Administration and Sub-Fund Accounting Services Agreement between VCM and Citi. VCM pays Citi a fee for providing these services. The Trust reimburses VCM and Citi for out-of-pocket expenses incurred in providing these services and certain other expenses specifically allocated to the Fund. Amounts incurred for the six months ended November 30, 2020, are reflected on the Statement of Operations as Sub-Administration fees.
Transfer Agency Fees:
Victory Capital Transfer Agency, Inc. ("VCTA"), an affiliate of the Adviser provides transfer agency services to the Fund. VCTA provides transfer agent services to the Fund Shares based on an annual charge of $23 per shareholder account plus out-of-pocket expenses. VCTA pays a portion of these fees to certain intermediaries for the administration and servicing of accounts that are held with such intermediaries. Transfer agent's fees for Institutional Shares, Class A shares and R6 Shares are paid monthly based on a fee accrued daily at an annualized rate of 0.10%, 0.10% and 0.01% of average daily net assets, respectively, plus out-of-pocket expenses. Amounts incurred and paid to VCTA for the six months ended November 30, 2020, are reflected on the Statement of Operations as Transfer Agent fees.
FIS Investor Services LLC serves as sub-transfer agent and dividend disbursing agent for the Fund pursuant to a Sub-Transfer Agent agreement between VCTA and FIS Investor Services LLC. VCTA provides FIS Investor Services LLC a fee for providing these services.
Distributor/Underwriting Services:
Victory Capital Services, Inc. (the "Distributor"), an affiliate of the Adviser, serves as distributor for the continuous offering of the shares of the Fund pursuant to a Distribution Agreement between the Distributor and the Trust. Effective June 30, 2020, the Distributor's name was changed from Victory Capital Advisers, Inc.
Pursuant to the Distribution and Service Plans adopted in accordance with Rule 12b-1 under the 1940 Act, the Distributor may receive a monthly distribution and service fee, at an annual rate of up to 0.25% of the average daily net assets of Class A shares. The distribution and service fees paid to the Distributor may be used by the Distributor to pay for activity primarily intended to result in the sale of Class A shares of the Fund. Amounts incurred and paid to VCTA for the period ended November 30, 2020, are reflected on the Statement of Operations as 12b-1 fees.
In addition, the Distributor is entitled to receive commissions on sales of the Class A shares of the Fund. For the six months ended November 30, 2020, the Distributor received approximately less than $1 thousand from commissions earned on sales of Class A shares of the Fund.
Other Fees:
Citibank serves as the Fund's custodian. The Fund pays Citibank a fee for providing these services. Amounts incurred for the six months ended November 30, 2020, are reflected on the Statement of Operations as Custodian fees.
K&L Gates LLP provides legal services to the Trust.
44
USAA Mutual Funds Trust | Notes to Financial Statements — continued November 30, 2020 | ||||||
(Unaudited)
The Adviser has entered into an expense limitation agreement with the Fund until at least September 30, 2021. Under the terms of the agreement, the Adviser has agreed to waive fees or reimburse certain expenses to the extent that ordinary operating expenses incurred by certain classes of the Fund in any fiscal year exceed the expense limit for such classes of the Fund. Such excess amounts will be the liability of the Adviser. Interest, taxes, brokerage commissions, other expenditures, which are capitalized in accordance with GAAP, and other extraordinary expenses not incurred in the ordinary course of the Fund's business are excluded from the expense limits. As of November 30, 2020, the expense limits (excluding voluntary waivers) are 1.06%, 0.99%, 1.35% and 0.85% for Fund Shares, Institutional Shares, Class A shares and Class R6 Shares, respectively.
Under this expense limitation agreement, the Fund has agreed to repay fees and expenses that were waived or reimbursed by the Adviser for a period up to three years after the fiscal year in which the waiver or reimbursement took place, subject to the lesser of any operating expense limits in effect at the time of: (a) the original waiver or expense reimbursement; or (b) the recoupment, after giving effect to the recoupment amount.
As of November 30, 2020, the following amounts are available to be repaid to the Adviser (amounts in thousands). The Fund has not recorded any amounts available to be repaid as a liability due to an assessment that such repayment is not probable at November 30, 2020.
| Expires May 31, 2023 | Expires May 31, 2024 | Total | |||||||||
| $ | 91 | $ | 160 | $ | 251 | ||||||
The Adviser may voluntarily waive or reimburse additional fees to assist the Fund in maintaining competitive expense ratios. Voluntary waivers and reimbursements applicable to the Fund are not available to be recouped at a future time. There were no voluntary waivers or reimbursements for the six months ended November 30, 2020.
Certain officers and/or interested trustees of the Fund are also officers and/or employees of the Adviser, Administrator, Sub-Administrator, Sub-Fund Accountant, and Legal.
6. Risks:
The Fund may be subject to other risks in addition to these identified risks.
Geopolitical/Natural Disaster Risk — Global economies and financial markets are increasingly interconnected, which increases the possibilities that conditions in one country or region might adversely affect issuers in another country or region. Geopolitical and other risks, including war, terrorism, trade disputes, political or economic dysfunction within some nations, public health crises and related geopolitical events, as well as environmental disasters such as earthquakes, fires, and floods, may add to instability in world economies and markets generally. Changes in trade policies and international trade agreements could affect the economies of many countries in unpredictable ways. Likewise, systemic market dislocations of the kind that occurred during the financial crisis that began in 2008, if repeated, would be highly disruptive to economies and markets, adversely affecting individual companies and industries, securities markets, interest rates, credit ratings, inflation, investor sentiment, and other factors affecting the value of a Fund's investments. Some countries, including the United States, are adopting more protectionist trade policies and moving away from the tighter financial industry regulations that followed the 2008 financial crisis, which may also affect the value of a Fund's investments.
Political events within the United States at times have resulted, and may in the future result, in a shutdown of government services, which could negatively affect the U.S. economy, decrease the value of a Fund's investments, increase uncertainty in or impair the operation of the U.S. or other securities markets and degrade investor and consumer confidence, perhaps suddenly and to a significant degree.
An outbreak of disease called COVID-19 has spread internationally. The transmission of COVID-19 and efforts to contain its spread have resulted in international, national and local border closings and other significant travel restrictions and disruptions, significant disruptions to business operations, supply
45
USAA Mutual Funds Trust | Notes to Financial Statements — continued November 30, 2020 | ||||||
(Unaudited)
chains and consumer activity, significant challenges in healthcare service preparation and delivery, quarantines and general concern and uncertainty. These negative impacts have caused significant volatility and declines in global financial markets, which have caused losses for Fund investors during and subsequent to period end. The impact of the COVID-19 pandemic last for an extended period of time, and could result in a substantial economic downturn or recession. Public health crises may exacerbate other pre-existing political, social, economic, market and financial risks. The extent of the impact to the financial performance of the Funds' investments will depend on future developments, including (i) the duration and spread of the outbreak, (ii) the restrictions and advisories, (iii) the effects on the financial markets, and (iv) the effects on the economy overall, all of which are highly uncertain and cannot be predicted.
Stock Market Risk — Overall stock market risks may affect the value of the Fund. Domestic and international factors such as political events, war, trade disputes, interest rate levels and other fiscal and monetary policy changes, pandemics and other public health crises, and related geopolitical events, as well as environmental disasters such as earthquakes, fires, and floods, may add to instability in world economies and markets generally. The impact of these and other factors may be short-term or may last for extended periods.
Equity Risk — The value of the equity securities in which the Fund invests may decline in response to developments affecting individual companies and/or general economic conditions. A company's earnings or dividends may not increase as expected due to poor management decisions, competitive pressures, breakthroughs in technology, reliance on suppliers, labor problems or shortages, corporate restructurings, fraudulent disclosures, natural disasters, military confrontations, war, terrorism, public health crises, or other events, conditions, and factors. Price changes may be temporary or last for extended periods.
Foreign Securities Risk — Foreign markets can be more volatile than the U.S. market due to increased risks of adverse issuer, political, regulatory, market, or economic developments and can perform differently from the U.S. market.
7. Borrowing and Interfund Lending:
Line of Credit:
For the six months ended November 30, 2020, the Victory Funds Complex participated in a short-term demand note "Line of Credit" agreement with Citibank. The Line of Credit agreement with Citibank was renewed on June 29, 2020 with a termination date of June 28, 2021. Under the agreement with Citibank, the Victory Funds Complex may borrow up to $600 million, of which $300 million is committed and $300 million is uncommitted. $40 million of the Line of Credit is reserved for use by the Victory Floating Rate Fund, another series of the Victory Funds Complex, with Victory Floating Rate Fund paying the related commitment fees for that amount. The purpose of the agreement is to meet temporary or emergency cash needs. For the six months ended November 30, 2020, Citibank received an annual commitment fee of 0.15% on $300 million for providing the Line of Credit. Each fund in the Victory Funds Complex pays a pro-rata portion of the commitment fees plus any interest (one month LIBOR plus one percent) on amounts borrowed. Effective June 29, 2020, under an amended Line of Credit agreement, Citibank will also receive an annual upfront fee of 0.10% on the $300 million committed line of credit. Each fund in the Victory Funds Complex will pay a pro-rata portion of the upfront fee. Interest charged to each Fund during the period, if applicable, is reflected on the Statements of Operations under Line of credit fees.
The Fund had no borrowings under the Line of Credit agreement during the six-months ended November 30, 2020.
Interfund Lending:
The Trust and Adviser rely on an exemptive order granted by the SEC in March 2017 (the "Order"), permitting the establishment and operation of an Interfund Lending Facility (the "Facility"). The Facility
46
USAA Mutual Funds Trust | Notes to Financial Statements — continued November 30, 2020 | ||||||
(Unaudited)
allows the Fund to directly lend and borrow money to or from any other Fund, that is permitted to participate in the Facility, in the Victory Funds Complex relying upon the Order at rates beneficial to both the borrowing and lending funds. Advances under the Facility are allowed for temporary or emergency purposes. The interfund loan rate is determined, as specified in the Order, by averaging the current repurchase agreement rate and the current bank loan rate. As a Borrower, interest charged to the Fund, if any, during the period is reflected on the Statement of Operations under Interfund lending fees. As a Lender, interest earned by the Fund, if any, during the period is reflected on the Statement of Operations under Income on Interfund lending.
The average borrowing or lending for the days outstanding and average interest rate for the Fund during the six months ended November 30, 2020 were as follows (amounts in thousands):
| Borrower or Lender | Amount Outstanding at November 30, 2020 | Average Borrowing* | Days Borrowing Outstanding | Average Interest Rate* | Maximum Borrowing During the Period | ||||||||||||||||||
| Borrower | $ | — | $ | 1,593 | 14 | 0.63 | % | $ | 1,952 | ||||||||||||||
* For the six months ended November 30, 2020, based on the number of days borrowings were outstanding.
8. Federal Income Tax Information:
The Fund intends to declare and distribute any net investment income annually. Distributable net realized gains, if any, are declared and paid at least annually.
The amounts of dividends from net investment income and distributions from net realized gains (collectively distributions to shareholders) are determined in accordance with federal income tax regulations, which may differ from GAAP. To the extent these "book/tax" differences are permanent in nature (e.g., net operating loss and distribution reclassification), such amounts are reclassified within the components of net assets based on their federal tax-basis treatment; temporary differences (e.g., wash sales) do not require reclassification. To the extent dividends and distributions exceed net investment income and net realized gains for tax purposes, they are reported as distributions of capital.
Net investment losses incurred by the Fund may be reclassified as an offset to capital on the accompanying Statement of Assets and Liabilities.
The tax character of current year distributions paid and the tax basis of the current components of accumulated earnings (deficit) will be determined at the end of the current tax year ending May 31, 2021.
At May 31, 2020, the Fund had no capital loss carryforwards for federal income tax purposes.
47
USAA Mutual Funds Trust | Supplemental Information November 30, 2020 | ||||||
(Unaudited)
Proxy Voting and Portfolio Holdings Information
Proxy Voting:
Information regarding the policies and procedures the Fund uses to determine how to vote proxies relating to portfolio securities is available without charge, upon request, by calling (800) 539-3863. The information is also included in the Fund's Statement of Additional Information, which is available on the SEC's website at www.sec.gov.
Information relating to how the Fund voted proxies relating to portfolio securities held during the most recent 12 months ended June 30 is available on the SEC's website at www.sec.gov.
Availability of Schedules of Portfolio Investments:
The Trust files a complete list of Schedules of Portfolio Investments with the SEC for the first and third quarter of each fiscal year on Form N-PORT. Form N-PORT is available on the SEC's website at www.sec.gov.
Expense Examples
As a shareholder of the Fund, you may incur two types of costs: (1) transaction costs, including sales charges (loads) on purchases, and (2) ongoing costs, including management fees and other Fund expenses. These examples are intended to help you understand your ongoing costs (in dollars) of investing in the Fund and to compare these costs with the ongoing costs of investing in other mutual funds.
These examples are based on an investment of $1,000 invested at the beginning of the period and held for the entire period from June 1, 2020 through November 30, 2020.
The Actual Expense figures in the table below provide information about actual account values and actual expenses. You may use the information below, together with the amount you invested, to estimate the expenses that you paid over the period. Simply divide your account value by $1,000 (for example, an $8,600 account value divided by $1,000 = 8.6), then multiply the result by the number in the table under the heading entitled "Actual Expenses Paid During Period" to estimate the expenses you paid on your account during this period.
The Hypothetical Expense figures in the table below provide information about hypothetical account values and hypothetical expenses based on the Fund's actual expense ratio and an assumed rate of return of 5% per year before expenses, which is not the Fund's actual return. The hypothetical account values and expenses may not be used to estimate the actual ending account balance or expenses you paid for the period. You may use this information to compare this 5% hypothetical example with the 5% hypothetical examples that appear in shareholder reports of other funds.
Please note the expenses shown in the table below are meant to highlight your ongoing costs only and do not reflect any transactional costs. If these transactional costs were included, your costs would have been higher.
| Beginning Account Value 6/1/20 | Actual Ending Account Value 11/30/20 | Hypothetical Ending Account Value 11/30/20 | Actual Expenses Paid During Period 6/1/20- 11/30/20* | Hypothetical Expenses Paid During Period 6/1/20- 11/30/20* | Annualized Expense Ratio During Period 6/1/20- 11/30/20 | ||||||||||||||||||||||
Fund Shares | $ | 1,000.00 | $ | 1,179.30 | $ | 1,020.00 | $ | 5.52 | $ | 5.11 | 1.01 | % | |||||||||||||||
Institutional Shares | 1,000.00 | 1,179.90 | 1,020.36 | 5.14 | 4.76 | 0.94 | % | ||||||||||||||||||||
Class A shares | 1,000.00 | 1,177.20 | 1,018.55 | 7.10 | 6.58 | 1.30 | % | ||||||||||||||||||||
Class R6 Shares | 1,000.00 | 1,180.80 | 1,021.06 | 4.37 | 4.05 | 0.80 | % | ||||||||||||||||||||
* Expenses are equal to the average account value multiplied by the Fund's annualized expense ratio multiplied by 183/365 (the number of days in the most recent fiscal half-year divided by the number of days in the fiscal year).
48
Privacy Policy
Protecting the Privacy of Information
The Trust respects your right to privacy. We also know that you expect us to conduct and process your business in an accurate and efficient manner. To do so, we must collect and maintain certain personal information about you. This is the information we collect from you on applications or other forms, and from the transactions you make with us or third parties. It may include your name, address, social security number, account transactions and balances, and information about investment goals and risk tolerance.
We do not disclose any information about you or about former customers to anyone except as permitted or required by law. Specifically, we may disclose the information we collect to companies that perform services on our behalf, such as the transfer agent that processes shareholder accounts and printers and mailers that assist us in the distribution of investor materials. We may also disclose this information to companies that perform marketing services on our behalf. This allows us to continue to offer you Victory investment products and services that meet your investing needs, and to effect transactions that you request or authorize. These companies will use this information only in connection with the services for which we hired them. They are not permitted to use or share this information for any other purpose.
To protect your personal information internally, we permit access only by authorized employees and maintain physical, electronic and procedural safeguards to guard your personal information.*
* You may have received communications regarding information about privacy policies from other financial institutions which gave you the opportunity to "opt-out" of certain information sharing with companies which are not affiliated with that financial institution. The Trust does not share information with other companies for purposes of marketing solicitations for products other than the Trust. Therefore, the Trust does not provide opt-out options to their shareholders.
P.O. Box 182593
Columbus, Ohio 43218-2593

Visit our website at: | Call | ||||||
vcm.com | (800) 235-8396 | ||||||
23410-0121

NOVEMBER 30, 2020
Semi Annual Report
USAA Managed Allocation Fund
Beginning January 1, 2021, as permitted by regulations adopted by the Securities and Exchange Commission, paper copies of the Fund's shareholder reports may no longer be sent by mail, unless you specifically request paper copies of the reports from the Fund or from your financial intermediary, such as a broker-dealer or bank. Instead, the reports will be made available on VictoryFunds.com, and you will be notified by mail each time a report is posted and provided with a website link to access the report. If you already elected to receive shareholder reports electronically, you will not be affected by this change and you need not take any action.
You may elect to receive shareholder reports and other communications from the Fund or your financial intermediary electronically by notifying your financial intermediary directly, or if you are a shareholder who has an account directly with the Fund, by calling (800) 235-8396 or by submitting your request via email to TA.Processing@FISGlobal.com.
You may elect to receive all future reports in paper free of charge. You can inform the Fund or your financial intermediary that you wish to continue receiving paper copies of your shareholder reports by notifying your financial intermediary directly, or if you are a shareholder who has an account directly with the Fund, by calling (800) 235-8396 or by submitting your request via email to TA.Processing@FISGlobal.com.
Your election to receive reports in paper will apply to all funds held with the USAA Mutual Funds or your financial intermediary.
Victory Capital means Victory Capital Management Inc., the investment adviser of the USAA Mutual Funds. USAA Mutual Funds are distributed by Victory Capital Services, Inc., member of FINRA, an affiliate of Victory Capital. Victory Capital and its affiliates are not affiliated with United Services Automobile Association or its affiliates. USAA and the USAA logo are registered trademarks and the USAA Mutual Funds and USAA Investments logos are trademarks of United Services Automobile Association and are being used by Victory Capital and its affiliates under license.
USAA Mutual Funds Trust
TABLE OF CONTENTS
Investment Objective & Portfolio Holdings | 2 | ||||||
Schedule of Portfolio Investments | 3 | ||||||
Financial Statements | |||||||
Statement of Assets and Liabilities | 4 | ||||||
Statement of Operations | 5 | ||||||
Statements of Changes in Net Assets | 6 | ||||||
Financial Highlights | 8 | ||||||
Notes to Financial Statements | 10 | ||||||
Supplemental Information | 17 | ||||||
Proxy Voting and Portfolio Holdings Information | 17 | ||||||
Expense Example | 17 | ||||||
Privacy Policy (inside back cover) | |||||||
This report is for the information of the shareholders and others who have received a copy of the currently effective prospectus of the Fund, managed by Victory Capital Management Inc. It may be used as sales literature only when preceded or accompanied by a current prospectus, which provides further details about the Fund.
IRA DISTRIBUTION WITHHOLDING DISCLOSURE
We generally must withhold federal income tax at a rate of 10% of the taxable portion of your distribution and, if you live in a state that requires state income tax withholding, at your state's tax rate. However, you may elect not to have withholding apply or to have income tax withheld at a higher rate. Any withholding election that you make will apply to any subsequent distribution unless and until you change or revoke the election. If you wish to make a withholding election, or change or revoke a prior withholding election, call (800) 235-8396, and form W-4P (OMB No. 1545-0074 withholding certificate for pension or annuity payments) will be electronically sent.
If you do not have a withholding election in place by the date of a distribution, federal income tax will be withheld from the taxable portion of your distribution at a rate of 10%. If you must pay estimated taxes, you may be subject to estimated tax penalties if your estimated tax payments are not sufficient and sufficient tax is not withheld from your distribution.
For more specific information, please consult your tax adviser.
1
| USAA Mutual Funds Trust USAA Managed Allocation Fund | November 30, 2020 | ||||||
(Unaudited)
Investment Objective & Portfolio Holdings:
The Fund's investment objective is to seek to maximize total return, consisting primarily of capital appreciation.
Asset Allocation*:
November 30, 2020
(% of Net Assets)
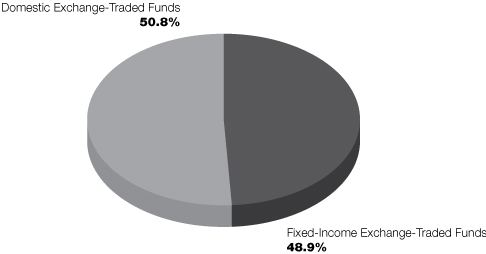
* Does not include futures, money market instruments, and short-term investments purchased with cash collateral from securities loaned.
Percentages are of the net assets of the Fund and may not equal 100%.
Refer to the Schedule of Portfolio Investments for a complete list of securities.
2
| USAA Mutual Funds Trust USAA Managed Allocation Fund | Schedule of Portfolio Investments November 30, 2020 | ||||||
(Amounts in Thousands, Except for Shares) (Unaudited)
Security Description | Shares | Value | |||||||||
Exchange-Traded Funds (99.7%) | |||||||||||
iShares Core S&P 500 ETF | 458,865 | $ | 166,715 | ||||||||
iShares iBoxx $ Investment Grade Corporate Bond ETF | 1,185,754 | 164,203 | |||||||||
iShares MSCI Emerging Markets ETF (a) | 3,372,408 | 164,338 | |||||||||
Vanguard Short-Term Bond ETF | 1,861,179 | 154,310 | |||||||||
Total Exchange-Traded Funds (Cost $578,371) | 649,566 | ||||||||||
Collateral for Securities Loaned^ (6.2%) | |||||||||||
| Goldman Sachs Financial Square Government Fund Institutional Shares, 0.02% (b) | 28,002,100 | 28,002 | |||||||||
HSBC U.S. Government Money Market Fund I Shares, 0.03% (b) | 159,930 | 160 | |||||||||
| Morgan Stanley Institutional Liquidity Funds — Government Portfolio Institutional Shares, 0.02% (b) | 12,174,000 | 12,174 | |||||||||
Total Collateral for Securities Loaned (Cost $40,336) | 40,336 | ||||||||||
Total Investments (Cost $618,707) — 105.9% | 689,902 | ||||||||||
Liabilities in excess of other assets — (5.9)% | (38,287 | ) | |||||||||
NET ASSETS — 100.00% | $ | 651,615 | |||||||||
ETF — Exchange-Traded Fund
^ Purchased with cash collateral from securities on loan.
(a) All or a portion of this security is on loan.
(b) Rate disclosed is the daily yield on November 30, 2020.
See notes to financial statements.
3
USAA Mutual Funds Trust | Statement of Assets and Liabilities November 30, 2020 | ||||||
(Amounts in Thousands, Except Per Share Amounts) (Unaudited)
| USAA Managed Allocation Fund | |||||||
Assets: | |||||||
Investments, at value (Cost $618,707) | $ | 689,902 | (a) | ||||
Cash and cash equivalents | 1,137 | ||||||
Receivables: | |||||||
Interest and dividends | 3 | ||||||
Capital shares issued | 19 | ||||||
Investments sold | 1,955 | ||||||
From Adviser | 85 | ||||||
Prepaid expenses | 16 | ||||||
Total assets | 693,117 | ||||||
Liabilities: | |||||||
Payables: | |||||||
Collateral received on loaned securities | 40,336 | ||||||
Capital shares redeemed | 739 | ||||||
Accrued expenses and other payables: | |||||||
Investment advisory fees | 319 | ||||||
Administration fees | 27 | ||||||
Custodian fees | 6 | ||||||
Transfer agent fees | 27 | ||||||
Compliance fees | — | (b) | |||||
Other accrued expenses | 48 | ||||||
Total liabilities | 41,502 | ||||||
Net Assets: | |||||||
Capital | 591,543 | ||||||
Total accumulated earnings/(loss) | 60,072 | ||||||
Net assets | $ | 651,615 | |||||
Shares (unlimited number of shares authorized with no par value): | 50,777 | ||||||
Net asset value, offering and redemption price per share: (c) | $ | 12.83 | |||||
(a) Includes $38,248 of securities on loan.
(b) Rounds to less than $1 thousand.
(c) Per share amount may not recalculate due to rounding of net assets and/or shares outstanding.
See notes to financial statements.
4
USAA Mutual Funds Trust | Statement of Operations For the Six Months Ended November 30, 2020 | ||||||
(Amounts in Thousands) (Unaudited)
| USAA Managed Allocation Fund | |||||||
Investment Income: | |||||||
Dividends | $ | 5,569 | |||||
Interest | 22 | ||||||
Securities lending (net of fees) | 12 | ||||||
Total income | 5,603 | ||||||
Expenses: | |||||||
Investment advisory fees | 1,979 | ||||||
Administration fees | 165 | ||||||
Sub-Administration fees | 9 | ||||||
Custodian fees | 15 | ||||||
Transfer agent fees | 165 | ||||||
Trustees' fees | 26 | ||||||
Compliance fees | 2 | ||||||
Legal and audit fees | 34 | ||||||
State registration and filing fees | 17 | ||||||
Other expenses | 57 | ||||||
Total expenses | 2,469 | ||||||
Expenses waived/reimbursed by Adviser | (528 | ) | |||||
Net expenses | 1,941 | ||||||
Net Investment Income (Loss) | 3,662 | ||||||
Realized/Unrealized Gains (Losses) from Investments: | |||||||
Net realized gains (losses) from investment securities | 35,415 | ||||||
Net change in unrealized appreciation/depreciation on investment securities | 31,579 | ||||||
Net realized/unrealized gains (losses) on investments | 66,994 | ||||||
Change in net assets resulting from operations | $ | 70,656 | |||||
See notes to financial statements.
5
USAA Mutual Funds Trust | Statements of Changes in Net Assets | ||||||
(Amounts in Thousands)
USAA Managed Allocation Fund | |||||||||||
| Six Months Ended November 30, 2020 (unaudited) | Year Ended May 31, 2020 | ||||||||||
From Investments: | |||||||||||
Operations: | |||||||||||
Net investment income (loss) | $ | 3,662 | $ | 17,207 | |||||||
Net realized gains (losses) from investments | 35,415 | (28,991 | ) | ||||||||
| Net change in unrealized appreciation/depreciation on investments | 31,579 | 57,008 | |||||||||
Change in net assets resulting from operations | 70,656 | 45,224 | |||||||||
Change in net assets resulting from distributions to shareholders | — | (19,579 | ) | ||||||||
Change in net assets resulting from capital transactions | (79,833 | ) | (89,372 | ) | |||||||
Change in net assets | (9,177 | ) | (63,727 | ) | |||||||
Net Assets: | |||||||||||
Beginning of period | 660,792 | 724,519 | |||||||||
End of period | $ | 651,615 | $ | 660,792 | |||||||
Capital Transactions: | |||||||||||
Proceeds from shares issued | $ | 17,570 | $ | 54,008 | |||||||
Distributions reinvested | — | 19,579 | |||||||||
Cost of shares redeemed | (97,403 | ) | (162,959 | ) | |||||||
Change in net assets resulting from capital transactions | $ | (79,833 | ) | $ | (89,372 | ) | |||||
Share Transactions: | |||||||||||
Issued | 1,423 | 4,613 | |||||||||
Reinvested | — | 1,636 | |||||||||
Redeemed | (7,965 | ) | (14,195 | ) | |||||||
Change in Shares | (6,542 | ) | (7,946 | ) | |||||||
See notes to financial statements.
6
This page is intentionally left blank.
7
USAA Mutual Funds Trust | Financial Highlights | ||||||
For a Share Outstanding Throughout Each Period
Investment Activities | Distributions to Shareholders From | ||||||||||||||||||||||||||
| Net Asset Value, Beginning of Period | Net Investment Income (Loss) | Net Realized and Unrealized Gains (Losses) on Investments | Total from Investment Activities | Net Investment Income | Net Realized Gains From Investments | ||||||||||||||||||||||
USAA Managed Allocation Fund | |||||||||||||||||||||||||||
| Six Months Ended November 30, 2020 (unaudited) | $ | 11.53 | 0.07 | (c) | 1.23 | 1.30 | — | — | |||||||||||||||||||
| Year Ended May 31, 2020 | $ | 11.10 | 0.28 | (c) | 0.47 | 0.75 | (0.32 | ) | — | ||||||||||||||||||
| Year Ended May 31, 2019 | $ | 12.01 | 0.20 | (0.92 | ) | (0.72 | ) | (0.11 | ) | (0.08 | ) | ||||||||||||||||
| Year Ended May 31, 2018 | $ | 11.61 | 0.23 | 0.46 | 0.69 | (0.29 | ) | — | |||||||||||||||||||
| Year Ended May 31, 2017 | $ | 10.90 | 0.24 | 0.72 | 0.96 | (0.25 | ) | — | |||||||||||||||||||
| Year Ended May 31, 2016 | $ | 11.99 | 0.24 | (c) | (0.97 | ) | (0.73 | ) | (0.21 | ) | (0.15 | ) | |||||||||||||||
* Assumes reinvestment of all net investment income and realized capital gain distributions, if any, during the period. Includes adjustments in accordance with U.S. generally accepted accounting principles and could differ from the Lipper reported return.
^ The net expense ratio may not correlate to the applicable expense limits in place during the period since the current contractual expense limitation is applied for a two year period beginning July 1, 2019 and in effect through September 30, 2021, instead of coinciding with the Fund's fiscal year end. Details of the current contractual expense limitation in effect can be found in Note 4 of the accompanying Notes to Financial Statements.
(a) Not annualized for periods less than one year.
(b) Annualized for periods less than one year.
(c) Per share net investment income (loss) has been calculated using the average daily shares method.
(d) Reflects an increase in trading activity due to asset allocation shifts.
(e) Reflects a return to normal trading levels after a prior year transition or allocation shift.
See notes to financial statements.
8
USAA Mutual Funds Trust | Financial Highlights — continued | ||||||
For a Share Outstanding Throughout Each Period
Ratios to Average Net Assets | Supplemental Data | ||||||||||||||||||||||||||||||||||
| Total Distributions | Net Asset Value, End of Period | Total Return*,(a) | Net Expenses^(b) | Net Investment Income (Loss)(b) | Gross Expenses(b) | Net Assets, End of Period (000's) | Portfolio Turnover(a) | ||||||||||||||||||||||||||||
USAA Managed Allocation Fund | |||||||||||||||||||||||||||||||||||
| Six Months Ended November 30, 2020 (unaudited) | — | $ | 12.83 | 11.27 | % | 0.59 | % | 1.11 | % | 0.75 | % | $ | 651,615 | 69 | % | ||||||||||||||||||||
| Year Ended May 31, 2020 | (0.32 | ) | $ | 11.53 | 6.66 | % | 0.60 | % | 2.38 | % | 0.74 | % | $ | 660,792 | 167 | % | |||||||||||||||||||
| Year Ended May 31, 2019 | (0.19 | ) | $ | 11.10 | (5.92 | )% | 0.75 | % | 1.72 | % | 0.75 | % | $ | 724,519 | 156 | %(d) | |||||||||||||||||||
| Year Ended May 31, 2018 | (0.29 | ) | $ | 12.01 | 5.91 | % | 0.74 | % | 1.83 | % | 0.74 | % | $ | 808,509 | 97 | %(e) | |||||||||||||||||||
| Year Ended May 31, 2017 | (0.25 | ) | $ | 11.61 | 8.94 | % | 0.76 | % | 2.13 | % | 0.76 | % | $ | 765,879 | 194 | %(d) | |||||||||||||||||||
| Year Ended May 31, 2016 | (0.36 | ) | $ | 10.90 | (6.13 | )% | 0.75 | % | 2.09 | % | 0.75 | % | $ | 708,592 | 90 | % | |||||||||||||||||||
See notes to financial statements.
9
USAA Mutual Funds Trust | Notes to Financial Statements November 30, 2020 | ||||||
(Unaudited)
1. Organization:
USAA Mutual Funds Trust (the "Trust") is organized as a Delaware statutory trust and is registered under the Investment Company Act of 1940, as amended (the "1940 Act"), as an open-end investment company. The Trust is comprised of 46 funds and is authorized to issue an unlimited number of shares, which are units of beneficial interest with no par value.
The accompanying financial statements are those of the USAA Managed Allocation Fund (the "Fund"). The Fund is classified as diversified under the 1940 Act.
Under the Trust's organizational documents, its officers and trustees are indemnified against certain liabilities arising out of the performance of their duties to the Fund. In addition, in the normal course of business, the Fund enters into contracts with its vendors and others that provide for general indemnifications. The Fund's maximum exposure under these arrangements is unknown, as this would involve future claims that may be made against the Fund. However, based on experience, the Fund expects that risk of loss to be remote.
2. Significant Accounting Policies:
The following is a summary of significant accounting policies followed by the Trust in the preparation of its financial statements. The policies are in conformity with Generally Accepted Accounting Principles in the United States of America ("GAAP"). The preparation of financial statements in accordance with GAAP requires management to make estimates and assumptions that affect the reported amounts of assets and liabilities and disclosure of contingent assets and liabilities at the date of the financial statements and the reported amounts of income and expenses for the period. Actual results could differ from those estimates. The Fund follows the specialized accounting and reporting requirements under GAAP that are applicable to investment companies under Accounting Standards Codification Topic 946.
Investment Valuation:
The Fund records investments at fair value. Fair value is defined as the price that would be received to sell an asset or paid to transfer a liability in an orderly transaction between market participants at the measurement date.
The valuation techniques described below maximize the use of observable inputs and minimize the use of unobservable inputs in determining fair value. The inputs used for valuing the Fund's investments are summarized in the three broad levels listed below:
• Level 1 — quoted prices in active markets for identical securities
• Level 2 — other significant observable inputs (including quoted prices for similar securities or interest rates applicable to those securities, etc.)
• Level 3 — significant unobservable inputs (including the Fund's own assumptions in determining the fair value of investments)
Changes in valuation techniques may result in transfers in or out of an assigned level within the disclosure hierarchy. The inputs or methodologies used for valuation techniques are not necessarily an indication of the risk associated with entering into those investments.
Victory Capital Management Inc. ("VCM" or the "Adviser") has established the Pricing and Liquidity Committee (the "Committee"), and subject to the Trust's Board of Trustees (the "Board") oversight, the Committee administers and oversees the Fund's valuation policies and procedures, which are approved by the Board.
Portfolio securities listed or traded on securities exchanges, including exchange-traded funds ("ETFs"), American Depositary Receipts ("ADRs") and Rights, are valued at the closing price on the exchange or system where the security is principally traded, if available, or at the Nasdaq Official Closing Price. If there have been no sales for that day on the exchange or system, then a security is valued at the last available bid quotation on the exchange or system where the security is principally traded. In each of these situations, valuations are typically categorized as Level 1 in the fair value hierarchy.
Investments in open-end investment companies are valued at their net asset value ("NAV"). These valuations are typically categorized as Level 1 in the fair value hierarchy.
10
USAA Mutual Funds Trust | Notes to Financial Statements — continued November 30, 2020 | ||||||
(Unaudited)
In the event that price quotations or valuations are not readily available, are not reflective of market value, or a significant event has been recognized in relation to a security or class of securities, the securities are valued in good faith by the Committee in accordance with valuation procedures approved by the Board. These valuations are typically categorized as Level 2 or Level 3 in the fair value hierarchy, based on the observability of inputs used to determine the fair value. The effect of fair value pricing is that securities may not be priced on the basis of quotations from the primary market in which they are traded and the actual price realized from the sale of a security may differ materially from the fair value price. Valuing these securities at fair value is intended to cause the Fund's NAV to be more reliable than it otherwise would be.
A summary of the valuations as of November 30, 2020, based upon the three levels defined above, is included in the table below while the breakdown, by category, of investments is disclosed on the Schedule of Portfolio Investments (amounts in thousands):
Level 1 | Level 2 | Level 3 | Total | ||||||||||||||||
Exchange-Traded Funds | $ | 649,566 | $ | — | $ | — | $ | 649,566 | |||||||||||
Collateral for Securities Loaned | 40,336 | — | — | 40,336 | |||||||||||||||
Total | $ | 689,902 | $ | — | $ | — | $ | 689,902 | |||||||||||
For the six months ended November 30, 2020, there were no transfers in or out of the Level 3 fair value hierarchy.
Investment Companies:
Exchange-Traded Funds:
The Fund may invest in ETFs, the shares of which are bought and sold on a securities exchange. An ETF trades like common stock and represents a portfolio of securities designed to track the performance and dividend yield of a particular domestic or foreign market index. The Fund may purchase shares of an ETF to temporarily gain exposure to a portion of the U.S. or a foreign market while awaiting purchase of underlying securities. The risks of owning an ETF generally reflect the risks of owning the underlying securities they are designed to track, although the lack of liquidity of an ETF could result in it being more volatile. Additionally, ETFs have fees and expenses that reduce their value.
Open-End Funds:
The Fund may invest in portfolios of open-end investment companies. These investment companies value securities in their portfolios for which market quotations are readily available at their market values (generally the last reported sale price) and all other securities and assets at their fair value by the methods established by the board of directors of the underlying funds.
Investment Transactions and Related Income:
Changes in holdings of investments are accounted for no later than one business day following the trade date. For financial reporting purposes, however, investment transactions are accounted for on trade date on the last business day of the reporting period. Interest income is determined on the basis of coupon interest accrued using the effective interest method which adjusts, where applicable, the amortization of premiums or accretion of discount. Gains or losses realized on sales of securities are determined by comparing the identified cost of the security lot sold with the net sales proceeds
Securities Lending:
The Fund, through a securities lending agreement with Citibank, N.A. ("Citibank"), may lend its securities to qualified financial institutions, such as certain broker-dealers, to earn additional income, net of income retained by Citibank. Borrowers are required to secure their loans for collateral in the amount of at least 102% of the value of U.S. securities loaned or at least 105% of the value of non-U.S. securities loaned, marked-to-market daily. Any collateral shortfalls associated with increases in the valuation of the securities loaned are cured the next business day once the shortfall exceeds $100 thousand. Collateral may be cash, U.S. government securities, or other securities as permitted by Securities and
11
USAA Mutual Funds Trust | Notes to Financial Statements — continued November 30, 2020 | ||||||
(Unaudited)
Exchange Commission ("SEC") guidelines. Cash collateral may be invested in high-quality short-term investments, primarily open-end investment companies. Collateral requirements are determined daily based on the value of the Fund's securities on loan as of the end of the prior business day. During the time portfolio securities are on loan, the borrower will pay the Fund any dividends or interest paid on such securities plus any fee negotiated between the parties to the lending agreement. The Fund also earns a return from the collateral. The Fund pays Citibank various fees in connection with the investment of cash collateral and fees based on the investment income received from securities lending activities. Securities lending income (net of these fees) is disclosed on the Statement of Operations. Loans are terminable upon demand and the borrower must return the loaned securities within the lesser of one standard settlement period or five business days. Risks relating to securities-lending transactions include that the borrower may not provide additional collateral when required or return the securities when due, and that the value of the short-term investments will be less than the amount of cash collateral required to be returned to the borrower. The Fund's agreement with Citibank does not include master netting provisions. Noncash collateral received by the Fund may not be sold or re-pledged, except to satisfy borrower default. Cash collateral is listed on the Fund's Schedule of Portfolio Investments and Financial Statements while non-cash collateral is not included.
The following table (amounts in thousands) is a summary of the Fund's securities lending transactions as of November 30, 2020.
| Value of Securities on Loan | Non-Cash Collateral | Cash Collateral | |||||||||
| $ | 38,248 | $ | — | $ | 40,336 | ||||||
Federal Income Taxes:
It is the Fund's policy to continue to qualify as a regulated investment company by complying with the provisions available to certain investment companies, as defined in applicable sections of the Internal Revenue Code, and to make distributions of net investment income and net realized gains sufficient to relieve it from all, or substantially all, federal income taxes. Accordingly, no provision for federal income taxes is required in the financial statements. The Fund has a tax year end of May 31.
Management of the Fund has reviewed tax positions taken in tax years that remain subject to examination by all major tax jurisdictions, including federal (i.e., the last four tax years, which includes the current fiscal tax year end). Management believes that there is no tax liability resulting from unrecognized tax benefits related to uncertain tax positions taken.
Allocations:
Expenses directly attributable to the Fund are charged to the Fund, while expenses that are attributable to more than one fund in the Trust, or jointly with an affiliated trust, are allocated among the respective funds in the Trust and/or affiliated trust based upon net assets or another appropriate basis.
3. Purchases and Sales:
Cost of purchases and proceeds from sales/maturities of securities (excluding securities maturing less than one year from acquisition) for the six months ended November 30, 2020, were as follows for the Fund (amounts in thousands):
| Purchases (excluding U.S. Government Securities) | Sales (excluding U.S. Government Securities) | ||||||
| $ | 488,256 | $ | 421,393 | ||||
There were no purchases and sales of U.S. government securities during the year ended November 30, 2020.
12
USAA Mutual Funds Trust | Notes to Financial Statements — continued November 30, 2020 | ||||||
(Unaudited)
4. Fees and Transactions with Affiliates and Related Parties:
Investment Advisory Fees:
Investment advisory services are provided to the Fund by the Adviser, which is a New York corporation registered as an investment adviser with the SEC. The Adviser is a wholly-owned indirect subsidiary of Victory Capital Holdings, Inc., a publicly traded Delaware corporation, and a wholly-owned direct subsidiary of Victory Capital Operating, LLC. Under the terms of the Investment Advisory Agreement, the Adviser is entitled to receive fees accrued daily and paid monthly at an annualized rate of 0.60% of the Fund's average daily net assets. The Adviser has contractually agreed to waive its management fee from 0.60% to 0.44%. Amounts incurred and paid to VCM for the six months ended November 30, 2020, are reflected on the Statement of Operations as Investment Advisory fees.
The Trust relies on an exemptive order granted to VCM and its affiliated funds by the SEC in March 2019 permitting the use of a "manager-of-managers" structure for certain funds. Under a manager-of managers structure, the investment adviser may select (with approval of the Board and without shareholder approval) one or more subadvisers to manage the day-to-day investment of a fund's assets. For the six months ended November 30, 2020, the Fund had no subadvisers.
Administration and Servicing Fees:
VCM serves as the Fund's administrator and fund accountant. Under the Administration, Servicing and Accounting Agreement, VCM is paid for its services an annual fee at a rate of 0.05% of average daily net assets of the Fund. Amounts incurred for the six months ended November 30, 2020, are reflected on the Statement of Operations as Administration fees.
The Fund (as part of the Trust) has entered into an agreement to provide compliance services with the Adviser, pursuant to which the Adviser furnishes its compliance personnel, including the services of the Chief Compliance Officer ("CCO"), and other resources reasonably necessary to provide the Trust with compliance oversight services related to the design, administration and oversight of a compliance program for the Trust in accordance with Rule 38a-1 under the 1940 Act. The CCO is an employee of the Adviser, which pays the compensation of the CCO and support staff. Funds in the Trust, Victory Variable Insurance Funds, Victory Portfolios, and Victory Portfolios II (collectively, the "Victory Funds Complex") in the aggregate, compensate the Adviser for these services. Amounts incurred for the six months ended November 30, 2020, are reflected on the Statement of Operations as Compliance fees.
Citi Fund Services Ohio, Inc. ("Citi"), an affiliate of Citibank, acts as sub-administrator and sub-fund accountant to the Fund pursuant to a Sub-Administration and Sub-Fund Accounting Services Agreement between VCM and Citi. VCM pays Citi a fee for providing these services. The Trust reimburses VCM and Citi for out-of-pocket expenses incurred in providing these services and certain other expenses specifically allocated to the Fund. Amounts incurred for the six months ended November 30, 2020, are reflected on the Statement of Operations as Sub-Administration fees.
Transfer Agency Fees:
Victory Capital Transfer Agency, Inc. ("VCTA") provides transfer agency services to the Fund. VCTA, an affiliate of the Adviser, provides transfer agent services to the Fund based on an annual rate of 0.05% of average daily net assets plus out-of-pocket expenses. VCTA pays a portion of these fees to certain intermediaries for the administration and servicing of accounts that are held with such intermediaries. Amounts incurred and paid to VCTA for the six months ended November 30, 2020, are reflected on the Statement of Operations as Transfer Agent fees.
FIS Investor Services LLC serves as sub-transfer agent and dividend disbursing agent for the Fund pursuant to a Sub-Transfer Agent agreement between VCTA and FIS Investor Services LLC. VCTA provides FIS Investor Services LLC a fee for providing these services.
13
USAA Mutual Funds Trust | Notes to Financial Statements — continued November 30, 2020 | ||||||
(Unaudited)
Distributor/Underwriting Services:
Victory Capital Services, Inc. (the "Distributor"), an affiliate of the Adviser, serves as distributor for the continuous offering of the shares of the Fund pursuant to a Distribution Agreement between the Distributor and the Trust. Effective June 30, 2020, the Distributor's name was changed from Victory Capital Advisers, Inc. The Distributor received no fees or other compensation for such distribution services.
Other Fees:
Citibank serves as the Fund's custodian. The Fund pays Citibank a fee for providing these services. Amounts incurred for the six months ended November 30, 2020, are reflected on the Statement of Operations as Custodian fees.
K&L Gates LLP provides legal services to the Trust.
The Adviser has entered into an expense limitation agreement with the Fund until at least September 30, 2021. Under the terms of the agreement, the Adviser has agreed to waive fees or reimburse certain expenses to the extent that ordinary operating expenses incurred in any fiscal year exceed the expense limit for the Fund. Such excess amounts will be the liability of the Adviser. Interest, taxes, brokerage commissions, other expenditures, which are capitalized in accordance with GAAP, and other extraordinary expenses not incurred in the ordinary course of the Fund's business are excluded from the expense limits. As of November 30, 2020, the expense limit (excluding voluntary waivers) is 0.74%.
Under this expense limitation agreement, the Fund has agreed to repay fees and expenses that were waived or reimbursed by the Adviser for a period up to three years after the fiscal year in which the waiver or reimbursement took place, subject to the lesser of any operating expense limits in effect at the time of: (a) the original waiver or expense reimbursement; or (b) the recoupment, after giving effect to the recoupment amount.
As of November 30, 2020, there are no amounts available to be repaid to the Adviser.
The Adviser may voluntarily waive or reimburse additional fees to assist the Fund in maintaining competitive expense ratios. Voluntary waivers and reimbursements applicable to the Fund are not available to be recouped at a future time. There were no voluntary waivers or reimbursements for the six months ended November 30, 2020.
Certain officers and/or interested trustees of the Fund are also officers and/or employees of the Adviser, Administrator, Sub-Administrator, Sub-Fund Accountant, and Legal.
5. Risks:
The Fund may be subject to other risks in addition to these identified risks.
Geopolitical/Natural Disaster Risk — Global economies and financial markets are increasingly interconnected, which increases the possibilities that conditions in one country or region might adversely affect issuers in another country or region. Geopolitical and other risks, including war, terrorism, trade disputes, political or economic dysfunction within some nations, public health crises and related geopolitical events, as well as environmental disasters such as earthquakes, fires, and floods, may add to instability in world economies and markets generally. Changes in trade policies and international trade agreements could affect the economies of many countries in unpredictable ways. Likewise, systemic market dislocations of the kind that occurred during the financial crisis that began in 2008, if repeated, would be highly disruptive to economies and markets, adversely affecting individual companies and industries, securities markets, interest rates, credit ratings, inflation, investor sentiment, and other factors affecting the value of a Fund's investments. Some countries, including the United States, are adopting more protectionist trade policies and moving away from the tighter financial industry regulations that followed the 2008 financial crisis, which may also affect the value of a Fund's investments.
14
USAA Mutual Funds Trust | Notes to Financial Statements — continued November 30, 2020 | ||||||
(Unaudited)
Political events within the United States at times have resulted, and may in the future result, in a shutdown of government services, which could negatively affect the U.S. economy, decrease the value of a Fund's investments, increase uncertainty in or impair the operation of the U.S. or other securities markets and degrade investor and consumer confidence, perhaps suddenly and to a significant degree.
An outbreak of disease called COVID-19 has spread internationally. The transmission of COVID-19 and efforts to contain its spread have resulted in international, national and local border closings and other significant travel restrictions and disruptions, significant disruptions to business operations, supply chains and consumer activity, significant challenges in healthcare service preparation and delivery, quarantines and general concern and uncertainty. These negative impacts have caused significant volatility and declines in global financial markets, which have caused losses for Fund investors during and subsequent to period end. The impact of the COVID-19 pandemic last for an extended period of time, and could result in a substantial economic downturn or recession. Public health crises may exacerbate other pre-existing political, social, economic, market and financial risks. The extent of the impact to the financial performance of the Funds' investments will depend on future developments, including (i) the duration and spread of the outbreak, (ii) the restrictions and advisories, (iii) the effects on the financial markets, and (iv) the effects on the economy overall, all of which are highly uncertain and cannot be predicted.
Portfolio Reallocation Risk — The frequent changes in the allocation of the Fund's portfolio holdings may result in higher portfolio turnover. In purchasing and selling securities in order to reallocate the portfolio, the Fund will pay more brokerage commissions than it would without a reallocation policy. In addition, the Fund may have a higher proportion of capital gains and a potentially lower return than a fund that does not reallocate from time to time.
ETF Risk — ETFs, which generally are registered investment companies, incur their own management and other fees and expenses, such as trustees' fees, operating expenses, registration fees, and marketing expenses, a proportionate share of which will be borne indirectly by the Fund as a shareholder in an ETF. As a result, the Fund's investment in an ETF will cause the Fund to indirectly bear the fees and expenses of the ETF and, in turn, the Fund's performance may be lower than if the Fund were to invest directly in the underlying securities held by the ETF. For investments in affiliated ETFs, the Fund's management fee is reimbursed by the Adviser to the extent of the indirect management fee incurred through the Fund's investment in the affiliated ETFs. The Adviser may have conflicts of interest in allocating assets among affiliated and unaffiliated ETFs, because the Adviser also manages and administers the affiliated ETFs, and the Adviser and its affiliates receive other fees from the affiliated ETFs. In addition, the Fund also will be subject to the risks associated with the securities or other investments held by the ETFs.
Stock Market Risk — Overall stock market risks may affect the value of the Fund. Domestic and international factors such as political events, war, trade disputes, interest rate levels and other fiscal and monetary policy changes, pandemics and other public health crises, and related geopolitical events, as well as environmental disasters such as earthquakes, fires, and floods, may add to instability in world economies and markets generally. The impact of these and other factors may be short-term or may last for extended periods.
6. Borrowing and Interfund Lending:
Line of Credit:
For the six months ended November 30, 2020, the Victory Funds Complex participated in a short-term demand note "Line of Credit" agreement with Citibank. The Line of Credit agreement with Citibank was renewed on June 29, 2020 with a termination date of June 28, 2021. Under the agreement with Citibank, the Victory Funds Complex may borrow up to $600 million, of which $300 million is committed and $300 million is uncommitted. $40 million of the Line of Credit is reserved for use by the Victory Floating Rate Fund, another series of the Victory Funds Complex, with Victory Floating Rate Fund paying the related commitment fees for that amount. The purpose of the agreement is to meet temporary or emergency cash needs. For the six months ended November 30, 2020, Citibank received an annual commitment fee of 0.15% on $300 million for providing the Line of Credit. Each fund in the Victory
15
USAA Mutual Funds Trust | Notes to Financial Statements — continued November 30, 2020 | ||||||
(Unaudited)
Funds Complex pays a pro-rata portion of the commitment fees plus any interest (one month LIBOR plus one percent) on amounts borrowed. Effective June 29, 2020, under an amended Line of Credit agreement, Citibank will also receive an annual upfront fee of 0.10% on the $300 million committed line of credit. Each fund in the Victory Funds Complex will pay a pro-rata portion of the upfront fee. Interest charged to each Fund during the period, if applicable, is reflected on the Statements of Operations under Line of credit fees.
The Fund had no borrowings under the Line of Credit agreement during the six months ended November 30, 2020.
Interfund Lending:
The Trust and Adviser rely on an exemptive order granted by the SEC in March 2017 (the "Order"), permitting the establishment and operation of an Interfund Lending Facility (the "Facility"). The Facility allows the Fund to directly lend and borrow money to or from any other Fund, that is permitted to participate in the Facility, in the Victory Funds Complex relying upon the Order at rates beneficial to both the borrowing and lending funds. Advances under the Facility are allowed for temporary or emergency purposes. The interfund loan rate is determined, as specified in the Order, by averaging the current repurchase agreement rate and the current bank loan rate. As a Borrower, interest charged to the Fund, if any, during the period is reflected on the Statement of Operations under Interfund lending fees. As a Lender, interest earned by the Fund, if any, during the period is reflected on the Statement of Operations under Income on Interfund lending.
The Fund did not utilize or participate in the Facility during the six months ended November 30, 2020.
7. Federal Income Tax Information:
The Fund intends to declare daily and distribute any net investment income annually. Distributable net realized gains, if any, are declared and paid at least annually.
The amounts of dividends from net investment income and distributions from net realized gains (collectively distributions to shareholders) are determined in accordance with federal income tax regulations, which may differ from GAAP. To the extent these "book/tax" differences are permanent in nature (e.g., net operating loss and distribution reclassification), such amounts are reclassified within the components of net assets based on their federal tax-basis treatment; temporary differences (e.g., wash sales) do not require reclassification. To the extent dividends and distributions exceed net investment income and net realized gains for tax purposes, they are reported as distributions of capital. Net investment losses incurred by the Fund may be reclassified as an offset to capital on the accompanying Statement of Assets and Liabilities.
The tax character of current year distributions paid and the tax basis of the current components of accumulated earnings (deficit) will be determined at the end of the current tax year ending May 31, 2021.
At May 31, 2020, the Fund had net capital loss carryforwards as shown in the table below (amounts in thousands).
| Short-Term Amount | Long-Term Amount | Total | |||||||||
| $ | 39,025 | $ | 13,188 | $ | 52,213 | ||||||
16
USAA Mutual Funds Trust | Supplemental Information November 30, 2020 | ||||||
(Unaudited)
Proxy Voting and Portfolio Holdings Information
Proxy Voting:
Information regarding the policies and procedures the Fund uses to determine how to vote proxies relating to portfolio securities is available without charge, upon request, by calling (800) 539-3863. The information is also included in the Fund's Statement of Additional Information, which is available on the SEC's website at www.sec.gov.
Information relating to how the Fund voted proxies relating to portfolio securities held during the most recent 12 months ended June 30 is available on the SEC's website at www.sec.gov.
Availability of Schedules of Portfolio Investments:
The Trust files a complete list of Schedules of Portfolio Investments with the SEC for the first and third quarter of each fiscal year on Form N-PORT. Form N-PORT is available on the SEC's website at www.sec.gov.
Expense Example
As a shareholder of the Fund, you may incur two types of costs: (1) transaction costs, and (2) ongoing costs, including management fees and other Fund expenses. These examples are intended to help you understand your ongoing costs (in dollars) of investing in the Fund and to compare these costs with the ongoing costs of investing in other mutual funds.
These examples are based on an investment of $1,000 invested at the beginning of the period and held for the entire period from June 1, 2020 through November 30, 2020.
The Actual Expense figures in the table below provide information about actual account values and actual expenses. You may use the information below, together with the amount you invested, to estimate the expenses that you paid over the period. Simply divide your account value by $1,000 (for example, an $8,600 account value divided by $1,000 = 8.6), then multiply the result by the number in the table under the heading entitled "Actual Expenses Paid During Period" to estimate the expenses you paid on your account during this period.
The Hypothetical Expense figures in the table below provide information about hypothetical account values and hypothetical expenses based on the Fund's actual expense ratio and an assumed rate of return of 5% per year before expenses, which is not the Fund's actual return. The hypothetical account values and expenses may not be used to estimate the actual ending account balance or expenses you paid for the period. You may use this information to compare this 5% hypothetical example with the 5% hypothetical examples that appear in shareholder reports of other funds.
Please note the expenses shown in the table below are meant to highlight your ongoing costs only and do not reflect any transactional costs. If these transactional costs were included, your costs would have been higher.
| Beginning Account Value 6/1/20 | Actual Ending Account Value 11/30/20 | Hypothetical Ending Account Value 11/30/20 | Actual Expenses Paid During Period 6/1/20- 11/30/20* | Hypothetical Expenses Paid During Period 6/1/20- 11/30/20* | Annualized Expense Ratio During Period 6/1/20- 11/30/20 | ||||||||||||||||||||||
$ | 1,000.00 | $ | 1,112.70 | $ | 1,022.11 | $ | 3.12 | $ | 2.99 | 0.59 | % | ||||||||||||||||
* Expenses are equal to the average account value multiplied by the Fund's annualized expense ratio multiplied by 183/365 (the number of days in the most recent fiscal half-year divided by the number of days in the fiscal year).
17
Privacy Policy
Protecting the Privacy of Information
The Trust respects your right to privacy. We also know that you expect us to conduct and process your business in an accurate and efficient manner. To do so, we must collect and maintain certain personal information about you. This is the information we collect from you on applications or other forms, and from the transactions you make with us or third parties. It may include your name, address, social security number, account transactions and balances, and information about investment goals and risk tolerance.
We do not disclose any information about you or about former customers to anyone except as permitted or required by law. Specifically, we may disclose the information we collect to companies that perform services on our behalf, such as the transfer agent that processes shareholder accounts and printers and mailers that assist us in the distribution of investor materials. We may also disclose this information to companies that perform marketing services on our behalf. This allows us to continue to offer you Victory investment products and services that meet your investing needs, and to effect transactions that you request or authorize. These companies will use this information only in connection with the services for which we hired them. They are not permitted to use or share this information for any other purpose.
To protect your personal information internally, we permit access only by authorized employees and maintain physical, electronic and procedural safeguards to guard your personal information.*
* You may have received communications regarding information about privacy policies from other financial institutions which gave you the opportunity to "opt-out" of certain information sharing with companies which are not affiliated with that financial institution. The Trust does not share information with other companies for purposes of marketing solicitations for products other than the Trust. Therefore, the Trust does not provide opt-out options to their shareholders.
P.O. Box 182593
Columbus, Ohio 43218-2593

Visit our website at: | Call | ||||||
vcm.com | (800) 235-8396 | ||||||
93924-0121

NOVEMBER 30, 2020
Semi Annual Report
USAA Precious Metals and Minerals Fund
Beginning January 1, 2021, as permitted by regulations adopted by the Securities and Exchange Commission, paper copies of the Fund's shareholder reports may no longer be sent by mail, unless you specifically request paper copies of the reports from the Fund or from your financial intermediary, such as a broker-dealer or bank. Instead, the reports will be made available on VictoryFunds.com, and you will be notified by mail each time a report is posted and provided with a website link to access the report. If you already elected to receive shareholder reports electronically, you will not be affected by this change and you need not take any action.
You may elect to receive shareholder reports and other communications from the Fund or your financial intermediary electronically by notifying your financial intermediary directly, or if you are a shareholder who has an account directly with the Fund, by calling (800) 235-8396 or by submitting your request via email to TA.Processing@FISGlobal.com.
You may elect to receive all future reports in paper free of charge. You can inform the Fund or your financial intermediary that you wish to continue receiving paper copies of your shareholder reports by notifying your financial intermediary directly, or if you are a shareholder who has an account directly with the Fund, by calling (800) 235-8396 or by submitting your request via email to TA.Processing@FISGlobal.com.
Your election to receive reports in paper will apply to all funds held with the USAA Mutual Funds or your financial intermediary.
Victory Capital means Victory Capital Management Inc., the investment adviser of the USAA Mutual Funds. USAA Mutual Funds are distributed by Victory Capital Services, Inc., member of FINRA, an affiliate of Victory Capital. Victory Capital and its affiliates are not affiliated with United Services Automobile Association or its affiliates. USAA and the USAA logo are registered trademarks and the USAA Mutual Funds and USAA Investments logos are trademarks of United Services Automobile Association and are being used by Victory Capital and its affiliates under license.
USAA Mutual Funds Trust
TABLE OF CONTENTS
Investment Objective & Portfolio Holdings | 2 | ||||||
Schedule of Portfolio Investments | 4 | ||||||
Financial Statements | |||||||
Statement of Assets and Liabilities | 6 | ||||||
Statement of Operations | 7 | ||||||
Statements of Changes in Net Assets | 8 | ||||||
Financial Highlights | 10 | ||||||
Notes to Financial Statements | 12 | ||||||
Supplemental Information | 22 | ||||||
Proxy Voting and Portfolio Holdings Information | 22 | ||||||
Expense Examples | 22 | ||||||
Privacy Policy (inside back cover) | |||||||
This report is for the information of the shareholders and others who have received a copy of the currently effective prospectus of the Fund, managed by Victory Capital Management Inc. It may be used as sales literature only when preceded or accompanied by a current prospectus, which provides further details about the Fund.
IRA DISTRIBUTION WITHHOLDING DISCLOSURE
We generally must withhold federal income tax at a rate of 10% of the taxable portion of your distribution and, if you live in a state that requires state income tax withholding, at your state's tax rate. However, you may elect not to have withholding apply or to have income tax withheld at a higher rate. Any withholding election that you make will apply to any subsequent distribution unless and until you change or revoke the election. If you wish to make a withholding election, or change or revoke a prior withholding election, call (800) 235-8396, and form W-4P (OMB No. 1545-0074 withholding certificate for pension or annuity payments) will be electronically sent.
If you do not have a withholding election in place by the date of a distribution, federal income tax will be withheld from the taxable portion of your distribution at a rate of 10%. If you must pay estimated taxes, you may be subject to estimated tax penalties if your estimated tax payments are not sufficient and sufficient tax is not withheld from your distribution.
For more specific information, please consult your tax adviser.
1
| USAA Mutual Funds Trust USAA Precious Metals and Minerals Fund | November 30, 2020 | ||||||
(Unaudited)
Investment Objective & Portfolio Holdings:
The Fund's investment objective is to seek long-term capital appreciation and to protect the purchasing power of shareholders' capital against inflation.
Top 10 Equity Holdings*:
November 30, 2020
(% of Net Assets)
Newmont Corp. | 11.3 | % | |||||
Barrick Gold Corp. | 9.8 | % | |||||
Kinross Gold Corp. | 5.1 | % | |||||
Franco-Nevada Corp. | 4.8 | % | |||||
B2Gold Corp. | 4.4 | % | |||||
Newcrest Mining Ltd. | 3.9 | % | |||||
Kirkland Lake Gold Ltd. | 3.7 | % | |||||
Sibanye Stillwater Ltd. | 3.7 | % | |||||
Agnico Eagle Mines Ltd. | 3.0 | % | |||||
Zijin Mining Group Co. Ltd. Class H | 3.0 | % | |||||
* Does not include short-term investments purchased with cash collateral from securities loaned.
Refer to the Schedule of Portfolio Investments for a complete list of securities.
2
| USAA Mutual Funds Trust USAA Precious Metals and Minerals Fund (continued) | November 30, 2020 | ||||||
(Unaudited)
Porfolio Composition*:
November 30, 2020
(% of Net Assets)
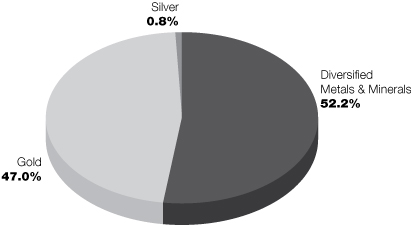
* Does not include short-term investments purchased with cash collateral from securities loaned.
Percentages are of the net assets of the Fund and may not equal 100%.
Refer to the Schedule of Portfolio Investments for a complete list of securities.
3
| USAA Mutual Funds Trust USAA Precious Metals and Minerals Fund | Schedule of Portfolio Investments November 30, 2020 | ||||||
(Amounts in Thousands, Except for Shares) (Unaudited)
Security Description | Shares | Value | |||||||||
Common Stocks (99.9%) | |||||||||||
Metals & Mining (99.9%): | |||||||||||
Agnico Eagle Mines Ltd. | 323,589 | $ | 21,315 | ||||||||
Alamos Gold, Inc. | 982,100 | 8,131 | |||||||||
AngloGold Ashanti Ltd. | 760,198 | 16,028 | |||||||||
Argonaut Gold, Inc. (a) | 655,200 | 1,171 | |||||||||
B2Gold Corp. | 5,459,170 | 30,438 | |||||||||
Barrick Gold Corp. (b) | 2,970,409 | 68,735 | |||||||||
Centamin PLC | 4,216,310 | 6,462 | |||||||||
Centerra Gold, Inc. | 2,011,602 | 19,643 | |||||||||
Cia de Minas Buenaventura SAA, ADR (a) | 68,157 | 756 | |||||||||
Coeur Mining, Inc. (a) | 333,807 | 2,367 | |||||||||
Dundee Precious Metals, Inc. | 1,781,264 | 11,660 | |||||||||
Eldorado Gold Corp. (a) | 448,099 | 5,287 | |||||||||
Endeavour Mining Corp. (a) | 544,418 | 12,842 | |||||||||
Equinox Gold Corp. (a) | 68,782 | 680 | |||||||||
Evolution Mining Ltd. | 4,178,674 | 15,242 | |||||||||
Franco-Nevada Corp. | 249,553 | 33,223 | |||||||||
Gold Fields Ltd., ADR | 1,764,209 | 15,366 | |||||||||
Gold Resource Corp. | 202,002 | 602 | |||||||||
Gold Road Resources Ltd. (a) | 313,388 | 275 | |||||||||
Golden Star Resources Ltd. (a) (b) | 464,607 | 1,789 | |||||||||
Great Basin Gold Ltd. (a) (c) (d) | 8,566,400 | — | |||||||||
Great Basin Gold Ltd. (a) (c) (d) | 6,500,000 | — | |||||||||
Harmony Gold Mining Co. Ltd. (a) | 1,463,504 | 5,982 | |||||||||
IAMGOLD Corp. (a) | 1,265,194 | 4,264 | |||||||||
IAMGOLD Corp. (a) | 411,532 | 1,391 | |||||||||
Kinross Gold Corp. | 4,946,760 | 35,320 | |||||||||
Kirkland Lake Gold Ltd. | 639,234 | 26,194 | |||||||||
Koza Altin Isletmeleri A/S (a) (b) | 298,319 | 2,844 | |||||||||
Lundin Gold, Inc. (a) | 78,200 | 692 | |||||||||
McEwen Mining, Inc. (a) (b) | 494,100 | 484 | |||||||||
Nautilus Minerals, Inc. (a) (c) (d) | 5,757,622 | — | |||||||||
New Gold, Inc. (a) | 1,183,000 | 2,177 | |||||||||
Newcrest Mining Ltd. | 1,388,921 | 27,451 | |||||||||
Newmont Corp. | 1,347,656 | 79,269 | |||||||||
Northern Star Mining Corp. (a) (c) (d) | 375,000 | — | |||||||||
Northern Star Resources Ltd. | 1,226,203 | 11,348 | |||||||||
Novagold Resources, Inc. (a) | 421,400 | 4,219 | |||||||||
OceanaGold Corp. (a) | 3,283,648 | 4,097 | |||||||||
Osisko Gold Royalties Ltd. | 303,400 | 3,297 | |||||||||
Perseus Mining Ltd. (a) | 5,838,238 | 4,901 | |||||||||
Polymetal International PLC | 704,177 | 14,661 | |||||||||
Polyus PJSC (f) | 62,088 | 11,821 | |||||||||
Premier Gold Mines Ltd. (a) (b) | 493,500 | 969 | |||||||||
Pretium Resources, Inc. (a) | 431,655 | 4,740 | |||||||||
Ramelius Resources Ltd. | 5,473,285 | 6,768 | |||||||||
Regis Resources Ltd. | 2,733,555 | 7,403 | |||||||||
Resolute Mining Ltd. (a) | 490,758 | 274 | |||||||||
Royal Gold, Inc. | 165,192 | 18,249 | |||||||||
See notes to financial statements.
4
| USAA Mutual Funds Trust USAA Precious Metals and Minerals Fund | Schedule of Portfolio Investments — continued November 30, 2020 | ||||||
(Amounts in Thousands, Except for Shares) (Unaudited)
Security Description | Shares | Value | |||||||||
Sandstorm Gold Ltd. (a) | 1,079,600 | $ | 7,865 | ||||||||
Seabridge Gold, Inc. (a) | 95,100 | 1,771 | |||||||||
Shandong Gold Mining Co. Ltd. Class H (b) (e) | 1,656,200 | 3,744 | |||||||||
Sibanye Stillwater Ltd. | 7,711,914 | 25,659 | |||||||||
Silver Lake Resources Ltd. (a) | 4,268,850 | 5,545 | |||||||||
SSR Mining, Inc. (a) | 803,122 | 14,785 | |||||||||
St Barbara Ltd. | 3,096,281 | 5,567 | |||||||||
Torex Gold Resources, Inc. (a) | 976,108 | 13,471 | |||||||||
Wesdome Gold Mines Ltd. (a) | 578,000 | 5,074 | |||||||||
Wheaton Precious Metals Corp. | 472,665 | 18,248 | |||||||||
Yamana Gold, Inc. | 3,023,400 | 15,782 | |||||||||
Yamana Gold, Inc. | 1,190,747 | 6,217 | |||||||||
Zhaojin Mining Industry Co. Ltd. Class H | 2,609,000 | 3,353 | |||||||||
Zijin Mining Group Co. Ltd. Class H | 21,124,000 | 21,067 | |||||||||
Total Common Stocks (Cost $466,913) | 698,975 | ||||||||||
Collateral for Securities Loaned^ (1.0%) | |||||||||||
| Goldman Sachs Financial Square Government Fund Institutional Shares, 0.02% (g) | 2,737,447 | 2,738 | |||||||||
HSBC U.S. Government Money Market Fund I Shares, 0.03% (g) | 4,025,230 | 4,025 | |||||||||
Total Collateral for Securities Loaned (Cost $6,763) | 6,763 | ||||||||||
Total Investments (Cost $473,676) — 100.9% | 705,738 | ||||||||||
Liabilities in excess of other assets — (0.9)% | (6,319 | ) | |||||||||
NET ASSETS — 100.00% | $ | 699,419 | |||||||||
At November 30, 2020 the Fund's investments in foreign securities were 77.5% of net assets.
^ Purchased with cash collateral from securities on loan.
(a) Non-income producing security.
(b) All or a portion of this security is on loan.
(c) The Fund's Adviser has deemed this security to be illiquid based upon procedures approved by the Board of Trustees. As of November 30, 2020, illiquid securities were less than 0.05% of the Fund's net assets.
(d) Security was fair valued based upon procedures approved by the Board of Trustees and represents less than 0.05% of the Fund's net assets as of November 30, 2020. This security is classified as Level 3 within the fair value hierarchy. (See Note 2)
(e) Rule 144A security or other security that is restricted as to resale to institutional investors. The Fund's Adviser has deemed this security to be liquid based upon procedures approved by the Board of Trustees. As of November 30, 2020, the fair value of these securities was $3,744 (thousands) and amounted to 0.5% of net assets.
(f) Security was fair valued based upon procedures approved by the Board of Trustees and represents 1.7% of the Fund's net assets as of November 30, 2020. (See Note 2)
(g) Rate disclosed is the daily yield on November 30, 2020.
ADR — American Depositary Receipt
PLC — Public Limited Company
See notes to financial statements.
5
USAA Mutual Funds Trust | Statement of Assets and Liabilities November 30, 2020 | ||||||
(Amounts in Thousands, Except Per Share Amounts) (Unaudited)
| USAA Precious Metals and Minerals Fund | |||||||
Investments, at value (Cost $473,676) | $ | 705,738 | (a) | ||||
Foreign currency, at value (Cost $901) | 901 | ||||||
Cash and cash equivalents | 1,155 | ||||||
Receivables: | |||||||
Interest and dividends | 584 | ||||||
Capital shares issued | 347 | ||||||
Reclaims | 7 | ||||||
From Adviser | 5 | ||||||
Prepaid expenses | 34 | ||||||
Total Assets | 708,771 | ||||||
Liabilities: | |||||||
Payables: | |||||||
Collateral received on loaned securities | 6,763 | ||||||
Capital shares redeemed | 1,038 | ||||||
Accrued foreign capital gains taxes | 877 | ||||||
Accrued expenses and other payables: | |||||||
Investment advisory fees | 440 | ||||||
Administration fees | 91 | ||||||
Custodian fees | 9 | ||||||
Transfer agent fees | 89 | ||||||
Compliance fees | — | (b) | |||||
| 12b-1 fees | 3 | ||||||
Other accrued expenses | 42 | ||||||
Total Liabilities | 9,352 | ||||||
Net Assets: | |||||||
Capital | 1,276,346 | ||||||
Total accumulated earnings/(loss) | (576,927 | ) | |||||
Net Assets | $ | 699,419 | |||||
Net Assets | |||||||
Fund Shares | $ | 648,626 | |||||
Institutional Shares | 23,467 | ||||||
Class A shares | 27,326 | ||||||
Total | $ | 699,419 | |||||
Shares (unlimited number of shares authorized with no par value): | |||||||
Fund Shares | 32,593 | ||||||
Institutional Shares | 1,154 | ||||||
Class A shares | 1,390 | ||||||
Total | 35,137 | ||||||
Net asset value, offering and redemption price per share: (c) | |||||||
Fund Shares | $ | 19.90 | |||||
Institutional Shares | $ | 20.34 | |||||
Class A shares | $ | 19.66 | |||||
Maximum Sales Charge — Class A shares | 5.75 | % | |||||
Maximum offering price | |||||||
| (100%/(100%-maximum sales charge) of net asset value adjusted to the nearest cent) per share — Class A shares | $ | 20.86 | |||||
(a) Includes $3,809 of securities on loan.
(b) Rounds to less than $1 thousand.
(c) Per share amount may not recalculate due to rounding of net assets and/or shares outstanding.
See notes to financial statements.
6
USAA Mutual Funds Trust | Statement of Operations For the Six Months Ended November 30, 2020 | ||||||
(Amounts in Thousands) (Unaudited)
| USAA Precious Metals and Minerals Fund | |||||||
Investment Income: | |||||||
Dividends | $ | 5,991 | |||||
Interest | — | (a) | |||||
Securities lending (net of fees) | 41 | ||||||
Foreign tax withholding | (847 | ) | |||||
Total Income | 5,185 | ||||||
Expenses: | |||||||
Investment advisory fees | 2,905 | ||||||
Administration fees — Fund Shares | 552 | ||||||
Administration fees — Institutional Shares | 13 | ||||||
Administration fees — Class A shares | 24 | ||||||
Sub-Administration fees | 11 | ||||||
12b-1 fees — Class A shares | 39 | ||||||
Custodian fees | 49 | ||||||
Transfer agent fees — Fund Shares | 645 | ||||||
Transfer agent fees — Institutional Shares | 13 | ||||||
Transfer agent fees — Class A shares | 14 | ||||||
Trustees' fees | 26 | ||||||
Compliance fees | 3 | ||||||
Legal and audit fees | 46 | ||||||
State registration and filing fees | 38 | ||||||
Interfund lending fees | — | (a) | |||||
Other expenses | 53 | ||||||
Total Expenses | 4,431 | ||||||
Expenses waived/reimbursed by Adviser | (11 | ) | |||||
Net Expenses | 4,420 | ||||||
Net Investment Income (Loss) | 765 | ||||||
Realized/Unrealized Gains (Losses) from Investments: | |||||||
| Net realized gains (losses) from investment securities and foreign currency translations | 20,262 | ||||||
| Net change in unrealized appreciation/depreciation on investment securities and foreign currency translations | 1,524 | ||||||
Net realized/unrealized gains (losses) on investments | 21,786 | ||||||
Change in net assets resulting from operations | $ | 22,551 | |||||
(a) Rounds to less than $1 thousand.
See notes to financial statements.
7
USAA Mutual Funds Trust | Statements of Changes in Net Assets | ||||||
(Amounts in Thousands)
| USAA Precious Metals and Minerals Fund | |||||||||||
| Six Months Ended November 30, 2020 (unaudited) | Year Ended May 31, 2020 | ||||||||||
From Investments: | |||||||||||
Operations: | |||||||||||
Net investment income (loss) | $ | 765 | $ | (1,522 | ) | ||||||
Net realized gains (losses) from investments | 20,262 | (113,742 | ) | ||||||||
| Net change in unrealized appreciation/depreciation on investments | 1,524 | 395,654 | |||||||||
Change in net assets resulting from operations | 22,551 | 280,390 | |||||||||
Change in net assets resulting from capital transactions | (34,410 | ) | (76,391 | ) | |||||||
Change in net assets | (11,859 | ) | 203,999 | ||||||||
Net Assets: | |||||||||||
Beginning of period | 711,278 | 507,279 | |||||||||
End of period | $ | 699,419 | $ | 711,278 | |||||||
Capital Transactions: | |||||||||||
Fund Shares | |||||||||||
Proceeds from shares issued | $ | 61,803 | $ | 95,260 | |||||||
Cost of shares redeemed | (95,265 | ) | (164,383 | ) | |||||||
Total Fund Shares | $ | (33,462 | ) | $ | (69,123 | ) | |||||
Institutional Shares | |||||||||||
Proceeds from shares issued | $ | 3,890 | $ | 1,928 | |||||||
Cost of shares redeemed | (2,664 | ) | (9,661 | ) | |||||||
Total Institutional Shares | $ | 1,226 | $ | (7,733 | ) | ||||||
Class A shares | |||||||||||
Proceeds from shares issued | $ | 34,602 | $ | 14,218 | |||||||
Cost of shares redeemed | (36,776 | ) | (13,753 | ) | |||||||
Total Class A shares | $ | (2,174 | ) | $ | 465 | ||||||
Change in net assets resulting from capital transactions | $ | (34,410 | ) | $ | (76,391 | ) | |||||
Share Transactions: | |||||||||||
Fund Shares | |||||||||||
Issued | 2,770 | 6,001 | |||||||||
Redeemed | (4,336 | ) | (10,335 | ) | |||||||
Total Fund Shares | (1,566 | ) | (4,334 | ) | |||||||
Institutional Shares | |||||||||||
Issued | 167 | 119 | |||||||||
Redeemed | (119 | ) | (733 | ) | |||||||
Total Institutional Shares | 48 | (614 | ) | ||||||||
Class A shares | |||||||||||
Issued | 1,711 | 895 | |||||||||
Redeemed | (1,819 | ) | (871 | ) | |||||||
Total Class A shares | (108 | ) | 24 | ||||||||
Change in Shares | (1,626 | ) | (4,924 | ) | |||||||
See notes to financial statements.
8
This page is intentionally left blank.
9
USAA Mutual Funds Trust | Financial Highlights | ||||||
For a Share Outstanding Throughout Each Period
Investment Activities | Distributions to Shareholders From | ||||||||||||||||||||||||||
| Net Asset Value, Beginning of Period | Net Investment Income (Loss) | Net Realized and Unrealized Gains (Losses) on Investments | Total from Investment Activities | Net Investment Income | Total Distributions | ||||||||||||||||||||||
USAA Precious Metals and Minerals Fund | |||||||||||||||||||||||||||
Fund Shares | |||||||||||||||||||||||||||
| Six Months Ended November 30, 2020 (unaudited) | $ | 19.34 | 0.02 | (d) | 0.54 | 0.56 | — | — | |||||||||||||||||||
Year Ended May 31, 2020 | $ | 12.16 | (0.04 | )(d) | 7.22 | 7.18 | — | — | |||||||||||||||||||
Year Ended May 31, 2019 | $ | 12.87 | (0.03 | )(d) | (0.68 | ) | (0.71 | ) | — | — | |||||||||||||||||
Year Ended May 31, 2018 | $ | 12.93 | (0.05 | )(d) | (0.01 | ) | (0.06 | ) | — | — | |||||||||||||||||
Year Ended May 31, 2017 | $ | 13.90 | 0.14 | (0.60 | ) | (0.46 | ) | (0.51 | ) | (0.51 | ) | ||||||||||||||||
Year Ended May 31, 2016 | $ | 12.29 | 0.08 | 1.53 | (f) | 1.61 | — | — | |||||||||||||||||||
Institutional Shares | |||||||||||||||||||||||||||
| Six Months Ended November 30, 2020 (unaudited) | $ | 19.76 | 0.03 | (d) | 0.55 | 0.58 | — | — | |||||||||||||||||||
Year Ended May 31, 2020 | $ | 12.40 | (0.01 | )(d) | 7.37 | 7.36 | — | — | |||||||||||||||||||
Year Ended May 31, 2019 | $ | 13.06 | 0.01 | (d) | (0.67 | ) | (0.66 | ) | — | — | |||||||||||||||||
Year Ended May 31, 2018 | $ | 13.07 | (0.01 | )(d) | — | (h) | (0.01 | ) | — | — | |||||||||||||||||
Year Ended May 31, 2017 | $ | 13.98 | 0.07 | (d) | (0.47 | ) | (0.40 | ) | (0.51 | ) | (0.51 | ) | |||||||||||||||
Year Ended May 31, 2016 | $ | 12.34 | 0.01 | (d) | 1.63 | (f) | 1.64 | — | — | ||||||||||||||||||
Class A shares | |||||||||||||||||||||||||||
| Six Months Ended November 30, 2020 (unaudited) | $ | 19.13 | — | (d)(h) | 0.53 | 0.53 | — | — | |||||||||||||||||||
Year Ended May 31, 2020 | $ | 12.04 | (0.05 | )(d) | 7.14 | 7.09 | — | — | |||||||||||||||||||
Year Ended May 31, 2019 | $ | 12.74 | (0.03 | )(d) | (0.67 | ) | (0.70 | ) | — | — | |||||||||||||||||
Year Ended May 31, 2018 | $ | 12.82 | 0.16 | (0.24 | ) | (0.08 | ) | — | — | ||||||||||||||||||
Year Ended May 31, 2017 | $ | 13.79 | 0.04 | (0.50 | ) | (0.46 | ) | (0.51 | ) | (0.51 | ) | ||||||||||||||||
Year Ended May 31, 2016 | $ | 12.20 | (0.04 | )(d) | 1.63 | (f) | 1.59 | — | — | ||||||||||||||||||
* Assumes reinvestment of all net investment income and realized capital gain distributions, if any, during the period. Includes adjustments in accordance with U.S. generally accepted accounting principles and could differ from the Lipper reported return.
^ The net expense ratio may not correlate to the applicable expense limits in place during the period since the current contractual expense limitation is applied for a two year period beginning July 1, 2019 and in effect through September 30, 2021, instead of coinciding with the Fund's fiscal year end. Details of the current contractual expense limitation in effect can be found in Note 5 of the accompanying Notes to Financial Statements.
(a) Not annualized for periods less than one year.
(b) Annualized for periods less than one year.
(c) Portfolio turnover is calculated on the basis of the Fund as a whole without distinguishing between the classes of shares issued.
(d) Per share net investment income (loss) has been calculated using the average daily shares method.
(e) Reflects increased trading activity due to current year transition or asset allocation shift.
See notes to financial statements.
10
USAA Mutual Funds Trust | Financial Highlights — continued | ||||||
For a Share Outstanding Throughout Each Period
Ratios to Average Net Assets | Supplemental Data | ||||||||||||||||||||||||||||||||||
| Redemption Fees Added to Beneficial Interests | Net Asset Value, End of Period | Total Return (Excludes Sales Charges)*(a) | Net Expenses^(b) | Net Investment Income (Loss)(b) | Gross Expenses(b) | Net Assets, End of Period (000's) | Portfolio Turnover(a)(c) | ||||||||||||||||||||||||||||
USAA Precious Metals and Minerals Fund | |||||||||||||||||||||||||||||||||||
Fund Shares | |||||||||||||||||||||||||||||||||||
| Six Months Ended November 30, 2020 (unaudited) | — | $ | 19.90 | 2.84 | % | 1.11 | % | 0.20 | % | 1.11 | % | $ | 648,626 | 3 | % | ||||||||||||||||||||
Year Ended May 31, 2020 | — | $ | 19.34 | 59.13 | % | 1.19 | % | (0.25 | )% | 1.19 | % | $ | 660,770 | 47 | %(e) | ||||||||||||||||||||
Year Ended May 31, 2019 | — | $ | 12.16 | (5.52 | )% | 1.31 | % | (0.22 | )% | 1.31 | % | $ | 468,208 | 7 | % | ||||||||||||||||||||
Year Ended May 31, 2018 | — | $ | 12.87 | (0.46 | )% | 1.23 | % | (0.36 | )% | 1.23 | % | $ | 540,952 | 13 | % | ||||||||||||||||||||
Year Ended May 31, 2017 | — | $ | 12.93 | (2.68 | )% | 1.22 | % | 0.02 | % | 1.22 | % | $ | 585,515 | 14 | % | ||||||||||||||||||||
Year Ended May 31, 2016 | — | $ | 13.90 | 13.10 | %(f) | 1.33 | % | (0.31 | )% | 1.33 | % | $ | 647,140 | 17 | % | ||||||||||||||||||||
Institutional Shares | |||||||||||||||||||||||||||||||||||
| Six Months Ended November 30, 2020 (unaudited) | — | $ | 20.34 | 2.94 | % | 0.99 | % | 0.30 | % | 1.05 | % | $ | 23,467 | 3 | % | ||||||||||||||||||||
Year Ended May 31, 2020 | — | $ | 19.76 | 59.35 | % | 1.00 | % | (0.05 | )% | 1.06 | % | $ | 21,855 | 47 | %(e) | ||||||||||||||||||||
Year Ended May 31, 2019 | — | $ | 12.40 | (5.05 | )% | 1.00 | %(g) | 0.12 | % | 1.19 | % | $ | 21,327 | 7 | % | ||||||||||||||||||||
Year Ended May 31, 2018 | — | $ | 13.06 | (0.08 | )% | 0.89 | % | (0.07 | )% | 0.89 | % | $ | 3,632 | 13 | % | ||||||||||||||||||||
Year Ended May 31, 2017 | — | $ | 13.07 | (2.23 | )% | 0.76 | % | 0.46 | % | 0.76 | % | $ | 2,893 | 14 | % | ||||||||||||||||||||
Year Ended May 31, 2016 | — | $ | 13.98 | 13.29 | %(f) | 0.99 | % | 0.13 | % | 0.99 | % | $ | 14,050 | 17 | % | ||||||||||||||||||||
Class A shares | |||||||||||||||||||||||||||||||||||
| Six Months Ended November 30, 2020 (unaudited) | — | $ | 19.66 | 2.77 | % | 1.32 | % | (0.02 | )% | 1.33 | % | $ | 27,326 | 3 | % | ||||||||||||||||||||
Year Ended May 31, 2020 | — | $ | 19.13 | 58.89 | % | 1.27 | % | (0.32 | )% | 1.27 | % | $ | 28,653 | 47 | %(e) | ||||||||||||||||||||
Year Ended May 31, 2019 | — | $ | 12.04 | (5.49 | )% | 1.38 | % | (0.27 | )% | 1.38 | % | $ | 17,744 | 7 | % | ||||||||||||||||||||
Year Ended May 31, 2018 | — | (h) | $ | 12.74 | (0.62 | )% | 1.30 | % | (0.43 | )% | 1.30 | % | $ | 16,881 | 13 | % | |||||||||||||||||||
Year Ended May 31, 2017 | — | (h) | $ | 12.82 | (2.68 | )% | 1.30 | % | (0.04 | )% | 1.30 | % | $ | 18,309 | 14 | % | |||||||||||||||||||
Year Ended May 31, 2016 | — | (h) | $ | 13.79 | 13.03 | %(f) | 1.37 | % | (0.36 | )% | 1.37 | % | $ | 16,873 | 17 | % | |||||||||||||||||||
(f) During the year ended May 31, 2016, USAA Asset Management Company ("AMCO") (previous Adviser) reimbursed the Fund Shares, Institutional Shares, and Class A shares $50,000, $1,000, and $1,000 for a loss incurred from the sale of a security that exceeded the amount allowed to be held of that type of security under the Fund's investment restrictions. The effect of this reimbursement on the Fund Shares', Institutional Shares, and Class A shares of net realized loss and total return was less than $0.005/0.005% per share.
(g) Effective June 6, 2018, AMCO has voluntarily agreed to limit the annual expenses of the Institutional Shares to 1.00% of the Institutional Shares' average daily net assets.
(h) Amount is less than $0.005 per share.
See notes to financial statements.
11
USAA Mutual Funds Trust | Notes to Financial Statements November 30, 2020 | ||||||
(Unaudited)
1. Organization:
USAA Mutual Funds Trust (the "Trust") is organized as a Delaware statutory trust and is registered under the Investment Company Act of 1940, as amended (the "1940 Act"), as an open-end investment company. The Trust is comprised of 46 funds and is authorized to issue an unlimited number of shares, which are units of beneficial interest with no par value.
The accompanying financial statements are those of the USAA Precious Metals and Minerals Fund (the "Fund"). The Fund offers three classes of shares: Fund Shares, Institutional Shares and Class A shares. The Fund is classified as non-diversified under the 1940 Act.
Effective June 29, 2020, the Fund's Adviser Shares were redesignated Class A shares and became subject to a front-end sales charge.
Each class of shares of the Fund has substantially identical rights and privileges except with respect to sales charges, fees paid under distribution plans, expenses allocable exclusively to each class of shares, voting rights on matters solely affecting a single class of shares, and the exchange privilege of each class of shares.
Under the Trust's organizational documents, its officers and trustees are indemnified against certain liabilities arising out of the performance of their duties to the Fund. In addition, in the normal course of business, the Fund enters into contracts with its vendors and others that provide for general indemnifications. The Fund's maximum exposure under these arrangements is unknown, as this would involve future claims that may be made against the Fund. However, based on experience, the Fund expects that risk of loss to be remote.
2. Significant Accounting Policies:
The following is a summary of significant accounting policies followed by the Trust in the preparation of its financial statements. The policies are in conformity with Generally Accepted Accounting Principles in the United States of America ("GAAP"). The preparation of financial statements in accordance with GAAP requires management to make estimates and assumptions that affect the reported amounts of assets and liabilities and disclosure of contingent assets and liabilities at the date of the financial statements and the reported amounts of income and expenses for the period. Actual results could differ from those estimates. The Fund follows the specialized accounting and reporting requirements under GAAP that are applicable to investment companies under Accounting Standards Codification Topic 946.
Investment Valuation:
The Fund records investments at fair value. Fair value is defined as the price that would be received to sell an asset or paid to transfer a liability in an orderly transaction between market participants at the measurement date.
The valuation techniques described below maximize the use of observable inputs and minimize the use of unobservable inputs in determining fair value. The inputs used for valuing the Fund's investments are summarized in the three broad levels listed below:
• Level 1 — quoted prices in active markets for identical securities
• Level 2 — other significant observable inputs (including quoted prices for similar securities or interest rates applicable to those securities, etc.)
• Level 3 — significant unobservable inputs (including the Fund's own assumptions in determining the fair value of investments)
Changes in valuation techniques may result in transfers in or out of an assigned level within the disclosure hierarchy. The inputs or methodologies used for valuation techniques are not necessarily an indication of the risk associated with entering into those investments.
Victory Capital Management Inc. ("VCM" or the "Adviser") has established the Pricing and Liquidity Committee (the "Committee"), and subject to the Trust's Board of Trustees (the "Board") oversight, the Committee administers and oversees the Fund's valuation policies and procedures, which are approved by the Board.
12
USAA Mutual Funds Trust | Notes to Financial Statements — continued November 30, 2020 | ||||||
(Unaudited)
Portfolio securities listed or traded on securities exchanges, including exchange-traded funds ("ETFs"), American Depositary Receipts ("ADRs") and Rights, are valued at the closing price on the exchange or system where the security is principally traded, if available, or at the Nasdaq Official Closing Price. If there have been no sales for that day on the exchange or system, then a security is valued at the last available bid quotation on the exchange or system where the security is principally traded. In each of these situations, valuations are typically categorized as Level 1 in the fair value hierarchy.
Investments in open-end investment companies are valued at net asset value ("NAV"). These valuations are typically categorized as Level 1 in the fair value hierarchy.
In the event that price quotations or valuations are not readily available, are not reflective of market value, or a significant event has been recognized in relation to a security or class of securities, the securities are valued in good faith by the Committee in accordance with valuation procedures approved by the Board. These valuations are typically categorized as Level 2 or Level 3 in the fair value hierarchy, based on the observability of inputs used to determine the fair value. The effect of fair value pricing is that securities may not be priced on the basis of quotations from the primary market in which they are traded and the actual price realized from the sale of a security may differ materially from the fair value price. Valuing these securities at fair value is intended to cause the Fund's NAV to be more reliable than it otherwise would be.
In accordance with procedures adopted by the Board, fair value pricing may be used if events materially affecting the value of foreign securities occur between the time the exchange on which they are traded closes and the time the Fund's NAV is calculated. The Fund uses a systematic valuation model, provided daily by an independent third party to fair value its international equity securities. The valuations are considered as Level 2 in the fair value hierarchy.
A summary of the valuations as of November 30, 2020, based upon the three levels defined above, is included in the table below while the breakdown, by category, of investments is disclosed on the Schedule of Portfolio Investments (amounts in thousands):
Level 1 | Level 2 | Level 3 | Total | ||||||||||||||||
Common Stocks | $ | 687,155 | $ | 11,820 | $ | — | $ | 698,975 | |||||||||||
Collateral for Securities Loaned | 6,763 | — | — | 6,763 | |||||||||||||||
Total | $ | 693,918 | $ | 11,820 | $ | — | $ | 705,738 | |||||||||||
For the six months ended November 30, 2020, there were no transfers in or out of the Level 3 fair value hierarchy.
Investment Companies:
Open-End Funds:
The Fund may invest in portfolios of open-end investment companies. These investment companies value securities in their portfolios for which market quotations are readily available at their market values (generally the last reported sale price) and all other securities and assets at their fair value by the methods established by the board of directors of the underlying funds.
Foreign Exchange Currency Contracts:
The Fund may enter into foreign exchange currency contracts to convert U.S. dollars to and from various foreign currencies. A foreign exchange currency contract is an obligation by the Fund to purchase or sell a specific currency at a future date at a price (in U.S. dollars) set at the time of the contract. The Fund does not engage in "cross-currency" foreign exchange contracts (i.e., contracts to purchase or sell one foreign currency in exchange for another foreign currency). The Fund's foreign exchange currency contracts might be considered spot contracts (typically a contract of one week or less) or forward contracts (typically a contract term over one week). A spot contract is entered into for purposes of hedging against foreign currency fluctuations relating to a specific portfolio transaction,
13
USAA Mutual Funds Trust | Notes to Financial Statements — continued November 30, 2020 | ||||||
(Unaudited)
such as the delay between a security transaction trade date and settlement date. Forward contracts are entered into for purposes of hedging portfolio holdings or concentrations of such holdings. Each foreign exchange currency contract is adjusted daily by the prevailing spot or forward rate of the underlying currency, and any appreciation or depreciation is recorded for financial statement purposes as unrealized until the contract settlement date, at which time the Fund records realized gains or losses equal to the difference between the value of a contract at the time it was opened and the value at the time it was closed. The Fund could be exposed to risk if a counterparty is unable to meet the terms of a foreign exchange currency contract or if the value of the foreign currency changes unfavorably. In addition, the use of foreign exchange currency contracts does not eliminate fluctuations in the underlying prices of the securities. As of November 30, 2020, the Fund had no open forward foreign exchange currency contracts.
Investment Transactions and Related Income:
Changes in holdings of investments are accounted for no later than one business day following the trade date. For financial reporting purposes, however, investment transactions are accounted for on trade date on the last business day of the reporting period. Interest income is determined on the basis of coupon interest accrued using the effective interest method which adjusts, where applicable, the amortization of premiums or accretion of discount. Gains or losses realized on sales of securities are determined by comparing the identified cost of the security lot sold with the net sales proceeds.
Withholding taxes on interest, dividends, and gains as a result of certain investments in ADRs by the Fund has been provided for in accordance with each investment's applicable country's tax rules and rates.
Securities Lending:
The Fund, through a securities lending agreement with Citibank, N.A. ("Citibank"), may lend its securities to qualified financial institutions, such as certain broker-dealers, to earn additional income, net of income retained by Citibank. Borrowers are required to secure their loans for collateral in the amount of at least 102% of the value of U.S. securities loaned or at least 105% of the value of non-U.S. securities loaned, marked-to-market daily. Any collateral shortfalls associated with increases in the valuation of the securities loaned are cured the next business day once the shortfall exceeds $100 thousand. Collateral may be cash, U.S. government securities, or other securities as permitted by Securities and Exchange Commission ("SEC") guidelines. Cash collateral may be invested in high-quality short-term investments, primarily open-end investment companies. Collateral requirements are determined daily based on the value of the Fund's securities on loan as of the end of the prior business day. During the time portfolio securities are on loan, the borrower will pay the Fund any dividends or interest paid on such securities plus any fee negotiated between the parties to the lending agreement. The Fund also earns a return from the collateral. The Fund pays Citibank various fees in connection with the investment of cash collateral and fees based on the investment income received from securities lending activities. Securities lending income (net of these fees) is disclosed on the Statement of Operations. Loans are terminable upon demand and the borrower must return the loaned securities within the lesser of one standard settlement period or five business days. Risks relating to securities-lending transactions include that the borrower may not provide additional collateral when required or return the securities when due, and that the value of the short-term investments will be less than the amount of cash collateral required to be returned to the borrower. The Fund's agreement with Citibank does not include master netting provisions. Noncash collateral received by the Fund may not be sold or re-pledged, except to satisfy borrower default. Cash collateral is listed on the Fund's Schedule of Portfolio Investments and Financial Statements while non-cash collateral is not included.
The following table (amounts in thousands) is a summary of the Fund's securities lending transactions as of November 30, 2020.
| Value of Securities on Loan | Non-Cash Collateral | Cash Collateral | |||||||||
| $ | 3,809 | $ | — | $ | 6,763 | ||||||
14
USAA Mutual Funds Trust | Notes to Financial Statements — continued November 30, 2020 | ||||||
(Unaudited)
Foreign Currency Translations:
The accounting records of the Fund are maintained in U.S. dollars. Investment securities and other assets and liabilities of the Fund denominated in a foreign currency are translated into U.S. dollars at current exchange rates. Purchases and sales of securities, income receipts, and expense payments are translated into U.S. dollars at the exchange rates on the date of the transactions. The Fund does not isolate the portion of the results of operations resulting from changes in foreign exchange rates on investments from fluctuations arising from changes in market prices of securities held. Such fluctuations are disclosed as net change in unrealized appreciation/depreciation on investments and foreign currency translations on the Statement of Operations. Any realized gains or losses from these fluctuations, including foreign currency arising from in-kind redemptions, are disclosed as net realized gains or losses from investment transactions and foreign currency translations on the Statement of Operations.
Foreign Taxes:
The Fund may be subject to foreign taxes related to foreign income received (a portion of which may be reclaimable), capital gains on the sale of securities, and certain foreign currency transactions. All foreign taxes are recorded in accordance with the applicable regulations and rates that exist in the foreign jurisdictions in which the Fund invests.
Federal Income Taxes:
It is the Fund's policy to continue to qualify as a regulated investment company by complying with the provisions available to certain investment companies, as defined in applicable sections of the Internal Revenue Code, and to make distributions of net investment income and net realized gains sufficient to relieve it from all, or substantially all, federal income taxes. Accordingly, no provision for federal income taxes is required in the financial statements. The Fund has a tax year end of May 31.
Management of the Fund has reviewed tax positions taken in tax years that remain subject to examination by all major tax jurisdictions, including federal (i.e., the last four tax years, which includes the current fiscal tax year end). Management believes that there is no tax liability resulting from unrecognized tax benefits related to uncertain tax positions taken.
Allocations:
Expenses directly attributable to the Fund are charged to the Fund, while expenses that are attributable to more than one fund in the Trust, or jointly with an affiliated trust, are allocated among the respective funds in the Trust and/or affiliated trust based upon net assets or another appropriate basis.
Income, expenses (other than class-specific expenses such as transfer agent fees, state registration fees, 12b-1 fees, and printing fees), and realized and unrealized gains or losses on investments are allocated to each class of shares based on its relative net assets on the date income is earned or expenses and realized and unrealized gains and losses are incurred.
3. Purchases and Sales:
Cost of purchases and proceeds from sales/maturities of securities (excluding securities maturing less than one year from acquisition) for the six months ended November 30, 2020, were as follows for the Fund (amounts in thousands):
| Purchases (excluding U.S. Government Securities) | Sales (excluding U.S. Government Securities) | ||||||||||
$ | 23,906 | $ | 57,655 | ||||||||
There were no purchases and sales of U.S. government securities during the six months ended November 30, 2020
15
USAA Mutual Funds Trust | Notes to Financial Statements — continued November 30, 2020 | ||||||
(Unaudited)
4. Affiliated Fund Ownership:
The Fund offers its shares for investment by other USAA Mutual Funds. The fund-of-funds do not invest in the underlying funds for the purpose of exercising management or control, and the affiliated fund-of-funds' annual and semi-annual reports may be viewed at vcm.com. As of November 30, 2020, certain fund-of-funds owned total outstanding shares of the Fund as follows:
Affiliated USAA Mutual Funds | Percent | ||||||
USAA Cornerstone Conservative Fund | 0.2 | % | |||||
USAA Cornerstone Equity Fund | 0.1 | % | |||||
USAA Target Income Fund | 0.6 | % | |||||
USAA Target 2030 Fund | 0.7 | % | |||||
USAA Target 2040 Fund | 0.8 | % | |||||
USAA Target 2050 Fund | 0.4 | % | |||||
USAA Target 2060 Fund | 0.1 | % | |||||
5. Fees and Transactions with Affiliates and Related Parties:
Investment Advisory Fees:
Investment advisory services are provided to the Fund by the Adviser, which is a New York corporation registered as an investment adviser with the SEC. The Adviser is a wholly-owned indirect subsidiary of Victory Capital Holdings, Inc., a publicly traded Delaware corporation, and a wholly-owned direct subsidiary of Victory Capital Operating, LLC. Under the terms of the Investment Advisory Agreement, the Adviser is entitled to receive a base fee and a performance adjustment. The Fund's base fee is accrued daily and paid monthly at an annualized rate of 0.75% of the Fund's average daily net assets. Amounts incurred and paid to VCM for the six months ended November 30, 2020, are reflected on the Statement of Operations as Investment Advisory fees.
On November 6, 2018, United Services Automobile Association ("USAA"), the parent company of USAA Asset Management Company ("AMCO"), the prior investment adviser to the Fund announced that AMCO would be acquired by Victory Capital Holdings Inc.(the "Transaction"). A special shareholder meeting was held on April 18, 2019, at which shareholders of the Fund approved a new investment advisory agreement between the Trust, on behalf of the Fund, and Victory Capital Management Inc. ("Victory Capital"). The Transaction closed on July 1, 2019. Effective July 1, 2019, VCM replaced AMCO as the investment adviser to the Fund and no performance adjustments were made for the periods beginning July 1, 2019, through June 30, 2020. Only performance beginning as of July 1, 2019, and thereafter is utilized in calculating future performance adjustments.
The performance adjustment for each share class is accrued daily and calculated monthly by comparing each class' performance to that of the Lipper Precious Metals Equity Funds Index. The Lipper Precious Metals Equity Funds Index tracks the total return performance of each class within the Lipper Precious Metals Equity Funds category.
The performance period for each share class consists of the current month plus the previous 35 months (or the number of months beginning July 1, 2019, if fewer). The following table is utilized to determine the extent of the performance adjustment:
| Over/Under Performance Relative to Index (in basis points)(a) | Annual Adjustment Rate (in basis points)(a) | ||||||
+/- 100 to 400 | +/- 4 | ||||||
+/- 401 to 700 | +/- 5 | ||||||
+/- 701 and greater | +/- 6 | ||||||
(a) Based on the difference between average annual performance of the relevant share class of the Fund and its relevant Lipper index, rounded to the nearest basis point. Average daily net assets of the share class are calculated over a rolling 36 month period.
16
USAA Mutual Funds Trust | Notes to Financial Statements — continued November 30, 2020 | ||||||
(Unaudited)
Each class' annual performance adjustment rate is multiplied by the average daily net assets of each respective class over the entire performance period, which is then multiplied by a fraction, the numerator of which is the number of days in the month and the denominator of which is 365 (366 in leap years). The resulting amount is then added to (in the case of overperformance), or subtracted from (in the case of underperformance) the base fee.
Under the performance fee arrangement, each class pays a positive performance fee adjustment for a performance period whenever the class outperforms the Lipper Precious Metals Equity Funds Index over that period, even if the class has overall negative returns during the performance period.
For the period July 1, 2020 through November 30, 2020, performance adjustments for Fund Shares, Institutional Shares and Class A shares were $(63), $(2) and $(3), respectively. For the Fund Shares, Institutional Shares and Class A shares the performance adjustments were (0.02)%, (0.01)% and (0.02)% of average daily net assets, respectively.
The Trust relies on an exemptive order granted to VCM and its affiliated funds by the SEC in March 2019 permitting the use of a "manager-of-managers" structure for certain funds. Under a manager-of-managers structure, the investment adviser may select (with approval of the Board and without shareholder approval) one or more subadvisers to manage the day-to-day investment of a fund's assets. For the six months ended November 30, 2020, the Fund had no subadvisors.
Administration and Servicing Fees:
VCM serves as the Fund's administrator and fund accountant. Under the Administration, Servicing and Accounting Agreement, VCM is paid for its services an annual fee at a rate of 0.15% of average daily net assets of the Fund Shares and Class A shares, 0.10% of average daily net assets of the Institutional Shares. Amounts incurred for the six months ended November 30, 2020, are reflected on the Statement of Operations as Administration fees.
The Fund (as part of the Trust) has entered into an agreement to provide compliance services with the Adviser, pursuant to which the Adviser furnishes its compliance personnel, including the services of the Chief Compliance Officer ("CCO"), and other resources reasonably necessary to provide the Trust with compliance oversight services related to the design, administration and oversight of a compliance program for the Trust in accordance with Rule 38a-1 under the 1940 Act. The CCO is an employee of the Adviser, which pays the compensation of the CCO and support staff. Funds in the Trust, Victory Variable Insurance Funds, Victory Portfolios, and Victory Portfolios II (collectively, the "Victory Funds Complex") in the aggregate, compensate the Adviser for these services. Amounts incurred for the six months ended November 30, 2020, are reflected on the Statement of Operations as Compliance fees.
Citi Fund Services Ohio, Inc. ("Citi"), an affiliate of Citibank, acts as sub-administrator and sub-fund accountant to the Fund pursuant to a Sub-Administration and Sub-Fund Accounting Services Agreement between VCM and Citi. VCM pays Citi a fee for providing these services. The Trust reimburses VCM and Citi for out-of-pocket expenses incurred in providing these services and certain other expenses specifically allocated to the Fund. Amounts incurred for the six months ended November 30, 2020, are reflected on the Statement of Operations as Sub-Administration fees.
Transfer Agency Fees:
Victory Capital Transfer Agency, Inc. ("VCTA"), an affiliate of the Adviser provides transfer agency services to the Fund. VCTA provides transfer agent services to the Fund Shares based on an annual charge of $23 per shareholder account plus out-of-pocket expenses. VCTA pays a portion of these fees to certain intermediaries for the administration and servicing of accounts that are held with such intermediaries. Transfer agent's fees for Institutional Shares and Class A shares are paid monthly based on a fee accrued daily at an annualized rate of 0.10%, of average daily net assets, plus out-of-pocket expenses. Amounts incurred and paid to VCTA for the six months ended November 30, 2020, are reflected on the Statement of Operations as Transfer Agent fees.
FIS Investor Services LLC serves as sub-transfer agent and dividend disbursing agent for the Fund pursuant to a Sub-Transfer Agent agreement between VCTA and FIS Investor Services LLC. VCTA provides FIS Investor Services LLC a fee for providing these services.
17
USAA Mutual Funds Trust | Notes to Financial Statements — continued November 30, 2020 | ||||||
(Unaudited)
Distributor/Underwriting Services:
Victory Capital Services, Inc. (the "Distributor"), an affiliate of the Adviser, serves as distributor for the continuous offering of the shares of the Fund pursuant to a Distribution Agreement between the Distributor and the Trust. Effective June 30, 2020, the Distributor's name was changed from Victory Capital Advisers, Inc.
Pursuant to the Distribution and Service Plans adopted in accordance with Rule 12b-1 under the1940 Act, the Distributor may receive a monthly distribution and service fee, at an annual rate of up to 0.25% of the average daily net assets of Class A shares. The distribution and service fees paid to the Distributor may be used by the Distributor to pay for activity primarily intended to result in the sale of Class A shares of the Fund. Amounts incurred and paid to VCTA for the period ended November 30, 2020, are reflected on the Statement of Operations as 12b-1 fees.
In addition, the Distributor is entitled to receive commissions on sales of the Class A shares of the Fund. For the six months ended November 30, 2020, the Distributor received approximately less than $1 thousand from commissions earned on sales of Class A shares of the Fund.
Other Fees:
Citibank serves as the Fund's custodian. The Fund pays Citibank a fee for providing these services. Amounts incurred for the six months ended November 30, 2020, are reflected on the Statement of Operations as Custodian fees.
K&L Gates LLP provides legal services to the Trust.
The Adviser has entered into an expense limitation agreement with the Fund until at least September 30, 2021. Under the terms of the agreement, the Adviser has agreed to waive fees or reimburse certain expenses to the extent that ordinary operating expenses incurred by certain classes of the Fund in any fiscal year exceed the expense limit for such classes of the Fund. Such excess amounts will be the liability of the Adviser. Interest, taxes, brokerage commissions, other expenditures, which are capitalized in accordance with GAAP, and other extraordinary expenses not incurred in the ordinary course of the Fund's business are excluded from the expense limits. As of November 30, 2020, the expense limits (excluding voluntary waivers) are 1.27%, 1.00% and 1.34% for Fund Shares, Institutional Shares and Class A shares, respectively.
Under this expense limitation agreement, the Fund has agreed to repay fees and expenses that were waived or reimbursed by the Adviser for a period up to three years after the fiscal year in which the waiver or reimbursement took place, subject to the lesser of any operating expense limits in effect at the time of: (a) the original waiver or expense reimbursement; or (b) the recoupment, after giving effect to the recoupment amount.
As of November 30, 2020, the following amounts are available to be repaid to the Adviser (amounts in thousands). The Fund has not recorded any amounts available to be repaid as a liability due to an assessment that such repayment is not probable at November 30, 2020.
| Expires May 31, 2023 | Expires May 31, 2024 | Total | |||||||||
| $ | 12 | $ | 11 | $ | 23 | ||||||
The Adviser may voluntarily waive or reimburse additional fees to assist the Fund in maintaining competitive expense ratios. Voluntary waivers and reimbursements applicable to the Fund are not available to be recouped at a future time. There were no voluntary waivers or reimbursements for the six months ended November 30, 2020.
Certain officers and/or interested trustees of the Fund are also officers and/or employees of the Adviser, Administrator, Sub-Administrator, Sub-Fund Accountant, and Legal.
6. Risks:
The Fund may be subject to other risks in addition to these identified risks.
18
USAA Mutual Funds Trust | Notes to Financial Statements — continued November 30, 2020 | ||||||
(Unaudited)
Geopolitical/Natural Disaster Risk — Global economies and financial markets are increasingly interconnected, which increases the possibilities that conditions in one country or region might adversely affect issuers in another country or region. Geopolitical and other risks, including war, terrorism, trade disputes, political or economic dysfunction within some nations, public health crises and related geopolitical events, as well as environmental disasters such as earthquakes, fires, and floods, may add to instability in world economies and markets generally. Changes in trade policies and international trade agreements could affect the economies of many countries in unpredictable ways. Likewise, systemic market dislocations of the kind that occurred during the financial crisis that began in 2008, if repeated, would be highly disruptive to economies and markets, adversely affecting individual companies and industries, securities markets, interest rates, credit ratings, inflation, investor sentiment, and other factors affecting the value of a Fund's investments. Some countries, including the United States, are adopting more protectionist trade policies and moving away from the tighter financial industry regulations that followed the 2008 financial crisis, which may also affect the value of a Fund's investments.
Political events within the United States at times have resulted, and may in the future result, in a shutdown of government services, which could negatively affect the U.S. economy, decrease the value of a Fund's investments, increase uncertainty in or impair the operation of the U.S. or other securities markets and degrade investor and consumer confidence, perhaps suddenly and to a significant degree.
An outbreak of disease called COVID-19 has spread internationally. The transmission of COVID-19 and efforts to contain its spread have resulted in international, national and local border closings and other significant travel restrictions and disruptions, significant disruptions to business operations, supply chains and consumer activity, significant challenges in healthcare service preparation and delivery, quarantines and general concern and uncertainty. These negative impacts have caused significant volatility and declines in global financial markets, which have caused losses for Fund investors during and subsequent to period end. The impact of the COVID-19 pandemic last for an extended period of time, and could result in a substantial economic downturn or recession. Public health crises may exacerbate other pre-existing political, social, economic, market and financial risks. The extent of the impact to the financial performance of the Funds' investments will depend on future developments, including (i) the duration and spread of the outbreak, (ii) the restrictions and advisories, (iii) the effects on the financial markets, and (iv) the effects on the economy overall, all of which are highly uncertain and cannot be predicted.
Stock Market Risk — Overall stock market risks may affect the value of the Fund. Domestic and international factors such as political events, war, trade disputes, interest rate levels and other fiscal and monetary policy changes, pandemics and other public health crises, and related geopolitical events, as well as environmental disasters such as earthquakes, fires, and floods, may add to instability in world economies and markets generally. The impact of these and other factors may be short-term or may last for extended periods.
Equity Risk — The value of the equity securities in which the Fund invests may decline in response to developments affecting individual companies and/or general economic conditions. A company's earnings or dividends may not increase as expected due to poor management decisions, competitive pressures, breakthroughs in technology, reliance on suppliers, labor problems or shortages, corporate restructurings, fraudulent disclosures, natural disasters, military confrontations, war, terrorism, public health crises, or other events, conditions, and factors. Price changes may be temporary or last for extended periods.
Foreign Securities Risk — Foreign markets can be more volatile than the U.S. market due to increased risks of adverse issuer, political, regulatory, market, or economic developments and can perform differently from the U.S. market.
7. Borrowing and Interfund Lending:
Line of Credit:
For the six months ended November 30, 2020, the Victory Funds Complex participated in a short-term demand note "Line of Credit" agreement with Citibank. The Line of Credit agreement with Citibank was renewed on June 29, 2020 with a termination date of June 28, 2021. Under the agreement with Citibank, the Victory Funds Complex may borrow up to $600 million, of which $300 million is committed
19
USAA Mutual Funds Trust | Notes to Financial Statements — continued November 30, 2020 | ||||||
(Unaudited)
and $300 million is uncommitted. $40 million of the Line of Credit is reserved for use by the Victory Floating Rate Fund, another series of the Victory Funds Complex, with Victory Floating Rate Fund paying the related commitment fees for that amount. The purpose of the agreement is to meet temporary or emergency cash needs. For the six months ended November 30, 2020, Citibank received an annual commitment fee of 0.15% on $300 million for providing the Line of Credit. Each fund in the Victory Funds Complex pays a pro-rata portion of the commitment fees plus any interest (one month LIBOR plus one percent) on amounts borrowed. Effective June 29, 2020, under an amended Line of Credit agreement, Citibank will also receive an annual upfront fee of 0.10% on the $300 million committed line of credit. Each fund in the Victory Funds Complex will pay a pro-rata portion of the upfront fee. Interest charged to each Fund during the period, if applicable, is reflected on the Statements of Operations under Line of credit fees.
The Fund had no borrowings under the Line of Credit agreement during the six months ended November 30, 2020.
Interfund Lending:
The Trust and Adviser rely on an exemptive order granted by the SEC in March 2017 (the "Order"), permitting the establishment and operation of an Interfund Lending Facility (the "Facility"). The Facility allows the Fund to directly lend and borrow money to or from any other Fund, that is permitted to participate in the Facility, in the Victory Funds Complex relying upon the Order at rates beneficial to both the borrowing and lending funds. Advances under the Facility are allowed for temporary or emergency purposes. The interfund loan rate is determined, as specified in the Order, by averaging the current repurchase agreement rate and the current bank loan rate. As a Borrower, interest charged to the Fund, if any, during the period is reflected on the Statement of Operations under Interfund lending fees. As a Lender, interest earned by the Fund, if any, during the period is reflected on the Statement of Operations under Income on Interfund lending.
The average borrowing or lending for the days outstanding and average interest rate for the Fund during the six months ended November 30, 2020 were as follows (amounts in thousands):
| Borrower or Lender | Amount Outstanding at November 30, 2020 | Average Borrowing* | Days Borrowing Outstanding | Average Interest Rate* | Maximum Borrowing During the Period | ||||||||||||||||||
| Borrower | $ | — | $ | 4,767 | 2 | 0.61 | % | $ | 4,767 | ||||||||||||||
* For the six months ended November 30, 2020, based on the number of days borrowings were outstanding.
8. Federal Income Tax Information:
The Fund intends to declare and distribute any net investment income annually. Distributable net realized gains, if any, are declared and paid at least annually.
The amounts of dividends from net investment income and distributions from net realized gains (collectively distributions to shareholders) are determined in accordance with federal income tax regulations, which may differ from GAAP. To the extent these "book/tax" differences are permanent in nature (e.g., net operating loss and distribution reclassification), such amounts are reclassified within the components of net assets based on their federal tax-basis treatment; temporary differences (e.g., wash sales) do not require reclassification. To the extent dividends and distributions exceed net investment income and net realized gains for tax purposes, they are reported as distributions of capital.
Net investment losses incurred by the Fund may be reclassified as an offset to capital on the accompanying Statement of Assets and Liabilities.
The tax character of current year distributions paid and the tax basis of the current components of accumulated earnings (deficit) will be determined at the end of the current tax year ending May 31, 2021.
20
USAA Mutual Funds Trust | Notes to Financial Statements — continued November 30, 2020 | ||||||
(Unaudited)
At May 31, 2020, the Fund had net capital loss carryforwards as shown in the table below (amounts in thousands).
| Short-Term Amount | Long-Term Amount | Total | |||||||||
| $ | 14,061 | $ | 795,840 | $ | 809,901 | ||||||
21
USAA Mutual Funds Trust | Supplemental Information November 30, 2020 | ||||||
(Unaudited)
Proxy Voting and Portfolio Holdings Information
Proxy Voting:
Information regarding the policies and procedures the Fund uses to determine how to vote proxies relating to portfolio securities is available without charge, upon request, by calling (800) 539-3863. The information is also included in the Fund's Statement of Additional Information, which is available on the SEC's website at www.sec.gov.
Information relating to how the Fund voted proxies relating to portfolio securities held during the most recent 12 months ended June 30 is available on the SEC's website at www.sec.gov.
Availability of Schedules of Portfolio Investments:
The Trust files a complete list of Schedules of Portfolio Investments with the SEC for the first and third quarter of each fiscal year on Form N-PORT. Form N-PORT is available on the SEC's website at www.sec.gov.
Expense Examples
As a shareholder of the Fund, you may incur two types of costs: (1) transaction costs, including sales charges (loads) on purchases, and (2) ongoing costs, including management fees and other Fund expenses. These examples are intended to help you understand your ongoing costs (in dollars) of investing in the Fund and to compare these costs with the ongoing costs of investing in other mutual funds.
These examples are based on an investment of $1,000 invested at the beginning of the period and held for the entire period from June 1, 2020 through November 30, 2020.
The Actual Expense figures in the table below provide information about actual account values and actual expenses. You may use the information below, together with the amount you invested, to estimate the expenses that you paid over the period. Simply divide your account value by $1,000 (for example, an $8,600 account value divided by $1,000 = 8.6), then multiply the result by the number in the table under the heading entitled "Actual Expenses Paid During Period" to estimate the expenses you paid on your account during this period.
The Hypothetical Expense figures in the table below provide information about hypothetical account values and hypothetical expenses based on the Fund's actual expense ratio and an assumed rate of return of 5% per year before expenses, which is not the Fund's actual return. The hypothetical account values and expenses may not be used to estimate the actual ending account balance or expenses you paid for the period. You may use this information to compare this 5% hypothetical example with the 5% hypothetical examples that appear in shareholder reports of other funds.
Please note the expenses shown in the table below are meant to highlight your ongoing costs only and do not reflect any transactional costs. If these transactional costs were included, your costs would have been higher.
| Beginning Account Value 6/1/20 | Actual Ending Account Value 11/30/20 | Hypothetical Ending Account Value 11/30/20 | Actual Expenses Paid During Period 6/1/20- 11/30/20* | Hypothetical Expenses Paid During Period 6/1/20- 11/30/20* | Annualized Expense Ratio During Period 6/1/20- 11/30/20 | ||||||||||||||||||||||
Fund Shares | $ | 1,000.00 | $ | 1,028.40 | $ | 1,019.50 | $ | 5.64 | $ | 5.62 | 1.11 | % | |||||||||||||||
Institutional Shares | 1,000.00 | 1,029.40 | 1,020.10 | 5.04 | 5.01 | 0.99 | % | ||||||||||||||||||||
Class A shares | 1,000.00 | 1,027.70 | 1,018.45 | 6.71 | 6.68 | 1.32 | % | ||||||||||||||||||||
* Expenses are equal to the average account value multiplied by the Fund's annualized expense ratio multiplied by 183/365 (the number of days in the most recent fiscal half-year divided by the number of days in the fiscal year).
22
Privacy Policy
Protecting the Privacy of Information
The Trust respects your right to privacy. We also know that you expect us to conduct and process your business in an accurate and efficient manner. To do so, we must collect and maintain certain personal information about you. This is the information we collect from you on applications or other forms, and from the transactions you make with us or third parties. It may include your name, address, social security number, account transactions and balances, and information about investment goals and risk tolerance.
We do not disclose any information about you or about former customers to anyone except as permitted or required by law. Specifically, we may disclose the information we collect to companies that perform services on our behalf, such as the transfer agent that processes shareholder accounts and printers and mailers that assist us in the distribution of investor materials. We may also disclose this information to companies that perform marketing services on our behalf. This allows us to continue to offer you Victory investment products and services that meet your investing needs, and to effect transactions that you request or authorize. These companies will use this information only in connection with the services for which we hired them. They are not permitted to use or share this information for any other purpose.
To protect your personal information internally, we permit access only by authorized employees and maintain physical, electronic and procedural safeguards to guard your personal information.*
* You may have received communications regarding information about privacy policies from other financial institutions which gave you the opportunity to "opt-out" of certain information sharing with companies which are not affiliated with that financial institution. The Trust does not share information with other companies for purposes of marketing solicitations for products other than the Trust. Therefore, the Trust does not provide opt-out options to their shareholders.
P.O. Box 182593
Columbus, Ohio 43218-2593

Visit our website at: | Call | ||||||
vcm.com | (800) 235-8396 | ||||||
23408-0121

NOVEMBER 30, 2020
Semi Annual Report
USAA Treasury Money Market Trust®
Beginning January 1, 2021, as permitted by regulations adopted by the Securities and Exchange Commission, paper copies of the Fund's shareholder reports may no longer be sent by mail, unless you specifically request paper copies of the reports from the Fund or from your financial intermediary, such as a broker-dealer or bank. Instead, the reports will be made available on VictoryFunds.com, and you will be notified by mail each time a report is posted and provided with a website link to access the report. If you already elected to receive shareholder reports electronically, you will not be affected by this change and you need not take any action.
You may elect to receive shareholder reports and other communications from the Fund or your financial intermediary electronically by notifying your financial intermediary directly, or if you are a shareholder who has an account directly with the Fund, by calling (800) 235-8396 or by submitting your request via email to TA.Processing@FISGlobal.com.
You may elect to receive all future reports in paper free of charge. You can inform the Fund or your financial intermediary that you wish to continue receiving paper copies of your shareholder reports by notifying your financial intermediary directly, or if you are a shareholder who has an account directly with the Fund, by calling (800) 235-8396 or by submitting your request via email to TA.Processing@FISGlobal.com.
Your election to receive reports in paper will apply to all funds held with the USAA Mutual Funds or your financial intermediary.
Victory Capital means Victory Capital Management Inc., the investment adviser of the USAA Mutual Funds. USAA Mutual Funds are distributed by Victory Capital Services, Inc., member of FINRA, an affiliate of Victory Capital. Victory Capital and its affiliates are not affiliated with United Services Automobile Association or its affiliates. USAA and the USAA logo are registered trademarks and the USAA Mutual Funds and USAA Investments logos are trademarks of United Services Automobile Association and are being used by Victory Capital and its affiliates under license.
TABLE OF CONTENTS
Investment Objective & Portfolio Holdings | 2 | ||||||
Schedule of Portfolio Investments | 3 | ||||||
Financial Statements | |||||||
Statement of Assets and Liabilities | 4 | ||||||
Statement of Operations | 5 | ||||||
Statements of Changes in Net Assets | 6 | ||||||
Financial Highlights | 8 | ||||||
Notes to Financial Statements | 10 | ||||||
Supplemental Information | 17 | ||||||
Proxy Voting and Portfolio Holdings Information | 17 | ||||||
Expense Example | 17 | ||||||
Privacy Policy (inside back cover) | |||||||
This report is for the information of the shareholders and others who have received a copy of the currently effective prospectus of the Fund, managed by Victory Capital Management Inc. It may be used as sales literature only when preceded or accompanied by a current prospectus, which provides further details about the Fund.
IRA DISTRIBUTION WITHHOLDING DISCLOSURE
We generally must withhold federal income tax at a rate of 10% of the taxable portion of your distribution and, if you live in a state that requires state income tax withholding, at your state's tax rate. However, you may elect not to have withholding apply or to have income tax withheld at a higher rate. Any withholding election that you make will apply to any subsequent distribution unless and until you change or revoke the election. If you wish to make a withholding election, or change or revoke a prior withholding election, call (800) 235-8396, and form W-4P (OMB No. 1545-0074 withholding certificate for pension or annuity payments) will be electronically sent.
If you do not have a withholding election in place by the date of a distribution, federal income tax will be withheld from the taxable portion of your distribution at a rate of 10%. If you must pay estimated taxes, you may be subject to estimated tax penalties if your estimated tax payments are not sufficient and sufficient tax is not withheld from your distribution.
For more specific information, please consult your tax adviser.
USAA Mutual Funds Trust
1
| USAA Mutual Funds Trust USAA Treasury Money Market Trust | November 30, 2020 | ||||||
(Unaudited)
Investment Objective & Portfolio Holdings:
The Fund's investment objective is to seek to provide investors maximum current income while maintaining the highest degree of safety and liquidity.
Portfolio Mix*:
November 30, 2020
(% of Net Assets)

* Percentages are of the net assets of the Fund and may not equal 100%.
Refer to the Schedule of Portfolio Investments for a complete list of securities.
2
| USAA Mutual Funds Trust USAA Treasury Money Market Trust | Schedule of Portfolio Investments November 30, 2020 | ||||||
(Amounts in Thousands, Except for Shares) (Unaudited)
Security Description | Principal Amount | Value | |||||||||
U.S. Treasury Obligations (75.7%) | |||||||||||
U.S. Treasury Bills | |||||||||||
0.10%, 12/10/20 (a) | $ | 25,000 | $ | 25,000 | |||||||
0.10%, 12/17/20 (a) | 25,000 | 24,999 | |||||||||
0.10%, 12/22/20 (a) | 25,000 | 24,998 | |||||||||
0.09%, 1/5/21 (a) | 25,000 | 24,998 | |||||||||
0.11%, 1/12/21 (a) | 25,000 | 24,997 | |||||||||
0.11%, 1/19/21 (a) | 25,000 | 24,996 | |||||||||
0.10%, 1/26/21 (a) | 25,000 | 24,996 | |||||||||
2/2/21 (a) (b) | 25,000 | 24,996 | |||||||||
2/4/21 (a) (b) | 25,000 | 24,996 | |||||||||
0.12%, 2/11/21 (a) | 25,000 | 24,994 | |||||||||
0.10%, 2/16/21 (a) | 25,000 | 24,995 | |||||||||
2/23/21 (a) (b) | 25,000 | 24,994 | |||||||||
2/25/21 (a) (b) | 25,000 | 24,994 | |||||||||
0.11%, 3/2/21 (a) | 25,000 | 24,993 | |||||||||
3/9/21 (a) (b) | 25,000 | 24,994 | |||||||||
0.11%, 4/8/21 (a) | 25,000 | 24,990 | |||||||||
Total U.S. Treasury Obligations (Cost $399,930) | 399,930 | ||||||||||
Repurchase Agreements (24.1%) | |||||||||||
| Fixed Income Clearing Corporation-State Street Bank & Trust Co., 0.08%, purchased on 11/30/20 with a maturity date of 12/1/20, with a value of $127,000,282 (collateralized by U.S. Treasury Bonds, 2.25%-3.38%, 2/15/50, with a value of $129,540,062) | 127,000 | 127,000 | |||||||||
Total Repurchase Agreements (Cost $127,000) | 127,000 | ||||||||||
Total Investments (Cost $526,930) — 99.8% | 526,930 | ||||||||||
Other assets in excess of liabilities — 0.2% | 948 | ||||||||||
NET ASSETS — 100.00% | $ | 527,878 | |||||||||
(a) Rate represents the effective yield at November 30, 2020.
(b) Zero-coupon bond.
See notes to financial statements.
3
USAA Mutual Funds Trust | Statement of Assets and Liabilities November 30, 2020 | ||||||
(Amounts in Thousands, Except for Shares) (Unaudited)
| USAA Treasury Money Market Trust | |||||||
Assets: | |||||||
Investments, at value (Cost $399,930) | $ | 399,930 | |||||
Repurchase agreements, at value (Cost $127,000) | 127,000 | ||||||
Cash and cash equivalents | 1,382 | ||||||
Receivables: | |||||||
Interest | — | (a) | |||||
Capital shares issued | 81 | ||||||
From Adviser | 254 | ||||||
Prepaid expenses | 31 | ||||||
Total assets | 528,678 | ||||||
Liabilities: | |||||||
Payables: | |||||||
Distributions | — | (a) | |||||
Capital shares redeemed | 641 | ||||||
Accrued expenses and other payables: | |||||||
Investment advisory fees | 54 | ||||||
Administration fees | 43 | ||||||
Transfer agent fees | 45 | ||||||
Other accrued expenses | 17 | ||||||
Total liabilities | 800 | ||||||
Net Assets: | |||||||
Capital | 527,878 | ||||||
Net assets | $ | 527,878 | |||||
Shares (unlimited number of shares authorized with no par value): | 527,878 | ||||||
Net asset value, offering and redemption price per share: (b) | $ | 1.00 | |||||
(a) Rounds to less than $1 thousand.
(b) Per share amount may not recalculate due to rounding of net assets and/or shares outstanding.
See notes to financial statements.
4
USAA Mutual Funds Trust | Statement of Operations For the Six Months Ended November 30, 2020 | ||||||
(Amounts in Thousands) (Unaudited)
| USAA Treasury Money Market Trust | |||||||
Investment Income: | |||||||
Interest | $ | 664 | |||||
Total income | 664 | ||||||
Expenses: | |||||||
Investment advisory fees | 332 | ||||||
Administration fees | 266 | ||||||
Sub-Administration fees | 7 | ||||||
Custodian fees | 11 | ||||||
Transfer agent fees | 266 | ||||||
Trustees' fees | 27 | ||||||
Compliance fees | 3 | ||||||
Legal and audit fees | 35 | ||||||
State registration and filing fees | 26 | ||||||
Other expenses | 41 | ||||||
Total expenses | 1,014 | ||||||
Expenses waived/reimbursed by Adviser | (497 | ) | |||||
Net expenses | 517 | ||||||
Net Investment Income | 147 | ||||||
Net realized gains from investments | — | (a) | |||||
Change in net assets resulting from operations | $ | 147 | |||||
(a) Rounds to less than $1 thousand.
See notes to financial statements.
5
USAA Mutual Funds Trust | Statements of Changes in Net Assets | ||||||
(Amounts in Thousands)
| USAA Treasury Money Market Trust | |||||||||||
| Six Months Ended November 30, 2020 (unaudited) | Year Ended May 31, 2020 | ||||||||||
From Investments: | |||||||||||
Operations: | |||||||||||
Net investment income | $ | 147 | $ | 65,177 | |||||||
Net realized gains from investments | — | (a) | — | ||||||||
Change in net assets resulting from operations | 147 | 65,177 | |||||||||
Change in net assets resulting from distributions to shareholders | (147 | ) | (65,177 | ) | |||||||
Change in net assets resulting from capital transactions | (16,035 | ) | (4,315,085 | ) | |||||||
Change in net assets | (16,035 | ) | (4,315,085 | ) | |||||||
Net Assets: | |||||||||||
Beginning of period | 543,913 | 4,858,998 | |||||||||
End of period | $ | 527,878 | $ | 543,913 | |||||||
Capital Transactions: | |||||||||||
Proceeds from shares issued | $ | 103,576 | $ | 15,634,427 | |||||||
Distributions reinvested | 146 | 65,132 | |||||||||
Cost of shares redeemed | (119,757 | ) | (20,014,644 | ) | |||||||
Change in net assets resulting from capital transactions | $ | (16,035 | ) | $ | (4,315,085 | ) | |||||
Share Transactions: | |||||||||||
Issued | 103,576 | 15,634,427 | |||||||||
Reinvested | 146 | 65,132 | |||||||||
Redeemed | (119,757 | ) | (20,014,644 | ) | |||||||
Change in Shares | (16,035 | ) | (4,315,085 | ) | |||||||
(a) Rounds to less than $1 thousand.
See notes to financial statements.
6
This page is intentionally left blank.
7
USAA Mutual Funds Trust | Financial Highlights | ||||||
For a Share Outstanding Throughout Each Period
Investment Activities | Distributions to Shareholders From | ||||||||||||||||||||||||||
| Net Asset Value, Beginning of Period | Net Investment Income | Net Realized Gains on Investments | Total from Investment Activities | Net Investment Income | Total Distributions | ||||||||||||||||||||||
USAA Treasury Money Market Trust | |||||||||||||||||||||||||||
| Six Months Ended November 30, 2020 (unaudited) | $ | 1.00 | — | (c)(d) | — | (d) | — | (d) | — | (d) | — | (d) | |||||||||||||||
| Year Ended May 31, 2020 | $ | 1.00 | 0.01 | (c) | — | 0.01 | (0.01 | ) | (0.01 | ) | |||||||||||||||||
| Year Ended May 31, 2019 | $ | 1.00 | 0.02 | — | 0.02 | (0.02 | ) | (0.02 | ) | ||||||||||||||||||
| Year Ended May 31, 2018 | $ | 1.00 | 0.01 | — | 0.01 | (0.01 | ) | (0.01 | ) | ||||||||||||||||||
| Year Ended May 31, 2017 | $ | 1.00 | — | (d) | — | — | (d) | — | (d) | — | (d) | ||||||||||||||||
| Year Ended May 31, 2016 | $ | 1.00 | — | (d) | — | — | (d) | — | (d) | — | (d) | ||||||||||||||||
* Assumes reinvestment of all net investment income and realized capital gain distributions, if any, during the period. Includes adjustments in accordance with U.S. generally accepted accounting principles and could differ from the Lipper reported return.
^ The net expense ratio may not correlate to the applicable expense limits in place during the period since the current contractual expense limitation is applied for a two year period beginning July 1, 2019 and in effect through September 30, 2021, instead of coinciding with the Fund's fiscal year end. Details of the current contractual expense limitation in effect can be found in Note 3 of the accompanying Notes to Financial Statements.
(a) Not annualized for periods less than one year.
(b) Annualized for periods less than one year.
(c) Per share net investment income (loss) has been calculated using the average daily shares method.
(d) Amount is less than $0.005 per share.
(e) Prior to August 1, 2017, USAA Asset Management Company ("AMCO") (previous Adviser) voluntarily agreed, on a temporary basis, to reimburse management, administrative, or other fees to limit the Fund's expenses and attempt to prevent a negative yield.
(f) Amount is less than 0.005%.
See notes to financial statements.
8
USAA Mutual Funds Trust | Financial Highlights — continued | ||||||
For a Share Outstanding Throughout Each Period
Ratios to Average Net Assets | Supplemental Data | ||||||||||||||||||||||||||
| Net Asset Value, End of Period | Total Return*(a) | Net Expenses^(b) | Net Investment Income (b) | Gross Expenses(b) | Net Assets, End of Period (000's) | ||||||||||||||||||||||
USAA Treasury Money Market Trust | |||||||||||||||||||||||||||
| Six Months Ended November 30, 2020 (unaudited) | $ | 1.00 | 0.03 | % | 0.19 | % | 0.06 | % | 0.38 | % | $ | 527,878 | |||||||||||||||
| Year Ended May 31, 2020 | $ | 1.00 | 1.23 | % | 0.33 | % | 1.21 | % | 0.34 | % | $ | 543,913 | |||||||||||||||
| Year Ended May 31, 2019 | $ | 1.00 | 1.88 | % | 0.35 | % | 1.88 | % | 0.35 | % | $ | 4,858,998 | |||||||||||||||
| Year Ended May 31, 2018 | $ | 1.00 | 0.89 | %(e) | 0.35 | %(e) | 0.91 | % | 0.35 | % | $ | 3,732,359 | |||||||||||||||
| Year Ended May 31, 2017 | $ | 1.00 | 0.08 | % | 0.35 | % | 0.12 | % | 0.39 | % | $ | 2,626,050 | |||||||||||||||
| Year Ended May 31, 2016 | $ | 1.00 | — | (f) | 0.17 | % | — | (f) | 0.49 | % | $ | 188,863 | |||||||||||||||
See notes to financial statements.
9
USAA Mutual Funds Trust | Notes to Financial Statements November 30, 2020 | ||||||
(Unaudited)
1. Organization:
USAA Mutual Funds Trust (the "Trust") is organized as a Delaware statutory trust and is registered under the Investment Company Act of 1940, as amended (the "1940 Act"), as an open-end investment company. The Trust is comprised of 46 funds and is authorized to issue an unlimited number of shares, which are units of beneficial interest with no par value.
The accompanying financial statements are those of the USAA Treasury Money Market Trust (the "Fund"). The Fund is classified as diversified under the 1940 Act.
The Fund operates as a government money market fund in compliance with the requirements of Rule 2a-7 under the 1940 Act; and as a government money market fund, shares of the Fund are available for sale only to accounts that are beneficially owned by natural persons.
The Fund has adopted policies and procedures permitting the Board of Trustees of the Fund to impose a liquidity fee or to temporarily suspend redemptions from the Fund (a "redemption gate") if the Fund's weekly liquid assets fall below specific thresholds, such as during times of market stress. The imposition of a liquidity fee would reduce the amount you would receive upon redemption of your shares of the Fund. The imposition of a redemption gate would temporarily delay your ability to redeem your investments in the Fund.
Under the Trust's organizational documents, its officers and trustees are indemnified against certain liabilities arising out of the performance of their duties to the Fund. In addition, in the normal course of business, the Fund enters into contracts with its vendors and others that provide for general indemnifications. The Fund's maximum exposure under these arrangements is unknown, as this would involve future claims that may be made against the Fund. However, based on experience, the Fund expects that risk of loss to be remote.
2. Significant Accounting Policies:
The following is a summary of significant accounting policies followed by the Trust in the preparation of its financial statements. The policies are in conformity with Generally Accepted Accounting Principles in the United States of America ("GAAP"). The preparation of financial statements in accordance with GAAP requires management to make estimates and assumptions that affect the reported amounts of assets and liabilities and disclosure of contingent assets and liabilities at the date of the financial statements and the reported amounts of income and expenses for the period. Actual results could differ from those estimates. The Fund follows the specialized accounting and reporting requirements under GAAP that are applicable to investment companies under Accounting Standards Codification Topic 946.
Investment Valuation:
The inputs or methodologies used for valuing securities are not necessarily an indication of the risks associated with investing in those securities. For example, money market securities are valued using amortized cost, in accordance with rules under the 1940 Act. Generally, amortized cost approximates the current fair value of a security, but since the value is not obtained from a quoted price in an active market, such securities are reflected as Level 2.
The Fund records investments at fair value. Fair value is defined as the price that would be received to sell an asset or paid to transfer a liability in an orderly transaction between market participants at the measurement date.
The valuation techniques described below maximize the use of observable inputs and minimize the use of unobservable inputs in determining fair value. The inputs used for valuing the Fund's investments are summarized in the three broad levels listed below:
• Level 1 — quoted prices in active markets for identical securities
• Level 2 — other significant observable inputs (including quoted prices for similar securities or interest rates applicable to those securities, etc.)
10
USAA Mutual Funds Trust | Notes to Financial Statements — continued November 30, 2020 | ||||||
(Unaudited)
• Level 3 — significant unobservable inputs (including the Fund's own assumptions in determining the fair value of investments)
Victory Capital Management Inc. ("VCM" or the "Adviser") has established the Pricing and Liquidity Committee (the "Committee"), and subject to the Trust's Board of Trustees (the "Board") oversight, the Committee administers and oversees the Fund's valuation policies and procedures, which are approved by the Board.
Repurchase agreements are valued at cost.
All securities held in the Fund are short-term debt securities, which are valued pursuant to Rule 2a-7 under the 1940 Act. This method values a security at its purchase price, and thereafter, assumes a constant amortization to maturity of any premiums or discounts. Securities for which amortized cost valuations are considered unreliable or whose values have been materially affected by a significant event are valued in good faith, at fair value, using methods determined by the Committee, under procedures to stabilize net assets and valuation procedures approved by the Board.
Repurchase Agreements:
The Fund may enter into repurchase agreements with commercial banks or recognized security dealers pursuant to the terms of a Master Repurchase Agreement. A repurchase agreement is an arrangement wherein the Fund purchases securities and the seller agrees to repurchase the securities at an agreed upon time and at an agreed upon price. The purchased securities are marked-to-market daily to ensure their value is equal to at least 102% of principal including accrued interest and are held by the Fund, either through its regular custodian or through a special "tri-party" custodian that maintains separate accounts for both the Fund and its counterparty, until maturity of the repurchase agreement. Master Repurchase Agreements typically contain netting provisions, which provide for the net settlement of all transactions and collateral with the Fund through a single payment in the event of default or termination. Repurchase agreements are subject to credit risk, and the Fund's Manager monitors the creditworthiness of sellers with which the Fund may enter into repurchase agreements.
Investments in repurchase agreements as presented on the Portfolio of Investments are not net settlement amounts but gross. At November 30, 2020, the value of the related collateral exceeded the value of the repurchase agreements, reducing the net settlement amount to zero. Details on the collateral are included on the Schedule of Portfolio Investments.
Investment Transactions and Related Income:
Changes in holdings of investments are accounted for no later than one business day following the trade date. For financial reporting purposes, however, investment transactions are accounted for on trade date on the last business day of the reporting period. Interest income is determined on the basis of coupon interest accrued using the effective interest method which adjusts, where applicable, the amortization of premiums or accretion of discount. Gains or losses realized on sales of securities are determined by comparing the identified cost of the security lot sold with the net sales proceeds.
Federal Income Taxes:
It is the Fund's policy to continue to qualify as a regulated investment company by complying with the provisions available to certain investment companies, as defined in applicable sections of the Internal Revenue Code, and to make distributions of net investment income and net realized gains sufficient to relieve it from all, or substantially all, federal income taxes. Accordingly, no provision for federal income taxes is required in the financial statements. The Fund has a tax year end of May 31.
Management of the Fund has reviewed tax positions taken in tax years that remain subject to examination by all major tax jurisdictions, including federal (i.e., the last four tax years, which includes the current fiscal tax year end). Management believes that there is no tax liability resulting from unrecognized tax benefits related to uncertain tax positions taken.
11
USAA Mutual Funds Trust | Notes to Financial Statements — continued November 30, 2020 | ||||||
(Unaudited)
Allocations:
Expenses directly attributable to the Fund are charged to the Fund, while expenses that are attributable to more than one fund in the Trust, or jointly with an affiliated trust, are allocated among the respective funds in the Trust and/or affiliated trust based upon net assets or another appropriate basis.
Fees Paid Indirectly:
Expense offsets to custody fees that arise from credits on cash balances maintained on deposit are reflected on the Statement of Operations, as applicable, as Fees paid indirectly.
3. Fees and Transactions with Affiliates and Related Parties:
Investment Advisory Fees:
Investment advisory services are provided to the Fund by the Adviser, which is a New York corporation registered as an investment adviser with the Securities and Exchange Commission ("SEC"). The Adviser is a wholly-owned indirect subsidiary of Victory Capital Holdings, Inc., a publicly traded Delaware corporation, and a wholly-owned direct subsidiary of Victory Capital Operating, LLC. The Fund's Investment Adviser fee is accrued daily and paid monthly at an annualized rate of 0.125% of the Fund's average daily net assets. Amounts incurred and paid to VCM for the six months ended November 30, 2020, are reflected on the Statement of Operations as Investment Advisory fees.
Administration and Servicing Fees:
VCM serves as the Fund's administrator and fund accountant. Under the Administration, Servicing and Accounting Agreement, VCM is paid for its services an annual fee at a rate of 0.10% of average daily net assets of the Fund. Amounts incurred for the six months ended November 30, 2020, are reflected on the Statement of Operations as Administration fees.
The Fund (as part of the Trust) has entered into an agreement to provide compliance services with the Adviser, pursuant to which the Adviser furnishes its compliance personnel, including the services of the Chief Compliance Officer ("CCO"), and other resources reasonably necessary to provide the Trust with compliance oversight services related to the design, administration and oversight of a compliance program for the Trust in accordance with Rule 38a-1 under the 1940 Act. The CCO is an employee of the Adviser, which pays the compensation of the CCO and support staff. Funds in the Trust, Victory Variable Insurance Funds, Victory Portfolios, and Victory Portfolios II (collectively, the "Victory Funds Complex") in the aggregate, compensate the Adviser for these services. Amounts incurred for the six months ended November 30, 2020, are reflected on the Statement of Operations as Compliance fees.
Citi Fund Services Ohio, Inc. ("Citi"), an affiliate of Citibank, acts as sub-administrator and sub-fund accountant to the Fund pursuant to a Sub-Administration and Sub-Fund Accounting Services Agreement between VCM and Citi. VCM pays Citi a fee for providing these services. The Trust reimburses VCM and Citi for out-of-pocket expenses incurred in providing these services and certain other expenses specifically allocated to the Funds. Amounts incurred for the six months ended November 30, 2020, are reflected on the Statement of Operations as Sub-Administration fees.
Transfer Agency Fees:
Victory Capital Transfer Agency, Inc. ("VCTA") provides transfer agency services to the Fund. VCTA, an affiliate of the Adviser, provides transfer agent services to the Fund. Transfer agent's fees for the Fund are paid monthly based on a fee accrued daily at an annualized rate of 0.10%, of average daily net assets, plus out-of-pocket expenses. VCTA pays a portion of these fees to certain intermediaries for the administration and servicing of accounts that are held with such intermediaries. Amounts incurred and paid to VCTA for the six months ended November 30, 2020, are reflected on the Statement of Operations as Transfer Agent fees.
12
USAA Mutual Funds Trust | Notes to Financial Statements — continued November 30, 2020 | ||||||
(Unaudited)
FIS Investor Services LLC serves as sub-transfer agent and dividend disbursing agent for the Fund pursuant to a Sub-Transfer Agent agreement between VCTA and FIS Investor Services LLC. VCTA provides FIS Investor Services LLC a fee for providing these services.
Distributor/Underwriting Services:
Victory Capital Services, Inc. (the "Distributor"), an affiliate of the Adviser, serves as distributor for the continuous offering of the shares of the Fund pursuant to a Distribution Agreement between the Distributor and the Trust. Effective June 30, 2020, the Distributor's name was changed from Victory Capital Advisers, Inc. The Distributor received no fees or other compensation for such distribution services.
Other Fees:
Citibank serves as the Fund's custodian. The Fund pays Citibank a fee for providing these services. Amounts incurred for the six months ended November 30, 2020, are reflected on the Statement of Operations as Custodian fees.
K&L Gates LLP provides legal services to the Trust.
The Adviser has entered into an expense limitation agreement with the Fund until at least September 30, 2021. Under the terms of the agreement, the Adviser has agreed to waive fees or reimburse certain expenses to the extent that ordinary operating expenses incurred in any fiscal year exceed the expense limit for the Fund. Such excess amounts will be the liability of the Adviser. Interest, taxes, brokerage commissions, other expenditures, which are capitalized in accordance with GAAP, and other extraordinary expenses not incurred in the ordinary course of the Fund's business are excluded from the expense limits. As of November 30, 2020, the expense limit (excluding voluntary waivers) is 0.35%.
Under this expense limitation agreement, the Fund has agreed to repay fees and expenses that were waived or reimbursed by the Adviser for a period up to three years after the fiscal year in which the waiver or reimbursement took place, subject to the lesser of any operating expense limits in effect at the time of: (a) the original waiver or expense reimbursement; or (b) the recoupment, after giving effect to the recoupment amount.
As of November 30, 2020, the following amounts are available to be repaid to the Adviser (amounts in thousands). The Fund has not recorded any amounts available to be repaid as a liability due to an assessment that such repayment is not probable at November 30, 2020.
| Expires May 31, 2024 | Total | ||||||
| $ | 105 | $ | 105 | ||||
Amendment #1 to the expense limitation agreement was effective March 23, 2020. Under this amendment, the Adviser agreed to further reimburse fees in excess of the Fund's expense limit agreement of 0.35% dated July 1, 2019. These voluntary reductions, to the extent necessary, are to maintain a certain minimum net yield of the Fund. Under this agreement to reimburse additional fees, the Fund has agreed to repay fees and expenses that were waived or reimbursed by the Adviser for a period up to three years after the fiscal year in which the waiver or reimbursement took place, to the extent any repayments would not cause the Fund's net yield to fall below the Fund's minimum yield at the time of: (a) the original waiver or expense reimbursement; or (b) the expense limit in effect at the time of the extra waiver. As of November 30, 2020, the following amounts are available to be repaid to the Adviser (amounts in thousands). The Fund has not recorded any amounts available to be repaid as a liability due to an assessment that such repayment is not probable at November 30, 2020.
| Expires May 31, 2023 | Expires May 31, 2024 | Total | |||||||||
| $ | 745 | $ | 392 | $ | 1,137 | ||||||
Certain officers and/or interested trustees of the Fund are also officers and/or employees of the Adviser, Administrator, Sub-Administrator, Sub-Fund Accountant, and Legal.
13
USAA Mutual Funds Trust | Notes to Financial Statements — continued November 30, 2020 | ||||||
(Unaudited)
4. Risks:
The Fund may be subject to other risks in addition to these identified risks.
Geopolitical/Natural Disaster Risk — Global economies and financial markets are increasingly interconnected, which increases the possibilities that conditions in one country or region might adversely affect issuers in another country or region. Geopolitical and other risks, including war, terrorism, trade disputes, political or economic dysfunction within some nations, public health crises and related geopolitical events, as well as environmental disasters such as earthquakes, fires, and floods, may add to instability in world economies and markets generally. Changes in trade policies and international trade agreements could affect the economies of many countries in unpredictable ways. Likewise, systemic market dislocations of the kind that occurred during the financial crisis that began in 2008, if repeated, would be highly disruptive to economies and markets, adversely affecting individual companies and industries, securities markets, interest rates, credit ratings, inflation, investor sentiment, and other factors affecting the value of a Fund's investments. Some countries, including the United States, are adopting more protectionist trade policies and moving away from the tighter financial industry regulations that followed the 2008 financial crisis, which may also affect the value of a Fund's investments.
Political events within the United States at times have resulted, and may in the future result, in a shutdown of government services, which could negatively affect the U.S. economy, decrease the value of a Fund's investments, increase uncertainty in or impair the operation of the U.S. or other securities markets and degrade investor and consumer confidence, perhaps suddenly and to a significant degree.
An outbreak of disease called COVID-19 has spread internationally. The transmission of COVID-19 and efforts to contain its spread have resulted in international, national and local border closings and other significant travel restrictions and disruptions, significant disruptions to business operations, supply chains and consumer activity, significant challenges in healthcare service preparation and delivery, quarantines and general concern and uncertainty. These negative impacts have caused significant volatility and declines in global financial markets, which have caused losses for Fund investors during and subsequent to period end. The impact of the COVID-19 pandemic last for an extended period of time, and could result in a substantial economic downturn or recession. Public health crises may exacerbate other pre-existing political, social, economic, market and financial risks. The extent of the impact to the financial performance of the Funds' investments will depend on future developments, including (i) the duration and spread of the outbreak, (ii) the restrictions and advisories, (iii) the effects on the financial markets, and (iv) the effects on the economy overall, all of which are highly uncertain and cannot be predicted.
Stable Net Asset Value Risk — You could lose money by investing in the Fund. Although the Fund seeks to preserve the value of your investment at $1 per share, it cannot guarantee it will do so. An investment in the Fund is not a deposit in a bank and is not insured or guaranteed by the Federal Deposit Insurance Corporation ("FDIC") or any other government agency. The Fund's sponsor has no legal obligation to provide financial support to the Fund, and you should not expect that the sponsor will provide financial support to the Fund at any time.
Interest Rate Risk — When interest rates rise, debt security prices generally fall. The opposite also generally is true: debt security prices rise when interest rates fall. Interest rate changes are influenced by a number of factors including government policy, monetary policy, inflation expectations, perceptions of risk, and supply and demand of debt securities. The Fund's yield will vary. A sharp and unexpected rise in interest rates could cause the Fund's share price to drop below a dollar. A low interest rate environment may prevent the Fund from providing a positive yield and could also impair the Fund's ability to maintain a stable NAV.
Large Shareholders Risk — The actions by one shareholder or multiple shareholders may have an impact on the Fund and, therefore, indirectly on other shareholders. Shareholder purchase and redemption activity may affect the per share amount of the Fund's distributions of its net investment income and net realized capital gains, if any, thereby affecting the tax burden on the Fund's shareholders subject to federal income tax. To the extent a larger shareholder (including, for example, an Affiliated
14
USAA Mutual Funds Trust | Notes to Financial Statements — continued November 30, 2020 | ||||||
(Unaudited)
Fund that operates as a fund-of-funds or 529 college savings plan) is permitted to invest in the Fund, the Fund may experience large inflows or outflows of cash from time to time. This activity could magnify these adverse effects on the Fund.
LIBOR Discontinuation Risk — Many debt securities, derivatives and other financial instruments, including some of the Fund's investments, use the London Interbank Offered Rate ("LIBOR") as the reference or benchmark rate for variable interest rate calculations. However, the use of LIBOR started to come under pressure following manipulation allegations in 2012. Despite increased regulation and other corrective actions since that time, concerns have arisen regarding its viability as a benchmark, due largely to reduced activity in the financial markets that it measures. In June 2017, the Alternative Reference Rates Committee, a group of large U.S. banks working with the Federal Reserve, announced its selection of a new Secured Overnight Funding Rate ("SOFR"), which is intended to be a broad measure of secured overnight U.S. Treasury repo rates, as an appropriate replacement for LIBOR. The Federal Reserve Bank of New York began publishing the SOFR in 2018, expecting that it could be used on a voluntary basis in new instruments and transactions. Bank working groups and regulators in other countries have suggested other alternatives for their markets, including the Sterling Overnight Interbank Average Rate ("SONIA") in England. In July 2017, the Financial Conduct Authority (the "FCA"), the United Kingdom financial regulatory body, announced that after 2021 it will cease its active encouragement of UK banks to provide the quotations needed to sustain LIBOR. That announcement suggests that LIBOR may cease to be published after that time. For U.S. dollar LIBOR, however, the relevant date may be deferred to June 30, 2023 for the most common tenors (overnight and one, three, six and 12 months). As to those tenors, the LIBOR administrator has published a consultation regarding its intention to cease publication of U.S. dollar LIBOR as of June 30, 2023 (instead of December 31, 2021, as previously expected), apparently based on continued rate submissions from banks. It is expected that there will be enough for market participants to transition to the use of a different benchmark for both new and existing securities and transactions. Various financial industry groups have begun planning for that transition, but there are obstacles to converting certain longer-term securities and transactions to a new benchmark. Transition planning is at an early stage, and neither the effect of the transition process nor its ultimate success can yet be known. Although the foregoing may provide some sense of timing, there is no assurance that LIBOR, or any particular currency and tenor, will continue to be published until any particular date, and it appears highly likely that LIBOR will be discontinued or modified after December 31, 2021 or June 30, 2023, depending on the currency and tenor. The transition process might lead to increased volatility and illiquidity in markets that currently rely on the LIBOR to determine interest rates. It could also lead to a reduction in the value of some LIBOR-based investments and reduce the effectiveness of new hedges placed against existing LIBOR-based instruments. Since the usefulness of LIBOR as a benchmark could deteriorate during the transition period, these effects could occur before the end of 2021.
5. Borrowing and Interfund Lending:
Line of Credit:
For the six months ended November 30, 2020, the Victory Funds Complex participated in a short-term demand note "Line of Credit" agreement with Citibank. The Line of Credit agreement with Citibank was renewed on June 29, 2020 with a termination date of June 28, 2021. Under the agreement with Citibank, the Victory Funds Complex may borrow up to $600 million, of which $300 million is committed and $300 million is uncommitted. $40 million of the Line of Credit is reserved for use by the Victory Floating Rate Fund, another series of the Victory Funds Complex, with Victory Floating Rate Fund paying the related commitment fees for that amount. The purpose of the agreement is to meet temporary or emergency cash needs. For the six months ended November 30, 2020, Citibank received an annual commitment fee of 0.15% on $300 million for providing the Line of Credit. Each fund in the Victory Funds Complex pays a pro-rata portion of the commitment fees plus any interest (one month LIBOR plus one percent) on amounts borrowed. Effective June 29, 2020, under an amended Line of Credit agreement, Citibank will also receive an annual upfront fee of 0.10% on the $300 million committed line of credit. Each fund in the Victory Funds Complex will pay a pro-rata portion of the upfront fee.
15
USAA Mutual Funds Trust | Notes to Financial Statements — continued November 30, 2020 | ||||||
(Unaudited)
Interest charged to each Fund during the period, if applicable, is reflected on the Statements of Operations under Line of credit fees.
The Fund had no borrowings under the Line of Credit agreement during the six months ended November 30, 2020.
6. Federal Income Tax Information:
The Fund intends to declare daily and distribute any net investment income monthly. Distributable net realized gains, if any, are declared and paid at least annually.
The amounts of dividends from net investment income and distributions from net realized gains (collectively distributions to shareholders) are determined in accordance with federal income tax regulations, which may differ from GAAP. To the extent these "book/tax" differences are permanent in nature (e.g., net operating loss and distribution reclassification), such amounts are reclassified within the components of net assets based on their federal tax-basis treatment; temporary differences (e.g., wash sales) do not require reclassification. To the extent dividends and distributions exceed net investment income and net realized gains for tax purposes, they are reported as distributions of capital.
Net investment losses incurred by the Fund may be reclassified as an offset to capital on the accompanying Statement of Assets and Liabilities.
The tax character of current year distributions paid and the tax basis of the current components of accumulated earnings (deficit) will be determined at the end of the current tax year ending May 31, 2021.
At May 31, 2020, the Fund had no capital loss carryforwards, for federal income tax purposes.
16
USAA Mutual Funds Trust | Supplemental Information November 30, 2020 | ||||||
(Unaudited)
Proxy Voting and Portfolio Holdings Information
Proxy Voting:
Information regarding the policies and procedures the Fund uses to determine how to vote proxies relating to portfolio securities is available without charge, upon request, by calling (800) 539-3863. The information is also included in the Fund's Statement of Additional Information, which is available on the SEC's website at www.sec.gov.
Information relating to how the Fund voted proxies relating to portfolio securities held during the most recent 12 months ended June 30 is available on the SEC's website at www.sec.gov.
Availability of Schedules of Portfolio Investments:
Form N-MFP is available on the SEC's website at www.sec.gov.
Expense Example
As a shareholder of the Fund, you may incur two types of costs: (1) transaction costs, and (2) ongoing costs, including management fees and other Fund expenses. These examples are intended to help you understand your ongoing costs (in dollars) of investing in the Fund and to compare these costs with the ongoing costs of investing in other mutual funds.
These examples are based on an investment of $1,000 invested at the beginning of the period and held for the entire period from June 1, 2020 through November 30, 2020.
The Actual Expense figures in the table below provide information about actual account values and actual expenses. You may use the information below, together with the amount you invested, to estimate the expenses that you paid over the period. Simply divide your account value by $1,000 (for example, an $8,600 account value divided by $1,000 = 8.6), then multiply the result by the number in the table under the heading entitled "Actual Expenses Paid During Period" to estimate the expenses you paid on your account during this period.
The Hypothetical Expense figures in the table below provide information about hypothetical account values and hypothetical expenses based on the Fund's actual expense ratio and an assumed rate of return of 5% per year before expenses, which is not the Fund's actual return. The hypothetical account values and expenses may not be used to estimate the actual ending account balance or expenses you paid for the period. You may use this information to compare this 5% hypothetical example with the 5% hypothetical examples that appear in shareholder reports of other funds.
Please note the expenses shown in the table below are meant to highlight your ongoing costs only and do not reflect any transactional costs. If these transactional costs were included, your costs would have been higher.
| Beginning Account Value 6/1/20 | Actual Ending Account Value 11/30/20 | Hypothetical Ending Account Value 11/30/20 | Actual Expenses Paid During Period 6/1/20- 11/30/20* | Hypothetical Expenses Paid During Period 6/1/20- 11/30/20* | Annualized Expense Ratio During Period 6/1/20- 11/30/20 | ||||||||||||||||||||||
$ | 1,000.00 | $ | 1,000.30 | $ | 1,024.12 | $ | 0.95 | $ | 0.96 | 0.19 | % | ||||||||||||||||
* Expenses are equal to the average account value multiplied by the Fund's annualized expense ratio multiplied by 183/365 (the number of days in the most recent fiscal half-year divided by the number of days in the fiscal year).
17
Privacy Policy
Protecting the Privacy of Information
The Trust respects your right to privacy. We also know that you expect us to conduct and process your business in an accurate and efficient manner. To do so, we must collect and maintain certain personal information about you. This is the information we collect from you on applications or other forms, and from the transactions you make with us or third parties. It may include your name, address, social security number, account transactions and balances, and information about investment goals and risk tolerance.
We do not disclose any information about you or about former customers to anyone except as permitted or required by law. Specifically, we may disclose the information we collect to companies that perform services on our behalf, such as the transfer agent that processes shareholder accounts and printers and mailers that assist us in the distribution of investor materials. We may also disclose this information to companies that perform marketing services on our behalf. This allows us to continue to offer you Victory investment products and services that meet your investing needs, and to effect transactions that you request or authorize. These companies will use this information only in connection with the services for which we hired them. They are not permitted to use or share this information for any other purpose.
To protect your personal information internally, we permit access only by authorized employees and maintain physical, electronic and procedural safeguards to guard your personal information.*
* You may have received communications regarding information about privacy policies from other financial institutions which gave you the opportunity to "opt-out" of certain information sharing with companies which are not affiliated with that financial institution. The Trust does not share information with other companies for purposes of marketing solicitations for products other than the Trust. Therefore, the Trust does not provide opt-out options to their shareholders.
P.O. Box 182593
Columbus, Ohio 43218-2593

Visit our website at: | Call | ||||||
vcm.com | (800) 235-8396 | ||||||
23416-0121

NOVEMBER 30, 2020
Semi Annual Report
USAA Sustainable World Fund
(Formerly USAA World Growth Fund)
Beginning January 1, 2021, as permitted by regulations adopted by the Securities and Exchange Commission, paper copies of the Fund's shareholder reports may no longer be sent by mail, unless you specifically request paper copies of the reports from the Fund or from your financial intermediary, such as a broker-dealer or bank. Instead, the reports will be made available on VictoryFunds.com, and you will be notified by mail each time a report is posted and provided with a website link to access the report. If you already elected to receive shareholder reports electronically, you will not be affected by this change and you need not take any action.
You may elect to receive shareholder reports and other communications from the Fund or your financial intermediary electronically by notifying your financial intermediary directly, or if you are a shareholder who has an account directly with the Fund, by calling (800) 235-8396 or by submitting your request via email to TA.Processing@FISGlobal.com.
You may elect to receive all future reports in paper free of charge. You can inform the Fund or your financial intermediary that you wish to continue receiving paper copies of your shareholder reports by notifying your financial intermediary directly, or if you are a shareholder who has an account directly with the Fund, by calling (800) 235-8396 or by submitting your request via email to TA.Processing@FISGlobal.com.
Your election to receive reports in paper will apply to all funds held with the USAA Mutual Funds or your financial intermediary.
Victory Capital means Victory Capital Management Inc., the investment adviser of the USAA Mutual Funds. USAA Mutual Funds are distributed by Victory Capital Services, Inc., member of FINRA, an affiliate of Victory Capital. Victory Capital and its affiliates are not affiliated with United Services Automobile Association or its affiliates. USAA and the USAA logo are registered trademarks and the USAA Mutual Funds and USAA Investments logos are trademarks of United Services Automobile Association and are being used by Victory Capital and its affiliates under license.
USAA Mutual Funds Trust
TABLE OF CONTENTS
Investment Objective & Portfolio Holdings | 2 | ||||||
Schedule of Portfolio Investments | 4 | ||||||
Financial Statements | |||||||
Statement of Assets and Liabilities | 20 | ||||||
Statement of Operations | 21 | ||||||
Statements of Changes in Net Assets | 22 | ||||||
Financial Highlights | 24 | ||||||
Notes to Financial Statements | 28 | ||||||
Supplemental Information | 38 | ||||||
Proxy Voting and Portfolio Holdings Information | 38 | ||||||
Expense Examples | 38 | ||||||
Privacy Policy (inside back cover) | |||||||
This report is for the information of the shareholders and others who have received a copy of the currently effective prospectus of the Fund, managed by Victory Capital Management Inc. It may be used as sales literature only when preceded or accompanied by a current prospectus, which provides further details about the Fund.
IRA DISTRIBUTION WITHHOLDING DISCLOSURE
We generally must withhold federal income tax at a rate of 10% of the taxable portion of your distribution and, if you live in a state that requires state income tax withholding, at your state's tax rate. However, you may elect not to have withholding apply or to have income tax withheld at a higher rate. Any withholding election that you make will apply to any subsequent distribution unless and until you change or revoke the election. If you wish to make a withholding election, or change or revoke a prior withholding election, call (800) 235-8396, and form W-4P (OMB No. 1545-0074 withholding certificate for pension or annuity payments) will be electronically sent.
If you do not have a withholding election in place by the date of a distribution, federal income tax will be withheld from the taxable portion of your distribution at a rate of 10%. If you must pay estimated taxes, you may be subject to estimated tax penalties if your estimated tax payments are not sufficient and sufficient tax is not withheld from your distribution.
For more specific information, please consult your tax adviser.
1
| USAA Mutual Funds Trust USAA Sustainable World Fund | November 30, 2020 | ||||||
(Unaudited)
Investment Objective & Portfolio Holdings:
The Fund's investment objective is to seek capital appreciation.
Top 10 Sectors:
November 30, 2020
(% of Net Assets)
Information Technology | 18.1 | % | |||||
Health Care | 13.8 | % | |||||
Financials | 13.1 | % | |||||
Industrials | 12.6 | % | |||||
Consumer Discretionary | 10.3 | % | |||||
Communication Services | 9.8 | % | |||||
Consumer Staples | 9.5 | % | |||||
Materials | 4.6 | % | |||||
Energy | 4.0 | % | |||||
Utilities | 1.8 | % | |||||
Refer to the Schedule of Portfolio Investments for a complete list of securities.
2
| USAA Mutual Funds Trust USAA Sustainable World Fund (continued) | November 30, 2020 | ||||||
(Unaudited)
Country Allocation:
November 30, 2020
(% of Net Assets)
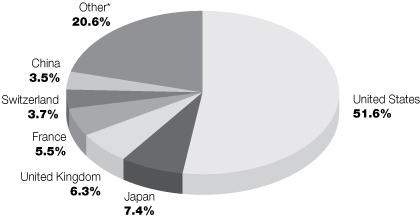
* Includes countries with less than 3.0% of portfolio and short-term investments purchased with cash collateral from securities loaned.
Percentages are of the net assets of the Fund and may not equal 100%.
3
| USAA Mutual Funds Trust USAA Sustainable World Fund | Schedule of Portfolio Investments November 30, 2020 | ||||||
(Amounts in Thousands, Except for Shares) (Unaudited)
Security Description | Shares | Value | |||||||||
Common Stocks (98.6%) | |||||||||||
Australia (1.4%): | |||||||||||
Consumer Discretionary (0.0%): (a) | |||||||||||
Aristocrat Leisure Ltd. | 11,021 | $ | 260 | ||||||||
Energy (0.0%): (a) | |||||||||||
Beach Energy Ltd. | 390,955 | 499 | |||||||||
Financials (0.4%): | |||||||||||
Australia & New Zealand Banking Group Ltd. | 26,033 | 431 | |||||||||
Macquarie Group Ltd. | 51,640 | 5,250 | |||||||||
5,681 | |||||||||||
Health Care (0.8%): | |||||||||||
CSL Ltd. | 50,170 | 10,984 | |||||||||
Sonic Healthcare Ltd. | 11,354 | 275 | |||||||||
11,259 | |||||||||||
Materials (0.1%): | |||||||||||
Rio Tinto Ltd. | 13,997 | 1,044 | |||||||||
Real Estate (0.1%): | |||||||||||
Charter Hall Group | 29,421 | 295 | |||||||||
Stockland | 83,149 | 276 | |||||||||
571 | |||||||||||
19,314 | |||||||||||
Austria (0.1%): | |||||||||||
Financials (0.1%): | |||||||||||
Erste Group Bank AG (b) | 19,538 | 561 | |||||||||
Raiffeisen Bank International AG (b) | 6,926 | 132 | |||||||||
693 | |||||||||||
Belgium (0.7%): | |||||||||||
Consumer Staples (0.0%): (a) | |||||||||||
Anheuser-Busch InBev SA/NV | 3,315 | 221 | |||||||||
Financials (0.0%): (a) | |||||||||||
KBC Group NV (b) | 3,764 | 262 | |||||||||
Health Care (0.1%): | |||||||||||
UCB SA | 3,903 | 418 | |||||||||
Information Technology (0.6%): | |||||||||||
Melexis NV | 84,106 | 8,067 | |||||||||
8,968 | |||||||||||
Bermuda (0.9%): | |||||||||||
Financials (0.1%): | |||||||||||
Everest Re Group Ltd. | 1,500 | 341 | |||||||||
RenaissanceRe Holdings Ltd. | 6,200 | 1,021 | |||||||||
1,362 | |||||||||||
See notes to financial statements.
4
| USAA Mutual Funds Trust USAA Sustainable World Fund | Schedule of Portfolio Investments — continued November 30, 2020 | ||||||
(Amounts in Thousands, Except for Shares) (Unaudited)
Security Description | Shares | Value | |||||||||
Industrials (0.8%): | |||||||||||
Triton International Ltd. | 246,205 | $ | 11,143 | ||||||||
12,505 | |||||||||||
Brazil (0.4%): | |||||||||||
Financials (0.4%): | |||||||||||
Itau Unibanco Holding SA Preference Shares | 1,024,900 | 5,465 | |||||||||
Canada (1.9%): | |||||||||||
Consumer Discretionary (0.0%): (a) | |||||||||||
Magna International, Inc. | 11,300 | 694 | |||||||||
Energy (0.5%): | |||||||||||
Parex Resources, Inc. (b) | 461,918 | 6,332 | |||||||||
Industrials (1.0%): | |||||||||||
Canadian National Railway Co. | 39,326 | 4,210 | |||||||||
Canadian Pacific Railway Ltd. | 29,450 | 9,516 | |||||||||
13,726 | |||||||||||
Information Technology (0.0%): (a) | |||||||||||
Shopify, Inc. Class A (b) | 590 | 643 | |||||||||
Materials (0.4%): | |||||||||||
Kirkland Lake Gold Ltd. | 129,395 | 5,302 | |||||||||
26,697 | |||||||||||
China (3.5%): | |||||||||||
Communication Services (1.4%): | |||||||||||
Tencent Holdings Ltd. | 272,500 | 19,865 | |||||||||
Consumer Discretionary (0.6%): | |||||||||||
Alibaba Group Holding Ltd., ADR (b) | 2,596 | 683 | |||||||||
China Meidong Auto Holdings Ltd. | 1,810,000 | 7,857 | |||||||||
8,540 | |||||||||||
Consumer Staples (0.7%): | |||||||||||
Foshan Haitan Flavouring & Food Co. Ltd. Class A | 383,260 | 9,265 | |||||||||
Financials (0.8%): | |||||||||||
Industrial & Commercial Bank of China Ltd. Class H | 16,768,000 | 10,593 | |||||||||
48,263 | |||||||||||
Denmark (0.8%): | |||||||||||
Consumer Staples (0.7%): | |||||||||||
Carlsberg A/S Class B | 10,798 | 1,609 | |||||||||
Royal Unibrew A/S | 70,046 | 7,313 | |||||||||
8,922 | |||||||||||
Health Care (0.0%): (a) | |||||||||||
Genmab A/S (b) | 591 | 227 | |||||||||
GN Store Nord A/S | 3,659 | 298 | |||||||||
525 | |||||||||||
See notes to financial statements.
5
| USAA Mutual Funds Trust USAA Sustainable World Fund | Schedule of Portfolio Investments — continued November 30, 2020 | ||||||
(Amounts in Thousands, Except for Shares) (Unaudited)
Security Description | Shares | Value | |||||||||
Industrials (0.0%): (a) | |||||||||||
AP Moller — Maersk A/S Class B | 214 | $ | 436 | ||||||||
Utilities (0.1%): | |||||||||||
Orsted A/S (c) | 3,221 | 580 | |||||||||
10,463 | |||||||||||
Finland (0.0%): (a) | |||||||||||
Industrials (0.0%): | |||||||||||
Metso Outotec Oyj | 42,446 | 380 | |||||||||
France (5.5%): | |||||||||||
Communication Services (0.0%): (a) | |||||||||||
Publicis Groupe SA | 5,101 | 230 | |||||||||
Vivendi SA | 11,000 | 330 | |||||||||
560 | |||||||||||
Consumer Discretionary (1.6%): | |||||||||||
Faurecia SE (b) | 176,110 | 8,723 | |||||||||
Hermes International | 583 | 567 | |||||||||
Kering SA | 314 | 226 | |||||||||
LVMH Moet Hennessy Louis Vuitton SE | 21,989 | 12,629 | |||||||||
22,145 | |||||||||||
Consumer Staples (0.5%): | |||||||||||
Danone SA | 63,126 | 4,070 | |||||||||
Pernod Ricard SA | 17,246 | 3,295 | |||||||||
7,365 | |||||||||||
Energy (0.9%): | |||||||||||
Gaztransport Et Technigaz SA | 67,244 | 6,645 | |||||||||
TOTAL SE | 135,098 | 5,734 | |||||||||
12,379 | |||||||||||
Financials (0.6%): | |||||||||||
Amundi SA (c) | 2,785 | 222 | |||||||||
AXA SA | 16,087 | 376 | |||||||||
BNP Paribas SA (b) | 146,212 | 7,441 | |||||||||
8,039 | |||||||||||
Health Care (0.1%): | |||||||||||
EssilorLuxottica SA (b) | 5,240 | 757 | |||||||||
Sanofi | 4,219 | 425 | |||||||||
Sartorius Stedim Biotech | 800 | 289 | |||||||||
1,471 | |||||||||||
Industrials (0.7%): | |||||||||||
Alstom SA (b) | 4,120 | 222 | |||||||||
Cie de Saint-Gobain (b) | 8,476 | 402 | |||||||||
Legrand SA | 27,587 | 2,336 | |||||||||
Schneider Electric SE | 45,363 | 6,319 | |||||||||
Teleperformance | 1,104 | 367 | |||||||||
9,646 | |||||||||||
See notes to financial statements.
6
| USAA Mutual Funds Trust USAA Sustainable World Fund | Schedule of Portfolio Investments — continued November 30, 2020 | ||||||
(Amounts in Thousands, Except for Shares) (Unaudited)
Security Description | Shares | Value | |||||||||
Information Technology (0.1%): | |||||||||||
Capgemini SE | 2,692 | $ | 375 | ||||||||
Worldline SA (b) (c) | 3,556 | 329 | |||||||||
704 | |||||||||||
Materials (1.0%): | |||||||||||
Air Liquide SA | 13,051 | 2,132 | |||||||||
Arkema SA | 98,973 | 11,525 | |||||||||
13,657 | |||||||||||
Utilities (0.0%): (a) | |||||||||||
Rubis SCA | 3,533 | 150 | |||||||||
76,116 | |||||||||||
Germany (1.1%): | |||||||||||
Communication Services (0.1%): | |||||||||||
Deutsche Telekom AG | 33,034 | 596 | |||||||||
Consumer Discretionary (0.1%): | |||||||||||
HelloFresh SE (b) | 4,975 | 294 | |||||||||
Volkswagen AG Preference Shares | 4,105 | 689 | |||||||||
983 | |||||||||||
Financials (0.2%): | |||||||||||
Allianz SE | 2,459 | 576 | |||||||||
Deutsche Boerse AG | 6,876 | 1,145 | |||||||||
Hannover Rueck SE | 1,260 | 211 | |||||||||
Muenchener Rueckversicherungs-Gesellschaft AG Class R | 744 | 206 | |||||||||
2,138 | |||||||||||
Health Care (0.4%): | |||||||||||
Bayer AG Registered Shares | 44,676 | 2,574 | |||||||||
Fresenius Medical Care AG & Co. KGaA | 2,811 | 237 | |||||||||
Merck KGaA | 16,688 | 2,664 | |||||||||
5,475 | |||||||||||
Industrials (0.2%): | |||||||||||
Brenntag AG | 14,253 | 1,091 | |||||||||
Deutsche Post AG Registered Shares | 11,310 | 546 | |||||||||
MTU Aero Engines AG | 4,826 | 1,136 | |||||||||
Siemens AG Registered Shares | 2,443 | 326 | |||||||||
3,099 | |||||||||||
Information Technology (0.0%): (a) | |||||||||||
SAP SE | 2,178 | 263 | |||||||||
TeamViewer AG (b) (c) | 5,509 | 262 | |||||||||
525 | |||||||||||
Materials (0.0%): (a) | |||||||||||
HeidelbergCement AG | 2,713 | 192 | |||||||||
See notes to financial statements.
7
| USAA Mutual Funds Trust USAA Sustainable World Fund | Schedule of Portfolio Investments — continued November 30, 2020 | ||||||
(Amounts in Thousands, Except for Shares) (Unaudited)
Security Description | Shares | Value | |||||||||
Real Estate (0.1%): | |||||||||||
alstria office REIT-AG | 10,611 | $ | 171 | ||||||||
Deutsche Wohnen SE | 16,027 | 804 | |||||||||
LEG Immobilien AG | 2,197 | 312 | |||||||||
1,287 | |||||||||||
Utilities (0.0%): (a) | |||||||||||
E.ON SE | 40,442 | 438 | |||||||||
14,733 | |||||||||||
Hong Kong (0.6%): | |||||||||||
Consumer Staples (0.0%): (a) | |||||||||||
WH Group Ltd. (c) | 370,000 | 301 | |||||||||
Energy (0.6%): | |||||||||||
CNOOC Ltd. | 7,547,792 | 7,511 | |||||||||
Financials (0.0%): (a) | |||||||||||
BOC Hong Kong Holdings Ltd. | 78,500 | 256 | |||||||||
Real Estate (0.0%): (a) | |||||||||||
CK Asset Holdings Ltd. | 35,500 | 194 | |||||||||
New World Development Co. Ltd. | 43,000 | 218 | |||||||||
412 | |||||||||||
8,480 | |||||||||||
India (0.5%): | |||||||||||
Consumer Staples (0.5%): | |||||||||||
Nestle India Ltd. | 30,307 | 7,294 | |||||||||
Indonesia (1.0%): | |||||||||||
Communication Services (1.0%): | |||||||||||
PT Telkom Indonesia Persero Tbk | 59,732,300 | 13,681 | |||||||||
Ireland (1.9%): | |||||||||||
Health Care (0.0%): (a) | |||||||||||
ICON PLC (b) | 2,742 | 534 | |||||||||
Industrials (1.5%): | |||||||||||
DCC PLC | 2,961 | 223 | |||||||||
Eaton Corp. PLC | 158,643 | 19,213 | |||||||||
Johnson Controls International PLC | 13,300 | 613 | |||||||||
Trane Technologies PLC | 4,994 | 730 | |||||||||
20,779 | |||||||||||
Information Technology (0.4%): | |||||||||||
Accenture PLC Class A | 22,636 | 5,638 | |||||||||
26,951 | |||||||||||
Israel (0.2%): | |||||||||||
Information Technology (0.2%): | |||||||||||
Check Point Software Technologies Ltd. (b) | 20,289 | 2,388 | |||||||||
See notes to financial statements.
8
| USAA Mutual Funds Trust USAA Sustainable World Fund | Schedule of Portfolio Investments — continued November 30, 2020 | ||||||
(Amounts in Thousands, Except for Shares) (Unaudited)
Security Description | Shares | Value | |||||||||
Italy (2.3%): | |||||||||||
Energy (0.5%): | |||||||||||
Snam SpA | 1,088,187 | $ | 6,146 | ||||||||
Financials (0.3%): | |||||||||||
Banca Generali SpA (b) | 139,313 | 4,644 | |||||||||
Health Care (0.8%): | |||||||||||
Recordati SpA | 204,304 | 10,926 | |||||||||
Industrials (0.0%): (a) | |||||||||||
Leonardo SpA | 29,723 | 216 | |||||||||
Utilities (0.7%): | |||||||||||
ACEA SpA | 14,068 | 298 | |||||||||
Enel SpA | 944,828 | 9,478 | |||||||||
9,776 | |||||||||||
31,708 | |||||||||||
Japan (7.4%): | |||||||||||
Communication Services (1.1%): | |||||||||||
Capcom Co. Ltd. | 91,600 | 5,180 | |||||||||
Kakaku.com, Inc. | 264,000 | 7,387 | |||||||||
KDDI Corp. | 15,500 | 441 | |||||||||
Nexon Co. Ltd. | 12,200 | 368 | |||||||||
Nintendo Co. Ltd. | 900 | 511 | |||||||||
Nippon Telegraph & Telephone Corp. | 21,500 | 509 | |||||||||
14,396 | |||||||||||
Consumer Discretionary (1.1%): | |||||||||||
Hikari Tsushin, Inc. | 21,100 | 5,065 | |||||||||
Nitori Holdings Co. Ltd. | 1,000 | 213 | |||||||||
Sony Corp. | 17,700 | 1,650 | |||||||||
Toyo Tire Corp. | 15,000 | 236 | |||||||||
Toyota Motor Corp. | 125,900 | 8,499 | |||||||||
15,663 | |||||||||||
Consumer Staples (0.9%): | |||||||||||
Kobe Bussan Co. Ltd. | 158,200 | 5,543 | |||||||||
Seven & i Holdings Co. Ltd. | 6,500 | 205 | |||||||||
Toyo Suisan Kaisha Ltd. | 133,200 | 6,553 | |||||||||
12,301 | |||||||||||
Financials (0.8%): | |||||||||||
JAFCO Group Co. Ltd. | 101,700 | 4,353 | |||||||||
Mitsubishi UFJ Financial Group, Inc. | 1,276,500 | 5,448 | |||||||||
Mizuho Financial Group, Inc. | 18,800 | 238 | |||||||||
Nomura Holdings, Inc. | 45,700 | 229 | |||||||||
ORIX Corp. | 37,000 | 548 | |||||||||
Shinsei Bank Ltd. | 13,700 | 162 | |||||||||
Sumitomo Mitsui Financial Group, Inc. | 7,100 | 204 | |||||||||
Sumitomo Mitsui Trust Holdings, Inc. | 5,300 | 154 | |||||||||
11,336 | |||||||||||
See notes to financial statements.
9
| USAA Mutual Funds Trust USAA Sustainable World Fund | Schedule of Portfolio Investments — continued November 30, 2020 | ||||||
(Amounts in Thousands, Except for Shares) (Unaudited)
Security Description | Shares | Value | |||||||||
Health Care (1.5%): | |||||||||||
As One Corp. | 43,700 | $ | 6,710 | ||||||||
Astellas Pharma, Inc. | 25,900 | 369 | |||||||||
Hoya Corp. | 91,200 | 12,131 | |||||||||
Olympus Corp. | 67,300 | 1,453 | |||||||||
Ono Pharmaceutical Co. Ltd. | 11,600 | 367 | |||||||||
Shionogi & Co. Ltd. | 4,700 | 252 | |||||||||
21,282 | |||||||||||
Industrials (1.3%): | |||||||||||
ITOCHU Corp. | 31,200 | 824 | |||||||||
Kubota Corp. | 149,200 | 2,947 | |||||||||
Mitsubishi Electric Corp. | 19,900 | 292 | |||||||||
Mitsui & Co. Ltd. | 20,200 | 343 | |||||||||
Nippon Yusen | 202,300 | 4,395 | |||||||||
Obayashi Corp. | 25,100 | 221 | |||||||||
OKUMA Corp. | 131,700 | 7,570 | |||||||||
Secom Co. Ltd. | 3,300 | 329 | |||||||||
Taisei Corp. | 5,500 | 194 | |||||||||
Yamato Holdings Co. Ltd. | 8,200 | 207 | |||||||||
17,322 | |||||||||||
Information Technology (0.6%): | |||||||||||
Anritsu Corp. | 11,300 | 258 | |||||||||
Fujitsu Ltd. | 3,200 | 443 | |||||||||
Hitachi Ltd. | 8,000 | 304 | |||||||||
Murata Manufacturing Co. Ltd. | 6,700 | 584 | |||||||||
Obic Co. Ltd. | 1,700 | 382 | |||||||||
Tokyo Electron Ltd. | 1,200 | 408 | |||||||||
Ulvac, Inc. | 145,800 | 5,887 | |||||||||
8,266 | |||||||||||
Materials (0.1%): | |||||||||||
Rengo Co. Ltd. | 27,200 | 206 | |||||||||
Shin-Etsu Chemical Co. Ltd. | 1,900 | 312 | |||||||||
Tosoh Corp. | 14,700 | 230 | |||||||||
748 | |||||||||||
Real Estate (0.0%): (a) | |||||||||||
Daiwa House Industry Co. Ltd. | 8,300 | 254 | |||||||||
Open House Co. Ltd. | 6,100 | 241 | |||||||||
495 | |||||||||||
Utilities (0.0%): (a) | |||||||||||
The Kansai Electric Power Co., Inc. | 21,200 | 194 | |||||||||
102,003 | |||||||||||
Jersey (0.0%): (a) | |||||||||||
Consumer Discretionary (0.0%): | |||||||||||
boohoo Group PLC (b) | 40,538 | 170 | |||||||||
See notes to financial statements.
10
| USAA Mutual Funds Trust USAA Sustainable World Fund | Schedule of Portfolio Investments — continued November 30, 2020 | ||||||
(Amounts in Thousands, Except for Shares) (Unaudited)
Security Description | Shares | Value | |||||||||
Korea, Republic Of (1.5%): | |||||||||||
Information Technology (1.5%): | |||||||||||
Samsung Electronics Co. Ltd. | 350,538 | $ | 21,135 | ||||||||
21,135 | |||||||||||
Mexico (0.5%): | |||||||||||
Financials (0.0%): (a) | |||||||||||
Grupo Financiero Banorte SAB de CV Class O (b) | 86,016 | 431 | |||||||||
Industrials (0.5%): | |||||||||||
Promotora y Operadora de Infraestructura SAB de CV | 840,350 | 6,710 | |||||||||
7,141 | |||||||||||
Netherlands (1.4%): | |||||||||||
Consumer Discretionary (0.1%): | |||||||||||
Fiat Chrysler Automobiles NV (b) | 29,401 | 460 | |||||||||
Prosus NV | 5,208 | 564 | |||||||||
1,024 | |||||||||||
Consumer Staples (0.3%): | |||||||||||
Heineken NV | 34,703 | 3,658 | |||||||||
Koninklijke Ahold Delhaize NV | 21,004 | 601 | |||||||||
4,259 | |||||||||||
Financials (0.0%): (a) | |||||||||||
Euronext NV (c) | 2,422 | 258 | |||||||||
ING Groep NV (b) | 21,435 | 208 | |||||||||
NN Group NV | 7,488 | 303 | |||||||||
769 | |||||||||||
Health Care (0.0%): (a) | |||||||||||
QIAGEN NV (b) | 4,219 | 203 | |||||||||
Industrials (0.7%): | |||||||||||
Wolters Kluwer NV | 118,459 | 9,916 | |||||||||
Information Technology (0.1%): | |||||||||||
| ASML Holding NV | 634 | 275 | |||||||||
STMicroelectronics NV | 14,210 | 560 | |||||||||
835 | |||||||||||
Materials (0.2%): | |||||||||||
Akzo Nobel NV | 27,946 | 2,959 | |||||||||
19,965 | |||||||||||
New Zealand (0.7%): | |||||||||||
Health Care (0.7%): | |||||||||||
Fisher & Paykel Healthcare Corp. Ltd. | 379,981 | 9,566 | |||||||||
See notes to financial statements.
11
| USAA Mutual Funds Trust USAA Sustainable World Fund | Schedule of Portfolio Investments — continued November 30, 2020 | ||||||
(Amounts in Thousands, Except for Shares) (Unaudited)
Security Description | Shares | Value | |||||||||
Norway (0.8%): | |||||||||||
Energy (0.4%): | |||||||||||
Aker BP ASA | 239,295 | $ | 5,376 | ||||||||
Financials (0.4%): | |||||||||||
SpareBank 1 SMN | 513,424 | 5,499 | |||||||||
10,875 | |||||||||||
Portugal (0.0%): (a) | |||||||||||
Communication Services (0.0%): | |||||||||||
NOS SGPS SA | 31,637 | 121 | |||||||||
Energy (0.0%): | |||||||||||
Galp Energia SGPS SA | 23,428 | 251 | |||||||||
372 | |||||||||||
Singapore (0.7%): | |||||||||||
Consumer Discretionary (0.0%): (a) | |||||||||||
Genting Singapore Ltd. | 377,600 | 231 | |||||||||
Consumer Staples (0.0%): (a) | |||||||||||
Wilmar International Ltd. | 71,100 | 221 | |||||||||
Financials (0.7%): | |||||||||||
DBS Group Holdings Ltd. | 17,500 | 327 | |||||||||
Singapore Exchange Ltd. | 1,289,400 | 8,504 | |||||||||
8,831 | |||||||||||
9,283 | |||||||||||
Spain (0.2%): | |||||||||||
Consumer Discretionary (0.0%): (a) | |||||||||||
Industria de Diseno Textil SA | 7,037 | 233 | |||||||||
Industrials (0.2%): | |||||||||||
ACS Actividades de Construccion y Servicios SA | 14,029 | 443 | |||||||||
Aena SME SA (b) (c) | 12,829 | 2,090 | |||||||||
2,533 | |||||||||||
Utilities (0.0%): (a) | |||||||||||
EDP Renovaveis SA | 17,307 | 367 | |||||||||
3,133 | |||||||||||
Sweden (1.0%): | |||||||||||
Consumer Staples (0.4%): | |||||||||||
Essity AB Class B | 128,534 | 4,086 | |||||||||
Swedish Match AB | 6,692 | 542 | |||||||||
4,628 | |||||||||||
Financials (0.0%): (a) | |||||||||||
Skandinaviska Enskilda Banken AB Class A (b) | 27,812 | 294 | |||||||||
See notes to financial statements.
12
| USAA Mutual Funds Trust USAA Sustainable World Fund | Schedule of Portfolio Investments — continued November 30, 2020 | ||||||
(Amounts in Thousands, Except for Shares) (Unaudited)
Security Description | Shares | Value | |||||||||
Industrials (0.6%): | |||||||||||
Atlas Copco AB Class B | 166,374 | $ | 7,371 | ||||||||
Sandvik AB (b) | 12,424 | 280 | |||||||||
| SKF AB B Shares | 12,310 | 304 | |||||||||
Volvo AB Class B | 16,262 | 371 | |||||||||
8,326 | |||||||||||
Information Technology (0.0%): (a) | |||||||||||
Telefonaktiebolaget LM Ericsson Class B | 26,734 | 328 | |||||||||
Materials (0.0%): (a) | |||||||||||
Boliden AB | 10,617 | 367 | |||||||||
Real Estate (0.0%): (a) | |||||||||||
Fastighets AB Balder B Shares (b) | 4,168 | 208 | |||||||||
14,151 | |||||||||||
Switzerland (3.7%): | |||||||||||
Consumer Discretionary (0.2%): | |||||||||||
Cie Financiere Richemont SA Registered Shares | 27,374 | 2,287 | |||||||||
Consumer Staples (0.5%): | |||||||||||
Coca-Cola HBC AG | 6,553 | 187 | |||||||||
Nestle SA Registered Shares | 60,327 | 6,759 | |||||||||
6,946 | |||||||||||
Financials (0.7%): | |||||||||||
Chubb Ltd. | 3,800 | 562 | |||||||||
Julius Baer Group Ltd. | 22,865 | 1,318 | |||||||||
Partners Group Holding AG | 5,109 | 5,510 | |||||||||
Swiss Life Holding AG | 1,716 | 766 | |||||||||
UBS Group AG Registered Shares | 128,842 | 1,828 | |||||||||
9,984 | |||||||||||
Health Care (1.6%): | |||||||||||
Lonza Group AG Registered Shares | 633 | 398 | |||||||||
Novartis AG Registered Shares | 10,841 | 982 | |||||||||
Roche Holding AG | 63,435 | 20,841 | |||||||||
Sonova Holding AG (b) | 2,249 | 559 | |||||||||
22,780 | |||||||||||
Industrials (0.6%): | |||||||||||
Adecco Group AG | 143,628 | 8,685 | |||||||||
Information Technology (0.1%): | |||||||||||
Logitech International SA Class R | 7,202 | 642 | |||||||||
Materials (0.0%): (a) | |||||||||||
LafargeHolcim Ltd. | 5,896 | 310 | |||||||||
51,634 | |||||||||||
See notes to financial statements.
13
| USAA Mutual Funds Trust USAA Sustainable World Fund | Schedule of Portfolio Investments — continued November 30, 2020 | ||||||
(Amounts in Thousands, Except for Shares) (Unaudited)
Security Description | Shares | Value | |||||||||
Thailand (0.0%): (a) | |||||||||||
Financials (0.0%): | |||||||||||
Kasikornbank PCL | 58,900 | $ | 215 | ||||||||
United Kingdom (6.3%): | |||||||||||
Communication Services (0.7%): | |||||||||||
ITV PLC | 6,307,971 | 7,848 | |||||||||
WPP PLC | 138,739 | 1,337 | |||||||||
9,185 | |||||||||||
Consumer Discretionary (0.7%): | |||||||||||
Aptiv PLC | 9,451 | 1,122 | |||||||||
Barratt Developments PLC (b) | 37,291 | 306 | |||||||||
Burberry Group PLC | 52,332 | 1,199 | |||||||||
Compass Group PLC | 79,009 | 1,390 | |||||||||
Next PLC | 60,402 | 5,217 | |||||||||
Whitbread PLC (b) | 26,534 | 1,063 | |||||||||
10,297 | |||||||||||
Consumer Staples (1.1%): | |||||||||||
British American Tobacco PLC | 11,009 | 388 | |||||||||
Diageo PLC | 122,069 | 4,698 | |||||||||
Imperial Brands PLC | 273,690 | 4,940 | |||||||||
Reckitt Benckiser Group PLC | 39,342 | 3,433 | |||||||||
Tate & Lyle PLC | 31,598 | 267 | |||||||||
Tesco PLC | 187,544 | 564 | |||||||||
Unilever PLC | 5,169 | 314 | |||||||||
14,604 | |||||||||||
Energy (0.0%): (a) | |||||||||||
| BP PLC | 134,579 | 437 | |||||||||
Cairn Energy PLC (b) | 114,600 | 243 | |||||||||
680 | |||||||||||
Financials (1.0%): | |||||||||||
| 3i Group PLC | 36,198 | 512 | |||||||||
Aon PLC Class A | 11,403 | 2,336 | |||||||||
Barclays PLC | 150,071 | 266 | |||||||||
Close Brothers Group PLC | 525,525 | 9,042 | |||||||||
Legal & General Group PLC | 85,714 | 283 | |||||||||
Standard Chartered PLC | 42,333 | 251 | |||||||||
Willis Towers Watson PLC | 4,139 | 862 | |||||||||
13,552 | |||||||||||
Health Care (0.1%): | |||||||||||
AstraZeneca PLC | 4,270 | 447 | |||||||||
Hikma Pharmaceuticals PLC | 12,476 | 431 | |||||||||
878 | |||||||||||
Industrials (0.2%): | |||||||||||
Ashtead Group PLC | 10,771 | 455 | |||||||||
BAE Systems PLC | 68,419 | 456 | |||||||||
See notes to financial statements.
14
| USAA Mutual Funds Trust USAA Sustainable World Fund | Schedule of Portfolio Investments — continued November 30, 2020 | ||||||
(Amounts in Thousands, Except for Shares) (Unaudited)
Security Description | Shares | Value | |||||||||
Rolls-Royce Holdings PLC (b) | 905,387 | $ | 1,255 | ||||||||
Sensata Technologies Holding PLC | 9,900 | 483 | |||||||||
2,649 | |||||||||||
Materials (2.5%): | |||||||||||
Anglo American PLC | 26,474 | 771 | |||||||||
Croda International PLC | 88,019 | 6,929 | |||||||||
Evraz PLC | 1,423,265 | 7,151 | |||||||||
Linde PLC | 4,026 | 1,032 | |||||||||
Linde PLC | 15,215 | 3,880 | |||||||||
Rio Tinto PLC | 237,542 | 15,504 | |||||||||
35,267 | |||||||||||
87,112 | |||||||||||
United States (51.6%): | |||||||||||
Communication Services (5.6%): | |||||||||||
Activision Blizzard, Inc. | 10,055 | 799 | |||||||||
Alphabet, Inc. Class C (b) | 12,676 | 22,319 | |||||||||
Alphabet, Inc. Class A (b) | 500 | 877 | |||||||||
Comcast Corp. Class A | 147,338 | 7,402 | |||||||||
Facebook, Inc. Class A (b) | 94,839 | 26,268 | |||||||||
Liberty Broadband Corp. Class C (b) | 7,552 | 1,188 | |||||||||
Omnicom Group, Inc. | 10,929 | 689 | |||||||||
The Walt Disney Co. | 27,864 | 4,124 | |||||||||
Verizon Communications, Inc. | 220,770 | 13,337 | |||||||||
77,003 | |||||||||||
Consumer Discretionary (5.8%): | |||||||||||
Amazon.com, Inc. (b) | 10,302 | 32,637 | |||||||||
Burlington Stores, Inc. (b) | 3,733 | 816 | |||||||||
Dollar Tree, Inc. (b) | 7,900 | 863 | |||||||||
eBay, Inc. | 41,345 | 2,085 | |||||||||
General Motors Co. | 8,800 | 386 | |||||||||
LKQ Corp. (b) | 20,800 | 733 | |||||||||
Lululemon Athletica, Inc. (b) | 2,855 | 1,057 | |||||||||
Marriott International, Inc. Class A | 10,551 | 1,339 | |||||||||
McDonald's Corp. | 86,339 | 18,773 | |||||||||
Ross Stores, Inc. | 111,294 | 11,966 | |||||||||
The TJX Cos., Inc. | 150,782 | 9,576 | |||||||||
80,231 | |||||||||||
Consumer Staples (4.0%): | |||||||||||
Colgate-Palmolive Co. | 234,082 | 20,047 | |||||||||
Keurig Dr Pepper, Inc. | 37,600 | 1,145 | |||||||||
Mondelez International, Inc. Class A | 17,100 | 983 | |||||||||
PepsiCo, Inc. | 131,277 | 18,934 | |||||||||
The Estee Lauder Cos., Inc. Class A | 58,574 | 14,369 | |||||||||
55,478 | |||||||||||
See notes to financial statements.
15
| USAA Mutual Funds Trust USAA Sustainable World Fund | Schedule of Portfolio Investments — continued November 30, 2020 | ||||||
(Amounts in Thousands, Except for Shares) (Unaudited)
Security Description | Shares | Value | |||||||||
Energy (1.2%): | |||||||||||
Chevron Corp. | 9,200 | $ | 802 | ||||||||
ConocoPhillips | 228,788 | 9,051 | |||||||||
Enterprise Products Partners LP | 43,300 | 840 | |||||||||
Phillips 66 | 94,021 | 5,696 | |||||||||
16,389 | |||||||||||
Financials (6.6%): | |||||||||||
Aflac, Inc. | 12,100 | 532 | |||||||||
American Express Co. | 19,782 | 2,346 | |||||||||
Bank of America Corp. | 522,372 | 14,710 | |||||||||
Brown & Brown, Inc. | 11,600 | 522 | |||||||||
Cboe Global Markets, Inc. | 4,200 | 384 | |||||||||
Citigroup, Inc. | 8,700 | 479 | |||||||||
Discover Financial Services | 7,500 | 571 | |||||||||
JPMorgan Chase & Co. | 164,945 | 19,444 | |||||||||
MSCI, Inc. | 32,665 | 13,374 | |||||||||
S&P Global, Inc. | 37,564 | 13,214 | |||||||||
State Street Corp. | 22,433 | 1,581 | |||||||||
The Bank of New York Mellon Corp. | 52,417 | 2,051 | |||||||||
The Charles Schwab Corp. | 51,339 | 2,504 | |||||||||
The Goldman Sachs Group, Inc. | 12,851 | 2,963 | |||||||||
The PNC Financial Services Group, Inc. | 66,001 | 9,113 | |||||||||
The Progressive Corp. | 83,372 | 7,262 | |||||||||
U.S. Bancorp | 16,800 | 726 | |||||||||
Voya Financial, Inc. | 7,800 | 449 | |||||||||
92,225 | |||||||||||
Health Care (7.6%): | |||||||||||
Abbott Laboratories | 29,425 | 3,184 | |||||||||
Amedisys, Inc. (b) | 21,871 | 5,354 | |||||||||
Amgen, Inc. | 54,183 | 12,031 | |||||||||
Cigna Corp. | 4,300 | 899 | |||||||||
CVS Health Corp. | 106,613 | 7,227 | |||||||||
Edwards Lifesciences Corp. (b) | 9,730 | 816 | |||||||||
Eli Lilly & Co. | 96,258 | 14,020 | |||||||||
Hill-Rom Holdings, Inc. | 6,600 | 626 | |||||||||
Humana, Inc. | 1,600 | 641 | |||||||||
IDEXX Laboratories, Inc. (b) | 27,784 | 12,808 | |||||||||
Johnson & Johnson | 122,232 | 17,684 | |||||||||
Masimo Corp. (b) | 2,315 | 589 | |||||||||
Medtronic PLC | 57,745 | 6,566 | |||||||||
Pfizer, Inc. | 14,600 | 559 | |||||||||
Quest Diagnostics, Inc. | 3,100 | 384 | |||||||||
Stryker Corp. | 17,178 | 4,009 | |||||||||
The Cooper Cos., Inc. | 6,079 | 2,038 | |||||||||
Thermo Fisher Scientific, Inc. | 15,491 | 7,203 | |||||||||
UnitedHealth Group, Inc. | 4,210 | 1,416 | |||||||||
Veeva Systems, Inc. Class A (b) | 2,943 | 815 | |||||||||
Vertex Pharmaceuticals, Inc. (b) | 2,255 | 514 | |||||||||
See notes to financial statements.
16
| USAA Mutual Funds Trust USAA Sustainable World Fund | Schedule of Portfolio Investments — continued November 30, 2020 | ||||||
(Amounts in Thousands, Except for Shares) (Unaudited)
Security Description | Shares | Value | |||||||||
Waters Corp. (b) | 9,218 | $ | 2,139 | ||||||||
Zimmer Biomet Holdings, Inc. | 24,334 | 3,629 | |||||||||
Zoetis, Inc. | 5,730 | 919 | |||||||||
106,070 | |||||||||||
Industrials (4.3%): | |||||||||||
3M Co. | 72,196 | 12,470 | |||||||||
Carrier Global Corp. | 13,996 | 533 | |||||||||
CoStar Group, Inc. (b) | 1,032 | 940 | |||||||||
Dover Corp. | 2,700 | 329 | |||||||||
Equifax, Inc. | 12,542 | 2,093 | |||||||||
HD Supply Holdings, Inc. (b) | 207,957 | 11,600 | |||||||||
Honeywell International, Inc. | 90,992 | 18,555 | |||||||||
Kansas City Southern | 21,159 | 3,939 | |||||||||
Otis Worldwide Corp. | 16,252 | 1,088 | |||||||||
Parker-Hannifin Corp. | 2,700 | 722 | |||||||||
Raytheon Technologies Corp. | 6,700 | 481 | |||||||||
Uber Technologies, Inc. (b) | 21,180 | 1,052 | |||||||||
Union Pacific Corp. | 11,850 | 2,418 | |||||||||
United Parcel Service, Inc. Class B | 13,893 | 2,377 | |||||||||
United Rentals, Inc. (b) | 2,300 | 522 | |||||||||
59,119 | |||||||||||
Information Technology (14.5%): | |||||||||||
Adobe, Inc. (b) | 2,315 | 1,108 | |||||||||
Amphenol Corp. Class A | 10,184 | 1,332 | |||||||||
Apple, Inc. | 395,443 | 47,077 | |||||||||
Cadence Design Systems, Inc. (b) | 4,708 | 548 | |||||||||
Cisco Systems, Inc. | 368,164 | 15,838 | |||||||||
Cognizant Technology Solutions Corp. Class A | 29,095 | 2,273 | |||||||||
EPAM Systems, Inc. (b) | 2,710 | 874 | |||||||||
Euronet Worldwide, Inc. (b) | 7,000 | 941 | |||||||||
Fidelity National Information Services, Inc. | 16,789 | 2,492 | |||||||||
FleetCor Technologies, Inc. (b) | 2,500 | 663 | |||||||||
Leidos Holdings, Inc. | 5,600 | 564 | |||||||||
Mastercard, Inc. Class A | 73,786 | 24,830 | |||||||||
Microchip Technology, Inc. | 8,397 | 1,128 | |||||||||
Microsoft Corp. | 212,258 | 45,438 | |||||||||
NVIDIA Corp. | 31,860 | 17,079 | |||||||||
Oracle Corp. | 49,638 | 2,865 | |||||||||
PayPal Holdings, Inc. (b) | 18,667 | 3,997 | |||||||||
salesforce.com, Inc. (b) | 4,290 | 1,054 | |||||||||
ServiceNow, Inc. (b) | 2,823 | 1,509 | |||||||||
Texas Instruments, Inc. | 124,227 | 20,032 | |||||||||
The Trade Desk, Inc. Class A (b) | 1,115 | 1,005 | |||||||||
Twilio, Inc. Class A (b) | 1,647 | 527 | |||||||||
Visa, Inc. Class A | 40,023 | 8,419 | |||||||||
201,593 | |||||||||||
See notes to financial statements.
17
| USAA Mutual Funds Trust USAA Sustainable World Fund | Schedule of Portfolio Investments — continued November 30, 2020 | ||||||
(Amounts in Thousands, Except for Shares) (Unaudited)
Security Description | Shares | Value | |||||||||
Materials (0.3%): | |||||||||||
PPG Industries, Inc. | 17,913 | $ | 2,629 | ||||||||
Sealed Air Corp. | 25,300 | 1,140 | |||||||||
3,769 | |||||||||||
Real Estate (0.7%): | |||||||||||
American Tower Corp. | 3,845 | 889 | |||||||||
Equity LifeStyle Properties, Inc. | 6,500 | 381 | |||||||||
National Retail Properties, Inc. | 11,600 | 437 | |||||||||
Prologis, Inc. | 81,684 | 8,173 | |||||||||
9,880 | |||||||||||
Utilities (1.0%): | |||||||||||
Exelon Corp. | 14,200 | 583 | |||||||||
FirstEnergy Corp. | 11,600 | 308 | |||||||||
MGE Energy, Inc. | 176,382 | 12,112 | |||||||||
Vistra Corp. | 53,800 | 1,005 | |||||||||
14,008 | |||||||||||
715,765 | |||||||||||
Total Common Stocks (Cost $994,556) | 1,366,619 | ||||||||||
Warrants (0.0%) (a) | |||||||||||
Switzerland (0.0%): | |||||||||||
Consumer Discretionary (0.0%): | |||||||||||
Cie Financiere Richemont SA | 55,260 | 11 | |||||||||
Total Warrants (Cost $—) | 11 | ||||||||||
Exchange-Traded Funds (0.1%) | |||||||||||
United States (0.1%): | |||||||||||
iShares Core MSCI EAFE ETF | 31,693 | 2,099 | |||||||||
Total Exchange-Traded Funds (Cost $2,009) | 2,099 | ||||||||||
Total Investments (Cost $996,565) — 98.7% | 1,368,729 | ||||||||||
Other assets in excess of liabilities — 1.3% | 17,849 | ||||||||||
NET ASSETS — 100.00% | $ | 1,386,578 | |||||||||
(a) Amount represents less than 0.05% of net assets.
(b) Non-income producing security.
(c) Rule 144A security or other security that is restricted as to resale to institutional investors. The Fund's Adviser has deemed this security to be liquid based upon procedures approved by the Board of Trustees. As of November 30, 2020, the fair value of these securities was $4,042 (thousands) and amounted to 0.3% of net assets.
See notes to financial statements.
18
| USAA Mutual Funds Trust USAA Sustainable World Fund | Schedule of Portfolio Investments — continued November 30, 2020 | ||||||
(Unaudited)
ADR — American Depositary Receipt
ETF — Exchange-Traded Fund
LP — Limited Partnership
PCL — Public Company Limited
PLC — Public Limited Company
REIT — Real Estate Investment Trust
See notes to financial statements.
19
USAA Mutual Funds Trust | Statement of Assets and Liabilities November 30, 2020 | ||||||
(Amounts in Thousands, Except Per Share Amounts) (Unaudited)
| USAA Sustainable World Fund | |||||||
Assets: | |||||||
Investments, at value (Cost $996,565) | $ | 1,368,729 | |||||
Foreign currency, at value (Cost $411) | 411 | ||||||
Cash and cash equivalents | 9,307 | ||||||
Receivables: | |||||||
Interest and dividends | 1,717 | ||||||
Capital shares issued | 285 | ||||||
Investments sold | 7,680 | ||||||
Reclaims | 1,583 | ||||||
From Adviser | 9 | ||||||
Prepaid expenses | 37 | ||||||
Total assets | 1,389,758 | ||||||
Liabilities: | |||||||
Payables: | |||||||
Investments purchased | 1,076 | ||||||
Capital shares redeemed | 773 | ||||||
Accrued foreign capital gains taxes | 122 | ||||||
Accrued expenses and other payables: | |||||||
Investment advisory fees | 838 | ||||||
Administration fees | 167 | ||||||
Custodian fees | 61 | ||||||
Transfer agent fees | 120 | ||||||
Compliance fees | 1 | ||||||
| 12b-1 fees | 1 | ||||||
Other accrued expenses | 21 | ||||||
Total liabilities | 3,180 | ||||||
Net Assets: | |||||||
Capital | 956,389 | ||||||
Total accumulated earnings/(loss) | 430,189 | ||||||
Net assets | $ | 1,386,578 | |||||
Net Assets | |||||||
Fund Shares | $ | 1,372,502 | |||||
Institutional Shares | 6,964 | ||||||
Class A shares | 7,112 | ||||||
Total | $ | 1,386,578 | |||||
Shares (unlimited number of shares authorized with no par value): | |||||||
Fund Shares | 48,972 | ||||||
Institutional Shares | 248 | ||||||
Class A shares | 254 | ||||||
Total | 49,474 | ||||||
Net asset value, offering and redemption price per share: (a) | |||||||
Fund Shares | $ | 28.03 | |||||
Institutional Shares | $ | 28.08 | |||||
Class A shares | $ | 28.01 | |||||
Maximum Sales Charge — Class A shares | 5.75 | % | |||||
| Maximum offering price (100%/(100%-maximum sales charge) of net asset value adjusted to the nearest cent) per share — Class A shares | $ | 29.72 | |||||
(a) Per share amount may not recalculate due to rounding of net assets and/or shares outstanding.
See notes to financial statements.
20
USAA Mutual Funds Trust | Statement of Operations For the Six Months Ended November 30, 2020 | ||||||
(Amounts in Thousands) (Unaudited)
| USAA Sustainable World Fund | |||||||
Investment Income: | |||||||
Dividends | $ | 12,977 | |||||
Interest | 1 | ||||||
Securities lending (net of fees) | 34 | ||||||
Foreign tax withholding | (674 | ) | |||||
Total income | 12,338 | ||||||
Expenses: | |||||||
Investment advisory fees | 4,968 | ||||||
Administration fees — Fund Shares | 975 | ||||||
Administration fees — Institutional Shares | 3 | ||||||
Administration fees — Class A shares | 5 | ||||||
Sub-Administration fees | 20 | ||||||
12b-1 fees — Class A shares | 8 | ||||||
Custodian fees | 131 | ||||||
Transfer agent fees — Fund Shares | 811 | ||||||
Transfer agent fees — Institutional Shares | 3 | ||||||
Transfer agent fees — Class A shares | 3 | ||||||
Trustees' fees | 26 | ||||||
Compliance fees | 4 | ||||||
Legal and audit fees | 44 | ||||||
State registration and filing fees | 36 | ||||||
Interfund lending fees | — | (a) | |||||
Other expenses | 65 | ||||||
Total expenses | 7,102 | ||||||
Expenses waived/reimbursed by Adviser | (18 | ) | |||||
Net expenses | 7,084 | ||||||
Net Investment Income (Loss) | 5,254 | ||||||
Realized/Unrealized Gains (Losses) from Investments: | |||||||
| Net realized gains (losses) from investment securities and foreign currency translations | 66,897 | ||||||
Foreign taxes on realized gains | (8 | ) | |||||
| Net change in unrealized appreciation/depreciation on investment securities and foreign currency translations | 165,804 | ||||||
| Net change in unrealized appreciation/depreciation on foreign capital gains taxes | (71 | ) | |||||
Net realized/unrealized gains (losses) on investments | 232,622 | ||||||
Change in net assets resulting from operations | $ | 237,876 | |||||
(a) Rounds to less than $1 thousand.
See notes to financial statements.
21
USAA Mutual Funds Trust | Statements of Changes in Net Assets | ||||||
(Amounts in Thousands)
USAA Sustainable World Fund | |||||||||||
| Six Months Ended November 30, 2020 (unaudited) | Year Ended May 31, 2020 | ||||||||||
From Investments: | |||||||||||
Operations: | |||||||||||
Net investment income (loss) | $ | 5,254 | $ | 13,124 | |||||||
Net realized gains (losses) from investments | 66,889 | 406,737 | |||||||||
| Net change in unrealized appreciation/depreciation on investments | 165,733 | (320,704 | ) | ||||||||
Change in net assets resulting from operations | 237,876 | 99,157 | |||||||||
Distributions to Shareholders: | |||||||||||
Fund Shares | — | (426,145 | ) | ||||||||
Institutional Shares | — | (4,055 | ) | ||||||||
Class A shares | — | (2,733 | ) | ||||||||
Change in net assets resulting from distributions to shareholders | — | (432,933 | ) | ||||||||
Change in net assets resulting from capital transactions | (92,852 | ) | 273,969 | ||||||||
Change in net assets | 145,024 | (59,807 | ) | ||||||||
Net Assets: | |||||||||||
Beginning of period | 1,241,554 | 1,301,361 | |||||||||
End of period | $ | 1,386,578 | $ | 1,241,554 | |||||||
(continues on next page)
See notes to financial statements.
22
USAA Mutual Funds Trust | Statements of Changes in Net Assets | ||||||
(Amounts in Thousands) (continued)
USAA Sustainable World Fund | |||||||||||
| Six Months Ended November 30, 2020 (unaudited) | Year Ended May 31, 2020 | ||||||||||
Capital Transactions: | |||||||||||
Fund Shares | |||||||||||
Proceeds from shares issued | $ | 22,858 | $ | 85,742 | |||||||
Distributions reinvested | — | 419,589 | |||||||||
Cost of shares redeemed | (114,848 | ) | (228,526 | ) | |||||||
Total Fund Shares | $ | (91,990 | ) | $ | 276,805 | ||||||
Institutional Shares | |||||||||||
Proceeds from shares issued | $ | 600 | $ | 958 | |||||||
Distributions reinvested | — | 2,199 | |||||||||
Cost of shares redeemed | (942 | ) | (6,304 | ) | |||||||
Total Institutional Shares | $ | (342 | ) | $ | (3,147 | ) | |||||
Class A shares | |||||||||||
Proceeds from shares issued | $ | 6,492 | $ | 969 | |||||||
Distributions reinvested | — | 556 | |||||||||
Cost of shares redeemed | (7,012 | ) | (1,214 | ) | |||||||
Total Class A shares | $ | (520 | ) | $ | 311 | ||||||
Change in net assets resulting from capital transactions | $ | (92,852 | ) | $ | 273,969 | ||||||
Share Transactions: | |||||||||||
Fund Shares | |||||||||||
Issued | 889 | 3,075 | |||||||||
Reinvested | — | 16,485 | |||||||||
Redeemed | (4,486 | ) | (8,689 | ) | |||||||
Total Fund Shares | (3,597 | ) | 10,871 | ||||||||
Institutional Shares | |||||||||||
Issued | 23 | 36 | |||||||||
Reinvested | — | 86 | |||||||||
Redeemed | (37 | ) | (269 | ) | |||||||
Total Institutional Shares | (14 | ) | (147 | ) | |||||||
Class A shares | |||||||||||
Issued | 273 | 36 | |||||||||
Reinvested | — | 22 | |||||||||
Redeemed | (294 | ) | (47 | ) | |||||||
Total Class A shares | (21 | ) | 11 | ||||||||
Change in Shares | (3,632 | ) | 10,735 | ||||||||
See notes to financial statements.
23
USAA Mutual Funds Trust | Financial Highlights | ||||||
For a Share Outstanding Throughout Each Period
Investment Activities | Distributions to Shareholders From | ||||||||||||||||||||||||||
| Net Asset Value, Beginning of Period | Net Investment Income (Loss) | Net Realized and Unrealized Gains (Losses) on Investments | Total from Investment Activities | Net Investment Income | Net Realized Gains from Investments | ||||||||||||||||||||||
USAA Sustainable World Fund | |||||||||||||||||||||||||||
Fund Shares | |||||||||||||||||||||||||||
| Six Months Ended November 30, 2020 (unaudited) | $ | 23.38 | 0.10 | (d) | 4.55 | 4.65 | — | — | |||||||||||||||||||
| Year Ended May 31, 2020 | $ | 30.71 | 0.27 | (d) | 2.87 | 3.14 | (0.32 | ) | (10.15 | ) | |||||||||||||||||
| Year Ended May 31, 2019 | $ | 31.82 | 0.33 | 0.51 | 0.84 | (0.28 | ) | (1.67 | ) | ||||||||||||||||||
| Year Ended May 31, 2018 | $ | 31.16 | 0.30 | 1.78 | 2.08 | (0.23 | ) | (1.19 | ) | ||||||||||||||||||
| Year Ended May 31, 2017 | $ | 27.20 | 0.19 | 4.55 | 4.74 | (0.21 | ) | (0.57 | ) | ||||||||||||||||||
| Year Ended May 31, 2016 | $ | 28.69 | 0.21 | (0.95 | ) | (0.74 | ) | (0.19 | ) | (0.56 | ) | ||||||||||||||||
* Assumes reinvestment of all net investment income and realized capital gain distributions, if any, during the period. Includes adjustments in accordance with U.S. generally accepted accounting principles and could differ from the Lipper reported return.
^ The net expense ratio may not correlate to the applicable expense limits in place during the period since the current contractual expense limitation is applied for a two year period beginning July 1, 2019 and in effect through September 30, 2021, instead of coinciding with the Fund's fiscal year end. Details of the current contractual expense limitation in effect can be found in Note 4 of the accompanying Notes to Financial Statements.
(a) Not annualized for periods less than one year.
(b) Annualized for periods less than one year.
(c) Portfolio turnover is calculated on the basis of the Fund as a whole without distinguishing between classes of shares issued.
(d) Per share net investment income (loss) has been calculated using the average daily shares method.
(e) Reflects increased trading activity due to current year transition or asset allocation shift.
See notes to financial statements.
24
USAA Mutual Funds Trust | Financial Highlights — continued | ||||||
For a Share Outstanding Throughout Each Period
Ratios to Average Net Assets | Supplemental Data | ||||||||||||||||||||||||||||||||||||||
| Total Distributions | Redemption Fees Added to Beneficial Interests | Net Asset Value, End of Period | Total Return (Excludes Sales Charges) *(a) | Net Expenses^(b) | Net Investment Income (Loss)(b) | Gross Expenses(b) | Net Assets, End of Period (000's) | Portfolio Turnover(a)(c) | |||||||||||||||||||||||||||||||
USAA Sustainable World Fund | |||||||||||||||||||||||||||||||||||||||
Fund Shares | |||||||||||||||||||||||||||||||||||||||
| Six Months Ended November 30, 2020 (unaudited) | — | — | $ | 28.03 | 19.89 | % | 1.07 | % | 0.80 | % | 1.07 | % | $ | 1,372,502 | 33 | % | |||||||||||||||||||||||
| Year Ended May 31, 2020 | (10.47 | ) | — | $ | 23.38 | 7.81 | % | 1.07 | % | 0.98 | % | 1.07 | % | $ | 1,228,986 | 103 | %(e) | ||||||||||||||||||||||
| Year Ended May 31, 2019 | (1.95 | ) | — | $ | 30.71 | 3.23 | % | 1.09 | % | 1.09 | % | 1.09 | % | $ | 1,280,661 | 8 | % | ||||||||||||||||||||||
| Year Ended May 31, 2018 | (1.42 | ) | — | $ | 31.82 | 6.68 | % | 1.10 | % | 0.98 | % | 1.10 | % | $ | 1,353,880 | 10 | % | ||||||||||||||||||||||
| Year Ended May 31, 2017 | (0.78 | ) | — | $ | 31.16 | 17.81 | % | 1.13 | % | 0.72 | % | 1.13 | % | $ | 1,319,357 | 12 | % | ||||||||||||||||||||||
| Year Ended May 31, 2016 | (0.75 | ) | — | $ | 27.20 | (2.49 | )% | 1.17 | % | 0.81 | % | 1.17 | % | $ | 1,157,148 | 10 | % | ||||||||||||||||||||||
(continues on next page)
See notes to financial statements.
25
USAA Mutual Funds Trust | Financial Highlights — continued | ||||||
For a Share Outstanding Throughout Each Period
Investment Activities | Distributions to Shareholders From | ||||||||||||||||||||||||||
| Net Asset Value, Beginning of Period | Net Investment Income (Loss) | Net Realized and Unrealized Gains (Losses) on Investments | Total from Investment Activities | Net Investment Income | Net Realized Gains from Investments | ||||||||||||||||||||||
USAA Sustainable World Fund | |||||||||||||||||||||||||||
Institutional Shares | |||||||||||||||||||||||||||
| Six Months Ended November 30, 2020 (unaudited) | $ | 23.42 | 0.11 | (d) | 4.55 | 4.66 | — | — | |||||||||||||||||||
| Year Ended May 31, 2020 | $ | 30.74 | 0.29 | (d) | 2.86 | 3.15 | (0.32 | ) | (10.15 | ) | |||||||||||||||||
| Year Ended May 31, 2019 | $ | 31.75 | 0.38 | 0.48 | 0.86 | (0.20 | ) | (1.67 | ) | ||||||||||||||||||
| Year Ended May 31, 2018 | $ | 31.14 | 0.29 | 1.80 | 2.09 | (0.29 | ) | (1.19 | ) | ||||||||||||||||||
| Year Ended May 31, 2017 | $ | 27.14 | 0.20 | 4.55 | 4.75 | (0.18 | ) | (0.57 | ) | ||||||||||||||||||
| August 10, 2015 (f) through May 31, 2016 | $ | 28.83 | 0.24 | (1.11 | ) | (0.87 | ) | (0.26 | ) | (0.56 | ) | ||||||||||||||||
Class A shares | |||||||||||||||||||||||||||
| Six Months Ended November 30, 2020 (unaudited) | $ | 23.40 | 0.07 | (d) | 4.54 | 4.61 | — | — | |||||||||||||||||||
| Year Ended May 31, 2020 | $ | 30.77 | 0.19 | (d) | 2.86 | 3.05 | (0.27 | ) | (10.15 | ) | |||||||||||||||||
| Year Ended May 31, 2019 | $ | 31.86 | 0.24 | (d) | 0.53 | 0.77 | (0.19 | ) | (1.67 | ) | |||||||||||||||||
| Year Ended May 31, 2018 | $ | 31.07 | 0.18 | (d) | 1.80 | 1.98 | — | (g) | (1.19 | ) | |||||||||||||||||
| Year Ended May 31, 2017 | $ | 27.13 | 0.12 | 4.53 | 4.65 | (0.14 | ) | (0.57 | ) | ||||||||||||||||||
| Year Ended May 31, 2016 | $ | 28.55 | 0.14 | (0.93 | ) | (0.79 | ) | (0.07 | ) | (0.56 | ) | ||||||||||||||||
* Assumes reinvestment of all net investment income and realized capital gain distributions, if any, during the period. Includes adjustments in accordance with U.S. generally accepted accounting principles and could differ from the Lipper reported return.
^ The net expense ratio may not correlate to the applicable expense limits in place during the period since the current contractual expense limitation is applied for a two year period beginning July 1, 2019 and in effect through September 30, 2021, instead of coinciding with the Fund's fiscal year end. Details of the current contractual expense limitation in effect can be found in Note 4 of the accompanying Notes to Financial Statements.
(a) Not annualized for periods less than one year.
(b) Annualized for periods less than one year.
(c) Portfolio turnover is calculated on the basis of the Fund as a whole without distinguishing between classes of shares issued.
(d) Per share net investment income (loss) has been calculated using the average daily shares method.
See notes to financial statements.
26
USAA Mutual Funds Trust | Financial Highlights — continued | ||||||
For a Share Outstanding Throughout Each Period (continued)
Ratios to Average Net Assets | Supplemental Data | ||||||||||||||||||||||||||||||||||||||
| Total Distributions | Redemption Fees Added to Beneficial Interests | Net Asset Value, End of Period | Total Return (Excludes Sales Charges) *(a) | Net Expenses^(b) | Net Investment Income (Loss)(b) | Gross Expenses(b) | Net Assets, End of Period (000's) | Portfolio Turnover(a)(c) | |||||||||||||||||||||||||||||||
USAA Sustainable World Fund | |||||||||||||||||||||||||||||||||||||||
Institutional Shares | |||||||||||||||||||||||||||||||||||||||
| Six Months Ended November 30, 2020 (unaudited) | — | — | $ | 28.08 | 19.90 | % | 1.01 | % | 0.86 | % | 1.30 | % | $ | 6,964 | 33 | % | |||||||||||||||||||||||
| Year Ended May 31, 2020 | (10.47 | ) | — | $ | 23.42 | 7.85 | % | 1.00 | % | 1.00 | % | 1.13 | % | $ | 6,143 | 103 | %(i) | ||||||||||||||||||||||
| Year Ended May 31, 2019 | (1.87 | ) | — | $ | 30.74 | 3.29 | % | 1.05 | %(e) | 1.13 | % | 1.11 | % | $ | 12,567 | 8 | % | ||||||||||||||||||||||
| Year Ended May 31, 2018 | (1.48 | ) | — | $ | 31.75 | 6.70 | % | 1.10 | % | 1.19 | % | 1.10 | % | $ | 30,127 | 10 | % | ||||||||||||||||||||||
| Year Ended May 31, 2017 | (0.75 | ) | — | $ | 31.14 | 17.89 | % | 1.09 | % | 0.78 | % | 1.37 | % | $ | 6,877 | 12 | % | ||||||||||||||||||||||
| August 10, 2015 (f) through May 31, 2016 | (0.82 | ) | — | $ | 27.14 | (2.92 | )% | 1.10 | % | 1.11 | % | 1.54 | % | $ | 5,228 | 10 | % | ||||||||||||||||||||||
Class A shares | |||||||||||||||||||||||||||||||||||||||
| Six Months Ended November 30, 2020 (unaudited) | — | — | $ | 28.01 | 19.70 | % | 1.35 | % | 0.51 | % | 1.63 | % | $ | 7,112 | 33 | % | |||||||||||||||||||||||
| Year Ended May 31, 2020 | (10.42 | ) | — | $ | 23.40 | 7.49 | % | 1.35 | % | 0.68 | % | 1.43 | % | $ | 6,425 | 103 | %(i) | ||||||||||||||||||||||
| Year Ended May 31, 2019 | (1.86 | ) | — | $ | 30.77 | 2.98 | % | 1.35 | % | 0.76 | % | 1.46 | % | $ | 8,133 | 8 | % | ||||||||||||||||||||||
| Year Ended May 31, 2018 | (1.19 | ) | — | (g) | $ | 31.86 | 6.36 | % | 1.39 | %(h) | 0.57 | % | 1.43 | % | $ | 10,114 | 10 | % | |||||||||||||||||||||
| Year Ended May 31, 2017 | (0.71 | ) | — | (g) | $ | 31.07 | 17.50 | % | 1.42 | % | 0.45 | % | 1.42 | % | $ | 19,722 | 12 | % | |||||||||||||||||||||
| Year Ended May 31, 2016 | (0.63 | ) | — | (g) | $ | 27.13 | (2.72 | )% | 1.42 | % | 0.49 | % | 1.42 | % | $ | 16,580 | 10 | % | |||||||||||||||||||||
(e) Effective October 1, 2018, USAA Asset Management Company ("AMCO") had voluntarily agreed to limit the annual expenses of the Institutional Shares to 1.00% of the Institutional Shares' average daily net assets.
(f) Commencement of operations.
(g) Amount is less than $0.005 per share.
(h) Effective October 1, 2017, AMCO had voluntarily agreed to limit the annual expenses of the Class A shares to 1.35% of the Class A shares' average daily net assets.
(i) Reflects increased trading activity due to current year transition or asset allocation shift.
See notes to financial statements.
27
USAA Mutual Funds Trust | Notes to Financial Statements November 30, 2020 | ||||||
(Unaudited)
1. Organization:
USAA Mutual Funds Trust (the "Trust") is organized as a Delaware statutory trust and is registered under the Investment Company Act of 1940, as amended (the "1940 Act"), as an open-end investment company. The Trust is comprised of 46 funds and is authorized to issue an unlimited number of shares, which are units of beneficial interest with no par value.
The accompanying financial statements are those of the USAA Sustainable World Fund (the "Fund"). The Fund offers three classes of shares: Fund Shares, Institutional Shares and Class A shares. The Fund is classified as diversified under the 1940 Act.
Effective October 1, 2020, the Fund changed its name from USAA World Growth Fund, changed its benchmark index from the MSCI World Index to the MSCI ACWI (All-Country World Index), and made corresponding changes to its principal investment strategy to reflect the repositioning of the Fund as a sustainability fund.
Effective June 29, 2020, the Fund's Adviser Shares were redesignated Class A shares and became subject to a front-end sales charge.
Each class of shares of the Fund has substantially identical rights and privileges except with respect to sales charges, fees paid under distribution plans, expenses allocable exclusively to each class of shares, voting rights on matters solely affecting a single class of shares, and the exchange privilege of each class of shares.
Under the Trust's organizational documents, its officers and trustees are indemnified against certain liabilities arising out of the performance of their duties to the Fund. In addition, in the normal course of business, the Fund enters into contracts with its vendors and others that provide for general indemnifications. The Fund's maximum exposure under these arrangements is unknown, as this would involve future claims that may be made against the Fund. However, based on experience, the Fund expects that risk of loss to be remote.
2. Significant Accounting Policies:
The following is a summary of significant accounting policies followed by the Trust in the preparation of its financial statements. The policies are in conformity with Generally Accepted Accounting Principles in the United States of America ("GAAP"). The preparation of financial statements in accordance with GAAP requires management to make estimates and assumptions that affect the reported amounts of assets and liabilities and disclosure of contingent assets and liabilities at the date of the financial statements and the reported amounts of income and expenses for the period. Actual results could differ from those estimates. The Fund follows the specialized accounting and reporting requirements under GAAP that are applicable to investment companies under Accounting Standards Codification Topic 946.
Investment Valuation:
The Fund records investments at fair value. Fair value is defined as the price that would be received to sell an asset or paid to transfer a liability in an orderly transaction between market participants at the measurement date.
The valuation techniques described below maximize the use of observable inputs and minimize the use of unobservable inputs in determining fair value. The inputs used for valuing the Fund's investments are summarized in the three broad levels listed below:
• Level 1 — quoted prices in active markets for identical securities
• Level 2 — other significant observable inputs (including quoted prices for similar securities or interest rates applicable to those securities, etc.)
• Level 3 — significant unobservable inputs (including the Fund's own assumptions in determining the fair value of investments)
Changes in valuation techniques may result in transfers in or out of an assigned level within the disclosure hierarchy. The inputs or methodologies used for valuation techniques are not necessarily an indication of the risk associated with entering into those investments.
28
USAA Mutual Funds Trust | Notes to Financial Statements — continued November 30, 2020 | ||||||
(Unaudited)
Victory Capital Management Inc. ("VCM" or the "Adviser") has established the Pricing and Liquidity Committee (the "Committee"), and subject to the Trust's Board of Trustees (the "Board") oversight, the Committee administers and oversees the Fund's valuation policies and procedures, which are approved by the Board.
Portfolio securities listed or traded on securities exchanges, including exchange-traded funds ("ETFs"), American Depositary Receipts ("ADRs") and Rights, are valued at the closing price on the exchange or system where the security is principally traded, if available, or at the Nasdaq Official Closing Price. If there have been no sales for that day on the exchange or system, then a security is valued at the last available bid quotation on the exchange or system where the security is principally traded. In each of these situations, valuations are typically categorized as Level 1 in the fair value hierarchy.
Investments in open-end investment companies are valued at their net asset value ("NAV"). These valuations are typically categorized as Level 1 in the fair value hierarchy.
In the event that price quotations or valuations are not readily available, are not reflective of market value, or a significant event has been recognized in relation to a security or class of securities, the securities are valued in good faith by the Committee in accordance with valuation procedures approved by the Board. These valuations are typically categorized as Level 2 or Level 3 in the fair value hierarchy, based on the observability of inputs used to determine the fair value. The effect of fair value pricing is that securities may not be priced on the basis of quotations from the primary market in which they are traded and the actual price realized from the sale of a security may differ materially from the fair value price. Valuing these securities at fair value is intended to cause the Fund's NAV to be more reliable than it otherwise would be.
In accordance with procedures adopted by the Board, fair value pricing may be used if events materially affecting the value of foreign securities occur between the time the exchange on which they are traded closes and the time the Fund's NAV is calculated. The Fund uses a systematic valuation model, provided daily by an independent third party to fair value its international equity securities. The valuations are considered as Level 2 in the fair value hierarchy.
A summary of the valuations as of November 30, 2020, based upon the three levels defined above, is included in the table below while the breakdown, by category, of investments is disclosed on the Schedule of Portfolio Investments (amounts in thousands):
Level 1 | Level 2 | Level 3 | Total | ||||||||||||||||
Common Stocks | $ | 803,770 | $ | 562,849 | $ | — | $ | 1,366,619 | |||||||||||
Warrants | 11 | — | — | 11 | |||||||||||||||
Exchange-Traded Funds | 2,099 | — | — | 2,099 | |||||||||||||||
Total | $ | 805,880 | $ | 562,849 | $ | — | $ | 1,368,729 | |||||||||||
For the six months ended November 30, 2020, there were no transfers in or out of the Level 3 fair value hierarchy.
Real Estate Investment Trusts ("REITs"):
The Fund may invest in REITs, which report information on the source of their distributions annually. REITs are pooled investment vehicles that invest primarily in income producing real estate or real estate related loans or interests (such as mortgages). Certain distributions received from REITs during the year are recorded as realized gains or return of capital as estimated by the Fund or when such information becomes known.
Investment Companies:
Exchange-Traded Funds:
The Fund may invest in ETFs, the shares of which are bought and sold on a securities exchange. An ETF trades like common stock and represents a portfolio of securities designed to track the performance and dividend yield of a particular domestic or foreign market index. The Fund may purchase shares of an ETF to temporarily gain exposure to a portion of the U.S. or a foreign market while awaiting purchase
29
USAA Mutual Funds Trust | Notes to Financial Statements — continued November 30, 2020 | ||||||
(Unaudited)
of underlying securities. The risks of owning an ETF generally reflect the risks of owning the underlying securities they are designed to track, although the lack of liquidity of an ETF could result in it being more volatile. Additionally, ETFs have fees and expenses that reduce their value.
Open-End Funds:
The Fund may invest in portfolios of open-end investment companies. These investment companies value securities in their portfolios for which market quotations are readily available at their market values (generally the last reported sale price) and all other securities and assets at their fair value by the methods established by the board of directors of the underlying funds.
Foreign Exchange Currency Contracts:
The Fund may enter into foreign exchange currency contracts to convert U.S. dollars to and from various foreign currencies. A foreign exchange currency contract is an obligation by the Fund to purchase or sell a specific currency at a future date at a price (in U.S. dollars) set at the time of the contract. The Fund does not engage in "cross-currency" foreign exchange contracts (i.e., contracts to purchase or sell one foreign currency in exchange for another foreign currency). The Fund's foreign exchange currency contracts might be considered spot contracts (typically a contract of one week or less) or forward contracts (typically a contract term over one week). A spot contract is entered into for purposes of hedging against foreign currency fluctuations relating to a specific portfolio transaction, such as the delay between a security transaction trade date and settlement date. Forward contracts are entered into for purposes of hedging portfolio holdings or concentrations of such holdings. Each foreign exchange currency contract is adjusted daily by the prevailing spot or forward rate of the underlying currency, and any appreciation or depreciation is recorded for financial statement purposes as unrealized until the contract settlement date, at which time the Fund records realized gains or losses equal to the difference between the value of a contract at the time it was opened and the value at the time it was closed. The Fund could be exposed to risk if a counterparty is unable to meet the terms of a foreign exchange currency contract or if the value of the foreign currency changes unfavorably. In addition, the use of foreign exchange currency contracts does not eliminate fluctuations in the underlying prices of the securities. As of November 30, 2020, the Fund had no open forward foreign exchange currency contracts.
Investment Transactions and Related Income:
Changes in holdings of investments are accounted for no later than one business day following the trade date. For financial reporting purposes, however, investment transactions are accounted for on trade date on the last business day of the reporting period. Interest income is determined on the basis of coupon interest accrued using the effective interest method which adjusts, where applicable, the amortization of premiums or accretion of discount. Gains or losses realized on sales of securities are determined by comparing the identified cost of the security lot sold with the net sales proceeds.
Withholding taxes on interest, dividends, and gains as a result of certain investments in ADRs by the Fund has been provided for in accordance with each investment's applicable country's tax rules and rates.
Securities Lending:
The Fund, through a securities lending agreement with Citibank, N.A. ("Citibank"), may lend its securities to qualified financial institutions, such as certain broker-dealers, to earn additional income, net of income retained by Citibank. Borrowers are required to secure their loans for collateral in the amount of at least 102% of the value of U.S. securities loaned or at least 105% of the value of non-U.S. securities loaned, marked-to-market daily. Any collateral shortfalls associated with increases in the valuation of the securities loaned are cured the next business day once the shortfall exceeds $100 thousand. Collateral may be cash, U.S. government securities, or other securities as permitted by Securities and Exchange Commission ("SEC") guidelines. Cash collateral may be invested in high-quality short-term investments, primarily open-end investment companies. Collateral requirements are determined daily based on the value of the Fund's securities on loan as of the end of the prior business day. During the
30
USAA Mutual Funds Trust | Notes to Financial Statements — continued November 30, 2020 | ||||||
(Unaudited)
time portfolio securities are on loan, the borrower will pay the Fund any dividends or interest paid on such securities plus any fee negotiated between the parties to the lending agreement. The Fund also earns a return from the collateral. The Fund pays Citibank various fees in connection with the investment of cash collateral and fees based on the investment income received from securities lending activities. Securities lending income (net of these fees) is disclosed on the Statement of Operations. Loans are terminable upon demand and the borrower must return the loaned securities within the lesser of one standard settlement period or five business days. Risks relating to securities-lending transactions include that the borrower may not provide additional collateral when required or return the securities when due, and that the value of the short-term investments will be less than the amount of cash collateral required to be returned to the borrower. The Fund's agreement with Citibank does not include master netting provisions. Noncash collateral received by the Fund may not be sold or re-pledged, except to satisfy borrower default. Cash collateral is listed on the Fund's Schedule of Portfolio Investments and Financial Statements while non-cash collateral is not included.
At November 30, 2020, the Fund had no securities on loan.
Foreign Currency Translations:
The accounting records of the Fund are maintained in U.S. dollars. Investment securities and other assets and liabilities of the Fund denominated in a foreign currency are translated into U.S. dollars at current exchange rates. Purchases and sales of securities, income receipts, and expense payments are translated into U.S. dollars at the exchange rates on the date of the transactions. The Fund does not isolate the portion of the results of operations resulting from changes in foreign exchange rates on investments from fluctuations arising from changes in market prices of securities held. Such fluctuations are disclosed as net change in unrealized appreciation/depreciation on investments and foreign currency translations on the Statement of Operations. Any realized gains or losses from these fluctuations, including foreign currency arising from in-kind redemptions, are disclosed as net realized gains or losses from investment transactions and foreign currency translations on the Statement of Operations.
Foreign Taxes:
The Fund may be subject to foreign taxes related to foreign income received (a portion of which may be reclaimable), capital gains on the sale of securities, and certain foreign currency transactions. All foreign taxes are recorded in accordance with the applicable regulations and rates that exist in the foreign jurisdictions in which the Fund invests.
Federal Income Taxes:
It is the Fund's policy to continue to qualify as a regulated investment company by complying with the provisions available to certain investment companies, as defined in applicable sections of the Internal Revenue Code, and to make distributions of net investment income and net realized gains sufficient to relieve it from all, or substantially all, federal income taxes. Accordingly, no provision for federal income taxes is required in the financial statements. The Fund has a tax year end of May 31.
Management of the Fund has reviewed tax positions taken in tax years that remain subject to examination by all major tax jurisdictions, including federal (i.e., the last four tax years, which includes the current fiscal tax year end). Management believes that there is no tax liability resulting from unrecognized tax benefits related to uncertain tax positions taken.
Allocations:
Expenses directly attributable to the Fund are charged to the Fund, while expenses that are attributable to more than one fund in the Trust, or jointly with an affiliated trust, are allocated among the respective funds in the Trust and/or affiliated trust based upon net assets or another appropriate basis.
Income, expenses (other than class-specific expenses such as transfer agent fees, state registration fees, 12b-1 fees, and printing fees), and realized and unrealized gains or losses on investments are allocated to each class of shares based on its relative net assets on the date income is earned or expenses and realized and unrealized gains and losses are incurred.
31
USAA Mutual Funds Trust | Notes to Financial Statements — continued November 30, 2020 | ||||||
(Unaudited)
3. Purchases and Sales:
Cost of purchases and proceeds from sales/maturities of securities (excluding securities maturing less than one year from acquisition) for the six months ended November 30, 2020, were as follows for the Fund (amounts in thousands):
| Purchases (excluding U.S. Government Securities) | Sales (excluding U.S. Government Securities) | ||||||
| $ | 418,231 | $ | 513,158 | ||||
There were no purchases and sales of U.S. government securities during the six months ended November 30, 2020
4. Fees and Transactions with Affiliates and Related Parties:
Investment Advisory Fees:
Investment advisory services are provided to the Fund by the Adviser, which is a New York corporation registered as an investment adviser with the SEC. The Adviser is a wholly-owned indirect subsidiary of Victory Capital Holdings, Inc., a publicly traded Delaware corporation, and a wholly-owned direct subsidiary of Victory Capital Operating, LLC. Under the terms of the Investment Advisory Agreement, the Adviser is entitled to receive a base fee and a performance adjustment. The Fund's base fee is accrued daily and paid monthly at an annualized rate of 0.75% of the Fund's average daily net assets. Amounts incurred and paid to VCM for the six months ended November 30, 2020, are reflected on the Statement of Operations as Investment Advisory fees.
On November 6, 2018, United Services Automobile Association ("USAA"), the parent company of USAA Asset Management Company ("AMCO"), the prior investment adviser to the Fund announced that AMCO would be acquired by Victory Capital Holdings Inc. (the "Transaction"). A special shareholder meeting was held on April 18, 2019, at which shareholders of the Fund approved a new investment advisory agreement between the Trust, on behalf of the Fund, and Victory Capital Management Inc. ("Victory Capital"). The Transaction closed on July 1, 2019. Effective July 1, 2019, VCM replaced AMCO as the investment adviser to the Fund and no performance adjustments were made for the periods beginning July 1, 2019, through June 30, 2020. Only performance beginning as of July 1, 2019, and thereafter is utilized in calculating future performance adjustments.
The performance adjustment for each share class is accrued daily and calculated monthly by comparing each class' performance to that of the Lipper Global Funds Index. The Lipper Global Funds Index tracks the total return performance of funds within the Lipper Global Funds Index category.
The performance period for each share class consists of the current month plus the previous 35 months (or the number of months beginning July 1, 2019, if fewer). The following table is utilized to determine the extent of the performance adjustment:
| Over/Under Performance Relative to Index (in basis points)(a) | Annual Adjustment Rate (in basis points)(a) | ||||||
+/- 100 to 400 | +/- 4 | ||||||
+/- 401 to 700 | +/- 5 | ||||||
+/- 701 and greater | +/- 6 | ||||||
(a) Based on the difference between average annual performance of the relevant share class of the Fund and its relevant Lipper index, rounded to the nearest basis point. Average daily net assets of the share class are calculated over a rolling 36 month period.
32
USAA Mutual Funds Trust | Notes to Financial Statements — continued November 30, 2020 | ||||||
(Unaudited)
Each class' annual performance adjustment rate is multiplied by the average daily net assets of each respective class over the entire performance period, which is then multiplied by a fraction, the numerator of which is the number of days in the month and the denominator of which is 365 (366 in leap years). The resulting amount is then added to (in the case of overperformance), or subtracted from (in the case of underperformance) the base fee.
Under the performance fee arrangement, each class pays a positive performance fee adjustment for a performance period whenever the class outperforms the Lipper Global Funds Index over that period, even if the class has overall negative returns during the performance period.
For the period July 1, 2020 through November 30, 2020, performance adjustments for Fund Shares, Institutional Shares and Class A shares were $44, less than $1 thousand and less than $(1) thousand, respectively. For the Fund Shares, Institutional Shares and Class A shares the performance adjustments were 0.01%, 0.01% and less than (0.01)% of average daily net assets, respectively.
The Trust relies on an exemptive order granted to VCM and its affiliated funds by the SEC in March 2019 permitting the use of a "manager-of-managers" structure for certain funds. Under a manager-of-managers structure, the investment adviser may select (with approval of the Board and without shareholder approval) one or more subadvisers to manage the day-to-day investment of a fund's assets.
VCM entered into an Investment Subadvisory Agreement with MFS Investment Management ("MFS"), under which MFS directs the investment and reinvestment of the Fund's assets (as allocated from time to time by VCM). This arrangement provides for monthly fees that are paid by VCM. VCM (not the Fund) pays the subadviser fees.
Administration and Servicing Fees:
VCM serves as the Fund's administrator and fund accountant. Under the Administration, Servicing and Accounting Agreement, VCM is paid for its services an annual fee at a rate of 0.15% of average daily net assets for both Fund Shares and Class A shares, and 0.10% of average daily net assets of the Institutional Shares. Amounts incurred for the six months ended November 30, 2020, are reflected on the Statement of Operations as Administration fees.
The Fund (as part of the Trust) has entered into an agreement to provide compliance services with the Adviser, pursuant to which the Adviser furnishes its compliance personnel, including the services of the Chief Compliance Officer ("CCO"), and other resources reasonably necessary to provide the Trust with compliance oversight services related to the design, administration and oversight of a compliance program for the Trust in accordance with Rule 38a-1 under the 1940 Act. The CCO is an employee of the Adviser, which pays the compensation of the CCO and support staff. Funds in the Trust, Victory Variable Insurance Funds, Victory Portfolios, and Victory Portfolios II (collectively, the "Victory Funds Complex") in the aggregate, compensate the Adviser for these services. Amounts incurred for the six months ended November 30, 2020, are reflected on the Statement of Operations as Compliance fees.
Citi Fund Services Ohio, Inc. ("Citi"), an affiliate of Citibank, acts as sub-administrator and sub-fund accountant to the Fund pursuant to a Sub-Administration and Sub-Fund Accounting Services Agreement between VCM and Citi. VCM pays Citi a fee for providing these services. The Trust reimburses VCM and Citi for out-of-pocket expenses incurred in providing these services and certain other expenses specifically allocated to the Funds. Amounts incurred for the six months ended November 30, 2020, are reflected on the Statement of Operations as Sub-Administration fees.
Transfer Agency Fees:
Victory Capital Transfer Agency, Inc. ("VCTA") provides transfer agency services to the Fund. VCTA, an affiliate of the Adviser, provides transfer agent services to the Fund Shares based on an annual charge of $23 per shareholder account plus out-of-pocket expenses. VCTA pays a portion of these fees to certain intermediaries for the administration and servicing of accounts that are held with such intermediaries. Transfer agent's fees for Institutional Shares and Class A shares are paid monthly based on a fee accrued daily at an annualized rate of 0.10%, of average daily net assets, plus out-of-pocket
33
USAA Mutual Funds Trust | Notes to Financial Statements — continued November 30, 2020 | ||||||
(Unaudited)
expenses. Amounts incurred and paid to VCTA for the six months ended November 30, 2020, are reflected on the Statement of Operations as Transfer Agent fees.
FIS Investor Services LLC serves as sub-transfer agent and dividend disbursing agent for the Fund pursuant to a Sub-Transfer Agent agreement between VCTA and FIS Investor Services LLC. VCTA provides FIS Investor Services LLC a fee for providing these services.
Distributor/Underwriting Services:
Victory Capital Services, Inc. (the "Distributor"), an affiliate of the Adviser, serves as distributor for the continuous offering of the shares of the Fund pursuant to a Distribution Agreement between the Distributor and the Trust. Effective June 30, 2020, the Distributor's name was changed from Victory Capital Advisers, Inc.
Pursuant to the Distribution and Service Plans adopted in accordance with Rule 12b-1 under the 1940 Act, the Distributor may receive a monthly distribution and service fee, at an annual rate of up to 0.25% of the average daily net assets of Class A shares. The distribution and service fees paid to the Distributor may be used by the Distributor to pay for activity primarily intended to result in the sale of Class A shares of the Fund. Amounts incurred and paid to VCTA for the six months ended November 30, 2020, are reflected on the Statement of Operations as 12b-1 fees.
In addition, the Distributor is entitled to receive commissions on sales of the Class A shares of the Fund. For the six months ended November 30, 2020, the Distributor did not receive any commissions.
Other Fees:
Citibank serves as the Fund's custodian. The Fund pays Citibank a fee for providing these services. Amounts incurred for the six months ended November 30, 2020, are reflected on the Statement of Operations as Custodian fees.
K&L Gates LLP provides legal services to the Trust.
The Adviser has entered into an expense limitation agreement with the Fund until at least September 30, 2021. Under the terms of the agreement, the Adviser has agreed to waive fees or reimburse certain expenses to the extent that ordinary operating expenses incurred by certain classes of the Fund in any fiscal year exceed the expense limit for such classes of the Fund. Such excess amounts will be the liability of the Adviser. Interest, taxes, brokerage commissions, other expenditures, which are capitalized in accordance with GAAP, and other extraordinary expenses not incurred in the ordinary course of the Fund's business are excluded from the expense limits. As of November 30, 2020, the expense limits (excluding voluntary waivers) are 1.09%, 1.00%, and 1.35% for Fund Shares, Institutional Shares and Class A shares, respectively.
Under this expense limitation agreement, the Fund has agreed to repay fees and expenses that were waived or reimbursed by the Adviser for a period up to three years after the fiscal year in which the waiver or reimbursement took place, subject to the lesser of any operating expense limits in effect at the time of: (a) the original waiver or expense reimbursement; or (b) the recoupment, after giving effect to the recoupment amount. As of November 30, 2020, the following amounts are available to be repaid to the Adviser (amounts in thousands). The Fund has not recorded any amounts available to be repaid as a liability due to an assessment that such repayment is not probable at November 30, 2020.
| Expires May 31, 2023 | Expires May 31, 2024 | Total | |||||||||
| $ | 14 | $ | 18 | $ | 32 | ||||||
The Adviser may voluntarily waive or reimburse additional fees to assist the Fund in maintaining competitive expense ratios. Voluntary waivers and reimbursements applicable to the Fund are not available to be recouped at a future time. There were no voluntary waivers or reimbursements for the six months ended November 30, 2020.
Certain officers and/or interested trustees of the Fund are also officers and/or employees of the Adviser, Administrator, Sub-Administrator, Sub-Fund Accountant, and Legal.
34
USAA Mutual Funds Trust | Notes to Financial Statements — continued November 30, 2020 | ||||||
(Unaudited)
5. Risks:
The Fund may be subject to other risks in addition to these identified risks.
Geopolitical/Natural Disaster Risk — Global economies and financial markets are increasingly interconnected, which increases the possibilities that conditions in one country or region might adversely affect issuers in another country or region. Geopolitical and other risks, including war, terrorism, trade disputes, political or economic dysfunction within some nations, public health crises and related geopolitical events, as well as environmental disasters such as earthquakes, fires, and floods, may add to instability in world economies and markets generally. Changes in trade policies and international trade agreements could affect the economies of many countries in unpredictable ways. Likewise, systemic market dislocations of the kind that occurred during the financial crisis that began in 2008, if repeated, would be highly disruptive to economies and markets, adversely affecting individual companies and industries, securities markets, interest rates, credit ratings, inflation, investor sentiment, and other factors affecting the value of a Fund's investments. Some countries, including the United States, are adopting more protectionist trade policies and moving away from the tighter financial industry regulations that followed the 2008 financial crisis, which may also affect the value of a Fund's investments.
Political events within the United States at times have resulted, and may in the future result, in a shutdown of government services, which could negatively affect the U.S. economy, decrease the value of a Fund's investments, increase uncertainty in or impair the operation of the U.S. or other securities markets and degrade investor and consumer confidence, perhaps suddenly and to a significant degree.
An outbreak of disease called COVID-19 has spread internationally. The transmission of COVID-19 and efforts to contain its spread have resulted in international, national and local border closings and other significant travel restrictions and disruptions, significant disruptions to business operations, supply chains and consumer activity, significant challenges in healthcare service preparation and delivery, quarantines and general concern and uncertainty. These negative impacts have caused significant volatility and declines in global financial markets, which have caused losses for Fund investors during and subsequent to period end. The impact of the COVID-19 pandemic last for an extended period of time, and could result in a substantial economic downturn or recession. Public health crises may exacerbate other pre-existing political, social, economic, market and financial risks. The extent of the impact to the financial performance of the Funds' investments will depend on future developments, including (i) the duration and spread of the outbreak, (ii) the restrictions and advisories, (iii) the effects on the financial markets, and (iv) the effects on the economy overall, all of which are highly uncertain and cannot be predicted.
Stock Market Risk — Overall stock market risks may affect the value of the Fund. Domestic and international factors such as political events, war, trade disputes, interest rate levels and other fiscal and monetary policy changes, pandemics and other public health crises, and related geopolitical events, as well as environmental disasters such as earthquakes, fires, and floods, may add to instability in world economies and markets generally. The impact of these and other factors may be short-term or may last for extended periods.
Equity Risk — The value of the equity securities in which the Fund invests may decline in response to developments affecting individual companies and/or general economic conditions. A company's earnings or dividends may not increase as expected due to poor management decisions, competitive pressures, breakthroughs in technology, reliance on suppliers, labor problems or shortages, corporate restructurings, fraudulent disclosures, natural disasters, military confrontations, war, terrorism, public health crises, or other events, conditions, and factors. Price changes may be temporary or last for extended periods.
Foreign Securities Risk — Foreign markets can be more volatile than the U.S. market due to increased risks of adverse issuer, political, regulatory, market, or economic developments and can perform differently from the U.S. market.
35
USAA Mutual Funds Trust | Notes to Financial Statements — continued November 30, 2020 | ||||||
(Unaudited)
6. Borrowing and Interfund Lending:
Line of Credit:
For the six months ended November 30, 2020, the Victory Funds Complex participated in a short-term demand note "Line of Credit" agreement with Citibank. The Line of Credit agreement with Citibank was renewed on June 29, 2020 with a termination date of June 28, 2021. Under the agreement with Citibank, the Victory Funds Complex may borrow up to $600 million, of which $300 million is committed and $300 million is uncommitted. $40 million of the Line of Credit is reserved for use by the Victory Floating Rate Fund, another series of the Victory Funds Complex, with that Fund paying the related commitment fees for that amount. The purpose of the agreement is to meet temporary or emergency cash needs. For the six months ended November 30, 2020, Citibank received an annual commitment fee of 0.15% on $300 million for providing the Line of Credit. Each fund in the Victory Funds Complex pays a pro-rata portion of the commitment fees plus any interest (one month LIBOR plus one percent) on amounts borrowed. Effective June 29, 2020, under an amended Line of Credit agreement, Citibank will also receive an annual upfront fee of 0.10% on the $300 million committed line of credit. Each fund in the Victory Funds Complex will pay a pro-rata portion of the upfront fee. Interest charged to each Fund during the period, if applicable, is reflected on the Statements of Operations under Line of credit fees.
The Fund had no borrowings under the Line of Credit agreement during the six months ended November 30, 2020.
Interfund Lending:
The Trust and Adviser rely on an exemptive order granted by the SEC in March 2017 (the "Order"), permitting the establishment and operation of an Interfund Lending Facility (the "Facility"). The Facility allows the Fund to directly lend and borrow money to or from any other Fund, that is permitted to participate in the Facility, in the Victory Funds Complex relying upon the Order at rates beneficial to both the borrowing and lending funds. Advances under the Facility are allowed for temporary or emergency purposes. The interfund loan rate is determined, as specified in the Order, by averaging the current repurchase agreement rate and the current bank loan rate. As a Borrower, interest charged to the Fund, if any, during the period is reflected on the Statement of Operations under Interfund lending fees. As a Lender, interest earned by the Fund, if any, during the period is reflected on the Statement of Operations under Income on Interfund lending.
The average borrowing or lending for the days outstanding and average interest rate for the Fund during the six months ended November 30, 2020 were as follows (amounts in thousands):
| Borrower or Lender | Amount Outstanding at November 30, 2020 | Average Borrowing* | Days Borrowing Outstanding | Average Interest Rate* | Maximum Borrowing During the Period | ||||||||||||||||||
| Borrower | $ | — | $ | 732 | 1 | 0.61 | % | $ | 732 | ||||||||||||||
* For the six months ended November 30, 2020, based on the number of days borrowings were outstanding.
7. Federal Income Tax Information:
The Fund intends to declare and distribute any net investment income annually. Distributable net realized gains, if any, are declared and paid at least annually.
The amounts of dividends from net investment income and distributions from net realized gains (collectively distributions to shareholders) are determined in accordance with federal income tax regulations, which may differ from GAAP. To the extent these "book/tax" differences are permanent in nature (e.g., net operating loss and distribution reclassification), such amounts are reclassified within the components of net assets based on their federal tax-basis treatment; temporary
36
USAA Mutual Funds Trust | Notes to Financial Statements — continued November 30, 2020 | ||||||
(Unaudited)
differences (e.g., wash sales) do not require reclassification. To the extent dividends and distributions exceed net investment income and net realized gains for tax purposes, they are reported as distributions of capital.
Net investment losses incurred by the Fund may be reclassified as an offset to capital on the accompanying Statement of Assets and Liabilities.
The tax character of current year distributions paid and the tax basis of the current components of accumulated earnings (deficit) will be determined at the end of the current tax year ending May 31, 2021.
37
USAA Mutual Funds Trust | Supplemental Information November 30, 2020 | ||||||
(Unaudited)
Proxy Voting and Portfolio Holdings Information
Proxy Voting:
Information regarding the policies and procedures the Fund uses to determine how to vote proxies relating to portfolio securities is available without charge, upon request, by calling (800) 539-3863. The information is also included in the Fund's Statement of Additional Information, which is available on the SEC's website at www.sec.gov.
Information relating to how the Fund voted proxies relating to portfolio securities held during the most recent 12 months ended June 30 is available on the SEC's website at www.sec.gov.
Availability of Schedules of Portfolio Investments:
The Trust files a complete list of Schedules of Portfolio Investments with the SEC for the first and third quarter of each fiscal year on Form N-PORT. Form N-PORT is available on the SEC's website at www.sec.gov.
Expense Examples
As a shareholder of the Fund, you may incur two types of costs: (1) transaction costs, including sales charges (loads) on purchases; and (2) ongoing costs, including management fees and other Fund expenses. These examples are intended to help you understand your ongoing costs (in dollars) of investing in the Fund and to compare these costs with the ongoing costs of investing in other mutual funds.
These examples are based on an investment of $1,000 invested at the beginning of the period and held for the entire period from June 1, 2020 through November 30, 2020.
The Actual Expense figures in the table below provide information about actual account values and actual expenses. You may use the information below, together with the amount you invested, to estimate the expenses that you paid over the period. Simply divide your account value by $1,000 (for example, an $8,600 account value divided by $1,000 = 8.6), then multiply the result by the number in the table under the heading entitled "Actual Expenses Paid During Period" to estimate the expenses you paid on your account during this period.
The Hypothetical Expense figures in the table below provide information about hypothetical account values and hypothetical expenses based on the Fund's actual expense ratio and an assumed rate of return of 5% per year before expenses, which is not the Fund's actual return. The hypothetical account values and expenses may not be used to estimate the actual ending account balance or expenses you paid for the period. You may use this information to compare this 5% hypothetical example with the 5% hypothetical examples that appear in shareholder reports of other funds.
Please note the expenses shown in the table below are meant to highlight your ongoing costs only and do not reflect any transactional costs. If these transactional costs were included, your costs would have been higher.
| Beginning Account Value 6/1/20 | Actual Ending Account Value 11/30/20 | Hypothetical Ending Account Value 11/30/20 | Actual Expenses Paid During Period 6/1/20- 11/30/20* | Hypothetical Expenses Paid During Period 6/1/20- 11/30/20* | Annualized Expense Ratio During Period 6/1/20- 11/30/20 | ||||||||||||||||||||||
Fund Shares | $ | 1,000.00 | $ | 1,198.90 | $ | 1,019.70 | $ | 5.90 | $ | 5.42 | 1.07 | % | |||||||||||||||
Institutional Shares | 1,000.00 | 1,199.00 | 1,020.00 | 5.57 | 5.11 | 1.01 | % | ||||||||||||||||||||
Class A shares | 1,000.00 | 1,197.00 | 1,018.30 | 7.44 | 6.83 | 1.35 | % | ||||||||||||||||||||
* Expenses are equal to the average account value multiplied by the Fund's annualized expense ratio multiplied by 183/365 (the number of days in the most recent fiscal half-year divided by the number of days in the fiscal year).
38
USAA Mutual Funds Trust | Supplemental Information — continued November 30, 2020 | ||||||
(Unaudited)
For the period July 1, 2020 to November 30, 2020, performance adjustments were applied to the Fund. The annualized expense ratio of 1.01% for the Institutional Shares as represented in the table above, reflect these adjustments. The values in the table below reflect your costs (in dollars) of investing in the Fund, had these adjustments not been applied for the six months ended November 30, 2020.
| Beginning Acount Value 6/1/20 | Actual Ending Acount Value 11/30/20 | Hypothetical Ending Acount Value 11/30/20 | Actual Expenses Paid During Period 6/1/20- 11/30/20* | Hypothetical Expenses Paid During Period 6/1/20- 11/30/20* | Annualized Expense Ratio During Period 6/1/20- 11/30/20 | ||||||||||||||||||||||
Institutional Shares | $ | 1,000.00 | $ | 1,199.00 | $ | 1,020.05 | $ | 5.51 | $ | 5.06 | 1.00 | % | |||||||||||||||
39
Privacy Policy
Protecting the Privacy of Information
The Trust respects your right to privacy. We also know that you expect us to conduct and process your business in an accurate and efficient manner. To do so, we must collect and maintain certain personal information about you. This is the information we collect from you on applications or other forms, and from the transactions you make with us or third parties. It may include your name, address, social security number, account transactions and balances, and information about investment goals and risk tolerance.
We do not disclose any information about you or about former customers to anyone except as permitted or required by law. Specifically, we may disclose the information we collect to companies that perform services on our behalf, such as the transfer agent that processes shareholder accounts and printers and mailers that assist us in the distribution of investor materials. We may also disclose this information to companies that perform marketing services on our behalf. This allows us to continue to offer you Victory investment products and services that meet your investing needs, and to effect transactions that you request or authorize. These companies will use this information only in connection with the services for which we hired them. They are not permitted to use or share this information for any other purpose.
To protect your personal information internally, we permit access only by authorized employees and maintain physical, electronic and procedural safeguards to guard your personal information.*
* You may have received communications regarding information about privacy policies from other financial institutions which gave you the opportunity to "opt-out" of certain information sharing with companies which are not affiliated with that financial institution. The Trust does not share information with other companies for purposes of marketing solicitations for products other than the Trust. Therefore, the Trust does not provide opt-out options to their shareholders.
P.O. Box 182593
Columbus, Ohio 43218-2593

Visit our website at: | Call | ||||||
vcm.com | (800) 235-8396 | ||||||
23412-0121
Item 2. Code of Ethics.
Not applicable – only for annual reports.
Item 3. Audit Committee Financial Expert.
Not applicable – only for annual reports.
Item 4. Principal Accountant Fees and Services.
Not applicable – only for annual reports.
Item 5. Audit Committee of Listed Registrants.
Not applicable.
Item 6. Investments.
(a) Not applicable.
(b) Not applicable.
Item 7. Disclosure of Proxy Voting Policies and Procedures for Closed-End Management Investment Companies.
Not applicable.
Item 8. Portfolio Managers of Closed-End Management Investment Companies.
Not applicable.
Item 9. Purchases of Equity Securities by Closed-End Management Investment Company and Affiliated Purchasers.
Not applicable.
Item 10. Submission of Matters to a Vote of Security Holders.
Not applicable.
Item 11. Controls and Procedures.
(a)The registrant’s principal executive officer and principal financial officer have concluded, based on their evaluation of the registrant's disclosure controls and procedures as conducted within 90 days of the filing date of this report, that these disclosure controls and procedures are adequately designed and are operating effectively to ensure that information required to be disclosed by the registrant on Form N-CSR is recorded, processed, summarized and reported within the time periods specified in the Securities and Exchange Commission's rules and forms.
(b)There were no changes in the registrant’s internal control over financial reporting (as defined in Rule 30a-3(d) under the Investment Company Act of 1940 (17 CFR 270.30a-3(d)) that occurred during the period covered by this report that have materially affected or are reasonably likely to materially affect, the registrant’s internal control over financial reporting.
Item 12. Disclosure of Securities Lending Activities for Closed-End Management Investment Companies.
(a)(1) Not applicable.
(a)(2) Not applicable.
(a)(3) Not applicable.
(a)(4) Not applicable.
(b) Not applicable.
Item 13. Exhibits.
(a)(1) Not applicable.
(a)(2) Certifications pursuant to Rule 30a-2(a) are attached hereto.
(a)(3) Not applicable.
(a)(4) Not applicable.
(b) Certifications pursuant to Rule 30a-2(b) are furnished herewith.
SIGNATURES
Pursuant to the requirements of the Securities Exchange Act of 1934 and the Investment Company Act of 1940, the registrant has duly caused this report to be signed on its behalf by the undersigned, thereunto duly authorized.
| (Registrant) | USAA Mutual Fund Trust |
| By (Signature and Title)* | /s/ James K. De Vries | |
| James K. De Vries, Principal Financial Officer |
| Date | February 4, 2021 |
Pursuant to the requirements of the Securities Exchange Act of 1934 and the Investment Company Act of 1940, this report has been signed below by the following persons on behalf of the registrant and in the capacities and on the dates indicated.
| By (Signature and Title)* | /s/ Christopher K. Dyer | |
| Christopher K. Dyer, Principal Executive Officer |
| Date | February 4, 2021 |
| By (Signature and Title)* | /s/ James K. De Vries | |
| James K. De Vries, Principal Financial Officer |
| Date | February 4, 2021 |