UNITED STATES
SECURITIES AND EXCHANGE COMMISSION
Washington, D.C. 20549
FORM N-CSR
CERTIFIED SHAREHOLDER REPORT OF REGISTERED
MANAGEMENT INVESTMENT COMPANIES
Investment Company Act file number: 811-07852
USAA Mutual Funds Trust
(Exact name of registrant as specified in charter)
15935 La Cantera Pkwy, Building Two, San Antonio, Texas 78256
(Address of principal executive offices) (Zip code)
Citi Fund Services Ohio, Inc., 4400 Easton Commons, Suite 200, Columbus, Ohio 43219
(Name and address of agent for service)
Registrant’s telephone number, including area code: 800-235-8396
Date of fiscal year end: March 31
Date of reporting period: March 31, 2021
Item 1. Reports to Stockholders.

MARCH 31, 2021
Annual Report
USAA Global Equity Income Fund
As permitted by regulations adopted by the Securities and Exchange Commission, paper copies of the Fund's shareholder reports may no longer be sent by mail, unless you specifically request paper copies of the reports from the Fund or from your financial intermediary, such as a broker-dealer or bank. Instead, the reports will be made available on VictoryFunds.com, and you will be notified by mail each time a report is posted and provided with a website link to access the report. If you already elected to receive shareholder reports electronically, you will not be affected by this change and you need not take any action.
You may elect to receive shareholder reports and other communications from the Fund or your financial intermediary electronically by notifying your financial intermediary directly, or if you are a shareholder who has an account directly with the Fund, by calling (800) 235-8396 or by submitting your request via email to TA.Processing@FISGlobal.com.
You may elect to receive all future reports in paper form free of charge. You can inform the Fund or your financial intermediary that you wish to continue receiving paper copies of your shareholder reports by notifying your financial intermediary directly, or if you are a shareholder who has an account directly with the Fund, by calling (800) 235-8396 or by submitting your request via email to TA.Processing@FISGlobal.com. Your election to receive reports in paper will apply to all funds held with the USAA Mutual Funds or your financial intermediary.
Victory Capital means Victory Capital Management Inc., the investment adviser of the USAA Mutual Funds. USAA Mutual Funds are distributed by Victory Capital Services, Inc., member of FINRA, an affiliate of Victory Capital. Victory Capital and its affiliates are not affiliated with United Services Automobile Association or its affiliates. USAA and the USAA logos are registered trademarks and the USAA Mutual Funds and USAA Investments logos are trademarks of United Services Automobile Association and are being used by Victory Capital and its affiliates under license.
www.vcm.com
News, Information And Education 24 Hours A Day, 7 Days A Week
The Victory Funds site gives fund shareholders, prospective shareholders, and investment professionals a convenient way to access fund information, get guidance, and track fund performance anywhere they can access the Internet. The site includes:
• Detailed performance records
• Daily share prices
• The latest fund news
• Investment resources to help you become a better investor
• A section dedicated to investment professionals
Whether you're a potential investor searching for the fund that matches your investment philosophy, a seasoned investor interested in planning tools, or an investment professional, www.vcm.com has what you seek. Visit us anytime. We're always open.
USAA Mutual Funds Trust
TABLE OF CONTENTS
Shareholder Letter (Unaudited) | 2 | ||||||
Managers' Commentary (Unaudited) | 4 | ||||||
Investment Overview (Unaudited) | 6 | ||||||
| Investment Objective & Portfolio Holdings (Unaudited) | 7 | ||||||
Schedule of Portfolio Investments | 9 | ||||||
Financial Statements | |||||||
Statement of Assets and Liabilities | 18 | ||||||
Statement of Operations | 19 | ||||||
Statements of Changes in Net Assets | 20 | ||||||
Financial Highlights | 22 | ||||||
Notes to Financial Statements | 24 | ||||||
| Report of Independent Registered Public Accounting Firm | 34 | ||||||
Supplemental Information (Unaudited) | 35 | ||||||
Trustees' and Officers' Information | 35 | ||||||
Proxy Voting and Portfolio Holdings Information | 41 | ||||||
Expense Example | 41 | ||||||
Additional Federal Income Tax Information | 43 | ||||||
Advisory Contract Agreement | 44 | ||||||
Liquidity Risk Management Program | 47 | ||||||
Privacy Policy (inside back cover) | |||||||
This report is for the information of the shareholders and others who have received a copy of the currently effective prospectus of the Fund, managed by Victory Capital Management Inc. It may be used as sales literature only when preceded or accompanied by a current prospectus, which provides further details about the Fund.
IRA DISTRIBUTION WITHHOLDING DISCLOSURE
We generally must withhold federal income tax at a rate of 10% of the taxable portion of your distribution and, if you live in a state that requires state income tax withholding, at your state's tax rate. However, you may elect not to have withholding apply or to have income tax withheld at a higher rate. Any withholding election that you make will apply to any subsequent distribution unless and until you change or revoke the election. If you wish to make a withholding election, or change or revoke a prior withholding election, call (800) 235-8396, and form W-4P (OMB No. 1545-0074 withholding certificate for pension or annuity payments) will be electronically sent.
If you do not have a withholding election in place by the date of a distribution, federal income tax will be withheld from the taxable portion of your distribution at a rate of 10%. If you must pay estimated taxes, you may be subject to estimated tax penalties if your estimated tax payments are not sufficient and sufficient tax is not withheld from your distribution.
For more specific information, please consult your tax adviser.
1
(Unaudited)
Dear Shareholder,
The annual reporting period ended March 31, 2021, was a year like no other. It wasn't that long ago that we were all coming to grips with an emerging global pandemic, economic shutdowns, and financial markets in turmoil. We somehow persevered and have even emerged from those challenging days—dare I say—with a renewed sense of optimism. In retrospect, the trajectory of financial markets over the past year was nothing short of extraordinary.
Consider everything that transpired over the past 12 months. A novel coronavirus ("COVID-19") and the subsequent worldwide spread of COVID-19 prompted governments everywhere to issue austere shelter-in-place orders, and the global economy slowed abruptly. Equity markets sold off, while unprecedented levels of volatility roiled traditionally placid bond markets. During the second quarter of 2020, domestic GDP contracted by an alarming annual rate of 31.4%, according to the U.S. Department of Commerce ("Commerce Department").
It's no surprise that many investors flocked to the perceived safety of U.S. Treasurys during this period of tumult. Meanwhile, liquidity evaporated (for a short spell) in other segments of the fixed-income world, including higher-yielding credits and municipal bonds. The outlook was tenuous, and credit spreads widened while prices declined for most securities perceived to be higher risk.
Fortunately, a response came swiftly. The U.S. Federal Reserve (the "Fed") and other monetary authorities worldwide leapt into action—cutting interest rates, (re)starting quantitative easing and, in the case of the Fed, launching an array of programs to provide liquidity to stabilize fixed-income markets. The U.S. government also stepped up to provide fiscal stimulus in the form of the Coronavirus Aid, Relief, and Economic Security Act ("CARES Act").
It was impressive how quickly those actions helped arrest the stock market's freefall and restore order across much of the fixed-income universe. The rebound was as robust as the drawdown, and third quarter 2020 GDP bounced back and grew at a 33.4% annualized rate, according to the Commerce Department.
Late in the year, financial markets were alternately fueled and roiled by a contentious election season, growing optimism for an effective vaccine, and a fluid debate regarding the need for additional fiscal stimulus. Ultimately, stocks were propelled higher in the fourth quarter as it became clear Congress would provide another dose of stimulus in the form of direct payments, more unemployment insurance, and additional aid to businesses.
As the year ended and we moved into the first quarter of 2021, stocks continued their upward trajectory. Meanwhile, the yield on the 10-Year U.S. Treasury continued rallying sharply, and many investors began to worry about inflation in the post-pandemic world.
Through all the unprecedented events and volatility, the S&P 500® Index registered an impressive annual return of 56.35% for the 12-month period ended March 31, 2021. Over this same period, the yield on the 10-Year U.S. Treasury jumped more than 100 basis points, reflecting both the very low starting rate and substantial fiscal
2
stimulus. At the end of the reporting period, the yield on the 10-Year U.S. Treasury was 1.74%
On the whole, markets endured and surprised to the upside, but perhaps the key takeaway is that the unexpected can and will happen. That's why it's important to remain focused on your long-term investment goals and avoid making emotional decisions.
On the following pages, you will find information relating to your USAA Mutual Funds, brought to you by Victory Capital. If you have any questions regarding the current market dynamics or your specific portfolio or investment plan, we encourage you to contact our Member Service Representatives. Call (800) 235-8396, or visit our website at www.vcm.com.
Thank you for letting us help you work toward your investment goals.

Christopher K. Dyer, CFA
President,
USAA Mutual Funds Trust
3
USAA Mutual Funds Trust
USAA Global Equity Income Fund
Manager's Commentary
(Unaudited)
Victory Solutions
Mannik S. Dhillon, CFA, CAIA
Lance Humphrey, CFA*
Elie Masri*
• What were the market conditions during the reporting period?
The beginning of the reporting period brought a dramatic reversal from the difficult environment that characterized the first three months of 2020. While COVID-19 cases continued to rise, investors grew increasingly confident that the economy would be able to recover from its sharp downturn of February and March. The optimism stemmed, in part, from a series of better-than-expected economic reports interpreted as evidence that the slump in growth would be less severe than was initially feared. The markets were further cheered by the aggressive response by the U.S. Federal Reserve (the "Fed"). In addition to reiterating its commitment to keep short-term interest rates near zero for an extended period, the Fed announced the direct purchase of both individual bonds and exchange-traded bond funds. The central bank's unusual steps offered corporations the latitude to issue debt at ultra-low rates, providing them with the cash necessary to withstand the effects of the COVID-19.
The global financial markets produced healthy returns during the second half of 2020, wrapping up a positive year for the major asset classes. Investors' appetite for risk improved considerably in early November, when the approval of vaccines for COVID-19 raised expectations that the world economy could gradually return to normal in 2021. The conclusion of the U.S. elections, which removed a source of uncertainty that had depressed performance in September and October, was an additional tailwind. The markets were also aided by continued indications that the Fed and other central banks would maintain their highly accommodative policies indefinitely. Not least, an agreement on a new round of U.S. fiscal stimulus further cheered investors in late December. Together, these developments outweighed negative headlines surrounding renewed lockdowns and the persistence of the coronavirus.
The first quarter of 2021 proved to be a continuation of the strong equity markets investors experienced over the second half of 2020. Gains from global equity markets were fueled by optimism surrounding the successful rollout of the COVID-19 vaccines coupled with further monetary and fiscal stimulus proposals. Faster-than-expected economic growth produced a meaningful increase in real interest rates, which led to negative returns across most major fixed income asset classes. The 10-year U.S. Treasury bond yield finished at its highest level of the reporting period climbing from under 1% to 1.74% at March 31, 2021.
*Effective February 12, 2021, Lance Humphrey and Elie Masri were added as portfolio managers on the Fund and Wasif Latif was removed.
4
USAA Mutual Funds Trust
USAA Global Equity Income Fund (continued)
Manager's Commentary (continued)
• How did the USAA Global Equity Income Fund (the "Fund") perform during the reporting period?
The Fund has two share classes: Fund Shares and Institutional Shares. For the fiscal year ended March 31, 2021, the Fund Shares and Institutional Shares had a total return of 45.23% and 45.32%, respectively. This compares to returns of 35.69% for the MSCI World High Dividend Yield Index (the "Index") and 41.22% for the Lipper Global Equity Income Funds Index.
• What strategies did you employ during the reporting period?
The Fund focuses on income-oriented global equities and normally will have roughly equal weights in U.S. and international stocks, although this will vary to some degree depending on where we see the better value. In selecting stocks, we emphasize not only the current dividend but also a company's likely ability to grow its dividend. As a result, the average current dividend of companies held by the Fund generally will be somewhat lower than the benchmark. However, our view is that a focus on dividend growers should provide an improved total return profile as we invest within the global dividend stock universe.
For the 12-month period ended March 31, 2021, strong stock selection and sector allocation effects positively impacted relative performance. An overweight to Information Technology and Consumer Discretionary, as well as the underweight to Health Care, positively contributed to relative performance. Selection effects in Information Technology and Health Care contributed to the relative performance, while stock selection within Consumer Staples, Materials and Industrials detracted.
From a country perspective, strong overall stock selection in the United States positively contributed to relative performance against the benchmark. An overweight to Denmark and underweight to Switzerland and the United Kingdom relative to the benchmark added to performance, while an underweight to Japan and Germany negatively impacted performance relative to the benchmark.
Looking ahead to the Fund's new fiscal year, the global community's united efforts to distribute COVID-19 vaccines are central to how quickly the global economy will recover. On a long-term basis, we believe that focusing on quality companies with attractive valuations and dividend income is a sound strategy from a total return perspective.
Thank you for allowing us to assist you with your investment needs.
5
USAA Mutual Funds Trust
USAA Global Equity Income Fund
Investment Overview
(Unaudited)
Average Annual Total Return
Year Ended March 31, 2021
Fund Shares | Institutional Shares | ||||||||||||||||||
INCEPTION DATE | 8/7/15 | 8/7/15 | |||||||||||||||||
Net Asset Value | Net Asset Value | MSCI World High Dividend Yield Index1 | Lipper Global Equity Income Funds Index2 | ||||||||||||||||
One Year | 45.23 | % | 45.32 | % | 35.69 | % | 41.22 | % | |||||||||||
Five Year | 9.47 | % | 9.54 | % | 8.48 | % | 8.53 | % | |||||||||||
Since Inception | 7.29 | % | 7.35 | % | 7.51 | % | 7.13 | % | |||||||||||
The performance data quoted represents past performance and current returns may be lower or higher. The investment return and principal value will fluctuate so that an investor's shares, when redeemed, may be worth more or less than the original cost. To obtain performance information current to the most recent month's end, please visit www.vcm.com.
Total return measures the price change in a share assuming the reinvestment of all net investment income and realized capital gain distributions, if any. The total returns quoted do not reflect adjustments made to the enclosed financial statements in accordance with U.S. Generally Accepted Accounting Principles or the deduction of taxes that a shareholder would pay on net investment income and realized capital gain distributions, including reinvested distributions, or redemptions of shares.
The total return figures set forth above include all waivers of fees. Without such fee waivers, the total returns would have been lower.
USAA Global Equity Income Fund — Growth of $10,000
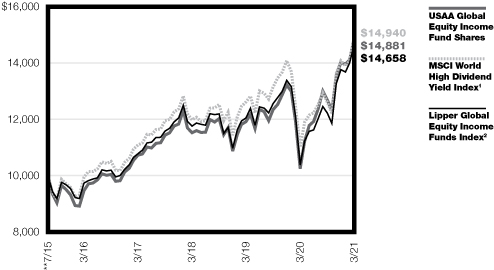
**The performance of the MSCI World High Dividend Yield Index and Lipper Global Equity Income Funds Index is calculated from the end of the month, July 31, 2015, while the inception date of the USAA Global Equity Income Fund is August 7, 2015. There may be a slight variation of performance numbers because of this difference.
1The unmanaged MSCI World High Dividend Yield Index is a free float-adjusted market capitalization weighed index that is designed to measure the equity market performance of developed and emerging markets. This index does not include the effect of sales charges, commissions, expenses or taxes, is not representative of the Fund, and it is not possible to invest directly in an index.
2The unmanaged Lipper Global Equity Income Funds Index measures the Fund's performance to that of the Lipper Global Equity Income Funds category. This index does not include the effect of sales charges, commissions, expenses or taxes, is not representative of the Fund, and it is not possible to invest directly in an index.
The graph reflects investment of growth of a hypothetical $10,000 investment in the Fund.
The graph and table do not reflect the deduction of taxes that a shareholder would pay on Fund distributions or the redemption of Fund shares.
Past performance is not indicative of future results.
6
| USAA Mutual Funds Trust USAA Global Equity Income Fund | March 31, 2021 | ||||||
(Unaudited)
Investment Objective & Portfolio Holdings:
The Fund's investment objective seeks to provide investors with total return with an emphasis on current income.
Top 10 Holdings*:
March 31, 2021
(% of Net Assets)
Apple, Inc. | 4.4 | % | |||||
Microsoft Corp. | 2.2 | % | |||||
The Home Depot, Inc. | 1.4 | % | |||||
Texas Instruments, Inc. | 1.4 | % | |||||
Johnson & Johnson | 1.4 | % | |||||
Cisco Systems, Inc. | 1.2 | % | |||||
The Procter & Gamble Co. | 1.2 | % | |||||
T. Rowe Price Group, Inc. | 1.2 | % | |||||
Amgen, Inc. | 1.2 | % | |||||
Target Corp. | 1.2 | % | |||||
* Does not include futures, money market instruments, and short-term investments purchased with cash collateral from securities loaned.
Refer to the Schedule of Portfolio Investments for a complete list of securities.
7
| USAA Mutual Funds Trust USAA Global Equity Income Fund | March 31, 2021 | ||||||
(Unaudited)
Sector Allocation*:
March 31, 2021
(% of Net Assets)

* Does not include futures, money market instruments, and short-term investments purchased with cash collateral from securities loaned.
Percentages are of the net assets of the Fund and may not equal 100%.
8
| USAA Mutual Funds Trust USAA Global Equity Income Fund | Schedule of Portfolio Investments March 31, 2021 | ||||||
(Amounts in Thousands, Except for Shares)
Security Description | Shares | Value | |||||||||
Common Stocks (99.5%) | |||||||||||
Australia (0.9%): | |||||||||||
Energy (0.2%): | |||||||||||
Washington H Soul Pattinson & Co. Ltd. | 6,532 | $ | 157 | ||||||||
Financials (0.4%): | |||||||||||
ASX Ltd. | 5,463 | 296 | |||||||||
Materials (0.3%): | |||||||||||
Evolution Mining Ltd. | 70,468 | 219 | |||||||||
672 | |||||||||||
Belgium (0.6%): | |||||||||||
Communication Services (0.3%): | |||||||||||
Telenet Group Holding NV | 4,803 | 195 | |||||||||
Consumer Staples (0.3%): | |||||||||||
Etablissements Franz Colruyt | 3,929 | 234 | |||||||||
429 | |||||||||||
Canada (5.1%): | |||||||||||
Consumer Discretionary (0.9%): | |||||||||||
Dollarama, Inc. | 5,639 | 249 | |||||||||
Magna International, Inc. | 5,147 | 454 | |||||||||
703 | |||||||||||
Consumer Staples (0.3%): | |||||||||||
Metro, Inc. (a) | 4,503 | 205 | |||||||||
Energy (0.6%): | |||||||||||
Canadian Natural Resources Ltd. | 7,015 | 217 | |||||||||
Parkland Corp. | 8,807 | 265 | |||||||||
482 | |||||||||||
Financials (2.5%): | |||||||||||
Bank of Montreal | 5,065 | 451 | |||||||||
Manulife Financial Corp. | 13,254 | 285 | |||||||||
Power Corp. of Canada | 7,926 | 208 | |||||||||
Sun Life Financial, Inc. | 6,426 | 325 | |||||||||
The Bank of Nova Scotia | 4,500 | 282 | |||||||||
The Toronto-Dominion Bank | 5,611 | 366 | |||||||||
1,917 | |||||||||||
Industrials (0.2%): | |||||||||||
Thomson Reuters Corp. | 1,824 | 160 | |||||||||
Information Technology (0.4%): | |||||||||||
Constellation Software, Inc. | 178 | 248 | |||||||||
Topicus.com, Inc. (b) | 331 | 22 | |||||||||
270 | |||||||||||
Materials (0.2%): | |||||||||||
Wheaton Precious Metals Corp. | 3,897 | 149 | |||||||||
3,886 | |||||||||||
See notes to financial statements.
9
| USAA Mutual Funds Trust USAA Global Equity Income Fund | Schedule of Portfolio Investments — continued March 31, 2021 | ||||||
(Amounts in Thousands, Except for Shares)
Security Description | Shares | Value | |||||||||
Denmark (1.2%): | |||||||||||
Health Care (1.0%): | |||||||||||
Coloplast A/S Class B | 2,277 | $ | 342 | ||||||||
Novo Nordisk A/S Class B | 5,850 | 394 | |||||||||
736 | |||||||||||
Utilities (0.2%): | |||||||||||
Orsted A/S (c) | 1,145 | 185 | |||||||||
921 | |||||||||||
Finland (0.9%): | |||||||||||
Communication Services (0.2%): | |||||||||||
Elisa Oyj | 2,407 | 144 | |||||||||
Industrials (0.3%): | |||||||||||
Kone Oyj Class B | 2,644 | 216 | |||||||||
Utilities (0.4%): | |||||||||||
Fortum Oyj | 11,424 | 305 | |||||||||
665 | |||||||||||
France (0.7%): | |||||||||||
Consumer Discretionary (0.3%): | |||||||||||
Hermes International | 226 | 250 | |||||||||
Consumer Staples (0.4%): | |||||||||||
L'Oreal SA | 780 | 299 | |||||||||
549 | |||||||||||
Germany (1.4%): | |||||||||||
Financials (1.2%): | |||||||||||
Allianz SE Registered Shares | 2,768 | 704 | |||||||||
Deutsche Boerse AG | 963 | 160 | |||||||||
864 | |||||||||||
Information Technology (0.2%): | |||||||||||
SAP SE | 1,304 | 160 | |||||||||
1,024 | |||||||||||
Hong Kong (1.5%): | |||||||||||
Financials (1.0%): | |||||||||||
BOC Hong Kong Holdings Ltd. | 77,500 | 271 | |||||||||
Hang Seng Bank Ltd. | 17,300 | 336 | |||||||||
Hong Kong Exchanges and Clearing Ltd. | 2,700 | 160 | |||||||||
767 | |||||||||||
Industrials (0.2%): | |||||||||||
Jardine Matheson Holdings Ltd. | 2,000 | 131 | |||||||||
Utilities (0.3%): | |||||||||||
Power Assets Holdings Ltd. | 37,000 | 219 | |||||||||
1,117 | |||||||||||
See notes to financial statements.
10
| USAA Mutual Funds Trust USAA Global Equity Income Fund | Schedule of Portfolio Investments — continued March 31, 2021 | ||||||
(Amounts in Thousands, Except for Shares)
Security Description | Shares | Value | |||||||||
Ireland (2.2%): | |||||||||||
Health Care (0.2%): | |||||||||||
STERIS PLC | 800 | $ | 152 | ||||||||
Industrials (1.1%): | |||||||||||
Eaton Corp. PLC | 3,029 | 419 | |||||||||
Trane Technologies PLC | 2,322 | 384 | |||||||||
803 | |||||||||||
Information Technology (0.9%): | |||||||||||
Seagate Technology PLC | 8,814 | 677 | |||||||||
1,632 | |||||||||||
Italy (0.7%): | |||||||||||
Utilities (0.7%): | |||||||||||
Enel SpA | 25,013 | 249 | |||||||||
Terna Rete Elettrica Nazionale SpA | 39,286 | 296 | |||||||||
545 | |||||||||||
Japan (7.6%): | |||||||||||
Communication Services (1.8%): | |||||||||||
Kakaku.com, Inc. | 6,300 | 173 | |||||||||
KDDI Corp. | 14,700 | 453 | |||||||||
Nintendo Co. Ltd. | 600 | 338 | |||||||||
Nippon Telegraph & Telephone Corp. | 16,400 | 423 | |||||||||
1,387 | |||||||||||
Consumer Discretionary (1.6%): | |||||||||||
Bridgestone Corp. | 6,700 | 272 | |||||||||
Iida Group Holdings Co. Ltd. | 7,500 | 182 | |||||||||
Sony Group Corp. | 1,600 | 169 | |||||||||
Toyota Motor Corp. | 7,600 | 592 | |||||||||
1,215 | |||||||||||
Consumer Staples (0.5%): | |||||||||||
Pigeon Corp. | 3,600 | 137 | |||||||||
Seven & i Holdings Co. Ltd. | 6,400 | 258 | |||||||||
395 | |||||||||||
Energy (0.5%): | |||||||||||
ENEOS Holdings, Inc. | 80,400 | 365 | |||||||||
Financials (0.9%): | |||||||||||
ORIX Corp. | 9,100 | 154 | |||||||||
Resona Holdings, Inc. | 29,800 | 125 | |||||||||
Sumitomo Mitsui Financial Group, Inc. | 10,000 | 363 | |||||||||
642 | |||||||||||
Health Care (0.7%): | |||||||||||
Chugai Pharmaceutical Co. Ltd. | 2,100 | 85 | |||||||||
Hoya Corp. | 1,700 | 200 | |||||||||
M3, Inc. | 1,000 | 69 | |||||||||
Shionogi & Co. Ltd. | 3,400 | 184 | |||||||||
538 | |||||||||||
See notes to financial statements.
11
| USAA Mutual Funds Trust USAA Global Equity Income Fund | Schedule of Portfolio Investments — continued March 31, 2021 | ||||||
(Amounts in Thousands, Except for Shares)
Security Description | Shares | Value | |||||||||
Industrials (0.6%): | |||||||||||
ITOCHU Corp. | 10,600 | $ | 344 | ||||||||
Recruit Holdings Co. Ltd. | 2,900 | 143 | |||||||||
487 | |||||||||||
Information Technology (0.6%): | |||||||||||
Fujitsu Ltd. | 1,100 | 160 | |||||||||
Nomura Research Institute Ltd. | 9,400 | 292 | |||||||||
452 | |||||||||||
Materials (0.2%): | |||||||||||
Asahi Kasei Corp. | 13,300 | 153 | |||||||||
Utilities (0.2%): | |||||||||||
Chubu Electric Power Co., Inc. | 12,300 | 158 | |||||||||
5,792 | |||||||||||
Netherlands (1.7%): | |||||||||||
Communication Services (0.3%): | |||||||||||
Koninklijke KPN NV | 73,078 | 248 | |||||||||
Consumer Staples (0.6%): | |||||||||||
Koninklijke Ahold Delhaize NV | 14,985 | 418 | |||||||||
Industrials (0.3%): | |||||||||||
Wolters Kluwer NV | 3,057 | 266 | |||||||||
Information Technology (0.5%): | |||||||||||
| ASML Holding NV | 625 | 383 | |||||||||
1,315 | |||||||||||
Singapore (1.3%): | |||||||||||
Financials (1.3%): | |||||||||||
DBS Group Holdings Ltd. | 24,500 | 525 | |||||||||
Oversea-Chinese Banking Corp. Ltd. | 14,700 | 129 | |||||||||
Singapore Exchange Ltd. | 32,900 | 244 | |||||||||
United Overseas Bank Ltd. | 6,400 | 124 | |||||||||
1,022 | |||||||||||
Spain (1.1%): | |||||||||||
Energy (0.2%): | |||||||||||
Enagas SA | 6,585 | 143 | |||||||||
Utilities (0.9%): | |||||||||||
Endesa SA | 9,299 | 246 | |||||||||
Iberdrola SA | 9,493 | 123 | |||||||||
Red Electrica Corp. SA | 17,395 | 309 | |||||||||
678 | |||||||||||
821 | |||||||||||
Switzerland (5.9%): | |||||||||||
Consumer Discretionary (0.3%): | |||||||||||
Garmin Ltd. | 1,881 | 248 | |||||||||
See notes to financial statements.
12
| USAA Mutual Funds Trust USAA Global Equity Income Fund | Schedule of Portfolio Investments — continued March 31, 2021 | ||||||
(Amounts in Thousands, Except for Shares)
Security Description | Shares | Value | |||||||||
Consumer Staples (0.6%): | |||||||||||
Nestle SA Registered Shares | 4,121 | $ | 459 | ||||||||
Financials (0.9%): | |||||||||||
Banque Cantonale Vaudoise Registered Shares (b) | 1,729 | 169 | |||||||||
Partners Group Holding AG (a) | 96 | 122 | |||||||||
Zurich Insurance Group AG | 843 | 359 | |||||||||
650 | |||||||||||
Health Care (2.0%): | |||||||||||
Lonza Group AG Registered Shares | 158 | 89 | |||||||||
Novartis AG Registered Shares | 8,016 | 685 | |||||||||
Roche Holding AG | 2,217 | 718 | |||||||||
1,492 | |||||||||||
Industrials (1.0%): | |||||||||||
ABB Ltd. Registered Shares | 6,186 | 188 | |||||||||
Geberit AG Registered Shares | 660 | 420 | |||||||||
SGS SA Registered Shares | 58 | 165 | |||||||||
773 | |||||||||||
Information Technology (0.4%): | |||||||||||
Logitech International SA Class R | 2,831 | 297 | |||||||||
Materials (0.7%): | |||||||||||
EMS-Chemie Holding AG | 233 | 208 | |||||||||
Givaudan SA Registered Shares | 50 | 193 | |||||||||
LafargeHolcim Ltd. | 2,542 | 150 | |||||||||
551 | |||||||||||
4,470 | |||||||||||
United Kingdom (2.7%): | |||||||||||
Consumer Discretionary (0.1%): | |||||||||||
Barratt Developments PLC (b) | 7,795 | 80 | |||||||||
Financials (0.9%): | |||||||||||
Admiral Group PLC | 4,108 | 175 | |||||||||
Aon PLC Class A | 2,141 | 493 | |||||||||
668 | |||||||||||
Health Care (0.2%): | |||||||||||
Smith & Nephew PLC | 5,733 | 109 | |||||||||
Industrials (0.8%): | |||||||||||
Ferguson PLC | 1,922 | 229 | |||||||||
Intertek Group PLC | 2,263 | 175 | |||||||||
RELX PLC | 8,774 | 220 | |||||||||
624 | |||||||||||
Information Technology (0.2%): | |||||||||||
The Sage Group PLC | 20,416 | 173 | |||||||||
Materials (0.5%): | |||||||||||
Rio Tinto PLC | 4,978 | 380 | |||||||||
2,034 | |||||||||||
See notes to financial statements.
13
| USAA Mutual Funds Trust USAA Global Equity Income Fund | Schedule of Portfolio Investments — continued March 31, 2021 | ||||||
(Amounts in Thousands, Except for Shares)
Security Description | Shares | Value | |||||||||
United States (64.0%): | |||||||||||
Communication Services (2.9%): | |||||||||||
Activision Blizzard, Inc. | 3,112 | $ | 289 | ||||||||
Comcast Corp. Class A | 4,505 | 244 | |||||||||
Omnicom Group, Inc. | 6,949 | 515 | |||||||||
The Interpublic Group of Cos., Inc. | 5,500 | 161 | |||||||||
Verizon Communications, Inc. | 13,966 | 812 | |||||||||
ViacomCBS, Inc. Class B | 3,527 | 159 | |||||||||
2,180 | |||||||||||
Consumer Discretionary (6.1%): | |||||||||||
Best Buy Co., Inc. | 7,093 | 814 | |||||||||
D.R. Horton, Inc. | 1,887 | 168 | |||||||||
Genuine Parts Co. | 1,200 | 139 | |||||||||
Lowe's Cos., Inc. | 4,514 | 859 | |||||||||
McDonald's Corp. | 930 | 208 | |||||||||
Starbucks Corp. | 1,909 | 209 | |||||||||
Target Corp. | 4,424 | 876 | |||||||||
The Home Depot, Inc. | 3,537 | 1,080 | |||||||||
Tractor Supply Co. | 1,552 | 275 | |||||||||
4,628 | |||||||||||
Consumer Staples (5.2%): | |||||||||||
Campbell Soup Co. | 3,100 | 156 | |||||||||
Church & Dwight Co., Inc. | 1,700 | 148 | |||||||||
Colgate-Palmolive Co. | 3,883 | 306 | |||||||||
General Mills, Inc. | 8,686 | 533 | |||||||||
Kimberly-Clark Corp. | 745 | 103 | |||||||||
Philip Morris International, Inc. | 3,234 | 287 | |||||||||
The Clorox Co. | 2,585 | 499 | |||||||||
The Hershey Co. | 1,176 | 186 | |||||||||
The Kroger Co. | 9,494 | 342 | |||||||||
The Procter & Gamble Co. | 6,958 | 942 | |||||||||
Tyson Foods, Inc. Class A | 3,679 | 273 | |||||||||
Walmart, Inc. | 1,294 | 176 | |||||||||
3,951 | |||||||||||
Energy (1.3%): | |||||||||||
Cabot Oil & Gas Corp. | 27,330 | 513 | |||||||||
EOG Resources, Inc. | 3,850 | 279 | |||||||||
Pioneer Natural Resources Co. | 1,334 | 212 | |||||||||
1,004 | |||||||||||
Financials (8.2%): | |||||||||||
Aflac, Inc. | 3,700 | 189 | |||||||||
Ameriprise Financial, Inc. | 2,265 | 526 | |||||||||
Citizens Financial Group, Inc. | 3,500 | 155 | |||||||||
Comerica, Inc. | 1,389 | 100 | |||||||||
Erie Indemnity Co. Class A | 884 | 195 | |||||||||
Fifth Third Bancorp | 5,000 | 187 | |||||||||
Huntington Bancshares, Inc. | 17,386 | 273 | |||||||||
See notes to financial statements.
14
| USAA Mutual Funds Trust USAA Global Equity Income Fund | Schedule of Portfolio Investments — continued March 31, 2021 | ||||||
(Amounts in Thousands, Except for Shares)
Security Description | Shares | Value | |||||||||
KeyCorp | 30,965 | $ | 619 | ||||||||
M&T Bank Corp. | 2,346 | 356 | |||||||||
MarketAxess Holdings, Inc. | 327 | 163 | |||||||||
MetLife, Inc. | 9,512 | 578 | |||||||||
MSCI, Inc. | 554 | 232 | |||||||||
Regions Financial Corp. | 9,856 | 204 | |||||||||
S&P Global, Inc. | 1,194 | 421 | |||||||||
T. Rowe Price Group, Inc. | 5,408 | 928 | |||||||||
The Allstate Corp. | 3,932 | 452 | |||||||||
The PNC Financial Services Group, Inc. | 1,394 | 245 | |||||||||
The Progressive Corp. | 2,287 | 219 | |||||||||
The Travelers Cos., Inc. | 1,000 | 150 | |||||||||
6,192 | |||||||||||
Health Care (8.8%): | |||||||||||
Abbott Laboratories | 2,500 | 300 | |||||||||
AmerisourceBergen Corp. | 1,737 | 205 | |||||||||
Amgen, Inc. | 3,674 | 914 | |||||||||
Anthem, Inc. | 951 | 341 | |||||||||
Bristol-Myers Squibb Co. | 4,940 | 312 | |||||||||
Cardinal Health, Inc. | 1,871 | 114 | |||||||||
Danaher Corp. | 1,200 | 270 | |||||||||
Eli Lilly & Co. | 3,562 | 665 | |||||||||
Johnson & Johnson | 6,287 | 1,033 | |||||||||
McKesson Corp. | 1,181 | 230 | |||||||||
Medtronic PLC | 1,251 | 148 | |||||||||
Pfizer, Inc. | 13,945 | 505 | |||||||||
Quest Diagnostics, Inc. | 945 | 121 | |||||||||
Stryker Corp. | 700 | 171 | |||||||||
Thermo Fisher Scientific, Inc. | 258 | 118 | |||||||||
UnitedHealth Group, Inc. | 2,293 | 853 | |||||||||
Zoetis, Inc. | 2,112 | 333 | |||||||||
6,633 | |||||||||||
Industrials (8.9%): | |||||||||||
3M Co. | 3,247 | 626 | |||||||||
C.H. Robinson Worldwide, Inc. | 1,500 | 143 | |||||||||
Cummins, Inc. | 2,806 | 727 | |||||||||
Dover Corp. | 1,500 | 206 | |||||||||
Fastenal Co. | 5,169 | 260 | |||||||||
FedEx Corp. | 1,406 | 399 | |||||||||
Honeywell International, Inc. | 1,526 | 331 | |||||||||
Illinois Tool Works, Inc. | 1,208 | 268 | |||||||||
Lockheed Martin Corp. | 1,372 | 507 | |||||||||
Norfolk Southern Corp. | 419 | 112 | |||||||||
Northrop Grumman Corp. | 334 | 108 | |||||||||
PACCAR, Inc. | 4,744 | 441 | |||||||||
Parker-Hannifin Corp. | 428 | 135 | |||||||||
Republic Services, Inc. | 1,400 | 139 | |||||||||
Robert Half International, Inc. | 4,014 | 313 | |||||||||
Rockwell Automation, Inc. | 2,162 | 574 | |||||||||
Rollins, Inc. | 10,383 | 357 | |||||||||
Snap-on, Inc. | 700 | 162 | |||||||||
See notes to financial statements.
15
| USAA Mutual Funds Trust USAA Global Equity Income Fund | Schedule of Portfolio Investments — continued March 31, 2021 | ||||||
(Amounts in Thousands, Except for Shares)
Security Description | Shares | Value | |||||||||
Union Pacific Corp. | 1,264 | $ | 279 | ||||||||
United Parcel Service, Inc. Class B | 1,961 | 333 | |||||||||
W.W. Grainger, Inc. | 384 | 154 | |||||||||
Waste Management, Inc. | 1,100 | 142 | |||||||||
6,716 | |||||||||||
Information Technology (16.4%): | |||||||||||
Apple, Inc. | 27,152 | 3,317 | |||||||||
Applied Materials, Inc. | 2,819 | 377 | |||||||||
Broadcom, Inc. | 804 | 373 | |||||||||
Cisco Systems, Inc. | 18,241 | 943 | |||||||||
Citrix Systems, Inc. | 1,150 | 161 | |||||||||
Intel Corp. | 8,644 | 553 | |||||||||
Intuit, Inc. | 947 | 363 | |||||||||
Juniper Networks, Inc. | 4,700 | 119 | |||||||||
KLA Corp. | 1,000 | 330 | |||||||||
Lam Research Corp. | 308 | 183 | |||||||||
Mastercard, Inc. Class A | 922 | 328 | |||||||||
Microsoft Corp. | 7,110 | 1,676 | |||||||||
NetApp, Inc. | 11,588 | 842 | |||||||||
NVIDIA Corp. | 659 | 352 | |||||||||
Oracle Corp. | 9,640 | 676 | |||||||||
Paychex, Inc. | 2,331 | 229 | |||||||||
QUALCOMM, Inc. | 1,633 | 217 | |||||||||
Texas Instruments, Inc. | 5,638 | 1,066 | |||||||||
Visa, Inc. Class A | 1,448 | 307 | |||||||||
12,412 | |||||||||||
Materials (3.4%): | |||||||||||
Air Products & Chemicals, Inc. | 715 | 201 | |||||||||
Celanese Corp. | 3,243 | 486 | |||||||||
International Paper Co. | 3,995 | 216 | |||||||||
Nucor Corp. | 2,198 | 177 | |||||||||
Packaging Corp. of America | 4,781 | 643 | |||||||||
PPG Industries, Inc. | 1,600 | 240 | |||||||||
RPM International, Inc. | 2,429 | 223 | |||||||||
Steel Dynamics, Inc. | 3,669 | 186 | |||||||||
The Sherwin-Williams Co. | 249 | 184 | |||||||||
2,556 | |||||||||||
Utilities (2.8%): | |||||||||||
American Electric Power Co., Inc. | 1,400 | 119 | |||||||||
American Water Works Co., Inc. | 821 | 123 | |||||||||
Duke Energy Corp. | 4,073 | 393 | |||||||||
Exelon Corp. | 4,236 | 186 | |||||||||
OGE Energy Corp. | 13,780 | 446 | |||||||||
UGI Corp. | 12,979 | 532 | |||||||||
WEC Energy Group, Inc. | 2,714 | 254 | |||||||||
Xcel Energy, Inc. | 1,658 | 110 | |||||||||
2,163 | |||||||||||
48,435 | |||||||||||
Total Common Stocks (Cost $58,108) | 75,329 | ||||||||||
See notes to financial statements.
16
| USAA Mutual Funds Trust USAA Global Equity Income Fund | Schedule of Portfolio Investments — continued March 31, 2021 | ||||||
(Amounts in Thousands, Except for Shares)
Security Description | Shares | Value | |||||||||
Collateral for Securities Loaned^ (0.4%) | |||||||||||
United States (0.4%): | |||||||||||
HSBC U.S. Government Money Market Fund I Shares, 0.04% (d) | 309,763 | $ | 310 | ||||||||
Total Collateral for Securities Loaned (Cost $310) | 310 | ||||||||||
Total Investments (Cost $58,418) — 99.9% | 75,639 | ||||||||||
Other assets in excess of liabilities — 0.1% | 73 | ||||||||||
NET ASSETS — 100.00% | $ | 75,712 | |||||||||
^ Purchased with cash collateral from securities on loan.
(a) All or a portion of this security is on loan.
(b) Non-income producing security.
(c) Rule 144A security or other security that is restricted as to resale to institutional investors. The Fund's Adviser has deemed this security to be liquid based upon procedures approved by the Board of Trustees. As of March 31, 2021, the fair value of these securities was $185 (thousands) and amounted to 0.2% of net assets.
(d) Rate disclosed is the daily yield on March 31, 2021.
PLC — Public Limited Company
See notes to financial statements.
17
USAA Mutual Funds Trust | Statement of Assets and Liabilities March 31, 2021 | ||||||
(Amounts in Thousands, Except Per Share Amounts)
| USAA Global Equity Income Fund | |||||||
Assets: | |||||||
Investments, at value (Cost $58,418) | $ | 75,639 | (a) | ||||
Foreign currency, at value (Cost $28) | 28 | ||||||
Cash | 169 | ||||||
Receivables: | |||||||
Interest and dividends | 157 | ||||||
Capital shares issued | 6 | ||||||
Investments sold | 16 | ||||||
Reclaims | 200 | ||||||
Prepaid expenses and other assets | 4 | ||||||
Total assets | 76,219 | ||||||
Liabilities: | |||||||
Payables: | |||||||
Collateral received on loaned securities | 310 | ||||||
Investments purchased | 16 | ||||||
Capital shares redeemed | 40 | ||||||
Accrued expenses and other payables: | |||||||
Investment advisory fees | 46 | ||||||
Administration fees | 9 | ||||||
Custodian fees | 5 | ||||||
Transfer agent fees | 20 | ||||||
Compliance fees | — | (b) | |||||
Trustees' fees | — | (b) | |||||
Other accrued expenses | 61 | ||||||
Total liabilities | 507 | ||||||
Net Assets: | |||||||
Capital | 58,973 | ||||||
Total accumulated earnings/(loss) | 16,739 | ||||||
Net assets | $ | 75,712 | |||||
Net Assets | |||||||
Fund Shares | $ | 69,690 | |||||
Institutional Shares | 6,022 | ||||||
Total | $ | 75,712 | |||||
Shares (unlimited number of shares authorized with no par value): | |||||||
Fund Shares | 5,792 | ||||||
Institutional Shares | 500 | ||||||
Total | 6,292 | ||||||
Net asset value, offering and redemption price per share: (c) | |||||||
Fund Shares | $ | 12.03 | |||||
Institutional Shares | $ | 12.04 | |||||
(a) Includes $292 of securities on loan.
(b) Rounds to less than $1 thousand.
(c) Per share amount may not recalculate due to rounding of net assets and/or shares outstanding.
See notes to financial statements.
18
USAA Mutual Funds Trust | Statement of Operations For the Year Ended March 31, 2021 | ||||||
(Amounts in Thousands)
| USAA Global Equity Income Fund | |||||||
Investment Income: | |||||||
Dividends | $ | 2,068 | |||||
Securities lending (net of fees) | 3 | ||||||
Foreign tax withholding | (106 | ) | |||||
Total income | 1,965 | ||||||
Expenses: | |||||||
Investment advisory fees | 388 | ||||||
Administration fees — Fund Shares | 102 | ||||||
Administration fees — Institutional Shares | 5 | ||||||
Sub-Administration fees | 20 | ||||||
Custodian fees | 35 | ||||||
Transfer agent fees — Fund Shares | 115 | ||||||
Transfer agent fees — Institutional Shares | 5 | ||||||
Trustees' fees | 46 | ||||||
Compliance fees | — | (a) | |||||
Legal and audit fees | 75 | ||||||
State registration and filing fees | 26 | ||||||
Other expenses | 50 | ||||||
Total expenses | 867 | ||||||
Expenses waived/reimbursed by Adviser | (117 | ) | |||||
Net Expenses | 750 | ||||||
Net Investment Income (Loss) | 1,215 | ||||||
Realized/Unrealized Gains (Losses) from Investments: | |||||||
| Net realized gains (losses) from investment securities and foreign currency translations | (359 | ) | |||||
| Net change in unrealized appreciation/depreciation on investment securities and foreign currency translations | 25,890 | ||||||
Net realized/unrealized gains (losses) on investments | 25,531 | ||||||
Change in net assets resulting from operations | $ | 26,746 | |||||
(a) Rounds to less than $1 thousand.
See notes to financial statements.
19
USAA Mutual Funds Trust | Statements of Changes in Net Assets | ||||||
(Amounts in Thousands)
| USAA Global Equity Income Fund | |||||||||||
| Year Ended March 31, 2021 | Year Ended March 31, 2020 | ||||||||||
From Investments: | |||||||||||
Operations: | |||||||||||
Net investment income (loss) | $ | 1,215 | $ | 1,871 | |||||||
Net realized gains (losses) from investments | (359 | ) | 4,817 | ||||||||
| Net change in unrealized appreciation/depreciation on investments | 25,890 | (17,160 | ) | ||||||||
Change in net assets resulting from operations | 26,746 | (10,472 | ) | ||||||||
Distributions to Shareholders: | |||||||||||
Fund Shares | (1,102 | ) | �� | (5,419 | ) | ||||||
Institutional Shares | (89 | ) | (391 | ) | |||||||
Change in net assets resulting from distributions to shareholders | (1,191 | ) | (5,810 | ) | |||||||
Change in net assets resulting from capital transactions | (14,549 | ) | 641 | ||||||||
Change in net assets | 11,006 | (15,641 | ) | ||||||||
Net Assets: | |||||||||||
Beginning of period | 64,706 | 80,347 | |||||||||
End of period | $ | 75,712 | $ | 64,706 | |||||||
Capital Transactions: | |||||||||||
Fund Shares | |||||||||||
Proceeds from shares issued | $ | 5,174 | $ | 10,388 | |||||||
Distributions reinvested | 921 | 4,427 | |||||||||
Cost of shares redeemed | (20,644 | ) | (14,174 | ) | |||||||
Total Fund Shares | $ | (14,549 | ) | $ | 641 | ||||||
Institutional Shares | |||||||||||
Proceeds from shares issued | — | — | |||||||||
Distributions reinvested | — | — | |||||||||
Cost of shares redeemed | — | — | |||||||||
Total Institutional Shares | — | — | |||||||||
Change in net assets resulting from capital transactions | $ | (14,549 | ) | $ | 641 | ||||||
Share Transactions: | |||||||||||
Fund Shares | |||||||||||
Issued | 499 | 993 | |||||||||
Reinvested | 90 | 415 | |||||||||
Redeemed | (1,981 | ) | (1,368 | ) | |||||||
Total Fund Shares | (1,392 | ) | 40 | ||||||||
Institutional Shares | |||||||||||
Issued | — | — | |||||||||
Reinvested | — | — | |||||||||
Redeemed | — | — | |||||||||
Total Institutional Shares | — | — | |||||||||
Change in Shares | (1,392 | ) | 40 | ||||||||
See notes to financial statements.
20
This page is intentionally left blank.
21
USAA Mutual Funds Trust | Financial Highlights | ||||||
For a Share Outstanding Throughout Each Period
Investment Activities | Distributions to Shareholders From | ||||||||||||||||||||||||||
| Net Asset Value, Beginning of Period | Net Investment Income (Loss) | Net Realized and Unrealized Gains (Losses) on Investments | Total from Investment Activities | Net Investment Income | Net Realized Gains From Investments | ||||||||||||||||||||||
USAA Global Equity Income Fund | |||||||||||||||||||||||||||
Fund Shares | |||||||||||||||||||||||||||
| Year Ended March 31, 2021 | $ | 8.42 | 0.17 | (b) | 3.61 | 3.78 | (0.17 | ) | — | ||||||||||||||||||
| Year Ended March 31, 2020 | $ | 10.51 | 0.24 | (b) | (1.57 | ) | (1.33 | ) | (0.22 | ) | (0.54 | ) | |||||||||||||||
| Year Ended March 31, 2019 | $ | 10.88 | 0.27 | 0.06 | 0.33 | (0.27 | ) | (0.43 | ) | ||||||||||||||||||
| Year Ended March 31, 2018 | $ | 10.42 | 0.23 | 0.54 | 0.77 | (0.23 | ) | (0.08 | ) | ||||||||||||||||||
| Year Ended March 31, 2017 | $ | 9.39 | 0.21 | 1.03 | 1.24 | (0.21 | ) | — | |||||||||||||||||||
Institutional Shares | |||||||||||||||||||||||||||
| Year Ended March 31, 2021 | $ | 8.43 | 0.18 | (b) | 3.61 | 3.79 | (0.18 | ) | — | ||||||||||||||||||
| Year Ended March 31, 2020 | $ | 10.52 | 0.25 | (b) | (1.56 | ) | (1.31 | ) | (0.24 | ) | (0.54 | ) | |||||||||||||||
| Year Ended March 31, 2019 | $ | 10.89 | 0.27 | 0.07 | 0.34 | (0.28 | ) | (0.43 | ) | ||||||||||||||||||
| Year Ended March 31, 2018 | $ | 10.43 | 0.23 | 0.54 | 0.77 | (0.23 | ) | (0.08 | ) | ||||||||||||||||||
| Year Ended March 31, 2017 | $ | 9.39 | 0.23 | 1.02 | 1.25 | (0.21 | ) | — | |||||||||||||||||||
* Assumes reinvestment of all net investment income and realized capital gain distributions, if any, during the period. Includes adjustments in accordance with U.S. Generally Accepted Accounting Principles and could differ from the Lipper reported return.
** For the period beginning July 1, 2019, the amount of any waivers or reimbursements and the amount of any recoupment is calculated without regard to the impact of any performance adjustment to the Fund's management fee.
^ The net expense ratio may not correlate to the applicable expense limits in place during the period since the current contractual expense limitation is applied for a period beginning July 1, 2019, and in effect through June 30, 2023, instead of coinciding with the Fund's fiscal year end. Details of the current contractual expense limitation in effect can be found in Note 4 of the accompanying Notes to Financial Statements.
(a) Portfolio turnover is calculated on the basis of the Fund as a whole without distinguishing between the classes of shares.
(b) Per share net investment income (loss) has been calculated using the average daily shares method.
(c) Reflects a return to normal trading levels after a prior year transition or asset allocation shift.
(d) Reflects increased trading activity due to current year transition or asset allocation shift.
(e) Prior to August 1, 2018, USAA Asset Management Company ("AMCO") (previous investment Adviser) had voluntarily agreed to limit the annual expenses of the Fund Shares to 1.20% of the Fund Shares' average daily net assets.
(f) Prior to August 1, 2018, AMCO (previous investment Adviser) had voluntarily agreed to limit the annual expenses of the Institutional Shares to 1.10% of the Institutional Shares' average daily net assets.
See notes to financial statements.
22
USAA Mutual Funds Trust | Financial Highlights — continued | ||||||
For a Share Outstanding Throughout Each Period
Ratios to Average Net Assets | Supplemental Data | ||||||||||||||||||||||||||||||||||
| Total Distributions | Net Asset Value, End of Period | Total Return* | Net Expenses**^ | Net Investment Income (Loss) | Gross Expenses | Net Assets, End of Period (000's) | Portfolio Turnover(a) | ||||||||||||||||||||||||||||
USAA Global Equity Income Fund | |||||||||||||||||||||||||||||||||||
Fund Shares | |||||||||||||||||||||||||||||||||||
| Year Ended March 31, 2021 | (0.17 | ) | $ | 12.03 | 45.23 | % | 1.03 | % | 1.65 | % | 1.18 | % | $ | 69,690 | 46 | %(c) | |||||||||||||||||||
| Year Ended March 31, 2020 | (0.76 | ) | $ | 8.42 | (14.02 | )% | 1.00 | % | 2.30 | % | 1.14 | % | $ | 60,491 | 109 | %(d) | |||||||||||||||||||
| Year Ended March 31, 2019 | (0.70 | ) | $ | 10.51 | 3.43 | % | 1.03 | %(e) | 2.56 | % | 1.10 | % | $ | 75,086 | 15 | % | |||||||||||||||||||
| Year Ended March 31, 2018 | (0.31 | ) | $ | 10.88 | 7.41 | % | 1.05 | % | 2.17 | % | 1.05 | % | $ | 96,101 | 22 | % | |||||||||||||||||||
| Year Ended March 31, 2017 | (0.21 | ) | $ | 10.42 | 13.33 | % | 1.20 | % | 2.28 | % | 1.26 | % | $ | 85,830 | 22 | % | |||||||||||||||||||
Institutional Shares | |||||||||||||||||||||||||||||||||||
| Year Ended March 31, 2021 | (0.18 | ) | $ | 12.04 | 45.32 | % | 0.93 | % | 1.74 | % | 1.25 | % | $ | 6,022 | 46 | %(c) | |||||||||||||||||||
| Year Ended March 31, 2020 | (0.78 | ) | $ | 8.43 | (13.90 | )% | 0.90 | % | 2.40 | % | 1.51 | % | $ | 4,215 | 109 | %(d) | |||||||||||||||||||
| Year Ended March 31, 2019 | (0.71 | ) | $ | 10.52 | 3.47 | % | 0.97 | %(f) | 2.58 | % | 1.22 | % | $ | 5,261 | 15 | % | |||||||||||||||||||
| Year Ended March 31, 2018 | (0.31 | ) | $ | 10.89 | 7.35 | % | 1.10 | % | 2.14 | % | 1.29 | % | $ | 5,447 | 22 | % | |||||||||||||||||||
| Year Ended March 31, 2017 | (0.21 | ) | $ | 10.43 | 13.49 | % | 1.10 | % | 2.40 | % | 1.55 | % | $ | 5,214 | 22 | % | |||||||||||||||||||
See notes to financial statements.
23
USAA Mutual Funds Trust | Notes to Financial Statements March 31, 2021 | ||||||
1. Organization:
USAA Mutual Funds Trust (the "Trust") is organized as a Delaware statutory trust and is registered under the Investment Company Act of 1940, as amended (the "1940 Act"), as an open-end investment company. The Trust is comprised of 46 funds and is authorized to issue an unlimited number of shares, which are units of beneficial interest with no par value.
The accompanying financial statements are those of the USAA Global Equity Income Fund (the "Fund"). The Fund offers two classes of shares: Fund Shares and Institutional Shares. The Fund is classified as diversified under the 1940 Act.
Each class of shares of the Fund has substantially identical rights and privileges, except with respect to fees paid under distribution plans, expenses allocable exclusively to each class of shares, voting rights on matters solely affecting a single class of shares, and the exchange privilege of each class of shares.
Under the Trust's organizational documents, its officers and trustees are indemnified against certain liabilities arising out of the performance of their duties to the Fund. In addition, in the normal course of business, the Fund enters into contracts with its vendors and others that provide for general indemnifications. The Fund's maximum exposure under these arrangements is unknown, as this would involve future claims that may be made against the Fund. However, based on experience, the Fund expects that risk of loss to be remote.
2. Significant Accounting Policies:
The following is a summary of significant accounting policies followed by the Trust in the preparation of its financial statements. The policies are in conformity with Generally Accepted Accounting Principles in the United States of America ("GAAP"). The preparation of financial statements in accordance with GAAP requires management to make estimates and assumptions that affect the reported amounts of assets and liabilities and disclosure of contingent assets and liabilities at the date of the financial statements and the reported amounts of income and expenses for the period. Actual results could differ from those estimates. The Fund follows the specialized accounting and reporting requirements under GAAP that are applicable to investment companies under Accounting Standards Codification Topic 946.
Investment Valuation:
The Fund records investments at fair value. Fair value is defined as the price that would be received to sell an asset or paid to transfer a liability in an orderly transaction between market participants at the measurement date.
The valuation techniques described below maximize the use of observable inputs and minimize the use of unobservable inputs in determining fair value. The inputs used for valuing the Fund's investments are summarized in the three broad levels listed below:
• Level 1 — quoted prices in active markets for identical securities
• Level 2 — other significant observable inputs (including quoted prices for similar securities or interest rates applicable to those securities, etc.)
• Level 3 — significant unobservable inputs (including the Fund's own assumptions in determining the fair value of investments)
Changes in valuation techniques may result in transfers in or out of an assigned level within the disclosure hierarchy. The inputs or methodologies used for valuation techniques are not necessarily an indication of the risks associated with entering into those investments.
Victory Capital Management Inc. ("VCM" or the "Adviser") has established the Pricing and Liquidity Committee (the "Committee"), and subject to the Trust's Board of Trustees (the "Board") oversight, the Committee administers and oversees the Fund's valuation policies and procedures, which are approved by the Board.
24
USAA Mutual Funds Trust | Notes to Financial Statements — continued March 31, 2021 | ||||||
Portfolio securities listed or traded on securities exchanges, including Exchange-Traded Funds ("ETFs"), American Depositary Receipts ("ADRs") and Rights, are valued at the closing price on the exchange or system where the security is principally traded, if available, or at the Nasdaq Official Closing Price. If there have been no sales for that day on the exchange or system, then a security is valued at the last available bid quotation on the exchange or system where the security is principally traded. In each of these situations, valuations are typically categorized as Level 1 in the fair value hierarchy.
Investments in open-end investment companies are valued at their net asset value ("NAV"). These valuations are typically categorized as Level 1 in the fair value hierarchy.
In the event that price quotations or valuations are not readily available, are not reflective of market value, or a significant event has been recognized in relation to a security or class of securities, the securities are valued in good faith by the Committee in accordance with valuation procedures approved by the Board. These valuations are typically categorized as Level 2 or Level 3 in the fair value hierarchy, based on the observability of inputs used to determine the fair value. The effect of fair value pricing is that securities may not be priced on the basis of quotations from the primary market in which they are traded and the actual price realized from the sale of a security may differ materially from the fair value price. Valuing these securities at fair value is intended to cause the Fund's NAV to be more reliable than it otherwise would be.
In accordance with procedures adopted by the Board, fair value pricing may be used if events materially affecting the value of foreign securities occur between the time the exchange on which they are traded closes and the time the Fund's NAV is calculated. The Fund uses a systematic valuation model, provided daily by an independent third party to fair value its international equity securities. The valuations are considered as Level 2 in the fair value hierarchy.
A summary of the valuations as of March 31, 2021, based upon the three levels defined above, is included in the table below while the breakdown, by category, of investments is disclosed on the Schedule of Portfolio Investments (amounts in thousands):
Level 1 | Level 2 | Level 3 | Total | ||||||||||||||||
Common Stocks | $ | 54,693 | $ | 20,636 | $ | — | $ | 75,329 | |||||||||||
Collateral for Securities Loaned | 310 | — | — | 310 | |||||||||||||||
Total | $ | 55,003 | $ | 20,636 | $ | — | $ | 75,639 | |||||||||||
For the year ended March 31, 2021, there were no transfers in or out of Level 3 in the fair value hierarchy.
Real Estate Investment Trusts ("REITs"):
The Fund may invest in REITs, which report information on the source of their distributions annually. REITs are pooled investment vehicles that invest primarily in income producing real estate or real estate related loans or interests (such as mortgages). Certain distributions received from REITs during the year are recorded as realized gains or return of capital as estimated by the Fund or when such information becomes known.
Investment Companies:
Open-End Funds:
The Fund may invest in portfolios of open-end investment companies. These investment companies value securities in their portfolios for which market quotations are readily available at their market values (generally the last reported sale price) and all other securities and assets at their fair value by the methods established by the board of directors of the underlying funds.
Foreign Exchange Currency Contracts:
The Fund may enter into foreign exchange currency contracts to convert U.S. dollars to and from various foreign currencies. A foreign exchange currency contract is an obligation by the Fund to
25
USAA Mutual Funds Trust | Notes to Financial Statements — continued March 31, 2021 | ||||||
purchase or sell a specific currency at a future date at a price (in U.S. dollars) set at the time of the contract. The Fund does not engage in "cross-currency" foreign exchange contracts (i.e., contracts to purchase or sell one foreign currency in exchange for another foreign currency). The Fund's foreign exchange currency contracts might be considered spot contracts (typically a contract of one week or less) or forward contracts (typically a contract term over one week). A spot contract is entered into for purposes of hedging against foreign currency fluctuations relating to a specific portfolio transaction, such as the delay between a security transaction trade date and settlement date. Forward contracts are entered into for purposes of hedging portfolio holdings or concentrations of such holdings. Each foreign exchange currency contract is adjusted daily by the prevailing spot or forward rate of the underlying currency, and any appreciation or depreciation is recorded for financial statement purposes as unrealized until the contract settlement date, at which time the Fund records realized gains or losses equal to the difference between the value of a contract at the time it was opened and the value at the time it was closed. The Fund could be exposed to risk if a counterparty is unable to meet the terms of a foreign exchange currency contract or if the value of the foreign currency changes unfavorably. In addition, the use of foreign exchange currency contracts does not eliminate fluctuations in the underlying prices of the securities. As of March 31, 2021, the Fund had no open forward foreign exchange currency contracts.
Investment Transactions and Related Income:
Changes in holdings of investments are accounted for no later than one business day following the trade date. For financial reporting purposes, however, investment transactions are accounted for on trade date on the last business day of the reporting period. Interest income is determined on the basis of coupon interest accrued using the effective interest method which adjusts, where applicable, the amortization of premiums or accretion of discount. Dividend income is recorded on the ex-dividend date. Gains or losses realized on sales of securities are determined by comparing the identified cost of the security lot sold with the net sales proceeds.
Withholding taxes on interest, dividends, and gains as a result of certain investments in ADRs by the Fund have been provided for in accordance with each investment's applicable country's tax rules and rates.
Securities Lending:
The Fund, through a securities lending agreement with Citibank, N.A. ("Citibank"), may lend its securities to qualified financial institutions, such as certain broker-dealers, to earn additional income, net of income retained by Citibank. Borrowers are required to secure their loans for collateral in the amount of at least 102% of the value of U.S. securities loaned or at least 105% of the value of non-U.S. securities loaned, marked-to-market daily. Any collateral shortfalls associated with increases in the valuation of the securities loaned are cured the next business day once the shortfall exceeds $100 thousand. Collateral may be cash, U.S. government securities, or other securities as permitted by Securities and Exchange Commission ("SEC") guidelines. Cash collateral may be invested in high-quality short-term investments, primarily open-end investment companies. Collateral requirements are determined daily based on the value of the Fund's securities on loan as of the end of the prior business day. During the time portfolio securities are on loan, the borrower will pay the Fund any dividends or interest paid on such securities plus any fee negotiated between the parties to the lending agreement. The Fund also earns a return from the collateral. The Fund pays Citibank various fees in connection with the investment of cash collateral and fees based on the investment income received from securities lending activities. Securities lending income (net of these fees) is disclosed on the Statement of Operations. Loans are terminable upon demand and the borrower must return the loaned securities within the lesser of one standard settlement period or five business days. Risks relating to securities-lending transactions include that the borrower may not provide additional collateral when required or return the securities when due, and that the value of the short-term investments will be less than the amount of cash collateral required to be returned to the borrower. The Fund's agreement with Citibank does
26
USAA Mutual Funds Trust | Notes to Financial Statements — continued March 31, 2021 | ||||||
not include master netting provisions. Non-cash collateral received by the Fund may not be sold or re-pledged, except to satisfy borrower default. Cash collateral is listed on the Fund's Schedule of Portfolio Investments and Financial Statements while non-cash collateral is not included.
The following table (amounts in thousands) is a summary of the Fund's securities lending transactions as of March 31, 2021.
| Value of Securities on Loan | Non-Cash Collateral | Cash Collateral | |||||||||
| $ | 292 | $ | — | $ | 310 | ||||||
Foreign Currency Translations:
The accounting records of the Fund are maintained in U.S. dollars. Investment securities and other assets and liabilities of the Fund denominated in a foreign currency are translated into U.S. dollars at current exchange rates. Purchases and sales of securities, income receipts, and expense payments are translated into U.S. dollars at the exchange rates on the date of the transactions. The Fund does not isolate the portion of the results of operations resulting from changes in foreign exchange rates on investments from fluctuations arising from changes in market prices of securities held. Such fluctuations are disclosed as net change in unrealized appreciation/depreciation on investments and foreign currency translations on the Statement of Operations. Any realized gains or losses from these fluctuations, including foreign currency arising from in-kind redemptions, are disclosed as net realized gains or losses from investment transactions and foreign currency translations on the Statement of Operations.
Foreign Taxes:
The Fund may be subject to foreign taxes related to foreign income received (a portion of which may be reclaimable), capital gains on the sale of securities, and certain foreign currency transactions. All foreign taxes are recorded in accordance with the applicable regulations and rates that exist in the foreign jurisdictions in which the Fund invests.
Federal Income Taxes:
It is the Fund's policy to continue to qualify as a regulated investment company by complying with the provisions available to certain investment companies, as defined in applicable sections of the Internal Revenue Code, and to make distributions of net investment income and net realized gains sufficient to relieve it from all, or substantially all, federal income taxes. Accordingly, no provision for federal income taxes is required in the financial statements. The Fund has a tax year end of March 31.
Management of the Fund has reviewed tax positions taken in tax years that remain subject to examination by all major tax jurisdictions, including federal (i.e., the last four tax years, which includes the current fiscal tax year end). Management believes that there is no tax liability resulting from unrecognized tax benefits related to uncertain tax positions taken.
Allocations:
Expenses directly attributable to the Fund are charged to the Fund, while expenses that are attributable to more than one fund in the Trust, or jointly with an affiliated trust, are allocated among the respective funds in the Trust and/or affiliated trust based upon net assets or another appropriate basis.
Income, expenses (other than class-specific expenses such as transfer agent fees, state registration fees, and printing fees), and realized and unrealized gains or losses on investments are allocated to each class of shares based on its relative net assets on the date income is earned or expenses and realized and unrealized gains and losses are incurred.
27
USAA Mutual Funds Trust | Notes to Financial Statements — continued March 31, 2021 | ||||||
3. Purchases and Sales:
Cost of purchases and proceeds from sales/maturities of securities (excluding securities maturing less than one year from acquisition) for the year ended March 31, 2021, were as follows for the Fund (amounts in thousands):
| Excluding U.S. Government Securities | |||||||||||
Purchases | Sales | ||||||||||
$ | 33,392 | $ | 47,693 | ||||||||
There were no purchases or sales of U.S. government securities during the year ended March 31, 2021.
4. Fees and Transactions with Affiliates and Related Parties:
Investment Advisory Fees:
Investment advisory services are provided to the Fund by the Adviser, which is a New York corporation registered as an investment adviser with the SEC. The Adviser is a wholly-owned indirect subsidiary of Victory Capital Holdings, Inc., a publicly traded Delaware corporation, and a wholly-owned direct subsidiary of Victory Capital Operating, LLC.
Under the terms of the Investment Advisory Agreement, the Adviser is entitled to receive a base fee and a performance adjustment. The Fund's base fee is accrued daily and paid monthly at an annualized rate of 0.50% of the Fund's average daily net assets. Amounts incurred and paid to VCM for the year ended March 31, 2021, are reflected on the Statement of Operations as Investment Advisory fees.
On November 6, 2018, United Services Automobile Association ("USAA"), the parent company of USAA Asset Management Company ("AMCO"), the prior investment adviser to the Fund announced that AMCO would be acquired by Victory Capital Holdings Inc. (the "Transaction"). A special shareholder meeting was held on April 18, 2019, at which shareholders of the Fund approved a new investment advisory agreement between the Trust, on behalf of the Fund, and VCM. The Transaction closed on July 1, 2019 and effective July 1, 2019, VCM replaced AMCO as the investment adviser to the Fund and no performance adjustments were made for the period beginning July 1, 2019, through June 30, 2020. Only performance beginning as of July 1, 2019, and thereafter is utilized in calculating future performance adjustments.
The performance adjustment for each share class is accrued daily and calculated monthly by comparing each class' performance to that of the Lipper Global Equity Income Funds Index. The Lipper Global Equity Income Funds Index tracks the total return performance of the largest funds within the Lipper Global Equity Income Funds category.
The performance period for each share class consists of the current month plus the previous 35 months (or the number of months beginning July 1, 2019, if fewer). The following table is utilized to determine the extent of the performance adjustment:
| Over/Under Performance Relative to Index (in basis points)(a) | Annual Adjustment Rate (in basis points)(a) | ||||||
| +/- 100 to 400 | +/- 4 | ||||||
| +/- 401 to 700 | +/- 5 | ||||||
| +/- 701 and greater | +/- 6 | ||||||
(a) Based on the difference between average annual performance of the relevant share class of the Fund and its relevant Lipper index, rounded to the nearest basis point. Average daily net assets of the share class are calculated over a rolling 36 month period.
Each class' annual performance adjustment rate is multiplied by the average daily net assets of each respective class over the entire performance period, which is then multiplied by a fraction, the numerator of which is the number of days in the month and the denominator of which is 365 (366 in
28
USAA Mutual Funds Trust | Notes to Financial Statements — continued March 31, 2021 | ||||||
leap years). The resulting amount is then added to (in the case of overperformance), or subtracted from (in the case of underperformance) the base fee.
Under the performance fee arrangement, each class pays a positive performance fee adjustment for a performance period whenever the class outperforms the Lipper Global Equity Income Funds Index over that period, even if the class has overall negative returns during the performance period.
For the performance period July 1, 2020, to March 31, 2021, performance adjustments were $20 and $2, in thousands for Fund Shares and Institutional Shares, respectively. Performance adjustments were 0.03% and 0.03% for the Fund Shares and Institutional Shares, respectively.
The Trust relies on an exemptive order granted to VCM and its affiliated funds by the SEC in March 2019 permitting the use of a "manager-of-managers" structure for certain funds. Under a manager-of-managers structure, the investment adviser may select (with approval of the Board and without shareholder approval) one or more subadvisers to manage the day-to-day investment of a fund's assets. For the year ended March 31, 2021, the Fund had no subadvisors.
Administration and Servicing Fees:
VCM serves as the Fund's administrator and fund accountant. Under the Fund Administration, Servicing and Accounting Agreement, VCM is paid for its services an annual fee at a rate of 0.15% and 0.10% of average daily net assets of the Fund Shares and Institutional Shares, respectively. Amounts incurred for the year ended March 31, 2021, are reflected on the Statement of Operations as Administration fees.
The Fund (as part of the Trust) has entered into an agreement to provide compliance services with the Adviser, pursuant to which the Adviser furnishes its compliance personnel, including the services of the Chief Compliance Officer ("CCO"), and other resources reasonably necessary to provide the Trust with compliance oversight services related to the design, administration and oversight of a compliance program for the Trust in accordance with Rule 38a-1 under the 1940 Act. The CCO is an employee of the Adviser, which pays the compensation of the CCO and support staff. Funds in the Trust, Victory Variable Insurance Funds, Victory Portfolios, and Victory Portfolios II (collectively, the "Victory Funds Complex") in the aggregate, compensate the Adviser for these services. Amounts incurred for the year ended March 31, 2021, are reflected on the Statement of Operations as Compliance fees.
Citi Fund Services Ohio, Inc. ("Citi"), an affiliate of Citibank, acts as sub-administrator and sub-fund accountant to the Fund pursuant to a Sub-Administration and Sub-Fund Accounting Services Agreement between VCM and Citi. VCM pays Citi a fee for providing these services. The Fund reimburses VCM and Citi for out-of-pocket expenses incurred in providing these services and certain other expenses specifically allocated to the Fund. Amounts incurred for the year ended March 31, 2021, are reflected on the Statement of Operations as Sub-Administration fees.
Transfer Agency Fees:
Victory Capital Transfer Agency, Inc. ("VCTA"), an affiliate of the Adviser, provides transfer agency services to the Fund. VCTA provides transfer agent services to the Fund Shares based on an annual charge of $23 per shareholder account plus out-of-pocket expenses. VCTA pays a portion of these fees to certain intermediaries for the administration and servicing of accounts that are held with such intermediaries. Transfer agent's fees for Institutional Shares are paid monthly based on a fee accrued daily at an annualized rate of 0.10% of average daily net assets, plus out-of-pocket expenses. Amounts incurred and paid to VCTA for the year ended March 31, 2021, are reflected on the Statement of Operations as Transfer Agent fees.
FIS Investor Services LLC serves as sub-transfer agent and dividend disbursing agent for the Fund pursuant to a Sub-Transfer Agent Agreement between VCTA and FIS Investor Services LLC. VCTA provides FIS Investor Services LLC a fee for providing these services.
29
USAA Mutual Funds Trust | Notes to Financial Statements — continued March 31, 2021 | ||||||
Distributor/Underwriting Services:
Victory Capital Services, Inc. (the "Distributor"), an affiliate of the Adviser, serves as distributor for the continuous offering of the shares of the Fund pursuant to a Distribution Agreement between the Distributor and the Trust and receives no fee or other compensation for these services.
Effective June 30, 2020, the Distributor's name was changed from Victory Capital Advisers, Inc.
Other Fees:
Citibank serves as the Fund's custodian. The Fund pays Citibank a fee for providing these services. Amounts incurred for the year ended March 31, 2021, are reflected on the Statement of Operations as Custodian fees.
K&L Gates LLP provides legal services to the Trust.
The Adviser has entered into an expense limitation agreement with the Fund until at least June 30, 2023. Under the terms of the agreement, the Adviser has agreed to waive fees or reimburse certain expenses to the extent that ordinary operating expenses incurred by certain classes of the Fund in any fiscal year exceed the expense limit for such classes of the Fund. Such excess amounts will be the liability of the Adviser. Acquired fund fees and expenses, interest, taxes, brokerage commissions, other expenditures, which are capitalized in accordance with GAAP, and other extraordinary expenses not incurred in the ordinary course of the Fund's business are excluded from the expense limits. As of March 31, 2021, the expense limits (excluding voluntary waivers) were 1.00% and 0.90% for Fund Shares and Institutional Shares, respectively.
Under the terms of the agreement, the Fund has agreed to repay fees and expenses that were waived or reimbursed by the Adviser for a period of up to three years after the fiscal year in which the waiver or reimbursement took place, subject to the lesser of any operating expense limits in effect at the time of: (a) the original waiver or expense reimbursement; or (b) the recoupment, after giving effect to the recoupment amount.
As of March 31, 2021, the following amounts are available to be repaid to the Adviser (amounts in thousands). The Fund has not recorded any amounts available to be repaid as a liability due to an assessment that such repayment is not probable at March 31, 2021.
| Expires March 31, 2023 | Expires March 31, 2024 | Total | |||||||||
| $ | 93 | $ | 117 | $ | 210 | ||||||
The Adviser may voluntarily waive or reimburse additional fees to assist the Fund in maintaining competitive expense ratios. Voluntary waivers and reimbursements applicable to the Fund are not available to be recouped at a future time. There were no voluntary waivers or reimbursements for the year ended March 31, 2021.
Certain officers and/or interested trustees of the Fund are also officers and/or employees of the Adviser, administrator, sub-administrator, sub-fund accountant, custodian, and Distributor.
5. Risks:
The Fund may be subject to other risks in addition to these identified risks.
Geopolitical/Natural Disaster Risk — Global economies and financial markets are increasingly interconnected, which increases the possibilities that conditions in one country or region might adversely affect issuers in another country or region. Geopolitical and other risks, including war, terrorism, trade disputes, political or economic dysfunction within some nations, public health crises and related geopolitical events, as well as environmental disasters such as earthquakes, fires, and floods, may add to instability in world economies and markets generally. Changes in trade policies and international trade agreements could affect the economies of many countries in unpredictable ways. Likewise, systemic market dislocations of the kind that occurred during the financial crisis that began in 2008, if repeated, would be highly disruptive to economies and markets, adversely affecting individual
30
USAA Mutual Funds Trust | Notes to Financial Statements — continued March 31, 2021 | ||||||
companies and industries, securities markets, interest rates, credit ratings, inflation, investor sentiment, and other factors affecting the value of a Fund's investments. Some countries, including the United States, are adopting more protectionist trade policies and moving away from the tighter financial industry regulations that followed the 2008 financial crisis, which may also affect the value of a Fund's investments.
Political events within the United States at times have resulted, and may in the future result, in a shutdown of government services, which could negatively affect the U.S. economy, decrease the value of a Fund's investments, increase uncertainty in or impair the operation of the U.S. or other securities markets and degrade investor and consumer confidence, perhaps suddenly and to a significant degree.
An outbreak of disease called COVID-19 has spread internationally. The transmission of COVID-19 and efforts to contain its spread have resulted in international, national and local border closings and other significant travel restrictions and disruptions, significant disruptions to business operations, supply chains and consumer activity, significant challenges in healthcare service preparation and delivery, quarantines and general concern and uncertainty. These negative impacts have caused significant volatility and declines in global financial markets, which have caused losses for Fund investors during and subsequent to period end. The impact of the COVID-19 pandemic may last for an extended period of time, and could result in a substantial economic downturn or recession. Public health crises may exacerbate other pre-existing political, social, economic, market and financial risks. The extent of the impact to the financial performance of the Fund's investments will depend on future developments, including (i) the duration and spread of the outbreak, (ii) the restrictions and advisories, (iii) the effects on the financial markets, and (iv) the effects on the economy overall, all of which are highly uncertain and cannot be predicted.
Stock Market Risk — Overall stock market risks may affect the value of the Fund. Domestic and international factors such as political events, war, trade disputes, interest rate levels and other fiscal and monetary policy changes, pandemics and other public health crises, and related geopolitical events, as well as environmental disasters such as earthquakes, fires, and floods, may add to instability in world economies and markets generally. The impact of these and other factors may be short-term or may last for extended periods.
Equity Risk — The value of the equity securities in which the Fund invests may decline in response to developments affecting individual companies and/or general economic conditions. A company's earnings or dividends may not increase as expected due to poor management decisions, competitive pressures, breakthroughs in technology, reliance on suppliers, labor problems or shortages, corporate restructurings, fraudulent disclosures, natural disasters, military confrontations, war, terrorism, public health crises, or other events, conditions, and factors. Price changes may be temporary or last for extended periods.
Foreign Securities Risk — Foreign markets can be more volatile than the U.S. market due to increased risks of adverse issuer, political, regulatory, market, or economic developments and can perform differently from the U.S. market.
6. Borrowing and Interfund Lending:
Line of Credit:
For the year ended March 31, 2021, the Victory Funds Complex participated in a short-term demand note "Line of Credit" agreement with Citibank. The Line of Credit agreement with Citibank was renewed on June 29, 2020, with a termination date of June 28, 2021. Under the agreement with Citibank, the Victory Funds Complex may borrow up to $600 million, of which $300 million is committed and $300 million is uncommitted. $40 million of the Line of Credit is reserved for use by the Victory Floating Rate Fund, another series of the Victory Funds Complex, with Victory Floating Rate Fund paying the related commitment fees for that amount. The purpose of the agreement is to meet temporary or emergency cash needs. For the year ended March 31, 2021, Citibank received an annual commitment fee of 0.15% on $300 million for providing the Line of Credit. Each fund in the Victory Funds Complex paid a pro-rata portion of the commitment fees plus any interest (one month LIBOR plus one percent)
31
USAA Mutual Funds Trust | Notes to Financial Statements — continued March 31, 2021 | ||||||
on amounts borrowed. Effective June 29, 2020, under an amended Line of Credit agreement, Citibank also received an annual upfront fee of 0.10% on the $300 million committed line of credit. Each fund in the Victory Funds Complex paid a pro-rata portion of the upfront fee. Interest charged to each Fund during the period, if applicable, is reflected on the Statement of Operations under Line of credit fees.
The Fund had no borrowings under the Line of Credit agreement during the year ended March 31, 2021.
Interfund Lending:
The Trust and Adviser rely on an exemptive order granted by the SEC in March 2017 (the "Order"), permitting the establishment and operation of an Interfund Lending Facility (the "Facility"). The Facility allows the Fund to directly lend and borrow money to or from any other Fund, that is permitted to participate in the Facility, in the Victory Funds Complex relying upon the Order at rates beneficial to both the borrowing and lending funds. Advances under the Facility are allowed for temporary or emergency purposes, including the meeting of redemption requests that otherwise might require the untimely disposition of securities, and are subject to each Fund's borrowing restrictions. The interfund loan rate is determined, as specified in the Order, by averaging the current repurchase agreement rate and the current bank loan rate. As a Borrower, interest charged to the Fund, if any, during the period is reflected on the Statement of Operations under Interfund lending fees. As a Lender, interest earned by the Fund, if any, during the period is presented on the Statement of Operations under Interfund lending.
The Fund did not utilize or participate in the Facility during the year ended March 31, 2021.
7. Federal Income Tax Information:
The Fund intends to distribute any net investment income quarterly. Distributable net realized gains, if any, are declared and paid at least annually.
The amounts of dividends from net investment income and distributions from net realized gains (collectively distributions to shareholders) are determined in accordance with federal income tax regulations, which may differ from GAAP. To the extent these "book/tax" differences are permanent in nature (e.g., net operating loss and distribution reclassification), such amounts are reclassified within the components of net assets based on their federal tax-basis treatment; temporary differences (e.g., wash sales) do not require reclassification. To the extent dividends and distributions exceed net investment income and net realized gains for tax purposes, they are reported as distributions of capital. Net investment losses incurred by the Fund may be reclassified as an offset to capital on the accompanying Statement of Assets and Liabilities.
As of March 31, 2021, on the Statement of Assets and Liabilities, there were no permanent book-to-tax difference reclassification adjustments.
The tax character of distributions paid during the tax years ended as noted below, were as follows (total distributions paid may differ from the Statements of Changes in Net Assets because, for tax purposes, dividends are recognized when actually paid) (amounts in thousands).
Year Ended March 31, 2021 | Year Ended March 31, 2020 | ||||||||||||||||||||||
| Distributions paid from | Distributions paid from | ||||||||||||||||||||||
Ordinary Income | Total Distributions Paid | Ordinary Income | Net Long-Term Capital Gains | Total Distributions Paid | |||||||||||||||||||
$ | 1,191 | $ | 1,191 | $ | 1,722 | $ | 4,088 | $ | 5,810 | ||||||||||||||
32
USAA Mutual Funds Trust | Notes to Financial Statements — continued March 31, 2021 | ||||||
As of March 31, 2021, the components of accumulated earnings (loss) on a tax basis were as follows (amounts in thousands):
| Undistributed Ordinary Income | Accumulated Earnings | Accumulated Capital and Other Losses | Unrealized Appreciation (Depreciation)* | Total Accumulated Earnings (Loss) | |||||||||||||||
| $ | 222 | $ | 222 | $ | (697 | ) | $ | 17,214 | $ | 16,739 | |||||||||
* The difference between the book-basis and tax-basis of unrealized appreciation/depreciation is attributable to deferral of losses on wash sales, passive foreign investment company, REIT and non-REIT return of capital adjustments.
As of March 31, 2021, the Fund had net capital loss carryforwards as shown in the table below (amounts in thousands). It is unlikely that the Board will authorize a distribution of capital gains realized in the future until the capital loss carryforwards have been used.
| Short-Term Amount | Total | ||||||
| $ | 697 | $ | 697 | ||||
As of March 31, 2021, the cost basis for federal income tax purposes, gross unrealized appreciation, gross unrealized depreciation, and net unrealized appreciation (depreciation) for investments were as follows (amounts in thousands):
| Cost of Investments for Federal Tax Purposes | Gross Unrealized Appreciation | Gross Unrealized Depreciation | Net Unrealized Appreciation (Depreciation) | ||||||||||||||||
| $ | 58,427 | $ | 17,843 | $ | (629 | ) | $ | 17,214 | |||||||||||
33
REPORT OF INDEPENDENT REGISTERED PUBLIC ACCOUNTING FIRM
To the Shareholders and the Board of Trustees of USAA Global Equity Income Fund
Opinion on the Financial Statements
We have audited the accompanying statement of assets and liabilities of USAA Global Equity Income Fund (the "Fund") (one of the funds constituting USAA Mutual Funds Trust (the "Trust")), including the schedule of portfolio investments, as of March 31, 2021, and the related statement of operations for the year then ended, the statements of changes in net assets for each of the two years in the period then ended, the financial highlights for each of the five years in the period then ended and the related notes (collectively referred to as the "financial statements"). In our opinion, the financial statements present fairly, in all material respects, the financial position of the Fund at March 31, 2021, the results of its operations for the year then ended, the changes in its net assets for each of the two years in the period then ended and its financial highlights for each of the five years in the period then ended, in conformity with U.S. generally accepted accounting principles.
Basis for Opinion
These financial statements are the responsibility of the Trust's management. Our responsibility is to express an opinion on the Fund's financial statements based on our audits. We are a public accounting firm registered with the Public Company Accounting Oversight Board (United States) ("PCAOB") and are required to be independent with respect to the Trust in accordance with the U.S. federal securities laws and the applicable rules and regulations of the Securities and Exchange Commission and the PCAOB.
We conducted our audits in accordance with the standards of the PCAOB. Those standards require that we plan and perform the audit to obtain reasonable assurance about whether the financial statements are free of material misstatement, whether due to error or fraud. The Trust is not required to have, nor were we engaged to perform, an audit of the Trust's internal control over financial reporting. As part of our audits we are required to obtain an understanding of internal control over financial reporting, but not for the purpose of expressing an opinion on the effectiveness of the Trust's internal control over financial reporting. Accordingly, we express no such opinion.
Our audits included performing procedures to assess the risks of material misstatement of the financial statements, whether due to error or fraud, and performing procedures that respond to those risks. Such procedures included examining, on a test basis, evidence regarding the amounts and disclosures in the financial statements. Our procedures included confirmation of securities owned as of March 31, 2021, by correspondence with the custodian and brokers or by other appropriate auditing procedures where replies from brokers were not received. Our audits also included evaluating the accounting principles used and significant estimates made by management, as well as evaluating the overall presentation of the financial statements. We believe that our audits provide a reasonable basis for our opinion.

We have served as the auditor of one or more Victory Capital investment companies since 1995.
San Antonio, Texas
May 26, 2021
34
USAA Mutual Funds Trust | Supplemental Information March 31, 2021 | ||||||
(Unaudited)
Trustee and Officer Information
Board of Trustees:
Overall responsibility for management of the Trust rests with the Board. The Trust is managed by the Board in accordance with the laws of the state of Delaware. There are currently nine Trustees, seven of whom are not "interested persons" of the Trust within the meaning of that term under the 1940 Act ("Independent Trustees") and two of whom is an "interested person" of the Trust within the meaning of that term under the 1940 Act ("Interested Trustee"). The Trustees, in turn, elect the officers of the Trust to actively supervise its day-to-day operations.
The following tables list the Trustees, their ages, position with the Trust, commencement of service, principal occupations during the past five years and any directorships of other investment companies or companies whose securities are registered under the Securities Exchange Act of 1934, as amended, or who file reports under that Act. Each Trustee oversees 46 portfolios in the Trust. Each Trustee's address is 15935 La Cantera Pkwy, San Antonio, TX, 78256. Pursuant to a policy adopted by the Board, the term of office for each Trustee shall be until the Independent Trustee reaches age 75 or an Interested Trustee reaches age 75. The Board may change or grant exceptions from this policy at any time without shareholder approval. A Trustee may resign or be removed by a vote of the other Trustees or the holders of a majority of the outstanding shares of the Trust at any time. Vacancies on the Board can be filled by the action of a majority of the Trustees, provided that after filling such vacancy at least two-thirds of the Trustees have been elected by the shareholders.
Name and Date of Birth | Position Held with the Trust | Year Commenced Service | Principal Occupation During Past 5 Years | Other Directorships Held During Past 5 Years | |||||||||||||||
Independent Trustees. | |||||||||||||||||||
| Jefferson C. Boyce, (c) Born September 1957 | Independent Chairman | 2021 | Senior Managing Director, New York Life Investments, LLC (1992-2012) | Westhab, Inc. | |||||||||||||||
| John C. Walters, Born February 1962 | Trustee | 2019 | Retired. Mr. Walters brings significant Board experience including active involvement with the board of a Fortune 500 company, and a proven record of leading large, complex financial organizations. He has a demonstrated record of success in distribution, manufacturing, investment brokerage, and investment management in both the retail and institutional investment businesses. He has substantial experience in the investment management business with a demonstrated ability to develop and drive strategy while managing operation, financial, and investment risk. | Guardian Variable Products Trust (16 series), Lead Independent Director; Amerilife Holdings LLC, Director; Stadion Money Management; Director; University of North Carolina (Chapel Hill), Member Board of Governors | |||||||||||||||
35
USAA Mutual Funds Trust | Supplemental Information — continued March 31, 2021 | ||||||
(Unaudited)
Name and Date of Birth | Position Held with the Trust | Year Commenced Service | Principal Occupation During Past 5 Years | Other Directorships Held During Past 5 Years | |||||||||||||||
| Robert L. Mason, Ph.D., Born July 1946 | Trustee | 1997 | Adjunct Professor in the Department of Management Science and Statistics in the College of Business at the University of Texas at San Antonio (since 2001); Institute Analyst, Southwest Research Institute (March 2002-January 2016) | None | |||||||||||||||
| Dawn M. Hawley, Born February 1954 | Trustee | 2014 | Manager of Finance, Menil Foundation, Inc. (May 2007-June 2011), which is a private foundation that oversees the assemblage of sculptures, prints, drawings, photographs, and rare books. Director of Financial Planning and Analysis and Chief Financial Officer, AIM Management Group, Inc. (October 1987-January 2006) | None | |||||||||||||||
| Paul L. McNamara, Born July 1948 | Trustee | 2012 | Director, Cantor Opportunistic Alternatives Fund, LLC (March 2010-February 2014), which is a closed-end fund of funds by Cantor Fitzgerald Investment Advisors, LLC | None | |||||||||||||||
36
USAA Mutual Funds Trust | Supplemental Information — continued March 31, 2021 | ||||||
(Unaudited)
Name and Date of Birth | Position Held with the Trust | Year Commenced Service | Principal Occupation During Past 5 Years | Other Directorships Held During Past 5 Years | |||||||||||||||
| Richard Y. Newton III, Born January 1956 | Trustee | 2017 | Director, Elta North America (01/18-present), which is a global leader in the design, manufacture, and support of innovative electronic systems in the ground, maritime, airborne, and security domains for the nation's warfighters, security personnel, and first responders; Managing Partner, Pioneer Partnership Development Group (December 2015-present)); Executive Director, The Union League Club of New York (June 2014-November 2015): Executive Vice President, Air Force Association (August 2012-May 2014); Lieutenant General, United States Air Force (January 2008-June 2012) | PredaSAR Corp. | |||||||||||||||
| Barbara B. Ostdiek, Ph.D., Born March 1964 | Trustee | 2008 | Senior Associate Dean of Degree Programs at Jesse H. Jones Graduate School of Business at Rice University (since 2013); Associate Professor of Finance at Jessie H. Jones Graduate School of Business at Rice University (since 2001) | None | |||||||||||||||
| Michael F. Reimherr, (a) Born August 1945 | Trustee | 2000 | President of Reimherr Business Consulting (May 1995-December 2017); St. Mary's University Investment Committee overseeing University Endowment (since 2014) | None | |||||||||||||||
(a) Effective at the close of business on December 31, 2020, Michael F. Reimherr retired from the Board of Trustees.
37
USAA Mutual Funds Trust | Supplemental Information — continued March 31, 2021 | ||||||
(Unaudited)
Name and Date of Birth | Position Held with the Trust | Year Commenced Service | Principal Occupation During Past 5 Years | Other Directorships Held During Past 5 Years | |||||||||||||||
Interested Trustees. | |||||||||||||||||||
| David C. Brown, (b) Born May 1972 | Trustee | 2019 | Chairman and Chief Executive Officer (since 2013), Victory Capital Management Inc.; Chairman and Chief Executive Officer, Victory Capital Holdings, Inc. (since 2013). Mr. Brown brings to the Board extensive business, finance and leadership skills gained and developed through years of experience in the financial services industry, including his tenure overseeing the strategic direction as CEO of Victory Capital. These skills, combined with Mr. Brown's extensive knowledge of the financial services industry and demonstrated success in the development and distribution of investment strategies and products, enable him to provide valuable insights to the Board and strategic direction for the Funds. | Trustee, Victory Portfolios (41 series), Victory Portfolios II (26 series), Victory Variable Insurance Funds (8 series) | |||||||||||||||
38
USAA Mutual Funds Trust | Supplemental Information — continued March 31, 2021 | ||||||
(Unaudited)
Name and Date of Birth | Position Held with the Trust | Year Commenced Service | Principal Occupation During Past 5 Years | Other Directorships Held During Past 5 Years | |||||||||||||||
| Daniel S. McNamara, (b)(c) Born June 1966 | Trustee | 2012 | Trustee, President, and Vice Chairman of USAA ETF Trust (June 2017-June 2019); President of Financial Advice & Solutions Group (FASG), USAA (February 2013-March 2021); Director of USAA Investment Services Company (ISCO) (formerly USAA Investment Management) (September 2009-March 2021); President, Asset Management Company (AMCO) (August, 2011-June 2019); Senior Vice President of USAA Financial Planning Services Insurance Agency, Inc. (FPS) (April 2011-March 2021) Chairman of Board of ISCO (April 2013-December 2020); Director of AMCO (August 2011-June 2019); President and Director of USAA Shareholder Account Services (SAS) (October 2009-June 2019); Director and Vice Chairman of FPS (December 2013-March 2021); President and Director of USAA Investment Corporation (ICORP) (March 2010-March 2021); Chairman of Board of ICORP (December 2013-March 2021); Director of USAA Financial Advisors, Inc. (FAI) (December 2013-March 2021); Chairman of Board of FAI (March 2015-March 2021). Mr. McNamara brings to the Board extensive experience in the financial services industry, including experience as an officer of the Trust. | None | |||||||||||||||
(b) Mr. Dan McNamara, the Chairman of the Board, is deemed an "interested person" due to his previous position as Director of AMCO, the former investment adviser of the Funds. Mr. Brown is deemed an "interested person" due to his position as Chief Executive Officer of Victory Capital, investment adviser to the Funds.
(c) Effective at the close of business on December 31, 2020, Jefferson C. Boyce replaced Dan McNamara as Chair of the Board and assumed the title of Independent Chair.
The Statement of Additional Information includes additional information about the Trustees of the Trust and is available, without charge, on the SEC's website at www.sec.gov and/or by calling (800)-235-8396.
39
USAA Mutual Funds Trust | Supplemental Information — continued March 31, 2021 | ||||||
(Unaudited)
Officers:
The officers of the Trust, their ages, commencement of service and their principal occupations during the past five years, are detailed in the following table. Each officer serves until the earlier of his or her resignation, removal, retirement, death, or the election of a successor. The mailing address of each officer of the Trust is 15935 La Cantera Pkwy, San Antonio, TX, 78256. The officers of the Trust receive no compensation directly from the Trust for performing the duties of their offices.
Name and Date of Birth | Position with the Trust | Year Commenced Service | Principal Occupation During Past 5 Years | ||||||||||||
Interested Officers.
| Christopher K. Dyer, Born February 1962 | President | 2019 | Director of Fund Administration, Victory Capital (since 2004); Chief Operating Officer, Victory Capital Services, Inc. (since 2020) | ||||||||||||
| Scott A Stahorsky, Born July 1969 | Vice President | 2019 | Manager, Fund Administration, Victory Capital (since 2015) | ||||||||||||
| James K. De Vries, Born April 1969 | Treasurer | 2018 | Executive Director, Victory Capital Management Inc. (since 2019); Treasurer, USAA ETF Trust (September 2018-June 2019); Executive Director, Investment and Financial Administration, USAA (April 2012-June 2019); Assistant Treasurer, USAA ETF Trust (June 2017-September 2018); Assistant Treasurer, USAA Mutual Funds Trust (December 2013-February 2018) | ||||||||||||
| Allan Shaer, Born March 1965 | Assistant Treasurer | 2019 | Senior Vice President, Financial Administration, Citi Fund Services Ohio, Inc. (since 2016); Vice President, Mutual Fund Administration, JP Morgan Chase (2011-2016) | ||||||||||||
| Carol D. Trevino, Born October 1965 | Assistant Treasurer | 2018 | Director, Accounting and Finance, Victory Capital Management Inc. (since 2019); Accounting/Financial Director, USAA (December 2013-June 2019); Assistant Treasurer, USAA ETF Trust (September 2018-June 2019) | ||||||||||||
| Erin G. Wagner, Born February 1974 | Secretary | 2019 | Deputy General Counsel, the Adviser (since 2013) | ||||||||||||
| Charles Booth, Born April 1960 | Anti-Money Laundering Compliance Officer and Identity Theft Officer | 2019 | Director, Regulatory Administration and CCO Support Services, Citi Fund Services Ohio, Inc. (since 2007) | ||||||||||||
| Amy Campos, Born July 1976 | Chief Compliance Officer | 2019 | Chief Compliance Officer, USAA Mutual Funds Trust (since 2019); Executive Director, Deputy Chief Compliance Officer, USAA Mutual Funds Trust and USAA ETF Trust (July 2017-June 2019); Compliance Director, USAA Mutual Funds Trust (2014-July 2017) | ||||||||||||
40
USAA Mutual Funds Trust | Supplemental Information — continued March 31, 2021 | ||||||
(Unaudited)
Proxy Voting and Portfolio Holdings Information
Proxy Voting:
Information regarding the policies and procedures the Fund uses to determine how to vote proxies relating to portfolio securities is available without charge, upon request, by calling (800) 235-8396. The information is also included in the Fund's Statement of Additional Information, which is available on the SEC's website at www.sec.gov.
Information relating to how the Fund voted proxies relating to portfolio securities held during the most recent 12 months ended June 30 is available on the SEC's website at www.sec.gov.
Availability of Schedules of Portfolio Investments:
The Trust files a complete list of Schedules of Portfolio Investments with the SEC for the first and third quarter of each fiscal year on Form N-PORT. Form N-PORT is available on the SEC's website at www.sec.gov.
Expense Examples
As a shareholder of the Fund, you may incur two types of costs: (1) transaction costs, and (2) ongoing costs, including management fees and other Fund expenses. These examples are intended to help you understand your ongoing costs (in dollars) of investing in the Fund and to compare these costs with the ongoing costs of investing in other mutual funds.
These examples are based on an investment of $1,000 invested at the beginning of the period and held for the entire period from October 1, 2020 through March 31, 2021.
The Actual Expense figures in the table below provide information about actual account values and actual expenses. You may use the information below, together with the amount you invested, to estimate the expenses that you paid over the period. Simply divide your account value by $1,000 (for example, an $8,600 account value divided by $1,000 = 8.6), then multiply the result by the number in the table under the heading entitled "Actual Expenses Paid During Period" to estimate the expenses you paid on your account during this period.
The Hypothetical Expense figures in the table below provide information about hypothetical account values and hypothetical expenses based on the Fund's actual expense ratio and an assumed rate of return of 5% per year before expenses, which is not the Fund's actual return. The hypothetical account values and expenses may not be used to estimate the actual ending account balance or expenses you paid for the period. You may use this information to compare this 5% hypothetical example with the 5% hypothetical examples that appear in shareholder reports of other funds.
Please note the expenses shown in the table below are meant to highlight your ongoing costs only and do not reflect any transactional costs. If these transactional costs were included, your costs would have been higher.
| Beginning Account Value 10/1/20 | Actual Ending Account Value 3/31/21 | Hypothetical Ending Account Value 3/31/21 | Actual Expenses Paid During Period 10/1/20- 3/31/21* | Hypothetical Expenses Paid During Period 10/1/20- 3/31/21* | Annualized Expense Ratio During Period 10/1/20- 3/31/21 | ||||||||||||||||||||||
Fund Shares | $ | 1,000.00 | $ | 1,172.80 | $ | 1,019.75 | $ | 5.63 | $ | 5.24 | 1.04 | % | |||||||||||||||
Institutional Shares | 1,000.00 | 1,173.10 | 1,020.24 | 5.09 | 4.73 | 0.94 | % | ||||||||||||||||||||
* Expenses are equal to the average account value multiplied by the Fund's annualized expense ratio multiplied by 182/365 (the number of days in the most recent fiscal half-year divided by the number of days in the fiscal year).
41
USAA Mutual Funds Trust | Supplemental Information — continued March 31, 2021 | ||||||
(Unaudited)
For the period October 1, 2020 to March 31, 2021, performance adjustments were applied to the Fund. The annualized expense ratios of 1.04% and 0.94% for the Fund Shares and Institutional Shares, respectively, as represented in the table above, reflect these adjustments. The values in the table below reflect your costs (in dollars) of investing in the Fund, had these adjustments not been applied for the six months ended March 31, 2021.
| Beginning Account Value 10/1/20 | Actual Ending Account Value 3/31/21 | Hypothetical Ending Account Value 3/31/21 | Actual Expenses Paid During Period 10/1/20- 3/31/21* | Hypothetical Expenses Paid During Period 10/1/20- 3/31/21* | Annualized Expense Ratio During Period 10/1/20- 3/31/21 | ||||||||||||||||||||||
Fund Shares | $ | 1,000.00 | $ | 1,172.80 | $ | 1,019.95 | $ | 5.42 | $ | 5.04 | 1.00 | % | |||||||||||||||
Institutional Shares | 1,000.00 | 1,173.10 | 1,020.44 | 4.88 | 4.53 | 0.90 | % | ||||||||||||||||||||
* Expenses are equal to the average account value multiplied by the Fund's annualized expense ratio multiplied by 182/365 (the number of days in the most recent fiscal half-year divided by the number of days in the fiscal year).
42
USAA Mutual Funds Trust | Supplemental Information — continued March 31, 2021 | ||||||
(Unaudited)
Additional Federal Income Tax Information
The following federal tax information related to the Fund's fiscal year ended March 31, 2021, is provided for information purposes only and should not be used for reporting to federal or state revenue agencies. Federal tax information for the calendar year will be reported to you on Form 1099-DIV in January 2022.
With respect to distributions paid, the Fund designates the following amounts (or, if subsequently determined to be different, the maximum amount allowable) for the fiscal year ended March 31, 2021 (amounts in thousands):
| Dividend Received Deduction (corporate shareholders) | Qualified Dividend Income (non-corporate shareholders) | ||||||||||
92 | % | 100 | % | ||||||||
43
USAA Mutual Funds Trust | Supplemental Information — continued March 31, 2021 | ||||||
(Unaudited)
Considerations of the Board in Continuing the Investment Advisory Agreement
USAA Global Equity Income Fund (the "Fund")
At a meeting of the Board of Trustees (the "Board") held on December 10-11, 2020, the Board, including the Trustees who are not "interested persons" (as that term is defined in the Investment Company Act of 1940, as amended) of the Trust (the "Independent Trustees"), approved for an annual period the continuance of the Investment Advisory Agreement (the "Advisory Agreement") between the Trust and Victory Capital Management Inc. (the "Adviser") with respect to the Fund. Prior to the December 10-11, 2020, meeting, at which the Advisory Agreement was approved, the Independent Trustees also discussed and considered information regarding the proposed continuation of the Advisory Agreement at a meeting held on November 19, 2020.
In advance of the foregoing meetings, the Trustees received and considered a variety of information relating to the Advisory Agreement and the Adviser, and were given the opportunity to ask questions and request additional information from management. The information provided to the Board included, among other things: (i) a separate report prepared by an independent third party of mutual fund data, which provided a statistical analysis comparing the Fund's investment performance, expenses, and fees to comparable investment companies; (ii) information concerning the services rendered to the Fund, as well as information regarding the Adviser's revenues and costs of providing services to the Fund and compensation paid to affiliates of the Adviser; and (iii) information about the Adviser's operations and personnel. Prior to voting, the Independent Trustees reviewed the proposed continuance of the Advisory Agreement with management and with experienced independent counsel retained by the Independent Trustees ("Independent Counsel") and received materials from such Independent Counsel discussing the legal standards for their consideration of the proposed continuation of the Advisory Agreement with respect to the Fund. The Independent Trustees also reviewed the proposed continuation of the Advisory Agreement with respect to the Fund in private sessions with Independent Counsel at which no representatives of management were present.
At each regularly scheduled meeting of the Board and its committees, the Board receives and reviews, among other things, information concerning the Fund's performance and related services provided by the Adviser. At the meeting at which the renewal of the Advisory Agreement is considered, particular focus is given to information concerning Fund performance, fees and total expenses as compared to comparable investment companies, and the Adviser's profitability with respect to the Fund. However, the Board noted that the evaluation process with respect to the Adviser is an ongoing one. In this regard, the Board's and its committees' consideration of the Advisory Agreement included information previously received at such meetings.
Advisory Agreement
After full consideration of a variety of factors, the Board, including the Independent Trustees, voted to approve the Advisory Agreement. In approving the Advisory Agreement, the Trustees did not identify any single factor as controlling, and each Trustee may have attributed different weights to various factors. Throughout their deliberations, the Independent Trustees were represented and assisted by Independent Counsel.
Nature, Extent, and Quality of Services — In considering the nature, extent, and quality of the services provided by the Adviser under the Advisory Agreement, the Board reviewed information provided by the Adviser relating to its operations and personnel. The Board also took into account its knowledge of the Adviser's management and the quality of the performance of the Adviser's duties through Board meetings, discussions, and reports during the preceding year. The Board considered the fees paid to the Adviser and the services provided to the Fund by the Adviser under the Advisory Agreement, as well as other services provided by the Adviser and its affiliates under other agreements, and the personnel who provide these services. In addition to the investment advisory services provided to the Fund, the Adviser and its affiliates provide administrative services, shareholder services, oversight of Fund accounting, marketing services, assistance in meeting legal and regulatory requirements, and other services necessary for the operation of the Fund and the Trust.
The Board considered the scope of services provided by, and the undertakings required of, the Adviser in connection with those services, including, among other things, maintaining (i) its own and the Fund's compliance programs, (ii) risk management programs, (iii) liquidity risk management programs, and (iv) cybersecurity
44
USAA Mutual Funds Trust | Supplemental Information — continued March 31, 2021 | ||||||
(Unaudited)
programs, each of which had expanded over time as a result of regulatory, market, and other developments. The Board also considered the significant risks assumed by the Adviser in connection with the services provided to the Fund, including investment, operational, enterprise, litigation, regulatory and compliance risks.
The Board considered the Adviser's management style and the performance of the Adviser's duties under the Advisory Agreement. The Board considered the level and depth of knowledge of the Adviser, including the professional experience and qualifications of its senior and investment personnel, as well as current staffing levels. The allocation of the Fund's brokerage, including the Adviser's process for monitoring "best execution," also was considered. The Adviser's role in coordinating the activities of the Fund's other service providers was also considered. The Board also considered the Adviser's risk management processes. The Board considered the Adviser's financial condition and that it had the financial wherewithal to continue to provide the same scope and high quality of services under the Advisory Agreement. In reviewing the Advisory Agreement, the Board focused on the experience, resources, and strengths of the Adviser and its affiliates in managing the Fund, as well as the other funds in the Trust.
The Board also reviewed the compliance and administrative services provided to the Fund by the Adviser and its affiliates, including the Adviser's oversight of the Fund's day-to-day operations and oversight of Fund accounting. The Trustees, guided also by information obtained from their experiences as trustees of the Trust, also focused on the quality of the Adviser's compliance and administrative staff.
Expenses and Performance — In connection with its consideration of the Advisory Agreement, the Board evaluated the Fund's advisory fees and total expense ratio as compared to other open-end investment companies deemed to be comparable to the Fund as determined by the independent third party in its report. The Fund's expenses were compared to (i) a group of investment companies chosen by the independent third party to be comparable to the Fund based upon certain factors, including fund type, comparability of investment objective and classification, sales load type, asset size, and expense components (the "expense group") and (ii) a larger group of investment companies with the same investment classification/objective as the Fund regardless of asset size, excluding outliers (the "expense universe"). Among other data, the Board noted that the Fund's management fee rate—which includes advisory and administrative services and the effects of any performance adjustment1, as well as any fee waivers and reimbursements—was below the medians of its expense group and expense universe. The data indicated that the Fund's total expenses, including after any reimbursements, were below the medians of its expense group and expense universe. The Board also took into account the Adviser's current undertakings to maintain expense limitations for the Fund. The Board took into account the various other services provided to the Fund by the Adviser and its affiliates, and noted the high quality of services received by the Fund.
In considering the Fund's performance, the Board noted that it reviews at its regularly scheduled meetings information about the Fund's performance results. The Trustees also reviewed various comparative data provided to them in connection with their consideration of the renewal of the Advisory Agreement, including, among other information, a comparison of the Fund's average annual total returns relative to its Lipper index and other mutual funds deemed to be in its peer group by the independent third party in its report (the "performance universe"). The Fund's performance universe consisted of the Fund and all retail and institutional open-end investment companies with the same classification/objective as the Fund regardless of asset size or primary channel of distribution. This comparison indicated that, among other data, the Fund's performance was above the average of its performance universe and its Lipper index for the one-, three-, and five-year periods ended September 30, 2020.
Compensation and Profitability — The Board took into consideration the level and method of computing the management fee. The information considered by the Board included operating profit margin information for the Adviser's business as a whole. The Board also received and considered profitability information related to the management revenues from the Fund. This information included a review of the methodology used in the allocation of certain costs to the Fund. In considering the profitability data with respect to the Fund, the Trustees noted that the Adviser waived a portion of its management fees and/or reimbursed certain expenses with respect
1 The Adviser has agreed that no performance adjustment (positive or negative) would be made to the amount payable to the Adviser from July 1, 2019, through June 30, 2020.
45
USAA Mutual Funds Trust | Supplemental Information — continued March 31, 2021 | ||||||
(Unaudited)
to the Fund. The Trustees reviewed the profitability of the Adviser's relationship with the Fund before tax expenses. The Board was also provided with a profitability analysis of other publicly traded asset managers prepared by an independent information service. In reviewing the overall profitability of the management fee to the Adviser, the Board also considered the fact that the Adviser and its affiliates provide shareholder servicing and administrative services to the Fund for which they receive compensation. The Board also considered the possible direct and indirect benefits to the Adviser from its relationship with the Trust, including that the Adviser may derive reputational and other benefits from its association with the Fund. The Trustees recognized that the Adviser should be entitled to earn a reasonable level of profits in exchange for the level of services it provides to the Fund and the entrepreneurial and other risks that it assumes as Adviser.
Economies of Scale — The Board considered whether there should be changes in the management fee rate or structure in order to enable the Fund to participate in any economies of scale. The Board also considered the fee waiver and expense reimbursement arrangements by the Adviser. The Board also considered the effect of the Fund's change in size, if any, on its performance and fees, noting that the Fund may realize other economies of scale if assets increase proportionally more than expenses. The Board determined that the current investment management fee structure was reasonable.
Conclusions — The Board reached the following conclusions regarding the Fund's Advisory Agreement with the Adviser: (i) the Adviser has demonstrated that it possesses the capability and resources to perform the duties required of it under the Advisory Agreement; (ii) the Adviser maintains an appropriate compliance program; (iii) the overall performance of the Fund is reasonable in relation to the performance of funds with similar investment objectives and to relevant indices; (iv) the Fund's advisory expenses are reasonable in relation to those of similar funds and to the services to be provided by the Adviser; and (v) the Adviser's and its affiliates' level of profitability from their relationship with the Fund is reasonable in light of the nature and high quality of services provided by the Adviser and the type of fund. Based on its conclusions, the Board determined that continuation of the Advisory Agreement would be in the best interests of the Fund and its shareholders.
46
USAA Mutual Funds Trust | Supplemental Information — continued March 31, 2021 | ||||||
(Unaudited)
Liquidity Risk Management Program:
The USAA Mutual Funds have adopted and implemented a written liquidity risk management program (the "LRMP") as required by Rule 22e-4 under the Investment Company Act of 1940, as amended. The LRMP is reasonably designed to assess and manage the Fund's liquidity risk, taking into consideration the Fund's investment strategy and the liquidity of its portfolio investments during normal and reasonably foreseeable stressed market conditions; its short and long-term cash flow projections; and its cash holdings and access to other liquidity management tools such as available funding sources including the Victory Funds Complex Interfund Lending Facility and Line of Credit (discussed in the Notes to Financial Statements). The USAA Mutual Funds' Board of Trustees approved the appointment of the Fund's investment adviser, Victory Capital Management Inc. ("Victory Capital"), as the administrator of the LRMP.
Victory Capital manages liquidity risks associated with the Fund's investments by monitoring, among other things, cash and cash equivalents, any use of derivatives, the concentration of investments, the appropriateness of the Fund's investment strategy, and by classifying every fund investment as either highly liquid, moderately liquid, less liquid or illiquid on at least a monthly basis. To assist with the classification of Fund investments, Victory Capital has retained a third-party provider of liquidity evaluation services. This provider determines preliminary liquidity classifications for all portfolio holdings based upon portfolio-level data and certain assumptions provided by Victory Capital. Victory Capital reviews the preliminary liquidity classifications, and, when appropriate, considers other information including input from the Fund's portfolio managers (including the portfolio managers employed by any investment sub-advisers) in determining final liquidity classifications.
At a virtual video conference meeting held on March 10, 2021, Victory Capital provided an oral and written report to the Trustees on the operation and effectiveness of the LRMP during the previous year. The report from Victory Capital concluded that the Fund did not experience any significant liquidity challenges during the covered period, and the Fund's LRMP is reasonably designed to assess and manage its liquidity risk. The report also concluded that the LRMP continues to operate adequately and effectively to enable Victory Capital to oversee and manage liquidity risk and ensure the Fund is able to meet redemption requests without significant dilution to the remaining investors' interest in the Fund. During the review period, the Fund's portfolio consisted primarily of highly liquid investments, which are defined as cash and any investments reasonably expected to be converted to cash in current market conditions in three business days or less without significantly changing the market value of the investment. Therefore, the Fund has not adopted a Highly Liquid Investment Minimum. The Fund's investments were below the limitation on illiquid investments during the review period. Additionally, Victory Capital indicated that no events occurred that would require the filing of Form N-LIQUID and recommended no material changes to the LRMP.
47
Privacy Policy
Protecting the Privacy of Information
The Trust respects your right to privacy. We also know that you expect us to conduct and process your business in an accurate and efficient manner. To do so, we must collect and maintain certain personal information about you. This is the information we collect from you on applications or other forms, and from the transactions you make with us or third parties. It may include your name, address, social security number, account transactions and balances, and information about investment goals and risk tolerance.
We do not disclose any information about you or about former customers to anyone except as permitted or required by law. Specifically, we may disclose the information we collect to companies that perform services on our behalf, such as the transfer agent that processes shareholder accounts and printers and mailers that assist us in the distribution of investor materials. We may also disclose this information to companies that perform marketing services on our behalf. This allows us to continue to offer you Victory investment products and services that meet your investing needs, and to effect transactions that you request or authorize. These companies will use this information only in connection with the services for which we hired them. They are not permitted to use or share this information for any other purpose.
To protect your personal information internally, we permit access only by authorized employees and maintain physical, electronic and procedural safeguards to guard your personal information.*
* You may have received communications regarding information about privacy policies from other financial institutions which gave you the opportunity to "opt-out" of certain information sharing with companies which are not affiliated with that financial institution. The Trust does not share information with other companies for purposes of marketing solicitations for products other than the Trust. Therefore, the Trust does not provide opt-out options to their shareholders.
P.O. Box 182593
Columbus, Ohio 43218-2593

Visit our website at: | Call | ||||||
vcm.com | (800) 235-8396 | ||||||
98354-0521

MARCH 31, 2021
Annual Report
USAA California Bond Fund
As permitted by regulations adopted by the Securities and Exchange Commission, paper copies of the Fund's shareholder reports may no longer be sent by mail, unless you specifically request paper copies of the reports from the Fund or from your financial intermediary, such as a broker-dealer or bank. Instead, the reports will be made available on VictoryFunds.com, and you will be notified by mail each time a report is posted and provided with a website link to access the report. If you already elected to receive shareholder reports electronically, you will not be affected by this change and you need not take any action.
You may elect to receive shareholder reports and other communications from the Fund or your financial intermediary electronically by notifying your financial intermediary directly, or if you are a shareholder who has an account directly with the Fund, by calling (800) 235-8396 or by submitting your request via email to TA.Processing@FISGlobal.com.
You may elect to receive all future reports in paper form free of charge. You can inform the Fund or your financial intermediary that you wish to continue receiving paper copies of your shareholder reports by notifying your financial intermediary directly, or if you are a shareholder who has an account directly with the Fund, by calling (800) 235-8396 or by submitting your request via email to TA.Processing@FISGlobal.com. Your election to receive reports in paper will apply to all funds held with the USAA Mutual Funds or your financial intermediary.
Victory Capital means Victory Capital Management Inc., the investment adviser of the USAA Mutual Funds. USAA Mutual Funds are distributed by Victory Capital Services, Inc., member of FINRA, an affiliate of Victory Capital. Victory Capital and its affiliates are not affiliated with United Services Automobile Association or its affiliates. USAA and the USAA logos are registered trademarks and the USAA Mutual Funds and USAA Investments logos are trademarks of United Services Automobile Association and are being used by Victory Capital and its affiliates under license.
www.vcm.com
News, Information And Education 24 Hours A Day, 7 Days A Week
The Victory Funds site gives fund shareholders, prospective shareholders, and investment professionals a convenient way to access fund information, get guidance, and track fund performance anywhere they can access the Internet. The site includes:
• Detailed performance records
• Daily share prices
• The latest fund news
• Investment resources to help you become a better investor
• A section dedicated to investment professionals
Whether you're a potential investor searching for the fund that matches your investment philosophy, a seasoned investor interested in planning tools, or an investment professional, www.vcm.com has what you seek. Visit us anytime. We're always open.
USAA Mutual Funds Trust
TABLE OF CONTENTS
Shareholder Letter (Unaudited) | 2 | ||||||
Managers' Commentary (Unaudited) | 4 | ||||||
Investment Overview (Unaudited) | 6 | ||||||
| Investment Objective & Portfolio Holdings (Unaudited) | 7 | ||||||
Schedule of Portfolio Investments | 9 | ||||||
Financial Statements | |||||||
Statement of Assets and Liabilities | 17 | ||||||
Statement of Operations | 18 | ||||||
Statements of Changes in Net Assets | 19 | ||||||
Financial Highlights | 22 | ||||||
Notes to Financial Statements | 24 | ||||||
| Report of Independent Registered Public Accounting Firm | 34 | ||||||
Supplemental Information (Unaudited) | 35 | ||||||
Trustees' and Officers' Information | 35 | ||||||
Proxy Voting and Portfolio Holdings Information | 41 | ||||||
Expense Example | 41 | ||||||
Additional Federal Income Tax Information | 43 | ||||||
Advisory Contract Agreement | 44 | ||||||
Liquidity Risk Management Program | 47 | ||||||
Privacy Policy (inside back cover) | |||||||
This report is for the information of the shareholders and others who have received a copy of the currently effective prospectus of the Fund, managed by Victory Capital Management Inc. It may be used as sales literature only when preceded or accompanied by a current prospectus, which provides further details about the Fund.
IRA DISTRIBUTION WITHHOLDING DISCLOSURE
We generally must withhold federal income tax at a rate of 10% of the taxable portion of your distribution and, if you live in a state that requires state income tax withholding, at your state's tax rate. However, you may elect not to have withholding apply or to have income tax withheld at a higher rate. Any withholding election that you make will apply to any subsequent distribution unless and until you change or revoke the election. If you wish to make a withholding election, or change or revoke a prior withholding election, call (800) 235-8396, and form W-4P (OMB No. 1545-0074 withholding certificate for pension or annuity payments) will be electronically sent.
If you do not have a withholding election in place by the date of a distribution, federal income tax will be withheld from the taxable portion of your distribution at a rate of 10%. If you must pay estimated taxes, you may be subject to estimated tax penalties if your estimated tax payments are not sufficient and sufficient tax is not withheld from your distribution.
For more specific information, please consult your tax adviser.
1
(Unaudited)
Dear Shareholder,
The annual reporting period ended March 31, 2021, was a year like no other. It wasn't that long ago that we were all coming to grips with an emerging global pandemic, economic shutdowns, and financial markets in turmoil. We somehow persevered and have even emerged from those challenging days—dare I say—with a renewed sense of optimism. In retrospect, the trajectory of financial markets over the past year was nothing short of extraordinary.
Consider everything that transpired over the past 12 months. A novel coronavirus ("COVID-19") and the subsequent worldwide spread of COVID-19 prompted governments everywhere to issue austere shelter-in-place orders, and the global economy slowed abruptly. Equity markets sold off, while unprecedented levels of volatility roiled traditionally placid bond markets. During the second quarter of 2020, domestic GDP contracted by an alarming annual rate of 31.4%, according to the U.S. Department of Commerce ("Commerce Department").
It's no surprise that many investors flocked to the perceived safety of U.S. Treasurys during this period of tumult. Meanwhile, liquidity evaporated (for a short spell) in other segments of the fixed-income world, including higher-yielding credits and municipal bonds. The outlook was tenuous, and credit spreads widened while prices declined for most securities perceived to be higher risk.
Fortunately, a response came swiftly. The U.S. Federal Reserve (the "Fed") and other monetary authorities worldwide leapt into action—cutting interest rates, (re)starting quantitative easing and, in the case of the Fed, launching an array of programs to provide liquidity to stabilize fixed-income markets. The U.S. government also stepped up to provide fiscal stimulus in the form of the Coronavirus Aid, Relief, and Economic Security Act ("CARES Act").
It was impressive how quickly those actions helped arrest the stock market's freefall and restore order across much of the fixed-income universe. The rebound was as robust as the drawdown, and third quarter 2020 GDP bounced back and grew at a 33.4% annualized rate, according to the Commerce Department.
Late in the year, financial markets were alternately fueled and roiled by a contentious election season, growing optimism for an effective vaccine, and a fluid debate regarding the need for additional fiscal stimulus. Ultimately, stocks were propelled higher in the fourth quarter as it became clear Congress would provide another dose of stimulus in the form of direct payments, more unemployment insurance, and additional aid to businesses.
As the year ended and we moved into the first quarter of 2021, stocks continued their upward trajectory. Meanwhile, the yield on the 10-Year U.S. Treasury continued rallying sharply, and many investors began to worry about inflation in the post-pandemic world.
Through all the unprecedented events and volatility, the S&P 500® Index registered an impressive annual return of 56.35% for the 12-month period ended March 31, 2021. Over this same period, the yield on the 10-Year U.S. Treasury jumped more than 100 basis points, reflecting both the very low starting rate and substantial fiscal
2
stimulus. At the end of the reporting period, the yield on the 10-Year U.S. Treasury was 1.74%
On the whole, markets endured and surprised to the upside, but perhaps the key takeaway is that the unexpected can and will happen. That's why it's important to remain focused on your long-term investment goals and avoid making emotional decisions.
On the following pages, you will find information relating to your USAA Mutual Funds, brought to you by Victory Capital. If you have any questions regarding the current market dynamics or your specific portfolio or investment plan, we encourage you to contact our Member Service Representatives. Call (800) 235-8396, or visit our website at www.vcm.com.
Thank you for letting us help you work toward your investment goals.

Christopher K. Dyer, CFA
President,
USAA Mutual Funds Trust
3
USAA Mutual Funds Trust
USAA California Bond Fund
Manager's Commentary
(Unaudited)
Regina G. Conklin, CFA, CPA
Andrew Hattman, CFA, CAIA
Lauren Spalten*
• What were the market conditions during the reporting period?
Tax-exempt bonds as measured by the Bloomberg Barclays Municipal Bond Index generated positive returns during the 12-month reporting period ended March 31, 2021, due in part to falling municipal bond yields. (Bond prices and yields move in opposite directions.) However, the market saw significant volatility during the reporting period due primarily to COVID-19 and related economic and government reactions.
The reporting period began near the beginning of the COVID-19 crisis in the United States. The market had just sold off sharply in March 2020, and the first month of the reporting period was highlighted by significant volatility as the market reacted to COVID-19 and subsequent economic shutdowns, but also substantial fiscal and monetary response from the federal government. Starting in May 2020, the municipal market began a long, uneven recovery for the rest of the calendar year, driven by significant government intervention and investor expectations of a future return to normalcy. The recovery was marked by sizeable fund flows into tax-exempt mutual funds and material tightening of credit spreads (the yield difference between riskier bond yields and the safest bond yields). The recovery took a slight pause in the months ahead of the election, as uncertainty surrounding the election, as well as uncertainty around aid for municipal borrowers weighed on the market for a couple of months. However, the year ended with the market up significantly from the start of both the calendar year and the reporting period. January of 2021 saw a continuation of the market recovery, but the last part of the reporting period was highlighted by a sell-off in the municipal market as tax-exempt bonds finally succumbed to pressures caused by the meaningful increase in U.S. Treasury yields in the first quarter of 2021.
The end of the reporting period found the municipal market fighting the headwinds of potential higher U.S. Treasury rates and inflation, but with several notable tailwinds in support to include: heavy fund flows into tax-exempt mutual funds, investor expectations of increasing tax rates, and stimulus money flowing to municipal borrowers.
• How did the USAA California Bond Fund (the "Fund") perform during the reporting period?
The Fund has three share classes: Fund Shares, Institutional Shares, and Class A (effective June 29, 2020, the Adviser Shares were redesignated Class A and became subject to a front-end sales charge). For the reporting period ended March 31, 2021, the Fund Shares and Class A had a total return of 5.36% and 5.01%, respectively, versus an average of 6.74% for the funds in the Lipper California Municipal Debt Funds category. This compares to returns of 6.34% for the Lipper California Municipal Debt Funds Index and 5.51% for the Bloomberg Barclays Municipal Bond Index. The Institutional Shares commenced
*Effective March 2, 2021, Lauren Spalten was added as a portfolio manager on the Fund and John C. Bonnell was removed.
4
USAA Mutual Funds Trust
USAA California Bond Fund (continued)
Manager's Commentary (continued)
operations on June 29, 2020, and from that time through March 31, 2021, had a total return of 3.01%.
• What are the conditions in the state of California?
The COVID-19 pandemic has resulted in unprecedented business shutdowns and economic stress. These conditions have resulted in financial stress for both the state and local governments to varying degrees. California's economy of nearly 40 million people, the largest among the 50 states, is broad, diverse, and considerable. However, the economic impact to the state of California has been significant as evidenced by a February 2021 unemployment rate of 8.5%, which, while greatly improved from peak unemployment rate levels in 2020, remains elevated.
On a positive note, following the Great Recession, California made significant structural changes to its fiscal operations that contributed to improved financial position. Areas of improvement include timely budgets, restrained spending, and the creation of rainy-day reserve funds. These factors, combined with significant one-time measures in the 2021 budget, should enable California to complete fiscal 2021 with good reserve levels. However, significant budget pressure in fiscal 2022 and beyond remains a credit concern. High dependence upon revenues generated from the cyclical personal income tax and a rising trend of outmigration, while still small relative to the population, are areas of potential fiscal concern.
The state as of March 31, 2021, maintains strong ratings of Aa2 with stable outlook by Moody's, AA- with stable outlook by S&P, and AA with stable outlook by Fitch Ratings.
• What strategies did you employ during the reporting period?
In keeping with our investment approach, we continued to focus on income generation. The Fund's long-term income distribution, not its price appreciation, accounts for most of its total return.
Our commitment to independent credit research continued to help us identify attractive opportunities for the Fund. We employ fundamental analysis that emphasizes an issuer's ability and willingness to repay its debt. Through our credit research, we strive both to recognize relative value and to avoid potential pitfalls, which is especially important in volatile times like the present. As always, we worked with our in-house team of analysts to select investments for the Fund on a bond-by-bond basis. Our team continuously monitors all the holdings in the Fund's portfolio.
The Fund continues to hold a diversified portfolio of longer-term, primarily investment- grade municipal bonds. To limit exposure to an unexpected event, the Fund is diversified by sector, issuer, and geography. In addition, we avoid bonds subject to the federal alternative minimum tax for individuals.
Thank you for allowing us to assist you with your investment needs.
5
USAA Mutual Funds Trust
USAA California Bond Fund
Investment Overview
(Unaudited)
Average Annual Total Return
Year Ended March 31, 2021
Fund Shares | Institutional Shares | Class A | |||||||||||||||||||||||||
INCEPTION DATE | 10/10/90 | 6/29/20 | 8/1/10 | ||||||||||||||||||||||||
| Net Asset Value | Net Asset Value | Net Asset Value | Maximum Offering Price | Bloomberg Barclays Municpal Bond Index1 | Lipper California Municipal Debt Funds Index2 | ||||||||||||||||||||||
One Year | 5.36 | % | NA | 5.01 | % | 2.62 | % | 5.51 | % | 6.34 | % | ||||||||||||||||
Five Year | 3.38 | % | NA | 3.11 | % | 2.64 | % | 3.49 | % | 3.33 | % | ||||||||||||||||
Ten Year | 5.78 | % | NA | 5.51 | % | 5.27 | % | 4.54 | % | 5.31 | % | ||||||||||||||||
Since Inception | NA | 3.01 | % | NA | NA | NA | NA | ||||||||||||||||||||
The performance data quoted represents past performance and current returns may be lower or higher. The investment return and principal value will fluctuate so that an investor's shares, when redeemed, may be worth more or less than the original cost. To obtain performance information current to the most recent month's end, please visit www.vcm.com.
The maximum offering price figures reflect a maximum sales charge of 2.25% for Class A. Net Asset Value does not reflect sales charges.
Total return measures the price change in a share assuming the reinvestment of all net investment income and realized capital gain distributions, if any. The total returns quoted do not reflect adjustments made to the enclosed financial statements in accordance with U.S. Generally Accepted Accounting Principles or the deduction of taxes that a shareholder would pay on net investment income and realized capital gain distributions, including reinvested distributions, or redemptions of shares. The total return figures set forth above include all waivers of fees. Without such fee waivers, the total returns would have been lower.
USAA California Bond Fund — Growth of $10,000

1 The unmanaged, broad-based Bloomberg Barclays Municipal Bond Index tracks total return performance for the long-term, investment-grade, tax-exempt bond market. This index does not include the effect of sales charges, commissions, expenses or taxes, is not representative of the Fund, and it is not possible to invest directly in an index.
2 The unmanaged Lipper California Municipal Debt Funds Index measures the Fund's performance to that of the Lipper California Municipal Debt Funds category that limit their assets to those securities exempt from taxation in the state of California.This index does not include the effect of sales charges, commissions, expenses or taxes, is not representative of the Fund, and it is not possible to invest directly in an index.
The graph reflects investment of growth of a hypothetical $10,000 investment in the Fund.
The graph and table do not reflect the deduction of taxes that a shareholder would pay on Fund distributions or the redemption of Fund shares.
Past performance is not indicative of future results.
6
| USAA Mutual Funds Trust USAA California Bond Fund | March 31, 2021 | ||||||
(Unaudited)
Investment Objective & Portfolio Holdings:
The Fund's investment objective seeks to provide California investors with a high level of current interest income that is exempt from federal and California state income taxes.
Top 10 Industries
March 31, 2021
(% of Net Assets)
General Obligation | 23.1 | % | |||||
Hospital | 17.0 | % | |||||
Special Assessment/Tax/Fee | 10.4 | % | |||||
Water/Sewer Utility | 9.3 | % | |||||
Appropriated Debt | 8.7 | % | |||||
Multifamily Housing | 7.4 | % | |||||
Toll Road | 5.8 | % | |||||
Nursing/CCRC | 4.4 | % | |||||
Real Estate Tax/Fee | 4.4 | % | |||||
Education | 2.9 | % | |||||
Refer to the Schedule of Portfolio Investments for a complete list of securities.
7
| USAA Mutual Funds Trust USAA California Bond Fund (continued) | March 31, 2021 | ||||||
(Unaudited)
Portfolio Ratings Mix:
March 31, 2021
(% of Net Assets)

This chart reflects the highest long-term rating from a Nationally Recognized Statistical Rating Organization ("NRSRO"), with the four highest long-term credit ratings labeled, in descending order of credit quality, AAA, AA, A, and BBB. These categories represent investment-grade quality. NRSRO ratings are shown because they provide independent analysis of the credit quality of the Fund's investments. Victory Capital Management Inc. ("Adviser") also performs its own fundamental credit analysis of each security. As a part of its fundamental credit analysis, the Adviser considers various criteria, including industry specific actions, peer comparisons, payment ranking, and structure specific characteristics. Any of the Fund's securities that are not rated by an NRSRO appear in the chart above as "Unrated," but these securities are analyzed and monitored by the Adviser on an ongoing basis. Government securities that are issued or guaranteed as to principal and interest by the U.S. government and pre-refunded and escrowed-to-maturity municipal bonds that are not rated are treated as AAA for credit quality purposes.
8
| USAA Mutual Funds Trust USAA California Bond Fund | Schedule of Portfolio Investments March 31, 2021 | ||||||
(Amounts in Thousands, Except for Shares)
Security Description | Principal Amount | Value | |||||||||
Municipal Bonds (99.1%) | |||||||||||
California (96.0%): | |||||||||||
| Abag Finance Authority for Nonprofit Corp. Revenue, 5.00%, 7/1/42, Continuously Callable @100 | $ | 1,500 | $ | 1,577 | |||||||
| Abag Finance Authority for Nonprofit Corp. Revenue (NBGA — California Health Insurance Construction Loan Insurance Program), 5.00%, 1/1/33, Continuously Callable @101 | 4,235 | 4,568 | |||||||||
| Adelanto Public Utility Authority Revenue (INS — Assured Guaranty Municipal Corp.), 5.00%, 7/1/39, Continuously Callable @100 | 2,000 | 2,406 | |||||||||
| Alameda Corridor Transportation Authority Revenue, Series B, 5.00%, 10/1/37, Continuously Callable @100 | 2,000 | 2,306 | |||||||||
| Albany Unified School District, GO Series B, 5.00%, 8/1/43, Continuously Callable @100 | 2,000 | 2,394 | |||||||||
Series B, 4.00%, 8/1/46, Continuously Callable @100 | 1,500 | 1,670 | |||||||||
| Anaheim Public Financing Authority Revenue, Series A, 5.00%, 5/1/46, Continuously Callable @100 | 1,500 | 1,615 | |||||||||
| Bay Area Toll Authority Revenue 1.30% (MUNIPSA+125bps), 4/1/36, (Put Date 4/1/27) (a) (b) | 15,000 | 15,472 | |||||||||
Series H, 5.00%, 4/1/49, Continuously Callable @100 | 4,000 | 5,000 | |||||||||
| Burbank Unified School District, GO 8/1/33, Continuously Callable @100 (c) | 3,085 | 3,438 | |||||||||
8/1/34, Continuously Callable @100 (d) | 3,000 | 3,342 | |||||||||
| California Community Housing Agency Revenue, Series A, 5.00%, 8/1/50, Continuously Callable @100 (e) | 2,000 | 2,275 | |||||||||
| California County Tobacco Securitization Agency Revenue 1.38%, 6/1/30 | 150 | 149 | |||||||||
4.00%, 6/1/49, Continuously Callable @100 | 500 | 571 | |||||||||
Series A, 4.00%, 6/1/49, Continuously Callable @100 | 500 | 572 | |||||||||
Series A, 4.00%, 6/1/49, Continuously Callable @100 | 1,000 | 1,148 | |||||||||
| California Educational Facilities Authority Revenue 5.00%, 10/1/43, Continuously Callable @100 | 2,000 | 2,391 | |||||||||
5.00%, 10/1/48, Continuously Callable @100 | 2,000 | 2,329 | |||||||||
5.00%, 10/1/49, Continuously Callable @100 | 3,100 | 3,610 | |||||||||
Series A, 5.00%, 10/1/37, Continuously Callable @100 | 1,000 | 1,126 | |||||||||
| California Enterprise Development Authority Revenue 4.00%, 11/1/49, Continuously Callable @100 | 1,900 | 2,099 | |||||||||
4.00%, 11/1/50, Continuously Callable @100 | 680 | 752 | |||||||||
| California Health Facilities Financing Authority Revenue 4.00%, 3/1/39, Continuously Callable @100 | 7,375 | 8,154 | |||||||||
4.00%, 10/1/47, Continuously Callable @100 | 10,000 | 11,168 | |||||||||
Series A, 5.00%, 7/1/33, Continuously Callable @100 | 5,000 | 5,498 | |||||||||
Series A, 5.00%, 11/15/39, Continuously Callable @100 | 2,100 | 2,266 | |||||||||
Series A, 5.00%, 8/15/42, Continuously Callable @100 | 1,000 | 1,162 | |||||||||
Series A, 4.00%, 4/1/45, Continuously Callable @100 | 2,500 | 2,877 | |||||||||
Series A, 4.00%, 4/1/49, Continuously Callable @100 | 1,000 | 1,151 | |||||||||
Series A, 4.00%, 8/15/50, Continuously Callable @100 | 2,000 | 2,330 | |||||||||
Series A-2, 5.00%, 11/1/47 | 10,000 | 14,991 | |||||||||
Series B, 4.00%, 11/15/41, Continuously Callable @100 | 14,000 | 15,449 | |||||||||
See notes to financial statements.
9
| USAA Mutual Funds Trust USAA California Bond Fund | Schedule of Portfolio Investments — continued March 31, 2021 | ||||||
(Amounts in Thousands, Except for Shares)
Security Description | Principal Amount | Value | |||||||||
| California Health Facilities Financing Authority Revenue (NBGA — California Health Insurance Construction Loan Insurance Program) | |||||||||||
5.00%, 7/1/39, Continuously Callable @100 | $ | 1,050 | $ | 1,205 | |||||||
5.00%, 6/1/42, Continuously Callable @100 | 7,805 | 8,206 | |||||||||
5.00%, 7/1/44, Continuously Callable @100 | 2,300 | 2,607 | |||||||||
| California Infrastructure & Economic Development Bank Revenue, 4.00%, 7/1/50, Continuously Callable @100 | 4,000 | 4,552 | |||||||||
| California Municipal Finance Authority Revenue 5.00%, 6/1/43, Continuously Callable @100 | 2,500 | 3,056 | |||||||||
Series A, 5.00%, 2/1/37, Continuously Callable @100 | 750 | 881 | |||||||||
Series A, 5.00%, 2/1/42, Continuously Callable @100 | 1,000 | 1,162 | |||||||||
Series A, 4.00%, 10/1/44, Continuously Callable @100 | 2,000 | 2,137 | |||||||||
Series A, 5.00%, 2/1/47, Continuously Callable @100 | 1,000 | 1,148 | |||||||||
Series A, 5.00%, 7/1/47, Continuously Callable @100 | 1,000 | 1,152 | |||||||||
Series A, 5.00%, 6/1/50, Continuously Callable @100 | 1,000 | 1,071 | |||||||||
| California Municipal Finance Authority Revenue (NBGA — California Health Insurance Construction Loan Insurance Program) 4.13%, 5/15/39, Continuously Callable @100 | 1,900 | 2,085 | |||||||||
4.13%, 5/15/46, Continuously Callable @100 | 2,100 | 2,273 | |||||||||
Series B, 5.00%, 5/15/47, Continuously Callable @102 | 2,500 | 2,845 | |||||||||
| California Pollution Control Financing Authority Revenue 5.00%, 7/1/39, Continuously Callable @100 (e) | 6,000 | 7,200 | |||||||||
5.00%, 11/21/45, Continuously Callable @100 (e) | 2,000 | 2,356 | |||||||||
| California Public Finance Authority Revenue 5.00%, 10/15/37, Continuously Callable @100 | 1,000 | 1,159 | |||||||||
5.00%, 10/15/47, Continuously Callable @100 | 3,000 | 3,401 | |||||||||
Series B, 4.00%, 10/15/51, (Put Date 10/15/31) (b) | 685 | 813 | |||||||||
| California School Finance Authority Revenue 5.00%, 8/1/41, Continuously Callable @100 (e) | 1,750 | 1,979 | |||||||||
5.00%, 8/1/46, Continuously Callable @100 (e) | 2,250 | 2,525 | |||||||||
Series A, 5.00%, 7/1/47, Continuously Callable @100 (e) | 1,370 | 1,599 | |||||||||
Series A, 5.00%, 7/1/49, Continuously Callable @100 (e) | 1,000 | 1,197 | |||||||||
Series A, 5.00%, 7/1/54, Continuously Callable @100 (e) | 2,150 | 2,564 | |||||||||
| California Statewide Communities Development Authority Revenue 5.00%, 5/15/24 | 1,300 | 1,461 | |||||||||
5.00%, 5/15/40, Continuously Callable @100 | 2,750 | 3,164 | |||||||||
5.00%, 5/15/42, Continuously Callable @100 | 1,500 | 1,568 | |||||||||
5.00%, 11/1/43, Pre-refunded 11/1/24 @ 100 | 500 | 582 | |||||||||
5.00%, 10/1/46, Continuously Callable @100 | 2,750 | 3,110 | |||||||||
5.00%, 5/15/47, Continuously Callable @100 | 1,000 | 1,152 | |||||||||
5.00%, 5/15/47, Continuously Callable @100 | 1,500 | 1,568 | |||||||||
5.00%, 1/1/48, Continuously Callable @100 | 1,995 | 2,307 | |||||||||
5.00%, 7/1/48, Continuously Callable @100 | 4,000 | 4,738 | |||||||||
5.00%, 5/15/50, Continuously Callable @100 | 1,000 | 1,141 | |||||||||
Series A, 5.00%, 5/15/25 | 2,180 | 2,520 | |||||||||
Series A, 4.00%, 4/1/40, Continuously Callable @100 | 650 | 754 | |||||||||
Series A, 4.00%, 4/1/45, Continuously Callable @100 | 1,500 | 1,711 | |||||||||
Series A, 4.00%, 8/15/51, Continuously Callable @100 | 3,000 | 3,255 | |||||||||
Series A, 5.00%, 12/1/53, Continuously Callable @100 | 1,000 | 1,192 | |||||||||
Series A, 5.00%, 12/1/57, Continuously Callable @100 | 2,500 | 3,001 | |||||||||
See notes to financial statements.
10
| USAA Mutual Funds Trust USAA California Bond Fund | Schedule of Portfolio Investments — continued March 31, 2021 | ||||||
(Amounts in Thousands, Except for Shares)
Security Description | Principal Amount | Value | |||||||||
| California Statewide Communities Development Authority Revenue (LIQ — Deutsche Bank A.G.), 0.71%, 4/1/52, Callable 5/10/21 @ 100 (e) (f) | $ | 25,000 | $ | 25,000 | |||||||
| California Statewide Communities Development Authority Revenue (NBGA — California Health Insurance Construction Loan Insurance Program) 4.00%, 11/1/46, Continuously Callable @100 | 4,000 | 4,314 | |||||||||
Series S, 5.00%, 8/1/44, Pre-refunded 8/1/22 @ 102 | 2,400 | 2,601 | |||||||||
| Centinela Valley Union High School District, GO, Series B, 4.00%, 8/1/50, Continuously Callable @100 | 9,500 | 10,359 | |||||||||
| Chino Valley Unified School District, GO, Series B, 4.00%, 8/1/45, Continuously Callable @100 | 1,000 | 1,178 | |||||||||
| City & County of San Francisco Revenue (LIQ — Deutsche Bank A.G.), Series DBE-8059, 0.58%, 12/1/52, Callable 12/1/21 @ 100 (e) (f) | 6,000 | 6,000 | |||||||||
| City of Atwater Wastewater Revenue (INS — Assured Guaranty Municipal Corp.), Series A, 5.00%, 5/1/43, Continuously Callable @100 | 1,300 | 1,534 | |||||||||
City of Fillmore Wastewater Revenue, 5.00%, 5/1/47, Continuously Callable @100 | 2,000 | 2,336 | |||||||||
| City of Santa Clara Electric Revenue, Series A, 5.25%, 7/1/32, Pre-refunded 7/1/21 @ 100 | 2,000 | 2,025 | |||||||||
| City of Tulare Sewer Revenue (INS — Assured Guaranty Municipal Corp.) 4.00%, 11/15/41, Continuously Callable @100 | 5,710 | 6,267 | |||||||||
4.00%, 11/15/44, Continuously Callable @100 | 5,000 | 5,446 | |||||||||
| City of Upland Certificate of Participation 4.00%, 1/1/42, Continuously Callable @100 | 3,000 | 3,237 | |||||||||
5.00%, 1/1/47, Continuously Callable @100 | 2,000 | 2,275 | |||||||||
| Corona-Norco Unified School District Special Tax, 5.00%, 9/1/32, Continuously Callable @100 | 1,350 | 1,497 | |||||||||
| County of Sacramento Airport System Revenue 4.00%, 7/1/40, Continuously Callable @100 | 4,000 | 4,590 | |||||||||
Series B, 5.00%, 7/1/41, Continuously Callable @100 | 1,100 | 1,300 | |||||||||
| East Bay Municipal Utility District Wastewater System Revenue, Series A-2, 5.00%, 6/1/38 | 9,000 | 12,831 | |||||||||
| Elk Grove Finance Authority Special Tax (INS — Build America Mutual Assurance Co.), 5.00%, 9/1/38, Continuously Callable @100 | 1,500 | 1,748 | |||||||||
| Foothill-Eastern Transportation Corridor Agency Revenue, Series B-2, 3.50%, 1/15/53, Continuously Callable @100 | 1,500 | 1,618 | |||||||||
| Foothill-Eastern Transportation Corridor Agency Revenue (INS — Assured Guaranty Municipal Corp.) 1/15/34 (g) | 15,000 | 11,057 | |||||||||
1/15/35 (g) | 7,500 | 5,359 | |||||||||
| Fresno Joint Powers Financing Authority Revenue (INS — Assured Guaranty Municipal Corp.), Series A, 4.00%, 4/1/46, Continuously Callable @100 | 1,225 | 1,388 | |||||||||
| Golden State Tobacco Securitization Corp. Revenue, Series A, 5.00%, 6/1/35, Continuously Callable @100 | 5,500 | 6,634 | |||||||||
| Grass Valley School District, GO (INS — Build America Mutual Assurance Co.), 5.00%, 8/1/45, Continuously Callable @100 | 2,400 | 2,816 | |||||||||
| Hanford Joint Union High School District Certificate of Participation (INS — Assured Guaranty Municipal Corp.), 4.00%, 6/1/40, Continuously Callable @100 | 2,640 | 2,968 | |||||||||
| Hayward Unified School District, GO (INS — Build America Mutual Assurance Co.), Series A, 5.00%, 8/1/44, Continuously Callable @100 | 3,000 | 3,651 | |||||||||
| Indio Redevelopment Agency Successor Agency Tax Allocation, Series A, 5.25%, 8/15/31, Continuously Callable @100 | 2,940 | 2,951 | |||||||||
See notes to financial statements.
11
| USAA Mutual Funds Trust USAA California Bond Fund | Schedule of Portfolio Investments — continued March 31, 2021 | ||||||
(Amounts in Thousands, Except for Shares)
Security Description | Principal Amount | Value | |||||||||
| Inglewood Unified School District, GO (INS — Build America Mutual Assurance Co.) Series B, 5.00%, 8/1/38, Continuously Callable @100 | $ | 750 | $ | 897 | |||||||
Series C, 4.00%, 8/1/36, Continuously Callable @100 | 220 | 254 | |||||||||
Series C, 4.00%, 8/1/37, Continuously Callable @100 | 450 | 517 | |||||||||
Series C, 4.00%, 8/1/39, Continuously Callable @100 | 450 | 514 | |||||||||
| Irvine Unified School District Special Tax 5.00%, 9/1/45, Continuously Callable @100 | 1,000 | 1,177 | |||||||||
5.00%, 9/1/49, Continuously Callable @100 | 2,000 | 2,315 | |||||||||
Series A, 4.00%, 9/1/39, Continuously Callable @100 | 1,020 | 1,184 | |||||||||
Series A, 4.00%, 9/1/50, Continuously Callable @100 | 1,800 | 2,022 | |||||||||
Series B, 5.00%, 9/1/42, Continuously Callable @100 | 1,000 | 1,184 | |||||||||
Series B, 5.00%, 9/1/47, Continuously Callable @100 | 1,000 | 1,169 | |||||||||
Series C, 5.00%, 9/1/42, Continuously Callable @100 | 1,000 | 1,184 | |||||||||
Series C, 5.00%, 9/1/47, Continuously Callable @100 | 525 | 613 | |||||||||
Series D, 5.00%, 9/1/49, Continuously Callable @100 | 1,000 | 1,157 | |||||||||
| Irvine Unified School District Special Tax (INS — Build America Mutual Assurance Co.), 5.00%, 9/1/56, Continuously Callable @100 | 6,000 | 7,020 | |||||||||
| Jurupa Public Financing Authority Special Tax, Series A, 5.00%, 9/1/42, Continuously Callable @100 | 1,000 | 1,143 | |||||||||
| Local Public Schools Funding Authority School Improvement District No. 2016-1, GO (INS — Build America Mutual Assurance Co.), Series A, 4.00%, 8/1/52, Continuously Callable @100 | 1,500 | 1,657 | |||||||||
Long Beach Bond Finance Authority Revenue, Series A, 5.00%, 11/15/35 | 3,875 | 5,318 | |||||||||
| Los Angeles County Facilities, Inc. Revenue, 5.00%, 12/1/51, Continuously Callable @100 | 4,000 | 4,774 | |||||||||
| Los Angeles County Public Works Financing Authority Revenue Series A, 5.00%, 12/1/44, Continuously Callable @100 | 2,000 | 2,274 | |||||||||
Series D, 5.00%, 12/1/45, Continuously Callable @100 | 6,000 | 7,007 | |||||||||
| March Joint Powers Redevelopment Agency Successor Agency Tax Allocation (INS — Build America Mutual Assurance Co.), 4.00%, 8/1/41, Continuously Callable @100 | 5,790 | 6,439 | |||||||||
| Middle Fork Project Finance Authority Revenue 5.00%, 4/1/33, Continuously Callable @100 | 2,205 | 2,753 | |||||||||
5.00%, 4/1/35, Continuously Callable @100 | 225 | 278 | |||||||||
5.00%, 4/1/36, Continuously Callable @100 | 1,830 | 2,252 | |||||||||
| Monrovia Financing Authority Revenue, 5.00%, 12/1/45, Continuously Callable @100 | 3,435 | 3,986 | |||||||||
| Monrovia Financing Authority Revenue (INS — Assured Guaranty Municipal Corp.), 5.00%, 12/1/45, Continuously Callable @100 | 2,345 | 2,683 | |||||||||
| Moreno Valley Unified School District, GO (INS — Assured Guaranty Municipal Corp.), Series B, 5.00%, 8/1/47, Continuously Callable @100 | 6,500 | 7,895 | |||||||||
| Mountain View School District/Los Angeles County, GO (INS — Build America Mutual Assurance Co.), Series B, 5.00%, 8/1/48, Continuously Callable @100 | 3,315 | 3,879 | |||||||||
| Mountain View Shoreline Regional Park Community Tax Allocation, Series A, 5.63%, 8/1/35, Continuously Callable @100 | 2,000 | 2,035 | |||||||||
| New York State Housing Finance Agency Revenue (LIQ — Deutsche Bank A.G.), Series DBE-8072, 0.58%, 1/1/52, Callable 4/15/21 @ 100 (e) (f) | 5,000 | 5,000 | |||||||||
| Norwalk Redevelopment Agency Tax Allocation (INS — National Public Finance Guarantee Corp.) Series A, 5.00%, 10/1/30, Continuously Callable @100 | 5,000 | 5,018 | |||||||||
Series A, 5.00%, 10/1/35, Continuously Callable @100 | 3,500 | 3,512 | |||||||||
See notes to financial statements.
12
| USAA Mutual Funds Trust USAA California Bond Fund | Schedule of Portfolio Investments — continued March 31, 2021 | ||||||
(Amounts in Thousands, Except for Shares)
Security Description | Principal Amount | Value | |||||||||
| Norwalk-La Mirada Unified School District, GO (INS — Assured Guaranty Municipal Corp.), Series C, 8/1/30 (g) | $ | 7,500 | $ | 6,521 | |||||||
Palomar Health, GO (INS — Assured Guaranty Municipal Corp.), Series A, 8/1/31 (g) | 12,230 | 10,380 | |||||||||
Palomar Health, GO (INS — National Public Finance Guarantee Corp.), 8/1/26 (g) | 5,500 | 5,125 | |||||||||
| Perris Union High School District, GO (INS — Assured Guaranty Corp.), Series A, 4.00%, 9/1/48, Continuously Callable @100 | 5,000 | 5,693 | |||||||||
| Pittsburg Successor Agency Redevelopment Agency Tax Allocation (INS — Assured Guaranty Municipal Corp.), Series A, 5.00%, 9/1/29, Continuously Callable @100 | 2,000 | 2,414 | |||||||||
| Pomona Unified School District, GO (INS — Build America Mutual Assurance Co.), Series F, 5.00%, 8/1/39, Continuously Callable @100 | 1,500 | 1,705 | |||||||||
| Poway Unified School District Special Tax (INS — Assured Guaranty Municipal Corp.), 4.00%, 9/1/50, Continuously Callable @100 | 4,750 | 5,290 | |||||||||
| Regents of the University of California Medical Center Pooled Revenue, Series L, 4.00%, 5/15/44, Continuously Callable @100 | 2,000 | 2,210 | |||||||||
| Rio Elementary School District, GO (INS — Assured Guaranty Municipal Corp.), Series B, 4.00%, 8/1/45, Continuously Callable @100 | 2,800 | 3,080 | |||||||||
| Riverside County Public Financing Authority Tax Allocation (INS — Build America Mutual Assurance Co.) 4.00%, 10/1/36, Continuously Callable @100 | 1,250 | 1,399 | |||||||||
4.00%, 10/1/37, Continuously Callable @100 | 1,625 | 1,816 | |||||||||
| Riverside County Redevelopment Successor Agency Tax Allocation (INS — Build America Mutual Assurance Co.), 4.00%, 10/1/37, Continuously Callable @100 | 2,000 | 2,232 | |||||||||
| Riverside County Transportation Commission Revenue, Series A, 5.25%, 6/1/39, Pre-refunded 6/1/23 @ 100 | 2,000 | 2,217 | |||||||||
| RNR School Financing Authority Special Tax (INS — Build America Mutual Assurance Co.), Series A, 5.00%, 9/1/41, Continuously Callable @100 | 2,000 | 2,351 | |||||||||
| Sacramento Area Flood Control Agency Special Assessment, 5.00%, 10/1/44, Continuously Callable @100 | 2,000 | 2,273 | |||||||||
| Sacramento City Financing Authority Revenue (LIQ — Deutsche Bank A.G.), Series XG0100, 0.12%, 12/1/33 (e) (f) | 4,400 | 4,400 | |||||||||
| Sacramento City Unified School District, GO (INS — Build America Mutual Assurance Co.), Series S, 5.00%, 7/1/38, Continuously Callable @100 | 1,020 | 1,123 | |||||||||
| San Bruno Park Elementary School District, GO, Series A, 5.00%, 8/1/48, Continuously Callable @100 | 3,000 | 3,547 | |||||||||
| San Diego County Regional Airport Authority Revenue Series A, 4.00%, 7/1/38, Continuously Callable @100 | 2,000 | 2,331 | |||||||||
Series A, 5.00%, 7/1/47, Continuously Callable @100 | 1,500 | 1,771 | |||||||||
Series A, 5.00%, 7/1/49, Continuously Callable @100 | 2,000 | 2,429 | |||||||||
| San Diego Public Facilities Financing Authority Revenue, Series A, 5.00%, 10/15/44, Continuously Callable @100 | 2,500 | 2,900 | |||||||||
| San Jose Financing Authority Revenue, Series A, 5.00%, 6/1/39, Pre-refunded 6/1/23 @ 100 | 10,000 | 11,033 | |||||||||
| San Leandro Unified School District, GO (INS — Build America Mutual Assurance Co.), Series B, 5.00%, 8/1/43, Continuously Callable @100 | 2,750 | 3,360 | |||||||||
| San Luis & Delta Mendota Water Authority Revenue (INS — Build America Mutual Assurance Co.), Series A, 5.00%, 3/1/38, Pre-refunded 3/1/23 @ 100 | 1,500 | 1,637 | |||||||||
| San Ramon Redevelopment Agency Successor Agency Tax Allocation (INS — Build America Mutual Assurance Co.), Series A, 5.00%, 2/1/38, Continuously Callable @100 | 5,000 | 5,736 | |||||||||
See notes to financial statements.
13
| USAA Mutual Funds Trust USAA California Bond Fund | Schedule of Portfolio Investments — continued March 31, 2021 | ||||||
(Amounts in Thousands, Except for Shares)
Security Description | Principal Amount | Value | |||||||||
| Santa Clarita Community College District, GO, 4.00%, 8/1/46, Continuously Callable @100 | $ | 5,250 | $ | 5,762 | |||||||
| Santa Cruz County Redevelopment Agency Tax Allocation (INS — Assured Guaranty Municipal Corp.), Series A, 5.00%, 9/1/35, Continuously Callable @100 | 6,000 | 7,049 | |||||||||
| Santa Rosa High School District, GO (INS — Assured Guaranty Municipal Corp.), Series C, 5.00%, 8/1/43, Continuously Callable @100 | 1,000 | 1,194 | |||||||||
| State of California, GO 5.25%, 2/1/30, Continuously Callable @100 | 4,000 | 4,166 | |||||||||
5.00%, 2/1/43, Continuously Callable @100 | 3,000 | 3,229 | |||||||||
4.00%, 10/1/44, Continuously Callable @100 | 1,000 | 1,171 | |||||||||
5.00%, 9/1/45, Continuously Callable @100 | 2,500 | 2,986 | |||||||||
5.00%, 8/1/46, Continuously Callable @100 | 9,500 | 11,286 | |||||||||
5.00%, 11/1/47, Continuously Callable @100 | 7,000 | 8,524 | |||||||||
| Stockton Public Financing Authority Revenue 4.00%, 3/1/40, Continuously Callable @100 | 920 | 1,008 | |||||||||
5.00%, 3/1/47, Continuously Callable @100 | 2,760 | 3,215 | |||||||||
| Tahoe-Truckee Unified School District Certificate of Participation (INS — Build America Mutual Assurance Co.), 4.00%, 6/1/43, Continuously Callable @100 | 1,000 | 1,104 | |||||||||
| Temecula Valley Unified School District Financing Authority Special Tax (INS — Build America Mutual Assurance Co.), 5.00%, 9/1/40, Continuously Callable @100 | 1,575 | 1,819 | |||||||||
| Temecula Valley Unified School District, GO (INS — Assured Guaranty Municipal Corp.), Series B, 4.00%, 8/1/45, Continuously Callable @100 | 7,500 | 8,151 | |||||||||
| Tobacco Securitization Authority of Southern California Revenue 5.00%, 6/1/48, Continuously Callable @100 | 1,000 | 1,194 | |||||||||
5.00%, 6/1/48, Continuously Callable @100 | 1,000 | 1,226 | |||||||||
| Transbay Joint Powers Authority Tax Allocation Series A, 5.00%, 10/1/49, Continuously Callable @100 | 800 | 976 | |||||||||
Series B, 2.40%, 10/1/49, Continuously Callable @100 | 1,365 | 1,378 | |||||||||
| Tulare Local Health Care District, GO (INS-Build America Mutual Assurance Co.) 4.00%, 8/1/35, Continuously Callable @100 | 650 | 766 | |||||||||
4.00%, 8/1/39, Continuously Callable @100 | 1,900 | 2,208 | |||||||||
| Vacaville Unified School District, GO, Series D, 4.00%, 8/1/45, Continuously Callable @100 | 1,850 | 2,124 | |||||||||
| Val Verde Unified School District Certificate of Participation (INS — Build America Mutual Assurance Co.) Series A, 5.00%, 8/1/34, Continuously Callable @100 | 1,105 | 1,299 | |||||||||
Series A, 5.00%, 8/1/35, Continuously Callable @100 | 1,530 | 1,797 | |||||||||
| Val Verde Unified School District, GO (INS — Assured Guaranty Municipal Corp.), Series C, 4.00%, 8/1/45, Continuously Callable @100 | 4,475 | 4,923 | |||||||||
| Val Verde Unified School District, GO (INS-Build America Mutual Assurance Co.), Series B, 5.00%, 8/1/44, Continuously Callable @100 | 4,000 | 4,625 | |||||||||
| Victor Valley Union High School District, GO (INS — Assured Guaranty Municipal Corp.), Series B, 4.00%, 8/1/37, Continuously Callable @100 | 5,000 | 5,699 | |||||||||
| Washington Township Health Care District Revenue Series A, 4.00%, 7/1/35, Continuously Callable @100 | 600 | 686 | |||||||||
Series A, 5.00%, 7/1/42, Continuously Callable @100 | 1,000 | 1,157 | |||||||||
| West Kern Water District Certificate of Participation, 5.00%, 6/1/28, Continuously Callable @100 | 4,585 | 4,619 | |||||||||
See notes to financial statements.
14
| USAA Mutual Funds Trust USAA California Bond Fund | Schedule of Portfolio Investments — continued March 31, 2021 | ||||||
(Amounts in Thousands, Except for Shares)
Security Description | Principal Amount | Value | |||||||||
| Western Placer Unified School District Certificate of Participation (INS — Assured Guaranty Municipal Corp.), 4.00%, 8/1/41, Continuously Callable @100 | $ | 6,000 | $ | 6,591 | |||||||
637,248 | |||||||||||
Guam (2.5%): | |||||||||||
| Guam Government Waterworks Authority Revenue 5.50%, 7/1/43, Pre-refunded 7/1/23 @ 100 | 4,000 | 4,453 | |||||||||
5.00%, 1/1/46, Continuously Callable @100 | 7,000 | 7,923 | |||||||||
| Guam Power Authority Revenue Series A, 5.00%, 10/1/34, Continuously Callable @100 | 1,000 | 1,054 | |||||||||
Series A, 5.00%, 10/1/40, Continuously Callable @100 | 2,800 | 3,208 | |||||||||
16,638 | |||||||||||
Virgin Islands (0.6%): | |||||||||||
| Virgin Islands Public Finance Authority Revenue 5.00%, 9/1/33, Continuously Callable @100 (e) | 3,000 | 3,319 | |||||||||
Series A, 4.00%, 10/1/22 | 625 | 614 | |||||||||
3,933 | |||||||||||
Total Municipal Bonds (Cost $611,663) | 657,819 | ||||||||||
Total Investments (Cost $611,663) — 99.1% | 657,819 | ||||||||||
Other assets in excess of liabilities — 0.9% | 5,823 | ||||||||||
NET ASSETS — 100.00% | $ | 663,642 | |||||||||
(a) Variable or Floating-Rate Security. Rate disclosed is as of March 31, 2021.
(b) Put Bond.
(c) Stepped-coupon security converts to coupon form on 8/1/23 with a rate of 4.30%.
(d) Stepped-coupon security converts to coupon form on 8/1/23 with a rate of 4.35%.
(e) Rule 144A security or other security that is restricted as to resale to institutional investors. The Fund's Adviser has deemed this security to be liquid based upon procedures approved by the Board of Trustees. As of March 31, 2021, the fair value of these securities was $65,414 (thousands) and amounted to 9.9% of net assets.
(f) Variable Rate Demand Notes that provide the rights to sell the security at face value on either that day or within the rate-reset period. The interest rate is reset on the put date at a stipulated daily, weekly, monthly, quarterly, or other specified time interval to reflect current market conditions. These securities do not indicate a reference rate and spread in their description.
(g) Zero-coupon bond.
bps — Basis points
Continuously callable — Investment is continuously callable or will be continuously callable on any date after the first call date until its maturity.
GO — General Obligation
MUNIPSA — Municipal Swap Index
See notes to financial statements.
15
| USAA Mutual Funds Trust USAA California Bond Fund | Schedule of Portfolio Investments — continued March 31, 2021 | ||||||
Credit Enhancements — Adds the financial strength of the provider of the enhancement to support the issuer's ability to repay the principal and interest payments when due. The enhancement may be provided by a high-quality bank, insurance company or other corporation, or a collateral trust. The enhancements do not guarantee the market values of the securities.
INS Principal and interest payments are insured by the name listed. Although bond insurance reduces the risk of loss due to default by an issuer, such bonds remain subject to the risk that value may fluctuate for other reasons, and there is no assurance that the insurance company will meet its obligations.
LIQ Liquidity enhancement that may, under certain circumstances, provide for repayment of principal and interest upon demand from the name listed.
NBGA Principal and interest payments or, under certain circumstances, underlying mortgages are guaranteed by a nonbank guarantee agreement from the name listed.
See notes to financial statements.
16
USAA Mutual Funds Trust | Statement of Assets and Liabilities March 31, 2021 | ||||||
(Amounts in Thousands, Except Per Share Amounts)
| USAA California Bond Fund | |||||||
Assets: | |||||||
Investments, at value (Cost $611,663) | $ | 657,819 | |||||
Cash | 292 | ||||||
Receivables: | |||||||
Interest | 6,321 | ||||||
Capital shares issued | 239 | ||||||
From adviser | 1 | ||||||
Prepaid expenses and other assets | 6 | ||||||
Total Assets | 664,678 | ||||||
Liabilities: | |||||||
Payables: | |||||||
Distributions | 215 | ||||||
Capital shares redeemed | 448 | ||||||
Accrued expenses and other payables: | |||||||
Investment advisory fees | 205 | ||||||
Administration fees | 84 | ||||||
Custodian fees | — | (a) | |||||
Transfer agent fees | 21 | ||||||
Compliance fees | — | (a) | |||||
Trustees' fees | — | (a) | |||||
| 12b-1 fees | 1 | ||||||
Other accrued expenses | 62 | ||||||
Total Liabilities | 1,036 | ||||||
Net Assets: | |||||||
Capital | 621,956 | ||||||
Total accumulated earnings/(loss) | 41,686 | ||||||
Net Assets | $ | 663,642 | |||||
Net Assets | |||||||
Fund Shares | $ | 655,948 | |||||
Institutional Shares | 911 | ||||||
Class A | 6,783 | ||||||
Total | $ | 663,642 | |||||
Shares (unlimited number of shares authorized with no par value): | |||||||
Fund Shares | 57,109 | ||||||
Institutional Shares | 79 | ||||||
Class A | 591 | ||||||
Total | 57,779 | ||||||
Net asset value, offering and redemption price per share: (b) | |||||||
Fund Shares | $ | 11.49 | |||||
Institutional Shares | $ | 11.48 | |||||
Class A | $ | 11.47 | |||||
Maximum Sales Charge — Class A | 2.25 | % | |||||
Maximum offering price | |||||||
| (100%/(100%-maximum sales charge) of net asset value adjusted to the nearest cent) per share — Class A | $ | 11.74 | |||||
(a) Rounds to less than $1 thousand.
(b) Per share amount may not recalculate due to rounding of net assets and/or shares outstanding.
See notes to financial statements.
17
USAA Mutual Funds Trust | Statement of Operations For the Year Ended March 31, 2021 | ||||||
(Amounts in Thousands)
| USAA California Bond Fund | |||||||
Investment Income: | |||||||
Interest | $ | 19,833 | |||||
Total Income | 19,833 | ||||||
Expenses: | |||||||
Investment advisory fees | 2,373 | ||||||
Administration fees — Fund Shares | 993 | ||||||
Administration fees — Institutional Shares (a) | 1 | ||||||
Administration fees — Class A | 10 | ||||||
Sub-Administration fees | 20 | ||||||
| 12b-1 fees — Class A | 17 | ||||||
Custodian fees | 6 | ||||||
Transfer agent fees — Fund Shares | 140 | ||||||
Transfer agent fees — Institutional Shares (a) | 1 | ||||||
Transfer agent fees — Class A | 5 | ||||||
Trustees' fees | 62 | ||||||
Compliance fees | 4 | ||||||
Legal and audit fees | 83 | ||||||
State registration and filing fees | 4 | ||||||
Other expenses | 76 | ||||||
Total Expenses | 3,795 | ||||||
Expenses waived/reimbursed by Adviser | (7 | ) | |||||
Net Expenses | 3,788 | ||||||
Net Investment Income (Loss) | 16,045 | ||||||
Realized/Unrealized Gains (Losses) from Investments: | |||||||
Net realized gains (losses) from investment securities | (447 | ) | |||||
Net change in unrealized appreciation/depreciation on investment securities | 19,043 | ||||||
Net realized/unrealized gains (losses) on investments | 18,596 | ||||||
Change in net assets resulting from operations | $ | 34,641 | |||||
(a) Institutional Shares commenced operations on June 29, 2020.
See notes to financial statements.
18
USAA Mutual Funds Trust | Statements of Changes in Net Assets | ||||||
(Amounts in Thousands)
USAA California Bond Fund | |||||||||||
| Year Ended March 31, 2021 | Year Ended March 31, 2020 | ||||||||||
From Investments: | |||||||||||
Operations: | |||||||||||
Net investment income (loss) | $ | 16,045 | $ | 19,016 | |||||||
Net realized gains (losses) from investments | (447 | ) | 795 | ||||||||
| Net change in unrealized appreciation/depreciation on investments | 19,043 | 4,404 | |||||||||
Change in net assets resulting from operations | 34,641 | 24,215 | |||||||||
Distributions to Shareholders: | |||||||||||
Fund Shares | (15,912 | ) | (18,841 | ) | |||||||
Institutional Shares (a) | (13 | ) | — | ||||||||
Class A | (142 | ) | (172 | ) | |||||||
Change in net assets resulting from distributions to shareholders | (16,067 | ) | (19,013 | ) | |||||||
Change in net assets resulting from capital transactions | (39,098 | ) | (19,432 | ) | |||||||
Change in net assets | (20,524 | ) | (14,230 | ) | |||||||
Net Assets: | |||||||||||
Beginning of period | 684,166 | 698,396 | |||||||||
End of period | $ | 663,642 | $ | 684,166 | |||||||
(a) Institutional Shares commenced operations on June 29, 2020.
(continues on next page)
See notes to financial statements.
19
USAA Mutual Funds Trust | Statements of Changes in Net Assets | ||||||
(Amounts in Thousands) (continued)
USAA California Bond Fund | |||||||||||
| Year Ended March 31, 2021 | Year Ended March 31, 2020 | ||||||||||
Capital Transactions: | |||||||||||
Fund Shares | |||||||||||
Proceeds from shares issued | $ | 45,712 | $ | 74,813 | |||||||
Distributions reinvested | 13,309 | 15,317 | |||||||||
Cost of shares redeemed | (99,256 | ) | (108,864 | ) | |||||||
Total Fund Shares | $ | (40,235 | ) | $ | (18,734 | ) | |||||
Institutional Shares (a) | |||||||||||
Proceeds from shares issued | $ | 1,751 | $ | — | |||||||
Distributions reinvested | 11 | — | |||||||||
Cost of shares redeemed | (847 | ) | — | ||||||||
Total Institutional Shares | $ | 915 | $ | — | |||||||
Class A | |||||||||||
Proceeds from shares issued | $ | 6,931 | $ | 341 | |||||||
Distributions reinvested | 17 | 29 | |||||||||
Cost of shares redeemed | (6,726 | ) | (1,068 | ) | |||||||
Total Class A | $ | 222 | $ | (698 | ) | ||||||
Change in net assets resulting from capital transactions | $ | (39,098 | ) | $ | (19,432 | ) | |||||
Share Transactions: | |||||||||||
Fund Shares | |||||||||||
Issued | 3,996 | 6,614 | |||||||||
Reinvested | 1,164 | 1,352 | |||||||||
Redeemed | (8,723 | ) | (9,723 | ) | |||||||
Total Fund Shares | (3,563 | ) | (1,757 | ) | |||||||
Institutional Shares (a) | |||||||||||
Issued | 152 | — | |||||||||
Reinvested | 1 | — | |||||||||
Redeemed | (74 | ) | — | ||||||||
Total Institutional Shares | 79 | — | |||||||||
Class A | |||||||||||
Issued | 610 | 30 | |||||||||
Reinvested | 2 | 3 | |||||||||
Redeemed | (593 | ) | (94 | ) | |||||||
Total Class A | 19 | (61 | ) | ||||||||
Change in Shares | (3,465 | ) | (1,818 | ) | |||||||
(a) Institutional Shares commenced operations on June 29, 2020.
See notes to financial statements.
20
This page is intentionally left blank.
21
USAA Mutual Funds Trust | Financial Highlights | ||||||
For a Share Outstanding Throughout Each Period
Investment Activities | Distributions to Shareholders From | ||||||||||||||||||||||||||
| Net Asset Value, Beginning of Period | Net Investment Income (Loss) | Net Realized and Unrealized Gains (Losses) on Investments | Total from Investment Activities | Net Investment Income | Total Distributions | ||||||||||||||||||||||
USAA California Bond Fund | |||||||||||||||||||||||||||
Fund Shares | |||||||||||||||||||||||||||
| Year Ended March 31, 2021 | $ | 11.17 | 0.27 | (e) | 0.32 | 0.59 | (0.27 | ) | (0.27 | ) | |||||||||||||||||
| Year Ended March 31, 2020 | $ | 11.07 | 0.30 | (e) | 0.10 | 0.40 | (0.30 | ) | (0.30 | ) | |||||||||||||||||
| Year Ended March 31, 2019 | $ | 10.92 | 0.34 | 0.15 | 0.49 | (0.34 | ) | (0.34 | ) | ||||||||||||||||||
| Year Ended March 31, 2018 | $ | 10.92 | 0.37 | — | (f) | 0.37 | (0.37 | ) | (0.37 | ) | |||||||||||||||||
| Year Ended March 31, 2017 | $ | 11.29 | 0.37 | (0.37 | ) | — | (f) | (0.37 | ) | (0.37 | ) | ||||||||||||||||
Institutional Shares | |||||||||||||||||||||||||||
| June 29, 2020 (g) through March 31, 2021 | $ | 11.35 | 0.21 | (e) | 0.13 | 0.34 | (0.21 | ) | (0.21 | ) | |||||||||||||||||
Class A | |||||||||||||||||||||||||||
| Year Ended March 31, 2021 | $ | 11.16 | 0.25 | (e) | 0.31 | 0.56 | (0.25 | ) | (0.25 | ) | |||||||||||||||||
| Year Ended March 31, 2020 | $ | 11.06 | 0.27 | (e) | 0.10 | 0.37 | (0.27 | ) | (0.27 | ) | |||||||||||||||||
| Year Ended March 31, 2019 | $ | 10.91 | 0.32 | 0.15 | 0.47 | (0.32 | ) | (0.32 | ) | ||||||||||||||||||
| Year Ended March 31, 2018 | $ | 10.91 | 0.34 | — | (f) | 0.34 | (0.34 | ) | (0.34 | ) | |||||||||||||||||
| Year Ended March 31, 2017 | $ | 11.28 | 0.35 | (0.37 | ) | (0.02 | ) | (0.35 | ) | (0.35 | ) | ||||||||||||||||
* Assumes reinvestment of all net investment income and realized capital gain distributions, if any, during the period. Includes adjustments in accordance with U.S. Generally Accepted Accounting Principles and could differ from the Lipper reported return.
** For the period beginning July 1, 2019, the amount of any waivers or reimbursements and the amount of any recoupment is calculated without regard to the impact of any performance adjustment to the Fund's management fee.
^ The net expense ratio may not correlate to the applicable expense limits in place during the period since the current contractual expense limitation is applied for a period beginning July 1, 2019, and in effect through June 30, 2023, instead of coinciding with the Fund's fiscal year end. Details of the current contractual expense limitation in effect can be found in Note 4 of the accompanying Notes to Financial Statements.
(a) Not annualized for periods less than one year.
(b) Annualized for periods less than one year.
(c) Reflects total annual operating expenses for reductions of expenses paid indirectly for the March 31 fiscal year ended 2017. Expenses paid indirectly decreased the expense ratio by less than 0.01%.
(d) Portfolio turnover is calculated on the basis of the Fund as a whole without distinguishing between the classes of shares.
(e) Per share net investment income (loss) has been calculated using the average daily shares method.
(f) Amount is less than $0.005 per share.
(g) Commencement of operations.
See notes to financial statements.
22
USAA Mutual Funds Trust | Financial Highlights — continued | ||||||
For a Share Outstanding Throughout Each Period
Ratios to Average Net Assets | Supplemental Data | ||||||||||||||||||||||||||||||||||
| Redemption fees added to beneficial interests | Net Asset Value, End of Period | Total Return (Excludes Sales Charge)*(a) | Net Expenses**^(b)(c) | Net Investment Income (Loss)(b) | Gross Expenses(b)(c) | Net Assets, End of Period (000's) | Portfolio Turnover(a)(d) | ||||||||||||||||||||||||||||
USAA California Bond Fund | |||||||||||||||||||||||||||||||||||
Fund Shares | |||||||||||||||||||||||||||||||||||
| Year Ended March 31, 2021 | — | $ | 11.49 | 5.36 | % | 0.56 | % | 2.40 | % | 0.56 | % | $ | 655,948 | 32 | % | ||||||||||||||||||||
| Year Ended March 31, 2020 | — | $ | 11.17 | 3.62 | % | 0.53 | % | 2.66 | % | 0.53 | % | $ | 677,785 | 33 | % | ||||||||||||||||||||
| Year Ended March 31, 2019 | — | $ | 11.07 | 4.61 | % | 0.52 | % | 3.15 | % | 0.52 | % | $ | 691,391 | 18 | % | ||||||||||||||||||||
| Year Ended March 31, 2018 | — | $ | 10.92 | 3.37 | % | 0.51 | % | 3.32 | % | 0.51 | % | $ | 674,498 | 6 | % | ||||||||||||||||||||
| Year Ended March 31, 2017 | — | $ | 10.92 | 0.01 | % | 0.51 | % | 3.34 | % | 0.51 | % | $ | 669,435 | 26 | % | ||||||||||||||||||||
Institutional Shares | |||||||||||||||||||||||||||||||||||
| June 29, 2020 (g) through March 31, 2021 | — | $ | 11.48 | 3.01 | % | 0.50 | % | 2.44 | % | 0.94 | % | $ | 911 | 32 | % | ||||||||||||||||||||
Class A | |||||||||||||||||||||||||||||||||||
| Year Ended March 31, 2021 | — | $ | 11.47 | 5.01 | % | 0.81 | % | 2.15 | % | 0.88 | % | $ | 6,783 | 32 | % | ||||||||||||||||||||
| Year Ended March 31, 2020 | — | $ | 11.16 | 3.36 | % | 0.78 | % | 2.41 | % | 0.78 | % | $ | 6,381 | 33 | % | ||||||||||||||||||||
| Year Ended March 31, 2019 | — | $ | 11.06 | 4.37 | % | 0.76 | % | 2.92 | % | 0.76 | % | $ | 7,005 | 18 | % | ||||||||||||||||||||
| Year Ended March 31, 2018 | — | $ | 10.91 | 3.12 | % | 0.75 | % | 3.08 | % | 0.75 | % | $ | 6,985 | 6 | % | ||||||||||||||||||||
| Year Ended March 31, 2017 | — | (f) | $ | 10.91 | (0.24 | )% | 0.75 | % | 3.09 | % | 0.75 | % | $ | 7,083 | 26 | % | |||||||||||||||||||
See notes to financial statements.
23
USAA Mutual Funds Trust | Notes to Financial Statements March 31, 2021 | ||||||
1. Organization:
USAA Mutual Funds Trust (the "Trust") is organized as a Delaware statutory trust and is registered under the Investment Company Act of 1940, as amended (the "1940 Act"), as an open-end investment company. The Trust is comprised of 46 funds and is authorized to issue an unlimited number of shares, which are units of beneficial interest with no par value.
The accompanying financial statements are those of the USAA California Bond Fund (the "Fund"). The Fund offers three classes of shares: Fund Shares, Institutional Shares, and Class A. The Fund is classified as diversified under the 1940 Act.
Effective June 29, 2020, the Fund's Institutional Shares commenced operations and the Adviser Shares were redesignated Class A shares and became subject to a front-end sales charge.
Each class of shares of the Fund has substantially identical rights and privileges, except with respect to sales charges, fees paid under distribution plans, expenses allocable exclusively to each class of shares, voting rights on matters solely affecting a single class of shares, and the exchange privilege of each class of shares.
Under the Trust's organizational documents, its officers and trustees are indemnified against certain liabilities arising out of the performance of their duties to the Fund. In addition, in the normal course of business, the Fund enters into contracts with its vendors and others that provide for general indemnifications. The Fund's maximum exposure under these arrangements is unknown, as this would involve future claims that may be made against the Fund. However, based on experience, the Fund expects that risk of loss to be remote.
2. Significant Accounting Policies:
The following is a summary of significant accounting policies followed by the Trust in the preparation of its financial statements. The policies are in conformity with Generally Accepted Accounting Principles in the United States of America ("GAAP"). The preparation of financial statements in accordance with GAAP requires management to make estimates and assumptions that affect the reported amounts of assets and liabilities and disclosure of contingent assets and liabilities at the date of the financial statements and the reported amounts of income and expenses for the period. Actual results could differ from those estimates. The Fund follows the specialized accounting and reporting requirements under GAAP that are applicable to investment companies under Accounting Standards Codification Topic 946.
Investment Valuation:
The Fund records investments at fair value. Fair value is defined as the price that would be received to sell an asset or paid to transfer a liability in an orderly transaction between market participants at the measurement date.
The valuation techniques described below maximize the use of observable inputs and minimize the use of unobservable inputs in determining fair value. The inputs used for valuing the Fund's investments are summarized in the three broad levels listed below:
• Level 1 — quoted prices in active markets for identical securities
• Level 2 — other significant observable inputs (including quoted prices for similar securities or interest rates applicable to those securities, etc.)
• Level 3 — significant unobservable inputs (including the Fund's own assumptions in determining the fair value of investments)
Changes in valuation techniques may result in transfers in or out of an assigned level within the disclosure hierarchy. The inputs or methodologies used for valuation techniques are not necessarily an indication of the risks associated with entering into those investments.
Victory Capital Management Inc. ("VCM" or the "Adviser") has established the Pricing and Liquidity Committee (the "Committee"), and subject to the Trust's Board of Trustees (the "Board") oversight, the Committee administers and oversees the Fund's valuation policies and procedures, which are approved by the Board.
24
USAA Mutual Funds Trust | Notes to Financial Statements — continued March 31, 2021 | ||||||
Debt securities of United States ("U.S.") issuers, along with corporate and municipal securities, including short-term investments maturing in 60 days or less, may be valued using evaluated bid or the last sales price to price securities by dealers or an independent pricing service approved by the Board. These valuations are typically categorized as Level 2 in the fair value hierarchy.
In the event that price quotations or valuations are not readily available, are not reflective of market value, or a significant event has been recognized in relation to a security or class of securities, the securities are valued in good faith by the Committee in accordance with valuation procedures approved by the Board. These valuations are typically categorized as Level 2 or Level 3 in the fair value hierarchy, based on the observability of inputs used to determine the fair value. The effect of fair value pricing is that securities may not be priced on the basis of quotations from the primary market in which they are traded and the actual price realized from the sale of a security may differ materially from the fair value price. Valuing these securities at fair value is intended to cause the Fund's net asset value ("NAV") to be more reliable than it otherwise would be.
A summary of the valuations as of March 31, 2021, based upon the three levels defined above, is included in the table below while the breakdown, by category, of investments is disclosed on the Schedule of Portfolio Investments (amounts in thousands):
Level 1 | Level 2 | Level 3 | Total | ||||||||||||||||
Municipal Bonds | $ | — | $ | 657,819 | $ | — | $ | 657,819 | |||||||||||
Total | $ | — | $ | 657,819 | $ | — | $ | 657,819 | |||||||||||
For the year ended March 31, 2021, there were no transfers in or out of Level 3 in the fair value hierarchy.
Securities Purchased on a Delayed-Delivery or When-Issued Basis:
The Fund may purchase securities on a delayed-delivery or when-issued basis. Delivery and payment for securities that have been purchased by the Fund on a delayed-delivery or when-issued basis, or for delayed draws on loans can take place a month or more after the trade date. At the time the Fund makes the commitment to purchase a security on a delayed-delivery or when-issued basis, the Fund records the transaction and reflects the value of the security in determining NAV. No interest accrues to the Fund until the transaction settles and payment takes place. A segregated account is established and the Fund maintains cash and/or marketable securities at least equal in value to commitments for delayed-delivery or when-issued securities. If the Fund owns delayed-delivery or when-issued securities, these values are included in Payable for investments purchased on the accompanying Statement of Assets and Liabilities and the segregated assets are identified on the Schedule of Portfolio Investments.
Municipal Obligations:
The values of municipal obligations can fluctuate and may be affected by adverse tax, legislative, or political changes, and by financial developments affecting municipal issuers. Payment of municipal obligations may depend on a relatively limited source of revenue, resulting in greater credit risk. Future changes in federal tax laws or the activity of an issuer may adversely affect the tax-exempt status of municipal obligations.
Investment Transactions and Related Income:
Changes in holdings of investments are accounted for no later than one business day following the trade date. For financial reporting purposes, however, investment transactions are accounted for on trade date on the last business day of the reporting period. Interest income is determined on the basis of coupon interest accrued using the effective interest method which adjusts, where applicable, the amortization of premiums or accretion of discount. Gains or losses realized on sales of securities are determined by comparing the identified cost of the security lot sold with the net sales proceeds.
25
USAA Mutual Funds Trust | Notes to Financial Statements — continued March 31, 2021 | ||||||
Federal Income Taxes:
It is the Fund's policy to continue to qualify as a regulated investment company by complying with the provisions available to certain investment companies, as defined in applicable sections of the Internal Revenue Code, and to make distributions of net investment income and net realized gains sufficient to relieve it from all, or substantially all, federal income taxes. Accordingly, no provision for federal income taxes is required in the financial statements. The Fund has a tax year end of March 31.
Management of the Fund has reviewed tax positions taken in tax years that remain subject to examination by all major tax jurisdictions, including federal (i.e., the last four tax years, which includes the current fiscal tax year end). Management believes that there is no tax liability resulting from unrecognized tax benefits related to uncertain tax positions taken.
Allocations:
Expenses directly attributable to the Fund are charged to the Fund, while expenses that are attributable to more than one fund in the Trust, or jointly with an affiliated trust, are allocated among the respective funds in the Trust and/or affiliated trust based upon net assets or another appropriate basis.
Income, expenses (other than class-specific expenses such as transfer agent fees, state registration fees, 12b-1 fees, and printing fees), and realized and unrealized gains or losses on investments are allocated to each class of shares based on its relative net assets on the date income is earned or expenses and realized and unrealized gains and losses are incurred.
Cross-Trade Transactions:
Pursuant to Rule 17a-7 under the 1940 Act, the Fund may engage in cross-trades, which are securities transactions with affiliated investment companies and advisory accounts managed by the Adviser and any applicable sub-adviser. Any such purchase or sale transaction must be effected without brokerage commission or other remuneration, except for customary transfer fees. The transaction must be effected at the current market price, which is either the security's last sale price on an exchange or, if there are no transactions in the security that day, at the average of the highest bid and lowest asked price. For the year ended March 31, 2021, the Fund engaged in the following securities transactions with affiliated funds, which resulted in the following net realized gains (losses) (amounts in thousands):
| Purchases | Sales | Realized Gains (Losses) | |||||||||
| $ | 22,125 | $ | 38,825 | $ | — | ||||||
Fees Paid Indirectly:
Expense offsets to custody fees that arise from credits on cash balances maintained on deposit are reflected on the Statement of Operations, as applicable, as Fees paid indirectly.
3. Purchases and Sales:
Cost of purchases and proceeds from sales/maturities of securities (excluding securities maturing less than one year from acquisition) for the year ended March 31, 2021, were as follows for the Fund (amounts in thousands):
| Excluding U.S. Government Securities | |||||||||||
Purchases | Sales | ||||||||||
$ | 210,886 | $ | 242,764 | ||||||||
There were no purchases or sales of U.S. government securities during the year ended March 31, 2021.
26
USAA Mutual Funds Trust | Notes to Financial Statements — continued March 31, 2021 | ||||||
4. Fees and Transactions with Affiliates and Related Parties:
Investment Advisory Fees:
Investment advisory services are provided to the Fund by the Adviser, which is a New York corporation registered as an investment adviser with the Securities and Exchange Commission ("SEC"). The Adviser is a wholly-owned indirect subsidiary of Victory Capital Holdings, Inc., a publicly traded Delaware corporation, and a wholly-owned direct subsidiary of Victory Capital Operating, LLC.
Under the terms of the Investment Advisory Agreement, the Adviser is entitled to receive a base fee and a performance adjustment. The Fund's base fee is accrued daily and paid monthly at an annualized rate of 0.50% of the first $50 million of the Fund's average daily net assets, 0.40% of that portion of average daily net assets over $50 million but not over $100 million, and 0.30% of that portion of average daily net assets over $100 million. Amounts incurred and paid to VCM for the year ended March 31, 2021, are reflected on the Statement of Operations as Investment Advisory fees.
On November 6, 2018, United Services Automobile Association ("USAA"), the parent company of USAA Asset Management Company ("AMCO"), the prior investment adviser to the Fund announced that AMCO would be acquired by Victory Capital Holdings Inc. (the "Transaction"). A special shareholder meeting was held on April 18, 2019, at which shareholders of the Fund approved a new investment advisory agreement between the Trust, on behalf of the Fund, and VCM. The Transaction closed on July 1, 2019, and effective July 1, 2019, VCM replaced AMCO as the investment adviser to the Fund and no performance adjustments were made for the period beginning July 1, 2019, through June 30, 2020. Only performance beginning as of July 1, 2019, and thereafter is utilized in calculating future performance adjustments.
The performance adjustment for each share class is accrued daily and calculated monthly by comparing each class' performance to that of the Lipper California Municipal Debt Funds Index. The Lipper California Municipal Debt Funds Index tracks the total return performance of the largest funds within the Lipper California Municipal Debt Funds category.
The performance period for each share class consists of the current month plus the previous 35 months (or the number of months beginning July 1, 2019, if fewer). The following table is utilized to determine the extent of the performance adjustment:
| Over/Under Performance Relative to Index (in basis points)(a) | Annual Adjustment Rate (in basis points)(a) | ||||||||||
+/- 20 to 50 | +/- 4 | ||||||||||
+/- 51 to 100 | +/- 5 | ||||||||||
+/- 101 and greater | +/- 6 | ||||||||||
(a) Based on the difference between average annual performance of the relevant share class of the Fund and its relevant Lipper index, rounded to the nearest basis point. Average daily net assets of the share class are calculated over a rolling 36-month period.
Each class' annual performance adjustment rate is multiplied by the average daily net assets of each respective class over the entire performance period, which is then multiplied by a fraction, the numerator of which is the number of days in the month and the denominator of which is 365 (366 in leap years). The resulting amount is then added to (in the case of overperformance), or subtracted from (in the case of underperformance) the base fee.
Under the performance fee arrangement, each class pays a positive performance fee adjustment for a performance period whenever the class outperforms the Lipper California Municipal Debt Funds Index over that period, even if the class has overall negative returns during the performance period.
For the performance period July 1, 2020, to March 31, 2021, performance adjustments were $215, less than $1 and $1, in thousands, for Fund Shares, Institutional Shares and Class A, respectively.
27
USAA Mutual Funds Trust | Notes to Financial Statements — continued March 31, 2021 | ||||||
Performance adjustments were 0.03%, 0.01%, and 0.02% for Fund Shares, Institutional Shares, and Class A, respectively.
The Trust relies on an exemptive order granted to VCM and its affiliated funds by the SEC in March 2019 permitting the use of a "manager-of-managers" structure for certain funds. Under a manager-of-managers structure, the investment adviser may select (with approval of the Board and without shareholder approval) one or more subadvisers to manage the day-to-day investment of a fund's assets. For the year ended March 31, 2021, the Fund had no subadvisors.
Administration and Servicing Fees:
VCM serves as the Fund's administrator and fund accountant. Under the Fund Administration, Servicing and Accounting Agreement, VCM is paid for its services an annual fee at a rate of 0.15%, 0.10%, and 0.15% of average daily net assets, of the Fund Shares, Institutional Shares, and Class A, respectively. Amounts incurred for the year ended March 31, 2021, are reflected on the Statement of Operations as Administration fees.
The Fund (as part of the Trust) has entered into an agreement to provide compliance services with the Adviser, pursuant to which the Adviser furnishes its compliance personnel, including the services of the Chief Compliance Officer ("CCO"), and other resources reasonably necessary to provide the Trust with compliance oversight services related to the design, administration and oversight of a compliance program for the Trust in accordance with Rule 38a-1 under the 1940 Act. The CCO is an employee of the Adviser, which pays the compensation of the CCO and support staff. Funds in the Trust, Victory Variable Insurance Funds, Victory Portfolios, and Victory Portfolios II (collectively, the "Victory Funds Complex") in the aggregate, compensate the Adviser for these services. Amounts incurred for the year ended March 31, 2021, are reflected on the Statement of Operations as Compliance fees.
Citi Fund Services Ohio, Inc. ("Citi"), an affiliate of Citibank, acts as sub-administrator and sub-fund accountant to the Fund pursuant to a Sub-Administration and Sub-Fund Accounting Services Agreement between VCM and Citi. VCM pays Citi a fee for providing these services. The Fund reimburses VCM and Citi for out-of-pocket expenses incurred in providing these services and certain other expenses specifically allocated to the Fund. Amounts incurred for the year ended March 31, 2021, are reflected on the Statement of Operations as Sub-Administration fees.
Transfer Agency Fees:
Victory Capital Transfer Agency, Inc. ("VCTA"), an affiliate of the Adviser, provides transfer agency services to the Fund. VCTA provides transfer agent services to the Fund Shares based on an annual charge of $25.50 per shareholder account plus out-of-pocket expenses. VCTA pays a portion of these fees to certain intermediaries for the administration and servicing of accounts that are held with such intermediaries. Transfer agent's fees are accrued daily and paid monthly at an annualized rate of 0.10% and 0.10% of average daily net assets of the Institutional Shares and Class A, respectively, plus out-of-pocket expenses. Amounts incurred and paid to VCTA for the year ended March 31, 2021, are reflected on the Statement of Operations as Transfer Agent fees.
FIS Investor Services LLC serves as sub-transfer agent and dividend disbursing agent for the Fund pursuant to a Sub-Transfer Agent Agreement between VCTA and FIS Investor Services LLC. VCTA provides FIS Investor Services LLC a fee for providing these services.
Distributor/Underwriting Services:
Victory Capital Services, Inc. (the "Distributor"), an affiliate of the Adviser, serves as distributor for the continuous offering of the shares of the Fund pursuant to a Distribution Agreement between the Distributor and the Trust. Effective June 30, 2020, the Distributor's name was changed from Victory Capital Advisers, Inc.
Pursuant to the Distribution and Service Plans adopted in accordance with Rule 12b-1 under the 1940 Act, the Distributor may receive a monthly distribution and service fee, at an annual rate of up to 0.25% of the average daily net assets of Class A. The distribution and service fees paid to the Distributor
28
USAA Mutual Funds Trust | Notes to Financial Statements — continued March 31, 2021 | ||||||
may be used by the Distributor to pay for activity primarily intended to result in the sale of Class A. Amounts incurred and paid to the Distributor for the year ended March 31, 2021, are reflected on the Statement of Operations as 12b-1 fees.
In addition, the Distributor is entitled to receive commissions on sales of the Class A. For the year ended March 31, 2021, the Distributor received less than $1 thousand from commissions earned on sales of Class A.
Other Fees:
Citibank serves as the Fund's custodian. The Fund pays Citibank a fee for providing these services. Amounts incurred for the year ended March 31, 2021, are reflected on the Statement of Operations as Custodian fees.
K&L Gates LLP provides legal services to the Trust.
The Adviser has entered into an expense limitation agreement with the Fund until at least June 30, 2023. Under the terms of the agreement, the Adviser has agreed to waive fees or reimburse certain expenses to the extent that ordinary operating expenses incurred by certain classes of the Fund in any fiscal year exceed the expense limit for such classes of the Fund. Such excess amounts will be the liability of the Adviser. Interest, taxes, brokerage commissions, other expenditures, which are capitalized in accordance with GAAP, and other extraordinary expenses not incurred in the ordinary course of the Fund's business are excluded from the expense limits. As of March 31, 2021, the expense limits (excluding voluntary waivers) were 0.54%, 0.50%, and 0.80% for Fund Shares, Institutional Shares, and Class A, respectively.
Under the terms of the agreement, the Fund has agreed to repay fees and expenses that were waived or reimbursed by the Adviser for a period of up to three years after the fiscal year in which the waiver or reimbursement took place, subject to the lesser of any operating expense limits in effect at the time of: (a) the original waiver or expense reimbursement; or (b) the recoupment, after giving effect to the recoupment amount.
As of March 31, 2021, the following amounts are available to be repaid to the Adviser (amounts in thousands). The Fund has not recorded any amounts available to be repaid as a liability due to an assessment that such repayment is not probable at March 31, 2021.
Expires March 31, 2024 | |||||||
$ | 7 | ||||||
The Adviser may voluntarily waive or reimburse additional fees to assist the Fund in maintaining competitive expense ratios. Voluntary waivers and reimbursements applicable to the Fund are not available to be recouped at a future time. There were no voluntary waivers or reimbursements for the year ended March 31, 2021.
Certain officers and/or interested trustees of the Fund are also officers and/or employees of the Adviser, administrator, sub-administrator, sub-fund accountant, custodian, and Distributor.
5. Risks:
The Fund may be subject to other risks in addition to these identified risks.
Geopolitical/Natural Disaster Risk — Global economies and financial markets are increasingly interconnected, which increases the possibilities that conditions in one country or region might adversely affect issuers in another country or region. Geopolitical and other risks, including war, terrorism, trade disputes, political or economic dysfunction within some nations, public health crises and related geopolitical events, as well as environmental disasters such as earthquakes, fires, and floods, may add to instability in world economies and markets generally. Changes in trade policies and international trade agreements could affect the economies of many countries in unpredictable ways. Likewise, systemic market dislocations of the kind that occurred during the financial crisis that began in 2008, if repeated, would be highly disruptive to economies and markets, adversely affecting individual
29
USAA Mutual Funds Trust | Notes to Financial Statements — continued March 31, 2021 | ||||||
companies and industries, securities markets, interest rates, credit ratings, inflation, investor sentiment, and other factors affecting the value of a Fund's investments. Some countries, including the United States, are adopting more protectionist trade policies and moving away from the tighter financial industry regulations that followed the 2008 financial crisis, which may also affect the value of a Fund's investments.
Political events within the United States at times have resulted, and may in the future result, in a shutdown of government services, which could negatively affect the U.S. economy, decrease the value of a Fund's investments, increase uncertainty in or impair the operation of the U.S. or other securities markets and degrade investor and consumer confidence, perhaps suddenly and to a significant degree.
An outbreak of disease called COVID-19 has spread internationally. The transmission of COVID-19 and efforts to contain its spread have resulted in international, national and local border closings and other significant travel restrictions and disruptions, significant disruptions to business operations, supply chains and consumer activity, significant challenges in healthcare service preparation and delivery, quarantines and general concern and uncertainty. These negative impacts have caused significant volatility and declines in global financial markets, which have caused losses for Fund investors during and subsequent to period end. The impact of the COVID-19 pandemic may last for an extended period of time, and could result in a substantial economic downturn or recession. Public health crises may exacerbate other pre-existing political, social, economic, market and financial risks. The extent of the impact to the financial performance of the Fund's investments will depend on future developments, including (i) the duration and spread of the outbreak, (ii) the restrictions and advisories, (iii) the effects on the financial markets, and (iv) the effects on the economy overall, all of which are highly uncertain and cannot be predicted.
Credit Risk — The fixed-income securities in the Fund's portfolio are subject to credit risk, which is the possibility that an issuer of a fixed-income security will fail to make timely interest and/or principal payments on its securities or that negative market perceptions of the issuer's ability to make such payments will cause the price of that security to decline. The Fund accepts some credit risk as a recognized means to enhance an investor's return. All fixed-income securities, varying from the highest quality to the very speculative, have some degree of credit risk.
Debt Securities Risk — The value of a debt security or other income-producing security changes in response to various factors, including, for example, market-related factors (such as changes in interest rates or changes in the risk appetite of investors generally) and changes in the actual or perceived ability of the issuer (or of issuers generally) to meet its (or their) obligations.
Other factors that may affect the value of debt securities, include, among others, public health crises and responses by governments and companies to such crises. These and other events may affect the creditworthiness of the issuer of a debt security and may impair an issuers ability to timely meet its debt obligations as they come due.
Interest Rate Risk — The Fund is subject to the risk that the market value of the bonds in its portfolio will fluctuate because of changes in interest rates, changes in the supply of and demand for tax-exempt securities, and other market factors. Bond prices generally are linked to the prevailing market interest rates. In general, when interest rates rise, bond prices fall; conversely, when interest rates fall, bond prices rise. The price volatility of a bond also depends on its duration. Generally, the longer the duration of a bond, the greater is its sensitivity to interest rates. To compensate investors for this higher interest rate risk, bonds with longer durations generally offer higher yields than bonds with shorter durations. The ability of an issuer of a debt security to repay principal prior to a security's maturity can increase the security's sensitivity to interest rate changes.
Decisions by the U.S. Federal Reserve (also known as the "Fed") regarding interest rate and monetary policy, which can be difficult to predict and sometimes change direction suddenly in response to economic and market events, can have a significant effect on the value of fixed income securities as well as the overall strength of the U.S. economy. Precise interest rate predictions are difficult to make, and interest rates may change unexpectedly and dramatically in response to extreme changes in market
30
USAA Mutual Funds Trust | Notes to Financial Statements — continued March 31, 2021 | ||||||
or economic conditions. As a result, the value of fixed income securities may vary widely under certain market conditions.
LIBOR Discontinuation Risk — Many debt securities, derivatives and other financial instruments, including some of the Fund's investments, use the London Interbank Offered Rate ("LIBOR") as the reference or benchmark rate for variable interest rate calculations. In June 2017, the Alternative Reference Rates Committee, a group of large U.S. banks working with the Federal Reserve, announced its selection of a new Secured Overnight Funding Rate ("SOFR"), which is intended to be a broad measure of secured overnight U.S. Treasury repo rates, as an appropriate replacement for LIBOR. The Federal Reserve Bank of New York began publishing the SOFR in 2018, expecting that it could be used on a voluntary basis in new instruments and transactions. Bank working groups and regulators in other countries have suggested other alternatives for their markets, including the Sterling Overnight Interbank Average Rate ("SONIA") in England. In July 2017, the Financial Conduct Authority (the "FCA"), the United Kingdom financial regulatory body, announced that after 2021 it will cease its active encouragement of UK banks to provide the quotations needed to sustain LIBOR. That announcement suggests that LIBOR may cease to be published after that time. For U.S. dollar LIBOR, however, the relevant date may be deferred to June 30, 2023, for the most common tenors (overnight and one, three, six and 12 months). As to those tenors, the LIBOR administrator has published a consultation regarding its intention to cease publication of U.S. dollar LIBOR as of June 30, 2023, (instead of December 31, 2021, as previously expected), apparently based on continued rate submissions from banks. It is expected that there will be enough time for market participants to transition to the use of a different benchmark for both new and existing securities and transactions. Various financial industry groups have begun planning for that transition, but there are obstacles to converting certain longer-term securities and transactions to a new benchmark. Transition planning is at an early stage, and neither the effect of the transition process nor its ultimate success can yet be known. Although the foregoing may provide some sense of timing, there is no assurance that LIBOR, or any particular currency and tenor, will continue to be published until any particular date, and it appears highly likely that LIBOR will be discontinued or modified after December 31, 2021, or June 30, 2023, depending on the currency and tenor. The transition process might lead to increased volatility and illiquidity in markets that currently rely on the LIBOR to determine interest rates. It could also lead to a reduction in the value of some LIBOR-based investments and reduce the effectiveness of new hedges placed against existing LIBOR-based instruments. Since the usefulness of LIBOR as a benchmark could deteriorate during the transition period, these effects could occur before the end of 2021.
6. Borrowing and Interfund Lending:
Line of Credit:
For the year ended March 31, 2021, the Victory Funds Complex participated in a short-term demand note "Line of Credit" agreement with Citibank. The Line of Credit agreement with Citibank was renewed on June 29, 2020, with a termination date of June 28, 2021. Under the agreement with Citibank, the Victory Funds Complex may borrow up to $600 million, of which $300 million is committed and $300 million is uncommitted. $40 million of the Line of Credit is reserved for use by the Victory Floating Rate Fund, another series of the Victory Funds Complex, with Victory Floating Rate Fund paying the related commitment fees for that amount. The purpose of the agreement is to meet temporary or emergency cash needs. For the year ended March 31, 2021, Citibank received an annual commitment fee of 0.15% on $300 million for providing the Line of Credit. Each fund in the Victory Funds Complex paid a pro-rata portion of the commitment fees plus any interest (one month LIBOR plus one percent) on amounts borrowed. Effective June 29, 2020, under an amended Line of Credit agreement, Citibank also received an annual upfront fee of 0.10% on the $300 million committed line of credit. Each fund in the Victory Funds Complex paid a pro-rata portion of the upfront fee. Interest charged to each Fund during the period, if applicable, is reflected on the Statement of Operations under Line of credit fees.
The Fund had no borrowings under the Line of Credit agreement during the year ended March 31, 2021.
31
USAA Mutual Funds Trust | Notes to Financial Statements — continued March 31, 2021 | ||||||
Interfund Lending:
The Trust and Adviser rely on an exemptive order granted by the SEC in March 2017 (the "Order"), permitting the establishment and operation of an Interfund Lending Facility (the "Facility"). The Facility allows the Fund to directly lend and borrow money to or from any other Fund, that is permitted to participate in the Facility, in the Victory Funds Complex relying upon the Order at rates beneficial to both the borrowing and lending funds. Advances under the Facility are allowed for temporary or emergency purposes, including the meeting of redemption requests that otherwise might require the untimely disposition of securities, and are subject to each Fund's borrowing restrictions. The interfund loan rate is determined, as specified in the Order, by averaging the current repurchase agreement rate and the current bank loan rate. As a Borrower, interest charged to the Fund, if any, during the period is reflected on the Statement of Operations under Interfund lending fees. As a Lender, interest earned by the Fund, if any, during the period is presented on the Statement of Operations under Interfund lending.
The Fund did not utilize or participate in the Facility during the year ended March 31, 2021.
7. Federal Income Tax Information:
The Fund intends to declare daily and distribute any net investment income monthly. Distributable net realized gains, if any, are declared and paid at least annually.
The amounts of dividends from net investment income and distributions from net realized gains (collectively distributions to shareholders) are determined in accordance with federal income tax regulations, which may differ from GAAP. To the extent these "book/tax" differences are permanent in nature (e.g., net operating loss and distribution reclassification), such amounts are reclassified within the components of net assets based on their federal tax-basis treatment; temporary differences (e.g., wash sales) do not require reclassification. To the extent dividends and distributions exceed net investment income and net realized gains for tax purposes, they are reported as distributions of capital. Net investment losses incurred by the Fund may be reclassified as an offset to capital on the accompanying Statement of Assets and Liabilities.
As of March 31, 2021, on the Statement of Assets and Liabilities, there were no permanent book-to-tax difference reclassification adjustments.
The tax character of distributions paid during the tax years ended as noted below, were as follows (total distributions paid may differ from the Statements of Changes in Net Assets because, for tax purposes, dividends are recognized when actually paid) (amounts in thousands).
| Year Ended March 31, 2021 | Year Ended March 31, 2020 | ||||||||||||||
| Distributions Paid from | Distributions Paid from | ||||||||||||||
| Tax-Exempt Income | Total Distributions Paid | Tax-Exempt Income | Total Distributions Paid | ||||||||||||
| $ | 16,067 | $ | 16,067 | $ | 19,013 | $ | 19,013 | ||||||||
32
USAA Mutual Funds Trust | Notes to Financial Statements — continued March 31, 2021 | ||||||
As of March 31, 2021, the components of accumulated earnings (loss) on a tax basis were as follows (amounts in thousands):
| Undistributed Tax-Exempt Income | Distributions Payable | Accumulated Earnings | Accumulated Capital and Other Losses | Unrealized Appreciation (Depreciation) | Total Accumulated Earnings (Loss) | ||||||||||||||||||
| $ | 1,325 | $ | (1,363 | ) | $ | (38 | ) | $ | (4,432 | ) | $ | 46,156 | $ | 41,686 | |||||||||
As of March 31, 2021, the Fund had net capital loss carryforwards as shown in the table below (amounts in thousands). It is unlikely that the Board will authorize a distribution of capital gains realized in the future until the capital loss carryforwards have been used.
| Short-Term Amount | Long-Term Amount | Total | |||||||||
| $ | 530 | $ | 3,902 | $ | 4,432 | ||||||
As of March 31, 2021, the cost basis for federal income tax purposes, gross unrealized appreciation, gross unrealized depreciation, and net unrealized appreciation (depreciation) for investments were as follows (amounts in thousands):
| Cost of Investments for Federal Tax Purposes | Gross Unrealized Appreciation | Gross Unrealized Depreciation | Net Unrealized Appreciation (Depreciation) | ||||||||||||
| $ | 611,663 | $ | 46,805 | $ | (649 | ) | $ | 46,156 | |||||||
33
REPORT OF INDEPENDENT REGISTERED PUBLIC ACCOUNTING FIRM
To the Shareholders and the Board of Trustees of USAA California Bond Fund
Opinion on the Financial Statements
We have audited the accompanying statement of assets and liabilities of USAA California Bond Fund (the "Fund") (one of the funds constituting USAA Mutual Funds Trust (the "Trust")), including the schedule of portfolio investments, as of March 31, 2021, and the related statement of operations for the year then ended, the statements of changes in net assets for each of the two years in the period then ended, the financial highlights for each of the five years in the period then ended and the related notes (collectively referred to as the "financial statements"). In our opinion, the financial statements present fairly, in all material respects, the financial position of the Fund at March 31, 2021, the results of its operations for the year then ended, the changes in its net assets for each of the two years in the period then ended and its financial highlights for each of the five years in the period then ended, in conformity with U.S. generally accepted accounting principles.
Basis for Opinion
These financial statements are the responsibility of the Trust's management. Our responsibility is to express an opinion on the Fund's financial statements based on our audits. We are a public accounting firm registered with the Public Company Accounting Oversight Board (United States) ("PCAOB") and are required to be independent with respect to the Trust in accordance with the U.S. federal securities laws and the applicable rules and regulations of the Securities and Exchange Commission and the PCAOB.
We conducted our audits in accordance with the standards of the PCAOB. Those standards require that we plan and perform the audit to obtain reasonable assurance about whether the financial statements are free of material misstatement, whether due to error or fraud. The Trust is not required to have, nor were we engaged to perform, an audit of the Trust's internal control over financial reporting. As part of our audits we are required to obtain an understanding of internal control over financial reporting, but not for the purpose of expressing an opinion on the effectiveness of the Trust's internal control over financial reporting. Accordingly, we express no such opinion.
Our audits included performing procedures to assess the risks of material misstatement of the financial statements, whether due to error or fraud, and performing procedures that respond to those risks. Such procedures included examining, on a test basis, evidence regarding the amounts and disclosures in the financial statements. Our procedures included confirmation of securities owned as of March 31, 2021, by correspondence with the custodian. Our audits also included evaluating the accounting principles used and significant estimates made by management, as well as evaluating the overall presentation of the financial statements. We believe that our audits provide a reasonable basis for our opinion.

We have served as the auditor of one or more Victory Capital investment companies since 1995.
San Antonio, Texas
May 26, 2021
34
USAA Mutual Funds Trust | Supplemental Information March 31, 2021 | ||||||
(Unaudited)
Trustee and Officer Information
Board of Trustees:
Overall responsibility for management of the Trust rests with the Board. The Trust is managed by the Board in accordance with the laws of the state of Delaware. There are currently nine Trustees, seven of whom are not "interested persons" of the Trust within the meaning of that term under the 1940 Act ("Independent Trustees") and two of whom is an "interested person" of the Trust within the meaning of that term under the 1940 Act ("Interested Trustee"). The Trustees, in turn, elect the officers of the Trust to actively supervise its day-to-day operations.
The following tables list the Trustees, their ages, position with the Trust, commencement of service, principal occupations during the past five years and any directorships of other investment companies or companies whose securities are registered under the Securities Exchange Act of 1934, as amended, or who file reports under that Act. Each Trustee oversees 46 portfolios in the Trust. Each Trustee's address is 15935 La Cantera Pkwy, San Antonio, TX, 78256. Pursuant to a policy adopted by the Board, the term of office for each Trustee shall be until the Independent Trustee reaches age 75 or an Interested Trustee reaches age 75. The Board may change or grant exceptions from this policy at any time without shareholder approval. A Trustee may resign or be removed by a vote of the other Trustees or the holders of a majority of the outstanding shares of the Trust at any time. Vacancies on the Board can be filled by the action of a majority of the Trustees, provided that after filling such vacancy at least two-thirds of the Trustees have been elected by the shareholders.
Name and Date of Birth | Position Held with the Trust | Year Commenced Service | Principal Occupation During Past 5 Years | Other Directorships Held During Past 5 Years | |||||||||||||||
Independent Trustees. | |||||||||||||||||||
| Jefferson C. Boyce, (c) Born September 1957 | Independent Chairman | 2021 | Senior Managing Director, New York Life Investments, LLC (1992-2012) | Westhab, Inc. | |||||||||||||||
| John C. Walters, Born February 1962 | Trustee | 2019 | Retired. Mr. Walters brings significant Board experience including active involvement with the board of a Fortune 500 company, and a proven record of leading large, complex financial organizations. He has a demonstrated record of success in distribution, manufacturing, investment brokerage, and investment management in both the retail and institutional investment businesses. He has substantial experience in the investment management business with a demonstrated ability to develop and drive strategy while managing operation, financial, and investment risk. | Guardian Variable Products Trust (16 series), Lead Independent Director; Amerilife Holdings LLC, Director; Stadion Money Management; Director; University of North Carolina (Chapel Hill), Member Board of Governors | |||||||||||||||
35
USAA Mutual Funds Trust | Supplemental Information — continued March 31, 2021 | ||||||
(Unaudited)
Name and Date of Birth | Position Held with the Trust | Year Commenced Service | Principal Occupation During Past 5 Years | Other Directorships Held During Past 5 Years | |||||||||||||||
| Robert L. Mason, Ph.D., Born July 1946 | Trustee | 1997 | Adjunct Professor in the Department of Management Science and Statistics in the College of Business at the University of Texas at San Antonio (since 2001); Institute Analyst, Southwest Research Institute (March 2002-January 2016) | None | |||||||||||||||
| Dawn M. Hawley, Born February 1954 | Trustee | 2014 | Manager of Finance, Menil Foundation, Inc. (May 2007-June 2011), which is a private foundation that oversees the assemblage of sculptures, prints, drawings, photographs, and rare books. Director of Financial Planning and Analysis and Chief Financial Officer, AIM Management Group, Inc. (October 1987-January 2006) | None | |||||||||||||||
| Paul L. McNamara, Born July 1948 | Trustee | 2012 | Director, Cantor Opportunistic Alternatives Fund, LLC (March 2010-February 2014), which is a closed-end fund of funds by Cantor Fitzgerald Investment Advisors, LLC | None | |||||||||||||||
36
USAA Mutual Funds Trust | Supplemental Information — continued March 31, 2021 | ||||||
(Unaudited)
Name and Date of Birth | Position Held with the Trust | Year Commenced Service | Principal Occupation During Past 5 Years | Other Directorships Held During Past 5 Years | |||||||||||||||
| Richard Y. Newton III, Born January 1956 | Trustee | 2017 | Director, Elta North America (01/18-present), which is a global leader in the design, manufacture, and support of innovative electronic systems in the ground, maritime, airborne, and security domains for the nation's warfighters, security personnel, and first responders; Managing Partner, Pioneer Partnership Development Group (December 2015-present)); Executive Director, The Union League Club of New York (June 2014-November 2015): Executive Vice President, Air Force Association (August 2012-May 2014); Lieutenant General, United States Air Force (January 2008-June 2012) | PredaSAR Corp. | |||||||||||||||
| Barbara B. Ostdiek, Ph.D., Born March 1964 | Trustee | 2008 | Senior Associate Dean of Degree Programs at Jesse H. Jones Graduate School of Business at Rice University (since 2013); Associate Professor of Finance at Jessie H. Jones Graduate School of Business at Rice University (since 2001) | None | |||||||||||||||
| Michael F. Reimherr, (a) Born August 1945 | Trustee | 2000 | President of Reimherr Business Consulting (May 1995-December 2017); St. Mary's University Investment Committee overseeing University Endowment (since 2014) | None | |||||||||||||||
(a) Effective at the close of business on December 31, 2020, Michael F. Reimherr retired from the Board of Trustees.
37
USAA Mutual Funds Trust | Supplemental Information — continued March 31, 2021 | ||||||
(Unaudited)
Name and Date of Birth | Position Held with the Trust | Year Commenced Service | Principal Occupation During Past 5 Years | Other Directorships Held During Past 5 Years | |||||||||||||||
Interested Trustees. | |||||||||||||||||||
| David C. Brown, (b) Born May 1972 | Trustee | 2019 | Chairman and Chief Executive Officer (since 2013), Victory Capital Management Inc.; Chairman and Chief Executive Officer, Victory Capital Holdings, Inc. (since 2013). Mr. Brown brings to the Board extensive business, finance and leadership skills gained and developed through years of experience in the financial services industry, including his tenure overseeing the strategic direction as CEO of Victory Capital. These skills, combined with Mr. Brown's extensive knowledge of the financial services industry and demonstrated success in the development and distribution of investment strategies and products, enable him to provide valuable insights to the Board and strategic direction for the Funds. | Trustee, Victory Portfolios (41 series), Victory Portfolios II (26 series), Victory Variable Insurance Funds (8 series) | |||||||||||||||
38
USAA Mutual Funds Trust | Supplemental Information — continued March 31, 2021 | ||||||
(Unaudited)
Name and Date of Birth | Position Held with the Trust | Year Commenced Service | Principal Occupation During Past 5 Years | Other Directorships Held During Past 5 Years | |||||||||||||||
| Daniel S. McNamara, (b)(c) Born June 1966 | Trustee | 2012 | Trustee, President, and Vice Chairman of USAA ETF Trust (June 2017-June 2019); President of Financial Advice & Solutions Group (FASG), USAA (February 2013-March 2021); Director of USAA Investment Services Company (ISCO) (formerly USAA Investment Management) (September 2009-March 2021); President, Asset Management Company (AMCO) (August, 2011-June 2019); Senior Vice President of USAA Financial Planning Services Insurance Agency, Inc. (FPS) (April 2011-March 2021) Chairman of Board of ISCO (April 2013-December 2020); Director of AMCO (August 2011-June 2019); President and Director of USAA Shareholder Account Services (SAS) (October 2009-June 2019); Director and Vice Chairman of FPS (December 2013-March 2021); President and Director of USAA Investment Corporation (ICORP) (March 2010-March 2021); Chairman of Board of ICORP (December 2013-March 2021); Director of USAA Financial Advisors, Inc. (FAI) (December 2013-March 2021); Chairman of Board of FAI (March 2015-March 2021). Mr. McNamara brings to the Board extensive experience in the financial services industry, including experience as an officer of the Trust. | None | |||||||||||||||
(b) Mr. Dan McNamara, the Chairman of the Board, is deemed an "interested person" due to his previous position as Director of AMCO, the former investment adviser of the Funds. Mr. Brown is deemed an "interested person" due to his position as Chief Executive Officer of Victory Capital, investment adviser to the Funds.
(c) Effective at the close of business on December 31, 2020, Jefferson C. Boyce replaced Dan McNamara as Chair of the Board and assumed the title of Independent Chair.
The Statement of Additional Information includes additional information about the Trustees of the Trust and is available, without charge, on the SEC's website at www.sec.gov and/or by calling (800)-235-8396.
39
USAA Mutual Funds Trust | Supplemental Information — continued March 31, 2021 | ||||||
(Unaudited)
Officers:
The officers of the Trust, their ages, commencement of service and their principal occupations during the past five years, are detailed in the following table. Each officer serves until the earlier of his or her resignation, removal, retirement, death, or the election of a successor. The mailing address of each officer of the Trust is 15935 La Cantera Pkwy, San Antonio, TX, 78256. The officers of the Trust receive no compensation directly from the Trust for performing the duties of their offices.
Name and Date of Birth | Position with the Trust | Year Commenced Service | Principal Occupation During Past 5 Years | ||||||||||||
Interested Officers.
| Christopher K. Dyer, Born February 1962 | President | 2019 | Director of Fund Administration, Victory Capital (since 2004); Chief Operating Officer, Victory Capital Services, Inc. (since 2020) | ||||||||||||
| Scott A Stahorsky, Born July 1969 | Vice President | 2019 | Manager, Fund Administration, Victory Capital (since 2015) | ||||||||||||
| James K. De Vries, Born April 1969 | Treasurer | 2018 | Executive Director, Victory Capital Management Inc. (since 2019); Treasurer, USAA ETF Trust (September 2018-June 2019); Executive Director, Investment and Financial Administration, USAA (April 2012-June 2019); Assistant Treasurer, USAA ETF Trust (June 2017-September 2018); Assistant Treasurer, USAA Mutual Funds Trust (December 2013-February 2018) | ||||||||||||
| Allan Shaer, Born March 1965 | Assistant Treasurer | 2019 | Senior Vice President, Financial Administration, Citi Fund Services Ohio, Inc. (since 2016); Vice President, Mutual Fund Administration, JP Morgan Chase (2011-2016) | ||||||||||||
| Carol D. Trevino, Born October 1965 | Assistant Treasurer | 2018 | Director, Accounting and Finance, Victory Capital Management Inc. (since 2019); Accounting/Financial Director, USAA (December 2013-June 2019); Assistant Treasurer, USAA ETF Trust (September 2018-June 2019) | ||||||||||||
| Erin G. Wagner, Born February 1974 | Secretary | 2019 | Deputy General Counsel, the Adviser (since 2013) | ||||||||||||
| Charles Booth, Born April 1960 | Anti-Money Laundering Compliance Officer and Identity Theft Officer | 2019 | Director, Regulatory Administration and CCO Support Services, Citi Fund Services Ohio, Inc. (since 2007) | ||||||||||||
| Amy Campos, Born July 1976 | Chief Compliance Officer | 2019 | Chief Compliance Officer, USAA Mutual Funds Trust (since 2019); Executive Director, Deputy Chief Compliance Officer, USAA Mutual Funds Trust and USAA ETF Trust (July 2017-June 2019); Compliance Director, USAA Mutual Funds Trust (2014-July 2017) | ||||||||||||
40
USAA Mutual Funds Trust | Supplemental Information — continued March 31, 2021 | ||||||
(Unaudited)
Proxy Voting and Portfolio Holdings Information
Proxy Voting:
Information regarding the policies and procedures the Fund uses to determine how to vote proxies relating to portfolio securities is available without charge, upon request, by calling (800) 235-8396. The information is also included in the Fund's Statement of Additional Information, which is available on the SEC's website at www.sec.gov.
Information relating to how the Fund voted proxies relating to portfolio securities held during the most recent 12 months ended June 30 is available on the SEC's website at www.sec.gov.
Availability of Schedules of Portfolio Investments:
The Trust files a complete list of Schedules of Portfolio Investments with the SEC for the first and third quarter of each fiscal year on Form N-PORT. Form N-PORT is available on the SEC's website at www.sec.gov.
Expense Examples
As a shareholder of the Fund, you may incur two types of costs: (1) transaction costs, including sales charges (loads) on purchases; and (2) ongoing costs, including management fees and other Fund expenses. These examples are intended to help you understand your ongoing costs (in dollars) of investing in the Fund and to compare these costs with the ongoing costs of investing in other mutual funds.
These examples are based on an investment of $1,000 invested at the beginning of the period and held for the entire period from October 1, 2020 through March 31, 2021.
The Actual Expense figures in the table below provide information about actual account values and actual expenses. You may use the information below, together with the amount you invested, to estimate the expenses that you paid over the period. Simply divide your account value by $1,000 (for example, an $8,600 account value divided by $1,000 = 8.6), then multiply the result by the number in the table under the heading entitled "Actual Expenses Paid During Period" to estimate the expenses you paid on your account during this period.
The Hypothetical Expense figures in the table below provide information about hypothetical account values and hypothetical expenses based on the Fund's actual expense ratio and an assumed rate of return of 5% per year before expenses, which is not the Fund's actual return. The hypothetical account values and expenses may not be used to estimate the actual ending account balance or expenses you paid for the period. You may use this information to compare this 5% hypothetical example with the 5% hypothetical examples that appear in shareholder reports of other funds.
Please note the expenses shown in the table below are meant to highlight your ongoing costs only and do not reflect any transactional costs. If these transactional costs were included, your costs would have been higher.
| Beginning Account Value 10/1/20 | Actual Ending Account Value 3/31/21 | Hypothetical Ending Account Value 3/31/21 | Actual Expenses Paid During Period 10/1/20- 3/31/21* | Hypothetical Expenses Paid During Period 10/1/20- 3/31/21* | Annualized Expense Ratio During Period 10/1/20- 3/31/21 | ||||||||||||||||||||||
Fund Shares | $ | 1,000.00 | $ | 1,016.30 | $ | 1,022.09 | $ | 2.87 | $ | 2.87 | 0.57 | % | |||||||||||||||
Institutional Shares | 1,000.00 | 1,015.70 | 1,022.44 | 2.51 | 2.52 | 0.50 | % | ||||||||||||||||||||
Class A | 1,000.00 | 1,014.20 | 1,020.89 | 4.07 | 4.08 | 0.81 | % | ||||||||||||||||||||
* Expenses are equal to the average account value multiplied by the Fund's annualized expense ratio multiplied by 182/365 (the number of days in the most recent fiscal half-year divided by the number of days in the fiscal year).
41
USAA Mutual Funds Trust | Supplemental Information — continued March 31, 2021 | ||||||
(Unaudited)
For the period October 1, 2020 to March 31, 2021, performance adjustments were applied to the Fund. The annualized expense ratios of 0.57%, and 0.81% for the Fund Shares, and Class A, respectively, as represented in the table above, reflect these adjustments. The values in the table below reflect your costs (in dollars) of investing in the Fund, had these adjustments not been applied for the six months ended March 31, 2021.
| Beginning Account Value 10/1/20 | Actual Ending Account Value 3/31/21 | Hypothetical Ending Account Value 3/31/21 | Actual Expenses Paid During Period 10/1/20- 3/31/21* | Hypothetical Expenses Paid During Period 10/1/20- 3/31/21* | Annualized Expense Ratio During Period 10/1/20- 3/31/21 | ||||||||||||||||||||||
Fund Shares | $ | 1,000.00 | $ | 1,016.30 | $ | 1,022.24 | $ | 2.71 | $ | 2.72 | 0.54 | % | |||||||||||||||
Class A | 1,000.00 | 1,014.20 | 1,020.94 | 4.02 | 4.03 | 0.80 | % | ||||||||||||||||||||
* Expenses are equal to the average account value multiplied by the Fund's annualized expense ratio multiplied by 182/365 (the number of days in the most recent fiscal half-year divided by the number of days in the fiscal year).
42
USAA Mutual Funds Trust | Supplemental Information — continued March 31, 2021 | ||||||
(Unaudited)
Additional Federal Income Tax Information
The following federal tax information related to the Fund's fiscal year ended March 31, 2021, is provided for information purposes only and should not be used for reporting to federal or state revenue agencies. Federal tax information for the calendar year will be reported to you on Form 1099-DIV in January 2022.
With respect to distributions paid, the Fund designates the following amounts (or, if subsequently determined to be different, the maximum amount allowable) for the fiscal year ended March 31, 2021 (amounts in thousands):
| Tax Exempt Distributions | |||||||
$ | 16,067 | ||||||
43
USAA Mutual Funds Trust | Supplemental Information — continued March 31, 2021 | ||||||
(Unaudited)
Considerations of the Board in Continuing the Investment Advisory Agreement
USAA California Bond Fund (the "Fund")
At a meeting of the Board of Trustees (the "Board") held on December 10-11, 2020, the Board, including the Trustees who are not "interested persons" (as that term is defined in the Investment Company Act of 1940, as amended) of the Trust (the "Independent Trustees"), approved for an annual period the continuance of the Investment Advisory Agreement (the "Advisory Agreement") between the Trust and Victory Capital Management Inc. (the "Adviser") with respect to the Fund. Prior to the December 10-11, 2020, meeting, at which the Advisory Agreement was approved, the Independent Trustees also discussed and considered information regarding the proposed continuation of the Advisory Agreement at a meeting held on November 19, 2020.
In advance of the foregoing meetings, the Trustees received and considered a variety of information relating to the Advisory Agreement and the Adviser, and were given the opportunity to ask questions and request additional information from management. The information provided to the Board included, among other things: (i) a separate report prepared by an independent third party of mutual fund data, which provided a statistical analysis comparing the Fund's investment performance, expenses, and fees to comparable investment companies; (ii) information concerning the services rendered to the Fund, as well as information regarding the Adviser's revenues and costs of providing services to the Fund and compensation paid to affiliates of the Adviser; and (iii) information about the Adviser's operations and personnel. Prior to voting, the Independent Trustees reviewed the proposed continuance of the Advisory Agreement with management and with experienced independent counsel retained by the Independent Trustees ("Independent Counsel") and received materials from such Independent Counsel discussing the legal standards for their consideration of the proposed continuation of the Advisory Agreement with respect to the Fund. The Independent Trustees also reviewed the proposed continuation of the Advisory Agreement with respect to the Fund in private sessions with Independent Counsel at which no representatives of management were present.
At each regularly scheduled meeting of the Board and its committees, the Board receives and reviews, among other things, information concerning the Fund's performance and related services provided by the Adviser. At the meeting at which the renewal of the Advisory Agreement is considered, particular focus is given to information concerning Fund performance, fees and total expenses as compared to comparable investment companies, and the Adviser's profitability with respect to the Fund. However, the Board noted that the evaluation process with respect to the Adviser is an ongoing one. In this regard, the Board's and its committees' consideration of the Advisory Agreement included information previously received at such meetings.
Advisory Agreement
After full consideration of a variety of factors, the Board, including the Independent Trustees, voted to approve the Advisory Agreement. In approving the Advisory Agreement, the Trustees did not identify any single factor as controlling, and each Trustee may have attributed different weights to various factors. Throughout their deliberations, the Independent Trustees were represented and assisted by Independent Counsel.
Nature, Extent, and Quality of Services — In considering the nature, extent, and quality of the services provided by the Adviser under the Advisory Agreement, the Board reviewed information provided by the Adviser relating to its operations and personnel. The Board also took into account its knowledge of the Adviser's management and the quality of the performance of the Adviser's duties through Board meetings, discussions, and reports during the preceding year. The Board considered the fees paid to the Adviser and the services provided to the Fund by the Adviser under the Advisory Agreement, as well as other services provided by the Adviser and its affiliates under other agreements, and the personnel who provide these services. In addition to the investment advisory services provided to the Fund, the Adviser and its affiliates provide administrative services, shareholder services, oversight of Fund accounting, marketing services, assistance in meeting legal and regulatory requirements, and other services necessary for the operation of the Fund and the Trust.
The Board considered the scope of services provided by, and the undertakings required of, the Adviser in connection with those services, including, among other things, maintaining (i) its own and the Fund's compliance programs, (ii) risk management programs, (iii) liquidity risk management programs, and (iv) cybersecurity
44
USAA Mutual Funds Trust | Supplemental Information — continued March 31, 2021 | ||||||
(Unaudited)
programs, each of which had expanded over time as a result of regulatory, market, and other developments. The Board also considered the significant risks assumed by the Adviser in connection with the services provided to the Fund, including investment, operational, enterprise, litigation, regulatory and compliance risks.
The Board considered the Adviser's management style and the performance of the Adviser's duties under the Advisory Agreement. The Board considered the level and depth of knowledge of the Adviser, including the professional experience and qualifications of its senior and investment personnel, as well as current staffing levels. The allocation of the Fund's brokerage, including the Adviser's process for monitoring "best execution," also was considered. The Adviser's role in coordinating the activities of the Fund's other service providers was also considered. The Board also considered the Adviser's risk management processes. The Board considered the Adviser's financial condition and that it had the financial wherewithal to continue to provide the same scope and high quality of services under the Advisory Agreement. In reviewing the Advisory Agreement, the Board focused on the experience, resources, and strengths of the Adviser and its affiliates in managing the Fund, as well as the other funds in the Trust.
The Board also reviewed the compliance and administrative services provided to the Fund by the Adviser and its affiliates, including the Adviser's oversight of the Fund's day-to-day operations and oversight of Fund accounting. The Trustees, guided also by information obtained from their experiences as trustees of the Trust, also focused on the quality of the Adviser's compliance and administrative staff.
Expenses and Performance — In connection with its consideration of the Advisory Agreement, the Board evaluated the Fund's advisory fees and total expense ratio as compared to other open-end investment companies deemed to be comparable to the Fund as determined by the independent third party in its report. The Fund's expenses were compared to (i) a group of investment companies chosen by the independent third party to be comparable to the Fund based upon certain factors, including fund type, comparability of investment objective and classification, sales load type, asset size, and expense components (the "expense group") and (ii) a larger group of investment companies with the same investment classification/objective as the Fund regardless of asset size, excluding outliers (the "expense universe"). Among other data, the Board noted that the Fund's management fee rate—which includes advisory and administrative services and the effects of any performance adjustment1, as well as any fee waivers and reimbursements—was equal to the medians of its expense group and expense universe. The data indicated that the Fund's total expenses, including after any reimbursements, were equal to the medians of its expense group and expense universe. The Board also took into account the Adviser's current undertakings to maintain expense limitations for the Fund. The Board took into account the various other services provided to the Fund by the Adviser and its affiliates, and noted the high quality of services received by the Fund.
In considering the Fund's performance, the Board noted that it reviews at its regularly scheduled meetings information about the Fund's performance results. The Trustees also reviewed various comparative data provided to them in connection with their consideration of the renewal of the Advisory Agreement, including, among other information, a comparison of the Fund's average annual total returns relative to its Lipper index and other mutual funds deemed to be in its peer group by the independent third party in its report (the "performance universe"). The Fund's performance universe consisted of the Fund and all retail and institutional open-end investment companies with the same classification/objective as the Fund regardless of asset size or primary channel of distribution. This comparison indicated that, among other data, the Fund's performance was above the average of its performance universe and its Lipper index for the one-, three-, and ten-year periods ended September 30, 2020, and was below the average of its performance universe and its Lipper index for the five-year period ended September 30, 2020.
Compensation and Profitability — The Board took into consideration the level and method of computing the management fee. The information considered by the Board included operating profit margin information for the Adviser's business as a whole. The Board also received and considered profitability information related to the management revenues from the Fund. This information included a review of the methodology used in the allocation of certain costs to the Fund. In considering the profitability data with respect to the Fund, the Trustees noted that the Adviser waived a portion of its management fees and/or reimbursed certain expenses with respect
1 The Adviser has agreed that no performance adjustment (positive or negative) would be made to the amount payable to the Adviser from July 1, 2019, through June 30, 2020.
45
USAA Mutual Funds Trust | Supplemental Information — continued March 31, 2021 | ||||||
(Unaudited)
to the Fund. The Trustees reviewed the profitability of the Adviser's relationship with the Fund before tax expenses. The Board was also provided with a profitability analysis of other publicly traded asset managers prepared by an independent information service. In reviewing the overall profitability of the management fee to the Adviser, the Board also considered the fact that the Adviser and its affiliates provide shareholder servicing and administrative services to the Fund for which they receive compensation. The Board also considered the possible direct and indirect benefits to the Adviser from its relationship with the Trust, including that the Adviser may derive reputational and other benefits from its association with the Fund. The Trustees recognized that the Adviser should be entitled to earn a reasonable level of profits in exchange for the level of services it provides to the Fund and the entrepreneurial and other risks that it assumes as Adviser.
Economies of Scale — The Board noted that the Fund has advisory fee breakpoints that allow the Fund to participate in economies of scale and that such economies of scale were currently reflected in the advisory fee. The Board also considered the fee waiver and expense reimbursement arrangements by the Adviser. The Board also considered the effect of the Fund's change in size, if any, on its performance and fees, noting that the Fund may realize other economies of scale if assets increase proportionally more than expenses. The Board determined that the current investment management fee structure was reasonable.
Conclusions — The Board reached the following conclusions regarding the Fund's Advisory Agreement with the Adviser: (i) the Adviser has demonstrated that it possesses the capability and resources to perform the duties required of it under the Advisory Agreement; (ii) the Adviser maintains an appropriate compliance program; (iii) the overall performance of the Fund is reasonable in relation to the performance of funds with similar investment objectives and to relevant indices; (iv) the Fund's advisory expenses are reasonable in relation to those of similar funds and to the services to be provided by the Adviser; and (v) the Adviser's and its affiliates' level of profitability from their relationship with the Fund is reasonable in light of the nature and high quality of services provided by the Adviser and the type of fund. Based on its conclusions, the Board determined that continuation of the Advisory Agreement would be in the best interests of the Fund and its shareholders.
46
USAA Mutual Funds Trust | Supplemental Information — continued March 31, 2021 | ||||||
(Unaudited)
Liquidity Risk Management Program:
The USAA Mutual Funds have adopted and implemented a written liquidity risk management program (the "LRMP") as required by Rule 22e-4 under the Investment Company Act of 1940, as amended. The LRMP is reasonably designed to assess and manage the Fund's liquidity risk, taking into consideration the Fund's investment strategy and the liquidity of its portfolio investments during normal and reasonably foreseeable stressed market conditions; its short and long-term cash flow projections; and its cash holdings and access to other liquidity management tools such as available funding sources including the Victory Funds Complex Interfund Lending Facility and Line of Credit (discussed in the Notes to Financial Statements). The USAA Mutual Funds' Board of Trustees approved the appointment of the Fund's investment adviser, Victory Capital Management Inc. ("Victory Capital"), as the administrator of the LRMP.
Victory Capital manages liquidity risks associated with the Fund's investments by monitoring, among other things, cash and cash equivalents, any use of derivatives, the concentration of investments, the appropriateness of the Fund's investment strategy, and by classifying every fund investment as either highly liquid, moderately liquid, less liquid or illiquid on at least a monthly basis. To assist with the classification of Fund investments, Victory Capital has retained a third-party provider of liquidity evaluation services. This provider determines preliminary liquidity classifications for all portfolio holdings based upon portfolio-level data and certain assumptions provided by Victory Capital. Victory Capital reviews the preliminary liquidity classifications, and, when appropriate, considers other information including input from the Fund's portfolio managers (including the portfolio managers employed by any investment sub-advisers) in determining final liquidity classifications.
At a virtual video conference meeting held on March 10, 2021, Victory Capital provided an oral and written report to the Trustees on the operation and effectiveness of the LRMP during the previous year. The report from Victory Capital concluded that the Fund did not experience any significant liquidity challenges during the covered period, and the Fund's LRMP is reasonably designed to assess and manage its liquidity risk. The report also concluded that the LRMP continues to operate adequately and effectively to enable Victory Capital to oversee and manage liquidity risk and ensure the Fund is able to meet redemption requests without significant dilution to the remaining investors' interest in the Fund. During the review period, the Fund's portfolio consisted primarily of highly liquid investments, which are defined as cash and any investments reasonably expected to be converted to cash in current market conditions in three business days or less without significantly changing the market value of the investment. Therefore, the Fund has not adopted a Highly Liquid Investment Minimum. The Fund's investments were below the limitation on illiquid investments during the review period. Additionally, Victory Capital indicated that no events occurred that would require the filing of Form N-LIQUID and recommended no material changes to the LRMP.
47
Privacy Policy
Protecting the Privacy of Information
The Trust respects your right to privacy. We also know that you expect us to conduct and process your business in an accurate and efficient manner. To do so, we must collect and maintain certain personal information about you. This is the information we collect from you on applications or other forms, and from the transactions you make with us or third parties. It may include your name, address, social security number, account transactions and balances, and information about investment goals and risk tolerance.
We do not disclose any information about you or about former customers to anyone except as permitted or required by law. Specifically, we may disclose the information we collect to companies that perform services on our behalf, such as the transfer agent that processes shareholder accounts and printers and mailers that assist us in the distribution of investor materials. We may also disclose this information to companies that perform marketing services on our behalf. This allows us to continue to offer you Victory investment products and services that meet your investing needs, and to effect transactions that you request or authorize. These companies will use this information only in connection with the services for which we hired them. They are not permitted to use or share this information for any other purpose.
To protect your personal information internally, we permit access only by authorized employees and maintain physical, electronic and procedural safeguards to guard your personal information.*
* You may have received communications regarding information about privacy policies from other financial institutions which gave you the opportunity to "opt-out" of certain information sharing with companies which are not affiliated with that financial institution. The Trust does not share information with other companies for purposes of marketing solicitations for products other than the Trust. Therefore, the Trust does not provide opt-out options to their shareholders.
P.O. Box 182593
Columbus, Ohio 43218-2593

Visit our website at: | Call | ||||||
vcm.com | (800) 235-8396 | ||||||
40860-05201

MARCH 31, 2021
Annual Report
USAA New York Bond Fund
As permitted by regulations adopted by the Securities and Exchange Commission, paper copies of the Fund's shareholder reports may no longer be sent by mail, unless you specifically request paper copies of the reports from the Fund or from your financial intermediary, such as a broker-dealer or bank. Instead, the reports will be made available on VictoryFunds.com, and you will be notified by mail each time a report is posted and provided with a website link to access the report. If you already elected to receive shareholder reports electronically, you will not be affected by this change and you need not take any action.
You may elect to receive shareholder reports and other communications from the Fund or your financial intermediary electronically by notifying your financial intermediary directly, or if you are a shareholder who has an account directly with the Fund, by calling (800) 235-8396 or by submitting your request via email to TA.Processing@FISGlobal.com.
You may elect to receive all future reports in paper form free of charge. You can inform the Fund or your financial intermediary that you wish to continue receiving paper copies of your shareholder reports by notifying your financial intermediary directly, or if you are a shareholder who has an account directly with the Fund, by calling (800) 235-8396 or by submitting your request via email to TA.Processing@FISGlobal.com. Your election to receive reports in paper will apply to all funds held with the USAA Mutual Funds or your financial intermediary.
Victory Capital means Victory Capital Management Inc., the investment adviser of the USAA Mutual Funds. USAA Mutual Funds are distributed by Victory Capital Services, Inc., member of FINRA, an affiliate of Victory Capital. Victory Capital and its affiliates are not affiliated with United Services Automobile Association or its affiliates. USAA and the USAA logos are registered trademarks and the USAA Mutual Funds and USAA Investments logos are trademarks of United Services Automobile Association and are being used by Victory Capital and its affiliates under license.
www.vcm.com
News, Information And Education 24 Hours A Day, 7 Days A Week
The Victory Funds site gives fund shareholders, prospective shareholders, and investment professionals a convenient way to access fund information, get guidance, and track fund performance anywhere they can access the Internet. The site includes:
• Detailed performance records
• Daily share prices
• The latest fund news
• Investment resources to help you become a better investor
• A section dedicated to investment professionals
Whether you're a potential investor searching for the fund that matches your investment philosophy, a seasoned investor interested in planning tools, or an investment professional, www.vcm.com has what you seek. Visit us anytime. We're always open.
USAA Mutual Funds Trust
TABLE OF CONTENTS
Shareholder Letter (Unaudited) | 2 | ||||||
Managers' Commentary (Unaudited) | 4 | ||||||
Investment Overview (Unaudited) | 7 | ||||||
| Investment Objective & Portfolio Holdings (Unaudited) | 8 | ||||||
Schedule of Portfolio Investments | 10 | ||||||
Financial Statements | |||||||
Statement of Assets and Liabilities | 16 | ||||||
Statement of Operations | 17 | ||||||
Statements of Changes in Net Assets | 18 | ||||||
Financial Highlights | 20 | ||||||
Notes to Financial Statements | 22 | ||||||
| Report of Independent Registered Public Accounting Firm | 32 | ||||||
Supplemental Information (Unaudited) | 33 | ||||||
Trustees' and Officers' Information | 33 | ||||||
Proxy Voting and Portfolio Holdings Information | 39 | ||||||
Expense Example | 39 | ||||||
Additional Federal Income Tax Information | 40 | ||||||
Advisory Contract Agreement | 41 | ||||||
Liquidity Risk Management Program | 44 | ||||||
Privacy Policy (inside back cover) | |||||||
This report is for the information of the shareholders and others who have received a copy of the currently effective prospectus of the Fund, managed by Victory Capital Management Inc. It may be used as sales literature only when preceded or accompanied by a current prospectus, which provides further details about the Fund.
IRA DISTRIBUTION WITHHOLDING DISCLOSURE
We generally must withhold federal income tax at a rate of 10% of the taxable portion of your distribution and, if you live in a state that requires state income tax withholding, at your state's tax rate. However, you may elect not to have withholding apply or to have income tax withheld at a higher rate. Any withholding election that you make will apply to any subsequent distribution unless and until you change or revoke the election. If you wish to make a withholding election, or change or revoke a prior withholding election, call (800) 235-8396, and form W-4P (OMB No. 1545-0074 withholding certificate for pension or annuity payments) will be electronically sent.
If you do not have a withholding election in place by the date of a distribution, federal income tax will be withheld from the taxable portion of your distribution at a rate of 10%. If you must pay estimated taxes, you may be subject to estimated tax penalties if your estimated tax payments are not sufficient and sufficient tax is not withheld from your distribution.
For more specific information, please consult your tax adviser.
1
(Unaudited)
Dear Shareholder,
The annual reporting period ended March 31, 2021, was a year like no other. It wasn't that long ago that we were all coming to grips with an emerging global pandemic, economic shutdowns, and financial markets in turmoil. We somehow persevered and have even emerged from those challenging days—dare I say—with a renewed sense of optimism. In retrospect, the trajectory of financial markets over the past year was nothing short of extraordinary.
Consider everything that transpired over the past 12 months. A novel coronavirus ("COVID-19") and the subsequent worldwide spread of COVID-19 prompted governments everywhere to issue austere shelter-in-place orders, and the global economy slowed abruptly. Equity markets sold off, while unprecedented levels of volatility roiled traditionally placid bond markets. During the second quarter of 2020, domestic GDP contracted by an alarming annual rate of 31.4%, according to the U.S. Department of Commerce ("Commerce Department").
It's no surprise that many investors flocked to the perceived safety of U.S. Treasurys during this period of tumult. Meanwhile, liquidity evaporated (for a short spell) in other segments of the fixed-income world, including higher-yielding credits and municipal bonds. The outlook was tenuous, and credit spreads widened while prices declined for most securities perceived to be higher risk.
Fortunately, a response came swiftly. The U.S. Federal Reserve (the "Fed") and other monetary authorities worldwide leapt into action—cutting interest rates, (re)starting quantitative easing and, in the case of the Fed, launching an array of programs to provide liquidity to stabilize fixed-income markets. The U.S. government also stepped up to provide fiscal stimulus in the form of the Coronavirus Aid, Relief, and Economic Security Act ("CARES Act").
It was impressive how quickly those actions helped arrest the stock market's freefall and restore order across much of the fixed-income universe. The rebound was as robust as the drawdown, and third quarter 2020 GDP bounced back and grew at a 33.4% annualized rate, according to the Commerce Department.
Late in the year, financial markets were alternately fueled and roiled by a contentious election season, growing optimism for an effective vaccine, and a fluid debate regarding the need for additional fiscal stimulus. Ultimately, stocks were propelled higher in the fourth quarter as it became clear Congress would provide another dose of stimulus in the form of direct payments, more unemployment insurance, and additional aid to businesses.
As the year ended and we moved into the first quarter of 2021, stocks continued their upward trajectory. Meanwhile, the yield on the 10-Year U.S. Treasury continued rallying sharply, and many investors began to worry about inflation in the post-pandemic world.
Through all the unprecedented events and volatility, the S&P 500® Index registered an impressive annual return of 56.35% for the 12-month period ended March 31, 2021. Over this same period, the yield on the 10-Year U.S. Treasury jumped more than 100 basis points, reflecting both the very low starting rate and substantial fiscal
2
stimulus. At the end of the reporting period, the yield on the 10-Year U.S. Treasury was 1.74%
On the whole, markets endured and surprised to the upside, but perhaps the key takeaway is that the unexpected can and will happen. That's why it's important to remain focused on your long-term investment goals and avoid making emotional decisions.
On the following pages, you will find information relating to your USAA Mutual Funds, brought to you by Victory Capital. If you have any questions regarding the current market dynamics or your specific portfolio or investment plan, we encourage you to contact our Member Service Representatives. Call (800) 235-8396, or visit our website at www.vcm.com.
Thank you for letting us help you work toward your investment goals.

Christopher K. Dyer, CFA
President,
USAA Mutual Funds Trust
3
USAA Mutual Funds Trust
USAA New York Bond Fund
Manager's Commentary
(Unaudited)
Regina G. Conklin, CFA, CPA
Andrew Hattman, CFA, CAIA
Lauren Spalten*
• What were the market conditions during the reporting period?
Tax-exempt bonds as measured by the Bloomberg Barclays Municipal Bond Index generated positive returns during the 12-month reporting period ended March 31, 2021, due in part to falling municipal bond yields. (Bond prices and yields move in opposite directions.) However, the market saw significant volatility during the reporting period due primarily to COVID-19 and related economic and government reactions.
The reporting period began near the beginning of the COVID-19 crisis in the United States. The market had just sold off sharply in March 2020, and the first month of the reporting period was highlighted by significant volatility as the market reacted to COVID-19 and subsequent economic shutdowns, but also substantial fiscal and monetary response from the federal government. Starting in May 2020, the municipal market began a long, uneven recovery for the rest of the calendar year, driven by significant government intervention and investor expectations of a future return to normalcy. The recovery was marked by sizeable fund flows into tax-exempt mutual funds and material tightening of credit spreads (the yield difference between riskier bond yields and the safest bond yields). The recovery took a slight pause in the months ahead of the election, as uncertainty surrounding the election, as well as uncertainty around aid for municipal borrowers weighed on the market for a couple of months. However, the year ended with the market up significantly from the start of both the calendar year and the reporting period. January of 2021 saw a continuation of the market recovery, but the last part of the reporting period was highlighted by a sell-off in the municipal market as tax-exempt bonds finally succumbed to pressures caused by the meaningful increase in U.S. Treasury yields in the first quarter of 2021.
The end of the reporting period found the municipal market fighting the headwinds of potential higher U.S. Treasury rates and inflation, but with several notable tailwinds in support to include: heavy fund flows into tax-exempt mutual funds, investor expectations of increasing tax rates, and stimulus money flowing to municipal borrowers.
• How did the USAA New York Bond Fund (the "Fund") perform during the reporting period?
The Fund has three share classes: Fund Shares, Institutional Shares, and Class A (effective June 29, 2020, the Adviser Shares were redesignated Class A and became subject to a front-end sales charge). For the reporting period ended March 31, 2021, the Fund Shares and Class A had a total return of 5.61% and 5.38%, respectively, versus an average return of 6.06% for the funds in the Lipper New York Municipal Debt Funds category. This compares to returns of 6.31% for the Lipper New York Municipal Debt Funds Index and 5.51% for the Bloomberg Barclays Municipal Bond Index. The Institutional Shares
*Effective March 2, 2021, Lauren Spalten was added as a portfolio manager on the Fund and John C. Bonnell was removed.
4
USAA Mutual Funds Trust
USAA New York Bond Fund (continued)
Manager's Commentary (continued)
commenced operations on June 29, 2020, and from that time through March 31, 2021, had a total return of 3.55%.
• What are the conditions in the state of New York?
New York State continues to struggle with challenges related to the COVID-19 pandemic. Nevertheless, GDP growth has improved while lagging the nation as a whole. Employment numbers are also trending higher but remain well below the pre-pandemic level. Importantly, the State's economic base is diverse and substantial including New York City, a center for world commerce and culture. Distribution of vaccines for COVID-19 are expected to aid the State's ability to reopen its economy in a more expeditious manner.
Financial management for the State has traditionally been sound with multi-year budgeting and quarterly plan updates. Although the pandemic has disrupted revenue sources and pressured expenditures, appropriate actions are expected to produce ongoing balanced operations. Sizable financial reserves provide additional strength. The Legislature recently approved a budget which is intended to maintain a satisfactory fiscal condition through the utilization of reserves, additional federal aid, the implementation of spending controls, and tax increases. It must be mentioned that vital public agencies, such as the Metropolitan Transportation Authority, may require a degree of State assistance to address pandemic related financial stress. The State continues to have an above average debt burden while pension obligations are well funded.
Ratings as of March 31, 2021, remain strong at Aa2 (stable outlook), by Moody's, AA+ (negative outlook) by Standard & Poor's, and a AA+ (negative outlook) by Fitch. Depending on the duration of the pandemic and the speed of the State's economic recovery, modest downward ratings pressure may continue, but overall credit quality will likely remain sound.
• What strategies did you employ during the reporting period?
In keeping with our investment approach, we continued to focus on income generation. The Fund's long-term income distribution, not its price appreciation, accounts for most of its total return.
Our commitment to independent credit research continued to help us identify attractive opportunities for the Fund. We employ fundamental analysis that emphasizes an issuer's ability and willingness to repay its debt. Through our credit research, we strive both to recognize relative value and to avoid potential pitfalls, which is especially important in volatile times like the present. As always, we worked with our in-house team of credit analysts to select investments for the Fund on a bond-by-bond basis. Our team continuously monitors all the holdings in the Fund's portfolio.
The Fund continues to hold a diversified portfolio of longer-term, primarily investment- grade municipal bonds. To limit exposure to an unexpected event, the Fund is diversified
5
USAA Mutual Funds Trust
USAA New York Bond Fund (continued)
Manager's Commentary (continued)
by sector, issuer, and geography. In addition, we avoid bonds subject to the federal alternative minimum tax for individuals.
Thank you for allowing us to assist you with your investment needs.
6
USAA Mutual Funds Trust
USAA New York Bond Fund
Investment Overview
(Unaudited)
Average Annual Total Return
Year Ended March 31, 2021
Fund Shares | Institutional Shares | Class A | |||||||||||||||||||||||||
INCEPTION DATE | 10/10/90 | 6/29/20 | 8/1/10 | ||||||||||||||||||||||||
Net Asset Value | Net Asset Value | Net Asset Value | Maximum Offering Price | Bloomberg Barclays Municipal Bond Index1 | Lipper New York Municipal Debt Funds Index2 | ||||||||||||||||||||||
One Year | 5.61 | % | NA | 5.38 | % | 3.02 | % | 5.51 | % | 6.31 | % | ||||||||||||||||
Five Year | 3.02 | % | NA | 2.77 | % | 2.31 | % | 3.49 | % | 3.57 | % | ||||||||||||||||
Ten Year | 4.50 | % | NA | 4.25 | % | 4.01 | % | 4.54 | % | 4.55 | % | ||||||||||||||||
Since Inception | NA | 3.55 | % | NA | NA | NA | NA | ||||||||||||||||||||
The performance data quoted represents past performance and current returns may be lower or higher. The investment return and principal value will fluctuate so that an investor's shares, when redeemed, may be worth more or less than the original cost. To obtain performance information current to the most recent month's end, please visit www.vcm.com.
Total return measures the price change in a share assuming the reinvestment of all net investment income and realized capital gain distributions, if any. The total returns quoted do not reflect adjustments made to the enclosed financial statements in accordance with U.S. Generally Accepted Accounting Principles or the deduction of taxes that a shareholder would pay on net investment income and realized capital gain distributions, including reinvested distributions, or redemptions of shares. The total return figures set forth above include all waivers of fees. Without such fee waivers, the total returns would have been lower.
USAA New York Bond Fund — Growth of $10,000
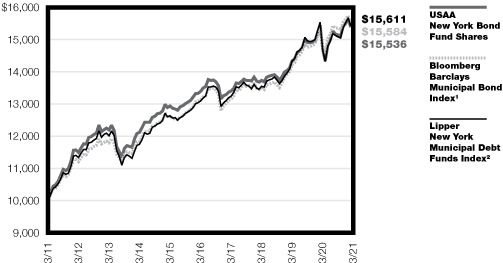
1 The unmanaged, broad-based Bloomberg Barclays Municipal Bond Index tracks total return performance for the long-term, investment-grade, tax-exempt bond market. This index does not include the effect of sales charges, commissions, expenses or taxes, is not representative of the Fund, and it is not possible to invest directly in an index.
2 The unmanaged Lipper New York Municipal Debt Funds Index measures the Fund's performance to that of the Lipper New York Municipal Debt Funds category. This index does not include the effect of sales charges, commissions, expenses or taxes, is not representative of the Fund, and it is not possible to invest directly in an index.
The graph reflects investment of growth of a hypothetical $10,000 investment in the Fund.
The graph and table do not reflect the deduction of taxes that a shareholder would pay on Fund distributions or the redemption of Fund shares.
Past performance is not indicative of future results.
7
| USAA Mutual Funds Trust USAA New York Bond Fund | March 31, 2021 | ||||||
(Unaudited)
Investment Objective & Portfolio Holdings:
The Fund's investment objective seeks to provide New York investors with a high level of current interest income that is exempt from federal income tax and New York State and New York City personal income taxes.
Top 10 Industries
March 31, 2021
(% of Net Assets)
Education | 24.0 | % | |||||
Special Assessment/Tax/Fee | 19.7 | % | |||||
Hospital | 14.2 | % | |||||
General Obligation | 7.5 | % | |||||
Escrowed Bonds | 7.5 | % | |||||
Multifamily Housing | 3.9 | % | |||||
Buildings | 3.8 | % | |||||
Nursing/CCRC | 3.4 | % | |||||
Electric/Gas Utility | 3.0 | % | |||||
Appropriated Debt | 2.2 | % | |||||
Refer to the Schedule of Portfolio Investments for a complete list of securities.
8
| USAA Mutual Funds Trust USAA New York Bond Fund | March 31, 2021 | ||||||
(Unaudited)
Portfolio Ratings Mix:
March 31, 2021
(% of Net Assets)
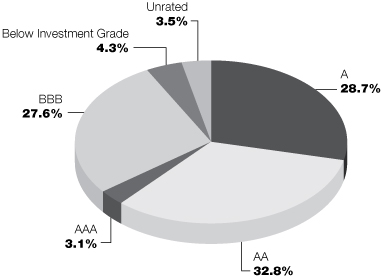
This chart reflects the highest long-term rating from a Nationally Recognized Statistical Rating Organization ("NRSRO"), with the four highest long-term credit ratings labeled, in descending order of credit quality, AAA, AA, A, and BBB. These categories represent investment-grade quality. NRSRO ratings are shown because they provide independent analysis of the credit quality of the Fund's investments. Victory Capital Management Inc. ("Adviser") also performs its own fundamental credit analysis of each security. As a part of its fundamental credit analysis, the Adviser considers various criteria, including industry specific actions, peer comparisons, payment ranking, and structure specific characteristics. Any of the Fund's securities that are not rated by an NRSRO appear in the chart above as "Unrated," but these securities are analyzed and monitored by the Adviser on an ongoing basis. Government securities that are issued or guaranteed as to principal and interest by the U.S. government and pre-refunded and escrowed-to-maturity municipal bonds that are not rated are treated as AAA for credit quality purposes.
9
| USAA Mutual Funds Trust USAA New York Bond Fund | Schedule of Portfolio Investments March 31, 2021 | ||||||
(Amounts in Thousands, Except for Shares)
| Security Description | Principal Amount or Units | Value | |||||||||
Other Equity Interests (0.2%) | |||||||||||
Utilities (0.2%): | |||||||||||
CMS Liquidating Trust (a) (b) (c) | 200 | $ | 442 | ||||||||
Total Other Equity Interests (Cost $499) | 442 | ||||||||||
Municipal Bonds (99.4%) | |||||||||||
New York (94.5%): | |||||||||||
| Albany Capital Resource Corp. Revenue, 5.00%, 6/1/49, Continuously Callable @100 | $ | 1,500 | 1,581 | ||||||||
| Albany County Airport Authority Revenue, Series A, 5.00%, 12/15/48, Continuously Callable @100 | 1,000 | 1,159 | |||||||||
| Brookhaven Local Development Corp. Revenue 5.25%, 11/1/36, Continuously Callable @100 | 1,500 | 1,682 | |||||||||
4.00%, 10/1/45, Continuously Callable @100 | 1,000 | 1,125 | |||||||||
Series B, 4.00%, 11/1/55, Continuously Callable @102 | 1,000 | 1,018 | |||||||||
| Buffalo & Erie County Industrial Land Development Corp. Revenue 6.00%, 10/1/31, Pre-refunded 4/1/21 @ 100 | 500 | 500 | |||||||||
5.00%, 6/1/35, Continuously Callable @103 | 1,000 | 1,122 | |||||||||
5.00%, 7/1/40, Continuously Callable @100 | 2,000 | 2,255 | |||||||||
5.00%, 8/1/52, Continuously Callable @100 | 1,000 | 1,075 | |||||||||
| Build NYC Resource Corp. Revenue 5.00%, 6/1/40, Continuously Callable @100 | 700 | 800 | |||||||||
5.00%, 8/1/40, Continuously Callable @100 | 1,000 | 1,117 | |||||||||
5.00%, 7/1/41, Continuously Callable @100 | 500 | 545 | |||||||||
5.00%, 8/1/42, Pre-refunded 8/1/22 @ 100 | 1,500 | 1,596 | |||||||||
4.00%, 8/1/42, Continuously Callable @100 | 1,000 | 1,102 | |||||||||
5.50%, 4/1/43, Continuously Callable @100 | 1,000 | 1,073 | |||||||||
5.00%, 7/1/45, Continuously Callable @100 | 2,000 | 2,262 | |||||||||
5.00%, 11/1/47 | 2,000 | 3,080 | |||||||||
5.00%, 6/1/48, Continuously Callable @102 | 2,000 | 2,183 | |||||||||
4.00%, 7/1/49, Continuously Callable @100 | 500 | 565 | |||||||||
City of Elmira, GO, 5.00%, 7/1/35, Continuously Callable @100 | 1,575 | 1,819 | |||||||||
| City of New York, GO 0.21%, 10/1/46, Continuously Callable @100 (d) | 3,300 | 3,300 | |||||||||
Series D-1, 4.00%, 12/1/43, Continuously Callable @100 (e) | 4,000 | 4,498 | |||||||||
| City of Newburgh, GO Series A, 5.00%, 6/15/23, Continuously Callable @100 | 825 | 870 | |||||||||
Series A, 5.00%, 6/15/24, Continuously Callable @100 | 870 | 920 | |||||||||
| City of Poughkeepsie, GO 2.50%, 4/29/22 (f) | 800 | 812 | |||||||||
4.00%, 4/15/27 (f) | 235 | 258 | |||||||||
4.00%, 4/15/28 (f) | 125 | 138 | |||||||||
4.00%, 4/15/29 (f) | 125 | 138 | |||||||||
4.00%, 4/15/30 (f) | 135 | 148 | |||||||||
5.00%, 6/1/31, Continuously Callable @100 | 600 | 663 | |||||||||
| City of Yonkers, GO (INS — Assured Guaranty Municipal Corp.) Series A, 5.00%, 10/1/24, Continuously Callable @100 | 1,000 | 1,024 | |||||||||
Series A, 3.00%, 7/1/25, Continuously Callable @100 | 665 | 704 | |||||||||
See notes to financial statements.
10
| USAA Mutual Funds Trust USAA New York Bond Fund | Schedule of Portfolio Investments — continued March 31, 2021 | ||||||
(Amounts in Thousands, Except for Shares)
Security Description | Principal Amount | Value | |||||||||
County of Nassau, GO, Series A, 5.00%, 1/1/38, Continuously Callable @100 | $ | 1,000 | $ | 1,162 | |||||||
| County of Nassau, GO (INS — Assured Guaranty Municipal Corp.), Series C, 5.00%, 4/1/38, Continuously Callable @100 | 1,000 | 1,084 | |||||||||
County of Rockland, GO, Series B, 5.00%, 12/15/21 | 600 | 620 | |||||||||
| Dutchess County Local Development Corp. Revenue 5.00%, 7/1/46, Continuously Callable @100 | 600 | 654 | |||||||||
Series A, 5.00%, 7/1/44, Pre-refunded 7/1/24 @ 100 | 1,000 | 1,151 | |||||||||
Series A, 5.00%, 7/1/45, Continuously Callable @100 | 2,000 | 2,281 | |||||||||
Series B, 4.00%, 7/1/41, Continuously Callable @100 | 2,000 | 2,158 | |||||||||
Series B, 4.00%, 7/1/49, Continuously Callable @100 | 1,750 | 1,960 | |||||||||
| Erie County Industrial Development Agency Revenue, Series A, 5.25%, 5/1/32, Continuously Callable @100 | 250 | 251 | |||||||||
| Hempstead Town Local Development Corp. Revenue 5.00%, 7/1/47, Continuously Callable @100 | 600 | 706 | |||||||||
5.00%, 7/1/48, Continuously Callable @100 | 300 | 337 | |||||||||
| Hudson Yards Infrastructure Corp. Revenue, Series A, 4.00%, 2/15/44, Continuously Callable @100 | 2,000 | 2,218 | |||||||||
| Jefferson County Civic Facility Development Corp. Revenue, 4.00%, 11/1/47, Continuously Callable @100 | 1,000 | 1,052 | |||||||||
| Long Island Power Authority Revenue Series A, 5.00%, 5/1/38, Pre-refunded 5/1/21 @ 100 | 2,000 | 2,007 | |||||||||
Series A, 5.00%, 9/1/44, Continuously Callable @100 | 2,000 | 2,277 | |||||||||
Series B, 5.00%, 9/1/41, Continuously Callable @100 | 1,000 | 1,192 | |||||||||
| Metropolitan Transportation Authority Revenue 0.55% (MUNIPSA+50bps), 11/15/42, (Put Date 3/1/22) (g) (h) | 1,000 | 996 | |||||||||
Series A, 5.25%, 11/15/38, Pre-refunded 11/15/21 @ 100 | 1,500 | 1,547 | |||||||||
Series A-1, 5.25%, 11/15/56, Continuously Callable @100 | 1,000 | 1,150 | |||||||||
Series B, 4.00%, 11/15/50, Continuously Callable @100 | 1,000 | 1,093 | |||||||||
Series D-1, 5.00%, 11/15/34, Continuously Callable @100 | 3,000 | 3,491 | |||||||||
Series D-2, 0.50% (MUNIPSA+45bps), 11/15/44, (Put Date 11/15/22) (g) (h) | 2,000 | 1,992 | |||||||||
Series D-3, 4.00%, 11/15/49, Continuously Callable @100 | 2,000 | 2,217 | |||||||||
| Monroe County Industrial Development Corp. Revenue 5.25%, 10/1/31, Pre-refunded 10/1/21 @ 100 | 500 | 512 | |||||||||
4.00%, 7/1/43, Continuously Callable @100 | 1,000 | 1,111 | |||||||||
5.00%, 12/1/46, Continuously Callable @100 | 1,000 | 1,147 | |||||||||
4.00%, 12/1/46, Continuously Callable @100 | 2,000 | 2,258 | |||||||||
4.00%, 10/1/47, Continuously Callable @100 | 1,000 | 1,035 | |||||||||
5.00%, 6/1/59, Continuously Callable @100 (i) | 1,000 | 1,149 | |||||||||
Series A, 5.00%, 12/1/37, Continuously Callable @100 | 1,000 | 1,068 | |||||||||
Series A, 5.00%, 12/1/42, Continuously Callable @100 | 2,000 | 2,131 | |||||||||
| Monroe County Industrial Development Corp. Revenue (INS — Assured Guaranty Municipal Corp.), 5.00%, 1/15/38, Continuously Callable @100 | 500 | 546 | |||||||||
| Nassau County Local Economic Assistance Corp. Revenue, 5.00%, 7/1/37, Pre-refunded 7/1/22 @ 100 | 1,000 | 1,060 | |||||||||
| New York City Housing Development Corp. Revenue, Series K, 4.20%, 11/1/58, Continuously Callable @100 | 3,000 | 3,234 | |||||||||
| New York City Industrial Development Agency Revenue, 4.00%, 3/1/45, Continuously Callable @100 | 1,005 | 1,130 | |||||||||
| New York City Industrial Development Agency Revenue (INS — Assured Guaranty Municipal Corp.), 2.25%, 10/1/29 | 1,325 | 1,365 | |||||||||
See notes to financial statements.
11
| USAA Mutual Funds Trust USAA New York Bond Fund | Schedule of Portfolio Investments — continued March 31, 2021 | ||||||
(Amounts in Thousands, Except for Shares)
Security Description | Principal Amount | Value | |||||||||
| New York City Transitional Finance Authority Building Aid Revenue Series S, 5.00%, 7/15/43, Continuously Callable @100 | $ | 1,250 | $ | 1,442 | |||||||
Series S, 4.00%, 7/15/45, Continuously Callable @100 | 2,000 | 2,244 | |||||||||
| New York City Transitional Finance Authority Future Tax Secured Revenue 4.00%, 8/1/41, Continuously Callable @100 | 1,000 | 1,136 | |||||||||
4.00%, 11/1/42, Continuously Callable @100 | 2,000 | 2,280 | |||||||||
Series B, 4.00%, 8/1/41, Continuously Callable @100 | 1,000 | 1,105 | |||||||||
Series B-1, 4.00%, 11/1/45, Continuously Callable @100 | 2,000 | 2,264 | |||||||||
| New York City Trust for Cultural Resources Revenue 5.00%, 8/1/43, Pre-refunded 8/1/23 @ 100 | 1,000 | 1,111 | |||||||||
4.00%, 7/1/46, Continuously Callable @100 | 1,000 | 1,038 | |||||||||
Series A, 4.00%, 12/1/35, Continuously Callable @100 | 1,000 | 1,176 | |||||||||
| New York Convention Center Development Corp. Revenue 5.00%, 11/15/45, Continuously Callable @100 | 500 | 562 | |||||||||
Series S, 11/15/37 (j) | 1,000 | 634 | |||||||||
| New York Convention Center Development Corp. Revenue (INS — Assured Guaranty Municipal Corp.), Series B, 2.97%, 11/15/48 | 2,000 | 886 | |||||||||
| New York Counties Tobacco Trust VI Revenue, 5.00%, 6/1/45, Continuously Callable @100 | 500 | 532 | |||||||||
| New York Liberty Development Corp. Revenue 5.25%, 10/1/35 | 2,500 | 3,498 | |||||||||
5.50%, 10/1/37 | 560 | 819 | |||||||||
5.00%, 11/15/44, Continuously Callable @100 (i) | 1,000 | 1,092 | |||||||||
2.80%, 9/15/69, Continuously Callable @100 | 3,000 | 2,903 | |||||||||
| New York State Dormitory Authority Revenue 5.00%, 7/1/34, Continuously Callable @100 | 500 | 566 | |||||||||
5.00%, 12/1/37, Continuously Callable @100 (i) | 1,300 | 1,498 | |||||||||
4.00%, 8/1/38, Continuously Callable @100 | 4,000 | 4,480 | |||||||||
6.00%, 7/1/40, Continuously Callable @100 (c) (i) | 3,000 | 2,987 | |||||||||
5.00%, 7/1/42, Continuously Callable @100 | 250 | 259 | |||||||||
5.00%, 5/1/43, Continuously Callable @100 | 1,000 | 1,142 | |||||||||
5.75%, 7/1/43, Continuously Callable @100 | 1,000 | 1,075 | |||||||||
3.50%, 7/1/44, Continuously Callable @100 | 1,000 | 1,065 | |||||||||
4.00%, 7/1/45, Continuously Callable @100 | 2,000 | 2,210 | |||||||||
5.00%, 7/1/51, Continuously Callable @100 | 725 | 817 | |||||||||
Series A, 5.00%, 7/1/31, Pre-refunded 7/1/21 @ 100 | 1,000 | 1,012 | |||||||||
Series A, 5.00%, 5/1/38, Continuously Callable @100 | 500 | 534 | |||||||||
Series A, 5.00%, 5/1/41, Pre-refunded 5/1/21 @ 100 | 2,000 | 2,007 | |||||||||
Series A, 4.00%, 7/1/41, Continuously Callable @100 | 1,000 | 1,124 | |||||||||
Series A, 4.00%, 7/1/43, Continuously Callable @100 | 2,000 | 2,133 | |||||||||
Series A, 5.00%, 7/1/44, Continuously Callable @100 | 1,500 | 1,634 | |||||||||
Series A, 4.00%, 7/1/45, Continuously Callable @100 | 2,250 | 2,594 | |||||||||
Series A, 4.00%, 3/15/47, Continuously Callable @100 | 4,000 | 4,595 | |||||||||
Series A, 4.00%, 3/15/48, Continuously Callable @100 | 3,000 | 3,290 | |||||||||
Series A, 5.00%, 7/1/48, Continuously Callable @100 | 1,000 | 1,208 | |||||||||
Series A, 4.00%, 3/15/49, Continuously Callable @100 | 1,500 | 1,674 | |||||||||
Series A, 4.00%, 7/1/49, Continuously Callable @100 | 1,000 | 1,136 | |||||||||
Series A, 4.00%, 9/1/50, Continuously Callable @100 | 500 | 557 | |||||||||
Series A, 4.00%, 7/1/53, Continuously Callable @100 | 500 | 567 | |||||||||
Series A-1, 4.00%, 7/1/45, Continuously Callable @100 | 3,000 | 3,274 | |||||||||
See notes to financial statements.
12
| USAA Mutual Funds Trust USAA New York Bond Fund | Schedule of Portfolio Investments — continued March 31, 2021 | ||||||
(Amounts in Thousands, Except for Shares)
Security Description | Principal Amount | Value | |||||||||
Series C, 4.00%, 7/1/47, Continuously Callable @100 | $ | 1,000 | $ | 1,107 | |||||||
Series D, 5.00%, 5/1/39, Continuously Callable @100 | 500 | 523 | |||||||||
| New York State Dormitory Authority Revenue (INS — AMBAC Assurance Corp.), Series A, 5.50%, 5/15/30 (e) | 3,275 | 4,444 | |||||||||
| New York State Dormitory Authority Revenue (INS — Assured Guaranty Municipal Corp.), 5.63%, 11/1/32, Pre-refunded 5/1/21 @ 100 | 500 | 502 | |||||||||
| New York State Dormitory Authority Revenue (INS-AMBAC Assurance Corp.), Series 1, 5.50%, 7/1/40 | 2,000 | 2,926 | |||||||||
| New York State Dormitory Authority Revenue (NBGA — State of New York Mortgage Agency), 5.00%, 6/1/33, Continuously Callable @100 | 2,320 | 2,329 | |||||||||
| New York State Environmental Facilities Corp. Revenue, 4.00%, 8/15/46, Continuously Callable @100 | 1,000 | 1,110 | |||||||||
| New York State Housing Finance Agency Revenue (LIQ — Deutsche Bank A.G.), Series DBE-DBE-8073, 0.58%, 8/1/50, Continuously Callable @100 (d) (i) | 1,000 | 1,000 | |||||||||
| New York State Thruway Authority Revenue Series A, 4.00%, 1/1/56, Continuously Callable @100 | 1,000 | 1,069 | |||||||||
Series B, 4.00%, 1/1/53, Continuously Callable @100 | 1,000 | 1,124 | |||||||||
| New York State Urban Development Corp. Revenue, 5.00%, 3/15/42, Continuously Callable @100 | 3,000 | 3,650 | |||||||||
| Niagara Tobacco Asset Securitization Corp. Revenue, 5.25%, 5/15/40, Continuously Callable @100 | 750 | 812 | |||||||||
| Oneida County Local Development Corp. Revenue, 4.00%, 7/1/39, Continuously Callable @100 | 750 | 789 | |||||||||
| Onondaga Civic Development Corp. Revenue 4.00%, 7/1/40, Continuously Callable @100 | 300 | 331 | |||||||||
5.00%, 10/1/40, Continuously Callable @100 | 1,000 | 1,003 | |||||||||
5.00%, 7/1/42, Continuously Callable @100 | 1,000 | 1,044 | |||||||||
5.00%, 1/1/43, Continuously Callable @100 | 740 | 845 | |||||||||
| Onondaga County Trust for Cultural Resources Revenue 5.00%, 12/1/36, Pre-refunded 12/1/21 @ 100 | 1,000 | 1,032 | |||||||||
5.00%, 5/1/40, Continuously Callable @100 | 800 | 874 | |||||||||
| Southold Local Development Corp. Revenue, 5.00%, 12/1/45, Continuously Callable @100 | 1,000 | 1,047 | |||||||||
| St. Lawrence County Industrial Development Agency Revenue 4.00%, 7/1/43, Continuously Callable @100 | 500 | 548 | |||||||||
5.00%, 9/1/47, Continuously Callable @100 | 1,770 | 1,957 | |||||||||
| State of New York Mortgage Agency Revenue, Series 211, 3.80%, 10/1/48, Continuously Callable @100 | 1,955 | 2,122 | |||||||||
| Suffolk County Economic Development Corp. Revenue 5.00%, 7/1/28, Pre-refunded 7/1/21 @ 100 | 220 | 223 | |||||||||
5.00%, 7/1/28, Continuously Callable @100 | 1,280 | 1,294 | |||||||||
Series C, 5.00%, 7/1/33, Continuously Callable @100 | 250 | 282 | |||||||||
| Suffolk Tobacco Asset Securitization Corp. Revenue, Series B, 5.00%, 6/1/32, Continuously Callable @100 | 1,450 | 1,494 | |||||||||
| Tompkins County Development Corp. Revenue, 5.00%, 7/1/44, Continuously Callable @100 | 1,375 | 1,483 | |||||||||
Triborough Bridge & Tunnel Authority Revenue, Series B, 11/15/32 (j) | 1,000 | 807 | |||||||||
TSASC, Inc. Revenue, Series A, 5.00%, 6/1/41, Continuously Callable @100 | 1,000 | 1,158 | |||||||||
| Westchester County Healthcare Corp. Revenue, Series B, 6.00%, 11/1/30, Continuously Callable @100 | 130 | 131 | |||||||||
See notes to financial statements.
13
| USAA Mutual Funds Trust USAA New York Bond Fund | Schedule of Portfolio Investments — continued March 31, 2021 | ||||||
(Amounts in Thousands, Except for Shares)
Security Description | Principal Amount | Value | |||||||||
| Westchester County Local Development Corp. Revenue 5.00%, 1/1/34, Continuously Callable @100 | $ | 1,500 | $ | 1,571 | |||||||
5.00%, 7/1/42, Continuously Callable @104 | 450 | 502 | |||||||||
5.00%, 11/1/46, Continuously Callable @100 | 1,000 | 1,125 | |||||||||
5.00%, 6/1/47, Continuously Callable @100 | 1,000 | 1,070 | |||||||||
| Westchester Tobacco Asset Securitization Revenue, Series B, 5.00%, 6/1/41, Continuously Callable @100 | 500 | 593 | |||||||||
204,555 | |||||||||||
Guam (4.2%): | |||||||||||
| Antonio B. Won Pat International Airport Authority Revenue (INS — Assured Guaranty Municipal Corp.), Series B, 5.75%, 10/1/43, Continuously Callable @100 | 1,000 | 1,112 | |||||||||
| Guam Government Waterworks Authority Revenue 5.50%, 7/1/43, Pre-refunded 7/1/23 @ 100 | 1,000 | 1,113 | |||||||||
Series A, 5.00%, 7/1/29, Continuously Callable @100 | 1,000 | 1,121 | |||||||||
Series A, 5.00%, 7/1/35, Continuously Callable @100 | 500 | 554 | |||||||||
| Guam Power Authority Revenue, Series A, 5.00%, 10/1/37, Continuously Callable @100 | 1,165 | 1,346 | |||||||||
| Guam Power Authority Revenue (INS — Assured Guaranty Municipal Corp.) Series A, 5.00%, 10/1/30, Continuously Callable @100 | 1,000 | 1,059 | |||||||||
Series A, 5.00%, 10/1/39, Continuously Callable @100 | 500 | 559 | |||||||||
| Territory of Guam Revenue Series A, 5.00%, 12/1/46, Continuously Callable @100 | 500 | 559 | |||||||||
Series B, 5.00%, 1/1/37, Continuously Callable @100 | 500 | 510 | |||||||||
Series D, 5.00%, 11/15/39, Continuously Callable @100 | 1,000 | 1,109 | |||||||||
9,042 | |||||||||||
Puerto Rico (0.7%): | |||||||||||
| Puerto Rico Industrial Tourist Educational Medical & Environmental Control Facilities Financing Authority Revenue, 5.13%, 4/1/32, Continuously Callable @100 | 1,390 | 1,408 | |||||||||
Total Municipal Bonds (Cost $201,634) | 215,005 | ||||||||||
Total Investments (Cost $202,133) — 99.6% | 215,447 | ||||||||||
Other assets in excess of liabilities — 0.4% | 971 | ||||||||||
NET ASSETS — 100.00% | $ | 216,418 | |||||||||
(a) Non-income producing security.
(b) Security was fair valued based upon procedures approved by the Board of Trustees and represents 0.2% of the Fund's net assets as of March 31, 2021. This security is classified as Level 3 within the fair value hierarchy. (See Note 2 in the Notes to Financial Statements)
(c) The Fund's Adviser has deemed this security to be illiquid based upon procedures approved by the Board of Trustees. As of March 31, 2021, illiquid securities were 1.6% of the Fund's net assets.
(d) Variable Rate Demand Notes that provide the rights to sell the security at face value on either that day or within the rate-reset period. The interest rate is reset on the put date at a stipulated daily, weekly, monthly, quarterly, or other specified time interval to reflect current market conditions. These securities do not indicate a reference rate and spread in their description.
See notes to financial statements.
14
| USAA Mutual Funds Trust USAA New York Bond Fund | Schedule of Portfolio Investments — continued March 31, 2021 | ||||||
(e) All or a portion of this security has been segregated as collateral for securities purchased on a when-issued basis.
(f) Security or portion of security purchased on a delayed-delivery and/or when-issued basis.
(g) Put Bond.
(h) Variable or Floating-Rate Security. Rate disclosed is as of March 31, 2021.
(i) Rule 144A security or other security that is restricted as to resale to institutional investors. The Fund's Adviser has deemed this security to be liquid based upon procedures approved by the Board of Trustees. As of March 31, 2021, the fair value of these securities was $7,726 (thousands) and amounted to 3.6% of net assets.
(j) Zero-coupon bond.
AMBAC — American Municipal Bond Assurance Corporation
bps — Basis points
Continuously callable — Investment is continuously callable or will be continuously callable on any date after the first call date until its maturity.
GO — General Obligation
MUNIPSA — Municipal Swap Index
Credit Enhancements — Adds the financial strength of the provider of the enhancement to support the issuer's ability to repay the principal and interest payments when due. The enhancement may be provided by a high-quality bank, insurance company or other corporation, or a collateral trust. The enhancements do not guarantee the market values of the securities.
INS Principal and interest payments are insured by the name listed. Although bond insurance reduces the risk of loss due to default by an issuer, such bonds remain subject to the risk that value may fluctuate for other reasons, and there is no assurance that the insurance company will meet its obligations.
LIQ Liquidity enhancement that may, under certain circumstances, provide for repayment of principal and interest upon demand from the name listed.
NBGA Principal and interest payments or, under certain circumstances, underlying mortgages are guaranteed by a nonbank guarantee agreement from one of the name listed.
See notes to financial statements.
15
USAA Mutual Funds Trust | Statement of Assets and Liabilities March 31, 2021 | ||||||
(Amounts in Thousands, Except Per Share Amounts)
| USAA New York Bond Fund | |||||||
Assets: | |||||||
Investments, at value (Cost $202,133) | $ | 215,447 | |||||
Cash | 224 | ||||||
Receivables: | |||||||
Interest | 2,474 | ||||||
Capital shares issued | 80 | ||||||
From Adviser | 1 | ||||||
Prepaid expenses and other assets | 5 | ||||||
Total assets | 218,231 | ||||||
Liabilities: | |||||||
Payables: | |||||||
Distributions | 94 | ||||||
Investments purchased | 1,490 | ||||||
Capital shares redeemed | 82 | ||||||
Accrued expenses and other payables: | |||||||
Investment advisory fees | 60 | ||||||
Administration fees | 27 | ||||||
Custodian fees | 1 | ||||||
Transfer agent fees | 9 | ||||||
Compliance fees | — | (a) | |||||
Trustees' fees | — | (a) | |||||
| 12b-1 fees | 1 | ||||||
Other accrued expenses | 49 | ||||||
Total liabilities | 1,813 | ||||||
Net Assets: | |||||||
Capital | 206,626 | ||||||
Total accumulated earnings/(loss) | 9,792 | ||||||
Net assets | $ | 216,418 | |||||
Net Assets | |||||||
Fund Shares | $ | 207,085 | |||||
Institutional Shares | 2,958 | ||||||
Class A | 6,375 | ||||||
Total | $ | 216,418 | |||||
Shares (unlimited number of shares authorized with no par value): | |||||||
Fund Shares | 17,103 | ||||||
Institutional Shares | 244 | ||||||
Class A | 528 | ||||||
Total | 17,875 | ||||||
Net asset value, offering and redemption price per share: (b) | |||||||
Fund Shares | $ | 12.11 | |||||
Institutional Shares | $ | 12.10 | |||||
Class A | $ | 12.08 | |||||
Maximum Sales Charge — Class A | 2.25 | % | |||||
| Maximum offering price (100%/(100%-maximum sales charge) of net asset value adjusted to the nearest cent) per share — Class A | $ | 12.36 | |||||
(a) Rounds to less than $1 thousand.
(b) Per share amount may not recalculate due to rounding of net assets and/or shares outstanding.
See notes to financial statements.
16
USAA Mutual Funds Trust | Statement of Operations For the Year Ended March 31, 2021 | ||||||
(Amounts in Thousands)
| USAA New York Bond Fund | |||||||
Investment Income: | |||||||
Interest | $ | 7,665 | |||||
Total income | 7,665 | ||||||
Expenses: | |||||||
Investment advisory fees | 831 | ||||||
Administration fees — Fund Shares | 313 | ||||||
Administration fees — Institutional Shares (a) | 2 | ||||||
Administration fees — Class A | 10 | ||||||
Sub-Administration fees | 20 | ||||||
| 12b-1 fees — Class A | 16 | ||||||
Custodian fees | 4 | ||||||
Transfer agent fees — Fund Shares | 55 | ||||||
Transfer agent fees — Institutional Shares (a) | 2 | ||||||
Transfer agent fees — Class A | 5 | ||||||
Trustees' fees | 51 | ||||||
Compliance fees | 1 | ||||||
Legal and audit fees | 79 | ||||||
State registration and filing fees | 4 | ||||||
Other expenses | 51 | ||||||
Total expenses | 1,444 | ||||||
Expenses waived/reimbursed by Adviser | (7 | ) | |||||
Net expenses | 1,437 | ||||||
Net Investment Income (Loss) | 6,228 | ||||||
Realized/Unrealized Gains (Losses) from Investments: | |||||||
Net realized gains (losses) from investment securities | (460 | ) | |||||
Net change in unrealized appreciation/depreciation on investment securities | 5,952 | ||||||
Net realized/unrealized gains (losses) on investments | 5,492 | ||||||
Change in net assets resulting from operations | $ | 11,720 | |||||
(a) Institutional Shares commenced operations on June 29, 2020.
See notes to financial statements.
17
USAA Mutual Funds Trust | Statements of Changes in Net Assets | ||||||
(Amounts in Thousands)
| USAA New York Bond Fund | |||||||||||
| Year Ended March 31, 2021 | Year Ended March 31, 2020 | ||||||||||
From Investments: | |||||||||||
Operations: | |||||||||||
Net investment income (loss) | $ | 6,228 | $ | 7,298 | |||||||
Net realized gains (losses) from investments | (460 | ) | 274 | ||||||||
| Net change in unrealized appreciation/depreciation on investments | 5,952 | (1,752 | ) | ||||||||
Change in net assets resulting from operations | 11,720 | 5,820 | |||||||||
Distributions to Shareholders: | |||||||||||
Fund Shares | (5,993 | ) | (7,103 | ) | |||||||
Institutional Shares (a) | (55 | ) | — | ||||||||
Class A | (172 | ) | (195 | ) | |||||||
Change in net assets resulting from distributions to shareholders | (6,220 | ) | (7,298 | ) | |||||||
Change in net assets resulting from capital transactions | (13,646 | ) | (7,226 | ) | |||||||
Change in net assets | (8,146 | ) | (8,704 | ) | |||||||
Net Assets: | |||||||||||
Beginning of period | 224,564 | 233,268 | |||||||||
End of period | $ | 216,418 | $ | 224,564 | |||||||
(a) Institutional Shares commenced operations on June 29, 2020.
(continues on next page)
See notes to financial statements.
18
USAA Mutual Funds Trust | Statements of Changes in Net Assets | ||||||
(Amounts in Thousands) (continued)
| USAA New York Bond Fund | |||||||||||
| Year Ended March 31, 2021 | Year Ended March 31, 2020 | ||||||||||
Capital Transactions: | |||||||||||
Fund Shares | |||||||||||
Proceeds from shares issued | $ | 20,168 | $ | 24,913 | |||||||
Distributions reinvested | 4,938 | 5,877 | |||||||||
Cost of shares redeemed | (41,447 | ) | (38,234 | ) | |||||||
Total Fund Shares | $ | (16,341 | ) | $ | (7,444 | ) | |||||
Institutional Shares (a) | |||||||||||
Proceeds from shares issued | $ | 3,777 | $ | — | |||||||
Distributions reinvested | 55 | — | |||||||||
Cost of shares redeemed | (874 | ) | — | ||||||||
Total Institutional Shares | $ | 2,958 | $ | — | |||||||
Class A | |||||||||||
Proceeds from shares issued | $ | 6,686 | $ | 301 | |||||||
Distributions reinvested | 46 | 34 | |||||||||
Cost of shares redeemed | (6,995 | ) | (117 | ) | |||||||
Total Class A | $ | (263 | ) | $ | 218 | ||||||
Change in net assets resulting from capital transactions | $ | (13,646 | ) | $ | (7,226 | ) | |||||
Share Transactions: | |||||||||||
Fund Shares | |||||||||||
Issued | 1,681 | 2,067 | |||||||||
Reinvested | 412 | 486 | |||||||||
Redeemed | (3,474 | ) | (3,186 | ) | |||||||
Total Fund Shares | (1,381 | ) | (633 | ) | |||||||
Institutional Shares (a) | |||||||||||
Issued | 312 | — | |||||||||
Reinvested | 5 | — | |||||||||
Redeemed | (73 | ) | — | ||||||||
Total Institutional Shares | 244 | — | |||||||||
Class A | |||||||||||
Issued | 561 | 25 | |||||||||
Reinvested | 4 | 3 | |||||||||
Redeemed | (587 | ) | (10 | ) | |||||||
Total Class A | (22 | ) | 18 | ||||||||
Change in Shares | (1,159 | ) | (615 | ) | |||||||
(a) Institutional Shares commenced operations on June 29, 2020.
See notes to financial statements.
19
USAA Mutual Funds Trust | Financial Highlights | ||||||
For a Share Outstanding Throughout Each Period
Investment Activities | Distributions to Shareholders From | ||||||||||||||||||||||||||
| Net Asset Value, Beginning of Period | Net Investment Income (Loss) | Net Realized and Unrealized Gains (Losses) on Investments | Total from Investment Activities | Net Investment Income | Total Distributions | ||||||||||||||||||||||
USAA New York Bond Fund | |||||||||||||||||||||||||||
Fund Shares | |||||||||||||||||||||||||||
| Year Ended March 31, 2021 | $ | 11.80 | 0.34 | (e) | 0.31 | 0.65 | (0.34 | ) | (0.34 | ) | |||||||||||||||||
| Year Ended March 31, 2020 | $ | 11.87 | 0.38 | (e) | (0.07 | ) | 0.31 | (0.38 | ) | (0.38 | ) | ||||||||||||||||
| Year Ended March 31, 2019 | $ | 11.76 | 0.40 | 0.11 | 0.51 | (0.40 | ) | (0.40 | ) | ||||||||||||||||||
| Year Ended March 31, 2018 | $ | 11.88 | 0.41 | (0.12 | ) | 0.29 | (0.41 | ) | (0.41 | ) | |||||||||||||||||
| Year Ended March 31, 2017 | $ | 12.28 | 0.42 | (0.41 | ) | 0.01 | (0.41 | ) | (0.41 | ) | |||||||||||||||||
Institutional Shares | |||||||||||||||||||||||||||
| June 29, 2020 (f) through March 31, 2021 | $ | 11.94 | 0.26 | (e) | 0.16 | 0.42 | (0.26 | ) | (0.26 | ) | |||||||||||||||||
Class A | |||||||||||||||||||||||||||
| Year Ended March 31, 2021 | $ | 11.77 | 0.32 | (e) | 0.31 | 0.63 | (0.32 | ) | (0.32 | ) | |||||||||||||||||
| Year Ended March 31, 2020 | $ | 11.84 | 0.35 | (e) | (0.07 | ) | 0.28 | (0.35 | ) | (0.35 | ) | ||||||||||||||||
| Year Ended March 31, 2019 | $ | 11.73 | 0.37 | 0.11 | 0.48 | (0.37 | ) | (0.37 | ) | ||||||||||||||||||
| Year Ended March 31, 2018 | $ | 11.85 | 0.38 | (0.12 | ) | 0.26 | (0.38 | ) | (0.38 | ) | |||||||||||||||||
| Year Ended March 31, 2017 | $ | 12.25 | 0.39 | (0.40 | ) | (0.01 | ) | (0.39 | ) | (0.39 | ) | ||||||||||||||||
* Assumes reinvestment of all net investment income and realized capital gain distributions, if any, during the period. Includes adjustments in accordance with U.S. Generally Accepted Accounting Principles and could differ from the Lipper reported return.
** For the period beginning July 1, 2019, the amount of any waivers or reimbursements and the amount of any recoupment is calculated without regard to the impact of any performance adjustment to the Fund's management fee.
^ The net expense ratio may not correlate to the applicable expense limits in place during the period since the current contractual expense limitation is applied for a period beginning July 1, 2019, and in effect through June 30, 2023, instead of coinciding with the Fund's fiscal year end. Details of the current contractual expense limitation in effect can be found in Note 4 of the accompanying Notes to Financial Statements.
(a) Not annualized for periods less than one year.
(b) Annualized for periods less than one year.
(c) Reflects total annual operating expenses for reductions of expenses paid indirectly for the March 31 fiscal year ended 2017. Expenses paid indirectly decreased the expense ratio by less than 0.01%.
(d) Portfolio turnover is calculated on the basis of the Fund as a whole without distinguishing between the classes of shares issued.
(e) Per share net investment income (loss) has been calculated using the average daily shares method.
(f) Commencement of operations.
See notes to financial statements.
20
USAA Mutual Funds Trust | Financial Highlights — continued | ||||||
For a Share Outstanding Throughout Each Period
Ratios to Average Net Assets | Supplemental Data | ||||||||||||||||||||||||||||||
| Net Asset Value, End of Period | Total Return (Excludes Sales Charge)*(a) | Net Expenses**^(b)(c) | Net Investment Income (Loss)(b) | Gross Expenses(b)(c) | Net Assets, End of Period (000's) | Portfolio Turnover(a)(d) | |||||||||||||||||||||||||
USAA New York Bond Fund | |||||||||||||||||||||||||||||||
Fund Shares | |||||||||||||||||||||||||||||||
| Year Ended March 31, 2021 | $ | 12.11 | 5.61 | % | 0.66 | % | 2.87 | % | 0.66 | % | $ | 207,085 | 19 | % | |||||||||||||||||
| Year Ended March 31, 2020 | $ | 11.80 | 2.60 | % | 0.61 | % | 3.17 | % | 0.61 | % | $ | 218,096 | 18 | % | |||||||||||||||||
| Year Ended March 31, 2019 | $ | 11.87 | 4.41 | % | 0.60 | % | 3.39 | % | 0.60 | % | $ | 226,973 | 15 | % | |||||||||||||||||
| Year Ended March 31, 2018 | $ | 11.76 | 2.45 | % | 0.59 | % | 3.43 | % | 0.59 | % | $ | 216,090 | 6 | % | |||||||||||||||||
| Year Ended March 31, 2017 | $ | 11.88 | 0.10 | % | 0.61 | % | 3.41 | % | 0.61 | % | $ | 208,513 | 10 | % | |||||||||||||||||
Institutional Shares | |||||||||||||||||||||||||||||||
| June 29, 2020 (f) through March 31, 2021 | $ | 12.10 | 3.55 | % | 0.61 | % | 2.86 | % | 0.77 | % | $ | 2,958 | 19 | % | |||||||||||||||||
Class A | |||||||||||||||||||||||||||||||
| Year Ended March 31, 2021 | $ | 12.08 | 5.38 | % | 0.89 | % | 2.65 | % | 0.96 | % | $ | 6,375 | 19 | % | |||||||||||||||||
| Year Ended March 31, 2020 | $ | 11.77 | 2.36 | % | 0.85 | % | 2.93 | % | 0.85 | % | $ | 6,468 | 18 | % | |||||||||||||||||
| Year Ended March 31, 2019 | $ | 11.84 | 4.16 | % | 0.85 | % | 3.15 | % | 0.85 | % | $ | 6,295 | 15 | % | |||||||||||||||||
| Year Ended March 31, 2018 | $ | 11.73 | 2.19 | % | 0.84 | % | 3.18 | % | 0.84 | % | $ | 5,971 | 6 | % | |||||||||||||||||
| Year Ended March 31, 2017 | $ | 11.85 | (0.13 | )% | 0.83 | % | 3.19 | % | 0.83 | % | $ | 6,302 | 10 | % | |||||||||||||||||
See notes to financial statements.
21
USAA Mutual Funds Trust | Notes to Financial Statements March 31, 2021 | ||||||
1. Organization:
USAA Mutual Funds Trust (the "Trust") is organized as a Delaware statutory trust and is registered under the Investment Company Act of 1940, as amended (the "1940 Act"), as an open-end investment company. The Trust is comprised of 46 funds and is authorized to issue an unlimited number of shares, which are units of beneficial interest with no par value.
The accompanying financial statements are those of the USAA New York Bond Fund (the "Fund"). The Fund offers three classes of shares: Fund Shares, Institutional Shares, and Class A. The Fund is classified as diversified under the 1940 Act.
Effective June 29, 2020, the Fund's Institutional Shares commenced operations and the Adviser Shares were redesignated Class A shares and became subject to a front-end sales charge.
Each class of shares of the Fund has substantially identical rights and privileges, except with respect to sales charges, fees paid under distribution plans, expenses allocable exclusively to each class of shares, voting rights on matters solely affecting a single class of shares, and the exchange privilege of each class of shares.
Under the Trust's organizational documents, its officers and trustees are indemnified against certain liabilities arising out of the performance of their duties to the Fund. In addition, in the normal course of business, the Fund enters into contracts with its vendors and others that provide for general indemnifications. The Fund's maximum exposure under these arrangements is unknown, as this would involve future claims that may be made against the Fund. However, based on experience, the Fund expects that risk of loss to be remote.
2. Significant Accounting Policies:
The following is a summary of significant accounting policies followed by the Trust in the preparation of its financial statements. The policies are in conformity with Generally Accepted Accounting Principles in the United States of America ("GAAP"). The preparation of financial statements in accordance with GAAP requires management to make estimates and assumptions that affect the reported amounts of assets and liabilities and disclosure of contingent assets and liabilities at the date of the financial statements and the reported amounts of income and expenses for the period. Actual results could differ from those estimates. The Fund follows the specialized accounting and reporting requirements under GAAP that are applicable to investment companies under Accounting Standards Codification Topic 946.
Investment Valuation:
The Fund records investments at fair value. Fair value is defined as the price that would be received to sell an asset or paid to transfer a liability in an orderly transaction between market participants at the measurement date.
The valuation techniques described below maximize the use of observable inputs and minimize the use of unobservable inputs in determining fair value. The inputs used for valuing the Fund's investments are summarized in the three broad levels listed below:
• Level 1 — quoted prices in active markets for identical securities
• Level 2 — other significant observable inputs (including quoted prices for similar securities or interest rates applicable to those securities, etc.)
• Level 3 — significant unobservable inputs (including the Fund's own assumptions in determining the fair value of investments)
Changes in valuation techniques may result in transfers in or out of an assigned level within the disclosure hierarchy. The inputs or methodologies used for valuation techniques are not necessarily an indication of the risks associated with entering into those investments.
Victory Capital Management Inc. ("VCM" or the "Adviser") has established the Pricing and Liquidity Committee (the "Committee"), and subject to the Trust's Board of Trustees (the "Board") oversight, the Committee administers and oversees the Fund's valuation policies and procedures, which are approved by the Board.
22
USAA Mutual Funds Trust | Notes to Financial Statements — continued March 31, 2021 | ||||||
Portfolio securities listed or traded on securities exchanges, including Exchange-Traded Funds ("ETFs"), American Depositary Receipts ("ADRs") and Rights, are valued at the closing price on the exchange or system where the security is principally traded, if available, or at the Nasdaq Official Closing Price. If there have been no sales for that day on the exchange or system, then a security is valued at the last available bid quotation on the exchange or system where the security is principally traded. In each of these situations, valuations are typically categorized as Level 1 in the fair value hierarchy.
Debt securities of United States ("U.S.") issuers, along with corporate and municipal securities, including short-term investments maturing in 60 days or less, may be valued using evaluated bid or the last sales price to price securities by dealers or an independent pricing service approved by the Board. These valuations are typically categorized as Level 2 in the fair value hierarchy.
In the event that price quotations or valuations are not readily available, are not reflective of market value, or a significant event has been recognized in relation to a security or class of securities, the securities are valued in good faith by the Committee in accordance with valuation procedures approved by the Board. These valuations are typically categorized as Level 2 or Level 3 in the fair value hierarchy, based on the observability of inputs used to determine the fair value. The effect of fair value pricing is that securities may not be priced on the basis of quotations from the primary market in which they are traded and the actual price realized from the sale of a security may differ materially from the fair value price. Valuing these securities at fair value is intended to cause the Fund's net asset value ("NAV") to be more reliable than it otherwise would be.
A summary of the valuations as of March 31, 2021, based upon the three levels defined above, is included in the table below while the breakdown, by category, of investments is disclosed on the Schedule of Portfolio Investments (amounts in thousands):
Level 1 | Level 2 | Level 3 | Total | ||||||||||||||||
Other Equity Interests | $ | — | $ | — | $ | 442 | $ | 442 | |||||||||||
Municipal Bonds | — | 215,005 | — | 215,005 | |||||||||||||||
Total | $ | — | $ | 215,005 | $ | 442 | $ | 215,447 | |||||||||||
For the year ended March 31, 2021, there were no transfers in or out of Level 3 in the fair value hierarchy.
Securities Purchased on a Delayed-Delivery or When-Issued Basis:
The Fund may purchase securities on a delayed-delivery or when-issued basis. Delivery and payment for securities that have been purchased by the Fund on a delayed-delivery or when-issued basis, or for delayed draws on loans can take place a month or more after the trade date. At the time the Fund makes the commitment to purchase a security on a delayed-delivery or when-issued basis, the Fund records the transaction and reflects the value of the security in determining NAV. No interest accrues to the Fund until the transaction settles and payment takes place. A segregated account is established and the Fund maintains cash and/or marketable securities at least equal in value to commitments for delayed-delivery or when-issued securities. If the Fund owns delayed-delivery or when-issued securities, these values are included in Payable for investments purchased on the accompanying Statement of Assets and Liabilities and the segregated assets are identified on the Schedule of Portfolio Investments.
Municipal Obligations:
The values of municipal obligations can fluctuate and may be affected by adverse tax, legislative, or political changes, and by financial developments affecting municipal issuers. Payment of municipal obligations may depend on a relatively limited source of revenue, resulting in greater credit risk. Future changes in federal tax laws or the activity of an issuer may adversely affect the tax-exempt status of municipal obligations.
Investment Transactions and Related Income:
Changes in holdings of investments are accounted for no later than one business day following the trade date. For financial reporting purposes, however, investment transactions are accounted for on trade date on the last business day of the reporting period. Interest income is determined on the basis
23
USAA Mutual Funds Trust | Notes to Financial Statements — continued March 31, 2021 | ||||||
of coupon interest accrued using the effective interest method which adjusts, where applicable, the amortization of premiums or accretion of discount. Gains or losses realized on sales of securities are determined by comparing the identified cost of the security lot sold with the net sales proceeds.
Federal Income Taxes:
It is the Fund's policy to continue to qualify as a regulated investment company by complying with the provisions available to certain investment companies, as defined in applicable sections of the Internal Revenue Code, and to make distributions of net investment income and net realized gains sufficient to relieve it from all, or substantially all, federal income taxes. Accordingly, no provision for federal income taxes is required in the financial statements. The Fund has a tax year end of March 31.
Management of the Fund has reviewed tax positions taken in tax years that remain subject to examination by all major tax jurisdictions, including federal (i.e., the last four tax years, which includes the current fiscal tax year end). Management believes that there is no tax liability resulting from unrecognized tax benefits related to uncertain tax positions taken.
Allocations:
Expenses directly attributable to the Fund are charged to the Fund, while expenses that are attributable to more than one fund in the Trust, or jointly with an affiliated trust, are allocated among the respective funds in the Trust and/or affiliated trust based upon net assets or another appropriate basis.
Income, expenses (other than class-specific expenses such as transfer agent fees, state registration fees, 12b-1 fees, and printing fees), and realized and unrealized gains or losses on investments are allocated to each class of shares based on its relative net assets on the date income is earned or expenses and realized and unrealized gains and losses are incurred.
Cross-Trade Transactions:
Pursuant to Rule 17a-7 under the 1940 Act, the Fund may engage in cross-trades, which are securities transactions with affiliated investment companies and advisory accounts managed by the Adviser and any applicable sub-adviser. Any such purchase or sale transaction must be effected without brokerage commission or other remuneration, except for customary transfer fees. The transaction must be effected at the current market price, which is either the security's last sale price on an exchange or, if there are no transactions in the security that day, at the average of the highest bid and lowest asked price. For the year ended March 31, 2021, the Fund engaged in the following securities transactions with affiliated funds, which resulted in the following net realized gains (losses) (amounts in thousands):
| Purchases | Sales | Realized Gains (Losses) | |||||||||
| $ | 3,600 | $ | 1,300 | $ | — | ||||||
Fees Paid Indirectly:
Expense offsets to custody fees that arise from credits on cash balances maintained on deposit are reflected on the Statement of Operations, as applicable, as Fees paid indirectly.
3. Purchases and Sales:
Cost of purchases and proceeds from sales/maturities of securities (excluding securities maturing less than one year from acquisition) for the year ended March 31, 2021, were as follows for the Fund (amounts in thousands):
| Excluding U.S. Government Securities | |||||||
Purchases | Sales | ||||||
$ | 39,431 | $ | 51,213 | ||||
There were no purchases or sales of U.S. government securities during the year ended March 31, 2021
24
USAA Mutual Funds Trust | Notes to Financial Statements — continued March 31, 2021 | ||||||
4. Fees and Transactions with Affiliates and Related Parties:
Investment Advisory Fees:
Investment advisory services are provided to the Fund by the Adviser, which is a New York corporation registered as an investment adviser with the Securities and Exchange Commission ("SEC"). The Adviser is a wholly-owned indirect subsidiary of Victory Capital Holdings, Inc., a publicly traded Delaware corporation, and a wholly-owned direct subsidiary of Victory Capital Operating, LLC.
Under the terms of the Investment Advisory Agreement, the Adviser is entitled to receive a base fee and a performance adjustment. The Fund's base fee is accrued daily and paid monthly at an annualized rate of 0.50% of the first $50 million of the Fund's average daily net assets, 0.40% of that portion of average daily net assets over $50 million but not over $100 million, and 0.30% of that portion of average daily net assets over $100 million. Amounts incurred and paid to VCM for the year ended March 31, 2021, are reflected on the Statement of Operations as Investment Advisory fees.
On November 6, 2018, United Services Automobile Association ("USAA"), the parent company of USAA Asset Management Company ("AMCO"), the prior investment adviser to the Fund announced that AMCO would be acquired by Victory Capital Holdings Inc. (the "Transaction"). A special shareholder meeting was held on April 18, 2019, at which shareholders of the Fund approved a new investment advisory agreement between the Trust, on behalf of the Fund, and VCM. The Transaction closed on July 1, 2019 and effective July 1, 2019, VCM replaced AMCO as the investment adviser to the Fund and no performance adjustments were made for the period beginning July 1, 2019, through June 30, 2020. Only performance beginning as of July 1, 2019, and thereafter is utilized in calculating future performance adjustments.
The performance adjustment for each share class is accrued daily and calculated monthly by comparing each class' performance to that of the Lipper New York Municipal Debt Funds Index. The Lipper New York Municipal Debt Funds Index tracks the total return performance of the largest funds within the Lipper New York Municipal Debt Funds category.
The performance period for each share class consists of the current month plus the previous 35 months (or the number of months beginning July 1, 2019, if fewer). The following table is utilized to determine the extent of the performance adjustment:
| Over/Under Performance Relative to Index (in basis points)(a) | Annual Adjustment Rate (in basis points)(a) | ||||||||||
+/- 20 to 50 | +/- 4 | ||||||||||
+/- 51 to 100 | +/- 5 | ||||||||||
+/- 101 and greater | +/- 6 | ||||||||||
(a) Based on the difference between average annual performance of the relevant share class of the Fund and its relevant Lipper index, rounded to the nearest basis point. Average daily net assets of the share class are calculated over a rolling 36-month period.
Each class' annual performance adjustment rate is multiplied by the average daily net assets of each respective class over the entire performance period, which is then multiplied by a fraction, the numerator of which is the number of days in the month and the denominator of which is 365 (366 in leap years). The resulting amount is then added to (in the case of overperformance), or subtracted from (in the case of underperformance) the base fee.
Under the performance fee arrangement, each class pays a positive performance fee adjustment for a performance period whenever the class outperforms the Lipper New York Municipal Debt Funds Bond Index over that period, even if the class has overall negative returns during the performance period.
For the performance period July 1, 2020, to March 31, 2021, performance adjustments were $31, less than $1 and less than $(1), in thousands, for Fund Shares, Institutional Shares and Class A, respectively.
25
USAA Mutual Funds Trust | Notes to Financial Statements — continued March 31, 2021 | ||||||
Performance adjustments were 0.01%, less than 0.01%, and less than (0.01)% for Fund Shares, Institutional Shares, and Class A, respectively.
The Trust relies on an exemptive order granted to VCM and its affiliated funds by the SEC in March 2019 permitting the use of a "manager-of-managers" structure for certain funds. Under a manager-of-managers structure, the investment adviser may select (with approval of the Board and without shareholder approval) one or more subadvisers to manage the day-to-day investment of a fund's assets. For the year ended March 31, 2021, the Fund had no subadvisors.
Administration and Servicing Fees:
VCM serves as the Fund's administrator and fund accountant. Under the Fund Administration, Servicing and Accounting Agreement, VCM is paid for its services an annual fee at a rate of 0.15%, 0.10%, and 0.15% of average daily net assets, of the Fund Shares, Institutional Shares, and Class A, respectively. Amounts incurred for the year ended March 31, 2021, are reflected on the Statement of Operations as Administration fees.
The Fund (as part of the Trust) has entered into an agreement to provide compliance services with the Adviser, pursuant to which the Adviser furnishes its compliance personnel, including the services of the Chief Compliance Officer ("CCO"), and other resources reasonably necessary to provide the Trust with compliance oversight services related to the design, administration and oversight of a compliance program for the Trust in accordance with Rule 38a-1 under the 1940 Act. The CCO is an employee of the Adviser, which pays the compensation of the CCO and support staff. Funds in the Trust, Victory Variable Insurance Funds, Victory Portfolios, and Victory Portfolios II (collectively, the "Victory Funds Complex") in the aggregate, compensate the Adviser for these services. Amounts incurred for the year ended March 31, 2021, are reflected on the Statement of Operations as Compliance fees.
Citi Fund Services Ohio, Inc. ("Citi"), an affiliate of Citibank, acts as sub-administrator and sub-fund accountant to the Fund pursuant to a Sub-Administration and Sub-Fund Accounting Services Agreement between VCM and Citi. VCM pays Citi a fee for providing these services. The Fund reimburses VCM and Citi for out-of-pocket expenses incurred in providing these services and certain other expenses specifically allocated to the Fund. Amounts incurred for the year ended March 31, 2021, are reflected on the Statement of Operations as Sub-Administration fees.
Transfer Agency Fees:
Victory Capital Transfer Agency, Inc. ("VCTA"), an affiliate of the Adviser, provides transfer agency services to the Fund. VCTA provides transfer agent services to the Fund Shares based on an annual charge of $25.50 per shareholder account plus out-of-pocket expenses. VCTA pays a portion of these fees to certain intermediaries for the administration and servicing of accounts that are held with such intermediaries. Transfer agent's fees are accrued daily and paid monthly at an annualized rate of 0.10% and 0.10% of average daily net assets of the Institutional Shares and Class A, respectively, plus out-of-pocket expenses. Amounts incurred and paid to VCTA for the year ended March 31, 2021, are reflected on the Statement of Operations as Transfer Agent fees.
FIS Investor Services LLC serves as sub-transfer agent and dividend disbursing agent for the Fund pursuant to a Sub-Transfer Agent Agreement between VCTA and FIS Investor Services LLC. VCTA provides FIS Investor Services LLC a fee for providing these services.
Distributor/Underwriting Services:
Victory Capital Services, Inc. (the "Distributor"), an affiliate of the Adviser, serves as distributor for the continuous offering of the shares of the Fund pursuant to a Distribution Agreement between the Distributor and the Trust. Effective June 30, 2020, the Distributor's name was changed from Victory Capital Advisers, Inc.
Pursuant to the Distribution and Service Plans adopted in accordance with Rule 12b-1 under the 1940 Act, the Distributor may receive a monthly distribution and service fee, at an annual rate of up to 0.25% of the average daily net assets of Class A. The distribution and service fees paid to the Distributor
26
USAA Mutual Funds Trust | Notes to Financial Statements — continued March 31, 2021 | ||||||
may be used by the Distributor to pay for activity primarily intended to result in the sale of Class A. Amounts incurred and paid to the Distributor for the year ended March 31, 2021, are reflected on the Statement of Operations as 12b-1 fees.
In addition, the Distributor is entitled to receive commissions on sales of the Class A. For the year ended March 31, 2021, the Distributor received less than $1 thousand from commissions earned on sales of Class A.
Other Fees:
Citibank serves as the Fund's custodian. The Fund pays Citibank a fee for providing these services. Amounts incurred for the year ended March 31, 2021, are reflected on the Statement of Operations as Custodian fees.
K&L Gates LLP provides legal services to the Trust.
The Adviser has entered into an expense limitation agreement with the Fund until at least June 30, 2023. Under the terms of the agreement, the Adviser has agreed to waive fees or reimburse certain expenses to the extent that ordinary operating expenses incurred by certain classes of the Fund in any fiscal year exceed the expense limit for such classes of the Fund. Such excess amounts will be the liability of the Adviser. Interest, taxes, brokerage commissions, other expenditures, which are capitalized in accordance with GAAP, and other extraordinary expenses not incurred in the ordinary course of the Fund's business are excluded from the expense limits. As of March 31, 2021, the expense limits (excluding voluntary waivers) were 0.65%, 0.61%, and 0.90% for Fund Shares, Institutional Shares, and Class A, respectively.
Under the terms of the expense limitation agreement, the Fund has agreed to repay fees and expenses that were waived or reimbursed by the Adviser for a period of up to three years after the fiscal year in which the waiver or reimbursement took place, subject to the lesser of any operating expense limits in effect at the time of: (a) the original waiver or expense reimbursement; or (b) the recoupment, after giving effect to the recoupment amount.
As of March 31, 2021, the following amounts are available to be repaid to the Adviser (amounts in thousands). The Fund has not recorded any amounts available to be repaid as a liability due to an assessment that such repayment is not probable at March 31, 2021.
| Expires March 31, 2024 | |||
| $ | 7 | ||
The Adviser may voluntarily waive or reimburse additional fees to assist the Fund in maintaining competitive expense ratios. Voluntary waivers and reimbursements applicable to the Fund are not available to be recouped at a future time. There were no voluntary waivers or reimbursements for the year ended March 31, 2021.
Certain officers and/or interested trustees of the Fund are also officers and/or employees of the Adviser, administrator, sub-administrator, sub-fund accountant, custodian, and Distributor.
5. Risks:
The Fund may be subject to other risks in addition to these identified risks.
Geopolitical/Natural Disaster Risk — Global economies and financial markets are increasingly interconnected, which increases the possibilities that conditions in one country or region might adversely affect issuers in another country or region. Geopolitical and other risks, including war, terrorism, trade disputes, political or economic dysfunction within some nations, public health crises and related geopolitical events, as well as environmental disasters such as earthquakes, fires, and floods, may add to instability in world economies and markets generally. Changes in trade policies and international trade agreements could affect the economies of many countries in unpredictable ways. Likewise,
27
USAA Mutual Funds Trust | Notes to Financial Statements — continued March 31, 2021 | ||||||
systemic market dislocations of the kind that occurred during the financial crisis that began in 2008, if repeated, would be highly disruptive to economies and markets, adversely affecting individual companies and industries, securities markets, interest rates, credit ratings, inflation, investor sentiment, and other factors affecting the value of a Fund's investments. Some countries, including the United States, are adopting more protectionist trade policies and moving away from the tighter financial industry regulations that followed the 2008 financial crisis, which may also affect the value of a Fund's investments.
Political events within the United States at times have resulted, and may in the future result, in a shutdown of government services, which could negatively affect the U.S. economy, decrease the value of a Fund's investments, increase uncertainty in or impair the operation of the U.S. or other securities markets and degrade investor and consumer confidence, perhaps suddenly and to a significant degree.
An outbreak of disease called COVID-19 has spread internationally. The transmission of COVID-19 and efforts to contain its spread have resulted in international, national and local border closings and other significant travel restrictions and disruptions, significant disruptions to business operations, supply chains and consumer activity, significant challenges in healthcare service preparation and delivery, quarantines and general concern and uncertainty. These negative impacts have caused significant volatility and declines in global financial markets, which have caused losses for Fund investors during and subsequent to period end. The impact of the COVID-19 pandemic may last for an extended period of time, and could result in a substantial economic downturn or recession. Public health crises may exacerbate other pre-existing political, social, economic, market and financial risks. The extent of the impact to the financial performance of the Fund's investments will depend on future developments, including (i) the duration and spread of the outbreak, (ii) the restrictions and advisories, (iii) the effects on the financial markets, and (iv) the effects on the economy overall, all of which are highly uncertain and cannot be predicted.
Credit Risk — The fixed-income securities in the Fund's portfolio are subject to credit risk, which is the possibility that an issuer of a fixed-income security will fail to make timely interest and/or principal payments on its securities or that negative market perceptions of the issuer's ability to make such payments will cause the price of that security to decline. The Fund accepts some credit risk as a recognized means to enhance an investor's return. All fixed-income securities, varying from the highest quality to the very speculative, have some degree of credit risk.
Debt Securities Risk — The value of a debt security or other income-producing security changes in response to various factors, including, for example, market-related factors (such as changes in interest rates or changes in the risk appetite of investors generally) and changes in the actual or perceived ability of the issuer (or of issuers generally) to meet its (or their) obligations.
Other factors that may affect the value of debt securities, include, among others, public health crises and responses by governments and companies to such crises. These and other events may affect the creditworthiness of the issuer of a debt security and may impair an issuers ability to timely meet its debt obligations as they come due.
Interest Rate Risk — The Fund is subject to the risk that the market value of the bonds in its portfolio will fluctuate because of changes in interest rates, changes in the supply of and demand for tax-exempt securities, and other market factors. Bond prices generally are linked to the prevailing market interest rates. In general, when interest rates rise, bond prices fall; conversely, when interest rates fall, bond prices rise. The price volatility of a bond also depends on its duration. Generally, the longer the duration of a bond, the greater is its sensitivity to interest rates. To compensate investors for this higher interest rate risk, bonds with longer durations generally offer higher yields than bonds with shorter durations. The ability of an issuer of a debt security to repay principal prior to a security's maturity can increase the security's sensitivity to interest rate changes.
Decisions by the U.S. Federal Reserve (also known as the "Fed") regarding interest rate and monetary policy, which can be difficult to predict and sometimes change direction suddenly in response to economic and market events, can have a significant effect on the value of fixed income securities as well as the overall strength of the U.S. economy. Precise interest rate predictions are difficult to make,
28
USAA Mutual Funds Trust | Notes to Financial Statements — continued March 31, 2021 | ||||||
and interest rates may change unexpectedly and dramatically in response to extreme changes in market or economic conditions. As a result, the value of fixed income securities may vary widely under certain market conditions.
LIBOR Discontinuation Risk — Many debt securities, derivatives and other financial instruments, including some of the Fund's investments, use the London Interbank Offered Rate ("LIBOR") as the reference or benchmark rate for variable interest rate calculations. In June 2017, the Alternative Reference Rates Committee, a group of large U.S. banks working with the Federal Reserve, announced its selection of a new Secured Overnight Funding Rate ("SOFR"), which is intended to be a broad measure of secured overnight U.S. Treasury repo rates, as an appropriate replacement for LIBOR. The Federal Reserve Bank of New York began publishing the SOFR in 2018, expecting that it could be used on a voluntary basis in new instruments and transactions. Bank working groups and regulators in other countries have suggested other alternatives for their markets, including the Sterling Overnight Interbank Average Rate ("SONIA") in England. In July 2017, the Financial Conduct Authority (the "FCA"), the United Kingdom financial regulatory body, announced that after 2021 it will cease its active encouragement of UK banks to provide the quotations needed to sustain LIBOR. That announcement suggests that LIBOR may cease to be published after that time. For U.S. dollar LIBOR, however, the relevant date may be deferred to June 30, 2023, for the most common tenors (overnight and one, three, six and 12 months). As to those tenors, the LIBOR administrator has published a consultation regarding its intention to cease publication of U.S. dollar LIBOR as of June 30, 2023, (instead of December 31, 2021, as previously expected), apparently based on continued rate submissions from banks. It is expected that there will be enough time for market participants to transition to the use of a different benchmark for both new and existing securities and transactions. Various financial industry groups have begun planning for that transition, but there are obstacles to converting certain longer-term securities and transactions to a new benchmark. Transition planning is at an early stage, and neither the effect of the transition process nor its ultimate success can yet be known. Although the foregoing may provide some sense of timing, there is no assurance that LIBOR, or any particular currency and tenor, will continue to be published until any particular date, and it appears highly likely that LIBOR will be discontinued or modified after December 31, 2021, or June 30, 2023, depending on the currency and tenor. The transition process might lead to increased volatility and illiquidity in markets that currently rely on the LIBOR to determine interest rates. It could also lead to a reduction in the value of some LIBOR-based investments and reduce the effectiveness of new hedges placed against existing LIBOR-based instruments. Since the usefulness of LIBOR as a benchmark could deteriorate during the transition period, these effects could occur before the end of 2021.
6. Borrowing and Interfund Lending:
Line of Credit:
For the year ended March 31, 2021, the Victory Funds Complex participated in a short-term demand note "Line of Credit" agreement with Citibank. The Line of Credit agreement with Citibank was renewed on June 29, 2020, with a termination date of June 28, 2021. Under the agreement with Citibank, the Victory Funds Complex may borrow up to $600 million, of which $300 million is committed and $300 million is uncommitted. $40 million of the Line of Credit is reserved for use by the Victory Floating Rate Fund, another series of the Victory Funds Complex, with Victory Floating Rate Fund paying the related commitment fees for that amount. The purpose of the agreement is to meet temporary or emergency cash needs. For the year ended March 31, 2021, Citibank received an annual commitment fee of 0.15% on $300 million for providing the Line of Credit. Each fund in the Victory Funds Complex paid a pro-rata portion of the commitment fees plus any interest (one month LIBOR plus one percent) on amounts borrowed. Effective June 29, 2020, under an amended Line of Credit agreement, Citibank also received an annual upfront fee of 0.10% on the $300 million committed line of credit. Each fund in the Victory Funds Complex paid a pro-rata portion of the upfront fee. Interest charged to each Fund during the period, if applicable, is reflected on the Statement of Operations under Line of credit fees.
The Fund had no borrowings under the Line of Credit agreement during the year ended March 31, 2021.
29
USAA Mutual Funds Trust | Notes to Financial Statements — continued March 31, 2021 | ||||||
Interfund Lending:
The Trust and Adviser rely on an exemptive order granted by the SEC in March 2017 (the "Order"), permitting the establishment and operation of an Interfund Lending Facility (the "Facility"). The Facility allows the Fund to directly lend and borrow money to or from any other Fund, that is permitted to participate in the Facility, in the Victory Funds Complex relying upon the Order at rates beneficial to both the borrowing and lending funds. Advances under the Facility are allowed for temporary or emergency purposes, including the meeting of redemption requests that otherwise might require the untimely disposition of securities, and are subject to each Fund's borrowing restrictions. The interfund loan rate is determined, as specified in the Order, by averaging the current repurchase agreement rate and the current bank loan rate. As a Borrower, interest charged to the Fund, if any, during the period is reflected on the Statement of Operations under Interfund lending fees. As a Lender, interest earned by the Fund, if any, during the period is presented on the Statement of Operations under Interfund lending.
The Fund did not utilize or participate in the Facility during the year ended March 31, 2021.
7. Federal Income Tax Information:
The Fund intends to declare daily and distribute any net investment income monthly. Distributable net realized gains, if any, are declared and paid at least annually.
The amounts of dividends from net investment income and distributions from net realized gains (collectively distributions to shareholders) are determined in accordance with federal income tax regulations, which may differ from GAAP. To the extent these "book/tax" differences are permanent in nature (e.g., net operating loss and distribution reclassification), such amounts are reclassified within the components of net assets based on their federal tax-basis treatment; temporary differences (e.g., wash sales) do not require reclassification. To the extent dividends and distributions exceed net investment income and net realized gains for tax purposes, they are reported as distributions of capital. Net investment losses incurred by the Fund may be reclassified as an offset to capital on the accompanying Statement of Assets and Liabilities.
As of March 31, 2021, on the Statement of Assets and Liabilities, there were no permanent book-to-tax difference reclassification adjustments.
The tax character of distributions paid during the tax years ended as noted below, were as follows (total distributions paid may differ from the Statements of Changes in Net Assets because, for tax purposes, dividends are recognized when actually paid) (amounts in thousands).
Year Ended March 31, 2021 | Year Ended March 31, 2020 | ||||||||||||||||||||||||||
Distributions Paid from | Distributions Paid from | ||||||||||||||||||||||||||
Ordinary Income | Tax-Exempt Income | Total Distributions Paid | Ordinary Income | Tax-Exempt Income | Total Distributions Paid | ||||||||||||||||||||||
$ | 1 | $ | 6,219 | $ | 6,220 | $ | 4 | $ | 7,294 | $ | 7,298 | ||||||||||||||||
As of March 31, 2021, the components of accumulated earnings (loss) on a tax basis were as follows (amounts in thousands):
| Undistributed Tax-Exempt Income | Distributions Payable | Accumulated Earnings | Accumulated Capital and Other Losses | Unrealized Appreciation (Depreciation)* | Total Accumulated Earnings (Loss) | ||||||||||||||||||
| $ | 581 | $ | (505 | ) | $ | 76 | $ | (3,530 | ) | $ | 13,246 | $ | 9,792 | ||||||||||
* The difference between the book-basis and tax-basis of unrealized appreciation/depreciation is attributable to investment in partnerships.
30
USAA Mutual Funds Trust | Notes to Financial Statements — continued March 31, 2021 | ||||||
As of March 31, 2021, the Fund had net capital loss carryforwards as shown in the table below (amounts in thousands). It is unlikely that the Board will authorize a distribution of capital gains realized in the future until the capital loss carryforwards have been used.
| Short-Term Amount | Long-Term Amount | Total | |||||||||
| $ | 1,220 | $ | 2,310 | $ | 3,530 | ||||||
As of March 31, 2021, the cost basis for federal income tax purposes, gross unrealized appreciation, gross unrealized depreciation, and net unrealized appreciation (depreciation) for investments were as follows (amounts in thousands):
| Cost of Investments for Federal Tax Purposes | Gross Unrealized Appreciation | Gross Unrealized Depreciation | Net Unrealized Appreciation (Depreciation) | ||||||||||||
| $ | 202,201 | $ | 13,624 | $ | (378 | ) | $ | 13,246 | |||||||
31
REPORT OF INDEPENDENT REGISTERED PUBLIC ACCOUNTING FIRM
To the Shareholders and the Board of Trustees of USAA New York Bond Fund
Opinion on the Financial Statements
We have audited the accompanying statement of assets and liabilities of USAA New York Bond Fund (the "Fund") (one of the funds constituting USAA Mutual Funds Trust (the "Trust")), including the schedule of portfolio investments, as of March 31, 2021, and the related statement of operations for the year then ended, the statements of changes in net assets for each of the two years in the period then ended, the financial highlights for each of the five years in the period then ended and the related notes (collectively referred to as the "financial statements"). In our opinion, the financial statements present fairly, in all material respects, the financial position of the Fund at March 31, 2021, the results of its operations for the year then ended, the changes in its net assets for each of the two years in the period then ended and its financial highlights for each of the five years in the period then ended, in conformity with U.S. generally accepted accounting principles.
Basis for Opinion
These financial statements are the responsibility of the Trust's management. Our responsibility is to express an opinion on the Fund's financial statements based on our audits. We are a public accounting firm registered with the Public Company Accounting Oversight Board (United States) ("PCAOB") and are required to be independent with respect to the Trust in accordance with the U.S. federal securities laws and the applicable rules and regulations of the Securities and Exchange Commission and the PCAOB.
We conducted our audits in accordance with the standards of the PCAOB. Those standards require that we plan and perform the audit to obtain reasonable assurance about whether the financial statements are free of material misstatement, whether due to error or fraud. The Trust is not required to have, nor were we engaged to perform, an audit of the Trust's internal control over financial reporting. As part of our audits we are required to obtain an understanding of internal control over financial reporting, but not for the purpose of expressing an opinion on the effectiveness of the Trust's internal control over financial reporting. Accordingly, we express no such opinion.
Our audits included performing procedures to assess the risks of material misstatement of the financial statements, whether due to error or fraud, and performing procedures that respond to those risks. Such procedures included examining, on a test basis, evidence regarding the amounts and disclosures in the financial statements. Our procedures included confirmation of securities owned as of March 31, 2021, by correspondence with the custodian and brokers or by other appropriate auditing procedures where replies from brokers were not received. Our audits also included evaluating the accounting principles used and significant estimates made by management, as well as evaluating the overall presentation of the financial statements. We believe that our audits provide a reasonable basis for our opinion.

We have served as the auditor of one or more Victory Capital investment companies since 1995.
San Antonio, Texas
May 26, 2021
32
USAA Mutual Funds Trust | Supplemental Information March 31, 2021 | ||||||
(Unaudited)
Trustee and Officer Information
Board of Trustees:
Overall responsibility for management of the Trust rests with the Board. The Trust is managed by the Board in accordance with the laws of the state of Delaware. There are currently nine Trustees, seven of whom are not "interested persons" of the Trust within the meaning of that term under the 1940 Act ("Independent Trustees") and two of whom is an "interested person" of the Trust within the meaning of that term under the 1940 Act ("Interested Trustee"). The Trustees, in turn, elect the officers of the Trust to actively supervise its day-to-day operations.
The following tables list the Trustees, their ages, position with the Trust, commencement of service, principal occupations during the past five years and any directorships of other investment companies or companies whose securities are registered under the Securities Exchange Act of 1934, as amended, or who file reports under that Act. Each Trustee oversees 46 portfolios in the Trust. Each Trustee's address is 15935 La Cantera Pkwy, San Antonio, TX, 78256. Pursuant to a policy adopted by the Board, the term of office for each Trustee shall be until the Independent Trustee reaches age 75 or an Interested Trustee reaches age 75. The Board may change or grant exceptions from this policy at any time without shareholder approval. A Trustee may resign or be removed by a vote of the other Trustees or the holders of a majority of the outstanding shares of the Trust at any time. Vacancies on the Board can be filled by the action of a majority of the Trustees, provided that after filling such vacancy at least two-thirds of the Trustees have been elected by the shareholders.
Name and Date of Birth | Position Held with the Trust | Year Commenced Service | Principal Occupation During Past 5 Years | Other Directorships Held During Past 5 Years | |||||||||||||||
Independent Trustees. | |||||||||||||||||||
| Jefferson C. Boyce (c), Born September 1957 | Independent Chairman | 2021 | Senior Managing Director, New York Life Investments, LLC (1992-2012) | Westhab, Inc. | |||||||||||||||
| John C. Walters, Born February 1962 | Trustee | 2019 | Retired. Mr. Walters brings significant Board experience including active involvement with the board of a Fortune 500 company, and a proven record of leading large, complex financial organizations. He has a demonstrated record of success in distribution, manufacturing, investment brokerage, and investment management in both the retail and institutional investment businesses. He has substantial experience in the investment management business with a demonstrated ability to develop and drive strategy while managing operation, financial, and investment risk. | Guardian Variable Products Trust (16 series), Lead Independent Director; Amerilife Holdings LLC, Director; Stadion Money Management; Director; University of North Carolina (Chapel Hill), Member Board of Governors | |||||||||||||||
33
USAA Mutual Funds Trust | Supplemental Information — continued March 31, 2021 | ||||||
(Unaudited)
Name and Date of Birth | Position Held with the Trust | Year Commenced Service | Principal Occupation During Past 5 Years | Other Directorships Held During Past 5 Years | |||||||||||||||
| Robert L. Mason, Ph.D., Born July 1946 | Trustee | 1997 | Adjunct Professor in the Department of Management Science and Statistics in the College of Business at the University of Texas at San Antonio (since 2001); Institute Analyst, Southwest Research Institute (March 2002-January 2016) | None | |||||||||||||||
| Dawn M. Hawley, Born February 1954 | Trustee | 2014 | Manager of Finance, Menil Foundation, Inc. (May 2007-June 2011), which is a private foundation that oversees the assemblage of sculptures, prints, drawings, photographs, and rare books. Director of Financial Planning and Analysis and Chief Financial Officer, AIM Management Group, Inc. (October 1987-January 2006) | None | |||||||||||||||
| Paul L. McNamara, Born July 1948 | Trustee | 2012 | Director, Cantor Opportunistic Alternatives Fund, LLC (March 2010-February 2014), which is a closed-end fund of funds by Cantor Fitzgerald Investment Advisors, LLC | None | |||||||||||||||
34
USAA Mutual Funds Trust | Supplemental Information — continued March 31, 2021 | ||||||
(Unaudited)
Name and Date of Birth | Position Held with the Trust | Year Commenced Service | Principal Occupation During Past 5 Years | Other Directorships Held During Past 5 Years | |||||||||||||||
| Richard Y. Newton III, Born January 1956 | Trustee | 2017 | Director, Elta North America (01/18-present), which is a global leader in the design, manufacture, and support of innovative electronic systems in the ground, maritime, airborne, and security domains for the nation's warfighters, security personnel, and first responders; Managing Partner, Pioneer Partnership Development Group (December 2015-present)); Executive Director, The Union League Club of New York (June 2014-November 2015): Executive Vice President, Air Force Association (August 2012-May 2014); Lieutenant General, United States Air Force (January 2008-June 2012) | PredaSAR Corp. | |||||||||||||||
| Barbara B. Ostdiek, Ph.D., Born March 1964 | Trustee | 2008 | Senior Associate Dean of Degree Programs at Jesse H. Jones Graduate School of Business at Rice University (since 2013); Associate Professor of Finance at Jessie H. Jones Graduate School of Business at Rice University (since 2001) | None | |||||||||||||||
| Michael F. Reimherr, (a) Born August 1945 | Trustee | 2000 | President of Reimherr Business Consulting (May 1995-December 2017); St. Mary's University Investment Committee overseeing University Endowment (since 2014) | None | |||||||||||||||
(a) Effective at the close of business on December 31, 2020, Michael F. Reimherr retired from the Board of Trustees.
35
USAA Mutual Funds Trust | Supplemental Information — continued March 31, 2021 | ||||||
(Unaudited)
Name and Date of Birth | Position Held with the Trust | Year Commenced Service | Principal Occupation During Past 5 Years | Other Directorships Held During Past 5 Years | |||||||||||||||
Interested Trustees. | |||||||||||||||||||
| David C. Brown, (b) Born May 1972 | Trustee | 2019 | Chairman and Chief Executive Officer (since 2013), Victory Capital Management Inc.; Chairman and Chief Executive Officer, Victory Capital Holdings, Inc. (since 2013). Mr. Brown brings to the Board extensive business, finance and leadership skills gained and developed through years of experience in the financial services industry, including his tenure overseeing the strategic direction as CEO of Victory Capital. These skills, combined with Mr. Brown's extensive knowledge of the financial services industry and demonstrated success in the development and distribution of investment strategies and products, enable him to provide valuable insights to the Board and strategic direction for the Funds. | Trustee, Victory Portfolios (41 series), Victory Portfolios II (26 series), Victory Variable Insurance Funds (8 series) | |||||||||||||||
36
USAA Mutual Funds Trust | Supplemental Information — continued March 31, 2021 | ||||||
(Unaudited)
Name and Date of Birth | Position Held with the Trust | Year Commenced Service | Principal Occupation During Past 5 Years | Other Directorships Held During Past 5 Years | |||||||||||||||
| Daniel S. McNamara, (b)(c) Born June 1966 | Trustee | 2012 | Trustee, President, and Vice Chairman of USAA ETF Trust (June 2017-June 2019); President of Financial Advice & Solutions Group (FASG), USAA (February 2013-March 2021); Director of USAA Investment Services Company (ISCO) (formerly USAA Investment Management) (September 2009-March 2021); President, Asset Management Company (AMCO) (August, 2011-June 2019); Senior Vice President of USAA Financial Planning Services Insurance Agency, Inc. (FPS) (April 2011-March 2021) Chairman of Board of ISCO (April 2013-December 2020); Director of AMCO (August 2011-June 2019); President and Director of USAA Shareholder Account Services (SAS) (October 2009-June 2019); Director and Vice Chairman of FPS (December 2013-March 2021); President and Director of USAA Investment Corporation (ICORP) (March 2010-March 2021); Chairman of Board of ICORP (December 2013-March 2021) Director of USAA Financial Advisors, Inc. (FAI) (December 2013-March 2021); Chairman of Board of FAI (March 2015-March 2021). Mr. McNamara brings to the Board extensive experience in the financial services industry, including experience as an officer of the Trust. | None | |||||||||||||||
(b) Mr. Dan McNamara, the Chairman of the Board, is deemed an "interested person" due to his previous position as Director of AMCO, the former investment adviser of the Funds. Mr. Brown is deemed an "interested person" due to his position as Chief Executive Officer of Victory Capital, investment adviser to the Funds.
(c) Effective at the close of business on December 31, 2020, Jefferson C. Boyce replaced Dan McNamara as Chair of the Board and assumed the title of Independent Chair.
The Statement of Additional Information includes additional information about the Trustees of the Trust and is available, without charge, on the SEC's website at www.sec.gov and/or by calling (800)-235-8396.
37
USAA Mutual Funds Trust | Supplemental Information — continued March 31, 2021 | ||||||
(Unaudited)
Officers:
The officers of the Trust, their ages, commencement of service and their principal occupations during the past five years, are detailed in the following table. Each officer serves until the earlier of his or her resignation, removal, retirement, death, or the election of a successor. The mailing address of each officer of the Trust is 15935 La Cantera Pkwy, San Antonio, TX, 78256. The officers of the Trust receive no compensation directly from the Trust for performing the duties of their offices.
Name and Date of Birth | Position with the Trust | Year Commenced Service | Principal Occupation During Past 5 Years | ||||||||||||
Interested Officers.
| Christopher K. Dyer, Born February 1962 | President | 2019 | Director of Fund Administration, Victory Capital (since 2004); Chief Operating Officer, Victory Capital Services, Inc. (since 2020) | ||||||||||||
| Scott A Stahorsky, Born July 1969 | Vice President | 2019 | Manager, Fund Administration, Victory Capital (since 2015) | ||||||||||||
| James K. De Vries, Born April 1969 | Treasurer | 2018 | Executive Director, Victory Capital Management Inc. (since 2019); Treasurer, USAA ETF Trust (September 2018-June 2019); Executive Director, Investment and Financial Administration, USAA (April 2012-June 2019); Assistant Treasurer, USAA ETF Trust (June 2017-September 2018); Assistant Treasurer, USAA Mutual Funds Trust (December 2013-February 2018) | ||||||||||||
| Allan Shaer, Born March 1965 | Assistant Treasurer | 2019 | Senior Vice President, Financial Administration, Citi Fund Services Ohio, Inc. (since 2016); Vice President, Mutual Fund Administration, JP Morgan Chase (2011-2016) | ||||||||||||
| Carol D. Trevino, Born October 1965 | Assistant Treasurer | 2018 | Director, Accounting and Finance, Victory Capital Management Inc. (since 2019); Accounting/Financial Director, USAA (December 2013-June 2019); Assistant Treasurer, USAA ETF Trust (September 2018-June 2019) | ||||||||||||
| Erin G. Wagner, Born February 1974 | Secretary | 2019 | Deputy General Counsel, the Adviser (since 2013) | ||||||||||||
| Charles Booth, Born April 1960 | Anti-Money Laundering Compliance Officer and Identity Theft Officer | 2019 | Director, Regulatory Administration and CCO Support Services, Citi Fund Services Ohio, Inc. (since 2007) | ||||||||||||
| Amy Campos, Born July 1976 | Chief Compliance Officer | 2019 | Chief Compliance Officer, USAA Mutual Funds Trust (since 2019); Executive Director, Deputy Chief Compliance Officer, USAA Mutual Funds Trust and USAA ETF Trust (July 2017-June 2019); Compliance Director, USAA Mutual Funds Trust (2014-July 2017) | ||||||||||||
38
USAA Mutual Funds Trust | Supplemental Information — continued March 31, 2021 | ||||||
(Unaudited)
Proxy Voting and Portfolio Holdings Information
Proxy Voting:
Information regarding the policies and procedures the Fund uses to determine how to vote proxies relating to portfolio securities is available without charge, upon request, by calling (800) 235-8396. The information is also included in the Fund's Statement of Additional Information, which is available on the SEC's website at www.sec.gov.
Information relating to how the Fund voted proxies relating to portfolio securities held during the most recent 12 months ended June 30 is available on the SEC's website at www.sec.gov.
Availability of Schedules of Portfolio Investments:
The Trust files a complete list of Schedules of Portfolio Investments with the SEC for the first and third quarter of each fiscal year on Form N-PORT. Form N-PORT is available on the SEC's website at www.sec.gov.
Expense Examples
As a shareholder of the Fund, you may incur two types of costs: (1) transaction costs, including sales charges (loads) on purchases; and (2) ongoing costs, including management fees and other Fund expenses. These examples are intended to help you understand your ongoing costs (in dollars) of investing in the Fund and to compare these costs with the ongoing costs of investing in other mutual funds.
These examples are based on an investment of $1,000 invested at the beginning of the period and held for the entire period from October 1, 2020 through March 31, 2021.
The Actual Expense figures in the table below provide information about actual account values and actual expenses. You may use the information below, together with the amount you invested, to estimate the expenses that you paid over the period. Simply divide your account value by $1,000 (for example, an $8,600 account value divided by $1,000 = 8.6), then multiply the result by the number in the table under the heading entitled "Actual Expenses Paid During Period" to estimate the expenses you paid on your account during this period.
The Hypothetical Expense figures in the table below provide information about hypothetical account values and hypothetical expenses based on the Fund's actual expense ratio and an assumed rate of return of 5% per year before expenses, which is not the Fund's actual return. The hypothetical account values and expenses may not be used to estimate the actual ending account balance or expenses you paid for the period. You may use this information to compare this 5% hypothetical example with the 5% hypothetical examples that appear in shareholder reports of other funds.
Please note the expenses shown in the table below are meant to highlight your ongoing costs only and do not reflect any transactional costs. If these transactional costs were included, your costs would have been higher.
| Beginning Account Value 10/1/20 | Actual Ending Account Value 3/31/21 | Hypothetical Ending Account Value 3/31/21 | Actual Expenses Paid During Period 10/1/20- 3/31/21* | Hypothetical Expenses Paid During Period 10/1/20- 3/31/21* | Annualized Expense Ratio During Period 10/1/20- 3/31/21 | ||||||||||||||||||||||
Fund Shares | $ | 1,000.00 | $ | 1,025.90 | $ | 1,021.69 | $ | 3.28 | $ | 3.28 | 0.65 | % | |||||||||||||||
Institutional Shares | 1,000.00 | 1,026.20 | 1,021.89 | 3.08 | 3.07 | 0.61 | % | ||||||||||||||||||||
Class A | 1,000.00 | 1,024.90 | 1,020.59 | 4.39 | 4.38 | 0.87 | % | ||||||||||||||||||||
* Expenses are equal to the average account value multiplied by the Fund's annualized expense ratio multiplied by 182/365 (the number of days in the most recent fiscal half-year divided by the number of days in the fiscal year).
39
USAA Mutual Funds Trust | Supplemental Information — continued March 31, 2021 | ||||||
(Unaudited)
Additional Federal Income Tax Information
The following federal tax information related to the Fund's fiscal year ended March 31, 2021, is provided for information purposes only and should not be used for reporting to federal or state revenue agencies. Federal tax information for the calendar year will be reported to you on Form 1099-DIV in January 2022.
With respect to distributions paid, the Fund designates the following amounts (or, if subsequently determined to be different, the maximum amount allowable) for the fiscal year ended March 31, 2021 (amounts in thousands):
| Tax-Exempt Distributions | |||||||
$ | 6,219 | ||||||
40
USAA Mutual Funds Trust | Supplemental Information — continued March 31, 2021 | ||||||
(Unaudited)
Considerations of the Board in Continuing the Investment Advisory Agreement
USAA New York Bond Fund (the "Fund")
At a meeting of the Board of Trustees (the "Board") held on December 10-11, 2020, the Board, including the Trustees who are not "interested persons" (as that term is defined in the Investment Company Act of 1940, as amended) of the Trust (the "Independent Trustees"), approved for an annual period the continuance of the Investment Advisory Agreement (the "Advisory Agreement") between the Trust and Victory Capital Management Inc. (the "Adviser") with respect to the Fund. Prior to the December 10-11, 2020, meeting, at which the Advisory Agreement was approved, the Independent Trustees also discussed and considered information regarding the proposed continuation of the Advisory Agreement at a meeting held on November 19, 2020.
In advance of the foregoing meetings, the Trustees received and considered a variety of information relating to the Advisory Agreement and the Adviser, and were given the opportunity to ask questions and request additional information from management. The information provided to the Board included, among other things: (i) a separate report prepared by an independent third party of mutual fund data, which provided a statistical analysis comparing the Fund's investment performance, expenses, and fees to comparable investment companies; (ii) information concerning the services rendered to the Fund, as well as information regarding the Adviser's revenues and costs of providing services to the Fund and compensation paid to affiliates of the Adviser; and (iii) information about the Adviser's operations and personnel. Prior to voting, the Independent Trustees reviewed the proposed continuance of the Advisory Agreement with management and with experienced independent counsel retained by the Independent Trustees ("Independent Counsel") and received materials from such Independent Counsel discussing the legal standards for their consideration of the proposed continuation of the Advisory Agreement with respect to the Fund. The Independent Trustees also reviewed the proposed continuation of the Advisory Agreement with respect to the Fund in private sessions with Independent Counsel at which no representatives of management were present.
At each regularly scheduled meeting of the Board and its committees, the Board receives and reviews, among other things, information concerning the Fund's performance and related services provided by the Adviser. At the meeting at which the renewal of the Advisory Agreement is considered, particular focus is given to information concerning Fund performance, fees and total expenses as compared to comparable investment companies, and the Adviser's profitability with respect to the Fund. However, the Board noted that the evaluation process with respect to the Adviser is an ongoing one. In this regard, the Board's and its committees' consideration of the Advisory Agreement included information previously received at such meetings.
Advisory Agreement
After full consideration of a variety of factors, the Board, including the Independent Trustees, voted to approve the Advisory Agreement. In approving the Advisory Agreement, the Trustees did not identify any single factor as controlling, and each Trustee may have attributed different weights to various factors. Throughout their deliberations, the Independent Trustees were represented and assisted by Independent Counsel.
Nature, Extent, and Quality of Services — In considering the nature, extent, and quality of the services provided by the Adviser under the Advisory Agreement, the Board reviewed information provided by the Adviser relating to its operations and personnel. The Board also took into account its knowledge of the Adviser's management and the quality of the performance of the Adviser's duties through Board meetings, discussions, and reports during the preceding year. The Board considered the fees paid to the Adviser and the services provided to the Fund by the Adviser under the Advisory Agreement, as well as other services provided by the Adviser and its affiliates under other agreements, and the personnel who provide these services. In addition to the investment advisory services provided to the Fund, the Adviser and its affiliates provide administrative services, shareholder services, oversight of Fund accounting, marketing services, assistance in meeting legal and regulatory requirements, and other services necessary for the operation of the Fund and the Trust.
The Board considered the scope of services provided by, and the undertakings required of, the Adviser in connection with those services, including, among other things, maintaining (i) its own and the Fund's compliance programs, (ii) risk management programs, (iii) liquidity risk management programs, and (iv) cybersecurity
41
USAA Mutual Funds Trust | Supplemental Information — continued March 31, 2021 | ||||||
(Unaudited)
programs, each of which had expanded over time as a result of regulatory, market, and other developments. The Board also considered the significant risks assumed by the Adviser in connection with the services provided to the Fund, including investment, operational, enterprise, litigation, regulatory and compliance risks.
The Board considered the Adviser's management style and the performance of the Adviser's duties under the Advisory Agreement. The Board considered the level and depth of knowledge of the Adviser, including the professional experience and qualifications of its senior and investment personnel, as well as current staffing levels. The allocation of the Fund's brokerage, including the Adviser's process for monitoring "best execution," also was considered. The Adviser's role in coordinating the activities of the Fund's other service providers was also considered. The Board also considered the Adviser's risk management processes. The Board considered the Adviser's financial condition and that it had the financial wherewithal to continue to provide the same scope and high quality of services under the Advisory Agreement. In reviewing the Advisory Agreement, the Board focused on the experience, resources, and strengths of the Adviser and its affiliates in managing the Fund, as well as the other funds in the Trust.
The Board also reviewed the compliance and administrative services provided to the Fund by the Adviser and its affiliates, including the Adviser's oversight of the Fund's day-to-day operations and oversight of Fund accounting. The Trustees, guided also by information obtained from their experiences as trustees of the Trust, also focused on the quality of the Adviser's compliance and administrative staff.
Expenses and Performance — In connection with its consideration of the Advisory Agreement, the Board evaluated the Fund's advisory fees and total expense ratio as compared to other open-end investment companies deemed to be comparable to the Fund as determined by the independent third party in its report. The Fund's expenses were compared to (i) a group of investment companies chosen by the independent third party to be comparable to the Fund based upon certain factors, including fund type, comparability of investment objective and classification, sales load type, asset size, and expense components (the "expense group") and (ii) a larger group of investment companies with the same investment classification/objective as the Fund regardless of asset size, excluding outliers (the "expense universe"). Among other data, the Board noted that the Fund's management fee rate—which includes advisory and administrative services and the effects of any performance adjustment1, as well as any fee waivers and reimbursements—was above the median of its expense group and below the median of its expense universe. The data indicated that the Fund's total expenses, including after any reimbursements, were below the medians of its expense group and expense universe. The Board also took into account the Adviser's current undertakings to maintain expense limitations for the Fund. The Board took into account the various other services provided to the Fund by the Adviser and its affiliates, and noted the high quality of services received by the Fund.
In considering the Fund's performance, the Board noted that it reviews at its regularly scheduled meetings information about the Fund's performance results. The Trustees also reviewed various comparative data provided to them in connection with their consideration of the renewal of the Advisory Agreement, including, among other information, a comparison of the Fund's average annual total returns relative to its Lipper index and other mutual funds deemed to be in its peer group by the independent third party in its report (the "performance universe"). The Fund's performance universe consisted of the Fund and all retail and institutional open-end investment companies with the same classification/objective as the Fund regardless of asset size or primary channel of distribution. This comparison indicated that, among other data, the Fund's performance was above the average of its performance universe for the one-, three-, and ten-year periods ended September 30, 2020, and was below the average of its performance universe for the five-year period ended September 30, 2020, and was above its Lipper index for the one- and ten-year periods ended September 30, 2020, and was below its Lipper index for the three- and five-year periods ended September 30, 2020.
Compensation and Profitability — The Board took into consideration the level and method of computing the management fee. The information considered by the Board included operating profit margin information for the Adviser's business as a whole. The Board also received and considered profitability information related to the management revenues from the Fund. This information included a review of the methodology used in the allocation of certain costs to the Fund. In considering the profitability data with respect to the Fund, the Trustees
1 The Adviser has agreed that no performance adjustment (positive or negative) would be made to the amount payable to the Adviser from July 1, 2019, through June 30, 2020.
42
USAA Mutual Funds Trust | Supplemental Information — continued March 31, 2021 | ||||||
(Unaudited)
noted that the Adviser waived a portion of its management fees and/or reimbursed certain expenses with respect to the Fund. The Trustees reviewed the profitability of the Adviser's relationship with the Fund before tax expenses. The Board was also provided with a profitability analysis of other publicly traded asset managers prepared by an independent information service. In reviewing the overall profitability of the management fee to the Adviser, the Board also considered the fact that the Adviser and its affiliates provide shareholder servicing and administrative services to the Fund for which they receive compensation. The Board also considered the possible direct and indirect benefits to the Adviser from its relationship with the Trust, including that the Adviser may derive reputational and other benefits from its association with the Fund. The Trustees recognized that the Adviser should be entitled to earn a reasonable level of profits in exchange for the level of services it provides to the Fund and the entrepreneurial and other risks that it assumes as Adviser.
Economies of Scale — The Board noted that the Fund has advisory fee breakpoints that allow the Fund to participate in economies of scale and that such economies of scale were currently reflected in the advisory fee. The Board also considered the fee waiver and expense reimbursement arrangements by the Adviser. The Board also considered the effect of the Fund's change in size, if any, on its performance and fees, noting that the Fund may realize other economies of scale if assets increase proportionally more than expenses. The Board determined that the current investment management fee structure was reasonable.
Conclusions — The Board reached the following conclusions regarding the Fund's Advisory Agreement with the Adviser: (i) the Adviser has demonstrated that it possesses the capability and resources to perform the duties required of it under the Advisory Agreement; (ii) the Adviser maintains an appropriate compliance program; (iii) the overall performance of the Fund is reasonable in relation to the performance of funds with similar investment objectives and to relevant indices; (iv) the Fund's advisory expenses are reasonable in relation to those of similar funds and to the services to be provided by the Adviser; and (v) the Adviser's and its affiliates' level of profitability from their relationship with the Fund is reasonable in light of the nature and high quality of services provided by the Adviser and the type of fund. Based on its conclusions, the Board determined that continuation of the Advisory Agreement would be in the best interests of the Fund and its shareholders.
43
USAA Mutual Funds Trust | Supplemental Information — continued March 31, 2021 | ||||||
(Unaudited)
Liquidity Risk Management Program:
The USAA Mutual Funds have adopted and implemented a written liquidity risk management program (the "LRMP") as required by Rule 22e-4 under the Investment Company Act of 1940, as amended. The LRMP is reasonably designed to assess and manage the Fund's liquidity risk, taking into consideration the Fund's investment strategy and the liquidity of its portfolio investments during normal and reasonably foreseeable stressed market conditions; its short and long-term cash flow projections; and its cash holdings and access to other liquidity management tools such as available funding sources including the Victory Funds Complex Interfund Lending Facility and Line of Credit (discussed in the Notes to Financial Statements). The USAA Mutual Funds' Board of Trustees approved the appointment of the Funds' investment adviser, Victory Capital Management Inc. ("Victory Capital"), as the administrator of the LRMP.
Victory Capital manages liquidity risks associated with the Fund's investments by monitoring, among other things, cash and cash equivalents, any use of derivatives, the concentration of investments, the appropriateness of the Fund's investment strategy, and by classifying every fund investment as either highly liquid, moderately liquid, less liquid or illiquid on at least a monthly basis. To assist with the classification of Fund investments, Victory Capital has retained a third-party provider of liquidity evaluation services. This provider determines preliminary liquidity classifications for all portfolio holdings based upon portfolio-level data and certain assumptions provided by Victory Capital. Victory Capital reviews the preliminary liquidity classifications, and, when appropriate, considers other information including input from the Fund's portfolio managers (including the portfolio managers employed by any investment sub-advisers) in determining final liquidity classifications.
At a virtual video conference meeting held on March 10, 2021, Victory Capital provided an oral and written report to the Trustees on the operation and effectiveness of the LRMP during the previous year. The report from Victory Capital concluded that the Fund did not experience any significant liquidity challenges during the covered period, and the Fund's LRMP is reasonably designed to assess and manage its liquidity risk. The report also concluded that the LRMP continues to operate adequately and effectively to enable Victory Capital to oversee and manage liquidity risk and ensure the Fund is able to meet redemption requests without significant dilution to the remaining investors' interest in the Fund. During the review period, the Fund's portfolio consisted primarily of highly liquid investments, which are defined as cash and any investments reasonably expected to be converted to cash in current market conditions in three business days or less without significantly changing the market value of the investment. Therefore, the Fund has not adopted a Highly Liquid Investment Minimum. The Fund's investments were below the limitation on illiquid investments during the review period. Additionally, Victory Capital indicated that no events occurred that would require the filing of Form N-LIQUID and recommended no material changes to the LRMP.
44
Privacy Policy
Protecting the Privacy of Information
The Trust respects your right to privacy. We also know that you expect us to conduct and process your business in an accurate and efficient manner. To do so, we must collect and maintain certain personal information about you. This is the information we collect from you on applications or other forms, and from the transactions you make with us or third parties. It may include your name, address, social security number, account transactions and balances, and information about investment goals and risk tolerance.
We do not disclose any information about you or about former customers to anyone except as permitted or required by law. Specifically, we may disclose the information we collect to companies that perform services on our behalf, such as the transfer agent that processes shareholder accounts and printers and mailers that assist us in the distribution of investor materials. We may also disclose this information to companies that perform marketing services on our behalf. This allows us to continue to offer you Victory investment products and services that meet your investing needs, and to effect transactions that you request or authorize. These companies will use this information only in connection with the services for which we hired them. They are not permitted to use or share this information for any other purpose.
To protect your personal information internally, we permit access only by authorized employees and maintain physical, electronic and procedural safeguards to guard your personal information.*
* You may have received communications regarding information about privacy policies from other financial institutions which gave you the opportunity to "opt-out" of certain information sharing with companies which are not affiliated with that financial institution. The Trust does not share information with other companies for purposes of marketing solicitations for products other than the Trust. Therefore, the Trust does not provide opt-out options to their shareholders.
P.O. Box 182593
Columbus, Ohio 43218-2593

Visit our website at: | Call | ||||||
vcm.com | (800) 235-8396 | ||||||
40864-0521

MARCH 31, 2021
Annual Report
USAA Virginia Bond Fund
As permitted by regulations adopted by the Securities and Exchange Commission, paper copies of the Fund's shareholder reports may no longer be sent by mail, unless you specifically request paper copies of the reports from the Fund or from your financial intermediary, such as a broker-dealer or bank. Instead, the reports will be made available on VictoryFunds.com, and you will be notified by mail each time a report is posted and provided with a website link to access the report. If you already elected to receive shareholder reports electronically, you will not be affected by this change and you need not take any action.
You may elect to receive shareholder reports and other communications from the Fund or your financial intermediary electronically by notifying your financial intermediary directly, or if you are a shareholder who has an account directly with the Fund, by calling (800) 235-8396 or by submitting your request via email to TA.Processing@FISGlobal.com.
You may elect to receive all future reports in paper form free of charge. You can inform the Fund or your financial intermediary that you wish to continue receiving paper copies of your shareholder reports by notifying your financial intermediary directly, or if you are a shareholder who has an account directly with the Fund, by calling (800) 235-8396 or by submitting your request via email to TA.Processing@FISGlobal.com. Your election to receive reports in paper will apply to all funds held with the USAA Mutual Funds or your financial intermediary.
Victory Capital means Victory Capital Management Inc., the investment adviser of the USAA Mutual Funds. USAA Mutual Funds are distributed by Victory Capital Services, Inc., member of FINRA, an affiliate of Victory Capital. Victory Capital and its affiliates are not affiliated with United Services Automobile Association or its affiliates. USAA and the USAA logos are registered trademarks and the USAA Mutual Funds and USAA Investments logos are trademarks of United Services Automobile Association and are being used by Victory Capital and its affiliates under license.
www.vcm.com
News, Information And Education 24 Hours A Day, 7 Days A Week
The Victory Funds site gives fund shareholders, prospective shareholders, and investment professionals a convenient way to access fund information, get guidance, and track fund performance anywhere they can access the Internet. The site includes:
• Detailed performance records
• Daily share prices
• The latest fund news
• Investment resources to help you become a better investor
• A section dedicated to investment professionals
Whether you're a potential investor searching for the fund that matches your investment philosophy, a seasoned investor interested in planning tools, or an investment professional, www.vcm.com has what you seek. Visit us anytime. We're always open.
USAA Mutual Funds Trust
TABLE OF CONTENTS
Shareholder Letter (Unaudited) | 2 | ||||||
Managers' Commentary (Unaudited) | 4 | ||||||
Investment Overview (Unaudited) | 7 | ||||||
| Investment Objective & Portfolio Holdings (Unaudited) | 8 | ||||||
Schedule of Portfolio Investments | 10 | ||||||
Financial Statements | |||||||
Statement of Assets and Liabilities | 17 | ||||||
Statement of Operations | 18 | ||||||
Statements of Changes in Net Assets | 19 | ||||||
Financial Highlights | 22 | ||||||
Notes to Financial Statements | 24 | ||||||
| Report of Independent Registered Public Accounting Firm | 34 | ||||||
Supplemental Information (Unaudited) | 35 | ||||||
Trustees' and Officers' Information | 35 | ||||||
Proxy Voting and Portfolio Holdings Information | 41 | ||||||
Expense Example | 41 | ||||||
Additional Federal Income Tax Information | 42 | ||||||
Advisory Contract Agreement | 43 | ||||||
Liquidity Risk Management Program | 46 | ||||||
Privacy Policy (inside back cover) | |||||||
This report is for the information of the shareholders and others who have received a copy of the currently effective prospectus of the Fund, managed by Victory Capital Management Inc. It may be used as sales literature only when preceded or accompanied by a current prospectus, which provides further details about the Fund.
IRA DISTRIBUTION WITHHOLDING DISCLOSURE
We generally must withhold federal income tax at a rate of 10% of the taxable portion of your distribution and, if you live in a state that requires state income tax withholding, at your state's tax rate. However, you may elect not to have withholding apply or to have income tax withheld at a higher rate. Any withholding election that you make will apply to any subsequent distribution unless and until you change or revoke the election. If you wish to make a withholding election, or change or revoke a prior withholding election, call (800) 235-8396, and form W-4P (OMB No. 1545-0074 withholding certificate for pension or annuity payments) will be electronically sent.
If you do not have a withholding election in place by the date of a distribution, federal income tax will be withheld from the taxable portion of your distribution at a rate of 10%. If you must pay estimated taxes, you may be subject to estimated tax penalties if your estimated tax payments are not sufficient and sufficient tax is not withheld from your distribution.
For more specific information, please consult your tax adviser.
1
(Unaudited)
Dear Shareholder,
The annual reporting period ended March 31, 2021, was a year like no other. It wasn't that long ago that we were all coming to grips with an emerging global pandemic, economic shutdowns, and financial markets in turmoil. We somehow persevered and have even emerged from those challenging days—dare I say—with a renewed sense of optimism. In retrospect, the trajectory of financial markets over the past year was nothing short of extraordinary.
Consider everything that transpired over the past 12 months. A novel coronavirus ("COVID-19") and the subsequent worldwide spread of COVID-19 prompted governments everywhere to issue austere shelter-in-place orders, and the global economy slowed abruptly. Equity markets sold off, while unprecedented levels of volatility roiled traditionally placid bond markets. During the second quarter of 2020, domestic GDP contracted by an alarming annual rate of 31.4%, according to the U.S. Department of Commerce ("Commerce Department").
It's no surprise that many investors flocked to the perceived safety of U.S. Treasurys during this period of tumult. Meanwhile, liquidity evaporated (for a short spell) in other segments of the fixed-income world, including higher-yielding credits and municipal bonds. The outlook was tenuous, and credit spreads widened while prices declined for most securities perceived to be higher risk.
Fortunately, a response came swiftly. The U.S. Federal Reserve (the "Fed") and other monetary authorities worldwide leapt into action—cutting interest rates, (re)starting quantitative easing and, in the case of the Fed, launching an array of programs to provide liquidity to stabilize fixed-income markets. The U.S. government also stepped up to provide fiscal stimulus in the form of the Coronavirus Aid, Relief, and Economic Security Act ("CARES Act").
It was impressive how quickly those actions helped arrest the stock market's freefall and restore order across much of the fixed-income universe. The rebound was as robust as the drawdown, and third quarter 2020 GDP bounced back and grew at a 33.4% annualized rate, according to the Commerce Department.
Late in the year, financial markets were alternately fueled and roiled by a contentious election season, growing optimism for an effective vaccine, and a fluid debate regarding the need for additional fiscal stimulus. Ultimately, stocks were propelled higher in the fourth quarter as it became clear Congress would provide another dose of stimulus in the form of direct payments, more unemployment insurance, and additional aid to businesses.
As the year ended and we moved into the first quarter of 2021, stocks continued their upward trajectory. Meanwhile, the yield on the 10-Year U.S. Treasury continued rallying sharply, and many investors began to worry about inflation in the post-pandemic world.
Through all the unprecedented events and volatility, the S&P 500® Index registered an impressive annual return of 56.35% for the 12-month period ended March 31, 2021. Over this same period, the yield on the 10-Year U.S. Treasury jumped more than 100 basis points, reflecting both the very low starting rate and substantial fiscal
2
stimulus. At the end of the reporting period, the yield on the 10-Year U.S. Treasury was 1.74%
On the whole, markets endured and surprised to the upside, but perhaps the key takeaway is that the unexpected can and will happen. That's why it's important to remain focused on your long-term investment goals and avoid making emotional decisions.
On the following pages, you will find information relating to your USAA Mutual Funds, brought to you by Victory Capital. If you have any questions regarding the current market dynamics or your specific portfolio or investment plan, we encourage you to contact our Member Service Representatives. Call (800) 235-8396, or visit our website at www.vcm.com.
Thank you for letting us help you work toward your investment goals.

Christopher K. Dyer, CFA
President,
USAA Mutual Funds Trust
3
USAA Mutual Funds Trust
USAA Virginia Bond Fund
Manager's Commentary
(Unaudited)
Regina G. Conklin, CFA, CPA
Andrew Hattman, CFA, CAIA
Lauren Spalten*
• What were the market conditions during the reporting period?
Tax-exempt bonds as measured by the Bloomberg Barclays Municipal Bond Index generated positive returns during the 12-month reporting period ended March 31, 2021, due in part to falling municipal bond yields. (Bond prices and yields move in opposite directions.) However, the market saw significant volatility during the reporting period due primarily to COVID-19 and related economic and government reactions.
The reporting period began near the beginning of the COVID-19 crisis in the United States. The market had just sold off sharply in March 2020, and the first month of the reporting period was highlighted by significant volatility as the market reacted to COVID-19 and subsequent economic shutdowns, but also substantial fiscal and monetary response from the federal government. Starting in May 2020, the municipal market began a long, uneven recovery for the rest of the calendar year, driven by significant government intervention and investor expectations of a future return to normalcy. The recovery was marked by sizeable fund flows into tax-exempt mutual funds and material tightening of credit spreads (the yield difference between riskier bond yields and the safest bond yields). The recovery took a slight pause in the months ahead of the election, as uncertainty surrounding the election, as well as uncertainty around aid for municipal borrowers weighed on the market for a couple of months. However, the year ended with the market up significantly from the start of both the calendar year and the reporting period. January of 2021 saw a continuation of the market recovery, but the last part of the reporting period was highlighted by a sell-off in the municipal market as tax-exempt bonds finally succumbed to pressures caused by the meaningful increase in U.S. Treasury yields in the first quarter of 2021.
The end of the reporting period found the municipal market fighting the headwinds of potential higher U.S. Treasury rates and inflation, but with several notable tailwinds in support to include: heavy fund flows into tax-exempt mutual funds, investor expectations of increasing tax rates, and stimulus money flowing to municipal borrowers.
• How did the USAA Virginia Bond Fund (the "Fund") perform during the reporting period?
The Fund has three share classes: Fund Shares, Institutional Shares, and Class A (effective June 29, 2020, the Adviser Shares were redesignated Class A and became subject to a front-end sales charge). For the reporting period ended March 31, 2021, the Fund Shares and Class A had a total return of 5.53%, and 5.26% respectively, versus an average return of 5.01% for the funds in the Lipper Virginia Municipal Debt Funds category. This compares to returns of 5.17% for the Lipper Virginia Municipal Debt Funds Index and
*Effective March 2, 2021, Lauren Spalten was added as a portfolio manager on the Fund and John C. Bonnell was removed.
4
USAA Mutual Funds Trust
USAA Virginia Bond Fund (continued)
Manager's Commentary (continued)
5.51% for the Bloomberg Barclays Municipal Bond Index. The Institutional Shares commenced operations on June 29, 2020, and from that time through March 31, 2021, had a total return of 3.04%.
• What are the conditions in the Commonwealth of Virginia?
The Commonwealth of Virginia was significantly impacted by the COVID-19 pandemic, along with the rest of the country. However comparatively, Virginia fared better than most in terms of ultimate economic and fiscal impact, and the recovery has been relatively stable. Unemployment spiked to 11.3% in April 2020 but has slowly returned to lower levels, dropping down to 5.2% as of February 2021. Virginia continues to benefit from significant military and government sector employment throughout the Commonwealth.
Over the course of the year, Virginia legislators worked in special sessions to attempt to close the budget gap through expenditure cuts and freezes where possible. These efforts, coupled with better-than-anticipated income tax and sales tax revenues have helped preserve Virginia's exceptional liquidity and overall budgetary strength. According to Commonwealth officials, as of February 28, 2021, Virginia had approximately $7.3 billion in available cash and investments (equal to over 30% of the year's budget). The Commonwealth also received $3.3 billion in CARES Act funding to help offset pandemic related costs, and is expected to receive an additional $3.8 billion in direct federal aid as part of the American Rescue Plan Act.
While we will continue to monitor the ongoing impact from the current pandemic as well as the overall performance of the state, we continue to view the underlying credit quality of Virginia as exceptionally strong. At the end of the reporting period, Virginia remains rated AAA by all three credit-rating agencies.
• What strategies did you employ during the reporting period?
In keeping with our investment approach, we continued to focus on income generation. The Fund's long-term income distribution, not its price appreciation, accounts for most of its total return. Because of the Fund's income orientation, it has a higher allocation to BBB and A rated categories when compared to its peer group.
Our commitment to independent credit research continued to help us identify attractive opportunities for the Fund. We employ fundamental analysis that emphasizes an issuer's ability and willingness to repay its debt. Through our credit research, we strive both to recognize relative value and to avoid potential pitfalls, which is especially important in volatile times like the present. As always, we worked with our in-house team of analysts to select investments for the Fund on a bond-by-bond basis. Our team continuously monitors all the holdings in the Fund's portfolio.
The Fund continues to hold a diversified portfolio of longer-term, primarily investment- grade municipal bonds. To limit exposure to an unexpected event, the Fund is diversified
5
USAA Mutual Funds Trust
USAA Virginia Bond Fund (continued)
Manager's Commentary (continued)
by sector, issuer, and geography. In addition, we avoid bonds subject to the federal alternative minimum tax for individuals.
Thank you for allowing us to assist you with your investment needs.
6
USAA Mutual Funds Trust
USAA Virginia Bond Fund
Investment Overview
(Unaudited)
Average Annual Total Return
Year Ended March 31, 2021
Fund Shares | Institutional Shares | Class A | |||||||||||||||||||||||||
INCEPTION DATE | 10/10/90 | 6/29/20 | 8/1/10 | ||||||||||||||||||||||||
| Net Asset Value | Net Asset Value | Net Asset Value | Maximum Offering Price | Bloomberg Barclays Municipal Bond Index1 | Lipper Virginia Municipal Debt Funds Index2 | ||||||||||||||||||||||
One Year | 5.53 | % | NA | 5.26 | % | 2.88 | % | 5.51 | % | 5.17 | % | ||||||||||||||||
Five Year | 3.03 | % | NA | 2.78 | % | 2.33 | % | 3.49 | % | 2.71 | % | ||||||||||||||||
Ten Year | 4.45 | % | NA | 4.22 | % | 3.98 | % | 4.54 | % | 3.89 | % | ||||||||||||||||
Since Inception | NA | 3.04 | % | NA | NA | NA | NA | ||||||||||||||||||||
The performance data quoted represents past performance and current returns may be lower or higher. The investment return and principal value will fluctuate so that an investor's shares, when redeemed, may be worth more or less than the original cost. To obtain performance information current to the most recent month's end, please visit www.vcm.com.
The maximum offering price figures reflect a maximum sales charge of 2.25% for Class A. Net Asset Value does not reflect sales charges.
Total return measures the price change in a share assuming the reinvestment of all net investment income and realized capital gain distributions, if any. The total returns quoted do not reflect adjustments made to the enclosed financial statements in accordance with U.S. Generally Accepted Accounting Principles or the deduction of taxes that a shareholder would pay on net investment income and realized capital gain distributions, including reinvested distributions, or redemptions of shares. The total return figures set forth above include all waivers of fees. Without such fee waivers, the total returns would have been lower.
USAA Virginia Bond Fund — Growth of $10,000
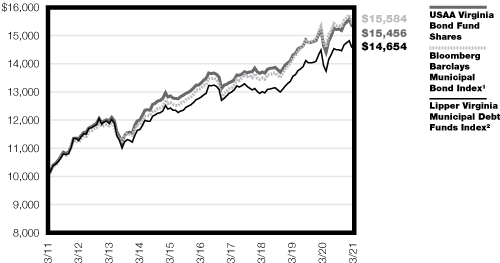
1The unmanaged, broad-based Bloomberg Barclays Municipal Bond Index tracks total return performance for the long-term, investment-grade, tax-exempt bond market. This index does not include the effect of sales charges, commissions, expenses or taxes, is not representative of the Fund, and it is not possible to invest directly in an index.
2The unmanaged Lipper Virginia Municipal Debt Funds Index measures the Fund's performance to that of the Lipper Virginia Municipal Debt Funds category. This index does not include the effect of sales charges, commissions, expenses or taxes, is not representative of the Fund, and it is not possible to invest directly in an index.
The graph reflects investment of growth of a hypothetical $10,000 investment in the Fund.
The graph and table do not reflect the deduction of taxes that a shareholder would pay on Fund distributions or the redemption of Fund shares.
Past performance is not indicative of future results.
7
| USAA Mutual Funds Trust USAA Virginia Bond Fund | March 31, 2021 | ||||||
(Unaudited)
Investment Objective & Portfolio Holdings:
The Fund's investment objective seeks to provide Virginia investors with a high level of current interest income that is exempt from federal and Virginia state income taxes.
Top 10 Industries
March 31, 2021
(% of Net Assets)
Hospital | 18.4 | % | |||||
Education | 16.0 | % | |||||
Appropriated Debt | 10.3 | % | |||||
Nursing/CCRC | 9.5 | % | |||||
Escrowed Bonds | 7.5 | % | |||||
Toll Road | 5.2 | % | |||||
Special Assessment/Tax/Fee | 4.7 | % | |||||
Health Miscellaneous | 4.1 | % | |||||
Water/Sewer Utility | 3.8 | % | |||||
General Obligation | 3.7 | % | |||||
Refer to the Schedule of Portfolio Investments for a complete list of securities.
8
| USAA Mutual Funds Trust USAA Virginia Bond Fund (continued) | March 31, 2021 | ||||||
(Unaudited)
Portfolio Ratings Mix:
March 31, 2021
(% of Net Assets)
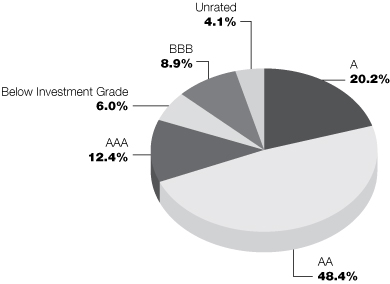
This chart reflects the highest long-term rating from a Nationally Recognized Statistical Rating Organization ("NRSRO"), with the four highest long-term credit ratings labeled, in descending order of credit quality, AAA, AA, A, and BBB. These categories represent investment-grade quality. NRSRO ratings are shown because they provide independent analysis of the credit quality of the Fund's investments. Victory Capital Management Inc. ("Adviser") also performs its own fundamental credit analysis of each security. As a part of its fundamental credit analysis, the Adviser considers various criteria, including industry specific actions, peer comparisons, payment ranking, and structure specific characteristics. Any of the Fund's securities that are not rated by an NRSRO appear in the chart above as "Unrated," but these securities are analyzed and monitored by the Adviser on an ongoing basis. Government securities that are issued or guaranteed as to principal and interest by the U.S. government and pre-refunded and escrowed-to-maturity municipal bonds that are not rated are treated as AAA for credit quality purposes.
9
| USAA Mutual Funds Trust USAA Virginia Bond Fund | Schedule of Portfolio Investments March 31, 2021 | ||||||
(Amounts in Thousands, Except for Shares)
Security Description | Principal Amount | Value | |||||||||
Municipal Bonds (99.1%) | |||||||||||
Virginia (90.0%): | |||||||||||
Amherst IDA Revenue | |||||||||||
5.00%, 9/1/26, Continuously Callable @100 | $ | 1,575 | $ | 1,575 | |||||||
4.75%, 9/1/30, Continuously Callable @100 | 2,000 | 1,918 | |||||||||
| Arlington County IDA Revenue 5.00%, 2/15/43, Continuously Callable @100 | 1,775 | 2,164 | |||||||||
4.00%, 7/1/45, Continuously Callable @100 | 1,585 | 1,826 | |||||||||
Campbell County IDA Revenue, 4.00%, 6/1/44, Continuously Callable @100 | 4,600 | 5,303 | |||||||||
| Capital Region Airport Commission Revenue Series A, 4.00%, 7/1/36, Continuously Callable @100 | 700 | 762 | |||||||||
Series A, 4.00%, 7/1/38, Continuously Callable @100 | 750 | 811 | |||||||||
| Charles City County Economic Development Authority Revenue, Series A, 2.88%, 2/1/29, Continuously Callable @101 | 10,000 | 11,072 | |||||||||
| Chesapeake Bay Bridge & Tunnel District Revenue 5.50%, 7/1/25 | 5,000 | 5,792 | |||||||||
5.00%, 7/1/51, Continuously Callable @100 | 9,240 | 10,532 | |||||||||
| Chesapeake Bay Bridge & Tunnel District Revenue (INS — Assured Guaranty Municipal Corp.), 5.00%, 7/1/41, Continuously Callable @100 | 5,000 | 5,938 | |||||||||
| Chesapeake Hospital Authority Revenue 4.00%, 7/1/39, Continuously Callable @100 | 1,000 | 1,143 | |||||||||
4.00%, 7/1/43, Continuously Callable @100 | 4,000 | 4,528 | |||||||||
| City of Chesapeake Expressway Toll Road Revenue 7/15/32, Continuously Callable @100 (a) | 6,520 | 6,969 | |||||||||
7/15/40, Continuously Callable @100 (g) | 3,000 | 3,207 | |||||||||
City of Lynchburg, GO, 4.00%, 6/1/44, Continuously Callable @100 | 5,000 | 5,442 | |||||||||
| City of Norfolk, GO Series A, 4.00%, 9/1/37, Continuously Callable @100 | 2,040 | 2,440 | |||||||||
Series A, 4.00%, 9/1/39, Continuously Callable @100 | 1,535 | 1,825 | |||||||||
| City of Norfolk, GO (LIQ — Bank of America Corp.), 0.08%, 8/1/37, Continuously Callable @100 (b) | 3,830 | 3,830 | |||||||||
| City of Portsmouth, GO 5.00%, 2/1/33, Pre-refunded 2/1/23 @ 100 | 880 | 957 | |||||||||
5.00%, 2/1/33, Continuously Callable @100 | 120 | 130 | |||||||||
| City of Richmond Public Utility Revenue 4.00%, 1/15/40, Continuously Callable @100 | 6,000 | 6,738 | |||||||||
Series A, 5.00%, 1/15/38, Pre-refunded 1/15/23 @ 100 | 6,000 | 6,513 | |||||||||
Series A, 4.00%, 1/15/50, Continuously Callable @100 | 1,730 | 2,012 | |||||||||
| City of Richmond, GO Series D, 5.00%, 3/1/32 | 800 | 1,109 | |||||||||
Series D, 5.00%, 3/1/33 | 1,000 | 1,412 | |||||||||
| Fairfax County Economic Development Authority Revenue 5.00%, 4/1/47, Continuously Callable @100 | 4,000 | 4,786 | |||||||||
Series A, 5.00%, 10/1/29, Continuously Callable @100 | 2,000 | 2,311 | |||||||||
Series A, 5.00%, 10/1/30, Continuously Callable @100 | 2,000 | 2,309 | |||||||||
Series A, 5.00%, 10/1/31, Continuously Callable @100 | 2,000 | 2,308 | |||||||||
Series A, 5.00%, 10/1/32, Continuously Callable @100 | 1,500 | 1,729 | |||||||||
Series A, 5.00%, 12/1/32, Continuously Callable @100 | 1,500 | 1,645 | |||||||||
Series A, 5.00%, 10/1/33, Continuously Callable @100 | 2,200 | 2,535 | |||||||||
Series A, 5.00%, 10/1/34, Continuously Callable @100 | 2,000 | 2,303 | |||||||||
See notes to financial statements.
10
| USAA Mutual Funds Trust USAA Virginia Bond Fund | Schedule of Portfolio Investments — continued March 31, 2021 | ||||||
(Amounts in Thousands, Except for Shares)
Security Description | Principal Amount | Value | |||||||||
Series A, 5.00%, 10/1/42, Continuously Callable @102 | $ | 2,250 | $ | 2,514 | |||||||
Series A, 4.00%, 10/1/42, Continuously Callable @102 | 2,750 | 2,924 | |||||||||
Series A, 5.00%, 12/1/42, Continuously Callable @100 | 2,800 | 2,986 | |||||||||
Series B, 5.00%, 10/1/35, Continuously Callable @100 | 2,620 | 3,232 | |||||||||
Series B, 5.00%, 10/1/36, Continuously Callable @100 | 2,000 | 2,464 | |||||||||
| Fairfax County Economic Development Authority Revenue (LIQ — Northern Trust Corp.), Series A, 0.05%, 12/1/33, Continuously Callable @100 (b) | 4,475 | 4,475 | |||||||||
| Fairfax County Economic Development Authority Revenue (LOC — SunTrust Bank), 0.09%, 6/1/37, Continuously Callable @100 (b) | 7,060 | 7,060 | |||||||||
| Fairfax County IDA Revenue 5.00%, 5/15/37, Continuously Callable @100 | 14,000 | 14,717 | |||||||||
4.00%, 5/15/42, Continuously Callable @100 | 1,000 | 1,039 | |||||||||
Series A, 4.00%, 5/15/44, Continuously Callable @100 | 6,900 | 7,474 | |||||||||
Series S, 4.00%, 5/15/48, Continuously Callable @100 | 1,500 | 1,708 | |||||||||
| Front Royal & Warren County IDA Revenue, 4.00%, 1/1/50, Continuously Callable @103 | 7,000 | 7,608 | |||||||||
| Greater Richmond Convention Center Authority Revenue, 5.00%, 6/15/32, Continuously Callable @100 | 1,500 | 1,717 | |||||||||
| Hampton Roads Sanitation District Revenue, Series A, 5.00%, 8/1/43, Pre-refunded 8/1/26 @ 100 | 4,700 | 5,781 | |||||||||
| Hampton Roads Transportation Accountability Commission Revenue Series A, 4.00%, 7/1/50, Continuously Callable @100 | 5,000 | 5,819 | |||||||||
Series A, 5.00%, 7/1/52, Continuously Callable @100 | 15,000 | 17,761 | |||||||||
| Hanover County Economic Development Authority Revenue 5.00%, 7/1/51, Continuously Callable @103 | 1,200 | 1,296 | |||||||||
Series A, 4.50%, 7/1/30, Continuously Callable @100 | 2,795 | 2,846 | |||||||||
Series A, 4.50%, 7/1/32, Continuously Callable @100 | 1,100 | 1,119 | |||||||||
Series A, 5.00%, 7/1/42, Continuously Callable @100 | 2,000 | 2,046 | |||||||||
| Henrico County Economic Development Authority Revenue 5.00%, 6/1/24, Continuously Callable @100 | 1,200 | 1,241 | |||||||||
4.25%, 6/1/26, Continuously Callable @100 | 140 | 143 | |||||||||
5.00%, 11/1/30, Pre-refunded 11/1/22 @ 100 | 2,105 | 2,266 | |||||||||
5.00%, 10/1/37, Continuously Callable @103 | 2,500 | 2,776 | |||||||||
4.00%, 10/1/40, Continuously Callable @103 | 500 | 539 | |||||||||
4.00%, 10/1/45, Continuously Callable @103 | 725 | 770 | |||||||||
4.00%, 10/1/50, Continuously Callable @103 | 1,500 | 1,582 | |||||||||
| Lewistown Commerce Center Community Development Authority Tax Allocation 3.63%, 3/1/44, Continuously Callable @103 | 1,422 | 1,169 | |||||||||
6.05%, 3/1/44, Continuously Callable @103 | 680 | 544 | |||||||||
Series C, 6.05%, 3/1/54, Continuously Callable @100 | 2,340 | 426 | |||||||||
| Lexington IDA Revenue 4.00%, 1/1/31, Continuously Callable @102 | 750 | 789 | |||||||||
4.00%, 1/1/37, Continuously Callable @102 | 1,000 | 1,029 | |||||||||
5.00%, 1/1/43, Pre-refunded 1/1/22 @ 100 | 2,000 | 2,072 | |||||||||
5.00%, 1/1/48, Continuously Callable @100 | 1,000 | 1,197 | |||||||||
Series A, 5.00%, 1/1/42, Continuously Callable @103 | 1,000 | 1,054 | |||||||||
Series A, 5.00%, 1/1/48, Continuously Callable @103 | 1,250 | 1,318 | |||||||||
| Loudoun County Economic Development Authority Revenue 5.00%, 12/1/31, Continuously Callable @100 | 1,135 | 1,316 | |||||||||
5.00%, 12/1/32, Continuously Callable @100 | 800 | 927 | |||||||||
See notes to financial statements.
11
| USAA Mutual Funds Trust USAA Virginia Bond Fund | Schedule of Portfolio Investments — continued March 31, 2021 | ||||||
(Amounts in Thousands, Except for Shares)
Security Description | Principal Amount | Value | |||||||||
5.00%, 12/1/33, Continuously Callable @100 | $ | 775 | $ | 898 | |||||||
5.00%, 12/1/34, Continuously Callable @100 | 805 | 932 | |||||||||
Series B, 0.04%, 2/15/38, Callable 5/3/21 @ 100 (b) | 8,545 | 8,545 | |||||||||
Series E, 0.08%, 2/15/38, Callable 5/3/21 @ 100 (b) | 7,255 | 7,255 | |||||||||
Series F, 0.08%, 2/15/38, Callable 5/3/21 @ 100 (b) | 12,810 | 12,810 | |||||||||
| Lynchburg Economic Development Authority Revenue 5.00%, 9/1/43, Continuously Callable @100 | 3,000 | 3,194 | |||||||||
Series A, 5.00%, 1/1/47, Continuously Callable @100 | 2,250 | 2,605 | |||||||||
| Lynchburg Economic Development Authority Revenue (LIQ — JPMorgan Chase & Co.), Series 2018-XL0075, 0.20%, 1/1/25 (b) (c) | 5,400 | 5,400 | |||||||||
| Lynchburg Economic Development Authority Revenue (LOC — Branch Banking & Trust Co.), Series C, 0.13%, 1/1/47, Continuously Callable @100 (b) | 1,965 | 1,965 | |||||||||
| Manassas Park Economic Development Authority Revenue, 4.00%, 12/15/52, Continuously Callable @100 | 4,500 | 5,111 | |||||||||
| Marquis Community Development Authority of York County Virginia Tax Allocation, Series B, 3.66%, 9/1/41 (d) | 3,532 | 1,695 | |||||||||
Marquis Community Development Authority Revenue, 9/1/45 (c) (d) (h) | 1,093 | 571 | |||||||||
Marquis Community Development Authority Tax Allocation, Series C, 9/1/41 (d) (e) | 5,389 | 248 | |||||||||
| Montgomery County Economic Development Authority Revenue Series A, 4.00%, 6/1/36, Continuously Callable @100 | 1,125 | 1,317 | |||||||||
Series A, 4.00%, 6/1/39, Continuously Callable @100 | 1,750 | 2,025 | |||||||||
| Norfolk Airport Authority Revenue, 5.00%, 7/1/43, Continuously Callable @100 | 2,800 | 3,328 | |||||||||
| Norfolk Economic Development Authority Revenue 5.00%, 11/1/30, Pre-refunded 11/1/22 @ 100 | 1,000 | 1,076 | |||||||||
Series A, 0.08%, 11/1/34, Continuously Callable @100 (b) | 1,900 | 1,900 | |||||||||
Series B, 5.00%, 11/1/43, Continuously Callable @100 | 3,500 | 3,740 | |||||||||
Series B, 5.00%, 11/1/48, (Put Date 11/1/28) (f) | 1,600 | 2,071 | |||||||||
Series B, 4.00%, 11/1/48, Continuously Callable @100 | 1,100 | 1,252 | |||||||||
| Prince Edward County IDA Revenue 4.00%, 9/1/43, Continuously Callable @100 | 2,250 | 2,472 | |||||||||
5.00%, 9/1/48, Continuously Callable @100 | 2,055 | 2,396 | |||||||||
| Prince William County IDA Revenue 5.50%, 9/1/31, Pre-refunded 9/1/21 @ 100 | 1,705 | 1,742 | |||||||||
5.50%, 9/1/31, Pre-refunded 9/1/21 @ 100 | 2,000 | 2,044 | |||||||||
5.50%, 9/1/34, Pre-refunded 9/1/21 @ 100 | 1,000 | 1,022 | |||||||||
5.00%, 1/1/37, Continuously Callable @102 | 1,000 | 1,024 | |||||||||
5.00%, 1/1/46, Continuously Callable @102 | 4,000 | 4,028 | |||||||||
5.00%, 11/1/46, Continuously Callable @100 | 10,000 | 10,663 | |||||||||
| Radford IDA Revenue (NBGA — Fannie Mae), 3.50%, 9/15/29, Continuously Callable @100 | 4,000 | 4,143 | |||||||||
| Rappahannock Regional Jail Authority Revenue 5.00%, 10/1/34, Pre-refunded 10/1/25 @ 100 | 2,340 | 2,807 | |||||||||
5.00%, 10/1/35, Pre-refunded 10/1/25 @ 100 | 1,165 | 1,398 | |||||||||
| Roanoke Economic Development Authority Revenue 5.00%, 7/1/47 | 6,250 | 9,249 | |||||||||
4.00%, 7/1/51, Continuously Callable @100 | 5,000 | 5,772 | |||||||||
Series A, 5.00%, 9/1/36, Continuously Callable @100 | 1,640 | 1,908 | |||||||||
Series A, 5.00%, 9/1/43, Continuously Callable @100 | 4,060 | 4,617 | |||||||||
| Rockingham County Economic Development Authority Revenue 4.00%, 12/1/33, Continuously Callable @100 | 1,000 | 1,134 | |||||||||
See notes to financial statements.
12
| USAA Mutual Funds Trust USAA Virginia Bond Fund | Schedule of Portfolio Investments — continued March 31, 2021 | ||||||
(Amounts in Thousands, Except for Shares)
Security Description | Principal Amount | Value | |||||||||
5.00%, 12/1/39, Continuously Callable @100 | $ | 4,180 | $ | 4,993 | |||||||
| Salem Economic Development Authority Revenue 4.00%, 4/1/38, Continuously Callable @100 | 250 | 273 | |||||||||
4.00%, 4/1/39, Continuously Callable @100 | 225 | 245 | |||||||||
4.00%, 4/1/40, Continuously Callable @100 | 250 | 271 | |||||||||
4.00%, 4/1/45, Continuously Callable @100 | 750 | 805 | |||||||||
5.00%, 4/1/49, Continuously Callable @100 | 910 | 1,052 | |||||||||
| Stafford County Economic Development Authority Revenue 5.00%, 6/15/36, Continuously Callable @100 | 5,900 | 6,903 | |||||||||
4.00%, 6/15/37, Continuously Callable @100 | 6,495 | 7,163 | |||||||||
| Tobacco Settlement Financing Corp. Revenue, Series B-1, 5.00%, 6/1/47, Continuously Callable @100 | 10,000 | 10,086 | |||||||||
| University of Virginia Revenue Series A, 5.00%, 6/1/37, Pre-refunded 6/1/23 @ 100 | 4,405 | 4,860 | |||||||||
Series A, 5.00%, 4/1/42, Continuously Callable @100 | 4,000 | 4,853 | |||||||||
Series A, 5.00%, 4/1/47, Continuously Callable @100 | 5,000 | 6,025 | |||||||||
Series A-1, 4.00%, 4/1/45, Continuously Callable @100 | 5,000 | 5,479 | |||||||||
Series B, 5.00%, 4/1/46, Continuously Callable @100 | 5,000 | 6,028 | |||||||||
| Upper Occoquan Sewage Authority Revenue, 4.00%, 7/1/39, Pre-refunded 7/1/25 @ 100 | 5,000 | 5,740 | |||||||||
| Virginia Beach Development Authority Revenue 5.00%, 9/1/40, Continuously Callable @103 | 3,250 | 3,659 | |||||||||
5.00%, 9/1/44, Continuously Callable @103 | 4,865 | 5,411 | |||||||||
4.00%, 9/1/48, Continuously Callable @103 | 3,755 | 3,943 | |||||||||
Series A, 5.00%, 5/1/29, Continuously Callable @100 | 1,795 | 2,045 | |||||||||
| Virginia College Building Authority Revenue 5.00%, 6/1/29, Continuously Callable @100 | 5,000 | 5,002 | |||||||||
5.00%, 2/1/31, Continuously Callable @100 | 10,000 | 12,578 | |||||||||
5.00%, 2/1/32, Continuously Callable @100 | 4,000 | 5,012 | |||||||||
4.00%, 1/15/33, Continuously Callable @100 | 965 | 1,107 | |||||||||
4.00%, 1/15/35, Continuously Callable @100 | 545 | 619 | |||||||||
4.00%, 1/15/36, Continuously Callable @100 | 650 | 736 | |||||||||
5.00%, 6/1/36, Continuously Callable @100 | 11,710 | 11,684 | |||||||||
4.00%, 1/15/43, Continuously Callable @100 | 1,285 | 1,430 | |||||||||
Series A, 5.00%, 9/1/31, Pre-refunded 9/1/24 @ 100 | 2,725 | 3,154 | |||||||||
Series A, 5.00%, 9/1/32, Pre-refunded 9/1/24 @ 100 | 5,615 | 6,499 | |||||||||
Series A, 5.00%, 9/1/33, Pre-refunded 9/1/24 @ 100 | 6,380 | 7,384 | |||||||||
Series A, 4.00%, 2/1/35, Continuously Callable @100 | 8,000 | 8,975 | |||||||||
| Virginia College Building Authority Revenue (LIQ — Wells Fargo & Co.), 0.05%, 11/1/36, Continuously Callable @100 (b) | 4,560 | 4,560 | |||||||||
| Virginia College Building Authority Revenue (LIQ — U.S. Bancorp), 0.05%, 8/1/34, Callable 5/5/21 @ 100 (b) | 2,200 | 2,200 | |||||||||
| Virginia Commonwealth Transportation Board Revenue 5.00%, 3/15/32, Continuously Callable @100 | 3,350 | 4,167 | |||||||||
5.00%, 9/15/32, Continuously Callable @100 | 9,190 | 11,404 | |||||||||
4.00%, 5/15/42, Continuously Callable @100 | 10,000 | 11,420 | |||||||||
Series A, 4.00%, 5/15/36, Continuously Callable @100 | 2,000 | 2,327 | |||||||||
| Virginia Commonwealth University Health System Authority Revenue 4.75%, 7/1/36, Pre-refunded 7/1/21 @ 100 | 6,315 | 6,385 | |||||||||
4.75%, 7/1/41, Pre-refunded 7/1/21 @ 100 | 3,000 | 3,033 | |||||||||
5.00%, 7/1/46, Continuously Callable @100 | 5,500 | 6,562 | |||||||||
See notes to financial statements.
13
| USAA Mutual Funds Trust USAA Virginia Bond Fund | Schedule of Portfolio Investments — continued March 31, 2021 | ||||||
(Amounts in Thousands, Except for Shares)
Security Description | Principal Amount | Value | |||||||||
| Virginia Commonwealth University Revenue Series A, 4.00%, 11/1/37, Continuously Callable @100 | $ | 750 | $ | 871 | |||||||
Series A, 5.00%, 11/1/38, Continuously Callable @100 | 350 | 434 | |||||||||
Series A, 4.00%, 5/1/48, Continuously Callable @100 | 2,475 | 2,804 | |||||||||
| Virginia Housing Development Authority Revenue Series B, 4.50%, 10/1/36, Continuously Callable @100 | 3,175 | 3,175 | |||||||||
Series B, 3.60%, 5/1/46, Continuously Callable @100 | 7,000 | 7,304 | |||||||||
Series E, 2.65%, 7/1/50, Continuously Callable @100 | 1,640 | 1,646 | |||||||||
Series I, 2.45%, 11/1/45, Continuously Callable @100 | 1,500 | 1,478 | |||||||||
| Virginia Public Building Authority Revenue, Series A, 4.00%, 8/1/30, Continuously Callable @100 | 4,000 | 4,730 | |||||||||
Virginia Public School Authority Revenue, 5.00%, 8/1/24 | 10,000 | 11,542 | |||||||||
| Virginia Resources Authority Revenue 5.00%, 11/1/32, Continuously Callable @100 | 80 | 89 | |||||||||
5.00%, 11/1/32, Pre-refunded 11/1/23 @ 100 | 950 | 1,066 | |||||||||
4.00%, 11/1/41, Pre-refunded 11/1/22 @ 100 | 7,310 | 7,751 | |||||||||
4.00%, 11/1/49, Continuously Callable @100 | 6,700 | 7,879 | |||||||||
| Virginia Resources Authority Revenue (LIQ — JPMorgan Chase & Co.), Series 2016-XF0453, 0.08%, 5/1/21 (b) (c) | 5,000 | 5,000 | |||||||||
| Virginia Small Business Financing Authority Revenue 4.00%, 11/1/39, Continuously Callable @100 | 2,550 | 2,994 | |||||||||
4.00%, 12/1/49, Continuously Callable @100 | 6,000 | 6,851 | |||||||||
Series A, 4.00%, 1/1/45, Continuously Callable @103 | 3,000 | 3,288 | |||||||||
Series A, 4.00%, 1/1/51, Continuously Callable @103 | 13,265 | 14,448 | |||||||||
| Virginia Small Business Financing Authority Revenue (LOC — Bank of America Corp.), 0.07%, 7/1/30 (b) | 1,840 | 1,840 | |||||||||
| Virginia Small Business Financing Authority Revenue (LOC — PNC Financial Services Group), Series A, 0.05%, 7/1/42, Continuously Callable @100 (b) | 14,025 | 14,025 | |||||||||
| Western Regional Jail Authority Revenue 5.00%, 12/1/35, Continuously Callable @100 | 1,540 | 1,831 | |||||||||
5.00%, 12/1/35, Pre-refunded 12/1/26 @ 100 | 1,545 | 1,916 | |||||||||
5.00%, 12/1/38, Continuously Callable @100 | 1,000 | 1,182 | |||||||||
5.00%, 12/1/38, Pre-refunded 12/1/26 @ 100 | 1,000 | 1,240 | |||||||||
| Winchester Economic Development Authority Revenue 5.00%, 1/1/44, Continuously Callable @100 | 3,250 | 3,743 | |||||||||
Series S, 5.00%, 1/1/44, Pre-refunded 1/1/24 @ 100 | 3,250 | 3,671 | |||||||||
| Wise County IDA Revenue, Series A, 0.75%, 10/1/40, (Put Date 9/2/25) (f) | 2,500 | 2,493 | |||||||||
669,338 | |||||||||||
District of Columbia (3.1%): | |||||||||||
| Metropolitan Washington Airports Authority Dulles Toll Road Revenue 5.00%, 10/1/53, Continuously Callable @100 | 4,000 | 4,155 | |||||||||
4.00%, 10/1/53, Continuously Callable @100 | 1,500 | 1,678 | |||||||||
Series A, 5.00%, 10/1/44, Continuously Callable @100 | 1,500 | 1,825 | |||||||||
| Metropolitan Washington Airports Authority Dulles Toll Road Revenue (INS — Assured Guaranty Municipal Corp.), Series B, 10/1/30 (e) | 5,500 | 4,693 | |||||||||
| Metropolitan Washington Airports Authority Revenue (LOC — Sumitomo Mitsui Banking Corp.), Series C-2, 0.05%, 10/1/39, Continuously Callable @100 (b) | 1,910 | 1,910 | |||||||||
See notes to financial statements.
14
| USAA Mutual Funds Trust USAA Virginia Bond Fund | Schedule of Portfolio Investments — continued March 31, 2021 | ||||||
(Amounts in Thousands, Except for Shares)
Security Description | Principal Amount | Value | |||||||||
| Washington Metropolitan Area Transit Authority Revenue 5.00%, 7/1/43, Continuously Callable @100 | $ | 5,000 | $ | 5,996 | |||||||
Series A, 4.00%, 7/15/45, Continuously Callable @100 | 2,500 | 2,910 | |||||||||
23,167 | |||||||||||
Guam (6.0%): | |||||||||||
| Antonio B. Won Pat International Airport Authority Revenue (INS — Assured Guaranty Municipal Corp.), Series B, 5.75%, 10/1/43, Continuously Callable @100 | 1,255 | 1,395 | |||||||||
| Guam Government Waterworks Authority Revenue 5.00%, 7/1/37, Continuously Callable @100 | 1,000 | 1,175 | |||||||||
5.00%, 7/1/40, Continuously Callable @100 | 3,250 | 3,796 | |||||||||
5.50%, 7/1/43, Pre-refunded 7/1/23 @ 100 | 4,000 | 4,454 | |||||||||
Series A, 5.00%, 7/1/35, Continuously Callable @100 | 2,850 | 3,158 | |||||||||
Series A, 5.00%, 1/1/50, Continuously Callable @100 | 1,000 | 1,201 | |||||||||
| Guam Power Authority Revenue Series A, 5.00%, 10/1/31, Continuously Callable @100 | 500 | 559 | |||||||||
Series A, 5.00%, 10/1/34, Continuously Callable @100 | 1,000 | 1,054 | |||||||||
Series A, 5.00%, 10/1/40, Continuously Callable @100 | 4,000 | 4,583 | |||||||||
| Guam Power Authority Revenue (INS — Assured Guaranty Municipal Corp.) Series A, 5.00%, 10/1/39, Continuously Callable @100 | 750 | 839 | |||||||||
Series A, 5.00%, 10/1/44, Continuously Callable @100 | 1,000 | 1,092 | |||||||||
| Port Authority of Guam Revenue, Series A, 5.00%, 7/1/48, Continuously Callable @100 | 1,500 | 1,747 | |||||||||
| Territory of Guam Revenue Series A, 5.00%, 11/1/27 | 200 | 241 | |||||||||
Series A, 5.00%, 11/1/28 | 250 | 306 | |||||||||
Series A, 5.00%, 11/1/29 | 250 | 310 | |||||||||
Series A, 5.00%, 11/1/30 | 250 | 313 | |||||||||
Series A, 5.00%, 11/1/35, Continuously Callable @100 | 1,000 | 1,232 | |||||||||
Series A, 5.00%, 11/1/40, Continuously Callable @100 | 1,000 | 1,211 | |||||||||
Series A, 5.00%, 12/1/46, Continuously Callable @100 | 1,250 | 1,398 | |||||||||
Series B-1, 5.00%, 1/1/42, Continuously Callable @100 | 1,500 | 1,527 | |||||||||
Series D, 5.00%, 11/15/39, Continuously Callable @100 | 2,000 | 2,218 | |||||||||
| Territory of Guam Revenue (LOC — Barclays Bank PLC), Series 2017-XF2510, 0.25%, 12/1/46, Callable 12/1/26 @ 100 (b) (c) | 10,870 | 10,870 | |||||||||
44,679 | |||||||||||
Total Municipal Bonds (Cost $703,572) | 737,184 | ||||||||||
Total Investments (Cost $703,572) — 99.1% | 737,184 | ||||||||||
Other assets in excess of liabilities — 0.9% | 7,028 | ||||||||||
NET ASSETS — 100.00% | $ | 744,212 | |||||||||
(a) Stepped-coupon security converts to coupon form on 7/15/23 with a rate of 4.75%
(b) Variable Rate Demand Notes that provide the rights to sell the security at face value on either that day or within the rate-reset period. The interest rate is reset on the put date at a stipulated daily, weekly, monthly, quarterly, or other specified time interval to reflect current market conditions. These securities do not indicate a reference rate and spread in their description.
See notes to financial statements.
15
| USAA Mutual Funds Trust USAA Virginia Bond Fund | Schedule of Portfolio Investments — continued March 31, 2021 | ||||||
(c) Rule 144A security or other security that is restricted as to resale to institutional investors. The Fund's Adviser has deemed this security to be liquid based upon procedures approved by the Board of Trustees. As of March 31, 2021, the fair value of these securities was $21,841 (thousands) and amounted to 2.9% of net assets.
(d) This security is classified as Level 3 within the fair value hierarchy. (See Note 2 in the Notes to Financial Statements)
(e) Zero-coupon bond.
(f) Put Bond.
(g) Stepped-coupon security converts to coupon form on 7/15/23 with a rate of 4.88%.
(h) Stepped-coupon security converts to coupon form on 9/01/21 with a rate of 7.50%.
Continuously callable — Investment is continuously callable or will be continuously callable on any date after the first call date until its maturity.
GO — General Obligation
IDA — Industrial Development Authority
LOC — Letter of Credit
PLC — Public Limited Company
Credit Enhancements — Adds the financial strength of the provider of the enhancement to support the issuer's ability to repay the principal and interest payments when due. The enhancement may be provided by a high-quality bank, insurance company or other corporation, or a collateral trust. The enhancements do not guarantee the market values of the securities.
INS Principal and interest payments are insured by the name listed. Although bond insurance reduces the risk of loss due to default by an issuer, such bonds remain subject to the risk that value may fluctuate for other reasons, and there is no assurance that the insurance company will meet its obligations.
LIQ Liquidity enhancement that may, under certain circumstances, provide for repayment of principal and interest upon demand from the name listed.
LOC Principal and interest payments are guaranteed by a bank letter of credit or other bank credit agreement.
NBGA Principal and interest payments or, under certain circumstances, underlying mortgages are guaranteed by a nonbank guarantee agreement from the name listed.
See notes to financial statements.
16
USAA Mutual Funds Trust | Statement of Assets and Liabilities March 31, 2021 | ||||||
(Amounts in Thousands, Except Per Share Amounts)
| USAA Virginia Bond Fund | |||||||
Assets: | |||||||
Investments, at value (Cost $703,572) | $ | 737,184 | |||||
Cash | 277 | ||||||
Receivables: | |||||||
Interest | 7,298 | ||||||
Capital shares issued | 341 | ||||||
From Adviser | 4 | ||||||
Prepaid expenses and other assets | 6 | ||||||
Total Assets | 745,110 | ||||||
Liabilities: | |||||||
Payables: | |||||||
Distributions | 212 | ||||||
Capital shares redeemed | 288 | ||||||
Accrued expenses and other payables: | |||||||
Investment advisory fees | 201 | ||||||
Administration fees | 94 | ||||||
Custodian fees | 5 | ||||||
Transfer agent fees | 31 | ||||||
Compliance fees | — | (a) | |||||
Trustees' fees | — | (a) | |||||
| 12b-1 fees | 2 | ||||||
Other accrued expenses | 65 | ||||||
Total Liabilities | 898 | ||||||
Net Assets: | |||||||
Capital | 719,978 | ||||||
Total accumulated earnings/(loss) | 24,234 | ||||||
Net Assets | $ | 744,212 | |||||
Net Assets | |||||||
Fund Shares | $ | 713,075 | |||||
Institutional Shares | 12,105 | ||||||
Class A | 19,032 | ||||||
Total | $ | 744,212 | |||||
Shares (unlimited number of shares authorized with no par value): | |||||||
Fund Shares | 61,428 | ||||||
Institutional Shares | 1,043 | ||||||
Class A | 1,640 | ||||||
Total | 64,111 | ||||||
Net asset value, offering and redemption price per share: (b) | |||||||
Fund Shares | $ | 11.61 | |||||
Institutional Shares | $ | 11.61 | |||||
Class A | $ | 11.60 | |||||
Maximum Sales Charge — Class A | 2.25 | % | |||||
Maximum offering price | |||||||
| (100%/(100%-maximum sales charge) of net asset value adjusted to the nearest cent) per share — Class A | $ | 11.87 | |||||
(a) Rounds to less than $1 thousand.
(b) Per share amount may not recalculate due to rounding of net assets and/or shares outstanding.
See notes to financial statements.
17
USAA Mutual Funds Trust | Statement of Operations For the Year Ended March 31, 2021 | ||||||
(Amounts in Thousands)
| USAA Virginia Bond Fund | |||||||
Investment Income: | |||||||
Interest | $ | 20,576 | |||||
Total Income | 20,576 | ||||||
Expenses: | |||||||
Investment advisory fees | 2,158 | ||||||
Administration fees — Fund Shares | 1,057 | ||||||
Administration fees — Institutional Shares (a) | 6 | ||||||
Administration fees — Class A | 28 | ||||||
Sub-Administration fees | 20 | ||||||
| 12b-1 fees — Class A | 47 | ||||||
Custodian fees | 13 | ||||||
Transfer agent fees — Fund Shares | 184 | ||||||
Transfer agent fees — Institutional Shares (a) | 6 | ||||||
Transfer agent fees — Class A | 17 | ||||||
Trustees' fees | 41 | ||||||
Compliance fees | 5 | ||||||
Legal and audit fees | 62 | ||||||
State registration and filing fees | 4 | ||||||
Other expenses | 68 | ||||||
Total Expenses | 3,716 | ||||||
Expenses waived/reimbursed by Adviser | (15 | ) | |||||
Net Expenses | 3,701 | ||||||
Net Investment Income (Loss) | 16,875 | ||||||
Realized/Unrealized Gains (Losses) from Investments: | |||||||
Net realized gains (losses) from investment securities | 137 | ||||||
Net change in unrealized appreciation/depreciation on investment securities | 21,658 | ||||||
Net realized/unrealized gains (losses) on investments | 21,795 | ||||||
Change in net assets resulting from operations | $ | 38,670 | |||||
(a) Institutional Shares commenced operations on June 29, 2020.
See notes to financial statements.
18
USAA Mutual Funds Trust | Statements of Changes in Net Assets | ||||||
(Amounts in Thousands)
USAA Virginia Bond Fund | |||||||||||
| Year Ended March 31, 2021 | Year Ended March 31, 2020 | ||||||||||
From Investments: | |||||||||||
Operations: | |||||||||||
Net investment income (loss) | $ | 16,875 | $ | 19,474 | |||||||
Net realized gains (losses) from investments | 137 | 380 | |||||||||
| Net change in unrealized appreciation/depreciation on investments | 21,658 | (4,249 | ) | ||||||||
Change in net assets resulting from operations | 38,670 | 15,605 | |||||||||
Distributions to Shareholders: | |||||||||||
Fund Shares | (16,365 | ) | (19,127 | ) | |||||||
Institutional Shares (a) | (132 | ) | — | ||||||||
Class A | (388 | ) | (493 | ) | |||||||
Change in net assets resulting from distributions to shareholders | (16,885 | ) | (19,620 | ) | |||||||
Change in net assets resulting from capital transactions | 17,248 | 17,564 | |||||||||
Change in net assets | 39,033 | 13,549 | |||||||||
Net Assets: | |||||||||||
Beginning of period | 705,179 | 691,630 | |||||||||
End of period | $ | 744,212 | $ | 705,179 | |||||||
(a) Institutional Shares commenced operations on June 29, 2020.
(continues on next page)
See notes to financial statements.
19
USAA Mutual Funds Trust | Statements of Changes in Net Assets | ||||||
(Amounts in Thousands) (continued)
USAA Virginia Bond Fund | |||||||||||
| Year Ended March 31, 2021 | Year Ended March 31, 2020 | ||||||||||
Capital Transactions: | |||||||||||
Fund Shares | |||||||||||
Proceeds from shares issued | $ | 90,498 | $ | 92,819 | |||||||
Distributions reinvested | 13,707 | 15,757 | |||||||||
Cost of shares redeemed | (97,801 | ) | (91,351 | ) | |||||||
Total Fund Shares | $ | 6,404 | $ | 17,225 | |||||||
Institutional Shares (a) | |||||||||||
Proceeds from shares issued | $ | 12,682 | $ | — | |||||||
Distributions reinvested | 53 | — | |||||||||
Cost of shares redeemed | (697 | ) | — | ||||||||
Total Institutional Shares | $ | 12,038 | $ | — | |||||||
Class A | |||||||||||
Proceeds from shares issued | $ | 22,363 | $ | 3,929 | |||||||
Distributions reinvested | 375 | 482 | |||||||||
Cost of shares redeemed | (23,932 | ) | (4,072 | ) | |||||||
Total Class A | $ | (1,194 | ) | $ | 339 | ||||||
Change in net assets resulting from capital transactions | $ | 17,248 | $ | 17,564 | |||||||
Share Transactions: | |||||||||||
Fund Shares | |||||||||||
Issued | 7,843 | 8,111 | |||||||||
Reinvested | 1,189 | 1,374 | |||||||||
Redeemed | (8,490 | ) | (8,081 | ) | |||||||
Total Fund Shares | 542 | 1,404 | |||||||||
Institutional Shares (a) | |||||||||||
Issued | 1,098 | — | |||||||||
Reinvested | 5 | — | |||||||||
Redeemed | (60 | ) | — | ||||||||
Total Institutional Shares | 1,043 | — | |||||||||
Class A | |||||||||||
Issued | 1,949 | 343 | |||||||||
Reinvested | 33 | 42 | |||||||||
Redeemed | (2,090 | ) | (358 | ) | |||||||
Total Class A | (108 | ) | 27 | ||||||||
Change in Shares | 1,477 | 1,431 | |||||||||
(a) Institutional Shares commenced operations on June 29, 2020.
See notes to financial statements.
20
This page is intentionally left blank.
21
USAA Mutual Funds Trust | Financial Highlights | ||||||
For a Share Outstanding Throughout Each Period
Investment Activities | Distributions to Shareholders From | ||||||||||||||||||||||||||
| Net Asset Value, Beginning of Period | Net Investment Income (Loss) | Net Realized and Unrealized Gains (Losses) on Investments | Total from Investment Activities | Net Investment Income | Total Distributions | ||||||||||||||||||||||
USAA Virginia Bond Fund | |||||||||||||||||||||||||||
Fund Shares | |||||||||||||||||||||||||||
| Year Ended March 31, 2021 | $ | 11.26 | 0.27 | (e) | 0.35 | 0.62 | (0.27 | ) | (0.27 | ) | |||||||||||||||||
| Year Ended March 31, 2020 | $ | 11.30 | 0.31 | (e) | (0.04 | ) | 0.27 | (0.31 | ) | (0.31 | ) | ||||||||||||||||
| Year Ended March 31, 2019 | $ | 11.16 | 0.34 | 0.14 | 0.48 | (0.34 | ) | (0.34 | ) | ||||||||||||||||||
| Year Ended March 31, 2018 | $ | 11.21 | 0.34 | (0.05 | ) | 0.29 | (0.34 | ) | (0.34 | ) | |||||||||||||||||
| Year Ended March 31, 2017 | $ | 11.52 | 0.35 | (0.31 | ) | 0.04 | (0.35 | ) | (0.35 | ) | |||||||||||||||||
Institutional Shares | |||||||||||||||||||||||||||
| June 29, 2020 (f) through March 31, 2021 | $ | 11.46 | 0.20 | (e) | 0.15 | 0.35 | (0.20 | ) | (0.20 | ) | |||||||||||||||||
Class A | |||||||||||||||||||||||||||
| Year Ended March 31, 2021 | $ | 11.25 | 0.24 | (e) | 0.35 | 0.59 | (0.24 | ) | (0.24 | ) | |||||||||||||||||
| Year Ended March 31, 2020 | $ | 11.29 | 0.28 | (e) | (0.04 | ) | 0.24 | (0.28 | ) | (0.28 | ) | ||||||||||||||||
| Year Ended March 31, 2019 | $ | 11.16 | 0.32 | 0.12 | 0.44 | (0.31 | ) | (0.31 | ) | ||||||||||||||||||
| Year Ended March 31, 2018 | $ | 11.20 | 0.31 | (0.04 | ) | 0.27 | (0.31 | ) | (0.31 | ) | |||||||||||||||||
| Year Ended March 31, 2017 | $ | 11.51 | 0.33 | (0.31 | ) | 0.02 | (0.33 | ) | (0.33 | ) | |||||||||||||||||
* Assumes reinvestment of all net investment income and realized capital gain distributions, if any, during the period. Includes adjustments in accordance with U.S. Generally Accepted Accounting Principles and could differ from the Lipper reported return.
** For the period beginning July 1, 2019, the amount of any waivers or reimbursements and the amount of any recoupment is calculated without regard to the impact of any performance adjustment to the Fund's management fee.
^ The net expense ratio may not correlate to the applicable expense limits in place during the period since the current contractual expense limitation is applied for a period beginning July 1, 2019, and in effect through June 30, 2023, instead of coinciding with the Fund's fiscal year end. Details of the current contractual expense limitation in effect can be found in Note 4 of the accompanying Notes to Financial Statements.
(a) Not annualized for periods less than one year.
(b) Annualized for periods less than one year.
(c) Reflects total annual operating expenses for reductions of expenses paid indirectly for the March 31 fiscal year ended 2017. Expenses paid indirectly decreased the expense ratio by less than 0.01%.
(d) Portfolio turnover is calculated on the basis of the Fund as a whole without distinguishing between the classes of shares.
See notes to financial statements.
22
USAA Mutual Funds Trust | Financial Highlights — continued | ||||||
For a Share Outstanding Throughout Each Period
Ratios to Average Net Assets | Supplemental Data | ||||||||||||||||||||||||||||||||||
| Redemption fees added to beneficial interests | Net Asset Value, End of Period | Total Return (Excludes Sales Charge)*(a) | Net Expenses**^(b)(c) | Net Investment Income (Loss)(b) | Gross Expenses(b)(c) | Net Assets, End of Period (000's) | Portfolio Turnover(a)(d) | ||||||||||||||||||||||||||||
USAA Virginia Bond Fund | |||||||||||||||||||||||||||||||||||
Fund Shares | |||||||||||||||||||||||||||||||||||
| Year Ended March 31, 2021 | $ | — | $ | 11.61 | 5.53 | % | 0.50 | % | 2.32 | % | 0.50 | % | $ | 713,075 | 28 | % | |||||||||||||||||||
| Year Ended March 31, 2020 | — | $ | 11.26 | 2.39 | % | 0.55 | % | 2.70 | % | 0.55 | % | $ | 685,508 | 24 | % | ||||||||||||||||||||
| Year Ended March 31, 2019 | — | $ | 11.30 | 4.36 | % | 0.59 | % | 3.03 | % | 0.59 | % | $ | 672,191 | 9 | % | ||||||||||||||||||||
| Year Ended March 31, 2018 | — | $ | 11.16 | 2.56 | % | 0.56 | % | 2.98 | % | 0.56 | % | $ | 666,772 | 11 | % | ||||||||||||||||||||
| Year Ended March 31, 2017 | — | $ | 11.21 | 0.36 | % | 0.58 | % | 3.10 | % | 0.58 | % | $ | 658,452 | 13 | % | ||||||||||||||||||||
Institutional Shares | |||||||||||||||||||||||||||||||||||
| June 29, 2020 (f) through March 31, 2021 | — | $ | 11.61 | 3.04 | % | 0.49 | % | 2.26 | % | 0.58 | % | $ | 12,105 | 28 | % | ||||||||||||||||||||
Class A | |||||||||||||||||||||||||||||||||||
| Year Ended March 31, 2021 | — | $ | 11.60 | 5.26 | % | 0.76 | % | 2.06 | % | 0.81 | % | $ | 19,032 | 28 | % | ||||||||||||||||||||
| Year Ended March 31, 2020 | — | $ | 11.25 | 2.14 | % | 0.80 | % | 2.46 | % | 0.82 | % | $ | 19,671 | 24 | % | ||||||||||||||||||||
| Year Ended March 31, 2019 | — | $ | 11.29 | 4.05 | % | 0.80 | % | 2.82 | % | 0.86 | % | $ | 19,439 | 9 | % | ||||||||||||||||||||
| Year Ended March 31, 2018 | — | (g) | $ | 11.16 | 2.42 | % | 0.79 | %(h) | 2.76 | % | 0.81 | % | $ | 19,894 | 11 | % | |||||||||||||||||||
| Year Ended March 31, 2017 | — | $ | 11.20 | 0.12 | % | 0.81 | % | 2.85 | % | 0.81 | % | $ | 25,496 | 13 | % | ||||||||||||||||||||
(e) Per share net investment income (loss) has been calculated using the average daily shares method.
(f) Commencement of operations.
(g) Amount is less than $0.005 per share.
(h) Effective October 12, 2017, USAA Asset Management Company ("AMCO") (previous Investment Adviser) had voluntarily agreed to limit the annual expenses of Class A to 0.80% of Class A average daily net assets.
See notes to financial statements.
23
USAA Mutual Funds Trust | Notes to Financial Statements March 31, 2021 | ||||||
1. Organization:
USAA Mutual Funds Trust (the "Trust") is organized as a Delaware statutory trust and is registered under the Investment Company Act of 1940, as amended (the "1940 Act"), as an open-end investment company. The Trust is comprised of 46 funds and is authorized to issue an unlimited number of shares, which are units of beneficial interest with no par value.
The accompanying financial statements are those of the USAA Virginia Bond Fund (the "Fund"). The Fund offers three classes of shares: Fund Shares, Institutional Shares, and Class A. The Fund is classified as diversified under the 1940 Act.
Effective June 29, 2020, the Fund's Institutional Shares commenced operations and the Adviser Shares were redesignated Class A shares and became subject to a front-end sales charge.
Each class of shares of the Fund has substantially identical rights and privileges, except with respect to sales charges, fees paid under distribution plans, expenses allocable exclusively to each class of shares, voting rights on matters solely affecting a single class of shares, and the exchange privilege of each class of shares.
Under the Trust's organizational documents, its officers and trustees are indemnified against certain liabilities arising out of the performance of their duties to the Fund. In addition, in the normal course of business, the Fund enters into contracts with its vendors and others that provide for general indemnifications. The Fund's maximum exposure under these arrangements is unknown, as this would involve future claims that may be made against the Fund. However, based on experience, the Fund expects that risk of loss to be remote.
2. Significant Accounting Policies:
The following is a summary of significant accounting policies followed by the Trust in the preparation of its financial statements. The policies are in conformity with Generally Accepted Accounting Principles in the United States of America ("GAAP"). The preparation of financial statements in accordance with GAAP requires management to make estimates and assumptions that affect the reported amounts of assets and liabilities and disclosure of contingent assets and liabilities at the date of the financial statements and the reported amounts of income and expenses for the period. Actual results could differ from those estimates. The Fund follows the specialized accounting and reporting requirements under GAAP that are applicable to investment companies under Accounting Standards Codification Topic 946.
Investment Valuation:
The Fund records investments at fair value. Fair value is defined as the price that would be received to sell an asset or paid to transfer a liability in an orderly transaction between market participants at the measurement date.
The valuation techniques described below maximize the use of observable inputs and minimize the use of unobservable inputs in determining fair value. The inputs used for valuing the Fund's investments are summarized in the three broad levels listed below:
• Level 1 — quoted prices in active markets for identical securities
• Level 2 — other significant observable inputs (including quoted prices for similar securities or interest rates applicable to those securities, etc.)
• Level 3 — significant unobservable inputs (including the Fund's own assumptions in determining the fair value of investments)
Changes in valuation techniques may result in transfers in or out of an assigned level within the disclosure hierarchy. The inputs or methodologies used for valuation techniques are not necessarily an indication of the risks associated with entering into those investments.
Victory Capital Management Inc. ("VCM" or the "Adviser") has established the Pricing and Liquidity Committee (the "Committee"), and subject to the Trust's Board of Trustees (the "Board") oversight, the Committee administers and oversees the Fund's valuation policies and procedures, which are approved by the Board.
24
USAA Mutual Funds Trust | Notes to Financial Statements — continued March 31, 2021 | ||||||
Debt securities of United States ("U.S.") issuers, along with corporate and municipal securities, including short-term investments maturing in 60 days or less, may be valued using evaluated bid or the last sales price to price securities by dealers or an independent pricing service approved by the Board. These valuations are typically categorized as Level 2 in the fair value hierarchy.
In the event that price quotations or valuations are not readily available, are not reflective of market value, or a significant event has been recognized in relation to a security or class of securities, the securities are valued in good faith by the Committee in accordance with valuation procedures approved by the Board. These valuations are typically categorized as Level 2 or Level 3 in the fair value hierarchy, based on the observability of inputs used to determine the fair value. The effect of fair value pricing is that securities may not be priced on the basis of quotations from the primary market in which they are traded and the actual price realized from the sale of a security may differ materially from the fair value price. Valuing these securities at fair value is intended to cause the Fund's net asset value ("NAV") to be more reliable than it otherwise would be.
A summary of the valuations as of March 31, 2021, based upon the three levels defined above, is included in the table below while the breakdown, by category, of investments is disclosed on the Schedule of Portfolio Investments (amounts in thousands):
Level 1 | Level 2 | Level 3 | Total | ||||||||||||||||
Municipal Bonds | $ | — | $ | 734,670 | $ | 2,514 | $ | 737,184 | |||||||||||
Total | $ | — | $ | 734,670 | $ | 2,514 | $ | 737,184 | |||||||||||
For the year ended March 31, 2021, there were no transfers in or out of Level 3 in the fair value hierarchy.
Securities Purchased on a Delayed-Delivery or When-Issued Basis:
The Fund may purchase securities on a delayed-delivery or when-issued basis. Delivery and payment for securities that have been purchased by the Fund on a delayed-delivery or when-issued basis, or for delayed draws on loans can take place a month or more after the trade date. At the time the Fund makes the commitment to purchase a security on a delayed-delivery or when-issued basis, the Fund records the transaction and reflects the value of the security in determining NAV. No interest accrues to the Fund until the transaction settles and payment takes place. A segregated account is established and the Fund maintains cash and/or marketable securities at least equal in value to commitments for delayed-delivery or when-issued securities. If the Fund owns delayed-delivery or when-issued securities, these values are included in Payable for investments purchased on the accompanying Statement of Assets and Liabilities and the segregated assets are identified on the Schedule of Portfolio Investments.
Municipal Obligations:
The values of municipal obligations can fluctuate and may be affected by adverse tax, legislative, or political changes, and by financial developments affecting municipal issuers. Payment of municipal obligations may depend on a relatively limited source of revenue, resulting in greater credit risk. Future changes in federal tax laws or the activity of an issuer may adversely affect the tax-exempt status of municipal obligations.
Investment Transactions and Related Income:
Changes in holdings of investments are accounted for no later than one business day following the trade date. For financial reporting purposes, however, investment transactions are accounted for on trade date on the last business day of the reporting period. Interest income is determined on the basis of coupon interest accrued using the effective interest method which adjusts, where applicable, the amortization of premiums or accretion of discount. Gains or losses realized on sales of securities are determined by comparing the identified cost of the security lot sold with the net sales proceeds.
25
USAA Mutual Funds Trust | Notes to Financial Statements — continued March 31, 2021 | ||||||
Federal Income Taxes:
It is the Fund's policy to continue to qualify as a regulated investment company by complying with the provisions available to certain investment companies, as defined in applicable sections of the Internal Revenue Code, and to make distributions of net investment income and net realized gains sufficient to relieve it from all, or substantially all, federal income taxes. Accordingly, no provision for federal income taxes is required in the financial statements. The Fund has a tax year end of March 31.
Management of the Fund has reviewed tax positions taken in tax years that remain subject to examination by all major tax jurisdictions, including federal (i.e., the last four tax years, which includes the current fiscal tax year end). Management believes that there is no tax liability resulting from unrecognized tax benefits related to uncertain tax positions taken.
Allocations:
Expenses directly attributable to the Fund are charged to the Fund, while expenses that are attributable to more than one fund in the Trust, or jointly with an affiliated trust, are allocated among the respective funds in the Trust and/or affiliated trust based upon net assets or another appropriate basis.
Income, expenses (other than class-specific expenses such as transfer agent fees, state registration fees, 12b-1 fees, and printing fees), and realized and unrealized gains or losses on investments are allocated to each class of shares based on its relative net assets on the date income is earned or expenses and realized and unrealized gains and losses are incurred.
Cross-Trade Transactions:
Pursuant to Rule 17a-7 under the 1940 Act, the Fund may engage in cross-trades which are securities transactions with affiliated investment companies and advisory accounts managed by the Adviser and any applicable sub-adviser. Any such purchase or sale transaction must be effected without brokerage commission or other remuneration, except for customary transfer fees. The transaction must be effected at the current market price, which is either the security's last sale price on an exchange or, if there are no transactions in the security that day, at the average of the highest bid and lowest asked price. For the year ended March 31, 2021, the Fund engaged in the following securities transactions with affiliated funds, which resulted in the following net realized gains (losses) (amounts in thousands):
| Purchases | Sales | Net Realized Gains (Losses) | |||||||||
| $ | 17,100 | $ | 16,250 | $ | — | ||||||
Fees Paid Indirectly:
Expense offsets to custody fees that arise from credits on cash balances maintained on deposit are reflected on the Statement of Operations, as applicable, as Fees paid indirectly.
3. Purchases and Sales:
Cost of purchases and proceeds from sales/maturities of securities (excluding securities maturing less than one year from acquisition) for the year ended March 31, 2021, were as follows for the Fund (amounts in thousands):
| Excluding U.S. Government Securities | |||||||||||
Purchases | Sales | ||||||||||
$ | 204,889 | $ | 202,552 | ||||||||
There were no purchases or sales of U.S. government securities during the year ended March 31, 2021.
26
USAA Mutual Funds Trust | Notes to Financial Statements — continued March 31, 2021 | ||||||
4. Fees and Transactions with Affiliates and Related Parties:
Investment Advisory Fees:
Investment advisory services are provided to the Fund by the Adviser, which is a New York corporation registered as an investment adviser with the Securities and Exchange Commission ("SEC"). The Adviser is a wholly-owned indirect subsidiary of Victory Capital Holdings, Inc., a publicly traded Delaware corporation, and a wholly-owned direct subsidiary of Victory Capital Operating, LLC.
Under the terms of the Investment Advisory Agreement, the Adviser is entitled to receive a base fee and a performance adjustment. The Fund's base fee is accrued daily and paid monthly at an annualized rate of 0.50% of the first $50 million of the Fund's average daily net assets, 0.40% of that portion of average daily net assets over $50 million but not over $100 million, and 0.30% of that portion of average daily net assets over $100 million. Amounts incurred and paid to VCM for the year ended March 31, 2021, are reflected on the Statement of Operations as Investment Advisory fees.
On November 6, 2018, United Services Automobile Association ("USAA"), the parent company of USAA Asset Management Company ("AMCO"), the prior investment adviser to the Fund announced that AMCO would be acquired by Victory Capital Holdings Inc. (the "Transaction"). A special shareholder meeting was held on April 18, 2019, at which shareholders of the Fund approved a new investment advisory agreement between the Trust, on behalf of the Fund, and VCM. The Transaction closed on July 1, 2019 and effective July 1, 2019, VCM replaced AMCO as the investment adviser to the Fund and no performance adjustments were made for the period beginning July 1, 2019, through June 30, 2020. Only performance beginning as of July 1, 2019, and thereafter is utilized in calculating future performance adjustments.
The performance adjustment for each share class is accrued daily and calculated monthly by comparing each class' performance to that of the Lipper Virginia Municipal Debt Funds Index. The Lipper Virginia Municipal Debt Funds Index tracks the total return performance of the largest funds within the Lipper Virginia Municipal Debt Funds category.
The performance period for each share class consists of the current month plus the previous 35 months (or the number of months beginning July 1, 2019, if fewer). The following table is utilized to determine the extent of the performance adjustment:
| Over/Under Performance Relative to Index (in basis points)(a) | Annual Adjustment Rate (in basis points)(a) | ||||||||||
+/- 20 to 50 | +/- 4 | ||||||||||
+/- 51 to 100 | +/- 5 | ||||||||||
+/- 101 and greater | +/- 6 | ||||||||||
(a) Based on the difference between average annual performance of the relevant share class of the Fund and its relevant Lipper index, rounded to the nearest basis point. Average daily net assets of the share class are calculated over a rolling 36-month period.
Each class' annual performance adjustment rate is multiplied by the average daily net assets of each respective class over the entire performance period, which is then multiplied by a fraction, the numerator of which is the number of days in the month and the denominator of which is 365 (366 in leap years). The resulting amount is then added to (in the case of overperformance), or subtracted from (in the case of underperformance) the base fee.
Under the performance fee arrangement, each class pays a positive performance fee adjustment for a performance period whenever the class outperforms the Lipper Virginia Municipal Debt Funds Index over that period, even if the class has overall negative returns during the performance period.
For the performance period July 1, 2020, to March 31, 2021, performance adjustments were $(172), less than $(1) and $(7), in thousands, for Fund Shares, Institutional Shares and Class A, respectively. Performance adjustments were (0.02)%, less than (0.01)%, and (0.04)% for Fund Shares, Institutional Shares, and Class A, respectively.
27
USAA Mutual Funds Trust | Notes to Financial Statements — continued March 31, 2021 | ||||||
The Trust relies on an exemptive order granted to VCM and its affiliated funds by the SEC in March 2019 permitting the use of a "manager-of-managers" structure for certain funds. Under a manager-of-managers structure, the investment adviser may select (with approval of the Board and without shareholder approval) one or more subadvisers to manage the day-to-day investment of a fund's assets. For the year ended March 31, 2021, the Fund had no subadvisors.
Administration and Servicing Fees:
VCM serves as the Fund's administrator and fund accountant. Under the Fund Administration, Servicing and Accounting Agreement, VCM is paid for its services an annual fee at a rate of 0.15%, 0.10%, and 0.15% of average daily net assets of the Fund Shares, Institutional Shares, and Class A, respectively. Amounts incurred for the year ended March 31, 2021, are reflected on the Statement of Operations as Administration fees.
The Fund (as part of the Trust) has entered into an agreement to provide compliance services with the Adviser, pursuant to which the Adviser furnishes its compliance personnel, including the services of the Chief Compliance Officer ("CCO"), and other resources reasonably necessary to provide the Trust with compliance oversight services related to the design, administration and oversight of a compliance program for the Trust in accordance with Rule 38a-1 under the 1940 Act. The CCO is an employee of the Adviser, which pays the compensation of the CCO and support staff. Funds in the Trust, Victory Variable Insurance Funds, Victory Portfolios, and Victory Portfolios II (collectively, the "Victory Funds Complex") in the aggregate, compensate the Adviser for these services. Amounts incurred for the year ended March 31, 2021, are reflected on the Statement of Operations as Compliance fees.
Citi Fund Services Ohio, Inc. ("Citi"), an affiliate of Citibank, acts as sub-administrator and sub-fund accountant to the Fund pursuant to a Sub-Administration and Sub-Fund Accounting Services Agreement between VCM and Citi. VCM pays Citi a fee for providing these services. The Fund reimburses VCM and Citi for out-of-pocket expenses incurred in providing these services and certain other expenses specifically allocated to the Fund. Amounts incurred for the year ended March 31, 2021, are reflected on the Statement of Operations as Sub-Administration fees.
Transfer Agency Fees:
Victory Capital Transfer Agency, Inc. ("VCTA"), an affiliate of the Adviser, provides transfer agency services to the Fund. VCTA provides transfer agent services to the Fund Shares based on an annual charge of $25.50 per shareholder account plus out-of-pocket expenses. VCTA pays a portion of these fees to certain intermediaries for the administration and servicing of accounts that are held with such intermediaries. Transfer agent's fees are accrued daily and paid monthly at an annualized rate of 0.10% and 0.10% of average daily net assets of the Institutional Shares and Class A, respectively, plus out-of-pocket expenses. Amounts incurred and paid to VCTA for the year ended March 31, 2021, are reflected on the Statement of Operations as Transfer Agent fees.
FIS Investor Services LLC serves as sub-transfer agent and dividend disbursing agent for the Fund pursuant to a Sub-Transfer Agent Agreement between VCTA and FIS Investor Services LLC. VCTA provides FIS Investor Services LLC a fee for providing these services.
Distributor/Underwriting Services:
Victory Capital Services, Inc. (the "Distributor"), an affiliate of the Adviser, serves as distributor for the continuous offering of the shares of the Fund pursuant to a Distribution Agreement between the Distributor and the Trust. Effective June 30, 2020, the Distributor's name was changed from Victory Capital Advisers, Inc.
Pursuant to the Distribution and Service Plans adopted in accordance with Rule 12b-1 under the 1940 Act, the Distributor may receive a monthly distribution and service fee, at an annual rate of up to 0.25% of the average daily net assets of Class A. The distribution and service fees paid to the Distributor may be used by the Distributor to pay for activity primarily intended to result in the sale of Class A. Amounts incurred and paid to the Distributor for the year ended March 31, 2021, are reflected on the Statement of Operations as 12b-1 fees.
28
USAA Mutual Funds Trust | Notes to Financial Statements — continued March 31, 2021 | ||||||
In addition, the Distributor is entitled to receive commissions on sales of the Class A. For the year ended March 31, 2021, the Distributor received less than $1 thousand from commissions earned on sales of Class A.
Other Fees:
Citibank serves as the Fund's custodian. The Fund pays Citibank a fee for providing these services. Amounts incurred for the year ended March 31, 2021, are reflected on the Statement of Operations as Custodian fees.
K&L Gates LLP provides legal services to the Trust.
The Adviser has entered into an expense limitation agreement with the Fund until at least June 30, 2023. Under the terms of the agreement, the Adviser has agreed to waive fees or reimburse certain expenses to the extent that ordinary operating expenses incurred by certain classes of the Fund in any fiscal year exceed the expense limit for such classes of the Fund. Such excess amounts will be the liability of the Adviser. Interest, taxes, brokerage commissions, other expenditures, which are capitalized in accordance with GAAP, and other extraordinary expenses not incurred in the ordinary course of the Fund's business are excluded from the expense limits. As of March 31, 2021, the expense limits (excluding voluntary waivers) were 0.54%, 0.50%, and 0.80% for Fund Shares, Institutional Shares, and Class A, respectively.
Under the terms of the agreement, the Fund has agreed to repay fees and expenses that were waived or reimbursed by the Adviser for a period of up to three years after the fiscal year in which the waiver or reimbursement took place, subject to the lesser of any operating expense limits in effect at the time of: (a) the original waiver or expense reimbursement; or (b) the recoupment, after giving effect to the recoupment amount.
As of March 31, 2021, the following amounts are available to be repaid to the Adviser (amounts in thousands). The Fund has not recorded any amounts available to be repaid as a liability due to an assessment that such repayment is not probable at March 31, 2021.
| Expires March 31, 2023 | Expires March 31, 2024 | Total | |||||||||
| $ | 1 | $ | 15 | $ | 16 | ||||||
The Adviser may voluntarily waive or reimburse additional fees to assist the Fund in maintaining competitive expense ratios. Voluntary waivers and reimbursements applicable to the Fund are not available to be recouped at a future time. There were no voluntary waivers or reimbursements for the year ended March 31, 2021.
Certain officers and/or interested trustees of the Fund are also officers and/or employees of the Adviser, administrator, sub-administrator, sub-fund accountant, custodian, and Distributor.
5. Risks:
The Fund may be subject to other risks in addition to these identified risks.
Geopolitical/Natural Disaster Risk — Global economies and financial markets are increasingly interconnected, which increases the possibilities that conditions in one country or region might adversely affect issuers in another country or region. Geopolitical and other risks, including war, terrorism, trade disputes, political or economic dysfunction within some nations, public health crises and related geopolitical events, as well as environmental disasters such as earthquakes, fires, and floods, may add to instability in world economies and markets generally. Changes in trade policies and international trade agreements could affect the economies of many countries in unpredictable ways. Likewise, systemic market dislocations of the kind that occurred during the financial crisis that began in 2008, if repeated, would be highly disruptive to economies and markets, adversely affecting individual companies and industries, securities markets, interest rates, credit ratings, inflation, investor sentiment, and other factors affecting the value of a Fund's investments. Some countries, including the United States, are adopting more protectionist trade policies and moving away from the tighter financial industry regulations that followed the 2008 financial crisis, which may also affect the value of a Fund's investments.
29
USAA Mutual Funds Trust | Notes to Financial Statements — continued March 31, 2021 | ||||||
Political events within the United States at times have resulted, and may in the future result, in a shutdown of government services, which could negatively affect the U.S. economy, decrease the value of a Fund's investments, increase uncertainty in or impair the operation of the U.S. or other securities markets and degrade investor and consumer confidence, perhaps suddenly and to a significant degree.
An outbreak of disease called COVID-19 has spread internationally. The transmission of COVID-19 and efforts to contain its spread have resulted in international, national and local border closings and other significant travel restrictions and disruptions, significant disruptions to business operations, supply chains and consumer activity, significant challenges in healthcare service preparation and delivery, quarantines and general concern and uncertainty. These negative impacts have caused significant volatility and declines in global financial markets, which have caused losses for Fund investors during and subsequent to period end. The impact of the COVID-19 pandemic may last for an extended period of time, and could result in a substantial economic downturn or recession. Public health crises may exacerbate other pre-existing political, social, economic, market and financial risks. The extent of the impact to the financial performance of the Fund's investments will depend on future developments, including (i) the duration and spread of the outbreak, (ii) the restrictions and advisories, (iii) the effects on the financial markets, and (iv) the effects on the economy overall, all of which are highly uncertain and cannot be predicted.
Credit Risk — The fixed-income securities in the Fund's portfolio are subject to credit risk, which is the possibility that an issuer of a fixed-income security will fail to make timely interest and/or principal payments on its securities or that negative market perceptions of the issuer's ability to make such payments will cause the price of that security to decline. The Fund accepts some credit risk as a recognized means to enhance an investor's return. All fixed-income securities, varying from the highest quality to the very speculative, have some degree of credit risk.
Debt Securities Risk — The value of a debt security or other income-producing security changes in response to various factors, including, for example, market-related factors (such as changes in interest rates or changes in the risk appetite of investors generally) and changes in the actual or perceived ability of the issuer (or of issuers generally) to meet its (or their) obligations.
Other factors that may affect the value of debt securities, include, among others, public health crises and responses by governments and companies to such crises. These and other events may affect the creditworthiness of the issuer of a debt security and may impair an issuers ability to timely meet its debt obligations as they come due.
Interest Rate Risk — The Fund is subject to the risk that the market value of the bonds in its portfolio will fluctuate because of changes in interest rates, changes in the supply of and demand for tax-exempt securities, and other market factors. Bond prices generally are linked to the prevailing market interest rates. In general, when interest rates rise, bond prices fall; conversely, when interest rates fall, bond prices rise. The price volatility of a bond also depends on its duration. Generally, the longer the duration of a bond, the greater is its sensitivity to interest rates. To compensate investors for this higher interest rate risk, bonds with longer durations generally offer higher yields than bonds with shorter durations. The ability of an issuer of a debt security to repay principal prior to a security's maturity can increase the security's sensitivity to interest rate changes.
Decisions by the U.S. Federal Reserve (also known as the "Fed") regarding interest rate and monetary policy, which can be difficult to predict and sometimes change direction suddenly in response to economic and market events, can have a significant effect on the value of fixed-income securities as well as the overall strength of the U.S. economy. Precise interest rate predictions are difficult to make, and interest rates may change unexpectedly and dramatically in response to extreme changes in market or economic conditions. As a result, the value of fixed income securities may vary widely under certain market conditions.
LIBOR Discontinuation Risk — Many debt securities, derivatives and other financial instruments, including some of the Fund's investments, use the London Interbank Offered Rate ("LIBOR") as the reference or benchmark rate for variable interest rate calculations. In June 2017, the Alternative Reference Rates Committee, a group of large U.S. banks working with the Federal Reserve, announced its selection of a new Secured Overnight Funding Rate ("SOFR"), which is intended to be a broad measure of secured overnight U.S. Treasury repo rates, as an appropriate replacement for LIBOR. The
30
USAA Mutual Funds Trust | Notes to Financial Statements — continued March 31, 2021 | ||||||
Federal Reserve Bank of New York began publishing the SOFR in 2018, expecting that it could be used on a voluntary basis in new instruments and transactions. Bank working groups and regulators in other countries have suggested other alternatives for their markets, including the Sterling Overnight Interbank Average Rate ("SONIA") in England. In July 2017, the Financial Conduct Authority (the "FCA"), the United Kingdom financial regulatory body, announced that after 2021 it will cease its active encouragement of UK banks to provide the quotations needed to sustain LIBOR. That announcement suggests that LIBOR may cease to be published after that time. For U.S. dollar LIBOR, however, the relevant date may be deferred to June 30, 2023, for the most common tenors (overnight and one, three, six and 12 months). As to those tenors, the LIBOR administrator has published a consultation regarding its intention to cease publication of U.S. dollar LIBOR as of June 30, 2023, (instead of December 31, 2021, as previously expected), apparently based on continued rate submissions from banks. It is expected that there will be enough time for market participants to transition to the use of a different benchmark for both new and existing securities and transactions. Various financial industry groups have begun planning for that transition, but there are obstacles to converting certain longer-term securities and transactions to a new benchmark. Transition planning is at an early stage, and neither the effect of the transition process nor its ultimate success can yet be known. Although the foregoing may provide some sense of timing, there is no assurance that LIBOR, or any particular currency and tenor, will continue to be published until any particular date, and it appears highly likely that LIBOR will be discontinued or modified after December 31, 2021, or June 30, 2023, depending on the currency and tenor. The transition process might lead to increased volatility and illiquidity in markets that currently rely on the LIBOR to determine interest rates. It could also lead to a reduction in the value of some LIBOR-based investments and reduce the effectiveness of new hedges placed against existing LIBOR-based instruments. Since the usefulness of LIBOR as a benchmark could deteriorate during the transition period, these effects could occur before the end of 2021.
6. Borrowing and Interfund Lending:
Line of Credit:
For the year ended March 31, 2021, the Victory Funds Complex participated in a short-term demand note "Line of Credit" agreement with Citibank. The Line of Credit agreement with Citibank was renewed on June 29, 2020, with a termination date of June 28, 2021. Under the agreement with Citibank, the Victory Funds Complex may borrow up to $600 million, of which $300 million is committed and $300 million is uncommitted. $40 million of the Line of Credit is reserved for use by the Victory Floating Rate Fund, another series of the Victory Funds Complex, with Victory Floating Rate Fund paying the related commitment fees for that amount. The purpose of the agreement is to meet temporary or emergency cash needs. For the year ended March 31, 2021, Citibank received an annual commitment fee of 0.15% on $300 million for providing the Line of Credit. Each fund in the Victory Funds Complex paid a pro-rata portion of the commitment fees plus any interest (one month LIBOR plus one percent) on amounts borrowed. Effective June 29, 2020, under an amended Line of Credit agreement, Citibank also received an annual upfront fee of 0.10% on the $300 million committed line of credit. Each fund in the Victory Funds Complex paid a pro-rata portion of the upfront fee. Interest charged to each Fund during the period, if applicable, is reflected on the Statement of Operations under Line of credit fees.
The Fund had no borrowings under the Line of Credit agreement during the year ended March 31, 2021.
Interfund Lending:
The Trust and Adviser rely on an exemptive order granted by the SEC in March 2017 (the "Order"), permitting the establishment and operation of an Interfund Lending Facility (the "Facility"). The Facility allows the Fund to directly lend and borrow money to or from any other Fund, that is permitted to participate in the Facility, in the Victory Funds Complex relying upon the Order at rates beneficial to both the borrowing and lending funds. Advances under the Facility are allowed for temporary or emergency purposes, including the meeting of redemption requests that otherwise might require the untimely disposition of securities, and are subject to each Fund's borrowing restrictions. The interfund loan rate is determined, as specified in the Order, by averaging the current repurchase agreement rate and the current bank loan rate. As a Borrower, interest charged to the Fund, if any, during the period
31
USAA Mutual Funds Trust | Notes to Financial Statements — continued March 31, 2021 | ||||||
is reflected on the Statement of Operations under Interfund lending fees. As a Lender, interest earned by the Fund, if any, during the period is presented on the Statement of Operations under Interfund lending.
The Fund did not utilize or participate in the Facility during the year ended March 31, 2021.
7. Federal Income Tax Information:
The Fund intends to declare daily and distribute any net investment income monthly. Distributable net realized gains, if any, are declared and paid at least annually.
The amounts of dividends from net investment income and distributions from net realized gains (collectively distributions to shareholders) are determined in accordance with federal income tax regulations, which may differ from GAAP. To the extent these "book/tax" differences are permanent in nature (e.g., net operating loss and distribution reclassification), such amounts are reclassified within the components of net assets based on their federal tax-basis treatment; temporary differences (e.g., wash sales) do not require reclassification. To the extent dividends and distributions exceed net investment income and net realized gains for tax purposes, they are reported as distributions of capital. Net investment losses incurred by the Fund may be reclassified as an offset to capital on the accompanying Statement of Assets and Liabilities.
As of March 31, 2021, on the Statement of Assets and Liabilities, there were no permanent book-to-tax difference reclassification adjustments.
The tax character of distributions paid during the tax years ended as noted below, were as follows (total distributions paid may differ from the Statements of Changes in Net Assets because, for tax purposes, dividends are recognized when actually paid) (amounts in thousands).
Year Ended March 31, 2021 | Year Ended March 31, 2020 | ||||||||||||||||||
| Distributions paid from | Distributions paid from | ||||||||||||||||||
Tax-Exempt Income | Total Distributions Paid | Tax-Exempt Income | Total Distributions Paid | ||||||||||||||||
$ | 16,885 | $ | 16,885 | $ | 19,620 | $ | 19,620 | ||||||||||||
As of March 31, 2021, the components of accumulated earnings (loss) on a tax basis were as follows (amounts in thousands):
| Undistributed Tax-Exempt Income | Distributions Payable | Accumulated Earnings | Accumulated Capital and Other Losses | Unrealized Appreciation (Depreciation)* | Total Accumulated Earnings (Loss) | ||||||||||||||||||
| $ | 2,406 | $ | (1,411 | ) | $ | 995 | $ | (9,554 | ) | $ | 32,793 | $ | 24,234 | ||||||||||
* The difference between the book-basis and tax-basis of unrealized appreciation/depreciation is attributable to defaulted bond adjustments.
As of March 31, 2021, the Fund had net capital loss carryforwards as shown in the table below (amounts in thousands). It is unlikely that the Board will authorize a distribution of capital gains realized in the future until the capital loss carryforwards have been used.
| Short-Term Amount | Long-Term Amount | Total | |||||||||
| $ | 945 | $ | 8,609 | $ | 9,554 | ||||||
During the most recent tax year ended March 31, 2021, the Fund utilized $137 capital loss carryforwards (amounts in thousands).
32
USAA Mutual Funds Trust | Notes to Financial Statements — continued March 31, 2021 | ||||||
As of March 31, 2021, the cost basis for federal income tax purposes, gross unrealized appreciation, gross unrealized depreciation, and net unrealized appreciation (depreciation) for investments were as follows (amounts in thousands):
| Cost of Investments for Federal Tax Purposes | Gross Unrealized Appreciation | Gross Unrealized Depreciation | Net Unrealized Appreciation (Depreciation) | ||||||||||||
| $ | 704,391 | $ | 39,340 | $ | (6,547 | ) | $ | 32,793 | |||||||
33
REPORT OF INDEPENDENT REGISTERED PUBLIC ACCOUNTING FIRM
To the Shareholders and the Board of Trustees of USAA Virginia Bond Fund
Opinion on the Financial Statements
We have audited the accompanying statement of assets and liabilities of USAA Virginia Bond Fund (the "Fund") (one of the funds constituting USAA Mutual Funds Trust (the "Trust")), including the schedule of portfolio investments, as of March 31, 2021, and the related statement of operations for the year then ended, the statements of changes in net assets for each of the two years in the period then ended, the financial highlights for each of the five years in the period then ended and the related notes (collectively referred to as the "financial statements"). In our opinion, the financial statements present fairly, in all material respects, the financial position of the Fund at March 31, 2021, the results of its operations for the year then ended, the changes in its net assets for each of the two years in the period then ended and its financial highlights for each of the five years in the period then ended, in conformity with U.S. generally accepted accounting principles.
Basis for Opinion
These financial statements are the responsibility of the Trust's management. Our responsibility is to express an opinion on the Fund's financial statements based on our audits. We are a public accounting firm registered with the Public Company Accounting Oversight Board (United States) ("PCAOB") and are required to be independent with respect to the Trust in accordance with the U.S. federal securities laws and the applicable rules and regulations of the Securities and Exchange Commission and the PCAOB.
We conducted our audits in accordance with the standards of the PCAOB. Those standards require that we plan and perform the audit to obtain reasonable assurance about whether the financial statements are free of material misstatement, whether due to error or fraud. The Trust is not required to have, nor were we engaged to perform, an audit of the Trust's internal control over financial reporting. As part of our audits we are required to obtain an understanding of internal control over financial reporting, but not for the purpose of expressing an opinion on the effectiveness of the Trust's internal control over financial reporting. Accordingly, we express no such opinion.
Our audits included performing procedures to assess the risks of material misstatement of the financial statements, whether due to error or fraud, and performing procedures that respond to those risks. Such procedures included examining, on a test basis, evidence regarding the amounts and disclosures in the financial statements. Our procedures included confirmation of securities owned as of March 31, 2021, by correspondence with the custodian. Our audits also included evaluating the accounting principles used and significant estimates made by management, as well as evaluating the overall presentation of the financial statements. We believe that our audits provide a reasonable basis for our opinion.

We have served as the auditor of one or more Victory Capital investment companies since 1995.
San Antonio, Texas
May 26, 2021
34
USAA Mutual Funds Trust | Supplemental Information March 31, 2021 | ||||||
(Unaudited)
Trustee and Officer Information
Board of Trustees:
Overall responsibility for management of the Trust rests with the Board. The Trust is managed by the Board in accordance with the laws of the state of Delaware. There are currently nine Trustees, seven of whom are not "interested persons" of the Trust within the meaning of that term under the 1940 Act ("Independent Trustees") and two of whom is an "interested person" of the Trust within the meaning of that term under the 1940 Act ("Interested Trustee"). The Trustees, in turn, elect the officers of the Trust to actively supervise its day-to-day operations.
The following tables list the Trustees, their ages, position with the Trust, commencement of service, principal occupations during the past five years and any directorships of other investment companies or companies whose securities are registered under the Securities Exchange Act of 1934, as amended, or who file reports under that Act. Each Trustee oversees 46 portfolios in the Trust. Each Trustee's address is 15935 La Cantera Pkwy, San Antonio, TX, 78256. Pursuant to a policy adopted by the Board, the term of office for each Trustee shall be until the Independent Trustee reaches age 75 or an Interested Trustee reaches age 75. The Board may change or grant exceptions from this policy at any time without shareholder approval. A Trustee may resign or be removed by a vote of the other Trustees or the holders of a majority of the outstanding shares of the Trust at any time. Vacancies on the Board can be filled by the action of a majority of the Trustees, provided that after filling such vacancy at least two-thirds of the Trustees have been elected by the shareholders.
Name and Date of Birth | Position Held with the Trust | Year Commenced Service | Principal Occupation During Past 5 Years | Other Directorships Held During Past 5 Years | |||||||||||||||
Independent Trustees. | |||||||||||||||||||
| Jefferson C. Boyce, (c) Born September 1957 | Independent Chairman | 2021 | Senior Managing Director, New York Life Investments, LLC (1992-2012) | Westhab, Inc. | |||||||||||||||
| John C. Walters, Born February 1962 | Trustee | 2019 | Retired. Mr. Walters brings significant Board experience including active involvement with the board of a Fortune 500 company, and a proven record of leading large, complex financial organizations. He has a demonstrated record of success in distribution, manufacturing, investment brokerage, and investment management in both the retail and institutional investment businesses. He has substantial experience in the investment management business with a demonstrated ability to develop and drive strategy while managing operation, financial, and investment risk. | Guardian Variable Products Trust (16 series), Lead Independent Director; Amerilife Holdings LLC, Director; Stadion Money Management; Director; University of North Carolina (Chapel Hill), Member Board of Governors | |||||||||||||||
35
USAA Mutual Funds Trust | Supplemental Information — continued March 31, 2021 | ||||||
(Unaudited)
| Name and Date of Birth | Position Held with the Trust | Year Commenced Service | Principal Occupation During Past 5 Years | Other Directorships Held During Past 5 Years | |||||||||||||||
| Robert L. Mason, Ph.D., Born July 1946 | Trustee | 1997 | Adjunct Professor in the Department of Management Science and Statistics in the College of Business at the University of Texas at San Antonio (since 2001); Institute Analyst, Southwest Research Institute (March 2002-January 2016) | None | |||||||||||||||
| Dawn M. Hawley, Born February 1954 | Trustee | 2014 | Manager of Finance, Menil Foundation, Inc. (May 2007-June 2011), which is a private foundation that oversees the assemblage of sculptures, prints, drawings, photographs, and rare books. Director of Financial Planning and Analysis and Chief Financial Officer, AIM Management Group, Inc. (October 1987-January 2006) | None | |||||||||||||||
| Paul L. McNamara, Born July 1948 | Trustee | 2012 | Director, Cantor Opportunistic Alternatives Fund, LLC (March 2010-February 2014), which is a closed-end fund of funds by Cantor Fitzgerald Investment Advisors, LLC | None | |||||||||||||||
36
USAA Mutual Funds Trust | Supplemental Information — continued March 31, 2021 | ||||||
(Unaudited)
Name and Date of Birth | Position Held with the Trust | Year Commenced Service | Principal Occupation During Past 5 Years | Other Directorships Held During Past 5 Years | |||||||||||||||
| Richard Y. Newton III, Born January 1956 | Trustee | 2017 | Director, Elta North America (01/18-present), which is a global leader in the design, manufacture, and support of innovative electronic systems in the ground, maritime, airborne, and security domains for the nation's warfighters, security personnel, and first responders; Managing Partner, Pioneer Partnership Development Group (December 2015-present)); Executive Director, The Union League Club of New York (June 2014-November 2015): Executive Vice President, Air Force Association (August 2012-May 2014); Lieutenant General, United States Air Force (January 2008-June 2012) | PredaSAR Corp. | |||||||||||||||
| Barbara B. Ostdiek, Ph.D., Born March 1964 | Trustee | 2008 | Senior Associate Dean of Degree Programs at Jesse H. Jones Graduate School of Business at Rice University (since 2013); Associate Professor of Finance at Jessie H. Jones Graduate School of Business at Rice University (since 2001) | None | |||||||||||||||
| Michael F. Reimherr, (a) Born August 1945 | Trustee | 2000 | President of Reimherr Business Consulting (May 1995-December 2017); St. Mary's University Investment Committee overseeing University Endowment (since 2014) | None | |||||||||||||||
(a) Effective at the close of business on December 31, 2020, Michael F. Reimherr retired from the Board of Trustees.
37
USAA Mutual Funds Trust | Supplemental Information — continued March 31, 2021 | ||||||
(Unaudited)
Name and Date of Birth | Position Held with the Trust | Year Commenced Service | Principal Occupation During Past 5 Years | Other Directorships Held During Past 5 Years | |||||||||||||||
Interested Trustees. | |||||||||||||||||||
| David C. Brown, (b) Born May 1972 | Trustee | 2019 | Chairman and Chief Executive Officer (since 2013), Victory Capital Management Inc.; Chairman and Chief Executive Officer, Victory Capital Holdings, Inc. (since 2013). Mr. Brown brings to the Board extensive business, finance and leadership skills gained and developed through years of experience in the financial services industry, including his tenure overseeing the strategic direction as CEO of Victory Capital. These skills, combined with Mr. Brown's extensive knowledge of the financial services industry and demonstrated success in the development and distribution of investment strategies and products, enable him to provide valuable insights to the Board and strategic direction for the Funds. | Trustee, Victory Portfolios (41 series), Victory Portfolios II (26 series), Victory Variable Insurance Funds (8 series) | |||||||||||||||
38
USAA Mutual Funds Trust | Supplemental Information — continued March 31, 2021 | ||||||
(Unaudited)
Name and Date of Birth | Position Held with the Trust | Year Commenced Service | Principal Occupation During Past 5 Years | Other Directorships Held During Past 5 Years | |||||||||||||||
| Daniel S. McNamara, (b)(c) Born June 1966 | Trustee | 2012 | Trustee, President, and Vice Chairman of USAA ETF Trust (June 2017-June 2019); President of Financial Advice & Solutions Group (FASG), USAA (February 2013-March 2021); Director of USAA Investment Services Company (ISCO) (formerly USAA Investment Management) (September 2009-March 2021); President, Asset Management Company (AMCO) (August, 2011-June 2019); Senior Vice President of USAA Financial Planning Services Insurance Agency, Inc. (FPS) (April 2011-March 2021); Chairman of Board of ISCO (April 2013-December 2020); Director of AMCO (August 2011-June 2019); President and Director of USAA Shareholder Account Services (SAS) (October 2009-June 2019); Director and Vice Chairman of FPS (December 2013-March 2021); President and Director of USAA Investment Corporation (ICORP) (March 2010-March 2021); Chairman of Board of ICORP (December 2013-March 2021); Director of USAA Financial Advisors, Inc. (FAI) (December 2013-March 2021); Chairman of Board of FAI (March 2015-March 2021). Mr. McNamara brings to the Board extensive experience in the financial services industry, including experience as an officer of the Trust. | None | |||||||||||||||
(b) Mr. Dan McNamara, the Chairman of the Board, is deemed an "interested person" due to his previous position as Director of AMCO, the former investment adviser of the Funds. Mr. Brown is deemed an "interested person" due to his position as Chief Executive Officer of Victory Capital, investment adviser to the Funds.
(c) Effective at the close of business on December 31, 2020, Jefferson C. Boyce replaced Dan McNamara as Chair of the Board and assumed the title of Independent Chair.
The Statement of Additional Information includes additional information about the Trustees of the Trust and is available, without charge, on the SEC's website at www.sec.gov and/or by calling (800)-235-8396.
39
USAA Mutual Funds Trust | Supplemental Information — continued March 31, 2021 | ||||||
(Unaudited)
Officers:
The officers of the Trust, their ages, commencement of service and their principal occupations during the past five years, are detailed in the following table. Each officer serves until the earlier of his or her resignation, removal, retirement, death, or the election of a successor. The mailing address of each officer of the Trust is 15935 La Cantera Pkwy, San Antonio, TX, 78256. The officers of the Trust receive no compensation directly from the Trust for performing the duties of their offices.
Name and Date of Birth | Position with the Trust | Year Commenced Service | Principal Occupation During Past 5 Years | ||||||||||||
Interested Officers.
| Christopher K. Dyer, Born February 1962 | President | 2019 | Director of Fund Administration, Victory Capital (since 2004); Chief Operating Officer, Victory Capital Services, Inc. (since 2020) | ||||||||||||
| Scott A Stahorsky, Born July 1969 | Vice President | 2019 | Manager, Fund Administration, Victory Capital (since 2015) | ||||||||||||
| James K. De Vries, Born April 1969 | Treasurer | 2018 | Executive Director, Victory Capital Management Inc. (since 2019); Treasurer, USAA ETF Trust (September 2018-June 2019); Executive Director, Investment and Financial Administration, USAA (April 2012-June 2019); Assistant Treasurer, USAA ETF Trust (June 2017-September 2018); Assistant Treasurer, USAA Mutual Funds Trust (December 2013-February 2018) | ||||||||||||
| Allan Shaer, Born March 1965 | Assistant Treasurer | 2019 | Senior Vice President, Financial Administration, Citi Fund Services Ohio, Inc. (since 2016); Vice President, Mutual Fund Administration, JP Morgan Chase (2011-2016) | ||||||||||||
| Carol D. Trevino, Born October 1965 | Assistant Treasurer | 2018 | Director, Accounting and Finance, Victory Capital Management Inc. (since 2019); Accounting/Financial Director, USAA (December 2013-June 2019); Assistant Treasurer, USAA ETF Trust (September 2018-June 2019) | ||||||||||||
| Erin G. Wagner, Born February 1974 | Secretary | 2019 | Deputy General Counsel, the Adviser (since 2013) | ||||||||||||
| Charles Booth, Born April 1960 | Anti-Money Laundering Compliance Officer and Identity Theft Officer | 2019 | Director, Regulatory Administration and CCO Support Services, Citi Fund Services Ohio, Inc. (since 2007) | ||||||||||||
| Amy Campos, Born July 1976 | Chief Compliance Officer | 2019 | Chief Compliance Officer, USAA Mutual Funds Trust (since 2019); Executive Director, Deputy Chief Compliance Officer, USAA Mutual Funds Trust and USAA ETF Trust (July 2017-June 2019); Compliance Director, USAA Mutual Funds Trust (2014-July 2017) | ||||||||||||
40
USAA Mutual Funds Trust | Supplemental Information — continued March 31, 2021 | ||||||
(Unaudited)
Proxy Voting and Portfolio Holdings Information
Proxy Voting:
Information regarding the policies and procedures the Fund uses to determine how to vote proxies relating to portfolio securities is available without charge, upon request, by calling (800) 235-8396. The information is also included in the Fund's Statement of Additional Information, which is available on the SEC's website at www.sec.gov.
Information relating to how the Fund voted proxies relating to portfolio securities held during the most recent 12 months ended June 30 is available on the SEC's website at www.sec.gov.
Availability of Schedules of Portfolio Investments:
The Trust files a complete list of Schedules of Portfolio Investments with the SEC for the first and third quarter of each fiscal year on Form N-PORT. Form N-PORT is available on the SEC's website at www.sec.gov.
Expense Examples
As a shareholder of the Fund, you may incur two types of costs: (1) transaction costs, including sales charges (loads) on purchases; and (2) ongoing costs, including management fees and other Fund expenses. These examples are intended to help you understand your ongoing costs (in dollars) of investing in the Fund and to compare these costs with the ongoing costs of investing in other mutual funds.
These examples are based on an investment of $1,000 invested at the beginning of the period and held for the entire period from October 1, 2020 through March 31, 2021.
The Actual Expense figures in the table below provide information about actual account values and actual expenses. You may use the information below, together with the amount you invested, to estimate the expenses that you paid over the period. Simply divide your account value by $1,000 (for example, an $8,600 account value divided by $1,000 = 8.6), then multiply the result by the number in the table under the heading entitled "Actual Expenses Paid During Period" to estimate the expenses you paid on your account during this period.
The Hypothetical Expense figures in the table below provide information about hypothetical account values and hypothetical expenses based on the Fund's actual expense ratio and an assumed rate of return of 5% per year before expenses, which is not the Fund's actual return. The hypothetical account values and expenses may not be used to estimate the actual ending account balance or expenses you paid for the period. You may use this information to compare this 5% hypothetical example with the 5% hypothetical examples that appear in shareholder reports of other funds.
Please note the expenses shown in the table below are meant to highlight your ongoing costs only and do not reflect any transactional costs. If these transactional costs were included, your costs would have been higher.
| Beginning Account Value 10/1/20 | Actual Ending Account Value 3/31/21 | Hypothetical Ending Account Value 3/31/21 | Actual Expenses Paid During Period 10/1/20- 3/31/21* | Hypothetical Expenses Paid During Period 10/1/20- 3/31/21* | Annualized Expense Ratio During Period 10/1/20- 3/31/21 | ||||||||||||||||||||||
Fund Shares | $ | 1,000.00 | $ | 1,014.80 | $ | 1,022.44 | $ | 2.51 | $ | 2.52 | 0.50 | % | |||||||||||||||
Institutional Shares | 1,000.00 | 1,014.80 | 1,022.49 | 2.46 | 2.47 | 0.49 | % | ||||||||||||||||||||
Class A | 1,000.00 | 1,013.60 | 1,021.19 | 3.77 | 3.78 | 0.75 | % | ||||||||||||||||||||
* Expenses are equal to the average account value multiplied by the Fund's annualized expense ratio multiplied by 182/365 (the number of days in the most recent fiscal half-year divided by the number of days in the fiscal year).
41
USAA Mutual Funds Trust | Supplemental Information — continued March 31, 2021 | ||||||
(Unaudited)
Additional Federal Income Tax Information
The following federal tax information related to the Fund's fiscal year ended March 31, 2021, is provided for information purposes only and should not be used for reporting to federal or state revenue agencies. Federal tax information for the calendar year will be reported to you on Form 1099-DIV in January 2022.
With respect to distributions paid, the Fund designates the following amounts (or, if subsequently determined to be different, the maximum amount allowable) for the fiscal year ended March 31, 2021 (amounts in thousands):
| Tax Exempt Distributions | |||||||
$ | 16,885 | ||||||
42
USAA Mutual Funds Trust | Supplemental Information — continued March 31, 2021 | ||||||
(Unaudited)
Considerations of the Board in Continuing the Investment Advisory Agreement
USAA Virginia Bond Fund (the "Fund")
At a meeting of the Board of Trustees (the "Board") held on December 10-11, 2020, the Board, including the Trustees who are not "interested persons" (as that term is defined in the Investment Company Act of 1940, as amended) of the Trust (the "Independent Trustees"), approved for an annual period the continuance of the Investment Advisory Agreement (the "Advisory Agreement") between the Trust and Victory Capital Management Inc. (the "Adviser") with respect to the Fund. Prior to the December 10-11, 2020, meeting, at which the Advisory Agreement was approved, the Independent Trustees also discussed and considered information regarding the proposed continuation of the Advisory Agreement at a meeting held on November 19, 2020.
In advance of the foregoing meetings, the Trustees received and considered a variety of information relating to the Advisory Agreement and the Adviser, and were given the opportunity to ask questions and request additional information from management. The information provided to the Board included, among other things: (i) a separate report prepared by an independent third party of mutual fund data, which provided a statistical analysis comparing the Fund's investment performance, expenses, and fees to comparable investment companies; (ii) information concerning the services rendered to the Fund, as well as information regarding the Adviser's revenues and costs of providing services to the Fund and compensation paid to affiliates of the Adviser; and (iii) information about the Adviser's operations and personnel. Prior to voting, the Independent Trustees reviewed the proposed continuance of the Advisory Agreement with management and with experienced independent counsel retained by the Independent Trustees ("Independent Counsel") and received materials from such Independent Counsel discussing the legal standards for their consideration of the proposed continuation of the Advisory Agreement with respect to the Fund. The Independent Trustees also reviewed the proposed continuation of the Advisory Agreement with respect to the Fund in private sessions with Independent Counsel at which no representatives of management were present.
At each regularly scheduled meeting of the Board and its committees, the Board receives and reviews, among other things, information concerning the Fund's performance and related services provided by the Adviser. At the meeting at which the renewal of the Advisory Agreement is considered, particular focus is given to information concerning Fund performance, fees and total expenses as compared to comparable investment companies, and the Adviser's profitability with respect to the Fund. However, the Board noted that the evaluation process with respect to the Adviser is an ongoing one. In this regard, the Board's and its committees' consideration of the Advisory Agreement included information previously received at such meetings.
Advisory Agreement
After full consideration of a variety of factors, the Board, including the Independent Trustees, voted to approve the Advisory Agreement. In approving the Advisory Agreement, the Trustees did not identify any single factor as controlling, and each Trustee may have attributed different weights to various factors. Throughout their deliberations, the Independent Trustees were represented and assisted by Independent Counsel.
Nature, Extent, and Quality of Services — In considering the nature, extent, and quality of the services provided by the Adviser under the Advisory Agreement, the Board reviewed information provided by the Adviser relating to its operations and personnel. The Board also took into account its knowledge of the Adviser's management and the quality of the performance of the Adviser's duties through Board meetings, discussions, and reports during the preceding year. The Board considered the fees paid to the Adviser and the services provided to the Fund by the Adviser under the Advisory Agreement, as well as other services provided by the Adviser and its affiliates under other agreements, and the personnel who provide these services. In addition to the investment advisory services provided to the Fund, the Adviser and its affiliates provide administrative services, shareholder services, oversight of Fund accounting, marketing services, assistance in meeting legal and regulatory requirements, and other services necessary for the operation of the Fund and the Trust.
The Board considered the scope of services provided by, and the undertakings required of, the Adviser in connection with those services, including, among other things, maintaining (i) its own and the Fund's compliance programs, (ii) risk management programs, (iii) liquidity risk management programs, and (iv) cybersecurity
43
USAA Mutual Funds Trust | Supplemental Information — continued March 31, 2021 | ||||||
(Unaudited)
programs, each of which had expanded over time as a result of regulatory, market, and other developments. The Board also considered the significant risks assumed by the Adviser in connection with the services provided to the Fund, including investment, operational, enterprise, litigation, regulatory and compliance risks.
The Board considered the Adviser's management style and the performance of the Adviser's duties under the Advisory Agreement. The Board considered the level and depth of knowledge of the Adviser, including the professional experience and qualifications of its senior and investment personnel, as well as current staffing levels. The allocation of the Fund's brokerage, including the Adviser's process for monitoring "best execution," also was considered. The Adviser's role in coordinating the activities of the Fund's other service providers was also considered. The Board also considered the Adviser's risk management processes. The Board considered the Adviser's financial condition and that it had the financial wherewithal to continue to provide the same scope and high quality of services under the Advisory Agreement. In reviewing the Advisory Agreement, the Board focused on the experience, resources, and strengths of the Adviser and its affiliates in managing the Fund, as well as the other funds in the Trust.
The Board also reviewed the compliance and administrative services provided to the Fund by the Adviser and its affiliates, including the Adviser's oversight of the Fund's day-to-day operations and oversight of Fund accounting. The Trustees, guided also by information obtained from their experiences as trustees of the Trust, also focused on the quality of the Adviser's compliance and administrative staff.
Expenses and Performance — In connection with its consideration of the Advisory Agreement, the Board evaluated the Fund's advisory fees and total expense ratio as compared to other open-end investment companies deemed to be comparable to the Fund as determined by the independent third party in its report. The Fund's expenses were compared to (i) a group of investment companies chosen by the independent third party to be comparable to the Fund based upon certain factors, including fund type, comparability of investment objective and classification, sales load type, asset size, and expense components (the "expense group") and (ii) a larger group of investment companies with the same investment classification/objective as the Fund regardless of asset size, excluding outliers (the "expense universe"). Among other data, the Board noted that the Fund's management fee rate—which includes advisory and administrative services and the effects of any performance adjustment1, as well as any fee waivers and reimbursements—was below the medians of its expense group and its expense universe. The data indicated that the Fund's total expenses, including after any reimbursements, were below the medians of its expense group and expense universe. The Board also took into account the Adviser's current undertakings to maintain expense limitations for the Fund. The Board took into account the various other services provided to the Fund by the Adviser and its affiliates, and noted the high quality of services received by the Fund.
In considering the Fund's performance, the Board noted that it reviews at its regularly scheduled meetings information about the Fund's performance results. The Trustees also reviewed various comparative data provided to them in connection with their consideration of the renewal of the Advisory Agreement, including, among other information, a comparison of the Fund's average annual total returns relative to its Lipper index and other mutual funds deemed to be in its peer group by the independent third party in its report (the "performance universe"). The Fund's performance universe consisted of the Fund and all retail and institutional open-end investment companies with the same classification/objective as the Fund regardless of asset size or primary channel of distribution. This comparison indicated that, among other data, the Fund's performance was above the average of its performance universe and below its Lipper index for the one-year period ended September 30, 2020, and was above the average of its performance universe and its Lipper index for the three-, five-, and ten-year periods ended September 30, 2020.
Compensation and Profitability — The Board took into consideration the level and method of computing the management fee. The information considered by the Board included operating profit margin information for the Adviser's business as a whole. The Board also received and considered profitability information related to the management revenues from the Fund. This information included a review of the methodology used in the allocation of certain costs to the Fund. In considering the profitability data with respect to the Fund, the Trustees noted that the Adviser waived a portion of its management fees and/or reimbursed certain expenses with respect
1 The Adviser has agreed that no performance adjustment (positive or negative) would be made to the amount payable to the Adviser from July 1, 2019, through June 30, 2020.
44
USAA Mutual Funds Trust | Supplemental Information — continued March 31, 2021 | ||||||
(Unaudited)
to the Fund. The Trustees reviewed the profitability of the Adviser's relationship with the Fund before tax expenses. The Board was also provided with a profitability analysis of other publicly traded asset managers prepared by an independent information service. In reviewing the overall profitability of the management fee to the Adviser, the Board also considered the fact that the Adviser and its affiliates provide shareholder servicing and administrative services to the Fund for which they receive compensation. The Board also considered the possible direct and indirect benefits to the Adviser from its relationship with the Trust, including that the Adviser may derive reputational and other benefits from its association with the Fund. The Trustees recognized that the Adviser should be entitled to earn a reasonable level of profits in exchange for the level of services it provides to the Fund and the entrepreneurial and other risks that it assumes as Adviser.
Economies of Scale — The Board noted that the Fund has advisory fee breakpoints that allow the Fund to participate in economies of scale and that such economies of scale were currently reflected in the advisory fee. The Board also considered the fee waiver and expense reimbursement arrangements by the Adviser. The Board also considered the effect of the Fund's change in size, if any, on its performance and fees, noting that the Fund may realize other economies of scale if assets increase proportionally more than expenses. The Board determined that the current investment management fee structure was reasonable.
Conclusions — The Board reached the following conclusions regarding the Fund's Advisory Agreement with the Adviser: (i) the Adviser has demonstrated that it possesses the capability and resources to perform the duties required of it under the Advisory Agreement; (ii) the Adviser maintains an appropriate compliance program; (iii) the overall performance of the Fund is reasonable in relation to the performance of funds with similar investment objectives and to relevant indices; (iv) the Fund's advisory expenses are reasonable in relation to those of similar funds and to the services to be provided by the Adviser; and (v) the Adviser's and its affiliates' level of profitability from their relationship with the Fund is reasonable in light of the nature and high quality of services provided by the Adviser and the type of fund. Based on its conclusions, the Board determined that continuation of the Advisory Agreement would be in the best interests of the Fund and its shareholders.
45
USAA Mutual Funds Trust | Supplemental Information — continued March 31, 2021 | ||||||
(Unaudited)
Liquidity Risk Management Program:
The USAA Mutual Funds have adopted and implemented a written liquidity risk management program (the "LRMP") as required by Rule 22e-4 under the Investment Company Act of 1940, as amended. The LRMP is reasonably designed to assess and manage the Fund's liquidity risk, taking into consideration the Fund's investment strategy and the liquidity of its portfolio investments during normal and reasonably foreseeable stressed market conditions; its short and long-term cash flow projections; and its cash holdings and access to other liquidity management tools such as available funding sources including the Victory Funds Complex Interfund Lending Facility and Line of Credit (discussed in the Notes to Financial Statements). The USAA Mutual Funds' Board of Trustees approved the appointment of the Funds' investment adviser, Victory Capital Management Inc. ("Victory Capital"), as the administrator of the LRMP.
Victory Capital manages liquidity risks associated with the Fund's investments by monitoring, among other things, cash and cash equivalents, any use of derivatives, the concentration of investments, the appropriateness of the Fund's investment strategy, and by classifying every fund investment as either highly liquid, moderately liquid, less liquid or illiquid on at least a monthly basis. To assist with the classification of Fund investments, Victory Capital has retained a third-party provider of liquidity evaluation services. This provider determines preliminary liquidity classifications for all portfolio holdings based upon portfolio-level data and certain assumptions provided by Victory Capital. Victory Capital reviews the preliminary liquidity classifications, and, when appropriate, considers other information including input from the Fund's portfolio managers (including the portfolio managers employed by any investment sub-advisers) in determining final liquidity classifications.
At a virtual video conference meeting held on March 10, 2021, Victory Capital provided an oral and written report to the Trustees on the operation and effectiveness of the LRMP during the previous year. The report from Victory Capital concluded that the Fund did not experience any significant liquidity challenges during the covered period, and the Fund's LRMP is reasonably designed to assess and manage its liquidity risk. The report also concluded that the LRMP continues to operate adequately and effectively to enable Victory Capital to oversee and manage liquidity risk and ensure the Fund is able to meet redemption requests without significant dilution to the remaining investors' interest in the Fund. During the review period, the Fund's portfolio consisted primarily of highly liquid investments, which are defined as cash and any investments reasonably expected to be converted to cash in current market conditions in three business days or less without significantly changing the market value of the investment. Therefore, the Fund has not adopted a Highly Liquid Investment Minimum. The Fund's investments were below the limitation on illiquid investments during the review period. Additionally, Victory Capital indicated that no events occurred that would require the filing of Form N-LIQUID and recommended no material changes to the LRMP.
46
Privacy Policy
Protecting the Privacy of Information
The Trust respects your right to privacy. We also know that you expect us to conduct and process your business in an accurate and efficient manner. To do so, we must collect and maintain certain personal information about you. This is the information we collect from you on applications or other forms, and from the transactions you make with us or third parties. It may include your name, address, social security number, account transactions and balances, and information about investment goals and risk tolerance.
We do not disclose any information about you or about former customers to anyone except as permitted or required by law. Specifically, we may disclose the information we collect to companies that perform services on our behalf, such as the transfer agent that processes shareholder accounts and printers and mailers that assist us in the distribution of investor materials. We may also disclose this information to companies that perform marketing services on our behalf. This allows us to continue to offer you Victory investment products and services that meet your investing needs, and to effect transactions that you request or authorize. These companies will use this information only in connection with the services for which we hired them. They are not permitted to use or share this information for any other purpose.
To protect your personal information internally, we permit access only by authorized employees and maintain physical, electronic and procedural safeguards to guard your personal information.*
* You may have received communications regarding information about privacy policies from other financial institutions which gave you the opportunity to "opt-out" of certain information sharing with companies which are not affiliated with that financial institution. The Trust does not share information with other companies for purposes of marketing solicitations for products other than the Trust. Therefore, the Trust does not provide opt-out options to their shareholders.
P.O. Box 182593
Columbus, Ohio 43218-2593

Visit our website at: | Call | ||||||
vcm.com | (800) 235-8396 | ||||||
40862-0521

MARCH 31, 2021
Annual Report
USAA Tax Exempt Money Market Fund
As permitted by regulations adopted by the Securities and Exchange Commission, paper copies of the Fund's shareholder reports may no longer be sent by mail, unless you specifically request paper copies of the reports from the Fund or from your financial intermediary, such as a broker-dealer or bank. Instead, the reports will be made available on VictoryFunds.com, and you will be notified by mail each time a report is posted and provided with a website link to access the report. If you already elected to receive shareholder reports electronically, you will not be affected by this change and you need not take any action.
You may elect to receive shareholder reports and other communications from the Fund or your financial intermediary electronically by notifying your financial intermediary directly, or if you are a shareholder who has an account directly with the Fund, by calling (800) 235-8396 or by submitting your request via email to TA.Processing@FISGlobal.com.
You may elect to receive all future reports in paper form free of charge. You can inform the Fund or your financial intermediary that you wish to continue receiving paper copies of your shareholder reports by notifying your financial intermediary directly, or if you are a shareholder who has an account directly with the Fund, by calling (800) 235-8396 or by submitting your request via email to TA.Processing@FISGlobal.com. Your election to receive reports in paper will apply to all funds held with the USAA Mutual Funds or your financial intermediary.
Victory Capital means Victory Capital Management Inc., the investment adviser of the USAA Mutual Funds. USAA Mutual Funds are distributed by Victory Capital Services, Inc., member of FINRA, an affiliate of Victory Capital. Victory Capital and its affiliates are not affiliated with United Services Automobile Association or its affiliates. USAA and the USAA logos are registered trademarks and the USAA Mutual Funds and USAA Investments logos are trademarks of United Services Automobile Association and are being used by Victory Capital and its affiliates under license.
www.vcm.com
News, Information And Education 24 Hours A Day, 7 Days A Week
The Victory Funds site gives fund shareholders, prospective shareholders, and investment professionals a convenient way to access fund information, get guidance, and track fund performance anywhere they can access the Internet. The site includes:
• Detailed performance records
• Daily share prices
• The latest fund news
• Investment resources to help you become a better investor
• A section dedicated to investment professionals
Whether you're a potential investor searching for the fund that matches your investment philosophy, a seasoned investor interested in planning tools, or an investment professional, www.vcm.com has what you seek. Visit us anytime. We're always open.
USAA Mutual Funds Trust
TABLE OF CONTENTS
Shareholder Letter (Unaudited) | 2 | ||||||
Managers' Commentary (Unaudited) | 4 | ||||||
Investment Overview (Unaudited) | 5 | ||||||
| Investment Objective & Portfolio Holdings (Unaudited) | 6 | ||||||
Schedule of Portfolio Investments | 7 | ||||||
Financial Statements | |||||||
Statement of Assets and Liabilities | 12 | ||||||
Statement of Operations | 13 | ||||||
Statements of Changes in Net Assets | 14 | ||||||
Financial Highlights | 16 | ||||||
Notes to Financial Statements | 18 | ||||||
| Report of Independent Registered Public Accounting Firm | 26 | ||||||
Supplemental Information (Unaudited) | 27 | ||||||
Trustees' and Officers' Information | 27 | ||||||
Proxy Voting and Portfolio Holdings Information | 33 | ||||||
Expense Example | 33 | ||||||
Additional Federal Income Tax Information | 34 | ||||||
Advisory Contract Agreement | 35 | ||||||
Privacy Policy (inside back cover) | |||||||
This report is for the information of the shareholders and others who have received a copy of the currently effective prospectus of the Fund, managed by Victory Capital Management Inc. It may be used as sales literature only when preceded or accompanied by a current prospectus, which provides further details about the Fund.
IRA DISTRIBUTION WITHHOLDING DISCLOSURE
We generally must withhold federal income tax at a rate of 10% of the taxable portion of your distribution and, if you live in a state that requires state income tax withholding, at your state's tax rate. However, you may elect not to have withholding apply or to have income tax withheld at a higher rate. Any withholding election that you make will apply to any subsequent distribution unless and until you change or revoke the election. If you wish to make a withholding election, or change or revoke a prior withholding election, call (800) 235-8396, and form W-4P (OMB No. 1545-0074 withholding certificate for pension or annuity payments) will be electronically sent.
If you do not have a withholding election in place by the date of a distribution, federal income tax will be withheld from the taxable portion of your distribution at a rate of 10%. If you must pay estimated taxes, you may be subject to estimated tax penalties if your estimated tax payments are not sufficient and sufficient tax is not withheld from your distribution.
For more specific information, please consult your tax adviser.
1
(Unaudited)
Dear Shareholder,
The annual reporting period ended March 31, 2021, was a year like no other. It wasn't that long ago that we were all coming to grips with an emerging global pandemic, economic shutdowns, and financial markets in turmoil. We somehow persevered and have even emerged from those challenging days—dare I say—with a renewed sense of optimism. In retrospect, the trajectory of financial markets over the past year was nothing short of extraordinary.
Consider everything that transpired over the past 12 months. A novel coronavirus ("COVID-19") and the subsequent worldwide spread of COVID-19 prompted governments everywhere to issue austere shelter-in-place orders, and the global economy slowed abruptly. Equity markets sold off, while unprecedented levels of volatility roiled traditionally placid bond markets. During the second quarter of 2020, domestic GDP contracted by an alarming annual rate of 31.4%, according to the U.S. Department of Commerce ("Commerce Department").
It's no surprise that many investors flocked to the perceived safety of U.S. Treasurys during this period of tumult. Meanwhile, liquidity evaporated (for a short spell) in other segments of the fixed-income world, including higher-yielding credits and municipal bonds. The outlook was tenuous, and credit spreads widened while prices declined for most securities perceived to be higher risk.
Fortunately, a response came swiftly. The U.S. Federal Reserve (the "Fed") and other monetary authorities worldwide leapt into action—cutting interest rates, (re)starting quantitative easing and, in the case of the Fed, launching an array of programs to provide liquidity to stabilize fixed-income markets. The U.S. government also stepped up to provide fiscal stimulus in the form of the Coronavirus Aid, Relief, and Economic Security Act ("CARES Act").
It was impressive how quickly those actions helped arrest the stock market's freefall and restore order across much of the fixed-income universe. The rebound was as robust as the drawdown, and third quarter 2020 GDP bounced back and grew at a 33.4% annualized rate, according to the Commerce Department.
Late in the year, financial markets were alternately fueled and roiled by a contentious election season, growing optimism for an effective vaccine, and a fluid debate regarding the need for additional fiscal stimulus. Ultimately, stocks were propelled higher in the fourth quarter as it became clear Congress would provide another dose of stimulus in the form of direct payments, more unemployment insurance, and additional aid to businesses.
As the year ended and we moved into the first quarter of 2021, stocks continued their upward trajectory. Meanwhile, the yield on the 10-Year U.S. Treasury continued rallying sharply, and many investors began to worry about inflation in the post-pandemic world.
Through all the unprecedented events and volatility, the S&P 500® Index registered an impressive annual return of 56.35% for the 12-month period ended March 31, 2021. Over this same period, the yield on the 10-Year U.S. Treasury jumped more than 100 basis points, reflecting both the very low starting rate and substantial fiscal
2
stimulus. At the end of the reporting period, the yield on the 10-Year U.S. Treasury was 1.74%
On the whole, markets endured and surprised to the upside, but perhaps the key takeaway is that the unexpected can and will happen. That's why it's important to remain focused on your long-term investment goals and avoid making emotional decisions.
On the following pages, you will find information relating to your USAA Mutual Funds, brought to you by Victory Capital. If you have any questions regarding the current market dynamics or your specific portfolio or investment plan, we encourage you to contact our Member Service Representatives. Call (800) 235-8396, or visit our website at www.vcm.com.
Thank you for letting us help you work toward your investment goals.

Christopher K. Dyer, CFA
President,
USAA Mutual Funds Trust
3
USAA Mutual Funds Trust
USAA Tax Exempt Money Market Fund
Manager's Commentary
(Unaudited)
Cody Perkins, CFA
Andrew Hattman, CFA, CAIA
• What were the market conditions during the reporting period?
Throughout the 12-month reporting period ended March 31, 2021, the target federal funds rate was anchored at a range of between 0.00% and 0.25%. Officials at the U.S. Federal Reserve (the "Fed") set the short-term rate to these low levels in order to support the U.S. economy during the country's battle with COVID-19. In March 2021, the Fed indicated that it doesn't expect to hike rates anytime soon.
Interest rates on tax-exempt money market securities started the reporting period at elevated levels as many tax-exempt mutual funds were forced to sell their most liquid holdings to meet investor redemptions. However, this technical anomaly was short-lived, and levels eventually approached those of other short-term interest rates. At the beginning of the reporting period, the SIFMA Municipal Swap Index, the index of seven-day variable rate demand notes ("VRDNs"), was 1.83%. The index ended the reporting period at just 0.07%.
• How did the USAA Tax Exempt Money Market Fund (the "Fund") perform during the reporting period?
For the reporting period ended March 31, 2021, the Fund had a return of 0.10%, compared to an average return of 0.07% for the funds in the Lipper Tax-Exempt Money Market Funds category.
• What strategies did you employ during the reporting period?
We continued to focus on our two primary goals: preservation of capital and liquidity. The Fund invests the majority of its assets in VRDNs, which generally have interest rates that adjust daily/weekly to the market. The VRDNs owned by the Fund continued to provide both flexibility and liquidity because they can be sold at par value (100% of face value) upon seven days or less notice. They also offer the Fund a degree of safety as many of these VRDNs are guaranteed by a bank letter of credit for the payment of both principal and interest.
As always, we continued to work with our in-house team of analysts to help us identify attractive opportunities for the portfolio. They also continue to analyze and monitor every holding in the Fund.
Thank you for allowing us to assist you with your investment needs.
4
USAA Mutual Funds Trust
USAA Tax Exempt Money Market Fund
Investment Overview
(Unaudited)
Average Annual Total Return
Year Ended March 31, 2021
INCEPTION DATE | 2/6/84 | ||||||
Net Asset Value | |||||||
One Year | 0.10 | % | |||||
Five Year | 0.59 | % | |||||
Ten Year | 0.30 | % | |||||
The performance data quoted represents past performance and current returns may be lower or higher. The investment return and principal value will fluctuate so that an investor's shares, when redeemed, may be worth more or less than the original cost. To obtain performance information current to the most recent month's end, please visit www.vcm.com.
You could lose money by investing in the Fund. Although the Fund seeks to preserve the value of your investment at $1 per share, it cannot guarantee it will do so. The Fund may impose a fee upon the sale of your shares or may temporarily suspend your ability to sell shares if the Fund's liquidity falls below required minimums because of market conditions or other factors. An investment in the Fund is not a deposit in a bank, and is not insured or guaranteed by the Federal Deposit Insurance Corporation or any other government agency. The Fund's sponsor has no legal obligation to provide financial support to the Fund, and you should not expect that the sponsor will provide financial support to the Fund at any time.
Total return measures the price change in a share assuming the reinvestment of all net investment income and realized capital gain distributions, if any. The total returns quoted do not reflect adjustments made to the enclosed financial statements in accordance with U.S. Generally Accepted Accounting Principles or the deduction of taxes that a shareholder would pay on net investment income and realized capital gain distributions, including reinvested distributions, or redemptions of shares. The total return figures set forth above include all waivers of fees. Without such fee waivers, the total returns would have been lower.
USAA Tax Exempt Money Market Fund — Growth of $10,000

The graph reflects investment of growth of a hypothetical $10,000 investment in the Fund.
The graph and table do not reflect the deduction of taxes that a shareholder would pay on Fund distributions or the redemption of Fund shares.
Past performance is not indicative of future results.
5
| USAA Mutual Funds Trust USAA Tax Exempt Money Market Fund | March 31, 2021 | ||||||
(Unaudited)
Investment Objective & Portfolio Holdings:
The Fund's investment objective seeks to provide investors with interest income that is exempt from federal income tax and has a further objective of preserving capital and maintaining liquidity.
Top 10 Industries
March 31, 2021
(% of Net Assets)
Electric Utilities | 18.3 | % | |||||
General Obligation | 14.6 | % | |||||
Education | 9.5 | % | |||||
Steel | 7.3 | % | |||||
Hospital | 7.1 | % | |||||
Community Service | 6.7 | % | |||||
Nursing/CCRC | 6.4 | % | |||||
Buildings | 4.8 | % | |||||
Integrated Oil & Gas | 4.1 | % | |||||
Pharmaceuticals | 3.6 | % | |||||
Refer to the Schedule of Portfolio Investments for a complete list of securities.
6
| USAA Mutual Funds Trust USAA Tax Exempt Money Market Fund | Schedule of Portfolio Investments March 31, 2021 | ||||||
(Amounts in Thousands, Except for Shares)
Security Description | Principal Amount | Value | |||||||||
Municipal Bonds (91.8%) | |||||||||||
Alabama (5.4%): | |||||||||||
| Columbia Industrial Development Board Revenue, 0.15%, 12/1/37, Continuously Callable @100 (a) | $ | 10,000 | $ | 10,000 | |||||||
| Mobile County IDA Revenue (LOC — Swedbank AB), Series B, 0.10%, 7/1/40, Continuously Callable @100 (a) | 15,000 | 15,000 | |||||||||
| West Jefferson Industrial Development Board Revenue, 0.15%, 6/1/28, Continuously Callable @100 (a) | 5,190 | 5,190 | |||||||||
30,190 | |||||||||||
California (1.0%): | |||||||||||
| City of Los Angeles Certificate of Participation (LOC — U.S. Bancorp), Series A, 0.16%, 8/1/35, Continuously Callable @100 (a) | 5,885 | 5,885 | |||||||||
Florida (4.4%): | |||||||||||
City of Jacksonville Revenue, 0.08%, 5/1/29, Continuously Callable @100 (a) | 3,000 | 3,000 | |||||||||
| County of Escambia Revenue 0.09%, 7/1/22 (a) | 18,200 | 18,200 | |||||||||
0.07%, 4/1/39, Continuously Callable @100 (a) | 800 | 800 | |||||||||
County of St. Lucie Revenue, 0.08%, 9/1/28, Continuously Callable @100 (a) | 2,800 | 2,800 | |||||||||
24,800 | |||||||||||
Georgia (1.8%): | |||||||||||
| Appling County Development Authority Revenue (NBGA — Southern Co.), 0.11%, 9/1/41, Continuously Callable @100 (a) | 5,100 | 5,100 | |||||||||
| The Burke County Development Authority Revenue, Series 1, 0.10%, 7/1/49, Continuously Callable @100 (a) | 5,175 | 5,175 | |||||||||
10,275 | |||||||||||
Illinois (5.4%): | |||||||||||
| Illinois Finance Authority Revenue (LOC — Huntington National Bank), 0.11%, 10/1/33, Continuously Callable @100 (a) | 2,785 | 2,785 | |||||||||
| Illinois State Educational Facilities Revenue (LOC — Huntington National Bank), Series A, 0.10%, 10/1/32, Continuously Callable @100 (a) | 14,165 | 14,165 | |||||||||
| Metropolitan Pier & Exposition Authority Revenue (LIQ — Barclays Bank PLC), Series 2015-XF1045, 0.20%, 6/15/52, Callable 6/15/22 @ 100 (a) (b) | 13,155 | 13,155 | |||||||||
30,105 | |||||||||||
Indiana (2.9%): | |||||||||||
| City of Berne Revenue (LOC — Federal Home Loan Bank of Indianapolis), 0.12%, 10/1/33, Continuously Callable @100 (a) | 4,505 | 4,505 | |||||||||
| City of Evansville Revenue (LOC — Fifth Third Bank), 0.13%, 1/1/25, Callable 4/16/21 @ 100 (a) | 1,905 | 1,905 | |||||||||
| Indiana Finance Authority Revenue (LOC — Federal Home Loan Bank of Indianapolis), 0.14%, 7/1/29, Continuously Callable @100 (a) | 6,845 | 6,845 | |||||||||
| Indiana Finance Authority Revenue (LOC — Fifth Third Bank), 0.15%, 9/1/31, Callable 4/16/21 @ 100 (a) | 3,500 | 3,500 | |||||||||
16,755 | |||||||||||
See notes to financial statements.
7
| USAA Mutual Funds Trust USAA Tax Exempt Money Market Fund | Schedule of Portfolio Investments — continued March 31, 2021 | ||||||
(Amounts in Thousands, Except for Shares)
Security Description | Principal Amount | Value | |||||||||
Iowa (2.9%): | |||||||||||
| Iowa Finance Authority Revenue 0.09%, 6/1/39, Continuously Callable @100 (a) | $ | 9,600 | $ | 9,600 | |||||||
Series B, 0.09%, 9/1/36, Continuously Callable @100 (a) | 6,763 | 6,763 | |||||||||
16,363 | |||||||||||
Kansas (4.7%): | |||||||||||
| City of Burlington Revenue 0.19%, 9/1/35, Continuously Callable @100 (a) | 8,250 | 8,250 | |||||||||
Series B, 0.19%, 9/1/35, Continuously Callable @100 (a) | 4,200 | 4,200 | |||||||||
City of St. Marys Revenue, 0.15%, 4/15/32, Continuously Callable @100 (a) | 13,800 | 13,800 | |||||||||
26,250 | |||||||||||
Kentucky (2.2%): | |||||||||||
| City of Georgetown Revenue (LOC — Fifth Third Bank), 0.13%, 11/15/29, Callable 4/15/21 @ 100 (a) | 10,820 | 10,820 | |||||||||
| Lexington-Fayette Urban County Government Revenue (LOC — Federal Home Loan Bank of Cincinnati), 0.23%, 12/1/27, Callable 4/15/21 @ 100 (a) | 1,635 | 1,635 | |||||||||
12,455 | |||||||||||
Louisiana (6.1%): | |||||||||||
| City of New Orleans Revenue (LOC — Capital One, N.A.), 0.25%, 8/1/24, Continuously Callable @100 (a) | 3,225 | 3,225 | |||||||||
| Parish of St. James Revenue, Series A-1, 0.15%, 11/1/40, Continuously Callable @100 (a) | 1,985 | 1,985 | |||||||||
| Parish of St. James Revenue (NBGA — Nucor Corp.), Series B-1, 0.14%, 11/1/40, Continuously Callable @100 (a) | 24,150 | 24,150 | |||||||||
| St. Tammany Corp. Revenue (LOC — Federal Home Loan Bank of Dallas), 0.09%, 3/1/33, Continuously Callable @100 (a) | 5,050 | 5,050 | |||||||||
34,410 | |||||||||||
Maryland (1.5%): | |||||||||||
| Town of Williamsport Revenue (LOC — Manufacturers & Traders Trust Co.), 0.10%, 11/1/37 (a) | 8,155 | 8,155 | |||||||||
Michigan (0.4%): | |||||||||||
| Michigan State Strategic Fund Revenue (LOC — Fifth Third Bank), 0.15%, 3/1/37, Continuously Callable @100 (a) | 2,100 | 2,100 | |||||||||
Mississippi (0.6%): | |||||||||||
| Mississippi Business Finance Corp. Revenue (LOC — Federal Home Loan Bank of Dallas), 0.09%, 3/1/33, Continuously Callable @100 (a) | 3,565 | 3,565 | |||||||||
Missouri (3.6%): | |||||||||||
| Jackson County IDA Revenue (LOC — Commerce Bank, N.A.), 0.10%, 7/1/25, Continuously Callable @100 (a) | 20,000 | 20,000 | |||||||||
Nebraska (2.5%): | |||||||||||
| County of Custer Revenue (LOC — U.S. Bancorp), 0.10%, 12/1/36, Callable 6/3/21 @ 100 (a) | 11,000 | 11,000 | |||||||||
| County of Washington Revenue, Series B, 0.08%, 12/1/40, Continuously Callable @100 (a) | 3,000 | 3,000 | |||||||||
14,000 | |||||||||||
See notes to financial statements.
8
| USAA Mutual Funds Trust USAA Tax Exempt Money Market Fund | Schedule of Portfolio Investments — continued March 31, 2021 | ||||||
(Amounts in Thousands, Except for Shares)
Security Description | Principal Amount | Value | |||||||||
New Hampshire (3.6%): | |||||||||||
| New Hampshire Business Finance Authority Revenue (LOC — Landesbank Hessen-Thuringen), 0.10%, 9/1/30, Continuously Callable @100 (a) | $ | 19,990 | $ | 19,990 | |||||||
New Mexico (0.9%): | |||||||||||
| New Mexico Hospital Equipment Loan Council Revenue (LOC — Fifth Third Bank), 0.14%, 7/1/25, Continuously Callable @100 (a) | 5,000 | 5,000 | |||||||||
New York (21.0%): | |||||||||||
Adirondack Central School District, GO, 1.25%, 7/16/21 | 5,390 | 5,400 | |||||||||
Akron Central School District, GO, 1.25%, 7/22/21 | 6,000 | 6,012 | |||||||||
Broadalbin-Perth Central School District, GO, 1.25%, 6/24/21 | 5,000 | 5,008 | |||||||||
| Build NYC Resource Corp. Revenue (LOC — Toronto-Dominion Bank), 0.22%, 12/1/45, Continuously Callable @100 (a) | 5,355 | 5,355 | |||||||||
Chenango Forks Central School District, GO, 1.25%, 8/5/21 | 5,000 | 5,010 | |||||||||
City of Tonawanda, GO, 2.00%, 6/3/21 | 6,824 | 6,839 | |||||||||
| County of Chautauqua Industrial Development Agency Revenue (LOC — Citizens Financial Group), Series A, 0.12%, 8/1/27, Continuously Callable @100 (a) | 1,560 | 1,560 | |||||||||
Gowanda Central School District, GO, 1.25%, 6/22/21 | 5,000 | 5,007 | |||||||||
| Guilderland Industrial Development Agency Revenue (LOC — Key Bank, N.A.), Series A, 0.20%, 7/1/32, Continuously Callable @100 (a) | 2,875 | 2,875 | |||||||||
Highland Central School District, GO, 1.00%, 6/30/21, Continuously Callable @100 | 6,310 | 6,312 | |||||||||
Holland Patent Central School District, GO, 1.25%, 6/25/21 | 4,000 | 4,006 | |||||||||
Minisink Valley Central School District, GO, 1.25%, 6/25/21 | 5,000 | 5,005 | |||||||||
| New York City Capital Resources Corp. Revenue (LOC — Manufacturers & Traders Trust Co.), 0.27%, 12/1/40, Continuously Callable @100 (a) | 7,500 | 7,500 | |||||||||
| New York Liberty Development Corp. Revenue (LIQ — Royal Bank of Canada), Series 2016-ZF0464, 0.09%, 5/15/21 (a) (b) | 13,000 | 13,000 | |||||||||
| Oneida County Industrial Development Agency Revenue (LOC — Citizens Financial Group), 0.15%, 7/1/37, Continuously Callable @100 (a) | 1,710 | 1,710 | |||||||||
| Onondaga County Industrial Development Agency Revenue (LOC — Manufacturers & Traders Trust Co.), 0.10%, 12/1/31, Continuously Callable @100 (a) | 5,210 | 5,210 | |||||||||
| Ramapo Housing Authority Revenue (LOC — Manufacturers & Traders Trust Co.), 0.10%, 12/1/29, Continuously Callable @100 (a) | 8,285 | 8,285 | |||||||||
Sandy Creek Central School District, GO, 1.25%, 6/25/21 | 6,400 | 6,408 | |||||||||
Schuylerville Central School District, GO, 1.50%, 6/25/21 | 5,000 | 5,006 | |||||||||
| St. Lawrence County Industrial Development Agency Revenue (LOC — Citizens Financial Group), 0.25%, 7/1/37 (a) | 1,865 | 1,865 | |||||||||
Stillwater Central School District, GO, 1.50%, 6/25/21 | 5,000 | 5,006 | |||||||||
Wappingers Central School District, GO, Series A, 1.25%, 7/14/21 | 6,275 | 6,287 | |||||||||
118,666 | |||||||||||
Ohio (0.4%): | |||||||||||
County of Hamilton Revenue (LOC — Fifth Third Bank), 0.13%, 12/1/24 (a) | 2,000 | 2,000 | |||||||||
Oklahoma (5.6%): | |||||||||||
| Edmond Economic Development Authority Revenue (LOC — Bank of Oklahoma, N.A.), Series A, 0.11%, 6/1/31, Callable 5/1/21 @ 100 (a) | 5,260 | 5,260 | |||||||||
See notes to financial statements.
9
| USAA Mutual Funds Trust USAA Tax Exempt Money Market Fund | Schedule of Portfolio Investments — continued March 31, 2021 | ||||||
(Amounts in Thousands, Except for Shares)
Security Description | Principal Amount | Value | |||||||||
| Garfield County Industrial Authority Revenue, Series A, 0.22%, 1/1/25, Callable 5/5/21 @ 100 (a) | $ | 24,100 | $ | 24,100 | |||||||
| Muskogee Industrial Trust Revenue, Series A, 0.22%, 6/1/27, Continuously Callable @100 (a) | 2,000 | 2,000 | |||||||||
31,360 | |||||||||||
Rhode Island (0.6%): | |||||||||||
| Rhode Island Commerce Corp. Revenue (LOC — Citizens Financial Group), 0.14%, 3/1/38, Callable 5/1/21 @ 100 (a) | 3,405 | 3,405 | |||||||||
Tennessee (6.3%): | |||||||||||
| Chattanooga Health Educational & Housing Facility Board Revenue, Series C, 0.12%, 5/1/39, Continuously Callable @100 (a) | 26,700 | 26,700 | |||||||||
| Metropolitan Government Nashville & Davidson County Health & Educational Facilities Board Revenue (LOC — Fifth Third Bank), 0.13%, 12/1/24, Callable 4/16/21 @ 100 (a) | 8,500 | 8,500 | |||||||||
35,200 | |||||||||||
Texas (4.1%): | |||||||||||
| Port of Arthur Navigation District Industrial Development Corp. Revenue 0.10%, 3/1/42, Callable 6/1/21 @ 100 (a) | 7,000 | 7,000 | |||||||||
Series A, 0.10%, 12/1/40, Callable 5/3/21 @ 100 (a) | 16,000 | 16,000 | |||||||||
23,000 | |||||||||||
Utah (1.8%): | |||||||||||
| Utah Housing Corp. Revenue (LIQ — Deutsche Bank A.G.), Series 2019-XF1081, 0.35%, 3/1/62, Callable 2/1/31 @ 100 (a) (b) | 10,000 | 10,000 | |||||||||
Virginia (0.7%): | |||||||||||
| Loudoun County Economic Development Authority Revenue (LOC — Northern Trust Corp.), 0.06%, 6/1/34, Callable 5/3/21 @ 100 (a) | 4,000 | 4,000 | |||||||||
Washington (1.4%): | |||||||||||
| Washington Higher Education Facilities Authority Revenue, 0.12%, 10/1/31, Callable 5/5/21 @ 100 (a) | 8,025 | 8,025 | |||||||||
Total Municipal Bonds (Cost $515,954) | 515,954 | ||||||||||
Commercial Paper (8.0%) | |||||||||||
Texas (8.0%): | |||||||||||
| Houston Texas 0.10%, 4/6/21 | 15,000 | 15,000 | |||||||||
0.10%, 4/9/21 | 10,000 | 10,000 | |||||||||
University of Texas System, 0.06%, 5/11/21 | 20,000 | 20,000 | |||||||||
Total Commercial Paper (Cost $45,000) | 45,000 | ||||||||||
Total Investments (Cost $560,954) — 99.8% | 560,954 | ||||||||||
Other assets in excess of liabilities — 0.2% | 1,061 | ||||||||||
NET ASSETS — 100.00% | $ | 562,015 | |||||||||
(a) Variable Rate Demand Notes that provide the rights to sell the security at face value on either that day or within the rate-reset period. The interest rate is reset on the put date at a stipulated daily, weekly, monthly, quarterly, or other specified time interval to reflect current market conditions. These securities do not indicate a reference rate and spread in their description.
See notes to financial statements.
10
| USAA Mutual Funds Trust USAA Tax Exempt Money Market Fund | Schedule of Portfolio Investments — continued March 31, 2021 | ||||||
(b) Rule 144A security or other security that is restricted as to resale to institutional investors. The Fund's Adviser has deemed this security to be liquid based upon procedures approved by the Board of Trustees. As of March 31, 2021, the fair value of these securities was $36,155 (thousands) and amounted to 6.4% of net assets.
Continuously callable — Investment is continuously callable or will be continuously callable on any date after the first call date until its maturity.
GO — General Obligation
IDA — Industrial Development Authority
LOC — Letter of Credit
PLC — Public Limited Company
Credit Enhancements — Adds the financial strength of the provider of the enhancement to support the issuer's ability to repay the principal and interest payments when due. The enhancement may be provided by a high-quality bank, insurance company or other corporation, or a collateral trust. The enhancements do not guarantee the market values of the securities.
LIQ Liquidity enhancement that may, under certain circumstances, provide for repayment of principal and interest upon demand from the name listed.
LOC Principal and interest payments are guaranteed by a bank letter of credit or other bank credit agreement.
NBGA Principal and interest payments or, under certain circumstances, underlying mortgages are guaranteed by a nonbank guarantee agreement from the name listed.
See notes to financial statements.
11
USAA Mutual Funds Trust | Statement of Assets and Liabilities March 31, 2021 | ||||||
(Amounts in Thousands, Except Per Share Amounts)
| USAA Tax Exempt Money Market Fund | |||||||
Assets: | |||||||
Investments, at value (Cost $560,954) | $ | 560,954 | |||||
Cash | 54 | ||||||
Receivables: | |||||||
Interest | 767 | ||||||
Capital shares issued | 375 | ||||||
From Adviser | 337 | ||||||
Prepaid expenses and other assets | 31 | ||||||
Total assets | 562,518 | ||||||
Liabilities: | |||||||
Payables: | |||||||
Distributions | — | (a) | |||||
Capital shares redeemed | 190 | ||||||
Accrued expenses and other payables: | |||||||
Investment advisory fees | 135 | ||||||
Administration fees | 48 | ||||||
Custodian fees | 14 | ||||||
Transfer agent fees | 72 | ||||||
Compliance fees | — | (a) | |||||
Trustees' fees | — | (a) | |||||
Other accrued expenses | 44 | ||||||
Total liabilities | 503 | ||||||
Net Assets: | |||||||
Capital | 562,016 | ||||||
Total accumulated earnings/(loss) | (1 | ) | |||||
Net assets | $ | 562,015 | |||||
Shares (unlimited number of shares authorized with no par value): | 562,008 | ||||||
Net asset value, offering and redemption price per share: (b) | $ | 1.00 | |||||
(a) Rounds to less than $1 thousand.
(b) Per share amount may not recalculate due to rounding of net assets and/or shares outstanding.
See notes to financial statements.
12
USAA Mutual Funds Trust | Statement of Operations For the Year Ended March 31, 2021 | ||||||
(Amounts in Thousands)
| USAA Tax Exempt Money Market Fund | |||||||
Investment Income: | |||||||
Interest | $ | 3,315 | |||||
Total income | 3,315 | ||||||
Expenses: | |||||||
Investment advisory fees | 2,006 | ||||||
Administration fees | 716 | ||||||
Sub-Administration fees | 12 | ||||||
Custodian fees | 30 | ||||||
Transfer agent fees | 1,075 | ||||||
Trustees' fees | 47 | ||||||
Compliance fees | 5 | ||||||
Legal and audit fees | 82 | ||||||
State registration and filing fees | 29 | ||||||
Other expenses | 103 | ||||||
Total expenses | 4,105 | ||||||
Expenses waived/reimbursed by Adviser | (1,557 | ) | |||||
Net expenses | 2,548 | ||||||
Net Investment Income | 767 | ||||||
Change in net assets resulting from operations | $ | 767 | |||||
See notes to financial statements.
13
USAA Mutual Funds Trust | Statements of Changes in Net Assets | ||||||
(Amounts in Thousands)
USAA Tax Exempt Money Market Fund | |||||||||||
| Year Ended March 31, 2021 | Year Ended March 31, 2020 | ||||||||||
From Investments: | |||||||||||
Operations: | |||||||||||
Net investment income | $ | 767 | $ | 15,054 | |||||||
Net realized gains from investments | — | 251 | |||||||||
Change in net assets resulting from operations | 767 | 15,305 | |||||||||
Change in net assets resulting from distributions to shareholders | (988 | ) | (15,244 | ) | |||||||
Change in net assets resulting from capital transactions | (783,392 | ) | (252,647 | ) | |||||||
Change in net assets | (783,613 | ) | (252,586 | ) | |||||||
Net Assets: | |||||||||||
Beginning of period | 1,345,628 | 1,598,214 | |||||||||
End of period | $ | 562,015 | $ | 1,345,628 | |||||||
Capital Transactions: | |||||||||||
Proceeds from shares issued | $ | 268,164 | $ | 1,014,473 | |||||||
Distributions reinvested | 967 | 15,087 | |||||||||
Cost of shares redeemed | (1,052,523 | ) | (1,282,207 | ) | |||||||
Change in net assets resulting from capital transactions | $ | (783,392 | ) | $ | (252,647 | ) | |||||
Share Transactions: | |||||||||||
Issued | 268,164 | 1,014,473 | |||||||||
Reinvested | 967 | 15,087 | |||||||||
Redeemed | (1,052,523 | ) | (1,282,207 | ) | |||||||
Change in Shares | (783,392 | ) | (252,647 | ) | |||||||
See notes to financial statements.
14
This page is intentionally left blank.
15
USAA Mutual Funds Trust | Financial Highlights | ||||||
For a Share Outstanding Throughout Each Period
Investment Activities | Distributions to Shareholders From | ||||||||||||||||||||||||||
| Net Asset Value, Beginning of Period | Net Investment Income | Net Realized and Unrealized Gains on Investments | Total from Investment Activities | Net Investment Income | Net Realized Gains from Investments | ||||||||||||||||||||||
USAA Tax Exempt Money Market Fund | |||||||||||||||||||||||||||
| Year Ended March 31, 2021 | $ | 1.00 | — | (b)(c) | — | — | (b) | — | (b) | — | (b) | ||||||||||||||||
| Year Ended March 31, 2020 | $ | 1.00 | 0.01 | (c) | — | (b) | 0.01 | (0.01 | ) | — | |||||||||||||||||
| Year Ended March 31, 2019 | $ | 1.00 | 0.01 | — | (b) | 0.01 | (0.01 | ) | — | ||||||||||||||||||
| Year Ended March 31, 2018 | $ | 1.00 | 0.01 | — | (b) | 0.01 | (0.01 | ) | — | ||||||||||||||||||
| Year Ended March 31, 2017 | $ | 1.00 | — | (b) | — | (b) | — | (b) | — | (b) | — | (b) | |||||||||||||||
* Assumes reinvestment of all net investment income and realized capital gain distributions, if any, during the period. Includes adjustments in accordance with U.S. Generally Accepted Accounting Principles and could differ from the Lipper reported return.
^ The net expense ratio may not correlate to the applicable expense limits in place during the period since the current contractual expense limitation is applied for a period beginning July 1, 2019, and in effect through June 30, 2023, instead of coinciding with the Fund's fiscal year end. Details of the current contractual expense limitation in effect can be found in Note 3 of the accompanying Notes to Financial Statements.
(a) Reflects total annual operating expenses for reductions of expenses paid indirectly for the March 31, fiscal year ended 2017. Expenses paid indirectly decreased the expense ratio by less than 0.01%.
(b) Amount is less than $0.005 per share.
(c) Per share net investment income (loss) has been calculated using the average daily shares method.
(d) Prior to August 1, 2017, USAA Asset Management Company ("AMCO") (previous Investment Adviser) had voluntarily agreed, on a temporary basis, to reimburse management, administrative, or other fees to limit the Fund's expenses and attempt to prevent a negative yield.
See notes to financial statements.
16
USAA Mutual Funds Trust | Financial Highlights — continued | ||||||
For a Share Outstanding Throughout Each Period
Ratios to Average Net Assets | Supplemental Data | ||||||||||||||||||||||||||||||
| Total Distributions | Net Asset Value, End of Period | Total Return* | Net Expenses^(a) | Net Investment Income | Gross Expenses(a) | Net Assets, End of Period (000's) | |||||||||||||||||||||||||
USAA Tax Exempt Money Market Fund | |||||||||||||||||||||||||||||||
| Year Ended March 31, 2021 | — | (b) | $ | 1.00 | 0.10 | % | 0.35 | % | 0.11 | % | 0.57 | % | $ | 562,015 | |||||||||||||||||
| Year Ended March 31, 2020 | (0.01 | ) | $ | 1.00 | 1.05 | % | 0.56 | % | 1.04 | % | 0.56 | % | $ | 1,345,628 | |||||||||||||||||
| Year Ended March 31, 2019 | (0.01 | ) | $ | 1.00 | 1.05 | % | 0.56 | % | 1.04 | % | 0.56 | % | $ | 1,598,214 | |||||||||||||||||
| Year Ended March 31, 2018 | (0.01 | ) | $ | 1.00 | 0.51 | %(d) | 0.56 | %(d) | 0.50 | % | 0.56 | % | $ | 1,761,649 | |||||||||||||||||
| Year Ended March 31, 2017 | — | (b) | $ | 1.00 | 0.23 | % | 0.54 | % | 0.11 | % | 0.58 | % | $ | 2,007,091 | |||||||||||||||||
See notes to financial statements.
17
USAA Mutual Funds Trust | Notes to Financial Statements March 31, 2021 | ||||||
1. Organization:
USAA Mutual Funds Trust (the "Trust") is organized as a Delaware statutory trust and is registered under the Investment Company Act of 1940, as amended (the "1940 Act"), as an open-end investment company. The Trust is comprised of 46 funds and is authorized to issue an unlimited number of shares, which are units of beneficial interest with no par value.
The accompanying financial statements are those of the USAA Tax Exempt Money Market Fund (the "Fund"). The Fund is classified as diversified under the 1940 Act.
The Fund operates as a retail money market fund in compliance with the requirements of Rule 2a-7 under the 1940 Act; and as a retail money market fund, shares of the Fund are available for sale only to accounts that are beneficially owned by natural persons.
The Fund has adopted policies and procedures permitting the Board of Trustees (the "Board") of the Fund to impose a liquidity fee or to temporarily suspend redemptions from the Fund (a "redemption gate") if the Fund's weekly liquid assets fall below specific thresholds, such as during times of market stress. The imposition of a liquidity fee would reduce the amount you would receive upon redemption of your shares of the Fund. The imposition of a redemption gate would temporarily delay your ability to redeem your investments in the Fund.
Under the Trust's organizational documents, its officers and trustees are indemnified against certain liabilities arising out of the performance of their duties to the Fund. In addition, in the normal course of business, the Fund enters into contracts with its vendors and others that provide for general indemnifications. The Fund's maximum exposure under these arrangements is unknown, as this would involve future claims that may be made against the Fund. However, based on experience, the Fund expects that risk of loss to be remote.
2. Significant Accounting Policies:
The following is a summary of significant accounting policies followed by the Trust in the preparation of its financial statements. The policies are in conformity with Generally Accepted Accounting Principles in the United States of America ("GAAP"). The preparation of financial statements in accordance with GAAP requires management to make estimates and assumptions that affect the reported amounts of assets and liabilities and disclosure of contingent assets and liabilities at the date of the financial statements and the reported amounts of income and expenses for the period. Actual results could differ from those estimates. The Fund follows the specialized accounting and reporting requirements under GAAP that are applicable to investment companies under Accounting Standards Codification Topic 946.
Investment Valuation:
The inputs or methodologies used for valuing securities are not necessarily an indication of the risks associated with investing in those securities. For example, money market securities are valued using amortized cost, in accordance with rules under the 1940 Act. Generally, amortized cost approximates the current fair value of a security, but since the value is not obtained from a quoted price in an active market, such securities are reflected as Level 2.
The Fund records investments at fair value. Fair value is defined as the price that would be received to sell an asset or paid to transfer a liability in an orderly transaction between market participants at the measurement date.
The valuation techniques described below maximize the use of observable inputs and minimize the use of unobservable inputs in determining fair value. The inputs used for valuing the Fund's investments are summarized in the three broad levels listed below:
• Level 1 — quoted prices in active markets for identical securities
• Level 2 — other significant observable inputs (including quoted prices for similar securities or interest rates applicable to those securities, etc.)
• Level 3 — significant unobservable inputs (including the Fund's own assumptions in determining the fair value of investments)
18
USAA Mutual Funds Trust | Notes to Financial Statements — continued March 31, 2021 | ||||||
Victory Capital Management Inc. ("VCM" or the "Adviser") has established the Pricing and Liquidity Committee (the "Committee"), and subject to the Trust's Board oversight, the Committee administers and oversees the Fund's valuation policies and procedures, which are approved by the Board.
All securities held in the Fund are short-term debt securities, which are valued pursuant to Rule 2a-7 under the 1940 Act. This method values a security at its purchase price, and thereafter, assumes a constant amortization to maturity of any premiums or discounts.
Securities for which amortized cost valuations are considered unreliable or for whose values have been materially affected by a significant event are valued in good faith, at fair value, using methods determined by the Committee, under procedures to stabilize net assets and valuation procedures approved by the Board.
Securities Purchased on a Delayed-Delivery or When-Issued Basis:
The Fund may purchase securities on a delayed-delivery or when-issued basis. Delivery and payment for securities that have been purchased by the Fund on a delayed-delivery or when-issued basis, or for delayed draws on loans can take place a month or more after the trade date. At the time the Fund makes the commitment to purchase a security on a delayed-delivery or when-issued basis, the Fund records the transaction and reflects the value of the security in determining net asset value ("NAV"). No interest accrues to the Fund until the transaction settles and payment takes place. A segregated account is established and the Fund maintains cash and/or marketable securities at least equal in value to commitments for delayed-delivery or when-issued securities. If the Fund owns delayed-delivery or when-issued securities, these values are included in Payable for investments purchased on the accompanying Statement of Assets and Liabilities and the segregated assets are identified on the Schedule of Portfolio Investments.
Municipal Obligations:
The values of municipal obligations can fluctuate and may be affected by adverse tax, legislative, or political changes, and by financial developments affecting municipal issuers. Payment of municipal obligations may depend on a relatively limited source of revenue, resulting in greater credit risk. Future changes in federal tax laws or the activity of an issuer may adversely affect the tax-exempt status of municipal obligations.
Investment Transactions and Related Income:
Changes in holdings of investments are accounted for no later than one business day following the trade date. For financial reporting purposes, however, investment transactions are accounted for on trade date on the last business day of the reporting period. Interest income is determined on the basis of coupon interest accrued using the effective interest method which adjusts, where applicable, the amortization of premiums or accretion of discount. Gains or losses realized on sales of securities are determined by comparing the identified cost of the security lot sold with the net sales proceeds.
Federal Income Taxes:
It is the Fund's policy to continue to qualify as a regulated investment company by complying with the provisions available to certain investment companies, as defined in applicable sections of the Internal Revenue Code, and to make distributions of net investment income and net realized gains sufficient to relieve it from all, or substantially all, federal income taxes. Accordingly, no provision for federal income taxes is required in the financial statements. The Fund has a tax year end of March 31.
Management of the Fund has reviewed tax positions taken in tax years that remain subject to examination by all major tax jurisdictions, including federal (i.e., the last four tax years, which includes the current fiscal tax year end). Management believes that there is no tax liability resulting from unrecognized tax benefits related to uncertain tax positions taken.
19
USAA Mutual Funds Trust | Notes to Financial Statements — continued March 31, 2021 | ||||||
Allocations:
Expenses directly attributable to the Fund are charged to the Fund, while expenses that are attributable to more than one fund in the Trust, or jointly with an affiliated trust, are allocated among the respective funds in the Trust and/or affiliated trust based upon net assets or another appropriate basis.
Cross-Trade Transactions:
Pursuant to Rule 17a-7 under the 1940 Act, the Fund may engage in cross-trades which are securities transactions with affiliated investment companies and advisory accounts managed by the Adviser and any applicable sub-adviser. Any such purchase or sale transaction must be effected without brokerage commission or other remuneration, except for customary transfer fees. The transaction must be effected at the current market price, which is either the security's last sale price on an exchange or, if there are no transactions in the security that day, at the average of the highest bid and lowest asked price. For the year ended March 31, 2021, the Fund engaged in the following securities transactions with affiliated funds, which resulted in the following net realized gains (losses) (amounts in thousands):
| Purchases | Sales | Realized Gains (Losses) | |||||||||
| $ | 166,155 | $ | 183,050 | $ | — | ||||||
Fees Paid Indirectly:
Expense offsets to custody fees that arise from credits on cash balances maintained on deposit are reflected on the Statement of Operations, as applicable, as Fees paid indirectly.
3. Fees and Transactions with Affiliates and Related Parties:
Investment Advisory Fees:
Investment advisory services are provided to the Fund by the Adviser, which is a New York corporation registered as an investment adviser with the Securities and Exchange Commission ("SEC"). The Adviser is a wholly-owned indirect subsidiary of Victory Capital Holdings, Inc., a publicly traded Delaware corporation, and a wholly-owned direct subsidiary of Victory Capital Operating, LLC. The Fund's Investment Adviser fee is accrued daily and paid monthly at an annualized rate of 0.28% of the Fund's average daily net assets. Amounts incurred and paid to VCM for the year ended March 31, 2021, are reflected on the Statement of Operations as Investment Advisory fees.
The Trust relies on an exemptive order granted to VCM and its affiliated funds by the SEC in March 2019 permitting the use of a "manager-of-managers" structure for certain funds. Under a manager-of-managers structure, the investment adviser may select (with approval of the Board and without shareholder approval) one or more subadvisers to manage the day-to-day investment of a fund's assets. For the year ended March 31, 2021, the Fund had no subadvisors.
Administration and Servicing Fees:
VCM serves as the Fund's administrator and fund accountant. Under the Fund Administration, Servicing and Accounting Agreement, VCM is paid for its services an annual fee at a rate of 0.10% of average daily net assets, of the Fund. Amounts incurred for the year ended March 31, 2021, are reflected on the Statement of Operations as Administration fees.
The Fund (as part of the Trust) has entered into an agreement to provide compliance services with the Adviser, pursuant to which the Adviser furnishes its compliance personnel, including the services of the Chief Compliance Officer ("CCO"), and other resources reasonably necessary to provide the Trust with compliance oversight services related to the design, administration and oversight of a compliance program for the Trust in accordance with Rule 38a-1 under the 1940 Act. The CCO is an employee of the Adviser, which pays the compensation of the CCO and support staff. Funds in the Trust, Victory
20
USAA Mutual Funds Trust | Notes to Financial Statements — continued March 31, 2021 | ||||||
Variable Insurance Funds, Victory Portfolios, and Victory Portfolios II (collectively, the "Victory Funds Complex") in the aggregate, compensate the Adviser for these services. Amounts incurred for the year ended March 31, 2021, are reflected on the Statement of Operations as Compliance fees.
Citi Fund Services Ohio, Inc. ("Citi"), an affiliate of Citibank, acts as sub-administrator and sub-fund accountant to the Fund pursuant to a Sub-Administration and Sub-Fund Accounting Services Agreement between VCM and Citi. VCM pays Citi a fee for providing these services. The Fund reimburses VCM and Citi for out-of-pocket expenses incurred in providing these services and certain other expenses specifically allocated to the Fund. Amounts incurred for the year ended March 31, 2021, are reflected on the Statement of Operations as Sub-Administration fees.
Transfer Agency Fees:
Victory Capital Transfer Agency, Inc. ("VCTA"), an affiliate of the Adviser, provides transfer agency services to the Fund. Transfer agent's fees for the Fund are accrued daily and paid monthly at an annualized rate of 0.15% of average daily net assets, plus out-of-pocket expenses. Amounts incurred and paid to VCTA for the year ended March 31, 2021, are reflected on the Statement of Operations as Transfer Agent fees.
FIS Investor Services LLC serves as sub-transfer agent and dividend disbursing agent for the Fund pursuant to a Sub-Transfer Agent Agreement between VCTA and FIS Investor Services LLC. VCTA provides FIS Investor Services LLC a fee for providing these services.
Distributor/Underwriting Services:
Victory Capital Services, Inc. (the "Distributor"), an affiliate of the Adviser, serves as distributor for the continuous offering of the shares of the Fund pursuant to a Distribution Agreement between the Distributor and the Trust and receives no fee or other compensation for these services. Effective June 30, 2020, the Distributor's name was changed from Victory Capital Advisers, Inc.
Other Fees:
Citibank serves as the Fund's custodian. The Fund pays Citibank a fee for providing these services. Amounts incurred for the year ended March 31, 2021, are reflected on the Statement of Operations as Custodian fees.
K&L Gates LLP provides legal services to the Trust.
The Adviser has entered into an expense limitation agreement with the Fund until at least June 30, 2023. Under the terms of the agreement, the Adviser has agreed to waive fees or reimburse certain expenses to the extent that ordinary operating expenses incurred in any fiscal year exceed the expense limit for the Fund. Such excess amounts will be the liability of the Adviser. Interest, taxes, brokerage commissions, other expenditures, which are capitalized in accordance with GAAP, and other extraordinary expenses not incurred in the ordinary course of the Fund's business are excluded from the expense limits. As of March 31, 2021, the expense limit (excluding voluntary waivers) was 0.56%.
Under the terms of the expense limitation agreement, the Fund has agreed to repay fees and expenses that were waived or reimbursed by the Adviser for a period of up to three years after the fiscal year in which the waiver or reimbursement took place, subject to the lesser of any operating expense limits in effect at the time of: (a) the original waiver or expense reimbursement; or (b) the recoupment, after giving effect to the recoupment amount.
Amendment #1 to the expense limitation agreement was effective March 23, 2020. Under this amendment, the Adviser agreed to further reimburse fees in excess of the Fund's expense limit agreement of 0.56% dated July 1, 2019. These voluntary reductions, to the extent necessary, are to maintain a certain minimum net yield of the Fund. Under this agreement to reimburse additional fees, the Fund has agreed to repay fees and expenses that were waived or reimbursed by the Adviser for a period up to three years after the fiscal year in which the waiver or reimbursement took place, to the extent any repayments would not cause the Fund's net yield to fall below the Fund's minimum yield at
21
USAA Mutual Funds Trust | Notes to Financial Statements — continued March 31, 2021 | ||||||
the time of: (a) the original waiver or expense reimbursement; or (b) the expense limit in effect at the time of the extra waiver.
As of March 31, 2021, the following amounts are available to be repaid to the Adviser (amounts in thousands). The Fund has not recorded any amounts available to be repaid as a liability due to an assessment that such repayment is not probable at March 31, 2021.
| Expires March 31, 2023 | Expires March 31, 2024 | Total | |||||||||
$ | 19 | $ | 1,557 | $ | 1,576 | ||||||
Certain officers and/or interested trustees of the Fund are also officers and/or employees of the Adviser, administrator, sub-administrator, sub-fund accountant, custodian, and Distributor.
4. Risks:
The Fund may be subject to other risks in addition to these identified risks.
Geopolitical/Natural Disaster Risk — Global economies and financial markets are increasingly interconnected, which increases the possibilities that conditions in one country or region might adversely affect issuers in another country or region. Geopolitical and other risks, including war, terrorism, trade disputes, political or economic dysfunction within some nations, public health crises and related geopolitical events, as well as environmental disasters such as earthquakes, fires, and floods, may add to instability in world economies and markets generally. Changes in trade policies and international trade agreements could affect the economies of many countries in unpredictable ways. Likewise, systemic market dislocations of the kind that occurred during the financial crisis that began in 2008, if repeated, would be highly disruptive to economies and markets, adversely affecting individual companies and industries, securities markets, interest rates, credit ratings, inflation, investor sentiment, and other factors affecting the value of a Fund's investments. Some countries, including the United States, are adopting more protectionist trade policies and moving away from the tighter financial industry regulations that followed the 2008 financial crisis, which may also affect the value of a Fund's investments.
Political events within the United States at times have resulted, and may in the future result, in a shutdown of government services, which could negatively affect the U.S. economy, decrease the value of a Fund's investments, increase uncertainty in or impair the operation of the U.S. or other securities markets and degrade investor and consumer confidence, perhaps suddenly and to a significant degree.
An outbreak of disease called COVID-19 has spread internationally. The transmission of COVID-19 and efforts to contain its spread have resulted in international, national and local border closings and other significant travel restrictions and disruptions, significant disruptions to business operations, supply chains and consumer activity, significant challenges in healthcare service preparation and delivery, quarantines and general concern and uncertainty. These negative impacts have caused significant volatility and declines in global financial markets, which have caused losses for Fund investors during and subsequent to period end. The impact of the COVID-19 pandemic may last for an extended period of time, and could result in a substantial economic downturn or recession. Public health crises may exacerbate other pre-existing political, social, economic, market and financial risks. The extent of the impact to the financial performance of the Fund's investments will depend on future developments, including (i) the duration and spread of the outbreak, (ii) the restrictions and advisories, (iii) the effects on the financial markets, and (iv) the effects on the economy overall, all of which are highly uncertain and cannot be predicted.
Stable Net Asset Value Risk — You could lose money by investing in the Fund. Although the Fund seeks to preserve the value of your investment at $1 per share, it cannot guarantee it will do so. The Fund may impose a fee upon the sale of your shares or may temporarily suspend your ability to sell shares if the Fund's liquidity falls below required minimums because of market conditions or other factors. An investment in the Fund is not a deposit in a bank and is not insured or guaranteed by the
22
USAA Mutual Funds Trust | Notes to Financial Statements — continued March 31, 2021 | ||||||
Federal Deposit Insurance Corporation ("FDIC") or any other government agency. The Fund's sponsor has no legal obligation to provide financial support to the Fund, and you should not expect that the sponsor will provide financial support to the Fund at any time.
Credit Risk — The fixed-income securities held in the Fund's portfolio are subject to credit risk, which is the possibility that an issuer of a fixed-income security will fail to make timely interest and/or principal payments on its securities or that negative market perceptions of the issuer's ability to make such payments will cause the price of that security to decline. The Fund accepts some credit risk as a recognized means to enhance an investor's return. All fixed-income securities, varying from the highest quality to the very speculative, have some degree of credit risk.
Interest Rate Risk — The Fund is subject to the risk that the market value of the bonds in its portfolio will fluctuate because of changes in interest rates, changes in the supply of and demand for tax-exempt securities, and other market factors.
Decisions by the U.S. Federal Reserve (also known as the "Fed") regarding interest rate and monetary policy, which can be difficult to predict and sometimes change direction suddenly in response to economic and market events, can have a significant effect on the value of fixed-income securities as well as the overall strength of the U.S. economy. Precise interest rate predictions are difficult to make, and interest rates may change unexpectedly and dramatically in response to extreme changes in market or economic conditions. As a result, the value of fixed income securities may vary widely under certain market conditions.
LIBOR Discontinuation Risk — Many debt securities, derivatives and other financial instruments, including some of the Fund's investments, use the London Interbank Offered Rate ("LIBOR") as the reference or benchmark rate for variable interest rate calculations. In June 2017, the Alternative Reference Rates Committee, a group of large U.S. banks working with the Federal Reserve, announced its selection of a new Secured Overnight Funding Rate ("SOFR"), which is intended to be a broad measure of secured overnight U.S. Treasury repo rates, as an appropriate replacement for LIBOR. The Federal Reserve Bank of New York began publishing the SOFR in 2018, expecting that it could be used on a voluntary basis in new instruments and transactions. Bank working groups and regulators in other countries have suggested other alternatives for their markets, including the Sterling Overnight Interbank Average Rate ("SONIA") in England. In July 2017, the Financial Conduct Authority (the "FCA"), the United Kingdom financial regulatory body, announced that after 2021 it will cease its active encouragement of UK banks to provide the quotations needed to sustain LIBOR. That announcement suggests that LIBOR may cease to be published after that time. For U.S. dollar LIBOR, however, the relevant date may be deferred to June 30, 2023, for the most common tenors (overnight and one, three, six and 12 months). As to those tenors, the LIBOR administrator has published a consultation regarding its intention to cease publication of U.S. dollar LIBOR as of June 30, 2023, (instead of December 31, 2021, as previously expected), apparently based on continued rate submissions from banks. It is expected that there will be enough time for market participants to transition to the use of a different benchmark for both new and existing securities and transactions. Various financial industry groups have begun planning for that transition, but there are obstacles to converting certain longer-term securities and transactions to a new benchmark. Transition planning is at an early stage, and neither the effect of the transition process nor its ultimate success can yet be known. Although the foregoing may provide some sense of timing, there is no assurance that LIBOR, or any particular currency and tenor, will continue to be published until any particular date, and it appears highly likely that LIBOR will be discontinued or modified after December 31, 2021, or June 30, 2023, depending on the currency and tenor. The transition process might lead to increased volatility and illiquidity in markets that currently rely on the LIBOR to determine interest rates. It could also lead to a reduction in the value of some LIBOR-based investments and reduce the effectiveness of new hedges placed against existing LIBOR-based instruments. Since the usefulness of LIBOR as a benchmark could deteriorate during the transition period, these effects could occur before the end of 2021.
23
USAA Mutual Funds Trust | Notes to Financial Statements — continued March 31, 2021 | ||||||
5. Borrowing and Interfund Lending:
Line of Credit:
For the year ended March 31, 2021, the Victory Funds Complex participated in a short-term demand note "Line of Credit" agreement with Citibank. The Line of Credit agreement with Citibank was renewed on June 29, 2020, with a termination date of June 28, 2021. Under the agreement with Citibank, the Victory Funds Complex may borrow up to $600 million, of which $300 million is committed and $300 million is uncommitted. $40 million of the Line of Credit is reserved for use by the Victory Floating Rate Fund, another series of the Victory Funds Complex, with Victory Floating Rate Fund paying the related commitment fees for that amount. The purpose of the agreement is to meet temporary or emergency cash needs. For the year ended March 31, 2021, Citibank received an annual commitment fee of 0.15% on $300 million for providing the Line of Credit. Each fund in the Victory Funds Complex paid a pro-rata portion of the commitment fees plus any interest (one month LIBOR plus one percent) on amounts borrowed. Effective June 29, 2020, under an amended Line of Credit agreement, Citibank also received an annual upfront fee of 0.10% on the $300 million committed line of credit. Each fund in the Victory Funds Complex paid a pro-rata portion of the upfront fee. Interest charged to each Fund during the period, if applicable, is reflected on the Statement of Operations under Line of credit fees.
The Fund had no borrowings under the Line of Credit agreement during the year ended March 31, 2021.
6. Federal Income Tax Information:
Distributions from the Fund's net investment income are accrued daily and distributed on the last business day of each month. Distributable net realized gains, if any, are declared and paid at least annually.
The amounts of dividends from net investment income and distributions from net realized gains (collectively distributions to shareholders) are determined in accordance with federal income tax regulations, which may differ from GAAP. To the extent these "book/tax" differences are permanent in nature (e.g., net operating loss and distribution reclassification), such amounts are reclassified within the components of net assets based on their federal tax-basis treatment; temporary differences (e.g., wash sales) do not require reclassification. To the extent dividends and distributions exceed net investment income and net realized gains for tax purposes, they are reported as distributions of capital. Net investment losses incurred by the Fund may be reclassified as an offset to capital on the accompanying Statement of Assets and Liabilities.
As of March 31, 2021, on the Statement of Assets and Liabilities, there were no permanent book-to-tax difference reclassification adjustments.
The tax character of distributions paid during the tax years ended as noted below, were as follows (total distributions paid may differ from the Statements of Changes in Net Assets because, for tax purposes, dividends are recognized when actually paid) (amounts in thousands).
24
USAA Mutual Funds Trust | Notes to Financial Statements — continued March 31, 2021 | ||||||
Year Ended March 31, 2021 | Year Ended March 31, 2020 | ||||||||||||||||||||||||||||||||||||||||||
| Distributions paid from | Distributions paid from | ||||||||||||||||||||||||||||||||||||||||||
Ordinary Income | Net Long- Term Capital Gains | Total Taxable Distributions | Tax- Exempt Distributions | Total Distributions Paid | Ordinary Income | Net Long- Term Capital Gains | Total Taxable Distributions | Tax- Exempt Distributions | Total Distributions Paid | ||||||||||||||||||||||||||||||||||
$ | 75 | $ | 101 | $ | 176 | $ | 812 | $ | 988 | $ | 202 | $ | 32 | $ | 234 | $ | 15,010 | $ | 15,244 | ||||||||||||||||||||||||
As of March 31, 2021, the components of accumulated earnings (loss) on a tax basis were as follows (amounts in thousands):
| Undistributed Tax-Exempt Income | Distributions Payable | Total Accumulated Earnings (Loss) | |||||||||
| $ | 4 | $ | (5 | ) | $ | (1 | ) | ||||
As of March 31, 2021, the Fund had no capital loss carryforwards, for federal income tax purposes.
As of March 31, 2021, the cost basis for federal income tax purposes, gross unrealized appreciation, gross unrealized depreciation, and net unrealized appreciation (depreciation) for investments were as follows (amounts in thousands):
| Cost of Investments for Federal Tax Purposes | Tax Unrealized Appreciation | Tax Unrealized Depreciation | Net Unrealized Appreciation (Depreciation) | ||||||||||||
| $ | 560,954 | $ | — | $ | — | $ | — | ||||||||
25
REPORT OF INDEPENDENT REGISTERED PUBLIC ACCOUNTING FIRM
To the Shareholders and the Board of Trustees of USAA Tax Exempt Money Market Fund
Opinion on the Financial Statements
We have audited the accompanying statement of assets and liabilities of USAA Tax Exempt Money Market Fund (the "Fund") (one of the funds constituting USAA Mutual Funds Trust (the "Trust")), including the schedule of portfolio investments, as of March 31, 2021, and the related statement of operations for the year then ended, the statements of changes in net assets for each of the two years in the period then ended, the financial highlights for each of the five years in the period then ended and the related notes (collectively referred to as the "financial statements"). In our opinion, the financial statements present fairly, in all material respects, the financial position of the Fund at March 31, 2021, the results of its operations for the year then ended, the changes in its net assets for each of the two years in the period then ended, and its financial highlights for each of the five years in the period then ended, in conformity with U.S. generally accepted accounting principles.
Basis for Opinion
These financial statements are the responsibility of the Trust's management. Our responsibility is to express an opinion on the Fund's financial statements based on our audits. We are a public accounting firm registered with the Public Company Accounting Oversight Board (United States) ("PCAOB") and are required to be independent with respect to the Trust in accordance with the U.S. federal securities laws and the applicable rules and regulations of the Securities and Exchange Commission and the PCAOB.
We conducted our audits in accordance with the standards of the PCAOB. Those standards require that we plan and perform the audit to obtain reasonable assurance about whether the financial statements are free of material misstatement, whether due to error or fraud. The Trust is not required to have, nor were we engaged to perform, an audit of the Trust's internal control over financial reporting. As part of our audits we are required to obtain an understanding of internal control over financial reporting, but not for the purpose of expressing an opinion on the effectiveness of the Trust's internal control over financial reporting. Accordingly, we express no such opinion.
Our audits included performing procedures to assess the risks of material misstatement of the financial statements, whether due to error or fraud, and performing procedures that respond to those risks. Such procedures included examining, on a test basis, evidence regarding the amounts and disclosures in the financial statements. Our procedures included confirmation of securities owned as of March 31, 2021, by correspondence with the custodian. Our audits also included evaluating the accounting principles used and significant estimates made by management, as well as evaluating the overall presentation of the financial statements. We believe that our audits provide a reasonable basis for our opinion.

We have served as the auditor of one or more Victory Capital investment companies since 1995.
San Antonio, Texas
May 26, 2021
26
USAA Mutual Funds Trust | Supplemental Information March 31, 2021 | ||||||
(Unaudited)
Trustee and Officer Information
Board of Trustees:
Overall responsibility for management of the Trust rests with the Board. The Trust is managed by the Board in accordance with the laws of the state of Delaware. There are currently nine Trustees, seven of whom are not "interested persons" of the Trust within the meaning of that term under the 1940 Act ("Independent Trustees") and two of whom is an "interested person" of the Trust within the meaning of that term under the 1940 Act ("Interested Trustee"). The Trustees, in turn, elect the officers of the Trust to actively supervise its day-to-day operations.
The following tables list the Trustees, their ages, position with the Trust, commencement of service, principal occupations during the past five years and any directorships of other investment companies or companies whose securities are registered under the Securities Exchange Act of 1934, as amended, or who file reports under that Act. Each Trustee oversees 46 portfolios in the Trust. Each Trustee's address is 15935 La Cantera Pkwy, San Antonio, TX, 78256. Pursuant to a policy adopted by the Board, the term of office for each Trustee shall be until the Independent Trustee reaches age 75 or an Interested Trustee reaches age 75. The Board may change or grant exceptions from this policy at any time without shareholder approval. A Trustee may resign or be removed by a vote of the other Trustees or the holders of a majority of the outstanding shares of the Trust at any time. Vacancies on the Board can be filled by the action of a majority of the Trustees, provided that after filling such vacancy at least two-thirds of the Trustees have been elected by the shareholders.
Name and Date of Birth | Position Held with the Trust | Year Commenced Service | Principal Occupation During Past 5 Years | Other Directorships Held During Past 5 Years | |||||||||||||||
Independent Trustees. | |||||||||||||||||||
| Jefferson C. Boyce, (c) Born September 1957 | Independent Chairman | 2021 | Senior Managing Director, New York Life Investments, LLC (1992-2012) | Westhab, Inc. | |||||||||||||||
| John C. Walters, Born February 1962 | Trustee | 2019 | Retired. Mr. Walters brings significant Board experience including active involvement with the board of a Fortune 500 company, and a proven record of leading large, complex financial organizations. He has a demonstrated record of success in distribution, manufacturing, investment brokerage, and investment management in both the retail and institutional investment businesses. He has substantial experience in the investment management business with a demonstrated ability to develop and drive strategy while managing operation, financial, and investment risk. | Guardian Variable Products Trust (16 series), Lead Independent Director; Amerilife Holdings LLC, Director; Stadion Money Management; Director; University of North Carolina (Chapel Hill), Member Board of Governors | |||||||||||||||
27
USAA Mutual Funds Trust | Supplemental Information — continued March 31, 2021 | ||||||
(Unaudited)
Name and Date of Birth | Position Held with the Trust | Year Commenced Service | Principal Occupation During Past 5 Years | Other Directorships Held During Past 5 Years | |||||||||||||||
| Robert L. Mason, Ph.D., Born July 1946 | Trustee | 1997 | Adjunct Professor in the Department of Management Science and Statistics in the College of Business at the University of Texas at San Antonio (since 2001); Institute Analyst, Southwest Research Institute (March 2002-January 2016) | None | |||||||||||||||
| Dawn M. Hawley, Born February 1954 | Trustee | 2014 | Manager of Finance, Menil Foundation, Inc. (May 2007-June 2011), which is a private foundation that oversees the assemblage of sculptures, prints, drawings, photographs, and rare books. Director of Financial Planning and Analysis and Chief Financial Officer, AIM Management Group, Inc. (October 1987-January 2006) | None | |||||||||||||||
| Paul L. McNamara, Born July 1948 | Trustee | 2012 | Director, Cantor Opportunistic Alternatives Fund, LLC (March 2010-February 2014), which is a closed-end fund of funds by Cantor Fitzgerald Investment Advisors, LLC | None | |||||||||||||||
28
USAA Mutual Funds Trust | Supplemental Information — continued March 31, 2021 | ||||||
(Unaudited)
Name and Date of Birth | Position Held with the Trust | Year Commenced Service | Principal Occupation During Past 5 Years | Other Directorships Held During Past 5 Years | |||||||||||||||
| Richard Y. Newton III, Born January 1956 | Trustee | 2017 | Director, Elta North America (01/18-present), which is a global leader in the design, manufacture, and support of innovative electronic systems in the ground, maritime, airborne, and security domains for the nation's warfighters, security personnel, and first responders; Managing Partner, Pioneer Partnership Development Group (December 2015-present)); Executive Director, The Union League Club of New York (June 2014-November 2015): Executive Vice President, Air Force Association (August 2012-May 2014); Lieutenant General, United States Air Force (January 2008-June 2012) | PredaSAR Corp. | |||||||||||||||
| Barbara B. Ostdiek, Ph.D., Born March 1964 | Trustee | 2008 | Senior Associate Dean of Degree Programs at Jesse H. Jones Graduate School of Business at Rice University (since 2013); Associate Professor of Finance at Jessie H. Jones Graduate School of Business at Rice University (since 2001) | None | |||||||||||||||
| Michael F. Reimherr, (a) Born August 1945 | Trustee | 2000 | President of Reimherr Business Consulting (May 1995-December 2017); St. Mary's University Investment Committee overseeing University Endowment (since 2014) | None | |||||||||||||||
(a) Effective at the close of business on December 31, 2020, Michael F. Reimherr retired from the Board of Trustees.
29
USAA Mutual Funds Trust | Supplemental Information — continued March 31, 2021 | ||||||
(Unaudited)
Name and Date of Birth | Position Held with the Trust | Year Commenced Service | Principal Occupation During Past 5 Years | Other Directorships Held During Past 5 Years | |||||||||||||||
Interested Trustees. | |||||||||||||||||||
| David C. Brown, (b) Born May 1972 | Trustee | 2019 | Chairman and Chief Executive Officer (since 2013), Victory Capital Management Inc.; Chairman and Chief Executive Officer, Victory Capital Holdings, Inc. (since 2013). Mr. Brown brings to the Board extensive business, finance and leadership skills gained and developed through years of experience in the financial services industry, including his tenure overseeing the strategic direction as CEO of Victory Capital. These skills, combined with Mr. Brown's extensive knowledge of the financial services industry and demonstrated success in the development and distribution of investment strategies and products, enable him to provide valuable insights to the Board and strategic direction for the Funds. | Trustee, Victory Portfolios (41 series), Victory Portfolios II (26 series), Victory Variable Insurance Funds (8 series) | |||||||||||||||
30
USAA Mutual Funds Trust | Supplemental Information — continued March 31, 2021 | ||||||
(Unaudited)
Name and Date of Birth | Position Held with the Trust | Year Commenced Service | Principal Occupation During Past 5 Years | Other Directorships Held During Past 5 Years | |||||||||||||||
| Daniel S. McNamara, (b)(c) Born June 1966 | Trustee | 2012 | Trustee, President, and Vice Chairman of USAA ETF Trust (June 2017-June 2019); President of Financial Advice & Solutions Group (FASG), USAA (February 2013-March 2021); Director of USAA Investment Services Company (ISCO) (formerly USAA Investment Management) (September 2009-March 2021); President, Asset Management Company (AMCO) (August, 2011-June 2019); Senior Vice President of USAA Financial Planning Services Insurance Agency, Inc. (FPS) (April 2011-March 2021); Chairman of Board of ISCO (April 2013-December 2020); Director of AMCO (August 2011-June 2019); President and Director of USAA Shareholder Account Services (SAS) (October 2009-June 2019); Director and Vice Chairman of FPS (December 2013-March 2021); President and Director of USAA Investment Corporation (ICORP) (March 2010-March 2021); Chairman of Board of ICORP (December 2013-March 2021); Director of USAA Financial Advisors, Inc. (FAI) (December 2013-March 2021); Chairman of Board of FAI (March 2015-March 2021). Mr. McNamara brings to the Board extensive experience in the financial services industry, including experience as an officer of the Trust. | None | |||||||||||||||
(b) Mr. Dan McNamara, the Chairman of the Board, is deemed an "interested person" due to his previous position as Director of AMCO, the former investment adviser of the Funds. Mr. Brown is deemed an "interested person" due to his position as Chief Executive Officer of Victory Capital, investment adviser to the Funds.
(c) Effective at the close of business on December 31, 2020, Jefferson C. Boyce replaced Dan McNamara as Chair of the Board and assumed the title of Independent Chair.
The Statement of Additional Information includes additional information about the Trustees of the Trust and is available, without charge, on the SEC's website at www.sec.gov and/or by calling (800)-235-8396.
31
USAA Mutual Funds Trust | Supplemental Information — continued March 31, 2021 | ||||||
(Unaudited)
Officers:
The officers of the Trust, their ages, commencement of service and their principal occupations during the past five years, are detailed in the following table. Each officer serves until the earlier of his or her resignation, removal, retirement, death, or the election of a successor. The mailing address of each officer of the Trust is 15935 La Cantera Pkwy, San Antonio, TX, 78256. The officers of the Trust receive no compensation directly from the Trust for performing the duties of their offices.
Name and Date of Birth | Position with the Trust | Year Commenced Service | Principal Occupation During Past 5 Years | ||||||||||||
Interested Officers.
| Christopher K. Dyer, Born February 1962 | President | 2019 | Director of Fund Administration, Victory Capital (since 2004); Chief Operating Officer, Victory Capital Services, Inc. (since 2020) | ||||||||||||
| Scott A Stahorsky, Born July 1969 | Vice President | 2019 | Manager, Fund Administration, Victory Capital (since 2015) | ||||||||||||
| James K. De Vries, Born April 1969 | Treasurer | 2018 | Executive Director, Victory Capital Management Inc. (since 2019); Treasurer, USAA ETF Trust (September 2018-June 2019); Executive Director, Investment and Financial Administration, USAA (April 2012-June 2019); Assistant Treasurer, USAA ETF Trust (June 2017-September 2018); Assistant Treasurer, USAA Mutual Funds Trust (December 2013-February 2018) | ||||||||||||
| Allan Shaer, Born March 1965 | Assistant Treasurer | 2019 | Senior Vice President, Financial Administration, Citi Fund Services Ohio, Inc. (since 2016); Vice President, Mutual Fund Administration, JP Morgan Chase (2011-2016) | ||||||||||||
| Carol D. Trevino, Born October 1965 | Assistant Treasurer | 2018 | Director, Accounting and Finance, Victory Capital Management Inc. (since 2019); Accounting/Financial Director, USAA (December 2013-June 2019); Assistant Treasurer, USAA ETF Trust (September 2018-June 2019) | ||||||||||||
| Erin G. Wagner, Born February 1974 | Secretary | 2019 | Deputy General Counsel, the Adviser (since 2013) | ||||||||||||
| Charles Booth, Born April 1960 | Anti-Money Laundering Compliance Officer and Identity Theft Officer | 2019 | Director, Regulatory Administration and CCO Support Services, Citi Fund Services Ohio, Inc. (since 2007) | ||||||||||||
| Amy Campos, Born July 1976 | Chief Compliance Officer | 2019 | Chief Compliance Officer, USAA Mutual Funds Trust (since 2019); Executive Director, Deputy Chief Compliance Officer, USAA Mutual Funds Trust and USAA ETF Trust (July 2017-June 2019); Compliance Director, USAA Mutual Funds Trust (2014-July 2017) | ||||||||||||
32
USAA Mutual Funds Trust | Supplemental Information — continued March 31, 2021 | ||||||
(Unaudited)
Proxy Voting and Portfolio Holdings Information
Proxy Voting:
Information regarding the policies and procedures the Fund uses to determine how to vote proxies relating to portfolio securities is available without charge, upon request, by calling (800) 235-8396. The information is also included in the Fund's Statement of Additional Information, which is available on the SEC's website at www.sec.gov.
Information relating to how the Fund voted proxies relating to portfolio securities held during the most recent 12 months ended June 30 is available on the SEC's website at www.sec.gov.
Availability of Schedules of Portfolio Investments:
The Fund makes available on VCM.com a complete list of portfolio holdings no sooner than 5 business days after the end of each month. Form N-MFP is available on the SEC's website at www.sec.gov.
Expense Example
As a shareholder of the Fund, you may incur two types of costs: (1) transaction costs, and (2) ongoing costs, including management fees and other Fund expenses. These examples are intended to help you understand your ongoing costs (in dollars) of investing in the Fund and to compare these costs with the ongoing costs of investing in other mutual funds.
These examples are based on an investment of $1,000 invested at the beginning of the period and held for the entire period from October 1, 2020 through March 31, 2021.
The Actual Expense figures in the table below provide information about actual account values and actual expenses. You may use the information below, together with the amount you invested, to estimate the expenses that you paid over the period. Simply divide your account value by $1,000 (for example, an $8,600 account value divided by $1,000 = 8.6), then multiply the result by the number in the table under the heading entitled "Actual Expenses Paid During Period" to estimate the expenses you paid on your account during this period.
The Hypothetical Expense figures in the table below provide information about hypothetical account values and hypothetical expenses based on the Fund's actual expense ratio and an assumed rate of return of 5% per year before expenses, which is not the Fund's actual return. The hypothetical account values and expenses may not be used to estimate the actual ending account balance or expenses you paid for the period. You may use this information to compare this 5% hypothetical example with the 5% hypothetical examples that appear in shareholder reports of other funds.
Please note the expenses shown in the table below are meant to highlight your ongoing costs only and do not reflect any transactional costs. If these transactional costs were included, your costs would have been higher.
| Beginning Account Value 10/1/20 | Actual Ending Account Value 3/31/21 | Hypothetical Ending Account Value 3/31/21 | Actual Expenses Paid During Period 10/1/20- 3/31/21* | Hypothetical Expenses Paid During Period 10/1/20- 3/31/21* | Annualized Expense Ratio During Period 10/1/20- 3/31/21 | ||||||||||||||||||
| $ | 1,000.00 | $ | 1,000.30 | $ | 1,023.68 | $ | 1.25 | $ | 1.26 | 0.25 | % | ||||||||||||
* Expenses are equal to the average account value multiplied by the Fund's annualized expense ratio multiplied by 182/365 (the number of days in the most recent fiscal half-year divided by the number of days in the fiscal year).
33
USAA Mutual Funds Trust | Supplemental Information — continued March 31, 2021 | ||||||
(Unaudited)
Additional Federal Income Tax Information
The following federal tax information related to the Fund's fiscal year ended March 31, 2021, is provided for information purposes only and should not be used for reporting to federal or state revenue agencies. Federal tax information for the calendar year will be reported to you on Form 1099-DIV in January 2022.
With respect to distributions paid, the Fund designates the following amounts (or, if subsequently determined to be different, the maximum amount allowable) for the fiscal year ended March 31, 2021 (amounts in thousands):
| Short-Term Capital Gain Distributions | Long-Term Capital Gain Distributions | Tax Exempt Distributions | |||||||||||||
$ | 75 | $ | 101 | $ | 812 | ||||||||||
34
USAA Mutual Funds Trust | Supplemental Information — continued March 31, 2021 | ||||||
(Unaudited)
Considerations of the Board in Continuing the Investment Advisory Agreement
USAA Tax Exempt Money Market Fund (the "Fund")
At a meeting of the Board of Trustees (the "Board") held on December 10-11, 2020, the Board, including the Trustees who are not "interested persons" (as that term is defined in the Investment Company Act of 1940, as amended) of the Trust (the "Independent Trustees"), approved for an annual period the continuance of the Investment Advisory Agreement (the "Advisory Agreement") between the Trust and Victory Capital Management Inc. (the "Adviser") with respect to the Fund. Prior to the December 10-11, 2020, meeting, at which the Advisory Agreement was approved, the Independent Trustees also discussed and considered information regarding the proposed continuation of the Advisory Agreement at a meeting held on November 19, 2020.
In advance of the foregoing meetings, the Trustees received and considered a variety of information relating to the Advisory Agreement and the Adviser, and were given the opportunity to ask questions and request additional information from management. The information provided to the Board included, among other things: (i) a separate report prepared by an independent third party of mutual fund data, which provided a statistical analysis comparing the Fund's investment performance, expenses, and fees to comparable investment companies; (ii) information concerning the services rendered to the Fund, as well as information regarding the Adviser's revenues and costs of providing services to the Fund and compensation paid to affiliates of the Adviser; and (iii) information about the Adviser's operations and personnel. Prior to voting, the Independent Trustees reviewed the proposed continuance of the Advisory Agreement with management and with experienced independent counsel retained by the Independent Trustees ("Independent Counsel") and received materials from such Independent Counsel discussing the legal standards for their consideration of the proposed continuation of the Advisory Agreement with respect to the Fund. The Independent Trustees also reviewed the proposed continuation of the Advisory Agreement with respect to the Fund in private sessions with Independent Counsel at which no representatives of management were present.
At each regularly scheduled meeting of the Board and its committees, the Board receives and reviews, among other things, information concerning the Fund's performance and related services provided by the Adviser. At the meeting at which the renewal of the Advisory Agreement is considered, particular focus is given to information concerning Fund performance, fees and total expenses as compared to comparable investment companies, and the Adviser's profitability with respect to the Fund. However, the Board noted that the evaluation process with respect to the Adviser is an ongoing one. In this regard, the Board's and its committees' consideration of the Advisory Agreement included information previously received at such meetings.
Advisory Agreement
After full consideration of a variety of factors, the Board, including the Independent Trustees, voted to approve the Advisory Agreement. In approving the Advisory Agreement, the Trustees did not identify any single factor as controlling, and each Trustee may have attributed different weights to various factors. Throughout their deliberations, the Independent Trustees were represented and assisted by Independent Counsel.
Nature, Extent, and Quality of Services — In considering the nature, extent, and quality of the services provided by the Adviser under the Advisory Agreement, the Board reviewed information provided by the Adviser relating to its operations and personnel. The Board also took into account its knowledge of the Adviser's management and the quality of the performance of the Adviser's duties through Board meetings, discussions, and reports during the preceding year. The Board considered the fees paid to the Adviser and the services provided to the Fund by the Adviser under the Advisory Agreement, as well as other services provided by the Adviser and its affiliates under other agreements, and the personnel who provide these services. In addition to the investment advisory services provided to the Fund, the Adviser and its affiliates provide administrative services, shareholder services, oversight of Fund accounting, marketing services, assistance in meeting legal and regulatory requirements, and other services necessary for the operation of the Fund and the Trust.
The Board considered the scope of services provided by, and the undertakings required of, the Adviser in connection with those services, including, among other things, maintaining (i) its own and the Fund's compliance programs, (ii) risk management programs, (iii) liquidity risk management programs, and (iv) cybersecurity
35
USAA Mutual Funds Trust | Supplemental Information — continued March 31, 2021 | ||||||
(Unaudited)
programs, each of which had expanded over time as a result of regulatory, market, and other developments. The Board also considered the significant risks assumed by the Adviser in connection with the services provided to the Fund, including investment, operational, enterprise, litigation, regulatory and compliance risks.
The Board considered the Adviser's management style and the performance of the Adviser's duties under the Advisory Agreement. The Board considered the level and depth of knowledge of the Adviser, including the professional experience and qualifications of its senior and investment personnel, as well as current staffing levels. The allocation of the Fund's brokerage, including the Adviser's process for monitoring "best execution," also was considered. The Adviser's role in coordinating the activities of the Fund's other service providers was also considered. The Board also considered the Adviser's risk management processes. The Board considered the Adviser's financial condition and that it had the financial wherewithal to continue to provide the same scope and high quality of services under the Advisory Agreement. In reviewing the Advisory Agreement, the Board focused on the experience, resources, and strengths of the Adviser and its affiliates in managing the Fund, as well as the other funds in the Trust.
The Board also reviewed the compliance and administrative services provided to the Fund by the Adviser and its affiliates, including the Adviser's oversight of the Fund's day-to-day operations and oversight of Fund accounting. The Trustees, guided also by information obtained from their experiences as trustees of the Trust, also focused on the quality of the Adviser's compliance and administrative staff.
Expenses and Performance — In connection with its consideration of the Advisory Agreement, the Board evaluated the Fund's advisory fees and total expense ratio as compared to other open-end investment companies deemed to be comparable to the Fund as determined by the independent third party in its report. The Fund's expenses were compared to (i) a group of investment companies chosen by the independent third party to be comparable to the Fund based upon certain factors, including fund type, comparability of investment objective and classification, sales load type, asset size, and expense components (the "expense group") and (ii) a larger group of investment companies with the same investment classification/objective as the Fund regardless of asset size, excluding outliers (the "expense universe"). Among other data, the Board noted that the Fund's management fee rate—which includes advisory and administrative services, as well as any fee waivers and reimbursements—was above the medians of its expense group and expense universe. The data indicated that the Fund's total expenses, including after any reimbursements, were above the medians of its expense group and expense universe. The Board also took into account the Adviser's current undertakings to maintain expense limitations for the Fund. The Board took into account the various other services provided to the Fund by the Adviser and its affiliates, and noted the high quality of services received by the Fund.
In considering the Fund's performance, the Board noted that it reviews at its regularly scheduled meetings information about the Fund's performance results. The Trustees also reviewed various comparative data provided to them in connection with their consideration of the renewal of the Advisory Agreement, including, among other information, a comparison of the Fund's average annual total returns relative to its Lipper index and other mutual funds deemed to be in its peer group by the independent third party in its report (the "performance universe"). The Fund's performance universe consisted of the Fund and all retail open-end investment companies with the same classification/objective as the Fund regardless of asset size or primary channel of distribution. This comparison indicated that, among other data, the Fund's performance was above the average of its performance universe and below its Lipper index for the one-year period ended September 30, 2020, and was below the average of its performance universe and its Lipper index for the three-, five-, and ten-year periods ended September 30, 2020.
Compensation and Profitability — The Board took into consideration the level and method of computing the management fee. The information considered by the Board included operating profit margin information for the Adviser's business as a whole. The Board also received and considered profitability information related to the management revenues from the Fund. This information included a review of the methodology used in the allocation of certain costs to the Fund. In considering the profitability data with respect to the Fund, the Trustees noted that the Adviser waived a portion of its management fees and/or reimbursed certain expenses with respect to the Fund. The Trustees reviewed the profitability of the Adviser's relationship with the Fund before tax expenses. The Board was also provided with a profitability analysis of other publicly traded asset managers prepared by an independent information service. In reviewing the overall profitability of the management fee to the Adviser, the Board also considered the fact that the Adviser and its affiliates provide shareholder servicing
36
USAA Mutual Funds Trust | Supplemental Information — continued March 31, 2021 | ||||||
(Unaudited)
and administrative services to the Fund for which they receive compensation. The Board also considered the possible direct and indirect benefits to the Adviser from its relationship with the Trust, including that the Adviser may derive reputational and other benefits from its association with the Fund. The Trustees recognized that the Adviser should be entitled to earn a reasonable level of profits in exchange for the level of services it provides to the Fund and the entrepreneurial and other risks that it assumes as Adviser.
Economies of Scale — The Board considered whether there should be changes in the management fee rate or structure in order to enable the Fund to participate in any economies of scale. The Board also considered the fee waiver and expense reimbursement arrangements by the Adviser. The Board also considered the effect of the Fund's change in size, if any, on its performance and fees, noting that the Fund may realize other economies of scale if assets increase proportionally more than expenses. The Board determined that the current investment management fee structure was reasonable.
Conclusions — The Board reached the following conclusions regarding the Fund's Advisory Agreement with the Adviser: (i) the Adviser has demonstrated that it possesses the capability and resources to perform the duties required of it under the Advisory Agreement; (ii) the Adviser maintains an appropriate compliance program; (iii) the overall performance of the Fund is reasonable in relation to the performance of funds with similar investment objectives and to relevant indices; (iv) the Fund's advisory expenses are reasonable in relation to those of similar funds and to the services to be provided by the Adviser; and (v) the Adviser's and its affiliates' level of profitability from their relationship with the Fund is reasonable in light of the nature and high quality of services provided by the Adviser and the type of fund. Based on its conclusions, the Board determined that continuation of the Advisory Agreement would be in the best interests of the Fund and its shareholders.
37
Privacy Policy
Protecting the Privacy of Information
The Trust respects your right to privacy. We also know that you expect us to conduct and process your business in an accurate and efficient manner. To do so, we must collect and maintain certain personal information about you. This is the information we collect from you on applications or other forms, and from the transactions you make with us or third parties. It may include your name, address, social security number, account transactions and balances, and information about investment goals and risk tolerance.
We do not disclose any information about you or about former customers to anyone except as permitted or required by law. Specifically, we may disclose the information we collect to companies that perform services on our behalf, such as the transfer agent that processes shareholder accounts and printers and mailers that assist us in the distribution of investor materials. We may also disclose this information to companies that perform marketing services on our behalf. This allows us to continue to offer you Victory investment products and services that meet your investing needs, and to effect transactions that you request or authorize. These companies will use this information only in connection with the services for which we hired them. They are not permitted to use or share this information for any other purpose.
To protect your personal information internally, we permit access only by authorized employees and maintain physical, electronic and procedural safeguards to guard your personal information.*
* You may have received communications regarding information about privacy policies from other financial institutions which gave you the opportunity to "opt-out" of certain information sharing with companies which are not affiliated with that financial institution. The Trust does not share information with other companies for purposes of marketing solicitations for products other than the Trust. Therefore, the Trust does not provide opt-out options to their shareholders.
P.O. Box 182593
Columbus, Ohio 43218-2593

Visit our website at: | Call | ||||||
vcm.com | (800) 235-8396 | ||||||
40859-0521

MARCH 31, 2021
Annual Report
USAA Target Managed Allocation Fund
As permitted by regulations adopted by the Securities and Exchange Commission, paper copies of the Fund's shareholder reports may no longer be sent by mail, unless you specifically request paper copies of the reports from the Fund or from your financial intermediary, such as a broker-dealer or bank. Instead, the reports will be made available on VictoryFunds.com, and you will be notified by mail each time a report is posted and provided with a website link to access the report. If you already elected to receive shareholder reports electronically, you will not be affected by this change and you need not take any action.
You may elect to receive shareholder reports and other communications from the Fund or your financial intermediary electronically by notifying your financial intermediary directly, or if you are a shareholder who has an account directly with the Fund, by calling (800) 235-8396 or by submitting your request via email to TA.Processing@FISGlobal.com.
You may elect to receive all future reports in paper form free of charge. You can inform the Fund or your financial intermediary that you wish to continue receiving paper copies of your shareholder reports by notifying your financial intermediary directly, or if you are a shareholder who has an account directly with the Fund, by calling (800) 235-8396 or by submitting your request via email to TA.Processing@FISGlobal.com. Your election to receive reports in paper will apply to all funds held with the USAA Mutual Funds or your financial intermediary.
Victory Capital means Victory Capital Management Inc., the investment adviser of the USAA Mutual Funds. USAA Mutual Funds are distributed by Victory Capital Services, Inc., member of FINRA, an affiliate of Victory Capital. Victory Capital and its affiliates are not affiliated with United Services Automobile Association or its affiliates. USAA and the USAA logos are registered trademarks and the USAA Mutual Funds and USAA Investments logos are trademarks of United Services Automobile Association and are being used by Victory Capital and its affiliates under license.
www.vcm.com
News, Information And Education 24 Hours A Day, 7 Days A Week
The Victory Funds site gives fund shareholders, prospective shareholders, and investment professionals a convenient way to access fund information, get guidance, and track fund performance anywhere they can access the Internet. The site includes:
• Detailed performance records
• Daily share prices
• The latest fund news
• Investment resources to help you become a better investor
• A section dedicated to investment professionals
Whether you're a potential investor searching for the fund that matches your investment philosophy, a seasoned investor interested in planning tools, or an investment professional, www.vcm.com has what you seek. Visit us anytime. We're always open.
USAA Mutual Funds Trust
TABLE OF CONTENTS
Shareholder Letter (Unaudited) | 2 | ||||||
Managers' Commentary (Unaudited) | 4 | ||||||
Investment Overview (Unaudited) | 6 | ||||||
| Investment Objective & Portfolio Holdings (Unaudited) | 7 | ||||||
Schedule of Portfolio Investments | 8 | ||||||
Financial Statements | |||||||
Statement of Assets and Liabilities | 10 | ||||||
Statement of Operations | 11 | ||||||
Statements of Changes in Net Assets | 12 | ||||||
Financial Highlights | 14 | ||||||
Notes to Financial Statements | 16 | ||||||
| Report of Independent Registered Public Accounting Firm | 27 | ||||||
Supplemental Information (Unaudited) | 28 | ||||||
Trustees' and Officers' Information | 28 | ||||||
Proxy Voting and Portfolio Holdings Information | 34 | ||||||
Expense Example | 34 | ||||||
Additional Federal Income Tax Information | 35 | ||||||
Advisory Contract Agreement | 36 | ||||||
Liquidity Risk Management Program | 39 | ||||||
Privacy Policy (inside back cover) | |||||||
This report is for the information of the shareholders and others who have received a copy of the currently effective prospectus of the Fund, managed by Victory Capital Management Inc. It may be used as sales literature only when preceded or accompanied by a current prospectus, which provides further details about the Fund.
IRA DISTRIBUTION WITHHOLDING DISCLOSURE
We generally must withhold federal income tax at a rate of 10% of the taxable portion of your distribution and, if you live in a state that requires state income tax withholding, at your state's tax rate. However, you may elect not to have withholding apply or to have income tax withheld at a higher rate. Any withholding election that you make will apply to any subsequent distribution unless and until you change or revoke the election. If you wish to make a withholding election, or change or revoke a prior withholding election, call (800) 235-8396, and form W-4P (OMB No. 1545-0074 withholding certificate for pension or annuity payments) will be electronically sent.
If you do not have a withholding election in place by the date of a distribution, federal income tax will be withheld from the taxable portion of your distribution at a rate of 10%. If you must pay estimated taxes, you may be subject to estimated tax penalties if your estimated tax payments are not sufficient and sufficient tax is not withheld from your distribution.
For more specific information, please consult your tax adviser.
1
(Unaudited)
Dear Shareholder,
The annual reporting period ended March 31, 2021, was a year like no other. It wasn't that long ago that we were all coming to grips with an emerging global pandemic, economic shutdowns, and financial markets in turmoil. We somehow persevered and have even emerged from those challenging days—dare I say—with a renewed sense of optimism. In retrospect, the trajectory of financial markets over the past year was nothing short of extraordinary.
Consider everything that transpired over the past 12 months. A novel coronavirus ("COVID-19") and the subsequent worldwide spread of COVID-19 prompted governments everywhere to issue austere shelter-in-place orders, and the global economy slowed abruptly. Equity markets sold off, while unprecedented levels of volatility roiled traditionally placid bond markets. During the second quarter of 2020, domestic GDP contracted by an alarming annual rate of 31.4%, according to the U.S. Department of Commerce ("Commerce Department").
It's no surprise that many investors flocked to the perceived safety of U.S. Treasurys during this period of tumult. Meanwhile, liquidity evaporated (for a short spell) in other segments of the fixed-income world, including higher-yielding credits and municipal bonds. The outlook was tenuous, and credit spreads widened while prices declined for most securities perceived to be higher risk.
Fortunately, a response came swiftly. The U.S. Federal Reserve (the "Fed") and other monetary authorities worldwide leapt into action—cutting interest rates, (re)starting quantitative easing and, in the case of the Fed, launching an array of programs to provide liquidity to stabilize fixed-income markets. The U.S. government also stepped up to provide fiscal stimulus in the form of the Coronavirus Aid, Relief, and Economic Security Act ("CARES Act").
It was impressive how quickly those actions helped arrest the stock market's freefall and restore order across much of the fixed-income universe. The rebound was as robust as the drawdown, and third quarter 2020 GDP bounced back and grew at a 33.4% annualized rate, according to the Commerce Department.
Late in the year, financial markets were alternately fueled and roiled by a contentious election season, growing optimism for an effective vaccine, and a fluid debate regarding the need for additional fiscal stimulus. Ultimately, stocks were propelled higher in the fourth quarter as it became clear Congress would provide another dose of stimulus in the form of direct payments, more unemployment insurance, and additional aid to businesses.
As the year ended and we moved into the first quarter of 2021, stocks continued their upward trajectory. Meanwhile, the yield on the 10-Year U.S. Treasury continued rallying sharply, and many investors began to worry about inflation in the post-pandemic world.
Through all the unprecedented events and volatility, the S&P 500® Index registered an impressive annual return of 56.35% for the 12-month period ended March 31, 2021. Over this same period, the yield on the 10-Year U.S. Treasury jumped more than 100 basis points, reflecting both the very low starting rate and substantial fiscal
2
stimulus. At the end of the reporting period, the yield on the 10-Year U.S. Treasury was 1.74%
On the whole, markets endured and surprised to the upside, but perhaps the key takeaway is that the unexpected can and will happen. That's why it's important to remain focused on your long-term investment goals and avoid making emotional decisions.
On the following pages, you will find information relating to your USAA Mutual Funds, brought to you by Victory Capital. If you have any questions regarding the current market dynamics or your specific portfolio or investment plan, we encourage you to contact our Member Service Representatives. Call (800) 235-8396, or visit our website at www.vcm.com.
Thank you for letting us help you work toward your investment goals.

Christopher K. Dyer, CFA
President,
USAA Mutual Funds Trust
3
USAA Mutual Funds Trust
USAA Target Managed Allocation Fund
Manager's Commentary
(Unaudited)
Victory Solutions
Mannik S. Dhillon, CFA, CAIA
Lance Humphrey, CFA
• What were the market conditions during the reporting period?
The beginning of the reporting period brought a dramatic reversal from the difficult environment that characterized the first three months of 2020. While COVID-19 cases continued to rise investors grew increasingly confident that the economy would be able to recover from its sharp downturn of February and March. The optimism stemmed, in part, from a series of better-than-expected economic reports interpreted as evidence that the slump in growth would be less severe than was initially feared. The markets were further cheered by the aggressive response by the U.S. Federal Reserve (the "Fed"). In addition to reiterating its commitment to keep short-term interest rates near zero for an extended period, the Fed announced the direct purchase of both individual bonds and exchange-traded bond funds. The central bank's unusual steps offered corporations the latitude to issue debt at ultra-low rates, providing them with the cash necessary to withstand the effects of the COVID-19.
The global financial markets produced healthy returns during the second half of 2020, wrapping up a positive year for the major asset classes. Investors' appetite for risk improved considerably in early November, when the approval of vaccines for COVID-19 raised expectations that the world economy could gradually return to normal in 2021. The conclusion of the U.S. elections, which removed a source of uncertainty that had depressed performance in September and October, was an additional tailwind. The markets were also aided by continued indications that the Fed and other central banks would maintain their highly accommodative policies indefinitely. Not least, an agreement on a new round of U.S. fiscal stimulus further cheered investors in late December. Together, these developments outweighed negative headlines surrounding renewed lockdowns and the persistence of the coronavirus.
The first quarter of 2021 proved to be a continuation of the strong equity markets investors experienced over the second half of 2020. Gains from global equity markets were fueled by optimism surrounding the successful rollout of the COVID-19 vaccines coupled with further monetary and fiscal stimulus proposals. Faster-than-expected economic growth produced a meaningful increase in real interest rates, which led to negative returns across most major fixed income asset classes. The 10-year U.S. Treasury bond yield finished at its highest level of the reporting period climbing from under 1% to 1.74%.
• How did the USAA Target Managed Allocation Fund (the "Fund") perform during the reporting period?
For the reporting period ended March 31, 2021, the Fund had a total return of 44.39%. This compares to total returns of 54.60% for the MSCI All-Country World Index and 2.95% for the Bloomberg Barclays U.S. Universal Index.
4
USAA Mutual Funds Trust
USAA Target Managed Allocation Fund (continued)
• What strategies did you employ during the reporting period?
USAA Mutual Funds offer five funds in the Target Retirement Series, each of which has a different strategic asset allocation based on investors' risk tolerance and time horizon. Depending on our continuous assessment of market opportunities and risks, we apply tactical asset allocation decisions by overweighting or underweighting the various asset classes in each fund versus our respective strategic allocations. The Target Managed Allocation Fund allows us to make allocation changes to the Target Retirement Series more quickly and with less disruption to the underlying funds in the portfolios. The Fund's asset allocation therefore reflects the need to round out the portfolios of the Target Retirement Series, rather than representing an active strategy. We primarily use exchange-traded funds ("ETFs") and futures to implement our asset allocation views, since they are highly liquid vehicles that allow us to apply our decisions more quickly and efficiently than investing in individual securities.
With this in mind, following the equity market sell off in March, the Fund generally was positioned more conservatively. The Fund had higher than average defensive positions in various fixed income and commodity asset classes that were invested tactically over the period. These positions detracted from performance as investors concern around the global pandemic faded and markets returned to a risk on environment. A substantial portion of the portfolio was invested in U.S. equities, which outperformed the broader global equity markets. Additionally, positions in U.S. small-cap equities and emerging markets equities were added towards the end of 2020 and remained in 2021 adding value to the fund's performance.
The Fund also employs a tactically-oriented equity futures strategy designed to provide incremental return on top of the underlying ETF positions. This strategy performance was mixed over the time period with long positions in U.S. large-cap equities providing value but short positions in U.S. small-cap equities detracting from performance. Short positions in futures tracking the Japan Topix Index also contributed positively to performance of the strategy.
Thank you for allowing us to assist you with your investment needs.
5
USAA Mutual Funds Trust
USAA Target Managed Allocation Fund
Investment Overview
(Unaudited)
Average Annual Total Return
Year Ended March 31, 2021
INCEPTION DATE | 8/7/15 | ||||||||||||||
Net Asset Value | MSCI All-Country World Index1 | Bloomberg Barclays U.S. Universal Index2 | |||||||||||||
One Year | 44.39 | % | 54.60 | % | 2.95 | % | |||||||||
Five Year | 10.23 | % | 13.21 | % | 3.59 | % | |||||||||
Since Inception | 8.23 | % | 10.70 | % | 3.65 | % | |||||||||
The performance data quoted represents past performance and current returns may be lower or higher. The investment return and principal value will fluctuate so that an investor's shares, when redeemed, may be worth more or less than the original cost. To obtain performance information current to the most recent month's end, please visit www.vcm.com.
Total return measures the price change in a share assuming the reinvestment of all net investment income and realized capital gain distributions, if any. The total returns quoted do not reflect adjustments made to the enclosed financial statements in accordance with U.S. Generally Accepted Accounting Principles or the deduction of taxes that a shareholder would pay on net investment income and realized capital gain distributions, including reinvested distributions, or redemptions of shares.
The total return figures set forth above include all waivers of fees. Without such fee waivers, the total returns would have been lower.
USAA Target Managed Allocation Fund — Growth of $10,000
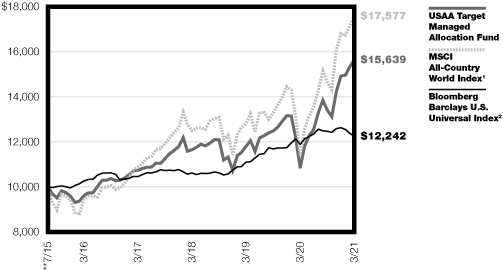
**The performance of the MSCI All-Country World Index and Bloomberg Barclays U.S. Universal Index is calculated from the end of the month, July 31, 2015, while the inception date of the USAA Target Managed Allocation Fund is August 7, 2015. There may be a slight variation of performance numbers because of this difference.
1The unmanaged MSCI All-Country World Index is a free float-adjusted market capitalization weighted index that is designed to measure the equity market performance of developed and emerging markets. This index does not include the effect of sales charges, commissions, expenses or taxes, is not representative of the Fund, and it is not possible to invest directly in an index.
2The unmanaged Bloomberg Barclays U.S. Universal Bond Index is comprised of U.S. dollar-denominated, taxable bonds that are related investment grade or below investment grade. This index does not include the effect of sales charges, commissions, expenses or taxes, is not representative of the Fund, and it is not possible to invest directly in an index.
The graph reflects investment of growth of a hypothetical $10,000 investment in the Fund.
The graph and table do not reflect the deduction of taxes that a shareholder would pay on Fund distributions or the redemption of Fund shares.
Past performance is not indicative of future results.
6
| USAA Mutual Funds Trust USAA Target Managed Allocation Fund | March 31, 2021 | ||||||
(Unaudited)
Investment Objective & Portfolio Holdings:
The Fund's investment objective seeks to maximize total return primarily through capital appreciation.
Asset Allocation*:
March 31, 2021
(% of Net Assets)

*Does not include futures, money market instruments, and short-term investments purchased with cash collateral from securities loaned.
Percentages are of the net assets of the Fund and may not equal 100%.
7
| USAA Mutual Funds Trust USAA Target Managed Allocation Fund | Schedule of Portfolio Investments March 31, 2021 | ||||||
(Amounts in Thousands, Except for Shares)
Security Description | Shares | Value | |||||||||
Exchange-Traded Funds (99.2%) | |||||||||||
iShares MSCI Canada ETF | 1,872,550 | $ | 63,760 | ||||||||
iShares MSCI Japan ETF | 242,842 | 16,640 | |||||||||
iShares Russell 2000 ETF (a) | 316,087 | 69,836 | |||||||||
JPMorgan BetaBuilders Canada ETF | 721,350 | 21,316 | |||||||||
JPMorgan BetaBuilders Japan ETF | 371,201 | 10,572 | |||||||||
United States Oil Fund LP (a)(b) | 156,732 | 6,352 | |||||||||
Vanguard FTSE All-World ex-U.S. ETF | 1,255,340 | 76,174 | |||||||||
Vanguard FTSE Emerging Markets ETF (a) (c) | 1,573,118 | 81,881 | |||||||||
Vanguard FTSE Europe ETF (a) | 422,119 | 26,594 | |||||||||
Vanguard S&P 500 ETF (c) | 156,731 | 57,097 | |||||||||
Vanguard Total Stock Market ETF (c) | 460,162 | 95,111 | |||||||||
Total Exchange-Traded Funds (Cost $462,805) | 525,333 | ||||||||||
Collateral for Securities Loaned^ (11.8%) | |||||||||||
Federated Government Obligations Fund Institutional Shares, 0.04% (d) | 420,405 | 420 | |||||||||
Goldman Sachs Financial Square Government Fund Institutional Shares, 0.04% (d) | 22,689,039 | 22,689 | |||||||||
HSBC U.S. Government Money Market Fund I Shares, 0.04% (d) | 12,089,897 | 12,090 | |||||||||
Invesco Government & Agency Portfolio Institutional Shares, 0.03% (d) | 16,112,417 | 16,112 | |||||||||
| Morgan Stanley Institutional Liquidity Government Portfolio Institutional Shares, 0.03% (d) | 11,379,493 | 11,380 | |||||||||
Total Collateral for Securities Loaned (Cost $62,691) | 62,691 | ||||||||||
Total Investments (Cost $525,496) — 111.0% | 588,024 | ||||||||||
Liabilities in excess of other assets — (11.0)% | (58,411 | ) | |||||||||
NET ASSETS — 100.00% | $ | 529,613 | |||||||||
At March 31, 2021, the Fund's investments in international securities were 56.1% of net assets.
^ Purchased with cash collateral from securities on loan.
(a) All or a portion of this security is on loan.
(b) Non-income producing security.
(c) All or a portion of this security has been segregated as collateral for derivative instruments.
(d) Rate disclosed is the daily yield on March 31, 2021.
ETF — Exchange-Traded Fund
LP — Limited Partnership
See notes to financial statements.
8
| USAA Mutual Funds Trust USAA Target Managed Allocation Fund | Schedule of Portfolio Investments — continued March 31, 2021 | ||||||
(Amounts in Thousands, Except for Shares)
Futures Contracts Purchased
(Amounts not in thousands)
| Number of Contracts | Expiration Date | Notional Amount | Value | Unrealized Appreciation (Depreciation) | |||||||||||||||||||
ASX SPI 200 Index Futures | 187 | 6/17/21 | $ | 24,447,220 | $ | 24,020,603 | $ | 51,318 | |||||||||||||||
E-Mini S&P 500 Futures | 409 | 6/18/21 | 80,425,781 | 81,133,330 | 707,549 | ||||||||||||||||||
Hang Seng Index Futures | 60 | 4/29/21 | 10,755,112 | 10,927,474 | 180,362 | ||||||||||||||||||
Swiss Market Index Futures | 270 | 6/18/21 | 31,051,912 | 31,222,857 | 771,050 | ||||||||||||||||||
$ | 1,710,279 | ||||||||||||||||||||||
Futures Contracts Sold
(Amounts not in thousands)
| Number of Contracts | Expiration Date | Notional Amount | Value | Unrealized Appreciation (Depreciation) | |||||||||||||||||||
| E-Mini Russell 2000 Index Futures | 349 | 6/18/21 | $ | 40,990,481 | $ | 38,782,625 | $ | 2,207,856 | |||||||||||||||
Euro Stoxx 50 Futures | 588 | 6/18/21 | 26,367,084 | 26,655,503 | (734,853 | ) | |||||||||||||||||
FTSE 100 Index Futures | 593 | 6/18/21 | 55,092,935 | 54,597,556 | 48,252 | ||||||||||||||||||
Tokyo Price Index Futures | 141 | 6/10/21 | 24,704,765 | 24,886,099 | (688,211 | ) | |||||||||||||||||
$ | 833,044 | ||||||||||||||||||||||
Total unrealized appreciation | $ | 3,966,387 | |||||||||||||||||||||
Total unrealized depreciation | (1,423,064 | ) | |||||||||||||||||||||
Total net unrealized appreciation (depreciation) | $ | 2,543,323 | |||||||||||||||||||||
See notes to financial statements.
9
USAA Mutual Funds Trust | Statement of Assets and Liabilities March 31, 2021 | ||||||
(Amounts in Thousands, Except Per Share Amounts)
| USAA Target Managed Allocation Fund | |||||||
Assets: | |||||||
Investments, at value (Cost $525,496) | $ | 588,024 | (a) | ||||
Cash | 1,143 | ||||||
Deposit with brokers for futures contracts | 1,798 | ||||||
Receivables: | |||||||
Interest and dividends | 9 | ||||||
Investments sold | 46,750 | ||||||
Variation margin on open futures contracts | 1,374 | ||||||
Prepaid expenses and other assets | 5 | ||||||
Total Assets | 639,103 | ||||||
Liabilities: | |||||||
Payables: | |||||||
Collateral received on loaned securities | 62,691 | ||||||
Investments purchased | 45,685 | ||||||
Variation margin on open futures contracts | 792 | ||||||
Accrued expenses and other payables: | |||||||
Investment advisory fees | 226 | ||||||
Administration fees | 23 | ||||||
Custodian fees | 4 | ||||||
Transfer agent fees | 23 | ||||||
Compliance fees | — | (b) | |||||
Trustees' fees | — | (b) | |||||
Other accrued expenses | 46 | ||||||
Total Liabilities | 109,490 | ||||||
Net Assets: | |||||||
Capital | 416,860 | ||||||
Total accumulated earnings/(loss) | 112,753 | ||||||
Net Assets | $ | 529,613 | |||||
Shares (unlimited number of shares authorized with no par value): | 43,310 | ||||||
Net asset value, offering and redemption price per share: (c) | $ | 12.23 | |||||
(a) Includes $61,852 of securities on loan.
(b) Rounds to less than $1 thousand.
(c) Per share amount may not recalculate due to rounding of net assets and/or shares outstanding.
See notes to financial statements.
10
USAA Mutual Funds Trust | Statement of Operations For the Year Ended March 31, 2021 | ||||||
(Amounts in Thousands)
| USAA Target Managed Allocation Fund | |||||||
Investment Income: | |||||||
Dividends | $ | 7,779 | |||||
Interest | 267 | ||||||
Securities lending (net of fees) | 81 | ||||||
Total Income | 8,127 | ||||||
Expenses: | |||||||
Investment advisory fees | 2,542 | ||||||
Administration fees | 254 | ||||||
Sub-Administration fees | 17 | ||||||
Custodian fees | 23 | ||||||
Transfer agent fees | 254 | ||||||
Trustees' fees | 46 | ||||||
Compliance fees | 3 | ||||||
Legal and audit fees | 67 | ||||||
State registration and filing fees | 3 | ||||||
Interfund lending fees | 1 | ||||||
Other expenses | 40 | ||||||
Total Expenses | 3,250 | ||||||
Net Investment Income (Loss) | 4,877 | ||||||
Realized/Unrealized Gains (Losses) from Investments: | |||||||
Net realized gains (losses) from investment securities | 99,290 | ||||||
Net realized gains (losses) from foreign currency transactions | 90 | ||||||
Net realized gains (losses) from futures contracts | (17,887 | ) | |||||
Net change in unrealized appreciation/depreciation on investment securities | 93,401 | ||||||
Net change in unrealized appreciation/depreciation on foreign currency translations | 365 | ||||||
Net change in unrealized appreciation/depreciation on futures contracts | 3,220 | ||||||
Net realized/unrealized gains (losses) on investments | 178,479 | ||||||
Change in net assets resulting from operations | $ | 183,356 | |||||
See notes to financial statements.
11
USAA Mutual Funds Trust | Statements of Changes in Net Assets | ||||||
(Amounts in Thousands)
| USAA Target Managed Allocation Fund | |||||||||||
| Year Ended March 31, 2021 | Year Ended March 31, 2020 | ||||||||||
From Investments: | |||||||||||
Operations: | |||||||||||
Net investment income (loss) | $ | 4,877 | $ | 9,984 | |||||||
Net realized gains (losses) from investments | 81,493 | 9,438 | |||||||||
| Net change in unrealized appreciation/depreciation on investments | 96,986 | (57,387 | ) | ||||||||
Change in net assets resulting from operations | 183,356 | (37,965 | ) | ||||||||
Change in net assets resulting from distributions to shareholders | (30,747 | ) | (25,937 | ) | |||||||
Change in net assets resulting from capital transactions | (69,612 | ) | (1,689 | ) | |||||||
Change in net assets | 82,997 | (65,591 | ) | ||||||||
Net Assets: | |||||||||||
Beginning of period | 446,616 | 512,207 | |||||||||
End of period | $ | 529,613 | $ | 446,616 | |||||||
Capital Transactions: | |||||||||||
Proceeds from shares issued | $ | 1,065 | $ | 5,264 | |||||||
Distributions reinvested | 30,747 | 25,937 | |||||||||
Cost of shares redeemed | (101,424 | ) | (32,890 | ) | |||||||
Change in net assets resulting from capital transactions | $ | (69,612 | ) | $ | (1,689 | ) | |||||
Share Transactions: | |||||||||||
Issued | 94 | 590 | |||||||||
Reinvested | 2,654 | �� | 2,372 | ||||||||
Redeemed | (9,179 | ) | (3,127 | ) | |||||||
Change in Shares | (6,431 | ) | (165 | ) | |||||||
See notes to financial statements.
12
This page is intentionally left blank.
13
USAA Mutual Funds Trust | Financial Highlights | ||||||
For a Share Outstanding Throughout Each Period
Investment Activities | Distributions to Shareholders From | ||||||||||||||||||||||||||
| Net Asset Value, Beginning of Period | Net Investment Income (Loss) | Net Realized and Unrealized Gains (Losses) on Investments | Total from Investment Activities | Net Investment Income | Net Realized Gains from Investments | ||||||||||||||||||||||
USAA Target Managed Allocation Fund | |||||||||||||||||||||||||||
| Year Ended March 31, 2021 | $ | 8.98 | 0.11 | (a) | 3.84 | 3.95 | (0.09 | ) | (0.61 | ) | |||||||||||||||||
| Year Ended March 31, 2020 | $ | 10.26 | 0.20 | (a) | (0.96 | ) | (0.76 | ) | (0.22 | ) | (0.30 | ) | |||||||||||||||
| Year Ended March 31, 2019 | $ | 11.22 | 0.17 | (0.10 | ) | 0.07 | (0.15 | ) | (0.88 | ) | |||||||||||||||||
| Year Ended March 31, 2018 | $ | 10.46 | 0.16 | 0.73 | 0.89 | (0.13 | ) | — | (d) | ||||||||||||||||||
| Year Ended March 31, 2017 | $ | 9.49 | 0.14 | 0.97 | 1.11 | (0.14 | ) | — | |||||||||||||||||||
* Assumes reinvestment of all net investment income and realized capital gain distributions, if any, during the period. Includes adjustments in accordance with U.S. Generally Accepted Accounting Principles and could differ from the Lipper reported return.
^ The net expense ratio may not correlate to the applicable expense limits in place during the period since the current contractual expense limitation is applied for a period beginning July 1, 2019, and in effect through June 30, 2023, instead of coinciding with the Fund's fiscal year end. Details of the current contractual expense limitation in effect can be found in Note 5 of the accompanying Notes to Financial Statements.
(a) Per share net investment income (loss) has been calculated using the average daily shares method.
(b) Reflects overall decrease in purchases and sales of securities.
(c) Reflects an increase in trading activity due to asset allocation shifts.
(d) Amount is less than $0.005 per share.
(e) Prior to August 1, 2016, USAA Asset Management Company ("AMCO") (previous Investment Adviser) had voluntarily agreed to limit the annual expenses of the Fund to 0.70% of the Fund's average daily net assets.
See notes to financial statements.
14
USAA Mutual Funds Trust | Financial Highlights — continued | ||||||
For a Share Outstanding Throughout Each Period
Ratios to Average Net Assets | Supplemental Data | ||||||||||||||||||||||||||||||||||
| Total Distributions | Net Asset Value, End of Period | Total Return* | Net Expenses^ | Net Investment Income (Loss) | Gross Expenses | Net Assets, End of Period (000's) | Portfolio Turnover | ||||||||||||||||||||||||||||
USAA Target Managed Allocation Fund | |||||||||||||||||||||||||||||||||||
| Year Ended March 31, 2021 | (0.70 | ) | $ | 12.23 | 44.39 | % | 0.64 | % | 0.96 | % | 0.64 | % | $ | 529,613 | 202 | %(b) | |||||||||||||||||||
| Year Ended March 31, 2020 | (0.52 | ) | $ | 8.98 | (8.20 | )% | 0.64 | % | 1.88 | % | 0.64 | % | $ | 446,616 | 298 | %(c) | |||||||||||||||||||
| Year Ended March 31, 2019 | (1.03 | ) | $ | 10.26 | 1.32 | % | 0.65 | % | 1.83 | % | 0.65 | % | $ | 512,207 | 195 | %(c) | |||||||||||||||||||
| Year Ended March 31, 2018 | (0.13 | ) | $ | 11.22 | 8.48 | % | 0.65 | % | 1.50 | % | 0.65 | % | $ | 487,599 | 75 | %(b) | |||||||||||||||||||
| Year Ended March 31, 2017 | (0.14 | ) | $ | 10.46 | 11.72 | % | 0.64 | %(e) | 1.37 | % | 0.64 | % | $ | 462,794 | 125 | % | |||||||||||||||||||
See notes to financial statements.
15
USAA Mutual Funds Trust | Notes to Financial Statements March 31, 2021 | ||||||
1. Organization:
USAA Mutual Funds Trust (the "Trust") is organized as a Delaware statutory trust and is registered under the Investment Company Act of 1940, as amended (the "1940 Act"), as an open-end investment company. The Trust is comprised of 46 funds and is authorized to issue an unlimited number of shares, which are units of beneficial interest with no par value.
The accompanying financial statements are those of the USAA Target Managed Allocation Fund (the "Fund"). The Fund is classified as diversified under the 1940 Act.
The Fund is not offered for sale directly to the general public and is available currently for investment only to other USAA Mutual Funds participating in a fund-of-funds investment strategy or other persons or legal entities that the Fund may approve from time to time.
Under the Trust's organizational documents, its officers and trustees are indemnified against certain liabilities arising out of the performance of their duties to the Fund. In addition, in the normal course of business, the Fund enters into contracts with its vendors and others that provide for general indemnifications. The Fund's maximum exposure under these arrangements is unknown, as this would involve future claims that may be made against the Fund. However, based on experience, the Fund expects that risk of loss to be remote.
2. Significant Accounting Policies:
The following is a summary of significant accounting policies followed by the Trust in the preparation of its financial statements. The policies are in conformity with Generally Accepted Accounting Principles in the United States of America ("GAAP"). The preparation of financial statements in accordance with GAAP requires management to make estimates and assumptions that affect the reported amounts of assets and liabilities and disclosure of contingent assets and liabilities at the date of the financial statements and the reported amounts of income and expenses for the period. Actual results could differ from those estimates. The Fund follows the specialized accounting and reporting requirements under GAAP that are applicable to investment companies under Accounting Standards Codification Topic 946.
Investment Valuation:
The Fund records investments at fair value. Fair value is defined as the price that would be received to sell an asset or paid to transfer a liability in an orderly transaction between market participants at the measurement date.
The valuation techniques described below maximize the use of observable inputs and minimize the use of unobservable inputs in determining fair value. The inputs used for valuing the Fund's investments are summarized in the three broad levels listed below:
• Level 1 — quoted prices in active markets for identical securities
• Level 2 — other significant observable inputs (including quoted prices for similar securities or interest rates applicable to those securities, etc.)
• Level 3 — significant unobservable inputs (including the Fund's own assumptions in determining the fair value of investments)
Changes in valuation techniques may result in transfers in or out of an assigned level within the disclosure hierarchy. The inputs or methodologies used for valuation techniques are not necessarily an indication of the risks associated with entering into those investments.
Victory Capital Management Inc. ("VCM" or the "Adviser") has established the Pricing and Liquidity Committee (the "Committee"), and subject to the Trust's Board of Trustees (the "Board") oversight, the Committee administers and oversees the Fund's valuation policies and procedures, which are approved by the Board.
Portfolio securities listed or traded on securities exchanges, including Exchange-Traded Funds ("ETFs"), American Depositary Receipts ("ADRs") and Rights, are valued at the closing price on the exchange or
16
USAA Mutual Funds Trust | Notes to Financial Statements — continued March 31, 2021 | ||||||
system where the security is principally traded, if available, or at the Nasdaq Official Closing Price. If there have been no sales for that day on the exchange or system, then a security is valued at the last available bid quotation on the exchange or system where the security is principally traded. In each of these situations, valuations are typically categorized as Level 1 in the fair value hierarchy.
Investments in open-end investment companies are valued at their net asset value ("NAV"). These valuations are typically categorized as Level 1 in the fair value hierarchy.
Debt securities of United States ("U.S.") issuers, along with corporate and municipal securities, including short-term investments maturing in 60 days or less, may be valued using evaluated bid or the last sales price to price securities by dealers or an independent pricing service approved by the Board. These valuations are typically categorized as Level 2 in the fair value hierarchy.
Futures contracts are valued at the settlement price established each day by the board of trade or an exchange on which they are traded. These valuations are typically categorized as Level 1 in the fair value hierarchy.
In the event that price quotations or valuations are not readily available, are not reflective of market value, or a significant event has been recognized in relation to a security or class of securities, the securities are valued in good faith by the Committee in accordance with valuation procedures approved by the Board. These valuations are typically categorized as Level 2 or Level 3 in the fair value hierarchy, based on the observability of inputs used to determine the fair value. The effect of fair value pricing is that securities may not be priced on the basis of quotations from the primary market in which they are traded and the actual price realized from the sale of a security may differ materially from the fair value price. Valuing these securities at fair value is intended to cause the Fund's NAV to be more reliable than it otherwise would be.
A summary of the valuations as of March 31, 2021, based upon the three levels defined above, is included in the table below while the breakdown, by category, of investments is disclosed on the Schedule of Portfolio Investments (amounts in thousands):
Level 1 | Level 2 | Level 3 | Total | ||||||||||||||||
Exchange-Traded Funds | $ | 525,333 | $ | — | $ | — | $ | 525,333 | |||||||||||
Collateral for Securities Loaned | 62,691 | — | — | 62,691 | |||||||||||||||
Total | $ | 588,024 | $ | — | $ | — | $ | 588,024 | |||||||||||
Other Financial Investments* | |||||||||||||||||||
Assets: | |||||||||||||||||||
Futures Contracts | $ | 3,966 | $ | — | $ | — | $ | 3,966 | |||||||||||
Liabilities: | |||||||||||||||||||
Futures Contracts | $ | (1,423 | ) | $ | — | $ | — | $ | (1,423 | ) | |||||||||
Total | $ | 2,543 | $ | — | $ | — | $ | 2,543 | |||||||||||
* Futures contracts are valued at the unrealized appreciation (depreciation) on the investment.
For the year ended March 31, 2021, there were no transfers in or out of Level 3 in the fair value hierarchy.
Investment Companies:
Exchange-Traded Funds:
The Fund may invest in ETFs, the shares of which are bought and sold on a securities exchange. An ETF trades like common stock and represents a fixed portfolio of securities often designed to track the performance and dividend yield of a particular domestic or foreign market index. The Fund may purchase shares of an ETF to temporarily gain exposure to a portion of the U.S. or a foreign market while awaiting purchase of underlying securities. The risks of owning an ETF generally reflect the risks of owning the underlying securities they are designed to track, although the lack of liquidity of an
17
USAA Mutual Funds Trust | Notes to Financial Statements — continued March 31, 2021 | ||||||
ETF could result in it being more volatile. Additionally, ETFs have fees and expenses that reduce their value.
Open-End Funds:
The Fund may invest in portfolios of open-end investment companies. These investment companies value securities in their portfolios for which market quotations are readily available at their market values (generally the last reported sale price) and all other securities and assets at their fair value by the methods established by the board of directors of the underlying funds.
Derivative Instruments:
Futures Contracts:
The Fund may enter into contracts for the future delivery of securities or foreign currencies and futures contracts based on a specific security, class of securities, foreign currency or an index, and purchase or sell options on any such futures contracts. A futures contract on a securities index is an agreement obligating either party to pay, and entitling the other party to receive, while the contract is outstanding, cash payments based on the level of a specified securities index. No physical delivery of the underlying asset is made. The Fund may enter into futures contracts in an effort to hedge against market risks. The acquisition of put and call options on futures contracts will give the Fund the right (but not the obligation), for a specified price, to sell or to purchase the underlying futures contract, upon exercise of the option, at any time during the option period. Futures transactions involve brokerage costs and require the Fund to segregate assets to cover contracts that would require it to purchase securities or currencies. A good faith margin deposit, known as initial margin, of cash or government securities with a broker or custodian is required to initiate and maintain open positions in futures contracts. Subsequent payments, known as variation margin, are made or received by the Fund based on the change in the market value of the position and are recorded as unrealized appreciation or depreciation until the contract is closed out, at which time the gain or loss is realized. The Fund may lose the expected benefit of futures transactions if interest rates, exchange rates or securities prices change in an unanticipated manner. Such unanticipated changes may also result in lower overall performance than if the Fund had not entered into any futures transactions. In addition, the value of the Fund's futures positions may not prove to be perfectly or even highly correlated with the value of its portfolio securities or foreign currencies, limiting the Fund's ability to hedge effectively against interest rate, exchange rate and/or market risk and giving rise to additional risks. There is no assurance of liquidity in the secondary market for purposes of closing out futures positions. The collateral held by the Fund is reflected on the Statement of Assets and Liabilities under Deposit with brokers for futures contracts.
During the year ended March 31, 2021, the Fund entered into futures contracts primarily for the strategy of hedging or other purposes, including but not limited to, providing liquidity and equitizing cash.
Summary of Derivative Instruments:
The following table summarizes the fair values of derivative instruments on the Statement of Assets and Liabilities, categorized by risk exposure, as of March 31, 2021 (amounts in thousands):
Assets | Liabilities | ||||||||||
| Variation Margin Receivable on Open Futures Contracts* | Variation Margin Payable on Open Futures Contracts* | ||||||||||
Equity Risk Exposure | $ | 3,966 | $ | 1,423 | |||||||
* Includes cumulative unrealized appreciation (depreciation) of futures contracts as reported on the Schedule of Portfolio Investments. Only current day's variation margin for futures contracts is reported within the Statement of Assets and Liabilities.
18
USAA Mutual Funds Trust | Notes to Financial Statements — continued March 31, 2021 | ||||||
The following table presents the effect of derivative instruments on the Statement of Operations, categorized by risk exposure, for the year ended March 31, 2021 (amounts in thousands):
| Net Realized Gains (Losses) on Derivatives Recognized as a Result of Operations | Net Change in Unrealized Appreciation/Depreciation on Derivatives Recognized as a Result of Operations | ||||||||||
| Net Realized Gains (Losses) from Futures Contracts | Net Change in Unrealized Appreciation/Depreciation on Futures Contracts | ||||||||||
Equity Risk Exposure | $ | (17,887 | ) | $ | 3,220 | ||||||
All open derivative positions at year end are reflected on the Fund's Schedule of Portfolio Investments. The underlying face value of open derivative positions relative to the Fund's net assets at year end is generally representative of the notional amount of open positions to net assets throughout the year.
Investment Transactions and Related Income:
Changes in holdings of investments are accounted for no later than one business day following the trade date. For financial reporting purposes, however, investment transactions are accounted for on trade date on the last business day of the reporting period. Interest income is determined on the basis of coupon interest accrued using the effective interest method which adjusts, where applicable, the amortization of premiums or accretion of discount. Dividend income is recorded on the ex-dividend date. Gains or losses realized on sales of securities are determined by comparing the identified cost of the security lot sold with the net sales proceeds.
Securities Lending:
The Fund, through a securities lending agreement with Citibank, N.A. ("Citibank"), may lend its securities to qualified financial institutions, such as certain broker-dealers, to earn additional income, net of income retained by Citibank. Borrowers are required to secure their loans for collateral in the amount of at least 102% of the value of U.S. securities loaned or at least 105% of the value of non-U.S. securities loaned, marked-to-market daily. Any collateral shortfalls associated with increases in the valuation of the securities loaned are cured the next business day once the shortfall exceeds $100 thousand. Collateral may be cash, U.S. government securities, or other securities as permitted by Securities and Exchange Commission ("SEC") guidelines. Cash collateral may be invested in high-quality short-term investments, primarily open-end investment companies. Collateral requirements are determined daily based on the value of the Fund's securities on loan as of the end of the prior business day. During the time portfolio securities are on loan, the borrower will pay the Fund any dividends or interest paid on such securities plus any fee negotiated between the parties to the lending agreement. The Fund also earns a return from the collateral. The Fund pays Citibank various fees in connection with the investment of cash collateral and fees based on the investment income received from securities lending activities. Securities lending income (net of these fees) is disclosed on the Statement of Operations. Loans are terminable upon demand and the borrower must return the loaned securities within the lesser of one standard settlement period or five business days. Risks relating to securities-lending transactions include that the borrower may not provide additional collateral when required or return the securities when due, and that the value of the short-term investments will be less than the amount of cash collateral required to be returned to the borrower. The Fund's agreement with Citibank does not include master netting provisions. Non-cash collateral received by the Fund may not be sold or re-pledged, except to satisfy borrower default. Cash collateral is listed on the Fund's Schedule of Portfolio Investments and Financial Statements while non-cash collateral is not included.
19
USAA Mutual Funds Trust | Notes to Financial Statements — continued March 31, 2021 | ||||||
The following table (amounts in thousands) is a summary of the Fund's securities lending transactions as of March 31, 2021.
| Value of Securities on Loan | Non-Cash Collateral | Cash Collateral | |||||||||
| $ | 61,852 | $ | — | $ | 62,691 | ||||||
Foreign Currency Translations:
The accounting records of the Fund are maintained in U.S. dollars. Investment securities and other assets and liabilities of the Fund denominated in a foreign currency are translated into U.S. dollars at current exchange rates. Purchases and sales of securities, income receipts, and expense payments are translated into U.S. dollars at the exchange rates on the date of the transactions. The Fund does not isolate the portion of the results of operations resulting from changes in foreign exchange rates on investments from fluctuations arising from changes in market prices of securities held. Such fluctuations are disclosed as net change in unrealized appreciation/depreciation on investments and foreign currency translations on the Statement of Operations. Any realized gains or losses from these fluctuations, including foreign currency arising from in-kind redemptions, are disclosed as net realized gains or losses from investment transactions and foreign currency translations on the Statement of Operations.
Foreign Taxes:
The Fund may be subject to foreign taxes related to foreign income received (a portion of which may be reclaimable), capital gains on the sale of securities, and certain foreign currency transactions. All foreign taxes are recorded in accordance with the applicable regulations and rates that exist in the foreign jurisdictions in which the Fund invests.
Federal Income Taxes:
It is the Fund's policy to continue to qualify as a regulated investment company by complying with the provisions available to certain investment companies, as defined in applicable sections of the Internal Revenue Code, and to make distributions of net investment income and net realized gains sufficient to relieve it from all, or substantially all, federal income taxes. Accordingly, no provision for federal income taxes is required in the financial statements. The Fund has a tax year end of March 31.
Management of the Fund has reviewed tax positions taken in tax years that remain subject to examination by all major tax jurisdictions, including federal (i.e., the last four tax years, which includes the current fiscal tax year end). Management believes that there is no tax liability resulting from unrecognized tax benefits related to uncertain tax positions taken.
Allocations:
Expenses directly attributable to the Fund are charged to the Fund, while expenses that are attributable to more than one fund in the Trust, or jointly with an affiliated trust, are allocated among the respective funds in the Trust and/or affiliated trust based upon net assets or another appropriate basis.
3. Purchases and Sales:
Cost of purchases and proceeds from sales/maturities of securities (excluding securities maturing less than one year from acquisition) for the year ended March 31, 2021, were as follows for the Fund (amounts in thousands):
| Excluding U.S. Government Securities | U.S. Government Securities | ||||||||||||||
| Purchases | Sales | Purchases | Sales | ||||||||||||
| $ | 990,893 | $ | 1,071,056 | $ | — | $ | 18,035 | ||||||||
20
USAA Mutual Funds Trust | Notes to Financial Statements — continued March 31, 2021 | ||||||
4. Affiliated Fund Ownership:
The Fund offers its shares for investment by other USAA Mutual Funds. The fund-of-funds do not invest in the underlying funds for the purpose of exercising management or control, and the affiliated fund-of-funds' annual and semi annual reports may be viewed at vcm.com. As of March 31, 2021, certain fund-of-funds owned total outstanding shares of the Fund as follows:
Affiliated USAA Fund | Ownership % | ||||||
USAA Cornerstone Conservative Fund | 1.2 | % | |||||
USAA Cornerstone Equity Fund | 2.7 | % | |||||
USAA Target Retirement Income Fund | 8.0 | % | |||||
USAA Target Retirement 2030 Fund | 24.4 | % | |||||
USAA Target Retirement 2040 Fund | 36.3 | % | |||||
USAA Target Retirement 2050 Fund | 24.1 | % | |||||
USAA Target Retirement 2060 Fund | 3.3 | % | |||||
5. Fees and Transactions with Affiliates and Related Parties:
Investment Advisory Fees:
Investment advisory services are provided to the Fund by the Adviser, which is a New York corporation registered as an investment adviser with the SEC. The Adviser is a wholly-owned indirect subsidiary of Victory Capital Holdings, Inc., a publicly traded Delaware corporation, and a wholly-owned direct subsidiary of Victory Capital Operating, LLC.
Under the terms of the Investment Advisory Agreement, the Adviser is entitled to receive fees accrued daily and paid monthly at an annual rate of 0.50% of the Fund's average daily net assets. Amounts incurred and paid to VCM for the year ended March 31, 2021, are reflected on the Statement of Operations as Investment Advisory fees.
The Trust relies on an exemptive order granted to VCM and its affiliated funds by the SEC in March 2019 permitting the use of a "manager-of-managers" structure for certain funds. Under a manager-of-managers structure, the investment adviser may select (with approval of the Board and without shareholder approval) one or more subadvisers to manage the day-to-day investment of a fund's assets. For the year ended March 31, 2021, the Fund had no subadvisors.
Administration and Servicing Fees:
VCM serves as the Fund's administrator and fund accountant. Under the Fund Administration, Servicing and Accounting Agreement, VCM is paid for its services an annual fee at a rate of 0.05% of average daily net assets, of the Fund Shares. Amounts incurred for the year ended March 31, 2021, are reflected on the Statement of Operations as Administration fees.
The Fund (as part of the Trust) has entered into an agreement to provide compliance services with the Adviser, pursuant to which the Adviser furnishes its compliance personnel, including the services of the Chief Compliance Officer ("CCO"), and other resources reasonably necessary to provide the Trust with compliance oversight services related to the design, administration and oversight of a compliance program for the Trust in accordance with Rule 38a-1 under the 1940 Act. The CCO is an employee of the Adviser, which pays the compensation of the CCO and support staff. Funds in the Trust, Victory Variable Insurance Funds, Victory Portfolios, and Victory Portfolios II (collectively, the "Victory Funds Complex") in the aggregate, compensate the Adviser for these services. Amounts incurred for the year ended March 31, 2021, are reflected on the Statement of Operations as Compliance fees.
Citi Fund Services Ohio, Inc. ("Citi"), an affiliate of Citibank, acts as sub-administrator and sub-fund accountant to the Fund pursuant to a Sub-Administration and Sub-Fund Accounting Services Agreement between VCM and Citi. VCM pays Citi a fee for providing these services. The Trust reimburses VCM and Citi for out-of-pocket expenses incurred in providing these services and certain other expenses
21
USAA Mutual Funds Trust | Notes to Financial Statements — continued March 31, 2021 | ||||||
specifically allocated to the Fund. Amounts incurred for the year ended March 31, 2021, are reflected on the Statement of Operations as Sub-Administration fees.
Transfer Agency Fees:
Victory Capital Transfer Agency, Inc. ("VCTA"), an affiliate of the Adviser, provides transfer agency services to the Fund. Transfer agent's fees for the Fund are accrued daily and paid monthly at an annualized rate of 0.05% of average daily net assets, plus out-of-pocket expenses. Amounts incurred and paid to VCTA for year ended March 31, 2021, are reflected on the Statement of Operations as Transfer Agent fees.
FIS Investor Services LLC serves as sub-transfer agent and dividend disbursing agent for the Fund pursuant to a Sub-Transfer Agent Agreement between VCTA and FIS Investor Services LLC. VCTA provides FIS Investor Services LLC a fee for providing these services.
Distributor/Underwriting Services:
Victory Capital Services, Inc. (the "Distributor"), an affiliate of the Adviser, serves as distributor for the continuous offering of the shares of the Fund pursuant to a Distribution Agreement between the Distributor and the Trust and receives no fee or other compensation for these services. Effective June 30, 2020, the Distributor's name was changed from Victory Capital Advisers, Inc.
Other Fees:
Citibank serves as the Fund's custodian. The Fund pays Citibank a fee for providing these services. Amounts incurred for the year ended March 31, 2021, are reflected on the Statement of Operations as Custodian fees.
K&L Gates LLP provides legal services to the Trust.
The Adviser has entered into an expense limitation agreement with the Fund until at least June 30, 2023. Under the terms of the agreement, the Adviser has agreed to waive fees or reimburse certain expenses to the extent that ordinary operating expenses incurred in any fiscal year exceed the expense limit for the Fund. Such excess amounts will be the liability of the Adviser. Acquired fund fees and expenses, interest, taxes, brokerage commissions, other expenditures, which are capitalized in accordance with GAAP, and other extraordinary expenses not incurred in the ordinary course of the Fund's business are excluded from the expense limits. As of March 31, 2021, the expense limit (excluding voluntary waivers) was 0.65%.
Under the terms of the agreement, the Fund has agreed to repay fees and expenses that were waived or reimbursed by the Adviser for a period of up to three years after the fiscal year in which the waiver or reimbursement took place, subject to the lesser of any operating expense limits in effect at the time of: (a) the original waiver or expense reimbursement; or (b) the recoupment, after giving effect to the recoupment amount. As of March 31, 2021, there are no amounts available to be repaid to the Adviser.
The Adviser may voluntarily waive or reimburse additional fees to assist the Fund in maintaining competitive expense ratios. Voluntary waivers and reimbursements applicable to the Fund are not available to be recouped at a future time. There were no voluntary waivers or reimbursements for the year ended March 31, 2021.
Certain officers and/or interested trustees of the Fund are also officers and/or employees of the Adviser, administrator, sub-administrator, sub-fund accountant, custodian, and Distributor.
6. Risks:
The Fund may be subject to other risks in addition to these identified risks.
Geopolitical/Natural Disaster Risk — Global economies and financial markets are increasingly interconnected, which increases the possibilities that conditions in one country or region might adversely
22
USAA Mutual Funds Trust | Notes to Financial Statements — continued March 31, 2021 | ||||||
affect issuers in another country or region. Geopolitical and other risks, including war, terrorism, trade disputes, political or economic dysfunction within some nations, public health crises and related geopolitical events, as well as environmental disasters such as earthquakes, fires, and floods, may add to instability in world economies and markets generally. Changes in trade policies and international trade agreements could affect the economies of many countries in unpredictable ways. Likewise, systemic market dislocations of the kind that occurred during the financial crisis that began in 2008, if repeated, would be highly disruptive to economies and markets, adversely affecting individual companies and industries, securities markets, interest rates, credit ratings, inflation, investor sentiment, and other factors affecting the value of a Fund's investments. Some countries, including the United States, are adopting more protectionist trade policies and moving away from the tighter financial industry regulations that followed the 2008 financial crisis, which may also affect the value of a Fund's investments.
Political events within the United States at times have resulted, and may in the future result, in a shutdown of government services, which could negatively affect the U.S. economy, decrease the value of a Fund's investments, increase uncertainty in or impair the operation of the U.S. or other securities markets and degrade investor and consumer confidence, perhaps suddenly and to a significant degree.
An outbreak of disease called COVID-19 has spread internationally. The transmission of COVID-19 and efforts to contain its spread have resulted in international, national and local border closings and other significant travel restrictions and disruptions, significant disruptions to business operations, supply chains and consumer activity, significant challenges in healthcare service preparation and delivery, quarantines and general concern and uncertainty. These negative impacts have caused significant volatility and declines in global financial markets, which have caused losses for Fund investors during and subsequent to period end. The impact of the COVID-19 pandemic may last for an extended period of time, and could result in a substantial economic downturn or recession. Public health crises may exacerbate other pre-existing political, social, economic, market and financial risks. The extent of the impact to the financial performance of the Fund's investments will depend on future developments, including (i) the duration and spread of the outbreak, (ii) the restrictions and advisories, (iii) the effects on the financial markets, and (iv) the effects on the economy overall, all of which are highly uncertain and cannot be predicted.
Portfolio Reallocation Risk — The Frequent changes in the allocation of the Fund's portfolio holdings portfolio holdings may result in higher portfolio turnover. In purchasing and selling securities in order to reallocate the portfolio, the Fund will pay more brokerage commissions than it would without a reallocation policy. In addition, the Fund may have a higher proportion of capital gains and a potentially lower return than a fund that does not reallocate from time to time.
ETF Risk — ETFs, which generally are registered investment companies, incur their own management and other fees and expenses, such as trustees' fees, operating expenses, registration fees, and marketing expenses, a proportionate share of which will be borne indirectly by the Fund as a shareholder in an ETF. As a result, the Fund's investment in an ETF will cause the Fund to indirectly bear the fees and expenses of the ETF and, in turn, the Fund's performance may be lower than if the Fund were to invest directly in the underlying securities held by the ETF. For investments in affiliated ETFs, the Fund's management fee is reimbursed by the Adviser to the extent of the indirect management fee incurred through the Fund's investment in the affiliated ETFs. The Adviser may have conflicts of interest in allocating assets among affiliated and unaffiliated ETFs, because the Adviser also manages and administers the affiliated ETFs, and the Adviser and its affiliates receive other fees from the affiliated ETFs. In addition, the Fund also will be subject to the risks associated with the securities or other investments held by the ETFs.
Debt Securities Risk — The value of a debt security or other income-producing security changes in response to various factors, including, for example, market-related factors (such as changes in interest rates or changes in the risk appetite of investors generally) and changes in the actual or perceived ability of the issuer (or of issuers generally) to meet its (or their) obligations.
23
USAA Mutual Funds Trust | Notes to Financial Statements — continued March 31, 2021 | ||||||
Other factors that may affect the value of debt securities, include, among others, public health crises and responses by governments and companies to such crises. These and other events may affect the creditworthiness of the issuer of a debt security and may impair an issuers ability to timely meet its debt obligations as they come due.
LIBOR Discontinuation Risk — Many debt securities, derivatives and other financial instruments, including some of the Fund's investments, use the London Interbank Offered Rate ("LIBOR") as the reference or benchmark rate for variable interest rate calculations. In June 2017, the Alternative Reference Rates Committee, a group of large U.S. banks working with the Federal Reserve, announced its selection of a new Secured Overnight Funding Rate ("SOFR"), which is intended to be a broad measure of secured overnight U.S. Treasury repo rates, as an appropriate replacement for LIBOR. The Federal Reserve Bank of New York began publishing the SOFR in 2018, expecting that it could be used on a voluntary basis in new instruments and transactions. Bank working groups and regulators in other countries have suggested other alternatives for their markets, including the Sterling Overnight Interbank Average Rate ("SONIA") in England. In July 2017, the Financial Conduct Authority (the "FCA"), the United Kingdom financial regulatory body, announced that after 2021, it will cease its active encouragement of UK banks to provide the quotations needed to sustain LIBOR. That announcement suggests that LIBOR may cease to be published after that time. For U.S. dollar LIBOR, however, the relevant date may be deferred to June 30, 2023, for the most common tenors (overnight and one, three, six and 12 months). As to those tenors, the LIBOR administrator has published a consultation regarding its intention to cease publication of U.S. dollar LIBOR as of June 30, 2023, (instead of December 31, 2021, as previously expected), apparently based on continued rate submissions from banks. It is expected that there will be enough time for market participants to transition to the use of a different benchmark for both new and existing securities and transactions. Various financial industry groups have begun planning for that transition, but there are obstacles to converting certain longer-term securities and transactions to a new benchmark. Transition planning is at an early stage, and neither the effect of the transition process nor its ultimate success can yet be known. Although the foregoing may provide some sense of timing, there is no assurance that LIBOR, or any particular currency and tenor, will continue to be published until any particular date, and it appears highly likely that LIBOR will be discontinued or modified after December 31, 2021, or June 30, 2023, depending on the currency and tenor. The transition process might lead to increased volatility and illiquidity in markets that currently rely on the LIBOR to determine interest rates. It could also lead to a reduction in the value of some LIBOR-based investments and reduce the effectiveness of new hedges placed against existing LIBOR-based instruments. Since the usefulness of LIBOR as a benchmark could deteriorate during the transition period, these effects could occur before the end of 2021.
7. Borrowing and Interfund Lending:
Line of Credit:
For the year ended March 31, 2021, the Victory Funds Complex participated in a short-term demand note "Line of Credit" agreement with Citibank. The Line of Credit agreement with Citibank was renewed on June 29, 2020, with a termination date of June 28, 2021. Under the agreement with Citibank, the Victory Funds Complex may borrow up to $600 million, of which $300 million is committed and $300 million is uncommitted. $40 million of the Line of Credit is reserved for use by the Victory Floating Rate Fund, another series of the Victory Funds Complex, with Victory Floating Rate Fund paying the related commitment fees for that amount. The purpose of the agreement is to meet temporary or emergency cash needs. For the year ended March 31, 2021, Citibank received an annual commitment fee of 0.15% on $300 million for providing the Line of Credit. Each fund in the Victory Funds Complex paid a pro-rata portion of the commitment fees plus any interest (one month LIBOR plus one percent) on amounts borrowed. Effective June 29, 2020, under an amended Line of Credit agreement, Citibank also received an annual upfront fee of 0.10% on the $300 million committed line of credit. Each fund in the Victory Funds Complex paid a pro-rata portion of the upfront fee. Interest charged to each Fund during the period, if applicable, is reflected on the Statement of Operations under Line of credit fees.
24
USAA Mutual Funds Trust | Notes to Financial Statements — continued March 31, 2021 | ||||||
The Fund had no borrowings under the Line of Credit agreement during the year ended March 31, 2021.
Interfund Lending:
The Trust and Adviser rely on an exemptive order granted by the SEC in March 2017 (the "Order"), permitting the establishment and operation of an Interfund Lending Facility (the "Facility"). The Facility allows the Fund to directly lend and borrow money to or from any other Fund, that is permitted to participate in the Facility, in the Victory Funds Complex relying upon the Order at rates beneficial to both the borrowing and lending funds. Advances under the Facility are allowed for temporary or emergency purposes, including the meeting of redemption requests that otherwise might require the untimely disposition of securities, and are subject to each Fund's borrowing restrictions. The interfund loan rate is determined, as specified in the Order, by averaging the current repurchase agreement rate and the current bank loan rate. As a Borrower, interest charged to the Fund, if any, during the period is reflected on the Statement of Operations under Interfund lending fees. As a Lender, interest earned by the Fund, if any, during the period is presented on the Statement of Operations under Interfund lending.
The average borrowing or lending for the days outstanding and average interest rate for the Fund during the year ended March 31, 2021, were as follows (amounts in thousands):
| Borrower or Lender | Amount Outstanding at March 31, 2021 | Average Borrowing* | Days Borrowing Outstanding | Average Interest Rate* | Maximum Borrowing During the Period | ||||||||||||||||||
| Borrower | $ | — | $ | 9,368 | 4 | 0.58 | % | $ | 15,457 | ||||||||||||||
* For the year ended March 31, 2021, based on the number of days borrowings were outstanding.
8. Federal Income Tax Information:
The Fund intends to distribute any net investment income annually. Distributable net realized gains, if any, are declared and paid at least annually.
The amounts of dividends from net investment income and distributions from net realized gains (collectively distributions to shareholders) are determined in accordance with federal income tax regulations, which may differ from GAAP. To the extent these "book/tax" differences are permanent in nature (e.g., net operating loss and distribution reclassification), such amounts are reclassified within the components of net assets based on their federal tax-basis treatment; temporary differences (e.g., wash sales) do not require reclassification. To the extent dividends and distributions exceed net investment income and net realized gains for tax purposes, they are reported as distributions of capital. Net investment losses incurred by the Fund may be reclassified as an offset to capital on the accompanying Statement of Assets and Liabilities.
As of March 31, 2021, on the Statement of Assets and Liabilities, there were no permanent book-to-tax difference reclassification adjustments.
The tax character of distributions paid during the tax years ended as noted below, were as follows (total distributions paid may differ from the Statements of Changes in Net Assets because, for tax purposes, dividends are recognized when actually paid) (amounts in thousands).
Year Ended March 31, 2021 | Year Ended March 31, 2020 | ||||||||||||||||||||||||||
Distributions Paid from | Distributions Paid from | ||||||||||||||||||||||||||
| Ordinary Income | Net Long-Term Capital Gains | Total Distributions Paid | Ordinary Income | Net Long-Term Capital Gains | Total Distributions Paid | ||||||||||||||||||||||
$ | 22,170 | $ | 8,577 | $ | 30,747 | $ | 24,166 | $ | 1,771 | $ | 25,937 | ||||||||||||||||
25
USAA Mutual Funds Trust | Notes to Financial Statements — continued March 31, 2021 | ||||||
As of March 31, 2021, the components of accumulated earnings (loss) on a tax basis were as follows (amounts in thousands):
| Undistributed Ordinary Income | Undistributed Long-Term Capital Gains | Accumulated Earnings | Unrealized Appreciation (Depreciation)* | Total Accumulated Earnings (Loss) | |||||||||||||||
| $ | 17,936 | $ | 33,295 | $ | 51,231 | $ | 61,522 | $ | 112,753 | ||||||||||
* The difference between the book-basis and tax-basis of unrealized appreciation/depreciation is attributable to the tax deferral of losses on wash sales.
As of March 31, 2021, the Fund had no capital loss carryforwards, for federal income tax purposes.
As of March 31, 2021, the cost basis for federal income tax purposes, gross unrealized appreciation, gross unrealized depreciation, and net unrealized appreciation (depreciation) for investments were as follows (amounts in thousands):
| Cost of Investments for Federal Tax Purposes | Gross Unrealized Appreciation | Gross Unrealized Depreciation | Net Unrealized Appreciation (Depreciation) | ||||||||||||
| $ | 526,305 | $ | 62,638 | $ | (1,116 | ) | $ | 61,522 | |||||||
26
REPORT OF INDEPENDENT REGISTERED PUBLIC ACCOUNTING FIRM
To the Shareholders and the Board of Trustees of USAA Target Managed Allocation Fund
Opinion on the Financial Statements
We have audited the accompanying statement of assets and liabilities of USAA Target Managed Allocation Fund (the "Fund") (one of the funds constituting USAA Mutual Funds Trust (the "Trust")), including the schedule of portfolio investments, as of March 31, 2021, and the related statement of operations for the year then ended, the statements of changes in net assets for each of the two years in the period then ended, the financial highlights for each of the five years in the period then ended and the related notes (collectively referred to as the "financial statements"). In our opinion, the financial statements present fairly, in all material respects, the financial position of the Fund at March 31, 2021, the results of its operations for the year then ended, the changes in its net assets for each of the two years in the period then ended and its financial highlights for each of the five years in the period then ended, in conformity with U.S. generally accepted accounting principles.
Basis for Opinion
These financial statements are the responsibility of the Trust's management. Our responsibility is to express an opinion on the Fund's financial statements based on our audits. We are a public accounting firm registered with the Public Company Accounting Oversight Board (United States) ("PCAOB") and are required to be independent with respect to the Trust in accordance with the U.S. federal securities laws and the applicable rules and regulations of the Securities and Exchange Commission and the PCAOB.
We conducted our audits in accordance with the standards of the PCAOB. Those standards require that we plan and perform the audit to obtain reasonable assurance about whether the financial statements are free of material misstatement, whether due to error or fraud. The Trust is not required to have, nor were we engaged to perform, an audit of the Trust's internal control over financial reporting. As part of our audits we are required to obtain an understanding of internal control over financial reporting, but not for the purpose of expressing an opinion on the effectiveness of the Trust's internal control over financial reporting. Accordingly, we express no such opinion.
Our audits included performing procedures to assess the risks of material misstatement of the financial statements, whether due to error or fraud, and performing procedures that respond to those risks. Such procedures included examining, on a test basis, evidence regarding the amounts and disclosures in the financial statements. Our procedures included confirmation of securities owned as of March 31, 2021, by correspondence with the custodian and brokers or by other appropriate auditing procedures where replies from brokers were not received. Our audits also included evaluating the accounting principles used and significant estimates made by management, as well as evaluating the overall presentation of the financial statements. We believe that our audits provide a reasonable basis for our opinion.

We have served as the auditor of one or more Victory Capital investment companies since 1995.
San Antonio, Texas
May 26, 2021
27
USAA Mutual Funds Trust | Supplemental Information March 31, 2021 | ||||||
(Unaudited)
Trustee and Officer Information
Board of Trustees:
Overall responsibility for management of the Trust rests with the Board. The Trust is managed by the Board in accordance with the laws of the state of Delaware. There are currently nine Trustees, seven of whom are not "interested persons" of the Trust within the meaning of that term under the 1940 Act ("Independent Trustees") and two of whom is an "interested person" of the Trust within the meaning of that term under the 1940 Act ("Interested Trustee"). The Trustees, in turn, elect the officers of the Trust to actively supervise its day-to-day operations.
The following tables list the Trustees, their ages, position with the Trust, commencement of service, principal occupations during the past five years and any directorships of other investment companies or companies whose securities are registered under the Securities Exchange Act of 1934, as amended, or who file reports under that Act. Each Trustee oversees 46 portfolios in the Trust. Each Trustee's address is 15935 La Cantera Pkwy, San Antonio, TX, 78256. Pursuant to a policy adopted by the Board, the term of office for each Trustee shall be until the Independent Trustee reaches age 75 or an Interested Trustee reaches age 75. The Board may change or grant exceptions from this policy at any time without shareholder approval. A Trustee may resign or be removed by a vote of the other Trustees or the holders of a majority of the outstanding shares of the Trust at any time. Vacancies on the Board can be filled by the action of a majority of the Trustees, provided that after filling such vacancy at least two-thirds of the Trustees have been elected by the shareholders.
Name and Date of Birth | Position Held with the Trust | Year Commenced Service | Principal Occupation During Past 5 Years | Other Directorships Held During Past 5 Years | |||||||||||||||
Independent Trustees. | |||||||||||||||||||
| Jefferson C. Boyce, (c) Born September 1957 | Independent Chairman | 2021 | Senior Managing Director, New York Life Investments, LLC (1992-2012) | Westhab, Inc. | |||||||||||||||
| John C. Walters, Born February 1962 | Trustee | 2019 | Retired. Mr. Walters brings significant Board experience including active involvement with the board of a Fortune 500 company, and a proven record of leading large, complex financial organizations. He has a demonstrated record of success in distribution, manufacturing, investment brokerage, and investment management in both the retail and institutional investment businesses. He has substantial experience in the investment management business with a demonstrated ability to develop and drive strategy while managing operation, financial, and investment risk. | Guardian Variable Products Trust (16 series), Lead Independent Director; Amerilife Holdings LLC, Director; Stadion Money Management; Director; University of North Carolina (Chapel Hill), Member Board of Governors | |||||||||||||||
28
USAA Mutual Funds Trust | Supplemental Information — continued March 31, 2021 | ||||||
(Unaudited)
Name and Date of Birth | Position Held with the Trust | Year Commenced Service | Principal Occupation During Past 5 Years | Other Directorships Held During Past 5 Years | |||||||||||||||
| Robert L. Mason, Ph.D., Born July 1946 | Trustee | 1997 | Adjunct Professor in the Department of Management Science and Statistics in the College of Business at the University of Texas at San Antonio (since 2001); Institute Analyst, Southwest Research Institute (March 2002-January 2016) | None | |||||||||||||||
| Dawn M. Hawley, Born February 1954 | Trustee | 2014 | Manager of Finance, Menil Foundation, Inc. (May 2007-June 2011), which is a private foundation that oversees the assemblage of sculptures, prints, drawings, photographs, and rare books. Director of Financial Planning and Analysis and Chief Financial Officer, AIM Management Group, Inc. (October 1987-January 2006) | None | |||||||||||||||
| Paul L. McNamara, Born July 1948 | Trustee | 2012 | Director, Cantor Opportunistic Alternatives Fund, LLC (March 2010-February 2014), which is a closed-end fund of funds by Cantor Fitzgerald Investment Advisors, LLC | None | |||||||||||||||
29
USAA Mutual Funds Trust | Supplemental Information — continued March 31, 2021 | ||||||
(Unaudited)
Name and Date of Birth | Position Held with the Trust | Year Commenced Service | Principal Occupation During Past 5 Years | Other Directorships Held During Past 5 Years | |||||||||||||||
| Richard Y. Newton III, Born January 1956 | Trustee | 2017 | Director, Elta North America (01/18-present), which is a global leader in the design, manufacture, and support of innovative electronic systems in the ground, maritime, airborne, and security domains for the nation's warfighters, security personnel, and first responders; Managing Partner, Pioneer Partnership Development Group (December 2015-present)); Executive Director, The Union League Club of New York (June 2014-November 2015): Executive Vice President, Air Force Association (August 2012-May 2014); Lieutenant General, United States Air Force (January 2008-June 2012) | PredaSAR Corp. | |||||||||||||||
| Barbara B. Ostdiek, Ph.D., Born March 1964 | Trustee | 2008 | Senior Associate Dean of Degree Programs at Jesse H. Jones Graduate School of Business at Rice University (since 2013); Associate Professor of Finance at Jessie H. Jones Graduate School of Business at Rice University (since 2001) | None | |||||||||||||||
| Michael F. Reimherr, (a) Born August 1945 | Trustee | 2000 | President of Reimherr Business Consulting (May 1995-December 2017); St. Mary's University Investment Committee overseeing University Endowment (since 2014) | None | |||||||||||||||
(a) Effective at the close of business on December 31, 2020, Michael F. Reimherr retired from the Board of Trustees.
30
USAA Mutual Funds Trust | Supplemental Information — continued March 31, 2021 | ||||||
(Unaudited)
Name and Date of Birth | Position Held with the Trust | Year Commenced Service | Principal Occupation During Past 5 Years | Other Directorships Held During Past 5 Years | |||||||||||||||
Interested Trustees. | |||||||||||||||||||
| David C. Brown, (b) Born May 1972 | Trustee | 2019 | Chairman and Chief Executive Officer (since 2013), Victory Capital Management Inc.; Chairman and Chief Executive Officer, Victory Capital Holdings, Inc. (since 2013). Mr. Brown brings to the Board extensive business, finance and leadership skills gained and developed through years of experience in the financial services industry, including his tenure overseeing the strategic direction as CEO of Victory Capital. These skills, combined with Mr. Brown's extensive knowledge of the financial services industry and demonstrated success in the development and distribution of investment strategies and products, enable him to provide valuable insights to the Board and strategic direction for the Funds. | Trustee, Victory Portfolios (41 series), Victory Portfolios II (26 series), Victory Variable Insurance Funds (8 series) | |||||||||||||||
31
USAA Mutual Funds Trust | Supplemental Information — continued March 31, 2021 | ||||||
(Unaudited)
Name and Date of Birth | Position Held with the Trust | Year Commenced Service | Principal Occupation During Past 5 Years | Other Directorships Held During Past 5 Years | |||||||||||||||
| Daniel S. McNamara, (b)(c) Born June 1966 | Trustee | 2012 | Trustee, President, and Vice Chairman of USAA ETF Trust (June 2017-June 2019); President of Financial Advice & Solutions Group (FASG), USAA (February 2013-March 2021); Director, Investment Director of USAA Investment Services Company (ISCO) (formerly USAA Investment Management) (September 2009-March 2021); President, Asset Management Company (AMCO) (August, 2011-June 2019); Senior Vice President of USAA Financial Planning Services Insurance Agency, Inc. (FPS) (April 2011-March 2021) Chairman of Board of ISCO (April 2013-December 2020); Director of AMCO (August 2011-June 2019); President and Director of USAA Shareholder Account Services (SAS) (October 2009-June 2019); Director and Vice Chairman of FPS (December 2013-March 2021); President and Director of USAA Investment Corporation (ICORP) ((March 2010-March 2021)); Chairman of Board of ICORP (December 2013-March 2021); Director of USAA Financial Advisors, Inc. (FAI) (December 2013-March 2021); Chairman of Board of FAI (March 2015-March 2021). Mr. McNamara brings to the Board extensive experience in the financial services industry, including experience as an officer of the Trust. | None | |||||||||||||||
(b) Mr. Dan McNamara, the Chairman of the Board, is deemed an "interested person" due to his previous position as Director of AMCO, the former investment adviser of the Funds. Mr. Brown is deemed an "interested person" due to his position as Chief Executive Officer of Victory Capital, investment adviser to the Funds.
(c) Effective at the close of business on December 31, 2020, Jefferson C. Boyce replaced Dan McNamara as Chair of the Board and assumed the title of Independent Chair.
The Statement of Additional Information includes additional information about the Trustees of the Trust and is available, without charge, on the SEC's website at www.sec.gov and/or by calling (800)-235-8396.
32
USAA Mutual Funds Trust | Supplemental Information — continued March 31, 2021 | ||||||
(Unaudited)
Officers:
The officers of the Trust, their ages, commencement of service and their principal occupations during the past five years, are detailed in the following table. Each officer serves until the earlier of his or her resignation, removal, retirement, death, or the election of a successor. The mailing address of each officer of the Trust is 15935 La Cantera Pkwy, San Antonio, TX, 78256. The officers of the Trust receive no compensation directly from the Trust for performing the duties of their offices.
Name and Date of Birth | Position with the Trust | Year Commenced Service | Principal Occupation During Past 5 Years | ||||||||||||
Interested Officers.
| Christopher K. Dyer, Born February 1962 | President | 2019 | Director of Fund Administration, Victory Capital (since 2004); Chief Operating Officer, Victory Capital Services, Inc. (since 2020) | ||||||||||||
| Scott A Stahorsky, Born July 1969 | Vice President | 2019 | Manager, Fund Administration, Victory Capital (since 2015) | ||||||||||||
| James K. De Vries, Born April 1969 | Treasurer | 2018 | Executive Director, Victory Capital Management Inc. (since 2019); Treasurer, USAA ETF Trust (September 2018-June 2019); Executive Director, Investment and Financial Administration, USAA (April 2012-June 2019); Assistant Treasurer, USAA ETF Trust (June 2017-September 2018); Assistant Treasurer, USAA Mutual Funds Trust (December 2013-February 2018) | ||||||||||||
| Allan Shaer, Born March 1965 | Assistant Treasurer | 2019 | Senior Vice President, Financial Administration, Citi Fund Services Ohio, Inc. (since 2016); Vice President, Mutual Fund Administration, JP Morgan Chase (2011-2016) | ||||||||||||
| Carol D. Trevino, Born October 1965 | Assistant Treasurer | 2018 | Director, Accounting and Finance, Victory Capital Management Inc. (since 2019); Accounting/Financial Director, USAA (December 2013-June 2019); Assistant Treasurer, USAA ETF Trust (September 2018-June 2019) | ||||||||||||
| Erin G. Wagner, Born February 1974 | Secretary | 2019 | Deputy General Counsel, the Adviser (since 2013) | ||||||||||||
| Charles Booth, Born April 1960 | Anti-Money Laundering Compliance Officer and Identity Theft Officer | 2019 | Director, Regulatory Administration and CCO Support Services, Citi Fund Services Ohio, Inc. (since 2007) | ||||||||||||
| Amy Campos, Born July 1976 | Chief Compliance Officer | 2019 | Chief Compliance Officer, USAA Mutual Funds Trust (since 2019); Executive Director, Deputy Chief Compliance Officer, USAA Mutual Funds Trust and USAA ETF Trust (July 2017-June 2019); Compliance Director, USAA Mutual Funds Trust (2014-July 2017) | ||||||||||||
33
USAA Mutual Funds Trust | Supplemental Information — continued March 31, 2021 | ||||||
(Unaudited)
Proxy Voting and Portfolio Holdings Information
Proxy Voting:
Information regarding the policies and procedures the Fund uses to determine how to vote proxies relating to portfolio securities is available without charge, upon request, by calling (800) 235-8396. The information is also included in the Fund's Statement of Additional Information, which is available on the SEC's website at www.sec.gov.
Information relating to how the Fund voted proxies relating to portfolio securities held during the most recent 12 months ended June 30 is available on the SEC's website at www.sec.gov.
Availability of Schedules of Portfolio Investments:
The Trust files a complete list of Schedules of Portfolio Investments with the SEC for the first and third quarter of each fiscal year on Form N-PORT. Form N-PORT is available on the SEC's website at www.sec.gov.
Expense Example
As a shareholder of the Fund, you may incur two types of costs: (1) transaction costs, and (2) ongoing costs, including management fees and other Fund expenses. These examples are intended to help you understand your ongoing costs (in dollars) of investing in the Fund and to compare these costs with the ongoing costs of investing in other mutual funds.
These examples are based on an investment of $1,000 invested at the beginning of the period and held for the entire period from October 1, 2020 through March 31, 2021.
The Actual Expense figures in the table below provide information about actual account values and actual expenses. You may use the information below, together with the amount you invested, to estimate the expenses that you paid over the period. Simply divide your account value by $1,000 (for example, an $8,600 account value divided by $1,000 = 8.6), then multiply the result by the number in the table under the heading entitled "Actual Expenses Paid During Period" to estimate the expenses you paid on your account during this period.
The Hypothetical Expense figures in the table below provide information about hypothetical account values and hypothetical expenses based on the Fund's actual expense ratio and an assumed rate of return of 5% per year before expenses, which is not the Fund's actual return. The hypothetical account values and expenses may not be used to estimate the actual ending account balance or expenses you paid for the period. You may use this information to compare this 5% hypothetical example with the 5% hypothetical examples that appear in shareholder reports of other funds.
Please note the expenses shown in the table below are meant to highlight your ongoing costs only and do not reflect any transactional costs. If these transactional costs were included, your costs would have been higher.
| Beginning Account Value 10/1/20 | Actual Ending Account Value 3/31/21 | Hypothetical Ending Account Value 3/31/21 | Actual Expenses Paid During Period 10/1/20- 3/31/21* | Hypothetical Expenses Paid During Period 10/1/20- 3/31/21* | Annualized Expense Ratio During Period 10/1/20- 3/31/21 | ||||||||||||||||||
| $ | 1,000.00 | $ | 1,166.00 | $ | 1,021.74 | $ | 3.46 | $ | 3.23 | 0.64 | % | ||||||||||||
* Expenses are equal to the average account value multiplied by the Fund's annualized expense ratio multiplied by 182/365 (the number of days in the most recent fiscal half-year divided by the number of days in the fiscal year).
34
USAA Mutual Funds Trust | Supplemental Information — continued March 31, 2021 | ||||||
(Unaudited)
Additional Federal Income Tax Information
The following federal tax information related to the Fund's fiscal year ended March 31, 2021, is provided for information purposes only and should not be used for reporting to federal or state revenue agencies. Federal tax information for the calendar year will be reported to you on Form 1099-DIV in January 2022.
With respect to distributions paid, the Fund designates the following amounts (or, if subsequently determined to be different, the maximum amount allowable) for the fiscal year ended March 31, 2021 (amounts in thousands):
| Short-Term Capital Gain Distributions | Long-Term Capital Gain Distributions | ||||||||||
$ | 18,212 | $ | 8,577 | ||||||||
35
USAA Mutual Funds Trust | Supplemental Information — continued March 31, 2021 | ||||||
(Unaudited)
Considerations of the Board in Continuing the Investment Advisory Agreement
USAA Target Managed Allocation Fund (the "Fund")
At a meeting of the Board of Trustees (the "Board") held on December 10-11, 2020, the Board, including the Trustees who are not "interested persons" (as that term is defined in the Investment Company Act of 1940, as amended) of the Trust (the "Independent Trustees"), approved for an annual period the continuance of the Investment Advisory Agreement (the "Advisory Agreement") between the Trust and Victory Capital Management Inc. (the "Adviser") with respect to the Fund. Prior to the December 10-11, 2020, meeting, at which the Advisory Agreement was approved, the Independent Trustees also discussed and considered information regarding the proposed continuation of the Advisory Agreement at a meeting held on November 19, 2020.
In advance of the foregoing meetings, the Trustees received and considered a variety of information relating to the Advisory Agreement and the Adviser, and were given the opportunity to ask questions and request additional information from management. The information provided to the Board included, among other things: (i) a separate report prepared by an independent third party of mutual fund data, which provided a statistical analysis comparing the Fund's investment performance, expenses, and fees to comparable investment companies; (ii) information concerning the services rendered to the Fund, as well as information regarding the Adviser's revenues and costs of providing services to the Fund and compensation paid to affiliates of the Adviser; and (iii) information about the Adviser's operations and personnel. Prior to voting, the Independent Trustees reviewed the proposed continuance of the Advisory Agreement with management and with experienced independent counsel retained by the Independent Trustees ("Independent Counsel") and received materials from such Independent Counsel discussing the legal standards for their consideration of the proposed continuation of the Advisory Agreement with respect to the Fund. The Independent Trustees also reviewed the proposed continuation of the Advisory Agreement with respect to the Fund in private sessions with Independent Counsel at which no representatives of management were present.
At each regularly scheduled meeting of the Board and its committees, the Board receives and reviews, among other things, information concerning the Fund's performance and related services provided by the Adviser. At the meeting at which the renewal of the Advisory Agreement is considered, particular focus is given to information concerning Fund performance, fees and total expenses as compared to comparable investment companies, and the Adviser's profitability with respect to the Fund. However, the Board noted that the evaluation process with respect to the Adviser is an ongoing one. In this regard, the Board's and its committees' consideration of the Advisory Agreement included information previously received at such meetings.
Advisory Agreement
After full consideration of a variety of factors, the Board, including the Independent Trustees, voted to approve the Advisory Agreement. In approving the Advisory Agreement, the Trustees did not identify any single factor as controlling, and each Trustee may have attributed different weights to various factors. Throughout their deliberations, the Independent Trustees were represented and assisted by Independent Counsel.
Nature, Extent, and Quality of Services — In considering the nature, extent, and quality of the services provided by the Adviser under the Advisory Agreement, the Board reviewed information provided by the Adviser relating to its operations and personnel. The Board also took into account its knowledge of the Adviser's management and the quality of the performance of the Adviser's duties through Board meetings, discussions, and reports during the preceding year. The Board considered the fees paid to the Adviser and the services provided to the Fund by the Adviser under the Advisory Agreement, as well as other services provided by the Adviser and its affiliates under other agreements, and the personnel who provide these services. In addition to the investment advisory services provided to the Fund, the Adviser and its affiliates provide administrative services, shareholder services, oversight of
36
USAA Mutual Funds Trust | Supplemental Information — continued March 31, 2021 | ||||||
(Unaudited)
Fund accounting, marketing services, assistance in meeting legal and regulatory requirements, and other services necessary for the operation of the Fund and the Trust.
The Board considered the scope of services provided by, and the undertakings required of, the Adviser in connection with those services, including, among other things, maintaining (i) its own and the Fund's compliance programs, (ii) risk management programs, (iii) liquidity risk management programs, and (iv) cybersecurity programs, each of which had expanded over time as a result of regulatory, market, and other developments. The Board also considered the significant risks assumed by the Adviser in connection with the services provided to the Fund, including investment, operational, enterprise, litigation, regulatory and compliance risks.
The Board considered the Adviser's management style and the performance of the Adviser's duties under the Advisory Agreement. The Board considered the level and depth of knowledge of the Adviser, including the professional experience and qualifications of its senior and investment personnel, as well as current staffing levels. The allocation of the Fund's brokerage, including the Adviser's process for monitoring "best execution," also was considered. The Adviser's role in coordinating the activities of the Fund's other service providers was also considered. The Board also considered the Adviser's risk management processes. The Board considered the Adviser's financial condition and that it had the financial wherewithal to continue to provide the same scope and high quality of services under the Advisory Agreement. In reviewing the Advisory Agreement, the Board focused on the experience, resources, and strengths of the Adviser and its affiliates in managing the Fund, as well as the other funds in the Trust.
The Board also reviewed the compliance and administrative services provided to the Fund by the Adviser and its affiliates, including the Adviser's oversight of the Fund's day-to-day operations and oversight of Fund accounting. The Trustees, guided also by information obtained from their experiences as trustees of the Trust, also focused on the quality of the Adviser's compliance and administrative staff.
Expenses and Performance — In connection with its consideration of the Advisory Agreement, the Board evaluated the Fund's advisory fees and total expense ratio as compared to other open-end investment companies deemed to be comparable to the Fund as determined by the independent third party in its report. The Fund's expenses were compared to (i) a group of investment companies chosen by the independent third party to be comparable to the Fund based upon certain factors, including fund type, comparability of investment objective and classification, sales load type, asset size, and expense components (the "expense group") and (ii) a larger group of investment companies with the same investment classification/objective as the Fund regardless of asset size, excluding outliers (the "expense universe"). Among other data, the Board noted that the Fund's management fee rate—which includes advisory and administrative services, as well as any fee waivers and reimbursements—was above the medians of its expense group and expense universe. The data indicated that the Fund's total expenses, including after any reimbursements, were below the medians of its expense group and expense universe. The Board also took into account the Adviser's current undertakings to maintain expense limitations for the Fund. The Board took into account the various other services provided to the Fund by the Adviser and its affiliates, and noted the high quality of services received by the Fund.
In considering the Fund's performance, the Board noted that it reviews at its regularly scheduled meetings information about the Fund's performance results. The Trustees also reviewed various comparative data provided to them in connection with their consideration of the renewal of the Advisory Agreement, including, among other information, a comparison of the Fund's average annual total returns relative to its Lipper index and other mutual funds deemed to be in its peer group by the independent third party in its report (the "performance universe"). The Fund's performance universe consisted of the Fund and all retail and institutional open-end investment companies with the same classification/objective as the Fund regardless of asset size or primary channel of distribution. This comparison indicated that, among other data, the Fund's performance was above the average of its performance universe and its Lipper index for the one- and three-year periods ended September 30, 2020, and was above the average of its performance universe and below its Lipper index for the five-year period ended September 30, 2020.
37
USAA Mutual Funds Trust | Supplemental Information — continued March 31, 2021 | ||||||
(Unaudited)
Compensation and Profitability — The Board took into consideration the level and method of computing the management fee. The information considered by the Board included operating profit margin information for the Adviser's business as a whole. The Board also received and considered profitability information related to the management revenues from the Fund. This information included a review of the methodology used in the allocation of certain costs to the Fund. In considering the profitability data with respect to the Fund, the Trustees noted that the Adviser waived a portion of its management fees and/or reimbursed certain expenses with respect to the Fund. The Trustees reviewed the profitability of the Adviser's relationship with the Fund before tax expenses. The Board was also provided with a profitability analysis of other publicly traded asset managers prepared by an independent information service. In reviewing the overall profitability of the management fee to the Adviser, the Board also considered the fact that the Adviser and its affiliates provide shareholder servicing and administrative services to the Fund for which they receive compensation. The Board also considered the possible direct and indirect benefits to the Adviser from its relationship with the Trust, including that the Adviser may derive reputational and other benefits from its association with the Fund. The Trustees recognized that the Adviser should be entitled to earn a reasonable level of profits in exchange for the level of services it provides to the Fund and the entrepreneurial and other risks that it assumes as Adviser.
Economies of Scale — The Board considered whether there should be changes in the management fee rate or structure in order to enable the Fund to participate in any economies of scale. The Board also considered the fee waiver and expense reimbursement arrangements by the Adviser. The Board also considered the effect of the Fund's change in size, if any, on its performance and fees, noting that the Fund may realize other economies of scale if assets increase proportionally more than expenses. The Board determined that the current investment management fee structure was reasonable.
Conclusions — The Board reached the following conclusions regarding the Fund's Advisory Agreement with the Adviser: (i) the Adviser has demonstrated that it possesses the capability and resources to perform the duties required of it under the Advisory Agreement; (ii) the Adviser maintains an appropriate compliance program; (iii) the overall performance of the Fund is reasonable in relation to the performance of funds with similar investment objectives and to relevant indices; (iv) the Fund's advisory expenses are reasonable in relation to those of similar funds and to the services to be provided by the Adviser; and (v) the Adviser's and its affiliates' level of profitability from their relationship with the Fund is reasonable in light of the nature and high quality of services provided by the Adviser and the type of fund. Based on its conclusions, the Board determined that continuation of the Advisory Agreement would be in the best interests of the Fund and its shareholders.
38
USAA Mutual Funds Trust | Supplemental Information — continued March 31, 2021 | ||||||
(Unaudited)
Liquidity Risk Management Program:
The USAA Mutual Funds have adopted and implemented a written liquidity risk management program (the "LRMP") as required by Rule 22e-4 under the Investment Company Act of 1940, as amended. The LRMP is reasonably designed to assess and manage the Fund's liquidity risk, taking into consideration the Fund's investment strategy and the liquidity of its portfolio investments during normal and reasonably foreseeable stressed market conditions; its short and long-term cash flow projections; and its cash holdings and access to other liquidity management tools such as available funding sources including the Victory Funds Complex Interfund Lending Facility and Line of Credit (discussed in the Notes to Financial Statements). The USAA Mutual Funds' Board of Trustees approved the appointment of the Funds' investment adviser, Victory Capital Management Inc. ("Victory Capital"), as the administrator of the LRMP.
Victory Capital manages liquidity risks associated with the Fund's investments by monitoring, among other things, cash and cash equivalents, any use of derivatives, the concentration of investments, the appropriateness of the Fund's investment strategy, and by classifying every fund investment as either highly liquid, moderately liquid, less liquid or illiquid on at least a monthly basis. To assist with the classification of Fund investments, Victory Capital has retained a third-party provider of liquidity evaluation services. This provider determines preliminary liquidity classifications for all portfolio holdings based upon portfolio-level data and certain assumptions provided by Victory Capital. Victory Capital reviews the preliminary liquidity classifications, and, when appropriate, considers other information including input from the Fund's portfolio managers (including the portfolio managers employed by any investment sub-advisers) in determining final liquidity classifications.
At a virtual video conference meeting held on March 10, 2021, Victory Capital provided an oral and written report to the Trustees on the operation and effectiveness of the LRMP during the previous year. The report from Victory Capital concluded that the Fund did not experience any significant liquidity challenges during the covered period, and the Fund's LRMP is reasonably designed to assess and manage its liquidity risk. The report also concluded that the LRMP continues to operate adequately and effectively to enable Victory Capital to oversee and manage liquidity risk and ensure the Fund is able to meet redemption requests without significant dilution to the remaining investors' interest in the Fund. During the review period, the Fund's portfolio consisted primarily of highly liquid investments, which are defined as cash and any investments reasonably expected to be converted to cash in current market conditions in three business days or less without significantly changing the market value of the investment. Therefore, the Fund has not adopted a Highly Liquid Investment Minimum. The Fund's investments were below the limitation on illiquid investments during the review period. Additionally, Victory Capital indicated that no events occurred that would require the filing of Form N-LIQUID and recommended no material changes to the LRMP.
39
Privacy Policy
Protecting the Privacy of Information
The Trust respects your right to privacy. We also know that you expect us to conduct and process your business in an accurate and efficient manner. To do so, we must collect and maintain certain personal information about you. This is the information we collect from you on applications or other forms, and from the transactions you make with us or third parties. It may include your name, address, social security number, account transactions and balances, and information about investment goals and risk tolerance.
We do not disclose any information about you or about former customers to anyone except as permitted or required by law. Specifically, we may disclose the information we collect to companies that perform services on our behalf, such as the transfer agent that processes shareholder accounts and printers and mailers that assist us in the distribution of investor materials. We may also disclose this information to companies that perform marketing services on our behalf. This allows us to continue to offer you Victory investment products and services that meet your investing needs, and to effect transactions that you request or authorize. These companies will use this information only in connection with the services for which we hired them. They are not permitted to use or share this information for any other purpose.
To protect your personal information internally, we permit access only by authorized employees and maintain physical, electronic and procedural safeguards to guard your personal information.*
* You may have received communications regarding information about privacy policies from other financial institutions which gave you the opportunity to "opt-out" of certain information sharing with companies which are not affiliated with that financial institution. The Trust does not share information with other companies for purposes of marketing solicitations for products other than the Trust. Therefore, the Trust does not provide opt-out options to their shareholders.
P.O. Box 182593
Columbus, Ohio 43218-2593

Visit our website at: | Call | ||||||
vcm.com | (800 | ) 235-8396 | |||||
98358-0521

MARCH 31, 2021
Annual Report
USAA Tax Exempt Long-Term Fund
As permitted by regulations adopted by the Securities and Exchange Commission, paper copies of the Fund's shareholder reports may no longer be sent by mail, unless you specifically request paper copies of the reports from the Fund or from your financial intermediary, such as a broker-dealer or bank. Instead, the reports will be made available on VictoryFunds.com, and you will be notified by mail each time a report is posted and provided with a website link to access the report. If you already elected to receive shareholder reports electronically, you will not be affected by this change and you need not take any action.
You may elect to receive shareholder reports and other communications from the Fund or your financial intermediary electronically by notifying your financial intermediary directly, or if you are a shareholder who has an account directly with the Fund, by calling (800) 235-8396 or by submitting your request via email to TA.Processing@FISGlobal.com.
You may elect to receive all future reports in paper form free of charge. You can inform the Fund or your financial intermediary that you wish to continue receiving paper copies of your shareholder reports by notifying your financial intermediary directly, or if you are a shareholder who has an account directly with the Fund, by calling (800) 235-8396 or by submitting your request via email to TA.Processing@FISGlobal.com. Your election to receive reports in paper will apply to all funds held with the USAA Mutual Funds or your financial intermediary.
Victory Capital means Victory Capital Management Inc., the investment adviser of the USAA Mutual Funds. USAA Mutual Funds are distributed by Victory Capital Services, Inc., member of FINRA, an affiliate of Victory Capital. Victory Capital and its affiliates are not affiliated with United Services Automobile Association or its affiliates. USAA and the USAA logos are registered trademarks and the USAA Mutual Funds and USAA Investments logos are trademarks of United Services Automobile Association and are being used by Victory Capital and its affiliates under license.
www.vcm.com
News, Information And Education 24 Hours A Day, 7 Days A Week
The Victory Funds site gives fund shareholders, prospective shareholders, and investment professionals a convenient way to access fund information, get guidance, and track fund performance anywhere they can access the Internet. The site includes:
• Detailed performance records
• Daily share prices
• The latest fund news
• Investment resources to help you become a better investor
• A section dedicated to investment professionals
Whether you're a potential investor searching for the fund that matches your investment philosophy, a seasoned investor interested in planning tools, or an investment professional, www.vcm.com has what you seek. Visit us anytime. We're always open.
USAA Mutual Funds Trust
TABLE OF CONTENTS
Shareholder Letter (Unaudited) | 2 | ||||||
Managers' Commentary (Unaudited) | 4 | ||||||
Investment Overview (Unaudited) | 6 | ||||||
| Investment Objective & Portfolio Holdings (Unaudited) | 7 | ||||||
Schedule of Portfolio Investments | 9 | ||||||
Financial Statements | |||||||
Statement of Assets and Liabilities | 29 | ||||||
Statement of Operations | 30 | ||||||
Statements of Changes in Net Assets | 31 | ||||||
Financial Highlights | 34 | ||||||
Notes to Financial Statements | 36 | ||||||
| Report of Independent Registered Public Accounting Firm | 46 | ||||||
Supplemental Information (Unaudited) | 47 | ||||||
Trustees' and Officers' Information | 47 | ||||||
Proxy Voting and Portfolio Holdings Information | 53 | ||||||
Expense Examples | 53 | ||||||
Additional Federal Income Tax Information | 54 | ||||||
Advisory Contract Agreement | 55 | ||||||
Liquidity Risk Management Program | 58 | ||||||
Privacy Policy (inside back cover) | |||||||
This report is for the information of the shareholders and others who have received a copy of the currently effective prospectus of the Fund, managed by Victory Capital Management Inc. It may be used as sales literature only when preceded or accompanied by a current prospectus, which provides further details about the Fund.
IRA DISTRIBUTION WITHHOLDING DISCLOSURE
We generally must withhold federal income tax at a rate of 10% of the taxable portion of your distribution and, if you live in a state that requires state income tax withholding, at your state's tax rate. However, you may elect not to have withholding apply or to have income tax withheld at a higher rate. Any withholding election that you make will apply to any subsequent distribution unless and until you change or revoke the election. If you wish to make a withholding election, or change or revoke a prior withholding election, call (800) 235-8396, and form W-4P (OMB No. 1545-0074 withholding certificate for pension or annuity payments) will be electronically sent.
If you do not have a withholding election in place by the date of a distribution, federal income tax will be withheld from the taxable portion of your distribution at a rate of 10%. If you must pay estimated taxes, you may be subject to estimated tax penalties if your estimated tax payments are not sufficient and sufficient tax is not withheld from your distribution.
For more specific information, please consult your tax adviser.
1
(Unaudited)
Dear Shareholder,
The annual reporting period ended March 31, 2021, was a year like no other. It wasn't that long ago that we were all coming to grips with an emerging global pandemic, economic shutdowns, and financial markets in turmoil. We somehow persevered and have even emerged from those challenging days—dare I say—with a renewed sense of optimism. In retrospect, the trajectory of financial markets over the past year was nothing short of extraordinary.
Consider everything that transpired over the past 12 months. A novel coronavirus ("COVID-19") and the subsequent worldwide spread of COVID-19 prompted governments everywhere to issue austere shelter-in-place orders, and the global economy slowed abruptly. Equity markets sold off, while unprecedented levels of volatility roiled traditionally placid bond markets. During the second quarter of 2020, domestic GDP contracted by an alarming annual rate of 31.4%, according to the U.S. Department of Commerce ("Commerce Department").
It's no surprise that many investors flocked to the perceived safety of U.S. Treasurys during this period of tumult. Meanwhile, liquidity evaporated (for a short spell) in other segments of the fixed-income world, including higher-yielding credits and municipal bonds. The outlook was tenuous, and credit spreads widened while prices declined for most securities perceived to be higher risk.
Fortunately, a response came swiftly. The U.S. Federal Reserve (the "Fed") and other monetary authorities worldwide leapt into action—cutting interest rates, (re)starting quantitative easing and, in the case of the Fed, launching an array of programs to provide liquidity to stabilize fixed-income markets. The U.S. government also stepped up to provide fiscal stimulus in the form of the Coronavirus Aid, Relief, and Economic Security Act ("CARES Act").
It was impressive how quickly those actions helped arrest the stock market's freefall and restore order across much of the fixed-income universe. The rebound was as robust as the drawdown, and third quarter 2020 GDP bounced back and grew at a 33.4% annualized rate, according to the Commerce Department.
Late in the year, financial markets were alternately fueled and roiled by a contentious election season, growing optimism for an effective vaccine, and a fluid debate regarding the need for additional fiscal stimulus. Ultimately, stocks were propelled higher in the fourth quarter as it became clear Congress would provide another dose of stimulus in the form of direct payments, more unemployment insurance, and additional aid to businesses.
As the year ended and we moved into the first quarter of 2021, stocks continued their upward trajectory. Meanwhile, the yield on the 10-Year U.S. Treasury continued rallying sharply, and many investors began to worry about inflation in the post-pandemic world.
Through all the unprecedented events and volatility, the S&P 500® Index registered an impressive annual return of 56.35% for the 12-month period ended March 31, 2021. Over this same period, the yield on the 10-Year U.S. Treasury jumped more than 100 basis points, reflecting both the very low starting rate and substantial fiscal
2
stimulus. At the end of the reporting period, the yield on the 10-Year U.S. Treasury was 1.74%
On the whole, markets endured and surprised to the upside, but perhaps the key takeaway is that the unexpected can and will happen. That's why it's important to remain focused on your long-term investment goals and avoid making emotional decisions.
On the following pages, you will find information relating to your USAA Mutual Funds, brought to you by Victory Capital. If you have any questions regarding the current market dynamics or your specific portfolio or investment plan, we encourage you to contact our Member Service Representatives. Call (800) 235-8396, or visit our website at www.vcm.com.
Thank you for letting us help you work toward your investment goals.

Christopher K. Dyer, CFA
President,
USAA Mutual Funds Trust
3
USAA Mutual Funds Trust
USAA Tax Exempt Long-Term Fund
Manager's Commentary
(Unaudited)
Regina G. Conklin, CFA, CPA
Andrew Hattman, CFA, CAIA
Lauren Spalten*
• What were the market conditions during the reporting period?
Tax-exempt bonds as measured by the Bloomberg Barclays Municipal Bond Index generated positive returns during the 12-month reporting period ended March 31, 2021, due in part to falling municipal bond yields. (Bond prices and yields move in opposite directions.) However, the market saw significant volatility during the reporting period due primarily to COVID-19 and related economic and government reactions.
The reporting period began near the beginning of the COVID-19 crisis in the United States. The market had just sold off sharply in March 2020, and the first month of the reporting period was highlighted by significant volatility as the market reacted to COVID-19 and subsequent economic shutdowns, but also substantial fiscal and monetary response from the federal government. Starting in May 2020, the municipal market began a long, uneven recovery for the rest of the calendar year, driven by significant government intervention and investor expectations of a future return to normalcy. The recovery was marked by sizeable fund flows into tax-exempt mutual funds and material tightening of credit spreads (the yield difference between riskier bond yields and the safest bond yields). The recovery took a slight pause in the months ahead of the election, as uncertainty surrounding the election, as well as uncertainty around aid for municipal borrowers weighed on the market for a couple of months. However, the year ended with the market up significantly from the start of both the calendar year and the reporting period. January of 2021 saw a continuation of the market recovery, but the last part of the reporting period was highlighted by a sell-off in the municipal market as tax-exempt bonds finally succumbed to pressures caused by the meaningful increase in U.S. Treasury yields in the first quarter of 2021.
The end of the reporting period found the municipal market fighting the headwinds of potential higher U.S. Treasury rates and inflation, but with several notable tailwinds in support to include: heavy fund flows into tax-exempt mutual funds, investor expectations of increasing tax rates, and stimulus money flowing to municipal borrowers.
• How did the USAA Tax Exempt Long-Term Fund (the "Fund") perform during the reporting period?
The Fund has three share classes: Fund Shares, Institutional Shares and Class A (effective June 29, 2020, the Adviser Shares were were redesignated Class A and became subject to a front-end sales charge). For the reporting period ended March 31, 2021, the Fund Shares and Class A had a total return of 7.00% and 6.80%, respectively, versus an average return of 6.74% amongst the funds in the Lipper General & Insured Municipal Debt Funds category. This compares to returns of 7.54% for the Lipper General & Insured Municipal
*Effective March 2, 2021, Lauren Spalten was added as a portfolio manager on the Fund and John C. Bonnell was removed.
4
USAA Mutual Funds Trust
USAA Tax Exempt Long-Term Fund (continued)
Manager's Commentary (continued)
Debt Funds Index and 5.51% for the Bloomberg Barclays Municipal Bond Index. The Institutional Shares commenced operations on June 29, 2020, and from that time through March 31, 2021, had a total return of 4.71%.
• What strategies did you employ during the reporting period?
In keeping with our investment approach, we continued to focus on income generation. The Fund's long-term income distribution, not its price appreciation, accounts for most of its total return. Because of the Fund's income orientation, it has a higher allocation to BBB and A rated categories when compared to its peer group.
Our commitment to independent credit research continued to help us identify attractive opportunities for the Fund. We employ fundamental analysis that emphasizes an issuer's ability and willingness to repay its debt. Through our credit research, we strive both to recognize relative value and to avoid potential pitfalls, which is especially important in volatile times like the present. As always, we worked with our in-house team of analysts to select investments for the Fund on a bond-by-bond basis. Our team continuously monitors all the holdings in the Fund's portfolio.
The Fund continues to hold a diversified portfolio of longer-term, primarily investment- grade municipal bonds. To limit exposure to an unexpected event, the Fund is diversified by sector, issuer, and geography. In addition, we avoid bonds subject to the federal alternative minimum tax for individuals.
Thank you for allowing us to assist you with your investment needs.
5
USAA Mutual Funds Trust
USAA Tax Exempt Long-Term Fund
Investment Overview
(Unaudited)
Average Annual Total Return
Year Ended March 31, 2021
Fund Shares | Institutional Shares | Class A | |||||||||||||||||||||||||
INCEPTION DATE | 3/19/82 | 6/29/20 | 8/1/10 | ||||||||||||||||||||||||
| Net Asset Value | Net Asset Value | Net Asset Value | Maximum Offering Price | Bloomberg Barclays Municpal Bond Index1 | Lipper General & Insured Municipal Debt Funds Index2 | ||||||||||||||||||||||
One Year | 7.00 | % | NA | 6.80 | % | 4.43 | % | 5.51 | % | 7.54 | % | ||||||||||||||||
Five Year | 3.64 | % | NA | 3.39 | % | 2.92 | % | 3.49 | % | 3.72 | % | ||||||||||||||||
Ten Year | 5.25 | % | NA | 4.95 | % | 4.71 | % | 4.54 | % | 5.03 | % | ||||||||||||||||
Since Inception | NA | 4.71 | % | NA | NA | NA | NA | ||||||||||||||||||||
The performance data quoted represents past performance and current returns may be lower or higher. The investment return and principal value will fluctuate so that an investor's shares, when redeemed, may be worth more or less than the original cost. To obtain performance information current to the most recent month's end, please visit www.vcm.com.
The maximum offering price figures reflect a maximum sales charge of 2.25% for Class A. Net Asset Value does not reflect sales charges.
Total return measures the price change in a share assuming the reinvestment of all net investment income and realized capital gain distributions, if any. The total returns quoted do not reflect adjustments made to the enclosed financial statements in accordance with U.S. Generally Accepted Accounting Principles or the deduction of taxes that a shareholder would pay on net investment income and realized capital gain distributions, including reinvested distributions, or redemptions of shares. The total return figures set forth above include all waivers of fees. Without such fee waivers, the total returns would have been lower.
USAA Tax Exempt Long-Term Fund — Growth of $10,000
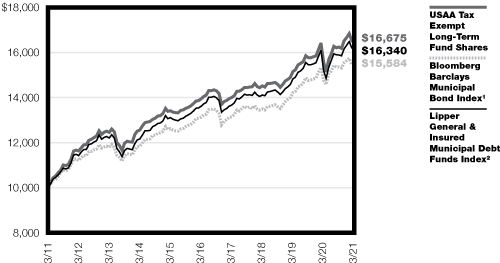
1 The unmanaged, broad-based Bloomberg Barclays Municipal Bond Index tracks total return performance for the long-term, investment-grade, tax-exempt bond market. This index does not include the effect of sales charges, commissions, expenses or taxes, is not representative of the Fund, and it is not possible to invest directly in an index.
2 The unmanaged Lipper General & Insured Municipal Debt Funds Index measures the Fund's performance to that of the Lipper General & Insured Municipal Debt Funds category. This index does not include the effect of sales charges, commmissions, expenses or taxes, is not representative of the Fund, and it is not possible to invest directly in an index.
The graph reflects investment of growth of a hypothetical $10,000 investment in the Fund.
The graph and table do not reflect the deduction of taxes that a shareholder would pay on Fund distributions or the redemption of Fund shares.
Past performance is not indicative of future results.
6
| USAA Mutual Funds Trust USAA Tax Exempt Long-Term Fund | March 31, 2021 | ||||||
(Unaudited)
Investment Objective & Portfolio Holdings:
The Fund's investment objective seeks to provide investors with interest income that is exempt from federal income tax.
Top 10 Industries
March 31, 2021
(% of Net Assets)
Hospital | 18.0 | % | |||||
General Obligation | 13.1 | % | |||||
Education | 11.8 | % | |||||
Nursing/CCRC | 9.2 | % | |||||
Special Assessment/Tax/Fee | 7.1 | % | |||||
Toll Road | 6.5 | % | |||||
Escrowed Bonds | 4.7 | % | |||||
Water/Sewer Utility | 4.1 | % | |||||
Multifamily Housing | 4.0 | % | |||||
Oil & Gas Refining & Marketing | 3.9 | % | |||||
Refer to the Schedule of Portfolio Investments for a complete list of securities.
7
| USAA Mutual Funds Trust USAA Tax Exempt Long-Term Fund (continued) | March 31, 2021 | ||||||
(Unaudited)
Portfolio Ratings Mix:
March 31, 2021
(% of Net Assets)
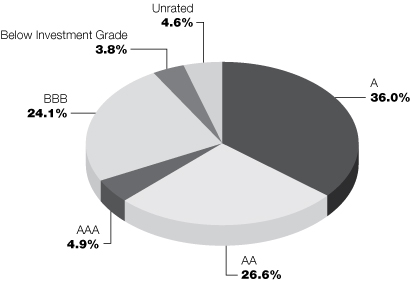
This chart reflects the highest long-term rating from a Nationally Recognized Statistical Rating Organization ("NRSRO"), with the four highest long-term credit ratings labeled, in descending order of credit quality, AAA, AA, A, and BBB. These categories represent investment-grade quality. NRSRO ratings are shown because they provide independent analysis of the credit quality of the Fund's investments. Victory Capital Management Inc. ("Adviser") also performs its own fundamental credit analysis of each security. As a part of its fundamental credit analysis, the Adviser considers various criteria, including industry specific actions, peer comparisons, payment ranking, and structure specific characteristics. Any of the Fund's securities that are not rated by an NRSRO appear in the chart above as "Unrated," but these securities are analyzed and monitored by the Adviser on an ongoing basis. Government securities that are issued or guaranteed as to principal and interest by the U.S. government and pre-refunded and escrowed-to-maturity municipal bonds that are not rated are treated as AAA for credit quality purposes.
8
| USAA Mutual Funds Trust USAA Tax Exempt Long-Term Fund | Schedule of Portfolio Investments March 31, 2021 | ||||||
(Amounts in Thousands, Except for Shares)
Security Description | Shares or Principal Amount | Value | |||||||||
Common Stocks (0.1%) | |||||||||||
Utilities (0.1%): | |||||||||||
Energy Harbor Corp. (a) | 67,456 | $ | 1,811 | ||||||||
Total Common Stocks (Cost $1,678) | 1,811 | ||||||||||
Municipal Bonds (98.9%) | |||||||||||
Alabama (1.0%): | |||||||||||
| Homewood Educational Building Authority Revenue, 5.00%, 12/1/47, Continuously Callable @ 100 | $ | 4,500 | 5,167 | ||||||||
| Montgomery Medical Clinic Board Revenue, 5.00%, 3/1/36, Continuously Callable @ 100 | 1,750 | 1,988 | |||||||||
The Lower Alabama Gas District Revenue, Series A, 5.00%, 9/1/46 | 11,500 | 16,342 | |||||||||
23,497 | |||||||||||
Arizona (3.0%): | |||||||||||
| Apache County IDA Revenue, Series A, 4.50%, 3/1/30, Continuously Callable @ 100 | 5,000 | 5,179 | |||||||||
Arizona Health Facilities Authority Revenue | |||||||||||
5.00%, 2/1/42, Continuously Callable @ 100 | 6,000 | 6,214 | |||||||||
1.90% (MUNIPSA+185bps), 2/1/48, (Put Date 2/1/23) (b) (h) | 5,000 | 5,131 | |||||||||
Arizona IDA Revenue, 5.00%, 7/1/52, Continuously Callable @ 100 | 1,725 | 1,970 | |||||||||
| City of Phoenix Civic Improvement Corp. Revenue (INS — National Public Finance Guarantee Corp.) | |||||||||||
Series B, 5.50%, 7/1/29 | 1,000 | 1,295 | |||||||||
Series B, 5.50%, 7/1/30 | 1,500 | 1,973 | |||||||||
Maricopa County IDA Revenue, 5.00%, 7/1/47, Continuously Callable @ 100 | 1,600 | 1,748 | |||||||||
| Maricopa County Pollution Control Corp. Revenue, Series A, 0.14%, 6/1/43, Callable 5/3/21 @ 100 (c) | 19,300 | 19,300 | |||||||||
| Pinal County Electric District No. 3 Revenue, 4.00%, 7/1/41, Continuously Callable @ 100 | 10,000 | 11,084 | |||||||||
The City of Phoenix IDA Revenue | |||||||||||
5.00%, 7/1/41, Continuously Callable @ 100 | 1,200 | 1,316 | |||||||||
5.00%, 7/1/42, Continuously Callable @ 100 | 1,250 | 1,411 | |||||||||
5.00%, 7/1/44, Continuously Callable @ 100 | 6,000 | 6,445 | |||||||||
The Pima County IDA Revenue | |||||||||||
4.00%, 9/1/29, Continuously Callable @ 100 | 3,000 | 3,192 | |||||||||
5.00%, 6/15/52, Continuously Callable @ 100 (d) | 2,000 | 2,017 | |||||||||
| The Prima County IDA Revenue, Series A, 4.50%, 6/1/30, Continuously Callable @ 100 | 2,685 | 2,807 | |||||||||
The Yavapai County IDA Revenue, 4.00%, 8/1/43, Continuously Callable @ 100 | 1,725 | 1,887 | |||||||||
72,969 | |||||||||||
Arkansas (0.2%): | |||||||||||
| Arkansas Development Finance Authority Revenue (INS — AMBAC Assurance Corp.) | |||||||||||
7/1/28 (e) | 1,000 | 894 | |||||||||
7/1/29 (e) | 1,165 | 1,013 | |||||||||
7/1/30 (e) | 1,150 | 973 | |||||||||
7/1/36 (e) | 2,500 | 1,676 | |||||||||
4,556 | |||||||||||
See notes to financial statements.
9
| USAA Mutual Funds Trust USAA Tax Exempt Long-Term Fund | Schedule of Portfolio Investments — continued March 31, 2021 | ||||||
(Amounts in Thousands, Except for Shares)
Security Description | Principal Amount | Value | |||||||||
California (6.8%): | |||||||||||
| California Health Facilities Financing Authority Revenue, 5.00%, 11/15/56, Continuously Callable @ 100 | $ | 1,000 | $ | 1,198 | |||||||
| California Municipal Finance Authority Revenue (LIQ — Deutsche Bank A.G.), Series DBE-8061, 0.58%, 1/1/60, Callable 1/1/37 @ 100 (c) (d) | 5,000 | 5,000 | |||||||||
California State Public Works Board Revenue | |||||||||||
5.00%, 6/1/31, Continuously Callable @ 100 | 2,950 | 3,241 | |||||||||
Series B, 5.00%, 10/1/30, Pre-refunded 10/1/21 @ 100 | 2,000 | 2,048 | |||||||||
Series B, 5.00%, 10/1/31, Pre-refunded 10/1/21 @ 100 | 1,110 | 1,136 | |||||||||
Series B, 5.00%, 10/1/39, Continuously Callable @ 100 | 3,500 | 3,991 | |||||||||
Series D, 5.00%, 12/1/29, Continuously Callable @ 100 | 2,500 | 2,580 | |||||||||
Series D, 5.00%, 12/1/31, Continuously Callable @ 100 | 2,000 | 2,063 | |||||||||
| California Statewide Communities Development Authority Revenue (LIQ — Deutsche Bank A.G.) | |||||||||||
0.71%, 4/1/52, Callable 5/10/21 @ 100 (c) (d) | 3,245 | 3,245 | |||||||||
Series DBE-8065, 0.58%, 11/1/52, Callable 11/1/21 @ 100 (c) (d) | 10,000 | 10,000 | |||||||||
Cerritos Community College District, GO | |||||||||||
Series D, 8/1/31 (e) | 1,000 | 835 | |||||||||
Series D, 8/1/32 (e) | 2,500 | 2,030 | |||||||||
Series D, 8/1/33 (e) | 2,175 | 1,716 | |||||||||
Series D, 8/1/34 (e) | 1,000 | 765 | |||||||||
Series D, 8/1/35 (e) | 1,500 | 1,113 | |||||||||
Series D, 8/1/36 (e) | 2,200 | 1,583 | |||||||||
| City & County of San Francisco Revenue (LIQ — Deutsche Bank A.G.), Series DBE-8059, 0.58%, 12/1/52, Callable 12/1/21 @ 100 (c) (d) | 13,000 | 13,000 | |||||||||
| Coachella Valley Unified School District, GO (INS — Assured Guaranty Municipal Corp.), Series D, 8/1/41 (e) | 8,500 | 4,931 | |||||||||
El Camino Community College District, GO | |||||||||||
Series C, 8/1/34 (e) | 3,000 | 2,332 | |||||||||
Series C, 8/1/38 (e) | 3,000 | 1,997 | |||||||||
| El Monte Union High School District, GO (INS — Assured Guaranty Municipal Corp.), 6/1/42 (e) | 10,000 | 5,560 | |||||||||
| Golden State Tobacco Securitization Corp. Revenue, Series A, 5.00%, 6/1/30, Continuously Callable @ 100 | 2,000 | 2,185 | |||||||||
| Indio Redevelopment Agency Successor Agency Tax Allocation, Series A, 5.25%, 8/15/35, Continuously Callable @ 100 | 1,580 | 1,586 | |||||||||
Los Alamitos Unified School District Certificate of Participation | |||||||||||
8/1/34, Continuously Callable @ 100 (f) | 1,200 | 1,361 | |||||||||
8/1/42, Continuously Callable @ 100 (g) | 4,500 | 4,848 | |||||||||
| Monterey Peninsula Unified School District, GO (INS-Assured Guaranty Municipal Corp.), Series A, 5.50%, 8/1/34, Pre-refunded 8/1/21 @ 100 | 3,000 | 3,052 | |||||||||
| New York State Housing Finance Agency Revenue (LIQ — Deutsche Bank A.G.), Series DBE-8072, 0.58%, 1/1/52, Callable 4/15/21 @ 100 (c) (d) | 5,000 | 5,000 | |||||||||
Paramount Unified School District, GO | |||||||||||
8/1/34 (e) | 1,860 | 1,426 | |||||||||
8/1/35 (e) | 2,000 | 1,483 | |||||||||
8/1/36 (e) | 2,750 | 1,971 | |||||||||
8/1/37 (e) | 2,750 | 1,910 | |||||||||
See notes to financial statements.
10
| USAA Mutual Funds Trust USAA Tax Exempt Long-Term Fund | Schedule of Portfolio Investments — continued March 31, 2021 | ||||||
(Amounts in Thousands, Except for Shares)
Security Description | Principal Amount | Value | |||||||||
| Sacramento City Schools Joint Powers Financing Authority Revenue (INS — Build America Mutual Assurance Co.) | |||||||||||
Series A, 5.00%, 3/1/36, Continuously Callable @ 100 | $ | 2,560 | $ | 2,785 | |||||||
Series A, 5.00%, 3/1/40, Continuously Callable @ 100 | 2,000 | 2,157 | |||||||||
| San Diego Public Facilities Financing Authority Revenue, Series A, 5.00%, 10/15/44, Continuously Callable @ 100 | 2,500 | 2,900 | |||||||||
San Ysidro School District, GO (INS — Assured Guaranty Municipal Corp.) | |||||||||||
Series G, 8/1/36 (e) | 13,605 | 9,972 | |||||||||
Series G, 8/1/37 (e) | 14,285 | 10,171 | |||||||||
| Santa Ana Unified School District Certificate of Participation (INS — Assured Guaranty Municipal Corp.), 4/1/29 (e) | 15,000 | 12,340 | |||||||||
State of California, GO | |||||||||||
5.25%, 4/1/35, Continuously Callable @ 100 | 8,000 | 8,390 | |||||||||
5.00%, 2/1/38, Continuously Callable @ 100 | 6,750 | 7,299 | |||||||||
5.00%, 10/1/47, Continuously Callable @ 100 | 5,000 | 5,893 | |||||||||
| Stockton Unified School District, GO (INS — Assured Guaranty Municipal Corp.), Series D, 8/1/34 (e) | 8,885 | 6,650 | |||||||||
163,743 | |||||||||||
Colorado (2.3%): | |||||||||||
Colorado Educational & Cultural Facilities Authority Revenue | |||||||||||
4.00%, 12/1/48, Continuously Callable @ 100 | 2,500 | 2,740 | |||||||||
5.00%, 4/1/53, Continuously Callable @ 100 | 750 | 896 | |||||||||
Series A, 5.25%, 4/1/43, Continuously Callable @ 100 | 2,500 | 2,664 | |||||||||
Colorado Health Facilities Authority Revenue | |||||||||||
5.00%, 12/1/42, Pre-refunded 6/1/22 @ 100 | 5,000 | 5,278 | |||||||||
5.00%, 6/1/45, Pre-refunded 6/1/25 @ 100 | 6,000 | 7,117 | |||||||||
5.00%, 6/1/47, Pre-refunded 6/1/27 @ 100 | 1,250 | 1,573 | |||||||||
Series A, 4.00%, 8/1/49, Continuously Callable @ 100 | 2,500 | 2,817 | |||||||||
Series A, 4.00%, 9/1/50, Continuously Callable @ 100 | 1,500 | 1,667 | |||||||||
Series A, 4.00%, 12/1/50, Continuously Callable @ 103 | 7,250 | 7,738 | |||||||||
| Denver Health & Hospital Authority Revenue, Series A, 4.00%, 12/1/40, Continuously Callable @ 100 | 750 | 861 | |||||||||
| E-470 Public Highway Authority Revenue (INS — National Public Finance Guarantee Corp.), Series B, 9/1/35, Continuously Callable @ 64 (e) | 10,000 | 5,811 | |||||||||
Park Creek Metropolitan District Revenue | |||||||||||
5.00%, 12/1/45, Continuously Callable @ 100 | 1,000 | 1,132 | |||||||||
5.00%, 12/1/46, Continuously Callable @ 100 | 2,500 | 2,826 | |||||||||
5.00%, 12/1/51, Continuously Callable @ 100 | 2,000 | 2,244 | |||||||||
| Rampart Range Metropolitan District No. 1 Revenue (INS — Assured Guaranty Municipal Corp.), 5.00%, 12/1/47, Continuously Callable @ 100 | 4,000 | 4,784 | |||||||||
| Regional Transportation District Certificate of Participation, Series A, 5.00%, 6/1/44, Continuously Callable @ 100 | 5,000 | 5,446 | |||||||||
| Southlands Metropolitan District No. 1, GO, Series A-1, 5.00%, 12/1/47, Continuously Callable @ 100 | 1,000 | 1,080 | |||||||||
56,674 | |||||||||||
Connecticut (0.6%): | |||||||||||
| Connecticut State Health & Educational Facilities Authority Revenue, Series A, 4.00%, 7/1/49, Continuously Callable @ 100 | 3,000 | 3,286 | |||||||||
Mashantucket Western Pequot Tribe Revenue, 6.05%, 7/1/31 | 59,890 | 1,737 | |||||||||
See notes to financial statements.
11
| USAA Mutual Funds Trust USAA Tax Exempt Long-Term Fund | Schedule of Portfolio Investments — continued March 31, 2021 | ||||||
(Amounts in Thousands, Except for Shares)
Security Description | Principal Amount | Value | |||||||||
State of Connecticut, GO | |||||||||||
Series A, 5.00%, 4/15/38, Continuously Callable @ 100 | $ | 5,500 | $ | 6,730 | |||||||
Series A, 5.00%, 4/15/39, Continuously Callable @ 100 | 1,550 | 1,925 | |||||||||
13,678 | |||||||||||
District of Columbia (1.5%): | |||||||||||
| District of Columbia Housing Finance Agency Revenue (LIQ — Deutsche Bank A.G.), Series DBE-8070, 0.58%, 8/1/40, Callable 1/1/32 @ 105 (c) (d) | 7,500 | 7,500 | |||||||||
District of Columbia Revenue | |||||||||||
5.00%, 7/1/36, Pre-refunded 7/1/22 @ 100 | 1,305 | 1,378 | |||||||||
5.00%, 7/1/42, Pre-refunded 7/1/22 @ 100 | 1,500 | 1,581 | |||||||||
6.00%, 7/1/43, Pre-refunded 7/1/23 @ 100 | 1,700 | 1,921 | |||||||||
6.00%, 7/1/48, Pre-refunded 7/1/23 @ 100 | 1,450 | 1,638 | |||||||||
5.00%, 7/1/49, Continuously Callable @ 100 | 1,275 | 1,471 | |||||||||
5.00%, 7/1/54, Continuously Callable @ 100 | 1,140 | 1,310 | |||||||||
| Metropolitan Washington Airports Authority Dulles Toll Road Revenue, 5.00%, 10/1/53, Continuously Callable @ 100 | 10,000 | 10,388 | |||||||||
| Washington Convention & Sports Authority Tax Allocation, 5.00%, 10/1/40, Continuously Callable @ 100 | 10,000 | 10,021 | |||||||||
37,208 | |||||||||||
Florida (7.5%): | |||||||||||
| Alachua County Health Facilities Authority Revenue, 4.00%, 12/1/49, Continuously Callable @ 100 | 7,000 | 7,859 | |||||||||
City of Atlantic Beach Revenue | |||||||||||
Series A, 5.00%, 11/15/53, Continuously Callable @ 103 | 2,000 | 2,220 | |||||||||
Series B, 5.63%, 11/15/43, Continuously Callable @ 100 | 7,000 | 7,700 | |||||||||
City of Jacksonville Revenue | |||||||||||
5.00%, 10/1/29, Continuously Callable @ 100 | 2,270 | 2,431 | |||||||||
4.00%, 11/1/45, Continuously Callable @ 100 | 2,500 | 2,817 | |||||||||
City of Lakeland Revenue | |||||||||||
5.00%, 9/1/37, Continuously Callable @ 100 | 500 | 528 | |||||||||
5.00%, 9/1/42, Continuously Callable @ 100 | 1,000 | 1,053 | |||||||||
City of Pompano Beach Revenue, 4.00%, 9/1/50, Continuously Callable @ 103 | 8,000 | 8,487 | |||||||||
| County of Miami-Dade Rickenbacker Causeway Revenue, 5.00%, 10/1/43, Continuously Callable @ 100 | 1,750 | 1,938 | |||||||||
| County of Miami-Dade Water & Sewer System Revenue, Series B, 4.00%, 10/1/49, Continuously Callable @ 100 | 22,000 | 25,275 | |||||||||
| County of Polk Florida Utility System Revenue, 4.00%, 10/1/43, Continuously Callable @ 100 | 2,000 | 2,372 | |||||||||
Escambia County Health Facilities Authority Revenue | |||||||||||
4.00%, 8/15/45, Continuously Callable @ 100 | 5,050 | 5,602 | |||||||||
4.00%, 8/15/50, Continuously Callable @ 100 | 6,265 | 6,951 | |||||||||
Florida Development Finance Corp. Revenue | |||||||||||
4.00%, 7/1/45, Continuously Callable @ 100 | 600 | 637 | |||||||||
4.00%, 7/1/55, Continuously Callable @ 100 | 500 | 529 | |||||||||
Series A, 5.00%, 6/15/55, Continuously Callable @ 100 | 1,500 | 1,651 | |||||||||
Florida Higher Educational Facilities Financial Authority Revenue | |||||||||||
5.00%, 3/1/44, Continuously Callable @ 100 | 4,280 | 4,703 | |||||||||
4.00%, 10/1/44, Continuously Callable @ 100 | 1,400 | 1,470 | |||||||||
5.00%, 3/1/49, Continuously Callable @ 100 | 1,250 | 1,362 | |||||||||
4.00%, 10/1/49, Continuously Callable @ 100 | 1,150 | 1,197 | |||||||||
See notes to financial statements.
12
| USAA Mutual Funds Trust USAA Tax Exempt Long-Term Fund | Schedule of Portfolio Investments — continued March 31, 2021 | ||||||
(Amounts in Thousands, Except for Shares)
Security Description | Principal Amount | Value | |||||||||
Series A, 5.00%, 4/1/32, Pre-refunded 4/1/22 @ 100 | $ | 600 | $ | 628 | |||||||
Series A, 5.25%, 4/1/42, Pre-refunded 4/1/22 @ 100 | 1,500 | 1,575 | |||||||||
| Florida Municipal Loan Council Revenue (INS — Assured Guaranty Municipal Corp.), Series D, 5.25%, 10/1/33, Continuously Callable @ 100 | 2,500 | 2,560 | |||||||||
| Halifax Hospital Medical Center Revenue, 5.00%, 6/1/46, Continuously Callable @ 100 | 3,000 | 3,380 | |||||||||
Lee County IDA Revenue | |||||||||||
5.75%, 10/1/42, Pre-refunded 10/1/22 @ 100 | 4,000 | 4,328 | |||||||||
5.50%, 10/1/47, Pre-refunded 10/1/22 @ 102 | 5,000 | 5,491 | |||||||||
5.00%, 11/15/49, Continuously Callable @ 103 | 12,350 | 13,971 | |||||||||
| Lee Memorial Health System Revenue, Series A-1, 4.00%, 4/1/49, Continuously Callable @ 100 | 4,500 | 5,044 | |||||||||
Miami-Dade County Expressway Authority Revenue | |||||||||||
Series A, 5.00%, 7/1/39, Continuously Callable @ 100 | 5,000 | 5,647 | |||||||||
Series A, 5.00%, 7/1/40, Continuously Callable @ 100 | 5,000 | 5,017 | |||||||||
| Miami-Dade County Health Facilities Authority Revenue, 4.00%, 8/1/47, Continuously Callable @ 100 | 2,000 | 2,192 | |||||||||
| Orange County Health Facilities Authority Revenue, Series B, 4.00%, 10/1/45, Continuously Callable @ 100 | 1,500 | 1,645 | |||||||||
Palm Beach County Health Facilities Authority Revenue | |||||||||||
5.00%, 11/15/45, Continuously Callable @ 103 | 150 | 167 | |||||||||
5.00%, 5/15/47, Continuously Callable @ 100 | 5,000 | 5,623 | |||||||||
Series B, 5.00%, 11/15/42, Continuously Callable @ 103 | 1,000 | 1,156 | |||||||||
Palm Beach County Solid Waste Authority Revenue | |||||||||||
5.00%, 10/1/31, Pre-refunded 10/1/21 @ 100 | 155 | 159 | |||||||||
5.00%, 10/1/31, Continuously Callable @ 100 | 9,845 | 10,071 | |||||||||
Pinellas County Educational Facilities Authority Revenue | |||||||||||
5.00%, 10/1/27, Continuously Callable @ 100 | 1,000 | 1,055 | |||||||||
5.25%, 10/1/30, Continuously Callable @ 100 | 1,000 | 1,057 | |||||||||
6.00%, 10/1/41, Continuously Callable @ 100 | 3,650 | 3,729 | |||||||||
Polk County IDA Revenue | |||||||||||
5.00%, 1/1/49, Continuously Callable @ 103 | 1,000 | 1,072 | |||||||||
5.00%, 1/1/55, Continuously Callable @ 103 | 1,000 | 1,070 | |||||||||
| Sarasota County Health Facilities Authority Revenue, 5.00%, 5/15/48, Continuously Callable @ 103 | 1,835 | 2,039 | |||||||||
St. Johns County IDA Revenue, 4.00%, 8/1/55, Continuously Callable @ 103 | 6,000 | 6,363 | |||||||||
Tampa Housing Authority Revenue, 4.85%, 7/1/36, Callable 5/1/21 @ 100 | 2,200 | 2,205 | |||||||||
| Tampa-Hillsborough County Expressway Authority Revenue, Series B, 5.00%, 7/1/42, Pre-refunded 7/1/22 @ 100 | 3,050 | 3,235 | |||||||||
| Volusia County Educational Facility Authority Revenue, Series B, 5.00%, 10/15/45, Pre-refunded 4/15/25 @ 100 | 2,000 | 2,359 | |||||||||
| Volusia County Educational Facility Authority Revenue (INS — Assured Guaranty Municipal Corp.), 5.00%, 10/15/29, Pre-refunded 10/15/21 @ 100 | 2,350 | 2,410 | |||||||||
182,030 | |||||||||||
Georgia (1.6%): | |||||||||||
| Gainesville & Hall County Hospital Authority Revenue, 4.00%, 2/15/45, Continuously Callable @ 100 | 15,000 | 17,109 | |||||||||
| Glynn-Brunswick Memorial Hospital Authority Revenue, 5.00%, 8/1/47, Continuously Callable @ 100 | 1,500 | 1,722 | |||||||||
See notes to financial statements.
13
| USAA Mutual Funds Trust USAA Tax Exempt Long-Term Fund | Schedule of Portfolio Investments — continued March 31, 2021 | ||||||
(Amounts in Thousands, Except for Shares)
Security Description | Principal Amount | Value | |||||||||
Main Street Natural Gas, Inc. Revenue, Series A, 5.00%, 5/15/49 | $ | 3,000 | $ | 4,358 | |||||||
| Private Colleges & Universities Authority Revenue, Series A, 5.00%, 10/1/32, Continuously Callable @ 100 | 1,600 | 1,631 | |||||||||
| The Development Authority of Monroe County Revenue, 0.11%, 11/1/48, Continuously Callable @ 100 (c) | 700 | 700 | |||||||||
| Valdosta Housing Authority Revenue (LIQ — Deutsche Bank A.G.), Series 2020-XF1089, 0.35%, 4/1/60, Callable 4/1/35 @ 100 (c) (d) | 13,325 | 13,325 | |||||||||
38,845 | |||||||||||
Illinois (13.2%): | |||||||||||
| Bureau County Township High School District No. 502, GO (INS — Build America Mutual Assurance Co.) | |||||||||||
Series A, 5.00%, 12/1/38, Continuously Callable @ 100 | 1,555 | 1,867 | |||||||||
Series A, 5.00%, 12/1/39, Continuously Callable @ 100 | 1,400 | 1,680 | |||||||||
| Bureau County Township High School District No. 502, GO (INS-Build America Mutual Assurance Co.), Series A, 5.00%, 12/1/37, Continuously Callable @ 100 | 1,530 | 1,843 | |||||||||
| Chicago Board of Education, GO, Series H, 5.00%, 12/1/36, Continuously Callable @ 100 | 5,000 | 5,806 | |||||||||
| Chicago Board of Education, GO (LIQ — Deutsche Bank A.G.), Series 2017-XM0188, 0.20%, 12/1/39, Callable 12/1/21 @ 100 (c) (d) | 4,000 | 4,000 | |||||||||
Chicago Midway International Airport Revenue | |||||||||||
Series B, 5.00%, 1/1/41, Continuously Callable @ 100 | 2,500 | 2,865 | |||||||||
Series B, 5.00%, 1/1/46, Continuously Callable @ 100 | 3,500 | 3,982 | |||||||||
Chicago O'Hare International Airport Revenue | |||||||||||
5.75%, 1/1/43, Continuously Callable @ 100 | 5,000 | 5,296 | |||||||||
Series C, 4.00%, 1/1/38, Continuously Callable @ 100 | 1,000 | 1,159 | |||||||||
Series C, 5.00%, 1/1/41, Continuously Callable @ 100 | 5,000 | 5,915 | |||||||||
Chicago Park District, GO | |||||||||||
Series A, 5.00%, 1/1/40, Continuously Callable @ 100 | 3,000 | 3,361 | |||||||||
Series F-2, 5.00%, 1/1/40, Continuously Callable @ 100 | 1,125 | 1,347 | |||||||||
City of Chicago Special Assessment, 6.75%, 12/1/32, Continuously Callable @ 100 | 3,924 | 3,934 | |||||||||
City of Chicago Wastewater Transmission Revenue | |||||||||||
5.00%, 1/1/44, Continuously Callable @ 100 | 4,000 | 4,438 | |||||||||
Series A, 5.00%, 1/1/47, Continuously Callable @ 100 | 3,000 | 3,471 | |||||||||
Series C, 5.00%, 1/1/39, Continuously Callable @ 100 | 3,000 | 3,399 | |||||||||
| City of Chicago Waterworks Revenue, 5.00%, 11/1/44, Continuously Callable @ 100 | 3,000 | 3,360 | |||||||||
| City of Springfield Electric Revenue (INS — Assured Guaranty Municipal Corp.), 5.00%, 3/1/40, Continuously Callable @ 100 | 3,000 | 3,453 | |||||||||
| Cook County Community College District No. 508, GO (INS-Build America Mutual Assurance Co.), 5.00%, 12/1/47, Continuously Callable @ 100 | 9,500 | 11,018 | |||||||||
| County of Cook Sales Tax Revenue, 5.00%, 11/15/38, Continuously Callable @ 100 | 7,750 | 9,471 | |||||||||
County of Will, GO, 4.00%, 11/15/47, Continuously Callable @ 100 | 2,000 | 2,338 | |||||||||
Illinois Finance Authority Revenue | |||||||||||
3.90%, 3/1/30, Continuously Callable @ 100 | 14,000 | 15,467 | |||||||||
5.50%, 4/1/32, Continuously Callable @ 100 | 7,065 | 7,080 | |||||||||
4.00%, 2/1/33, Continuously Callable @ 100 | 6,000 | 6,411 | |||||||||
5.00%, 5/15/37, Continuously Callable @ 100 | 700 | 764 | |||||||||
4.00%, 3/1/38, Continuously Callable @ 100 | 2,000 | 2,226 | |||||||||
4.00%, 2/15/41, Pre-refunded 2/15/27 @ 100 | 20 | 24 | |||||||||
See notes to financial statements.
14
| USAA Mutual Funds Trust USAA Tax Exempt Long-Term Fund | Schedule of Portfolio Investments — continued March 31, 2021 | ||||||
(Amounts in Thousands, Except for Shares)
Security Description | Principal Amount | Value | |||||||||
5.00%, 8/1/42, Continuously Callable @ 100 | $ | 750 | $ | 846 | |||||||
6.00%, 7/1/43, Continuously Callable @ 100 | 5,000 | 5,552 | |||||||||
5.00%, 1/1/44, Continuously Callable @ 100 | 10,000 | 12,017 | |||||||||
5.00%, 8/15/44, Continuously Callable @ 100 | 2,000 | 2,231 | |||||||||
4.00%, 12/1/46, Continuously Callable @ 100 | 4,500 | 4,865 | |||||||||
5.00%, 2/15/47, Continuously Callable @ 100 | 1,000 | 1,085 | |||||||||
5.00%, 5/15/47, Continuously Callable @ 100 | 1,155 | 1,240 | |||||||||
5.00%, 8/1/47, Continuously Callable @ 100 | 750 | 844 | |||||||||
5.00%, 12/1/47, Continuously Callable @ 100 | 2,000 | 2,232 | |||||||||
5.00%, 10/1/49, Continuously Callable @ 100 | 1,250 | 1,506 | |||||||||
5.00%, 2/15/50, Continuously Callable @ 100 | 500 | 540 | |||||||||
5.00%, 10/1/51, Continuously Callable @ 100 | 1,000 | 1,203 | |||||||||
4.00%, 10/1/55, Continuously Callable @ 100 | 2,000 | 2,222 | |||||||||
Series A, 6.00%, 10/1/32, Pre-refunded 4/1/21 @ 100 | 8,000 | 8,000 | |||||||||
Series A, 4.00%, 7/1/38, Continuously Callable @ 100 | 5,000 | 5,512 | |||||||||
Series A, 4.00%, 10/1/40, Continuously Callable @ 100 | 12,395 | 13,837 | |||||||||
Series C, 4.00%, 2/15/41, Pre-refunded 2/15/27 @ 100 | 485 | 578 | |||||||||
Series C, 4.00%, 2/15/41, Continuously Callable @ 100 | 10,495 | 11,706 | |||||||||
| Illinois State Toll Highway Authority Revenue, Series A, 4.00%, 1/1/44, Continuously Callable @ 100 | 4,000 | 4,520 | |||||||||
| Metropolitan Pier & Exposition Authority Revenue, 5.00%, 6/15/42, Continuously Callable @ 100 | 2,000 | 2,440 | |||||||||
| Northern Illinois Municipal Power Agency Revenue, Series A, 4.00%, 12/1/41, Continuously Callable @ 100 | 9,000 | 10,001 | |||||||||
| Northern Illinois University Revenue (INS — Build America Mutual Assurance Co.), Series B, 4.00%, 4/1/41, Continuously Callable @ 100 | 600 | 673 | |||||||||
| Railsplitter Tobacco Settlement Authority Revenue, 5.50%, 6/1/23, Pre-refunded 6/1/21 @ 100 | 10,000 | 10,084 | |||||||||
| Regional Transportation Authority Revenue (INS — National Public Finance Guarantee Corp.), 6.50%, 7/1/30 | 37,550 | 50,959 | |||||||||
Sangamon County Water Reclamation District, GO | |||||||||||
Series A, 4.00%, 1/1/49, Continuously Callable @ 100 | 15,000 | 16,553 | |||||||||
Series A, 5.75%, 1/1/53, Continuously Callable @ 100 | 2,000 | 2,366 | |||||||||
State of Illinois, GO | |||||||||||
5.50%, 5/1/39, Continuously Callable @ 100 | 2,275 | 2,826 | |||||||||
Series A, 5.00%, 10/1/33, Continuously Callable @ 100 | 2,000 | 2,368 | |||||||||
State of Illinois, GO (INS — Assured Guaranty Municipal Corp.) | |||||||||||
4.00%, 2/1/31, Continuously Callable @ 100 | 1,000 | 1,117 | |||||||||
4.00%, 2/1/32, Continuously Callable @ 100 | 1,000 | 1,110 | |||||||||
Series A, 5.00%, 4/1/29, Continuously Callable @ 100 | 8,000 | 8,701 | |||||||||
| University of Illinois Revenue, Series A, 5.13%, 4/1/36, Continuously Callable @ 100 | 1,000 | 1,004 | |||||||||
| Village of Rosemont, GO (INS — Assured Guaranty Municipal Corp.), Series A, 5.00%, 12/1/46, Continuously Callable @ 100 | 10,000 | 11,646 | |||||||||
318,359 | |||||||||||
Indiana (1.7%): | |||||||||||
| Evansville Redevelopment Authority Revenue (INS — Build America Mutual Assurance Co.), 4.00%, 2/1/38, Continuously Callable @ 100 | 5,540 | 6,210 | |||||||||
| Evansville Redevelopment Authority Revenue (INS-Build America Mutual Assurance Co.), 4.00%, 2/1/39, Continuously Callable @ 100 | 3,605 | 4,029 | |||||||||
See notes to financial statements.
15
| USAA Mutual Funds Trust USAA Tax Exempt Long-Term Fund | Schedule of Portfolio Investments — continued March 31, 2021 | ||||||
(Amounts in Thousands, Except for Shares)
Security Description | Principal Amount | Value | |||||||||
Indiana Finance Authority Revenue | |||||||||||
5.00%, 2/1/40, Continuously Callable @ 100 | $ | 1,495 | $ | 1,666 | |||||||
5.00%, 11/15/43, Continuously Callable @ 103 | 1,970 | 2,215 | |||||||||
5.00%, 10/1/44, Pre-refunded 10/1/23 @ 100 | 4,000 | 4,472 | |||||||||
5.00%, 11/15/48, Continuously Callable @ 103 | 3,895 | 4,332 | |||||||||
Series A, 5.00%, 6/1/39, Continuously Callable @ 100 | 5,000 | 5,128 | |||||||||
Series A, 5.50%, 4/1/46, Continuously Callable @ 100 | 5,000 | 5,733 | |||||||||
| Richmond Hospital Authority Revenue, 5.00%, 1/1/39, Continuously Callable @ 100 | 7,000 | 7,980 | |||||||||
41,765 | |||||||||||
Iowa (0.6%): | |||||||||||
Iowa Finance Authority Revenue | |||||||||||
2.88%, 5/15/49, Continuously Callable @ 100 | 1,500 | 1,503 | |||||||||
Series A, 5.00%, 5/15/43, Continuously Callable @ 100 | 6,235 | 7,169 | |||||||||
Series B, 5.00%, 2/15/48, Continuously Callable @ 100 | 4,000 | 4,816 | |||||||||
13,488 | |||||||||||
Kansas (0.5%): | |||||||||||
| City of Coffeyville Electric System Revenue (INS-National Public Finance Guarantee Corp.), Series B, 5.00%, 6/1/42, Pre-refunded 6/1/25 @ 100 (d) | 2,500 | 2,960 | |||||||||
City of Lawrence Revenue, 5.00%, 7/1/48, Continuously Callable @ 100 | 5,000 | 5,835 | |||||||||
| Wyandotte County-Kansas City Unified Government Utility System Revenue, Series A, 5.00%, 9/1/45, Continuously Callable @ 100 | 2,000 | 2,275 | |||||||||
11,070 | |||||||||||
Kentucky (0.5%): | |||||||||||
City of Ashland Revenue, 5.00%, 2/1/40, Continuously Callable @ 100 | 1,000 | 1,091 | |||||||||
Kentucky Economic Development Finance Authority Revenue | |||||||||||
5.00%, 5/15/46, Continuously Callable @ 100 | 5,500 | 5,558 | |||||||||
Series B, 5.00%, 8/15/41, Continuously Callable @ 100 | 3,000 | 3,597 | |||||||||
| Kentucky Economic Development Finance Authority Revenue (INS — Assured Guaranty Municipal Corp.), 4.00%, 12/1/41, Continuously Callable @ 100 | 500 | 567 | |||||||||
| Kentucky Economic Development Finance Authority Revenue (INS — Assured Guaranty Municipal Corp.), Series A, 5.00%, 12/1/45, Continuously Callable @ 100 | 2,000 | 2,428 | |||||||||
13,241 | |||||||||||
Louisiana (3.9%): | |||||||||||
City of Shreveport Water & Sewer Revenue | |||||||||||
5.00%, 12/1/40, Continuously Callable @ 100 | 1,000 | 1,142 | |||||||||
Series B, 5.00%, 12/1/41, Continuously Callable @ 100 | 5,500 | 6,396 | |||||||||
Series B, 4.00%, 12/1/49, Continuously Callable @ 100 | 1,000 | 1,110 | |||||||||
| City of Shreveport Water & Sewer Revenue (INS — Assured Guaranty Municipal Corp.), Series B, 5.00%, 12/1/41, Continuously Callable @ 100 | 2,100 | 2,499 | |||||||||
| City of Shreveport Water & Sewer Revenue (INS — Build America Mutual Assurance Co.), Series B, 4.00%, 12/1/37, Continuously Callable @ 100 | 1,100 | 1,238 | |||||||||
| Jefferson Sales Tax District Revenue, Series B, 4.00%, 12/1/42, Continuously Callable @ 100 | 7,000 | 8,051 | |||||||||
| Louisiana Local Government Environmental Facilities & Community Development Authority Revenue, 3.50%, 11/1/32, Continuously Callable @ 100 | 6,250 | 6,804 | |||||||||
See notes to financial statements.
16
| USAA Mutual Funds Trust USAA Tax Exempt Long-Term Fund | Schedule of Portfolio Investments — continued March 31, 2021 | ||||||
(Amounts in Thousands, Except for Shares)
Security Description | Principal Amount | Value | |||||||||
| Louisiana Local Government Environmental Facilities & Community Development Authority Revenue (INS — Assured Guaranty Municipal Corp.), 5.00%, 10/1/48, Continuously Callable @ 100 | $ | 5,000 | $ | 5,752 | |||||||
| Louisiana Local Government Environmental Facilities & Community Development Authority Revenue (INS-Assured Guaranty Municipal Corp.) | |||||||||||
5.00%, 10/1/39, Continuously Callable @ 100 | 1,685 | 2,048 | |||||||||
4.00%, 10/1/46, Continuously Callable @ 100 | 8,210 | 8,842 | |||||||||
Louisiana Public Facilities Authority Revenue | |||||||||||
4.00%, 5/15/41, Pre-refunded 5/15/26 @ 100 | 15 | 18 | |||||||||
4.00%, 5/15/41, Continuously Callable @ 100 | 1,235 | 1,348 | |||||||||
5.00%, 11/1/45, Pre-refunded 11/1/25 @ 100 | 6,000 | 7,234 | |||||||||
5.00%, 5/15/46, Continuously Callable @ 100 | 5,000 | 5,847 | |||||||||
4.00%, 12/15/50, Continuously Callable @ 100 | 1,000 | 1,100 | |||||||||
5.00%, 7/1/52, Continuously Callable @ 100 | 400 | 456 | |||||||||
4.00%, 1/1/56, Continuously Callable @ 100 | 9,000 | 9,564 | |||||||||
5.00%, 7/1/57, Continuously Callable @ 100 | 2,000 | 2,274 | |||||||||
| Louisiana Public Facilities Authority Revenue (INS-Build America Mutual Assurance Co.), 5.25%, 6/1/51, Continuously Callable @ 100 | 5,000 | 5,717 | |||||||||
Parish of St. Charles Revenue, 4.00%, 12/1/40, (Put Date 6/1/22) (b) | 6,750 | 7,025 | |||||||||
| State of Louisiana Gasoline & Fuels Tax Revenue, Series C, 5.00%, 5/1/45, Continuously Callable @ 100 | 6,000 | 7,382 | |||||||||
| Tobacco Settlement Financing Corp. Revenue, Series A, 5.25%, 5/15/35, Continuously Callable @ 100 | 1,500 | 1,619 | |||||||||
93,466 | |||||||||||
Maine (0.4%): | |||||||||||
| Maine Health & Higher Educational Facilities Authority Revenue, Series A, 4.00%, 7/1/46, Continuously Callable @ 100 | 9,000 | 9,175 | |||||||||
Massachusetts (1.4%): | |||||||||||
Massachusetts Development Finance Agency Revenue | |||||||||||
5.00%, 4/15/40, Continuously Callable @ 100 | 1,000 | 1,095 | |||||||||
5.00%, 7/1/46, Continuously Callable @ 100 | 4,000 | 4,610 | |||||||||
5.00%, 7/1/47, Continuously Callable @ 100 | 2,280 | 2,572 | |||||||||
Series A, 5.50%, 7/1/44, Continuously Callable @ 100 | 4,000 | 3,957 | |||||||||
Series A, 4.00%, 10/1/46, Continuously Callable @ 100 | 3,370 | 3,592 | |||||||||
Series A, 4.00%, 6/1/49, Continuously Callable @ 100 | 1,000 | 1,113 | |||||||||
Series C, 4.00%, 10/1/45, Continuously Callable @ 100 | 1,250 | 1,413 | |||||||||
Series D, 5.00%, 7/1/44, Continuously Callable @ 100 | 3,000 | 3,370 | |||||||||
Series E, 4.00%, 7/1/38, Continuously Callable @ 100 | 1,000 | 1,090 | |||||||||
Series J2, 5.00%, 7/1/53, Continuously Callable @ 100 | 10,000 | 11,870 | |||||||||
34,682 | |||||||||||
Michigan (2.3%): | |||||||||||
County of Genesee, GO, Series B, 4.00%, 2/1/41, Continuously Callable @ 100 | 2,000 | 2,200 | |||||||||
| County of Genesee, GO (INS — Build America Mutual Assurance Co.), Series B, 5.00%, 2/1/46, Continuously Callable @ 100 | 2,900 | 3,358 | |||||||||
| Downriver Utility Wastewater Authority Revenue (INS — Assured Guaranty Municipal Corp.), 5.00%, 4/1/43, Continuously Callable @ 100 | 2,500 | 2,979 | |||||||||
| Flint Hospital Building Authority Revenue, 4.00%, 7/1/38, Continuously Callable @ 100 | 2,500 | 2,703 | |||||||||
See notes to financial statements.
17
| USAA Mutual Funds Trust USAA Tax Exempt Long-Term Fund | Schedule of Portfolio Investments — continued March 31, 2021 | ||||||
(Amounts in Thousands, Except for Shares)
Security Description | Principal Amount | Value | |||||||||
| Jackson Public Schools, GO (NBGA — Michigan School Bond Qualification and Loan Program) | |||||||||||
5.00%, 5/1/45, Continuously Callable @ 100 | $ | 6,000 | $ | 7,272 | |||||||
5.00%, 5/1/48, Continuously Callable @ 100 | 3,000 | 3,627 | |||||||||
| Karegnondi Water Authority Revenue, 5.00%, 11/1/45, Continuously Callable @ 100 | 2,750 | 3,250 | |||||||||
| Lansing Board of Water & Light Revenue, Series A, 5.00%, 7/1/37, Pre-refunded 7/1/21 @ 100 | 4,500 | 4,553 | |||||||||
| Livonia Public Schools, GO (INS — Assured Guaranty Municipal Corp.), 5.00%, 5/1/45, Continuously Callable @ 100 | 4,000 | 4,616 | |||||||||
Michigan Finance Authority Revenue | |||||||||||
5.00%, 11/1/43, Continuously Callable @ 100 | 1,000 | 1,221 | |||||||||
4.00%, 2/15/47, Continuously Callable @ 100 | 8,000 | 9,061 | |||||||||
4.00%, 9/1/50, Continuously Callable @ 100 | 1,000 | 1,076 | |||||||||
4.00%, 11/1/55, Continuously Callable @ 100 | 4,000 | 4,538 | |||||||||
Series A, 4.00%, 11/15/50, Continuously Callable @ 100 | 3,000 | 3,390 | |||||||||
| Michigan State Building Authority Revenue, 4.00%, 4/15/54, Continuously Callable @ 100 | 2,000 | 2,259 | |||||||||
56,103 | |||||||||||
Mississippi (0.1%): | |||||||||||
County of Warren Revenue, 5.38%, 12/1/35, Continuously Callable @ 100 | 3,000 | 3,094 | |||||||||
Missouri (2.8%): | |||||||||||
Cape Girardeau County IDA Revenue | |||||||||||
5.00%, 3/1/36, Continuously Callable @ 100 | 750 | 830 | |||||||||
Series A, 6.00%, 3/1/33, Continuously Callable @ 103 | 2,210 | 2,401 | |||||||||
Hannibal IDA Revenue, 5.00%, 10/1/47, Continuously Callable @ 100 | 3,000 | 3,471 | |||||||||
Health & Educational Facilities Authority of the State of Missouri Revenue | |||||||||||
5.00%, 5/15/40, Continuously Callable @ 103 | 5,510 | 5,980 | |||||||||
5.00%, 2/1/42, Continuously Callable @ 104 | 3,500 | 3,843 | |||||||||
4.00%, 2/1/48, Continuously Callable @ 100 | 10,000 | 10,475 | |||||||||
Series A, 5.00%, 11/15/43, Continuously Callable @ 100 | 1,000 | 1,208 | |||||||||
Series A, 4.00%, 2/15/54, Continuously Callable @ 100 | 2,500 | 2,774 | |||||||||
| Missouri Development Finance Board Revenue, 4.00%, 6/1/46, Continuously Callable @ 100 | 17,775 | 19,130 | |||||||||
St. Louis County IDA Revenue | |||||||||||
5.88%, 9/1/43, Continuously Callable @ 100 | 5,000 | 5,341 | |||||||||
5.00%, 9/1/48, Continuously Callable @ 100 | 2,000 | 2,203 | |||||||||
| St. Louis Municipal Finance Corp. Revenue (INS — Assured Guaranty Municipal Corp.), 5.00%, 10/1/38, Continuously Callable @ 100 | 3,065 | 3,667 | |||||||||
| St. Louis Municipal Finance Corp. Revenue (INS — Assured Guaranty Municipal Corp.), 5.00%, 10/1/49, Continuously Callable @ 100 | 3,000 | 3,696 | |||||||||
| Stoddard County IDA Revenue, Series B, 6.00%, 3/1/37, Continuously Callable @ 103 | 1,940 | 2,099 | |||||||||
67,118 | |||||||||||
Montana (0.2%): | |||||||||||
City of Forsyth Revenue, 3.90%, 3/1/31, Callable 3/1/23 @ 100 | 4,000 | 4,246 | |||||||||
See notes to financial statements.
18
| USAA Mutual Funds Trust USAA Tax Exempt Long-Term Fund | Schedule of Portfolio Investments — continued March 31, 2021 | ||||||
(Amounts in Thousands, Except for Shares)
Security Description | Principal Amount | Value | |||||||||
Nebraska (0.6%): | |||||||||||
Central Plains Energy Project Revenue, Series A, 5.00%, 9/1/42 | $ | 2,000 | $ | 2,815 | |||||||
| Douglas County Hospital Authority No. 3 Revenue, 5.00%, 11/1/48, Continuously Callable @ 100 | 3,400 | 3,898 | |||||||||
| Nebraska Educational Health Cultural & Social Services Finance Authority Revenue, 4.00%, 1/1/49, Continuously Callable @ 102 | 7,500 | 8,023 | |||||||||
14,736 | |||||||||||
Nevada (0.9%): | |||||||||||
City of Carson City Revenue, 5.00%, 9/1/47, Continuously Callable @ 100 | 2,775 | 3,215 | |||||||||
Las Vegas Convention & Visitors Authority Revenue | |||||||||||
Series C, 4.00%, 7/1/41, Continuously Callable @ 100 | 4,400 | 4,746 | |||||||||
Series C, 4.00%, 7/1/46, Continuously Callable @ 100 | 12,140 | 13,021 | |||||||||
20,982 | |||||||||||
New Hampshire (0.1%): | |||||||||||
| New Hampshire Business Finance Authority Revenue, 4.00%, 1/1/51, Continuously Callable @ 103 | 2,500 | 2,714 | |||||||||
New Jersey (5.0%): | |||||||||||
New Jersey Economic Development Authority Revenue | |||||||||||
1.65% (MUNIPSA+160bps), 3/1/28, Callable 3/1/23 @ 100 (h) | 20,000 | 19,927 | |||||||||
5.00%, 6/15/28, Continuously Callable @ 100 | 2,000 | 2,078 | |||||||||
5.00%, 6/15/40, Continuously Callable @ 100 | 8,125 | 8,928 | |||||||||
5.00%, 6/15/40, Pre-refunded 6/15/24 @ 100 | 1,875 | 2,156 | |||||||||
4.00%, 11/1/44, Continuously Callable @ 100 | 3,000 | 3,292 | |||||||||
4.00%, 6/15/49, Continuously Callable @ 100 | 4,000 | 4,398 | |||||||||
Series A, 5.00%, 6/15/47, Continuously Callable @ 100 | 3,000 | 3,450 | |||||||||
Series AAA, 5.00%, 6/15/41, Continuously Callable @ 100 | 4,000 | 4,617 | |||||||||
Series B, 5.00%, 6/15/43, Continuously Callable @ 100 | 3,500 | 4,136 | |||||||||
Series WW, 5.25%, 6/15/40, Continuously Callable @ 100 | 2,835 | 3,234 | |||||||||
Series WW, 5.25%, 6/15/40, Pre-refunded 6/15/25 @ 100 | 165 | 198 | |||||||||
| New Jersey Economic Development Authority Revenue (INS — Assured Guaranty Municipal Corp.), 5.00%, 6/1/42, Continuously Callable @ 100 | 1,200 | 1,395 | |||||||||
New Jersey Educational Facilities Authority Revenue | |||||||||||
Series B, 5.00%, 9/1/36, Continuously Callable @ 100 | 5,000 | 5,787 | |||||||||
Series F, 5.00%, 7/1/47, Continuously Callable @ 100 | 3,000 | 3,043 | |||||||||
New Jersey Health Care Facilities Financing Authority Revenue | |||||||||||
5.00%, 10/1/38, Continuously Callable @ 100 | 2,250 | 2,614 | |||||||||
Series A, 5.63%, 7/1/32, Pre-refunded 7/1/21 @ 100 | 15,000 | 15,197 | |||||||||
| New Jersey Health Care Facilities Financing Authority Revenue (INS — Assured Guaranty Municipal Corp.), Series A, 5.00%, 7/1/46, Continuously Callable @ 100 | 1,250 | 1,397 | |||||||||
New Jersey Transportation Trust Fund Authority Revenue | |||||||||||
5.25%, 6/15/43, Continuously Callable @ 100 | 4,000 | 4,837 | |||||||||
Series A, 5.00%, 12/15/36, Continuously Callable @ 100 | 2,125 | 2,560 | |||||||||
Series AA, 5.25%, 6/15/41, Continuously Callable @ 100 | 2,000 | 2,280 | |||||||||
Series AA, 4.00%, 6/15/50, Continuously Callable @ 100 | 3,000 | 3,328 | |||||||||
Series BB, 4.00%, 6/15/50, Continuously Callable @ 100 | 15,000 | 16,337 | |||||||||
| New Jersey Turnpike Authority Revenue, Series A, 4.00%, 1/1/51, Continuously Callable @ 100 | 1,000 | 1,151 | |||||||||
See notes to financial statements.
19
| USAA Mutual Funds Trust USAA Tax Exempt Long-Term Fund | Schedule of Portfolio Investments — continued March 31, 2021 | ||||||
(Amounts in Thousands, Except for Shares)
Security Description | Principal Amount | Value | |||||||||
| South Jersey Transportation Authority Revenue, Series A, 4.00%, 11/1/50, Continuously Callable @ 100 | $ | 2,000 | $ | 2,265 | |||||||
| Tobacco Settlement Financing Corp. Revenue, Series A, 5.25%, 6/1/46, Continuously Callable @ 100 | 3,000 | 3,556 | |||||||||
122,161 | |||||||||||
New Mexico (0.4%): | |||||||||||
| New Mexico Hospital Equipment Loan Council Revenue, Series A, 5.00%, 7/1/49, Continuously Callable @ 102 | 8,625 | 9,545 | |||||||||
New York (2.4%): | |||||||||||
| Buffalo & Erie County Industrial Land Development Corp. Revenue, 5.38%, 10/1/41, Pre-refunded 4/1/21 @ 100 | 2,040 | 2,040 | |||||||||
Metropolitan Transportation Authority Revenue | |||||||||||
Series A, 11/15/32 (e) | 5,000 | 3,913 | |||||||||
Series A-2, 5.00%, 11/15/45, (Put Date 5/15/30) (b) | 5,490 | 6,928 | |||||||||
Series B-2A, 5.00%, 5/15/21 | 1,000 | 1,005 | |||||||||
New York Liberty Development Corp. Revenue | |||||||||||
5.25%, 10/1/35 | 16,130 | 22,572 | |||||||||
2.80%, 9/15/69, Continuously Callable @ 100 | 1,500 | 1,451 | |||||||||
New York State Dormitory Authority Revenue | |||||||||||
Series A, 4.00%, 3/15/47, Continuously Callable @ 100 | 5,000 | 5,744 | |||||||||
Series A, 4.00%, 9/1/50, Continuously Callable @ 100 | 3,000 | 3,342 | |||||||||
| New York State Thruway Authority Revenue, Series A, 5.00%, 1/1/51, Continuously Callable @ 100 | 2,000 | 2,298 | |||||||||
Triborough Bridge & Tunnel Authority Revenue | |||||||||||
Series A, 11/15/31 (e) | 5,000 | 4,046 | |||||||||
Series A, 11/15/32 (e) | 3,000 | 2,344 | |||||||||
Series B, 11/15/32 (e) | 2,500 | 2,019 | |||||||||
TSASC, Inc. Revenue, Series A, 5.00%, 6/1/41, Continuously Callable @ 100 | 1,000 | 1,158 | |||||||||
58,860 | |||||||||||
North Carolina (0.2%): | |||||||||||
North Carolina Medical Care Commission Revenue | |||||||||||
5.00%, 1/1/49, Continuously Callable @ 104 | 2,725 | 3,018 | |||||||||
Series A, 4.00%, 10/1/50, Continuously Callable @ 103 | 1,000 | 1,075 | |||||||||
4,093 | |||||||||||
North Dakota (0.6%): | |||||||||||
City of Fargo Revenue, 6.25%, 11/1/31, Pre-refunded 11/1/21 @ 100 | 4,685 | 4,849 | |||||||||
County of Ward Revenue, Series C, 5.00%, 6/1/43, Continuously Callable @ 100 | 7,500 | 8,608 | |||||||||
13,457 | |||||||||||
Ohio (2.5%): | |||||||||||
City of Centerville Revenue, 5.25%, 11/1/47, Continuously Callable @ 100 | 2,700 | 2,749 | |||||||||
| City of Cleveland Airport System Revenue (INS — Assured Guaranty Municipal Corp.), Series A, 5.00%, 1/1/31, Pre-refunded 1/1/22 @ 100 | 1,000 | 1,036 | |||||||||
| City of Middleburg Heights Revenue, Series A, 4.00%, 8/1/47, Continuously Callable @ 100 | 2,000 | 2,279 | |||||||||
County of Cuyahoga Revenue, 4.75%, 2/15/47, Continuously Callable @ 100 | 9,000 | 10,032 | |||||||||
| County of Franklin Revenue, Series B, 5.00%, 7/1/45, Continuously Callable @ 103 | 5,000 | 5,712 | |||||||||
County of Hamilton Revenue, 5.00%, 1/1/51, Continuously Callable @ 100 | 2,500 | 2,641 | |||||||||
County of Lake Revenue, 5.63%, 8/15/29, Continuously Callable @ 100 | 320 | 321 | |||||||||
See notes to financial statements.
20
| USAA Mutual Funds Trust USAA Tax Exempt Long-Term Fund | Schedule of Portfolio Investments — continued March 31, 2021 | ||||||
(Amounts in Thousands, Except for Shares)
Security Description | Principal Amount | Value | |||||||||
County of Lucas Revenue, 5.25%, 11/15/48, Continuously Callable @ 100 | $ | 6,000 | $ | 6,886 | |||||||
County of Montgomery Revenue | |||||||||||
4.00%, 11/15/42, Continuously Callable @ 100 | 2,500 | 2,774 | |||||||||
4.00%, 11/15/45, Continuously Callable @ 100 | 2,000 | 2,196 | |||||||||
County of Ross Revenue | |||||||||||
5.00%, 12/1/44, Continuously Callable @ 100 | 3,100 | 3,797 | |||||||||
5.00%, 12/1/49, Continuously Callable @ 100 | 6,000 | 7,323 | |||||||||
Ohio Air Quality Development Authority Revenue, 8/1/30 (i) (j) | 6,000 | — | |||||||||
| Ohio Higher Educational Facility Commission Revenue, 5.25%, 1/1/48, Continuously Callable @ 104 | 1,000 | 967 | |||||||||
| Ohio Turnpike & Infrastructure Commission Revenue, 5.25%, 2/15/33, Continuously Callable @ 100 | 2,000 | 2,175 | |||||||||
State of Ohio Revenue | |||||||||||
4.00%, 11/15/40, Continuously Callable @ 100 | 655 | 741 | |||||||||
Series A, 4.00%, 1/15/50, Continuously Callable @ 100 | 7,000 | 7,895 | |||||||||
59,524 | |||||||||||
Oklahoma (1.1%): | |||||||||||
| Comanche County Hospital Authority Revenue, Series A, 5.00%, 7/1/32, Continuously Callable @ 100 | 4,200 | 4,318 | |||||||||
| Norman Regional Hospital Authority Revenue, 4.00%, 9/1/45, Continuously Callable @ 100 | 3,000 | 3,287 | |||||||||
| Oklahoma Development Finance Authority Revenue, Series B, 5.50%, 8/15/57, Continuously Callable @ 100 | 4,250 | 5,145 | |||||||||
| Oklahoma Municipal Power Authority Revenue, Series A, 4.00%, 1/1/47, Continuously Callable @ 100 | 10,000 | 10,823 | |||||||||
| Tulsa County Industrial Authority Revenue, 5.25%, 11/15/45, Continuously Callable @ 102 | 2,000 | 2,100 | |||||||||
25,673 | |||||||||||
Oregon (0.4%): | |||||||||||
City of Keizer Special Assessment, 5.20%, 6/1/31, Continuously Callable @ 100 | 850 | 853 | |||||||||
| Deschutes County Hospital Facilities Authority Revenue, 4.00%, 1/1/46, Continuously Callable @ 100 | 2,000 | 2,141 | |||||||||
| Medford Hospital Facilities Authority Revenue, Series A, 4.00%, 8/15/50, Continuously Callable @ 100 | 3,800 | 4,295 | |||||||||
| Salem Hospital Facility Authority Revenue, 5.00%, 5/15/53, Continuously Callable @ 102 | 1,000 | 1,110 | |||||||||
| Yamhill County Hospital Authority Revenue, 5.00%, 11/15/51, Continuously Callable @ 102 | 1,180 | 1,243 | |||||||||
9,642 | |||||||||||
Pennsylvania (8.0%): | |||||||||||
| Adams County General Authority Revenue, 4.00%, 8/15/45, Continuously Callable @ 100 | 7,400 | 8,513 | |||||||||
| Allegheny County Hospital Development Authority Revenue, 5.00%, 4/1/47, Continuously Callable @ 100 | 6,500 | 7,598 | |||||||||
| Allegheny County Sanitary Authority Revenue, 5.00%, 6/1/43, Continuously Callable @ 100 | 3,170 | 3,827 | |||||||||
| Allentown Commercial & IDA Revenue, 6.25%, 7/1/47, Continuously Callable @ 100 (d) | 5,000 | 5,204 | |||||||||
See notes to financial statements.
21
| USAA Mutual Funds Trust USAA Tax Exempt Long-Term Fund | Schedule of Portfolio Investments — continued March 31, 2021 | ||||||
(Amounts in Thousands, Except for Shares)
Security Description | Principal Amount | Value | |||||||||
| Altoona Area School District, GO (INS — Build America Mutual Assurance Co.), 5.00%, 12/1/45, Continuously Callable @ 100 | $ | 1,000 | $ | 1,158 | |||||||
| Altoona Area School District, GO (INS-Build America Mutual Assurance Co.), 5.00%, 12/1/48, Continuously Callable @ 100 | 300 | 347 | |||||||||
Armstrong School District, GO | |||||||||||
Series A, 4.00%, 3/15/38, Continuously Callable @ 100 | 1,000 | 1,165 | |||||||||
Series A, 4.00%, 3/15/41, Continuously Callable @ 100 | 2,250 | 2,590 | |||||||||
Berks County IDA Revenue | |||||||||||
5.00%, 5/15/48, Continuously Callable @ 102 | 1,000 | 1,073 | |||||||||
5.00%, 11/1/50, Continuously Callable @ 100 | 8,500 | 8,729 | |||||||||
Bucks County IDA Revenue, 4.00%, 8/15/50, Continuously Callable @ 100 | 3,000 | 3,300 | |||||||||
Canon Mcmillan School District, GO | |||||||||||
4.00%, 6/1/48, Continuously Callable @ 100 | 4,605 | 5,129 | |||||||||
4.00%, 6/1/50, Continuously Callable @ 100 | 6,065 | 6,747 | |||||||||
| Chester County IDA Revenue, Series A, 5.25%, 10/15/47, Continuously Callable @ 100 | 3,250 | 3,577 | |||||||||
| Commonwealth Financing Authority Revenue, 5.00%, 6/1/35, Continuously Callable @ 100 | 500 | 610 | |||||||||
| Commonwealth of Pennsylvania Certificate of Participation, Series A, 5.00%, 7/1/43, Continuously Callable @ 100 | 1,000 | 1,193 | |||||||||
County of Lehigh Revenue, 4.00%, 7/1/49, Continuously Callable @ 100 | 15,000 | 17,106 | |||||||||
| Delaware County Authority Revenue, 5.00%, 10/1/39, Continuously Callable @ 100 | 2,250 | 2,591 | |||||||||
| Delaware River Joint Toll Bridge Commission Revenue, 5.00%, 7/1/47, Continuously Callable @ 100 | 5,000 | 5,949 | |||||||||
Montgomery County Higher Education & Health Authority Revenue | |||||||||||
4.00%, 9/1/49, Continuously Callable @ 100 | 2,500 | 2,788 | |||||||||
4.00%, 9/1/51, Continuously Callable @ 100 | 3,500 | 3,901 | |||||||||
Montgomery County IDA Revenue | |||||||||||
5.00%, 12/1/48, Continuously Callable @ 102 | 2,000 | 2,208 | |||||||||
5.00%, 12/1/49, Continuously Callable @ 103 | 2,000 | 2,250 | |||||||||
Northampton County General Purpose Authority Revenue | |||||||||||
4.00%, 8/15/40, Continuously Callable @ 100 | 4,000 | 4,360 | |||||||||
5.00%, 8/15/48, Continuously Callable @ 100 | 2,440 | 2,869 | |||||||||
Northeastern Pennsylvania Hospital & Education Authority Revenue | |||||||||||
5.00%, 5/1/44, Continuously Callable @ 100 | 1,000 | 1,144 | |||||||||
5.00%, 5/1/49, Continuously Callable @ 100 | 1,350 | 1,530 | |||||||||
Pennsylvania Higher Educational Facilities Authority Revenue | |||||||||||
Series A, 5.25%, 7/15/33, Continuously Callable @ 100 | 1,970 | 2,126 | |||||||||
Series A, 5.50%, 7/15/38, Continuously Callable @ 100 | 2,750 | 2,974 | |||||||||
Pennsylvania Turnpike Commission Revenue | |||||||||||
5.00%, 12/1/37, Continuously Callable @ 100 | 1,000 | 1,219 | |||||||||
Series A, 4.00%, 12/1/49, Continuously Callable @ 100 | 5,000 | 5,648 | |||||||||
Series A-1, 5.00%, 12/1/46, Continuously Callable @ 100 | 3,000 | 3,457 | |||||||||
Series A-1, 5.00%, 12/1/47, Continuously Callable @ 100 | 4,000 | 4,758 | |||||||||
Series A-2, 5.00%, 12/1/33, Continuously Callable @ 100 | 1,250 | 1,571 | |||||||||
Series B, 5.00%, 6/1/39, Continuously Callable @ 100 | 8,000 | 9,479 | |||||||||
Series B, 5.00%, 12/1/43, Continuously Callable @ 100 | 5,000 | 6,055 | |||||||||
Series B, 5.25%, 12/1/44, Continuously Callable @ 100 | 10,000 | 11,558 | |||||||||
Series B-1, 5.00%, 6/1/42, Continuously Callable @ 100 | 4,000 | 4,774 | |||||||||
See notes to financial statements.
22
| USAA Mutual Funds Trust USAA Tax Exempt Long-Term Fund | Schedule of Portfolio Investments — continued March 31, 2021 | ||||||
(Amounts in Thousands, Except for Shares)
Security Description | Principal Amount | Value | |||||||||
| Philadelphia School District, GO, Series A, 5.00%, 9/1/44, Continuously Callable @ 100 | $ | 10,000 | $ | 12,269 | |||||||
| Pittsburgh Water & Sewer Authority Revenue (INS — Assured Guaranty Municipal Corp.), Series A, 5.00%, 9/1/44, Continuously Callable @ 100 | 5,000 | 6,151 | |||||||||
| Reading School District, GO (INS — Build America Mutual Assurance Co.), Series A, 4.00%, 4/1/44, Continuously Callable @ 100 | 1,055 | 1,206 | |||||||||
School District of Philadelphia, GO | |||||||||||
Series B, 5.00%, 9/1/43, Continuously Callable @ 100 | 2,500 | 3,037 | |||||||||
Series F, 5.00%, 9/1/37, Continuously Callable @ 100 | 1,000 | 1,189 | |||||||||
Series F, 5.00%, 9/1/38, Continuously Callable @ 100 | 2,000 | 2,373 | |||||||||
| Scranton School District, GO (INS — Build America Mutual Assurance Co.), Series E, 4.00%, 12/1/37, Continuously Callable @ 100 | 1,025 | 1,167 | |||||||||
| Wilkes-Barre Area School District, GO (INS — Build America Mutual Assurance Co.), 5.00%, 4/15/59, Continuously Callable @ 100 | 3,000 | 3,607 | |||||||||
| Wilkes-Barre Area School District, GO (INS-Build America Mutual Assurance Co.), 4.00%, 4/15/49, Continuously Callable @ 100 | 750 | 845 | |||||||||
192,919 | |||||||||||
Puerto Rico (0.1%): | |||||||||||
| Puerto Rico Industrial Tourist Educational Medical & Environmental Control Facilities Authority Revenue, 5.38%, 4/1/42, Continuously Callable @ 100 | 2,000 | 2,019 | |||||||||
Rhode Island (0.1%): | |||||||||||
| Rhode Island Health & Educational Building Corp. Revenue, 6.00%, 9/1/33, Pre-refunded 9/1/23 @ 100 | 2,000 | 2,275 | |||||||||
| Rhode Island Housing & Mortgage Finance Corp. Revenue, Series 15-A, 6.85%, 10/1/24, Continuously Callable @ 100 | 180 | 181 | |||||||||
2,456 | |||||||||||
South Carolina (0.6%): | |||||||||||
| City of Rock Hill Combined Utility System Revenue, Series A, 4.00%, 1/1/49, Continuously Callable @ 100 | 2,500 | 2,809 | |||||||||
South Carolina Jobs-Economic Development Authority Revenue | |||||||||||
5.00%, 11/15/47, Continuously Callable @ 103 | 1,850 | 2,058 | |||||||||
5.00%, 4/1/54, Continuously Callable @ 103 | 1,000 | 1,082 | |||||||||
4.00%, 4/1/54, Continuously Callable @ 103 | 1,165 | 1,178 | |||||||||
| South Carolina Public Service Authority Revenue, Series E, 5.25%, 12/1/55, Continuously Callable @ 100 | 7,000 | 8,155 | |||||||||
15,282 | |||||||||||
South Dakota (0.2%): | |||||||||||
| Educational Enhancement Funding Corp. Revenue, Series B, 5.00%, 6/1/27, Continuously Callable @ 100 | 500 | 549 | |||||||||
| South Dakota Health & Educational Facilities Authority Revenue, Series A, 5.00%, 7/1/42, Pre-refunded 7/1/21 @ 100 | 4,000 | 4,047 | |||||||||
4,596 | |||||||||||
Tennessee (0.5%): | |||||||||||
| Greeneville Health & Educational Facilities Board Revenue, 5.00%, 7/1/44, Continuously Callable @ 100 | 2,000 | 2,364 | |||||||||
| Johnson City Health & Educational Facilities Board Revenue, 5.00%, 8/15/42, Continuously Callable @ 100 | 2,000 | 2,109 | |||||||||
See notes to financial statements.
23
| USAA Mutual Funds Trust USAA Tax Exempt Long-Term Fund | Schedule of Portfolio Investments — continued March 31, 2021 | ||||||
(Amounts in Thousands, Except for Shares)
Security Description | Principal Amount | Value | |||||||||
| Metropolitan Government Nashville & Davidson County Health & Educational Facilities Board Revenue | |||||||||||
5.00%, 10/1/45, Continuously Callable @ 100 | $ | 1,500 | $ | 1,628 | |||||||
5.00%, 7/1/46, Continuously Callable @ 100 | 4,000 | 4,702 | |||||||||
| Metropolitan Nashville Airport Authority Revenue, Series A, 4.00%, 7/1/54, Continuously Callable @ 100 | 2,000 | 2,276 | |||||||||
13,079 | |||||||||||
Texas (18.3%): | |||||||||||
| Arlington Higher Education Finance Corp. Revenue (NBGA — Texas Permanent School Fund) | |||||||||||
4.00%, 8/15/43, Continuously Callable @ 100 | 10,000 | 11,362 | |||||||||
Series A, 5.00%, 2/15/41, Continuously Callable @ 100 | 3,000 | 3,436 | |||||||||
Series A, 5.00%, 12/1/53, Continuously Callable @ 100 | 7,200 | 8,503 | |||||||||
| Arlington Higher Education Finance Corp. Revenue (NBGA-Texas Permanent School Fund), 4.00%, 8/15/44, Continuously Callable @ 100 | 2,170 | 2,505 | |||||||||
Bexar County Health Facilities Development Corp. Revenue | |||||||||||
5.00%, 7/15/42, Continuously Callable @ 105 | 600 | 643 | |||||||||
4.00%, 7/15/45, Continuously Callable @ 100 | 8,450 | 8,463 | |||||||||
Central Texas Regional Mobility Authority Revenue | |||||||||||
4.00%, 1/1/41, Continuously Callable @ 100 | 5,000 | 5,395 | |||||||||
5.00%, 1/1/42, Pre-refunded 1/1/23 @ 100 | 2,500 | 2,707 | |||||||||
Series A, 5.00%, 1/1/45, Continuously Callable @ 100 | 3,500 | 3,975 | |||||||||
Central Texas Turnpike System Revenue | |||||||||||
Series A, 5.00%, 8/15/41, Pre-refunded 8/15/22 @ 100 | 3,850 | 4,101 | |||||||||
Series C, 5.00%, 8/15/42, Continuously Callable @ 100 | 6,500 | 7,323 | |||||||||
| Central Texas Turnpike System Revenue (INS — AMBAC Assurance Corp.), Series A, 8/15/30 (e) | 18,530 | 15,737 | |||||||||
| City of Arlington Special Tax (INS-Assured Guaranty Municipal Corp.), Series A, 5.00%, 2/15/48, Continuously Callable @ 100 | 7,500 | 9,005 | |||||||||
| City of Corpus Christi Utility System Revenue, 4.00%, 7/15/39, Continuously Callable @ 100 | 5,900 | 6,616 | |||||||||
| City of Houston Hotel Occupancy Tax & Special Revenue, 5.00%, 9/1/40, Continuously Callable @ 100 | 3,715 | 4,015 | |||||||||
| City of Laredo Waterworks & Sewer System Revenue, 4.00%, 3/1/41, Continuously Callable @ 100 | 700 | 778 | |||||||||
Clifton Higher Education Finance Corp. Revenue | |||||||||||
6.00%, 8/15/33, Continuously Callable @ 100 | 1,000 | 1,111 | |||||||||
6.00%, 8/15/43, Continuously Callable @ 100 | 2,750 | 3,030 | |||||||||
| Clifton Higher Education Finance Corp. Revenue (NBGA — Texas Permanent School Fund), 5.00%, 8/15/48, Continuously Callable @ 100 | 10,000 | 12,358 | |||||||||
| Clifton Higher Education Finance Corp. Revenue (NBGA-Texas Permanent School Fund) | |||||||||||
5.00%, 8/15/39, Continuously Callable @ 100 | 4,250 | 4,848 | |||||||||
4.00%, 8/15/44, Continuously Callable @ 100 | 11,000 | 12,941 | |||||||||
County of Bexar Revenue | |||||||||||
4.00%, 8/15/44, Continuously Callable @ 100 | 500 | 542 | |||||||||
4.00%, 8/15/49, Continuously Callable @ 100 | 1,700 | 1,831 | |||||||||
| Del Mar College District, GO, Series A, 5.00%, 8/15/48, Continuously Callable @ 100 | 6,500 | 7,814 | |||||||||
See notes to financial statements.
24
| USAA Mutual Funds Trust USAA Tax Exempt Long-Term Fund | Schedule of Portfolio Investments — continued March 31, 2021 | ||||||
(Amounts in Thousands, Except for Shares)
Security Description | Principal Amount | Value | |||||||||
| Everman Independent School District, GO (NBGA-Texas Permanent School Fund), 4.00%, 2/15/50, Continuously Callable @ 100 | $ | 4,500 | $ | 5,240 | |||||||
| Grand Parkway Transportation Corp. Revenue, 4.00%, 10/1/49, Continuously Callable @ 100 | 2,000 | 2,301 | |||||||||
| Harris County Cultural Education Facilities Finance Corp. Revenue, 5.00%, 6/1/38, Continuously Callable @ 100 | 6,100 | 6,363 | |||||||||
| Harris County Hospital District Revenue, 4.00%, 2/15/42, Continuously Callable @ 100 | 15,000 | 16,499 | |||||||||
| Houston Higher Education Finance Corp. Revenue, Series A, 5.00%, 9/1/42, Pre-refunded 9/1/22 @ 100 | 10,000 | 10,681 | |||||||||
| Karnes County Hospital District Revenue, 5.00%, 2/1/44, Continuously Callable @ 100 | 6,000 | 6,640 | |||||||||
| Kerrville Health Facilities Development Corp. Revenue, 5.00%, 8/15/35, Continuously Callable @ 100 | 1,900 | 2,210 | |||||||||
Matagorda County Navigation District No. 1 Revenue | |||||||||||
4.00%, 6/1/30, Continuously Callable @ 100 | 6,000 | 6,416 | |||||||||
4.00%, 6/1/30, Continuously Callable @ 100 | 9,615 | 10,201 | |||||||||
| Midlothian Independent School District, GO (NBGA — Texas Permanent School Fund), 5.00%, 2/15/47, Continuously Callable @ 100 | 15,000 | 18,038 | |||||||||
New Hope Cultural Education Facilities Finance Corp. Revenue | |||||||||||
5.00%, 7/1/47, Continuously Callable @ 102 | 1,000 | 688 | |||||||||
5.00%, 7/1/47, Continuously Callable @ 102 | 1,000 | 900 | |||||||||
5.00%, 4/1/48, Pre-refunded 4/1/26 @ 100 | 1,250 | 1,266 | |||||||||
Series A, 5.00%, 7/1/47, Continuously Callable @ 100 | 6,000 | 5,100 | |||||||||
| New Hope Cultural Education Facilities Finance Corp. Revenue (INS — Assured Guaranty Municipal Corp.), 5.00%, 7/1/48, Continuously Callable @ 100 | 1,000 | 1,154 | |||||||||
| North Fort Bend Water Authority Revenue, 5.00%, 12/15/36, Continuously Callable @ 100 | 5,000 | 5,162 | |||||||||
North Texas Tollway Authority Revenue | |||||||||||
5.00%, 1/1/48, Continuously Callable @ 100 | 2,000 | 2,423 | |||||||||
5.00%, 1/1/50, Continuously Callable @ 100 | 1,750 | 2,116 | |||||||||
Series B, 9/1/37, Pre-refunded 9/1/31 @ 64.1040 (e) | 3,000 | 1,598 | |||||||||
Series B, 5.00%, 1/1/45, Continuously Callable @ 100 | 5,000 | 5,676 | |||||||||
| North Texas Tollway Authority Revenue (INS — National Public Finance Guarantee Corp.), Series B, 5.00%, 1/1/48, Continuously Callable @ 100 | 5,000 | 5,906 | |||||||||
Port of Port Arthur Navigation District Revenue | |||||||||||
0.16%, 11/1/40, Continuously Callable @ 100 (c) | 17,000 | 17,000 | |||||||||
0.14%, 11/1/40, Continuously Callable @ 100 (c) | 2,700 | 2,700 | |||||||||
Series A, 0.08%, 4/1/40, Continuously Callable @ 100 (c) | 5,715 | 5,715 | |||||||||
Series B, 0.08%, 4/1/40, Continuously Callable @ 100 (c) | 35,760 | 35,760 | |||||||||
Series C, 0.10%, 4/1/40, Continuously Callable @ 100 (c) | 25,670 | 25,670 | |||||||||
| Princeton Independent School District, GO (NBGA — Texas Permanent School Fund), 5.00%, 2/15/48, Continuously Callable @ 100 | 7,000 | 8,580 | |||||||||
| Prosper Independent School District, GO (NBGA-Texas Permanent School Fund), 5.00%, 2/15/48, Continuously Callable @ 100 | 15,000 | 18,398 | |||||||||
Red River Education Finance Corp. Revenue | |||||||||||
4.00%, 6/1/41, Continuously Callable @ 100 | 2,000 | 2,075 | |||||||||
5.50%, 10/1/46, Continuously Callable @ 100 | 3,000 | 3,367 | |||||||||
See notes to financial statements.
25
| USAA Mutual Funds Trust USAA Tax Exempt Long-Term Fund | Schedule of Portfolio Investments — continued March 31, 2021 | ||||||
(Amounts in Thousands, Except for Shares)
Security Description | Principal Amount | Value | |||||||||
Tarrant County Cultural Education Facilities Finance Corp. Revenue | |||||||||||
5.63%, 11/15/27, Continuously Callable @ 100 (k) | $ | 6,315 | $ | 2,842 | |||||||
5.75%, 11/15/37, Continuously Callable @ 100 (k) | 4,000 | 1,800 | |||||||||
5.00%, 11/15/46, Continuously Callable @ 100 | 1,000 | 1,142 | |||||||||
Series A, 5.00%, 11/15/45, Continuously Callable @ 100 | 4,500 | 3,966 | |||||||||
Series B, 5.00%, 11/15/36, Continuously Callable @ 100 | 3,600 | 3,375 | |||||||||
Series B, 5.00%, 11/15/46, Continuously Callable @ 100 | 7,000 | 7,945 | |||||||||
Series B, 5.00%, 7/1/48, Continuously Callable @ 100 | 10,000 | 11,952 | |||||||||
Texas Municipal Gas Acquisition & Supply Corp. III Revenue, 5.00%, 12/15/32 | 2,000 | 2,648 | |||||||||
| Texas Transportation Commission Revenue, 5.00%, 8/1/57, Continuously Callable @ 100 | 5,000 | 5,765 | |||||||||
Uptown Development Authority Tax Allocation | |||||||||||
5.00%, 9/1/37, Continuously Callable @ 100 | 4,365 | 4,918 | |||||||||
5.00%, 9/1/40, Continuously Callable @ 100 | 2,490 | 2,785 | |||||||||
Series A, 5.00%, 9/1/39, Continuously Callable @ 100 | 1,645 | 1,872 | |||||||||
West Harris County Regional Water Authority Revenue | |||||||||||
4.00%, 12/15/45, Continuously Callable @ 100 | 1,600 | 1,881 | |||||||||
4.00%, 12/15/49, Continuously Callable @ 100 | 3,945 | 4,620 | |||||||||
| Wood County Central Hospital District Revenue, 6.00%, 11/1/41, Pre-refunded 11/1/21 @ 100 | 4,770 | 4,929 | |||||||||
| Ysleta Independent School District, GO (NBGA — Texas Permanent School Fund), 4.00%, 8/15/52, Continuously Callable @ 100 | 5,000 | 5,888 | |||||||||
443,210 | |||||||||||
Vermont (0.1%): | |||||||||||
| Vermont Educational & Health Buildings Financing Agency Revenue, 5.00%, 10/15/46, Continuously Callable @ 100 | 3,000 | 3,176 | |||||||||
Virginia (1.1%): | |||||||||||
Alexandria IDA Revenue | |||||||||||
5.00%, 10/1/45, Continuously Callable @ 100 | 2,600 | 2,895 | |||||||||
5.00%, 10/1/50, Continuously Callable @ 100 | 2,400 | 2,655 | |||||||||
Lewistown Commerce Center Community Development Authority Tax Allocation | |||||||||||
3.63%, 3/1/44, Continuously Callable @ 103 | 3,464 | 2,846 | |||||||||
6.05%, 3/1/44, Continuously Callable @ 103 | 1,657 | 1,325 | |||||||||
Series C, 6.05%, 3/1/54, Continuously Callable @ 100 | 5,697 | 1,037 | |||||||||
Virginia College Building Authority Revenue | |||||||||||
5.00%, 6/1/26, Continuously Callable @ 100 | 11,280 | 11,286 | |||||||||
5.00%, 6/1/29, Continuously Callable @ 100 | 5,000 | 5,002 | |||||||||
27,046 | |||||||||||
Washington (1.1%): | |||||||||||
| King County Public Hospital District No. 1, GO, 5.00%, 12/1/43, Continuously Callable @ 100 | 9,000 | 10,754 | |||||||||
| King County Public Hospital District No. 2, GO, Series A, 4.00%, 12/1/45, Continuously Callable @ 100 | 4,000 | 4,637 | |||||||||
| Washington Health Care Facilities Authority Revenue, 4.00%, 7/1/42, Continuously Callable @ 100 | 5,500 | 6,155 | |||||||||
| Washington Higher Education Facilities Authority Revenue, 4.00%, 5/1/50, Continuously Callable @ 100 | 1,250 | 1,431 | |||||||||
See notes to financial statements.
26
| USAA Mutual Funds Trust USAA Tax Exempt Long-Term Fund | Schedule of Portfolio Investments — continued March 31, 2021 | ||||||
(Amounts in Thousands, Except for Shares)
Security Description | Principal Amount | Value | |||||||||
| Washington State Housing Finance Commission Revenue, 5.00%, 1/1/43, Continuously Callable @ 102 (d) | $ | 3,055 | $ | 3,479 | |||||||
26,456 | |||||||||||
West Virginia (0.1%): | |||||||||||
| West Virginia Hospital Finance Authority Revenue, 5.00%, 1/1/43, Continuously Callable @ 100 | 2,000 | 2,383 | |||||||||
Wisconsin (2.4%): | |||||||||||
| City of Kaukauna Electric System Revenue (INS — Assured Guaranty Municipal Corp.), Series A, 5.00%, 12/15/35, Pre-refunded 12/15/22 @ 100 | 7,800 | 8,435 | |||||||||
Public Finance Authority Revenue | |||||||||||
5.25%, 5/15/42, Continuously Callable @ 102 (d) | 2,200 | 2,327 | |||||||||
5.00%, 7/1/44, Continuously Callable @ 100 | 6,000 | 7,283 | |||||||||
5.00%, 11/15/44, Continuously Callable @ 103 | 460 | 511 | |||||||||
4.00%, 1/1/45, Continuously Callable @ 100 | 1,500 | 1,692 | |||||||||
5.00%, 7/1/47, Continuously Callable @ 100 | 1,000 | 1,068 | |||||||||
5.00%, 6/15/49, Continuously Callable @ 100 (d) | 520 | 555 | |||||||||
5.00%, 6/15/49, Continuously Callable @ 100 | 1,480 | 1,682 | |||||||||
5.00%, 11/15/49, Continuously Callable @ 103 | 2,400 | 2,653 | |||||||||
5.00%, 7/1/52, Continuously Callable @ 100 | 1,000 | 1,058 | |||||||||
5.00%, 6/15/53, Continuously Callable @ 100 | 1,000 | 1,133 | |||||||||
5.00%, 6/15/54, Continuously Callable @ 100 (d) | 455 | 482 | |||||||||
Series A, 5.25%, 10/1/43, Continuously Callable @ 100 | 3,090 | 3,586 | |||||||||
Series A, 4.00%, 10/1/49, Continuously Callable @ 100 | 11,000 | 12,291 | |||||||||
Series A, 4.00%, 7/1/56, Continuously Callable @ 100 | 2,250 | 2,479 | |||||||||
Public Finance Authority Revenue (INS — Assured Guaranty Municipal Corp.) | |||||||||||
5.00%, 7/1/54, Continuously Callable @ 100 | 1,285 | 1,497 | |||||||||
5.00%, 7/1/58, Continuously Callable @ 100 | 1,500 | 1,747 | |||||||||
Wisconsin Health & Educational Facilities Authority Revenue | |||||||||||
5.00%, 7/1/49, Continuously Callable @ 100 | 1,000 | 1,160 | |||||||||
5.00%, 3/15/50, Continuously Callable @ 100 | 1,175 | 1,369 | |||||||||
Series A, 5.00%, 9/15/50, Continuously Callable @ 100 | 5,000 | 5,152 | |||||||||
Series B, 5.00%, 9/15/45, Continuously Callable @ 100 | 1,000 | 1,020 | |||||||||
59,180 | |||||||||||
Total Municipal Bonds (Cost $2,259,079) | 2,392,196 | ||||||||||
Total Investments (Cost $2,260,757) — 99.0% | 2,394,007 | ||||||||||
Other assets in excess of liabilities — 1.0% | 24,170 | ||||||||||
NET ASSETS — 100.00% | $ | 2,418,177 | |||||||||
(a) Non-income producing security.
(b) Put Bond.
(c) Variable Rate Demand Notes that provide the rights to sell the security at face value on either that day or within the rate-reset period. The interest rate is reset on the put date at a stipulated daily, weekly, monthly, quarterly, or other specified time interval to reflect current market conditions. These securities do not indicate a reference rate and spread in their description.
See notes to financial statements.
27
| USAA Mutual Funds Trust USAA Tax Exempt Long-Term Fund | Schedule of Portfolio Investments — continued March 31, 2021 | ||||||
(d) Rule 144A security or other security that is restricted as to resale to institutional investors. The Fund's Adviser has deemed this security to be liquid based upon procedures approved by the Board of Trustees. As of March 31, 2021, the fair value of these securities was $78,094 (thousands) and amounted to 3.2% of net assets.
(e) Zero-coupon bond.
(f) Stepped-coupon security converts to coupon form on 8/1/24 with a rate of 5.95%.
(g) Stepped-coupon security converts to coupon form on 8/1/24 with a rate of 6.05%.
(h) Variable or Floating-Rate Security. Rate disclosed is as of March 31, 2021.
(i) Security was fair valued based upon procedures approved by the Board of Trustees and represents 0.0% of the Fund's net assets as of March 31, 2021. This security is classified as Level 3 within the fair value hierarchy. (See Note 2 in the Notes to Financial Statements).
(j) The Fund's Adviser has deemed this security to be illiquid based upon procedures approved by the Board of Trustees. As of March 31, 2021, illiquid securities were less than 0.05% of the Fund's net assets.
(k) Defaulted security.
AMBAC — American Municipal Bond Assurance Corporation
bps — Basis points
Continuously callable — Investment is continuously callable or will be continuously callable on any date after the first call date until its maturity.
GO — General Obligation
IDA — Industrial Development Authority
MUNIPSA — Municipal Swap Index
Credit Enhancements — Adds the financial strength of the provider of the enhancement to support the issuer's ability to repay the principal and interest payments when due. The enhancement may be provided by a high-quality bank, insurance company or other corporation, or a collateral trust. The enhancements do not guarantee the market values of the securities.
INS Principal and interest payments are insured by the name listed. Although bond insurance reduces the risk of loss due to default by an issuer, such bonds remain subject to the risk that value may fluctuate for other reasons, and there is no assurance that the insurance company will meet its obligations.
LIQ Liquidity enhancement that may, under certain circumstances, provide for repayment of principal and interest upon demand from the name listed.
NBGA Principal and interest payments or, under certain circumstances, underlying mortgages are guaranteed by a nonbank guarantee agreement from the name listed.
See notes to financial statements.
28
USAA Mutual Funds Trust | Statement of Assets and Liabilities March 31, 2021 | ||||||
(Amounts in Thousands, Except Per Share Amounts)
| USAA Tax Exempt Long-Term Fund | |||||||
Assets: | |||||||
Investments, at value (Cost $2,260,757) | $ | 2,394,007 | |||||
Receivables: | |||||||
Interest and dividends | 26,366 | ||||||
Capital shares issued | 1,293 | ||||||
From Adviser | 44 | ||||||
Prepaid expenses and other assets | 28 | ||||||
Total assets | 2,421,738 | ||||||
Liabilities: | |||||||
Payables: | |||||||
Distributions | 981 | ||||||
To custodian | 131 | ||||||
Capital shares redeemed | 1,349 | ||||||
Accrued expenses and other payables: | |||||||
Investment advisory fees | 573 | ||||||
Administration fees | 307 | ||||||
Custodian fees | 16 | ||||||
Transfer agent fees | 100 | ||||||
Compliance fees | 1 | ||||||
Trustees' fees | — | (a) | |||||
| 12b-1 fees | 1 | ||||||
Other accrued expenses | 102 | ||||||
Total liabilities | 3,561 | ||||||
Net Assets: | |||||||
Capital | 2,347,283 | ||||||
Total accumulated earnings/(loss) | 70,894 | ||||||
Net assets | $ | 2,418,177 | |||||
Net Assets | |||||||
Fund Shares | $ | 2,404,178 | |||||
Institutional Shares | 5,533 | ||||||
Class A | 8,466 | ||||||
Total | $ | 2,418,177 | |||||
Shares (unlimited number of shares authorized with no par value): | |||||||
Fund Shares | 175,353 | ||||||
Institutional Shares | 404 | ||||||
Class A | 618 | ||||||
Total | 176,375 | ||||||
Net asset value, offering and redemption price per share: (b) | |||||||
Fund Shares | $ | 13.71 | |||||
Institutional Shares | $ | 13.71 | |||||
Class A | $ | 13.69 | |||||
Maximum Sales Charge — Class A | 2.25 | % | |||||
Maximum offering price | |||||||
| (100%/(100%-maximum sales charge) of net asset value adjusted to the nearest cent) per share — Class A | $ | 14.01 | |||||
(a) Rounds to less than $1 thousand.
(b) Per share amount may not recalculate due to rounding of net assets and/or shares outstanding.
See notes to financial statements.
29
USAA Mutual Funds Trust | Statement of Operations For the Year Ended March 31, 2021 | ||||||
(Amounts in Thousands)
| USAA Tax Exempt Long-Term Fund | |||||||
Investment Income: | |||||||
Interest | $ | 86,527 | |||||
Total income | 86,527 | ||||||
Expenses: | |||||||
Investment advisory fees | 6,621 | ||||||
Administration fees — Fund Shares | 3,576 | ||||||
Administration fees — Institutional Shares (a) | 3 | ||||||
Administration fees — Class A | 12 | ||||||
Sub-Administration fees | 24 | ||||||
| 12b-1 fees — Class A | 20 | ||||||
Custodian fees | 88 | ||||||
Transfer agent fees — Fund Shares | 693 | ||||||
Transfer agent fees — Institutional Shares (a) | 3 | ||||||
Transfer agent fees — Class A | 8 | ||||||
Trustees' fees | 48 | ||||||
Compliance fees | 15 | ||||||
Legal and audit fees | 118 | ||||||
State registration and filing fees | 73 | ||||||
Interfund lending fees | — | (b) | |||||
Other expenses | 195 | ||||||
Total expenses | 11,497 | ||||||
Expenses waived/reimbursed by Adviser | (85 | ) | |||||
Net expenses | 11,412 | ||||||
Net Investment Income (Loss) | 75,115 | ||||||
Realized/Unrealized Gains (Losses) from Investments: | |||||||
Net realized gains (losses) from investment securities | (731 | ) | |||||
Net change in unrealized appreciation/depreciation on investment securities | 87,771 | ||||||
Net realized/unrealized gains (losses) on investments | 87,040 | ||||||
Change in net assets resulting from operations | $ | 162,155 | |||||
(a) Institutional Shares commenced operations on June 29, 2020.
(b) Rounds to less than $1 thousand.
See notes to financial statements.
30
USAA Mutual Funds Trust | Statements of Changes in Net Assets | ||||||
(Amounts in Thousands)
USAA Tax Exempt Long-Term Fund | |||||||||||
| Year Ended March 31, 2021 | Year Ended March 31, 2020 | ||||||||||
From Investments: | |||||||||||
Operations: | |||||||||||
Net investment income (loss) | $ | 75,115 | $ | 83,172 | |||||||
Net realized gains (losses) from investments | (731 | ) | (937 | ) | |||||||
| Net change in unrealized appreciation/depreciation on investments | 87,771 | (16,375 | ) | ||||||||
Change in net assets resulting from operations | 162,155 | 65,860 | |||||||||
Distributions to Shareholders: | |||||||||||
Fund Shares | (74,812 | ) | (82,112 | ) | |||||||
Institutional Shares (a) | (88 | ) | — | ||||||||
Class A | (232 | ) | (249 | ) | |||||||
Change in net assets resulting from distributions to shareholders | (75,132 | ) | (82,361 | ) | |||||||
Change in net assets resulting from capital transactions | (79,868 | ) | 56,959 | ||||||||
Change in net assets | 7,155 | 40,458 | |||||||||
Net Assets: | |||||||||||
Beginning of period | 2,411,022 | 2,370,564 | |||||||||
End of period | $ | 2,418,177 | $ | 2,411,022 | |||||||
(a) Institutional Shares commenced operations on June 29, 2020.
(continues on next page)
See notes to financial statements.
31
USAA Mutual Funds Trust | Statements of Changes in Net Assets | ||||||
(Amounts in Thousands) (continued)
USAA Tax Exempt Long-Term Fund | |||||||||||
| Year Ended March 31, 2021 | Year Ended March 31, 2020 | ||||||||||
Capital Transactions: | |||||||||||
Fund Shares | |||||||||||
Proceeds from shares issued | $ | 184,740 | $ | 291,358 | |||||||
Distributions reinvested | 62,179 | 66,585 | |||||||||
Cost of shares redeemed | (332,780 | ) | (300,957 | ) | |||||||
Total Fund Shares | $ | (85,861 | ) | $ | 56,986 | ||||||
Institutional Shares (a) | |||||||||||
Proceeds from shares issued | $ | 6,625 | $ | — | |||||||
Distributions reinvested | 75 | — | |||||||||
Cost of shares redeemed | (1,210 | ) | — | ||||||||
Total Institutional Shares | $ | 5,490 | $ | — | |||||||
Class A | |||||||||||
Proceeds from shares issued | $ | 8,389 | $ | 325 | |||||||
Distributions reinvested | 79 | 69 | |||||||||
Cost of shares redeemed | (7,965 | ) | (421 | ) | |||||||
Total Class A | $ | 503 | $ | (27 | ) | ||||||
Change in net assets resulting from capital transactions | $ | (79,868 | ) | $ | 56,959 | ||||||
Share Transactions: | |||||||||||
Fund Shares | |||||||||||
Issued | 13,640 | 21,540 | |||||||||
Reinvested | 4,599 | 4,911 | |||||||||
Redeemed | (24,772 | ) | (22,454 | ) | |||||||
Total Fund Shares | (6,533 | ) | 3,997 | ||||||||
Institutional Shares (a) | |||||||||||
Issued | 487 | — | |||||||||
Reinvested | 5 | — | |||||||||
Redeemed | (88 | ) | — | ||||||||
Total Institutional Shares | 404 | — | |||||||||
Class A | |||||||||||
Issued | 625 | 23 | |||||||||
Reinvested | 6 | 5 | |||||||||
Redeemed | (595 | ) | (30 | ) | |||||||
Total Class A | 36 | (2 | ) | ||||||||
Change in Shares | (6,093 | ) | 3,995 | ||||||||
(a) Institutional Shares commenced operations on June 29, 2020.
See notes to financial statements.
32
This page is intentionally left blank.
33
USAA Mutual Funds Trust | Financial Highlights | ||||||
For a Share Outstanding Throughout Each Period
Investment Activities | Distributions to Shareholders From | ||||||||||||||||||||||||||
| Net Asset Value, Beginning of Period | Net Investment Income (Loss) | Net Realized and Unrealized Gains (Losses) on Investments | Total from Investment Activities | Net Investment Income | Total Distributions | ||||||||||||||||||||||
USAA Tax Exempt Long-Term Fund | |||||||||||||||||||||||||||
Fund Shares | |||||||||||||||||||||||||||
| Year Ended March 31, 2021 | $ | 13.21 | 0.42 | (e) | 0.50 | 0.92 | (0.42 | ) | (0.42 | ) | |||||||||||||||||
| Year Ended March 31, 2020 | $ | 13.28 | 0.45 | (e) | (0.07 | ) | 0.38 | (0.45 | ) | (0.45 | ) | ||||||||||||||||
| Year Ended March 31, 2019 | $ | 13.21 | 0.49 | 0.07 | 0.56 | (0.49 | ) | (0.49 | ) | ||||||||||||||||||
| Year Ended March 31, 2018 | $ | 13.25 | 0.51 | (0.03 | ) | 0.48 | (0.52 | ) | (0.52 | ) | |||||||||||||||||
| Year Ended March 31, 2017 | $ | 13.73 | 0.54 | (0.48 | ) | 0.06 | (0.54 | ) | (0.54 | ) | |||||||||||||||||
Institutional Shares | |||||||||||||||||||||||||||
| June 29, 2020(f) through March 31, 2021 | $ | 13.40 | 0.31 | (e) | 0.32 | 0.63 | (0.32 | ) | (0.32 | ) | |||||||||||||||||
Class A | |||||||||||||||||||||||||||
| Year Ended March 31, 2021 | $ | 13.19 | 0.40 | (e) | 0.50 | 0.90 | (0.40 | ) | (0.40 | ) | |||||||||||||||||
| Year Ended March 31, 2020 | $ | 13.26 | 0.43 | (e) | (0.08 | ) | 0.35 | (0.42 | ) | (0.42 | ) | ||||||||||||||||
| Year Ended March 31, 2019 | $ | 13.19 | 0.46 | 0.08 | 0.54 | (0.47 | ) | (0.47 | ) | ||||||||||||||||||
| Year Ended March 31, 2018 | $ | 13.23 | 0.48 | (0.04 | ) | 0.44 | (0.48 | ) | (0.48 | ) | |||||||||||||||||
| Year Ended March 31, 2017 | $ | 13.71 | 0.49 | (0.48 | ) | 0.01 | (0.49 | ) | (0.49 | ) | |||||||||||||||||
* Assumes reinvestment of all net investment income and realized capital gain distributions, if any, during the period. Includes adjustments in accordance with U.S. Generally Accepted Accounting Principles and could differ from the Lipper reported return.
** For the period beginning July 1, 2019, the amount of any waivers or reimbursements and the amount of any recoupment is calculated without regard to the impact of any performance adjustment to the Fund's management fee.
^ The net expense ratio may not correlate to the applicable expense limits in place during the period since the current contractual expense limitation is applied for a period beginning July 1, 2019, and in effect through June 30, 2023, instead of coinciding with the Fund's fiscal year end. Details of the current contractual expense limitation in effect can be found in Note 4 of the accompanying Notes to Financial Statements.
(a) Not annualized for periods less than one year.
(b) Annualized for periods less than one year.
(c) Reflects total annual operating expenses for reductions of expenses paid indirectly for the March 31 fiscal year ended 2017. Expenses paid indirectly decreased the expense ratio by less than 0.01%.
(d) Portfolio turnover is calculated on the basis of the Fund as a whole without distinguishing between the classes of shares.
(e) Per share net investment income (loss) has been calculated using the average daily shares method.
(f) Commencement of operations.
(g) Prior to August 1, 2017, USAA Asset Management Company ("AMCO") (previous Investment Adviser) had voluntarily agreed to limit the annual expenses of Class A to 0.80% of Class A average daily net assets.
See notes to financial statements.
34
USAA Mutual Funds Trust | Financial Highlights — continued | ||||||
For a Share Outstanding Throughout Each Period
Ratios to Average Net Assets | Supplemental Data | ||||||||||||||||||||||||||||||
| Net Asset Value, End of Period | Total Return (Excludes Sales Charge)*(a) | Net Expenses**^(b)(c) | Net Investment Income (Loss)(b) | Gross Expenses(b)(c) | Net Assets, End of Period (000's) | Portfolio Turnover(a)(d) | |||||||||||||||||||||||||
USAA Tax Exempt Long-Term Fund | |||||||||||||||||||||||||||||||
Fund Shares | |||||||||||||||||||||||||||||||
| Year Ended March 31, 2021 | $ | 13.71 | 7.00 | % | 0.47 | % | 3.13 | % | 0.48 | % | $ | 2,404,178 | 21 | % | |||||||||||||||||
| Year Ended March 31, 2020 | $ | 13.21 | 2.74 | % | 0.48 | % | 3.36 | % | 0.48 | % | $ | 2,403,342 | 24 | % | |||||||||||||||||
| Year Ended March 31, 2019 | $ | 13.28 | 4.39 | % | 0.48 | % | 3.73 | % | 0.48 | % | $ | 2,362,819 | 13 | % | |||||||||||||||||
| Year Ended March 31, 2018 | $ | 13.21 | 3.62 | % | 0.47 | % | 3.83 | % | 0.47 | % | $ | 2,358,955 | 14 | % | |||||||||||||||||
| Year Ended March 31, 2017 | $ | 13.25 | 0.41 | % | 0.48 | % | 3.97 | % | 0.48 | % | $ | 2,343,165 | 15 | % | |||||||||||||||||
Institutional Shares | |||||||||||||||||||||||||||||||
| June 29, 2020(f) through March 31, 2021 | $ | 13.71 | 4.71 | % | 0.44 | % | 3.03 | % | 0.98 | % | $ | 5,533 | 21 | % | |||||||||||||||||
Class A | |||||||||||||||||||||||||||||||
| Year Ended March 31, 2021 | $ | 13.69 | 6.80 | % | 0.67 | % | 2.94 | % | 1.08 | % | $ | 8,466 | 21 | % | |||||||||||||||||
| Year Ended March 31, 2020 | $ | 13.19 | 2.53 | % | 0.70 | % | 3.15 | % | 1.01 | % | $ | 7,680 | 24 | % | |||||||||||||||||
| Year Ended March 31, 2019 | $ | 13.26 | 4.16 | % | 0.70 | % | 3.51 | % | 0.94 | % | $ | 7,745 | 13 | % | |||||||||||||||||
| Year Ended March 31, 2018 | $ | 13.19 | 3.36 | % | 0.74 | %(g) | 3.57 | % | 0.92 | % | $ | 8,577 | 14 | % | |||||||||||||||||
| Year Ended March 31, 2017 | $ | 13.23 | 0.07 | % | 0.80 | % | 3.64 | % | 0.87 | % | $ | 10,976 | 15 | % | |||||||||||||||||
See notes to financial statements.
35
USAA Mutual Funds Trust | Notes to Financial Statements March 31, 2021 | ||||||
1. Organization:
USAA Mutual Funds Trust (the "Trust") is organized as a Delaware statutory trust and is registered under the Investment Company Act of 1940, as amended (the "1940 Act"), as an open-end investment company. The Trust is comprised of 46 funds and is authorized to issue an unlimited number of shares, which are units of beneficial interest with no par value.
The accompanying financial statements are those of the USAA Tax Exempt Long-Term Fund (the "Fund"). The Fund offers three classes of shares: Fund Shares, Institutional Shares, and Class A. The Fund is classified as diversified under the 1940 Act.
Effective June 29, 2020, the Fund's Institutional Shares commenced operations and the Adviser Shares were redesignated Class A shares and became subject to a front-end sales charge.
The Board of Trustees of USAA Mutual Funds Trust has approved the addition of Class Z for the Fund. This new share class was effective February 5, 2021, but has not yet been funded. Class Z is only available to participants in certain eligible separately managed accounts (also referred to as wrap fee programs) and other advisory clients of the Fund's Adviser or its affiliates that are subject to a separate contractual fee for investment management services. The Adviser has contractually agreed to waive its management fee and/or reimburse expenses so that the total annual operating expenses (excluding acquired fund fees and expenses, interest, taxes, brokerage commissions, capitalized expenses, and other extraordinary expenses) do not exceed 0.00% of the Fund's Class Z shares for an indefinite term.
Each class of shares of the Fund has substantially identical rights and privileges, except with respect to sales charges, fees paid under distribution plans, expenses allocable exclusively to each class of shares, voting rights on matters solely affecting a single class of shares, and the exchange privilege of each class of shares.
Under the Trust's organizational documents, its officers and trustees are indemnified against certain liabilities arising out of the performance of their duties to the Fund. In addition, in the normal course of business, the Fund enters into contracts with its vendors and others that provide for general indemnifications. The Fund's maximum exposure under these arrangements is unknown, as this would involve future claims that may be made against the Fund. However, based on experience, the Fund expects that risk of loss to be remote.
2. Significant Accounting Policies:
The following is a summary of significant accounting policies followed by the Trust in the preparation of its financial statements. The policies are in conformity with Generally Accepted Accounting Principles in the United States of America ("GAAP"). The preparation of financial statements in accordance with GAAP requires management to make estimates and assumptions that affect the reported amounts of assets and liabilities and disclosure of contingent assets and liabilities at the date of the financial statements and the reported amounts of income and expenses for the period. Actual results could differ from those estimates. The Fund follows the specialized accounting and reporting requirements under GAAP that are applicable to investment companies under Accounting Standards Codification Topic 946.
Investment Valuation:
The Fund records investments at fair value. Fair value is defined as the price that would be received to sell an asset or paid to transfer a liability in an orderly transaction between market participants at the measurement date.
The valuation techniques described below maximize the use of observable inputs and minimize the use of unobservable inputs in determining fair value. The inputs used for valuing the Fund's investments are summarized in the three broad levels listed below:
• Level 1 — quoted prices in active markets for identical securities
• Level 2 — other significant observable inputs (including quoted prices for similar securities or interest rates applicable to those securities, etc.)
• Level 3 — significant unobservable inputs (including the Fund's own assumptions in determining the fair value of investments)
36
USAA Mutual Funds Trust | Notes to Financial Statements — continued March 31, 2021 | ||||||
Changes in valuation techniques may result in transfers in or out of an assigned level within the disclosure hierarchy. The inputs or methodologies used for valuation techniques are not necessarily an indication of the risks associated with entering into those investments.
Victory Capital Management Inc. ("VCM" or the "Adviser") has established the Pricing and Liquidity Committee (the "Committee"), and subject to the Trust's Board of Trustees (the "Board") oversight, the Committee administers and oversees the Fund's valuation policies and procedures, which are approved by the Board.
Portfolio securities listed or traded on securities exchanges, including American Depositary Receipts ("ADRs") and Rights, are valued at the closing price on the exchange or system where the security is principally traded, if available, or at the Nasdaq Official Closing Price. If there have been no sales for that day on the exchange or system, then a security is valued at the last available bid quotation on the exchange or system where the security is principally traded. In each of these situations, valuations are typically categorized as Level 1 in the fair value hierarchy.
Debt securities of United States ("U.S.") issuers, along with corporate and municipal securities, including short-term investments maturing in 60 days or less, may be valued using evaluated bid or the last sales price to price securities by dealers or an independent pricing service approved by the Board. These valuations are typically categorized as Level 2 in the fair value hierarchy.
In the event that price quotations or valuations are not readily available, are not reflective of market value, or a significant event has been recognized in relation to a security or class of securities, the securities are valued in good faith by the Committee in accordance with valuation procedures approved by the Board. These valuations are typically categorized as Level 2 or Level 3 in the fair value hierarchy, based on the observability of inputs used to determine the fair value. The effect of fair value pricing is that securities may not be priced on the basis of quotations from the primary market in which they are traded and the actual price realized from the sale of a security may differ materially from the fair value price. Valuing these securities at fair value is intended to cause the Fund's net asset value ("NAV") to be more reliable than it otherwise would be.
A summary of the valuations as of March 31, 2021, based upon the three levels defined above, is included in the table below while the breakdown, by category, of investments is disclosed on the Schedule of Portfolio Investments (amounts in thousands):
Level 1 | Level 2 | Level 3 | Total | ||||||||||||||||
Common Stocks | $ | 1,811 | $ | — | $ | — | $ | 1,811 | |||||||||||
Municipal Bonds | — | 2,392,196 | 0 | 2,392,196 | |||||||||||||||
Total | $ | 1,811 | $ | 2,392,196 | $ | 0 | $ | 2,394,007 | |||||||||||
For the year ended March 31, 2021, there were no transfers in or out of Level 3 in the fair value hierarchy.
Securities Purchased on a Delayed-Delivery or When-Issued Basis:
The Fund may purchase securities on a delayed-delivery or when-issued basis. Delivery and payment for securities that have been purchased by the Fund on a delayed-delivery or when-issued basis, or for delayed draws on loans can take place a month or more after the trade date. At the time the Fund makes the commitment to purchase a security on a delayed-delivery or when-issued basis, the Fund records the transaction and reflects the value of the security in determining NAV. No interest accrues to the Fund until the transaction settles and payment takes place. A segregated account is established and the Fund maintains cash and/or marketable securities at least equal in value to commitments for delayed-delivery or when-issued securities. If the Fund owns delayed-delivery or when-issued securities, these values are included in Payable for investments purchased on the accompanying Statement of Assets and Liabilities and the segregated assets are identified on the Schedule of Portfolio Investments.
Municipal Obligations:
The values of municipal obligations can fluctuate and may be affected by adverse tax, legislative, or political changes, and by financial developments affecting municipal issuers. Payment of municipal
37
USAA Mutual Funds Trust | Notes to Financial Statements — continued March 31, 2021 | ||||||
obligations may depend on a relatively limited source of revenue, resulting in greater credit risk. Future changes in federal tax laws or the activity of an issuer may adversely affect the tax-exempt status of municipal obligations.
Below-Investment-Grade Securities:
The Fund may invest in below-investment-grade securities (i.e. lower-quality, "junk" debt), which are subject to various risks. Lower-quality debt is considered to be speculative because it is less certain that the issuer will be able to pay interest or repay the principal than in the case of investment grade debt. These securities can involve a substantially greater risk of default than higher-rated securities, and their values can decline significantly over short periods of time. Lower-quality debt securities tend to be more sensitive to adverse news about their issuers, the market and the economy in general, than higher-quality debt securities. The market for these securities can be less liquid, especially during periods of recession or general market decline.
Investment Transactions and Related Income:
Changes in holdings of investments are accounted for no later than one business day following the trade date. For financial reporting purposes, however, investment transactions are accounted for on trade date on the last business day of the reporting period. Interest income is determined on the basis of coupon interest accrued using the effective interest method which adjusts, where applicable, the amortization of premiums or accretion of discount. Gains or losses realized on sales of securities are determined by comparing the identified cost of the security lot sold with the net sales proceeds.
Federal Income Taxes:
It is the Fund's policy to continue to qualify as a regulated investment company by complying with the provisions available to certain investment companies, as defined in applicable sections of the Internal Revenue Code, and to make distributions of net investment income and net realized gains sufficient to relieve it from all, or substantially all, federal income taxes. Accordingly, no provision for federal income taxes is required in the financial statements. The Fund has a tax year end of March 31.
Management of the Fund has reviewed tax positions taken in tax years that remain subject to examination by all major tax jurisdictions, including federal (i.e., the last four tax years, which includes the current fiscal tax year end). Management believes that there is no tax liability resulting from unrecognized tax benefits related to uncertain tax positions taken.
Allocations:
Expenses directly attributable to the Fund are charged to the Fund, while expenses that are attributable to more than one fund in the Trust, or jointly with an affiliated trust, are allocated among the respective funds in the Trust and/or affiliated trust based upon net assets or another appropriate basis.
Income, expenses (other than class-specific expenses such as transfer agent fees, state registration fees, 12b-1 fees, and printing fees), and realized and unrealized gains or losses on investments are allocated to each class of shares based on its relative net assets on the date income is earned or expenses and realized and unrealized gains and losses are incurred.
Cross-Trade Transactions:
Pursuant to Rule 17a-7 under the 1940 Act, the Fund may engage in cross-trades, which are securities transactions with affiliated investment companies and advisory accounts managed by the Adviser and any applicable sub-adviser. Any such purchase or sale transaction must be effected without brokerage commission or other remuneration, except for customary transfer fees. The transaction must be effected at the current market price, which is either the security's last sale price on an exchange or, if there are no transactions in the security that day, at the average of the highest bid and lowest asked price. For the year ended March 31, 2021, the Fund engaged in the following securities transactions with affiliated funds, which resulted in the following net realized gains (losses) (amounts in thousands):
| Purchases | Sales | Realized Gains (Losses) | |||||||||
| $ | 112,100 | $ | 110,525 | $ | — | ||||||
38
USAA Mutual Funds Trust | Notes to Financial Statements — continued March 31, 2021 | ||||||
Fees Paid Indirectly:
Expense offsets to custody fees that arise from credits on cash balances maintained on deposit are reflected on the Statement of Operations, as applicable, as Fees paid indirectly.
3. Purchases and Sales:
Cost of purchases and proceeds from sales/maturities of securities (excluding securities maturing less than one year from acquisition) for the year ended March 31, 2021, were as follows for the Fund (amounts in thousands):
| Excluding U.S. Government Securities | |||||||||||
Purchases | Sales | ||||||||||
$ | 509,633 | $ | 586,965 | ||||||||
There were no purchases or sales of U.S. government securities during the year ended March 31, 2021.
4. Fees and Transactions with Affiliates and Related Parties:
Investment Advisory Fees:
Investment advisory services are provided to the Fund by the Adviser, which is a New York corporation registered as an investment adviser with the SEC. The Adviser is a wholly-owned indirect subsidiary of Victory Capital Holdings, Inc., a publicly traded Delaware corporation, and a wholly-owned direct subsidiary of Victory Capital Operating, LLC.
Under the terms of the Investment Advisory Agreement, the Adviser is entitled to receive a base fee and a performance adjustment. The Fund's base fee is accrued daily and paid monthly at an annualized rate of 0.28% of the Fund's average daily net assets. Amounts incurred and paid to VCM for the year ended March 31, 2021, are reflected on the Statement of Operations as Investment Advisory fees.
On November 6, 2018, United Services Automobile Association ("USAA"), the parent company of USAA Asset Management Company ("AMCO"), the prior investment adviser to the Fund announced that AMCO would be acquired by Victory Capital Holdings Inc. (the "Transaction"). A special shareholder meeting was held on April 18, 2019, at which shareholders of the Fund approved a new investment advisory agreement between the Trust, on behalf of the Fund, and VCM. The Transaction closed on July 1, 2019 and effective July 1, 2019, VCM replaced AMCO as the investment adviser to the Fund and no performance adjustments were made for the period beginning July 1, 2019, through June 30, 2020. Only performance beginning as of July 1, 2019, and thereafter is utilized in calculating future performance adjustments.
Effective July 1, 2019, no performance adjustments were made for the periods beginning July 1, 2019 through June 30, 2020. Only performance beginning as of July 1, 2019, and thereafter is utilized in calculating future performance adjustments.
The performance adjustment for each share class is accrued daily and calculated monthly by comparing each class' performance to that of the Lipper General & Insured Municipal Debt Funds Index. The Lipper General & Insured Municipal Debt Funds Index tracks the total return performance of funds within the Lipper General & Insured Municipal Debt Funds category.
The performance period for each share class consists of the current month plus the previous 35 months (or the number of months beginning July 1, 2019, if fewer). The following table is utilized to determine the extent of the performance adjustment:
| Over/Under Performance Relative to Index (in basis points)(a) | Annual Adjustment Rate (in basis points)(a) | ||||||
| +/- 20 to 50 | +/- 4 | ||||||
| +/- 51 to 100 | +/- 5 | ||||||
| +/- 101 and greater | +/- 6 | ||||||
39
USAA Mutual Funds Trust | Notes to Financial Statements — continued March 31, 2021 | ||||||
(a) Based on the difference between average annual performance of the relevant share class of the Fund and its relevant Lipper index, rounded to the nearest basis point. Average daily net assets of the share class are calculated over a rolling 36-month period.
Each class' annual performance adjustment rate is multiplied by the average daily net assets of each respective class over the entire performance period, which is then multiplied by a fraction, the numerator of which is the number of days in the month and the denominator of which is 365 (366 in leap years). The resulting amount is then added to (in the case of overperformance), or subtracted from (in the case of underperformance) the base fee.
Under the performance fee arrangement, each class pays a positive performance fee adjustment for a performance period whenever the class outperforms the Lipper General & Insured Municipal Debt Funds Index over that period, even if the class has overall negative returns during the performance period.
For the period July 1, 2020, to March 31, 2021, performance adjustments were $(83), less than $(1) and $(2) for Fund Shares, Institutional Shares and Class A, in thousands, respectively. Performance adjustments were less than (0.01)%, less than (0.01)%, and (0.03)% for Fund Shares, Institutional Shares, and Class A, respectively.
The Trust relies on an exemptive order granted to VCM and its affiliated funds by the SEC in March 2019 permitting the use of a "manager-of-managers" structure for certain funds. Under a manager-of-managers structure, the investment adviser may select (with approval of the Board and without shareholder approval) one or more subadvisers to manage the day-to-day investment of a fund's assets. For the year ended March 31, 2021, the Fund had no subadvisors.
Administration and Servicing Fees:
VCM serves as the Fund's administrator and fund accountant. Under the Fund Administration, Servicing and Accounting Agreement, VCM is paid for its services an annual fee at a rate of 0.15%, 0.10%, and 0.15% of average daily net assets, of the Fund Shares, Institutional Shares, and Class A, respectively. Amounts incurred for the year ended March 31, 2021, are reflected on the Statement of Operations as Administration fees.
The Fund (as part of the Trust) has entered into an agreement to provide compliance services with the Adviser, pursuant to which the Adviser furnishes its compliance personnel, including the services of the Chief Compliance Officer ("CCO"), and other resources reasonably necessary to provide the Trust with compliance oversight services related to the design, administration and oversight of a compliance program for the Trust in accordance with Rule 38a-1 under the 1940 Act. The CCO is an employee of the Adviser, which pays the compensation of the CCO and support staff. Funds in the Trust, Victory Variable Insurance Funds, Victory Portfolios, and Victory Portfolios II (collectively, the "Victory Funds Complex") in the aggregate, compensate the Adviser for these services. Amounts incurred for the year ended March 31, 2021, are reflected on the Statement of Operations as Compliance fees.
Citi Fund Services Ohio, Inc. ("Citi"), an affiliate of Citibank, acts as sub-administrator and sub-fund accountant to the Fund pursuant to a Sub-Administration and Sub-Fund Accounting Services Agreement between VCM and Citi. VCM pays Citi a fee for providing these services. The Fund reimburses VCM and Citi for out-of-pocket expenses incurred in providing these services and certain other expenses specifically allocated to the Fund. Amounts incurred for the year ended March 31, 2021, are reflected on the Statement of Operations as Sub-Administration fees.
Transfer Agency Fees:
Victory Capital Transfer Agency, Inc. ("VCTA"), an affiliate of the Adviser, provides transfer agency services to the Fund. VCTA provides transfer agent services to the Fund Shares based on an annual charge of $25.50 per shareholder account plus out-of-pocket expenses. VCTA pays a portion of these fees to certain intermediaries for the administration and servicing of accounts that are held with such intermediaries. Transfer agent's fees are accrued daily and paid monthly at an annualized rate of 0.10% and 0.10% of average daily net assets of the Institutional Shares and Class A, respectively, plus out-of-pocket expenses. Amounts incurred and paid to VCTA for the year ended March 31, 2021, are reflected on the Statement of Operations as Transfer Agent fees.
40
USAA Mutual Funds Trust | Notes to Financial Statements — continued March 31, 2021 | ||||||
FIS Investor Services LLC serves as sub-transfer agent and dividend disbursing agent for the Fund pursuant to a Sub-Transfer Agent Agreement between VCTA and FIS Investor Services LLC. VCTA provides FIS Investor Services LLC a fee for providing these services.
Distributor/Underwriting Services:
Victory Capital Services, Inc. (the "Distributor"), an affiliate of the Adviser, serves as distributor for the continuous offering of the shares of the Fund pursuant to a Distribution Agreement between the Distributor and the Trust. Effective June 30, 2020, the Distributor's name was changed from Victory Capital Advisers, Inc.
Pursuant to the Distribution and Service Plans adopted in accordance with Rule 12b-1 under the 1940 Act, the Distributor may receive a monthly distribution and service fee, at an annual rate of up to 0.25% of the average daily net assets of the Class A. The distribution and service fees paid to the Distributor may be used by the Distributor to pay for activity primarily intended to result in the sale of Class A. Amounts incurred and paid to the Distributor for the year ended March 31, 2021, are reflected on the Statement of Operations as 12b-1 fees.
In addition, the Distributor is entitled to receive commissions on sales of the Class A. For the year ended March 31, 2021, the Distributor received less than $1 thousand from commissions earned on sales of Class A.
Other Fees:
Citibank serves as the Fund's custodian. The Fund pays Citibank a fee for providing these services. Amounts incurred for the year ended March 31, 2021, are reflected on the Statement of Operations as Custodian fees.
K&L Gates LLP provides legal services to the Trust.
The Adviser has entered into an expense limitation agreement with the Fund until at least June 30, 2023. Under the terms of the agreement, the Adviser has agreed to waive fees or reimburse certain expenses to the extent that ordinary operating expenses incurred by certain classes of the Fund in any fiscal year exceed the expense limit for such classes of the Fund. Such excess amounts will be the liability of the Adviser. Acquired fund fees and expenses, interest, taxes, brokerage commissions, other expenditures, which are capitalized in accordance with GAAP, and other extraordinary expenses not incurred in the ordinary course of the Fund's business are excluded from the expense limits. As of March 31, 2021, the expense limits (excluding voluntary waivers) were 0.48%, 0.44%, and 0.70% for Fund Shares, Institutional Shares, and Class A, respectively.
Under the terms of the agreement, the Fund has agreed to repay fees and expenses that were waived or reimbursed by the Adviser for a period of up to three years after the fiscal year in which the waiver or reimbursement took place, subject to the lesser of any operating expense limits in effect at the time of: (a) the original waiver or expense reimbursement; or (b) the recoupment, after giving effect to the recoupment amount.
As of March 31, 2021, the following amounts are available to be repaid to the Adviser (amounts in thousands). The Fund has not recorded any amounts available to be repaid as a liability due to an assessment that such repayment is not probable at March 31, 2021.
| Expires March 31, 2023 | Expires March 31, 2024 | Total | |||||||||
| $ | 14 | $ | 85 | $ | 99 | ||||||
The Adviser may voluntarily waive or reimburse additional fees to assist the Fund in maintaining competitive expense ratios. Voluntary waivers and reimbursements applicable to the Fund are not available to be recouped at a future time. There were no voluntary waivers or reimbursements for the year ended March 31, 2021.
41
USAA Mutual Funds Trust | Notes to Financial Statements — continued March 31, 2021 | ||||||
Certain officers and/or interested trustees of the Fund are also officers and/or employees of the Adviser, administrator, sub-administrator, sub-fund accountant, custodian, and Distributor.
5. Risks:
The Fund may be subject to other risks in addition to these identified risks.
Geopolitical/Natural Disaster Risk — Global economies and financial markets are increasingly interconnected, which increases the possibilities that conditions in one country or region might adversely affect issuers in another country or region. Geopolitical and other risks, including war, terrorism, trade disputes, political or economic dysfunction within some nations, public health crises and related geopolitical events, as well as environmental disasters such as earthquakes, fires, and floods, may add to instability in world economies and markets generally. Changes in trade policies and international trade agreements could affect the economies of many countries in unpredictable ways. Likewise, systemic market dislocations of the kind that occurred during the financial crisis that began in 2008, if repeated, would be highly disruptive to economies and markets, adversely affecting individual companies and industries, securities markets, interest rates, credit ratings, inflation, investor sentiment, and other factors affecting the value of a Fund's investments. Some countries, including the United States, are adopting more protectionist trade policies and moving away from the tighter financial industry regulations that followed the 2008 financial crisis, which may also affect the value of a Fund's investments.
Political events within the United States at times have resulted, and may in the future result, in a shutdown of government services, which could negatively affect the U.S. economy, decrease the value of a Fund's investments, increase uncertainty in or impair the operation of the U.S. or other securities markets and degrade investor and consumer confidence, perhaps suddenly and to a significant degree.
An outbreak of disease called COVID-19 has spread internationally. The transmission of COVID-19 and efforts to contain its spread have resulted in international, national and local border closings and other significant travel restrictions and disruptions, significant disruptions to business operations, supply chains and consumer activity, significant challenges in healthcare service preparation and delivery, quarantines and general concern and uncertainty. These negative impacts have caused significant volatility and declines in global financial markets, which have caused losses for Fund investors during and subsequent to period end. The impact of the COVID-19 pandemic may last for an extended period of time, and could result in a substantial economic downturn or recession. Public health crises may exacerbate other pre-existing political, social, economic, market and financial risks. The extent of the impact to the financial performance of the Fund's investments will depend on future developments, including (i) the duration and spread of the outbreak, (ii) the restrictions and advisories, (iii) the effects on the financial markets, and (iv) the effects on the economy overall, all of which are highly uncertain and cannot be predicted.
Credit Risk — The fixed-income securities held in the Fund's portfolio are subject to credit risk, which is the possibility that an issuer of a fixed-income security will fail to make timely interest and/or principal payments on its securities or that negative market perceptions of the issuer's ability to make such payments will cause the price of that security to decline. The Fund accepts some credit risk as a recognized means to enhance an investor's return. All fixed-income securities, varying from the highest quality to the very speculative, have some degree of credit risk.
Debt Securities Risk — The value of a debt security or other income-producing security changes in response to various factors, including, for example, market-related factors (such as changes in interest rates or changes in the risk appetite of investors generally) and changes in the actual or perceived ability of the issuer (or of issuers generally) to meet its (or their) obligations.
Other factors that may affect the value of debt securities, include, among others, public health crises and responses by governments and companies to such crises. These and other events may affect the creditworthiness of the issuer of a debt security and may impair an issuers ability to timely meet its debt obligations as they come due.
42
USAA Mutual Funds Trust | Notes to Financial Statements — continued March 31, 2021 | ||||||
Interest Rate Risk — The Fund is subject to the risk that the market value of the bonds in its portfolio will fluctuate because of changes in interest rates, changes in the supply of and demand for tax-exempt securities, and other market factors. Bond prices generally are linked to the prevailing market interest rates. In general, when interest rates rise, bond prices fall; conversely, when interest rates fall, bond prices rise. The price volatility of a bond also depends on its duration. Generally, the longer the duration of a bond, the greater is its sensitivity to interest rates. To compensate investors for this higher interest rate risk, bonds with longer durations generally offer higher yields than bonds with shorter durations. The ability of an issuer of a debt security to repay principal prior to a security's maturity can increase the security's sensitivity to interest rate changes.
Decisions by the U.S. Federal Reserve (also known as the "Fed") regarding interest rate and monetary policy, which can be difficult to predict and sometimes change direction suddenly in response to economic and market events, can have a significant effect on the value of fixed-income securities as well as the overall strength of the U.S. economy. Precise interest rate predictions are difficult to make, and interest rates may change unexpectedly and dramatically in response to extreme changes in market or economic conditions. As a result, the value of fixed-income securities may vary widely under certain market conditions.
LIBOR Discontinuation Risk — Many debt securities, derivatives and other financial instruments, including some of the Fund's investments, use the London Interbank Offered Rate ("LIBOR") as the reference or benchmark rate for variable interest rate calculations. In June 2017, the Alternative Reference Rates Committee, a group of large U.S. banks working with the Federal Reserve, announced its selection of a new Secured Overnight Funding Rate ("SOFR"), which is intended to be a broad measure of secured overnight U.S. Treasury repo rates, as an appropriate replacement for LIBOR. The Federal Reserve Bank of New York began publishing the SOFR in 2018, expecting that it could be used on a voluntary basis in new instruments and transactions. Bank working groups and regulators in other countries have suggested other alternatives for their markets, including the Sterling Overnight Interbank Average Rate ("SONIA") in England. In July 2017, the Financial Conduct Authority (the "FCA"), the United Kingdom financial regulatory body, announced that after 2021, it will cease its active encouragement of UK banks to provide the quotations needed to sustain LIBOR. That announcement suggests that LIBOR may cease to be published after that time. For U.S. dollar LIBOR, however, the relevant date may be deferred to June 30, 2023, for the most common tenors (overnight and one, three, six and 12 months). As to those tenors, the LIBOR administrator has published a consultation regarding its intention to cease publication of U.S. dollar LIBOR as of June 30, 2023, (instead of December 31, 2021, as previously expected), apparently based on continued rate submissions from banks. It is expected that there will be enough time for market participants to transition to the use of a different benchmark for both new and existing securities and transactions. Various financial industry groups have begun planning for that transition, but there are obstacles to converting certain longer-term securities and transactions to a new benchmark. Transition planning is at an early stage, and neither the effect of the transition process nor its ultimate success can yet be known. Although the foregoing may provide some sense of timing, there is no assurance that LIBOR, or any particular currency and tenor, will continue to be published until any particular date, and it appears highly likely that LIBOR will be discontinued or modified after December 31, 2021, or June 30, 2023, depending on the currency and tenor. The transition process might lead to increased volatility and illiquidity in markets that currently rely on the LIBOR to determine interest rates. It could also lead to a reduction in the value of some LIBOR-based investments and reduce the effectiveness of new hedges placed against existing LIBOR-based instruments. Since the usefulness of LIBOR as a benchmark could deteriorate during the transition period, these effects could occur before the end of 2021.
6. Borrowing and Interfund Lending:
Line of Credit:
For the year ended March 31, 2021, the Victory Funds Complex participated in a short-term demand note "Line of Credit" agreement with Citibank. The Line of Credit agreement with Citibank was renewed
43
USAA Mutual Funds Trust | Notes to Financial Statements — continued March 31, 2021 | ||||||
on June 29, 2020, with a termination date of June 28, 2021. Under the agreement with Citibank, the Victory Funds Complex may borrow up to $600 million, of which $300 million is committed and $300 million is uncommitted. $40 million of the Line of Credit is reserved for use by the Victory Floating Rate Fund, another series of the Victory Funds Complex, with Victory Floating Rate Fund paying the related commitment fees for that amount. The purpose of the agreement is to meet temporary or emergency cash needs. For the year ended March 31, 2021, Citibank received an annual commitment fee of 0.15% on $300 million for providing the Line of Credit. Each fund in the Victory Funds Complex paid a pro-rata portion of the commitment fees plus any interest (one month LIBOR plus one percent) on amounts borrowed. Effective June 29, 2020, under an amended Line of Credit agreement, Citibank also received an annual upfront fee of 0.10% on the $300 million committed line of credit. Each fund in the Victory Funds Complex paid a pro-rata portion of the upfront fee. Interest charged to each Fund during the period, if applicable, is reflected on the Statement of Operations under Line of credit fees.
The Fund had no borrowings under the Line of Credit agreement during the year ended March 31, 2021.
Interfund Lending:
The Trust and Adviser rely on an exemptive order granted by the SEC in March 2017 (the "Order"), permitting the establishment and operation of an Interfund Lending Facility (the "Facility"). The Facility allows the Fund to directly lend and borrow money to or from any other Fund, that is permitted to participate in the Facility, in the Victory Funds Complex relying upon the Order at rates beneficial to both the borrowing and lending funds. Advances under the Facility are allowed for temporary or emergency purposes, including the meeting of redemption requests that otherwise might require the untimely disposition of securities, and are subject to each Fund's borrowing restrictions. The interfund loan rate is determined, as specified in the Order, by averaging the current repurchase agreement rate and the current bank loan rate. As a Borrower, interest charged to the Fund, if any, during the period is reflected on the Statement of Operations under Interfund lending fees. As a Lender, interest earned by the Fund, if any, during the period is presented on the Statement of Operations under Interfund lending.
The average borrowing or lending for the days outstanding and average interest rate for the Fund during the year ended March 31, 2021 were as follows (amounts in thousands):
| Borrower or Lender | Amount Outstanding at March 31, 2021 | Average Borrowing* | Days Borrowing Outstanding | Maximum Average Interest Rate* | Borrowing During the Period | ||||||||||||||||||
Borrower | $ | — | $ | 1,650 | 10 | 0.65 | % | $ | 3,288 | ||||||||||||||
* For the year ended March 31, 2021, based on the number of days borrowings were outstanding.
7. Federal Income Tax Information:
Distributions from the Fund's net investment income are accrued daily and distributed on the last business day of each month. Distributable net realized gains, if any, are declared and paid at least annually.
The amounts of dividends from net investment income and distributions from net realized gains (collectively distributions to shareholders) are determined in accordance with federal income tax regulations, which may differ from GAAP. To the extent these "book/tax" differences are permanent in nature (e.g., net operating loss and distribution reclassification), such amounts are reclassified within the components of net assets based on their federal tax-basis treatment; temporary differences (e.g., wash sales) do not require reclassification. To the extent dividends and distributions exceed net investment income and net realized gains for tax purposes, they are reported as distributions of capital.
44
USAA Mutual Funds Trust | Notes to Financial Statements — continued March 31, 2021 | ||||||
Net investment losses incurred by the Fund may be reclassified as an offset to capital on the accompanying Statement of Assets and Liabilities.
As of March 31, 2021, on the Statement of Assets and Liabilities, there were no permanent book-to-tax difference reclassification adjustments.
The tax character of distributions paid during the tax years ended as noted below, were as follows (total distributions paid may differ from the Statements of Changes in Net Assets because, for tax purposes, dividends are recognized when actually paid) (amounts in thousands).
Year Ended March 31, 2021 | Year Ended March 31, 2020 | ||||||||||||||||||
Distributions Paid from | Distributions Paid from | ||||||||||||||||||
Tax-Exempt Income | Total Distributions Paid | Tax-Exempt Income | Total Distributions Paid | ||||||||||||||||
$ | 75,132 | $ | 75,132 | $ | 82,361 | $ | 82,361 | ||||||||||||
As of March 31, 2021, the components of accumulated earnings (loss) on a tax basis were as follows (amounts in thousands):
| Undistributed Tax-Exempt Income | Distributions Payable | Accumulated Earnings | Accumulated Capital and Other Losses | Unrealized Appreciation (Depreciation)* | Total Accumulated Earnings (Loss) | ||||||||||||||||||
| $ | 10,978 | $ | (6,068 | ) | $ | 4,910 | $ | (62,280 | ) | $ | 128,264 | $ | 70,894 | ||||||||||
* The difference between the book-basis and tax-basis of unrealized appreciation/depreciation is attributable to the tax deferral of losses on wash sales and defaulted bond adjustments.
As of March 31, 2021, the Fund had net capital loss carryforwards as shown in the table below (amounts in thousands). It is unlikely that the Board will authorize a distribution of capital gains realized in the future until the capital loss carryforwards have been used.
| Short-Term Amount | Long-Term Amount | Total | |||||||||
| $ | 12,896 | $ | 49,384 | $ | 62,280 | ||||||
As of March 31, 2021, the cost basis for federal income tax purposes, gross unrealized appreciation, gross unrealized depreciation, and net unrealized appreciation (depreciation) for investments were as follows (amounts in thousands):
| Cost of Investments for Federal Tax Purposes | Gross Unrealized Appreciation | Gross Unrealized Depreciation | Net Unrealized Appreciation (Depreciation) | ||||||||||||
| $ | 2,265,743 | $ | 188,038 | $ | (59,774 | ) | $ | 128,264 | |||||||
45
REPORT OF INDEPENDENT REGISTERED PUBLIC ACCOUNTING FIRM
To the Shareholders and the Board of Trustees of USAA Tax Exempt Long-Term Fund
Opinion on the Financial Statements
We have audited the accompanying statement of assets and liabilities of USAA Tax Exempt Long-Term Fund (the "Fund") (one of the funds constituting USAA Mutual Funds Trust (the "Trust")), including the schedule of portfolio investments, as of March 31, 2021, and the related statement of operations for the year then ended, the statements of changes in net assets for each of the two years in the period then ended, the financial highlights for each of the five years in the period then ended and the related notes (collectively referred to as the "financial statements"). In our opinion, the financial statements present fairly, in all material respects, the financial position of the Fund at March 31, 2021, the results of its operations for the year then ended, the changes in its net assets for each of the two years in the period then ended and its financial highlights for each of the five years in the period then ended, in conformity with U.S. generally accepted accounting principles.
Basis for Opinion
These financial statements are the responsibility of the Trust's management. Our responsibility is to express an opinion on the Fund's financial statements based on our audits. We are a public accounting firm registered with the Public Company Accounting Oversight Board (United States) ("PCAOB") and are required to be independent with respect to the Trust in accordance with the U.S. federal securities laws and the applicable rules and regulations of the Securities and Exchange Commission and the PCAOB.
We conducted our audits in accordance with the standards of the PCAOB. Those standards require that we plan and perform the audit to obtain reasonable assurance about whether the financial statements are free of material misstatement, whether due to error or fraud. The Trust is not required to have, nor were we engaged to perform, an audit of the Trust's internal control over financial reporting. As part of our audits we are required to obtain an understanding of internal control over financial reporting, but not for the purpose of expressing an opinion on the effectiveness of the Trust's internal control over financial reporting. Accordingly, we express no such opinion.
Our audits included performing procedures to assess the risks of material misstatement of the financial statements, whether due to error or fraud, and performing procedures that respond to those risks. Such procedures included examining, on a test basis, evidence regarding the amounts and disclosures in the financial statements. Our procedures included confirmation of securities owned as of March 31, 2021, by correspondence with the custodian. Our audits also included evaluating the accounting principles used and significant estimates made by management, as well as evaluating the overall presentation of the financial statements. We believe that our audits provide a reasonable basis for our opinion.

We have served as the auditor of one or more Victory Capital investment companies since 1995.
San Antonio, Texas
May 26, 2021
46
USAA Mutual Funds Trust | Supplemental Information March 31, 2021 | ||||||
(Unaudited)
Trustee and Officer Information
Board of Trustees:
Overall responsibility for management of the Trust rests with the Board. The Trust is managed by the Board in accordance with the laws of the state of Delaware. There are currently nine Trustees, seven of whom are not "interested persons" of the Trust within the meaning of that term under the 1940 Act ("Independent Trustees") and two of whom is an "interested person" of the Trust within the meaning of that term under the 1940 Act ("Interested Trustee"). The Trustees, in turn, elect the officers of the Trust to actively supervise its day-to-day operations.
The following tables list the Trustees, their ages, position with the Trust, commencement of service, principal occupations during the past five years and any directorships of other investment companies or companies whose securities are registered under the Securities Exchange Act of 1934, as amended, or who file reports under that Act. Each Trustee oversees 46 portfolios in the Trust. Each Trustee's address is 15935 La Cantera Pkwy, San Antonio, TX, 78256. Pursuant to a policy adopted by the Board, the term of office for each Trustee shall be until the Independent Trustee reaches age 75 or an Interested Trustee reaches age 75. The Board may change or grant exceptions from this policy at any time without shareholder approval. A Trustee may resign or be removed by a vote of the other Trustees or the holders of a majority of the outstanding shares of the Trust at any time. Vacancies on the Board can be filled by the action of a majority of the Trustees, provided that after filling such vacancy at least two-thirds of the Trustees have been elected by the shareholders.
Name and Date of Birth | Position Held with the Trust | Year Commenced Service | Principal Occupation During Past 5 Years | Other Directorships Held During Past 5 Years | |||||||||||||||
Independent Trustees. | |||||||||||||||||||
| Jefferson C. Boyce, (c) Born September 1957 | Independent Chairman | 2021 | Senior Managing Director, New York Life Investments, LLC (1992-2012) | Westhab, Inc. | |||||||||||||||
| John C. Walters, Born February 1962 | Trustee | 2019 | Retired. Mr. Walters brings significant Board experience including active involvement with the board of a Fortune 500 company, and a proven record of leading large, complex financial organizations. He has a demonstrated record of success in distribution, manufacturing, investment brokerage, and investment management in both the retail and institutional investment businesses. He has substantial experience in the investment management business with a demonstrated ability to develop and drive strategy while managing operation, financial, and investment risk. | Guardian Variable Products Trust (16 series), Lead Independent Director; Amerilife Holdings LLC, Director; Stadion Money Management; Director; University of North Carolina (Chapel Hill), Member Board of Governors | |||||||||||||||
47
USAA Mutual Funds Trust | Supplemental Information — continued March 31, 2021 | ||||||
(Unaudited)
Name and Date of Birth | Position Held with the Trust | Year Commenced Service | Principal Occupation During Past 5 Years | Other Directorships Held During Past 5 Years | |||||||||||||||
| Robert L. Mason, Ph.D., Born July 1946 | Trustee | 1997 | Adjunct Professor in the Department of Management Science and Statistics in the College of Business at the University of Texas at San Antonio (since 2001); Institute Analyst, Southwest Research Institute (March 2002-January 2016) | None | |||||||||||||||
| Dawn M. Hawley, Born February 1954 | Trustee | 2014 | Manager of Finance, Menil Foundation, Inc. (May 2007-June 2011), which is a private foundation that oversees the assemblage of sculptures, prints, drawings, photographs, and rare books. Director of Financial Planning and Analysis and Chief Financial Officer, AIM Management Group, Inc. (October 1987-January 2006) | None | |||||||||||||||
| Paul L. McNamara, Born July 1948 | Trustee | 2012 | Director, Cantor Opportunistic Alternatives Fund, LLC (March 2010-February 2014), which is a closed-end fund of funds by Cantor Fitzgerald Investment Advisors, LLC | None | |||||||||||||||
48
USAA Mutual Funds Trust | Supplemental Information — continued March 31, 2021 | ||||||
(Unaudited)
Name and Date of Birth | Position Held with the Trust | Year Commenced Service | Principal Occupation During Past 5 Years | Other Directorships Held During Past 5 Years | |||||||||||||||
| Richard Y. Newton III, Born January 1956 | Trustee | 2017 | Director, Elta North America (01/18-present), which is a global leader in the design, manufacture, and support of innovative electronic systems in the ground, maritime, airborne, and security domains for the nation's warfighters, security personnel, and first responders; Managing Partner, Pioneer Partnership Development Group (December 2015-present)); Executive Director, The Union League Club of New York (June 2014-November 2015): Executive Vice President, Air Force Association (August 2012-May 2014); Lieutenant General, United States Air Force (January 2008-June 2012) | PredaSAR Corp. | |||||||||||||||
| Barbara B. Ostdiek, Ph.D., Born March 1964 | Trustee | 2008 | Senior Associate Dean of Degree Programs at Jesse H. Jones Graduate School of Business at Rice University (since 2013); Associate Professor of Finance at Jessie H. Jones Graduate School of Business at Rice University (since 2001) | None | |||||||||||||||
| Michael F. Reimherr, (a) Born August 1945 | Trustee | 2000 | President of Reimherr Business Consulting (May 1995-December 2017); St. Mary's University Investment Committee overseeing University Endowment (since 2014) | None | |||||||||||||||
(a) Effective at the close of business on December 31, 2020, Michael F. Reimherr retired from the Board of Trustees.
49
USAA Mutual Funds Trust | Supplemental Information — continued March 31, 2021 | ||||||
(Unaudited)
Name and Date of Birth | Position Held with the Trust | Year Commenced Service | Principal Occupation During Past 5 Years | Other Directorships Held During Past 5 Years | |||||||||||||||
Interested Trustees. | |||||||||||||||||||
| David C. Brown, (b) Born May 1972 | Trustee | 2019 | Chairman and Chief Executive Officer (since 2013), Victory Capital Management Inc.; Chairman and Chief Executive Officer, Victory Capital Holdings, Inc. (since 2013). Mr. Brown brings to the Board extensive business, finance and leadership skills gained and developed through years of experience in the financial services industry, including his tenure overseeing the strategic direction as CEO of Victory Capital. These skills, combined with Mr. Brown's extensive knowledge of the financial services industry and demonstrated success in the development and distribution of investment strategies and products, enable him to provide valuable insights to the Board and strategic direction for the Funds. | Trustee, Victory Portfolios (41 series), Victory Portfolios II (26 series), Victory Variable Insurance Funds (8 series) | |||||||||||||||
50
USAA Mutual Funds Trust | Supplemental Information — continued March 31, 2021 | ||||||
(Unaudited)
Name and Date of Birth | Position Held with the Trust | Year Commenced Service | Principal Occupation During Past 5 Years | Other Directorships Held During Past 5 Years | |||||||||||||||
| Daniel S. McNamara, (b)(c) Born June 1966 | Trustee | 2012 | Trustee, President, and Vice Chairman of USAA ETF Trust (June 2017-June 2019); President of Financial Advice & Solutions Group (FASG), USAA (February 2013-March 2021); Director of USAA Investment Services Company (ISCO) (formerly USAA Investment Management) (September 2009-March 2021); President, Asset Management Company (AMCO) (August, 2011-June 2019); Senior Vice President of USAA Financial Planning Services Insurance Agency, Inc. (FPS) (April 2011-March 2021); Chairman of Board of ISCO (April 2013-December 2020); Director of AMCO (August 2011-June 2019); President and Director of USAA Shareholder Account Services (SAS) (October 2009-June 2019); Director and Vice Chairman of FPS (December 2013-March 2021); President and Director of USAA Investment Corporation (ICORP) (March 2010-March 2021); Chairman of Board of ICORP (December 2013-March 2021);); Director of USAA Financial Advisors, Inc. (FAI) (December 2013-March 2021); Chairman of Board of FAI (March 2015-March 2021). Mr. McNamara brings to the Board extensive experience in the financial services industry, including experience as an officer of the Trust. | None | |||||||||||||||
(b) Mr. Dan McNamara, the Chairman of the Board, is deemed an "interested person" due to his previous position as Director of AMCO, the former investment adviser of the Funds. Mr. Brown is deemed an "interested person" due to his position as Chief Executive Officer of Victory Capital, investment adviser to the Funds.
(c) Effective at the close of business on December 31, 2020, Jefferson C. Boyce replaced Dan McNamara as Chair of the Board and assumed the title of Independent Chair.
The Statement of Additional Information includes additional information about the Trustees of the Trust and is available, without charge, on the SEC's website at www.sec.gov and/or by calling (800)-235-8396.
51
USAA Mutual Funds Trust | Supplemental Information �� continued March 31, 2021 | ||||||
(Unaudited)
Officers:
The officers of the Trust, their ages, commencement of service and their principal occupations during the past five years, are detailed in the following table. Each officer serves until the earlier of his or her resignation, removal, retirement, death, or the election of a successor. The mailing address of each officer of the Trust is 15935 La Cantera Pkwy, San Antonio, TX, 78256. The officers of the Trust receive no compensation directly from the Trust for performing the duties of their offices.
Name and Date of Birth | Position with the Trust | Year Commenced Service | Principal Occupation During Past 5 Years | ||||||||||||
Interested Officers.
| Christopher K. Dyer, Born February 1962 | President | 2019 | Director of Fund Administration, Victory Capital (since 2004); Chief Operating Officer, Victory Capital Services, Inc. (since 2020) | ||||||||||||
| Scott A Stahorsky, Born July 1969 | Vice President | 2019 | Manager, Fund Administration, Victory Capital (since 2015) | ||||||||||||
| James K. De Vries, Born April 1969 | Treasurer | 2018 | Executive Director, Victory Capital Management Inc. (since 2019); Treasurer, USAA ETF Trust (September 2018-June 2019); Executive Director, Investment and Financial Administration, USAA (April 2012-June 2019); Assistant Treasurer, USAA ETF Trust (June 2017-September 2018); Assistant Treasurer, USAA Mutual Funds Trust (December 2013-February 2018) | ||||||||||||
| Allan Shaer, Born March 1965 | Assistant Treasurer | 2019 | Senior Vice President, Financial Administration, Citi Fund Services Ohio, Inc. (since 2016); Vice President, Mutual Fund Administration, JP Morgan Chase (2011-2016) | ||||||||||||
| Carol D. Trevino, Born October 1965 | Assistant Treasurer | 2018 | Director, Accounting and Finance, Victory Capital Management Inc. (since 2019); Accounting/Financial Director, USAA (December 2013-June 2019); Assistant Treasurer, USAA ETF Trust (September 2018-June 2019) | ||||||||||||
| Erin G. Wagner, Born February 1974 | Secretary | 2019 | Deputy General Counsel, the Adviser (since 2013) | ||||||||||||
| Charles Booth, Born April 1960 | Anti-Money Laundering Compliance Officer and Identity Theft Officer | 2019 | Director, Regulatory Administration and CCO Support Services, Citi Fund Services Ohio, Inc. (since 2007) | ||||||||||||
| Amy Campos, Born July 1976 | Chief Compliance Officer | 2019 | Chief Compliance Officer, USAA Mutual Funds Trust (since 2019); Executive Director, Deputy Chief Compliance Officer, USAA Mutual Funds Trust and USAA ETF Trust (July 2017-June 2019); Compliance Director, USAA Mutual Funds Trust (2014-July 2017) | ||||||||||||
52
USAA Mutual Funds Trust | Supplemental Information — continued March 31, 2021 | ||||||
(Unaudited)
Proxy Voting and Portfolio Holdings Information
Proxy Voting:
Information regarding the policies and procedures the Fund uses to determine how to vote proxies relating to portfolio securities is available without charge, upon request, by calling (800) 235-8396. The information is also included in the Fund's Statement of Additional Information, which is available on the SEC's website at www.sec.gov.
Information relating to how the Fund voted proxies relating to portfolio securities held during the most recent 12 months ended June 30 is available on the SEC's website at www.sec.gov.
Availability of Schedules of Portfolio Investments:
The Trust files a complete list of Schedules of Portfolio Investments with the SEC for the first and third quarter of each fiscal year on Form N-PORT. Form N-PORT is available on the SEC's website at www.sec.gov.
Expense Examples
As a shareholder of the Fund, you may incur two types of costs: (1) transaction costs, including sales charges (loads) on purchases; and (2) ongoing costs, including management fees and other Fund expenses. These examples are intended to help you understand your ongoing costs (in dollars) of investing in the Fund and to compare these costs with the ongoing costs of investing in other mutual funds.
These examples are based on an investment of $1,000 invested at the beginning of the period and held for the entire period from October 1, 2020 through March 31, 2021.
The Actual Expense figures in the table below provide information about actual account values and actual expenses. You may use the information below, together with the amount you invested, to estimate the expenses that you paid over the period. Simply divide your account value by $1,000 (for example, an $8,600 account value divided by $1,000 = 8.6), then multiply the result by the number in the table under the heading entitled "Actual Expenses Paid During Period" to estimate the expenses you paid on your account during this period.
The Hypothetical Expense figures in the table below provide information about hypothetical account values and hypothetical expenses based on the Fund's actual expense ratio and an assumed rate of return of 5% per year before expenses, which is not the Fund's actual return. The hypothetical account values and expenses may not be used to estimate the actual ending account balance or expenses you paid for the period. You may use this information to compare this 5% hypothetical example with the 5% hypothetical examples that appear in shareholder reports of other funds.
Please note the expenses shown in the table below are meant to highlight your ongoing costs only and do not reflect any transactional costs. If these transactional costs were included, your costs would have been higher.
| Beginning Account Value 10/1/20 | Actual Ending Account Value 3/31/21 | Hypothetical Ending Account Value 3/31/21 | Actual Expenses Paid During Period 10/1/20- 3/31/21* | Hypothetical Expenses Paid During Period 10/1/20- 3/31/21* | Annualized Expense Ratio During Period 10/1/20- 3/31/21 | ||||||||||||||||||||||
Fund Shares | $ | 1,000.00 | $ | 1,026.80 | $ | 1,022.54 | $ | 2.43 | $ | 2.42 | 0.48 | % | |||||||||||||||
Institutional Shares | 1,000.00 | 1,027.10 | 1,022.74 | 2.22 | 2.22 | 0.44 | % | ||||||||||||||||||||
Class A | 1,000.00 | 1,026.00 | 1,021.64 | 3.33 | 3.33 | 0.66 | % | ||||||||||||||||||||
* Expenses are equal to the average account value multiplied by the Fund's annualized expense ratio multiplied by 182/365 (the number of days in the most recent fiscal half-year divided by the number of days in the fiscal year).
53
USAA Mutual Funds Trust | Supplemental Information — continued March 31, 2021 | ||||||
(Unaudited)
Additional Federal Income Tax Information
The following federal tax information related to the Fund's fiscal year ended March 31, 2021, is provided for information purposes only and should not be used for reporting to federal or state revenue agencies. Federal tax information for the calendar year will be reported to you on Form 1099-DIV in January 2022.
With respect to distributions paid, the Fund designates the following amounts (or, if subsequently determined to be different, the maximum amount allowable) for the fiscal year ended March 31, 2021 (amounts in thousands):
| Tax Exempt Income | |||||||
$ | 75,132 | ||||||
54
USAA Mutual Funds Trust | Supplemental Information — continued March 31, 2021 | ||||||
(Unaudited)
Considerations of the Board in Continuing the Investment Advisory Agreement
USAA Tax Exempt Long-Term Fund (the "Fund")
At a meeting of the Board of Trustees (the "Board") held on December 10-11, 2020, the Board, including the Trustees who are not "interested persons" (as that term is defined in the Investment Company Act of 1940, as amended) of the Trust (the "Independent Trustees"), approved for an annual period the continuance of the Investment Advisory Agreement (the "Advisory Agreement") between the Trust and Victory Capital Management Inc. (the "Adviser") with respect to the Fund. Prior to the December 10-11, 2020, meeting, at which the Advisory Agreement was approved, the Independent Trustees also discussed and considered information regarding the proposed continuation of the Advisory Agreement at a meeting held on November 19, 2020.
In advance of the foregoing meetings, the Trustees received and considered a variety of information relating to the Advisory Agreement and the Adviser, and were given the opportunity to ask questions and request additional information from management. The information provided to the Board included, among other things: (i) a separate report prepared by an independent third party of mutual fund data, which provided a statistical analysis comparing the Fund's investment performance, expenses, and fees to comparable investment companies; (ii) information concerning the services rendered to the Fund, as well as information regarding the Adviser's revenues and costs of providing services to the Fund and compensation paid to affiliates of the Adviser; and (iii) information about the Adviser's operations and personnel. Prior to voting, the Independent Trustees reviewed the proposed continuance of the Advisory Agreement with management and with experienced independent counsel retained by the Independent Trustees ("Independent Counsel") and received materials from such Independent Counsel discussing the legal standards for their consideration of the proposed continuation of the Advisory Agreement with respect to the Fund. The Independent Trustees also reviewed the proposed continuation of the Advisory Agreement with respect to the Fund in private sessions with Independent Counsel at which no representatives of management were present.
At each regularly scheduled meeting of the Board and its committees, the Board receives and reviews, among other things, information concerning the Fund's performance and related services provided by the Adviser. At the meeting at which the renewal of the Advisory Agreement is considered, particular focus is given to information concerning Fund performance, fees and total expenses as compared to comparable investment companies, and the Adviser's profitability with respect to the Fund. However, the Board noted that the evaluation process with respect to the Adviser is an ongoing one. In this regard, the Board's and its committees' consideration of the Advisory Agreement included information previously received at such meetings.
Advisory Agreement
After full consideration of a variety of factors, the Board, including the Independent Trustees, voted to approve the Advisory Agreement. In approving the Advisory Agreement, the Trustees did not identify any single factor as controlling, and each Trustee may have attributed different weights to various factors. Throughout their deliberations, the Independent Trustees were represented and assisted by Independent Counsel.
Nature, Extent, and Quality of Services — In considering the nature, extent, and quality of the services provided by the Adviser under the Advisory Agreement, the Board reviewed information provided by the Adviser relating to its operations and personnel. The Board also took into account its knowledge of the Adviser's management and the quality of the performance of the Adviser's duties through Board meetings, discussions, and reports during the preceding year. The Board considered the fees paid to the Adviser and the services provided to the Fund by the Adviser under the Advisory Agreement, as well as other services provided by the Adviser and its affiliates under other agreements, and the personnel who provide these services. In addition to the investment advisory services provided to the Fund, the Adviser and its affiliates provide administrative services, shareholder services, oversight of Fund accounting, marketing services, assistance in meeting legal and regulatory requirements, and other services necessary for the operation of the Fund and the Trust.
The Board considered the scope of services provided by, and the undertakings required of, the Adviser in connection with those services, including, among other things, maintaining (i) its own and the Fund's compliance programs, (ii) risk management programs, (iii) liquidity risk management programs, and (iv) cybersecurity
55
USAA Mutual Funds Trust | Supplemental Information — continued March 31, 2021 | ||||||
(Unaudited)
programs, each of which had expanded over time as a result of regulatory, market, and other developments. The Board also considered the significant risks assumed by the Adviser in connection with the services provided to the Fund, including investment, operational, enterprise, litigation, regulatory and compliance risks.
The Board considered the Adviser's management style and the performance of the Adviser's duties under the Advisory Agreement. The Board considered the level and depth of knowledge of the Adviser, including the professional experience and qualifications of its senior and investment personnel, as well as current staffing levels. The allocation of the Fund's brokerage, including the Adviser's process for monitoring "best execution," also was considered. The Adviser's role in coordinating the activities of the Fund's other service providers was also considered. The Board also considered the Adviser's risk management processes. The Board considered the Adviser's financial condition and that it had the financial wherewithal to continue to provide the same scope and high quality of services under the Advisory Agreement. In reviewing the Advisory Agreement, the Board focused on the experience, resources, and strengths of the Adviser and its affiliates in managing the Fund, as well as the other funds in the Trust.
The Board also reviewed the compliance and administrative services provided to the Fund by the Adviser and its affiliates, including the Adviser's oversight of the Fund's day-to-day operations and oversight of Fund accounting. The Trustees, guided also by information obtained from their experiences as trustees of the Trust, also focused on the quality of the Adviser's compliance and administrative staff.
Expenses and Performance — In connection with its consideration of the Advisory Agreement, the Board evaluated the Fund's advisory fees and total expense ratio as compared to other open-end investment companies deemed to be comparable to the Fund as determined by the independent third party in its report. The Fund's expenses were compared to (i) a group of investment companies chosen by the independent third party to be comparable to the Fund based upon certain factors, including fund type, comparability of investment objective and classification, sales load type, asset size, and expense components (the "expense group") and (ii) a larger group of investment companies with the same investment classification/objective as the Fund regardless of asset size, excluding outliers (the "expense universe"). Among other data, the Board noted that the Fund's management fee rate—which includes advisory and administrative services and the effects of any performance adjustment1, as well as any fee waivers and reimbursements—was below the medians of its expense group and expense universe. The data indicated that the Fund's total expenses, including after any reimbursements, were below the medians of its expense group and expense universe. The Board also took into account the Adviser's current undertakings to maintain expense limitations for the Fund. The Board took into account the various other services provided to the Fund by the Adviser and its affiliates, and noted the high quality of services received by the Fund.
In considering the Fund's performance, the Board noted that it reviews at its regularly scheduled meetings information about the Fund's performance results. The Trustees also reviewed various comparative data provided to them in connection with their consideration of the renewal of the Advisory Agreement, including, among other information, a comparison of the Fund's average annual total returns relative to its Lipper index and other mutual funds deemed to be in its peer group by the independent third party in its report (the "performance universe"). The Fund's performance universe consisted of the Fund and all retail and institutional open-end investment companies with the same classification/objective as the Fund regardless of asset size or primary channel of distribution. This comparison indicated that, among other data, the Fund's performance was above the average of its performance universe for the one-, three-, five-, and ten-year periods ended September 30, 2020, and was above its Lipper index for the one- and ten-year periods ended September 30, 2020, and was below its Lipper index for the three- and five-year periods ended September 30, 2020.
Compensation and Profitability — The Board took into consideration the level and method of computing the management fee. The information considered by the Board included operating profit margin information for the Adviser's business as a whole. The Board also received and considered profitability information related to the management revenues from the Fund. This information included a review of the methodology used in the allocation of certain costs to the Fund. In considering the profitability data with respect to the Fund, the Trustees noted that the Adviser waived a portion of its management fees and/or reimbursed certain expenses with respect to the Fund. The Trustees reviewed the profitability of the Adviser's relationship with the Fund before tax expenses. The Board was also provided with a profitability analysis of other publicly traded asset managers
1 The Adviser has agreed that no performance adjustment (positive or negative) would be made to the amount payable to the Adviser from July 1, 2019, through June 30, 2020.
56
USAA Mutual Funds Trust | Supplemental Information — continued March 31, 2021 | ||||||
(Unaudited)
prepared by an independent information service. In reviewing the overall profitability of the management fee to the Adviser, the Board also considered the fact that the Adviser and its affiliates provide shareholder servicing and administrative services to the Fund for which they receive compensation. The Board also considered the possible direct and indirect benefits to the Adviser from its relationship with the Trust, including that the Adviser may derive reputational and other benefits from its association with the Fund. The Trustees recognized that the Adviser should be entitled to earn a reasonable level of profits in exchange for the level of services it provides to the Fund and the entrepreneurial and other risks that it assumes as Adviser.
Economies of Scale — The Board considered whether there should be changes in the management fee rate or structure in order to enable the Fund to participate in any economies of scale. The Board also considered the fee waiver and expense reimbursement arrangements by the Adviser. The Board also considered the effect of the Fund's change in size, if any, on its performance and fees, noting that the Fund may realize other economies of scale if assets increase proportionally more than expenses. The Board determined that the current investment management fee structure was reasonable.
Conclusions — The Board reached the following conclusions regarding the Fund's Advisory Agreement with the Adviser: (i) the Adviser has demonstrated that it possesses the capability and resources to perform the duties required of it under the Advisory Agreement; (ii) the Adviser maintains an appropriate compliance program; (iii) the overall performance of the Fund is reasonable in relation to the performance of funds with similar investment objectives and to relevant indices; (iv) the Fund's advisory expenses are reasonable in relation to those of similar funds and to the services to be provided by the Adviser; and (v) the Adviser's and its affiliates' level of profitability from their relationship with the Fund is reasonable in light of the nature and high quality of services provided by the Adviser and the type of fund. Based on its conclusions, the Board determined that continuation of the Advisory Agreement would be in the best interests of the Fund and its shareholders.
57
USAA Mutual Funds Trust | Supplemental Information — continued March 31, 2021 | ||||||
(Unaudited)
Liquidity Risk Management Program:
The USAA Mutual Funds have adopted and implemented a written liquidity risk management program (the "LRMP") as required by Rule 22e-4 under the Investment Company Act of 1940, as amended. The LRMP is reasonably designed to assess and manage the Fund's liquidity risk, taking into consideration the Fund's investment strategy and the liquidity of its portfolio investments during normal and reasonably foreseeable stressed market conditions; its short and long-term cash flow projections; and its cash holdings and access to other liquidity management tools such as available funding sources including the Victory Funds Complex Interfund Lending Facility and Line of Credit (discussed in the Notes to Financial Statements). The USAA Mutual Funds' Board of Trustees approved the appointment of the Funds' investment adviser, Victory Capital Management Inc. ("Victory Capital"), as the administrator of the LRMP.
Victory Capital manages liquidity risks associated with the Fund's investments by monitoring, among other things, cash and cash equivalents, any use of derivatives, the concentration of investments, the appropriateness of the Fund's investment strategy, and by classifying every fund investment as either highly liquid, moderately liquid, less liquid or illiquid on at least a monthly basis. To assist with the classification of Fund investments, Victory Capital has retained a third-party provider of liquidity evaluation services. This provider determines preliminary liquidity classifications for all portfolio holdings based upon portfolio-level data and certain assumptions provided by Victory Capital. Victory Capital reviews the preliminary liquidity classifications, and, when appropriate, considers other information including input from the Fund's portfolio managers (including the portfolio managers employed by any investment sub-advisers) in determining final liquidity classifications.
At a virtual video conference meeting held on March 10, 2021, Victory Capital provided an oral and written report to the Trustees on the operation and effectiveness of the LRMP during the previous year. The report from Victory Capital concluded that the Fund did not experience any significant liquidity challenges during the covered period, and the Fund's LRMP is reasonably designed to assess and manage its liquidity risk. The report also concluded that the LRMP continues to operate adequately and effectively to enable Victory Capital to oversee and manage liquidity risk and ensure the Fund is able to meet redemption requests without significant dilution to the remaining investors' interest in the Fund. During the review period, the Fund's portfolio consisted primarily of highly liquid investments, which are defined as cash and any investments reasonably expected to be converted to cash in current market conditions in three business days or less without significantly changing the market value of the investment. Therefore, the Fund has not adopted a Highly Liquid Investment Minimum. The Fund's investments were below the limitation on illiquid investments during the review period. Additionally, Victory Capital indicated that no events occurred that would require the filing of Form N-LIQUID and recommended no material changes to the LRMP.
58
Privacy Policy
Protecting the Privacy of Information
The Trust respects your right to privacy. We also know that you expect us to conduct and process your business in an accurate and efficient manner. To do so, we must collect and maintain certain personal information about you. This is the information we collect from you on applications or other forms, and from the transactions you make with us or third parties. It may include your name, address, social security number, account transactions and balances, and information about investment goals and risk tolerance.
We do not disclose any information about you or about former customers to anyone except as permitted or required by law. Specifically, we may disclose the information we collect to companies that perform services on our behalf, such as the transfer agent that processes shareholder accounts and printers and mailers that assist us in the distribution of investor materials. We may also disclose this information to companies that perform marketing services on our behalf. This allows us to continue to offer you Victory investment products and services that meet your investing needs, and to effect transactions that you request or authorize. These companies will use this information only in connection with the services for which we hired them. They are not permitted to use or share this information for any other purpose.
To protect your personal information internally, we permit access only by authorized employees and maintain physical, electronic and procedural safeguards to guard your personal information.*
* You may have received communications regarding information about privacy policies from other financial institutions which gave you the opportunity to "opt-out" of certain information sharing with companies which are not affiliated with that financial institution. The Trust does not share information with other companies for purposes of marketing solicitations for products other than the Trust. Therefore, the Trust does not provide opt-out options to their shareholders.
P.O. Box 182593
Columbus, Ohio 43218-2593

Visit our website at: | Call | ||||||
vcm.com | (800) 235-8396 | ||||||
40858-0521

MARCH 31, 2021
Annual Report
USAA Tax Exempt Intermediate-Term Fund
As permitted by regulations adopted by the Securities and Exchange Commission, paper copies of the Fund's shareholder reports may no longer be sent by mail, unless you specifically request paper copies of the reports from the Fund or from your financial intermediary, such as a broker-dealer or bank. Instead, the reports will be made available on VictoryFunds.com, and you will be notified by mail each time a report is posted and provided with a website link to access the report. If you already elected to receive shareholder reports electronically, you will not be affected by this change and you need not take any action.
You may elect to receive shareholder reports and other communications from the Fund or your financial intermediary electronically by notifying your financial intermediary directly, or if you are a shareholder who has an account directly with the Fund, by calling (800) 235-8396 or by submitting your request via email to TA.Processing@FISGlobal.com.
You may elect to receive all future reports in paper form free of charge. You can inform the Fund or your financial intermediary that you wish to continue receiving paper copies of your shareholder reports by notifying your financial intermediary directly, or if you are a shareholder who has an account directly with the Fund, by calling (800) 235-8396 or by submitting your request via email to TA.Processing@FISGlobal.com. Your election to receive reports in paper will apply to all funds held with the USAA Mutual Funds or your financial intermediary.
Victory Capital means Victory Capital Management Inc., the investment adviser of the USAA Mutual Funds. USAA Mutual Funds are distributed by Victory Capital Services, Inc., member of FINRA, an affiliate of Victory Capital. Victory Capital and its affiliates are not affiliated with United Services Automobile Association or its affiliates. USAA and the USAA logos are registered trademarks and the USAA Mutual Funds and USAA Investments logos are trademarks of United Services Automobile Association and are being used by Victory Capital and its affiliates under license.
www.vcm.com
News, Information And Education 24 Hours A Day, 7 Days A Week
The Victory Funds site gives fund shareholders, prospective shareholders, and investment professionals a convenient way to access fund information, get guidance, and track fund performance anywhere they can access the Internet. The site includes:
• Detailed performance records
• Daily share prices
• The latest fund news
• Investment resources to help you become a better investor
• A section dedicated to investment professionals
Whether you're a potential investor searching for the fund that matches your investment philosophy, a seasoned investor interested in planning tools, or an investment professional, www.vcm.com has what you seek. Visit us anytime. We're always open.
TABLE OF CONTENTS
Shareholder Letter (Unaudited) | 2 | ||||||
Managers' Commentary (Unaudited) | 4 | ||||||
Investment Overview (Unaudited) | 6 | ||||||
| Investment Objective & Portfolio Holdings (Unaudited) | 7 | ||||||
Schedule of Portfolio Investments | 9 | ||||||
Financial Statements | |||||||
Statement of Assets and Liabilities | 45 | ||||||
Statement of Operations | 46 | ||||||
Statements of Changes in Net Assets | 47 | ||||||
Financial Highlights | 50 | ||||||
Notes to Financial Statements | 52 | ||||||
| Report of Independent Registered Public Accounting Firm | 63 | ||||||
Supplemental Information (Unaudited) | 64 | ||||||
Trustees' and Officers' Information | 64 | ||||||
Proxy Voting and Portfolio Holdings Information | 70 | ||||||
Expense Examples | 70 | ||||||
Additional Federal Income Tax Information | 72 | ||||||
Advisory Contract Agreement | 73 | ||||||
Liquidity Risk Management Program | 76 | ||||||
Privacy Policy (inside back cover) | |||||||
This report is for the information of the shareholders and others who have received a copy of the currently effective prospectus of the Fund, managed by Victory Capital Management Inc. It may be used as sales literature only when preceded or accompanied by a current prospectus, which provides further details about the Fund.
IRA DISTRIBUTION WITHHOLDING DISCLOSURE
We generally must withhold federal income tax at a rate of 10% of the taxable portion of your distribution and, if you live in a state that requires state income tax withholding, at your state's tax rate. However, you may elect not to have withholding apply or to have income tax withheld at a higher rate. Any withholding election that you make will apply to any subsequent distribution unless and until you change or revoke the election. If you wish to make a withholding election, or change or revoke a prior withholding election, call (800) 235-8396, and form W-4P (OMB No. 1545-0074 withholding certificate for pension or annuity payments) will be electronically sent.
If you do not have a withholding election in place by the date of a distribution, federal income tax will be withheld from the taxable portion of your distribution at a rate of 10%. If you must pay estimated taxes, you may be subject to estimated tax penalties if your estimated tax payments are not sufficient and sufficient tax is not withheld from your distribution.
For more specific information, please consult your tax adviser.
USAA Mutual Funds Trust
1
(Unaudited)
Dear Shareholder,
The annual reporting period ended March 31, 2021, was a year like no other. It wasn't that long ago that we were all coming to grips with an emerging global pandemic, economic shutdowns, and financial markets in turmoil. We somehow persevered and have even emerged from those challenging days—dare I say—with a renewed sense of optimism. In retrospect, the trajectory of financial markets over the past year was nothing short of extraordinary.
Consider everything that transpired over the past 12 months. A novel coronavirus ("COVID-19") and the subsequent worldwide spread of COVID-19 prompted governments everywhere to issue austere shelter-in-place orders, and the global economy slowed abruptly. Equity markets sold off, while unprecedented levels of volatility roiled traditionally placid bond markets. During the second quarter of 2020, domestic GDP contracted by an alarming annual rate of 31.4%, according to the U.S. Department of Commerce ("Commerce Department").
It's no surprise that many investors flocked to the perceived safety of U.S. Treasurys during this period of tumult. Meanwhile, liquidity evaporated (for a short spell) in other segments of the fixed-income world, including higher-yielding credits and municipal bonds. The outlook was tenuous, and credit spreads widened while prices declined for most securities perceived to be higher risk.
Fortunately, a response came swiftly. The U.S. Federal Reserve (the "Fed") and other monetary authorities worldwide leapt into action—cutting interest rates, (re)starting quantitative easing and, in the case of the Fed, launching an array of programs to provide liquidity to stabilize fixed-income markets. The U.S. government also stepped up to provide fiscal stimulus in the form of the Coronavirus Aid, Relief, and Economic Security Act ("CARES Act").
It was impressive how quickly those actions helped arrest the stock market's freefall and restore order across much of the fixed-income universe. The rebound was as robust as the drawdown, and third quarter 2020 GDP bounced back and grew at a 33.4% annualized rate, according to the Commerce Department.
Late in the year, financial markets were alternately fueled and roiled by a contentious election season, growing optimism for an effective vaccine, and a fluid debate regarding the need for additional fiscal stimulus. Ultimately, stocks were propelled higher in the fourth quarter as it became clear Congress would provide another dose of stimulus in the form of direct payments, more unemployment insurance, and additional aid to businesses.
As the year ended and we moved into the first quarter of 2021, stocks continued their upward trajectory. Meanwhile, the yield on the 10-Year U.S. Treasury continued rallying sharply, and many investors began to worry about inflation in the post-pandemic world.
Through all the unprecedented events and volatility, the S&P 500® Index registered an impressive annual return of 56.35% for the 12-month period ended March 31, 2021. Over this same period, the yield on the 10-Year U.S. Treasury jumped more than 100 basis points, reflecting both the very low starting rate and substantial fiscal
2
stimulus. At the end of the reporting period, the yield on the 10-Year U.S. Treasury was 1.74%
On the whole, markets endured and surprised to the upside, but perhaps the key takeaway is that the unexpected can and will happen. That's why it's important to remain focused on your long-term investment goals and avoid making emotional decisions.
On the following pages, you will find information relating to your USAA Mutual Funds, brought to you by Victory Capital. If you have any questions regarding the current market dynamics or your specific portfolio or investment plan, we encourage you to contact our Member Service Representatives. Call (800) 235-8396, or visit our website at www.vcm.com.
Thank you for letting us help you work toward your investment goals.

Christopher K. Dyer, CFA
President,
USAA Mutual Funds Trust
3
USAA Mutual Funds Trust
USAA Tax Exempt Intermediate-Term Fund
Manager's Commentary
(Unaudited)
Regina G. Conklin, CFA, CPA
Andrew Hattman, CFA, CAIA
Lauren Spalten*
• What were the market conditions during the reporting period?
Tax-exempt bonds as measured by the Bloomberg Barclays Municipal Bond Index generated positive returns during the 12-month reporting period ended March 31, 2021, due in part to falling municipal bond yields. (Bond prices and yields move in opposite directions.) However, the market saw significant volatility during the reporting period due primarily to COVID-19 and related economic and government reactions.
The reporting period began near the beginning of the COVID-19 crisis in the United States. The market had just sold off sharply in March 2020, and the first month of the reporting period was highlighted by significant volatility as the market reacted to COVID-19 and subsequent economic shutdowns, but also substantial fiscal and monetary response from the federal government. Starting in May 2020, the municipal market began a long, uneven recovery for the rest of the calendar year, driven by significant government intervention and investor expectations of a future return to normalcy. The recovery was marked by sizeable fund flows into tax-exempt mutual funds and material tightening of credit spreads (the yield difference between riskier bond yields and the safest bond yields). The recovery took a slight pause in the months ahead of the election, as uncertainty surrounding the election, as well as uncertainty around aid for municipal borrowers weighed on the market for a couple of months. However, the year ended with the market up significantly from the start of both the calendar year and the reporting period. January of 2021 saw a continuation of the market recovery, but the last part of the reporting period was highlighted by a sell-off in the municipal market as tax-exempt bonds finally succumbed to pressures caused by the meaningful increase in U.S. Treasury yields in the first quarter of 2021.
The end of the reporting period found the municipal market fighting the headwinds of potential higher U.S. Treasury rates and inflation, but with several notable tailwinds in support to include: heavy fund flows into tax-exempt mutual funds, investor expectations of increasing tax rates, and stimulus money flowing to municipal borrowers.
• How did the USAA Tax Exempt Intermediate-Term Fund (the "Fund") perform during the reporting period?
The Fund has four share classes: Fund Shares, Institutional Shares, Class A (effective June 29, 2020, the Adviser Shares were redesignated Class A and became subject to a front-end sales charge), and Class Z. For the reporting period ended March 31, 2021, the Fund Shares and Class A, had a total return of 6.72% and 6.46%, respectively, versus an average return of 5.81% amongst the funds in the Lipper Intermediate Municipal Debt Funds category. This compares to returns of 5.39% for the Lipper Intermediate Municipal Debt Funds Index, and 4.92% for the Bloomberg Barclays Municipal 1-15 Years Blend.
*Effective March 2, 2021, Lauren Spalten was added as a portfolio manager on the Fund and John C. Bonnell was removed.
4
USAA Mutual Funds Trust
USAA Tax Exempt Intermediate-Term Fund (continued)
Manager's Commentary (continued)
The Institutional Shares commenced operations on June 29, 2020, and the Class Z on March 4, 2021, and from that time through March 31, 2021, had a total return of 4.15% and 0.51%, respectively.
• What strategies did you employ during the reporting period?
In keeping with our investment approach, we continued to focus on income generation. The Fund's long-term income distribution, not its price appreciation, accounts for most of its total return. Because of the Fund's income orientation, it has a higher allocation to BBB and A rated categories when compared to its peer group.
Our commitment to independent credit research continued to help us identify attractive opportunities for the Fund. We employ fundamental analysis that emphasizes an issuer's ability and willingness to repay its debt. Through our credit research, we strive both to recognize relative value and to avoid potential pitfalls, which is especially important in volatile times like the present. As always, we worked with our in-house team of analysts to select investments for the Fund on a bond-by-bond basis. Our team continuously monitors all the holdings in the Fund's portfolio.
The Fund continues to hold a diversified portfolio of intermediate-term, primarily investment-grade municipal bonds. To limit exposure to an unexpected event, the Fund is diversified by sector, issuer, and geography. In addition, we avoid bonds subject to the federal alternative minimum tax for individuals.
Thank you for allowing us to assist you with your investment needs.
5
USAA Mutual Funds Trust
USAA Tax Exempt Intermediate-Term Fund
Investment Overview
(Unaudited)
Average Annual Total Return
Year Ended March 31, 2021
Fund Shares | Institutional Shares | Class A | Class Z | ||||||||||||||||||||||||||||
INCEPTION DATE | 3/19/82 | 6/29/20 | 8/1/10 | 3/4/21 | |||||||||||||||||||||||||||
Net Asset Value | Net Asset Value | Net Asset Value | Maximum Offering Price | Net Asset Value | Bloomberg Barclays Municipal 1-15 Years Blend Index1 | Lipper Intermediate Municipal Debt Funds Index2 | |||||||||||||||||||||||||
One Year | 6.72 | % | NA | 6.46 | % | 4.04 | % | NA | 4.92 | % | 5.39 | % | |||||||||||||||||||
Five Year | 3.36 | % | NA | 3.10 | % | 2.64 | % | NA | 3.03 | % | 2.87 | % | |||||||||||||||||||
Ten Year | 4.35 | % | NA | 4.10 | % | 3.87 | % | NA | 3.72 | % | 3.62 | % | |||||||||||||||||||
Since Inception | NA | 4.15 | % | NA | NA | 0.51 | % | NA | NA | ||||||||||||||||||||||
The performance data quoted represents past performance and current returns may be lower or higher. The investment return and principal value will fluctuate so that an investor's shares, when redeemed, may be worth more or less than the original cost. To obtain performance information current to the most recent month's end, please visit www.vcm.com.
The maximum offering price figures reflect a maximum sales charge of 2.25% for Class A. Net Asset Value does not reflect sales charges.
Total return measures the price change in a share assuming the reinvestment of all net investment income and realized capital gain distributions, if any. The total returns quoted do not reflect adjustments made to the enclosed financial statements in accordance with U.S. Generally Accepted Accounting Principles or the deduction of taxes that a shareholder would pay on net investment income and realized capital gain distributions, including reinvested distributions, or redemptions of shares.
The total return figures set forth above include all waivers of fees. Without such fee waivers, the total returns would have been lower.
USAA Tax Exempt Intermediate-Term Fund — Growth of $10,000
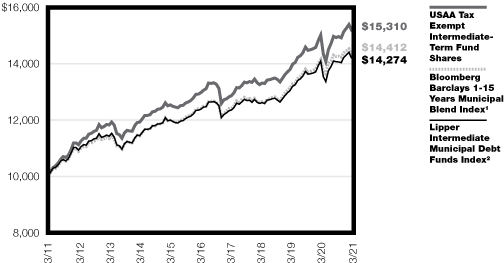
1The unmanaged Bloomberg Barclays 1-15 Years Municipal Blend Index is a market value-weighted index which covers the short and intermediate components of the Bloomberg Barclays Municipal Bond Index. This index does not include the effect of sales charges, commissions, expenses or taxes, is not representative of the Fund, and it is not possible to invest directly in an index.
2The unmanaged Lipper Intermediate Municipal Debt Funds Index measures the Fund's performance to that of the Lipper Intermediate Municipal Debt Funds category. This index does not include the effect of sales charges, commmissions, expenses or taxes, is not representative of the Fund, and it is not possible to invest directly in an index.
The graph reflects investment of growth of a hypothetical $10,000 investment in the Fund.
The graph and table do not reflect the deduction of taxes that a shareholder would pay on Fund distributions or the redemption of Fund shares.
Past performance is not indicative of future results.
6
| USAA Mutual Funds Trust USAA Tax Exempt Intermediate-Term Fund | March 31, 2021 | ||||||
(Unaudited)
Investment Objective & Portfolio Holdings:
The Fund's investment objective seeks to provide investors with interest income that is exempt from federal income tax.
Top 10 Industries
March 31, 2021
(% of Net Assets)
Hospital | 19.5 | % | |||||
General Obligation | 12.0 | % | |||||
Special Assessment/Tax/Fee | 12.0 | % | |||||
Education | 7.9 | % | |||||
Toll Road | 7.2 | % | |||||
Appropriated Debt | 6.1 | % | |||||
Electric/Gas Utility | 5.7 | % | |||||
Electric Utilities | 4.6 | % | |||||
Nursing/CCRC | 4.1 | % | |||||
Escrowed Bonds | 3.2 | % | |||||
Refer to the Schedule of Portfolio Investments for a complete list of securities.
7
| USAA Mutual Funds Trust USAA Tax Exempt Intermediate-Term Fund (continued) | March 31, 2021 | ||||||
(Unaudited)
Portfolio Ratings Mix:
March 31, 2021
(% of Net Assets)
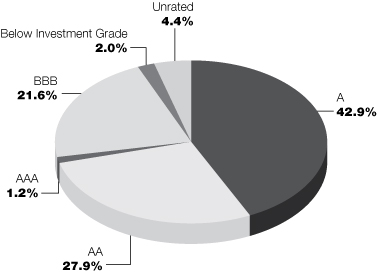
This chart reflects the highest long-term rating from a Nationally Recognized Statistical Rating Organization ("NRSRO"), with the four highest long-term credit ratings labeled, in descending order of credit quality, AAA, AA, A, and BBB. These categories represent investment-grade quality. NRSRO ratings are shown because they provide independent analysis of the credit quality of the Fund's investments. Victory Capital Management Inc. ("Adviser") also performs its own fundamental credit analysis of each security. As a part of its fundamental credit analysis, the Adviser considers various criteria, including industry specific actions, peer comparisons, payment ranking, and structure specific characteristics. Any of the Fund's securities that are not rated by an NRSRO appear in the chart above as "Unrated," but these securities are analyzed and monitored by the Adviser on an ongoing basis. Government securities that are issued or guaranteed as to principal and interest by the U.S. government and pre-refunded and escrowed-to-maturity municipal bonds that are not rated are treated as AAA for credit quality purposes.
8
| USAA Mutual Funds Trust USAA Tax Exempt Intermediate-Term Fund | Schedule of Portfolio Investments March 31, 2021 | ||||||
(Amounts in Thousands, Except for Shares)
Security Description | Shares or Principal Amount | Value | |||||||||
Common Stocks (0.2%) | |||||||||||
Utilities (0.2%): | |||||||||||
Energy Harbor Corp. (a) | 278,001 | $ | 7,464 | ||||||||
Total Common Stocks (Cost $6,914) | 7,464 | ||||||||||
Municipal Bonds (99.1%) | |||||||||||
Alabama (1.7%): | |||||||||||
| Columbia Industrial Development Board Revenue, Series C, 0.09%, 12/1/37, Continuously Callable @100 (b) | $ | 2,300 | 2,300 | ||||||||
| Infirmary Health System Special Care Facilities Financing Authority of Mobile Revenue, 5.00%, 2/1/36, Continuously Callable @100 | 8,000 | 9,278 | |||||||||
| Lower Alabama Gas District Revenue Series A, 5.00%, 9/1/27 | 5,000 | 6,194 | |||||||||
Series A, 5.00%, 9/1/28 | 7,000 | 8,832 | |||||||||
Series A, 5.00%, 9/1/34 (c) | 35,000 | 47,119 | |||||||||
| Montgomery Medical Clinic Board Revenue 5.00%, 3/1/33, Continuously Callable @100 | 5,955 | 6,868 | |||||||||
5.00%, 3/1/36, Continuously Callable @100 | 1,750 | 1,988 | |||||||||
| The Health Care Authority of the City of Huntsville Revenue Series B1, 4.00%, 6/1/39, Continuously Callable @100 | 2,000 | 2,333 | |||||||||
Series B1, 4.00%, 6/1/40, Continuously Callable @100 | 2,555 | 2,970 | |||||||||
87,882 | |||||||||||
Arizona (2.0%): | |||||||||||
| Apache County IDA Revenue, Series A, 4.50%, 3/1/30, Continuously Callable @100 | 20,310 | 21,038 | |||||||||
| Arizona Health Facilities Authority Revenue 5.00%, 2/1/27, Continuously Callable @100 | 6,000 | 6,230 | |||||||||
1.90% (MUNIPSA+185bps), 2/1/48, (Put Date 2/1/23) (d) (k) | 30,000 | 30,785 | |||||||||
| City of Phoenix Civic Improvement Corp. Revenue (INS — National Public Finance Guarantee Corp.) 5.50%, 7/1/24 | 3,270 | 3,743 | |||||||||
5.50%, 7/1/25 | 2,115 | 2,498 | |||||||||
| Maricopa County IDA Revenue 0.62% (MUNIPSA+57bps), 1/1/35, (Put Date 10/18/24) (d) (k) | 2,360 | 2,400 | |||||||||
5.00%, 7/1/39, Continuously Callable @100 (e) | 2,000 | 2,310 | |||||||||
| The City of Phoenix IDA Revenue 3.75%, 7/1/24 | 4,545 | 4,744 | |||||||||
5.00%, 7/1/34, Continuously Callable @100 | 11,100 | 12,245 | |||||||||
5.00%, 7/1/36, Continuously Callable @100 | 1,675 | 1,857 | |||||||||
5.00%, 10/1/36, Continuously Callable @100 | 4,250 | 4,948 | |||||||||
| The Pima County IDA Revenue, 4.13%, 6/15/29, Continuously Callable @100 (e) | 4,900 | 4,964 | |||||||||
| The Prima County IDA Revenue 4.00%, 6/15/22 (e) | 470 | 476 | |||||||||
Series A, 4.50%, 6/1/30, Continuously Callable @100 | 2,680 | 2,802 | |||||||||
The Yavapai County IDA Revenue, 4.00%, 8/1/38, Continuously Callable @100 | 1,000 | 1,112 | |||||||||
102,152 | |||||||||||
See notes to financial statements.
9
| USAA Mutual Funds Trust USAA Tax Exempt Intermediate-Term Fund | Schedule of Portfolio Investments — continued March 31, 2021 | ||||||
(Amounts in Thousands, Except for Shares)
Security Description | Principal Amount | Value | |||||||||
Arkansas (0.8%): | |||||||||||
| Arkansas Development Finance Authority Revenue 5.00%, 9/1/37, Continuously Callable @100 | $ | 1,000 | $ | 1,239 | |||||||
5.00%, 9/1/38, Continuously Callable @100 | 1,000 | 1,236 | |||||||||
5.00%, 9/1/39, Continuously Callable @100 | 1,000 | 1,232 | |||||||||
5.00%, 9/1/40, Continuously Callable @100 | 1,045 | 1,284 | |||||||||
1.60% (MUNIPSA+155bps), 9/1/44, (Put Date 9/1/22) (d) (k) | 29,000 | 29,474 | |||||||||
| University of Arkansas — Pulaski Technical College Revenue (INS — Build America Mutual Assurance Co.), 5.00%, 9/1/30, Continuously Callable @100 | 4,290 | 5,067 | |||||||||
39,532 | |||||||||||
California (5.6%): | |||||||||||
| Anaheim Public Financing Authority Revenue Series A, 5.00%, 5/1/28, Continuously Callable @100 | 500 | 555 | |||||||||
Series A, 5.00%, 5/1/29, Continuously Callable @100 | 500 | 554 | |||||||||
Series A, 5.00%, 5/1/30, Continuously Callable @100 | 1,000 | 1,108 | |||||||||
| Bay Area Toll Authority Revenue 1.15% (MUNIPSA+110bps), 4/1/45, (Put Date 4/1/24) (d) (k) | 17,000 | 17,479 | |||||||||
0.95% (MUNIPSA+90bps), 4/1/45, (Put Date 5/1/23) (d) (k) | 10,000 | 10,096 | |||||||||
| California Health Facilities Financing Authority Revenue 2.00%, 10/1/36, (Put Date 10/1/25) (d) | 8,500 | 9,025 | |||||||||
Series D, 5.00%, 8/15/27, Pre-refunded 8/15/21 @100 | 2,000 | 2,035 | |||||||||
Series D, 5.25%, 8/15/31, Pre-refunded 8/15/21 @100 | 5,000 | 5,091 | |||||||||
| California Municipal Finance Authority Revenue (LIQ — Deutsche Bank A.G.), Series DBE-8061, 0.58%, 1/1/60, Callable 1/1/37 @100 (b) (e) | 10,000 | 10,000 | |||||||||
| California School Finance Authority Revenue 5.00%, 8/1/31, Continuously Callable @100 (e) | 500 | 579 | |||||||||
5.00%, 8/1/36, Continuously Callable @100 (e) | 1,600 | 1,836 | |||||||||
| California State Public Works Board Revenue Series A, 5.00%, 3/1/25, Continuously Callable @100 | 1,250 | 1,363 | |||||||||
Series A, 5.00%, 3/1/26, Continuously Callable @100 | 1,365 | 1,488 | |||||||||
Series A, 5.00%, 4/1/28, Continuously Callable @100 | 10,000 | 10,477 | |||||||||
Series A, 5.00%, 4/1/29, Continuously Callable @100 | 5,000 | 5,238 | |||||||||
Series B, 5.00%, 10/1/31, Continuously Callable @100 | 11,465 | 13,219 | |||||||||
Series B-1, 5.13%, 3/1/23, Continuously Callable @100 | 3,000 | 3,012 | |||||||||
Series B-1, 5.25%, 3/1/24, Continuously Callable @100 | 2,500 | 2,510 | |||||||||
Series B-1, 5.38%, 3/1/25, Continuously Callable @100 | 2,000 | 2,008 | |||||||||
Series G, 5.00%, 11/1/23, Continuously Callable @100 | 1,185 | 1,275 | |||||||||
Series G, 5.00%, 11/1/24, Continuously Callable @100 | 2,000 | 2,151 | |||||||||
Series G, 5.00%, 11/1/28, Continuously Callable @100 | 7,000 | 7,524 | |||||||||
| California State University Revenue Series A, 5.00%, 11/1/29, Continuously Callable @100 | 10,000 | 11,600 | |||||||||
Series A, 5.00%, 11/1/33, Continuously Callable @100 | 10,000 | 11,961 | |||||||||
| California Statewide Communities Development Authority Revenue 5.13%, 5/15/31, Continuously Callable @100 | 1,000 | 1,005 | |||||||||
5.00%, 5/15/32, Continuously Callable @100 | 1,250 | 1,473 | |||||||||
5.00%, 5/15/33, Continuously Callable @100 | 2,000 | 2,346 | |||||||||
5.00%, 5/15/34, Continuously Callable @100 | 1,250 | 1,461 | |||||||||
5.00%, 5/15/35, Continuously Callable @100 | 2,000 | 2,328 | |||||||||
See notes to financial statements.
10
| USAA Mutual Funds Trust USAA Tax Exempt Intermediate-Term Fund | Schedule of Portfolio Investments — continued March 31, 2021 | ||||||
(Amounts in Thousands, Except for Shares)
Security Description | Principal Amount | Value | |||||||||
| Cerritos Community College District, GO Series D, 8/1/25 (f) | $ | 1,510 | $ | 1,457 | |||||||
Series D, 8/1/27 (f) | 1,000 | 929 | |||||||||
Series D, 8/1/28 (f) | 1,000 | 907 | |||||||||
| Chula Vista Municipal Financing Authority Special Tax Series B, 5.00%, 9/1/27, Continuously Callable @100 | 1,520 | 1,796 | |||||||||
Series B, 5.00%, 9/1/28, Continuously Callable @100 | 1,700 | 2,006 | |||||||||
Series B, 5.00%, 9/1/29, Continuously Callable @100 | 1,785 | 2,105 | |||||||||
Series B, 5.00%, 9/1/30, Continuously Callable @100 | 2,635 | 3,105 | |||||||||
Series B, 5.00%, 9/1/31, Continuously Callable @100 | 2,095 | 2,466 | |||||||||
| City & County of San Francisco Revenue (LIQ — Deutsche Bank A.G.), Series DBE-8059, 0.58%, 12/1/52, Callable 12/1/21 @100 (b) (e) | 20,000 | 20,000 | |||||||||
City of Irvine Special Assessment, 5.00%, 9/2/29, Callable 9/2/23 @100 | 1,000 | 1,112 | |||||||||
| City of Los Angeles Revenue (LIQ — Deutsche Bank A.G.), Series DBE-8067, 0.58%, 10/1/58, Callable 10/1/21 @100 (b) (e) | 10,500 | 10,500 | |||||||||
| City of San Diego Tobacco Settlement Revenue Funding Corp. Revenue, Series C, 4.00%, 6/1/32, Continuously Callable @100 | 830 | 872 | |||||||||
| City of Tulare Sewer Revenue (INS — Assured Guaranty Municipal Corp.) 5.00%, 11/15/32, Continuously Callable @100 | 1,605 | 1,908 | |||||||||
5.00%, 11/15/33, Continuously Callable @100 | 1,570 | 1,865 | |||||||||
5.00%, 11/15/34, Continuously Callable @100 | 3,655 | 4,337 | |||||||||
5.00%, 11/15/35, Continuously Callable @100 | 2,340 | 2,774 | |||||||||
County of Los Angeles Certificate of Participation, 5.00%, 3/1/23 | 1,300 | 1,419 | |||||||||
| El Camino Community College District, GO Series C, 8/1/26 (f) | 6,810 | 6,510 | |||||||||
Series C, 8/1/27 (f) | 7,665 | 7,201 | |||||||||
Series C, 8/1/28 (f) | 5,500 | 5,056 | |||||||||
| Foothill-Eastern Transportation Corridor Agency Revenue (INS — Assured Guaranty Municipal Corp.), 1/15/35 (f) | 5,500 | 3,930 | |||||||||
| Fresno Joint Powers Financing Authority Revenue (INS — Assured Guaranty Municipal Corp.) Series A, 5.00%, 4/1/32, Continuously Callable @100 | 1,000 | 1,204 | |||||||||
Series A, 5.00%, 4/1/35, Continuously Callable @100 | 1,000 | 1,193 | |||||||||
Series A, 5.00%, 4/1/36, Continuously Callable @100 | 420 | 499 | |||||||||
| Golden State Tobacco Securitization Corp. Revenue (INS — Assured Guaranty Municipal Corp.), Series A, 6/1/25 (f) | 46,605 | 45,268 | |||||||||
| Pittsburg Successor Agency Redevelopment Agency Tax Allocation (INS — Assured Guaranty Municipal Corp.) Series A, 5.00%, 9/1/27, Continuously Callable @100 | 3,500 | 4,234 | |||||||||
Series A, 5.00%, 9/1/28, Continuously Callable @100 | 2,640 | 3,190 | |||||||||
| San Diego Public Facilities Financing Authority Revenue Series A, 5.00%, 10/15/33, Continuously Callable @100 | 1,635 | 1,946 | |||||||||
Series A, 5.00%, 10/15/34, Continuously Callable @100 | 1,000 | 1,189 | |||||||||
Series A, 5.00%, 10/15/35, Continuously Callable @100 | 1,250 | 1,485 | |||||||||
Series B, 5.00%, 10/15/30, Continuously Callable @100 | 775 | 925 | |||||||||
Series B, 5.00%, 10/15/31, Continuously Callable @100 | 1,000 | 1,192 | |||||||||
Series B, 5.00%, 10/15/32, Continuously Callable @100 | 1,000 | 1,192 | |||||||||
286,569 | |||||||||||
See notes to financial statements.
11
| USAA Mutual Funds Trust USAA Tax Exempt Intermediate-Term Fund | Schedule of Portfolio Investments — continued March 31, 2021 | ||||||
(Amounts in Thousands, Except for Shares)
Security Description | Principal Amount | Value | |||||||||
Colorado (2.2%): | |||||||||||
Adams & Arapahoe Joint School District 28J Aurora, GO, 12/1/22 (f) | $ | 5,000 | $ | 4,982 | |||||||
| Colorado Health Facilities Authority Revenue 5.00%, 6/1/28, Pre-refunded 6/1/23 @100 | 2,750 | 3,032 | |||||||||
5.00%, 12/1/28, Continuously Callable @100 | 1,000 | 1,139 | |||||||||
5.00%, 12/1/29, Continuously Callable @100 | 1,500 | 1,708 | |||||||||
5.00%, 6/1/31, Pre-refunded 6/1/25 @100 | 2,310 | 2,740 | |||||||||
5.00%, 6/1/32, Pre-refunded 6/1/25 @100 | 2,000 | 2,373 | |||||||||
5.00%, 6/1/33, Pre-refunded 6/1/25 @100 | 2,470 | 2,930 | |||||||||
5.00%, 6/1/34, Pre-refunded 6/1/25 @100 | 6,385 | 7,574 | |||||||||
5.00%, 6/1/34, Pre-refunded 6/1/27 @100 | 4,455 | 5,608 | |||||||||
5.00%, 6/1/35, Pre-refunded 6/1/25 @100 | 3,385 | 4,015 | |||||||||
5.00%, 6/1/35, Pre-refunded 6/1/27 @100 | 2,000 | 2,518 | |||||||||
5.00%, 12/1/35, Continuously Callable @100 | 4,000 | 4,476 | |||||||||
5.00%, 6/1/36, Pre-refunded 6/1/27 @100 | 4,000 | 5,035 | |||||||||
Series A, 4.00%, 8/1/38, Continuously Callable @100 | 1,000 | 1,143 | |||||||||
Series A, 4.00%, 8/1/39, Continuously Callable @100 | 1,250 | 1,438 | |||||||||
Series A, 4.00%, 11/1/39, Continuously Callable @100 | 3,500 | 4,074 | |||||||||
Series A, 4.00%, 12/1/40, Continuously Callable @103 | 2,000 | 2,183 | |||||||||
| Denver Health & Hospital Authority Revenue Series A, 5.00%, 12/1/34, Continuously Callable @100 (e) | 7,355 | 8,925 | |||||||||
Series A, 4.00%, 12/1/37, Continuously Callable @100 | 1,250 | 1,447 | |||||||||
Series A, 4.00%, 12/1/38, Continuously Callable @100 | 1,250 | 1,444 | |||||||||
Series A, 4.00%, 12/1/39, Continuously Callable @100 | 1,000 | 1,152 | |||||||||
| Park Creek Metropolitan District Revenue 5.00%, 12/1/32, Continuously Callable @100 | 1,250 | 1,458 | |||||||||
5.00%, 12/1/34, Continuously Callable @100 | 1,000 | 1,160 | |||||||||
| Regional Transportation District Certificate of Participation Series A, 5.00%, 6/1/29, Continuously Callable @100 | 7,585 | 8,325 | |||||||||
Series A, 5.00%, 6/1/30, Continuously Callable @100 | 14,175 | 15,549 | |||||||||
Series A, 5.00%, 6/1/31, Continuously Callable @100 | 15,005 | 16,449 | |||||||||
112,877 | |||||||||||
Connecticut (4.0%): | |||||||||||
| City of Bridgeport, GO Series B, 5.00%, 8/15/27 | 4,485 | 5,472 | |||||||||
Series B, 5.00%, 8/15/27 | 180 | 228 | |||||||||
Series B, 5.00%, 8/15/27 | 335 | 424 | |||||||||
| City of New Haven, GO Series A, 5.00%, 8/1/28 | 1,000 | 1,210 | |||||||||
Series A, 5.50%, 8/1/30, Continuously Callable @100 | 1,000 | 1,231 | |||||||||
Series A, 5.50%, 8/1/32, Continuously Callable @100 | 1,200 | 1,457 | |||||||||
Series A, 5.50%, 8/1/36, Continuously Callable @100 | 1,810 | 2,164 | |||||||||
| City of New Haven, GO (INS — Assured Guaranty Municipal Corp.) Series A, 5.00%, 8/15/30, Continuously Callable @100 | 1,000 | 1,199 | |||||||||
Series A, 5.00%, 8/15/32, Continuously Callable @100 | 1,000 | 1,190 | |||||||||
Series A, 5.00%, 8/15/33, Continuously Callable @100 | 1,000 | 1,184 | |||||||||
Series A, 5.00%, 8/15/34, Continuously Callable @100 | 1,350 | 1,591 | |||||||||
| City of West Haven, GO Series B, 5.00%, 11/1/32, Continuously Callable @100 | 400 | 462 | |||||||||
Series B, 5.00%, 11/1/37, Continuously Callable @100 | 350 | 398 | |||||||||
See notes to financial statements.
12
| USAA Mutual Funds Trust USAA Tax Exempt Intermediate-Term Fund | Schedule of Portfolio Investments — continued March 31, 2021 | ||||||
(Amounts in Thousands, Except for Shares)
Security Description | Principal Amount | Value | |||||||||
| Connecticut State Health & Educational Facilities Authority Revenue 5.00%, 7/1/32, Continuously Callable @100 | $ | 1,950 | $ | 2,278 | |||||||
5.00%, 7/1/34, Continuously Callable @100 | 725 | 841 | |||||||||
5.00%, 7/1/35, Continuously Callable @100 | 1,170 | 1,351 | |||||||||
5.00%, 7/1/36, Continuously Callable @100 | 1,125 | 1,294 | |||||||||
5.00%, 7/1/37, Continuously Callable @100 | 1,275 | 1,463 | |||||||||
Series A, 5.00%, 7/1/33, Continuously Callable @100 | 2,000 | 2,436 | |||||||||
Series A, 4.00%, 7/1/38, Continuously Callable @100 | 2,000 | 2,319 | |||||||||
Series A, 4.00%, 7/1/38, Continuously Callable @100 | 7,000 | 7,846 | |||||||||
Series A, 4.00%, 7/1/39, Continuously Callable @100 | 2,000 | 2,313 | |||||||||
Series E, 5.00%, 7/1/34, Continuously Callable @100 | 10,000 | 11,373 | |||||||||
| Harbor Point Infrastructure Improvement District Tax Allocation, 5.00%, 4/1/30, Continuously Callable @100 (e) | 10,000 | 11,796 | |||||||||
Mashantucket Western Pequot Tribe Revenue, 6.05%, 7/1/31 | 8,475 | 246 | |||||||||
| Metropolitan District, GO 5.00%, 7/15/33, Continuously Callable @100 | 750 | 939 | |||||||||
5.00%, 7/15/34, Continuously Callable @100 | 1,000 | 1,249 | |||||||||
5.00%, 7/15/35, Continuously Callable @100 | 750 | 935 | |||||||||
5.00%, 7/15/36, Continuously Callable @100 | 1,000 | 1,244 | |||||||||
4.00%, 7/15/37, Continuously Callable @100 | 1,000 | 1,164 | |||||||||
| State of Connecticut Special Tax Revenue 5.00%, 1/1/34, Continuously Callable @100 | 20,000 | 24,589 | |||||||||
5.00%, 1/1/35, Continuously Callable @100 | 20,000 | 24,523 | |||||||||
Series B, 5.00%, 10/1/37, Continuously Callable @100 | 6,000 | 7,411 | |||||||||
Series B, 5.00%, 10/1/38, Continuously Callable @100 | 4,000 | 4,930 | |||||||||
| State of Connecticut, GO Series A, 5.00%, 4/15/33, Continuously Callable @100 | 5,000 | 6,188 | |||||||||
Series A, 5.00%, 4/15/34, Continuously Callable @100 | 5,575 | 6,882 | |||||||||
Series A, 5.00%, 4/15/35, Continuously Callable @100 | 5,000 | 6,159 | |||||||||
Series A, 4.00%, 4/15/37, Continuously Callable @100 | 1,825 | 2,123 | |||||||||
Series C, 5.00%, 6/15/33, Continuously Callable @100 | 1,100 | 1,365 | |||||||||
Series C, 5.00%, 6/15/34, Continuously Callable @100 | 2,625 | 3,250 | |||||||||
Series C, 5.00%, 6/15/35, Continuously Callable @100 | 2,500 | 3,088 | |||||||||
Series E, 5.00%, 9/15/35, Continuously Callable @100 | 2,000 | 2,479 | |||||||||
Series E, 5.00%, 9/15/37, Continuously Callable @100 | 2,000 | 2,469 | |||||||||
Series G, 5.00%, 11/15/35, Continuously Callable @100 | 5,000 | 5,942 | |||||||||
| Town of Hamden, GO (INS — Build America Mutual Assurance Co.), Series A, 5.00%, 8/15/30, Continuously Callable @100 | 1,200 | 1,469 | |||||||||
| University of Connecticut Revenue Series A, 5.00%, 4/15/34, Continuously Callable @100 | 6,805 | 8,387 | |||||||||
Series A, 5.00%, 4/15/35, Continuously Callable @100 | 6,500 | 7,995 | |||||||||
Series A, 5.00%, 4/15/36, Continuously Callable @100 | 11,175 | 13,710 | |||||||||
202,256 | |||||||||||
District of Columbia (0.7%): | |||||||||||
| District of Columbia Housing Finance Agency Revenue (LIQ — Deutsche Bank A.G.), Series DBE-8069, 0.58%, 6/1/39, Callable 6/1/38 @101 (b) (e) | 10,000 | 10,000 | |||||||||
| District of Columbia Revenue 5.00%, 7/1/23 | 290 | 307 | |||||||||
6.00%, 7/1/33, Pre-refunded 7/1/23 @100 | 1,280 | 1,446 | |||||||||
See notes to financial statements.
13
| USAA Mutual Funds Trust USAA Tax Exempt Intermediate-Term Fund | Schedule of Portfolio Investments — continued March 31, 2021 | ||||||
(Amounts in Thousands, Except for Shares)
Security Description | Principal Amount | Value | |||||||||
4.00%, 7/1/39, Continuously Callable @100 | $ | 1,000 | $ | 1,112 | |||||||
5.00%, 7/1/39, Continuously Callable @100 | 800 | 938 | |||||||||
Series A, 5.63%, 10/1/25, Pre-refunded 4/1/21 @100 | 3,870 | 3,870 | |||||||||
Series A, 5.75%, 10/1/26, Pre-refunded 4/1/21 @100 | 5,000 | 5,000 | |||||||||
Series A, 5.75%, 10/1/27, Pre-refunded 4/1/21 @100 | 6,000 | 6,000 | |||||||||
| Metropolitan Washington Airports Authority Dulles Toll Road Revenue 4.00%, 10/1/35, Continuously Callable @100 | 1,000 | 1,149 | |||||||||
4.00%, 10/1/36, Continuously Callable @100 | 1,250 | 1,431 | |||||||||
4.00%, 10/1/37, Continuously Callable @100 | 1,500 | 1,713 | |||||||||
4.00%, 10/1/38, Continuously Callable @100 | 1,000 | 1,140 | |||||||||
34,106 | |||||||||||
Florida (5.4%): | |||||||||||
| City of Cape Coral Water & Sewer Revenue 4.00%, 10/1/35, Continuously Callable @100 | 1,485 | 1,701 | |||||||||
4.00%, 10/1/36, Continuously Callable @100 | 1,400 | 1,600 | |||||||||
4.00%, 10/1/37, Continuously Callable @100 | 3,000 | 3,420 | |||||||||
City of Jacksonville Revenue, 5.00%, 10/1/28, Continuously Callable @100 | 3,500 | 3,749 | |||||||||
| City of Pompano Beach Revenue 3.50%, 9/1/35, Continuously Callable @103 | 3,345 | 3,522 | |||||||||
4.00%, 9/1/40, Continuously Callable @103 | 2,500 | 2,671 | |||||||||
| City of Port St. Lucie Special Assessment 4.00%, 7/1/31, Continuously Callable @100 | 3,195 | 3,657 | |||||||||
4.00%, 7/1/32, Continuously Callable @100 | 2,000 | 2,275 | |||||||||
4.00%, 7/1/33, Continuously Callable @100 | 2,785 | 3,153 | |||||||||
| City of Port St. Lucie Utility System Revenue, 4.00%, 9/1/31, Continuously Callable @100 | 1,000 | 1,146 | |||||||||
| City of Tampa Revenue Series A, 3.00%, 9/1/36, Continuously Callable @80 | 700 | 443 | |||||||||
Series A, 3.08%, 9/1/37, Continuously Callable @77 | 700 | 423 | |||||||||
Series A, 3.17%, 9/1/38, Continuously Callable @74 | 850 | 492 | |||||||||
Series A, 3.25%, 9/1/39, Continuously Callable @71 | 700 | 386 | |||||||||
Series A, 3.33%, 9/1/40, Continuously Callable @67 | 850 | 447 | |||||||||
Series B, 4.00%, 7/1/38, Continuously Callable @100 | 350 | 408 | |||||||||
Series B, 4.00%, 7/1/39, Continuously Callable @100 | 700 | 814 | |||||||||
| Cityplace Community Development District Special Assessment (INS — Assured Guaranty Municipal Corp.) 5/1/33 (g) | 3,470 | 3,578 | |||||||||
5/1/38, Continuously Callable @100 (h) | 7,900 | 8,468 | |||||||||
| County of Escambia Revenue, Series 2, 0.07%, 4/1/39, Continuously Callable @100 (b) | 2,700 | 2,700 | |||||||||
County of Jackson Revenue, 0.09%, 7/1/22, Continuously Callable @100 (b) | 1,000 | 1,000 | |||||||||
County of Lee Airport Revenue, 5.00%, 10/1/33, Continuously Callable @100 | 4,000 | 4,755 | |||||||||
| County of Lee Revenue 5.00%, 10/1/23 | 2,500 | 2,752 | |||||||||
5.00%, 10/1/24 | 2,700 | 3,064 | |||||||||
| County of Lee Tourist Development Tax Revenue Series B, 4.00%, 10/1/36, Continuously Callable @100 | 4,685 | 5,522 | |||||||||
Series B, 4.00%, 10/1/37, Continuously Callable @100 | 4,970 | 5,832 | |||||||||
Series B, 4.00%, 10/1/38, Continuously Callable @100 | 5,230 | 6,115 | |||||||||
See notes to financial statements.
14
| USAA Mutual Funds Trust USAA Tax Exempt Intermediate-Term Fund | Schedule of Portfolio Investments — continued March 31, 2021 | ||||||
(Amounts in Thousands, Except for Shares)
Security Description | Principal Amount | Value | |||||||||
| County of Miami-Dade Revenue, Series A, 5.00%, 10/1/25, Pre-refunded 10/1/22 @100 | $ | 2,000 | $ | 2,141 | |||||||
| County of St Lucie Sales Tax Revenue (INS — Assured Guaranty Municipal Corp.), Series A, 5.00%, 10/1/28, Continuously Callable @100 | 7,370 | 8,196 | |||||||||
County of St. Lucie Revenue, 0.08%, 9/1/28, Continuously Callable @100 (b) | 22,165 | 22,165 | |||||||||
| Escambia County Health Facilities Authority Revenue 5.00%, 8/15/33, Continuously Callable @100 | 1,400 | 1,748 | |||||||||
5.00%, 8/15/35, Continuously Callable @100 | 1,290 | 1,595 | |||||||||
5.00%, 8/15/40, Continuously Callable @100 | 2,900 | 3,527 | |||||||||
| Florida Development Finance Corp. Revenue Series A, 5.00%, 6/15/35, Continuously Callable @100 | 1,000 | 1,138 | |||||||||
Series A, 5.00%, 6/15/40, Continuously Callable @100 | 1,650 | 1,851 | |||||||||
| Florida Higher Educational Facilities Financial Authority Revenue 5.00%, 10/1/35, Continuously Callable @100 | 1,250 | 1,457 | |||||||||
5.00%, 10/1/36, Continuously Callable @100 | 1,000 | 1,160 | |||||||||
4.00%, 10/1/37, Continuously Callable @100 | 1,000 | 1,073 | |||||||||
4.00%, 10/1/38, Continuously Callable @100 | 750 | 803 | |||||||||
5.00%, 3/1/39, Continuously Callable @100 | 7,055 | 7,870 | |||||||||
4.00%, 10/1/39, Continuously Callable @100 | 800 | 853 | |||||||||
| Halifax Hospital Medical Center Revenue 5.00%, 6/1/35, Continuously Callable @100 | 2,325 | 2,668 | |||||||||
5.00%, 6/1/36, Continuously Callable @100 | 2,750 | 3,187 | |||||||||
| Lake County School Board Certificate of Participation (INS — Assured Guaranty Municipal Corp.) Series A, 5.00%, 6/1/29, Continuously Callable @100 | 1,250 | 1,407 | |||||||||
Series A, 5.00%, 6/1/30, Continuously Callable @100 | 2,225 | 2,503 | |||||||||
| Lee County IDA Revenue 5.00%, 10/1/28, Pre-refunded 10/1/22 @100 | 7,245 | 7,758 | |||||||||
5.00%, 11/15/39, Continuously Callable @103 | 1,500 | 1,729 | |||||||||
| Lee County School Board Certificate of Participation, Series A, 5.00%, 8/1/28, Continuously Callable @100 | 3,750 | 4,293 | |||||||||
| Lee Memorial Health System Revenue, Series A-1, 4.00%, 4/1/37, Continuously Callable @100 | 5,000 | 5,743 | |||||||||
| Miami Beach Health Facilities Authority Revenue, 5.00%, 11/15/29, Pre-refunded 11/15/22 @100 | 6,560 | 7,062 | |||||||||
| Miami-Dade County Expressway Authority Revenue Series A, 5.00%, 7/1/28, Continuously Callable @100 | 10,000 | 10,559 | |||||||||
Series A, 5.00%, 7/1/29, Continuously Callable @100 | 1,000 | 1,136 | |||||||||
Series A, 5.00%, 7/1/29, Continuously Callable @100 | 7,000 | 7,390 | |||||||||
Series A, 5.00%, 7/1/30, Continuously Callable @100 | 1,610 | 1,828 | |||||||||
Series A, 5.00%, 7/1/31, Continuously Callable @100 | 1,255 | 1,424 | |||||||||
Series A, 5.00%, 7/1/32, Continuously Callable @100 | 2,000 | 2,268 | |||||||||
Series A, 5.00%, 7/1/33, Continuously Callable @100 | 2,000 | 2,266 | |||||||||
Series A, 5.00%, 7/1/34, Continuously Callable @100 | 2,000 | 2,265 | |||||||||
Series B, 5.00%, 7/1/30, Continuously Callable @100 | 2,000 | 2,270 | |||||||||
Series B, 5.00%, 7/1/31, Continuously Callable @100 | 2,000 | 2,269 | |||||||||
| Miami-Dade County Health Facilities Authority Revenue 5.00%, 8/1/27, Continuously Callable @100 | 4,750 | 5,238 | |||||||||
5.00%, 8/1/28, Continuously Callable @100 | 4,950 | 5,455 | |||||||||
5.00%, 8/1/29, Continuously Callable @100 | 5,250 | 5,781 | |||||||||
See notes to financial statements.
15
| USAA Mutual Funds Trust USAA Tax Exempt Intermediate-Term Fund | Schedule of Portfolio Investments — continued March 31, 2021 | ||||||
(Amounts in Thousands, Except for Shares)
Security Description | Principal Amount | Value | |||||||||
5.00%, 8/1/30, Continuously Callable @100 | $ | 3,500 | $ | 3,852 | |||||||
5.00%, 8/1/31, Continuously Callable @100 | 5,780 | 6,357 | |||||||||
| Orange County Health Facilities Authority Revenue, Series A, 5.00%, 10/1/35, Continuously Callable @100 | 4,000 | 4,773 | |||||||||
| Osceola County School Board Certificate of Participation, Series A, 5.00%, 6/1/28, Continuously Callable @100 | 3,055 | 3,355 | �� | ||||||||
| Palm Beach County Health Facilities Authority Revenue 5.00%, 11/15/23, Continuously Callable @100 | 7,595 | 7,920 | |||||||||
Series B, 4.00%, 11/15/41, Continuously Callable @103 | 250 | 273 | |||||||||
| Pinellas County Educational Facilities Authority Revenue 5.00%, 10/1/21 | 1,995 | 2,033 | |||||||||
4.00%, 10/1/22 | 1,080 | 1,125 | |||||||||
4.00%, 10/1/23, Continuously Callable @100 | 1,415 | 1,474 | |||||||||
5.38%, 10/1/26, Continuously Callable @100 | 2,045 | 2,087 | |||||||||
5.00%, 10/1/27, Continuously Callable @100 | 1,895 | 1,999 | |||||||||
6.50%, 10/1/31, Continuously Callable @100 | 2,615 | 2,682 | |||||||||
Pinellas County IDA Revenue, 5.00%, 7/1/29 | 1,000 | 1,152 | |||||||||
| School District of Broward County Certificate of Participation Series A, 5.00%, 7/1/29, Continuously Callable @100 | 2,000 | 2,360 | |||||||||
Series A, 5.00%, 7/1/30, Continuously Callable @100 | 2,000 | 2,358 | |||||||||
| Southeast Overtown Park West Community Redevelopment Agency Tax Allocation, Series A-1, 5.00%, 3/1/30, Continuously Callable @100 (e) | 3,195 | 3,519 | |||||||||
St. Lucie County School Board Certificate of Participation | |||||||||||
Series A, 5.00%, 7/1/25, Continuously Callable @100 | 2,045 | 2,256 | |||||||||
Series A, 5.00%, 7/1/26, Continuously Callable @100 | 1,500 | 1,654 | |||||||||
| Sunshine State Governmental Financing Commission Revenue (INS — Assured Guaranty Municipal Corp.), Series A, 5.00%, 9/1/21 | 1,055 | 1,076 | |||||||||
| Volusia County Educational Facility Authority Revenue Series B, 5.00%, 10/15/28, Continuously Callable @100 | 1,000 | 1,163 | |||||||||
Series B, 5.00%, 10/15/29, Continuously Callable @100 | 1,000 | 1,163 | |||||||||
Series B, 5.00%, 10/15/30, Continuously Callable @100 | 1,500 | 1,742 | |||||||||
Series B, 5.00%, 10/15/32, Continuously Callable @100 | 1,560 | 1,809 | |||||||||
274,351 | |||||||||||
Georgia (2.6%): | |||||||||||
| Appling County Development Authority Revenue, 0.11%, 9/1/29, Continuously Callable @100 (b) | 5,000 | 5,000 | |||||||||
| Appling County Development Authority Revenue, 0.11%, 9/1/41, Continuously Callable @100 (b) | 3,805 | 3,805 | |||||||||
| Cobb County Development Authority Revenue, Series A, 2.25%, 4/1/33, (Put Date 10/1/29) (d) | 4,975 | 5,309 | |||||||||
| Cobb County Housing Authority Revenue (LIQ — Deutsche Bank A.G.), Series DBE-8068, 0.58%, 10/1/59, Callable 10/1/35 @100 (b) (e) | 5,000 | 5,000 | |||||||||
| George L Smith II Congress Center Authority Revenue, 4.00%, 1/1/36, Continuously Callable @100 (i) | 1,000 | 1,146 | |||||||||
| Glynn-Brunswick Memorial Hospital Authority Revenue 4.00%, 8/1/36, Continuously Callable @100 | 1,840 | 2,105 | |||||||||
4.00%, 8/1/37, Continuously Callable @100 | 1,500 | 1,710 | |||||||||
| Main Street Natural Gas, Inc. Revenue 4.00%, 8/1/48, (Put Date 12/1/23) (d) | 15,000 | 16,352 | |||||||||
Series A, 5.00%, 5/15/36 | 2,000 | 2,712 | |||||||||
See notes to financial statements.
16
| USAA Mutual Funds Trust USAA Tax Exempt Intermediate-Term Fund | Schedule of Portfolio Investments — continued March 31, 2021 | ||||||
(Amounts in Thousands, Except for Shares)
Security Description | Principal Amount | Value | |||||||||
Series A, 5.00%, 5/15/37 | $ | 1,500 | $ | 2,047 | |||||||
Series A, 5.00%, 5/15/38 | 2,500 | 3,450 | |||||||||
Series C, 4.00%, 3/1/50, (Put Date 9/1/26) (d) | 27,500 | 31,748 | |||||||||
| Private Colleges & Universities Authority Revenue Series A, 5.25%, 10/1/27, Continuously Callable @100 | 3,000 | 3,063 | |||||||||
Series C, 5.25%, 10/1/27, Continuously Callable @100 | 2,000 | 2,125 | |||||||||
| Savannah Hospital Authority Revenue, 4.00%, 7/1/39, Continuously Callable @100 | 2,500 | 2,831 | |||||||||
| The Burke County Development Authority Revenue Series 1, 0.10%, 7/1/49, Continuously Callable @100 (b) | 12,100 | 12,100 | |||||||||
Series A, 1.50%, 1/1/40, (Put Date 2/3/25) (d) | 6,500 | 6,580 | |||||||||
| The Burke County Development Authority Revenue (NBGA — Southern Co.), 0.08%, 11/1/52, Continuously Callable @100 (b) | 20,500 | 20,500 | |||||||||
| The Development Authority of Monroe County Revenue, 0.11%, 11/1/48, Continuously Callable @100 (b) | 1,400 | 1,400 | |||||||||
The Monroe County Development Authority Revenue, 0.09%, 6/1/49 (b) | 4,925 | 4,925 | |||||||||
133,908 | |||||||||||
Guam (0.4%): | |||||||||||
| Guam Government Waterworks Authority Revenue 5.00%, 7/1/28, Continuously Callable @100 | 1,000 | 1,088 | |||||||||
5.25%, 7/1/33, Pre-refunded 7/1/23 @100 | 3,000 | 3,323 | |||||||||
5.00%, 7/1/36, Continuously Callable @100 | 1,250 | 1,447 | |||||||||
5.00%, 7/1/36, Continuously Callable @100 | 1,000 | 1,178 | |||||||||
Series A, 5.00%, 7/1/23 | 750 | 817 | |||||||||
Series A, 5.00%, 7/1/24 | 600 | 675 | |||||||||
Series A, 5.00%, 7/1/25, Continuously Callable @100 | 750 | 843 | |||||||||
Series A, 5.00%, 7/1/29, Continuously Callable @100 | 1,000 | 1,121 | |||||||||
| Guam Power Authority Revenue Series A, 5.00%, 10/1/29, Continuously Callable @100 | 1,000 | 1,120 | |||||||||
Series A, 5.00%, 10/1/30, Continuously Callable @100 | 1,000 | 1,119 | |||||||||
Series A, 5.00%, 10/1/31, Continuously Callable @100 | 695 | 778 | |||||||||
| Guam Power Authority Revenue (INS — Assured Guaranty Municipal Corp.) Series A, 5.00%, 10/1/27, Continuously Callable @100 | 1,000 | 1,059 | |||||||||
Series A, 5.00%, 10/1/30, Continuously Callable @100 | 1,000 | 1,059 | |||||||||
Series A, 5.00%, 10/1/32, Continuously Callable @100 | 1,000 | 1,127 | |||||||||
| Territory of Guam Revenue Series A, 5.00%, 12/1/30, Continuously Callable @100 | 1,500 | 1,738 | |||||||||
Series A, 5.00%, 12/1/31, Continuously Callable @100 | 2,000 | 2,310 | |||||||||
20,802 | |||||||||||
Idaho (0.3%): | |||||||||||
| Idaho Health Facilities Authority Revenue 5.00%, 3/1/35, Continuously Callable @100 | 5,805 | 7,073 | |||||||||
5.00%, 3/1/36, Continuously Callable @100 | 4,085 | 4,957 | |||||||||
5.00%, 3/1/37, Continuously Callable @100 | 3,000 | 3,634 | |||||||||
15,664 | |||||||||||
Illinois (14.4%): | |||||||||||
| Champaign County Community Unit School District No. 4 Champaign, GO 4.00%, 6/1/34, Continuously Callable @100 | 1,000 | 1,168 | |||||||||
See notes to financial statements.
17
| USAA Mutual Funds Trust USAA Tax Exempt Intermediate-Term Fund | Schedule of Portfolio Investments — continued March 31, 2021 | ||||||
(Amounts in Thousands, Except for Shares)
Security Description | Principal Amount | Value | |||||||||
4.00%, 6/1/35, Continuously Callable @100 | $ | 1,290 | $ | 1,500 | |||||||
4.00%, 6/1/36, Continuously Callable @100 | 1,575 | 1,824 | |||||||||
| Chicago Board of Education, GO Series A, 12/1/25 (f) | 1,600 | 1,484 | |||||||||
Series A, 12/1/26 (f) | 3,700 | 3,338 | |||||||||
Series A, 5.00%, 12/1/36, Continuously Callable @100 | 2,110 | 2,550 | |||||||||
Series A, 5.00%, 12/1/40, Continuously Callable @100 | 1,700 | 2,030 | |||||||||
Series B, 5.00%, 12/1/36, Continuously Callable @100 | 1,250 | 1,506 | |||||||||
| Chicago Midway International Airport Revenue Series B, 5.00%, 1/1/27, Continuously Callable @100 | 6,525 | 7,004 | |||||||||
Series B, 5.00%, 1/1/29, Continuously Callable @100 | 11,750 | 13,047 | |||||||||
Series B, 5.00%, 1/1/30, Continuously Callable @100 | 5,175 | 5,742 | |||||||||
Series B, 5.00%, 1/1/31, Continuously Callable @100 | 8,910 | 9,879 | |||||||||
Series B, 5.00%, 1/1/32, Continuously Callable @100 | 6,000 | 6,648 | |||||||||
Series B, 5.25%, 1/1/33, Continuously Callable @100 | 1,635 | 1,758 | |||||||||
Series B, 4.00%, 1/1/34, Continuously Callable @100 | 3,500 | 3,864 | |||||||||
Series B, 4.00%, 1/1/35, Continuously Callable @100 | 3,000 | 3,302 | |||||||||
| Chicago O'Hare International Airport Revenue 5.00%, 1/1/33, Continuously Callable @100 | 11,560 | 13,363 | |||||||||
5.00%, 1/1/34, Continuously Callable @100 | 5,675 | 6,555 | |||||||||
Series A, 4.00%, 1/1/37, Continuously Callable @100 | 2,000 | 2,322 | |||||||||
Series A, 4.00%, 1/1/38, Continuously Callable @100 | 1,000 | 1,159 | |||||||||
Series B, 5.25%, 1/1/29, Continuously Callable @100 | 13,480 | 14,609 | |||||||||
| Chicago O'Hare International Airport Revenue (INS — Assured Guaranty Municipal Corp.) 5.00%, 1/1/28, Continuously Callable @100 | 3,620 | 3,799 | |||||||||
5.00%, 1/1/29, Continuously Callable @100 | 1,500 | 1,573 | |||||||||
5.13%, 1/1/30, Continuously Callable @100 | 2,150 | 2,260 | |||||||||
| Chicago Park District, GO Series F-2, 4.00%, 1/1/34, Continuously Callable @100 | 1,200 | 1,364 | |||||||||
Series F-2, 4.00%, 1/1/36, Continuously Callable @100 | 1,300 | 1,458 | |||||||||
Series F-2, 5.00%, 1/1/37, Continuously Callable @100 | 2,000 | 2,412 | |||||||||
Series F-2, 4.00%, 1/1/38, Continuously Callable @100 | 1,750 | 1,952 | |||||||||
Series F-2, 5.00%, 1/1/39, Continuously Callable @100 | 1,500 | 1,800 | |||||||||
Series F-2, 5.00%, 1/1/40, Continuously Callable @100 | 1,125 | 1,347 | |||||||||
| Chicago Transit Authority Sales Tax Receipts Fund Revenue, Series A, 5.00%, 12/1/45, Continuously Callable @100 | 5,000 | 6,098 | |||||||||
| City of Chicago Special Assessment, 6.63%, 12/1/22, Continuously Callable @100 | 1,241 | 1,245 | |||||||||
| City of Chicago Wastewater Transmission Revenue 5.00%, 1/1/31, Continuously Callable @100 | 1,000 | 1,116 | |||||||||
5.00%, 1/1/32, Continuously Callable @100 | 1,000 | 1,116 | |||||||||
Series B, 5.00%, 1/1/35, Continuously Callable @100 | 8,000 | 9,611 | |||||||||
Series C, 5.00%, 1/1/33, Continuously Callable @100 | 3,500 | 4,030 | |||||||||
Series C, 5.00%, 1/1/34, Continuously Callable @100 | 1,000 | 1,151 | |||||||||
Series C, 5.00%, 1/1/35, Continuously Callable @100 | 1,250 | 1,434 | |||||||||
| City of Chicago Waterworks Revenue 5.00%, 11/1/28, Continuously Callable @100 | 1,500 | 1,815 | |||||||||
5.00%, 11/1/29, Continuously Callable @100 | 725 | 876 | |||||||||
5.00%, 11/1/30, Continuously Callable @100 | 2,000 | 2,413 | |||||||||
See notes to financial statements.
18
| USAA Mutual Funds Trust USAA Tax Exempt Intermediate-Term Fund | Schedule of Portfolio Investments — continued March 31, 2021 | ||||||
(Amounts in Thousands, Except for Shares)
Security Description | Principal Amount | Value | |||||||||
5.00%, 11/1/31, Continuously Callable @100 | $ | 2,000 | $ | 2,282 | |||||||
5.00%, 11/1/33, Continuously Callable @100 | 2,000 | 2,280 | |||||||||
5.00%, 11/1/36, Continuously Callable @100 | 2,665 | 3,209 | |||||||||
Series A-1, 5.00%, 11/1/29, Continuously Callable @100 | 1,000 | 1,208 | |||||||||
Series A-1, 5.00%, 11/1/31, Continuously Callable @100 | 1,000 | 1,203 | |||||||||
| City of Chicago Waterworks Revenue (INS — Assured Guaranty Municipal Corp.) 5.25%, 11/1/34, Continuously Callable @100 | 2,105 | 2,663 | |||||||||
5.25%, 11/1/35, Continuously Callable @100 | 1,635 | 2,048 | |||||||||
Series 2017-2, 5.00%, 11/1/36, Continuously Callable @100 | 3,145 | 3,879 | |||||||||
Series 2017-2, 5.00%, 11/1/37, Continuously Callable @100 | 2,500 | 3,080 | |||||||||
| City of Chicago, GO (INS — National Public Finance Guarantee Corp.), 1/1/23 (f) | 30,000 | 29,057 | |||||||||
| City of Springfield Electric Revenue (INS — Assured Guaranty Municipal Corp.), 5.00%, 3/1/34, Continuously Callable @100 | 3,000 | 3,470 | |||||||||
City of Springfield, GO, 5.00%, 12/1/30, Continuously Callable @100 | 8,500 | 10,103 | |||||||||
| County of Cook Sales Tax Revenue 4.00%, 11/15/34, Continuously Callable @100 | 3,750 | 4,351 | |||||||||
5.00%, 11/15/35, Continuously Callable @100 | 7,000 | 8,605 | |||||||||
5.00%, 11/15/36, Continuously Callable @100 | 5,000 | 6,135 | |||||||||
| County of Cook, GO 5.00%, 11/15/34, Continuously Callable @100 | 2,000 | 2,383 | |||||||||
5.00%, 11/15/35, Continuously Callable @100 | 2,000 | 2,364 | |||||||||
Series A, 5.00%, 11/15/31, Continuously Callable @100 | 2,500 | 3,030 | |||||||||
| Illinois Educational Facilities Authority Revenue 4.45%, 11/1/36, Continuously Callable @102 | 4,500 | 5,204 | |||||||||
3.90%, 11/1/36, Continuously Callable @102 | 2,220 | 2,490 | |||||||||
4.00%, 11/1/36, Continuously Callable @102 | 9,750 | 11,129 | |||||||||
| Illinois Finance Authority Revenue 3.25%, 5/15/22 | 1,125 | 1,134 | |||||||||
5.00%, 2/15/27 (j) | 7,650 | 5,444 | |||||||||
5.40%, 4/1/27, Continuously Callable @100 | 1,435 | 1,437 | |||||||||
4.00%, 5/15/27 | 3,065 | 3,268 | |||||||||
5.50%, 7/1/28, Continuously Callable @100 | 8,250 | 9,143 | |||||||||
3.90%, 3/1/30, Continuously Callable @100 | 20,000 | 22,096 | |||||||||
5.00%, 5/15/30, Continuously Callable @100 | 1,000 | 1,149 | |||||||||
5.00%, 5/15/31, Continuously Callable @100 | 1,875 | 2,073 | |||||||||
5.00%, 8/15/32, Pre-refunded 8/15/26 @100 | 1,500 | 1,846 | |||||||||
5.00%, 8/15/33, Pre-refunded 8/15/26 @100 | 1,155 | 1,422 | |||||||||
5.00%, 8/15/34, Pre-refunded 8/15/26 @100 | 1,000 | 1,231 | |||||||||
5.00%, 12/1/34, Continuously Callable @100 | 3,500 | 4,144 | |||||||||
5.00%, 5/15/35, Continuously Callable @100 | 1,100 | 1,256 | |||||||||
5.00%, 8/15/35, Continuously Callable @100 | 4,000 | 4,559 | |||||||||
5.00%, 10/1/35, Continuously Callable @100 | 600 | 746 | |||||||||
4.00%, 12/1/35, Continuously Callable @100 | 5,000 | 5,513 | |||||||||
5.00%, 5/15/36, Continuously Callable @100 | 1,400 | 1,518 | |||||||||
4.00%, 12/1/36, Continuously Callable @100 | 3,000 | 3,308 | |||||||||
5.00%, 2/15/37, Continuously Callable @100 | 1,000 | 1,101 | |||||||||
5.00%, 10/1/37, Continuously Callable @100 | 700 | 866 | |||||||||
2.45%, 10/1/39, (Put Date 10/1/29) (d) | 14,000 | 15,004 | |||||||||
5.00%, 10/1/39, Continuously Callable @100 | 700 | 862 | |||||||||
See notes to financial statements.
19
| USAA Mutual Funds Trust USAA Tax Exempt Intermediate-Term Fund | Schedule of Portfolio Investments — continued March 31, 2021 | ||||||
(Amounts in Thousands, Except for Shares)
Security Description | Principal Amount | Value | |||||||||
4.00%, 10/1/40, Continuously Callable @100 | $ | 1,000 | $ | 1,132 | |||||||
Series A, 4.50%, 5/15/25, Pre-refunded 5/15/22 @100 | 8,210 | 8,605 | |||||||||
Series A, 5.38%, 8/15/26, Continuously Callable @100 | 7,665 | 7,807 | |||||||||
Series A, 4.00%, 10/1/31, Continuously Callable @100 | 1,000 | 1,153 | |||||||||
Series A, 4.00%, 10/1/32, Continuously Callable @100 | 1,000 | 1,145 | |||||||||
Series A, 5.00%, 9/1/34, Continuously Callable @100 | 3,385 | 3,902 | |||||||||
Series A, 4.00%, 10/1/34, Continuously Callable @100 | 1,000 | 1,135 | |||||||||
Series A, 5.00%, 11/15/34, Continuously Callable @100 | 3,700 | 4,352 | |||||||||
Series A, 5.00%, 11/15/35, Continuously Callable @100 | 3,000 | 3,516 | |||||||||
Series C, 4.00%, 2/15/36, Continuously Callable @100 | 18,000 | 20,077 | |||||||||
| Illinois Municipal Electric Agency Revenue, Series A, 4.00%, 2/1/33, Continuously Callable @100 | 14,650 | 16,512 | |||||||||
Illinois Sports Facilities Authority Revenue | |||||||||||
5.25%, 6/15/30, Continuously Callable @100 | 3,000 | 3,319 | |||||||||
5.00%, 6/15/30, Continuously Callable @100 | 1,025 | 1,217 | |||||||||
5.25%, 6/15/31, Continuously Callable @100 | 5,000 | 5,520 | |||||||||
5.25%, 6/15/32, Continuously Callable @100 | 5,000 | 5,510 | |||||||||
Illinois State Toll Highway Authority Revenue | |||||||||||
Series A, 5.00%, 12/1/32, Continuously Callable @100 | 5,000 | 5,960 | |||||||||
Series A, 5.00%, 1/1/34, Continuously Callable @100 | 5,870 | 6,890 | |||||||||
Series A, 5.00%, 1/1/35, Continuously Callable @100 | 5,600 | 6,568 | |||||||||
Series A, 5.00%, 1/1/36, Continuously Callable @100 | 7,000 | 8,203 | |||||||||
Kane Cook & DuPage Counties School District No. U-46 Elgin, GO | |||||||||||
Series D, 5.00%, 1/1/32, Continuously Callable @100 | 2,800 | 3,126 | |||||||||
Series D, 5.00%, 1/1/33, Continuously Callable @100 | 4,000 | 4,464 | |||||||||
Kendall Kane & Will Counties Community Unit School District No. 308, GO | |||||||||||
5.00%, 2/1/35, Continuously Callable @100 | 5,000 | 5,855 | |||||||||
5.00%, 2/1/36, Continuously Callable @100 | 6,000 | 6,928 | |||||||||
| Madison County Community Unit School District No. 7 Edwardsville, GO (INS — Build America Mutual Assurance Co.) | |||||||||||
5.00%, 12/1/28, Continuously Callable @100 | 1,210 | 1,422 | |||||||||
5.00%, 12/1/29, Continuously Callable @100 | 1,250 | 1,467 | |||||||||
| Madison-Macoupin Etc Counties Community College District No. 536, GO (INS — Assured Guaranty Municipal Corp.) | |||||||||||
Series A, 5.00%, 11/1/31, Continuously Callable @100 | 1,000 | 1,203 | |||||||||
Series A, 5.00%, 11/1/32, Continuously Callable @100 | 2,000 | 2,395 | |||||||||
Series A, 5.00%, 11/1/33, Continuously Callable @100 | 750 | 891 | |||||||||
| Metropolitan Pier & Exposition Authority Revenue, 5.00%, 6/15/42, Continuously Callable @100 | 2,000 | 2,440 | |||||||||
| Metropolitan Pier & Exposition Authority Revenue (INS — Assured Guaranty Municipal Corp.), 6/15/26 (f) | 5,000 | 4,644 | |||||||||
Northern Illinois Municipal Power Agency Revenue | |||||||||||
Series A, 4.00%, 12/1/31, Continuously Callable @100 | 1,800 | 2,077 | |||||||||
Series A, 4.00%, 12/1/32, Continuously Callable @100 | 2,100 | 2,411 | |||||||||
Series A, 4.00%, 12/1/33, Continuously Callable @100 | 4,000 | 4,578 | |||||||||
Series A, 4.00%, 12/1/35, Continuously Callable @100 | 5,000 | 5,691 | |||||||||
| Northern Illinois University Revenue (INS — Build America Mutual Assurance Co.), Series B, 4.00%, 4/1/39, Continuously Callable @100 | 1,375 | 1,545 | |||||||||
| Railsplitter Tobacco Settlement Authority Revenue, 5.50%, 6/1/23, Pre-refunded 6/1/21 @100 | 10,000 | 10,084 | |||||||||
See notes to financial statements.
20
| USAA Mutual Funds Trust USAA Tax Exempt Intermediate-Term Fund | Schedule of Portfolio Investments — continued March 31, 2021 | ||||||
(Amounts in Thousands, Except for Shares)
Security Description | Principal Amount | Value | |||||||||
| Regional Transportation Authority Revenue Series A, 4.00%, 7/1/34, Continuously Callable @100 | $ | 23,160 | $ | 27,070 | |||||||
Series A, 4.00%, 7/1/35, Continuously Callable @100 | 11,650 | 13,582 | |||||||||
| Sales Tax Securitization Corp. Revenue Series A, 4.00%, 1/1/38, Continuously Callable @100 | 6,310 | 7,193 | |||||||||
Series A, 4.00%, 1/1/39, Continuously Callable @100 | 500 | 569 | |||||||||
| Sangamon County School District No. 186 Springfield, GO Series B, 5.00%, 2/1/24 | 2,660 | 2,998 | |||||||||
Series B, 5.00%, 2/1/24 | 1,040 | 1,177 | |||||||||
Series B, 5.00%, 2/1/25, Continuously Callable @100 | 5,765 | 6,490 | |||||||||
Series B, 5.00%, 2/1/25, Pre-refunded 2/1/24 @100 | 1,435 | 1,625 | |||||||||
| Sangamon County School District No. 186 Springfield, GO (INS — Build America Mutual Assurance Co.), Series B, 5.00%, 2/1/26, Continuously Callable @100 | 4,215 | 4,743 | |||||||||
| State of Illinois, GO 5.25%, 2/1/31, Continuously Callable @100 | 9,000 | 9,999 | |||||||||
Series A, 5.00%, 11/1/25 | 11,000 | 12,768 | |||||||||
Series B, 5.00%, 10/1/28 | 3,000 | 3,651 | |||||||||
Series B, 5.00%, 11/1/32, Continuously Callable @100 | 10,000 | 12,094 | |||||||||
Series C, 5.00%, 11/1/29, Continuously Callable @100 | 6,705 | 7,803 | |||||||||
Series D, 5.00%, 11/1/28, Continuously Callable @100 | 5,795 | 6,793 | |||||||||
| State of Illinois, GO (INS — Assured Guaranty Municipal Corp.) 4.00%, 2/1/30, Continuously Callable @100 | 7,000 | 7,893 | |||||||||
Series A, 5.00%, 4/1/29, Continuously Callable @100 | 10,000 | 10,876 | |||||||||
| State of Illinois, GO (INS — Build America Mutual Assurance Co.), Series D, 5.00%, 11/1/25 (c) | 10,000 | 11,768 | |||||||||
| University of Illinois Revenue, Series A, 4.00%, 4/1/33, Continuously Callable @100 | 12,475 | 13,902 | |||||||||
| Village of Bolingbrook, GO (INS — Assured Guaranty Municipal Corp.) Series A, 5.00%, 1/1/29, Continuously Callable @100 | 1,750 | 2,161 | |||||||||
Series A, 5.00%, 1/1/30, Continuously Callable @100 | 1,500 | 1,836 | |||||||||
Series A, 5.00%, 1/1/31, Continuously Callable @100 | 2,400 | 2,921 | |||||||||
Series A, 5.00%, 1/1/32, Continuously Callable @100 | 2,350 | 2,845 | |||||||||
Series A, 5.00%, 1/1/33, Continuously Callable @100 | 1,450 | 1,749 | |||||||||
Series A, 5.00%, 1/1/38, Continuously Callable @100 | 1,500 | 1,791 | |||||||||
| Village of Gilberts Special Tax (INS — Build America Mutual Assurance Co.), 5.00%, 3/1/30, Continuously Callable @100 | 5,225 | 6,050 | |||||||||
| Village of Rosemont, GO (INS — Assured Guaranty Municipal Corp.) Series A, 5.00%, 12/1/25 | 2,010 | 2,365 | |||||||||
Series A, 5.00%, 12/1/26 | 2,110 | 2,541 | |||||||||
| Volo Village Special Service Area No. 3 & 6 Special Tax (INS — Assured Guaranty Municipal Corp.) | |||||||||||
5.00%, 3/1/34, Continuously Callable @100 | 2,997 | 3,511 | |||||||||
4.00%, 3/1/36, Continuously Callable @100 | 1,250 | 1,370 | |||||||||
| Will County Community High School District No 210 Lincoln-Way, GO, 4.00%, 1/1/34, Continuously Callable @100 | 650 | 719 | |||||||||
| Williamson Jackson Etc Counties Community Unit School District No. 4, GO (INS — Assured Guaranty Municipal Corp.) 5.00%, 12/1/28, Continuously Callable @100 | 1,835 | 2,158 | |||||||||
5.00%, 12/1/29, Continuously Callable @100 | 1,925 | 2,261 | |||||||||
See notes to financial statements.
21
| USAA Mutual Funds Trust USAA Tax Exempt Intermediate-Term Fund | Schedule of Portfolio Investments — continued March 31, 2021 | ||||||
(Amounts in Thousands, Except for Shares)
Security Description | Principal Amount | Value | |||||||||
5.00%, 12/1/30, Continuously Callable @100 | $ | 2,025 | $ | 2,376 | |||||||
5.00%, 12/1/34, Continuously Callable @100 | 6,000 | 6,926 | |||||||||
733,133 | |||||||||||
Indiana (1.3%): | |||||||||||
City of Rockport Revenue, Series A, 3.05%, 6/1/25 | 5,750 | 6,295 | |||||||||
Hammond Multi-School Building Corp. Revenue | |||||||||||
5.00%, 7/15/33, Continuously Callable @100 | 1,165 | 1,427 | |||||||||
5.00%, 7/15/34, Continuously Callable @100 | 1,000 | 1,223 | |||||||||
5.00%, 7/15/35, Continuously Callable @100 | 1,250 | 1,527 | |||||||||
5.00%, 7/15/38, Continuously Callable @100 | 3,000 | 3,658 | |||||||||
| Indiana Bond Bank Revenue 1/15/30, Continuously Callable @97 (f) | 740 | 632 | |||||||||
7/15/30, Continuously Callable @96 (f) | 750 | 632 | |||||||||
7/15/31, Continuously Callable @93 (f) | 1,490 | 1,215 | |||||||||
7/15/32, Continuously Callable @91 (f) | 1,400 | 1,096 | |||||||||
| Indiana Finance Authority Revenue 3.13%, 12/1/24 | 6,000 | 6,538 | |||||||||
5.00%, 9/1/30, Continuously Callable @100 | 1,250 | 1,484 | |||||||||
5.00%, 9/1/31, Continuously Callable @100 | 1,500 | 1,774 | |||||||||
5.00%, 11/15/33, Continuously Callable @103 | 2,000 | 2,304 | |||||||||
4.00%, 7/1/36, Continuously Callable @100 | 3,660 | 3,998 | |||||||||
4.00%, 7/1/38, Continuously Callable @100 | 4,030 | 4,375 | |||||||||
5.00%, 11/15/38, Continuously Callable @103 | 3,000 | 3,411 | |||||||||
4.00%, 7/1/39, Continuously Callable @100 | 3,605 | 3,901 | |||||||||
Series A, 5.00%, 5/1/24, Pre-refunded 5/1/23 @100 | 1,470 | 1,616 | |||||||||
Series A, 5.00%, 5/1/27, Pre-refunded 5/1/23 @100 | 1,200 | 1,319 | |||||||||
Series A, 5.00%, 6/1/32, Continuously Callable @100 | 10,500 | 10,824 | |||||||||
| Richmond Hospital Authority Revenue, 5.00%, 1/1/35, Continuously Callable @100 | 6,500 | 7,431 | |||||||||
66,680 | |||||||||||
Iowa (0.5%): | |||||||||||
City of Waverly Revenue, 2.50%, 12/31/22, Continuously Callable @100 | 2,000 | 2,057 | |||||||||
| Iowa Finance Authority Revenue Series E, 4.00%, 8/15/35, Continuously Callable @100 | 5,425 | 6,067 | |||||||||
Series E, 4.00%, 8/15/36, Continuously Callable @100 | 15,105 | 16,851 | |||||||||
24,975 | |||||||||||
Kansas (0.3%): | |||||||||||
| City of Wichita Revenue 4.20%, 9/1/27, Continuously Callable @100 | 2,750 | 2,781 | |||||||||
4.63%, 9/1/33, Continuously Callable @100 | 10,000 | 10,105 | |||||||||
12,886 | |||||||||||
Kentucky (3.2%): | |||||||||||
| City of Ashland Revenue 4.00%, 2/1/35, Continuously Callable @100 | 470 | 506 | |||||||||
4.00%, 2/1/36, Continuously Callable @100 | 2,410 | 2,511 | |||||||||
4.00%, 2/1/37, Continuously Callable @100 | 1,115 | 1,191 | |||||||||
County of Trimble Revenue, 3.75%, 6/1/33, Continuously Callable @100 | 15,000 | 16,920 | |||||||||
See notes to financial statements.
22
| USAA Mutual Funds Trust USAA Tax Exempt Intermediate-Term Fund | Schedule of Portfolio Investments — continued March 31, 2021 | ||||||
(Amounts in Thousands, Except for Shares)
Security Description | Principal Amount | Value | |||||||||
| Kentucky Economic Development Finance Authority Revenue 5.00%, 5/15/26 | $ | 6,750 | $ | 6,929 | |||||||
5.00%, 5/15/31, Continuously Callable @100 | 7,205 | 7,385 | |||||||||
5.00%, 5/15/36, Continuously Callable @100 | 2,500 | 2,565 | |||||||||
Series B, 10/1/24 (f) | 6,130 | 5,910 | |||||||||
Series B-3, 1.45% (MUNIPSA+140bps), 2/1/46, (Put Date 2/1/25) (d) (k) | 20,000 | 20,002 | |||||||||
| Kentucky Municipal Power Agency Revenue, Series A, 3.45%, 9/1/42, (Put Date 3/1/26) (d) | 7,000 | 7,268 | |||||||||
| Kentucky Public Energy Authority Revenue Series B, 4.00%, 1/1/49, (Put Date 1/1/25) (d) | 14,285 | 15,921 | |||||||||
Series C-1, 4.00%, 12/1/49, (Put Date 6/1/25) (d) | 20,000 | 22,500 | |||||||||
Series C-3, 1.10% (MUNIPSA+105bps), 12/1/49, (Put Date 6/1/25) (d) (k) | 20,000 | 20,305 | |||||||||
| Kentucky State Property & Building Commission Revenue 5.00%, 5/1/35, Continuously Callable @100 | 1,000 | 1,204 | |||||||||
5.00%, 5/1/36, Continuously Callable @100 | 1,000 | 1,201 | |||||||||
5.00%, 5/1/37, Continuously Callable @100 | 3,000 | 3,596 | |||||||||
Series A, 5.00%, 2/1/32, Continuously Callable @100 | 2,000 | 2,356 | |||||||||
Series A, 5.00%, 2/1/33, Continuously Callable @100 | 2,250 | 2,647 | |||||||||
Series A, 4.00%, 11/1/35, Continuously Callable @100 | 565 | 655 | |||||||||
Series A, 4.00%, 11/1/36, Continuously Callable @100 | 750 | 869 | |||||||||
Series A, 4.00%, 11/1/37, Continuously Callable @100 | 750 | 864 | |||||||||
Series A, 4.00%, 11/1/38, Continuously Callable @100 | 500 | 576 | |||||||||
| Louisville/Jefferson County Metropolitan Government Revenue 5.00%, 12/1/22, Pre-refunded 6/1/22 @100 | 3,830 | 4,045 | |||||||||
5.00%, 12/1/23, Pre-refunded 6/1/22 @100 | 2,760 | 2,915 | |||||||||
5.00%, 12/1/24, Pre-refunded 6/1/22 @100 | 7,160 | 7,562 | |||||||||
1.75%, 2/1/35, (Put Date 7/1/26) (d) | 5,000 | 5,206 | |||||||||
163,609 | |||||||||||
Louisiana (3.7%): | |||||||||||
| City of New Orleans Sewerage Service Revenue 5.00%, 6/1/31, Pre-refunded 6/1/25 @100 | 700 | 832 | |||||||||
5.00%, 6/1/32, Pre-refunded 6/1/25 @100 | 1,150 | 1,368 | |||||||||
5.00%, 6/1/34, Pre-refunded 6/1/25 @100 | 1,500 | 1,784 | |||||||||
City of New Orleans Water System Revenue | |||||||||||
5.00%, 12/1/33, Pre-refunded 12/1/25 @100 | 1,500 | 1,813 | |||||||||
5.00%, 12/1/35, Pre-refunded 12/1/25 @100 | 1,500 | 1,813 | |||||||||
City of Shreveport Water & Sewer Revenue | |||||||||||
Series B, 5.00%, 12/1/31, Continuously Callable @100 | 5,330 | 6,142 | |||||||||
Series B, 5.00%, 12/1/32, Continuously Callable @100 | 5,125 | 5,901 | |||||||||
| City of Shreveport Water & Sewer Revenue (INS — Assured Guaranty Municipal Corp.) | |||||||||||
5.00%, 12/1/33, Continuously Callable @100 | 1,515 | 1,781 | |||||||||
5.00%, 12/1/34, Continuously Callable @100 | 1,500 | 1,775 | |||||||||
5.00%, 12/1/35, Continuously Callable @100 | 1,510 | 1,785 | |||||||||
| City of Shreveport Water & Sewer Revenue (INS — Build America Mutual Assurance Co.) Series C, 5.00%, 12/1/30, Continuously Callable @100 | 1,000 | 1,246 | |||||||||
Series C, 5.00%, 12/1/31, Continuously Callable @100 | 2,000 | 2,480 | |||||||||
See notes to financial statements.
23
| USAA Mutual Funds Trust USAA Tax Exempt Intermediate-Term Fund | Schedule of Portfolio Investments — continued March 31, 2021 | ||||||
(Amounts in Thousands, Except for Shares)
Security Description | Principal Amount | Value | |||||||||
| Louisiana Local Government Environmental Facilities & Community Development Authority Revenue, 3.50%, 11/1/32, Continuously Callable @100 | $ | 18,750 | $ | 20,414 | |||||||
| Louisiana Public Facilities Authority Revenue 5.00%, 7/1/33, Pre-refunded 7/1/25 @100 | 55 | 66 | |||||||||
5.00%, 7/1/33, Continuously Callable @100 | 8,940 | 10,515 | |||||||||
5.00%, 5/15/34, Continuously Callable @100 | 2,975 | 3,566 | |||||||||
5.00%, 5/15/34, Pre-refunded 5/15/26 @100 | 25 | 31 | |||||||||
5.00%, 5/15/34, Continuously Callable @100 | 2,225 | 2,634 | |||||||||
5.00%, 7/1/34, Pre-refunded 7/1/25 @100 | 85 | 101 | |||||||||
5.00%, 7/1/34, Continuously Callable @100 | 13,465 | 15,822 | |||||||||
5.00%, 5/15/35, Continuously Callable @100 | 2,000 | 2,391 | |||||||||
4.00%, 5/15/35, Pre-refunded 5/15/26 @100 | 35 | 41 | |||||||||
4.00%, 5/15/35, Continuously Callable @100 | 3,465 | 3,853 | |||||||||
5.00%, 5/15/36, Continuously Callable @100 | 1,560 | 1,860 | |||||||||
4.00%, 5/15/36, Pre-refunded 5/15/26 @100 | 15 | 18 | |||||||||
4.00%, 5/15/36, Continuously Callable @100 | 1,485 | 1,645 | |||||||||
Series A, 4.00%, 12/15/32, Continuously Callable @100 | 2,735 | 3,109 | |||||||||
Series A, 4.00%, 12/15/33, Continuously Callable @100 | 3,095 | 3,504 | |||||||||
Series B, 3.50%, 6/1/30, Continuously Callable @100 | 14,000 | 14,067 | |||||||||
| Louisiana Public Facilities Authority Revenue (INS — Assured Guaranty Municipal Corp.), 5.00%, 6/1/36, Continuously Callable @100 | 2,000 | 2,351 | |||||||||
| Louisiana State University & Agricultural & Mechanical College Revenue Series A, 4.00%, 7/1/31, Continuously Callable @100 | 1,000 | 1,142 | |||||||||
Series A, 4.00%, 7/1/32, Continuously Callable @100 | 1,000 | 1,133 | |||||||||
Series A, 4.00%, 7/1/33, Continuously Callable @100 | 1,000 | 1,127 | |||||||||
| New Orleans Aviation Board Revenue (INS — Assured Guaranty Municipal Corp.) 5.00%, 1/1/35, Continuously Callable @100 | 1,840 | 2,240 | |||||||||
5.00%, 1/1/36, Continuously Callable @100 | 1,250 | 1,520 | |||||||||
5.00%, 1/1/37, Continuously Callable @100 | 1,500 | 1,821 | |||||||||
5.00%, 10/1/37, Continuously Callable @100 | 2,000 | 2,435 | |||||||||
5.00%, 1/1/38, Continuously Callable @100 | 1,300 | 1,575 | |||||||||
Parish of St. Charles Revenue, 4.00%, 12/1/40, (Put Date 6/1/22) (d) | 16,750 | 17,432 | |||||||||
| Parish of St. James Revenue, Series A-1, 0.15%, 11/1/40, Continuously Callable @100 (b) | 22,500 | 22,500 | |||||||||
Parish of St. John the Baptist Revenue, 2.20%, 6/1/37, (Put Date 7/1/26) (d) | 6,750 | 6,950 | |||||||||
| Tobacco Settlement Financing Corp. Revenue Series A, 5.00%, 5/15/23 | 5,000 | 5,496 | |||||||||
Series A, 5.25%, 5/15/31, Continuously Callable @100 | 10,000 | 10,046 | |||||||||
190,125 | |||||||||||
Maine (0.3%): | |||||||||||
| Maine Health & Higher Educational Facilities Authority Revenue 5.00%, 7/1/24, Continuously Callable @100 | 1,635 | 1,756 | |||||||||
5.00%, 7/1/26, Continuously Callable @100 | 1,000 | 1,073 | |||||||||
6.00%, 7/1/26, Pre-refunded 7/1/21 @100 | 11,500 | 11,662 | |||||||||
5.00%, 7/1/27, Continuously Callable @100 | 1,000 | 1,073 | |||||||||
15,564 | |||||||||||
See notes to financial statements.
24
| USAA Mutual Funds Trust USAA Tax Exempt Intermediate-Term Fund | Schedule of Portfolio Investments — continued March 31, 2021 | ||||||
(Amounts in Thousands, Except for Shares)
Security Description | Principal Amount | Value | |||||||||
Maryland (1.1%): | |||||||||||
| City of Gaithersburg Revenue 5.00%, 1/1/33, Continuously Callable @104 | $ | 3,000 | $ | 3,397 | |||||||
5.00%, 1/1/36, Continuously Callable @104 | 1,000 | 1,125 | |||||||||
Maryland Economic Development Corp. Revenue | |||||||||||
Series A, 5.00%, 6/1/30, Continuously Callable @100 | 1,250 | 1,469 | |||||||||
Series A, 5.00%, 6/1/31, Continuously Callable @100 | 1,000 | 1,161 | |||||||||
Series A, 5.00%, 6/1/32, Continuously Callable @100 | 1,000 | 1,150 | |||||||||
Series A, 5.00%, 6/1/35, Continuously Callable @100 | 2,000 | 2,263 | |||||||||
| Maryland Health & Higher Educational Facilities Authority Revenue 5.50%, 1/1/29, Continuously Callable @100 | 1,415 | 1,737 | |||||||||
5.50%, 1/1/30, Continuously Callable @100 | 1,750 | 2,144 | |||||||||
5.50%, 1/1/31, Continuously Callable @100 | 1,585 | 1,937 | |||||||||
5.00%, 7/1/31, Continuously Callable @100 | 3,190 | 3,749 | |||||||||
5.00%, 7/1/32, Continuously Callable @100 | 6,505 | 7,598 | |||||||||
5.00%, 7/1/33, Continuously Callable @100 | 3,600 | 4,187 | |||||||||
5.00%, 7/1/33, Continuously Callable @100 | 1,000 | 1,159 | |||||||||
5.00%, 7/1/34, Continuously Callable @100 | 2,500 | 2,898 | |||||||||
5.00%, 7/1/34, Continuously Callable @100 | 2,200 | 2,551 | |||||||||
5.50%, 1/1/36, Continuously Callable @100 | 5,000 | 5,978 | |||||||||
4.00%, 1/1/38, Continuously Callable @100 | 865 | 979 | |||||||||
4.00%, 7/1/38, Continuously Callable @100 | 1,500 | 1,727 | |||||||||
4.00%, 7/1/39, Continuously Callable @100 | 1,585 | 1,819 | |||||||||
4.00%, 7/1/40, Continuously Callable @100 | 1,645 | 1,883 | |||||||||
Series A, 5.00%, 7/1/33, Continuously Callable @100 | 1,000 | 1,179 | |||||||||
Series A, 5.00%, 7/1/34, Continuously Callable @100 | 1,000 | 1,174 | |||||||||
Series A, 5.00%, 7/1/35, Continuously Callable @100 | 1,310 | 1,530 | |||||||||
Series A, 5.00%, 7/1/36, Continuously Callable @100 | 1,000 | 1,164 | |||||||||
55,958 | |||||||||||
Massachusetts (1.3%): | |||||||||||
| Massachusetts Clean Water Trust Revenue, Series 11, 4.75%, 8/1/25, Continuously Callable @100 | 110 | 110 | |||||||||
| Massachusetts Development Finance Agency Revenue 5.00%, 7/1/30, Continuously Callable @100 | 2,000 | 2,404 | |||||||||
5.00%, 7/1/31, Continuously Callable @100 | 1,675 | 2,011 | |||||||||
5.00%, 7/1/32, Continuously Callable @100 | 1,250 | 1,481 | |||||||||
4.00%, 10/1/32, Continuously Callable @105 (e) | 3,600 | 3,879 | |||||||||
5.00%, 4/15/33, Continuously Callable @100 | 2,155 | 2,416 | |||||||||
5.00%, 7/1/33, Continuously Callable @100 | 1,250 | 1,472 | |||||||||
5.00%, 7/1/34, Continuously Callable @100 | 1,000 | 1,174 | |||||||||
5.00%, 7/1/36, Continuously Callable @100 | 1,000 | 1,249 | |||||||||
5.00%, 7/1/36, Continuously Callable @100 | 895 | 1,071 | |||||||||
5.00%, 7/1/36, Continuously Callable @100 | 2,000 | 2,350 | |||||||||
5.00%, 7/1/37, Continuously Callable @100 | 800 | 997 | |||||||||
5.00%, 7/1/37, Continuously Callable @100 | 1,215 | 1,447 | |||||||||
5.00%, 10/1/37, Continuously Callable @105 (e) | 1,000 | 1,093 | |||||||||
5.00%, 7/1/38, Continuously Callable @100 | 600 | 746 | |||||||||
5.00%, 7/1/38, Continuously Callable @100 | 335 | 398 | |||||||||
Series A, 5.00%, 7/1/22 | 1,480 | 1,568 | |||||||||
Series A, 5.00%, 7/1/27, Pre-refunded 7/1/22 @100 | 1,720 | 1,823 | |||||||||
See notes to financial statements.
25
| USAA Mutual Funds Trust USAA Tax Exempt Intermediate-Term Fund | Schedule of Portfolio Investments — continued March 31, 2021 | ||||||
(Amounts in Thousands, Except for Shares)
Security Description | Principal Amount | Value | |||||||||
Series A, 5.00%, 1/1/31, Continuously Callable @100 | $ | 450 | $ | 540 | |||||||
Series A, 5.00%, 1/1/32, Continuously Callable @100 | 645 | 769 | |||||||||
Series A, 5.00%, 1/1/33, Continuously Callable @100 | 535 | 634 | |||||||||
Series A, 5.00%, 1/1/34, Continuously Callable @100 | 700 | 825 | |||||||||
Series A, 5.00%, 1/1/35, Continuously Callable @100 | 735 | 863 | |||||||||
Series A, 5.00%, 1/1/36, Continuously Callable @100 | 1,000 | 1,170 | |||||||||
Series A, 5.00%, 7/1/36, Continuously Callable @100 | 2,000 | 2,439 | |||||||||
Series A, 5.00%, 7/1/38, Continuously Callable @100 | 1,000 | 1,211 | |||||||||
Series A, 5.00%, 7/1/39, Continuously Callable @100 | 2,250 | 2,716 | |||||||||
Series E, 5.00%, 7/1/35, Continuously Callable @100 | 1,500 | 1,755 | |||||||||
Series E, 5.00%, 7/1/36, Continuously Callable @100 | 1,000 | 1,166 | |||||||||
Series G, 5.00%, 7/1/35, Continuously Callable @100 | 200 | 256 | |||||||||
Series G, 5.00%, 7/1/36, Continuously Callable @100 | 200 | 255 | |||||||||
Series G, 5.00%, 7/1/37, Continuously Callable @100 | 400 | 507 | |||||||||
Series G, 5.00%, 7/1/38, Continuously Callable @100 | 300 | 380 | |||||||||
Series G, 5.00%, 7/1/39, Continuously Callable @100 | 350 | 442 | |||||||||
Series J2, 5.00%, 7/1/35, Continuously Callable @100 | 5,375 | 6,621 | |||||||||
Series J2, 5.00%, 7/1/36, Continuously Callable @100 | 4,415 | 5,419 | |||||||||
Series J2, 5.00%, 7/1/37, Continuously Callable @100 | 5,285 | 6,474 | |||||||||
Series J2, 5.00%, 7/1/38, Continuously Callable @100 | 5,000 | 6,115 | |||||||||
68,246 | |||||||||||
Michigan (2.1%): | |||||||||||
| Detroit Downtown Development Authority Tax Allocation (INS — Assured Guaranty Municipal Corp.) Series A, 5.00%, 7/1/36, Continuously Callable @100 | 1,000 | 1,128 | |||||||||
Series A, 5.00%, 7/1/37, Continuously Callable @100 | 2,000 | 2,255 | |||||||||
Flint Hospital Building Authority Revenue | |||||||||||
4.00%, 7/1/32, Continuously Callable @100 | 2,525 | 2,803 | |||||||||
4.00%, 7/1/33, Continuously Callable @100 | 2,620 | 2,895 | |||||||||
4.00%, 7/1/34, Continuously Callable @100 | 2,730 | 3,003 | |||||||||
4.00%, 7/1/35, Continuously Callable @100 | 1,635 | 1,791 | |||||||||
4.00%, 7/1/38, Continuously Callable @100 | 1,855 | 2,006 | |||||||||
| Grand Traverse County Hospital Finance Authority Revenue, Series A, 5.00%, 7/1/29, Continuously Callable @100 | 10,000 | 10,111 | |||||||||
| Great Lakes Water Authority Water Supply System Revenue, Series D, 4.00%, 7/1/32, Continuously Callable @100 | 13,560 | 15,378 | |||||||||
| Kent Hospital Finance Authority Revenue, Series A, 5.00%, 11/15/29, Pre-refunded 11/15/21 @100 | 12,000 | 12,358 | |||||||||
Livonia Public Schools, GO (INS — Assured Guaranty Municipal Corp.) | |||||||||||
5.00%, 5/1/32, Continuously Callable @100 | 2,775 | 3,299 | |||||||||
5.00%, 5/1/33, Continuously Callable @100 | 2,875 | 3,404 | |||||||||
5.00%, 5/1/34, Continuously Callable @100 | 2,965 | 3,499 | |||||||||
5.00%, 5/1/35, Continuously Callable @100 | 3,065 | 3,603 | |||||||||
5.00%, 5/1/36, Continuously Callable @100 | 2,770 | 3,244 | |||||||||
Michigan Finance Authority Revenue | |||||||||||
5.00%, 11/1/34, Continuously Callable @100 | 1,000 | 1,240 | |||||||||
5.00%, 11/1/35, Continuously Callable @100 | 1,000 | 1,237 | |||||||||
4.00%, 11/15/35, Continuously Callable @100 | 6,000 | 6,790 | |||||||||
5.00%, 11/1/36, Continuously Callable @100 | 1,000 | 1,235 | |||||||||
4.00%, 11/15/36, Continuously Callable @100 | 1,000 | 1,128 | |||||||||
See notes to financial statements.
26
| USAA Mutual Funds Trust USAA Tax Exempt Intermediate-Term Fund | Schedule of Portfolio Investments — continued March 31, 2021 | ||||||
(Amounts in Thousands, Except for Shares)
Security Description | Principal Amount | Value | |||||||||
5.00%, 11/1/37, Continuously Callable @100 | $ | 1,250 | $ | 1,542 | |||||||
Series 2016, 5.00%, 12/1/34, Continuously Callable @100 | 8,200 | 9,852 | |||||||||
Series 2016, 5.00%, 12/1/35, Continuously Callable @100 | 4,600 | 5,502 | |||||||||
| Michigan Finance Authority Revenue (NBGA — Michigan School Bond Qualification and Loan Program) Series A, 5.00%, 5/1/24 | 2,000 | 2,280 | |||||||||
Series A, 5.00%, 5/1/25 | 1,700 | 2,003 | |||||||||
| Michigan State Building Authority Revenue, Series I-A, 5.00%, 10/15/29, Continuously Callable @100 | 3,000 | 3,349 | |||||||||
106,935 | |||||||||||
Minnesota (0.2%): | |||||||||||
| City of Minneapolis Revenue, Series A, 5.00%, 11/15/36, Continuously Callable @100 | 5,000 | 6,089 | |||||||||
| Housing & Redevelopment Authority of The City of St Paul Minnesota Revenue 5.00%, 11/15/29, Pre-refunded 11/15/25 @100 | 1,750 | 2,106 | |||||||||
5.00%, 11/15/30, Pre-refunded 11/15/25 @100 | 1,275 | 1,535 | |||||||||
9,730 | |||||||||||
Mississippi (0.5%): | |||||||||||
| Mississippi Business Finance Corp. Revenue, 3.20%, 9/1/28, Continuously Callable @100 | 6,000 | 6,316 | |||||||||
| Mississippi Development Bank Revenue Series A, 5.00%, 4/1/28, Continuously Callable @100 | 755 | 816 | |||||||||
Series A, 5.00%, 4/1/28, Pre-refunded 4/1/23 @100 | 920 | 1,008 | |||||||||
| Mississippi Development Bank Revenue (INS — Assured Guaranty Municipal Corp.), 5.00%, 9/1/30, Continuously Callable @100 | 6,930 | 7,325 | |||||||||
| Mississippi Hospital Equipment & Facilities Authority Revenue 4.00%, 1/1/36, Continuously Callable @100 | 2,240 | 2,630 | |||||||||
4.00%, 1/1/37, Continuously Callable @100 | 2,260 | 2,640 | |||||||||
4.00%, 1/1/39, Continuously Callable @100 | 1,850 | 2,150 | |||||||||
4.00%, 1/1/40, Continuously Callable @100 | 2,675 | 3,100 | |||||||||
25,985 | |||||||||||
Missouri (1.2%): | |||||||||||
| Cape Girardeau County IDA Revenue 5.00%, 3/1/32, Continuously Callable @100 | 500 | 560 | |||||||||
5.00%, 3/1/36, Continuously Callable @100 | 750 | 830 | |||||||||
Series A, 5.00%, 6/1/25, Continuously Callable @100 | 1,780 | 1,875 | |||||||||
Series A, 5.00%, 6/1/27, Continuously Callable @100 | 2,555 | 2,691 | |||||||||
Series A, 6.00%, 3/1/33, Continuously Callable @103 | 2,215 | 2,407 | |||||||||
| Health & Educational Facilities Authority of the State of Missouri Revenue 5.00%, 2/1/29, Continuously Callable @104 | 1,000 | 1,132 | |||||||||
5.00%, 5/1/30, Continuously Callable @100 | 2,310 | 2,454 | |||||||||
5.00%, 5/15/32, Continuously Callable @103 | 1,555 | 1,721 | |||||||||
5.25%, 5/1/33, Continuously Callable @100 | 2,350 | 2,503 | |||||||||
5.00%, 2/1/34, Continuously Callable @104 | 2,000 | 2,250 | |||||||||
5.00%, 5/15/36, Continuously Callable @103 | 4,565 | 4,996 | |||||||||
| Missouri Development Finance Board Revenue Series A, 5.00%, 6/1/30, Continuously Callable @100 | 1,000 | 1,072 | |||||||||
Series A, 5.00%, 6/1/31, Continuously Callable @100 | 4,215 | 4,518 | |||||||||
See notes to financial statements.
27
| USAA Mutual Funds Trust USAA Tax Exempt Intermediate-Term Fund | Schedule of Portfolio Investments — continued March 31, 2021 | ||||||
(Amounts in Thousands, Except for Shares)
Security Description | Principal Amount | Value | |||||||||
| Missouri State Environmental Improvement & Energy Resources Authority Revenue, Series A-R, 2.90%, 9/1/33, Continuously Callable @102 | $ | 25,000 | $ | 26,684 | |||||||
| St. Louis County IDA Revenue 5.00%, 9/1/23 | 870 | 904 | |||||||||
5.50%, 9/1/33, Continuously Callable @100 | 2,750 | 2,934 | |||||||||
| Stoddard County IDA Revenue, Series B, 6.00%, 3/1/37, Continuously Callable @103 | 1,935 | 2,094 | |||||||||
61,625 | |||||||||||
Montana (0.2%): | |||||||||||
City of Forsyth Revenue, 3.90%, 3/1/31, Callable 3/1/23 @100 | 8,500 | 9,023 | |||||||||
Nebraska (0.4%): | |||||||||||
Central Plains Energy Project Revenue, Series A, 5.00%, 9/1/36 | 3,550 | 4,821 | |||||||||
Douglas County Hospital Authority No. 3 Revenue | |||||||||||
5.00%, 11/1/28, Continuously Callable @100 | 1,250 | 1,492 | |||||||||
5.00%, 11/1/30, Continuously Callable @100 | 1,600 | 1,905 | |||||||||
| Nebraska Educational Health Cultural & Social Services Finance Authority Revenue 4.00%, 1/1/35, Continuously Callable @102 | 795 | 882 | |||||||||
4.00%, 1/1/36, Continuously Callable @102 | 1,240 | 1,369 | |||||||||
4.00%, 1/1/37, Continuously Callable @102 | 1,000 | 1,099 | |||||||||
4.00%, 1/1/38, Continuously Callable @102 | 1,295 | 1,419 | |||||||||
4.00%, 1/1/39, Continuously Callable @102 | 1,800 | 1,965 | |||||||||
| Public Power Generation Agency Revenue, 5.00%, 1/1/37, Continuously Callable @100 | 2,400 | 2,849 | |||||||||
17,801 | |||||||||||
Nevada (1.6%): | |||||||||||
| City of Carson City Revenue 5.00%, 9/1/29, Continuously Callable @100 | 620 | 758 | |||||||||
5.00%, 9/1/31, Continuously Callable @100 | 1,000 | 1,210 | |||||||||
5.00%, 9/1/33, Continuously Callable @100 | 1,000 | 1,201 | |||||||||
5.00%, 9/1/37, Continuously Callable @100 | 1,950 | 2,322 | |||||||||
| City of North Las Vegas, GO (INS — Assured Guaranty Municipal Corp.) 4.00%, 6/1/35, Continuously Callable @100 | 1,870 | 2,166 | |||||||||
4.00%, 6/1/37, Continuously Callable @100 | 7,345 | 8,445 | |||||||||
4.00%, 6/1/38, Continuously Callable @100 | 6,135 | 7,034 | |||||||||
| City of Sparks Revenue Series A, 2.50%, 6/15/24 (e) | 900 | 908 | |||||||||
Series A, 2.75%, 6/15/28 (e) | 1,500 | 1,536 | |||||||||
County of Clark Department of Aviation Revenue | |||||||||||
5.00%, 7/1/26 | 3,660 | 4,440 | |||||||||
5.00%, 7/1/27 | 2,220 | 2,759 | |||||||||
Series A-2, 5.00%, 7/1/32, Continuously Callable @100 | 20,470 | 23,255 | |||||||||
Series A-2, 5.00%, 7/1/33, Continuously Callable @100 | 10,845 | 12,310 | |||||||||
| Las Vegas Convention & Visitors Authority Revenue Series C, 4.00%, 7/1/33, Continuously Callable @100 | 2,000 | 2,203 | |||||||||
Series C, 4.00%, 7/1/34, Continuously Callable @100 | 4,560 | 5,009 | |||||||||
Series C, 4.00%, 7/1/35, Continuously Callable @100 | 5,075 | 5,558 | |||||||||
81,114 | |||||||||||
See notes to financial statements.
28
| USAA Mutual Funds Trust USAA Tax Exempt Intermediate-Term Fund | Schedule of Portfolio Investments — continued March 31, 2021 | ||||||
(Amounts in Thousands, Except for Shares)
Security Description | Principal Amount | Value | |||||||||
New Hampshire (0.3%): | |||||||||||
| New Hampshire Business Finance Authority Revenue, 4.00%, 1/1/41, Continuously Callable @103 | $ | 2,250 | $ | 2,465 | |||||||
| New Hampshire Health and Education Facilities Authority Act Revenue 5.00%, 8/1/34, Continuously Callable @100 | 2,880 | 3,481 | |||||||||
5.00%, 8/1/35, Continuously Callable @100 | 2,700 | 3,256 | |||||||||
5.00%, 8/1/36, Continuously Callable @100 | 2,000 | 2,405 | |||||||||
5.00%, 8/1/37, Continuously Callable @100 | 1,500 | 1,800 | |||||||||
13,407 | |||||||||||
New Jersey (6.1%): | |||||||||||
| Casino Reinvestment Development Authority Revenue (INS — Assured Guaranty Municipal Corp.) 5.00%, 11/1/29, Continuously Callable @100 | 1,000 | 1,118 | |||||||||
5.00%, 11/1/30, Continuously Callable @100 | 1,000 | 1,117 | |||||||||
| City of Atlantic City, GO (INS — Assured Guaranty Municipal Corp.) Series B, 5.00%, 3/1/32, Continuously Callable @100 | 1,660 | 1,995 | |||||||||
Series B, 5.00%, 3/1/37, Continuously Callable @100 | 1,250 | 1,478 | |||||||||
| City of Atlantic City, GO (INS — Build America Mutual Assurance Co.) Series A, 5.00%, 3/1/32, Continuously Callable @100 | 630 | 758 | |||||||||
Series A, 5.00%, 3/1/37, Continuously Callable @100 | 750 | 889 | |||||||||
| City of Bayonne, GO (INS — Build America Mutual Assurance Co.) 5.00%, 7/1/34, Continuously Callable @100 | 1,135 | 1,342 | |||||||||
5.00%, 7/1/35, Continuously Callable @100 | 1,000 | 1,177 | |||||||||
| New Brunswick Parking Authority Revenue (INS — Build America Mutual Assurance Co.) Series A, 5.00%, 9/1/35, Continuously Callable @100 | 1,455 | 1,714 | |||||||||
Series A, 5.00%, 9/1/36, Continuously Callable @100 | 2,000 | 2,345 | |||||||||
| New Jersey Building Authority Revenue Series A, 4.00%, 6/15/30, Pre-refunded 6/15/26 @100 | 400 | 471 | |||||||||
Series A, 4.00%, 6/15/30, Continuously Callable @100 | 600 | 674 | |||||||||
| New Jersey Economic Development Authority Revenue 5.00%, 3/1/25, Continuously Callable @100 | 18,410 | 20,008 | |||||||||
5.00%, 6/15/26, Continuously Callable @100 | 2,500 | 2,622 | |||||||||
1.60% (MUNIPSA+155bps), 9/1/27, Callable 3/1/23 @100 (k) | 10,000 | 10,151 | |||||||||
1.65% (MUNIPSA+160bps), 3/1/28, Callable 3/1/23 @100 (k) | 10,000 | 9,963 | |||||||||
5.00%, 11/1/36, Continuously Callable @100 | 2,000 | 2,446 | |||||||||
4.00%, 11/1/38, Continuously Callable @100 | 1,500 | 1,671 | |||||||||
4.00%, 11/1/39, Continuously Callable @100 | 2,000 | 2,222 | |||||||||
Series A, 5.00%, 6/15/25 | 5,125 | 5,989 | |||||||||
Series A, 3.13%, 7/1/29, Continuously Callable @100 | 665 | 661 | |||||||||
Series A, 3.38%, 7/1/30, Continuously Callable @100 | 1,000 | 1,033 | |||||||||
Series B, 5.00%, 6/15/36, Continuously Callable @100 | 16,455 | 19,861 | |||||||||
Series B, 5.00%, 6/15/37, Continuously Callable @100 | 16,280 | 19,612 | |||||||||
Series WW, 5.25%, 6/15/33, Continuously Callable @100 | 9,000 | 10,483 | |||||||||
| New Jersey Economic Development Authority Revenue (INS — Assured Guaranty Municipal Corp.), 5.00%, 6/15/25, Continuously Callable @100 | 10,000 | 11,432 | |||||||||
| New Jersey Educational Facilities Authority Revenue Series B, 5.50%, 9/1/28, Continuously Callable @100 | 5,740 | 7,008 | |||||||||
Series B, 5.50%, 9/1/29, Continuously Callable @100 | 4,000 | 4,877 | |||||||||
See notes to financial statements.
29
| USAA Mutual Funds Trust USAA Tax Exempt Intermediate-Term Fund | Schedule of Portfolio Investments — continued March 31, 2021 | ||||||
(Amounts in Thousands, Except for Shares)
Security Description | Principal Amount | Value | |||||||||
Series B, 5.50%, 9/1/30, Continuously Callable @100 | $ | 3,000 | $ | 3,653 | |||||||
Series B, 5.50%, 9/1/31, Continuously Callable @100 | 4,590 | 5,582 | |||||||||
Series B, 5.50%, 9/1/32, Continuously Callable @100 | 8,075 | 9,792 | |||||||||
Series F, 4.00%, 7/1/33, Continuously Callable @100 | 150 | 168 | |||||||||
Series F, 4.00%, 7/1/33, Pre-refunded 7/1/26 @100 | 350 | 412 | |||||||||
Series F, 4.00%, 7/1/34, Continuously Callable @100 | 260 | 290 | |||||||||
Series F, 4.00%, 7/1/34, Pre-refunded 7/1/26 @100 | 490 | 577 | |||||||||
Series F, 4.00%, 7/1/35, Continuously Callable @100 | 975 | 1,086 | |||||||||
Series F, 4.00%, 7/1/35, Pre-refunded 7/1/26 @100 | 275 | 324 | |||||||||
| New Jersey Educational Facilities Authority Revenue (INS — Assured Guaranty Municipal Corp.) Series A, 5.00%, 7/1/34, Continuously Callable @100 | 3,000 | 3,561 | |||||||||
Series A, 5.00%, 7/1/35, Continuously Callable @100 | 3,350 | 3,969 | |||||||||
Series A, 4.00%, 7/1/36, Continuously Callable @100 | 1,800 | 1,981 | |||||||||
| New Jersey Health Care Facilities Financing Authority Revenue 5.00%, 10/1/33, Continuously Callable @100 | 2,000 | 2,368 | |||||||||
5.00%, 10/1/34, Continuously Callable @100 | 2,000 | 2,360 | |||||||||
5.00%, 10/1/35, Continuously Callable @100 | 2,620 | 3,080 | |||||||||
| New Jersey Health Care Facilities Financing Authority Revenue (INS — Assured Guaranty Municipal Corp.) Series A, 5.00%, 7/1/27, Continuously Callable @100 | 2,000 | 2,338 | |||||||||
Series A, 5.00%, 7/1/30, Continuously Callable @100 | 1,500 | 1,739 | |||||||||
| New Jersey Transportation Trust Fund Authority Revenue 5.00%, 6/15/30, Continuously Callable @100 | 3,000 | 3,499 | |||||||||
5.00%, 6/15/31, Continuously Callable @100 | 3,000 | 3,483 | |||||||||
1.25% (MUNIPSA+120bps), 6/15/34, (Put Date 12/15/21) (d) (k) | 10,000 | 10,080 | |||||||||
Series A, 12/15/25 (f) | 20,000 | 18,816 | |||||||||
Series A, 5.00%, 12/15/33, Continuously Callable @100 | 2,000 | 2,433 | |||||||||
Series A, 5.00%, 12/15/35, Continuously Callable @100 | 1,050 | 1,269 | |||||||||
Series AA, 5.25%, 6/15/33, Continuously Callable @100 | 2,000 | 2,329 | |||||||||
Series AA, 5.25%, 6/15/34, Continuously Callable @100 | 3,000 | 3,490 | |||||||||
Series BB, 5.00%, 6/15/31, Continuously Callable @100 | 2,500 | 3,068 | |||||||||
Series BB, 5.00%, 6/15/34, Continuously Callable @100 | 10,000 | 12,152 | |||||||||
| New Jersey Transportation Trust Fund Authority Revenue (INS — AMBAC Assurance Corp.), Series B, 5.25%, 12/15/22 | 5,000 | 5,414 | |||||||||
New Jersey Turnpike Authority Revenue | |||||||||||
Series A, 5.00%, 1/1/34, Continuously Callable @100 | 10,000 | 11,364 | |||||||||
Series A, 5.00%, 1/1/34, Continuously Callable @100 | 7,675 | 9,133 | |||||||||
Series A, 5.00%, 1/1/35, Continuously Callable @100 | 4,725 | 5,617 | |||||||||
Series A, 4.00%, 1/1/42, Continuously Callable @100 | 3,000 | 3,503 | |||||||||
Series B, 4.00%, 1/1/35, Continuously Callable @100 | 3,500 | 4,031 | |||||||||
| Newark Housing Authority Revenue (INS — Assured Guaranty Municipal Corp.) 4.00%, 12/1/29, Continuously Callable @100 | 500 | 568 | |||||||||
4.00%, 12/1/30, Continuously Callable @100 | 750 | 844 | |||||||||
4.00%, 12/1/31, Continuously Callable @100 | 500 | 558 | |||||||||
South Jersey Transportation Authority Revenue | |||||||||||
Series A, 5.00%, 11/1/30, Continuously Callable @100 | 500 | 572 | |||||||||
Series A, 5.00%, 11/1/31, Continuously Callable @100 | 750 | 857 | |||||||||
Series A, 5.00%, 11/1/34, Continuously Callable @100 | 1,085 | 1,240 | |||||||||
Series A, 4.00%, 11/1/40, Continuously Callable @100 | 4,300 | 4,966 | |||||||||
See notes to financial statements.
30
| USAA Mutual Funds Trust USAA Tax Exempt Intermediate-Term Fund | Schedule of Portfolio Investments — continued March 31, 2021 | ||||||
(Amounts in Thousands, Except for Shares)
Security Description | Principal Amount | Value | |||||||||
State of New Jersey, GO, Series A, 4.00%, 6/1/32 | $ | 3,000 | $ | 3,692 | |||||||
| Tobacco Settlement Financing Corp. Revenue, Series A, 5.00%, 6/1/36, Continuously Callable @100 | 5,000 | 6,135 | |||||||||
307,510 | |||||||||||
New Mexico (0.6%): | |||||||||||
| City of Farmington Revenue 1.88%, 4/1/33, (Put Date 10/1/21) (d) | 12,000 | 12,090 | |||||||||
Series A, 0.14%, 6/1/40, Callable 5/3/21 @100 (b) | 11,000 | 11,000 | |||||||||
| City of Santa Revenue 2.25%, 5/15/24, Continuously Callable @100 | 600 | 588 | |||||||||
2.63%, 5/15/25, Continuously Callable @100 | 1,000 | 985 | |||||||||
5.00%, 5/15/34, Continuously Callable @103 | 625 | 687 | |||||||||
5.00%, 5/15/39, Continuously Callable @103 | 480 | 523 | |||||||||
| New Mexico Hospital Equipment Loan Council Revenue, 5.00%, 7/1/39, Continuously Callable @102 | 1,075 | 1,212 | |||||||||
| Village of Los Ranchos de Albuquerque Revenue 4.00%, 9/1/35, Continuously Callable @100 | 300 | 337 | |||||||||
4.00%, 9/1/40, Continuously Callable @100 | 1,200 | 1,323 | |||||||||
28,745 | |||||||||||
New York (5.7%): | |||||||||||
| Chautauqua Tobacco Asset Securitization Corp. Revenue, 5.00%, 6/1/34, Continuously Callable @100 | 3,700 | 3,869 | |||||||||
City of Long Beach, GO, Series A, 0.63%, 2/22/22, Continuously Callable @100 | 9,300 | 9,320 | |||||||||
City of New York, GO, Series 3, 0.21%, 4/1/42, Continuously Callable @100 (b) | 9,000 | 9,000 | |||||||||
City of Newburgh, GO, Series B, 5.00%, 6/15/23, Continuously Callable @100 | 575 | 606 | |||||||||
| City of Yonkers, GO (INS — Assured Guaranty Municipal Corp.), Series A, 5.00%, 10/1/23, Continuously Callable @100 | 2,600 | 2,662 | |||||||||
County of Nassau, GO, Series A, 5.00%, 1/1/36, Continuously Callable @100 | 1,150 | 1,337 | |||||||||
County of Suffolk, GO, Series I, 2.00%, 7/22/21 | 4,000 | 4,015 | |||||||||
| Erie County Industrial Development Agency Revenue, 5.00%, 5/1/28, Continuously Callable @100 | 2,000 | 2,189 | |||||||||
| Hudson Yards Infrastructure Corp. Revenue, Series A, 5.00%, 2/15/37, Continuously Callable @100 | 2,500 | 2,987 | |||||||||
| Metropolitan Transportation Authority Revenue 4.00%, 11/15/35, Continuously Callable @100 | 9,040 | 10,089 | |||||||||
Series 2, (SOFR+80bps) 11/1/32, (Put Date 4/1/26) (d) (i) (k) | 3,000 | 3,000 | |||||||||
Series A-1, 5.00%, 2/1/23 | 4,000 | 4,303 | |||||||||
Series A-2, 5.00%, 11/15/45, (Put Date 5/15/30) (d) | 7,315 | 9,232 | |||||||||
Series B-1, 5.00%, 5/15/22 | 1,000 | 1,047 | |||||||||
Series C-1, 5.00%, 11/15/29, Continuously Callable @100 | 7,030 | 8,630 | |||||||||
Series C-1, 4.00%, 11/15/32, Continuously Callable @100 | 9,300 | 10,600 | |||||||||
Series C-1, 5.00%, 11/15/34, Continuously Callable @100 | 6,295 | 7,433 | |||||||||
Series C-1, 5.00%, 11/15/36, Continuously Callable @100 | 3,705 | 4,325 | |||||||||
Series D-1, 5.00%, 11/15/34, Continuously Callable @100 | 2,000 | 2,327 | |||||||||
Series F, 5.00%, 11/15/34, Continuously Callable @100 | 2,000 | 2,326 | |||||||||
Series F, 5.00%, 11/15/35, Continuously Callable @100 | 3,000 | 3,433 | |||||||||
| Metropolitan Transportation Authority Revenue (INS — Assured Guaranty Municipal Corp.), Series A-1, 4.00%, 11/15/41, Continuously Callable @100 | 9,820 | 11,246 | |||||||||
See notes to financial statements.
31
| USAA Mutual Funds Trust USAA Tax Exempt Intermediate-Term Fund | Schedule of Portfolio Investments — continued March 31, 2021 | ||||||
(Amounts in Thousands, Except for Shares)
Security Description | Principal Amount | Value | |||||||||
| Monroe County Industrial Development Corp. Revenue 4.00%, 12/1/38, Continuously Callable @100 | $ | 1,200 | $ | 1,386 | |||||||
4.00%, 12/1/39, Continuously Callable @100 | 1,200 | 1,381 | |||||||||
| New York City Transitional Finance Authority Future Tax Secured Revenue, 4.00%, 11/1/38, Continuously Callable @100 (i) | 1,250 | 1,473 | |||||||||
| New York City Trust for Cultural Resources Revenue, Series A, 4.00%, 12/1/34, Continuously Callable @100 | 2,000 | 2,367 | |||||||||
| New York Liberty Development Corp. Revenue 2.63%, 9/15/69, Continuously Callable @100 | 3,350 | 3,386 | |||||||||
2.80%, 9/15/69, Continuously Callable @100 | 20,500 | 19,834 | |||||||||
| New York State Dormitory Authority Revenue 5.00%, 12/1/35, Continuously Callable @100 (e) | 600 | 695 | |||||||||
6.00%, 7/1/40, Continuously Callable @100 (e) (j) | 3,630 | 3,614 | |||||||||
Series A, 5.00%, 5/1/23 | 15 | 16 | |||||||||
Series A, 5.00%, 5/1/23 | 735 | 791 | |||||||||
Series A, 5.00%, 5/1/24, Continuously Callable @100 | 735 | 791 | |||||||||
Series A, 5.00%, 5/1/24, Pre-refunded 5/1/23 @100 | 15 | 17 | |||||||||
Series A, 5.00%, 5/1/25, Continuously Callable @100 | 1,175 | 1,264 | |||||||||
Series A, 5.00%, 5/1/25, Pre-refunded 5/1/23 @100 | 25 | 28 | |||||||||
Series A, 5.00%, 5/1/26, Continuously Callable @100 | 980 | 1,053 | |||||||||
Series A, 5.00%, 5/1/26, Pre-refunded 5/1/23 @100 | 20 | 22 | |||||||||
Series A, 4.00%, 9/1/36, Continuously Callable @100 | 500 | 570 | |||||||||
Series A, 4.00%, 9/1/37, Continuously Callable @100 | 350 | 398 | |||||||||
Series A, 4.00%, 9/1/38, Continuously Callable @100 | 1,250 | 1,420 | |||||||||
Series A, 4.00%, 9/1/40, Continuously Callable @100 | 750 | 849 | |||||||||
Series A, 4.00%, 3/15/41, Continuously Callable @100 | 20,000 | 23,307 | |||||||||
Series A, 4.00%, 3/15/43, Continuously Callable @100 | 20,000 | 23,136 | |||||||||
Series A-1, 4.00%, 7/1/40, Continuously Callable @100 | 4,535 | 5,025 | |||||||||
Series B, 5.00%, 2/15/32, Continuously Callable @100 | 19,995 | 23,298 | |||||||||
Series B, 5.00%, 2/15/32, Pre-refunded 2/15/25 @100 | 5 | 6 | |||||||||
| New York State Dormitory Authority Revenue (INS — Assured Guaranty Municipal Corp.) Series A, 5.00%, 10/1/27, Continuously Callable @100 | 1,000 | 1,148 | |||||||||
Series A, 5.00%, 10/1/28, Continuously Callable @100 | 1,000 | 1,147 | |||||||||
Series A, 5.00%, 10/1/29, Continuously Callable @100 | 1,300 | 1,489 | |||||||||
| New York State Housing Finance Agency Revenue (LIQ — Deutsche Bank A.G.), Series DBE-DBE-8073, 0.58%, 8/1/50, Continuously Callable @100 (b) (e) | 5,110 | 5,110 | |||||||||
| New York State Urban Development Corp. Revenue, Series E, 4.00%, 3/15/38, Continuously Callable @100 | 20,000 | 23,214 | |||||||||
| Niagara Falls City School District Certificate of Participation (INS — Assured Guaranty Municipal Corp.) 5.00%, 6/15/23 | 1,670 | 1,826 | |||||||||
5.00%, 6/15/24 | 1,450 | 1,642 | |||||||||
5.00%, 6/15/25, Continuously Callable @100 | 1,670 | 1,889 | |||||||||
| Saratoga County Capital Resource Corp. Revenue, Series A, 5.00%, 12/1/28, Continuously Callable @100 | 790 | 885 | |||||||||
| Suffolk County Economic Development Corp. Revenue 5.00%, 7/1/28, Pre-refunded 7/1/21 @100 | 220 | 222 | |||||||||
5.00%, 7/1/28, Continuously Callable @100 | 1,280 | 1,294 | |||||||||
See notes to financial statements.
32
| USAA Mutual Funds Trust USAA Tax Exempt Intermediate-Term Fund | Schedule of Portfolio Investments — continued March 31, 2021 | ||||||
(Amounts in Thousands, Except for Shares)
Security Description | Principal Amount | Value | |||||||||
| Town of Oyster Bay, GO 4.00%, 2/15/24 | $ | 5,415 | $ | 5,959 | |||||||
4.00%, 2/15/25 | 9,750 | 11,009 | |||||||||
4.00%, 2/15/26 | 3,000 | 3,468 | |||||||||
| Westchester County Local Development Corp. Revenue, 5.00%, 1/1/28, Continuously Callable @100 | 1,350 | 1,432 | |||||||||
291,837 | |||||||||||
North Carolina (0.4%): | |||||||||||
| North Carolina Medical Care Commission Revenue 5.00%, 10/1/25 | 1,500 | 1,588 | |||||||||
6.38%, 7/1/26, Pre-refunded 7/1/21 @100 | 4,805 | 4,877 | |||||||||
5.00%, 10/1/30, Continuously Callable @100 | 1,850 | 1,968 | |||||||||
5.00%, 10/1/40, Continuously Callable @103 | 1,050 | 1,163 | |||||||||
5.00%, 10/1/45, Continuously Callable @103 | 1,000 | 1,096 | |||||||||
Series A, 4.00%, 9/1/40, Continuously Callable @100 | 3,050 | 3,244 | |||||||||
Series A, 4.00%, 10/1/40, Continuously Callable @103 | 600 | 656 | |||||||||
Series A, 5.00%, 10/1/40, Continuously Callable @103 | 1,800 | 2,117 | |||||||||
Series A, 5.00%, 10/1/45, Continuously Callable @103 | 1,800 | 2,089 | |||||||||
Series A, 4.00%, 10/1/45, Continuously Callable @103 | 1,000 | 1,081 | |||||||||
19,879 | |||||||||||
North Dakota (0.3%): | |||||||||||
City of Grand Forks Revenue, 5.00%, 12/1/29, Continuously Callable @100 | 11,085 | 11,403 | |||||||||
| County of Ward Revenue, Series C, 5.00%, 6/1/43, Continuously Callable @100 | 4,500 | 5,164 | |||||||||
16,567 | |||||||||||
Ohio (2.9%): | |||||||||||
| Akron Bath Copley Joint Township Hospital District Revenue 4.00%, 11/15/36, Continuously Callable @100 | 1,000 | 1,143 | |||||||||
4.00%, 11/15/37, Continuously Callable @100 | 800 | 913 | |||||||||
4.00%, 11/15/38, Continuously Callable @100 | 500 | 567 | |||||||||
City of Centerville Revenue, 5.25%, 11/1/37, Continuously Callable @100 | 2,250 | 2,335 | |||||||||
| City of Cleveland Airport System Revenue Series A, 5.00%, 1/1/30, Pre-refunded 1/1/22 @100 | 2,000 | 2,072 | |||||||||
Series A, 5.00%, 1/1/31, Pre-refunded 1/1/22 @100 | 1,000 | 1,036 | |||||||||
| County of Allen Hospital Facilities Revenue 4.00%, 12/1/40, Continuously Callable @100 | 7,500 | 8,783 | |||||||||
Series A, 4.00%, 8/1/36, Continuously Callable @100 | 5,000 | 5,774 | |||||||||
Series A, 4.00%, 8/1/37, Continuously Callable @100 | 10,800 | 12,439 | |||||||||
| County of Cuyahoga Revenue 4.00%, 2/15/29, Continuously Callable @100 | 7,430 | 8,456 | |||||||||
5.00%, 2/15/37, Continuously Callable @100 | 4,000 | 4,607 | |||||||||
| County of Hamilton Revenue 5.00%, 1/1/31, Continuously Callable @100 | 1,350 | 1,491 | |||||||||
5.00%, 1/1/36, Continuously Callable @100 | 1,400 | 1,514 | |||||||||
5.00%, 9/15/39, Continuously Callable @100 | 1,375 | 1,695 | |||||||||
5.00%, 9/15/40, Continuously Callable @100 | 1,100 | 1,350 | |||||||||
| County of Hamilton Sales Tax Revenue (INS — AMBAC Assurance Corp.), Series B, 12/1/25 (f) | 4,365 | 4,141 | |||||||||
See notes to financial statements.
33
| USAA Mutual Funds Trust USAA Tax Exempt Intermediate-Term Fund | Schedule of Portfolio Investments — continued March 31, 2021 | ||||||
(Amounts in Thousands, Except for Shares)
Security Description | Principal Amount | Value | |||||||||
County of Hancock Revenue, 6.50%, 12/1/30, Pre-refunded 6/1/21 @100 | $ | 9,000 | $ | 9,090 | |||||||
County of Hardi Revenue, 5.25%, 5/1/40, Continuously Callable @103 | 2,000 | 2,094 | |||||||||
| County of Montgomery Revenue 3.00%, 11/15/36, Continuously Callable @100 | 7,000 | 7,453 | |||||||||
5.00%, 11/15/37, Continuously Callable @100 | 2,200 | 2,692 | |||||||||
County of Ross Revenue, 5.00%, 12/1/39, Continuously Callable @100 | 2,405 | 2,977 | |||||||||
| Dayton City School District, GO 5.00%, 11/1/28 | 2,805 | 3,577 | |||||||||
5.00%, 11/1/29 | 3,655 | 4,741 | |||||||||
5.00%, 11/1/30 | 3,160 | 4,170 | |||||||||
5.00%, 11/1/31 | 2,000 | 2,685 | |||||||||
| Ohio Higher Educational Facility Commission Revenue 5.00%, 5/1/31, Continuously Callable @100 | 1,000 | 1,165 | |||||||||
5.00%, 5/1/33, Continuously Callable @100 | 500 | 582 | |||||||||
| Ohio Turnpike & Infrastructure Commission Revenue, 5.25%, 2/15/29, Continuously Callable @100 | 2,000 | 2,179 | |||||||||
Ohio Water Development Authority Revenue, 12/1/33 (j) (l) | 26,000 | — | |||||||||
| Port of Greater Cincinnati Development Authority Revenue, Series A, 3.00%, 5/1/23, Continuously Callable @100 | 9,535 | 9,507 | |||||||||
| Southeastern Ohio Port Authority Revenue 5.50%, 12/1/29, Continuously Callable @100 | 750 | 833 | |||||||||
5.00%, 12/1/35, Continuously Callable @100 | 750 | 808 | |||||||||
| State of Ohio Revenue 5.00%, 1/15/34, Continuously Callable @100 | 7,210 | 8,556 | |||||||||
5.00%, 1/15/35, Continuously Callable @100 | 6,000 | 7,093 | |||||||||
5.00%, 1/15/36, Continuously Callable @100 | 3,070 | 3,610 | |||||||||
4.00%, 11/15/36, Continuously Callable @100 | 1,260 | 1,451 | |||||||||
4.00%, 11/15/38, Continuously Callable @100 | 1,270 | 1,452 | |||||||||
4.00%, 11/15/40, Continuously Callable @100 | 655 | 741 | |||||||||
Series A, 4.00%, 1/15/38, Continuously Callable @100 | 1,000 | 1,156 | |||||||||
Series A, 4.00%, 1/15/40, Continuously Callable @100 | 1,800 | 2,072 | |||||||||
| Village of Bluffton Revenue 5.00%, 12/1/31, Continuously Callable @100 | 1,500 | 1,843 | |||||||||
4.00%, 12/1/32, Continuously Callable @100 | 1,500 | 1,729 | |||||||||
4.00%, 12/1/33, Continuously Callable @100 | 1,600 | 1,838 | |||||||||
4.00%, 12/1/34, Continuously Callable @100 | 1,795 | 2,053 | |||||||||
146,463 | |||||||||||
Oklahoma (0.5%): | |||||||||||
Comanche County Hospital Authority Revenue, Series A, 5.00%, 7/1/21 | 710 | 715 | |||||||||
| Muskogee Industrial Trust Revenue, Series A, 0.22%, 6/1/27, Continuously Callable @100 (b) | 15,000 | 15,000 | |||||||||
| Oklahoma Development Finance Authority Revenue, Series B, 5.00%, 8/15/33, Continuously Callable @100 | 4,100 | 5,031 | |||||||||
| Tulsa County Industrial Authority Revenue 5.00%, 11/15/28, Continuously Callable @102 | 940 | 1,025 | |||||||||
5.00%, 11/15/30, Continuously Callable @102 | 1,780 | 1,911 | |||||||||
23,682 | |||||||||||
See notes to financial statements.
34
| USAA Mutual Funds Trust USAA Tax Exempt Intermediate-Term Fund | Schedule of Portfolio Investments — continued March 31, 2021 | ||||||
(Amounts in Thousands, Except for Shares)
Security Description | Principal Amount | Value | |||||||||
Oregon (0.1%): | |||||||||||
| Clackamas County Hospital Facility Authority Revenue 5.00%, 11/15/32, Continuously Callable @102 | $ | 500 | $ | 558 | |||||||
5.00%, 11/15/37, Continuously Callable @102 | 500 | 555 | |||||||||
Oregon State Facilities Authority Revenue | |||||||||||
Series A, 5.00%, 10/1/35, Continuously Callable @100 | 275 | 345 | |||||||||
Series A, 5.00%, 10/1/40, Continuously Callable @100 | 1,750 | 2,161 | |||||||||
3,619 | |||||||||||
Pennsylvania (7.8%): | |||||||||||
| Allegheny County Hospital Development Authority Revenue 5.00%, 4/1/35, Continuously Callable @100 | 7,315 | 8,852 | |||||||||
5.00%, 4/1/36, Continuously Callable @100 | 8,000 | 9,652 | |||||||||
4.00%, 7/15/37, Continuously Callable @100 | 2,000 | 2,295 | |||||||||
4.00%, 7/15/38, Continuously Callable @100 | 1,500 | 1,735 | |||||||||
4.00%, 7/15/39, Continuously Callable @100 | 1,440 | 1,645 | |||||||||
| Allegheny County Sanitary Authority Revenue (INS — Assured Guaranty Municipal Corp.) 4.00%, 12/1/33, Continuously Callable @100 | 1,500 | 1,707 | |||||||||
4.00%, 12/1/34, Continuously Callable @100 | 1,475 | 1,674 | |||||||||
| Berks County IDA Revenue 4.00%, 11/1/33, Continuously Callable @100 | 1,300 | 1,313 | |||||||||
5.00%, 11/1/34, Continuously Callable @100 | 2,000 | 2,127 | |||||||||
5.00%, 11/1/35, Continuously Callable @100 | 3,000 | 3,182 | |||||||||
Bethlehem Authority Revenue, 5.00%, 11/15/30, Continuously Callable @100 | 3,000 | 3,219 | |||||||||
| Bucks County IDA Revenue 5.00%, 10/1/30, Continuously Callable @103 | 325 | 375 | |||||||||
5.00%, 10/1/31, Continuously Callable @103 | 450 | 519 | |||||||||
5.00%, 10/1/37, Continuously Callable @103 | 2,260 | 2,529 | |||||||||
| Butler County Hospital Authority Revenue, 5.00%, 7/1/35, Continuously Callable @100 | 1,885 | 2,171 | |||||||||
| Chester County IDA Revenue 5.00%, 10/1/34, Continuously Callable @100 | 1,000 | 1,105 | |||||||||
Series A, 5.13%, 10/15/37, Continuously Callable @100 | 2,750 | 3,074 | |||||||||
| City of Philadelphia Airport Revenue, Series A, 4.00%, 7/1/33, Continuously Callable @100 | 11,420 | 13,629 | |||||||||
| Commonwealth Financing Authority Revenue 5.00%, 6/1/33, Continuously Callable @100 | 1,250 | 1,533 | |||||||||
5.00%, 6/1/34, Continuously Callable @100 | 2,000 | 2,447 | |||||||||
Series A, 5.00%, 6/1/34, Continuously Callable @100 | 5,000 | 5,809 | |||||||||
| Commonwealth of Pennsylvania Certificate of Participation Series A, 5.00%, 7/1/34, Continuously Callable @100 | 1,350 | 1,647 | |||||||||
Series A, 5.00%, 7/1/35, Continuously Callable @100 | 750 | 913 | |||||||||
Series A, 5.00%, 7/1/37, Continuously Callable @100 | 800 | 969 | |||||||||
| County of Beaver, GO 4.00%, 4/15/28 | 2,195 | 2,562 | |||||||||
4.00%, 4/15/28 | 695 | 850 | |||||||||
4.00%, 4/15/29, Continuously Callable @100 | 1,900 | 2,212 | |||||||||
4.00%, 4/15/29, Pre-refunded 4/15/28 @100 | 600 | 731 | |||||||||
4.00%, 4/15/30, Continuously Callable @100 | 4,490 | 5,172 | |||||||||
4.00%, 4/15/30, Pre-refunded 4/15/28 @100 | 510 | 621 | |||||||||
See notes to financial statements.
35
| USAA Mutual Funds Trust USAA Tax Exempt Intermediate-Term Fund | Schedule of Portfolio Investments — continued March 31, 2021 | ||||||
(Amounts in Thousands, Except for Shares)
Security Description | Principal Amount | Value | |||||||||
| County of Lehigh Revenue 4.00%, 7/1/37, Continuously Callable @100 | $ | 2,000 | $ | 2,321 | |||||||
4.00%, 7/1/38, Continuously Callable @100 | 2,000 | 2,315 | |||||||||
4.00%, 7/1/39, Continuously Callable @100 | 2,000 | 2,307 | |||||||||
| County of Luzerne, GO (INS — Assured Guaranty Municipal Corp.), Series A, 5.00%, 11/15/29, Continuously Callable @100 | 5,000 | 5,862 | |||||||||
| Cumberland County Municipal Authority Revenue 4.00%, 11/1/36, Continuously Callable @100 | 1,250 | 1,459 | |||||||||
4.00%, 11/1/37, Continuously Callable @100 | 2,130 | 2,479 | |||||||||
Series C-6, 4.00%, 12/1/26, Continuously Callable @102 | 6,500 | 6,756 | |||||||||
| Dauphin County General Authority Revenue 4.00%, 6/1/30, Continuously Callable @100 | 2,000 | 2,308 | |||||||||
4.00%, 6/1/31, Continuously Callable @100 | 1,000 | 1,113 | |||||||||
| Delaware County Authority Revenue 5.00%, 10/1/30 | 1,200 | 1,424 | |||||||||
5.00%, 10/1/35, Continuously Callable @100 | 2,220 | 2,610 | |||||||||
5.00%, 10/1/39, Continuously Callable @100 | 2,250 | 2,591 | |||||||||
| Delaware River Joint Toll Bridge Commission Revenue, 5.00%, 7/1/34, Continuously Callable @100 | 3,000 | 3,663 | |||||||||
| Delaware River Port Authority Revenue, 5.00%, 1/1/25, Continuously Callable @100 | 2,720 | 2,899 | |||||||||
| Montgomery County Higher Education & Health Authority Revenue 5.00%, 9/1/34, Continuously Callable @100 | 1,750 | 2,131 | |||||||||
5.00%, 9/1/35, Continuously Callable @100 | 1,850 | 2,244 | |||||||||
4.00%, 9/1/36, Continuously Callable @100 | 1,100 | 1,256 | |||||||||
5.00%, 9/1/37, Continuously Callable @100 | 1,750 | 2,114 | |||||||||
4.00%, 9/1/37, Continuously Callable @100 | 1,000 | 1,139 | |||||||||
4.00%, 9/1/38, Continuously Callable @100 | 900 | 1,024 | |||||||||
4.00%, 9/1/39, Continuously Callable @100 | 1,000 | 1,136 | |||||||||
| Montgomery County IDA Revenue 5.00%, 11/15/23, Pre-refunded 5/15/22 @100 | 1,200 | 1,265 | |||||||||
5.00%, 11/15/24, Pre-refunded 5/15/22 @100 | 2,750 | 2,898 | |||||||||
| Montour School District, GO (INS — Assured Guaranty Municipal Corp.) Series B, 5.00%, 4/1/33, Continuously Callable @100 | 1,000 | 1,187 | |||||||||
Series B, 5.00%, 4/1/34, Continuously Callable @100 | 1,500 | 1,778 | |||||||||
Series B, 5.00%, 4/1/35, Continuously Callable @100 | 1,500 | 1,776 | |||||||||
| Northampton County General Purpose Authority Revenue, 1.12% (LIBOR01M+104bps), 8/15/48, (Put Date 8/15/24) (d) (k) | 4,645 | 4,568 | |||||||||
| Northeastern Pennsylvania Hospital & Education Authority Revenue, Series A, 5.00%, 3/1/37, Continuously Callable @100 | 1,525 | 1,629 | |||||||||
| Pennsylvania Economic Development Financing Authority Revenue, 3.00%, 4/1/39, Continuously Callable @100 | 30,000 | 32,300 | |||||||||
| Pennsylvania Higher Educational Facilities Authority Revenue 5.00%, 7/1/32, Pre-refunded 7/1/22 @100 | 1,625 | 1,722 | |||||||||
Series A, 5.25%, 7/15/25, Continuously Callable @100 | 1,730 | 1,878 | |||||||||
Series A, 5.25%, 7/15/26, Continuously Callable @100 | 2,020 | 2,192 | |||||||||
Series A, 5.25%, 7/15/27, Continuously Callable @100 | 2,125 | 2,304 | |||||||||
Series A, 5.25%, 7/15/28, Continuously Callable @100 | 2,245 | 2,432 | |||||||||
Series A, 5.00%, 7/15/30, Continuously Callable @100 | 2,415 | 2,599 | |||||||||
Series A, 5.25%, 7/15/33, Continuously Callable @100 | 1,965 | 2,121 | |||||||||
See notes to financial statements.
36
| USAA Mutual Funds Trust USAA Tax Exempt Intermediate-Term Fund | Schedule of Portfolio Investments — continued March 31, 2021 | ||||||
(Amounts in Thousands, Except for Shares)
Security Description | Principal Amount | Value | |||||||||
| Pennsylvania Turnpike Commission Revenue 5.00%, 6/1/35, Continuously Callable @100 | $ | 10,655 | $ | 12,683 | |||||||
5.00%, 6/1/36, Continuously Callable @100 | 8,255 | 9,806 | |||||||||
Series A-1, 5.00%, 12/1/32, Continuously Callable @100 | 1,500 | 1,734 | |||||||||
Series A-1, 5.00%, 12/1/33, Continuously Callable @100 | 4,345 | 5,021 | |||||||||
Series A-1, 5.00%, 12/1/34, Continuously Callable @100 | 3,000 | 3,574 | |||||||||
Series A-1, 5.00%, 12/1/35, Continuously Callable @100 | 3,320 | 3,952 | |||||||||
Series A-1, 5.00%, 12/1/36, Continuously Callable @100 | 3,690 | 4,379 | |||||||||
Series B, 5.00%, 12/1/32, Continuously Callable @100 | 3,500 | 4,177 | |||||||||
Series B, 5.00%, 12/1/33, Continuously Callable @100 | 7,145 | 8,520 | |||||||||
Series B, 4.00%, 6/1/34, Continuously Callable @100 | 20,000 | 22,682 | |||||||||
Series B, 5.00%, 12/1/34, Continuously Callable @100 | 6,250 | 7,446 | |||||||||
Series B, 5.00%, 12/1/34, Continuously Callable @100 | 2,000 | 2,388 | |||||||||
Series B, 5.00%, 12/1/35, Continuously Callable @100 | 5,700 | 6,785 | |||||||||
Series B, 5.00%, 12/1/35, Continuously Callable @100 | 2,000 | 2,385 | |||||||||
Philadelphia IDA Revenue | |||||||||||
5.00%, 5/1/35, Continuously Callable @100 | 750 | 925 | |||||||||
5.00%, 5/1/36, Continuously Callable @100 | 1,500 | 1,847 | |||||||||
5.00%, 5/1/38, Continuously Callable @100 | 1,000 | 1,226 | |||||||||
5.00%, 6/15/40, Continuously Callable @100 (e) | 900 | 1,011 | |||||||||
| Pittsburgh Water & Sewer Authority Revenue (INS — Assured Guaranty Municipal Corp.) Series B, 4.00%, 9/1/34, Continuously Callable @100 | 1,750 | 2,066 | |||||||||
Series B, 4.00%, 9/1/35, Continuously Callable @100 | 300 | 352 | |||||||||
| Reading School District, GO (INS — Assured Guaranty Municipal Corp.) 5.00%, 3/1/36, Continuously Callable @100 | 2,000 | 2,391 | |||||||||
5.00%, 3/1/37, Continuously Callable @100 | 1,500 | 1,792 | |||||||||
| School District of Philadelphia, GO Series A, 5.00%, 9/1/34, Continuously Callable @100 | 1,000 | 1,243 | |||||||||
Series A, 5.00%, 9/1/35, Continuously Callable @100 | 1,000 | 1,238 | |||||||||
Series A, 5.00%, 9/1/36, Continuously Callable @100 | 1,000 | 1,234 | |||||||||
Series A, 5.00%, 9/1/37, Continuously Callable @100 | 1,000 | 1,232 | |||||||||
Series A, 4.00%, 9/1/38, Continuously Callable @100 | 1,700 | 1,965 | |||||||||
Series A, 4.00%, 9/1/39, Continuously Callable @100 | 1,600 | 1,844 | |||||||||
Series F, 5.00%, 9/1/31, Continuously Callable @100 | 9,895 | 11,985 | |||||||||
Series F, 5.00%, 9/1/32, Continuously Callable @100 | 5,000 | 6,036 | |||||||||
Series F, 5.00%, 9/1/33, Continuously Callable @100 | 4,000 | 4,811 | |||||||||
Series F, 5.00%, 9/1/34, Continuously Callable @100 | 5,100 | 6,113 | |||||||||
| School District of the City of Erie, GO (INS — Assured Guaranty Municipal Corp.), Series A, 4.00%, 4/1/33, Continuously Callable @100 | 1,150 | 1,317 | |||||||||
| Scranton School District, GO (INS — Build America Mutual Assurance Co.) Series E, 5.00%, 12/1/32, Continuously Callable @100 | 1,000 | 1,228 | |||||||||
Series E, 5.00%, 12/1/33, Continuously Callable @100 | 1,600 | 1,961 | |||||||||
Series E, 5.00%, 12/1/35, Continuously Callable @100 | 750 | 915 | |||||||||
| State Public School Building Authority Revenue 5.00%, 4/1/23, Pre-refunded 4/1/22 @100 | 1,250 | 1,310 | |||||||||
5.00%, 6/1/29, Continuously Callable @100 | 10,000 | 12,118 | |||||||||
See notes to financial statements.
37
| USAA Mutual Funds Trust USAA Tax Exempt Intermediate-Term Fund | Schedule of Portfolio Investments — continued March 31, 2021 | ||||||
(Amounts in Thousands, Except for Shares)
Security Description | Principal Amount | Value | |||||||||
| State Public School Building Authority Revenue (INS — Assured Guaranty Municipal Corp.) 5.00%, 6/1/31, Continuously Callable @100 | $ | 6,100 | $ | 7,345 | |||||||
4.00%, 12/1/31, Continuously Callable @100 | 13,085 | 14,852 | |||||||||
4.00%, 12/1/31, Pre-refunded 12/1/26 @100 | 2,295 | 2,724 | |||||||||
| The Berks County Municipal Authority Revenue, Series B, 5.00%, 2/1/40, (Put Date 2/1/30) (d) | 3,300 | 3,632 | |||||||||
| Westmoreland County IDA Revenue, Series A, 4.00%, 7/1/37, Continuously Callable @100 | 1,400 | 1,610 | |||||||||
393,924 | |||||||||||
Puerto Rico (0.1%): | |||||||||||
| Puerto Rico Industrial Tourist Educational Medical & Environmental Control Facilities Authority Revenue, 5.00%, 4/1/27, Continuously Callable @100 | 2,600 | 2,642 | |||||||||
Rhode Island (0.3%): | |||||||||||
| Rhode Island Health & Educational Building Corp. Revenue, 6.00%, 9/1/33, Pre-refunded 9/1/23 @100 | 2,000 | 2,275 | |||||||||
| Rhode Island Turnpike & Bridge Authority Revenue Series A, 5.00%, 10/1/33, Continuously Callable @100 | 1,350 | 1,625 | |||||||||
Series A, 5.00%, 10/1/35, Continuously Callable @100 | 4,345 | 5,189 | |||||||||
| Tobacco Settlement Financing Corp. Revenue Series A, 5.00%, 6/1/28, Continuously Callable @100 | 2,000 | 2,304 | |||||||||
Series A, 5.00%, 6/1/29, Continuously Callable @100 | 2,000 | 2,302 | |||||||||
Series A, 5.00%, 6/1/30, Continuously Callable @100 | 2,500 | 2,875 | |||||||||
16,570 | |||||||||||
South Carolina (1.0%): | |||||||||||
| Lexington County Health Services District, Inc. Revenue 4.00%, 11/1/31, Continuously Callable @100 | 1,000 | 1,167 | |||||||||
4.00%, 11/1/32, Continuously Callable @100 | 1,000 | 1,162 | |||||||||
| Patriots Energy Group Financing Agency Revenue, Series B, 0.94% (LIBOR01M+86bps), 10/1/48, (Put Date 2/1/24) (d) (k) | 20,000 | 20,339 | |||||||||
| Piedmont Municipal Power Agency Revenue (INS — Assured Guaranty Corp.) Series C, 5.00%, 1/1/28, Continuously Callable @100 | 7,200 | 7,281 | |||||||||
Series D, 5.00%, 1/1/28, Continuously Callable @100 | 2,700 | 2,730 | |||||||||
| South Carolina Public Service Authority Revenue Series A, 5.00%, 12/1/34, Continuously Callable @100 | 9,835 | 11,681 | |||||||||
Series A, 5.00%, 12/1/35, Continuously Callable @100 | 7,000 | 8,276 | |||||||||
52,636 | |||||||||||
Tennessee (0.5%): | |||||||||||
| Chattanooga Health Educational & Housing Facility Board Revenue, Series C, 0.12%, 5/1/39, Continuously Callable @100 (b) (c) | 6,200 | 6,200 | |||||||||
| Greeneville Health & Educational Facilities Board Revenue 5.00%, 7/1/35, Continuously Callable @100 | 2,710 | 3,271 | |||||||||
5.00%, 7/1/36, Continuously Callable @100 | 3,000 | 3,608 | |||||||||
5.00%, 7/1/37, Continuously Callable @100 | 3,500 | 4,203 | |||||||||
| Metropolitan Government Nashville & Davidson County Health & Educational Facilities Board Revenue, 5.00%, 7/1/35, Continuously Callable @100 | 5,000 | 6,004 | |||||||||
23,286 | |||||||||||
See notes to financial statements.
38
| USAA Mutual Funds Trust USAA Tax Exempt Intermediate-Term Fund | Schedule of Portfolio Investments — continued March 31, 2021 | ||||||
(Amounts in Thousands, Except for Shares)
Security Description | Principal Amount | Value | |||||||||
Texas (11.3%): | |||||||||||
| Austin Convention Enterprises, Inc. Revenue 5.00%, 1/1/34, Continuously Callable @100 | $ | 1,105 | $ | 1,229 | |||||||
5.00%, 1/1/34, Continuously Callable @100 | 550 | 544 | |||||||||
| Board of Managers Joint Guadalupe County-City of Seguin Hospital Revenue 5.00%, 12/1/25 | 2,740 | 3,076 | |||||||||
5.00%, 12/1/27, Continuously Callable @100 | 2,990 | 3,331 | |||||||||
5.00%, 12/1/28, Continuously Callable @100 | 1,640 | 1,821 | |||||||||
5.00%, 12/1/29, Continuously Callable @100 | 1,600 | 1,771 | |||||||||
5.00%, 12/1/30, Continuously Callable @100 | 1,700 | 1,876 | |||||||||
5.25%, 12/1/35, Continuously Callable @100 | 5,150 | 5,656 | |||||||||
| Central Texas Regional Mobility Authority Revenue 1/1/22 (f) | 885 | 882 | |||||||||
5.00%, 1/1/22 | 500 | 517 | |||||||||
5.00%, 1/1/23 | 500 | 539 | |||||||||
1/1/24 (f) | 7,000 | 6,869 | |||||||||
1/1/26 (f) | 2,535 | 2,393 | |||||||||
5.00%, 1/1/33, Pre-refunded 1/1/23 @100 | 3,500 | 3,790 | |||||||||
Series A, 5.00%, 1/1/34, Continuously Callable @100 | 1,250 | 1,454 | |||||||||
Series A, 5.00%, 1/1/35, Continuously Callable @100 | 1,100 | 1,278 | |||||||||
| Central Texas Turnpike System Revenue Series C, 5.00%, 8/15/33, Continuously Callable @100 | 10,000 | 11,342 | |||||||||
Series C, 5.00%, 8/15/34, Continuously Callable @100 | 8,500 | 9,633 | |||||||||
| City of Arlington Special Tax (INS — Build America Mutual Assurance Co.) Series C, 5.00%, 2/15/34, Continuously Callable @100 | 1,500 | 1,805 | |||||||||
Series C, 5.00%, 2/15/35, Continuously Callable @100 | 1,500 | 1,801 | |||||||||
Series C, 5.00%, 2/15/36, Continuously Callable @100 | 3,100 | 3,711 | |||||||||
Series C, 5.00%, 2/15/37, Continuously Callable @100 | 3,305 | 3,946 | |||||||||
Series C, 5.00%, 2/15/38, Continuously Callable @100 | 4,380 | 5,220 | |||||||||
| City of Corpus Christi Utility System Revenue 4.00%, 7/15/32, Continuously Callable @100 | 1,800 | 2,062 | |||||||||
4.00%, 7/15/33, Continuously Callable @100 | 1,100 | 1,253 | |||||||||
4.00%, 7/15/34, Continuously Callable @100 | 1,050 | 1,191 | |||||||||
4.00%, 7/15/35, Continuously Callable @100 | 1,000 | 1,131 | |||||||||
| City of Houston Hotel Occupancy Tax & Special Revenue 5.00%, 9/1/29, Continuously Callable @100 | 2,300 | 2,558 | |||||||||
5.00%, 9/1/30, Continuously Callable @100 | 1,000 | 1,112 | |||||||||
5.00%, 9/1/32, Continuously Callable @100 | 5,615 | 6,232 | |||||||||
5.00%, 9/1/33, Continuously Callable @100 | 5,345 | 5,928 | |||||||||
5.00%, 9/1/34, Continuously Callable @100 | 2,150 | 2,378 | |||||||||
5.00%, 9/1/35, Continuously Callable @100 | 1,575 | 1,732 | |||||||||
| City of Laredo Waterworks & Sewer System Revenue 4.00%, 3/1/32, Continuously Callable @100 | 740 | 845 | |||||||||
4.00%, 3/1/33, Continuously Callable @100 | 1,000 | 1,134 | |||||||||
4.00%, 3/1/34, Continuously Callable @100 | 1,000 | 1,129 | |||||||||
4.00%, 3/1/36, Continuously Callable @100 | 1,500 | 1,682 | |||||||||
| Clifton Higher Education Finance Corp. Revenue (NBGA — Texas Permanent School Fund) 4.00%, 8/15/33, Continuously Callable @100 | 2,130 | 2,562 | |||||||||
4.00%, 8/15/34, Continuously Callable @100 | 2,275 | 2,724 | |||||||||
See notes to financial statements.
39
| USAA Mutual Funds Trust USAA Tax Exempt Intermediate-Term Fund | Schedule of Portfolio Investments — continued March 31, 2021 | ||||||
(Amounts in Thousands, Except for Shares)
Security Description | Principal Amount | Value | |||||||||
4.00%, 8/15/35, Continuously Callable @100 | $ | 2,375 | $ | 2,829 | |||||||
4.00%, 8/15/36, Continuously Callable @100 | 3,710 | 4,409 | |||||||||
4.00%, 8/15/37, Continuously Callable @100 | 3,860 | 4,576 | |||||||||
4.00%, 8/15/38, Continuously Callable @100 | 4,015 | 4,750 | |||||||||
4.00%, 8/15/39, Continuously Callable @100 | 4,305 | 5,083 | |||||||||
Series A, 4.00%, 8/15/32, Continuously Callable @100 | 1,300 | 1,496 | |||||||||
| Dallas/Fort Worth International Airport Revenue Series D, 5.25%, 11/1/28, Continuously Callable @100 | 2,000 | 2,245 | |||||||||
Series D, 5.25%, 11/1/29, Continuously Callable @100 | 7,500 | 8,413 | |||||||||
| Decatur Hospital Authority Revenue Series A, 5.25%, 9/1/29, Continuously Callable @100 | 1,000 | 1,133 | |||||||||
Series A, 5.00%, 9/1/34, Continuously Callable @100 | 1,000 | 1,121 | |||||||||
| Harris County Cultural Education Facilities Finance Corp. Revenue 5.00%, 12/1/27, Pre-refunded 12/1/22 @100 | 4,710 | 5,083 | |||||||||
5.00%, 6/1/28, Continuously Callable @100 | 1,400 | 1,491 | |||||||||
0.62% (MUNIPSA+57bps), 12/1/49, (Put Date 12/4/24) (d) (k) | 3,330 | 3,274 | |||||||||
| Harris County Municipal Utility District No. 165, GO (INS — Build America Mutual Assurance Co.) 5.00%, 3/1/30, Continuously Callable @100 | 750 | 860 | |||||||||
5.00%, 3/1/31, Continuously Callable @100 | 2,030 | 2,325 | |||||||||
5.00%, 3/1/32, Continuously Callable @100 | 2,500 | 2,861 | |||||||||
| Houston Higher Education Finance Corp. Revenue Series A, 5.25%, 9/1/31, Pre-refunded 9/1/22 @100 | 3,850 | 4,125 | |||||||||
Series A, 5.25%, 9/1/32, Pre-refunded 9/1/22 @100 | 4,075 | 4,367 | |||||||||
| Karnes County Hospital District Revenue 5.00%, 2/1/29, Continuously Callable @100 | 4,000 | 4,508 | |||||||||
5.00%, 2/1/34, Continuously Callable @100 | 4,000 | 4,493 | |||||||||
| Main Street Market Square Redevelopment Authority Tax Allocation (INS — Build America Mutual Assurance Co.) 5.00%, 9/1/29, Continuously Callable @100 | 1,215 | 1,422 | |||||||||
5.00%, 9/1/30, Continuously Callable @100 | 1,380 | 1,614 | |||||||||
5.00%, 9/1/31, Continuously Callable @100 | 2,000 | 2,337 | |||||||||
5.00%, 9/1/32, Continuously Callable @100 | 1,500 | 1,752 | |||||||||
5.00%, 9/1/33, Continuously Callable @100 | 2,680 | 3,128 | |||||||||
| Matagorda County Navigation District No. 1 Revenue 2.60%, 11/1/29 | 14,010 | 14,913 | |||||||||
4.00%, 6/1/30, Continuously Callable @100 | 5,405 | 5,780 | |||||||||
| Mesquite Health Facilities Development Corp. Revenue 5.00%, 2/15/26 | 3,100 | 2,458 | |||||||||
5.00%, 2/15/35, Continuously Callable @100 | 1,075 | 852 | |||||||||
| New Hope Cultural Education Facilities Finance Corp. Revenue 5.00%, 11/1/31, Continuously Callable @102 | 1,000 | 1,138 | |||||||||
4.00%, 11/1/36, Continuously Callable @102 | 1,475 | 1,567 | |||||||||
Series A, 5.00%, 7/1/30, Continuously Callable @100 | 7,500 | 6,375 | |||||||||
Series A, 5.00%, 7/1/35, Continuously Callable @100 | 9,000 | 7,650 | |||||||||
| Newark Higher Education Finance Corp. Revenue 4.00%, 4/1/32, Continuously Callable @100 | 1,635 | 1,821 | |||||||||
4.00%, 4/1/33, Continuously Callable @100 | 2,000 | 2,212 | |||||||||
4.00%, 4/1/34, Continuously Callable @100 | 4,470 | 4,921 | |||||||||
4.00%, 4/1/35, Continuously Callable @100 | 1,650 | 1,809 | |||||||||
4.00%, 4/1/36, Continuously Callable @100 | 2,150 | 2,346 | |||||||||
See notes to financial statements.
40
| USAA Mutual Funds Trust USAA Tax Exempt Intermediate-Term Fund | Schedule of Portfolio Investments — continued March 31, 2021 | ||||||
(Amounts in Thousands, Except for Shares)
Security Description | Principal Amount | Value | |||||||||
| North East Texas Regional Mobility Authority Revenue 5.00%, 1/1/36, Continuously Callable @100 | $ | 7,000 | $ | 8,104 | |||||||
Series B, 5.00%, 1/1/36, Continuously Callable @100 | 5,485 | 6,416 | |||||||||
| North Texas Tollway Authority Revenue Series A, 5.00%, 1/1/32, Continuously Callable @100 | 8,000 | 9,230 | |||||||||
Series A, 5.00%, 1/1/34, Continuously Callable @100 | 1,515 | 1,793 | |||||||||
Series A, 4.00%, 1/1/39, Continuously Callable @100 | 14,620 | 16,826 | |||||||||
Series B, 5.00%, 1/1/31, Continuously Callable @100 | 1,500 | 1,676 | |||||||||
Series B, 5.00%, 1/1/34, Continuously Callable @100 | 7,500 | 8,629 | |||||||||
| North Texas Tollway Authority Revenue (INS — Assured Guaranty Corp.), 1/1/29 (f) | 20,000 | 17,904 | |||||||||
| North Texas Tollway Authority Revenue (INS — Assured Guaranty Municipal Corp.) Series B, 4.00%, 1/1/35, Continuously Callable @100 | 2,000 | 2,277 | |||||||||
Series B, 4.00%, 1/1/36, Continuously Callable @100 | 1,695 | 1,922 | |||||||||
| Permanent University Fund — University of Texas System Revenue 5.00%, 7/1/32, Continuously Callable @100 | 2,230 | 2,636 | |||||||||
5.00%, 7/1/33, Continuously Callable @100 | 3,250 | 3,838 | |||||||||
5.00%, 7/1/34, Continuously Callable @100 | 2,500 | 2,950 | |||||||||
| Port of Port Arthur Navigation District Revenue 0.16%, 11/1/40, Continuously Callable @100 (b) (c) | 55,000 | 55,000 | |||||||||
0.14%, 11/1/40, Continuously Callable @100 (b) | 9,800 | 9,800 | |||||||||
Series A, 0.08%, 4/1/40, Continuously Callable @100 (b) | 19,790 | 19,790 | |||||||||
Series B, 0.08%, 4/1/40, Continuously Callable @100 (b) | 16,150 | 16,150 | |||||||||
Series C, 0.10%, 4/1/40, Continuously Callable @100 (b) | 21,710 | 21,710 | |||||||||
| San Antonio Housing Trust Finance Corp. Revenue (NBGA — Federal Home Loan Mortgage Corp.), 3.50%, 4/1/43, (Put Date 10/1/28) (d) | 14,935 | 15,984 | |||||||||
| Tarrant County Cultural Education Facilities Finance Corp. Revenue 5.00%, 11/15/30, Continuously Callable @100 | 2,145 | 2,596 | |||||||||
5.00%, 11/15/31, Continuously Callable @100 | 2,250 | 2,707 | |||||||||
5.00%, 11/15/32, Continuously Callable @100 | 2,365 | 2,833 | |||||||||
5.00%, 11/15/37, Continuously Callable @100 | 2,175 | 2,565 | |||||||||
Series B, 5.00%, 7/1/37, Continuously Callable @100 | 18,225 | 22,511 | |||||||||
Series B, 5.00%, 7/1/38, Continuously Callable @100 | 19,115 | 23,559 | |||||||||
| Texas Municipal Gas Acquisition & Supply Corp. III Revenue, 5.00%, 12/15/32 | 9,835 | 13,021 | |||||||||
| Texas Private Activity Bond Surface Transportation Corp. Revenue 4.00%, 6/30/38, Continuously Callable @100 | 3,300 | 3,786 | |||||||||
4.00%, 12/31/38, Continuously Callable @100 | 3,850 | 4,417 | |||||||||
4.00%, 6/30/39, Continuously Callable @100 | 2,150 | 2,461 | |||||||||
| Texas Transportation Commission State Highway Fund Revenue, 5.00%, 10/1/26 | 7,235 | 8,962 | |||||||||
| Trophy Club Public Improvement District No. 1 Special Assessment (INS — Assured Guaranty Municipal Corp.), 5.00%, 6/1/33, Continuously Callable @100 | 6,960 | 8,013 | |||||||||
| Tyler Health Facilities Development Corp. Revenue, 5.50%, 7/1/27, Pre-refunded 7/1/21 @100 | 10,000 | 10,128 | |||||||||
573,868 | |||||||||||
See notes to financial statements.
41
| USAA Mutual Funds Trust USAA Tax Exempt Intermediate-Term Fund | Schedule of Portfolio Investments — continued March 31, 2021 | ||||||
(Amounts in Thousands, Except for Shares)
Security Description | Principal Amount | Value | |||||||||
Utah (0.1%): | |||||||||||
| Jordanelle Special Service District Special Assessment Series A, 12.00%, 8/1/30, Continuously Callable @100 (e) | $ | 3,540 | $ | 3,551 | |||||||
Series B, 12.00%, 8/1/30, Continuously Callable @100 (e) | 1,938 | 1,944 | |||||||||
5,495 | |||||||||||
Vermont (0.3%): | |||||||||||
| Vermont Educational & Health Buildings Financing Agency Revenue, Series A, 5.00%, 12/1/36, Continuously Callable @100 | 2,500 | 2,944 | |||||||||
Winooski School District, GO, 1.25%, 10/15/21 | 12,500 | 12,535 | |||||||||
15,479 | |||||||||||
Virgin Islands (0.1%): | |||||||||||
| Virgin Islands Public Finance Authority Revenue, 5.00%, 9/1/30, Continuously Callable @100 (e) | 6,500 | 7,353 | |||||||||
Virginia (0.8%): | |||||||||||
| Chesapeake Hospital Authority Revenue 4.00%, 7/1/36, Continuously Callable @100 | 1,175 | 1,354 | |||||||||
4.00%, 7/1/37, Continuously Callable @100 | 1,205 | 1,384 | |||||||||
| Fairfax County Economic Development Authority Revenue, Series A, 5.00%, 10/1/36, Continuously Callable @102 | 2,150 | 2,405 | |||||||||
| Stafford County Economic Development Authority Revenue 5.00%, 6/15/33, Continuously Callable @100 | 750 | 888 | |||||||||
5.00%, 6/15/34, Continuously Callable @100 | 2,620 | 3,091 | |||||||||
5.00%, 6/15/35, Continuously Callable @100 | 1,930 | 2,267 | |||||||||
| Virginia College Building Authority Revenue 5.00%, 6/1/21, Continuously Callable @100 | 500 | 500 | |||||||||
4.00%, 2/1/34, Continuously Callable @100 | 10,000 | 11,561 | |||||||||
4.00%, 2/1/36, Continuously Callable @100 | 3,000 | 3,453 | |||||||||
| Virginia Small Business Financing Authority Revenue Series A, 4.00%, 1/1/37, Continuously Callable @103 | 2,750 | 3,071 | |||||||||
Series A, 4.00%, 1/1/38, Continuously Callable @103 | 3,000 | 3,343 | |||||||||
Series A, 4.00%, 1/1/39, Continuously Callable @103 | 3,500 | 3,889 | |||||||||
Series A, 4.00%, 1/1/40, Continuously Callable @103 | 4,000 | 4,434 | |||||||||
41,640 | |||||||||||
Washington (0.4%): | |||||||||||
| Tobacco Settlement Authority Revenue, 5.25%, 6/1/31, Continuously Callable @100 | 2,710 | 2,716 | |||||||||
Washington Health Care Facilities Authority Revenue | |||||||||||
5.00%, 8/15/33, Continuously Callable @100 | 3,090 | 3,658 | |||||||||
5.00%, 8/15/34, Continuously Callable @100 | 3,470 | 4,095 | |||||||||
5.00%, 7/1/35, Continuously Callable @100 | 2,355 | 2,877 | |||||||||
5.00%, 7/1/36, Continuously Callable @100 | 2,250 | 2,742 | |||||||||
4.00%, 7/1/37, Continuously Callable @100 | 3,125 | 3,567 | |||||||||
19,655 | |||||||||||
West Virginia (0.3%): | |||||||||||
| West Virginia Hospital Finance Authority Revenue 5.00%, 6/1/33, Continuously Callable @100 | 1,850 | 2,234 | |||||||||
5.00%, 1/1/34, Continuously Callable @100 | 2,360 | 2,888 | |||||||||
See notes to financial statements.
42
| USAA Mutual Funds Trust USAA Tax Exempt Intermediate-Term Fund | Schedule of Portfolio Investments — continued March 31, 2021 | ||||||
(Amounts in Thousands, Except for Shares)
Security Description | Principal Amount | Value | |||||||||
5.00%, 6/1/34, Continuously Callable @100 | $ | 2,970 | $ | 3,576 | |||||||
5.00%, 1/1/35, Continuously Callable @100 | 2,920 | 3,559 | |||||||||
5.00%, 6/1/35, Continuously Callable @100 | 2,405 | 2,888 | |||||||||
5.00%, 9/1/38, Continuously Callable @100 | 1,000 | 1,217 | |||||||||
5.00%, 9/1/39, Continuously Callable @100 | 1,000 | 1,213 | |||||||||
17,575 | |||||||||||
Wisconsin (1.2%): | |||||||||||
| Public Finance Authority Revenue 3.00%, 4/1/25 (e) | 425 | 438 | |||||||||
4.00%, 6/15/29, Continuously Callable @100 (e) | 325 | 349 | |||||||||
4.00%, 9/1/29, Continuously Callable @103 (e) | 1,250 | 1,380 | |||||||||
5.25%, 5/15/37, Continuously Callable @102 (e) | 1,000 | 1,066 | |||||||||
5.00%, 6/15/39, Continuously Callable @100 (e) | 410 | 446 | |||||||||
5.00%, 9/1/39, Continuously Callable @103 (e) | 2,230 | 2,504 | |||||||||
5.00%, 1/1/40, Continuously Callable @100 | 3,500 | 4,112 | |||||||||
5.00%, 4/1/40, Continuously Callable @100 (e) | 1,175 | 1,361 | |||||||||
5.00%, 1/1/45, Continuously Callable @100 | 3,275 | 3,790 | |||||||||
Series A, 5.25%, 10/1/38, Continuously Callable @100 | 3,250 | 3,831 | |||||||||
Series A, 5.00%, 11/15/41, Continuously Callable @103 | 4,480 | 5,191 | |||||||||
Series A, 4.00%, 7/1/46, Continuously Callable @100 | 1,100 | 1,214 | |||||||||
Series D, 4.05%, 11/1/30, Continuously Callable @100 | 1,500 | 1,606 | |||||||||
| Wisconsin Health & Educational Facilities Authority Revenue 5.00%, 8/15/34, Continuously Callable @100 | 1,000 | 1,123 | |||||||||
4.00%, 2/15/35, Continuously Callable @100 | 500 | 593 | |||||||||
4.00%, 11/15/36, Continuously Callable @100 | 9,830 | 11,075 | |||||||||
4.00%, 2/15/37, Continuously Callable @100 | 1,000 | 1,173 | |||||||||
4.00%, 3/15/40, Continuously Callable @100 | 750 | 821 | |||||||||
0.18%, 2/15/53, Callable 5/3/21 @100 (b) | 6,500 | 6,500 | |||||||||
Series A, 5.00%, 7/15/28, Pre-refunded 7/15/21 @100 | 2,000 | 2,027 | |||||||||
Series A, 5.13%, 4/15/31, Pre-refunded 4/15/23 @100 | 5,000 | 5,490 | |||||||||
Series C, 5.00%, 8/15/26, Pre-refunded 8/15/22 @100 | 1,500 | 1,599 | |||||||||
Series C, 5.00%, 8/15/29, Pre-refunded 8/15/22 @100 | 1,935 | 2,062 | |||||||||
59,751 | |||||||||||
Total Municipal Bonds (Cost $4,689,565) | 5,035,071 | ||||||||||
Total Investments (Cost $4,696,479) — 99.3% | 5,042,535 | ||||||||||
Other assets in excess of liabilities — 0.7% | 37,799 | ||||||||||
NET ASSETS — 100.00% | $ | 5,080,334 | |||||||||
(a) Non-income producing security.
(b) Variable Rate Demand Notes that provide the rights to sell the security at face value on either that day or within the rate-reset period. The interest rate is reset on the put date at a stipulated daily, weekly, monthly, quarterly, or other specified time interval to reflect current market conditions. These securities do not indicate a reference rate and spread in their description.
(c) All or a portion of this security has been segregated as collateral for securities purchased on a when-issued basis.
(d) Put Bond.
See notes to financial statements.
43
| USAA Mutual Funds Trust USAA Tax Exempt Intermediate-Term Fund | Schedule of Portfolio Investments — continued March 31, 2021 | ||||||
(e) Rule 144A security or other security that is restricted as to resale to institutional investors. The Fund's Adviser has deemed this security to be liquid based upon procedures approved by the Board of Trustees. As of March 31, 2021, the fair value of these securities was $128,143 (thousands) and amounted to 2.5% of net assets.
(f) Zero-coupon bond.
(g) Stepped-coupon security converts to coupon form on 11/1/25 with a rate of 4.00%.
(h) Stepped-coupon security converts to coupon form on 11/1/25 with a rate of 4.35%.
(i) Security or portion of security purchased on a delayed-delivery and/or when-issued basis.
(j) The Fund's Adviser has deemed this security to be illiquid based upon procedures approved by the Board of Trustees. As of March 31, 2021, illiquid securities were 0.2% of the Fund's net assets.
(k) Variable or Floating-Rate Security. Rate disclosed is as of March 31, 2021.
(l) Security was fair valued based upon procedures approved by the Board of Trustees and represents 0.0% of the Fund's net assets as of March 31, 2021. This security is classified as Level 3 within the fair value hierarchy. (See Note 2 in the Notes to Financial Statements)
AMBAC — American Municipal Bond Assurance Corporation
bps — Basis points
Continuously callable — Investment is continuously callable or will be continuously callable on any date after the first call date until its maturity.
GO — General Obligation
IDA — Industrial Development Authority
LIBOR — London InterBank Offered Rate
LIBOR01M — 1 Month US Dollar LIBOR, rate disclosed as of March 31, 2021, based on the last reset date of the security
MUNIPSA — Municipal Swap Index
SOFR — Secured Overnight Financing Rate
Credit Enhancements — Adds the financial strength of the provider of the enhancement to support the issuer's ability to repay the principal and interest payments when due. The enhancement may be provided by a high-quality bank, insurance company or other corporation, or a collateral trust. The enhancements do not guarantee the market values of the securities.
INS Principal and interest payments are insured by the name listed. Although bond insurance reduces the risk of loss due to default by an issuer, such bonds remain subject to the risk that value may fluctuate for other reasons, and there is no assurance that the insurance company will meet its obligations.
LIQ Liquidity enhancement that may, under certain circumstances, provide for repayment of principal and interest upon demand from the name listed.
NBGA Principal and interest payments or, under certain circumstances, underlying mortgages are guaranteed by a nonbank guarantee agreement from the name listed.
See notes to financial statements.
44
USAA Mutual Funds Trust | Statement of Assets and Liabilities March 31, 2021 | ||||||
(Amounts in Thousands, Except Per Share Amounts)
| USAA Tax Exempt Intermediate-Term Fund | |||||||
Assets: | |||||||
Investments, at value (Cost $4,696,479) | $ | 5,042,535 | |||||
Cash | 340 | ||||||
Receivables: | |||||||
Interest and dividends | 49,503 | ||||||
Capital shares issued | 1,538 | ||||||
From Adviser | 109 | ||||||
Prepaid expenses and other assets | 376 | ||||||
Total assets | 5,094,401 | ||||||
Liabilities: | |||||||
Payables: | |||||||
Distributions | 1,126 | ||||||
Investments purchased | 5,598 | ||||||
Capital shares redeemed | 4,732 | ||||||
Accrued expenses and other payables: | |||||||
Investment advisory fees | 1,410 | ||||||
Administration fees | 602 | ||||||
Custodian fees | 34 | ||||||
Transfer agent fees | 349 | ||||||
Compliance fees | 3 | ||||||
Trustees' fees | — | (a) | |||||
| 12b-1 fees | 3 | ||||||
Other accrued expenses | 210 | ||||||
Total liabilities | 14,067 | ||||||
Net Assets: | |||||||
Capital | 4,828,238 | ||||||
Total accumulated earnings/(loss) | 252,096 | ||||||
Net assets | $ | 5,080,334 | |||||
Net Assets | |||||||
Fund Shares | $ | 4,059,780 | |||||
Institutional Shares | 996,601 | ||||||
Class A | 23,934 | ||||||
Class Z | 19 | ||||||
Total | $ | 5,080,334 | |||||
Shares (unlimited number of shares authorized with no par value): | |||||||
Fund Shares | 293,114 | ||||||
Institutional Shares | 71,973 | ||||||
Class A | 1,728 | ||||||
Class Z | 1 | ||||||
Total | 366,816 | ||||||
Net asset value, offering and redemption price per share: (b) | |||||||
Fund Shares | $ | 13.85 | |||||
Institutional Shares | $ | 13.85 | |||||
Class A | $ | 13.85 | |||||
Class Z | $ | 13.85 | |||||
Maximum Sales Charge — Class A | 2.25 | % | |||||
Maximum offering price | |||||||
| (100%/(100%-maximum sales charge) of net asset value adjusted to the nearest cent) per share — Class A | $ | 14.17 | |||||
(a) Rounds to less than $1 thousand.
(b) Per share amount may not recalculate due to rounding of net assets and/or shares outstanding.
See notes to financial statements.
45
USAA Mutual Funds Trust | Statement of Operations For the Year Ended March 31, 2021 | ||||||
(Amounts in Thousands)
| USAA Tax Exempt Intermediate-Term Fund | |||||||
Investment Income: | |||||||
Interest | $ | 156,647 | |||||
Total income | 156,647 | ||||||
Expenses (a): | |||||||
Investment advisory fees | 14,810 | ||||||
Administration fees — Fund Shares | 7,011 | ||||||
Administration fees — Institutional Shares | 217 | ||||||
Administration fees — Class A | 35 | ||||||
Sub-Administration fees | 24 | ||||||
| 12b-1 fees — Class A | 58 | ||||||
Custodian fees | 187 | ||||||
Transfer agent fees — Fund Shares | 1,355 | ||||||
Transfer agent fees — Institutional Shares | 217 | ||||||
Transfer agent fees — Class A | 22 | ||||||
Trustees' fees | 50 | ||||||
Compliance fees | 32 | ||||||
Legal and audit fees | 90 | ||||||
State registration and filing fees | 206 | ||||||
Interfund lending fees | — | (b) | |||||
Other expenses | 390 | ||||||
Total expenses | 24,704 | ||||||
Expenses waived/reimbursed by Adviser | (172 | ) | |||||
Net expenses | 24,532 | ||||||
Net Investment Income (Loss) | 132,115 | ||||||
Realized/Unrealized Gains (Losses) from Investments: | |||||||
Net realized gains (losses) from investment securities | (6,469 | ) | |||||
Net change in unrealized appreciation/depreciation on investment securities | 191,773 | ||||||
Net realized/unrealized gains (losses) on investments | 185,304 | ||||||
Change in net assets resulting from operations | $ | 317,419 | |||||
(a) Institutional Shares and Class Z commenced operations on June 29, 2020, and March 4, 2021, respectively.
(b) Rounds to less than $1 thousand.
See notes to financial statements.
46
USAA Mutual Funds Trust | Statements of Changes in Net Assets | ||||||
(Amounts in Thousands)
| USAA Tax Exempt Intermediate-Term Fund | |||||||||||
| Year Ended March 31, 2021 | Year Ended March 31, 2020 | ||||||||||
From Investments: | |||||||||||
Operations: | |||||||||||
Net investment income (loss) | $ | 132,115 | $ | 140,749 | |||||||
Net realized gains (losses) from investments | (6,469 | ) | (11,622 | ) | |||||||
| Net change in unrealized appreciation/depreciation on investments | 191,773 | (9,397 | ) | ||||||||
Change in net assets resulting from operations | 317,419 | 119,730 | |||||||||
Distributions to Shareholders: | |||||||||||
Fund Shares | (125,814 | ) | (140,378 | ) | |||||||
Institutional Shares (a) | (5,737 | ) | — | ||||||||
Class A | (567 | ) | (613 | ) | |||||||
Class Z (b) | — | (c) | — | ||||||||
Change in net assets resulting from distributions to shareholders | (132,118 | ) | (140,991 | ) | |||||||
Change in net assets resulting from capital transactions | 81,708 | 57,378 | |||||||||
Change in net assets | 267,009 | 36,117 | |||||||||
Net Assets: | |||||||||||
Beginning of period | 4,813,325 | 4,777,208 | |||||||||
End of period | $ | 5,080,334 | $ | 4,813,325 | |||||||
(a) Institutional Shares commenced operations on June 29, 2020.
(b) Class Z commenced operations on March 4, 2021.
(c) Rounds to less than $1 thousand.
(continues on next page)
See notes to financial statements.
47
USAA Mutual Funds Trust | Statements of Changes in Net Assets | ||||||
(Amounts in Thousands) (continued)
| USAA Tax Exempt Intermediate-Term Fund | |||||||||||
| Year Ended March 31, 2021 | Year Ended March 31, 2020 | ||||||||||
Capital Transactions: | |||||||||||
Fund Shares | |||||||||||
Proceeds from shares issued | $ | 696,196 | $ | 821,794 | |||||||
Distributions reinvested | 111,273 | 120,977 | |||||||||
Cost of shares redeemed | (1,722,488 | ) | (887,865 | ) | |||||||
Total Fund Shares | $ | (915,019 | ) | $ | 54,906 | ||||||
Institutional Shares (a) | |||||||||||
Proceeds from shares issued | $ | 1,027,555 | $ | — | |||||||
Distributions reinvested | 5,305 | — | |||||||||
Cost of shares redeemed | (33,953 | ) | — | ||||||||
Total Institutional Shares | $ | 998,907 | $ | — | |||||||
Class A | |||||||||||
Proceeds from shares issued | $ | 26,772 | $ | 6,875 | |||||||
Distributions reinvested | 498 | 512 | |||||||||
Cost of shares redeemed | (29,469 | ) | (4,915 | ) | |||||||
Total Class A | $ | (2,199 | ) | $ | 2,472 | ||||||
Class Z (b) | |||||||||||
Proceeds from shares issued | $ | 19 | $ | — | |||||||
Distributions reinvested | — | (c) | — | ||||||||
Total Class Z | $ | 19 | $ | — | |||||||
Change in net assets resulting from capital transactions | $ | 81,708 | $ | 57,378 | |||||||
Share Transactions: | |||||||||||
Fund Shares | |||||||||||
Issued | 50,950 | 60,384 | |||||||||
Reinvested | 8,143 | 8,878 | |||||||||
Redeemed | (125,198 | ) | (65,764 | ) | |||||||
Total Fund Shares | (66,105 | ) | 3,498 | ||||||||
Institutional Shares (a) | |||||||||||
Issued | 74,035 | — | |||||||||
Reinvested | 383 | — | |||||||||
Redeemed | (2,445 | ) | — | ||||||||
Total Institutional Shares | 71,973 | — | |||||||||
Class A | |||||||||||
Issued | 1,969 | 510 | |||||||||
Reinvested | 36 | 38 | |||||||||
Redeemed | (2,173 | ) | (365 | ) | |||||||
Total Class A | (168 | ) | 183 | ||||||||
Class Z (b) | |||||||||||
Issued | 1 | — | |||||||||
Reinvested | — | (d) | — | ||||||||
Total Class Z | 1 | — | |||||||||
Change in Shares | 5,701 | 3,681 | |||||||||
(a) Institutional Shares commenced operations on June 29, 2020.
(b) Class Z commenced operations on March 4, 2021.
(c) Rounds to less than $1 thousand.
(d) Rounds to less than 1 thousand shares.
See notes to financial statements.
48
This page is intentionally left blank.
49
USAA Mutual Funds Trust | Financial Highlights | ||||||
For a Share Outstanding Throughout Each Period
Investment Activities | Distributions to Shareholders From | ||||||||||||||||||||||||||
| Net Asset Value, Beginning of Period | Net Investment Income (Loss) | Net Realized and Unrealized Gains (Losses) on Investments | Total from Investment Activities | Net Investment Income | Total Distributions | ||||||||||||||||||||||
USAA Tax Exempt Intermediate-Term Fund | |||||||||||||||||||||||||||
Fund Shares | |||||||||||||||||||||||||||
| Year Ended March 31, 2021 | $ | 13.33 | 0.37 | (e) | 0.52 | 0.89 | (0.37 | ) | (0.37 | ) | |||||||||||||||||
| Year Ended March 31, 2020 | $ | 13.37 | 0.38 | (e) | (0.03 | ) | 0.35 | (0.39 | ) | (0.39 | ) | ||||||||||||||||
| Year Ended March 31, 2019 | $ | 13.12 | 0.41 | 0.24 | 0.65 | (0.40 | ) | (0.40 | ) | ||||||||||||||||||
| Year Ended March 31, 2018 | $ | 13.08 | 0.41 | 0.04 | 0.45 | (0.41 | ) | (0.41 | ) | ||||||||||||||||||
| Year Ended March 31, 2017 | $ | 13.61 | 0.42 | (0.53 | ) | (0.11 | ) | (0.42 | ) | (0.42 | ) | ||||||||||||||||
Institutional Shares | |||||||||||||||||||||||||||
| June 29, 2020 (g) through March 31, 2021 | $ | 13.57 | 0.27 | (e) | 0.29 | 0.56 | (0.28 | ) | (0.28 | ) | |||||||||||||||||
Class A | |||||||||||||||||||||||||||
| Year Ended March 31, 2021 | $ | 13.33 | 0.33 | (e) | 0.52 | 0.85 | (0.33 | ) | (0.33 | ) | |||||||||||||||||
| Year Ended March 31, 2020 | $ | 13.36 | 0.35 | (e) | (0.03 | ) | 0.32 | (0.35 | ) | (0.35 | ) | ||||||||||||||||
| Year Ended March 31, 2019 | $ | 13.12 | 0.38 | 0.23 | 0.61 | (0.37 | ) | (0.37 | ) | ||||||||||||||||||
| Year Ended March 31, 2018 | $ | 13.07 | 0.38 | 0.05 | 0.43 | (0.38 | ) | (0.38 | ) | ||||||||||||||||||
| Year Ended March 31, 2017 | $ | 13.61 | 0.38 | (0.54 | ) | (0.16 | ) | (0.38 | ) | (0.38 | ) | ||||||||||||||||
Class Z | |||||||||||||||||||||||||||
| March 4, 2021 (g) through March 31, 2021 | $ | 13.81 | 0.03 | (e) | 0.04 | 0.07 | (0.03 | ) | (0.03 | ) | |||||||||||||||||
* Assumes reinvestment of all net investment income and realized capital gain distributions, if any, during the period. Includes adjustments in accordance with U.S. Generally Accepted Accounting Principles and could differ from the Lipper reported return.
** For the period beginning July 1, 2019, the amount of any waivers or reimbursements and the amount of any recoupment for all classes, except for Class Z, is calculated without regard to the impact of any performance adjustment to the Fund's management fee.
^ The net expense ratio for all classes, except for Class Z, may not correlate to the applicable expense limits in place during the period since the current contractual expense limitation is applied for a period beginning July 1, 2019, and in effect through June 30, 2023, instead of coinciding with the Fund's fiscal year end. Details of the current contractual expense limitation in effect can be found in Note 4 of the accompanying Notes to Financial Statements.
(a) Not annualized for periods less than one year.
(b) Annualized for periods less than one year.
See notes to financial statements.
50
USAA Mutual Funds Trust | Financial Highlights — continued | ||||||
For a Share Outstanding Throughout Each Period
Ratios to Average Net Assets | Supplemental Data | ||||||||||||||||||||||||||||||||||
| Redemption Fees added to Beneficial Interests | Net Asset Value, End of Period | Total Return (Excludes Sales Charge)*(a) | Net Expenses**^(b) | Net Investment Income (Loss)(b) | Gross Expenses(b)(c) | Net Assets, End of Period (000's) | Portfolio Turnover(a)(d) | ||||||||||||||||||||||||||||
USAA Tax Exempt Intermediate-Term Fund | |||||||||||||||||||||||||||||||||||
Fund Shares | |||||||||||||||||||||||||||||||||||
| Year Ended March 31, 2021 | — | $ | 13.85 | 6.72 | % | 0.50 | % | 2.69 | % | 0.50 | % | $ | 4,059,780 | 23 | % | ||||||||||||||||||||
| Year Ended March 31, 2020 | — | $ | 13.33 | 2.56 | % | 0.49 | % | 2.82 | % | 0.49 | % | $ | 4,788,060 | 26 | % | ||||||||||||||||||||
| Year Ended March 31, 2019 | — | $ | 13.37 | 5.06 | % | 0.52 | % | 3.07 | % | 0.52 | % | $ | 4,754,320 | 8 | % | ||||||||||||||||||||
| Year Ended March 31, 2018 | — | $ | 13.12 | 3.47 | % | 0.51 | % | 3.09 | % | 0.51 | % | $ | 4,605,543 | 11 | % | ||||||||||||||||||||
| Year Ended March 31, 2017 | — | (f) | $ | 13.08 | (0.84 | )% | 0.52 | % | 3.13 | % | 0.52 | % | $ | 4,280,892 | 16 | % | |||||||||||||||||||
Institutional Shares | |||||||||||||||||||||||||||||||||||
| June 29, 2020 (g) through March 31, 2021 | — | $ | 13.85 | 4.15 | % | 0.44 | % | 2.61 | % | 0.51 | % | $ | 996,601 | 23 | % | ||||||||||||||||||||
Class A | |||||||||||||||||||||||||||||||||||
| Year Ended March 31, 2021 | — | $ | 13.85 | 6.46 | % | 0.75 | % | 2.43 | % | 0.86 | % | $ | 23,934 | 23 | % | ||||||||||||||||||||
| Year Ended March 31, 2020 | — | $ | 13.33 | 2.37 | % | 0.75 | % | 2.57 | % | 0.87 | % | $ | 25,265 | 26 | % | ||||||||||||||||||||
| Year Ended March 31, 2019 | — | $ | 13.36 | 4.75 | % | 0.75 | % | 2.85 | % | 0.84 | % | $ | 22,888 | 8 | % | ||||||||||||||||||||
| Year Ended March 31, 2018 | — | $ | 13.12 | 3.28 | % | 0.77 | %(h) | 2.83 | % | 0.85 | % | $ | 26,397 | 11 | % | ||||||||||||||||||||
| Year Ended March 31, 2017 | — | (f) | $ | 13.07 | (1.19 | )% | 0.80 | % | 2.84 | % | 0.83 | % | $ | 37,351 | 16 | % | |||||||||||||||||||
Class Z | |||||||||||||||||||||||||||||||||||
| March 4, 2021 (g) through March 31, 2021 | — | $ | 13.85 | 0.51 | % | 0.00 | % | 3.02 | % | 92.34 | % | $ | 19 | 23 | % | ||||||||||||||||||||
(c) Reflects total annual operating expenses for reductions of expenses paid indirectly for the March 31 fiscal year ended 2017. Expenses paid indirectly decreased the expense ratio by less than 0.01%.
(d) Portfolio turnover is calculated on the basis of the Fund as a whole without distinguishing between the classes of shares.
(e) Per share net investment income (loss) has been calculated using the average daily shares method.
(f) Amount is less than $0.005 per share.
(g) Commencement of operations.
(h) Effective August 1, 2017, USAA Asset Management Company ("AMCO") (previous Investment Adviser) had voluntarily agreed to limit the annual expenses of Class A to 0.75% of Class A average daily net assets. Prior to this date, the voluntary expense limit was 0.80%.
See notes to financial statements.
51
USAA Mutual Funds Trust | Notes to Financial Statements March 31, 2021 | ||||||
1. Organization:
USAA Mutual Funds Trust (the "Trust") is organized as a Delaware statutory trust and is registered under the Investment Company Act of 1940, as amended (the "1940 Act"), as an open-end investment company. The Trust is comprised of 46 funds and is authorized to issue an unlimited number of shares, which are units of beneficial interest with no par value.
The accompanying financial statements are those of the USAA Tax Exempt Intermediate-Term Fund (the "Fund"). The Fund offers four classes of shares: Fund Shares, Institutional Shares, Class A, and Class Z. The Fund is classified as diversified under the 1940 Act.
Effective June 29, 2020, the Institutional Shares commenced operations and the Fund's Adviser Shares were redesignated Class A and became subject to a front-end sales charge.
The Board of Trustees of USAA Mutual Funds Trust approved the addition of Class Z for the Fund. This new share class became effective February 5, 2021. Class Z is only available to participants in certain eligible separately managed accounts (also referred to as wrap fee programs) and other advisory clients of the Fund's Adviser or its affiliates that are subject to a separate contractual fee for investment management services.
Each class of shares of the Fund has substantially identical rights and privileges, except with respect to sales charges, fees paid under distribution plans, expenses allocable exclusively to each class of shares, voting rights on matters solely affecting a single class of shares, and the exchange privilege of each class of shares.
Under the Trust's organizational documents, its officers and trustees are indemnified against certain liabilities arising out of the performance of their duties to the Fund. In addition, in the normal course of business, the Fund enters into contracts with its vendors and others that provide for general indemnifications. The Fund's maximum exposure under these arrangements is unknown, as this would involve future claims that may be made against the Fund. However, based on experience, the Fund expects that risk of loss to be remote.
2. Significant Accounting Policies:
The following is a summary of significant accounting policies followed by the Trust in the preparation of its financial statements. The policies are in conformity with Generally Accepted Accounting Principles in the United States of America ("GAAP"). The preparation of financial statements in accordance with GAAP requires management to make estimates and assumptions that affect the reported amounts of assets and liabilities and disclosure of contingent assets and liabilities at the date of the financial statements and the reported amounts of income and expenses for the period. Actual results could differ from those estimates. The Fund follows the specialized accounting and reporting requirements under GAAP that are applicable to investment companies under Accounting Standards Codification Topic 946.
Investment Valuation:
The Fund records investments at fair value. Fair value is defined as the price that would be received to sell an asset or paid to transfer a liability in an orderly transaction between market participants at the measurement date.
The valuation techniques described below maximize the use of observable inputs and minimize the use of unobservable inputs in determining fair value. The inputs used for valuing the Fund's investments are summarized in the three broad levels listed below:
• Level 1 — quoted prices in active markets for identical securities
• Level 2 — other significant observable inputs (including quoted prices for similar securities or interest rates applicable to those securities, etc.)
• Level 3 — significant unobservable inputs (including the Fund's own assumptions in determining the fair value of investments)
52
USAA Mutual Funds Trust | Notes to Financial Statements — continued March 31, 2021 | ||||||
Changes in valuation techniques may result in transfers in or out of an assigned level within the disclosure hierarchy. The inputs or methodologies used for valuation techniques are not necessarily an indication of the risks associated with entering into those investments.
Victory Capital Management Inc. ("VCM" or the "Adviser") has established the Pricing and Liquidity Committee (the "Committee"), and subject to the Trust's Board of Trustees (the "Board") oversight, the Committee administers and oversees the Fund's valuation policies and procedures, which are approved by the Board.
Portfolio securities listed or traded on securities exchanges, including Exchange-Traded Funds ("ETFs"), American Depositary Receipts ("ADRs") and Rights, are valued at the closing price on the exchange or system where the security is principally traded, if available, or at the Nasdaq Official Closing Price. If there have been no sales for that day on the exchange or system, then a security is valued at the last available bid quotation on the exchange or system where the security is principally traded. In each of these situations, valuations are typically categorized as Level 1 in the fair value hierarchy.
Debt securities of United States ("U.S.") issuers, along with corporate and municipal securities, including short-term investments maturing in 60 days or less, may be valued using evaluated bid or the last sales price to price securities by dealers or an independent pricing service approved by the Board. These valuations are typically categorized as Level 2 in the fair value hierarchy.
In the event that price quotations or valuations are not readily available, are not reflective of market value, or a significant event has been recognized in relation to a security or class of securities, the securities are valued in good faith by the Committee in accordance with valuation procedures approved by the Board. These valuations are typically categorized as Level 2 or Level 3 in the fair value hierarchy, based on the observability of inputs used to determine the fair value. The effect of fair value pricing is that securities may not be priced on the basis of quotations from the primary market in which they are traded and the actual price realized from the sale of a security may differ materially from the fair value price. Valuing these securities at fair value is intended to cause the Fund's net asset value ("NAV") to be more reliable than it otherwise would be.
A summary of the valuations as of March 31, 2021, based upon the three levels defined above, is included in the table below while the breakdown, by category, of investments is disclosed on the Schedule of Portfolio Investments (amounts in thousands):
Level 1 | Level 2 | Level 3 | Total | ||||||||||||||||
Common Stocks | $ | 7,464 | $ | — | $ | — | $ | 7,464 | |||||||||||
Municipal Bonds | — | 5,035,071 | 0 | 5,035,071 | |||||||||||||||
Total | $ | 7,464 | $ | 5,035,071 | $ | 0 | $ | 5,042,535 | |||||||||||
For the year ended March 31, 2021, there were no transfers in or out of Level 3 in the fair value hierarchy.
Securities Purchased on a Delayed-Delivery or When-Issued Basis:
The Fund may purchase securities on a delayed-delivery or when-issued basis. Delivery and payment for securities that have been purchased by the Fund on a delayed-delivery or when-issued basis or for delayed draws on loans can take place a month or more after the trade date. At the time the Fund makes the commitment to purchase a security on a delayed-delivery or when-issued basis, the Fund records the transaction and reflects the value of the security in determining NAV. No interest accrues to the Fund until the transaction settles and payment takes place. A segregated account is established and the Fund maintains cash and/or marketable securities at least equal in value to commitments for delayed-delivery or when-issued securities. If the Fund owns delayed-delivery or when-issued securities, these values are included in Payable for investments purchased on the accompanying Statement of Assets and Liabilities and the segregated assets are identified on the Schedule of Portfolio Investments.
53
USAA Mutual Funds Trust | Notes to Financial Statements — continued March 31, 2021 | ||||||
Municipal Obligations:
The values of municipal obligations can fluctuate and may be affected by adverse tax, legislative, or political changes, and by financial developments affecting municipal issuers. Payment of municipal obligations may depend on a relatively limited source of revenue, resulting in greater credit risk. Future changes in federal tax laws or the activity of an issuer may adversely affect the tax-exempt status of municipal obligations.
Below-Investment-Grade Securities:
The Fund may invest in below-investment-grade securities (i.e. lower-quality, "junk" debt), which are subject to various risks. Lower-quality debt is considered to be speculative because it is less certain that the issuer will be able to pay interest or repay the principal than in the case of investment grade debt. These securities can involve a substantially greater risk of default than higher-rated securities, and their values can decline significantly over short periods of time. Lower-quality debt securities tend to be more sensitive to adverse news about their issuers, the market and the economy in general, than higher-quality debt securities. The market for these securities can be less liquid, especially during periods of recession or general market decline.
Investment Transactions and Related Income:
Changes in holdings of investments are accounted for no later than one business day following the trade date. For financial reporting purposes, however, investment transactions are accounted for on trade date on the last business day of the reporting period. Interest income is determined on the basis of coupon interest accrued using the effective interest method which adjusts, where applicable, the amortization of premiums or accretion of discount. Gains or losses realized on sales of securities are determined by comparing the identified cost of the security lot sold with the net sales proceeds.
Federal Income Taxes:
It is the Fund's policy to continue to qualify as a regulated investment company by complying with the provisions available to certain investment companies, as defined in applicable sections of the Internal Revenue Code, and to make distributions of net investment income and net realized gains sufficient to relieve it from all, or substantially all, federal income taxes. Accordingly, no provision for federal income taxes is required in the financial statements. The Fund has a tax year end of March 31.
Management of the Fund has reviewed tax positions taken in tax years that remain subject to examination by all major tax jurisdictions, including federal (i.e., the last four tax years, which includes the current fiscal tax year end). Management believes that there is no tax liability resulting from unrecognized tax benefits related to uncertain tax positions taken.
Allocations:
Expenses directly attributable to the Fund are charged to the Fund, while expenses that are attributable to more than one fund in the Trust, or jointly with an affiliated trust, are allocated among the respective funds in the Trust and/or affiliated trust based upon net assets or another appropriate basis.
Income, expenses (other than class-specific expenses such as transfer agent fees, state registration fees, 12b-1 fees, and printing fees), and realized and unrealized gains or losses on investments are allocated to each class of shares based on its relative net assets on the date income is earned or expenses and realized and unrealized gains and losses are incurred.
Cross-Trade Transactions:
Pursuant to Rule 17a-7 under the 1940 Act, the Fund may engage in cross-trades, which are securities transactions with affiliated investment companies and advisory accounts managed by the Adviser and any applicable sub-adviser. Any such purchase or sale transaction must be effected without brokerage commission or other remuneration, except for customary transfer fees. The transaction must be effected at the current market price, which is either the security's last sale price on an exchange or, if there are no transactions in the security that day, at the average of the highest bid and lowest asked price. For
54
USAA Mutual Funds Trust | Notes to Financial Statements — continued March 31, 2021 | ||||||
the year ended March 31, 2021, the Fund engaged in the following securities transactions with affiliated funds, which resulted in the following net realized gains (losses) (amounts in thousands):
| Purchases | Sales | Realized Gains (Losses) | |||||||||
| $ | 127,775 | $ | 93,564 | $ | 64 | ||||||
Fees Paid Indirectly:
Expense offsets to custody fees that arise from credits on cash balances maintained on deposit are reflected on the Statement of Operations, as applicable, as Fees paid indirectly.
3. Purchases and Sales:
Cost of purchases and proceeds from sales/maturities of securities (excluding securities maturing less than one year from acquisition) for the year ended March 31, 2021, were as follows for the Fund (amounts in thousands):
| Excluding U.S. Government Securities | |||||||||||
Purchases | Sales | ||||||||||
$ | 1,244,242 | $ | 1,123,478 | ||||||||
There were no purchases or sales of U.S. government securities during the year ended March 31, 2021.
4. Fees and Transactions with Affiliates and Related Parties:
Investment Advisory Fees:
Investment advisory services are provided to the Fund by the Adviser, which is a New York corporation registered as an investment adviser with the SEC. The Adviser is a wholly-owned indirect subsidiary of Victory Capital Holdings, Inc., a publicly traded Delaware corporation, and a wholly-owned direct subsidiary of Victory Capital Operating, LLC.
Under the terms of the Investment Advisory Agreement, the Adviser is entitled to receive a base fee and a performance adjustment. The Fund's base fee is accrued daily and paid monthly at an annualized rate of 0.28% of the Fund's average daily net assets. Amounts incurred and paid to VCM for the year ended March 31, 2021, are reflected on the Statement of Operations as Investment Advisory fees.
On November 6, 2018, United Services Automobile Association ("USAA"), the parent company of USAA Asset Management Company ("AMCO"), the prior investment adviser to the Fund announced that AMCO would be acquired by Victory Capital Holdings Inc. (the "Transaction"). A special shareholder meeting was held on April 18, 2019, at which shareholders of the Fund approved a new investment advisory agreement between the Trust, on behalf of the Fund, and VCM. The Transaction closed on July 1, 2019, and effective July 1, 2019, VCM replaced AMCO as the investment adviser to the Fund and no performance adjustments were made for the period beginning July 1, 2019, through June 30, 2020. Only performance beginning as of July 1, 2019, and thereafter is utilized in calculating future performance adjustments.
The performance adjustment for each share class is accrued daily and calculated monthly by comparing each class' performance to that of the Lipper Intermediate Municipal Debt Funds Index. The Lipper Intermediate Municipal Debt Funds Index tracks the total return performance of the largest funds within the Lipper Intermediate Municipal Debt Funds category.
55
USAA Mutual Funds Trust | Notes to Financial Statements — continued March 31, 2021 | ||||||
The performance period for each share class consists of the current month plus the previous 35 months (or the number of months beginning July 1, 2019, if fewer). The following table is utilized to determine the extent of the performance adjustment:
| Over/Under Performance Relative to Index (in basis points)(a) | Annual Adjustment Rate (in basis points)(a) | ||||||||||
+/- 20 to 50 | +/- 4 | ||||||||||
+/- 51 to 100 | +/- 5 | ||||||||||
+/- 101 and greater | +/- 6 | ||||||||||
(a) Based on the difference between average annual performance of the relevant share class of the Fund and its relevant Lipper index, rounded to the nearest basis point. Average daily net assets of the share class are calculated over a rolling 36-month period.
Each class' annual performance adjustment rate is multiplied by the average daily net assets of each respective class over the entire performance period, which is then multiplied by a fraction, the numerator of which is the number of days in the month and the denominator of which is 365 (366 in leap years). The resulting amount is then added to (in the case of overperformance), or subtracted from (in the case of underperformance) the base fee.
Under the performance fee arrangement, each class pays a positive performance fee adjustment for a performance period whenever the class outperforms the Lipper Intermediate Municipal Debt Funds Index over that period, even if the class has overall negative returns during the performance period.
For the period July 1, 2020 to March 31, 2021, performance fees were $1,049, less than $(1), and less than $(1), in thousands, respectively, for Fund Shares, Institutional Shares and Class A. Performance adjustments were 0.02%, less than (0.01)%, and less than (0.01)% for Fund Shares, Institutional Shares, and Class A, respectively.
For the period March 4, 2021 to March 31, 2021, performance fees were less than $1 thousand for Class Z. Performance adjustments were less than 0.01% for Class Z.
The Trust relies on an exemptive order granted to VCM and its affiliated funds by the. SEC in March 2019 permitting the use of a "manager-of-managers" structure for certain funds. Under a manager-of-managers structure, the investment adviser may select (with approval of the Board and without shareholder approval) one or more subadvisers to manage the day-to-day investment of a fund's assets. For the year ended March 31, 2021, the Fund had no subadvisors.
Administration and Servicing Fees:
VCM serves as the Fund's administrator and fund accountant. Under the Fund Administration, Servicing and Accounting Agreement, VCM is paid for its services an annual fee at a rate of 0.15%, 0.10%, and 0.15% of average daily net assets, of the Fund Shares, Institutional Shares, and Class A, respectively. VCM does not receive any fees from Class Z for these services. Amounts incurred for the year ended March 31, 2021, are reflected on the Statement of Operations as Administration fees.
The Fund (as part of the Trust) has entered into an agreement to provide compliance services with the Adviser, pursuant to which the Adviser furnishes its compliance personnel, including the services of the Chief Compliance Officer ("CCO"), and other resources reasonably necessary to provide the Trust with compliance oversight services related to the design, administration and oversight of a compliance program for the Trust in accordance with Rule 38a-1 under the 1940 Act. The CCO is an employee of the Adviser, which pays the compensation of the CCO and support staff. Funds in the Trust, Victory Variable Insurance Funds, Victory Portfolios, and Victory Portfolios II (collectively, the "Victory Funds Complex") in the aggregate, compensate the Adviser for these services. Amounts incurred for the year ended March 31, 2021, are reflected on the Statement of Operations as Compliance fees.
Citi Fund Services Ohio, Inc. ("Citi"), an affiliate of Citibank, acts as sub-administrator and sub-fund accountant to the Fund pursuant to a Sub-Administration and Sub-Fund Accounting Services Agreement between VCM and Citi. VCM pays Citi a fee for providing these services. The Fund reimburses VCM and
56
USAA Mutual Funds Trust | Notes to Financial Statements — continued March 31, 2021 | ||||||
Citi for out-of-pocket expenses incurred in providing these services and certain other expenses specifically allocated to the Fund. Amounts incurred for the year ended March 31, 2021, are reflected on the Statement of Operations as Sub-Administration fees.
Transfer Agency Fees:
Victory Capital Transfer Agency, Inc. ("VCTA"), an affiliate of the Adviser, provides transfer agency services to the Fund. VCTA provides transfer agent services to the Fund Shares based on an annual charge of $25.50 per shareholder account plus out-of-pocket expenses. VCTA pays a portion of these fees to certain intermediaries for the administration and servicing of accounts that are held with such intermediaries. Transfer agent's fees are accrued daily and paid monthly at an annualized rate of 0.10% and 0.10% of average daily net assets of the Institutional Shares and Class A, respectively, plus out-of-pocket expenses. VCTA does not receive any fees from Class Z for these services. Amounts incurred and paid to VCTA for the year ended March 31, 2021, are reflected on the Statement of Operations as Transfer Agent fees.
FIS Investor Services LLC serves as sub-transfer agent and dividend disbursing agent for the Fund pursuant to a Sub-Transfer Agent Agreement between VCTA and FIS Investor Services LLC. VCTA provides FIS Investor Services LLC a fee for providing these services.
Distributor/Underwriting Services:
Victory Capital Services, Inc. (the "Distributor"), an affiliate of the Adviser, serves as distributor for the continuous offering of the shares of the Fund pursuant to a Distribution Agreement between the Distributor and the Trust. Effective June 30, 2020, the Distributor's name was changed from Victory Capital Advisers, Inc.
Pursuant to the Distribution and Service Plans adopted in accordance with Rule 12b-1 under the 1940 Act, the Distributor may receive a monthly distribution and service fee, at an annual rate of up to 0.25% of the average daily net assets of Class A. The distribution and service fees paid to the Distributor may be used by the Distributor to pay for activity primarily intended to result in the sale of Class A of the Fund. Amounts incurred and paid to the Distributor for the year ended March 31, 2021, are reflected on the Statement of Operations as 12b-1 fees.
In addition, the Distributor is entitled to receive commissions on sales of the Class A. For the year ended March 31, 2021, the Distributor received less than $1 thousand from commissions earned on sales of Class A.
Other Fees:
Citibank serves as the Fund's custodian. The Fund pays Citibank a fee for providing these services. Amounts incurred for the year ended March 31, 2021, are reflected on the Statement of Operations as Custodian fees.
K&L Gates LLP provides legal services to the Trust.
The Adviser has entered into an expense limitation agreement with the Fund until at least June 30, 2023, except for Class Z, which remains in effect indefinitely, unless the Board approves otherwise.
Under the terms of the agreement for Fund Shares, Institutional Shares, and Class A, the Adviser has agreed to waive fees or reimburse certain expenses to the extent that ordinary operating expenses incurred by certain classes of the Fund in any fiscal year exceed the expense limit for such classes of the Fund. Such excess amounts will be the liability of the Adviser. Acquired fund fees and expenses, interest, taxes, brokerage commissions, other expenditures, which are capitalized in accordance with GAAP, and other extraordinary expenses not incurred in the ordinary course of the Fund's business are excluded from the expense limits.
Under the terms of the agreement for Class Z, the Adviser has agreed to waive fees or reimburse aggregate expenses to the extent that ordinary operating expenses incurred by Class Z in any fiscal year exceed the expense limit for such class of the Fund. Such excess amounts will be the liability of the Adviser. Including but not limited to investment management fees of the Investment Adviser inclusive
57
USAA Mutual Funds Trust | Notes to Financial Statements — continued March 31, 2021 | ||||||
of the impact of any performance fee adjustment as provided in the Advisory Agreement but excluding acquired fund fees and expenses, interest, taxes, brokerage commissions, other expenditures, which are capitalized in accordance with GAAP, and other extraordinary expenses not incurred in the ordinary course of the Fund's business are excluded from the expense limits. As of March 31, 2021, the expense limits (excluding voluntary waivers) were 0.48%, 0.44%, 0.75%, and 0.0% for Fund Shares, Institutional Shares, Class A, and Class Z, respectively.
Under the terms of the agreement, the Fund Shares, Institutional Shares, and Class A have agreed to repay fees and expenses that were waived or reimbursed by the Adviser for a period of up to three years after the fiscal year in which the waiver or reimbursement took place, subject to the lesser of any operating expense limits in effect at the time of: (a) the original waiver or expense reimbursement; or (b) the recoupment, after giving effect to the recoupment amount.
Under the terms of the agreement for Class Z, recoupment is not permitted.
As of March 31, 2021, the following amounts are available to be repaid to the Adviser (amounts in thousands). The Fund has not recorded any amounts available to be repaid as a liability due to an assessment that such repayment is not probable at March 31, 2021.
| Expires March 31, 2023 | Expires March 31, 2024 | Total | |||||||||
| $ | 16 | $ | 172 | $ | 188 | ||||||
The Adviser may voluntarily waive or reimburse additional fees to assist the Fund in maintaining competitive expense ratios. Voluntary waivers and reimbursements applicable to the Fund are not available to be recouped at a future time. There were no voluntary waivers or reimbursements for the year ended March 31, 2021.
Certain officers and/or interested trustees of the Fund are also officers and/or employees of the Adviser, administrator, sub-administrator, sub-fund accountant, custodian, and Distributor.
5. Risks:
The Fund may be subject to other risks in addition to these identified risks.
Geopolitical/Natural Disaster Risk — Global economies and financial markets are increasingly interconnected, which increases the possibilities that conditions in one country or region might adversely affect issuers in another country or region. Geopolitical and other risks, including war, terrorism, trade disputes, political or economic dysfunction within some nations, public health crises and related geopolitical events, as well as environmental disasters such as earthquakes, fires, and floods, may add to instability in world economies and markets generally. Changes in trade policies and international trade agreements could affect the economies of many countries in unpredictable ways. Likewise, systemic market dislocations of the kind that occurred during the financial crisis that began in 2008, if repeated, would be highly disruptive to economies and markets, adversely affecting individual companies and industries, securities markets, interest rates, credit ratings, inflation, investor sentiment, and other factors affecting the value of a Fund's investments. Some countries, including the United States, are adopting more protectionist trade policies and moving away from the tighter financial industry regulations that followed the 2008 financial crisis, which may also affect the value of a Fund's investments.
Political events within the United States at times have resulted, and may in the future result, in a shutdown of government services, which could negatively affect the U.S. economy, decrease the value of a Fund's investments, increase uncertainty in or impair the operation of the U.S. or other securities markets and degrade investor and consumer confidence, perhaps suddenly and to a significant degree.
An outbreak of disease called COVID-19 has spread internationally. The transmission of COVID-19 and efforts to contain its spread have resulted in international, national and local border closings and other significant travel restrictions and disruptions, significant disruptions to business operations, supply chains and consumer activity, significant challenges in healthcare service preparation and delivery,
58
USAA Mutual Funds Trust | Notes to Financial Statements — continued March 31, 2021 | ||||||
quarantines and general concern and uncertainty. These negative impacts have caused significant volatility and declines in global financial markets, which have caused losses for Fund investors during and subsequent to period end. The impact of the COVID-19 pandemic may last for an extended period of time, and could result in a substantial economic downturn or recession. Public health crises may exacerbate other pre-existing political, social, economic, market and financial risks. The extent of the impact to the financial performance of the Fund's investments will depend on future developments, including (i) the duration and spread of the outbreak, (ii) the restrictions and advisories, (iii) the effects on the financial markets, and (iv) the effects on the economy overall, all of which are highly uncertain and cannot be predicted.
Credit Risk — The fixed-income securities held in the Fund's portfolio are subject to credit risk, which is the possibility that an issuer of a fixed-income security will fail to make timely interest and/or principal payments on its securities or that negative market perceptions of the issuer's ability to make such payments will cause the price of that security to decline. The Fund accepts some credit risk as a recognized means to enhance an investor's return. All fixed-income securities, varying from the highest quality to the very speculative, have some degree of credit risk.
Debt Securities Risk — The value of a debt security or other income-producing security changes in response to various factors, including, for example, market-related factors (such as changes in interest rates or changes in the risk appetite of investors generally) and changes in the actual or perceived ability of the issuer (or of issuers generally) to meet its (or their) obligations.
Other factors that may affect the value of debt securities, include, among others, public health crises and responses by governments and companies to such crises. These and other events may affect the creditworthiness of the issuer of a debt security and may impair an issuers ability to timely meet its debt obligations as they come due.
Interest Rate Risk — The Fund is subject to the risk that the market value of the bonds in its portfolio will fluctuate because of changes in interest rates, changes in the supply of and demand for tax-exempt securities, and other market factors. Bond prices generally are linked to the prevailing market interest rates. In general, when interest rates rise, bond prices fall; conversely, when interest rates fall, bond prices rise. The price volatility of a bond also depends on its duration. Generally, the longer the duration of a bond, the greater is its sensitivity to interest rates. To compensate investors for this higher interest rate risk, bonds with longer durations generally offer higher yields than bonds with shorter durations. The ability of an issuer of a debt security to repay principal prior to a security's maturity can increase the security's sensitivity to interest rate changes.
Decisions by the U.S. Federal Reserve (also known as the "Fed") regarding interest rate and monetary policy, which can be difficult to predict and sometimes change direction suddenly in response to economic and market events, can have a significant effect on the value of fixed-income securities as well as the overall strength of the U.S. economy. Precise interest rate predictions are difficult to make, and interest rates may change unexpectedly and dramatically in response to extreme changes in market or economic conditions. As a result, the value of fixed-income securities may vary widely under certain market conditions.
LIBOR Discontinuation Risk — Many debt securities, derivatives and other financial instruments, including some of the Fund's investments, use the London Interbank Offered Rate ("LIBOR") as the reference or benchmark rate for variable interest rate calculations. In June 2017, the Alternative Reference Rates Committee, a group of large U.S. banks working with the Federal Reserve, announced its selection of a new Secured Overnight Funding Rate ("SOFR"), which is intended to be a broad measure of secured overnight U.S. Treasury repo rates, as an appropriate replacement for LIBOR. The Federal Reserve Bank of New York began publishing the SOFR in 2018, expecting that it could be used on a voluntary basis in new instruments and transactions. Bank working groups and regulators in other countries have suggested other alternatives for their markets, including the Sterling Overnight Interbank Average Rate ("SONIA") in England. In July 2017, the Financial Conduct Authority (the "FCA"), the United Kingdom financial regulatory body, announced that after 2021, it will cease its active encouragement of UK banks to provide the quotations needed to sustain LIBOR. That announcement
59
USAA Mutual Funds Trust | Notes to Financial Statements — continued March 31, 2021 | ||||||
suggests that LIBOR may cease to be published after that time. For U.S. dollar LIBOR, however, the relevant date may be deferred to June 30, 2023, for the most common tenors (overnight and one, three, six and 12 months). As to those tenors, the LIBOR administrator has published a consultation regarding its intention to cease publication of U.S. dollar LIBOR as of June 30, 2023, (instead of December 31, 2021, as previously expected), apparently based on continued rate submissions from banks. It is expected that there will be enough time for market participants to transition to the use of a different benchmark for both new and existing securities and transactions. Various financial industry groups have begun planning for that transition, but there are obstacles to converting certain longer-term securities and transactions to a new benchmark. Transition planning is at an early stage, and neither the effect of the transition process nor its ultimate success can yet be known. Although the foregoing may provide some sense of timing, there is no assurance that LIBOR, or any particular currency and tenor, will continue to be published until any particular date, and it appears highly likely that LIBOR will be discontinued or modified after December 31, 2021, or June 30, 2023, depending on the currency and tenor. The transition process might lead to increased volatility and illiquidity in markets that currently rely on the LIBOR to determine interest rates. It could also lead to a reduction in the value of some LIBOR-based investments and reduce the effectiveness of new hedges placed against existing LIBOR-based instruments. Since the usefulness of LIBOR as a benchmark could deteriorate during the transition period, these effects could occur before the end of 2021.
6. Borrowing and Interfund Lending:
Line of Credit:
For the year ended March 31, 2021, the Victory Funds Complex participated in a short-term demand note "Line of Credit" agreement with Citibank. The Line of Credit agreement with Citibank was renewed on June 29, 2020, with a termination date of June 28, 2021. Under the agreement with Citibank, the Victory Funds Complex may borrow up to $600 million, of which $300 million is committed and $300 million is uncommitted. $40 million of the Line of Credit is reserved for use by the Victory Floating Rate Fund, another series of the Victory Funds Complex, with Victory Floating Rate Fund paying the related commitment fees for that amount. The purpose of the agreement is to meet temporary or emergency cash needs. For the year ended March 31, 2021, Citibank received an annual commitment fee of 0.15% on $300 million for providing the Line of Credit. Each fund in the Victory Funds Complex paid a pro-rata portion of the commitment fees plus any interest (one month LIBOR plus one percent) on amounts borrowed. Effective June 29, 2020, under an amended Line of Credit agreement, Citibank also received an annual upfront fee of 0.10% on the $300 million committed line of credit. Each fund in the Victory Funds Complex paid a pro-rata portion of the upfront fee. Interest charged to each Fund during the period, if applicable, is reflected on the Statement of Operations under Line of credit fees.
The Fund had no borrowings under the Line of Credit agreement during the year ended March 31, 2021.
Interfund Lending:
The Trust and Adviser rely on an exemptive order granted by the SEC in March 2017 (the "Order"), permitting the establishment and operation of an Interfund Lending Facility (the "Facility"). The Facility allows the Fund to directly lend and borrow money to or from any other Fund, that is permitted to participate in the Facility, in the Victory Funds Complex relying upon the Order at rates beneficial to both the borrowing and lending funds. Advances under the Facility are allowed for temporary or emergency purposes, including the meeting of redemption requests that otherwise might require the untimely disposition of securities, and are subject to each Fund's borrowing restrictions. The interfund loan rate is determined, as specified in the Order, by averaging the current repurchase agreement rate and the current bank loan rate. As a Borrower, interest charged to the Fund, if any, during the period
60
USAA Mutual Funds Trust | Notes to Financial Statements — continued March 31, 2021 | ||||||
is reflected on the Statement of Operations under Interfund lending fees. As a Lender, interest earned by the Fund, if any, during the period is presented on the Statement of Operations under Interfund lending.
The average borrowing or lending for the days outstanding and average interest rate for the Fund during the year ended March 31, 2021, were as follows (amounts in thousands):
| Borrower or Lender | Amount Outstanding at March 31, 2021 | Average Borrowing* | Days Borrowing Outstanding | Average Interest Rate* | Maximum Borrowing During the Period | ||||||||||||||||||
| Borrower | $ | — | $ | 1,417 | 4 | 0.62 | % | $ | 1,417 | ||||||||||||||
* For the year ended March 31, 2021, based on the number of days borrowings were outstanding.
7. Federal Income Tax Information:
Distributions from the Fund's net investment income are accrued daily and distributed on the last business day of each month. Distributable net realized gains, if any, are declared and paid at least annually.
The amounts of dividends from net investment income and distributions from net realized gains (collectively distributions to shareholders) are determined in accordance with federal income tax regulations, which may differ from GAAP. To the extent these "book/tax" differences are permanent in nature (e.g., net operating loss and distribution reclassification), such amounts are reclassified within the components of net assets based on their federal tax-basis treatment; temporary differences (e.g., wash sales) do not require reclassification. To the extent dividends and distributions exceed net investment income and net realized gains for tax purposes, they are reported as distributions of capital. Net investment losses incurred by the Fund may be reclassified as an offset to capital on the accompanying Statement of Assets and Liabilities.
As of March 31, 2021, on the Statement of Assets and Liabilities, there were no permanent book-to-tax difference reclassification adjustments.
The tax character of distributions paid during the tax years ended as noted below, were as follows (total distributions paid may differ from the Statements of Changes in Net Assets because, for tax purposes, dividends are recognized when actually paid) (amounts in thousands).
Year Ended March 31, 2021 | Year Ended March 31, 2020 | ||||||||||||||||||
| Distributions Paid from | Distributions Paid from | ||||||||||||||||||
| Total Tax-Exempt Income | Distributions Paid | Total Tax-Exempt Income | Distributions Paid | ||||||||||||||||
$ | 132,118 | $ | 132,118 | $ | 140,991 | $ | 140,991 | ||||||||||||
As of March 31, 2021, the components of accumulated earnings (loss) on a tax basis were as follows (amounts in thousands):
| Undistributed Tax-Exempt Income | Distributions Payable | Accumulated Earnings | Accumulated Capital and Other Losses | Unrealized Appreciation (Depreciation)* | Total Accumulated Earnings (Loss) | ||||||||||||||||||
| $ | 12,678 | $ | (10,596 | ) | $ | 2,082 | $ | (94,495 | ) | $ | 344,509 | $ | 252,096 | ||||||||||
* The difference between the book-basis and tax-basis of unrealized appreciation/depreciation is attributable to the tax deferral of losses on wash sales and defaulted bond adjustments.
61
USAA Mutual Funds Trust | Notes to Financial Statements — continued March 31, 2021 | ||||||
As of March 31, 2021, the Fund had net capital loss carryforwards as shown in the table below (amounts in thousands). It is unlikely that the Board will authorize a distribution of capital gains realized in the future until the capital loss carryforwards have been used.
| Short-Term Amount | Long-Term Amount | Total | |||||||||
| $ | 32,966 | $ | 61,529 | $ | 94,495 | ||||||
As of March 31, 2021, the cost basis for federal income tax purposes, gross unrealized appreciation, gross unrealized depreciation, and net unrealized appreciation (depreciation) for investments were as follows (amounts in thousands):
| Cost of Investments for Federal Tax Purposes | Gross Unrealized Appreciation | Gross Unrealized Depreciation | Net Unrealized Appreciation (Depreciation) | ||||||||||||
| $ | 4,698,026 | $ | 361,192 | $ | (16,683 | ) | $ | 344,509 | |||||||
62
REPORT OF INDEPENDENT REGISTERED PUBLIC ACCOUNTING FIRM
To the Shareholders and the Board of Trustees of USAA Tax Exempt Intermediate-Term Fund
Opinion on the Financial Statements
We have audited the accompanying statement of assets and liabilities of USAA Tax Exempt Intermediate-Term Fund (the "Fund") (one of the funds constituting USAA Mutual Funds Trust (the "Trust")), including the schedule of portfolio investments, as of March 31, 2021, and the related statement of operations for the year then ended, the statements of changes in net assets for each of the two years in the period then ended, the financial highlights for each of the five years in the period then ended and the related notes (collectively referred to as the "financial statements"). In our opinion, the financial statements present fairly, in all material respects, the financial position of the Fund at March 31, 2021, the results of its operations for the year then ended, the changes in its net assets for each of the two years in the period then ended and its financial highlights for each of the five years in the period then ended, in conformity with U.S. generally accepted accounting principles.
Basis for Opinion
These financial statements are the responsibility of the Trust's management. Our responsibility is to express an opinion on the Fund's financial statements based on our audits. We are a public accounting firm registered with the Public Company Accounting Oversight Board (United States) ("PCAOB") and are required to be independent with respect to the Trust in accordance with the U.S. federal securities laws and the applicable rules and regulations of the Securities and Exchange Commission and the PCAOB.
We conducted our audits in accordance with the standards of the PCAOB. Those standards require that we plan and perform the audit to obtain reasonable assurance about whether the financial statements are free of material misstatement, whether due to error or fraud. The Trust is not required to have, nor were we engaged to perform, an audit of the Trust's internal control over financial reporting. As part of our audits we are required to obtain an understanding of internal control over financial reporting, but not for the purpose of expressing an opinion on the effectiveness of the Trust's internal control over financial reporting. Accordingly, we express no such opinion.
Our audits included performing procedures to assess the risks of material misstatement of the financial statements, whether due to error or fraud, and performing procedures that respond to those risks. Such procedures included examining, on a test basis, evidence regarding the amounts and disclosures in the financial statements. Our procedures included confirmation of securities owned as of March 31, 2021, by correspondence with the custodian and brokers or by other appropriate auditing procedures where replies from brokers were not received. Our audits also included evaluating the accounting principles used and significant estimates made by management, as well as evaluating the overall presentation of the financial statements. We believe that our audits provide a reasonable basis for our opinion.

We have served as the auditor of one or more Victory Capital investment companies since 1995.
San Antonio, Texas
May 26, 2021
63
USAA Mutual Funds Trust | Supplemental Information March 31, 2021 | ||||||
(Unaudited)
Trustee and Officer Information
Board of Trustees:
Overall responsibility for management of the Trust rests with the Board. The Trust is managed by the Board in accordance with the laws of the state of Delaware. There are currently nine Trustees, seven of whom are not "interested persons" of the Trust within the meaning of that term under the 1940 Act ("Independent Trustees") and two of whom is an "interested person" of the Trust within the meaning of that term under the 1940 Act ("Interested Trustee"). The Trustees, in turn, elect the officers of the Trust to actively supervise its day-to-day operations.
The following tables list the Trustees, their ages, position with the Trust, commencement of service, principal occupations during the past five years and any directorships of other investment companies or companies whose securities are registered under the Securities Exchange Act of 1934, as amended, or who file reports under that Act. Each Trustee oversees 46 portfolios in the Trust. Each Trustee's address is 15935 La Cantera Pkwy, San Antonio, TX, 78256. Pursuant to a policy adopted by the Board, the term of office for each Trustee shall be until the Independent Trustee reaches age 75 or an Interested Trustee reaches age 75. The Board may change or grant exceptions from this policy at any time without shareholder approval. A Trustee may resign or be removed by a vote of the other Trustees or the holders of a majority of the outstanding shares of the Trust at any time. Vacancies on the Board can be filled by the action of a majority of the Trustees, provided that after filling such vacancy at least two-thirds of the Trustees have been elected by the shareholders.
Name and Date of Birth | Position Held with the Trust | Year Commenced Service | Principal Occupation During Past 5 Years | Other Directorships Held During Past 5 Years | |||||||||||||||
Independent Trustees. | |||||||||||||||||||
| Jefferson C. Boyce, (c) Born September 1957 | Independent Chairman | 2021 | Senior Managing Director, New York Life Investments, LLC (1992-2012) | Westhab, Inc. | |||||||||||||||
| John C. Walters, Born February 1962 | Trustee | 2019 | Retired. Mr. Walters brings significant Board experience including active involvement with the board of a Fortune 500 company, and a proven record of leading large, complex financial organizations. He has a demonstrated record of success in distribution, manufacturing, investment brokerage, and investment management in both the retail and institutional investment businesses. He has substantial experience in the investment management business with a demonstrated ability to develop and drive strategy while managing operation, financial, and investment risk. | Guardian Variable Products Trust (16 series), Lead Independent Director; Amerilife Holdings LLC, Director; Stadion Money Management; Director; University of North Carolina (Chapel Hill), Member Board of Governors | |||||||||||||||
64
USAA Mutual Funds Trust | Supplemental Information — continued March 31, 2021 | ||||||
(Unaudited)
Name and Date of Birth | Position Held with the Trust | Year Commenced Service | Principal Occupation During Past 5 Years | Other Directorships Held During Past 5 Years | |||||||||||||||
| Robert L. Mason, Ph.D., Born July 1946 | Trustee | 1997 | Adjunct Professor in the Department of Management Science and Statistics in the College of Business at the University of Texas at San Antonio (since 2001); Institute Analyst, Southwest Research Institute (March 2002-January 2016) | None | |||||||||||||||
| Dawn M. Hawley, Born February 1954 | Trustee | 2014 | Manager of Finance, Menil Foundation, Inc. (May 2007-June 2011), which is a private foundation that oversees the assemblage of sculptures, prints, drawings, photographs, and rare books. Director of Financial Planning and Analysis and Chief Financial Officer, AIM Management Group, Inc. (October 1987-January 2006) | None | |||||||||||||||
| Paul L. McNamara, Born July 1948 | Trustee | 2012 | Director, Cantor Opportunistic Alternatives Fund, LLC (March 2010-February 2014), which is a closed-end fund of funds by Cantor Fitzgerald Investment Advisors, LLC | None | |||||||||||||||
65
USAA Mutual Funds Trust | Supplemental Information — continued March 31, 2021 | ||||||
(Unaudited)
Name and Date of Birth | Position Held with the Trust | Year Commenced Service | Principal Occupation During Past 5 Years | Other Directorships Held During Past 5 Years | |||||||||||||||
| Richard Y. Newton III, Born January 1956 | Trustee | 2017 | Director, Elta North America (01/18-present), which is a global leader in the design, manufacture, and support of innovative electronic systems in the ground, maritime, airborne, and security domains for the nation's warfighters, security personnel, and first responders; Managing Partner, Pioneer Partnership Development Group (December 2015-present)); Executive Director, The Union League Club of New York (June 2014-November 2015): Executive Vice President, Air Force Association (August 2012-May 2014); Lieutenant General, United States Air Force (January 2008-June 2012) | PredaSAR Corp. | |||||||||||||||
| Barbara B. Ostdiek, Ph.D., Born March 1964 | Trustee | 2008 | Senior Associate Dean of Degree Programs at Jesse H. Jones Graduate School of Business at Rice University (since 2013); Associate Professor of Finance at Jessie H. Jones Graduate School of Business at Rice University (since 2001) | None | |||||||||||||||
| Michael F. Reimherr, (a) Born August 1945 | Trustee | 2000 | President of Reimherr Business Consulting (May 1995-December 2017); St. Mary's University Investment Committee overseeing University Endowment (since 2014) | None | |||||||||||||||
(a) Effective at the close of business on December 31, 2020, Michael F. Reimherr retired from the Board of Trustees.
66
USAA Mutual Funds Trust | Supplemental Information — continued March 31, 2021 | ||||||
(Unaudited)
Name and Date of Birth | Position Held with the Trust | Year Commenced Service | Principal Occupation During Past 5 Years | Other Directorships Held During Past 5 Years | |||||||||||||||
Interested Trustees. | |||||||||||||||||||
| David C. Brown, (b) Born May 1972 | Trustee | 2019 | Chairman and Chief Executive Officer (since 2013), Victory Capital Management Inc.; Chairman and Chief Executive Officer, Victory Capital Holdings, Inc. (since 2013). Mr. Brown brings to the Board extensive business, finance and leadership skills gained and developed through years of experience in the financial services industry, including his tenure overseeing the strategic direction as CEO of Victory Capital. These skills, combined with Mr. Brown's extensive knowledge of the financial services industry and demonstrated success in the development and distribution of investment strategies and products, enable him to provide valuable insights to the Board and strategic direction for the Funds. | Trustee, Victory Portfolios (41 series), Victory Portfolios II (26 series), Victory Variable Insurance Funds (8 series) | |||||||||||||||
67
USAA Mutual Funds Trust | Supplemental Information — continued March 31, 2021 | ||||||
(Unaudited)
Name and Date of Birth | Position Held with the Trust | Year Commenced Service | Principal Occupation During Past 5 Years | Other Directorships Held During Past 5 Years | |||||||||||||||
| Daniel S. McNamara, (b)(c) Born June 1966 | Trustee | 2012 | Trustee, President, and Vice Chairman of USAA ETF Trust (June 2017-June 2019); President of Financial Advice & Solutions Group (FASG), USAA (February 2013-March 2021); Director of USAA Investment Services Company (ISCO) (formerly USAA Investment Management) (September 2009-March 2021); President, Asset Management Company (AMCO) (August, 2011-June 2019); Senior Vice President of USAA Financial Planning Services Insurance Agency, Inc. (FPS) (April 2011-March 2011); Chairman of Board of ISCO (April 2013-December 2020); Director of AMCO (August 2011-June 2019); President and Director of USAA Shareholder Account Services (SAS) (October 2009-June 2019); Director and Vice Chairman of FPS (December 2013-March 2021); President and Director of USAA Investment Corporation (ICORP) (March 2010-March 2021); Chairman of Board of ICORP (December 2013-March 2021); Director of USAA Financial Advisors, Inc. (FAI) (December 2013-March 2021); Chairman of Board of FAI (March 2015-March 2021). Mr. McNamara brings to the Board extensive experience in the financial services industry, including experience as an officer of the Trust. | None | |||||||||||||||
(b) Mr. Dan McNamara, the Chairman of the Board, is deemed an "interested person" due to his previous position as Director of AMCO, the former investment adviser of the Funds. Mr. Brown is deemed an "interested person" due to his position as Chief Executive Officer of Victory Capital, investment adviser to the Funds.
(c) Effective at the close of business on December 31, 2020, Jefferson C. Boyce replaced Dan McNamara as Chair of the Board and assumed the title of Independent Chair.
The Statement of Additional Information includes additional information about the Trustees of the Trust and is available, without charge, on the SEC's website at www.sec.gov and/or by calling (800)-235-8396.
68
USAA Mutual Funds Trust | Supplemental Information — continued March 31, 2021 | ||||||
(Unaudited)
Officers:
The officers of the Trust, their ages, commencement of service and their principal occupations during the past five years, are detailed in the following table. Each officer serves until the earlier of his or her resignation, removal, retirement, death, or the election of a successor. The mailing address of each officer of the Trust is 15935 La Cantera Pkwy, San Antonio, TX, 78256. The officers of the Trust receive no compensation directly from the Trust for performing the duties of their offices.
Name and Date of Birth | Position with the Trust | Year Commenced Service | Principal Occupation During Past 5 Years | ||||||||||||
Interested Officers.
| Christopher K. Dyer, Born February 1962 | President | 2019 | Director of Fund Administration, Victory Capital (since 2004); Chief Operating Officer, Victory Capital Services, Inc. (since 2020) | ||||||||||||
| Scott A Stahorsky, Born July 1969 | Vice President | 2019 | Manager, Fund Administration, Victory Capital (since 2015) | ||||||||||||
| James K. De Vries, Born April 1969 | Treasurer | 2018 | Executive Director, Victory Capital Management Inc. (since 2019); Treasurer, USAA ETF Trust (September 2018-June 2019); Executive Director, Investment and Financial Administration, USAA (April 2012-June 2019); Assistant Treasurer, USAA ETF Trust (June 2017-September 2018); Assistant Treasurer, USAA Mutual Funds Trust (December 2013-February 2018) | ||||||||||||
| Allan Shaer, Born March 1965 | Assistant Treasurer | 2019 | Senior Vice President, Financial Administration, Citi Fund Services Ohio, Inc. (since 2016); Vice President, Mutual Fund Administration, JP Morgan Chase (2011-2016) | ||||||||||||
| Carol D. Trevino, Born October 1965 | Assistant Treasurer | 2018 | Director, Accounting and Finance, Victory Capital Management Inc. (since 2019); Accounting/Financial Director, USAA (December 2013-June 2019); Assistant Treasurer, USAA ETF Trust (September 2018-June 2019) | ||||||||||||
| Erin G. Wagner, Born February 1974 | Secretary | 2019 | Deputy General Counsel, the Adviser (since 2013) | ||||||||||||
| Charles Booth, Born April 1960 | Anti-Money Laundering Compliance Officer and Identity Theft Officer | 2019 | Director, Regulatory Administration and CCO Support Services, Citi Fund Services Ohio, Inc. (since 2007) | ||||||||||||
| Amy Campos, Born July 1976 | Chief Compliance Officer | 2019 | Chief Compliance Officer, USAA Mutual Funds Trust (since 2019); Executive Director, Deputy Chief Compliance Officer, USAA Mutual Funds Trust and USAA ETF Trust (July 2017-June 2019); Compliance Director, USAA Mutual Funds Trust (2014-July 2017) | ||||||||||||
69
USAA Mutual Funds Trust | Supplemental Information — continued March 31, 2021 | ||||||
(Unaudited)
Proxy Voting and Portfolio Holdings Information
Proxy Voting:
Information regarding the policies and procedures the Fund uses to determine how to vote proxies relating to portfolio securities is available without charge, upon request, by calling (800) 235-8396. The information is also included in the Fund's Statement of Additional Information, which is available on the SEC's website at www.sec.gov.
Information relating to how the Fund voted proxies relating to portfolio securities held during the most recent 12 months ended June 30 is available on the SEC's website at www.sec.gov.
Availability of Schedules of Portfolio Investments:
The Trust files a complete list of Schedules of Portfolio Investments with the SEC for the first and third quarter of each fiscal year on Form N-PORT. Form N-PORT is available on the SEC's website at www.sec.gov.
Expense Examples
As a shareholder of the Fund, you may incur two types of costs: (1) transaction costs, including sales charges (loads) on purchases; and (2) ongoing costs, including management fees and other Fund expenses. These examples are intended to help you understand your ongoing costs (in dollars) of investing in the Fund and to compare these costs with the ongoing costs of investing in other mutual funds.
These examples are based on an investment of $1,000 invested at the beginning of the period and held for the entire period from October 1, 2020 through March 31, 2021 (unless otherwise noted).
The Actual Expense figures in the table below provide information about actual account values and actual expenses. You may use the information below, together with the amount you invested, to estimate the expenses that you paid over the period. Simply divide your account value by $1,000 (for example, an $8,600 account value divided by $1,000 = 8.6), then multiply the result by the number in the table under the heading entitled "Actual Expenses Paid During Period" to estimate the expenses you paid on your account during this period.
The Hypothetical Expense figures in the table below provide information about hypothetical account values and hypothetical expenses based on the Fund's actual expense ratio and an assumed rate of return of 5% per year before expenses, which is not the Fund's actual return. The hypothetical account values and expenses may not be used to estimate the actual ending account balance or expenses you paid for the period. You may use this information to compare this 5% hypothetical example with the 5% hypothetical examples that appear in shareholder reports of other funds.
Please note the expenses shown in the table below are meant to highlight your ongoing costs only and do not reflect any transactional costs. If these transactional costs were included, your costs would have been higher.
| Beginning Account Value 10/1/20 | Actual Ending Account Value 3/31/21 | Hypothetical Ending Account Value 3/31/21 | Actual Expenses Paid During Period 10/1/20- 3/31/21* | Hypothetical Expenses Paid During Period 10/1/20- 3/31/21* | Annualized Expense Ratio During Period 10/1/20- 3/31/21 | ||||||||||||||||||||||
Fund Shares | $ | 1,000.00 | $ | 1,023.20 | $ | 1,022.34 | $ | 2.62 | $ | 2.62 | 0.52 | % | |||||||||||||||
Institutional Shares | 1,000.00 | 1,024.40 | 1,022.74 | 2.22 | 2.22 | 0.44 | % | ||||||||||||||||||||
Class A | 1,000.00 | 1,022.00 | 1,021.14 | 3.83 | 3.83 | 0.76 | % | ||||||||||||||||||||
Class Z** | 1,000.00 | 1,005.10 | 1,024.93 | — | — | 0.00 | % | ||||||||||||||||||||
* Expenses are equal to the average account value multiplied by the Fund's annualized expense ratio multiplied by 182/365 (the number of days in the most recent fiscal half-year divided by the number of days in the fiscal year).
** Actual Expenses Paid are equal to the average account value multiplied by the Fund's annualized expense ratio multiplied by 27/365 to reflect the stub period from commencement of operations March 4, 2021 through March 31, 2021.
70
USAA Mutual Funds Trust | Supplemental Information — continued March 31, 2021 | ||||||
(Unaudited)
For the period October 1, 2020 to March 31, 2021, performance adjustments were applied to the Fund. The annualized expense ratios of 0.52% and 0.76% for the Fund Shares and Class A, respectively, as represented in the table above, reflect these adjustments. The values in the table below reflect your costs (in dollars) of investing in the Fund, had these adjustments not been applied for the six month period ended March 31, 2021.
| Beginning Account Value 10/1/20 | Actual Ending Account Value 3/31/21 | Hypothetical Ending Account Value 3/31/21 | Actual Expenses Paid During Period 10/1/20- 3/31/21* | Hypothetical Expenses Paid During Period 10/1/20- 3/31/21* | Annualized Expense Ratio During Period 10/1/20- 3/31/21 | ||||||||||||||||||||||
Fund Shares | $ | 1,000.00 | $ | 1,023.20 | $ | 1,022.54 | $ | 2.42 | $ | 2.42 | 0.48 | % | |||||||||||||||
Class A | 1,000.00 | 1,022.00 | 1,021.19 | 3.78 | 3.78 | 0.75 | % | ||||||||||||||||||||
* Expenses are equal to the average account value multiplied by the Fund's annualized expense ratio multiplied by 182/365 (the number of days in the most recent fiscal half-year divided by the number of days in the fiscal year).
71
USAA Mutual Funds Trust | Supplemental Information — continued March 31, 2021 | ||||||
(Unaudited)
Additional Federal Income Tax Information
The following federal tax information related to the Fund's fiscal year ended March 31, 2021, is provided for information purposes only and should not be used for reporting to federal or state revenue agencies. Federal tax information for the calendar year will be reported to you on Form 1099-DIV in January 2022.
With respect to distributions paid, the Fund designates the following amounts (or, if subsequently determined to be different, the maximum amount allowable) for the fiscal year ended March 31, 2021 (amounts in thousands):
| Tax Exempt Income | |||||||
$ | 132,118 | ||||||
72
USAA Mutual Funds Trust | Supplemental Information — continued March 31, 2021 | ||||||
(Unaudited)
Considerations of the Board in Continuing the Investment Advisory Agreement
USAA Tax Exempt Intermediate-Term Fund (the "Fund")
At a meeting of the Board of Trustees (the "Board") held on December 10-11, 2020, the Board, including the Trustees who are not "interested persons" (as that term is defined in the Investment Company Act of 1940, as amended) of the Trust (the "Independent Trustees"), approved for an annual period the continuance of the Investment Advisory Agreement (the "Advisory Agreement") between the Trust and Victory Capital Management Inc. (the "Adviser") with respect to the Fund. Prior to the December 10-11, 2020, meeting, at which the Advisory Agreement was approved, the Independent Trustees also discussed and considered information regarding the proposed continuation of the Advisory Agreement at a meeting held on November 19, 2020.
In advance of the foregoing meetings, the Trustees received and considered a variety of information relating to the Advisory Agreement and the Adviser, and were given the opportunity to ask questions and request additional information from management. The information provided to the Board included, among other things: (i) a separate report prepared by an independent third party of mutual fund data, which provided a statistical analysis comparing the Fund's investment performance, expenses, and fees to comparable investment companies; (ii) information concerning the services rendered to the Fund, as well as information regarding the Adviser's revenues and costs of providing services to the Fund and compensation paid to affiliates of the Adviser; and (iii) information about the Adviser's operations and personnel. Prior to voting, the Independent Trustees reviewed the proposed continuance of the Advisory Agreement with management and with experienced independent counsel retained by the Independent Trustees ("Independent Counsel") and received materials from such Independent Counsel discussing the legal standards for their consideration of the proposed continuation of the Advisory Agreement with respect to the Fund. The Independent Trustees also reviewed the proposed continuation of the Advisory Agreement with respect to the Fund in private sessions with Independent Counsel at which no representatives of management were present.
At each regularly scheduled meeting of the Board and its committees, the Board receives and reviews, among other things, information concerning the Fund's performance and related services provided by the Adviser. At the meeting at which the renewal of the Advisory Agreement is considered, particular focus is given to information concerning Fund performance, fees and total expenses as compared to comparable investment companies, and the Adviser's profitability with respect to the Fund. However, the Board noted that the evaluation process with respect to the Adviser is an ongoing one. In this regard, the Board's and its committees' consideration of the Advisory Agreement included information previously received at such meetings.
Advisory Agreement
After full consideration of a variety of factors, the Board, including the Independent Trustees, voted to approve the Advisory Agreement. In approving the Advisory Agreement, the Trustees did not identify any single factor as controlling, and each Trustee may have attributed different weights to various factors. Throughout their deliberations, the Independent Trustees were represented and assisted by Independent Counsel.
Nature, Extent, and Quality of Services — In considering the nature, extent, and quality of the services provided by the Adviser under the Advisory Agreement, the Board reviewed information provided by the Adviser relating to its operations and personnel. The Board also took into account its knowledge of the Adviser's management and the quality of the performance of the Adviser's duties through Board meetings, discussions, and reports during the preceding year. The Board considered the fees paid to the Adviser and the services provided to the Fund by the Adviser under the Advisory Agreement, as well as other services provided by the Adviser and its affiliates under other agreements, and the personnel who provide these services. In addition to the investment advisory services provided to the Fund, the Adviser and its affiliates provide administrative services, shareholder services, oversight of Fund accounting, marketing services, assistance in meeting legal and regulatory requirements, and other services necessary for the operation of the Fund and the Trust.
The Board considered the scope of services provided by, and the undertakings required of, the Adviser in connection with those services, including, among other things, maintaining (i) its own and the Fund's compliance programs, (ii) risk management programs, (iii) liquidity risk management programs, and (iv) cybersecurity
73
USAA Mutual Funds Trust | Supplemental Information — continued March 31, 2021 | ||||||
(Unaudited)
programs, each of which had expanded over time as a result of regulatory, market, and other developments. The Board also considered the significant risks assumed by the Adviser in connection with the services provided to the Fund, including investment, operational, enterprise, litigation, regulatory and compliance risks.
The Board considered the Adviser's management style and the performance of the Adviser's duties under the Advisory Agreement. The Board considered the level and depth of knowledge of the Adviser, including the professional experience and qualifications of its senior and investment personnel, as well as current staffing levels. The allocation of the Fund's brokerage, including the Adviser's process for monitoring "best execution," also was considered. The Adviser's role in coordinating the activities of the Fund's other service providers was also considered. The Board also considered the Adviser's risk management processes. The Board considered the Adviser's financial condition and that it had the financial wherewithal to continue to provide the same scope and high quality of services under the Advisory Agreement. In reviewing the Advisory Agreement, the Board focused on the experience, resources, and strengths of the Adviser and its affiliates in managing the Fund, as well as the other funds in the Trust.
The Board also reviewed the compliance and administrative services provided to the Fund by the Adviser and its affiliates, including the Adviser's oversight of the Fund's day-to-day operations and oversight of Fund accounting. The Trustees, guided also by information obtained from their experiences as trustees of the Trust, also focused on the quality of the Adviser's compliance and administrative staff.
Expenses and Performance — In connection with its consideration of the Advisory Agreement, the Board evaluated the Fund's advisory fees and total expense ratio as compared to other open-end investment companies deemed to be comparable to the Fund as determined by the independent third party in its report. The Fund's expenses were compared to (i) a group of investment companies chosen by the independent third party to be comparable to the Fund based upon certain factors, including fund type, comparability of investment objective and classification, sales load type, asset size, and expense components (the "expense group") and (ii) a larger group of investment companies with the same investment classification/objective as the Fund regardless of asset size, excluding outliers (the "expense universe"). Among other data, the Board noted that the Fund's management fee rate—which includes advisory and administrative services and the effects of any performance adjustment1, as well as any fee waivers and reimbursements—was below the median of its expense group and equal to the median of its expense universe. The data indicated that the Fund's total expenses, including after any reimbursements, were below the medians of its expense group and expense universe. The Board also took into account the Adviser's current undertakings to maintain expense limitations for the Fund. The Board took into account the various other services provided to the Fund by the Adviser and its affiliates, and noted the high quality of services received by the Fund.
In considering the Fund's performance, the Board noted that it reviews at its regularly scheduled meetings information about the Fund's performance results. The Trustees also reviewed various comparative data provided to them in connection with their consideration of the renewal of the Advisory Agreement, including, among other information, a comparison of the Fund's average annual total returns relative to its Lipper index and other mutual funds deemed to be in its peer group by the independent third party in its report (the "performance universe"). The Fund's performance universe consisted of the Fund and all retail and institutional open-end investment companies with the same classification/objective as the Fund regardless of asset size or primary channel of distribution. This comparison indicated that, among other data, the Fund's performance was above the average of its performance universe and its Lipper index for the one-, three-, five-, and ten-year periods ended September 30, 2020.
Compensation and Profitability — The Board took into consideration the level and method of computing the management fee. The information considered by the Board included operating profit margin information for the Adviser's business as a whole. The Board also received and considered profitability information related to the management revenues from the Fund. This information included a review of the methodology used in the allocation of certain costs to the Fund. In considering the profitability data with respect to the Fund, the Trustees noted that the Adviser waived a portion of its management fees and/or reimbursed certain expenses with respect
1 The Adviser has agreed that no performance adjustment (positive or negative) would be made to the amount payable to the Adviser from July 1, 2019, through June 30, 2020.
74
USAA Mutual Funds Trust | Supplemental Information — continued March 31, 2021 | ||||||
(Unaudited)
to the Fund. The Trustees reviewed the profitability of the Adviser's relationship with the Fund before tax expenses. The Board was also provided with a profitability analysis of other publicly traded asset managers prepared by an independent information service. In reviewing the overall profitability of the management fee to the Adviser, the Board also considered the fact that the Adviser and its affiliates provide shareholder servicing and administrative services to the Fund for which they receive compensation. The Board also considered the possible direct and indirect benefits to the Adviser from its relationship with the Trust, including that the Adviser may derive reputational and other benefits from its association with the Fund. The Trustees recognized that the Adviser should be entitled to earn a reasonable level of profits in exchange for the level of services it provides to the Fund and the entrepreneurial and other risks that it assumes as Adviser.
Economies of Scale — The Board considered whether there should be changes in the management fee rate or structure in order to enable the Fund to participate in any economies of scale. The Board also considered the fee waiver and expense reimbursement arrangements by the Adviser. The Board also considered the effect of the Fund's change in size, if any, on its performance and fees, noting that the Fund may realize other economies of scale if assets increase proportionally more than expenses. The Board determined that the current investment management fee structure was reasonable.
Conclusions — The Board reached the following conclusions regarding the Fund's Advisory Agreement with the Adviser: (i) the Adviser has demonstrated that it possesses the capability and resources to perform the duties required of it under the Advisory Agreement; (ii) the Adviser maintains an appropriate compliance program; (iii) the overall performance of the Fund is reasonable in relation to the performance of funds with similar investment objectives and to relevant indices; (iv) the Fund's advisory expenses are reasonable in relation to those of similar funds and to the services to be provided by the Adviser; and (v) the Adviser's and its affiliates' level of profitability from their relationship with the Fund is reasonable in light of the nature and high quality of services provided by the Adviser and the type of fund. Based on its conclusions, the Board determined that continuation of the Advisory Agreement would be in the best interests of the Fund and its shareholders.
75
USAA Mutual Funds Trust | Supplemental Information — continued March 31, 2021 | ||||||
(Unaudited)
Liquidity Risk Management Program:
The USAA Mutual Funds have adopted and implemented a written liquidity risk management program (the "LRMP") as required by Rule 22e-4 under the Investment Company Act of 1940, as amended. The LRMP is reasonably designed to assess and manage the Fund's liquidity risk, taking into consideration the Fund's investment strategy and the liquidity of its portfolio investments during normal and reasonably foreseeable stressed market conditions; its short and long-term cash flow projections; and its cash holdings and access to other liquidity management tools such as available funding sources including the Victory Funds Complex Interfund Lending Facility and Line of Credit (discussed in the Notes to Financial Statements). The USAA Mutual Funds' Board of Trustees approved the appointment of the Funds' investment adviser, Victory Capital Management Inc. ("Victory Capital"), as the administrator of the LRMP.
Victory Capital manages liquidity risks associated with the Fund's investments by monitoring, among other things, cash and cash equivalents, any use of derivatives, the concentration of investments, the appropriateness of the Fund's investment strategy, and by classifying every fund investment as either highly liquid, moderately liquid, less liquid or illiquid on at least a monthly basis. To assist with the classification of Fund investments, Victory Capital has retained a third-party provider of liquidity evaluation services. This provider determines preliminary liquidity classifications for all portfolio holdings based upon portfolio-level data and certain assumptions provided by Victory Capital. Victory Capital reviews the preliminary liquidity classifications, and when appropriate, considers other information including input from the Funds' portfolio managers (including the portfolio managers employed by any investment sub-advisers) in determining final liquidity classifications.
At a virtual video conference meeting held on March 10, 2021, Victory Capital provided an oral and written report to the Trustees on the operation and effectiveness of the LRMP during the previous year. The report from Victory Capital concluded that the Fund did not experience any significant liquidity challenges during the covered period, and the Fund's LRMP is reasonably designed to assess and manage its liquidity risk. The report also concluded that the LRMP continues to operate adequately and effectively to enable Victory Capital to oversee and manage liquidity risk and ensure the Fund is able to meet redemption requests without significant dilution to the remaining investors' interest in the Fund. During the review period, the Fund's portfolio consisted primarily of highly liquid investments, which are defined as cash and any investments reasonably expected to be converted to cash in current market conditions in three business days or less without significantly changing the market value of the investment. Therefore, the Fund has not adopted a Highly Liquid Investment Minimum. The Fund's investments were below the limitation on illiquid investments during the review period. Additionally, Victory Capital indicated that no events occurred that would require the filing of Form N-LIQUID and recommended no material changes to the LRMP.
76
Privacy Policy
Protecting the Privacy of Information
The Trust respects your right to privacy. We also know that you expect us to conduct and process your business in an accurate and efficient manner. To do so, we must collect and maintain certain personal information about you. This is the information we collect from you on applications or other forms, and from the transactions you make with us or third parties. It may include your name, address, social security number, account transactions and balances, and information about investment goals and risk tolerance.
We do not disclose any information about you or about former customers to anyone except as permitted or required by law. Specifically, we may disclose the information we collect to companies that perform services on our behalf, such as the transfer agent that processes shareholder accounts and printers and mailers that assist us in the distribution of investor materials. We may also disclose this information to companies that perform marketing services on our behalf. This allows us to continue to offer you Victory investment products and services that meet your investing needs, and to effect transactions that you request or authorize. These companies will use this information only in connection with the services for which we hired them. They are not permitted to use or share this information for any other purpose.
To protect your personal information internally, we permit access only by authorized employees and maintain physical, electronic and procedural safeguards to guard your personal information.*
* You may have received communications regarding information about privacy policies from other financial institutions which gave you the opportunity to "opt-out" of certain information sharing with companies which are not affiliated with that financial institution. The Trust does not share information with other companies for purposes of marketing solicitations for products other than the Trust. Therefore, the Trust does not provide opt-out options to their shareholders.
P.O. Box 182593
Columbus, Ohio 43218-2593

Visit our website at: | Call | ||||||
vcm.com | (800) 235-8396 | ||||||
40857-0521

MARCH 31, 2021
Annual Report
USAA Tax Exempt Short-Term Fund
As permitted by regulations adopted by the Securities and Exchange Commission, paper copies of the Fund's shareholder reports may no longer be sent by mail, unless you specifically request paper copies of the reports from the Fund or from your financial intermediary, such as a broker-dealer or bank. Instead, the reports will be made available on VictoryFunds.com, and you will be notified by mail each time a report is posted and provided with a website link to access the report. If you already elected to receive shareholder reports electronically, you will not be affected by this change and you need not take any action.
You may elect to receive shareholder reports and other communications from the Fund or your financial intermediary electronically by notifying your financial intermediary directly, or if you are a shareholder who has an account directly with the Fund, by calling (800) 235-8396 or by submitting your request via email to TA.Processing@FISGlobal.com.
You may elect to receive all future reports in paper form free of charge. You can inform the Fund or your financial intermediary that you wish to continue receiving paper copies of your shareholder reports by notifying your financial intermediary directly, or if you are a shareholder who has an account directly with the Fund, by calling (800) 235-8396 or by submitting your request via email to TA.Processing@FISGlobal.com. Your election to receive reports in paper will apply to all funds held with the USAA Mutual Funds or your financial intermediary.
Victory Capital means Victory Capital Management Inc., the investment adviser of the USAA Mutual Funds. USAA Mutual Funds are distributed by Victory Capital Services, Inc., member of FINRA, an affiliate of Victory Capital. Victory Capital and its affiliates are not affiliated with United Services Automobile Association or its affiliates. USAA and the USAA logos are registered trademarks and the USAA Mutual Funds and USAA Investments logos are trademarks of United Services Automobile Association and are being used by Victory Capital and its affiliates under license.
www.vcm.com
News, Information And Education 24 Hours A Day, 7 Days A Week
The Victory Funds site gives fund shareholders, prospective shareholders, and investment professionals a convenient way to access fund information, get guidance, and track fund performance anywhere they can access the Internet. The site includes:
• Detailed performance records
• Daily share prices
• The latest fund news
• Investment resources to help you become a better investor
• A section dedicated to investment professionals
Whether you're a potential investor searching for the fund that matches your investment philosophy, a seasoned investor interested in planning tools, or an investment professional, www.vcm.com has what you seek. Visit us anytime. We're always open.
USAA Mutual Funds Trust
TABLE OF CONTENTS
Shareholder Letter (Unaudited) | 2 | ||||||
Managers' Commentary (Unaudited) | 4 | ||||||
Investment Overview (Unaudited) | 6 | ||||||
| Investment Objective & Portfolio Holdings (Unaudited) | 7 | ||||||
Schedule of Portfolio Investments | 9 | ||||||
Financial Statements | |||||||
Statement of Assets and Liabilities | 24 | ||||||
Statement of Operations | 25 | ||||||
Statements of Changes in Net Assets | 26 | ||||||
Financial Highlights | 28 | ||||||
Notes to Financial Statements | 30 | ||||||
| Report of Independent Registered Public Accounting Firm | 40 | ||||||
Supplemental Information (Unaudited) | 41 | ||||||
Trustees' and Officers' Information | 41 | ||||||
Proxy Voting and Portfolio Holdings Information | 47 | ||||||
Expense Examples | 47 | ||||||
Additional Federal Income Tax Information | 49 | ||||||
Advisory Contract Agreement | 50 | ||||||
Liquidity Risk Management Program | 53 | ||||||
Privacy Policy (inside back cover) | |||||||
This report is for the information of the shareholders and others who have received a copy of the currently effective prospectus of the Fund, managed by Victory Capital Management Inc. It may be used as sales literature only when preceded or accompanied by a current prospectus, which provides further details about the Fund.
IRA DISTRIBUTION WITHHOLDING DISCLOSURE
We generally must withhold federal income tax at a rate of 10% of the taxable portion of your distribution and, if you live in a state that requires state income tax withholding, at your state's tax rate. However, you may elect not to have withholding apply or to have income tax withheld at a higher rate. Any withholding election that you make will apply to any subsequent distribution unless and until you change or revoke the election. If you wish to make a withholding election, or change or revoke a prior withholding election, call (800) 235-8396, and form W-4P (OMB No. 1545-0074 withholding certificate for pension or annuity payments) will be electronically sent.
If you do not have a withholding election in place by the date of a distribution, federal income tax will be withheld from the taxable portion of your distribution at a rate of 10%. If you must pay estimated taxes, you may be subject to estimated tax penalties if your estimated tax payments are not sufficient and sufficient tax is not withheld from your distribution.
For more specific information, please consult your tax adviser.
1
(Unaudited)
Dear Shareholder,
The annual reporting period ended March 31, 2021, was a year like no other. It wasn't that long ago that we were all coming to grips with an emerging global pandemic, economic shutdowns, and financial markets in turmoil. We somehow persevered and have even emerged from those challenging days—dare I say—with a renewed sense of optimism. In retrospect, the trajectory of financial markets over the past year was nothing short of extraordinary.
Consider everything that transpired over the past 12 months. A novel coronavirus ("COVID-19") and the subsequent worldwide spread of COVID-19 prompted governments everywhere to issue austere shelter-in-place orders, and the global economy slowed abruptly. Equity markets sold off, while unprecedented levels of volatility roiled traditionally placid bond markets. During the second quarter of 2020, domestic GDP contracted by an alarming annual rate of 31.4%, according to the U.S. Department of Commerce ("Commerce Department").
It's no surprise that many investors flocked to the perceived safety of U.S. Treasurys during this period of tumult. Meanwhile, liquidity evaporated (for a short spell) in other segments of the fixed-income world, including higher-yielding credits and municipal bonds. The outlook was tenuous, and credit spreads widened while prices declined for most securities perceived to be higher risk.
Fortunately, a response came swiftly. The U.S. Federal Reserve (the "Fed") and other monetary authorities worldwide leapt into action—cutting interest rates, (re)starting quantitative easing and, in the case of the Fed, launching an array of programs to provide liquidity to stabilize fixed-income markets. The U.S. government also stepped up to provide fiscal stimulus in the form of the Coronavirus Aid, Relief, and Economic Security Act ("CARES Act").
It was impressive how quickly those actions helped arrest the stock market's freefall and restore order across much of the fixed-income universe. The rebound was as robust as the drawdown, and third quarter 2020 GDP bounced back and grew at a 33.4% annualized rate, according to the Commerce Department.
Late in the year, financial markets were alternately fueled and roiled by a contentious election season, growing optimism for an effective vaccine, and a fluid debate regarding the need for additional fiscal stimulus. Ultimately, stocks were propelled higher in the fourth quarter as it became clear Congress would provide another dose of stimulus in the form of direct payments, more unemployment insurance, and additional aid to businesses.
As the year ended and we moved into the first quarter of 2021, stocks continued their upward trajectory. Meanwhile, the yield on the 10-Year U.S. Treasury continued rallying sharply, and many investors began to worry about inflation in the post-pandemic world.
Through all the unprecedented events and volatility, the S&P 500® Index registered an impressive annual return of 56.35% for the 12-month period ended March 31, 2021. Over this same period, the yield on the 10-Year U.S. Treasury jumped more than 100 basis points, reflecting both the very low starting rate and substantial fiscal
2
stimulus. At the end of the reporting period, the yield on the 10-Year U.S. Treasury was 1.74%
On the whole, markets endured and surprised to the upside, but perhaps the key takeaway is that the unexpected can and will happen. That's why it's important to remain focused on your long-term investment goals and avoid making emotional decisions.
On the following pages, you will find information relating to your USAA Mutual Funds, brought to you by Victory Capital. If you have any questions regarding the current market dynamics or your specific portfolio or investment plan, we encourage you to contact our Member Service Representatives. Call (800) 235-8396, or visit our website at www.vcm.com.
Thank you for letting us help you work toward your investment goals.

Christopher K. Dyer, CFA
President,
USAA Mutual Funds Trust
3
USAA Mutual Funds Trust
USAA Tax Exempt Short-Term Fund
Manager's Commentary
(Unaudited)
Regina G. Conklin, CFA, CPA
Andrew Hattman, CFA, CAIA
Lauren Spalten*
• What were the market conditions during the reporting period?
Tax-exempt bonds as measured by the Bloomberg Barclays Municipal Bond Index generated positive returns during the 12-month reporting period ended March 31, 2021, due in part to falling municipal bond yields. (Bond prices and yields move in opposite directions.) However, the market saw significant volatility during the reporting period due primarily to COVID-19 and related economic and government reactions.
The reporting period began near the beginning of the COVID-19 crisis in the United States. The market had just sold off sharply in March 2020, and the first month of the reporting period was highlighted by significant volatility as the market reacted to COVID-19 and subsequent economic shutdowns, but also substantial fiscal and monetary response from the federal government. Starting in May 2020, the municipal market began a long, uneven recovery for the rest of the calendar year, driven by significant government intervention and investor expectations of a future return to normalcy. The recovery was marked by sizeable fund flows into tax-exempt mutual funds and material tightening of credit spreads (the yield difference between riskier bond yields and the safest bond yields). The recovery took a slight pause in the months ahead of the election, as uncertainty surrounding the election, as well as uncertainty around aid for municipal borrowers weighed on the market for a couple of months. However, the year ended with the market up significantly from the start of both the calendar year and the reporting period. January of 2021 saw a continuation of the market recovery, but the last part of the reporting period was highlighted by a sell-off in the municipal market as tax-exempt bonds finally succumbed to pressures caused by the meaningful increase in U.S. Treasury yields in the first quarter of 2021.
The end of the reporting period found the municipal market fighting the headwinds of potential higher U.S Treasury rates and inflation, but with several notable tailwinds in support to include: heavy fund flows into tax-exempt mutual funds, investor expectations of increasing tax rates, and stimulus money flowing to municipal borrowers.
• How did the USAA Tax Exempt Short-Term Fund (the "Fund") perform during the reporting period?
The Fund has three share classes: Fund Shares, Institutional Shares and Class A (effective June 29, 2020, the Adviser Shares were redesignated Class A and became subject to a front-end sales charge). For the reporting period ended March 31, 2021, the Fund Shares and Class A had a total return of 4.42% and 4.07%, respectively, versus an average return of 2.35% amongst the funds in the Lipper Short Municipal Debt Funds category. This compares to returns of 2.32% for the Lipper Short Municipal Debt Funds Index and 3.33% for the Bloomberg Barclays Municipal Bond Short (1-5 Years) Index. The Institutional
*Effective March 2, 2021, Lauren Spalten was added as a portfolio manager on the Fund and John C. Bonnell was removed.
4
USAA Mutual Funds Trust
USAA Tax Exempt Short-Term Fund (continued)
Manager's Commentary (continued)
Shares commenced operations on June 29, 2020, and from that time through March 31, 2021, had a total return of 2.39%.
• What strategies did you employ during the reporting period?
In keeping with our investment approach, we continued to focus on income generation. The Fund's long-term income distribution, not its price appreciation, accounts for most of its total return.
During the reporting period, we continued to invest a portion of the portfolio in variable rate demand notes ("VRDNs"). The VRDNs owned by the Fund have interest rates that adjust daily/weekly to the market. VRDNs also possess a "demand" feature that allows us to sell the bond at par value with notice of seven days or less, which helps us reduce share price volatility and gives us the flexibility to act when attractive opportunities arise.
Our commitment to independent credit research continued to help us identify attractive opportunities for the Fund. We employ fundamental analysis that emphasizes an issuer's ability and willingness to repay its debt. Through our credit research, we strive both to recognize relative value and to avoid potential pitfalls, which is especially important in volatile times like the present. As always, we worked with our in-house team of analysts to select investments for the Fund on a bond-by-bond basis. Our team continuously monitors all the holdings in the Fund's portfolio.
The Fund continues to hold a diversified portfolio of shorter-term, primarily investment- grade municipal bonds. To limit exposure to an unexpected event, the Fund is diversified by sector, issuer, and geography. In addition, we avoid bonds subject to the federal alternative minimum tax for individuals.
Thank you for allowing us to assist you with your investment needs.
5
USAA Mutual Funds Trust
USAA Tax Exempt Short-Term Fund
Investment Overview
(Unaudited)
Average Annual Total Return
Year Ended March 31, 2021
Fund Shares | Institutional Shares | Class A | |||||||||||||||||||||||||
INCEPTION DATE | 3/19/82 | 6/29/20 | 8/1/10 | ||||||||||||||||||||||||
| Net Asset Value | Net Asset Value | Net Asset Value | Maximum Offering Price | Bloomberg Barclays Municipal Bond Short (1-5 Years) Index1 | Lipper Short Municipal Debt Funds Index2 | ||||||||||||||||||||||
One Year | 4.42 | % | NA | 4.07 | % | 1.71 | % | 3.33 | % | 2.32 | % | ||||||||||||||||
Five Year | 1.68 | % | NA | 1.44 | % | 0.99 | % | 1.85 | % | 1.33 | % | ||||||||||||||||
Ten Year | 1.77 | % | NA | 1.52 | % | 1.29 | % | 1.81 | % | 1.25 | % | ||||||||||||||||
Since Inception | NA | 2.39 | % | NA | NA | NA | NA | ||||||||||||||||||||
The performance data quoted represents past performance and current returns may be lower or higher. The investment return and principal value will fluctuate so that an investor's shares, when redeemed, may be worth more or less than the original cost. To obtain performance information current to the most recent month's end, please visit www.vcm.com.
The maximum offering price figures reflect a maximum sales charge of 2.25% for Class A. Net Asset Value does not reflect sales charges.
Total return measures the price change in a share assuming the reinvestment of all net investment income and realized capital gain distributions, if any. The total returns quoted do not reflect adjustments made to the enclosed financial statements in accordance with U.S. Generally Accepted Accounting Principles or the deduction of taxes that a shareholder would pay on net investment income and realized capital gain distributions, including reinvested distributions, or redemptions of shares.
The total return figures set forth above include all waivers of fees. Without such fee waivers, the total returns would have been lower.
USAA Tax Exempt Short-Term Fund — Growth of $10,000
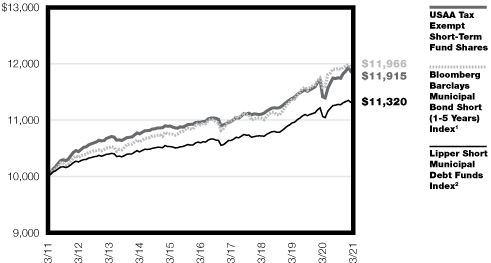
1The Bloomberg Barclays Municipal Bond Short (1-5 Years) Index is a market value-weighted index which covers the short components of the Bloomberg Barclays Municipal Bond Index. This index does not include the effect of sales charges, commissions, expenses or taxes, is not representative of the Fund, and it is not possible to invest directly in an index.
2The unmanaged Lipper Short Municipal Debt Funds Index measures the Fund's performance to that of the Lipper Short Municipal Debt Funds category. This index does not include the effect of sales charges, commissions, expenses or taxes, is not representative of the Fund, and it is not possible to invest directly in an index.
The graph reflects investment of growth of a hypothetical $10,000 investment in the Fund.
The graph and table do not reflect the deduction of taxes that a shareholder would pay on Fund distributions or the redemption of Fund shares.
Past performance is not indicative of future results.
6
| USAA Mutual Funds Trust USAA Tax Exempt Short-Term Fund | March 31, 2021 | ||||||
(Unaudited)
Investment Objective & Portfolio Holdings:
The Fund's investment objective seeks to provide investors with interest income that is exempt from federal income tax.
Top 10 Industries
March 31, 2021
(% of Net Assets)
Hospital | 21.1 | % | |||||
General Obligation | 17.7 | % | |||||
Electric Utilities | 10.5 | % | |||||
Electric/Gas Utility | 9.2 | % | |||||
Education | 7.4 | % | |||||
Special Assessment/Tax/Fee | 7.3 | % | |||||
Oil & Gas Refining & Marketing | 4.7 | % | |||||
Multifamily Housing | 3.4 | % | |||||
Appropriated Debt | 3.3 | % | |||||
Nursing/CCRC | 2.3 | % | |||||
Refer to the Schedule of Portfolio Investments for a complete list of securities.
7
| USAA Mutual Funds Trust USAA Tax Exempt Short-Term Fund (continued) | March 31, 2021 | ||||||
(Unaudited)
Portfolio Ratings Mix:
March 31, 2021
(% of Net Assets)
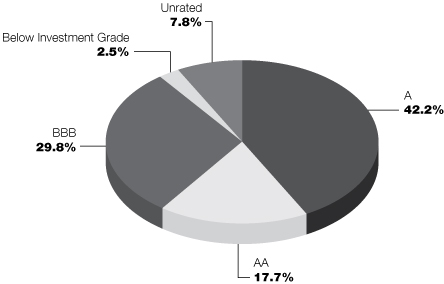
This chart reflects the highest long-term rating from a Nationally Recognized Statistical Rating Organization ("NRSRO"), with the four highest long-term credit ratings labeled, in descending order of credit quality, AAA, AA, A, and BBB. These categories represent investment-grade quality. NRSRO ratings are shown because they provide independent analysis of the credit quality of the Fund's investments. Victory Capital Management Inc. ("Adviser") also performs its own fundamental credit analysis of each security. As a part of its fundamental credit analysis, the Adviser considers various criteria, including industry specific actions, peer comparisons, payment ranking, and structure specific characteristics. Any of the Fund's securities that are not rated by an NRSRO appear in the chart above as "Unrated," but these securities are analyzed and monitored by the Adviser on an ongoing basis. Government securities that are issued or guaranteed as to principal and interest by the U.S. government and pre-refunded and escrowed-to-maturity municipal bonds that are not rated are treated as AAA for credit quality purposes.
8
| USAA Mutual Funds Trust USAA Tax Exempt Short-Term Fund | Schedule of Portfolio Investments March 31, 2021 | ||||||
(Amounts in Thousands, Except for Shares)
Security Description | Shares or Principal Amount | Value | |||||||||
Common Stocks (0.1%) | |||||||||||
Utilities (0.1%): | |||||||||||
Energy Harbor Corp. (a) | 46,323 | $ | 1,244 | ||||||||
Total Common Stocks (Cost $1,152) | 1,244 | ||||||||||
Municipal Bonds (99.5%) | |||||||||||
Alabama (2.7%): | |||||||||||
Birmingham Airport Authority Revenue, 5.00%, 7/1/30 | $ | 1,200 | 1,550 | ||||||||
| Black Belt Energy Gas District Revenue, Series B-1, 0.98% (LIBOR01M+90bps), 12/1/48, (Put Date 12/1/23) (b) (j) | 10,000 | 10,059 | |||||||||
| Chatom Industrial Development Board Revenue 5.00%, 8/1/21 | 280 | 284 | |||||||||
5.00%, 8/1/30 | 1,275 | 1,614 | |||||||||
| Columbia Industrial Development Board Revenue, Series C, 0.09%, 12/1/37, Continuously Callable @100 (c) | 4,900 | 4,900 | |||||||||
| Prattville Industrial Development Board Revenue 2.00%, 11/1/33, (Put Date 10/1/24) (b) | 450 | 471 | |||||||||
2.00%, 11/1/33, (Put Date 10/1/24) (b) | 425 | 444 | |||||||||
| Selma Industrial Development Board Revenue 2.00%, 11/1/33, (Put Date 10/1/24) (b) | 3,650 | 3,818 | |||||||||
1.37%, 5/1/34, (Put Date 6/16/25) (b) | 5,875 | 6,019 | |||||||||
| The Lower Alabama Gas District Revenue (LOC — Goldman Sachs Bank USA), 4.00%, 12/1/50, (Put Date 12/1/25) (b) | 3,000 | 3,418 | |||||||||
32,577 | |||||||||||
Arizona (3.8%): | |||||||||||
| Arizona Health Facilities Authority Revenue, 1.90% (MUNIPSA+185bps), 2/1/48, (Put Date 2/1/23) (b) (j) | 25,000 | 25,654 | |||||||||
| Maricopa County IDA Revenue 4.00%, 7/1/29 (d) | 750 | 829 | |||||||||
0.62% (MUNIPSA+57bps), 1/1/35, (Put Date 10/18/24) (b) (j) | 2,365 | 2,406 | |||||||||
Series C, 0.85% (MUNIPSA+80bps), 9/1/48, (Put Date 9/1/24) (b) (j) | 7,735 | 7,789 | |||||||||
| Maricopa County Pollution Control Corp. Revenue, Series B, 0.14%, 6/1/43, Callable 5/3/21 @ 100 (c) | 6,000 | 6,000 | |||||||||
| Pinal County IDA Revenue 4.00%, 10/1/21 | 650 | 659 | |||||||||
4.00%, 10/1/22 | 3,600 | 3,757 | |||||||||
47,094 | |||||||||||
Arkansas (0.6%): | |||||||||||
| Arkansas Development Finance Authority Revenue 5.00%, 9/1/30 | 1,180 | 1,517 | |||||||||
5.00%, 9/1/31, Continuously Callable @100 | 1,200 | 1,539 | |||||||||
5.00%, 9/1/44, (Put Date 9/1/27) (b) | 4,000 | 4,850 | |||||||||
7,906 | |||||||||||
California (3.7%): | |||||||||||
| Anaheim Public Financing Authority Revenue Series A, 5.00%, 5/1/22 | 500 | 521 | |||||||||
Series A, 5.00%, 5/1/24 | 250 | 278 | |||||||||
See notes to financial statements.
9
| USAA Mutual Funds Trust USAA Tax Exempt Short-Term Fund | Schedule of Portfolio Investments — continued March 31, 2021 | ||||||
(Amounts in Thousands, Except for Shares)
Security Description | Principal Amount | Value | |||||||||
| California County Tobacco Securitization Agency Revenue Series A, 5.00%, 6/1/30 | $ | 200 | $ | 266 | |||||||
Series B-1, 1.75%, 6/1/30 | 250 | 257 | |||||||||
| California Infrastructure & Economic Development Bank Revenue, Series B, 1.25% (MUNIPSA+120bps), 8/1/37, (Put Date 6/1/22) (b) (j) | 8,000 | 8,038 | |||||||||
| California Municipal Finance Authority Revenue (LIQ — Deutsche Bank A.G.), Series DBE-8061, 0.58%, 1/1/60, Callable 1/1/37 @ 100 (c) (d) | 5,000 | 5,000 | |||||||||
| California Public Finance Authority Revenue Series A, 4.00%, 10/15/21 | 215 | 219 | |||||||||
Series A, 4.00%, 10/15/22 | 245 | 257 | |||||||||
California State Public Works Board Revenue, Series A, 5.00%, 4/1/21 | 1,500 | 1,500 | |||||||||
| California Statewide Communities Development Authority Revenue (LIQ — Deutsche Bank A.G.), Series DBE-8066, 0.58%, 4/1/60, Callable 10/1/32 @ 100 (c) (d) | 5,000 | 5,000 | |||||||||
| City & County of San Francisco Revenue (LIQ — Deutsche Bank A.G.), Series DBE-8059, 0.58%, 12/1/52, Callable 12/1/21 @ 100 (c) (d) | 10,000 | 10,000 | |||||||||
City of Irvine Special Assessment, 5.00%, 9/2/21 | 1,125 | 1,148 | |||||||||
Contra Costa County Schools Pooled Notes Revenue, Series A, 2.00%, 12/1/21 | 4,500 | 4,538 | |||||||||
County of Los Angeles Certificate of Participation, 5.00%, 9/1/21 | 1,000 | 1,020 | |||||||||
| Sierra View Local Health Care District Revenue 5.00%, 7/1/27 | 315 | 391 | |||||||||
5.00%, 7/1/28 | 330 | 417 | |||||||||
5.00%, 7/1/29 | 315 | 405 | |||||||||
5.00%, 7/1/30 | 310 | 405 | |||||||||
Tobacco Securitization Authority of Southern California Revenue, 2.25%, 6/1/29 | 290 | 293 | |||||||||
| Western Placer Unified School District Special Tax, 2.00%, 6/1/25, Continuously Callable @100 | 4,750 | 4,910 | |||||||||
44,863 | |||||||||||
Colorado (0.8%): | |||||||||||
| Colorado Health Facilities Authority Revenue Series A, 5.00%, 8/1/29 | 500 | 645 | |||||||||
Series A, 5.00%, 11/1/29 | 3,225 | 4,228 | |||||||||
Series A, 5.00%, 11/1/30, Continuously Callable @100 | 2,215 | 2,891 | |||||||||
Series B-2, 5.00%, 8/1/49, (Put Date 8/1/26) (b) | 1,000 | 1,192 | |||||||||
| Southlands Metropolitan District No. 1, GO Series A-1, 3.00%, 12/1/22 | 197 | 199 | |||||||||
Series A-1, 3.50%, 12/1/27 | 1,000 | 1,051 | |||||||||
10,206 | |||||||||||
Connecticut (2.6%): | |||||||||||
City of Bridgeport, GO, Series B, 5.00%, 8/15/26 | 3,450 | 4,120 | |||||||||
| City of New Haven, GO Series A, 5.00%, 8/1/22 | 1,190 | 1,249 | |||||||||
Series A, 5.00%, 8/1/24 | 1,000 | 1,116 | |||||||||
Series A, 5.00%, 8/1/25 | 580 | 663 | |||||||||
Series A, 5.00%, 8/1/26 | 580 | 678 | |||||||||
Series A, 5.00%, 8/1/27 | 1,000 | 1,192 | |||||||||
| City of New Haven, GO (INS — Assured Guaranty Municipal Corp.) Series A, 5.00%, 8/1/27 | 2,500 | 3,077 | |||||||||
Series A, 5.00%, 8/1/28 | 1,000 | 1,254 | |||||||||
See notes to financial statements.
10
| USAA Mutual Funds Trust USAA Tax Exempt Short-Term Fund | Schedule of Portfolio Investments — continued March 31, 2021 | ||||||
(Amounts in Thousands, Except for Shares)
Security Description | Principal Amount | Value | |||||||||
Series B, 5.00%, 2/1/27 | $ | 600 | $ | 730 | |||||||
Series B, 5.00%, 2/1/28 | 525 | 652 | |||||||||
Series B, 5.00%, 2/1/29 | 550 | 695 | |||||||||
| City of West Haven, GO Series A, 4.00%, 11/1/21 | 800 | 810 | |||||||||
Series A, 5.00%, 11/1/23 | 800 | 871 | |||||||||
Series A, 5.00%, 11/1/24 | 815 | 910 | |||||||||
Series A, 5.00%, 11/1/27 | 650 | 770 | |||||||||
| Connecticut State Health & Educational Facilities Authority Revenue Series A, 5.00%, 7/1/30, Continuously Callable @100 | 2,000 | 2,599 | |||||||||
Series B-2, 5.00%, 7/1/53, (Put Date 1/1/27) (b) | 3,000 | 3,694 | |||||||||
| Harbor Point Infrastructure Improvement District Tax Allocation, 5.00%, 4/1/22 (d) | 3,045 | 3,167 | |||||||||
| State of Connecticut Special Tax Revenue, Series A, 5.00%, 5/1/31, Continuously Callable @100 | 2,500 | 3,282 | |||||||||
31,529 | |||||||||||
District of Columbia (1.6%): | |||||||||||
| District of Columbia Revenue (LIQ — Deutsche Bank A.G.), Series 2016-XG0094, 0.15%, 10/1/41 (c) (d) | 20,000 | 20,000 | |||||||||
Florida (3.8%): | |||||||||||
| Alachua County Health Facilities Authority Revenue 4.00%, 12/1/23 | 1,100 | 1,196 | |||||||||
5.00%, 12/1/37, (Put Date 12/1/26) (b) | 3,000 | 3,586 | |||||||||
Capital Trust Agency, Inc. Revenue, 4.00%, 8/1/30 | 200 | 225 | |||||||||
| City of Atlantic Beach Revenue, Series B-2, 3.00%, 11/15/23, Continuously Callable @100 | 2,750 | 2,754 | |||||||||
City of Pompano Beach Revenue, 3.50%, 9/1/30, Continuously Callable @103 | 3,590 | 3,921 | |||||||||
| County of Escambia Revenue 2.00%, 11/1/33, (Put Date 10/1/24) (b) | 775 | 809 | |||||||||
Series 2, 0.07%, 4/1/39, Continuously Callable @100 (c) | 600 | 600 | |||||||||
County of St. Lucie Revenue, 0.08%, 9/1/28, Continuously Callable @100 (c) | 25,000 | 25,000 | |||||||||
| Florida Development Finance Corp. Revenue Series A, 5.00%, 6/15/26 | 370 | 429 | |||||||||
Series A, 5.00%, 6/15/27 | 390 | 460 | |||||||||
Series A, 5.00%, 6/15/28, Continuously Callable @100 | 410 | 482 | |||||||||
Series A, 5.00%, 6/15/29, Continuously Callable @100 | 360 | 422 | |||||||||
Series A, 5.00%, 6/15/30, Continuously Callable @100 | 475 | 553 | |||||||||
| Florida Higher Educational Facilities Financial Authority Revenue 5.00%, 10/1/22 | 500 | 527 | |||||||||
5.00%, 10/1/24 | 500 | 558 | |||||||||
5.00%, 10/1/25 | 445 | 506 | |||||||||
Series A, 5.00%, 4/1/21 | 1,385 | 1,385 | |||||||||
Lee County IDA Revenue, 4.75%, 10/1/22 | 1,350 | 1,412 | |||||||||
| Southeast Overtown Park West Community Redevelopment Agency Tax Allocation, Series A-1, 5.00%, 3/1/23 (d) | 1,000 | 1,073 | |||||||||
45,898 | |||||||||||
See notes to financial statements.
11
| USAA Mutual Funds Trust USAA Tax Exempt Short-Term Fund | Schedule of Portfolio Investments — continued March 31, 2021 | ||||||
(Amounts in Thousands, Except for Shares)
Security Description | Principal Amount | Value | |||||||||
Georgia (5.8%): | |||||||||||
| Appling County Development Authority Revenue, Series A, 1.50%, 1/1/38, (Put Date 2/3/25) (b) | $ | 2,000 | $ | 2,025 | |||||||
| Appling County Development Authority Revenue (NBGA — Southern Co.), 0.11%, 9/1/41, Continuously Callable @100 (c) | 6,000 | 6,000 | |||||||||
| Burke County Development Authority Revenue, 1.70%, 12/1/49, (Put Date 8/22/24) (b) | 7,500 | 7,765 | |||||||||
| Cobb County Development Authority Revenue, Series A, 2.25%, 4/1/33, (Put Date 10/1/29) (b) | 5,000 | 5,336 | |||||||||
| Cobb County Housing Authority Revenue (LIQ — Deutsche Bank A.G.), Series DBE-8068, 0.58%, 10/1/59, Callable 10/1/35 @ 100 (c) (d) | 5,000 | 5,000 | |||||||||
George L Smith II Congress Center Authority Revenue, 2.38%, 1/1/31 (e) | 1,000 | 1,017 | |||||||||
| Heard County Development Authority Revenue, 0.14%, 9/1/26, Continuously Callable @100 (c) | 1,200 | 1,200 | |||||||||
| Main Street Natural Gas, Inc. Revenue 4.00%, 8/1/48, (Put Date 12/1/23) (b) | 5,000 | 5,451 | |||||||||
Series A, 5.00%, 5/15/28 | 1,000 | 1,250 | |||||||||
Series A, 5.00%, 5/15/29 | 1,775 | 2,249 | |||||||||
Series C, 4.00%, 3/1/50, (Put Date 9/1/26) (b) | 10,000 | 11,544 | |||||||||
| Savannah Economic Development Authority Revenue, 2.00%, 11/1/33, (Put Date 10/1/24) (b) | 815 | 851 | |||||||||
| The Burke County Development Authority Revenue, Series 1, 0.10%, 7/1/49, Continuously Callable @100 (c) | 3,890 | 3,890 | |||||||||
| The Burke County Development Authority Revenue (NBGA — Southern Co.), 0.08%, 11/1/52, Continuously Callable @100 (c) | 11,800 | 11,800 | |||||||||
| The Development Authority of Monroe County Revenue 0.11%, 4/1/32, Continuously Callable @100 (c) | 500 | 500 | |||||||||
0.11%, 11/1/48, Continuously Callable @100 (c) | 1,400 | 1,400 | |||||||||
| The Monroe County Development Authority Revenue, Series A, 1.50%, 1/1/39, (Put Date 2/3/25) (b) | 3,500 | 3,525 | |||||||||
70,803 | |||||||||||
Guam (0.3%): | |||||||||||
| Territory of Guam Revenue Series A, 5.00%, 12/1/23 | 1,500 | 1,639 | |||||||||
Series A, 5.00%, 12/1/24 | 2,000 | 2,247 | |||||||||
3,886 | |||||||||||
Idaho (0.4%): | |||||||||||
County of Nez Perce Revenue, 2.75%, 10/1/24 | 5,000 | 5,352 | |||||||||
Illinois (12.1%): | |||||||||||
| Chicago Board of Education, GO Series A, 4.00%, 12/1/27 | 1,400 | 1,602 | |||||||||
Series B, 5.00%, 12/1/21 | 400 | 412 | |||||||||
Series B, 5.00%, 12/1/22 | 1,500 | 1,608 | |||||||||
Series B, 5.00%, 12/1/22 | 400 | 429 | |||||||||
Series B, 5.00%, 12/1/31, Continuously Callable @100 | 1,000 | 1,234 | |||||||||
| Chicago Board of Education, GO (LIQ — Deutsche Bank A.G.) Series 2016-XG0073, 0.20%, 12/1/39, Callable 12/1/21 @ 100 (c) (d) | 11,000 | 11,000 | |||||||||
Series 2017-XM0188, 0.20%, 12/1/39, Callable 12/1/21 @ 100 (c) (d) | 5,000 | 5,000 | |||||||||
See notes to financial statements.
12
| USAA Mutual Funds Trust USAA Tax Exempt Short-Term Fund | Schedule of Portfolio Investments — continued March 31, 2021 | ||||||
(Amounts in Thousands, Except for Shares)
Security Description | Principal Amount | Value | |||||||||
| Chicago Park District, GO Series A, 4.00%, 1/1/31, Continuously Callable @100 | $ | 750 | $ | 894 | |||||||
Series F-2, 5.00%, 1/1/27 | 600 | 714 | |||||||||
Series F-2, 5.00%, 1/1/28 | 1,000 | 1,213 | |||||||||
Series F-2, 5.00%, 1/1/29 | 1,000 | 1,232 | |||||||||
Series F-2, 5.00%, 1/1/30 | 1,305 | 1,628 | |||||||||
Series F-2, 5.00%, 1/1/31, Continuously Callable @100 | 2,115 | 2,634 | |||||||||
Series F-2, 5.00%, 1/1/32, Continuously Callable @100 | 1,750 | 2,161 | |||||||||
| Chicago Park District, GO (INS — Build America Mutual Assurance Co.), Series 2015-XF2111, 0.15%, 1/1/22 (c) (d) | 10,200 | 10,200 | |||||||||
| Chicago Transit Authority Revenue 5.00%, 6/1/25 | 1,720 | 2,012 | |||||||||
5.00%, 6/1/26 | 1,000 | 1,202 | |||||||||
| City of Chicago Waterworks Revenue 5.00%, 11/1/25 | 4,000 | 4,722 | |||||||||
5.00%, 11/1/26 | 1,000 | 1,213 | |||||||||
Series A-1, 5.00%, 11/1/25 | 2,000 | 2,361 | |||||||||
Series A-1, 4.00%, 11/1/26 | 2,500 | 2,896 | |||||||||
| County of Cook, GO (LIQ-JPMorgan Chase & Co.), Series 2015-XF0124, 0.23%, 5/15/22 (c) (d) | 11,160 | 11,160 | |||||||||
| Illinois Finance Authority Revenue 5.00%, 10/1/29 | 500 | 633 | |||||||||
5.00%, 10/1/30 | 250 | 321 | |||||||||
0.80% (MUNIPSA+75bps), 1/1/46, (Put Date 7/1/23) (b) (j) | 9,000 | 9,174 | |||||||||
Series B, (MUNIPSA+70bps) 5/1/42, (Put Date 5/1/26) (b) (j) | 2,250 | 2,257 | |||||||||
Series C, 4.00%, 2/15/25 | 10,000 | 11,303 | |||||||||
Illinois Sports Facilities Authority Revenue, 5.00%, 6/15/28 | 1,000 | 1,191 | |||||||||
| Northern Illinois University Revenue (INS — Build America Mutual Assurance Co.), Series B, 5.00%, 4/1/30 | 250 | 319 | |||||||||
Railsplitter Tobacco Settlement Authority Revenue, 5.25%, 6/1/21 | 1,090 | 1,098 | |||||||||
| Sales Tax Securitization Corp. Revenue Series A, 5.00%, 1/1/28 | 1,000 | 1,230 | |||||||||
Series A, 5.00%, 1/1/29 | 2,500 | 3,128 | |||||||||
Series A, 5.00%, 1/1/30 | 2,000 | 2,538 | |||||||||
| State of Illinois, GO Series A, 5.00%, 3/1/22 | 1,500 | 1,558 | |||||||||
Series A, 5.00%, 10/1/23 | 3,000 | 3,299 | |||||||||
Series A, 5.00%, 11/1/25 | 5,000 | 5,803 | |||||||||
Series C, 5.00%, 11/1/29, Continuously Callable @100 | 8,985 | 10,457 | |||||||||
| State of Illinois, GO (INS — Build America Mutual Assurance Co.), Series D, 5.00%, 11/1/25 (f) | 15,000 | 17,653 | |||||||||
| Village of Rosemont, GO (INS — Assured Guaranty Municipal Corp.) Series A, 5.00%, 12/1/22 | 1,735 | 1,859 | |||||||||
Series A, 5.00%, 12/1/23 | 1,825 | 2,028 | |||||||||
Series A, 5.00%, 12/1/24 | 1,915 | 2,194 | |||||||||
| Western Illinois University Revenue (INS — Build America Mutual Assurance Co.) 4.00%, 4/1/29 | 750 | 889 | |||||||||
4.00%, 4/1/30 | 750 | 899 | |||||||||
See notes to financial statements.
13
| USAA Mutual Funds Trust USAA Tax Exempt Short-Term Fund | Schedule of Portfolio Investments — continued March 31, 2021 | ||||||
(Amounts in Thousands, Except for Shares)
Security Description | Principal Amount | Value | |||||||||
| Will County Community High School District No 210 Lincoln-Way, GO, 4.00%, 1/1/22 | $ | 975 | $ | 996 | |||||||
148,354 | |||||||||||
Indiana (0.8%): | |||||||||||
Hammond Local Public Improvement Bond Bank Revenue, 2.00%, 12/31/21 | 1,170 | 1,180 | |||||||||
| Indiana Bond Bank Revenue 1/15/27 (g) | 1,280 | 1,205 | |||||||||
1/15/28 (g) | 1,100 | 1,015 | |||||||||
1/15/29 (g) | 565 | 508 | |||||||||
7/15/29, Continuously Callable @99 (g) | 730 | 633 | |||||||||
| Indiana Finance Authority Revenue, 2.95%, 10/1/22, Continuously Callable @100 | 5,000 | 5,169 | |||||||||
9,710 | |||||||||||
Iowa (0.2%): | |||||||||||
City of Waverly Revenue, 2.50%, 12/31/22, Continuously Callable @100 | 2,000 | 2,057 | |||||||||
Kansas (0.4%): | |||||||||||
| City of Burlington Revenue, Series B, 0.19%, 9/1/35, Continuously Callable @100 (c) | 4,050 | 4,050 | |||||||||
City of St. Marys Revenue, 0.15%, 4/15/32, Continuously Callable @100 (c) | 1,200 | 1,200 | |||||||||
5,250 | |||||||||||
Kentucky (6.4%): | |||||||||||
| City of Ashland Revenue 5.00%, 2/1/28 | 1,775 | 2,093 | |||||||||
5.00%, 2/1/30 | 740 | 887 | |||||||||
County of Carroll Revenue, 1.55%, 9/1/42, (Put Date 9/1/26) (b) | 5,000 | 5,049 | |||||||||
| County of Owen Revenue 2.45%, 6/1/39, (Put Date 10/1/29) (b) | 10,000 | 10,717 | |||||||||
2.45%, 9/1/39, (Put Date 10/1/29) (b) | 5,000 | 5,277 | |||||||||
| Kentucky Economic Development Finance Authority Revenue, Series B-3, 1.45% (MUNIPSA+140bps), 2/1/46, (Put Date 2/1/25) (b) (j) | 10,000 | 10,001 | |||||||||
| Kentucky Public Energy Authority Revenue Series B, 4.00%, 1/1/49, (Put Date 1/1/25) (b) | 5,715 | 6,370 | |||||||||
Series C, 4.00%, 2/1/50, (Put Date 2/1/28) (b) | 10,000 | 11,765 | |||||||||
Series C-1, 4.00%, 12/1/49, (Put Date 6/1/25) (b) | 10,000 | 11,250 | |||||||||
Series C-3, 1.10% (MUNIPSA+105bps), 12/1/49, (Put Date 6/1/25) (b) (j) | 10,000 | 10,152 | |||||||||
| Louisville/Jefferson County Metropolitan Government Revenue, 5.00%, 10/1/47, (Put Date 10/1/29) (b) | 4,000 | 5,123 | |||||||||
78,684 | |||||||||||
Louisiana (2.3%): | |||||||||||
| Louisiana Local Government Environmental Facilities & Community Development Authority Revenue, Series A, 2.00%, 6/1/30, Continuously Callable @100 (e) | 1,000 | 1,004 | |||||||||
| Louisiana Public Facilities Authority Revenue, 0.70% (MUNIPSA+65bps), 9/1/57, (Put Date 9/1/23) (b) (j) | 10,000 | 10,128 | |||||||||
Parish of St. Charles Revenue, 4.00%, 12/1/40, (Put Date 6/1/22) (b) | 4,000 | 4,163 | |||||||||
| Parish of St. James Revenue (NBGA — Nucor Corp.), Series B-1, 0.14%, 11/1/40, Continuously Callable @100 (c) (f) | 3,300 | 3,300 | |||||||||
See notes to financial statements.
14
| USAA Mutual Funds Trust USAA Tax Exempt Short-Term Fund | Schedule of Portfolio Investments — continued March 31, 2021 | ||||||
(Amounts in Thousands, Except for Shares)
Security Description | Principal Amount | Value | |||||||||
| Parish of St. John the Baptist Revenue 2.20%, 6/1/37, (Put Date 7/1/26) (b) | $ | 1,750 | $ | 1,802 | |||||||
2.10%, 6/1/37, (Put Date 7/1/24) (b) | 2,000 | 2,052 | |||||||||
Tobacco Settlement Financing Corp. Revenue, Series A, 5.00%, 5/15/22 | 5,000 | 5,266 | |||||||||
27,715 | |||||||||||
Maryland (0.9%): | |||||||||||
| Maryland Economic Development Corp. Revenue Series A, 5.00%, 6/1/25 | 1,500 | 1,686 | |||||||||
Series A, 5.00%, 6/1/26 | 2,000 | 2,295 | |||||||||
Series A, 5.00%, 6/1/27 | 1,340 | 1,566 | |||||||||
| Maryland Health & Higher Educational Facilities Authority Revenue 5.00%, 7/1/28 | 1,910 | 2,393 | |||||||||
5.00%, 7/1/29 | 1,130 | 1,438 | |||||||||
5.00%, 7/1/30 | 1,000 | 1,292 | |||||||||
10,670 | |||||||||||
Massachusetts (0.7%): | |||||||||||
| Massachusetts Development Finance Agency Revenue 5.00%, 7/15/21 (d) | 225 | 227 | |||||||||
5.00%, 7/1/25 | 1,250 | 1,458 | |||||||||
5.00%, 7/1/26 | 1,500 | 1,790 | |||||||||
5.00%, 7/15/26 (d) | 310 | 347 | |||||||||
5.00%, 7/15/28 (d) | 340 | 391 | |||||||||
5.00%, 7/15/30 (d) | 640 | 751 | |||||||||
Series A, 5.00%, 7/1/29, Continuously Callable @100 | 1,425 | 1,806 | |||||||||
Series C, 5.00%, 10/1/30 | 975 | 1,271 | |||||||||
8,041 | |||||||||||
Michigan (0.8%): | |||||||||||
| Flint Hospital Building Authority Revenue 5.00%, 7/1/29 | 1,995 | 2,373 | |||||||||
5.00%, 7/1/30 | 2,290 | 2,757 | |||||||||
| Michigan Finance Authority Revenue, Series D-2, 0.55% (MUNIPSA+50bps), 10/15/38, (Put Date 8/9/21) (b) (j) | 4,360 | 4,364 | |||||||||
9,494 | |||||||||||
Minnesota (0.2%): | |||||||||||
| Housing & Redevelopment Authority of The City of St Paul Minnesota Revenue, 5.00%, 11/15/21 | 1,575 | 1,621 | |||||||||
| Sanford Canby Community Hospital District No. 1 Revenue, 0.43%, 11/1/26, Continuously Callable @100 (c) | 1,295 | 1,295 | |||||||||
2,916 | |||||||||||
Mississippi (1.9%): | |||||||||||
County of Warren Revenue, 2.90%, 9/1/32, (Put Date 9/1/23) (b) | 2,000 | 2,113 | |||||||||
| Mississippi Business Finance Corp. Revenue, 3.20%, 9/1/28, Continuously Callable @100 | 4,000 | 4,211 | |||||||||
| Mississippi Hospital Equipment & Facilities Authority Revenue 5.00%, 9/1/24 | 10,000 | 11,425 | |||||||||
Series A-2, 0.65%, 9/1/36, (Put Date 9/1/21) (b) | 5,760 | 5,764 | |||||||||
23,513 | |||||||||||
See notes to financial statements.
15
| USAA Mutual Funds Trust USAA Tax Exempt Short-Term Fund | Schedule of Portfolio Investments — continued March 31, 2021 | ||||||
(Amounts in Thousands, Except for Shares)
Security Description | Principal Amount | Value | |||||||||
Montana (0.8%): | |||||||||||
City of Forsyth Revenue, 2.00%, 8/1/23 | $ | 6,000 | $ | 6,189 | |||||||
| Montana State Board of Regents Revenue, Series F, 0.50% (MUNIPSA+45bps), 11/15/35, (Put Date 9/1/23) (b) (j) | 3,075 | 3,047 | |||||||||
9,236 | |||||||||||
Nevada (0.4%): | |||||||||||
County of Washoe Revenue, Series B, 3.00%, 3/1/36, (Put Date 6/1/22) (b) | 4,400 | 4,533 | |||||||||
New Hampshire (0.1%): | |||||||||||
| New Hampshire Business Finance Authority Revenue 4.00%, 1/1/30, Continuously Callable @103 | 280 | 317 | |||||||||
4.00%, 1/1/31, Continuously Callable @103 | 295 | 331 | |||||||||
648 | |||||||||||
New Jersey (7.9%): | |||||||||||
| Casino Reinvestment Development Authority Revenue (INS — Assured Guaranty Municipal Corp.), 5.00%, 11/1/24 | 1,000 | 1,127 | |||||||||
| City of Newark, GO 3.50%, 7/27/21 | 3,532 | 3,568 | |||||||||
Series B, 2.00%, 10/5/21 | 1,160 | 1,170 | |||||||||
Series C, 2.00%, 10/5/21 | 4,200 | 4,237 | |||||||||
| New Jersey Building Authority Revenue Series A, 3.00%, 6/15/23 | 600 | 634 | |||||||||
Series A, 3.00%, 6/15/23 | 400 | 425 | |||||||||
Series A, 5.00%, 6/15/24 | 2,405 | 2,738 | |||||||||
Series A, 5.00%, 6/15/24 | 1,595 | 1,833 | |||||||||
| New Jersey Economic Development Authority Revenue 5.00%, 6/15/21 | 7,000 | 7,064 | |||||||||
Series BBB, 5.00%, 6/15/23 | 7,000 | 7,701 | |||||||||
Series XX, 5.00%, 6/15/22 (f) | 20,000 | 21,110 | |||||||||
| New Jersey Economic Development Authority Revenue (LOC — Valley National Bank), 0.35%, 3/1/31, Continuously Callable @100 (c) | 1,390 | 1,390 | |||||||||
| New Jersey Educational Facilities Authority Revenue Series B, 5.00%, 9/1/22 | 4,735 | 5,044 | |||||||||
Series B, 5.00%, 9/1/23 | 4,000 | 4,435 | |||||||||
Series B, 4.00%, 9/1/24 | 4,730 | 5,259 | |||||||||
| New Jersey Transportation Trust Fund Authority Revenue 5.00%, 6/15/24 | 5,095 | 5,802 | |||||||||
1.25% (MUNIPSA+120bps), 6/15/34, (Put Date 12/15/21) (b) (j) | 10,000 | 10,080 | |||||||||
Series AA, 5.00%, 6/15/22 | 1,500 | 1,583 | |||||||||
Series AA, 5.00%, 6/15/23 | 3,835 | 4,220 | |||||||||
State of New Jersey, GO, Series A, 4.00%, 6/1/31 | 3,000 | 3,673 | |||||||||
Tobacco Settlement Financing Corp. Revenue, Series B, 3.20%, 6/1/27 | 1,145 | 1,189 | |||||||||
Township of Weehawken, GO, 1.25%, 12/30/21 | 2,412 | 2,421 | |||||||||
96,703 | |||||||||||
New Mexico (1.5%): | |||||||||||
City of Farmington Revenue | |||||||||||
1.88%, 4/1/33, (Put Date 10/1/21) (b) | 6,000 | 6,045 | |||||||||
2.13%, 6/1/40, (Put Date 6/1/22) (b) | 2,000 | 2,041 | |||||||||
Series A, 0.14%, 6/1/40, Callable 5/3/21 @ 100 (c) | 4,000 | 4,000 | |||||||||
See notes to financial statements.
16
| USAA Mutual Funds Trust USAA Tax Exempt Short-Term Fund | Schedule of Portfolio Investments — continued March 31, 2021 | ||||||
(Amounts in Thousands, Except for Shares)
Security Description | Principal Amount | Value | |||||||||
| New Mexico Hospital Equipment Loan Council Revenue 5.00%, 6/1/21 | $ | 225 | $ | 227 | |||||||
5.00%, 6/1/22 | 445 | 468 | |||||||||
5.00%, 6/1/27 | 770 | 943 | |||||||||
5.00%, 6/1/28 | 780 | 973 | |||||||||
5.00%, 6/1/29 | 835 | 1,056 | |||||||||
5.00%, 6/1/30 | 525 | 673 | |||||||||
5.00%, 6/1/31, Continuously Callable @100 | 690 | 883 | |||||||||
| Village of Los Ranchos de Albuquerque Revenue 5.00%, 9/1/28 | 840 | 1,031 | |||||||||
5.00%, 9/1/31, Continuously Callable @100 | 300 | 376 | |||||||||
18,716 | |||||||||||
New York (9.4%): | |||||||||||
City of Elmira, GO, 4.00%, 5/27/21 | 790 | 791 | |||||||||
City of Long Beach, GO, Series A, 0.63%, 2/22/22, Continuously Callable @100 | 9,335 | 9,355 | |||||||||
| City of New York, GO 0.21%, 10/1/46, Continuously Callable @100 (c) | 8,700 | 8,700 | |||||||||
Series 2, 0.21%, 4/1/42, Continuously Callable @100 (c) | 4,000 | 4,000 | |||||||||
Series 3, 0.21%, 4/1/42, Continuously Callable @100 (c) | 2,000 | 2,000 | |||||||||
| City of Poughkeepsie, GO 4.00%, 10/15/21 (e) | 100 | 101 | |||||||||
4.00%, 4/15/22 (e) | 130 | 133 | |||||||||
4.00%, 4/15/23 (e) | 135 | 142 | |||||||||
4.00%, 4/15/24 (e) | 140 | 150 | |||||||||
4.00%, 4/15/25 (e) | 215 | 232 | |||||||||
4.00%, 4/15/26 (e) | 230 | 251 | |||||||||
| County of Rockland, GO (INS — Assured Guaranty Municipal Corp.) Series A, 5.00%, 3/1/23 | 2,500 | 2,724 | |||||||||
Series A, 5.00%, 3/1/24 | 1,600 | 1,811 | |||||||||
County of Suffolk, GO, Series I, 2.00%, 7/22/21 | 4,000 | 4,015 | |||||||||
| Long Island Power Authority Revenue Series B, 1.65%, 9/1/49, (Put Date 9/1/24) (b) | 4,500 | 4,656 | |||||||||
Series C, 0.83% (LIBOR01M+75bps), 5/1/33, (Put Date 10/1/23) (b) (j) | 4,000 | 3,984 | |||||||||
Series C, 0.83% (LIBOR01M+75bps), 5/1/33, (Put Date 10/1/23) (b) (j) | 5,000 | 4,929 | |||||||||
| Metropolitan Transportation Authority Revenue 0.55% (MUNIPSA+50bps), 11/15/42, (Put Date 3/1/22) (b) (j) | 10,000 | 9,958 | |||||||||
Series 2, 0.85% (SOFR+80bps) 11/1/32, (Put Date 4/1/26) (b) (e) (j) | 2,000 | 2,000 | |||||||||
Series A-1, 5.00%, 2/1/23 | 8,050 | 8,659 | |||||||||
Series A-2, 5.00%, 11/15/45, (Put Date 5/15/30) (b) | 1,830 | 2,309 | |||||||||
Series B-1, 5.00%, 5/15/22 | 3,155 | 3,304 | |||||||||
Series D-2, 0.50% (MUNIPSA+45bps), 11/15/44, (Put Date 11/15/22) (b) (j) | 8,000 | 7,967 | |||||||||
Monroe County Industrial Development Corp. Revenue, 5.00%, 12/1/21 | 525 | 541 | |||||||||
| New York Liberty Development Corp. Revenue 2.63%, 9/15/69, Continuously Callable @100 | 1,650 | 1,667 | |||||||||
2.80%, 9/15/69, Continuously Callable @100 | 14,950 | 14,465 | |||||||||
| New York Liberty Development Corp. Revenue (LIQ — Royal Bank of Canada), Series 2016-ZF0464, 0.09%, 5/15/21 (c) (d) | 2,000 | 2,000 | |||||||||
| New York State Dormitory Authority Revenue 5.00%, 12/1/24 (d) | 1,200 | 1,365 | |||||||||
5.00%, 12/1/25 (d) | 1,200 | 1,400 | |||||||||
See notes to financial statements.
17
| USAA Mutual Funds Trust USAA Tax Exempt Short-Term Fund | Schedule of Portfolio Investments — continued March 31, 2021 | ||||||
(Amounts in Thousands, Except for Shares)
Security Description | Principal Amount | Value | |||||||||
| New York State Housing Finance Agency Revenue (LIQ — Deutsche Bank A.G.), Series DBE-DBE-8073, 0.58%, 8/1/50, Continuously Callable @100 (c) (d) | $ | 5,000 | $ | 5,000 | |||||||
| Niagara Area Development Corp. Revenue, Series B, 3.50%, 11/1/24, Continuously Callable @100 (d) | 500 | 519 | |||||||||
Town of Watertown, GO, 3.50%, 4/15/21 | 3,170 | 3,173 | |||||||||
| Troy Capital Resource Corp. Revenue 5.00%, 8/1/26, Continuously Callable @100 | 1,050 | 1,248 | |||||||||
5.00%, 9/1/27 | 1,250 | 1,540 | |||||||||
115,089 | |||||||||||
North Carolina (0.7%): | |||||||||||
| Columbus County Industrial Facilities & Pollution Control Financing Authority Revenue 2.00%, 11/1/33, (Put Date 10/1/24) (b) | 825 | 866 | |||||||||
2.00%, 11/1/33, (Put Date 10/1/24) (b) | 825 | 867 | |||||||||
Series A, 1.37%, 5/1/34, (Put Date 6/16/25) (b) | 2,000 | 2,059 | |||||||||
| North Carolina Medical Care Commission Revenue 2.50%, 10/1/24, Continuously Callable @100 | 745 | 740 | |||||||||
2.30%, 9/1/25, Continuously Callable @100 | 1,250 | 1,252 | |||||||||
2.88%, 10/1/26, Continuously Callable @100 | 650 | 650 | |||||||||
Series A, 4.00%, 10/1/27 | 600 | 688 | |||||||||
Series B-1, 2.55%, 9/1/26, Continuously Callable @100 | 1,575 | 1,577 | |||||||||
8,699 | |||||||||||
Ohio (2.3%): | |||||||||||
| Akron Bath Copley Joint Township Hospital District Revenue 5.00%, 11/15/29 | 275 | 349 | |||||||||
5.00%, 11/15/30 | 350 | 449 | |||||||||
5.00%, 11/15/31, Continuously Callable @100 | 300 | 384 | |||||||||
| County of Allen Hospital Facilities Revenue, 5.00%, 12/1/30, Continuously Callable @100 | 2,000 | 2,648 | |||||||||
County of Hamilton Revenue, 5.00%, 9/15/29 | 1,345 | 1,719 | |||||||||
| Ohio Air Quality Development Authority Revenue 1.90%, 5/1/26, (Put Date 10/1/24) (b) | 3,500 | 3,640 | |||||||||
2.40%, 12/1/38, (Put Date 10/1/29) (b) | 3,250 | 3,379 | |||||||||
| Ohio Higher Educational Facility Commission Revenue 5.00%, 5/1/21 | 1,000 | 1,003 | |||||||||
5.00%, 5/1/22 | 500 | 525 | |||||||||
5.00%, 5/1/23 | 550 | 603 | |||||||||
5.00%, 5/1/24 | 1,000 | 1,137 | |||||||||
| Ohio Water Development Authority Revenue 1.55%, 7/1/21 | 1,800 | 1,804 | |||||||||
6/1/33 (h) (i) | 5,000 | — | |||||||||
| Port of Greater Cincinnati Development Authority Revenue, Series A, 3.00%, 5/1/23, Continuously Callable @100 | 4,765 | 4,751 | |||||||||
| Southeastern Ohio Port Authority Revenue 5.00%, 12/1/21 | 1,150 | 1,173 | |||||||||
5.00%, 12/1/25, Continuously Callable @100 | 1,000 | 1,104 | |||||||||
| State of Ohio Revenue 5.00%, 11/15/27 | 425 | 525 | |||||||||
5.00%, 11/15/30 | 710 | 917 | |||||||||
See notes to financial statements.
18
| USAA Mutual Funds Trust USAA Tax Exempt Short-Term Fund | Schedule of Portfolio Investments — continued March 31, 2021 | ||||||
(Amounts in Thousands, Except for Shares)
Security Description | Principal Amount | Value | |||||||||
5.00%, 11/15/31, Continuously Callable @100 | $ | 465 | $ | 599 | |||||||
Series A, 5.00%, 1/15/30 | 1,000 | 1,293 | |||||||||
28,002 | |||||||||||
Oklahoma (3.0%): | |||||||||||
| Garfield County Industrial Authority Revenue, Series A, 0.22%, 1/1/25, Callable 5/5/21 @ 100 (c) (f) | 3,100 | 3,100 | |||||||||
| Muskogee Industrial Trust Revenue 4.00%, 9/1/28 | 2,500 | 2,898 | |||||||||
4.00%, 9/1/29 | 3,010 | 3,511 | |||||||||
Series A, 0.22%, 6/1/27, Continuously Callable @100 (c) | 21,590 | 21,590 | |||||||||
| Oklahoma Development Finance Authority Revenue Series B, 5.00%, 8/15/23 | 500 | 553 | |||||||||
Series B, 5.00%, 8/15/24 | 600 | 688 | |||||||||
Series B, 5.00%, 8/15/25 | 550 | 649 | |||||||||
| Oklahoma Municipal Power Authority Revenue, Series A, 0.44% (MUNIPSA+39bps), 1/1/23 (j) | 3,135 | 3,143 | |||||||||
36,132 | |||||||||||
Oregon (0.2%): | |||||||||||
| County of Yamhill Revenue 4.00%, 10/1/21 | 330 | 335 | |||||||||
4.00%, 10/1/22 | 555 | 578 | |||||||||
4.00%, 10/1/23 | 425 | 453 | |||||||||
4.00%, 10/1/24 | 425 | 461 | |||||||||
| Oregon State Facilities Authority Revenue Series A, 5.00%, 10/1/28 | 150 | 188 | |||||||||
Series A, 5.00%, 10/1/29 | 300 | 382 | |||||||||
Series A, 5.00%, 10/1/30 | 300 | 388 | |||||||||
2,785 | |||||||||||
Pennsylvania (6.9%): | |||||||||||
Chester County IDA Revenue, 3.75%, 10/1/24 | 485 | 509 | |||||||||
| Coatesville School District, GO (INS — Assured Guaranty Municipal Corp.) 5.00%, 8/1/24 | 1,000 | 1,174 | |||||||||
5.00%, 8/1/25 | 800 | 946 | |||||||||
Commonwealth Financing Authority Revenue, 5.00%, 6/1/26 | 2,000 | 2,409 | |||||||||
| County of Lehigh Revenue 5.00%, 7/1/28 | 1,750 | 2,235 | |||||||||
5.00%, 7/1/29 | 2,000 | 2,595 | |||||||||
| Delaware County Authority Revenue 4.00%, 10/1/21 | 180 | 182 | |||||||||
4.00%, 10/1/22 | 200 | 208 | |||||||||
5.00%, 10/1/23 | 235 | 256 | |||||||||
5.00%, 10/1/24 | 505 | 563 | |||||||||
5.00%, 10/1/25 | 525 | 597 | |||||||||
5.00%, 10/1/30 | 1,200 | 1,424 | |||||||||
| Geisinger Authority Revenue 1.14% (LIBOR01M+107bps), 6/1/28, (Put Date 6/1/24) (b) (j) | 7,000 | 7,114 | |||||||||
5.00%, 4/1/43, (Put Date 4/1/30) (b) (j) | 4,250 | 5,495 | |||||||||
See notes to financial statements.
19
| USAA Mutual Funds Trust USAA Tax Exempt Short-Term Fund | Schedule of Portfolio Investments — continued March 31, 2021 | ||||||
(Amounts in Thousands, Except for Shares)
Security Description | Principal Amount | Value | |||||||||
| General Authority of Southcentral Pennsylvania Revenue, 0.65% (MUNIPSA+60bps), 6/1/49, (Put Date 6/1/24) (b) (j) | $ | 6,000 | $ | 6,045 | |||||||
| Hospitals & Higher Education Facilities Authority of Philadelphia Revenue, 5.00%, 7/1/22 | 1,595 | 1,663 | |||||||||
| Luzerne County IDA Revenue (INS — Assured Guaranty Municipal Corp.) 5.00%, 12/15/25 | 550 | 649 | |||||||||
5.00%, 12/15/26, Continuously Callable @100 | 500 | 589 | |||||||||
5.00%, 12/15/27, Continuously Callable @100 | 1,000 | 1,177 | |||||||||
| Montgomery County Higher Education & Health Authority Revenue, 0.77% (MUNIPSA+72bps), 9/1/51, (Put Date 9/1/23) (b) | 6,250 | 6,250 | |||||||||
| Northampton County General Purpose Authority Revenue, 1.12% (LIBOR01M+104bps), 8/15/48, (Put Date 8/15/24) (b) (j) | 1,855 | 1,824 | |||||||||
| Pennsylvania Higher Educational Facilities Authority Revenue, Series A, 5.00%, 7/15/21 | 1,090 | 1,102 | |||||||||
| Pennsylvania Turnpike Commission Revenue, Series B-1, 1.03% (MUNIPSA+98bps), 12/1/21, Callable 6/1/21 @ 100 (j) | 6,500 | 6,543 | |||||||||
| Philadelphia IDA Revenue 5.00%, 6/15/28 (d) | 210 | 245 | |||||||||
5.00%, 6/15/29, Continuously Callable @100 (d) | 220 | 255 | |||||||||
5.00%, 6/15/30, Continuously Callable @100 (d) | 145 | 168 | |||||||||
| Pittsburgh Water & Sewer Authority Revenue, Series C, 0.70% (MUNIPSA+65bps), 9/1/40, (Put Date 12/1/23) (b) (j) | 7,500 | 7,575 | |||||||||
| School District of Philadelphia, GO Series D, 5.00%, 9/1/21 | 5,000 | 5,094 | |||||||||
Series D, 5.00%, 9/1/22 | 5,500 | 5,853 | |||||||||
| Scranton School District, GO 0.93% (LIBOR01M+85bps), 4/1/31, (Put Date 4/1/21) (b) (j) | 6,975 | 6,995 | |||||||||
Series A, 5.00%, 6/1/23 | 2,435 | 2,650 | |||||||||
| The Berks County Municipal Authority Revenue, Series B, 5.00%, 2/1/40, (Put Date 2/1/30) (b) | 1,700 | 1,871 | |||||||||
| West Mifflin School District, GO (INS — Assured Guaranty Municipal Corp.), 5.00%, 10/1/21 | 1,570 | 1,605 | |||||||||
| Westmoreland County IDA Revenue Series A, 4.00%, 7/1/21 | 225 | 227 | |||||||||
Series A, 4.00%, 7/1/22 | 300 | 313 | |||||||||
84,400 | |||||||||||
South Carolina (0.8%): | |||||||||||
| Patriots Energy Group Financing Agency Revenue, Series B, 0.94% (LIBOR01M+86bps), 10/1/48, (Put Date 2/1/24) (b) (j) | 10,000 | 10,170 | |||||||||
South Dakota (0.4%): | |||||||||||
| South Dakota Health & Educational Facilities Authority Revenue 0.43%, 11/1/25, Continuously Callable @100 (c) | 1,505 | 1,505 | |||||||||
0.43%, 11/1/27, Continuously Callable @100 (c) | 2,975 | 2,975 | |||||||||
4,480 | |||||||||||
Tennessee (0.3%): | |||||||||||
| Chattanooga Health Educational & Housing Facility Board Revenue, Series C, 0.12%, 5/1/39, Continuously Callable @100 (c) (f) | 3,100 | 3,100 | |||||||||
See notes to financial statements.
20
| USAA Mutual Funds Trust USAA Tax Exempt Short-Term Fund | Schedule of Portfolio Investments — continued March 31, 2021 | ||||||
(Amounts in Thousands, Except for Shares)
Security Description | Principal Amount | Value | |||||||||
Texas (6.5%): | |||||||||||
| Austin Convention Enterprises, Inc. Revenue 5.00%, 1/1/25 | $ | 400 | $ | 403 | |||||||
5.00%, 1/1/27 | 400 | 401 | |||||||||
| Decatur Hospital Authority Revenue Series A, 5.00%, 9/1/21 | 700 | 712 | |||||||||
Series A, 5.00%, 9/1/24 | 780 | 881 | |||||||||
| Harris County Cultural Education Facilities Finance Corp. Revenue 5.00%, 7/1/49, (Put Date 12/1/26) (b) | 1,400 | 1,717 | |||||||||
0.62% (MUNIPSA+57bps), 12/1/49, (Put Date 12/4/24) (b) (j) | 1,670 | 1,642 | |||||||||
| Harris County Municipal Utility District No. 165, GO (INS — Build America Mutual Assurance Co.) 3.00%, 3/1/22 | 650 | 664 | |||||||||
3.00%, 3/1/23 | 520 | 543 | |||||||||
| Irving Hospital Authority Revenue, 1.15% (MUNIPSA+110bps), 10/15/44, (Put Date 10/15/23) (b) (j) | 1,665 | 1,665 | |||||||||
Karnes County Hospital District Revenue, 5.00%, 2/1/24 | 1,885 | 2,051 | |||||||||
Matagorda County Navigation District No. 1 Revenue, 2.60%, 11/1/29 | 4,000 | 4,258 | |||||||||
| New Hope Cultural Education Facilities Finance Corp. Revenue Series A, 5.00%, 7/1/23 | 1,250 | 1,062 | |||||||||
Series A, 5.00%, 7/1/24 | 2,300 | 1,955 | |||||||||
Series A, 5.00%, 7/1/25 | 2,135 | 1,815 | |||||||||
| Port of Port Arthur Navigation District Revenue 0.16%, 11/1/40, Continuously Callable @100 (c) (f) | 38,675 | 38,675 | |||||||||
Series A, 0.08%, 4/1/40, Continuously Callable @100 (c) | 8,600 | 8,600 | |||||||||
Series B, 0.08%, 4/1/40, Continuously Callable @100 (c) | 4,800 | 4,800 | |||||||||
Series C, 0.10%, 4/1/40, Continuously Callable @100 (c) | 1,100 | 1,100 | |||||||||
| Texas Municipal Gas Acquisition & Supply Corp. III Revenue 5.00%, 12/15/21 | 2,000 | 2,065 | |||||||||
5.00%, 12/15/32 | 1,000 | 1,324 | |||||||||
| Texas Private Activity Bond Surface Transportation Corp. Revenue, 4.00%, 6/30/31, Continuously Callable @100 | 2,355 | 2,783 | |||||||||
79,116 | |||||||||||
Utah (0.5%): | |||||||||||
| Utah Housing Corp. Revenue (LIQ — Deutsche Bank A.G.), Series 2019-XF1081, 0.35%, 3/1/62, Callable 2/1/31 @ 100 (c) (d) | 6,565 | 6,565 | |||||||||
Vermont (1.0%): | |||||||||||
Winooski School District, GO, 1.25%, 10/15/21 | 12,500 | 12,535 | |||||||||
Virginia (1.1%): | |||||||||||
| Albermarle County Economic Development Authority Revenue, Series B, 0.06%, 10/1/48, Continuously Callable @100 (c) | 1,750 | 1,750 | |||||||||
Chesapeake Bay Bridge & Tunnel District Revenue, 5.00%, 11/1/23 | 5,140 | 5,730 | |||||||||
Marquis Community Development Authority Revenue, 9/1/45 (d) (h) (k) | 1,074 | 561 | |||||||||
| Marquis Community Development Authority Tax Allocation Series A, 3.32%, 9/1/36 (h) | 3,506 | 1,683 | |||||||||
Series C, 9/1/41 (g) (h) | 5,111 | 235 | |||||||||
Prince William County IDA Revenue, 5.00%, 1/1/31, Continuously Callable @102 | 1,700 | 1,762 | |||||||||
See notes to financial statements.
21
| USAA Mutual Funds Trust USAA Tax Exempt Short-Term Fund | Schedule of Portfolio Investments — continued March 31, 2021 | ||||||
(Amounts in Thousands, Except for Shares)
Security Description | Principal Amount | Value | |||||||||
| Virginia Small Business Financing Authority Revenue Series A, 5.00%, 1/1/22 | $ | 370 | $ | 382 | |||||||
Series A, 5.00%, 1/1/31, Continuously Callable @103 | 1,250 | 1,532 | |||||||||
13,635 | |||||||||||
Washington (1.2%): | |||||||||||
| Washington Health Care Facilities Authority Revenue 5.00%, 8/15/26 | 2,000 | 2,390 | |||||||||
5.00%, 8/15/27 | 2,175 | 2,652 | |||||||||
Series B-2, 1.45% (MUNIPSA+140bps), 1/1/35, (Put Date 1/1/25) (b) (j) | 10,000 | 10,161 | |||||||||
15,203 | |||||||||||
Wisconsin (1.7%): | |||||||||||
| Public Finance Authority Revenue 4.00%, 9/1/24 (d) | 1,140 | 1,193 | |||||||||
3.25%, 1/1/30 | 1,795 | 1,964 | |||||||||
5.00%, 4/1/30 (d) | 500 | 592 | |||||||||
| Wisconsin Health & Educational Facilities Authority Revenue 2.25%, 11/1/26, Continuously Callable @100 | 3,000 | 3,001 | |||||||||
2.55%, 11/1/27, Continuously Callable @100 | 1,500 | 1,501 | |||||||||
4.00%, 3/15/30 | 400 | 456 | |||||||||
0.18%, 2/15/53, Callable 5/3/21 @ 100 (c) | 6,500 | 6,500 | |||||||||
0.70% (MUNIPSA+65bps), 8/15/54, (Put Date 7/31/24) (b) (j) | 1,700 | 1,720 | |||||||||
Series B-2, 5.00%, 2/15/51, (Put Date 2/15/27) (b) | 2,000 | 2,401 | |||||||||
Series C, 5.00%, 8/15/21 | 1,200 | 1,220 | |||||||||
20,548 | |||||||||||
Total Municipal Bonds (Cost $1,188,859) | 1,216,813 | ||||||||||
Total Investments (Cost $1,190,011) — 99.6% | 1,218,057 | ||||||||||
Other assets in excess of liabilities — 0.4% | 4,582 | ||||||||||
NET ASSETS — 100.00% | $ | 1,222,639 | |||||||||
(a) Non-income producing security.
(b) Put Bond.
(c) Variable Rate Demand Notes that provide the rights to sell the security at face value on either that day or within the rate-reset period. The interest rate is reset on the put date at a stipulated daily, weekly, monthly, quarterly, or other specified time interval to reflect current market conditions. These securities do not indicate a reference rate and spread in their description.
(d) Rule 144A security or other security that is restricted as to resale to institutional investors. The Fund's Adviser has deemed this security to be liquid based upon procedures approved by the Board of Trustees. As of March 31, 2021, the fair value of these securities was $109,008 (thousands) and amounted to 8.9% of net assets.
(e) Security or portion of security purchased on a delayed-delivery and/or when-issued basis.
(f) All or a portion of this security has been segregated as collateral for securities purchased on a when-issued basis.
(g) Zero-coupon bond.
See notes to financial statements.
22
| USAA Mutual Funds Trust USAA Tax Exempt Short-Term Fund | Schedule of Portfolio Investments — continued March 31, 2021 | ||||||
(h) Security was fair valued based upon procedures approved by the Board of Trustees and represents 0.2% of the Fund's net assets as of March 31, 2021. This security is classified as Level 3 within the fair value hierarchy. (See Note 2 in the Notes to Financial Statements)
(i) The Fund's Adviser has deemed this security to be illiquid based upon procedures approved by the Board of Trustees. As of March 31, 2021, illiquid securities were 0.0% of the Fund's net assets.
(j) Variable or Floating-Rate Security. Rate disclosed is as of March 31, 2021.
(k) Stepped-coupon security converts to coupon form on 9/1/21 with a rate of 7.50%
bps — Basis points
Continuously callable — Investment is continuously callable or will be continuously callable on any date after the first call date until its maturity.
GO — General Obligation
IDA — Industrial Development Authority
LIBOR — London InterBank Offered Rate
LIBOR01M — 1 Month US Dollar LIBOR, rate disclosed as of March 31, 2021, based on the last reset date of the security
LOC — Letter of Credit
MUNIPSA — Municipal Swap Index
SOFR — Secured Overnight Financing Rate
Credit Enhancements — Adds the financial strength of the provider of the enhancement to support the issuer's ability to repay the principal and interest payments when due. The enhancement may be provided by a high-quality bank, insurance company or other corporation, or a collateral trust. The enhancements do not guarantee the market values of the securities.
INS Principal and interest payments are insured by the name listed. Although bond insurance reduces the risk of loss due to default by an issuer, such bonds remain subject to the risk that value may fluctuate for other reasons, and there is no assurance that the insurance company will meet its obligations.
LIQ Liquidity enhancement that may, under certain circumstances, provide for repayment of principal and interest upon demand from the name listed.
LOC Principal and interest payments are guaranteed by a bank letter of credit or other bank credit agreement.
NBGA Principal and interest payments or, under certain circumstances, underlying mortgages are guaranteed by a nonbank guarantee agreement from the name listed.
See notes to financial statements.
23
USAA Mutual Funds Trust | Statement of Assets and Liabilities March 31, 2021 | ||||||
(Amounts in Thousands, Except Per Share Amounts)
| USAA Tax Exempt Short-Term Fund | |||||||
Assets: | |||||||
Investments, at value (Cost $1,190,011) | $ | 1,218,057 | |||||
Cash | 3,675 | ||||||
Receivables: | |||||||
Dividends and interest | 7,535 | ||||||
Capital shares issued | 232 | ||||||
From Adviser | 24 | ||||||
Prepaid expenses and other assets | 27 | ||||||
Total Assets | 1,229,550 | ||||||
Liabilities: | |||||||
Payables: | |||||||
Distributions | 169 | ||||||
Investments purchased | 5,009 | ||||||
Capital shares redeemed | 1,021 | ||||||
Accrued expenses and other payables: | |||||||
Investment advisory fees | 346 | ||||||
Administration fees | 155 | ||||||
Custodian fees | 8 | ||||||
Transfer agent fees | 119 | ||||||
Compliance fees | 1 | ||||||
Trustees' fees | — | (a) | |||||
| 12b-1 fees | 2 | ||||||
Other accrued expenses | 81 | ||||||
Total Liabilities | 6,911 | ||||||
Net Assets: | |||||||
Capital | 1,221,040 | ||||||
Total accumulated earnings/(loss) | 1,599 | ||||||
Net Assets | $ | 1,222,639 | |||||
Net Assets | |||||||
Fund Shares | $ | 1,181,011 | |||||
Institutional Shares | 25,038 | ||||||
Class A | 16,590 | ||||||
Total | $ | 1,222,639 | |||||
Shares (unlimited number of shares authorized with no par value): | |||||||
Fund Shares | 111,085 | ||||||
Institutional Shares | 2,354 | ||||||
Class A | 1,559 | ||||||
Total | 114,998 | ||||||
Net asset value, offering and redemption price per share: (b) | |||||||
Fund Shares | $ | 10.63 | |||||
Institutional Shares | $ | 10.64 | |||||
Class A | $ | 10.64 | |||||
Maximum Sales Charge — Class A | 2.25 | % | |||||
| Maximum offering price (100%/(100%-maximum sales charge) of net asset value adjusted to the nearest cent) per share — Class A | $ | 10.88 | |||||
(a) Rounds to less than $1 thousand.
(b) Per share amount may not recalculate due to rounding of net assets and/or shares outstanding.
See notes to financial statements.
24
USAA Mutual Funds Trust | Statement of Operations For the Year Ended March 31, 2021 | ||||||
(Amounts in Thousands)
| USAA Tax Exempt Short-Term Fund | |||||||
Investment Income: | |||||||
Interest | $ | 23,492 | |||||
Total Income | 23,492 | ||||||
Expenses: | |||||||
Investment advisory fees | 3,745 | ||||||
Administration fees — Fund Shares | 1,818 | ||||||
Administration fees — Institutional Shares (a) | 8 | ||||||
Administration fees — Class A | 24 | ||||||
Sub-Administration fees | 20 | ||||||
| 12b-1 fees — Class A | 40 | ||||||
Custodian fees | 43 | ||||||
Transfer agent fees — Fund Shares | 674 | ||||||
Transfer agent fees — Institutional Shares (a) | 8 | ||||||
Transfer agent fees — Class A | 14 | ||||||
Trustees' fees | 47 | ||||||
Compliance fees | 8 | ||||||
Legal and audit fees | 81 | ||||||
State registration and filing fees | 53 | ||||||
Interfund lending fees | — | (b) | |||||
Other expenses | 137 | ||||||
Total Expenses | 6,720 | ||||||
Expenses waived/reimbursed by Adviser | (107 | ) | |||||
Net Expenses | 6,613 | ||||||
Net Investment Income (Loss) | 16,879 | ||||||
Realized/Unrealized Gains (Losses) from Investments: | |||||||
Net realized gains (losses) from investment securities | (332 | ) | |||||
Net change in unrealized appreciation/depreciation on investment securities | 36,891 | ||||||
Net realized/unrealized gains (losses) on investments | 36,559 | ||||||
Change in net assets resulting from operations | $ | 53,438 | |||||
(a) Institutional Shares commenced operations on June 29, 2020.
(b) Rounds to less than $1 thousand.
See notes to financial statements.
25
USAA Mutual Funds Trust | Statements of Changes in Net Assets | ||||||
(Amounts in Thousands)
| USAA Tax Exempt Short-Term Fund | |||||||||||
| Year Ended March 31, 2021 | Year Ended March 31, 2020 | ||||||||||
From Investments: | |||||||||||
Operations: | |||||||||||
Net investment income (loss) | $ | 16,879 | $ | 25,176 | |||||||
Net realized gains (losses) from investments | (332 | ) | (2,484 | ) | |||||||
| Net change in unrealized appreciation/depreciation on investments | 36,891 | (17,785 | ) | ||||||||
Change in net assets resulting from operations | 53,438 | 4,907 | |||||||||
Distributions to Shareholders: | |||||||||||
Fund Shares | (16,599 | ) | (24,970 | ) | |||||||
Institutional Shares (a) | (106 | ) | — | ||||||||
Class A | (181 | ) | (167 | ) | |||||||
Change in net assets resulting from distributions to shareholders | (16,886 | ) | (25,137 | ) | |||||||
Change in net assets resulting from capital transactions | (95,956 | ) | (198,223 | ) | |||||||
Change in net assets | (59,404 | ) | (218,453 | ) | |||||||
Net Assets: | |||||||||||
Beginning of period | 1,282,043 | 1,500,496 | |||||||||
End of period | $ | 1,222,639 | $ | 1,282,043 | |||||||
(a) Institutional Shares commenced operations on June 29, 2020.
(continues on next page)
See notes to financial statements.
26
USAA Mutual Funds Trust | Statements of Changes in Net Assets | ||||||
(Amounts in Thousands) (continued)
| USAA Tax Exempt Short-Term Fund | |||||||||||
| Year Ended March 31, 2021 | Year Ended March 31, 2020 | ||||||||||
Capital Transactions: | |||||||||||
Fund Shares | |||||||||||
Proceeds from shares issued | $ | 163,202 | $ | 175,721 | |||||||
Distributions reinvested | 13,673 | 19,688 | |||||||||
Cost of shares redeemed | (303,776 | ) | (393,239 | ) | |||||||
Total Fund Shares | $ | (126,901 | ) | $ | (197,830 | ) | |||||
Institutional Shares (a) | |||||||||||
Proceeds from shares issued | $ | 30,936 | $ | — | |||||||
Distributions reinvested | 52 | — | |||||||||
Cost of shares redeemed | (6,031 | ) | — | ||||||||
Total Institutional Shares | $ | 24,957 | $ | — | |||||||
Class A | |||||||||||
Proceeds from shares issued | $ | 31,132 | $ | 15,776 | |||||||
Distributions reinvested | 163 | 127 | |||||||||
Cost of shares redeemed | (25,307 | ) | (16,296 | ) | |||||||
Total Class A | $ | 5,988 | $ | (393 | ) | ||||||
Change in net assets resulting from capital transactions | $ | (95,956 | ) | $ | (198,223 | ) | |||||
Share Transactions: | |||||||||||
Fund Shares | |||||||||||
Issued | 15,479 | 16,721 | |||||||||
Reinvested | 1,298 | 1,874 | |||||||||
Redeemed | (28,894 | ) | (37,505 | ) | |||||||
Total Fund Shares | (12,117 | ) | (18,910 | ) | |||||||
Institutional Shares (a) | |||||||||||
Issued | 2,918 | — | |||||||||
Reinvested | 5 | — | |||||||||
Redeemed | (569 | ) | — | ||||||||
Total Institutional Shares | 2,354 | — | |||||||||
Class A | |||||||||||
Issued | 2,966 | 1,497 | |||||||||
Reinvested | 15 | 12 | |||||||||
Redeemed | (2,403 | ) | (1,548 | ) | |||||||
Total Class A | 578 | (39 | ) | ||||||||
Change in Shares | (9,185 | ) | (18,949 | ) | |||||||
(a) Institutional Shares commenced operations on June 29, 2020.
See notes to financial statements.
27
USAA Mutual Funds Trust | Financial Highlights | ||||||
For a Share Outstanding Throughout Each Period
Investment Activities | Distributions to Shareholders From | ||||||||||||||||||||||||||
| Net Asset Value, Beginning of Period | Net Investment Income (Loss) | Net Realized and Unrealized Gains (Losses) on Investments | Total from Investment Activities | Net Investment Income | Total Distributions | ||||||||||||||||||||||
USAA Tax Exempt Short-Term Fund | |||||||||||||||||||||||||||
Fund Shares | |||||||||||||||||||||||||||
| Year Ended March 31, 2021 | $ | 10.32 | 0.14 | (e) | 0.31 | 0.45 | (0.14 | ) | (0.14 | ) | |||||||||||||||||
| Year Ended March 31, 2020 | $ | 10.48 | 0.19 | (e) | (0.16 | ) | 0.03 | (0.19 | ) | (0.19 | ) | ||||||||||||||||
| Year Ended March 31, 2019 | $ | 10.41 | 0.19 | 0.07 | 0.26 | (0.19 | ) | (0.19 | ) | ||||||||||||||||||
| Year Ended March 31, 2018 | $ | 10.45 | 0.16 | (0.03 | ) | 0.13 | (0.17 | ) | (0.17 | ) | |||||||||||||||||
| Year Ended March 31, 2017 | $ | 10.59 | 0.15 | (0.14 | ) | 0.01 | (0.15 | ) | (0.15 | ) | |||||||||||||||||
Institutional Shares | |||||||||||||||||||||||||||
| June 29, 2020 (f) through March 31, 2021 | $ | 10.50 | 0.11 | (e) | 0.14 | 0.25 | (0.11 | ) | (0.11 | ) | |||||||||||||||||
Class A | |||||||||||||||||||||||||||
| Year Ended March 31, 2021 | $ | 10.34 | 0.12 | (e) | 0.30 | 0.42 | (0.12 | ) | (0.12 | ) | |||||||||||||||||
| Year Ended March 31, 2020 | $ | 10.49 | 0.16 | (e) | (0.15 | ) | 0.01 | (0.16 | ) | (0.16 | ) | ||||||||||||||||
| Year Ended March 31, 2019 | $ | 10.42 | 0.17 | 0.06 | 0.23 | (0.16 | ) | (0.16 | ) | ||||||||||||||||||
| Year Ended March 31, 2018 | $ | 10.46 | 0.13 | (0.03 | ) | 0.10 | (0.14 | ) | (0.14 | ) | |||||||||||||||||
| Year Ended March 31, 2017 | $ | 10.59 | 0.12 | (0.13 | ) | (0.01 | ) | (0.12 | ) | (0.12 | ) | ||||||||||||||||
* Assumes reinvestment of all net investment income and realized capital gain distributions, if any, during the period. Includes adjustments in accordance with U.S. Generally Accepted Accounting Principles and could differ from the Lipper reported return.
** For the period beginning July 1, 2019, the amount of any waivers or reimbursements and the amount of any recoupment is calculated without regard to the impact of any performance adjustment to the Fund's management fee.
^ The net expense ratio may not correlate to the applicable expense limits in place during the period since the current contractual expense limitation is applied for a period beginning July 1, 2019, and in effect through June 30, 2023, instead of coinciding with the Fund's fiscal year end. Details of the current contractual expense limitation in effect can be found in Note 4 of the accompanying Notes to Financial Statements.
(a) Not annualized for periods less than one year.
(b) Annualized for periods less than one year.
(c) Reflects total annual operating expenses for reductions of expenses paid indirectly for the March 31 fiscal year ended 2017. Expenses paid indirectly decreased the expense ratio by less than 0.01%.
See notes to financial statements.
28
USAA Mutual Funds Trust | Financial Highlights — continued | ||||||
For a Share Outstanding Throughout Each Period
Ratios to Average Net Assets | Supplemental Data | ||||||||||||||||||||||||||||||
| Net Asset Value, End of Period | Total Return (Excludes Sales Charge)*(a) | Net Expenses**^(b)(c) | Net Investment Income (Loss)(b) | Gross Expenses(b)(c) | Net Assets, End of Period (000's) | Portfolio Turnover(a)(d) | |||||||||||||||||||||||||
USAA Tax Exempt Short-Term Fund | |||||||||||||||||||||||||||||||
Fund Shares | |||||||||||||||||||||||||||||||
| Year Ended March 31, 2021 | $ | 10.63 | 4.42 | % | 0.53 | % | 1.37 | % | 0.54 | % | $ | 1,181,011 | 66 | % | |||||||||||||||||
| Year Ended March 31, 2020 | $ | 10.32 | 0.23 | % | 0.51 | % | 1.77 | % | 0.51 | % | $ | 1,271,899 | 54 | % | |||||||||||||||||
| Year Ended March 31, 2019 | $ | 10.48 | 2.52 | % | 0.52 | % | 1.84 | % | 0.52 | % | $ | 1,489,789 | 31 | % | |||||||||||||||||
| Year Ended March 31, 2018 | $ | 10.41 | 1.21 | % | 0.51 | % | 1.57 | % | 0.51 | % | $ | 1,550,994 | 25 | % | |||||||||||||||||
| Year Ended March 31, 2017 | $ | 10.45 | 0.09 | % | 0.54 | % | 1.43 | % | 0.54 | % | $ | 1,669,691 | 34 | % | |||||||||||||||||
Institutional Shares | |||||||||||||||||||||||||||||||
| June 29, 2020 (f) through March 31, 2021 | $ | 10.64 | 2.39 | % | 0.47 | % | 1.33 | % | 0.69 | % | $ | 25,038 | 66 | % | |||||||||||||||||
Class A | |||||||||||||||||||||||||||||||
| Year Ended March 31, 2021 | $ | 10.64 | 4.07 | % | 0.76 | % | 1.12 | % | 0.88 | % | $ | 16,590 | 66 | % | |||||||||||||||||
| Year Ended March 31, 2020 | $ | 10.34 | 0.09 | % | 0.75 | % | 1.54 | % | 0.93 | % | $ | 10,144 | 54 | % | |||||||||||||||||
| Year Ended March 31, 2019 | $ | 10.49 | 2.27 | % | 0.77 | %(g) | 1.56 | % | 0.92 | % | $ | 10,707 | 31 | % | |||||||||||||||||
| Year Ended March 31, 2018 | $ | 10.42 | 0.91 | % | 0.80 | % | 1.27 | % | 0.83 | % | $ | 11,349 | 25 | % | |||||||||||||||||
| Year Ended March 31, 2017 | $ | 10.46 | (0.08 | )% | 0.80 | % | 1.16 | % | 0.81 | % | $ | 32,191 | 34 | % | |||||||||||||||||
(d) Portfolio turnover is calculated on the basis of the Fund as a whole without distinguishing between the classes of shares.
(e) Per share net investment income (loss) has been calculated using the average daily shares method.
(f) Commencement of operations.
(g) Prior to August 1, 2018, USAA Asset Management Company ("AMCO") (previous Investment Adviser) had voluntarily agreed to limit the annual expenses of Class A to 0.80% of Class A average daily net assets.
See notes to financial statements.
29
USAA Mutual Funds Trust | Notes to Financial Statements March 31, 2021 | ||||||
1. Organization:
USAA Mutual Funds Trust (the "Trust") is organized as a Delaware statutory trust and is registered under the Investment Company Act of 1940, as amended (the "1940 Act"), as an open-end investment company. The Trust is comprised of 46 funds and is authorized to issue an unlimited number of shares, which are units of beneficial interest with no par value.
The accompanying financial statements are those of the USAA Tax Exempt Short-Term Fund (the "Fund"). The Fund offers three classes of shares: Fund Shares, Institutional Shares and Class A. The Fund is classified as diversified under the 1940 Act.
Effective June 29, 2020, the Institutional Shares commenced operations and the Fund's Adviser Shares were redesignated Class A and became subject to a front-end sales charge.
The Board of Trustees of USAA Mutual Funds Trust has approved the addition of Class Z for the Fund. This new share class was effective February 5, 2021, but has not yet been funded. Class Z is only available to participants in certain eligible separately managed accounts (also referred to as wrap fee programs) and other advisory clients of the Fund's Adviser or its affiliates that are subject to a separate contractual fee for investment management services. The Adviser has contractually agreed to waive its management fee and/or reimburse expenses so that the total annual operating expenses (excluding acquired fund fees and expenses, interest, taxes, brokerage commissions, capitalized expenses, and other extraordinary expenses) do not exceed 0.00% of the Fund's Class Z shares for an indefinite term.
Each class of shares of the Fund has substantially identical rights and privileges, except with respect to sales charges, fees paid under distribution plans, expenses allocable exclusively to each class of shares, voting rights on matters solely affecting a single class of shares, and the exchange privilege of each class of shares.
Under the Trust's organizational documents, its officers and trustees are indemnified against certain liabilities arising out of the performance of their duties to the Fund. In addition, in the normal course of business, the Fund enters into contracts with its vendors and others that provide for general indemnifications. The Fund's maximum exposure under these arrangements is unknown, as this would involve future claims that may be made against the Fund. However, based on experience, the Fund expects that risk of loss to be remote.
2. Significant Accounting Policies:
The following is a summary of significant accounting policies followed by the Trust in the preparation of its financial statements. The policies are in conformity with Generally Accepted Accounting Principles in the United States of America ("GAAP"). The preparation of financial statements in accordance with GAAP requires management to make estimates and assumptions that affect the reported amounts of assets and liabilities and disclosure of contingent assets and liabilities at the date of the financial statements and the reported amounts of income and expenses for the period. Actual results could differ from those estimates. The Fund follows the specialized accounting and reporting requirements under GAAP that are applicable to investment companies under Accounting Standards Codification Topic 946.
Investment Valuation:
The Fund records investments at fair value. Fair value is defined as the price that would be received to sell an asset or paid to transfer a liability in an orderly transaction between market participants at the measurement date.
The valuation techniques described below maximize the use of observable inputs and minimize the use of unobservable inputs in determining fair value. The inputs used for valuing the Fund's investments are summarized in the three broad levels listed below:
• Level 1 — quoted prices in active markets for identical securities
• Level 2 — other significant observable inputs (including quoted prices for similar securities or interest rates applicable to those securities, etc.)
• Level 3 — significant unobservable inputs (including the Fund's own assumptions in determining the fair value of investments)
30
USAA Mutual Funds Trust | Notes to Financial Statements — continued March 31, 2021 | ||||||
Changes in valuation techniques may result in transfers in or out of an assigned level within the disclosure hierarchy. The inputs or methodologies used for valuation techniques are not necessarily an indication of the risks associated with entering into those investments.
Victory Capital Management Inc. ("VCM" or the "Adviser") has established the Pricing and Liquidity Committee (the "Committee"), and subject to the Trust's Board of Trustees (the "Board") oversight, the Committee administers and oversees the Fund's valuation policies and procedures, which are approved by the Board.
Portfolio securities listed or traded on securities exchanges, including Exchange-Traded Funds ("ETFs"), American Depositary Receipts ("ADRs") and Rights, are valued at the closing price on the exchange or system where the security is principally traded, if available, or at the Nasdaq Official Closing Price. If there have been no sales for that day on the exchange or system, then a security is valued at the last available bid quotation on the exchange or system where the security is principally traded. In each of these situations, valuations are typically categorized as Level 1 in the fair value hierarchy.
Debt securities of United States ("U.S.") issuers, along with corporate and municipal securities, including short-term investments maturing in 60 days or less, may be valued using evaluated bid or the last sales price to price securities by dealers or an independent pricing service approved by the Board. These valuations are typically categorized as Level 2 in the fair value hierarchy.
In the event that price quotations or valuations are not readily available, are not reflective of market value, or a significant event has been recognized in relation to a security or class of securities, the securities are valued in good faith by the Committee in accordance with valuation procedures approved by the Board. These valuations are typically categorized as Level 2 or Level 3 in the fair value hierarchy, based on the observability of inputs used to determine the fair value. The effect of fair value pricing is that securities may not be priced on the basis of quotations from the primary market in which they are traded and the actual price realized from the sale of a security may differ materially from the fair value price. Valuing these securities at fair value is intended to cause the Fund's net asset value ("NAV") to be more reliable than it otherwise would be.
A summary of the valuations as of March 31, 2021, based upon the three levels defined above, is included in the table below while the breakdown, by category, of investments is disclosed on the Schedule of Portfolio Investments (amounts in thousands):
Level 1 | Level 2 | Level 3 | Total | ||||||||||||||||
Common Stocks | $ | 1,244 | $ | — | $ | — | $ | 1,244 | |||||||||||
Municipal Bonds | — | 1,214,334 | 2,479 | 1,216,813 | |||||||||||||||
Total | $ | 1,244 | $ | 1,214,334 | $ | 2,479 | $ | 1,218,057 | |||||||||||
For the year ended March 31, 2021, there were no transfers in or out of Level 3 in the fair value hierarchy.
Securities Purchased on a Delayed-Delivery or When-Issued Basis:
The Fund may purchase securities on a delayed-delivery or when-issued basis. Delivery and payment for securities that have been purchased by the Fund on a delayed-delivery or when-issued basis or for delayed draws on loans can take place a month or more after the trade date. At the time the Fund makes the commitment to purchase a security on a delayed-delivery or when-issued basis, the Fund records the transaction and reflects the value of the security in determining NAV. No interest accrues to the Fund until the transaction settles and payment takes place. A segregated account is established and the Fund maintains cash and/or marketable securities at least equal in value to commitments for delayed-delivery or when-issued securities. If the Fund owns delayed-delivery or when-issued securities, these values are included in Payable for investments purchased on the accompanying Statement of Assets and Liabilities and the segregated assets are identified on the Schedule of Portfolio Investments.
31
USAA Mutual Funds Trust | Notes to Financial Statements — continued March 31, 2021 | ||||||
Municipal Obligations:
The values of municipal obligations can fluctuate and may be affected by adverse tax, legislative, or political changes, and by financial developments affecting municipal issuers. Payment of municipal obligations may depend on a relatively limited source of revenue, resulting in greater credit risk. Future changes in federal tax laws or the activity of an issuer may adversely affect the tax-exempt status of municipal obligations.
Below-Investment-Grade Securities:
The Fund may invest in below-investment-grade securities (i.e. lower-quality, "junk" debt), which are subject to various risks. Lower-quality debt is considered to be speculative because it is less certain that the issuer will be able to pay interest or repay the principal than in the case of investment grade debt. These securities can involve a substantially greater risk of default than higher-rated securities, and their values can decline significantly over short periods of time. Lower-quality debt securities tend to be more sensitive to adverse news about their issuers, the market and the economy in general, than higher-quality debt securities. The market for these securities can be less liquid, especially during periods of recession or general market decline.
Investment Transactions and Related Income:
Changes in holdings of investments are accounted for no later than one business day following the trade date. For financial reporting purposes, however, investment transactions are accounted for on trade date on the last business day of the reporting period. Interest income is determined on the basis of coupon interest accrued using the effective interest method which adjusts, where applicable, the amortization of premiums or accretion of discount. Gains or losses realized on sales of securities are determined by comparing the identified cost of the security lot sold with the net sales proceeds.
Federal Income Taxes:
It is the Fund's policy to continue to qualify as a regulated investment company by complying with the provisions available to certain investment companies, as defined in applicable sections of the Internal Revenue Code, and to make distributions of net investment income and net realized gains sufficient to relieve it from all, or substantially all, federal income taxes. Accordingly, no provision for federal income taxes is required in the financial statements. The Fund has a tax year end of March 31.
Management of the Fund has reviewed tax positions taken in tax years that remain subject to examination by all major tax jurisdictions, including federal (i.e., the last four tax years, which includes the current fiscal tax year end). Management believes that there is no tax liability resulting from unrecognized tax benefits related to uncertain tax positions taken.
Allocations:
Expenses directly attributable to the Fund are charged to the Fund, while expenses that are attributable to more than one fund in the Trust, or jointly with an affiliated trust, are allocated among the respective funds in the Trust and/or affiliated trust based upon net assets or another appropriate basis.
Income, expenses (other than class-specific expenses such as transfer agent fees, state registration fees, 12b-1 fees, and printing fees), and realized and unrealized gains or losses on investments are allocated to each class of shares based on its relative net assets on the date income is earned or expenses and realized and unrealized gains and losses are incurred.
Cross-Trade Transactions:
Pursuant to Rule 17a-7 under the 1940 Act, the Fund may engage in cross-trades, which are securities transactions with affiliated investment companies and advisory accounts managed by the Adviser and any applicable sub-adviser. Any such purchase or sale transaction must be effected without brokerage commission or other remuneration, except for customary transfer fees. The transaction must be effected at the current market price, which is either the security's last sale price on an exchange or, if there are
32
USAA Mutual Funds Trust | Notes to Financial Statements — continued March 31, 2021 | ||||||
no transactions in the security that day, at the average of the highest bid and lowest asked price. For the year ended March 31, 2021, the Fund engaged in the following securities transactions with affiliated funds, which resulted in the following net realized gains (losses) (amounts in thousands):
| Purchases | Sales | Realized Gains (Losses) | |||||||||
| $ | 234,015 | $ | 129,175 | $ | — | ||||||
Fees Paid Indirectly:
Expense offsets to custody fees that arise from credits on cash balances maintained on deposit are reflected on the Statement of Operations, as applicable, as Fees paid indirectly.
3. Purchases and Sales:
Cost of purchases and proceeds from sales/maturities of securities (excluding securities maturing less than one year from acquisition) for the year ended March 31, 2021, were as follows for the Fund (amounts in thousands):
| Excluding U.S. Government Securities | |||||||||||
Purchases | Sales | ||||||||||
$ | 781,994 | $ | 830,845 | ||||||||
There were no purchases or sales of U.S. government securities during the year ended March 31, 2021
4. Fees and Transactions with Affiliates and Related Parties:
Investment Advisory Fees:
Investment advisory services are provided to the Fund by the Adviser, which is a New York corporation registered as an investment adviser with the SEC. The Adviser is a wholly-owned indirect subsidiary of Victory Capital Holdings, Inc., a publicly traded Delaware corporation, and a wholly-owned direct subsidiary of Victory Capital Operating, LLC.
Under the terms of the Investment Advisory Agreement, the Adviser is entitled to receive a base fee and a performance adjustment. The Fund's base fee is accrued daily and paid monthly at an annualized rate of 0.28% of the Fund's average daily net assets. Amounts incurred and paid to VCM for the year ended March 31, 2021, are reflected on the Statement of Operations as Investment Advisory fees.
On November 6, 2018, United Services Automobile Association ("USAA"), the parent company of USAA Asset Management Company ("AMCO"), the prior investment adviser to the Fund announced that AMCO would be acquired by Victory Capital Holdings Inc. (the "Transaction"). A special shareholder meeting was held on April 18, 2019, at which shareholders of the Fund approved a new investment advisory agreement between the Trust, on behalf of the Fund, and VCM. The Transaction closed on July 1, 2019 and effective July 1, 2019, no performance adjustments were made for the period beginning July 1, 2019, through June 30, 2020. Only performance beginning as of July 1, 2019, and thereafter is utilized in calculating future performance adjustments.
The performance adjustment for each share class is accrued daily and calculated monthly by comparing each class' performance to that of the Lipper Short Municipal Debt Funds Index. The Lipper Short Municipal Debt Funds Index tracks the total return performance of each class within the Lipper Short Municipal Debt Funds category.
33
USAA Mutual Funds Trust | Notes to Financial Statements — continued March 31, 2021 | ||||||
The performance period for each share class consists of the current month plus the previous 35 months (or the number of months beginning July 1, 2019, if fewer). The following table is utilized to determine the extent of the performance adjustment:
| Over/Under Performance Relative to Index (in basis points)(a) | Annual Adjustment Rate (in basis points)(a) | ||||||||||
+/- 20 to 50 | +/- 4 | ||||||||||
+/- 51 to 100 | +/- 5 | ||||||||||
+/- 101 and greater | +/- 6 | ||||||||||
(a) Based on the difference between average annual performance of the relevant share class of the Fund and its relevant Lipper index, rounded to the nearest basis point. Average daily net assets of the share class are calculated over a rolling 36-month period.
Each class' annual performance adjustment rate is multiplied by the average daily net assets of each respective class over the entire performance period, which is then multiplied by a fraction, the numerator of which is the number of days in the month and the denominator of which is 365 (366 in leap years). The resulting amount is then added to (in the case of overperformance), or subtracted from (in the case of underperformance) the base fee.
Under the performance fee arrangement, each class pays a positive performance fee adjustment for a performance period whenever the class outperforms the Lipper Short Municipal Debt Funds Index over that period, even if the class has overall negative returns during the performance period.
For the period July 1, 2020 to March 31, 2021, performance fees were $283, less than $1 and $2 for Fund Shares, Institutional Shares and Class A, in thousands, respectively. Performance adjustments were 0.02%, less than 0.01%, and 0.01% for Fund Shares, Institutional Shares, and Class A, respectively.
The Trust relies on an exemptive order granted to VCM and its affiliated funds by the SEC in March 2019 permitting the use of a "manager-of-managers" structure for certain funds. Under a manager-of-managers structure, the investment adviser may select (with approval of the Board and without shareholder approval) one or more subadvisers to manage the day-to-day investment of a fund's assets. For the year ended March 31, 2021, the Fund had no subadvisors.
Administration and Servicing Fees:
VCM serves as the Fund's administrator and fund accountant. Under the Fund Administration, Servicing and Accounting Agreement, VCM is paid for its services an annual fee at a rate of 0.15%, 0.10%, and 0.15% of average daily net assets, of the Fund Shares, Institutional Shares, and Class A, respectively. Amounts incurred for the year ended March 31, 2021, are reflected on the Statement of Operations as Administration fees.
The Fund (as part of the Trust) has entered into an agreement to provide compliance services with the Adviser, pursuant to which the Adviser furnishes its compliance personnel, including the services of the Chief Compliance Officer ("CCO"), and other resources reasonably necessary to provide the Trust with compliance oversight services related to the design, administration and oversight of a compliance program for the Trust in accordance with Rule 38a-1 under the 1940 Act. The CCO is an employee of the Adviser, which pays the compensation of the CCO and support staff. Funds in the Trust, Victory Variable Insurance Funds, Victory Portfolios, and Victory Portfolios II (collectively, the "Victory Funds Complex") in the aggregate, compensate the Adviser for these services. Amounts incurred for the year ended March 31, 2021, are reflected on the Statement of Operations as Compliance fees.
Citi Fund Services Ohio, Inc. ("Citi"), an affiliate of Citibank, acts as sub-administrator and sub-fund accountant to the Fund pursuant to a Sub-Administration and Sub-Fund Accounting Services Agreement between VCM and Citi. VCM pays Citi a fee for providing these services. The Fund reimburses VCM and Citi for out-of-pocket expenses incurred in providing these services and certain other expenses
34
USAA Mutual Funds Trust | Notes to Financial Statements — continued March 31, 2021 | ||||||
specifically allocated to the Fund. Amounts incurred for the year ended March 31, 2021, are reflected on the Statement of Operations as Sub-Administration fees.
Transfer Agency Fees:
Victory Capital Transfer Agency, Inc. ("VCTA"), an affiliate of the Adviser, provides transfer agency services to the Fund. VCTA provides transfer agent services to the Fund Shares based on an annual charge of $25.50 per shareholder account plus out-of-pocket expenses. VCTA pays a portion of these fees to certain intermediaries for the administration and servicing of accounts that are held with such intermediaries. Transfer agent's fees are accrued daily and paid monthly at an annualized rate of 0.10% and 0.10% of average daily net assets of the Institutional Shares and Class A, respectively, plus out-of-pocket expenses. Amounts incurred and paid to VCTA for the year ended March 31, 2021, are reflected on the Statement of Operations as Transfer Agent fees.
FIS Investor Services LLC serves as sub-transfer agent and dividend disbursing agent for the Fund pursuant to a Sub-Transfer Agent Agreement between VCTA and FIS Investor Services LLC. VCTA provides FIS Investor Services LLC a fee for providing these services.
Distributor/Underwriting Services:
Victory Capital Services, Inc. (the "Distributor"), an affiliate of the Adviser, serves as distributor for the continuous offering of the shares of the Fund pursuant to a Distribution Agreement between the Distributor and the Trust. Effective June 30, 2020, the Distributor's name was changed from Victory Capital Advisers, Inc.
Pursuant to the Distribution and Service Plans adopted in accordance with Rule 12b-1 under the 1940 Act, the Distributor may receive a monthly distribution and service fee, at an annual rate of up to 0.25% of the average daily net assets of Class A. The distribution and service fees paid to the Distributor may be used by the Distributor to pay for activity primarily intended to result in the sale of Class A of the Fund. Amounts incurred and paid to VCTA for the year ended March 31, 2021, are reflected on the Statement of Operations as 12b-1 fees.
In addition, the Distributor is entitled to receive commissions on sales of Class A. For the year ended March 31, 2021, the Distributor received less than $1 thousand from commissions earned on sales of Class A.
Other Fees:
Citibank serves as the Fund's custodian. The Fund pays Citibank a fee for providing these services. Amounts incurred for the year ended March 31, 2021, are reflected on the Statement of Operations as Custodian fees.
K&L Gates LLP provides legal services to the Trust.
The Adviser has entered into an expense limitation agreement with the Fund until at least June 30, 2023. Under the terms of the agreement for Fund Shares, Institutional Shares, and Class A, the Adviser has agreed to waive fees or reimburse certain expenses to the extent that ordinary operating expenses incurred by certain classes of the Fund in any fiscal year exceed the expense limit for such classes of the Fund. Such excess amounts will be the liability of the Adviser. Acquired fund fees and expenses, interest, taxes, brokerage commissions, other expenditures, which are capitalized in accordance with GAAP, and other extraordinary expenses not incurred in the ordinary course of the Fund's business are excluded from the expense limits. As of March 31, 2021, the expense limits (excluding voluntary waivers) were 0.51%, 0.47%, and 0.75% for Fund Shares, Institutional Shares, and Class A shares, respectively.
Under the terms of the expense limitation agreement, the Fund has agreed to repay fees and expenses that were waived or reimbursed by the Adviser for a period of up to three years after the fiscal year in which the waiver or reimbursement took place, subject to the lesser of any operating expense limits in effect at the time of: (a) the original waiver or expense reimbursement; or (b) the recoupment, after giving effect to the recoupment amount.
35
USAA Mutual Funds Trust | Notes to Financial Statements — continued March 31, 2021 | ||||||
As of March 31, 2021, the following amounts are available to be repaid to the Adviser (amounts in thousands). The Fund has not recorded any amounts available to be repaid as a liability due to an assessment that such repayment is not probable at March 31, 2021.
| Expires March 31, 2023 | Expires March 31, 2024 | Total | |||||||||
| $ | 10 | $ | 107 | $ | 117 | ||||||
The Adviser may voluntarily waive or reimburse additional fees to assist the Fund in maintaining competitive expense ratios. Voluntary waivers and reimbursements applicable to the Fund are not available to be recouped at a future time. There were no voluntary waivers or reimbursements for the year ended March 31, 2021.
Certain officers and/or interested trustees of the Fund are also officers and/or employees of the Adviser, administrator, sub-administrator, sub-fund accountant, custodian, and Distributor.
5. Risks:
The Fund may be subject to other risks in addition to these identified risks.
Geopolitical/Natural Disaster Risk — Global economies and financial markets are increasingly interconnected, which increases the possibilities that conditions in one country or region might adversely affect issuers in another country or region. Geopolitical and other risks, including war, terrorism, trade disputes, political or economic dysfunction within some nations, public health crises and related geopolitical events, as well as environmental disasters such as earthquakes, fires, and floods, may add to instability in world economies and markets generally. Changes in trade policies and international trade agreements could affect the economies of many countries in unpredictable ways. Likewise, systemic market dislocations of the kind that occurred during the financial crisis that began in 2008, if repeated, would be highly disruptive to economies and markets, adversely affecting individual companies and industries, securities markets, interest rates, credit ratings, inflation, investor sentiment, and other factors affecting the value of a Fund's investments. Some countries, including the United States, are adopting more protectionist trade policies and moving away from the tighter financial industry regulations that followed the 2008 financial crisis, which may also affect the value of a Fund's investments.
Political events within the United States at times have resulted, and may in the future result, in a shutdown of government services, which could negatively affect the U.S. economy, decrease the value of a Fund's investments, increase uncertainty in or impair the operation of the U.S. or other securities markets and degrade investor and consumer confidence, perhaps suddenly and to a significant degree.
An outbreak of disease called COVID-19 has spread internationally. The transmission of COVID-19 and efforts to contain its spread have resulted in international, national and local border closings and other significant travel restrictions and disruptions, significant disruptions to business operations, supply chains and consumer activity, significant challenges in healthcare service preparation and delivery, quarantines and general concern and uncertainty. These negative impacts have caused significant volatility and declines in global financial markets, which have caused losses for Fund investors during and subsequent to period end. The impact of the COVID-19 pandemic may last for an extended period of time, and could result in a substantial economic downturn or recession. Public health crises may exacerbate other pre-existing political, social, economic, market and financial risks. The extent of the impact to the financial performance of the Fund's investments will depend on future developments, including (i) the duration and spread of the outbreak, (ii) the restrictions and advisories, (iii) the effects on the financial markets, and (iv) the effects on the economy overall, all of which are highly uncertain and cannot be predicted.
Credit Risk — The fixed-income securities held in the Fund's portfolio are subject to credit risk, which is the possibility that an issuer of a fixed-income security will fail to make timely interest and/or principal payments on its securities or that negative market perceptions of the issuer's ability to make
36
USAA Mutual Funds Trust | Notes to Financial Statements — continued March 31, 2021 | ||||||
such payments will cause the price of that security to decline. The Fund accepts some credit risk as a recognized means to enhance an investor's return. All fixed-income securities, varying from the highest quality to the very speculative, have some degree of credit risk.
Debt Securities Risk — The value of a debt security or other income-producing security changes in response to various factors, including, for example, market-related factors (such as changes in interest rates or changes in the risk appetite of investors generally) and changes in the actual or perceived ability of the issuer (or of issuers generally) to meet its (or their) obligations.
Other factors that may affect the value of debt securities, include, among others, public health crises and responses by governments and companies to such crises. These and other events may affect the creditworthiness of the issuer of a debt security and may impair an issuers ability to timely meet its debt obligations as they come due.
Interest Rate Risk — The Fund is subject to the risk that the market value of the bonds in its portfolio will fluctuate because of changes in interest rates, changes in the supply of and demand for tax-exempt securities, and other market factors. Bond prices generally are linked to the prevailing market interest rates. In general, when interest rates rise, bond prices fall; conversely, when interest rates fall, bond prices rise. The price volatility of a bond also depends on its duration. Generally, the longer the duration of a bond, the greater is its sensitivity to interest rates. To compensate investors for this higher interest rate risk, bonds with longer durations generally offer higher yields than bonds with shorter durations. The ability of an issuer of a debt security to repay principal prior to a security's maturity can increase the security's sensitivity to interest rate changes.
Decisions by the U.S. Federal Reserve (also known as the "Fed") regarding interest rate and monetary policy, which can be difficult to predict and sometimes change direction suddenly in response to economic and market events, can have a significant effect on the value of fixed-income securities as well as the overall strength of the U.S. economy. Precise interest rate predictions are difficult to make, and interest rates may change unexpectedly and dramatically in response to extreme changes in market or economic conditions. As a result, the value of fixed-income securities may vary widely under certain market conditions.
LIBOR Discontinuation Risk — Many debt securities, derivatives and other financial instruments, including some of the Fund's investments, use the London Interbank Offered Rate ("LIBOR") as the reference or benchmark rate for variable interest rate calculations. In June 2017, the Alternative Reference Rates Committee, a group of large U.S. banks working with the Federal Reserve, announced its selection of a new Secured Overnight Funding Rate ("SOFR"), which is intended to be a broad measure of secured overnight U.S. Treasury repo rates, as an appropriate replacement for LIBOR. The Federal Reserve Bank of New York began publishing the SOFR in 2018, expecting that it could be used on a voluntary basis in new instruments and transactions. Bank working groups and regulators in other countries have suggested other alternatives for their markets, including the Sterling Overnight Interbank Average Rate ("SONIA") in England. In July 2017, the Financial Conduct Authority (the "FCA"), the United Kingdom financial regulatory body, announced that after 2021, it will cease its active encouragement of UK banks to provide the quotations needed to sustain LIBOR. That announcement suggests that LIBOR may cease to be published after that time. For U.S. dollar LIBOR, however, the relevant date may be deferred to June 30, 2023, for the most common tenors (overnight and one, three, six and 12 months). As to those tenors, the LIBOR administrator has published a consultation regarding its intention to cease publication of U.S. dollar LIBOR as of June 30, 2023, (instead of December 31, 2021, as previously expected), apparently based on continued rate submissions from banks. It is expected that there will be enough time for market participants to transition to the use of a different benchmark for both new and existing securities and transactions. Various financial industry groups have begun planning for that transition, but there are obstacles to converting certain longer-term securities and transactions to a new benchmark. Transition planning is at an early stage, and neither the effect of the transition process nor its ultimate success can yet be known. Although the foregoing may provide some sense of timing, there is no assurance that LIBOR, or any particular currency and tenor, will continue to be published until any particular date, and it appears highly likely that LIBOR will be discontinued or modified after December 31, 2021, or June 30, 2023, depending on the currency
37
USAA Mutual Funds Trust | Notes to Financial Statements — continued March 31, 2021 | ||||||
and tenor. The transition process might lead to increased volatility and illiquidity in markets that currently rely on the LIBOR to determine interest rates. It could also lead to a reduction in the value of some LIBOR-based investments and reduce the effectiveness of new hedges placed against existing LIBOR-based instruments. Since the usefulness of LIBOR as a benchmark could deteriorate during the transition period, these effects could occur before the end of 2021.
6. Borrowing and Interfund Lending:
Line of Credit:
For the year ended March 31, 2021, the Victory Funds Complex participated in a short-term demand note "Line of Credit" agreement with Citibank. The Line of Credit agreement with Citibank was renewed on June 29, 2020, with a termination date of June 28, 2021. Under the agreement with Citibank, the Victory Funds Complex may borrow up to $600 million, of which $300 million is committed and $300 million is uncommitted. $40 million of the Line of Credit is reserved for use by the Victory Floating Rate Fund, another series of the Victory Funds Complex, with Victory Floating Rate Fund paying the related commitment fees for that amount. The purpose of the agreement is to meet temporary or emergency cash needs. For the year ended March 31, 2021, Citibank received an annual commitment fee of 0.15% on $300 million for providing the Line of Credit. Each fund in the Victory Funds Complex paid a pro-rata portion of the commitment fees plus any interest (one month LIBOR plus one percent) on amounts borrowed. Effective June 29, 2020, under an amended Line of Credit agreement, Citibank also received an annual upfront fee of 0.10% on the $300 million committed line of credit. Each fund in the Victory Funds Complex paid a pro-rata portion of the upfront fee. Interest charged to each Fund during the period, if applicable, is reflected on the Statement of Operations under Line of credit fees.
The Fund had no borrowings under the Line of Credit agreement during the year ended March 31, 2021.
Interfund Lending:
The Trust and Adviser rely on an exemptive order granted by the SEC in March 2017 (the "Order"), permitting the establishment and operation of an Interfund Lending Facility (the "Facility"). The Facility allows the Fund to directly lend and borrow money to or from any other Fund, that is permitted to participate in the Facility, in the Victory Funds Complex relying upon the Order at rates beneficial to both the borrowing and lending funds. Advances under the Facility are allowed for temporary or emergency purposes, including the meeting of redemption requests that otherwise might require the untimely disposition of securities, and are subject to each Fund's borrowing restrictions. The interfund loan rate is determined, as specified in the Order, by averaging the current repurchase agreement rate and the current bank loan rate. As a Borrower, interest charged to the Fund, if any, during the period is reflected on the Statement of Operations under Interfund lending fees. As a Lender, interest earned by the Fund, if any, during the period is presented on the Statement of Operations under Interfund lending.
The average borrowing or lending for the days outstanding and average interest rate for the Fund during the year ended March 31, 2021 were as follows (amounts in thousands):
| Borrower or Lender | Amount Outstanding at March 31, 2021 | Average Borrowing* | Days Borrowing Outstanding | Average Interest Rate* | Maximum Borrowing During the Period | ||||||||||||||||||
| Borrower | $ | — | $ | 1,577 | 1 | 0.64 | % | $ | 1,577 | ||||||||||||||
* For the year ended March 31, 2021, based on the number of days borrowings were outstanding.
38
USAA Mutual Funds Trust | Notes to Financial Statements — continued March 31, 2021 | ||||||
7. Federal Income Tax Information:
Distributions from the Fund's net investment income are accrued daily and distributed on the last business day of each month. Distributable net realized gains, if any, are declared and paid at least annually.
The amounts of dividends from net investment income and distributions from net realized gains (collectively distributions to shareholders) are determined in accordance with federal income tax regulations, which may differ from GAAP. To the extent these "book/tax" differences are permanent in nature (e.g., net operating loss and distribution reclassification), such amounts are reclassified within the components of net assets based on their federal tax-basis treatment; temporary differences (e.g., wash sales) do not require reclassification. To the extent dividends and distributions exceed net investment income and net realized gains for tax purposes, they are reported as distributions of capital. Net investment losses incurred by the Fund may be reclassified as an offset to capital on the accompanying Statement of Assets and Liabilities.
As of March 31, 2021, on the Statement of Assets and Liabilities, there were no permanent book-to-tax difference reclassification adjustments.
The tax character of distributions paid during the tax years ended as noted below, were as follows (total distributions paid may differ from the Statements of Changes in Net Assets because, for tax purposes, dividends are recognized when actually paid) (amounts in thousands).
Year Ended March 31, 2021 | Year Ended March 31, 2020 | ||||||||||||||||||
| Distributions paid from | Distributions paid from | ||||||||||||||||||
| | Tax-Exempt Income | Total Distributions Paid | Tax-Exempt Income | Total Distributions Paid | |||||||||||||||
| $ | 16.886 | $ | 16,886 | $ | 25,137 | $ | 25,137 | |||||||||||
As of March 31, 2021, the components of accumulated earnings (loss) on a tax basis were as follows (amounts in thousands):
| Undistributed Tax-Exempt Income | Distributions Payable | Accumulated Earnings | Accumulated Capital and Other (Losses) | Unrealized Appreciation (Depreciation) | Total Accumulated Earnings (Loss) | ||||||||||||||||||
| $ | 1,208 | $ | (1,234 | ) | $ | (26 | ) | $ | (26,421 | ) | $ | 28,046 | $ | 1,599 | |||||||||
As of March 31, 2021, the Fund had net capital loss carryforwards as shown in the table below (amounts in thousands). It is unlikely that the Board will authorize a distribution of capital gains realized in the future until the capital loss carryforwards have been used.
| Short-Term Amount | Long-Term Amount | Total | |||||||||
| $ | 2,151 | $ | 24,270 | $ | 26,421 | ||||||
As of March 31, 2021, the cost basis for federal income tax purposes, gross unrealized appreciation, gross unrealized depreciation, and net unrealized appreciation (depreciation) for investments were as follows (amounts in thousands):
| Cost of Investments for Federal Tax Purposes | Gross Unrealized Appreciation | Gross Unrealized Depreciation | Net Unrealized Appreciation (Depreciation) | ||||||||||||
| $ | 1,190,011 | $ | 32,961 | $ | (4,915 | ) | $ | 28,046 | |||||||
39
REPORT OF INDEPENDENT REGISTERED PUBLIC ACCOUNTING FIRM
To the Shareholders and the Board of Trustees of USAA Tax Exempt Short-Term Fund
Opinion on the Financial Statements
We have audited the accompanying statement of assets and liabilities of USAA Tax Exempt Short-Term Fund (the "Fund") (one of the funds constituting USAA Mutual Funds Trust (the "Trust")), including the schedule of portfolio investments, as of March 31, 2021, and the related statement of operations for the year then ended, the statements of changes in net assets for each of the two years in the period then ended, the financial highlights for each of the five years in the period then ended and the related notes (collectively referred to as the "financial statements"). In our opinion, the financial statements present fairly, in all material respects, the financial position of the Fund at March 31, 2021, the results of its operations for the year then ended, the changes in its net assets for each of the two years in the period then ended and its financial highlights for each of the five years in the period then ended, in conformity with U.S. generally accepted accounting principles.
Basis for Opinion
These financial statements are the responsibility of the Trust's management. Our responsibility is to express an opinion on the Fund's financial statements based on our audits. We are a public accounting firm registered with the Public Company Accounting Oversight Board (United States) ("PCAOB") and are required to be independent with respect to the Trust in accordance with the U.S. federal securities laws and the applicable rules and regulations of the Securities and Exchange Commission and the PCAOB.
We conducted our audits in accordance with the standards of the PCAOB. Those standards require that we plan and perform the audit to obtain reasonable assurance about whether the financial statements are free of material misstatement, whether due to error or fraud. The Trust is not required to have, nor were we engaged to perform, an audit of the Trust's internal control over financial reporting. As part of our audits we are required to obtain an understanding of internal control over financial reporting, but not for the purpose of expressing an opinion on the effectiveness of the Trust's internal control over financial reporting. Accordingly, we express no such opinion.
Our audits included performing procedures to assess the risks of material misstatement of the financial statements, whether due to error or fraud, and performing procedures that respond to those risks. Such procedures included examining, on a test basis, evidence regarding the amounts and disclosures in the financial statements. Our procedures included confirmation of securities owned as of March 31, 2021, by correspondence with the custodian and brokers or by other appropriate auditing procedures where replies from brokers were not received. Our audits also included evaluating the accounting principles used and significant estimates made by management, as well as evaluating the overall presentation of the financial statements. We believe that our audits provide a reasonable basis for our opinion.

We have served as the auditor of one or more Victory Capital investment companies since 1995.
San Antonio, Texas
May 26, 2021
40
USAA Mutual Funds Trust | Supplemental Information March 31, 2021 | ||||||
(Unaudited)
Trustee and Officer Information
Board of Trustees:
Overall responsibility for management of the Trust rests with the Board. The Trust is managed by the Board in accordance with the laws of the state of Delaware. There are currently nine Trustees, seven of whom are not "interested persons" of the Trust within the meaning of that term under the 1940 Act ("Independent Trustees") and two of whom is an "interested person" of the Trust within the meaning of that term under the 1940 Act ("Interested Trustee"). The Trustees, in turn, elect the officers of the Trust to actively supervise its day-to-day operations.
The following tables list the Trustees, their ages, position with the Trust, commencement of service, principal occupations during the past five years and any directorships of other investment companies or companies whose securities are registered under the Securities Exchange Act of 1934, as amended, or who file reports under that Act. Each Trustee oversees 46 portfolios in the Trust. Each Trustee's address is 15935 La Cantera Pkwy, San Antonio, TX, 78256. Pursuant to a policy adopted by the Board, the term of office for each Trustee shall be until the Independent Trustee reaches age 75 or an Interested Trustee reaches age 75. The Board may change or grant exceptions from this policy at any time without shareholder approval. A Trustee may resign or be removed by a vote of the other Trustees or the holders of a majority of the outstanding shares of the Trust at any time. Vacancies on the Board can be filled by the action of a majority of the Trustees, provided that after filling such vacancy at least two-thirds of the Trustees have been elected by the shareholders.
Name and Date of Birth | Position Held with the Trust | Year Commenced Service | Principal Occupation During Past 5 Years | Other Directorships Held During Past 5 Years | |||||||||||||||
Independent Trustees. | |||||||||||||||||||
| Jefferson C. Boyce, (c) Born September 1957 | Independent Chairman | 2021 | Senior Managing Director, New York Life Investments, LLC (1992-2012) | Westhab, Inc. | |||||||||||||||
| John C. Walters, Born February 1962 | Trustee | 2019 | Retired. Mr. Walters brings significant Board experience including active involvement with the board of a Fortune 500 company, and a proven record of leading large, complex financial organizations. He has a demonstrated record of success in distribution, manufacturing, investment brokerage, and investment management in both the retail and institutional investment businesses. He has substantial experience in the investment management business with a demonstrated ability to develop and drive strategy while managing operation, financial, and investment risk. | Guardian Variable Products Trust (16 series), Lead Independent Director; Amerilife Holdings LLC, Director; Stadion Money Management; Director; University of North Carolina (Chapel Hill), Member Board of Governors | |||||||||||||||
41
USAA Mutual Funds Trust | Supplemental Information — continued March 31, 2021 | ||||||
(Unaudited)
Name and Date of Birth | Position Held with the Trust | Year Commenced Service | Principal Occupation During Past 5 Years | Other Directorships Held During Past 5 Years | |||||||||||||||
| Robert L. Mason, Ph.D., Born July 1946 | Trustee | 1997 | Adjunct Professor in the Department of Management Science and Statistics in the College of Business at the University of Texas at San Antonio (since 2001); Institute Analyst, Southwest Research Institute (March 2002-January 2016) | None | |||||||||||||||
| Dawn M. Hawley, Born February 1954 | Trustee | 2014 | Manager of Finance, Menil Foundation, Inc. (May 2007-June 2011), which is a private foundation that oversees the assemblage of sculptures, prints, drawings, photographs, and rare books. Director of Financial Planning and Analysis and Chief Financial Officer, AIM Management Group, Inc. (October 1987-January 2006) | None | |||||||||||||||
| Paul L. McNamara, Born July 1948 | Trustee | 2012 | Director, Cantor Opportunistic Alternatives Fund, LLC (March 2010-February 2014), which is a closed-end fund of funds by Cantor Fitzgerald Investment Advisors, LLC | None | |||||||||||||||
42
USAA Mutual Funds Trust | Supplemental Information — continued March 31, 2021 | ||||||
(Unaudited)
Name and Date of Birth | Position Held with the Trust | Year Commenced Service | Principal Occupation During Past 5 Years | Other Directorships Held During Past 5 Years | |||||||||||||||
| Richard Y. Newton III, Born January 1956 | Trustee | 2017 | Director, Elta North America (01/18-present), which is a global leader in the design, manufacture, and support of innovative electronic systems in the ground, maritime, airborne, and security domains for the nation's warfighters, security personnel, and first responders; Managing Partner, Pioneer Partnership Development Group (December 2015-present)); Executive Director, The Union League Club of New York (June 2014-November 2015): Executive Vice President, Air Force Association (August 2012-May 2014); Lieutenant General, United States Air Force (January 2008-June 2012) | PredaSAR Corp. | |||||||||||||||
| Barbara B. Ostdiek, Ph.D., Born March 1964 | Trustee | 2008 | Senior Associate Dean of Degree Programs at Jesse H. Jones Graduate School of Business at Rice University (since 2013); Associate Professor of Finance at Jessie H. Jones Graduate School of Business at Rice University (since 2001) | None | |||||||||||||||
| Michael F. Reimherr, (a) Born August 1945 | Trustee | 2000 | President of Reimherr Business Consulting (May 1995-December 2017); St. Mary's University Investment Committee overseeing University Endowment (since 2014) | None | |||||||||||||||
(a) Effective at the close of business on December 31, 2020, Michael F. Reimherr retired from the Board of Trustees.
43
USAA Mutual Funds Trust | Supplemental Information — continued March 31, 2021 | ||||||
(Unaudited)
Name and Date of Birth | Position Held with the Trust | Year Commenced Service | Principal Occupation During Past 5 Years | Other Directorships Held During Past 5 Years | |||||||||||||||
Interested Trustees. | |||||||||||||||||||
| David C. Brown, (b) Born May 1972 | Trustee | 2019 | Chairman and Chief Executive Officer (since 2013), Victory Capital Management Inc.; Chairman and Chief Executive Officer, Victory Capital Holdings, Inc. (since 2013). Mr. Brown brings to the Board extensive business, finance and leadership skills gained and developed through years of experience in the financial services industry, including his tenure overseeing the strategic direction as CEO of Victory Capital. These skills, combined with Mr. Brown's extensive knowledge of the financial services industry and demonstrated success in the development and distribution of investment strategies and products, enable him to provide valuable insights to the Board and strategic direction for the Funds. | Trustee, Victory Portfolios (41 series), Victory Portfolios II (26 series), Victory Variable Insurance Funds (8 series) | |||||||||||||||
44
USAA Mutual Funds Trust | Supplemental Information — continued March 31, 2021 | ||||||
(Unaudited)
Name and Date of Birth | Position Held with the Trust | Year Commenced Service | Principal Occupation During Past 5 Years | Other Directorships Held During Past 5 Years | |||||||||||||||
| Daniel S. McNamara, (b)(c) Born June 1966 | Trustee | 2012 | Trustee, President, and Vice Chairman of USAA ETF Trust (June 2017-June 2019); President of Financial Advice & Solutions Group (FASG), USAA (February 2013-March 2021); Director of USAA Investment Services Company (ISCO) (formerly USAA Investment Management) (September 2009-March 2021); President, Asset Management Company (AMCO) (August, 2011-June 2019); Senior Vice President of USAA Financial Planning Services Insurance Agency, Inc. (FPS) (April 2011-March 2021); Chairman of Board of ISCO (April 2013-December 2020); Director of AMCO (August 2011-June 2019); President and Director of USAA Shareholder Account Services (SAS) (October 2009-June 2019); Director and Vice Chairman of FPS (December 2013-March 2021); President and Director of USAA Investment Corporation (ICORP) (March 2010-March 2021); Chairman of Board of ICORP (December 2013-March 2021); Director of USAA Financial Advisors, Inc. (FAI) (December 2013-March 2021); Chairman of Board of FAI (March 2015-March 2021). Mr. McNamara brings to the Board extensive experience in the financial services industry, including experience as an officer of the Trust. | None | |||||||||||||||
(b) Mr. Dan McNamara, the Chairman of the Board, is deemed an "interested person" due to his previous position as Director of AMCO, the former investment adviser of the Funds. Mr. Brown is deemed an "interested person" due to his position as Chief Executive Officer of Victory Capital, investment adviser to the Funds.
(c) Effective at the close of business on December 31, 2020, Jefferson C. Boyce replaced Dan McNamara as Chair of the Board and assumed the title of Independent Chair.
The Statement of Additional Information includes additional information about the Trustees of the Trust and is available, without charge, on the SEC's website at www.sec.gov and/or by calling (800)-235-8396.
45
USAA Mutual Funds Trust | Supplemental Information — continued March 31, 2021 | ||||||
(Unaudited)
Officers:
The officers of the Trust, their ages, commencement of service and their principal occupations during the past five years, are detailed in the following table. Each officer serves until the earlier of his or her resignation, removal, retirement, death, or the election of a successor. The mailing address of each officer of the Trust is 15935 La Cantera Pkwy, San Antonio, TX, 78256. The officers of the Trust receive no compensation directly from the Trust for performing the duties of their offices.
Name and Date of Birth | Position with the Trust | Year Commenced Service | Principal Occupation During Past 5 Years | ||||||||||||
Interested Officers.
| Christopher K. Dyer, Born February 1962 | President | 2019 | Director of Fund Administration, Victory Capital (since 2004); Chief Operating Officer, Victory Capital Services, Inc. (since 2020) | ||||||||||||
| Scott A Stahorsky, Born July 1969 | Vice President | 2019 | Manager, Fund Administration, Victory Capital (since 2015) | ||||||||||||
| James K. De Vries, Born April 1969 | Treasurer | 2018 | Executive Director, Victory Capital Management Inc. (since 2019); Treasurer, USAA ETF Trust (September 2018-June 2019); Executive Director, Investment and Financial Administration, USAA (April 2012-June 2019); Assistant Treasurer, USAA ETF Trust (June 2017-September 2018); Assistant Treasurer, USAA Mutual Funds Trust (December 2013-February 2018) | ||||||||||||
| Allan Shaer, Born March 1965 | Assistant Treasurer | 2019 | Senior Vice President, Financial Administration, Citi Fund Services Ohio, Inc. (since 2016); Vice President, Mutual Fund Administration, JP Morgan Chase (2011-2016) | ||||||||||||
| Carol D. Trevino, Born October 1965 | Assistant Treasurer | 2018 | Director, Accounting and Finance, Victory Capital Management Inc. (since 2019); Accounting/Financial Director, USAA (December 2013-June 2019); Assistant Treasurer, USAA ETF Trust (September 2018-June 2019) | ||||||||||||
| Erin G. Wagner, Born February 1974 | Secretary | 2019 | Deputy General Counsel, the Adviser (since 2013) | ||||||||||||
| Charles Booth, Born April 1960 | Anti-Money Laundering Compliance Officer and Identity Theft Officer | 2019 | Director, Regulatory Administration and CCO Support Services, Citi Fund Services Ohio, Inc. (since 2007) | ||||||||||||
| Amy Campos, Born July 1976 | Chief Compliance Officer | 2019 | Chief Compliance Officer, USAA Mutual Funds Trust (since 2019); Executive Director, Deputy Chief Compliance Officer, USAA Mutual Funds Trust and USAA ETF Trust (July 2017-June 2019); Compliance Director, USAA Mutual Funds Trust (2014-July 2017) | ||||||||||||
46
USAA Mutual Funds Trust | Supplemental Information — continued March 31, 2021 | ||||||
(Unaudited)
Proxy Voting and Portfolio Holdings Information
Proxy Voting:
Information regarding the policies and procedures the Fund uses to determine how to vote proxies relating to portfolio securities is available without charge, upon request, by calling (800) 235-8396. The information is also included in the Fund's Statement of Additional Information, which is available on the SEC's website at www.sec.gov.
Information relating to how the Fund voted proxies relating to portfolio securities held during the most recent 12 months ended June 30 is available on the SEC's website at www.sec.gov.
Availability of Schedules of Portfolio Investments:
The Trust files a complete list of Schedules of Portfolio Investments with the SEC for the first and third quarter of each fiscal year on Form N-PORT. Form N-PORT is available on the SEC's website at www.sec.gov.
Expense Examples
As a shareholder of the Fund, you may incur two types of costs: (1) transaction costs, including sales charges (loads) on purchases; and (2) ongoing costs, including management fees and other Fund expenses. These examples are intended to help you understand your ongoing costs (in dollars) of investing in the Fund and to compare these costs with the ongoing costs of investing in other mutual funds.
These examples are based on an investment of $1,000 invested at the beginning of the period and held for the entire period from October 1, 2020 through March 31, 2021.
The Actual Expense figures in the table below provide information about actual account values and actual expenses. You may use the information below, together with the amount you invested, to estimate the expenses that you paid over the period. Simply divide your account value by $1,000 (for example, an $8,600 account value divided by $1,000 = 8.6), then multiply the result by the number in the table under the heading entitled "Actual Expenses Paid During Period" to estimate the expenses you paid on your account during this period.
The Hypothetical Expense figures in the table below provide information about hypothetical account values and hypothetical expenses based on the Fund's actual expense ratio and an assumed rate of return of 5% per year before expenses, which is not the Fund's actual return. The hypothetical account values and expenses may not be used to estimate the actual ending account balance or expenses you paid for the period. You may use this information to compare this 5% hypothetical example with the 5% hypothetical examples that appear in shareholder reports of other funds.
Please note the expenses shown in the table below are meant to highlight your ongoing costs only and do not reflect any transactional costs. If these transactional costs were included, your costs would have been higher.
| Beginning Account Value 10/1/20 | Actual Ending Account Value 3/31/21 | Hypothetical Ending Account Value 3/31/21 | Actual Expenses Paid During Period 10/1/20- 3/31/21* | Hypothetical Expenses Paid During Period 10/1/20- 3/31/21* | Annualized Expense Ratio During Period 10/1/20 - 3/31/21 | ||||||||||||||||||||||
Fund Shares | $ | 1,000.00 | $ | 1,014.00 | $ | 1,022.19 | $ | 2.76 | $ | 2.77 | 0.55 | % | |||||||||||||||
Institutional Shares | 1,000.00 | 1,014.30 | 1,022.59 | 2.36 | 2.37 | 0.47 | % | ||||||||||||||||||||
Class A | 1,000.00 | 1,011.90 | 1,021.09 | 3.86 | 3.88 | 0.77 | % | ||||||||||||||||||||
* Expenses are equal to the average account value multiplied by the Fund's annualized expense ratio multiplied by 182/365 (the number of days in the most recent fiscal half-year divided by the number of days in the fiscal year).
47
USAA Mutual Funds Trust | Supplemental Information — continued March 31, 2021 | ||||||
(Unaudited)
For the period October 1, 2020 to March 31, 2021, performance adjustments were applied to the Fund. The annualized expense ratios of 0.55% and 0.77% for the Fund Shares and Class A, respectively, as represented in the table above, reflect these adjustments. The values in the table below reflect your costs (in dollars) of investing in the Fund, had these adjustments not been applied for the six month period ended March 31, 2021.
| Beginning Account Value 10/1/20 | Actual Ending Account Value 3/31/21 | Hypothetical Account Value 3/31/21 | Actual Expenses Paid During Period 10/1/20- 3/31/21* | Hypothetical Expenses Paid During Period 10/1/20- 3/31/21* | Annualized Expense Ratio During Period 10/1/20- 3/31/21 | ||||||||||||||||||||||
Fund Shares | $ | 1,000.00 | $ | 1,014.00 | $ | 1,022.39 | $ | 2.56 | $ | 2.57 | 0.51 | % | |||||||||||||||
Class A | 1,000.00 | 1,011.90 | 1,021.19 | 3.76 | 3.78 | 0.75 | % | ||||||||||||||||||||
* Expenses are equal to the average account value multiplied by the Fund's annualized expense ratio multiplied by 182/365 (the number of days in the most recent fiscal half-year divided by the number of days in the fiscal year).
48
USAA Mutual Funds Trust | Supplemental Information — continued March 31, 2021 | ||||||
(Unaudited)
Additional Federal Income Tax Information
The following federal tax information related to the Fund's fiscal year ended March 31, 2021, is provided for information purposes only and should not be used for reporting to federal or state revenue agencies. Federal tax information for the calendar year will be reported to you on Form 1099-DIV in January 2022.
With respect to distributions paid, the Fund designates the following amounts (or, if subsequently determined to be different, the maximum amount allowable) for the fiscal year ended March 31, 2021 (amounts in thousands):
| Tax Exempt Income | |||||||
$ | 16,886 | ||||||
49
USAA Mutual Funds Trust | Supplemental Information — continued March 31, 2021 | ||||||
(Unaudited)
Considerations of the Board in Continuing the Investment Advisory Agreement
USAA Tax Exempt Short-Term Fund (the "Fund")
At a meeting of the Board of Trustees (the "Board") held on December 10-11, 2020, the Board, including the Trustees who are not "interested persons" (as that term is defined in the Investment Company Act of 1940, as amended) of the Trust (the "Independent Trustees"), approved for an annual period the continuance of the Investment Advisory Agreement (the "Advisory Agreement") between the Trust and Victory Capital Management Inc. (the "Adviser") with respect to the Fund. Prior to the December 10-11, 2020, meeting, at which the Advisory Agreement was approved, the Independent Trustees also discussed and considered information regarding the proposed continuation of the Advisory Agreement at a meeting held on November 19, 2020.
In advance of the foregoing meetings, the Trustees received and considered a variety of information relating to the Advisory Agreement and the Adviser, and were given the opportunity to ask questions and request additional information from management. The information provided to the Board included, among other things: (i) a separate report prepared by an independent third party of mutual fund data, which provided a statistical analysis comparing the Fund's investment performance, expenses, and fees to comparable investment companies; (ii) information concerning the services rendered to the Fund, as well as information regarding the Adviser's revenues and costs of providing services to the Fund and compensation paid to affiliates of the Adviser; and (iii) information about the Adviser's operations and personnel. Prior to voting, the Independent Trustees reviewed the proposed continuance of the Advisory Agreement with management and with experienced independent counsel retained by the Independent Trustees ("Independent Counsel") and received materials from such Independent Counsel discussing the legal standards for their consideration of the proposed continuation of the Advisory Agreement with respect to the Fund. The Independent Trustees also reviewed the proposed continuation of the Advisory Agreement with respect to the Fund in private sessions with Independent Counsel at which no representatives of management were present.
At each regularly scheduled meeting of the Board and its committees, the Board receives and reviews, among other things, information concerning the Fund's performance and related services provided by the Adviser. At the meeting at which the renewal of the Advisory Agreement is considered, particular focus is given to information concerning Fund performance, fees and total expenses as compared to comparable investment companies, and the Adviser's profitability with respect to the Fund. However, the Board noted that the evaluation process with respect to the Adviser is an ongoing one. In this regard, the Board's and its committees' consideration of the Advisory Agreement included information previously received at such meetings.
Advisory Agreement
After full consideration of a variety of factors, the Board, including the Independent Trustees, voted to approve the Advisory Agreement. In approving the Advisory Agreement, the Trustees did not identify any single factor as controlling, and each Trustee may have attributed different weights to various factors. Throughout their deliberations, the Independent Trustees were represented and assisted by Independent Counsel.
Nature, Extent, and Quality of Services — In considering the nature, extent, and quality of the services provided by the Adviser under the Advisory Agreement, the Board reviewed information provided by the Adviser relating to its operations and personnel. The Board also took into account its knowledge of the Adviser's management and the quality of the performance of the Adviser's duties through Board meetings, discussions, and reports during the preceding year. The Board considered the fees paid to the Adviser and the services provided to the Fund by the Adviser under the Advisory Agreement, as well as other services provided by the Adviser and its affiliates under other agreements, and the personnel who provide these services. In addition to the investment advisory services provided to the Fund, the Adviser and its affiliates provide administrative services, shareholder services, oversight of Fund accounting, marketing services, assistance in meeting legal and regulatory requirements, and other services necessary for the operation of the Fund and the Trust.
The Board considered the scope of services provided by, and the undertakings required of, the Adviser in connection with those services, including, among other things, maintaining (i) its own and the Fund's compliance programs, (ii) risk management programs, (iii) liquidity risk management programs, and (iv) cybersecurity
50
USAA Mutual Funds Trust | Supplemental Information — continued March 31, 2021 | ||||||
(Unaudited)
programs, each of which had expanded over time as a result of regulatory, market, and other developments. The Board also considered the significant risks assumed by the Adviser in connection with the services provided to the Fund, including investment, operational, enterprise, litigation, regulatory and compliance risks.
The Board considered the Adviser's management style and the performance of the Adviser's duties under the Advisory Agreement. The Board considered the level and depth of knowledge of the Adviser, including the professional experience and qualifications of its senior and investment personnel, as well as current staffing levels. The allocation of the Fund's brokerage, including the Adviser's process for monitoring "best execution," also was considered. The Adviser's role in coordinating the activities of the Fund's other service providers was also considered. The Board also considered the Adviser's risk management processes. The Board considered the Adviser's financial condition and that it had the financial wherewithal to continue to provide the same scope and high quality of services under the Advisory Agreement. In reviewing the Advisory Agreement, the Board focused on the experience, resources, and strengths of the Adviser and its affiliates in managing the Fund, as well as the other funds in the Trust.
The Board also reviewed the compliance and administrative services provided to the Fund by the Adviser and its affiliates, including the Adviser's oversight of the Fund's day-to-day operations and oversight of Fund accounting. The Trustees, guided also by information obtained from their experiences as trustees of the Trust, also focused on the quality of the Adviser's compliance and administrative staff.
Expenses and Performance — In connection with its consideration of the Advisory Agreement, the Board evaluated the Fund's advisory fees and total expense ratio as compared to other open-end investment companies deemed to be comparable to the Fund as determined by the independent third party in its report. The Fund's expenses were compared to (i) a group of investment companies chosen by the independent third party to be comparable to the Fund based upon certain factors, including fund type, comparability of investment objective and classification, sales load type, asset size, and expense components (the "expense group") and (ii) a larger group of investment companies with the same investment classification/objective as the Fund regardless of asset size, excluding outliers (the "expense universe"). Among other data, the Board noted that the Fund's management fee rate—which includes advisory and administrative services and the effects of any performance adjustment1, as well as any fee waivers and reimbursements—was below the median of its expense group and above the median of its expense universe. The data indicated that the Fund's total expenses, including after any reimbursements, were below the medians of its expense group and expense universe. The Board also took into account the Adviser's current undertakings to maintain expense limitations for the Fund. The Board took into account the various other services provided to the Fund by the Adviser and its affiliates, and noted the high quality of services received by the Fund.
In considering the Fund's performance, the Board noted that it reviews at its regularly scheduled meetings information about the Fund's performance results. The Trustees also reviewed various comparative data provided to them in connection with their consideration of the renewal of the Advisory Agreement, including, among other information, a comparison of the Fund's average annual total returns relative to its Lipper index and other mutual funds deemed to be in its peer group by the independent third party in its report (the "performance universe"). The Fund's performance universe consisted of the Fund and all retail and institutional open-end investment companies with the same classification/objective as the Fund regardless of asset size or primary channel of distribution. This comparison indicated that, among other data, the Fund's performance was above the average of its performance universe and its Lipper index for the one-, three-, five-, and ten-year periods ended September 30, 2020.
Compensation and Profitability — The Board took into consideration the level and method of computing the management fee. The information considered by the Board included operating profit margin information for the Adviser's business as a whole. The Board also received and considered profitability information related to the management revenues from the Fund. This information included a review of the methodology used in the allocation of certain costs to the Fund. In considering the profitability data with respect to the Fund, the Trustees noted that the Adviser waived a portion of its management fees and/or reimbursed certain expenses with respect
1 The Adviser has agreed that no performance adjustment (positive or negative) would be made to the amount payable to the Adviser from July 1, 2019, through June 30, 2020.
51
USAA Mutual Funds Trust | Supplemental Information — continued March 31, 2021 | ||||||
(Unaudited)
to the Fund. The Trustees reviewed the profitability of the Adviser's relationship with the Fund before tax expenses. The Board was also provided with a profitability analysis of other publicly traded asset managers prepared by an independent information service. In reviewing the overall profitability of the management fee to the Adviser, the Board also considered the fact that the Adviser and its affiliates provide shareholder servicing and administrative services to the Fund for which they receive compensation. The Board also considered the possible direct and indirect benefits to the Adviser from its relationship with the Trust, including that the Adviser may derive reputational and other benefits from its association with the Fund. The Trustees recognized that the Adviser should be entitled to earn a reasonable level of profits in exchange for the level of services it provides to the Fund and the entrepreneurial and other risks that it assumes as Adviser.
Economies of Scale — The Board considered whether there should be changes in the management fee rate or structure in order to enable the Fund to participate in any economies of scale. The Board also considered the fee waiver and expense reimbursement arrangements by the Adviser. The Board also considered the effect of the Fund's change in size, if any, on its performance and fees, noting that the Fund may realize other economies of scale if assets increase proportionally more than expenses. The Board determined that the current investment management fee structure was reasonable.
Conclusions — The Board reached the following conclusions regarding the Fund's Advisory Agreement with the Adviser: (i) the Adviser has demonstrated that it possesses the capability and resources to perform the duties required of it under the Advisory Agreement; (ii) the Adviser maintains an appropriate compliance program; (iii) the overall performance of the Fund is reasonable in relation to the performance of funds with similar investment objectives and to relevant indices; (iv) the Fund's advisory expenses are reasonable in relation to those of similar funds and to the services to be provided by the Adviser; and (v) the Adviser's and its affiliates' level of profitability from their relationship with the Fund is reasonable in light of the nature and high quality of services provided by the Adviser and the type of fund. Based on its conclusions, the Board determined that continuation of the Advisory Agreement would be in the best interests of the Fund and its shareholders.
52
USAA Mutual Funds Trust | Supplemental Information — continued March 31, 2021 | ||||||
(Unaudited)
Liquidity Risk Management Program:
The USAA Mutual Funds have adopted and implemented a written liquidity risk management program (the "LRMP") as required by Rule 22e-4 under the Investment Company Act of 1940, as amended. The LRMP is reasonably designed to assess and manage the Fund's liquidity risk, taking into consideration the Fund's investment strategy and the liquidity of its portfolio investments during normal and reasonably foreseeable stressed market conditions; its short and long-term cash flow projections; and its cash holdings and access to other liquidity management tools such as available funding sources including the Victory Funds Complex Interfund Lending Facility and Line of Credit (discussed in the Notes to Financial Statements). The USAA Mutual Funds' Board of Trustees approved the appointment of the Funds' investment adviser, Victory Capital Management Inc. ("Victory Capital"), as the administrator of the LRMP.
Victory Capital manages liquidity risks associated with the Fund's investments by monitoring, among other things, cash and cash equivalents, any use of derivatives, the concentration of investments, the appropriateness of the Fund's investment strategy, and by classifying every fund investment as either highly liquid, moderately liquid, less liquid or illiquid on at least a monthly basis. To assist with the classification of Fund investments, Victory Capital has retained a third-party provider of liquidity evaluation services. This provider determines preliminary liquidity classifications for all portfolio holdings based upon portfolio-level data and certain assumptions provided by Victory Capital. Victory Capital reviews the preliminary liquidity classifications, and, when appropriate, considers other information including input from the Fund's portfolio managers (including the portfolio managers employed by any investment sub-advisers) in determining final liquidity classifications.
At a virtual video conference meeting held on March 10, 2021, Victory Capital provided an oral and written report to the Trustees on the operation and effectiveness of the LRMP during the previous year. The report from Victory Capital concluded that the Fund did not experience any significant liquidity challenges during the covered period, and the Fund's LRMP is reasonably designed to assess and manage its liquidity risk. The report also concluded that the LRMP continues to operate adequately and effectively to enable Victory Capital to oversee and manage liquidity risk and ensure the Fund is able to meet redemption requests without significant dilution to the remaining investors' interest in the Fund. During the review period, the Fund's portfolio consisted primarily of highly liquid investments, which are defined as cash and any investments reasonably expected to be converted to cash in current market conditions in three business days or less without significantly changing the market value of the investment. Therefore, the Fund has not adopted a Highly Liquid Investment Minimum. The Fund's investments were below the limitation on illiquid investments during the review period. Additionally, Victory Capital indicated that no events occurred that would require the filing of Form N-LIQUID and recommended no material changes to the LRMP.
53
Privacy Policy
Protecting the Privacy of Information
The Trust respects your right to privacy. We also know that you expect us to conduct and process your business in an accurate and efficient manner. To do so, we must collect and maintain certain personal information about you. This is the information we collect from you on applications or other forms, and from the transactions you make with us or third parties. It may include your name, address, social security number, account transactions and balances, and information about investment goals and risk tolerance.
We do not disclose any information about you or about former customers to anyone except as permitted or required by law. Specifically, we may disclose the information we collect to companies that perform services on our behalf, such as the transfer agent that processes shareholder accounts and printers and mailers that assist us in the distribution of investor materials. We may also disclose this information to companies that perform marketing services on our behalf. This allows us to continue to offer you Victory investment products and services that meet your investing needs, and to effect transactions that you request or authorize. These companies will use this information only in connection with the services for which we hired them. They are not permitted to use or share this information for any other purpose.
To protect your personal information internally, we permit access only by authorized employees and maintain physical, electronic and procedural safeguards to guard your personal information.*
* You may have received communications regarding information about privacy policies from other financial institutions which gave you the opportunity to "opt-out" of certain information sharing with companies which are not affiliated with that financial institution. The Trust does not share information with other companies for purposes of marketing solicitations for products other than the Trust. Therefore, the Trust does not provide opt-out options to their shareholders.
P.O. Box 182593
Columbus, Ohio 43218-2593

Visit our website at: | Call | ||||||
vcm.com | (800 | ) 235-8396 | |||||
40856-0521
Item 2. Code of Ethics.
| (a) | The registrant has adopted a code of ethics that applies to the registrant’s principal executive officer, principal financial officer, principal accounting officer or controller, or persons performing similar functions. This code of ethics in included as an Exhibit. |
| (b) | During the period covered by the report, with respect to the registrant’s code of ethics that applies to its principal executive officer, principal financial officer, principal accounting officer or controller, or persons performing similar functions; on July 1, 2019, the Board of Trustees of USAA Mutual Funds Trust approved a Code of Ethics ("Sarbanes Code") applicable solely to its senior financial officers, including its principal executive officer (President), as defined under the Sarbanes-Oxley Act of 2002 and implementing regulations of the Securities and Exchange Commission. A copy of the Sarbanes Code is attached as an Exhibit to this Form N-CSR. |
No waivers (explicit or implicit) have been granted from a provision of the Sarbanes Code.
Item 3. Audit Committee Financial Expert.
(a)(1) The registrant’s board of trustees has determined that the registrant has at least one audit committee financial expert serving on its audit committee.
(a)(2) The audit committee financial experts are Dr. Barbara B. Ostdiek, Ph.D. and Dawn M. Hawley, who are “independent” for purposes of this Item 3 of Form N-CSR.
Dr. Ostdiek has served as an Associate Professor of Management at Rice University since 2001. Dr. Ostdiek also has served as an Academic Director at El Paso Corporation Finance Center since 2002. Ms. Hawley was Chief Financial Officer, Director of Financial Planning and Analysis for AIM Management Group Inc. from October 1987 through January 2006 and was Manager of Finance at Menil Foundation, Inc. from May 2007 through June 2011. Each of Dr. Ostdiek and Ms. Hawley is an independent trustee who serves as a member of the Audit and Compliance Committee, Investments Committee, Product Management and Distribution Committee, and the Corporate Governance Committee of the Board of Trustees of USAA Mutual Funds Trust.
Item 4. Principal Accountant Fees and Services.
| 2021 | 2020 | |||||||
| (a) Audit Fees (1) | $ | 311,132 | $ | 195,700 | ||||
| (b) Audit-Related Fees (2) | - | - | ||||||
| (c) Tax Fees (3) | - | 2,174 | ||||||
| (d) All Other Fees (4) | - | - | ||||||
(1) Audit fees include amounts related to the audit of the Registrant’s annual financial statements and services normally provided by the accountant in connection with statutory and regulatory filings. Audit fees billed were for professional services provided by Ernst & Young LLP for statutory and regulatory filings.
(2) For the fiscal years ended March 31, 2021 and March 31, 2020, there were no audit-related fees billed by Ernst & Young LLP to the Registrant.
(3) Represents the aggregate tax fee billed for professional services rendered by Ernst & Young LLP for assistance with PFIC Analyzer Service and tax consulting services.
(4) For the fiscal years ended March 31, 2021 and March 31, 2020, there were no other fees billed by Ernst & Young LLP to the Registrant.
(e)(1) All audit and non-audit services to be performed for the Registrant by Ernst & Young LLP must be pre-approved by the Audit and Compliance Committee. The Audit and Compliance Committee Charter also permits the Chair of the Audit and Compliance Committee to pre-approve any permissible non-audit service that must be commenced prior to a scheduled meeting of the Audit and Compliance Committee. All non-audit services were pre-approved by the Audit and Compliance Committee or its Chair, consistent with the Audit and Compliance Committee's preapproval procedures.
(e)(2) There were no services performed under Rule 2.01 (c)(7)(i)(C).
(f) Not applicable.
(g) Aggregate non-audit fees for services rendered to the:
| Registrant | Adviser | |||||||
| 2021 | $ | - | $ | 123,784 | ||||
| 2020 | $ | 2,174 | $ | 209,662 | ||||
(h) The aggregate non-audit fees related to fees billed by Ernst & Young LLP for services rendered to the Registrant; the investment adviser, USAA Asset Management Company (AMCO) and its affiliate, USAA Investment Management Company (IMCO); and the Funds' transfer agent, Victory Capital Transfer Agency Inc. and prior transfer agent, USAA Shareholder Account Services (SAS), which includes aggregate fees accrued or paid to Ernst & Young, LLP for professional services rendered related to the annual study of internal controls of the transfer agent for fiscal years listed above. All services were preapproved by the Audit Committee.
Effective July 1, 2019, AMCO, the prior investment adviser to the Funds, and SAS, the prior transfer agent to the Funds, were acquired by Victory Capital Holdings, Inc. Effective July 1, 2019, Victory Capital Management Inc. is the new investment adviser and administrator to the Funds; SAS was renamed Victory Capital Transfer Agency, Inc. and is the new transfer agent to the Funds.
Ernst & Young LLP provided non-audit services to AMCO and IMCO in 2020 and also provided certain tax services to Victory Capital Holdings, Inc. in 2019 that were not required to be pre-approved by the Registrant's Audit and Compliance Committee because the services were not directly related to the operations of the Registrant's Funds. The Board of Trustees will consider Ernst & Young LLP's independence and will consider whether the provision of these non-audit services to AMCO is compatible with maintaining Ernst & Young LLP's independence.
| Item 5. | Audit Committee of Listed Registrants. |
Not applicable.
| Item 6. | Investments. |
(a) Not applicable.
(b) Not applicable.
Item 7. Disclosure of Proxy Voting Policies and Procedures for Closed-End Management Investment Companies.
Not applicable.
Item 8. Portfolio Managers of Closed-End Management Investment Companies.
Not applicable.
Item 9. Purchases of Equity Securities by Closed-End Management Investment Company and Affiliated Purchasers.
Not applicable.
Item 10. Submission of Matters to a Vote of Security Holders.
The Corporate Governance Committee selects and nominates candidates for membership on the Board as independent trustees. The Corporate Governance Committee has adopted procedures to consider Board candidates suggested by shareholders. The procedures are initiated by the receipt of nominations submitted by a fund shareholder sent to Board member(s) at the address specified in fund disclosure documents or as received by the Adviser or a fund officer. Any recommendations for a nomination by a shareholder, to be considered by the Board, must include at least the following information: name; date of birth; contact information; education; business profession and other expertise; affiliations; experience relating to serving on the Board; and references. The Corporate Governance Committee gives shareholder recommendations the same consideration as any other candidate.
Item 11. Controls and Procedures.
(a)The registrant’s principal executive officer and principal financial officer have concluded, based on their evaluation of the registrant's disclosure controls and procedures as conducted within 90 days of the filing date of this report, that these disclosure controls and procedures are adequately designed and are operating effectively to ensure that information required to be disclosed by the registrant on Form N-CSR is recorded, processed, summarized and reported within the time periods specified in the Securities and Exchange Commission's rules and forms.
(b)There were no changes in the registrant’s internal control over financial reporting (as defined in Rule 30a-3(d) under the Investment Company Act of 1940 (17 CFR 270.30a-3(d)) that occurred during the period covered by this report that have materially affected or are reasonably likely to materially affect, the registrant’s internal control over financial reporting.
Item 12. Disclosure of Securities Lending Activities for Closed-End Management Investment Companies.
(a)(1) Not applicable.
(a)(2) Not applicable.
(a)(3) Not applicable.
(a)(4) Not applicable.
(b) Not applicable.
Item 13. Exhibits.
(a)(2) Certifications pursuant to Rule 30a-2(a) are attached hereto.
(a)(3) Not applicable.
(a)(4) Not applicable.
(b) Certifications pursuant to Rule 30a-2(b) are attached hereto.
SIGNATURES
Pursuant to the requirements of the Securities Exchange Act of 1934 and the Investment Company Act of 1940, the registrant has duly caused this report to be signed on its behalf by the undersigned, thereunto duly authorized.
| (Registrant) | USAA Mutual Fund Trust |
| By (Signature and Title)* | /s/ James K. De Vries | |
| James K. De Vries, Principal Financial Officer |
| Date | June 2, 2021 |
Pursuant to the requirements of the Securities Exchange Act of 1934 and the Investment Company Act of 1940, this report has been signed below by the following persons on behalf of the registrant and in the capacities and on the dates indicated.
| By (Signature and Title)* | /s/ Christopher K. Dyer | |
| Christopher K. Dyer, Principal Executive Officer |
| Date | June 2, 2021 |
| By (Signature and Title)* | /s/ James K. De Vries | |
| James K. De Vries, Principal Financial Officer |
| Date | June 2, 2021 |