UNITED STATES
SECURITIES AND EXCHANGE COMMISSION
Washington, D.C. 20549
FORM 10-K
| x | ANNUAL REPORT PURSUANT TO SECTION 13 OR 15(d) OF THE SECURITIES EXCHANGE ACT OF 1934 |
December 31, 2011 For the fiscal year ended December 31, 2011
Commission file number 0-23134

NB&T FINANCIAL GROUP, INC.
(Exact name of registrant as specified in its charter)
| | |
| Ohio | | 31-1004998 |
(State or other jurisdiction of incorporation or organization) | | (I.R.S. Employer Identification Number) |
48 N. South Street, Wilmington, Ohio 45177
(Address of principal executive offices) (Zip Code)
Registrant’s telephone number: (937) 382-1441
Securities registered pursuant to Section 12(b) of the Act:
| | |
Title of each class | | Name of each exchange on which registered |
| Common Shares, without par value | | The NASDAQ Stock Market LLC (NASDAQ Capital Market) |
Securities registered pursuant to 12(g) of the Act:
None
Indicate by check mark if the registrant is a well-known seasoned issuer, as defined in Rule 405 of the Securities Act. Yes ¨ No x
Indicate by check mark if the registrant is not required to file reports pursuant to Section 13 or Section 15 of the Act. Yes ¨ No x
Indicate by check mark whether the Registrant (1) has filed all reports required to be filed by Section 13 or 15(d) of the Securities Exchange Act of 1934 during the preceding 12 months (or for such shorter period that the registrant was required to file such reports), and (2) has been subject to such filing requirements for the past 90 days. Yes x No ¨
Indicate by check mark whether the registrant has submitted electronically and submitted on its corporate website, if any, every Interactive Data File required to be submitted and posted pursuant to Rule 405 of Regulation S-T (Section 232.405 of this chapter) during the preceding 12 months (or for such shorter period that the registrant was required to submit and post such files). Yes x No ¨
Indicate by check mark if disclosure of delinquent filers pursuant to Item 405 of Regulation S-K is not contained herein, and will not be contained, to the best of the registrant’s knowledge, in definitive proxy or information statements incorporated by reference in Part III of this Form 10-K or any amendment to this Form 10-K. ¨
Indicate by check mark whether the registrant is a large accelerated filer, an accelerated filer, a non-accelerated filer or a smaller reporting company. See the definitions of “large accelerated filer”, “accelerated filer” and “smaller reporting company” in Rule 12b-2 of the Exchange Act. (Check one):
| | | | | | |
| Large accelerated filer | | ¨ | | Accelerated filer | | ¨ |
| Non-accelerated filer | | ¨ | | Smaller reporting company | | x |
(Do not check if a smaller reporting company)
Indicate by check mark whether the registrant is a shell company (as defined in Rule 12b-2 of the Act) Yes ¨ No x
Based on the closing sales price of $20.81 per share on June 30, 2011, the aggregate market value of the issuer’s shares held by nonaffiliates on such date was $50,442,670. For this purpose, shares held by nonaffiliates are all outstanding shares except those held by the directors and executive officers of the registrant and those held by The National Bank and Trust Company (the “Bank”) as trustee with respect to which the Bank has sole or shared voting or dispositive power. As of March 1, 2012, 3,423,252 common shares were issued and outstanding.
DOCUMENTS INCORPORATED BY REFERENCE
The following sections of the definitive Proxy Statement for the 2012 Annual Meeting of Shareholders of NB&T Financial Group, Inc. (the “Proxy Statement”), are incorporated by reference into Part III of this Form 10-K:
1. Proposal 1: Election of Directors;
2. Section 16(a) Beneficial Ownership Reporting Compliance;
3. Compensation of Executive Officers and Directors;
4. Voting Securities and Ownership of Certain Beneficial Owners and Management;
5. Certain Relationships and Related Transactions; and
6. Proposal 2: Ratification of Selection of BKD, LLP as the Independent Registered Public Accounting Firm
2
PART I
Item 1. Description of Business
GENERAL
NB&T Financial Group, Inc. (“NB&T Financial” or the “Company”), an Ohio corporation, is a financial holding company which owns all of the issued and outstanding common shares of The National Bank and Trust Company, chartered under the laws of the United States (the “Bank”). The Bank is engaged in the commercial banking business primarily in southwestern Ohio, providing a variety of consumer and commercial financial services. The primary business of the Bank consists of accepting deposits, through various consumer and commercial deposit products, and using such deposits to fund loans secured by residential and non-residential real estate, commercial and agricultural loans and consumer loans, including automobile loans. All of the foregoing deposit and lending services are available at each of the Bank’s full-service offices. The Bank also has a trust department with assets under management of approximately $197.3 million. As of December 31, 2011, the Bank had 211 employees.
On March 19, 2010, the Bank assumed all the deposits and acquired certain assets and other liabilities of American National Bank in Parma, Ohio, from the Federal Deposit Insurance Corporation (the “FDIC”), pursuant to the terms of a purchase and assumption agreement. As part of the acquisition, the Bank and the FDIC entered into loss-sharing agreements that collectively cover approximately $48.2 million of assets, consisting almost entirely of commercial real estate and commercial and industrial loans.
On January 8, 2010, the Bank sold its wholly-owned subsidiary, NB&T Insurance Agency, Inc. (“NB&T Insurance”), which had three locations, with its principal office in Wilmington, Ohio. NB&T Insurance sells a full line of insurance products, including property and casualty, life, health, and annuities. NB&T Insurance Group, Inc., another wholly-owned subsidiary of the Bank, then obtained a license to sell insurance. NB&T Insurance Group, Inc. offers annuities and, through a third-party, brokerage services to the Bank’s customers.
On December 31, 2009, Community National Corporation (“CNC”) merged into NB&T Financial and CNC’s subsidiary, Community National Bank (“CNB”), located in Franklin, Ohio, merged into the Bank. The merger added approximately $86 million to the Company’s assets and $76 million in deposits. CNB had five branches located in Warren, Montgomery and Butler counties in Ohio. NB&T Financial paid $3.6 million in cash and issued 237,582 shares of NB&T Financial in exchange for all of the outstanding common shares of CNC.
As a registered bank holding company and financial holding company under the Bank Holding Company Act, NB&T Financial is subject to regulation, examination and oversight by the Board of Governors of the Federal Reserve System (the “FRB”). The Bank, as a national bank, is subject to regulation, examination and oversight by the Office of the Comptroller of the Currency (the “OCC”) and special examination by the FRB. The Bank is a member of the Federal Reserve Bank of Cleveland. In addition, since its deposits are insured by the FDIC, the Bank is also subject to some regulation, oversight and special examination by the FDIC. The Bank must file periodic financial reports with the FDIC, the OCC and the Federal Reserve Bank of Cleveland. Examinations are conducted periodically by these federal regulators to determine whether the Bank and NB&T Financial are in compliance with various regulatory requirements and are operating in a safe and sound manner.
Since its incorporation in 1980, NB&T Financial’s activities have been limited primarily to holding the common shares of the Bank. Consequently, the following discussion focuses primarily on the business of the Bank.
3
Lending Activities
General. The Bank’s income consists primarily of interest income generated by lending activities, including the origination of loans secured by residential and nonresidential real estate, commercial and agricultural loans, and consumer loans. Please refer to Table 7 on page 24, which summarizes the loan portfolio mix.
Commercial and Industrial Lending. The Bank originates loans to businesses in its market area, including “floor plan” loans to automobile dealers and loans guaranteed by the Small Business Administration. The typical commercial borrower is a small to mid-sized company with annual sales under $5,000,000. The majority of commercial loans are made at adjustable rates of interest tied to the prime rate. Commercial loans typically have terms of up to five years. Commercial and industrial lending entails significant risks. Such loans are subject to greater risk of default during periods of adverse economic conditions. Because such loans are secured by equipment, inventory, accounts receivable and other non-real estate assets, the collateral may not be sufficient to ensure full payment of the loan in the event of a default.
Commercial Real Estate. The Bank makes loans secured by commercial real estate located in its market area. Such loans generally are adjustable-rate loans for terms of up to 20 years. The types of properties securing loans in the Bank’s portfolio include warehouses, retail outlets and general industrial use properties. Commercial real estate lending generally entails greater risks than residential real estate lending. Such loans typically involve larger balances and depend on the income of the property to service the debt. Consequently, the risk of default on such loans may be more sensitive to adverse economic conditions. The Bank attempts to minimize such risks through prudent underwriting practices.
Real Estate Construction. The Bank originates loans for the purpose of constructing both commercial and residential buildings. The Company offers both construction-phase-only and permanent financing.
Agricultural Loans. The Bank makes agricultural loans, which include loans to finance farm operations, equipment purchases, and land acquisition. The repayment of such loans is significantly dependent upon income from farm operations, which can be adversely affected by weather and other physical conditions, government policies and general economic conditions.
Residential Real Estate. The Bank makes loans secured by one- to four-family residential real estate and multi-family (over four units) real estate located in its market area. The Bank originates both fixed-rate mortgage loans and adjustable-rate mortgage loans (“ARMs”) to meet the needs of its customers. The Bank will sell loans in the secondary market it does not intend to hold for the foreseeable future.
Installment Loans. The Bank makes a variety of consumer installment loans, including home equity loans, automobile loans, recreational vehicle loans, and overdraft protection. Over the past five years, the Company has significantly reduced its indirect lending activities through automobile dealers. Consumer loans involve a higher risk of default than loans secured by one- to four-family residential real estate, particularly in the case of consumer loans which are unsecured or secured by rapidly depreciating assets, such as automobiles. Various federal and state laws, including federal and state bankruptcy and insolvency laws, may also limit the amount that can be recovered on such loans.
Credit Card Service. The Bank offers credit card services through a correspondent bank.
Loan Processing. Loan officers are authorized by the Board of Directors to approve loans up to specified limits. Loans exceeding the loan officers’ approval authority are referred to the Bank’s Senior Loan Committee. Any loans made by the Bank in excess of the limits established for the Senior Loan Committee must be approved by the Chairman of the Board and the President of the Bank as representatives of the Board of Directors. All loans in excess of $50,000 are reported to the Board on a monthly basis.
4
Loan Originations, Purchases and Sales. Although the Bank generally does not purchase loans, purchases could occur in the future. Residential real estate loans are originated for sale in the secondary market. From time to time, the Bank sells participation interests in loans it originates.
Allowance for Loan Losses. Federal regulations require that the Bank establish prudent general allowances for loan losses. Senior management, with oversight responsibility provided by the Board of Directors, reviews on a monthly basis the allowance for loan losses as it relates to a number of relevant factors, including but not limited to, historical trends in the level of non-performing assets and classified loans, current charge-offs and the amount of the allowance as a percent of the total loan portfolio. While management believes that it uses the best information available to determine the allowance for loan losses, unforeseen market conditions could result in adjustments, and net earnings could be significantly affected if circumstances differ substantially from the assumptions used in making the final determination.
Investment Activities
Funds not used in the Bank’s lending or banking function are dedicated to the investment portfolio. Those funds will be placed in investment programs approved by the Asset/Liability Management Committee (ALCO). The deployment of these funds will be consistent with the overall strategy and risk profile of the Bank. The Bank primarily invests in high-quality securities to provide sufficient liquidity, secure pledged deposits, minimize current tax liability, and increase earnings.
Trust Services
The Bank received trust powers in 1922 and had approximately $197.3 million in assets under management at December 31, 2011 in the Trust Department. These assets are not included in the Bank’s balance sheet because, under federal law, neither the Bank nor its creditors can assert any claim against funds held by the Bank in its fiduciary capacity. In addition to administering trusts, the services offered by the Trust Department include investment purchase and management, estate planning and administration, tax and financial planning and employee benefit plan administration.
Deposits and Borrowings
General. Deposits have traditionally been the primary source of the Bank’s funds for use in lending and other investment activities. In addition to deposits, the Bank derives funds from interest payments and principal repayments on loans and income on earning assets. Loan payments are a relatively stable source of funds, while deposit inflows and outflows fluctuate more in response to general interest rates and money market conditions.
Deposits. Deposits are attracted principally from within the Bank’s market area through the offering of numerous deposit instruments, including checking accounts, savings accounts, money market deposit accounts, and term certificate accounts. Interest rates paid, maturity terms, service fees and withdrawal penalties for the various types of accounts are established periodically by the Bank’s Asset/Liability Committee and the Executive Committee based on the Bank’s liquidity requirements, growth goals and market trends. The Company has also used brokers, on a limited basis, to obtain deposits. Currently the amount of deposits from outside the Bank’s market area is not significant.
Borrowings. The Federal Reserve System functions as a central reserve bank providing credit for its member banks and certain other financial institutions. As a member in good standing of the Federal Reserve Bank of Cleveland, the Bank is authorized to apply for advances, provided certain standards of credit-worthiness have been met. The Bank is also a member of the Federal Home Loan Bank system. Short-term borrowings include federal funds purchased and U.S Treasury demand notes.
5
Competition
The Bank competes for deposits with other commercial banks, savings associations and credit unions and with the issuers of commercial paper and other securities, such as shares in money market mutual funds. The primary factors in competing for deposits are interest rates and convenience of office location. In making loans, the Bank competes with other commercial banks, savings associations, mortgage bankers, consumer finance companies, credit unions, leasing companies, insurance companies and other lenders. The Bank competes for loan originations primarily through the interest rates and loan fees it charges and through the efficiency and quality of services it provides to borrowers. Competition is affected by, among other things, the general availability of lendable funds, general and local economic conditions, current interest rate levels and other factors which are not readily predictable. For years the Bank has competed within its market area with several regional bank holding companies, each with assets far exceeding those of the Bank.
REGULATION
General
Because of its ownership of all the outstanding stock of the Bank, NB&T Financial is subject to regulation, examination and oversight by the FRB as a bank holding company and financial holding company under the Bank Holding Company Act. The FRB has extensive enforcement authority over financial holding companies. The FRB may assess civil money penalties, issue cease and desist or removal orders and require that a financial holding company divest subsidiaries. The Bank, as a national bank, is subject to regulation, examination and oversight by the OCC and special examination by the FRB. The Bank is a member of the Federal Reserve Bank of Cleveland and a member of the Federal Home Loan Bank of Cincinnati. In addition, since its deposits are insured by the FDIC, the Bank is also subject to some regulation, oversight and special examination by the FDIC. The Bank must file periodic financial reports with the FDIC, the OCC and the Federal Reserve Bank of Cleveland. Examinations are conducted periodically by these federal regulators to determine whether the Bank and NB&T Financial are in compliance with various regulatory requirements and are operating in a safe and sound manner. In general, the FRB may initiate enforcement actions for violations of law and regulations.
Bank Holding Company Regulation
The FRB has adopted capital adequacy guidelines for bank holding companies, pursuant to which, on a consolidated basis, NB&T Financial must maintain total capital of at least 8% of risk-weighted assets. Risk-weighted assets consist of all assets, plus credit equivalent amounts of certain off- balance sheet items, which are weighted at percentage levels ranging from 0% to 100%, based on the relative credit risk of the asset. At least half of the total capital to meet this risk-based requirement must consist of core or “Tier 1” capital, which includes common stockholders’ equity, qualifying perpetual preferred stock (up to 25% of Tier 1 capital) and minority interests in the equity accounts of consolidated subsidiaries, less goodwill, certain other intangibles, and portions of certain non-financial equity investments. The remainder of total capital may consist of supplementary or “Tier 2 capital.” In addition to this risk-based capital requirement, the FRB requires bank holding companies to meet a leverage ratio of a minimum level of Tier 1 capital to average total consolidated assets of 3%, if they have the highest regulatory examination rating, well-diversified risk and minimal anticipated growth or expansion. All other bank holding companies are expected to maintain a leverage ratio of at least 4% of average total consolidated assets. NB&T Financial was in compliance with these capital requirements at December 31, 2011. For NB&T Financial’s capital ratios, see Note 17 to the Consolidated Financial Statements in Item 8. The current capital requirements are based on the 1998 capital accord of the Basel Committee on Banking supervision (the “Basel Committee”). In December 2010, the Basel Committee released a new framework, referred to as “Basel III.” The banking regulators are considering the extent to which they will apply the Basel III principles to smaller financial institutions, such as NB&T Financial and the Bank.
6
A bank holding company is required by law to guarantee the compliance of any insured depository institution subsidiary that may become “undercapitalized” (defined in the regulations as not meeting minimum capital requirements) with the terms of the capital restoration plan filed by such subsidiary with its appropriate federal banking agency.
The Bank Holding Company Act restricts NB&T Financial’s ownership or control of the outstanding shares of any class of voting stock of any company engaged in a nonbanking business, other than companies engaged in certain activities determined by the FRB to be closely related to banking. In addition, the FRB has the authority to require a bank holding company to terminate any activity or relinquish control of any nonbank subsidiary (other than a nonbank subsidiary of a bank) upon the determination by the FRB that such activity or control constitutes a serious risk to the financial soundness and stability of any bank subsidiary of the bank holding company. NB&T Financial currently has no nonbank subsidiaries, except subsidiaries of the Bank. The ownership of subsidiaries of the Bank is regulated by the OCC, rather than the FRB.
The Financial Services Modernization Act of 1999 permits bank holding companies to become financial holding companies and thereby affiliate with securities firms and insurance companies and engage in other activities that are financial in nature. A bank holding company may become a financial holding company if each of its subsidiary banks is well capitalized under the Federal Deposit Insurance Corporation Act of 1991 prompt corrective action provisions, is well managed, and has at least a satisfactory rating under the Community Reinvestment Act, by filing a declaration that the bank holding company wishes to become a financial holding company. In October 2006, NB&T Financial Group, Inc. became a financial holding company. No regulatory approval is required for a financial holding company to acquire a company, other than a bank or savings association, engaged in activities that are financial in nature or incidental to activities that are financial in nature, as determined by the Federal Reserve Board.
The Financial Services Modernization Act defines “financial in nature” to include:
| | • | | securities underwriting, dealing and market making; |
| | • | | sponsoring mutual funds and investment companies; |
| | • | | insurance underwriting and agency; |
| | • | | activities that the Federal Reserve Board has determined to be closely related to banking. |
A national bank also may engage, subject to limitations on investment, in activities that are financial in nature, other than insurance underwriting, insurance company portfolio investment, real estate development and real estate investment, through a financial subsidiary of the bank, if the bank is well capitalized, well managed and has at least a satisfactory Community Reinvestment Act rating. Subsidiary banks of a financial holding company or national banks with financial subsidiaries must continue to be well capitalized and well managed in order to continue to engage in activities that are financial in nature without regulatory actions or restrictions, which could include divestiture of the financial in nature subsidiary or subsidiaries. In addition, a financial holding company or a bank may not acquire a company that is engaged in activities that are financial in nature unless each of the subsidiary banks of the financial holding company or the bank has a Community Reinvestment Act rating of satisfactory or better. NB&T Insurance Group, Inc. is a financial subsidiary.
Transactions between NB&T Financial and the Bank are subject to statutory limits in Sections 23A and 23B of the Federal Reserve Act, which limit the amounts of such transactions and require that the terms of the transactions be at least as favorable to the Bank as the terms would be of a similar transaction between the Bank and an unrelated party. NB&T Financial and the Bank were in compliance with these requirements and restrictions at December 31, 2011.
The FRB must approve the application of a bank holding company to acquire any bank or savings association. The Company’s ability to pay dividends to its shareholders may be restricted. Current FRB policy
7
requires bank holding companies to act as a source of financial strength to its banking subsidiaries. Under this policy, the FRB may require the Company to commit resources or contribute additional capital to the Bank, which could restrict the amount of cash available for dividends to the Company’s shareholders. The FRB has issued guidance on the payment of dividends by bank holding companies, which includes conditions under which bank holding companies must provide advance notification of their intentions to declare and pay dividends.
National Bank Regulation
Office of the Comptroller of the Currency. The OCC is an office in the Department of the Treasury and is subject to the general oversight of the Secretary of the Treasury. The OCC is responsible for the regulation and supervision of all national banks, including the Bank. The OCC issues regulations governing the operation of national banks and, in accordance with federal law, prescribes the permissible investments and activities of national banks. The Bank is authorized to exercise trust powers in accordance with OCC guidelines. National banks are subject to regulatory oversight under various consumer protection and fair lending laws. These laws govern, among other things, truth-in-lending disclosure, equal credit opportunity, fair credit reporting and community reinvestment. The OCC has the authority to impose sanctions on the Bank and, under certain circumstances, may appoint a receiver for the Bank.
The Bank is required to meet certain minimum capital requirements set by the OCC. These requirements consist of risk-based capital guidelines and a leverage ratio, which are substantially the same as the capital requirements imposed on NB&T Financial. The Bank was in compliance with those capital requirements at December 31, 2011. For the Bank capital ratios, see Note 17 to the Consolidated Financial Statements in Item 8. The OCC may adjust the risk-based capital requirement of a national bank on an individualized basis to take into account risks due to concentrations of credit or nontraditional activities.
The OCC has adopted regulations governing prompt corrective action to resolve the problems of capital deficient and otherwise troubled national banks. At each successively lower defined capital category, a national bank is subject to more restrictive and numerous mandatory or discretionary regulatory actions or limits, and the OCC has less flexibility in determining how to resolve the problems of the institution. In addition, the OCC generally can downgrade a national bank’s capital category, notwithstanding its capital level, if, after notice and opportunity for hearing, the national bank is deemed to be engaging in an unsafe or unsound practice, because it has not corrected deficiencies that resulted in it receiving a less than satisfactory examination rating on matters other than capital or it is deemed to be in an unsafe or unsound condition. The Bank’s capital at December 31, 2011, met the standards for the highest capital category, a well-capitalized bank.
A national bank is subject to restrictions on the payment of dividends, including dividends to a holding company. The Bank may not pay a dividend if it would cause the Bank not to meet its capital requirements. In addition, the dividends that a Bank subsidiary can pay to its holding company without prior approval of regulatory agencies is limited to net income plus its retained net income for the preceding two years. Based on the current financial condition of the Bank, the Bank does not expect these provisions to affect the current ability of the Bank to pay dividends to NB&T Financial in an amount customary for the Bank.
OCC regulations generally limit the aggregate amount that a national bank can lend to one borrower or aggregated groups of related borrowers to an amount equal to 15% of the bank’s unimpaired capital and surplus. A national bank may loan to one borrower an additional amount not to exceed 10% of the association’s unimpaired capital and surplus, if the additional amount is fully secured by certain forms of “readily marketable collateral”. Loans to executive officers, directors and principal shareholders and their related interests must conform to the OCC lending limits. All transactions between national banks and their affiliates, including NB&T Financial, must comply with Sections 23A and 23B of the Federal Reserve Act.
Federal Deposit Insurance Corporation. The FDIC is an independent federal agency that insures the deposits, up to prescribed statutory limits, of federally insured banks and thrifts and safeguards the safety and
8
soundness of the banking and thrift industries. The FDIC is authorized to establish annual assessment rates for deposit insurance. The FDIC has established a risk-based assessment system for members. Under this system, assessments vary based on the risk the institution poses to its deposit insurance fund. The risk level is determined based on the institution’s capital level and the FDIC’s level of supervisory concern about the institution. Insurance of deposits may be terminated by the FDIC if it finds that the institution has engaged in unsafe or unsound practices, is in an unsafe or unsound condition to continue operations, or has violated any applicable law, regulation, rule, order or condition enacted or imposed by the institution’s regulatory agency. On February 7, 2011, the FDIC issued final regulations, effective April 1, 2011, as required by the Dodd-Frank Wall Street Reform and Consumer Protection Act (the “Dodd-Frank Act”), to change the deposit insurance assessment base from total domestic deposits to average total assets minus average tangible equity, as well as changing the assessment for larger institutions and the assessment rate schedules.
Federal Reserve Board. The Federal Reserve Act requires national banks to maintain reserves against their net transaction accounts (primarily checking and NOW accounts). The amounts are subject to adjustment by the FRB. At December 31, 2011, the Bank was in compliance with its reserve requirements.
Federal Home Loan Banks. The Federal Home Loan Banks (the “FHLBs”) provide credit to their members in the form of advances. As a member, the Bank must maintain an investment in the capital stock of the FHLB of Cincinnati in an amount equal to the greater of 1% of the aggregate outstanding principal amount of the Bank’s residential real estate loans, home purchase contracts and similar obligations at the beginning of each year, or 5% of its advances from the FHLB. The Bank is in compliance with this requirement with an investment in FHLB of Cincinnati stock having a book value of $9.1 million at December 31, 2011. The FHLB advances are secured by collateral in one or more specified categories. The amount a member may borrow from the FHLB is limited based upon the amounts of various assets held by the member.
Insurance Agency Regulation
The Bank’s insurance agency subsidiary is subject to insurance laws and regulations of the State of Ohio and the Ohio Department of Insurance. The insurance laws and regulations require education and licensing of agencies and individual agents, require reports and impose business conduct rules.
Recent Legislation
On July 21, 2010, President Obama signed into law the Dodd-Frank Act. This new law is significantly changing the regulation of financial institutions and the financial services industry. Because the Dodd-Frank Act requires various federal agencies to adopt a broad range of regulations with significant discretion, many of the details of the new law and the effects they will have on our company will not be known for months and even years. For further information about the Dodd-Frank Act, see “Item 1.A. Risk Factors—The enactment of new legislation and increased regulatory oversight may significantly affect our financial condition and results of operations.”
Item 1A. Risk Factors
Like all financial companies, NB&T Financial’s business and results of operations are subject to a number of risks, many of which are outside of our control. In addition to the other information in this report, readers should carefully consider that the following important factors could materially impact our business and future results of operations.
Our business may be adversely affected by current conditions in the financial markets, the real estate market and economic conditions generally.
Beginning in the latter half of 2007, negative developments in the capital markets resulted in uncertainty in the financial markets and an economic downturn. The housing market declined, resulting in decreasing home
9
prices and increasing delinquencies and foreclosures. The credit performance of mortgage and construction loans resulted in significant write-downs of asset values by financial institutions, including government-sponsored entities and major commercial and investment banks. The declines in the performance and value of mortgage assets encompassed all mortgage and real estate asset types, leveraged bank loans and nearly all other asset classes, including equity securities. These write-downs have caused many financial institutions to seek additional capital or to merge with larger and stronger institutions. Some financial institutions have failed. Although some improvements in the U.S. economy have occurred, housing prices are still depressed and continue to decline in some markets and unemployment remains high compared to levels prior to the recession. Debt concerns in Europe have added to volatility in the capital markets and concerns over whether such improvements in the U.S. economy will continue.
In addition to the increases in delinquencies and foreclosures on existing loans and the reductions in the value of collateral, the slowing of business activity and the high unemployment rates have had an adverse effect on loan demand from both businesses and consumers. A worsening of current conditions would likely adversely affect our business and results of operations, as well as those of our customers. As a result, we may experience increased foreclosures, delinquencies and customer bankruptcies, as well as decreased loan demand.
The enactment of new legislation and increased regulatory oversight may significantly affect our financial condition and results of operations.
The Federal Reserve Board, Congress, the Treasury, the FDIC and others have taken numerous actions to address the current liquidity and credit situation in the financial markets. These measures include actions to encourage loan restructuring and modification for homeowners; the establishment of significant liquidity and credit facilities for financial institutions and investment banks; the lowering of the federal funds rate; and coordinated efforts to address liquidity and other weaknesses in the banking sector. The long-term effect of actions already taken as well as new legislation is unknown. Continued or renewed instability in the financial markets could weaken public confidence in financial institutions and adversely affect our ability to attract and retain new customers.
Further, legislation has been proposed that would reduce the amount that our customers are required to pay under existing loan contracts or limit our ability to foreclose on collateral. There can be no assurance that future legislation will not significantly impact our ability to collect on our current loans or foreclose on collateral.
On July 21, 2010, President Obama signed into law the Dodd-Frank Act. This new law is significantly changing the regulation of financial institutions and the financial services industry. Because the Dodd-Frank Act requires various federal agencies to adopt a broad range of regulations with significant discretion, many of the details of the new law and the effects they will have on our company will not be known for months and even years.
Many of the provisions of the Dodd-Frank Act apply directly only to institutions much larger than ours, and some will affect only institutions with different charters than ours or institutions that engage in activities in which we do not engage. Among the changes to occur pursuant to the Dodd-Frank Act that can be expected to have an effect on our business are the following:
| | • | | the Dodd-Frank Act creates a Consumer Financial Protection Bureau with broad powers to adopt and enforce consumer protection regulations; |
| | • | | new capital regulations for bank holding companies will be adopted, which may impose stricter requirements, and any new trust preferred securities will no longer count toward Tier I capital; |
| | • | | the federal law prohibition on the payment of interest on commercial demand deposit accounts was eliminated effective in July 2011; |
| | • | | the standard maximum amount of deposit insurance per customer is permanently increased to $250,000, and non-interest bearing transaction accounts will have unlimited insurance through December 31, 2012; |
10
| | • | | the assessment base for determining deposit insurance premiums has been expanded to include liabilities other than just deposits; |
| | • | | new corporate governance requirements applicable generally to all public companies in all industries will require new compensation practices, including requiring companies to “claw back” incentive compensation under certain circumstances, to provide shareholders the opportunity to cast a non-binding vote on executive compensation, and to consider the independence of compensation advisers, and new executive compensation disclosure requirements. |
New regulations pertaining to debit card fees were enacted by the Federal Reserve in October 2011. The new rules cap debit interchange fees for banks with more than $10 billion in assets. Although there is no cap for smaller banks, including the Bank, it is still unclear what other market changes may impact debit card fees as the debit cards with higher fees become less competitive and larger banks take steps to recover income lost due to the caps on their debit card interchange fees.
In addition, the FDIC has recently issued guidance prescribing the order in which Banks may process customer debit items and imposing limits on the overdraft fees Banks may charge. Currently, these limits only apply to banks governed by the FDIC but may eventually impact all banks. These limitations could negatively impact the Company’s earnings.
Although it is impossible for us to predict at this time all the effects the Dodd-Frank Act will have on us and the rest of our industry, it is possible that our non-interest income could decrease, both our interest expense and our non-interest expense could increase, deposit insurance premiums could change, and steps may need to be taken to increase qualifying capital. We expect that our operating and compliance costs will increase and could adversely affect our financial condition and results of operations.
Adverse changes in the financial markets may adversely impact our results of operations.
The global financial markets have experienced increased volatility and an overall loss of investor confidence in recent years. While we generally invest in securities issued by U.S. government agencies and sponsored entities and U.S. state and local governments with limited credit risk, certain investment securities we hold possess higher credit risk since they represent beneficial interests in structured investments collateralized by residential mortgages, debt obligations and other similar asset-backed assets. Regardless of the level of credit risk, all investment securities are subject to changes in market value due to changing interest rates, implied credit spreads and credit ratings.
Over the last few years, structured investments, like our collateralized debt obligations, have been subject to significant market volatility due to the uncertainty of the credit ratings, deterioration in credit losses occurring within certain types of residential mortgages, changes in prepayments of the underlying collateral and the lack of transparency related to the investment structures and the collateral underlying the structured investment vehicles. These conditions have resulted in our recognizing impairment charges on certain investment securities during 2010 and 2009. Given recent market conditions and changing economic factors, we may be required to recognize additional impairment changes on securities held in our investment portfolio in the future.
We may not be able to access capital when needed.
We are required by regulatory authorities to maintain specified levels of capital. Should we experience significant loan losses, we may need additional capital. In addition, we may elect to raise additional capital to support our business, to finance acquisitions, if any, or for other purposes. Our ability to raise additional capital, if needed, will depend on our financial performance, conditions in the capital markets, economic conditions and a number of other factors, many of which are outside of our control. There can be no assurance, therefore, that we can raise additional capital at all or on terms acceptable to us. If we cannot raise additional capital when needed or desired, it may have a material adverse effect on our financial condition, results of operations and prospects.
11
A default by another larger financial institution could adversely affect financial markets generally.
The commercial soundness of many financial institutions may be closely interrelated as a result of relationships between the institutions. As a result, concerns about, or a default or threatened default by, one institution could lead to significant market-wide liquidity and credit problems, losses or defaults by other institutions. This “systemic risk” may adversely affect our business.
Changes in national and local economic and political conditions could adversely affect our earnings, as our borrowers’ ability to repay loans and the value of the collateral securing our loans decline and as loans and deposits decline.
There are inherent risks associated with our lending activities, including credit risk, which is the risk that borrowers may not repay outstanding loans or the value of the collateral securing loans will decrease. Conditions such as inflation, recession, unemployment, changes in interest rates and money supply and other factors beyond our control may adversely affect the ability of our borrowers to repay their loans and the value of collateral securing the loans, which could adversely affect our earnings. Because we have a significant amount of real estate loans, a decline in the value of real estate could have a material adverse affect on us. As of December 31, 2011, 69% of our loan portfolio consisted of commercial and industrial, commercial real estate, real estate construction, installment and agricultural loans, all of which are generally viewed as having more risk of default than residential real estate loans and all of which, with the exception of installment loans, are typically larger than residential real estate loans. Residential real estate loans held in the portfolio are typically originated using conservative underwriting standards that does not include sub-prime lending. We attempt to manage credit risk through a program of underwriting standards, the review of certain credit decisions and an on-going process of assessment of the quality of the credit already extended. Economic and political changes could also adversely affect our deposits and loan demand, which could adversely affect our earnings and financial condition. Since substantially all of our loans are to individuals and businesses in Ohio, any decline in the economy of this market area could have a materially adverse effect on our credit risk and on our deposit and loan levels.
Changes in our local economy resulting from the departure of a large employer may adversely affect our financial condition and results of operations.
Although the Company has branch offices in several counties, the departure of a large employer in any of these communities could adversely affect our market area. This occurred with the departure of DHL Express (USA), Inc. and DHL Network Operations (USA), Inc. (collectively, “DHL”) and ABX Air, Inc. (“ABX Air”), which employed more people in Clinton County than any other employer. Although this departure had a significant short-term, negative impact on the local economy, the long-term effects are still not completely known.
Changes in interest rates could adversely affect our financial condition and results of operations.
Our results of operations depend substantially on our net interest income, which is the difference between (i) the interest earned on loans, securities and other interest-earning assets and (ii) the interest paid on deposits and borrowings. These rates are highly sensitive to many factors beyond our control, including general economic conditions, inflation, recession, unemployment, money supply and the policies of various governmental and regulatory authorities. If the interest we pay on deposits and other borrowings increases at a faster rate than the interest we receive on loans and other investments, our net interest income and therefore earnings, could be adversely affected. Earnings could also be adversely affected if the interest we receive on loans and other investments falls more quickly than the interest we pay on deposits and borrowings. While we have taken measures intended to manage the risks of operating in a changing interest rate environment, there can be no assurance that these measures will be effective in avoiding undue interest rate risk.
Increases in interest rates also can affect the value of loans and other assets, including our ability to realize gains on the sale of assets. We originate loans for sale and for our portfolio. Increasing interest rates may reduce
12
the origination of loans for sale and consequently the fee income we earn on such sales. Further, increasing interest rates may adversely affect the ability of borrowers to pay the principal or interest on loans and leases, resulting in an increase in non-performing assets and a reduction of income recognized.
Increases in FDIC insurance premiums may have a material adverse effect on our earnings.
During the last few years, there have been higher levels of bank failures, which dramatically increased resolution costs of the FDIC and depleted the deposit insurance fund. In order to maintain a strong funding position and restore reserve ratios of the deposit insurance fund, the FDIC increased assessment rates of insured institutions uniformly by 7 basis points (7 cents for every $100 of deposits) for 2009 and 2010. Additional changes were also made to require riskier institutions to pay a larger share of premiums by factoring in rate adjustments based on secured liabilities and unsecured debt levels.
The Emergency Economic Stabilization Act of 2008 (the “EESA”) instituted two temporary programs to further insure customer deposits at FDIC-member banks: deposit accounts became insured up to $250,000 per customer (up from $100,000) and noninterest bearing transactional accounts became fully insured (unlimited coverage). Since then, the Dodd-Frank Act made the increase in the standard maximum insurance amount permanent, and the unlimited coverage of non-interest bearing transactions accounts has been extended until December 31, 2012.
On May 22, 2009, the FDIC adopted a rule that imposed a special assessment for the second quarter of 2009 of 5 basis points on each insured depository institution’s assets minus its Tier 1 capital as of June 30, 2009, which was collected on September 30, 2009. We paid $241,000.
On November 12, 2009, the FDIC adopted a rule requiring insured institutions to prepay their estimated quarterly risk-based assessments for the fourth quarter of 2009 and for all of 2010, 2011 and 2012. The prepaid assessments for these periods were collected on December 30, 2009, along with the regular quarterly risk-based deposit insurance assessment for the third quarter of 2009. For the fourth quarter of 2009 and for all of 2010, the prepaid assessment rate was based on each institution’s total base assessment rate in effect on September 30, 2009, modified to assume that the assessment rate in effect for the institution on September 30, 2009, was in effect for the entire third quarter of 2009. On September 29, 2009, the FDIC increased annual assessment rates uniformly by 3 basis points beginning in 2011. As a result, an institution’s total base assessment rate for purposes estimating an institution’s assessment for 2011 and 2012 was increased by 3 basis points. Each institution’s prepaid assessment base was calculated using its third quarter 2009 assessment base, adjusted quarterly for an estimated five percent annual growth rate in the assessment base through the end of 2012. The three-year prepayment was $3.1 million for us, of which $1.5 million has been expensed through 2011.
On February 7, 2011, the FDIC issued final regulations, effective April 1, 2011, as required by the Dodd-Frank Act to change the deposit insurance assessment base from total domestic deposits to average total assets minus average tangible equity, as well as changing the assessment for larger institutions and the assessment rate schedules. These changes have reduced the Bank’s FDIC premiums due to a lower assessment rate.
We are generally unable to control the amount of premiums that we are required to pay for FDIC insurance. If there are additional financial institution failures, we may be required to pay higher FDIC premiums. Increases in FDIC insurance premiums may materially adversely affect our results of operations and our ability to continue to pay dividends on our common shares at the current rate or at all.
Our allowance for loan losses may be insufficient.
We maintain an allowance for loan losses to provide for probable loan losses based on management’s quarterly analysis of the loan portfolio. The preparation of consolidated financial statements in conformity with accounting principles generally accepted in the United States (“GAAP”) requires management to make significant estimates that affect the financial statements. One of our most critical estimates is the level of the
13
allowance for loan losses. Due to the inherent nature of these estimates, we cannot provide absolute assurance that we will not be required to charge earnings for significant unexpected loan losses. For more information on the sensitivity of these estimates, refer to the discussion of our “Critical Accounting Policies” on pages 31 and 32.
We maintain an allowance for loan losses that we believe is a reasonable estimate of known and inherent losses within the loan portfolio. We make various assumptions and judgments about the collectability of our loan portfolio, including the creditworthiness of our borrowers and the value of the real estate and other assets serving as collateral for the repayment of loans. In deciding whether to extend credit or enter into other transactions with customers and counterparties, we may rely on information provided to us by customers and counterparties, including financial statements and other financial information. We may also rely on representations of customers and counterparties as to the accuracy and completeness of that information and, with respect to financial statements, on reports of independent auditors. For example, in deciding whether to extend credit to a business, we may assume that the customer’s audited financial statements conform with GAAP and present fairly, in all material respects, the financial condition, results of operations and cash flows of the customer. We may also rely on the audit report covering those financial statements. Our financial condition, results of operations and cash flows could be negatively impacted to the extent that we rely on financial statements that do not comply with GAAP or on financial statements and other financial information that are materially misleading.
Through a periodic review and consideration of the loan portfolio, management determines the amount of the allowance for loan losses by considering general market conditions, credit quality of the loan portfolio, the collateral supporting the loans and performance of customers relative to their financial obligations with us. The amount of future losses is susceptible to changes in economic, operating and other conditions, including changes in interest rates, which may be beyond our control, and these losses may exceed current estimates. We cannot fully predict the amount or timing of losses or whether the loss allowance will be adequate in the future. If our assumptions prove to be incorrect, our allowance for loan losses may not be sufficient to cover losses inherent in our loan portfolio, resulting in additions could have a material adverse impact on our financial condition and results of operations. In addition, federal and state regulators periodically review our allowance for loan losses as part of their examination process and may require management to increase the allowance or recognize further loan charge-offs based on judgments different than those of management. Any increase in the provision for loan losses would decrease our pretax and net income.
We operate in an extremely competitive market, and our business will suffer if we are unable to compete effectively.
In our market area, we encounter significant competition from other banks, savings and loan associations, credit unions, mortgage banking firms, securities brokerage firms, asset management firms and insurance companies. The increasingly competitive environment is a result primarily of changes in regulation and the accelerating pace of consolidation among financial service providers. NB&T Financial is smaller than many of our competitors. Many of our competitors have substantially greater resources and lending limits than we do and may offer services that we do not or cannot provide.
Our ability to pay cash dividends is limited.
We are dependent primarily upon the earnings of our operating subsidiaries for funds to pay dividends on our common shares. The payment of dividends by us and our subsidiaries is subject to certain regulatory restrictions. As a result, any payment of dividends in the future will be dependent, in large part, on our ability to satisfy these regulatory restrictions and our subsidiaries’ earnings, capital requirements, financial condition and other factors. Although our financial earnings and financial condition have allowed us to declare and pay periodic cash dividends to our shareholders, there can be no assurance that our dividend policy or size of dividend distribution will continue in the future.
14
The preparation of financial statements requires management to make estimates about matters that are inherently uncertain.
Management’s accounting policies and methods are fundamental to how we record and report our financial condition and results of operations. Our management must exercise judgment in selecting and applying many of these accounting policies and methods in order to ensure that they comply with generally accepted accounting principles and reflect management’s judgment as to the most appropriate manner in which to record and report our financial condition and results of operations. One of the most critical estimates is the level of the allowance of loan losses. Due to the inherent nature of these estimates, we cannot provide absolute assurance that we will not significantly increase the allowance for loan losses or sustain loan losses that are significantly higher than the provided allowance.
Material breaches in security of our systems may have a significant effect on our business.
We collect, process and store sensitive consumer data by utilizing computer systems and telecommunications networks operated by both us and third party service providers. We have security and backup and recovery systems in place, as well as a business continuity plan, to ensure the computer systems will not be inoperable, to the extent possible. We also have implemented security controls to prevent unauthorized access to the computer systems and requires its third party service providers to maintain similar controls. However, management cannot be certain that these measures will be successful. A security breach of the computer systems and loss of confidential information, such as customer account numbers and related information, could result in a loss of customers’ confidence and, thus, loss of business.
Trading in our common shares is very limited, which may adversely affect the time and the price at which you can sell your NB&T Financial common shares.
Although the common shares of NB&T Financial are quoted on The NASDAQ Capital Market, trading in NB&T Financial’s common shares is not active, and the spread between the bid and the asked price is often wide. As a result, you may not be able to sell your shares on short notice, and the sale of a large number of shares at one time could temporarily depress the market price. The price at which you may be able to sell your common shares may be significantly lower than the price at which you could buy NB&T Financial common shares at that time.
Our organizational documents and the large percentage of shares controlled by management and family members of management may have the effect of discouraging a third party from acquiring us.
Our articles of incorporation and code of regulations contain provisions, including a staggered board of directors and a supermajority vote requirement, that make it more difficult for a third party to gain control or acquire us without the consent of the board of directors. These provisions could also discourage proxy contests and may make it more difficult for dissident shareholders to elect representatives as directors and take other corporate actions. Moreover, as of March 1, 2012, directors and executive officers controlled the vote of 6.3% of the outstanding common shares of NB&T Financial in addition to the 4.0% of the outstanding shares with respect to which the Bank controls the vote as trustee and an additional 27.6% owned by relatives of a director. The provisions in our articles and code of regulations and the percentage of voting control by NB&T Financial affiliates and relatives could have the effect of delaying or preventing a transaction or a change in control that a shareholder might deem to be in the best interests of that shareholder.
Future expansion may adversely affect our financial condition and results of operations.
We may acquire other financial institutions or parts of institutions in the future and may open new branches. We also may consider and enter into new lines of business or offer new products or services. Expansions of our business involve a number of expenses and risks, including:
| | • | | the time and costs associated with identifying and evaluating potential acquisitions; |
15
| | • | | the potential inaccuracy of estimates and judgments used to evaluate credit, operations, management and market risk with respect to the target institutions; |
| | • | | the time and costs of evaluating new markets, hiring local management and opening new offices, and the delay between commencing these activities and the generation of profits from the expansion; |
| | • | | our ability to finance an acquisition or other expansion and the possible dilution to our existing shareholders; |
| | • | | the diversion of management’s attention to the negotiation of a transaction and the integration of the operations and personnel of the combining businesses; |
| | • | | entry into unfamiliar markets; |
| | • | | the introduction of new products and services into our existing business; |
| | • | | the incurrence and possible impairment of goodwill associated with an acquisition and possible adverse short-term effects on our results of operations; and |
| | • | | the risk of loss of key employees and customers. |
We may incur substantial costs to expand, and we can give no assurance that such expansion will result in the levels of profits we expect. Neither can we assure that integration efforts for any future acquisitions will be successful. We may issue equity securities in connection with acquisitions, which could dilute the economic and voting interests of our existing shareholders.
The Company undertakes no obligation and disclaims any intention to publish revised information or updates to forward-looking statements contained in the above risk factors or in any other statement made at any time by any director, officer, employee or other representative of the Company unless and until any such revisions or updates are required to be disclosed by applicable securities laws or regulations.
Item 1B. Unresolved Staff Comments
Not applicable.
Item 2. Properties
NB&T Financial and the Bank own and occupy their main offices located at 48 North South Street, Wilmington, Ohio. The Bank also owns or leases 23 full-service branch offices and one remote drive-through ATM facility, all of which are located in Brown, Clermont, Clinton, Highland, Montgomery, Warren and Cuyahoga counties in Ohio. The Bank owns a building at 1600 West Main Street, Wilmington, Ohio, which serves as an operation center for the Bank and is leased in part to the insurance agency sold by the Bank in early 2010.
Item 3. Legal Proceedings
Neither NB&T Financial nor the Bank is presently involved in any legal proceedings of a material nature. From time to time, the Bank is a party to legal proceedings incidental to its business to enforce its security interest in collateral pledged to secure loans made by the Bank.
Item 4. Mine Safety Disclosures
Not applicable.
16
PART II
Item 5. Market for Registrant’s Common Equity, Related Stockholder Matters and Issuer Purchases of Equity Securities
There were 3,423,252 common shares of the Company outstanding on December 31, 2011 held by approximately 431 shareholders of record.
The Company’s shares trade on the NASDAQ Capital Market under the symbol NBTF. The following table summarizes the quarterly common stock prices and dividends declared for the last two years.
| | | | | | | | | | | | | | | | | | | | | | | | |
| | | 2011 | | | 2010 | |
| | | High | | | Low | | | Dividend | | | High | | | Low | | | Dividend | |
Fourth Quarter | | $ | 20.00 | | | $ | 16.70 | | | $ | 0.30 | | | $ | 27.06 | | | $ | 18.72 | | | $ | 0.30 | |
Third Quarter | | | 20.81 | | | | 17.85 | | | | 0.30 | | | | 20.25 | | | | 16.50 | | | | 0.29 | |
Second Quarter | | | 22.00 | | | | 19.55 | | | | 0.30 | | | | 18.50 | | | | 17.00 | | | | 0.29 | |
First Quarter | | | 27.06 | | | | 20.00 | | | | 0.30 | | | | 18.00 | | | | 15.00 | | | | 0.29 | |
As a national bank, the Bank is subject to restrictions on the payment of dividends to the Company, which could restrict the ability of the Company to pay dividends. The Bank may not pay a dividend if it would cause the Bank not to meet its capital requirements. In addition, without regulatory approval, the Bank is limited to paying dividends equal to net income to date in the fiscal year plus its retained net income for the preceding two years. The Company’s ability to pay dividends to its shareholders may be restricted. Current FRB policy requires bank holding companies to act as a source of financial strength to its banking subsidiaries. Under this policy, the FRB may require the Company to commit resources or contribute additional capital to the Bank, which could restrict the amount of cash available for dividends to the Company’s shareholders. The FRB has issued guidance on the payment of dividends by bank holding companies, which includes conditions under which bank holding companies must provide advance notification of their intentions to declare and pay dividends.
The Company has an equity plan under which the Company may grant options, restricted stock and stock appreciation rights to selected directors and employees for up to 270,000 common shares of the Company. The Company also has a stock option plan that has been terminated but under which options to purchase shares remain exercisable. Finally, an option to purchase 30,000 shares was awarded to Mr. Limbert upon his employment. These options may be exercised at $20.88, vested over five years and expire in 2016. The following table summarizes the securities authorized for issuance at December 31, 2011 under all equity compensation plans in existence at that date:
| | | | | | | | | | | | |
Plan Category | | Number of securities to be
issued upon exercise of
outstanding options,
warrants and rights
(a) | | | Weighted-average
exercise price of
outstanding
options, warrants
and rights
(b) | | | Number of securities
remaining available
for future issuance
under equity
compensation plans
(excluding securities
reflected in column
(a)) (c) | |
Equity compensation plans approved by security holders: | | | | | | | | | | | | |
2006 Equity Plan | | | 198,602 | | | $ | 19.22 | | | | 47,567 | |
1992 Nonqualified Stock Option Plan (Terminated 2006) | | | 59,000 | | | | 24.79 | | | | 0 | |
Equity compensation plans not approved by security holders | | | 30,000 | | | | 20.88 | | | | 0 | |
| | | | | | | | | | | | |
Total | | | 248,502 | | | $ | 20.50 | | | | 47,567 | |
| | | | | | | | | | | | |
17
Unregistered Sales of Equity Securities and Use of Proceeds
None.
Issuer Purchases of Equity Securities
| | | | | | | | | | | | | | | | |
Period | | (a) Total
Number of
Shares
Purchased | | | (b) Average
Price Paid per
Share | | | (c) Total Number of Shares
Purchased as Part of Publicly
Announced Plans or Programs | | | (d) Maximum Number
(or Approximate
Dollar Value) of Shares
that May Yet Be
Purchased Under the
Plans or Programs | |
10/1/11 to 10/31/11 | | | 910 | | | $ | 17.49 | | | | — | | | | — | |
11/1/11 to 11/30/11 | | | — | | | | — | | | | — | | | | — | |
12/1/11 to 12/31/11 | | | — | | | | — | | | | — | | | | — | |
Total | | | 910 | | | $ | 17.49 | | | | — | | | | — | |
The 910 shares were repurchased to facilitate distributions from the Company’s Employee Stock Ownership plan.
Performance Graph
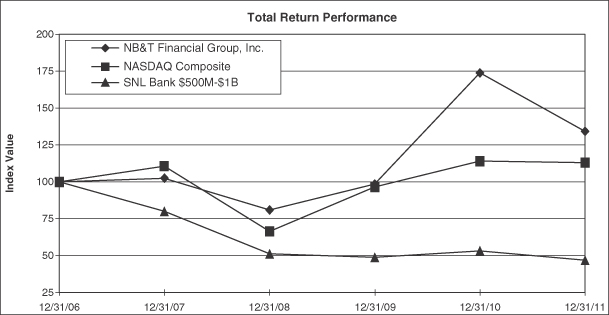
The following line graph compares the yearly percentage change in NB&T Financial’s cumulative total shareholder return against the cumulative return of The NASDAQ Composite Index, which includes all Nasdaq domestic and international based common type stocks listed on The NASDAQ Stock Market, and an index of banks with total assets of $500 million to $1 billion. The graph assumes the investment of $100 on December 31, 2006. Cumulative total shareholder return is measured by dividing (i) the sum of (A) the cumulative amount of dividends for the measurement period, assuming dividend reinvestment, and (B) the difference between the price of NB&T Financial’s common shares at the end and at the beginning of the measurement period; by (ii) the price of NB&T Financial’s common shares at the beginning of the measurement period.
NB&T Financial Group, Inc.
18
| | | | | | | | | | | | | | | | | | | | | | | | |
| | | Period Ending | |
Index | | 12/31/06 | | | 12/31/07 | | | 12/31/08 | | | 12/31/09 | | | 12/31/10 | | | 12/31/11 | |
NB&T Financial Group, Inc. | | | 100.00 | | | | 102.55 | | | | 81.05 | | | | 98.64 | | | | 173.88 | | | | 134.34 | |
NASDAQ Composite | | | 100.00 | | | | 110.66 | | | | 66.42 | | | | 96.54 | | | | 114.06 | | | | 113.16 | |
SNL Bank $500M-$1B | | | 100.00 | | | | 80.13 | | | | 51.35 | | | | 48.90 | | | | 53.38 | | | | 46.96 | |
Item 6. Selected Financial Data
(Dollars and shares in thousands, except per share data)
| | | | | | | | | | | | | | | | | | | | |
| | | 2011 | | | 2010 | | | 2009 | | | 2008 | | | 2007 | |
Consolidated Statements of Income | | | | | | | | | | | | | | | | | | | | |
Interest income | | $ | 28,172 | | | $ | 31,613 | | | $ | 25,916 | | | $ | 28,828 | | | $ | 32,947 | |
Interest expense | | | 4,734 | | | | 7,333 | | | | 7,475 | | | | 10,353 | | | | 14,276 | |
| | | | | | | | | | | | | | | | | | | | |
Net interest income | | | 23,438 | | | | 24,280 | | | | 18,441 | | | | 18,475 | | | | 18,671 | |
Provision for loan losses | | | 2,935 | | | | 1,610 | | | | 1,550 | | | | 400 | | | | 135 | |
Non-interest income | | | 9,724 | | | | 16,397 | | | | 9,924 | | | | 8,236 | | | | 8,240 | |
Non-interest expense | | | 25,123 | | | | 26,458 | | | | 22,481 | | | | 21,679 | | | | 21,316 | |
| | | | | | | | | | | | | | | | | | | | |
Income before income taxes | | | 5,104 | | | | 12,609 | | | | 4,334 | | | | 4,632 | | | | 5,460 | |
Income taxes | | | 1,303 | | | | 3,800 | | | | 297 | | | | 801 | | | | 1,028 | |
| | | | | | | | | | | | | | | | | | | | |
Net income | | $ | 3,801 | | | $ | 8,809 | | | $ | 4,037 | | | $ | 3,831 | | | $ | 4,432 | |
| | | | | | | | | | | | | | | | | | | | |
| | | | | |
Per Share Data | | | | | | | | | | | | | | | | | | | | |
Basic earnings per share | | $ | 1.11 | | | $ | 2.58 | | | $ | 1.28 | | | $ | 1.22 | | | $ | 1.39 | |
Diluted earnings per share | | | 1.11 | | | | 2.58 | | | | 1.28 | | | | 1.22 | | | | 1.39 | |
Dividends per share | | | 1.20 | | | | 1.17 | | | | 1.16 | | | | 1.16 | | | | 1.12 | |
Book value at year end | | | 20.68 | | | | 20.74 | | | | 18.91 | | | | 18.52 | | | | 18.52 | |
Weighted average shares outstanding—basic | | | 3,424 | | | | 3,411 | | | | 3,154 | | | | 3,143 | | | | 3,188 | |
Weighted average shares outstanding—diluted | | | 3,436 | | | | 3,414 | | | | 3,154 | | | | 3,143 | | | | 3,190 | |
| | | | | |
Consolidated Balance Sheets (Year End) | | | | | | | | | | | | | | | | | | | | |
Total assets | | $ | 675,588 | | | $ | 690,618 | | | $ | 649,340 | | | $ | 524,841 | | | $ | 518,922 | |
Securities | | | 139,744 | | | | 133,855 | | | | 142,424 | | | | 87,908 | | | | 89,285 | |
Loans, including loans held for sale | | | 404,469 | | | | 414,978 | | | | 395,548 | | | | 336,184 | | | | 357,763 | |
Allowance for loan losses | | | 4,668 | | | | 3,714 | | | | 3,776 | | | | 3,411 | | | | 3,594 | |
Deposits | | | 581,383 | | | | 584,373 | | | | 541,422 | | | | 420,728 | | | | 420,254 | |
Long-term debt | | | 15,310 | | | | 15,310 | | | | 39,810 | | | | 39,810 | | | | 34,810 | |
Total shareholders’ equity | | | 70,790 | | | | 71,019 | | | | 64,485 | | | | 58,791 | | | | 58,883 | |
| | | | | |
Selected Financial Ratios | | | | | | | | | | | | | | | | | | | | |
Return on average assets | | | 0.56 | % | | | 1.27 | % | | | 0.74 | % | | | 0.73 | % | | | 0.82 | % |
Return on average equity | | | 5.33 | | | | 12.65 | | | | 6.76 | | | | 6.49 | | | | 7.53 | |
Dividend payout ratio | | | 108.11 | | | | 45.35 | | | | 90.63 | | | | 95.08 | | | | 80.58 | |
Net interest margin | | | 3.77 | | | | 3.83 | | | | 3.70 | | | | 3.84 | | | | 3.78 | |
Non-interest expense to total revenue | | | 75.66 | | | | 65.04 | | | | 79.26 | | | | 81.16 | | | | 79.21 | |
Average loans to average total assets | | | 59.62 | | | | 60.53 | | | | 60.83 | | | | 65.19 | | | | 71.62 | |
Average equity to average total assets | | | 10.47 | | | | 10.04 | | | | 10.93 | | | | 11.21 | | | | 10.94 | |
Total risk-based capital ratio (at year end) | | | 19.15 | | | | 18.36 | | | | 16.87 | | | | 18.80 | | | | 17.69 | |
Ratio of non-performing loans to total loans | | | 3.00 | | | | 2.65 | | | | 1.74 | | | | 0.95 | | | | 0.55 | |
Ratio of loan loss allowance to total loans | | | 1.15 | | | | 0.89 | | | | 0.95 | | | | 1.01 | | | | 1.00 | |
Ratio of loan loss allowance to non-performing loans | | | 38 | | | | 34 | | | | 55 | | | | 107 | | | | 181 | |
Net charge-offs to average loans | | | 0.49 | | | | 0.40 | | | | 0.36 | | | | 0.17 | | | | 0.34 | |
19
Item 7. Management’s Discussion and Analysis of Financial Condition and Results of Operations
The following discussion and analysis comparing 2011 to prior years should be read in conjunction with the audited consolidated financial statements at December 31, 2011 and 2010 and for the three years ended December 31, 2011.
FORWARD-LOOKING STATEMENTS
Statements preceded by, followed by or that otherwise include the words “believes,” “expects,” “anticipates,” “intends,” “estimates,” “plans,” “may increase,” “may fluctuate,” “will likely result,” and similar expressions or future or conditional verbs such as “will,” “should,” “would,” and “could” are generally forward-looking in nature and not historical facts. Results could differ materially from those expressed in such forward-looking statements due to a number of factors, including (1) changes in interest rates; (2) changes in national and local economic and political conditions; (3) competitive pressures in the retail banking, financial services, insurance and other industries; (4) changes in laws and regulations, including changes in accounting standards; (5) changes in policy by regulatory agencies; and (6) changes in the securities markets. Any forward-looking statements are not guarantees of future performance. They involve risks, uncertainties and assumptions, and actual results could differ materially from those contemplated by those forward-looking statements. Many of the factors that will determine these results are beyond the Company’s ability to control or predict. The Company disclaims any duty to update any forward-looking statements, all of which are qualified by the statements in this section. See Item 1.A. “Risk Factors” in this annual report for further discussion of the risks affecting the business of the Company and the value of an investment in its shares.
RESULTS OF OPERATIONS
PURCHASE AND ASSUMPTION OF AMERICAN NATIONAL BANK
On March 19, 2010, the Company acquired, through the Bank, the banking operations of American National Bank (“ANB”), based in Parma, Ohio, under a Purchase and Assumption agreement with the FDIC. The Office of the Comptroller of the Currency declared ANB closed and appointed the FDIC as receiver. The Bank did not pay the FDIC a premium for the deposits of ANB. In addition to assuming all of the deposits of the failed bank, the Bank agreed to purchase essentially all of the assets. The book value of the net assets of ANB were acquired from the FDIC at a $10.0 million discount. The acquisition did not include the mortgage servicing business conducted by ANB by its division Leader Financial Services. The FDIC and the Bank entered into a loss-share transaction on $48.2 million of ANB assets. The Bank will share in the losses on the asset pools covered under the loss-share agreement. Under the loss-share agreement, the Bank shares in 20% of losses for the first $8.0 million in losses and 5% for any losses in excess of $8.0 million.
The transaction resulted in a gain on bargain purchase of $7.6 million for the year ended December 31, 2010. The more significant fair value adjustments in our purchase accounting for the purchase and assumption of ANB’s business were to loans and the FDIC loss share receivable. Certain of the loans acquired from ANB have evidence of deterioration since origination, and it is probable that we will not collect all contractually required principal and interest payments. Such credit-impaired loans are recorded at fair value, and the related allowance for loan losses is not carried forward. Of the $42.2 million in loans purchased, $4.2 million were determined to be credit-impaired. The estimation of fair value of credit-impaired loans involves estimating the principal and interest cash flows expected to be collected on the loans and discounting those cash flows at market rates of interest. The difference between contractually required payments at acquisition and the cash flows expected to be collected at acquisition is referred to as the nonaccretable difference. Subsequent decreases to the expected cash flows will generally result in a charge to the provision for loan losses resulting in an increase to the allowance for loan losses. Subsequent increases in cash flows result in reversal of any nonaccretable difference (or allowance for loan losses to the extent any has been recorded) with a positive impact on interest income. Disposals of loans, which may include sales of loans, receipt of payments in full by the borrower, foreclosure or troubled debt restructurings, result in removal of the loan from the acquired credit-impaired portfolio at its carrying amount.
20
Because acquired credit-impaired loans are written down to an amount estimated to be collectible, such loans are no longer classified as nonaccrual even though they may be contractually past due. We expect to fully collect the new carrying values of such loans (that is the new cost basis arising out of our acquisition accounting). Acquired credit-impaired loans are also excluded from the disclosure of loans 90 days or more past due and still accruing interest even though substantially all of them are 90 days or more contractually past due. Under accounting standards, such loans are considered to be accruing because the interest income on these loans relates to the establishment of an accretable yield. Loans acquired from ANB but not considered credit impaired are recorded net of an adjustment to reflect market rates and an estimate of potential credit losses for the pool of loans. The allowance for loan losses was not carried forward. The FDIC loss share receivable was estimated based on a review of the credit quality of the loan portfolio and expected losses.
As a result of the application of the new accounting standards related to the purchase of loans from ANB, certain ratios of the combined company cannot be used to compare a portfolio that includes acquired loans against one that does not (for example, in comparing peer companies), and cannot be used to compare ratios across years, such as comparing 2010 ratios, which include the ANB purchase, against prior periods, which do not. The ratios particularly affected include the allowance for loan losses as a percentage of loans and nonperforming assets, and nonaccrual loans and nonperforming assets as a percentage of loans.
ACQUISITION OF COMMUNITY NATIONAL CORPORATION
On December 31, 2009, the Company acquired Community National Corporation (“CNC”), and its wholly-owned subsidiary, Community National Bank (“CNB”), located in Franklin, Ohio. CNB had five branches located in Warren, Montgomery and Butler counties in Ohio. The Company paid $3.6 million cash and issued 237,582 shares of common stock, which had a market price of $16.30 per share on the acquisition date, totaling $3.9 million.
CNC’s assets and liabilities are included in the consolidated balance sheet at their respective acquisition date fair values. CNC’s year-end assets at fair value totaled $85.9 million. Because the acquisition was completed at the end of 2009, CNC’s results of operations are not included in our 2009 income statement.
Based on the purchase price of $7.4 million and the fair value of net assets acquired of $9.2 million, the transaction resulted in a gain on bargain purchase of $1.8 million for the year ended December 31, 2009. The accounting with respect to the loans acquired from CNC is the same as described with respect to the loans acquired from ANB, although there is no FDIC loss share agreement.
Of the $59.2 million in loans acquired, $3.6 million were determined to be credit-impaired. Generally, loans on nonaccrual status were considered to be credit-impaired. Of CNC’s pre-acquisition non-accrual loans, $2.9 million of such loans were not considered to be nonaccrual at the acquisition date as required under accounting standards.
EXECUTIVE SUMMARY
Net income for 2011 declined to $3.8 million, or $1.11 per share, from $8.8 million, or $2.58 per share, for 2010. Net income for 2010 was higher largely due to the bargain purchase pre-tax gain of approximately $7.6 million in the FDIC assisted acquisition of certain of the assets and liabilities of ANB. In addition, the Company realized a pre-tax gain of $1.4 million on the sale of its insurance agency subsidiary in January 2010.
Net income for 2010 increased to $8.8 million, or $2.58 per share, from net income of $4.0 million, or $1.28 per share, for 2009. This increase is primarily attributable to the increased earning assets and net interest income resulting from the acquisitions of CNC in December 2009 and ANB in March 2010, partially offset by the increased operating expenses related to these acquired branches, and the bargain purchase pre-tax gain of approximately $7.6 million in the FDIC-assisted acquisition of certain of the assets and liabilities of ANB. In addition, the Company realized a pre-tax gain of $1.4 million on the sale of its insurance agency subsidiary in January 2010.
21
NET INTEREST INCOME
Net interest income, the difference between interest income earned on interest-earning assets and interest expense incurred on interest-bearing liabilities, is the most significant component of the Company’s earnings. Net interest income is affected by changes in the volumes, rates and composition of interest-earning assets and interest-bearing liabilities. Table 1 reflects the components of the Company’s net interest income for each of the three years ended December 31, 2011, setting forth: (i) average assets, liabilities and shareholders’ equity, (ii) interest income earned on interest-earning assets and interest expense incurred on interest-bearing liabilities, (iii) average yields earned on interest-earning assets and interest expense incurred on interest-bearing liabilities, and (iv) the net interest margin (i.e., net interest income divided by average interest-earning assets). Non-accrual loans have been included in the average loan balances.
TABLE 1—NET INTEREST INCOME AND NET INTEREST MARGIN
(Dollars in thousands)
| | | | | | | | | | | | | | | | | | | | | | | | | | | | | | | | | | | | |
| | | 2011 | | | 2010 | | | 2009 | |
| | | Average
Outstanding
Balance | | | Yield /
Rate | | | Interest
Earned/
Paid | | | Average
Outstanding
Balance | | | Yield /
Rate | | | Interest
Earned/
Paid | | | Average
Outstanding
Balance | | | Yield /
Rate | | | Interest
Earned /Paid | |
Assets | | | | | | | | | | | | | | | | | | | | | | | | | | | | | | | | | | | | |
Loans (1) | | $ | 405,809 | | | | 5.88 | % | | $ | 23,873 | | | $ | 419,701 | | | | 6.25 | % | | $ | 26,228 | | | $ | 332,281 | | | | 6.03 | % | | $ | 20,025 | |
Taxable securities | | | 138,591 | | | | 2.70 | | | | 3,745 | | | | 145,609 | | | | 3.20 | | | | 4,662 | | | | 105,044 | | | | 4.56 | | | | 4,787 | |
Tax-exempt securities (2) | | | 9,951 | | | | 3.86 | | | | 384 | | | | 12,130 | | | | 4.84 | | | | 587 | | | | 21,365 | | | | 4.44 | | | | 948 | |
Deposits in banks | | | 67,722 | | | | .25 | | | | 169 | | | | 55,795 | | | | .24 | | | | 135 | | | | 40,337 | | | | .39 | | | | 156 | |
Federal funds sold | | | 373 | | | | .06 | | | | 1 | | | | 446 | | | | .13 | | | | 1 | | | | 357 | | | | .10 | | | | 0 | |
| | | | | | | | | | | | | | | | | | | | | | | | | | | | | | | | | | | | |
Total interest-earning assets | | | 622,446 | | | | 4.53 | | | | 28,172 | | | | 633,681 | | | | 4.99 | | | | 31,613 | | | | 499,384 | | | | 5.19 | | | | 25,916 | |
Non-earning assets | | | 58,212 | | | | | | | | | | | | 59,644 | | | | | | | | | | | | 46,869 | | | | | | | | | |
| | | | | | | | | | | | | | | | | | | | | | | | | | | | | | | | | | | | |
Total assets | | $ | 680,658 | | | | | | | | | | | $ | 693,325 | | | | | | | | | | | $ | 546,253 | | | | | | | | | |
| | | | | | | | | | | | | | | | | | | | | | | | | | | | | | | | | | | | |
Liabilities and Stockholder’s Equity | | | | | | | | | | | | | | | | | | | | | | | | | | | | | | | | | | | | |
Non-interest-bearing demand deposits | | $ | 92,349 | | | | 0 | | | | 0 | | | $ | 93,405 | | | | 0 | | | | 0 | | | $ | 67,103 | | | | 0 | | | | 0 | |
Interest-bearing demand deposits | | | 122,896 | | | | .07 | | | | 90 | | | | 110,109 | | | | .14 | | | | 151 | | | | 91,740 | | | | .15 | | | | 141 | |
Savings deposits | | | 202,704 | | | | .26 | | | | 536 | | | | 178,167 | | | | .44 | | | | 784 | | | | 125,554 | | | | .58 | | | | 728 | |
Time deposits | | | 168,056 | | | | 1.91 | | | | 3,206 | | | | 195,668 | | | | 2.22 | | | | 4,342 | | | | 159,892 | | | | 2.84 | | | | 4,536 | |
Short-term borrowings | | | 1,284 | | | | 2.43 | | | | 31 | | | | 12,164 | | | | 4.83 | | | | 588 | | | | 503 | | | | 0 | | | | 0 | |
Junior subordinated debentures | | | 10,310 | | | | 7.08 | | | | 730 | | | | 10,310 | | | | 7.08 | | | | 730 | | | | 10,310 | | | | 7.08 | | | | 729 | |
FHLB advances | | | 5,000 | | | | 2.82 | | | | 141 | | | | 17,563 | | | | 4.20 | | | | 738 | | | | 29,500 | | | | 4.55 | | | | 1,341 | |
| | | | | | | | | | | | | | | | | | | | | | | | | | | | | | | | | | | | |
Total interest-bearing liabilities | | | 510,250 | | | | .93 | | | | 4,734 | | | | 523,981 | | | | 1.40 | | | | 7,333 | | | | 416,499 | | | | 1.79 | | | | 7,475 | |
Non-interest bearing liabilities | | | 99,121 | | | | | | | | | | | | 99,701 | | | | | | | | | | | | 70,033 | | | | | | | | | |
Equity | | | 71,287 | | | | | | | | | | | | 69,643 | | | | | | | | | | | | 59,721 | | | | | | | | | |
| | | | | | | | | | | | | | | | | | | | | | | | | | | | | | | | | | | | |
Total liabilities and equity | | $ | 680,658 | | | | | | | | | | | $ | 693,325 | | | | | | | | | | | $ | 546,253 | | | | | | | | | |
| | | | | | | | | | | | | | | | | | | | | | | | | | | | | | | | | | | | |
Net interest income | | | | | | | | | | $ | 23,438 | | | | | | | | | | | $ | 24,280 | | | | | | | | | | | $ | 18,441 | |
| | | | | | | | | | | | | | | | | | | | | | | | | | | | | | | | | | | | |
Net interest margin | | | | | | | 3.77 | % | | | | | | | | | | | 3.83 | % | | | | | | | | | | | 3.70 | % | | | | |
22
| (1) | Includes nonaccrual loans and loan fees. |
| (2) | Yields are not on a tax equivalent basis. |
Net interest income was $23.4 million for 2011, compared to $24.3 million for 2010. Net interest margin declined to 3.77% for 2011 from 3.83% for 2010. The net interest margin decreased primarily due to a decline in higher-yielding loans. Average loans outstanding for 2011, which had an average rate of 5.88%, decreased to $405.8 million from $419.7 million for last year. Due to increased liquidity from lower loan demand, the Company lowered rates on interest-bearing deposits and reduced higher cost Federal Home Loan Bank debt by $12.8 million, decreasing the cost of interest-bearing liabilities from 1.40% for 2010 to .93% for 2011.
Net interest income was $24.3 million for 2010, compared to $18.4 million for 2009. Net interest margin increased to 3.83% for 2010, compared to 3.70% for 2009. The net interest margin increased primarily due to two factors. First, average loans outstanding for 2010, which had an average rate of 6.25%, increased $87.4 million, largely a result of the CNB and ANB acquisitions. Second, the average cost of interest-bearing liabilities declined from 1.79% in 2009 to 1.40% in 2010 on increased average deposits of $134.1 million. Due to increased liquidity, NB&T was able to lower rates on non-transaction accounts during 2010.
Net interest income may also be analyzed by segregating the volume and rate components of interest income and interest expense. Table 2 presents an analysis of increases and decreases in interest income and expense in terms of changes in volume and interest rates during the three years ended December 31, 2011. Changes attributable to both rate and volume are allocated to each of rate and volume on an equal basis.
TABLE 2—NET INTEREST INCOME—RATE/VOLUME ANALYSIS
(Dollars in thousands)
| | | | | | | | | | | | | | | | | | | | | | | | |
| | | Years ended December 31, 2011 vs. 2010 | | | | | | Years ended December 31, 2010 vs. 2009 | | | | |
| | | Increase (decrease) due to | | | | | | Increase (decrease) due to | | | | |
| | | Volume | | | Rate | | | Total | | | Volume | | | Rate | | | Total | |
Interest income attributable to: | | | | | | | | | | | | | | | | | | | | | | | | |
Loans | | $ | (871 | ) | | $ | (1,485 | ) | | $ | (2,356 | ) | | $ | 5,329 | | | $ | 874 | | | $ | 6,203 | |
Securities | | | (281 | ) | | | (839 | ) | | | (1,120 | ) | | | 1,232 | | | | (1,718 | ) | | | (486 | ) |
Deposits in banks | | | 29 | | | | 5 | | | | 34 | | | | 49 | | | | (70 | ) | | | (21 | ) |
Federal funds sold | | | 0 | | | | 0 | | | | 0 | | | | 0 | | | | 1 | | | | 1 | |
| | | | | | | | | | | | | | | | | | | | | | | | |
Total interest-earning assets | | | (1,123 | ) | | | (2,319 | ) | | | (3,442 | ) | | | 6,610 | | | | (913 | ) | | | 5,697 | |
| | | | | | | | | | | | | | | | | | | | | | | | |
Interest expense attributable to: | | | | | | | | | | | | | | | | | | | | | | | | |
Interest-bearing deposits | | | 91 | | | | (1,535 | ) | | | (1,444 | ) | | | 1,361 | | | | (1,489 | ) | | | (128 | ) |
Short-term borrowings | | | (395 | ) | | | (162 | ) | | | (557 | ) | | | 282 | | | | 306 | | | | 588 | |
Junior subordinated debentures | | | 0 | | | | 0 | | | | 0 | | | | 0 | | | | 0 | | | | 0 | |
FHLB advances | | | (441 | ) | | | (156 | ) | | | (597 | ) | | | (521 | ) | | | (81 | ) | | | (602 | ) |
| | | | | | | | | | | | | | | | | | | | | | | | |
Total interest-bearing liabilities | | | (745 | ) | | | (1,853 | ) | | | (2,598 | ) | | | 1,122 | | | | (1,264 | ) | | | (142 | ) |
| | | | | | | | | | | | | | | | | | | | | | | | |
Net interest income | | $ | (378 | ) | | $ | (466 | ) | | $ | (844 | ) | | $ | 5,488 | | | $ | 351 | | | $ | 5,839 | |
| | | | | | | | | | | | | | | | | | | | | | | | |
NON-INTEREST INCOME
Table 3 details the components of non-interest income, excluding securities gains and losses, and the percentage change from the two previous years. Total non-interest income was $9.7 million in 2011, $16.4 million in 2010 and $9.9 million in 2009. The higher non-interest income for 2010 is largely due to the bargain purchase gains of $7.6 million from the ANB acquisition and the $1.4 million pre-tax gain on the sale of NB&T’s insurance agency subsidiary. Other service charges and fees increased 16.0% in 2011 due to additional fee income on debit card transactions. In addition, insurance agency commissions increased in 2011 due to higher brokerage and annuity sales.
23
Service charges on deposits increased 18.6% in 2010 due to a larger number of deposit accounts acquired from CNB and ANB and increased daily overdraft fees. Other service charges and fees increased 24.7% in 2010 due to additional fee income on debit card transactions. Due to the January 2010 sale of the Company’s insurance agency subsidiary, insurance agency income declined 83.6% in 2010. The Company commenced offering more limited insurance products through a new insurance agency subsidiary in January 2010. The income earned of $362,000 is that of the new agency, NB&T Insurance Group, Inc. In addition, in 2010, other income includes approximately $159,000 in servicing income related to loans acquired from ANB and serviced for third-party government-sponsored entities.
The Company recognized an impairment charge of $150,000 in 2009 and $50,000 in 2010 related to the credit impairment on a $1.1 million private-label mortgage-backed security, which has been downgraded by three major bond rating agencies. Through December 31, 2011, the bond had realized losses of approximately $82,000, which were in line with prior period projections.
TABLE 3—NON-INTEREST INCOME
(Dollars in thousands)
| | | | | | | | | | | | | | | | | | | | |
| | | | | | | | | | | | Percent Change | |
| | | 2011 | | | 2010 | | | 2009 | | | 2011 vs. 2010 | | | 2010 vs. 2009 | |
Trust | | $ | 1,030 | | | $ | 936 | | | $ | 882 | | | | 10.04 | % | | | 6.12 | % |
Service charges on deposits | | | 2,929 | | | | 2,873 | | | | 2,423 | | | | 1.95 | | | | 18.57 | |
Other service charges | | | 1,925 | | | | 1,659 | | | | 1,330 | | | | 16.03 | | | | 24.74 | |
Insurance agency commissions | | | 396 | | | | 362 | | | | 2,201 | | | | 9.39 | | | | (83.55 | ) |
Net realized gains on sales of available-for-sale securities | | | 1,820 | | | | 0 | | | | 0 | | | | NM | | | | NM | |
Income from BOLI | | | 486 | | | | 479 | | | | 466 | | | | 1.46 | | | | 2.79 | |
Bargain purchase gain | | | 0 | | | | 7,572 | | | | 1,807 | | | | NM | | | | 319.04 | |
Gain on sale of insurance agency | | | 0 | | | | 1,390 | | | | 0 | | | | NM | | | | NM | |
Security impairment charge | | | 0 | | | | (50 | ) | | | (150 | ) | | | NM | | | | (66.67 | ) |
Other | | | 1,138 | | | | 1,176 | | | | 965 | | | | (3.23 | ) | | | 27.55 | |
| | | | | | | | | | | | | | | | | | | | |
Total | | $ | 9,724 | | | $ | 16,397 | | | $ | 9,924 | | | | (51.80 | )% | | | 65.94 | % |
| | | | | | | | | | | | | | | | | | | | |
Gross gains of $1,830,000 and gross losses of $10,000 were realized on security sales of approximately $45.4 million in 2011. There were no security sales in 2010, and gross gains of $43,000 were realized on premium calls of approximately $2.0 million in municipal bonds in 2009.
24
NON-INTEREST EXPENSE
Table 4 details the components of non-interest expense and the percentage change from the two previous years.
TABLE 4—NON-INTEREST EXPENSE
(Dollars in thousands)
| | | | | | | | | | | | | | | | | | | | |
| | | | | | | | | | | | Percent Change | |
| | | 2011 | | | 2010 | | | 2009 | | | 2011 vs. 2010 | | | 2010 vs. 2009 | |
Salaries & employee benefits | | $ | 11,971 | | | $ | 13,448 | | | $ | 11,233 | | | | (10.98 | )% | | | 19.72 | % |
Occupancy | | | 2,382 | | | | 2,484 | | | | 1,933 | | | | (4.11 | ) | | | 28.50 | |
Equipment | | | 1,480 | | | | 1,441 | | | | 1,459 | | | | 2.71 | | | | (1.23 | ) |
Data processing | | | 1,611 | | | | 1,651 | | | | 1,341 | | | | (2.42 | ) | | | 23.12 | |
Professional fees | | | 1,867 | | | | 1,932 | | | | 1,825 | | | | (3.36 | ) | | | 5.86 | |
Marketing | | | 648 | | | | 677 | | | | 623 | | | | (4.28 | ) | | | 8.67 | |
Printing, postage and supplies | | | 834 | | | | 864 | | | | 725 | | | | (3.47 | ) | | | 19.17 | |
State franchise tax | | | 829 | | | | 842 | | | | 772 | | | | (1.54 | ) | | | 9.07 | |
FDIC Insurance | | | 622 | | | | 846 | | | | 879 | | | | (26.48 | ) | | | (3.75 | ) |
Amortization of intangibles | | | 353 | | | | 396 | | | | 167 | | | | (10.86 | ) | | | 137.13 | |
Expenses related to OREO | | | 1,259 | | | | 281 | | | | 232 | | | | 348.04 | | | | 21.12 | |
Other | | | 1,267 | | | | 1,596 | | | | 1,292 | | | | (20.61 | ) | | | 23.53 | |
| | | | | | | | | | | | | | | | | | | | |
Total | | $ | 25,123 | | | $ | 26,458 | | | $ | 22,481 | | | | (5.05 | )% | | | 17.69 | % |
| | | | | | | | | | | | | | | | | | | | |
Total non-interest expense for 2011 was $25.1 million, compared to $26.5 million for 2010. Salaries and employee benefits expense declined almost 11% in 2011 primarily due to reduction in executive management bonuses and full allocation of the shares in the Company’s ESOP plan in 2010, resulting in a combined expense reduction of approximately $1.4 million. FDIC insurance expense declined about 26% in 2011 due to reduction in the FDIC assessment rate, which was implemented by the FDIC at the beginning of 2011. Expenses related to other real estate owned (“OREO”) increased approximately $978,000 in 2011. Approximately $226,000 relates to losses on sales of OREO properties, and approximately $506,000 relates to declines in appraised values on properties still held by the Company. In addition, the Company realized higher expenses related to property maintenance and real estate taxes in 2011. Other expense was higher in 2010, compared to 2011, largely due to the prepayment penalty of approximately $416,000 on the early payoff of $12.5 million in FHLB debt.
In 2010, total non-interest expense was $26.5 million, compared to $22.5 million for 2009, with the increase primarily due to the ANB and CNB acquisitions. Personnel and occupancy costs increased with the addition of six new branches. In addition, personnel expenses were higher in 2010, compared to 2009, due to the early release of the unallocated shares in the Company’s ESOP in 2010 which resulted in additional personnel expense of approximately $213,000. The Company also recognized bonus expense in 2010 of approximately $1.4 million, compared to $7,000 bonus expense in 2009. Data processing expense was up approximately 23.1% due to the system conversions and the number of accounts processed resulting from the ANB and CNB acquisitions. Postage and supplies expenses also increased approximately 19.1% in 2010 due to the increased number of accounts from the acquisitions. Amortization expense increased in 2010 due to the core deposit intangibles associated with both acquisitions. Other expense increased approximately 23.2 % in 2010 largely due to the prepayment penalty on $12.5 million in FHLB debt.
INCOME TAXES
In 2011, the effective tax rate was 25.5%, compared to 30.1% in 2010. The higher effective tax rate for 2010 was primarily due to the increase in taxable income at the full 34% marginal rate.
25
FINANCIAL CONDITION
ASSETS
Total assets declined from $690.6 million at December 31, 2010 to $675.6 million at December 31, 2011. The decrease is primarily attributable to the payoff $12.0 million in maturing Federal Home Loan Bank debt in January 2011. In addition, net loans declined $10.8 million in 2011 due to decreased loan demand and increased competitive factors. Although commercial loan volume increased in the last quarter of 2011, outstanding balances for residential mortgages and consumer loans declined. Residential mortgage balances declined due to increased sales of fixed-rate loans into the secondary market and lower demand, and consumer loans continued to decline due to the Company’s departure from the indirect lending market and decreased demand for consumer loans. The excess funds from the slower loan volume were partially invested in the securities portfolio, the fair value of which increased to $139.7 million at December 31, 2011 from $133.9 million at December 31, 2010.
SECURITIES
The following table sets forth the composition of the Bank’s securities portfolio, based on fair value, at the dates indicated:
TABLE 5—SECURITIES PORTFOLIO
(Dollars in thousands)
| | | | | | | | | | | | |
| | | At December 31, | |
| | | 2011 | | | 2010 | | | 2009 | |
Securities available for sale: | | | | | | | | | | | | |
U.S. Government sponsored entities | | $ | 6,434 | | | $ | 21,094 | | | $ | 14,626 | |
Mortgage-backed securities: | | | | | | | | | | | | |
U.S. Government agency and sponsored entity | | | 99,168 | | | | 85,311 | | | | 97,161 | |
Private-label - residential | | | 6,942 | | | | 10,162 | | | | 12,771 | |
Municipals | | | 27,200 | | | | 17,288 | | | | 17,866 | |
| | | | | | | | | | | | |
Total securities available for sale | | $ | 139,744 | | | $ | 133,855 | | | $ | 142,424 | |
| | | | | | | | | | | | |
Approximately $45.4 million in agency and mortgage-backed securities were sold in 2011 at a net realized gain of $1.8 million to take advantage of current market pricing. Investment purchases in 2011 were mainly in mortgage-backed securities and tax-exempt municipals.
At December 31, 2010, the securities portfolio decreased to $133.9 million, compared to $142.4 million at December 31, 2009. The Company experienced increased pay downs of $25.0 million in its mortgage-backed securities portfolio in 2010 with proceeds reinvested in U.S. Government agency and sponsored entity mortgage-backed securities.
The following table sets forth the fair value of the Bank’s securities portfolio at December 31, 2011. Expected maturities of individual securities will differ from contractual maturities because issuers may have the right to call or prepay obligations with or without call or prepayment penalties. Mortgage-backed securities are presented in the table based on current prepayment assumptions. U.S. Government agency and sponsored entity notes, as well as municipal securities, are categorized based on contractual maturity. Yields do not include the effect of income taxes.
26
TABLE 6—SECURITIES PORTFOLIO REPRICING
(Dollars in thousands)
| | | | | | | | | | | | | | | | | | | | | | | | | | | | | | | | | | | | | | | | |
| | | One Year or Less | | | Over 1 Year
Through 5 Years | | | Over 5 Years
Through 10
Years | | | Over 10 Years | | | Total | |
| | | Fair
Value | | | Weighted
Average
Yield | | | Fair
Value | | | Weighted
Average
Yield | | | Fair
Value | | | Weighted
Average
Yield | | | Fair
Value | | | Weighted
Average
Yield | | | Fair
Value | | | Weighted
Average
Yield | |
Securities available for sale: | | | | | | | | | | | | | | | | | | | | | | | | | | | | | | | | | | | | | | | | |
U.S. Government sponsored entity notes | | $ | 0 | | | | 0 | % | | $ | 6,316 | | | | 1.26 | % | | $ | 118 | | | | 2.16 | % | | $ | 0 | | | | 0 | % | | $ | 6,434 | | | | 1.27 | % |
Mortgage-backed securities: | | | | | | | | | | | | | | | | | | | | | | | | | | | | | | | | | | | | | | | | |
U.S. Government agency and sponsored entity | | | 28,028 | | | | 2.05 | | | | 68,343 | | | | 2.44 | | | | 0 | | | | 0 | | | | 2,797 | | | | 3.64 | | | | 99,168 | | | | 2.40 | |
Private-label- residential | | | 1,125 | | | | 2.80 | | | | 5,292 | | | | 5.71 | | | | 525 | | | | 6.00 | | | | 0 | | | | 0 | | | | 6,942 | | | | 4.81 | |
Municipals | | | 1,772 | | | | 4.48 | | | | 2,456 | | | | 3.60 | | | | 5,965 | | | | 4.14 | | | | 17,007 | | | | 3.70 | | | | 27,200 | | | | 3.86 | |
| | | | | | | | | | | | | | | | | | | | | | | | | | | | | | | | | | | | | | | | |
Total securities available for sale | | $ | 30,925 | | | | 2.22 | | | $ | 82,407 | | | | 2.60 | | | $ | 6,608 | | | | 4.25 | | | $ | 19,804 | | | | 3.69 | | | $ | 139,744 | | | | 2.75 | |
| | | | | | | | | | | | | | | | | | | | | | | | | | | | | | | | | | | | | | | | |
LOANS
Table 7 shows loans outstanding at period end by type of loan. Commercial and industrial loans increased moderately from $62.5 million in 2007 to $67.3 million in 2011. Commercial real estate loans have increased more significantly from $95.8 million in 2007 to $179.6 million in 2011. Most of this growth has been the result of the ANB and CNB acquisitions in 2009 and 2010, which has been partially offset by decreased demand and increased competitive factors. One of the Bank’s primary target markets continues to be commercial lending to small- to medium-sized companies with established track records in the Company’s market area.
Residential real estate loans decreased $8.6 million to $115.9 million from December 31, 2010 to December 31, 2011 due to decreased originations of adjustable-rate mortgages retained in the Company’s portfolio and increased sales of fixed-rate mortgages into the secondary market. In addition, the Company began selling mortgage loans with servicing retained in 2009, which allows the Company to maintain its relationship with the customer while controlling its level of longer-term, fixed-rate assets. Home equity loans declined from $32.9 million at December 31, 2010 to $31.0 million at December 31, 2011. Currently, the Company has approximately $6.3 million in residential real estate loans with a loan-to-value ratio, based on original appraised value, greater than 80% for which private mortgage insurance has not been required. The Company does not offer residential real estate loan products with negative amortization.
Consumer loans declined $2.2 million to $8.3 million in 2011 from $10.5 million at December 31, 2010. Most of this decline is the result of the Company discontinuing its indirect lending activity and lower consumer loan demand.
The Company has avoided concentration of commercial lending in any one industry. As of December 31, 2011, the highest commercial lending concentration was in commercial rental real estate properties at 19.2% of the total commercial loan portfolio.
27
TABLE 7—LOAN PORTFOLIO
(Dollars in thousands)
| | | | | | | | | | | | | | | | | | | | |
| | | At December 31, | |
| | | 2011 | | | 2010 | | | 2009 | | | 2008 | | | 2007 | |
Commercial & industrial | | $ | 67,298 | | | $ | 65,304 | | | $ | 58,013 | | | $ | 52,490 | | | $ | 62,455 | |
Commercial real estate | | | 179,556 | | | | 177,640 | | | | 133,545 | | | | 96,755 | | | | 95,801 | |
Real estate construction | | | 1,064 | | | | 5,029 | | | | 6,732 | | | | 6,064 | | | | 9,203 | |
Agricultural | | | 32,460 | | | | 31,354 | | | | 28,130 | | | | 26,265 | | | | 24,910 | |
Residential real estate | | | 115,920 | | | | 124,497 | | | | 153,172 | | | | 130,091 | | | | 124,849 | |
Installment | | | 8,257 | | | | 10,510 | | | | 15,995 | | | | 24,440 | | | | 40,552 | |
Deferred net origination costs | | | (86 | ) | | | (44 | ) | | | (39 | ) | | | (89 | ) | | | (7 | ) |
| | | | | | | | | | | | | | | | | | | | |
Total | | | 404,469 | | | | 414,290 | | | | 395,548 | | | | 336,016 | | | | 357,763 | |
Allowance for loan losses | | | (4,668 | ) | | | (3,714 | ) | | | (3,776 | ) | | | (3,411 | ) | | | (3,594 | ) |
| | | | | | | | | | | | | | | | | | | | |
| | $ | 399,801 | | | $ | 410,576 | | | $ | 391,772 | | | $ | 332,605 | | | $ | 354,169 | |
| | | | | | | | | | | | | | | | | | | | |
Table 8 shows the amount of commercial, construction and agricultural loans outstanding as of December 31, 2011, which, based on contractual maturities, are due in each of the periods indicated. The table also sets forth the amounts of loans due after one year from December 31, 2011, divided into those that have predetermined rates and those that have floating or adjustable rates.
TABLE 8—LOAN MATURITIES AND PRICE SENSITIVITY
(Dollars in thousands)
| | | | | | | | | | | | | | | | |
| | | Due in 1 Year or
Less | | | Due After 1 Year
to 5 Years | | | Due after
5 Years | | | Total | |
Commercial and industrial | | $ | 20,604 | | | $ | 18,547 | | | $ | 28,147 | | | $ | 67,298 | |
Commercial real estate | | | 7,681 | | | | 18,133 | | | | 153,742 | | | | 179,556 | |
Real estate construction | | | 403 | | | | 355 | | | | 306 | | | | 1,064 | |
Agricultural | | | 15,117 | | | | 3,520 | | | | 13,823 | | | | 32,460 | |
| | | | | | | | | | | | | | | | |
Total | | $ | 43,805 | | | $ | 40,555 | | | $ | 196,018 | | | $ | 280,378 | |
| | | | | | | | | | | | | | | | |
| | | | |
| | | Predetermined
Rates | | | Floating or
Adjustable Rates | | | Total | | | | |
Commercial and industrial | | $ | 17,464 | | | $ | 49,834 | | | $ | 67,298 | | | | | |
Commercial real estate | | | 21,075 | | | | 158,481 | | | | 179,556 | | | | | |
Real estate construction | | | 691 | | | | 373 | | | | 1,064 | | | | | |
Agricultural | | | 3,725 | | | | 28,735 | | | | 32,460 | | | | | |
| | | | | | | | | | | | | | | | |
Total | | $ | 42,955 | | | $ | 237,423 | | | $ | 280,378 | | | | | |
| | | | | | | | | | | | | | | | |
28
NON-PERFORMING ASSETS
Table 9 shows the amount of non-performing assets outstanding as of December 31 for each of the last five years:
TABLE 9—NON-PERFORMING ASSETS
(Dollars in thousands)
| | | | | | | | | | | | | | | | | | | | |
| | | 2011 | | | 2010 | | | 2009 | | | 2008 | | | 2007 | |
Non-accrual loans | | $ | 12,007 | | | $ | 9,490 | | | $ | 6,857 | | | $ | 2,982 | | | $ | 1,729 | |
Accruing loans 90 days or more past due | | | 133 | | | | 1,037 | | | | 19 | | | | 200 | | | | 253 | |
Other real estate owned | | | 3,520 | | | | 4,254 | | | | 3,455 | | | | 321 | | | | 176 | |
| | | | | | | | | | | | | | | | | | | | |
Total non-performing assets | | $ | 15,660 | | | $ | 15,238 | | | $ | 10,331 | | | $ | 3,503 | | | $ | 2,158 | |
| | | | | | | | | | | | | | | | | | | | |
Troubled debt restructurings, accruing | | $ | 2,050 | | | $ | 457 | | | $ | 0 | | | $ | 0 | | | $ | 0 | |
RATIOS | | | | | | | | | | | | | | | | | | | | |
Non-performing assets to total loans and other real estate owned | | | 3.84 | % | | | 3.63 | % | | | 2.59 | % | | | 1.04 | % | | | .60 | % |
Ratio of loan loss allowance to non-performing loans | | | 38 | % | | | 34 | % | | | 55 | % | | | 107 | % | | | 181 | % |
The Company’s policy is to place a commercial loan on non-accrual status when it reaches 90 days past due and any of the following conditions exist: 1) the borrower cannot meet the payment obligations under the loan; 2) full payment of principal and interest is not expected; 3) the borrower has filed for bankruptcy and a plan of reorganization or liquidation is not imminent; or 4) foreclosure action has been initiated. All other loans are typically placed on non-accrual status when legal action or charge-off is anticipated but no later than 120 days past due. The amount of non-accrual loans was $12.0 million at year-end 2011, compared to $9.5 million at year-end 2010. Of this total, $9.1 million are commercial loans with $4.1 million in outstanding balances relating to four commercial loans secured by commercial real estate and one secured by intangible property and equipment. Nonaccrual loans secured by one- to four -family mortgages represent $2.4 million, or 29 loans, with the largest loan balance being $297,000. Although the ratio of loan loss allowance to non-performing loans has declined from 181% at December 31, 2007 to 38% at December 31, 2011, the specific analysis of projected cash flows from business operations and estimated collateral values indicates the specific reserves on these loans are adequate. In addition, approximately $1.8 million in nonaccrual loans and $892,000 in other real estate owned at December 31, 2011 are covered under the FDIC loss share agreement.
At December 31, 2011, other real estate owned (“OREO”) was $3.5 million, compared to $4.2 million at December 31, 2010. OREO mainly consisted of three undeveloped residential development lots and one commercial lot acquired in the CNC acquisition.
No interest income was recognized in 2011 on non-accrual loans outstanding at December 31, 2011. Had the non-accrual loans been accruing, the interest income recognized would have been approximately $813,000. Interest income of $119,000 was recognized in 2011 on accruing, restructured loans outstanding at December 31, 2011.
As of December 31, 2011, other than the loans identified in Table 9, the Company is not aware of any other loans with possible credit problems of borrowers which causes management to have serious doubts as to the ability of such borrowers to comply with the present loan repayment terms.
ALLOWANCE FOR LOAN LOSSES
The provision for loan losses for 2011 was $2,935,000, compared to $1,610,000 in 2010. For the year, net charge-offs were $1,981,000 in 2011, compared to $1,672,000 in 2010. Charge-offs in 2011 increased primarily due to the first quarter write-down of one commercial real estate loan. The Company later foreclosed on this loan, and the property securing the loan was sold. The provision for loan losses is based on management’s
29
evaluation of the loan loss allowance considering specific loan reserves, general reserves related to charge-off experience and current economic conditions. Specific reserves on problem loans increased $1.3 million in the fourth quarter of 2011 primarily due to one large commercial loan relationship of approximately $1.0 million secured by intangible property and equipment.
The provision for loan losses for 2010 was $1,610,000, compared to $1,550,000 in 2009. For the year, net charge-offs were $1,672,000 in 2010, compared to $1,185,000 in 2009. During the first quarter of 2010, the Company foreclosed on a $1.2 million commercial real estate loan for which specific reserves of $300,000 had been previously allocated. Approximately $300,000 was charged off with the balance of $900,000 transferred to other real estate owned. In addition, net charge-offs on residential real estate loans increased approximately $320,000 in 2010, due to declining home values. This increase was offset by a reduction of approximately $143,000 in net charge-offs on installment loans, a portfolio which is declining.
Table 10 shows selected information relating to the Company’s allowance for loan losses. The allowance is maintained to absorb probable incurred losses in the portfolio. If, as a result of charge-offs or increases in risk characteristics of the loan portfolio, the reserve is below the level considered by management to be adequate to absorb future loan losses, a provision for loan losses is recorded to increase the allowance. Loans deemed not collectible are charged off and deducted from the reserve. Recoveries on loans previously charged off are added to the reserve.
TABLE 10—ALLOWANCE FOR LOAN LOSSES
(Dollars in thousands)
| | | | | | | | | | | | | | | | | | | | |
| | | December 31, | |
| | | 2011 | | | 2010 | | | 2009 | | | 2008 | | | 2007 | |
Balance at beginning of period | | $ | 3,714 | | | $ | 3,776 | | | $ | 3,411 | | | $ | 3,594 | | | $ | 4,762 | |
Charge-offs: | | | | | | | | | | | | | | | | | | | | |
Commercial and industrial | | | (350 | ) | | | (102 | ) | | | (206 | ) | | | (69 | ) | | | (140 | ) |
Commercial real estate | | | (1,300 | ) | | | (1,071 | ) | | | (616 | ) | | | (155 | ) | | | (826 | ) |
Real estate construction | | | 0 | | | | 0 | | | | 0 | | | | 0 | | | | 0 | |
Agricultural | | | (2 | ) | | | 0 | | | | (4 | ) | | | 0 | | | | (17 | ) |
Residential real estate | | | (402 | ) | | | (500 | ) | | | (172 | ) | | | (124 | ) | | | (123 | ) |
Installment | | | (198 | ) | | | (207 | ) | | | (425 | ) | | | (530 | ) | | | (658 | ) |
| | | | | | | | | | | | | | | | | | | | |
Total charge-offs | | | (2,252 | ) | | | (1,880 | ) | | | (1,423 | ) | | | (878 | ) | | | (1,764 | ) |
| | | | | | | | | | | | | | | | | | | | |
Recoveries: | | | | | | | | | | | | | | | | | | | | |
Commercial and industrial | | | 16 | | | | 5 | | | | 18 | | | | 22 | | | | 39 | |
Commercial real estate | | | 167 | | | | 81 | | | | 18 | | | | 50 | | | | 118 | |
Real estate construction | | | 0 | | | | 0 | | | | 0 | | | | 0 | | | | 0 | |
Agricultural | | | 6 | | | | 8 | | | | 22 | | | | 34 | | | | 13 | |
Residential real estate | | | 12 | | | | 17 | | | | 36 | | | | 32 | | | | 76 | |
Installment | | | 70 | | | | 97 | | | | 144 | | | | 157 | | | | 215 | |
| | | | | | | | | | | | | | | | | | | | |
Total recoveries | | | 271 | | | | 208 | | | | 238 | | | | 295 | | | | 461 | |
| | | | | | | | | | | | | | | | | | | | |
Net charge-offs | | | (1,981 | ) | | | (1,672 | ) | | | (1,185 | ) | | | (583 | ) | | | (1,303 | ) |
Provision for loan losses | | | 2,935 | | | | 1,610 | | | | 1,550 | | | | 400 | | | | 135 | |
| | | | | | | | | | | | | | | | | | | | |
Balance at end of period | | $ | 4,668 | | | $ | 3,714 | | | $ | 3,776 | | | $ | 3,411 | | | $ | 3,594 | |
| | | | | | | | | | | | | | | | | | | | |
Ratio of net charge-offs to average loans outstanding during the period | | | 0.49 | % | | | 0.40 | % | | | 0.36 | % | | | 0.17 | % | | | 0.34 | % |
| | | | | | | | | | | | | | | | | | | | |
Average loans outstanding | | $ | 405,809 | | | $ | 419,701 | | | $ | 332,281 | | | $ | 343,453 | | | $ | 385,370 | |
| | | | | | | | | | | | | | | | | | | | |
30
The Company allocates the allowance for loan losses to specifically classified loans and non-classified loans generally based on the one- and three-year net charge-off history. In assessing the adequacy of the allowance for loan losses, the Company considers three principal factors: (1) the one- and three-year rolling average charge-off percentage applied to the current outstanding balance by portfolio type; (2) specific percentages applied to individual loans estimated by management to have a potential loss; and (3) estimated losses attributable to economic conditions. Economic conditions considered include estimated changes in real estate values, unemployment levels, the condition of the agricultural business, and other local economic factors.
Table 11 shows the allocation of the allowance for loan losses as of December 31, 2011. In 2011, more of the allowance was allocated to the commercial portfolio due to increased specific reserves on problem commercial loans. Less allowance was allocated to the residential real estate portfolio in 2011 due to declining outstanding loan balances.
TABLE 11—ALLOCATION OF ALLOWANCE FOR LOAN LOSSES
(Dollars in thousands)
| | | | | | | | | | | | | | | | | | | | |
| | | December 31, | |
| | | 2011 | | | 2010 | | | 2009 | | | 2008 | | | 2007 | |
Commercial and industrial | | $ | 1,380 | | | $ | 474 | | | $ | 481 | | | $ | 194 | | | $ | 221 | |
Commercial real estate | | | 2,372 | | | | 2,057 | | | | 2,465 | | | | 1,688 | | | | 2,064 | |
Real estate construction | | | 0 | | | | 0 | | | | 3 | | | | 4 | | | | 3 | |
Agricultural | | | 231 | | | | 184 | | | | 112 | | | | 39 | | | | 20 | |
Residential real estate | | | 568 | | | | 865 | | | | 506 | | | | 1,210 | | | | 621 | |
Installment | | | 117 | | | | 134 | | | | 209 | | | | 276 | | | | 362 | |
Unallocated | | | 0 | | | | 0 | | | | 0 | | | | 0 | | | | 303 | |
| | | | | | | | | | | | | | | | | | | | |
Total | | $ | 4,668 | | | $ | 3,714 | | | $ | 3,776 | | | $ | 3,411 | | | $ | 3,594 | |
| | | | | | | | | | | | | | | | | | | | |
| | | | | |
Percent of loans in each category to total loans | | | | | | | | | | | | | | | | | | | | |
Commercial and industrial | | | 30 | % | | | 13 | % | | | 14 | % | | | 15 | % | | | 17 | % |
Commercial real estate | | | 51 | | | | 55 | | | | 34 | | | | 29 | | | | 27 | |
Real estate construction | | | 0 | | | | 0 | | | | 2 | | | | 2 | | | | 3 | |
Agricultural | | | 5 | | | | 5 | | | | 7 | | | | 8 | | | | 7 | |
Residential real estate | | | 12 | | | | 23 | | | | 39 | | | | 39 | | | | 35 | |
Installment | | | 2 | | | | 4 | | | | 4 | | | | 7 | | | | 11 | |
Other | | | 0 | | | | 0 | | | | 0 | | | | 0 | | | | 0 | |
| | | | | | | | | | | | | | | | | | | | |
Total | | | 100 | % | | | 100 | % | | | 100 | % | | | 100 | % | | | 100 | % |
| | | | | | | | | | | | | | | | | | | | |
OTHER ASSETS
In September 2000, $10 million was used to purchase bank owned life insurance with a cash surrender value that increases tax-free at an adjustable rate. At December 31, 2011, the cash surrender value was $15.5 million.
At December 31, 2011, core deposit intangibles were $831,000, of which $623,000 million relates to the CNC acquisition and $166,000 relates to the ANB acquisition, and goodwill was $3.6 million. The core deposit intangibles are amortized over the expected life of the related core deposits, and the goodwill is tested annually for impairment.
In 2011 and 2010, no goodwill was expensed due to impairment of value. In both years, most publicly-traded financial institutions experienced a significant decline in the market value of their stock due to the global financial crisis, including the Company. Management considered the market value of the stock in evaluating
31
goodwill impairment, but also evaluated the economic value of equity using discounted cash flows and recent acquisition prices for community-oriented banks. Both the economic value calculation and comparison with acquisition prices exceeded the book value of the Company, including the goodwill. As a result, management concluded no goodwill needed to be expensed due to impairment of value. At December 31, 2011, the market value of the Company’s stock was $19.69, which was less than its book value of $20.68.
DEPOSITS
Table 12 presents a summary of period end deposit balances. Total deposits declined $3.0 million from December 31, 2010 to December 31, 2011. As loan volume declined in 2011, the Company was not aggressive in seeking significant deposit growth, maintaining deposit rates in the middle of the local market. Customers did continue to move deposits to more liquid, interest-bearing accounts such as NOW, savings and money market accounts, while balances in time deposits declined.
Total deposits increased in 2010 $43.0 million to $584.4 million at December 31, 2010 with $16.6 million attributable to the ANB acquisition. The remaining growth was in the Company’s demand, NOW, savings and money market accounts as consumers and businesses sought to keep funds more liquid. Excluding the ANB acquisition, demand deposits increased $11.1 million in 2010, with most of that growth in business and public fund checking accounts. NOW accounts grew $2.0 million in 2010, savings grew $4.4 million and money market accounts experienced the most significant growth of $17.8 million. The Company’s money market rates were higher than the cash management sweep rates throughout 2010, and some customers moved funds from the cash management sweep program to the Company’s money market accounts. In addition, time deposits declined $2.1 million in 2010 as customers moved to shorter-term, more liquid deposits.
Throughout the last four years, the Federal Reserve Board maintained lower managed interest rates throughout the country. The accounts immediately affected by lower rates were NOW and money market accounts. For certificates of deposit, the decline in rates did not occur as quickly due to the timing of maturities. Additionally, other banks in some of our markets maintained higher rates to meet their liquidity needs. Although we experienced some loss in accounts due to higher competitive rates, the impact on our core deposits was minimal. Core deposits remained at 93.6% and 91.7% of total deposits at December 31, 2011 and 2010. Deposits are attracted principally from within the Company’s market area through the offering of numerous deposit instruments. Interest rates, maturity terms, service fees, and withdrawal penalties for the various types of accounts are established periodically by management based on the Company’s liquidity requirements, growth goals and market trends. The Company had approximately $1.5 million of brokered deposits at December 31, 2011 through the Certificate of Deposit Account Registry Service (“CDARS”). CDARS allows the Bank to offer FDIC insurance to local certificate customers in excess of the $250,000 limit through a national relationship with other banks. The amount of deposits currently from outside the Company’s market area is not significant.
TABLE 12—DEPOSITS
| | | | | | | | | | | | | | | | | | | | | | | | |
| | | 2011 | | | 2010 | | | 2009 | |
| | | Amount | | | Percent of
Total | | | Amount | | | Percent of
Total | | | Amount | | | Percent of
Total | |
Demand | | $ | 97,732 | | | | 17 | % | | $ | 105,187 | | | | 18 | % | | $ | 89,827 | | | | 17 | % |
NOW | | | 125,374 | | | | 22 | | | | 108,944 | | | | 19 | | | | 105,801 | | | | 20 | |
Savings | | | 71,923 | | | | 12 | | | | 65,345 | | | | 11 | | | | 56,820 | | | | 10 | |
Money market | | | 134,227 | | | | 23 | | | | 118,484 | | | | 20 | | | | 100,008 | | | | 18 | |
CD’s less than $100,000 | | | 115,130 | | | | 20 | | | | 138,196 | | | | 24 | | | | 146,648 | | | | 27 | |
CD’s $100,000 and over | | | 36,997 | | | | 6 | | | | 48,217 | | | | 8 | | | | 42,318 | | | | 8 | |
| | | | | | | | | | | | | | | | | | | | | | | | |
Total | | $ | 581,383 | | | | 100 | % | | $ | 584,373 | | | | 100 | % | | $ | 541,422 | | | | 100 | % |
| | | | | | | | | | | | | | | | | | | | | | | | |
32
The following table sets forth the dollar amount of time deposits maturing in the periods indicated:
TABLE 13—MATURITY OF TIME DEPOSITS
(Dollars in thousands)
| | | | | | | | | | | | |
| | | $100,000 or
More | | | Less than
$100,000 | | | Total | |
Three months or less | | $ | 5,615 | | | $ | 14,175 | | | $ | 19,790 | |
Over 3 months to 6 months | | | 6,563 | | | | 19,062 | | | | 25,625 | |
Over 6 months to 12 months | | | 10,207 | | | | 34,522 | | | | 44,729 | |
Over twelve months | | | 14,612 | | | | 47,371 | | | | 61,983 | |
| | | | | | | | | | | | |
Total | | $ | 36,997 | | | $ | 115,130 | | | $ | 152,127 | |
| | | | | | | | | | | | |
OTHER BORROWINGS
At December 31, 2011, the Bank had outstanding $5.0 million of total borrowings from the FHLB. This advance is at a fixed rate of interest of 2.82% and matures on January 14, 2015. Until maturity, the Federal Home Loan Bank has the option quarterly to terminate the advance and require full payment. One advance of $12.0 million was paid off in January 2011.
At December 31, 2011, the Company had no short-term borrowings. As of that same date, the U.S. Treasury is no longer depositing tax funds overnight with most banks, and as a result, U.S. Treasury demand notes are no longer a source of liquidity for the Company. Table 14 sets forth certain information regarding the Company’s outstanding short-term borrowings at the dates and for the periods indicated:
TABLE 14—SHORT-TERM BORROWINGS
(Dollars in thousands)
| | | | | | | | | | | | |
| | | December 31, | |
| | | 2011 | | | 2010 | | | 2009 | |
Amount of short-term borrowings outstanding at end of period | | $ | 0 | | | $ | 12,779 | | | $ | 406 | |
Maximum amount of short-term borrowings outstanding at any month end during period | | $ | 10,507 | | | $ | 25,323 | | | $ | 918 | |
Average amount of short-term borrowings outstanding during period | | $ | 1,284 | | | $ | 12,164 | | | $ | 503 | |
Weighted average interest rate of short-term borrowings during period | | | 2.43 | % | | | 4.83 | % | | | 0.12 | % |
Weighted average interest rate of short-term borrowings at end of period | | | 0 | % | | | 4.92 | % | | | 0.00 | % |
On June 25, 2007, the Company participated in a securities sale commonly referred to as a “pooled trust preferred securities offering”. In that offering, the Company issued to a trust controlled by the Company $10.3 million in thirty-year debt securities. These securities have a fixed rate of 7.071% through September 6, 2012 and thereafter at the rate of 1.50% over the three-month LIBOR rate. The securities issued by the Company are classified as Tier I capital for regulatory purposes, and the interest is deductible for federal income tax purposes.
The Company has a line of credit of $30.0 million with the Federal Home Loan Bank of Cincinnati and two lines of credit with two other correspondent banks totaling $14.0 million at December 31, 2011.
OFF-BALANCE SHEET ARRANGEMENTS
The Company has not entered into off-balance sheet arrangements that have or are reasonably likely to have a material current or future effect on the Company’s financial condition, changes in financial condition, revenues or expenses, results of operations, liquidity, capital expenditures or capital resources.
33
CAPITAL
The Federal Reserve Board has adopted risk-based capital guidelines that assign risk weightings to assets and off-balance sheet items and also define and set minimum capital requirements (risk-based capital ratios). Bank holding companies must maintain total risk-based, Tier 1 risk-based and Tier 1 leverage ratios of 8%, 4% and 3%, respectively. At December 31, 2011, NB&T Financial met all of its capital requirements with a total risk-based capital ratio of 19.15%, a Tier 1 risk-based capital ratio of 18.02%, and a Tier 1 leverage ratio of 11.03%. For further information regarding NB&T Financial’s capital, see Note 17 to the Financial Statements in Item 8 of this annual report.
The Company decided not to participate in the Capital Purchase Program of the Troubled Assets Relief Program, commonly referred to as “TARP”.
LIQUIDITY
Effective liquidity management ensures that the cash flow requirements of depositors and borrowers, as well as Company cash needs, are met. The Company manages liquidity on both the asset and liability sides of the balance sheet. As part of the process, daily management reports are produced to monitor fluctuations in the balance sheet and liquidity ratios. As part of its monthly Asset/Liability Committee reporting, the Bank updates cash flow projections for investments, loans, deposits and significant borrowings. Additionally, the Asset/Liability Committee reviews the Bank’s liquidity position relative to available sources of funds, both on the balance sheet and from third parties, and deposits and short-term liabilities.
The loan to deposit ratio at December 31, 2011, was 69.6%, compared to 71.0%% at December 31, 2010. Loans to total assets were 59.9% at the end of 2011, compared to 60.1% at the same time last year. At December 31, 2011, the Company had $61.4 million in interest-bearing deposits. The securities portfolio is 100% available-for-sale securities that are readily marketable. Approximately 75.9% of the investment portfolio consists of mortgage-backed securities which provide monthly principal and interest cash flow. Approximately 55.0% of the available-for-sale portfolio is pledged to secure public deposits, short-term and long-term borrowings and for other purposes as required by law. The balance of the available-for-sale securities could be sold if necessary for liquidity purposes. Also, a stable deposit base, consisting of over 93.6% core deposits, makes the Company less susceptible to large fluctuations in funding needs. The Company has short-term borrowing lines of credit with two correspondent banks. The Company also has both short- and long-term borrowing available through the FHLB. The Company has the ability to obtain deposits in the brokered certificate of deposit market to help provide liquidity to fund loan growth.
INTEREST RATE RISK MANAGEMENT
Market risk is the risk of loss arising from adverse changes in the fair value of financial instruments due to interest rate risk, exchange rate risk, equity price risk and commodity price risk. The Company does not maintain a trading account for any class of financial instrument, and is not currently subject to foreign currency exchange rate risk, equity price risk or commodity price risk. The Company’s market risk is composed primarily of interest rate risk.
The Bank manages its interest rate risk regularly through its Asset/Liability Committee. The Committee meets on a monthly basis and reviews various asset and liability management information, including, but not limited to, the Bank’s interest rate risk position, liquidity position, projected sources and uses of funds and economic conditions.
The Bank uses simulation models to manage interest rate risk. In the Bank’s simulation models, each asset and liability balance is projected over a two-year horizon. Net interest income is then projected based on expected cash flows and projected interest rates under a stable rate scenario and analyzed on a monthly basis. The
34
results of this analysis are used in decisions made concerning pricing strategies for loans and deposits, balance sheet mix, securities portfolio strategies, liquidity and capital adequacy. The Bank’s current one-year simulation model under stable rates indicates increasing yields on interest-earning assets will exceed increasing costs of interest-bearing liabilities. This position could have a positive effect on projected net interest margin over the next twelve months.
Simulation models are performed for 100, 200, 300 and 400 basis point increases ramped up over a two year period and also for immediate rate shocks. Historically, simulation models would also be performed for similar basis point decreases. However, these decreasing rate changes are not calculated because the rates would be less than zero for most of the Bank’s liabilities in today’s current low interest rate environment. These rate changes are modeled using both projected dynamic balance sheets and a flat static balance sheet over a two year period. The results of these simulation models are compared with the stable rate simulation. The model includes assumptions as to repricing and expected prepayments, anticipated calls, and expected decay rates of transaction accounts under the different rate scenarios. The results of these simulations include changes in both net interest income and market value of equity. ALCO guidelines that measure interest rate risk by the percent of change from stable rates, and capital adequacy, have been established, and as the table below indicates at December 31, 2011, the Bank is within the guidelines established by the Board for net interest income changes and economic value of equity changes for increasing rate changes of 100, 200, 300 and 400 basis points.
As noted in the table below, the Bank exceeded the guidelines for the economic value of equity change in the +200 and +300 rate ramp environments. This variance is primarily due to the projected increasing value of non-maturity deposits. This variance has been reviewed and approved by the Board of Directors.
As with any method of measuring interest rate risk, certain shortcomings are inherent in the simulation modeling. For example, although certain assets and liabilities may have similar maturities or periods of repricing, they may react in different degrees to changes in market rates. In addition, the interest rates on certain types of assets and liabilities may fluctuate in advance of changes in market rates, while interest rates on other types may lag behind changes in market rates. Further, in the event of a change in interest rates, expected rates of prepayment on loans and mortgage-backed securities and early withdrawals from certificates of deposit may deviate significantly from those assumed in making the risk calculations. The Bank’s rate ramp simulation models provide results in extreme interest rate environments and results are used accordingly. Reacting to changes in economic conditions, interest rates and market forces, the Bank has been able to alter the mix of short-and long-term loans and investments, and increase or decrease the emphasis on fixed- and variable-rate products in response to changing market conditions.
| | | | | | | | | | | | | | | | |
| | | One Year Net Interest
Income Change | | | Economic Value of
Equity Change | |
Rate Ramp | | Year End
2011 | | | ALCO
Guideline | | | Year End
2011 | | | ALCO
Guideline | |
+400 | | | 4.1 | % | | | ±20 | % | | | 23.5 | % | | | ±30 | % |
+300 | | | 3.1 | | | | ±15 | | | | 20.4 | % | | | ±20 | |
+200 | | | 2.2 | | | | ±10 | | | | 16.5 | | | | ±15 | |
+100 | | | 1.3 | | | | ± 5 | | | | 9.9 | | | | ±10 | |
-100 | | | NA | | | | ± 5 | | | | NA | | | | ±10 | |
-200 | | | NA | | | | ±10 | | | | NA | | | | ±15 | |
-300 | | | NA | | | | ±15 | | | | NA | | | | ±20 | |
-400 | | | NA | | | | ±20 | | | | NA | | | | ±30 | |
IMPACT OF INFLATION AND CHANGING PRICES
The majority of a financial institution’s assets and liabilities are monetary in nature. Changes in interest rates affect the financial condition of a financial institution to a greater degree than inflation. Although interest rates are determined in large measure by changes in the general level of inflation, they do not change at the same
35
rate or in the same magnitude, but rather react in correlation to changes in expected rate of inflation and to changes in monetary and fiscal policy. The Company’s ability to react to changes in interest rates has a significant impact on financial results. As discussed previously, management attempts to control interest rate sensitivity in order to protect against wide interest rate fluctuations.
CRITICAL ACCOUNTING POLICIES
The accounting and reporting policies of the Company are in accordance with accounting principles generally accepted in the United States and conform to general practices within the banking industry. The Company’s significant accounting policies are described in detail in the notes to the Company’s consolidated financial statements for the year ended December 31, 2011. The preparation of financial statements in conformity with generally accepted accounting principles requires management to make estimates and assumptions. The financial position and results of operations can be affected by these estimates and assumptions and are integral to the understanding of reported results. Critical accounting policies are those policies that management believes are the most important to the portrayal of the Company’s financial condition and results, and they require management to make estimates that are difficult, subjective, or complex.
Allowance for Loan Losses—The allowance for loan losses provides coverage for probable losses inherent in the Company’s loan portfolio. Management evaluates the adequacy of the allowance for loan losses each quarter based on changes, if any, in underwriting activities, the loan portfolio composition (including product mix and geographic, industry or customer-specific concentrations), trends in loan performance, regulatory guidance and economic factors. This evaluation is inherently subjective, as it requires the use of significant management estimates. Many factors can affect management’s estimates of specific and expected losses, including volatility of default probabilities, collateral values, rating migrations, loss severity and economic and political conditions. The allowance is increased through provisions charged to operating earnings and reduced by net charge-offs.
The Company determines the amount of the allowance based on relative risk characteristics of the loan portfolio. The allowance recorded for commercial loans is based on reviews of individual credit relationships and historical loss experience. The allowance recorded for homogeneous consumer loans is based on an analysis of loan mix, risk characteristics of the portfolio, and historical losses, adjusted for current trends, for each homogeneous category or group of loans. The allowance for loan losses relating to impaired loans is based on the loan’s observable market price, the collateral for certain collateral-dependent loans, or the discounted cash flows using the loan’s effective interest rate.
Regardless of the extent of the Company’s analysis of customer performance, portfolio trends or risk management processes, certain inherent but undetected losses are probable within the loan portfolio. This is due to several factors, including inherent delays in obtaining information regarding a customer’s financial condition or changes in their unique business conditions, the judgmental nature of individual loan evaluations, collateral assessments and the interpretation of economic trends. Volatility of economic or customer-specific conditions affecting the identification and estimation of losses for larger non-homogeneous credits and the sensitivity of assumptions utilized to establish allowances for homogenous groups of loans are among other factors. The Company estimates a range of inherent losses related to the existence of these exposures. The estimates are based upon the Company’s evaluation of risk associated with the commercial and consumer allowance levels and the estimated impact of the current economic environment.
Fair Value of Securities—The Company uses the Fair Value Measurements prescribed under the FASB Accounting Standards Codification to value its securities. The ASC defines fair value as the price that would be received to sell an asset or paid to transfer a liability in an orderly transaction between market participants at the
measurement date. The ASC also establishes a fair value hierarchy which requires an entity to maximize the use of observable inputs and minimize the use of unobservable inputs when measuring fair value. The standard describes three levels of inputs that may be used to measure fair value:
| | Level 1 | Quoted prices in active markets for identical assets or liabilities |
36
| | Level 2 | Observable inputs other than Level 1 prices, such as quoted prices for similar assets or liabilities; quoted prices in markets that are not active; or other inputs that are observable or can be corroborated by observable market data for substantially the full term of the assets or liabilities |
| | Level 3 | Unobservable inputs that are supported by little or no market activity and that are significant to the fair value of the assets or liabilities |
The fair value of available-for-sale securities are determined by various valuation methodologies. Level 2 securities include U.S. Government agency securities, mortgage-backed securities, and obligations of political and state subdivisions. Level 2 inputs do not include quoted prices for individual securities in active markets; however, they do include inputs that are either directly or indirectly observable for the individual security being valued. Such observable inputs include interest rates and yield curves at commonly quoted intervals, volatilities, prepayment speeds, credit risks and default rates. Also included are inputs derived principally from or corroborated by observable market data by correlation or other means.
Goodwill and Other Intangibles—The Company records all assets and liabilities acquired in purchase acquisitions, including goodwill and other intangibles, at fair value as required by the “Intangibles – Goodwill & Other” topic of the FASB Accounting Standards Codification. Goodwill is subject, at a minimum, to annual tests for impairment. Testing includes evaluating the current market price of the stock versus book value, the current economic value of equity versus current book value, and recent market sales of financial institutions. Based on the review of all three factors, management has concluded goodwill is not impaired. Other intangible assets are amortized over their estimated useful lives using straight-line and accelerated methods, and are subject to impairment if events or circumstances indicate a possible inability to realize the carrying amount. The initial goodwill and other intangibles recorded and subsequent impairment analysis requires management to make subjective judgments concerning estimates of how the acquired asset will perform in the future. Events and factors that may significantly affect the estimates include, among others, customer attrition, changes in revenue growth trends, specific industry conditions and changes in competition.
Item 7A. Quantitative and Qualitative Disclosures About Market Risk.
Not applicable.
37
Item 8. Financial Statements and Supplementary Data
- I N D E X -
38
NB&T Financial Group, Inc.
Management’s Report on Internal Control Over Financial Reporting
Management of NB&T Financial Group, Inc. and subsidiaries (the “Company”) is responsible for establishing and maintaining effective internal control over financial reporting. Internal control over financial reporting is a process designed to provide reasonable assurance regarding the reliability of financial reporting and the preparation of financial statements for external purposes in accordance with U.S. generally accepted accounting principles.
Under the supervision and with the participation of management, including the principal executive officer and principal financial officer, the Company conducted an evaluation of the effectiveness of internal control over financial reporting based on the framework in Internal Control – Integrated Framework issued by the Committee of Sponsoring Organizations of the Treadway Commission. Based on this evaluation, management of the Company has concluded the Company maintained effective internal control over financial reporting, as such term is defined in Securities Exchange Act of 1934 Rules 13a-15(f), as of December 31, 2011.
Internal control over financial reporting cannot provide absolute assurance of achieving financial reporting objectives because of its inherent limitations. Internal control over financial reporting is a process that involves human diligence and compliance and is subject to lapses in judgment and breakdowns resulting from human failures. Internal control over financial reporting can also be circumvented by collusion or improper management override. Because of such limitations, there is a risk that material misstatements may not be prevented or detected on a timely basis by internal control over financial reporting. These inherent limitations, however, are known features of the financial reporting process. It is possible, therefore, to design into the process safeguards to reduce, though not eliminate, this risk.
This annual report does not include an attestation report of the Company’s registered public accounting firm regarding internal control over financial reporting. Management’s report was not subject to attestation by the Company’s registered public accounting firm pursuant to temporary rules of the Securities and Exchange Commission that permit the Company to provide only management’s report in this annual report.
| | |
/s/ John J. Limbert | | /s/ Craig F. Fortin |
President & Chief Executive Officer March 20, 2012 | | Chief Financial Officer March 20, 2012 |
39
Report of Independent Registered Public Accounting Firm
Audit Committee, Board of Directors and Stockholders
NB&T Financial Group, Inc.
Wilmington, Ohio
We have audited the accompanying consolidated balance sheets of NB&T Financial Group, Inc. as of December 31, 2011 and 2010, and the related consolidated statements of income, comprehensive income, stockholders’ equity and cash flows for each of the years in the three-year period ended December 31, 2011. The Company’s management is responsible for these financial statements. Our responsibility is to express an opinion on these financial statements based on our audits.
We conducted our audits in accordance with the standards of the Public Company Accounting Oversight Board (United States). Those standards require that we plan and perform the audits to obtain reasonable assurance about whether the financial statements are free of material misstatement. The Company is not required to have, nor were we engaged to perform, an audit of its internal control over financial reporting. Our audits included consideration of internal control over financial reporting as a basis for designing auditing procedures that are appropriate in the circumstances, but not for the purpose of expressing an opinion on the effectiveness of the Company’s internal control over financial reporting. Accordingly, we express no such opinion. Our audits also included examining, on a test basis, evidence supporting the amounts and disclosures in the financial statements, assessing the accounting principles used and significant estimates made by management and evaluating the overall financial statement presentation. We believe that our audits provide a reasonable basis for our opinion.
In our opinion, the consolidated financial statements referred to above present fairly, in all material respects, the financial position of NB&T Financial Group, Inc. as of December 31, 2011 and 2010, and the results of its operations and its cash flows for each of the years in the three-year period ended December 31, 2011, in conformity with accounting principles generally accepted in the United States of America.
/s/ BKD, LLP
Cincinnati, Ohio
March 20, 2012
40
NB&T Financial Group, Inc.
Consolidated Balance Sheets
December 31, 2011 and 2010
(Dollars in Thousands)
| | | | | | | | |
| | | 2011 | | | 2010 | |
Assets | | | | | | | | |
Cash and due from banks | | $ | 13,861 | | | $ | 8,693 | |
Interest-bearing deposits | | | 61,441 | | | | 72,678 | |
Federal funds sold | | | 366 | | | | 380 | |
| | | | | | | | |
Cash and cash equivalents | | | 75,668 | | | | 81,751 | |
| | | | | | | | |
Available-for-sale securities | | | 139,744 | | | | 133,855 | |
Loans held for sale | | | 0 | | | | 688 | |
Loans, net of allowance for loan losses of $4,668 and $3,714 at December 31, 2011 and 2010 | | | 399,801 | | | | 410,576 | |
Premises and equipment | | | 18,934 | | | | 20,519 | |
Federal Reserve and Federal Home Loan Bank stock | | | 10,025 | | | | 10,021 | |
Earned income receivable | | | 2,948 | | | | 2,909 | |
Goodwill | | | 3,625 | | | | 3,625 | |
Core deposits and other intangibles | | | 831 | | | | 1,183 | |
Bank-owned life insurance | | | 15,488 | | | | 15,002 | |
Other real estate owned | | | 3,520 | | | | 4,254 | |
FDIC loss share receivable | | | 1,928 | | | | 2,078 | |
Other | | | 3,076 | | | | 4,157 | |
| | | | | | | | |
Total assets | | $ | 675,588 | | | $ | 690,618 | |
| | | | | | | | |
Liabilities and Stockholders’ Equity | | | | | | | | |
Liabilities | | | | | | | | |
Deposits | | | | | | | | |
Demand | | $ | 97,732 | | | $ | 105,187 | |
Savings, NOW and money market | | | 331,524 | | | | 292,773 | |
Time | | | 152,127 | | | | 186,413 | |
| | | | | | | | |
Total deposits | | | 581,383 | | | | 584,373 | |
| | | | | | | | |
Short-term borrowings | | | 0 | | | | 12,779 | |
Long-term debt | | | 15,310 | | | | 15,310 | |
Interest payable and other liabilities | | | 8,105 | | | | 7,137 | |
| | | | | | | | |
Total liabilities | | | 604,798 | | | | 619,599 | |
| | | | | | | | |
Commitments and Contingencies | | | | | | | | |
Stockholders’ Equity | | | | | | | | |
Preferred stock, no par value, authorized 100,000 shares; none issued Common stock, no par value; authorized 6,000,000 shares; issued – 3,818,950 shares | | | 1,000 | | | | 1,000 | |
Additional paid-in capital | | | 12,183 | | | | 12,013 | |
Retained earnings | | | 59,913 | | | | 60,221 | |
Accumulated other comprehensive income | | | 2,208 | | | | 2,283 | |
Treasury stock, at cost | | | | | | | | |
Common; 2011—395,698 shares, 2010 —394,788 shares | | | (4,514 | ) | | | (4,498 | ) |
| | | | | | | | |
Total stockholders’ equity | | | 70,790 | | | | 71,019 | |
| | | | | | | | |
Total liabilities and stockholders’ equity | | $ | 675,588 | | | $ | 690,618 | |
| | | | | | | | |
See Notes to Consolidated Financial Statements.
41
NB&T Financial Group, Inc.
Consolidated Statements of Income
Years Ended December 31, 2011, 2010 and 2009
(Dollars in Thousands, except per share amounts)
| | | | | | | | | | | | |
| | | 2011 | | | 2010 | | | 2009 | |
Interest and Dividend Income | | | | | | | | | | | | |
Loans | | $ | 23,873 | | | $ | 26,228 | | | $ | 20,025 | |
Securities | | | | | | | | | | | | |
Taxable | | | 3,302 | | | | 4,212 | | | | 4,344 | |
Tax-exempt | | | 384 | | | | 587 | | | | 948 | |
Federal funds sold | | | 0 | | | | 1 | | | | 0 | |
Dividends on Federal Home Loan and Federal Reserve Bank stock | | | 443 | | | | 450 | | | | 443 | |
Deposits with financial institutions | | | 170 | | | | 135 | | | | 156 | |
| | | | | | | | | | | | |
Total interest and dividend income | | | 28,172 | | | | 31,613 | | | | 25,916 | |
| | | | | | | | | | | | |
Interest Expense | | | | | | | | | | | | |
Deposits | | | 3,832 | | | | 5,277 | | | | 5,405 | |
Short-term borrowings | | | 31 | | | | 588 | | | | 0 | |
Long-term debt | | | 871 | | | | 1,468 | | | | 2,070 | |
| | | | | | | | | | | | |
Total interest expense | | | 4,734 | | | | 7,333 | | | | 7,475 | |
| | | | | | | | | | | | |
Net Interest Income | | | 23,438 | | | | 24,280 | | | | 18,441 | |
Provision for Loan Losses | | | 2,935 | | | | 1,610 | | | | 1,550 | |
| | | | | | | | | | | | |
Net Interest Income After Provision for Loan Losses | | | 20,503 | | | | 22,670 | | | | 16,891 | |
| | | | | | | | | | | | |
Noninterest Income | | | | | | | | | | | | |
Trust income | | | 1,030 | | | | 936 | | | | 882 | |
Service charges on deposits | | | 2,929 | | | | 2,873 | | | | 2,423 | |
Other service charges and fees | | | 1,925 | | | | 1,659 | | | | 1,330 | |
Insurance agency commissions | | | 396 | | | | 362 | | | | 2,201 | |
Net realized gains on sales of available-for-sale securities | | | 1,820 | | | | 0 | | | | 0 | |
Income from bank owned life insurance | | | 486 | | | | 479 | | | | 466 | |
Gain on bargain purchase | | | 0 | | | | 7,572 | | | | 1,807 | |
Gain on sale of insurance agency | | | 0 | | | | 1,390 | | | | 0 | |
Other-than-temporary losses on investments: | | | | | | | | | | | | |
Total other-than-temporary losses | | | 0 | | | | (148 | ) | | | (588 | ) |
Portion of loss recognized in other comprehensive income (before taxes) | | | 0 | | | | 98 | | | | 438 | |
| | | | | | | | | | | | |
Net impairment losses recognized in earnings | | | 0 | | | | (50 | ) | | | (150 | ) |
Other | | | 1,138 | | | | 1,176 | | | | 965 | |
| | | | | | | | | | | | |
Total noninterest income | | | 9,724 | | | | 16,397 | | | | 9,924 | |
| | | | | | | | | | | | |
Noninterest Expense | | | | | | | | | | | | |
Salaries and employee benefits | | $ | 11,971 | | | $ | 13,448 | | | $ | 11,233 | |
Net occupancy expense | | | 2,382 | | | | 2,484 | | | | 1,933 | |
Equipment expense | | | 1,480 | | | | 1,441 | | | | 1,459 | |
Data processing fees | | | 1,611 | | | | 1,651 | | | | 1,341 | |
Professional fees | | | 1,867 | | | | 1,932 | | | | 1,825 | |
Marketing expense | | | 648 | | | | 677 | | | | 623 | |
Printing, postage and supplies | | | 834 | | | | 864 | | | | 725 | |
State franchise tax | | | 829 | | | | 842 | | | | 772 | |
FDIC insurance | | | 622 | | | | 846 | | | | 879 | |
Amortization of intangibles | | | 353 | | | | 396 | | | | 167 | |
Net costs of operation of other real estate | | | 1,259 | | | | 281 | | | | 232 | |
Other | | | 1,267 | | | | 1,596 | | | | 1,292 | |
| | | | | | | | | | | | |
Total non-interest expense | | | 25,123 | | | | 26,458 | | | | 22,481 | |
| | | | | | | | | | | | |
Income Before Income Tax | | | 5,104 | | | | 12,609 | | | | 4,334 | |
Provision for Income Taxes | | | 1,303 | | | | 3,800 | | | | 297 | |
| | | | | | | | | | | | |
Net Income | | $ | 3,801 | | | $ | 8,809 | | | $ | 4,037 | |
| | | | | | | | | | | | |
Basic Earnings Per Share | | $ | 1.11 | | | $ | 2.58 | | | $ | 1.28 | |
| | | | | | | | | | | | |
Diluted Earnings Per Share | | $ | 1.11 | | | $ | 2.58 | | | $ | 1.28 | |
| | | | | | | | | | | | |
See Notes to Consolidated Financial Statements.
42
NB&T Financial Group, Inc.
Consolidated Statements of Comprehensive Income
Years Ended December 31, 2011, 2010 and 2009
(Dollars in Thousands, except per share amounts)
| | | | | | | | | | | | |
| | | 2011 | | | 2010 | | | 2009 | |
Net income | | $ | 3,801 | | | $ | 8,809 | | | $ | 4,037 | |
Other comprehensive income (loss), before tax effect: | | | | | | | | | | | | |
Unrealized gains on securities available for sale | | | 1,706 | | | | 1,137 | | | | 1,720 | |
Net unrealized gain (loss) on available-for-sale securities for which a portion of an other-than-temporary impairment has been recognized in income | | | 0 | | | | 240 | | | | (85 | ) |
Reclassification of amount realized in income | | | (1,820 | ) | | | 50 | | | | 150 | |
| | | | | | | | | | | | |
Other comprehensive income (loss), before tax effect | | | (114 | ) | | | 1,427 | | | | 1,785 | |
Tax expense (credit) | | | (39 | ) | | | 484 | | | | 607 | |
| | | | | | | | | | | | |
Other comprehensive income (loss) | | | (75 | ) | | | 943 | | | | 1,178 | |
| | | | | | | | | | | | |
Comprehensive Income | | $ | 3,726 | | | $ | 9,752 | | | $ | 5,215 | |
| | | | | | | | | | | | |
43
NB&T Financial Group, Inc.
Consolidated Statements of Stockholders’ Equity
Years Ended December 31, 2011, 2010 and 2009
(Dollars in Thousands, except per share amounts)
| | | | | | | | | | | | | | | | | | | | | | | | | | | | |
| | | Common
Stock
Amount | | | Additional
Paid-in
Capital | | | Retained
Earnings | | | Unearned
ESOP
Shares | | | Accumulated
Other
Comprehensive
Income | | | Treasury
Stock | | | Total | |
Balance, December 31, 2008 | | $ | 1,000 | | | $ | 10,513 | | | $ | 55,004 | | | $ | (551 | ) | | $ | 162 | | | $ | (7,337 | ) | | $ | 58,791 | |
Net income | | | 0 | | | | 0 | | | | 4,037 | | | | 0 | | | | 0 | | | | 0 | | | | 4,037 | |
Other comprehensive income | | | 0 | | | | 0 | | | | 0 | | | | 0 | | | | 1,178 | | | | 0 | | | | 1,178 | |
Dividends on common stock, $1.16 per share | | | 0 | | | | 0 | | | | (3,651 | ) | | | 0 | | | | 0 | | | | 0 | | | | (3,651 | ) |
Purchase of stock (1,665 shares) | | | 0 | | | | 0 | | | | 0 | | | | 0 | | | | 0 | | | | (23 | ) | | | (23 | ) |
Community National Corporation acquisition, treasury stock (237,582 shares) | | | 0 | | | | 1,164 | | | | 0 | | | | 0 | | | | 0 | | | | 2,709 | | | | 3,873 | |
Stock options expense | | | 0 | | | | 136 | | | | 0 | | | | 0 | | | | 0 | | | | 0 | | | | 136 | |
ESOP shares earned | | | 0 | | | | (48 | ) | | | 0 | | | | 192 | | | | 0 | | | | 0 | | | | 144 | |
| | | | | | | | | | | | | | | | | | | | | | | | | | | | |
Balance, December 31, 2009 | | | 1,000 | | | | 11,765 | | | | 55,390 | | | | (359 | ) | | | 1,340 | | | | (4,651 | ) | | | 64,485 | |
Net income | | | 0 | | | | 0 | | | | 8,809 | | | | 0 | | | | 0 | | | | 0 | | | | 8,809 | |
Other comprehensive income | | | 0 | | | | 0 | | | | 0 | | | | 0 | | | | 943 | | | | 0 | | | | 943 | |
Dividends on common stock, $1.17 per share | | | 0 | | | | 0 | | | | (3,978 | ) | | | 0 | | | | 0 | | | | 0 | | | | (3,978 | ) |
Stock options exercised | | | 0 | | | | 76 | | | | 0 | | | | 0 | | | | 0 | | | | 153 | | | | 229 | |
Stock options expense | | | 0 | | | | 145 | | | | 0 | | | | 0 | | | | 0 | | | | 0 | | | | 145 | |
ESOP shares earned | | | 0 | | | | 27 | | | | 0 | | | | 359 | | | | 0 | | | | 0 | | | | 386 | |
| | | | | | | | | | | | | | | | | | | | | | | | | | | | |
Balance, December 31, 2010 | | | 1,000 | | | | 12,013 | | | | 60,221 | | | | 0 | | | | 2,283 | | | | (4,498 | ) | | | 71,019 | |
| | | | | | | | | | | | | | | | | | | | | | | | | | | | |
Net income | | | 0 | | | | 0 | | | | 3,801 | | | | 0 | | | | 0 | | | | 0 | | | | 3,801 | |
Other comprehensive income (loss) | | | 0 | | | | 0 | | | | 0 | | | | 0 | | | | (75 | ) | | | 0 | | | | (75 | ) |
Dividends on common stock, $1.20 per share | | | 0 | | | | 0 | | | | (4,109 | ) | | | 0 | | | | 0 | | | | 0 | | | | (4,109 | ) |
Purchase of stock (910 shares) | | | 0 | | | | 0 | | | | 0 | | | | 0 | | | | | | | | (16 | ) | | | (16 | ) |
Stock options expense | | | 0 | | | | 170 | | | | 0 | | | | 0 | | | | 0 | | | | 0 | | | | 170 | |
| | | | | | | | | | | | | | | | | | | | | | | | | | | | |
Balance, December 31, 2011 | | $ | 1,000 | | | $ | 12,183 | | | $ | 59,913 | | | $ | 0 | | | $ | 2,208 | | | $ | (4,514 | ) | | $ | 70,790 | |
| | | | | | | | | | | | | | | | | | | | | | | | | | | | |
See Notes to Consolidated Financial Statements.
44
NB&T Financial Group, Inc.
Consolidated Statements of Cash Flows
Years Ended December 31, 2011, 2010 and 2009
(Dollars in Thousands)
| | | | | | | | | | | | |
| | | 2011 | | | 2010 | | | 2009 | |
Operating Activities | | | | | | | | | | | | |
Net income | | $ | 3,801 | | | $ | 8,809 | | | $ | 4,037 | |
Items not requiring (providing) cash: | | | | | | | | | | | | |
Depreciation and amortization | | | 1,748 | | | | 1,749 | | | | 1,570 | |
Provision for loan losses | | | 2,935 | | | | 1,610 | | | | 1,550 | |
Amortization of premiums and discounts on securities | | | 2,351 | | | | 1,369 | | | | 110 | |
Increase in cash surrender value on bank owned life insurance | | | (486 | ) | | | (479 | ) | | | (466 | ) |
Gain on bargain purchase | | | 0 | | | | (7,572 | ) | | | (1,807 | ) |
Gain on sale of insurance agency | | | 0 | | | | (1,390 | ) | | | 0 | |
Proceeds from FDIC loss share receivable | | | 163 | | | | 1,290 | | | | 0 | �� |
ESOP shares earned | | | 0 | | | | 359 | | | | 192 | |
Stock options expense | | | 170 | | | | 145 | | | | 136 | |
Deferred income taxes | | | 40 | | | | 2,813 | | | | (131 | ) |
Proceeds from sale of loans held for sale | | | 11,753 | | | | 16,988 | | | | 15,048 | |
Originations of loans held for sale | | | (11,020 | ) | | | (17,295 | ) | | | (15,042 | ) |
Gain from sale of loans | | | (45 | ) | | | (107 | ) | | | (111 | ) |
Impairment loss on other real estate | | | 506 | | | | 60 | | | | 12 | |
(Gain) Loss on sale of other real estate | | | 226 | | | | (37 | ) | | | (21 | ) |
Loss on sale of fixed assets | | | 108 | | | | 30 | | | | 0 | |
Other-than-temporary impairment of available-for-sale securities | | | 0 | | | | 50 | | | | 150 | |
Net realized gains on available-for-sale securities | | | (1,820 | ) | | | 0 | | | | 0 | |
Changes in: | | | | | | | | | | | | |
Interest receivable | | | (39 | ) | | | 265 | | | | 227 | |
Other assets | | | 1,068 | | | | 5,539 | | | | (2,730 | ) |
Interest payable and other liabilities | | | 967 | | | | (2,027 | ) | | | (2,387 | ) |
| | | | | | | | | | | | |
Net cash provided by operating activities | | | 12,426 | | | | 12,169 | | | | 337 | |
| | | | | | | | | | | | |
Investing Activities | | | | | | | | | | | | |
Purchases of available-for-sale securities | | | (113,670 | ) | | | (96,189 | ) | | | (101,651 | ) |
Proceeds from sales of available-for-sale securities | | | 45,396 | | | | 0 | | | | 0 | |
Proceeds from maturities of available-for-sale securities | | | 61,740 | | | | 104,771 | | | | 60,524 | |
(Purchase)/ Sales of Federal Reserve Bank stock | | | (4 | ) | | | 2 | | | | (5 | ) |
Net change in loans | | | 6,153 | | | | 17,861 | | | | (1,484 | ) |
Net cash acquired from acquisitions, including $9,493 proceeds from FDIC in 2010 | | | 0 | | | | 25,821 | | | | 1,772 | |
Proceeds from sale of insurance agency | | | 0 | | | | 2,276 | | | | 0 | |
Proceeds on sale of other real estate | | | 2,003 | | | | 484 | | | | 248 | |
Purchases of premises and equipment | | | (587 | ) | | | (1,457 | ) | | | (972 | ) |
Proceeds on sales of premises and equipment | | | 354 | | | | 10 | | | | 0 | |
| | | | | | | | | | | | |
Net cash provided by (used in) investing activities | | | 1,385 | | | | 53,579 | | | | (41,568 | ) |
| | | | | | | | | | | | |
Financing Activities | | | | | | | | | | | | |
Net increase in demand deposits, money market, now and savings accounts | | $ | 31,296 | | | $ | 34,510 | | | $ | 62,665 | |
Net decrease in certificates of deposit | | | (34,286 | ) | | | (56,230 | ) | | | (17,513 | ) |
Repayment of short-term borrowings | | | (12,779 | ) | | | (12,127 | ) | | | (1,287 | ) |
Proceeds from stock options exercised | | | 0 | | | | 229 | | | | 0 | |
Purchase of treasury stock | | | (16 | ) | | | 0 | | | | (23 | ) |
Dividends paid | | | (4,109 | ) | | | (3,978 | ) | | | (3,651 | ) |
| | | | | | | | | | | | |
Net cash provided by (used in) financing activities | | | (19,894 | ) | | | (37,596 | ) | | | 40,191 | |
| | | | | | | | | | | | |
Increase (Decrease) in Cash and Cash Equivalents | | | (6,083 | ) | | | 28,152 | | | | (1,040 | ) |
Cash and Cash Equivalents, Beginning of Year | | | 81,751 | | | | 53,599 | | | | 54,639 | |
| | | | | | | | | | | | |
Cash and Cash Equivalents, End of Year | | $ | 75,668 | | | $ | 81,751 | | | $ | 53,599 | |
| | | | | | | | | | | | |
Supplemental Cash Flows Information | | | | | | | | | | | | |
Interest paid | | $ | 4,884 | | | $ | 7,469 | | | $ | 7,456 | |
Income taxes paid (net of refunds) | | | 593 | | | | 1,005 | | | | 450 | |
Assets acquired in business combination | | | 0 | | | | 72,313 | | | | 85,914 | |
Liabilities assumed in business combination | | | 0 | | | | 67,316 | | | | 76,671 | |
Transfers of loans into other real estate owned | | | 2,001 | | | | 1,306 | | | | 3,373 | |
See Notes to Consolidated Financial Statements.
45
Notes to Consolidated Financial Statements
Years Ended December 31, 2011, 2010 and 2009
Note 1: Nature of Operations and Summary of Significant Accounting Policies
Nature of Operations
NB&T Financial Group, Inc. (“Company”) is a financial holding company whose principal activity is the ownership and management of its wholly-owned subsidiaries, The National Bank and Trust Company (the “Bank”), NB&T Insurance Group, Inc., and NB&T Statutory Trust III (“Trust III”). In accordance with the Consolidation topic of the FASB Accounting Standards Codification (“ASC”), Trust III is not consolidated into these financial statements. The Bank is primarily engaged in providing a full range of banking and financial services to individual and corporate customers in Brown, Clermont, Clinton, Highland, Montgomery, Warren and Cuyahoga counties in Ohio. The Bank offers certain investment products through its wholly-owned subsidiary, NB&T Insurance Group, Inc. (“Group”). The Bank is subject to competition from other financial institutions. The Bank is subject to the regulation of certain federal and state agencies and undergoes periodic examinations by those regulatory authorities.
Principles of Consolidation
The consolidated financial statements include the accounts of the Company, the Bank and the Group. All significant intercompany accounts and transactions have been eliminated in consolidation.
Use of Estimates
The preparation of financial statements in conformity with accounting principles generally accepted in the United States of America requires management to make estimates and assumptions that affect the reported amounts of assets and liabilities and disclosure of contingent assets and liabilities at the date of the financial statements and the reported amounts of revenues and expenses during the reporting period. Actual results could differ from those estimates.
Material estimates that are particularly susceptible to significant change relate to the determination of the allowance for loan losses. In connection with the determination of the allowance for loan losses, management obtains independent appraisals for significant properties and collateral securing impaired loans.
Cash Equivalents
The Company considers all liquid investments with original maturities of three months or less to be cash equivalents. At December 31, 2011 and 2010, cash equivalents consisted primarily of interest-bearing accounts with the Federal Reserve Bank and the Federal Home Loan Bank of Cincinnati, certificates of deposit with other financial institutions through the CDARS network and non-interest bearing cash accounts with other financial institutions.
All cash accounts held at other financial institutions, with the exception of funds placed through the CDARS network, are noninterest-bearing accounts, which are fully guaranteed by the FDIC for the entire amount.
Effective October 3, 2008, the FDIC’s insurance limits increased to $250,000. At December 31, 2011, the Company’s interest-bearing cash accounts exceeded federally insured limits by $61,057,000. Of that amount, $60,424,000 was held at the Federal Reserve Bank and $517,000 was held at the Federal Home Loan Bank of Cincinnati.
Securities
The Company classifies all securities as available-for-sale securities, which are carried at fair value. The Company has no immediate plan to sell but may sell securities in the future. Unrealized gains and losses are recorded, net of related income tax effects, in other comprehensive income.
46
Notes to Consolidated Financial Statements—(Continued)
Years Ended December 31, 2011, 2010 and 2009
Amortization of premiums and accretion of discounts are recorded as interest income from securities. Realized gains and losses are recorded as net security gains (losses). Gains and losses on sales of securities are recorded on the trade date and are determined on the specific-identification method.
Effective April 1, 2009, the Company adopted new accounting guidance related to recognition and presentation of other-than-temporary impairment (ASC 320-10). When the Company does not intend to sell a debt security, and it is more likely than not that the Company will not have to sell the security before recovery of its cost basis, it recognizes the credit component of an other-than-temporary impairment of a debt security in earnings and the remaining portion in other comprehensive income.
As a result of this guidance, available-for-sale debt securities that management has no intent to sell and believes it is more likely than not the debt security will not be required to sell prior to recovery, only the credit loss component of the impairment is recognized in earnings, while the noncredit loss is recognized in accumulated other comprehensive income. The credit loss component recognized in earnings is identified as the amount of principal cash flows not expected to be received over the remaining term of the security as projected based on cash flow projections.
Loans Held for Sale
Mortgage loans originated and intended for sale in the secondary market are carried at the lower of cost or fair value in the aggregate. Net unrealized losses, if any, are recognized through a valuation allowance by charges to income.
Loans
Loans that management has the intent and ability to hold for the foreseeable future or until maturity or payoff are reported at their outstanding principal balances adjusted for any charge-offs, the allowance for loan losses, any deferred fees or costs on originated loans and unamortized premiums or discounts on purchased loans. Interest income is reported on the interest method and includes amortization of net deferred loan fees and costs over the loan term. Generally, loans are placed on non-accrual status at ninety days past due and interest is considered a loss, unless the loan is well-secured and in the process of collection.
Allowance for Loan Losses
The allowance for loan losses is established as losses are estimated to have occurred through a provision for loan losses charged to income. Loan losses are charged against the allowance when management believes the uncollectability of a loan balance is confirmed. Subsequent recoveries, if any, are credited to the allowance.
The allowance for loan losses is evaluated on a regular basis by management and is based upon management’s periodic review of the collectability of the loans in light of historical experience, the nature and volume of the loan portfolio, adverse situations that may affect the borrower’s ability to repay, estimated value of any underlying collateral and prevailing economic conditions. This evaluation is inherently subjective as it requires estimates that are susceptible to significant revision as more information becomes available.
A loan is considered impaired when, based on current information and events, it is probable that the Bank will be unable to collect the scheduled payments of principal or interest when due according to the contractual terms of the loan agreement. Factors considered by management in determining impairment include payment status, collateral value and the probability of collecting scheduled principal and interest payments when due.
47
Notes to Consolidated Financial Statements—(Continued)
Years Ended December 31, 2011, 2010 and 2009
Loans that experience insignificant payment delays and payment shortfalls generally are not classified as impaired. Management determines the significance of payment delays and payment shortfalls on a case-by-case basis, taking into consideration all of the circumstances surrounding the loan and the borrower, including the length of the delay, the reasons for the delay, the borrower’s prior payment record and the amount of the shortfall in relation to the principal and interest owed. Impairment is measured on a loan-by-loan basis for commercial and construction loans by either the present value of expected future cash flows discounted at the loan’s effective interest rate, the loan’s obtainable market price or the fair value of the collateral if the loan is collateral dependent.
Large groups of smaller balance homogenous loans are collectively evaluated for impairment. Accordingly, except for loans identified as troubled debt restructuring, the Bank does not separately identify individual consumer and residential loans for impairment measurements.
Premises and Equipment
Depreciable assets are stated at cost less accumulated depreciation. Depreciation is charged to expense using the straight-line method over the estimated useful lives of the assets. Buildings and building improvements are depreciated over an average of 40 years and 10 years, respectively. Furniture, fixtures and equipment is depreciated over a range of three to seven years. Leasehold improvements are amortized over the lesser of the asset’s useful life or the lease term, including any renewal periods for which renewal is reasonably assured.
Federal Reserve and Federal Home Loan Bank Stock
Federal Reserve and Federal Home Loan Bank stock are required investments for institutions that are members of the Federal Reserve and Federal Home Loan Bank systems. The required investment in the common stock is based on a predetermined formula.
Foreclosed Assets Held for Sale
Assets acquired through, or in lieu of, loan foreclosure are held for sale and are initially recorded at fair value at the date of foreclosure, establishing a new cost basis. Subsequent to foreclosure, valuations are periodically performed by management and the assets are carried at the lower of carrying amount or fair value less cost to sell. Revenue and expenses from operations and changes in the valuation allowance are included in net income or expense from foreclosed assets.
Goodwill
Goodwill is tested at least annually for impairment. If the implied fair value of goodwill is lower than its carrying amount, a goodwill impairment is indicated and goodwill is written down to its implied fair value. Subsequent increases in goodwill value are not recognized in the financial statements.
Intangible Assets
Intangible assets are being amortized on an accelerated basis over periods ranging from seven to ten years. Such assets are periodically evaluated as to the recoverability of their carrying value.
Treasury Stock
Treasury stock is stated at cost. Cost is determined based on the average cost of all shares.
48
Notes to Consolidated Financial Statements—(Continued)
Years Ended December 31, 2011, 2010 and 2009
Income Taxes
Deferred tax assets and liabilities are recognized for the tax effects of differences between the financial statement and tax bases of assets and liabilities. A valuation allowance is established to reduce deferred tax assets if it is more likely than not that a deferred tax asset will not be realized. The Company files consolidated income tax returns with its subsidiaries.
Earnings Per Share
Basic earnings per share represents income available to common stockholders divided by the weighted-average number of common shares outstanding during each period. Diluted earnings per share reflects additional potential common shares that would have been outstanding if dilutive potential common shares had been issued, as well as any adjustment to income that would result from the assumed issuance. Potential common shares that may be issued by the Company relate solely to outstanding stock options and are determined using the treasury stock method.
Unearned employee stock ownership plan (“ESOP”) shares and treasury stock shares are not deemed outstanding for earnings per share calculations.
Marketing Expenses
Marketing costs are expensed as incurred.
Reclassifications
Certain reclassifications have been made to the 2010 and 2009 financial statements to conform to the 2011 financial statement presentation. These reclassifications had no effect on net income.
Current Economic Conditions
The current economic environment presents financial institutions with unprecedented circumstances and challenges which in some cases have resulted in large declines in the fair values of investments and other assets, constraints on liquidity and significant credit quality problems, including severe volatility in the valuation of real estate and other collateral supporting loans. The financial statements have been prepared using values and information currently available to the Company.
At December 31, 2011, the Company held $179,556,000 in commercial real estate loans collateralized by commercial and development real estate predominantly in Ohio. Due to national, state and local economic conditions, values for commercial and development real estate have declined significantly, and the market for these properties is depressed.
The accompanying financial statements have been prepared using values and information currently available to the Company.
Given the volatility of current economic conditions, the values of assets and liabilities recorded in the financial statements could change rapidly, resulting in material future adjustments in asset values, the allowance for loan losses, and capital that could negatively impact the Company’s ability to meet regulatory capital requirements and maintain sufficient liquidity.
49
Notes to Consolidated Financial Statements—(Continued)
Years Ended December 31, 2011, 2010 and 2009
Note 2: Effect of Recent Accounting Standards
The Financial Accounting Standards Board finalized Accounting Standards Update No. 2011-02 in April 2011 to give banks new criteria for determining whether a particular loan modification represents a troubled debt restructuring for accounting purposes. The determination is significant because it signals when a bank should also record an impairment loss associated with the same loan. The new guidance is effective for quarterly and annual reports for periods beginning on or after June 15, 2011 and should be applied retroactively to the beginning of the annual period of adoption. As of December 31, 2011, these new disclosures are included in Note 6 of the financial statements.
In May 2011, the FASB issued Accounting Standards Update No. 2011-04, which contains amendments explaining further how to measure fair value. The amendments in this Update apply to all reporting entities that are required or permitted to measure or disclose the fair value of an asset, liability or a financial instrument. The amendments also require disclosures about quantitative information about the unobservable inputs under in a fair value measurement that is categorized within Level 3 of the fair value hierarchy. The amendments are to be applied prospectively and are effective for periods beginning after December 15, 2011
The FASB issued Accounting Standards Update No. 2011-05 and 2011-12. ASU 2011-015 will increase the prominence of other comprehensive income (“OCI”) in the financial statements, no longer allowing OCI to be presented in the Statement of Changes in Equity. The amendments are effective for fiscal years, and interim periods within those years, beginning after December 15, 2011. Early adoption is permitted, and the Company has elected to include this statement in the December 31, 2011 financial statements. ASU 2011-12 defers certain changes in ASU 2011-05 that relate to the presentation of reclassification adjustments, such that the presentation requirements of reclassifications out of accumulated other comprehensive income coincide with the requirements in place prior to the issuance of ASU 2011-05.
In September 2011, the FASB issued Accounting Standards Update No. 2011-08 regarding the testing for goodwill impairment. Under the revised standard, an entity will be allowed to first assess qualitative factors to determine whether it is more likely than not that the fair value of a reporting unit is less than its carrying amount as a basis for determining whether it is necessary to perform the two-step goodwill impairment test. The amendments are effective on annual or interim goodwill impairment tests performed for fiscal years beginning after December 15, 2011. Early adoption is permitted.
Note 3: Business Combinations
American National Bank
On March 19, 2010, the Company acquired, through the Bank, the banking operations of American National Bank (“ANB”), based in Parma, Ohio, under a purchase and assumption agreement with the Federal Deposit Insurance Corporation (“FDIC”). The Office of the Comptroller of the Currency declared ANB closed and appointed the FDIC as receiver. The Bank did not pay the FDIC a premium for the deposits of ANB. In addition to assuming all of the deposits of the failed bank, the Bank agreed to purchase essentially all of the assets. The book value of the net assets of ANB were acquired from the FDIC at a $10.0 million discount. The acquisition did not include the mortgage servicing business conducted by ANB by its division Leader Financial Services. The FDIC and the Bank entered into a loss-share transaction on $48.2 million of ANB assets. The Bank will share in the losses on the asset pools covered under the loss-share agreement. Under the loss-share agreement, the Bank shares in 20% of losses for the first $8.0 million in losses and 5% for any losses in excess of $8.0 million.
The Company entered into the transaction with the expectation it would increase profits by increasing its loans receivable and deposits within a new market area.
50
Notes to Consolidated Financial Statements—(Continued)
Years Ended December 31, 2011, 2010 and 2009
During 2010, the Company incurred $118,000 of third-party acquisition-related costs. The expenses are included in professional fees in the Company’s condensed consolidated statement of income for the twelve months ended December 31, 2010.
The acquisition was accounted for under the acquisition method of accounting in accordance with the Business Combinations topic of the ASC. The statement of net assets acquired as of March 19, 2010, the proceeds from the FDIC and the computation of the gain on bargain purchase related to the acquisition are presented in the table below. The assets and liabilities of ANB were recorded at their respective acquisition date fair values, and identifiable intangible assets were recorded at fair value. The pro forma consolidated condensed statements of income for the Company and ANB for the period ended December 31, 2010, is also presented below. The unaudited pro forma information presented does not necessarily reflect the results of operations that would have resulted had the acquisition been completed at the beginning of the applicable period presented, nor does it indicate the results of operations in future periods.
Statement of Net Assets Acquired (at fair value and in thousands)
| | | | | | | | | | |
ASSETS | | | | | | Proceeds from FDIC & Gain on Purchase | | | | |
Cash and cash equivalents | | $ | 16,328 | | | Proceeds from FDIC | | $ | 9,493 | |
Receivable from FDIC | | | 9,493 | | | ANB carrying value of net assets acquired | | | 507 | |
| | | | | | | | | | |
Covered loans | | | 42,215 | | | Total asset discount | | | 10,000 | |
| | | | | | | | | | |
Core deposit intangible | | | 280 | | | | | | | |
FDIC loss share receivable | | | 3,309 | | | Adjustments to reflect assets acquired and liabilities assumed at fair value: | | | | |
Other assets | | | 688 | | | Covered loans | | | (5,424 | ) |
| | | | | | | | | | |
Total assets | | | 72,313 | | | FDIC loss share receivable | | | 3,309 | |
| | | | | | | | | | |
| | | | | | Intangible assets | | | 280 | |
LIABILITIES | | | | | | Other assets | | | (593 | ) |
| | | | | | | | | | |
Deposits | | | 64,671 | | | | | | | |
Other liabilities | | | 2,645 | | | Fair value of net assets acquired | | | (2,428 | ) |
| | | | | | | | | | |
Total liabilities | | | 67,316 | | | Gain on bargain purchase | | $ | 7,572 | |
| | | | | | | | | | |
Net assets acquired | | $ | 4,997 | | | | | | | |
| | | | | | | | | | |
The fair value of the loans acquired, excluding those considered impaired under the Receivables topic of the ASC, is $39,892,000. The gross amount due under the contracts is $43,341,000, of which $2,572,000 is expected to be uncollectible. The fair value of impaired loans acquired is outlined in Note 5.
| | | | |
| | | Pro Forma Year Ended
December 31, 2010 | |
Interest income | | $ | 32,276 | |
Interest expense | | | 7,510 | |
Net interest income | | | 24,766 | |
Provision for loan losses | | | 1,668 | |
Non-interest income | | | 16,455 | |
Non-interest expenses | | | 27,022 | |
| | | | |
Income before income taxes | | | 12,531 | |
Income taxes | | | 3,800 | |
| | | | |
Net income | | $ | 8,731 | |
| | | | |
51
Notes to Consolidated Financial Statements—(Continued)
Years Ended December 31, 2011, 2010 and 2009
The pro forma consolidated condensed statements of income do not reflect any adjustments to ANB’s historical provision for loan losses and goodwill impairment charges.
Community National Corporation
On December 31, 2009, Community National Corporation (“CNC”), based in Franklin, Ohio was merged into the Company. Under the terms of the merger agreement, shareholders of CNC holding of record more than 1,500 shares were entitled to elect cash compensation of $11.41 or 0.761 Company common shares, per share of CNC common stock. The elections were subject to a limitation that 50% of all CNC shares would be exchanged for cash and 50% would be exchanged for Company shares. Shareholders of CNC holding of record 1,500 or fewer shares were entitled to receive $11.41 in cash for each share of CNC common stock. In total, the Company paid $3.6 million cash and issued 237,582 common shares at a market price of $16.30 per share on the acquisition date, totaling $3.9 million. The Company entered into the transaction with the expectation it would increase profits by increasing its loans receivable and deposits and achieving efficiencies through economies of scale.
In 2009, the Company incurred $367,000 of third-party acquisition-related costs. The expenses are included in professional fees and other expense in the Company’s consolidated statement of income for the year ended December 31, 2009.
The acquisition was accounted for under the acquisition method of accounting in accordance with the Business Combinations topic of the ASC. The statement of net assets acquired as of December 31, 2009, purchase price and the computation of negative goodwill related to the merger are presented in the table below. The assets and liabilities of CNC were recorded at their respective acquisition date fair values, and identifiable intangible assets were recorded at fair value. The pro forma consolidated condensed statements of income for the Company and CNC for the year ended December 31, 2009 is also presented below. The unaudited pro forma information presented does not necessarily reflect the results of operations that would have resulted had the merger been completed at the beginning of the applicable period presented, nor does it indicate the results of operations in future periods.
Statement of Net Assets Acquired (at fair value and in thousands)
| | | | | | | | | | |
ASSETS | | | | | | Purchase Price and Gain on Purchase | |
Cash and cash equivalents | | $ | 5,335 | | | Purchase price: | | | | |
Securities | | | 11,821 | | | Value of common shares | | $ | 3,873 | |
Loans | | | 59,233 | | | Cash | | | 3,562 | |
| | | | | | | | | | |
Core deposit intangible | | | 1,243 | | | Total purchase price | | | 7,435 | |
| | | | | | | | | | |
Other assets | | | 8,282 | | | Allocation of purchase price: | | | | |
| | | | | | | | | | |
Total assets | | | 85,914 | | | CNC tangible shareholder’s equity | | | 8,177 | |
| | | | | | | | | | |
| | | | | | Adjustments to reflect assets acquired and liabilities assumed at fair value: | | | | |
LIABILITIES | | | | | | Securities | | | (110 | ) |
Deposits | | | 75,542 | | | Loans | | | (57 | ) |
Other liabilities | | | 1,130 | | | Premises & equipment | | | 442 | |
| | | | | | | | | | |
Total liabilities | | | 76,672 | | | Intangible assets | | | 1,045 | |
| | | | | | | | | | |
| | | | | | Other assets | | | 517 | |
Net assets acquired | | $ | 9,242 | | | Deposits | | | (274 | ) |
| | | | | | | | | | |
| | | | | | Other liabilities | | | (498 | ) |
| | | | | | | | | | |
| | | | | | Fair value of net assets acquired | | | 9,242 | |
| | | | | | | | | | |
| | | | | | Gain on bargain purchase | | $ | (1,807 | ) |
| | | | | | | | | | |
52
Notes to Consolidated Financial Statements—(Continued)
Years Ended December 31, 2011, 2010 and 2009
The fair value of the loans acquired, excluding those considered impaired under the Receivables topic of the FASB ASC, is $55,630,000. The gross amount due under the contracts is $57,660,000, of which $1,972,000 is expected to be uncollectible. The fair value of impaired loans acquired is outlined in Note 6.
| | | | |
| | | Pro Forma Year Ended
December 31, 2009 | |
Interest income | | $ | 31,102 | |
Interest expense | | | 8,807 | |
| | | | |
Net interest income | | | 22,295 | |
Provision for loan losses | | | 2,060 | |
Non-interest income | | | 11,150 | |
Non-interest expenses | | | 27,839 | |
| | | | |
Income before income taxes | | | 3,546 | |
Income taxes | | | 335 | |
| | | | |
Net income | | $ | 3,211 | |
| | | | |
The pro forma consolidated condensed statements of income do not reflect any adjustments to CNC’s historical provision for loan losses and goodwill impairment charges.
Note 4: Restriction on Cash and Due From Banks
The Bank is required to maintain reserve funds in cash and/or on deposit with the Federal Reserve Bank. The reserve required at December 31, 2011 was $4,827,000.
Note 5: Securities
The amortized cost and approximate fair values of securities are as follows (thousands):
| | | | | | | | | | | | | | | | |
| | | Amortized
Cost | | | Gross
Unrealized
Gains | | | Gross
Unrealized
Losses | | | Approximate
Fair Value | |
Available-for-Sale Securities: | | | | | | | | | | | | | | | | |
December 31, 2011: | | | | | | | | | | | | | | | | |
U.S. government sponsored entities | | $ | 6,321 | | | $ | 113 | | | $ | (0 | ) | | $ | 6,434 | |
Mortgage-backed securities: | | | | | | | | | | | | | | | | |
U.S. Government sponsored entities-residential | | | 97,203 | | | | 2,080 | | | | (115 | ) | | | 99,168 | |
Private label-residential | | | 6,997 | | | | 213 | | | | (268 | ) | | | 6,942 | |
State and political subdivisions | | | 25,878 | | | | 1,322 | | | | (0 | ) | | | 27,200 | |
| | | | | | | | | | | | | | | | |
| | $ | 136,399 | | | $ | 3,728 | | | $ | (383 | ) | | $ | 139,744 | |
| | | | | | | | | | | | | | | | |
December 31, 2010: | | | | | | | | | | | | | | | | |
U.S. government sponsored entities | | $ | 21,081 | | | $ | 13 | | | $ | 0 | | | $ | 21,094 | |
Mortgage-backed securities: | | | | | | | | | | | | | | | | |
U.S. Government sponsored entities-residential | | | 82,346 | | | | 2,985 | | | | (20 | ) | | | 85,311 | |
Private label-residential | | | 9,929 | | | | 387 | | | | (154 | ) | | | 10,162 | |
State and political subdivisions | | | 17,040 | | | | 332 | | | | (84 | ) | | | 17,288 | |
| | | | | | | | | | | | | | | | |
| | $ | 130,396 | | | $ | 3,717 | | | $ | (258 | ) | | $ | 133,855 | |
| | | | | | | | | | | | | | | | |
53
Notes to Consolidated Financial Statements—(Continued)
Years Ended December 31, 2011, 2010 and 2009
The amortized cost and fair value of securities available for sale at December 31, 2011, by contractual maturity, are shown below (thousands). Expected maturities will differ from contractual maturities because issuers may have the right to call or prepay obligations with or without call or prepayment penalties.
| | | | | | | | |
| | | Amortized Cost | | | Fair Value | |
Within one year | | $ | 1,753 | | | $ | 1,772 | |
One to five years | | | 8,520 | | | | 8,772 | |
Five to ten years | | | 5,578 | | | | 6,083 | |
After ten years | | | 16,348 | | | | 17,007 | |
| | | | | | | | |
| | | 32,199 | | | | 33,634 | |
Mortgage-backed securities | | | 104,200 | | | | 106,110 | |
| | | | | | | | |
Totals | | $ | 136,399 | | | $ | 139,744 | |
| | | | | | | | |
The carrying value of securities pledged as collateral, to secure public deposits and for other purposes, was $76,915,000 at December 31, 2011, and $51,867,000 at December 31, 2010.
In 2010, there was a write down on one private label mortgage-backed security of $50,000 due to an other- than -temporary impairment charge. In 2009, there was also a write down on the same private label mortgage-backed security of $150,000. Gross gains of $1,830,000 and gross losses of $10,000 resulting from sales of available-for sale securities were realized during 2011. There were no sales of securities in 2010. Gross gains are determined under the specific identification method.
The table below indicates the gross unrealized losses and fair value, aggregated by investment category and length of time that individual securities have been in a continuous unrealized loss position at December 31, 2011 and 2010 (thousands):
| | | | | | | | | | | | | | | | | | | | | | | | |
| | | Less than 12 months | | | 12 months or more | | | Total | |
| | Fair
Value | | | Unrealized
Loss | | | Fair
Value | | | Unrealized
Loss | | | Fair
Value | | | Unrealized
Loss | |
December 31, 2011 | | | | | | | | | | | | | | | | | | | | | | | | |
Mortgage-backed securities: | | | | | | | | | | | | | | | | | | | | | | | | |
U.S. Government-sponsored entities-residential | | $ | 22,560 | | | $ | (115 | ) | | $ | 0 | | | $ | 0 | | | $ | 22,560 | | | $ | (115 | ) |
Private label-residential | | | 1,364 | | | | (24 | ) | | | 525 | | | | (244 | ) | | | 1,889 | | | | (268 | ) |
Municipal securities | | | 0 | | | | 0 | | | | 0 | | | | 0 | | | | 0 | | | | 0 | |
| | | | | | | | | | | | | | | | | | | | | | | | |
Total Securities | | $ | 23,924 | | | $ | (139 | ) | | $ | 525 | | | $ | (244 | ) | | $ | 24,449 | | | $ | (383 | ) |
| | | | | | | | | | | | | | | | | | | | | | | | |
December 31, 2010 | | | | | | | | | | | | | | | | | | | | | | | | |
Mortgage-backed securities: | | | | | | | | | | | | | | | | | | | | | | | | |
U.S. Government-sponsored entities-residential | | | 4,146 | | | | (20 | ) | | | 0 | | | | 0 | | | | 4,146 | | | | (20 | ) |
Private label-residential | | | 0 | | | | 0 | | | | 1,341 | | | | (154 | ) | | | 1,341 | | | | (154 | ) |
States and political subdivisions | | | 4,111 | | | | (84 | ) | | | 0 | | | | 0 | | | | 4,111 | | | | (84 | ) |
| | | | | | | | | | | | | | | | | | | | | | | | |
Total Securities | | $ | 8,257 | | | $ | (104 | ) | | $ | 1,341 | | | $ | (154 | ) | | $ | 9,598 | | | $ | (258 | ) |
| | | | | | | | | | | | | | | | | | | | | | | | |
The unrealized losses outstanding 12 months or more of $244,000 at December 31, 2011 is due to one private-label collateralized mortgage obligation, which has been downgraded by three major bond rating
54
Notes to Consolidated Financial Statements—(Continued)
Years Ended December 31, 2011, 2010 and 2009
agencies. Based on management’s review of the underlying collateral performance and estimate of projected future cash flows, the Company recognized an other-than-temporary impairment charge of $200,000 in prior periods. In 2011, approximately $52,000 of losses were realized on this security with total realized losses through December 31, 2011 totaling approximately $82,000. These losses were in line with prior period loss projections.
Other-than-temporary Impairment
Upon acquisition of a security, the Company decides whether it is within the scope of the accounting guidance for beneficial interests in securitized financial assets or will be evaluated for impairment under the accounting guidance for investments in debt and equity securities.
The accounting guidance for beneficial interests in securitized financial assets provides incremental impairment guidance for a subset of the debt securities within the scope of the guidance for investments in debt and equity securities. For securities where the security is a beneficial interest in securitized financial assets, the Company uses the beneficial interests in securitized financial asset impairment model. For securities where the security is not a beneficial interest in securitized financial assets, the Company uses debt and equity securities impairment model.
The Company routinely conducts periodic reviews to identify and evaluate each investment security to determine whether an other-than-temporary impairment has occurred. Economic models are used to determine whether an other-than-temporary impairment has occurred on these securities. While all securities are considered, the securities primarily impacted by other-than-temporary impairment testing are private-label mortgage-backed securities. For each private-label mortgage-backed security in the investment portfolio (including but not limited to those whose fair value is less than their amortized cost basis), an extensive, regular review is conducted to determine if an other-than-temporary impairment has occurred. Various inputs to the economic models are used to determine if an unrealized loss is other-than-temporary. The most significant inputs are the following:
Other inputs may include the actual collateral attributes, which include geographic concentrations, credit ratings and other performance indicators of the underlying asset. To determine if the unrealized loss for private label mortgage-backed securities is other-than-temporary, the Company projects total estimated defaults of the underlying assets (mortgages) and multiplies that calculated amount by an estimate of realizable value upon sale in the marketplace (severity) in order to determine the projected collateral loss. The Company also evaluates the current credit enhancement underlying the bond to determine the impact on cash flows. If the Company determines that a given mortgage-backed security position will be subject to a write-down or loss, the Company records the expected credit loss as a charge to earnings.
For those securities for which an other-than-temporary impairment was determined to have occurred as of December 31, 2011 (that is, a determination was made that the entire amortized cost bases will not likely be recovered), the following table presents the inputs used to measure the amount of the credit loss recognized in earnings. The table shows the projected weighted average default rates and loss severities for the recent-vintage private-label mortgage-backed securities portfolios at December 31, 2011.
| | | | | | | | |
| | | Default Rate | | | Severity | |
Alt-A | | | 19.1 | % | | | 63.1 | % |
55
Notes to Consolidated Financial Statements—(Continued)
Years Ended December 31, 2011, 2010 and 2009
Credit Losses Recognized on Investments
The following table provides information about debt securities for which only a credit loss was recognized in income and other losses are recorded in other comprehensive income (thousands):
| | | | | | | | |
| | | Accumulated
Credit Losses | |
| | | 2011 | | | 2010 | |
Credit losses on debt securities held | | | | | | | | |
Balance, beginning of year | | $ | (170 | ) | | $ | (150 | ) |
Reductions related to losses realized which were previously recognized | | | 52 | | | | (50 | ) |
| | | | | | | | |
Balance, end of period | | $ | (118 | ) | | $ | (170 | ) |
| | | | | | | | |
Note 6: Loans and Allowance for Loan Losses
Categories of loans at December 31, include (thousands):
| | | | | | | | |
| | | 2011 | | | 2010 | |
Commercial and industrial | | $ | 67,298 | | | $ | 65,304 | |
Agricultural | | | 32,460 | | | | 31,354 | |
Real estate construction | | | 1,064 | | | | 5,029 | |
Commercial real estate | | | 179,556 | | | | 177,640 | |
Residential real estate | | | 115,920 | | | | 124,497 | |
Consumer | | | 8,257 | | | | 10,510 | |
| | | | | | | | |
Total loans | | | 404,555 | | | | 414,334 | |
Less: Net deferred loan fees, premiums and discounts | | | (86 | ) | | | (44 | ) |
Allowance for loan losses | | | (4,668 | ) | | | (3,714 | ) |
| | | | | | | | |
Net loans | | $ | 399,801 | | | $ | 410,576 | |
| | | | | | | | |
Activity in the allowance for loan losses was as follows (thousands):
| | | | | | | | | | | | |
| | | 2011 | | | 2010 | | | 2009 | |
Balance, beginning of year | | $ | 3,714 | | | $ | 3,776 | | | $ | 3,411 | |
Provision charged to expense | | | 2,935 | | | | 1,610 | | | | 1,550 | |
Recoveries of previous charge-offs | | | 271 | | | | 208 | | | | 238 | |
Losses charged off | | | (2,252 | ) | | | (1,880 | ) | | | (1,423 | ) |
| | | | | | | | | | | | |
Balance, end of year | | $ | 4,668 | | | $ | 3,714 | | | $ | 3,776 | |
| | | | | | | | | | | | |
The allowance for loan losses is established as losses are estimated to have occurred through a provision for loan losses charged to income. Loan losses are charged against the allowance when management believes the uncollectability of a loan balance is confirmed. Subsequent recoveries, if any, are credited to the allowance.
The allowance for loan losses is evaluated on a regular basis by management and is based upon management’s periodic review of the collectability of the loans in light of historical experience, the nature and volume of the loan portfolio, adverse situations that may affect the borrower’s ability to repay, estimated value of any underlying collateral and prevailing economic conditions. This evaluation is inherently subjective as it requires estimates that are susceptible to significant revision as more information becomes available.
56
Notes to Consolidated Financial Statements—(Continued)
Years Ended December 31, 2011, 2010 and 2009
A loan is considered impaired when, based on current information and events, it is probable that the Bank will be unable to collect the scheduled payments of principal or interest when due according to the contractual terms of the loan agreement. Factors considered by management in determining impairment include payment status, collateral value and the probability of collecting scheduled principal and interest payments when due. Loans that experience insignificant payment delays and payment shortfalls generally are not classified as impaired. Management determines the significance of payment delays and payment shortfalls on a case-by-case basis, taking into consideration all of the circumstances surrounding the loan and the borrower, including the length of the delay, the reasons for the delay, the borrower’s prior payment record and the amount of the shortfall in relation to the principal and interest owed. Impairment is measured on a loan-by-loan basis for commercial and construction loans by either the present value of expected future cash flows discounted at the loan’s effective interest rate, the loan’s obtainable market price or the fair value of the collateral if the loan is collateral dependent.
Large groups of smaller balance homogenous loans are collectively evaluated for impairment. Accordingly, except for loans identified as troubled debt restructuring, the Bank does not separately identify individual consumer and residential loans for impairment measurements.
The following tables provide a breakdown of the allowance for loan losses for the years ended December 31, 2011 and December 31, 2010 (thousands):
Allowance for loan losses:
| | | | | | | | | | | | | | | | | | | | | | | | | | | | |
| | | Commercial | | | Commercial
Real Estate | | | Agricultural | | | Residential
1-4 Family | | | Residential
Home Equity | | | Consumer | | | Total | |
Beginning Balance December 31, 2009 | | $ | 481 | | | $ | 2,468 | | | $ | 112 | | | $ | 406 | | | $ | 100 | | | $ | 209 | | | $ | 3,776 | |
Charge-offs | | | (102 | ) | | | (1,071 | ) | | | — | | | | (278 | ) | | | (222 | ) | | | (207 | ) | | | (1,880 | ) |
Recoveries | | | 5 | | | | 81 | | | | 8 | | | | 4 | | | | 13 | | | | 97 | | | | 208 | |
Provision | | | 90 | | | | 579 | | | | 64 | | | | 396 | | | | 446 | | | | 35 | | | | 1,610 | |
| | | | | | | | | | | | | | | | | | | | | | | | | | | | |
Ending Balance December 31, 2010 | | $ | 474 | | | $ | 2,057 | | | $ | 184 | | | $ | 528 | | | $ | 337 | | | $ | 134 | | | $ | 3,714 | |
| | | | | | | | | | | | | | | | | | | | | | | | | | | | |
Charge-offs | | | (350 | ) | | | (1,300 | ) | | | (2 | ) | | | (262 | ) | | | (140 | ) | | | (198 | ) | | | (2,252 | ) |
Recoveries | | | 16 | | | | 167 | | | | 6 | | | | 9 | | | | 3 | | | | 70 | | | | 271 | |
Provision | | | 1,240 | | | | 1,448 | | | | 43 | | | | 98 | | | | (5 | ) | | | 111 | | | | 2,935 | |
| | | | | | | | | | | | | | | | | | | | | | | | | | | | |
Ending Balance December 31, 2011 | | $ | 1,380 | | | $ | 2,372 | | | $ | 231 | | | $ | 373 | | | $ | 195 | | | $ | 117 | | | $ | 4,668 | |
| | | | | | | | | | | | | | | | | | | | | | | | | | | | |
57
Notes to Consolidated Financial Statements—(Continued)
Years Ended December 31, 2011, 2010 and 2009
The following tables present the balance in the allowance for loan losses and the recorded investment in financing receivables based on portfolio segment and impairment method as of December 31, 2011 and December 31, 2010 (thousands):
December 31, 2011:
| | | | | | | | | | | | | | | | | | | | | | | | | | | | |
| | | Commercial | | | Commercial
Real Estate | | | Agricultural | | | Residential
1-4 Family | | | Residential
Home
Equity | | | Consumer | | | Total | |
Allowance for loan losses: | | | | | | | | | | | | | | | | | | | | | | | | | | | | |
Ending balance: | | | | | | | | | | | | | | | | | | | | | | | | | | | | |
Individually evaluated for impairment | | $ | 1,004 | | | $ | 634 | | | $ | 0 | | | $ | 0 | | | $ | 0 | | | $ | 0 | | | $ | 1,638 | |
| | | | | | | | | | | | | | | | | | | | | | | | | | | | |
Collectively evaluated for impairment | | | 366 | | | | 1,365 | | | | 231 | | | | 373 | | | | 195 | | | | 117 | | | | 2,647 | |
| | | | | | | | | | | | | | | | | | | | | | | | | | | | |
Loans acquired with deteriorated credit quality: | | | | | | | | | | | | | | | | | | | | | | | | | | | | |
Individually evaluated for impairment | | | 10 | | | | 354 | | | | 0 | | | | 0 | | | | 0 | | | | 0 | | | | 364 | |
| | | | | | | | | | | | | | | | | | | | | | | | | | | | |
Collectively evaluated for impairment | | | 0 | | | | 19 | | | | 0 | | | | 0 | | | | 0 | | | | 0 | | | | 19 | |
| | | | | | | | | | | | | | | | | | | | | | | | | | | | |
Financing Receivables: | | | | | | | | | | | | | | | | | | | | | | | | | | | | |
Ending balance | | $ | 67,298 | | | $ | 180,257 | | | $ | 32,460 | | | $ | 85,254 | | | $ | 31,029 | | | $ | 8,257 | | | $ | 404,555 | |
| | | | | | | | | | | | | | | | | | | | | | | | | | | | |
Ending balance: | | | | | | | | | | | | | | | | | | | | | | | | | | | | |
Individually evaluated for impairment | | | 2,887 | | | | 5,914 | | | | 0 | | | | 997 | | | | 0 | | | | 0 | | | | 9,798 | |
| | | | | | | | | | | | | | | | | | | | | | | | | | | | |
Collectively evaluated for impairment | | | 64,212 | | | | 170,953 | | | | 32,460 | | | | 84,257 | | | | 31,029 | | | | 8,257 | | | | 391,168 | |
| | | | | | | | | | | | | | | | | | | | | | | | | | | | |
Loans acquired with deteriorated credit quality: | | | | | | | | | | | | | | | | | | | | | | | | | | | | |
Individually evaluated for impairment | | | 190 | | | | 1,279 | | | | 0 | | | | 0 | | | | 0 | | | | 0 | | | | 1,469 | |
| | | | | | | | | | | | | | | | | | | | | | | | | | | | |
Collectively evaluated for impairment | | | 9 | | | | 2,111 | | | | 0 | | | | 0 | | | | 0 | | | | 0 | | | | 2,120 | |
| | | | | | | | | | | | | | | | | | | | | | | | | | | | |
58
Notes to Consolidated Financial Statements—(Continued)
Years Ended December 31, 2011, 2010 and 2009
December 31, 2010:
| | | | | | | | | | | | | | | | | | | | | | | | | | | | |
| | | Commercial | | | Commercial
Real Estate | | | Agricultural | | | Residential
1-4 Family | | | Residential
Home
Equity | | | Consumer | | | Total | |
Allowance for loan losses: | | | | | | | | | | | | | | | | | | | | | | | | | | | | |
Ending balance: | | | | | | | | | | | | | | | | | | | | | | | | | | | | |
Individually evaluated for impairment | | $ | 37 | | | $ | 430 | | | $ | 0 | | | $ | 0 | | | $ | 0 | | | $ | 0 | | | $ | 467 | |
| | | | | | | | | | | | | | | | | | | | | | | | | | | | |
Collectively evaluated for impairment | | | 391 | | | | 1,479 | | | | 184 | | | | 528 | | | | 337 | | | | 134 | | | | 3,053 | |
| | | | | | | | | | | | | | | | | | | | | | | | | | | | |
Loans acquired with deteriorated credit quality: | | | | | | | | | | | | | | | | | | | | | | | | | | | | |
Individually evaluated for impairment | | | 46 | | | | 129 | | | | 0 | | | | 0 | | | | 0 | | | | 0 | | | | 175 | |
| | | | | | | | | | | | | | | | | | | | | | | | | | | | |
Collectively evaluated for impairment | | | 0 | | | | 19 | | | | 0 | | | | 0 | | | | 0 | | | | 0 | | | | 19 | |
| | | | | | | | | | | | | | | | | | | | | | | | | | | | |
Financing Receivables: | | | | | | | | | | | | | | | | | | | | | | | | | | | | |
Ending balance | | $ | 65,304 | | | $ | 182,372 | | | $ | 31,354 | | | $ | 91,901 | | | $ | 32,893 | | | $ | 10,510 | | | $ | 414,334 | |
| | | | | | | | | | | | | | | | | | | | | | | | | | | | |
Ending balance: | | | | | | | | | | | | | | | | | | | | | | | | | | | | |
Individually evaluated for impairment | | | 696 | | | | 4,420 | | | | 0 | | | | 1,061 | | | | 0 | | | | 0 | | | | 6,177 | |
| | | | | | | | | | | | | | | | | | | | | | | | | | | | |
Collectively evaluated for impairment | | | 64,343 | | | | 173,548 | | | | 31,354 | | | | 90,738 | | | | 32,893 | | | | 10,510 | | | | 403,386 | |
| | | | | | | | | | | | | | | | | | | | | | | | | | | | |
Loans acquired with deteriorated credit quality: | | | | | | | | | | | | | | | | | | | | | | | | | | | | |
Individually evaluated for impairment | | | 206 | | | | 1,437 | | | | 0 | | | | 102 | | | | 0 | | | | 0 | | | | 1,745 | |
| | | | | | | | | | | | | | | | | | | | | | | | | | | | |
Collectively evaluated for impairment | | | 59 | | | | 2,967 | | | | 0 | | | | 0 | | | | 0 | | | | 0 | | | | 3,026 | |
| | | | | | | | | | | | | | | | | | | | | | | | | | | | |
The following table outlines the Company’s corporate and consumer credit exposure by category and standard regulatory classification as of December 31, 2011 and December 31, 2010 (thousands):
Corporate Credit Exposure
Credit Risk Profile by Creditworthiness Category:
| | | | | | | | | | | | | | | | | | | | | | | | |
| | | Commercial | | | Commercial Real Estate | | | Agricultural | |
| | | 2011 | | | 2010 | | | 2011 | | | 2010 | | | 2011 | | | 2010 | |
December 31, | | | | | | | | | | | | | | | | | | | | | | | | |
Pass | | $ | 57,422 | | | $ | 53,758 | | | $ | 158,142 | | | $ | 153,490 | | | $ | 32,192 | | | $ | 30,108 | |
Other Assets Especially Mentioned | | | 1,972 | | | | 5,722 | | | | 5,960 | | | | 10,312 | | | | 0 | | | | 962 | |
Substandard | | | 7,758 | | | | 5,678 | | | | 16,012 | | | | 18,529 | | | | 268 | | | | 284 | |
Doubtful | | | 146 | | | | 146 | | | | 143 | | | | 61 | | | | 0 | | | | 0 | |
Non-rated | | | 0 | | | | 0 | | | | 0 | | | | (21 | ) | | | 0 | | | | 0 | |
| | | | | | | | | | | | | | | | | | | | | | | | |
Total | | $ | 67,298 | | | $ | 65,304 | | | $ | 180,257 | | | $ | 182,372 | | | $ | 32,460 | | | $ | 31,354 | |
| | | | | | | | | | | | | | | | | | | | | | | | |
59
Notes to Consolidated Financial Statements—(Continued)
Years Ended December 31, 2011, 2010 and 2009
Consumer Credit Exposure
Credit Risk Profile by Internally Assigned Grade
| | | | | | | | | | | | | | | | | | | | | | | | |
| | | Residential-1 to 4 Family | | | Residential Home Equity | | | Consumer | |
| | | 2011 | | | 2010 | | | 2011 | | | 2010 | | | 2011 | | | 2010 | |
December 31, | | | | | | | | | | | | | | | | | | | | | | | | |
Pass | | $ | 82,030 | | | $ | 88,582 | | | $ | 30,729 | | | $ | 32,761 | | | $ | 8,219 | | | $ | 10,304 | |
Substandard | | | 3,224 | | | | 3,319 | | | | 300 | | | | 132 | | | | 38 | | | | 206 | |
| | | | | | | | | | | | | | | | | | | | | | | | |
Total | | $ | 85,254 | | | $ | 91,901 | | | $ | 31,029 | | | $ | 32,893 | | | $ | 8,257 | | | $ | 10,510 | |
| | | | | | | | | | | | | | | | | | | | | | | | |
For purposes of monitoring the credit quality and risk characteristics of its commercial portfolio segment, the Company disaggregates the segment into the following classes: commercial and industrial, commercial real estate and agricultural.
To facilitate the monitoring of credit quality within the commercial portfolio segment, and for purposes of analyzing historical loss rates used in the determination of the allowance for loan losses for the commercial portfolio segment, the Company utilizes the following categories of credit grades: pass, other assets especially mentioned, substandard, doubtful or loss. The five categories, which are derived from standard regulatory rating definitions, are assigned upon initial approval of credit to borrowers and updated periodically thereafter.
Pass ratings, which are assigned to those borrowers that do not have identified potential or well defined weaknesses and for which there is a high likelihood of orderly repayment, are updated periodically based on the size and credit characteristics of the borrower. All other categories are updated on a quarterly basis.
The Company assigns an Other Assets Especially Mentioned rating to loans and leases that have potential weaknesses that deserve management’s close attention. If left uncorrected, these potential weaknesses may, at some future date, result in the deterioration of the repayment prospects for the loan or the Company’s credit position.
The Company assigns a substandard rating to loans that are inadequately protected by the current sound worth and paying capacity of the borrower or of the collateral pledged. Substandard loans have well defined weaknesses or weaknesses that could jeopardize the orderly repayment of the debt. Loans in this grade also are characterized by the distinct possibility that the Company will sustain some loss if the deficiencies noted are not addressed and corrected.
The Company assigns a doubtful rating to loans that have all the attributes of a substandard rating with the added characteristic that the weaknesses make collection or liquidation in full, on the basis of currently existing facts, conditions, and values, highly questionable and improbable. The possibility of loss is extremely high, but because of certain important and reasonable specific pending factors that may work to the advantage of and strengthen the credit quality of the loan or lease, its classification as an estimated loss is deferred until its more exact status may be determined. Pending factors may include a proposed merger or acquisition, liquidation proceeding, capital injection, perfecting liens on additional collateral or refinancing plans. Loans rated as loss are loans with advances in excess of calculated current fair value which are considered uncollectible.
For purposes of monitoring the credit quality and risk characteristics of its consumer portfolio segment, the Company disaggregates the segment into the following classes: residential mortgage, home equity and other consumer. The Company considers repayment performance as the best indicator of credit quality for residential mortgage and consumer loans. Consumer loans that have principal and interest payments that have become past due ninety days are classified as substandard unless such loans are both well secured and in the process of collection. All other loans are classified as pass. Well secured loans are collateralized by perfected security
60
Notes to Consolidated Financial Statements—(Continued)
Years Ended December 31, 2011, 2010 and 2009
interests in real and/or personal property for which the Company estimates proceeds from sale would be sufficient to recover the outstanding principal and accrued interest balance of the loan and pay all costs to sell the collateral. The Company considers a loan in the process of collection if collection efforts or legal action is proceeding and the Company expects to collect funds sufficient to bring the loan current or recover the entire outstanding principal and accrued interest balance.
Generally, all classes of loans are placed on non-accrual status at ninety days past due and interest is considered a loss, unless the loan is well-secured and in the process of collection. Most impaired loans are on non-accrual status. Past due status is based on the contractual terms of the loan. Payments made while a loan is on non-accrual are treated as reductions of principal. Typically, loans are not returned to accrual status until all loan payments have been current for at least six months. The following tables outline the Company’s past due and non-accrual loans as of December 31, 2011 and December 31, 2010 (thousands):
| | | | | | | | | | | | | | | | | | | | | | | | | | | | | | | | |
December 31, 2011: | | | | | | | | | | | | | | | | | | | | | | | | | | | | | | | | |
| | | Past Due Days | | | | | | Total
Financing
Receivables | | | 90+ Days
&
Accruing | | | Non-
accrual | |
| | | 30-59 | | | 60-89 | | | 90+ | | | Total | | | Current | | | | |
Commercial | | $ | 263 | | | $ | 1,640 | | | $ | 2,076 | | | $ | 3,979 | | | $ | 63,319 | | | $ | 67,298 | | | $ | 0 | | | $ | 3,406 | |
Commercial Real Estate | | | 393 | | | | 1,363 | | | | 4,411 | | | | 6,167 | | | | 174,090 | | | | 180,257 | | | | 0 | | | | 5,695 | |
Agricultural | | | 90 | | | | 0 | | | | 41 | | | | 131 | | | | 32,329 | | | | 32,460 | | | | 0 | | | | 41 | |
Residential - 1 to 4 Family | | | 1,142 | | | | 431 | | | | 810 | | | | 2,383 | | | | 82,871 | | | | 85,254 | | | | 116 | | | | 2,442 | |
Residential - Home Equity | | | 171 | | | | 99 | | | | 118 | | | | 388 | | | | 30,641 | | | | 31,029 | | | | 17 | | | | 275 | |
Consumer | | | 74 | | | | 53 | | | | 119 | | | | 246 | | | | 8,011 | | | | 8,257 | | | | 0 | | | | 148 | |
| | | | | | | | | | | | | | | | | | | | | | | | | | | | | | | | |
Total | | $ | 2,133 | | | $ | 3,586 | | | $ | 7,575 | | | $ | 13,294 | | | $ | 391,261 | | | $ | 404,555 | | | $ | 133 | | | $ | 12,007 | |
| | | | | | | | | | | | | | | | | | | | | | | | | | | | | | | | |
| | | | | | | | |
December 31, 2010: | | | | | | | | | | | | | | | | | | | | | | | | | | | | | | | | |
| | | Past Due Days | | | | | | Total
Financing
Receivables | | | 90+ Days
&
Accruing | | | Non-
accrual | |
| | | 30-59 | | | 60-89 | | | 90+ | | | Total | | | Current | | | | |
Commercial | | $ | 526 | | | $ | 380 | | | $ | 1,807 | | | $ | 2,713 | | | $ | 62,591 | | | $ | 65,304 | | | $ | 1,037 | | | $ | 1,025 | |
Commercial Real Estate | | | 1,145 | | | | 282 | | | | 4,158 | | | | 5,585 | | | | 176,787 | | | | 182,372 | | | | 0 | | | | 5,725 | |
Agricultural | | | 36 | | | | 0 | | | | 0 | | | | 36 | | | | 31,318 | | | | 31,354 | | | | 0 | | | | 43 | |
Residential - 1 to 4 Family | | | 835 | | | | 761 | | | | 1,028 | | | | 2,624 | | | | 89,277 | | | | 91,901 | | | | 0 | | | | 2,365 | |
Residential - Home Equity | | | 54 | | | | 41 | | | | 68 | | | | 163 | | | | 32,730 | | | | 32,893 | | | | 0 | | | | 126 | |
Consumer | | | 41 | | | | 1 | | | | 148 | | | | 190 | | | | 10,320 | | | | 10,510 | | | | 0 | | | | 206 | |
| | | | | | | | | | | | | | | | | | | | | | | | | | | | | | | | |
Total | | $ | 2,637 | | | $ | 1,465 | | | $ | 7,209 | | | $ | 11,311 | | | $ | 403,023 | | | $ | 414,334 | | | $ | 1,037 | | | $ | 9,490 | |
| | | | | | | | | | | | | | | | | | | | | | | | | | | | | | | | |
61
Notes to Consolidated Financial Statements—(Continued)
Years Ended December 31, 2011, 2010 and 2009
The following table represents loans considered impaired at December 31, 2011 and December 31, 2010 and the related allowance for loan losses. Interest income recognized is not materially different than interest income that would have been recognized on a cash basis (thousands):
| | | | | | | | | | | | | | | | | | | | |
December 31, 2011: | | Recorded
Investment | | | Unpaid
Principal
Balance | | | Related
Allowance | | | Average
Recorded
Investment | | | Interest
Income
Recognized | |
With no related allowance recorded: | | | | | | | | | | | | | | | | | | | | |
Commercial | | $ | 856 | | | $ | 894 | | | $ | 0 | | | $ | 982 | | | $ | 0 | |
Commercial real estate | | | 4,006 | | | | 4,112 | | | | 0 | | | | 3,659 | | | | 136 | |
Agricultural | | | 0 | | | | 0 | | | | 0 | | | | 0 | | | | 0 | |
Residential—1 to 4 Family | | | 997 | | | | 997 | | | | 0 | | | | 1,105 | | | | 51 | |
Residential—Home equity | | | 0 | | | | 0 | | | | 0 | | | | 0 | | | | 0 | |
Consumer | | | 0 | | | | 0 | | | | 0 | | | | 0 | | | | 0 | |
With an allowance recorded: | | | | | | | | | | | | | | | | | | | | |
Commercial | | $ | 2,221 | | | $ | 2,251 | | | $ | 1,014 | | | $ | 1,090 | | | $ | 0 | |
Commercial real estate | | | 3,187 | | | | 3,316 | | | | 988 | | | | 2,191 | | | | 0 | |
Agricultural | | | 0 | | | | 0 | | | | 0 | | | | 0 | | | | 0 | |
Residential—1 to 4 Family | | | 0 | | | | 0 | | | | 0 | | | | 0 | | | | 0 | |
Residential—Home equity | | | 0 | | | | 0 | | | | 0 | | | | 0 | | | | 0 | |
Consumer | | | 0 | | | | 0 | | | | 0 | | | | 0 | | | | 0 | |
Total: | | | | | | | | | | | | | | | | | | | | |
Commercial | | $ | 3,077 | | | $ | 3,145 | | | $ | 1,014 | | | $ | 2,072 | | | $ | 0 | |
Commercial real estate | | | 7,193 | | | | 7,428 | | | | 988 | | | | 5,850 | | | | 136 | |
Agricultural | | | 0 | | | | 0 | | | | 0 | | | | 0 | | | | 0 | |
Residential—1 to 4 Family | | | 997 | | | | 997 | | | | 0 | | | | 1,105 | | | | 51 | |
Residential—Home equity | | | 0 | | | | 0 | | | | 0 | | | | 0 | | | | 0 | |
Consumer | | | 0 | | | | 0 | | | | 0 | | | | 0 | | | | 0 | |
| | | | | | | | | | | | | | | | | | | | |
December 31, 2010: | | Recorded
Investment | | | Unpaid
Principal
Balance | | | Related
Allowance | | | Average
Recorded
Investment | | | Interest Income
Recognized | |
With no related allowance recorded: | | | | | | | | | | | | | | | | | | | | |
Commercial | | $ | 711 | | | $ | 734 | | | $ | 0 | | | $ | 814 | | | $ | 19 | |
Commercial real estate | | | 3,178 | | | | 3,204 | | | | 0 | | | | 7,638 | | | | 526 | |
Agricultural | | | 0 | | | | 0 | | | | 0 | | | | 33 | | | | 0 | |
Residential—1 to 4 Family | | | 1,163 | | | | 1,165 | | | | 0 | | | | 411 | | | | 38 | |
Residential—Home equity | | | 0 | | | | 0 | | | | 0 | | | | 0 | | | | 0 | |
Consumer | | | 0 | | | | 0 | | | | 0 | | | | 0 | | | | 0 | |
With an allowance recorded: | | | | | | | | | | | | | | | | | | | | |
Commercial | | $ | 191 | | | $ | 222 | | | $ | 82 | | | $ | 0 | | | $ | 0 | |
Commercial real estate | | | 2,681 | | | | 2,752 | | | | 560 | | | | 0 | | | | 0 | |
Agricultural | | | 0 | | | | 0 | | | | 0 | | | | 0 | | | | 0 | |
Residential—1 to 4 Family | | | 0 | | | | 0 | | | | 0 | | | | 0 | | | | 0 | |
Residential—Home equity | | | 0 | | | | 0 | | | | 0 | | | | 0 | | | | 0 | |
Consumer | | | | | | | | | | | | | | | | | | | | |
Total: | | | | | | | | | | | | | | | | | | | | |
Commercial | | $ | 902 | | | $ | 956 | | | $ | 82 | | | $ | 814 | | | $ | 19 | |
Commercial real estate | | | 5,859 | | | | 5,956 | | | | 560 | | | | 7,638 | | | | 526 | |
Agricultural | | | 0 | | | | 0 | | | | 0 | | | | 33 | | | | 0 | |
Residential—1 to 4 Family | | | 1,163 | | | | 1,165 | | | | 0 | | | | 411 | | | | 38 | |
Residential—Home equity | | | 0 | | | | 0 | | | | 0 | | | | 0 | | | | 0 | |
Consumer | | | 0 | | | | 0 | | | | 0 | | | | 0 | | | | 0 | |
62
Notes to Consolidated Financial Statements—(Continued)
Years Ended December 31, 2011, 2010 and 2009
The Company’s financing receivables contain certain loans restructured in 2011 and determined to be troubled debt restructurings (“TDRs”) under Accounting Standards Update (“ASU”) No. 2011-02, which are summarized below (thousands):
| | | | | | | | | | | | |
| | | Twelve Months Ended December 31, 2011 | |
| | | Number of
Contracts | | | Pre-Modification
Outstanding
Recorded
Investment | | | Post-Modification
Outstanding
Recorded Investment | |
Commercial | | | 1 | | | $ | 89 | | | $ | 88 | |
Commercial Real Estate | | | 2 | | | | 1,681 | | | | 1,603 | |
Residential | | | 1 | | | | 105 | | | | 105 | |
The above TDRs involved one commercial real estate loan and one residential mortgage loan where the term was extended. For one commercial real estate loan, the loan was restructured into two notes where the second note of approximately $65,000 was charged off by the Company. In addition, the allowance for loan losses increased approximately $53,000 for this commercial real estate loan. For one commercial loan, the payment was lowered for one year, which resulted in an increase in the allowance for loan losses of approximately $9,000. All TDRs are considered impaired loans.
The Company had no loans classified as a TDR in the last twelve months where there was a payment default during the year.
The Company acquired loans in the ANB acquisition on March 19, 2010 and the acquisition by merger of CNC on December 31, 2009. At the time of each acquisition, there was evidence of deterioration of credit quality since origination for which it was probable, at acquisition, that all contractually required payments would not be collected. ASC 310-30 requires that acquired credit-impaired loans be recorded at fair value and prohibits carryover of the related allowance for loan losses. Loans within the scope of this accounting standard were initially recorded by the Company at fair value. The process of estimating fair value involves estimating the principal and interest cash flows expected to be collected on the credit impaired loans and discounting those cash flows at a market rate of interest. Under this accounting standard, the excess of cash flows expected at acquisition over the estimated fair value is referred to as the accretable yield and is recognized into interest income over the remaining life of the loan in situations where there is reasonable expectation about the timing and amount of cash flows collected. The difference between contractually required payments at acquisition and the cash flows expected at acquisition to be collected, considering the impact of prepayments, is referred to as the non-accretable difference. Subsequent decreases to the expected cash flows will generally result in a charge to the provision for loan losses resulting in an increase to the allowance for loan losses. Subsequent increases in cash flows result in reversal of non-accretable discount (or allowance for loan losses to the extent any had been recorded) with a positive impact on interest income. Disposals of loans, which may include sales of loans, receipt of payments in full by the borrower, foreclosure, or troubled debt restructurings result in removal of the loan from the impaired loan portfolio at its carrying amount. Loans subject to this accounting standard are written down to an amount estimated to be collectible. Accordingly, such loans are no longer classified as nonaccrual even though they may be contractually past due. We expect to fully collect the new carrying values of such loans. If a loan, or a pool of loans, deteriorates post acquisition, a provision for loan losses is recorded. Acquired loans subject to this accounting standard are also excluded from the disclosure of loans 90 days or more past due and still accruing interest; however, the Bank’s regulatory reporting instructions require these loans to be reported as past due based upon the borrower’s contractual obligations. Even though substantially all of them are 90 days or more contractually past due, they are considered to be accruing because the interest income on these loans relates to the establishment of an accretable yield.
63
Notes to Consolidated Financial Statements—(Continued)
Years Ended December 31, 2011, 2010 and 2009
The carrying amount of those loans is included in the balance sheet amounts of loans receivable at December 31, 2011 and December 31, 2010. The amounts are as follows:
| | | | | | | | |
| | | December 31,
2011 | | | December 31,
2010 | |
Commercial | | $ | 4,913 | | | $ | 6,013 | |
Consumer | | | 9 | | | | 112 | |
| | | | | | | | |
Outstanding balance | | $ | 4,922 | | | $ | 6,125 | |
| | | | | | | | |
Carrying amount, net of discount of $552 | | $ | 3,589 | | | $ | 4,771 | |
| | | | | | | | |
Accretable yield | | $ | 76 | | | $ | 279 | |
| | | | | | | | |
Accretable yield, or income expected to be collected, is as follows:
| | | | | | | | |
| | | 2011 | | | 2010 | |
Balance, beginning of year | | | 279 | | | | 169 | |
Additions | | | 0 | | | | 247 | |
Accretion | | | (186 | ) | | | (136 | ) |
Reclassification from nonaccretable difference | | | 0 | | | | 0 | |
Disposals | | | (17 | ) | | | (1 | ) |
| | | | | | | | |
Balance, end of year | | $ | 76 | | | $ | 279 | |
| | | | | | | | |
Note 7: Premises and Equipment
Major classifications of premises and equipment, stated at cost, were as follows (thousands):
| | | | | | | | |
| | | 2011 | | | 2010 | |
Land | | $ | 4,588 | | | $ | 4,588 | |
Buildings and improvements | | | 18,816 | | | | 19,579 | |
Leasehold improvements | | | 420 | | | | 420 | |
Equipment | | | 16,585 | | | | 16,031 | |
| | | | | | | | |
| | $ | 40,409 | | | $ | 40,618 | |
Less accumulated depreciation and amortization | | | (21,475 | ) | | | (20,099 | ) |
| | | | | | | | |
Net premises and equipment | | $ | 18,934 | | | $ | 20,519 | |
| | | | | | | | |
Note 8: Operating Leases
The Bank has entered into certain operating leases for some of its branch locations. Operating lease expense was $80,000, $91,000, and $77,000 for years 2011, 2010, and 2009, respectively. The minimum future lease payments for each of the next five years are as follows (thousands):
| | | | |
2012 | | $ | 82 | |
2013 | | | 45 | |
2014 | | | 36 | |
2015 | | | 36 | |
2016 | | | 38 | |
64
Notes to Consolidated Financial Statements—(Continued)
Years Ended December 31, 2011, 2010 and 2009
Note 9: Goodwill
All goodwill is allocated to the banking segment of the business and totaled $3,625,000 at December 31, 2011 and December 31, 2010.
Note 10: Other Intangible Assets
The carrying basis and accumulated amortization of recognized intangible assets at December 31, 2011 and 2010, were (thousands):
| | | | | | | | | | | | | | | | |
| | | 2011 | | | 2010 | |
| | | Gross Carrying
Amount | | | Accumulated
Amortization | | | Gross Carrying
Amount | | | Accumulated
Amortization | |
Core deposit intangibles | �� | $ | 4,515 | | | $ | (3,684 | ) | | $ | 4,515 | | | $ | (3,332 | ) |
| | | | | | | | | | | | | | | | |
Amortization expense for the years ended December 31, 2011, 2010 and 2009, was $353,000, $396,000 and $167,000, respectively. Estimated amortization expense for each of the following four years is (thousands):
| | | | |
2012 | | $ | 274 | |
2013 | | | 220 | |
2014 | | | 166 | |
2015 | | | 111 | |
2016 | | | 52 | |
Note 11: Interest-Bearing Deposits
Interest-bearing deposits in denominations of $100,000 or more were $36,997,000 on December 31, 2011, and $48,217,000 on December 31, 2010. At December 31, 2011, the scheduled maturities of time deposits were as follows (thousands):
| | | | |
2012 | | $ | 90,144 | |
2013 | | | 29,716 | |
2014 | | | 11,104 | |
2015 | | | 6,278 | |
2016 | | | 6,480 | |
Thereafter | | | 8,405 | |
| | | | |
| | $ | 152,127 | |
| | | | |
Included in time deposits at December 31, 2011 and 2010 were $1,608,000 and $981,000 respectively, of deposits which were obtained through the Certificate of Deposit Account Registry Service (CDARS). This service allows deposit customers to maintain fully insured balances in excess of the $250,000 FDIC insurance limit without the inconvenience of having multi-banking relationships. Under the reciprocal program in which the Bank is currently participating, customers agree to allow the Bank to place their deposits with other participating banks in the CDARS program in insurable amounts under $250,000. In exchange, other banks in the program agree to place their deposits with the Bank also in insurable amounts under $250,000.
65
Notes to Consolidated Financial Statements—(Continued)
Years Ended December 31, 2011, 2010 and 2009
Note 12: Short-Term Borrowings
Short-term borrowings included the following (thousands):
| | | | | | | | |
| | | 2011 | | | 2010 | |
U. S. Treasury demand notes | | $ | 0 | | | $ | 779 | |
Federal Home Loan Bank Advances | | | 0 | | | | 12,000 | |
| | | | | | | | |
| | $ | 0 | | | $ | 12,779 | |
| | | | | | | | |
As of December 31, 2011, the U.S. Treasury is no longer depositing tax funds overnight with most banks, and as a result, U.S. Treasury demand notes are no longer a source of liquidity for the Company. The Company has a line of credit of $30.0 million with the Federal Home Loan Bank of Cincinnati and two lines of credit with two other correspondent banks totaling $14.0 million at December 31, 2011. The Company has also pledged $5.9 million of securities with the Federal Reserve Bank to secure discount window borrowing if necessary.
Note 13: Long-Term Debt
Long-term debt consisted of the following components (thousands):
| | | | | | | | |
| | | 2011 | | | 2010 | |
Federal Home Loan Bank Advances | | $ | 5,000 | | | $ | 5,000 | |
Junior subordinated debentures | | | 10,310 | | | | 10,310 | |
| | | | | | | | |
Total | | $ | 15,310 | | | $ | 15,310 | |
| | | | | | | | |
The Federal Home Loan Bank advances are secured by mortgage loans totaling $93,833,000 at December 31, 2011. One advance of $5.0 million, at a fixed interest rate of 2.82%, matures on January 14, 2015. Until maturity, the Federal Home Loan Bank has the option quarterly to terminate the advance and require full payment.
On June 25, 2007, Trust III, a wholly owned subsidiary of the Company, closed a pooled private offering of 10,000 Capital Securities with a liquidation amount of $1,000 per security. The proceeds of the offering were loaned to the Company in exchange for junior subordinated debentures with terms similar to the Capital Securities. The sole assets of Trust III are the junior subordinated debentures of the Company and payments thereunder. The junior subordinated debentures and the back-up obligations, in the aggregate, constitute a full and unconditional guarantee by the Company of the obligations of Trust III under the Capital Securities. Distributions on the Capital Securities are payable quarterly at a fixed interest rate of 7.071% through September 6, 2012 and thereafter at the annual rate of 1.50% over the 3 month LIBOR. Distributions on the Capital Securities are included in interest expense in the consolidated financial statements. These securities are considered Tier I capital (with certain limitations applicable) under current regulatory guidelines.
The junior subordinated debentures are subject to mandatory redemption, in whole or in part, upon repayment of the Capital Securities at maturity or their earlier redemption at the liquidation amount. Subject to the Company having received prior approval of the Federal Reserve, if then required, the Capital Securities are redeemable prior to the maturity date of September 6, 2037, at the option of the Company. On or after September 6, 2012, the Capital Securities are redeemable at par. Upon occurrence of specific events defined within the trust indenture, the Capital Securities may also be redeemed prior to September 6, 2012 at a premium. The Corporation has the option to defer distributions on the Capital Securities from time to time for a period not to exceed 20 consecutive semi-annual periods.
66
Notes to Consolidated Financial Statements—(Continued)
Years Ended December 31, 2011, 2010 and 2009
As of December 31, 2011 and December 31, 2010, the outstanding principal balance of the Capital Securities was $10,000,000. The Company accounts for its investment in the trust as assets, its subordinated debentures as debt, and the interest paid thereon as interest expense.
Note 14: Income Taxes
The provision for income taxes includes these components (thousands):
| | | | | | | | | | | | |
| | | 2011 | | | 2010 | | | 2009 | |
Taxes currently payable | | $ | 1,263 | | | $ | 987 | | | $ | 428 | |
Deferred income taxes | | | 40 | | | | 2,813 | | | | (131 | ) |
| | | | | | | | | | | | |
Income tax expense | | $ | 1,303 | | | $ | 3,800 | | | $ | 297 | |
| | | | | | | | | | | | |
A reconciliation of income tax expense at the statutory rate to actual income tax expense is shown below (thousands):
| | | | | | | | | | | | |
| | | 2011 | | | 2010 | | | 2009 | |
Computed at the statutory rate (34%) | | $ | 1,735 | | | $ | 4,287 | | | $ | 1,473 | |
Increase (decrease) resulting from | | | | | | | | | | | | |
Tax exempt interest | | | (153 | ) | | | (232 | ) | | | (312 | ) |
ESOP dividend | | | (158 | ) | | | (154 | ) | | | (186 | ) |
Bank owned life insurance | | | (165 | ) | | | (163 | ) | | | (158 | ) |
Negative goodwill | | | 0 | | | | 0 | | | | (614 | ) |
Acquisition costs | | | 0 | | | | 0 | | | | 100 | |
Gain on sale of insurance agency | | | 0 | | | | 28 | | | | 0 | |
Other | | | 44 | | | | 34 | | | | (6 | ) |
| | | | | | | | | | | | |
Actual tax expense | | $ | 1,303 | | | $ | 3,800 | | | $ | 297 | |
| | | | | | | | | | | | |
67
Notes to Consolidated Financial Statements—(Continued)
Years Ended December 31, 2011, 2010 and 2009
The tax effects of temporary differences related to deferred taxes shown on the balance sheets were (thousands):
| | | | | | | | |
| | | 2011 | | | 2010 | |
Deferred tax assets | | | | | | | | |
Allowance for loan losses | | | 1,518 | | | | 1,180 | |
Accruals not currently deductible | | | 246 | | | | 255 | |
AMT credit carry forward | | | 286 | | | | 903 | |
Nonaccrual loan interest collected | | | 289 | | | | 280 | |
Stock options not currently deductible | | | 88 | | | | 74 | |
OREO expenses not currently deductible | | | 385 | | | | 175 | |
Other-than-temporary impairment charge | | | 40 | | | | 58 | |
Other | | | 24 | | | | 3 | |
| | | | | | | | |
| | $ | 2,876 | | | $ | 2,928 | |
| | | | | | | | |
Deferred tax liabilities | | | | | | | | |
Deferred loan costs | | | (163 | ) | | | (163 | ) |
Depreciation | | | (530 | ) | | | (293 | ) |
FHLB stock dividends | | | (1,453 | ) | | | (1,453 | ) |
Prepaid assets currently deductible | | | (164 | ) | | | (135 | ) |
Unrealized gains on available-for-sale securities | | | (1,137 | ) | | | (1,176 | ) |
ANB purchase | | | (1,827 | ) | | | (2,227 | ) |
Non-taxable purchase accounting adjustments | | | (322 | ) | | | (291 | ) |
Bad debt recapture | | | (229 | ) | | | (295 | ) |
Intangible asset amortization | | | (379 | ) | | | (223 | ) |
Other | | | (61 | ) | | | (58 | ) |
| | | | | | | | |
| | | (6,265 | ) | | | (6,314 | ) |
| | | | | | | | |
Net deferred tax liability | | $ | (3,389 | ) | | $ | (3,386 | ) |
| | | | | | | | |
Note 15: Accounting for Uncertainty in Income Taxes
The Company or one of its subsidiaries files income tax returns in the U.S. federal and Ohio jurisdictions. With few exceptions, the Company is no longer subject to U.S. federal, state and local examinations by tax authorities for years before 2009.
The Revenue Recognition topic of the FASB ASC prescribes a recognition threshold and measurement attribute for the financial statement recognition and measurement of a tax position taken or expected to be taken in a tax return. The standard also provides guidance on derecognition, classification, interest and penalties, accounting in interim periods, disclosure and transition. The Company did not identify any uncertain tax positions that it believes should be recognized in the financial statements.
68
Notes to Consolidated Financial Statements—(Continued)
Years Ended December 31, 2011, 2010 and 2009
Note 16: Other Comprehensive Income
The components of accumulated other comprehensive income, included in stockholders’ equity, are as follows:
| | | | | | | | | | | | |
| | | 2011 | | | 2010 | | | 2009 | |
Net unrealized gain on available-for-sale securities | | $ | 3,345 | | | $ | 3,607 | | | $ | 2,468 | |
Net unrealized loss on available-for-sale securities for which a portion of an other-than-temporary impairment has been recognized in income | | | 0 | | | | (148 | ) | | | (438 | ) |
| | | | | | | | | | | | |
| | | 3,345 | | | | 3,459 | | | | 2,030 | |
Tax effect | | | 1,137 | | | | 1,176 | | | | 690 | |
| | | | | | | | | | | | |
Net-of-tax amount | | $ | 2,208 | | | $ | 2,283 | | | $ | 1,340 | |
| | | | | | | | | | | | |
Note 17: Regulatory Matters
The Company and the Bank are subject to various regulatory capital requirements administered by the federal banking agencies. Failure to meet minimum capital requirements can initiate certain mandatory and possibly additional discretionary actions by regulators that, if undertaken, could have a direct material effect on the Company’s financial statements. Under capital adequacy guidelines and the regulatory framework for prompt corrective action, the Company and the Bank must meet specific capital guidelines that involve quantitative measures of assets, liabilities and certain off-balance-sheet items as calculated under regulatory accounting practices. The capital amounts and classification are also subject to qualitative judgments by the regulators about components, risk weightings and other factors.
Quantitative measures established by regulation to ensure capital adequacy require the Company and the subsidiary Bank to maintain minimum amounts and ratios (set forth in the table below) of total and Tier I capital (as defined in the regulations) to risk-weighted assets (as defined), and of Tier I capital (as defined) to average assets (as defined). Management believes, as of December 31, 2011, that the Company and the Bank met all capital adequacy requirements to which they were subject.
As of December 31, 2011, the Company met the capital requirements to be deemed well capitalized under the regulatory framework for prompt corrective action.
69
Notes to Consolidated Financial Statements—(Continued)
Years Ended December 31, 2011, 2010 and 2009
The Company’s and the Bank’s actual and required capital amounts and ratios are presented in the following table (thousands):
| | | | | | | | | | | | | | | | | | | | | | | | |
| | | Actual | | | For Capital Adequacy
Purposes | | | To Be Well Capitalized
Under Prompt
Corrective Action
Provisions | |
| | | Amount | | | Ratio | | | Amount | | | Ratio | | | Amount | | | Ratio | |
As of December 31, 2011 | | | | | | | | | | | | | | | | | | | | | | | | |
Total Risk-Based Capital to Risk-Weighted Assets: | | | | | | | | | | | | | | | | | | | | | | | | |
Consolidated | | $ | 79,620 | | | | 19.15 | % | | $ | 33,270 | | | | 8.0 | % | | | N/A | | | | N/A | |
Bank | | | 71,285 | | | | 17.16 | | | | 33,242 | | | | 8.0 | | | $ | 41,552 | | | | 10.0 | % |
Tier I Capital to Risk-Weighted Assets: | | | | | | | | | | | | | | | | | | | | | | | | |
Consolidated | | | 74,952 | | | | 18.02 | | | | 16,635 | | | | 4.0 | | | | N/A | | | | N/A | |
Bank | | | 66,617 | | | | 16.03 | | | | 16,621 | | | | 4.0 | | | | 24,931 | | | | 6.0 | |
Tier I Capital to Average Assets: | | | | | | | | | | | | | | | | | | | | | | | | |
Consolidated | | | 74,952 | | | | 11.03 | | | | 27,185 | | | | 4.0 | | | | N/A | | | | N/A | |
Bank | | | 66,617 | | | | 9.87 | | | | 27,009 | | | | 4.0 | | | | 33,762 | | | | 5.0 | |
As of December 31, 2010 | | | | | | | | | | | | | | | | | | | | | | | | |
Total Risk-Based Capital to Risk-Weighted Assets: | | | | | | | | | | | | | | | | | | | | | | | | |
Consolidated | | $ | 78,385 | | | | 18.36 | % | | $ | 34,161 | | | | 8.0 | % | | | N/A | | | | N/A | |
Bank | | | 69,514 | | | | 16.31 | | | | 34,099 | | | | 8.0 | | | $ | 42,623 | | | | 10.0 | % |
Tier I Capital to Risk-Weighted Assets: | | | | | | | | | | | | | | | | | | | | | | | | |
Consolidated | | | 74,671 | | | | 17.49 | | | | 17,081 | | | | 4.0 | | | | N/A | | | | N/A | |
Bank | | | 65,800 | | | | 15.44 | | | | 17,049 | | | | 4.0 | | | | 25,574 | | | | 6.0 | |
Tier I Capital to Average Assets: | | | | | | | | | | | | | | | | | | | | | | | | |
Consolidated | | | 74,671 | | | | 10.65 | | | | 28,033 | | | | 4.0 | | | | N/A | | | | N/A | |
Bank | | | 65,800 | | | | 9.45 | | | | 27,846 | | | | 4.0 | | | | 34,807 | | | | 5.0 | |
The Bank is subject to certain restrictions on the amount of dividends that it may declare without prior regulatory approval. At December 31, 2011, approximately $1,423,000 in retained earnings were available for dividend declaration without prior regulatory approval.
Note 18: Related Party Transactions
The Bank had loans outstanding to executive officers, directors, significant shareholders and their affiliates (related parties). A summary of the related party loan activity follows (thousands):
| | | | | | | | |
| | | 2011 | | | 2010 | |
Balance, January 1 | | $ | 2,806 | | | $ | 2,587 | |
New loans | | | 314 | | | | 519 | |
Payments | | | (109 | ) | | | (300 | ) |
| | | | | | | | |
Balance, December 31 | | $ | 3,011 | | | $ | 2,806 | |
| | | | | | | | |
In management’s opinion, such loans and other extensions of credit and deposits were made in the ordinary course of business and were made on substantially the same terms (including interest rates and collateral) as those prevailing at the time for comparable transactions with other persons. Further, in management’s opinion, these loans did not involve more than normal risk of collectability or present other unfavorable features.
70
Notes to Consolidated Financial Statements—(Continued)
Years Ended December 31, 2011, 2010 and 2009
Deposits from related parties held by the Bank at December 31, 2011 and 2010 totaled $847,000 and $609,000 respectively.
Note 19: Employee Benefits
The Company has a retirement savings 401(k) plan covering substantially all employees. Employees may contribute up to 50% of their compensation. The Bank will match up to 3% of an employee’s compensation for the first 8% of their compensation contributed to the plan. Employer contributions charged to expense for 2011, 2010 and 2009 were $195,000, $222,000, and $183,000, respectively.
Also, the Bank has a deferred compensation agreement with one retired officer. The agreement provides level monthly or annual payments ranging for twenty years after retirement. The charge to expense for the agreement was $47,000, $49,000 and $50,000 for 2011, 2010 and 2009, respectively. Such charges reflect the straight-line interest accrual using a 6.5% discount factor.
The Company sponsors a leveraged employee stock ownership plan (ESOP) that covers substantially all employees who meet minimum age and length of service requirements. Shares of the Company’s common stock held by the ESOP were purchased with the proceeds of borrowings from the Company. During 2010 and 2009, all dividends on unallocated shares received by the ESOP were used to pay debt service. The ESOP shares initially were pledged as collateral for its debt. As the debt was repaid, shares were released from collateral and allocated to plan participants, based on the proportion of debt service paid in the year to total expected debt service. The Bank accounts for its ESOP in accordance with the Compensation-Stock Compensation topic of the FASB ASC. In 2010 and 2009, as shares were released from collateral, the Company reported compensation expense equal to the current fair value of the shares. Dividends on allocated ESOP shares were recorded as a reduction of retained earnings; dividends on unallocated ESOP shares are recorded as a reduction of debt and accrued interest. In December 2010, the Plan’s debt, which was due to mature in 2011, was paid in full and all remaining shares were released for allocation. There was no ESOP compensation expense in 2011 due to all shares being fully allocated. ESOP compensation expense was $386,000 and $144,000 for years 2010 and 2009, respectively. The ESOP shares were as follows:
| | | | | | | | |
| | | Total Shares | |
| | | December 31, 2011 | | | December 31, 2010 | |
Allocated shares | | | 357,121 | | | | 421,201 | |
Committed to be released | | | 0 | | | | 0 | |
Unearned shares | | | 0 | | | | 0 | |
| | | | | | | | |
Total ESOP shares | | | 357,121 | | | | 421,201 | |
| | | | | | | | |
Note 20: Stock Option Plans
The Company adopted a new equity plan in 2006, which is shareholder approved and permits the Company to grant options, restricted stock or stock appreciation rights of up to 270,000 shares of common stock. The Company believes that such awards better align the interests of its directors and employees with those of its shareholders. Option awards are generally granted with an exercise price equal to the market price of the Company’s stock at the date of grant; those option awards generally vest based on three years of continuous service and have a ten-year contractual term. The previous plan, which was terminated in 2006, still has options to purchase 59,000 shares outstanding at December 31, 2011. These options vest over five years. In addition, an option to purchase 30,000 shares was awarded to the Company’s President upon his employment, which vested
71
Notes to Consolidated Financial Statements—(Continued)
Years Ended December 31, 2011, 2010 and 2009
over five years. Certain option and share awards provide for an exchange of unvested options for a cash payment or shares of stock if there is a change in control (as defined in the plan). The compensation cost for the stock option expense recognized in 2011, 2010 and 2009 was calculated for all grants based on the grant date’s fair value and totaled $171,000, $145,000 and $136,000, respectively. The related tax benefit for 2011, 2010 and 2009 was $58,000, $49,000 and $46,000
The fair value of each option award is estimated on the date of grant using a binomial option valuation model that uses the assumptions noted in the following table. Expected volatility is based on historical volatility of the Company’s stock and other factors. The Company uses historical data to estimate option exercise and participant termination within the valuation model; separate groups of participants that have similar historical exercise behavior are considered separately for valuation purposes. The expected term of options granted is derived from the output of the option valuation model and represents the period of time that options granted are expected to be outstanding. The risk-free rate for periods within the contractual life of the option is based on the U.S. Treasury yield curve in effect at the time of grant.
| | | | | | | | | | | | |
| | | 2011 | | | 2010 | | | 2009 | |
Expected volatility | | | 50.4% | | | | 49.3% | | | | 48.5 - 48.9% | |
Weighted-average volatility | | | 50.44% | | | | 49.27% | | | | 48.84% | |
Expected dividends | | | 6.00% | | | | 6.00% | | | | 7.00% | |
Expected term (in years) | | | 6.0 | | | | 6.0 | | | | 6.0 | |
Risk-free rate | | | 2.40% | | | | 2.88% | | | | 2.35% - 2.53% | |
Weighted-average fair value of options granted during the year | | $ | 6.16 | | | $ | 4.93 | | | $ | 3.72 | |
Historically, the Company has fulfilled option exercises through available treasury shares.
A summary of option activity under the plans as of December 31, 2011, and changes during the year then ended, is presented below.
| | | | | | | | | | | | | | | | |
| | | Shares | | | Weighted-
Average
Exercise
Price | | | Weighted-
Average
Remaining
Contractual
Term | | | Aggregate
Intrinsic
Value | |
Outstanding, beginning of year | | | 248,502 | | | $ | 20.50 | | | | | | | | | |
Granted | | | 60,200 | | | | 21.12 | | | | | | | | | |
Exercised | | | 0 | | | | | | | | | | | | | |
Forfeited or expired | | | (21,100 | ) | | | 21.85 | | | | | | | | | |
| | | | | | | | | | | | | | | | |
Outstanding, end of year | | | 287,602 | | | $ | 20.53 | | | | 5.83 | | | $ | 226,758 | |
| | | | | | | | | | | | | | | | |
Exercisable, end of year | | | 208,324 | | | $ | 20.84 | | | | 4.65 | | | $ | 149,320 | |
| | | | | | | | | | | | | | | | |
There were no options exercised in 2011 or 2009. The total intrinsic value of options exercised during the year ended December 31, 2010 was $91,000. As of December 31, 2011, there was $281,000 of total unrecognized compensation cost related to non-vested share-based compensation arrangements granted under the Plan. That cost is expected to be recognized over a weighted-average period of 1.2 years.
72
Notes to Consolidated Financial Statements—(Continued)
Years Ended December 31, 2011, 2010 and 2009
Note 21: Earnings Per Share
Earnings per share (EPS) were computed as follows (thousands, except share and per share amounts):
| | | | | | | | | | | | |
| | | 2011 | | | 2010 | | | 2009 | |
Basic earnings per share: | | | | | | | | | | | | |
Net income | | $ | 3,801 | | | $ | 8,809 | | | $ | 4,037 | |
| | | | | | | | | | | | |
Weighted average common shares outstanding | | | 3,423,995 | | | | 3,411,110 | | | | 3,154,093 | |
Basic earnings per share | | $ | 1.11 | | | $ | 2.58 | | | $ | 1.28 | |
| | | | | | | | | | | | |
Diluted earnings per share: | | | | | | | | | | | | |
Net income | | $ | 3,801 | | | $ | 8,809 | | | $ | 4,037 | |
| | | | | | | | | | | | |
Weighted average common shares outstanding | | | 3,423,995 | | | | 3,411,110 | | | | 3,154,093 | |
Effect of dilutive securities – stock options | | | 12,364 | | | | 2,597 | | | | 0 | |
| | | | | | | | | | | | |
Average shares and dilutive potential common shares | | | 3,436,359 | | | | 3,413,707 | | | | 3,154,093 | |
| | | | | | | | | | | | |
Diluted earnings per share | | $ | 1.11 | | | $ | 2.58 | | | $ | 1.28 | |
| | | | | | | | | | | | |
As of December 31, 2011, options to purchase 193,600 shares of common stock at $20.88 to $30.50 per share were outstanding, but not included in the computation of diluted EPS because the options’ exercise prices were greater than the average market price of the common share.
As of December 31, 2010, options to purchase 201,667 shares of common stock at $18.63 to $30.50 per share were outstanding, but not included in the computation of diluted EPS because the options’ exercise prices were greater than the average market price of the common share.
As of December 31, 2009, options to purchase 270,000 shares of common stock at $15.00 to $30.50 per share were outstanding, but not included in the computation of diluted EPS because the options’ exercise prices were greater than the average market price of the common share.
73
Notes to Consolidated Financial Statements—(Continued)
Years Ended December 31, 2011, 2010 and 2009
Note 22: Disclosures about Fair Value of Financial Instruments
The following table presents estimated fair values of the Company’s financial instruments. The fair values of certain of these instruments were calculated by discounting expected cash flows, which involves significant judgments by management and uncertainties. Fair value is the estimated amount at which financial assets or liabilities could be exchanged in a current transaction between willing parties, other than in a forced or liquidation sale. Because no market exists for certain of these financial instruments and because management does not intend to sell these financial instruments, the Company does not know whether the fair values shown below represent values at which the respective financial instruments could be sold individually or in the aggregate (thousands):
| | | | | | | | | | | | | | | | |
| | | December 31, 2011 | | | December 31, 2010 | |
| | | Carrying
Amount | | | Fair Value | | | Carrying
Amount | | | Fair Value | |
Financial assets | | | | | | | | | | | | | | | | |
Cash and cash equivalents | | $ | 75,668 | | | $ | 75,668 | | | $ | 81,751 | | | $ | 81,751 | |
Available-for-sale securities | | | 139,744 | | | | 139,744 | | | | 133,855 | | | | 133,855 | |
Loans including loans held for sale, net | | | 399,801 | | | | 411,499 | | | | 411,264 | | | | 418,683 | |
Stock in FRB and FHLB | | | 10,025 | | | | 10,025 | | | | 10,021 | | | | 10,021 | |
Earned income receivable | | | 2,948 | | | | 2,948 | | | | 2,909 | | | | 2,909 | |
FDIC loss share receivable | | | 1,928 | | | | 1,928 | | | | 2,078 | | | | 2,078 | |
Financial liabilities | | | | | | | | | | | | | | | | |
Deposits | | | 581,383 | | | | 584,573 | | | | 584,373 | | | | 588,424 | |
Short-term borrowings | | | 0 | | | | 0 | | | | 12,779 | | | | 12,779 | |
Long-term debt | | | 15,310 | | | | 9,933 | | | | 15,310 | | | | 8,975 | |
Interest payable | | | 202 | | | | 202 | | | | 352 | | | | 352 | |
For purposes of the above disclosures of estimated fair value, the following assumptions were used as of December 31, 2011 and 2010. The estimated fair value for cash and cash equivalents, interest-bearing deposits, FRB and FHLB stock, earned income receivable, FDIC loss share receivable, demand deposits, savings accounts, NOW accounts, certain money market deposits, short-term borrowings, and interest payable is considered to approximate cost. The estimated fair value for securities is based on quoted market values for the individual securities or for equivalent securities. The estimated fair value for loans receivable, including loans held for sale, net, is based on estimates of the rate the Bank would charge for similar loans at December 31, 2011 and 2010 applied for the time period until the loans are assumed to reprice or be paid. The estimated fair value for fixed-maturity time deposits as well as borrowings is based on estimates of the rate the Bank would pay on such liabilities at December 31, 2011 and 2010, applied for the time period until maturity. The fair value of commitments is estimated using the fees currently charged to enter into similar agreements, taking into account the remaining terms of the agreements and the present creditworthiness of the counterparties. For fixed-rate loan commitments, fair value also considers the difference between current levels of interest rates and the committed rates. The fair value of letters of credit and lines of credit is based on fees currently charged for similar agreements or on the estimated cost to terminate or otherwise settle the obligations with the counterparties at the reporting date. At December 31, 2011 and 2010, the fair value of commitments was not material.
Note 23: Commitments and Credit Risk
Commitments to extend credit are agreements to lend to a customer as long as there is no violation of any condition established in the contract. Commitments generally have fixed expiration dates or other termination clauses and may require payment of a fee. Since a portion of the commitments may expire without being drawn upon, the total commitment amounts do not necessarily represent future cash requirements. Each customer’s
74
Notes to Consolidated Financial Statements—(Continued)
Years Ended December 31, 2011, 2010 and 2009
creditworthiness is evaluated on a case-by-case basis. The amount of collateral obtained, if deemed necessary, is based on management’s credit evaluation of the counterparty. Collateral held varies, but may include accounts receivable, inventory, property, plant and equipment, commercial real estate and residential real estate.
At December 31, 2011 and 2010, the Bank had outstanding commitments to originate business loans aggregating approximately $10.0 million and $7.0 million, respectively. The commitments extended over varying periods of time with the majority being disbursed within a one-year period. Loan commitments at fixed rates of interest amounted to $4.0 million and $4.1 million at December 31, 2011 and 2010 respectively, with the remainder at floating market rates.
Letters of credit are conditional commitments issued by the Bank to guarantee the performance of a customer to a third party. Those guarantees are primarily issued to support public and private borrowing arrangements, including commercial paper, bond financing and similar transactions. The credit risk involved in issuing letters of credit is essentially the same as that involved in extending loans to customers.
The Bank had total outstanding letters of credit amounting to $2,475,000 and $2,087,000, at December 31, 2011 and 2010, respectively, with terms ranging from 30 days to 1 year.
Mortgage loans in the process of origination represent amounts that the Bank plans to fund within a normal period of 60 to 90 days, some of which are intended for sale to investors in the secondary market. Forward commitments to sell mortgage loans are obligations to deliver loans at a specified price on or before a specified future date. The Bank acquires such commitments to reduce market risk on mortgage loans in the process of origination and mortgage loans held for sale.
Total mortgage loans in the process of origination amounted to $1.2 million and $2.8 million at December 31, 2011 and 2010. Of these commitments $769,000 and $2.8 million were fixed-rate commitments at December 31, 2011 and 2010. There were no loans held for sale at December 31, 2011 and $688,000 mortgage loans held for sale at December 31, 2010.
Lines of credit are agreements to lend to a customer as long as there is no violation of any condition established in the contract. Lines of credit generally have fixed expiration dates. Since a portion of the line may expire without being drawn upon, the total unused lines do not necessarily represent future cash requirements. Each customer’s creditworthiness is evaluated on a case-by-case basis. The amount of collateral obtained, if deemed necessary, is based on management’s credit evaluation of the counterparty. Collateral held varies but may include accounts receivable, inventory, property, plant and equipment, commercial real estate and residential real estate. Management uses the same credit policies in granting lines of credit as it does for on-balance-sheet instruments.
At December 31, 2011, the Bank had granted unused lines of credit to borrowers aggregating approximately $30,956,000 and $39,420,000 for commercial lines and open-end consumer lines, respectively. At December 31, 2010, the Bank had granted unused lines of credit to borrowers aggregating approximately $31,806,000 and $39,283,000 for commercial lines and open-end consumer lines, respectively. At December 31, 2011, the Bank had $366,000 in Federal Funds sold invested at U.S. Bank.
Note 24: Fair Value Measurements
The Company has adopted theFair Value Measurements prescribed under the FASB Accounting Standards Codification. The ASC defines fair value, establishes a framework for measuring fair value and expands disclosures about fair value measurements. The fair value measurements have been applied prospectively as of the beginning of the period.
75
Notes to Consolidated Financial Statements—(Continued)
Years Ended December 31, 2011, 2010 and 2009
The ASC defines fair value as the price that would be received to sell an asset or paid to transfer a liability in an orderly transaction between market participants at the measurement date. The ASC also establishes a fair value hierarchy which requires an entity to maximize the use of observable inputs and minimize the use of unobservable inputs when measuring fair value. The standard describes three levels of inputs that may be used to measure fair value:
| | | | |
| | Level 1 | | Quoted prices in active markets for identical assets or liabilities |
| | |
| | Level 2 | | Observable inputs other than Level 1 prices, such as quoted prices for similar assets or liabilities; quoted prices in markets that are not active; or other inputs that are observable or can be corroborated by observable market data for substantially the full term of the assets or liabilities |
| | |
| | Level 3 | | Unobservable inputs that are supported by little or no market activity and that are significant to the fair value of the assets or liabilities |
Available-for-Sale Securities
The fair value of available-for-sale securities are determined by various valuation methodologies. Level 2 securities include U.S. Government agencies, mortgage-backed securities, and obligations of political and state subdivisions. Level 2 inputs do not include quoted prices for individual securities in active markets; however, they do include inputs that are either directly or indirectly observable for the individual security being valued. Such observable inputs include interest rates and yield curves at commonly quoted intervals, volatilities, prepayment speeds, credit risks and default rates. Also included are inputs derived principally from or corroborated by observable market data by correlation or other means.
The following table presents the fair value measurements of assets measured at fair value on a recurring basis and the level within the ASC fair value hierarchy in which the fair value measurements fall at December 31, 2011 and 2010. (See fair values by type of security in Note 5) (thousands):
| | | | | | | | | | | | | | | | |
| | | | | | Fair Value Measurements at Reporting Date Using | |
Description | | Fair
Value | | | Quoted Prices in
Active Markets for
Identical Assets
(Level 1) | | | Significant Other
Observable Inputs
(Level 2) | | | Significant
Unobservable Inputs
(Level 3) | |
December 31, 2011: | | | | | | | | | | | | | | | | |
Available-for-sale securities | | $ | 139,744 | | | $ | 0 | | | $ | 139,744 | | | $ | 0 | |
December 31, 2010: | | | | | | | | | | | | | | | | |
Available-for-sale securities | | $ | 133,855 | | | $ | 0 | | | $ | 133,855 | | | $ | 0 | |
The following is a description of the valuation methodologies used for assets measured at fair value on a non-recurring basis and recognized in the accompanying balance sheet, as well as the general classification of such assets pursuant to the valuation hierarchy:
Impaired Loans (Collateral Dependent)
At December 31, 2011 and 2010, impaired loans consisted primarily of loans secured by commercial real estate. Management has determined fair value measurements on impaired loans primarily through evaluations of appraisals performed. As of December 31, 2011, one impaired loans of approximately $987,000 is secured by equipment. Management has determined fair value measurements based on research of current equipment values.
76
Notes to Consolidated Financial Statements—(Continued)
Years Ended December 31, 2011, 2010 and 2009
Other Real Estate Owned
Real estate acquired through, or in lieu of, loan foreclosure is held for sale and initially recorded at fair value (based on current appraised value) at the date of foreclosure, establishing a new cost basis. Subsequent to foreclosure, valuations are periodically performed by management and the assets are carried at the lower of carrying amount or fair value less estimated costs to sell. Management has determined fair value measurements on real estate owned primarily through evaluations of appraisals performed.
The following table presents the fair value measurements of assets measured at fair value on a nonrecurring basis and the level within the ASC fair value hierarchy in which the fair value measurements fall at December 31, 2011 and 2010. The values below only represent those assets with a change in their fair value estimate since the previous year end (thousands).
| | | | | | | | | | | | | | | | |
| | | Fair Value Measurements at Reporting Date Using | |
Description | | Fair
Value | | | Quoted Prices in
Active Markets for
Identical Assets
(Level 1) | | | Significant Other
Observable Inputs
(Level 2) | | | Significant
Unobservable
Inputs (Level 3) | |
December 31, 2011: | | | | | | | | | | | | | | | | |
Impaired loans Other real estate owned | | $
| 2,647
2,043 |
| | $
| 0
0 |
| | $
| 0
0 |
| | $
| 2,647
2,043 |
|
December 31, 2010: | | | | | | | | | | | | | | | | |
Impaired loans Other real estate owned | | $
| 2,792
72 |
| | $
| 0
0 |
| | $
| 0
0 |
| | $
| 2,792
72 |
|
Note 25: Condensed Financial Information (Parent Company Only)
Presented below is condensed financial information as to financial position, results of operations and cash flows of the Company (thousands):
CONDENSED BALANCE SHEETS
| | | | | | | | |
| | | 2011 | | | 2010 | |
Assets | | | | | | | | |
Cash and due from banks | | $ | 7,568 | | | $ | 8,577 | |
Investment in common stock of banking subsidiary | | | 72,455 | | | | 72,148 | |
Investment in nonbanking subsidiary | | | 329 | | | | 307 | |
Other assets | | | 1,828 | | | | 1,376 | |
| | | | | | | | |
Total assets | | $ | 82,180 | | | $ | 82,408 | |
| | | | | | | | |
Liabilities | | | | | | | | |
Long-term debt | | $ | 10,310 | | | $ | 10,310 | |
Other liabilities | | | 1,080 | | | | 1,079 | |
| | | | | | | | |
Total liabilities | | | 11,390 | | | | 11,389 | |
Stockholders’ Equity | | | 70,790 | | | | 71,019 | |
| | | | | | | | |
Total liabilities and stockholders’ equity | | $ | 82,180 | | | $ | 82,408 | |
| | | | | | | | |
77
Notes to Consolidated Financial Statements—(Continued)
Years Ended December 31, 2011, 2010 and 2009
CONDENSED STATEMENTS OF INCOME
| | | | | | | | | | | | |
| | | 2011 | | | 2010 | | | 2009 | |
Income | | | | | | | | | | | | |
Dividends from banking subsidiary | | $ | 4,000 | | | $ | 8,000 | | | $ | 4,000 | |
Dividends from non-banking subsidiary | | | 0 | | | | 144 | | | | 0 | |
| | | | | | | | | | | | |
Total income | | | 4,000 | | | | 8,144 | | | | 4,000 | |
| | | | | | | | | | | | |
Expenses | | | | | | | | | | | | |
Interest expense | | | 730 | | | | 730 | | | | 730 | |
Acquisition costs | | | 0 | | | | 0 | | | | 346 | |
Directors fees | | | 66 | | | | 56 | | | | 61 | |
Other expenses | | | 88 | | | | 78 | | | | 81 | |
| | | | | | | | | | | | |
Total expenses | | | 884 | | | | 864 | | | | 1,218 | |
| | | | | | | | | | | | |
Income Before Income Tax and Equity in Undistributed Income of Subsidiaries | | | 3,116 | | | | 7,280 | | | | 2,782 | |
Income Tax Benefit | | | (451 | ) | | | (440 | ) | | | (494 | ) |
| | | | | | | | | | | | |
Income Before Equity in Undistributed Income of Subsidiaries | | | 3,567 | | | | 7,720 | | | | 3,276 | |
Equity in Undistributed Income of Banking Subsidiary | | | 212 | | | | 1,211 | | | | 739 | |
Equity in Undistributed Income (Loss) of Nonbanking Subsidiary | | | 22 | | | | (122 | ) | | | 22 | |
| | | | | | | | | | | | |
Net Income | | $ | 3,801 | | | $ | 8,809 | | | $ | 4,037 | |
| | | | | | | | | | | | |
CONDENSED STATEMENTS OF CASH FLOWS
| | | | | | | | | | | | |
| | | 2011 | | | 2010 | | | 2009 | |
Operating Activities | | | | | | | | | | | | |
Net income | | $ | 3,801 | | | $ | 8,809 | | | $ | 4,037 | |
Items not requiring (providing) cash | | | (685 | ) | | | (975 | ) | | | 406 | |
| | | | | | | | | | | | |
Net cash provided by operating activities | | | 3,116 | | | | 7,834 | | | | 4,443 | |
| | | | | | | | | | | | |
Investing Activities | | | | | | | | | | | | |
Net cash paid for acquisitions | | | 0 | | | | 0 | | | | (3,562 | ) |
| | | | | | | | | | | | |
Net cash required for investing activities | | | 0 | | | | 0 | | | | (3,562 | ) |
| | | | | | | | | | | | |
Financing Activities | | | | | | | | | | | | |
Cash dividends paid | | | (4,109 | ) | | | (3,978 | ) | | | (3,651 | ) |
Proceeds from stock options exercised | | | 0 | | | | 229 | | | | 0 | |
Purchase of treasury stock | | | (16 | ) | | | 0 | | | | (23 | ) |
| | | | | | | | | | | | |
Net cash used in financing activities | | | (4,125 | ) | | | (3,749 | ) | | | (3,674 | ) |
| | | | | | | | | | | | |
Net Change in Cash and Cash Equivalents | | | (1,009 | ) | | | 4,085 | | | | (2,793 | ) |
Cash and Cash Equivalents at Beginning of Year | | | 8,577 | | | | 4,492 | | | | 7,285 | |
| | | | | | | | | | | | |
Cash and Cash Equivalents at End of Year | | $ | 7,568 | | | $ | 8,577 | | | $ | 4,492 | |
| | | | | | | | | | | | |
78
Item 9. Changes in and Disagreements With Accountants on Accounting and Financial Disclosure
None.
Item 9A. Controls and Procedures
Based upon their evaluation of the Company’s disclosure controls and procedures (as defined in Rule 13a-15(e) under the Securities Exchange Act of 1934) as of December 31, 2011, the Company’s principal executive officer and principal financial officer have concluded that the Company’s disclosure controls and procedures were effective. During the quarter ended December 31, 2011, no changes have occurred in the Company’s internal control over financial reporting that have materially affected or are reasonably likely to materially affect the Company’s internal control over financial reporting.
The “Management’s Report on Internal Control Over Financial Reporting” in Item 8 of this annual report is incorporated herein by reference.
Item 9B. Other Information
None.
PART III
Item 10. Directors, Executive Officers and Corporate Governance
The information contained in the Proxy Statement under the captions “PROPOSAL 1: ELECTION OF DIRECTORS,” “COMPENSATION OF DIRECTORS AND EXECUTIVE OFFICERS-Executive Officers” and “SECTION 16(a) BENEFICIAL OWNERSHIP REPORTING COMPLIANCE” is incorporated herein by reference.
The Board of Directors has determined that Audit Committee Member, Charles L. Dehner, is an “audit committee financial expert,” as defined in 17 C.F.R. Section 229.407(d)(5), and that he is “independent” under the applicable rules of The NASDAQ Stock Market LLC.
NB&T Financial Group, Inc. has adopted a Code of Ethics applicable to its principal executive officer, principal financial officer, principal accounting officer and others. The Code of Ethics is posted on the registrant’s web site at www.nbtdirect.com. Amendments to the Code of Ethics and waivers of the provisions of the Code of Ethics will also be posted on the registrant’s web site.
Item 11. Executive Compensation
The information contained in the Proxy Statement under the caption “COMPENSATION OF EXECUTIVE OFFICERS AND DIRECTORS” is incorporated herein by reference.
Item 12. Security Ownership of Certain Beneficial Owners and Management and Related Stockholders Matters
The information contained in the Proxy Statement under the caption “VOTING SECURITIES AND OWNERSHIP OF CERTAIN BENEFICIAL OWNERS AND MANAGEMENT” is incorporated herein by reference. The information in Item 5 of this Form 10-K regarding shares to be issued upon the exercise of options and restricted stock awards is incorporated herein by reference.
79
Item 13. Certain Relationships and Related Transactions, and Director Independence
The information contained in the Proxy Statement under the caption “CERTAIN RELATIONSHIPS AND RELATED TRANSACTIONS” is incorporated herein by reference. The Board of Directors of NBTF has determined that all of the directors except Mr. Limbert are “independent” under the listing standards of The NASDAQ Stock Market, LLC (“Nasdaq”). In determining independence, the Board of Directors considered loan and deposit relationships with each director. The rules of Nasdaq do not deem such relationships to disqualify a director from being deemed independent. In addition, all loans and other extensions of credit to directors were made and deposits accepted in the ordinary course of business and were made on substantially the same terms (including interest rates and collateral) as those prevailing at the time for comparable transactions with persons not related to the Bank. Further, in management’s opinion, the loans did not involve more than normal risk of collectibility or present other unfavorable features. The Board of Directors does not believe such relationships interfere with the directors’ exercise of independent judgment in carrying out their responsibilities as directors.
Item 14. Principal Accountant Fees and Services
The information contained in the Proxy Statement under the caption “PROPOSAL 2: RATIFICATION OF THE SELECTION OF BKD, LLP AS THE INDEPENDENT REGISTERED PUBLIC ACCOUNTING FIRM” is incorporated herein by reference.
80
PART IV
Item 15. Exhibits and Financial Statement Schedules
(a)
(1) Financial Statements—See Index to Consolidated Financial Statements in Item 8 of this Form 10-K.
(2) Financial Statement Schedules—None
| | |
EXHIBIT NUMBER | | DESCRIPTION |
| |
| 3.1 | | Third Amended and Restated Articles of Incorporation of NB&T Financial Group, Inc. |
| |
| 3.2 | | Amended and Restated Code of Regulations of NB&T Financial Group, Inc. |
| |
| 4.0 | | Agreement to furnish instruments and agreements defining rights of holders of long-term debt |
| |
| 10.1* | | InterCounty Bancshares, Inc. Non-qualified Stock Option Plan |
| |
| 10.2* | | NB&T Financial Group, Inc. Supplemental Executive Retirement Plan |
| |
| 10.3* | | NB&T Financial Group, Inc. Supplemental Executive Retirement Plan Participation Agreement – Timothy L. Smith |
| |
| 10.4* | | National Bank & Trust Incentive Plan – Prior to December 20, 2011 |
| |
| 10.5* | | Stock Option Award Agreement for John J. Limbert |
| |
| 10.6* | | Severance Agreement for Craig F. Fortin |
| |
| 10.7* | | Severance Agreement for Stephen G. Klumb |
| |
| 10.8* | | Employment Agreement with John J. Limbert |
| |
| 10.9* | | NB&T Financial Group, Inc. Amended and Restated 2006 Equity Plan |
| |
| 10.10* | | First Amendment to Stock Option Award Agreement for John J. Limbert |
| |
| 10.11* | | First Amendment to Employment Agreement with John J. Limbert |
| |
| 10.12* | | First Amendment to the Severance Agreement with Craig F. Fortin and Stephen G. Klumb |
| |
| 10.13* | | Form of Amended and Restated 2006 Equity Plan Award Agreement (Employee Award) for awards beginning 4/23/08 |
| |
| 10.14* | | Form of Amended and Restated 2006 Equity Plan Award Agreement (Directors’ Nonqualified Stock Option)-for awards beginning 4/23/08 |
| |
| 10.15* | | Form of NB&T Financial Group, Inc. 2006 Equity Plan Award Agreement for Employee Awards – for awards prior to 4/23/08 |
| |
| 10.16* | | Form of NB&T Financial Group, Inc. 2006 Equity Plan Award Agreement for Directors’ Nonqualified Stock Options – for awards prior to 4/23/08 |
| |
| 10.17 | | Agreement and Plan of Merger dated as of June 30, 2009, by and between NB&T Financial Group, Inc., and Community National Corporation, and amendment thereto |
| |
| 10.18* | | The National Bank and Trust company Annual Incentive Plan Amended and Restated Effective January 1, 2011 |
| |
| 10.19 | | Purchase and Assumption Agreement Whole Bank All Deposits, Among Federal Deposit Insurance Corporation, Receiver of American National Bank, Parma, Ohio, Federal Deposit Insurance Corporation and the National Bank and Trust Company, dated as of March 19, 2010 |
81
| | |
EXHIBIT NUMBER | | DESCRIPTION |
| |
| 21 | | Subsidiaries of NB&T Financial Group, Inc. |
| |
| 23 | | Consent of Independent Accountants – BKD, LLP |
| |
| 31.1 | | Rule 13a-14(a)/Section 302 Certification of Chief Executive Officer |
| |
| 31.2 | | Rule 13a-14(b)/Section 302 Certification of Chief Financial Officer |
| |
| 32.1 | | Rule 13a-14(b)/Section 906 Certification of Chief Executive Officer |
| |
| 32.2 | | Rule 13a-14(b)/Section 906 Certification of Chief Financial Officer |
| |
| 99.2 | | Proxy Statement for 2011 annual meeting of shareholders |
| |
| 101# | | The following materials from NB&T Financial Group, Inc.’s, Annual Report on Form 10-K for the annual period ended December 31, 2011 formatted in XBRL pursuant to Rule 405 of Regulation S-T: (i) the Consolidated Balance Sheets as of December 31, 2011and December 31, 2010; (ii) the Consolidated Statements of Income for the three years ended December 31, 2011, 2010 and 2009 ; (iii) the Consolidated Statements of Cash Flows for the three years ended December 31, 2011, 2010 and 2009; the Consolidated Statements of Changes in Shareholders Equity for the three years ended Decemeber 31, 2011, 2010 and 2009; the Consolidated Statements of Comprehensive Income for the three years ended December 31, 2011, 2010 and 2009 and (iv) the Notes to Condensed Consolidated Financial Statements tagged as blocks of text (furnished herewith). |
| * | Indicates a management contract or compensatory plan or arrangement. |
| # | As provided in Rule 406T of SEC Regulation S-T, the Interactive Data Files are furnished and not deemed filed or part of a Registration Statement or prospectus for purposes of Sections 11 and 12 of the Securities Exchange Act of 1933, as amended, and are not deemed filed for purposes of Section 18 of the Securities Exchange Act of 1934, as amended, and otherwise are not subject to liability under those sections. |
82
SIGNATURES
Pursuant to the requirements of Section 13 or 15(d) of the Securities Exchange Act of 1934, the registrant has duly caused this report to be signed on its behalf by the undersigned, thereunto duly authorized.
| | | | | | |
| | | | | NB&T Financial Group, Inc. |
| | | |
| | | | By | | /s/ JOHN J. LIMBERT |
| | | | | | John J. Limbert |
| | | | | | President and Chief Executive Officer |
| March 20, 2012 | | | | | | (Principal Executive Officer) |
Pursuant to the requirements of the Securities Exchange Act of 1934, this report has been signed below by the following persons on behalf of the registrant and in the capacities and on the dates indicated.
| | | | | | | | |
| | | | |
| By: | | /S/ CRAIG F. FORTIN | | | | By: | | /S/ JOHN J. LIMBERT |
| | Craig F. Fortin Senior Vice President and Chief Financial Officer (Principal Accounting Officer) | | | | | | John J. Limbert President, Chief Executive Officer and a Director |
| Date: March 20, 2012 | | | | Date: March 20, 2012 |
| | | | |
| By: | | /S/ TIMOTHY L. SMITH | | | | By: | | /S/ G. DAVID HAWLEY |
| | Timothy L. Smith Director | | | | | | G. David Hawley Director |
| Date: March 20, 2012 | | | | Date: March 20, 2012 |
| | | | |
| By: | | /S/ CRAIG BEAM | | | | By: | | /S/ BROOKE WILLIAMS JAMES |
| | S. Craig Beam Director | | | | | | Brooke Williams James Director |
| Date: March 20, 2012 | | | | Date: March 20, 2012 |
| | | | |
| By: | | /S/ ROBERT A. RAIZK | | | | By: | | /S/ CHARLES L. DEHNER |
| | Robert A. Raizk Director | | | | | | Charles L. Dehner Director |
| Date: March 20, 2012 | | | | Date: March 20, 2012 |
| | | | |
| By: | | /S/ DANIEL A. DIBIASIO | | | | By: | | /S/ D. JEFFERY LYKINS |
| | Daniel A. DiBiasio Director | | | | | | D. Jeffery Lykins Director |
| Date: March 20, 2012 | | | | Date: March 20, 2012 |
83
INDEX TO EXHIBITS
| | | | |
EXHIBIT
NUMBER | | DESCRIPTION | | PAGE REFERENCE |
| 3.1 | | Third Amended and Restated Articles of Incorporation of NB&T Financial Group, Inc. | | Incorporated by reference to registrant’s Definitive Proxy Statement filed on March 21, 2003, Exhibit A (File No. 000-23134) |
| | |
| 3.2 | | Amended and Restated Code of Regulations of NB&T Financial Group, Inc. | | Incorporated by reference to registrant’s Definitive Proxy Statement filed on March 21, 2003 (File No. 000-23134) |
| | |
| 4.0 | | Agreement to furnish instruments and agreements defining rights of holders of long-term debt | | Included herewith |
| | |
| 10.1* | | InterCounty Bancshares, Inc. Non-qualified Stock Option Plan | | Incorporated by reference to the Registration Statement on Form S-1 filed by registrant on July 2, 1993 (Registration No. 33-65608), Exhibit 10.1 |
| | |
| 10.2* | | NB&T Financial Group, Inc. Supplemental Executive Retirement Plan | | Incorporated by reference to registrant’s Quarterly Report on Form 10-Q for the Quarter Ended September 30, 2002, Exhibit 10.1 (File No. 000-23134) |
| | |
| 10.3* | | NB&T Financial Group, Inc. Supplemental Executive Retirement Plan Participation Agreement – Timothy L. Smith | | Incorporated by reference to registrant’s Quarterly Report on Form 10-Q for the Quarter Ended September 30, 2002, Exhibit 10.2 (File No. 000-23134) |
| | |
| 10.4* | | National Bank & Trust Incentive Plan | | Incorporated by reference to registrant’s Current Report on Form 8-K filed on February 27, 2006, Exhibit 99.1 (File No. 000-23134) |
| | |
| 10.5* | | Stock Option Award Agreement for John J. Limbert | | Incorporated by reference to registrant’s Form 10-Q filed on May 11, 2006, Exhibit 10.4 (File No. 000-23134) |
| | |
| 10.6* | | Severance Agreement for Craig F. Fortin | | Incorporated by reference to registrant’s Form 10-Q filed on November 9, 2007, Exhibit 10.2 (File No. 000-23134) |
| | |
| 10.7* | | Severance Agreement for Stephen G. Klumb | | Incorporated by reference to registrant’s Form 10-Q filed on November 9, 2007, Exhibit 10.3 (File No. 000-23134) |
| | |
| 10.8* | | Employment Agreement with John J. Limbert | | Incorporated by reference to registrant’s Form 8-K filed on November 23, 2007, Exhibit 1 (File No. 000-23134) |
| | |
| 10.9* | | NB&T Financial Group, Inc. Amended and Restated 2006 Equity Plan | | Incorporated by reference to registrant’s Annual Report on Form 10-K filed on March 17, 2009, Exhibit 10.9 (File No. 000-23134) |
| | |
| 10.10* | | First Amendment to Stock Option Award Agreement for John J. Limbert | | Incorporated by reference to registrant’s Annual Report on Form 10-K filed on March 17, 2009, Exhibit 10.10 (File No. 000-23134) |
84
| | | | |
EXHIBIT
NUMBER | | DESCRIPTION | | PAGE REFERENCE |
| | |
| 10.11* | | First Amendment to Employment Agreement with John J. Limbert | | Incorporated by reference to registrant’s Annual Report on Form 10-K filed on March 17, 2009, Exhibit 10.11 (File No. 000-23134) |
| | |
| 10.12* | | First Amendment to the Severance Agreement with Craig F. Fortin and Stephen G. Klumb | | Incorporated by reference to registrant’s Annual Report on Form 10-K filed on March 17, 2009, Exhibit 10.12 (File No. 000-23134) |
| | |
| 10.13* | | Form of Amended and Restated 2006 Equity Plan Award Agreement (Employee Award) for awards beginning 4/23/08 | | Incorporated by reference to registrant’s Annual Report on Form 10-K filed on March 17, 2009, Exhibit 10.13 (File No. 000-23134) |
| | |
| 10.14* | | Form of Amended and Restated 2006 Equity Plan Award Agreement (Directors’ Nonqualified Stock Option) for awards beginning 4/23/08 | | Incorporated by reference to registrant’s Annual Report on Form 10-K filed on March 17, 2009, Exhibit 10.14 (File No. 000-23134) |
| | |
| 10.15* | | Form of NB&T Financial Group, Inc. 2006 Equity Plan Award Agreement for Employee Awards – for awards prior to 4/23/08 | | Incorporated by reference to registrant’s Form 10-Q filed on November 13, 2006 (File No. 000-23134) |
| | |
| 10.16* | | Form of NB&T Financial Group, Inc. 2006 Equity Plan Award Agreement for Directors’ Nonqualified Stock Options – for awards prior to 4/23/08 | | Incorporated by reference to registrant’s Form 8-K filed on April 28, 2006 (File No. 000-23134) |
| | |
| 10.17 | | Agreement and Plan of Merger dated as of June 30, 2009, by and between NB&T Financial Group, Inc., and Community National Corporation, and amendment thereto | | Incorporated by reference to Annex A to Prospectus/Proxy Statement in Registration Statement on Form S-4 filed by the registrant on October 10, 2009 |
| | |
| 10.18* | | The National Bank and Trust company Annual Incentive Plan Amended and Restated Effective January 1, 2011 | | Incorporated by reference to registrant’s Current Report on Form 8-K filed on February 24, 2012 (File No. 000-23134) |
| | |
| 10.19 | | Purchase and Assumption Agreement Whole Bank All Deposits, Among Federal Deposit Insurance Corporation, Receiver of American National Bank, Parma, Ohio, Federal Deposit Insurance Corporation and the National Bank and Trust Company, dated as of March 19, 2010 | | Incorporated by reference to registrant’s Current Report on Form 8-K filed on March 23, 2010, Exhibit 2.1 (SEC File No. 000-23134) |
| | |
| 21 | | Subsidiaries of NB&T Financial Group, Inc. | | Included herewith |
| | |
| 23 | | Consent of Independent Accountants – BKD, LLP | | Included herewith |
| | |
| 31.1 | | Rule 13a-14(a)/Section 302 Certification of Chief Executive Officer | | Included herewith |
| | |
| 31.2 | | Rule 13a-14(b)/Section 302 Certification of Chief Financial Officer | | Included herewith |
| | |
| 32.1 | | Rule 13a-14(b)/Section 906 Certification of Chief Executive Officer | | Included herewith |
| | |
| 32.2 | | Rule 13a-14(b)/Section 906 Certification of Chief Financial Officer | | Included herewith |
85
| | | | |
EXHIBIT
NUMBER | | DESCRIPTION | | PAGE REFERENCE |
| | |
| 99.2 | | Proxy Statement for 2011 annual meeting of shareholders | | Incorporated by reference to the registrant’s definitive proxy statement to be filed on or before March 30, 2011. |
| | |
| 101# | | The following materials from NB&T Financial Group, Inc.’s, Annual Report on Form 10-K for the annual period ended December 31, 2011 formatted in XBRL pursuant to Rule 405 of Regulation S-T: (i) the Consolidated Balance Sheets as of December 31, 2011and December 31, 2010; (ii) the Consolidated Statements of Income for the three years ended December 31, 2011, 2010 and 2009 ; (iii) the Consolidated Statements of Cash Flows for the three years ended December 31, 2011, 2010 and 2009; the Consolidated Statements of Changes in Shareholders Equity for the three years ended Decemeber 31, 2011, 2010 and 2009; the Consolidated Statements of Comprehensive Income for the three years ended December 31, 2011, 2010 and 2009 and (iv) the Notes to Condensed Consolidated Financial Statements tagged as blocks of text (furnished herewith). | | Included herewith |
| * | Indicates a management contract or compensatory plan or arrangement. |
| # | As provided in Rule 406T of SEC Regulation S-T, the Interactive Data Files are furnished and not deemed filed or part of a Registration Statement or prospectus for purposes of Sections 11 and 12 of the Securities Exchange Act of 1933, as amended, and are not deemed filed for purposes of Section 18 of the Securities Exchange Act of 1934, as amended, and otherwise are not subject to liability under those sections. |
86