Table of Contents
SECURITIES AND EXCHANGE COMMISSION
Washington, D.C. 20549
FORM 6-K
REPORT OF FOREIGN PRIVATE ISSUER
PURSUANT TO RULE 13a-16 OR 15D-16 OF
THE SECURITIES EXCHANGE ACT OF 1934
For the month ofApril 2003
CE FRANKLIN LTD.
(Translation of Registrant’s Name into English)
Suite 1900, 300 5th Avenue S.W.
Calgary, Alberta, Canada T2P 3C4
(Address of Principal Executive Offices)
(Indicate by check mark whether the registrant files or will file annual reports under cover of Form 20-F or Form 40-F.)
| Form 20-F x | Form 40-F o |
(Indicate by check mark whether the registrant by furnishing the information contained in this form is also thereby furnished the information to the Commission pursuant to Rule 12g3-2(b) under the Securities Exchange Act of 1934.)
| Yes o | No x |
(If “Yes” is marked, indicate below the file number assigned to the registrant in connection with Rule 12g3-2(b): 82- )
TABLE OF CONTENTS
Table of Contents
SIGNATURE
Pursuant to the requirement of the Securities Exchange Act of 1934, the registrant has duly caused this report to be signed on its behalf by the undersigned, thereto duly authorized.
| Date: April 16, 2003 | CE FRANKLIN LTD. | |||
| By: | “signed” Name: Denise Jones Title: Controller | |||
Table of Contents

Table of Contents
| IMPLEMENTING OUR STRATEGY |
 THE EMPLOYEES OF CE FRANKLIN ARE FULLY ENGAGED IN IMPLEMENTING THE NEW STRATEGY FOR GROWTH THAT WE INTRODUCED IN EARLY 2002. OUR STRATEGY IS ALL ABOUT PROVIDING OUR CUSTOMERS THE BEST SERVICE POSSIBLE, INCREASING MARKET SHARE, IMPROVING EARNINGS, MAXIMIZING GROSS PROFIT MARGINS, RATIONALIZING EXPENSES AND CREATING SHAREHOLDER VALUE. |
CE Franklin is one of the largest distributors of thousands of complex products to the Canadian oil and gas exploration, production and refining industry, as well as an important provider of materials to other resource-based industries including oil sands, refineries, petrochemicals, pulp and paper and mining. Our energy industry customers drill for, produce, process, pipeline and refine hydrocarbons. We provide them with a complete range of tubular products and production equipment, including air and gas compressors and artificial lift technology, plus pipe, valves, fittings and
maintenance supplies. We provide complete customer inventory procurement and management services through our 37 locations across Canada. We are also leveraging our relationship with Wilson Supply in the U.S. in order to provide our customers with an even wider range of products and services.
CE Franklin’s common shares trade on the Toronto Stock Exchange under the symbol CFT and on the American Stock Exchange under the symbol CFK.
ANNUAL MEETING OF SHAREHOLDERS:CE FRANKLIN’S 2003 ANNUAL MEETING OF SHAREHOLDERS WILL BE HELD AT THE CALGARY PETROLEUM CLUB IN THE TROPHY LOUNGE, 319 — 5 AVENUE S.W., CALGARY, ALBERTA ON MAY 1, 2003 AT 2:30 PM CALGARY TIME. SHAREHOLDERS AND OTHER INTERESTED PARTIES ARE INVITED TO ATTEND.
Table of Contents
| | CE FRANKLIN LTD.ANNUAL REPORT 2002 1 |
| (In millions of Canadian dollars except wells completed and per share amounts) | 2002 | 2001 | 2000 | 1999 | 1998 | ||||||||||||||||
| OPERATING RESULTS | |||||||||||||||||||||
Number of wells completed (excluding dry and service) | 12,977 | 15,902 | 14,395 | 8,514 | 8,296 | ||||||||||||||||
Sales | 261.3 | 377.8 | 359.4 | 237.1 | 307.9 | ||||||||||||||||
Gross profit | 36.7 | 43.8 | 42.7 | 27.4 | 42.5 | ||||||||||||||||
Gross profit margin (%) | 14.0 | 11.6 | 11.9 | 11.5 | 13.8 | ||||||||||||||||
Selling, general and administrative | 35.5 | 39.7 | 34.7 | 31.0 | 34.6 | ||||||||||||||||
EBITDA(1) | 1.2 | 4.1 | 8.0 | (3.6 | ) | 7.9 | |||||||||||||||
Income (loss) from continuing operations | (2.5 | ) | (1.6 | ) | 0.2 | (5.5 | ) | 1.5 | |||||||||||||
Net income (loss) | (2.5 | ) | 0.6 | 1.5 | (5.4 | ) | 2.2 | ||||||||||||||
Net income (loss) per share (diluted) | |||||||||||||||||||||
Continuing operations | (0.15 | ) | (0.09 | ) | 0.01 | (0.33 | ) | 0.09 | |||||||||||||
Net income (loss) | (0.15 | ) | 0.04 | 0.08 | (0.33 | ) | 0.13 | ||||||||||||||
| BALANCE SHEET RESULTS | |||||||||||||||||||||
Current assets | 79.0 | 89.8 | 135.1 | 106.9 | 96.5 | ||||||||||||||||
Total assets | 99.5 | 112.9 | 166.2 | 138.1 | 127.7 | ||||||||||||||||
Current liabilities(2) | 27.9 | 42.3 | 65.2 | 52.8 | 29.3 | ||||||||||||||||
Financed debt(3) | 22.1 | 17.2 | 48.6 | 37.4 | 46.8 | ||||||||||||||||
Shareholders’ equity | 47.2 | 50.0 | 49.3 | 46.4 | 51.4 | ||||||||||||||||
| (1) | Earnings before interest, taxes, depreciation and amortization (EBITDA) is presented to provide the reader with operating financial information that is comparable to prior years’ operating financial information. It should be noted that EBITDA is not defined principles and has no standardized meaning. by Canadian generally accepted accounting Therefore, these results may not be readily comparable to other companies’ presentations of operating results. | |
| (2) | Excludes financed debt. | |
| (3) | Includes bank operating loan, current portion of long-term debt and long-term debt. |
| 1 | HIGHLIGHTS | 2 | CHAIRMAN’S MESSAGE | 3 | PRESIDENT’S MESSAGE |
| 6 | IMPLEMENTING THE STRATEGY | 10 | OPERATION’S OVERVIEW | 12 | MANAGEMENT’S DISCUSSION AND ANALYSIS |
| 20 | FINANCIAL STATEMENTS AND NOTES | 36 | SUPPLEMENTARY INFORMATION | 40 | CORPORATE INFORMATION |
Table of Contents
2 CE FRANKLIN LTD.ANNUAL REPORT 2002 | |
 | TO OUR SHAREHOLDERS:CE FRANKLIN TRANSFORMED ITSELF IN 2002 INTO A MORE STREAMLINED AND STRONGER ORGANIZATION. I BELIEVE OUR COMPANY IS NOW BETTER POSITIONED AND EQUIPPED THAN EVER TO CAPITALIZE ON NEW MARKET OPPORTUNITIES. |
The dynamics of our marketplace changed in 2002. Capital spending in the oil and gas sector declined early in the year. A couple of our larger customers began ordering their pipe directly from steel mills and this affected volumes, earnings and cash flow. Our financial results in 2002 were, therefore, disappointing.
Energy sector income trusts have also changed the market landscape. These trusts focus on extraction and for the most part leave exploration to others. This has resulted in a delay in new exploration activity.
Michael West, who joined the Company as President and Chief Executive Officer in January 2002, provided excellent leadership for the Company when we needed it most. He and his management team acted quickly and decisively throughout the
year to position CE Franklin strongly for the changing marketplace.
I am particularly pleased to see that our management is building a team and customer-oriented culture within CE Franklin and making individual employees more accountable for their contribution to the Company’s success. Employees now fully understand the direction and possibilities for the Company and how they as individuals can have a positive impact on our customers. I congratulate all the employees for their considerable efforts during 2002.
I also believe that we have a knowledgeable and effective Board of Directors that can provide not only the sound governance judgment the Company requires, but also valuable market intelligence. The Board of Directors has a comprehensive committee structure in
place – audit; compensation; corporate governance; and quality, safety and environment – as well as independent access to our external auditors.
When all the changes that we made in 2002 are taken together, I believe that we now have the right vision, mission, people, structure, operating values, value proposition, and customer-centric approach to successfully execute our business plan. All the pieces are now in place for us to deliver on our promise.
Thank you for your continuing support.
“signed”
S. DOUGLAS MARTIN
Chairman
Table of Contents
| | CE FRANKLIN LTD.ANNUAL REPORT 2002 3 |
 | TO OUR SHAREHOLDERS:CE FRANKLIN MADE GREAT IMPROVEMENTS DURING 2002 BUT THERE IS STILL MUCH WORK TO BE DONE. |
The Company focused on several necessary and complementary initiatives during the year to build value for our shareholders. Among other actions, we:
| n | restructured and rationalized operations; |
| n | improved margins and average total capitalization (financed debt plus equity); |
| n | enhanced our customer-service culture and expanded our sales network so that we are in a strong position to grow market share; and |
| n | met our customers changing needs by being able to offer a North American solution by working diligently with our sister company Wilson Supply in the U.S. |
While the Company has made significant progress with all of these initiatives, we have a lot of work ahead of us. However, I firmly believe that the foundation that
we laid in 2002 has positioned the Company well for 2003 and beyond.
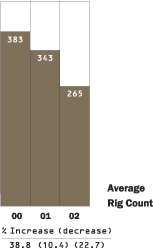
We took these steps in an uncertain market environment. At the start of 2002, the Canadian energy sector, our largest customer segment, reduced its capital spending. Although commodity prices strengthened significantly during the course of the year, our customers did not revise their capital spending programs. As a result, well completions fell 18% in 2002 and average rig count decreased 23%. Also, merger and acquisition activity resulted in two of our major Tubulars’ customers purchasing directly from steel mills.
These developments hit the Company’s top line, with sales falling 31% to $261.3 million in 2002, from $377.8 million in 2001. Gross profit decreased 16% to $36.7 million in 2002, compared to $43.8 million in 2001. Average gross profit margin increased to 14.0% in 2002 from 11.6% in 2001. Through
restructuring and rationalizations, we reduced selling, general and administrative (SG&A) costs by 10.5% to $35.5 million in 2002 from $39.7 million in 2001. Our net loss from continuing operations was $2.5 million or 15 cents a share (diluted), compared to a net loss of $1.6 million or 9 cents a share (diluted) in 2001.
By late 2002, activity in the energy sector strengthened somewhat. Although well completions in the fourth quarter were down 6%, this was a considerable improvement over the double-digit declines in each of the previous three quarters. Rig counts rose slightly in December after declining 73% in the third quarter and 43% in the second quarter.
This was a cause for some optimism as we entered 2003 and appeared to lend credibility to analysts’ forecasts that predicted stronger activity in the Canadian energy sector in 2003.
Table of Contents
4 CE FRANKLIN LTD.ANNUAL REPORT 2002 | PRESIDENT’S MESSAGE |
Tubulars revenue fell 48% in 2002. This lost market share will be harder to win back but we are planning to do so by targeting small- and medium-sized customers.
All this adds up to the fact that there is no room for complacency in our highly competitive marketplace. CE Franklin will continue to build on the foundations the Company started in 2002 so that we can respond well to the marketplace and position ourselves for growth.
RESTRUCTURING AND RATIONALIZATION
CE Franklin amalgamated its Prolift, Piping Resources, IT and Distribution business units in 2002 into General Supplies, the Company’s largest division, while maintaining both Brittania Compression and Tubulars as standalone divisions. This new structure has allowed us to further focus our marketing strategy and clarify our product and service offering to customers.
We also streamlined operations and reduced costs by closing several underperforming stores, improving our business processes and reducing inventories.
Consequently, we cut our staffing levels by 111 people or 25% in late 2001 and 2002. There were layoffs at all levels of the organization, including the executive, but we were careful to
minimize reductions in front-line customer service areas. We believe we now have the right balance between front-line and support personnel and the right tools in place for our employees to provide the service that our customers expect.
In early 2003, CE Franklin sold 50% of Brittania Compression to Nusco Supply & Manufacturing Inc., a subsidiary of Midfield Supply Ltd. CE Franklin and Nusco are now 50-50 shareholders of Brittania Industries Inc. Nusco brings to the joint venture over 20 years of experience in the manufacture of engineered products for the oil and gas industry. This joint venture positions Brittania to grow its product lines and to become a strong player in its niche market by combining the new Company’s well-developed products, service and sales and marketing strategy with Nusco’s manufacturing expertise and customer base.
In 2003, we will continue to be diligent in managing our business to ensure it has the proper infrastructure-to-revenue ratios.
IMPROVING MARGINS AND REDUCING DEBT
CE Franklin is focused on enhancing margins. In a competitive environment and in a down market, the Company’s General Supplies, Brittania and Tubulars divisions all showed margin improvements in 2002. Brittania, which had
been experiencing losses in 2001 and 2002, broke even by the end of the year.
One of CE Franklin’s most significant initiatives is the Company’s developing relationship with Wilson Supply, the U.S.-based division of Smith International, CE Franklin’s major shareholder.
We are leveraging the best practices of CE Franklin and Wilson Supply to develop a seamless North American offering for customers, many of whom are looking increasingly for continent-wide support. This relationship is already giving CE Franklin the opportunity to diversify its product line in the area of safety and general supplies.
This initiative and others, such as vendor leveraging, are all starting to have a positive impact on CE Franklin’s ability to gain market share.
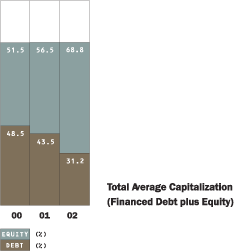
CE Franklin also made good progress in 2002 on strengthening its balance sheet. We are continuing to reduce inventories while maintaining our product mix to provide premier customer service and show strong performance in our accounts receivable by improving business processes. The Company’s average total capitalization (financed debt plus equity) at the end of this year improved to average debt of 31.2% in 2002 from 43.5% in 2001 and average equity of 68.8% in 2002 from 56.5% in 2001.
Table of Contents
| PRESIDENT’S MESSAGE | CE FRANKLIN LTD.ANNUAL REPORT 2002 5 |
BUILDING A CUSTOMER-SERVICE CULTURE
We believe CE Franklin will gain market share by providing our customers premier service and a clear value proposition. This was a major focus for the Company in 2002.
We completed a customer survey in the second half of the year. Through the survey, CE Franklin customers defined 11 key measures for improving customer service and told us loud and clear what the Company needs to do to exceed their expectations. As a result, we will be paying particular attention to four service areas in 2003 — on-time delivery; order accuracy; responsiveness; and fulfilling promises. We will survey our customers again in 2003 to track our improvements. I encourage you to read the results of the 2002 survey on our web site.
CE Franklin employees are doing several things to deliver on their commitment to improving customer service. They are redesigning processes and rolling them out to all 37 service centers. CE Franklin will continue to work with our customers to use e-commerce to lower transaction costs. The Company has introduced a program that rewards employees who develop ways to provide cost savings to our customers. We restructured and refocused our sales
force, putting more resources toward serving our major alliance customers and gaining new customers through old-fashioned sales hustle.
CE Franklin also developed a new marketing strategy and a value proposition that we have taken to the market. These were designed around our strong operating values, which appear on page six of this report.
All of this work is already showing results. In 2002, after developing our new value proposition, we won our first two maintenance, repair and operating supplies (MRO) contracts in over three years.
PEOPLE ARE OUR GREATEST ASSET
I want to thank the employees of CE Franklin for their dedication during 2002. They have persevered through what has been a year of phenomenal change for both the industry and the Company. They have risen to the challenge.
In a service industry, it is the quality of our people that differentiates us from our competitors. We recognize that our employees are the Company’s greatest asset and we will continue to provide them the systems, processes and training they need to succeed and provide our customers peace of mind and premier service.
CE Franklin’s new value proposition and restructuring gave us an opportunity to recruit more market-leading personnel with considerable industry experience. Joining our senior ranks in 2002 were Ron Brown as Vice President of National Accounts; Rod Tatham to the newly-created post of Director of Customer Service and Quality; Dale Rawson as Procurement Manager; and Graeme Monteith as Tubulars Sales Manager. We also hired key personnel in regional management and upgraded some branch management positions.
CE Franklin started an important journey in 2002. We are confident that the Company is on the right path. While we have not gone for any quick fixes, all the steps the Company has taken are showing positive results. During 2003, we will further strengthen and solidify the strategies that the Company has put in place in order to provide excellence in customer service, gain market share, diversify our product line and provide our shareholders the returns they expect and deserve.
“signed”
MICHAEL S. WEST
President and Chief Executive Officer
Table of Contents
6 CE FRANKLIN LTD.ANNUAL REPORT 2002 | |
MISSION STATEMENT:CE FRANKLIN WILL BE THE MARKET LEADER IN THE SUPPLY OF PRODUCTS, SERVICES AND SOLUTIONS TO THE ENERGY INDUSTRY. WE WILL ACHIEVE LEADERSHIP BY DELIVERING SUPERIOR CUSTOMER SERVICE THROUGH OUR PEOPLE, OUR PERFORMANCE AND OUR PARTNERSHIPS.
IMPLEMENTING THE STRATEGY:CE FRANKLIN’S STRATEGY IS TO INCREASE MARKET SHARE, MAXIMIZE GROSS PROFIT MARGINS, RATIONALIZE EXPENSES, ENHANCE CUSTOMER SERVICE, IMPROVE EARNINGS AND CREATE SHAREHOLDER WEALTH. UNDERPINNING THE STRATEGY ARE OUR EIGHT OPERATING VALUES – INTEGRITY; CREDIBILITY; PERFORMANCE; TEAMWORK; SERVICE ETHIC; TRUST; RESPONSIBILITY; AND COMMUNITY. IN THE FOLLOWING INTERVIEWS, THREE OF OUR EMPLOYEES TALK ABOUT WHAT OUR STRATEGY AND OPERATING VALUES MEAN TO THEM AND, ULTIMATELY, OUR CUSTOMERS.
Table of Contents
CE FRANKLIN LTD.ANNUAL REPORT 2002 7
 DAVID WALLACEIS CE FRANKLIN’S VICE PRESIDENT, BUSINESS DEVELOPMENT. DAVID AND HIS TEAM ARE FOCUSED PRIMARILY ON ACQUIRING NEW MAINTENANCE, REPAIR AND OPERATING SUPPLIES (MRO) CONTRACTS. HE ALSO MANAGES OUR RELATIONSHIP WITH WILSON SUPPLY, CE FRANKLIN’S U.S. AFFILIATE. | STRATEGY: INCREASING MARKET SHARE “The restructuring that CE Franklin went through in 2002 has transformed the Company. The team that we now have in place is very, very strong, definitely the strongest that I have seen in my almost 25 years with the Company. They’re all completely customer focused, driven by results and accountable for their actions. And I have to say, they’re very optimistic about being able to deliver results. We all want the same results – to make the Company profitable for the benefit of all of our stakeholders. One of the ways we will achieve this is by increasing market share. We are going after new MRO contracts very aggressively. We won two MRO accounts in 2002 on the strength of our comprehensive customer service offering and a value proposition that is focused on saving our customers money. We are also leveraging our strong relationship with Wilson Supply to provide a North American solution for our multinational customers. This relationship is absolutely huge for us because it means we are no longer limited to the Canadian domestic market. It opens up a lot of opportunities for us, not only in North America but worldwide as well. CE Franklin is now in the best possible position to pursue and capture new opportunities and to profit from them.” |
Table of Contents
8 CE FRANKLIN LTD.ANNUAL REPORT 2002 | |
| CHRIS ZATELNYIS CE FRANKLIN’S AREA MANAGER IN NORTHWESTERN ALBERTA. HE FOCUSES MAINLY ON PROVIDING FRONT-LINE CUSTOMER SERVICE THROUGH THE THREE FIELD STORES HE OVERSEES. | ||||
 | STRATEGY: RATIONALIZING EXPENSES “It comes down to this: if we’re not rationalizing our expenses every day, we’re letting our customers down by not being as efficient as we can be. If we’re not an efficiently run business, we cannot provide the service and the value that our customers require. They expect a lot from us and it is our job to give them the products they need at the best possible price. To do that, we are managing our purchases very carefully with our vendors to ensure we get the best deals that are out there. My customers are telling me that they are seeing a very positive, can-do attitude from CE Franklin employees. I think every time we can save our customers a dollar and provide them value-added service — like anticipating their needs and advising them on their purchases — it comes back to us ten fold. If we do the best job we can and achieve the best possible outcome for our customers and CE Franklin, we have done our job. It builds credibility and trust and everybody wins.” | |||
Table of Contents
ANNUAL REPORT 2002 CE FRANKLIN LTD. 9
STRATEGY:
ENHANCING CUSTOMER SERVICE
“ ‘Shared success’ is one of CE Franklin’s corporate values. But from my vantage point, I think shared success is more like a personal value for each of our employees. Every day, I see them working together to make our customers, our vendors, the Company itself and each other successful.
We are already sharing a lot of success. For example, instead of going through our field stores, all large project orders are now channeled through our Edmonton Distribution Centre for shipment direct to customers. This means our customers receive their large orders faster and that the people in our field stores can spend more time with their customers on day-today business. We are also working with our field stores to help them improve their internal processes so that our customers always receive their materials at the right time and at the right price.
We still have lots of work to do but I know that what we have done so far is already making a difference to our customers. We want to meet or, preferably, exceed our customers’ expectations so that they are successful. And let’s not forget: all elements of the supply chain must be maximized to enhance customer service and value.”

BASED IN EDMONTON,WENDY WITTCHENIS OPERATIONS ANALYST IN CE FRANKLIN’S CUSTOMER SERVICE AND QUALITY DEPARTMENT, WHICH IS SPEARHEADING EFFORTS TO REDESIGN PROCESSES TO IMPROVE BOTH CUSTOMER SERVICE AND OPERATIONAL PERFORMANCE.
Table of Contents
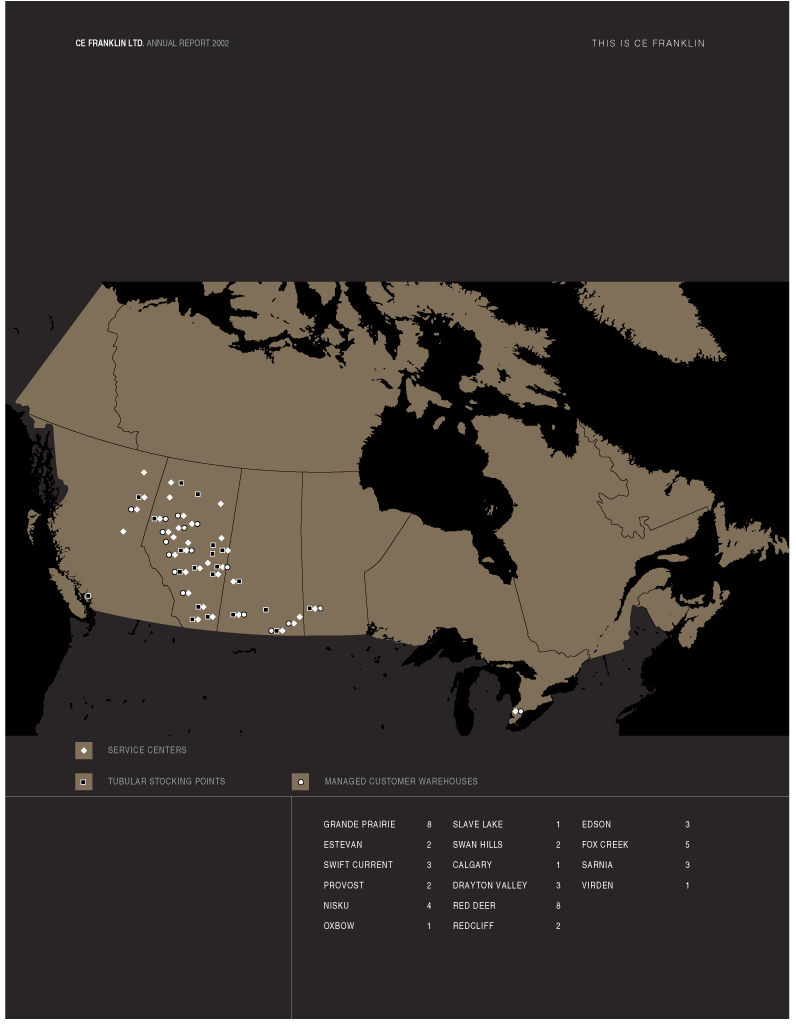
Table of Contents
| | CE FRANKLIN LTD.ANNUAL REPORT 2002 11 |
THIS IS CE FRANKLIN
IN 2002, WE RESTRUCTURED INTO THREE DIVISIONS – GENERAL SUPPLIES, BRITTANIA COMPRESSION AND TUBULARS – TO GIVE GREATER FOCUS TO OUR MARKETING AND SALES EFFORTS, IMPROVE SERVICE TO OUR CUSTOMERS AND ELIMINATE DUPLICATE INFRASTRUCTURES.
GENERAL SUPPLIES
Our General Supplies division is one of the largest suppliers to the energy industry. With over 25,000 items stocked and priced in our master catalogue, we provide all of the products that our energy-industry customers need to drill, gather, process, pipeline and refine hydrocarbons. We do this through our infrastructure of 37 service centers, approximately 50 managed customer warehouses and a sophisticated distribution hub, all connected by state-of-the-art technology that provides a sophisticated supply chain management solution.
BRITTANIA COMPRESSION
Brittania manufactures, sells, rents and services natural gas boosters, casing gas compressors, vapor recovery units and a wide range of air compression equipment. In early 2003, we created Brittania Industries Inc. as a 50-50 joint venture between CE Franklin and Nusco Supply & Manufacturing Inc. The joint venture combines Brittania’s well-developed products, service and sales and marketing strategy with Nusco’s manufacturing expertise and customer base.
TUBULARS
Our Tubulars division provides energy customers a complete range of quality tubular products, including casing, tubing, line pipe, coatings and other complementary products. We also offer a variety of specialty services designed to enhance our products’ value and increase our customers’ efficiency. We distribute tubing from approximately 20 sites across Canada that are strategically located in the areas of highest energy-industry activity. Our stock points and inventories virtually eliminate the need for our customers to carry inventories of standard items.

Table of Contents
12 CE FRANKLIN LTD.ANNUAL REPORT 2002 | |
MANAGEMENT’S DISCUSSION AND ANALYSIS (MD&A)
(All amounts shown in Canadian dollars)
FORWARD LOOKING STATEMENTS
Certain of the statements set forth in this MD&A, such as statements regarding planned activity and revenue levels, capital expenditures and the availability of capital resources to fund capital expenditures and working capital, are forward-looking statements within the meaning of Section 27A of the United States Securities Act of 1933 and Section 21E of the United States Securities Exchange Act of 1934. Although the Company believes that its expectations are based on reasonable assumptions, it can give no assurance that expected results will be achieved. There are numerous risks and uncertainties that can affect the outcome and timing of such events, including many factors beyond the control of the Company. These factors include, but are not limited to, economic conditions, seasonality of drilling activity, shift in drilling activity from conventional oil to gas and heavy oil, commodity prices for oil and gas, currency fluctuations, and government regulations. Should one or more of these risks or uncertainties occur, or should underlying assumptions prove incorrect, the Company’s actual results and plans for 2003 and beyond could differ materially from those expressed in the forward looking statements.
RESULTS OF OPERATIONS – COMPARISON OF 2002 TO 2001
The average price of oil during 2002 was U.S. $26.10 (West Texas Intermediate) and the average price of gas was Cdn. $4.18 (AECO spot price). Oil and gas commodity prices started 2002 with the price of oil at U.S. $19.51 and the price of gas at Cdn. $3.52, and as a result many exploration and production companies reduced their capital spending programs for 2002. Although commodity prices improved significantly during the year with the price of oil and gas ending the year at U.S. $29.42 and Cdn. $5.97, respectively, this increase in oil and gas prices did not result in a revision in E&P companies’ capital spending programs for 2002.
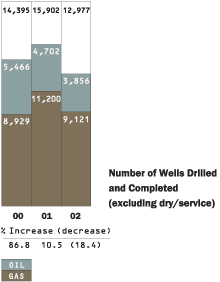
The total number of oil and gas wells completed during 2002 (excluding dry/service wells) in western Canada decreased 18.4% to 12,977 wells completed as compared to 15,902 wells completed during 2001. The average rig count decreased 22.7% to 265 rigs during 2002 compared to 343 rigs during 2001.
Table of Contents
| MANAGEMENT’S DISCUSSION AND ANALYSIS | CE FRANKLIN LTD.ANNUAL REPORT 2002 13 |
Oil well completions accounted for 3,856 (29.7%) of total wells completed in 2002 as compared to 4,702 (29.6%) in 2001, while gas well completions accounted for 9,121 (70.3%) of total wells completed in 2002 as compared to 11,200 (70.4%) in 2001.
Sales
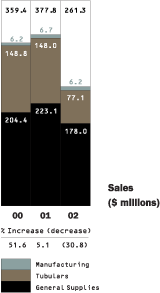
Sales for the year ended December 31, 2002 decreased to $261.3 million from $377.8 million for the year ended December 31, 2001.
Sales for General Supplies decreased $45.1 million or 20.2% to $178.0 million during 2002 from $223.1 million during 2001. Of this decline, $19.8 million relates to the completion of a large capital oilsands project in northern Alberta in 2001. Excluding this capital project, General Supplies sales decreased 12.7% or $25.3 million for the year ended December 31, 2002 while well completion activity decreased 18.4% during 2002. General Supplies sales outperformed market conditions in 2002.
Tubulars sales for the year ended December 31, 2002 were $77.1 million, a decline of 47.9% or $70.9 million, as compared to $148.0 million for the year ended December 31, 2001. A significant component of the decrease in Tubulars
sales is attributed to E&P customer merger and acquisition activity, resulting in larger customers now being able to directly access steel mills, and an overall decline in activity levels.
Gross Profit
Total gross profit decreased $7.1 million or 16.2% to $36.7 million in 2002 as compared to $43.8 million during 2001. Included in the 2001 gross profit of $43.8 million was a $1.1 million inventory write-down. Excluding the inventory write-down, total gross profit decreased $8.2 million or 18.2% for the year ended December 31, 2002 as compared to the year ended December 31, 2001.
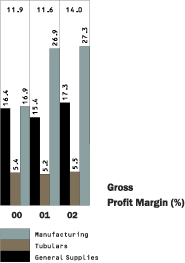
Average gross profit margin for the year ended December 31, 2002 increased to 14.0% from 11.6% for the year ended December 31, 2001. General Supplies profit margin increased to 17.3% from 15.4% due to the $1.1 million inventory write-down described above coupled with the lower margin earned on the capital oilsands project, which was completed in 2001. Excluding these two items, 2002 General Supplies profit margin was consistent with 2001.
Tubulars gross profit margin increased marginally in 2002 to 5.5% from 5.2%.
Table of Contents
14 CE FRANKLIN LTD.ANNUAL REPORT 2002 | MANAGEMENT’S DISCUSSION AND ANALYSIS |
Selling, General and Administrative Costs (SG&A)
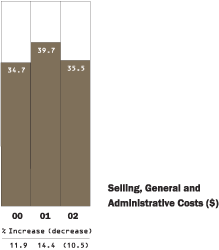
For the year ended December 31, 2002, SG&A costs decreased $4.2 million or 10.5% to $35.5 million from $39.7 million. Included in 2002 and 2001 SG&A were approximately $1.2 million and $1.7 million, respectively, in charges relating to severance, termination and closure costs. With the decline in drilling activity and well completions during the last six months of 2001 and, during 2002, the Company adjusted its infrastructure to support the reduced revenue levels.
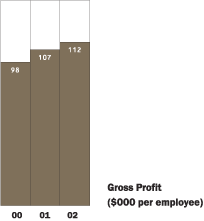
As a result of the Company’s restructuring efforts, SG&A before severance, termination and closure costs decreased by $3.7 million or 9.7% during 2002 as compared to 2001. CE Franklin reduced its employee base by 25.3% to 327 employees as at December 31, 2002 from 438 employees as at September 30, 2001 to offset the decline in activity levels. As a result of the employee reductions, gross profit margin per employee has increased to $112,000 per employee from $98,000 in 2000 and $107,000 in 2001.
EBITDA(1)
Earnings before interest, tax, depreciation, amortization and other expenses (EBITDA) for the year ended December 31, 2002
decreased to $1.2 million from $4.1 million. The $116.5 million decrease in sales resulting from the 18.4% decline in well completion activity coupled with the reduction in Tubulars sales resulted in only 2.5% decremental flow through to EBITDA. This was due to an improvement in gross profit margins from 11.6% to 14.0%, and a reduction in SG&A by $4.2 million. The Company is positioned to flow 10% of any incremental revenue increases for General Supplies to EBITDA in 2003.
Income (loss) before Income Taxes, and Income (loss) from Continuing Operations
Loss from continuing operations before income taxes was $3.9 million for the year ended 2002 as compared to a loss of $2.1 million for the year ended 2001. The $1.8 million decline in income reflects the $2.9 million reduction in EBITDA coupled with an increase in amortization expense of $366,000 relating to the Company's eCommerce initiative offset by a reduction in interest and other expenses of $1.4 million. The reduction in interest expense reflects lower debt levels due to better working capital management by the Company and the sale of its Domino Machine operations at the end of 2001.
Table of Contents
| MANAGEMENT’S DISCUSSION AND ANALYSIS | CE FRANKLIN LTD.ANNUAL REPORT 2002 15 |
Loss from continuing operations was $2.5 million or a loss of $0.15 per share (diluted) for 2002 as compared to a loss of $1.6 million or $0.09 per share (diluted) for 2001.
Discontinued Operations – Year Ended December 31, 2001
On December 18, 2001 the Company sold its Domino Machine operations for net cash proceeds of $7.9 million resulting in an after tax gain on disposition of $1.1 million. Domino Machine provided custom-machining services to the energy industry, which was not considered a core operation to the Company. The net proceeds from this transaction were used to reduce the Company’s outstanding bank operating loan. Operating results for Domino Machine operations were included in 2001 and 2000 Statements of Operations.
Net Income and Earnings per Share
Net loss for the year ended 2002 was $2.5 million or $0.15 per share (diluted) as compared to net income of $619,000 or $0.04 per share (diluted) for 2001.
RESULTS OF OPERATIONS – COMPARISON OF 2001 TO 2000
Commodity prices for oil and gas had a significant impact on drilling activity in western Canada during 2001. The average price for oil in 2001 was U.S. $25.41 and the average price for gas was Cdn. $6.09. However, commodity
prices dropped significantly during the last six months of 2001, and as at December 31, 2001 the price of oil and gas was U.S. $19.51 and Cdn. $3.52, respectively.
The total number of oil and gas wells completed during 2001 (excluding dry/service wells) in western Canada increased 10.5% to 15,902 wells completed as compared to 14,395 wells completed during 2000. Oil and gas wells completed in western Canada for the first six months of 2001 exceeded 2000 by 28.5%. However, the number of well completions during the last six months of 2001 declined by 3.0% as compared to 2000 reflecting the decline in activity levels during the second half of 2001 as a result of the weakening in commodity prices.
Oil well completions accounted for 4,702 (30%) of total wells completed in 2001 as compared to 5,466 (38%) in 2000, while gas well completions accounted for 11,200 (70%) of total wells completed in 2001 as compared to 8,929 (62%) in 2000.
Sales
Sales for the year ended December 31, 2001 increased 5.1% to $377.8 million from $359.4 million for the year ended December 31, 2000.
Sales for General Supplies increased 9.2% or $18.7 million to $223.1 during 2001 from $204.4 million in 2000. Approximately $10.7 million of the revenue increase relates to the Company delivering pipe, valves and fittings to a large oilsands project. This project was completed in 2001. The remainder of the increase relates to the Company’s traditional General Supplies sales reflecting the general increase in well completion activity during 2001.
Tubular sales remained relatively constant at $148.0 million during 2001 as compared to 2000. Although drilling activity increased during 2001, the majority of the increase was in shallow gas wells, which has a small component of tubular sales.
Gross Profit
Total gross profit increased $1.1 million or 2.5% to $43.8 million in 2001 as compared to $42.7 million during 2000. The increase in gross profit dollars reflects the increased sales for the Company’s General Supplies and manufacturing operations offset by a $1.1 million inventory write-down. As a result of the decline in activity levels during the last six months of 2001, the Company reviewed its inventory to determine if there was an increase in obsolescence or impairment in value.
Table of Contents
16 CE FRANKLIN LTD.ANNUAL REPORT 2002 | MANAGEMENT’S DISCUSSION AND ANALYSIS |
This resulted in the additional inventory write-down of $1.1 Million relating to the General Supplies and manufacturing operations.
Average gross profit margin for the year ended December 31, 2001 decreased marginally to 11.6% from 11.9%. Excluding the inventory write-down, gross profit margin for 2001 was 11.9% and consistent with 2000. General Supplies profit margin decreased to 15.4% from 16.4% due to the inventory write-down described above coupled with lower gross profit margins for the large oilsands project, which is typical with distribution of pipe valves and fittings to such projects.
Selling, General and Administrative Costs (SG&A)
For the year ended December 31, 2001, SG&A costs increased $5.0 million or 14.4% to $39.7 million from $34.7 million. Included in SG&A was approximately $1.7 million in charges relating to severance, termination and closure costs. With the decline in drilling activity and well completions during the last six months of 2001, the Company adjusted its infrastructure to support the reduced revenue levels.
Excluding these charges, SG&A increased by $3.3 million or 9.5% during 2001 as compared to 2000. This increase relates to salary costs in General Supplies and Tubulars of $2.0 million relating to increased activity levels in the last half of 2000 and the first half of 2001.
EBITDA(1)
Earnings before interest, tax, depreciation, amortization and other expenses (EBITDA) for the year ended December 31, 2001 decreased to $4.1 million from $8.0 million. Included in the $3.9 million decrease was the $2.8 million of charges relating to inventory write-downs, severance, termination and closure costs, the $3.3 million increase in SG&A from operations offset by the $2.1 million increase in gross profit.
Income (Loss) from Continuing Operations before Income Taxes, and Income (loss) from Continuing Operations
Loss from continuing operations before income taxes was $2.1 million for the year ended 2001 as compared to income of $1.5 million for 2000. The decline in income reflects the $3.9 million reduction in EBITDA coupled with an increase in amortization expense of $352,000 relating to the Company’s e-commerce initiative offset by a
Table of Contents
| MANAGEMENT’S DISCUSSION AND ANALYSIS | CE FRANKLIN LTD.ANNUAL REPORT 2002 17 |
reduction in interest expense of $668,000. The reduction in interest expense reflects lower debt levels due to better working capital management by the Company coupled with a reduction in interest rates.
Loss from continuing operations was $1.6 million or a loss of $0.09 per share (diluted) for 2001 as compared to income of $210,000 or $0.01 per share (diluted) for 2000.
Net Income and Earnings per Share
Net income for the year ended 2001 was $619,000 or $0.04 per share (diluted) as compared to $1.5 million or $0.08 per share (diluted) for 2000. Domino Machine Operations, which was sold on December 18, 2001, were included in 2001 and 2000 results.
LIQUIDITY AND CAPITAL RESOURCES
Asset Management
CE Franklin maintains debt primarily to finance its working capital requirements. CE Franklin’s total average capitalization (financed debt plus equity) improved in 2002 with average debt of 31.2% in 2002 and 43.5% in 2001 and average equity of 68.8% in 2002 and 56.5% in 2001.
Average Days Sales Outstanding (DSO) were 49.8 days in 2002 as compared to
46.1 days in 2001. Trade accounts receivable are tightly managed by the Company with daily calls to customers to solve payment issues. In addition, the Company’s accounts receivable team works closely with customers to help simplify payment and approval processes. Bad debt expense in 2002 was $688,000 compared to $1.0 million in 2001.
Total inventory for the Company decreased by $10.2 million ($9.3 million from a cash flow perspective) or 20.0% to $40.7 million. CE Franklin measures the quality of inventory using an inventory turns calculation. Inventory turned 4.9 times in 2002, compared to 5.4 times in 2001. The Company monitors its inventory on a daily basis in order to reduce surplus, improve turns, and reduce obsolescence.
Cash Management
In 2002, CE Franklin generated $974,000 in cash flow from continuing operations, $1.4 million of cash flow from the collection of accounts receivable and generated $9.3 million in cash flow from the reduction of inventories. The Company used this cash generated to reduce its accounts payable and accrued liabilities and bank overdraft by $14.8 million, and invested $1.2 million in capital assets. These
primary activities resulted in CE Franklin increasing its bank line by $5.2 million.
At December 31, 2002, CE Franklin had a $35.0 million credit facility. During the year ended December 31, 2002, the Company was offside of certain financial ratio covenants relating to earnings which were waived by the Company’s primary lender. In management’s opinion the $35.0 million credit facility is considered sufficient to finance its current operating needs.
RISKS AND UNCERTAINTIES
CE Franklin’s financial performance may be influenced favourably or adversely by certain external factors, as described below:
Adverse weather conditions could temporarily decrease the demand for CE Franklin’s products and services. CE Franklin’s financial performance is tied closely to the seasonality of drilling activity. Higher drilling activity in Canada is generally experienced in the winter months. In the spring and early summer, drilling activity slows due to the difficulty in moving equipment during the spring thaws. To the extent that unseasonable weather conditions such as excessive rain or unusually warm winters affect the ability of CE Franklin’s customers to access their
Table of Contents
18 CE FRANKLIN LTD.ANNUAL REPORT 2002 | MANAGEMENT’S DISCUSSION AND ANALYSIS |
oil and gas wells, then the demand for CE Franklin’s products and services would temporarily decrease and the Company’s cash generated from operations would be adversely affected.
The loss of CE Franklin’s major supplier for tubular goods could adversely affect the Company’s revenue and gross profit. A substantial portion of CE Franklin’s business is the sale of Tubulars that are primarily obtained from one supplier. For the year ended December 31, 2002, 29.5% of CE Franklin’s revenue and 11.6% of CE Franklin’s gross profit was from the sale of Tubulars. Although the Company believes that it has historically had and continues to have a good relationship with its supplier, there can be no assurance that such relationship will continue. In the event the Company is unable to source tubular goods from its existing supplier, then CE Franklin would need to search for an alternate supplier of theses goods. Such suppliers are available.
Fluctuations in oil and gas prices could adversely affect demand for CE Franklin’s products and services and, therefore, CE Franklin’s revenues, cash flows and profitability.
CE Franklin’s operations are materially dependent upon the level of activity in oil and gas exploration and production. Both short-term and long-term trends in oil and gas prices affect the level of such activity. Oil and gas prices and, therefore, the level of drilling, exploration and production activity can be volatile. Factors that can cause price fluctuations include:
| n | relatively minor changes in the worldwide supply of and demand for oil and natural gas; |
| n | the ability of the members of the Organization of Petroleum Exporting Countries (“OPEC”) to maintain price stability through voluntary production limits; |
| n | the level of production by non-OPEC countries; |
| n | North American demand for gas; |
| n | general economic and political conditions; and |
| n | the presence or absence of drilling incentives such as Canadian provincial royalty holidays, fluctuation in the value of the Canadian dollar, availability of new leases and concessions and government regulations regarding, among other things, export controls, environmental protection, taxation, price controls and product allocation. |
Worldwide military, political and economic events, including initiatives by OPEC, affect both the demand for, and the supply of, oil and gas. Fluctuations during the last few years in the demand and supply of oil and gas have contributed to, and are likely to continue to contribute to, price volatility. CE Franklin believes that any prolonged reduction in oil and gas prices would depress the level of exploration and production activity. This would likely result in a corresponding decline in the demand for CE Franklin’s products and services and could have a material adverse effect on CE Franklin’s revenues, cash flows and profitability. There can be no assurances as to the future level of demand for CE Franklin’s products and services or future conditions in the oil and gas and oilfield supply industries.
CE Franklin operates in a highly competitive industry, which may adversely affect CE Franklin’s results of operations and profitability. The Canadian oilfield supply industry in which CE Franklin operates is very competitive. The Company believes that its future profitability is partially influenced by competitive factors beyond its control, including:
Table of Contents
| MANAGEMENT’S DISCUSSION AND ANALYSIS | CE FRANKLIN LTD.ANNUAL REPORT 2002 19 |
| n | the ability of some customers to purchase oilfield supplies directly from the manufacturer rather than from independent oilfield supply distributors; |
| n | the ability for new brokers and distributors to enter the tubular supply business and the general supply business if the oil and gas industry were to experience significant growth in drilling activity; and |
| n | price competitions among major supply companies. |
CE Franklin and its largest competitors are generally operating at low profit margins due to price competition. Price competition is due in part to consumer price pressure, in addition to the major supply companies competing for the same business.
Shifts in drilling activity from conventional oil to gas affect CE Franklin’s revenues, cash flows and profitability. CE Franklin sells an average of 3.5 times more product into an oil well versus a gas well and as a result a change in oil well completion activity has an impact on sales.
(1) Non-GAAP Earnings Measures
The Company’s EBITDA results are presented to provide the reader with operating financial information that is comparable to prior years’ operating financial information. It should be noted that EBITDA is not defined by Canadian generally accepted accounting principles and has no standardized meaning. Therefore, these results may not be readily comparable to other companies’ presentations of operating results. EBITDA is defined as earnings before interest, tax, depreciation and amortization.
Table of Contents
20 CE FRANKLIN LTD.ANNUAL REPORT 2002 | |
MANAGEMENT’S REPORT
The preparation and presentation of the accompanying financial statements are the responsibility of the management of the Company. The statements have been prepared in accordance with Canadian generally accepted accounting principles as described in note 1 to the financial statements. The financial information elsewhere in the annual report has been reviewed to ensure consistency with that in the financial statements.
Management acknowledges responsibility for the integrity of its financial information. Where appropriate, management has made informed judgments and estimates in accounting for transactions, which were not complete at the balance sheet date. Management maintains appropriate systems of internal control. Policies and procedures are designed to give reasonable assurance that transactions are properly authorized, assets are safeguarded and financial records are properly maintained.
The Board of Directors has appointed an Audit Committee that consists of three directors who are not officers or employees of the Company. The committee meets with management and the Company's external auditors to discuss internal control, accounting policies and financial reporting matters. The Audit Committee has reviewed the financial statements. The Board of Directors has approved the financial statements on the recommendation of the Audit Committee.
| “signed” Michael West President and Chief Executive Officer January 31, 2003 | “signed” Salvatore Secreti Vice President and Chief Financial Officer |
Table of Contents
| | CE FRANKLIN LTD.ANNUAL REPORT 2002 21 |
AUDITORS’ REPORT
TO THE SHAREHOLDERS OF CE FRANKLIN LTD.
We have audited the balance sheets of CE Franklin Ltd. as at December 31, 2002 and 2001 and the statements of operations, changes in shareholders' equity and cash flows for each of the years in the three year period ended December 31, 2002. These financial statements are the responsibility of the Company’s management. Our responsibility is to express an opinion on these financial statements based on our audits.
We conducted our audits in accordance with Canadian and United States generally accepted auditing standards. Those standards require that we plan and perform an audit to obtain reasonable assurance whether the financial statements are free of material misstatement. An audit includes examining, on a test basis, evidence supporting the amounts and disclosures in the financial statements. An audit also includes assessing the accounting principles used and significant estimates made by management, as well as evaluating the overall financial statement presentation.
In our opinion, these financial statements present fairly, in all material respects, the financial position of the Company as at December 31, 2002 and 2001 and the results of its operations and its cash flows for each of the years in the three year period ended December 31, 2002 in accordance with Canadian generally accepted accounting principles.
“signed”
PricewaterhouseCoopers LLP
Chartered Accountants
Calgary, Alberta, Canada
January 31, 2003
COMMENTS BY AUDITORS FOR U.S. READERS ON CANADA-U.S. REPORTING DIFFERENCES
In the United States, reporting standards for auditors require the addition of an explanatory paragraph (following the opinion paragraph) when there is a change in accounting principles that has a material effect on the comparability of the Company’s financial statements, such as the change described in note 2a to the financial statements. Our report to the shareholders dated January 31, 2003 is expressed in accordance with Canadian reporting standards which do not require a reference to such a change in accounting principles in the auditors’ report when the change is properly accounted for and adequately disclosed in the financial statements.
“signed”
PricewaterhouseCoopers LLP
Chartered Accountants
Calgary, Alberta, Canada
January 31, 2003
Table of Contents
22 CE FRANKLIN LTD.ANNUAL REPORT 2002 | FINANCIAL STATEMENTS |
BALANCE SHEETS
As at December 31
| (in thousands of Canadian dollars) | 2002 | 2001 | |||||||
| ASSETS | |||||||||
| CURRENT ASSETS | |||||||||
Accounts receivable(note 3) | 36,992 | 38,407 | |||||||
Inventories | 40,679 | 50,876 | |||||||
Income taxes recoverable(note 8) | 741 | – | |||||||
Other | 600 | 500 | |||||||
| 79,012 | 89,783 | ||||||||
Property and equipment(note 4) | 12,757 | 14,963 | |||||||
Goodwill, net of accumulated amortization of $1,366 (2001 – $1,439) (note 2) | 7,765 | 8,180 | |||||||
Other assets | – | 3 | |||||||
| 99,534 | 112,929 | ||||||||
| LIABILITIES | |||||||||
| CURRENT LIABILITIES | |||||||||
Bank overdraft | 1,148 | 1,836 | |||||||
Bank operating loan(note 5) | 21,500 | 16,300 | |||||||
Accounts payable | 16,525 | 25,066 | |||||||
Accrued liabilities | 10,213 | 15,414 | |||||||
Current portion of long-term debt(note 6) | 297 | 251 | |||||||
| 49,683 | 58,867 | ||||||||
Long-term debt(note 6) | 299 | 614 | |||||||
Future income taxes(note 8) | 2,381 | 3,491 | |||||||
| 52,363 | 62,972 | ||||||||
COMMITMENTS AND CONTINGENCIES(note 13) | |||||||||
| SHAREHOLDERS’ EQUITY | |||||||||
Capital stock(note 9) | 19,268 | 19,186 | |||||||
Contributed surplus | 13,566 | 13,566 | |||||||
Retained earnings | 14,337 | 17,205 | |||||||
| 47,171 | 49,957 | ||||||||
| 99,534 | 112,929 | ||||||||
| The accompanying notes are an integral part of these financial statements. |
Approved by the Board of Directors
| “signed” | “signed” |
| S. Douglas Martin | John J. Kennedy |
| Director | Director |
Table of Contents
| FINANCIAL STATEMENTS | CE FRANKLIN LTD.ANNUAL REPORT 2002 23 |
STATEMENTS OF CHANGES IN SHAREHOLDERS’ EQUITY
| Capital Stock | ||||||||||||||||||||
| Number of | Contributed | Retained | Shareholders’ | |||||||||||||||||
| (in thousands of Canadian dollars except number of shares) | Shares | $ | Surplus | Earnings | Equity | |||||||||||||||
December 31, 1999 | 16,725,961 | 17,709 | 13,566 | 15,086 | 46,361 | |||||||||||||||
Issue of shares for cash | 6,580 | 25 | – | – | 25 | |||||||||||||||
Stock options exercised(note 9) | 416,612 | 1,403 | – | – | 1,403 | |||||||||||||||
Net income | – | – | – | 1,500 | 1,500 | |||||||||||||||
December 31, 2000 | 17,149,153 | 19,137 | 13,566 | 16,586 | 49,289 | |||||||||||||||
Stock options exercised(note 9) | 8,938 | 49 | – | – | 49 | |||||||||||||||
Net income | – | – | – | 619 | 619 | |||||||||||||||
December 31, 2001 | 17,158,091 | 19,186 | 13,566 | 17,205 | 49,957 | |||||||||||||||
Effect of change in accounting policy(note 2) | – | – | – | (375 | ) | (375 | ) | |||||||||||||
Stock options exercised(note 9) | 20,605 | 82 | – | – | 82 | |||||||||||||||
Net loss | – | – | – | (2,493 | ) | (2,493 | ) | |||||||||||||
December 31, 2002 | 17,178,696 | 19,268 | 13,566 | 14,337 | 47,171 | |||||||||||||||
| The accompanying notes are an integral part of these financial statements. |
Table of Contents
24 CE FRANKLIN LTD.ANNUAL REPORT 2002 | FINANCIAL STATEMENTS |
STATEMENTS OF OPERATIONS
| For the years ended December 31 (in thousands of Canadian dollars except per share amounts) | 2002 | 2001 | 2000 | ||||||||||
Sales | |||||||||||||
General supplies | 177,990 | 223,137 | 204,351 | ||||||||||
Tubulars | 77,138 | 148,030 | 148,787 | ||||||||||
Manufacturing | 6,201 | 6,678 | 6,289 | ||||||||||
| 261,329 | 377,845 | 359,427 | |||||||||||
Cost of Sales | |||||||||||||
General supplies | 147,245 | 188,871 | 170,762 | ||||||||||
Tubulars | 72,868 | 140,311 | 140,724 | ||||||||||
Manufacturing | 4,510 | 4,883 | 5,227 | ||||||||||
| 224,623 | 334,065 | 316,713 | |||||||||||
Gross Profit | |||||||||||||
General supplies | 30,745 | 34,266 | 33,589 | ||||||||||
Tubulars | 4,270 | 7,719 | 8,063 | ||||||||||
Manufacturing | 1,691 | 1,795 | 1,062 | ||||||||||
| 36,706 | 43,780 | 42,714 | |||||||||||
Other expenses (income) | |||||||||||||
Selling, general and administrative expenses(note 7) | 35,537 | 39,696 | 34,696 | ||||||||||
Amortization | 4,245 | 3,879 | 3,527 | ||||||||||
Interest expense | 1,099 | 2,031 | 2,699 | ||||||||||
Foreign exchange loss (gain) | (116 | ) | 299 | 259 | |||||||||
Other expense (income) | (151 | ) | (52 | ) | 13 | ||||||||
| 40,614 | 45,853 | 41,194 | |||||||||||
Income (loss) before income taxes | (3,908 | ) | (2,073 | ) | 1,520 | ||||||||
Income tax expense (recovery)(note 8) | |||||||||||||
Current | (678 | ) | (835 | ) | (153 | ) | |||||||
Future | (737 | ) | 315 | 1,463 | |||||||||
| (1,415 | ) | (520 | ) | 1,310 | |||||||||
Income (loss) from continuing operations | (2,493 | ) | (1,553 | ) | 210 | ||||||||
Income from discontinued operations(note 10) | – | 2,172 | 1,290 | ||||||||||
Net income (loss) for the year | (2,493 | ) | 619 | 1,500 | |||||||||
Net income (loss) per share | |||||||||||||
Continuing operations | |||||||||||||
Basic and diluted | (0.15 | ) | (0.09 | ) | 0.01 | ||||||||
Discontinued operations | |||||||||||||
Basic | 0.00 | 0.13 | 0.08 | ||||||||||
Diluted | 0.00 | 0.13 | 0.07 | ||||||||||
Net income (loss) per share | |||||||||||||
Basic | (0.15 | ) | 0.04 | 0.09 | |||||||||
Diluted | (0.15 | ) | 0.04 | 0.08 | |||||||||
Weighted average basic number of shares outstanding | 17,172,373 | 17,156,964 | 16,993,647 | ||||||||||
| The accompanying notes are an integral part of these financial statements. |
Table of Contents
| FINANCIAL STATEMENTS | CE FRANKLIN LTD.ANNUAL REPORT 2002 25 |
STATEMENTS OF CASH FLOWS
| For the years ended December 31 (in thousands of Canadian dollars) | 2002 | 2001 | 2000 | ||||||||||
Cash flows from operating activities | |||||||||||||
Income (loss) from continuing operations | (2,493 | ) | (1,553 | ) | 210 | ||||||||
Items not affecting cash | |||||||||||||
Amortization | 4,245 | 3,879 | 3,527 | ||||||||||
Loss (gain) on disposal of property and equipment | (128 | ) | (48 | ) | 56 | ||||||||
Future income tax expense (recovery) | (737 | ) | 315 | 1,463 | |||||||||
Increase (decrease) in inventory reserves | 87 | 1,593 | (290 | ) | |||||||||
| 974 | 4,186 | 4,966 | |||||||||||
Decrease (increase) in non-cash working capital balances related to operations(note 11) | (4,244 | ) | 22,331 | (13,743 | ) | ||||||||
Net cash flow from continuing operations | (3,270 | ) | 26,517 | (8,777 | ) | ||||||||
Net cash flow from discontinued operations | – | 2,699 | 2,687 | ||||||||||
| (3,270 | ) | 29,216 | (6,090 | ) | |||||||||
Cash flows from financing activities | |||||||||||||
Issuance of capital stock | 82 | 49 | 1,428 | ||||||||||
Increase (decrease) in bank operating loan | 5,200 | (31,700 | ) | 11,500 | |||||||||
Decrease in bank overdraft | (688 | ) | (4,093 | ) | (2,366 | ) | |||||||
Decrease in long-term debt | (269 | ) | (278 | ) | (299 | ) | |||||||
Other | – | 225 | – | ||||||||||
| 4,325 | (35,797 | ) | 10,263 | ||||||||||
Cash flows from investing activities | |||||||||||||
Purchase of property and equipment | (1,234 | ) | (2,313 | ) | (4,297 | ) | |||||||
Proceeds on disposal of property and equipment | 179 | 970 | 124 | ||||||||||
Net proceeds on disposal of Domino Machine(note 10) | – | 7,924 | – | ||||||||||
| (1,055 | ) | 6,581 | (4,173 | ) | |||||||||
Change in cash and cash equivalents during the year | – | – | – | ||||||||||
Cash and cash equivalents – Beginning of year | – | – | – | ||||||||||
Cash and cash equivalents – End of year | – | – | – | ||||||||||
Cash paid during the year | |||||||||||||
Interest on bank operating loan | 1,046 | 2,589 | 3,426 | ||||||||||
Interest on long-term debt | 53 | 60 | 58 | ||||||||||
Income taxes | 247 | 567 | 104 | ||||||||||
| The accompanying notes are an integral part of these financial statements. |
Table of Contents
26 CE FRANKLIN LTD.ANNUAL REPORT 2002 | |
NOTES TO FINANCIAL STATEMENTS
December 31, 2002, 2001 and 2000
(tabular amounts in thousands of Canadian dollars except share and per share amounts)
1. ACCOUNTING POLICIES
Generally accepted accounting principles
The financial statements of the Company have been prepared in accordance with accounting principles generally accepted in Canada. These principles differ in certain respects from accounting principles generally accepted in the United States (“U.S.”). The material differences that affect the Company’s financial statements are described in note 17.
The preparation of financial statements in conformity with generally accepted accounting principles requires management to make estimates and assumptions that affect the reported amounts of assets and liabilities and disclosure of contingent assets and liabilities at the dates of the financial statements and the reported amounts of revenues and expenses during the reporting periods. Actual results could differ from those estimates.
Basis of presentation
On February 1, 2002 the Company amalgamated with its wholly owned subsidiary CEF Technologies Ltd.
Inventories
Inventories, consisting primarily of goods purchased and held for resale, are valued at the lower of cost or net realizable value. Cost is determined on an average cost basis.
Foreign currency translation
Monetary assets and liabilities are translated into Canadian dollars at year-end exchange rates and gains or losses from translation are recognized in the Statements of Operations. Revenue and expenses are translated at the exchange rate prevailing on the date the transaction occurs.
In the normal course of business, the Company enters into foreign currency forward exchange contracts with financial institutions to fix the value of liabilities or future commitments. Gains and losses arising from these contracts offset the losses and gains from the underlying hedged transactions.
Property and equipment
Property and equipment are recorded at cost less related accumulated amortization. The Company provides for amortization of property and equipment using rates as follows:
| Buildings | 5% to 10% | straight line | ||||||
| Leasehold improvements | 10% to 20% | straight line | ||||||
| Computer equipment and software | 15% to 33% | straight line | ||||||
| Equipment and machinery | 10% to 20% | straight line | ||||||
| Furniture and office equipment | 15% to 20% | straight line | ||||||
| Automotive equipment | 30 | % | straight line | |||||
Assets held under capital lease are amortized by the straight-line method over the term of the lease or the estimated useful life of the assets, whichever is shorter.
Goodwill and other intangibles
Goodwill represents the excess of the purchase price over the fair value of net assets acquired related to an acquisition. Effective January 1, 2002 (see note 2a), the Company adopted the new Canadian Institute of Chartered Accountants’ (“CICA”) standard relating to goodwill and other intangible assets. The new standard requires that goodwill and intangible assets with indefinite useful lives no longer be amortized, and are tested annually for a permanent impairment.
Table of Contents
| NOTES TO FINANCIAL STATEMENTS | CE FRANKLIN LTD.ANNUAL REPORT 2002 27 |
Revenue recognition
Revenue from the sale of general supplies, tubular goods and manufactured products is recognized upon delivery to the customer.
Earnings per share
Earnings per share are computed based on the weighted average basic number of shares outstanding for the period. Diluted earnings per share have been calculated using the treasury stock method, whereby diluted earnings per share are calculated as if options were exercised at the beginning of the year and funds received were used to purchase the Company’s own stock.
In the year ended December 31, 2000, the Company adopted the new CICA standard relating to earnings per share.
Income taxes
The Company uses the liability method of accounting for income taxes under which future tax assets and liabilities are recognized when there are differences between the financial statement carrying amounts of existing assets and liabilities and their respective tax bases. Future tax assets and liabilities are measured using substantively enacted tax rates in effect in the period in which those temporary differences are expected to be recovered or settled. The effect on future tax assets and liabilities of a change in tax rates is recognized as part of the provision for income taxes in the period that includes the enactment date.
Cash and cash equivalents
Cash and cash equivalents are defined as cash and short-term, highly liquid investments, which have a maturity of less than 90 days at the time of purchase.
Stock options
The Company has a stock option plan, which is described in note 9c. The Company applies the intrinsic method in accounting for common share options granted. No compensation expense is recognized when stock options are issued to and paid by employees. Any consideration received on exercise of stock options is credited to share capital.
2. CHANGES IN ACCOUNTING POLICIES
a) Goodwill and other intangibles
Effective January 1, 2002, the Company adopted the new CICA standard relating to goodwill and other intangible assets. The new standard requires that goodwill and intangible assets with indefinite useful lives no longer be amortized, and are tested annually for a permanent impairment. As a result of adopting the new standard, the Company has determined that $415,000 of its goodwill ($375,000 after-tax) is impaired, and in accordance with the new standard, applied the $375,000 impairment against retained earnings as at January 1, 2002.
The Company’s net income for the year ended December 31, 2001 would have been $859,000 (2000 – $1,740,000) versus $619,000 (2000 – $1,500,000) as previously reported had this amortization expense not been recorded in that period. The Company’s basic and diluted earnings per share for the year ended December 31, 2001 would have been $0.05 (2000 – $0.10) versus $0.04 (2000 – $0.09 basic, $0.08 diluted) as previously reported.
b) Stock-based compensation
On January 1, 2002 the Company adopted the new CICA standard relating to stock-based compensation and other stock-based payments, and has continued to account for common share options granted to employees, officers and directors using the intrinsic method. Accordingly, no compensation expense has been recognized in the Statements of Operations.
Table of Contents
28 CE FRANKLIN LTD.ANNUAL REPORT 2002 | NOTES TO FINANCIAL STATEMENTS |
3. ACCOUNTS RECEIVABLE
Concentration of credit risk
The Company specializes in the distribution of equipment and supplies to producers of oil and gas in Canada. These customers principally operate in the oil and gas exploration and production industry.
4. PROPERTY AND EQUIPMENT
| Accumulated | ||||||||||||
| As at December 31, 2002 | Cost | Amortization | Net | |||||||||
Land, buildings and leasehold improvements | 3,628 | 2,465 | 1,163 | |||||||||
Computer equipment and software | 21,645 | 12,391 | 9,254 | |||||||||
Equipment and machinery | 4,703 | 2,651 | 2,052 | |||||||||
Furniture and office equipment | 1,701 | 1,428 | 273 | |||||||||
Automotive equipment | 61 | 46 | 15 | |||||||||
| 31,738 | 18,981 | 12,757 | ||||||||||
| Accumulated | ||||||||||||
| As at December 31, 2001 | Cost | Amortization | Net | |||||||||
Land, buildings and leasehold improvements | 3,086 | 2,334 | 752 | |||||||||
Computer equipment and software | 21,362 | 9,091 | 12,271 | |||||||||
Equipment and machinery | 3,749 | 2,204 | 1,545 | |||||||||
Furniture and office equipment | 1,658 | 1,284 | 374 | |||||||||
Automotive equipment | 61 | 40 | 21 | |||||||||
| 29,916 | 14,953 | 14,963 | ||||||||||
Included in computer equipment and software at December 31, 2002 is leased computer equipment with a cost of $1,060,000 (2001 – $1,060,000) and related accumulated amortization of $529,000 (2001 – $252,000).
5. BANK OPERATING LOAN
The Company has a demand operating loan facility in the amount of $35.0 million (2001 – a 364-day revolving loan facility – $53.0 million). Amounts drawn against this facility bear interest at prime plus 0.5%. The prime rate as at December 31, 2002 was 4.5% (2001 – 4.0%). The maximum amount available under this facility is subject to a borrowing base formula applied to accounts receivable and inventories. As at December 31, 2002 the maximum available under this facility based on the borrowing base formula was $35.0 million (2001 – $40.8 million).
The facility is collateralized by a general security agreement covering all present and after-acquired property of the Company including accounts receivable, inventories and property and equipment.
This facility contains certain restrictive covenants which include a requirement to obtain prior approval for acquisitions and capital asset additions in excess of certain limits, to maintain certain financial ratios and obtain approval prior to payment of dividends, repurchase or redemption of shares.
Table of Contents
| NOTES TO FINANCIAL STATEMENTS | CE FRANKLIN LTD.ANNUAL REPORT 2002 29 |
6. LONG-TERM DEBT
| As at December 31 | 2002 | 2001 | ||||||
Obligations under capital leases | 596 | 865 | ||||||
Less: Current portion | (297 | ) | (251 | ) | ||||
| 299 | 614 | |||||||
The capital leases are payable in equal monthly installments of $27,000 including principal and interest at a rate of 7%. The leases are collateralized by the underlying assets and expire in November 2004.
Repayments of capital leases are as follows:
| Year ending December 31 | ||||
2003 | 333 | |||
2004 | 305 | |||
| 638 | ||||
Less: interest | 42 | |||
| 596 | ||||
7. SELLING, GENERAL AND ADMINISTRATIVE EXPENSES
Selling, general and administrative expenses include the following amounts:
| For the years ended December 31 | 2002 | 2001 | 2000 | |||||||||
Bad debt expense | 688 | 1,027 | 889 | |||||||||
Rental expense | 3,773 | 4,204 | 3,577 | |||||||||
8. INCOME TAXES
a) Reconciliation of the income tax provision
The difference between the income tax provision recorded and the provision obtained by applying the combined federal and provincial statutory rates is as follows:
| For the years ended December 31 | 2002 | % | 2001 | % | 2000 | % | ||||||||||||||||||
Income (loss) before income taxes | (3,908 | ) | (2,073 | ) | 1,520 | |||||||||||||||||||
Income taxes (recovery) calculated at expected rates | (1,547 | ) | (39.6 | ) | (884 | ) | (42.6 | ) | 681 | 44.8 | ||||||||||||||
Losses not previously recognized | (139 | ) | (3.5 | ) | – | – | – | – | ||||||||||||||||
Non-deductible items | 156 | 4.0 | 224 | 10.8 | 193 | 12.7 | ||||||||||||||||||
Difference in tax rates | (116 | ) | (3.0 | ) | 143 | 6.9 | 205 | 13.5 | ||||||||||||||||
Effect of changes in tax rates | – | – | – | – | (649 | ) | (42.7 | ) | ||||||||||||||||
Future tax asset not recognized | – | – | – | – | 669 | 44.0 | ||||||||||||||||||
Capital taxes and other items | 231 | 5.9 | (3 | ) | (0.2 | ) | 211 | 13.9 | ||||||||||||||||
| (1,415 | ) | (36.2 | ) | (520 | ) | (25.1 | ) | 1,310 | 86.2 | |||||||||||||||
Table of Contents
30 CE FRANKLIN LTD.ANNUAL REPORT 2002 | NOTES TO FINANCIAL STATEMENTS |
b) Significant components of future income tax assets and liabilities are as follows:
| As at December 31 | 2002 | 2001 | ||||||
Assets | ||||||||
Unused loss carry forwards | 142 | – | ||||||
Warranty provision | 39 | 43 | ||||||
Other | 131 | 7 | ||||||
| 312 | 50 | |||||||
Liabilities | ||||||||
Property and equipment | 1,811 | 2,740 | ||||||
Goodwill | 567 | 648 | ||||||
Other | 315 | 153 | ||||||
| 2,693 | 3,541 | |||||||
Net future income tax liability | 2,381 | 3,491 | ||||||
c) Income taxes recoverable represent amounts due to the Company, net of amounts received, for recovery of prior years taxes paid due to the application of tax losses.
d) As at December 31, 2002 the Company had non-capital loss carry forwards for income tax purposes of $399,000, which expire in 2009.
9. CAPITAL STOCK
a) The Company has authorized an unlimited number of common shares with no par value.
b) On October 24, 2001 the Company extended, until November 3, 2003, its principal shareholder’s irrevocable option to acquire an amount of common shares, at market value, such that its interest in the Company will not be diluted.
c) The Board of Directors may grant options to substantially all employees, officers and directors to purchase up to 2,240,925 common shares. The exercise period and the vesting schedule after the grant date are not to exceed 10 years and are to be established by the Compensation Committee of the Board of Directors.
Option activity for each of the years ended December 31 was as follows:
| 2002 | 2001 | 2000 | ||||||||||||||||||||||
| Weighted | Weighted | Weighted | ||||||||||||||||||||||
| average | average | average | ||||||||||||||||||||||
| exercise | exercise | exercise | ||||||||||||||||||||||
| Number of | price | Number of | price | Number of | price | |||||||||||||||||||
| Options | per share | options | per share | options | per share | |||||||||||||||||||
Outstanding – Beginning of year | 1,123,164 | 6.43 | 845,747 | 6.85 | 949,026 | 5.15 | ||||||||||||||||||
Granted | 876,951 | 3.48 | 470,161 | 5.73 | 417,082 | 7.76 | ||||||||||||||||||
Exercised | (20,605) | 4.40 | (8,938 | ) | 4.48 | (416,612 | ) | 3.42 | ||||||||||||||||
Cancelled and expired | (484,593) | 6.11 | (183,806 | ) | 6.67 | (103,749 | ) | 7.46 | ||||||||||||||||
Outstanding – End of year | 1,494,917 | 4.83 | 1,123,164 | 6.43 | 845,747 | 6.85 | ||||||||||||||||||
Exercisable – End of year | 470,056 | 6.61 | 538,149 | 6.73 | 324,070 | 6.94 | ||||||||||||||||||
Table of Contents
| NOTES TO FINANCIAL STATEMENTS | CE FRANKLIN LTD.ANNUAL REPORT 2002 31 |
As at December 31, 2002 the following stock options were outstanding:
| Exercisable | ||||||||||||
| Outstanding stock options | stock options | |||||||||||
| Weighted | ||||||||||||
| average | ||||||||||||
| remaining | ||||||||||||
| Exercise price | Number | contractual life | Number | |||||||||
| $3.28 | 41,500 | 8.67 years | 13,833 | |||||||||
| $3.30 | 100,000 | 9.04 years | – | |||||||||
| $3.49 | 364,178 | 9.96 years | – | |||||||||
| $3.50 | 325,831 | 9.01 years | – | |||||||||
| $4.00 | 10,000 | 9.17 years | – | |||||||||
| $4.40 | 93,802 | 1.33 years | 93,802 | |||||||||
| $5.50 | 58,500 | 0.61 years | 58,500 | |||||||||
| $6.05 | 242,846 | 3.13 years | 80,949 | |||||||||
| $7.50 | 153,364 | 2.17 years | 118,076 | |||||||||
| $8.50 | 49,500 | 2.42 years | 49,500 | |||||||||
| $9.60 | 55,396 | 0.17 years | 55,396 | |||||||||
| 1,494,917 | 3.79 years | 470,056 | ||||||||||
The Company applies the intrinsic method of accounting for common share options granted to employees, officers and directors. Accordingly, no compensation expense has been recognized in the Statements of Operations. Had the Company adopted the fair value based method of accounting, the amount expensed in each period would be the fair value of the options, calculated using the Black-Scholes options pricing model and net of options forfeited in the period, amortized over the expected life of the options. The pro forma net earnings attributable to common shareholders and pro forma net earnings attributable to common shareholders per common share of the Company would be as follows:
| 2002 | 2001 | 2000 | |||||||||||
Net income (loss) | |||||||||||||
As reported | (2,493) | 619 | 1,500 | ||||||||||
Proforma | (2,857) | (401 | ) | 647 | |||||||||
Basic earnings (loss) per share | |||||||||||||
As reported | (0.15) | 0.04 | 0.09 | ||||||||||
Proforma | (0.17) | (0.02 | ) | 0.04 | |||||||||
Diluted earnings (loss) per share | |||||||||||||
As reported | (0.15) | 0.04 | 0.08 | ||||||||||
Proforma | (0.17) | (0.02 | ) | 0.03 | |||||||||
The fair value of common share options granted in 2002 is $1,831,000 (2001 – $1,269,000). The fair value of common share options granted is estimated as at the grant date using the Black-Scholes option-pricing model, using the following assumptions:
| Dividend yield | nil | ||||
Risk-free interest rate | 4.83% | ||||
| Expected life | 7 years | ||||
Expected volatility | 70% | ||||
Table of Contents
32 CE FRANKLIN LTD.ANNUAL REPORT 2002 | NOTES TO FINANCIAL STATEMENTS |
10. DISCONTINUED OPERATIONS
On December 18, 2001 the Company sold its Domino Machine operations for net cash proceeds of $7,924,000 resulting in a net after tax gain of $1,102,000. Domino Machine provided custom machining services to the energy industry and was not considered a core operation to the Company. The net proceeds from this transaction were used to reduce the Company’s outstanding bank operating loan. The results of discontinued operations for the years ended December 31, 2001 and 2000 were as follows:
| For the years ended December 31 | 2001 | 2000 | ||||||
Sales | 9,390 | 9,333 | ||||||
Income before interest, taxes and gain on sale | 2,207 | 2,603 | ||||||
Gain on sale | 1,355 | – | ||||||
Income before interest and taxes | 3,562 | 2,603 | ||||||
Interest expense | 500 | 616 | ||||||
Income taxes – operations | 637 | 697 | ||||||
Income taxes – gain on sale | 253 | – | ||||||
Income for the year | 2,172 | 1,290 | ||||||
Total assets, excluding goodwill | 4,582 | 5,570 | ||||||
Total liabilities | 588 | 679 | ||||||
Goodwill | 2,575 | 2,647 | ||||||
11. DECREASE (INCREASE) IN NON-CASH WORKING CAPITAL BALANCES RELATED TO OPERATIONS
| For the years ended December 31 | 2002 | 2001 | 2000 | |||||||||
Accounts receivable | 1,415 | 23,950 | (11,224 | ) | ||||||||
Income taxes recoverable | (741 | ) | 4,094 | 1,113 | ||||||||
Inventories | 9,254 | 11,639 | (15,429 | ) | ||||||||
Other current assets | (100 | ) | 1,825 | (1,958 | ) | |||||||
Accounts payable | (8,541 | ) | (15,857 | ) | 14,955 | |||||||
Accrued liabilities | (5,531 | ) | (3,320 | ) | (1,200 | ) | ||||||
| (4,244 | ) | 22,331 | (13,743 | ) | ||||||||
12. RELATED PARTIES
During the year, the Company purchased inventory from subsidiaries of its principal shareholder at commercial rates. Included in inventory at December 31, 2002 is $2,160,000, (2001 – $2,653,000) of inventory purchased from subsidiaries of its principal shareholder. Cost of sales includes $5,960,000 (2001 – $7,387,000; 2000 – $7,786,000) of inventory purchased from subsidiaries of its principal shareholder. Accounts payable and accrued liabilities includes $926,000 (2001 – $535,000) owing to subsidiaries of its principal shareholder. Transactions with related parties are in the normal course of business and are recorded at the exchange amount. Accounts payable and accrued liabilities are non-interest bearing and have no fixed terms of repayment.
Table of Contents
| NOTES TO FINANCIAL STATEMENTS | CE FRANKLIN LTD.ANNUAL REPORT 2002 33 |
13. COMMITMENTS AND CONTINGENCIES
a) The Company leases certain office, warehouse and store facilities and automobiles under long-term operating leases. Commitments for such non-cancellable operating leases for the next five years are as follows:
Year ending December 31, 2003 | 3,393 | ||||
2004 | 2,653 | ||||
2005 | 1,678 | ||||
2006 | 800 | ||||
2007 | 538 | ||||
| 9,062 | |||||
b) The Company is involved in various lawsuits, the losses from which, if any, are not anticipated to be material to the financial statements.
14. SEGMENT INFORMATION
The Company has two identifiable industry segments, which are the distribution of equipment and supplies to producers of oil and gas and manufacturing for rent or sale of air and gas compression equipment for the producers of oil and gas.
| Distribution | Manufacturing | Total | ||||||||||
2002 | ||||||||||||
Revenue | 255,128 | 6,201 | 261,329 | |||||||||
Gross Profit | 35,015 | 1,691 | 36,706 | |||||||||
Loss before interest and taxes | (2,233 | ) | (576 | ) | (2,809 | ) | ||||||
Assets | 94,764 | 4,770 | 99,534 | |||||||||
Goodwill | 7,765 | – | 7,765 | |||||||||
Capital expenditures | 1,230 | 4 | 1,234 | |||||||||
2001 | ||||||||||||
Revenue | 371,167 | 6,678 | 377,845 | |||||||||
Gross Profit | 41,985 | 1,795 | 43,780 | |||||||||
Income (loss) before interest and taxes | 604 | (646 | ) | (42 | ) | |||||||
Assets | 107,534 | 5,395 | 112,929 | |||||||||
Goodwill | 7,916 | 264 | 8,180 | |||||||||
Capital expenditures | 2,274 | 39 | 2,313 | |||||||||
2000 | ||||||||||||
Revenue | 353,138 | 6,289 | 359,427 | |||||||||
Gross Profit | 41,652 | 1,062 | 42,714 | |||||||||
Income (loss) before interest and taxes | 5,276 | (1,057 | ) | 4,219 | ||||||||
Assets | 152,832 | 5,103 | 157,935 | |||||||||
Goodwill | 8,147 | 272 | 8,419 | |||||||||
Capital expenditures | 4,232 | 65 | 4,297 | |||||||||
Table of Contents
34 CE FRANKLIN LTD.ANNUAL REPORT 2002 | NOTES TO FINANCIAL STATEMENTS |
15. FINANCIAL INSTRUMENTS
The Company’s financial instruments recognized in the balance sheets consist of accounts receivable, bank overdraft, accounts payable, accrued liabilities, income taxes recoverable, bank operating loan and long-term debt. The fair values of these recognized financial instruments, excluding long-term debt, approximate their carrying amounts due to the short-term maturity of these instruments. At December 31, 2002 the fair value of the demand operating loan facility approximated its carrying value since the cost of the Company’s borrowing approximated the current market rate of such borrowings.
16. ECONOMIC DEPENDENCY
In respect of the Company’s revenue, 30% (2001 – 39%; 2000 – 41%) is derived from the sale of oilfield tubular goods, where the majority of these products are purchased from one supplier.
17. RECONCILIATION OF CANADIAN AND UNITED STATES GENERALLY ACCEPTED ACCOUNTING PRINCIPLES (GAAP)
These financial statements have been prepared in accordance with Canadian GAAP. The Company’s accounting policies are consistent with U.S. GAAP with the following exceptions:
a) Statement of operations
| For the years ended December 31 | 2002 | 2001 | 2000 | |||||||||
Net income (loss) for the year under Canadian GAAP | (2,493 | ) | 619 | 1,500 | ||||||||
Effect of change in accounting policy (i) | (375 | ) | – | – | ||||||||
Effect of change in tax rates (ii) | – | 649 | (649 | ) | ||||||||
Restructuring provision adjustment (iii) | – | 9 | 9 | |||||||||
Benefit of deferred tax assets applied to goodwill (iv) | – | 30 | 30 | |||||||||
Net income (loss) for the year under U.S. GAAP | (2,868 | ) | 1,307 | 890 | ||||||||
Basic and diluted earnings per share (U.S. GAAP) Continuing Operations | (0.17 | ) | (0.05 | ) | (0.03 | ) | ||||||
Net Income (loss) | (0.17 | ) | 0.08 | 0.05 | ||||||||
| i) | Under Canadian GAAP, the transitional impairment of goodwill, net of tax, is recorded as a charge to opening retained earnings, whereas under U.S. GAAP, the transitional impairment of goodwill, net of tax, is recorded as a charge to net income. | |
| ii) | Under Canadian GAAP, future income tax assets and liabilities are calculated using substantively enacted tax rates, whereas under U.S. GAAP changes in tax rates are not applied to the future income tax calculation until they are actually enacted. Changes to Canadian tax rates were entered into legislation in 2001 and as a result these rates are applied to future tax assets and liabilities under U.S. GAAP in 2001. | |
| iii) | The restructuring provision adjustment relates to a 1995 transaction where $379,386 in restructuring expenditures were recorded in the purchase equation as goodwill under Canadian GAAP but were recorded in the statement of operations for U.S. GAAP. | |
| iv) | In 1996, the Company realized the benefit of certain deferred tax assets on which a 100% valuation provision had been recorded in 1995. This benefit was recorded as a reduction of goodwill for U.S. GAAP. | |
| The 2001 and 2000 adjustments in respect of both of the GAAP differences identified in (iii) and (iv) relate to differences in annual goodwill amortization. | ||
Table of Contents
\
| NOTES TO FINANCIAL STATEMENTS | CE FRANKLIN LTD.ANNUAL REPORT 2002 35 |
b) Statements of changes in shareholders’ equity
The reconciliation of the changes in shareholders’ equity from Canadian to U.S. GAAP is as follows:
| As at December 31 | 2002 | 2001 | 2000 | |||||||||
Shareholders’ equity under Canadian GAAP | 47,171 | 49,957 | 49,289 | |||||||||
Restructuring provision adjustment (a)(iii) | (324 | ) | (324 | ) | (333 | ) | ||||||
Benefit of deferred tax assets applied to goodwill (a)(iv) | (1,058 | ) | (1,058 | ) | (1,088 | ) | ||||||
Effect of change in tax rates (a)(ii) | – | – | (649 | ) | ||||||||
Shareholders’ equity under U.S. GAAP | 45,789 | 48,575 | 47,219 | |||||||||
c) Balance sheets
The following table indicates the restated amounts for the items in the balance sheets of the Company that would be affected had the financial statements been prepared in accordance with U.S. GAAP.
| As at December 31 | 2002 | 2001 | ||||||
Goodwill (a)(i), (a)(iii), and (a)(iv) | 6,383 | 6,798 | ||||||
Retained earnings (a)(iii) and (a)(iv) | 12,955 | 15,823 | ||||||
d) Recent accounting pronouncements
i. SFAS 145 Accounting for Gains and Losses on Settlement of Debt
In April 2002, Statement of Financial Accounting Standard No. 145 was issued rescinding the requirement to include gains and losses on the settlement of debt as extraordinary items. FAS 145 is applicable for fiscal years beginning on or after May 15, 2002. The standard has been adopted by the Company with no impact.
ii. SFAS 146 Accounting for Costs Associated with Exit or Disposal Activities
In June 2002, Statement of Financial Accounting Standard No. 146 was issued. The standard requires that liabilities for exit or disposal activity costs be recognized and measured at fair value when the liability is incurred. This standard is effective for disposal activities initiated after December 31, 2002.
iii. SFAS 148 Accounting for Stock-Based Compensation – Transition and Disclosure
In December 2002, Statement of Financial Accounting Standard No. 148 was issued as an amendment to FAS 123 Accounting for Stock-Based Compensation, to provide alternative methods of transition for a voluntary change to the fair value based method of accounting for stock-based employee compensation. FAS 148 is applicable for fiscal years beginning after December 15, 2003. The Company does not expect that the adoption of this pronouncement will have an impact on its financial statements.
18. SUBSEQUENT EVENT
Effective January 31, 2003, the Company sold for net cash proceeds of $538,000, a 50% interest in the property and equipment and operations of its Brittania Compression operations. Brittania Compression manufactures air and gas compression equipment for sale or rent.
Table of Contents
36 CE FRANKLIN LTD.ANNUAL REPORT 2002 | SUPPLEMENTARY INFORMATION |
FIVE YEARS OF FINANCIAL DATA
| (In millions of Canadian dollars except statistics and per share amounts) | 2002 | 2001 | 2000 | 1999 | 1998 | |||||||||||||||||
Sales | ||||||||||||||||||||||
General supplies | 178.0 | 223.1 | 204.3 | 140.3 | 180.9 | |||||||||||||||||
Tubulars | 77.1 | 148.0 | 148.8 | 91.1 | 120.2 | |||||||||||||||||
Manufacturing | 6.2 | 6.7 | 6.3 | 5.7 | 6.8 | |||||||||||||||||
Total sales | 261.3 | 377.8 | 359.4 | 237.1 | 307.9 | |||||||||||||||||
# of oil wells completed (excluding dry/service) | 3,856 | 4,702 | 5,466 | 2,516 | 4,039 | |||||||||||||||||
# of gas wells completed (excluding dry/service) | 9,121 | 11,200 | 8,929 | 5,998 | 4,257 | |||||||||||||||||
Gross Profit | ||||||||||||||||||||||
General supplies | 30.7 | 34.3 | 33.6 | 22.4 | 34.4 | |||||||||||||||||
% of sales | 17.3 | % | 15.4 | % | 16.4 | % | 16.0 | % | 19.0 | % | ||||||||||||
Tubulars | 4.3 | 7.7 | 8.1 | 4.0 | 7.2 | |||||||||||||||||
% of sales | 5.5 | % | 5.2 | % | 5.4 | % | 4.4 | % | 6.0 | % | ||||||||||||
Manufacturing | 1.7 | 1.8 | 1.0 | 1.0 | 0.9 | |||||||||||||||||
% of sales | 27.3 | % | 26.9 | % | 16.9 | % | 17.5 | % | 13.2 | % | ||||||||||||
Total gross profit | 36.7 | 43.8 | 42.7 | 27.4 | 42.5 | |||||||||||||||||
% of sales | 14.0 | % | 11.6 | % | 11.9 | % | 11.5 | % | 13.8 | % | ||||||||||||
Selling, general & administrative | 35.5 | 39.7 | 34.7 | 31.0 | 34.6 | |||||||||||||||||
% of gross profit | 96.8 | % | 90.7 | % | 81.2 | % | 113.2 | % | 81.4 | % | ||||||||||||
Earnings before interest, tax, depreciation, amortization and other expenses (income) EBITDA(1) | 1.2 | 4.1 | 8.0 | (3.6 | ) | 7.9 | ||||||||||||||||
| (1) EBITDA is a non-GAAP measurement and therefore is unlikely to be comparable to similar measures presented by other issuers | ||||||||||||||||||||||
Income (loss) from continuing operations | (2.5 | ) | (1.6 | ) | 0.2 | (5.5 | ) | 1.5 | ||||||||||||||
Income from discontinued operations | – | 2.2 | 1.3 | 0.1 | 0.7 | |||||||||||||||||
Net income (loss) | (2.5 | ) | 0.6 | 1.5 | (5.4 | ) | 2.2 | |||||||||||||||
% of sales | (1.0 | %) | 0.2 | % | 0.4 | % | (2.3 | %) | 0.7 | % | ||||||||||||
Earnings per share | ||||||||||||||||||||||
Basic | (0.15 | ) | 0.04 | 0.09 | (0.33 | ) | 0.14 | |||||||||||||||
Diluted | (0.15 | ) | 0.04 | 0.08 | (0.33 | ) | 0.13 | |||||||||||||||
Total assets | 99.5 | 112.9 | 166.2 | 138.1 | 127.7 | |||||||||||||||||
Total financed debt(2) | 22.1 | 17.2 | 48.6 | 37.4 | 46.8 | |||||||||||||||||
| (2) Bank operating loan, current portion of long-term debt and long-term debt | ||||||||||||||||||||||
Total capitalization (average) | ||||||||||||||||||||||
Average financed debt | 21.9 | 39.0 | 45.7 | 42.1 | 47.5 | |||||||||||||||||
% to total capitalization | 31.2 | % | 43.5 | % | 48.5 | % | 47.0 | % | 48.0 | % | ||||||||||||
Average equity | 48.4 | 50.6 | 48.4 | 47.4 | 51.5 | |||||||||||||||||
% to total capitalization | 68.8 | % | 56.5 | % | 51.5 | % | 53.0 | % | 52.0 | % | ||||||||||||
Total capitalization | 70.3 | 89.6 | 94.1 | 89.5 | 99.0 | |||||||||||||||||
Current assets % of total assets (average) | ||||||||||||||||||||||
Average current assets | 86.0 | 118.4 | 119.6 | 92.6 | 110.3 | |||||||||||||||||
Average total assets | 107.4 | 147.8 | 150.8 | 125.3 | 137.8 | |||||||||||||||||
| % | 80.1 | % | 80.1 | % | 79.3 | % | 73.9 | % | 80.1 | % | ||||||||||||
Table of Contents
| SUPPLEMENTARY INFORMATION | CE FRANKLIN LTD.ANNUAL REPORT 2002 37 |
FIVE YEARS OF FINANCIAL DATA
| (In millions of Canadian dollars except statistics) | 2002 | 2001 | 2000 | 1999 | 1998 | |||||||||||||||||
Days sales outstanding (DSO)(3) | ||||||||||||||||||||||
Average accounts receivable – trade | 38.1 | 49.0 | 51.4 | 41.3 | 50.4 | |||||||||||||||||
DSO | 49.8 | 46.1 | 50.8 | 62.2 | 58.6 | |||||||||||||||||
| (3) (Average A/R/Sales)*365 days (includes Discontinued operations) | ||||||||||||||||||||||
Bad debt % to accounts receivable | ||||||||||||||||||||||
Bad debt | 0.7 | 1.0 | 0.9 | 1.1 | 0.5 | |||||||||||||||||
Average accounts receivable – trade | 38.1 | 49.0 | 51.4 | 41.3 | 50.4 | |||||||||||||||||
% | 1.8 | % | 2.0 | % | 1.8 | % | 2.6 | % | 0.9 | % | ||||||||||||
Inventory turns(4) | ||||||||||||||||||||||
Average inventory | 45.6 | 62.6 | 57.9 | 43.2 | 53.9 | |||||||||||||||||
Inventory turns | 4.9 | 5.4 | 5.6 | 4.9 | 5.0 | |||||||||||||||||
| (4) Cost of Sales /Average Inventory | ||||||||||||||||||||||
| (includes Discontinued operations) | ||||||||||||||||||||||
Inventory writeoff %(5) | ||||||||||||||||||||||
Inventory writeoffs | 1.1 | 2.2 | 0.4 | 0.4 | 1.0 | |||||||||||||||||
Average inventory | 45.6 | 62.6 | 57.9 | 43.2 | 53.9 | |||||||||||||||||
% | 2.4 | % | 3.5 | % | 0.7 | % | 1.0 | % | 1.9 | % | ||||||||||||
| (5) Inventory Writeoffs/Average Inventory | ||||||||||||||||||||||
| (includes Discontinued Operations) | ||||||||||||||||||||||
ROI (after tax) = return on investment(6) | ||||||||||||||||||||||
Interest after tax | 0.7 | 1.4 | 1.3 | 1.8 | 1.7 | |||||||||||||||||
ROI (after tax) | (2.6 | %) | 2.2 | % | 2.9 | % | (4.0 | %) | 4.0 | % | ||||||||||||
(6) Net Income + Interest After Tax | ||||||||||||||||||||||
| Average (Equity + Financed Debt) | ||||||||||||||||||||||
ROE (after tax) = return on equity(7) | (5.2 | %) | 1.2 | % | 3.1 | % | (11.5 | %) | 4.3 | % | ||||||||||||
| (7) (Net Income/Average Equity) | ||||||||||||||||||||||
Net income (loss) and shareholders equity as determined in accordance with Canadian GAAP differ from those determined in accordance with U.S. GAAP, due principally to the recording of certain restructuring expenditures as goodwill, the realization of certain deferred tax benefits, the change in tax rates and the transitional provision in 2002 with respect to impairment of goodwill. Under U.S. GAAP, the restructuring expenditures, the change in tax rates and the transitional provision with respect to goodwill, would have been recorded in the statement of operations and the benefit of the deferred tax assets would have been recorded as a reduction of goodwill.
Under U.S. GAAP future income tax assets and liabilities are calculated using different rates from those used under Canadian GAAP.
Table of Contents
38 CE FRANKLIN LTD.ANNUAL REPORT 2002 | SUPPLEMENTARY INFORMATION |
| (Unaudited) | |||||||||||||||||||||
| (In millions of Canadian dollars except per share amounts and statistics) | Q1 | Q2 | Q3 | Q4 | 2002 | ||||||||||||||||
Sales | |||||||||||||||||||||
General supplies | 45.9 | 39.7 | 47.1 | 45.3 | 178.0 | ||||||||||||||||
Tubulars | 32.3 | 16.4 | 14.0 | 14.4 | 77.1 | ||||||||||||||||
Manufacturing | 1.5 | 1.5 | 1.8 | 1.4 | 6.2 | ||||||||||||||||
Total sales | 79.7 | 57.6 | 62.9 | 61.1 | 261.3 | ||||||||||||||||
# of oil wells completed (excluding dry/service) | 708 | 866 | 1,272 | 1,010 | 3,856 | ||||||||||||||||
# of gas wells completed (excluding dry/service) | 2,152 | 2,196 | 2,213 | 2,560 | 9,121 | ||||||||||||||||
Gross Profit | |||||||||||||||||||||
General supplies | 7.8 | 6.9 | 7.8 | 8.2 | 30.7 | ||||||||||||||||
% of sales | 17.0 | % | 17.4 | % | 16.6 | % | 18.1 | % | 17.3 | % | |||||||||||
Tubulars | 1.8 | 0.9 | 0.8 | 0.8 | 4.3 | ||||||||||||||||
% of sales | 5.6 | % | 5.5 | % | 5.7 | % | 5.6 | % | 5.5 | % | |||||||||||
Manufacturing | 0.4 | 0.4 | 0.5 | 0.4 | 1.7 | ||||||||||||||||
% of sales | 26.7 | % | 26.7 | % | 27.8 | % | 28.6 | % | 27.3 | % | |||||||||||
Total gross profit | 10.0 | 8.2 | 9.1 | 9.4 | 36.7 | ||||||||||||||||
% of sales | 12.5 | % | 14.2 | % | 14.5 | % | 15.4 | % | 14.0 | % | |||||||||||
Selling, general & administrative | 9.5 | 8.6 | 8.4 | 9.0 | 35.5 | ||||||||||||||||
% of gross profit | 95.0 | % | 104.9 | % | 92.3 | % | 95.7 | % | 96.8 | % | |||||||||||
Earnings before interest, tax, depreciation, amortization | |||||||||||||||||||||
and other expenses (income) EBITDA (1) | 0.5 | (0.4 | ) | 0.7 | 0.4 | 1.2 | |||||||||||||||
| (1) EBITDA is a non-GAAP measurement and therefore is unlikely to be comparable to similar measures presented by other issuers | |||||||||||||||||||||
Net loss | (0.4 | ) | (1.1 | ) | (0.4 | ) | (0.6 | ) | (2.5 | ) | |||||||||||
% of sales | (0.5 | %) | (1.9 | %) | (0.6 | %) | (1.1 | %) | (1.0 | %) | |||||||||||
Earnings per share | |||||||||||||||||||||
Basic and diluted | (0.02 | ) | (0.07 | ) | (0.02 | ) | (0.04 | ) | (0.15 | ) | |||||||||||
Total assets | 111.9 | 103.1 | 107.3 | 99.5 | 99.5 | ||||||||||||||||
Total financed debt (2) | 18.4 | 21.3 | 20.8 | 22.1 | 22.1 | ||||||||||||||||
| (2) Bank operating loan, current portion of long-term debt and long-term debt | |||||||||||||||||||||
Total capitalization (average) | |||||||||||||||||||||
Average financed debt | 21.4 | 19.7 | 23.6 | 22.9 | 21.9 | ||||||||||||||||
% to total capitalization | 30.2 | % | 28.8 | % | 33.0 | % | 32.5 | % | 31.2 | % | |||||||||||
Average equity | 49.4 | 48.6 | 48.0 | 47.6 | 48.4 | ||||||||||||||||
% to total capitalization | 69.8 | % | 71.2 | % | 67.0 | % | 67.5 | % | 68.8 | % | |||||||||||
Total capitalization | 70.8 | 68.3 | 71.6 | 70.5 | 70.3 | ||||||||||||||||
Current assets % of total assets (average) | |||||||||||||||||||||
Average current assets | 93.3 | 80.7 | 87.2 | 82.9 | 86.0 | ||||||||||||||||
Average total assets | 115.5 | 102.3 | 108.1 | 103.5 | 107.4 | ||||||||||||||||
% | 80.8 | % | 78.9 | % | 80.7 | % | 80.1 | % | 80.1 | % | |||||||||||
Table of Contents
| SUPPLEMENTARY INFORMATION | CE FRANKLIN LTD.ANNUAL REPORT 2002 39 |
QUARTERLY FINANCIAL DATA
| (Unaudited) | |||||||||||||||||||||
| (In millions of Canadian dollars except statistics) | Q1 | Q2 | Q3 | Q4 | 2002 | ||||||||||||||||
Days sales outstanding (DSO) (3) | |||||||||||||||||||||
Average accounts receivable – trade | 43.4 | 32.1 | 37.9 | 39.1 | 38.1 | ||||||||||||||||
DSO – days | 46.4 | 47.5 | 51.4 | 54.6 | 49.8 | ||||||||||||||||
| (3) (Average A/R/Sales)*365 days | |||||||||||||||||||||
Bad debt % to accounts receivable | |||||||||||||||||||||
Bad debt | 0.2 | 0.2 | 0.2 | 0.1 | 0.7 | ||||||||||||||||
Average accounts receivable – trade | 43.4 | 32.1 | 37.9 | 39.1 | 38.1 | ||||||||||||||||
% | 0.5 | % | 0.6 | % | 0.5 | % | 0.3 | % | 1.8 | % | |||||||||||
Inventory turns(4) | |||||||||||||||||||||
Average inventory | 47.9 | 46.1 | 46.2 | 42.1 | 45.6 | ||||||||||||||||
Inventory turns | 5.8 | 4.3 | 4.7 | 4.9 | 4.9 | ||||||||||||||||
| (4) Cost of Sales /Average Inventory | |||||||||||||||||||||
Inventory writeoff %(5) | |||||||||||||||||||||
Inventory writeoffs | 0.2 | 0.3 | 0.1 | 0.5 | 1.1 | ||||||||||||||||
Average inventory | 47.9 | 46.1 | 46.2 | 42.1 | 45.6 | ||||||||||||||||
% | 0.4 | % | 0.7 | % | 0.2 | % | 1.2 | % | 2.4 | % | |||||||||||
| (5) Inventory Writeoffs/Average Inventory | |||||||||||||||||||||
ROI (after tax) = return on investment(6) | |||||||||||||||||||||
Interest after tax | 0.1 | 0.2 | 0.2 | 0.2 | 0.7 | ||||||||||||||||
ROI (after tax) | (1.6 | %) | (5.3 | %) | (0.8 | %) | (2.8 | %) | (2.6 | %) | |||||||||||
| (6) Net Income + Interest After Tax | |||||||||||||||||||||
| Average (Equity + Financed Debt) | |||||||||||||||||||||
ROE (after tax) = return on equity(7) | (3.1 | %) | (9.1 | %) | (2.9 | %) | (5.9 | %) | (5.2 | %) | |||||||||||
| (7) (Net Income/Average Equity) | |||||||||||||||||||||
Table of Contents
40 CE FRANKLIN LTD.ANNUAL REPORT 2002 | CORPORATE INFORMATION |
ROBERT S. BOSWELL
Mr. Boswell, a resident of Denver, Colorado, has been a Director of CE Franklin since 1976. He is Chairman and Chief Executive Officer of Forest Oil Corporation. He is a regional Governor of the Independent Petroleum Association of America. He also serves on the Board of the Gas Research Institute.
JOHN J. KENNEDY
Mr. Kennedy, a resident of Houston, Texas, has been a director of CE Franklin since 1999. Mr. Kennedy is President and CEO of Wilson Supply, a division of Smith International, Inc. He is currently a member of the Association of Corporate Treasurers (UK) and Institute of Petroleum (UK).
S. DOUGLAS MARTIN
Mr. Martin, a resident of Calgary, Alberta, became Chairman of the Board of the Company on October 16, 2001 and has been a Director of CE Franklin since 1994. He is Chairman of the Fort Calgary Capital Project, Past District Governor for Rotary and Past Co-Chairman for the Rotary Convention. Mr. Martin is one of the founders of the Calgary Performing Arts Centre.
DOUGLAS L. ROCK
Mr. Rock, a resident of Houston, Texas, has been a Director of CE Franklin since 1999. He is Chairman of the Board and CEO of Smith International, Inc. He also serves on the Board of Directors of Viad Corp.
GORDON R. SCHNELL
Mr. Schnell, a resident of Cochrane, Alberta, has been a Director of CE Franklin since 1995. Mr. Schnell was interim President and Chief Executive Officer of the Company from October 16, 2001 to January 15, 2002. He retired from CE Franklin in 1998 where he was the President and Chief Operating Officer. Mr. Schnell holds an advisory position with Martec Crane. He is past Governor of the Oilmens.
MICHAEL S. WEST
Mr. West, a resident of Calgary, Alberta, has been a Director, President and Chief Executive Officer of CE Franklin Ltd. since January 15, 2002. Prior to this, Mr. West has held progressively more senior positions up to and including Vice President, Operations in the supply and distribution business in western Canada’s oil and gas industry for the past six and a half years.
Table of Contents
| CORPORATE INFORMATION | CE FRANKLIN LTD.ANNUAL REPORT 2002 41 |
CORPORATE GOVERNANCE
The Company’s Board has ultimate responsibility for the way in which the Company is managed, including overseeing the conduct of the business of the Company and supervising management which is responsible for the day-to-day conduct of the business. The Board’s fundamental objectives are to enhance and preserve long-term shareholder value, to ensure the Company meets its obligations on an on-going basis and to ensure the Company operates in a reliable and safe manner. The Board of Directors is responsible for the development of a strategic plan, identifying and controlling the principal risks of the Company, succession planning, developing communications policies and internal control and management systems. The Board discharges its responsibilities directly and through committees. At regularly scheduled meetings, members of the Board receive and discuss reports from operating and financial management, review the Company’s overall financial position, discuss current trends, developments, issues and plans. A budget is reviewed and approved by the Board on an annual basis and a comparison of actual results to budget is monitored on a monthly basis pursuant to management reports. Significant transactions or activities outside of the ordinary course of business and activities not contemplated by the
budget require Board approval and are considered at additional meetings which are held as required. Informal discussion occurs between management and members of the Board on a regular basis. The Board met four times during 2002.
BOARD COMPOSITION
The Board is composed of six members, being a size considered appropriate by the Board, having regard to the Company’s size and complexity. The Board believes that one of the directors, being the President and Chief Executive Officer, is a related director within the meaning of the guidelines of the Toronto Stock Exchange (the “TSX Guidelines”) and accordingly the Board is constituted with a majority of individuals who qualify as “unrelated directors” within the meaning of the TSX Guidelines — being a director that is free from any interest and any business or other relationship which could, or could reasonably be perceived to, materially interfere with the director’s ability to act with a view to the best interests of the Company, other than interests arising from shareholdings. In this discussion the term “related director” means a director who is not an unrelated director and “independent director” is used to describe an unrelated director who is free from any interests in, or relationships with the significant shareholder or any of its affiliates.
To the extent necessary, and subject to the approval of the Board as a whole, any member of the Board is entitled to engage an outside advisor at the expense of the Company.
The Company is controlled by Smith International, Inc., which owns 55.1% of the outstanding shares of the Company and is a “significant shareholder” within the meaning of the TSX Guidelines. Approximately 44.9% of the outstanding Common Shares are held by shareholders other than the Company’s significant shareholder and its affiliates. The directors believe that three of the unrelated directors (or half of the total number of directors) do not have any interests in or relationships with the significant shareholder or its affiliates.
BOARD COMMITTEES
The Board has established four committees: the Audit Committee, the Compensation Committee, the Corporate Governance and Nominating Committee and the Environment, Health and Safety Committee. The Company does not have an Executive Committee and utilizes in its place ad hoc committees on an as required basis. The following is a brief description of the mandate and composition of each Committee.
Table of Contents
42 CE FRANKLIN LTD.ANNUAL REPORT 2002 | CORPORATE INFORMATION |
AUDIT COMMITTEE
The Audit Committee is composed entirely of unrelated directors, S. Douglas Martin, Gordon R. Schnell and John J. Kennedy. The Audit Committee is responsible for, among other matters, reviewing the Company’s financial reporting process (including reviewing annual and quarterly financial statements) and enquiring as to the adequacy of internal controls. Although it is management’s responsibility to design and implement an effective internal control system, the Audit Committee ensures that management has done so.
The Audit Committee is also responsible for reviewing the performance of external auditors. The Audit Committee has direct communication channels with the Company’s auditors and meets with them on a regular basis. The Audit Committee met four times during 2002.
COMPENSATION COMMITTEE
The Compensation Committee is composed of unrelated directors, S. Douglas Martin, Robert S. Boswell and Douglas L. Rock, and is responsible for, among other matters, formulating and making recommendations to the Board on compensation issues relating to the directors and senior management including establishing the compensation philosophy, reviewing the performance of the Chief Executive Officer and recommending compensation for the Chief Executive Officer and other senior executives. The Compensation Committee also approves the granting of and terms of stock options to the senior executives and employees of the
Company. The Compensation Committee met two times during 2002.
CORPORATE GOVERNANCE AND NOMINATING COMMITTEE
The Corporate Governance and Nominating Committee, comprised of Douglas L. Rock and Michael S. West, is responsible for, among other matters, monitoring and managing the Corporate Governance process of the Board including recommending the number of directors to be elected, recommending nominees, including candidates to fill vacancies and reviewing the performance and effectiveness of the Board and each member of the Board. The Committee is comprised of two directors being the President and Chief Executive Officer and one representative of the significant shareholder. The Board believes the participation of the President and Chief Executive Officer, who is a related director, is important to the proper functioning of the Committee because of his knowledge of the industry and the Company’s business and does not prejudice its opinion, due in part to the existence of the representative of the significant shareholder. The Company does not provide formal education programs for new directors as recommended in the TSX Guidelines, but does provide such orientation and information as individual directors may request.
ENVIRONMENT, HEALTH AND SAFETY COMMITTEE
The Environment, Health and Safety Committee is comprised of unrelated directors, S. Douglas Martin, Gordon R.
Schnell and John J. Kennedy, and is responsible for, among other matters, monitoring the management of the Company’s environmental, health and safety risks, liabilities, policies, practices and procedures.
EXPECTATION OF MANAGEMENT
The Board relies on management to provide the information required by it to properly perform its duties and expects management to keep it apprised of matters affecting the Company, significant risks and opportunities available to the Company.
While the Board has not established specific position descriptions for the Board and Chief Executive Officer or determined specific corporate objectives which the Chief Executive Officer is responsible for meeting, the Board does not feel that the lack of such specific descriptions or objectives compromises the effectiveness of the governance of the Company. Due to the relatively small size of the Board and of the Company, the effectiveness of management generally and of the Chief Executive Officer specifically can be determined on a more informal basis.
SHAREHOLDER FEEDBACK
The Company has one employee, Salvatore Secreti, Vice President and Chief Financial Officer with designated responsibility for investor relations. Every shareholder enquiry receives a prompt response and significant shareholder concerns are reported to management and, where appropriate, the Board.
Table of Contents
CORPORATE INFORMATION
DIRECTORS
Robert S. Boswell(2)
FOREST OIL CORPORATION
FOREST OIL CORPORATION
John J. Kennedy(3)(4)
WILSON SUPPLY
S. Douglas Martin(2)(3)(4)
CHAIRMAN
Douglas L. Rock(1)(2)
SMITH INTERNATIONAL, INC.
Gordon R. Schnell(3)(4)
PAST PRESIDENT
Michael S. West(1)
PRESIDENT AND
CHIEF EXECUTIVE OFFICER
CHIEF EXECUTIVE OFFICER
| (1) | Member of the Corporate Governance and Nominating Committee | |
| (2) | Member of the Compensation Committee | |
| (3) | Member of the Audit Committee | |
| (4) | Member of the Environment, Health and Safety Committee |
LEADERSHIP TEAM
James E. Baumgartner
VICE PRESIDENT – SALES
VICE PRESIDENT – SALES
Brent W. Greenwood
VICE PRESIDENT – MARKETING AND SUPPLY
Ronald L. Koper
VICE PRESIDENT –
BUSINESS EFFECTIVENESS
BUSINESS EFFECTIVENESS
Timothy M. Ritchie
VICE PRESIDENT – OPERATIONS
Salvatore Secreti
VICE PRESIDENT AND
CHIEF FINANCIAL OFFICER
CHIEF FINANCIAL OFFICER
Roderick H. Tatham
DIRECTOR OF CUSTOMER SERVICE
AND QUALITY
AND QUALITY
Michael S. West
PRESIDENT AND
CHIEF EXECUTIVE OFFICER
CHIEF EXECUTIVE OFFICER
Designed and Produced by Result Inc.
Printed in Canada
AUDITORS
PricewaterhouseCoopers LLP
CALGARY, ALBERTA
CALGARY, ALBERTA
LEGAL COUNSEL
Canada – Macleod Dixon LLP
CALGARY, ALBERTA
CALGARY, ALBERTA
U.S. – Vinson & Elkins LLP
NEW YORK, NEW YORK
BANKERS
Toronto Dominion Bank
CALGARY, ALBERTA
CALGARY, ALBERTA
STOCK EXCHANGE LISTINGS
CE Franklin is listed on the American Stock Exchange, under the trading symbol CFK and the Toronto Stock Exchange, under the trading symbol CFT.
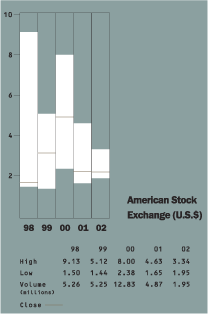
TRANSFER AGENT
Computershare Trust
Company of Canada,
600, 530 – 8th Avenue S.W.,
Calgary, Alberta, T2P 3S8
Company of Canada,
600, 530 – 8th Avenue S.W.,
Calgary, Alberta, T2P 3S8
Computershare Trust
Company of New York
NEW YORK, NEW YORK
SHAREHOLDER INQUIRIES
Computershare Trust
Company of Canada,
600, 530 – 8th Avenue S.W.,
Calgary, Alberta, T2P 3S8
1-800-332-0095
Company of Canada,
600, 530 – 8th Avenue S.W.,
Calgary, Alberta, T2P 3S8
1-800-332-0095
INVESTOR RELATIONS
Investors seeking information about CE Franklin, including copies of our annual and interim reports or recent news releases contact:
Investor Relations
tel.: (403) 531-5604
toll free: (800) 345-2858
email: investor@cefranklin.com
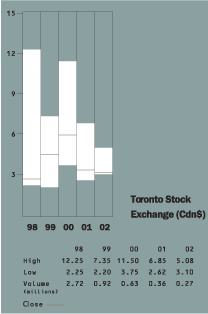
Table of Contents

Table of Contents
NEWS RELEASE
FOR IMMEDIATE RELEASE
CE Franklin Ltd. announces significant improvement in its first quarter 2003 results
Calgary, Alberta, April 16, 2003 — CE FRANKLIN LTD. (TSX.CFT, AMEX.CFK) announced its results for the first quarter ended March 31, 2003.
“CE Franklin showed continued improvement with its first quarter 2003 results”, said Michael West, President and Chief Executive Officer. “The Company has shown significant improvements in the areas of margin enhancement and cost rationalization. This results in a year over year Earnings before interest, taxes, depreciation and amortization (“EBITDA”) improvement of $742,000 or 152%. Earnings before income taxes were a positive $33,000 compared to a loss of $819,000 in Q1 2002. We will continue to develop and execute our strategies and will look for incremental improvement as we go forward.”
Net loss for the first quarter ended March 31, 2003 was $62,000 or $0.00 per share diluted as compared to a loss of $389,000 or $0.02 per share diluted for the quarter ended March 31, 2002.
Sales decreased $16.7 million or 21% for the quarter ended March 31, 2003 to $63.0 million as compared to the quarter ended March 31, 2002. Tubulars sales decreased $19.6 million reflecting two large customers now ordering their tubular goods directly from steel mills.
General Supplies sales increased $3.2 million or 7.0% to $49.1 million reflecting the increase in well completion activity to 3,615 wells completed during the first quarter of 2003 as compared to 2,860 wells completed during the first quarter of 2002.
Net loss for the first quarter ended March 31, 2003 was $62,000 or $0.00 per share diluted as compared to a net loss of $678,000 or $0.04 per share diluted for the fourth quarter ended December 31, 2002. Sales increased $1.9 million Q1 2003 vs. Q4 2002, however earnings increased $616,000 as a result of an improvement in gross profit margins and a reduction in SG&A expenses representing an incremental flow through of approximately 33%.
Conference Call and Webcast Information
A conference call to review the quarterly results, which is open to the public, will be held on Thursday, April 17, 2003, beginning at 11:00 a.m. EDT. Participants may join the call by dialing 1-888-881-4892 at the scheduled time. A recording of the entire call may be accessed by 1 p.m. EDT on the same day by calling 1-877-289-8525 and entering the pass code of 233113# and may be accessed until midnight Wednesday, April 19th, 2003.
1 of 2
Table of Contents
The call will also be webcast live at:http://www.newswire.ca/webcast/viewEventCNW.html?eventID=458480 and will be available on the Company’s website athttp://www.cefranklin.com.
About CE Franklin
CE Franklin is one of the largest distributors of thousands of complex products to the Canadian oil and gas exploration, production and refining industry, as well as an important provider of materials to other resource-based industries including oil sands, refineries, petro-chemicals, pulp and paper and mining. Our energy industry customers drill for, produce, process, pipeline and refine hydrocarbons. We provide them with a complete range of tubular products and production equipment, including air and gas compressors and artificial lift technology, plus pipe, valves, fittings and maintenance supplies. We provide complete customer inventory procurement and management services through our 37 locations across Canada. We are also leveraging our relationship with Wilson Supply in the U.S. in order to provide our customers with an even wider range of products and services.
CE Franklin’s strategy is to increase market share, maximize gross profit margins, rationalize expenses, enhance customer service, improve earnings and create shareholder wealth. Underpinning the strategy are our eight operating values — integrity; credibility; performance; teamwork; service ethic; trust; responsibility and community.
EBITDA is defined as earnings before interest, tax and amortization. EBITDA is a Non-GAAP earnings measure and is presented to provide the reader with operating financial information that is comparable to prior years operating financial information. It should be noted that EBITDA is not defined by Canadian generally accepted accounting principles and has no standardized meaning. Therefore, these results may not be readily comparable to other companies’ presentations of operating results.
This news release includes forward looking statements within the meaning of section 27A of the United States Securities Act of 1933 and Section 21E of the United States Securities Exchange Act of 1934. Although the Company believes that its expectations are based on reasonable assumptions, it can give no assurance that expected results will be achieved. Important factors that could cause actual results to differ materially from those in the forward looking statements herein include economic conditions, seasonality of drilling activity, commodity prices for oil and gas, currency fluctuations and government regulations, and other risks and uncertainties as described in the Company’s 2001 Annual Report on Form 20-F as filed with the United States Securities and Exchange Commission.
For Further Information Contact:
Sam Secreti
Chief Financial Officer
403-531-5603
ssecreti@cefranklin.com
*****
2 of 2
Table of Contents
Management’s Discussion and Analysis of Financial Condition and Results of Operations
(All amounts shown in CDN $’s)
Forward Looking Statements
Certain of the statements set forth in this MD&A, such as statements regarding planned activity and revenue levels, capital expenditures and the availability of capital resources to fund capital expenditures and working capital, are forward-looking statements within the meaning of Section 27A of the United States Securities Act of 1933 and Section 21E of the United States Securities Exchange Act of 1934. Although the Company believes that its expectations are based on reasonable assumptions, it can give no assurance that expected results will be achieved. There are numerous risks and uncertainties that can affect the outcome and timing of such events, including many factors beyond the control of the Company. These factors include, but are not limited to, economic conditions, seasonality of drilling activity, shift in drilling activity from conventional oil to gas and heavy oil, commodity prices for oil and gas, currency fluctuations, and government regulations. Should one or more of these risks or uncertainties occur, or should underlying assumptions prove incorrect, the Company’s actual results and plans for 2003 and beyond could differ materially from those expressed in the forward looking statements.
Results of Operations — For the Three Months ended March 31, 2003
The price of oil and gas as at March 31, 2003 was U.S. $31.04 (West Texas Intermediate) and Cdn. $5.95 (AECO spot price) respectively. This compares to U.S. $24.41 for oil and Cdn. $3.29 for gas as at March 31, 2002, and U.S. $29.42 and Cdn. $5.97, respectively as at December 31, 2002.
The total number of oil and gas wells completed for the quarter ended March 31, 2003 (excluding dry/service wells) in western Canada increased 26.4% to 3,615 wells completed as compared to 2,860 wells completed for the quarter ended March 31, 2002. The total number of oil and gas wells completed for the quarter ended March 31, 2003 (excluding dry/service wells) in western Canada increased 1.3% to 3,615 wells completed as compared to 3,570 wells completed for the quarter ended December 31, 2002. The average rig count increased 31.5% to 505 rigs for the quarter ended March 31, 2003 as compared to 384 rigs for the quarter ended March 31, 2002, and 282 rigs or 79.1% as compared to the quarter ended December 31, 2002.
Sales
Sales for the quarter ended March 31, 2003 decreased 21.0% to $63.0 million from $79.7 million for the quarter ended March 31, 2002. Sales for the quarter ended March 31, 2003 increased $1.9 million or 3.0% as compared to the quarter end December 31, 2002.
Tubulars sales for the quarter ended March 31, 2003 were $12.7 million, a decline of 60.7% or $19.6 million, as compared to $32.3 million for the quarter ended March 31, 2002. A significant component of the decrease in Tubulars sales is attributed to merger and acquisition activity, resulting in larger customers now being able to purchase tubular products directly from steel mills.
Sales for General Supplies increased $3.2 million or 7.0% to $49.1 million for the quarter ended March 31, 2003 from $45.9 million for the quarter ended March 31, 2002 due to the increase in activity levels. Sales increased $3.9 million, or 8.5%, for the quarter ended March 31, 2003 as compared to the quarter ended December 31, 2002.
Gross Profit
Total gross profit remained constant at $10.0 million for the quarter ended March 31, 2003 as compared to March 31, 2002 despite a $16.7 million decrease in sales, and increased $614,000, or 6.5%, as compared to the quarter ended December 31, 2002.
Average gross profit margin for the quarter ended March 31, 2003 increased to 15.9% from 12.6% for the quarter ended March 31, 2002 and from 15.4% for the quarter ended December 31, 2002. General Supplies profit margin increased to 18.0% from 17.0%, March 2003 as compared to March 2002, due to various profit margin initiatives implemented in 2002 and the beginning of 2003 which are beginning to show results.
Tubulars average gross profit margin increased to 6.8% from 5.4% for the quarter ended March 31, 2003 as compared to the previous year due to a shift away from larger customers who traditionally received better pricing due to the volume of purchases. The Company is also looking outside its normal sources of supply resulting in improved gross profit margins.
1 of 3
Table of Contents
Selling, General and Administrative Costs (SG&A)
For the quarter ended March 31, 2003, SG&A costs decreased $768,000 or 8.0% to $8.8 million from $9.6 million for the quarter ended March 31, 2002. Included in 2002 SG&A was approximately $512,000 in charges relating to severance, termination and closure costs as a result of the Company adjusting its infrastructure to support revenue levels. These reductions in 2002 have resulted in lower SG&A for the quarter ended March 31, 2003.
EBITDA (1)
Earnings before interest, tax, depreciation, amortization and other expenses (EBITDA) for quarter ended March 31, 2003 increased to $1.2 million or 152% from $487,000 for the quarter ended March 31, 2002. The $16.7 million decrease in sales was offset by an improvement in gross profit margins and a reduction in SG&A expense.
EBITDA increased $857,000 for the quarter ended March 31, 2003 as compared to the quarter ended December 31, 2002, while revenue increased $1.9 million. This resulted in an incremental flow through of approximately 46%.
Income (loss) before Income Taxes
Income before income taxes was $33,000 for the quarter ended March 31, 2003 as compared to a loss of $819,000 for the quarter ended March 31, 2002 and a loss of $979,000 for the quarter ended December 31, 2002. The $1.9 million revenue increase during the first quarter of 2003 as compared to the fourth quarter of 2002 resulted in an incremental flow through of 55%.
Net Income (loss) and Earnings per Share
Net loss for the quarter ended March 31, 2003 was $62,000 or $0.00 per share (diluted) as compared to net loss of $389,000 or $0.02 per share (diluted) for the quarter ended March 31, 2002 and a loss of $678,000 or $0.04 per share diluted for the quarter ended December 31, 2002.
Liquidity and Capital Resources
Asset and Cash Management
CE Franklin maintains debt primarily to finance its working capital requirements. CE Franklin’s total average capitalization (financed debt plus equity) improved in the first quarter of 2003 with average debt of 28.6% compared to 30.2% in the first quarter of 2002 and average equity of 71.4% in the first quarter of 2003 compared to 69.8% in the first quarter of 2002.
For the three months ended March 31, 2003, CE Franklin generated $1.2 million in cash flow from operations, $6.2 million of cash flow from the increase of accounts payable, accrued liabilities and bank overdraft, $0.6 million from proceeds on sale of 50% interest in Brittania and generated $1.5 million in cash flow from the reduction of inventories. The Company invested $4.1 million in its accounts receivable due to increased activity levels. This activity resulted in CE Franklin reducing its bank line by $5.4 million.
At March 31, 2003, CE Franklin had a $35.0 million credit facility, which in management’s opinion is considered sufficient to finance its current operating needs.
Risks and Uncertainties
CE Franklin’s financial performance may be influenced favourably or adversely by certain external factors, as described below:
Adverse weather conditions could decrease the demand for CE Franklin’s products and services. CE Franklin’s financial performance is tied closely to the seasonality of drilling activity, and field work including construction completions and rig activity. Higher drilling activity in Canada is generally experienced in the winter months. In the spring and early summer, drilling activity slows due to the difficulty in moving equipment during the spring thaws. To the extent that unseasonable weather conditions such as excessive rain or unusually warm winters affect the ability of CE Franklin’s customers to access their oil and gas wells, then the demand for CE Franklin’s products and services would temporarily decrease and the Company’s cash generated from operations would be adversely affected.
The loss of CE Franklin’s major supplier for its tubular goods business could adversely affect the Company’s revenue and gross profit. A substantial portion of CE Franklin’s business is the sale of tubular goods that are primarily obtained from one supplier. For the year ended December 31, 2002, 29.5% of CE Franklin’s revenue and 11.6% of CE Franklin’s gross profit was from the sale of oilfield tubular goods. Although the
2 of 3
Table of Contents
Company believes that it has historically had and continues to have a good relationship with its supplier, there can be no assurance that such relationship will continue. In the event the Company is unable to source tubular supplies from its existing supplier, then CE Franklin would need to search for an alternate supplier of theses goods. Such suppliers are available.
Fluctuations in oil and gas prices could adversely affect demand for CE Franklin’s products and services and, therefore, CE Franklin’s revenues, cash flows and profitability. CE Franklin’s operations are materially dependent upon the level of activity in oil and gas exploration and production. Both short-term and long-term trends in oil and gas prices affect the level of such activity. Oil and gas prices and, therefore, the level of drilling, exploration and production activity can be volatile. Factors that can cause price fluctuations include:
| • | relatively minor changes in the worldwide supply of and demand for oil and natural gas; | ||
| • | the ability of the members of the Organization of Petroleum Exporting Countries (“OPEC”) to maintain price stability through voluntary production limits; | ||
| • | the level of production by non-OPEC countries; | ||
| • | North American demand for gas; | ||
| • | general economic and political conditions; and | ||
| • | the presence or absence of drilling incentives such as Canadian provincial royalty holidays, fluctuation in the value of the Canadian dollar, availability of new leases and concessions and government regulations regarding, among other things, export controls, environmental protection, taxation, price controls and product allocation. |
Worldwide military, political and economic events, including initiatives by OPEC, affect both the demand for, and the supply of, oil and gas. Fluctuations during the last few years in the demand and supply of oil and gas have contributed to, and are likely to continue to contribute to, price volatility. CE Franklin believes that any prolonged reduction in oil and gas prices would depress the level of exploration and production activity. This would likely result in a corresponding decline in the demand for CE Franklin’s products and services and could have a material adverse effect on CE Franklin’s revenues, cash flows and profitability. There can be no assurances as to the future level of demand for CE Franklin’s products and services or future conditions in the oil and gas and oilfield supply industries.
CE Franklin operates in a highly competitive industry, which may adversely affect CE Franklin’s results of operations and profitability. The Canadian oilfield supply industry in which CE Franklin operates is very competitive. The Company believes that its future profitability is partially influenced by competitive factors beyond its control, including:
| • | the ability of some customers to purchase oilfield supplies directly from the manufacturer rather than from independent oilfield supply distributors; | ||
| • | the ability for new brokers and distributors to enter the tubular supply business and the general supply business if the oil and gas industry were to experience significant growth in drilling activity; and | ||
| • | price competitions among major supply companies. |
CE Franklin and its largest competitors are generally operating at low profit margins due to price competition. Price competition is due in part to consumer price pressure, in addition to the major supply companies competing for the same business.
Shifts in drilling activity from conventional oil to gas affect CE Franklin’s revenues, cash flows and profitability. CE Franklin sells an average of 3.5 times more product into an oil well versus a gas well and as a result a change in oil well completion activity has an impact on sales.
CE Franklin and its competitors are subject to changes in its customer base due to a high degree of merger and acquisition activity. This could adversely or positively impact the customer’s revenues.
(1) Non-GAAP Earnings Measures
EBITDA is defined as earnings before interest, tax and amortization. The Company’s EBITDA results are presented to provide the reader with operating financial information that is comparable to prior years operating financial information. It should be noted that EBITDA is not defined by Canadian generally accepted accounting principles and has no standardized meaning. Therefore, these results may not be readily comparable to other companies’ presentations of operating results.
3 of 3
Table of Contents
CE Franklin Ltd.
Interim Consolidated Statements of Operations
(Unaudited)
| Three Months Ended March 31 | ||||||||
| (in thousands of Canadian dollars, except per share data) | 2003 | 2002 | ||||||
Sales | ||||||||
| General supplies | 49,121 | 45,914 | ||||||
| Tubulars | 12,677 | 32,284 | ||||||
| Manufacturing | 1,181 | 1,536 | ||||||
| 62,979 | 79,734 | |||||||
Cost of sales | ||||||||
| General supplies | 40,301 | 38,097 | ||||||
| Tubulars | 11,811 | 30,527 | ||||||
| Manufacturing | 856 | 1,074 | ||||||
| 52,968 | 69,698 | |||||||
Gross profit | ||||||||
| General supplies | 8,820 | 7,817 | ||||||
| Tubulars | 866 | 1,757 | ||||||
| Manufacturing | 325 | 462 | ||||||
| 10,011 | 10,036 | |||||||
Other expenses (income) | ||||||||
| Selling, general and administrative expenses | 8,782 | 9,550 | ||||||
| Amortization | 1,072 | 1,055 | ||||||
| Interest expense | 270 | 226 | ||||||
| Foreign exchange loss (gain) | (118 | ) | 37 | |||||
| Other income | (28 | ) | (13 | ) | ||||
| 9,978 | 10,855 | |||||||
Income (loss) before income taxes | 33 | (819 | ) | |||||
Income tax expense (recovery) | ||||||||
| Current | 142 | (266 | ) | |||||
| Future | (47 | ) | (164 | ) | ||||
| 95 | (430 | ) | ||||||
Net loss for the period | (62 | ) | (389 | ) | ||||
Net income (loss) per share (note 4) | ||||||||
| Basic and diluted | 0.00 | (0.02 | ) | |||||
Weighted average basic number of shares outstanding | 17,178,696 | 17,158,091 | ||||||
Table of Contents
CE Franklin Ltd.
Interim Consolidated Balance Sheets
(Unaudited)
| March 31, | December 31, | |||||||
| (in thousands of Canadian dollars) | 2003 | 2002 | ||||||
ASSETS | ||||||||
Current assets | ||||||||
| Accounts receivable | 41,115 | 36,992 | ||||||
| Inventories | 38,934 | 40,679 | ||||||
| Income taxes recoverable | 599 | 741 | ||||||
| Other | 547 | 600 | ||||||
| 81,195 | 79,012 | |||||||
Property and equipment | 11,210 | 12,757 | ||||||
Goodwill | 7,765 | 7,765 | ||||||
| 100,170 | 99,534 | |||||||
LIABILITIES | ||||||||
Current liabilities | ||||||||
| Bank overdraft | 6,191 | 1,148 | ||||||
| Bank operating loan | 16,100 | 21,500 | ||||||
| Accounts payable | 17,721 | 16,525 | ||||||
| Accrued liabilities | 10,189 | 10,213 | ||||||
| Current portion of long-term debt | 297 | 297 | ||||||
| 50,498 | 49,683 | |||||||
Long-term debt | 229 | 299 | ||||||
Future income taxes | 2,334 | 2,381 | ||||||
| 53,061 | 52,363 | |||||||
SHAREHOLDERS’ EQUITY | ||||||||
Capital stock | 19,268 | 19,268 | ||||||
Contributed surplus | 13,566 | 13,566 | ||||||
Retained earnings | 14,275 | 14,337 | ||||||
| 47,109 | 47,171 | |||||||
| 100,170 | 99,534 | |||||||
Table of Contents
CE Franklin Ltd.
Interim Consolidated Statements of Cash Flows
(Unaudited)
| Three Months Ended March 31 | |||||||||
| (in thousands of Canadian dollars) | 2003 | 2002 | |||||||
Cash flows from operating activities | |||||||||
| Net loss | (62 | ) | (389 | ) | |||||
| Items not affecting cash — | |||||||||
| Amortization | 1,072 | 1,055 | |||||||
| Gain on disposal of property and equipment | (21 | ) | (11 | ) | |||||
| Future income taxes | (47 | ) | (164 | ) | |||||
| Increase in inventory reserves | 298 | 29 | |||||||
| 1,240 | 520 | ||||||||
| Net change in non-cash working capital balances related to operations — | |||||||||
| Accounts receivable | (4,123 | ) | (4,826 | ) | |||||
| Income taxes recoverable | 142 | — | |||||||
| Inventories | 1,498 | 4,981 | |||||||
| Other current assets | 53 | 26 | |||||||
| Accounts payable | 1,196 | (2,098 | ) | ||||||
| Accrued liabilities | (24 | ) | (3,560 | ) | |||||
| (18 | ) | (4,957 | ) | ||||||
Cash flows from financing activities | |||||||||
| Increase (decrease) in bank operating loan | (5,400 | ) | 1,300 | ||||||
| Increase in bank overdraft | 5,043 | 3,917 | |||||||
| Decrease in long-term debt | (70 | ) | (70 | ) | |||||
| (427 | ) | 5,147 | |||||||
Cash flows from investing activities | |||||||||
| Purchase of property and equipment | (108 | ) | (247 | ) | |||||
| Proceeds on disposal of property and equipment | 15 | 57 | |||||||
| Proceeds on sale of 50% interest in Brittania | 538 | — | |||||||
| 445 | (190 | ) | |||||||
Change in cash and cash equivalents during the period | — | — | |||||||
Cash and cash equivalents — Beginning of period | — | — | |||||||
Cash and cash equivalents — End of period | — | — | |||||||
| Cash paid during the period for: | |||||||||
| Interest on bank operating loan | 258 | 213 | |||||||
| Interest on long-term debt | 12 | 13 | |||||||
| Income taxes | — | 82 | |||||||
Table of Contents
CE Franklin Ltd.
Interim Consolidated Statement of Changes in Shareholders’ Equity
(Unaudited)
| Capital Stock | ||||||||||||||||||||
| Number of | Contributed | Retained | Shareholders' | |||||||||||||||||
| (in thousands of Canadian dollars, except share amounts) | Shares | $ | surplus | earnings | equity | |||||||||||||||
Balance — December 31, 2001 | 17,158,091 | 19,186 | 13,566 | 17,205 | 49,957 | |||||||||||||||
| Effect of change in accounting policy (note 3) | — | — | — | (375 | ) | (375 | ) | |||||||||||||
| Stock options exercised | 20,605 | 82 | — | — | 82 | |||||||||||||||
| Net loss | — | — | — | (2,493 | ) | (2,493 | ) | |||||||||||||
Balance — December 31, 2002 | 17,178,696 | 19,268 | 13,566 | 14,337 | 47,171 | |||||||||||||||
| Net loss | — | — | — | (62 | ) | (62 | ) | |||||||||||||
Balance — March 31, 2003 | 17,178,696 | 19,268 | 13,566 | 14,275 | 47,109 | |||||||||||||||
CE Franklin Ltd.
Notes to Consolidated Financial Statements (Unaudited)
Note 1 — Accounting policies
These interim consolidated financial statements are prepared following accounting policies consistent with the Company’s financial statements for the years ended December 31, 2002 and 2001, except as described in note 2. These consolidated financial statements are in accordance with generally accepted accounting principles in Canada which, in the case of the Company, conform in all material respects with those in the United States.
The disclosures provided below are incremental to those included in the annual audited financial statements. The interim consolidated financial statements should be read in conjunction with the annual audited financial statements and the notes thereto for the year ended December 31, 2002.
These unaudited interim consolidated financial statements reflect all adjustments which are, in the opinion of management, necessary to a fair statement of the results for the interim periods presented; all such adjustments are of a normal recurring nature.
Note 2 — Basis of presentation
On January 31, 2003, the Company transferred the property and equipment and operations of its Brittania Compression operations into a wholly owned subsidiary. Subsequently, 50% interest in the new subsidiary was sold. The Company accounts for its remaining 50% investment using the proportionate consolidation method of accounting.
Note 3 — Changes in accounting policy
Effective January 1, 2002, the Company adopted the new Canadian Institute of Chartered Accountants’ standard relating to goodwill and other intangible assets. The new standard requires that goodwill and intangible assets with indefinite useful lives no longer be amortized, and are tested annually for a permanent impairment. As a result of adopting the new standard, the Company has determined that $415,000 of its goodwill ($375,000 after-tax) is impaired, and in accordance with the new standard, applied the $375,000 impairment against retained earnings as at January 1, 2002.
Note 4 — Share data
At March 31, 2003 the Company had 17,178,696 common shares and 1,336,668 options to acquire common shares outstanding. 483,747 of those options were currently vested and exercisable.
On January 1, 2002 the Company adopted the new CICA Handbook Section on “Stock-Based Compensation and Other Stock-Based Payments”, and has continued to account for common share options granted to employees, officers and directors using the intrinsic method. Accordingly, no compensation cost has been recognized in the interim consolidated statements of operations. Had compensation cost been determined on the basis of fair values, net loss for the quarter ended March 31, 2003 would have increased by $144,000 or $0.01 per common share.
Table of Contents
39,458 common share options were granted in the first quarter of 2003. The fair value of common share options granted in the three months ended March 31, 2003 is $83,000. The fair value of common share options granted is estimated as at the grant date using the Black-Scholes option pricing model, using the following assumptions:
| Dividend yield | nil | |||
| Risk-free interest rate | 4.83% | |||
| Expected life | 7 years | |||
| Expected volatility | 70% | |||
Note 5 — Segment information
The Company has two identifiable industry segments. Distribution of equipment and supplies to producers of oil and gas and manufacturing of air and gas compression equipment for the producers of oil and gas.
| (in thousands of dollars) | Distribution | Manufacturing | Total | |||||||||
For the three months ended March 31, 2003 | ||||||||||||
| Revenue | 61,798 | 1,181 | 62,979 | |||||||||
| Gross Profit | 9,686 | 325 | 10,011 | |||||||||
| Income (loss) before interest and taxes | 356 | (53 | ) | 303 | ||||||||
| Assets | 96,405 | 3,765 | 100,170 | |||||||||
| Goodwill | 7,765 | — | 7,765 | |||||||||
| Capital expenditures | 94 | 14 | 108 | |||||||||
For the three months ended March 31, 2002 | ||||||||||||
| Revenue | 78,198 | 1,536 | 79,734 | |||||||||
| Gross Profit | 9,574 | 462 | 10,036 | |||||||||
| Loss before interest and taxes | (484 | ) | (109 | ) | (593 | ) | ||||||
| Assets | 98,787 | 4,898 | 103,685 | |||||||||
| Goodwill | 7,765 | — | 7,765 | |||||||||
| Capital expenditures | 247 | — | 247 | |||||||||