UNITED STATES
SECURITIES AND EXCHANGE COMMISSION
Washington, DC 20549
FORM N-CSR
CERTIFIED SHAREHOLDER REPORT OF REGISTERED MANAGEMENT INVESTMENT COMPANIES
Investment Company Act file number 811-08034
Franklin Real Estate Securities Trust
(Exact name of registrant as specified in charter)
_One Franklin Parkway, San Mateo, CA 94403-1906
(Address of principal executive offices) (Zip code)
_Craig S. Tyle, One Franklin Parkway, San Mateo, CA 94403-1906
(Name and address of agent for service)
Registrant's telephone number, including area code: 650 312-2000
Date of fiscal year end: _4/30
Date of reporting period: _4/30/16
Item 1. Reports to Stockholders.
| Contents | |
| Annual Report | |
| Franklin Real Estate Securities Fund | 3 |
| Performance Summary | 6 |
| Your Fund’s Expenses | 11 |
| Financial Highlights and Statement of Investments | 13 |
| FinancialStatements | 19 |
| Notes to Financial Statements | 23 |
| Report of Independent Registered | |
| Public Accounting Firm | 30 |
| Tax Information | 31 |
| Board Members and Officers | 32 |
| Shareholder Information | 36 |
Visit franklintempleton.com for fund updates, to access your account, or to find helpful financial planning tools.
2 Annual Report
franklintempleton.com
Annual Report
Franklin Real Estate Securities Fund
This annual report for Franklin Real Estate Securities Fund covers the fiscal year ended April 30, 2016.
Your Fund’s Goal and Main Investments
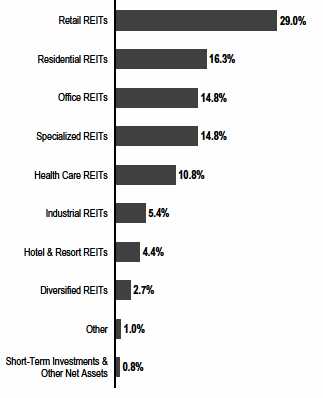
The Fund seeks to maximize total return by investing at least 80% of its net assets in equity securities of companies operating in the real estate industry predominantly in the U.S., including real estate investment trusts (REITs) and companies that derive at least half of their assets or revenues from the ownership, construction, management, operation, development or sale of commercial or residential real estate.1
Portfolio Breakdown
Based on Total Net Assets as of 4/30/16
Performance Overview
For the 12 months ended April 30, 2016, Franklin Real Estate Securities Fund’s Class A shares delivered a +7.17% cumulative total return. In comparison, the Standard & Poor’s (S&P®) U.S. Property Index, which tracks the investable universe of publicly traded U.S. property companies, produced a +7.28% total return.2 You can find the Fund’s long-term performance data in the Performance Summary beginning on page 6.
Performance data represent past performance, which does not guarantee future results. Investment return and principal value will fluctuate, and you may have a gain or loss when you sell your shares. Current performance may differ from figures shown. For most recent month-end performance, go to franklintempleton.com or call (800) 342-5236.
Economic and Market Overview
The U.S. economy moderated during the 12 months under review. After strengthening in 2015’s second quarter, the economy moderated in the third and fourth quarters. Growth slowed further in 2016’s first quarter as exports, business investment and federal government spending declined. The manufacturing sector expanded in March and April after contracting for five consecutive months, while the services sector expanded throughout the 12-month period. Growth in services contributed to new jobs and helped the unemployment rate decrease from 5.4% in April 2015 to 5.0% at period-end.3 Home sales and prices rose amid relatively low mortgage rates. Monthly retail sales grew during most of the review period and rose to the highest level in April in more than a year, driven mainly by automobile sales. Inflation, as measured by the Consumer Price Index, remained relatively subdued due to low energy prices.
After maintaining a near-zero interest rate for seven years to support the U.S. economy’s recovery, the U.S. Federal Reserve
1. A REIT is a type of real estate company that is dedicated to owning and usually operating income-producing real estate properties such as apartments, hotels, industrial
properties, office buildings or shopping centers. Equity REITs generally receive income from rents received, are generally operated by experienced property management
teams and typically concentrate on a specific geographic region or property type.
2. Source: Morningstar.
The index is unmanaged and includes reinvestment of any income or distributions. It does not reflect any fees, expenses or sales charges. One cannot invest directly in an
index, and an index is not representative of the Fund’s portfolio.
3. Source: Bureau of Labor Statistics.
The dollar value, number of shares or principal amount, and names of all portfolio holdings are listed in the Fund’s Statement of Investments (SOI).
The SOI begins on page 17.
franklintempleton.com
Annual Report
3
FRANKLIN REAL ESTATE SECURITIES FUND
| Top 10 Holdings | ||
| 4/30/16 | ||
| Company | % of Total | |
| Sector/Industry | Net Assets | |
| Simon Property Group Inc. | 10.0 | % |
| Retail REITs | ||
| Public Storage | 4.4 | % |
| Specialized REITs | ||
| Boston Properties Inc. | 4.1 | % |
| Office REITs | ||
| Prologis Inc. | 4.0 | % |
| Industrial REITs | ||
| Welltower Inc. | 3.7 | % |
| Health Care REITs | ||
| Equity Residential | 3.6 | % |
| Residential REITs | ||
| Ventas Inc. | 3.6 | % |
| Health Care REITs | ||
| Realty Income Corp. | 3.2 | % |
| Retail REITs | ||
| Extra Space Storage Inc. | 2.7 | % |
| Specialized REITs | ||
| UDR Inc. | 2.7 | % |
| Residential REITs |
(Fed) raised its target range for the federal funds rate to 0.25%–0.50% at its December meeting. At the time of the increase, policymakers cited the labor market’s considerable improvement and were reasonably confident that inflation would move back to the Fed’s 2.00% medium-term objective. The Fed maintained the rate through period-end, indicating it would monitor domestic and global developments and their implications on the labor markets as it tracks actual and expected progression toward its employment and inflation goals.
U.S. stock markets experienced sell-offs during the period under review, resulting from investor concerns about the timing of the Fed’s interest rate increases, global economic growth, China’s slowing economy and tumbling stock market, geopolitical tensions in certain regions and a plunge in crude oil prices. Investors generally remained confident, however, as the Fed remained cautious about further interest rate increases, the eurozone economy improved, the European Central Bank expanded its quantitative easing measures and cut its benchmark interest rate to zero, the People’s Bank of China introduced further easing measures, and the Bank of Japan adopted a negative interest rate policy. The rally in crude oil prices toward period-end also boosted investor sentiment.
Despite periods of volatility, the broad U.S. stock market ended the 12-month period relatively flat, as measured by the Standard & Poor’s 500 Index.
Investment Strategy
We are research-driven, fundamental investors with an active investment strategy. We use a bottom-up security selection process that incorporates macro-level views in our evaluation process. We analyze individual stock and real estate market fundamentals to provide regional, property type and company-size perspectives in identifying local cyclical and thematic trends that highlight investment opportunities.
Manager’s Discussion
During the 12 months ended April 30, 2016, under review, security selection and an underweighting in the diversified sector contributed to the Fund’s performance relative to the S&P U.S. Property Index, with much of the contributing effects coming from a lack of exposure to certain companies in the Fund’s benchmark that performed poorly over the period. Stock selection and an overweighting in the specialized REIT sector contributed to relative performance, including an investment in U.S.-based data center operator CoreSite Realty. The company’s shares steadily rose in value as the company reported significant increases in quarterly revenue growth compared with the same periods in the prior year. Investors also welcomed the company’s aggressive expansion in Northern Virginia and California’s Silicon Valley.
Within the self-storage sector, our overweighted position in CubeSmart contributed positively to performance over the reporting period.4 The company outperformed its sector during the reporting period, reflecting continued strength in storage operating trends as the company benefited from favorable demand and supply dynamics for this property sector. The company’s core results consistently remained one of the best among its sector peers as it successfully increased its occupancy and rent levels for its operating portfolio and recently acquired assets. We believe CubeSmart has remained well positioned to take advantage of additional consolidation opportunities within the highly fragmented self-storage property sector.
The Fund’s positioning in the residential sector also boosted relative results. Shares of Equity Lifestyle Properties, a manufactured housing focused REIT, outperformed during the reporting period. The stock’s attractiveness over the past year
4. Self-storage sector holdings can be found under specialized REITS in the SOI.
4 Annual Report
franklintempleton.com
FRANKLIN REAL ESTATE SECURITIES FUND
among investors grew steadily in an uncertain economic environment given its defensive characteristics with a predictable and stable cash flow as well as a solid balance sheet. Additionally, the company’s results consistently reflected strong sector fundamentals, which were supportive for the stock’s attractiveness despite its premium valuation relative to earnings.
In contrast, security selection and an overweighting in the office sector detracted from relative performance compared to the Fund’s benchmark. Shares of SL Green Realty, a major office REIT which focuses on Midtown Manhattan, underperformed during the period under review mainly due to expectations of a slowdown in New York City office fundamentals and its high leverage compared to its peers despite delivering healthy core results. The stock’s sell-off accelerated following management’s cautionary remarks and downbeat outlook for New York City’s job growth and leasing environment in 2016 during their fourth quarter 2015 conference call.
Positioning in the apartments sector also weighed on results over the reporting period, including an underweighted investment in Mid-America Apartment Communities, a new holding initiated during the reporting period.5 In February the company reported record fourth-quarter and full year revenue based on higher net operating income, average revenue per occupied unit and occupancy rates as well as low resident turnover. In the fourth quarter, Mid-America completed construction of a Jacksonville, Florida project and purchased two new properties that boosted revenue along with its renovation of thousands of units during its fiscal year.
Within the health care property sector, shares of Sabra Healthcare REIT underperformed during the period, largely reflecting heightened investor concerns about the company’s ability to weather specific issues related to its Texas-based operator which failed to cover its rents as it was suffering a liquidity crisis.6 Despite, in our view, the company’s manageable exposure to this problematic tenant, the stock sold off given uncertainty about the severity of the impact on core results related to this Texas-based operator and the loss of management credibility among investors in terms of the company’s future capital allocation decisions. Additionally, the company’s cost of capital deteriorated after the recent sell-off, making it much harder for the company to pencil in accretive future acquisitions.
Thank you for your continued participation in Franklin Real Estate Securities Fund. We look forward to serving your future investment needs.

Portfolio Management Team
The foregoing information reflects our analysis, opinions and portfolio holdings as of April 30, 2016, the end of the reporting period. The way we implement our main investment strategies and the resulting portfolio holdings may change depending on factors such as market and economic conditions. These opinions may not be relied upon as investment advice or an offer for a particular security. The information is not a complete analysis of every aspect of any market, country, industry, security or the Fund. Statements of fact are from sources considered reliable, but the investment manager makes no representation or warranty as to their completeness or accuracy. Although historical performance is no guarantee of future results, these insights may help you understand our investment management philosophy.
CFA® is a trademark owned by CFA Institute.
5. Apartment sector holdings can be found under Residential REITS in the SOI.
6. Not held by period-end.
franklintempleton.com
Annual Report
5
FRANKLIN REAL ESTATE SECURITIES FUND
Performance Summary as of April 30, 2016
Your dividend income will vary depending on dividends or interest paid by securities in the Fund’s portfolio, adjusted for operating expenses of each class. Capital gain distributions are net profits realized from the sale of portfolio securities. The performance table and graphs do not reflect any taxes that a shareholder would pay on Fund dividends, capital gain distributions, if any, or any realized gains on the sale of Fund shares. Total return reflects reinvestment of the Fund’s dividends and capital gain distributions, if any, and any unrealized gains or losses.
| Net Asset Value | |||||
| Share Class (Symbol) | 4/30/16 | 4/30/15 | Change | ||
| A (FREEX) | $ | 22.65 | $ | 21.49 | +$1.16 |
| C (FRRSX) | $ | 21.86 | $ | 20.75 | +$1.11 |
| R6 (FSERX) | $ | 22.83 | $ | 21.67 | +$1.16 |
| Advisor (FRLAX) | $ | 22.83 | $ | 21.67 | +$1.16 |
| Distributions1 (5/1/15–4/30/16) | |||||
| Dividend | |||||
| Share Class | Income | ||||
| A | $ | 0.3670 | |||
| C | $ | 0.2072 | |||
| R6 | $ | 0.4674 | |||
| Advisor | $ | 0.4229 | |||
See page 10 for Performance Summary footnotes.
6 Annual Report
franklintempleton.com
FRANKLIN REAL ESTATE SECURITIES FUND
PERFORMANCE SUMMARY
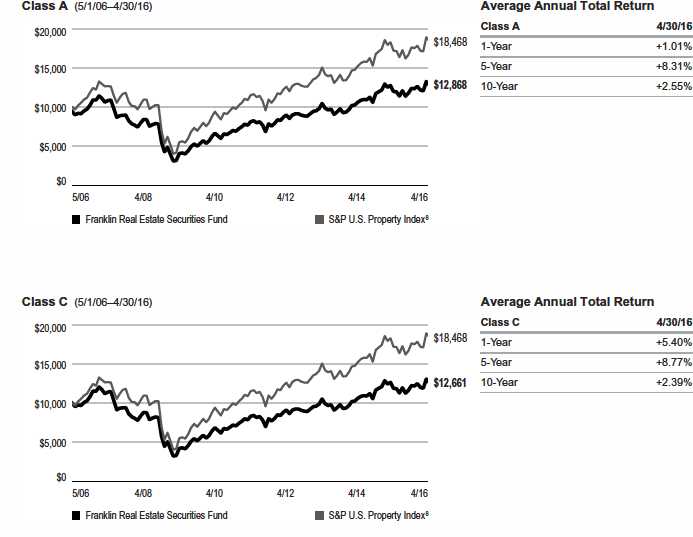
Performance as of 4/30/162
Cumulative total return excludes sales charges. Average annual total return and value of $10,000 investment include maximum sales charges. Class A: 5.75% maximum initial sales charge; Class C: 1% contingent deferred sales charge in first year only;
Class R6/Advisor Class: no sales charges.
| Cumulative | Average Annual | Value of | Average Annual | Total Annual | ||||||
| Share Class | Total Return3 | Total Return4 | $ | 10,000 Investment5 | Total Return (3/31/16)6 | Operating Expenses7 | ||||
| A | 0.99 | % | ||||||||
| 1-Year | +7.17 | % | +1.01 | % | $ | 10,101 | -1.88 | % | ||
| 5-Year | +58.13 | % | +8.31 | % | $ | 14,904 | +10.22 | % | ||
| 10-Year | +36.51 | % | +2.55 | % | $ | 12,868 | +2.56 | % | ||
| C | 1.74 | % | ||||||||
| 1-Year | +6.40 | % | +5.40 | % | $ | 10,540 | +2.33 | % | ||
| 5-Year | +52.25 | % | +8.77 | % | $ | 15,225 | +10.70 | % | ||
| 10-Year | +26.61 | % | +2.39 | % | $ | 12,661 | +2.40 | % | ||
| R6 | 0.54 | % | ||||||||
| 1-Year | +7.66 | % | +7.66 | % | $ | 10,766 | +4.54 | % | ||
| Since Inception (5/1/13) | +25.44 | % | +7.86 | % | $ | 12,544 | +9.27 | % | ||
| Advisor | 0.74 | % | ||||||||
| 1-Year | +7.44 | % | +7.44 | % | $ | 10,744 | +4.32 | % | ||
| 5-Year | +60.21 | % | +9.89 | % | $ | 16,021 | +11.82 | % | ||
| 10-Year | +39.98 | % | +3.42 | % | $ | 13,998 | +3.43 | % |
Performance data represent past performance, which does not guarantee future results. Investment return and principal value will fluctuate, and you may have a gain or loss when you sell your shares. Current performance may differ from figures shown. For most recent month-end performance, go to franklintempleton.com or call (800) 342-5236.
See page 10 for Performance Summary footnotes.
franklintempleton.com
Annual Report
7
FRANKLIN REAL ESTATE SECURITIES FUND
PERFORMANCE SUMMARY
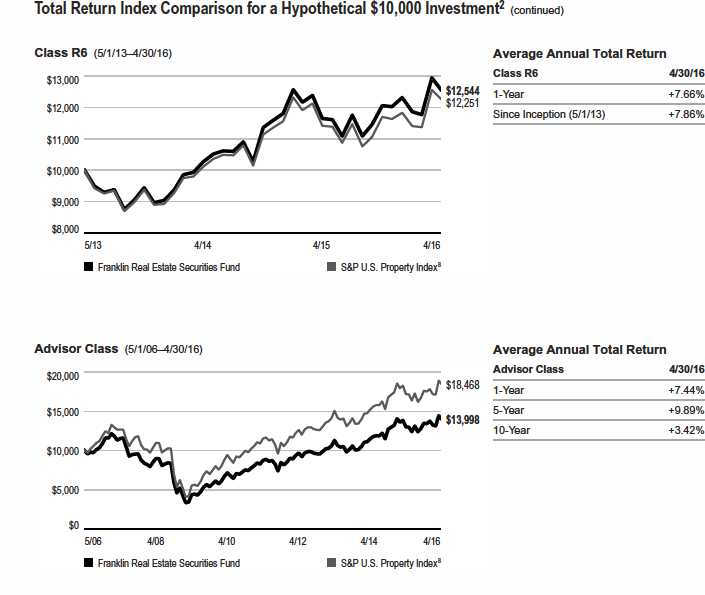
Total Return Index Comparison for a Hypothetical $10,000 Investment2
Total return represents the change in value of an investment over the periods shown. It includes any applicable maximum sales charge, Fund expenses, account fees and reinvested distributions. The unmanaged index includes reinvestment of any income or distributions. It differs from the Fund in composition and does not pay management fees or expenses. One cannot invest directly in an index.
See page 10 for Performance Summary footnotes.
8 Annual Report
franklintempleton.com
FRANKLIN REAL ESTATE SECURITIES FUND
PERFORMANCE SUMMARY
See page 10 for Performance Summary footnotes.
franklintempleton.com
Annual Report
9
FRANKLIN REAL ESTATE SECURITIES FUND
PERFORMANCE SUMMARY
All investments involve risks, including possible loss of principal. The Fund concentrates in securities of companies in the real estate industry, which involve special risks, such as declines in the value of real estate and increased susceptibility to adverse economic or regulatory developments affecting the sector. The Fund’s investments in REITs involve additional risks; since REITs typically are invested in a limited number of projects or in a particular market segment, they are more susceptible to adverse developments affecting a single project or market segment than more broadly diversified investments. Loss of status as a qualified REIT under the U.S. federal tax laws could adversely affect the value of a particular REIT or the market for REITs, as a whole. Also, the Fund is a nondiversified fund and investing in a nondiversified fund involves the risk of greater price fluctuation than a more diversified portfolio. The Fund is actively managed but there is no guarantee that the manager’s investment decisions will produce the desired results. The Fund’s prospectus also includes a description of the main investment risks.
| Class C: | These shares have higher annual fees and expenses than Class A shares. |
| Class R: | Shares are available to certain eligible investors as described in the prospectus. These shares have higher annual fees and expenses than Class A shares. |
| Class R6: | Shares are available to certain eligible investors as described in the prospectus. |
| Advisor Class: | Shares are available to certain eligible investors as described in the prospectus. |
1. The distribution amount is the sum of the dividend payments to shareholders for the period shown and includes only estimated tax-basis net investment income.
2. The Fund has a fee waiver associated with any investment in a Franklin Templeton money fund, contractually guaranteed through at least its current fiscal year-end. Fund
investment results reflect the fee waiver, to the extent applicable; without this reduction, the results would have been lower.
3. Cumulative total return represents the change in value of an investment over the periods indicated.
4. Average annual total return represents the average annual change in value of an investment over the periods indicated. Six-month return has not been annualized.
5. These figures represent the value of a hypothetical $10,000 investment in the Fund over the periods indicated.
6. In accordance with SEC rules, we provide standardized average annual total return information through the latest calendar quarter.
7. Figures are as stated in the Fund’s current prospectus and may differ from the expense ratios disclosed in the Financial Highlights in this report. In periods of market volatility,
assets may decline significantly, causing total annual Fund operating expenses to become higher than the figures shown.
8. Source: Morningstar. The S&P U.S. Property Index measures the investable universe of publicly traded property companies in the U.S.
See www.franklintempletondatasources.com for additional data provider information.
10 Annual Report
franklintempleton.com
FRANKLIN REAL ESTATE SECURITIES FUND
Your Fund’s Expenses
As a Fund shareholder, you can incur two types of costs:
- Transaction costs, including sales charges (loads) on Fund purchases, if applicable; and
- Ongoing Fund costs, including management fees, distribution and service (12b-1) fees, if applicable, and other Fund expenses. All mutual funds have ongoing costs, sometimes referred to as operating expenses.
The following table shows ongoing costs of investing in the Fund and can help you understand these costs and compare them with those of other mutual funds. The table assumes a $1,000 investment held for the six months indicated.
Actual Fund Expenses
The first line (Actual) for each share class listed in the table provides actual account values and expenses. The “Ending Account Value” is derived from the Fund’s actual return, which includes the effect of Fund expenses.
You can estimate the expenses you paid during the period by following these steps. Of course, your account value and expenses will differ from those in this illustration:
| 1. | Divide your account value by $1,000. |
| If an account had an $8,600 value, then $8,600 ÷ $1,000 = 8.6. | |
| 2. | Multiply the result by the number under the heading “Expenses Paid During Period.” |
| If Expenses Paid During Period were $7.50, then 8.6 x $7.50 = $64.50. |
In this illustration, the estimated expenses paid this period are $64.50.
Hypothetical Example for Comparison with Other Funds
Information in the second line (Hypothetical) for each class in the table can help you compare ongoing costs of investing in the Fund with those of other mutual funds. This information may not be used to estimate the actual ending account balance or expenses you paid during the period. The hypothetical “Ending Account Value” is based on the actual expense ratio for each class and an assumed 5% annual rate of return before expenses, which does not represent the Fund’s actual return. The figure under the heading “Expenses Paid During Period” shows the hypothetical expenses your account would have incurred under this scenario. You can compare this figure with the 5% hypothetical examples that appear in shareholder reports of other funds.
Please note that expenses shown in the table are meant to highlight ongoing costs and do not reflect any transaction costs, such as sales charges. Therefore, the second line for each class is useful in comparing ongoing costs only, and will not help you compare total costs of owning different funds. In addition, if transaction costs were included, your total costs would have been higher. Please refer to the Fund prospectus for additional information on operating expenses.
franklintempleton.com
Annual Report
11
| FRANKLIN REAL ESTATE SECURITIES FUND | ||||||
| YOUR FUND’S EXPENSES | ||||||
| Beginning Account | Ending Account | Expenses Paid During | ||||
| Share Class | Value 11/1/15 | Value 4/30/16 | Period* 11/1/15–4/30/16 | |||
| A | ||||||
| Actual | $ | 1,000 | $ | 1,037.40 | $ | 5.07 |
| Hypothetical (5% return before expenses) | $ | 1,000 | $ | 1,019.89 | $ | 5.02 |
| C | ||||||
| Actual | $ | 1,000 | $ | 1,033.70 | $ | 8.85 |
| Hypothetical (5% return before expenses) | $ | 1,000 | $ | 1,016.16 | $ | 8.77 |
| R6 | ||||||
| Actual | $ | 1,000 | $ | 1,040.00 | $ | 2.74 |
| Hypothetical (5% return before expenses) | $ | 1,000 | $ | 1,022.18 | $ | 2.72 |
| Advisor | ||||||
| Actual | $ | 1,000 | $ | 1,038.90 | $ | 3.80 |
| Hypothetical (5% return before expenses) | $ | 1,000 | $ | 1,021.13 | $ | 3.77 |
*Expenses are calculated using the most recent six-month expense ratio, net of expense waivers, annualized for each class (A: 1.00%; C: 1.75%; R6: 0.54%; and Advisor: 0.75%), multiplied by the average account value over the period, multiplied by 182/366 to reflect the one-half year period.
12 Annual Report
franklintempleton.com
| FRANKLIN REAL ESTATE SECURITIES TRUST | |||||||||||||||
| Financial Highlights | |||||||||||||||
| Franklin Real Estate Securities Fund | |||||||||||||||
| Year Ended April 30, | |||||||||||||||
| 2016 | 2015 | 2014 | 2013 | 2012 | |||||||||||
| Class A | |||||||||||||||
| Per share operating performance | |||||||||||||||
| (for a share outstanding throughout the year) | |||||||||||||||
| Net asset value, beginning of year | $ | 21.49 | $ | 19.31 | $ | 19.29 | $ | 16.78 | $ | 15.26 | |||||
| Income from investment operationsa: | |||||||||||||||
| Net investment incomeb | 0.48 | c | 0.30 | 0.26 | 0.23 | 0.14 | |||||||||
| Net realized and unrealized gains (losses) | 1.05 | 2.17 | —d | 2.49 | 1.46 | ||||||||||
| Total from investment operations | 1.53 | 2.47 | 0.26 | 2.72 | 1.60 | ||||||||||
| Less distributions from net investment income | (0.37 | ) | (0.29 | ) | (0.24 | ) | (0.21 | ) | (0.08 | ) | |||||
| Net asset value, end of year. | $ | 22.65 | $ | 21.49 | $ | 19.31 | $ | 19.29 | $ | 16.78 | |||||
| Total returne | 7.17 | % | 12.95 | % | 1.49 | % | 16.38 | % | 10.59 | % | |||||
| Ratios to average net assets | |||||||||||||||
| Expenses before waiver and payments by affiliates | 1.00 | % | 0.99 | % | 1.05 | % | 1.03 | % | 1.14 | % | |||||
| Expenses net of waiver and payments by affiliates | 1.00 | %f | 0.99 | %f | 1.04 | % | 1.03 | % | 1.14 | % | |||||
| Net investment income | 2.21 | %c | 1.41 | % | 1.43 | % | 1.33 | % | 0.92 | % | |||||
| Supplemental data | |||||||||||||||
| Net assets, end of year (000’s) | $ | 364,981 | $ | 381,925 | $ | 303,815 | $ | 347,101 | $ | 262,991 | |||||
| Portfolio turnover rate | 24.21 | % | 24.12 | % | 17.04 | % | 22.69 | % | 23.43 | % | |||||
aThe amount shown for a share outstanding throughout the period may not correlate with the Statement of Operations for the period due to the timing of sales and
repurchases of the Fund’s shares in relation to income earned and/or fluctuating fair value of the investments of the Fund.
bBased on average daily shares outstanding.
cNet investment income per share includes approximately $0.11 per share related to income received in the form of a special dividend in connection with certain Fund
holdings. Excluding this amount, the ratio of net investment income to average net assets would have been 1.71%.
dAmount rounds to less than $0.01 per share.
eTotal return does not reflect sales commissions or contingent deferred sales charges, if applicable.
fBenefit of waiver and payments by affiliates rounds to less than 0.01%.
franklintempleton.com
The accompanying notes are an integral part of these financial statements. | Annual Report 13
| FRANKLIN REAL ESTATE SECURITIES TRUST | |||||||||||||||
| FINANCIAL HIGHLIGHTS | |||||||||||||||
| Franklin Real Estate Securities Fund (continued) | |||||||||||||||
| Year Ended April 30, | |||||||||||||||
| 2016 | 2015 | 2014 | 2013 | 2012 | |||||||||||
| Class C | |||||||||||||||
| Per share operating performance | |||||||||||||||
| (for a share outstanding throughout the year) | |||||||||||||||
| Net asset value, beginning of year | $ | 20.75 | $ | 18.66 | $ | 18.65 | $ | 16.20 | $ | 14.77 | |||||
| Income from investment operationsa: | |||||||||||||||
| Net investment incomeb | 0.30 | c | 0.13 | 0.12 | 0.10 | 0.02 | |||||||||
| Net realized and unrealized gains (losses) | 1.02 | 2.11 | —d | 2.40 | 1.42 | ||||||||||
| Total from investment operations | 1.32 | 2.24 | 0.12 | 2.50 | 1.44 | ||||||||||
| Less distributions from net investment income | (0.21 | ) | (0.15 | ) | (0.11 | ) | (0.05 | ) | (0.01 | ) | |||||
| Net asset value, end of year. | $ | 21.86 | $ | 20.75 | $ | 18.66 | $ | 18.65 | $ | 16.20 | |||||
| Total returne | 6.40 | % | 12.07 | % | 0.73 | % | 15.47 | % | 9.77 | % | |||||
| Ratios to average net assets | |||||||||||||||
| Expenses before waiver and payments by affiliates | 1.75 | % | 1.74 | % | 1.80 | % | 1.78 | % | 1.89 | % | |||||
| Expenses net of waiver and payments by affiliates | 1.75 | %f | 1.74 | %f | 1.79 | % | 1.78 | % | 1.89 | % | |||||
| Net investment income | 1.46 | %c | 0.66 | % | 0.68 | % | 0.58 | % | 0.17 | % | |||||
| Supplemental data | |||||||||||||||
| Net assets, end of year (000’s) | $ | 82,147 | $ | 89,328 | $ | 68,914 | $ | 77,324 | $ | 58,296 | |||||
| Portfolio turnover rate | 24.21 | % | 24.12 | % | 17.04 | % | 22.69 | % | 23.43 | % | |||||
aThe amount shown for a share outstanding throughout the period may not correlate with the Statement of Operations for the period due to the timing of sales and
repurchases of the Fund’s shares in relation to income earned and/or fluctuating fair value of the investments of the Fund.
bBased on average daily shares outstanding.
cNet investment income per share includes approximately $0.11 per share related to income received in the form of a special dividend in connection with certain Fund
holdings. Excluding this amount, the ratio of net investment income to average net assets would have been 0.96%.
dAmount rounds to less than $0.01 per share.
eTotal return does not reflect sales commissions or contingent deferred sales charges, if applicable.
fBenefit of waiver and payments by affiliates rounds to less than 0.01%.
14 Annual Report | The accompanying notes are an integral part of these financial statements.
franklintempleton.com
| FRANKLIN REAL ESTATE SECURITIES TRUST | |||||||||
| FINANCIAL HIGHLIGHTS | |||||||||
| Franklin Real Estate Securities Fund (continued) | |||||||||
| Year Ended April 30, | |||||||||
| 2016 | 2015 | 2014 | a | ||||||
| Class R6 | |||||||||
| Per share operating performance | |||||||||
| (for a share outstanding throughout the year) | |||||||||
| Net asset value, beginning of year | $ | 21.67 | $ | 19.46 | $ | 19.30 | |||
| Income from investment operationsb: | |||||||||
| Net investment incomec | 0.58 | d | 0.41 | 0.34 | |||||
| Net realized and unrealized gains (losses) | 1.05 | 2.19 | 0.14 | ||||||
| Total from investment operations. | 1.63 | 2.60 | 0.48 | ||||||
| Less distributions from net investment income | (0.47 | ) | (0.39 | ) | (0.32 | ) | |||
| Net asset value, end of year | $ | 22.83 | $ | 21.67 | $ | 19.46 | |||
| Total return | 7.66 | % | 13.47 | % | 2.69 | % | |||
| Ratios to average net assets | |||||||||
| Expenses before waiver and payments by affiliates | 0.54 | % | 0.54 | % | 0.57 | % | |||
| Expenses net of waiver and payments by affiliates | 0.54 | % e | 0.54 | %e | 0.56 | % | |||
| Net investment income. | 2.67 | %d | 1.86 | % | 1.91 | % | |||
| Supplemental data | |||||||||
| Net assets, end of year (000’s) | $ | 104,392 | $ | 106,725 | $ | 97,224 | |||
| Portfolio turnover rate | 24.21 | % | 24.12 | % | 17.04 | % | |||
aFor the year May 1, 2013 (effective date) to April 30, 2014.
bThe amount shown for a share outstanding throughout the period may not correlate with the Statement of Operations for the period due to the timing of sales and
repurchases of the Fund’s shares in relation to income earned and/or fluctuating fair value of the investments of the Fund.
cBased on average daily shares outstanding.
dNet investment income per share includes approximately $0.11 per share related to income received in the form of a special dividend in connection with certain Fund
holdings. Excluding this amount, the ratio of net investment income to average net assets would have been 2.17%.
eBenefit of waiver and payments by affiliates rounds to less than 0.01%.
franklintempleton.com
The accompanying notes are an integral part of these financial statements. | Annual Report 15
| FRANKLIN REAL ESTATE SECURITIES TRUST | |||||||||||||||
| FINANCIAL HIGHLIGHTS | |||||||||||||||
| Franklin Real Estate Securities Fund (continued) | |||||||||||||||
| Year Ended April 30, | |||||||||||||||
| 2016 | 2015 | 2014 | 2013 | 2012 | |||||||||||
| Advisor Class | |||||||||||||||
| Per share operating performance | |||||||||||||||
| (for a share outstanding throughout the year) | |||||||||||||||
| Net asset value, beginning of year | $ | 21.67 | $ | 19.46 | $ | 19.43 | $ | 16.92 | $ | 15.38 | |||||
| Income from investment operationsa: | |||||||||||||||
| Net investment incomeb | 0.54 | c | 0.33 | 0.29 | 0.27 | 0.16 | |||||||||
| Net realized and unrealized gains (losses) | 1.04 | 2.23 | 0.03 | 2.51 | 1.50 | ||||||||||
| Total from investment operations | 1.58 | 2.56 | 0.32 | 2.78 | 1.66 | ||||||||||
| Less distributions from net investment income | (0.42 | ) | (0.35 | ) | (0.29 | ) | (0.27 | ) | (0.12 | ) | |||||
| Net asset value, end of year. | $ | 22.83 | $ | 21.67 | $ | 19.46 | $ | 19.43 | $ | 16.92 | |||||
| Total return | 7.44 | % | 13.24 | % | 1.79 | % | 16.64 | % | 10.91 | % | |||||
| Ratios to average net assets | |||||||||||||||
| Expenses before waiver and payments by affiliates | 0.75 | % | 0.74 | % | 0.80 | % | 0.78 | % | 0.89 | % | |||||
| Expenses net of waiver and payments by affiliates | 0.75 | %d | 0.74 | %d | 0.79 | % | 0.78 | % | 0.89 | % | |||||
| Net investment income | 2.46 | %c | 1.66 | % | 1.68 | % | 1.58 | % | 1.17 | % | |||||
| Supplemental data | |||||||||||||||
| Net assets, end of year (000’s) | $ | 22,346 | $ | 17,644 | $ | 12,402 | $ | 108,076 | $ | 10,542 | |||||
| Portfolio turnover rate | 24.21 | % | 24.12 | % | 17.04 | % | 22.69 | % | 23.43 | % | |||||
aThe amount shown for a share outstanding throughout the period may not correlate with the Statement of Operations for the period due to the timing of sales and
repurchases of the Fund’s shares in relation to income earned and/or fluctuating fair value of the investments of the Fund.
bBased on average daily shares outstanding.
cNet investment income per share includes approximately $0.11 per share related to income received in the form of a special dividend in connection with certain Fund
holdings. Excluding this amount, the ratio of net investment income to average net assets would have been 1.96%.
dBenefit of waiver and payments by affiliates rounds to less than 0.01%.
16 Annual Report | The accompanying notes are an integral part of these financial statements.
franklintempleton.com
FRANKLIN REAL ESTATE SECURITIES TRUST
| Statement of Investments, April 30, 2016 | |||
| Franklin Real Estate Securities Fund | |||
| Shares | Value | ||
| Common Stocks 99.2% | |||
| Diversified REITs 2.7% | |||
| Duke Realty Corp | 538,200 | $ | 11,770,434 |
| WP Carey Inc | 56,400 | 3,445,476 | |
| 15,215,910 | |||
| Health Care REITs 10.8% | |||
| HCP Inc | 253,200 | 8,565,756 | |
| OMEGA Healthcare Investors Inc | 228,500 | 7,716,445 | |
| Physicians Realty Trust | 210,300 | 3,812,739 | |
| Ventas Inc | 331,620 | 20,600,235 | |
| Welltower Inc | 302,900 | 21,027,318 | |
| 61,722,493 | |||
| Homebuilding 0.5% | |||
| D.R. Horton Inc | 99,700 | 2,996,982 | |
| Hotel & Resort REITs 4.4% | |||
| Host Hotels & Resorts Inc | 657,800 | 10,406,396 | |
| a MGM Growth Properties LLC, A | 122,900 | 2,712,403 | |
| Summit Hotel Properties Inc | 542,800 | 6,187,920 | |
| Sunstone Hotel Investors Inc | 464,635 | 5,951,974 | |
| 25,258,693 | |||
| Hotels, Resorts & Cruise Lines 0.5% | |||
| Hilton Worldwide Holdings Inc | 120,400 | 2,654,820 | |
| Industrial REITs 5.4% | |||
| First Industrial Realty Trust Inc | 350,000 | 8,029,000 | |
| Prologis Inc | 511,061 | 23,207,280 | |
| 31,236,280 | |||
| Office REITs 14.8% | |||
| Alexandria Real Estate Equities Inc | 124,200 | 11,544,390 | |
| Boston Properties Inc | 181,900 | 23,439,634 | |
| Highwoods Properties Inc | 210,400 | 9,831,992 | |
| Kilroy Realty Corp | 161,200 | 10,447,372 | |
| Mack-Cali Realty Corp | 186,400 | 4,764,384 | |
| Paramount Group Inc | 213,300 | 3,562,110 | |
| SL Green Realty Corp | 65,800 | 6,914,264 | |
| Vornado Realty Trust | 153,545 | 14,698,863 | |
| 85,203,009 | |||
| Residential REITs 16.3% | |||
| Apartment Investment & Management Co., A | 224,400 | 8,989,464 | |
| AvalonBay Communities Inc | 85,372 | 15,092,916 | |
| Equity Lifestyle Properties Inc | 181,800 | 12,451,482 | |
| Equity Residential | 304,744 | 20,743,924 | |
| Essex Property Trust Inc | 62,263 | 13,725,878 | |
| Mid-America Apartment Communities Inc | 23,600 | 2,258,756 | |
| Post Properties Inc | 91,400 | 5,242,704 | |
| UDR Inc | 437,562 | 15,279,665 | |
| 93,784,789 | |||
| Retail REITs 29.0% | |||
| Equity One Inc | 207,000 | 5,858,100 | |
| Federal Realty Investment Trust | 78,700 | 11,968,696 | |
| General Growth Properties Inc | 362,400 | 10,158,072 | |
franklintempleton.com
Annual Report
17
FRANKLIN REAL ESTATE SECURITIES TRUST
STATEMENT OF INVESTMENTS
| Franklin Real Estate Securities Fund (continued) | ||||
| Shares | Value | |||
| Common Stocks (continued) | ||||
| Retail REITs (continued) | ||||
| Kimco Realty Corp | 510,700 | $ | 14,360,884 | |
| The Macerich Co | 153,921 | 11,710,310 | ||
| National Retail Properties Inc | 207,100 | 9,062,696 | ||
| Realty Income Corp | 310,600 | 18,387,520 | ||
| Regency Centers Corp | 184,800 | 13,619,760 | ||
| Simon Property Group Inc | 285,700 | 57,474,269 | ||
| Taubman Centers Inc | 95,400 | 6,625,530 | ||
| Weingarten Realty Investors | 193,600 | 7,147,712 | ||
| 166,373,549 | ||||
| Specialized REITs 14.8% | ||||
| Coresite Realty Corp | 137,600 | 10,310,368 | ||
| CubeSmart | 381,900 | 11,308,059 | ||
| CyrusOne Inc | 181,800 | 8,022,834 | ||
| Digital Realty Trust Inc | 165,400 | 14,551,892 | ||
| Extra Space Storage Inc | 180,500 | 15,333,475 | ||
| Public Storage | 103,400 | 25,313,354 | ||
| 84,839,982 | ||||
| Total Common Stocks (Cost $344,798,531) | 569,286,507 | |||
| Short Term Investments (Cost $5,353,674) 0.9% | ||||
| Money Market Funds 0.9% | ||||
| a,b Institutional Fiduciary Trust Money Market Portfolio | 5,353,674 | 5,353,674 | ||
| Total Investments (Cost $350,152,205) 100.1% | 574,640,181 | |||
| Other Assets, less Liabilities (0.1)% | (774,177 | ) | ||
| Net Assets 100.0% | $ | 573,866,004 | ||
See Abbreviations on page 29.
aNon-income producing.
bSee Note 3(f) regarding investments in affiliated management investment companies.
18 Annual Report | The accompanying notes are an integral part of these financial statements.
franklintempleton.com
FRANKLIN REAL ESTATE SECURITIES TRUST
Financial Statements
Statement of Assets and Liabilities
April 30, 2016
| Franklin Real Estate Securities Fund | |||
| Assets: | |||
| Investments in securities: | |||
| Cost - Unaffiliated issuers | $ | 344,798,531 | |
| Cost - Non-controlled affiliates (Note 3f) | 5,353,674 | ||
| Total cost of investments | $ | 350,152,205 | |
| Value - Unaffiliated issuers | $ | 569,286,507 | |
| Value - Non-controlled affiliates (Note 3f) | 5,353,674 | ||
| Total value of investments | 574,640,181 | ||
| Receivables: | |||
| Investment securities sold | 2,903,331 | ||
| Capital shares sold | 665,656 | ||
| Dividends | 414,187 | ||
| Other assets | 328 | ||
| Total assets | 578,623,683 | ||
| Liabilities: | |||
| Payables: | |||
| Investment securities purchased | 2,998,862 | ||
| Capital shares redeemed | 1,158,407 | ||
| Management fees | 235,692 | ||
| Distribution fees | 146,358 | ||
| Transfer agent fees | 145,396 | ||
| Accrued expenses and other liabilities | 72,964 | ||
| Total liabilities | 4,757,679 | ||
| Net assets, at value | $ | 573,866,004 | |
| Net assets consist of: | |||
| Paid-in capital | $ | 394,051,031 | |
| Undistributed net investment income | 5,315,693 | ||
| Net unrealized appreciation (depreciation) | 224,487,976 | ||
| Accumulated net realized gain (loss) | (49,988,696 | ) | |
| Net assets, at value | $ | 573,866,004 | |
franklintempleton.com
The accompanying notes are an integral part of these financial statements. | Annual Report 19
| FRANKLIN REAL ESTATE SECURITIES TRUST | ||
| FINANCIAL STATEMENTS | ||
| Statement of Assets and Liabilities (continued) | ||
| April 30, 2016 | ||
| Franklin Real Estate Securities Fund | ||
| Class A: | ||
| Net assets, at value | $ | 364,980,754 |
| Shares outstanding | 16,114,141 | |
| Net asset value per sharea | $ | 22.65 |
| Maximum offering price per share (net asset value per share ÷ 94.25%) | $ | 24.03 |
| Class C: | ||
| Net assets, at value | $ | 82,146,993 |
| Shares outstanding | 3,757,871 | |
| Net asset value and maximum offering price per sharea | $ | 21.86 |
| Class R6: | ||
| Net assets, at value | $ | 104,392,197 |
| Shares outstanding | 4,572,404 | |
| Net asset value and maximum offering price per share | $ | 22.83 |
| Advisor Class : | ||
| Net assets, at value | $ | 22,346,060 |
| Shares outstanding | 978,740 | |
| Net asset value and maximum offering price per share | $ | 22.83 |
aRedemption price is equal to net asset value less contingent deferred sales charges, if applicable.
20 Annual Report | The accompanying notes are an integral part of these financial statements.
franklintempleton.com
FRANKLIN REAL ESTATE SECURITIES TRUST
FINANCIAL STATEMENTS
Statement of Operations
for the year ended April 30, 2016
| Franklin Real Estate Securities Fund | |||
| Investment income: | |||
| Dividends | $ | 18,044,211 | |
| Expenses: | |||
| Management fees (Note 3a) | 2,779,381 | ||
| Distribution fees: (Note 3c) | |||
| Class A | 893,299 | ||
| Class C | 808,945 | ||
| Transfer agent fees: (Note 3e) | |||
| Class A | 751,170 | ||
| Class C | 170,055 | ||
| Class R6 | 333 | ||
| Advisor Class | 39,362 | ||
| Custodian fees (Note 4) | 5,095 | ||
| Reports to shareholders | 84,969 | ||
| Registration and filing fees | 94,371 | ||
| Professional fees. | 42,070 | ||
| Trustees’ fees and expenses. | 34,131 | ||
| Other | 10,673 | ||
| Total expenses | 5,713,854 | ||
| Expenses waived/paid by affiliates (Note 3f) | (10,651 | ) | |
| Net expenses | 5,703,203 | ||
| Net investment income | 12,341,008 | ||
| Realized and unrealized gains (losses): | |||
| Net realized gain (loss) from: | |||
| Investments | 12,589,080 | ||
| Realized gain distributions from REITs | 4,074,938 | ||
| Net realized gain (loss) | 16,664,018 | ||
| Net change in unrealized appreciation (depreciation) on investments | 8,941,661 | ||
| Net realized and unrealized gain (loss) | 25,605,679 | ||
| Net increase (decrease) in net assets resulting from operations | $ | 37,946,687 | |
franklintempleton.com
The accompanying notes are an integral part of these financial statements. | Annual Report 21
| FRANKLIN REAL ESTATE SECURITIES TRUST | ||||||
| FINANCIAL STATEMENTS | ||||||
| Statements of Changes in Net Assets | ||||||
| Franklin Real Estate Securities Fund | ||||||
| Year Ended April 30, | ||||||
| 2016 | 2015 | |||||
| Increase (decrease) in net assets: | ||||||
| Operations: | ||||||
| Net investment income. | $ | 12,341,008 | $ | 7,742,758 | ||
| Net realized gain (loss) | 16,664,018 | 23,238,538 | ||||
| Net change in unrealized appreciation (depreciation) | 8,941,661 | 29,138,076 | ||||
| Net increase (decrease) in net assets resulting from operations | 37,946,687 | 60,119,372 | ||||
| Distributions to shareholders from: | ||||||
| Net investment income: | ||||||
| Class A | (6,024,463 | ) | (4,821,385 | ) | ||
| Class C | (801,106 | ) | (605,677 | ) | ||
| Class R6 | (2,274,410 | ) | (1,923,476 | ) | ||
| Advisor Class | (360,289 | ) | (276,200 | ) | ||
| Total distributions to shareholders. | (9,460,268 | ) | (7,626,738 | ) | ||
| Capital share transactions: (Note 2) | ||||||
| Class A | (34,932,065 | ) | 45,395,649 | |||
| Class C | (10,924,295 | ) | 12,902,054 | |||
| Class R6 | (8,164,611 | ) | (1,177,228 | ) | ||
| Advisor Class | 3,779,393 | 3,654,047 | ||||
| Total capital share transactions | (50,241,578 | ) | 60,774,522 | |||
| Net increase (decrease) in net assets | (21,755,159 | ) | 113,267,156 | |||
| Net assets: | ||||||
| Beginning of year | 595,621,163 | 482,354,007 | ||||
| End of year | $ | 573,866,004 | $ | 595,621,163 | ||
| Undistributed net investment income included in net assets: | ||||||
| End of year | $ | 5,315,693 | $ | 2,434,942 | ||
22 Annual Report | The accompanying notes are an integral part of these financial statements.
franklintempleton.com
FRANKLIN REAL ESTATE SECURITIES TRUST
Notes to Financial Statements
Franklin Real Estate Securities Fund
1. Organization and Significant Accounting Policies
Franklin Real Estate Securities Trust (Trust) is registered under the Investment Company Act of 1940 (1940 Act) as an open-end management investment company, consisting of one fund, Franklin Real Estate Securities Fund (Fund) and applies the specialized accounting and reporting guidance in U.S. Generally Accepted Accounting Principles (U.S. GAAP). The Fund offers four classes of shares: Class A, Class C, Class R6, and Advisor Class. Each class of shares differs by its initial sales load, contingent deferred sales charges, voting rights on matters affecting a single class, its exchange privilege and fees primarily due to differing arrangements for distribution and transfer agent fees.
The following summarizes the Fund’s significant accounting policies.
a. Financial Instrument Valuation
The Fund’s investments in financial instruments are carried at fair value daily. Fair value is the price that would be received to sell an asset or paid to transfer a liability in an orderly transaction between market participants on the measurement date. The Fund calculates the net asset value (NAV) per share as of 4 p.m. Eastern time each day the New York Stock Exchange (NYSE) is open for trading. Under compliance policies and procedures approved by the Fund’s Board of Trustees (the Board), the Fund’s administrator has responsibility for oversight of valuation, including leading the cross-functional Valuation and Liquidity Oversight Committee (VLOC). The VLOC provides administration and oversight of the Fund’s valuation policies and procedures, which are approved annually by the Board. Among other things, these procedures allow the Fund to utilize independent pricing services, quotations from securities and financial instrument dealers, and other market sources to determine fair value.
Equity securities listed on an exchange or on the NASDAQ National Market System are valued at the last quoted sale price or the official closing price of the day, respectively. Over-the-counter securities are valued within the range of the most recent quoted bid and ask prices. Securities that trade in multiple markets or on multiple exchanges are valued according to the broadest and most representative market. Certain equity securities are valued based upon fundamental characteristics or relationships to similar securities.
Investments in open-end mutual funds are valued at the closing NAV.
The Fund has procedures to determine the fair value of financial instruments for which market prices are not reliable or readily available. Under these procedures, the VLOC convenes on a regular basis to review such financial instruments and considers a number of factors, including significant unobservable valuation inputs, when arriving at fair value. The VLOC primarily employs a market-based approach which may use related or comparable assets or liabilities, recent transactions, market multiples, book values, and other relevant information for the investment to determine the fair value of the investment. An income-based valuation approach may also be used in which the anticipated future cash flows of the investment are discounted to calculate fair value. Discounts may also be applied due to the nature or duration of any restrictions on the disposition of the investments. Due to the inherent uncertainty of valuations of such investments, the fair values may differ significantly from the values that would have been used had an active market existed. The VLOC employs various methods for calibrating these valuation approaches including a regular review of key inputs and assumptions, transactional back-testing or disposition analysis, and reviews of any related market activity.
b. Securities Lending
The Fund participates in an agency based securities lending program to earn additional income. The Fund receives cash collateral against the loaned securities in an amount equal to at least 102% of the fair value of the loaned securities. Collateral is maintained over the life of the loan in an amount not less than 100% of the fair value of loaned securities, as determined at the close of Fund business each day; any additional collateral required due to changes in security values is delivered to the Fund on the next business day. The collateral is deposited into a joint cash account with other funds and is used to invest in a money market fund managed by Franklin Advisers, Inc., an affiliate of the Fund, and/or a joint repurchase agreement. The Fund may receive income from the investment of cash collateral, in addition to lending fees and rebates paid by the borrower. Income from securities loaned, net of fees paid to the securities lending agent and/or third-party vendor, is reported separately in the Statement of Operations. The Fund bears the market risk with respect to the collateral investment, securities loaned, and the risk that the agent may default on its obligations to the Fund. If the borrower defaults on its obligation to return
franklintempleton.com
Annual Report
23
FRANKLIN REAL ESTATE SECURITIES TRUST
NOTES TO FINANCIAL STATEMENTS
Franklin Real Estate Securities Fund (continued)
1. Organization and Significant Accounting
Policies (continued)
b. Securities Lending (continued)
the securities loaned, the Fund has the right to repurchase the securities in the open market using the collateral received. The securities lending agent has agreed to indemnify the Fund in the event of default by a third party borrower. At April 30, 2016, the Fund had no securities on loan.
c. Income Taxes
It is the Fund’s policy to qualify as a regulated investment company under the Internal Revenue Code. The Fund intends to distribute to shareholders substantially all of its taxable income and net realized gains to relieve it from federal income and excise taxes. As a result, no provision for U.S. federal income taxes is required.
The Fund may recognize an income tax liability related to its uncertain tax positions under U.S. GAAP when the uncertain tax position has a less than 50% probability that it will be sustained upon examination by the tax authorities based on its technical merits. As of April 30, 2016, the Fund has determined that no tax liability is required in its financial statements related to uncertain tax positions for any open tax years (or expected to be taken in future tax years). Open tax years are those that remain subject to examination and are based on each tax jurisdiction’s statute of limitation.
d. Security Transactions, Investment Income, Expenses and Distributions
Security transactions are accounted for on trade date. Realized gains and losses on security transactions are determined on a specific identification basis. Estimated expenses are accrued daily. Dividend income is recorded on the ex-dividend date. Distributions to shareholders are recorded on the ex-dividend date and are determined according to income tax regulations (tax basis). Distributable earnings determined on a tax basis may differ from earnings recorded in accordance with U.S. GAAP. These differences may be permanent or temporary.
Permanent differences are reclassified among capital accounts to reflect their tax character. These reclassifications have no impact on net assets or the results of operations. Temporary differences are not reclassified, as they may reverse in subsequent periods.
Realized and unrealized gains and losses and net investment income, not including class specific expenses, are allocated daily to each class of shares based upon the relative proportion of net assets of each class. Differences in per share distributions, by class, are generally due to differences in class specific expenses.
Distributions received by the Fund from certain securities may be a return of capital (ROC). Such distributions reduce the cost basis of the securities, and any distributions in excess of the cost basis are recognized as capital gains. For Real Estate Investment Trust (REIT) securities, the Fund records ROC estimates, if any, on the ex-dividend date and are adjusted once actual tax designations are known.
e. Accounting Estimates
The preparation of financial statements in accordance with U.S. GAAP requires management to make estimates and assumptions that affect the reported amounts of assets and liabilities at the date of the financial statements and the amounts of income and expenses during the reporting period. Actual results could differ from those estimates.
f. Guarantees and Indemnifications
Under the Fund’s organizational documents, its officers and trustees are indemnified by the Fund against certain liabilities arising out of the performance of their duties to the Fund. Additionally, in the normal course of business, the Fund enters into contracts with service providers that contain general indemnification clauses. The Fund’s maximum exposure under these arrangements is unknown as this would involve future claims that may be made against the Fund that have not yet occurred. Currently, the Fund expects the risk of loss to be remote.
24 Annual Report
franklintempleton.com
FRANKLIN REAL ESTATE SECURITIES TRUST
NOTES TO FINANCIAL STATEMENTS
Franklin Real Estate Securities Fund (continued)
2. Shares of Beneficial Interest
At April 30, 2016, there were an unlimited number of shares authorized ($0.01 par value). Transactions in the Fund’s shares were as follows:
| Year Ended April 30, | |||||||||||
| 2016 | 2015 | ||||||||||
| Shares | Amount | Shares | Amount | ||||||||
| Class A Shares: | |||||||||||
| Shares sold | 2,532,484 | $ | 54,961,855 | 5,397,559 | $ | 117,086,369 | |||||
| Shares issued in reinvestment of distributions | 270,471 | 5,785,357 | 224,169 | 4,596,250 | |||||||
| Shares redeemed | (4,456,988 | ) | (95,679,277 | ) | (3,587,998 | ) | (76,286,970 | ) | |||
| Net increase (decrease) | (1,654,033 | ) | $ | (34,932,065 | ) | 2,033,730 | $ | 45,395,649 | |||
| Class C Shares: | |||||||||||
| Shares sold | 784,919 | $ | 16,561,370 | 1,454,556 | $ | 30,447,174 | |||||
| Shares issued in reinvestment of distributions | 37,341 | 775,562 | 29,496 | 583,390 | |||||||
| Shares redeemed | (1,368,796 | ) | (28,261,227 | ) | (872,763 | ) | (18,128,510 | ) | |||
| Net increase (decrease) | (546,536 | ) | $ | (10,924,295 | ) | 611,289 | $ | 12,902,054 | |||
| Class R6 Shares: | |||||||||||
| Shares sold | 67,691 | $ | 1,480,907 | 314,578 | $ | 6,879,683 | |||||
| Shares issued in reinvestment of distributions | 105,709 | 2,274,410 | 93,382 | 1,923,476 | |||||||
| Shares redeemed | (526,930 | ) | (11,919,928 | ) | (478,049 | ) | (9,980,387 | ) | |||
| Net increase (decrease) | (353,530 | ) | $ | (8,164,611 | ) | (70,089 | ) | $ | (1,177,228 | ) | |
| Advisor Class Shares: | |||||||||||
| Shares sold | 518,718 | $ | 11,446,692 | 622,016 | $ | 13,399,905 | |||||
| Shares issued in reinvestment of distributions | 14,543 | 313,892 | 11,465 | 237,490 | |||||||
| Shares redeemed | (368,908 | ) | (7,981,191 | ) | (456,386 | ) | (9,983,348 | ) | |||
| Net increase (decrease) | 164,353 | $ | 3,779,393 | 177,095 | $ | 3,654,047 | |||||
3. Transactions with Affiliates
Franklin Resources, Inc. is the holding company for various subsidiaries that together are referred to as Franklin Templeton Investments. Certain officers and trustees of the Trust are also officers and/or directors of the following subsidiaries:
| Subsidiary | Affiliation |
| Franklin Templeton Institutional, LLC (FT Institutional) | Investment manager |
| Franklin Templeton Services, LLC (FT Services) | Administrative manager |
| Franklin Templeton Distributors, Inc. (Distributors) | Principal underwriter |
| Franklin Templeton Investor Services, LLC (Investor Services) | Transfer agent |
franklintempleton.com
Annual Report
25
FRANKLIN REAL ESTATE SECURITIES TRUST
NOTES TO FINANCIAL STATEMENTS
Franklin Real Estate Securities Fund (continued)
| 3. | Transactions with Affiliates (continued) |
| a. | Management Fees |
The Fund pays an investment management fee to FT Institutional based on the month-end net assets of the Fund as follows:
| Annualized Fee Rate | Net Assets | |
| 0.625 | % | Up to and including $100 million |
| 0.500 | % | Over $100 million, up to and including $250 million |
| 0.450 | % | Over $250 million, up to and including $7.5 billion |
| 0.440 | % | Over $7.5 billion, up to and including $10 billion |
| 0.430 | % | Over $10 billion, up to and including $12.5 billion |
| 0.420 | % | Over $12.5 billion, up to and including $15 billion |
| 0.400 | % | In excess of $15 billion |
For the year ended April 30, 2016, the effective investment management fee rate was 0.495% of the Fund’s average daily net assets.
b. Administrative Fees
Under an agreement with FT Institutional, FT Services provides administrative services to the Fund. The fee is paid by FT Institutional based on the Fund’s average daily net assets, and is not an additional expense of the Fund.
c. Distribution Fees
The Board has adopted distribution plan for each share class, with the exception of Class R6 and Advisor Class shares, pursuant to Rule 12b-1 under the 1940 Act. Under the Fund’s Class A reimbursement distribution plan, the Fund reimburses Distributors for costs incurred in connection with the servicing, sale and distribution of the Fund’s shares up to the maximum annual plan rate. Under the Class A reimbursement distribution plan, costs exceeding the maximum for the current plan year cannot be reimbursed in subsequent periods. In addition, under the Fund’s Class C compensation distribution plan, the Fund pays Distributors for costs incurred in connection with the servicing, sale and distribution of the Fund’s shares up to the maximum annual plan rate. The plan year, for purposes of monitoring compliance with the maximum annual plan rate, is February 1 through January 31.
The maximum annual plan rates, based on the average daily net assets, for each class, are as follows:
| Class A | 0.25 | % |
| Class C | 1.00 | % |
| d. Sales Charges/Underwriting Agreements | ||
Front-end sales charges and contingent deferred sales charges (CDSC) do not represent expenses of the Fund. These charges are deducted from the proceeds of sales of Fund shares prior to investment or from redemption proceeds prior to remittance, as applicable. Distributors has advised the Fund of the following commission transactions related to the sales and redemptions of the Fund’s shares for the year:
| Sales charges retained net of commissions paid to | ||
| unaffiliated brokers/dealers | $ | 119,753 |
| CDSC retained | $ | 12,899 |
26 Annual Report
franklintempleton.com
FRANKLIN REAL ESTATE SECURITIES TRUST
NOTES TO FINANCIAL STATEMENTS
Franklin Real Estate Securities Fund (continued)
e. Transfer Agent Fees
Each class of shares, except for Class R6, pays transfer agent fees to Investor Services for its performance of shareholder servicing obligations and reimburses Investor Services for out of pocket expenses incurred, including shareholder servicing fees paid to third parties. These fees are allocated daily based upon their relative proportion of such classes’ aggregate net assets. Class R6 pays Investor Services transfer agent fees specific to that class.
For the year ended April 30, 2016, the Fund paid transfer agent fees of $960,920, of which $473,905 was retained by Investor Services.
f. Investments in Affiliated Management Investment Companies
The Fund invests in an affiliated management investment company for purposes other than exercising a controlling influence over the management or policies. Management fees paid by the Fund are waived on assets invested in the affiliated management investment company, as noted in the Statement of Operations, in an amount not to exceed the management and administrative fees paid directly or indirectly by each affiliate. Prior to May 1, 2013, the waiver was accounted for as a reduction to management fees.
| % of | |||||||||||
| Affiliated | |||||||||||
| Number of | Number of | Fund Shares | |||||||||
| Shares Held | Shares | Value | Outstanding | ||||||||
| at Beginning | Gross | Gross | Held at End | at End | Investment | Realized | Held at End | ||||
| of Year | Additions | Reductions | of Year | of Year | Income | Gain (Loss) | of Year | ||||
| Non-Controlled Affiliates | |||||||||||
| Institutional Fiduciary Trust Money | |||||||||||
| Market Portfolio | 6,059,485 | 71,727,850 | (72,433,661 | ) | 5,353,674 | $ | 5,353,674 | $- | $- | 0.03 | % |
| g. Waiver and Expense Reimbursements | |||||||||||
Investor Services has contractually agreed in advance to waive or limit its fees so that the Class R6 transfer agent fees do not exceed 0.01% until August 31, 2016. There were no Class R6 transfer agent fees waived during the year ended April 30, 2016.
h. Other Affiliated Transactions
At April 30, 2016, one or more of the funds in Franklin Fund Allocator Series owned 17.77% of the Fund’s outstanding shares.
4. Expense Offset Arrangement
The Fund has entered into an arrangement with its custodian whereby credits realized as a result of uninvested cash balances are used to reduce a portion of the Fund’s custodian expenses. During the year ended April 30, 2016, there were no credits earned.
5. Income Taxes
For tax purposes, capital losses may be carried over to offset future capital gains. Capital loss carryforwards with no expiration, if any, must be fully utilized before those losses with expiration dates.
At April 30, 2016, the Fund had capital loss carryforwards of $19,102,558 expiring in 2018.
During the year ended April 30, 2016, the Fund utilized $16,586,604 of capital loss carryforwards.
For tax purposes, the Fund may elect to defer any portion of a post-October capital loss to the first day of the following fiscal year.
At April 30, 2016, the Fund deferred post-October capital losses of $1,700,366.
franklintempleton.com
Annual Report
27
FRANKLIN REAL ESTATE SECURITIES TRUST
NOTES TO FINANCIAL STATEMENTS
Franklin Real Estate Securities Fund (continued)
5. Income Taxes (continued)
The tax character of distributions paid during the years ended April 30, 2016 and 2015, was as follows:
| 2016 | 2015 | |||
| Distributions paid from ordinary income | $ | 9,460,268 | $ | 7,626,738 |
At April 30, 2016, the cost of investments, net unrealized appreciation (depreciation) and undistributed ordinary income for income tax purposes were as follows:
| Cost of investments | $ | 379,337,981 | |
| Unrealized appreciation | $ | 226,991,732 | |
| Unrealized depreciation | (31,689,532 | ) | |
| Net unrealized appreciation (depreciation) | $ | 195,302,200 | |
| Distributable earnings - undistributed ordinary income . | $ | 5,315,689 | |
Differences between income and/or capital gains as determined on a book basis and a tax basis are primarily due to differing treatments of wash sales.
6. Investment Transactions
Purchases and sales of investments (excluding short term securities) for the year ended April 30, 2016, aggregated $134,708,529 and $177,040,777, respectively.
7. Concentration of Risk
The Fund invests a large percentage of its total assets in REIT securities. Such concentration may subject the Fund to special risks associated with real estate securities. These securities may be more sensitive to economic or regulatory developments due to a variety of factors such as local, regional, national and global economic conditions, interest rates and tax considerations.
8. Credit Facility
The Fund, together with other U.S. registered and foreign investment funds (collectively, Borrowers), managed by Franklin Templeton Investments, are borrowers in a joint syndicated senior unsecured credit facility totaling $2 billion (Global Credit Facility) which matures on February 10, 2017. This Global Credit Facility provides a source of funds to the Borrowers for temporary and emergency purposes, including the ability to meet future unanticipated or unusually large redemption requests.
Under the terms of the Global Credit Facility, the Fund shall, in addition to interest charged on any borrowings made by the Fund and other costs incurred by the Fund, pay its share of fees and expenses incurred in connection with the implementation and maintenance of the Global Credit Facility, based upon its relative share of the aggregate net assets of all of the Borrowers, including an annual commitment fee of 0.07% based upon the unused portion of the Global Credit Facility. Effective February 12, 2016, the annual commitment fee is 0.15%. These fees are reflected in other expenses in the Statement of Operations. During the year ended April 30, 2016, the Fund did not use the Global Credit Facility.
28 Annual Report
franklintempleton.com
FRANKLIN REAL ESTATE SECURITIES TRUST
NOTES TO FINANCIAL STATEMENTS
Franklin Real Estate Securities Fund (continued)
9. Fair Value Measurements
The Fund follows a fair value hierarchy that distinguishes between market data obtained from independent sources (observable inputs) and the Fund’s own market assumptions (unobservable inputs). These inputs are used in determining the value of the Fund’s financial instruments and are summarized in the following fair value hierarchy:
- Level 1 – quoted prices in active markets for identical financial instruments
- Level 2 – other significant observable inputs (including quoted prices for similar financial instruments, interest rates, prepayment speed, credit risk, etc.)
- Level 3 – significant unobservable inputs (including the Fund’s own assumptions in determining the fair value of financial instruments)
The input levels are not necessarily an indication of the risk or liquidity associated with financial instruments at that level.
For movements between the levels within the fair value hierarchy, the Fund has adopted a policy of recognizing the transfers as of the date of the underlying event which caused the movement.
At April 30, 2016, all of the Fund’s investments in financial instruments carried at fair value were valued using Level 1 inputs. For detailed categories, see the accompanying Statement of Investments.
10. Subsequent Events
The Fund has evaluated subsequent events through the issuance of the financial statements and determined that no events have occurred that require disclosure.
| Abbreviations |
| Selected Portfolio |
| REIT Real Estate Investment Trust |
franklintempleton.com
Annual Report
29
FRANKLIN REAL ESTATE SECURITIES TRUST
Report of Independent Registered Public Accounting Firm
To the Board of Trustees and Shareholders of Franklin Real Estate Securities Fund
In our opinion, the accompanying statement of assets and liabilities, including the statement of investments, and the related statements of operations and of changes in net assets and the financial highlights present fairly, in all material respects, the financial position of Franklin Real Estate Securities Fund (the "Fund") at April 30, 2016, the results of its operations for the year then ended, the changes in its net assets for each of the two years in the period then ended and the financial highlights for each of the five years in the period then ended, in conformity with accounting principles generally accepted in the United States of America. These financial statements and financial highlights (hereafter referred to as "financial statements") are the responsibility of the Fund’s management. Our responsibility is to express an opinion on these financial statements based on our audits. We conducted our audits of these financial statements in accordance with the standards of the Public Company Accounting Oversight Board (United States). Those standards require that we plan and perform the audit to obtain reasonable assurance about whether the financial statements are free of material misstatement. An audit includes examining, on a test basis, evidence supporting the amounts and disclosures in the financial statements, assessing the accounting principles used and significant estimates made by management, and evaluating the overall financial statement presentation. We believe that our audit, which included confirmation of securities at April 30, 2016 by correspondence with the custodian, transfer agent and brokers, provide a reasonable basis for our opinion.
PricewaterhouseCoopers LLP
San Francisco, California
June 15, 2016
30 Annual Report
franklintempleton.com
FRANKLIN REAL ESTATE SECURITIES TRUST
Tax Information (unaudited)
Franklin Real Estate Securities Fund
Under Section 854(b)(1)(B) of the Internal Revenue Code (Code), the Fund hereby reports the maximum amount allowable but no less than $56,887 as qualified dividends for purposes of the maximum rate under Section 1(h)(11) of the Code for the fiscal year ended April 30, 2016. Distributions, including qualified dividend income, paid during calendar year 2016 will be reported to shareholders on Form 1099-DIV by mid-February 2017. Shareholders are advised to check with their tax advisors for information on the treatment of these amounts on their individual income tax returns.
franklintempleton.com
Annual Report
31
FRANKLIN REAL ESTATE SECURITIES TRUST
Board Members and Officers
The name, year of birth and address of the officers and board members, as well as their affiliations, positions held with the Trust, principal occupations during at least the past five years and number of U.S. registered portfolios overseen in the Franklin Templeton Investments fund complex, are shown below. Generally, each board member serves until that person’s successor is elected and qualified.
| Independent Board Members | ||||
| Number of Portfolios in | ||||
| Name, Year of Birth | Length of | Fund Complex Overseen | Other Directorships Held | |
| and Address | Position | Time Served | by Board Member* | During at Least the Past 5 Years |
| Harris J. Ashton (1932) | Trustee | Since 1993 | 145 | Bar-S Foods (meat packing company) |
| One Franklin Parkway | (1981-2010). | |||
| San Mateo, CA 94403-1906 | ||||
| Principal Occupation During at Least the Past 5 Years: | ||||
| Director of various companies; and formerly, Director, RBC Holdings, Inc. (bank holding company) (until 2002); and President, Chief Executive | ||||
| Officer and Chairman of the Board, General Host Corporation (nursery and craft centers) (until 1998). | ||||
| Mary C. Choksi (1950) | Trustee | Since 2014 | 121 | Avis Budget Group Inc. (car rental) |
| One Franklin Parkway | (2007-present), Omnicom Group Inc. | |||
| San Mateo, CA 94403-1906 | (advertising and marketing | |||
| communications services) | ||||
| (2011-present) and H.J. Heinz | ||||
| Company (processed foods and allied | ||||
| products) (1998-2006) | ||||
| Principal Occupation During at Least the Past 5 Years: | ||||
| Senior Advisor, Strategic Investment Group (investment management group) (2015-present); director of various companies; and formerly, | ||||
| Founding Partner and Senior Managing Director, Strategic Investment Group (1987-2015); Founding Partner and Managing Director, Emerging | ||||
| Markets Management LLC (investment management firm) (1987-2011); and Loan Officer/Senior Loan Officer/Senior Pension Investment | ||||
| Officer, World Bank Group (international financial institution) (1977-1987). | ||||
| Edith E. Holiday (1952) | Trustee | Since 2005 | 145 | Hess Corporation (exploration and |
| One Franklin Parkway | refining of oil and gas) (1993-present), | |||
| San Mateo, CA 94403-1906 | Canadian National Railway (railroad) | |||
| (2001-present), White Mountains | ||||
| Insurance Group, Ltd. (holding | ||||
| company) (2004-present), RTI | ||||
| International Metals, Inc. (manufacture | ||||
| and distribution of titanium) | ||||
| (1999-2015) and H.J. Heinz Company | ||||
| (processed foods and allied products) | ||||
| (1994-2013). | ||||
| Principal Occupation During at Least the Past 5 Years: | ||||
| Director or Trustee of various companies and trusts; and formerly, Assistant to the President of the United States and Secretary of the | ||||
| Cabinet (1990-1993); General Counsel to the United States Treasury Department (1989-1990); and Counselor to the Secretary and Assistant | ||||
| Secretary for Public Affairs and Public Liaison – United States Treasury Department (1988-1989). | ||||
| J. Michael Luttig (1954) | Trustee | Since 2009 | 145 | Boeing Capital Corporation (aircraft |
| One Franklin Parkway | financing) (2006-2013). | |||
| San Mateo, CA 94403-1906 | ||||
| Principal Occupation During at Least the Past 5 Years: | ||||
| Executive Vice President, General Counsel and member of the Executive Council, The Boeing Company (aerospace company) (2006-present); | ||||
| and formerly, Federal Appeals Court Judge, U.S. Court of Appeals for the Fourth Circuit (1991-2006). | ||||
| Frank A. Olson (1932) | Trustee | Since 2007 | 145 | Hess Corporation (exploration and |
| One Franklin Parkway | refining of oil and gas) (1998-2013). | |||
| San Mateo, CA 94403-1906 | ||||
| Principal Occupation During at Least the Past 5 Years: | ||||
| Director of various companies; and formerly, Chairman of the Board, The Hertz Corporation (car rental) (1980-2000) and Chief Executive | ||||
| Officer (1977-1999); and Chairman of the Board, President and Chief Executive Officer, UAL Corporation (airlines) (June-December 1987). | ||||
32 Annual Report
franklintempleton.com
FRANKLIN REAL ESTATE SECURITIES TRUST
| Independent Board Members (continued) | ||||
| Number of Portfolios in | ||||
| Name, Year of Birth | Length of | Fund Complex Overseen | Other Directorships Held | |
| and Address | Position | Time Served | by Board Member* | During at Least the Past 5 Years |
| Larry D. Thompson (1945) | Trustee | Since 2007 | 145 | The Southern Company (energy |
| One Franklin Parkway | company) (2014-present; previously | |||
| San Mateo, CA 94403-1906 | 2010-2012), Graham Holdings | |||
| Company (education and media | ||||
| organization) (2011-present) and | ||||
| Cbeyond, Inc. (business | ||||
| communications provider) | ||||
| (2010-2012). | ||||
| Principal Occupation During at Least the Past 5 Years: | ||||
| Director of various companies; John A. Sibley Professor of Corporate and Business Law, University of Georgia School of Law (2015-present; | ||||
| previously 2011-2012); and formerly, Executive Vice President — Government Affairs, General Counsel and Corporate Secretary, PepsiCo, | ||||
| Inc. (consumer products) (2012-2014); Senior Vice President — Government Affairs, General Counsel and Secretary, PepsiCo, Inc. | ||||
| (2004-2011); Senior Fellow of The Brookings Institution (2003-2004); Visiting Professor, University of Georgia School of Law (2004); and | ||||
| Deputy Attorney General, U.S. Department of Justice (2001-2003). | ||||
| John B. Wilson (1959) | Lead | Trustee since | 121 | None |
| One Franklin Parkway | Independent | 2006 and Lead | ||
| San Mateo, CA 94403-1906 | Trustee | Independent | ||
| Trustee since | ||||
| 2008 | ||||
| Principal Occupation During at Least the Past 5 Years: | ||||
| President, Staples Europe (office supplies) (2012-present); President and Founder, Hyannis Port Capital, Inc. (real estate and private equity | ||||
| investing); serves on private and non-profit boards; and formerly, Chief Operating Officer and Executive Vice President, Gap, Inc. (retail) | ||||
| (1996-2000); Chief Financial Officer and Executive Vice President – Finance and Strategy, Staples, Inc. (1992-1996); Senior Vice President – | ||||
| Corporate Planning, Northwest Airlines, Inc. (airlines) (1990-1992); and Vice President and Partner, Bain & Company (consulting firm) | ||||
| (1986-1990). | ||||
| Interested Board Members and Officers | ||||
| Number of Portfolios in | ||||
| Name, Year of Birth | Length of | Fund Complex Overseen | Other Directorships Held | |
| and Address | Position | Time Served | by Board Member* | During at Least the Past 5 Years |
| **Gregory E. Johnson (1961) | Trustee | Since 2007 | 160 | None |
| One Franklin Parkway | ||||
| San Mateo, CA 94403-1906 | ||||
| Principal Occupation During at Least the Past 5 Years: | ||||
| Chairman of the Board, Member - Office of the Chairman, Director, President and Chief Executive Officer, Franklin Resources, Inc.; officer | ||||
| and/or director or trustee, as the case may be, of some of the other subsidiaries of Franklin Resources, Inc. and of 44 of the investment | ||||
| companies in Franklin Templeton Investments; Vice Chairman, Investment Company Institute; and formerly, President, Franklin Resources, | ||||
| Inc. (1994-2015). | ||||
| **Rupert H. Johnson, Jr. (1940) | Chairman of | Chairman of the | 145 | None |
| One Franklin Parkway | the Board and | Board and Trustee | ||
| San Mateo, CA 94403-1906 | Trustee | since 2013 | ||
| Principal Occupation During at Least the Past 5 Years: | ||||
| Vice Chairman, Member – Office of the Chairman and Director, Franklin Resources, Inc.; Director, Franklin Advisers, Inc.; Senior Vice | ||||
| President, Franklin Advisory Services, LLC; and officer and/or director or trustee, as the case may be, of some of the other subsidiaries of | ||||
| Franklin Resources, Inc. and of 42 of the investment companies in Franklin Templeton Investments. | ||||
| Alison E. Baur (1964) | Vice President | Since 2012 | Not Applicable | Not Applicable |
| One Franklin Parkway | ||||
| San Mateo, CA 94403-1906 | ||||
| Principal Occupation During at Least the Past 5 Years: | ||||
| Deputy General Counsel, Franklin Templeton Investments; and officer of some of the other subsidiaries of Franklin Resources, Inc. and of 45 | ||||
| of the investment companies in Franklin Templeton Investments. | ||||
franklintempleton.com
Annual Report
33
FRANKLIN REAL ESTATE SECURITIES TRUST
| Interested Board Members and Officers (continued) | ||||
| Number of Portfolios in | ||||
| Name, Year of Birth | Length of | Fund Complex Overseen | Other Directorships Held | |
| and Address | Position | Time Served | by Board Member* | During at Least the Past 5 Years |
| Laura F. Fergerson (1962) | Chief | Since 2009 | Not Applicable | Not Applicable |
| One Franklin Parkway | Executive | |||
| San Mateo, CA 94403-1906 | Officer – | |||
| Finance and | ||||
| Administration | ||||
| Principal Occupation During at Least the Past 5 Years: | ||||
| Senior Vice President, Franklin Templeton Services, LLC; Vice President, Franklin Advisers, Inc. and Franklin Templeton Institutional, LLC; and | ||||
| officer of 45 of the investment companies in Franklin Templeton Investments. | ||||
| Gaston Gardey (1967) | Treasurer, | Since 2009 | Not Applicable | Not Applicable |
| One Franklin Parkway | Chief Financial | |||
| San Mateo, CA 94403-1906 | Officer and | |||
| Chief | ||||
| Accounting | ||||
| Officer | ||||
| Principal Occupation During at Least the Past 5 Years: | ||||
| Treasurer, U.S. Fund Administration & Reporting, Franklin Templeton Investments; and officer of 28 of the investment companies in Franklin | ||||
| Templeton Investments. | ||||
| Aliya S. Gordon (1973) | Vice President | Since 2009 | Not Applicable | Not Applicable |
| One Franklin Parkway | ||||
| San Mateo, CA 94403-1906 | ||||
| Principal Occupation During at Least the Past 5 Years: | ||||
| Senior Associate General Counsel, Franklin Templeton Investments; and officer of 44 of the investment companies in Franklin Templeton | ||||
| Investments. | ||||
| Steven J. Gray (1955) | Vice President | Since 2009 | Not Applicable | Not Applicable |
| One Franklin Parkway | ||||
| San Mateo, CA 94403-1906 | ||||
| Principal Occupation During at Least the Past 5 Years: | ||||
| Senior Associate General Counsel, Franklin Templeton Investments; Vice President, Franklin Templeton Distributors, Inc. and Franklin | ||||
| Alternative Strategies Advisers, LLC; and officer of 45 of the investment companies in Franklin Templeton Investments. | ||||
| Edward B. Jamieson (1948) | President and | Since 2010 | Not Applicable | Not Applicable |
| One Franklin Parkway | Chief | |||
| San Mateo, CA 94403-1906 | Executive | |||
| Officer – | ||||
| Investment | ||||
| Management | ||||
| Principal Occupation During at Least the Past 5 Years: | ||||
| President, Chief Investment Officer and Director, Franklin Advisers, Inc.; Executive Vice President, Franklin Templeton Institutional, LLC; and | ||||
| officer and/or trustee, as the case may be, of some of the other subsidiaries of Franklin Resources, Inc. and of 10 of the investment | ||||
| companies in Franklin Templeton Investments. | ||||
| Robert Lim (1948) | Vice President | Since May 2016 | Not Applicable | Not Applicable |
| One Franklin Parkway | – AML | |||
| San Mateo, CA 94403-1906 | Compliance | |||
| Principal Occupation During at Least the Past 5 Years: | ||||
| Vice President, Franklin Templeton Companies, LLC; Chief Compliance Officer, Franklin Templeton Distributors, Inc. and Franklin Templeton | ||||
| Investor Services, LLC; and officer of 45 of the investment companies in Franklin Templeton Investments. | ||||
| Kimberly H. Novotny (1972) | Vice President | Since 2013 | Not Applicable | Not Applicable |
| 300 S.E. 2nd Street | ||||
| Fort Lauderdale, FL 33301-1923 | ||||
| Principal Occupation During at Least the Past 5 Years: | ||||
| Associate General Counsel, Franklin Templeton Investments; Vice President and Corporate Secretary, Fiduciary Trust International of the | ||||
| South; Vice President and Assistant Secretary, Templeton Investment Counsel, LLC; Assistant Secretary, Franklin Resources, Inc.; and officer | ||||
| of 45 of the investment companies in Franklin Templeton Investments. | ||||
34 Annual Report
franklintempleton.com
FRANKLIN REAL ESTATE SECURITIES TRUST
| Interested Board Members and Officers (continued) | ||||
| Number of Portfolios in | ||||
| Name, Year of Birth | Length of | Fund Complex Overseen | Other Directorships Held | |
| and Address | Position | Time Served | by Board Member* | During at Least the Past 5 Years |
| Robert C. Rosselot (1960) | Chief | Since 2013 | Not Applicable | Not Applicable |
| 300 S.E. 2nd Street | Compliance | |||
| Fort Lauderdale, FL 33301-1923 | Officer | |||
| Principal Occupation During at Least the Past 5 Years: | ||||
| Director, Global Compliance, Franklin Templeton Investments; Vice President, Franklin Templeton Companies, LLC; officer of 45 of the | ||||
| investment companies in Franklin Templeton Investments; and formerly, Senior Associate General Counsel, Franklin Templeton Investments | ||||
| (2007-2013); and Secretary and Vice President, Templeton Group of Funds (2004-2013). | ||||
| Karen L. Skidmore (1952) | Vice President | Since 2006 | Not Applicable | Not Applicable |
| One Franklin Parkway | and Secretary | |||
| San Mateo, CA 94403-1906 | ||||
| Principal Occupation During at Least the Past 5 Years: | ||||
| Senior Associate General Counsel, Franklin Templeton Investments; and officer of 45 of the investment companies in Franklin Templeton | ||||
| Investments. | ||||
| Navid Tofigh (1972) | Vice President | Since November | Not Applicable | Not Applicable |
| One Franklin Parkway | 2015 | |||
| San Mateo, CA 94403-1906 | ||||
| Principal Occupation During at Least the Past 5 Years: | ||||
| Associate General Counsel, Franklin Templeton Investments; and officer of 45 of the investment companies in Franklin Templeton Investments. | ||||
| Craig S. Tyle (1960) | Vice President | Since 2005 | Not Applicable | Not Applicable |
| One Franklin Parkway | ||||
| San Mateo, CA 94403-1906 | ||||
| Principal Occupation During at Least the Past 5 Years: | ||||
| General Counsel and Executive Vice President, Franklin Resources, Inc.; and officer of some of the other subsidiaries of Franklin Resources, | ||||
| Inc. and of 45 of the investment companies in Franklin Templeton Investments. | ||||
| Lori A. Weber (1964) | Vice President | Since 2011 | Not Applicable | Not Applicable |
| 300 S.E. 2nd Street | ||||
| Fort Lauderdale, FL 33301-1923 | ||||
| Principal Occupation During at Least the Past 5 Years: | ||||
| Senior Associate General Counsel, Franklin Templeton Investments; Assistant Secretary, Franklin Resources, Inc.; Vice President and | ||||
| Secretary, Templeton Investment Counsel, LLC; and officer of 45 of the investment companies in Franklin Templeton Investments. | ||||
| *We base the number of portfolios on each separate series of the U.S. registered investment companies within the Franklin Templeton Investments fund complex. These | ||||
| portfolios have a common investment manager or affiliated investment managers. | ||||
| **Gregory E. Johnson is considered to be an interested person of the Fund under the federal securities laws due to his position as an officer and director of Franklin | ||||
| Resources, Inc. (Resources), which is the parent company of the Fund’s investment manager and distributor. Rupert H. Johnson, Jr. is considered to be an interested person | ||||
| of the Fund under the federal securities laws due to his position as officer and director and major shareholder of Resources. | ||||
Note 1: Rupert H. Johnson, Jr. is the uncle of Gregory E. Johnson.
Note 2: Officer information is current as of the date of this report. It is possible that after this date, information about officers may change.
The Sarbanes-Oxley Act of 2002 and Rules adopted by the Securities and Exchange Commission require the Fund to disclose whether the Fund’s Audit
Committee includes at least one member who is an audit committee financial expert within the meaning of such Act and Rules. The Fund’s Board has determined
that there is at least one such financial expert on the Audit Committee and has designated John B. Wilson as its audit committee financial expert. The Board
believes that Mr. Wilson qualifies as such an expert in view of his extensive business background and experience, including service as chief financial officer of
Staples, Inc. from 1992 to 1996. Mr. Wilson has been a Member and Chairman of the Fund’s Audit Committee since 2006. As a result of such background and
experience, the Board believes that Mr. Wilson has acquired an understanding of generally accepted accounting principles and financial statements, the general
application of such principles in connection with the accounting estimates, accruals and reserves, and analyzing and evaluating financial statements that
present a breadth and level of complexity of accounting issues generally comparable to those of the Fund, as well as an understanding of internal controls and
procedures for financial reporting and an understanding of audit committee functions. Mr. Wilson is an independent Board member as that term is defined under
the relevant Securities and Exchange Commission Rules and Releases.
The Statement of Additional Information (SAI) includes additional information about the board members and is available, without charge, upon request.
Shareholders may call (800) DIAL BEN/342-5236 to request the SAI.
franklintempleton.com
Annual Report
35
FRANKLIN REAL ESTATE SECURITIES TRUST FRANKLIN REAL ESTATE SECURITIES FUND
Shareholder Information
Board Review of Investment Management Agreement
At a meeting held April 12, 2016, the Board of Trustees (Board), including a majority of trustees that are not “interested persons” as such term is defined in section 2(a)(19) of the Investment Company Act of 1940 (hereinafter referred to as “non-interested Trustees” or “independent Trustees”), approved renewal of the investment management agreement for the Trust (Fund). In reaching this decision, the Board took into account information furnished throughout the year at regular Board meetings, as well as information prepared specifically in connection with the annual renewal review process. Information furnished and discussed throughout the year included investment performance reports and related financial information for the Fund, along with periodic reports on expenses, shareholder services, legal and compliance matters, risk control, pricing, brokerage commissions and execution, and other services provided by the Investment Manager (Manager) and its affiliates, as well as marketing support payments made to financial intermediaries. Information furnished specifically in connection with the renewal process included a report for the Fund prepared by Broadridge Financial Solutions, Inc. (Broadridge), an independent organization, as well as additional material, including a Fund profitability analysis prepared by management. The Broadridge report, which utilized data from Lipper, Inc. (Lipper), compared the Fund’s investment performance and expenses with those of other mutual funds deemed comparable to the Fund as selected by Lipper. The Fund profitability analysis discussed the profitability to Franklin Templeton Investments (FTI) from its overall U.S. fund operations, as well as on an individual fund-by-fund basis. Additional material accompanying such profitability analysis included information on a fund-by-fund basis listing portfolio managers and other accounts they manage, as well as information on management fees charged by the Manager and its affiliates to U.S. mutual funds and other accounts, including management’s explanation of differences where relevant. Such material also included a memorandum prepared by management describing project initiatives and capital investments relating to the services provided to the Fund by the FTI organization, as well as a memorandum relating to economies of scale and an analysis concerning transfer agent fees charged by an affiliate of the Manager. The Board also received a report on all marketing support payments made by FTI to financial intermediaries during the past year, as well as a memorandum relating to third-party servicing arrangements in response to a Guidance Update from the U.S. Securities and Exchange Commission (SEC) relating to mutual fund distribution and sub-accounting fees.
In considering such materials, the independent Trustees received assistance and advice from and met separately with independent counsel. In approving continuance of the investment management agreement for the Fund, the Board, including a majority of independent Trustees, determined that the existing management fee structure was fair and reasonable and that continuance of the investment management agreement was in the best interests of the Fund and its shareholders. While attention was given to all information furnished, the following discusses some primary factors relevant to the Board’s decision.
NATURE, EXTENT AND QUALITY OF SERVICES. The Board was satisfied with the nature and quality of the overall services provided by the Manager and its affiliates to the Fund and its shareholders. In addition to investment performance and expenses discussed later, the Board’s opinion was based, in part, upon periodic reports furnished it showing that the investment policies and restrictions for the Fund were consistently complied with as well as other reports periodically furnished the Board covering matters such as the compliance of portfolio managers and other management personnel with the code of ethics adopted throughout the Franklin Templeton fund complex, the adherence to fair value pricing procedures established by the Board, and the accuracy of net asset value calculations. The Board also noted the extent of benefits provided Fund shareholders from being part of the Franklin Templeton family of funds, including the right to exchange investments between the same class of shares of different funds without a sales charge, the ability to reinvest Fund dividends into other funds and the right to combine holdings in other funds to obtain a reduced sales charge. Favorable consideration was given to management’s continual efforts and expenditures in establishing effective business continuity plans and developing strategies to address cybersecurity threats. Additionally, the Board noted the Manager’s continued attention to pricing and valuation issues, particularly with respect to complex securities. Among other factors taken into
36 Annual Report
franklintempleton.com
FRANKLIN REAL ESTATE SECURITIES TRUST
FRANKLIN REAL ESTATE SECURITIES FUND
SHAREHOLDER INFORMATION
account by the Board were the Manager’s best execution trading policies. Consideration was also given to the experience of the Fund’s portfolio management team, the number of accounts managed and general method of compensation. In this latter respect, the Board noted that a primary factor in management’s determination of a portfolio manager’s bonus compensation was the relative investment performance of the funds he or she managed and that a portion of such bonus was required to be invested in a pre-designated list of funds within such person’s fund management area so as to be aligned with the interests of shareholders. The Board also took into account the quality of transfer agent and shareholder services provided to Fund shareholders by an affiliate of the Manager and steps taken by FTI to enhance analytical support to the investment management groups and provide additional oversight of liquidity risk and complex securities. The Board also took into account, among other things, management’s efforts in establishing a global credit facility for the benefit of the Fund and other accounts managed by FTI to provide a source of cash for temporary and emergency purposes or to meet unusual redemption requests as well as the strong financial position of the Manager’s parent company and its commitment to the mutual fund business as evidenced by its continued introduction of new funds and reassessment of the fund offerings in response to the market environment.
INVESTMENT PERFORMANCE. The Board placed significant emphasis on the investment performance of the Fund in view of its importance to shareholders. While consideration was given to performance reports and discussions with portfolio managers at Board meetings during the year, particular attention in assessing performance was given to the Broadridge report furnished for the agreement renewal. The Broadridge report prepared for the Fund showed the investment performance of its Class A shares for the 12-month period ended January 31, 2016, as well as the previous 10-year period ended that date in comparison with a performance universe consisting of the Fund and all retail and institutional real estate funds as selected by Lipper. The Broadridge report showed the Fund’s total return to be in the second-highest performing quintile of such universe for the one-year period, and on an annualized basis to be in the highest performing quintile of such universe for the previous three-year period, the second-highest performing quintile of such universe for the previous five-year period, and the lowest performing quintile of such universe for the previous 10-year period. The Board found such comparative performance to be satisfactory, noting steps taken by management to improve performance. The Board observed that the Fund’s total return for the annualized three-and five-year periods exceeded 8% and 10%, respectively, as shown in the Broadridge report.
COMPARATIVE EXPENSES. Consideration was given to the management fee and total expense ratio of the Fund compared with those of a group of other funds selected by Lipper as constituting its appropriate Lipper expense group. Lipper expense data is based upon information taken from each fund’s most recent annual report, which reflects historical asset levels that may be quite different from those currently existing, particularly in a period of market volatility. While recognizing such inherent limitation and the fact that expense ratios generally increase as assets decline and decrease as assets grow, the Board believed the independent analysis conducted by Lipper to be an appropriate measure of comparative expenses. In reviewing comparative costs, Lipper provides information on the Fund’s contractual investment management fee in comparison with the contractual investment management fee that would have been charged by other funds within its Lipper expense group assuming they were similar in size to the Fund, as well as the actual total expense ratio of the Fund in comparison with those of its Lipper expense group. The Lipper contractual investment management fee analysis considers administrative charges as being part of management fees and total expenses, for comparative consistency, are shown by Lipper for Fund Class A shares for those funds with multiple share classes. The results of such expense comparisons showed the Fund’s contractual investment management fee rate, as well as its actual total expense ratio to both be in the least expensive quintile of its Lipper expense group. The Board was satisfied with the management fees and total expenses of the Fund in comparison to its respective Lipper expense group.
MANAGEMENT PROFITABILITY. The Board also considered the level of profits realized by the Manager and its affiliates in connection with the operation of the Fund. In this respect, the Board reviewed the Fund profitability analysis that addresses the overall profitability of Franklin Templeton’s U.S. fund business, as well as its profits in providing management and other services to each of the individual funds during the 12-month period ended September 30, 2015, being the most recent fiscal year end for Franklin Resources, Inc., the Manager’s parent. In reviewing the analysis, the Board
franklintempleton.com
Annual Report
37
FRANKLIN REAL ESTATE SECURITIES TRUST
FRANKLIN REAL ESTATE SECURITIES FUND
SHAREHOLDER INFORMATION
recognized that allocation methodologies are inherently subjective and various allocation methodologies may be reasonable while producing different results. In this respect, the Board noted that while Management continually makes refinements to its methodologies in response to organizational and product related changes, the overall approach as defined by the primary drivers and activity measurements has remained consistent with that used in the Fund’s profitability report presentations from prior years. Additionally, the Fund’s independent registered public accounting firm had been engaged by the Manager to periodically review the reasonableness of the allocation methodologies to be used solely by the Fund’s Board in reference to the profitability analysis. In reviewing and discussing such analysis, management discussed with the Board its belief that costs incurred in establishing the infrastructure necessary for the type of mutual fund operations conducted by the Manager and its affiliates may not be fully reflected in the expenses allocated to the Fund in determining its profitability, as well as the fact that the level of profits, to a certain extent, reflected operational cost savings and efficiencies initiated by management. The Board also took into account management’s expenditures in improving shareholder services provided the Fund, as well as the need to implement systems and meet additional regulatory and compliance requirements resulting from statutes such as the Sarbanes-Oxley and Dodd-Frank Acts and recent SEC and other regulatory requirements. In addition, the Board considered a third-party study comparing the profitability of the Manager’s parent on an overall basis to other publicly held managers broken down to show profitability from management operations exclusive of distribution expenses, as well as profitability including distribution expenses. The Board also considered the extent to which the Manager and its affiliates might derive ancillary benefits from fund operations, including revenues generated from transfer agent services, potential benefits resulting from personnel and systems enhancements necessitated by fund growth, as well as increased leverage with the service providers and counter-parties. Based upon its consideration of all these factors, the Board determined that the level of profits realized by the Manager and its affiliates from providing services to the Fund was not excessive in view of the nature, quality and extent of services provided.
ECONOMIES OF SCALE. The Board also considered whether economies of scale are realized by the Manager as the Fund grows larger and the extent to which this is reflected in the level of management fees charged. While recognizing that any precise determination is inherently subjective, the Board noted that based upon the Fund profitability analysis, it appears that as some funds get larger, at some point economies of scale do result in the Manager realizing a larger profit margin on management services provided such a fund. The Board also noted that economies of scale are shared with a fund and its shareholders through management fee breakpoints so that as a fund grows in size, its effective management fee rate declines. The fee structure under the Fund’s investment management agreement provides an initial fee of 0.625% on the first $100 million of assets; 0.50% on the next $150 million of assets; and 0.45% on the next $7.25 billion of assets, with breakpoints continuing in stages thereafter until declining to a final breakpoint of 0.40% on assets in excess of $15 billion. The Fund had assets of approximately $572 million at the end of 2015 and management expressed its view that the existing fee schedule reaches a relatively low rate quickly as the Fund grows and anticipates economies of scale as shown in the favorable effective management fee and expense comparisons within its Lipper expense group. The Board believes that to the extent any economies of scale may be realized by the Manager and its affiliates, the schedule of fees under the investment management agreement provides a sharing of benefits with the Fund and its shareholders.
Proxy Voting Policies and Procedures
The Fund’s investment manager has established Proxy Voting Policies and Procedures (Policies) that the Fund uses to determine how to vote proxies relating to portfolio securities. Shareholders may view the Fund’s complete Policies online at franklintempleton.com. Alternatively, shareholders may request copies of the Policies free of charge by calling the Proxy Group collect at (954) 527-7678 or by sending a written request to: Franklin Templeton Companies, LLC, 300 S.E. 2nd Street, Fort Lauderdale, FL 33301, Attention: Proxy Group. Copies of the Fund’s proxy voting records are also made available online at franklintempleton.com and posted on the U.S. Securities and Exchange Commission’s website at sec.gov and reflect the most recent 12-month period ended June 30.
38 Annual Report
franklintempleton.com
FRANKLIN REAL ESTATE SECURITIES TRUST
FRANKLIN REAL ESTATE SECURITIES FUND
SHAREHOLDER INFORMATION
Quarterly Statement of Investments
The Trust, on behalf of the Fund, files a complete statement of investments with the U.S. Securities and Exchange Commission for the first and third quarters for each fiscal year on Form N-Q. Shareholders may view the filed Form N-Q by visiting the Commission’s website at sec.gov. The filed form may also be viewed and copied at the Commission’s Public Reference Room in Washington, DC. Information regarding the operations of the Public Reference Room may be obtained by calling (800) SEC-0330.
Householding of Reports and Prospectuses
You will receive each Fund’s financial reports every six months as well as an annual updated summary prospectus (prospectus available upon request). To reduce Fund expenses, we try to identify related shareholders in a household and send only one copy of the financial reports and summary prospectus. This process, called “householding,” will continue indefinitely unless you instruct us otherwise. If you prefer not to have these documents householded, please call us at (800) 632-2301. At any time you may view current prospectuses/summary prospectuses and financial reports on our website. If you choose, you may receive these documents through electronic delivery.
franklintempleton.com
Annual Report
39
This page intentionally left blank.

Item 2. Code of Ethics.
(a) The Registrant has adopted a code of ethics that applies to its principal executive officers and principal financial and accounting officer.
(c) N/A
(d) N/A
(f) Pursuant to Item 12(a)(1), the Registrant is attaching as an exhibit a copy of its code of ethics that applies to its principal executive officers and principal financial and accounting officer.
Item 3. Audit Committee Financial Expert.
(a)(1) The Registrant has an audit committee financial expert serving on its audit committee.
(2) The audit committee financial expert is John B. Wilson and he is "independent" as defined under the relevant Securities and Exchange Commission Rules and Releases.
Item 4. Principal Accountant Fees and Services.
(a) Audit Fees
The aggregate fees paid to the principal accountant for professional services rendered by the principal accountant for the audit of the registrant’s annual financial statements or for services that are normally provided by the principal accountant in connection with statutory and regulatory filings or engagements were $32,874 for the fiscal year ended April 30, 2016 and $41,739 for the fiscal year ended April 30, 2015.
(b) Audit-Related Fees
There were no fees paid to the principal accountant for assurance and related services rendered by the principal accountant to the registrant that are reasonably related to the performance of the audit of the registrant's financial statements and are not reported under paragraph (a) of Item 4.
There were no fees paid to the principal accountant for assurance and related services rendered by the principal accountant to the registrant's investment adviser and any entity controlling, controlled by or under common control with the investment adviser that provides ongoing services to the registrant that are reasonably related to the performance of the audit of their financial statements.
(c) Tax Fees
There were no fees paid to the principal accountant for professional services rendered by the principal accountant to the registrant for tax compliance, tax advice and tax planning.
There were no fees paid to the principal accountant for professional services rendered by the principal accountant to the registrant’s investment adviser and any entity controlling, controlled by or under common control with the investment adviser that provides ongoing services to the registrant for tax compliance, tax advice and tax planning.
(d) All Other Fees
There were no fees paid to the principal accountant for products and services rendered by the principal accountant to the registrant not reported in paragraphs (a)-(c) of Item 4.
The aggregate fees paid to the principal accountant for products and services rendered by the principal accountant to the registrant’s investment adviser and any entity controlling, controlled by or under common control with the investment adviser that provides ongoing services to the registrant other than services reported in paragraphs (a)-(c) of Item 4 were $13,232 for the fiscal year ended April 30, 2016 and $15,579 for the fiscal year ended April 30, 2015. The services for which these fees were paid included preparation and review of materials provided to the fund Board in connection with the investment management contract renewal process, compliance examination for Investment Advisor Act rule 204-2 and 206-4(2) and certifying asset under management.
(e) (1) The registrant’s audit committee is directly responsible for approving the services to be provided by the auditors, including:
(i) pre-approval of all audit and audit related services;
(ii) pre-approval of all non-audit related services to be provided to the Fund by the auditors;
(iii) pre-approval of all non-audit related services to be provided to the registrant by the auditors to the registrant’s investment adviser or to any entity that controls, is controlled by or is under common control with the registrant’s investment adviser and that provides ongoing services to the registrant where the non-audit services relate directly to the operations or financial reporting of the registrant; and
(iv) establishment by the audit committee, if deemed necessary or appropriate, as an alternative to committee pre-approval of services to be provided by the auditors, as required by paragraphs (ii) and (iii) above, of policies and procedures to permit such services to be pre-approved by other means, such as through establishment of guidelines or by action of a designated member or members of the committee; provided the policies and procedures are detailed as to the particular service and the committee is informed of each service and such policies and procedures do not include delegation of audit committee responsibilities, as contemplated under the Securities Exchange Act of 1934, to management; subject, in the case of (ii) through (iv), to any waivers, exceptions or exemptions that may be available under applicable law or rules.
(e) (2) None of the services provided to the registrant described in paragraphs (b)-(d) of Item 4 were approved by the audit committee pursuant to paragraph (c)(7)(i)(C) of Rule 2-01 of regulation S-X.
(f) No disclosures are required by this Item 4(f).
(g) The aggregate non-audit fees paid to the principal accountant for services rendered by the principal accountant to the registrant and the registrant’s investment adviser and any entity controlling, controlled by or under common control with the investment adviser that provides ongoing services to the registrant were $13,232 for the fiscal year ended April 30, 2016 and $15,579 for the fiscal year ended April 30, 2015.
(h) The registrant’s audit committee of the board has considered whether the provision of non-audit services that were rendered to the registrant’s investment adviser (not including any sub-adviser whose role is primarily portfolio management and is subcontracted with or overseen by another investment adviser), and any entity controlling, controlled by, or under common control with the investment adviser that provides ongoing services to the registrant that were not pre-approved pursuant to paragraph (c)(7)(ii) of Rule 2-01 of Regulation S-X is compatible with maintaining the principal accountant’s independence.
Item 5. Audit Committee of Listed Registrants. N/A
Item 6. Schedule of Investments. N/A
Item 7. Disclosure of Proxy Voting Policies and Procedures for Closed-End Management Investment Companies. N/A
Item 8. Portfolio Managers of Closed-End Management Investment Companies. N/A
Item 9. Purchases of Equity Securities by Closed-End Management Investment Company and Affiliated Purchasers. N/A
Item 10. Submission of Matters to a Vote of Security Holders.
There have been no changes to the procedures by which shareholders may recommend nominees to the Registrant's Board of Trustees that would require disclosure herein.
Item 11. Controls and Procedures.
(a) Evaluation of Disclosure Controls and Procedures. The Registrant maintains disclosure controls and procedures that are designed to ensure that information required to be disclosed in the Registrant’s filings under the Securities Exchange Act of 1934 and the Investment Company Act of 1940 is recorded, processed, summarized and reported within the periods specified in the rules and forms of the Securities and Exchange Commission. Such information is accumulated and communicated to the Registrant’s management, including its principal executive officer and principal financial officer, as appropriate, to allow timely decisions regarding required disclosure. The Registrant’s management, including the principal executive officer and the principal financial officer, recognizes that any set of controls and procedures, no matter how well designed and operated, can provide only reasonable assurance of achieving the desired control objectives.
Within 90 days prior to the filing date of this Shareholder Report on Form N-CSR, the Registrant had carried out an evaluation, under the supervision and with the participation of the Registrant’s management, including the Registrant’s principal executive officer and the Registrant’s principal financial officer, of the effectiveness of the design and operation of the Registrant’s disclosure controls and procedures. Based on such evaluation, the Registrant’s principal executive officer and principal financial officer concluded that the Registrant’s disclosure controls and procedures are effective.
(b) Changes in Internal Controls. There have been no changes in the Registrant’s internal controls or in other factors that could materially affect the internal controls over financial reporting subsequent to the date of their evaluation in connection with the preparation of this Shareholder Report on Form N-CSR.
Item 12. Exhibits.
(a) (1) Code of Ethics
(a) (2) Certifications pursuant to Section 302 of the Sarbanes-Oxley Act of 2002 of Laura F. Fergerson, Chief Executive Officer - Finance and Administration, and Gaston Gardey, Chief Financial Officer and Chief Accounting Officer
(b) Certifications pursuant to Section 906 of the Sarbanes-Oxley Act of 2002 of Laura F. Fergerson, Chief Executive Officer - Finance and Administration, and Gaston Gardey, Chief Financial Officer and Chief Accounting Officer
SIGNATURES
Pursuant to the requirements of the Securities Exchange Act of 1934 and the Investment Company Act of 1940, the registrant has duly caused this report to be signed on its behalf by the undersigned, thereunto duly authorized.
FRANKLIN REAL ESTATE SECURITIES TRUST
By /s/ Laura F. Fergerson
Laura F. Fergerson
Chief Executive Officer –
Finance and Administration
Date June 24, 2016
Pursuant to the requirements of the Securities Exchange Act of 1934 and the Investment Company Act of 1940, this report has been signed below by the following persons on behalf of the registrant and in the capacities and on the dates indicated.
By /s/ Laura F. Fergerson
Laura F. Fergerson
Chief Executive Officer –
Finance and Administration
Date June 24, 2016
By /s/ Gaston Gardey
Gaston Gardey
Chief Financial Officer and
Chief Accounting Officer
Date June 24, 2016