United States
Securities and Exchange Commission
Washington, D.C. 20549
Form N-CSR
Certified Shareholder Report of Registered Management Investment Companies
811-8042
(Investment Company Act File Number)
Federated Hermes Insurance Series
_______________________________________________________________
(Exact Name of Registrant as Specified in Charter)
Federated Hermes Funds
4000 Ericsson Drive
Warrendale, Pennsylvania 15086-7561
(Address of Principal Executive Offices)
(412) 288-1900
(Registrant's Telephone Number)
Peter J. Germain, Esquire
1001 Liberty Avenue
Pittsburgh, Pennsylvania 15222-3779
(Name and Address of Agent for Service)
(Notices should be sent to the Agent for Service)
Date of Fiscal Year End: 12/31/20
Date of Reporting Period: 12/31/20
| Item 1. | Reports to Stockholders |

Share Class | Primary | Service |
Federated Hermes Government Money Fund II
A Portfolio of Federated Hermes Insurance Series

Security Type | Percentage of Total Net Assets |
U.S. Treasuries | 35.3% |
Government Agencies | 26.7% |
Repurchase Agreements | 37.5% |
Other Assets and Liabilities—Net2 | 0.5% |
TOTAL | 100% |
1 | See the Fund’s prospectus and Statement of Additional Information for a description of the types of securities in which the Fund invests. |
2 | Assets, other than investments in securities, less liabilities. See Statement of Assets and Liabilities. |
Securities With an Effective Maturity of: | Percentage of Total Net Assets |
1-7 Days | 60.0% |
8-30 Days | 6.9% |
31-90 Days | 17.3% |
91-180 Days | 9.1% |
181 Days or more | 6.2% |
Other Assets and Liabilities—Net | 0.5% |
Total | 100% |
1 | Effective maturity is determined in accordance with the requirements of Rule 2a-7 under the Investment Company Act of 1940, which regulates money market mutual funds. |
Principal Amount | Value | ||
GOVERNMENT AGENCIES—26.7% | |||
$ 400,000 | 1 | Federal Farm Credit System Floating Rate Notes, 0.145% (Secured Overnight Financing Rate +0.055%), 1/1/2021 | $399,961 |
300,000 | 1 | Federal Farm Credit System Floating Rate Notes, 0.150% (Secured Overnight Financing Rate +0.060%), 1/1/2021 | 300,000 |
400,000 | 1 | Federal Farm Credit System Floating Rate Notes, 0.165% (Secured Overnight Financing Rate +0.075%), 1/1/2021 | 400,000 |
250,000 | 1 | Federal Farm Credit System Floating Rate Notes, 0.210% (Secured Overnight Financing Rate +0.120%), 1/1/2021 | 250,000 |
200,000 | 1 | Federal Farm Credit System Floating Rate Notes, 0.215% (Effective Fed Funds +0.125%), 1/1/2021 | 199,998 |
300,000 | 1 | Federal Farm Credit System Floating Rate Notes, 0.215% (Secured Overnight Financing Rate +0.125%), 1/1/2021 | 300,000 |
300,000 | 1 | Federal Farm Credit System Floating Rate Notes, 0.270% (Secured Overnight Financing Rate +0.180%), 1/1/2021 | 300,000 |
300,000 | 1 | Federal Farm Credit System Floating Rate Notes, 0.300% (Secured Overnight Financing Rate +0.210%), 1/1/2021 | 300,000 |
500,000 | 1 | Federal Farm Credit System Floating Rate Notes, 0.390% (Secured Overnight Financing Rate +0.300%), 1/1/2021 | 500,000 |
600,000 | Federal Farm Credit System, 0.080% - 0.090%, 12/3/2021 - 12/21/2021 | 599,813 | |
2,250,000 | 2 | Federal Home Loan Bank System Discount Notes, 0.098% - 0.450%, 1/29/2021 - 5/19/2021 | 2,249,092 |
500,000 | 1 | Federal Home Loan Bank System Floating Rate Notes, 0.098% (1-month USLIBOR -0.050%), 1/27/2021 | 500,000 |
1,000,000 | 1 | Federal Home Loan Bank System Floating Rate Notes, 0.110% (Secured Overnight Financing Rate +0.020%), 1/1/2021 | 1,000,000 |
500,000 | 1 | Federal Home Loan Bank System Floating Rate Notes, 0.120% (Secured Overnight Financing Rate +0.030%), 1/1/2021 | 500,000 |
300,000 | 1 | Federal Home Loan Bank System Floating Rate Notes, 0.123% (1-month USLIBOR -0.030%), 1/19/2021 | 300,000 |
500,000 | 1 | Federal Home Loan Bank System Floating Rate Notes, 0.125% (Secured Overnight Financing Rate +0.035%), 1/1/2021 | 500,000 |
1,000,000 | 1 | Federal Home Loan Bank System Floating Rate Notes, 0.135% (Secured Overnight Financing Rate +0.045%), 1/1/2021 | 1,000,000 |
1,000,000 | 1 | Federal Home Loan Bank System Floating Rate Notes, 0.140% (Secured Overnight Financing Rate +0.050%), 1/1/2021 | 1,000,000 |
1,300,000 | 1 | Federal Home Loan Bank System Floating Rate Notes, 0.150% (Secured Overnight Financing Rate +0.060%), 1/1/2021 | 1,300,000 |
550,000 | 1 | Federal Home Loan Bank System Floating Rate Notes, 0.155% (Secured Overnight Financing Rate +0.065%), 1/1/2021 | 550,000 |
350,000 | 1 | Federal Home Loan Bank System Floating Rate Notes, 0.165% (Secured Overnight Financing Rate +0.075%), 1/1/2021 | 350,000 |
300,000 | 1 | Federal Home Loan Bank System Floating Rate Notes, 0.175% (Secured Overnight Financing Rate +0.085%), 1/1/2021 | 300,000 |
1,000,000 | 1 | Federal Home Loan Bank System Floating Rate Notes, 0.170% (Secured Overnight Financing Rate +0.080%), 1/1/2021 | 1,000,000 |
500,000 | 1 | Federal Home Loan Bank System Floating Rate Notes, 0.171% (1-month USLIBOR +0.020%), 1/19/2021 | 500,000 |
400,000 | 1 | Federal Home Loan Bank System Floating Rate Notes, 0.180% (Secured Overnight Financing Rate +0.090%), 1/1/2021 | 400,000 |
200,000 | 1 | Federal Home Loan Bank System Floating Rate Notes, 0.190% (Secured Overnight Financing Rate +0.100%), 1/1/2021 | 200,000 |
200,000 | 1 | Federal Home Loan Bank System Floating Rate Notes, 0.192% (1-month USLIBOR +0.040%), 1/17/2021 | 200,000 |
300,000 | 1 | Federal Home Loan Bank System Floating Rate Notes, 0.205% (Secured Overnight Financing Rate +0.115%), 1/1/2021 | 300,000 |
600,000 | 1 | Federal Home Loan Bank System Floating Rate Notes, 0.210% (Secured Overnight Financing Rate +0.120%), 1/1/2021 | 600,000 |
200,000 | 1 | Federal Home Loan Bank System Floating Rate Notes, 0.225% (Secured Overnight Financing Rate +0.135%), 1/1/2021 | 200,000 |
350,000 | 1 | Federal Home Loan Bank System Floating Rate Notes, 0.240% (Secured Overnight Financing Rate +0.150%), 1/1/2021 | 350,000 |
300,000 | 1 | Federal Home Loan Bank System Floating Rate Notes, 0.260% (Secured Overnight Financing Rate +0.170%), 1/1/2021 | 300,000 |
3,400,000 | Federal Home Loan Bank System, 0.120% - 0.150%, 1/22/2021 - 10/6/2021 | 3,399,925 | |
600,000 | 1 | Federal Home Loan Mortgage Corp. Floating Rate Notes, 0.155% (Secured Overnight Financing Rate +0.065%), 1/1/2021 | 600,000 |
400,000 | 1 | Federal Home Loan Mortgage Corp. Floating Rate Notes, 0.180% (Secured Overnight Financing Rate +0.090%), 1/1/2021 | 400,000 |
250,000 | 1 | Federal National Mortgage Association Floating Rate Notes, 0.260% (Secured Overnight Financing Rate +0.170%), 1/1/2021 | 250,000 |
300,000 | 1 | Federal National Mortgage Association Floating Rate Notes, 0.280% (Secured Overnight Financing Rate +0.190%), 1/1/2021 | 299,957 |
200,000 | 1 | Federal National Mortgage Association Floating Rate Notes, 0.290% (Secured Overnight Financing Rate +0.200%), 1/1/2021 | 200,000 |
200,000 | 1 | Federal National Mortgage Association Floating Rate Notes, 0.310% (Secured Overnight Financing Rate +0.220%), 1/1/2021 | 200,000 |
250,000 | 1 | Federal National Mortgage Association Floating Rate Notes, 0.320% (Secured Overnight Financing Rate +0.230%), 1/1/2021 | 250,000 |
400,000 | 1 | Federal National Mortgage Association Floating Rate Notes, 0.360% (Secured Overnight Financing Rate +0.270%), 1/1/2021 | 400,000 |
200,000 | 1 | Federal National Mortgage Association Floating Rate Notes, 0.400% (Secured Overnight Financing Rate +0.310%), 1/1/2021 | 200,000 |
450,000 | 1 | Federal National Mortgage Association Floating Rate Notes, 0.410% (Secured Overnight Financing Rate +0.320%), 1/1/2021 | 450,000 |
450,000 | Federal National Mortgage Association Notes, 1.400%, 8/25/2021 | 453,694 | |
TOTAL GOVERNMENT AGENCIES | 24,252,440 | ||
U.S. TREASURIES—35.3% | |||
U.S. Treasury Bills—27.8% | |||
250,000 | 2 | United States Treasury Bills, 0.090%, 1/28/2021 | 249,983 |
500,000 | 2 | United States Treasury Bills, 0.090%, 5/18/2021 | 499,829 |
Principal Amount | Value | ||
U.S. TREASURIES—continued | |||
U.S. Treasury Bills—27.8% | |||
$ 500,000 | 2 | United States Treasury Bills, 0.090%, 6/24/2021 | $499,783 |
2,600,000 | 2 | United States Treasury Bills, 0.095% - 0.120%, 1/19/2021 | 2,599,856 |
500,000 | 2 | United States Treasury Bills, 0.095%, 2/4/2021 | 499,955 |
1,000,000 | 2 | United States Treasury Bills, 0.095%, 6/1/2021 | 999,602 |
750,000 | 2 | United States Treasury Bills, 0.100%, 2/11/2021 | 749,915 |
1,850,000 | 2 | United States Treasury Bills, 0.100% - 0.125%, 3/11/2021 | 1,849,597 |
750,000 | 2 | United States Treasury Bills, 0.100%, 3/2/2021 | 749,875 |
250,000 | 2 | United States Treasury Bills, 0.100%, 5/20/2021 | 249,903 |
1,500,000 | 2 | United States Treasury Bills, 0.100%, 7/1/2021 | 1,499,246 |
500,000 | 2 | United States Treasury Bills, 0.105%, 3/9/2021 | 499,902 |
400,000 | 2 | United States Treasury Bills, 0.105%, 4/13/2021 | 399,881 |
750,000 | 2 | United States Treasury Bills, 0.110%, 2/23/2021 | 749,879 |
250,000 | 2 | United States Treasury Bills, 0.110%, 5/6/2021 | 249,905 |
620,000 | 2 | United States Treasury Bills, 0.110%, 12/2/2021 | 619,365 |
1,000,000 | 2 | United States Treasury Bills, 0.115%, 1/26/2021 | 999,920 |
2,000,000 | 2 | United States Treasury Bills, 0.115%, 3/4/2021 | 1,999,604 |
1,950,000 | 2 | United States Treasury Bills, 0.115%, 4/15/2021 | 1,949,352 |
800,000 | 2 | United States Treasury Bills, 0.120%, 1/7/2021 | 799,984 |
1,000,000 | 2 | United States Treasury Bills, 0.120%, 2/9/2021 | 999,870 |
1,400,000 | 2 | United States Treasury Bills, 0.120%, 2/16/2021 | 1,399,785 |
800,000 | 2 | United States Treasury Bills, 0.120%, 2/18/2021 | 799,872 |
3,000,000 | 2 | United States Treasury Bills, 0.120%, 2/25/2021 | 2,999,450 |
250,000 | 2 | United States Treasury Bills, 0.120%, 3/18/2021 | 249,937 |
TOTAL | 25,164,250 | ||
U.S. Treasury Notes—7.5% | |||
500,000 | 1 | United States Treasury Floating Rate Notes, 0.150% (91-day T-Bill +0.055%), 1/5/2021 | 500,000 |
2,700,000 | 1 | United States Treasury Floating Rate Notes, 0.210% (91-day T-Bill +0.115%), 1/5/2021 | 2,699,915 |
200,000 | 1 | United States Treasury Floating Rate Notes, 0.249% (91-day T-Bill +0.154%), 1/5/2021 | 200,000 |
150,000 | 1 | United States Treasury Floating Rate Notes, 0.395% (91-day T-Bill +0.300%), 1/5/2021 | 150,074 |
250,000 | United States Treasury Notes, 1.375%, 1/31/2021 | 250,187 | |
410,000 | United States Treasury Notes, 1.500%, 10/31/2021 | 414,651 | |
150,000 | United States Treasury Notes, 2.000%, 1/15/2021 | 150,093 | |
500,000 | United States Treasury Notes, 2.000%, 8/31/2021 | 506,302 | |
450,000 | United States Treasury Notes, 2.125%, 5/31/2021 | 453,732 | |
200,000 | United States Treasury Notes, 2.250%, 2/15/2021 | 200,213 | |
250,000 | United States Treasury Notes, 2.250%, 4/30/2021 | 251,732 | |
300,000 | United States Treasury Notes, 2.375%, 4/15/2021 | 301,722 | |
200,000 | United States Treasury Notes, 2.500%, 2/28/2021 | 200,358 | |
500,000 | United States Treasury Notes, 2.875%, 11/15/2021 | 512,001 | |
TOTAL | 6,790,980 | ||
TOTAL U.S. TREASURIES | 31,955,230 | ||
REPURCHASE AGREEMENTS—37.5% | |||
10,000,000 | Interest in $2,150,000,000 joint repurchase agreement 0.08%, dated 12/31/2020 under which Mitsubishi UFJ Securities (USA), Inc. will repurchase securities provided as collateral for $2,150,019,111 on 1/4/2021. The securities provided as collateral at the end of the period held with BNY Mellon as tri-party agent, were U.S. Government Agency securities with various maturities to 7/15/2061 and the market value of those underlying securities was $2,201,661,516. | 10,000,000 | |
18,000,000 | Interest in $300,000,000 joint repurchase agreement 0.08%, dated 12/31/2020 under which Pershing LLC will repurchase securities provided as collateral for $300,002,667 on 1/4/2021. The securities provided as collateral at the end of the period held with BNY Mellon as tri-party agent, were U.S. Government Agency and U.S. Treasury securities with various maturities to 8/16/2052 and the market value of those underlying securities was $306,021,156. | 18,000,000 |
Principal Amount | Value | ||
REPURCHASE AGREEMENTS—continued | |||
$ 5,964,000 | Interest in $2,000,000,000 joint repurchase agreement 0.08%, dated 12/31/2020 under which Sumitomo Mitsui Banking Corp will repurchase securities provided as collateral for $2,000,017,778 on 1/4/2021. The securities provided as collateral at the end of the period held with BNY Mellon as tri-party agent, were U.S. Government Agency securities with various maturities to 5/1/2050 and the market value of those underlying securities was $2,040,018,134. | $5,964,000 | |
TOTAL REPURCHASE AGREEMENTS | 33,964,000 | ||
TOTAL INVESTMENT IN SECURITIES—99.5% (AT AMORTIZED COST)3 | 90,171,670 | ||
OTHER ASSETS AND LIABILITIES - NET—0.5%4 | 419,779 | ||
TOTAL NET ASSETS—100% | $90,591,449 |
1 | Floating/variable note with current rate and current maturity or next reset date shown. |
2 | Discount rate(s) at time of purchase. |
3 | Also represents cost for federal tax purposes. |
4 | Assets, other than investments in securities, less liabilities. See Statement of Assets and Liabilities. |
The following acronym(s) are used throughout this portfolio: | ||
LIBOR | ��London Interbank Offered Rate | |
Year Ended December 31, | Period Ended 12/31/20162 | ||||
20201 | 20191 | 2018 | 2017 | ||
Net Asset Value, Beginning of Period | $1.00 | $1.00 | $1.00 | $1.00 | $1.00 |
Income From Investment Operations: | |||||
Net investment income (loss) | 0.003 | 0.019 | 0.015 | 0.002 | 0.0003 |
Net realized gain (loss) | 0.0003 | 0.0003 | 0.0003 | 0.004 | — |
Total From Investment Operations | 0.003 | 0.019 | 0.015 | 0.006 | 0.0003 |
Less Distributions: | |||||
Distributions from net investment income | (0.003) | (0.019) | (0.015) | (0.006) | (0.000)3 |
Net Asset Value, End of Period | $1.00 | $1.00 | $1.00 | $1.00 | $1.00 |
Total Return4 | 0.31% | 1.89% | 1.50% | 0.56% | 0.06% |
Ratios to Average Net Assets: | |||||
Net expenses5 | 0.26% | 0.29% | 0.38% | 0.38% | —% |
Net investment income | 0.23% | 2.06% | 0.84% | 0.17% | 0.02%6 |
Expense waiver/reimbursement7 | 0.21% | 0.09% | —% | —% | —% |
Supplemental Data: | |||||
Net assets, end of period (000 omitted) | $08 | $08 | $08 | $08 | $08 |
1 | Certain ratios included in Ratios to Average Net Assets and per share amounts may be inflated or deflated as compared to the fee structure for each respective share class as a result of daily systematic allocations being rounded to the nearest penny for fund level income, expense and realized gain/loss amounts. Such differences are immaterial. |
2 | Reflects operations for the period from April 29, 2016 (date of initial investment) to December 31, 2016. |
3 | Represents less than $0.001. |
4 | Based on net asset value. Total returns do not reflect any additional fees or expenses that may be imposed by separate accounts of insurance companies or in connection with any variable annuity or variable life insurance contract. Total returns for periods of less than one year are not annualized. |
5 | Amount does not reflect net expenses incurred by investment companies in which the Fund may invest. |
6 | Computed on an annualized basis. |
7 | This expense decrease is reflected in both the net expense and the net investment income ratios shown above. Amount does not reflect expense waiver/ reimbursement recorded by investment companies in which the Fund may invest. |
8 | Represents less than $1,000. |
Year Ended December 31, | |||||
2020 | 2019 | 2018 | 2017 | 2016 | |
Net Asset Value, Beginning of Period | $1.00 | $1.00 | $1.00 | $1.00 | $1.00 |
Income From Investment Operations: | |||||
Net investment income (loss) | 0.002 | 0.016 | 0.012 | 0.003 | 0.0001 |
Net realized gain (loss) | 0.0001 | 0.0001 | (0.000)1 | 0.0001 | (0.000)1 |
Total From Investment Operations | 0.002 | 0.016 | 0.012 | 0.003 | (0.000)1 |
Less Distributions: | |||||
Distributions from net investment income | (0.002) | (0.016) | (0.012) | (0.003) | (0.000)1 |
Net Asset Value, End of Period | $1.00 | $1.00 | $1.00 | $1.00 | $1.00 |
Total Return2 | 0.20% | 1.64% | 1.25% | 0.31% | 0.00% |
Ratios to Average Net Assets: | |||||
Net expenses3 | 0.31% | 0.63% | 0.63% | 0.63% | 0.49% |
Net investment income | 0.18% | 1.66% | 1.26% | 0.30% | 0.00%4 |
Expense waiver/reimbursement5 | 0.40% | 0.09% | 0.11% | 0.07% | 0.19% |
Supplemental Data: | |||||
Net assets, end of period (000 omitted) | $90,591 | $80,054 | $130,261 | $93,719 | $112,214 |
1 | Represents less than $0.001. |
2 | Based on net asset value. Total returns do not reflect any additional fees or expenses that may be imposed by separate accounts of insurance companies or in connection with any variable annuity or variable life insurance contract. |
3 | Amount does not reflect net expenses incurred by investment companies in which the Fund may invest. |
4 | Represents less than 0.01%. |
5 | This expense decrease is reflected in both the net expense and the net investment income ratios shown above. Amount does not reflect expense waiver/ reimbursement recorded by investment companies in which the Fund may invest. |
Assets: | |
Investment in repurchase agreements | $33,964,000 |
Investment in securities | 56,207,670 |
Total investment in securities, at amortized cost and fair value | 90,171,670 |
Income receivable | 23,928 |
Receivable for shares sold | 434,279 |
Total Assets | 90,629,877 |
Liabilities: | |
Payable for shares redeemed | 3,007 |
Bank overdraft | 832 |
Payable for investment adviser fee (Note 5) | 1,457 |
Payable for administrative fee (Note 5) | 192 |
Payable for portfolio accounting fees | 32,274 |
Accrued expenses (Note 5) | 666 |
Total Liabilities | 38,428 |
Net assets for 90,592,766 shares outstanding | $90,591,449 |
Net Assets Consist of: | |
Paid-in capital | $90,592,315 |
Total distributable earnings (loss) | (866) |
Total Net Assets | $90,591,449 |
Net Asset Value, Offering Price and Redemption Proceeds Per Share: | |
Primary Shares: | |
$100 ÷ 100 shares outstanding, no par value, unlimited shares authorized | $1.00 |
Service Shares: | |
$90,591,349 ÷ 90,592,666 shares outstanding, no par value, unlimited shares authorized | $1.00 |
Investment Income: | |
Interest | $441,211 |
Expenses: | |
Investment adviser fee (Note 5) | 179,099 |
Administrative fee (Note 5) | 70,936 |
Custodian fees | 8,377 |
Transfer agent fees | 5,146 |
Directors’/Trustees’ fees (Note 5) | 1,578 |
Auditing fees | 21,343 |
Legal fees | 8,589 |
Portfolio accounting fees | 76,780 |
Other service fees (Notes 2 and 5) | 221,739 |
Printing and postage | 39,651 |
Miscellaneous (Note 5) | 5,762 |
TOTAL EXPENSES | 639,000 |
Waivers and Reimbursements: | |
Waiver of investment adviser fee (Note 5) | (151,673) |
Waivers/reimbursements of other operating expenses (Notes 2 and 5) | (209,922) |
TOTAL WAIVERS AND REIMBURSEMENTS | (361,595) |
Net expenses | 277,405 |
Net investment income | 163,806 |
Net realized gain on investments | 275 |
Change in net assets resulting from operations | $164,081 |
Year Ended December 31 | 2020 | 2019 |
Increase (Decrease) in Net Assets | ||
Operations: | ||
Net investment income (loss) | $163,806 | $1,572,238 |
Net realized gain (loss) | 275 | 133 |
CHANGE IN NET ASSETS RESULTING FROM OPERATIONS | 164,081 | 1,572,371 |
Distributions to Shareholders: | ||
Primary Shares | 1(0) | (2) |
Service Shares | (163,816) | (1,572,255) |
CHANGE IN NET ASSETS RESULTING FROM DISTRIBUTIONS TO SHAREHOLDERS | (163,816) | (1,572,257) |
Share Transactions: | ||
Proceeds from sale of shares | 61,398,870 | 38,630,012 |
Net asset value of shares issued to shareholders in payment of distributions declared | 163,816 | 1,572,252 |
Cost of shares redeemed | (51,025,382) | (90,410,033) |
CHANGE IN NET ASSETS RESULTING FROM SHARE TRANSACTIONS | 10,537,304 | (50,207,769) |
Change in net assets | 10,537,569 | (50,207,655) |
Net Assets: | ||
Beginning of period | 80,053,880 | 130,261,535 |
End of period | $90,591,449 | $80,053,880 |
1 | Represents less than $1. |
Other Service Fees Incurred | Other Service Fees Reimbursed | Other Service Fees Waived by Unaffiliated Third Parties | |
Service Shares | $221,739 | $(2,798) | $(173,041) |
Year Ended 12/31/2020 | Year Ended 12/31/2019 | |||
Primary Shares: | Shares | Amount | Shares | Amount |
Shares sold | — | $— | — | $— |
Shares issued to shareholders in payment of distributions declared | — | — | — | — |
Shares redeemed | — | — | — | — |
NET CHANGE RESULTING FROM PRIMARY SHARE TRANSACTIONS | — | $— | — | $— |
Year Ended 12/31/2020 | Year Ended 12/31/2019 | |||
Service Shares: | Shares | Amount | Shares | Amount |
Shares sold | 61,398,870 | $61,398,870 | 38,630,012 | $38,630,012 |
Shares issued to shareholders in payment of distributions declared | 163,816 | 163,816 | 1,572,252 | 1,572,252 |
Shares redeemed | (51,025,382) | (51,025,382) | (90,410,033) | (90,410,033) |
NET CHANGE RESULTING FROM SERVICE SHARE TRANSACTIONS | 10,537,304 | $10,537,304 | (50,207,769) | $(50,207,769) |
NET CHANGE RESULTING FROM TOTAL FUND SHARE TRANSACTIONS | 10,537,304 | $10,537,304 | (50,207,769) | $(50,207,769) |
2020 | 2019 | |
Ordinary income | $163,816 | $1,572,257 |
Capital loss carryforwards | $(866) |
Short-Term | Long-Term | Total |
$368 | $498 | $866 |
Administrative Fee | Average Daily Net Assets of the Investment Complex |
0.100% | on assets up to $50 billion |
0.075% | on assets over $50 billion |
Percentage of Average Daily Net Assets of Class | |
Primary Shares | 0.25% |
February 16, 2021
Beginning Account Value 7/1/2020 | Ending Account Value 12/31/2020 | Expenses Paid During Period1 | |
Actual: | |||
Primary Shares | $1,000 | $1,000.00 | $21.01 |
Service Shares | $1,000 | $1,000.00 | $30.90 |
Hypothetical (assuming a 5% return before expenses): | |||
Primary Shares | $1,000 | $1,024.13 | $21.02 |
Service Shares | $1,000 | $1,024.23 | $30.92 |
1 | Expenses are equal to the Fund’s annualized net expense ratios, multiplied by the average account value over the period, multiplied by 184/366 (to reflect the one-half-year period). The expenses shown in the table do not include the charges and expenses imposed by the insurance company under the variable insurance product contract. Please refer to the variable insurance product prospectus for a complete listing of these expenses. The annualized net expense ratios are as follows: |
Primary Shares | 0.20% |
Service Shares | 0.18% |
2 | Actual and Hypothetical expenses paid during the period utilizing the Fund’s Primary Shares current Fee Limit of 0.38% (as reflected in the Notes to Financial Statements, Note 5 under Expense Limitation), multiplied by the average account value over the period, multiplied by 184/366 (to reflect expenses paid as if they had been in effect throughout the most recent one-half-year period) would be $1.91 and $1.93, respectively. |
3 | Actual and Hypothetical expenses paid during the period utilizing the Fund’s Service Shares current Fee Limit of 0.63% (as reflected in the Notes to Financial Statements, Note 5 under Expense Limitation), multiplied by the average account value over the period, multiplied by 184/366 (to reflect expenses paid as if they had been in effect throughout the most recent one-half-year period) would be $3.17 and $3.21, respectively. |
Name Birth Date Positions Held with Trust Date Service Began | Principal Occupation(s) for Past Five Years, Other Directorships Held and Previous Position(s) |
J. Christopher Donahue* Birth Date: April 11, 1949 Trustee Indefinite Term Began serving: September 1993 | Principal Occupations: Principal Executive Officer and President of certain of the Funds in the Federated Hermes Fund Family; Director or Trustee of the Funds in the Federated Hermes Fund Family; President, Chief Executive Officer and Director, Federated Hermes, Inc.; Chairman and Trustee, Federated Investment Management Company; Trustee, Federated Investment Counseling; Chairman and Director, Federated Global Investment Management Corp.; Chairman and Trustee, Federated Equity Management Company of Pennsylvania; Trustee, Federated Shareholder Services Company; Director, Federated Services Company. Previous Positions: President, Federated Investment Counseling; President and Chief Executive Officer, Federated Investment Management Company, Federated Global Investment Management Corp. and Passport Research, Ltd; Chairman, Passport Research, Ltd. |
Thomas R. Donahue* Birth Date: October 20, 1958 Trustee Indefinite Term Began serving: May 2016 | Principal Occupations: Director or Trustee of certain of the funds in the Federated Hermes Fund Family; Chief Financial Officer, Treasurer, Vice President and Assistant Secretary, Federated Hermes, Inc.; Chairman and Trustee, Federated Administrative Services; Chairman and Director, Federated Administrative Services, Inc.; Trustee and Treasurer, Federated Advisory Services Company; Director or Trustee and Treasurer, Federated Equity Management Company of Pennsylvania, Federated Global Investment Management Corp., Federated Investment Counseling, and Federated Investment Management Company; Director, MDTA LLC; Director, Executive Vice President and Assistant Secretary, Federated Securities Corp.; Director or Trustee and Chairman, Federated Services Company and Federated Shareholder Services Company; and Director and President, FII Holdings, Inc. Previous Positions: Director, Federated Hermes, Inc.; Assistant Secretary, Federated Investment Management Company, Federated Global Investment Management Company and Passport Research, LTD; Treasurer, Passport Research, LTD; Executive Vice President, Federated Securities Corp.; and Treasurer, FII Holdings, Inc. |
Name Birth Date Positions Held with Trust Date Service Began | Principal Occupation(s) for Past Five Years, Other Directorships Held, Previous Position(s) and Qualifications |
John T. Collins Birth Date: January 24, 1947 Trustee Indefinite Term Began serving: October 2013 | Principal Occupations: Director or Trustee, and Chair of the Board of Directors or Trustees, of the Federated Hermes Fund Family; formerly, Chairman and CEO, The Collins Group, Inc. (a private equity firm) (Retired). Other Directorships Held: Chairman of the Board of Directors, Director, KLX Energy Services Holdings, Inc. (oilfield services); former Director of KLX Corp. (aerospace). Qualifications: Mr. Collins has served in several business and financial management roles and directorship positions throughout his career. Mr. Collins previously served as Chairman and CEO of The Collins Group, Inc. (a private equity firm) and as a Director of KLX Corp. Mr. Collins serves as Chairman Emeriti, Bentley University. Mr. Collins previously served as Director and Audit Committee Member, Bank of America Corp.; Director, FleetBoston Financial Corp.; and Director, Beth Israel Deaconess Medical Center (Harvard University Affiliate Hospital). |
Name Birth Date Positions Held with Trust Date Service Began | Principal Occupation(s) for Past Five Years, Other Directorships Held, Previous Position(s) and Qualifications |
G. Thomas Hough Birth Date: February 28, 1955 Trustee Indefinite Term Began serving: August 2015 | Principal Occupations: Director or Trustee, Chair of the Audit Committee of the Federated Hermes Fund Family; formerly, Vice Chair, Ernst & Young LLP (public accounting firm) (Retired). Other Directorships Held: Director, Chair of the Audit Committee, Equifax, Inc.; Director, Member of the Audit Committee, Haverty Furniture Companies, Inc.; formerly, Director, Member of Governance and Compensation Committees, Publix Super Markets, Inc. Qualifications: Mr. Hough has served in accounting, business management and directorship positions throughout his career. Mr. Hough most recently held the position of Americas Vice Chair of Assurance with Ernst & Young LLP (public accounting firm). Mr. Hough serves on the President’s Cabinet and Business School Board of Visitors for the University of Alabama. Mr. Hough previously served on the Business School Board of Visitors for Wake Forest University, and he previously served as an Executive Committee member of the United States Golf Association. |
Maureen Lally-Green Birth Date: July 5, 1949 Trustee Indefinite Term Began serving: August 2009 | Principal Occupations: Director or Trustee of the Federated Hermes Fund Family; Adjunct Professor Emerita of Law, Duquesne University School of Law; formerly, Dean of the Duquesne University School of Law and Professor of Law and Interim Dean of the Duquesne University School of Law; formerly, Associate General Secretary and Director, Office of Church Relations, Diocese of Pittsburgh. Other Directorships Held: Director, CNX Resources Corporation (formerly known as CONSOL Energy Inc.). Qualifications: Judge Lally-Green has served in various legal and business roles and directorship positions throughout her career. Judge Lally-Green previously held the position of Dean of the School of Law of Duquesne University (as well as Interim Dean). Judge Lally-Green previously served as a member of the Superior Court of Pennsylvania and as a Professor of Law, Duquesne University School of Law. Judge Lally-Green was appointed by the Supreme Court of Pennsylvania to serve on the Supreme Court’s Board of Continuing Judicial Education and the Supreme Court’s Appellate Court Procedural Rules Committee. Judge Lally-Green also currently holds the positions on not for profit or for profit boards of directors as follows: Director and Chair, UPMC Mercy Hospital; Regent, Saint Vincent Seminary; Member, Pennsylvania State Board of Education (public); Director, Catholic Charities, Pittsburgh; and Director CNX Resources Corporation (formerly known as CONSOL Energy Inc.). Judge Lally-Green has held the positions of: Director, Auberle; Director, Epilepsy Foundation of Western and Central Pennsylvania; Director, Ireland Institute of Pittsburgh; Director, Saint Thomas More Society; Director and Chair, Catholic High Schools of the Diocese of Pittsburgh, Inc.; Director, Pennsylvania Bar Institute; Director, St. Vincent College; Director and Chair, North Catholic High School, Inc.; and Director and Vice Chair, Our Campaign for the Church Alive!, Inc. |
Thomas M. O’Neill Birth Date: June 14, 1951 Trustee Indefinite Term Began serving: August 2006 | Principal Occupations: Director or Trustee of the Federated Hermes Fund Family; Sole Proprietor, Navigator Management Company (investment and strategic consulting). Other Directorships Held: None. Qualifications: Mr. O’Neill has served in several business, mutual fund and financial management roles and directorship positions throughout his career. Mr. O’Neill serves as Director, Medicines for Humanity and Director, The Golisano Children’s Museum of Naples, Florida. Mr. O’Neill previously served as Chief Executive Officer and President, Managing Director and Chief Investment Officer, Fleet Investment Advisors; President and Chief Executive Officer, Aeltus Investment Management, Inc.; General Partner, Hellman, Jordan Management Co., Boston, MA; Chief Investment Officer, The Putnam Companies, Boston, MA; Credit Analyst and Lending Officer, Fleet Bank; Director and Consultant, EZE Castle Software (investment order management software); and Director, Midway Pacific (lumber). |
Madelyn A. Reilly Birth Date: February 2, 1956 Trustee Indefinite Term Began serving: November 2020 | Principal Occupations: Director or Trustee of the Federated Hermes Fund Family; Senior Vice President for Legal Affairs, General Counsel and Secretary of the Board of Trustees, Duquesne University. Other Directorships Held: None. Qualifications: Ms. Reilly has served in various business and legal management roles throughout her career. Ms. Reilly previously served as Director of Risk Management and Associate General Counsel, Duquesne University. Prior to her work at Duquesne University, Ms. Reilly served as Assistant General Counsel of Compliance and Enterprise Risk as well as Senior Counsel of Environment, Health and Safety, PPG Industries. |
P. Jerome Richey Birth Date: February 23, 1949 Trustee Indefinite Term Began serving: October 2013 | Principal Occupations: Director or Trustee of the Federated Hermes Fund Family; Management Consultant; Retired; formerly, Senior Vice Chancellor and Chief Legal Officer, University of Pittsburgh and Executive Vice President and Chief Legal Officer, CONSOL Energy Inc. (now split into two separate publicly traded companies known as CONSOL Energy Inc. and CNX Resources Corp.). Other Directorships Held: None. Qualifications: Mr. Richey has served in several business and legal management roles and directorship positions throughout his career. Mr. Richey most recently held the positions of Senior Vice Chancellor and Chief Legal Officer, University of Pittsburgh. Mr. Richey previously served as Chairman of the Board, Epilepsy Foundation of Western Pennsylvania and Chairman of the Board, World Affairs Council of Pittsburgh. Mr. Richey previously served as Chief Legal Officer and Executive Vice President, CONSOL Energy Inc. and CNX Gas Company; and Board Member, Ethics Counsel and Shareholder, Buchanan Ingersoll & Rooney PC (a law firm). |
Name Birth Date Positions Held with Trust Date Service Began | Principal Occupation(s) for Past Five Years, Other Directorships Held, Previous Position(s) and Qualifications |
John S. Walsh Birth Date: November 28, 1957 Trustee Indefinite Term Began serving: January 1999 | Principal Occupations: Director or Trustee of the Federated Hermes Fund Family; President and Director, Heat Wagon, Inc. (manufacturer of construction temporary heaters); President and Director, Manufacturers Products, Inc. (distributor of portable construction heaters); President, Portable Heater Parts, a division of Manufacturers Products, Inc. Other Directorships Held: None. Qualifications: Mr. Walsh has served in several business management roles and directorship positions throughout his career. Mr. Walsh previously served as Vice President, Walsh & Kelly, Inc. (paving contractors). |
Name Birth Date Address Positions Held with Trust Date Service Began | Principal Occupation(s) for Past Five Years and Previous Position(s) |
Lori A. Hensler Birth Date: January 6, 1967 TREASURER Officer since: April 2013 | Principal Occupations: Principal Financial Officer and Treasurer of the Federated Hermes Fund Family; Senior Vice President, Federated Administrative Services; Financial and Operations Principal for Federated Securities Corp.; and Assistant Treasurer, Federated Investors Trust Company. Ms. Hensler has received the Certified Public Accountant designation. Previous Positions: Controller of Federated Hermes, Inc.; Senior Vice President and Assistant Treasurer, Federated Investors Management Company; Treasurer, Federated Investors Trust Company; Assistant Treasurer, Federated Administrative Services, Federated Administrative Services, Inc., Federated Securities Corp., Edgewood Services, Inc., Federated Advisory Services Company, Federated Equity Management Company of Pennsylvania, Federated Global Investment Management Corp., Federated Investment Counseling, Federated Investment Management Company, Passport Research, Ltd., and Federated MDTA, LLC; Financial and Operations Principal for Federated Securities Corp., Edgewood Services, Inc. and Southpointe Distribution Services, Inc. |
Peter J. Germain Birth Date: September 3, 1959 CHIEF LEGAL OFFICER, SECRETARY and EXECUTIVE VICE PRESIDENT Officer since: January 2005 | Principal Occupations: Mr. Germain is Chief Legal Officer, Secretary and Executive Vice President of the Federated Hermes Fund Family. He is General Counsel, Chief Legal Officer, Secretary and Executive Vice President, Federated Hermes, Inc.; Trustee and Senior Vice President, Federated Investors Management Company; Trustee and President, Federated Administrative Services; Director and President, Federated Administrative Services, Inc.; Director and Vice President, Federated Securities Corp.; Director and Secretary, Federated Private Asset Management, Inc.; Secretary, Federated Shareholder Services Company; and Secretary, Retirement Plan Service Company of America. Mr. Germain joined Federated Hermes, Inc. in 1984 and is a member of the Pennsylvania Bar Association. Previous Positions: Deputy General Counsel, Special Counsel, Managing Director of Mutual Fund Services, Federated Hermes, Inc.; Senior Vice President, Federated Services Company; and Senior Corporate Counsel, Federated Hermes, Inc. |
John B. Fisher Birth Date: May 16, 1956 PRESIDENT Officer since: November 2004 | Principal Occupations: Principal Executive Officer and President of certain of the Funds in the Federated Hermes Fund Family; Director or Trustee of certain of the Funds in the Federated Hermes Fund Family; Vice President, Federated Hermes, Inc.; President, Director/Trustee and CEO, Federated Advisory Services Company, Federated Equity Management Company of Pennsylvania, Federated Global Investment Management Corp., Federated Investment Counseling, Federated Investment Management Company; President and CEO of Passport Research, Ltd.; President of some of the Funds in the Federated Fund Complex and Director, Federated Investors Trust Company. Previous Positions: President and Director of the Institutional Sales Division of Federated Securities Corp.; President and Director of Federated Investment Counseling; Director, Edgewood Securities Corp.; Director, Federated Services Company; Director, Federated Hermes, Inc.; Chairman and Director, Southpointe Distribution Services, Inc. and President, Technology, Federated Services Company. |
Stephen Van Meter Birth Date: June 5, 1975 CHIEF COMPLIANCE OFFICER AND SENIOR VICE PRESIDENT Officer since: July 2015 | Principal Occupations: Senior Vice President and Chief Compliance Officer of the Federated Hermes Fund Family; Vice President and Chief Compliance Officer of Federated Hermes, Inc. and Chief Compliance Officer of certain of its subsidiaries. Mr. Van Meter joined Federated Hermes, Inc. in October 2011. He holds FINRA licenses under Series 3, 7, 24 and 66. Previous Positions: Mr. Van Meter previously held the position of Compliance Operating Officer, Federated Hermes, Inc. Prior to joining Federated Hermes, Inc., Mr. Van Meter served at the United States Securities and Exchange Commission in the positions of Senior Counsel, Office of Chief Counsel, Division of Investment Management and Senior Counsel, Division of Enforcement. |
Stephen F. Auth Birth Date: September 13, 1956 101 Park Avenue 41st Floor New York, NY 10178 CHIEF INVESTMENT OFFICER Officer since: November 2002 | Principal Occupations: Stephen F. Auth is Chief Investment Officer of various Funds in the Federated Hermes Fund Family; Executive Vice President, Federated Investment Counseling, Federated Global Investment Management Corp. and Federated Equity Management Company of Pennsylvania. Previous Positions: Executive Vice President, Federated Investment Management Company and Passport Research, Ltd. (investment advisory subsidiary of Federated); Senior Vice President, Global Portfolio Management Services Division; Senior Vice President, Federated Investment Management Company and Passport Research, Ltd.; Senior Managing Director and Portfolio Manager, Prudential Investments. |
Name Birth Date Address Positions Held with Trust Date Service Began | Principal Occupation(s) for Past Five Years and Previous Position(s) |
Robert J. Ostrowski Birth Date: April 26, 1963 Chief Investment Officer Officer since: May 2004 | Principal Occupations: Robert J. Ostrowski joined Federated Hermes, Inc. in 1987 as an Investment Analyst and became a Portfolio Manager in 1990. He was named Chief Investment Officer of Federated Hermes’ taxable fixed-income products in 2004 and also serves as a Senior Portfolio Manager. Mr. Ostrowski became an Executive Vice President of the Fund’s Adviser in 2009 and served as a Senior Vice President of the Fund’s Adviser from 1997 to 2009. Mr. Ostrowski has received the Chartered Financial Analyst designation. He received his M.S. in Industrial Administration from Carnegie Mellon University. |
Deborah A. Cunningham Birth Date: September 15, 1959 Chief Investment Officer Officer since: June 2012 | Principal Occupations: Deborah A. Cunningham was named Chief Investment Officer of Federated Hermes’ money market products in 2004. She joined Federated Hermes in 1981 and has been a Senior Portfolio Manager since 1997 and an Executive Vice President of the Fund’s Adviser since 2009. Ms. Cunningham has received the Chartered Financial Analyst designation and holds an M.S.B.A. in Finance from Robert Morris College. |

Federated Hermes Funds
4000 Ericsson Drive
Warrendale, PA 15086-7561
or call 1-800-341-7400.
CUSIP 313916504

Share Class | Primary | Service |
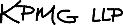
Federated Hermes High Income Bond Fund II
A Portfolio of Federated Hermes Insurance Series
1 Year | 5 Years | 10 Years | |
Primary Shares | 5.59% | 7.51% | 6.37% |
Service Shares | 5.46% | 7.24% | 6.11% |
BBHY2%ICI | 7.05% | 8.57% | 6.79% |
LVHYFA | 4.99% | 6.88% | 5.78% |
Index Classification | Percentage of Total Net Assets |
Cable Satellite | 8.0% |
Midstream | 7.5% |
Health Care | 7.4% |
Technology | 7.3% |
Media Entertainment | 6.7% |
Independent Energy | 5.7% |
Packaging | 5.6% |
Automotive | 5.4% |
Insurance - P&C | 4.3% |
Gaming | 3.9% |
Other2 | 35.1% |
Cash Equivalents3 | 1.8% |
Other Assets and Liabilities - Net4 | 1.3% |
Total | 100% |
1 | Index classifications are based upon, and individual portfolio securities are assigned to, the classifications and sub-classifications of the Bloomberg Barclays U.S. Corporate High Yield 2% Issuer Capped Index (BBHY2%ICI). Individual portfolio securities that are not included in the BBHY2%ICI are assigned to an index classification by the Fund’s Adviser. |
2 | For purposes of this table, index classifications which constitute less than 3.5% of the Fund’s total net assets have been aggregated under the designation “Other.” |
3 | Cash Equivalents include any investments in money market mutual funds and/or overnight repurchase agreements. |
4 | Assets, other than investments in securities, less liabilities. See Statement of Assets and Liabilities. |
Principal Amount or Shares | Value | ||
CORPORATE BONDS—96.1% | |||
Aerospace/Defense—1.4% | |||
$ 500,000 | TransDigm, Inc., Sec. Fac. Bond, 144A, 6.250%, 3/15/2026 | $533,128 | |
375,000 | TransDigm, Inc., Sr. Sub., 6.875%, 5/15/2026 | 397,378 | |
525,000 | TransDigm, Inc., Sr. Sub. Note, 6.500%, 7/15/2024 | 535,287 | |
675,000 | TransDigm, Inc., Sr. Sub., Series WI, 5.500%, 11/15/2027 | 710,640 | |
100,000 | TransDigm, Inc., Sr. Sub., Series WI, 7.500%, 3/15/2027 | 106,919 | |
TOTAL | 2,283,352 | ||
Automotive—5.4% | |||
500,000 | Adient Global Holdings Ltd., Sr. Unsecd. Note, 144A, 4.875%, 8/15/2026 | 514,375 | |
25,000 | Adient US LLC, 144A, 7.000%, 5/15/2026 | 27,234 | |
100,000 | Adient US LLC, 144A, 9.000%, 4/15/2025 | 111,625 | |
300,000 | American Axle & Manufacturing, Inc., Sr. Unsecd. Note, Series WI, 6.500%, 4/1/2027 | 316,125 | |
25,000 | Clarios Global LP, Sec. Fac. Bond, 144A, 6.750%, 5/15/2025 | 26,977 | |
450,000 | Dana Financing Lux Sarl, 144A, 6.500%, 6/1/2026 | 472,444 | |
125,000 | Dana, Inc., Sr. Unsecd. Note, 5.375%, 11/15/2027 | 132,734 | |
400,000 | Ford Motor Credit Co. LLC, Sr. Unsecd. Note, 3.096%, 5/4/2023 | 404,624 | |
300,000 | Ford Motor Credit Co. LLC, Sr. Unsecd. Note, 3.336%, 3/18/2021 | 301,125 | |
550,000 | Ford Motor Credit Co. LLC, Sr. Unsecd. Note, 3.375%, 11/13/2025 | 563,920 | |
250,000 | Ford Motor Credit Co. LLC, Sr. Unsecd. Note, 3.813%, 10/12/2021 | 253,281 | |
300,000 | Ford Motor Credit Co. LLC, Sr. Unsecd. Note, 4.000%, 11/13/2030 | 315,954 | |
300,000 | Ford Motor Credit Co. LLC, Sr. Unsecd. Note, 4.063%, 11/1/2024 | 315,546 | |
275,000 | Ford Motor Credit Co. LLC, Sr. Unsecd. Note, 4.125%, 8/17/2027 | 288,406 | |
200,000 | Ford Motor Credit Co. LLC, Sr. Unsecd. Note, 4.271%, 1/9/2027 | 210,000 | |
450,000 | Ford Motor Credit Co. LLC, Sr. Unsecd. Note, 5.113%, 5/3/2029 | 501,728 | |
325,000 | Ford Motor Credit Co. LLC, Sr. Unsecd. Note, 5.125%, 6/16/2025 | 353,779 | |
625,000 | Ford Motor Credit Co. LLC, Sr. Unsecd. Note, Series GMTN, 4.389%, 1/8/2026 | 656,931 | |
75,000 | IHO Verwaltungs GmbH, Sec. Fac. Bond, 144A, 6.000%, 5/15/2027 | 79,720 | |
325,000 | IHO Verwaltungs GmbH, Sec. Fac. Bond, 144A, 6.375%, 5/15/2029 | 358,657 | |
450,000 | J.B. Poindexter & Co., Inc., Sr. Unsecd. Note, 144A, 7.125%, 4/15/2026 | 477,000 | |
375,000 | KAR Auction Services, Inc., Sr. Unsecd. Note, 144A, 5.125%, 6/1/2025 | 386,355 | |
50,000 | Panther BF Aggregator 2 LP, Sec. Fac. Bond, 144A, 6.250%, 5/15/2026 | 53,688 | |
1,100,000 | Panther BF Aggregator 2 LP, Sr. Unsecd. Note, 144A, 8.500%, 5/15/2027 | 1,196,865 | |
300,000 | Schaeffler Verwaltung Zw, 144A, 4.750%, 9/15/2026 | 311,625 | |
TOTAL | 8,630,718 | ||
Building Materials—2.5% | |||
150,000 | American Builders & Contractors Supply Co., Inc., 144A, 4.000%, 1/15/2028 | 155,503 | |
600,000 | American Builders & Contractors Supply Co., Inc., Sr. Unsecd. Note, 144A, 5.875%, 5/15/2026 | 622,875 | |
675,000 | CD&R Waterworks Merger Subsidiary LLC, Sr. Unsecd. Note, 144A, 6.125%, 8/15/2025 | 699,047 | |
100,000 | Cornerstone Building Brands, Sr. Unsecd. Note, 144A, 6.125%, 1/15/2029 | 106,438 | |
175,000 | Cp Atlas Buyer, Inc., Sr. Unsecd. Note, 144A, 7.000%, 12/1/2028 | 181,891 | |
50,000 | Interface, Inc., Sr. Unsecd. Note, 144A, 5.500%, 12/1/2028 | 52,719 | |
125,000 | Masonite International Corp., Sr. Unsecd. Note, 144A, 5.750%, 9/15/2026 | 131,070 | |
525,000 | Pisces Midco, Inc., Sec. Fac. Bond, 144A, 8.000%, 4/15/2026 | 553,219 | |
375,000 | Standard Industries, Inc., Sr. Unsecd. Note, 144A, 3.375%, 1/15/2031 | 377,344 | |
750,000 | Standard Industries, Inc., Sr. Unsecd. Note, 144A, 5.000%, 2/15/2027 | 785,156 | |
300,000 | White Cap Buyer LLC, Sr. Unsecd. Note, 144A, 6.875%, 10/15/2028 | 320,437 | |
TOTAL | 3,985,699 |
Principal Amount or Shares | Value | ||
CORPORATE BONDS—continued | |||
Cable Satellite—8.0% | |||
$ 450,000 | Cablevision Systems Corp., Sr. Unsecd. Note, 5.875%, 9/15/2022 | $477,281 | |
400,000 | CCO Holdings LLC/Cap Corp., 144A, 5.750%, 2/15/2026 | 413,240 | |
75,000 | CCO Holdings LLC/Cap Corp., Sr. Unsecd. Note, 144A, 4.250%, 2/1/2031 | 79,133 | |
175,000 | CCO Holdings LLC/Cap Corp., Sr. Unsecd. Note, 144A, 4.500%, 8/15/2030 | 185,938 | |
1,075,000 | CCO Holdings LLC/Cap Corp., Sr. Unsecd. Note, 144A, 4.750%, 3/1/2030 | 1,161,269 | |
650,000 | CCO Holdings LLC/Cap Corp., Sr. Unsecd. Note, 144A, 5.000%, 2/1/2028 | 688,025 | |
275,000 | CCO Holdings LLC/Cap Corp., Sr. Unsecd. Note, 144A, 5.375%, 6/1/2029 | 301,782 | |
775,000 | CCO Holdings LLC/Cap Corp., Sr. Unsecd. Note, 144A, 5.875%, 5/1/2027 | 805,806 | |
325,000 | CSC Holdings LLC, 144A, 5.500%, 5/15/2026 | 338,406 | |
450,000 | CSC Holdings LLC, Sr. Unsecd. Note, 5.250%, 6/1/2024 | 487,924 | |
225,000 | CSC Holdings LLC, Sr. Unsecd. Note, 144A, 3.375%, 2/15/2031 | 221,063 | |
325,000 | CSC Holdings LLC, Sr. Unsecd. Note, 144A, 4.125%, 12/1/2030 | 340,145 | |
450,000 | CSC Holdings LLC, Sr. Unsecd. Note, 144A, 4.625%, 12/1/2030 | 470,311 | |
200,000 | CSC Holdings LLC, Sr. Unsecd. Note, 144A, 5.750%, 1/15/2030 | 219,501 | |
350,000 | CSC Holdings LLC, Sr. Unsecd. Note, 144A, 6.500%, 2/1/2029 | 395,824 | |
350,000 | CSC Holdings LLC, Sr. Unsecd. Note, 144A, 7.500%, 4/1/2028 | 394,088 | |
725,000 | DISH DBS Corp., Sr. Unsecd. Note, 5.875%, 11/15/2024 | 761,250 | |
125,000 | DISH DBS Corp., Sr. Unsecd. Note, 7.750%, 7/1/2026 | 140,093 | |
325,000 | 1,2 | Intelsat Jackson Holdings S.A., Sr. Unsecd. Note, 5.500%, 8/1/2023 | 221,000 |
300,000 | 1,2 | Intelsat Jackson Holdings S.A., Sr. Unsecd. Note, 144A, 8.500%, 10/15/2024 | 215,220 |
225,000 | Sirius XM Radio, Inc., Sr. Unsecd. Note, 144A, 3.875%, 8/1/2022 | 228,656 | |
375,000 | Sirius XM Radio, Inc., Sr. Unsecd. Note, 144A, 4.125%, 7/1/2030 | 399,609 | |
175,000 | Sirius XM Radio, Inc., Sr. Unsecd. Note, 144A, 4.625%, 7/15/2024 | 181,563 | |
50,000 | Sirius XM Radio, Inc., Sr. Unsecd. Note, 144A, 5.000%, 8/1/2027 | 53,199 | |
450,000 | Sirius XM Radio, Inc., Sr. Unsecd. Note, 144A, 5.500%, 7/1/2029 | 495,984 | |
850,000 | Telenet Finance Luxembourg, Sec. Fac. Bond, 144A, 5.500%, 3/1/2028 | 909,288 | |
250,000 | Virgin Media Finance PLC, Sr. Unsecd. Note, 144A, 5.000%, 7/15/2030 | 259,688 | |
200,000 | Virgin Media Secured Finance PLC, 144A, 5.500%, 8/15/2026 | 208,125 | |
200,000 | Virgin Media Secured Finance PLC, Sec. Fac. Bond, 144A, 4.500%, 8/15/2030 | 209,200 | |
200,000 | Virgin Media Secured Finance PLC, Sec. Fac. Bond, 144A, 5.500%, 5/15/2029 | 217,068 | |
200,000 | Vmed O2 UK Financing I PLC, Sec. Fac. Bond, 144A, 4.250%, 1/31/2031 | 204,828 | |
200,000 | Ziggo Bond Co. BV, Sr. Unsecd. Note, 144A, 5.125%, 2/28/2030 | 211,310 | |
629,000 | Ziggo Finance BV, Sec. Fac. Bond, 144A, 5.500%, 1/15/2027 | 657,679 | |
200,000 | Ziggo Finance BV, Sr. Unsecd. Note, 144A, 6.000%, 1/15/2027 | 211,729 | |
TOTAL | 12,765,225 | ||
Chemicals—3.0% | |||
200,000 | Alpha 2 BV, Sr. Unsecd. Note, 144A, 8.750%, 6/1/2023 | 202,229 | |
450,000 | Alpha 3 BV, Sr. Unsecd. Note, 144A, 6.250%, 2/1/2025 | 460,125 | |
150,000 | Axalta Coat/Dutch Holding BV, Sr. Unsecd. Note, 144A, 4.750%, 6/15/2027 | 159,750 | |
150,000 | Axalta Coating Systems LLC, Sr. Unsecd. Note, 3.375%, 2/15/2029 | 150,281 | |
675,000 | Compass Minerals International, Inc., 144A, 4.875%, 7/15/2024 | 702,773 | |
100,000 | Compass Minerals International, Inc., Sr. Unsecd. Note, 144A, 6.750%, 12/1/2027 | 108,581 | |
300,000 | Element Solutions, Inc., Sr. Unsecd. Note, 144A, 3.875%, 9/1/2028 | 309,188 | |
175,000 | H.B. Fuller Co., Sr. Unsecd. Note, 4.250%, 10/15/2028 | 179,703 | |
450,000 | Hexion, Inc., Sr. Unsecd. Note, 144A, 7.875%, 7/15/2027 | 482,344 | |
125,000 | Illuminate Buyer LLC/Illuminate Holdings IV, Inc., Sr. Unsecd. Note, 144A, 9.000%, 7/1/2028 | 137,656 | |
750,000 | Koppers, Inc., Sr. Unsecd. Note, 144A, 6.000%, 2/15/2025 | 773,906 | |
250,000 | PQ Corp., Sr. Unsecd. Note, 144A, 5.750%, 12/15/2025 | 257,031 | |
700,000 | Starfruit Finco BV, Sr. Unsecd. Note, 144A, 8.000%, 10/1/2026 | 745,062 |
Principal Amount or Shares | Value | ||
CORPORATE BONDS—continued | |||
Chemicals—continued | |||
$ 150,000 | WR Grace & Co-Conn, Sr. Unsecd. Note, 144A, 4.875%, 6/15/2027 | $159,266 | |
TOTAL | 4,827,895 | ||
Construction Machinery—0.8% | |||
350,000 | H&E Equipment Services, Inc., Sr. Unsecd. Note, 144A, 3.875%, 12/15/2028 | 353,073 | |
75,000 | United Rentals, Inc., Sr. Unsecd. Note, 3.875%, 2/15/2031 | 78,819 | |
275,000 | United Rentals, Inc., Sr. Unsecd. Note, 5.500%, 5/15/2027 | 295,110 | |
450,000 | United Rentals, Inc., Sr. Unsecd. Note, 5.875%, 9/15/2026 | 476,917 | |
75,000 | United Rentals North America, Inc., Sr. Unsecd. Note, 4.000%, 7/15/2030 | 79,031 | |
TOTAL | 1,282,950 | ||
Consumer Cyclical Services—1.8% | |||
225,000 | Allied Universal Holdco LLC, Sec. Fac. Bond, 144A, 6.625%, 7/15/2026 | 240,199 | |
1,125,000 | Allied Universal Holdco LLC, Sr. Unsecd. Note, 144A, 9.750%, 7/15/2027 | 1,228,207 | |
125,000 | Garda World Security Corp., Sec. Fac. Bond, 144A, 4.625%, 2/15/2027 | 126,563 | |
125,000 | Go Daddy Operating Co. LLC / GD Finance Co., Inc., Sr. Unsecd. Note, 144A, 5.250%, 12/1/2027 | 131,797 | |
954,000 | GW B-CR Security Corp., Sr. Unsecd. Note, 144A, 9.500%, 11/1/2027 | 1,058,167 | |
75,000 | The Brink’s Co., Sr. Unsecd. Note, 144A, 5.500%, 7/15/2025 | 80,203 | |
TOTAL | 2,865,136 | ||
Consumer Products—1.0% | |||
150,000 | Edgewell Personal Care Co., Sr. Unsecd. Note, 144A, 5.500%, 6/1/2028 | 161,413 | |
275,000 | Energizer Holdings, Inc., Sr. Unsecd. Note, 144A, 4.375%, 3/31/2029 | 285,180 | |
175,000 | Energizer Holdings, Inc., Sr. Unsecd. Note, 144A, 4.750%, 6/15/2028 | 184,415 | |
125,000 | Energizer Holdings, Inc., Sr. Unsecd. Note, 144A, 7.750%, 1/15/2027 | 139,016 | |
100,000 | Prestige Brands, Inc., Sr. Unsecd. Note, 144A, 5.125%, 1/15/2028 | 106,812 | |
700,000 | Prestige Brands, Inc., Sr. Unsecd. Note, 144A, 6.375%, 3/1/2024 | 716,625 | |
TOTAL | 1,593,461 | ||
Diversified Manufacturing—1.3% | |||
75,000 | CFX Escrow Corp., Sr. Unsecd. Note, 144A, 6.375%, 2/15/2026 | 80,180 | |
800,000 | Gates Global LLC, Sr. Unsecd. Note, 144A, 6.250%, 1/15/2026 | 841,336 | |
625,000 | WESCO Distribution, Inc., Sr. Unsecd. Note, 5.375%, 12/15/2021 | 625,687 | |
175,000 | WESCO Distribution, Inc., Sr. Unsecd. Note, 5.375%, 6/15/2024 | 179,813 | |
125,000 | WESCO Distribution, Inc., Sr. Unsecd. Note, 144A, 7.125%, 6/15/2025 | 137,644 | |
250,000 | WESCO Distribution, Inc., Sr. Unsecd. Note, 144A, 7.250%, 6/15/2028 | 284,674 | |
TOTAL | 2,149,334 | ||
Finance Companies—1.7% | |||
50,000 | Navient Corp., Sr. Unsecd. Note, 5.000%, 3/15/2027 | 50,507 | |
850,000 | Navient Corp., Sr. Unsecd. Note, 5.875%, 10/25/2024 | 905,250 | |
100,000 | Navient Corp., Sr. Unsecd. Note, 6.750%, 6/25/2025 | 108,875 | |
100,000 | Navient Corp., Sr. Unsecd. Note, 6.750%, 6/15/2026 | 109,187 | |
475,000 | Quicken Loans, Inc., Sr. Unsecd. Note, 144A, 5.250%, 1/15/2028 | 507,953 | |
150,000 | Quicken Loans Llc / Quicken Loans Co-Issuer, Inc., Sr. Unsecd. Note, 144A, 3.625%, 3/1/2029 | 153,281 | |
200,000 | Quicken Loans Llc / Quicken Loans Co-Issuer, Inc., Sr. Unsecd. Note, 144A, 3.875%, 3/1/2031 | 208,000 | |
675,000 | United Shore Financial Services, Sr. Unsecd. Note, 144A, 5.500%, 11/15/2025 | 712,969 | |
TOTAL | 2,756,022 | ||
Food & Beverage—2.2% | |||
475,000 | Aramark Services, Inc., Sr. Unsecd. Note, 144A, 5.000%, 4/1/2025 | 489,963 | |
175,000 | Aramark Services, Inc., Sr. Unsecd. Note, 144A, 5.000%, 2/1/2028 | 184,625 | |
200,000 | Aramark Services, Inc., Sr. Unsecd. Note, 144A, 6.375%, 5/1/2025 | 214,000 | |
750,000 | Kraft Heinz Foods Co., Sr. Unsecd. Note, 4.375%, 6/1/2046 | 811,491 | |
175,000 | Kraft Heinz Foods Co., Sr. Unsecd. Note, 5.200%, 7/15/2045 | 208,092 | |
75,000 | Kraft Heinz Foods Co., Sr. Unsecd. Note, 144A, 4.250%, 3/1/2031 | 83,652 |
Principal Amount or Shares | Value | ||
CORPORATE BONDS—continued | |||
Food & Beverage—continued | |||
$ 150,000 | Post Holdings, Inc., Sr. Unsecd. Note, 144A, 5.500%, 12/15/2029 | $163,879 | |
200,000 | Post Holdings, Inc., Sr. Unsecd. Note, 144A, 5.625%, 1/15/2028 | 213,375 | |
1,075,000 | Post Holdings, Inc., Sr. Unsecd. Note, 144A, 5.750%, 3/1/2027 | 1,140,172 | |
TOTAL | 3,509,249 | ||
Gaming—3.9% | |||
225,000 | Affinity Gaming LLC, 144A, 6.875%, 12/15/2027 | 235,969 | |
275,000 | Boyd Gaming Corp., Sr. Unsecd. Note, 4.750%, 12/1/2027 | 286,223 | |
325,000 | Boyd Gaming Corp., Sr. Unsecd. Note, 6.375%, 4/1/2026 | 338,065 | |
25,000 | Boyd Gaming Corp., Sr. Unsecd. Note, 144A, 8.625%, 6/1/2025 | 27,836 | |
100,000 | Boyd Gaming Corp., Sr. Unsecd. Note, Series WI, 6.000%, 8/15/2026 | 104,000 | |
50,000 | CCM Merger, Inc., Sr. Unsecd. Note, 144A, 6.375%, 5/1/2026 | 52,625 | |
100,000 | Colt Merger Sub, Inc., Sr. Secd. Note, 144A, 5.750%, 7/1/2025 | 106,083 | |
275,000 | Colt Merger Sub, Inc., Sr. Secd. Note, 144A, 6.250%, 7/1/2025 | 293,220 | |
475,000 | Colt Merger Sub, Inc., Sr. Unsecd. Note, 144A, 8.125%, 7/1/2027 | 526,456 | |
175,000 | CRC Escrow Issuer LLC, Sr. Unsecd. Note, 144A, 5.250%, 10/15/2025 | 177,083 | |
50,000 | MGM Growth Properties LLC, Sr. Unsecd. Note, 5.625%, 5/1/2024 | 54,401 | |
50,000 | MGM Growth Properties LLC, Sr. Unsecd. Note, 144A, 3.875%, 2/15/2029 | 51,219 | |
625,000 | MGM Resorts International, 6.000%, 3/15/2023 | 671,875 | |
77,000 | MGM Resorts International, Sr. Unsecd. Note, 4.625%, 9/1/2026 | 81,626 | |
175,000 | MGM Resorts International, Sr. Unsecd. Note, 4.750%, 10/15/2028 | 187,905 | |
181,000 | MGM Resorts International, Sr. Unsecd. Note, 5.750%, 6/15/2025 | 200,462 | |
75,000 | MGM Resorts International, Sr. Unsecd. Note, 6.750%, 5/1/2025 | 81,298 | |
475,000 | Mohegan Tribal Gaming Authority, Sr. Unsecd. Note, 144A, 7.875%, 10/15/2024 | 496,969 | |
850,000 | Star Group Holdings BV, Sr. Unsecd. Note, 144A, 7.000%, 7/15/2026 | 896,219 | |
100,000 | Station Casinos, Inc., Sr. Unsecd. Note, 144A, 4.500%, 2/15/2028 | 100,938 | |
575,000 | Station Casinos, Inc., Sr. Unsecd. Note, 144A, 5.000%, 10/1/2025 | 582,719 | |
150,000 | Twin River Worldwide Holdings, Inc., Sr. Unsecd. Note, 144A, 6.750%, 6/1/2027 | 161,156 | |
25,000 | VICI Properties LP/ VICI Note Co., Inc., 144A, 3.500%, 2/15/2025 | 25,616 | |
50,000 | VICI Properties LP/ VICI Note Co., Inc., 144A, 3.750%, 2/15/2027 | 51,211 | |
25,000 | VICI Properties LP/ VICI Note Co., Inc., Sr. Unsecd. Note, 144A, 4.125%, 8/15/2030 | 26,422 | |
200,000 | VICI Properties LP/ VICI Note Co., Inc., Sr. Unsecd. Note, 144A, 4.250%, 12/1/2026 | 207,745 | |
225,000 | VICI Properties LP/ VICI Note Co., Inc., Sr. Unsecd. Note, 144A, 4.625%, 12/1/2029 | 241,130 | |
TOTAL | 6,266,471 | ||
Health Care—7.4% | |||
175,000 | Acadia Healthcare Co., Inc., Sr. Unsecd. Note, 5.625%, 2/15/2023 | 175,875 | |
675,000 | Acadia Healthcare Co., Inc., Sr. Unsecd. Note, 6.500%, 3/1/2024 | 691,804 | |
25,000 | Acadia Healthcare Co., Inc., Sr. Unsecd. Note, 144A, 5.000%, 4/15/2029 | 26,750 | |
75,000 | Acadia Healthcare Co., Inc., Sr. Unsecd. Note, 144A, 5.500%, 7/1/2028 | 80,694 | |
100,000 | AdaptHealth LLC, Sr. Unsecd. Note, 144A, 4.625%, 8/1/2029 | 102,875 | |
550,000 | Avantor Funding, Inc., Sec. Fac. Bond, 144A, 4.625%, 7/15/2028 | 582,312 | |
100,000 | Charles River Laboratories International, Inc., Sr. Unsecd. Note, 144A, 5.500%, 4/1/2026 | 104,928 | |
150,000 | CHS/Community Health Systems, Inc., Sec. Fac. Bond, 144A, 5.625%, 3/15/2027 | 161,475 | |
50,000 | CHS/Community Health Systems, Inc., Sec. Fac. Bond, 144A, 6.000%, 1/15/2029 | 54,076 | |
50,000 | CHS/Community Health Systems, Inc., Sec. Fac. Bond, 144A, 6.625%, 2/15/2025 | 52,718 | |
200,000 | CHS/Community Health Systems, Inc., Sec. Fac. Bond, 144A, 8.000%, 3/15/2026 | 215,700 | |
150,000 | CHS/Community Health Systems, Inc., Sec. Fac. Bond, 144A, 8.625%, 1/15/2024 | 156,656 | |
725,000 | Global Medical Response, Inc., Sec. Fac. Bond, 144A, 6.500%, 10/1/2025 | 758,531 | |
250,000 | HCA, Inc., Sr. Unsecd. Note, 3.500%, 9/1/2030 | 265,714 | |
750,000 | HCA, Inc., Sr. Unsecd. Note, 5.375%, 2/1/2025 | 844,511 | |
175,000 | HCA, Inc., Sr. Unsecd. Note, 5.375%, 9/1/2026 | 201,473 |
Principal Amount or Shares | Value | ||
CORPORATE BONDS—continued | |||
Health Care—continued | |||
$ 275,000 | HCA, Inc., Sr. Unsecd. Note, 5.625%, 9/1/2028 | $325,332 | |
150,000 | HCA, Inc., 5.875%, 5/1/2023 | 165,031 | |
425,000 | HCA, Inc., 5.875%, 2/15/2026 | 489,281 | |
525,000 | IMS Health, Inc., Sr. Unsecd. Note, 144A, 5.000%, 10/15/2026 | 550,922 | |
200,000 | Iqvia, Inc., Sr. Unsecd. Note, 144A, 5.000%, 5/15/2027 | 212,998 | |
175,000 | LifePoint Health, Inc., 144A, 6.750%, 4/15/2025 | 188,354 | |
100,000 | LifePoint Health, Inc., Sec. Fac. Bond, 144A, 4.375%, 2/15/2027 | 101,750 | |
100,000 | LifePoint Health, Inc., Sr. Unsecd. Note, 144A, 5.375%, 1/15/2029 | 100,055 | |
625,000 | LifePoint Health, Inc., Sr. Unsecd. Note, 144A, 9.750%, 12/1/2026 | 690,234 | |
350,000 | MEDNAX, Inc., Sr. Unsecd. Note, 144A, 6.250%, 1/15/2027 | 375,805 | |
625,000 | MPH Acquisition Holdings LLC, Sr. Unsecd. Note, 144A, 5.750%, 11/1/2028 | 611,719 | |
525,000 | Team Health Holdings, Inc., Sr. Unsecd. Note, 144A, 6.375%, 2/1/2025 | 454,125 | |
50,000 | Teleflex, Inc., Sr. Unsecd. Note, 4.625%, 11/15/2027 | 53,851 | |
50,000 | Teleflex, Inc., Sr. Unsecd. Note, 144A, 4.250%, 6/1/2028 | 53,063 | |
450,000 | Tenet Healthcare Corp., 5.125%, 5/1/2025 | 459,333 | |
25,000 | Tenet Healthcare Corp., 144A, 4.625%, 6/15/2028 | 26,234 | |
175,000 | Tenet Healthcare Corp., 144A, 4.875%, 1/1/2026 | 183,286 | |
300,000 | Tenet Healthcare Corp., 144A, 5.125%, 11/1/2027 | 318,375 | |
25,000 | Tenet Healthcare Corp., 144A, 7.500%, 4/1/2025 | 27,348 | |
275,000 | Tenet Healthcare Corp., Sr. Secd. Note, 4.625%, 7/15/2024 | 282,156 | |
375,000 | Tenet Healthcare Corp., Sr. Unsecd. Note, 6.750%, 6/15/2023 | 403,800 | |
325,000 | Tenet Healthcare Corp., Sr. Unsecd. Note, 7.000%, 8/1/2025 | 336,546 | |
50,000 | Tenet Healthcare Corp., Sr. Unsecd. Note, 144A, 6.125%, 10/1/2028 | 52,277 | |
150,000 | Vizient, Inc., Sr. Unsecd. Note, 144A, 6.250%, 5/15/2027 | 161,784 | |
800,000 | West Street Merger Subsidiary, Inc., Sr. Unsecd. Note, 144A, 6.375%, 9/1/2025 | 821,500 | |
TOTAL | 11,921,251 | ||
Health Insurance—1.5% | |||
225,000 | Centene Corp., Sr. Unsecd. Note, 3.000%, 10/15/2030 | 238,759 | |
350,000 | Centene Corp., Sr. Unsecd. Note, 4.750%, 1/15/2025 | 359,618 | |
175,000 | Centene Corp., Sr. Unsecd. Note, 4.750%, 1/15/2025 | 179,809 | |
250,000 | Centene Corp., Sr. Unsecd. Note, 144A, 5.375%, 6/1/2026 | 263,990 | |
625,000 | Centene Corp., Sr. Unsecd. Note, Series WI, 4.250%, 12/15/2027 | 663,947 | |
575,000 | Centene Corp., Sr. Unsecd. Note, Series WI, 4.625%, 12/15/2029 | 639,115 | |
75,000 | Molina Healthcare, Inc., Sr. Unsecd. Note, 144A, 3.875%, 11/15/2030 | 80,625 | |
TOTAL | 2,425,863 | ||
Independent Energy—5.7% | |||
325,000 | Antero Resources Corp., Sr. Unsecd. Note, 5.000%, 3/1/2025 | 309,359 | |
75,000 | Antero Resources Corp., Sr. Unsecd. Note, 144A, 8.375%, 7/15/2026 | 76,739 | |
50,000 | Apache Corp., Sr. Unsecd. Note, 4.625%, 11/15/2025 | 52,563 | |
125,000 | Apache Corp., Sr. Unsecd. Note, 4.875%, 11/15/2027 | 132,687 | |
50,000 | Ascent Resources Utica Holdings LLC/ ARU Finance Corp., Sr. Unsecd. Note, 144A, 7.000%, 11/1/2026 | 47,950 | |
50,000 | Ascent Resources Utica Holdings LLC/ ARU Finance Corp., Sr. Unsecd. Note, 144A, 8.250%, 12/31/2028 | 50,000 | |
98,000 | Ascent Resources Utica Holdings LLC/ ARU Finance Corp., Sr. Unsecd. Note, 144A, 9.000%, 11/1/2027 | 109,270 | |
250,000 | Berry Petroleum Co., Sr. Unsecd. Note, 144A, 7.000%, 2/15/2026 | 213,390 | |
175,000 | Callon Petroleum Corp., Sr. Unsecd. Note, 6.125%, 10/1/2024 | 101,063 | |
75,000 | Callon Petroleum Corp., Sr. Unsecd. Note, Series WI, 6.375%, 7/1/2026 | 39,000 | |
400,000 | Carrizo Oil & Gas, Inc., Sr. Unsecd. Note, 8.250%, 7/15/2025 | 217,458 | |
275,000 | Centennial Resource Production, LLC, Sr. Unsecd. Note, 144A, 6.875%, 4/1/2027 | 198,111 | |
577,000 | 1,2 | Chesapeake Energy Corp., 144A, 11.500%, 1/1/2025 | 101,841 |
200,000 | Continental Resources, Inc., Sr. Unsecd. Note, 4.375%, 1/15/2028 | 204,358 |
Principal Amount or Shares | Value | ||
CORPORATE BONDS—continued | |||
Independent Energy—continued | |||
$ 250,000 | Continental Resources, Inc., Sr. Unsecd. Note, 144A, 5.750%, 1/15/2031 | $277,964 | |
525,000 | Crownrock LP/ Crownrock F, 144A, 5.625%, 10/15/2025 | 536,484 | |
325,000 | Double Eagle Iii Midco, Sr. Unsecd. Note, 144A, 7.750%, 12/15/2025 | 345,436 | |
25,000 | Endeavor Energy Resources LP, Sr. Unsecd. Note, 144A, 5.500%, 1/30/2026 | 25,701 | |
125,000 | Endeavor Energy Resources LP, Sr. Unsecd. Note, 144A, 5.750%, 1/30/2028 | 135,025 | |
175,000 | Endeavor Energy Resources LP, Sr. Unsecd. Note, 144A, 6.625%, 7/15/2025 | 187,523 | |
50,000 | EQT Corp., Sr. Unsecd. Note, 5.000%, 1/15/2029 | 52,841 | |
225,000 | EQT Corp., Sr. Unsecd. Note, 7.875%, 2/1/2025 | 256,533 | |
150,000 | EQT Corp., Sr. Unsecd. Note, 8.750%, 2/1/2030 | 183,562 | |
100,000 | 1,2 | Gulfport Energy Corp., Sr. Unsecd. Note, 6.000%, 10/15/2024 | 66,250 |
200,000 | 1,2 | Gulfport Energy Corp., Sr. Unsecd. Note, 6.375%, 5/15/2025 | 132,500 |
200,000 | Jagged Peak Energy, Inc., Sr. Unsecd. Note, Series WI, 5.875%, 5/1/2026 | 207,593 | |
350,000 | Occidental Petroleum Corp., Sr. Unsecd. Note, 2.900%, 8/15/2024 | 337,400 | |
75,000 | Occidental Petroleum Corp., Sr. Unsecd. Note, 3.200%, 8/15/2026 | 70,266 | |
275,000 | Occidental Petroleum Corp., Sr. Unsecd. Note, 3.500%, 6/15/2025 | 265,983 | |
125,000 | Occidental Petroleum Corp., Sr. Unsecd. Note, 4.100%, 2/15/2047 | 102,416 | |
225,000 | Occidental Petroleum Corp., Sr. Unsecd. Note, 4.300%, 8/15/2039 | 190,243 | |
200,000 | Occidental Petroleum Corp., Sr. Unsecd. Note, 4.400%, 8/15/2049 | 168,935 | |
250,000 | Occidental Petroleum Corp., Sr. Unsecd. Note, 5.875%, 9/1/2025 | 266,625 | |
125,000 | Occidental Petroleum Corp., Sr. Unsecd. Note, 6.125%, 1/1/2031 | 134,087 | |
250,000 | Occidental Petroleum Corp., Sr. Unsecd. Note, 6.450%, 9/15/2036 | 262,125 | |
275,000 | Occidental Petroleum Corp., Sr. Unsecd. Note, 6.625%, 9/1/2030 | 298,994 | |
150,000 | Occidental Petroleum Corp., Sr. Unsecd. Note, 8.000%, 7/15/2025 | 171,131 | |
300,000 | Occidental Petroleum Corp., Sr. Unsecd. Note, 8.875%, 7/15/2030 | 352,687 | |
50,000 | Parsley Energy LLC / Parsley Finance Corp., Sr. Unsecd. Note, 144A, 5.375%, 1/15/2025 | 51,514 | |
100,000 | Parsley Energy LLC / Parsley Finance Corp., Sr. Unsecd. Note, 144A, 5.625%, 10/15/2027 | 109,600 | |
175,000 | PDC Energy, Inc., Sr. Unsecd. Note, 6.125%, 9/15/2024 | 180,160 | |
225,000 | PDC Energy, Inc., Sr. Unsecd. Note, Series WI, 5.750%, 5/15/2026 | 232,734 | |
200,000 | QEP Resources, Inc., Sr. Unsecd. Note, 5.250%, 5/1/2023 | 210,800 | |
175,000 | QEP Resources, Inc., Sr. Unsecd. Note, 5.625%, 3/1/2026 | 192,224 | |
425,000 | Range Resources Corp., Sr. Unsecd. Note, 4.875%, 5/15/2025 | 402,248 | |
50,000 | Range Resources Corp., Sr. Unsecd. Note, Series WI, 9.250%, 2/1/2026 | 52,325 | |
200,000 | SM Energy Co., Sr. Unsecd. Note, 5.000%, 1/15/2024 | 169,000 | |
150,000 | SM Energy Co., Sr. Unsecd. Note, 5.625%, 6/1/2025 | 122,047 | |
25,000 | SM Energy Co., Sr. Unsecd. Note, 6.625%, 1/15/2027 | 20,063 | |
100,000 | SM Energy Co., Sr. Unsecd. Note, 6.750%, 9/15/2026 | 81,250 | |
175,000 | 1,2,3 | Ultra Resources, Inc., Sr. Unsecd. Note, Series 144A, 7.125%, 04/15/2025 | 0 |
50,000 | WPX Energy, Inc., Sr. Unsecd. Note, 4.500%, 1/15/2030 | 53,075 | |
150,000 | WPX Energy, Inc., Sr. Unsecd. Note, 5.250%, 10/15/2027 | 159,196 | |
200,000 | WPX Energy, Inc., Sr. Unsecd. Note, 5.750%, 6/1/2026 | 210,550 | |
TOTAL | 9,128,879 | ||
Industrial - Other—0.5% | |||
75,000 | Booz Allen Hamilton, Inc., Sr. Unsecd. Note, 144A, 3.875%, 9/1/2028 | 77,391 | |
125,000 | Cushman & Wakefield US Borrower LLC, Sec. Fac. Bond, 144A, 6.750%, 5/15/2028 | 138,203 | |
200,000 | Vertical Holdco GmbH, Sr. Unsecd. Note, 144A, 7.625%, 7/15/2028 | 218,375 | |
275,000 | Vertical U.S. Newco, Inc., Sr. Unsecd. Note, 144A, 5.250%, 7/15/2027 | 292,015 | |
TOTAL | 725,984 | ||
Insurance - P&C—4.3% | |||
750,000 | Alliant Holdings Intermediate LLC / Alliant Holdings Co-Issuer, Sr. Unsecd. Note, 144A, 6.750%, 10/15/2027 | 803,768 | |
825,000 | AmWINS Group, Inc., Sr. Unsecd. Note, 144A, 7.750%, 7/1/2026 | 888,905 |
Principal Amount or Shares | Value | ||
CORPORATE BONDS—continued | |||
Insurance - P&C—continued | |||
$ 300,000 | Ardonagh Midco 2 PLC, Sr. Unsecd. Note, 144A, 11.500% / 12.750% PIK, 1/15/2027 | $321,750 | |
25,000 | AssuredPartners, Inc., Sr. Unsecd. Note, 144A, 5.625%, 1/15/2029 | 26,125 | |
600,000 | AssuredPartners, Inc., Sr. Unsecd. Note, 144A, 7.000%, 8/15/2025 | 623,739 | |
225,000 | GTCR AP Finance, Inc., Sr. Unsecd. Note, 144A, 8.000%, 5/15/2027 | 244,901 | |
1,825,000 | Hub International Ltd., Sr. Unsecd. Note, 144A, 7.000%, 5/1/2026 | 1,910,401 | |
75,000 | NFP Corp., Sec. Fac. Bond, 144A, 7.000%, 5/15/2025 | 80,953 | |
1,025,000 | NFP Corp., Sr. Unsecd. Note, 144A, 6.875%, 8/15/2028 | 1,095,653 | |
900,000 | USIS Merger Subsidiary, Inc., Sr. Unsecd. Note, 144A, 6.875%, 5/1/2025 | 925,303 | |
TOTAL | 6,921,498 | ||
Leisure—0.4% | |||
450,000 | Six Flags Entertainment Corp., Sr. Unsecd. Note, 144A, 5.500%, 4/15/2027 | 462,937 | |
50,000 | Six Flags Theme Parks, Sec. Fac. Bond, 144A, 7.000%, 7/1/2025 | 54,094 | |
200,000 | Voc Escrow Ltd., 144A, 5.000%, 2/15/2028 | 198,963 | |
TOTAL | 715,994 | ||
Lodging—0.6% | |||
375,000 | Hilton Domestic Operating Company, Inc., Sr. Unsecd. Note, 5.125%, 5/1/2026 | 388,125 | |
75,000 | Hilton Domestic Operating Company, Inc., Sr. Unsecd. Note, 144A, 3.750%, 5/1/2029 | 78,342 | |
75,000 | Hilton Domestic Operating Company, Inc., Sr. Unsecd. Note, 144A, 5.375%, 5/1/2025 | 79,763 | |
100,000 | Hilton Domestic Operating Company, Inc., Sr. Unsecd. Note, 144A, 5.750%, 5/1/2028 | 108,937 | |
175,000 | Hilton Domestic Operating Company, Inc., Sr. Unsecd. Note, Series WI, 4.875%, 1/15/2030 | 191,516 | |
150,000 | Wyndham Hotels & Resorts, Inc., Sr. Unsecd. Note, 144A, 4.375%, 8/15/2028 | 156,139 | |
TOTAL | 1,002,822 | ||
Media Entertainment—6.7% | |||
100,000 | AMC Networks, Inc., Sr. Unsecd. Note, 4.750%, 8/1/2025 | 103,421 | |
550,000 | AMC Networks, Inc., Sr. Unsecd. Note, 5.000%, 4/1/2024 | 559,625 | |
425,000 | CBS Radio, Inc., Sr. Unsecd. Note, 144A, 7.250%, 11/1/2024 | 424,734 | |
183,000 | Cumulus Media News Holdings, Inc., 144A, 6.750%, 7/1/2026 | 187,417 | |
350,000 | Diamond Sports Group LLC / Diamond Sports Finance Co., Sec. Fac. Bond, 144A, 5.375%, 8/15/2026 | 285,031 | |
450,000 | Diamond Sports Group LLC / Diamond Sports Finance Co., Sec. Fac. Bond, 144A, 6.625%, 8/15/2027 | 272,813 | |
350,000 | Entercom Media Corp., 144A, 6.500%, 5/1/2027 | 356,933 | |
75,000 | Gray Escrow, Inc., Sr. Unsecd. Note, 144A, 7.000%, 5/15/2027 | 82,219 | |
325,000 | Gray Television, Inc., Sr. Unsecd. Note, 144A, 4.750%, 10/15/2030 | 330,484 | |
250,000 | Gray Television, Inc., Sr. Unsecd. Note, 144A, 5.875%, 7/15/2026 | 262,031 | |
50,000 | iHeartCommunications, Inc., 6.375%, 5/1/2026 | 53,594 | |
100,000 | iHeartCommunications, Inc., 144A, 4.750%, 1/15/2028 | 103,169 | |
175,000 | iHeartCommunications, Inc., 144A, 5.250%, 8/15/2027 | 183,608 | |
881,114 | iHeartCommunications, Inc., Sr. Unsecd. Note, 8.375%, 5/1/2027 | 942,065 | |
100,000 | Lamar Media Corp., Sr. Unsecd. Note, 4.875%, 1/15/2029 | 106,500 | |
450,000 | Match Group, Inc., Sr. Unsecd. Note, 144A, 4.125%, 8/1/2030 | 467,649 | |
50,000 | Match Group, Inc., Sr. Unsecd. Note, 144A, 4.625%, 6/1/2028 | 52,500 | |
325,000 | Match Group, Inc., Sr. Unsecd. Note, 144A, 5.000%, 12/15/2027 | 346,580 | |
575,000 | Nexstar Broadcasting, Inc., Sr. Unsecd. Note, 144A, 4.750%, 11/1/2028 | 602,672 | |
425,000 | Nexstar Escrow Corp., Sr. Unsecd. Note, 144A, 5.625%, 7/15/2027 | 455,946 | |
170,000 | Nielsen Finance LLC/Nielsen Finance Co., 144A, 5.000%, 4/15/2022 | 170,617 | |
325,000 | Nielsen Finance LLC/Nielsen Finance Co., Sr. Unsecd. Note, 144A, 5.000%, 2/1/2025 | 334,141 | |
75,000 | Nielsen Finance LLC/Nielsen Finance Co., Sr. Unsecd. Note, 144A, 5.625%, 10/1/2028 | 81,632 | |
175,000 | Nielsen Finance LLC/Nielsen Finance Co., Sr. Unsecd. Note, 144A, 5.875%, 10/1/2030 | 198,297 | |
150,000 | Outfront Media Capital LLC / Outfront Media Capital Corp., Sr. Unsecd. Note, 144A, 4.625%, 3/15/2030 | 153,508 | |
100,000 | Scripps Escrow II, Inc., Sr. Unsecd. Note, 144A, 3.875%, 1/15/2029 | 104,437 | |
175,000 | Scripps Escrow II, Inc., Sr. Unsecd. Note, 144A, 5.375%, 1/15/2031 | 184,359 |
Principal Amount or Shares | Value | ||
CORPORATE BONDS—continued | |||
Media Entertainment—continued | |||
$ 225,000 | Scripps Escrow, Inc., Sr. Unsecd. Note, 144A, 5.875%, 7/15/2027 | $235,339 | |
75,000 | Sinclair Television Group, Sr. Unsecd. Note, 144A, 5.125%, 2/15/2027 | 76,453 | |
875,000 | Sinclair Television Group, Sr. Unsecd. Note, 144A, 5.875%, 3/15/2026 | 902,772 | |
475,000 | Tegna, Inc., Sr. Unsecd. Note, 144A, 4.625%, 3/15/2028 | 486,578 | |
100,000 | Tegna, Inc., Sr. Unsecd. Note, 144A, 4.750%, 3/15/2026 | 106,905 | |
325,000 | Tegna, Inc., Sr. Unsecd. Note, 144A, 5.000%, 9/15/2029 | 343,641 | |
925,000 | Terrier Media Buyer, Inc., Sr. Unsecd. Note, 144A, 8.875%, 12/15/2027 | 1,021,547 | |
100,000 | Townsquare Media, Inc., Sec. Fac. Bond, 144A, 6.875%, 2/1/2026 | 105,028 | |
TOTAL | 10,684,245 | ||
Metals & Mining—1.2% | |||
425,000 | Coeur Mining, Inc., Sr. Unsecd. Note, 5.875%, 6/1/2024 | 429,737 | |
150,000 | Freeport-McMoRan, Inc., Sr. Unsecd. Note, 4.375%, 8/1/2028 | 159,656 | |
275,000 | Freeport-McMoRan, Inc., Sr. Unsecd. Note, 4.625%, 8/1/2030 | 302,301 | |
200,000 | Freeport-McMoRan, Inc., Sr. Unsecd. Note, 5.000%, 9/1/2027 | 212,704 | |
75,000 | Freeport-McMoRan, Inc., Sr. Unsecd. Note, 5.250%, 9/1/2029 | 83,564 | |
375,000 | Freeport-McMoRan, Inc., Sr. Unsecd. Note, 5.400%, 11/14/2034 | 469,922 | |
250,000 | HudBay Minerals, Inc., Sr. Unsecd. Note, 144A, 7.625%, 1/15/2025 | 260,156 | |
TOTAL | 1,918,040 | ||
Midstream—7.5% | |||
175,000 | AmeriGas Partners LP, Sr. Unsecd. Note, 5.750%, 5/20/2027 | 199,604 | |
400,000 | AmeriGas Partners LP, Sr. Unsecd. Note, 5.875%, 8/20/2026 | 450,926 | |
550,000 | Antero Midstream Partners LP, Sr. Unsecd. Note, 5.375%, 9/15/2024 | 537,625 | |
225,000 | Antero Midstream Partners LP, Sr. Unsecd. Note, 144A, 5.750%, 3/1/2027 | 221,484 | |
500,000 | Antero Midstream Partners LP, Sr. Unsecd. Note, 144A, 5.750%, 1/15/2028 | 481,300 | |
250,000 | Antero Midstream Partners LP, Sr. Unsecd. Note, 144A, 7.875%, 5/15/2026 | 258,770 | |
500,000 | Atlas Pipeline Partners LP, 5.875%, 8/1/2023 | 502,500 | |
150,000 | Buckeye Partners, Sr. Unsecd. Note, 144A, 4.500%, 3/1/2028 | 154,781 | |
175,000 | Cheniere Energy, Inc., Sr. Secd. Note, 144A, 4.625%, 10/15/2028 | 183,969 | |
250,000 | Cheniere Energy Partners, LP, Series WI, 5.250%, 10/1/2025 | 256,812 | |
425,000 | Cheniere Energy Partners, LP, Sr. Unsecd. Note, 5.625%, 10/1/2026 | 443,785 | |
225,000 | Cheniere Energy Partners, LP, Sr. Unsecd. Note, Series WI, 4.500%, 10/1/2029 | 238,336 | |
575,000 | CNX Midstream Partners LP / CNX Midstream Finance Corp., Sr. Unsecd. Note, 144A, 6.500%, 3/15/2026 | 586,500 | |
300,000 | EQM Midstream Partners, LP, Sr. Unsecd. Note, 144A, 6.500%, 7/1/2027 | 338,235 | |
150,000 | EQT Midstream Partners LP, Sr. Unsecd. Note, 4.750%, 7/15/2023 | 157,985 | |
275,000 | EQT Midstream Partners LP, Sr. Unsecd. Note, 5.500%, 7/15/2028 | 301,119 | |
200,000 | EQT Midstream Partners LP, Sr. Unsecd. Note, 6.500%, 7/15/2048 | 207,813 | |
175,000 | EQT Midstream Partners LP, Sr. Unsecd. Note, 144A, 6.000%, 7/1/2025 | 191,844 | |
275,000 | Hess Midstream Partners LP, Sr. Unsecd. Note, 144A, 5.125%, 6/15/2028 | 287,719 | |
225,000 | Holly Energy Partners LP, Sr. Unsecd. Note, 144A, 5.000%, 2/1/2028 | 227,109 | |
700,000 | NuStar Logistics LP, Sr. Unsecd. Note, 5.625%, 4/28/2027 | 747,120 | |
25,000 | NuStar Logistics LP, Sr. Unsecd. Note, 5.750%, 10/1/2025 | 26,663 | |
100,000 | NuStar Logistics LP, Sr. Unsecd. Note, 6.000%, 6/1/2026 | 108,323 | |
75,000 | NuStar Logistics LP, Sr. Unsecd. Note, 6.375%, 10/1/2030 | 85,101 | |
150,000 | Rattler Midstream Partners LP, Sr. Unsecd. Note, 144A, 5.625%, 7/15/2025 | 158,719 | |
425,000 | Suburban Propane Partners LP, 5.500%, 6/1/2024 | 435,355 | |
450,000 | Suburban Propane Partners LP, Sr. Unsecd. Note, 5.875%, 3/1/2027 | 471,656 | |
250,000 | Summit Midstream Holdings LLC, Sr. Unsecd. Note, 5.500%, 8/15/2022 | 225,625 | |
475,000 | Summit Midstream Holdings LLC, Sr. Unsecd. Note, 5.750%, 4/15/2025 | 305,731 | |
75,000 | Sunoco LP/Finance Corp., Sr. Unsecd. Note, Series WI, 5.875%, 3/15/2028 | 81,267 | |
75,000 | Targa Resources Partners LP / Targa Resources Partners Finance Corp., Sr. Unsecd. Note, 5.000%, 1/15/2028 | 79,308 |
Principal Amount or Shares | Value | ||
CORPORATE BONDS—continued | |||
Midstream—continued | |||
$ 275,000 | Targa Resources Partners LP / Targa Resources Partners Finance Corp., Sr. Unsecd. Note, 5.375%, 2/1/2027 | $289,488 | |
475,000 | Targa Resources Partners LP / Targa Resources Partners Finance Corp., Sr. Unsecd. Note, 5.875%, 4/15/2026 | 504,495 | |
75,000 | Targa Resources Partners LP / Targa Resources Partners Finance Corp., Sr. Unsecd. Note, 6.500%, 7/15/2027 | 81,563 | |
500,000 | Targa Resources Partners LP / Targa Resources Partners Finance Corp., Sr. Unsecd. Note, 144A, 5.500%, 3/1/2030 | 543,320 | |
250,000 | TransMontaigne Partners LP/TLP Finance Corp., Sr. Unsecd. Note, 6.125%, 2/15/2026 | 252,140 | |
100,000 | Western Gas Partners LP, Sr. Unsecd. Note, 4.000%, 7/1/2022 | 102,938 | |
200,000 | Western Gas Partners LP, Sr. Unsecd. Note, 4.500%, 3/1/2028 | 208,000 | |
25,000 | Western Gas Partners LP, Sr. Unsecd. Note, 4.650%, 7/1/2026 | 26,297 | |
575,000 | Western Gas Partners LP, Sr. Unsecd. Note, 5.300%, 3/1/2048 | 572,677 | |
125,000 | Western Gas Partners LP, Sr. Unsecd. Note, 5.450%, 4/1/2044 | 126,643 | |
75,000 | Western Gas Partners LP, Sr. Unsecd. Note, 5.500%, 8/15/2048 | 73,994 | |
150,000 | Western Midstream Operating, LP, Sr. Unsecd. Note, 5.050%, 2/1/2030 | 167,075 | |
100,000 | Western Midstream Operating, LP, Sr. Unsecd. Note, 6.250%, 2/1/2050 | 110,179 | |
TOTAL | 12,011,893 | ||
Oil Field Services—1.8% | |||
125,000 | Archrock Partners LP / Archrock Partners Finance Corp., Sr. Unsecd. Note, 144A, 6.250%, 4/1/2028 | 130,433 | |
675,000 | Archrock Partners LP / Archrock Partners Finance Corp., Sr. Unsecd. Note, 144A, 6.875%, 4/1/2027 | 728,156 | |
225,000 | Nabors Industries Ltd., Sr. Unsecd. Note, 144A, 7.250%, 1/15/2026 | 158,185 | |
75,000 | Nabors Industries Ltd., Sr. Unsecd. Note, 144A, 7.500%, 1/15/2028 | 51,587 | |
225,000 | Precision Drilling Corp., Sr. Unsecd. Note, 7.750%, 12/15/2023 | 207,422 | |
150,000 | Precision Drilling Corp., Sr. Unsecd. Note, 144A, 7.125%, 1/15/2026 | 131,034 | |
175,000 | 1,2 | Sesi LLC, 7.125%, 12/15/2021 | 56,875 |
675,000 | 1,2 | Sesi LLC, Sr. Unsecd. Note, Series WI, 7.750%, 9/15/2024 | 219,375 |
325,000 | Shelf Drilling Holdings Ltd., Sr. Unsecd. Note, 144A, 8.250%, 2/15/2025 | 150,719 | |
375,000 | USA Compression Partners LP, Sr. Unsecd. Note, 6.875%, 9/1/2027 | 400,976 | |
550,000 | USA Compression Partners LP, Sr. Unsecd. Note, Series WI, 6.875%, 4/1/2026 | 575,781 | |
TOTAL | 2,810,543 | ||
Packaging—5.6% | |||
850,000 | ARD Finance SA, Sec. Fac. Bond, 144A, 6.500%, 6/30/2027 | 908,437 | |
200,000 | Ardagh Packaging Finance PLC/Ardagh Holdings, Sec. Fac. Bond, 144A, 5.250%, 8/15/2027 | 210,162 | |
350,000 | Ardagh Packaging Finance PLC/Ardagh Holdings, Sr. Unsecd. Note, 144A, 5.250%, 8/15/2027 | 367,783 | |
200,000 | Ardagh Packaging Finance PLC/Ardagh Holdings, Sr. Unsecd. Note, 144A, 6.000%, 2/15/2025 | 207,450 | |
375,000 | Ball Corp., Sr. Unsecd. Note, 2.875%, 8/15/2030 | 374,531 | |
400,000 | Berry Global Escrow Corp., 144A, 4.875%, 7/15/2026 | 430,094 | |
225,000 | Berry Global Escrow Corp., 144A, 5.625%, 7/15/2027 | 242,367 | |
300,000 | Bway Holding Co., Sec. Fac. Bond, 144A, 5.500%, 4/15/2024 | 306,357 | |
800,000 | Bway Holding Co., Sr. Unsecd. Note, 144A, 7.250%, 4/15/2025 | 809,000 | |
175,000 | Crown Americas LLC / Crown Americas Capital Corp. VI, Sr. Unsecd. Note, 4.750%, 2/1/2026 | 182,186 | |
950,000 | Flex Acquisition Co., Inc., Sr. Unsecd. Note, 144A, 6.875%, 1/15/2025 | 966,625 | |
700,000 | Flex Acquisition Co., Inc., Sr. Unsecd. Note, 144A, 7.875%, 7/15/2026 | 737,324 | |
425,000 | Owens-Brockway Glass Container, Inc., 144A, 5.375%, 1/15/2025 | 459,487 | |
150,000 | Owens-Brockway Glass Container, Inc., 144A, 5.875%, 8/15/2023 | 160,969 | |
200,000 | Owens-Brockway Glass Container, Inc., 144A, 6.375%, 8/15/2025 | 222,125 | |
100,000 | Owens-Brockway Glass Container, Inc., Sr. Unsecd. Note, 144A, 6.625%, 5/13/2027 | 108,438 | |
600,000 | Reynolds Group Issuer, Inc. / LLC / LU, Sec. Fac. Bond, 144A, 4.000%, 10/15/2027 | 615,750 | |
125,000 | Sealed Air Corp., Sr. Unsecd. Note, 144A, 4.000%, 12/1/2027 | 133,750 | |
150,000 | Sealed Air Corp., Sr. Unsecd. Note, 144A, 5.500%, 9/15/2025 | 168,281 | |
500,000 | Trident Merger Subsidiary, Inc., Sr. Unsecd. Note, 144A, 6.625%, 11/1/2025 | 509,322 | |
175,000 | Trident Merger Subsidiary, Inc., Sr. Unsecd. Note, 144A, 9.250%, 8/1/2024 | 186,813 | |
375,000 | Trivium Packaging Finance BV, Sec. Fac. Bond, 144A, 5.500%, 8/15/2026 | 397,266 |
Principal Amount or Shares | Value | ||
CORPORATE BONDS—continued | |||
Packaging—continued | |||
$ 300,000 | Trivium Packaging Finance BV, Sr. Unsecd. Note, 144A, 8.500%, 8/15/2027 | $329,032 | |
TOTAL | 9,033,549 | ||
Paper—0.7% | |||
725,000 | Clearwater Paper Corp., Sr. Unsecd. Note, 144A, 5.375%, 2/1/2025 | 787,984 | |
150,000 | Graphic Packaging International, LLC, Sr. Unsecd. Note, 144A, 3.500%, 3/1/2029 | 153,656 | |
125,000 | Graphic Packaging International, LLC, Sr. Unsecd. Note, 144A, 4.750%, 7/15/2027 | 138,883 | |
TOTAL | 1,080,523 | ||
Pharmaceuticals—3.4% | |||
200,000 | Bausch Health Cos, Inc., Sec. Fac. Bond, 144A, 5.500%, 11/1/2025 | 207,458 | |
200,000 | Bausch Health Cos, Inc., Sec. Fac. Bond, 144A, 5.750%, 8/15/2027 | 214,875 | |
175,000 | Bausch Health Cos, Inc., Sr. Unsecd. Note, 144A, 5.000%, 1/30/2028 | 180,563 | |
50,000 | Bausch Health Cos, Inc., Sr. Unsecd. Note, 144A, 5.000%, 2/15/2029 | 51,504 | |
225,000 | Bausch Health Cos, Inc., Sr. Unsecd. Note, 144A, 5.250%, 2/15/2031 | 235,484 | |
1,175,000 | Bausch Health Cos, Inc., Sr. Unsecd. Note, 144A, 6.125%, 4/15/2025 | 1,212,200 | |
75,000 | Bausch Health Cos, Inc., Sr. Unsecd. Note, 144A, 6.250%, 2/15/2029 | 81,577 | |
300,000 | Bausch Health Cos, Inc., Sr. Unsecd. Note, 144A, 7.250%, 5/30/2029 | 337,739 | |
600,000 | Bausch Health Cos, Inc., Sr. Unsecd. Note, 144A, 8.500%, 1/31/2027 | 668,151 | |
375,000 | Bausch Health Cos, Inc., Sr. Unsecd. Note, 144A, 9.000%, 12/15/2025 | 415,483 | |
431,000 | Endo Dac / Endo Finance LLC / Endo Finco, Inc., 144A, 6.000%, 6/30/2028 | 366,781 | |
196,000 | Endo Dac / Endo Finance LLC / Endo Finco, Inc., Term Loan - 2nd Lien, 144A, 9.500%, 7/31/2027 | 219,153 | |
225,000 | Jaguar Holding Co. II/Pharmaceutical Product Development LLC, Sr. Unsecd. Note, 144A, 4.625%, 6/15/2025 | 237,654 | |
175,000 | Jaguar Holding Co. II/Pharmaceutical Product Development LLC, Sr. Unsecd. Note, 144A, 5.000%, 6/15/2028 | 187,031 | |
925,000 | 1,2 | Mallinckrodt International Finance SA/Mallinckrodt CB LLC, Sr. Unsecd. Note, 144A, 5.500%, 4/15/2025 | 323,750 |
575,000 | 1,2 | Mallinckrodt International Finance SA/Mallinckrodt CB LLC, Sr. Unsecd. Note, 144A, 5.625%, 10/15/2023 | 201,250 |
250,000 | Syneos Health, Inc., Sr. Unsecd. Note, 144A, 3.625%, 1/15/2029 | 251,160 | |
TOTAL | 5,391,813 | ||
Restaurant—1.5% | |||
250,000 | 1011778 BC Unltd. Liability Co./New Red Finance, Inc., 144A, 4.375%, 1/15/2028 | 257,923 | |
178,000 | 1011778 BC Unltd. Liability Co./New Red Finance, Inc., Sr. Secd. Note, 144A, 4.250%, 5/15/2024 | 181,738 | |
125,000 | 1011778 BC Unltd. Liability Co./New Red Finance, Inc., Term Loan - 1st Lien, 144A, 3.500%, 2/15/2029 | 125,078 | |
1,100,000 | 1011778 BC Unltd. Liability Co./New Red Finance, Inc., Term Loan - 2nd Lien, 144A, 4.000%, 10/15/2030 | 1,116,951 | |
75,000 | KFC Holding Co./Pizza Hut Holdings LLC/Taco Bell of America LLC, Sr. Unsecd. Note, 144A, 4.750%, 6/1/2027 | 79,419 | |
75,000 | Yum! Brands, Inc., Sr. Unsecd. Note, 144A, 4.750%, 1/15/2030 | 82,350 | |
500,000 | Yum! Brands, Inc., Sr. Unsecd. Note, 144A, 5.250%, 6/1/2026 | 519,687 | |
75,000 | Yum! Brands, Inc., Sr. Unsecd. Note, 144A, 7.750%, 4/1/2025 | 83,156 | |
TOTAL | 2,446,302 | ||
Retailers—0.5% | |||
75,000 | Academy Ltd., Sec. Fac. Bond, 144A, 6.000%, 11/15/2027 | 78,750 | |
300,000 | Michaels Stores, Inc., Sr. Unsecd. Note, 144A, 8.000%, 7/15/2027 | 323,007 | |
228,532 | 4 | Party City Holdings, Inc., 144A, 5.750% (6-month USLIBOR 0.750% Floor +5.000%), 7/15/2025 | 206,821 |
75,000 | William Carter Co., Sr. Unsecd. Note, 144A, 5.500%, 5/15/2025 | 79,790 | |
50,000 | William Carter Co., Sr. Unsecd. Note, 144A, 5.625%, 3/15/2027 | 52,719 | |
TOTAL | 741,087 | ||
Supermarkets—1.1% | |||
480,000 | Albertsons Cos. LLC/SAFEW, Sr. Unsecd. Note, 5.750%, 3/15/2025 | 496,150 | |
975,000 | Albertsons Cos. LLC/SAFEW, Sr. Unsecd. Note, 144A, 3.500%, 3/15/2029 | 986,212 | |
75,000 | Albertsons Cos. LLC/SAFEW, Sr. Unsecd. Note, 144A, 4.875%, 2/15/2030 | 82,716 | |
75,000 | Albertsons Cos. LLC/SAFEW, Sr. Unsecd. Note, 144A, 5.875%, 2/15/2028 | 81,741 | |
50,000 | Albertsons Cos. LLC/SAFEW, Sr. Unsecd. Note, 144A, 7.500%, 3/15/2026 | 56,046 | |
TOTAL | 1,702,865 |
Principal Amount or Shares | Value | ||
CORPORATE BONDS—continued | |||
Technology—7.3% | |||
$ 325,000 | AMS AG, Sr. Unsecd. Note, 144A, 7.000%, 7/31/2025 | $353,641 | |
175,000 | Banff Merger Subsidiary, Inc., Sr. Unsecd. Note, 144A, 9.750%, 9/1/2026 | 189,213 | |
225,000 | Black Knight InfoServ LLC, Sr. Unsecd. Note, 144A, 3.625%, 9/1/2028 | 230,625 | |
75,000 | BY Crown Parent LLC / BY Bond Finance, Inc., 144A, 4.250%, 1/31/2026 | 76,969 | |
375,000 | Cars.com, Inc., Sr. Unsecd. Note, 144A, 6.375%, 11/1/2028 | 398,989 | |
150,000 | CDW LLC/ CDW Finance, Sr. Unsecd. Note, 3.250%, 2/15/2029 | 153,143 | |
125,000 | CDW LLC/ CDW Finance, Sr. Unsecd. Note, 4.250%, 4/1/2028 | 132,181 | |
900,000 | Diamond 1 Finance Corp./Diamond 2 Finance Corp., Sr. Unsecd. Note, 144A, 7.125%, 6/15/2024 | 934,312 | |
50,000 | Diebold Nixdorf, Inc., Sr. Secd. Note, 144A, 9.375%, 7/15/2025 | 56,094 | |
125,000 | Financial & Risk US Holdings, Inc., 144A, 6.250%, 5/15/2026 | 133,672 | |
900,000 | Financial & Risk US Holdings, Inc., Sr. Unsecd. Note, 144A, 8.250%, 11/15/2026 | 983,250 | |
100,000 | Gartner, Inc., Sr. Unsecd. Note, 144A, 3.750%, 10/1/2030 | 105,125 | |
25,000 | Gartner, Inc., Sr. Unsecd. Note, 144A, 4.500%, 7/1/2028 | 26,406 | |
675,000 | JDA Escrow LLC / JDA Bond Finance, Inc., 144A, 7.375%, 10/15/2024 | 689,273 | |
325,000 | Logan Merger Sub, Inc., Sr. Secd. Note, 144A, 5.500%, 9/1/2027 | 340,844 | |
225,000 | Microchip Technology, Inc., Sr. Unsecd. Note, 144A, 4.250%, 9/1/2025 | 238,095 | |
250,000 | NCR Corp., Sr. Unsecd. Note, 144A, 5.000%, 10/1/2028 | 264,219 | |
350,000 | NCR Corp., Sr. Unsecd. Note, 144A, 5.250%, 10/1/2030 | 376,031 | |
50,000 | NCR Corp., Sr. Unsecd. Note, 144A, 5.750%, 9/1/2027 | 53,219 | |
150,000 | NCR Corp., Sr. Unsecd. Note, 144A, 8.125%, 4/15/2025 | 167,234 | |
125,000 | ON Semiconductor Corp., Sr. Unsecd. Note, 144A, 3.875%, 9/1/2028 | 129,219 | |
150,000 | Open Text Corp., Sr. Unsecd. Note, 144A, 3.875%, 2/15/2028 | 155,883 | |
150,000 | Open Text Corp., Sr. Unsecd. Note, 144A, 4.125%, 2/15/2030 | 159,846 | |
150,000 | PTC, Inc., Sr. Unsub., 144A, 3.625%, 2/15/2025 | 154,486 | |
200,000 | Qorvo, Inc., Sr. Unsecd. Note, 4.375%, 10/15/2029 | 220,388 | |
250,000 | Qorvo, Inc., Sr. Unsecd. Note, 144A, 3.375%, 4/1/2031 | 258,437 | |
300,000 | Rackspace Technology, Inc., Sr. Unsecd. Note, 144A, 5.375%, 12/1/2028 | 314,872 | |
75,000 | Science Applications International Corp., Sr. Unsecd. Note, 144A, 4.875%, 4/1/2028 | 79,629 | |
275,000 | Seagate HDD Cayman, Sr. Unsecd. Note, 144A, 3.125%, 7/15/2029 | 275,546 | |
225,000 | Seagate HDD Cayman, Sr. Unsecd. Note, 144A, 3.375%, 7/15/2031 | 226,639 | |
75,000 | Sensata Technologies B.V., Sr. Unsecd. Note, 144A, 4.375%, 2/15/2030 | 80,859 | |
75,000 | Sensata Technologies, Inc., 144A, 3.750%, 2/15/2031 | 77,837 | |
200,000 | Sensata Technologies UK Financing Co. PLC, Sr. Unsecd. Note, 144A, 6.250%, 2/15/2026 | 208,250 | |
625,000 | SS&C Technologies, Inc., Sr. Unsecd. Note, 144A, 5.500%, 9/30/2027 | 668,294 | |
120,000 | Star Merger Sub, Inc., 144A, 6.875%, 8/15/2026 | 129,225 | |
510,000 | Star Merger Sub, Inc., Sr. Unsecd. Note, 144A, 10.250%, 2/15/2027 | 576,206 | |
1,200,000 | Tempo Acquisition LLC, Sr. Unsecd. Note, 144A, 6.750%, 6/1/2025 | 1,241,760 | |
375,000 | TTM Technologies, Inc., Sr. Unsecd. Note, 144A, 5.625%, 10/1/2025 | 385,273 | |
475,000 | Veritas US, Inc./Veritas Bermuda, Ltd., Sr. Secd. Note, 144A, 7.500%, 9/1/2025 | 488,062 | |
TOTAL | 11,733,246 | ||
Transportation Services—0.3% | |||
200,000 | Stena International S.A., Sec. Fac. Bond, 144A, 6.125%, 2/1/2025 | 198,000 | |
275,000 | Watco Cos LLC/Finance Co., Sr. Unsecd. Note, 144A, 6.500%, 6/15/2027 | 298,203 | |
TOTAL | 496,203 | ||
Utility - Electric—2.9% | |||
300,000 | Calpine Corp., 144A, 4.500%, 2/15/2028 | 312,450 | |
135,000 | Calpine Corp., 144A, 5.250%, 6/1/2026 | 139,860 | |
325,000 | Calpine Corp., Sr. Secd. Note, 144A, 3.750%, 3/1/2031 | 322,467 | |
25,000 | Calpine Corp., Sr. Unsecd. Note, 144A, 4.625%, 2/1/2029 | 25,745 | |
25,000 | Calpine Corp., Sr. Unsecd. Note, 144A, 5.000%, 2/1/2031 | 26,162 |
Principal Amount or Shares | Value | ||
CORPORATE BONDS—continued | |||
Utility - Electric—continued | |||
$ 125,000 | Calpine Corp., Sr. Unsecd. Note, 144A, 5.125%, 3/15/2028 | $131,673 | |
775,000 | Enviva Partners LP/Enviva Partners Finance Corp., Sr. Unsecd. Note, 144A, 6.500%, 1/15/2026 | 824,891 | |
450,000 | NRG Energy, Inc., Sr. Unsecd. Note, 7.250%, 5/15/2026 | 475,425 | |
50,000 | NRG Energy, Inc., Sr. Unsecd. Note, 144A, 3.375%, 2/15/2029 | 51,284 | |
50,000 | NRG Energy, Inc., Sr. Unsecd. Note, 144A, 3.625%, 2/15/2031 | 51,534 | |
300,000 | NRG Energy, Inc., Sr. Unsecd. Note, 144A, 5.250%, 6/15/2029 | 330,694 | |
50,000 | NRG Energy, Inc., Sr. Unsecd. Note, Series WI, 5.750%, 1/15/2028 | 54,719 | |
125,000 | Pattern Energy Operations LP / Pattern Energy Operations, Inc., Sr. Unsecd. Note, 144A, 4.500%, 8/15/2028 | 132,109 | |
50,000 | TerraForm Power Operating LLC, Sr. Unsecd. Note, 144A, 4.250%, 1/31/2023 | 51,781 | |
50,000 | TerraForm Power Operating LLC, Sr. Unsecd. Note, 144A, 4.750%, 1/15/2030 | 53,610 | |
675,000 | TerraForm Power Operating LLC, Sr. Unsecd. Note, 144A, 5.000%, 1/31/2028 | 759,729 | |
300,000 | Vistra Operations Co., LLC, Sr. Unsecd. Note, 144A, 5.000%, 7/31/2027 | 318,300 | |
175,000 | Vistra Operations Co., LLC, Sr. Unsecd. Note, 144A, 5.500%, 9/1/2026 | 182,604 | |
400,000 | Vistra Operations Co., LLC, Sr. Unsecd. Note, 144A, 5.625%, 2/15/2027 | 426,040 | |
TOTAL | 4,671,077 | ||
Wireless Communications—2.2% | |||
850,000 | Numericable-SFR SAS, 144A, 7.375%, 5/1/2026 | 895,687 | |
300,000 | Sprint Capital Corp., Company Guarantee, 6.875%, 11/15/2028 | 396,106 | |
700,000 | Sprint Corp., 7.125%, 6/15/2024 | 819,455 | |
150,000 | Sprint Corp., 7.875%, 9/15/2023 | 173,858 | |
100,000 | Sprint Corp., Sr. Unsecd. Note, 7.625%, 2/15/2025 | 119,771 | |
150,000 | T-Mobile USA, Inc., Sr. Unsecd. Note, 4.500%, 2/1/2026 | 153,632 | |
250,000 | T-Mobile USA, Inc., Sr. Unsecd. Note, 4.750%, 2/1/2028 | 269,035 | |
275,000 | T-Mobile USA, Inc., Sr. Unsecd. Note, 6.000%, 3/1/2023 | 275,688 | |
325,000 | T-Mobile USA, Inc., Sr. Unsecd. Note, 6.500%, 1/15/2026 | 336,781 | |
TOTAL | 3,440,013 | ||
TOTAL CORPORATE BONDS (IDENTIFIED COST $149,323,994) | 153,919,202 | ||
COMMON STOCKS—0.5% | |||
Chemicals—0.1% | |||
8,506 | 2 | Hexion Holdings Corp. | 104,198 |
Independent Energy—0.3% | |||
6,297 | 2 | Oasis Petroleum, Inc. | 233,367 |
7,874 | 2 | Whiting Petroleum Corp. | 196,850 |
TOTAL | 430,217 | ||
Media Entertainment—0.0% | |||
7,915 | 2 | iHeartMedia, Inc. | 102,737 |
Retailers—0.1% | |||
23,254 | 2 | Party City Holdco, Inc. | 143,012 |
TOTAL COMMON STOCKS (IDENTIFIED COST $1,223,841) | 780,164 | ||
FLOATING RATE LOANS—0.3% | |||
Health Care—0.2% | |||
$ 328,947 | 4 | Envision Healthcare Corp., 1st Lien PIK Term Loan B, 7.000% (3-month USLIBOR 1.000% Floor +6.000%), 10/10/2025 | 260,487 |
Independent Energy—0.1% | |||
202,000 | 4 | Ascent Resources Utica Holdings, LLC, Term Loan - 2nd Lien, 10.000% (1-month USLIBOR 1.000% Floor +9.000%), 11/1/2025 | 220,811 |
TOTAL FLOATING RATE LOANS (IDENTIFIED COST $772,154) | 481,298 |
Principal Amount or Shares | Value | ||
REPURCHASE AGREEMENT—1.8% | |||
$2,945,000 | Interest in $1,000,000,000 joint repurchase agreement 0.08%, dated 12/31/2020 under which Bank of Montreal will repurchase securities provided as collateral for $1,000,008,889 on 1/4/2021. The securities provided as collateral at the end of the period held with BNY Mellon as tri-party agent, were U.S. Government Agency and U.S. Treasury securities with various maturities to 5/20/2069 and the market value of those underlying securities was $1,022,038,963. (IDENTIFIED COST $2,945,000) | $2,945,000 | |
TOTAL INVESTMENT IN SECURITIES—98.7% (IDENTIFIED COST $154,264,989)5 | 158,125,664 | ||
OTHER ASSETS AND LIABILITIES - NET—1.3%6 | 2,085,074 | ||
TOTAL NET ASSETS—100% | $160,210,738 |
1 | Issuer in default. |
2 | Non-income-producing security. |
3 | Market quotations and price evaluations are not available. Fair value determined using significant unobservable inputs in accordance with procedures established by and under the general supervision of the Fund’s Board of Trustees (the “Trustees”). |
4 | Floating/variable note with current rate and current maturity or next reset date shown. |
5 | The cost of investments for federal tax purposes amounts to $154,743,949. |
6 | Assets, other than investments in securities, less liabilities. See Statement of Assets and Liabilities. |
Valuation Inputs | ||||
Level 1— Quoted Prices | Level 2— Other Significant Observable Inputs | Level 3— Significant Unobservable Inputs | Total | |
Debt Securities: | ||||
Corporate Bonds | $— | $153,919,202 | $0* | $153,919,202 |
Floating Rate Loans | — | 481,298 | — | 481,298 |
Equity Securities: | ||||
Common Stocks | ||||
Domestic | 780,164 | — | — | 780,164 |
Repurchase Agreement | — | 2,945,000 | — | 2,945,000 |
TOTAL SECURITIES | $780,164 | $157,345,500 | $0 | $158,125,664 |
* | Includes $12,250 transferred from Level 2 to Level 3 because fair values were determined using valuation techniques utilizing unobservable market date due to observable market value being unavailable. This transfer represents the value of the security at the beginning of the period. |
The following acronym(s) are used throughout this portfolio: | ||
GMTN | —Global Medium Term Note | |
LIBOR | —London Interbank Offered Rate | |
PIK | —Payment in Kind | |
Year Ended December 31, | |||||
2020 | 2019 | 2018 | 2017 | 2016 | |
Net Asset Value, Beginning of Period | $6.53 | $6.07 | $6.82 | $6.84 | $6.36 |
Income From Investment Operations: | |||||
Net investment income (loss)1 | 0.30 | 0.33 | 0.34 | 0.36 | 0.37 |
Net realized and unrealized gain (loss) | (0.05) | 0.53 | (0.55) | 0.09 | 0.53 |
Total From Investment Operations | 0.25 | 0.86 | (0.21) | 0.45 | 0.90 |
Less Distributions: | |||||
Distributions from net investment income | (0.37) | (0.40) | (0.54) | (0.47) | (0.42) |
Net Asset Value, End of Period | $6.41 | $6.53 | $6.07 | $6.82 | $6.84 |
Total Return2 | 5.59% | 14.54% | (3.29)% | 6.94% | 14.82% |
Ratios to Average Net Assets: | |||||
Net expenses3 | 0.81% | 0.81% | 0.81% | 0.78% | 0.72% |
Net investment income | 4.95% | 5.26% | 5.27% | 5.26% | 5.74% |
Expense waiver/reimbursement4 | 0.03% | 0.02% | 0.01% | 0.00%5 | 0.06% |
Supplemental Data: | |||||
Net assets, end of period (000 omitted) | $109,888 | $109,538 | $106,628 | $192,194 | $190,070 |
Portfolio turnover | 36% | 31% | 18% | 32% | 26% |
1 | Per share numbers have been calculated using the average shares method. |
2 | Based on net asset value. Total returns do not reflect any additional fees or expenses that may be imposed by separate accounts of insurance companies or in connection with any variable annuity or variable life insurance contract. |
3 | Amount does not reflect net expenses incurred by investment companies in which the Fund may invest. |
4 | This expense decrease is reflected in both the net expense and the net investment income ratios shown above. Amount does not reflect expense waiver/ reimbursement recorded by investment companies in which the Fund may invest. |
5 | Represents less than 0.01%. |
Year Ended December 31, | |||||
2020 | 2019 | 2018 | 2017 | 2016 | |
Net Asset Value, Beginning of Period | $6.49 | $6.04 | $6.78 | $6.81 | $6.33 |
Income From Investment Operations: | |||||
Net investment income (loss)1 | 0.28 | 0.31 | 0.32 | 0.34 | 0.35 |
Net realized and unrealized gain (loss) | (0.03) | 0.52 | (0.54) | 0.09 | 0.53 |
Total From Investment Operations | 0.25 | 0.83 | (0.22) | 0.43 | 0.88 |
Less Distributions: | |||||
Distributions from net investment income | (0.36) | (0.38) | (0.52) | (0.46) | (0.40) |
Net Asset Value, End of Period | $6.38 | $6.49 | $6.04 | $6.78 | $6.81 |
Total Return2 | 5.46% | 14.13% | (3.43)% | 6.56% | 14.53% |
Ratios to Average Net Assets: | |||||
Net expenses3 | 1.06% | 1.06% | 1.06% | 1.03% | 0.96% |
Net investment income | 4.70% | 4.99% | 5.03% | 5.01% | 5.48% |
Expense waiver/reimbursement4 | 0.03% | 0.02% | 0.01% | 0.00%5 | 0.08% |
Supplemental Data: | |||||
Net assets, end of period (000 omitted) | $50,322 | $58,591 | $43,012 | $50,284 | $49,183 |
Portfolio turnover | 36% | 31% | 18% | 32% | 26% |
1 | Per share numbers have been calculated using the average shares method. |
2 | Based on net asset value. Total returns do not reflect any additional fees or expenses that may be imposed by separate accounts of insurance companies or in connection with any variable annuity or variable life insurance contract. |
3 | Amount does not reflect net expenses incurred by investment companies in which the Fund may invest. |
4 | This expense decrease is reflected in both the net expense and the net investment income ratios shown above. Amount does not reflect expense waiver/ reimbursement recorded by investment companies in which the Fund may invest. |
5 | Represents less than 0.01%. |
Assets: | |
Investment in securities, at value (identified cost $154,264,989) | $158,125,664 |
Cash | 1,586 |
Income receivable | 2,400,907 |
Receivable for shares sold | 41,698 |
Other receivable | 9,525 |
Total Assets | 160,579,380 |
Liabilities: | |
Payable for investments purchased | 275,250 |
Payable for shares redeemed | 32,911 |
Payable to adviser (Note 5) | 2,591 |
Payable for administrative fee (Note 5) | 341 |
Payable for portfolio accounting fees | 37,930 |
Payable for distribution services fee (Note 5) | 10,589 |
Accrued expenses (Note 5) | 9,030 |
Total Liabilities | 368,642 |
Net assets for 25,038,986 shares outstanding | $160,210,738 |
Net Assets Consist of: | |
Paid-in capital | $163,397,828 |
Total distributable earnings (loss) | (3,187,090) |
Total Net Assets | $160,210,738 |
Net Asset Value, Offering Price and Redemption Proceeds Per Share: | |
Primary Shares: | |
$109,888,338 ÷ 17,146,199 shares outstanding, no par value, unlimited shares authorized | $6.41 |
Service Shares: | |
$50,322,400 ÷ 7,892,787 shares outstanding, no par value, unlimited shares authorized | $6.38 |
Investment Income: | |
Interest | $8,653,374 |
Expenses: | |
Investment adviser fee (Note 5) | 900,179 |
Administrative fee (Note 5) | 120,368 |
Custodian fees | 17,158 |
Transfer agent fees | 15,715 |
Directors’/Trustees’ fees (Note 5) | 1,909 |
Auditing fees | 30,952 |
Legal fees | 9,648 |
Portfolio accounting fees | 94,163 |
Distribution services fee (Note 5) | 122,598 |
Printing and postage | 50,847 |
Miscellaneous (Note 5) | 24,072 |
TOTAL EXPENSES | 1,387,609 |
Waiver : | |
Waiver of investment adviser fee (Note 5) | (42,405) |
Net expenses | 1,345,204 |
Net investment income | 7,308,170 |
Realized and Unrealized Gain (Loss) on Investments: | |
Net realized loss on investments | (1,116,433) |
Net change in unrealized appreciation of investments | 2,255,015 |
Net realized and unrealized gain (loss) on investments | 1,138,582 |
Change in net assets resulting from operations | $8,446,752 |
Year Ended December 31 | 2020 | 2019 |
Increase (Decrease) in Net Assets | ||
Operations: | ||
Net investment income (loss) | $7,308,170 | $8,215,344 |
Net realized gain (loss) | (1,116,433) | (529,999) |
Net change in unrealized appreciation/depreciation | 2,255,015 | 13,556,833 |
CHANGE IN NET ASSETS RESULTING FROM OPERATIONS | 8,446,752 | 21,242,178 |
Distributions to Shareholders: | ||
Primary Shares | (5,812,160) | (6,917,851) |
Service Shares | (2,736,746) | (2,697,708) |
CHANGE IN NET ASSETS RESULTING FROM DISTRIBUTIONS TO SHAREHOLDERS | (8,548,906) | (9,615,559) |
Share Transactions: | ||
Proceeds from sale of shares | 37,016,529 | 42,973,449 |
Net asset value of shares issued to shareholders in payment of distributions declared | 8,548,900 | 9,615,553 |
Cost of shares redeemed | (53,381,895) | (45,725,985) |
CHANGE IN NET ASSETS RESULTING FROM SHARE TRANSACTIONS | (7,816,466) | 6,863,017 |
Change in net assets | (7,918,620) | 18,489,636 |
Net Assets: | ||
Beginning of period | 168,129,358 | 149,639,722 |
End of period | $160,210,738 | $168,129,358 |
Year Ended 12/31/2020 | Year Ended 12/31/2019 | |||
Primary Shares: | Shares | Amount | Shares | Amount |
Shares sold | 4,782,556 | $28,203,580 | 3,164,991 | $19,950,540 |
Shares issued to shareholders in payment of distributions declared | 1,181,333 | 5,812,160 | 1,132,218 | 6,917,851 |
Shares redeemed | (5,600,398) | (33,846,638) | (5,078,703) | (31,964,711) |
NET CHANGE RESULTING FROM PRIMARY SHARE TRANSACTIONS | 363,491 | $169,102 | (781,494) | $(5,096,320) |
Year Ended 12/31/2020 | Year Ended 12/31/2019 | |||
Service Shares: | Shares | Amount | Shares | Amount |
Shares sold | 1,481,388 | $8,812,949 | 3,668,502 | $23,022,909 |
Shares issued to shareholders in payment of distributions declared | 558,519 | 2,736,740 | 442,972 | 2,697,702 |
Shares redeemed | (3,171,995) | (19,535,257) | (2,207,531) | (13,761,274) |
NET CHANGE RESULTING FROM SERVICE SHARE TRANSACTIONS | (1,132,088) | $(7,985,568) | 1,903,943 | $11,959,337 |
NET CHANGE RESULTING FROM TOTAL FUND SHARE TRANSACTIONS | (768,597) | $(7,816,466) | 1,122,449 | $6,863,017 |
2020 | 2019 | |
Ordinary income | $8,548,906 | $9,615,559 |
Undistributed ordinary income | $7,729,943 |
Net unrealized appreciation | $3,381,715 |
Capital loss carryforwards | $(14,298,748) |
Short-Term | Long-Term | Total |
$— | $14,298,748 | $14,298,748 |
Administrative Fee | Average Daily Net Assets of the Investment Complex |
0.100% | on assets up to $50 billion |
0.075% | on assets over $50 billion |
Distribution Services Fees Incurred | |
Service Shares | $122,598 |
Purchases | $51,146,589 |
Sales | $52,949,570 |
February 16, 2021
Beginning Account Value 7/1/2020 | Ending Account Value 12/31/2020 | Expenses Paid During Period1 | |
Actual: | |||
Primary Shares | $1,000 | $1,103.30 | $4.28 |
Service Shares | $1,000 | $1,101.90 | $5.60 |
Hypothetical (assuming a 5% return before expenses): | |||
Primary Shares | $1,000 | $1,021.06 | $4.12 |
Service Shares | $1,000 | $1,019.81 | $5.38 |
1 | Expenses are equal to the Fund’s annualized net expense ratios, multiplied by the average account value over the period, multiplied by 184/366 (to reflect the one-half-year period). The expenses shown in the table do not include the charges and expenses imposed by the insurance company under the variable insurance product contract. Please refer to the variable insurance product prospectus for a complete listing of these expenses. The annualized net expense ratios are as follows: |
Primary Shares | 0.81% |
Service Shares | 1.06% |
Name Birth Date Positions Held with Trust Date Service Began | Principal Occupation(s) for Past Five Years, Other Directorships Held and Previous Position(s) |
J. Christopher Donahue* Birth Date: April 11, 1949 Trustee Indefinite Term Began serving: September 1993 | Principal Occupations: Principal Executive Officer and President of certain of the Funds in the Federated Hermes Fund Family; Director or Trustee of the Funds in the Federated Hermes Fund Family; President, Chief Executive Officer and Director, Federated Hermes, Inc.; Chairman and Trustee, Federated Investment Management Company; Trustee, Federated Investment Counseling; Chairman and Director, Federated Global Investment Management Corp.; Chairman and Trustee, Federated Equity Management Company of Pennsylvania; Trustee, Federated Shareholder Services Company; Director, Federated Services Company. Previous Positions: President, Federated Investment Counseling; President and Chief Executive Officer, Federated Investment Management Company, Federated Global Investment Management Corp. and Passport Research, Ltd; Chairman, Passport Research, Ltd. |
Thomas R. Donahue* Birth Date: October 20, 1958 Trustee Indefinite Term Began serving: May 2016 | Principal Occupations: Director or Trustee of certain of the funds in the Federated Hermes Fund Family; Chief Financial Officer, Treasurer, Vice President and Assistant Secretary, Federated Hermes, Inc.; Chairman and Trustee, Federated Administrative Services; Chairman and Director, Federated Administrative Services, Inc.; Trustee and Treasurer, Federated Advisory Services Company; Director or Trustee and Treasurer, Federated Equity Management Company of Pennsylvania, Federated Global Investment Management Corp., Federated Investment Counseling, and Federated Investment Management Company; Director, MDTA LLC; Director, Executive Vice President and Assistant Secretary, Federated Securities Corp.; Director or Trustee and Chairman, Federated Services Company and Federated Shareholder Services Company; and Director and President, FII Holdings, Inc. Previous Positions: Director, Federated Hermes, Inc.; Assistant Secretary, Federated Investment Management Company, Federated Global Investment Management Company and Passport Research, LTD; Treasurer, Passport Research, LTD; Executive Vice President, Federated Securities Corp.; and Treasurer, FII Holdings, Inc. |
Name Birth Date Positions Held with Trust Date Service Began | Principal Occupation(s) for Past Five Years, Other Directorships Held, Previous Position(s) and Qualifications |
John T. Collins Birth Date: January 24, 1947 Trustee Indefinite Term Began serving: October 2013 | Principal Occupations: Director or Trustee, and Chair of the Board of Directors or Trustees, of the Federated Hermes Fund Family; formerly, Chairman and CEO, The Collins Group, Inc. (a private equity firm) (Retired). Other Directorships Held: Chairman of the Board of Directors, Director, KLX Energy Services Holdings, Inc. (oilfield services); former Director of KLX Corp. (aerospace). Qualifications: Mr. Collins has served in several business and financial management roles and directorship positions throughout his career. Mr. Collins previously served as Chairman and CEO of The Collins Group, Inc. (a private equity firm) and as a Director of KLX Corp. Mr. Collins serves as Chairman Emeriti, Bentley University. Mr. Collins previously served as Director and Audit Committee Member, Bank of America Corp.; Director, FleetBoston Financial Corp.; and Director, Beth Israel Deaconess Medical Center (Harvard University Affiliate Hospital). |
Name Birth Date Positions Held with Trust Date Service Began | Principal Occupation(s) for Past Five Years, Other Directorships Held, Previous Position(s) and Qualifications |
G. Thomas Hough Birth Date: February 28, 1955 Trustee Indefinite Term Began serving: August 2015 | Principal Occupations: Director or Trustee, Chair of the Audit Committee of the Federated Hermes Fund Family; formerly, Vice Chair, Ernst & Young LLP (public accounting firm) (Retired). Other Directorships Held: Director, Chair of the Audit Committee, Equifax, Inc.; Director, Member of the Audit Committee, Haverty Furniture Companies, Inc.; formerly, Director, Member of Governance and Compensation Committees, Publix Super Markets, Inc. Qualifications: Mr. Hough has served in accounting, business management and directorship positions throughout his career. Mr. Hough most recently held the position of Americas Vice Chair of Assurance with Ernst & Young LLP (public accounting firm). Mr. Hough serves on the President’s Cabinet and Business School Board of Visitors for the University of Alabama. Mr. Hough previously served on the Business School Board of Visitors for Wake Forest University, and he previously served as an Executive Committee member of the United States Golf Association. |
Maureen Lally-Green Birth Date: July 5, 1949 Trustee Indefinite Term Began serving: August 2009 | Principal Occupations: Director or Trustee of the Federated Hermes Fund Family; Adjunct Professor Emerita of Law, Duquesne University School of Law; formerly, Dean of the Duquesne University School of Law and Professor of Law and Interim Dean of the Duquesne University School of Law; formerly, Associate General Secretary and Director, Office of Church Relations, Diocese of Pittsburgh. Other Directorships Held: Director, CNX Resources Corporation (formerly known as CONSOL Energy Inc.). Qualifications: Judge Lally-Green has served in various legal and business roles and directorship positions throughout her career. Judge Lally-Green previously held the position of Dean of the School of Law of Duquesne University (as well as Interim Dean). Judge Lally-Green previously served as a member of the Superior Court of Pennsylvania and as a Professor of Law, Duquesne University School of Law. Judge Lally-Green was appointed by the Supreme Court of Pennsylvania to serve on the Supreme Court’s Board of Continuing Judicial Education and the Supreme Court’s Appellate Court Procedural Rules Committee. Judge Lally-Green also currently holds the positions on not for profit or for profit boards of directors as follows: Director and Chair, UPMC Mercy Hospital; Regent, Saint Vincent Seminary; Member, Pennsylvania State Board of Education (public); Director, Catholic Charities, Pittsburgh; and Director CNX Resources Corporation (formerly known as CONSOL Energy Inc.). Judge Lally-Green has held the positions of: Director, Auberle; Director, Epilepsy Foundation of Western and Central Pennsylvania; Director, Ireland Institute of Pittsburgh; Director, Saint Thomas More Society; Director and Chair, Catholic High Schools of the Diocese of Pittsburgh, Inc.; Director, Pennsylvania Bar Institute; Director, St. Vincent College; Director and Chair, North Catholic High School, Inc.; and Director and Vice Chair, Our Campaign for the Church Alive!, Inc. |
Thomas M. O’Neill Birth Date: June 14, 1951 Trustee Indefinite Term Began serving: August 2006 | Principal Occupations: Director or Trustee of the Federated Hermes Fund Family; Sole Proprietor, Navigator Management Company (investment and strategic consulting). Other Directorships Held: None. Qualifications: Mr. O’Neill has served in several business, mutual fund and financial management roles and directorship positions throughout his career. Mr. O’Neill serves as Director, Medicines for Humanity and Director, The Golisano Children’s Museum of Naples, Florida. Mr. O’Neill previously served as Chief Executive Officer and President, Managing Director and Chief Investment Officer, Fleet Investment Advisors; President and Chief Executive Officer, Aeltus Investment Management, Inc.; General Partner, Hellman, Jordan Management Co., Boston, MA; Chief Investment Officer, The Putnam Companies, Boston, MA; Credit Analyst and Lending Officer, Fleet Bank; Director and Consultant, EZE Castle Software (investment order management software); and Director, Midway Pacific (lumber). |
Madelyn A. Reilly Birth Date: February 2, 1956 Trustee Indefinite Term Began serving: November 2020 | Principal Occupations: Director or Trustee of the Federated Hermes Fund Family; Senior Vice President for Legal Affairs, General Counsel and Secretary of the Board of Trustees, Duquesne University. Other Directorships Held: None. Qualifications: Ms. Reilly has served in various business and legal management roles throughout her career. Ms. Reilly previously served as Director of Risk Management and Associate General Counsel, Duquesne University. Prior to her work at Duquesne University, Ms. Reilly served as Assistant General Counsel of Compliance and Enterprise Risk as well as Senior Counsel of Environment, Health and Safety, PPG Industries. |
P. Jerome Richey Birth Date: February 23, 1949 Trustee Indefinite Term Began serving: October 2013 | Principal Occupations: Director or Trustee of the Federated Hermes Fund Family; Management Consultant; Retired; formerly, Senior Vice Chancellor and Chief Legal Officer, University of Pittsburgh and Executive Vice President and Chief Legal Officer, CONSOL Energy Inc. (now split into two separate publicly traded companies known as CONSOL Energy Inc. and CNX Resources Corp.). Other Directorships Held: None. Qualifications: Mr. Richey has served in several business and legal management roles and directorship positions throughout his career. Mr. Richey most recently held the positions of Senior Vice Chancellor and Chief Legal Officer, University of Pittsburgh. Mr. Richey previously served as Chairman of the Board, Epilepsy Foundation of Western Pennsylvania and Chairman of the Board, World Affairs Council of Pittsburgh. Mr. Richey previously served as Chief Legal Officer and Executive Vice President, CONSOL Energy Inc. and CNX Gas Company; and Board Member, Ethics Counsel and Shareholder, Buchanan Ingersoll & Rooney PC (a law firm). |
Name Birth Date Positions Held with Trust Date Service Began | Principal Occupation(s) for Past Five Years, Other Directorships Held, Previous Position(s) and Qualifications |
John S. Walsh Birth Date: November 28, 1957 Trustee Indefinite Term Began serving: January 1999 | Principal Occupations: Director or Trustee of the Federated Hermes Fund Family; President and Director, Heat Wagon, Inc. (manufacturer of construction temporary heaters); President and Director, Manufacturers Products, Inc. (distributor of portable construction heaters); President, Portable Heater Parts, a division of Manufacturers Products, Inc. Other Directorships Held: None. Qualifications: Mr. Walsh has served in several business management roles and directorship positions throughout his career. Mr. Walsh previously served as Vice President, Walsh & Kelly, Inc. (paving contractors). |
Name Birth Date Address Positions Held with Trust Date Service Began | Principal Occupation(s) for Past Five Years and Previous Position(s) |
Lori A. Hensler Birth Date: January 6, 1967 TREASURER Officer since: April 2013 | Principal Occupations: Principal Financial Officer and Treasurer of the Federated Hermes Fund Family; Senior Vice President, Federated Administrative Services; Financial and Operations Principal for Federated Securities Corp.; and Assistant Treasurer, Federated Investors Trust Company. Ms. Hensler has received the Certified Public Accountant designation. Previous Positions: Controller of Federated Hermes, Inc.; Senior Vice President and Assistant Treasurer, Federated Investors Management Company; Treasurer, Federated Investors Trust Company; Assistant Treasurer, Federated Administrative Services, Federated Administrative Services, Inc., Federated Securities Corp., Edgewood Services, Inc., Federated Advisory Services Company, Federated Equity Management Company of Pennsylvania, Federated Global Investment Management Corp., Federated Investment Counseling, Federated Investment Management Company, Passport Research, Ltd., and Federated MDTA, LLC; Financial and Operations Principal for Federated Securities Corp., Edgewood Services, Inc. and Southpointe Distribution Services, Inc. |
Peter J. Germain Birth Date: September 3, 1959 CHIEF LEGAL OFFICER, SECRETARY and EXECUTIVE VICE PRESIDENT Officer since: January 2005 | Principal Occupations: Mr. Germain is Chief Legal Officer, Secretary and Executive Vice President of the Federated Hermes Fund Family. He is General Counsel, Chief Legal Officer, Secretary and Executive Vice President, Federated Hermes, Inc.; Trustee and Senior Vice President, Federated Investors Management Company; Trustee and President, Federated Administrative Services; Director and President, Federated Administrative Services, Inc.; Director and Vice President, Federated Securities Corp.; Director and Secretary, Federated Private Asset Management, Inc.; Secretary, Federated Shareholder Services Company; and Secretary, Retirement Plan Service Company of America. Mr. Germain joined Federated Hermes, Inc. in 1984 and is a member of the Pennsylvania Bar Association. Previous Positions: Deputy General Counsel, Special Counsel, Managing Director of Mutual Fund Services, Federated Hermes, Inc.; Senior Vice President, Federated Services Company; and Senior Corporate Counsel, Federated Hermes, Inc. |
John B. Fisher Birth Date: May 16, 1956 PRESIDENT Officer since: November 2004 | Principal Occupations: Principal Executive Officer and President of certain of the Funds in the Federated Hermes Fund Family; Director or Trustee of certain of the Funds in the Federated Hermes Fund Family; Vice President, Federated Hermes, Inc.; President, Director/Trustee and CEO, Federated Advisory Services Company, Federated Equity Management Company of Pennsylvania, Federated Global Investment Management Corp., Federated Investment Counseling, Federated Investment Management Company; President and CEO of Passport Research, Ltd.; President of some of the Funds in the Federated Fund Complex and Director, Federated Investors Trust Company. Previous Positions: President and Director of the Institutional Sales Division of Federated Securities Corp.; President and Director of Federated Investment Counseling; Director, Edgewood Securities Corp.; Director, Federated Services Company; Director, Federated Hermes, Inc.; Chairman and Director, Southpointe Distribution Services, Inc. and President, Technology, Federated Services Company. |
Stephen Van Meter Birth Date: June 5, 1975 CHIEF COMPLIANCE OFFICER AND SENIOR VICE PRESIDENT Officer since: July 2015 | Principal Occupations: Senior Vice President and Chief Compliance Officer of the Federated Hermes Fund Family; Vice President and Chief Compliance Officer of Federated Hermes, Inc. and Chief Compliance Officer of certain of its subsidiaries. Mr. Van Meter joined Federated Hermes, Inc. in October 2011. He holds FINRA licenses under Series 3, 7, 24 and 66. Previous Positions: Mr. Van Meter previously held the position of Compliance Operating Officer, Federated Hermes, Inc. Prior to joining Federated Hermes, Inc., Mr. Van Meter served at the United States Securities and Exchange Commission in the positions of Senior Counsel, Office of Chief Counsel, Division of Investment Management and Senior Counsel, Division of Enforcement. |
Stephen F. Auth Birth Date: September 13, 1956 101 Park Avenue 41st Floor New York, NY 10178 CHIEF INVESTMENT OFFICER Officer since: November 2002 | Principal Occupations: Stephen F. Auth is Chief Investment Officer of various Funds in the Federated Hermes Fund Family; Executive Vice President, Federated Investment Counseling, Federated Global Investment Management Corp. and Federated Equity Management Company of Pennsylvania. Previous Positions: Executive Vice President, Federated Investment Management Company and Passport Research, Ltd. (investment advisory subsidiary of Federated); Senior Vice President, Global Portfolio Management Services Division; Senior Vice President, Federated Investment Management Company and Passport Research, Ltd.; Senior Managing Director and Portfolio Manager, Prudential Investments. |
Name Birth Date Address Positions Held with Trust Date Service Began | Principal Occupation(s) for Past Five Years and Previous Position(s) |
Robert J. Ostrowski Birth Date: April 26, 1963 Chief Investment Officer Officer since: May 2004 | Principal Occupations: Robert J. Ostrowski joined Federated Hermes, Inc. in 1987 as an Investment Analyst and became a Portfolio Manager in 1990. He was named Chief Investment Officer of Federated Hermes’ taxable fixed-income products in 2004 and also serves as a Senior Portfolio Manager. Mr. Ostrowski became an Executive Vice President of the Fund’s Adviser in 2009 and served as a Senior Vice President of the Fund’s Adviser from 1997 to 2009. Mr. Ostrowski has received the Chartered Financial Analyst designation. He received his M.S. in Industrial Administration from Carnegie Mellon University. |
Deborah A. Cunningham Birth Date: September 15, 1959 Chief Investment Officer Officer since: June 2012 | Principal Occupations: Deborah A. Cunningham was named Chief Investment Officer of Federated Hermes’ money market products in 2004. She joined Federated Hermes in 1981 and has been a Senior Portfolio Manager since 1997 and an Executive Vice President of the Fund’s Adviser since 2009. Ms. Cunningham has received the Chartered Financial Analyst designation and holds an M.S.B.A. in Finance from Robert Morris College. |
Federated Hermes Funds
4000 Ericsson Drive
Warrendale, PA 15086-7561
or call 1-800-341-7400.
CUSIP 313916843

Share Class | Primary | Service |
Federated Hermes Kaufmann Fund II
A Portfolio of Federated Hermes Insurance Series
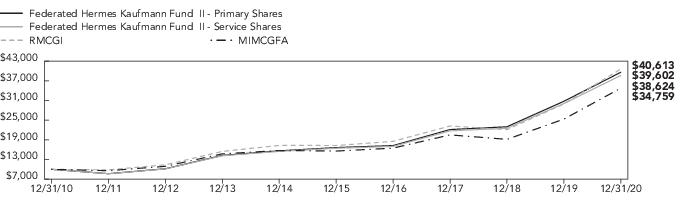
1 Year | 5 Years | 10 Years | |
Primary Shares | 28.79% | 18.95% | 14.75% |
Service Shares | 28.48% | 18.65% | 14.47% |
RMCGI | 35.59% | 18.66% | 15.04% |
MIMCGFA | 39.26% | 17.80% | 13.83% |
Sector Composition | Percentage of Total Net Assets |
Health Care | 34.2% |
Information Technology | 19.6% |
Materials | 9.9% |
Industrials | 9.4% |
Consumer Discretionary | 7.0% |
Financials | 4.9% |
Energy | 1.5% |
Real Estate | 1.3% |
Communication Services | 0.9% |
Consumer Staples | 0.4% |
Securities Lending Collateral2 | 2.7% |
Cash Equivalents3 | 11.1% |
Other Assets and Liabilities—Net4 | (2.9)% |
TOTAL | 100% |
1 | Except for Securities Lending Collateral, Cash Equivalents and Other Assets and Liabilities, sector classifications are based upon, and individual portfolio securities are assigned to, the classifications of the Global Industry Classification Standard (GICS), except that the Adviser assigns a classification to securities not classified by the GICS and to securities for which the Adviser does not have access to the classification made by the GICS. |
2 | Represents cash collateral received for portfolio securities on loan that may be invested in affiliated money market funds, other money market instruments and/or repurchase agreements. |
3 | Cash Equivalents include any investments in money market mutual funds and/or overnight repurchase agreements other than those representing securities lending collateral. |
4 | Assets, other than investments in securities, less liabilities. See Statement of Assets and Liabilities. |
Shares or Principal Amount | Value | ||
COMMON STOCKS—88.8% | |||
Communication Services—0.9% | |||
2,756 | Activision Blizzard, Inc. | $255,895 | |
38,462 | 1 | ZoomInfo Technologies, Inc. | 1,855,022 |
TOTAL | 2,110,917 | ||
Consumer Discretionary—7.0% | |||
550 | 1 | Airbnb, Inc. | 80,740 |
4,600 | 1 | Alibaba Group Holding Ltd., ADR | 1,070,558 |
651 | 1 | Amazon.com, Inc. | 2,120,261 |
1,330 | 1 | Bright Horizons Family Solutions, Inc. | 230,077 |
5,530 | 1 | DraftKings, Inc. | 257,477 |
3,350 | 1 | Etsy, Inc. | 595,998 |
26,000 | 1,2 | Fisker, Inc. | 380,900 |
19,900 | 1 | Floor & Decor Holdings, Inc. | 1,847,715 |
1,925 | 1 | GrubHub, Inc. | 142,970 |
2,100 | Home Depot, Inc. | 557,802 | |
3,950 | 1,3 | Just Eat Takeaway | 445,265 |
18,500 | Las Vegas Sands Corp. | 1,102,600 | |
3,700 | 1 | Lululemon Athletica, Inc. | 1,287,711 |
280 | 1 | Mercadolibre, Inc. | 469,061 |
16,700 | Moncler S.p.A | 1,021,475 | |
714,400 | NagaCorp Ltd. | 937,048 | |
5,165 | 1 | Planet Fitness, Inc. | 400,959 |
825 | Vail Resorts, Inc. | 230,142 �� | |
16,600 | Wingstop, Inc. | 2,200,330 | |
15,000 | 1 | YETI Holdings, Inc. | 1,027,050 |
TOTAL | 16,406,139 | ||
Consumer Staples—0.4% | |||
500 | Costco Wholesale Corp. | 188,390 | |
2,700 | 1 | Freshpet, Inc. | 383,373 |
8,600 | 1 | Grocery Outlet Holding Corp. | 337,550 |
TOTAL | 909,313 | ||
Energy—1.5% | |||
64,441 | New Fortress Energy, Inc. | 3,453,393 | |
Financials—4.9% | |||
24,100 | Apollo Global Management LLC | 1,180,418 | |
98,700 | Ashmore Group PLC | 582,557 | |
2,400 | BlackRock, Inc. | 1,731,696 | |
128,900 | 1 | FinecoBank Banca Fineco SPA | 2,103,600 |
1,400 | Goldman Sachs Group, Inc. | 369,194 | |
22,200 | Hamilton Lane, Inc. | 1,732,710 | |
20,200 | Housing Development Finance Corp. Ltd. | 709,835 | |
33,400 | KKR & Co., Inc, Class Common | 1,352,366 | |
18,015 | 1,3 | Longview Acquistion Corp. | 356,517 |
1,000 | 1 | Markel Corp. | 1,033,300 |
11,125 | 1,3 | Root, Inc. | 174,774 |
TOTAL | 11,326,967 | ||
Health Care—33.9% | |||
11,500 | Abbott Laboratories | 1,259,135 | |
29,970 | 1,3 | Akouos, Inc. | 594,305 |
40,300 | 1 | Albireo Pharma, Inc. | 1,511,653 |
55,606 | 1 | Alector, Inc. | 841,319 |
4,180 | 1 | Alnylam Pharmaceuticals, Inc. | 543,275 |
14,500 | 1,3 | American Well Corp. | 367,285 |
36,400 | 1 | Amphastar Pharmaceuticals, Inc. | 732,004 |
Shares or Principal Amount | Value | ||
COMMON STOCKS—continued | |||
Health Care—continued | |||
12,000 | 1 | Annexon, Inc. | $300,360 |
52,800 | 1 | Arcturus Therapeutics Holdings, Inc. | 2,290,464 |
29,000 | 1 | Argenx SE | 8,548,514 |
18,100 | 1 | Avidity Biosciences LLC | 461,912 |
14,300 | 1 | Avrobio, Inc. | 199,342 |
11,000 | 1 | Boston Scientific Corp. | 395,450 |
97,600 | 1 | Calithera Biosciences, Inc. | 479,216 |
19,800 | 1 | Catalent, Inc. | 2,060,586 |
137,500 | 1 | Corcept Therapeutics, Inc. | 3,597,000 |
7,100 | 1 | CRISPR Therapeutics AG | 1,087,081 |
11,700 | Danaher Corp. | 2,599,038 | |
8,275 | 1 | Dexcom, Inc. | 3,059,433 |
171,800 | 1 | Dynavax Technologies Corp. | 764,510 |
26,300 | 1 | Editas Medicine, Inc. | 1,843,893 |
7,700 | 1 | Edwards Lifesciences Corp. | 702,471 |
3,200 | 1 | Fate Therapeutics, Inc. | 290,976 |
20,900 | 1,3 | Frequency Therapeutics, Inc. | 736,934 |
5,088 | 1 | Frequency Therapeutics, Inc. | 179,403 |
2,900 | 1 | Galapagos NV | 285,355 |
137,523 | 1 | Gamida Cell Ltd. | 1,153,818 |
7,000 | 1 | Genmab A/S | 2,831,371 |
16,300 | 1 | Genmab A/S, ADR | 662,758 |
12,200 | 1 | Gossamer Bio, Inc. | 117,974 |
12,618 | 1 | GW Pharmaceuticals PLC, ADR | 1,456,243 |
11,275 | 1 | IDEAYA Biosciences, Inc. | 157,850 |
1,700 | 1 | IDEXX Laboratories, Inc. | 849,779 |
10,000 | 1,2 | Immatics N.V. | 107,900 |
9,400 | 1 | Immatics N.V. | 101,426 |
7,100 | 1 | Insulet Corp. | 1,814,973 |
4,000 | 1 | Intellia Therapeutics, Inc. | 217,600 |
715 | 1 | Intuitive Surgical, Inc. | 584,941 |
13,000 | 1,3 | Kaleido Biosciences, Inc. | 118,300 |
2,504 | 1 | Karuna Therapeutics, Inc. | 254,381 |
23,600 | 1 | Legend Biotech Corp., ADR | 664,576 |
38,400 | 1 | Merus NV | 673,152 |
137,800 | 1 | Minerva Neurosciences, Inc. | 322,452 |
19,400 | 1 | Moderna, Inc. | 2,026,718 |
20,852 | 1 | Molecular Partners AG | 486,302 |
29,312 | 1 | Orchard Therapeutics PLC, ADR | 126,628 |
55,425 | 1 | Otonomy, Inc. | 358,600 |
9,000 | 1 | PDS Biotechnology Corp. | 19,260 |
6,988 | 1 | Repligen Corp. | 1,339,110 |
17,262 | 1 | Rezolute, Inc. | 206,971 |
29,000 | 1 | Rhythm Pharmaceuticals, Inc. | 862,170 |
3,500 | 1 | Sarepta Therapeutics, Inc. | 596,715 |
13,770 | 1,3 | Scynexis, Inc. | 105,341 |
58,800 | 1 | Seres Therapeutics, Inc. | 1,440,600 |
12,087 | 1 | Stoke Therapeutics, Inc. | 748,548 |
3,300 | Stryker Corp. | 808,632 | |
23,800 | 1 | Tandem Diabetes Care, Inc. | 2,277,184 |
29,000 | 1 | Translate Bio, Inc. | 534,470 |
5,805 | 1 | TransMedics Group, Inc. | 115,520 |
6,300 | 1 | Turning Point Therapeutics, Inc. | 767,655 |
54,360 | 1 | Ultragenyx Pharmaceutical, Inc. | 7,525,055 |
58,500 | 1 | UniQure N.V. | 2,113,605 |
16,700 | 1 | Veeva Systems, Inc. | 4,546,575 |
Shares or Principal Amount | Value | ||
COMMON STOCKS—continued | |||
Health Care—continued | |||
24,500 | 1 | Zai Lab Ltd., ADR | $3,315,830 |
3,175 | 1 | Zentalis Pharmaceuticals, LLC | 164,909 |
26,400 | 1 | Zogenix, Inc. | 527,736 |
TOTAL | 78,834,542 | ||
Industrials—9.4% | |||
29,705 | 1 | Azek Co., Inc. | 1,142,157 |
30,100 | 1,3 | Azul S.A., ADR | 686,882 |
3,530 | 1 | CoStar Group, Inc. | 3,262,709 |
19,300 | 1 | Dun & Bradstreet Holdings, Inc. | 480,570 |
2,750 | 1 | FTI Consulting, Inc. | 307,230 |
7,020 | 1 | Generac Holdings, Inc. | 1,596,418 |
10,300 | HEICO Corp. | 1,363,720 | |
10,000 | IHS Markit Ltd. | 898,300 | |
40,038 | 1 | Mercury Systems, Inc. | 3,525,747 |
5,200 | Roper Technologies, Inc. | 2,241,668 | |
10,801 | Trane Technologies PLC | 1,567,873 | |
19,096 | 1 | Trex Co., Inc. | 1,598,717 |
6,600 | United Parcel Service, Inc. | 1,111,440 | |
7,219 | Verisk Analytics, Inc. | 1,498,592 | |
5,300 | 1 | XPO Logistics, Inc. | 631,760 |
TOTAL | 21,913,783 | ||
Information Technology—19.6% | |||
1,300 | 1 | Adobe, Inc. | 650,156 |
34,832 | 1 | Advanced Micro Devices, Inc. | 3,194,443 |
5,300 | 1 | Ansys, Inc. | 1,928,140 |
7,616 | 1 | Coupa Software, Inc. | 2,581,139 |
2,800 | 1 | DocuSign, Inc. | 622,440 |
9,225 | 1 | Envestnet, Inc. | 759,125 |
5,400 | 1 | Everbridge, Inc. | 804,978 |
8,400 | Fidelity National Information Services, Inc. | 1,188,264 | |
37,500 | 1,3 | GDS Holdings Ltd., ADR | 3,511,500 |
7,580 | 1 | GoDaddy, Inc. | 628,761 |
38,500 | Marvell Technology Group Ltd. | 1,830,290 | |
53,741 | McAfee Corp. | 896,937 | |
15,359 | 1 | Medallia, Inc. | 510,226 |
49,200 | 1 | Nexi SpA | 977,357 |
50,000 | 1 | PagSeguro Digital Ltd. | 2,844,000 |
14,300 | 1 | Q2 Holdings, Inc. | 1,809,379 |
34,300 | 1 | Radware Ltd. | 951,825 |
15,900 | 1 | Rapid7, Inc. | 1,433,544 |
5,000 | 1 | RealPage, Inc. | 436,200 |
2,900 | 1 | Salesforce.com, Inc. | 645,337 |
7,000 | 1 | ServiceNow, Inc. | 3,853,010 |
5,850 | 1 | Shopify, Inc. | 6,621,907 |
10,400 | 1 | Splunk, Inc. | 1,766,856 |
4,900 | 1 | Tyler Technologies, Inc. | 2,138,948 |
1,661 | 1,3 | Unity Software, Inc. | 254,914 |
11,462 | 1 | Workday, Inc. | 2,746,410 |
TOTAL | 45,586,086 | ||
Materials—9.9% | |||
46,000 | Agnico Eagle Mines Ltd. | 3,243,460 | |
255,900 | B2Gold Corp. | 1,433,394 | |
11,600 | Ball Corp. | 1,080,888 | |
86,000 | Barrick Gold Corp. | 1,959,080 | |
48,200 | Endeavour Financial Corp. | 1,121,599 | |
4,700 | Franco-Nevada Corp. | 589,300 |
Shares or Principal Amount | Value | ||
COMMON STOCKS—continued | |||
Materials—continued | |||
150,497 | Kinross Gold Corp. | $1,104,648 | |
37,544 | Kirkland Lake Gold Ltd. | 1,549,441 | |
46,500 | Newcrest Mining Ltd. | 926,326 | |
43,700 | Newmont Corp. | 2,617,193 | |
38,510 | Osisko Gold Royalties Ltd. | 488,307 | |
59,900 | 1 | Pretium Resources, Inc. | 687,652 |
10,873 | Scotts Miracle-Gro Co. | 2,165,249 | |
3,590 | Sherwin-Williams Co. | 2,638,327 | |
13,500 | Wheaton Precious Metals Corp. | 563,490 | |
134,485 | Yamana Gold, Inc. | 767,909 | |
TOTAL | 22,936,263 | ||
Real Estate—1.3% | |||
19,400 | Americold Realty Trust | 724,202 | |
5,400 | Crown Castle International Corp. | 859,626 | |
16,500 | MGM Growth Properties LLC | 516,450 | |
7,704 | Ryman Hospitality Properties | 522,023 | |
12,192 | STAG Industrial, Inc. | 381,853 | |
TOTAL | 3,004,154 | ||
TOTAL COMMON STOCKS (IDENTIFIED COST $97,750,333) | 206,481,557 | ||
WARRANTS—0.3% | |||
Health Care—0.3% | |||
11,450 | 1 | Catabasis Pharmaceuticals, Inc., Warrants, Expiration Date 2/8/2024 | 13,298 |
21,500 | 1 | Catabasis Pharmaceuticals, Inc., Warrants, Expiration Date 6/22/2022 | 15,628 |
87,500 | 1 | ContraFect Corp., Warrants, Expiration Date 7/20/2022 | 4,489 |
42,500 | 1 | ContraFect Corp., Warrants, Expiration Date 7/27/2021 | 26 |
10,000 | 1 | Dynavax Technologies Corp., Warrants, Expiration Date 2/12/2022 | 18,923 |
4,700 | 1 | Immatics N.V., Warrants, Expiration Date 12/31/2025 | 13,536 |
5,696 | 1 | Rezolute, Inc., Warrants, Expiration Date 10/8/2027 | 56,253 |
53,000 | 1 | Scynexis, Inc., Warrants, Expiration Date 1/1/2099 | 405,450 |
26,500 | 1 | Scynexis, Inc., Warrants, Expiration Date 12/21/2021 | 63,727 |
25,200 | 1 | Scynexis, Inc., Warrants, Expiration Date 3/8/2023 | 3,384 |
21,060 | 1 | Scynexis, Inc., Warrants, Expiration Date 4/6/2021 | 32 |
26,500 | 1 | Scynexis, Inc., Warrants, Expiration Date 5/21/2024 | 100,276 |
TOTAL WARRANTS (IDENTIFIED COST $346,465) | 695,022 | ||
REPURCHASE AGREEMENTS—13.8% | |||
$25,899,000 | Interest in $1,000,000,000 joint repurchase agreement 0.08%, dated 12/31/2020 under which Bank of Montreal will repurchase securities provided as collateral for $1,000,008,889 on 1/4/2021. The securities provided as collateral at the end of the period held with BNY Mellon as tri-party agent, were U.S. Government Agency and U.S. Treasury securities with various maturities to 5/20/2069 and the market value of those underlying securities was $1,022,038,963. | 25,899,000 | |
5,882,957 | Interest in $1,000,000,000 joint repurchase agreement 0.08%, dated 12/31/2020 under which Bank of Montreal will repurchase securities provided as collateral for $1,000,008,889 on 1/4/2021. The securities provided as collateral at the end of the period held with BNY Mellon as tri-party agent, were U.S. Government Agency and U.S. Treasury securities with various maturities to 5/20/2069 and the market value of those underlying securities was $1,022,038,963 (purchased with proceeds from securities lending collateral). | 5,882,957 | |
354,210 | Interest in $1,000,000,000 joint repurchase agreement 0.08%, dated 12/31/2020 under which Bank of Montreal will repurchase securities provided as collateral for $1,000,008,889 on 1/4/2021. The securities provided as collateral at the end of the period held with BNY Mellon as tri-party agent, were U.S. Government Agency and U.S. Treasury securities with various maturities to 5/20/2069 and the market value of those underlying securities was $1,022,038,963 (purchased with proceeds from securities lending collateral). | 354,210 | |
TOTAL REPURCHASE AGREEMENTS (IDENTIFIED COST $32,136,167) | 32,136,167 | ||
TOTAL INVESTMENT IN SECURITIES—102.9% (IDENTIFIED COST $130,232,965)4 | 239,312,746 | ||
OTHER ASSETS AND LIABILITIES - NET—(2.9)%5 | (6,749,505) | ||
TOTAL NET ASSETS—100% | $232,563,241 |
Value as of 12/31/2019 | Purchases at Cost* | Proceeds from Sales* | Change in Unrealized Appreciation/ Depreciation | Net Realized Gain/ (Loss)* | Value as of 12/31/2020 | Shares Held as of 12/31/2020 | Dividend Income* | |
Consumer Discretionary: | ||||||||
Wingstop, Inc.** | $1,377,093 | $281,353 | $(162,318) | $680,957 | $23,245 | $2,200,330 | 16,600 | $91,078 |
Energy: | ||||||||
New Fortress Energy, Inc.** | $503,007 | $917,914 | $(217,900) | $2,132,004 | $118,368 | $3,453,393 | 64,441 | $11,717 |
Health Care: | ||||||||
Akouos, Inc. | $— | $631,160 | $— | $(36,855) | $— | $594,305 | 29,970 | $— |
Albireo Pharma, Inc. | $663,462 | $463,548 | $— | $384,643 | $— | $1,511,653 | 40,300 | $— |
Alector, Inc. | $1,056,199 | $687,587 | $(586,505) | $2,562 | $(318,524) | $841,319 | 55,606 | $— |
Amphastar Pharmaceuticals, Inc. | $426,309 | $282,695 | $— | $23,000 | $— | $732,004 | 36,400 | $— |
Arcturus Therapeutics Holdings, Inc. | $— | $3,253,857 | $— | $(963,393) | $— | $2,290,464 | 52,800 | $— |
Calithera Biosciences, Inc. | $480,211 | $72,649 | $— | $(73,644) | $— | $479,216 | 97,600 | $— |
Catabasis Pharmaceuticals, Inc., Warrants, Expiration Date 2/8/2024 | $35,344 | $— | $— | $(22,046) | $— | $13,298 | 11,450 | $— |
Catabasis Pharmaceuticals, Inc., Warrants, Expiration Date 6/22/2022 | $40,489 | $— | $— | $(24,861) | $— | $15,628 | 21,500 | $— |
ContraFect Corp., Warrants, Expiration Date 7/20/2022 | $13,554 | $— | $— | $(9,065) | $— | $4,489 | 87,500 | $— |
ContraFect Corp., Warrants, Expiration Date 7/27/2021 | $5,550 | $— | $— | $(5,524) | $— | $26 | 42,500 | $— |
Corcept Therapeutics, Inc.** | $2,836,240 | $176,341 | $(1,368,121) | $969,673 | $982,867 | $3,597,000 | 137,500 | $— |
Dynavax Technologies Corp. | $839,696 | $212,998 | $(92,700) | $(178,124) | $(17,360) | $764,510 | 171,800 | $— |
Dynavax Technologies Corp., Warrants, Expiration Date 2/12/2022 | $32,724 | $— | $— | $(13,801) | $— | $18,923 | 10,000 | $— |
Frequency Therapeutics, Inc. | $366,377 | $— | $— | $370,557 | $— | $736,934 | 20,900 | $— |
Frequency Therapeutics, Inc. | $— | $91,584 | $— | $87,819 | $— | $179,403 | 5,088 | $— |
Gamida Cell Ltd. | $— | $835,445 | $— | $318,373 | $— | $1,153,818 | 137,523 | $— |
Merus NV | $160,512 | $370,361 | $— | $142,279 | $— | $673,152 | 38,400 | $— |
Minerva Neurosciences, Inc. | $1,458,972 | $— | $(523,698) | $(535,299) | $(77,523) | $322,452 | 137,800 | $— |
Molecular Partners AG | $324,040 | $48,769 | $(4,707) | $117,184 | $1,016 | $486,302 | 20,852 | $— |
Otonomy, Inc. | $— | $185,393 | $— | $173,207 | $— | $358,600 | 55,425 | $— |
Rezolute, Inc. | $— | $284,810 | $— | $(77,839) | $— | $206,971 | 17,262 | $— |
Rezolute, Inc., Warrants, Expiration Date 10/8/2027 | $— | $— | $— | $56,253 | $— | $56,253 | 5,696 | $— |
Rhythm Pharmaceuticals, Inc. | $626,808 | $35,115 | $— | $200,247 | $— | $862,170 | 29,000 | $— |
Scynexis, Inc. | $126,763 | $— | $(822) | $(6,099) | $(14,501) | $105,341 | 13,770 | $— |
Scynexis, Inc., Warrants, Expiration Date 1/1/2099 | $— | $331,197 | $— | $74,253 | $— | $405,450 | 53,000 | $— |
Scynexis, Inc., Warrants, Expiration Date 12/21/2021 | $— | $— | $— | $63,727 | $— | $63,727 | 26,500 | $— |
Scynexis, Inc., Warrants, Expiration Date 3/8/2023 | $7,033 | $— | $— | $(3,649) | $— | $3,384 | 25,200 | $— |
Scynexis, Inc., Warrants, Expiration Date 4/6/2021 | $1,308 | $— | $— | $(1,276) | $— | $32 | 21,060 | $— |
Scynexis, Inc., Warrants, Expiration Date 5/21/2024 | $— | $— | $— | $100,276 | $— | $100,276 | 26,500 | $— |
TransMedics Group, Inc.** | $— | $338,526 | $(239,167) | $34,907 | $(18,746) | $115,520 | 5,805 | $— |
Ultragenyx Pharmaceutical, Inc. | $2,220,920 | $564,469 | $(397,289) | $5,121,631 | $15,324 | $7,525,055 | 54,360 | $— |
UniQure N.V. | $4,127,616 | $524,861 | $(629,056) | $(1,845,749) | $(64,067) | $2,113,605 | 58,500 | $— |
Affiliated Issuers no longer in the portfolio at period end | $1,064,673 | $— | $(776,934) | $1,001,876 | $(1,289,615) | $— | — | $— |
TOTAL OF AFFILIATED COMPANIES TRANSACTIONS | $18,794,900 | $10,590,632 | $(4,999,217) | $8,258,204 | $(659,516) | $31,985,003 | 1,628,608 | $102,795 |
* | A portion of the amount shown was recorded when the Fund no longer had ownership of at least 5% of the voting shares. |
** | At December 31, 2020, the Fund no longer has ownership of at least 5% voting shares. |
1 | Non-income-producing security. |
2 | Denotes a restricted security that either: (a) cannot be offered for public sale without first being registered, or availing of an exemption from registration, under the Securities Act of 1933; or (b) is subject to a contractual restriction on public sales. At December 31, 2020, these restricted securities amounted to $488,800, which represented 0.2% of total net assets. |
3 | All or a portion of these securities are temporarily on loan to unaffiliated broker/dealers. |
4 | The cost of investments for federal tax purposes amounts to $130,698,496. |
5 | Assets, other than investments in securities, less liabilities. See Statement of Assets and Liabilities. |
Valuation Inputs | ||||
Level 1— Quoted Prices | Level 2— Other Significant Observable Inputs | Level 3— Significant Unobservable Inputs | Total | |
Equity Securities: | ||||
Common Stocks | ||||
Domestic | $183,482,259 | $— | $— | $183,482,259 |
International | — | 22,999,298 | — | 22,999,298 |
Debt Securities: | ||||
Warrants | — | 695,022 | — | 695,022 |
Repurchase Agreements | — | 32,136,167 | — | 32,136,167 |
TOTAL SECURITIES | $183,482,259 | $55,830,487 | $— | $239,312,746 |
The following acronym(s) are used throughout this portfolio: | ||
ADR | —American Depositary Receipt | |
Year Ended December 31, | |||||
2020 | 2019 | 2018 | 2017 | 2016 | |
Net Asset Value, Beginning of Period | $22.63 | $18.55 | $19.16 | $16.70 | $17.42 |
Income From Investment Operations: | |||||
Net investment income (loss)1 | (0.22) | (0.10) | (0.11) | (0.14) | (0.11) |
Net realized and unrealized gain | 5.27 | 6.15 | 0.95 | 4.54 | 0.56 |
Total From Investment Operations | 5.05 | 6.05 | 0.84 | 4.40 | 0.45 |
Less Distributions: | |||||
Distributions from net realized gain | (2.22) | (1.97) | (1.45) | (1.94) | (1.17) |
Net Asset Value, End of Period | $25.46 | $22.63 | $18.55 | $19.16 | $16.70 |
Total Return2 | 28.79% | 33.82% | 3.84% | 28.33% | 3.66% |
Ratios to Average Net Assets: | |||||
Net expenses3 | 1.50% | 1.51% | 1.52% | 1.54% | 1.54%4 |
Net investment loss | (1.01)% | (0.49)% | (0.53)% | (0.77)% | (0.67)% |
Expense waiver/reimbursement5 | —% | —% | —% | —% | 0.03% |
Supplemental Data: | |||||
Net assets, end of period (000 omitted) | $63,502 | $57,988 | $46,160 | $47,985 | $42,122 |
Portfolio turnover | 45% | 43% | 41% | 44% | 59% |
1 | Per share numbers have been calculated using the average shares method. |
2 | Based on net asset value. Total returns do not reflect any additional fees or expenses that may be imposed by separate accounts of insurance companies or in connection with any variable annuity or variable life insurance contract. |
3 | Amount does not reflect net expenses incurred by investment companies in which the Fund may invest. |
4 | The net expense ratio is calculated without reduction for expense offset arrangements. The net expense ratio was 1.54% for the year ended December 31, 2016, after taking into account these expense reductions. |
5 | This expense decrease is reflected in both the net expense and the net investment income ratios shown above. Amount does not reflect expense waiver/ reimbursement recorded by investment companies in which the Fund may invest. |
Year Ended December 31, | |||||
2020 | 2019 | 2018 | 2017 | 2016 | |
Net Asset Value, Beginning of Period | $21.27 | $17.57 | $18.26 | $16.04 | $16.82 |
Income From Investment Operations: | |||||
Net investment income (loss)1 | (0.26) | (0.15) | (0.15) | (0.17) | (0.14) |
Net realized gain (loss) | 4.86 | 5.82 | 0.91 | 4.33 | 0.53 |
Total From Investment Operations | 4.60 | 5.67 | 0.76 | 4.16 | 0.39 |
Less Distributions: | |||||
Distributions from net realized gain | (2.22) | (1.97) | (1.45) | (1.94) | (1.17) |
Net Asset Value, End of Period | $23.65 | $21.27 | $17.57 | $18.26 | $16.04 |
Total Return2 | 28.48% | 33.52% | 3.58% | 27.97% | 3.42% |
Ratios to Average Net Assets: | |||||
Net expenses3 | 1.75% | 1.76% | 1.77% | 1.79% | 1.79%4 |
Net investment loss | (1.26)% | (0.74)% | (0.77)% | (1.02)% | (0.92)% |
Expense waiver/reimbursement5 | —% | —% | —% | —% | 0.03% |
Supplemental Data: | |||||
Net assets, end of period (000 omitted) | $169,061 | $129,327 | $105,132 | $96,037 | $78,870 |
Portfolio turnover | 45% | 43% | 41% | 44% | 59% |
1 | Per share numbers have been calculated using the average shares method. |
2 | Based on net asset value. Total returns do not reflect any additional fees or expenses that may be imposed by separate accounts of insurance companies or in connection with any variable annuity or variable life insurance contract. |
3 | Amount does not reflect net expenses incurred by investment companies in which the Fund may invest. |
4 | The net expense ratio is calculated without reduction for expense offset arrangements. The net expense ratio was 1.79% for the year ended December 31, 2016, after taking into account these expense reductions. |
5 | This expense decrease is reflected in both the net expense and the net investment income ratios shown above. Amount does not reflect expense waiver/ reimbursement recorded by investment companies in which the Fund may invest. |
Assets: | |
Investment in repurchase agreements | $32,136,167 |
Investment in securities | 207,176,579 |
Investment in securities, at value including $6,021,858 of securities loaned and $22,618,760 of investment in affiliated companies* (identified cost $130,232,965) | 239,312,746 |
Cash | 436,823 |
Income receivable | 43,733 |
Receivable for shares sold | 163,918 |
Total Assets | 239,957,220 |
Liabilities: | |
Payable for investments purchased | 514,399 |
Payable for shares redeemed | 521,161 |
Payable for collateral due to broker for securities lending | 6,237,167 |
Payable for investment adviser fee (Note 5) | 8,335 |
Payable for administrative fee (Note 5) | 500 |
Payable for distribution services fee (Note 5) | 36,135 |
Accrued expenses (Note 5) | 76,282 |
Total Liabilities | 7,393,979 |
Net assets for 9,642,195 shares outstanding | $232,563,241 |
Net Assets Consist of: | |
Paid-in capital | $107,470,602 |
Total distributable earnings (loss) | 125,092,639 |
Total Net Assets | $232,563,241 |
Net Asset Value, Offering Price and Redemption Proceeds Per Share: | |
Primary Shares: | |
Net asset value per share ($63,502,190 ÷ 2,493,851 shares outstanding), no par value, unlimited shares authorized | $25.46 |
Service Shares: | |
Net asset value per share ($169,061,051 ÷ 7,148,344 shares outstanding), no par value, unlimited shares authorized | $23.65 |
* | See information listed after the Fund’s Portfolio of Investments. |
Investment Income: | |
Dividends (including $102,795 received from affiliated holdings* and net of foreign taxes withheld of $28,375) | $849,827 |
Interest | 97,351 |
Net income on securities loaned (Note 2) | 45,235 |
TOTAL INCOME | 992,413 |
Expenses: | |
Investment adviser fee (Note 5) | 2,605,273 |
Administrative fee (Note 5) | 157,654 |
Custodian fees | 35,775 |
Transfer agent fees | 17,334 |
Directors’/Trustees’ fees (Note 5) | 2,038 |
Auditing fees | 32,840 |
Legal fees | 11,429 |
Portfolio accounting fees | 75,764 |
Distribution services fee (Note 5) | 356,330 |
Printing and postage | 36,039 |
Miscellaneous (Note 5) | 36,287 |
TOTAL EXPENSES | 3,366,763 |
Net investment income (loss) | (2,374,350) |
Realized and Unrealized Gain (Loss) on Investments, Foreign Currency Transactions and Futures Contracts: | |
Net realized gain on investments (including net realized loss of $(659,516) on sales of investments in affiliated companies*) | 18,626,091 |
Net realized gain on foreign currency transactions | 15,939 |
Net realized loss on futures contracts | (1,518,084) |
Net change in unrealized appreciation of investments (including net change in unrealized appreciation of $8,258,204 on investments in affiliated companies*) | 36,971,842 |
Net change in unrealized appreciation/depreciation of translation of assets and liabilities in foreign currency | 119 |
Net realized and unrealized gain (loss) on investments, foreign currency transactions and futures contracts | 54,095,907 |
Change in net assets resulting from operations | $51,721,557 |
* | See information listed after the Fund’s Portfolio of Investments. |
Year Ended December 31 | 2020 | 2019 |
Increase (Decrease) in Net Assets | ||
Operations: | ||
Net investment income (loss) | $(2,374,350) | $(1,173,930) |
Net realized gain (loss) | 17,123,946 | 18,258,834 |
Net change in unrealized appreciation/depreciation | 36,971,961 | 31,925,071 |
CHANGE IN NET ASSETS RESULTING FROM OPERATIONS | 51,721,557 | 49,009,975 |
Distributions to Shareholders: | ||
Primary Shares | (5,382,824) | (4,810,725) |
Service Shares | (12,836,300) | (11,433,059) |
CHANGE IN NET ASSETS RESULTING FROM DISTRIBUTIONS TO SHAREHOLDERS | (18,219,124) | (16,243,784) |
Share Transactions: | ||
Proceeds from sale of shares | 51,579,563 | 39,703,166 |
Net asset value of shares issued to shareholders in payment of distributions declared | 18,219,109 | 16,243,770 |
Cost of shares redeemed | (58,053,310) | (52,689,616) |
CHANGE IN NET ASSETS RESULTING FROM SHARE TRANSACTIONS | 11,745,362 | 3,257,320 |
Change in net assets | 45,247,795 | 36,023,511 |
Net Assets: | ||
Beginning of period | 187,315,446 | 151,291,935 |
End of period | $232,563,241 | $187,315,446 |
Market Value of Securities Loaned | Collateral Received |
$6,021,858 | $6,237,167 |
Security | Acquisition Date | Cost | Value |
Fisker, Inc. | 10/29/2020 | $260,000 | $380,900 |
Immatics N.V. | 6/30/2020 | $100,000 | $107,900 |
Amount of Realized Gain or (Loss) on Derivatives Recognized in Income | |
Futures Contracts | |
Equity contracts | $(1,518,084) |
Year Ended 12/31/2020 | Year Ended 12/31/2019 | |||
Primary Shares: | Shares | Amount | Shares | Amount |
Shares sold | 146,298 | $3,203,683 | 271,211 | $5,716,979 |
Shares issued to shareholders in payment of distributions declared | 350,901 | 5,382,822 | 236,865 | 4,810,723 |
Shares redeemed | (566,093) | (12,397,252) | (434,328) | (9,130,046) |
NET CHANGE RESULTING FROM PRIMARY SHARE TRANSACTIONS | (68,894) | $(3,810,747) | 73,748 | $1,397,656 |
Year Ended 12/31/2020 | Year Ended 12/31/2019 | |||
Service Shares: | Shares | Amount | Shares | Amount |
Shares sold | 2,374,103 | $48,375,880 | 1,711,055 | $33,986,187 |
Shares issued to shareholders in payment of distributions declared | 898,900 | 12,836,287 | 597,650 | 11,433,047 |
Shares redeemed | (2,205,894) | (45,656,058) | (2,211,316) | (43,559,570) |
NET CHANGE RESULTING FROM SERVICE SHARE TRANSACTIONS | 1,067,109 | $15,556,109 | 97,389 | $1,859,664 |
NET CHANGE RESULTING FROM TOTAL FUND SHARE TRANSACTIONS | 998,215 | $11,745,362 | 171,137 | $3,257,320 |
Increase (Decrease) | |
Paid-In Capital | Total Distributable Earnings (Loss) |
$(1,596,082) | $1,596,082 |
2020 | 2019 | |
Long-term capital gains | $18,219,124 | $16,243,784 |
Net unrealized appreciation | $108,614,241 |
Undistributed long-term capital gains | $16,478,398 |
Administrative Fee | Average Daily Net Assets of the Investment Complex |
0.100% | on assets up to $50 billion |
0.075% | on assets over $50 billion |
Percentage of Average Daily Net Assets of Class | |
Primary Shares | 0.25% |
Service Shares | 0.25% |
Distribution Services Fees Incurred | |
Service Shares | $356,330 |
Purchases | $76,786,093 |
Sales | $84,245,987 |
February 16, 2021
Beginning Account Value 7/1/2020 | Ending Account Value 12/31/2020 | Expenses Paid During Period1 | |
Actual: | |||
Primary Shares | $1,000 | $1,162.60 | $8.15 |
Service Shares | $1,000 | $1,161.60 | $9.45 |
Hypothetical (assuming a 5% return before expenses): | |||
Primary Shares | $1,000 | $1,017.60 | $7.61 |
Service Shares | $1,000 | $1,016.39 | $8.82 |
1 | Expenses are equal to the Fund’s annualized net expense ratios, multiplied by the average account value over the period, multiplied by 184/366 (to reflect the one-half-year period). The expenses shown in the table do not include the charges and expenses imposed by the insurance company under the variable insurance product contract. Please refer to the variable insurance product prospectus for a complete listing of these expenses. The annualized net expense ratios are as follows: |
Primary Shares | 1.50% |
Service Shares | 1.74% |
Name Birth Date Positions Held with Trust Date Service Began | Principal Occupation(s) for Past Five Years, Other Directorships Held and Previous Position(s) |
J. Christopher Donahue* Birth Date: April 11, 1949 Trustee Indefinite Term Began serving: September 1993 | Principal Occupations: Principal Executive Officer and President of certain of the Funds in the Federated Hermes Fund Family; Director or Trustee of the Funds in the Federated Hermes Fund Family; President, Chief Executive Officer and Director, Federated Hermes, Inc.; Chairman and Trustee, Federated Investment Management Company; Trustee, Federated Investment Counseling; Chairman and Director, Federated Global Investment Management Corp.; Chairman and Trustee, Federated Equity Management Company of Pennsylvania; Trustee, Federated Shareholder Services Company; Director, Federated Services Company. Previous Positions: President, Federated Investment Counseling; President and Chief Executive Officer, Federated Investment Management Company, Federated Global Investment Management Corp. and Passport Research, Ltd; Chairman, Passport Research, Ltd. |
Thomas R. Donahue* Birth Date: October 20, 1958 Trustee Indefinite Term Began serving: May 2016 | Principal Occupations: Director or Trustee of certain of the funds in the Federated Hermes Fund Family; Chief Financial Officer, Treasurer, Vice President and Assistant Secretary, Federated Hermes, Inc.; Chairman and Trustee, Federated Administrative Services; Chairman and Director, Federated Administrative Services, Inc.; Trustee and Treasurer, Federated Advisory Services Company; Director or Trustee and Treasurer, Federated Equity Management Company of Pennsylvania, Federated Global Investment Management Corp., Federated Investment Counseling, and Federated Investment Management Company; Director, MDTA LLC; Director, Executive Vice President and Assistant Secretary, Federated Securities Corp.; Director or Trustee and Chairman, Federated Services Company and Federated Shareholder Services Company; and Director and President, FII Holdings, Inc. Previous Positions: Director, Federated Hermes, Inc.; Assistant Secretary, Federated Investment Management Company, Federated Global Investment Management Company and Passport Research, LTD; Treasurer, Passport Research, LTD; Executive Vice President, Federated Securities Corp.; and Treasurer, FII Holdings, Inc. |
Name Birth Date Positions Held with Trust Date Service Began | Principal Occupation(s) for Past Five Years, Other Directorships Held, Previous Position(s) and Qualifications |
John T. Collins Birth Date: January 24, 1947 Trustee Indefinite Term Began serving: October 2013 | Principal Occupations: Director or Trustee, and Chair of the Board of Directors or Trustees, of the Federated Hermes Fund Family; formerly, Chairman and CEO, The Collins Group, Inc. (a private equity firm) (Retired). Other Directorships Held: Chairman of the Board of Directors, Director, KLX Energy Services Holdings, Inc. (oilfield services); former Director of KLX Corp. (aerospace). Qualifications: Mr. Collins has served in several business and financial management roles and directorship positions throughout his career. Mr. Collins previously served as Chairman and CEO of The Collins Group, Inc. (a private equity firm) and as a Director of KLX Corp. Mr. Collins serves as Chairman Emeriti, Bentley University. Mr. Collins previously served as Director and Audit Committee Member, Bank of America Corp.; Director, FleetBoston Financial Corp.; and Director, Beth Israel Deaconess Medical Center (Harvard University Affiliate Hospital). |
Name Birth Date Positions Held with Trust Date Service Began | Principal Occupation(s) for Past Five Years, Other Directorships Held, Previous Position(s) and Qualifications |
G. Thomas Hough Birth Date: February 28, 1955 Trustee Indefinite Term Began serving: August 2015 | Principal Occupations: Director or Trustee, Chair of the Audit Committee of the Federated Hermes Fund Family; formerly, Vice Chair, Ernst & Young LLP (public accounting firm) (Retired). Other Directorships Held: Director, Chair of the Audit Committee, Equifax, Inc.; Director, Member of the Audit Committee, Haverty Furniture Companies, Inc.; formerly, Director, Member of Governance and Compensation Committees, Publix Super Markets, Inc. Qualifications: Mr. Hough has served in accounting, business management and directorship positions throughout his career. Mr. Hough most recently held the position of Americas Vice Chair of Assurance with Ernst & Young LLP (public accounting firm). Mr. Hough serves on the President’s Cabinet and Business School Board of Visitors for the University of Alabama. Mr. Hough previously served on the Business School Board of Visitors for Wake Forest University, and he previously served as an Executive Committee member of the United States Golf Association. |
Maureen Lally-Green Birth Date: July 5, 1949 Trustee Indefinite Term Began serving: August 2009 | Principal Occupations: Director or Trustee of the Federated Hermes Fund Family; Adjunct Professor Emerita of Law, Duquesne University School of Law; formerly, Dean of the Duquesne University School of Law and Professor of Law and Interim Dean of the Duquesne University School of Law; formerly, Associate General Secretary and Director, Office of Church Relations, Diocese of Pittsburgh. Other Directorships Held: Director, CNX Resources Corporation (formerly known as CONSOL Energy Inc.). Qualifications: Judge Lally-Green has served in various legal and business roles and directorship positions throughout her career. Judge Lally-Green previously held the position of Dean of the School of Law of Duquesne University (as well as Interim Dean). Judge Lally-Green previously served as a member of the Superior Court of Pennsylvania and as a Professor of Law, Duquesne University School of Law. Judge Lally-Green was appointed by the Supreme Court of Pennsylvania to serve on the Supreme Court’s Board of Continuing Judicial Education and the Supreme Court’s Appellate Court Procedural Rules Committee. Judge Lally-Green also currently holds the positions on not for profit or for profit boards of directors as follows: Director and Chair, UPMC Mercy Hospital; Regent, Saint Vincent Seminary; Member, Pennsylvania State Board of Education (public); Director, Catholic Charities, Pittsburgh; and Director CNX Resources Corporation (formerly known as CONSOL Energy Inc.). Judge Lally-Green has held the positions of: Director, Auberle; Director, Epilepsy Foundation of Western and Central Pennsylvania; Director, Ireland Institute of Pittsburgh; Director, Saint Thomas More Society; Director and Chair, Catholic High Schools of the Diocese of Pittsburgh, Inc.; Director, Pennsylvania Bar Institute; Director, St. Vincent College; Director and Chair, North Catholic High School, Inc.; and Director and Vice Chair, Our Campaign for the Church Alive!, Inc. |
Thomas M. O’Neill Birth Date: June 14, 1951 Trustee Indefinite Term Began serving: August 2006 | Principal Occupations: Director or Trustee of the Federated Hermes Fund Family; Sole Proprietor, Navigator Management Company (investment and strategic consulting). Other Directorships Held: None. Qualifications: Mr. O’Neill has served in several business, mutual fund and financial management roles and directorship positions throughout his career. Mr. O’Neill serves as Director, Medicines for Humanity and Director, The Golisano Children’s Museum of Naples, Florida. Mr. O’Neill previously served as Chief Executive Officer and President, Managing Director and Chief Investment Officer, Fleet Investment Advisors; President and Chief Executive Officer, Aeltus Investment Management, Inc.; General Partner, Hellman, Jordan Management Co., Boston, MA; Chief Investment Officer, The Putnam Companies, Boston, MA; Credit Analyst and Lending Officer, Fleet Bank; Director and Consultant, EZE Castle Software (investment order management software); and Director, Midway Pacific (lumber). |
Madelyn A. Reilly Birth Date: February 2, 1956 Trustee Indefinite Term Began serving: November 2020 | Principal Occupations: Director or Trustee of the Federated Hermes Fund Family; Senior Vice President for Legal Affairs, General Counsel and Secretary of the Board of Trustees, Duquesne University. Other Directorships Held: None. Qualifications: Ms. Reilly has served in various business and legal management roles throughout her career. Ms. Reilly previously served as Director of Risk Management and Associate General Counsel, Duquesne University. Prior to her work at Duquesne University, Ms. Reilly served as Assistant General Counsel of Compliance and Enterprise Risk as well as Senior Counsel of Environment, Health and Safety, PPG Industries. |
P. Jerome Richey Birth Date: February 23, 1949 Trustee Indefinite Term Began serving: October 2013 | Principal Occupations: Director or Trustee of the Federated Hermes Fund Family; Management Consultant; Retired; formerly, Senior Vice Chancellor and Chief Legal Officer, University of Pittsburgh and Executive Vice President and Chief Legal Officer, CONSOL Energy Inc. (now split into two separate publicly traded companies known as CONSOL Energy Inc. and CNX Resources Corp.). Other Directorships Held: None. Qualifications: Mr. Richey has served in several business and legal management roles and directorship positions throughout his career. Mr. Richey most recently held the positions of Senior Vice Chancellor and Chief Legal Officer, University of Pittsburgh. Mr. Richey previously served as Chairman of the Board, Epilepsy Foundation of Western Pennsylvania and Chairman of the Board, World Affairs Council of Pittsburgh. Mr. Richey previously served as Chief Legal Officer and Executive Vice President, CONSOL Energy Inc. and CNX Gas Company; and Board Member, Ethics Counsel and Shareholder, Buchanan Ingersoll & Rooney PC (a law firm). |
Name Birth Date Positions Held with Trust Date Service Began | Principal Occupation(s) for Past Five Years, Other Directorships Held, Previous Position(s) and Qualifications |
John S. Walsh Birth Date: November 28, 1957 Trustee Indefinite Term Began serving: January 1999 | Principal Occupations: Director or Trustee of the Federated Hermes Fund Family; President and Director, Heat Wagon, Inc. (manufacturer of construction temporary heaters); President and Director, Manufacturers Products, Inc. (distributor of portable construction heaters); President, Portable Heater Parts, a division of Manufacturers Products, Inc. Other Directorships Held: None. Qualifications: Mr. Walsh has served in several business management roles and directorship positions throughout his career. Mr. Walsh previously served as Vice President, Walsh & Kelly, Inc. (paving contractors). |
Name Birth Date Address Positions Held with Trust Date Service Began | Principal Occupation(s) for Past Five Years and Previous Position(s) |
Lori A. Hensler Birth Date: January 6, 1967 TREASURER Officer since: April 2013 | Principal Occupations: Principal Financial Officer and Treasurer of the Federated Hermes Fund Family; Senior Vice President, Federated Administrative Services; Financial and Operations Principal for Federated Securities Corp.; and Assistant Treasurer, Federated Investors Trust Company. Ms. Hensler has received the Certified Public Accountant designation. Previous Positions: Controller of Federated Hermes, Inc.; Senior Vice President and Assistant Treasurer, Federated Investors Management Company; Treasurer, Federated Investors Trust Company; Assistant Treasurer, Federated Administrative Services, Federated Administrative Services, Inc., Federated Securities Corp., Edgewood Services, Inc., Federated Advisory Services Company, Federated Equity Management Company of Pennsylvania, Federated Global Investment Management Corp., Federated Investment Counseling, Federated Investment Management Company, Passport Research, Ltd., and Federated MDTA, LLC; Financial and Operations Principal for Federated Securities Corp., Edgewood Services, Inc. and Southpointe Distribution Services, Inc. |
Peter J. Germain Birth Date: September 3, 1959 CHIEF LEGAL OFFICER, SECRETARY and EXECUTIVE VICE PRESIDENT Officer since: January 2005 | Principal Occupations: Mr. Germain is Chief Legal Officer, Secretary and Executive Vice President of the Federated Hermes Fund Family. He is General Counsel, Chief Legal Officer, Secretary and Executive Vice President, Federated Hermes, Inc.; Trustee and Senior Vice President, Federated Investors Management Company; Trustee and President, Federated Administrative Services; Director and President, Federated Administrative Services, Inc.; Director and Vice President, Federated Securities Corp.; Director and Secretary, Federated Private Asset Management, Inc.; Secretary, Federated Shareholder Services Company; and Secretary, Retirement Plan Service Company of America. Mr. Germain joined Federated Hermes, Inc. in 1984 and is a member of the Pennsylvania Bar Association. Previous Positions: Deputy General Counsel, Special Counsel, Managing Director of Mutual Fund Services, Federated Hermes, Inc.; Senior Vice President, Federated Services Company; and Senior Corporate Counsel, Federated Hermes, Inc. |
John B. Fisher Birth Date: May 16, 1956 PRESIDENT Officer since: November 2004 | Principal Occupations: Principal Executive Officer and President of certain of the Funds in the Federated Hermes Fund Family; Director or Trustee of certain of the Funds in the Federated Hermes Fund Family; Vice President, Federated Hermes, Inc.; President, Director/Trustee and CEO, Federated Advisory Services Company, Federated Equity Management Company of Pennsylvania, Federated Global Investment Management Corp., Federated Investment Counseling, Federated Investment Management Company; President and CEO of Passport Research, Ltd.; President of some of the Funds in the Federated Fund Complex and Director, Federated Investors Trust Company. Previous Positions: President and Director of the Institutional Sales Division of Federated Securities Corp.; President and Director of Federated Investment Counseling; Director, Edgewood Securities Corp.; Director, Federated Services Company; Director, Federated Hermes, Inc.; Chairman and Director, Southpointe Distribution Services, Inc. and President, Technology, Federated Services Company. |
Stephen Van Meter Birth Date: June 5, 1975 CHIEF COMPLIANCE OFFICER AND SENIOR VICE PRESIDENT Officer since: July 2015 | Principal Occupations: Senior Vice President and Chief Compliance Officer of the Federated Hermes Fund Family; Vice President and Chief Compliance Officer of Federated Hermes, Inc. and Chief Compliance Officer of certain of its subsidiaries. Mr. Van Meter joined Federated Hermes, Inc. in October 2011. He holds FINRA licenses under Series 3, 7, 24 and 66. Previous Positions: Mr. Van Meter previously held the position of Compliance Operating Officer, Federated Hermes, Inc. Prior to joining Federated Hermes, Inc., Mr. Van Meter served at the United States Securities and Exchange Commission in the positions of Senior Counsel, Office of Chief Counsel, Division of Investment Management and Senior Counsel, Division of Enforcement. |
Stephen F. Auth Birth Date: September 13, 1956 101 Park Avenue 41st Floor New York, NY 10178 CHIEF INVESTMENT OFFICER Officer since: November 2002 | Principal Occupations: Stephen F. Auth is Chief Investment Officer of various Funds in the Federated Hermes Fund Family; Executive Vice President, Federated Investment Counseling, Federated Global Investment Management Corp. and Federated Equity Management Company of Pennsylvania. Previous Positions: Executive Vice President, Federated Investment Management Company and Passport Research, Ltd. (investment advisory subsidiary of Federated); Senior Vice President, Global Portfolio Management Services Division; Senior Vice President, Federated Investment Management Company and Passport Research, Ltd.; Senior Managing Director and Portfolio Manager, Prudential Investments. |
Name Birth Date Address Positions Held with Trust Date Service Began | Principal Occupation(s) for Past Five Years and Previous Position(s) |
Robert J. Ostrowski Birth Date: April 26, 1963 Chief Investment Officer Officer since: May 2004 | Principal Occupations: Robert J. Ostrowski joined Federated Hermes, Inc. in 1987 as an Investment Analyst and became a Portfolio Manager in 1990. He was named Chief Investment Officer of Federated Hermes’ taxable fixed-income products in 2004 and also serves as a Senior Portfolio Manager. Mr. Ostrowski became an Executive Vice President of the Fund’s Adviser in 2009 and served as a Senior Vice President of the Fund’s Adviser from 1997 to 2009. Mr. Ostrowski has received the Chartered Financial Analyst designation. He received his M.S. in Industrial Administration from Carnegie Mellon University. |
Deborah A. Cunningham Birth Date: September 15, 1959 Chief Investment Officer Officer since: June 2012 | Principal Occupations: Deborah A. Cunningham was named Chief Investment Officer of Federated Hermes’ money market products in 2004. She joined Federated Hermes in 1981 and has been a Senior Portfolio Manager since 1997 and an Executive Vice President of the Fund’s Adviser since 2009. Ms. Cunningham has received the Chartered Financial Analyst designation and holds an M.S.B.A. in Finance from Robert Morris College. |
Federated Hermes Funds
4000 Ericsson Drive
Warrendale, PA 15086-7561
or call 1-800-341-7400.
CUSIP 313916777

Share Class | Primary | Service |
Federated Hermes Managed Volatility Fund II
A Portfolio of Federated Hermes Insurance Series
1 Year | 5 Years | 10 Years | |
Primary Shares | 0.93% | 7.15% | 6.99% |
Service Shares5 | 0.71% | 7.02% | 6.93% |
S&P 500 | 18.40% | 15.22% | 13.88% |
R1000V | 2.80% | 9.74% | 10.50% |
Blended Index | 6.56% | 6.89% | 6.75% |
Portfolio Composition | Percentage of Total Net Assets |
Domestic Fixed-Income Securities | 46.2% |
Domestic Equity Securities | 42.1% |
International Equity Securities | 1.5% |
Federated Hermes High Income Bond Fund II, Class P | 3.5% |
Emerging Markets Core Fund | 2.1% |
Project and Trade Finance Core Fund | 1.6% |
Bank Loan Core Fund | 1.6% |
Federated Hermes Short-Intermediate Government Fund, Institutional Shares2 | 0.0% |
Cash Equivalents3 | 1.2% |
Derivative Contracts4 | 0.5% |
Repurchase Agreement | 2.2% |
Other Assets and Liabilities—Net5 | (2.5)% |
TOTAL | 100% |
Sector Composition of Equity Holdings | Percentage of Equity Securities |
Financials | 20.3% |
Health Care | 13.9% |
Industrials | 13.1% |
Information Technology | 9.8% |
Communication Services | 9.6% |
Consumer Staples | 8.1% |
Consumer Discretionary | 7.1% |
Utilities | 5.3% |
Materials | 4.6% |
Real Estate | 4.2% |
Energy | 4.0% |
TOTAL | 100% |
1 | See the Fund’s Prospectus and Statement of Additional Information for a description of the types of securities in which the Fund invests. As of the date specified above, the Fund owned shares of one or more affiliated investment companies. For purposes of this table, affiliated investment companies (other than an affiliated money market mutual fund) in which the Fund invested greater than 10% of its net assets are not treated as a single portfolio security, but rather the Fund is treated as owning a pro rata portion of each security and each other asset and liability owned by the affiliated investment company. Accordingly, the percentages of total net assets shown in the table will differ from those presented on the Portfolio of Investments. Affiliated investment companies (other than an affiliated money market mutual fund) in which the Fund invested less than 10% of its net assets are listed individually in the table. |
2 | Represents less than 0.1%. |
3 | Cash Equivalents include any investments in money market mutual funds. |
4 | Based upon net unrealized appreciation (depreciation) or value of the derivative contracts as applicable. Derivative contracts may consist of futures, forwards, options and swaps. The impact of a derivative contract on the Fund’s performance may be larger than its unrealized appreciation (depreciation) or value may indicate. In many cases, the notional value or amount of a derivative contract may provide a better indication of the contract’s significance to the portfolio. More complete information regarding the Fund’s direct investments in derivative contracts, including unrealized appreciation (depreciation), value and notional values or amounts of such contracts, can be found in the table at the end of the Portfolio of Investments included in this Report. |
5 | Assets, other than investments in securities and derivative contracts, less liabilities. See Statement of Assets and Liabilities. |
6 | Sector classifications are based upon, and individual portfolio securities are assigned to, the classifications of the Global Industry Classification Standard (GICS) except that the Co-Advisers assign a classification to securities not classified by the GICS and to securities for which the Co-Advisers do not have access to the classification made by the GICS. |
Shares or Principal Amount | Value | ||
COMMON STOCKS—43.6% | |||
Communication Services—4.2% | |||
12,995 | Activision Blizzard, Inc. | $1,206,586 | |
1,761 | 1 | Alphabet, Inc., Class A | 3,086,399 |
684 | 1 | Alphabet, Inc., Class C | 1,198,286 |
127,524 | AT&T, Inc. | 3,667,590 | |
100,000 | 1 | BBTV Holdings Inc. | 1,114,777 |
1,922 | 1 | Charter Communications, Inc. | 1,271,499 |
62,134 | Comcast Corp., Class A | 3,255,822 | |
7,492 | 1 | Discovery, Inc., Class C | 196,215 |
48 | 1 | DISH Network Corp., Class A | 1,552 |
268 | Electronic Arts, Inc. | 38,485 | |
3,325 | 1 | Pinterest, Inc. | 219,118 |
3,898 | 1 | Take-Two Interactive Software, Inc. | 809,965 |
10,266 | 1 | Twitter, Inc. | 555,904 |
78,176 | Verizon Communications, Inc. | 4,592,840 | |
23,406 | 1 | Walt Disney Co. | 4,240,699 |
4,873 | 1 | Zillow Group, Inc. | 662,436 |
13,565 | 1 | Zynga, Inc. | 133,887 |
TOTAL | 26,252,060 | ||
Consumer Discretionary—3.1% | |||
7,091 | Best Buy Co., Inc. | 707,611 | |
6,677 | Brunswick Corp. | 509,054 | |
10,582 | Carter’s, Inc. | 995,449 | |
7,500 | 1 | ContextLogic, Inc. | 136,800 |
1,068 | Darden Restaurants, Inc. | 127,220 | |
20,873 | eBay, Inc. | 1,048,868 | |
5,100 | Extended Stay America, Inc. | 75,531 | |
188,428 | Ford Motor Co. | 1,656,282 | |
9,674 | Gentex Corp. | 328,239 | |
5,111 | Harley-Davidson, Inc. | 187,574 | |
10,227 | Hilton Worldwide Holdings, Inc. | 1,137,856 | |
8,690 | Home Depot, Inc. | 2,308,238 | |
929 | Kohl’s Corp. | 37,801 | |
3,139 | L Brands, Inc. | 116,739 | |
7,508 | Lennar Corp., Class A | 572,335 | |
7,085 | Marriott International, Inc., Class A | 934,653 | |
14,916 | McDonald’s Corp. | 3,200,675 | |
331 | 1 | Mohawk Industries, Inc. | 46,654 |
6,238 | Newell Brands, Inc. | 132,433 | |
1,756 | 1 | Peloton Interactive, Inc. | 266,420 |
2,003 | 1 | Planet Fitness, Inc. | 155,493 |
2,474 | Polaris, Inc., Class A | 235,723 | |
10,355 | PVH Corp. | 972,231 | |
2,817 | Six Flags Entertainment Corp. | 96,060 | |
12,379 | Target Corp. | 2,185,265 | |
12,000 | 1 | Vasta Platform Ltd. | 174,000 |
18,067 | Wyndham Destinations, Inc. | 810,486 | |
3,003 | Wyndham Hotels & Resorts, Inc. | 178,498 |
Shares or Principal Amount | Value | ||
COMMON STOCKS—continued | |||
Consumer Discretionary—continued | |||
2,376 | Yum China Holding, Inc. | $135,646 | |
TOTAL | 19,469,834 | ||
Consumer Staples—3.5% | |||
84,638 | Albertsons Cos., Inc. | 1,487,936 | |
46,231 | Altria Group, Inc. | 1,895,471 | |
16,000 | 1 | Bellring Brands, Inc. | 388,960 |
7,907 | Colgate-Palmolive Co. | 676,128 | |
12,314 | Conagra Brands, Inc. | 446,506 | |
1,658 | Constellation Brands, Inc., Class A | 363,185 | |
9,289 | General Mills, Inc. | 546,193 | |
6,362 | Hershey Foods Corp. | 969,123 | |
4,000 | 1 | Jde Peet’s B.V. | 180,315 |
673 | Kimberly-Clark Corp. | 90,741 | |
36,796 | Kraft Heinz Co./The | 1,275,349 | |
24,908 | Kroger Co. | 791,078 | |
60,000 | 1 | Mission Produce, Inc. | 903,000 |
25,609 | Mondelez International, Inc. | 1,497,358 | |
5,848 | PepsiCo, Inc. | 867,258 | |
23,894 | Philip Morris International, Inc. | 1,978,184 | |
862 | 1 | Post Holdings, Inc. | 87,071 |
27,299 | Procter & Gamble Co. | 3,798,383 | |
9,358 | Spectrum Brands Holdings, Inc. | 739,095 | |
7,641 | The Coca-Cola Co. | 419,032 | |
18,312 | WalMart, Inc. | 2,639,675 | |
TOTAL | 22,040,041 | ||
Energy—1.8% | |||
23,772 | Apache Corp. | 337,325 | |
5,155 | Cabot Oil & Gas Corp., Class A | 83,923 | |
41,019 | Chevron Corp. | 3,464,055 | |
24,894 | Concho Resources, Inc. | 1,452,565 | |
22,424 | ConocoPhillips | 896,736 | |
8,820 | EOG Resources, Inc. | 439,853 | |
29,546 | Exxon Mobil Corp. | 1,217,886 | |
158 | Helmerich & Payne, Inc. | 3,659 | |
23,156 | Kinder Morgan, Inc. | 316,542 | |
24,713 | 1 | National Oilwell Varco, Inc. | 339,309 |
4,738 | Phillips 66 | 331,376 | |
866 | Pioneer Natural Resources, Inc. | 98,629 | |
60,220 | Schlumberger Ltd. | 1,314,603 | |
1,770 | Valero Energy Corp. | 100,129 | |
25,578 | Williams Cos., Inc. | 512,839 | |
TOTAL | 10,909,429 | ||
Financials—8.8% | |||
63,288 | AGNC Investment Corp. | 987,293 | |
12,369 | Allstate Corp. | 1,359,724 | |
14,458 | Ally Financial, Inc. | 515,572 | |
3,340 | Ameriprise Financial, Inc. | 649,062 | |
164,061 | Bank of America Corp. | 4,972,689 | |
36,150 | Bank of New York Mellon Corp. | 1,534,206 | |
30,962 | 1 | Berkshire Hathaway, Inc., Class B | 7,179,159 |
Shares or Principal Amount | Value | ||
COMMON STOCKS—continued | |||
Financials—continued | |||
947 | BlackRock, Inc. | $683,298 | |
38,263 | 1 | Brighthouse Financial, Inc. | 1,385,312 |
7,292 | Charles Schwab Corp. | 386,768 | |
730 | Chubb Ltd. | 112,362 | |
41,693 | Citigroup, Inc. | 2,570,790 | |
1,349 | CME Group, Inc. | 245,585 | |
13,587 | CNA Financial Corp. | 529,350 | |
57,927 | Equitable Holdings, Inc. | 1,482,352 | |
1,559 | First Citizens Bancshares, Inc., Class A | 895,287 | |
98 | First Horizon Corp. | 1,250 | |
74,000 | 1 | GoHealth, Inc. | 1,010,840 |
5,292 | Goldman Sachs Group, Inc. | 1,395,553 | |
28,000 | 1 | Guild Holdings Co. | 474,320 |
11,268 | Hanover Insurance Group, Inc. | 1,317,455 | |
55,196 | JPMorgan Chase & Co. | 7,013,756 | |
2,065 | Kemper Corp. | 158,654 | |
7,257 | Lincoln National Corp. | 365,100 | |
3,028 | LPL Investment Holdings, Inc. | 315,578 | |
32,458 | MetLife, Inc. | 1,523,903 | |
48,028 | MGIC Investment Corp. | 602,751 | |
16,558 | Morgan Stanley | 1,134,720 | |
10,639 | NASDAQ, Inc. | 1,412,221 | |
34,258 | Old Republic International Corp. | 675,225 | |
13,273 | OneMain Holdings, Inc. | 639,228 | |
50,000 | 1 | Oportun Financial Corp. | 968,500 |
28,847 | Popular, Inc. | 1,624,663 | |
11,844 | Prudential Financial, Inc. | 924,661 | |
632 | Regions Financial Corp. | 10,188 | |
16,000 | 1 | Root, Inc. | 251,360 |
12,000 | 1 | SelectQuote, Inc. | 249,000 |
104,252 | SLM Corp. | 1,291,682 | |
7,191 | Sterling Bancorp | 129,294 | |
522 | 1 | SVB Financial Group | 202,447 |
21,791 | Synchrony Financial | 756,366 | |
24,000 | 1 | Trean Insurance Group, Inc. | 314,400 |
3,029 | U.S. Bancorp | 141,121 | |
55,601 | Unum Group | 1,275,487 | |
48,000 | 1 | Velocity Financial, LLC | 299,040 |
27,655 | Virtu Financial, Inc. | 696,076 | |
5,934 | VOYA Financial, Inc. | 348,979 | |
57,701 | Wells Fargo & Co. | 1,741,416 | |
12,614 | Zions Bancorporation, N.A. | 547,952 | |
TOTAL | 55,301,995 | ||
Health Care—6.1% | |||
17,751 | Abbott Laboratories | 1,943,557 | |
6,140 | AbbVie, Inc. | 657,901 | |
8,000 | 1 | Akouos, Inc. | 158,640 |
2,553 | 1 | Alexion Pharmaceuticals, Inc. | 398,881 |
2,501 | 1 | Alkermes, Inc. | 49,895 |
2,982 | Anthem, Inc. | 957,490 |
Shares or Principal Amount | Value | ||
COMMON STOCKS—continued | |||
Health Care—continued | |||
8,175 | Baxter International, Inc. | $655,962 | |
163 | Becton Dickinson & Co. | 40,786 | |
2,855 | 1 | Biogen, Inc. | 699,075 |
34,376 | Bristol-Myers Squibb Co. | 2,132,343 | |
40 | 1 | Charles River Laboratories International, Inc. | 9,994 |
10,781 | 1 | Checkmate Pharmaceuticals, Inc. | 157,295 |
24,657 | CVS Health Corp. | 1,684,073 | |
13,340 | Danaher Corp. | 2,963,348 | |
13,739 | 1 | Davita, Inc. | 1,612,959 |
6,707 | Dentsply Sirona, Inc. | 351,178 | |
8,000 | 1 | Freeline Therapeutics Holdings PLC, ADR | 146,080 |
8,000 | 1 | Frequency Therapeutics, Inc. | 282,080 |
8,000 | 1 | Galecto, Inc. | 100,000 |
16,000 | 1 | Genetron Holdings Ltd., ADR | 224,000 |
37,078 | Gilead Sciences, Inc. | 2,160,164 | |
10,714 | 1 | HCA Healthcare, Inc. | 1,762,024 |
3,934 | Humana, Inc. | 1,614,002 | |
2,521 | 1 | IQVIA Holdings, Inc. | 451,688 |
520 | 1 | Jazz Pharmaceuticals PLC. | 85,826 |
42,029 | Johnson & Johnson | 6,614,524 | |
8,000 | 1 | Maravai LifeSciences Holdings, Inc. | 224,400 |
7,010 | McKesson Corp. | 1,219,179 | |
15,433 | Medtronic PLC | 1,807,822 | |
3,040 | Merck & Co., Inc. | 248,672 | |
63,899 | Pfizer, Inc. | 2,352,122 | |
12,130 | 1 | PolyPid Ltd. | 120,693 |
4,000 | 1 | Progyny, Inc. | 169,560 |
59,631 | 2 | Recursion Pharmaceuticals, Inc. | 841,272 |
1,781 | STERIS PLC | 337,571 | |
125 | 1 | Tandem Diabetes Care, Inc. | 11,960 |
210 | 1 | Teladoc, Inc. | 41,992 |
2,309 | Thermo Fisher Scientific, Inc. | 1,075,486 | |
609 | 1 | United Therapeutics Corp. | 92,440 |
1,179 | UnitedHealth Group, Inc. | 413,452 | |
4,374 | Universal Health Services, Inc., Class B | 601,425 | |
7,928 | 1 | Viatris, Inc. | 148,571 |
2,417 | Zimmer Biomet Holdings, Inc. | 372,436 | |
TOTAL | 37,992,818 | ||
Industrials—5.7% | |||
3,045 | 3M Co. | 532,236 | |
29,116 | ADT, Inc. | 228,561 | |
4,228 | 1 | AECOM | 210,470 |
6,528 | Ametek, Inc. | 789,496 | |
5,379 | Armstrong World Industries, Inc. | 400,144 | |
2,152 | Boeing Co. | 460,657 | |
9,964 | Carrier Global Corp. | 375,842 | |
4,467 | Caterpillar, Inc. | 813,083 | |
3,132 | CoreLogic, Inc. | 242,166 | |
6,005 | Crane Co. | 466,348 | |
11,686 | CSX Corp. | 1,060,504 |
Shares or Principal Amount | Value | ||
COMMON STOCKS—continued | |||
Industrials—continued | |||
4,300 | Cummins, Inc. | $976,530 | |
5,935 | Deere & Co. | 1,596,812 | |
5,897 | Dover Corp. | 744,496 | |
12,417 | Eaton Corp. PLC | 1,491,778 | |
11,275 | Emerson Electric Co. | 906,172 | |
21 | FedEx Corp. | 5,452 | |
1,395 | Fortune Brands Home & Security, Inc. | 119,579 | |
1,945 | 1 | Generac Holdings, Inc. | 442,312 |
110,664 | General Electric Co. | 1,195,171 | |
38,769 | GrafTech International Ltd. | 413,278 | |
10,305 | Honeywell International, Inc. | 2,191,873 | |
2,835 | Hubbell, Inc. | 444,500 | |
1,670 | Hunt (J.B.) Transportation Services, Inc. | 228,206 | |
867 | Huntington Ingalls Industries, Inc. | 147,806 | |
785 | 1 | IAA Spinco, Inc. | 51,009 |
44,206 | 1 | IBEX LTD | 826,652 |
5,231 | Kansas City Southern Industries, Inc. | 1,067,804 | |
3,224 | Lennox International, Inc. | 883,279 | |
1,403 | 1 | Lyft, Inc. | 68,929 |
10,917 | Manpower, Inc. | 984,495 | |
12,620 | Masco Corp. | 693,217 | |
4,000 | 1 | Montrose Environmental Group, Inc. | 123,840 |
327 | Nielsen Holdings PLC | 6,824 | |
597 | Nordson Corp. | 119,967 | |
2,583 | Norfolk Southern Corp. | 613,747 | |
2,649 | Northrop Grumman Corp. | 807,203 | |
6,093 | Old Dominion Freight Lines, Inc. | 1,189,232 | |
5,749 | Otis Worldwide Corp. | 388,345 | |
18,664 | Owens Corning, Inc. | 1,413,985 | |
2,360 | Parker-Hannifin Corp. | 642,888 | |
19,881 | Quanta Services, Inc. | 1,431,830 | |
4,184 | Raytheon Technologies Corp. | 299,198 | |
4,110 | Regal Beloit Corp. | 504,749 | |
5,134 | Rockwell Automation, Inc. | 1,287,659 | |
8,617 | Ryder System, Inc. | 532,186 | |
11,845 | Schneider National, Inc. | 245,192 | |
1,918 | 1 | Teledyne Technologies, Inc. | 751,818 |
6,069 | Trane Technologies PLC | 880,976 | |
2,266 | TransUnion | 224,833 | |
5,728 | 1 | Uber Technologies, Inc. | 292,128 |
5,210 | Union Pacific Corp. | 1,084,826 | |
6,153 | United Parcel Service, Inc. | 1,036,165 | |
1,360 | 1 | United Rentals, Inc. | 315,398 |
495 | W.W. Grainger, Inc. | 202,128 | |
3,886 | Waste Management, Inc. | 458,276 | |
TOTAL | 35,912,250 | ||
Information Technology—4.3% | |||
1,538 | 1 | Advanced Micro Devices, Inc. | 141,050 |
967 | 1 | Akamai Technologies, Inc. | 101,525 |
369 | 1 | Arista Networks, Inc. | 107,220 |
Shares or Principal Amount | Value | ||
COMMON STOCKS—continued | |||
Information Technology—continued | |||
8,579 | Arrow Electronics, Inc. | $834,737 | |
5,786 | 1 | Autodesk, Inc. | 1,766,697 |
526 | Broadcom, Inc. | 230,309 | |
13,508 | 1 | Ciena Corp. | 713,898 |
14,046 | 1 | Cirrus Logic, Inc. | 1,154,581 |
42,078 | Cisco Systems, Inc. | 1,882,991 | |
3,284 | Citrix Systems, Inc. | 427,248 | |
6,575 | Cognizant Technology Solutions Corp. | 538,821 | |
76,905 | 1 | CommScope Holdings Co., Inc. | 1,030,527 |
3,481 | 1 | Concentrix Corp. | 343,575 |
4,656 | Corning, Inc. | 167,616 | |
2,268 | 1 | Crowdstrike Holdings, Inc. | 480,408 |
5,202 | 1 | Dell Technologies, Inc. | 381,255 |
47,225 | DXC Technology Co. | 1,216,044 | |
3,125 | 1 | Euronet Worldwide, Inc. | 452,875 |
1,392 | Fidelity National Information Services, Inc. | 196,912 | |
1,463 | Global Payments, Inc. | 315,160 | |
3,522 | HP, Inc. | 86,606 | |
7,147 | IBM Corp. | 899,664 | |
84,744 | Intel Corp. | 4,221,946 | |
1,913 | 1 | IPG Photonics Corp. | 428,110 |
2,160 | 1 | Jamf Holding Corp. | 64,627 |
3,260 | 1 | Lumentum Holdings, Inc. | 309,048 |
19,190 | 1 | Micron Technology, Inc. | 1,442,704 |
1,257 | Motorola, Inc. | 213,765 | |
4,807 | 1 | ON Semiconductor Corp. | 157,333 |
38,269 | 1 | Pure Storage, Inc. | 865,262 |
4,226 | 1 | Qorvo, Inc. | 702,657 |
6,493 | Science Applications International Corp. | 614,498 | |
5,395 | Skyworks Solutions, Inc. | 824,788 | |
3,481 | Synnex Corp. | 283,493 | |
5,256 | 1 | Synopsys, Inc. | 1,362,566 |
8,000 | 1 | Telos Corp. | 263,840 |
254 | 1 | Twilio, Inc. | 85,979 |
6,659 | 1 | WEX, Inc. | 1,355,306 |
TOTAL | 26,665,641 | ||
Materials—2.0% | |||
3,116 | Air Products & Chemicals, Inc. | 851,354 | |
11,885 | Amcor PLC | 139,886 | |
2,569 | Aptargroup, Inc. | 351,670 | |
19,221 | Cabot Corp. | 862,639 | |
4,361 | Celanese Corp. | 566,668 | |
16,374 | CF Industries Holdings, Inc. | 633,838 | |
16,349 | Dow, Inc | 907,370 | |
6,277 | DuPont de Nemours, Inc. | 446,357 | |
5,426 | 1 | Eagle Materials, Inc. | 549,925 |
8,784 | Element Solutions, Inc. | 155,740 | |
81,497 | Graphic Packaging Holding Co. | 1,380,559 | |
2,895 | International Paper Co. | 143,939 | |
11,376 | Linde PLC | 2,997,690 |
Shares or Principal Amount | Value | ||
COMMON STOCKS—continued | |||
Materials—continued | |||
4,539 | LyondellBasell Industries N.V. | $416,045 | |
7,402 | Mosaic Co./The | 170,320 | |
9,494 | Newmont Corp. | 568,596 | |
11,397 | Reliance Steel & Aluminum Co. | 1,364,791 | |
TOTAL | 12,507,387 | ||
Real Estate—1.8% | |||
3,139 | Avalonbay Communities, Inc. | 503,590 | |
16,358 | 1 | CBRE Group, Inc. | 1,025,974 |
3,433 | Crown Castle International Corp. | 546,499 | |
32,564 | Duke Realty Corp. | 1,301,583 | |
35,404 | Equity Commonwealth | 965,821 | |
22,308 | Equity Residential Properties Trust | 1,322,418 | |
1,757 | Essex Property Trust, Inc. | 417,147 | |
802 | Extra Space Storage, Inc. | 92,920 | |
18,244 | Highwoods Properties, Inc. | 723,010 | |
48,004 | Invitation Homes, Inc. | 1,425,719 | |
42 | Life Storage, Inc. | 5,014 | |
11,378 | Mid-American Apartment Communities, Inc. | 1,441,479 | |
5,598 | Public Storage | 1,292,746 | |
1,172 | SBA Communications, Corp. | 330,656 | |
TOTAL | 11,394,576 | ||
Utilities—2.3% | |||
5,014 | AES Corp. | 117,829 | |
3,177 | American Electric Power Co., Inc. | 264,549 | |
5,279 | American Water Works Co., Inc. | 810,168 | |
2,006 | Consolidated Edison Co. | 144,974 | |
3,209 | Dominion Energy, Inc. | 241,317 | |
13,812 | Evergy, Inc. | 766,704 | |
24,992 | Exelon Corp. | 1,055,162 | |
7,080 | FirstEnergy Corp. | 216,719 | |
30,457 | MDU Resources Group, Inc. | 802,237 | |
44,809 | NextEra Energy, Inc. | 3,457,014 | |
52,782 | NiSource, Inc. | 1,210,819 | |
10,089 | NRG Energy, Inc. | 378,842 | |
38,731 | OGE Energy Corp. | 1,233,970 | |
20,195 | 1 | P G & E Corp. | 251,630 |
26,610 | Public Service Enterprises Group, Inc. | 1,551,363 | |
1,417 | Southern Co. | 87,046 | |
71,365 | Vistra Corp. | 1,403,036 | |
6,746 | WEC Energy Group, Inc. | 620,834 | |
TOTAL | 14,614,213 | ||
TOTAL COMMON STOCKS (IDENTIFIED COST $216,090,354) | 273,060,244 | ||
CORPORATE BONDS—21.2% | |||
Basic Industry - Chemicals—0.3% | |||
$ 200,000 | Albemarle Corp., 4.150%, 12/1/2024 | 222,020 | |
200,000 | Albemarle Corp., Sr. Unsecd. Note, 5.450%, 12/1/2044 | 239,825 | |
85,000 | Nutrition & Biosciences, Inc., Sr. Unsecd. Note, 144A, 1.832%, 10/15/2027 | 87,623 | |
650,000 | Nutrition & Biosciences, Inc., Sr. Unsecd. Note, 144A, 2.300%, 11/1/2030 | 669,706 |
Shares or Principal Amount | Value | ||
CORPORATE BONDS—continued | |||
Basic Industry - Chemicals—continued | |||
$ 300,000 | RPM International, Inc., Sr. Unsecd. Note, 4.550%, 3/1/2029 | $349,918 | |
TOTAL | 1,569,092 | ||
Basic Industry - Metals & Mining—0.2% | |||
156,000 | Carpenter Technology Corp., Sr. Unsecd. Note, 4.450%, 3/1/2023 | 163,448 | |
650,000 | Reliance Steel & Aluminum Co., Sr. Unsecd. Note, 4.500%, 4/15/2023 | 701,465 | |
150,000 | Worthington Industries, Inc., Sr. Unsecd. Note, 4.300%, 8/1/2032 | 174,181 | |
55,000 | Worthington Industries, Inc., Sr. Unsecd. Note, 4.550%, 4/15/2026 | 62,668 | |
TOTAL | 1,101,762 | ||
Capital Goods - Aerospace & Defense—0.9% | |||
750,000 | Airbus Group SE, Sr. Unsecd. Note, 144A, 3.150%, 4/10/2027 | 813,004 | |
200,000 | BAE Systems PLC, Sr. Unsecd. Note, 144A, 3.000%, 9/15/2050 | 209,310 | |
300,000 | Boeing Co., Sr. Unsecd. Note, 2.700%, 2/1/2027 | 312,096 | |
535,000 | Boeing Co., Sr. Unsecd. Note, 2.950%, 2/1/2030 | 553,849 | |
200,000 | Boeing Co., Sr. Unsecd. Note, 3.625%, 2/1/2031 | 219,468 | |
90,000 | Boeing Co., Sr. Unsecd. Note, 3.950%, 8/1/2059 | 96,328 | |
200,000 | Boeing Co., Sr. Unsecd. Note, 4.508%, 5/1/2023 | 216,247 | |
200,000 | Boeing Co., Sr. Unsecd. Note, 4.875%, 5/1/2025 | 228,116 | |
400,000 | Embraer Netherlands BV, Sr. Unsecd. Note, 5.050%, 6/15/2025 | 424,604 | |
50,000 | Embraer Overseas Ltd., Sr. Unsecd. Note, 144A, 5.696%, 9/16/2023 | 53,376 | |
160,000 | Huntington Ingalls Industries, Inc., Sr. Unsecd. Note, 3.483%, 12/1/2027 | 179,551 | |
140,000 | Leidos, Inc., Unsecd. Note, 144A, 3.625%, 5/15/2025 | 156,708 | |
400,000 | Leidos, Inc., Unsecd. Note, 144A, 4.375%, 5/15/2030 | 479,648 | |
155,000 | Lockheed Martin Corp., Sr. Unsecd. Note, 1.850%, 6/15/2030 | 162,732 | |
400,000 | Lockheed Martin Corp., Sr. Unsecd. Note, 2.900%, 3/1/2025 | 436,447 | |
585,000 | Northrop Grumman Corp., Sr. Unsecd. Note, 3.250%, 1/15/2028 | 661,666 | |
500,000 | Textron Inc., Sr. Unsecd. Note, 3.650%, 3/15/2027 | 552,475 | |
20,000 | Textron Inc., Sr. Unsecd. Note, 4.000%, 3/15/2026 | 22,573 | |
25,000 | Textron, Inc., Sr. Unsecd. Note, 4.300%, 3/1/2024 | 27,480 | |
TOTAL | 5,805,678 | ||
Capital Goods - Building Materials—0.2% | |||
60,000 | Allegion PLC, Sr. Unsecd. Note, 3.500%, 10/1/2029 | 66,651 | |
110,000 | Allegion US Holdings Co., Inc., Sr. Unsecd. Note, 3.200%, 10/1/2024 | 117,587 | |
490,000 | Allegion US Holdings Co., Inc., Sr. Unsecd. Note, 3.550%, 10/1/2027 | 536,468 | |
200,000 | Carrier Global Corp., Sr. Unsecd. Note, 2.700%, 2/15/2031 | 215,134 | |
40,000 | Masco Corp., Sr. Unsecd. Note, 4.375%, 4/1/2026 | 46,986 | |
165,000 | Masco Corp., Sr. Unsecd. Note, 4.500%, 5/15/2047 | 207,281 | |
TOTAL | 1,190,107 | ||
Capital Goods - Construction Machinery—0.2% | |||
770,000 | CNH Industrial NV, Sr. Unsecd. Note, Series MTN, 3.850%, 11/15/2027 | 868,409 | |
450,000 | John Deere Capital Corp., Sr. Unsecd. Note, Series MTN, 3.450%, 3/7/2029 | 522,697 | |
TOTAL | 1,391,106 | ||
Capital Goods - Diversified Manufacturing—0.4% | |||
125,000 | General Electric Co., Sr. Unsecd. Note, 3.625%, 5/1/2030 | 142,954 | |
105,000 | Honeywell International, Inc., Sr. Unsecd. Note, 1.350%, 6/1/2025 | 108,703 | |
110,000 | Honeywell International, Inc., Sr. Unsecd. Note, 2.800%, 6/1/2050 | 120,659 | |
750,000 | Lennox International, Inc., Sr. Unsecd. Note, 3.000%, 11/15/2023 | 791,267 | |
305,000 | Otis Worldwide Corp., Sr. Unsecd. Note, Series WI, 2.565%, 2/15/2030 | 327,866 | |
500,000 | Roper Technologies, Inc., Sr. Unsecd. Note, 2.800%, 12/15/2021 | 510,741 | |
120,000 | Wabtec Corp., Sr. Unsecd. Note, 3.200%, 6/15/2025 | 129,570 |
Shares or Principal Amount | Value | ||
CORPORATE BONDS—continued | |||
Capital Goods - Diversified Manufacturing—continued | |||
$ 220,000 | Xylem, Inc., Sr. Unsecd. Note, 2.250%, 1/30/2031 | $231,871 | |
TOTAL | 2,363,631 | ||
Capital Goods - Packaging—0.2% | |||
600,000 | Packaging Corp. of America, Sr. Unsecd. Note, 3.650%, 9/15/2024 | 657,963 | |
360,000 | WestRock Co., Sr. Unsecd. Note, Series WI, 4.000%, 3/15/2028 | 417,763 | |
TOTAL | 1,075,726 | ||
Communications - Cable & Satellite—0.6% | |||
250,000 | CCO Safari II LLC, 6.484%, 10/23/2045 | 354,999 | |
200,000 | Charter Communications Operating, LLC/Charter Communications Operating Capital Corp., Sec. Fac. Bond, 2.800%, 4/1/2031 | 211,551 | |
200,000 | Charter Communications Operating, LLC/Charter Communications Operating Capital Corp., Sec. Fac. Bond, 3.850%, 4/1/2061 | 201,553 | |
1,000,000 | Comcast Corp., Sr. Unsecd. Note, 3.150%, 2/15/2028 | 1,129,208 | |
650,000 | Comcast Corp., Sr. Unsecd. Note, 3.300%, 2/1/2027 | 734,638 | |
250,000 | Comcast Corp., Sr. Unsecd. Note, 3.400%, 4/1/2030 | 288,397 | |
300,000 | Comcast Corp., Sr. Unsecd. Note, 3.950%, 10/15/2025 | 344,814 | |
300,000 | Time Warner Cable, Inc., Company Guarantee, 5.500%, 9/1/2041 | 386,231 | |
TOTAL | 3,651,391 | ||
Communications - Media & Entertainment—0.7% | |||
345,000 | Alphabet, Inc., Sr. Unsecd. Note, 1.900%, 8/15/2040 | 338,619 | |
600,000 | British Sky Broadcasting Group PLC, 144A, 3.750%, 9/16/2024 | 668,561 | |
300,000 | Discovery Communications LLC, Sr. Unsecd. Note, 4.650%, 5/15/2050 | 375,565 | |
135,000 | Fox Corp, Sr. Unsecd. Note, Series WI, 4.709%, 1/25/2029 | 163,887 | |
180,000 | Fox Corp, Sr. Unsecd. Note, Series WI, 5.576%, 1/25/2049 | 263,124 | |
500,000 | Grupo Televisa S.A., Sr. Unsecd. Note, 5.000%, 5/13/2045 | 604,535 | |
100,000 | Omnicom Group, Inc., Sr. Unsecd. Note, 3.600%, 4/15/2026 | 114,164 | |
260,000 | Omnicom Group, Inc., Sr. Unsecd. Note, 4.200%, 6/1/2030 | 312,502 | |
200,000 | ViacomCBS Inc., Sr. Unsecd. Note, 4.200%, 6/1/2029 | 239,473 | |
400,000 | ViacomCBS, Inc., Sr. Unsecd. Note, 4.950%, 1/15/2031 | 501,531 | |
200,000 | Walt Disney Co., Sr. Unsecd. Note, 2.000%, 9/1/2029 | 209,086 | |
110,000 | Walt Disney Co., Sr. Unsecd. Note, 3.600%, 1/13/2051 | 133,523 | |
135,000 | Walt Disney Co., Sr. Unsecd. Note, 3.800%, 5/13/2060 | 171,530 | |
TOTAL | 4,096,100 | ||
Communications - Telecom Wireless—0.6% | |||
425,000 | America Movil S.A.B. de C.V., Sr. Unsecd. Note, 2.875%, 5/7/2030 | 461,146 | |
400,000 | American Tower Corp., Sr. Unsecd. Note, 2.100%, 6/15/2030 | 411,006 | |
300,000 | American Tower Corp., Sr. Unsecd. Note, 5.000%, 2/15/2024 | 339,763 | |
350,000 | Bell Canada, Sr. Unsecd. Note, 4.464%, 4/1/2048 | 468,134 | |
250,000 | Crown Castle International Corp., Sr. Unsecd. Note, 3.250%, 1/15/2051 | 263,788 | |
160,000 | Crown Castle International Corp., Sr. Unsecd. Note, 3.300%, 7/1/2030 | 179,277 | |
400,000 | T-Mobile USA, Inc., Sec. Fac. Bond, 144A, 3.875%, 4/15/2030 | 463,704 | |
120,000 | T-Mobile USA, Inc., Sec. Fac. Bond, 144A, 4.500%, 4/15/2050 | 148,231 | |
350,000 | T-Mobile USA, Inc., Sr. Sub. Note, 144A, 3.000%, 2/15/2041 | 363,508 | |
250,000 | Vodafone Group PLC, Sr. Unsecd. Note, 4.125%, 5/30/2025 | 285,992 | |
280,000 | Vodafone Group PLC, Sr. Unsecd. Note, 5.250%, 5/30/2048 | 389,568 | |
TOTAL | 3,774,117 | ||
Communications - Telecom Wirelines—0.8% | |||
350,000 | AT&T, Inc., Sr. Unsecd. Note, 3.500%, 6/1/2041 | 377,897 | |
350,000 | AT&T, Inc., Sr. Unsecd. Note, 3.650%, 6/1/2051 | 366,500 | |
978,000 | AT&T, Inc., Sr. Unsecd. Note, 144A, 3.800%, 12/1/2057 | 1,019,820 | |
800,000 | Deutsche Telekom International Finance BV, Sr. Unsecd. Note, 144A, 3.600%, 1/19/2027 | 900,320 | |
580,000 | Telefonica Emisiones SAU, Sr. Unsecd. Note, 5.213%, 3/8/2047 | 748,902 |
Shares or Principal Amount | Value | ||
CORPORATE BONDS—continued | |||
Communications - Telecom Wirelines—continued | |||
$ 350,000 | Verizon Communications, Inc., Sr. Unsecd. Note, 4.125%, 8/15/2046 | $430,470 | |
534,000 | Verizon Communications, Inc., Sr. Unsecd. Note, 4.672%, 3/15/2055 | 717,610 | |
125,000 | Verizon Communications, Inc., Sr. Unsecd. Note, 5.150%, 9/15/2023 | 140,974 | |
TOTAL | 4,702,493 | ||
Consumer Cyclical - Automotive—0.7% | |||
300,000 | American Honda Finance Corp., Sr. Unsecd. Note, Series MTN, 0.875%, 7/7/2023 | 303,745 | |
500,000 | Daimler Finance NA LLC, Sr. Unsecd. Note, 144A, 3.350%, 2/22/2023 | 529,448 | |
350,000 | Fiat Chrysler Automobiles NV, Sr. Unsecd. Note, 5.250%, 4/15/2023 | 375,813 | |
450,000 | General Motors Co., Sr. Unsecd. Note, 6.125%, 10/1/2025 | 546,180 | |
400,000 | General Motors Financial Co., Inc., Sr. Unsecd. Note, 4.000%, 10/6/2026 | 450,576 | |
205,000 | Hyundai Capital America, Sr. Unsecd. Note, 144A, 2.375%, 2/10/2023 | 211,483 | |
180,000 | Hyundai Capital America, Sr. Unsecd. Note, 144A, 2.375%, 10/15/2027 | 188,935 | |
720,000 | Toyota Motor Credit Corp., Sr. Unsecd. Note, Series GMTN, 2.700%, 1/11/2023 | 754,409 | |
250,000 | Volkswagen Group of America Finance LLC, Sr. Unsecd. Note, 144A, 1.250%, 11/24/2025 | 252,199 | |
365,000 | Volkswagen Group of America Finance LLC, Sr. Unsecd. Note, 144A, 3.125%, 5/12/2023 | 385,706 | |
200,000 | Volkswagen Group of America Finance LLC, Sr. Unsecd. Note, 144A, 4.000%, 11/12/2021 | 206,163 | |
TOTAL | 4,204,657 | ||
Consumer Cyclical - Retailers—0.9% | |||
295,000 | Advance Auto Parts, Inc., Sr. Unsecd. Note, 1.750%, 10/1/2027 | 299,936 | |
350,000 | Advance Auto Parts, Inc., Sr. Unsecd. Note, Series WI, 3.900%, 4/15/2030 | 403,050 | |
600,000 | Alimentation Couche-Tard, Inc., Sr. Unsecd. Note, 144A, 3.800%, 1/25/2050 | 712,846 | |
170,000 | AutoNation, Inc., Sr. Unsecd. Note, 4.750%, 6/1/2030 | 204,697 | |
15,000 | AutoZone, Inc., Sr. Unsecd. Note, 3.625%, 4/15/2025 | 16,816 | |
215,000 | AutoZone, Inc., Sr. Unsecd. Note, 4.000%, 4/15/2030 | 255,074 | |
600,000 | CVS Health Corp., Sr. Unsecd. Note, 4.250%, 4/1/2050 | 750,564 | |
310,000 | CVS Health Corp., Sr. Unsecd. Note, 4.300%, 3/25/2028 | 369,218 | |
540,000 | Dollar General Corp., Sr. Unsecd. Note, 3.875%, 4/15/2027 | 625,578 | |
600,000 | Dollar Tree, Inc., Sr. Unsecd. Note, 3.700%, 5/15/2023 | 642,448 | |
120,000 | Home Depot, Inc., Sr. Unsecd. Note, 2.950%, 6/15/2029 | 136,436 | |
600,000 | Home Depot, Inc., Sr. Unsecd. Note, 3.300%, 4/15/2040 | 707,697 | |
195,000 | O’Reilly Automotive, Inc., Sr. Unsecd. Note, 1.750%, 3/15/2031 | 195,626 | |
40,000 | O’Reilly Automotive, Inc., Sr. Unsecd. Note, 3.550%, 3/15/2026 | 45,181 | |
115,000 | O’Reilly Automotive, Inc., Sr. Unsecd. Note, 4.200%, 4/1/2030 | 138,728 | |
160,000 | Tractor Supply Co., Sr. Unsecd. Note, 1.750%, 11/1/2030 | 161,072 | |
TOTAL | 5,664,967 | ||
Consumer Cyclical - Services—0.2% | |||
400,000 | Amazon.com, Inc., Sr. Unsecd. Note, 3.875%, 8/22/2037 | 499,004 | |
200,000 | Booking Holdings, Inc., Sr. Unsecd. Note, 4.625%, 4/13/2030 | 248,674 | |
400,000 | IHS Markit Ltd., Sr. Unsecd. Note, 4.750%, 8/1/2028 | 493,362 | |
200,000 | Visa, Inc., Sr. Unsecd. Note, 2.800%, 12/14/2022 | 209,297 | |
30,000 | Visa, Inc., Sr. Unsecd. Note, 3.150%, 12/14/2025 | 33,670 | |
TOTAL | 1,484,007 | ||
Consumer Non-Cyclical - Food/Beverage—1.1% | |||
165,000 | Anheuser-Busch InBev Finance, Inc., 4.900%, 2/1/2046 | 212,365 | |
1,000,000 | Anheuser-Busch InBev Worldwide, Inc., Sr. Unsecd. Note, 4.500%, 6/1/2050 | 1,260,490 | |
400,000 | Campbell Soup Co., Sr. Unsecd. Note, 2.375%, 4/24/2030 | 422,985 | |
150,000 | Coca-Cola Femsa S.A.B. de C.V., Sr. Unsecd. Note, 1.850%, 9/1/2032 | 150,412 | |
230,000 | Coca-Cola Femsa S.A.B. de C.V., Sr. Unsecd. Note, 2.750%, 1/22/2030 | 248,399 | |
235,000 | Conagra Brands, Inc., Sr. Unsecd. Note, 1.375%, 11/1/2027 | 237,266 | |
75,000 | Constellation Brands, Inc., Sr. Unsecd. Note, 3.750%, 5/1/2050 | 88,559 |
Shares or Principal Amount | Value | ||
CORPORATE BONDS—continued | |||
Consumer Non-Cyclical - Food/Beverage—continued | |||
$ 500,000 | Flowers Foods, Inc., Sr. Unsecd. Note, 3.500%, 10/1/2026 | $557,928 | |
200,000 | General Mills, Inc., Sr. Unsecd. Note, 3.700%, 10/17/2023 | 218,000 | |
150,000 | General Mills, Inc., Sr. Unsecd. Note, 4.550%, 4/17/2038 | 193,149 | |
500,000 | Grupo Bimbo S.A.B. de CV, 144A, 4.875%, 6/27/2044 | 628,205 | |
250,000 | Keurig Dr Pepper, Inc., Sr. Unsecd. Note, 3.200%, 5/1/2030 | 283,357 | |
220,000 | Keurig Dr Pepper, Inc., Sr. Unsecd. Note, 4.417%, 5/25/2025 | 253,747 | |
455,000 | McCormick & Co., Inc., Sr. Unsecd. Note, 2.500%, 4/15/2030 | 487,764 | |
160,000 | Mondelez International, Inc., Sr. Unsecd. Note, 1.500%, 5/4/2025 | 165,617 | |
170,000 | Smithfield Foods, Inc., Sr. Unsecd. Note, 144A, 3.000%, 10/15/2030 | 180,192 | |
350,000 | Smucker (J.M.) Co., Sr. Unsecd. Note, 2.375%, 3/15/2030 | 371,027 | |
300,000 | Smucker (J.M.) Co., Sr. Unsecd. Note, 3.500%, 3/15/2025 | 334,707 | |
495,000 | Tyson Foods, Inc., Sr. Unsecd. Note, 3.550%, 6/2/2027 | 566,000 | |
TOTAL | 6,860,169 | ||
Consumer Non-Cyclical - Health Care—0.4% | |||
155,000 | Agilent Technologies, Inc., Sr. Unsecd. Note, 2.750%, 9/15/2029 | 169,332 | |
600,000 | Alcon Finance Corp., Sr. Unsecd. Note, 144A, 2.600%, 5/27/2030 | 639,800 | |
392,000 | Becton Dickinson & Co., Sr. Unsecd. Note, 3.700%, 6/6/2027 | 449,948 | |
79,000 | Becton Dickinson & Co., Sr. Unsecd. Note, 4.685%, 12/15/2044 | 102,057 | |
340,000 | Danaher Corp., Sr. Unsecd. Note, 2.600%, 10/1/2050 | 353,040 | |
135,000 | Dentsply Sirona, Inc., Sr. Unsecd. Note, 3.250%, 6/1/2030 | 150,454 | |
140,000 | DH Europe Finance II S.a.r.l., Sr. Unsecd. Note, 2.600%, 11/15/2029 | 153,151 | |
300,000 | PerkinElmer, Inc., Sr. Unsecd. Note, 3.300%, 9/15/2029 | 338,716 | |
10,000 | Stryker Corp., Sr. Unsecd. Note, 3.500%, 3/15/2026 | 11,326 | |
TOTAL | 2,367,824 | ||
Consumer Non-Cyclical - Pharmaceuticals—1.2% | |||
283,000 | Abbott Laboratories, Sr. Unsecd. Note, 3.750%, 11/30/2026 | 331,693 | |
225,000 | AbbVie, Inc., Sr. Unsecd. Note, 3.200%, 11/21/2029 | 252,413 | |
255,000 | AbbVie, Inc., Sr. Unsecd. Note, 4.250%, 11/21/2049 | 320,749 | |
250,000 | Amgen, Inc., 2.300%, 2/25/2031 | 266,956 | |
500,000 | Amgen, Inc., Sr. Unsecd. Note, 2.450%, 2/21/2030 | 535,982 | |
190,000 | AstraZeneca PLC, Sr. Unsecd. Note, 2.375%, 6/12/2022 | 195,331 | |
600,000 | AstraZeneca PLC, Sr. Unsecd. Note, 3.125%, 6/12/2027 | 675,713 | |
600,000 | Bayer US Finance LLC, Sr. Unsecd. Note, 144A, 3.375%, 10/8/2024 | 655,454 | |
350,000 | Biogen, Inc., Sr. Unsecd. Note, 2.250%, 5/1/2030 | 365,772 | |
375,000 | Biogen, Inc., Sr. Unsecd. Note, 3.150%, 5/1/2050 | 389,238 | |
500,000 | Bristol-Myers Squibb Co., Sr. Unsecd. Note, Series WI, 3.900%, 2/20/2028 | 592,116 | |
110,000 | Bristol-Myers Squibb Co., Sr. Unsecd. Note, Series WI, 4.250%, 10/26/2049 | 148,996 | |
500,000 | Eli Lilly & Co., Sr. Unsecd. Note, 3.375%, 3/15/2029 | 580,567 | |
700,000 | Merck & Co., Inc., Sr. Unsecd. Note, 3.400%, 3/7/2029 | 814,553 | |
91,000 | Regeneron Pharmaceuticals, Inc., Sr. Unsecd. Note, 2.800%, 9/15/2050 | 88,529 | |
670,000 | Royalty Pharma PLC, Sr. Unsecd. Note, 144A, 1.750%, 9/2/2027 | 689,959 | |
210,000 | Takeda Pharmaceutical Co. Ltd., Sr. Unsecd. Note, 2.050%, 3/31/2030 | 215,006 | |
450,000 | Zoetis, Inc., Sr. Unsecd. Note, 3.000%, 5/15/2050 | 497,665 | |
TOTAL | 7,616,692 | ||
Consumer Non-Cyclical - Products—0.1% | |||
230,000 | Clorox Co., Sr. Unsecd. Note, 1.800%, 5/15/2030 | 237,725 | |
70,000 | Newell Rubbermaid, Inc., Sr. Unsecd. Note, 4.700%, 4/1/2026 | 77,205 | |
TOTAL | 314,930 | ||
Consumer Non-Cyclical - Supermarkets—0.1% | |||
300,000 | Kroger Co., Sr. Unsecd. Note, 2.650%, 10/15/2026 | 328,031 |
Shares or Principal Amount | Value | ||
CORPORATE BONDS—continued | |||
Consumer Non-Cyclical - Supermarkets—continued | |||
$ 200,000 | Kroger Co., Sr. Unsecd. Note, 4.450%, 2/1/2047 | $252,119 | |
TOTAL | 580,150 | ||
Consumer Non-Cyclical - Tobacco—0.3% | |||
400,000 | Altria Group, Inc., Sr. Unsecd. Note, 5.950%, 2/14/2049 | 560,406 | |
350,000 | Bat Capital Corp., Sr. Unsecd. Note, Series WI, 4.540%, 8/15/2047 | 388,674 | |
315,000 | Philip Morris International, Inc., Sr. Unsecd. Note, 2.100%, 5/1/2030 | 328,755 | |
280,000 | Reynolds American, Inc., Sr. Unsecd. Note, 7.000%, 8/4/2041 | 376,810 | |
TOTAL | 1,654,645 | ||
Energy - Independent—0.2% | |||
100,000 | Canadian Natural Resources Ltd., 3.900%, 2/1/2025 | 110,717 | |
250,000 | Canadian Natural Resources Ltd., Sr. Unsecd. Note, 2.050%, 7/15/2025 | 262,471 | |
250,000 | Cimarex Energy Co., Sr. Unsecd. Note, 3.900%, 5/15/2027 | 275,660 | |
430,000 | Cimarex Energy Co., Sr. Unsecd. Note, 4.375%, 3/15/2029 | 489,915 | |
TOTAL | 1,138,763 | ||
Energy - Integrated—0.5% | |||
340,000 | BP Capital Markets America, Inc., Sr. Unsecd. Note, 1.749%, 8/10/2030 | 341,397 | |
250,000 | BP Capital Markets America, Inc., Sr. Unsecd. Note, Series, 2.520%, 9/19/2022 | 258,718 | |
110,000 | BP Capital Markets America, Inc., Sr. Unsecd. Note, 3.119%, 5/4/2026 | 121,789 | |
325,000 | Chevron Corp., Sr. Unsecd. Note, 3.078%, 5/11/2050 | 361,373 | |
600,000 | Exxon Mobil Corp., Sr. Unsecd. Note, 3.482%, 3/19/2030 | 699,343 | |
300,000 | Husky Energy, Inc., 4.000%, 4/15/2024 | 321,788 | |
75,000 | Shell International Finance B.V., Sr. Unsecd. Note, 4.000%, 5/10/2046 | 94,501 | |
500,000 | Shell International Finance B.V., Sr. Unsecd. Note, 4.125%, 5/11/2035 | 625,764 | |
500,000 | Suncor Energy, Inc., Sr. Unsecd. Note, 3.600%, 12/1/2024 | 551,785 | |
TOTAL | 3,376,458 | ||
Energy - Midstream—0.6% | |||
465,000 | Boardwalk Pipeline Partners LP, Sr. Unsecd. Note, 3.400%, 2/15/2031 | 485,942 | |
115,000 | Boardwalk Pipeline Partners LP, Sr. Unsecd. Note, 4.800%, 5/3/2029 | 131,897 | |
200,000 | Energy Transfer Operating, Sr. Unsecd. Note, 5.000%, 5/15/2050 | 216,758 | |
40,000 | Energy Transfer Partners LP, Sr. Unsecd. Note, 4.900%, 2/1/2024 | 43,816 | |
475,000 | Energy Transfer Partners LP, Sr. Unsecd. Note, Series 10Y, 4.950%, 6/15/2028 | 547,604 | |
400,000 | Enterprise Products Operating LLC, Sr. Unsecd. Note, 3.700%, 1/31/2051 | 441,148 | |
70,000 | Enterprise Products Operating LLC, Sr. Unsecd. Note, 3.950%, 2/15/2027 | 80,686 | |
200,000 | Kinder Morgan Energy Partners LP, Sr. Unsecd. Note, 6.375%, 3/1/2041 | 262,995 | |
200,000 | Kinder Morgan, Inc., 5.050%, 2/15/2046 | 245,130 | |
335,000 | ONEOK, Inc., Sr. Unsecd. Note, 4.950%, 7/13/2047 | 374,305 | |
120,000 | TC Pipelines, LP, Sr. Unsecd. Note, 3.900%, 5/25/2027 | 135,105 | |
490,000 | Williams Partners LP, Sr. Unsecd. Note, 4.900%, 1/15/2045 | 579,461 | |
TOTAL | 3,544,847 | ||
Energy - Refining—0.1% | |||
220,000 | Phillips 66, Sr. Unsecd. Note, 4.875%, 11/15/2044 | 277,905 | |
405,000 | Valero Energy Corp., Sr. Unsecd. Note, 2.150%, 9/15/2027 | 414,268 | |
175,000 | Valero Energy Corp., Sr. Unsecd. Note, 2.700%, 4/15/2023 | 182,723 | |
TOTAL | 874,896 | ||
Financial Institution - Banking—3.9% | |||
600,000 | American Express Credit Corp., Sr. Unsecd. Note, Series MTN, 3.300%, 5/3/2027 | 682,691 | |
400,000 | Associated Banc-Corp., Sub. Note, 4.250%, 1/15/2025 | 433,800 | |
1,850,000 | Bank of America Corp., Sr. Unsecd. Note, 3.419%, 12/20/2028 | 2,093,019 | |
250,000 | Bank of America Corp., Sr. Unsecd. Note, Series MTN, 1.922%, 10/24/2031 | 253,381 | |
150,000 | Bank of America Corp., Sub. Note, 6.500%, 9/15/2037 | 213,081 |
Shares or Principal Amount | Value | ||
CORPORATE BONDS—continued | |||
Financial Institution - Banking—continued | |||
$ 50,000 | Bank of America Corp., Sub. Note, Series L, 3.950%, 4/21/2025 | $56,385 | |
300,000 | Bank of America Corp., Sub. Note, Series MTN, 4.000%, 1/22/2025 | 337,289 | |
800,000 | Bank of New York Mellon Corp., Sr. Unsecd. Note, Series MTN, 2.200%, 8/16/2023 | 838,378 | |
200,000 | Bank of New York Mellon Corp., Sr. Unsecd. Note, Series MTN, 2.661%, 5/16/2023 | 206,192 | |
125,000 | Capital One Financial Corp., Sr. Unsecd. Note, 3.900%, 1/29/2024 | 136,981 | |
580,000 | Citigroup, Inc., Sr. Unsecd. Note, 3.352%, 4/24/2025 | 630,764 | |
570,000 | Citigroup, Inc., Sr. Unsecd. Note, 3.400%, 5/1/2026 | 643,148 | |
900,000 | Citigroup, Inc., Sr. Unsecd. Note, 3.668%, 7/24/2028 | 1,020,535 | |
265,000 | Citizens Bank, N.A., Providence, Sr. Unsecd. Note, Series BKNT, 2.250%, 4/28/2025 | 281,414 | |
250,000 | Citizens Bank N.A., Sr. Unsecd. Note, Series BKNT, 3.750%, 2/18/2026 | 284,199 | |
30,000 | Comerica, Inc., 3.800%, 7/22/2026 | 34,130 | |
350,000 | Compass Bank, Birmingham, Sub. Note, Series BKNT, 3.875%, 4/10/2025 | 392,642 | |
800,000 | Fifth Third Bancorp, Sr. Unsecd. Note, 3.950%, 3/14/2028 | 940,731 | |
165,000 | FNB Corp. (PA), Sr. Unsecd. Note, 2.200%, 2/24/2023 | 168,222 | |
1,300,000 | Goldman Sachs Group, Inc., Sr. Unsecd. Note, 2.876%, 10/31/2022 | 1,326,523 | |
500,000 | Goldman Sachs Group, Inc., Sr. Unsecd. Note, 6.250%, 2/1/2041 | 783,056 | |
1,400,000 | HSBC Holdings PLC, Sr. Unsecd. Note, 3.900%, 5/25/2026 | 1,598,822 | |
345,000 | Huntington Bancshares, Inc., Sr. Unsecd. Note, 2.550%, 2/4/2030 | 370,239 | |
1,850,000 | JPMorgan Chase & Co., Sr. Unsecd. Note, 3.509%, 1/23/2029 | 2,111,732 | |
850,000 | JPMorgan Chase & Co., Sub. Note, 3.375%, 5/1/2023 | 908,721 | |
210,000 | M&T Bank Corp., Sr. Unsecd. Note, 3.550%, 7/26/2023 | 227,005 | |
500,000 | Manufacturers & Traders Trust Co., Sr. Unsecd. Note, Series BKNT, 2.500%, 5/18/2022 | 514,530 | |
950,000 | Morgan Stanley, Sr. Unsecd. Note, Series GMTN, 3.772%, 1/24/2029 | 1,101,554 | |
40,000 | Morgan Stanley, Sr. Unsecd. Note, Series MTN, 1.794%, 2/13/2032 | 40,260 | |
250,000 | Morgan Stanley, Sr. Unsecd. Note, Series MTN, 6.250%, 8/9/2026 | 319,269 | |
275,000 | Morgan Stanley, Sub. Note, Series MTN, 4.100%, 5/22/2023 | 298,540 | |
400,000 | Northern Trust Corp., Sr. Unsecd. Note, 1.950%, 5/1/2030 | 417,224 | |
400,000 | PNC Bank N.A., Sr. Unsecd. Note, Series BKNT, 3.250%, 1/22/2028 | 456,494 | |
235,000 | Regions Financial Corp., Sr. Unsecd. Note, 2.250%, 5/18/2025 | 249,418 | |
250,000 | Synovus Bank GA, Sr. Unsecd. Note, 2.289%, 2/10/2023 | 253,254 | |
600,000 | Truist Bank, Sr. Unsecd. Note, Series BKNT, 3.000%, 2/2/2023 | 631,683 | |
60,000 | Truist Financial Corp., Sr. Unsecd. Note, 2.900%, 3/3/2021 | 60,125 | |
495,000 | Truist Financial Corp., Sr. Unsecd. Note, Series MTN, 2.750%, 4/1/2022 | 509,389 | |
250,000 | Truist Financial Corp., Sr. Unsecd. Note, Series MTN, 3.750%, 12/6/2023 | 274,758 | |
250,000 | US Bancorp, Sr. Unsecd. Note, Series MTN, 1.375%, 7/22/2030 | 250,669 | |
50,000 | 3 | Wells Fargo & Co., Sr. Unsecd. Note, 1.444% (3-month USLIBOR +1.230%), 10/31/2023 | 50,799 |
410,000 | Wells Fargo & Co., Sr. Unsecd. Note, 2.188%, 4/30/2026 | 432,044 | |
300,000 | Wells Fargo & Co., Sr. Unsecd. Note, 3.000%, 10/23/2026 | 332,729 | |
1,300,000 | Wells Fargo & Co., Sr. Unsecd. Note, Series MTN, 3.584%, 5/22/2028 | 1,473,951 | |
TOTAL | 24,639,770 | ||
Financial Institution - Broker/Asset Mgr/Exchange—0.2% | |||
130,000 | BlackRock, Inc., Sr. Unsecd. Note, 1.900%, 1/28/2031 | 136,116 | |
40,000 | Invesco Finance PLC, Sr. Unsecd. Note, 3.750%, 1/15/2026 | 45,177 | |
140,000 | Jefferies Group LLC, Sr. Unsecd. Note, 2.750%, 10/15/2032 | 147,196 | |
165,000 | Nuveen LLC, Sr. Unsecd. Note, 144A, 4.000%, 11/1/2028 | 197,294 | |
150,000 | Raymond James Financial, Inc., Sr. Unsecd. Note, 4.650%, 4/1/2030 | 184,183 | |
350,000 | Stifel Financial Corp., Sr. Unsecd. Note, 4.000%, 5/15/2030 | 400,513 | |
TOTAL | 1,110,479 | ||
Financial Institution - Finance Companies—0.2% | |||
350,000 | GE Capital Funding LLC, Sr. Unsecd. Note, 144A, 4.400%, 5/15/2030 | 412,696 |
Shares or Principal Amount | Value | ||
CORPORATE BONDS—continued | |||
Financial Institution - Finance Companies—continued | |||
$ 600,000 | GE Capital International Funding, Inc., Sr. Unsecd. Note, 4.418%, 11/15/2035 | $716,271 | |
TOTAL | 1,128,967 | ||
Financial Institution - Insurance - Health—0.0% | |||
190,000 | UnitedHealth Group, Inc., Sr. Unsecd. Note, 2.900%, 5/15/2050 | 210,369 | |
Financial Institution - Insurance - Life—0.6% | |||
800,000 | Aflac, Inc., Sr. Unsecd. Note, 3.625%, 6/15/2023 | 863,115 | |
500,000 | AIA Group Ltd., Sr. Unsecd. Note, 144A, 3.600%, 4/9/2029 | 563,315 | |
800,000 | American International Group, Inc., Sr. Unsecd. Note, 4.125%, 2/15/2024 | 886,052 | |
450,000 | Lincoln National Corp., Sr. Unsecd. Note, 3.625%, 12/12/2026 | 519,952 | |
150,000 | Massachusetts Mutual Life Insurance Co., Sub. Note, 144A, 4.900%, 4/1/2077 | 206,314 | |
250,000 | MetLife, Inc., Sr. Unsecd. Note, 4.050%, 3/1/2045 | 320,551 | |
170,000 | Pacific Life Insurance Co., Sub. Note, 144A, 4.300%, 10/24/2067 | 193,573 | |
350,000 | Prudential Financial, Inc., Sr. Unsecd. Note, Series MTN, 4.600%, 5/15/2044 | 457,329 | |
TOTAL | 4,010,201 | ||
Financial Institution - Insurance - P&C—0.3% | |||
30,000 | Chubb INA Holdings, Inc., 3.350%, 5/3/2026 | 33,824 | |
300,000 | Chubb INA Holdings, Inc., Sr. Unsecd. Note, 1.375%, 9/15/2030 | 299,680 | |
240,000 | Hartford Financial Services Group, Inc., Sr. Unsecd. Note, 4.400%, 3/15/2048 | 317,115 | |
340,000 | Liberty Mutual Group, Inc., Sr. Unsecd. Note, 144A, 3.951%, 10/15/2050 | 407,921 | |
500,000 | Nationwide Mutual Insurance Co., Sub. Note, 144A, 9.375%, 8/15/2039 | 871,046 | |
90,000 | Travelers Cos., Inc., Sr. Unsecd. Note, 2.550%, 4/27/2050 | 94,845 | |
TOTAL | 2,024,431 | ||
Financial Institution - REIT - Apartment—0.4% | |||
750,000 | Avalonbay Communities, Inc., Sr. Unsecd. Note, Series MTN, 3.350%, 5/15/2027 | 840,911 | |
95,000 | Camden Property Trust, Sr. Unsecd. Note, 2.800%, 5/15/2030 | 105,617 | |
750,000 | Mid-America Apartment Communities LP, 4.000%, 11/15/2025 | 849,849 | |
550,000 | UDR, Inc., Sr. Unsecd. Note, Series GMTN, 3.500%, 1/15/2028 | 617,384 | |
TOTAL | 2,413,761 | ||
Financial Institution - REIT - Healthcare—0.2% | |||
300,000 | Healthcare Trust of America, Sr. Unsecd. Note, 2.000%, 3/15/2031 | 300,507 | |
600,000 | Physicians Realty Trust, Sr. Unsecd. Note, 3.950%, 1/15/2028 | 650,371 | |
450,000 | Welltower, Inc., Sr. Unsecd. Note, 4.250%, 4/1/2026 | 524,558 | |
TOTAL | 1,475,436 | ||
Financial Institution - REIT - Office—0.2% | |||
130,000 | Alexandria Real Estate Equities, Inc., Sr. Unsecd. Note, 1.875%, 2/1/2033 | 130,048 | |
400,000 | Alexandria Real Estate Equities, Inc., Sr. Unsecd. Note, 3.950%, 1/15/2028 | 464,996 | |
750,000 | Boston Properties LP, Sr. Unsecd. Note, 3.650%, 2/1/2026 | 855,685 | |
TOTAL | 1,450,729 | ||
Financial Institution - REIT - Other—0.1% | |||
150,000 | WP Carey, Inc., Sr. Unsecd. Note, 2.400%, 2/1/2031 | 156,033 | |
295,000 | WP Carey, Inc., Sr. Unsecd. Note, 3.850%, 7/15/2029 | 339,203 | |
250,000 | WP Carey, Inc., Sr. Unsecd. Note, 4.600%, 4/1/2024 | 277,709 | |
TOTAL | 772,945 | ||
Financial Institution - REIT - Retail—0.1% | |||
700,000 | Regency Centers LP, Sr. Unsecd. Note, 4.125%, 3/15/2028 | 798,854 | |
Technology—1.1% | |||
600,000 | Apple, Inc., Sr. Unsecd. Note, 2.400%, 8/20/2050 | 615,378 | |
350,000 | Apple, Inc., Sr. Unsecd. Note, 2.500%, 2/9/2022 | 358,014 | |
75,000 | Autodesk, Inc., Sr. Unsecd. Note, 4.375%, 6/15/2025 | 85,804 | |
318,000 | Broadcom, Inc., Sr. Unsecd. Note, 4.110%, 9/15/2028 | 364,381 |
Shares or Principal Amount | Value | ||
CORPORATE BONDS—continued | |||
Technology—continued | |||
$ 250,000 | Broadcom, Inc., Sr. Unsecd. Note, 4.150%, 11/15/2030 | $289,574 | |
75,000 | Broadcom, Inc., Sr. Unsecd. Note, 4.700%, 4/15/2025 | 85,965 | |
350,000 | Cisco Systems, Inc., 3.625%, 3/4/2024 | 384,985 | |
525,000 | Dell International LLC / EMC Corp., Sec. Fac. Bond, 144A, 5.850%, 7/15/2025 | 631,042 | |
240,000 | Equifax, Inc., Sr. Unsecd. Note, 2.600%, 12/1/2024 | 257,290 | |
200,000 | Experian Finance PLC., Sr. Unsecd. Note, 144A, 4.250%, 2/1/2029 | 241,001 | |
145,000 | Fidelity National Information Services, Inc., Sr. Unsecd. Note, 3.750%, 5/21/2029 | 170,270 | |
185,000 | Fiserv, Inc., Sr. Unsecd. Note, 3.500%, 7/1/2029 | 211,524 | |
380,000 | Fiserv, Inc., Sr. Unsecd. Note, 3.800%, 10/1/2023 | 414,078 | |
120,000 | Keysight Technologies, Inc., Sr. Unsecd. Note, 3.000%, 10/30/2029 | 132,574 | |
245,000 | Lam Research Corp., Sr. Unsecd. Note, 4.000%, 3/15/2029 | 293,970 | |
70,000 | Micron Technology, Inc., Sr. Unsecd. Note, 2.497%, 4/24/2023 | 72,998 | |
200,000 | Micron Technology, Inc., Sr. Unsecd. Note, 4.975%, 2/6/2026 | 236,555 | |
245,000 | Microsoft Corp., Sr. Unsecd. Note, 2.675%, 6/1/2060 | 266,182 | |
600,000 | Microsoft Corp., Sr. Unsecd. Note, 3.125%, 11/3/2025 | 670,998 | |
600,000 | Oracle Corp., Sr. Unsecd. Note, 3.600%, 4/1/2050 | 700,722 | |
20,000 | Total System Services, Inc., Sr. Unsecd. Note, 4.800%, 4/1/2026 | 23,813 | |
200,000 | Verisk Analytics, Inc., Sr. Unsecd. Note, 4.125%, 3/15/2029 | 240,400 | |
25,000 | Verisk Analytics, Inc., Sr. Unsecd. Note, 5.500%, 6/15/2045 | 35,480 | |
TOTAL | 6,782,998 | ||
Technology Services—0.0% | |||
145,000 | Global Payments, Inc., Sr. Unsecd. Note, 2.900%, 5/15/2030 | 157,788 | |
Transportation - Airlines—0.1% | |||
140,000 | Southwest Airlines Co., Sr. Unsecd. Note, 4.750%, 5/4/2023 | 152,205 | |
140,000 | Southwest Airlines Co., Sr. Unsecd. Note, 5.250%, 5/4/2025 | 162,238 | |
TOTAL | 314,443 | ||
Transportation - Railroads—0.1% | |||
175,000 | Burlington Northern Santa Fe Corp., Sr. Unsecd. Note, 3.000%, 4/1/2025 | 191,932 | |
105,000 | Canadian Pacific Railway Co., Sr. Unsecd. Note, 2.050%, 3/5/2030 | 110,491 | |
310,000 | Kansas City Southern Industries, Inc., Sr. Unsecd. Note, 3.500%, 5/1/2050 | 345,645 | |
230,000 | Union Pacific Corp., Sr. Unsecd. Note, 2.400%, 2/5/2030 | 247,961 | |
TOTAL | 896,029 | ||
Transportation - Services—0.3% | |||
400,000 | Enterprise Rent-A-Car USA Finance Co., Sr. Unsecd. Note, 144A, 3.300%, 10/15/2022 | 420,330 | |
100,000 | FedEx Corp., Sr. Unsecd. Note, 3.100%, 8/5/2029 | 111,822 | |
300,000 | FedEx Corp., Sr. Unsecd. Note, 4.050%, 2/15/2048 | 362,640 | |
500,000 | Penske Truck Leasing Co. LP & PTL Finance Corp., Sr. Unsecd. Note, 144A, 2.700%, 3/14/2023 | 523,013 | |
500,000 | Ryder System, Inc., Sr. Unsecd. Note, Series MTN, 3.400%, 3/1/2023 | 529,826 | |
TOTAL | 1,947,631 | ||
Utility - Electric—1.4% | |||
600,000 | American Electric Power Co., Inc., Sr. Unsecd. Note, 3.200%, 11/13/2027 | 672,161 | |
400,000 | Avangrid, Inc., Sr. Unsecd. Note, 3.800%, 6/1/2029 | 459,194 | |
300,000 | Berkshire Hathaway Energy Co., Sr. Unsecd. Note, 3.750%, 11/15/2023 | 326,933 | |
195,000 | Black Hills Corp., Sr. Unsecd. Note, 2.500%, 6/15/2030 | 205,112 | |
165,000 | Dominion Energy, Inc., Jr. Sub. Note, 3.071%, 8/15/2024 | 178,187 | |
210,000 | Dominion Energy, Inc., Sr. Unsecd. Note, Series C, 3.375%, 4/1/2030 | 239,367 | |
900,000 | Duke Energy Corp., Sr. Unsecd. Note, 2.650%, 9/1/2026 | 981,143 | |
200,000 | EDP Finance BV, Sr. Unsecd. Note, 144A, 3.625%, 7/15/2024 | 218,421 | |
400,000 | Emera US Finance LP, Sr. Unsecd. Note, 3.550%, 6/15/2026 | 449,762 | |
400,000 | Emera US Finance LP, Sr. Unsecd. Note, 4.750%, 6/15/2046 | 512,353 |
Shares or Principal Amount | Value | ||
CORPORATE BONDS—continued | |||
Utility - Electric—continued | |||
$ 470,000 | Enel Finance International NV, Sr. Unsecd. Note, 144A, 4.625%, 9/14/2025 | $547,481 | |
200,000 | Enel Finance International SA, Company Guarantee, 144A, 6.000%, 10/7/2039 | 285,724 | |
70,000 | EverSource Energy, Sr. Unsecd. Note, 3.350%, 3/15/2026 | 78,057 | |
500,000 | EverSource Energy, Sr. Unsecd. Note, Series N, 3.800%, 12/1/2023 | 547,845 | |
195,000 | Exelon Corp., Sr. Unsecd. Note, 4.700%, 4/15/2050 | 259,765 | |
50,000 | Exelon Generation Co. LLC, Sr. Unsecd. Note, 4.250%, 6/15/2022 | 52,215 | |
160,000 | FirstEnergy Transmission LLC, Sr. Unsecd. Note, 144A, 4.550%, 4/1/2049 | 186,861 | |
93,000 | Fortis, Inc. / Canada, Sr. Unsecd. Note, 3.055%, 10/4/2026 | 102,469 | |
20,000 | Indiana Michigan Power Co., Sr. Unsecd. Note, Series K, 4.550%, 3/15/2046 | 26,198 | |
490,000 | Kansas City Power and Light Co., Sr. Unsecd. Note, 4.200%, 3/15/2048 | 635,625 | |
200,000 | Mississippi Power Co., Sr. Unsecd. Note, 3.950%, 3/30/2028 | 233,309 | |
50,000 | National Rural Utilities Cooperative Finance Corp., Sr. Sub. Note, 5.250%, 4/20/2046 | 55,448 | |
110,000 | National Rural Utilities Cooperative Finance Corp., Sr. Unsecd. Note, 2.950%, 2/7/2024 | 117,756 | |
500,000 | NextEra Energy Capital Holdings, Inc., Sr. Unsecd. Note, 2.250%, 6/1/2030 | 524,570 | |
65,000 | NiSource Finance Corp., Sr. Unsecd. Note, 4.375%, 5/15/2047 | 82,608 | |
300,000 | PPL Capital Funding, Inc., Sr. Unsecd. Note, 3.100%, 5/15/2026 | 331,453 | |
300,000 | Southern Co., Jr. Sub. Note, Series B, 4.000%, 1/15/2051 | 318,068 | |
135,000 | Southern Co., Sr. Unsecd. Note, Series A, 3.700%, 4/30/2030 | 156,489 | |
140,000 | Virginia Electric & Power Co., Sr. Unsecd. Note, Series A, 3.500%, 3/15/2027 | 160,000 | |
TOTAL | 8,944,574 | ||
Utility - Natural Gas—0.5% | |||
35,000 | Dominion Energy Gas Holdings LLC, Sr. Unsecd. Note, Series B, 3.000%, 11/15/2029 | 38,827 | |
115,000 | Dominion Energy Gas Holdings LLC, Sr. Unsecd. Note, Series C, 3.900%, 11/15/2049 | 135,983 | |
700,000 | Enbridge Energy Partners LP, Sr. Unsecd. Note, 5.500%, 9/15/2040 | 865,432 | |
395,000 | National Fuel Gas Co., Sr. Unsecd. Note, 5.500%, 1/15/2026 | 456,013 | |
750,000 | Sempra Energy, Sr. Unsecd. Note, 3.400%, 2/1/2028 | 855,874 | |
120,000 | Southern Natural Gas, Sr. Unsecd. Note, 144A, 4.800%, 3/15/2047 | 140,573 | |
690,000 | TransCanada PipeLines Ltd., Sr. Secd. Note, 5.100%, 3/15/2049 | 923,382 | |
TOTAL | 3,416,084 | ||
TOTAL CORPORATE BONDS (IDENTIFIED COST $117,841,814) | 132,899,697 | ||
U.S. TREASURIES—10.8% | |||
Treasury Inflation-Indexed Note—1.3% | |||
2,318,561 | U.S. Treasury Inflation-Protected Notes, 0.125%, 4/15/2025 | 2,493,007 | |
2,335,811 | U.S. Treasury Inflation-Protected Notes, 0.125%, 7/15/2030 | 2,618,990 | |
2,329,417 | U.S. Treasury Inflation-Protected Notes, 0.250%, 2/15/2050 | 2,771,783 | |
10,989 | U.S. Treasury Inflation-Protected Notes, 1.000%, 2/15/2046 | 14,994 | |
TOTAL | 7,898,774 | ||
U.S. Treasury Bond—1.2% | |||
150,000 | United States Treasury Bond, 1.375%, 11/15/2040 | 148,263 | |
760,000 | United States Treasury Bond, 1.625%, 11/15/2050 | 756,289 | |
20,000 | United States Treasury Bond, 2.750%, 11/15/2047 | 25,094 | |
2,000,000 | United States Treasury Bond, 2.875%, 5/15/2049 | 2,580,564 | |
1,000 | United States Treasury Bond, 3.000%, 11/15/2044 | 1,294 | |
900,000 | United States Treasury Bond, 3.000%, 2/15/2049 | 1,186,322 | |
2,000,000 | United States Treasury Bond, 3.125%, 5/15/2048 | 2,683,900 | |
TOTAL | 7,381,726 | ||
U.S. Treasury Note—8.3% | |||
3,000,000 | United States Treasury Note, 0.125%, 6/30/2022 | 3,000,325 | |
1,350,000 | United States Treasury Note, 0.125%, 11/30/2022 | 1,350,032 |
Shares or Principal Amount | Value | ||
U.S. TREASURIES—continued | |||
U.S. Treasury Note—continued | |||
$ 1,500,000 | United States Treasury Note, 0.250%, 9/30/2025 | $1,493,922 | |
1,025,000 | United States Treasury Note, 0.375%, 11/30/2025 | 1,026,250 | |
5,700,000 | 4 | United States Treasury Note, 0.500%, 3/15/2023 | 5,746,107 |
600,000 | United States Treasury Note, 0.625%, 11/30/2027 | 599,614 | |
900,000 | United States Treasury Note, 0.625%, 8/15/2030 | 877,078 | |
400,000 | United States Treasury Note, 0.875%, 11/15/2030 | 398,393 | |
18,000,000 | 4 | United States Treasury Note, 1.375%, 6/30/2023 | 18,546,824 |
4,500,000 | United States Treasury Note, 1.500%, 8/31/2021 | 4,540,689 | |
2,500,000 | United States Treasury Note, 1.500%, 9/15/2022 | 2,558,022 | |
900,000 | United States Treasury Note, 1.750%, 12/31/2024 | 953,179 | |
7,500,000 | United States Treasury Note, 1.750%, 11/15/2029 | 8,101,469 | |
1,000,000 | United States Treasury Note, 2.000%, 10/31/2022 | 1,034,024 | |
900,000 | United States Treasury Note, 2.125%, 11/30/2024 | 965,486 | |
50,000 | United States Treasury Note, 2.250%, 11/15/2027 | 55,490 | |
40,000 | United States Treasury Note, 2.875%, 5/31/2025 | 44,502 | |
300,000 | United States Treasury Note, 2.875%, 5/15/2028 | 347,384 | |
500,000 | United States Treasury Note, 3.125%, 11/15/2028 | 591,660 | |
TOTAL | 52,230,450 | ||
TOTAL U.S. TREASURIES (IDENTIFIED COST $64,181,520) | 67,510,950 | ||
COMMERCIAL MORTGAGE-BACKED SECURITIES—0.8% | |||
Agency Commercial Mortgage-Backed Securities—0.5% | |||
1,826,820 | Federal Home Loan Mortgage Corp. REMIC, Series K105, Class A1, 1.536%, 9/25/2029 | 1,885,704 | |
790,000 | FREMF Mortgage Trust 2015-K49 REMIC, Class B, 3.720%, 10/25/2048 | 859,449 | |
TOTAL | 2,745,153 | ||
Commercial Mortgage—0.3% | |||
85,000 | Bank 2017-BN8, Class A4, 3.488%, 11/15/2050 | 96,902 | |
800,000 | Benchmark Mortgage Trust 2020-B19, Class A5, 1.850%, 9/15/2053 | 820,516 | |
50,000 | Commercial Mortgage Trust 2015-DC1, Class AM, 3.724%, 2/10/2048 | 54,362 | |
1,000,000 | Fontainebleau Miami Beach Trust, Class B, 3.447%, 12/10/2036 | 1,034,201 | |
100,000 | JPMDB Commercial Mortgage Securities Trust 2016-C4, Class A3, 3.141%, 12/15/2049 | 111,046 | |
TOTAL | 2,117,027 | ||
TOTAL COMMERCIAL MORTGAGE-BACKED SECURITIES (IDENTIFIED COST $4,686,061) | 4,862,180 | ||
FOREIGN GOVERNMENTS/AGENCIES—0.2% | |||
Sovereign—0.2% | |||
600,000 | Colombia, Government of, Sr. Unsecd. Note, 4.500%, 3/15/2029 | 693,750 | |
600,000 | Mexico, Government of, 3.750%, 1/11/2028 | 674,136 | |
200,000 | Poland, Government of, 4.000%, 1/22/2024 | 221,475 | |
TOTAL FOREIGN GOVERNMENTS/AGENCIES (IDENTIFIED COST $1,434,800) | 1,589,361 | ||
MORTGAGE-BACKED SECURITIES—0.0% | |||
Federal National Mortgage Association—0.0% | |||
21,958 | Federal National Mortgage Association, Pool AO8829, 3.500%, 7/1/2042 | 23,838 | |
Government National Mortgage Association—0.0% | |||
5,333 | Government National Mortgage Association, Pool 2796, 7.000%, 8/20/2029 | 6,080 | |
3,250 | Government National Mortgage Association, Pool 3040, 7.000%, 2/20/2031 | 3,754 | |
9,241 | Government National Mortgage Association, Pool 3188, 6.500%, 1/20/2032 | 10,682 |
Shares or Principal Amount | Value | ||
MORTGAGE-BACKED SECURITIES—continued | |||
Government National Mortgage Association—continued | |||
$ 10,654 | Government National Mortgage Association, Pool 3239, 6.500%, 5/20/2032 | $12,372 | |
TOTAL | 32,888 | ||
TOTAL MORTGAGE-BACKED SECURITIES (IDENTIFIED COST $51,558) | 56,726 | ||
ADJUSTABLE RATE MORTGAGE—0.0% | |||
Federal National Mortgage Association—0.0% | |||
2,452 | 3 | Federal National Mortgage Association ARM, 2.329%, 9/1/2037 (IDENTIFIED COST $2,470) | 2,578 |
INVESTMENT COMPANIES—20.8% | |||
1,065,167 | Bank Loan Core Fund | 10,204,299 | |
1,246,391 | Emerging Markets Core Fund | 13,049,717 | |
3,450,059 | Federated Hermes High Income Bond Fund II, Class P | 22,114,880 | |
1,050 | Federated Hermes Short-Intermediate Government Fund, Institutional Shares | 11,925 | |
7,384,327 | Federated Mortgage Core Portfolio | 74,360,167 | |
1,157,767 | Project and Trade Finance Core Fund | 10,223,086 | |
TOTAL INVESTMENT COMPANIES (IDENTIFIED COST $123,296,148) | 129,964,074 | ||
REPURCHASE AGREEMENT—2.2% | |||
$13,824,000 | Interest in $1,000,000,000 joint repurchase agreement 0.08%, dated 12/31/2020 under which Bank of Montreal will repurchase securities provided as collateral for $1,000,008,889 on 1/4/2021. The securities provided as collateral at the end of the period held with BNY Mellon as tri-party agent, were U.S. Government Agency securities with various maturities to 5/20/2069 and the market value of those underlying securities was $1,022,038,963. (IDENTIFIED COST $13,824,000) | 13,824,000 | |
TOTAL INVESTMENT IN SECURITIES—99.6% (IDENTIFIED COST $541,408,725)5 | 623,769,810 | ||
OTHER ASSETS AND LIABILITIES - NET—0.4%6 | 2,191,438 | ||
TOTAL NET ASSETS—100.0% | $625,961,248 |
Description | Number of Contracts | Notional Value | Expiration Date | Value and Unrealized Appreciation (Depreciation) |
Long Futures: | ||||
1S&P 500 E-Mini Long Futures | 865 | $162,135,600 | March 2021 | $2,953,713 |
1United States Treasury Notes 5-Year Long Futures | 69 | $8,705,320 | March 2021 | $16,578 |
1United States Treasury Ultra Bond Long Futures | 15 | $3,203,438 | March 2021 | $(62,260) |
Short Future: | ||||
1United States Treasury Notes 10-Year Short Futures | 48 | $6,627,750 | March 2021 | $1,023 |
NET UNREALIZED APPRECIATION ON FUTURES CONTRACTS | $2,909,054 | |||
Value as of 12/31/2019 | Purchases at Cost | Proceeds from Sales | Change in Unrealized Appreciation/ Depreciation | Net Realized Gain/ (Loss) | Value as of 12/31/2020 | Shares Held as of 12/31/2020 | Dividend Income | |
Health Care: | ||||||||
Akouos, Inc. | $— | $242,570 | $(151,674) | $18,070 | $49,674 | $158,640 | 8,000 | $— |
Frequency Therapeutics, Inc. | $525,900 | $601,587 | $(1,323,861) | $66,231 | $412,223 | $282,080 | 8,000 | $— |
TOTAL OF AFFILIATED COMPANIES TRANSACTIONS | $525,900 | $844,157 | $(1,475,535) | $84,301 | $461,897 | $440,720 | 16,000 | $— |
Affiliates | Value as of 12/31/2019 | Purchases at Cost | Proceeds from Sales | Change in Unrealized Appreciation/ Depreciation | Net Realized Gain/ (Loss) | Value as of 12/31/2020 | Shares Held as of 12/31/2020 | Dividend Income |
Bank Loan Core Fund | $7,249,549 | $5,080,558 | $(1,900,000) | $9,610 | $(235,418) | $10,204,299 | 1,065,167 | $280,542 |
Emerging Markets Core Fund | $12,098,932 | $4,998,934 | $(4,550,000) | $472,650 | $29,201 | $13,049,717 | 1,246,391 | $648,983 |
Federated Hermes High Income Bond Fund II, Class P | $17,136,381 | $10,246,383 | $(5,950,000) | $616,716 | $65,400 | $22,114,880 | 3,450,059 | $846,383 |
Federated Hermes Short- Intermediate Government Fund, Institutional Shares | $11,276 | $162 | $— | $487 | $— | $11,925 | 1,050 | $184 |
Federated Mortgage Core Portfolio | $83,776,815 | $24,359,910 | $(35,600,000) | $1,015,647 | $807,795 | $74,360,167 | 7,384,326 | $2,060,167 |
Project and Trade Finance Core Fund | $17,281,796 | $435,231 | $(7,200,000) | $163,540 | $(457,481) | $10,223,086 | 1,157,767 | $435,484 |
TOTAL OF AFFILIATED TRANSACTIONS | $137,554,749 | $45,121,178 | $(55,200,000) | $2,278,650 | $209,497 | $129,964,074 | 14,304,760 | $4,271,743 |
1 | Non-income-producing security. |
2 | Market quotations and price evaluations are not available. Fair value determined using significant unobservable inputs in accordance with procedures established by and under the general supervision of the Fund’s Board of Trustees (the “Trustees”). |
3 | Floating/adjustable note with current rate and current maturity or next reset date shown. Adjustable rate mortgage security coupons are based on the weighted average note rates of the underlying mortgages less the guarantee and servicing fees. These securities do not indicate an index and spread in their description above. |
4 | All or a portion of this security is pledged as collateral to ensure the Fund is able to satisfy the obligations of its outstanding futures contracts. |
5 | The cost of investments for federal tax purposes amounts to $547,610,823. |
6 | Assets, other than investments in securities, less liabilities. See Statement of Assets and Liabilities. |
Valuation Inputs | ||||
Level 1— Quoted Prices | Level 2— Other Significant Observable Inputs | Level 3— Significant Unobservable Inputs | Total | |
Equity Securities: | ||||
Common Stocks | ||||
Domestic | $259,791,177 | $— | $841,272 | $260,632,449 |
International | 12,247,480 | 180,315 | — | 12,427,795 |
Debt Securities: | ||||
Corporate Bonds | — | 132,899,697 | — | 132,899,697 |
U.S. Treasuries | — | 67,510,950 | — | 67,510,950 |
Commercial Mortgage-Backed Securities | — | 4,862,180 | — | 4,862,180 |
Foreign Governments/Agencies | — | 1,589,361 | — | 1,589,361 |
Mortgage-Backed Securities | — | 56,726 | — | 56,726 |
Adjustable Rate Mortgage | — | 2,578 | — | 2,578 |
Investment Companies1 | 119,740,988 | — | — | 129,964,074 |
Repurchase Agreement | — | 13,824,000 | — | 13,824,000 |
TOTAL SECURITIES | $391,779,645 | $220,925,807 | $841,272 | $623,769,810 |
Other Financial Instruments2 | ||||
Assets | $2,971,314 | $— | $— | $2,971,314 |
Liabilities | (62,260) | — | — | (62,260) |
TOTAL OTHER FINANCIAL INSTRUMENTS | $2,909,054 | $— | $— | $2,909,054 |
1 | As permitted by U.S. generally accepted accounting principles (GAAP), an Investment Company valued at $10,223,086 is measured at fair valued using the net asset value (NAV) per share practical expedient and has not been categorized in the chart above but is included in the Total column. The amount included herein is intended to permit reconciliation of the fair value classifications to the amounts presented on the Statement of Assets and Liabilities. The price of shares redeemed of Project and Trade Finance Core Fund may be determined as of the closing NAV of the fund up to twenty-four days after receipt of a shareholder redemption request. |
2 | Other financial instruments are futures contracts. |
The following acronym(s) are used throughout this portfolio: | ||
ADR | —American Depositary Receipt | |
ARM | —Adjustable Rate Mortgage | |
BKNT | —Bank Notes | |
FREMF | —Freddie Mac Multifamily K-Deals | |
GMTN | —Global Medium Term Note | |
LIBOR | —London Interbank Offered Rate | |
MTN | —Medium Term Note | |
REIT | —Real Estate Investment Trust | |
REMIC | —Real Estate Mortgage Investment Conduit | |
Year Ended December 31, | |||||
2020 | 2019 | 2018 | 2017 | 2016 | |
Net Asset Value, Beginning of Period | $11.30 | $9.60 | $10.80 | $9.52 | $9.29 |
Income From Investment Operations: | |||||
Net investment income (loss)1 | 0.19 | 0.24 | 0.23 | 0.29 | 0.34 |
Net realized and unrealized gain (loss) | (0.13) | 1.68 | (1.13) | 1.39 | 0.34 |
Total From Investment Operations | 0.06 | 1.92 | (0.90) | 1.68 | 0.68 |
Less Distributions: | |||||
Distributions from net investment income | (0.27) | (0.22) | (0.30) | (0.40) | (0.45) |
Net Asset Value, End of Period | $11.09 | $11.30 | $9.60 | $10.80 | $9.52 |
Total Return2 | 0.93% | 20.23% | (8.49)% | 18.11% | 7.69% |
Ratios to Average Net Assets: | |||||
Net expenses3 | 0.92% | 0.91% | 0.89% | 0.83% | 0.79%4 |
Net investment income | 1.82% | 2.28% | 2.26% | 2.91% | 3.72% |
Expense waiver/reimbursement5 | 0.01% | 0.02% | 0.03% | 0.09% | 0.14% |
Supplemental Data: | |||||
Net assets, end of period (000 omitted) | $586,281 | $651,498 | $632,957 | $621,804 | $563,745 |
Portfolio turnover | 61% | 47% | 96% | 71% | 90% |
1 | Per share numbers have been calculated using the average shares method. |
2 | Based on net asset value. Total returns do not reflect any additional fees or expenses that may be imposed by separate accounts of insurance companies or in connection with any variable annuity or variable life insurance contract. |
3 | Amount does not reflect net expenses incurred by investment companies in which the Fund may invest. |
4 | The net expense ratio is calculated without reduction for expense offset arrangements. The net expense ratio was 0.79% for the year ended December 31, 2016, after taking into account these expense reductions. |
5 | This expense decrease is reflected in both the net expense and the net investment income ratios shown above. Amount does not reflect expense waiver/ reimbursement recorded by investment companies in which the Fund may invest. |
Year Ended December 31, | Period Ended 12/31/20181 | ||
2020 | 2019 | ||
Net Asset Value, Beginning of Period | $11.27 | $9.59 | $10.08 |
Income From Investment Operations: | |||
Net investment income (loss)2 | 0.16 | 0.21 | 0.13 |
Net realized and unrealized gain (loss) | (0.12) | 1.68 | (0.62) |
Total From Investment Operations | 0.04 | 1.89 | (0.49) |
Less Distributions: | |||
Distributions from net investment income | (0.22) | (0.21) | — |
Net Asset Value, End of Period | $11.09 | $11.27 | $9.59 |
Total Return3 | 0.71% | 19.92% | (4.86)% |
Ratios to Average Net Assets: | |||
Net expenses4 | 1.17% | 1.16% | 1.15%5 |
Net investment income | 1.57% | 2.03% | 1.91%5 |
Expense waiver/reimbursement6 | 0.01% | 0.02% | 0.02%5 |
Supplemental Data: | |||
Net assets, end of period (000 omitted) | $39,680 | $44,161 | $44,037 |
Portfolio turnover | 61% | 47% | 96%7 |
1 | Reflects operations for the period from April 26, 2018 (date of initial investment) to December 31, 2018. |
2 | Per share numbers have been calculated using the average shares method. |
3 | Based on net asset value. Total returns do not reflect any additional fees or expenses that may be imposed by separate accounts of insurance companies or in connection with any variable annuity or variable life insurance contract. Total returns for periods of less than one year are not annualized. |
4 | Amount does not reflect net expenses incurred by investment companies in which the Fund may invest. |
5 | Computed on an annualized basis. |
6 | This expense decrease is reflected in both the net expense and the net investment income ratios shown above. Amount does not reflect expense waiver/ reimbursement recorded by investment companies in which the Fund may invest. |
7 | Portfolio turnover is calculated at the Fund level. Percentage indicated was calculated for the year ended December 31, 2018. |
Assets: | |
Investment in securities, at value including $129,964,074 of investment in affiliated holdings and $440,720 of investment in affiliated companies* (identified cost $541,408,725) | $623,769,810 |
Cash | 835 |
Due from broker (Note 2) | 2,000 |
Income receivable | 1,509,861 |
Income receivable from affiliated holdings | 296,290 |
Receivable for investments sold | 376,578 |
Receivable for shares sold | 18,711 |
Receivable for variation margin on futures contracts | 1,073,201 |
Total Assets | 627,047,286 |
Liabilities: | |
Payable for investments purchased | 300,179 |
Payable for shares redeemed | 626,376 |
Payable for investment adviser fee (Note 5) | 12,404 |
Payable for administrative fee (Note 5) | 1,669 |
Payable for custodian fees | 26,272 |
Payable for portfolio accounting fees | 78,802 |
Payable for distribution services fee (Note 5) | 8,321 |
Accrued expenses (Note 5) | 32,015 |
Total Liabilities | 1,086,038 |
Net assets for 56,466,180 shares outstanding | $625,961,248 |
Net Assets Consist of: | |
Paid-in capital | $588,024,559 |
Total distributable earnings (loss) | 37,936,689 |
Total Net Assets | $625,961,248 |
Net Asset Value, Offering Price and Redemption Proceeds Per Share: | |
Primary Shares: | |
$586,281,090 ÷ 52,887,537 shares outstanding, no par value, unlimited shares authorized | $11.09 |
Service Shares: | |
$39,680,158 ÷ 3,578,643 shares outstanding, no par value, unlimited shares authorized | $11.09 |
* | See information listed after the Fund’s Portfolio of Investments. |
Investment Income: | |
Dividends (including $4,271,743 received from affiliated holdings* and net of foreign taxes withheld of $5,444) | $10,971,589 |
Interest | 5,944,782 |
TOTAL INCOME | 16,916,371 |
Expenses: | |
Investment adviser fee (Note 5) | 4,636,543 |
Administrative fee (Note 5) | 611,557 |
Custodian fees | 50,018 |
Transfer agent fees | 46,212 |
Directors’/Trustees’ fees (Note 5) | 4,309 |
Auditing fees | 32,840 |
Legal fees | 16,195 |
Portfolio accounting fees | 187,616 |
Distribution services fee (Note 5) | 97,173 |
Printing and postage | 135,506 |
Miscellaneous (Note 5) | 34,935 |
TOTAL EXPENSES | 5,852,904 |
Reimbursement of investment adviser fee (Note 5) | (89,336) |
Net expenses | 5,763,568 |
Net investment income | 11,152,803 |
Realized and Unrealized Gain (Loss) on Investments, Foreign Currency Transactions, Futures Contracts and Written Options: | |
Net realized gain on investments (including net realized gain of $671,394 on sales of investments in affiliated companies and holdings*) | 13,550,335 |
Net realized gain on foreign currency transactions | 27,996 |
Net realized loss on futures contracts | (37,729,994) |
Net realized gain on written options | 152,624 |
Net change in unrealized appreciation of investments (including net change in unrealized appreciation of $2,362,951 on investments in affiliated companies and holdings*) | 23,532,316 |
Net change in unrealized appreciation of translation of assets and liabilities in foreign currency | 75 |
Net change in unrealized appreciation of futures contracts | (8,548,630) |
Net change in unrealized depreciation of written options | (4,089) |
Net realized and unrealized gain (loss) on investments, foreign currency transactions, futures contracts and written options | (9,019,367) |
Change in net assets resulting from operations | $2,133,436 |
* | See information listed after the Fund’s Portfolio of Investments. |
Year Ended December 31 | 2020 | 2019 |
Increase (Decrease) in Net Assets | ||
Operations: | ||
Net investment income (loss) | $11,152,803 | $15,670,104 |
Net realized gain (loss) | (23,999,039) | 24,776,133 |
Net change in unrealized appreciation/depreciation | 14,979,672 | 87,210,130 |
CHANGE IN NET ASSETS RESULTING FROM OPERATIONS | 2,133,436 | 127,656,367 |
Distributions to Shareholders: | ||
Primary Shares | (14,937,718) | (13,858,559) |
Service Shares | (827,265) | (900,138) |
CHANGE IN NET ASSETS RESULTING FROM DISTRIBUTIONS TO SHAREHOLDERS | (15,764,983) | (14,758,697) |
Share Transactions: | ||
Proceeds from sale of shares | 29,845,467 | 25,506,299 |
Net asset value of shares issued to shareholders in payment of distributions declared | 15,764,983 | 14,758,695 |
Cost of shares redeemed | (101,676,772) | (134,498,167) |
CHANGE IN NET ASSETS RESULTING FROM SHARE TRANSACTIONS | (56,066,322) | (94,233,173) |
Change in net assets | (69,697,869) | 18,664,497 |
Net Assets: | ||
Beginning of period | 695,659,117 | 676,994,620 |
End of period | $625,961,248 | $695,659,117 |
Fair Value of Derivative Instruments | ||
Assets | ||
Statement of Assets and Liabilities Location | Fair Value | |
Derivatives not accounted for as hedging instruments under ASC Topic 815 | ||
Interest rate contracts | Receivable for variation margin on futures contracts | $(44,659)* |
Equity contracts | Receivable for variation margin on futures contracts | 2,953,713* |
Total derivatives not accounted for as hedging instruments under ASC Topic 815 | $2,909,054 | |
* | Includes net cumulative appreciation of futures contracts as reported in the footnotes to the Portfolio of Investments. Only the current day’s variation margin is reported within the Statement of Assets and Liabilities. |
Amount of Realized Gain or (Loss) on Derivatives Recognized in Income | ||||
Futures Contracts | Purchased Options Contracts1 | Written Options Contracts | Total | |
Interest rate contracts | $791,058 | $— | $— | $791,058 |
Equity contracts | (38,521,052) | 4,728,361 | 152,624 | (33,640,067) |
TOTAL | $(37,729,994) | $4,728,361 | $152,624 | $(32,849,009) |
1 | The net realized gain on Purchased Option Contracts is found within the Net realized gain on investments on the Statement of Operations. |
Change in Unrealized Appreciation or (Depreciation) on Derivatives Recognized in Income | ||||
Futures Contracts | Purchased Options Contracts2 | Written Options Contracts | Total | |
Interest rate contracts | $167,515 | $— | $— | $167,515 |
Equity contracts | (8,716,145) | 31,904 | (4,089) | (8,688,330) |
TOTAL | $(8,548,630) | $31,904 | $(4,089) | $(8,520,815) |
2 | The net change in unrealized depreciation of Purchased Option Contracts is found within the Net change in unrealized appreciation of investments on the Statement of Operations. |
Year Ended 12/31/2020 | Year Ended 12/31/2019 | |||
Primary Shares: | Shares | Amount | Shares | Amount |
Shares sold | 2,708,594 | $27,733,700 | 2,373,923 | $24,532,576 |
Shares issued to shareholders in payment of distributions declared | 1,577,373 | 14,937,718 | 1,369,423 | 13,858,559 |
Shares redeemed | (9,062,173) | (95,024,537) | (12,039,584) | (125,610,367) |
NET CHANGE RESULTING FROM PRIMARY SHARE TRANSACTIONS | (4,776,206) | $(52,353,119) | (8,296,238) | $(87,219,232) |
Year Ended 12/31/2020 | Year Ended 12/31/2019 | |||
Service Shares: | Shares | Amount | Shares | Amount |
Shares sold | 209,920 | $2,111,767 | 94,757 | $973,723 |
Shares issued to shareholders in payment of distributions declared | 87,172 | 827,265 | 88,946 | 900,136 |
Shares redeemed | (635,596) | (6,652,235) | (858,584) | (8,887,800) |
NET CHANGE RESULTING FROM SERVICE SHARE TRANSACTIONS | (338,504) | $(3,713,203) | (674,881) | $(7,013,941) |
NET CHANGE RESULTING FROM TOTAL FUND SHARE TRANSACTIONS | (5,114,710) | $(56,066,322) | (8,971,119) | $(94,233,173) |
2020 | 2019 | |
Ordinary income | $15,764,983 | $14,758,697 |
Undistributed ordinary income | $11,448,269 |
Net unrealized appreciation | $75,706,771 |
Capital loss carryforwards | $(49,218,351) |
Short-Term | Long-Term | Total |
$14,831,773 | $34,386,578 | $49,218,351 |
Administrative Fee | Average Daily Net Assets of the Investment Complex |
0.100% | on assets up to $50 billion |
0.075% | on assets over $50 billion |
Distribution Services Fees Incurred | |
Service Shares | $97,173 |
Purchases | $302,820,521 |
Sales | $330,646,695 |
February 16, 2021
Beginning Account Value 7/1/2020 | Ending Account Value 12/31/2020 | Expenses Paid During Period1 | |
Actual: | |||
Primary Shares | $1,000 | $1,111.20 | $4.88 |
Service Shares | $1,000 | $1,109.00 | $6.20 |
Hypothetical (assuming a 5% return before expenses): | |||
Primary Shares | $1,000 | $1,020.51 | $4.67 |
Service Shares | $1,000 | $1,019.25 | $5.94 |
1 | Expenses are equal to the Fund’s annualized net expense ratios, multiplied by the average account value over the period, multiplied by 184/366 (to reflect the one-half-year period). The expenses shown in the table do not include the charges and expenses imposed by the insurance company under the variable insurance product contract. Please refer to the variable insurance product prospectus for a complete listing of these expenses. The annualized net expense ratios are as follows: |
Primary Shares | 0.92% |
Service Shares | 1.17% |
Name Birth Date Positions Held with Trust Date Service Began | Principal Occupation(s) for Past Five Years, Other Directorships Held and Previous Position(s) |
J. Christopher Donahue* Birth Date: April 11, 1949 Trustee Indefinite Term Began serving: September 1993 | Principal Occupations: Principal Executive Officer and President of certain of the Funds in the Federated Hermes Fund Family; Director or Trustee of the Funds in the Federated Hermes Fund Family; President, Chief Executive Officer and Director, Federated Hermes, Inc.; Chairman and Trustee, Federated Investment Management Company; Trustee, Federated Investment Counseling; Chairman and Director, Federated Global Investment Management Corp.; Chairman and Trustee, Federated Equity Management Company of Pennsylvania; Trustee, Federated Shareholder Services Company; Director, Federated Services Company. Previous Positions: President, Federated Investment Counseling; President and Chief Executive Officer, Federated Investment Management Company, Federated Global Investment Management Corp. and Passport Research, Ltd; Chairman, Passport Research, Ltd. |
Thomas R. Donahue* Birth Date: October 20, 1958 Trustee Indefinite Term Began serving: May 2016 | Principal Occupations: Director or Trustee of certain of the funds in the Federated Hermes Fund Family; Chief Financial Officer, Treasurer, Vice President and Assistant Secretary, Federated Hermes, Inc.; Chairman and Trustee, Federated Administrative Services; Chairman and Director, Federated Administrative Services, Inc.; Trustee and Treasurer, Federated Advisory Services Company; Director or Trustee and Treasurer, Federated Equity Management Company of Pennsylvania, Federated Global Investment Management Corp., Federated Investment Counseling, and Federated Investment Management Company; Director, MDTA LLC; Director, Executive Vice President and Assistant Secretary, Federated Securities Corp.; Director or Trustee and Chairman, Federated Services Company and Federated Shareholder Services Company; and Director and President, FII Holdings, Inc. Previous Positions: Director, Federated Hermes, Inc.; Assistant Secretary, Federated Investment Management Company, Federated Global Investment Management Company and Passport Research, LTD; Treasurer, Passport Research, LTD; Executive Vice President, Federated Securities Corp.; and Treasurer, FII Holdings, Inc. |
Name Birth Date Positions Held with Trust Date Service Began | Principal Occupation(s) for Past Five Years, Other Directorships Held, Previous Position(s) and Qualifications |
John T. Collins Birth Date: January 24, 1947 Trustee Indefinite Term Began serving: October 2013 | Principal Occupations: Director or Trustee, and Chair of the Board of Directors or Trustees, of the Federated Hermes Fund Family; formerly, Chairman and CEO, The Collins Group, Inc. (a private equity firm) (Retired). Other Directorships Held: Chairman of the Board of Directors, Director, KLX Energy Services Holdings, Inc. (oilfield services); former Director of KLX Corp. (aerospace). Qualifications: Mr. Collins has served in several business and financial management roles and directorship positions throughout his career. Mr. Collins previously served as Chairman and CEO of The Collins Group, Inc. (a private equity firm) and as a Director of KLX Corp. Mr. Collins serves as Chairman Emeriti, Bentley University. Mr. Collins previously served as Director and Audit Committee Member, Bank of America Corp.; Director, FleetBoston Financial Corp.; and Director, Beth Israel Deaconess Medical Center (Harvard University Affiliate Hospital). |
Name Birth Date Positions Held with Trust Date Service Began | Principal Occupation(s) for Past Five Years, Other Directorships Held, Previous Position(s) and Qualifications |
G. Thomas Hough Birth Date: February 28, 1955 Trustee Indefinite Term Began serving: August 2015 | Principal Occupations: Director or Trustee, Chair of the Audit Committee of the Federated Hermes Fund Family; formerly, Vice Chair, Ernst & Young LLP (public accounting firm) (Retired). Other Directorships Held: Director, Chair of the Audit Committee, Equifax, Inc.; Director, Member of the Audit Committee, Haverty Furniture Companies, Inc.; formerly, Director, Member of Governance and Compensation Committees, Publix Super Markets, Inc. Qualifications: Mr. Hough has served in accounting, business management and directorship positions throughout his career. Mr. Hough most recently held the position of Americas Vice Chair of Assurance with Ernst & Young LLP (public accounting firm). Mr. Hough serves on the President’s Cabinet and Business School Board of Visitors for the University of Alabama. Mr. Hough previously served on the Business School Board of Visitors for Wake Forest University, and he previously served as an Executive Committee member of the United States Golf Association. |
Maureen Lally-Green Birth Date: July 5, 1949 Trustee Indefinite Term Began serving: August 2009 | Principal Occupations: Director or Trustee of the Federated Hermes Fund Family; Adjunct Professor Emerita of Law, Duquesne University School of Law; formerly, Dean of the Duquesne University School of Law and Professor of Law and Interim Dean of the Duquesne University School of Law; formerly, Associate General Secretary and Director, Office of Church Relations, Diocese of Pittsburgh. Other Directorships Held: Director, CNX Resources Corporation (formerly known as CONSOL Energy Inc.). Qualifications: Judge Lally-Green has served in various legal and business roles and directorship positions throughout her career. Judge Lally-Green previously held the position of Dean of the School of Law of Duquesne University (as well as Interim Dean). Judge Lally-Green previously served as a member of the Superior Court of Pennsylvania and as a Professor of Law, Duquesne University School of Law. Judge Lally-Green was appointed by the Supreme Court of Pennsylvania to serve on the Supreme Court’s Board of Continuing Judicial Education and the Supreme Court’s Appellate Court Procedural Rules Committee. Judge Lally-Green also currently holds the positions on not for profit or for profit boards of directors as follows: Director and Chair, UPMC Mercy Hospital; Regent, Saint Vincent Seminary; Member, Pennsylvania State Board of Education (public); Director, Catholic Charities, Pittsburgh; and Director CNX Resources Corporation (formerly known as CONSOL Energy Inc.). Judge Lally-Green has held the positions of: Director, Auberle; Director, Epilepsy Foundation of Western and Central Pennsylvania; Director, Ireland Institute of Pittsburgh; Director, Saint Thomas More Society; Director and Chair, Catholic High Schools of the Diocese of Pittsburgh, Inc.; Director, Pennsylvania Bar Institute; Director, St. Vincent College; Director and Chair, North Catholic High School, Inc.; and Director and Vice Chair, Our Campaign for the Church Alive!, Inc. |
Thomas M. O’Neill Birth Date: June 14, 1951 Trustee Indefinite Term Began serving: August 2006 | Principal Occupations: Director or Trustee of the Federated Hermes Fund Family; Sole Proprietor, Navigator Management Company (investment and strategic consulting). Other Directorships Held: None. Qualifications: Mr. O’Neill has served in several business, mutual fund and financial management roles and directorship positions throughout his career. Mr. O’Neill serves as Director, Medicines for Humanity and Director, The Golisano Children’s Museum of Naples, Florida. Mr. O’Neill previously served as Chief Executive Officer and President, Managing Director and Chief Investment Officer, Fleet Investment Advisors; President and Chief Executive Officer, Aeltus Investment Management, Inc.; General Partner, Hellman, Jordan Management Co., Boston, MA; Chief Investment Officer, The Putnam Companies, Boston, MA; Credit Analyst and Lending Officer, Fleet Bank; Director and Consultant, EZE Castle Software (investment order management software); and Director, Midway Pacific (lumber). |
Madelyn A. Reilly Birth Date: February 2, 1956 Trustee Indefinite Term Began serving: November 2020 | Principal Occupations: Director or Trustee of the Federated Hermes Fund Family; Senior Vice President for Legal Affairs, General Counsel and Secretary of the Board of Trustees, Duquesne University. Other Directorships Held: None. Qualifications: Ms. Reilly has served in various business and legal management roles throughout her career. Ms. Reilly previously served as Director of Risk Management and Associate General Counsel, Duquesne University. Prior to her work at Duquesne University, Ms. Reilly served as Assistant General Counsel of Compliance and Enterprise Risk as well as Senior Counsel of Environment, Health and Safety, PPG Industries. |
P. Jerome Richey Birth Date: February 23, 1949 Trustee Indefinite Term Began serving: October 2013 | Principal Occupations: Director or Trustee of the Federated Hermes Fund Family; Management Consultant; Retired; formerly, Senior Vice Chancellor and Chief Legal Officer, University of Pittsburgh and Executive Vice President and Chief Legal Officer, CONSOL Energy Inc. (now split into two separate publicly traded companies known as CONSOL Energy Inc. and CNX Resources Corp.). Other Directorships Held: None. Qualifications: Mr. Richey has served in several business and legal management roles and directorship positions throughout his career. Mr. Richey most recently held the positions of Senior Vice Chancellor and Chief Legal Officer, University of Pittsburgh. Mr. Richey previously served as Chairman of the Board, Epilepsy Foundation of Western Pennsylvania and Chairman of the Board, World Affairs Council of Pittsburgh. Mr. Richey previously served as Chief Legal Officer and Executive Vice President, CONSOL Energy Inc. and CNX Gas Company; and Board Member, Ethics Counsel and Shareholder, Buchanan Ingersoll & Rooney PC (a law firm). |
Name Birth Date Positions Held with Trust Date Service Began | Principal Occupation(s) for Past Five Years, Other Directorships Held, Previous Position(s) and Qualifications |
John S. Walsh Birth Date: November 28, 1957 Trustee Indefinite Term Began serving: January 1999 | Principal Occupations: Director or Trustee of the Federated Hermes Fund Family; President and Director, Heat Wagon, Inc. (manufacturer of construction temporary heaters); President and Director, Manufacturers Products, Inc. (distributor of portable construction heaters); President, Portable Heater Parts, a division of Manufacturers Products, Inc. Other Directorships Held: None. Qualifications: Mr. Walsh has served in several business management roles and directorship positions throughout his career. Mr. Walsh previously served as Vice President, Walsh & Kelly, Inc. (paving contractors). |
Name Birth Date Address Positions Held with Trust Date Service Began | Principal Occupation(s) for Past Five Years and Previous Position(s) |
Lori A. Hensler Birth Date: January 6, 1967 TREASURER Officer since: April 2013 | Principal Occupations: Principal Financial Officer and Treasurer of the Federated Hermes Fund Family; Senior Vice President, Federated Administrative Services; Financial and Operations Principal for Federated Securities Corp.; and Assistant Treasurer, Federated Investors Trust Company. Ms. Hensler has received the Certified Public Accountant designation. Previous Positions: Controller of Federated Hermes, Inc.; Senior Vice President and Assistant Treasurer, Federated Investors Management Company; Treasurer, Federated Investors Trust Company; Assistant Treasurer, Federated Administrative Services, Federated Administrative Services, Inc., Federated Securities Corp., Edgewood Services, Inc., Federated Advisory Services Company, Federated Equity Management Company of Pennsylvania, Federated Global Investment Management Corp., Federated Investment Counseling, Federated Investment Management Company, Passport Research, Ltd., and Federated MDTA, LLC; Financial and Operations Principal for Federated Securities Corp., Edgewood Services, Inc. and Southpointe Distribution Services, Inc. |
Peter J. Germain Birth Date: September 3, 1959 CHIEF LEGAL OFFICER, SECRETARY and EXECUTIVE VICE PRESIDENT Officer since: January 2005 | Principal Occupations: Mr. Germain is Chief Legal Officer, Secretary and Executive Vice President of the Federated Hermes Fund Family. He is General Counsel, Chief Legal Officer, Secretary and Executive Vice President, Federated Hermes, Inc.; Trustee and Senior Vice President, Federated Investors Management Company; Trustee and President, Federated Administrative Services; Director and President, Federated Administrative Services, Inc.; Director and Vice President, Federated Securities Corp.; Director and Secretary, Federated Private Asset Management, Inc.; Secretary, Federated Shareholder Services Company; and Secretary, Retirement Plan Service Company of America. Mr. Germain joined Federated Hermes, Inc. in 1984 and is a member of the Pennsylvania Bar Association. Previous Positions: Deputy General Counsel, Special Counsel, Managing Director of Mutual Fund Services, Federated Hermes, Inc.; Senior Vice President, Federated Services Company; and Senior Corporate Counsel, Federated Hermes, Inc. |
John B. Fisher Birth Date: May 16, 1956 President Officer since: November 2004 | Principal Occupations: Principal Executive Officer and President of certain of the Funds in the Federated Hermes Fund Family; Director or Trustee of certain of the Funds in the Federated Hermes Fund Family; Vice President, Federated Hermes, Inc.; President, Director/Trustee and CEO, Federated Advisory Services Company, Federated Equity Management Company of Pennsylvania, Federated Global Investment Management Corp., Federated Investment Counseling, Federated Investment Management Company; President and CEO of Passport Research, Ltd.; President of some of the Funds in the Federated Fund Complex and Director, Federated Investors Trust Company. Previous Positions: President and Director of the Institutional Sales Division of Federated Securities Corp.; President and Director of Federated Investment Counseling; Director, Edgewood Securities Corp.; Director, Federated Services Company; Director, Federated Hermes, Inc.; Chairman and Director, Southpointe Distribution Services, Inc. and President, Technology, Federated Services Company. |
Stephen Van Meter Birth Date: June 5, 1975 CHIEF COMPLIANCE OFFICER AND SENIOR VICE PRESIDENT Officer since: July 2015 | Principal Occupations: Senior Vice President and Chief Compliance Officer of the Federated Hermes Fund Family; Vice President and Chief Compliance Officer of Federated Hermes, Inc. and Chief Compliance Officer of certain of its subsidiaries. Mr. Van Meter joined Federated Hermes, Inc. in October 2011. He holds FINRA licenses under Series 3, 7, 24 and 66. Previous Positions: Mr. Van Meter previously held the position of Compliance Operating Officer, Federated Hermes, Inc. Prior to joining Federated Hermes, Inc., Mr. Van Meter served at the United States Securities and Exchange Commission in the positions of Senior Counsel, Office of Chief Counsel, Division of Investment Management and Senior Counsel, Division of Enforcement. |
Stephen F. Auth Birth Date: September 13, 1956 101 Park Avenue 41st Floor New York, NY 10178 CHIEF INVESTMENT OFFICER Officer since: November 2002 | Principal Occupations: Stephen F. Auth is Chief Investment Officer of various Funds in the Federated Hermes Fund Family; Executive Vice President, Federated Investment Counseling, Federated Global Investment Management Corp. and Federated Equity Management Company of Pennsylvania. Previous Positions: Executive Vice President, Federated Investment Management Company and Passport Research, Ltd. (investment advisory subsidiary of Federated); Senior Vice President, Global Portfolio Management Services Division; Senior Vice President, Federated Investment Management Company and Passport Research, Ltd.; Senior Managing Director and Portfolio Manager, Prudential Investments. |
Name Birth Date Address Positions Held with Trust Date Service Began | Principal Occupation(s) for Past Five Years and Previous Position(s) |
Robert J. Ostrowski Birth Date: April 26, 1963 Chief Investment Officer Officer since: May 2004 | Principal Occupations: Robert J. Ostrowski joined Federated Hermes, Inc. in 1987 as an Investment Analyst and became a Portfolio Manager in 1990. He was named Chief Investment Officer of Federated Hermes’ taxable fixed-income products in 2004 and also serves as a Senior Portfolio Manager. Mr. Ostrowski became an Executive Vice President of the Fund’s Adviser in 2009 and served as a Senior Vice President of the Fund’s Adviser from 1997 to 2009. Mr. Ostrowski has received the Chartered Financial Analyst designation. He received his M.S. in Industrial Administration from Carnegie Mellon University. |
Deborah A. Cunningham Birth Date: September 15, 1959 Chief Investment Officer Officer since: June 2012 | Principal Occupations: Deborah A. Cunningham was named Chief Investment Officer of Federated Hermes’ money market products in 2004. She joined Federated Hermes in 1981 and has been a Senior Portfolio Manager since 1997 and an Executive Vice President of the Fund’s Adviser since 2009. Ms. Cunningham has received the Chartered Financial Analyst designation and holds an M.S.B.A. in Finance from Robert Morris College. |
Federated Hermes Funds
4000 Ericsson Drive
Warrendale, PA 15086-7561
or call 1-800-341-7400.
CUSIP 313916744

Share Class | Primary | Service |
Federated Hermes Quality Bond Fund II
A Portfolio of Federated Hermes Insurance Series
1 Year | 5 Years | 10 Years | |
Primary Shares | 8.12% | 4.91% | 4.08% |
Service Shares | 7.86% | 4.65% | 3.82% |
BBICI | 7.08% | 4.74% | 4.18% |
Security Type | Percentage of Total Net Assets |
Corporate Debt Securities | 96.9% |
Mortgage-Backed Securities2,3 | 0.0% |
Securities Lending Collateral4 | 2.4% |
Cash Equivalents5 | 2.3% |
Derivative Contracts3,6 | 0.0% |
Other Assets and Liabilities—Net7 | (1.6)% |
TOTAL | 100% |
1 | See the Fund’s Prospectus and Statement of Additional Information for a description of these security types. |
2 | For purposes of this table, mortgage-backed securities include mortgage-backed securities guaranteed by Government Sponsored Entities. |
3 | Represents less than 0.1%. |
4 | Represents cash collateral received for portfolio securities on loan that may be invested in affiliated money market funds, other money market instruments and/or repurchase agreements. |
5 | Cash Equivalents include any investments in money market mutual funds and/or overnight repurchase agreements other than those representing cash collateral for securities lending. |
6 | Based upon net unrealized appreciation (depreciation) or value of the derivative contracts as applicable. Derivative contracts may consist of futures, forwards, options and swaps. The impact of a derivative contract on the Fund’s performance may be larger than its unrealized appreciation (depreciation) or value may indicate. In many cases, the notional value or amount of a derivative contract may provide a better indication of the contract’s significance to the portfolio. More complete information regarding the Fund’s direct investments in derivative contracts, including unrealized appreciation (depreciation), value and notional values or amounts of such contracts, can be found in the table at the end of the Portfolio of Investments included in this Report. |
7 | Assets, other than investments in securities and derivative contracts, less liabilities. See Statement of Assets and Liabilities. |
Principal Amount | Value | ||
CORPORATE BONDS—96.9% | |||
Basic Industry - Chemicals—0.8% | |||
$ 640,000 | FMC Corp., Sr. Unsecd. Note, 3.950%, 2/1/2022 | $658,588 | |
215,000 | Nutrition & Biosciences, Inc., Sr. Unsecd. Note, 144A, 1.230%, 10/1/2025 | 217,382 | |
500,000 | RPM International, Inc., Sr. Unsecd. Note, 4.550%, 3/1/2029 | 583,197 | |
TOTAL | 1,459,167 | ||
Basic Industry - Metals & Mining—0.9% | |||
230,000 | Carpenter Technology Corp., Sr. Unsecd. Note, 4.450%, 3/1/2023 | 240,981 | |
1,000,000 | Reliance Steel & Aluminum Co., Sr. Unsecd. Note, 4.500%, 4/15/2023 | 1,079,177 | |
320,000 | Southern Copper Corp., Sr. Unsecd. Note, 3.500%, 11/8/2022 | 337,319 | |
TOTAL | 1,657,477 | ||
Capital Goods - Aerospace & Defense—3.2% | |||
600,000 | Airbus Group SE, Sr. Unsecd. Note, 144A, 3.150%, 4/10/2027 | 650,403 | |
280,000 | BAE Systems Holdings, Inc., Sr. Unsecd. Note, 144A, 3.850%, 12/15/2025 | 317,872 | |
200,000 | BAE Systems PLC, Sr. Unsecd. Note, 144A, 3.400%, 4/15/2030 | 226,813 | |
200,000 | Boeing Co., Sr. Unsecd. Note, 1.875%, 6/15/2023 | 203,578 | |
600,000 | Boeing Co., Sr. Unsecd. Note, 2.700%, 2/1/2027 | 624,192 | |
584,000 | 1 | Boeing Co., Sr. Unsecd. Note, 2.950%, 2/1/2030 | 604,576 |
519,000 | 1 | Embraer Overseas Ltd., Sr. Unsecd. Note, 144A, 5.696%, 9/16/2023 | 554,038 |
275,000 | General Dynamics Corp., Sr. Unsecd. Note, 3.250%, 4/1/2025 | 303,772 | |
410,000 | Huntington Ingalls Industries, Inc., Sr. Unsecd. Note, 3.483%, 12/1/2027 | 460,100 | |
145,000 | Huntington Ingalls Industries, Inc., Sr. Unsecd. Note, Series WI, 3.844%, 5/1/2025 | 161,587 | |
600,000 | Leidos, Inc., Sr. Unsecd. Note, 144A, 2.300%, 2/15/2031 | 612,044 | |
335,000 | Leidos, Inc., Unsecd. Note, 144A, 3.625%, 5/15/2025 | 374,979 | |
320,000 | Raytheon Technologies Corp., Sr. Unsecd. Note, 3.100%, 11/15/2021 | 325,818 | |
460,000 | 2 | Textron Financial Corp., Jr. Sub. Note, 144A, 1.956% (3-month USLIBOR +1.735%), 2/15/2042 | 336,582 |
295,000 | Textron, Inc., Sr. Unsecd. Note, 4.300%, 3/1/2024 | 324,266 | |
TOTAL | 6,080,620 | ||
Capital Goods - Building Materials—1.2% | |||
165,000 | Allegion PLC, Sr. Unsecd. Note, 3.500%, 10/1/2029 | 183,290 | |
800,000 | Allegion US Holdings Co., Inc., Sr. Unsecd. Note, 3.200%, 10/1/2024 | 855,177 | |
285,000 | Carrier Global Corp., Sr. Unsecd. Note, 2.700%, 2/15/2031 | 306,566 | |
300,000 | Masco Corp., Sr. Unsecd. Note, 2.000%, 10/1/2030 | 305,657 | |
300,000 | Masco Corp., Sr. Unsecd. Note, 3.500%, 11/15/2027 | 340,856 | |
275,000 | Masco Corp., Unsecd. Note, 4.450%, 4/1/2025 | 316,523 | |
TOTAL | 2,308,069 | ||
Capital Goods - Construction Machinery—1.1% | |||
195,000 | CNH Industrial Capital America LLC, Sr. Unsecd. Note, 1.950%, 7/2/2023 | 200,802 | |
500,000 | CNH Industrial Capital America LLC, Sr. Unsecd. Note, 4.375%, 4/5/2022 | 522,656 | |
595,000 | 1 | CNH Industrial NV, Sr. Unsecd. Note, Series MTN, 3.850%, 11/15/2027 | 671,044 |
750,000 | Deere & Co., Sr. Unsecd. Note, 2.600%, 6/8/2022 | 771,718 | |
TOTAL | 2,166,220 | ||
Capital Goods - Diversified Manufacturing—3.8% | |||
750,000 | CK Hutchison Holdings Ltd., Sr. Unsecd. Note, 144A, 2.750%, 3/29/2023 | 782,202 | |
225,000 | General Electric Co., Sr. Unsecd. Note, 4.350%, 5/1/2050 | 273,646 | |
205,000 | Honeywell International, Inc., Sr. Unsecd. Note, 1.350%, 6/1/2025 | 212,229 | |
400,000 | Honeywell International, Inc., Sr. Unsecd. Note, 1.950%, 6/1/2030 | 423,783 | |
585,000 | Lennox International, Inc., Sr. Unsecd. Note, 1.700%, 8/1/2027 | 595,621 | |
1,000,000 | Lennox International, Inc., Sr. Unsecd. Note, 3.000%, 11/15/2023 | 1,055,023 | |
210,000 | Otis Worldwide Corp., Sr. Unsecd. Note, Series WI, 2.565%, 2/15/2030 | 225,744 |
Principal Amount | Value | ||
CORPORATE BONDS—continued | |||
Capital Goods - Diversified Manufacturing—continued | |||
$ 430,000 | Roper Technologies, Inc., Sr. Unsecd. Note, 2.000%, 6/30/2030 | $439,634 | |
250,000 | Roper Technologies, Inc., Sr. Unsecd. Note, 3.650%, 9/15/2023 | 271,339 | |
875,000 | Roper Technologies, Inc., Sr. Unsecd. Note, 3.800%, 12/15/2026 | 1,011,883 | |
800,000 | United Technologies Corp., Sr. Unsecd. Note, 4.125%, 11/16/2028 | 953,944 | |
235,000 | Wabtec Corp., Sr. Unsecd. Note, 3.200%, 6/15/2025 | 253,741 | |
400,000 | Xylem, Inc., Sr. Unsecd. Note, 1.950%, 1/30/2028 | 421,853 | |
250,000 | Xylem, Inc., Sr. Unsecd. Note, 2.250%, 1/30/2031 | 263,490 | |
TOTAL | 7,184,132 | ||
Capital Goods - Packaging—0.3% | |||
500,000 | WestRock Co., Sr. Unsecd. Note, Series WI, 3.750%, 3/15/2025 | 557,591 | |
Communications - Cable & Satellite—1.9% | |||
1,000,000 | CCO Safari II LLC, 4.908%, 7/23/2025 | 1,162,538 | |
300,000 | Charter Communications Operating, LLC/Charter Communications Operating Capital Corp., Sec. Fac. Bond, 2.800%, 4/1/2031 | 317,326 | |
400,000 | Comcast Corp., Sr. Unsecd. Note, 2.350%, 1/15/2027 | 430,716 | |
300,000 | Comcast Corp., Sr. Unsecd. Note, 3.300%, 2/1/2027 | 339,064 | |
750,000 | 1 | Comcast Corp., Sr. Unsecd. Note, 3.950%, 10/15/2025 | 862,035 |
400,000 | Time Warner Cable, Inc., Sr. Unsecd. Note, 8.375%, 3/15/2023 | 467,813 | |
TOTAL | 3,579,492 | ||
Communications - Media & Entertainment—1.9% | |||
300,000 | British Sky Broadcasting Group PLC, 144A, 3.750%, 9/16/2024 | 334,281 | |
132,000 | Discovery Communications LLC, Sr. Unsecd. Note, 2.950%, 3/20/2023 | 139,151 | |
400,000 | Discovery Communications LLC, Sr. Unsecd. Note, 3.625%, 5/15/2030 | 458,504 | |
500,000 | Fox Corp, Sr. Unsecd. Note, 3.500%, 4/8/2030 | 568,544 | |
400,000 | Fox Corp, Sr. Unsecd. Note, Series WI, 4.709%, 1/25/2029 | 485,591 | |
270,000 | Omnicom Group, Inc., Sr. Unsecd. Note, 4.200%, 6/1/2030 | 324,521 | |
750,000 | ViacomCBS, Inc., Sr. Unsecd. Note, 3.700%, 8/15/2024 | 822,621 | |
310,000 | ViacomCBS, Inc., Sr. Unsecd. Note, 4.950%, 1/15/2031 | 388,687 | |
TOTAL | 3,521,900 | ||
Communications - Telecom Wireless—1.7% | |||
600,000 | American Tower Corp., Sr. Unsecd. Note, 3.500%, 1/31/2023 | 636,643 | |
300,000 | Crown Castle International Corp., 3.150%, 7/15/2023 | 319,302 | |
180,000 | Crown Castle International Corp., Sr. Unsecd. Note, 2.250%, 1/15/2031 | 186,847 | |
250,000 | Crown Castle International Corp., Sr. Unsecd. Note, 3.300%, 7/1/2030 | 280,120 | |
200,000 | Crown Castle International Corp., Sr. Unsecd. Note, 4.450%, 2/15/2026 | 231,520 | |
450,000 | T-Mobile USA, Inc., Sec. Fac. Bond, 144A, 3.875%, 4/15/2030 | 521,667 | |
450,000 | T-Mobile USA, Inc., Term Loan - 1st Lien, 144A, 3.750%, 4/15/2027 | 512,910 | |
395,000 | Vodafone Group PLC, Sr. Unsecd. Note, 4.125%, 5/30/2025 | 451,867 | |
TOTAL | 3,140,876 | ||
Communications - Telecom Wirelines—2.5% | |||
300,000 | AT&T, Inc., Sr. Unsecd. Note, 2.300%, 6/1/2027 | 320,130 | |
877,000 | AT&T, Inc., Sr. Unsecd. Note, 2.550%, 12/1/2033 | 903,753 | |
250,000 | AT&T, Inc., Sr. Unsecd. Note, 2.750%, 6/1/2031 | 267,313 | |
450,000 | AT&T, Inc., Sr. Unsecd. Note, 3.400%, 5/15/2025 | 500,253 | |
250,000 | Telefonica SA, Company Guarantee, 7.045%, 6/20/2036 | 373,306 | |
300,000 | Verizon Communications, Inc., Sr. Unsecd. Note, 0.850%, 11/20/2025 | 302,430 | |
300,000 | Verizon Communications, Inc., Sr. Unsecd. Note, 1.750%, 1/20/2031 | 298,866 | |
175,000 | Verizon Communications, Inc., Sr. Unsecd. Note, 3.150%, 3/22/2030 | 196,305 | |
600,000 | Verizon Communications, Inc., Sr. Unsecd. Note, 4.150%, 3/15/2024 | 664,404 | |
735,000 | Verizon Communications, Inc., Sr. Unsecd. Note, 5.150%, 9/15/2023 | 828,925 | |
TOTAL | 4,655,685 |
Principal Amount | Value | ||
CORPORATE BONDS—continued | |||
Consumer Cyclical - Automotive—3.6% | |||
$ 700,000 | Daimler Finance NA LLC, Sr. Unsecd. Note, 144A, 3.250%, 8/1/2024 | $759,606 | |
500,000 | Fiat Chrysler Automobiles NV, Sr. Unsecd. Note, 5.250%, 4/15/2023 | 536,875 | |
250,000 | Ford Motor Co., Sr. Unsecd. Note, 4.346%, 12/8/2026 | 266,610 | |
250,000 | Ford Motor Credit Co. LLC, Sr. Unsecd. Note, 3.336%, 3/18/2021 | 250,938 | |
920,000 | General Motors Co., Sr. Unsecd. Note, 4.000%, 4/1/2025 | 1,019,663 | |
250,000 | General Motors Co., Sr. Unsecd. Note, 6.125%, 10/1/2025 | 303,433 | |
500,000 | General Motors Financial Co., Inc., Sr. Unsecd. Note, 3.200%, 7/6/2021 | 505,418 | |
300,000 | General Motors Financial Co., Inc., Sr. Unsecd. Note, 4.000%, 10/6/2026 | 337,932 | |
355,000 | Hyundai Capital America, Sr. Unsecd. Note, 144A, 2.375%, 2/10/2023 | 366,226 | |
1,025,000 | 1 | Nissan Motor Acceptance Corp., Sr. Unsecd. Note, 144A, 2.650%, 7/13/2022 | 1,049,498 |
500,000 | Volkswagen Group of America Finance LLC, Sr. Unsecd. Note, 144A, 1.250%, 11/24/2025 | 504,399 | |
650,000 | Volkswagen Group of America Finance LLC, Sr. Unsecd. Note, 144A, 4.000%, 11/12/2021 | 670,031 | |
300,000 | Volkswagen Group of America Finance LLC, Sr. Unsecd. Note, 144A, 4.250%, 11/13/2023 | 330,236 | |
TOTAL | 6,900,865 | ||
Consumer Cyclical - Retailers—4.2% | |||
1,000,000 | Advance Auto Parts, Inc., Sr. Unsecd. Note, Series WI, 3.900%, 4/15/2030 | 1,151,572 | |
470,000 | Alimentation Couche-Tard, Inc., 144A, 2.950%, 1/25/2030 | 514,361 | |
665,000 | AutoNation, Inc., Sr. Unsecd. Note, 4.750%, 6/1/2030 | 800,726 | |
275,000 | Costco Wholesale Corp., Sr. Unsecd. Note, 1.375%, 6/20/2027 | 283,553 | |
250,000 | CVS Health Corp., Sr. Unsecd. Note, 1.300%, 8/21/2027 | 251,208 | |
1,290,000 | CVS Health Corp., Sr. Unsecd. Note, 4.300%, 3/25/2028 | 1,536,422 | |
200,000 | Dollar General Corp., Sr. Unsecd. Note, 4.150%, 11/1/2025 | 229,592 | |
600,000 | Dollar Tree, Inc., Sr. Unsecd. Note, 3.700%, 5/15/2023 | 642,448 | |
500,000 | Dollar Tree, Inc., Sr. Unsecd. Note, 4.000%, 5/15/2025 | 564,719 | |
500,000 | Home Depot, Inc., Sr. Unsecd. Note, 2.125%, 9/15/2026 | 539,446 | |
320,000 | O’Reilly Automotive, Inc., Sr. Unsecd. Note, 1.750%, 3/15/2031 | 321,028 | |
370,000 | O’Reilly Automotive, Inc., Sr. Unsecd. Note, 4.200%, 4/1/2030 | 446,341 | |
580,000 | Tractor Supply Co., Sr. Unsecd. Note, 1.750%, 11/1/2030 | 583,885 | |
TOTAL | 7,865,301 | ||
Consumer Cyclical - Services—2.0% | |||
500,000 | Alibaba Group Holding Ltd., Sr. Unsecd. Note, 3.400%, 12/6/2027 | 559,863 | |
170,000 | Amazon.com, Inc., Sr. Unsecd. Note, 3.150%, 8/22/2027 | 193,792 | |
400,000 | Booking Holdings, Inc., Sr. Unsecd. Note, 4.625%, 4/13/2030 | 497,347 | |
750,000 | Cintas Corp. No. 2, Sr. Unsecd. Note, 3.700%, 4/1/2027 | 864,530 | |
325,000 | IHS Markit Ltd., Sr. Unsecd. Note, 4.125%, 8/1/2023 | 353,881 | |
135,000 | IHS Markit Ltd., Sr. Unsecd. Note, Series 5YR, 3.625%, 5/1/2024 | 147,466 | |
500,000 | Visa, Inc., Sr. Unsecd. Note, 2.800%, 12/14/2022 | 523,242 | |
530,000 | Visa, Inc., Sr. Unsecd. Note, 3.150%, 12/14/2025 | 594,845 | |
TOTAL | 3,734,966 | ||
Consumer Non-Cyclical - Food/Beverage—5.0% | |||
250,000 | Anheuser-Busch InBev Worldwide, Inc., Sr. Unsecd. Note, 4.150%, 1/23/2025 | 284,764 | |
750,000 | 1 | Anheuser-Busch InBev Worldwide, Inc., Sr. Unsecd. Note, 4.750%, 1/23/2029 | 925,491 |
515,000 | Coca-Cola Femsa S.A.B. de C.V., Sr. Unsecd. Note, 2.750%, 1/22/2030 | 556,198 | |
385,000 | Conagra Brands, Inc., Sr. Unsecd. Note, 1.375%, 11/1/2027 | 388,712 | |
1,000,000 | Constellation Brands, Inc., Sr. Unsecd. Note, 4.650%, 11/15/2028 | 1,219,497 | |
340,000 | 1 | Danone SA, Sr. Unsecd. Note, 144A, 2.947%, 11/2/2026 | 373,914 |
380,000 | 1 | Flowers Foods, Inc., Sr. Unsecd. Note, 3.500%, 10/1/2026 | 424,025 |
500,000 | Grupo Bimbo S.A.B. de CV, Sr. Unsecd. Note, 144A, 3.875%, 6/27/2024 | 549,046 | |
660,000 | Grupo Bimbo S.A.B. de CV, Sr. Unsecd. Note, 144A, 4.500%, 1/25/2022 | 686,640 | |
85,000 | Keurig Dr Pepper, Inc., Sr. Unsecd. Note, 3.200%, 5/1/2030 | 96,341 | |
700,000 | Keurig Dr Pepper, Inc., Sr. Unsecd. Note, 4.057%, 5/25/2023 | 761,023 |
Principal Amount | Value | ||
CORPORATE BONDS—continued | |||
Consumer Non-Cyclical - Food/Beverage—continued | |||
$ 450,000 | Keurig Dr Pepper, Inc., Sr. Unsecd. Note, 4.417%, 5/25/2025 | $519,028 | |
1,000,000 | McCormick & Co., Inc., Sr. Unsecd. Note, 3.150%, 8/15/2024 | 1,084,984 | |
380,000 | Smithfield Foods, Inc., Sr. Unsecd. Note, 144A, 2.650%, 10/3/2021 | 383,459 | |
210,000 | 1 | Smithfield Foods, Inc., Sr. Unsecd. Note, 144A, 3.000%, 10/15/2030 | 222,590 |
240,000 | Smithfield Foods, Inc., Sr. Unsecd. Note, 144A, 3.350%, 2/1/2022 | 243,429 | |
60,000 | Smithfield Foods, Inc., Sr. Unsecd. Note, 144A, 4.250%, 2/1/2027 | 66,751 | |
600,000 | Smucker (J.M.) Co., Sr. Unsecd. Note, 2.375%, 3/15/2030 | 636,047 | |
TOTAL | 9,421,939 | ||
Consumer Non-Cyclical - Health Care—2.6% | |||
275,000 | Agilent Technologies, Inc., Sr. Unsecd. Note, 2.100%, 6/4/2030 | 285,987 | |
210,000 | Agilent Technologies, Inc., Sr. Unsecd. Note, 2.750%, 9/15/2029 | 229,417 | |
940,000 | Agilent Technologies, Inc., Sr. Unsecd. Note, 3.875%, 7/15/2023 | 1,011,997 | |
205,000 | Alcon Finance Corp., Sr. Unsecd. Note, 144A, 2.600%, 5/27/2030 | 218,598 | |
350,000 | Alcon Finance Corp., Sr. Unsecd. Note, 144A, 3.000%, 9/23/2029 | 382,083 | |
250,000 | Becton Dickinson & Co., Sr. Unsecd. Note, 3.700%, 6/6/2027 | 286,957 | |
740,000 | Becton Dickinson & Co., Sr. Unsecd. Note, 3.734%, 12/15/2024 | 820,719 | |
160,000 | Dentsply Sirona, Inc., Sr. Unsecd. Note, 3.250%, 6/1/2030 | 178,316 | |
235,000 | DH Europe Finance II S.a.r.l., Sr. Unsecd. Note, 2.600%, 11/15/2029 | 257,075 | |
470,000 | DH Europe Finance II S.a.r.l., Sr. Unsecd. Note, Series 5YR, 2.200%, 11/15/2024 | 498,304 | |
450,000 | PerkinElmer, Inc., Sr. Unsecd. Note, 3.300%, 9/15/2029 | 508,074 | |
250,000 | Thermo Fisher Scientific, Inc., Sr. Unsecd. Note, 2.950%, 9/19/2026 | 278,837 | |
50,000 | Thermo Fisher Scientific, Inc., Sr. Unsecd. Note, 4.133%, 3/25/2025 | 56,864 | |
TOTAL | 5,013,228 | ||
Consumer Non-Cyclical - Pharmaceuticals—5.0% | |||
210,000 | Abbott Laboratories, Sr. Unsecd. Note, 3.400%, 11/30/2023 | 227,706 | |
453,000 | Abbott Laboratories, Sr. Unsecd. Note, 3.750%, 11/30/2026 | 530,944 | |
580,000 | AbbVie, Inc., Sr. Unsecd. Note, 2.950%, 11/21/2026 | 642,091 | |
455,000 | AbbVie, Inc., Sr. Unsecd. Note, 3.200%, 11/21/2029 | 510,435 | |
300,000 | AbbVie, Inc., Sr. Unsecd. Note, 3.600%, 5/14/2025 | 334,487 | |
67,000 | AbbVie, Inc., Sr. Unsecd. Note, 4.750%, 3/15/2045 | 87,764 | |
235,000 | AstraZeneca PLC, 0.700%, 4/8/2026 | 233,883 | |
600,000 | AstraZeneca PLC, Sr. Unsecd. Note, 3.125%, 6/12/2027 | 675,713 | |
1,000,000 | Bayer US Finance II LLC, Sr. Unsecd. Note, 144A, 3.875%, 12/15/2023 | 1,090,284 | |
200,000 | Bayer US Finance II LLC, Sr. Unsecd. Note, 144A, 4.250%, 12/15/2025 | 228,868 | |
235,000 | Biogen, Inc., Sr. Unsecd. Note, 2.250%, 5/1/2030 | 245,590 | |
600,000 | Biogen, Inc., Sr. Unsecd. Note, 4.050%, 9/15/2025 | 687,858 | |
320,000 | Bristol-Myers Squibb Co., Sr. Unsecd. Note, Series WI, 3.400%, 7/26/2029 | 372,652 | |
200,000 | Bristol-Myers Squibb Co., Sr. Unsecd. Note, Series WI, 5.000%, 8/15/2045 | 289,669 | |
310,000 | Eli Lilly & Co., Sr. Unsecd. Note, 3.375%, 3/15/2029 | 359,952 | |
220,000 | Gilead Sciences, Inc., Sr. Unsecd. Note, 3.650%, 3/1/2026 | 250,055 | |
500,000 | Merck & Co., Inc., Sr. Unsecd. Note, 3.400%, 3/7/2029 | 581,824 | |
670,000 | Regeneron Pharmaceuticals, Inc., Sr. Unsecd. Note, 1.750%, 9/15/2030 | 660,555 | |
240,000 | Royalty Pharma PLC, 144A, 1.200%, 9/2/2025 | 243,889 | |
900,000 | Teva Pharmaceutical Finance Netherlands III BV, Sr. Unsecd. Note, 2.200%, 7/21/2021 | 899,437 | |
300,000 | Teva Pharmaceutical Finance Netherlands III BV, Sr. Unsecd. Note, 3.150%, 10/1/2026 | 288,940 | |
TOTAL | 9,442,596 | ||
Consumer Non-Cyclical - Supermarkets—0.5% | |||
610,000 | Kroger Co., Bond, 6.900%, 4/15/2038 | 922,005 | |
Consumer Non-Cyclical - Tobacco—1.2% | |||
800,000 | Altria Group, Inc., Sr. Unsecd. Note, 4.400%, 2/14/2026 | 929,053 | |
200,000 | BAT Capital Corp., Sr. Unsecd. Note, 3.215%, 9/6/2026 | 220,500 |
Principal Amount | Value | ||
CORPORATE BONDS—continued | |||
Consumer Non-Cyclical - Tobacco—continued | |||
$ 290,000 | BAT International Finance PLC, Sr. Unsecd. Note, 144A, 3.950%, 6/15/2025 | $326,387 | |
300,000 | Reynolds American, Inc., Sr. Unsecd. Note, 4.450%, 6/12/2025 | 341,767 | |
360,000 | Reynolds American, Inc., Sr. Unsecd. Note, 7.000%, 8/4/2041 | 484,470 | |
TOTAL | 2,302,177 | ||
Energy - Independent—1.8% | |||
250,000 | Canadian Natural Resources Ltd., Sr. Unsecd. Note, 2.050%, 7/15/2025 | 262,471 | |
420,000 | Canadian Natural Resources Ltd., Sr. Unsecd. Note, 2.950%, 1/15/2023 | 439,373 | |
500,000 | 1 | Cimarex Energy Co., Sr. Unsecd. Note, 3.900%, 5/15/2027 | 551,321 |
250,000 | Cimarex Energy Co., Sr. Unsecd. Note, 4.375%, 6/1/2024 | 272,912 | |
215,000 | Cimarex Energy Co., Sr. Unsecd. Note, 4.375%, 3/15/2029 | 244,957 | |
475,000 | Marathon Oil Corp., Sr. Unsecd. Note, 3.850%, 6/1/2025 | 509,594 | |
100,000 | Occidental Petroleum Corp., Sr. Unsecd. Note, 2.900%, 8/15/2024 | 96,400 | |
1,000,000 | Occidental Petroleum Corp., Sr. Unsecd. Note, 3.450%, 7/15/2024 | 957,500 | |
TOTAL | 3,334,528 | ||
Energy - Integrated—2.0% | |||
500,000 | BP Capital Markets America, Inc., Sr. Unsecd. Note, 3.796%, 9/21/2025 | 567,007 | |
500,000 | BP Capital Markets PLC, Sr. Unsecd. Note, 3.994%, 9/26/2023 | 547,830 | |
500,000 | Chevron Corp., Sr. Unsecd. Note, 1.141%, 5/11/2023 | 510,674 | |
530,000 | CNPC Hong Kong Overseas Capital Ltd., Company Guarantee, 144A, 5.950%, 4/28/2041 | 767,350 | |
585,000 | Husky Energy, Inc., 4.000%, 4/15/2024 | 627,487 | |
240,000 | 1 | Husky Energy, Inc., Sr. Unsecd. Note, 4.400%, 4/15/2029 | 267,277 |
175,000 | Petroleos Mexicanos, Sr. Unsecd. Note, 4.875%, 1/18/2024 | 184,075 | |
325,000 | Shell International Finance B.V., Sr. Unsecd. Note, 2.875%, 5/10/2026 | 359,890 | |
TOTAL | 3,831,590 | ||
Energy - Midstream—3.2% | |||
265,000 | Boardwalk Pipeline Partners LP, Sr. Unsecd. Note, 3.400%, 2/15/2031 | 276,935 | |
500,000 | Boardwalk Pipeline Partners LP, Sr. Unsecd. Note, 4.800%, 5/3/2029 | 573,465 | |
565,000 | Energy Transfer Partners LP, Sr. Unsecd. Note, 4.900%, 2/1/2024 | 618,896 | |
470,000 | Energy Transfer Partners LP, Sr. Unsecd. Note, Series 5Y, 4.200%, 9/15/2023 | 507,050 | |
500,000 | Kinder Morgan Energy Partners LP, 4.250%, 9/1/2024 | 557,663 | |
290,000 | MPLX LP, Sr. Unsecd. Note, 1.750%, 3/1/2026 | 300,271 | |
350,000 | 1 | MPLX LP, Sr. Unsecd. Note, 3.375%, 3/15/2023 | 370,891 |
395,000 | 1 | MPLX LP, Sr. Unsecd. Note, 4.125%, 3/1/2027 | 455,769 |
500,000 | MPLX LP, Sr. Unsecd. Note, Series WI, 3.500%, 12/1/2022 | 525,343 | |
345,000 | 1 | ONEOK, Inc., Sr. Unsecd. Note, 4.000%, 7/13/2027 | 385,080 |
600,000 | TC Pipelines, LP, Sr. Unsecd. Note, 3.900%, 5/25/2027 | 675,524 | |
540,000 | Texas Eastern Transmission LP, Sr. Unsecd. Note, 144A, 2.800%, 10/15/2022 | 558,443 | |
300,000 | Williams Partners LP, Sr. Unsecd. Note, 3.900%, 1/15/2025 | 332,922 | |
TOTAL | 6,138,252 | ||
Energy - Oil Field Services—0.2% | |||
300,000 | Schlumberger Holdings Corp., Sr. Unsecd. Note, 144A, 4.000%, 12/21/2025 | 341,267 | |
Energy - Refining—0.5% | |||
185,000 | Phillips 66, Sr. Unsecd. Note, 1.300%, 2/15/2026 | 188,288 | |
215,000 | Valero Energy Corp., 7.500%, 4/15/2032 | 300,597 | |
335,000 | Valero Energy Corp., Sr. Unsecd. Note, 6.625%, 6/15/2037 | 445,625 | |
TOTAL | 934,510 | ||
Financial Institution - Banking—20.1% | |||
1,250,000 | American Express Co., Sr. Unsecd. Note, 3.000%, 10/30/2024 | 1,365,737 | |
935,000 | Associated Banc-Corp., Sub. Note, 4.250%, 1/15/2025 | 1,014,008 | |
1,250,000 | Bank of America Corp., Sr. Unsecd. Note, 3.705%, 4/24/2028 | 1,423,344 | |
700,000 | Bank of America Corp., Sr. Unsecd. Note, Series GMTN, 2.816%, 7/21/2023 | 727,100 |
Principal Amount | Value | ||
CORPORATE BONDS—continued | |||
Financial Institution - Banking—continued | |||
$ 250,000 | Bank of America Corp., Sr. Unsecd. Note, Series MTN, 0.981%, 9/25/2025 | $252,860 | |
750,000 | Bank of America Corp., Sr. Unsecd. Note, Series MTN, 2.456%, 10/22/2025 | 799,818 | |
500,000 | Bank of America Corp., Sr. Unsecd. Note, Series MTN, 3.248%, 10/21/2027 | 559,701 | |
500,000 | Bank of America Corp., Sr. Unsecd. Note, Series MTN, 4.271%, 7/23/2029 | 595,504 | |
310,000 | 1 | Bank of New York Mellon Corp., Sr. Unsecd. Note, Series MTN, 2.100%, 10/24/2024 | 330,587 |
300,000 | Bank of New York Mellon Corp., Sr. Unsecd. Note, Series MTN, 2.661%, 5/16/2023 | 309,287 | |
550,000 | Bank of New York Mellon Corp., Sr. Unsecd. Note, Series MTN, 3.250%, 9/11/2024 | 604,563 | |
600,000 | 1 | Capital One Financial Corp., Sr. Unsecd. Note, 3.050%, 3/9/2022 | 618,377 |
350,000 | Capital One Financial Corp., Sr. Unsecd. Note, 3.200%, 1/30/2023 | 368,956 | |
500,000 | Citigroup, Inc., 4.125%, 7/25/2028 | 585,060 | |
500,000 | Citigroup, Inc., Sr. Unsecd. Note, 2.572%, 6/3/2031 | 533,080 | |
750,000 | Citigroup, Inc., Sr. Unsecd. Note, 2.876%, 7/24/2023 | 779,241 | |
730,000 | Citigroup, Inc., Sr. Unsecd. Note, 3.400%, 5/1/2026 | 823,681 | |
500,000 | Citigroup, Inc., Sr. Unsecd. Note, 3.700%, 1/12/2026 | 568,843 | |
500,000 | Citigroup, Inc., Sr. Unsecd. Note, 4.075%, 4/23/2029 | 586,568 | |
500,000 | Citizens Bank N.A., Sr. Unsecd. Note, Series BKNT, 3.750%, 2/18/2026 | 568,398 | |
90,000 | Citizens Financial Group, Inc., Sr. Unsecd. Note, 2.500%, 2/6/2030 | 95,707 | |
660,000 | Citizens Financial Group, Inc., Sub. Note, 144A, 4.150%, 9/28/2022 | 697,153 | |
300,000 | Comerica, Inc., 3.800%, 7/22/2026 | 341,301 | |
500,000 | Compass Bank, Birmingham, Sub. Note, Series BKNT, 3.875%, 4/10/2025 | 560,918 | |
140,000 | 1 | Fifth Third Bancorp, Sr. Unsecd. Note, 2.375%, 1/28/2025 | 149,134 |
250,000 | Fifth Third Bank, Sr. Unsecd. Note, Series BKNT, 2.250%, 2/1/2027 | 266,882 | |
685,000 | FNB Corp. (PA), Sr. Unsecd. Note, 2.200%, 2/24/2023 | 698,377 | |
500,000 | Goldman Sachs Group, Inc., Sr. Unsecd. Note, 3.000%, 4/26/2022 | 504,077 | |
1,250,000 | Goldman Sachs Group, Inc., Sr. Unsecd. Note, 3.500%, 11/16/2026 | 1,404,221 | |
500,000 | Goldman Sachs Group, Inc., Sr. Unsecd. Note, 4.223%, 5/1/2029 | 593,309 | |
500,000 | Goldman Sachs Group, Inc., Sub. Note, 4.250%, 10/21/2025 | 573,723 | |
1,000,000 | HSBC USA, Inc., Sr. Unsecd. Note, 3.500%, 6/23/2024 | 1,096,951 | |
240,000 | Huntington Bancshares, Inc., Sr. Unsecd. Note, 2.550%, 2/4/2030 | 257,558 | |
1,000,000 | JPMorgan Chase & Co., 3.250%, 9/23/2022 | 1,052,028 | |
500,000 | JPMorgan Chase & Co., Sr. Unsecd. Note, 1.045%, 11/19/2026 | 505,774 | |
500,000 | JPMorgan Chase & Co., Sr. Unsecd. Note, 3.782%, 2/1/2028 | 575,099 | |
500,000 | JPMorgan Chase & Co., Sr. Unsecd. Note, 4.452%, 12/5/2029 | 610,192 | |
1,000,000 | JPMorgan Chase & Co., Sub. Note, 3.375%, 5/1/2023 | 1,069,083 | |
500,000 | JPMorgan Chase & Co., Sub. Note, 3.875%, 9/10/2024 | 560,063 | |
750,000 | Morgan Stanley, Sec. Fac. Bond, 2.750%, 5/19/2022 | 774,679 | |
250,000 | Morgan Stanley, Sr. Unsecd. Note, 2.188%, 4/28/2026 | 264,226 | |
1,000,000 | Morgan Stanley, Sr. Unsecd. Note, 3.625%, 1/20/2027 | 1,148,316 | |
165,000 | Morgan Stanley, Sr. Unsecd. Note, Series GMTN, 2.699%, 1/22/2031 | 179,240 | |
500,000 | Morgan Stanley, Sr. Unsecd. Note, Series GMTN, 3.125%, 1/23/2023 | 527,815 | |
250,000 | Morgan Stanley, Sub. Note, 5.000%, 11/24/2025 | 299,268 | |
1,000,000 | Morgan Stanley, Sub. Note, Series MTN, 4.100%, 5/22/2023 | 1,085,600 | |
408,000 | MUFG Americas Holdings Corp., Sr. Unsecd. Note, 3.000%, 2/10/2025 | 445,995 | |
250,000 | MUFG Americas Holdings Corp., Sr. Unsecd. Note, 3.500%, 6/18/2022 | 261,421 | |
250,000 | MUFG Union Bank, N.A., Sr. Unsecd. Note, Series BKNT, 3.150%, 4/1/2022 | 258,247 | |
330,000 | Regions Financial Corp., Sr. Unsecd. Note, 2.250%, 5/18/2025 | 350,247 | |
230,000 | Regions Financial Corp., Sr. Unsecd. Note, 3.800%, 8/14/2023 | 249,610 | |
250,000 | State Street Corp., Sr. Unsecd. Note, 2.653%, 5/15/2023 | 257,911 | |
700,000 | State Street Corp., Sr. Unsecd. Note, 3.300%, 12/16/2024 | 777,011 | |
250,000 | Synovus Bank GA, Sr. Unsecd. Note, 2.289%, 2/10/2023 | 253,254 | |
475,000 | Truist Bank, Sr. Unsecd. Note, Series BKNT, 2.150%, 12/6/2024 | 503,610 |
Principal Amount | Value | ||
CORPORATE BONDS—continued | |||
Financial Institution - Banking—continued | |||
$ 500,000 | Truist Bank, Sr. Unsecd. Note, Series BKNT, 3.000%, 2/2/2023 | $526,402 | |
200,000 | Truist Bank, Sub. Note, Series BKNT, 3.300%, 5/15/2026 | 223,909 | |
245,000 | Truist Financial Corp., Sr. Unsecd. Note, Series MTN, 2.750%, 4/1/2022 | 252,122 | |
250,000 | US Bancorp, Sr. Unsecd. Note, Series MTN, 1.375%, 7/22/2030 | 250,669 | |
750,000 | US Bancorp, Sub. Note, Series MTN, 3.600%, 9/11/2024 | 829,854 | |
500,000 | Wells Fargo & Co., Series MTN, 3.500%, 3/8/2022 | 518,458 | |
750,000 | Wells Fargo & Co., Sr. Unsecd. Note, 2.188%, 4/30/2026 | 790,324 | |
620,000 | Wells Fargo & Co., Sr. Unsecd. Note, 3.000%, 10/23/2026 | 687,639 | |
250,000 | Wells Fargo & Co., Sr. Unsecd. Note, Series MTN, 2.406%, 10/30/2025 | 264,393 | |
500,000 | Wells Fargo & Co., Sr. Unsecd. Note, Series MTN, 2.572%, 2/11/2031 | 529,520 | |
500,000 | Wells Fargo & Co., Sr. Unsecd. Note, Series MTN, 3.584%, 5/22/2028 | 566,904 | |
TOTAL | 38,102,907 | ||
Financial Institution - Broker/Asset Mgr/Exchange—1.7% | |||
370,000 | Eaton Vance Corp., Sr. Unsecd. Note, 3.625%, 6/15/2023 | 398,747 | |
220,000 | Invesco Finance PLC, Sr. Unsecd. Note, 3.750%, 1/15/2026 | 248,472 | |
200,000 | Jefferies Group LLC, Sr. Unsecd. Note, 6.500%, 1/20/2043 | 275,092 | |
245,000 | Nuveen LLC, Sr. Unsecd. Note, 144A, 4.000%, 11/1/2028 | 292,952 | |
595,000 | Raymond James Financial, Inc., Sr. Unsecd. Note, 4.650%, 4/1/2030 | 730,593 | |
193,000 | 1 | Raymond James Financial, Inc., Sr. Unsecd. Note, 5.625%, 4/1/2024 | 222,908 |
390,000 | Stifel Financial Corp., 4.250%, 7/18/2024 | 438,536 | |
500,000 | TD Ameritrade Holding Corp., Sr. Unsecd. Note, 3.625%, 4/1/2025 | 556,541 | |
TOTAL | 3,163,841 | ||
Financial Institution - Finance Companies—1.4% | |||
550,000 | 1 | AerCap Ireland Capital Ltd / AerCap Global Aviation Trust, Sr. Unsecd. Note, 4.625%, 10/15/2027 | 623,289 |
500,000 | Discover Financial Services, Sr. Unsecd. Note, 3.850%, 11/21/2022 | 532,082 | |
250,000 | Discover Financial Services, Sr. Unsecd. Note, 4.100%, 2/9/2027 | 288,147 | |
950,000 | GE Capital Funding LLC, Sr. Unsecd. Note, 144A, 4.400%, 5/15/2030 | 1,120,174 | |
TOTAL | 2,563,692 | ||
Financial Institution - Insurance - Health—0.8% | |||
300,000 | CIGNA Corp., Sr. Unsecd. Note, 3.750%, 7/15/2023 | 324,377 | |
650,000 | CIGNA Corp., Sr. Unsecd. Note, 4.375%, 10/15/2028 | 785,819 | |
405,000 | UnitedHealth Group, Inc., Sr. Unsecd. Note, 3.750%, 7/15/2025 | 461,629 | |
TOTAL | 1,571,825 | ||
Financial Institution - Insurance - Life—0.9% | |||
350,000 | AIA Group Ltd., Sr. Unsecd. Note, 144A, 3.600%, 4/9/2029 | 394,321 | |
200,000 | AIG Global Funding, Sec. Fac. Bond, 144A, 2.300%, 7/1/2022 | 205,511 | |
800,000 | American International Group, Inc., Sr. Unsecd. Note, 4.125%, 2/15/2024 | 886,052 | |
172,000 | Massachusetts Mutual Life Insurance Co., Sub. Note, 144A, 8.875%, 6/1/2039 | 286,166 | |
TOTAL | 1,772,050 | ||
Financial Institution - Insurance - P&C—0.8% | |||
250,000 | 1 | Chubb INA Holdings, Inc., Sr. Unsecd. Note, 2.700%, 3/13/2023 | 263,419 |
300,000 | Chubb INA Holdings, Inc., Sr. Unsecd. Note, 3.350%, 5/15/2024 | 327,791 | |
250,000 | CNA Financial Corp., Sr. Unsecd. Note, 3.450%, 8/15/2027 | 283,513 | |
95,000 | 1 | CNA Financial Corp., Sr. Unsecd. Note, 3.900%, 5/1/2029 | 113,145 |
300,000 | Nationwide Mutual Insurance Co., Sub. Note, 144A, 9.375%, 8/15/2039 | 522,627 | |
TOTAL | 1,510,495 | ||
Financial Institution - REIT - Apartment—1.0% | |||
395,000 | Avalonbay Communities, Inc., Sr. Unsecd. Note, Series MTN, 3.350%, 5/15/2027 | 442,880 | |
115,000 | Camden Property Trust, Sr. Unsecd. Note, 2.800%, 5/15/2030 | 127,852 | |
500,000 | Mid-America Apartment Communities LP, Sr. Unsecd. Note, 3.750%, 6/15/2024 | 545,093 | |
320,000 | Mid-America Apartment Communities LP, Sr. Unsub. Note, 1.700%, 2/15/2031 | 319,362 |
Principal Amount | Value | ||
CORPORATE BONDS—continued | |||
Financial Institution - REIT - Apartment—continued | |||
$ 500,000 | UDR, Inc., Sr. Unsecd. Note, Series MTN, 2.950%, 9/1/2026 | $549,357 | |
TOTAL | 1,984,544 | ||
Financial Institution - REIT - Healthcare—1.2% | |||
445,000 | Healthcare Trust of America, Sr. Unsecd. Note, 2.000%, 3/15/2031 | 445,753 | |
710,000 | Physicians Realty Trust, Sr. Unsecd. Note, 4.300%, 3/15/2027 | 785,281 | |
155,000 | Welltower, Inc., Sr. Unsecd. Note, 2.700%, 2/15/2027 | 170,883 | |
375,000 | Welltower, Inc., Sr. Unsecd. Note, 2.750%, 1/15/2031 | 400,408 | |
500,000 | Welltower, Inc., Sr. Unsecd. Note, 3.100%, 1/15/2030 | 547,735 | |
TOTAL | 2,350,060 | ||
Financial Institution - REIT - Office—0.9% | |||
640,000 | Alexandria Real Estate Equities, Inc., Sr. Unsecd. Note, 4.000%, 1/15/2024 | 704,949 | |
250,000 | Alexandria Real Estate Equities, Inc., Sr. Unsecd. Note, 4.900%, 12/15/2030 | 318,612 | |
480,000 | Boston Properties LP, Sr. Unsecd. Note, 3.200%, 1/15/2025 | 525,163 | |
80,000 | Boston Properties LP, Sr. Unsecd. Note, 3.250%, 1/30/2031 | 88,301 | |
TOTAL | 1,637,025 | ||
Financial Institution - REIT - Other—0.6% | |||
320,000 | ProLogis LP, Sr. Unsecd. Note, 4.375%, 2/1/2029 | 393,239 | |
275,000 | WP Carey, Inc., Sr. Unsecd. Note, 2.400%, 2/1/2031 | 286,059 | |
450,000 | 1 | WP Carey, Inc., Sr. Unsecd. Note, 4.600%, 4/1/2024 | 499,876 |
TOTAL | 1,179,174 | ||
Financial Institution - REIT - Retail—0.6% | |||
250,000 | 1 | Kimco Realty Corp., Sr. Unsecd. Note, 1.900%, 3/1/2028 | 258,285 |
410,000 | Kimco Realty Corp., Sr. Unsecd. Note, 2.700%, 3/1/2024 | 433,245 | |
250,000 | 1 | Kimco Realty Corp., Sr. Unsecd. Note, 2.700%, 10/1/2030 | 269,621 |
100,000 | Kimco Realty Corp., Sr. Unsecd. Note, 3.400%, 11/1/2022 | 105,065 | |
TOTAL | 1,066,216 | ||
Sovereign—0.4% | |||
510,000 | Inter-American Development Bank, Series MTN, 6.750%, 7/15/2027 | 681,508 | |
Supranational—0.2% | |||
320,000 | Corp Andina De Fomento, Sr. Unsecd. Note, 4.375%, 6/15/2022 | 337,203 | |
Technology—7.3% | |||
500,000 | Adobe, Inc., Sr. Unsecd. Note, 3.250%, 2/1/2025 | 551,023 | |
500,000 | 1 | Apple, Inc., Sr. Unsecd. Note, 0.550%, 8/20/2025 | 502,579 |
315,000 | Apple, Inc., Sr. Unsecd. Note, 1.125%, 5/11/2025 | 324,140 | |
650,000 | Apple, Inc., Sr. Unsecd. Note, 2.400%, 5/3/2023 | 682,018 | |
125,000 | Apple, Inc., Sr. Unsecd. Note, 4.450%, 5/6/2044 | 171,724 | |
340,000 | Automatic Data Processing, Inc., 3.375%, 9/15/2025 | 382,962 | |
280,000 | Broadcom Corp., Sr. Unsecd. Note, Series WI, 3.875%, 1/15/2027 | 314,781 | |
666,000 | Broadcom, Inc., Sr. Unsecd. Note, 4.110%, 9/15/2028 | 763,137 | |
135,000 | Broadcom, Inc., Sr. Unsecd. Note, 4.700%, 4/15/2025 | 154,737 | |
650,000 | Dell International LLC / EMC Corp., Sec. Fac. Bond, 144A, 5.850%, 7/15/2025 | 781,290 | |
350,000 | Dell International LLC / EMC Corp., Term Loan - 1st Lien, 144A, 6.200%, 7/15/2030 | 455,425 | |
480,000 | Equifax, Inc., Sr. Unsecd. Note, 2.600%, 12/1/2024 | 514,580 | |
80,000 | Equifax, Inc., Sr. Unsecd. Note, Series 5Y, 3.950%, 6/15/2023 | 86,484 | |
83,000 | Fidelity National Information Services, Inc., Sr. Unsecd. Note, 3.875%, 6/5/2024 | 91,463 | |
600,000 | 1 | Fidelity National Information Services, Inc., Sr. Unsecd. Note, 5.000%, 10/15/2025 | 712,137 |
250,000 | Fiserv, Inc., Sr. Unsecd. Note, 2.650%, 6/1/2030 | 270,664 | |
230,000 | Fiserv, Inc., Sr. Unsecd. Note, 2.750%, 7/1/2024 | 247,054 | |
500,000 | Fiserv, Inc., Sr. Unsecd. Note, 4.200%, 10/1/2028 | 596,279 | |
670,000 | Ingram Micro, Inc., Sr. Unsecd. Note, 5.000%, 8/10/2022 | 691,420 | |
175,000 | Intel Corp., Sr. Unsecd. Note, 3.400%, 3/25/2025 | 194,765 |
Principal Amount | Value | ||
CORPORATE BONDS—continued | |||
Technology—continued | |||
$ 500,000 | Intel Corp., Sr. Unsecd. Note, 3.700%, 7/29/2025 | $565,998 | |
460,000 | Keysight Technologies, Inc., 4.550%, 10/30/2024 | 520,567 | |
100,000 | Keysight Technologies, Inc., Sr. Unsecd. Note, 3.000%, 10/30/2029 | 110,478 | |
310,000 | Lam Research Corp., Sr. Unsecd. Note, 4.000%, 3/15/2029 | 371,961 | |
105,000 | Micron Technology, Inc., Sr. Unsecd. Note, 2.497%, 4/24/2023 | 109,497 | |
250,000 | Micron Technology, Inc., Sr. Unsecd. Note, 4.640%, 2/6/2024 | 278,511 | |
750,000 | Microsoft Corp., Sr. Unsecd. Note, 2.400%, 8/8/2026 | 818,454 | |
190,000 | Molex Electronics Technologies LLC, Unsecd. Note, 144A, 3.900%, 4/15/2025 | 196,770 | |
750,000 | Oracle Corp., Sr. Unsecd. Note, 3.400%, 7/8/2024 | 821,171 | |
310,000 | Qualcomm, Inc., Sr. Unsecd. Note, 2.600%, 1/30/2023 | 325,207 | |
260,000 | Total System Services, Inc., Sr. Unsecd. Note, 4.450%, 6/1/2028 | 308,808 | |
195,000 | Verisk Analytics, Inc., Sr. Unsecd. Note, 4.125%, 9/12/2022 | 206,595 | |
600,000 | Verisk Analytics, Inc., Sr. Unsecd. Note, 4.125%, 3/15/2029 | 721,199 | |
TOTAL | 13,843,878 | ||
Technology Services—0.1% | |||
90,000 | Global Payments, Inc., Sr. Unsecd. Note, 2.900%, 5/15/2030 | 97,937 | |
Transportation - Airlines—0.3% | |||
275,000 | Southwest Airlines Co., Sr. Unsecd. Note, 4.750%, 5/4/2023 | 298,975 | |
215,000 | Southwest Airlines Co., Sr. Unsecd. Note, 5.250%, 5/4/2025 | 249,151 | |
TOTAL | 548,126 | ||
Transportation - Railroads—0.8% | |||
2,537 | Burlington Northern Santa Fe Corp., Pass Thru Cert., Series 99-2, 7.570%, 1/2/2021 | 2,538 | |
850,000 | Kansas City Southern Industries, Inc., Sr. Unsecd. Note, 3.000%, 5/15/2023 | 886,016 | |
500,000 | Union Pacific Corp., Sr. Unsecd. Note, 2.150%, 2/5/2027 | 531,759 | |
TOTAL | 1,420,313 | ||
Transportation - Services—1.5% | |||
550,000 | FedEx Corp., Sr. Unsecd. Note, 3.100%, 8/5/2029 | 615,019 | |
215,000 | Penske Truck Leasing Co. LP & PTL Finance Corp., Sr. Unsecd. Note, 144A, 1.200%, 11/15/2025 | 216,992 | |
250,000 | Penske Truck Leasing Co. LP & PTL Finance Corp., Sr. Unsecd. Note, 144A, 3.375%, 2/1/2022 | 256,657 | |
300,000 | Penske Truck Leasing Co. LP & PTL Finance Corp., Sr. Unsecd. Note, 144A, 3.450%, 7/1/2024 | 327,025 | |
250,000 | Penske Truck Leasing Co. LP & PTL Finance Corp., Sr. Unsecd. Note, 144A, 4.450%, 1/29/2026 | 289,703 | |
280,000 | Ryder System, Inc., Sr. Unsecd. Note, Series MTN, 2.800%, 3/1/2022 | 287,292 | |
150,000 | Ryder System, Inc., Sr. Unsecd. Note, Series MTN, 3.450%, 11/15/2021 | 153,599 | |
590,000 | United Parcel Service, Inc., Sr. Unsecd. Note, 3.900%, 4/1/2025 | 666,839 | |
TOTAL | 2,813,126 | ||
Utility - Electric—4.2% | |||
310,000 | 1 | AEP Texas, Inc., Sr. Unsecd. Note, 3.850%, 10/1/2025 | 348,870 |
125,000 | American Electric Power Co., Inc., Sr. Unsecd. Note, 2.300%, 3/1/2030 | 130,731 | |
380,000 | American Electric Power Co., Inc., Sr. Unsecd. Note, Series F, 2.950%, 12/15/2022 | 396,957 | |
500,000 | Berkshire Hathaway Energy Co., 3.500%, 2/1/2025 | 550,898 | |
130,000 | Berkshire Hathaway Energy Co., Sr. Unsecd. Note, 144A, 4.050%, 4/15/2025 | 147,397 | |
560,000 | Dominion Energy, Inc., Jr. Sub. Note, 3.071%, 8/15/2024 | 604,755 | |
400,000 | EDP Finance BV, Sr. Unsecd. Note, 144A, 1.710%, 1/24/2028 | 400,198 | |
500,000 | 1 | EDP Finance BV, Sr. Unsecd. Note, 144A, 3.625%, 7/15/2024 | 546,053 |
470,000 | Enel Finance International NV, Sr. Unsecd. Note, 144A, 2.875%, 5/25/2022 | 485,085 | |
380,000 | Enel Finance International NV, Sr. Unsecd. Note, 144A, 4.625%, 9/14/2025 | 442,644 | |
385,000 | Exelon Corp., Sr. Unsecd. Note, 4.050%, 4/15/2030 | 456,034 | |
250,000 | 1 | Exelon Generation Co. LLC, Sr. Unsecd. Note, 3.250%, 6/1/2025 | 273,216 |
240,000 | Fortis, Inc. / Canada, Sr. Unsecd. Note, 3.055%, 10/4/2026 | 264,435 | |
600,000 | National Rural Utilities Cooperative Finance Corp., Sec. Fac. Bond, 2.400%, 4/25/2022 | 615,656 | |
140,000 | National Rural Utilities Cooperative Finance Corp., Sr. Unsecd. Note, 2.950%, 2/7/2024 | 149,871 |
Principal Amount | Value | ||
CORPORATE BONDS—continued | |||
Utility - Electric—continued | |||
$ 300,000 | NextEra Energy Capital Holdings, Inc., Sr. Unsecd. Note, 3.550%, 5/1/2027 | $341,926 | |
500,000 | NiSource Finance Corp., Sr. Unsecd. Note, 3.490%, 5/15/2027 | 567,543 | |
590,000 | PPL Capital Funding, Inc., Sr. Unsecd. Note, 4.200%, 6/15/2022 | 616,214 | |
250,000 | Southern Co., Sr. Unsecd. Note, 3.250%, 7/1/2026 | 280,583 | |
378,000 | Wisconsin Energy Corp., Sr. Unsecd. Note, 3.550%, 6/15/2025 | 421,680 | |
TOTAL | 8,040,746 | ||
Utility - Natural Gas—0.8% | |||
205,000 | Dominion Energy Gas Holdings LLC, Sr. Unsecd. Note, Series A, 2.500%, 11/15/2024 | 219,520 | |
600,000 | National Fuel Gas Co., Sr. Unsecd. Note, 3.750%, 3/1/2023 | 630,164 | |
395,000 | National Fuel Gas Co., Sr. Unsecd. Note, 5.500%, 1/15/2026 | 456,013 | |
250,000 | Sempra Energy, Sr. Unsecd. Note, 2.900%, 2/1/2023 | 262,458 | |
TOTAL | 1,568,155 | ||
Utility - Natural Gas Distributor—0.2% | |||
450,000 | Southern Co. Gas Capital, Sr. Unsecd. Note, 2.450%, 10/1/2023 | 473,055 | |
TOTAL CORPORATE BONDS (IDENTIFIED COST $167,010,691) | 183,220,329 | ||
MORTGAGE-BACKED SECURITIES—0.0% | |||
Federal Home Loan Mortgage Corporation—0.0% | |||
567 | Federal Home Loan Mortgage Corp., Pool C01051, 8.000%, 9/1/2030 | 666 | |
Government National Mortgage Association—0.0% | |||
745 | Government National Mortgage Association, Pool 1512, 7.500%, 12/20/2023 | 790 | |
1,663 | Government National Mortgage Association, Pool 2630, 6.500%, 8/20/2028 | 1,868 | |
2,293 | Government National Mortgage Association, Pool 2631, 7.000%, 8/20/2028 | 2,582 | |
3,149 | Government National Mortgage Association, Pool 2658, 6.500%, 10/20/2028 | 3,546 | |
5,293 | Government National Mortgage Association, Pool 2701, 6.500%, 1/20/2029 | 5,956 | |
3,555 | Government National Mortgage Association, Pool 2796, 7.000%, 8/20/2029 | 4,053 | |
690 | Government National Mortgage Association, Pool 3039, 6.500%, 2/20/2031 | 789 | |
2,600 | Government National Mortgage Association, Pool 3040, 7.000%, 2/20/2031 | 3,003 | |
9,241 | Government National Mortgage Association, Pool 3188, 6.500%, 1/20/2032 | 10,682 | |
6,361 | Government National Mortgage Association, Pool 3239, 6.500%, 5/20/2032 | 7,387 | |
13,698 | Government National Mortgage Association, Pool 3261, 6.500%, 7/20/2032 | 15,928 | |
904 | Government National Mortgage Association, Pool 516688, 8.000%, 8/15/2029 | 1,056 | |
TOTAL | 57,640 | ||
TOTAL MORTGAGE-BACKED SECURITIES (IDENTIFIED COST $50,793) | 58,306 | ||
REPURCHASE AGREEMENTS—4.7% | |||
4,322,000 | Interest in $1,000,000,000 joint repurchase agreement 0.08%, dated 12/31/2020 under which Bank of Montreal will repurchase securities provided as collateral for $1,000,008,889 on 1/4/2021. The securities provided as collateral at the end of the period held with BNY Mellon as tri-party agent, were U.S. Government Agency and U.S. Treasury securities with various maturities to 5/20/2069 and the market value of those underlying securities was $1,022,038,963. | 4,322,000 | |
4,559,143 | Interest in $1,000,000,000 joint repurchase agreement 0.08%, dated 12/31/2020 under which Bank of Montreal will repurchase securities provided as collateral for $1,000,008,889 on 1/4/2021. The securities provided as collateral at the end of the period held with BNY Mellon as tri-party agent, were U.S. Government Agency and U.S. Treasury securities with various maturities to 5/20/2069 and the market value of those underlying securities was $1,022,038,963. (purchased with proceeds from securities lending collateral) | 4,559,143 | |
TOTAL REPURCHASE AGREEMENTS (IDENTIFIED COST $8,881,143) | 8,881,143 | ||
TOTAL INVESTMENT IN SECURITIES—101.6% (IDENTIFIED COST $175,942,627)3 | 192,159,778 | ||
OTHER ASSETS AND LIABILITIES - NET—(1.6)%4 | (2,945,944) | ||
TOTAL NET ASSETS—100% | $189,213,834 |
Description | Number of Contracts | Notional Value | Expiration Date | Value and Unrealized Appreciation |
Long Future: | ||||
5United States Treasury Notes 10-Year Long Futures | 40 | $5,523,125 | March 2021 | $8,349 |
Short Futures: | ||||
5United States Treasury Long Bond Short Futures | 35 | $6,061,562 | March 2021 | $56,622 |
5United States Treasury Ultra Bond Short Futures | 3 | $640,688 | March 2021 | $12,438 |
NET UNREALIZED APPRECIATION ON FUTURES CONTRACTS | $77,409 | |||
1 | All or a portion of these securities are temporarily on loan to unaffiliated broker/dealers. |
2 | Floating/variable note with current rate and current maturity or next reset date shown. |
3 | The cost of investments for federal tax purposes amounts to $175,942,775. |
4 | Assets, other than investments in securities, less liabilities. See Statement of Assets and Liabilities. |
5 | Non-income-producing security. |
Valuation Inputs | ||||
Level 1— Quoted Prices | Level 2— Other Significant Observable Inputs | Level 3— Significant Unobservable Inputs | Total | |
Debt Securities: | ||||
Corporate Bonds | $— | $183,220,329 | $— | $183,220,329 |
Mortgage-Backed Securities | — | 58,306 | — | 58,306 |
Repurchase Agreements | — | 8,881,143 | — | 8,881,143 |
TOTAL SECURITIES | $— | $192,159,778 | $— | $192,159,778 |
Other Financial Instruments:1 | ||||
Assets | $77,409 | $— | $— | $77,409 |
TOTAL OTHER FINANCIAL INSTRUMENTS | $77,409 | $— | $— | $77,409 |
1 | Other financial instruments are futures contracts. |
The following acronym(s) are used throughout this portfolio: | ||
BKNT | —Bank Notes | |
GMTN | —Global Medium Term Note | |
LIBOR | —London Interbank Offered Rate | |
MTN | —Medium Term Note | |
REIT | —Real Estate Investment Trust | |
Year Ended December 31, | |||||
2020 | 2019 | 2018 | 2017 | 2016 | |
Net Asset Value, Beginning of Period | $11.31 | $10.65 | $11.05 | $10.98 | $10.97 |
Income From Investment Operations: | |||||
Net investment income (loss)1 | 0.28 | 0.31 | 0.30 | 0.31 | 0.34 |
Net realized and unrealized gain (loss) | 0.58 | 0.68 | (0.37) | 0.12 | 0.07 |
Total From Investment Operations | 0.86 | 0.99 | (0.07) | 0.43 | 0.41 |
Less Distributions: | |||||
Distributions from net investment income | (0.32) | (0.33) | (0.33) | (0.36) | (0.40) |
Distributions from net realized gain | (0.03) | (0.00)2 | — | — | — |
Total Distributions | (0.35) | (0.33) | (0.33) | (0.36) | (0.40) |
Net Asset Value, End of Period | $11.82 | $11.31 | $10.65 | $11.05 | $10.98 |
Total Return3 | 8.12% | 9.44% | (0.59)% | 4.04% | 3.82% |
Ratios to Average Net Assets: | |||||
Net expenses4 | 0.74% | 0.74% | 0.74% | 0.74% | 0.73% |
Net investment income | 2.50% | 2.79% | 2.83% | 2.81% | 3.10% |
Expense waiver/reimbursement5 | 0.07% | 0.08% | 0.08% | 0.06% | 0.07% |
Supplemental Data: | |||||
Net assets, end of period (000 omitted) | $170,912 | $167,625 | $162,812 | $185,026 | $188,831 |
Portfolio turnover | 24% | 21% | 19% | 27% | 26% |
1 | Per share numbers have been calculated using the average shares method. |
2 | Represents less than $0.01. |
3 | Based on net asset value. Total returns do not reflect any additional fees or expenses that may be imposed by separate accounts of insurance companies or in connection with any variable annuity or variable life insurance contract. |
4 | Amount does not reflect net expenses incurred by investment companies in which the Fund may invest. |
5 | This expense decrease is reflected in both the net expense and the net investment income ratios shown above. Amount does not reflect expense waiver/ reimbursement recorded by investment companies in which the Fund may invest. |
Year Ended December 31, | |||||
2020 | 2019 | 2018 | 2017 | 2016 | |
Net Asset Value, Beginning of Period | $11.28 | $10.62 | $11.01 | $10.94 | $10.93 |
Income From Investment Operations: | |||||
Net investment income (loss)1 | 0.26 | 0.28 | 0.27 | 0.28 | 0.31 |
Net realized and unrealized gain (loss) | 0.57 | 0.68 | (0.36) | 0.12 | 0.07 |
Total From Investment Operations | 0.83 | 0.96 | (0.09) | 0.40 | 0.38 |
Less Distributions: | |||||
Distributions from net investment income | (0.29) | (0.30) | (0.30) | (0.33) | (0.37) |
Distributions from net realized gain | (0.03) | (0.00)2 | — | — | — |
Total Distributions | (0.32) | (0.30) | (0.30) | (0.33) | (0.37) |
Net Asset Value, End of Period | $11.79 | $11.28 | $10.62 | $11.01 | $10.94 |
Total Return3 | 7.86% | 9.17% | (0.78)% | 3.75% | 3.53% |
Ratios to Average Net Assets: | |||||
Net expenses4 | 0.99% | 0.99% | 0.99% | 0.99% | 0.98% |
Net investment income | 2.25% | 2.54% | 2.58% | 2.56% | 2.86% |
Expense waiver/reimbursement5 | 0.07% | 0.08% | 0.07% | 0.06% | 0.07% |
Supplemental Data: | |||||
Net assets, end of period (000 omitted) | $18,302 | $18,776 | $19,344 | $22,596 | $23,920 |
Portfolio turnover | 24% | 21% | 19% | 27% | 26% |
1 | Per share numbers have been calculated using the average shares method. |
2 | Represents less than $0.01. |
3 | Based on net asset value. Total returns do not reflect any additional fees or expenses that may be imposed by separate accounts of insurance companies or in connection with any variable annuity or variable life insurance contract. |
4 | Amount does not reflect net expenses incurred by investment companies in which the Fund may invest. |
5 | This expense decrease is reflected in both the net expense and the net investment income ratios shown above. Amount does not reflect expense waiver/ reimbursement recorded by investment companies in which the Fund may invest. |
Assets: | |
Investment in securities, at value including $4,437,458 of securities loaned (identified cost $175,942,627) | $192,159,778 |
Cash | 118,766 |
Due from broker (Note 2) | 135,020 |
Income receivable | 1,513,503 |
Receivable for shares sold | 91,692 |
Total Assets | 194,018,759 |
Liabilities: | |
Payable for investments purchased | 118,494 |
Payable for shares redeemed | 37,420 |
Payable for variation margin on futures contracts | 9,865 |
Payable for collateral due to broker for securities lending | 4,559,143 |
Payable to adviser (Note 5) | 2,734 |
Payable for administrative fee (Note 5) | 403 |
Payable for distribution services fee (Note 5) | 3,894 |
Accrued expenses (Note 5) | 72,972 |
Total Liabilities | 4,804,925 |
Net assets for 16,008,292 shares outstanding | $189,213,834 |
Net Assets Consist of: | |
Paid-in capital | $166,794,627 |
Total distributable earnings (loss) | 22,419,207 |
Total Net Assets | $189,213,834 |
Net Asset Value, Offering Price and Redemption Proceeds Per Share: | |
Primary Shares: | |
$170,911,549 ÷ 14,456,169 shares outstanding, no par value, unlimited shares authorized | $11.82 |
Service Shares: | |
$18,302,285 ÷ 1,552,123 shares outstanding, no par value, unlimited shares authorized | $11.79 |
Investment Income: | |
Interest | $6,020,032 |
Net income on securities loaned (Note 2) | 4,822 |
TOTAL INCOME | 6,024,854 |
Expenses: | |
Investment adviser fee (Note 5) | 1,115,484 |
Administrative fee (Note 5) | 146,012 |
Custodian fees | 10,633 |
Transfer agent fees | 16,991 |
Directors’/Trustees’ fees (Note 5) | 2,051 |
Auditing fees | 25,490 |
Legal fees | 9,647 |
Portfolio accounting fees | 96,237 |
Distribution services fee (Note 5) | 46,300 |
Printing and postage | 71,545 |
Miscellaneous (Note 5) | 27,601 |
TOTAL EXPENSES | 1,567,991 |
Waiver : | |
Waiver of investment adviser fee (Note 5) | (136,819) |
Net expenses | 1,431,172 |
Net investment income | 4,593,682 |
Realized and Unrealized Gain (Loss) on Investments and Futures Contracts: | |
Net realized gain on investments | 1,638,683 |
Net realized loss on futures contracts | (56,098) |
Net change in unrealized appreciation of investments | 8,220,187 |
Net change in unrealized appreciation of futures contracts | 26,355 |
Net realized and unrealized gain (loss) on investments and futures contracts | 9,829,127 |
Change in net assets resulting from operations | $14,422,809 |
Year Ended December 31 | 2020 | 2019 |
Increase (Decrease) in Net Assets | ||
Operations: | ||
Net investment income (loss) | $4,593,682 | $5,110,075 |
Net realized gain (loss) | 1,582,585 | 556,588 |
Net change in unrealized appreciation/depreciation | 8,246,542 | 10,915,627 |
CHANGE IN NET ASSETS RESULTING FROM OPERATIONS | 14,422,809 | 16,582,290 |
Distributions to Shareholders: | ||
Primary Shares | (5,129,491) | (4,859,559) |
Service Shares | (531,201) | (520,306) |
CHANGE IN NET ASSETS RESULTING FROM DISTRIBUTIONS TO SHAREHOLDERS | (5,660,692) | (5,379,865) |
Share Transactions: | ||
Proceeds from sale of shares | 16,225,144 | 11,736,570 |
Net asset value of shares issued to shareholders in payment of distributions declared | 5,660,688 | 5,379,862 |
Cost of shares redeemed | (27,834,646) | (24,074,695) |
CHANGE IN NET ASSETS RESULTING FROM SHARE TRANSACTIONS | (5,948,814) | (6,958,263) |
Change in net assets | 2,813,303 | 4,244,162 |
Net Assets: | ||
Beginning of period | 186,400,531 | 182,156,369 |
End of period | $189,213,834 | $186,400,531 |
Market Value of Securities Loaned | Collateral Received |
$4,437,458 | $4,559,143 |
Fair Value of Derivative Instruments | ||
Liabilities | ||
Statement of Assets and Liabilities Location | Fair Value | |
Derivatives not accounted for as hedging instruments under ASC Topic 815 | ||
Interest rate contracts | Payable for variation margin on futures contracts | $(77,409) |
* | Includes cumulative net appreciation of futures contracts as reported in the footnotes to the Portfolio of Investments. Only the current day’s variation margin is reported within the Statement of Assets and Liabilities. |
Amount of Realized Gain or (Loss) on Derivatives Recognized in Income | |
Futures Contracts | |
Interest rate contracts | $(56,098) |
Change in Unrealized Appreciation or (Depreciation) on Derivatives Recognized in Income | |
Futures Contracts | |
Interest rate contracts | $26,355 |
Year Ended 12/31/2020 | Year Ended 12/31/2019 | |||
Primary Shares: | Shares | Amount | Shares | Amount |
Shares sold | 1,321,059 | $15,137,018 | 1,017,072 | $11,219,212 |
Shares issued to shareholders in payment of distributions declared | 507,368 | 5,129,490 | 456,297 | 4,859,559 |
Shares redeemed | (2,197,120) | (24,859,601) | (1,939,194) | (21,305,622) |
NET CHANGE RESULTING FROM PRIMARY SHARE TRANSACTIONS | (368,693) | $(4,593,093) | (465,825) | $(5,226,851) |
Year Ended 12/31/2020 | Year Ended 12/31/2019 | |||
Service Shares: | Shares | Amount | Shares | Amount |
Shares sold | 97,027 | $1,088,126 | 47,093 | $517,358 |
Shares issued to shareholders in payment of distributions declared | 52,594 | 531,198 | 48,900 | 520,303 |
Shares redeemed | (262,468) | (2,975,045) | (252,919) | (2,769,073) |
NET CHANGE RESULTING FROM SERVICE SHARE TRANSACTIONS | (112,847) | $(1,355,721) | (156,926) | $(1,731,412) |
NET CHANGE RESULTING FROM TOTAL FUND SHARE TRANSACTIONS | (481,540) | $(5,948,814) | (622,751) | $(6,958,263) |
2020 | 2019 | |
Ordinary income | $5,262,359 | $5,379,865 |
Long-term capital gains | $398,333 | $— |
Undistributed ordinary income | $4,862,730 |
Net unrealized appreciation | $16,217,003 |
Undistributed long-term capital gains | $1,339,474 |
Administrative Fee | Average Daily Net Assets of the Investment Complex |
0.100% | on assets up to $50 billion |
0.075% | on assets over $50 billion |
Percentage of Average Daily Net Assets of Class | |
Primary Shares | 0.25% |
Service Shares | 0.25% |
Distribution Services Fees Incurred | |
Service Shares | $46,300 |
Purchases | $44,076,703 |
Sales | $51,540,527 |
February 16, 2021
Beginning Account Value 7/1/2020 | Ending Account Value 12/31/2020 | Expenses Paid During Period1 | |
Actual: | |||
Primary Shares | $1,000 | $1,033.20 | $3.78 |
Service Shares | $1,000 | $1,031.50 | $5.06 |
Hypothetical (assuming a 5% return before expenses): | |||
Primary Shares | $1,000 | $1,021.42 | $3.76 |
Service Shares | $1,000 | $1,020.16 | $5.03 |
1 | Expenses are equal to the Fund’s annualized net expense ratios, multiplied by the average account value over the period, multiplied by 184/366 (to reflect the one-half-year period). The expenses shown in the table do not include the charges and expenses imposed by the insurance company under the variable insurance product contract. Please refer to the variable insurance product prospectus for a complete listing of these expenses. The annualized net expense ratios are as follows: |
Primary Shares | 0.74% |
Service Shares | 0.99% |
Name Birth Date Positions Held with Trust Date Service Began | Principal Occupation(s) for Past Five Years, Other Directorships Held and Previous Position(s) |
J. Christopher Donahue* Birth Date: April 11, 1949 Trustee Indefinite Term Began serving: September 1993 | Principal Occupations: Principal Executive Officer and President of certain of the Funds in the Federated Hermes Fund Family; Director or Trustee of the Funds in the Federated Hermes Fund Family; President, Chief Executive Officer and Director, Federated Hermes, Inc.; Chairman and Trustee, Federated Investment Management Company; Trustee, Federated Investment Counseling; Chairman and Director, Federated Global Investment Management Corp.; Chairman and Trustee, Federated Equity Management Company of Pennsylvania; Trustee, Federated Shareholder Services Company; Director, Federated Services Company. Previous Positions: President, Federated Investment Counseling; President and Chief Executive Officer, Federated Investment Management Company, Federated Global Investment Management Corp. and Passport Research, Ltd; Chairman, Passport Research, Ltd. |
Thomas R. Donahue* Birth Date: October 20, 1958 Trustee Indefinite Term Began serving: May 2016 | Principal Occupations: Director or Trustee of certain of the funds in the Federated Hermes Fund Family; Chief Financial Officer, Treasurer, Vice President and Assistant Secretary, Federated Hermes, Inc.; Chairman and Trustee, Federated Administrative Services; Chairman and Director, Federated Administrative Services, Inc.; Trustee and Treasurer, Federated Advisory Services Company; Director or Trustee and Treasurer, Federated Equity Management Company of Pennsylvania, Federated Global Investment Management Corp., Federated Investment Counseling, and Federated Investment Management Company; Director, MDTA LLC; Director, Executive Vice President and Assistant Secretary, Federated Securities Corp.; Director or Trustee and Chairman, Federated Services Company and Federated Shareholder Services Company; and Director and President, FII Holdings, Inc. Previous Positions: Director, Federated Hermes, Inc.; Assistant Secretary, Federated Investment Management Company, Federated Global Investment Management Company and Passport Research, LTD; Treasurer, Passport Research, LTD; Executive Vice President, Federated Securities Corp.; and Treasurer, FII Holdings, Inc. |
Name Birth Date Positions Held with Trust Date Service Began | Principal Occupation(s) for Past Five Years, Other Directorships Held, Previous Position(s) and Qualifications |
John T. Collins Birth Date: January 24, 1947 Trustee Indefinite Term Began serving: October 2013 | Principal Occupations: Director or Trustee, and Chair of the Board of Directors or Trustees, of the Federated Hermes Fund Family; formerly, Chairman and CEO, The Collins Group, Inc. (a private equity firm) (Retired). Other Directorships Held: Chairman of the Board of Directors, Director, KLX Energy Services Holdings, Inc. (oilfield services); former Director of KLX Corp. (aerospace). Qualifications: Mr. Collins has served in several business and financial management roles and directorship positions throughout his career. Mr. Collins previously served as Chairman and CEO of The Collins Group, Inc. (a private equity firm) and as a Director of KLX Corp. Mr. Collins serves as Chairman Emeriti, Bentley University. Mr. Collins previously served as Director and Audit Committee Member, Bank of America Corp.; Director, FleetBoston Financial Corp.; and Director, Beth Israel Deaconess Medical Center (Harvard University Affiliate Hospital). |
Name Birth Date Positions Held with Trust Date Service Began | Principal Occupation(s) for Past Five Years, Other Directorships Held, Previous Position(s) and Qualifications |
G. Thomas Hough Birth Date: February 28, 1955 Trustee Indefinite Term Began serving: August 2015 | Principal Occupations: Director or Trustee, Chair of the Audit Committee of the Federated Hermes Fund Family; formerly, Vice Chair, Ernst & Young LLP (public accounting firm) (Retired). Other Directorships Held: Director, Chair of the Audit Committee, Equifax, Inc.; Director, Member of the Audit Committee, Haverty Furniture Companies, Inc.; formerly, Director, Member of Governance and Compensation Committees, Publix Super Markets, Inc. Qualifications: Mr. Hough has served in accounting, business management and directorship positions throughout his career. Mr. Hough most recently held the position of Americas Vice Chair of Assurance with Ernst & Young LLP (public accounting firm). Mr. Hough serves on the President’s Cabinet and Business School Board of Visitors for the University of Alabama. Mr. Hough previously served on the Business School Board of Visitors for Wake Forest University, and he previously served as an Executive Committee member of the United States Golf Association. |
Maureen Lally-Green Birth Date: July 5, 1949 Trustee Indefinite Term Began serving: August 2009 | Principal Occupations: Director or Trustee of the Federated Hermes Fund Family; Adjunct Professor Emerita of Law, Duquesne University School of Law; formerly, Dean of the Duquesne University School of Law and Professor of Law and Interim Dean of the Duquesne University School of Law; formerly, Associate General Secretary and Director, Office of Church Relations, Diocese of Pittsburgh. Other Directorships Held: Director, CNX Resources Corporation (formerly known as CONSOL Energy Inc.). Qualifications: Judge Lally-Green has served in various legal and business roles and directorship positions throughout her career. Judge Lally-Green previously held the position of Dean of the School of Law of Duquesne University (as well as Interim Dean). Judge Lally-Green previously served as a member of the Superior Court of Pennsylvania and as a Professor of Law, Duquesne University School of Law. Judge Lally-Green was appointed by the Supreme Court of Pennsylvania to serve on the Supreme Court’s Board of Continuing Judicial Education and the Supreme Court’s Appellate Court Procedural Rules Committee. Judge Lally-Green also currently holds the positions on not for profit or for profit boards of directors as follows: Director and Chair, UPMC Mercy Hospital; Regent, Saint Vincent Seminary; Member, Pennsylvania State Board of Education (public); Director, Catholic Charities, Pittsburgh; and Director CNX Resources Corporation (formerly known as CONSOL Energy Inc.). Judge Lally-Green has held the positions of: Director, Auberle; Director, Epilepsy Foundation of Western and Central Pennsylvania; Director, Ireland Institute of Pittsburgh; Director, Saint Thomas More Society; Director and Chair, Catholic High Schools of the Diocese of Pittsburgh, Inc.; Director, Pennsylvania Bar Institute; Director, St. Vincent College; Director and Chair, North Catholic High School, Inc.; and Director and Vice Chair, Our Campaign for the Church Alive!, Inc. |
Thomas M. O’Neill Birth Date: June 14, 1951 Trustee Indefinite Term Began serving: August 2006 | Principal Occupations: Director or Trustee of the Federated Hermes Fund Family; Sole Proprietor, Navigator Management Company (investment and strategic consulting). Other Directorships Held: None. Qualifications: Mr. O’Neill has served in several business, mutual fund and financial management roles and directorship positions throughout his career. Mr. O’Neill serves as Director, Medicines for Humanity and Director, The Golisano Children’s Museum of Naples, Florida. Mr. O’Neill previously served as Chief Executive Officer and President, Managing Director and Chief Investment Officer, Fleet Investment Advisors; President and Chief Executive Officer, Aeltus Investment Management, Inc.; General Partner, Hellman, Jordan Management Co., Boston, MA; Chief Investment Officer, The Putnam Companies, Boston, MA; Credit Analyst and Lending Officer, Fleet Bank; Director and Consultant, EZE Castle Software (investment order management software); and Director, Midway Pacific (lumber). |
Madelyn A. Reilly Birth Date: February 2, 1956 Trustee Indefinite Term Began serving: November 2020 | Principal Occupations: Director or Trustee of the Federated Hermes Fund Family; Senior Vice President for Legal Affairs, General Counsel and Secretary of the Board of Trustees, Duquesne University. Other Directorships Held: None. Qualifications: Ms. Reilly has served in various business and legal management roles throughout her career. Ms. Reilly previously served as Director of Risk Management and Associate General Counsel, Duquesne University. Prior to her work at Duquesne University, Ms. Reilly served as Assistant General Counsel of Compliance and Enterprise Risk as well as Senior Counsel of Environment, Health and Safety, PPG Industries. |
P. Jerome Richey Birth Date: February 23, 1949 Trustee Indefinite Term Began serving: October 2013 | Principal Occupations: Director or Trustee of the Federated Hermes Fund Family; Management Consultant; Retired; formerly, Senior Vice Chancellor and Chief Legal Officer, University of Pittsburgh and Executive Vice President and Chief Legal Officer, CONSOL Energy Inc. (now split into two separate publicly traded companies known as CONSOL Energy Inc. and CNX Resources Corp.). Other Directorships Held: None. Qualifications: Mr. Richey has served in several business and legal management roles and directorship positions throughout his career. Mr. Richey most recently held the positions of Senior Vice Chancellor and Chief Legal Officer, University of Pittsburgh. Mr. Richey previously served as Chairman of the Board, Epilepsy Foundation of Western Pennsylvania and Chairman of the Board, World Affairs Council of Pittsburgh. Mr. Richey previously served as Chief Legal Officer and Executive Vice President, CONSOL Energy Inc. and CNX Gas Company; and Board Member, Ethics Counsel and Shareholder, Buchanan Ingersoll & Rooney PC (a law firm). |
Name Birth Date Positions Held with Trust Date Service Began | Principal Occupation(s) for Past Five Years, Other Directorships Held, Previous Position(s) and Qualifications |
John S. Walsh Birth Date: November 28, 1957 Trustee Indefinite Term Began serving: January 1999 | Principal Occupations: Director or Trustee of the Federated Hermes Fund Family; President and Director, Heat Wagon, Inc. (manufacturer of construction temporary heaters); President and Director, Manufacturers Products, Inc. (distributor of portable construction heaters); President, Portable Heater Parts, a division of Manufacturers Products, Inc. Other Directorships Held: None. Qualifications: Mr. Walsh has served in several business management roles and directorship positions throughout his career. Mr. Walsh previously served as Vice President, Walsh & Kelly, Inc. (paving contractors). |
Name Birth Date Address Positions Held with Trust Date Service Began | Principal Occupation(s) for Past Five Years and Previous Position(s) |
Lori A. Hensler Birth Date: January 6, 1967 TREASURER Officer since: April 2013 | Principal Occupations: Principal Financial Officer and Treasurer of the Federated Hermes Fund Family; Senior Vice President, Federated Administrative Services; Financial and Operations Principal for Federated Securities Corp.; and Assistant Treasurer, Federated Investors Trust Company. Ms. Hensler has received the Certified Public Accountant designation. Previous Positions: Controller of Federated Hermes, Inc.; Senior Vice President and Assistant Treasurer, Federated Investors Management Company; Treasurer, Federated Investors Trust Company; Assistant Treasurer, Federated Administrative Services, Federated Administrative Services, Inc., Federated Securities Corp., Edgewood Services, Inc., Federated Advisory Services Company, Federated Equity Management Company of Pennsylvania, Federated Global Investment Management Corp., Federated Investment Counseling, Federated Investment Management Company, Passport Research, Ltd., and Federated MDTA, LLC; Financial and Operations Principal for Federated Securities Corp., Edgewood Services, Inc. and Southpointe Distribution Services, Inc. |
Peter J. Germain Birth Date: September 3, 1959 CHIEF LEGAL OFFICER, SECRETARY and EXECUTIVE VICE PRESIDENT Officer since: January 2005 | Principal Occupations: Mr. Germain is Chief Legal Officer, Secretary and Executive Vice President of the Federated Hermes Fund Family. He is General Counsel, Chief Legal Officer, Secretary and Executive Vice President, Federated Hermes, Inc.; Trustee and Senior Vice President, Federated Investors Management Company; Trustee and President, Federated Administrative Services; Director and President, Federated Administrative Services, Inc.; Director and Vice President, Federated Securities Corp.; Director and Secretary, Federated Private Asset Management, Inc.; Secretary, Federated Shareholder Services Company; and Secretary, Retirement Plan Service Company of America. Mr. Germain joined Federated Hermes, Inc. in 1984 and is a member of the Pennsylvania Bar Association. Previous Positions: Deputy General Counsel, Special Counsel, Managing Director of Mutual Fund Services, Federated Hermes, Inc.; Senior Vice President, Federated Services Company; and Senior Corporate Counsel, Federated Hermes, Inc. |
John B. Fisher Birth Date: May 16, 1956 PRESIDENT Officer since: November 2004 | Principal Occupations: Principal Executive Officer and President of certain of the Funds in the Federated Hermes Fund Family; Director or Trustee of certain of the Funds in the Federated Hermes Fund Family; Vice President, Federated Hermes, Inc.; President, Director/Trustee and CEO, Federated Advisory Services Company, Federated Equity Management Company of Pennsylvania, Federated Global Investment Management Corp., Federated Investment Counseling, Federated Investment Management Company; President and CEO of Passport Research, Ltd.; President of some of the Funds in the Federated Fund Complex and Director, Federated Investors Trust Company. Previous Positions: President and Director of the Institutional Sales Division of Federated Securities Corp.; President and Director of Federated Investment Counseling; Director, Edgewood Securities Corp.; Director, Federated Services Company; Director, Federated Hermes, Inc.; Chairman and Director, Southpointe Distribution Services, Inc. and President, Technology, Federated Services Company. |
Stephen Van Meter Birth Date: June 5, 1975 CHIEF COMPLIANCE OFFICER AND SENIOR VICE PRESIDENT Officer since: July 2015 | Principal Occupations: Senior Vice President and Chief Compliance Officer of the Federated Hermes Fund Family; Vice President and Chief Compliance Officer of Federated Hermes, Inc. and Chief Compliance Officer of certain of its subsidiaries. Mr. Van Meter joined Federated Hermes, Inc. in October 2011. He holds FINRA licenses under Series 3, 7, 24 and 66. Previous Positions: Mr. Van Meter previously held the position of Compliance Operating Officer, Federated Hermes, Inc. Prior to joining Federated Hermes, Inc., Mr. Van Meter served at the United States Securities and Exchange Commission in the positions of Senior Counsel, Office of Chief Counsel, Division of Investment Management and Senior Counsel, Division of Enforcement. |
Stephen F. Auth Birth Date: September 13, 1956 101 Park Avenue 41st Floor New York, NY 10178 CHIEF INVESTMENT OFFICER Officer since: November 2002 | Principal Occupations: Stephen F. Auth is Chief Investment Officer of various Funds in the Federated Hermes Fund Family; Executive Vice President, Federated Investment Counseling, Federated Global Investment Management Corp. and Federated Equity Management Company of Pennsylvania. Previous Positions: Executive Vice President, Federated Investment Management Company and Passport Research, Ltd. (investment advisory subsidiary of Federated); Senior Vice President, Global Portfolio Management Services Division; Senior Vice President, Federated Investment Management Company and Passport Research, Ltd.; Senior Managing Director and Portfolio Manager, Prudential Investments. |
Name Birth Date Address Positions Held with Trust Date Service Began | Principal Occupation(s) for Past Five Years and Previous Position(s) |
Robert J. Ostrowski Birth Date: April 26, 1963 Chief Investment Officer Officer since: May 2004 | Principal Occupations: Robert J. Ostrowski joined Federated Hermes, Inc. in 1987 as an Investment Analyst and became a Portfolio Manager in 1990. He was named Chief Investment Officer of Federated Hermes’ taxable fixed-income products in 2004 and also serves as a Senior Portfolio Manager. Mr. Ostrowski became an Executive Vice President of the Fund’s Adviser in 2009 and served as a Senior Vice President of the Fund’s Adviser from 1997 to 2009. Mr. Ostrowski has received the Chartered Financial Analyst designation. He received his M.S. in Industrial Administration from Carnegie Mellon University. |
Deborah A. Cunningham Birth Date: September 15, 1959 Chief Investment Officer Officer since: June 2012 | Principal Occupations: Deborah A. Cunningham was named Chief Investment Officer of Federated Hermes’ money market products in 2004. She joined Federated Hermes in 1981 and has been a Senior Portfolio Manager since 1997 and an Executive Vice President of the Fund’s Adviser since 2009. Ms. Cunningham has received the Chartered Financial Analyst designation and holds an M.S.B.A. in Finance from Robert Morris College. |
Federated Hermes Funds
4000 Ericsson Drive
Warrendale, PA 15086-7561
or call 1-800-341-7400.
CUSIP 313916785

Federated Hermes Fund for U.S. Government Securities II
A Portfolio of Federated Hermes Insurance Series
1 Year | 5 Years | 10 Years | |
Fund | 5.21% | 3.00% | 2.66% |
BBMBS | 3.87% | 3.05% | 3.01% |
BBGI | 7.94% | 3.76% | 3.26% |
Blended Index | 5.21% | 3.29% | 3.10% |
Type of Investments | Percentage of Total Net Assets |
U.S. Government Agency Mortgage-Backed Securities | 47.2% |
U.S. Treasury Securities | 21.0% |
U.S. Government Agency Securities | 12.1% |
Asset-Backed Securities | 10.4% |
U.S. Government Agency Commercial Mortgage-Backed Securities | 7.3% |
Non-Agency Commercial Mortgage-Backed Securities | 2.0% |
Non-Agency Mortgage-Backed Securities | 0.3% |
Cash Equivalents2 | 8.8% |
Other Assets and Liabilities—Net3 | (9.1)% |
TOTAL | 100% |
1 | See the Fund’s Prospectus and Statement of Additional Information for a description of these investments. |
2 | Cash equivalents include any investments in money market mutual funds and/or overnight repurchase agreements. |
3 | Assets, other than investments in securities, less liabilities. See Statement of Assets and Liabilities. |
Principal Amount | Value | ||
MORTGAGE-BACKED SECURITIES—44.4% | |||
Federal Home Loan Mortgage Corporation—12.0% | |||
$ 464,242 | 3.000%, 11/1/2045 | $498,457 | |
1,167,418 | 3.000%, 10/1/2046 | 1,231,933 | |
582,230 | 3.000%, 10/1/2046 | 628,415 | |
101,592 | 3.000%, 11/1/2046 | 107,111 | |
1,068,013 | 3.500%, 7/1/2042 | 1,171,794 | |
938,545 | 3.500%, 9/1/2043 | 1,018,308 | |
269,229 | 3.500%, 5/1/2046 | 294,296 | |
1,688,998 | 3.500%, 11/1/2047 | 1,790,840 | |
1,432,850 | 4.000%, 12/1/2041 | 1,588,039 | |
165,927 | 4.000%, 1/1/2042 | 183,898 | |
883,171 | 4.000%, 3/1/2046 | 962,265 | |
332,602 | 4.000%, 11/1/2047 | 356,569 | |
156,496 | 4.000%, 12/1/2047 | 167,773 | |
217,434 | 4.000%, 4/1/2048 | 233,033 | |
1,036,787 | 4.000%, 7/1/2048 | 1,109,552 | |
247,746 | 4.500%, 8/1/2040 | 277,524 | |
577,854 | 4.500%, 12/1/2040 | 647,309 | |
766,498 | 4.500%, 4/1/2041 | 857,669 | |
198 | 5.000%, 2/1/2021 | 198 | |
311,720 | 5.000%, 1/1/2034 | 354,520 | |
88,049 | 5.000%, 5/1/2034 | 100,240 | |
��73,610 | 5.000%, 4/1/2036 | 84,609 | |
21,866 | 5.000%, 5/1/2036 | 25,120 | |
16,300 | 5.000%, 6/1/2036 | 18,727 | |
95,288 | 5.000%, 6/1/2040 | 109,873 | |
521,722 | 5.500%, 5/1/2034 | 603,045 | |
13,271 | 5.500%, 12/1/2035 | 15,518 | |
119,570 | 5.500%, 2/1/2036 | 139,514 | |
53,347 | 5.500%, 5/1/2036 | 62,481 | |
9,344 | 5.500%, 5/1/2036 | 10,942 | |
10,657 | 5.500%, 5/1/2036 | 12,426 | |
4,353 | 5.500%, 6/1/2036 | 5,100 | |
2,275 | 5.500%, 6/1/2036 | 2,664 | |
82,088 | 5.500%, 11/1/2037 | 96,141 | |
165,794 | 5.500%, 1/1/2038 | 194,244 | |
4,827 | 6.000%, 1/1/2032 | 5,542 | |
22,755 | 6.000%, 2/1/2032 | 26,337 | |
78,454 | 6.000%, 4/1/2036 | 93,092 | |
13,822 | 6.000%, 5/1/2036 | 16,476 | |
165,812 | 6.000%, 6/1/2037 | 198,568 | |
19,933 | 6.000%, 7/1/2037 | 23,869 | |
6,338 | 6.500%, 6/1/2022 | 6,523 | |
397 | 6.500%, 5/1/2024 | 425 | |
6,282 | 6.500%, 3/1/2029 | 7,129 | |
2,484 | 6.500%, 6/1/2029 | 2,821 | |
2,419 | 6.500%, 7/1/2029 | 2,751 | |
511 | 6.500%, 9/1/2029 | 575 | |
1,655 | 7.000%, 12/1/2029 | 1,922 |
Principal Amount | Value | ||
MORTGAGE-BACKED SECURITIES—continued | |||
Federal Home Loan Mortgage Corporation—continued | |||
$ 879 | 7.000%, 6/1/2030 | $1,006 | |
167 | 7.000%, 11/1/2030 | 196 | |
171,250 | 7.000%, 4/1/2032 | 204,657 | |
16,946 | 7.500%, 12/1/2030 | 19,991 | |
10,086 | 7.500%, 1/1/2031 | 11,870 | |
2,596 | 8.500%, 5/1/2030 | 3,030 | |
667 | 9.000%, 2/1/2025 | 724 | |
708 | 9.000%, 5/1/2025 | 775 | |
TOTAL | 15,588,426 | ||
Federal National Mortgage Association—16.3% | |||
1,863,635 | 2.000%, 6/1/2050 | 1,938,326 | |
1,664,606 | 2.500%, 3/1/2050 | 1,753,993 | |
850,897 | 3.000%, 10/1/2046 | 897,921 | |
1,332,069 | 3.000%, 11/1/2046 | 1,404,435 | |
195,224 | 3.000%, 11/1/2046 | 209,063 | |
123,085 | 3.000%, 1/1/2047 | 129,618 | |
893,238 | 3.000%, 1/1/2047 | 940,647 | |
59,813 | 3.000%, 2/1/2047 | 64,782 | |
829,641 | 3.000%, 2/1/2048 | 890,786 | |
356,357 | 3.000%, 2/1/2048 | 382,621 | |
224,864 | 3.000%, 7/1/2049 | 235,252 | |
2,194,294 | 3.500%, 9/1/2042 | 2,420,547 | |
1,115,485 | 3.500%, 8/1/2046 | 1,201,326 | |
942,398 | 3.500%, 9/1/2046 | 1,014,919 | |
1,394,711 | 3.500%, 12/1/2046 | 1,488,222 | |
844,180 | 3.500%, 12/1/2047 | 898,100 | |
556,424 | 3.500%, 1/1/2048 | 609,102 | |
303,513 | 4.000%, 2/1/2041 | 336,575 | |
772,101 | 4.000%, 12/1/2041 | 856,208 | |
594,265 | 4.000%, 4/1/2042 | 658,443 | |
403,190 | 4.000%, 2/1/2048 | 431,865 | |
273,887 | 4.000%, 2/1/2048 | 293,965 | |
617,441 | 4.000%, 2/1/2048 | 661,933 | |
268,778 | 4.500%, 10/1/2041 | 300,412 | |
221,442 | 5.000%, 7/1/2034 | 252,621 | |
29,202 | 5.000%, 11/1/2035 | 33,588 | |
5,562 | 5.500%, 11/1/2021 | 5,650 | |
108,662 | 5.500%, 9/1/2034 | 126,382 | |
60,026 | 5.500%, 1/1/2036 | 70,004 | |
68,183 | 5.500%, 4/1/2036 | 79,443 | |
4,078 | 6.000%, 8/1/2021 | 4,134 | |
2,912 | 6.000%, 7/1/2029 | 3,277 | |
1,603 | 6.000%, 5/1/2031 | 1,844 | |
9,812 | 6.000%, 5/1/2036 | 11,667 | |
157,619 | 6.000%, 7/1/2036 | 188,693 | |
4,390 | 6.000%, 7/1/2036 | 5,248 | |
37,267 | 6.000%, 9/1/2037 | 44,744 | |
75,632 | 6.000%, 11/1/2037 | 90,597 | |
33,537 | 6.000%, 12/1/2037 | 39,247 | |
1,687 | 6.500%, 6/1/2029 | 1,939 | |
2,120 | 6.500%, 6/1/2029 | 2,429 |
Principal Amount | Value | ||
MORTGAGE-BACKED SECURITIES—continued | |||
Federal National Mortgage Association—continued | |||
$ 604 | 6.500%, 6/1/2029 | $692 | |
206 | 6.500%, 7/1/2029 | 235 | |
114 | 6.500%, 7/1/2029 | 115 | |
213 | 6.500%, 7/1/2029 | 243 | |
3,181 | 6.500%, 7/1/2029 | 3,644 | |
25 | 6.500%, 7/1/2029 | 28 | |
287 | 6.500%, 7/1/2029 | 327 | |
192 | 6.500%, 8/1/2029 | 213 | |
3,936 | 6.500%, 9/1/2030 | 4,549 | |
26,066 | 6.500%, 6/1/2031 | 30,233 | |
12,002 | 6.500%, 4/1/2032 | 14,108 | |
1,109 | 7.000%, 2/1/2024 | 1,184 | |
2,130 | 7.000%, 10/1/2029 | 2,448 | |
12,064 | 7.000%, 10/1/2029 | 14,103 | |
4,051 | 7.000%, 11/1/2030 | 4,787 | |
47,467 | 7.000%, 4/1/2031 | 56,188 | |
83,510 | 7.000%, 4/1/2032 | 99,743 | |
1,118 | 7.500%, 8/1/2028 | 1,268 | |
195 | 7.500%, 9/1/2028 | 224 | |
3,467 | 7.500%, 2/1/2030 | 4,070 | |
1,664 | 8.000%, 7/1/2030 | 1,963 | |
TOTAL | 21,220,933 | ||
Government Agency—0.0% | |||
33,374 | FDIC Trust 2013-R2, Class A, 1.250%, 3/25/2033 | 33,228 | |
Government National Mortgage Association—6.3% | |||
1,556,528 | 3.000%, 11/20/2047 | 1,637,232 | |
2,737,593 | 3.500%, 1/20/2048 | 2,988,587 | |
958,761 | 3.500%, 2/20/2048 | 1,051,757 | |
390,525 | 4.500%, 6/20/2039 | 435,382 | |
314,592 | 4.500%, 10/15/2039 | 358,237 | |
437,036 | 4.500%, 8/20/2040 | 487,704 | |
242,521 | 5.000%, 7/15/2034 | 273,997 | |
22,250 | 6.000%, 4/15/2032 | 25,579 | |
44,056 | 6.000%, 5/15/2032 | 51,147 | |
75,528 | 6.000%, 4/15/2036 | 88,852 | |
147,109 | 6.000%, 5/15/2036 | 172,815 | |
82,438 | 6.000%, 5/15/2036 | 96,981 | |
31,114 | 6.000%, 7/20/2036 | 36,370 | |
31,054 | 6.000%, 5/20/2037 | 36,377 | |
170,809 | 6.000%, 7/20/2038 | 200,959 | |
2,771 | 6.500%, 12/15/2023 | 2,920 | |
5,414 | 6.500%, 5/15/2024 | 5,742 | |
1,913 | 6.500%, 6/15/2029 | 2,176 | |
4,373 | 6.500%, 6/15/2031 | 5,001 | |
3,982 | 6.500%, 7/20/2031 | 4,600 | |
3,765 | 6.500%, 8/20/2031 | 4,346 | |
23,511 | 6.500%, 10/15/2031 | 27,338 | |
38,907 | 6.500%, 12/15/2031 | 45,016 | |
3,854 | 6.500%, 4/15/2032 | 4,465 | |
22,694 | 6.500%, 5/15/2032 | 26,323 | |
163,716 | 6.500%, 5/15/2032 | 191,152 |
Principal Amount | Value | ||
MORTGAGE-BACKED SECURITIES—continued | |||
Government National Mortgage Association—continued | |||
$ 1,531 | 7.500%, 10/15/2029 | $1,782 | |
357 | 7.500%, 10/15/2029 | 416 | |
3,833 | 7.500%, 3/20/2030 | 4,436 | |
943 | 8.000%, 4/15/2030 | 1,110 | |
TOTAL | 8,268,799 | ||
1 | Uniform Mortgage-Backed Securities, TBA—9.8% | ||
1,000,000 | 2.500%, 1/1/2051 | 1,054,492 | |
11,000,000 | 2.500%, 1/20/2051 | 11,645,667 | |
TOTAL | 12,700,159 | ||
TOTAL MORTGAGE-BACKED SECURITIES (IDENTIFIED COST $53,965,091) | 57,811,545 | ||
U.S. TREASURIES—21.0% | |||
U.S. Treasury Bonds—4.2% | |||
500,000 | 2.250%, 8/15/2046 | 570,635 | |
700,000 | 2.375%, 11/15/2049 | 822,008 | |
250,000 | 2.750%, 8/15/2042 | 309,651 | |
1,200,000 | 2.875%, 8/15/2045 | 1,526,022 | |
1,025,000 | 2.875%, 5/15/2049 | 1,322,539 | |
650,000 | 3.125%, 8/15/2044 | 856,718 | |
TOTAL | 5,407,573 | ||
U.S. Treasury Notes—16.8% | |||
1,500,000 | 0.125%, 12/15/2023 | 1,498,082 | |
1,000,000 | 0.250%, 9/30/2025 | 995,948 | |
1,000,000 | 0.375%, 9/30/2027 | 984,295 | |
1,500,000 | 0.625%, 11/30/2027 | 1,499,036 | |
1,000,000 | 0.625%, 8/15/2030 | 974,531 | |
525,000 | 1.375%, 9/30/2023 | 542,498 | |
1,500,000 | 1.750%, 5/15/2022 | 1,533,193 | |
2,000,000 | 2.000%, 2/15/2023 | 2,078,579 | |
250,000 | 2.250%, 11/15/2027 | 277,451 | |
3,000,000 | 2.375%, 1/31/2023 | 3,139,082 | |
3,000,000 | 2.500%, 1/15/2022 | 3,073,363 | |
1,800,000 | 2.500%, 3/31/2023 | 1,894,922 | |
250,000 | 2.500%, 2/28/2026 | 277,009 | |
500,000 | 2.750%, 8/15/2021 | 508,117 | |
2,500,000 | 2.750%, 7/31/2023 | 2,666,944 | |
TOTAL | 21,943,050 | ||
TOTAL U.S. TREASURIES (IDENTIFIED COST $25,582,150) | 27,350,623 | ||
GOVERNMENT AGENCIES—12.1% | |||
Federal Farm Credit System—2.2% | |||
1,500,000 | 0.375%, 4/8/2022 | 1,504,571 | |
1,000,000 | 5.750%, 12/7/2028 | 1,370,457 | |
TOTAL | 2,875,028 | ||
Federal Home Loan Bank System—3.4% | |||
1,650,000 | 0.500%, 4/14/2025 | 1,662,500 | |
1,500,000 | 2.375%, 3/13/2026 | 1,644,840 | |
1,000,000 | 3.125%, 12/12/2025 | 1,130,850 | |
TOTAL | 4,438,190 | ||
Federal Home Loan Mortgage Corporation—0.1% | |||
72,000 | 6.750%, 9/15/2029 | 107,941 |
Principal Amount | Value | ||
GOVERNMENT AGENCIES—continued | |||
Federal National Mortgage Association—1.2% | |||
$ 1,500,000 | 0.750%, 10/8/2027 | $1,506,152 | |
Tennessee Valley Authority Bonds—5.2% | |||
1,750,000 | 0.750%, 5/15/2025 | 1,775,291 | |
1,700,000 | 2.875%, 2/1/2027 | 1,915,273 | |
2,000,000 | 4.650%, 6/15/2035 | 2,770,888 | |
250,000 | 4.875%, 1/15/2048 | 378,863 | |
TOTAL | 6,840,315 | ||
TOTAL GOVERNMENT AGENCIES (IDENTIFIED COST $14,126,029) | 15,767,626 | ||
ASSET-BACKED SECURITIES—10.4% | |||
Auto Receivables—2.9% | |||
311,000 | AmeriCredit Automobile Receivables Trust 2020-2, Class C, 1.480%, 2/18/2026 | 311,946 | |
1,228,000 | Santander Drive Auto Receivables Trust 2020-1, Class A3, 2.030%, 2/15/2024 | 1,247,923 | |
550,000 | Santander Drive Auto Receivables Trust 2020-2, Class D, 2.220%, 9/15/2026 | 562,919 | |
1,085,000 | Santander Drive Auto Receivables Trust 2020-3, Class C, 1.120%, 1/15/2026 | 1,096,501 | |
500,000 | Santander Retail Auto Lease Trust 2019-A, Class D, 3.660%, 5/20/2024 | 514,044 | |
TOTAL | 3,733,333 | ||
Credit Card—5.0% | |||
4,000,000 | 2 | American Express Credit Account Master Trust 2018-9, Class A, 0.538% (1-month USLIBOR +0.380%), 4/15/2026 | 4,018,122 |
2,500,000 | 2 | Discover Card Execution Note Trust 2017-A7, Class A7, 0.518% (1-month USLIBOR +0.360%), 4/15/2025 | 2,507,200 |
TOTAL | 6,525,322 | ||
Other—0.0% | |||
62,546 | Sofi Consumer Loan Program Trust 2016-1, Class A, 3.260%, 8/25/2025 | 63,242 | |
Student Loans—2.5% | |||
519,281 | Navient Student Loan Trust 2020-FA, Class A, 1.220%, 7/15/2069 | 526,406 | |
1,098,822 | Navient Student Loan Trust 2020-GA, Class A, 1.170%, 9/16/2069 | 1,109,994 | |
650,000 | Navient Student Loan Trust 2020-HA, Class A, 1.310%, 1/15/2069 | 656,582 | |
1,002,999 | 2 | SMB Private Education Loan Trust 2020-BA, Class A1B, 1.249% (1-month USLIBOR +1.100%), 7/15/2053 | 1,009,052 |
TOTAL | 3,302,034 | ||
TOTAL ASSET-BACKED SECURITIES (IDENTIFIED COST $13,494,775) | 13,623,931 | ||
COMMERCIAL MORTGAGE-BACKED SECURITIES—9.3% | |||
Agency Commercial Mortgage-Backed Securities—7.3% | |||
1,455,000 | FHLMC REMIC, Series K064, Class A2, 3.224%, 3/25/2027 | 1,654,251 | |
1,189,246 | FHLMC REMIC, Series K104, Class A1, 1.938%, 10/25/2029 | 1,254,558 | |
1,143,000 | FHLMC REMIC, Series K727, Class A2, 2.946%, 7/25/2024 | 1,230,060 | |
2,500,000 | FHLMC REMIC, Series KC03, Class A2, 3.499%, 1/25/2026 | 2,728,103 | |
2,482,000 | FNMA REMIC, Series 2020-M14, Class A2, 1.784%, 5/25/2030 | 2,606,856 | |
TOTAL | 9,473,828 | ||
Non-Agency Commercial Mortgage-Backed Securities—2.0% | |||
1,400,000 | BANK 2017-BNK5 A3, Class A3, 3.020%, 6/15/2060 | 1,482,368 | |
1,100,000 | Fontainebleau Miami Beach Trust, Class A, 3.144%, 12/10/2036 | 1,153,777 | |
TOTAL | 2,636,145 | ||
TOTAL COMMERCIAL MORTGAGE-BACKED SECURITIES (IDENTIFIED COST $11,502,808) | 12,109,973 | ||
COLLATERALIZED MORTGAGE OBLIGATIONS—3.1% | |||
Federal National Mortgage Association—2.3% | |||
785,259 | 2 | FNMA REMIC, Series 2016-83, Class FA, 0.648% (1-month USLIBOR +0.500%), 11/25/2046 | 791,076 |
1,252,123 | 2 | FNMA REMIC, Series 2018-15, Class JF, 0.448% (1-month USLIBOR +0.300%), 3/25/2048 | 1,256,216 |
915,057 | 2 | FNMA REMIC, Series 2019-56, Class AF, 0.548% (1-month USLIBOR +0.400%), 10/25/2049 | 922,090 |
TOTAL | 2,969,382 |
Principal Amount | Value | ||
COLLATERALIZED MORTGAGE OBLIGATIONS—continued | |||
Government National Mortgage Association—0.5% | |||
$ 658,640 | GNMA REMIC, Series 2015-47, Class AE, 2.900%, 11/16/2055 | $688,745 | |
Non-Agency Mortgage—0.3% | |||
116,245 | Credit Suisse Mortgage Trust 2007-4, Class 4A2, 5.500%, 6/25/2037 | 67,078 | |
274,221 | Credit Suisse Mortgage Trust 2015-WIN1, Class A6, 3.500%, 12/25/2044 | 281,075 | |
TOTAL | 348,153 | ||
TOTAL COLLATERALIZED MORTGAGE OBLIGATIONS (IDENTIFIED COST $4,007,512) | 4,006,280 | ||
REPURCHASE AGREEMENT—8.8% | |||
11,498,000 | 3 | Interest in $1,000,000,000 joint repurchase agreement 0.08%, dated 12/31/2020 under which Bank of Montreal will repurchase securities provided as collateral for $1,000,008,889 on 1/4/2021. The securities provided as collateral at the end of the period held with BNY Mellon as tri-party agent, were U.S. Government Agency and U.S. Treasury securities with various maturities to 5/20/2069 and the market value of those underlying securities was $1,022,038,963. (IDENTIFIED COST $11,498,000) | 11,498,000 |
TOTAL INVESTMENT IN SECURITIES—109.1% (IDENTIFIED COST $134,176,365)4 | 142,167,978 | ||
OTHER ASSETS AND LIABILITIES - NET—(9.1)%5 | (11,862,477) | ||
TOTAL NET ASSETS—100% | $130,305,501 |
1 | All or a portion of these To Be Announced Securities (TBAs) are subject to dollar-roll transactions. |
2 | Floating/variable note with current rate and current maturity or next reset date shown. |
3 | All or a portion of these securities are segregated pending settlement of when issued and delayed delivery transaction. |
4 | The cost of investments for federal tax purposes amounts to $133,902,985. |
5 | Assets, other than investments in securities, less liabilities. See Statement of Assets and Liabilities. |
The following acronym(s) are used throughout this portfolio: | ||
FDIC | —Federal Deposit Insurance Corporation | |
FHLMC | —Federal Home Loan Mortgage Corporation | |
FNMA | —Federal National Mortgage Association | |
GNMA | —Government National Mortgage Association | |
LIBOR | —London Interbank Offered Rate | |
REMIC | —Real Estate Mortgage Investment Conduit | |
Year Ended December 31, | |||||
2020 | 2019 | 2018 | 2017 | 2016 | |
Net Asset Value, Beginning of Period | $10.87 | $10.52 | $10.73 | $10.78 | $10.88 |
Income From Investment Operations: | |||||
Net investment income (loss)1 | 0.20 | 0.27 | 0.24 | 0.23 | 0.23 |
Net realized and unrealized gain (loss) | 0.36 | 0.34 | (0.20) | (0.03) | (0.06) |
TOTAL FROM INVESTMENT OPERATIONS | 0.56 | 0.61 | 0.04 | 0.20 | 0.17 |
Less Distributions: | |||||
Distributions from net investment income | (0.27) | (0.26) | (0.25) | (0.25) | (0.27) |
Net Asset Value, End of Period | $11.16 | $10.87 | $10.52 | $10.73 | $10.78 |
Total Return2 | 5.21% | 5.90% | 0.45% | 1.92% | 1.61% |
Ratios to Average Net Assets: | |||||
Net expenses3 | 0.78% | 0.78% | 0.78% | 0.78% | 0.76% |
Net investment income | 1.79% | 2.49% | 2.28% | 2.13% | 2.12% |
Expense waiver/reimbursement4 | 0.08% | 0.10% | 0.08% | 0.07% | 0.06% |
Supplemental Data: | |||||
Net assets, end of period (000 omitted) | $130,306 | $116,935 | $120,654 | $132,958 | $152,795 |
Portfolio turnover | 139% | 65% | 64% | 24% | 53% |
Portfolio turnover (excluding purchases and sales from dollar-roll transactions) | 37% | 61% | 64% | 24% | 41% |
1 | Per share numbers have been calculated using the average shares method. |
2 | Based on net asset value. Total returns do not reflect any additional fees or expenses that may be imposed by separate accounts of insurance companies or in connection with any variable annuity or variable life insurance contract. |
3 | Amount does not reflect net expenses incurred by investment companies in which the Fund may invest. |
4 | This expense decrease is reflected in both the net expense and the net investment income ratios shown above. Amount does not reflect expense waiver/ reimbursement recorded by investment companies in which the Fund may invest. |
Assets: | |
Investment in securities, at value (identified cost $134,176,365) | $142,167,978 |
Cash | 797 |
Income receivable | 405,981 |
Receivable for shares sold | 408,290 |
Total Assets | 142,983,046 |
Liabilities: | |
Payable for investments purchased | 12,625,868 |
Payable for shares redeemed | 6,746 |
Payable for investment adviser fee (Note 5) | 1,880 |
Payable for administrative fee (Note 5) | 277 |
Accrued expenses (Note 5) | 42,774 |
Total Liabilities | 12,677,545 |
Net assets for 11,675,969 shares outstanding | $130,305,501 |
Net Assets Consist of: | |
Paid-in capital | $120,590,035 |
Total distributable earnings (loss) | 9,715,466 |
Total Net Assets | $130,305,501 |
Net Asset Value, Offering Price and Redemption Proceeds Per Share: | |
$130,305,501 ÷ 11,675,969 shares outstanding, no par value, unlimited shares authorized | $11.16 |
Investment Income: | |
Interest | $3,262,555 |
Net income on securities loaned (Note 2) | 467 |
TOTAL INCOME | 3,263,022 |
Expenses: | |
Investment adviser fee (Note 5) | 760,303 |
Administrative fee (Note 5) | 103,016 |
Custodian fees | 18,444 |
Transfer agent fees | 11,903 |
Directors’/Trustees’ fees (Note 5) | 1,766 |
Auditing fees | 23,889 |
Legal fees | 9,648 |
Portfolio accounting fees | 103,225 |
Printing and postage | 40,433 |
Miscellaneous (Note 5) | 23,699 |
TOTAL EXPENSES | 1,096,326 |
Waiver of investment adviser fee (Note 5) | (101,724) |
Net expenses | 994,602 |
Net investment income | 2,268,420 |
Realized and Unrealized Gain (Loss) on Investments: | |
Net realized gain on investments | 1,395,168 |
Net change in unrealized appreciation of investments | 2,528,043 |
Net realized and unrealized gain (loss) on investments | 3,923,211 |
Change in net assets resulting from operations | $6,191,631 |
Year Ended December 31 | 2020 | 2019 |
Increase (Decrease) in Net Assets | ||
Operations: | ||
Net investment income (loss) | $2,268,420 | $2,964,547 |
Net realized gain (loss) | 1,395,168 | 19,228 |
Net change in unrealized appreciation/depreciation | 2,528,043 | 3,916,810 |
CHANGE IN NET ASSETS RESULTING FROM OPERATIONS | 6,191,631 | 6,900,585 |
Distributions to Shareholders | (2,991,647) | (2,868,385) |
Share Transactions: | ||
Proceeds from sale of shares | 40,391,262 | 12,195,308 |
Net asset value of shares issued to shareholders in payment of distributions declared | 2,991,647 | 2,868,385 |
Cost of shares redeemed | (33,212,417) | (22,814,592) |
CHANGE IN NET ASSETS RESULTING FROM SHARE TRANSACTIONS | 10,170,492 | (7,750,899) |
Change in net assets | 13,370,476 | (3,718,699) |
Net Assets: | ||
Beginning of period | 116,935,025 | 120,653,724 |
End of period | $130,305,501 | $116,935,025 |
Year Ended 12/31/2020 | Year Ended 12/31/2019 | |
Shares sold | 3,638,718 | 1,141,328 |
Shares issued to shareholders in payment of distributions declared | 277,261 | 275,806 |
Shares redeemed | (2,997,109) | (2,134,461) |
NET CHANGE RESULTING FROM FUND SHARE TRANSACTIONS | 918,870 | (717,327) |
2020 | 2019 | |
Ordinary income | $2,991,647 | $2,868,385 |
Undistributed ordinary income | $2,509,764 |
Net unrealized appreciation | $8,243,496 |
Capital loss carryforwards | $(1,037,794) |
Short-Term | Long-Term | Total |
$75,297 | $962,497 | $1,037,794 |
Administrative Fee | Average Daily Net Assets of the Investment Complex |
0.100% | on assets up to $50 billion |
0.075% | on assets over $50 billion |
Purchases | $24,090,858 |
Sales | $6,117,481 |
February 16, 2021
Beginning Account Value 7/1/2020 | Ending Account Value 12/31/2020 | Expenses Paid During Period1 | |
Actual | $1,000.00 | $1,001.80 | $3.92 |
Hypothetical (assuming a 5% return before expenses) | $1,000.00 | $1,021.22 | $3.96 |
1 | Expenses are equal to the Fund’s annualized net expense ratio of 0.78%, multiplied by the average account value over the period, multiplied by 184/366 (to reflect the one-half-year period). The expenses shown in the table do not include the charges and expenses imposed by the insurance company under the variable insurance product contract. Please refer to the variable insurance product prospectus for a complete listing of these expenses. |
Name Birth Date Positions Held with Trust Date Service Began | Principal Occupation(s) for Past Five Years, Other Directorships Held and Previous Position(s) |
J. Christopher Donahue* Birth Date: April 11, 1949 Trustee Indefinite Term Began serving: September 1993 | Principal Occupations: Principal Executive Officer and President of certain of the Funds in the Federated Hermes Fund Family; Director or Trustee of the Funds in the Federated Hermes Fund Family; President, Chief Executive Officer and Director, Federated Hermes, Inc.; Chairman and Trustee, Federated Investment Management Company; Trustee, Federated Investment Counseling; Chairman and Director, Federated Global Investment Management Corp.; Chairman and Trustee, Federated Equity Management Company of Pennsylvania; Trustee, Federated Shareholder Services Company; Director, Federated Services Company. Previous Positions: President, Federated Investment Counseling; President and Chief Executive Officer, Federated Investment Management Company, Federated Global Investment Management Corp. and Passport Research, Ltd; Chairman, Passport Research, Ltd. |
Thomas R. Donahue* Birth Date: October 20, 1958 Trustee Indefinite Term Began serving: May 2016 | Principal Occupations: Director or Trustee of certain of the funds in the Federated Hermes Fund Family; Chief Financial Officer, Treasurer, Vice President and Assistant Secretary, Federated Hermes, Inc.; Chairman and Trustee, Federated Administrative Services; Chairman and Director, Federated Administrative Services, Inc.; Trustee and Treasurer, Federated Advisory Services Company; Director or Trustee and Treasurer, Federated Equity Management Company of Pennsylvania, Federated Global Investment Management Corp., Federated Investment Counseling, and Federated Investment Management Company; Director, MDTA LLC; Director, Executive Vice President and Assistant Secretary, Federated Securities Corp.; Director or Trustee and Chairman, Federated Services Company and Federated Shareholder Services Company; and Director and President, FII Holdings, Inc. Previous Positions: Director, Federated Hermes, Inc.; Assistant Secretary, Federated Investment Management Company, Federated Global Investment Management Company and Passport Research, LTD; Treasurer, Passport Research, LTD; Executive Vice President, Federated Securities Corp.; and Treasurer, FII Holdings, Inc. |
Name Birth Date Positions Held with Trust Date Service Began | Principal Occupation(s) for Past Five Years, Other Directorships Held, Previous Position(s) and Qualifications |
John T. Collins Birth Date: January 24, 1947 Trustee Indefinite Term Began serving: October 2013 | Principal Occupations: Director or Trustee, and Chair of the Board of Directors or Trustees, of the Federated Hermes Fund Family; formerly, Chairman and CEO, The Collins Group, Inc. (a private equity firm) (Retired). Other Directorships Held: Chairman of the Board of Directors, Director, KLX Energy Services Holdings, Inc. (oilfield services); former Director of KLX Corp. (aerospace). Qualifications: Mr. Collins has served in several business and financial management roles and directorship positions throughout his career. Mr. Collins previously served as Chairman and CEO of The Collins Group, Inc. (a private equity firm) and as a Director of KLX Corp. Mr. Collins serves as Chairman Emeriti, Bentley University. Mr. Collins previously served as Director and Audit Committee Member, Bank of America Corp.; Director, FleetBoston Financial Corp.; and Director, Beth Israel Deaconess Medical Center (Harvard University Affiliate Hospital). |
Name Birth Date Positions Held with Trust Date Service Began | Principal Occupation(s) for Past Five Years, Other Directorships Held, Previous Position(s) and Qualifications |
G. Thomas Hough Birth Date: February 28, 1955 Trustee Indefinite Term Began serving: August 2015 | Principal Occupations: Director or Trustee, Chair of the Audit Committee of the Federated Hermes Fund Family; formerly, Vice Chair, Ernst & Young LLP (public accounting firm) (Retired). Other Directorships Held: Director, Chair of the Audit Committee, Equifax, Inc.; Director, Member of the Audit Committee, Haverty Furniture Companies, Inc.; formerly, Director, Member of Governance and Compensation Committees, Publix Super Markets, Inc. Qualifications: Mr. Hough has served in accounting, business management and directorship positions throughout his career. Mr. Hough most recently held the position of Americas Vice Chair of Assurance with Ernst & Young LLP (public accounting firm). Mr. Hough serves on the President’s Cabinet and Business School Board of Visitors for the University of Alabama. Mr. Hough previously served on the Business School Board of Visitors for Wake Forest University, and he previously served as an Executive Committee member of the United States Golf Association. |
Maureen Lally-Green Birth Date: July 5, 1949 Trustee Indefinite Term Began serving: August 2009 | Principal Occupations: Director or Trustee of the Federated Hermes Fund Family; Adjunct Professor Emerita of Law, Duquesne University School of Law; formerly, Dean of the Duquesne University School of Law and Professor of Law and Interim Dean of the Duquesne University School of Law; formerly, Associate General Secretary and Director, Office of Church Relations, Diocese of Pittsburgh. Other Directorships Held: Director, CNX Resources Corporation (formerly known as CONSOL Energy Inc.). Qualifications: Judge Lally-Green has served in various legal and business roles and directorship positions throughout her career. Judge Lally-Green previously held the position of Dean of the School of Law of Duquesne University (as well as Interim Dean). Judge Lally-Green previously served as a member of the Superior Court of Pennsylvania and as a Professor of Law, Duquesne University School of Law. Judge Lally-Green was appointed by the Supreme Court of Pennsylvania to serve on the Supreme Court’s Board of Continuing Judicial Education and the Supreme Court’s Appellate Court Procedural Rules Committee. Judge Lally-Green also currently holds the positions on not for profit or for profit boards of directors as follows: Director and Chair, UPMC Mercy Hospital; Regent, Saint Vincent Seminary; Member, Pennsylvania State Board of Education (public); Director, Catholic Charities, Pittsburgh; and Director CNX Resources Corporation (formerly known as CONSOL Energy Inc.). Judge Lally-Green has held the positions of: Director, Auberle; Director, Epilepsy Foundation of Western and Central Pennsylvania; Director, Ireland Institute of Pittsburgh; Director, Saint Thomas More Society; Director and Chair, Catholic High Schools of the Diocese of Pittsburgh, Inc.; Director, Pennsylvania Bar Institute; Director, St. Vincent College; Director and Chair, North Catholic High School, Inc.; and Director and Vice Chair, Our Campaign for the Church Alive!, Inc. |
Thomas M. O’Neill Birth Date: June 14, 1951 Trustee Indefinite Term Began serving: August 2006 | Principal Occupations: Director or Trustee of the Federated Hermes Fund Family; Sole Proprietor, Navigator Management Company (investment and strategic consulting). Other Directorships Held: None. Qualifications: Mr. O’Neill has served in several business, mutual fund and financial management roles and directorship positions throughout his career. Mr. O’Neill serves as Director, Medicines for Humanity and Director, The Golisano Children’s Museum of Naples, Florida. Mr. O’Neill previously served as Chief Executive Officer and President, Managing Director and Chief Investment Officer, Fleet Investment Advisors; President and Chief Executive Officer, Aeltus Investment Management, Inc.; General Partner, Hellman, Jordan Management Co., Boston, MA; Chief Investment Officer, The Putnam Companies, Boston, MA; Credit Analyst and Lending Officer, Fleet Bank; Director and Consultant, EZE Castle Software (investment order management software); and Director, Midway Pacific (lumber). |
Madelyn A. Reilly Birth Date: February 2, 1956 Trustee Indefinite Term Began serving: November 2020 | Principal Occupations: Director or Trustee of the Federated Hermes Fund Family; Senior Vice President for Legal Affairs, General Counsel and Secretary of the Board of Trustees, Duquesne University. Other Directorships Held: None. Qualifications: Ms. Reilly has served in various business and legal management roles throughout her career. Ms. Reilly previously served as Director of Risk Management and Associate General Counsel, Duquesne University. Prior to her work at Duquesne University, Ms. Reilly served as Assistant General Counsel of Compliance and Enterprise Risk as well as Senior Counsel of Environment, Health and Safety, PPG Industries. |
P. Jerome Richey Birth Date: February 23, 1949 Trustee Indefinite Term Began serving: October 2013 | Principal Occupations: Director or Trustee of the Federated Hermes Fund Family; Management Consultant; Retired; formerly, Senior Vice Chancellor and Chief Legal Officer, University of Pittsburgh and Executive Vice President and Chief Legal Officer, CONSOL Energy Inc. (now split into two separate publicly traded companies known as CONSOL Energy Inc. and CNX Resources Corp.). Other Directorships Held: None. Qualifications: Mr. Richey has served in several business and legal management roles and directorship positions throughout his career. Mr. Richey most recently held the positions of Senior Vice Chancellor and Chief Legal Officer, University of Pittsburgh. Mr. Richey previously served as Chairman of the Board, Epilepsy Foundation of Western Pennsylvania and Chairman of the Board, World Affairs Council of Pittsburgh. Mr. Richey previously served as Chief Legal Officer and Executive Vice President, CONSOL Energy Inc. and CNX Gas Company; and Board Member, Ethics Counsel and Shareholder, Buchanan Ingersoll & Rooney PC (a law firm). |
Name Birth Date Positions Held with Trust Date Service Began | Principal Occupation(s) for Past Five Years, Other Directorships Held, Previous Position(s) and Qualifications |
John S. Walsh Birth Date: November 28, 1957 Trustee Indefinite Term Began serving: January 1999 | Principal Occupations: Director or Trustee of the Federated Hermes Fund Family; President and Director, Heat Wagon, Inc. (manufacturer of construction temporary heaters); President and Director, Manufacturers Products, Inc. (distributor of portable construction heaters); President, Portable Heater Parts, a division of Manufacturers Products, Inc. Other Directorships Held: None. Qualifications: Mr. Walsh has served in several business management roles and directorship positions throughout his career. Mr. Walsh previously served as Vice President, Walsh & Kelly, Inc. (paving contractors). |
Name Birth Date Address Positions Held with Trust Date Service Began | Principal Occupation(s) for Past Five Years and Previous Position(s) |
Lori A. Hensler Birth Date: January 6, 1967 TREASURER Officer since: April 2013 | Principal Occupations: Principal Financial Officer and Treasurer of the Federated Hermes Fund Family; Senior Vice President, Federated Administrative Services; Financial and Operations Principal for Federated Securities Corp.; and Assistant Treasurer, Federated Investors Trust Company. Ms. Hensler has received the Certified Public Accountant designation. Previous Positions: Controller of Federated Hermes, Inc.; Senior Vice President and Assistant Treasurer, Federated Investors Management Company; Treasurer, Federated Investors Trust Company; Assistant Treasurer, Federated Administrative Services, Federated Administrative Services, Inc., Federated Securities Corp., Edgewood Services, Inc., Federated Advisory Services Company, Federated Equity Management Company of Pennsylvania, Federated Global Investment Management Corp., Federated Investment Counseling, Federated Investment Management Company, Passport Research, Ltd., and Federated MDTA, LLC; Financial and Operations Principal for Federated Securities Corp., Edgewood Services, Inc. and Southpointe Distribution Services, Inc. |
Peter J. Germain Birth Date: September 3, 1959 CHIEF LEGAL OFFICER, SECRETARY and EXECUTIVE VICE PRESIDENT Officer since: January 2005 | Principal Occupations: Mr. Germain is Chief Legal Officer, Secretary and Executive Vice President of the Federated Hermes Fund Family. He is General Counsel, Chief Legal Officer, Secretary and Executive Vice President, Federated Hermes, Inc.; Trustee and Senior Vice President, Federated Investors Management Company; Trustee and President, Federated Administrative Services; Director and President, Federated Administrative Services, Inc.; Director and Vice President, Federated Securities Corp.; Director and Secretary, Federated Private Asset Management, Inc.; Secretary, Federated Shareholder Services Company; and Secretary, Retirement Plan Service Company of America. Mr. Germain joined Federated Hermes, Inc. in 1984 and is a member of the Pennsylvania Bar Association. Previous Positions: Deputy General Counsel, Special Counsel, Managing Director of Mutual Fund Services, Federated Hermes, Inc.; Senior Vice President, Federated Services Company; and Senior Corporate Counsel, Federated Hermes, Inc. |
John B. Fisher Birth Date: May 16, 1956 PRESIDENT Officer since: November 2004 | Principal Occupations: Principal Executive Officer and President of certain of the Funds in the Federated Hermes Fund Family; Director or Trustee of certain of the Funds in the Federated Hermes Fund Family; Vice President, Federated Hermes, Inc.; President, Director/Trustee and CEO, Federated Advisory Services Company, Federated Equity Management Company of Pennsylvania, Federated Global Investment Management Corp., Federated Investment Counseling, Federated Investment Management Company; President and CEO of Passport Research, Ltd.; President of some of the Funds in the Federated Fund Complex and Director, Federated Investors Trust Company. Previous Positions: President and Director of the Institutional Sales Division of Federated Securities Corp.; President and Director of Federated Investment Counseling; Director, Edgewood Securities Corp.; Director, Federated Services Company; Director, Federated Hermes, Inc.; Chairman and Director, Southpointe Distribution Services, Inc. and President, Technology, Federated Services Company. |
Stephen Van Meter Birth Date: June 5, 1975 CHIEF COMPLIANCE OFFICER AND SENIOR VICE PRESIDENT Officer since: July 2015 | Principal Occupations: Senior Vice President and Chief Compliance Officer of the Federated Hermes Fund Family; Vice President and Chief Compliance Officer of Federated Hermes, Inc. and Chief Compliance Officer of certain of its subsidiaries. Mr. Van Meter joined Federated Hermes, Inc. in October 2011. He holds FINRA licenses under Series 3, 7, 24 and 66. Previous Positions: Mr. Van Meter previously held the position of Compliance Operating Officer, Federated Hermes, Inc. Prior to joining Federated Hermes, Inc., Mr. Van Meter served at the United States Securities and Exchange Commission in the positions of Senior Counsel, Office of Chief Counsel, Division of Investment Management and Senior Counsel, Division of Enforcement. |
Stephen F. Auth Birth Date: September 13, 1956 101 Park Avenue 41st Floor New York, NY 10178 CHIEF INVESTMENT OFFICER Officer since: November 2002 | Principal Occupations: Stephen F. Auth is Chief Investment Officer of various Funds in the Federated Hermes Fund Family; Executive Vice President, Federated Investment Counseling, Federated Global Investment Management Corp. and Federated Equity Management Company of Pennsylvania. Previous Positions: Executive Vice President, Federated Investment Management Company and Passport Research, Ltd. (investment advisory subsidiary of Federated); Senior Vice President, Global Portfolio Management Services Division; Senior Vice President, Federated Investment Management Company and Passport Research, Ltd.; Senior Managing Director and Portfolio Manager, Prudential Investments. |
Name Birth Date Address Positions Held with Trust Date Service Began | Principal Occupation(s) for Past Five Years and Previous Position(s) |
Robert J. Ostrowski Birth Date: April 26, 1963 Chief Investment Officer Officer since: May 2004 | Principal Occupations: Robert J. Ostrowski joined Federated Hermes, Inc. in 1987 as an Investment Analyst and became a Portfolio Manager in 1990. He was named Chief Investment Officer of Federated Hermes’ taxable fixed-income products in 2004 and also serves as a Senior Portfolio Manager. Mr. Ostrowski became an Executive Vice President of the Fund’s Adviser in 2009 and served as a Senior Vice President of the Fund’s Adviser from 1997 to 2009. Mr. Ostrowski has received the Chartered Financial Analyst designation. He received his M.S. in Industrial Administration from Carnegie Mellon University. |
Deborah A. Cunningham Birth Date: September 15, 1959 Chief Investment Officer Officer since: June 2012 | Principal Occupations: Deborah A. Cunningham was named Chief Investment Officer of Federated Hermes’ money market products in 2004. She joined Federated Hermes in 1981 and has been a Senior Portfolio Manager since 1997 and an Executive Vice President of the Fund’s Adviser since 2009. Ms. Cunningham has received the Chartered Financial Analyst designation and holds an M.S.B.A. in Finance from Robert Morris College. |
Federated Hermes Funds
4000 Ericsson Drive
Warrendale, PA 15086-7561
or call 1-800-341-7400.
| Item 2. | Code of Ethics |
(a) As of the end of the period covered by this report, the registrant has adopted a code of ethics (the "Section 406 Standards for Investment Companies - Ethical Standards for Principal Executive and Financial Officers") that applies to the registrant's Principal Executive Officer and Principal Financial Officer; the registrant's Principal Financial Officer also serves as the Principal Accounting Officer.
(c) There was no amendment to the registrant’s code of ethics described in Item 2(a) above during the period covered by the report.
(d) There was no waiver granted, either actual or implicit, from a provision to the registrant’s code of ethics described in Item 2(a) above during the period covered by the report.
(e) Not Applicable
(f)(3) The registrant hereby undertakes to provide any person, without charge, upon request, a copy of the code of ethics. To request a copy of the code of ethics, contact the registrant at 1-800-341-7400, and ask for a copy of the Section 406 Standards for Investment Companies - Ethical Standards for Principal Executive and Financial Officers.
Item 3. Audit Committee Financial Expert
The registrant's Board has determined that each of the following members of the Board's Audit Committee is an “audit committee financial expert,” and is "independent," for purposes of this Item: G. Thomas Hough and Thomas M. O'Neill.
| Item 4. | Principal Accountant Fees and Services |
(a) Audit Fees billed to the registrant for the two most recent fiscal years:
Fiscal year ended 2020 – $172,285
Fiscal year ended 2019 - $181,350
(b) Audit-Related Fees billed to the registrant for the two most recent fiscal years:
Fiscal year ended 2020 - $0
Fiscal year ended 2019 - $0
Amount requiring approval of the registrant’s audit committee pursuant to paragraph (c)(7)(ii) of Rule 2-01 of Regulation S-X, $0 and $0 respectively.
(c) Tax Fees billed to the registrant for the two most recent fiscal years:
Fiscal year ended 2020 - $3,813
Fiscal year ended 2019 - $0
Fiscal year ended 2020- International tax advice with respect to exchange of American Depositary Receipt.
Amount requiring approval of the registrant’s audit committee pursuant to paragraph (c)(7)(ii) of Rule 2-01 of Regulation S-X, $0 and $0 respectively.
(d) All Other Fees billed to the registrant for the two most recent fiscal years:
Fiscal year ended 2020 - $0
Fiscal year ended 2019 - $0
Amount requiring approval of the registrant’s audit committee pursuant to paragraph (c)(7)(ii) of Rule 2-01 of Regulation S-X, $0 and $0 respectively.
(e)(1) Audit Committee Policies regarding Pre-approval of Services.
The Audit Committee is required to pre-approve audit and non-audit services performed by the independent auditor in order to assure that the provision of such services do not impair the auditor’s independence. Unless a type of service to be provided by the independent auditor has received general pre-approval, it will require specific pre-approval by the Audit Committee. Any proposed services exceeding pre-approved cost levels will require specific pre-approval by the Audit Committee.
Certain services have the general pre-approval of the Audit Committee. The term of the general pre-approval is 12 months from the date of pre-approval, unless the Audit Committee specifically provides for a different period. The Audit Committee will annually review the services that may be provided by the independent auditor without obtaining specific pre-approval from the Audit Committee and may grant general pre-approval for such services. The Audit Committee will revise the list of general pre-approved services from time to time, based on subsequent determinations. The Audit Committee will not delegate to management its responsibilities to pre-approve services performed by the independent auditor.
The Audit Committee has delegated pre-approval authority to its Chairman for services that do not exceed a specified dollar threshold. The Chairman or Chief Audit Executive will report any such pre-approval decisions to the Audit Committee at its next scheduled meeting. The Committee will designate another member with such pre-approval authority when the Chairman is unavailable.
AUDIT SERVICES
The annual Audit services engagement terms and fees will be subject to the specific pre-approval of the Audit Committee. The Audit Committee will approve, if necessary, any changes in terms, conditions and fees resulting from changes in audit scope, registered investment company (RIC) structure or other matters.
In addition to the annual Audit services engagement specifically approved by the Audit Committee, the Audit Committee may grant general pre-approval for other Audit services, which are those services that only the independent auditor reasonably can provide. The Audit Committee has pre-approved certain Audit services; with limited exception, all other audit services must be specifically pre-approved by the Audit Committee.
AUDIT-RELATED SERVICES
Audit-related services are assurance and related services that are reasonably related to the performance of the audit or review of the RIC’s financial statements or that are traditionally performed by the independent auditor. The Audit Committee believes that the provision of Audit-related services does not impair the independence of the auditor, and has pre-approved certain audit-related services; all other audit-related services must be specifically pre-approved by the Audit Committee.
TAX SERVICES
The Audit Committee believes that the independent auditor can provide Tax services to the RIC such as tax compliance, tax planning and tax advice without impairing the auditor’s independence. However, the Audit Committee will not permit the retention of the independent auditor in connection with a transaction initially recommended by the independent auditor, the purpose of which may be tax avoidance and the tax treatment of which may not be supported in the Internal Revenue Code and related regulations. The Audit Committee has pre-approved certain Tax services; with limited exception, all tax services involving large and complex transactions must be specifically pre-approved by the Audit Committee.
ALL OTHER SERVICES
With respect to the provision of permissible services other than audit, review or attest services the pre-approval requirement is waived if:
| (1) | With respect to such services rendered to the Funds, the aggregate amount of all such services provided constitutes no more than five percent of the total amount of revenues paid by the audit client to its accountant during the fiscal year in which the services are provided; and, |
| (2) | With respect to such services rendered to the Fund’s investment adviser and any entity controlling, controlled by to under common control with the investment adviser such as affiliated non-U.S. and U.S. funds not under the Audit Committee’s purview and which do not fall within a category of service which has been determined by the Audit Committee not to have a direct impact on the operations or financial reporting of the RIC, the aggregate amount of all services provided constitutes no more than five percent of the total amount of revenues paid to the RIC’s auditor by the RIC, its investment adviser and any entity controlling, controlled by, or under common control with the investment adviser during the fiscal year in which the services are provided; and |
| (3) | Such services were not recognized by the issuer or RIC at the time of the engagement to be non-audit services; and |
| (4) | Such services are promptly brought to the attention of the Audit Committee and approved prior to the completion of the audit by the Audit Committee or by one or more members of the Audit Committee who are members of the Board of Directors to whom authority to grant such approvals has been delegated by the Audit Committee. |
The Audit Committee may grant general pre-approval to those permissible non-audit services which qualify for pre-approval and which it believes are routine and recurring services, and would not impair the independence of the auditor.
The Securities and Exchange Commission’s (the “SEC”) rules and relevant guidance should be consulted to determine the precise definitions of these services and applicability of exceptions to certain of the prohibitions.
PRE-APPROVAL FEE LEVELS
Pre-approval fee levels for all services to be provided by the independent auditor will be established annually by the Audit Committee. Any proposed services exceeding these levels will require specific pre-approval by the Audit Committee.
PROCEDURES
Requests or applications to provide services that require specific approval by the Audit Committee will be submitted to the Audit Committee by the Fund’s Principal Accounting Officer and/or the Chief Audit Executive of Federated Hermes, Inc., only after those individuals have determined that the request or application is consistent with the SEC’s rules on auditor independence.
(e)(2) Percentage of services identified in items 4(b) through 4(d) that were approved by the registrant’s Audit Committee pursuant to paragraph (c)(7)(i)(C) of Rule 2-01 of Regulation S-X:
4(b)
Fiscal year ended 2020 – 0%
Fiscal year ended 2019 - 0%
Percentage of services provided to the registrant’s investment adviser and any entity controlling, controlled by, or under common control with the investment adviser that provides ongoing services to the registrant that were approved by the registrant’s Audit Committee pursuant to paragraph (c)(7)(i)(C) of Rule 2-01 of Regulation S-X, 0% and 0% respectively.
4(c)
Fiscal year ended 2020 – 0%
Fiscal year ended 2019 – 0%
Percentage of services provided to the registrant’s investment adviser and any entity controlling, controlled by, or under common control with the investment adviser that provides ongoing services to the registrant that were approved by the registrant’s Audit Committee pursuant to paragraph (c)(7)(i)(C) of Rule 2-01 of Regulation S-X, 0% and 0% respectively.
4(d)
Fiscal year ended 2020 – 0%
Fiscal year ended 2019 – 0%
Percentage of services provided to the registrant’s investment adviser and any entity controlling, controlled by, or under common control with the investment adviser that provides ongoing services to the registrant that were approved by the registrant’s Audit Committee pursuant to paragraph (c)(7)(i)(C) of Rule 2-01 of Regulation S-X, 0% and 0% respectively.
| (f) | NA |
| (g) | Non-Audit Fees billed to the registrant, the registrant’s investment adviser, and certain entities controlling, controlled by or under common control with the investment adviser: |
Fiscal year ended 2020 - $3,813
Fiscal year ended 2019 - $72,117
| (h) | The registrant’s Audit Committee has considered that the provision of non-audit services that were rendered to the registrant’s adviser (not including any sub-adviser whose role is primarily portfolio management and is subcontracted with or overseen by another investment adviser), and any entity controlling, controlled by, or under common control with the investment adviser that provides ongoing services to the registrant that were not pre-approved pursuant to paragraph (c)(7)(ii) of Rule 2-01 of Regulation S-X is compatible with maintaining the principal accountant’s independence. |
| Item 5. | Audit Committee of Listed Registrants |
Not Applicable
| Item 6. | Schedule of Investments |
(a) The registrant’s Schedule of Investments is included as part of the Report to Stockholders filed under Item 1 of this form.
(b) Not Applicable; Fund had no divestments during the reporting period covered since the previous Form N-CSR filing.
| Item 7. | Disclosure of Proxy Voting Policies and Procedures for Closed-End Management Investment Companies |
Not Applicable
| Item 8. | Portfolio Managers of Closed-End Management Investment Companies |
Not Applicable
| Item 9. | Purchases of Equity Securities by Closed-End Management Investment Company and Affiliated Purchasers |
Not Applicable
| Item 10. | Submission of Matters to a Vote of Security Holders |
No Changes to Report
| Item 11. | Controls and Procedures |
(a) The registrant’s President and Treasurer have concluded that the
registrant’s disclosure controls and procedures (as defined in rule 30a-3(c) under the Act) are effective in design and operation and are sufficient to form the basis of the certifications required by Rule 30a-(2) under the Act, based on their evaluation of these disclosure controls and procedures within 90 days of the filing date of this report on Form N-CSR.
(b) There were no changes in the registrant’s internal control over financial reporting (as defined in rule 30a-3(d) under the Act) during the registrant’s most recent fiscal half-year (the registrant’s second fiscal half-year in the case of an annual report) that have materially affected, or are reasonably likely to materially affect, the registrant’s internal control over financial reporting.
| Item 12. | Disclosure of Securities Lending Activities for Closed-End Management Investment Companies |
Not Applicable
| Item 13. | Exhibits |
(a)(1) Code of Ethics- Not Applicable to this Report.
(a)(2) Certifications of Principal Executive Officer and Principal Financial Officer.
(a)(3) Not Applicable.
(b) Certifications pursuant to 18 U.S.C. Section 1350.
SIGNATURES
Pursuant to the requirements of the Securities Exchange Act of 1934 and the Investment Company Act of 1940, the registrant has duly caused this report to be signed on its behalf by the undersigned, thereunto duly authorized.
Registrant Federated Hermes Insurance Series
By /S/ Lori A. Hensler
Lori A. Hensler, Principal Financial Officer
Date February 16, 2021
Pursuant to the requirements of the Securities Exchange Act of 1934 and the Investment Company Act of 1940, this report has been signed below by the following persons on behalf of the registrant and in the capacities and on the dates indicated.
By /S/ John B. Fisher
John B. Fisher, Principal Executive Officer
Date February 16, 2021
By /S/ Lori A. Hensler
Lori A. Hensler, Principal Financial Officer
Date February 16, 2021