UNITED STATES
SECURITIES AND EXCHANGE COMMISSION
Washington, D.C. 20549
FORM N-CSR
CERTIFIED SHAREHOLDER REPORT OF REGISTERED
MANAGEMENT INVESTMENT COMPANIES
Investment Company Act file number | 811-08044 | |||||||
| ||||||||
Morgan Stanley High Yield Fund, Inc. | ||||||||
(Exact name of registrant as specified in charter) | ||||||||
| ||||||||
1221 Avenue of the Americas 22nd Floor New York, NY |
| 10020 | ||||||
(Address of principal executive offices) |
| (Zip code) | ||||||
| ||||||||
Ronald E. Robison | ||||||||
(Name and address of agent for service) | ||||||||
| ||||||||
Registrant’s telephone number, including area code: | 1-800-221-6726 |
| ||||||
| ||||||||
Date of fiscal year end: | 12/31 |
| ||||||
| ||||||||
Date of reporting period: | 6/30/05 |
| ||||||
Form N-CSR is to be used by management investment companies to file reports with the Commission not later than 10 days after the transmission to stockholders of any report that is required to be transmitted to stockholders under Rule 30e-1 under the Investment Company Act of 1940 (17 CFR 270.30e-1). The Commission may use the information provided on Form N-CSR in its regulatory, disclosure review, inspection, and policymaking roles.
A registrant is required to disclose the information specified by Form N-CSR, and the Commission will make this information public. A registrant is not required to respond to the collection of information contained in Form N-CSR unless the Form displays a currently valid Office of Management and Budget (“OMB”) control number. Please direct comments concerning the accuracy of the information collection burden estimate and any suggestions for reducing the burden to Secretary, Securities and Exchange Commission, 450 Fifth Street, NW, Washington, DC 20549-0609. The OMB has reviewed this collection of information under the clearance requirements of 44 U.S.C. Section 3507.
ITEM 1. REPORTS TO STOCKHOLDERS.
The Fund’s semi-annual report transmitted to shareholders pursuant to Rule 30e-1 under the Investment Company Act of 1940 is as follows:
| 2005 Semi-Annual Report |
|
|
| June 30, 2005 |

Morgan Stanley High Yield Fund, Inc.
Morgan Stanley |
Investment Management Inc. |
Investment Adviser |
Morgan Stanley High Yield Fund, Inc. |
|
|
|
|
|
Directors |
|
|
Charles A. Fiumefreddo |
|
|
Michael Bozic |
|
|
Edwin J. Garn |
|
|
Wayne E. Hedien |
|
|
James F. Higgins |
|
|
Dr. Manuel H. Johnson |
|
|
Joseph J. Kearns |
|
|
Michael Nugent |
|
|
Fergus Reid |
|
|
|
|
|
Officers |
|
|
Charles A. Fiumefreddo |
|
|
Chairman of the Board |
|
|
|
|
|
Mitchell M. Merin |
|
|
President |
|
|
|
|
|
Ronald E. Robison |
|
|
Executive Vice President |
|
|
and Principal Executive |
|
|
Officer |
|
|
Joseph J. McAlinden |
Vice President |
|
Barry Fink |
Vice President |
|
Amy R. Doberman |
Vice President |
|
Stefanie V. Chang |
Vice President |
|
James W. Garrett |
Treasurer and Chief |
Financial Officer |
|
Carsten Otto |
Chief Compliance Officer |
|
Michael J. Leary |
Assistant Treasurer |
|
Mary E. Mullin |
Secretary |
Investment Adviser and Administrator |
|
Morgan Stanley Investment Management Inc. |
|
1221 Avenue of the Americas |
|
New York, New York 10020 |
|
|
|
Custodian |
|
JPMorgan Chase Bank |
|
270 Park Avenue |
|
New York, New York 10017 |
|
|
|
Stockholder Servicing Agent |
|
American Stock Transfer & Trust Company |
|
59 Maiden Lane |
|
New York, New York 10030 |
|
1 (800) 278-4353 |
|
|
|
Legal Counsel |
|
Clifford Chance US LLP |
|
31 West 52nd Street |
|
New York, New York 10019 |
|
|
|
Independent Registered Public Accounting Firm |
|
Ernst & Young LLP |
|
200 Clarendon Street |
|
Boston, Massachusetts 02116 |
|
For additional Fund information, including the Fund’s net asset value per share and information regarding the investments comprising the Fund’s portfolio, please call 1(800) 221-6726 or visit our website at www.morganstanley.com/im.
© 2005 Morgan Stanley
| Morgan Stanley High Yield Fund, Inc. |
|
|
Letter to Stockholders | Overview |
Performance
For the six months ended June 30, 2005, the Morgan Stanley High Yield Fund, Inc. (the “Fund”) had a total return, based on net asset value per share of -0.38%, net of fees, compared to 0.77% for the CSFB High Yield Index (the “Index”). On June 30, 2005, the closing price of the Fund’s shares on the New York Stock Exchange was $6.28, representing a 7.9% discount to the Fund’s net asset value per share.
Factors Affecting Performance
• The Fund experienced unfavorable security selection within the housing industry during the period. In particular, the Fund owned positions in several highly leveraged building products companies. These companies fell out of favor when the market declined in the spring partly due to the belief that building construction would slow in the second half of 2005.
• Security selection in the transportation sector added to performance as we avoided a few credits that had poor results while our investments in this sector generally posted solid numbers. In addition, an underweight to this sector benefited performance as the auto-related companies performed poorly.
• Security selection in telecommunications, forest products, manufacturing and diversified media detracted from relative performance. In each of these sectors one or two companies posted poor operating results and the securities declined more than the overall market.
Management Strategies
• We seek to maintain a balanced and well-diversified portfolio. The Fund consists of approximately 150 issuers. This diversifies the Fund’s credit risk, yet it also can allow sufficient average security size for strategic overweights. We continue to maintain an average credit quality of mid-to-high single B, which is very close to that of the benchmark.
• We have focused on larger companies because of their overall financial flexibility, their tendency to withstand less favorable financial markets and their superior access to capital markets.
• We believe the fundamentals of the high yield market remain positive, with favorable earnings and lower default rates. Many of these positive factors have already been “priced into” the market during the past two-and-a-half years.
• We have been moving the credit quality of the Fund slightly higher to try to protect the Fund against any market declines.
• As has been the case since last February, we believe high yield returns should continue to be driven primarily by coupon income rather than price appreciation. We look for the market fundamentals to remain favorable through at least the end of 2005 and potentially into 2006.
Sincerely,

Ronald E. Robison |
|
Executive Vice President— |
|
Principal Executive Officer | July 2005 |
2
| Morgan Stanley High Yield Fund, Inc. |
|
|
Investment Advisory Agreement Approval | June 30, 2005 (unaudited) |
Nature, Extent and Quality of Services
The Board reviewed and considered the nature and extent of the investment advisory services provided by the Investment Adviser under the Advisory Agreement, including portfolio management, investment research and equity and fixed income securities trading. The Board also reviewed and considered the nature and extent of the non-advisory, administrative services provided by the Fund’s Administrator under the Administration Agreement, including accounting, clerical, bookkeeping, compliance, business management and planning, and the provision of supplies, office space and utilities. (The Investment Adviser and the Administrator together are referred to as the “Adviser” and the Advisory and Administration Agreements together are referred to as the “Management Agreement.”) The Board also compared the nature of the services provided by the Adviser with similar services provided by non-affiliated advisers as reported to the Board by Lipper Inc. (“Lipper”).
The Board reviewed and considered the qualifications of the portfolio managers, the senior administrative managers and other key personnel of the Adviser who provide the administrative and investment advisory services to the Fund. The Board determined that the Adviser’s portfolio managers and key personnel are well qualified by education and/or training and experience to perform the services in an efficient and professional manner. The Board concluded that the nature and extent of the advisory and administrative services provided were necessary and appropriate for the conduct of the business and investment activities of the Fund. The Board also concluded that the overall quality of the advisory and administrative services was satisfactory.
Performance Relative to Comparable Funds Managed by Other Advisers
The Board reviewed the Fund’s performance for the one-, three- and five-year periods ended November 30, 2004, as shown in reports provided by Lipper (the “Lipper Reports”), compared to the performance of comparable funds selected by Lipper (the “performance peer group”), and noted that the Fund’s performance was lower than its performance peer group average for all three periods. The Board considered that the Fund’s performance, relative to is performance peer group, had steadily improved, as the gap between the peer group’s performance and the average of its performance peer group has steadily narrowed from the five- to the three- to the one-year period. The Board concluded that the Fund’s performance was improving and could reasonably be expected to continue to improve.
Fees Relative to Other Funds Managed by the Adviser with Comparable Investment Strategies
The Board reviewed the advisory and administrative fees (together, the “management fee”) paid by the Fund under the Management Agreement. The Board noted that the rate was comparable to the management fee rates charged by the Adviser to any other funds it manages with investment strategies comparable to those of the Fund.
Fees and Expenses Relative to Comparable Funds Managed by Other Advisers
The Board reviewed the management fee rate and the total expense ratio of the Fund. The Board noted that: (i) the Fund’s management fee rate was lower than the average management fee rate for funds, selected by Lipper (the “expense peer group”), managed by other advisers with investment strategies comparable to those of the Fund, as shown in the Lipper Report for the Fund; and (ii) the Fund’s total expense ratio was also lower than the average total expense ratio of the funds included in the Fund’s expense peer group. The Board concluded that the Fund’s management fee and total expense ratio were competitive with those of its expense peer group.
Breakpoints and Economies of Scale
The Board reviewed the structure of the Fund’s management fee schedule under the Management Agreement and noted that it does not include any breakpoints. The Board considered that the Fund is closed-end and is not a growth fund and, therefore, that the Fund’s assets are not likely to grow with new sales or grow significantly as a result of capital appreciation. The Board concluded that economies of scale for this Fund were not a factor that needed to be considered.
3
| Morgan Stanley High Yield Fund, Inc. |
|
|
Investment Advisory Agreement Approval (cont’d) | June 30, 2005 (unaudited) |
Profitability of Adviser and Affiliates
The Board considered and reviewed information concerning the costs incurred and profits realized by the Adviser and its affiliates during the last two years from their relationship with the Fund and the Morgan Stanley Fund Complex and reviewed with the Controller of the Adviser the cost allocation methodology used to determine the Adviser’s profitability. Based on their review of the information they received, the Board concluded that the profits earned by the Adviser and its affiliates were not excessive in light of the advisory, administrative and other services provided to the Fund.
Fall-Out Benefits
The Board considered so-called “fall-out benefits” derived by the Adviser and its affiliates from their relationship with the Fund and the Morgan Stanley Fund Complex, such as “float” benefits derived from handling of checks for purchases and sales of Fund shares through a broker-dealer affiliate of the Adviser. The Board considered the float benefits and concluded that they were relatively small.
Soft Dollar Benefits
The Board considered whether the Adviser realizes any benefits from commissions paid to brokers who execute securities transactions for the Fund (“soft dollars”). The Board noted that the Fund invests only in fixed income securities, which do not generate soft dollars.
Adviser Financially Sound and Financially Capable of Meeting the Fund’s Needs
The Board considered whether the Adviser is financially sound and has the resources necessary to perform its obligations under the Management Agreement. The Board noted that the Adviser’s operations remain profitable, although increased expenses in recent years have reduced the Adviser’s profitability. The Board concluded that the Adviser has the financial resources necessary to fulfill its obligations under the Management Agreement.
Historical Relationship Between the Fund and the Adviser
The Board also reviewed and considered the historical relationship between the Fund and the Adviser, including the organizational structure of the Adviser, the policies and procedures formulated and adopted by the Adviser for managing the Fund’s operations and the Board’s confidence in the competence and integrity of the senior managers and key personnel of the Adviser. The Board concluded that it is beneficial for the Fund to continue its relationship with the Adviser.
Other Factors and Current Trends
The Board considered the controls and procedures adopted and implemented by the Adviser and monitored by the Fund’s Chief Compliance Officer and concluded that the conduct of business by the Adviser indicates a good faith effort on its part to adhere to high ethical standards in the conduct of the Fund’s business.
General Conclusion
After considering and weighing all of the above factors, the Board concluded it would be in the best interest of the Fund and its stockholders to approve renewal of the Management Agreement for another year.
4
| Morgan Stanley High Yield Fund, Inc. |
Portfolio of Investments |
|
(Showing Percentage of Total Value of Investments) | June 30, 2005 (unaudited) |
|
| Face |
|
|
| |||||
|
| Amount |
| Value |
| |||||
CORPORATE BONDS AND NOTES (94.8%) |
|
|
|
|
| |||||
Aerospace (0.6%) |
|
|
|
|
| |||||
K&F Acquisition, Inc. |
|
|
|
|
| |||||
7.75%, 11/15/14 |
| $ | (a)570 |
| $ | 586 |
| |||
Cable (5.8%) |
|
|
|
|
| |||||
Cablecom Luxembourg SCA |
|
|
|
|
| |||||
9.375%, 4/15/14 |
| EUR | (a)670 |
| 919 |
| ||||
Cablevision Systems Corp. |
|
|
|
|
| |||||
7.89%, 4/1/09 |
| $ | (a)(b)300 |
| 302 |
| ||||
7.89%, 4/1/09 |
| (b)45 |
| 45 |
| |||||
Charter Communications Holdings LLC |
|
|
|
|
| |||||
9.625%, 11/15/09 |
| (c)100 |
| 75 |
| |||||
10.25%, 1/15/10 |
| (c)222 |
| 166 |
| |||||
17.19%, 1/15/11 |
| (c)(d)642 |
| 495 |
| |||||
Intelsat Bermuda Ltd. |
|
|
|
|
| |||||
7.805%, 1/15/12 |
| (a)(b)400 |
| 409 |
| |||||
8.25%, 1/15/13 |
| (a)55 |
| 57 |
| |||||
8.625%, 1/15/15 |
| (a)545 |
| 578 |
| |||||
Kabel Deutschland GmbH |
|
|
|
|
| |||||
10.625%, 7/1/14 |
| (a)925 |
| 1,008 |
| |||||
PanAmSat Corp. |
|
|
|
|
| |||||
9.00%, 8/15/14 |
| 621 |
| 681 |
| |||||
Renaissance Media Group LLC |
|
|
|
|
| |||||
10.00%, 4/15/08 |
| (d)275 |
| 274 |
| |||||
Satelites Mexicanos SA de CV, ‘B’ |
|
|
|
|
| |||||
10.125%, 11/1/04 |
| (e)495 |
| 265 |
| |||||
Telenet Group Holding NV |
|
|
|
|
| |||||
9.27%, 6/15/14 |
| (a)(c)(d)495 |
| 387 |
| |||||
|
|
|
| 5,661 |
| |||||
Chemicals (6.8%) |
|
|
|
|
| |||||
Cognis Deutschland GmbH & Co. KG |
|
|
|
|
| |||||
6.895%, 11/15/13 |
| EUR | (a)(b)540 |
| 670 |
| ||||
Equistar Chemicals LP |
|
|
|
|
| |||||
10.125%, 9/1/08 |
| $ | (c)601 |
| 653 |
| ||||
10.625%, 5/1/11 |
| (c)145 |
| 161 |
| |||||
Huntsman Advanced Materials LLC |
|
|
|
|
| |||||
11.00%, 7/15/10 |
| 235 |
| 267 |
| |||||
Huntsman International LLC |
|
|
|
|
| |||||
10.125%, 7/1/09 |
| 1 |
| @— |
| |||||
10.125%, 7/1/09 |
| EUR | (c)259 |
| 327 |
| ||||
Innophos Investments Holdings, Inc. |
|
|
|
|
| |||||
10.268%, 2/15/15 |
| $ | (a)(b)272 |
| 251 |
| ||||
ISP Chemco, Inc. |
|
|
|
|
| |||||
10.25%, 7/1/11 |
| (c)375 |
| 411 |
| |||||
ISP Holdings, Inc. |
|
|
|
|
| |||||
10.625%, 12/15/09 |
| $ | (c)330 |
| $ | 357 |
| |||
Koppers, Inc. |
|
|
|
|
| |||||
9.875%, 10/15/13 |
| 175 |
| 190 |
| |||||
Millennium America, Inc. |
|
|
|
|
| |||||
7.00%, 11/15/06 |
| 330 |
| 339 |
| |||||
9.25%, 6/15/08 |
| (c)438 |
| 476 |
| |||||
Nalco Co. |
|
|
|
|
| |||||
7.75%, 11/15/11 |
| (c)205 |
| 219 |
| |||||
8.875%, 11/15/13 |
| 765 |
| 824 |
| |||||
Rhodia SA |
|
|
|
|
| |||||
8.00%, 6/1/10 |
| EUR | 95 |
| 115 |
| ||||
8.875%, 6/1/11 |
| $ | (a)610 |
| 590 |
| ||||
Rockwood Specialties Group, Inc. |
|
|
|
|
| |||||
7.625%, 11/15/14 |
| EUR | (a)150 |
| 184 |
| ||||
10.625%, 5/15/11 |
| $ | 555 |
| 615 |
| ||||
|
|
|
| 6,649 |
| |||||
Consumer Products (2.7%) |
|
|
|
|
| |||||
Amscan Holdings, Inc. |
|
|
|
|
| |||||
8.75%, 5/1/14 |
| (c)330 |
| 303 |
| |||||
Levi Strauss & Co. |
|
|
|
|
| |||||
8.254%, 4/1/12 |
| (b)945 |
| 898 |
| |||||
Oxford Industries, Inc. |
|
|
|
|
| |||||
8.875%, 6/1/11 |
| 255 |
| 274 |
| |||||
Rayovac Corp. |
|
|
|
|
| |||||
8.50%, 10/1/13 |
| 755 |
| 793 |
| |||||
Spectrum Brands, Inc. |
|
|
|
|
| |||||
7.375%, 2/1/15 |
| (a)195 |
| 190 |
| |||||
Tempur-Pedic, Inc. |
|
|
|
|
| |||||
10.25%, 8/15/10 |
| 189 |
| 209 |
| |||||
|
|
|
| 2,667 |
| |||||
Diversified Media (5.8%) |
|
|
|
|
| |||||
Advanstar Communications, Inc. |
|
|
|
|
| |||||
10.75%, 8/15/10 |
| 100 |
| 110 |
| |||||
10.768%, 8/15/08 |
| (b)752 |
| 806 |
| |||||
AMC Entertainment, Inc. |
|
|
|
|
| |||||
7.518%, 8/15/10 |
| (a)(b)(c)345 |
| 358 |
| |||||
CanWest Media, Inc. |
|
|
|
|
| |||||
8.00%, 9/15/12 |
| 824 |
| 871 |
| |||||
Dex Media East LLC |
|
|
|
|
| |||||
12.125%, 11/15/12 |
| (c)270 |
| 325 |
| |||||
Dex Media West LLC |
|
|
|
|
| |||||
9.875%, 8/15/13 |
| 415 |
| 475 |
| |||||
The accompanying notes are an integral part of the financial statements. |
5
| Morgan Stanley High Yield Fund, Inc. |
Portfolio of Investments (cont’d) |
|
(Showing Percentage of Total Value of Investments) | June 30, 2005 (unaudited) |
|
| Face |
|
|
| ||||
|
| Amount |
| Value |
| ||||
Diversified Media (cont’d) |
|
|
|
|
| ||||
Houghton Mifflin Co. |
|
|
|
|
| ||||
4.21%, 10/15/13 |
| $ | (d)500 |
| $ | 368 |
| ||
8.25%, 2/1/11 |
| 80 |
| 83 |
| ||||
9.875%, 2/1/13 |
| (c)520 |
| 558 |
| ||||
Interpublic Group of Cos., Inc. |
|
|
|
|
| ||||
5.40%, 11/15/09 |
| 160 |
| 153 |
| ||||
6.25%, 11/15/14 |
| 230 |
| 216 |
| ||||
Nebraska Book Co., Inc. |
|
|
|
|
| ||||
8.625%, 3/15/12 |
| 490 |
| 459 |
| ||||
Primedia, Inc. |
|
|
|
|
| ||||
8.875%, 5/15/11 |
| (c)620 |
| 653 |
| ||||
Vertis, Inc. |
|
|
|
|
| ||||
13.50%, 12/7/09 |
| (a)275 |
| 207 |
| ||||
|
|
|
| 5,642 |
| ||||
Energy (9.0%) |
|
|
|
|
| ||||
CHC Helicopter Corp. |
|
|
|
|
| ||||
7.375%, 5/1/14 |
| (a)360 |
| 361 |
| ||||
7.375%, 5/1/14 |
| 625 |
| 627 |
| ||||
Chesapeake Energy Corp. |
|
|
|
|
| ||||
6.625%, 1/15/16 |
| (a)300 |
| 311 |
| ||||
7.50%, 9/15/13 |
| (c)745 |
| 810 |
| ||||
Citgo Petroleum Corp. |
|
|
|
|
| ||||
6.00%, 10/15/11 |
| (c)495 |
| 496 |
| ||||
Compagnie Generale de Geophysique SA |
|
|
|
|
| ||||
7.50%, 5/15/15 |
| (a)220 |
| 230 |
| ||||
El Paso Production Holding Co. |
|
|
|
|
| ||||
7.75%, 6/1/13 |
| (c)1,005 |
| 1,078 |
| ||||
Hanover Compressor Co. |
|
|
|
|
| ||||
8.625%, 12/15/10 |
| 120 |
| 128 |
| ||||
9.00%, 6/1/14 |
| 450 |
| 481 |
| ||||
Hanover Equipment Trust |
|
|
|
|
| ||||
8.75%, 9/1/11 |
| 250 |
| 267 |
| ||||
Hilcorp Energy I LP |
|
|
|
|
| ||||
10.50%, 9/1/10 |
| (a)730 |
| 810 |
| ||||
Husky Oil Co. |
|
|
|
|
| ||||
8.90%, 8/15/28 |
| (c)(b)855 |
| 950 |
| ||||
Magnum Hunter Resources, Inc. |
|
|
|
|
| ||||
9.60%, 3/15/12 |
| 231 |
| 257 |
| ||||
Pacific Energy Partners LP |
|
|
|
|
| ||||
7.125%, 6/15/14 |
| 450 |
| 471 |
| ||||
Pemex Project Funding Master Trust |
|
|
|
|
| ||||
9.125%, 10/13/10 |
| (c)345 |
| 405 |
| ||||
Plains Exploration & Production Co. |
|
|
|
|
| ||||
7.125%, 6/15/14 |
| 335 |
| 360 |
| ||||
Tesoro Corp. |
|
|
|
|
| ||||
9.625%, 4/1/12 |
| $ | 200 |
| $ | 222 |
| ||
Vintage Petroleum, Inc. |
|
|
|
|
| ||||
7.875%, 5/15/11 |
| 545 |
| 578 |
| ||||
|
|
|
| 8,842 |
| ||||
Financials (1.3%) |
|
|
|
|
| ||||
JSG Funding plc |
|
|
|
|
| ||||
10.125%, 10/1/12 |
| EUR | 311 |
| 393 |
| |||
Refco Finance Holdings LLC |
|
|
|
|
| ||||
9.00%, 8/1/12 |
| $ | 840 |
| 895 |
| |||
|
|
|
| 1,288 |
| ||||
Food & Drug (2.7%) |
|
|
|
|
| ||||
CA FM Lease Trust |
|
|
|
|
| ||||
8.50%, 7/15/17 |
| (a)611 |
| 699 |
| ||||
Delhaize America, Inc. |
|
|
|
|
| ||||
8.125%, 4/15/11 |
| (c)440 |
| 496 |
| ||||
Jean Coutu Group, Inc. |
|
|
|
|
| ||||
7.625%, 8/1/12 |
| 185 |
| 192 |
| ||||
8.50%, 8/1/14 |
| (c)830 |
| 824 |
| ||||
Rite Aid Corp. |
|
|
|
|
| ||||
8.125%, 5/1/10 |
| (c)385 |
| 398 |
| ||||
|
|
|
| 2,609 |
| ||||
Food & Tobacco (3.1%) |
|
|
|
|
| ||||
Michael Foods, Inc. |
|
|
|
|
| ||||
8.00%, 11/15/13 |
| 405 |
| 414 |
| ||||
Pilgrim’s Pride Corp. |
|
|
|
|
| ||||
9.25%, 11/15/13 |
| 215 |
| 240 |
| ||||
9.625%, 9/15/11 |
| 935 |
| 1,026 |
| ||||
Smithfield Foods, Inc. |
|
|
|
|
| ||||
7.00%, 8/1/11 |
| 970 |
| 1,026 |
| ||||
7.625%, 2/15/08 |
| (c)265 |
| 277 |
| ||||
|
|
|
| 2,983 |
| ||||
Forest Products (6.5%) |
|
|
|
|
| ||||
Abitibi-Consolidated, Inc. |
|
|
|
|
| ||||
6.00%, 6/20/13 |
| (c)705 |
| 652 |
| ||||
Crown European Holdings SA |
|
|
|
|
| ||||
6.25%, 9/1/11 |
| EUR | 245 |
| 314 |
| |||
Georgia-Pacific Corp. |
|
|
|
|
| ||||
8.875%, 2/1/10 |
| $ | (c)1,115 |
| 1,271 |
| |||
Graham Packaging Co., Inc. |
|
|
|
|
| ||||
9.875%, 10/15/14 |
| (a)810 |
| 816 |
| ||||
Graphic Packaging International Corp. |
|
|
|
|
| ||||
9.50%, 8/15/13 |
| (c)710 |
| 719 |
| ||||
Owens-Brockway |
|
|
|
|
| ||||
8.25%, 5/15/13 |
| 1,175 |
| 1,282 |
| ||||
The accompanying notes are an integral part of the financial statements.
6
| Morgan Stanley High Yield Fund, Inc. |
Portfolio of Investments (cont’d) |
|
(Showing Percentage of Total Value of Investments) | June 30, 2005 (unaudited) |
|
| Face |
|
|
| ||||
|
| Amount |
| Value |
| ||||
Forest Products (cont’d) |
|
|
|
|
| ||||
Owens-Illinois, Inc. |
|
|
|
|
| ||||
7.35%, 5/15/08 |
| $ | (c)360 |
| $ | 375 |
| ||
Pliant Corp. |
|
|
|
|
| ||||
13.00%, 6/1/10 |
| 230 |
| 188 |
| ||||
13.00%, 6/1/10 |
| (c)287 |
| 234 |
| ||||
Tembec Industries, Inc. |
|
|
|
|
| ||||
8.50%, 2/1/11 |
| (c)665 |
| 517 |
| ||||
|
|
|
| 6,368 |
| ||||
Gaming & Leisure (5.7%) |
|
|
|
|
| ||||
Caesar’s Entertainment, Inc. |
|
|
|
|
| ||||
7.875%, 12/15/05 |
| 355 |
| 361 |
| ||||
8.875%, 9/15/08 |
| 250 |
| 280 |
| ||||
HMH Properties, Inc. |
|
|
|
|
| ||||
7.875%, 8/1/08 |
| 31 |
| 32 |
| ||||
Host Marriott LP |
|
|
|
|
| ||||
6.375%, 3/15/15 |
| (a)760 |
| 756 |
| ||||
7.125%, 11/1/13 |
| (c)230 |
| 241 |
| ||||
Isle of Capri Casinos, Inc. |
|
|
|
|
| ||||
7.00%, 3/1/14 |
| 735 |
| 742 |
| ||||
MGM Mirage |
|
|
|
|
| ||||
6.00%, 10/1/09 |
| (c)1,525 |
| 1,540 |
| ||||
Starwood Hotels & Resorts Worldwide, Inc. |
|
|
|
|
| ||||
7.875%, 5/1/12 |
| 620 |
| 702 |
| ||||
Station Casinos, Inc. |
|
|
|
|
| ||||
6.00%, 4/1/12 |
| 885 |
| 903 |
| ||||
|
|
|
| 5,557 |
| ||||
Health Care (4.8%) |
|
|
|
|
| ||||
AmerisourceBergen Corp. |
|
|
|
|
| ||||
8.125%, 9/1/08 |
| (c)478 |
| 521 |
| ||||
Community Health Systems, Inc. |
|
|
|
|
| ||||
6.50%, 12/15/12 |
| (c)410 |
| 419 |
| ||||
DaVita, Inc. |
|
|
|
|
| ||||
6.625%, 3/15/13 |
| (a)405 |
| 420 |
| ||||
DEL Laboratories, Inc. |
|
|
|
|
| ||||
8.00%, 2/1/12 |
| 220 |
| 190 |
| ||||
Fisher Scientific International, Inc. |
|
|
|
|
| ||||
6.125%, 7/1/15 |
| (a)155 |
| 156 |
| ||||
6.75%, 8/15/14 |
| 275 |
| 289 |
| ||||
8.00%, 9/1/13 |
| 60 |
| 69 |
| ||||
Fresenius Medical Care Capital Trust II |
|
|
|
|
| ||||
7.875%, 2/1/08 |
| (c)490 |
| 513 |
| ||||
MedCath Holdings Corp. |
|
|
|
|
| ||||
9.875%, 7/15/12 |
| 500 |
| 561 |
| ||||
National Nephrology Associates, Inc. |
|
|
|
|
| ||||
9.00%, 11/1/11 |
| $ | (a)(c)100 |
| $ | 113 |
| ||
Tenet Healthcare Corp. |
|
|
|
|
| ||||
7.375%, 2/1/13 |
| 150 |
| 149 |
| ||||
9.875%, 7/1/14 |
| 270 |
| 291 |
| ||||
VWR International, Inc. |
|
|
|
|
| ||||
6.875%, 4/15/12 |
| 235 |
| 233 |
| ||||
8.00%, 4/15/14 |
| (c)290 |
| 278 |
| ||||
Warner Chilcott Corp. |
|
|
|
|
| ||||
8.75%, 2/1/15 |
| (a)485 |
| 474 |
| ||||
|
|
|
| 4,676 |
| ||||
Housing (6.1%) |
|
|
|
|
| ||||
Associated Materials, Inc. |
|
|
|
|
| ||||
5.12, 3/1/14 |
| (d)1,515 |
| 970 |
| ||||
Goodman Global Holding Co., Inc. |
|
|
|
|
| ||||
6.41%, 6/15/12 |
| (a)(b)170 |
| 168 |
| ||||
7.875%, 12/15/12 |
| (a)715 |
| 665 |
| ||||
Interface, Inc. |
|
|
|
|
| ||||
7.30%, 4/1/08 |
| 135 |
| 138 |
| ||||
9.50%, 2/1/14 |
| 535 |
| 548 |
| ||||
10.375%, 2/1/10 |
| 165 |
| 182 |
| ||||
Nortek, Inc. |
|
|
|
|
| ||||
8.50%, 9/1/14 |
| 750 |
| 701 |
| ||||
NTK Holdings, Inc. |
|
|
|
|
| ||||
6.97%, 3/1/14 |
| (a)(d)690 |
| 328 |
| ||||
Ply Gem Industries, Inc. |
|
|
|
|
| ||||
9.00%, 2/15/12 |
| 300 |
| 255 |
| ||||
RMCC Acquisition Co. |
|
|
|
|
| ||||
9.50%, 11/1/12 |
| (a)535 |
| 514 |
| ||||
Technical Olympic USA, Inc. |
|
|
|
|
| ||||
7.50%, 1/15/15 |
| 600 |
| 543 |
| ||||
9.00%, 7/1/10 |
| 133 |
| 138 |
| ||||
9.00%, 7/1/10 |
| (c)385 |
| 398 |
| ||||
10.375%, 7/1/12 |
| (c)380 |
| 399 |
| ||||
|
|
|
| 5,947 |
| ||||
Information Technology (2.8%) |
|
|
|
|
| ||||
Iron Mountain, Inc. |
|
|
|
|
| ||||
7.75%, 1/15/15 |
| (c)375 |
| 379 |
| ||||
8.625%, 4/1/13 |
| (c)595 |
| 619 |
| ||||
Nortel Networks Corp. (Convertible) |
|
|
|
|
| ||||
4.25%, 9/1/08 |
| 550 |
| 515 |
| ||||
Nortel Networks Ltd. |
|
|
|
|
| ||||
6.125%, 2/15/06 |
| (c)590 |
| 597 |
| ||||
Sanmina-SCI Corp. |
|
|
|
|
| ||||
6.75%, 3/1/13 |
| (a)670 |
| 643 |
| ||||
|
|
|
| 2,753 |
| ||||
The accompanying notes are an integral part of the financial statements.
7
| Morgan Stanley High Yield Fund, Inc. |
Portfolio of Investments (cont’d) |
|
(Showing Percentage of Total Value of Investments) | June 30, 2005 (unaudited) |
|
| Face |
|
|
| |||
|
| Amount |
| Value |
| |||
Manufacturing (4.3%) |
|
|
|
|
| |||
Flowserve Corp. |
|
|
|
|
| |||
12.25%, 8/15/10 |
| $ | (c)218 |
| $ | 236 |
| |
Hexcel Corp. |
|
|
|
|
| |||
6.75%, 2/1/15 |
| 485 |
| 487 |
| |||
Johnsondiversey, Inc. |
|
|
|
|
| |||
9.625%, 5/15/12 |
| 511 |
| 521 |
| |||
9.625%, 5/15/12 |
| EUR | 235 |
| 280 |
| ||
Manitowoc Co., Inc. |
|
|
|
|
| |||
10.375%, 5/15/11 |
| 768 |
| 1,032 |
| |||
NMHG Holding Co. |
|
|
|
|
| |||
10.00%, 5/15/09 |
| $ | 633 |
| 668 |
| ||
Propex Fabrics, Inc. |
|
|
|
|
| |||
10.00%, 12/1/12 |
| (c)410 |
| 392 |
| |||
Trimas Corp. |
|
|
|
|
| |||
9.875%, 6/15/12 |
| (c)747 |
| 631 |
| |||
|
|
|
| 4,247 |
| |||
Metals (2.5%) |
|
|
|
|
| |||
Foundation PA Coal Co. |
|
|
|
|
| |||
7.25%, 8/1/14 |
| 170 |
| 180 |
| |||
General Cable Corp. |
|
|
|
|
| |||
9.50%, 11/15/10 |
| 255 |
| 274 |
| |||
Glencore Nickel Property Ltd. |
|
|
|
|
| |||
9.00%, 12/1/14 |
| (f)515 |
| @— |
| |||
Murrin Murrin Holding Ltd. |
|
|
|
|
| |||
9.375%, 8/31/07 |
| (e)(f)1,595 |
| @— |
| |||
Novelis, Inc. |
|
|
|
|
| |||
7.25%, 2/15/15 |
| (a)815 |
| 822 |
| |||
Republic Technologies International LLC |
|
|
|
|
| |||
13.75%, 7/15/09 |
| (e)(f)720 |
| @— |
| |||
UCAR Finance, Inc. |
|
|
|
|
| |||
10.25%, 2/15/12 |
| 530 |
| 560 |
| |||
United States Steel Corp. |
|
|
|
|
| |||
9.75%, 5/15/10 |
| (c)555 |
| 602 |
| |||
|
|
|
| 2,438 |
| |||
Retail (1.7%) |
|
|
|
|
| |||
Brown Shoe Co., Inc. |
|
|
|
|
| |||
8.75%, 5/1/12 |
| (a)(e)415 |
| 435 |
| |||
General Nutrition Centers, Inc. |
|
|
|
|
| |||
8.50%, 12/1/10 |
| 585 |
| 471 |
| |||
Petro Stopping Centers LP |
|
|
|
|
| |||
9.00%, 2/15/12 |
| 710 |
| 717 |
| |||
|
|
|
| 1,623 |
| |||
Services (3.0%) |
|
|
|
|
| |||
Allied Waste North America |
|
|
|
|
| |||
6.375%, 4/15/11 |
| $ | (c)220 |
| $ | 212 |
| |
7.25%, 3/15/15 |
| (a)475 |
| 462 |
| |||
8.50%, 12/1/08 |
| 265 |
| 279 |
| |||
8.875%, 4/1/08 |
| (c)526 |
| 555 |
| |||
Buhrmann US, Inc. |
|
|
|
|
| |||
7.875%, 3/1/15 |
| (a)195 |
| 191 |
| |||
8.25%, 7/1/14 |
| 625 |
| 628 |
| |||
MSW Energy Holdings LLC |
|
|
|
|
| |||
8.50%, 9/1/10 |
| (c)105 |
| 112 |
| |||
MSW Energy Holdings II LLC |
|
|
|
|
| |||
7.375%, 9/1/10 |
| 495 |
| 510 |
| |||
|
|
|
| 2,949 |
| |||
Telecommunications (2.8%) |
|
|
|
|
| |||
AXtel SA |
|
|
|
|
| |||
11.00%, 12/15/13 |
| (c)745 |
| 816 |
| |||
Esprit Telecommunications Group plc |
|
|
|
|
| |||
11.50%, 12/15/07 |
| EUR | (e)(f)665 |
| @— |
| ||
EXDS, Inc. |
|
|
|
|
| |||
11.625%, 7/15/10 |
| $ | (e)(f)1,082 |
| @— |
| ||
Primus Telecommunications Group, Inc. |
|
|
|
|
| |||
8.00%, 1/15/14 |
|
|
| @— |
| |||
Qwest Communications International, Inc. |
|
|
|
|
| |||
7.268%, 2/15/09 |
| (b)515 |
| 508 |
| |||
Qwest Corp. |
|
|
|
|
| |||
5.625%, 11/15/08 |
| (c)115 |
| 114 |
| |||
Qwest Services Corp. |
|
|
|
|
| |||
13.50%, 12/15/10 |
| 950 |
| 1,102 |
| |||
14.00%, 12/15/14 |
| 185 |
| 225 |
| |||
Rhythms NetConnections, Inc. |
|
|
|
|
| |||
13.50%, 5/15/08 |
| (e)(f)2,591 |
| @— |
| |||
14.00%, 2/15/10 |
| (e)(f)1,476 |
| @— |
| |||
|
|
|
| 2,765 |
| |||
Transportation (5.8%) |
|
|
|
|
| |||
Amsted Industries, Inc. |
|
|
|
|
| |||
10.25%, 10/15/11 |
| (a)765 |
| 830 |
| |||
ArvinMeritor, Inc. |
|
|
|
|
| |||
8.75%, 3/1/12 |
| 225 |
| 236 |
| |||
AutoNation, Inc. |
|
|
|
|
| |||
9.00%, 8/1/08 |
| (c)552 |
| 606 |
| |||
Commercial Vehicle Group, Inc. |
|
|
|
|
| |||
8.00%, 7/1/13 |
| 145 |
| 148 |
| |||
General Motors Acceptance Corp. |
|
|
|
|
| |||
6.875%, 9/15/11 |
| 95 |
| 88 |
| |||
6.875%, 8/28/12 |
| 755 |
| 692 |
| |||
The accompanying notes are an integral part of the financial statements.
8
| Morgan Stanley High Yield Fund, Inc. |
Portfolio of Investments (cont’d) |
|
(Showing Percentage of Total Value of Investments) | June 30, 2005 (unaudited) |
|
| Face |
|
|
| ||
|
| Amount |
| Value |
| ||
Transportation (cont’d) |
|
|
|
|
| ||
Laidlaw International, Inc. |
|
|
|
|
| ||
10.75%, 6/15/11 |
| $ | 715 |
| $ | 838 |
|
Lear Corp. |
|
|
|
|
| ||
8.11%, 5/15/09 |
| 235 |
| 243 |
| ||
Meritor Automotive, Inc. |
|
|
|
|
| ||
6.80%, 2/15/09 |
| 285 |
| 283 |
| ||
Sonic Automotive, Inc. |
|
|
|
|
| ||
8.625%, 8/15/13 |
| (c)975 |
| 990 |
| ||
TRW Automotive, Inc. |
|
|
|
|
| ||
9.375%, 2/15/13 |
| 607 |
| 675 |
| ||
|
|
|
| 5,629 |
| ||
Utilities (8.3%) |
|
|
|
|
| ||
AES Corp. (The) |
|
|
|
|
| ||
7.75%, 3/1/14 |
| (c)300 |
| 327 |
| ||
8.875%, 2/15/11 |
| 59 |
| 66 |
| ||
9.00%, 5/15/15 |
| (a)(c)570 |
| 643 |
| ||
9.375%, 9/15/10 |
| 88 |
| 100 |
| ||
Allegheny Energy, Inc. |
|
|
|
|
| ||
7.75%, 8/1/05 |
| (c)285 |
| 286 |
| ||
CMS Energy Corp. |
|
|
|
|
| ||
7.50%, 1/15/09 |
| 75 |
| 79 |
| ||
8.50%, 4/15/11 |
| (c)450 |
| 504 |
| ||
Dynegy Holdings, Inc. |
|
|
|
|
| ||
6.875%, 4/1/11 |
| (c)578 |
| 574 |
| ||
9.875%, 7/15/10 |
| (a)(c)440 |
| 488 |
| ||
Ipalco Enterprises, Inc. |
|
|
|
|
| ||
8.625%, 11/14/11 |
| 165 |
| 186 |
| ||
Monongahela Power Co. |
|
|
|
|
| ||
5.00%, 10/1/06 |
| (c)570 |
| 575 |
| ||
Nevada Power Co. |
|
|
|
|
| ||
8.25%, 6/1/11 |
| 355 |
| 402 |
| ||
9.00%, 8/15/13 |
| 445 |
| 503 |
| ||
Northwest Pipeline Corp. |
|
|
|
|
| ||
8.125%, 3/1/10 |
| 115 |
| 125 |
| ||
Ormat Funding Corp. |
|
|
|
|
| ||
8.25%, 12/30/20 |
| 773 |
| 785 |
| ||
PSEG Energy Holdings LLC |
|
|
|
|
| ||
8.625%, 2/15/08 |
| (c)541 |
| 578 |
| ||
Reliant Energy, Inc. |
|
|
|
|
| ||
6.75%, 12/15/14 |
| 600 |
| 589 |
| ||
Southern Natural Gas Co. |
|
|
|
|
| ||
8.875%, 3/15/10 |
| 235 |
| 259 |
| ||
Williams Cos., Inc. |
|
|
|
|
| ||
7.875%, 9/1/21 |
| (c)875 |
| 1,000 |
| ||
|
|
|
| 8,069 |
| ||
Wireless Communications (2.7%) |
|
|
|
|
| ||
Rogers Wireless Communications, Inc. |
|
|
|
|
| ||
7.50%, 3/15/15 |
| $ | 350 |
| $ | 382 |
|
Rural Cellular Corp. |
|
|
|
|
| ||
7.91%, 3/15/10 |
| (b)(c)305 |
| 316 |
| ||
SBA Communications Corp. |
|
|
|
|
| ||
7.41%, 12/15/11 |
| (d)735 |
| 680 |
| ||
8.50%, 12/1/12 |
| 635 |
| 687 |
| ||
UbiquiTel Operating Co. |
|
|
|
|
| ||
9.875%, 3/1/11 |
| 505 |
| 557 |
| ||
|
|
|
| 2,622 |
| ||
TOTAL CORPORATE BONDS AND NOTES |
|
|
| 92,570 |
| ||
|
| Shares |
|
|
|
COMMON STOCKS (0.0%) |
|
|
|
|
|
Broadcasting (0.0%) |
|
|
|
|
|
Paxson Communications Corp. |
| (g)35,921 |
| 3 |
|
Telecommunications (0.0%) |
|
|
|
|
|
Viatel Holding Bermuda Ltd. |
| (g)1,105 |
| @— |
|
TOTAL COMMON STOCKS |
|
|
| 3 |
|
PREFERRED STOCKS (1.1%) |
|
|
|
|
|
Broadcasting (0.1%) |
|
|
|
|
|
Paxson Communications Corp., PIK, 14.25% |
| 16 |
| 103 |
|
Utilities (1.0%) |
|
|
|
|
|
TNP Enterprises, Inc., PIK, 14.50% |
| (f)860 |
| 974 |
|
|
|
|
|
|
|
TOTAL PREFERRED STOCKS |
|
|
| 1,077 |
|
|
| No. of |
|
|
|
|
| Warrants |
|
|
|
WARRANTS (0.0%) |
|
|
|
|
|
Utilities (0.0%) |
|
|
|
|
|
SW Acquisition LP, expiring 4/1/11 (Cost $45) |
| (a)(f)(g)1,677 |
| 40 |
|
The accompanying notes are an integral part of the financial statements.
9
| Morgan Stanley High Yield Fund, Inc. |
Portfolio of Investments (cont’d) |
|
(Showing Percentage of Total Value of Investments) | June 30, 2005 (unaudited) |
|
| Face |
|
|
| ||
|
| Amount |
| Value |
| ||
SHORT-TERM INVESTMENTS (4.1%) |
|
|
|
|
| ||
Repurchase Agreement (4.1%) |
|
|
|
|
| ||
J.P. Morgan Securities, Inc., 3.40% dated 6/30/05, due 7/1/05, repurchase price $4,017 (Cost $4,017) |
| $ | (h)4,017 |
| $ | 4,017 |
|
TOTAL INVESTMENTS (100.0%) |
|
|
| 97,707 |
| ||
LIABILITIES IN EXCESS OF OTHER ASSETS |
|
|
| (17,955) |
| ||
NET ASSETS |
|
|
| $ | 79,752 |
| |
(a) |
| 144A Security - Certain conditions for public sale may exist. |
(b) |
| Variable/Floating Rate Security — Interest rate changes on these instruments are based on changes in designated base rates. The rates shown are those in effect on June 30, 2005. |
(c) |
| Denotes all or a portion of securities subject to repurchase under the Reverse Repurchase Agreements as of June 30, 2005. See note A-3 to financial statements. |
(d) |
| Step Bond - coupon rate increases in increments to maturity. Rate disclosed is as of June 30, 2005. Maturity date disclosed is ultimate maturity. |
(e) |
| Security is in default. |
(f) |
| Security was valued at fair value - At June 30, 2005, the Fund held fair-valued securities, each valued at less than $500, representing less than 0.05% of net assets. |
(g) |
| Non-income producing. |
(h) |
| Represents the Fund’s undivided interest in a joint repurchase agreement which has a total value of $779,270,000. The repurchase agreement was fully collateralized by U.S. government agency securities at the date of this Portfolio of Investments as follows: Federal Home Loan Mortgage Corp., 3.739% to 5.627%, due 6/1/32 to 3/1/35; Federal National Mortgage Association, Conventional Pools, 4.001% to 5.373%, due 5/1/32 to 7/1/35, which had a total value of $794,856,745. The investment in the repurchase agreement is through participation in a joint account with affiliated parties pursuant to exemptive relief received by the Fund from the SEC. |
@ |
| Amount is less than $500. |
EUR |
| Euro |
PIK |
| Payment-in-Kind. Income may be paid in additional securities or cash at the discretion of the issuer. |
Foreign Currency Exchange Contract Information:
The Fund had the following foreign currency exchange contract(s) open at period end:
Currency |
|
|
|
|
| In |
|
|
| Net |
| |||||
to |
|
|
|
|
| Exchange |
|
|
| Appreciation |
| |||||
Deliver |
| Value |
| Settlement |
| For |
| Value |
| (Depreciation) |
| |||||
(000) |
| (000) |
| Date |
| (000) |
| (000) |
| (000) |
| |||||
EUR | 810 |
| $ | 981 |
| 7/26/05 |
| USD | 1,062 |
| $ | 1,062 |
| $ | 81 |
|
EUR | 2,731 |
| 3,307 |
| 7/26/05 |
| USD | 3,576 |
| 3,576 |
| 269 |
| |||
EUR | 1,145 |
| 1,387 |
| 7/26/05 |
| USD | 1,500 |
| 1,500 |
| 113 |
| |||
EUR | 535 |
| 648 |
| 7/26/05 |
| USD | 702 |
| 702 |
| 54 |
| |||
EUR | 270 |
| 327 |
| 7/26/05 |
| USD | 349 |
| 349 |
| 22 |
| |||
EUR | 349 |
| 422 |
| 7/05/05 |
| USD | 421 |
| 421 |
| (1 | ) | |||
USD | 350 |
| 350 |
| 7/26/05 |
| EUR | 270 |
| 327 |
| (23 | ) | |||
USD | 350 |
| 350 |
| 7/26/05 |
| EUR | 270 |
| 327 |
| (23 | ) | |||
USD | 674 |
| 674 |
| 7/26/05 |
| EUR | 530 |
| 642 |
| (32 | ) | |||
USD | 290 |
| 290 |
| 7/26/05 |
| EUR | 230 |
| 279 |
| (11 | ) | |||
USD | 148 |
| 148 |
| 7/26/05 |
| EUR | 120 |
| 145 |
| (3 | ) | |||
USD | 143 |
| 143 |
| 7/26/05 |
| EUR | 117 |
| 142 |
| (1 | ) | |||
USD | 317 |
| 317 |
| 7/26/05 |
| EUR | 261 |
| 316 |
| (1 | ) | |||
USD | 421 |
| 421 |
| 7/5/05 |
| EUR | 349 |
| 422 |
| 1 |
| |||
|
|
| $ | 9,765 |
|
|
|
|
| $ | 10,210 |
| $ | 445 |
| |
Graphic Presentation of Portfolio Holdings
The following graph depicts the Fund’s holdings by industry, as a percentage of total investments.
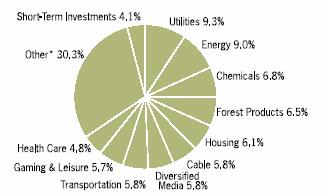
* Industries which do not appear in the top 10 industries and industries which represent less than 3% of total investments, if applicable, are included in the category labelled “Other”.
The accompanying notes are an integral part of the financial statements.
10
| Morgan Stanley High Yield Fund, Inc. |
|
|
| Financial Statements (unaudited) |
Statement of Assets and Liabilities
|
| June 30, 2005 |
| |
Assets: |
|
|
| |
Investments, at Value (Cost $100,517) |
| $ | 97,707 |
|
Receivable for Investments Sold |
| 1,996 |
| |
Interest Receivable |
| 1,914 |
| |
Unrealized Appreciation on Foreign Currency Exchange Contracts |
| 540 |
| |
Other Assets |
| 9 |
| |
Total Assets |
| 102,166 |
| |
Liabilities: |
|
|
| |
Payable For: |
|
|
| |
Reverse Repurchase Agreements |
| 20,988 |
| |
Investments Purchased |
| 557 |
| |
Dividends Declared |
| 527 |
| |
Bank Overdraft Payable |
| 96 |
| |
Unrealized Depreciation on Foreign Currency Exchange Contracts |
| 95 |
| |
Investment Advisory Fees |
| 46 |
| |
Directors’ Fees and Expenses |
| 14 |
| |
Custodian Fees |
| 5 |
| |
Administration Fees |
| 3 |
| |
Other Liabilities |
| 83 |
| |
Total Liabilities |
| 22,414 |
| |
NetAssets |
|
|
| |
Applicable to 11,700,448, Issued and Outstanding $0.01 Par Value Shares (100,000,000 Shares Authorized) |
| $ | 79,752 |
|
Net Asset Value Per Share |
| $ | 6.82 |
|
Net Assets Consist of: |
|
|
| |
Common Stock |
| $ | 117 |
|
Paid-in Capital |
| 156,080 |
| |
Undistributed (Distributions in Excess of) Net Investment Income |
| (1,322 | ) | |
Accumulated Net Realized Gain (Loss) |
| (72,655 | ) | |
Unrealized Appreciation (Depreciation) on Investments and Foreign Currency Translations |
| (2,468 | ) | |
Net Assets |
| $ | 79,752 |
|
The accompanying notes are an integral part of the financial statements.
11
| Morgan Stanley High Yield Fund, Inc. |
|
|
| Financial Statements (unaudited) |
Statement of Operations
|
| Six Months Ended |
| |
|
| June 30, 2005 |
| |
|
| (unaudited) |
| |
Investment Income |
|
|
| |
Interest |
| $ | 4,063 |
|
Expenses |
|
|
| |
Interest Expense on Reverse Repurchase Agreements |
| 324 |
| |
Investment Advisory Fees (Note B) |
| 281 |
| |
Administration Fees (Note C) |
| 32 |
| |
Stockholder Reporting Expenses |
| 29 |
| |
Professional Fees |
| 26 |
| |
Stockholder Servicing Fees |
| 14 |
| |
Custodian Fees (Note D) |
| 8 |
| |
Bank Overdraft Expense |
| 1 |
| |
Other Expenses |
| 23 |
| |
Total Expenses |
| 738 |
| |
Waiver of Administration Fees (Note C) |
| (10 | ) | |
Expense Offset (Note D) |
| @— |
| |
Net Expenses |
| 728 |
| |
Net Investment Income |
| 3,335 |
| |
Net Realized Gain (Loss) on: |
|
|
| |
Investments |
| 392 |
| |
Foreign Currency Transactions |
| 98 |
| |
Net Realized Gain (Loss) |
| 490 |
| |
Change in Unrealized Appreciation (Depreciation) on: |
|
|
| |
Investments |
| (5,277 | ) | |
Foreign Currency Translations |
| 871 |
| |
Change in Unrealized Appreciation (Depreciation) |
| (4,406 | ) | |
Total Net Realized Gain (Loss) and Change in Unrealized Appreciation (Depreciation) |
| (3,916 | ) | |
Net Increase (Decrease) in Net Assets Resulting from Operations |
| $ | (581 | ) |
@ Amount is less than $500. |
|
|
|
Statement of Changes in Net Assets
|
| Six Months Ended |
|
|
| ||
|
| June 30, 2005 |
| Year Ended |
| ||
|
| (unaudited) |
| December 31, 2004 |
| ||
Increase (Decrease) in Net Assets |
|
|
|
|
| ||
Operations: |
|
|
|
|
| ||
Net Investment Income |
| $ | 3,335 |
| $ | 7,517 |
|
Net Realized Gain (Loss) |
| 490 |
| 3,419 |
| ||
Change in Unrealized Appreciation (Depreciation) |
| (4,406 | ) | (1,009 | ) | ||
Net Increase (Decrease) in Net Assets Resulting from Operations |
| (581 | ) | 9,927 |
| ||
Distributions from and/or in Excess of: |
|
|
|
|
| ||
Net Investment Income |
| (3,159 | ) | (7,837 | ) | ||
Total Increase (Decrease) |
| (3,740 | ) | 2,090 |
| ||
Net Assets: |
|
|
|
|
| ||
Beginning of Period |
| 83,492 |
| 81,402 |
| ||
End of Period (including undistributed (distributions in excess of) net investment income of $(1,322) and $(1,498), respectively) |
| $ | 79,752 |
| $ | 83,492 |
|
The accompanying notes are an integral part of the financial statements.
12
| Morgan Stanley High Yield Fund, Inc. |
|
|
| Financial Statements (unaudited) |
Statement of Cash Flows
|
| Six Months Ended |
| |
Cash Flows From Operating Activities: |
|
|
| |
Proceeds from Sales and Maturities of Long-Term Investments |
| $ | 31,865 |
|
Purchases of Long-Term Investments |
| (26,462 | ) | |
Net (Increase) Decrease in Short-Term Investments |
| (1,578 | ) | |
Net Realized Gain (Loss) on Foreign Currency Transactions |
| 98 |
| |
Net Investment Income |
| 3,335 |
| |
Adjustments to Reconcile Net Investment Income to Net Cash Provided (Used) by Operating Activities: |
|
|
| |
Net (Increase) Decrease in Receivables Related to Operations |
| 45 |
| |
Net Increase (Decrease) in Payables Related to Operations |
| 155 |
| |
Accretion/Amortization of Discounts and Premiums |
| (101 | ) | |
Net Cash Provided (Used) by Operating Activities |
| 7,357 |
| |
Cash Flows from Financing Activities: |
|
|
| |
Cash Received for Reverse Repurchase Agreements |
| 26,435 |
| |
Cash Paid for Repurchase Agreements |
| (28,705 | ) | |
Cash Distributions Paid |
| (5,087 | ) | |
Net Cash Provided (Used) for Financing Activities |
| (7,357 | ) | |
Net Increase (Decrease) in Cash |
| — |
| |
Cash at Beginning of Period |
| — |
| |
Cash at End of Period |
| $ | — |
|
The accompanying notes are an integral part of the financial statements.
13
| Morgan Stanley High Yield Fund, Inc. |
|
|
Selected Per Share Data and Ratios | Financial Highlights |
|
| Six Months Ended |
|
|
| ||||||||||||||
Year Ended December 31, |
| ||||||||||||||||||
|
| (unaudited) |
| 2004 |
| 2003 |
| 2002 |
| 2001 |
| 2000 |
| ||||||
Net Asset Value, Beginning of Period |
| $ | 7.14 |
| $ | 6.96 |
| $ | 5.46 |
| $ | 7.26 |
| $ | 9.31 |
| $ | 12.73 |
|
Net Investment Income |
| 0.29 | † | 0.64 | † | 0.67 | † | 0.78 | † | 1.15 |
| 1.26 |
| ||||||
Net Realized and Unrealized Gain (Loss) on Investments |
| (0.34 | ) | 0.21 |
| 1.40 |
| (1.80 | ) | (2.01 | ) | (3.38 | ) | ||||||
Total from Investment Operations |
| (0.05 | ) | 0.85 |
| 2.07 |
| (1.02 | ) | (0.86 | ) | (2.12 | ) | ||||||
Distributions from and/or in Excess of: |
|
|
|
|
|
|
|
|
|
|
|
|
| ||||||
Net Investment Income |
| (0.27 | ) | (0.67 | ) | (0.57 | ) | (0.78 | ) | (1.19 | ) | (1.30 | ) | ||||||
Net Asset Value, End of Period |
| $ | 6.82 |
| $ | 7.14 |
| $ | 6.96 |
| $ | 5.46 |
| $ | 7.26 |
| $ | 9.31 |
|
Per Share Market Value, End of Period |
| $ | 6.28 |
| $ | 6.51 |
| $ | 6.55 |
| $ | 5.38 |
| $ | 8.04 |
| $ | 9.44 |
|
TOTAL INVESTMENT RETURN: |
|
|
|
|
|
|
|
|
|
|
|
|
| ||||||
Market Value |
| 0.61 | %** | 10.27 | % | 33.13 | % | (24.16 | )% | (2.82 | )% | (4.02 | )% | ||||||
Net Asset Value (1) |
| (0.38 | )%** | 13.82 | % | 39.29 | % | (14.69 | )% | (11.05 | )% | (17.72 | )% | ||||||
RATIOS, SUPPLEMENTAL DATA: |
|
|
|
|
|
|
|
|
|
|
|
|
| ||||||
Net Assets, End of Period (Thousands) |
| $ | 79,752 |
| $ | 83,492 |
| $ | 81,402 |
| $ | 63,878 |
| $ | 84,577 |
| $ | 107,840 |
|
Ratio of Expenses to Average Net Assets(2) |
| 1.81 | %* | 1.45 | % | 1.50 | % | 2.92 | % | 4.02 | % | 3.84 | % | ||||||
Ratio of Expenses Excluding Interest Expense to Average Net Assets(2) |
| 1.00 | %* | 1.00 | % | 1.05 | % | 1.25 | % | 1.17 | % | 1.05 | % | ||||||
Ratio of Net Investment Income to Average Net Assets |
| 8.31 | %* | 9.14 | % | 10.57 | % | 12.69 | % | 13.37 | % | 11.02 | % | ||||||
Portfolio Turnover Rate |
| 27 | %** | 55 | % | 68 | % | 56 | % | 51 | % | 35 | % | ||||||
(2) Supplemental Information on the Ratios to Average Net Assets: |
|
|
|
|
|
|
|
|
|
|
|
|
| ||||||
Ratio of Expenses to Average Net Assets Including Expense Offsets |
| 1.81 | %* | N/A |
| N/A |
| N/A |
| N/A |
| N/A |
| ||||||
Ratios Before Expenses Waived by Administrator: |
|
|
|
|
|
|
|
|
|
|
|
|
| ||||||
Ratio of Expenses to Average Net Assets |
| 1.84 | %* | 1.45 | % | N/A |
| N/A |
| N/A |
| N/A |
| ||||||
Ratio of Net Investment Income (Loss) to Average Net Assets |
| 8.28 | %* | 9.14 | % | N/A |
| N/A |
| N/A |
| N/A |
| ||||||
(1) Total investment return based on net asset value per share reflects the effects of changes in net asset value on the performance of the Fund during each period, and assumes dividends and distributions, if any, were reinvested. This percentage is not an indication of the performance of a stockholder’s investment in the Fund based on market value due to differences between the market price of the stock and the net asset value per share of the Fund.
† Per share amount is based on average shares outstanding.
* Annualized
** Not Annualized
The accompanying notes are an integral part of the financial statements.
14
| Morgan Stanley High Yield Fund, Inc. |
|
|
Notes to Financial Statements | June 30, 2005 (unaudited) |
Morgan Stanley High Yield Fund, Inc. (the “Fund”) was incorporated on September 23, 1993 and is registered as a non-diversified, closed-end management investment company under the Investment Company Act of 1940 (the “1940 Act”), as amended. The Fund’s primary objective is to produce high current income and as a secondary objective, to seek capital appreciation, through investments primarily in high yield securities.
A. Accounting Policies: The following significant accounting policies are in conformity with U.S. generally accepted accounting principles for investment companies. Such policies are consistently followed by the Fund in the preparation of its financial statements. U.S. generally accepted accounting principles may require management to make estimates and assumptions that affect the reported amounts and disclosures in the financial statements. Actual results may differ from those estimates.
1. Security Valuation: Equity securities listed on a U.S. exchange are valued at the latest quoted sales price on the valuation date. Equity securities listed or traded on NASDAQ, for which market quotations are available, are valued at the NASDAQ Official Closing Price. Securities listed on a foreign exchange are valued at their closing price. Unlisted securities and listed securities not traded on the valuation date for which market quotations are readily available are valued at the mean between the current bid and asked prices obtained from reputable brokers. Bonds and other fixed income securities may be valued according to the broadest and most representative market. In addition, bonds and other fixed income securities may be valued on the basis of prices provided by a pricing service. The prices provided by a pricing service take into account broker dealer market price quotations for institutional size trading in similar groups of securities, security quality, maturity, coupon and other security characteristics as well as any developments related to the specific securities. Debt securities purchased with remaining maturities of 60 days or less are valued at amortized cost, if it approximates value.
All other securities and investments for which market values are not readily available, including restricted securities, and those securities for which it is inappropriate to determine prices in accordance with the aforementioned procedures, are valued at fair value as determined in good faith under procedures adopted by the Board of Directors, although the actual calculations may be done by others. Factors considered in making this determination may include, but are not limited to, information obtained by contacting the issuer, analysts, or the appropriate stock exchange (for exchange-traded securities), analysis of the issuer’s financial statements or other available documents and, if necessary, available information concerning other securities in similar circumstances.
Most foreign markets close before the New York Stock Exchange (NYSE). Occasionally, developments that could affect the closing prices of securities and other assets may occur between the times at which valuations of such securities are determined (that is, close of the foreign market on which the securities trade) and the close of business on the NYSE. If these developments are expected to materially affect the value of the securities, the valuations may be adjusted to reflect the estimated fair value as of the close of the NYSE, as determined in good faith under procedures established by the Board of Directors.
2. Repurchase Agreements: The Fund may enter into repurchase agreements under which the Fund lends excess cash and takes possession of securities with an agreement that the counterparty will repurchase such securities. In connection with transactions in repurchase agreements, a bank as custodian for the Fund takes possession of the underlying securities (collateral), with a market value at least equal to the amount of the repurchase transaction, including principal and accrued interest. To the extent that any repurchase transaction exceeds one business day, the value of the collateral is marked-to-market on a daily basis to determine the adequacy of the collateral. In the event of default on the obligation to repurchase, the Fund has the right to liquidate the collateral and apply the proceeds in satisfaction of the obligation. In the event of default or bankruptcy by the counterparty to the agreement, realization and/or retention of the collateral or proceeds may be subject to legal proceedings.
The Fund, along with other affiliated investment companies, may utilize a joint trading account for the purpose of entering into one or more repurchase agreements.
3. Reverse Repurchase Agreements: The Fund may enter into reverse repurchase agreements with institutions that the Fund’s investment adviser has determined are creditworthy. Under a reverse repurchase agreement, the Fund sells securities and agrees to repurchase them at a mutually agreed upon date and price. Reverse repurchase agreements involve the risk that the market value of the securities purchased with the proceeds from the sale of securities received
15
| Morgan Stanley High Yield Fund, Inc. |
|
|
Notes to Financial Statements (cont’d) | June 30, 2005 (unaudited) |
by the Fund may decline below the price of the securities the Fund is obligated to repurchase. Reverse repurchase agreements also involve credit risk with the counterparty to the extent that the value of securities subject to repurchase exceed the Fund’s liability under the reverse repurchase agreement. Securities subject to repurchase under reverse repurchase agreements, if any, are designated as such in the Portfolio of Investments.
At June 30, 2005, the Fund had a reverse repurchase agreement outstanding with UBS Warburg as follows:
|
| Maturity in |
| |
Value of Securities Subject to Repurchase |
| $ | 20,702,000 |
|
Liability Under Reverse Repurchase Agreement |
| $ | 20,988,000 |
|
Weighted Average Days to Maturity |
| 19.58 |
| |
The weighted average weekly balance of reverse repurchase agreements outstanding during the six months ended June 30, 2005 was approximately $18,410,000 at a weighted average weekly interest rate of 3.24%.
4. Foreign Currency Translation: The books and records of the Fund are maintained in U.S. dollars. Foreign currency amounts are translated into U.S. dollars at the mean of the bid and asked prices of such currencies against U.S. dollars last quoted by a major bank as follows:
• investments, other assets and liabilities at the prevailing rates of exchange on the valuation date;
• investment transactions and investment income at the prevailing rates of exchange on the dates of such transactions.
Although the net assets of the Fund are presented at the foreign exchange rates and market values at the close of the period, the Fund does not isolate that portion of the results of operations arising as a result of changes in the foreign exchange rates from the fluctuations arising from changes in the market prices of the securities held at period end. Similarly, the Fund does not isolate the effect of changes in foreign exchange rates from the fluctuations arising from changes in the market prices of securities sold during the period. Accordingly, realized and unrealized foreign currency gains (losses) due to securities transactions are included in the reported net realized and unrealized gains (losses) on investment transactions and balances.
Net realized gains (losses) on foreign currency transactions represent net foreign exchange gains (losses) from sales and maturities of foreign currency exchange contracts, disposition of foreign currencies, currency gains or losses realized between the trade and settlement dates on securities transactions, and the difference between the amount of investment income and foreign withholding taxes recorded on the Fund’s books and the U.S. dollar equivalent amounts actually received or paid. Net unrealized currency gains (losses) from valuing foreign currency denominated assets and liabilities at period end exchange rates are reflected as a component of unrealized appreciation (depreciation) on investments and foreign currency translations in the Statement of Assets and Liabilities. The change in net unrealized currency gains (losses) on foreign currency translations for the period is reflected in the Statement of Operations.
Foreign security and currency transactions may involve certain considerations and risks not typically associated with those of U.S. dollar denominated transactions as a result of, among other factors, the possibility of lower levels of governmental supervision and regulation of foreign securities markets and the possibility of political or economic instability.
The Fund may use derivatives to achieve its investment objectives. The Fund may engage in transactions in futures contracts on foreign currencies, stock indices, as well as in options, swaps and structured notes. Consistent with the Fund’s investment objectives and policies, the Fund may use derivatives for non-hedging as well as hedging purposes.
Following is a description of derivative instruments that the Fund have utilized and their associated risks:
5. Foreign Currency Exchange Contracts: The Fund may enter into foreign currency exchange contracts generally to attempt to protect securities and related receivables and payables against changes in future foreign exchange rates and, in certain situations, to gain exposure to a foreign currency. A foreign currency exchange contract is an agreement between two parties to buy or sell currency at a set price on a future date. The market value of the contract will fluctuate with changes in currency exchange rates. The contract is marked-to-market daily and the change in market value is recorded by the Fund as unrealized gain or loss. The Fund records realized gains or losses when the contract is closed equal to the difference between the value of the contract at the time it was opened and the value at the time
16
| Morgan Stanley High Yield Fund, Inc. |
|
|
Notes to Financial Statements (cont’d) | June 30, 2005 (unaudited) |
it was closed. Risk may arise upon entering into these contracts from the potential inability of counterparties to meet the terms of their contracts and is generally limited to the amount of unrealized gain on the contracts, if any, at the date of default. Risks may also arise from unanticipated movements in the value of a foreign currency relative to the U.S. dollar.
6. Structured Securities: The Fund may invest in interests in entities organized and operated solely for the purpose of restructuring the investment characteristics of sovereign debt obligations. This type of restructuring involves the deposit with or purchase by an entity of specified instruments and the issuance by that entity of one or more classes of securities (“Structured Securities”) backed by, or representing interests in, the underlying instruments. Structured Securities generally will expose the Fund to credit risks of the underlying instruments as well as of the issuer of the Structured Security. Structured Securities are typically sold in private placement transactions with no active trading market. Investments in Structured Securities may be more volatile than their underlying instruments, however, any loss is limited to the amount of the original investment.
7. Futures: The Fund may purchase and sell futures contracts. Futures contracts provide for the sale by one party and purchase by another party of a specified amount of a specified security, index, instrument or basket of instruments. Futures contracts (secured by cash or government securities deposited with brokers or custodians as “initial margin”) are valued based upon their quoted daily settlement prices; changes in initial settlement value (represented by cash paid to or received from brokers as “variation margin”) are accounted for as unrealized appreciation (depreciation). When futures contracts are closed, the difference between the opening value at the date of purchase and the value at closing is recorded as realized gains or losses in the Statement of Operations.
The Fund may use futures contracts in order to manage exposure to the stock and bond markets, to hedge against unfavorable changes in the value of securities or to remain fully invested and to reduce transaction costs. Futures contracts involve market risk in excess of the amounts recognized in the Statement of Assets and Liabilities. Risks arise from the possible movements in security values underlying these instruments. The change in value of futures contracts primarily corresponds with the value of their underlying instruments, which may not correlate with the change in value of the hedged investments. In addition, there is the risk that the Fund may not be able to enter into a closing transaction because of an illiquid secondary market.
8. Over-the-Counter Trading: Securities and other derivative instruments that may be purchased or sold by the Fund may consist of instruments not traded on an exchange. The risk of nonperformance by the obligor on such an instrument may be greater, and the ease with which the Fund can dispose of or enter into closing transactions with respect to such an instrument may be less, than in the case of an exchange-traded instrument. In addition, significant disparities may exist between bid and asked prices for derivative instruments that are not traded on an exchange. Derivative instruments not traded on exchanges are also not subject to the same type of government regulation as exchange traded instruments, and many of the protections afforded to participants in a regulated environment may not be available in connection with such transactions.
9. Other: Security transactions are accounted for on the date the securities are purchased or sold. Realized gains and losses on the sale of investment securities are determined on the specific identified cost basis. Interest income is recognized on the accrual basis and discounts and premiums on investments purchased are accreted or amortized in accordance with the effective yield method over their respective lives, except where collection is in doubt. Distributions to stockholders are recorded on the ex-dividend date.
B. Investment Advisory Fees: Morgan Stanley Investment Management Inc. (the “Adviser” or “MS Investment Management”) provides investment advisory services to the Fund under the terms of an Investment Advisory and Management Agreement (the “Agreement”). Under the Agreement, the Adviser is paid a fee computed weekly and payable monthly at an annual rate of 0.70% of the Fund’s average weekly net assets.
C. Administration Fees: MS Investment Management also serves as Administrator to the Fund pursuant to an administration agreement for a monthly fee, computed weekly and payable monthly, which on an annual basis equals to 0.08% of the average weekly net assets of the Fund. As approved by the Board of Directors, MS Investment Management has agreed to limit the administration fee so that it will be no greater than the old administration fee of 0.02435% of the weekly net assets plus $24,000 per annum. This waiver is voluntary and may be terminated at any time. For the six months ended June 30, 2005, $10,000 of administration fees were waived pursuant to this arrangement. Under a sub-administration
17
| Morgan Stanley High Yield Fund, Inc. |
|
|
Notes to Financial Statements (cont’d) | June 30, 2005 (unaudited) |
agreement between the Administrator and J.P. Morgan Investor Services Co. (“JPMIS”), a corporate affiliate of JPMorgan Chase Bank, JPMIS provides certain administrative services to the Fund. For such services, the Administrator pays JPMIS a portion of the fee the Administrator receives from the Fund. An employee of JPMIS is an officer of the Fund. Administration costs (including out-of-pocket expenses) incurred in the ordinary course of providing services under the agreement, except pricing services and extraordinary expenses, will be covered under the administration fee.
D. Custodian Fees: JPMorgan Chase Bank and its affiliates serve as custodian for the Fund. The Custodian holds cash, securities, and other assets of the Fund as required by the 1940 Act. Custody fees are payable monthly based on assets held in custody, investment purchases and sales activity and account maintenance fees, plus reimbursement for certain out-of-pocket expenses.
The Fund has entered into an arrangement with its custodian whereby credits realized on uninvested cash balances were used to offset a portion of the Fund’s expenses. These custodian credits are shown as “Expense Offset” on the Statement of Operations.
E. Federal Income Taxes: It is the Fund’s intention to continue to qualify as a regulated investment company and distribute all of its taxable income. Accordingly, no provision for Federal income taxes is required in the financial statements.
The Fund may be subject to taxes imposed by countries in which it invests. Such taxes are generally based on income and/or capital gains earned or repatriated. Taxes are accrued and applied to net investment income, net realized gains and net unrealized appreciation as such income and/or gains are earned.
The tax character of distributions paid may differ from the character of distributions shown on the Statements of Changes in Net Assets due to short-term capital gains being treated as ordinary income for tax purposes. The tax character of distributions paid during 2004 and 2003 were as follows:
2004 Distributions |
| 2003 Distributions |
| ||||||||
Ordinary |
| Long-term |
| Ordinary |
| Long-term |
| ||||
$ | 7,837 |
| $ | — |
| $ | 6,671 |
| $ | — |
|
The amount and character of income and capital gain distributions to be paid by the Fund are determined in accordance with Federal income tax regulations, which may differ from U.S. generally accepted accounting principles. The book/tax differences are considered either temporary or permanent in nature.
Temporary differences are attributable to differing book and tax treatments for the timing of the recognition of gains and losses on certain investment transactions and the timing of the deductibility of certain expenses.
Permanent differences are generally due to differing treatments of gains and losses related to foreign currency transactions and paydown adjustments. Permanent book and tax basis differences may result in reclassifications among undistributed (distributions in excess of) net investment income (or accumulated net investment loss), accumulated net realized gain (loss) and paid-in capital.
At December 31, 2004, the Fund did not have distributable earnings on a tax basis.
At June 30, 2005, the Federal income tax cost basis of securities was $100,517,000 and, accordingly, net unrealized depreciation for Federal income tax purposes was $2,810,000 of which $4,976,000 related to appreciated securities and $7,786,000 related to depreciated securities.
At December 31, 2004, the Fund had a capital loss carryforward for U.S. Federal income tax purposes of approximately $72,451,000 available to offset future capital gains of which $1,337,000 will expire on December 31, 2007, $4,197,000 will expire on December 31, 2008, $4,214,000 to expire on December 31, 2009, $24,375,000 will expire on December 31, 2010, $38,087,000 will expire on December 31, 2011 and $241,000 will expire on December 31, 2012.
To the extent that capital loss carryforwards are used to offset any future capital gains realized during the carryforward period as provided by U.S. Federal income tax regulations, no capital gains tax liability will be incurred by the Fund for gains realized and not distributed. To the extent that capital gains are offset, such gains will not be distributed to the stockholders.
Net capital, currency and passive foreign investment company losses incurred after October 31, and within the taxable year are deemed to arise on the first day of the Fund’s next taxable year. For the year ended December 31, 2004, the Fund did not defer post-October capital, currency and passive foreign investment company losses to January 1, 2005, for U.S. Federal income tax purposes.
18
| Morgan Stanley High Yield Fund, Inc. |
|
|
Notes to Financial Statements (cont’d) | June 30, 2005 (unaudited) |
F. Contractual Obligations: The Fund enters into contracts that contain a variety of indemnifications. The Fund’s maximum exposure under these arrangements is unknown. However, the Fund has not had prior claims or losses pursuant to these contracts and expects the risk of loss to be remote.
G. Other: During the six months ended June 30, 2005, the Fund made purchases and sales totalling approximately $26,797,000 and $33,711,000, respectively, of investment securities other than long-term U.S. Government securities and short-term investments. There were no purchases or sales of long-term U.S. Government securities.
A substantial portion of the Fund’s total investments consist of high yield securities rated below investment grade. Investments in high yield securities are accompanied by a greater degree of credit risk and the risk tends to be more sensitive to economic conditions than higher-rated securities. These investments are often traded by one market maker who may also be utilized by the Fund to provide pricing information used to value such securities. The amounts which will be realized upon disposition of the securities may differ from the value reflected on the Statement of Assets and Liabilities and the differences could be material.
On June 20, 2005, the Officers of the Fund, pursuant to authority granted by the Board of Directors declared a distribution of $0.045 per share, derived from net investment income, payable on July 15, 2005, to stockholders of record on June 30, 2005.
Reporting to Stockholders
Each Morgan Stanley Fund provides a complete schedule of portfolio holdings in its semi-annual and annual reports within 60 days of the end of the Fund’s second and fourth fiscal quarters by filing the schedule electronically with the Securities and Exchange Commission (SEC). The semi-annual reports are filed on Form N-CSRS and the annual reports are filed on Form N-CSR. Morgan Stanley also delivers the semi-annual and annual reports to Fund shareholders and makes these reports available on its public website, www.morganstanley.com/im. Each Morgan Stanley Fund also files a complete schedule of portfolio holdings with the SEC for the Fund’s first and third fiscal quarters on Form N-Q. Morgan Stanley does not deliver the reports for the first and third fiscal quarters to shareholders, nor are the reports posted to the Morgan Stanley public website. You may, however, obtain the Form N-Q filings (as well as the Form N-CSR and N-CSRS filings) by accessing the SEC’s website, www.sec.gov. You may also review and copy them at the SEC’s Public Reference Room in Washington, DC. Information on the operation of the SEC’s Public Reference Room may be obtained by calling the SEC at 1(800) SEC-0330. You can also request copies of these materials, upon payment of a duplicating fee, by electronic request at the SEC’s email address (publicinfo@sec.gov) or by writing the Public Reference section of the SEC, Washington, DC 20549-0102.
Proxy Voting Policies and Procedures and Proxy Voting Record
A copy of (1) the Fund’s policies and procedures with respect to the voting of proxies relating to the Fund’s portfolio securities; and (2) how the Fund voted proxies relating to portfolio securities during the most recent twelve-month period ended June 30 is available without charge, upon request, by calling 1(800)548-7786 or by visiting our website at www.morganstanley.com/im. This information is also available on the SEC’s website at www.sec.gov.
19
| Morgan Stanley High Yield Fund, Inc. |
|
|
Dividend Reinvestment and Cash Purchase Plan |
|
Pursuant to the Dividend Reinvestment and Cash Purchase Plan (the “Plan”), each stockholder will be deemed to have elected, unless American Stock Transfer & Trust Company (the “Plan Agent”) is otherwise instructed by the stockholder in writing, to have all distributions automatically reinvested in Fund shares. Participants in the Plan have the option of making additional voluntary cash payments to the Plan Agent, annually, in any amount from $100 to $3,000, for investment in Fund shares.
Dividend and capital gain distributions will be reinvested on the reinvestment date in full and fractional shares. If the market price per share equals or exceeds net asset value per share on the reinvestment date, the Fund will issue shares to participants at net asset value or, if net asset value is less than 95% of the market price on the reinvestment date, shares will be issued at 95% of the market price. If net asset value exceeds the market price on the reinvestment date, participants will receive shares valued at market price. The Fund may purchase shares of its Common Stock in the open market in connection with dividend reinvestment requirements at the discretion of the Board of Directors. Should the Fund declare a dividend or capital gain distribution payable only in cash, the Plan Agent will purchase Fund shares for participants in the open market as agent for the participants.
The Plan Agent’s fees for the reinvestment of dividends and distributions will be paid by the Fund. However, each participant’s account will be charged a pro rata share of brokerage commissions incurred on any open market purchases effected on such participant’s behalf. A participant will also pay brokerage commissions incurred on purchases made by voluntary cash payments. Although stockholders in the Plan may receive no cash distributions, participation in the Plan will not relieve participants of any income tax which may be payable on such dividends or distributions.
In the case of stockholders, such as banks, brokers or nominees, that hold shares for others who are the beneficial owners, the Plan Agent will administer the Plan on the basis of the number of shares certified from time to time by the stockholder as representing the total amount registered in the stockholder’s name and held for the account of beneficial owners who are participating in the Plan.
Stockholders who do not wish to have distributions automatically reinvested should notify the Plan Agent in writing. There is no penalty for non-participation or withdrawal from the Plan, and stockholders who have previously withdrawn from the Plan may rejoin at any time. Requests for additional information or any correspondence concerning the Plan should be directed to the Plan Agent at:
Morgan Stanley High Yield Fund, Inc.
American Stock Transfer & Trust Company
Dividend Reinvestment and Cash Purchase Plan
59 Maiden Lane
New York, New York 10030
1 (800) 278-4353
20
Item 2. Code of Ethics.
Not applicable for semi-annual reports.
Item 3. Audit Committee Financial Expert.
Not applicable for semi-annual reports.
Item 4. Principal Accountant Fees and Services.
Not applicable for semi-annual reports.
Item 5. Audit Committee of Listed Registrants.
Not applicable for semi-annual reports.
Item 6. Schedule of Investments
Refer to Item 1.
Item 7. Disclosure of Proxy Voting Policies and Procedures for Closed-End Management Investment Companies.
Not applicable
Item 8. Portfolio Managers of Closed-End Management Investment Companies
Not applicable
Required disclosure beginning with fiscal year end 12/31/05.
Item 9. Closed-End Fund Repurchases
Not applicable.
Item 10. Submission of Matters to a Vote of Security Holders
Not applicable.
Item 11. Controls and Procedures
(a) The Fund’s principal executive officer and principal financial officer have concluded that the Fund’s disclosure controls and procedures are sufficient to ensure that information required to be disclosed by the Fund in this Form N-CSR was recorded, processed, summarized and reported within the time periods specified in the Securities and Exchange Commission’s rules and forms, based upon such officers’ evaluation of these controls and procedures as of a date within 90 days of the filing date of the report.
(b) There were no changes in the registrant’s internal control over financial reporting that occurred during the registrant’s most recent fiscal half-year (the registrant’s second fiscal half-year in the case of an annual report) that has materially affected, or is reasonably likely to materially affect, the registrant’s internal control over financial reporting.
Item 12. Exhibits
(a) The Code of Ethics — Not applicable for semi-annual reports.
(b) A separate certification for each principal executive officer and principal financial officer of the registrant are attached hereto as part of EX-99.CERT.
SIGNATURES
Pursuant to the requirements of the Securities Exchange Act of 1934 and the Investment Company Act of 1940, the registrant has duly caused this report to be signed on its behalf by the undersigned, thereunto duly authorized.
(Registrant) | Morgan Stanley High Yield Fund, Inc. |
|
By: | /s/ Ronald E. Robison |
| |
Name: | Ronald E. Robison | ||
Title: | Principal Executive Officer | ||
Date: | August 23, 2005 | ||
|
| ||
|
| ||
Pursuant to the requirements of the Securities Exchange Act of 1934 and the Investment Company Act of 1940, this report has been signed by the following persons on behalf of the registrant and in the capacities and on the dates indicated. | |||
|
| ||
By: | /s/ Ronald E. Robison |
| |
Name: | Ronald E. Robison | ||
Title: | Principal Executive Officer | ||
Date: | August 23, 2005 | ||
|
| ||
|
| ||
By: | /s/ James W. Garrett |
| |
Name: | James W. Garrett | ||
Title: | Principal Financial Officer | ||
Date: | August 23, 2005 | ||