UNITED STATES
SECURITIES AND EXCHANGE COMMISSION
Washington, D.C. 20549
FORM N-CSR
CERTIFIED SHAREHOLDER REPORT OF REGISTERED
MANAGEMENT INVESTMENT COMPANIES
Investment Company Act file number | 811-08044 | ||||||||
| |||||||||
Morgan Stanley High Yield Fund, Inc. | |||||||||
(Exact name of registrant as specified in charter) | |||||||||
| |||||||||
522 Fifth Avenue New York, NY |
| 10036 | |||||||
(Address of principal executive offices) |
| (Zip code) | |||||||
| |||||||||
Ronald E. Robison | |||||||||
(Name and address of agent for service) | |||||||||
| |||||||||
Registrant’s telephone number, including area code: | 1-800-231-2608 |
| |||||||
| |||||||||
Date of fiscal year end: | 12/31 |
| |||||||
| |||||||||
Date of reporting period: | 6/30/07 |
| |||||||
Form N-CSR is to be used by management investment companies to file reports with the Commission not later than 10 days after the transmission to stockholders of any report that is required to be transmitted to stockholders under Rule 30e-1 under the Investment Company Act of 1940 (17 CFR 270.30e-1). The Commission may use the information provided on Form N-CSR in its regulatory, disclosure review, inspection, and policymaking roles.
A registrant is required to disclose the information specified by Form N-CSR, and the Commission will make this information public. A registrant is not required to respond to the collection of information contained in Form N-CSR unless the Form displays a currently valid Office of Management and Budget (“OMB”) control number. Please direct comments concerning the accuracy of the information collection burden estimate and any suggestions for reducing the burden to Secretary, Securities and Exchange Commission, 450 Fifth Street, NW, Washington, DC 20549-0609. The OMB has reviewed this collection of information under the clearance requirements of 44 U.S.C. Section 3507.
ITEM 1. REPORTS TO STOCKHOLDERS.
The Fund’s semi-annual report transmitted to shareholders pursuant to Rule 30e-1 under the Investment Company Act of 1940 is as follows:
| 2007 Semi-Annual Report |
|
|
| June 30, 2007 |
|
|
|
|
|
|
|
|
Morgan Stanley |
|
High Yield Fund, Inc. |
|
|
|
|
|
Morgan Stanley |
|
| Morgan Stanley High Yield Fund, Inc. |
|
|
| Overview (unaudited) |
Letter to Stockholders
Performance
For the six months ended June 30, 2007, the Morgan Stanley High Yield Fund, Inc. (the “Fund”) had total returns, based on net asset value and market value per share of 2.51%, net of fees, and 2.93%, respectively, compared to 2.96% for the Lehman Brothers U.S. Corporate High Yield - 2% Issuer Cap Index (the “Index”). On June 30, 2007, the closing price of the Fund’s shares on the New York Stock Exchange was $5.94, representing a 10.9% discount to the Fund’s net asset value per share. Past performance is no guarantee of future results.
Factors Affecting Performance
• Moderate economic growth, accommodating Treasury yields, low defaults and reasonably good earnings combined to push high-yield debt prices higher during the first quarter of 2007. In the second quarter, however, the high-yield market faced a host of headwinds, including higher volatility, rising interest rates, ongoing problems in the sub-prime mortgage market and heavy new issue supply. These factors contributed to a decline in high-yield prices in June and only a slightly positive return for the sector for the overall quarter. Nonetheless, high-yield securities still outperformed Treasuries for the quarter, but underperformed equities.
• Spreads ended the period 16 basis points wider than at the beginning of the year, but still much tighter than they have historically been. These tight spreads generally reflect many factors that remain positive for the high-yield market, including very low default rates, moderate economic growth, global demand for high-yield and solid corporate earnings.
• The Federal Open Market Committee left the target federal funds rate unchanged at 5.25% throughout the reporting period, but stated that inflation risks still remain a concern.
• The high-yield market benefited from ongoing strong demand as investors continued to reach for yield. As such, CCC rated securities outperformed higher quality issues for the overall period. Industry returns varied considerably, but for the overall period, transportation services, wireless communications and cable turned in the best performance while finance companies, home construction and utilities were the worst performers.
• Although high-yield spreads widened in the latter months of the reporting period, they still remained tight by historical standards. As such, we continue to believe there is a strong likelihood that spreads will widen out further, which led us to maintain the Fund’s higher credit rating profile. Although this defensive positioning was beneficial late in the period when spreads widened, it detracted from performance for the overall period as lower quality bonds generally outperformed.
• Strong security selection in various sectors, including energy and utilities, added to relative returns, as did an underweight to the buildings products/home builders sector early in the period. Conversely, security selection in auto/vehicle parts and telecommunication services detracted from performance.
Management Strategies
• Given our view that spreads were likely to widen and interest rates would rise, we maintained the Fund’s defensive positioning in terms of both its credit quality profile and its duration (a measure of interest rate sensitivity).
• We continued to seek to maintain a balanced and well diversified portfolio while allowing for strategic overweights in securities and sectors that we believed possessed the most attractive risk profiles.
• In terms of issuer size, we generally focus on larger companies because of their financial flexibility, their ability to withstand less favorable financial conditions, and their superior access to capital markets.
2
| Morgan Stanley High Yield Fund, Inc. |
|
|
| Overview (unaudited) |
Letter to Stockholders (cont’d)
Management Strategies (cont’d)
• As of the end of the reporting period, the Fund’s major sector overweights were in the energy, health care, and food and tobacco sectors. The largest sector underweights were in technology, cable, telecommunications and media.
Sincerely,

Ronald E. Robison |
|
|
President and Principal Executive Officer |
| July 2007 |
3
| Morgan Stanley High Yield Fund, Inc. |
|
|
| June 30, 2007 (unaudited) |
Investment Advisory
Agreement Approval
Nature, Extent and Quality of Services
The Board reviewed and considered the nature and extent of the investment advisory services provided by the Investment Adviser under the Advisory Agreement, including portfolio management, investment research and equity and fixed income securities trading. The Board also reviewed and considered the nature and extent of the non-advisory, administrative services provided by the Fund’s Administrator under the Administration Agreement, including accounting, clerical, bookkeeping, compliance, business management and planning, and the provision of supplies, office space and utilities at the Investment Adviser’s expense. (The Investment Adviser and the Administrator together are referred to as the “Adviser” and the Advisory and Administration Agreements together are referred to as the “Management Agreement.”) The Board also compared the nature of the services provided by the Adviser with similar services provided by non-affiliated advisers as reported to the Board by Lipper Inc. (“Lipper”).
The Board reviewed and considered the qualifications of the portfolio managers, the senior administrative managers and other key personnel of the Adviser who provide the advisory and administrative services to the Fund. The Board determined that the Adviser’s portfolio managers and key personnel are well qualified by education and/or training and experience to perform the services in an efficient and professional manner. The Board concluded that the nature and extent of the advisory and administrative services provided were necessary and appropriate for the conduct of the business and investment activities of the Fund. The Board also concluded that the overall quality of the advisory and administrative services was satisfactory.
Performance Relative to Comparable Funds Managed by Other Advisers
On a regular basis, the Board reviews the performance of all funds in the Morgan Stanley Fund Complex, including the Fund, compared to their peers, paying specific attention to the underperforming funds. In addition, the Board specifically reviewed the Fund’s performance for the one-, three- and five-year periods ended November 30, 2006, as shown in a report provided by Lipper (the “Lipper Report”), compared to the performance of comparable funds selected by Lipper (the “performance peer group”). The Board also discussed with the Adviser the performance goals and the actual results achieved in managing the Fund. When a fund underperforms its performance peer group, the Board discusses with the Adviser the causes of the underperformance and, where necessary, specific changes to the fund’s investment strategy or investment personnel. The Board concluded that the Fund can reasonably be expected to be competitive with that of its performance peer group based on recent action taken or proposed to be taken by the Adviser with respect to the Fund’s investment strategy and/or investment personnel.
Fees Relative to Other Proprietary Funds Managed by the Adviser with Comparable Investment Strategies
The Board noted that the Adviser did not manage any other proprietary funds with investment strategies substantially comparable to those of the Fund.
Fees and Expenses Relative to Comparable Funds Managed by Other Advisers
The Board reviewed the advisory and administrative fee (together, the “management fee”) rate and total expense ratio of the Fund as compared to the average management fee rate and average total expense ratio for funds, selected by Lipper (the “expense peer group”), managed by other advisers with investment strategies comparable to those of the Fund, as shown in the Lipper Report. The Board concluded that the Fund’s management fee rate and total expense ratio were competitive with those of its expense peer group.
Breakpoints and Economies of Scale
The Board reviewed the structure of the Fund’s management fee schedule under the Management Agreement and noted that it does not include any breakpoints. The Board considered that the Fund is a closed-end fund and, therefore, that the Fund’s assets are not likely to grow with new sales or grow significantly as a result of capital appreciation. The Board concluded that economies of scale for the Fund were not a factor that needed to be considered at the present time.
Profitability of the Adviser and Affiliates
The Board considered information concerning the costs incurred and profits realized by the Adviser and affiliates during the last year from their relationship with the Fund and during the last two years from their relationship with the Morgan Stanley Fund Complex and reviewed with the Adviser the cost allocation methodology used to determine the profitability of the Adviser and affiliates. Based on its review of the information it received, the Board concluded that the profits earned by the Adviser and affiliates were not excessive in light of the advisory, administrative and other services provided to the Fund.
4
| Morgan Stanley High Yield Fund, Inc. |
|
|
| June 30, 2007 (unaudited) |
Investment Advisory
Agreement Approval (cont’d)
Fall-Out Benefits
The Board considered so-called “fall-out benefits” derived by the Adviser and affiliates from their relationship with the Fund and the Morgan Stanley Fund Complex, such as commissions on the purchase and sale of Fund shares and “float” benefits derived from handling of checks for purchases and sales of Fund shares, through a broker-dealer affiliate of the Adviser. The Board concluded that the commissions were competitive with those of other broker-dealers and the float benefits were relatively small.
Soft Dollar Benefits
The Board considered whether the Adviser realizes any benefits from commissions paid to brokers who execute securities transactions for the Fund (“soft dollars”). The Board noted that the Fund invests only in fixed income securities, which do not generate soft dollars.
Adviser Financially Sound and Financially Capable of Meeting the Fund’s Needs
The Board considered whether the Adviser is financially sound and has the resources necessary to perform its obligations under the Management Agreement. The Board concluded that the Adviser has the financial resources necessary to fulfill its obligations under the Management Agreement.
Historical Relationship Between the Fund and the Adviser
The Board also reviewed and considered the historical relationship between the Fund and the Adviser, including the organizational structure of the Adviser, the policies and procedures formulated and adopted by the Adviser for managing the Fund’s operations and the Board’s confidence in the competence and integrity of the senior managers and key personnel of the Adviser. The Board concluded that it is beneficial for the Fund to continue its relationship with the Adviser.
Other Factors and Current Trends
The Board considered the controls and procedures adopted and implemented by the Adviser and monitored by the Fund’s Chief Compliance Officer and concluded that the conduct of business by the Adviser indicates a good faith effort on its part to adhere to high ethical standards in the conduct of the Fund’s business.
General Conclusion
On April 25, 2007, after considering and weighing all of the above factors, the Board concluded that it would be in the best interest of the Fund and its stockholders to approve renewal of the Management Agreement for another year until April 30, 2008. On June 20, 2007, the Board again considered and weighed all of the above factors and concluded that it would be in the best interest of the Fund and its stockholders to approve renewal of the Management Agreement to continue until June 30, 2008.
5
| Morgan Stanley High Yield Fund, Inc. |
|
|
| June 30, 2007 (unaudited) |
Portfolio of Investments
(Showing Percentage of Total Value of Investments)
|
| Face |
|
|
| |||
|
| Amount |
| Value |
| |||
|
| (000) |
| (000) |
| |||
CORPORATE BONDS AND NOTES (90.8%) |
|
|
|
|
| |||
Aerospace (1.4%) |
|
|
|
|
| |||
Hexcel Corp., |
|
|
|
|
| |||
6.75%, 2/1/15 |
| $ | 680 |
| $ | 663 |
| |
K&F Acquisition, Inc., |
|
|
|
|
| |||
7.75%, 11/15/14 |
| (b)570 |
| 607 |
| |||
|
|
|
| 1,270 |
| |||
Broadcasting (1.2%) |
|
|
|
|
| |||
LIN Television Corp., |
|
|
|
|
| |||
6.50%, 5/15/13 |
| 470 |
| 462 |
| |||
6.50%, 5/15/13 |
| 230 |
| 226 |
| |||
Univision Communications, Inc., PIK, |
|
|
|
|
| |||
9.75%, 3/15/15 |
| (a)400 |
| 397 |
| |||
|
|
|
| 1,085 |
| |||
Cable (4.3%) |
|
|
|
|
| |||
Cablevision Systems Corp., |
|
|
|
|
| |||
9.82%, 4/1/09 |
| (d)775 |
| 814 |
| |||
CCH I LLC, |
|
|
|
|
| |||
11.00%, 10/1/15 |
| 246 |
| 258 |
| |||
Echostar DBS Corp., |
|
|
|
|
| |||
5.75%, 10/1/08 |
| 300 |
| 300 |
| |||
6.38%, 10/1/11 |
| 75 |
| 74 |
| |||
6.63%, 10/1/14 |
| (b)775 |
| 742 |
| |||
Intelsat Subsidiary Holdings Co., Ltd., |
|
|
|
|
| |||
8.25%, 1/15/13 |
| 55 |
| 56 |
| |||
8.63%, 1/15/15 |
| 545 |
| 561 |
| |||
8.87%, 1/15/15 |
| (d)130 |
| 133 |
| |||
NTL Cable plc, |
|
|
|
|
| |||
8.75%, 4/15/14 |
| 90 |
| 93 |
| |||
9.13%, 8/15/16 |
| 100 |
| 105 |
| |||
PanAmSat Corp., |
|
|
|
|
| |||
9.00%, 8/15/14 |
| 621 |
| 651 |
| |||
|
|
|
| 3,787 |
| |||
Chemicals (6.1%) |
|
|
|
|
| |||
Berry Plastics Holding Corp., |
|
|
|
|
| |||
8.88%, 9/15/14 |
| 860 |
| 875 |
| |||
Equistar Chemicals LP/Equistar Funding Corp., |
|
|
|
|
| |||
10.13%, 9/1/08 |
| (b)601 |
| 628 |
| |||
10.63%, 5/1/11 |
| 83 |
| 88 |
| |||
Innophos Holdings, Inc., |
|
|
|
|
| |||
9.50%, 4/15/12 |
| (a)260 |
| 265 |
| |||
Innophos, Inc., |
|
|
|
|
| |||
8.88%, 8/15/14 |
| 150 |
| 156 |
| |||
Koppers, Inc., |
|
|
|
|
| |||
9.88%, 10/15/13 |
| $ | 250 |
| $ | 268 |
| |
Koppers Holdings, Inc., |
|
|
|
|
| |||
Zero Coupon, 11/15/14 |
| (c)355 |
| 305 |
| |||
Nalco Co., |
|
|
|
|
| |||
7.75%, 11/15/11 |
| 345 |
| 349 |
| |||
8.88%, 11/15/13 |
| 550 |
| 573 |
| |||
RBS Global, Inc. and Rexnord Corp., |
|
|
|
|
| |||
9.50%, 8/1/14 |
| 715 |
| 737 |
| |||
Rockwood Specialties Group, Inc., |
|
|
|
|
| |||
7.63%, 11/15/14 |
| EUR | 150 |
| 213 |
| ||
Terra Capital, Inc., |
|
|
|
|
| |||
7.00%, 2/1/17 |
| $ | 455 |
| 441 |
| ||
Westlake Chemical Corp., |
|
|
|
|
| |||
6.63%, 1/15/16 |
| 455 |
| 434 |
| |||
|
|
|
| 5,332 |
| |||
Consumer Products (1.0%) |
|
|
|
|
| |||
Jarden Corp., |
|
|
|
|
| |||
7.50%, 5/1/17 |
| 555 |
| 551 |
| |||
Oxford Industries, Inc., |
|
|
|
|
| |||
8.88%, 6/1/11 |
| 345 |
| 358 |
| |||
|
|
|
| 909 |
| |||
Diversified Media (3.6%) |
|
|
|
|
| |||
CanWest Media, Inc., |
|
|
|
|
| |||
8.00%, 9/15/12 |
| 864 |
| 862 |
| |||
Dex Media East, LLC/Dex Media East Finance Co., |
|
|
|
|
| |||
12.13%, 11/15/12 |
| 270 |
| 291 |
| |||
Dex Media West, LLC/Dex Media West Finance Co., |
|
|
|
|
| |||
9.88%, 8/15/13 |
| 415 |
| 446 |
| |||
Idearc, Inc., |
|
|
|
|
| |||
8.00%, 11/15/16 |
| 670 |
| 680 |
| |||
Interpublic Group of Cos., Inc., |
|
|
|
|
| |||
6.25%, 11/15/14 |
| 315 |
| 291 |
| |||
Valassis Communications, Inc., |
|
|
|
|
| |||
8.25%, 3/1/15 |
| (a)600 |
| 588 |
| |||
|
|
|
| 3,158 |
| |||
Energy (10.6%) |
|
|
|
|
| |||
Chaparral Energy, Inc., |
|
|
|
|
| |||
8.50%, 12/1/15 |
| 755 |
| 742 |
| |||
8.88%, 2/1/17 |
| (a)100 |
| 99 |
| |||
CHC Helicopter Corp., |
|
|
|
|
| |||
7.38%, 5/1/14 |
| 960 |
| 919 |
| |||
Chesapeake Energy Corp., |
|
|
|
|
| |||
7.50%, 9/15/13 |
| (b)755 |
| 772 |
| |||
7.63%, 7/15/13 |
| 135 |
| 139 |
| |||
The accompanying notes are an integral part of the financial statements.
6
| Morgan Stanley High Yield Fund, Inc. |
|
|
| June 30, 2007 (unaudited) |
Portfolio of Investments (cont’d)
(Showing Percentage of Total Value of Investments)
|
| Face |
|
|
| |||
|
| Amount |
| Value |
| |||
|
| (000) |
| (000) |
| |||
Energy (cont’d) |
|
|
|
|
| |||
Cimarex Energy Co., |
|
|
|
|
| |||
7.13%, 5/1/17 |
| $ | 140 |
| $ | 137 |
| |
Cie Generale de Geophysique-Veritas, |
|
|
|
|
| |||
7.50%, 5/15/15 |
| 320 |
| 322 |
| |||
Hanover Compressor Co., |
|
|
|
|
| |||
8.63%, 12/15/10 |
| 120 |
| 124 |
| |||
9.00%, 6/1/14 |
| (b)450 |
| 478 |
| |||
Hanover Equipment Trust, |
|
|
|
|
| |||
8.75%, 9/1/11 |
| 300 |
| 310 |
| |||
Hilcorp Energy I, LP/Hilcorp Finance Co., |
|
|
|
|
| |||
7.75%, 11/1/15 |
| (a)1,005 |
| 980 |
| |||
Husky Oil Co., |
|
|
|
|
| |||
8.90%, 8/15/28 |
| (b)(d)855 |
| 886 |
| |||
Kinder Morgan, Inc., |
|
|
|
|
| |||
6.50%, 9/1/12 |
| 680 |
| 681 |
| |||
Massey Energy Co., |
|
|
|
|
| |||
6.88%, 12/15/13 |
| 880 |
| 811 |
| |||
OPTI Canada, Inc., |
|
|
|
|
| |||
8.25%, 12/15/14 |
| (a)380 |
| 388 |
| |||
Pacific Energy Partners, LP/Pacific Energy Finance Corp., |
|
|
|
|
| |||
7.13%, 6/15/14 |
| 450 |
| 466 |
| |||
Pogo Producing Co., |
|
|
|
|
| |||
6.88%, 10/1/17 |
| (b)660 |
| 658 |
| |||
Sandridge Energy, |
|
|
|
|
| |||
8.63%, 4/1/15 |
| 415 |
| 425 |
| |||
|
|
|
| 9,337 |
| |||
Financials (1.2%) |
|
|
|
|
| |||
Capmark Financial Group, Inc., |
|
|
|
|
| |||
5.88%, 5/10/12 |
| (a)125 |
| 124 |
| |||
6.30%, 5/10/17 |
| (a)55 |
| 54 |
| |||
Residential Capital Corp., |
|
|
|
|
| |||
6.38%, 6/30/10 |
| 485 |
| 479 |
| |||
6.50%, 4/17/13 |
| 405 |
| 392 |
| |||
|
|
|
| 1,049 |
| |||
Food & Drug (1.8%) |
|
|
|
|
| |||
CA FM Lease Trust, |
|
|
|
|
| |||
8.50%, 7/15/17 |
| (a)502 |
| 533 |
| |||
Delhaize America, Inc., |
|
|
|
|
| |||
9.00%, 4/15/31 |
| 305 |
| 370 |
| |||
Rite Aid Corp., |
|
|
|
|
| |||
8.13%, 5/1/10 |
| 345 |
| 351 |
| |||
SUPERVALU, Inc., |
|
|
|
|
| |||
7.50%, 5/15/12 |
| 340 |
| 356 |
| |||
|
|
|
| 1,610 |
| |||
Food & Tobacco (4.0%) |
|
|
|
|
| |||
Constellations Brands, Inc., |
|
|
|
|
| |||
7.25%, 5/15/17 |
| $ | (a)100 |
| $ | 98 |
| |
Michael Foods, Inc., |
|
|
|
|
| |||
8.00%, 11/15/13 |
| 405 |
| 411 |
| |||
Pilgrim’s Pride Corp., |
|
|
|
|
| |||
7.63%, 5/1/15 |
| 245 |
| 246 |
| |||
9.63%, 9/15/11 |
| 1,415 |
| 1,472 |
| |||
Reynolds American, Inc., |
|
|
|
|
| |||
6.50%, 7/15/10 |
| 440 |
| 449 |
| |||
Smithfield Foods, Inc., |
|
|
|
|
| |||
7.00%, 8/1/11 |
| 615 |
| 615 |
| |||
7.63%, 2/15/08 |
| 265 |
| 267 |
| |||
|
|
|
| 3,558 |
| |||
Forest Products (5.8%) |
|
|
|
|
| |||
Berry Plastics Holding Corp., |
|
|
|
|
| |||
10.25%, 3/1/16 |
| 405 |
| 407 |
| |||
Crown Americas LLC and Crown Americas Capital Corp., |
|
|
|
|
| |||
7.63%, 11/15/13 |
| 335 |
| 340 |
| |||
Crown European Holdings S.A., |
|
|
|
|
| |||
6.25%, 9/1/11 |
| EUR | 245 |
| 340 |
| ||
Georgia-Pacific Corp., |
|
|
|
|
| |||
7.13%, 1/15/17 |
| $ | (a)520 |
| 502 |
| ||
Graham Packaging Co., Inc., |
|
|
|
|
| |||
9.88%, 10/15/14 |
| 830 |
| 843 |
| |||
Graphic Packaging International Corp., |
|
|
|
|
| |||
9.50%, 8/15/13 |
| (b)670 |
| 699 |
| |||
Owens-Brockway Glass Container, Inc., |
|
|
|
|
| |||
8.25%, 5/15/13 |
| (b)1,175 |
| 1,222 |
| |||
Owens-Illinois, Inc., |
|
|
|
|
| |||
7.35%, 5/15/08 |
| 360 |
| 363 |
| |||
P.H. Glatfelter Co., |
|
|
|
|
| |||
7.13%, 5/1/16 |
| 145 |
| 147 |
| |||
Smurfit Kappa Funding plc, |
|
|
|
|
| |||
10.13%, 10/1/12 |
| EUR | 196 |
| 282 |
| ||
|
|
|
| 5,145 |
| |||
Gaming & Leisure (5.7%) |
|
|
|
|
| |||
Caesar’s Entertainment, Inc., |
|
|
|
|
| |||
8.88%, 9/15/08 |
| $ | 250 |
| 258 |
| ||
Host Marriott, LP REIT, |
|
|
|
|
| |||
6.38%, 3/15/15 |
| 250 |
| 241 |
| |||
7.13%, 11/1/13 |
| 450 |
| 452 |
| |||
Isle of Capri Casinos, Inc., |
|
|
|
|
| |||
7.00%, 3/1/14 |
| 985 |
| 937 |
| |||
The accompanying notes are an integral part of the financial statements.
7
| Morgan Stanley High Yield Fund, Inc. |
|
|
| June 30, 2007 (unaudited) |
Portfolio of Investments (cont’d)
(Showing Percentage of Total Value of Investments)
|
| Face |
|
|
| |||
|
| Amount |
| Value |
| |||
|
| (000) |
| (000) |
| |||
Gaming & Leisure (cont’d) |
|
|
|
|
| |||
Las Vegas Sands Corp., |
|
|
|
|
| |||
6.38%, 2/15/15 |
| $ | 520 |
| $ | 497 |
| |
MGM Mirage, |
|
|
|
|
| |||
6.00%, 10/1/09 |
| 1,565 |
| 1,559 |
| |||
Station Casinos, Inc., |
|
|
|
|
| |||
6.00%, 4/1/12 |
| 885 |
| 836 |
| |||
7.75%, 8/15/16 |
| 225 |
| 224 |
| |||
|
|
|
| 5,004 |
| |||
Health Care (10.5%) |
|
|
|
|
| |||
Community Health Systems, Inc., |
|
|
|
|
| |||
6.50%, 12/15/12 |
| 905 |
| 945 |
| |||
8.88%, 7/15/15 |
| (a)250 |
| 253 |
| |||
DaVita, Inc., |
|
|
|
|
| |||
6.63%, 3/15/13 |
| (b)1,115 |
| 1,094 |
| |||
Fisher Scientific International, Inc., |
|
|
|
|
| |||
6.13%, 7/1/15 |
| 895 |
| 880 |
| |||
FMC Finance III S.A., |
|
|
|
|
| |||
6.88%, 7/15/17 |
| (a)610 |
| 599 |
| |||
Fresenius Medical Care Capital Trust II, |
|
|
|
|
| |||
7.88%, 2/1/08 |
| 935 |
| 942 |
| |||
Fresenius Medical Care Capital Trust IV, |
|
|
|
|
| |||
7.88%, 6/15/11 |
| 440 |
| 458 |
| |||
HCA, Inc., |
|
|
|
|
| |||
5.75%, 3/15/14 |
| 200 |
| 170 |
| |||
6.25%, 2/15/13 |
| 390 |
| 353 |
| |||
8.70%, 2/10/10 |
| 265 |
| 278 |
| |||
8.75%, 9/1/10 |
| 685 |
| 717 |
| |||
Invacare Corp., |
|
|
|
|
| |||
9.75%, 2/15/15 |
| (a)100 |
| 101 |
| |||
National Mentor Holdings, Inc., |
|
|
|
|
| |||
11.25%, 7/1/14 |
| 370 |
| 401 |
| |||
Omnicare, Inc., |
|
|
|
|
| |||
6.75%, 12/15/13 |
| 495 |
| 475 |
| |||
6.88%, 12/15/15 |
| 395 |
| 377 |
| |||
Sun Healthcare Group, Inc., |
|
|
|
|
| |||
9.13%, 4/15/15 |
| (a)330 |
| 345 |
| |||
Tenet Healthcare Corp., |
|
|
|
|
| |||
7.38%, 2/1/13 |
| 230 |
| 209 |
| |||
9.88%, 7/1/14 |
| 225 |
| 224 |
| |||
Warner Chilcott Corp., |
|
|
|
|
| |||
8.75%, 2/1/15 |
| 395 |
| 408 |
| |||
|
|
|
| 9,229 |
| |||
Housing (2.1%) |
|
|
|
|
| |||
Goodman Global Holdings, Inc., |
|
|
|
|
| |||
8.36%, 6/15/12 |
| (d)122 |
| 123 |
| |||
Interface, Inc., |
|
|
|
|
| |||
9.50%, 2/1/14 |
| $ | 535 |
| $ | 579 |
| |
10.38%, 2/1/10 |
| 165 |
| 178 |
| |||
Nortek, Inc., |
|
|
|
|
| |||
8.50%, 9/1/14 |
| 755 |
| 723 |
| |||
Realogy Corp., |
|
|
|
|
| |||
10.50%, 4/15/14 |
| (a)225 |
| 215 |
| |||
|
|
|
| 1,818 |
| |||
Information Technology (3.3%) |
|
|
|
|
| |||
Freescale Semiconductor, Inc., |
|
|
|
|
| |||
8.88%, 12/15/14 |
| (a)670 |
| 643 |
| |||
Iron Mountain, Inc., |
|
|
|
|
| |||
7.75%, 1/15/15 |
| 375 |
| 368 |
| |||
8.63%, 4/1/13 |
| (b)595 |
| 600 |
| |||
Nortel Networks Corp. (Convertible), |
|
|
|
|
| |||
4.25%, 9/1/08 |
| 550 |
| 545 |
| |||
PGS Solutions, Inc., |
|
|
|
|
| |||
9.63%, 2/15/15 |
| (a)330 |
| 335 |
| |||
SunGard Data Systems, Inc., |
|
|
|
|
| |||
9.13%, 8/15/13 |
| 445 |
| 458 |
| |||
|
|
|
| 2,949 |
| |||
Manufacturing (1.5%) |
|
|
|
|
| |||
Johnsondiversey, Inc., |
|
|
|
|
| |||
9.63%, 5/15/12 |
| 511 |
| 535 |
| |||
9.63%, 5/15/12 |
| EUR | 235 |
| 336 |
| ||
Propex Fabrics, Inc., |
|
|
|
|
| |||
10.00%, 12/1/12 |
| $ | 470 |
| 423 |
| ||
|
|
|
| 1,294 |
| |||
Metals (2.4%) |
|
|
|
|
| |||
Foundation PA Coal Co., |
|
|
|
|
| |||
7.25%, 8/1/14 |
| 170 |
| 169 |
| |||
Freeport-McMoran Copper & Gold, Inc., |
|
|
|
|
| |||
8.38%, 4/1/17 |
| 390 |
| 417 |
| |||
Novelis, Inc., |
|
|
|
|
| |||
7.25%, 2/15/15 |
| 1,045 |
| 1,078 |
| |||
UCAR Finance, Inc., |
|
|
|
|
| |||
10.25%, 2/15/12 |
| 400 |
| 421 |
| |||
|
|
|
| 2,085 |
| |||
Retail (1.3%) |
|
|
|
|
| |||
Brown Shoe Co., Inc., |
|
|
|
|
| |||
8.75%, 5/1/12 |
| 415 |
| 436 |
| |||
Phillips-Van Heusen, |
|
|
|
|
| |||
7.25%, 2/15/11 |
| 655 |
| 668 |
| |||
|
|
|
| 1,104 |
| |||
The accompanying notes are an integral part of the financial statements.
8
| Morgan Stanley High Yield Fund, Inc. |
|
|
| June 30, 2007 (unaudited) |
Portfolio of Investments (cont’d)
(Showing Percentage of Total Value of Investments)
|
| Face |
|
|
| ||||
|
| Amount |
| Value |
| ||||
|
| (000) |
| (000) |
| ||||
Service (2.2%) |
|
|
|
|
| ||||
Allied Waste North America, Inc., |
|
|
|
|
| ||||
5.75%, 2/15/11 |
| $ | (a)475 |
| $ | 454 |
| ||
6.38%, 4/15/11 |
| 1,100 |
| 1,075 |
| ||||
Aramark Corp., |
|
|
|
|
| ||||
8.50%, 2/1/15 |
| (a)135 |
| 138 |
| ||||
8.86%, 2/1/15 |
| (a)(d)35 |
| 36 |
| ||||
Aramark Services, Inc., |
|
|
|
|
| ||||
5.00%, 6/1/12 |
| 250 |
| 221 |
| ||||
|
|
|
| 1,924 |
| ||||
Telecommunications (3.3%) |
|
|
|
|
| ||||
Axtel S.A.B. de CV, |
|
|
|
|
| ||||
11.00%, 12/15/13 |
| 607 |
| 671 |
| ||||
Citizens Communications Co., |
|
|
|
|
| ||||
6.25%, 1/15/13 |
| 230 |
| 222 |
| ||||
Esprit Telecom Group plc, |
|
|
|
|
| ||||
11.50%, 12/15/07 |
| EUR | (e)(f)(h)665 |
| @— |
| |||
Exodus Communications, Inc., |
|
|
|
|
| ||||
11.63%, 7/15/10 |
| $ | (e)(f)(h)1,068 |
| @— |
| |||
Nordic Telephone Co. Holdings A.p.S., |
|
|
|
|
| ||||
8.88%, 5/1/16 |
| (a)175 |
| 186 |
| ||||
Qwest Communications International, Inc., |
|
|
|
|
| ||||
8.86%, 2/15/09 |
| (d)669 |
| 679 |
| ||||
Qwest Corp., |
|
|
|
|
| ||||
5.63%, 11/15/08 |
| 115 |
| 115 |
| ||||
Rhythms NetConnections, Inc., |
|
|
|
|
| ||||
13.88%, 5/15/08 |
| (e)(f((h)2,591 |
| @— |
| ||||
14.00%, 2/15/10 |
| (e)(f)(h)1,476 |
| @— |
| ||||
TDC A/S, |
|
|
|
|
| ||||
6.50%, 4/19/12 |
| EUR | 195 |
| 271 |
| |||
Wind Acquisition Finance S.A., |
|
|
|
|
| ||||
10.75%, 12/1/15 |
| $ | (a)495 |
| 570 |
| |||
Windstream Corp., |
|
|
|
|
| ||||
8.13%, 8/1/13 |
| 210 |
| 221 |
| ||||
|
|
|
| 2,935 |
| ||||
Transportation (8.7%) |
|
|
|
|
| ||||
ArvinMeritor, Inc., |
|
|
|
|
| ||||
8.75%, 3/1/12 |
| 655 |
| 665 |
| ||||
Asbury Automotive Group, Inc., |
|
|
|
|
| ||||
7.63%, 3/15/17 |
| (a)235 |
| 233 |
| ||||
Ford Motor Credit Co., |
|
|
|
|
| ||||
5.80%, 1/12/09 |
| 565 |
| 553 |
| ||||
7.00%, 10/1/13 |
| (b)855 |
| 793 |
| ||||
7.25%, 10/25/11 |
| 610 |
| 587 |
| ||||
General Motors Corp., |
|
|
|
|
| ||||
7.13%, 7/15/13 |
| $ | 245 |
| $ | 230 |
| ||
8.38%, 7/15/33 |
| 315 |
| 289 |
| ||||
GMAC LLC, |
|
|
|
|
| ||||
4.38%, 12/10/07 |
| 585 |
| 581 |
| ||||
6.88%, 9/15/11 |
| (b)1,310 |
| 1,290 |
| ||||
Petro Stopping Centers, LP/Petro Financial Corp., |
|
|
|
|
| ||||
9.00%, 2/15/12 |
| 710 |
| 751 |
| ||||
Sonic Automotive, Inc., |
|
|
|
|
| ||||
8.63%, 8/15/13 |
| (b)1,250 |
| 1,294 |
| ||||
United Auto Group, Inc., |
|
|
|
|
| ||||
7.75%, 12/15/16 |
| 425 |
| 425 |
| ||||
|
|
|
| 7,691 |
| ||||
Utilities (8.0%) |
|
|
|
|
| ||||
AES Corp. (The), |
|
|
|
|
| ||||
8.88%, 2/15/11 |
| 59 |
| 63 |
| ||||
9.00%, 5/15/15 |
| (a)(b)570 |
| 606 |
| ||||
9.38%, 9/15/10 |
| 88 |
| 94 |
| ||||
CMS Energy Corp., |
|
|
|
|
| ||||
7.50%, 1/15/09 |
| (b)1,060 |
| 1,092 |
| ||||
Colorado Interstate Gas Co., |
|
|
|
|
| ||||
6.80%, 11/15/15 |
| 990 |
| 1,023 |
| ||||
Dynegy Holdings, Inc., |
|
|
|
|
| ||||
7.75%, 6/1/19 |
| (a)475 |
| 444 |
| ||||
Ipalco Enterprises, Inc., |
|
|
|
|
| ||||
8.38%, 11/14/08 |
| 360 |
| 369 |
| ||||
8.63%, 11/14/11 |
| 165 |
| 177 |
| ||||
Nevada Power Co., |
|
|
|
|
| ||||
8.25%, 6/1/11 |
| 355 |
| 386 |
| ||||
NRG Energy, Inc., |
|
|
|
|
| ||||
7.38%, 1/15/17 |
| 470 |
| 473 |
| ||||
Ormat Funding Corp., |
|
|
|
|
| ||||
8.25%, 12/30/20 |
| 700 |
| 718 |
| ||||
PSEG Energy Holdings, LLC, |
|
|
|
|
| ||||
8.63%, 2/15/08 |
| (b)532 |
| 542 |
| ||||
Reliant Energy, Inc., |
|
|
|
|
| ||||
7.88%, 6/15/17 |
| 145 |
| 142 |
| ||||
Sierra Pacific Power Co., |
|
|
|
|
| ||||
6.25%, 4/15/12 |
| 180 |
| 182 |
| ||||
TXU Energy Co., LLC, |
|
|
|
|
| ||||
7.00%, 3/15/13 |
| 210 |
| 217 |
| ||||
Williams Cos., Inc., |
|
|
|
|
| ||||
7.88%, 9/1/21 |
| 455 |
| 491 |
| ||||
|
|
|
| 7,019 |
| ||||
The accompanying notes are an integral part of the financial statements.
9
| Morgan Stanley High Yield Fund, Inc. |
|
|
| June 30, 2007 (unaudited) |
Portfolio of Investments (cont’d)
(Showing Percentage of Total Value of Investments)
|
| Face |
|
|
| |||
|
| Amount |
| Value |
| |||
|
| (000) |
| (000) |
| |||
Wireless Communications (0.8%) |
|
|
|
|
| |||
American Tower Corp., |
|
|
|
|
| |||
7.50%, 5/1/12 |
| $ | 680 |
| $ | 702 |
| |
TOTAL CORPORATE BONDS AND NOTES |
|
|
| 79,994 |
| |||
GOVERNMENT BONDS (0.4%) |
|
|
|
|
| |||
Sovereign (0.4%) |
|
|
|
|
| |||
Mexican Bonos, |
| MXN | 3,510 |
| 358 |
| ||
|
|
|
|
|
| |||
|
| Shares |
|
|
| |||
COMMON STOCKS (0.0%) |
|
|
|
|
| |||
Diversified Media (0.0%) |
|
|
|
|
| |||
Cyprion Media Network |
| (g)41,221 |
| 4 |
| |||
Telecommunications (0.0%) |
|
|
|
|
| |||
Viatel Holding Bermuda Ltd. |
| (g)1,105 |
| @— |
| |||
XO Holdings, Inc. |
| (g)969 |
| 4 |
| |||
|
|
|
| 4 |
| |||
Utilities (0.0%) |
|
|
|
|
| |||
PNM Resources, Inc. |
| 178 |
| 5 |
| |||
SW Acquisition LP |
| (g)(h)2 |
| @— |
| |||
|
|
|
| 5 |
| |||
TOTAL COMMON STOCKS |
|
|
| 13 |
| |||
|
|
|
|
|
| |||
|
| No. of |
|
|
| |||
|
| Warrants |
|
|
| |||
WARRANTS (0.0%) |
|
|
|
|
| |||
Telecommunications (0.0%) |
|
|
|
|
| |||
XO Holdings, Inc., Series A, expiring 1/16/10 |
| (g)1,939 |
| 1 |
| |||
XO Holdings, Inc., Series B, expiring 1/16/10 |
| (g)1,455 |
| 1 |
| |||
XO Holdings, Inc., Series C, expiring 1/16/10 |
| (g)1,455 |
| @— |
| |||
|
|
|
| 2 |
| |||
Utilities (0.0%) |
|
|
|
|
| |||
SW Acquisition LP, expiring 4/1/11 |
| (a)(f)(g)(h)1,677 |
| @— |
| |||
TOTAL WARRANTS |
|
|
| 2 |
| |||
|
|
|
|
|
| |||
|
|
|
| Value |
| |||
|
| Shares |
| (000) |
| |||
SHORT-TERM INVESTMENTS (8.8%) |
|
|
|
|
| |||
Investment Company (8.6%) |
|
|
|
|
| |||
Morgan Stanley Institutional Liquidity Money Market Portfolio — Institutional Class |
| (i)7,566,984 |
| $ | 7,567 |
| ||
|
|
|
|
|
| |||
|
| Face |
|
|
| |||
|
| Amount |
| Value |
| |||
|
| (000) |
| (000) |
| |||
U.S. Treasury Security (0.2%) |
|
|
|
|
| |||
U.S. Treasury Bill 7/1/12 |
| $ | 200 |
| 200 |
| ||
TOTAL SHORT-TERM INVESTMENTS |
|
|
| 7,767 |
| |||
TOTAL INVESTMENTS (100.0%) |
|
|
| 88,134 |
| |||
LIABILITIES IN EXCESS OF OTHER ASSETS |
|
|
| (10,078 | ) | |||
NET ASSETS |
|
|
| $ | 78,056 |
| ||
144A Security — Certain conditions for public sale may exist. Unless otherwise noted, these securities are deemed to be liquid. | |
(b) | Denotes all or a portion of securities subject to repurchase under the Reverse Repurchase Agreements as of June 30, 2007. See note A-3 to financial statements. |
(c) | Step Bond — coupon rate increases in increments to maturity. Rate disclosed is as of June 30, 2007. Maturity date disclosed is ultimate maturity. |
(d) | Variable/Floating Rate Security — Interest rate changes on these instruments are based on changes in designated base rates. The rates shown are those in effect on June 30, 2007. |
(e) | Issuer is in default. |
(f) | Security was valued at fair value — At June 30, 2007, the Fund held fair-valued securities, each valued at less than $500, representing less than 0.05% of net assets. |
(g) | Non-income producing. |
(h) | Security has been deemed illiquid at June 30, 2007. |
(i) | See Note G to the financial statements regarding investment in Morgan Stanley Institutional Liquidity Money Market Portfolio — Institutional Class. |
@ | Value is less than $500. |
EUR | Euro |
MXN | Mexican Peso |
PIK | Payment-in-Kind. Income may be paid in additional securities or cash at the discretion of the issuer. |
The accompanying notes are an integral part of the financial statements.
10
| Morgan Stanley High Yield Fund, Inc. |
|
|
| June 30, 2007 (unaudited) |
|
|
Portfolio of Investments (cont’d)
(Showing Percentage of Total Value of Investments)
Futures Contracts:
The Fund had the following futures contracts open at period end:
|
|
|
|
|
|
|
| Net |
| ||
|
|
|
|
|
|
|
| Unrealized |
| ||
|
| Number |
|
|
|
|
| Appreciation |
| ||
|
| of |
| Value |
| Expiration |
| (Depreciation) |
| ||
|
| Contracts |
| (000) |
| Date |
| (000) |
| ||
|
|
|
|
|
|
|
|
|
| ||
Long: |
|
|
|
|
|
|
|
|
| ||
U.S. Treasury |
|
|
|
|
|
|
|
|
| ||
2 yr. Note |
| 12 |
| $ | 2,445 |
| Sep-07 |
| $ | 3 |
|
U.S. Treasury |
|
|
|
|
|
|
|
|
| ||
5 yr. Note |
| 93 |
| 9,679 |
| Sep-07 |
| (73 | ) | ||
U.S. Treasury |
|
|
|
|
|
|
|
|
| ||
10 yr. Note |
| 125 |
| 13,213 |
| Sep-07 |
| (174 | ) | ||
|
|
|
|
|
|
|
|
|
| ||
Short: |
|
|
|
|
|
|
|
|
| ||
U.S. Treasury |
|
|
|
|
|
|
|
|
| ||
Bond |
| 77 |
| 8,297 |
| Sep-07 |
| 88 |
| ||
|
|
|
|
|
|
|
| $ | (156 | ) | |
Foreign Currency Exchange Contract Information:
The Fund had the following foreign currency exchange contract(s) open at period end:
|
|
|
|
|
|
|
|
|
|
|
| Net |
| ||||
Currency |
|
|
|
|
| In |
|
|
| Unrealized |
| ||||||
to |
|
|
|
|
| Exchange |
|
|
| Appreciation |
| ||||||
Deliver |
| Value |
| Settlement |
| For |
| Value |
| (Depreciation) |
| ||||||
(000) |
| (000) |
| Date |
| (000) |
| (000) |
| (000) |
| ||||||
EUR | 689 |
| $ | 933 |
| 7/31/07 |
| USD |
| 939 |
| $ | 939 |
| $ | 6 |
|
EUR | 884 |
| 1,198 |
| 7/31/07 |
| USD |
| 1,206 |
| 1,206 |
| 8 |
| |||
USD | 694 |
| 694 |
| 7/31/07 |
| EUR |
| 515 |
| 698 |
| 4 |
| |||
|
| $ | 2,825 |
|
|
|
|
|
|
| $ | 2,843 |
| $ | 18 |
| |
EUR — Euro
USD — United States Dollar
Graphic Presentation of Portfolio Holdings
The following graph depicts the Fund’s holdings by industry and/or security type, as a percentage of total investments.
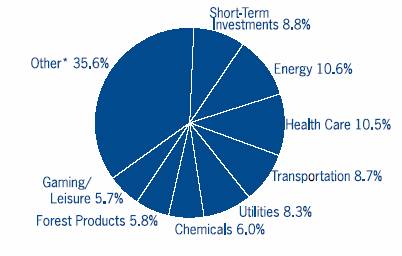
* Industries which do not appear in the above graph, as well as those which represent less than 5% of total investments, if applicable, are included in the category labeled “Other”.
The accompanying notes are an integral part of the financial statements.
11
| Morgan Stanley High Yield Fund, Inc. |
|
|
| Financial Statements |
Statement of Assets and Liabilities
|
| June 30, 2007 |
| ||
|
| (unaudited) |
| ||
|
| (000) |
| ||
Assets: |
|
|
| ||
Investments in Unaffiliated Issuers, at Value (Cost $86,206) |
| $ | 80,567 |
| |
Investment in Affiliated Issuer, at Value (Cost $7,567) |
| 7,567 |
| ||
Cash |
| 45 |
| ||
Interest Receivable |
| 1,596 |
| ||
Due from Broker |
| 20 |
| ||
Receivable for Investments Sold |
| 18 |
| ||
Unrealized Appreciation on Foreign Currency Exchange Contracts |
| 18 |
| ||
Foreign Currency, at Value (Cost $16) |
| 16 |
| ||
Receivable from Affiliate |
| 1 |
| ||
Unrealized Appreciation on Swap Agreements |
| @— |
| ||
Other Assets |
| 21 |
| ||
Total Assets |
| 89,869 |
| ||
Liabilities: |
|
|
| ||
Payable For: |
|
|
| ||
Reverse Repurchase Agreements |
| 9,941 |
| ||
Investments Purchased |
| 1,332 |
| ||
Dividends Declared |
| 410 |
| ||
Investment Advisory Fees |
| 45 |
| ||
Directors’ Fees and Expenses |
| 5 |
| ||
Administration Fees |
| 4 |
| ||
Custodian Fees |
| 3 |
| ||
Other Liabilities |
| 73 |
| ||
Total Liabilities |
| 11,813 |
| ||
Net Assets |
|
|
| ||
Applicable to 11,700,448, Issued and Outstanding $0.01 Par Value Shares (100,000,000 Shares Authorized) |
| $ | 78,056 |
| |
Net Asset Value Per Share |
| $ | 6.67 |
| |
Net Assets Consist of: |
|
|
| ||
Common Stock |
| $ | 117 |
| |
Paid-in Capital |
| 156,080 |
| ||
Undistributed (Distributions in Excess of) Net Investment Income |
| 82 |
| ||
Accumulated Net Realized Gain (Loss) |
| (72,344 | ) | ||
Unrealized Appreciation (Depreciation) on Investments, Swaps Contracts, and Foreign Currency Exchange Contracts and Translations |
| (5,879 | ) | ||
Net Assets |
| $ | 78,056 |
| |
@ Amount is less than $500.
The accompanying notes are an integral part of the financial statements.
12
| Morgan Stanley High Yield Fund, Inc. |
|
|
| Financial Statements |
Statement of Operations
|
| Six Months Ended |
| |
|
| June 30, 2007 |
| |
|
| (unaudited) |
| |
|
| (000) |
| |
Investment Income |
|
|
| |
Interest from Securities of Unaffiliated Issuers |
| $ | 3,382 |
|
Interest from Security of Affiliated Issuer |
| 75 |
| |
Dividends from Securities of Unaffiliated Issuers |
| @— |
| |
Total Investment Income |
| 3,457 |
| |
Expenses |
|
|
| |
Interest Expense on Reverse Repurchase Agreements |
| 280 |
| |
Investment Advisory Fees (Note B) |
| 276 |
| |
Administration Fees (Note C) |
| 32 |
| |
Professional Fees |
| 25 |
| |
Stockholder Servicing Agent Fees |
| 15 |
| |
Stockholder Reporting Expenses |
| 14 |
| |
Custodian Fees (Note D) |
| 6 |
| |
Directors’ Fees and Expenses |
| 2 |
| |
Bank Overdraft Expense |
| @— |
| |
Other Expenses |
| 12 |
| |
Total Expenses |
| 662 |
| |
Waiver of Administration Fees (Note C) |
| (10 | ) | |
Rebate from Morgan Stanley Affiliated Cash Sweep (Note G) |
| (2 | ) | |
Expense Offset (Note D) |
| (1 | ) | |
Net Expenses |
| 649 |
| |
Net Investment Income |
| 2,808 |
| |
Net Realized Gain (Loss) on: |
|
|
| |
Investments |
| 540 |
| |
Futures |
| (85 | ) | |
Foreign Currency Transactions |
| (42 | ) | |
Net Realized Gain (Loss) |
| 413 |
| |
Change in Unrealized Appreciation (Depreciation) on: |
|
|
| |
Investments |
| (1,427 | ) | |
Foreign Currency Translations |
| 163 |
| |
Futures Contracts |
| (155 | ) | |
Swaps |
| @— |
| |
Change in Unrealized Appreciation (Depreciation) |
| (1,419 | ) | |
Net Realized Gain (Loss) and Change in Unrealized Appreciation (Depreciation) |
| (1,006 | ) | |
Net Increase (Decrease) in Net Assets Resulting from Operations |
| $ | 1,802 |
|
The accompanying notes are an integral part of the financial statements.
13
| Morgan Stanley High Yield Fund, Inc. |
|
|
| Financial Statements |
Statements of Changes in Net Assets
|
| Six Months Ended |
|
|
| ||
|
| June 30, 2007 |
| Year Ended |
| ||
|
| (unaudited) |
| December 31, 2006 |
| ||
|
| (000) |
| (000) |
| ||
Increase (Decrease) in Net Assets |
|
|
|
|
| ||
Operations: |
|
|
|
|
| ||
Net Investment Income |
| $ | 2,808 |
| $ | 5,315 |
|
Net Realized Gain (Loss) |
| 413 |
| (254 | ) | ||
Change in Unrealized Appreciation (Depreciation) |
| (1,419 | ) | 1,474 |
| ||
Net Increase (Decrease) in Net Assets Resulting from Operations |
| 1,802 |
| 6,535 |
| ||
Distributions from and/or in Excess of: |
|
|
|
|
| ||
Net Investment Income |
| (2,282 | ) | (5,436 | ) | ||
Total Increase (Decrease) |
| (480 | ) | 1,099 |
| ||
Net Assets: |
|
|
|
|
| ||
Beginning of Period |
| 78,536 |
| 77,437 |
| ||
End of Period (Including Undistributed (Distributions in Excess of) Net Investment Income of $82 and $(444), respectively) |
| $ | 78,056 |
| $ | 78,536 |
|
The accompanying notes are an integral part of the financial statements.
14
| Morgan Stanley High Yield Fund, Inc. |
|
|
| Financial Statements |
Statement of Cash Flows
|
| Six Months Ended |
| |
|
| June 30, 2007 |
| |
|
| (unaudited) |
| |
|
| (000) |
| |
Cash Flows From Operating Activities: |
|
|
| |
Proceeds from Sales and Maturities of Long-Term Investments |
| $ | 17,673 |
|
Purchases of Long-Term Investments |
| (15,748 | ) | |
Net (Increase) Decrease in Short-Term Investments |
| (1,441 | ) | |
Net Increase (Decrease) in Foreign Currency Holdings |
| (7 | ) | |
Net Realized Gain (Loss) for Foreign Currency Translations |
| (42 | ) | |
Net Realized Gain (Loss) for Futures Contracts |
| (85 | ) | |
Net Investment Income |
| 2,808 |
| |
Adjustments to Reconcile Net Investment Income to Net Cash Provided (Used) by Operating Activities: |
|
|
| |
Net (Increase) Decrease in Receivables Related to Operations |
| 63 |
| |
Net Increase (Decrease) in Payables Related to Operations |
| (20 | ) | |
Accretion/Amortization of Discounts and Premiums |
| 9 |
| |
Net Cash Provided (Used) by Operating Activities |
| 3,210 |
| |
Cash Flows from Financing Activities: |
|
|
| |
Cash Received for Reverse Repurchase Agreements |
| 12,251 |
| |
Cash Paid for Repurchase Agreements |
| (12,437 | ) | |
Cash Distributions Paid |
| (2,979 | ) | |
Net Cash Provided (Used) for Financing Activities |
| (3,165 | ) | |
Net Increase (Decrease) in Cash |
| 45 |
| |
Cash at Beginning of Period |
| @— |
| |
Cash at End of Period |
| $ | 45 |
|
@ Amount is less than $500.
The accompanying notes are an integral part of the financial statements.
15
| Morgan Stanley High Yield Fund, Inc. |
|
|
| Financial Statements |
Selected Per Share Data and Ratios
|
| Six Months Ended |
|
|
| ||||||||||||||
|
| June 30, 2007 |
| Year Ended December 31, |
| ||||||||||||||
|
| (unaudited) |
| 2006 |
| 2005 |
| 2004 |
| 2003 |
| 2002 |
| ||||||
Net Asset Value, Beginning of Period |
| $ | 6.71 |
| $ | 6.62 |
| $ | 7.14 |
| $ | 6.96 |
| $ | 5.46 |
| $ | 7.26 |
|
Net Investment Income† |
| 0.24 |
| 0.45 |
| 0.55 |
| 0.64 |
| 0.67 |
| 0.78 |
| ||||||
Net Realized and Unrealized Gain (Loss) on Investments |
| (0.08 | ) | 0.10 |
| (0.55 | ) | 0.21 |
| 1.40 |
| (1.80 | ) | ||||||
Total from Investment Operations |
| 0.16 |
| 0.55 |
| 0.00 |
| 0.85 |
| 2.07 |
| (1.02 | ) | ||||||
Distributions from and/or in Excess of: |
|
|
|
|
|
|
|
|
|
|
|
|
| ||||||
Net Investment Income |
| (0.20 | ) | (0.46 | ) | (0.52 | ) | (0.67 | ) | (0.57 | ) | (0.78 | ) | ||||||
Net Asset Value, End of Period |
| $ | 6.67 |
| $ | 6.71 |
| $ | 6.62 |
| $ | 7.14 |
| $ | 6.96 |
| $ | 5.46 |
|
Per Share Market Value, End of Period |
| $ | 5.94 |
| $ | 5.96 |
| $ | 5.67 |
| $ | 6.51 |
| $ | 6.55 |
| $ | 5.38 |
|
TOTAL INVESTMENT RETURN: |
|
|
|
|
|
|
|
|
|
|
|
|
| ||||||
Market Value |
| 2.93 | %** | 13.81 | % | (5.36 | )% | 10.27 | % | 33.13 | % | (24.16 | )% | ||||||
Net Asset Value (1) |
| 2.51 | %** | 9.91 | % | 0.74 | % | 13.82 | % | 39.29 | % | (14.69 | )% | ||||||
RATIOS, SUPPLEMENTAL DATA: |
|
|
|
|
|
|
|
|
|
|
|
|
| ||||||
Net Assets, End of Period (Thousands) |
| $ | 78,056 |
| $ | 78,536 |
| $ | 77,437 |
| $ | 83,492 |
| $ | 81,402 |
| $ | 63,878 |
|
Ratio of Expenses to Average Net Assets (2) |
| 1.65 | %* | 2.02 | % | 2.17 | % | 1.45 | % | 1.50 | % | 2.92 | % | ||||||
Ratio of Expenses Excluding Interest Expense to Average Net Assets(2) |
| 0.94 | %* | 1.00 | % | 1.00 | % | 1.00 | % | 1.05 | % | 1.25 | % | ||||||
Ratio of Net Investment Income to Average Net Assets |
| 7.12 | %* | 6.83 | % | 7.99 | % | 9.14 | % | 10.57 | % | 12.69 | % | ||||||
Portfolio Turnover Rate |
| 21 | %** | 34 | % | 56 | % | 55 | % | 68 | % | 56 | % | ||||||
(2) Supplemental Information on the Ratios to Average Net Assets: |
|
|
|
|
|
|
|
|
|
|
|
|
|
Ratios Before Expenses Waived by Administrator: |
|
|
|
|
|
|
|
|
|
|
|
|
|
Ratio of Expenses to Average Net Assets |
| 1.68 | %* | 2.05 | % | 2.20 | % | 1.45 | % | N/A |
| N/A |
|
Ratio of Net Investment Income (Loss) to Average Net Assets |
| 7.09 | %* | 6.80 | % | 7.96 | % | 9.14 | % | N/A |
| N/A |
|
† | Per share amount is based on average shares outstanding. |
(1) | Total investment return based on net asset value per share reflects the effects of changes in net asset value on the performance of the Fund during each period, and assumes dividends and distributions, if any, were reinvested. This percentage is not an indication of the performance of a stockholder’s investment in the Fund based on market value due to differences between the market price of the stock and the net asset value per share of the Fund. |
** | Not Annualized |
* | Annualized |
The accompanying notes are an integral part of the financial statements.
16
| Morgan Stanley High Yield Fund, Inc. |
|
|
| June 30, 2007 (unaudited) |
Notes to Financial Statements
The Morgan Stanley High Yield Fund, Inc. (the “Fund”) was incorporated on September 23, 1993 and is registered as a diversified, closed-end management investment company under the Investment Company Act of 1940, as amended (the “1940 Act”). The Fund’s primary objective is to seek a high level of current income and as a secondary objective, to seek capital appreciation. The Fund seeks to achieve these ojectives through investments primarily in high yield securities.
A. Accounting Policies: The following significant accounting policies are in conformity with U.S. generally accepted accounting principles. Such policies are consistently followed by the Fund in the preparation of its financial statements. U.S. generally accepted accounting principles may require management to make estimates and assumptions that affect the reported amounts and disclosures in the financial statements. Actual results may differ from those estimates.
1. Security Valuation: Bonds and other fixed income securities may be valued according to the broadest and most representative market. In addition, bonds and other fixed income securities may be valued on the basis of prices provided by a pricing service. The prices provided by a pricing service take into account broker dealer market price quotations for institutional size trading in similar groups of securities, security quality, maturity, coupon and other security characteristics as well as any developments related to the specific securities. Equity securities listed on a U.S. exchange are valued at the latest quoted sales price on the valuation date. Equity securities listed or traded on NASDAQ, for which market quotations are available, are valued at the NASDAQ Official Closing Price. Securities listed on a foreign exchange are valued at their closing price. Unlisted securities and listed securities not traded on the valuation date for which market quotations are readily available are valued at the mean between the current bid and asked prices obtained from reputable brokers. Debt securities purchased with remaining maturities of 60 days or less are valued at amortized cost, if it approximates value.
All other securities and investments for which market values are not readily available, including restricted securities, and those securities for which it is inappropriate to determine prices in accordance with the aforementioned procedures, are valued at fair value as determined in good faith under procedures adopted by the Board of Directors (the “Directors”), although the actual calculations may be done by others. Factors considered in making this determination may include, but are not limited to, information obtained by contacting the issuer, analysts, or the appropriate stock exchange (for exchange-traded securities), analysis of the issuer’s financial statements or other available documents and, if necessary, available information concerning other securities in similar circumstances.
Most foreign markets close before the New York Stock Exchange (NYSE). Occasionally, developments that could affect the closing prices of securities and other assets may occur between the times at which valuations of such securities are determined (that is, close of the foreign market on which the securities trade) and the close of business on the NYSE. If these developments are expected to materially affect the value of the securities, the valuations may be adjusted to reflect the estimated fair value as of the close of the NYSE, as determined in good faith under procedures established by the Directors.
2. Repurchase Agreements: The Fund may enter into repurchase agreements under which the Fund lends excess cash and takes possession of securities with an agreement that the counterparty will repurchase such securities. In connection with transactions in repurchase agreements, a bank as custodian for the Fund takes possession of the underlying securities (collateral), with a market value at least equal to the amount of the repurchase transaction, including principal and accrued interest. To the extent that any repurchase transaction exceeds one business day, the value of the collateral is marked-to-market on a daily basis to determine the adequacy of the collateral. In the event of default on the obligation to repurchase, the Fund has the right to liquidate the collateral and apply the proceeds in satisfaction of the obligation. In the event of default or bankruptcy by the counterparty to the agreement, realization and/or retention of the collateral or proceeds may be subject to legal proceedings.
The Fund, along with other affiliated investment companies, may utilize a joint trading account for the purpose of entering into one or more repurchase agreements.
3. Reverse Repurchase Agreements: The Fund may enter into reverse repurchase agreements with institutions that the Fund’s investment adviser has determined are creditworthy. Under a reverse repurchase agreement, the Fund sells securities and agrees to repurchase them at a mutually agreed upon date and price. Reverse repurchase agreements involve the risk that the market value of the securities purchased with the proceeds from the sale of securities received
17
| Morgan Stanley High Yield Fund, Inc. |
|
|
| June 30, 2007 (unaudited) |
Notes to Financial Statements (cont’d)
by the Fund may decline below the price of the securities the Fund is obligated to repurchase. Reverse repurchase agreements also involve credit risk with the counterparty to the extent that the value of securities subject to repurchase exceed the Fund’s liability under the reverse repurchase agreement. Securities subject to repurchase under reverse repurchase agreements, if any, are designated as such in the Portfolio of Investments.
At June 30, 2007, the Fund had a reverse repurchase agreement outstanding with UBS Warburg as follows:
|
| Maturity in |
| |
Value of Securities Subject to Repurchase |
| $ | 9,717,000 |
|
Liability Under Reverse Repurchase Agreement |
| $ | 9,941,000 |
|
Weighted Average Days to Maturity |
| 89.51 |
| |
The weighted average weekly balance of reverse repurchase agreements outstanding during the six months ended June 30, 2007 was approximately $5,518,000 at a weighted average weekly interest rate of 5.45%.
4. Foreign Currency Translation: The books and records of the Fund are maintained in U.S. dollars. Foreign currency amounts are translated into U.S. dollars at the mean of the bid and asked prices of such currencies against U.S. dollars last quoted by a major bank as follows:
• investments, other assets and liabilities at the prevailing rates of exchange on the valuation date;
• investment transactions and investment income at the prevailing rates of exchange on the dates of such transactions.
Although the net assets of the Fund are presented at the foreign exchange rates and market values at the close of the period, the Fund does not isolate that portion of the results of operations arising as a result of changes in the foreign exchange rates from the fluctuations arising from changes in the market prices of the securities held at period end. Similarly, the Fund does not isolate the effect of changes in foreign exchange rates from the fluctuations arising from changes in the market prices of securities sold during the period. Accordingly, realized and unrealized foreign currency gains (losses) due to securities transactions are included in the reported net realized and unrealized gains (losses) on investment transactions and balances.
Net realized gains (losses) on foreign currency transactions represent net foreign exchange gains (losses) from sales and maturities of foreign currency exchange contracts, disposition of foreign currencies, currency gains or losses realized between the trade and settlement dates on securities transactions, and the difference between the amount of investment income and foreign withholding taxes recorded on the Fund’s books and the U.S. dollar equivalent amounts actually received or paid. Net unrealized currency gains (losses) from valuing foreign currency denominated assets and liabilities at period end exchange rates are reflected as a component of unrealized appreciation (depreciation) on investments and foreign currency translations in the Statement of Assets and Liabilities. The change in net unrealized currency gains (losses) on foreign currency translations for the period is reflected in the Statement of Operations.
Foreign security and currency transactions may involve certain considerations and risks not typically associated with those of U.S. dollar denominated transactions as a result of, among other factors, the possibility of lower levels of governmental supervision and regulation of foreign securities markets and the possibility of political or economic instability.
5. Derivatives: The Fund may use derivatives to achieve its investment objectives. The Fund may engage in transactions in futures contracts on foreign currencies, stock indices, as well as in options, swaps and structured products. Consistent with the Fund’s investment objectives and policies, the Fund may use derivatives for non-hedging as well as hedging purposes.
Following is a description of derivative instruments that the Fund has utilized and their associated risks:
Cross Currency Hedges: The Fund may enter into cross currency hedges, which involve the sale of one currency against the positive exposure to a different currency. Cross currency hedges may be used for hedging purposes or to establish an active exposure to the exchange rate between any two currencies. Hedging the Fund’s currency risks involves the risk of mismatching the Fund’s obligations under a forward or futures contract with the value of securities denominated in a particular currency. For cross currency hedges, there is an additional risk to the extent that these transactions create exposure to currencies in which the Fund’s securities are not denominated.
18
| Morgan Stanley High Yield Fund, Inc. |
|
|
| June 30, 2007 (unaudited) |
Notes to Financial Statements (cont’d)
Foreign Currency Exchange Contracts: The Fund may enter into foreign currency exchange contracts generally to attempt to protect securities and related receivables and payables against changes in future foreign exchange rates and, in certain situations, to gain exposure to a foreign currency. A foreign currency exchange contract is an agreement between two parties to buy or sell currency at a set price on a future date. The market value of the contract will fluctuate with changes in currency exchange rates. The contract is marked-to-market daily and the change in market value is recorded by the Fund as unrealized gain or loss. The Fund records realized gains or losses when the contract is closed equal to the difference between the value of the contract at the time it was opened and the value at the time it was closed. Risk may arise upon entering into these contracts from the potential inability of counterparties to meet the terms of their contracts and is generally limited to the amount of unrealized gain on the contracts, if any, at the date of default. Risks may also arise from unanticipated movements in the value of a foreign currency relative to the U.S. dollar.
Structured Securities: The Fund may invest in interests in entities organized and operated solely for the purpose of restructuring the investment characteristics of sovereign debt obligations. This type of restructuring involves the deposit with or purchase by an entity of specified instruments and the issuance by that entity of one or more classes of securities (“Structured Securities”) backed by, or representing interests in, the underlying instruments. Structured Securities generally will expose the Fund to credit risks of the underlying instruments as well as of the issuer of the Structured Security. Structured Securities are typically sold in private placement transactions with no active trading market. Investments in Structured Securities may be more volatile than their underlying instruments, however, any loss is limited to the amount of the original investment.
Futures: The Fund may purchase and sell futures contracts. Futures contracts provide for the sale by one party and purchase by another party of a specified amount of a specified security, index, instrument or basket of instruments. Futures contracts (secured by cash or government securities deposited with brokers or custodians as “initial margin”) are valued based upon their quoted daily settlement prices; changes in initial settlement value (represented by cash paid to or received from brokers as “variation margin”) are accounted for as unrealized appreciation (depreciation). When futures contracts are closed, the difference between the opening value at the date of purchase and the value at closing is recorded as realized gains or losses in the Statement of Operations.
The Fund may use futures contracts in order to manage exposure to the stock and bond markets, to hedge against unfavorable changes in the value of securities or to remain fully invested and to reduce transaction costs. Futures contracts involve market risk in excess of the amounts recognized in the Statement of Assets and Liabilities. Risks arise from the possible movements in security values underlying these instruments. The change in value of futures contracts primarily corresponds with the value of their underlying instruments, which may not correlate with the change in value of the hedged investments. In addition, there is the risk that the Fund may not be able to enter into a closing transaction because of an illiquid secondary market.
Over-the-Counter Trading: Securities and other derivative instruments that may be purchased or sold by the Fund may consist of instruments not traded on an exchange. The risk of nonperformance by the obligor on such an instrument may be greater, and the ease with which the Fund can dispose of or enter into closing transactions with respect to such an instrument may be less, than in the case of an exchange-traded instrument. In addition, significant disparities may exist between bid and ask prices for derivative instruments that are not traded on an exchange. Derivative instruments not traded on exchanges are also not subject to the same type of government regulation as exchange traded instruments, and many of the protections afforded to participants in a regulated environment may not be available in connection with such transactions.
6. New Accounting Pronouncements: In September 2006, Statement of Financial Accounting Standards No. 157, Fair Value Measurements (“SFAS 157”), was issued and is effective for fiscal years beginning after November 15, 2007. SFAS 157 defines fair value, establishes a framework for measuring fair value and expands disclosures about fair value measurements. Management is currently evaluating the impact the adoption of SFAS 157 will have on the Fund’s financial statement disclosures.
In February 2007, the FASB issued Statement of Financial Accounting Standards No. 159, “The Fair Value Option for Financial Assets and Financial Liabilities – including an amendment of FASB Statement No. 115”(“SFAS 159”),
19
| Morgan Stanley High Yield Fund, Inc. |
|
|
| June 30, 2007 (unaudited) |
Notes to Financial Statements (cont’d)
which is effective for fiscal years beginning after November 15, 2007. SFAS 159 permits entities to elect to measure certain financial assets and liabilities at fair value. The fair value option may be applied instrument by instrument, is irrevocable and is applied only to entire instruments and not to portions of instruments. SFAS 159 also establishes presentation and disclosure requirements designed to facilitate comparisons between entities that choose different measurement attributes for similar types of assets and liabilities. Management is currently evaluating the impact the adoption of SFAS 159 will have on the Fund’s financial statement disclosures.
7. Swap Agreements: The Fund may enter into swap agreements to exchange one return or cash flow for another return or cash flow in order to hedge against unfavorable changes in the value of securities or to remain fully invested and to reduce transaction costs. Cash collateral for swap agreements, if applicable, is deposited with the broker serving as counterparty to the agreement, and is included in “Due from (to) Broker” on the Statement of Assets and Liabilities. The following summarizes swaps which may be entered into by the Fund.
Credit Default Swaps: Credit default swaps involve commitments to pay a fixed rate in exchange for payment if a credit event affecting a third party (the referenced company) occurs. Credit events may include a failure to pay interest, bankruptcy, or restructuring. The Fund accrues for interim payments on swap contracts on a daily basis, with the net amount recorded within unrealized appreciation (depreciation) of swap contracts on the Statement of Assets and Liabilities. Once interim payments are settled in cash, the net amount is recorded within realized gain (loss) on swaps on the Statement of Operations. Credit default swaps are marked-to-market daily based upon quotations from market makers and the change, if any, is recorded as unrealized appreciation or depreciation in the Statements of Operations.
Interest Rate Swaps: Interest rate swaps involve the exchange of commitments to pay and receive interest based on a notional principal amount. The Fund accrues for interim payments on swap contracts on a daily basis, with the net amount recorded within unrealized appreciation (depreciation) of swap contracts on the Statement of Assets and Liabilities. Once interim payments are settled in cash, the net amount is recorded within realized gain (loss) on swaps on the Statementof Operations. In a zero-coupon interest rate swap, payments only occur at maturity, at which time one counterparty pays the total compounded fixed rate over the life of the swap and the other pays the total compounded floating rate that would have been earned had a series of LIBOR investments been rolled over through the life of the swap. The Fund amortizes its interest payment obligation over the life of the swap. The amortized portion of this payment is recorded in the Statement of Operations as an adjustment to interest income. The unamortized portion of this payment is included in “Due from (to) Broker” on the Statement of Assets and Liabilities. Interest rate swaps are marked-to-market daily based upon quotations from market makers and the change, if any, is recorded as unrealized appreciation or depreciation in the Statement of Operations.
Total Return Swaps: Total return swaps involve commitments to pay interest in exchange for a market-linked return based on a notional amount. To the extent the total return of the security or index underlying the transaction exceeds or falls short of the offsetting interest rate obligation, the Fund will receive a payment from or make a payment to the counterparty, respectively. Total return swaps are marked-to-market daily based upon quotations from market makers and the change, if any, is recorded as unrealized appreciation or depreciation in the Statement of Operations. Periodic payments received or made at the end of each measurement period are recorded as realized gains or losses in the Statement of Operations.
Realized gains or losses on maturity or termination of swap agreements are presented in the Statement of Operations. Because there is no organized market for these swap agreements, the unrealized gain (loss) reported in the Statement of Assets and Liabilities may differ from that which would be realized in the event the Fund terminated its position in the agreement.
Risks may arise upon entering into these agreements from the potential inability of the counterparties to meet the terms of the agreements and are generally limited to the amount of net interest payments to be received, if any, at the date of default. Risks also arise from potential losses from adverse market movements, and such losses could exceed the related amounts shown in the Statement of Assets and Liabilities.
20
| Morgan Stanley High Yield Fund, Inc. |
|
|
| June 30, 2007 (unaudited) |
Notes to Financial Statements (cont’d)
At June 30, 2007, the Fund had the following open Swap Agreements:
|
|
|
|
|
|
|
|
|
|
|
| Net Unrealized |
| ||
|
|
|
| Notional |
|
|
|
|
|
|
| Appreciation |
| ||
|
| Termination |
| Amount |
|
|
|
|
|
|
| (Depreciation) |
| ||
Counterparty |
| Date |
| (000) |
| Type |
| Pay |
| Receive |
| (000) |
| ||
|
|
|
|
|
|
|
|
|
|
|
|
|
| ||
JPMorgan Chase |
| 6/20/14 |
| $ | 625 |
| CDS |
| upon the occurrence of a negative credit event(1) |
| fixed rate of 1.3% |
| $ | @— |
|
(1) Receipt of $1,000,000 or $10,000,000, in the event of a failure to pay or default, respectively, by the issuer of Belo Corp., 8.00% Bond maturing 11/1/08.
@ — Value is less than $500.
CDS — Credit Default Swap
8. Other: Security transactions are accounted for on the date the securities are purchased or sold. Realized gains and losses on the sale of investment securities are determined on the specific identified cost basis. Interest income is recognized on the accrual basis and discounts and premiums on investments purchased are accreted or amortized in accordance with the effective yield method over their respective lives, except where collection is in doubt. Distributions to stockholders are recorded on the ex-dividend date.
B. Investment Advisory Fees: Morgan Stanley Investment Management Inc. (the “Adviser” or “MS Investment Management”) provides investment advisory services to the Fund under the terms of an Investment Advisory and Management Agreement (the “Agreement”). Under the Agreement, the Adviser is paid a fee computed weekly and payable monthly at an annual rate of 0.70% of the Fund’s average weekly net assets.
C. Administration Fees: MS Investment Management also serves as Administrator to the Fund pursuant to an Administration Agreement. Under the Administration Agreement, the administration fee is 0.08% of the Fund’s average daily net assets. MS Investment Management has agreed to limit the administration fee so that it will be no greater than the previous administration fee of 0.02435% of the Fund’s average weekly net assets plus $24,000 per annum. This waiver is voluntary and may be terminated at any time. For the six months ended June 30, 2007, $10,000 of administration fees were waived pursuant to this arrangement. Under a sub-administration agreement between the Administrator and JPMorgan Investor Services Co. (“JPMIS”), a corporate affiliate of JPMorgan Chase Bank, N.A., JPMIS provides certain administrative services to the Fund. For such services, the Administrator pays JPMIS a portion of the fee the Administrator receives from the Fund. An employee of JPMIS is an officer of the Fund. Administration costs (including out-of-pocket expenses) incurred in the ordinary course of providing services under the administration agreement, except pricing services and extraordinary expenses, are covered under the administration fee.
D. Custodian Fees: JPMorgan Chase Bank, N.A. (the “Custodian”) and its affiliates serve as Custodian for the Fund. The Custodian holds cash, securities, and other assets of the Fund as required by the 1940 Act. Custody fees are payable monthly based on assets held in custody, investment purchases and sales activity and account maintenance fees, plus reimbursement for certain out-of-pocket expenses. The Fund has entered into an arrangement with its custodian whereby credits realized on uninvested cash balances were used to offset a portion of the Fund’s expenses. These Custodian credits are shown as “Expense Offset” on the Statement of Operations.
E. Federal Income Taxes: It is the Fund’s intention to continue to qualify as a regulated investment company and distribute all of its taxable income. Accordingly, no provision for Federal income taxes is required in the financial statements.
The Fund may be subject to taxes imposed by countries in which it invests. Such taxes are generally based on income and/or capital gains earned or repatriated. Taxes are accrued and applied to net investment income, net realized gains and net unrealized appreciation as such income and/or gains are earned. The Fund adopted the provisions of the Financial Accounting Standards Board’s (“FASB”) Interpretation number 48 Accounting for Uncertainty in Income Taxes, on June 30, 2007. As of June 30, 2007, this did not result in an impact to the Fund’s financial statements.
The tax character of distributions paid may differ from the character of distributions shown on the Statements of Changes in Net Assets due to short-term capital gains being treated as
21
| Morgan Stanley High Yield Fund, Inc. |
|
|
| June 30, 2007 (unaudited) |
Notes to Financial Statements (cont’d)
ordinary income for tax purposes. The tax character of distributions paid during 2006 and 2005 were as follows:
2006 Distributions |
| 2005 Distributions |
| |||||||||
Paid From: |
| Paid From: |
| |||||||||
(000) |
| (000) |
| |||||||||
|
| Long-term |
|
|
| Long-term |
| |||||
Ordinary |
| Capital |
| Ordinary |
| Capital |
| |||||
Income |
| Gain |
| Income |
| Gain |
| |||||
$ | 5,315 |
| $ | — |
| $ | 6,101 |
| $ | — |
| |
The amount and character of income and capital gain distributions to be paid by the Fund are determined in accordance with Federal income tax regulations, which may differ from U.S. generally accepted accounting principles. These book/tax differences are considered either temporary or permanent in nature.
Temporary differences are attributable to differing book and tax treatments for the timing of the recognition of gains (losses) on certain investment transactions and the timing of the deductibility of certain expenses.
Permanent differences, primarily due to differing treatments of gains (losses) related to foreign currency transactions and pay-down adjustments, resulted in the following reclassifications among the components of net assets at December 31, 2006:
Increase (Decrease) |
| ||||||||
Accumulated |
|
|
|
|
| ||||
Undistributed |
|
|
|
|
| ||||
(Distributions in |
|
|
|
|
| ||||
Excess of) Net |
| Accumulated |
|
|
| ||||
Investment |
| Net Realized |
| Paid-in |
| ||||
Income (Loss) |
| Gain (Loss) |
| Capital |
| ||||
(000) |
| (000) |
| (000) |
| ||||
$ | 274 |
| $ | (274 | ) | $ | — |
| |
At December 31, 2006, the Fund had no distributable earnings on a tax basis.
At June 30, 2007, the Federal income tax cost basis of securities was $93,773,000 and, accordingly, net unrealized depreciation for Federal income tax purposes was $5,639,000 of which $1,437,000 related to appreciated securities and $7,076,000 related to depreciated securities.
At December 31, 2006, the Fund had a capital loss carryforward for U.S. Federal income tax purposes of approximately $72,506,000 available to offset future capital gains of which $735,000 will expire on December 31, 2007, $4,197,000 will expire on December 31, 2008, $4,214,000 will expire on December 31, 2009, $24,375,000 will expire on December 31, 2010, $38,087,000 will expire on December 31, 2011, $241,000 will expire on December 31, 2012 and $657,000 will expire on December 31, 2014.
To the extent that capital loss carryforwards are used to offset any future capital gains realized during the carryforward period as provided by U.S. Federal income tax regulations, no capital gains tax liability will be incurred by the Fund for gains realized and not distributed. To the extent that capital gains are offset, such gains will not be distributed to the stockholders.
Net capital, currency and passive foreign investment company losses incurred after October 31, and within the taxable year are deemed to arise on the first day of the Fund’s next taxable year. For the year ended December 31, 2006, the Fund deferred to January 3, 2007, for U.S. Federal income tax purposes, post-October capital and currency losses of $12,000 and $458,000, respectively.
F. Contractual Obligations: The Fund enters into contracts that contain a variety of indemnifications. The Fund’s maximum exposure under these arrangements is unknown. However, the Fund has not had prior claims or losses pursuant to these contracts and expects the risk of loss to be remote.
G. Security Transactions and Transactions with Affiliates: The Fund invests in the Institutional Class of the Morgan Stanley Institutional Liquidity Money Market Portfolio (the “Liquidity Fund”), an open-end management investment company managed by the Adviser. Investment Advisory fees paid by the Fund are reduced by an amount equal to the advisory and administration fees paid by the Liquidity Fund with respect to assets invested by the Fund in the Liquidity Fund. For the six months ended June 30, 2007, advisory fees paid were reduced by $2,000 relating to the Fund’s investment in the Liquidity Fund. Income distributions earned by the Fund are recorded as interest from affiliates in the Statement of Operations and totaled $75,000. During the six months ended June 30, 2007, cost of purchases and sales in the Liquidity Fund were $14,838,000 and $7,271,000, respectively.
During the six months ended June 30, 2007, the Fund made purchases and sales totaling approximately $17,080,000 and $18,027,000, respectively, of investment securities other than long-term U.S. Government securities and short-term investments. There were no purchases or sales of long-term U.S. Government securities.
22
| Morgan Stanley High Yield Fund, Inc. |
|
|
| June 30, 2007 (unaudited) |
Notes to Financial Statements (cont’d)
H. Other: A substantial portion of the Fund’s total investments consists of high yield securities rated below investment grade. Investments in high yield securities are accompanied by a greater degree of credit risk and the risk tends to be more sensitive to economic conditions than higher-rated securities. These investments are often traded by one market maker who may also be utilized by the Fund to provide pricing information used to value such securities. The amounts which will be realized upon disposition of the securities may differ from the value reflected on the Statement of Assets and Liabilities and the differences could be material.
On June 13, 2007, the Officers of the Fund, pursuant to authority granted by the Directors, declared a distribution of $0.0350 per share, derived from net investment income, payable on July 13, 2007, to stockholders of record on June 29, 2007.
I. Supplemental Proxy Information: On June 19, 2007, an annual meeting of the Fund’s stockholders was held for the purpose of voting on the following matter, the results of which were as follows:
Election of Directors by all stockholders:
|
| For |
| Withhold |
|
|
|
|
|
|
|
Frank L. Bowman |
| 9,506,121 |
| 231,912 |
|
James F. Higgins |
| 9,506,764 |
| 231,269 |
|
Manuel H. Johnson |
| 9,505,464 |
| 232,569 |
|
J. Subsequent Event: On July 1, 2007, the Stockholder Servicing Agent changed from American Stock Transfer & Trust Company to Computershare Trust Company, N.A. Requests for information or any correspondence concerning the Dividend Reinvestment and Cash Purchase Plan after July 1, 2007 should be directed to Computershare Trust Company, N.A. P.O. Box 43010, Providence, Rhode Island 02940-3010, 1 (800) 231-2608.
For More Information About Portfolio Holdings
The Fund provides a complete schedule of portfolio holdings in its semi-annual and annual reports within 60 days of the end of the Fund’s second and fourth fiscal quarters. The semi-annual reports and the annual reports are filed electronically with the Securities and Exchange Commission (SEC) on Form N-CSRS and Form N-CSR, respectively. Morgan Stanley also delivers the semi-annual and annual reports to Fund stockholders and makes these reports available on its public website, www.morganstanley.com. Each Morgan Stanley fund also files a complete schedule of portfolio holdings with the SEC for the Fund’s first and third fiscal quarters on Form N-Q. Morgan Stanley does not deliver the reports for the first and third fiscal quarters to stockholders, nor are the reports posted to the Morgan Stanley public website. You may, however, obtain the Form N-Q filings (as well as the Form N-CSR and N-CSRS filings) by accessing the SEC’s website, http://www.sec.gov. You may also review and copy them at the SEC’s public reference room in Washington, DC. Information on the operation of the SEC’s Public Reference Room may be obtained by calling the SEC at 1(800) SEC-0330. You can also request copies of these materials, upon payment of a duplicating fee, by electronic request at the SEC’s e-mail address (publicinfo@sec.gov) or by writing the public reference section of the SEC, Washington, DC 20549-0102.
In addition to filing a complete schedule of portfolio holdings with the SEC each fiscal quarter, the Fund makes portfolio holdings information available by periodically providing the information on its public website, www.morganstanley.com/im.
The Fund provides a complete schedule of portfolio holdings on the public website on a calendar-quarter basis approximately 31 calendar days after the close of the calendar quarter. The Fund also provides Top 10 holdings information on the public website approximately 15 business days following the end of each month. You may obtain copies of the Fund’s monthly or calendar-quarter website postings, by calling 1(800) 231-2608.
Proxy Voting Policy and Procedures and Proxy Voting Record
A copy of (1) the Fund’s policies and procedures with respect to the voting of proxies relating to the Fund’s portfolio securities; and (2) how the Fund voted proxies relating to portfolio securities during the most recent twelve-month period ended June 30, is available without charge, upon request, by calling 1 (800) 548-7786 or by visiting our website at www.morganstanley.com/im. This information is also available on the Securities and Exchange Commission’s website at www.sec.gov.
23
| Morgan Stanley High Yield Fund, Inc. |
|
|
| June 30, 2007 (unaudited) |
Revised Investment Policy
The Fund invests at least 80% of its assets in high yield securities issued by U.S. and non-U.S. corporate issuers.
The Board of Directors approved changes/clarifications in the investment policies discussed below.
The Board of Directors approved refining the limits with respect to options for the Fund to clarify that, subject to its current options percentage limits, the Fund would be able to purchase all types of options, including options on foreign currency, options on foreign securities and options on swaps.
Foreign Options. When conducted outside the United States, options and futures may not be regulated as rigorously as in the United States, may not involve a clearing mechanism and related guarantees, and are subject to the risk of governmental actions affecting trading in, or the prices of, foreign securities, currencies and other instruments. The value of such positions also could be adversely affected by: (i) other complex foreign political, legal and economic factors, (ii) lesser availability than in the United States of data on which to make trading decisions, (iii) delays in the Fund’s ability to act upon economic events occurring in foreign markets during non-business hours in the United States, (iv) the imposition of different exercise and settlement terms and procedures and margin requirements than in the United States and (v) lower trading volume and liquidity.
Options on Foreign Currencies. The Fund may purchase and write options on foreign currencies for purposes similar to those involved with investing in forward foreign currency exchange contracts.
The value of a foreign currency option depends upon the value of the underlying currency relative to the U.S. dollar. As a result, the price of the option position may vary with changes in the value of either or both currencies and have no relationship to the investment merits of a foreign security. Because foreign currency transactions occurring in the interbank market involve substantially larger amounts than those that may be involved in the use of foreign currency options, investors may be disadvantaged by having to deal in an odd lot market (generally consisting of transactions of less than $1 million) for the underlying foreign currencies at prices that are less favorable than for round lots.
There is no systematic reporting of last sale information for foreign currencies or any regulatory requirement that quotations available through dealers or other market sources be firm or revised on a timely basis. Quotation information available is generally representative of very large transactions in the interbank market and thus may not reflect relatively smaller transactions (i.e., less than $1 million) where rates may be less favorable. The interbank market in foreign currencies is a global, around-the-clock market. To the extent that the U.S. options markets are closed while the markets for the underlying currencies remain open, significant price and rate movements may take place in the underlying markets that are not reflected in the options market.
Structured Products. The Fund may invest in structured notes and other types of structured investments (referred to collectively as “structured products”). A structured note is a derivative security for which the amount of principal repayment and/or interest payments is based on the movement of one or more “factors.” These factors include, but are not limited to, currency exchange rates, interest rates (such as the prime lending rate or LIBOR), referenced bonds and stock indices. Some of these factors may or may not correlate to the total rate of return on one or more underlying instruments referenced in such notes. In some cases, the impact of the movements of these factors may increase or decrease through the use of multipliers or deflators.
Generally, investments in structured products are interests in entities organized and operated for the purpose of restructuring the investment characteristics of underlying investment interests or securities. These investment entities may be structured as trusts or other types of pooled investment vehicles. This type of restructuring generally involves the deposit with or purchase by an entity of the underlying investments and the issuance by that entity of one or more classes of securities backed by, or representing interests in, the underlying investments referencing an indicator related to such investments. The cash flow or rate of return on the underlying investments may be apportioned among the newly issued securities to create different investment characteristics, such as varying maturities, credit quality, payment priorities and interest rate provisions. The cash flow or rate of return on a structured product may be determined by applying a multiplier to the rate of total return on the underlying investments or referenced indicator. Application of a multiplier is comparable to the use of financial leverage, a speculative technique. Leverage magnifies the potential for gain and the risk
24
| Morgan Stanley High Yield Fund, Inc. |
|
|
| June 30, 2007 (unaudited) |
Revised Investment Policy (cont’d)
of loss. As a result, a relatively small decline in the value of the underlying investments or referenced indicator could result in a relatively large loss in the value of a structured product. Holders of structured products bear risks of the underlying index or reference obligation and are subject to counterparty risk.
The Fund may have the right to receive payments to which it is entitled only from the structured product, and generally does not have direct rights against the issuer. While certain structured investment vehicles enable the investor to acquire interests in a pool of securities without the brokerage and other expenses associated with directly holding the same securities, investors in structured vehicles generally pay their share of the investment vehicle’s administrative and other expenses. Certain structured products may be thinly traded or have a limited trading market and may have the effect of increasing the Fund’s illiquidity to the extent that the Fund, at a particular point in time, may be unable to find qualified buyers for these securities. Investments in structured notes involve risks including interest rate risk, credit risk and market risk. Where the Fund’s investments in structured notes are based upon the movement of one or more factors, including currency exchange rates, interest rates, referenced bonds and stock indices, depending on the factor used and the use of multipliers or deflators, changes in interest rates and movement of the factor may cause significant price fluctuations. Additionally, changes in the reference instrument or security may cause the interest rate on the structured note to be reduced to zero and any further changes in the reference instrument may then reduce the principal amount payable on maturity. Structured notes may be less liquid than other types of securities and more volatile than the reference instrument or security underlying the note.
Swaps. The Fund may enter into interest rate, total rate of return and credit default swaps and the purchase or sale of related caps, floors and collars. The Fund expects to enter into these transactions primarily to preserve a return or spread on a particular investment or portion of its portfolio, as a duration management technique or to protect against any increase in the price of securities the Fund anticipates purchasing at a later date. The Fund intends to use these transactions as hedges and not as speculative investments and will not sell interest rate caps or floors where it does not own securities or other instruments providing the income stream the Fund may be obligated to pay.
Interest swaps involve the exchange by the Fund with another party of their respective commitments to pay or receive interest, e.g., an exchange of floating rate payments for fixed rate payments with respect to a notional amount of principal. The purchase of an interest rate cap entitles the purchaser, to the extent that a specified index exceeds a predetermined interest rate, to receive payments of interest on a contractually-based principal amount from the party selling the interest rate cap. The purchase of an interest rate floor entitles the purchaser, to the extent that a specified index falls below a predetermined interest rate, to receive payments of interest on a contractually-based principal amount from the party selling the interest rate floor. An interest rate collar combines the elements of purchasing a cap and selling a floor. The collar protects against an interest rate rise above the maximum amount but foregoes the benefit of an interest rate decline below the minimum amount.
A total rate of return swap is an agreement in which one party (total return payer) transfers the total economic performance of a reference obligation to the other party (total return receiver). Total economic performance includes income from interest and fees, gains or losses from market movements, and credit losses. The total return receiver assumes the entire economic exposure—that is, both market and credit exposure—to the reference asset. The total return payer—often the owner of the reference obligation—gives up economic exposure to the performance of the reference asset and in return takes on counterparty credit exposure to the total return receiver in the event of a default or fall in value of the reference asset.
The Fund may enter into credit default swap contracts or credit-linked notes for hedging purposes or to gain exposure to a credit in which the Fund may otherwise invest. A credit default swap is an agreement between two parties to exchange the credit risk of an issuer (reference entity). A buyer of a credit default swap is said to buy protection by paying periodic fees in return for a contingent payment from the seller if the reference entity has a credit event such as a bankruptcy, a failure to pay outstanding obligations or deteriorating credit while the swap is outstanding. A seller of a credit default swap is said to sell protection and thus collects the periodic fees and profits if the credit of the reference entity remains stable or improves while the swap is outstanding but the seller in a credit default swap contract would be required to pay an agreed-upon amount to the buyer in the event of an adverse credit event of the reference entity. A credit-linked note is a synthetic security, typically issued by a special purpose vehicle, that trades like a bond issued by the
25
| Morgan Stanley High Yield Fund, Inc. |
|
|
| June 30, 2007 (unaudited) |
Revised Investment Policy (cont’d)
reference entity but with the economics of the credit default swap. For this security, the buyer of protection sells the note. The buyer of protection (note seller) will pay periodic payments and profit if the reference entity defaults. Unlike the swap, the buyer of protection in a credit-linked note will receive money at the time of transaction from the sale of the note, and will return this money at the contract’s maturity if no credit event occurs. Conversely, the seller of protection purchases the notes. As with a credit default swap, the note purchaser (protection seller) received periodic payments. Unlike the swap transaction, the protection seller must pay for the note at the time of the transaction and will collect this money at the contract’s maturity if no credit event occurs.
The Fund will enter into swap, cap or floor transactions only with counterparties approved by the Adviser in accordance with guidelines established by the Fund’s Board of Directors. The Adviser will monitor the creditworthiness of counterparties to the Fund’s swap, cap, floor and collar transactions on an ongoing basis. If there is a default by the other party to such a transaction, the Fund will have contractual remedies pursuant to the agreements related to the transaction. The Fund may enter into swaps, caps, collars and floors on either an asset-based or liability-based basis, and will usually enter into swaps on a net basis, i.e., the two payment streams are netted out, with the Fund receiving or paying, as the case may be, only the net amount of the two payments. The net amount of the excess, if any, of the Fund’s obligations over its entitlements with respect to each swap will be accrued on a daily basis and the Fund segregates an amount of cash and/or liquid securities having an aggregate net asset value at least equal to the accrued excess. If the Fund enters into a swap transaction on other than a net basis, the Fund would segregate the full amount accrued on a daily basis of the Fund’s obligations with respect to the swap. To the extent the Fund sells (i.e. writes) caps, floors and collars, it will segregate cash and/ or liquid securities having an aggregate net asset value at lease equal to the full amount, accrued on a daily basis, of the Fund’s net obligations with respect to the caps, floors or collars.
The use of swaps is a highly specialized activity which involves investment techniques and risks different from those associated with ordinary portfolio securities transactions. If the Adviser is incorrect in its forecasts of the market values, interest rates and other applicable factors, the investment performance of the Fund would diminish compared with what it would have been if these investment techniques were not used. The use of swaps, caps, collars and floors may also have the effect of shifting the recognition of income between current and future periods.
Swap Options. The Fund may write (sell) and purchase put and call swap options. A swap option is a contract that gives a counterparty the right (but not the obligation) to enter into a new swap agreement or to shorten, extend, cancel or otherwise modify an existing swap agreement, at some designated future time on specified terms. The Fund may use swap options for hedging purposes or to manage and mitigate the credit and interest rate risk of the Fund. A swap option is a contract that gives a counterparty the right (but not the obligation) to enter into a new swap agreement or to shorten, extend, cancel or otherwise modify an existing swap agreement, at some designated future time on specified terms. The Fund may write (sell) and purchase put and call swap options. The use of swap options involves risks, including, among others, changes in the market value of securities held by the Fund, and of swap options relating to those securities may not be proportionate, (ii) there may not be a liquid market for the Fund to sell a swap option, which could result in difficulty closing a position, (iii) swap options can magnify the extent of losses incurred due to changes in the market value of the securities to which they relate and (iv) counterparty risk.
The Fund may invest in mortgage-related securities, including mortgage-backed securities such as mortgage pass-through securities, collateralized mortgage obligations (“CMOs”) and commercial mortgage-backed securities (“CMBS”).
Mortgage-backed securities. One type of mortgage-backed security in which the Fund may invest is a mortgage pass-through security. These securities represent a participation interest in a pool of residential mortgage loans originated by U.S. governmental or private lenders such as banks. They differ from conventional debt securities, which provide for periodic payment of interest in fixed amounts and principal payments at maturity or on specified call dates. Mortgage pass-through securities provide for monthly payments that are a “pass-through” of the monthly interest and principal payments made by the individual borrowers on the pooled mortgage loans. Mortgage pass-through securities may be collateralized by mortgages with fixed rates of interest or adjustable rates.
Mortgage-backed securities in which the Fund may invest have different risk characteristics than traditional debt securities. Although generally the value of fixed-income securities increases during periods of falling interest rates and decreases during periods of rising
26
| Morgan Stanley High Yield Fund, Inc. |
|
|
| June 30, 2007 (unaudited) |
Revised Investment Policy (cont’d)
rates, this is not always the case with mortgage-backed securities. This is due to the fact that principal on underlying mortgages may be prepaid at any time as well as other factors. Generally, prepayments will increase during a period of falling interest rates and decrease during a period of rising interest rates. The rate of prepayments also may be influenced by economic and other factors. Prepayment risk includes the possibility that, as interest rates fall, securities with stated interest rates may have the principal prepaid earlier than expected, requiring the Fund to invest the proceeds at generally lower interest rates. Investments in mortgage-backed securities are made based upon, among other things, expectations regarding the rate of prepayments on underlying mortgage pools. Rates of prepayment, faster or slower than expected by the Investment Adviser, could reduce the Fund’s yield, increase the volatility of the Fund and/or cause a decline in net asset value. Certain mortgage-backed securities may be more volatile and less liquid than other traditional types of debt securities.
Collateralized mortgage obligations. CMOs are debt obligations collateralized by mortgage loans or mortgage pass-through securities (collectively “Mortgage Assets”). Payments of principal and interest on the Mortgage Assets and any reinvestment income are used to make payments on the CMOs. CMOs are issued in multiple classes. Each class has a fixed or floating rate and a stated maturity or final distribution date. The principal and interest on the Mortgage Assets may be allocated among the classes in a number of different ways. Certain classes will, as a result of the allocation, have more predictable cash flows than others. Interest is paid or accrues on all classes of the CMOs on a monthly, quarterly or semiannual basis.
As a general matter, the more predictable the cash flow, the lower the yield relative to other Mortgage Assets. The less predictable the cash flow, the higher the yield and the greater the risk. The Fund may invest in any class of CMO.
The principal and interest on the Mortgage Assets comprising a CMO may be allocated among the several classes of a CMO in many ways. The general goal in allocating cash flows on Mortgage Assets to the various classes of a CMO is to create certain tranches on which the expected cash flows have a higher degree of predictability than do the underlying Mortgage Assets. As a general matter, the more predictable the cash flow is on a particular CMO tranche, the lower the anticipated yield on that tranche at the time of issue will be relative to the prevailing market yields on the Mortgage Assets. As part of the process of creating more predictable cash flows on certain tranches of a CMO, one or more tranches generally must be created that absorb most of the changes in the cash flows on the underlying Mortgage Assets. The yields on these tranches are generally higher than prevailing market yields on other mortgage related securities with similar average lives. Principal prepayments on the underlying Mortgage Assets may cause the CMOs to be retired substantially earlier than their stated maturities or final distribution dates. Because of the uncertainty of the cash flows on these tranches, the market prices and yields of these tranches are more volatile and may increase or decrease in value substantially with changes in interest rates and/or the rates of prepayment. Due to the possibility that prepayments (on home mortgages and other collateral) will alter the cash flow on CMOs, it is not possible to determine in advance the final maturity date or average life. Faster prepayment will shorten the average life and slower prepayments will lengthen it. In addition, if the collateral securing CMOs or any third party guarantees are insufficient to make payments, the Fund could sustain a loss.
Commercial mortgage-backed securities. The Fund may invest in CMBS. CMBS are generally multi-class or pass-through securities backed by a mortgage loan or a pool of mortgage loans secured by commercial property, such as industrial and warehouse properties, office buildings, retail space and shopping malls, multifamily properties and cooperative apartments. Private lenders, such as banks or insurance companies, originate these loans and then sell the loans directly into a CMBS trust or other entity. The commercial mortgage loans that underlie CMBS are generally not amortizing or not fully amortizing. That is, at their maturity date, repayment of their remaining principal balance or “balloon” is due and is repaid through the attainment of an additional loan or sale of the property. An extension of a final payment on commercial mortgages will increase the average life of the CMBS, generally resulting in lower yield for discount bonds and a higher yield for premium bonds. Unlike most single family residential mortgages, commercial real estate property loans often contain provisions which substantially reduce the likelihood that such securities will be prepaid. The provisions generally impose significant prepayment penalties on loans and, in some cases, there may be prohibitions on principal prepayments for several years following origination.
CMBS are subject to credit risk and prepayment risk. Although prepayment risk is present, it is of a lesser degree in the CMBS than in the residential mortgage market; commercial real estate property loans often contain provisions which substantially reduce the
27
| Morgan Stanley High Yield Fund, Inc. |
|
|
| June 30, 2007 (unaudited) |
Revised Investment Policy (cont’d)
likelihood that such securities will be prepaid (e.g., significant prepayment penalties on loans and, in some cases, prohibition on principal payments for several years following origination).
Stripped Mortgage-Backed Securities. The Fund may invest in stripped mortgage-backed securities. Stripped mortgage-backed securities are usually structured in two classes. One class entitles the holder to receive all or most of the interest but little or none of the principal of a pool of Mortgage Assets (the interest-only or “IO” Class), while the other class entitles the holder to receive all or most of the principal but little or none of the interest (the principal-only or “PO” Class).
Investments in each class of stripped mortgage-backed securities are extremely sensitive to changes in interest rates. IOs tend to decrease in value substantially if interest rates decline and prepayment rates become more rapid. POs tend to decrease in value substantially if interest rates increase and the rate of prepayment decreases. If the Fund invests in stripped mortgage-backed securities and interest rates move in a manner not anticipated by Fund management, it is possible that the Fund could lose all or substantially all of its investment.
Inverse Floaters. The Fund may invest in inverse floaters. An inverse floater has a coupon rate that moves in the direction opposite to that of a designated interest rate index. Investments in inverse floaters are subject to certain risks. Like most other fixed-income securities, the value of inverse floaters will decrease as interest rates increase. They are more volatile, however, than most other fixed-income securities because the coupon rate on an inverse floater typically changes at a multiple of the change in the relevant index rate. Thus, any rise in the index rate (as a consequence of an increase in interest rates) causes a correspondingly greater drop in the coupon rate of an inverse floater while a drop in the index rate causes a correspondingly greater increase in the coupon of an inverse floater. Some inverse floaters may also increase or decrease substantially because of changes in the rate of prepayments.
28
| Morgan Stanley High Yield Fund, Inc. |
|
|
Dividend Reinvestment and Cash Purchase Plan |
|
Pursuant to the Dividend Reinvestment and Cash Purchase Plan (the “Plan”), each stockholder will be deemed to have elected, unless American Stock Transfer & Trust Company (the “Plan Agent”) is otherwise instructed by the stockholder in writing, to have all distributions automatically reinvested in Fund shares. Participants in the Plan have the option of making additional voluntary cash payments to the Plan Agent, monthly, in any amount from $100 to $3,000, for investment in Fund shares.
Dividend and capital gain distributions will be reinvested on the reinvestment date in full and fractional shares. If the market price per share equals or exceeds net asset value per share on the reinvestment date, the Fund will issue shares to participants at net asset value or, if net asset value is less than 95% of the market price on the reinvestment date, shares will be issued at 95% of the market price. If net asset value exceeds the market price on the reinvestment date, participants will receive shares valued at market price. The Fund may purchase shares of its Common Stock in the open market in connection with dividend reinvestment requirements at the discretion of the Board of Directors. Should the Fund declare a dividend or capital gain distribution payable only in cash, the Plan Agent will purchase Fund shares for participants in the open market as agent for the participants.
The Plan Agent’s fees for the reinvestment of dividends and distributions will be paid by the Fund. However, each participant’s account will be charged a pro rata share of brokerage commissions incurred on any open market purchases effected on such participant’s behalf. A participant will also pay brokerage commissions incurred on purchases made by voluntary cash payments. Although stockholders in the Plan may receive no cash distributions, participation in the Plan will not relieve participants of any income tax which may be payable on such dividends or distributions.
In the case of stockholders, such as banks, brokers or nominees, that hold shares for others who are the beneficial owners, the Plan Agent will administer the Plan on the basis of the number of shares certified from time to time by the stockholder as representing the total amount registered in the stockholder’s name and held for the account of beneficial owners who are participating in the Plan.
Stockholders who do not wish to have distributions automatically reinvested should notify the Plan Agent in writing. There is no penalty for non-participation or withdrawal from the Plan, and stockholders who have previously withdrawn from the Plan may rejoin at any time. Requests for additional information or any correspondence concerning the Plan should be directed to the Plan Agent at:
Morgan Stanley High Yield Fund, Inc.
American Stock Transfer & Trust Company
Dividend Reinvestment and Cash Purchase Plan
59 Maiden Lane
New York, New York 10030
29
| Morgan Stanley High Yield Fund, Inc. |
Morgan Stanley Institutional Closed End Funds
An Important Notice Concerning Our
U.S. Privacy Policy
We are required by federal law to provide you with a copy of our Privacy Policy annually.
The following Policy applies to current and former individual investors in Morgan Stanley Institutional closed end funds. This Policy is not applicable to partnerships, corporations, trusts or other non-individual clients or account holders. Please note that we may amend this Policy at any time, and will inform you of any changes to this Policy as required by law.
We Respect Your Privacy
We appreciate that you have provided us with your personal financial information. We strive to maintain the privacy of such information while we help you achieve your financial objectives. This Policy describes what non-public personal information we collect about you, why we collect it, and when we may share it with others. We hope this Policy will help you understand how we collect and share non-public personal information that we gather about you. Throughout this Policy, we refer to the non-public information that personally identifies you or your accounts as “personal information.”
1. What Personal Information Do We Collect About You?
To serve you better and manage our business, it is important that we collect and maintain accurate information about you. We may obtain this information from applications and other forms you submit to us, from your dealings with us, from consumer reporting agencies, from our Web sites and from third parties and other sources.
For example:
• We may collect information such as your name, address, e-mail address, telephone/fax numbers, assets, income and investment objectives through applications and other forms you submit to us.
• We may obtain information about account balances, your use of account(s) and the types of products and services you prefer to receive from us through your dealings and transactions with us and other sources.
• We may obtain information about your creditworthiness and credit history from consumer reporting agencies.
• We may collect background information from and through third-party vendors to verify representations you have made and to comply with various regulatory requirements.
• If you interact with us through our public and private Web sites, we may collect information that you provide directly through online communications (such as an e-mail address). We may also collect information about your Internet service provider, your domain name, your computer’s operating system and Web browser, your use of our Web sites and your product and service preferences, through the use of “cookies.” “Cookies” recognize your computer each time you return to one of our sites, and help to improve our sites’ content and personalize your experience on our sites by, for example, suggesting offerings that may interest you. Please consult the Terms of Use of these sites for more details on our use of cookies.
2. When Do We Disclose Personal Information We Collect About You?
To provide you with the products and services you request, to serve you better and to manage our business, we may disclose personal information we collect about you to our affiliated companies and to non-affiliated third parties as required or permitted by law.
A. Information We Disclose to Our Affiliated Companies. We do not disclose personal information that we collect about you to our affiliated companies except to enable them to provide services on our behalf or as otherwise required or permitted by law.
30
| Morgan Stanley High Yield Fund, Inc. |
Morgan Stanley Institutional Closed End Funds
An Important Notice Concerning Our
U.S. Privacy Policy (cont’d)
B. Information We Disclose to Third Parties. We do not disclose personal information that we collect about you to non-affiliated third parties except to enable them to provide services on our behalf, to perform joint marketing agreements with other financial institutions, or as otherwise required or permitted by law. For example, some instances where we may disclose information about you to nonaffiliated third parties include: for servicing and processing transactions, to offer our own products and services, to protect against fraud, for institutional risk control, to respond to judicial process or to perform services on our behalf. When we share personal information with these companies, they are required to limit their use of personal information to the particular purpose for which it was shared and they are not allowed to share personal information with others except to fulfill that limited purpose.
3. How Do We Protect the Security and Confidentiality of Personal Information We Collect About You?
We maintain physical, electronic and procedural security measures to help safeguard the personal information we collect about you. We have internal policies governing the proper handling of client information. Third parties that provide support or marketing services on our behalf may also receive personal information, and we require them to adhere to confidentiality standards with respect to such information.
31
Morgan Stanley High Yield Fund, Inc.
Directors
Michael E. Nugent
Frank L. Bowman
Michael Bozic
Kathleen A. Dennis
James F. Higgins
Dr. Manuel H. Johnson
Joseph J. Kearns
Michael F. Klein
W. Allen Reed
Fergus Reid
Officers
Michael E. Nugent
Chairman of the Board and
Director
Ronald E. Robison
President and Principal
Executive Officer
J. David Germany
Vice President
Dennis F. Shea
Vice President
Amy R. Doberman
Vice President
Stefanie V. Chang Yu
Vice President
James W. Garrett
Treasurer and Chief
Financial Officer
Carsten Otto
Chief Compliance Officer
Thomas A. Perugini
Assistant Treasurer
Mary E. Mullin
Secretary
Investment Adviser and Administrator
Morgan Stanley Investment Management Inc.
522 Fifth Avenue
New York, New York 10036
Custodian
JPMorgan Chase Bank, N.A.
270 Park Avenue
New York, NY 10036
Stockholder Servicing Agent
American Stock Transfer & Trust Company
59 Maiden Lane
New York, New York 10030
Legal Counsel
Clifford Chance US LLP
31 West 52nd Street
New York, New York 10019-6131
Independent Registered Public Accounting Firm
Ernst & Young LLP
200 Clarendon Street
Boston, Massachusetts 02116
For additional Fund information, including the Fund’s net asset value per share and information regarding the investments comprising the Fund’s portfolio, please call 1(800) 231-2608 or visit our website at www.morganstanley.com/im.
© 2007 Morgan Stanley
CEMSYSAN IU07-03053I-Y06/07
Item 2. Code of Ethics.
Not applicable for semiannual reports.
Item 3. Audit Committee Financial Expert.
Not applicable for semiannual reports.
Item 4. Principal Accountant Fees and Services
Not applicable for semiannual reports.
Item 5. Audit Committee of Listed Registrants.
Not applicable for semiannual reports.
Item 6. Schedule of Investments
Refer to Item 1.
Item 7. Disclosure of Proxy Voting Policies and Procedures for Closed-End Management Investment Companies.
Not applicable for semiannual reports.
Item 8. Portfolio Managers of Closed-End Management Investment Companies
Applicable only to annual reports filed by closed-end funds.
Item 9. Closed-End Fund Repurchases
None
Item 10. Submission of Matters to a Vote of Security Holders
Not applicable.
Item 11. Controls and Procedures
(a) The Fund’s principal executive officer and principal financial officer have concluded that the Fund’s disclosure controls and procedures are sufficient to ensure that information required to be disclosed by the Fund in this Form N-CSR was recorded, processed, summarized and reported within the time periods specified in the Securities and Exchange Commission’s rules and forms, based upon such officers’ evaluation of these controls and procedures as of a date within 90 days of the filing date of the report.
1
(b) There were no changes in the registrant’s internal control over financial reporting that occurred during the second fiscal quarter of the period that has materially affected, or is reasonably likely to materially affect, the registrant’s internal control over financial reporting.
Item 12. Exhibits
(a) Code of Ethics - Not applicable for semiannual reports.
(b) A separate certification for each principal executive officer and principal financial officer of the registrant are attached hereto as part of EX-99.CERT.
2
SIGNATURES
Pursuant to the requirements of the Securities Exchange Act of 1934 and the Investment Company Act of 1940, the registrant has duly caused this report to be signed on its behalf by the undersigned, thereunto duly authorized.
(Registrant) | Morgan Stanley High Yield Fund, Inc. |
|
By: | /s/ Ronald E. Robison |
| |
Name: | Ronald E. Robison |
| |
Title: | Principal Executive Officer |
| |
Date: | August 9, 2007 |
| |
|
|
| |
|
|
| |
Pursuant to the requirements of the Securities Exchange Act of 1934 and the Investment Company Act of 1940, this report has been signed by the following persons on behalf of the registrant and in the capacities and on the dates indicated. | |||
|
|
| |
By: | /s/ Ronald E. Robison |
| |
Name: | Ronald E. Robison |
| |
Title: | Principal Executive Officer |
| |
Date: | August 9, 2007 |
| |
|
|
| |
|
|
| |
By: | /s/ James W. Garrett |
| |
Name: | James W. Garrett |
| |
Title: | Principal Financial Officer |
| |
Date: | August 9, 2007 |
| |