UNITED STATES
SECURITIES AND EXCHANGE COMMISSION
Washington, D.C. 20549
FORM N-CSR
CERTIFIED SHAREHOLDER REPORT OF REGISTERED
MANAGEMENT INVESTMENT COMPANIES
Investment Company Act file number | 811-8104 | |||||||
| ||||||||
Touchstone Funds Group Trust | ||||||||
(Exact name of registrant as specified in charter) | ||||||||
| ||||||||
303 Broadway, Suite 1100, Cincinnati, Ohio |
| 45202 | ||||||
(Address of principal executive offices) |
| (Zip code) | ||||||
| ||||||||
Jill T. McGruder, 303 Broadway, Suite 1100, Cincinnati, Ohio 45202 | ||||||||
(Name and address of agent for service) | ||||||||
| ||||||||
Registrant’s telephone number, including area code: | (513) 878-4066 |
| ||||||
| ||||||||
Date of fiscal year end: | 09/30 |
| ||||||
| ||||||||
Date of reporting period: | 9/30/10 |
| ||||||
Form N-CSR is to be used by management investment companies to file reports with the Commission not later than 10 days after the transmission to stockholders of any report that is required to be transmitted to stockholders under Rule 30e-1 under the Investment Company Act of 1940 (17 CFR 270.30e-1). The Commission may use the information provided on Form N-CSR in its regulatory, disclosure review, inspection and policymaking roles.
A registrant is required to disclose the information specified by Form N-CSR, and the Commission will make this information public. A registrant is not required to respond to the collection of information contained in Form N-CSR unless the Form displays a currently valid Office of Management and Budget (“OMB”) control number. Please direct comments concerning the accuracy of the information collection burden estimate and any suggestions for reducing the burden to Secretary, Securities and Exchange Commission, 450 Fifth Street, NW, Washington, DC 20549-0609. The OMB has reviewed this collection of information under the clearance requirements of 44 U.S.C. § 3507.
Item 1. Reports to Stockholders.
September 30, 2010
Annual Report
Touchstone Funds Group Trust
Touchstone Capital Appreciation Fund
Touchstone Core Plus Fixed Income Fund
Touchstone Emerging Markets Equity Fund
Touchstone Focused Equity Fund
Touchstone Global Equity Fund
Touchstone Global Real Estate Fund
Touchstone Healthcare and Biotechnology Fund
Touchstone Intermediate Fixed Income Fund
Touchstone International Fixed Income Fund
Touchstone Large Cap Relative Value Fund
Touchstone Market Neutral Equity Fund
(formerly Touchstone Long/Short Equity Fund)
Touchstone Mid Cap Fund
Touchstone Mid Cap Value Fund
Touchstone Premium Yield Equity Fund
Touchstone Sands Capital Select Growth Fund
Touchstone Short Duration Fixed Income Fund
Touchstone Small Cap Core Fund
Touchstone Small Cap Value Opportunities Fund
Touchstone Ultra Short Duration Fixed Income Fund

Table of Contents
| Page | |||||||
| Letter from the President | 3 | ||||||
| Management's Discussion of Fund Performance (Unaudited) | 4-53 | ||||||
| Tabular Presentation of Portfolios of Investments (Unaudited) | 54-57 | ||||||
| Statements of Assets and Liabilities | 58-67 | ||||||
| Statements of Operations | 68-72 | ||||||
| Statements of Changes in Net Assets | 73-79 | ||||||
| Financial Highlights | 80-111 | ||||||
| Notes to Financial Statements | 112-137 | ||||||
| Portfolios of Investments: | |||||||
| Touchstone Capital Appreciation Fund | 138 | ||||||
| Touchstone Core Plus Fixed Income Fund | 139-144 | ||||||
| Touchstone Emerging Markets Equity Fund | 145-146 | ||||||
| Touchstone Focused Equity Fund | 147 | ||||||
| Touchstone Global Equity Fund | 148-149 | ||||||
| Touchstone Global Real Estate Fund | 150-152 | ||||||
| Touchstone Healthcare and Biotechnology Fund | 153 | ||||||
| Touchstone Intermediate Fixed Income Fund | 154-157 | ||||||
| Touchstone International Fixed Income | 158-159 | ||||||
| Touchstone Large Cap Relative Value Fund | 160 | ||||||
| Touchstone Market Neutral Equity Fund | 161-166 | ||||||
| Touchstone Mid Cap Fund | 167-168 | ||||||
| Touchstone Mid Cap Value Fund | 169-170 | ||||||
| Touchstone Premium Yield Equity Fund | 171 | ||||||
| Touchstone Sands Capital Select Growth Fund | 172 | ||||||
| Touchstone Short Duration Fixed Income Fund | 173-177 | ||||||
| Touchstone Small Cap Core Fund | 178 | ||||||
| Touchstone Small Cap Value Opportunities Fund | 179-180 | ||||||
| Touchstone Ultra Short Duration Fixed Income Fund | 181-186 | ||||||
| Report of Independent Registered Public Accounting Firm | 187 | ||||||
| Other Items (Unaudited) | 188-193 | ||||||
| Management of the Trust (Unaudited) | 194-196 | ||||||
| Privacy Protection Policy | 197 | ||||||
2
Letter from the President
Dear Shareholder:
We are pleased to provide you with the Touchstone Funds Group Trust Annual Report. Inside you will find key financial information, as well as manager commentaries for the Funds, for the twelve months ended September 30, 2010.
All traditional asset classes posted strong positive absolute returns regardless of style or geographic region during the year. The U.S. equity markets had a solid year, despite continued anxiety about the economy and capital markets. For the one-year period ending September 30, 2010, the U.S. stock market outperformed the international equity market. From an investment style and market capitalization perspective, U.S. growth equities outpaced their value counterparts, with mid cap leading the way. Over the last year, broad investment grade bonds and Treasuries exhibited solid returns.
The U.S. equity market is currently considered to be reasonably valued-to-undervalued, with a powerful rebound in corporate profits providing the main support. It is thought that given the current state of the economy, earnings growth should moderate somewhat during the balance of this year and into 2011. It is generally believed that the economy will continue to recover, albeit at a sub-par pace. Even though forecasters believe bond yields are expected to increase from current low levels over the coming year, it is recognized that interest rates could stay unusually low for a while longer.
One year ago we diversified our portfolio offerings and launched ten funds to provide greater investment breadth and depth to our chosen distribution partners. We selected 10 institutional asset managers who were carefully screened and selected for their considerable capabilities and strong track records to act in a sub-advisory capacity for each of the ten funds. Based on Lipper Analytical Services' rankings, five of the ten funds posted returns in the top quintile of their respective categories for the one-year period when ranked amongst their peers.
The Touchstone Sands Capital Select Growth Fund reached its 10-year milestone this past quarter; it proudly boasts top quartile performance across all time periods; year-to-date, as well as 1-, 3-, 5- and 10-years, according to Lipper Analytical Services' rankings amongst their peers. Sands Capital Management's strategy of investing in a concentrated portfolio of leading companies, also known as fortress franchises, has helped it achieve these strong, hard-earned results.
We continue to believe that diversification is essential to balancing risk and return. We recommend that you continue to work with your financial professional to employ a sound asset allocation strategy that invests in a combination of stock, bond, and money market mutual funds to help keep your financial strategy on course. It is critical to maintain a long-term approach to gain the full potential benefits of investing.
Touchstone is committed to helping investors achieve their financial goals by providing access to a distinctive selection of institutional asset managers who are known and respected for proficiency in their specific area of expertise. We hope that you will find the enclosed commentaries helpful.
We greatly appreciate your continued support. Thank you for including Touchstone as part of your investment plan.
Sincerely,

Jill T. McGruder
President
Touchstone Funds Group Trust
3
Management's Discussion of Fund Performance (Unaudited)
Touchstone Capital Appreciation Fund
Sub-Advised by Farr, Miller & Washington
Investment Philosophy and Process
The Touchstone Capital Appreciation Fund seeks long-term capital appreciation. The Fund invests, under normal market conditions, at least 80 percent of its net assets (including borrowings for investment purposes) in common stocks of large capitalization U.S. companies that are believed to be trading at attractive valuations.
Fund Performance and Positioning
The total return of the Touchstone Capital Appreciation Fund was 6.10% for the twelve month period ended September 30, 2010 which was calculated excluding the maximum sales charge. The total return of the Russell 1000® Growth Index was 12.65% and the total return of the S&P 500 Index was 10.16% for the same period. The Fund underperformed both of its benchmarks over the past 12-month period.
The majority of the Fund's underperformance occurred during the market's sharp rally in the third quarter. Despite signs that the U.S. economy had begun to weaken again, the market was up sharply on news that the Federal Reserve would be ready to stabilize things with a second round of quantitative easing (QE2). Needless to say, the Fund's portfolio of large-cap, stable growth companies did not keep up during a rally that generally favored higher beta sectors and stocks. The recent underperformance has left the stocks in the Fund trading at reasonable relative valuations, as there continues to be little to no premium being awarded for quality at this point.
The Fund's performance was hurt by its conservative stance over the past 12 months. Underperformance in the Information Technology, Financials and Consumer Staples sectors stood out over this time period. Stocks contributing to underperformance in the Fund were Cisco Systems Inc., Microsoft Corp., Dell Inc., Nokia Corp., Google Inc., and Paychex Inc. With the exception of Nokia, each of these companies produced solid results over this time period but were not rewarded with a higher P/E multiple by the market. Nokia underperformed due to its continuing struggle in the high-end smart phone market. Within the Energy sector, Exxon Mobil Corp., and Schlumberger Ltd., both hurt performance. Other underperformers for the year included Monsanto Co., Bank of America Corp., JPMorgan Chase & Co., Goldman Sachs Group Inc., and CVS Caremark Corp. The general trend has been that large, blue chip companies with stable growth prospects have not kept up with the market over the past 12 months. This trend was especially pronounced during the third quarter of 2010.
During the past 12 months, strong stock selection in the Consumer Discretionary and Industrial sectors contributed to the Fund's performance. O'Reilly Automotive Inc., and PetSmart Inc., both performed well during the downturn and continued to generate solid same-store sales growth and expense control as the economy recovered. Danaher Corp., United Technologies Corp., Donaldson Co. Inc., and Rockwell Collins Inc., each continued to recover nicely from the downturn and drove the outperformance in the Industrials sector. Genzyme Corp. and Waters Corp. also stood out as outperformers during this recovery period. However, contributions from these positions were not enough to overcome the underperformance.
Strategy and Outlook
We believe that the Fund continues to be conservatively postured vs. its benchmark, the Russell 1000® Growth Index. Roughly, 40 percent of the Fund is currently invested in the less economically sensitive Consumer Staples and Health Care sectors. We continue to add to positions in large-cap, blue-chip companies trading at what appear to be very attractive relative valuations. Proceeds for these purchases are generally coming from stocks that have outperformed and are now trading at rich valuations.
4
Management's Discussion of Fund Performance (Continued)
The economic rebound appears to have hit a bump in the road. However, the market has responded positively to the potential for more quantitative easing. We are not optimistic that more quantitative easing is a long-term solution to this country's problems. As such, we continue to favor global companies trading at reasonable valuations. We believe that the Fund is well positioned for this uncertain environment. If our stance is too cautious, it seems reasonable to believe that the Fund's stocks would continue to benefit from earnings growth and P/E multiple expansions.
Comparison of the Change in Value of a $10,000 Investment in the Touchstone Capital Appreciation Fund - Class A*, the Russell 1000® Growth Index and the S&P 500 Index

* The chart above represents performance for Class A shares only, which will vary from the performance of Class C shares, Class Y shares and Institutional Class shares based on the differences in loads and fees paid by shareholders in the different classes. The Fund commenced operations on September 30, 2009.
** The total returns shown above are adjusted for maximum applicable sales charges.
The performance of the above Fund does not reflect the deduction of taxes that a shareholder would pay on Fund distributions or the redemption of Fund shares.
5
Management's Discussion of Fund Performance (Continued)
Touchstone Core Plus Fixed Income Fund
Sub-Advised by Bradford & Marzec LLC
Investment Philosophy and Process
The Fund seeks to provide current income. Capital appreciation is a secondary goal. It seeks to add excess return by capturing relative value between fixed income sectors and securities through economic cycles using a traditional, long-only investment style.
Fund Performance and Positioning
The total return of the Touchstone Core Plus Fixed Income Fund was 7.46% for the twelve month period ended September 30, 2010 which was calculated excluding the maximum sales charge. The total return of the Barclays Capital Aggregate Bond Index was 8.16% for the same period. During the past 12 months, the Fund underperformed its benchmark.
During the first month the Fund was invested, it underperformed its benchmark by 112 basis points. This was partly due to initial investment costs as well as market timing. From the end of that initial month through the end of September 2010, the Fund outperformed its benchmark by 114 basis points. Sector rotation was the primary source of positive returns, due in large part to overweighting the spread sectors, High Yield and CMBS (Commercial Mortgage-Backed Securities) – both of which performed very well. Security selection detracted from performance, particularly within High Yield and CMBS. The duration and yield curve strategies were positive performers. Underweighting MBS (Mortgage-Backed Securities) also had a positive effect on performance. Finally, the Fund's currency positioning detracted from performance. Non-dollar bonds were used as surrogate treasuries which underperformed the benchmark.
Strategy and Outlook
Globally, European spending cuts continue to hurt; however, global growth is forecast to be resilient in the face of a possible U.S. slowdown. The global economic focus is increasingly on Europe and the strains appearing across the board as fiscally responsible governments address burgeoning budget deficits by introducing tax increases and painful spending cuts. France is expected to grow at about +1.0% for 2010 with Germany only slightly higher. Despite 2Q growth of 4.0%, recent data shows Germany to be slowing. The new conservative U.K. government cut child subsidy payments to the wealthy and reduced unemployment benefits as part of its ongoing effort to save $135 billion from the budget over the next 5 years. As a result, U.K. growth will likely slow along with the rest of core Europe. The effects of these Pan-European cuts are being felt across the Eurozone with strikes and demonstrations on the rise. Last month sizeable demonstrations o ccurred in Brussels, the home of the European Parliament, in protest to the cuts. Strikes in France, the U.K. and Greece also occurred. Although Greece continues to struggle it appears to be on target to meet its Gross Domestic Product (GDP) target of -8.1% for 2010, although in the first half of the year tax receipts were lower than expected. Ireland continues to take difficult action to reduce its budget deficit which presently stands at $12.1 billion (as of 08/10) down from $18.7 billion the previous year. Italy, Portugal and Spain are generally making headway toward meeting budget deficit targets. Further cuts, however, will need to be implemented.
The bifurcation of global recovery continues as Asian and South American growth outstrips Europe and the U.S. Although growth in Brazil is expected to slow, second quarter growth came in above expectations at a surprising +8.8%. This follows +9.0% in first quarter 2010. Chinese growth still underpins Asia with little signs of slowing. Major Wall Street economists are also predicting that world growth will only slow slightly to 4.6% despite a significant slowdown in U.S. growth in 2011. Japan's economy remains sluggish in the face of an overvalued Yen.
6
Management's Discussion of Fund Performance (Continued)
Domestically, the prospect of further quantitative easing is keeping rates low. Growth signals remain mixed with activity subpar. Outside of slightly disappointing economic data, the U.S. focus remains on the likelihood of further quantitative easing (QE2) by the Federal Reserve. On the surface, it is a win-win situation for the authorities. Excessive treasury supply will be met, interest rates should stay low, which should help the economy, stocks and commodities should rise, and the dollar will fall — boosting exports. At the end of the day, however, the action is nothing more than debt monetization that could ultimately lead to out-of-control inflation. For the time being, the markets are likely to view QE2 positively. U.S. data continues to be mixed with the U.S. economy struggling to grow. Although there are no immediate signs of a double dip, the lack of any clear recovery is causing concern as 2011 approaches, especially if no po litical agreement is reached on extending the Bush tax cuts. Regardless, other tax increases are in the pipeline.
The stock market's strong September was likely in response to the upcoming U.S. elections. Whether this helps consumer confidence is still a moot point as unemployment continues to remain high and is forecast to get worse before it gets better. On a more positive note, lower long-term U.S. yields are ultimately expected to provide significant stimulus to the slowing U.S. economy. The 30-year bond yield remains below 4%. Longer term, there is a close correlation between house prices and nominal GDP in the U.S. Therefore, housing needs to recover before any meaningful growth momentum is likely. Further quantitative easing, if enacted, will ensure that long-term rates remain low, at least for the time being.
Portfolio Strategy — Duration & Yield Curve
The possibility of further quantitative easing is keeping U.S. interest rates low as the Fed indicates concern over disinflation in its post FOMC meeting statement. Further yield curve flattening is possible. At the Fed's most recent meeting, concern was expressed over the continuing decline of U.S. inflation, raising the possibility of further quantitative easing. This is where the Fed simply buys U.S. treasuries issued by the U.S. Treasury. The action has three short-term positive effects; it absorbs treasury supply, pumps dollars into the system and keeps downward pressure on interest rates. As a result, long-term interest rates remain in a clearly defined, downward trend spurred on by declining inflation, in addition to the possibility of further quantitative easing by the Federal Reserve. With the U.S. economy slowing, the Fed is unlikely to begin tightening until well into 2011, at the earliest. Inflation continues to be of little conc ern. Long-term interest rates are likely to fall, further flattening the yield curve. Under this scenario, returns for bonds should be favorable. Looking farther ahead, massive fiscal imbalances in the U.S. will ultimately push long-term interest rates higher. The market could inevitably become saturated with U.S. treasuries as government spending as a percent of GDP grows, although the outcome of U.S. elections could have a beneficial impact on spending. Eventually investors' appetite for risk will direct capital away from (safe) low yielding assets. In that event, a strategic short duration position would be considered. Our stated philosophical range is +/- 25% of the index.
Portfolio Strategy — Investment Grade Credit
The Fund's overweight in Investment Grade Credit will be maintained. We expect Investment Grade Credit to continue to outperform higher rated asset classes as fundamentals and market technicals support further gains. Conservatively positioned corporate balance sheets, improved corporate earnings and attractive relative valuations will keep corporate bonds a favored investment alternative in the current low interest rate and sluggish macro-economic environment. Fundamentally, strong corporate balance sheets and healthy earnings momentum support corporate credit quality, even in the current soft patch of U.S. economic activity. Balance sheets have strengthened as companies have reduced financial leverage, meaningfully improved their liquidity, and continued to term-out their debt maturities. Furthermore, we expect tight expense controls to lead to further expansion of corporate profit margins. Importantly, financial institution profitability s hould continue to recover, irrespective of the new financial regulations, as credit losses have begun to moderate. Technicals remain strong as greater transparency regarding U.S. financial regulation, European banking system risk, and
7
Management's Discussion of Fund Performance (Continued)
second quarter earnings have encouraged investors to continue to put money into corporate bonds. Wall Street bond inventory remains relatively low despite the continued heavy new issue calendar. While new corporate bond issuance will remain high as companies refinance and extend debt maturities, we expect investor demand to absorb this issuance rather easily. Valuations are attractive. Corporate spreads are still well wide of long-term averages and are in-line with spread ranges of the prior two recessionary periods (1991 and 2001). We favor companies with improving operating trends, solid balance sheets, and that show a commitment to reducing leverage. We favor Financials as current valuations do not seem to reflect greater regulatory transparency and improvements in earnings, asset quality, and capital ratios. We continue to favor cross-over credits and BBB-rated bonds, as we believe quality spreads will continue to compress. The Fund is o verweight Banks, Insurance, Non-Captive Finance, Electric Utility Holding Companies, and Real Estate Investment Trusts (REITs). It is underweight Single-A Industrials, Consumer Discretionary, Pharmaceuticals, and Yankee Sovereign-related securities.
Portfolio Strategy — High Yield
We believe strong credit fundamentals and attractive yields position high yield relatively well for the remainder of 2010. Corporate earnings remained impressive in the second quarter despite slower overall economic growth, with top line revenue growth and profits beating estimates again. Strong cash flows continue to enhance balance sheet strength as corporations reduce debt and build cash balances. Corporate executives are becoming somewhat more upbeat, but remain reluctant to increase their leverage given numerous macro uncertainties. High yield mutual fund inflows in September were an impressive $3.6 billion, bringing year-to-date inflows to approximately $8.9 billion. High yield inflows have picked up significantly since the market correction in April/May, and we believe that strong underlying credit fundamentals and attractive relative yields will keep demand strong in the coming months. Global high yield default rates (Moody's 12 mont h trailing) fell again in August to 5% from their peak of 13.5% last November. Rating agencies are responding to the positive news with upgrades significantly outpacing downgrades in 2010. These trends support further gains in high yield. High yield new issuance remained historically high in September, with a near record $32 billion issued over the month. Year-to-date issuance stands at over $200 billion, already exceeding last year's record of $180 billion. Refinancing remains the key driver of issuance, accounting for over 75% of new deals year-to-date. Corporations continue to focus on maintaining balance sheet strength by reducing leverage and extending debt maturities through these refinancings. We continue to take advantage of recent strong performance to selectively swap into higher yielding credits possessing solid fundamentals. Smaller issuers that tend to fly below the radar of larger managers remain an attractive way to conservatively add yield. Given our outlook for subpar U.S. economic growth, w e remain underweight most consumer cyclical industries. We do find value in a few cyclical industries such as airlines, gaming/lodging and paper. We still anticipate yield/income to be the key driver of performance in 2010. Merger and Acquisition (M&A) activity should increase going forward, but we believe that most deals will be smaller in nature, conservatively financed and driven by larger/higher rated companies looking to grow revenues. The Fund is overweight Banking/Finance, Energy, Gaming/Lodging, Insurance, Paper/Packaging, Railroads, REITs, Technology and Transports and underweight Autos, Building Materials/Housing, Chemicals, Electric, Food/Beverage/Tobacco, Health Care, Non-captive Finance and Supermarkets.
Portfolio Strategy — Governments & TIPS
The Fund remains underweight Governments in both the U.S. Treasury and Agency debenture sectors given better relative value in other higher-yielding sectors. Treasuries gain support from the Fed's purchases with proceeds from their mortgage portfolio and in anticipation of a second round of quantitative easing, and domestic banks and foreign buyers continue to add to U.S. Treasury holdings. Agency debentures remain fully valued with a meager yield advantage to treasuries. Government Sponsored Enterprise (GSE) reform should
8
Management's Discussion of Fund Performance (Continued)
continue to make headlines, but resolution will wait until 2011. The Fund has no allocation to TIPS as this sector is out of favor as we believe deflation will be a larger concern than inflation in the next six months. Breakeven inflation rates have collapsed following modest inflation releases and a strong rally in nominal U.S. treasuries. The latest Federal Reserve policy statement cites "substantial resource slack" and that "inflation is likely to remain subdued for some time."
Portfolio Strategy — Structured Products
The Fund continues to be underweight agency mortgages given better upside potential in other risk sectors. Agency MBS remain vulnerable to elevated refinancing fears and potential GSE reforms. Recent underperformance has returned mortgage spreads to fair value. To increase portfolio yield, the Fund is currently overweight conventional 30-year mortgages rather than 15-year mortgages. Higher coupon mortgages, typically comprised of credit-impaired borrowers, provide an attractive yield with very muted refinancing response. We recommend non-agency mortgages which are supported by strong supply and demand and stabilizing fundamentals with focus on prime non-agency securities that provide 5% to 6% yields and attractive relative value versus other sectors. The Fund is underweight in Asset Backed Securities (ABS) as current ABS valuations leave little upside potential, but should remain firm given strong investor support. We believe fundamentals in consumer-related finance are showing early signs of reaching a bottom and weakness in the labor markets will continue to weigh on credit card, auto, and student loan ABS. The Fund remains overweight CMBS despite Europe; however, we recently reduced allocation from 10% to 7% following the strong recent performance. The CMBS sector continues to benefit from attractive yields and positive supply and demand technicals. Commercial real estate fundamentals are reaching a bottom — early signs include improved transaction volume and stabilizing prices.
Portfolio Strategy — Non-Dollar
Risk is back despite a weak U.S. economy/mixed Euro economy. Asia/emerging markets outpace the West and the U.K. is starting to fade. The Yen is selling off with huge government intervention, but pressure remains with strong Chinese buying. Despite economic vulnerabilities in the U.S. and Europe, risk products are well-supported, as Asia and emerging markets economies remain solid. Government intervention by the Japanese kept the Yen from further appreciation. Hints from the Fed for further quantitative easing kept treasuries bid in the face of a risk rally. While Asia doesn't appear as bullet-proof as before, strength remains, particularly in exports, with the powerhouse China retaining solid growth. This Asian/emerging market strength continues to benefit Australia and New Zealand, with increasingly stronger export and terms of trade figures being registered by the former. Aussie markets ignored the victory by the ruling labor party, despi te their support for increased resource taxes. The Reserve Bank of Australia (RBA) is poised to raise rates, possibly at the next meeting, unless an unexpected global event appears. New Zealand's economy is less robust than Australia's, with housing particularly precarious. This has pushed back rate hike expectations from the Reserve Bank of New England (RBNZ) to 2011. Government bonds are still attractive to global investors, but the unprecedented rally in U.S. rates widened spreads.
Canada has seen some softening in economic releases, but is still much stronger than its neighbor to the south. Canadian sovereign bonds continue to share the safe haven category with the U.S. and attract a record volume of foreign purchases. The attractiveness of its resource companies keeps the currency within a range, with current levels depending on M&A activity and the price of oil. The BHP Billiton attempt to pay $40 billion for Canada's prized Potash Corporation rocketed the CAD to recent highs versus the dollar, but the corporation's rebuff and Saskatchewan Province's efforts to thwart the transaction have pushed the currency backward. The Bank of Canada, also data-dependent, is expected to continue to be in rate-hike mode, albeit at a much slower pace than previously thought, especially after Governor Carney's recent dovish comments. Due to a budget-friendly U.K. electoral outcome, bond buying continues in gilts, leading to outp erformance
9
Management's Discussion of Fund Performance (Continued)
versus both U.S. and European sovereigns. Dovish comments by Bank of England officials regarding deflationary fears further support gilts. Talk about quantitative easing has grown, especially after heightened expectations of a U.S. move. Spreads remain attractive given the U.K. absence from the bailout packages and affirmation of the country's 'AAA' sovereign rating by the rating agencies. After "tranquility" imparted to the market by the bank stress tests, turmoil returned with concerns about Spain, Portugal and Ireland; however, at month-end, these concerns were assuaged by more concrete estimates regarding the Irish bank bailout and the elimination of any further debt issuance in 2010, assignment of a "stable outlook" by S&P for Spain after their expected downgrade, and stern austerity budget measures by Portugal. While European economic conditions remain mixed, there are some bright spots and the feared return-to-recession doesn't ap pear imminent. The euro remains buoyed by low yielding U.S. dollar assets, however the European Central Bank (ECB) is still reluctant to raise rates due to growth concerns.
Comparison of the Change in Value of a $10,000 Investment in the Touchstone Core Plus Fixed Income Fund - Class A* and the Barclays Capital Aggregate Bond Index

* The chart above represents performance for Class A shares only, which will vary from the performance of Class C shares, Class Y shares and Institutional Class shares based on the differences in loads and fees paid by shareholders in the different classes. The Fund commenced operations on September 30, 2009.
** The total returns shown above are adjusted for maximum applicable sales charges.
The performance of the above Fund does not reflect the deduction of taxes that a shareholder would pay on Fund distributions or the redemption of Fund shares.
10
Management's Discussion of Fund Performance (Continued)
Touchstone Emerging Markets Equity Fund
Sub-Advised by AGF Investments America, Inc.
Investment Philosophy and Process
The Touchstone Emerging Markets Equity Fund seeks capital appreciation by primarily investing in equity securities of companies in emerging markets. It seeks to invest in businesses believed to be mispriced by the market and that are expected to generate positive and sustainable earnings growth.
Fund Performance and Positioning
The total return of the Touchstone Emerging Markets Equity Fund was 26.80% for the twelve month period ended September 30, 2010 which was calculated excluding the maximum sales charge. The total return of the MSCI Emerging Markets Index was 20.54% for the same period. For the year, the Fund outperformed its benchmark.
Financials, Consumer Discretionary, Consumer Staples, Energy and Information Technology sectors represented the most significant positive contribution to relative return. The Health Care sector was the largest detractor during the period. Financials advanced amid positive domestic economic news and exposure to regional banks. Bank Mandiri, Indonesia's largest bank by assets, was a contributor, as the Indonesian stock market rose on expectations that faster economic growth and record-low interest rates will boost earnings. The central bank in Indonesia raised its growth forecast, citing rising consumer spending. The nation's sovereign debt rating was upgraded based on positive structural reforms, contributing to further appreciation in the rupiah, the second-best-performing currency in Asia. Optimism was also fueled by the finance ministry's efforts to improve governance and implement tax reforms to lure investment. Kasikornbank Public Compan y Ltd., Thailand's third-largest lender by assets, jumped to a 13-year high after lending climbed in February to 905.1 billion baht. Despite the implementation of tightening policies in China, Singapore property developers such as Keppel Land, reported encouraging news for the sector as sales activities remained robust. Also contributing to Fund performance was First Pacific Company, an investment and management company based in Hong Kong whose principal operations and business interests has exposure to Asia's growth in industries such as telecommunications, consumer food products, infrastructure and natural resources. Shares of the Hong Kong-listed company rose following an announcement to sell $300 million worth of bonds to pay down debt.
One of the main investment themes within the Fund focused on rising domestic income and consumption growth, and an overweight exposure in the Consumer Discretionary sector was positive. Lojas Renner, Brazil's largest publicly traded retailer was a positive performance contributor as quarterly profits rose while the company continued to focus on its growth strategy. Daphne International Holdings, a leading retailer of ladies footwear in China contributed as the company's operating profit rose 27 percent amid a challenging environment in 2009. Hankook Tire, South Korea's largest tire maker, was also a contributor following an announcement of plans to expand manufacturing capacity in China.
The Consumer Staples sector added to the Fund's relative return following an announcement that Wal-Mart planned to buy Massmart Holdings Ltd., in a transaction worth approximately U.S. $4.6 billion, to gain access into South Africa, the largest deal in more than a decade. Massmart is one of the Fund's top ten holdings and South Africa's largest food and general-goods wholesaler. Another top contributor was India-listed ITC Ltd., Asia's second-largest cigarette maker by market value, whose earnings continued to rise as price increases from higher taxes failed to deter smokers. Revenue from ITC's hotel business also rose as business travel gained momentum after the global recession and Mumbai terrorist attacks in November 2008. The Energy sector contributed positively from a relative underweight allocation and security selection. Oil prices remained volatile amid concerns that economic growth was slowing down in the U.S. and China, the world's two largest energy consumers. Oil and natural gas producer Petroleo Brasileiro S.A. added to positive performance as the company announced an aggressive five-year, $224 billion investment plan to double current oil production,
11
Management's Discussion of Fund Performance (Continued)
which included a stock offering worth a record U.S. $70 billion. No exposure to Russian natural gas producer Gazprom was also positive as the company's board approved a 13 percent increase in investments despite a decline in revenues. Tupras Turkiye Petrol Rafinerileri AS of Turkey contributed as the company reported a rise in total sales volume and in output, but first-half profit declined by 3 percent due to higher idle capacity costs.
A relative underweight exposure to the Information Technology sector, combined with positive security selection, was additive to Fund performance. Top holdings included VTech Holdings, a Hong Kong-based manufacturer of consumer electronics which recently announced new investment in factory equipment to reduce labor reliance and increase efficiency, and Infosys Technologies Limited, a provider of IT consulting and software services, whose revenue growth is expected to reach 20 percent this year.
The Health Care sector rose during the quarter, but detracted from Fund performance on company specific news. Teva Pharmaceutical was the primary detractor, as the world's largest generic drug manufacturer was in the midst of a legal dispute over existing patents which included a treatment for Alzheimer's. Exposure to Piramal Health Care was positive within the Fund, however, the position was trimmed following the sale of one of its largest operating business units to Abbott Laboratories.
Regionally, a relative underweight allocation to China/Hong Kong, Taiwan, and South Korea, and an overweight to Thailand and Singapore drove positive relative returns in Asia. Overweight exposure to Turkey and South Africa, and no exposure to Russia was beneficial in the EMEA region. In Latin America, an underweight allocation to Brazil and overweight Mexico was positive.
During the year, a number of holdings were added to the Fund. MTN Group Limited, a dominant wireless operator in Africa with exposure in the Middle East, has exhibited excellent fundamentals in terms of balance sheet quality, and a proven track record of positive EVA (Economic Value Added) creation. Fresnillo PLC, a silver mining company based in Mexico with an experienced management team, is a superior low cost producer with an attractive multi-year production growth profile from a high quality asset base. Bharti Airtel is the dominant wireless operator in India, and is well positioned in the growing wireless market. Enersis is a Chilean holding company whose main operating assets are in electricity generation, and is positioned to leverage increased electricity demand due to strong GDP growth. Southern Copper Corporation owns and operates mining operations in Peru and Mexico, and is a producer of copper and zinc. The company's earnings out look is expected to improve as capital requirements decline, and a strong production growth profile should provide positive exposure to the expected long-term secular growth in copper prices.
The Fund exited the following positions over the year: Johnson Health Tech Company, a manufacturer and global distributor of physical fitness equipment, was removed due to deterioration in the operating environment and a decline in demand across key Western markets. Gamuda Berhad, a Malaysian investment holding and civil engineering construction company was removed as recent valuation was becoming expensive against a backdrop of deteriorating fundamentals. Banco Compartamos SA, a Mexican bank that offers financial services to individuals within the lower economic segments, faced sustainability challenges of its current growth rate from increasing competition and regulation. Piramal Health Care Limited of India was also sold as the business model fundamentally changed when it sold its largest operating division, Health Care Solutions, which represented 49 percent of consolidated sales, to Abbott Laboratories. Genting Malaysia Berhad was sold following an aggressive acquisition in the U.K., resulting in a fundamental change in the capital structure of the company and we became concerned about management's ability to create value. Fibria Celulose SA was also removed, as declining profitability ratios for the pulp and paper company indicated a deteriorating business environment.
By the end of the period, the Fund remains overweight the Consumer Discretionary, Consumer Staples, and Materials sectors, and underweight Financials, Telecommunication Services, and Energy sectors.
12
Management's Discussion of Fund Performance (Continued)
Strategy and Outlook
Growth in emerging markets continues to be robust, supported by positive macroeconomic fundamentals, rising domestic consumption and infrastructure spending. Traditional growth economies like China, India and Brazil, are now joined by peripheral economies like Indonesia, Thailand, Turkey and South Africa. Domestic currencies are expected to appreciate further, reflecting optimism in the outlook. Policy reforms in emerging economies continue to translate into long-term structural improvements and long-term productivity advancements which should be positive for domestic economic growth.
As the risk of a double-dip scenario in the broader global economy gradually dissipates, there is support for further upside in EM valuations as long as corporate earnings remain strong. The key challenge for policymakers now rests in taming inflationary pressure as food and commodity prices recover from 2009 trough levels. In China, the government's determination to stabilize the property sector will likely result in further tightening on credit and financing, taxation and ownership. But as leading indicators have shown, growth in China remains unimpeded, largely attributable to supportive monetary and fiscal policies. Earlier fears of a slowdown now appear to be unwarranted. We continue to implement a disciplined investment approach to uncovering the best companies across all regions that have demonstrated a proven track record of generating sustainable and positive economic profits, to provide consistent long-term risk-adjusted returns fo r the Fund's shareholders.
Comparison of the Change in Value of a $10,000 Investment in the Touchstone Emerging Markets Equity Fund - Class A* and the MSCI Emerging Markets Index

* The chart above represents performance for Class A shares only, which will vary from the performance of Class C shares, Class Y shares and Institutional Class shares based on the differences in loads and fees paid by shareholders in the different classes. The Fund commenced operations on September 30, 2009.
** The total returns shown above are adjusted for maximum applicable sales charges.
The performance of the above Fund does not reflect the deduction of taxes that a shareholder would pay on Fund distributions or the redemption of Fund shares.
13
Management's Discussion of Fund Performance (Continued)
Touchstone Focused Equity Fund
Sub-Advised by Fort Washington Investment Advisors Inc.
Investment Philosophy and Process
The Touchstone Focused Equity Fund seeks capital appreciation by investing in equity securities of companies of any size.
Fund Performance and Positioning
The total return of the Touchstone Focused Equity Fund was 9.40% for the nine months ended September 30, 2010 which was calculated excluding the maximum sales charge. The Fund was launched on December 31, 2009. The total return of the Russell 3000® Index was 4.78% for the same period. The Fund outperformed its benchmark.
We are encouraged by the fact that the outperformance for this year has been broad based as six out of the nine sectors in which we were invested added value to the Fund. The key driver was significant outperformance in the Health Care, Consumer Discretionary, and Industrial sectors. Other sectors adding value to the Fund included Energy, Financials, and Telecommunication Services. Underperforming sectors included Information Technology, Consumer Staples, and Materials. Segmenting the Fund by market capitalization, companies under $10 billion increased in value more than 16% on average while the Fund's large capitalization companies also outperformed the Russell 3000® Index. Finally, the Fund's domestic holdings which made up 83% of the Fund, increased in value by more than 14%, dramatically outperforming its international holdings.
The companies that made the most positive contribution to performance in the past nine months included Time Warner Cable Inc. (Consumer Discretionary sector), Genzyme Corp. (Health Care sector), CORNELL COS. and AGCO Corp. (Industrials sector ). Detractors from performance included Nokia Corp. (Information Technology sector), Dean Foods Co. (Consumer Staples sector), Bank of America Corp. (Financials sector), and Cemex S.A.B. de C.V. (Materials sector). Over the course of 2010, we have increased exposure to the Information Technology, Telecommunication Services, Financials, and Materials sectors and decreased exposure to the Industrials and Consumer Staples sectors. While the Fund's weight in the Health Care sector remained generally the same throughout the course of 2010, we have made several changes within the sector as we emphasized names that are more attractive from a risk/reward basis. We were also able to take advantage of opportuniti es that arose from the decline in the Energy sector following the BP oil spill. The Fund is currently tilted to more non-defensive sectors as it has overweight positions in the Consumer Discretionary, Information Technology, and Financials sectors. Underweight sectors include Consumer Staples, Energy, and Industrials and no exposure to the Utilities sector.
Strategy and Outlook
What we are seeing is re-levering. Key segments of bank loans have stopped contracting (even standards for commercial & industrial loans to small businesses are starting to ease for the first time since late 2006); bank credit, the commercial-paper market, corporate-bond financing by non-financials and broad money (i.e. M3) are also growing. The commercial paper market is important to the shadow banking system. Notably, non-financial corporations access three times more credit from commercial paper and corporate bonds than they do from bank loans or said another way, the banking system provides only about 22% of private-sector credit in the U.S. In our opinion, these data points are providing evidence that deleveraging in the U.S. is ending; and when stocks are this cheap versus bonds then equities will move up and they should move up quickly (and that may be what is starting to happen in the equity market today). Moreover, we believe th e consumer is in better shape than most think and companies are still spending at depreciation which can't continue for a long period of time. Corporations cannot retain $2.4 trillion in liquidity while non-financial
14
Management's Discussion of Fund Performance (Continued)
corporations' accumulate an additional $1.7 trillion in cash flow this year. Listed companies cannot continue to keep this cash as the demand for the return of this cash to shareholders is inevitable; this will likely drive an increase in Merger & Acquisition activities and share buybacks hopefully at prices that create value for shareholders.
The several items mentioned previously give us comfort that we will reflate as a country. Think about the fact that real wages in the U.S. over the last several years have grown (versus in past recessions real wages declined); this country just came through one of the worst job cycles since the Great Depression and employee earnings held up remarkably well. This suggests wages are unlikely to be a source of deflationary pressure. Also, you have to ask yourself the question: if there is no demand for a strong exchange rate, how can the U.S. have deflation? If Japan, the U.S. and other countries cannot devalue their currencies against each other, then they must inevitably devalue them against goods and services. Lastly, on the inflation versus deflation argument, post World War II, it was the end of the gold standard which allowed central bankers to have a monetary response to all recessions and as a result post WWII recessions were started by inflation rather than deflation (which happened pre-WWII). We believe that inflation is of greater concern than deflation; and as you go from no inflation to 4%, equities tend to do well. As a result, we believe the Fund is positioned for a relatively solid equity market.
Comparison of the Change in Value of a $10,000 Investment in the Touchstone Focused Equity Fund - Class A* and the Russell 3000® Index

* The chart above represents performance for Class A shares only, which will vary from the performance of Class C shares, Class Y shares and Institutional Class shares based on the differences in loads and fees paid by shareholders in the different classes. The Fund commenced operations on December 31, 2009.
** The total returns shown above are adjusted for maximum applicable sales charges.
The performance of the above Fund does not reflect the deduction of taxes that a shareholder would pay on Fund distributions or the redemption of Fund shares.
15
Management's Discussion of Fund Performance (Continued)
Touchstone Global Equity Fund
Sub-Advised by Bedlam Asset Management plc
Investment Philosophy and Process
The Touchstone Global Equity Fund seeks capital appreciation by primarily investing in U.S. and foreign equity securities including those of emerging market countries without regard to market capitalizations.
Fund Performance and Positioning
The total return of the Touchstone Global Equity Fund was 6.50% for the twelve month period ended September 30, 2010 which was calculated excluding the maximum sales charge. The total return of the MSCI All Country World Index was 8.95% for the same period.
Although the Fund's performance lagged the Index, it was significantly less volatile in absolute terms. Thus, the Fund generated a positive return in each of the three months prior to September, in contrast to the Index's decline in August. This is a result of the Fund's valuation bias, as it seeks to buy undervalued growth companies and, in the process, provide downside protection. Performance was boosted towards year-end by the biggest September rally in 71 years for U.S. equities, together with a steady stream of positive announcements across the Fund's holdings. The cause for the recent market euphoria was the prospect of a second round of quantitative easing (QE2), which should benefit emerging market currencies and cheap equities (particularly companies geared to emerging market demand) as well as precious metals.
The largest contributors to performance were the Fund's agriculture and gold (Materials sector) weight, with corn and gold prices up by 26% and 30% respectively, over the year. Other notable performers at the stock level were the emerging market companies Genting Berhad, TVB (Television Broadcasts Ltd.) and Hutchison Telecommunications Hong Kong Holdings Ltd. However, it was not exclusively the cyclical stocks that drove performance. The Health Care sector in particular posted strong gains, most notably from Bristol-Myers Squibb Co., as management raised their estimate for trough earnings in 2013. The Consumer Staples sector also contributed strongly over the period; they continue to benefit from pricing power and sector consolidation, as exemplified by Sara Lee Corp., recently reported to have received two separate private equity bids. The lag in performance relative to the Index was mainly due to the underweight in the Information Technolo gy sector, together with the overweight in the Telecommunication Services sector. The latter position will be maintained, as the telecoms are virtually all high-yielding emerging market companies, profiting from the demand for smartphones and the growth in data.
In other sector themes, the Fund's 10% agricultural weight soared as the corn price jumped sharply, with the sector's attractive valuations and growth prospects starting to receive the market's attention. This followed the weight being sharply increased in June/July of 2010, with the best performers being fertilizer producers CF Industries Holdings Inc., and Yara International ASA. The leap in grain prices arose from the supply shock of droughts in Russia, floods in Canada and Pakistan and storage problems in India. Grain prices have continued their rise as the USDA announced that demand was higher than expected and corn inventories are set to hit their lowest level since 1998. The other overweight for the Fund is gold and silver miners. Given the prospect for increasingly aggressive money printing from the world's central banks, the long-term structural story for precious metals remains intact. Even so, following the strong rally in the sha re prices of the miners, the weight was reduced in early October, from 14% to 10%.
16
Management's Discussion of Fund Performance (Continued)
A top stock performer for the Fund, Genting Berhad, a leading Asian gambling conglomerate, announced strong numbers thanks to its 52%-owned Singaporean casino business. The new casino complex opened in Singapore (one of only two permitted there) in January and the ramp-up in volume and margins far exceeded expectations. In the space of mere months Singapore has become a regional gambling hub for South East Asia and the Indian subcontinent. Gaming revenue has reached $4 billion (more than a fifth of Macau's) and is forecast to surpass the $6 billion of the Las Vegas strip, to reach $7 billion in 2012. Hutchison Telecomm prospered on the back of a 5% increase in sales growth and 7% rise in mobile revenue. The market awoke to the realization that it is a prime beneficiary of the explosion in smartphone demand and the surge in data revenue. Thus, we believe revenue growth and margins should expand further in 2011. Late in the year both TVB and F osters Group Ltd., received bids for parts of their business, following two separate take-over bids for Lihir Gold Ltd., and Allegheny Energy Inc., earlier in the year.
Stocks that detracted from performance over the past twelve months included Tom Tom N.V. (Information Technology sector), Koninklijke KPN N.V., France Telecom (Telecommunication Services), and Japan Steel Works Ltd. (Industrials sector). Sectors that detracted for the same period were Telecommunication Services, Industrials and Financials.
Strategy and Outlook
The Fund is well positioned to prosper from the two long-term structural trends of continued corporate consolidation and faster economic growth (and appreciating currencies) across the developing world. Currently, 65% of the Fund is weighted to small and mid-sized companies (market capitalization of less than $10 billion). As always, the weight of the Fund to small and mid-sized companies is purely a consequence of the bottom-up stock picking process, being a factor of valuations and the business cycle. One of the key drivers of sector consolidation is the fact that corporate cash levels are at all-time highs. To add to this, corporate bond yields are now at record lows, providing inexpensive finance. We believe that consolidation is in fact, bad for corporate bonds as it means gearing levels rise. Investors now face the dilemma of having to take on more risk to obtain a higher yield and we feel that, for equities, it is exactly the opposite . Quality companies such as Sara Lee and Kimberly Clark appear to offer some of the better yields. The return prospects for equities look more appealing than either government or corporate bonds.
Emerging market currencies are the long-term structural winners from the increasingly aggressive monetary policy actions - not only in the U.S., but also in Japan and, most likely, the U.K. and euro-zone. Faced with ballooning foreign reserves, the central banks of the developing world have to choose between currency appreciation and asset inflation. Either way, we believe investors in emerging economies are set to benefit. At year-end the Fund was 23% exposed to emerging markets by company domicile, but 44% based on where companies generate their profits.
At the sector level, Fund overweights remain Materials, Industrials, Consumer Staples, Health Care and Telecommunication Services. Sector underweights are Information Technology and Financials, due to rich valuations and the expectation of slowing earnings growth. The Materials sector exposure is to gold/silver miners and agriculture. As noted above, we continue to be positive on both the soft commodities and precious metals sectors. The Industrials sector companies are heavily weighted to infrastructure spending across both developed and emerging markets. Finally, many of the Health Care sector stocks remain undervalued and are posting solid growth; this comes at a time when the sector is in the midst of major consolidation.
17
Management's Discussion of Fund Performance (Continued)
Comparison of the Change in Value of a $10,000 Investment in the Touchstone Global Equity Fund - Class A* and the MSCI All Country World Index

* The chart above represents performance for Class A shares only, which will vary from the performance of Class C shares, Class Y shares and Institutional Class shares based on the differences in loads and fees paid by shareholders in the different classes. The Fund commenced operations on September 30, 2009.
** The total returns shown above are adjusted for maximum applicable sales charges.
The performance of the above Fund does not reflect the deduction of taxes that a shareholder would pay on Fund distributions or the redemption of Fund shares.
18
Management's Discussion of Fund Performance (Continued)
Touchstone Global Real Estate Fund
Sub-Advised by Cornerstone Real Estate Advisers LLC
Investment Philosophy and Process
The Touchstone Global Real Estate Fund seeks capital appreciation by primarily investing in common stocks and other equity securities of U.S. and foreign real estate companies. Fund management utilizes a core research approach that combines top-down macroeconomic, capital and property market analysis with bottom-up understanding of local real estate and operational capacity to evaluate both property sectors and individual companies.
Fund Performance and Positioning
Global equity markets were volatile but ended on a strong upward trend during the twelve month period ending September 30, 2010. Throughout the year, investors were constantly re-adjusting views on the global economic outlook and implications on valuations, particularly as this twelve month period came on the heels of two quarters of very strong equity market performance. The market was also impacted by credit events in Dubai and southern European countries, including Greece. Government policy was another main theme during the year. In general, it has had a negative overall impact in emerging and commodities-based countries because of their tightening bias. On the other hand, it has mostly been a positive factor especially recently in some of the larger economies, such as the U.S. and Japan where the government is aggressive in providing liquidity to the market.
The total return of the Touchstone Global Real Estate Fund was 18.54% for the twelve month period ended September 30, 2010 which was calculated excluding the maximum sales charge. The total return of the FTSE EPRA/NAREIT Developed Index was 18.41% for the same period. The Fund outperformed its benchmark and other major global equity indices during the period.
While the MSCI World Index did not reach the recent twelve month high reached in April, the Fund's benchmark FTSE EPRA/NAREIT Developed Index (Index) surpassed this mark in September 2010 and continues to move higher. Real estate fundamentals continued to improve throughout the year, with a bottoming in real estate values and improvements in market fundamentals seen in many markets around the globe. The low interest rate environment has supported the real estate sector in multiple ways, such as the reduction of cost of capital for real estate companies, compression of cap rates and increasing fund flow from yield starved investors due to real estate's reasonably attractive yield spreads and inflation protection features. These positive factors should remain intact as the leading economies continue to promote accommodative monetary policy.
Within the Index, North America was the strongest region with a total return of 30.62%. Canada and the U.S. both contributed positively to this performance with total returns of 41.91% and 29.46%, respectively. Asia and Europe underperformed the Index with a total return of 11.77% and 7.98%, respectively. Within Asia, Singapore was the lone outperformer registering a total return of 28.00%. In Europe, while none of the major countries outperformed, two smaller Index weights Sweden and Switzerland, recorded strong total return performance of 51.53% and 31.66%, respectively.
The Fund benefited from strong security selection during the period, particularly in the U.S., Hong Kong, and Germany. The largest contributors to performance in the U.S. were Glimcher Realty Trust, ProLogis, AvalonBay Communities and BRE Properties.
Glimcher Realty Trust, a "B" quality Regional Mall REIT, was trading at an extremely discounted valuation relative to its peers due to concerns about its ability to refinance its balance sheet. Our analysis indicated that
19
Management's Discussion of Fund Performance (Continued)
the balance sheet issues were not as great as the market was pricing, in leading us to take a position in the company. When the company was able to alleviate its balance sheet problems through the sale of some assets into a joint venture early in 2010, the gap in valuation quickly began to close. We decided to underweight ProLogis, a global industrial REIT, based on our belief that the company would need to issue additional equity to strengthen its balance sheet and the recovery in fundamentals for industrial real estate would be slow due to weak global trade. Our belief that demand for apartments would recover faster than many were expecting due to positive demographics and a shift from homeownership to renting, drove our decision to overweight apartment REITs AvalonBay Communities and BRE Properties.
In Hong Kong, the Fund was generally overweight large cap developers and underweight REITs. Although Hong Kong property prices rose strongly during the period, the Hong Kong government was reluctant to impose harsh measures to contain the potential bubble. As developers sold projects at higher prices and paid record prices at land auctions, developer stocks performed well, which contributed positively to Fund performance during the period. Recently however, the Hong Kong government has begun to announce various measures addressing rising property prices and deteriorating affordability. As a result, we believe developer stocks may have hit a plateau and we have shifted some weights to retail-focused landlords.
During most of the period, the Fund held a position in what we perceive is one of the few quality companies in Germany, Alstria Office REIT, which had strong alpha contribution. This company invests in offices throughout Germany with its largest exposure to Hamburg. The company owns high quality, centrally located assets that are leased on long contracts to strong tenants like the City of Hamburg. On top of the quality of the company and the solid growth prospects, we saw two triggers for the share price. One is that the company was in danger of breaching a LTV covenant, but could not issue equity because the majority shareholder would not cooperate. Secondly, they had to arrange the refinancing of the major part of their debt maturing in 2014. We anticipated that these two problems would be solved, and after they were, the company performed very well.
Securities detracting from relative performance during the period were positions in the U.S., France, Norway, and Singapore. During the period, the Fund's performance was adversely impacted by our decision to underweight the U.S. region. This decision was predicated upon the belief that Asian economies would post greater economic growth than a still struggling U.S. economy and therefore fundamentals for U.S. commercial real estate would be slower to recover. Unfortunately, low borrowing costs and signs that fundamentals were beginning to improve were enough to drive investors seeking the predictable cash flows back into commercial real estate, boosting asset prices and spurring a rally in the U.S. REIT market. We were able to offset the impact of the Fund's underweight position during the year with strong security selection in the region.
The Fund's overweight position during the period in France did not work in its favor, although this was compensated by the positive security selection within the country. The U.S. Dollar denominated French EPRA Index underperformed the Index, while the Euro denominated French EPRA Index underperformed the Global EPRA/NAREIT Index. Hence, most of this underperformance was due to volatility in the U.S. Dollar to Euro exchange rate.
During the period, the Fund held a position in one stock in Norway, Norwegian Properties, which underperformed the benchmark during the period on two fronts. First, rental growth in the Oslo office market has turned out not to be as strong as expected given the general macroeconomic strength of the country. Secondly, we had expected Norwegian Properties to profit significantly from the disposal of the Norgani Hotel portfolio, making the company a more focused office play and taking down the gearing by paying off
20
Management's Discussion of Fund Performance (Continued)
debt with the sales proceeds. However, the sales price had been slightly disappointing and the share price reaction was negative. In Singapore, the government was proactive in trying to contain residential prices by announcing a number of measures addressing both supply and demand. As a result, we underweighted the developers and overweighted SREITs and diversified players for both defensiveness and yield. However, due to strong liquidity in the region, the Singapore residential market held up well and developer stocks had solid performance, contributing negatively to Fund performance during the period.
Strategy and Outlook
Cornerstone's expectations are for a slowly improving U.S. economy in 2011 with employment growth accelerating late in the year. Several factors support the slower-growth forecast, including sturdy corporate balance sheets and profits, aggressive austerity measures and stress tests that have eased Eurozone debt concerns for now, and relatively robust growth in Asia. While we are cognizant of the threats to this thesis, we believe modest growth should support continued improvement in the underlying real estate fundamentals and limit new development activity, positioning REITs for a period of moderate internal growth over the next few years. Interest rates will likely remain low for the foreseeable future, which supports real estate fundamentals and fund flows into real estate.
In Europe, we will begin to see the impact of the government austerity programs being implemented over the next few quarters. While the austerity programs will provide more certainty to corporations and individuals and may stimulate investment and demand, they could also increase unemployment and impact growth. Although Europe has made progress in economic recovery efforts, risk remains for growth to stall as a result of budget restructuring that needs to take place in Southern Europe. Northern Italy, French and Swedish retail markets are still among the most attractive in Europe. There is also rising investor interest in Spanish shopping centers in the healthier, more stable regions. The most attractive office markets are London, Paris and Stockholm.
In Asia, we generally have a positive macro fundamental outlook on the region, with the exception of Japan. Policy risk will continue to be a key theme in Asia and needs to be monitored closely. To that end, we are still cautious in China where central and local governments continue to have a tightening stance and have announced various measures targeted at both increasing supply and controlling demand since April. Hong Kong residential and commercial markets are tight and continue to perform extremely well. Policy is a risk in Hong Kong as well since surging home prices are politically disruptive. Although the RBA in Australia is biased towards further interest rate hikes, we have a favorable view on the country with a focus on careful stock selection. Valuations and return expectations are attractive based on strong fundamental underpinnings and positive currency trends. With a deteriorating macroeconomic outlook, which is exacerbated by t he strengthening Yen, and unfavorable supply-demand fundamentals in the Tokyo office market, it is difficult to take a positive view on Japan. Policy risk in the form of BOJ's newfound aggressive easing stance and asset purchase program and the resulting increase in real estate transactions are risks to our view.
We are grounded in fundamental research with the ability to adapt to changing market conditions. Our philosophy and process are focused on understanding management's business and financial strategies; and their ability to unlock value and growth from their properties and markets given where we are in the economic, property market, and capital market cycles. Our process is managed using a proprietary multifactor ranking model that considers quantitative and qualitative rankings for top-down and bottom-up factors which drive potential returns. The model allows appropriate adaptation to dynamic market conditions.
21
Management's Discussion of Fund Performance (Continued)
Comparison of the Change in Value of a $10,000 Investment in the Touchstone Global Real Estate Fund - Class A* and the FTSE EPRA/NAREIT Developed Index

* The chart above represents performance for Class A shares only, which will vary from the performance of Class C shares, Class Y shares and Institutional Class shares based on the differences in loads and fees paid by shareholders in the different classes. The Fund commenced operations on September 30, 2009.
** The total returns shown above are adjusted for maximum applicable sales charges.
The performance of the above Fund does not reflect the deduction of taxes that a shareholder would pay on Fund distributions or the redemption of Fund shares.
22
Management's Discussion of Fund Performance (Continued)
Touchstone Healthcare and Biotechnology Fund
Sub-advised by Turner Investment Partners
Investment Philosophy and Process
The Touchstone Healthcare and Biotechnology Fund invests primarily in common stocks of Health Care and biotechnology companies. The Fund employs rigorous fundamental research with supporting qualitative and technical analysis. Its bottom-up strategy emphasizes fundamental analysis. The Fund seeks companies with improving fundamentals, superior earnings prospects, reasonable valuations, and favorable trading-volume and price patterns.
Fund Performance and Positioning
The total return of the Touchstone Healthcare and Biotechnology Fund was 5.74% for the twelve month period ended September 30, 2010 which was calculated excluding the maximum sales charge. The total return of the S&P 500 Healthcare Index was 8.31% for the same period. The Fund underperformed its benchmark.
The Fund's relative performance was hurt by holdings held in the Health Care Providers & Services industry. Although these service holdings in the Fund's portfolio posted a positive return for the one-year period, it was not enough to overcome the return generated by these holdings held in the Index.
Strong stock selection in the Fund's Health Care Equipment & Supplies' holdings added to relative outperformance. These holdings traded higher for the period, whereas these holdings held in the Index posted a loss.
Within the Health Care Providers & Services industry, Tenet Healthcare Corp. and McKesson Corp. detracted from results. Hospital operator Tenet Healthcare Corp. traded lower after the company's attempt to buy an Australian hospital failed. Investors reacted negatively to this news as Tenet Healthcare Corp. is seen as a de-leveraging story. Additionally, hospitals are currently in a weakened state as a result of stagnant unemployment and a more cautious consumer along with the government not extending COBRA benefits to the unemployed. We sold the security from the Fund's portfolio. The performance of McKesson Corp., a pharmaceutical distribution and healthcare information technology company, was also a drag on relative results for the quarter. There is a short-term concern of an absence of new generics entering the market. This could potentially have an adverse impact on operating margins for McKesson Corp., as generic drugs have much hig her margins for Mckesson when compared to branded drugs. We believe these concerns are overblown, and we were pleased to see the recent launches of generic Lovenox and generic Taxotere, all within the past month. We continue to own the security in the Fund.
Merck & Co. Inc. (Pharmaceuticals industry) was the largest detractor in the Fund over the one year period ending September 30, 2010. The underperformance here had more to do with our timing of owning this security. We do own the security currently as Merck & Co. Inc. is the second largest company held in the Index.
Within the Health Care Equipment & Supplies industry, Fund holding ev3 Inc., a global endovascular company, traded substantially higher after the company was acquired by drug and medical device maker Covidien at a sizeable premium. We expect more deals to take shape in the medical technology space throughout the remainder of 2010 as large pharmaceutical companies have excess cash on hand to acquire smaller boutique companies. Edwards Lifesciences Corp., the developer of products and technologies to treat advanced cardiovascular disease, also advanced on the news of the buyout for ev3 Inc. We believe Edwards Lifesciences Corp. is likely a near-term takeout candidate.
23
Management's Discussion of Fund Performance (Continued)
Other outperformers included Valeant Pharmaceuticals International Inc. and Human Genome Sciences Inc. Within the Pharmaceuticals space, Valeant Pharmaceuticals International Inc. traded significantly higher as the U.S. based drug maker agreed to purchase Toronto based drug maker Biovail Laboratories Inc. Valeant Pharmaceuticals International Inc. benefits in many ways from this transaction in that they will be able to take advantage of Biovail Laboratories Inc.'s low tax base in Barbados and benefit from greater efficiencies as the new company will shed roughly 25% of its employee headcount, which will be accretive to earnings. Biotechnology company Human Genome Sciences Inc. spiked higher after the FDA gave a priority review for Human Genome Sciences Inc.'s and GlaxoSmithKline's joint drug Benlysta, their new drug aimed at treating systemic lupus. A decision for drug approval could be as early as December of this year and investors flocked to the stock anticipating good news from the FDA. If approved, Benlysta would be the first new lupus drug to reach the market in more than 50 years. Additionally, we believe that Human Genome Sciences Inc. could at some point be an acquisition target of GlaxoSmithKline, fueling the upside stock price potential.
Although the Fund underweight position in large capitalization pharmaceuticals detracted from performance, strong stock selection in this industry more than made up for the lack of exposure. Large cap pharmaceuticals stocks make up 52% of the Index and the Fund has typically been underweight this group. More recently, we have added to the Fund's exposure in large Pharmaceuticals companies as we have begun to witness a trade up for companies that pay a healthy dividend.
In general, the Fund has a higher weight in Health Care Technology companies as we believe this space is primed for Merger & Acquisition activity. We did slightly reduce the Fund's exposure to Health Care Providers & Services providers during the quarter but it still holds an overweight position compared to the benchmark.
Strategy and Outlook
We continue to find companies with compelling fundamentals. Balance sheets in the Health Care sector remain flush with cash, keeping open the possibility of stock buybacks, mergers and acquisitions in the sector. The November elections could play a role in healthcare reform if Republicans gain seats in Congress as they will look to lock down healthcare programs by limiting spending. Actual reversal of the reform initiatives is unlikely, but lack of funding could stall implementation indefinitely.
24
Management's Discussion of Fund Performance (Continued)
Comparison of the Change in Value of a $10,000 Investment in the Touchstone Healthcare and Biotechnology Fund - Class A* and the S&P 500 Health Care Index
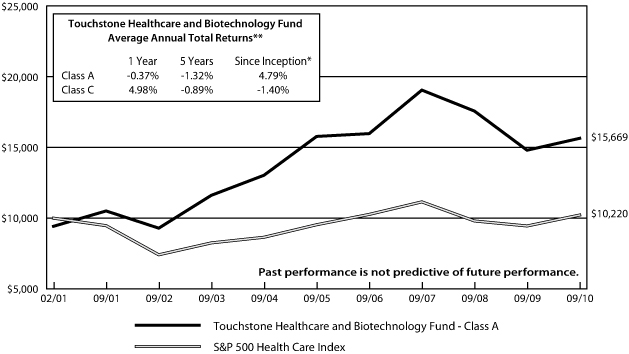
* The chart above represents performance for Class A shares only, which will vary from the performance of Class C shares based on the differences in loads and fees paid by shareholders in the different classes. The initial public offering of Class A shares commenced on February 28, 2001 and the initial public offering of Class C shares commenced on November 20, 2006. The Class C performance information is calculated using the historical performance of Class A.
** The average annual total returns shown above are adjusted for maximum applicable sales charges.
The performance of the above Fund does not reflect the deduction of taxes that a shareholder would pay on Fund distributions or the redemption of Fund shares.
25
Management's Discussion of Fund Performance (Continued)
Touchstone Intermediate Fixed Income Fund
Sub-Advised by JKMilne Asset Management
Investment Philosophy and Process
The Touchstone Intermediate Fixed Income Fund seeks to provide high current income with reasonable risk to capital. Fund management targets these goals by investing in U.S. Government obligations and other investment grade fixed income securities, including corporate debt obligations, mortgage-backed securities, commercial mortgage-backed securities and asset-backed securities. The Fund seeks fixed income securities of issuers that are believed to offer attractive income and/or capital appreciation potential with a reasonable level of risk. It invests in fixed income obligations of different issuers, maturities and structures depending on their assessment of the relative valuation of the securities' sector, as well as the security itself.
Fund Performance and Positioning
The total return of the Touchstone Intermediate Fixed Income Fund was 7.92% for the twelve month period ended September 30, 2010. The total return of the Barclays Capital Intermediate U.S. Government/Credit Index was 7.77% for the same period. The Fund outperformed its benchmark.
The global bond markets have been extremely volatile during the past year due to the continued aversion to risk by investors. A consequence has been a very modest improvement in economic activity as credit remains scarce, rolling into sluggish job gains in the United States.
The Fund participated in the U.S. Treasury, investment grade corporate bonds, Treasury Inflation Protected Securities (TIPS), and Government Agency notes and bond markets. These and other sectors were rebalanced to capitalize on the most advantageous markets with positive outlooks and an economy struggling with heavy consumer debt, weak housing, and companies managing expenses.
Strategy and Outlook
The outlook for the intermediate fixed income markets remains constructive as the world's economies recover slowly. The key data improvement for the global economies remains to what extent modest growth will create jobs. The current outlook is for U.S. Gross Domestic Product (GDP) growth, a measure of economic strength, to improve to an annualized rate year-over-year 2010 of 2.5-3.5%. To the extent the higher band can be achieved, this will improve employment prospects and the availability of credit to individuals and businesses.
Most economists believe interest rates are not expected to change substantially. Therefore, the Fund's strategy is to continue to be conservative by investing in diverse bond issuers, industries, and sectors likely to do well under the forecast above.
26
Management's Discussion of Fund Performance (Continued)
Comparison of the Change in Value of a $10,000 Investment in the Touchstone Intermediate Fixed Income Fund - Institutional Class, the Barclays Capital Intermediate U.S. Government/Credit Index

The initial public offering of the Institutional Class shares commenced on December 6, 1991.
The performance of the above Fund does not reflect the deduction of taxes that a shareholder would pay on Fund distributions or the redemption of Fund shares.
27
Management's Discussion of Fund Performance (Continued)
Touchstone International Fixed Income Fund
Sub-Advised by GAM International Management Ltd.
Investment Philosophy and Process
The Touchstone International Fixed Income Fund seeks total return by investing primarily in fixed income securities of issuers located outside the United States. Fund management selects foreign country and currency compositions based on an evaluation of various macroeconomic factors including relative interest rates, exchange rates, monetary and fiscal policies, economic growth, employment, trade and current account balances. Management invests core holdings in developed market government bonds and currencies with tactical allocations to alpha-generating sectors: investment grade corporate bonds, emerging market bonds, high yield bonds and convertible bonds. Currencies are actively managed in order to manage risk and enhance returns.
Fund Performance and Positioning
The total return of the Touchstone International Fixed Income Fund was 15.15% for the twelve month period ended September 30, 2010 which was calculated excluding the maximum sales charge. The total return of the Citigroup World Government Bond Index (excluding U.S.) was 4.47% for the same period. The Fund outperformed its benchmark primarily due to sector allocation and a decision to remove a U.S. dollar hedge in May 2010.
A strategic change in currency allocation (unrelated to the aforementioned hedge) helped capture the relative strength of foreign currencies after a period of dollar strength. Having been fully-hedged to the U.S. dollar from its October 1, 2009 inception, the Fund was unhedged in May 2010 and exposed primarily to the Euro-bloc and Yen, both of which rallied 10% against the dollar since the hedge was eliminated. Given our optimistic outlook for corporate growth, Fund allocations to convertible bonds were increased during the period and added to the Fund's performance advantage relative to the benchmark.
Australian and some emerging market debt underperformed slightly during the second quarter bond rally in 2010 in the face of a flight to quality to U.S. Treasuries. At the same time, debt in the periphery of the Euro, namely Greece and the other "PIIGS" (Portugal, Italy, Ireland, and Spain), performed poorly as Greece experienced a sovereign debt crisis. During this time, the Fund was underweight Greece versus the benchmark and had no exposure to debt in the other PIIGS countries. Ultimately, the European Central Bank and International Monetary Fund came to the rescue, allowing asset prices to recover.
During the third quarter 2010, the bounce in economic activity faded in most countries, helping bonds perform well. Monetary policy in core countries, such as the United Kingdom and Japan, remained very accommodative while rates were increased in some emerging countries like China, and in countries highly tied to growth in emerging markets, such as Australia.
Strategy and Outlook
The disparate paths and paces of recovery favor our cross market allocation approach. The active allocation approach, via currency management, has clearly added value. Sector allocation may be a driver of future returns if the investment universe continues to think in terms of broad economic themes.
Overall, duration is close to the benchmark, but focused on the long-term portion of the United Kingdom debt curve at the expense of Japanese short-term debt. The Fund has an off-benchmark allocation of 8% to convertible bonds. Relative to the benchmark, the Fund now is underweight to both the Yen and the Euro in favor of more pro-growth currencies known for the influence of commodity prices upon them, and on
28
Management's Discussion of Fund Performance (Continued)
emerging market currencies. The latter have underperformed economic expectations due to various attempts to limit their appreciation; we believe that these actions will only delay, not derail, their secular appreciation.
If the private sector can offset the public sector contraction, then the Fund's foreign exchange and convertible bond stance should work well. Conversely, if the global recovery withers, then the reach for yield and duration will benefit the longest dated bonds at the expense of the intermediate bonds of core countries that yield very little already.
Comparison of the Change in Value of a $10,000 Investment in the Touchstone International Fixed Income Fund - Class A* and the Citigroup World Government Bond Index ex-US
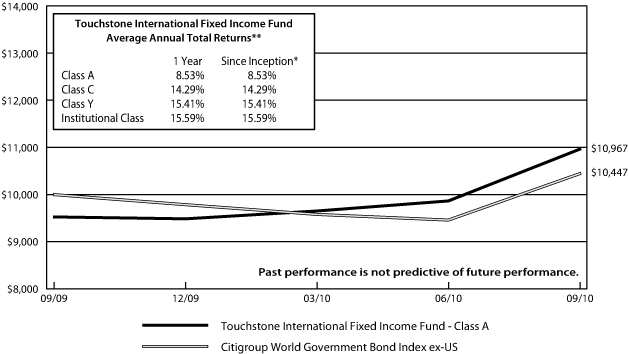
* The chart above represents performance for Class A shares only, which will vary from the performance of Class C shares, Class Y shares and Institutional Class shares based on the differences in loads and fees paid by shareholders in the different classes. The Fund commenced operations on September 30, 2009.
** The total returns shown above are adjusted for maximum applicable sales charges.
The performance of the above Fund does not reflect the deduction of taxes that a shareholder would pay on Fund distributions or the redemption of Fund shares.
29
Management's Discussion of Fund Performance (Continued)
Touchstone Large Cap Relative Value Fund
Sub-Advised by EARNEST Partners
Investment Philosophy and Process
The Touchstone Large Cap Relative Value Fund seeks capital appreciation by investing in stocks of large capitalization companies. The Fund seeks to identify stocks based on their financial characteristics and current environment including valuation measures, market trends, operating trends, growth measures, and profitability measures.
Fund Performance and Positioning
The total return of the Touchstone Large Cap Relative Value Fund was 11.34% for the twelve month period ended September 30, 2010 which was calculated excluding the maximum sales charge. The total return of the Russell 1000®Value Index was 8.90% for the same period. The Touchstone Large Cap Relative Value Fund outperformed its benchmark.
Large-cap stocks continued to rise for the 12 months ending September 30, 2010. Equity market investors responded to signs of gradual economic recovery in the U.S. and overseas; however, mixed economic data continued to create uncertainty and heightened volatility. Unemployment fell during the period from 10.2% to 9.6% but remains a central concern of investors and the government. After rising almost 6% in the final quarter of 2009, U.S. GDP growth slowed for each subsequent quarter settling at just under 2% for the second quarter 2010. The decline has been influenced by weaker consumer spending and housing data.
As GDP growth moderated in the back half of the period, the Federal Reserve reconsidered its plan to tighten monetary policy. Although inflation continues to be a long-term threat, exemplified by gold hitting record highs, deflation appears to be of equal concern in the short term. Companies have very little pricing power given the excess capacity in both manufacturing and employment. Core inflation was up less than 1% over the last 12 months, matching the lowest rate in 44 years. As a result, the Federal Reserve decided against reducing the size of its balance sheet from record levels. Instead, they now stand ready to re-invest proceeds from maturing securities into U.S. Treasuries. The purpose of this renewed quantitative easing is to keep interest rates low for both individuals and businesses. During the period, the yield on the benchmark 10-year Treasury bond fell to under 3%. The yield on the 2-year note dropped to under 0.50%. Mortgage rates responded in lockstep with standard 30 year mortgages reaching a record low of 4.30%.
Companies are taking full advantage of the low interest rate environment by issuing debt. Retail investors are obliging by continuing to pour money into bond funds. Many companies have no immediate need for cash as U.S. companies overall are now sitting on approximately $2 trillion in cash, the highest percentage of their total assets in almost 50 years. Corporate profits have continued to rebound as well, further adding to strong corporate balance sheets. Equity investors now hope that these companies put the cash to work prudently through increased dividends, stock repurchases, capital investment, or mergers and acquisitions. Evidence continues to emerge that businesses are starting to loosen the purse strings. Merger and acquisition activity has increased, while the annual rate of capital spending by businesses rose more than 20% in both the first and second quarters of 2010, with the second quarter increase being the largest since 1998.
Sectors contributing positively to relative performance during the period were Consumer Discretionary, Industrials, Materials, Telecommunication Services and Financials. An overweight position in the Consumer Discretionary sector and an underweight position in the Financials sector benefited relative performance. Stock selection within the Industrials sector contributed the most to relative performance. The largest contributors to return were Cummins Inc. (Industrials sector) , Freeport-McMoRan Copper & Gold Inc. (Materials sector), American Tower Corp.(Telecommunication Services sector) , Darden Restaurants Inc. (Consumer Discretionary sector), and Express Scripts Inc. (Health Care sector).
30
Management's Discussion of Fund Performance (Continued)
In the Industrials sector, Cummins Inc. rose significantly. Cummins Inc. designs, manufactures, sells and services diesel engines and related technology around the world. Its products are used in heavy and medium duty trucks and buses as well as industrial and military equipment. Industrial build out in China, India and Brazil is driving growth, and Cummins Inc. is the best positioned U.S. engine manufacturer in those markets. The company's emission reducing technologies are in demand both domestically and internationally as regulatory changes make emissions laws more stringent. Telecommunication Services company American Tower Corp. has also risen significantly over the trailing 12 months. American Tower Corp. is a leading provider of antenna space to cellular, television and radio broadcast companies, owning and/or managing more than 25,000 telecommunications towers and communication sites in the U.S. and abroad. The company's broad footpr int and established client relationships, along with the high cost of market entry, help protect its market share in a growing market. Increasing consumer demand for data content on their mobile devices (including music, video and digital communication) requires more tower space for mobile service providers and should continue to drive already strong revenue and cash flow growth. The company is also expanding in severely underpenetrated emerging markets. Yum! Brands Inc. (Consumer Discretionary sector), a leading quick service restaurant operator, rose significantly during the period. Yum! Brands Inc. includes KFC, Pizza Hut, Taco Bell and Long John Silvers. Significant growth in China is offsetting the weakness caused by the economic slowdown in the US. China currently represents more than 30% of Yum! Brands Inc.'s revenue. It is arguably the most popular franchise in China and outpaces McDonalds' store locations by a 2:1 ratio. A growing middle class and rising wealth should continue to drive that internat ional demand.
An overweight position in the Information Technology sector slightly detracted from relative performance. The largest detractors from return over the past twelve months included Beckman Coulter Inc. (Health Care sector), Transocean Ltd. (Energy sector), Bank of America Corp. and Goldman Sachs Group Inc. (Financials sector) and Flextronics International Ltd. (Information Technology Sector).
Strategy and Outlook
In managing the Touchstone Large Cap Relative Value Fund, we seek companies with share prices that we believe do not fully reflect their earnings growth outlook. Going forward, we will continue to employ our three-step investment methodology: screen the broad universe to identify stocks that are best positioned to outperform, measure and manage downside risk to the benchmark, and perform in-depth, thorough, fundamental research to find what we believe are the best stocks to include in the Fund.
31
Management's Discussion of Fund Performance (Continued)
Comparison of the Change in Value of a $10,000 Investment in the Touchstone Large Cap Relative Value Fund - Class A* and the Russell 1000® Value Index
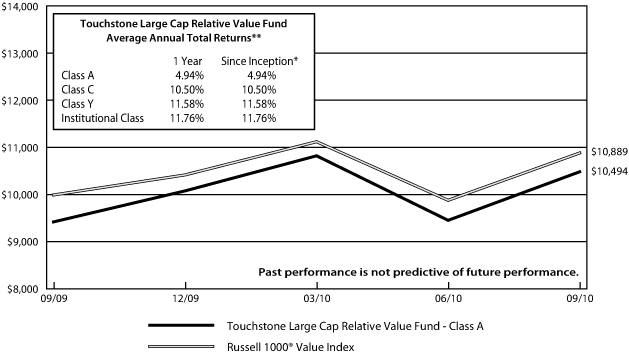
* The chart above represents performance for Class A shares only, which will vary from the performance of Class C shares, Class Y shares and Institutional Class shares based on the differences in loads and fees paid by shareholders in the different classes. The Fund commenced operations on September 30, 2009.
** The total returns shown above are adjusted for maximum applicable sales charges.
The performance of the above Fund does not reflect the deduction of taxes that a shareholder would pay on Fund distributions or the redemption of Fund shares.
32
Management's Discussion of Fund Performance (Continued)
Touchstone Market Neutral Equity Fund
Sub-Advised by Aronson + Johnson + Ortiz
Investment Philosophy and Process
The Touchstone Market Neutral Equity Fund seeks to achieve long-term capital appreciation and to provide positive returns regardless of the direction of the stock markets. It invests long in equity securities believed to be undervalued, and takes short positions in securities believed to be overvalued.
Fund Performance and Positioning
The total return of the Touchstone Market Neutral Equity Fund was -2.70% for the twelve month period ended September 30, 2010 which was calculated excluding the maximum sales charge. The total return of the Citigroup 3-Month Treasury Bill Index was 0.12%.
September was a strong month and the end of a positive year for stocks. However, even after gaining over 70% since March 9, 2009, stocks are still nearly $5 trillion below the market's October 9, 2007 peak. In percentage terms, stocks shed about 20% over the last three years (while long Treasuries tacked on over 35%).
Using the Russell 3000® Index as a proxy, the broad U.S. equity market was up nearly 11% for the 12 months ended September 30, 2010. The strength of the Consumer Discretionary sector's positive performance combined with its significant market weight was a dominating force. The Financials sector was the consistent laggard, with average returns that were flat. At the industry level, stocks within motor vehicles, transportation, and real estate were the leaders; while miscellaneous finance stocks and construction related names produced negative returns, on average.
The Touchstone Market Neutral Equity Fund is always sector-neutral long versus short and makes only limited industry decisions, driven solely by our individual stock selection. Since our stock-picking is, in turn, guided by our multi-factor valuation model, we look to the measures underlying our model to explain what worked this past year.
Weakest stock selection occurred within the Information Technology sector: our inclination to be long value-oriented technology stocks and short growthier names was punished. The software and hardware industries were among the most challenging, especially for short positions like Salesforce.com, where performance appeared to be most correlated with long-term growth prospects and price momentum. Fund positions within the Financials sector were rewarded, principally for their value orientation. Not only were short positions within banks on target, but our decision to be net short the industry was in the right direction. Industry positions in aggregate, though modest, gave a slight boost to the bottom line.
Strategy and Outlook
We believe outperformance will continue to require patience and discipline — two virtues that are entrenched into our investment process. As such, we do not allow the economic outlook — ours or anyone else's — to shift portfolio construction and structure. The Fund remains fully invested, well diversified, and sector-neutral, long versus short.
33
Management's Discussion of Fund Performance (Continued)
Comparison of the Change in Value of a $10,000 Investment in the Touchstone Market Neutral Equity Fund - Class A* and the Citigroup 3-Month Treasury Bill Index

* The chart above represents performance for Class A shares only, which will vary from the performance of Class C shares, Class Y shares and Institutional Class shares based on the differences in loads and fees paid by shareholders in the different classes. The Fund commenced operations on September 30, 2009.
** The total returns shown above are adjusted for maximum applicable sales charges.
The performance of the above Fund does not reflect the deduction of taxes that a shareholder would pay on Fund distributions or the redemption of Fund shares.
34
Management's Discussion of Fund Performance (Continued)
Touchstone Mid Cap Fund
Sub-Advised by Turner Investment Partners Inc.
Investment Philosophy and Process
The Touchstone Mid Cap Fund seeks long-term capital appreciation by primarily investing in stock of medium capitalization companies that are believed to have the potential for long-term growth and that appear to be attractively priced. It emphasizes companies operating in a broad range of industries based on a fundamental analysis of each company with consideration to such characteristics as price-to-cash flow, price-to-earnings, and price-to-book value ratios. The sub-advisor looks for companies with quality management teams that can take advantage of unique product opportunities, with an emphasis on companies that may be positioned to generate and sustain long-term growth.
Fund Performance and Positioning
The total return for the Touchstone Mid Cap Fund was 13.72% for the twelve month period ended September 30, 2010. The total return of the Russell MidCap® Index was 17.54% for the same period. The Fund underperformed its benchmark.
The Information Technology and Financials sectors were the largest detractors to relative performance during the period. McAfee Inc., the maker of anti-virus software, traded lower after the company reported a quarterly profit decline due to higher costs, which included an acquisition. Sales continue to be strong for the company, but key competitors Symantec Inc. and Microsoft Inc. are gaining strength in the cyber-security industry. The holding was sold from the Fund as a result.
Additionally, NCR Corporation lost nearly 21% during the period as retailers and banks continue to delay spending on upgrading ATM machines. Turner Investment Partners Inc. (TIP) believed NCR, the provider of services to ATM machines and point-of-sale hardware, was nicely positioned to take advantage of an area that has lacked investment over the last few years. However, the security was sold from the Fund to free up cash for more attractive ideas within the sector. ON Semiconductor Inc., which provides analog semiconductor components, was purchased in the Fund in June 2009 with the belief that the company was poised to gain market share given their restructuring efforts over the past few years and a likely upturn in the semiconductor market. The company reported solid earnings in the first quarter, but concerns grew regarding excess capacity coming online for the industry in late 2010, primarily from Texas Instruments. The security was sold from the Fund.
The Financials sector detracted from the relative performance of the Fund during the period primarily due to security selection. IntercontinentalExchange Inc., a derivatives exchange operator, fell in the third quarter 2010 due to expectations that volumes would come in lower. Although the position was pared back, the holding was maintained in the Fund as the company is bullish on their longer-term over-the-counter clearing business. The Fund's overweight position in commercial banks also impaired results as the sector posted a negative return compared to the index. Particularly, Fund holding Marshall & llsley Corporation lost ground as the company reported earnings that did not beat expectations. The earnings miss was attributed to higher expenses and lower fee revenues. The security was maintained in the Fund as TIP believes the bank trades at an attractive book value to its peers and the company is well positioned for improved credit conditions.
The performance of equity markets to a large extent appeared to be influenced by macroeconomic news during the period. Fund managers such as TIP that utilize fundamental research were challenged in this environment as stocks traded more on macro events and less on sound fundamental analysis. In this market
35
Management's Discussion of Fund Performance (Continued)
environment, the Fund underperformed its benchmark despite positive contributions by holdings in the Materials and Energy sectors.
As commodity prices moved higher during the period, the Materials sector provided nice upside capture for the Fund. Specifically, Cytec Industries Inc. contributed positively to performance. Cytec develops, manufactures and sells chemicals and materials to the aerospace, adhesives, mining, automotive and construction industries. The company reported strong earnings across all product lines as the company's restructuring over the past few years is now being realized. As a part of their restructuring efforts, the company rid itself of low-margin products and made a conscious effort to emphasize products with growth potential, such as their engineering materials franchise.
The steel industry continued to benefit from the global pickup in demand for steel and Fund holding Cliffs Natural Resources Inc. traded higher as a result. The mining company reported strong third quarter 2010 earnings aided by higher pricing and lower costs from their North American iron ore business. TIP believes earnings will continue to grow for the company through the remainder of 2010. The company also has expanded globally and should continue to post strong results as pricing for iron ore is expected to increase significantly in 2010.
The Energy sector also contributed positively to relative performance, particularly oil and gas companies and coal producers. Within oil and gas production, Concho Resources Inc. led the way as the independent oil and natural gas company beat expectations for the period due to increased production and strong growth within their reserves. Additionally, coal producer Alpha Natural Resources Inc. benefited from the pickup in global demand for metallurgical coal, a key component in making steel. The position was sold from the Fund to capitalize on the gain.
Although the low quality rally that dominated 2009 and continued into the first quarter 2010 has faded more recently, the impact on the Fund did impact results somewhat during the period. Fundamental factors, such as a strong return on equity and good balance sheet, do appear to be rebounding though, which bodes well for this strategy.
Strategy and Outlook
In managing the Fund, TIP remains focused on owning stocks that they believe have either undervalued assets or a strong prospective earnings power. We favor stocks that focus on controlling debt, while also maintaining above-average levels of cash on their balance sheets. From a sector view, the Fund is currently overweight the Materials and Consumer Staples sectors. In the Materials sector, the Fund favors chemical companies, as this area should benefit from an economic recovery. Within the Consumer Staples sector, the Fund favors food distributors. The Fund is currently underweight the Industrials and Financials sectors. Specifically, the Fund has an underweight position in machinery companies in the Industrials sector and limited exposure to insurers in the Financials sector.
Going forward, TIP believes the market's strong move to the upside could continue for several reasons. First, as stated in the past, the S&P's earnings yield (earnings per share divided by the stock price) is currently more than 6%, while the bond market, as represented by the Barclays Capital U.S. Aggregate Bond Index, is yielding less than 3% (generally the two yields are about equal). Second, although recent economic data has been mixed, it is TIP's belief that the economy will show gradual improvement going forward. Third, companies are beginning to deploy some of their capital by way of stock buy backs and acquisitions, which is generally positive for equities. Fourth, corporate America reported record-high profit margins for the second quarter and TIP believes this trend will continue as companies report third quarter earnings. Merrill Lynch forecasted that pro forma earnings per share of the S&P 500 companies will swell 31.5% over 2009; with an 8.4% year-over-year rise projected in 2011. (We think 2011 earnings may exceed those expectations, which could
36
Management's Discussion of Fund Performance (Continued)
bode well for the stock market). Last but not least, after the mid-term elections conclude in early November the uncertainty leading up to the elections will be replaced by clarity, which could provide additional strength to the equity market.
Comparison of the Change in Value of a $10,000 Investment in the Touchstone
Mid Cap Fund - Class Y* and the Russell Midcap® Index

* The chart above represents performance for the Class Y shares only, which will vary from the performance of Class A shares, Class C shares and Class Z shares based on the differences in loads and fees paid by shareholders in the different classes. The initial public offering of the Class Y shares commenced on January 2, 2003. The initial public offering of Class A shares and Class C commenced on May 14, 2007 and the initial public offering of Class Z shares commenced on April 24, 2006.
The Class A, Class C and Class Z performance information is calculated using the historical performance of Class Y.
** The average annual total returns shown above are adjusted for maximum applicable sales charges.
The performance of the above Fund does not reflect the deduction of taxes that a shareholder would pay on Fund distributions or the redemption of Fund shares.
37
Management's Discussion of Fund Performance (Continued)
Touchstone Mid Cap Value Fund
Sub-Advised by Lee Munder Capital Group LLC
Investment Philosophy and Process
The Touchstone Mid Cap Value Fund seeks capital appreciation by primarily investing in common stocks of medium capitalization companies. The Fund seeks to identify companies believed to be selling at a discount to their inherent value utilizing a classic value approach.
Fund Performance and Positioning
The total return of the Touchstone Mid Cap Value Fund was 18.70% for the twelve month period ended September 30, 2010 which was calculated excluding the maximum sales charge. The total return of the Russell Midcap® Value Index was 16.93% for the same period. The Touchstone Mid Cap Value Fund outperformed its benchmark.
The equity market recovery that began in March of 2009 continued into the Fund's first fiscal year. Although the market had a meaningful pullback in the second calendar quarter of 2010, the advance resumed in the third quarter as stocks climbed a "wall of worry" engendered by investor concerns about the sustainability of the economic recovery.
During the fiscal year, the Fund's investments in the Materials, Health Care, Energy, and Information Technology sectors proved especially rewarding. Stronger contributors to performance included Cliffs Natural Resources Inc. and Allegheny Technologies Inc., (both from the Materials sector), Cooper Cos.(Health Care sector), Pioneer Natural Resources Co. and Sunoco Inc. (both from the Energy sector) and Sybase Inc.(Information Technology sector). Each of these stocks outperformed because of positive fundamental developments specific to the company. Cliffs Natural Resources Inc. and Allegheny Technologies Inc. benefited from the business recovery, especially in Asia and supporting demand for iron ore and specialty metals. Cooper Cos. benefited from its improving position in the market for contact lenses. Pioneer Natural Resources announced a joint venture transaction with Reliance of India regarding the company's Eagle Ford gas and natural gas liquids acreage in Texas, on terms attractive to Pioneer Natural Resources. Sunoco announced a restructuring involving the spin-off of its environmentally friendly coal and coke business. Sybase Inc. agreed to a takeover bid from SAP AG of Germany.
The Fund also had several disappointing performers during the past year, especially in the Consumer Discretionary, Consumer Staples and Financials sectors. Companies in these sectors that detracted from performance included GameStop Corp., H&R Block Inc., Dean Foods Co., and Synovus Financial Corp. GameStop Corp. (Consumer Discretionary sector) suffered from a weak consumer environment and an increasingly competitive landscape. H&R Block Inc. (Consumer Discretionary sector) suffered from a lackluster tax season and from increased risk associated with it legacy mortgage origination business. These two companies were sold based on our conclusion that these risks posed an increased threat to the long-term health of their businesses. Dean Foods Co. (Consumer Staples sector) continues to be hurt by volatile raw milk prices and intense price competition among supermarkets, which has squeezed margins. We like Dean Foods Co. based on valuati on and the expectation that pressures on producer margins should in time abate. Synovus Financial Corp. (Financials sector) is a bank with credit quality concerns. Our analysis leads us to believe that the concerns are overstated, especially in light of the company's valuation. The Fund also was hurt by an underweight in REITs, which we continue to maintain because our analysis suggests that the sector is fairly valued.
38
Management's Discussion of Fund Performance (Continued)
Strategy and Outlook
Mid-cap value stocks as represented by the Russell Midcap® Value Index currently trade at yields competitive with the ten year Treasury bond. This valuation support combined with the stimulative monetary policy of the Federal Reserve System continues to be supportive of the equity market.
The Touchstone Mid Cap Value strategy is a classic value investment strategy focusing on solid companies whose stocks are temporarily out of favor in the market. Risk is controlled through diversification and by generally emphasizing stocks with lower business risk and market volatility. We believe that investors will find this to be a distinctive and rewarding approach to mid-cap value investing.
Comparison of the Change in Value of a $10,000 Investment in the Touchstone
Mid Cap Value Fund - Class A* and the Russell Midcap® Value Index

* The chart above represents performance for Class A shares only, which will vary from the performance of Class C shares, Class Y shares and Institutional Class shares based on the differences in loads and fees paid by shareholders in the different classes. The Fund commenced operations on September 30, 2009.
** The total returns shown above are adjusted for maximum applicable sales charges.
The performance of the above Fund does not reflect the deduction of taxes that a shareholder would pay on Fund distributions or the redemption of Fund shares.
39
Management's Discussion of Fund Performance (Continued)
Touchstone Premium Yield Equity Fund
Sub-advised by Miller/Howard Investments Inc.
Investment Philosophy and Process
The Touchstone Premium Yield Equity Fund seeks long-term growth of capital and high current income by focusing on dividend-paying equity securities of U.S. companies believed to possess attractive long-term return potential primarily due to lower than average valuations and improving business outlooks.
Fund Performance and Positioning
The total return of the Touchstone Premium Yield Equity Fund was 12.82% for the twelve month period ended September 30, 2010 which was calculated excluding the maximum sales charge. The total return of the Russell 3000® Value Index was 9.15% for the same period. The total return of the Dow Jones U.S. Select Dividend Index was 18.30% for the same period.
The Fund had a solid absolute and relative return versus the Russell 3000® Value benchmark as the economy and markets continued to recover. The Fund especially executed during the difficult second quarter global sell-off by providing meaningful downside protection. The Fund continued to make progress during this recovery and sustainable and growing dividends persisted as evidenced by the 26 dividend increases during the last 12 months. Dividend increases are and have been a good indicator of a company's financial strength and management's outlook for their business model. Financially strong companies providing growing cash flow streams (dividends) should continue to perform well going forward, especially in a world that is viewed as "unusually uncertain." The philosophy and focus of the Fund adheres to a simple, but powerful time-tested formula for success: High Quality + High Dividend + High Growth of Dividends = High Total R eturn.
Heavy weights in the Utilities, Health Care and Energy sectors, along with good stock selection in each of these sectors, were contributors to relative performance. Some of the standout performers were NiSource Inc., Pepco Holdings Inc., Northeast Utilities, and ONEOK Inc. (all from the Utilities sector), Bristol-Myers Squibb Co. and Merck & Co Inc. (Health Care sector), and Kinder Morgan Management L.LC., Spectra Energy Corp., and Enerplus Resources Fund (all from the Energy sector). An underweight in the Financials sector was also positive, as was stock selection in the sector with HCP Inc., Alexandria Real Estate Equities Inc., Bank of Montreal, and Cincinnati Financial Corp. Underweight in the Consumer Staples and Industrials sectors and stock selection were detractors to performance. Procter & Gamble Co. (Consumer Staples sector) provided a low return while R.R. Donnelley & Sons Co. (Industrials sector) was down for the 12 m onths. The underweight in the Consumer Discretionary sector was also a drag, but stock selection was a positive with McDonald's Corp. and Genuine Parts Co. up. The Telecommunication Services sector showed mixed results with BCE Inc., Windstream Corp., and AT&T Inc. all up while Tele Norte Leste Participacoes was down. The Information Technology sector also showed mixed results with Microchip Technologies Inc. up and Taiwan Semiconductor Manufacturing Co. and Intel Corp. down.
Strategy and Outlook
We have a high confidence level that the current forces driving investment in dividend stocks will persist, and still-low valuations make the choice an easy one for investors. Tax changes may be a temporary wild card, but we think the worst case scenario is already accepted by investors, so any alterations are likely to be a positive.
40
Management's Discussion of Fund Performance (Continued)
Comparison of the Change in Value of a $10,000 Investment in the
Touchstone Premium Yield Equity Fund - Class A* , the Russell 3000® Value Index
and the Dow Jones U.S. Select Dividend Index
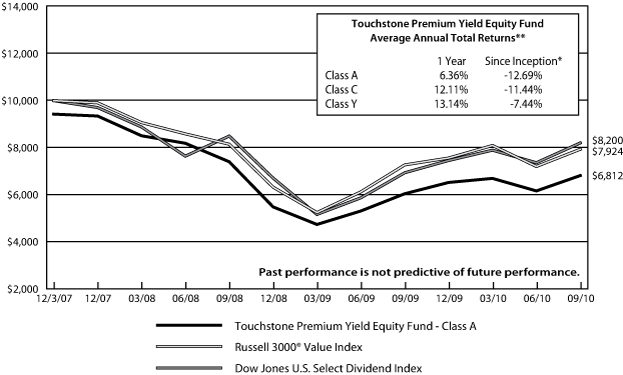
* The chart above represents performance for Class A shares only, which will vary from the performance of Class C shares and Class Y shares based on the differences in loads and fees paid by shareholders in the different classes. The initial public offering of Class A shares and Class C shares commenced on December 3, 2007. The initial public offering of Class Y shares commenced on August 12, 2008. The Class Y performance information is calculated using the historical performance of Class A.
** The total returns shown above are adjusted for maximum applicable sales charges.
The performance of the above Fund does not reflect the deduction of taxes that a shareholder would pay on Fund distributions or the redemption of Fund shares.
41
Management's Discussion of Fund Performance (Continued)
Touchstone Sands Capital Select Growth Fund
Sub-Advised by Sands Capital Management LLC
Investment Philosophy and Process
The Touchstone Sands Capital Select Growth Fund primarily invests in common stocks of large capitalization U.S. companies that are believed to have above-average potential for revenue or earnings growth. The Fund invests in 25 to 30 companies that are generally high-quality seasoned and growing businesses, spread across an array of attractive and growing industries. Sands Capital generally seeks stocks with sustainable above average earnings growth and capital appreciation potential. In addition, Sands Capital looks for companies that have a significant competitive advantage, a leadership position or proprietary niche, a clear mission in an understandable business, financial strength, and are valued rationally in relation to comparable companies, the market, and the business prospects for that particular company.
Fund Performance and Positioning
The total return of the Touchstone Sands Capital Select Growth Fund was 20.17% for the twelve month period ended September 30, 2010. The total return of the Russell 1000® Growth Index was 12.65% for the same period. The Fund outperformed its benchmark.
The largest individual contributors to the relative performance for the period were Salesforce.com Inc., Amazon.com Inc., Las Vegas Sands Corporation, Apple Inc., and FMC Technologies Inc. The largest detractors from relative performance were Charles Schwab Corporation, Monsanto Company, Iron Mountain Inc., CME Group Inc., and Staples Inc.
In aggregate, the sector allocation detracted from relative performance during the period primarily due to an overweight position in the Energy sector. In addition, an underweight position in the Industrials sector and overweight position in the Health Care and Financials sectors detracted from relative performance. The largest contributor to relative performance was an overweight position in the Consumer Discretionary sector.
The past year continued to be one of recovery for the capital markets and we are pleased that the companies owned in the Fund continue their very strong business results during a time when the broad economic growth has been anemic. We attribute this to our basic investment approach of seeking to identify and own businesses that will have sustainable multi-year above average earnings growth. The key to driving growth in this unattractive macro environment is the existence of long-term secular trends that may enhance our conviction that a company's growth is sustainable and can also provide important context for understanding and attempting to project the potential duration of that growth. For example, understanding the growing regulatory push to reduce systemic risk to the financial system posed by bilateral derivatives contracts by encouraging a shift to exchange-traded and centrally cleared venues is a fundamental driver for Intercontinenta lExchange Inc. In addition, this may provide additional growth in the outer years if this shift encourages more OTC transactions into cleared venues. Separately, the long-term trend of consumers shifting their payments from cash/check to credit/debit cards increases our visibility and conviction in the sustainability of growth for a company like Visa Inc., the largest payment network company in the world. Finally, the rise of the emerging market per-capita income provides us with greater conviction that a company like Nike Inc., despite less robust growth in the U.S. can sustain above-average growth for many years.
Businesses held in the Fund are often not only well-positioned as the beneficiaries of long-term secular growth trends, but many times actually are defining, pioneering, and/or driving these trends via leadership through innovation. For example, Apple Inc. did not invent the phone, but the iPhone has set the standard for this category by adding innovations such as touch screens and the App store capability. Intuitive Surgical Inc. did
42
Management's Discussion of Fund Performance (Continued)
not invent minimally invasive surgery, but pioneered robotic surgery and continues to stay at the front of this wave of innovation that is affecting most hospitals that perform advanced surgery.
Strategy and Outlook
Given the significant volatility in equities over the past few years, the importance of "owning the leaders" may seem more obvious to investors than at certain times in the past. However, there are considerable challenges to implementing this strategy profitably, as we do not think this approach simply means buying the largest company or market share leader in a given industry. Instead, our research work focuses on separating the truly special leaders from the conventional ones, by identifying those businesses that we think are in the "sweet spot" of sustainable above average growth. As indicated in the previous company examples, all of the companies held in the Fund are doing the same things to ensure long-term growth and success via essential activities that may include 1) creating growth drivers: new products/services and entering new markets; 2) developing and anticipating important industry trends; 3) creating competitive barriers; 4) g aining market share; 5) building financial muscle to weather adverse periods and funding new opportunities; 6) displaying superior management ability; and 7) applying technology to add value. The current macroeconomic headwinds serve as a powerful reminder of how important these activities are when it comes to a company's ability to effectively navigate market extremes and continue to create business value, and ultimately wealth for shareholders.
Comparison of the Change in Value of a $10,000 Investment in the Touchstone Sands Capital Select Growth Fund - Class Y*, Touchstone Sands Capital Select
Growth Fund - Class Z* and the Russell 1000® Growth Index

* The initial public offering of Class Y shares and Class Z shares commenced on August 27, 2004 and August 11, 2000, respectively. The Class Y performance information is calculated using the historical performance of Class Z.
The performance of the above Fund does not reflect the deduction of taxes that a shareholder would pay on Fund distributions or the redemption of Fund shares.
43
Management's Discussion of Fund Performance (Continued)
Touchstone Short Duration Fixed Income Fund
Sub-Advised by Longfellow Investment Management Company
Investment Philosophy and Process
The Touchstone Short Duration Fixed Income Fund seeks to provide above market income, liquidity and risk-adjusted total return. Fund management targets these goals using a low risk approach, selecting a core group of securities from better yielding sectors within the government and corporate markets, and enhancing liquidity and yield by combining very short maturities with fixed rate issues in a barbell structure. The Fund avoids higher risk strategies, including exposure to non-dollar currencies and lower quality credits. While the Fund may invest in securities with any maturity or duration, interest rate risk is managed by maintaining an effective duration that is comparable to or less than that of three year U.S. Treasury Notes.
Fund Performance and Positioning
The total return of the Touchstone Short Duration Fixed Income Fund was 3.36% for the twelve month period ended September 30, 2010. The total return of the Barclays Capital 1-3 year U.S. Treasury Index was 2.59% for the same period. The Fund outperformed its benchmark.
During the past twelve months, short rates have declined significantly. The Fund's treasury benchmark yield went from 0.91% to 0.42% primarily due to the slow pace of the economic recovery compared to past recoveries, and the low level of inflation. The economy is currently growing at a 2.5% annual pace, while a 4-5% growth rate would normally be expected. Also, investors continue to seek refuge in U.S. Treasuries, given the credit issues with many alternatives.
The Fund, which we began to sub-advise in February 2009, was initially a government-only mandate and included a significant allocation to collateralized mortgage obligations (CMOs). At September 30, 2009, the CMO allocation was 16.1% of the Fund. This was reduced to 6.9% by September 30, 2010 through a combination of pay-downs and sales. Much of the proceeds were reinvested in asset-backed securities (ABS), especially credit cards and commercial mortgage backed securities (CMBS), both conventional AAA-rated short tranche positions and GNMA project loans, which are U.S. government guaranteed.
Income was a primary source of return for the Fund. The benefit was partially offset by the negative effect of the pay-down of high coupon securities (mortgage and ABS securities), as well as the reduced yield curve benefit of an amortizing portfolio versus an all-treasury index, especially in the current steep yield curve environment. A secondary source of return was the strong performance of the non-treasury sectors, where yield spreads to treasuries narrowed in agency (especially SBA holdings), CMBS and corporate sectors.
Strategy and Outlook
As of September 30, 2010, the effective duration of the Fund was 1.58 years, which was less than the Index duration of 1.87 years. While we do not expect the Federal Reserve to change its accommodative interest rate policy in the near term, at current levels a small increase in rates will have a significant negative impact on the Fund.
44
Management's Discussion of Fund Performance (Continued)
Comparison of the Change in Value of a $10,000 Investment in the
Touchstone Short Duration Fixed Income Fund - Class Z*,
the Barclays Capital 1-3 Year U.S. Treasury Index
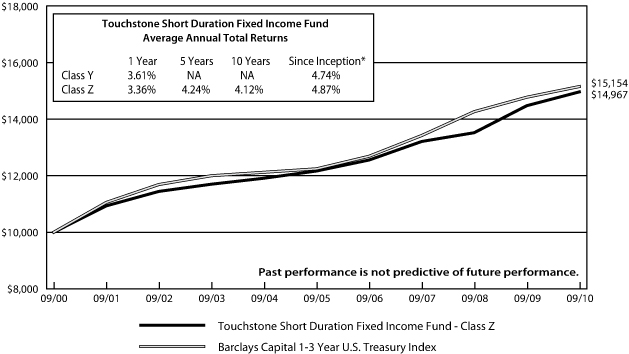
* The initial public offering of Class Z shares commenced on March 1, 1994 and the public offering of Class Y shares commenced on May 4, 2009.
The performance of the above Fund does not reflect the deduction of taxes that a shareholder would pay on Fund distributions or the redemption of Fund shares.
45
Management's Discussion of Fund Performance (Continued)
Touchstone Small Cap Core Fund
Sub-Advised by The London Company
Investment Philosophy and Process
The Touchstone Small Cap Core Fund seeks long-term capital appreciation by primarily investing in common stocks of companies with small market capitalizations. Fund management utilizes a bottom-up security selection process that screens potential investments against a proprietary quantitative model for return on capital, earnings to value ratio, free cash flow and return on equity. Their goal is to purchase generally profitable, financially stable companies that consistently generate high returns on unleveraged operating capital, are run by shareholder-oriented management, and are trading at a discount to their private market value.
Fund Performance and Positioning
The total return of the Touchstone Small Cap Core Fund was 16.20% for the twelve month period ended September 30, 2010 which was calculated excluding the maximum sales charge. The total return of the Russell 2000® Index was 13.35% for the same period. The Fund outperformed its benchmark due primarily to sector allocation and security selection.
During the period, the Fund's overweight positions in the Materials and Consumer Discretionary sectors contributed to relative performance. The Fund's underweight positions in the Telecommunication Services, Information Technology and Health Care sectors detracted from relative performance.
The largest contributors to relative performance during the period were PriceSmart Inc., Cabela's Inc. and Hasbro Inc. PriceSmart operates warehouse clubs in the Caribbean and Latin America. The retailer continued to show double digit "comp" growth and is likely to see larger opportunities with the opening of its first store in Columbia, which is significantly larger than its existing markets. We believe the company is still early in its growth cycle. Cabela's reported a third quarter 2010 above expectations. The company saw an improvement in operating margins and continued to see improving trends related to charge offs in its credit card portfolio. Hasbro continues to make progress with its Discovery Channel joint venture. We believe management is doing an excellent job on capital allocation, and even though the stock has appreciated significantly over the past year, we believe it is still trading at substantial discount to its private mark et value. The company has been approached by a private equity buyer, but management elected not to pursue the offer at this time.
The largest detractors to relative performance were First Industrial Realty Trust Inc., Brink's Company and Lance Inc. First Industrial has a blue chip customer list and a portfolio of high quality industrial real estate. We believe the market is valuing the company's assets at a deep discount to the true market value of its holdings. Despite management's progress towards de-levering the company, the stock's recent decline triggered our "stop loss" sell discipline and the Fund's exposure to the position was reduced. Brink's Company is a leader in the cash transport business with a brand name that is recognized globally. It has been impacted by irrational competitive pricing on the part of some of the more desperate players in its industry and we are no longer able to determine visibility into future cash flows. Lance makes private label salty snacks and snack crackers, in addition to its branded business. This year, the company's private lab el business was negatively impacted by aggressive pricing on the part of some its branded competitors. The operating leverage that should be inherent in its business model has failed to materialize. The position was sold to make room for more promising positions.
The Fund has benefited by the market's rotation into higher quality stocks as we have progressed through 2010. In March 2009, lower quality stocks were trading at more of a discount than normal due to the credit induced nature of the preceding sell off. As fears of the credit crisis passed, these lower quality stocks rallied and the Fund was fighting a headwind as it favors higher quality companies over lower quality. By April 2010, lower
46
Management's Discussion of Fund Performance (Continued)
quality stocks finally reached parity on a valuation basis and since then, higher quality stocks have outperformed, which benefited the Fund. We believe the markets will be led by accelerated consolidation, and some of the Fund's holdings will likely be targets.
Strategy and Outlook
After fears of a double-dip recession sent stocks lower in August 2010, investors responded positively to more encouraging economic reports in September. In the final estimate for the second quarter, GDP growth was revised upward, initial jobless claims remained below 500,000, existing home sales bounced, leading economic indicators improved, and the Federal Reserve committed to more quantitative easing if needed. Perhaps the most notable headline came from the National Bureau of Economic Research when it informed us rather belatedly that the Great Recession had ended in June 2009. Once investors grasped that the economy was perhaps settling into slow but steady growth instead of decline, stocks rebounded with a vengeance and turned in the best September in seventy-one years.
However, despite better economic data and improving prospects for stocks, equity investors remain on the sidelines. Money flows into bond funds at the expense of equity funds continues at a steady rate. We believe two factors are behind this. First, many investors are turning to bonds as a replacement for cash, looking only at current yields and not considering the adverse impact on bond prices should rates rise in the future, as we think they will. Second, we suspect many investors are chasing performance because bonds have out-performed stocks over the last ten years. While this may be understandable, it is shortsighted in our view. On a cash flow basis, and at today's stock prices, many companies are generating free cash flow yields that are superior to bonds and thus present better investment opportunities.
As a matter of fact, more U.S. companies are paying dividends that exceed their corporate bond yields than at any time in the last fifteen years. Johnson & Johnson is a case in point. In August, the company sold ten-year debt at a record low interest rate of 2.95%; yet, the stock has a current dividend yield of 3.5% after the company raised its dividend over 10% in April. Since 1995, bonds in the Bank of America Merrill Lynch U.S. Corporate Master Index have yielded 6.2% on average compared to an average dividend yield of just 1.8% for the S&P 500. This relationship began to reverse after the Federal Reserve's recent monetary easing lowered the Fed Funds rate to near zero, helping to send yields on the 10-Year U.S. Treasury Note to around 2.5%. Meanwhile, the recovery in the U.S. economy helped to boost equity payouts this year after many were slashed during the dim days of 2008 and early 2009. Johnson & Johnson is not alone when it comes to dividend increases. In the first six months of 2010, there were 135 dividend initiations or increases from the S&P 500 companies, up over 50% from the first six months of 2009.
Furthermore, in the third quarter we saw companies taking advantage of the strong demand for bonds and low interest rates to raise money for strategic acquisitions and share buybacks. Merger and Acquisition activity has been a strong point all year and really began to accelerate this quarter. With organic growth nonexistent and cash balances at an all-time high, we expect to see more deals come together. In fact, the 65 transactions announced in the small cap space this year already out pace all the activity in 2008 and 2009 combined. Moreover, targeted companies are receiving healthy premiums in the order of 50%-80% over current valuations. While forecasting takeout's is a difficult prognostication, we are encouraged to see higher quality companies that earn high returns on capital and generate strong free cash flow warrant this new found attention. As you would expect, the Fund holds companies that match this profile.
With $1.2 trillion in excess cash sitting on corporate balance sheets earning next to nothing, management teams recognize the need to allocate this capital. With rates so low, cash is a highly dilutive asset. As long as interest rates remain low, and thus the cost of holding cash remains high, we expect more firms will be putting cash to work. Companies can use excess cash as well as borrow in the corporate bond market and buy higher yielding assets in the equity market, immediately earning a spread.
47
Management's Discussion of Fund Performance (Continued)
Comparison of the Change in Value of a $10,000 Investment in the Touchstone
Small Cap Core Fund - Class A* and the Russell 2000® Index

* The chart above represents performance for Class A shares only, which will vary from the performance of Class C shares, Class Y shares and Institutional Class shares based on the differences in loads and fees paid by shareholders in the different classes. The Fund commenced operations on September 30, 2009.
** The total returns shown above are adjusted for maximum applicable sales charges.
The performance of the above Fund does not reflect the deduction of taxes that a shareholder would pay on Fund distributions or the redemption of Fund shares.
48
Management's Discussion of Fund Performance (Continued)
Touchstone Small Cap Value Opportunities Fund
Sub-Advised by Turner Investment Partners Inc.
Investment Philosophy and Process
The Touchstone Small Cap Value Opportunities Fund seeks long-term capital appreciation by primarily investing in common stock of companies with small market capitalizations that are believed to have the potential for growth and that appear to be trading below their perceived value. Securities are selected based primarily on fundamental analysis of each company with consideration to such characteristics as price-cash flow, price-earnings and price-book value ratios. The sub-advisor looks for companies with quality management teams that can take advantage of unique product opportunities, with an emphasis on companies that may be undervalued by the market.
Fund Performance and Positioning
The total return of the Touchstone Small Cap Value Opportunities Fund was 12.37% for the twelve month period ended September 30, 2010. The total return of the Russell 2000® Value Index was 11.84% for the same period. The Fund outperformed its benchmark primarily due to sector allocation and security selection.
The Consumer Discretionary and Materials sectors contributed positively to the Fund's relative performance during the period with specialty retailers 99 Cents Only Stores and Sally Beauty Holdings Inc. leading the way. 99 Cents Only Stores was purchased last quarter and has the ability to offer name-brand merchandise at lower prices, which positions it nicely to take advantage of a cautious consumer. In addition, it should benefit from its strategy of increasing margins while reducing costs. Sally Beauty traded substantially higher during the period, which added nicely to relative gains as well. Another Fund holding that was purchased during the second quarter 2010 and held up well through volatile markets was Shutterfly Inc. The online photo storage and printing company reported a strong first quarter and continues to gain market share in the print market. Their recent integration with Facebook was viewed as a positive catalyst for the comp any, which allows Facebook users to open their photos and their friends' photos to create quality photo books instantly.
With commodity prices moving higher during the quarter, the Materials sector provided nice upside capture for the Fund as well. Ferro Corporation and Globe Specialty Metals Inc. both traded significantly higher during the period. Ferro, a producer of specialty materials, reported strong earnings across all business segments. The main driver of growth was in their electronics materials business as the company benefited from increased demand for conductive pastes and powders used in the production of solar cells. The company also is managing their expenses efficiently and expects to deliver $20 to $30 million in cost savings by the end of 2010 with an additional $8 to $10 million in cost savings expected in 2011. Globe Specialty is a leading producer of silicon metals and silicon-based alloys. The company has a roughly 60% market share in the North American market and is seeing better than expected accretion from their recent acquisition of Co re Metals. Globe Specialty is on track to witness double-digit increases for its metal prices at the start of 2011. Chemical company Rockwood Holdings Inc. also traded higher as the company reported solid earnings driven by strong demand from the European auto market, as well as robust volume demand in lithium tied to the electronics market, two of their largest markets.
49
Management's Discussion of Fund Performance (Continued)
Conversely, the Industrials and Financials sectors detracted from relative performance during the period. Commercial service holdings in the Industrials sector impaired results, along with investments in capital markets and insurers in the Financials sector.
The Industrials sector was the largest detractor to relative performance. ACCO Brands Corp., which supplies office products to office and computer products wholesalers, retailers and mail order companies, reported a slightly optimistic sales outlook. However, despite management's cautious optimism we were concerned over limited revenue visibility and elected to exit the position. Another holding that detracted from relative performance was Genco Shipping & Trading Ltd, the provider of seaborne transportation of dry bulk commodities. The security was sold from the Fund in early 2010 as concerns grew of slower GDP growth in China and worries mounted over coal/iron ore demand in light of the substantial year-over-year price increases.
Within the Financials sector, overall concern over banks and their balance sheets led to a selloff in December 2009, which continued into 2010. As a result, the Fund holding PrivateBancorp Inc. detracted from results. Additionally, the Fund's capital market holdings, such as GLG Partners and GFI Group, hurt relative results. GLG Partners, a London based hedge fund manager with strong fundamentals, was negatively impacted by the fraudulent actions and scandals in the press from peers, such as Galleon. Results from GFI Group, a derivatives market maker, also were disappointing in late 2009 as the regulatory risk on instruments such as credit swap defaults was unattractive to investors. The company had lower than expected earnings and disappointing guidance. All the holdings detailed were sold from the Fund during the period.
Strategy and Outlook.
In managing the Fund, Turner's focus remains on owning stocks that we believe have either undervalued assets or strong prospective earnings power. We favor companies focused on controlling their debt levels that are also supported by above-average levels of cash on their balance sheets. From a sector view, the strategy is currently overweight the Materials and Information Technology sectors and is underweight the Financials and Industrials sectors.
Turner believes the market's strong move to the upside could continue through the last quarter of 2010 for several reasons. First, the S&P's earnings yield (earnings per share divided by the stock price) is currently more than 6%, while the bond market, as represented by the Barclays Capital U.S. Aggregate Bond Index, is yielding less than 3% (generally the two yields are about equal). Second, although recent economic data has been mixed, Turner believes the economy will show gradual improvement going forward. Third, companies are beginning to deploy some of their capital by way of stock buy backs and acquisitions which is generally positive for equities. Fourth, corporate America reported record-high profit margins for the second quarter 2010 and Turner believes this trend will continue as companies report third quarter earnings. Last but not least, after the mid-term elections conclude in early November the uncertainty leading up to th e elections will be replaced by clarity, which could provide additional strength to the equity market.
50
Management's Discussion of Fund Performance (Continued)
Comparison of the Change in Value of a $10,000 Investment in the Touchstone
Small Cap Value Opportunities Fund - Class Z* and the Russell 2000® Value Index

* The initial public offering of Class Z shares commenced on March 4, 2002.
The performance of the above Fund does not reflect the deduction of taxes that a shareholder would pay on Fund distributions or the redemption of Fund shares.
51
Management's Discussion of Fund Performance (Continued)
Touchstone Ultra Short Duration Fixed Income Fund
Sub-Advised by Fort Washington Investment Advisors Inc.
Investment Philosophy and Process
The Fund seeks maximum total return consistent with the preservation of capital by primarily investing in a diversified portfolio of fixed income securities of different maturities, including U.S. Treasury securities, U.S. government agency and U.S. government-sponsored enterprise securities, corporate bonds, mortgage-backed securities, commercial mortgage-backed securities, asset-backed securities, and municipal bonds. While the Fund may invest in securities with any maturity or duration, interest rate risk is managed by maintaining an effective duration of one year or less under normal market conditions.
Fund Performance and Positioning
The total return of the Touchstone Ultra Short Duration Fixed Income Fund was 2.49% for the twelve month period ended September 30, 2010. The total return of the Bank of America Merrill Lynch 3-Month U.S. Treasury Bill Index was 0.13% for the same period. The Fund outperformed its benchmark primarily due to a combination of stable investment income and declining risk premiums during the period. While all sectors of the fixed income market experienced significant contraction in spreads, the positive price performance was most notable in the non-government sectors, specifically mortgage- and asset-backed securities (including commercial mortgage-backed securities).
At the beginning of the fiscal year, the Fund's Principal Investment Strategy was a government/agency orientation (minimum 80% of assets invested in government or agency securities) effectively limiting its ability to participate in much of the market's upside. However, in April 2010 the Principal Investment Strategy was changed to a multi-sector orientation. By fiscal year-end, government/agency exposure was down to approximately 34% of Fund assets. Fort Washington believes that the additional diversification (and return potential) achieved through implementation of the multi-sector strategy will allow for improved risk adjusted returns over time.
The timing of the change in the Fund's Principal Investment Strategy was favorable, coinciding with the Greece debt crisis in April 2010. Risk premiums widened significantly on fears of a potential sovereign risk relating to the PIGS economies (Portugal, Italy, Greece and Spain), effectively creating an attractive entry point into the non-government sectors. The Fund's sector re-positioning was largely established by the end of June with significant allocations to commercial mortgage-backed securities, corporate bonds, asset-backed securities, and non-agency collateralized mortgage obligations. These sub-sectors were some of the best performing in the ultra short duration space in the third quarter.
Strategy and Outlook
The Fund currently maintains a duration of 0.67 years – midway through the traditional operating range of 0.5 to 0.8 years. With the Federal Reserve telegraphing an accommodative posture and Fed Funds futures contracts pointing to low short-term interest rates through 2011 and possibly into 2012, we may opportunistically extend duration for the next several quarters into the higher end of our operating range. We will continue to focus on high quality non-government securities in an effort to maximize alpha, and add to the core income-producing agency segments of the portfolio opportunistically – primarily agency ARMs.
Fort Washington believes that the economic recovery in the U.S. will be gradual, characterized by "fits and starts." Recent data has been mixed with most data series showing stabilizing trends. However, unemployment, one of the most critical metrics, remains stubbornly high. Even so, we've seen the delinquency metrics in most consumer asset-backed securitizations improve notably. Perhaps even more importantly, investors seem to
52
Management's Discussion of Fund Performance (Continued)
have gained a higher degree of comfort regarding future performance expectations for most structured products. We expect this trend to continue, further supported by very favorable supply/demand technicals. Against this backdrop, the outlook for the short-duration, fixed income markets is quite constructive.
Comparison of the Change in Value of a $10,000 Investment in the Touchstone
Ultra Short Duration Fixed Income Fund - Class Z* and the BofA Merrill Lynch
3-Month U.S. Treasury Bill Index

* The initial public offering of Class Z shares commenced on March 1, 1994.
The performance of the above Fund does not reflect the deduction of taxes that a shareholder would pay on Fund distributions or the redemption of Fund shares.
53
Tabular Presentation of Portfolios of Investments (Unaudited)
September 30, 2010
The illustrations below provide each Fund's sector allocation. We hope it will be useful to shareholders as it summarizes key information about each Fund's investments.
Touchstone Capital Appreciation Fund
| Sector Allocation | (% of Net Assets) | ||||||
| Information Technology | 23.1 | ||||||
| Health Care | 19.1 | ||||||
| Consumer Staples | 18.4 | ||||||
| Industrials | 9.0 | ||||||
| Financials | 8.1 | ||||||
| Consumer Discretionary | 8.0 | ||||||
| Energy | 6.3 | ||||||
| Materials | 2.4 | ||||||
| Investment Funds | 5.8 | ||||||
| Other Assets/Liabilities (Net) | (0.2 | ) | |||||
| Total | 100.0 | ||||||
Touchstone Core Plus Fixed Income Fund
| Credit Quality | (% of Investment Securities) | ||||||
| U.S. Treasury | 13.5 | ||||||
| U.S. Agency | 20.1 | ||||||
| AAA/Aaa | 15.0 | ||||||
| AA/Aa | 3.6 | ||||||
| A/A | 11.7 | ||||||
| BBB/Baa | 21.4 | ||||||
| BB/Ba | 8.1 | ||||||
| B/B | 6.6 | ||||||
| Total | 100.0 | ||||||
Touchstone Emerging Markets Equity Fund
| Sector Allocation | (% of Net Assets) | ||||||
| Financials | 27.0 | ||||||
| Materials | 16.8 | ||||||
| Consumer Discretionary | 14.7 | ||||||
| Energy | 9.2 | ||||||
| Consumer Staples | 8.2 | ||||||
| Information Technology | 6.4 | ||||||
| Industrials | 4.5 | ||||||
| Telecommunication Services | 4.2 | ||||||
| Utilities | 2.8 | ||||||
| Health Care | 1.2 | ||||||
| Investment Funds | 5.6 | ||||||
| Other Assets/Liabilities (Net) | (0.6 | ) | |||||
| Total | 100.0 | ||||||
Touchstone Focused Equity Fund
| Sector Allocation | (% of Net Assets) | ||||||
| Information Technology | 19.6 | ||||||
| Financials | 18.2 | ||||||
| Health Care | 16.9 | ||||||
| Consumer Discretionary | 16.5 | ||||||
| Consumer Staples | 7.6 | ||||||
| Industrials | 7.6 | ||||||
| Energy | 5.5 | ||||||
| Telecommunication Services | 4.4 | ||||||
| Materials | 2.8 | ||||||
| Investment Funds | 1.9 | ||||||
| Other Assets/Liabilities (Net) | (1.0 | ) | |||||
| Total | 100.0 | ||||||
54
Tabular Presentation of Portfolios of Investments (Continued)
Touchstone Global Equity Fund
| Sector Allocation | (% of Net Assets) | ||||||
| Materials | 23.0 | ||||||
| Consumer Staples | 17.8 | ||||||
| Industrials | 16.3 | ||||||
| Health Care | 11.0 | ||||||
| Telecommunication Services | 9.2 | ||||||
| Consumer Discretionary | 6.8 | ||||||
| Information Technology | 5.9 | ||||||
| Financials | 2.4 | ||||||
| Energy | 2.3 | ||||||
| Investment Funds | 2.7 | ||||||
| Other Assets/Liabilities (Net) | 2.6 | ||||||
| Total | 100.0 | ||||||
Touchstone Global Real Estate Fund
| Sector Allocation | (% of Net Assets) | ||||||
| Financials | 97.8 | ||||||
| Investment Funds | 4.0 | ||||||
| Other Assets/Liabilities (Net) | (1.8 | ) | |||||
| Total | 100.0 | ||||||
Touchstone Health Care and Biotechnology Fund
| Sector Allocation | (% of Net Assets) | ||||||
| Health Care | 98.9 | ||||||
| Investment Funds | 8.3 | ||||||
| Other Assets/Liabilities (Net) | (7.2 | ) | |||||
| Total | 100.0 | ||||||
Touchstone Intermediate Fixed Income Fund
| Credit Quality | (% of Investment Securities) | ||||||
| U.S. Treasury | 26.3 | ||||||
| U.S. Agency | 10.0 | ||||||
| AAA/Aaa | 6.5 | ||||||
| AA/Aa | 7.9 | ||||||
| A/A | 23.7 | ||||||
| BBB/Baa | 25.1 | ||||||
| BB/Ba | 0.5 | ||||||
| Total | 100.0 | ||||||
Touchstone International Fixed Income Fund
| Credit Quality | (% of Investment Securities) | ||||||
| AAA/Aaa | 59.5 | ||||||
| AA/Aa | 15.4 | ||||||
| A/A | 12.2 | ||||||
| BBB/Baa | 4.4 | ||||||
| BB/Ba | 4.7 | ||||||
| B/B | 1.0 | ||||||
| NR | 2.8 | ||||||
| Total | 100.0 | ||||||
Touchstone Large Cap Relative Value Fund
| Sector Allocation | (% of Net Assets) | ||||||
| Financials | 17.6 | ||||||
| Consumer Discretionary | 15.3 | ||||||
| Energy | 14.3 | ||||||
| Information Technology | 14.1 | ||||||
| Industrials | 13.2 | ||||||
| Health Care | 9.1 | ||||||
| Utilities | 4.9 | ||||||
| Materials | 4.7 | ||||||
| Telecommunication Services | 2.5 | ||||||
| Consumer Staples | 1.9 | ||||||
| Investment Funds | 3.1 | ||||||
| Other Assets/Liabilities (Net) | (0.7 | ) | |||||
| Total | 100.0 | ||||||
55
Tabular Presentation of Portfolios of Investments (Continued)
Touchstone Market Neutral Equity Fund
| Sector Allocation | (% of Net Assets) | ||||||
| Long Positions | |||||||
| Financials | 20.3 | ||||||
| Information Technology | 19.3 | ||||||
| Industrials | 12.1 | ||||||
| Health Care | 10.9 | ||||||
| Consumer Discretionary | 10.2 | ||||||
| Energy | 7.8 | ||||||
| Utilities | 4.5 | ||||||
| Consumer Staples | 3.1 | ||||||
| Materials | 2.9 | ||||||
| Telecommunication Services | 0.3 | ||||||
| Investment Funds | 3.1 | ||||||
| Cash Collateral for Securities Sold Short | 97.6 | ||||||
| Other Assets/Liabilities (Net) | (0.5 | ) | |||||
| 191.6 | |||||||
| Short Positions | |||||||
| Financials | (20.2 | ) | |||||
| Information Technology | (16.8 | ) | |||||
| Industrials | (13.3 | ) | |||||
| Health Care | (11.1 | ) | |||||
| Consumer Discretionary | (10.1 | ) | |||||
| Energy | (8.0 | ) | |||||
| Utilities | (4.4 | ) | |||||
| Materials | (4.1 | ) | |||||
| Consumer Staples | (3.3 | ) | |||||
| Telecommunication Services | (0.3 | ) | |||||
| (91.6 | ) | ||||||
| Total | 100.0 | ||||||
Touchstone Mid Cap Fund
| Sector Allocation | (% of Net Assets) | ||||||
| Information Technology | 16.3 | ||||||
| Financials | 16.1 | ||||||
| Consumer Discretionary | 14.0 | ||||||
| Materials | 9.4 | ||||||
| Health Care | 9.4 | ||||||
| Industrials | 9.4 | ||||||
| Consumer Staples | 8.5 | ||||||
| Energy | 8.1 | ||||||
| Utilities | 4.5 | ||||||
| Telecommunication Services | 3.9 | ||||||
| Investment Funds | 8.0 | ||||||
| Other Assets/Liabilities (Net) | (7.6 | ) | |||||
| Total | 100.0 | ||||||
Touchstone Mid Cap Value Fund
| Sector Allocation | (% of Net Assets) | ||||||
| Financials | 23.2 | ||||||
| Industrials | 12.8 | ||||||
| Consumer Discretionary | 10.5 | ||||||
| Utilities | 10.4 | ||||||
| Energy | 10.1 | ||||||
| Information Technology | 8.7 | ||||||
| Health Care | 7.8 | ||||||
| Consumer Staples | 7.6 | ||||||
| Materials | 7.2 | ||||||
| Investment Funds | 5.4 | ||||||
| Other Assets/Liabilities (Net) | (3.7 | ) | |||||
| Total | 100.0 | ||||||
56
Tabular Presentation of Portfolios of Investments (Continued)
Touchstone Premium Yield Equity Fund
| Sector Allocation | (% of Net Assets) | ||||||
| Energy | 18.7 | ||||||
| Health Care | 17.5 | ||||||
| Utilities | 16.3 | ||||||
| Financials | 15.2 | ||||||
| Telecommunication Services | 10.1 | ||||||
| Information Technology | 7.8 | ||||||
| Consumer Discretionary | 5.6 | ||||||
| Consumer Staples | 4.7 | ||||||
| Industrials | 2.0 | ||||||
| Investment Funds | 2.8 | ||||||
| Other Assets/Liabilities (Net) | (0.7 | ) | |||||
| Total | 100.0 | ||||||
Touchstone Sands Capital Select Growth Fund
| Sector Allocation | (% of Net Assets) | ||||||
| Information Technology | 34.9 | ||||||
| Health Care | 19.4 | ||||||
| Consumer Discretionary | 18.8 | ||||||
| Energy | 12.3 | ||||||
| Financials | 6.3 | ||||||
| Industrials | 3.3 | ||||||
| Materials | 2.0 | ||||||
| Investment Funds | 6.9 | ||||||
| Other Assets/Liabilities (Net) | (3.9 | ) | |||||
| Total | 100.0 | ||||||
Touchstone Short Duration Fixed Income Fund
| Credit Quality | (% of Investment Securities) | ||||||
| U.S. Treasury | 13.6 | ||||||
| U.S. Agency | 19.0 | ||||||
| AAA/Aaa | 40.5 | ||||||
| AA/Aa | 7.8 | ||||||
| A/A | 11.6 | ||||||
| BBB/Baa | 7.5 | ||||||
| Total | 100.0 | ||||||
Touchstone Small Cap Core Fund
| Sector Allocation | (% of Net Assets) | ||||||
| Financials | 20.7 | ||||||
| Industrials | 20.4 | ||||||
| Consumer Discretionary | 13.4 | ||||||
| Information Technology | 12.2 | ||||||
| Materials | 10.2 | ||||||
| Consumer Staples | 9.9 | ||||||
| Energy | 6.7 | ||||||
| Health Care | 4.6 | ||||||
| Investment Funds | 16.7 | ||||||
| Other Assets/Liabilities (Net) | (14.8 | ) | |||||
| Total | 100.0 | ||||||
Touchstone Small Cap Value Opportunities Fund
| Sector Allocation | (% of Net Assets) | ||||||
| Financials | 35.2 | ||||||
| Consumer Discretionary | 13.9 | ||||||
| Information Technology | 13.1 | ||||||
| Industrials | 10.1 | ||||||
| Materials | 9.6 | ||||||
| Energy | 5.9 | ||||||
| Utilities | 5.1 | ||||||
| Health Care | 4.3 | ||||||
| Consumer Staples | 2.5 | ||||||
| Investment Funds | 9.1 | ||||||
| Other Assets/Liabilities (Net) | (8.8 | ) | |||||
| Total | 100.0 | ||||||
Touchstone Ultra Short Duration Fixed Income Fund
| Credit Quality | (% of Investment Securities) | ||||||
| U.S. Agency | 33.8 | ||||||
| AAA/Aaa | 54.4 | ||||||
| AA/Aa | 2.8 | ||||||
| A/A | 4.6 | ||||||
| BBB/Baa | 3.7 | ||||||
| NR | 0.7 | ||||||
| Total | 100.0 | ||||||
57
Statements of Assets and Liabilities
September 30, 2010
| Touchstone Capital Appreciation Fund | Touchstone Core Plus Fixed Income Fund | Touchstone Emerging Markets Equity Fund | Touchstone Focused Equity Fund | ||||||||||||||||
| Assets | |||||||||||||||||||
| Investment securities: | |||||||||||||||||||
| At cost | $ | 6,122,311 | $ | 23,860,105 | $ | 136,820,016 | $ | 1,902,246 | |||||||||||
| Affiliated securities, at market value | $ | 351,779 | $ | 1,567,366 | $ | 6,859,541 | $ | 36,740 | |||||||||||
| Non-affiliated securities, at market value | 5,744,848 | 23,042,468 | 146,953,642 | 1,951,706 | |||||||||||||||
| At market value - including $1,629,252 of securities loaned for the Emerging Markets Equity Fund | $ | 6,096,627 | $ | 24,609,834 | $ | 153,813,183 | $ | 1,988,446 | |||||||||||
| Cash | — | — | 7 | — | |||||||||||||||
| Foreign currency, at cost of $3,477 and $134,660 for the Core Plus Fixed Income Fund and the Emerging Markets Equity Fund, respectively. | — | 3,549 | 134,703 | — | |||||||||||||||
| Unrealized appreciation on forward foreign currency contracts | — | 7,177 | 10,274 | — | |||||||||||||||
| Dividends and interest receivable | 2,991 | 264,772 | 114,515 | 2,962 | |||||||||||||||
| Receivable for capital shares sold | 7,500 | 171,204 | 1,515,953 | — | |||||||||||||||
| Receivable for securities sold | — | 359,399 | 461,741 | 6,940 | |||||||||||||||
| Receivable for securities lending income | — | — | 358 | — | |||||||||||||||
| Receivable from Advisor | 309 | — | — | 13,613 | |||||||||||||||
| Tax reclaims receivable | — | 264 | 1,964 | — | |||||||||||||||
| Other assets | 10,899 | 9,183 | 15,212 | 2,730 | |||||||||||||||
| Total Assets | 6,118,326 | 25,425,382 | 156,067,910 | 2,014,691 | |||||||||||||||
| Liabilities | |||||||||||||||||||
| Dividends payable | — | 70,815 | — | — | |||||||||||||||
| Unrealized depreciation on forward foreign currency contracts | — | 44,397 | — | — | |||||||||||||||
| Payable upon return of securities loaned | — | — | 1,669,388 | — | |||||||||||||||
| Payable for capital shares redeemed | — | 6,682 | 95,511 | — | |||||||||||||||
| Payable for securities purchased | — | 1,421,546 | 1,233,997 | 9,375 | |||||||||||||||
| Payable to Advisor | — | 3,615 | 50,045 | — | |||||||||||||||
| Payable to Trustees | 5,412 | 5,412 | 5,412 | 5,539 | |||||||||||||||
| Other accrued expenses and liabilities | 26,241 | 44,985 | 69,372 | 29,805 | |||||||||||||||
| Total Liabilities | 31,653 | 1,597,452 | 3,123,725 | 44,719 | |||||||||||||||
| Net Assets | $ | 6,086,673 | $ | 23,827,930 | $ | 152,944,185 | $ | 1,969,972 | |||||||||||
| Net assets consist of: | |||||||||||||||||||
| Paid-in capital | $ | 5,901,086 | $ | 23,072,676 | $ | 135,196,755 | $ | 1,845,510 | |||||||||||
| Accumulated net investment income (loss) | 22,693 | (82,980 | ) | 392,274 | 14,179 | ||||||||||||||
| Accumulated net realized gains on investments and foreign currency transactions | 188,578 | 124,989 | 361,300 | 24,083 | |||||||||||||||
| Net unrealized appreciation (depreciation) on investments | (25,684 | ) | 749,729 | 16,993,167 | 86,200 | ||||||||||||||
| Net unrealized appreciation (depreciation) on foreign currency and translation of other assets and liabilities denominated in foreign currency | — | (36,484 | ) | 689 | — | ||||||||||||||
| Net Assets | $ | 6,086,673 | $ | 23,827,930 | $ | 152,944,185 | $ | 1,969,972 | |||||||||||
| Pricing of Class A Shares | |||||||||||||||||||
| Net assets attributable to Class A shares | $ | 2,727,631 | $ | 4,818,632 | $ | 10,343,347 | $ | 813,900 | |||||||||||
| Shares of beneficial interest outstanding (unlimited number of shares authorized, no par value) | 257,186 | 462,966 | 815,722 | 74,348 | |||||||||||||||
| Net asset value and redemption price per share | $ | 10.61 | $ | 10.41 | $ | 12.68 | $ | 10.95 | |||||||||||
| Maximum offering price per share | $ | 11.26 | $ | 10.93 | $ | 13.45 | $ | 11.61 | |||||||||||
58
Statements of Assets and Liabilities (Continued)
| Touchstone Capital Appreciation Fund | Touchstone Core Plus Fixed Income Fund | Touchstone Emerging Markets Equity Fund | Touchstone Focused Equity Fund | ||||||||||||||||
| Pricing of Class C Shares | |||||||||||||||||||
| Net assets attributable to Class C shares | $ | 351,999 | $ | 1,867,919 | $ | 3,589,809 | $ | 187,363 | |||||||||||
| Shares of beneficial interest outstanding (unlimited number of shares authorized, no par value) | 33,433 | 179,589 | 285,375 | 17,214 | |||||||||||||||
| Net asset value, offering price and redemption price per share* | $ | 10.53 | $ | 10.40 | $ | 12.58 | $ | 10.88 | |||||||||||
| Pricing of Class Y Shares | |||||||||||||||||||
| Net assets attributable to Class Y shares | $ | 131,855 | $ | 816,560 | $ | 13,596,849 | $ | 200,641 | |||||||||||
| Shares of beneficial interest outstanding (unlimited number of shares authorized, no par value) | 12,410 | 78,404 | 1,069,157 | 18,300 | |||||||||||||||
| Net asset value, offering price and redemption price per share | $ | 10.63 | $ | 10.41 | $ | 12.72 | $ | 10.96 | |||||||||||
| Pricing of Institutional Class Shares | |||||||||||||||||||
| Net assets attributable to Institutional Class shares | $ | 2,875,188 | $ | 16,324,819 | $ | 125,414,180 | $ | 768,068 | |||||||||||
| Shares of beneficial interest outstanding (unlimited number of shares authorized, no par value) | 270,708 | 1,567,671 | 9,846,573 | 70,000 | |||||||||||||||
| Net asset value, offering price and redemption price per share | $ | 10.62 | $ | 10.41 | $ | 12.74 | $ | 10.97 | |||||||||||
* Redemption price per share varies by length of time shares are held.
See accompanying notes to financial statements.
59
Statements of Assets and Liabilities (Continued)
| Touchstone Global Equity Fund | Touchstone Global Real Estate Fund | Touchstone Healthcare and Biotechnology Fund | Touchstone Intermediate Fixed Income Fund | ||||||||||||||||
| Assets | |||||||||||||||||||
| Investment securities: | |||||||||||||||||||
| At cost | $ | 4,740,549 | $ | 4,123,401 | $ | 25,568,610 | $ | 102,661,250 | |||||||||||
| Affiliated securities, at market value | $ | 90,045 | $ | 128,215 | $ | 441,113 | $ | 4,393,607 | |||||||||||
| Non-affiliated securities, at market value | 4,963,753 | 4,313,676 | 27,591,813 | 104,024,209 | |||||||||||||||
| At market value - including $53,482, $45,350 and $1,667,739 of securities loaned for the Global Equity Fund, Global Real Estate Fund and the Healthcare and Biotechnology Fund, respectively | $ | 5,053,798 | $ | 4,441,891 | $ | 28,032,926 | $ | 108,417,816 | |||||||||||
| Cash | — | — | — | 4 | |||||||||||||||
| Foreign currency, at cost of $2,990 and $531 for the Global Equity Fund and the Global Real Estate Fund, respectively | 2,996 | 531 | — | — | |||||||||||||||
| Unrealized appreciation on forward foreign currency contracts | — | 30 | — | — | |||||||||||||||
| Dividends and interest receivable | 12,320 | 9,772 | 21,505 | 962,755 | |||||||||||||||
| Receivable for capital shares sold | 200,000 | 14,655 | 24,334 | 86,383 | |||||||||||||||
| Receivable for securities sold | — | 107,124 | — | 206,004 | |||||||||||||||
| Receivable for securities lending income | 49 | 1 | 1,056 | — | |||||||||||||||
| Receivable from Advisor | 7,237 | 25,591 | — | — | |||||||||||||||
| Tax reclaims receivable | 2,676 | 309 | — | — | |||||||||||||||
| Other assets | 7,276 | 2,734 | 1,092 | — | |||||||||||||||
| Total Assets | 5,286,352 | 4,602,638 | 28,080,913 | 109,672,962 | |||||||||||||||
| Liabilities | |||||||||||||||||||
| Unrealized depreciation on forward foreign currency contracts | — | 202 | — | — | |||||||||||||||
| Dividends payable | — | 18,989 | — | 257,860 | |||||||||||||||
| Payable upon return of securities loaned | 50,050 | 46,305 | 1,735,431 | — | |||||||||||||||
| Payable for capital shares redeemed | — | — | 11,236 | 1,121 | |||||||||||||||
| Payable for securities purchased | — | 129,771 | — | 206,020 | |||||||||||||||
| Payable to Advisor | — | — | 50,357 | 32,153 | |||||||||||||||
| Payable to other affiliates | — | — | 47,472 | — | |||||||||||||||
| Payable to Trustees | 5,412 | 5,412 | 4,461 | 5,496 | |||||||||||||||
| Other accrued expenses and liabilities | 40,191 | 37,250 | 70,357 | 31,903 | |||||||||||||||
| Total Liabilities | 95,653 | 237,929 | 1,919,314 | 534,553 | |||||||||||||||
| Net Assets | $ | 5,190,699 | $ | 4,364,709 | $ | 26,161,599 | $ | 109,138,409 | |||||||||||
| Net assets consist of: | |||||||||||||||||||
| Paid-in capital | $ | 4,861,549 | $ | 3,901,528 | $ | 33,161,730 | $ | 104,088,332 | |||||||||||
| Accumulated net investment income | 35,934 | 16,594 | — | 6,862 | |||||||||||||||
| Accumulated net realized gains (losses) on investments and foreign currency transactions | (20,378 | ) | 128,123 | (9,464,447 | ) | (713,351 | ) | ||||||||||||
| Net unrealized appreciation on investments | 313,249 | 318,490 | 2,464,316 | 5,756,566 | |||||||||||||||
| Net unrealized appreciation (depreciation) on foreign currency and translation of other assets and liabilities denominated in foreign currency | 345 | (26 | ) | — | — | ||||||||||||||
| Net Assets | $ | 5,190,699 | $ | 4,364,709 | $ | 26,161,599 | $ | 109,138,409 | |||||||||||
| Pricing of Class A Shares | |||||||||||||||||||
| Net assets attributable to Class A shares | $ | 1,856,754 | $ | 880,878 | $ | 23,696,134 | $ | — | |||||||||||
| Shares of beneficial interest outstanding (unlimited number of shares authorized, no par value) | 174,317 | 76,857 | 1,762,070 | — | |||||||||||||||
| Net asset value and redemption price per share | $ | 10.65 | $ | 11.46 | $ | 13.45 | $ | — | |||||||||||
| Maximum offering price per share | $ | 11.30 | $ | 12.16 | $ | 14.27 | $ | — | |||||||||||
60
Statements of Assets and Liabilities (Continued)
| Touchstone Global Equity Fund | Touchstone Global Real Estate Fund | Touchstone Healthcare and Biotechnology Fund | Touchstone Intermediate Fixed Income Fund | ||||||||||||||||
| Pricing of Class C Shares | |||||||||||||||||||
| Net assets attributable to Class C shares | $ | 105,710 | $ | 122,719 | $ | 2,465,465 | $ | — | |||||||||||
| Shares of beneficial interest outstanding (unlimited number of shares authorized, no par value) | 10,000 | 10,672 | 188,792 | — | |||||||||||||||
| Net asset value, offering price and redemption price per share* | $ | 10.57 | $ | 11.50 | $ | 13.06 | $ | — | |||||||||||
| Pricing of Class Y Shares | |||||||||||||||||||
| Net assets attributable to Class Y shares | $ | 141,979 | $ | 128,615 | $ | — | $ | — | |||||||||||
| Shares of beneficial interest outstanding (unlimited number of shares authorized, no par value) | 13,298 | 11,153 | — | — | |||||||||||||||
| Net asset value, offering price and redemption price per share | $ | 10.68 | $ | 11.53 | $ | — | $ | — | |||||||||||
| Pricing of Institutional Class Shares | |||||||||||||||||||
| Net assets attributable to Institutional Class shares | $ | 3,086,256 | $ | 3,232,497 | $ | — | $ | 109,138,409 | |||||||||||
| Shares of beneficial interest outstanding (unlimited number of shares authorized, no par value) | 288,773 | 278,484 | — | 11,914,619 | |||||||||||||||
| Net asset value, offering price and redemption price per share | $ | 10.69 | $ | 11.61 | $ | — | $ | 9.16 | |||||||||||
* Redemption price per share varies by length of time shares are held.
See accompanying notes to financial statements.
61
Statements of Assets and Liabilities (Continued)
| Touchstone International Fixed Income Fund | Touchstone Large Cap Relative Value Fund | Touchstone Market Neutral Equity Fund | Touchstone Mid Cap Fund | ||||||||||||||||
| Assets | |||||||||||||||||||
| Investment securities: | |||||||||||||||||||
| At cost | $ | 8,668,327 | $ | 3,534,370 | $ | 30,083,173 | $ | 116,115,967 | |||||||||||
| Affiliated securities, at market value | $ | 241,561 | $ | 117,676 | $ | 988,692 | $ | 564,694 | |||||||||||
| Non-affiliated securities, at market value | 8,808,701 | 3,750,601 | 30,374,629 | 133,977,675 | |||||||||||||||
| At market value - including $37,228 and $9,170,268 of securities loaned for the Market Neutral Equity Fund and the Mid Cap Fund, respectively. | $ | 9,050,262 | $ | 3,868,277 | $ | 31,363,321 | $ | 134,542,369 | |||||||||||
| Cash | — | — | 23 | — | |||||||||||||||
| Foreign currency, at cost of $294,763 for the International Fixed Income Fund | 296,770 | — | — | — | |||||||||||||||
| Cash collateral for securities sold short | — | — | 32,390,608 | — | |||||||||||||||
| Unrealized appreciation on forward foreign currency contracts | 63,663 | — | — | — | |||||||||||||||
| Dividends and interest receivable | 129,135 | 4,169 | 20,520 | 118,943 | |||||||||||||||
| Receivable for capital shares sold | 229,775 | — | 6,445 | 6,036 | |||||||||||||||
| Receivable for securities sold | 236,426 | — | 913,381 | 1,744,647 | |||||||||||||||
| Receivable for securities lending income | — | — | 4 | 1,547 | |||||||||||||||
| Receivable from Advisor | — | 4,466 | 9,046 | — | |||||||||||||||
| Tax reclaims receivable | 1,380 | — | — | — | |||||||||||||||
| Other assets | 2,081 | 2,940 | 3,592 | 6,064 | |||||||||||||||
| Total Assets | 10,009,492 | 3,879,852 | 64,706,940 | 136,419,606 | |||||||||||||||
| Liabilities | |||||||||||||||||||
| Securities sold short, at value (proceeds $29,356,048) | — | — | 30,410,075 | — | |||||||||||||||
| Bank overdraft | — | — | — | 292,831 | |||||||||||||||
| Dividends payable | 14,580 | — | — | — | |||||||||||||||
| Dividends for securities sold short | — | — | 17,686 | — | |||||||||||||||
| Unrealized depreciation on forward foreign currency contracts | 43,349 | — | — | — | |||||||||||||||
| Payable upon return of securities loaned | — | — | 37,699 | 9,417,147 | |||||||||||||||
| Payable for capital shares redeemed | 69 | — | 325,022 | 390,527 | |||||||||||||||
| Payable for securities purchased | 232,287 | — | 689,791 | 1,081,876 | |||||||||||||||
| Payable to Advisor | 10,144 | — | — | 82,177 | |||||||||||||||
| Payable to other affiliates | — | — | — | 18,996 | |||||||||||||||
| Payable to Trustees | 5,412 | 5,412 | 5,412 | 4,560 | |||||||||||||||
| Other accrued expenses and liabilities | 37,347 | 33,958 | 37,800 | 52,125 | |||||||||||||||
| Total Liabilities | 343,188 | 39,370 | 31,523,485 | 11,340,239 | |||||||||||||||
| Net Assets | $ | 9,666,304 | $ | 3,840,482 | $ | 33,183,455 | $ | 125,079,367 | |||||||||||
| Net assets consist of: | |||||||||||||||||||
| Paid-in capital | $ | 8,603,695 | $ | 3,488,071 | $ | 33,415,131 | $ | 299,153,951 | |||||||||||
| Accumulated net investment income (loss) | 628,712 | 16,828 | (9,165 | ) | 185,791 | ||||||||||||||
| Accumulated net realized gains (losses) on investments and foreign currency transactions | 25,219 | 1,676 | (448,632 | ) | (192,686,777 | ) | |||||||||||||
| Net unrealized appreciation on investments | 381,935 | 333,907 | 226,121 | 18,426,402 | |||||||||||||||
| Net unrealized appreciation on foreign currency and translation of other assets and liabilities denominated in foreign currency | 26,743 | — | — | — | |||||||||||||||
| Net Assets | $ | 9,666,304 | $ | 3,840,482 | $ | 33,183,455 | $ | 125,079,367 | |||||||||||
| Pricing of Class A Shares | |||||||||||||||||||
| Net assets attributable to Class A shares | $ | 1,319,435 | $ | 476,078 | $ | 609,801 | $ | 684,844 | |||||||||||
| Shares of beneficial interest outstanding (unlimited number of shares authorized, no par value) | 115,976 | 42,868 | 62,698 | 54,044 | |||||||||||||||
| Net asset value and redemption price per share | $ | 11.38 | $ | 11.11 | $ | 9.73 | $ | 12.67 | |||||||||||
| Maximum offering price per share | $ | 11.95 | $ | 11.79 | $ | 10.32 | $ | 13.44 | |||||||||||
62
Statements of Assets and Liabilities (Continued)
| Touchstone International Fixed Income Fund | Touchstone Large Cap Relative Value Fund | Touchstone Market Neutral Equity Fund | Touchstone Mid Cap Fund | ||||||||||||||||
| Pricing of Class C Shares | |||||||||||||||||||
| Net assets attributable to Class C shares | $ | 407,099 | $ | 234,508 | $ | 167,673 | $ | 248,662 | |||||||||||
| Shares of beneficial interest outstanding (unlimited number of shares authorized, no par value) | 35,805 | 21,220 | 17,363 | 19,770 | |||||||||||||||
| Net asset value, offering price and redemption price per share* | $ | 11.37 | $ | 11.05 | $ | 9.66 | $ | 12.58 | |||||||||||
| Pricing of Class Y Shares | |||||||||||||||||||
| Net assets attributable to Class Y shares | $ | 193,480 | $ | 111,620 | $ | 32,405,981 | $ | 123,493,472 | |||||||||||
| Shares of beneficial interest outstanding (unlimited number of shares authorized, no par value) | 17,011 | 10,034 | 3,322,219 | 9,741,651 | |||||||||||||||
| Net asset value, offering price and redemption price per share | $ | 11.37 | $ | 11.12 | $ | 9.75 | $ | 12.68 | |||||||||||
| Pricing of Class Z Shares | |||||||||||||||||||
| Net assets attributable to Class Y shares | $ | — | $ | — | $ | — | $ | 652,389 | |||||||||||
| Shares of beneficial interest outstanding (unlimited number of shares authorized, no par value) | — | — | — | 51,805 | |||||||||||||||
| Net asset value, offering price and redemption price per share | $ | — | $ | — | $ | — | $ | 12.59 | |||||||||||
| Pricing of Institutional Class Shares | |||||||||||||||||||
| Net assets attributable to Institutional Class shares | $ | 7,746,290 | $ | 3,018,276 | $ | — | $ | — | |||||||||||
| Shares of beneficial interest outstanding (unlimited number of shares authorized, no par value) | 681,121 | 271,107 | — | — | |||||||||||||||
| Net asset value, offering price and redemption price per share | $ | 11.37 | $ | 11.13 | $ | — | $ | — | |||||||||||
* Redemption price per share varies by length of time shares are held.
See accompanying notes to financial statements.
63
Statements of Assets and Liabilities (Continued)
| Touchstone Mid Cap Value Fund | Touchstone Premium Yield Equity Fund | Touchstone Sands Capital Select Growth Fund | Touchstone Short Duration Fixed Income Fund | ||||||||||||||||
| Assets | |||||||||||||||||||
| Investment securities: | |||||||||||||||||||
| At cost | $ | 41,321,923 | $ | 39,156,618 | $ | 525,782,529 | $ | 43,581,729 | |||||||||||
| Affiliated securities, at market value | $ | 554,647 | $ | 1,162,613 | $ | 30,084,351 | $ | 633,713 | |||||||||||
| Non-affiliated securities, at market value | 41,525,718 | 39,983,205 | 656,296,739 | 44,035,164 | |||||||||||||||
| At market value - including $1,473,549 and $14,785,563 of securities loaned for the Mid Cap Value Fund and the Sands Capital Select Growth Fund, respectively. | $ | 42,080,365 | $ | 41,145,818 | $ | 686,381,090 | $ | 44,668,877 | |||||||||||
| Cash | — | — | 2 | 1,166 | |||||||||||||||
| Dividends and interest receivable | 48,087 | 89,421 | 208,610 | 306,477 | |||||||||||||||
| Receivable for capital shares sold | 34,133 | 111,439 | 4,034,611 | 132,264 | |||||||||||||||
| Receivable for securities sold | — | — | 9,672,627 | — | |||||||||||||||
| Receivable for securities lending income | 26 | — | 115 | — | |||||||||||||||
| Tax reclaims receivable | — | 627 | — | — | |||||||||||||||
| Other assets | 534 | 3,128 | 31,103 | — | |||||||||||||||
| Total Assets | 42,163,145 | 41,350,433 | 700,328,158 | 45,108,784 | |||||||||||||||
| Liabilities | |||||||||||||||||||
| Dividends payable | 34,132 | 75,867 | — | 102,104 | |||||||||||||||
| Payable upon return of securities loaned | 1,507,083 | — | 15,443,326 | — | |||||||||||||||
| Payable for capital shares redeemed | 10 | 49,730 | 692,391 | 41,396 | |||||||||||||||
| Payable for securities purchased | — | 281,481 | 22,531,037 | 641,649 | |||||||||||||||
| Payable to Advisor | 8,715 | 23,540 | 699,514 | 8,986 | |||||||||||||||
| Payable to other affiliates | — | 37,393 | 193,004 | 72,306 | |||||||||||||||
| Payable to Trustees | 5,412 | 4,454 | 4,454 | 4,454 | |||||||||||||||
| Other accrued expenses and liabilities | 33,615 | 26,192 | 103,113 | 59,578 | |||||||||||||||
| Total Liabilities | 1,588,967 | 498,657 | 39,666,839 | 930,473 | |||||||||||||||
| Net Assets | $ | 40,574,178 | $ | 40,851,776 | $ | 660,661,319 | $ | 44,178,311 | |||||||||||
| Net assets consist of: | |||||||||||||||||||
| Paid-in capital | $ | 39,540,637 | $ | 47,720,509 | $ | 618,298,874 | $ | 48,500,941 | |||||||||||
| Accumulated net investment income | 35,000 | 28,330 | — | 79,721 | |||||||||||||||
| Accumulated net realized gains (losses) on investments and foreign currency transactions | 240,099 | (8,886,256 | ) | (118,236,116 | ) | (5,489,499 | ) | ||||||||||||
| Net unrealized appreciation on investments | 758,442 | 1,989,200 | 160,598,561 | 1,087,148 | |||||||||||||||
| Net unrealized depreciation on foreign currency and translation of other assets and liabilities denominated in foreign currency | — | (7 | ) | — | — | ||||||||||||||
| Net Assets | $ | 40,574,178 | $ | 40,851,776 | $ | 660,661,319 | $ | 44,178,311 | |||||||||||
| Pricing of Class A Shares | |||||||||||||||||||
| Net assets attributable to Class A shares | $ | 344,636 | $ | 22,441,423 | $ | — | $ | — | |||||||||||
| Shares of beneficial interest outstanding (unlimited number of shares authorized, no par value) | 29,304 | 3,461,054 | — | — | |||||||||||||||
| Net asset value and redemption price per share | $ | 11.76 | $ | 6.48 | $ | — | $ | — | |||||||||||
| Maximum offering price per share | $ | 12.48 | $ | 6.88 | $ | — | $ | — | |||||||||||
| Pricing of Class C Shares | |||||||||||||||||||
| Net assets attributable to Class C shares | $ | 132,045 | $ | 6,870,320 | $ | — | $ | — | |||||||||||
| Shares of beneficial interest outstanding (unlimited number of shares authorized, no par value) | 11,251 | 1,059,315 | — | — | |||||||||||||||
| Net asset value, offering price and redemption price per share* | $ | 11.74 | $ | 6.49 | $ | — | $ | — | |||||||||||
64
Statements of Assets and Liabilities (Continued)
| Touchstone Mid Cap Value Fund | Touchstone Premium Yield Equity Fund | Touchstone Sands Capital Select Growth Fund | Touchstone Short Duration Fixed Income Fund | ||||||||||||||||
| Pricing of Class Y Shares | |||||||||||||||||||
| Net assets attributable to Class Y shares | $ | 588,981 | $ | 11,540,033 | $ | 120,332,505 | $ | 766,964 | |||||||||||
| Shares of beneficial interest outstanding (unlimited number of shares authorized, no par value) | 49,963 | 1,782,756 | 13,625,415 | 76,949 | |||||||||||||||
| Net asset value, offering price and redemption price per share | $ | 11.79 | $ | 6.47 | $ | 8.83 | $ | 9.97 | |||||||||||
| Pricing of Class Z Shares | |||||||||||||||||||
| Net assets attributable to Class Y shares | $ | — | $ | — | $ | 540,328,814 | $ | 43,411,347 | |||||||||||
| Shares of beneficial interest outstanding (unlimited number of shares authorized, no par value) | — | — | 62,110,554 | 4,357,109 | |||||||||||||||
| Net asset value, offering price and redemption price per share | $ | — | $ | — | $ | 8.70 | $ | 9.96 | |||||||||||
| Pricing of Institutional Class Shares | |||||||||||||||||||
| Net assets attributable to Institutional Class shares | $ | 39,508,516 | $ | — | $ | — | $ | — | |||||||||||
| Shares of beneficial interest outstanding (unlimited number of shares authorized, no par value) | 3,340,840 | — | — | — | |||||||||||||||
| Net asset value, offering price and redemption price per share | $ | 11.83 | $ | — | $ | — | $ | — | |||||||||||
* Redemption price per share varies by length of time shares are held.
See accompanying notes to financial statements.
65
Statements of Assets and Liabilities (Continued)
| Touchstone Small Cap Core Fund | Touchstone Small Cap Value Oportunities Fund | Touchstone Ultra Short Duration Fixed Income Fund | |||||||||||||
| Assets | |||||||||||||||
| Investment securities: | |||||||||||||||
| At cost | $ | 109,151,224 | $ | 58,152,457 | $ | 237,181,095 | |||||||||
| Affiliated securities, at market value | $ | 1,696,266 | $ | 877,327 | $ | 34,353,028 | |||||||||
| Non-affiliated securities, at market value | 112,291,412 | 69,323,945 | 203,731,990 | ||||||||||||
| At market value - including $14,400,517 and $4,789,459 of securities loaned for the Small Cap Core Fund and the Small Cap Value Opportunities Fund, respectively. | $ | 113,987,678 | $ | 70,201,272 | $ | 238,085,018 | |||||||||
| Cash | — | — | 7,637 | ||||||||||||
| Dividends and interest receivable | 138,566 | 72,989 | 939,550 | ||||||||||||
| Receivable for capital shares sold | 434,650 | 33,377 | 1,363,393 | ||||||||||||
| Receivable for securities sold | — | 855,100 | 2,185,048 | ||||||||||||
| Receivable for securities lending income | 2,036 | 8,029 | — | ||||||||||||
| Other assets | 5,182 | 5,250 | 42,428 | ||||||||||||
| Total Assets | 114,568,112 | 71,176,017 | 242,623,074 | ||||||||||||
| Liabilities | |||||||||||||||
| Dividends payable | — | — | 378,105 | ||||||||||||
| Payable upon return of securities loaned | 14,930,317 | 4,991,256 | — | ||||||||||||
| Payable for capital shares redeemed | 266,687 | 50,833 | 1,147,769 | ||||||||||||
| Payable for securities purchased | — | 1,257,723 | 4,128,612 | ||||||||||||
| Payable to Advisor | 59,366 | 126,302 | 47,850 | ||||||||||||
| Payable to other affiliates | — | 117,724 | 200,704 | ||||||||||||
| Payable to Trustees | 5,412 | 4,560 | 4,560 | ||||||||||||
| Other accrued expenses and liabilities | 28,348 | 74,755 | 65,571 | ||||||||||||
| Total Liabilities | 15,290,130 | 6,623,153 | 5,973,171 | ||||||||||||
| Net Assets | $ | 99,277,982 | $ | 64,552,864 | $ | 236,649,903 | |||||||||
| Net assets consist of: | |||||||||||||||
| Paid-in capital | $ | 94,560,377 | $ | 101,713,063 | $ | 250,167,480 | |||||||||
| Accumulated net investment income | 168,505 | 56,761 | 137,423 | ||||||||||||
| Accumulated net realized losses on investments and foreign currency transactions | (287,354 | ) | (49,265,775 | ) | (14,558,923 | ) | |||||||||
| Net unrealized appreciation on investments | 4,836,454 | 12,048,815 | 903,923 | ||||||||||||
| Net Assets | $ | 99,277,982 | $ | 64,552,864 | $ | 236,649,903 | |||||||||
| Pricing of Class A Shares | |||||||||||||||
| Net assets attributable to Class A shares | $ | 50,110,284 | $ | — | $ | — | |||||||||
| Shares of beneficial interest outstanding (unlimited number of shares authorized, no par value) | 4,312,260 | — | — | ||||||||||||
| Net asset value and redemption price per share | $ | 11.62 | $ | — | $ | — | |||||||||
| Maximum offering price per share | $ | 12.33 | $ | — | $ | — | |||||||||
| Pricing of Class C Shares | |||||||||||||||
| Net assets attributable to Class C shares | $ | 5,245,232 | $ | — | $ | — | |||||||||
| Shares of beneficial interest outstanding (unlimited number of shares authorized, no par value) | 454,151 | — | — | ||||||||||||
| Net asset value, offering price and redemption price per share* | $ | 11.55 | $ | — | $ | — | |||||||||
| Pricing of Class Y Shares | |||||||||||||||
| Net assets attributable to Class Y shares | $ | 33,535,993 | $ | — | $ | — | |||||||||
| Shares of beneficial interest outstanding (unlimited number of shares authorized, no par value) | 2,874,782 | — | — | ||||||||||||
| Net asset value, offering price and redemption price per share | $ | 11.67 | $ | — | $ | — | |||||||||
66
Statements of Assets and Liabilities (Continued)
| Touchstone Small Cap Core Fund | Touchstone Small Cap Value Oportunities Fund | Touchstone Ultra Short Duration Fixed Income Fund | |||||||||||||
| Pricing of Class Z Shares | |||||||||||||||
| Net assets attributable to Class Y shares | $ | — | $ | 64,552,864 | $ | 236,649,903 | |||||||||
| Shares of beneficial interest outstanding (unlimited number of shares authorized, no par value) | — | 4,333,138 | 24,458,413 | ||||||||||||
| Net asset value, offering price and redemption price per share | $ | — | $ | 14.90 | $ | 9.68 | |||||||||
| Pricing of Institutional Class Shares | |||||||||||||||
| Net assets attributable to Institutional Class shares | $ | 10,386,473 | $ | — | $ | — | |||||||||
| Shares of beneficial interest outstanding (unlimited number of shares authorized, no par value) | 891,625 | — | — | ||||||||||||
| Net asset value, offering price and redemption price per share | $ | 11.65 | $ | — | $ | — | |||||||||
* Redemption price per share varies by length of time shares are held.
See accompanying notes to financial statements.
67
Statements of Operations
For the Year Ended September 30, 2010
| Touchstone Capital Appreciation Fund | Touchstone Core Plus Fixed Income Fund | Touchstone Emerging Markets Equity Fund | Touchstone Focused Equity Fund (C) | ||||||||||||||||
| Investment Income | |||||||||||||||||||
| Dividends from affiliated securities | $ | 1,524 | $ | 3,648 | $ | 9,388 | $ | 249 | |||||||||||
| Dividends from non-affiliated securities (A) | 77,372 | — | 1,064,124 | 30,675 | |||||||||||||||
| Interest (B) | — | 551,126 | 15 | — | |||||||||||||||
| Income from securities loaned | 294 | — | 567 | 25 | |||||||||||||||
| Total Investment Income | 79,190 | 554,774 | 1,074,094 | 30,949 | |||||||||||||||
| Expenses | |||||||||||||||||||
| Investment advisory fees | 37,722 | 58,358 | 458,487 | 12,325 | |||||||||||||||
| Distribution expenses, Class A | 4,458 | 5,289 | 7,654 | 957 | |||||||||||||||
| Distribution expenses, Class C | 2,372 | 11,612 | 16,992 | 1,001 | |||||||||||||||
| Administration fees | 10,026 | 25,937 | 82,561 | 3,500 | |||||||||||||||
| Professional fees | 26,126 | 36,041 | 45,648 | 26,749 | |||||||||||||||
| Transfer Agent fees, Class A | 696 | 1,375 | 3,089 | 94 | |||||||||||||||
| Transfer Agent fees, Class C | 121 | 372 | 1,081 | 60 | |||||||||||||||
| Transfer Agent fees, Class Y | 159 | 220 | 1,948 | 28 | |||||||||||||||
| Transfer Agent fees, Institutional Class | 121 | 220 | 1,530 | 27 | |||||||||||||||
| Reports to shareholders | 3,155 | 3,155 | 3,155 | 4,861 | |||||||||||||||
| Registration fees, Class A | 3,281 | 2,174 | 3,965 | 40 | |||||||||||||||
| Registration fees, Class C | 43 | 935 | 3,481 | 40 | |||||||||||||||
| Registration fees, Class Y | 194 | 534 | 1,223 | 40 | |||||||||||||||
| Registration fees, Institutional Class | 108 | 548 | 1,261 | 40 | |||||||||||||||
| Trustees' fees and expenses | 7,362 | 7,362 | 7,362 | 7,489 | |||||||||||||||
| Postage and supplies | 7,611 | 8,170 | 10,289 | 9,784 | |||||||||||||||
| Custodian fees | 898 | 3,040 | 109,540 | 34 | |||||||||||||||
| Compliance fees and expenses | 1,683 | 1,776 | 1,777 | 1,712 | |||||||||||||||
| Other expenses | 2,208 | 14,618 | 7,255 | 2,248 | |||||||||||||||
| Total Expenses | 108,344 | 181,736 | 768,298 | 71,029 | |||||||||||||||
| Fees waived by the Administrator | (10,026 | ) | (25,937 | ) | (82,561 | ) | (3,500 | ) | |||||||||||
| Fees waived and/or expenses reimbursed by the Advisor | (48,577 | ) | (66,104 | ) | (92,558 | ) | (50,598 | ) | |||||||||||
| Net Expenses | 49,741 | 89,695 | 593,179 | 16,931 | |||||||||||||||
| Net Investment Income | 29,449 | 465,079 | 480,915 | 14,018 | |||||||||||||||
| Realized and Unrealized Gains (Losses) on Investments | |||||||||||||||||||
| Net realized gains from security transactions | 188,578 | 157,838 | 361,300 | 24,083 | |||||||||||||||
| Net realized losses from foreign currency transactions | — | (85,574 | ) | (89,588 | ) | — | |||||||||||||
| Net change in unrealized appreciation/depreciation on investments | (25,684 | ) | 749,729 | 16,993,167 | 86,200 | ||||||||||||||
| Net change in unrealized appreciation/depreciation on foreign currency transactions | — | (36,484 | ) | 689 | — | ||||||||||||||
| Net Realized and Unrealized Gains on Investments | 162,894 | 785,509 | 17,265,568 | 110,283 | |||||||||||||||
| Net Increase in Net Assets from Operations | $ | 192,343 | $ | 1,250,588 | $ | 17,746,483 | $ | 124,301 | |||||||||||
| (A) Net of foreign tax withholding of: | $ | — | $ | — | $ | 55,177 | $ | 430 | |||||||||||
| (B) Net of foreign tax withholding of: | $ | — | $ | 104 | $ | — | $ | — | |||||||||||
(C) Represents the period from commencement of operations (December 31, 2009) through September 30, 2010.
See accompanying notes to financial statements.
68
Statements of Operations (Continued)
| Touchstone Global Equity Fund | Touchstone Global Real Estate Fund | Touchstone Healthcare and Biotechnology Fund | Touchstone Intermediate Fixed Income Fund | ||||||||||||||||
| Investment Income | |||||||||||||||||||
| Dividends from affiliated securities | $ | 814 | $ | 475 | $ | 2,918 | $ | 11,454 | |||||||||||
| Dividends from non-affiliated securities (A) | 75,981 | 133,254 | 463,815 | — | |||||||||||||||
| Interest (B) | — | — | — | 3,517,731 | |||||||||||||||
| Income from securities loaned | 261 | 20 | 7,561 | — | |||||||||||||||
| Total Investment Income | 77,056 | 133,749 | 474,294 | 3,529,185 | |||||||||||||||
| Expenses | |||||||||||||||||||
| Investment advisory fees | 29,296 | 28,076 | 302,973 | 436,209 | |||||||||||||||
| Distribution expenses, Class A | 1,229 | 1,036 | 68,268 | — | |||||||||||||||
| Distribution expenses, Class C | 1,013 | 1,099 | 29,901 | — | |||||||||||||||
| Administration fees | 6,866 | 6,995 | 60,595 | 218,106 | |||||||||||||||
| Professional fees | 31,770 | 32,929 | 18,792 | 26,680 | |||||||||||||||
| Transfer Agent fees, Class A | 439 | 295 | 66,037 | — | |||||||||||||||
| Transfer Agent fees, Class C | 108 | 108 | 10,956 | — | |||||||||||||||
| Transfer Agent fees, Class Y | 163 | 164 | — | — | |||||||||||||||
| Transfer Agent fees, Institutional Class | 108 | 108 | — | 4,024 | |||||||||||||||
| Reports to shareholders | 3,155 | 3,155 | 30,769 | 15,681 | |||||||||||||||
| Registration fees, Class A | 77 | 77 | 17,750 | — | |||||||||||||||
| Registration fees, Class C | 77 | 187 | 13,690 | — | |||||||||||||||
| Registration fees, Class Y | 132 | 132 | — | — | |||||||||||||||
| Registration fees, Institutional Class | 112 | 112 | — | 5,802 | |||||||||||||||
| Trustees' fees and expenses | 7,362 | 7,362 | 9,660 | 10,552 | |||||||||||||||
| Postage and supplies | 7,670 | 7,735 | 31,874 | 7,391 | |||||||||||||||
| Custodian fees | 13,248 | 26,743 | 11,851 | 4,310 | |||||||||||||||
| Compliance fees and expenses | 1,683 | 1,683 | 2,113 | 2,066 | |||||||||||||||
| Other expenses | 7,256 | 4,845 | 1,972 | 17,984 | |||||||||||||||
| Total Expenses | 111,764 | 122,841 | 677,201 | 748,805 | |||||||||||||||
| Fees waived by the Administrator | (6,866 | ) | (6,995 | ) | (60,595 | ) | (218,106 | ) | |||||||||||
| Fees waived and/or expenses reimbursed by the Advisor | (69,174 | ) | (78,008 | ) | (125,077 | ) | (94,430 | ) | |||||||||||
| Net Expenses | 35,724 | 37,838 | 491,529 | 436,269 | |||||||||||||||
| Net Investment Income (Loss) | 41,332 | 95,911 | (17,235 | ) | 3,092,916 | ||||||||||||||
| Realized and Unrealized Gains (Losses) on Investments | |||||||||||||||||||
| Net realized gains (losses) from security transactions | (20,378 | ) | 138,925 | 5,376,112 | 1,261,788 | ||||||||||||||
| Net realized gains (losses) from foreign currency transactions | (5,684 | ) | (865 | ) | 55 | — | |||||||||||||
| Net change in unrealized appreciation/depreciation on investments | 313,249 | 318,490 | (3,524,128 | ) | 4,058,725 | ||||||||||||||
| Net change in unrealized appreciation/depreciation on foreign currency transactions | 345 | (26 | ) | — | — | ||||||||||||||
| Net Realized and Unrealized Gains on Investments | 287,532 | 456,524 | 1,852,039 | 5,320,513 | |||||||||||||||
| Net Increase in Net Assets from Operations | $ | 328,864 | $ | 552,435 | $ | 1,834,804 | $ | 8,413,429 | |||||||||||
| (A) Net of foreign tax withholding of: | $ | 7,651 | $ | 4,306 | $ | — | $ | — | |||||||||||
| (B) Net of foreign tax withholding of: | $ | — | $ | — | $ | — | $ | 233 | |||||||||||
See accompanying notes to financial statements.
69
Statements of Operations (Continued)
| Touchstone International Fixed Income Fund | Touchstone Large Cap Relative Value Fund | Touchstone Market Neutral Equity Fund | Touchstone Mid Cap Fund | ||||||||||||||||
| Investment Income | |||||||||||||||||||
| Dividends from affiliated securities | $ | 1,824 | $ | 555 | $ | 1,975 | $ | 5,431 | |||||||||||
| Dividends from non-affiliated securities (A) | — | 60,872 | 148,570 | 2,268,571 | |||||||||||||||
| Interest (B) | 176,750 | — | — | — | |||||||||||||||
| Income from securities loaned | — | — | 27 | 77,662 | |||||||||||||||
| Total Investment Income | 178,574 | 61,427 | 150,572 | 2,351,664 | |||||||||||||||
| Expenses | |||||||||||||||||||
| Investment advisory fees | 41,327 | 24,994 | 146,895 | 1,139,745 | |||||||||||||||
| Dividend expense on securities sold short | — | — | 124,416 | — | |||||||||||||||
| Distribution expenses, Class A | 851 | 847 | 1,467 | 1,345 | |||||||||||||||
| Distribution expenses, Class C | 1,768 | 2,118 | 1,293 | 2,166 | |||||||||||||||
| Administration fees | 15,028 | 7,141 | 22,196 | 284,939 | |||||||||||||||
| Shareholder servicing fees | — | — | — | 3,742 | |||||||||||||||
| Professional fees | 38,565 | 30,341 | 34,322 | 39,378 | |||||||||||||||
| Transfer Agent fees, Class A | 484 | 1,149 | 1,240 | 2,061 | |||||||||||||||
| Transfer Agent fees, Class C | 164 | 328 | 224 | 320 | |||||||||||||||
| Transfer Agent fees, Class Y | 222 | 216 | 216 | 5,936 | |||||||||||||||
| Transfer Agent fees, Class Z | — | — | — | 7,551 | |||||||||||||||
| Transfer Agent fees, Institutional Class | 164 | 219 | — | — | |||||||||||||||
| Reports to shareholders | 3,155 | 3,155 | 3,155 | 9,454 | |||||||||||||||
| Registration fees, Class A | 1,078 | 155 | 161 | 6,140 | |||||||||||||||
| Registration fees, Class C | 906 | 90 | 102 | 5,109 | |||||||||||||||
| Registration fees, Class Y | 890 | 117 | 147 | 6,140 | |||||||||||||||
| Registration fees, Class Z | — | — | — | 6,140 | |||||||||||||||
| Registration fees, Institutional Class | 792 | 165 | — | — | |||||||||||||||
| Trustees' fees and expenses | 7,362 | 7,362 | 7,362 | 9,759 | |||||||||||||||
| Postage and supplies | 8,148 | 11,167 | 7,170 | 20,870 | |||||||||||||||
| Custodian fees | 4,163 | 674 | 32,335 | 6,759 | |||||||||||||||
| Compliance fees and expenses | 1,777 | 1,777 | 1,776 | 2,759 | |||||||||||||||
| Other expenses | 3,223 | 2,208 | 2,805 | 3,595 | |||||||||||||||
| Total Expenses | 130,067 | 94,223 | 387,282 | 1,563,908 | |||||||||||||||
| Fees waived by the Administrator | (15,028 | ) | (7,141 | ) | (22,196 | ) | (221,033 | ) | |||||||||||
| Fees waived and/or expenses reimbursed by the Advisor | (59,449 | ) | (54,832 | ) | (82,177 | ) | — | ||||||||||||
| Net Expenses | 55,590 | 32,250 | 282,909 | 1,342,875 | |||||||||||||||
| Net Investment Income (Loss) | 122,984 | 29,177 | (132,337 | ) | 1,008,789 | ||||||||||||||
| Realized and Unrealized Gains (Losses) on Investments | |||||||||||||||||||
| Net realized gains (losses) from security transactions | (90,113 | ) | 1,676 | (448,319 | ) | 23,865,581 | |||||||||||||
| Net realized gains from foreign currency transactions | 742,740 | — | — | — | |||||||||||||||
| Net change in unrealized appreciation/depreciation on investments | 381,935 | 333,907 | 226,121 | (6,883,713 | ) | ||||||||||||||
| Net change in unrealized appreciation/depreciation on foreign currency transactions | 26,743 | — | — | — | |||||||||||||||
| Net Realized and Unrealized Gains (Losses) on Investments | 1,061,305 | 335,583 | (222,198 | ) | 16,981,868 | ||||||||||||||
| Net Increase (Decrease) in Net Assets from Operations | $ | 1,184,289 | $ | 364,760 | $ | (354,535 | ) | $ | 17,990,657 | ||||||||||
| (A) Net of foreign tax withholding of: | $ | — | $ | — | $ | 42,606 | $ | 10,800 | |||||||||||
| (B) Net of foreign tax withholding of: | $ | 866 | $ | — | $ | — | $ | — | |||||||||||
See accompanying notes to financial statements.
70
Statements of Operations (Continued)
| Touchstone Mid Cap Value Fund | Touchstone Premium Yield Equity Fund | Touchstone Sands Capital Select Growth Fund | Touchstone Short Duration Fixed Income Fund | ||||||||||||||||
| Investment Income | |||||||||||||||||||
| Dividends from affiliated securities | $ | 873 | $ | 3,598 | $ | 30,712 | $ | 2,627 | |||||||||||
| Dividends from non-affiliated securities (A) | 161,835 | 1,448,927 | 3,504,468 | — | |||||||||||||||
| Interest | — | — | — | 1,573,292 | |||||||||||||||
| Income from securities loaned | 238 | — | 1,266 | — | |||||||||||||||
| Total Investment Income | 162,946 | 1,452,525 | 3,536,446 | 1,575,919 | |||||||||||||||
| Expenses | |||||||||||||||||||
| Investment advisory fees | 54,717 | 223,207 | 4,993,088 | 106,911 | |||||||||||||||
| Distribution expenses, Class A | 608 | 52,654 | — | — | |||||||||||||||
| Distribution expenses, Class C | 1,141 | 49,453 | — | — | |||||||||||||||
| Administration fees | 12,875 | 63,774 | 1,029,130 | 85,530 | |||||||||||||||
| Shareholder servicing fees | — | — | 922,220 | 101,281 | |||||||||||||||
| Professional fees | 30,781 | 15,708 | 44,551 | 31,651 | |||||||||||||||
| Transfer Agent fees, Class A | 479 | 7,115 | — | — | |||||||||||||||
| Transfer Agent fees, Class C | 114 | 2,154 | — | — | |||||||||||||||
| Transfer Agent fees, Class Y | 173 | 679 | 46,052 | 694 | |||||||||||||||
| Transfer Agent fees, Class Z | — | — | 346,287 | 39,682 | |||||||||||||||
| Transfer Agent fees, Institutional Class | 114 | — | — | — | |||||||||||||||
| Reports to shareholders | 3,155 | 8,136 | 89,659 | 20,420 | |||||||||||||||
| Registration fees, Class A | 1,248 | 12,140 | — | — | |||||||||||||||
| Registration fees, Class C | 705 | 6,508 | — | — | |||||||||||||||
| Registration fees, Class Y | 3,343 | 27,529 | 13,851 | 17,921 | |||||||||||||||
| Registration fees, Class Z | — | — | 49,991 | 13,684 | |||||||||||||||
| Registration fees, Institutional Class | 762 | — | — | — | |||||||||||||||
| Trustees' fees and expenses | 7,362 | 9,653 | 9,653 | 9,653 | |||||||||||||||
| Postage and supplies | 10,067 | 7,212 | 87,276 | 11,138 | |||||||||||||||
| Custodian fees | 1,511 | 5,917 | 10,908 | 4,116 | |||||||||||||||
| Compliance fees and expenses | 1,764 | 1,968 | 3,694 | 2,117 | |||||||||||||||
| Other expenses | 2,303 | 972 | 10,030 | 16,489 | |||||||||||||||
| Total Expenses | 133,222 | 494,779 | 7,656,390 | 461,287 | |||||||||||||||
| Fees waived by the Administrator | (12,875 | ) | (63,774 | ) | (319,792 | ) | (85,530 | ) | |||||||||||
| Fees waived and/or expenses reimbursed by the Advisor | (60,381 | ) | (25,421 | ) | — | (60,711 | ) | ||||||||||||
| Net Expenses | 59,966 | 405,584 | 7,336,598 | 315,046 | |||||||||||||||
| Net Investment Income (Loss) | 102,980 | 1,046,941 | (3,800,152 | ) | 1,260,873 | ||||||||||||||
| Realized and Unrealized Gains (Losses) on Investments | |||||||||||||||||||
| Net realized gains from security transactions | 238,449 | 50,767 | 23,075,415 | 91,449 | |||||||||||||||
| Net change in unrealized appreciation/depreciation on investments | 758,442 | 2,562,610 | 76,755,229 | 73,170 | |||||||||||||||
| Net change in unrealized appreciation/depreciation on foreign currency transactions | — | (7 | ) | — | — | ||||||||||||||
| Net Realized and Unrealized Gains on Investments | 996,891 | 2,613,370 | 99,830,644 | 164,619 | |||||||||||||||
| Net Increase in Net Assets from Operations | $ | 1,099,871 | $ | 3,660,311 | $ | 96,030,492 | $ | 1,425,492 | |||||||||||
| (A) Net of foreign tax withholding of: | $ | — | $ | 26,778 | $ | — | $ | — | |||||||||||
See accompanying notes to financial statements.
71
Statements of Operations (Continued)
| Touchstone Small Cap Core Fund | Touchstone Small Cap Value Oportunities Fund | Touchstone Ultra Short Duration Fixed Income Fund | |||||||||||||
| Investment Income | |||||||||||||||
| Dividends from affiliated securities | $ | 5,225 | $ | 3,709 | $ | 50,033 | |||||||||
| Dividends from non-affiliated securities | 774,611 | 911,978 | — | ||||||||||||
| Interest | — | — | 3,562,733 | ||||||||||||
| Income from securities loaned | 38,814 | 178,228 | — | ||||||||||||
| Total Investment Income | 818,650 | 1,093,915 | 3,612,766 | ||||||||||||
| Expenses | |||||||||||||||
| Investment advisory fees | 418,333 | 692,183 | 378,564 | ||||||||||||
| Distribution expenses, Class A | 64,398 | — | — | ||||||||||||
| Distribution expenses, Class C | 23,072 | — | — | ||||||||||||
| Administration fees | 97,893 | 145,724 | 302,855 | ||||||||||||
| Shareholder servicing fees | — | 182,153 | 333,137 | ||||||||||||
| Professional fees | 30,781 | 29,355 | 35,683 | ||||||||||||
| Transfer Agent fees, Class A | 17,400 | — | — | ||||||||||||
| Transfer Agent fees, Class C | 1,176 | — | — | ||||||||||||
| Transfer Agent fees, Class Y | 1,010 | — | — | ||||||||||||
| Transfer Agent fees, Class Z | — | 124,314 | 99,476 | ||||||||||||
| Transfer Agent fees, Institutional Class | 169 | — | — | ||||||||||||
| Reports to shareholders | 8,126 | 16,876 | 20,893 | ||||||||||||
| Registration fees, Class A | 10,610 | — | — | ||||||||||||
| Registration fees, Class C | 6,793 | — | — | ||||||||||||
| Registration fees, Class Y | 12,516 | — | — | ||||||||||||
| Registration fees, Class Z | — | 20,326 | 6,140 | ||||||||||||
| Registration fees, Institutional Class | 2,674 | — | — | ||||||||||||
| Trustees' fees and expenses | 7,362 | 9,759 | 9,759 | ||||||||||||
| Postage and supplies | 28,361 | 27,149 | 13,220 | ||||||||||||
| Custodian fees | 2,876 | 2,587 | 3,358 | ||||||||||||
| Compliance fees and expenses | 2,273 | 2,313 | 2,484 | ||||||||||||
| Other expenses | 2,306 | 4,048 | 17,828 | ||||||||||||
| Total Expenses | 738,129 | 1,256,787 | 1,223,397 | ||||||||||||
| Fees waived by the Administrator | (97,893 | ) | (145,724 | ) | (176,133 | ) | |||||||||
| Fees waived and/or expenses reimbursed by the Advisor | (26,132 | ) | (18,934 | ) | — | ||||||||||
| Net Expenses | 614,104 | 1,092,129 | 1,047,264 | ||||||||||||
| Net Investment Income | 204,546 | 1,786 | 2,565,502 | ||||||||||||
| Realized and Unrealized Gains (Losses) on Investments | |||||||||||||||
| Net realized gains (losses) from security transactions | (314,666 | ) | 11,410,624 | 194,688 | |||||||||||
| Net change in unrealized appreciation/depreciation on investments | 4,836,454 | (3,524,275 | ) | 606,191 | |||||||||||
| Net Realized and Unrealized Gains (Losses) on Investments | 4,521,788 | 7,886,349 | 800,879 | ||||||||||||
| Net Increase in Net Assets from Operations | $ | 4,726,334 | $ | 7,888,135 | $ | 3,366,381 | |||||||||
See accompanying notes to financial statements.
72
Statements of Changes in Net Assets
| Touchstone Capital Appreciation Fund | Touchstone Core Plus Fixed Income Fund | Touchstone Emerging Markets Equity Fund | Touchstone Focused Equity Fund | ||||||||||||||||
| Year Ended September 30, 2010 | Year Ended September 30, 2010 | Year Ended September 30, 2010 | Period Ended September 30, 2010 (A) | ||||||||||||||||
| From Operations | |||||||||||||||||||
| Net investment income | $ | 29,449 | $ | 465,079 | $ | 480,915 | $ | 14,018 | |||||||||||
| Net realized gains from security transactions | 188,578 | 157,838 | 361,300 | 24,083 | |||||||||||||||
| Net realized losses from foreign currency transactions | — | (85,574 | ) | (89,588 | ) | — | |||||||||||||
| Net change in unrealized appreciation/depreciation on investments | (25,684 | ) | 749,729 | 16,993,167 | 86,200 | ||||||||||||||
| Net change in unrealized appreciation/depreciation from foreign currency transactions | — | (36,484 | ) | 689 | — | ||||||||||||||
| Net Increase in Net Assets from Operations | 192,343 | 1,250,588 | 17,746,483 | 124,301 | |||||||||||||||
| Distributions to Shareholders | |||||||||||||||||||
| From net investment income, Class A | — | (78,223 | ) | — | — | ||||||||||||||
| From net investment income, Class C | — | (32,961 | ) | — | — | ||||||||||||||
| From net investment income, Class Y | (129 | ) | (18,976 | ) | — | — | |||||||||||||
| From net investment income, Institutional Class | (7,574 | ) | (366,121 | ) | — | — | |||||||||||||
| Decrease in Net Assets from Distributions to Shareholders | (7,703 | ) | (496,281 | ) | — | — | |||||||||||||
| From Capital Share Transactions | |||||||||||||||||||
| Class A | |||||||||||||||||||
| Proceeds from shares sold | 2,826,917 | 5,206,942 | 10,689,819 | 916,448 | |||||||||||||||
| Reinvested distributions | — | 49,984 | — | — | |||||||||||||||
| Payments for shares redeemed | (105,717 | ) | (568,880 | ) | (1,353,192 | ) | (137,021 | ) | |||||||||||
| Net Increase in Net Assets from Class A Share Transactions | 2,721,200 | 4,688,046 | 9,336,627 | 779,427 | |||||||||||||||
| Class C | |||||||||||||||||||
| Proceeds from shares sold | 387,455 | 1,874,613 | 3,375,452 | 191,017 | |||||||||||||||
| Reinvested distributions | — | 25,719 | — | — | |||||||||||||||
| Payments for shares redeemed | (39,304 | ) | (101,511 | ) | (177,973 | ) | (14,936 | ) | |||||||||||
| Net Increase in Net Assets from Class C Share Transactions | 348,151 | 1,798,821 | 3,197,479 | 176,081 | |||||||||||||||
| Class Y | |||||||||||||||||||
| Proceeds from shares sold | 172,799 | 964,338 | 13,519,919 | 187,471 | |||||||||||||||
| Reinvested distributions | 129 | 15,361 | — | — | |||||||||||||||
| Payments for shares redeemed | (47,635 | ) | (194,457 | ) | (789,864 | ) | — | ||||||||||||
| Net Increase in Net Assets from Class Y Share Transactions | 125,293 | 785,242 | 12,730,055 | 187,471 | |||||||||||||||
| Institutional Class | |||||||||||||||||||
| Proceeds from shares sold | 2,702,500 | 15,768,550 | 115,334,491 | 1,700,000 | |||||||||||||||
| Reinvested distributions | 7,574 | 292,688 | — | — | |||||||||||||||
| Payments for shares redeemed | (2,685 | ) | (259,724 | ) | (5,400,950 | ) | (997,308 | ) | |||||||||||
| Net Increase in Net Assets from Institutional Class Share Transactions | 2,707,389 | 15,801,514 | 109,933,541 | 702,692 | |||||||||||||||
| Total Increase in Net Assets | 6,086,673 | 23,827,930 | 152,944,185 | 1,969,972 | |||||||||||||||
| Net Assets | |||||||||||||||||||
| Beginning of period | — | — | — | — | |||||||||||||||
| End of period | $ | 6,086,673 | $ | 23,827,930 | $ | 152,944,185 | $ | 1,969,972 | |||||||||||
| Accumulated Net Investment Income (Loss) | $ | 22,693 | $ | (82,980 | ) | $ | 392,274 | $ | 14,179 | ||||||||||
(A) Represents the period from commencement of operations (December 31, 2009) through September 30, 2010.
See accompanying notes to financial statements.
73
Statements of Changes in Net Assets (Continued)
| Touchstone Global Equity Fund | Touchstone Global Real Estate Fund | Touchstone Healthcare and Biotechnology Fund | |||||||||||||||||
| Year Ended September 30, 2010 | Year Ended September 30, 2010 | Year Ended September 30, 2010 | Year Ended September 30, 2009 | ||||||||||||||||
| From Operations | |||||||||||||||||||
| Net investment income (loss) | $ | 41,332 | $ | 95,911 | $ | (17,235 | ) | $ | (226,577 | ) | |||||||||
| Net realized gains (losses) from security transactions | (20,378 | ) | 138,925 | 5,376,112 | (10,671,346 | ) | |||||||||||||
| Net realized gains (losses) from foreign currency transactions | (5,684 | ) | (865 | ) | 55 | (137,152 | ) | ||||||||||||
| Net change in unrealized appreciation/depreciation on investments | 313,249 | 318,490 | (3,524,128 | ) | (562,790 | ) | |||||||||||||
| Net change in unrealized appreciation/depreciation from foreign currency transactions | 345 | (26 | ) | — | 734 | ||||||||||||||
| Net Increase (Decrease) in Net Assets from Operations | 328,864 | 552,435 | 1,834,804 | (11,597,131 | ) | ||||||||||||||
| Distributions to Shareholders | |||||||||||||||||||
| From net investment income, Class A | — | (11,322 | ) | — | — | ||||||||||||||
| From net investment income, Class C | — | (2,628 | ) | — | — | ||||||||||||||
| From net investment income, Class Y | — | (3,504 | ) | — | — | ||||||||||||||
| From net investment income, Institutional Class | (661 | ) | (72,747 | ) | — | — | |||||||||||||
| Decrease in Net Assets from Distributions to Shareholders | (661 | ) | (90,201 | ) | — | — | |||||||||||||
| From Capital Share Transactions | |||||||||||||||||||
| Class A | |||||||||||||||||||
| Proceeds from shares sold | 2,163,712 | 1,809,940 | 3,388,085 | 13,960,719 | |||||||||||||||
| Reinvested distributions | — | 4,131 | — | — | |||||||||||||||
| Payments for shares redeemed | (434,302 | ) | (918,136 | ) | (15,401,735 | ) | (30,335,581 | ) | |||||||||||
| Net Increase (Decrease) in Net Assets from Class A Share Transactions | 1,729,410 | 895,935 | (12,013,650 | ) | (16,374,862 | ) | |||||||||||||
| Class C | |||||||||||||||||||
| Proceeds from shares sold | 102,506 | 107,708 | 71,965 | 592,896 | |||||||||||||||
| Reinvested distributions | — | 1,801 | — | — | |||||||||||||||
| Payments for shares redeemed | (2,578 | ) | (2,579 | ) | (1,246,774 | ) | (1,993,164 | ) | |||||||||||
| Net Increase (Decrease) in Net Assets from Class C Share Transactions | 99,928 | 106,930 | (1,174,809 | ) | (1,400,268 | ) | |||||||||||||
| Class Y | |||||||||||||||||||
| Proceeds from shares sold | 135,007 | 112,416 | — | — | |||||||||||||||
| Reinvested distributions | — | 2,338 | — | — | |||||||||||||||
| Payments for shares redeemed | (2,585 | ) | (2,587 | ) | — | — | |||||||||||||
| Net Increase in Net Assets from Class Y Share Transactions | 132,422 | 112,167 | — | — | |||||||||||||||
| Institutional Class | |||||||||||||||||||
| Proceeds from shares sold | 2,902,660 | 2,728,086 | — | — | |||||||||||||||
| Reinvested distributions | 661 | 62,162 | — | — | |||||||||||||||
| Payments for shares redeemed | (2,585 | ) | (2,805 | ) | — | — | |||||||||||||
| Net Increase in Net Assets from Institutional Class Share Transactions | 2,900,736 | 2,787,443 | — | — | |||||||||||||||
| Total Increase (Decrease) in Net Assets | 5,190,699 | 4,364,709 | (11,353,655 | ) | (29,372,261 | ) | |||||||||||||
| Net Assets | |||||||||||||||||||
| Beginning of year | — | — | 37,515,254 | 66,887,515 | |||||||||||||||
| End of year | $ | 5,190,699 | $ | 4,364,709 | $ | 26,161,599 | $ | 37,515,254 | |||||||||||
| Accumulated Net Investment Income (Loss) | $ | 35,934 | $ | 16,594 | $ | — | $ | (13,459 | ) | ||||||||||
See accompanying notes to financial statements.
74
Statements of Changes in Net Assets (Continued)
| Touchstone Intermediate Fixed Income Fund | Touchstone International Fixed Income Fund | Touchstone Large Cap Relative Value Fund | |||||||||||||||||
| Year Ended September 30, 2010 | Year Ended September 30, 2009 | Year Ended September 30, 2010 | Year Ended September 30, 2010 | ||||||||||||||||
| From Operations | |||||||||||||||||||
| Net investment income | $ | 3,092,916 | $ | 845,951 | $ | 122,984 | $ | 29,177 | |||||||||||
| Net realized gains (losses) from security transactions | 1,261,788 | (1,842,058 | ) | (90,113 | ) | 1,676 | |||||||||||||
| Net realized gains from foreign currency transactions | — | — | 742,740 | — | |||||||||||||||
| Net change in unrealized appreciation/depreciation on investments | 4,058,725 | 3,248,154 | 381,935 | 333,907 | |||||||||||||||
| Net change in unrealized appreciation/depreciation from foreign currency transactions | — | — | 26,743 | — | |||||||||||||||
| Net Increase in Net Assets from Operations | 8,413,429 | 2,252,047 | 1,184,289 | 364,760 | |||||||||||||||
| Distributions to Shareholders | |||||||||||||||||||
| From net investment income, Class A | — | — | (4,889 | ) | (671 | ) | |||||||||||||
| From net investment income, Class C | — | — | (1,083 | ) | — | ||||||||||||||
| From net investment income, Class Y | — | — | (1,666 | ) | (375 | ) | |||||||||||||
| From net investment income, Institutional Class | (3,085,391 | ) | (855,228 | ) | (114,989 | ) | (12,250 | ) | |||||||||||
| Decrease in Net Assets from Distributions to Shareholders | (3,085,391 | ) | (855,228 | ) | (122,627 | ) | (13,296 | ) | |||||||||||
| From Capital Share Transactions | |||||||||||||||||||
| Class A | |||||||||||||||||||
| Proceeds from shares sold | — | — | 1,245,905 | 478,479 | |||||||||||||||
| Reinvested distributions | — | — | 3,105 | 234 | |||||||||||||||
| Payments for shares redeemed | — | — | (13,119 | ) | (20,601 | ) | |||||||||||||
| Net Increase in Net Assets from Class A Share Transactions | — | — | 1,235,891 | 458,112 | |||||||||||||||
| Class C | |||||||||||||||||||
| Proceeds from shares sold | — | — | 435,129 | 224,349 | |||||||||||||||
| Reinvested distributions | — | — | 732 | — | |||||||||||||||
| Payments for shares redeemed | — | — | (61,506 | ) | (5,682 | ) | |||||||||||||
| Net Increase in Net Assets from Class C Share Transactions | — | — | 374,355 | 218,667 | |||||||||||||||
| Class Y | |||||||||||||||||||
| Proceeds from shares sold | — | — | 243,298 | 102,690 | |||||||||||||||
| Reinvested distributions | — | — | 1,369 | 185 | |||||||||||||||
| Payments for shares redeemed | — | — | (65,259 | ) | (2,693 | ) | |||||||||||||
| Net Increase in Net Assets from Class Y Share Transactions | — | — | 179,408 | 100,182 | |||||||||||||||
| Institutional Class | |||||||||||||||||||
| Proceeds from shares sold | 10,603,276 | 99,192,335 | 6,724,021 | 2,708,680 | |||||||||||||||
| Reinvested distributions | 70,548 | 370,061 | 93,468 | 6,070 | |||||||||||||||
| Payments for shares redeemed | (10,588,435 | ) | (12,610,797 | ) | (2,501 | ) | (2,693 | ) | |||||||||||
| Net Increase in Net Assets from Institutional Class Share Transactions | 85,389 | 86,951,599 | 6,814,988 | 2,712,057 | |||||||||||||||
| Total Increase in Net Assets | 5,413,427 | 88,348,418 | 9,666,304 | 3,840,482 | |||||||||||||||
| Net Assets | |||||||||||||||||||
| Beginning of year | 103,724,982 | 15,376,564 | — | — | |||||||||||||||
| End of year | $ | 109,138,409 | $ | 103,724,982 | $ | 9,666,304 | $ | 3,840,482 | |||||||||||
| Accumulated Net Investment Income | $ | 6,862 | $ | 1,292 | $ | 628,712 | $ | 16,828 | |||||||||||
See accompanying notes to financial statements.
75
Statements of Changes in Net Assets (Continued)
| Touchstone Market Neutral Equity Fund | Touchstone Mid Cap Fund (A) | Touchstone Mid Cap Value Fund | |||||||||||||||||
| Year Ended September 30, 2010 | Year Ended September 30, 2010 | Year Ended September 30, 2009 | Year Ended September 30, 2010 | ||||||||||||||||
| From Operations | |||||||||||||||||||
| Net investment income (loss) | $ | (132,337 | ) | $ | 1,008,789 | $ | 1,187,396 | $ | 102,980 | ||||||||||
| Net realized gains (losses) from security transactions | (448,319 | ) | 23,865,581 | (134,664,066 | ) | 238,449 | |||||||||||||
| Net change in unrealized appreciation/depreciation on investments | 226,121 | (6,883,713 | ) | 51,982,386 | 758,442 | ||||||||||||||
| Net Increase (Decrease) in Net Assets from Operations | (354,535 | ) | 17,990,657 | (81,494,284 | ) | 1,099,871 | |||||||||||||
| Distributions to Shareholders | |||||||||||||||||||
| From net investment income, Class A | — | (2,244 | ) | (760 | ) | (1,976 | ) | ||||||||||||
| From net investment income, Class C | — | — | — | (432 | ) | ||||||||||||||
| From net investment income, Class Y | — | (1,190,969 | ) | (1,025,805 | ) | (2,739 | ) | ||||||||||||
| From net investment income, Class Z | — | (9,678 | ) | (6,806 | ) | — | |||||||||||||
| From net investment income, Institutional Class | — | — | — | (62,130 | ) | ||||||||||||||
| From net realized gains, Class A | — | — | (679 | ) | — | ||||||||||||||
| From net realized gains, Class C | — | — | (196 | ) | — | ||||||||||||||
| From net realized gains, Class Y | — | — | (544,160 | ) | — | ||||||||||||||
| From net realized gains, Class Z | — | — | (6,060 | ) | — | ||||||||||||||
| Decrease in Net Assets from Distributions to Shareholders | — | (1,202,891 | ) | (1,584,466 | ) | (67,277 | ) | ||||||||||||
| From Capital Share Transactions | |||||||||||||||||||
| Class A | |||||||||||||||||||
| Proceeds from shares sold | 1,378,205 | 315,759 | 356,417 | 510,831 | |||||||||||||||
| Reinvested distributions | — | 1,943 | 1,271 | 1,628 | |||||||||||||||
| Payments for shares redeemed | (742,866 | ) | (136,363 | ) | (86,398 | ) | (180,663 | ) | |||||||||||
| Net Increase in Net Assets from Class A Share Transactions | 635,339 | 181,339 | 271,290 | 331,796 | |||||||||||||||
| Class C | |||||||||||||||||||
| Proceeds from shares sold | 179,574 | 74,942 | 177,196 | 115,187 | |||||||||||||||
| Reinvested distributions | — | — | 196 | 432 | |||||||||||||||
| Payments for shares redeemed | (7,513 | ) | (17,589 | ) | (51,251 | ) | (2,665 | ) | |||||||||||
| Net Increase in Net Assets from Class C Share Transactions | 172,061 | 57,353 | 126,141 | 112,954 | |||||||||||||||
| Class Y | |||||||||||||||||||
| Proceeds from shares sold | 32,758,376 | 4,737,552 | 62,211,281 | 531,122 | |||||||||||||||
| Reinvested distributions | — | 60,646 | 135,921 | 1,817 | |||||||||||||||
| Payments for shares redeemed | (27,786 | ) | (66,295,717 | ) | (233,893,142 | ) | (2,681 | ) | |||||||||||
| Net Increase (Decrease) in Net Assets from Class Y Share Transactions | 32,730,590 | (61,497,519 | ) | (171,545,940 | ) | 530,258 | |||||||||||||
| Class Z | |||||||||||||||||||
| Proceeds from shares sold | — | 1,292,972 | 905,071 | — | |||||||||||||||
| Reinvested distributions | — | 9,404 | 11,591 | — | |||||||||||||||
| Payments for shares redeemed | — | (2,500,722 | ) | (1,753,109 | ) | — | |||||||||||||
| Net Decrease in Net Assets from Class Z Share Transactions | — | (1,198,346 | ) | (836,447 | ) | — | |||||||||||||
| Institutional Class | |||||||||||||||||||
| Proceeds from shares sold | — | — | — | 38,539,982 | |||||||||||||||
| Reinvested distributions | — | — | — | 29,266 | |||||||||||||||
| Payments for shares redeemed | — | — | — | (2,672 | ) | ||||||||||||||
| Net Increase in Net Assets from Institutional Class Share Transactions | — | — | — | 38,566,576 | |||||||||||||||
| Total Increase (Decrease) in Net Assets | 33,183,455 | (45,669,407 | ) | (255,063,706 | ) | 40,574,178 | |||||||||||||
| Net Assets | |||||||||||||||||||
| Beginning of year | — | 170,748,774 | 425,812,480 | — | |||||||||||||||
| End of year | $ | 33,183,455 | $ | 125,079,367 | $ | 170,748,774 | $ | 40,574,178 | |||||||||||
| Accumulated Net Investment Income (Loss) | $ | (9,165 | ) | $ | 185,791 | $ | 224,960 | $ | 35,000 | ||||||||||
(A) Effective January 28, 2010, Institutional Class shares of Mid Cap Fund were renamed Class Y shares.
See accompanying notes to financial statements.
76
Statements of Changes in Net Assets (Continued)
| Touchstone Premium Yield Equity Fund | Touchstone Sands Capital Select Growth Fund | ||||||||||||||||||
| Year Ended September 30, 2010 | Year Ended September 30, 2009 | Year Ended September 30, 2010 | Year Ended September 30, 2009 | ||||||||||||||||
| From Operations | |||||||||||||||||||
| Net investment income (loss) | $ | 1,046,941 | $ | 660,837 | $ | (3,800,152 | ) | $ | (2,302,601 | ) | |||||||||
| Net realized gains (losses) from security transactions | 50,767 | (6,642,383 | ) | 23,075,415 | (121,258,262 | ) | |||||||||||||
| Net change in unrealized appreciation/depreciation on investments | 2,562,610 | 3,246,251 | 76,755,229 | 118,207,340 | |||||||||||||||
| Net change in unrealized appreciation/depreciation from foreign currency transactions | (7 | ) | — | — | — | ||||||||||||||
| Net Increase (Decrease) in Net Assets from Operations | 3,660,311 | (2,735,295 | ) | 96,030,492 | (5,353,523 | ) | |||||||||||||
| Distributions to Shareholders | |||||||||||||||||||
| From net investment income, Class A | (667,836 | ) | (617,662 | ) | — | — | |||||||||||||
| From net investment income, Class C | (122,960 | ) | (38,913 | ) | — | — | |||||||||||||
| From net investment income, Class Y | (223,195 | ) | (4,260 | ) | — | — | |||||||||||||
| Decrease in Net Assets from Distributions to Shareholders | (1,013,991 | ) | (660,835 | ) | — | — | |||||||||||||
| From Capital Share Transactions | |||||||||||||||||||
| Class A | |||||||||||||||||||
| Proceeds from shares sold | 2,968,118 | 3,921,903 | — | — | |||||||||||||||
| Reinvested distributions | 586,882 | 586,503 | — | — | |||||||||||||||
| Payments for shares redeemed | (2,878,322 | ) | (406,034 | ) | — | — | |||||||||||||
| Net Increase in Net Assets from Class A Share Transactions | 676,678 | 4,102,372 | — | — | |||||||||||||||
| Class C | |||||||||||||||||||
| Proceeds from shares sold | 3,646,302 | 2,576,967 | — | — | |||||||||||||||
| Reinvested distributions | 76,606 | 24,214 | — | — | |||||||||||||||
| Payments for shares redeemed | (575,335 | ) | (45,939 | ) | — | — | |||||||||||||
| Net Increase in Net Assets from Class C Share Transactions | 3,147,573 | 2,555,242 | — | — | |||||||||||||||
| Class Y | |||||||||||||||||||
| Proceeds from shares sold | 11,881,432 | 507,005 | 45,593,062 | 24,126,933 | |||||||||||||||
| Reinvested distributions | 168,237 | 4,260 | — | — | |||||||||||||||
| Payments for shares redeemed | (1,417,237 | ) | (4,189 | ) | (26,763,035 | ) | (67,763,802 | ) | |||||||||||
| Net Increase (Decrease) in Net Assets from Class Y Share Transactions | 10,632,432 | 507,076 | 18,830,027 | (43,636,869 | ) | ||||||||||||||
| Class Z | |||||||||||||||||||
| Proceeds from shares sold | — | — | 257,169,126 | 162,783,632 | |||||||||||||||
| Reinvested distributions | — | — | — | — | |||||||||||||||
| Payments for shares redeemed | — | — | (127,486,213 | ) | (192,550,314 | ) | |||||||||||||
| Net Increase (Decrease) in Net Assets from Class Z Share Transactions | — | — | 129,682,913 | (29,766,682 | ) | ||||||||||||||
| Total Increase (Decrease) in Net Assets | 17,103,003 | 3,768,560 | 244,543,432 | (78,757,074 | ) | ||||||||||||||
| Net Assets | |||||||||||||||||||
| Beginning of year | 23,748,773 | 19,980,213 | 416,117,887 | 494,874,961 | |||||||||||||||
| End of year | $ | 40,851,776 | $ | 23,748,773 | $ | 660,661,319 | $ | 416,117,887 | |||||||||||
| Accumulated Net Investment Income (Loss) | $ | 28,330 | $ | (4,195 | ) | $ | — | $ | — | ||||||||||
See accompanying notes to financial statements.
77
Statements of Changes in Net Assets (Continued)
| Touchstone Short Duration Fixed Income Fund | Touchstone Small Cap Core Fund | ||||||||||||||
| Year Ended September 30, 2010 | Year Ended September 30, 2009 (A) | Year Ended September 30, 2010 | |||||||||||||
| From Operations | |||||||||||||||
| Net investment income | $ | 1,260,873 | $ | 1,449,500 | $ | 204,546 | |||||||||
| Net realized gains (losses) from security transactions | 91,449 | 149,559 | (314,666 | ) | |||||||||||
| Net change in unrealized appreciation/depreciation on investments | 73,170 | 1,486,380 | 4,836,454 | ||||||||||||
| Net Increase in Net Assets from Operations | 1,425,492 | 3,085,439 | 4,726,334 | ||||||||||||
| Distributions to Shareholders | |||||||||||||||
| From net investment income, Class Y | (19,058 | ) | (3,115 | ) | — | ||||||||||
| From net investment income, Class Z | (1,309,105 | ) | (1,476,456 | ) | — | ||||||||||
| From net investment income, Institutional Class | — | — | (9,676 | ) | |||||||||||
| Decrease in Net Assets from Distributions to Shareholders | (1,328,163 | ) | (1,479,571 | ) | (9,676 | ) | |||||||||
| From Capital Share Transactions | |||||||||||||||
| Class A | |||||||||||||||
| Proceeds from shares sold | — | — | 57,444,349 | ||||||||||||
| Reinvested distributions | — | — | — | ||||||||||||
| Payments for shares redeemed | — | — | (9,088,619 | ) | |||||||||||
| Net Increase in Net Assets from Class A Share Transactions | — | — | 48,355,730 | ||||||||||||
| Class C | |||||||||||||||
| Proceeds from shares sold | — | — | 5,255,017 | ||||||||||||
| Reinvested distributions | — | — | — | ||||||||||||
| Payments for shares redeemed | — | — | (229,528 | ) | |||||||||||
| Net Increase in Net Assets from Class C Share Transactions | — | — | 5,025,489 | ||||||||||||
| Class Y | |||||||||||||||
| Proceeds from shares sold | 922,720 | 583,877 | 35,903,813 | ||||||||||||
| Reinvested distributions | 10,514 | 3,203 | — | ||||||||||||
| Payments for shares redeemed | (758,186 | ) | (60 | ) | (4,138,193 | ) | |||||||||
| Net Increase in Net Assets from Class Y Share Transactions | 175,048 | 587,020 | 31,765,620 | ||||||||||||
| Class Z | |||||||||||||||
| Proceeds from shares sold | 7,512,315 | 4,828,650 | — | ||||||||||||
| Reinvested distributions | 1,152,025 | 1,447,580 | — | ||||||||||||
| Payments for shares redeemed | (9,099,002 | ) | (11,117,272 | ) | — | ||||||||||
| Net Decrease in Net Assets from Class Z Share Transactions | (434,662 | ) | (4,841,042 | ) | — | ||||||||||
| Institutional Class | |||||||||||||||
| Proceeds from shares sold | — | — | 12,486,385 | ||||||||||||
| Reinvested distributions | — | — | 9,676 | ||||||||||||
| Payments for shares redeemed | — | — | (3,081,576 | ) | |||||||||||
| Net Increase in Net Assets from Institutional Class Share Transactions | — | — | 9,414,485 | ||||||||||||
| Total Increase (Decrease) in Net Assets | (162,285 | ) | (2,648,154 | ) | 99,277,982 | ||||||||||
| Net Assets | |||||||||||||||
| Beginning of year | 44,340,596 | 46,988,750 | — | ||||||||||||
| End of year | $ | 44,178,311 | $ | 44,340,596 | $ | 99,277,982 | |||||||||
| Accumulated Net Investment Income | $ | 79,721 | $ | 27,777 | $ | 168,505 | |||||||||
(A) Class Y represents the period from commencement of operations (May 4, 2009) through September 30, 2009.
See accompanying notes to financial statements.
78
Statements of Changes in Net Assets (Continued)
| Touchstone Small Cap Value Opportunities Fund | Touchstone Ultra Short Duration Fixed Income Fund | ||||||||||||||||||
| Year Ended September 30, 2010 | Year Ended September 30, 2009 | Year Ended September 30, 2010 | Year Ended September 30, 2009 | ||||||||||||||||
| From Operations | |||||||||||||||||||
| Net investment income | $ | 1,786 | $ | 169,523 | $ | 2,565,502 | $ | 4,034,852 | |||||||||||
| Net realized gains (losses) from security transactions | 11,410,624 | (38,806,211 | ) | 194,688 | (3,327,009 | ) | |||||||||||||
| Net change in unrealized appreciation/depreciation on investments | (3,524,275 | ) | 15,045,658 | 606,191 | 2,081,033 | ||||||||||||||
| Net Increase (Decrease) in Net Assets from Operations | 7,888,135 | (23,591,030 | ) | 3,366,381 | 2,788,876 | ||||||||||||||
| Distributions to Shareholders | |||||||||||||||||||
| From net investment income, Class Z | — | (155,058 | ) | (3,337,850 | ) | (4,095,134 | ) | ||||||||||||
| From net realized gains, Class Z | — | (135,276 | ) | — | — | ||||||||||||||
| Decrease in Net Assets from Distributions to Shareholders | — | (290,334 | ) | (3,337,850 | ) | (4,095,134 | ) | ||||||||||||
| From Capital Share Transactions | |||||||||||||||||||
| Class Z | |||||||||||||||||||
| Proceeds from shares sold | 10,847,236 | 13,589,393 | 193,844,586 | 39,273,005 | |||||||||||||||
| Reinvested distributions | — | 279,749 | 2,696,793 | 3,943,039 | |||||||||||||||
| Payments for shares redeemed | (38,228,648 | ) | (38,054,151 | ) | (68,472,264 | ) | (77,194,787 | ) | |||||||||||
| Net Increase (Decrease) in Net Assets from Class Z Share Transactions | (27,381,412 | ) | (24,185,009 | ) | 128,069,115 | (33,978,743 | ) | ||||||||||||
| Total Increase (Decrease) in Net Assets | (19,493,277 | ) | (48,066,373 | ) | 128,097,646 | (35,285,001 | ) | ||||||||||||
| Net Assets | |||||||||||||||||||
| Beginning of year | 84,046,141 | 132,112,514 | 108,552,257 | 143,837,258 | |||||||||||||||
| End of year | $ | 64,552,864 | $ | 84,046,141 | $ | 236,649,903 | $ | 108,552,257 | |||||||||||
| Accumulated Net Investment Income | $ | 56,761 | $ | 16,060 | $ | 137,423 | $ | 123,995 | |||||||||||
See accompanying notes to financial statements.
79
Financial Highlights
Touchstone Capital Appreciation Fund — Class A (A)
Per Share Data for a Share Outstanding Throughout the Period
| Year Ended September 30, 2010 | |||||||
| Net asset value at beginning of period | $ | 10.00 | |||||
| Income (loss) from investment operations: | |||||||
| Net investment income | 0.03 | ||||||
| Net realized and unrealized gains (losses) on investments | 0.58 | ||||||
| Total from investment operations | 0.61 | ||||||
| Net asset value at end of period | $ | 10.61 | |||||
| Total return (B) | 6.10 | % | |||||
| Net assets at end of period (000s) | $ | 2,728 | |||||
| Ratio of net expenses to average net assets | 1.19 | % | |||||
| Ratio of gross expenses to average net assets | 2.38 | % | |||||
| Ratio of net investment income to average net assets | 0.38 | % | |||||
| Portfolio turnover rate | 33 | % | |||||
Touchstone Capital Appreciation Fund — Class C (A)
Per Share Data for a Share Outstanding Throughout the Period
| Year Ended September 30, 2010 | |||||||
| Net asset value at beginning of period | $ | 10.00 | |||||
| Income (loss) from investment operations: | |||||||
| Net investment loss | (0.03 | ) | |||||
| Net realized and unrealized gains (losses) on investments | 0.56 | ||||||
| Total from investment operations | 0.53 | ||||||
| Net asset value at end of period | $ | 10.53 | |||||
| Total return (B) | 5.30 | % | |||||
| Net assets at end of period (000s) | $ | 352 | |||||
| Ratio of net expenses to average net assets | 1.94 | % | |||||
| Ratio of gross expenses to average net assets | 2.99 | % | |||||
| Ratio of net investment loss to average net assets | (0.37 | %) | |||||
| Portfolio turnover rate | 33 | % | |||||
(A) The Fund commenced operations on October 1, 2009.
(B) Total returns shown exclude the effect of applicable sales loads.
See accompanying notes to financial statements.
80
Financial Highlights (Continued)
Touchstone Capital Appreciation Fund — Class Y (A)
Per Share Data for a Share Outstanding Throughout the Period
| Year Ended September 30, 2010 | |||||||
| Net asset value at beginning of period | $ | 10.00 | |||||
| Income (loss) from investment operations: | |||||||
| Net investment income | 0.06 | ||||||
| Net realized and unrealized gains (losses) on investments | 0.58 | ||||||
| Total from investment operations | 0.64 | ||||||
| Less distributions from net investment income | (0.01 | ) | |||||
| Net asset value at end of period | $ | 10.63 | |||||
| Total return | 6.42 | % | |||||
| Net assets at end of period (000s) | $ | 132 | |||||
| Ratio of net expenses to average net assets | 0.94 | % | |||||
| Ratio of gross expenses to average net assets | 2.20 | % | |||||
| Ratio of net investment income to average net assets | 0.62 | % | |||||
| Portfolio turnover rate | 33 | % | |||||
Touchstone Capital Appreciation Fund — Institutional Class (A)
Per Share Data for a Share Outstanding Throughout the Period
| Year Ended September 30, 2010 | |||||||
| Net asset value at beginning of period | $ | 10.00 | |||||
| Income (loss) from investment operations: | |||||||
| Net investment income | 0.09 | ||||||
| Net realized and unrealized gains (losses) on investments | 0.56 | ||||||
| Total from investment operations | 0.65 | ||||||
| Less distributions from net investment income | (0.03 | ) | |||||
| Net asset value at end of period | $ | 10.62 | |||||
| Total return | 6.48 | % | |||||
| Net assets at end of period (000s) | $ | 2,875 | |||||
| Ratio of net expenses to average net assets | 0.79 | % | |||||
| Ratio of gross expenses to average net assets | 1.94 | % | |||||
| Ratio of net investment income to average net assets | 0.79 | % | |||||
| Portfolio turnover rate | 33 | % | |||||
(A) The Fund commenced operations on October 1, 2009.
See accompanying notes to financial statements.
81
Financial Highlights (Continued)
Touchstone Core Plus Fixed Income Fund — Class A (A)
Per Share Data for a Share Outstanding Throughout the Period
| Year Ended September 30, 2010 | |||||||
| Net asset value at beginning of period | $ | 10.00 | |||||
| Income (loss) from investment operations: | |||||||
| Net investment income | 0.31 | ||||||
| Net realized and unrealized gains (losses) on investments | 0.42 | ||||||
| Total from investment operations | 0.73 | ||||||
| Less distributions from net investment income | (0.32 | ) | |||||
| Net asset value at end of period | $ | 10.41 | |||||
| Total return (B) | 7.46 | % | |||||
| Net assets at end of period (000s) | $ | 4,819 | |||||
| Ratio of net expenses to average net assets | 0.95 | % | |||||
| Ratio of gross expenses to average net assets | 1.60 | % | |||||
| Ratio of net investment income to average net assets | 3.36 | % | |||||
| Portfolio turnover rate | 160 | % | |||||
Touchstone Core Plus Fixed Income Fund — Class C (A)
Per Share Data for a Share Outstanding Throughout the Period
| Year Ended September 30, 2010 | |||||||
| Net asset value at beginning of period | $ | 10.00 | |||||
| Income (loss) from investment operations: | |||||||
| Net investment income | 0.24 | ||||||
| Net realized and unrealized gains (losses) on investments | 0.41 | ||||||
| Total from investment operations | 0.65 | ||||||
| Less distributions from net investment income | (0.25 | ) | |||||
| Net asset value at end of period | $ | 10.40 | |||||
| Total return (B) | 6.63 | % | |||||
| Net assets at end of period (000s) | $ | 1,868 | |||||
| Ratio of net expenses to average net assets | 1.70 | % | |||||
| Ratio of gross expenses to average net assets | 2.32 | % | |||||
| Ratio of net investment income to average net assets | 2.60 | % | |||||
| Portfolio turnover rate | 160 | % | |||||
(A) The Fund commenced operations on October 1, 2009.
(B) Total returns shown exclude the effect of applicable sales loads.
See accompanying notes to financial statements.
82
Financial Highlights (Continued)
Touchstone Core Plus Fixed Income Fund — Class Y (A)
Per Share Data for a Share Outstanding Throughout the Period
| Year Ended September 30, 2010 | |||||||
| Net asset value at beginning of period | $ | 10.00 | |||||
| Income (loss) from investment operations: | |||||||
| Net investment income | 0.33 | ||||||
| Net realized and unrealized gains (losses) on investments | 0.42 | ||||||
| Total from investment operations | 0.75 | ||||||
| Less distributions from net investment income | (0.34 | ) | |||||
| Net asset value at end of period | $ | 10.41 | |||||
| Total return | 7.70 | % | |||||
| Net assets at end of period (000s) | $ | 817 | |||||
| Ratio of net expenses to average net assets | 0.70 | % | |||||
| Ratio of gross expenses to average net assets | 1.36 | % | |||||
| Ratio of net investment income to average net assets | 3.58 | % | |||||
| Portfolio turnover rate | 160 | % | |||||
Touchstone Core Plus Fixed Income Fund — Institutional Class (A)
Per Share Data for a Share Outstanding Throughout the Period
| Year Ended September 30, 2010 | |||||||
| Net asset value at beginning of period | $ | 10.00 | |||||
| Income (loss) from investment operations: | |||||||
| Net investment income | 0.35 | ||||||
| Net realized and unrealized gains (losses) on investments | 0.43 | ||||||
| Total from investment operations | 0.78 | ||||||
| Less distributions from net investment income | (0.37 | ) | |||||
| Net asset value at end of period | $ | 10.41 | |||||
| Total return | 7.92 | % | |||||
| Net assets at end of period (000s) | $ | 16,325 | |||||
| Ratio of net expenses to average net assets | 0.50 | % | |||||
| Ratio of gross expenses to average net assets | 1.23 | % | |||||
| Ratio of net investment income to average net assets | 3.74 | % | |||||
| Portfolio turnover rate | 160 | % | |||||
(A) The Fund commenced operations on October 1, 2009.
See accompanying notes to financial statements.
83
Financial Highlights (Continued)
Touchstone Emerging Markets Equity Fund — Class A (A)
Per Share Data for a Share Outstanding Throughout the Period
| Year Ended September 30, 2010 | |||||||
| Net asset value at beginning of period | $ | 10.00 | |||||
| Income (loss) from investment operations: | |||||||
| Net investment income | 0.03 | ||||||
| Net realized and unrealized gains (losses) on investments | 2.65 | ||||||
| Total from investment operations | 2.68 | ||||||
| Net asset value at end of period | $ | 12.68 | |||||
| Total return (B) | 26.80 | % | |||||
| Net assets at end of period (000s) | $ | 10,343 | |||||
| Ratio of net expenses to average net assets | 1.74 | % | |||||
| Ratio of gross expenses to average net assets | 2.25 | % | |||||
| Ratio of net investment income to average net assets | 0.76 | % | |||||
| Portfolio turnover rate | 8 | % | |||||
Touchstone Emerging Markets Equity Fund — Class C (A)
Per Share Data for a Share Outstanding Throughout the Period
| Year Ended September 30, 2010 | |||||||
| Net asset value at beginning of period | $ | 10.00 | |||||
| Income (loss) from investment operations: | |||||||
| Net investment loss | (0.00 | ) (C) | |||||
| Net realized and unrealized gains (losses) on investments | 2.58 | ||||||
| Total from investment operations | 2.58 | ||||||
| Net asset value at end of period | $ | 12.58 | |||||
| Total return (B) | 25.80 | % | |||||
| Net assets at end of period (000s) | $ | 3,590 | |||||
| Ratio of net expenses to average net assets | 2.49 | % | |||||
| Ratio of gross expenses to average net assets | 2.99 | % | |||||
| Ratio of net investment loss to average net assets | (0.03 | %) | |||||
| Portfolio turnover rate | 8 | % | |||||
(A) The Fund commenced operations on October 1, 2009.
(B) Total returns shown exclude the effect of applicable sales loads.
(C) Amount rounds to less than $0.01 per share.
See accompanying notes to financial statements.
84
Financial Highlights (Continued)
Touchstone Emerging Markets Equity Fund — Class Y (A)
Per Share Data for a Share Outstanding Throughout the Period
| Year Ended September 30, 2010 | |||||||
| Net asset value at beginning of period | $ | 10.00 | |||||
| Income (loss) from investment operations: | |||||||
| Net investment income | 0.01 | ||||||
| Net realized and unrealized gains (losses) on investments | 2.71 | ||||||
| Total from investment operations | 2.72 | ||||||
| Net asset value at end of period | $ | 12.72 | |||||
| Total return | 27.10 | % | |||||
| Net assets at end of period (000s) | $ | 13,597 | |||||
| Ratio of net expenses to average net assets | 1.49 | % | |||||
| Ratio of gross expenses to average net assets | 2.10 | % | |||||
| Ratio of net investment income to average net assets | 0.86 | % | |||||
| Portfolio turnover rate | 8 | % | |||||
Touchstone Emerging Markets Equity Fund — Institutional Class (A)
Per Share Data for a Share Outstanding Throughout the Period
| Year Ended September 30, 2010 | |||||||
| Net asset value at beginning of period | $ | 10.00 | |||||
| Income (loss) from investment operations: | |||||||
| Net investment income | 0.05 | ||||||
| Net realized and unrealized gains (losses) on investments | 2.69 | ||||||
| Total from investment operations | 2.74 | ||||||
| Net asset value at end of period | $ | 12.74 | |||||
| Total return | 27.40 | % | |||||
| Net assets at end of period (000s) | $ | 125,414 | |||||
| Ratio of net expenses to average net assets | 1.34 | % | |||||
| Ratio of gross expenses to average net assets | 1.74 | % | |||||
| Ratio of net investment income to average net assets | 1.26 | % | |||||
| Portfolio turnover rate | 8 | % | |||||
(A) The Fund commenced operations on October 1, 2009.
See accompanying notes to financial statements.
85
Financial Highlights (Continued)
Touchstone Focused Equity Fund — Class A (A)
Per Share Data for a Share Outstanding Throughout the Period
| Period Ended September 30, 2010 | |||||||
| Net asset value at beginning of period | $ | 10.00 | |||||
| Income (loss) from investment operations: | |||||||
| Net investment income | 0.02 | ||||||
| Net realized and unrealized gains (losses) on investments | 0.93 | ||||||
| Total from investment operations | 0.95 | ||||||
| Net asset value at end of period | $ | 10.95 | |||||
| Total return (B) | 9.40 | % (C) | |||||
| Net assets at end of period (000s) | $ | 814 | |||||
| Ratio of net expenses to average net assets | 1.20 | % (D) | |||||
| Ratio of gross expenses to average net assets | 4.65 | % (D) | |||||
| Ratio of net investment income to average net assets | 0.46 | % (D) | |||||
| Portfolio turnover rate | 101 | % (C) | |||||
Touchstone Focused Equity Fund — Class C (A)
Per Share Data for a Share Outstanding Throughout the Period
| Period Ended September 30, 2010 | |||||||
| Net asset value at beginning of period | $ | 10.00 | |||||
| Income (loss) from investment operations: | |||||||
| Net investment loss | (0.01 | ) | |||||
| Net realized and unrealized gains (losses) on investments | 0.89 | ||||||
| Total from investment operations | 0.88 | ||||||
| Net asset value at end of period | $ | 10.88 | |||||
| Total return (B) | 8.90 | % (C) | |||||
| Net assets at end of period (000s) | $ | 187 | |||||
| Ratio of net expenses to average net assets | 1.95 | % (D) | |||||
| Ratio of gross expenses to average net assets | 5.45 | % (D) | |||||
| Ratio of net investment loss to average net assets | (0.24 | %) (D) | |||||
| Portfolio turnover rate | 101 | % (C) | |||||
(A) Represents the period from commencement of operations (December 31, 2009) through September 30, 2010.
(B) Total returns shown exclude the effect of applicable sales loads.
(C) Not annualized.
(D) Annualized.
See accompanying notes to financial statements.
86
Financial Highlights (Continued)
Touchstone Focused Equity Fund — Class Y (A)
Per Share Data for a Share Outstanding Throughout the Period
| Period Ended September 30, 2010 | |||||||
| Net asset value at beginning of period | $ | 10.00 | |||||
| Income (loss) from investment operations: | |||||||
| Net investment income | 0.04 | ||||||
| Net realized and unrealized gains (losses) on investments | 0.92 | ||||||
| Total from investment operations | 0.96 | ||||||
| Net asset value at end of period | $ | 10.96 | |||||
| Total return | 9.60 | % (B) | |||||
| Net assets at end of period (000s) | $ | 201 | |||||
| Ratio of net expenses to average net assets | 0.95 | % (C) | |||||
| Ratio of gross expenses to average net assets | 4.62 | % (C) | |||||
| Ratio of net investment income to average net assets | 0.81 | % (C) | |||||
| Portfolio turnover rate | 101 | % (B) | |||||
Touchstone Focused Equity Fund — Institutional Class (A)
Per Share Data for a Share Outstanding Throughout the Period
| Period Ended September 30, 2010 | |||||||
| Net asset value at beginning of period | $ | 10.00 | |||||
| Income (loss) from investment operations: | |||||||
| Net investment income | 0.17 | ||||||
| Net realized and unrealized gains (losses) on investments | 0.80 | ||||||
| Total from investment operations | 0.97 | ||||||
| Net asset value at end of period | $ | 10.97 | |||||
| Total return | 9.70 | % (B) | |||||
| Net assets at end of period (000s) | $ | 768 | |||||
| Ratio of net expenses to average net assets | 0.80 | % (C) | |||||
| Ratio of gross expenses to average net assets | 3.66 | % (C) | |||||
| Ratio of net investment income to average net assets | 0.99 | % (C) | |||||
| Portfolio turnover rate | 101 | % (B) | |||||
(A) Represents the period from commencement of operations (December 31, 2009) through September 30, 2010.
(B) Not annualized.
(C) Annualized.
See accompanying notes to financial statements.
87
Financial Highlights (Continued)
Touchstone Global Equity Fund — Class A (A)
Per Share Data for a Share Outstanding Throughout the Period
| Year Ended September 30, 2010 | |||||||
| Net asset value at beginning of period | $ | 10.00 | |||||
| Income (loss) from investment operations: | |||||||
| Net investment income | 0.04 | ||||||
| Net realized and unrealized gains (losses) on investments | 0.61 | ||||||
| Total from investment operations | 0.65 | ||||||
| Net asset value at end of period | $ | 10.65 | |||||
| Total return (B) | 6.50 | % | |||||
| Net assets at end of period (000s) | $ | 1,857 | |||||
| Ratio of net expenses to average net assets | 1.34 | % | |||||
| Ratio of gross expenses to average net assets | 3.75 | % | |||||
| Ratio of net investment income to average net assets | 1.56 | % | |||||
| Portfolio turnover rate | 68 | % | |||||
Touchstone Global Equity Fund — Class C (A)
Per Share Data for a Share Outstanding Throughout the Period
| Year Ended September 30, 2010 | |||||||
| Net asset value at beginning of period | $ | 10.00 | |||||
| Income (loss) from investment operations: | |||||||
| Net investment income | 0.00 | (C) | |||||
| Net realized and unrealized gains (losses) on investments | 0.57 | ||||||
| Total from investment operations | 0.57 | ||||||
| Net asset value at end of period | $ | 10.57 | |||||
| Total return (B) | 5.70 | % | |||||
| Net assets at end of period (000s) | $ | 106 | |||||
| Ratio of net expenses to average net assets | 2.09 | % | |||||
| Ratio of gross expenses to average net assets | 4.28 | % | |||||
| Ratio of net investment income to average net assets | 0.02 | % | |||||
| Portfolio turnover rate | 68 | % | |||||
(A) The Fund commenced operations on October 1, 2009.
(B) Total returns shown exclude the effect of applicable sales loads.
(C) Amount rounds to less than $0.01 per share.
See accompanying notes to financial statements.
88
Financial Highlights (Continued)
Touchstone Global Equity Fund — Class Y (A)
Per Share Data for a Share Outstanding Throughout the Period
| Year Ended September 30, 2010 | |||||||
| Net asset value at beginning of period | $ | 10.00 | |||||
| Income (loss) from investment operations: | |||||||
| Net investment income | 0.09 | ||||||
| Net realized and unrealized gains (losses) on investments | 0.59 | ||||||
| Total from investment operations | 0.68 | ||||||
| Net asset value at end of period | $ | 10.68 | |||||
| Total return | 6.70 | % | |||||
| Net assets at end of period (000s) | $ | 142 | |||||
| Ratio of net expenses to average net assets | 1.09 | % | |||||
| Ratio of gross expenses to average net assets | 3.38 | % | |||||
| Ratio of net investment income to average net assets | 1.05 | % | |||||
| Portfolio turnover rate | 68 | % | |||||
Touchstone Global Equity Fund — Institutional Class (A)
Per Share Data for a Share Outstanding Throughout the Period
| Year Ended September 30, 2010 | |||||||
| Net asset value at beginning of period | $ | 10.00 | |||||
| Income (loss) from investment operations: | |||||||
| Net investment income | 0.11 | ||||||
| Net realized and unrealized gains (losses) on investments | 0.58 | ||||||
| Total from investment operations | 0.69 | ||||||
| Less distributions from net investment income | (0.00 | ) (B) | |||||
| Net asset value at end of period | $ | 10.69 | |||||
| Total return | 6.93 | % | |||||
| Net assets at end of period (000s) | $ | 3,086 | |||||
| Ratio of net expenses to average net assets | 0.94 | % | |||||
| Ratio of gross expenses to average net assets | 3.11 | % | |||||
| Ratio of net investment income to average net assets | 1.18 | % | |||||
| Portfolio turnover rate | 68 | % | |||||
(A) The Fund commenced operations on October 1, 2009.
(B) Amount rounds to less than $0.01 per share.
See accompanying notes to financial statements.
89
Financial Highlights (Continued)
Touchstone Global Real Estate Fund — Class A (A)
Per Share Data for a Share Outstanding Throughout the Period
| Year Ended September 30, 2010 | |||||||
| Net asset value at beginning of period | $ | 10.00 | |||||
| Income (loss) from investment operations: | |||||||
| Net investment income | 0.36 | ||||||
| Net realized and unrealized gains (losses) on investments | 1.45 | ||||||
| Total from investment operations | 1.81 | ||||||
| Less distributions from net investment income | (0.35 | ) | |||||
| Net asset value at end of period | $ | 11.46 | |||||
| Total return (B) | 18.54 | % | |||||
| Net assets at end of period (000s) | $ | 881 | |||||
| Ratio of net expenses to average net assets | 1.39 | % | |||||
| Ratio of gross expenses to average net assets | 4.27 | % | |||||
| Ratio of net investment income to average net assets | 2.94 | % | |||||
| Portfolio turnover rate | 107 | % | |||||
Touchstone Global Real Estate Fund — Class C (A)
Per Share Data for a Share Outstanding Throughout the Period
| Year Ended September 30, 2010 | |||||||
| Net asset value at beginning of period | $ | 10.00 | |||||
| Income (loss) from investment operations: | |||||||
| Net investment income | 0.17 | ||||||
| Net realized and unrealized gains (losses) on investments | 1.58 | ||||||
| Total from investment operations | 1.75 | ||||||
| Less distributions from net investment income | (0.25 | ) | |||||
| Net asset value at end of period | $ | 11.50 | |||||
| Total return (B) | 17.75 | % | |||||
| Net assets at end of period (000s) | $ | 123 | |||||
| Ratio of net expenses to average net assets | 2.14 | % | |||||
| Ratio of gross expenses to average net assets | 4.60 | % | |||||
| Ratio of net investment income to average net assets | 1.60 | % | |||||
| Portfolio turnover rate | 107 | % | |||||
(A) The Fund commenced operations on October 1, 2009.
(B) Total returns shown exclude the effect of applicable sales loads.
See accompanying notes to financial statements.
90
Financial Highlights (Continued)
Touchstone Global Real Estate Fund — Class Y (A)
Per Share Data for a Share Outstanding Throughout the Period
| Year Ended September 30, 2010 | |||||||
| Net asset value at beginning of period | $ | 10.00 | |||||
| Income (loss) from investment operations: | |||||||
| Net investment income | 0.28 | ||||||
| Net realized and unrealized gains (losses) on investments | 1.58 | ||||||
| Total from investment operations | 1.86 | ||||||
| Less distributions from net investment income | (0.33 | ) | |||||
| Net asset value at end of period | $ | 11.53 | |||||
| Total return | 18.90 | % | |||||
| Net assets at end of period (000s) | $ | 129 | |||||
| Ratio of net expenses to average net assets | 1.14 | % | |||||
| Ratio of gross expenses to average net assets | 3.62 | % | |||||
| Ratio of net investment income to average net assets | 2.61 | % | |||||
| Portfolio turnover rate | 107 | % | |||||
Touchstone Global Real Estate Fund — Institutional Class (A)
Per Share Data for a Share Outstanding Throughout the Period
| Year Ended September 30, 2010 | |||||||
| Net asset value at beginning of period | $ | 10.00 | |||||
| Income (loss) from investment operations: | |||||||
| Net investment income | 0.29 | ||||||
| Net realized and unrealized gains (losses) on investments | 1.59 | ||||||
| Total from investment operations | 1.88 | ||||||
| Less distributions from net investment income | (0.27 | ) | |||||
| Net asset value at end of period | $ | 11.61 | |||||
| Total return | 19.12 | % | |||||
| Net assets at end of period (000s) | $ | 3,232 | |||||
| Ratio of net expenses to average net assets | 0.99 | % | |||||
| Ratio of gross expenses to average net assets | 3.34 | % | |||||
| Ratio of net investment income to average net assets | 2.75 | % | |||||
| Portfolio turnover rate | 107 | % | |||||
(A) The Fund commenced operations on October 1, 2009.
See accompanying notes to financial statements.
91
Financial Highlights (Continued)
Touchstone Healthcare and Biotechnology Fund — Class A
Per Share Data for a Share Outstanding Throughout Each Period
| Year Ended September 30, | |||||||||||||||||||||||
| 2010 | 2009 | 2008 | 2007 | 2006 | |||||||||||||||||||
| Net asset value at beginning of period | $ | 12.72 | $ | 15.10 | $ | 18.28 | $ | 15.91 | $ | 16.13 | |||||||||||||
| Income (loss) from investment operations: | |||||||||||||||||||||||
| Net investment income (loss) | 0.01 | (0.07 | ) | (0.11 | ) | (0.14 | ) | (0.18 | ) | ||||||||||||||
| Net realized and unrealized gains (losses) on investments | 0.72 | (2.31 | ) | (1.09 | ) | 3.10 | 0.40 | ||||||||||||||||
| Total from investment operations | 0.73 | (2.38 | ) | (1.20 | ) | 2.96 | 0.22 | ||||||||||||||||
| Less distributions: | |||||||||||||||||||||||
| Distributions from net realized gains | — | — | (1.65 | ) | (0.59 | ) | (0.44 | ) | |||||||||||||||
| Distributions from return of capital | — | — | (0.33 | ) | — | — | |||||||||||||||||
| Total distributions | — | — | (1.98 | ) | (0.59 | ) | (0.44 | ) | |||||||||||||||
| Net asset value at end of period | $ | 13.45 | $ | 12.72 | $ | 15.10 | $ | 18.28 | $ | 15.91 | |||||||||||||
| Total return (A) | 5.74 | % | (15.76 | %) | (7.82 | %) | 19.25 | % | 1.37 | % | |||||||||||||
| Net assets at end of period (000's) | $ | 23,696 | $ | 34,029 | $ | 60,959 | $ | 53,295 | $ | 55,120 | |||||||||||||
| Ratio of net expenses to average net assets | 1.55 | % | 1.55 | % | 1.55 | % | 1.67 | % | 1.85 | % (B) | |||||||||||||
| Ratio of gross expenses to average net assets | 2.13 | % | 1.91 | % | 1.73 | % | 1.80 | % | 1.85 | % | |||||||||||||
| Ratio of net investment income (loss) to average net assets | 0.02 | % | (0.43 | %) | (0.72 | %) | (0.63 | %) | (0.99 | %) | |||||||||||||
| Portfolio turnover rate | 180 | % | 162 | % | 127 | % | 156 | % | 158 | % | |||||||||||||
Touchstone Healthcare and Biotechnology Fund — Class C
Per Share Data for a Share Outstanding Throughout Each Period
| Year Ended September 30, | Period Ended September 30, | ||||||||||||||||||
| 2010 | 2009 | 2008 | 2007 (E) | ||||||||||||||||
| Net asset value at beginning of period | $ | 12.44 | $ | 14.90 | $ | 18.19 | $ | 15.98 | |||||||||||
| Income (loss) from investment operations: | |||||||||||||||||||
| Net investment income (loss) | (0.22 | ) | (0.17 | ) | (0.16 | ) | (0.03 | ) | |||||||||||
| Net realized and unrealized gains (losses) on investments | 0.84 | (2.29 | ) | (1.15 | ) | 2.83 | |||||||||||||
| Total from investment operations | 0.62 | (2.46 | ) | (1.31 | ) | 2.80 | |||||||||||||
| Less distributions: | |||||||||||||||||||
| Distributions from net realized gains | — | — | (1.65 | ) | (0.59 | ) | |||||||||||||
| Distributions from return of capital | — | — | (0.33 | ) | — | ||||||||||||||
| Total distributions | — | — | (1.98 | ) | (0.59 | ) | |||||||||||||
| Net asset value at end of period | $ | 13.06 | $ | 12.44 | $ | 14.90 | $ | 18.19 | |||||||||||
| Total return (A) | 4.98 | % | (16.51 | %) | (8.53 | %) | 18.15 | % (C) | |||||||||||
| Net assets at end of period (000s) | $ | 2,465 | $ | 3,486 | $ | 5,929 | $ | 1,396 | |||||||||||
| Ratio of net expenses to average net assets | 2.30 | % | 2.30 | % | 2.30 | % | 2.23 | % (D) | |||||||||||
| Ratio of gross expenses to average net assets | 3.22 | % | 2.93 | % | 2.64 | % | 2.57 | % (D) | |||||||||||
| Ratio of net investment loss to average net assets | (0.76 | %) | (1.17 | %) | (1.46 | %) | (1.27 | %) (D) | |||||||||||
| Portfolio turnover rate | 180 | % | 162 | % | 127 | % | 156 | % (C) | |||||||||||
(A) Total returns shown exclude the effect of applicable sales loads.
(B) The ratio of net expenses to average net assets excludes the effect of fees paid indirectly. If these expense offsets were included, the ratio would have been 1.84%.
(C) Not annualized.
(D) Annualized.
(E) Represents the period from commencement of operations (November 20, 2006) through September 30, 2007.
See accompanying notes to financial statements.
92
Financial Highlights (Continued)
Touchstone Intermediate Fixed Income Fund — Institutional Class
Per Share Data for a Share Outstanding Throughout Each Period
| Year Ended September 30, | |||||||||||||||||||||||
| 2010 | 2009 | 2008 | 2007 | 2006 | |||||||||||||||||||
| Net asset value at beginning of period | $ | 8.73 | $ | 8.90 | $ | 9.51 | $ | 9.58 | $ | 9.94 | |||||||||||||
| Income (loss) from investment operations: | |||||||||||||||||||||||
| Net investment income | 0.25 | 0.30 | 0.44 | 0.45 | 0.39 | ||||||||||||||||||
| Net realized and unrealized gains (losses) on investments | 0.43 | (0.17 | ) | (0.60 | ) | (0.07 | ) | (0.12 | ) | ||||||||||||||
| Total from investment operations | 0.68 | 0.13 | (0.16 | ) | 0.38 | 0.27 | |||||||||||||||||
| Less distributions: | |||||||||||||||||||||||
| Dividends from net investment income | (0.25 | ) | (0.30 | ) | (0.45 | ) | (0.45 | ) | (0.40 | ) | |||||||||||||
| Distributions from net realized gains | — | — | — | — | (0.23 | ) | |||||||||||||||||
| Total distributions | (0.25 | ) | (0.30 | ) | (0.45 | ) | (0.45 | ) | (0.63 | ) | |||||||||||||
| Net asset value at end of period | $ | 9.16 | $ | 8.73 | $ | 8.90 | $ | 9.51 | $ | 9.58 | |||||||||||||
| Total return | 7.92 | % | 1.44 | % | (1.95 | %) | 4.07 | % | 2.87 | % | |||||||||||||
| Net assets at end of period (000's) | $ | 109,138 | $ | 103,725 | $ | 15,377 | $ | 19,485 | $ | 21,689 | |||||||||||||
| Ratio of net expenses to average net assets | 0.40 | % | 0.52 | % | 0.85 | % | 0.87 | % | 0.91 | % (A) | |||||||||||||
| Ratio of gross expenses to average net assets | 0.69 | % | 0.83 | % | 1.15 | % | 0.99 | % | 0.95 | % | |||||||||||||
| Ratio of net investment income to average net assets | 2.84 | % | 3.12 | % | 4.61 | % | 4.72 | % | 4.13 | % | |||||||||||||
| Portfolio turnover rate | 71 | % | 125 | % | 62 | % | 71 | % | 62 | % | |||||||||||||
(A) The ratio of net expenses to average net assets excludes the effect of fees paid indirectly. If these expense offsets were included, the ratio would have been 0.89%.
See accompanying notes to financial statements.
93
Financial Highlights (Continued)
Touchstone International Fixed Income Fund — Class A (A)
Per Share Data for a Share Outstanding Throughout the Period
| Year Ended September 30, 2010 | |||||||
| Net asset value at beginning of period | $ | 10.00 | |||||
| Income (loss) from investment operations: | |||||||
| Net investment income | 0.12 | ||||||
| Net realized and unrealized gains (losses) on investments | 1.38 | ||||||
| Total from investment operations | 1.50 | ||||||
| Less distributions from net investment income | (0.12 | ) | |||||
| Net asset value at end of period | $ | 11.38 | |||||
| Total return (B) | 15.15 | % | |||||
| Net assets at end of period (000s) | $ | 1,319 | |||||
| Ratio of net expenses to average net assets | 1.09 | % | |||||
| Ratio of gross expenses to average net assets | 2.47 | % | |||||
| Ratio of net investment income to average net assets | 1.39 | % | |||||
| Portfolio turnover rate | 160 | % | |||||
Touchstone International Fixed Income Fund — Class C (A)
Per Share Data for a Share Outstanding Throughout the Period
| Year Ended September 30, 2010 | |||||||
| Net asset value at beginning of period | $ | 10.00 | |||||
| Income (loss) from investment operations: | |||||||
| Net investment income | 0.05 | ||||||
| Net realized and unrealized gains (losses) on investments | 1.37 | ||||||
| Total from investment operations | 1.42 | ||||||
| Less distributions from net investment income | (0.05 | ) | |||||
| Net asset value at end of period | $ | 11.37 | |||||
| Total return (B) | 14.29 | % | |||||
| Net assets at end of period (000s) | $ | 407 | |||||
| Ratio of net expenses to average net assets | 1.84 | % | |||||
| Ratio of gross expenses to average net assets | 3.16 | % | |||||
| Ratio of net investment income to average net assets | 0.59 | % | |||||
| Portfolio turnover rate | 160 | % | |||||
(A) The Fund commenced operations on October 1, 2009.
(B) Total returns shown exclude the effect of applicable sales loads.
See accompanying notes to financial statements.
94
Financial Highlights (Continued)
Touchstone International Fixed Income Fund — Class Y (A)
Per Share Data for a Share Outstanding Throughout the Period
| Year Ended September 30, 2010 | |||||||
| Net asset value at beginning of period | $ | 10.00 | |||||
| Income (loss) from investment operations: | |||||||
| Net investment income | 0.16 | ||||||
| Net realized and unrealized gains (losses) on investments | 1.37 | ||||||
| Total from investment operations | 1.53 | ||||||
| Less distributions from net investment income | (0.16 | ) | |||||
| Net asset value at end of period | $ | 11.37 | |||||
| Total return | 15.41 | % | |||||
| Net assets at end of period (000s) | $ | 193 | |||||
| Ratio of net expenses to average net assets | 0.84 | % | |||||
| Ratio of gross expenses to average net assets | 2.50 | % | |||||
| Ratio of net investment income to average net assets | 1.52 | % | |||||
| Portfolio turnover rate | 160 | % | |||||
Touchstone International Fixed Income Fund — Institutional Class (A)
Per Share Data for a Share Outstanding Throughout the Period
| Year Ended September 30, 2010 | |||||||
| Net asset value at beginning of period | $ | 10.00 | |||||
| Income (loss) from investment operations: | |||||||
| Net investment income | 0.17 | ||||||
| Net realized and unrealized gains (losses) on investments | 1.37 | ||||||
| Total from investment operations | 1.54 | ||||||
| Less distributions from net investment income | (0.17 | ) | |||||
| Net asset value at end of period | $ | 11.37 | |||||
| Total return | 15.59 | % | |||||
| Net assets at end of period (000s) | $ | 7,746 | |||||
| Ratio of net expenses to average net assets | 0.69 | % | |||||
| Ratio of gross expenses to average net assets | 1.64 | % | |||||
| Ratio of net investment income to average net assets | 1.67 | % | |||||
| Portfolio turnover rate | 160 | % | |||||
(A) The Fund commenced operations on October 1, 2009.
See accompanying notes to financial statements.
95
Financial Highlights (Continued)
Touchstone Large Cap Relative Value Fund — Class A (A)
Per Share Data for a Share Outstanding Throughout the Period
| Year Ended September 30, 2010 | |||||||
| Net asset value at beginning of period | $ | 10.00 | |||||
| Income (loss) from investment operations: | |||||||
| Net investment income | 0.05 | ||||||
| Net realized and unrealized gains (losses) on investments | 1.08 | ||||||
| Total from investment operations | 1.13 | ||||||
| Less distributions from net investment income | (0.02 | ) | |||||
| Net asset value at end of period | $ | 11.11 | |||||
| Total return (B) | 11.34 | % | |||||
| Net assets at end of period (000s) | $ | 476 | |||||
| Ratio of net expenses to average net assets | 1.19 | % | |||||
| Ratio of gross expenses to average net assets | 3.22 | % | |||||
| Ratio of net investment income to average net assets | 0.52 | % | |||||
| Portfolio turnover rate | 2 | % | |||||
Touchstone Large Cap Relative Value Fund — Class C (A)
Per Share Data for a Share Outstanding Throughout the Period
| Year Ended September 30, 2010 | |||||||
| Net asset value at beginning of period | $ | 10.00 | |||||
| Income (loss) from investment operations: | |||||||
| Net investment loss | (0.02 | ) | |||||
| Net realized and unrealized gains (losses) on investments | 1.07 | ||||||
| Total from investment operations | 1.05 | ||||||
| Less distributions from net investment income | — | ||||||
| Net asset value at end of period | $ | 11.05 | |||||
| Total return (B) | 10.50 | % | |||||
| Net assets at end of period (000s) | $ | 235 | |||||
| Ratio of net expenses to average net assets | 1.94 | % | |||||
| Ratio of gross expenses to average net assets | 3.69 | % | |||||
| Ratio of net investment loss to average net assets | (0.24 | %) | |||||
| Portfolio turnover rate | 2 | % | |||||
(A) The Fund commenced operations on October 1, 2009.
(B) Total returns shown exclude the effect of applicable sales loads.
See accompanying notes to financial statements.
96
Financial Highlights (Continued)
Touchstone Large Cap Relative Value Fund — Class Y (A)
Per Share Data for a Share Outstanding Throughout the Period
| Year Ended September 30, 2010 | |||||||
| Net asset value at beginning of period | $ | 10.00 | |||||
| Income (loss) from investment operations: | |||||||
| Net investment income | 0.09 | ||||||
| Net realized and unrealized gains (losses) on investments | 1.07 | ||||||
| Total from investment operations | 1.16 | ||||||
| Less distributions from net investment income | (0.04 | ) | |||||
| Net asset value at end of period | $ | 11.12 | |||||
| Total return | 11.58 | % | |||||
| Net assets at end of period (000s) | $ | 112 | |||||
| Ratio of net expenses to average net assets | 0.94 | % | |||||
| Ratio of gross expenses to average net assets | 2.77 | % | |||||
| Ratio of net investment income to average net assets | 0.78 | % | |||||
| Portfolio turnover rate | 2 | % | |||||
Touchstone Large Cap Relative Value Fund — Institutional Class (A)
Per Share Data for a Share Outstanding Throughout the Period
| Year Ended September 30, 2010 | |||||||
| Net asset value at beginning of period | $ | 10.00 | |||||
| Income (loss) from investment operations: | |||||||
| Net investment income | 0.10 | ||||||
| Net realized and unrealized gains (losses) on investments | 1.08 | ||||||
| Total from investment operations | 1.18 | ||||||
| Less distributions from net investment income | (0.05 | ) | |||||
| Net asset value at end of period | $ | 11.13 | |||||
| Total return | 11.76 | % | |||||
| Net assets at end of period (000s) | $ | 3,018 | |||||
| Ratio of net expenses to average net assets | 0.79 | % | |||||
| Ratio of gross expenses to average net assets | 2.48 | % | |||||
| Ratio of net investment income to average net assets | 0.93 | % | |||||
| Portfolio turnover rate | 2 | % | |||||
(A) The Fund commenced operations on October 1, 2009.
See accompanying notes to financial statements.
97
Financial Highlights (Continued)
Touchstone Market Neutral Equity Fund — Class A (A)
Per Share Data for a Share Outstanding Throughout the Period
| Year Ended September 30, 2010 | |||||||
| Net asset value at beginning of period | $ | 10.00 | |||||
| Income (loss) from investment operations: | |||||||
| Net investment loss | (0.13 | ) | |||||
| Net realized and unrealized gains (losses) on investments | (0.14 | ) | |||||
| Total from investment operations | (0.27 | ) | |||||
| Net asset value at end of period | $ | 9.73 | |||||
| Total return (B) | (2.70 | %) | |||||
| Net assets at end of period (000s) | $ | 610 | |||||
| Ratio of net expenses to average net assets (including dividend expense on securities sold short) | 2.79 | % | |||||
| Ratio of net expenses to average net assets (excluding dividend expense on securities sold short) | 1.61 | % | |||||
| Ratio of gross expenses to average net assets (including dividend expense on securities sold short) | 3.89 | % | |||||
| Ratio of gross expenses to average net assets (excluding dividend expense on securities sold short) | 2.70 | % | |||||
| Ratio of net investment loss to average net assets | (1.38 | %) | |||||
| Portfolio turnover rate | 377 | % | |||||
Touchstone Market Neutral Equity Fund — Class C (A)
Per Share Data for a Share Outstanding Throughout the Period
| Year Ended September 30, 2010 | |||||||
| Net asset value at beginning of period | $ | 10.00 | |||||
| Income (loss) from investment operations: | |||||||
| Net investment loss | (0.16 | ) | |||||
| Net realized and unrealized gains (losses) on investments | (0.18 | ) | |||||
| Total from investment operations | (0.34 | ) | |||||
| Net asset value at end of period | $ | 9.66 | |||||
| Total return (B) | (3.40 | %) | |||||
| Net assets at end of period (000s) | $ | 168 | |||||
| Ratio of net expenses to average net assets (including dividend expense on securities sold short) | 3.40 | % | |||||
| Ratio of net expenses to average net assets (excluding dividend expense on securities sold short) | 2.37 | % | |||||
| Ratio of gross expenses to average net assets (including dividend expense on securities sold short) | 4.48 | % | |||||
| Ratio of gross expenses to average net assets (excluding dividend expense on securities sold short) | 3.44 | % | |||||
| Ratio of net investment loss to average net assets | (2.18 | %) | |||||
| Portfolio turnover rate | 377 | % | |||||
(A) The Fund commenced operations on October 1, 2009.
(B) Total returns shown exclude the effect of applicable sales loads.
See accompanying notes to financial statements.
98
Financial Highlights (Continued)
Touchstone Market Neutral Equity Fund — Class Y (A)
Per Share Data for a Share Outstanding Throughout the Period
| Year Ended September 30, 2010 | |||||||
| Net asset value at beginning of period | $ | 10.00 | |||||
| Income (loss) from investment operations: | |||||||
| Net investment loss | (0.04 | ) | |||||
| Net realized and unrealized gains (losses) on investments | (0.21 | ) | |||||
| Total from investment operations | (0.25 | ) | |||||
| Net asset value at end of period | $ | 9.75 | |||||
| Total return | (2.50 | %) | |||||
| Net assets at end of period (000s) | $ | 32,406 | |||||
| Ratio of net expenses to average net assets (including dividend expense on securities sold short) | 2.48 | % | |||||
| Ratio of net expenses to average net assets (excluding dividend expense on securities sold short) | 1.38 | % | |||||
| Ratio of gross expenses to average net assets (including dividend expense on securities sold short) | 3.39 | % | |||||
| Ratio of gross expenses to average net assets (excluding dividend expense on securities sold short) | 2.29 | % | |||||
| Ratio of net investment loss to average net assets | (1.15 | %) | |||||
| Portfolio turnover rate | 377 | % | |||||
(A) The Fund commenced operations on October 1, 2009.
See accompanying notes to financial statements.
99
Financial Highlights (Continued)
Touchstone Mid Cap Fund — Class A
Per Share Data for a Share Outstanding Throughout Each Period
| Year Ended September 30, | Period Ended September 30, | ||||||||||||||||||
| 2010 | 2009 | 2008 | 2007 (A) | ||||||||||||||||
| Net asset value at beginning of period | $ | 11.20 | $ | 13.07 | $ | 17.86 | $ | 18.14 | |||||||||||
| Income (loss) from investment operations: | |||||||||||||||||||
| Net investment income (loss) | 0.29 | 0.04 | (0.02 | ) | (0.00 | ) (B) | |||||||||||||
| Net realized and unrealized gains (losses) on investments | 1.24 | (1.85 | ) | (4.60 | ) | (0.28 | ) | ||||||||||||
| Total from investment operations | 1.53 | (1.81 | ) | (4.62 | ) | (0.28 | ) | ||||||||||||
| Less distributions: | |||||||||||||||||||
| Dividends from net investment income | (0.06 | ) | (0.03 | ) | — | — | |||||||||||||
| Distributions from net realized gains | — | (0.03 | ) | (0.17 | ) | — | |||||||||||||
| Total distributions | (0.06 | ) | (0.06 | ) | (0.17 | ) | — | ||||||||||||
| Net asset value at end of period | $ | 12.67 | $ | 11.20 | $ | 13.07 | $ | 17.86 | |||||||||||
| Total return (C) | 13.72 | % | (13.81 | %) | (26.11 | %) | (1.54 | %) (D) | |||||||||||
| Net assets at end of period (000s) | $ | 685 | $ | 453 | $ | 159 | $ | 210 | |||||||||||
| Ratio of net expenses to average net assets | 1.21 | % | 1.15 | % | 1.15 | % | 0.94 | % (E) | |||||||||||
| Ratio of gross expenses to average net assets | 2.84 | % | 3.84 | % | 4.09 | % | 14.21 | % (E) | |||||||||||
| Ratio of net investment income (loss) to average net assets | 0.34 | % | 0.39 | % | (0.16 | %) | (0.09 | %) (E) | |||||||||||
| Portfolio turnover rate | 132 | % | 187 | % | 157 | % | 193 | % (D) | |||||||||||
Touchstone Mid Cap Fund — Class C
Per Share Data for a Share Outstanding Throughout Each Period
| Year Ended September 30, | Period Ended September 30, | ||||||||||||||||||
| 2010 | 2009 | 2008 | 2007 (A) | ||||||||||||||||
| Net asset value at beginning of period | $ | 11.19 | $ | 13.12 | $ | 17.84 | $ | 18.14 | |||||||||||
| Loss from investment operations: | |||||||||||||||||||
| Net investment loss | (0.04 | ) | (0.03 | ) | (0.15 | ) | (0.02 | ) | |||||||||||
| Net realized and unrealized gains (losses) on investments | 1.43 | (1.87 | ) | (4.40 | ) | (0.28 | ) | ||||||||||||
| Total from investment operations | 1.39 | (1.90 | ) | (4.55 | ) | (0.30 | ) | ||||||||||||
| Distributions from net realized gains | — | (0.03 | ) | (0.17 | ) | — | |||||||||||||
| Net asset value at end of period | $ | 12.58 | $ | 11.19 | $ | 13.12 | $ | 17.84 | |||||||||||
| Total return (C) | 12.42 | % | (14.47 | %) | (25.74 | %) | (1.65 | %) (D) | |||||||||||
| Net assets at end of period (000s) | $ | 249 | $ | 169 | $ | 30 | $ | 36 | |||||||||||
| Ratio of net expenses to average net assets | 1.94 | % | 1.90 | % | 1.90 | % | 1.35 | % (E) | |||||||||||
| Ratio of gross expenses to average net assets | 4.57 | % | 6.99 | % | 31.40 | % | 28.68 | % (E) | |||||||||||
| Ratio of net investment loss to average net assets | (0.40 | %) | (0.38 | %) | (0.91 | %) | (0.51 | %) (E) | |||||||||||
| Portfolio turnover rate | 132 | % | 187 | % | 157 | % | 193 | % (D) | |||||||||||
(A) Represents the period from commencement of operations (May 14, 2007) through September 30, 2007.
(B) Amount rounds to less than $0.01 per share.
(C) Total returns shown exclude the effect of applicable sales loads.
(D) Not annualized.
(E) Annualized.
See accompanying notes to financial statements.
100
Financial Highlights (Continued)
Touchstone Mid Cap Fund — Class Y
Per Share Data for a Share Outstanding Throughout Each Period
| Year Ended September 30, | |||||||||||||||||||||||
| 2010 | 2009 | 2008 | 2007 | 2006 | |||||||||||||||||||
| Net asset value at beginning of period | $ | 11.25 | $ | 13.14 | $ | 17.91 | $ | 15.28 | $ | 15.36 | |||||||||||||
| Income (loss) from investment operations: | |||||||||||||||||||||||
| Net investment income | 0.08 | 0.07 | 0.01 | 0.11 | 0.04 | ||||||||||||||||||
| Net realized and unrealized gains (losses) on investments | 1.44 | (1.88 | ) | (4.61 | ) | 2.65 | 1.00 | ||||||||||||||||
| Total from investment operations | 1.52 | (1.81 | ) | (4.60 | ) | 2.76 | 1.04 | ||||||||||||||||
| Less distributions: | |||||||||||||||||||||||
| Dividends from net investment income | (0.09 | ) | (0.05 | ) | — | (0.13 | ) | (0.03 | ) | ||||||||||||||
| Distributions from net realized gains | — | (0.03 | ) | (0.17 | ) | — | (1.09 | ) | |||||||||||||||
| Total distributions | (0.09 | ) | (0.08 | ) | (0.17 | ) | (0.13 | ) | (1.12 | ) | |||||||||||||
| Net asset value at end of period | $ | 12.68 | $ | 11.25 | $ | 13.14 | $ | 17.91 | $ | 15.28 | |||||||||||||
| Total return | 13.58 | % | (13.68 | %) | (25.92 | %) | 18.13 | % | 7.10 | % | |||||||||||||
| Net assets at end of period (000s) | $ | 123,493 | $ | 168,313 | $ | 422,356 | $ | 482,047 | $ | 87,032 | |||||||||||||
| Ratio of net expenses to average net assets | 0.94 | % | 0.90 | % | 0.90 | % | 0.90 | % | 0.91 | % (A) | |||||||||||||
| Ratio of gross expenses to average net assets | 1.07 | % | 1.05 | % | 1.03 | % | 1.06 | % | 1.81 | % | |||||||||||||
| Ratio of net investment income to average net assets | 0.71 | % | 0.61 | % | 0.09 | % | 0.39 | % | 0.82 | % | |||||||||||||
| Portfolio turnover rate | 132 | % | 187 | % | 157 | % | 193 | % | 323 | % | |||||||||||||
Touchstone Mid Cap Fund — Class Z
Per Share Data for a Share Outstanding Throughout Each Period
| Year Ended September 30, | Period Ended September 30, | ||||||||||||||||||||||
| 2010 | 2009 | 2008 | 2007 | 2006 (B) | |||||||||||||||||||
| Net asset value at beginning of period | $ | 11.18 | $ | 13.05 | $ | 17.85 | $ | 15.26 | $ | 16.73 | |||||||||||||
| Income (loss) from investment operations: | |||||||||||||||||||||||
| Net investment income (loss) | 0.02 | 0.03 | (0.08 | ) | 0.09 | 0.01 | |||||||||||||||||
| Net realized and unrealized gains (losses) on investments | 1.45 | (1.84 | ) | (4.55 | ) | 2.62 | (1.48 | ) | |||||||||||||||
| Total from investment operations | 1.47 | (1.81 | ) | (4.63 | ) | 2.71 | (1.47 | ) | |||||||||||||||
| Less distributions: | |||||||||||||||||||||||
| Dividends from net investment income | (0.06 | ) | (0.03 | ) | — | (0.12 | ) | — | |||||||||||||||
| Distributions from net realized gains | — | (0.03 | ) | (0.17 | ) | — | — | ||||||||||||||||
| Total distributions | (0.06 | ) | (0.06 | ) | (0.17 | ) | (0.12 | ) | — | ||||||||||||||
| Net asset value at end of period | $ | 12.59 | $ | 11.18 | $ | 13.05 | $ | 17.85 | $ | 15.26 | |||||||||||||
| Total return | 13.20 | % | (13.83 | %) | (26.18 | %) | 17.84 | % | (8.79 | %) (C) | |||||||||||||
| Net assets at end of period (000s) | $ | 652 | $ | 1,814 | $ | 3,267 | $ | 15,203 | $ | 350 | |||||||||||||
| Ratio of net expenses to average net assets | 1.19 | % | 1.15 | % | 1.15 | % | 1.14 | % | 1.16 | % (D)(E) | |||||||||||||
| Ratio of gross expenses to average net assets | 2.14 | % | 2.22 | % | 1.48 | % | 1.25 | % | 1.82 | % (D) | |||||||||||||
| Ratio of net investment income (loss) to average net assets | 0.45 | % | 0.39 | % | (0.27 | %) | (0.12 | %) | 0.65 | % (D) | |||||||||||||
| Portfolio turnover rate | 132 | % | 187 | % | 157 | % | 193 | % | 323 | % (C) | |||||||||||||
(A) The ratio of net expenses to average net assets excludes the effect of fees paid indirectly. If these expense offsets were included, the ratio would have been 0.90%.
(B) Represents the period from commencement of operations (April 24, 2006) through September 30, 2006.
(C) Not annualized
(D) Annualized.
(E) The ratio of net expenses to average net assets excludes the effect of fees paid indirectly. If these expense offsets were included, the ratio would have been 1.15%.
See accompanying notes to financial statements.
101
Financial Highlights (Continued)
Touchstone Mid Cap Value Fund — Class A (A)
Per Share Data for a Share Outstanding Throughout the Period
| Year Ended September 30, 2010 | |||||||
| Net asset value at beginning of period | $ | 10.00 | |||||
| Income (loss) from investment operations: | |||||||
| Net investment income | 0.12 | ||||||
| Net realized and unrealized gains (losses) on investments | 1.74 | ||||||
| Total from investment operations | 1.86 | ||||||
| Less distributions from net investment income | (0.10 | ) | |||||
| Net asset value at end of period | $ | 11.76 | |||||
| Total return (B) | 18.70 | % | |||||
| Net assets at end of period (000s) | $ | 345 | |||||
| Ratio of net expenses to average net assets | 1.29 | % | |||||
| Ratio of gross expenses to average net assets | 3.07 | % | |||||
| Ratio of net investment income to average net assets | 1.07 | % | |||||
| Portfolio turnover rate | 45 | % | |||||
Touchstone Mid Cap Value Fund — Class C (A)
Per Share Data for a Share Outstanding Throughout the Period
| Year Ended September 30, 2010 | |||||||
| Net asset value at beginning of period | $ | 10.00 | |||||
| Income (loss) from investment operations: | |||||||
| Net investment income | 0.03 | ||||||
| Net realized and unrealized gains (losses) on investments | 1.75 | ||||||
| Total from investment operations | 1.78 | ||||||
| Less distributions from net investment income | (0.04 | ) | |||||
| Net asset value at end of period | $ | 11.74 | |||||
| Total return (B) | 17.88 | % | |||||
| Net assets at end of period (000s) | $ | 132 | |||||
| Ratio of net expenses to average net assets | 2.04 | % | |||||
| Ratio of gross expenses to average net assets | 3.86 | % | |||||
| Ratio of net investment income to average net assets | 0.27 | % | |||||
| Portfolio turnover rate | 45 | % | |||||
(A) The Fund commenced operations on October 1, 2009.
(B) Total returns shown exclude the effect of applicable sales loads.
See accompanying notes to financial statements.
102
Financial Highlights (Continued)
Touchstone Mid Cap Value Fund — Class Y (A)
Per Share Data for a Share Outstanding Throughout the Period
| Year Ended September 30, 2010 | |||||||
| Net asset value at beginning of period | $ | 10.00 | |||||
| Income (loss) from investment operations: | |||||||
| Net investment income | 0.14 | ||||||
| Net realized and unrealized gains (losses) on investments | 1.76 | ||||||
| Total from investment operations | 1.90 | ||||||
| Less distributions from net investment income | (0.11 | ) | |||||
| Net asset value at end of period | $ | 11.79 | |||||
| Total return | 19.07 | % | |||||
| Net assets at end of period (000s) | $ | 589 | |||||
| Ratio of net expenses to average net assets | 1.04 | % | |||||
| Ratio of gross expenses to average net assets | 3.19 | % | |||||
| Ratio of net investment income to average net assets | 1.40 | % | |||||
| Portfolio turnover rate | 45 | % | |||||
Touchstone Mid Cap Value Fund — Institutional Class (A)
Per Share Data for a Share Outstanding Throughout the Period
| Year Ended September 30, 2010 | |||||||
| Net asset value at beginning of period | $ | 10.00 | |||||
| Income (loss) from investment operations: | |||||||
| Net investment income | 0.10 | ||||||
| Net realized and unrealized gains (losses) on investments | 1.82 | ||||||
| Total from investment operations | 1.92 | ||||||
| Less distributions from net investment income | �� | (0.09 | ) | ||||
| Net asset value at end of period | $ | 11.83 | |||||
| Total return | 19.25 | % | |||||
| Net assets at end of period (000s) | $ | 39,509 | |||||
| Ratio of net expenses to average net assets | 0.89 | % | |||||
| Ratio of gross expenses to average net assets | 1.93 | % | |||||
| Ratio of net investment income to average net assets | 1.66 | % | |||||
| Portfolio turnover rate | 45 | % | |||||
(A) The Fund commenced operations on October 1, 2009.
See accompanying notes to financial statements.
103
Financial Highlights (Continued)
Touchstone Premium Yield Equity Fund — Class A
Per Share Data for a Share Outstanding Throughout Each Period
| Year Ended September 30, | Period Ended September 30, | ||||||||||||||
| 2010 | 2009 | 2008 (A) | |||||||||||||
| Net asset value at beginning of period | $ | 5.93 | $ | 7.56 | $ | 10.00 | |||||||||
| Income (loss) from investment operations: | |||||||||||||||
| Net investment income | 0.21 | 0.22 | 0.33 | ||||||||||||
| Net realized and unrealized gains (losses) on investments | 0.54 | (1.64 | ) | (2.44 | ) | ||||||||||
| Total from investment operations | 0.75 | (1.42 | ) | (2.11 | ) | ||||||||||
| Less distributions: | |||||||||||||||
| Dividends from net investment income | (0.20 | ) | (0.21 | ) | (0.32 | ) | |||||||||
| Distributions from return of capital | — | — | (0.01 | ) | |||||||||||
| Total distributions | (0.20 | ) | (0.21 | ) | (0.33 | ) | |||||||||
| Net asset value at end of period | $ | 6.48 | $ | 5.93 | $ | 7.56 | |||||||||
| Total return (B) | 12.82 | % | (18.40 | %) | (21.48 | %) (C) | |||||||||
| Net assets at end of period (000s) | $ | 22,441 | $ | 19,879 | $ | 19,411 | |||||||||
| Ratio of net expenses to average net assets | 1.20 | % | 1.20 | % | 1.20 | % (D) | |||||||||
| Ratio of gross expenses to average net assets | 1.40 | % | 1.55 | % | 1.53 | % (D) | |||||||||
| Ratio of net investment income to average net assets | 3.30 | % | 3.97 | % | 4.68 | % (D) | |||||||||
| Portfolio turnover rate | 29 | % | 30 | % | 181 | % (C) | |||||||||
Touchstone Premium Yield Equity Fund — Class C
Per Share Data for a Share Outstanding Throughout Each Period
| Year Ended September 30, | Period Ended September 30, | ||||||||||||||
| 2010 | 2009 | 2008 (A) | |||||||||||||
| Net asset value at beginning of period | $ | 5.93 | $ | 7.56 | $ | 10.00 | |||||||||
| Income (loss) from investment operations: | |||||||||||||||
| Net investment income | 0.16 | 0.10 | 0.29 | ||||||||||||
| Net realized and unrealized gains (losses) on investments | 0.55 | (1.55 | ) | (2.45 | ) | ||||||||||
| Total from investment operations | 0.71 | (1.45 | ) | (2.16 | ) | ||||||||||
| Less distributions: | |||||||||||||||
| Dividends from net investment income | (0.15 | ) | (0.18 | ) | (0.27 | ) | |||||||||
| Distributions from return of capital | — | — | (0.01 | ) | |||||||||||
| Total distributions | (0.15 | ) | (0.18 | ) | (0.28 | ) | |||||||||
| Net asset value at end of period | $ | 6.49 | $ | 5.93 | $ | 7.56 | |||||||||
| Total return (B) | 12.11 | % | (18.96 | %) | (21.95 | %) (C) | |||||||||
| Net assets at end of period (000s) | $ | 6,870 | $ | 3,319 | $ | 567 | |||||||||
| Ratio of net expenses to average net assets | 1.95 | % | 1.95 | % | 1.94 | % (D) | |||||||||
| Ratio of gross expenses to average net assets | 2.23 | % | 3.08 | % | 5.31 | % (D) | |||||||||
| Ratio of net investment income to average net assets | 2.60 | % | 2.80 | % | 3.93 | % (D) | |||||||||
| Portfolio turnover rate | 29 | % | 30 | % | 181 | % (C) | |||||||||
(A) Represents the period from commencement of operations (December 3, 2007) through September 30, 2008.
(B) Total returns shown exclude the effect of applicable sales loads.
(C) Not annualized.
(D) Annualized.
See accompanying notes to financial statements.
104
Financial Highlights (Continued)
Touchstone Premium Yield Equity Fund — Class Y
Per Share Data for a Share Outstanding Throughout Each Period
| Year Ended September 30, | Period Ended September 30, | ||||||||||||||
| 2010 | 2009 | 2008 (A) | |||||||||||||
| Net asset value at beginning of period | $ | 5.92 | $ | 7.55 | $ | 8.30 | |||||||||
| Income (loss) from investment operations: | |||||||||||||||
| Net investment income | 0.22 | 0.22 | 0.04 | ||||||||||||
| Net realized and unrealized gains (losses) on investments | 0.54 | (1.62 | ) | (0.73 | ) | ||||||||||
| Total from investment operations | 0.76 | (1.40 | ) | (0.69 | ) | ||||||||||
| Less distributions: | |||||||||||||||
| Dividends from net investment income | (0.21 | ) | (0.23 | ) | (0.05 | ) | |||||||||
| Distributions from return of capital | — | — | (0.01 | ) | |||||||||||
| Total Distributions | (0.21 | ) | (0.23 | ) | (0.06 | ) | |||||||||
| Net asset value at end of period | $ | 6.47 | $ | 5.92 | $ | 7.55 | |||||||||
| Total return | 13.14 | % | (18.22 | %) | (8.37 | %) (B) | |||||||||
| Net assets at end of period (000s) | $ | 11,540 | $ | 551 | $ | 2 | |||||||||
| Ratio of net expenses to average net assets | 0.95 | % | 0.95 | % | 0.90 | % (C) | |||||||||
| Ratio of gross expenses to average net assets | 1.53 | % | 13.70 | % | 453.70 | % (C) | |||||||||
| Ratio of net investment income to average net assets | 3.77 | % | 2.97 | % | 3.16 | % (C) | |||||||||
| Portfolio turnover rate | 29 | % | 30 | % | 181 | % (B) | |||||||||
(A) Represents the period from commencement of operations (August 12, 2008) through September 30, 2008.
(B) Not annualized.
(C) Annualized.
See accompanying notes to financial statements.
105
Financial Highlights (Continued)
Touchstone Sands Capital Select Growth Fund — Class Y
Per Share Data for a Share Outstanding Throughout Each Period
| Year Ended September 30, | |||||||||||||||||||||||
| 2010 | 2009 | 2008 | 2007 | 2006 | |||||||||||||||||||
| Net asset value at beginning of period | $ | 7.34 | $ | 6.86 | $ | 9.15 | $ | 7.60 | $ | 7.81 | |||||||||||||
| Income (loss) from investment operations: | |||||||||||||||||||||||
| Net investment loss | (0.07 | ) | (0.03 | ) | (0.06 | ) | (0.05 | ) | (0.06 | ) | |||||||||||||
| Net realized and unrealized gains (losses) on investments | 1.56 | 0.51 | (2.23 | ) | 1.60 | (0.15 | ) | ||||||||||||||||
| Total from investment operations | 1.49 | 0.48 | (2.29 | ) | 1.55 | (0.21 | ) | ||||||||||||||||
| Net asset value at end of period | $ | 8.83 | $ | 7.34 | $ | 6.86 | $ | 9.15 | $ | 7.60 | |||||||||||||
| Total return | 20.44 | % | 7.00 | % | (25.03 | %) | 20.39 | % | (2.69 | %) | |||||||||||||
| Net assets at end of period (000s) | $ | 120,333 | $ | 82,918 | $ | 130,920 | $ | 213,672 | $ | 182,001 | |||||||||||||
| Ratio of net expenses to average net assets | 1.22 | % | 0.98 | % | 1.16 | % | 1.03 | % | 1.10 | % | |||||||||||||
| Ratio of gross expenses to average net assets | 1.28 | % | 1.05 | % | 1.19 | % | 1.03 | % | 1.23 | % | |||||||||||||
| Ratio of net investment loss to average net assets | (0.52 | %) | (0.48 | %) | (0.59 | %) | (0.67 | %) | (0.74 | %) | |||||||||||||
| Portfolio turnover rate | 27 | % | 50 | % | 39 | % | 24 | % | 24 | % | |||||||||||||
Touchstone Sands Capital Select Growth Fund — Class Z
Per Share Data for a Share Outstanding Throughout Each Period
| Year Ended September 30, | |||||||||||||||||||||||
| 2010 | 2009 | 2008 | 2007 | 2006 | |||||||||||||||||||
| Net asset value at beginning of period | $ | 7.24 | $ | 6.79 | $ | 9.08 | $ | 7.57 | $ | 7.80 | |||||||||||||
| Income (loss) from investment operations: | |||||||||||||||||||||||
| Net investment loss | (0.04 | ) | (0.04 | ) | (0.06 | ) | (0.09 | ) | (0.05 | ) | |||||||||||||
| Net realized and unrealized gains (losses) on investments | 1.50 | 0.49 | (2.23 | ) | 1.60 | (0.18 | ) | ||||||||||||||||
| Total from investment operations | 1.46 | 0.45 | (2.29 | ) | 1.51 | (0.23 | ) | ||||||||||||||||
| Net asset value at end of period | $ | 8.70 | $ | 7.24 | $ | 6.79 | $ | 9.08 | $ | 7.57 | |||||||||||||
| Total return | 20.17 | % | 6.63 | % | (25.22 | %) | 19.95 | % | (2.95 | %) | |||||||||||||
| Net assets at end of period (000s) | $ | 540,329 | $ | 333,200 | $ | 363,955 | $ | 380,025 | $ | 365,390 | |||||||||||||
| Ratio of net expenses to average net assets | 1.47 | % | 1.23 | % | 1.41 | % | 1.29 | % | 1.35 | % | |||||||||||||
| Ratio of gross expenses to average net assets | 1.53 | % | 1.32 | % | 1.43 | % | 1.35 | % | 1.48 | % | |||||||||||||
| Ratio of net investment loss to average net assets | (0.79 | %) | (0.74 | %) | (0.85 | %) | (0.92 | %) | (0.99 | %) | |||||||||||||
| Portfolio turnover rate | 27 | % | 50 | % | 39 | % | 24 | % | 24 | % | |||||||||||||
See accompanying notes to financial statements.
106
Financial Highlights (Continued)
Touchstone Short Duration Fixed Income Fund — Class Y
Per Share Data for a Share Outstanding Throughout Each Period
| Year Ended September 30, 2010 | Period Ended September 30, 2009 (A) | ||||||||||
| Net asset value at beginning of period | $ | 9.95 | $ | 9.79 | |||||||
| Income from investment operations: | |||||||||||
| Net investment income | 0.32 | 0.13 | |||||||||
| Net realized and unrealized gains (losses) on investments | 0.03 | 0.16 | |||||||||
| Total from investment operations | 0.35 | 0.29 | |||||||||
| Dividends from net investment income | (0.33 | ) | (0.13 | ) | |||||||
| Net asset value at end of period | $ | 9.97 | $ | 9.95 | |||||||
| Total return | 3.61 | % | 3.02 | % (B) | |||||||
| Net assets at end of period (000's) | $ | 767 | $ | 592 | |||||||
| Ratio of net expenses to average net assets | 0.49 | % | 0.48 | % (C) | |||||||
| Ratio of gross expenses to average net assets | 3.98 | % | 1.49 | % (C) | |||||||
| Ratio of net investment income to average net assets | 3.22 | % | 3.03 | % (C) | |||||||
| Portfolio turnover rate | 45 | % | 79 | % (B) | |||||||
Touchstone Short Duration Fixed Income Fund — Class Z
Per Share Data for a Share Outstanding Throughout Each Period
| Year Ended September 30, | |||||||||||||||||||||||
| 2010 | 2009 | 2008 | 2007 | 2006 | |||||||||||||||||||
| Net asset value at beginning of period | $ | 9.94 | $ | 9.59 | $ | 9.81 | $ | 9.76 | $ | 9.87 | |||||||||||||
| Income (loss) from investment operations: | |||||||||||||||||||||||
| Net investment income | 0.29 | 0.32 | 0.45 | 0.45 | 0.38 | ||||||||||||||||||
| Net realized and unrealized gains (losses) on investments | 0.04 | 0.35 | (0.22 | ) | 0.05 | (0.07 | ) | ||||||||||||||||
| Total from investment operations | 0.33 | 0.67 | 0.23 | 0.50 | 0.31 | ||||||||||||||||||
| Dividends from net investment income | (0.31 | ) | (0.32 | ) | (0.45 | ) | (0.45 | ) | (0.42 | ) | |||||||||||||
| Net asset value at end of period | $ | 9.96 | $ | 9.94 | $ | 9.59 | $ | 9.81 | $ | 9.76 | |||||||||||||
| Total return | 3.36 | % | 7.13 | % | 2.36 | % | 5.19 | % | 3.23 | % | |||||||||||||
| Net assets at end of period (000's) | $ | 43,411 | $ | 43,749 | $ | 46,989 | $ | 59,192 | $ | 76,090 | |||||||||||||
| Ratio of net expenses to average net assets | 0.74 | % | 0.74 | % | 0.74 | % | 0.74 | % | 0.72 | % | |||||||||||||
| Ratio of gross expenses to average net assets | 1.04 | % | 0.96 | % | 0.94 | % | 0.82 | % | 0.74 | % | |||||||||||||
| Ratio of net investment income to average net assets | 2.94 | % | 3.24 | % | 4.60 | % | 4.62 | % | 3.97 | % | |||||||||||||
| Portfolio turnover rate | 45 | % | 79 | % | 25 | % | 21 | % | 10 | % | |||||||||||||
(A) Represents the period from commencement of operations (May 4, 2009) through September 30, 2009.
(B) Not annualized.
(C) Annualized.
See accompanying notes to financial statements.
107
Financial Highlights (Continued)
Touchstone Small Cap Core Fund — Class A (A)
Per Share Data for a Share Outstanding Throughout the Period
| Year Ended September 30, 2010 | |||||||
| Net asset value at beginning of period | $ | 10.00 | |||||
| Income (loss) from investment operations: | |||||||
| Net investment income | 0.02 | ||||||
| Net realized and unrealized gains (losses) on investments | 1.60 | ||||||
| Total from investment operations | 1.62 | ||||||
| Net asset value at end of period | $ | 11.62 | |||||
| Total return (B) | 16.20 | % | |||||
| Net assets at end of period (000s) | $ | 50,110 | |||||
| Ratio of net expenses to average net assets | 1.34 | % | |||||
| Ratio of gross expenses to average net assets | 1.55 | % | |||||
| Ratio of net investment income to average net assets | 0.32 | % | |||||
| Portfolio turnover rate | 29 | % | |||||
Touchstone Small Cap Core Fund — Class C (A)
Per Share Data for a Share Outstanding Throughout the Period
| Year Ended September 30, 2010 | |||||||
| Net asset value at beginning of period | $ | 10.00 | |||||
| Income (loss) from investment operations: | |||||||
| Net investment loss | (0.02 | ) | |||||
| Net realized and unrealized gains (losses) on investments | 1.57 | ||||||
| Total from investment operations | 1.55 | ||||||
| Net asset value at end of period | $ | 11.55 | |||||
| Total return (B) | 15.50 | % | |||||
| Net assets at end of period (000s) | $ | 5,245 | |||||
| Ratio of net expenses to average net assets | 2.09 | % | |||||
| Ratio of gross expenses to average net assets | 2.57 | % | |||||
| Ratio of net investment loss to average net assets | (0.43 | %) | |||||
| Portfolio turnover rate | 29 | % | |||||
(A) The Fund commenced operations on October 1, 2009.
(B) Total returns shown exclude the effect of applicable sales loads.
See accompanying notes to financial statements.
108
Financial Highlights (Continued)
Touchstone Small Cap Core Fund — Class Y (A)
Per Share Data for a Share Outstanding Throughout the Period
| Year Ended September 30, 2010 | |||||||
| Net asset value at beginning of period | $ | 10.00 | |||||
| Income (loss) from investment operations: | |||||||
| Net investment income | 0.03 | ||||||
| Net realized and unrealized gains (losses) on investments | 1.64 | ||||||
| Total from investment operations | 1.67 | ||||||
| Net asset value at end of period | $ | 11.67 | |||||
| Total return | 16.70 | % | |||||
| Net assets at end of period (000s) | $ | 33,536 | |||||
| Ratio of net expenses to average net assets | 1.09 | % | |||||
| Ratio of gross expenses to average net assets | 1.31 | % | |||||
| Ratio of net investment income to average net assets | 0.61 | % | |||||
| Portfolio turnover rate | 29 | % | |||||
Touchstone Small Cap Core Fund — Institutional Class (A)
Per Share Data for a Share Outstanding Throughout the Period
| Year Ended September 30, 2010 | |||||||
| Net asset value at beginning of period | $ | 10.00 | |||||
| Income (loss) from investment operations: | |||||||
| Net investment income | 0.06 | ||||||
| Net realized and unrealized gains (losses) on investments | 1.61 | ||||||
| Total from investment operations | 1.67 | ||||||
| Less distributions from net investment income | (0.02 | ) | |||||
| Net asset value at end of period | $ | 11.65 | |||||
| Total return | 16.74 | % | |||||
| Net assets at end of period (000s) | $ | 10,386 | |||||
| Ratio of net expenses to average net assets | 0.94 | % | |||||
| Ratio of gross expenses to average net assets | 1.32 | % | |||||
| Ratio of net investment income to average net assets | 0.66 | % | |||||
| Portfolio turnover rate | 29 | % | |||||
(A) The Fund commenced operations on October 1, 2009.
See accompanying notes to financial statements.
109
Financial Highlights (Continued)
Touchstone Small Cap Value Opportunities Fund — Class Z
Per Share Data for a Share Outstanding Throughout Each Period
| Year Ended September 30, | |||||||||||||||||||||||
| 2010 | 2009 | 2008 | 2007 | 2006 | �� | ||||||||||||||||||
| Net asset value at beginning of period | $ | 13.26 | $ | 15.45 | $ | 20.48 | $ | 18.94 | $ | 18.35 | |||||||||||||
| Income (loss) from investment operations: | |||||||||||||||||||||||
| Net investment income (loss) | 0.00 | (A) | 0.02 | (0.00 | ) (A) | (0.02 | ) | (0.08 | ) | ||||||||||||||
| Net realized and unrealized gains (losses) on investments | 1.64 | (2.17 | ) | (3.22 | ) | 2.05 | 0.96 | ||||||||||||||||
| Total from investment operations | 1.64 | (2.15 | ) | (3.22 | ) | 2.03 | 0.88 | ||||||||||||||||
| Less distributions: | |||||||||||||||||||||||
| Dividends from net investment income | — | (0.02 | ) | (0.02 | ) | — | (0.02 | ) | |||||||||||||||
| Distributions from net realized gains | — | (0.02 | ) | (1.79 | ) | (0.49 | ) | (0.27 | ) | ||||||||||||||
| Total distributions | — | (0.04 | ) | (1.81 | ) | (0.49 | ) | (0.29 | ) | ||||||||||||||
| Net asset value at end of period | $ | 14.90 | $ | 13.26 | $ | 15.45 | $ | 20.48 | $ | 18.94 | |||||||||||||
| Total return | 12.37 | % | (13.90 | %) | (16.81 | %) | 10.77 | % | 4.84 | % | |||||||||||||
| Net assets at end of period (000s) | $ | 64,553 | $ | 84,046 | $ | 132,113 | $ | 204,027 | $ | 249,431 | |||||||||||||
| Ratio of net expenses to average net assets | 1.50 | % | 1.50 | % | 1.50 | % | 1.58 | % | 1.63 | % (B) | |||||||||||||
| Ratio of gross expenses to average net assets | 1.73 | % | 1.72 | % | 1.74 | % | 1.71 | % | 1.65 | % | |||||||||||||
| Ratio of net investment income (loss) to average net assets | 0.00 | % (A) | 0.20 | % | (0.03 | %) | (0.01 | %) | (0.43 | %) | |||||||||||||
| Portfolio turnover rate | 158 | % | 215 | % | 222 | % | 127 | % | 99 | % | |||||||||||||
(A) Amount rounds to less than $.0.01 per share or 0.01%.
(B) The ratio of net expenses to average net assets excludes the effect of fees paid indirectly. If these expense offsets were included, the ratio would have been 1.62%.
See accompanying notes to financial statements.
110
Financial Highlights (Continued)
Touchstone Ultra Short Duration Fixed Income Fund — Class Z
Per Share Data for a Share Outstanding Throughout Each Period
| For the Year Ended September 30, | |||||||||||||||||||||||
| 2010 | 2009 | 2008 | 2007 | 2006 | |||||||||||||||||||
| Net asset value at beginning of period | $ | 9.66 | $ | 9.74 | $ | 10.08 | $ | 10.06 | $ | 10.08 | |||||||||||||
| Income (loss) from investment operations: | |||||||||||||||||||||||
| Net investment income | 0.18 | 0.32 | 0.47 | 0.53 | 0.44 | ||||||||||||||||||
| Net realized and unrealized gains (losses) on investments | 0.06 | (0.07 | ) | (0.34 | ) | 0.01 | (0.02 | ) | |||||||||||||||
| Total from investment operations | 0.24 | 0.25 | 0.13 | 0.54 | 0.42 | ||||||||||||||||||
| Less distributions from net investment income | (0.22 | ) | (0.33 | ) | (0.47 | ) | (0.52 | ) | (0.44 | ) | |||||||||||||
| Net asset value at end of period | $ | 9.68 | $ | 9.66 | $ | 9.74 | $ | 10.08 | $ | 10.06 | |||||||||||||
| Total return | 2.49 | % | 2.60 | % | 1.26 | % | 5.48 | % | 4.28 | % | |||||||||||||
| Net assets at end of period (000's) | $ | 236,650 | $ | 108,552 | $ | 143,837 | $ | 146,045 | $ | 173,716 | |||||||||||||
| Ratio of net expenses to average net assets | 0.69 | % | 0.69 | % | 0.69 | % | 0.69 | % | 0.69 | % | |||||||||||||
| Ratio of gross expenses to average net assets | 0.81 | % | 0.85 | % | 0.82 | % | 0.75 | % | 0.69 | % | |||||||||||||
| Ratio of net investment income to average net assets | 1.69 | % | 3.41 | % | 4.72 | % | 5.25 | % | 4.30 | % | |||||||||||||
| Portfolio turnover rate | 119 | % | 15 | % | 56 | % | 26 | % | 38 | % | |||||||||||||
See accompanying notes to financial statements.
111
Notes to Financial Statements
September 30, 2010
1. Organization
The Touchstone Funds Group Trust (the Trust), is registered under the Investment Company Act of 1940, as amended, (the Act), as an open-end management investment company. The Trust consists of the following nineteen mutual funds, individually, a Fund, and collectively, the Funds:
Touchstone Capital Appreciation Fund ("Capital Appreciation Fund")
Touchstone Core Plus Fixed Income Fund ("Core Plus Fixed Income Fund")
Touchstone Emerging Markets Equity Fund ("Emerging Markets Equity Fund")
Touchstone Focused Equity Fund ("Focused Equity Fund")
Touchstone Global Equity Fund ("Global Equity Fund")
Touchstone Global Real Estate Fund ("Global Real Estate Fund")
Touchstone Healthcare and Biotechnology Fund ("Healthcare and Biotechnology Fund")
Touchstone Intermediate Fixed Income Fund ("Intermediate Fixed Income Fund")
Touchstone International Fixed Income Fund ("International Fixed Income Fund")
Touchstone Large Cap Relative Value Fund ("Large Cap Relative Value Fund")
Touchstone Market Neutral Equity Fund ("Market Neutral Equity Fund")
Touchstone Mid Cap Fund ("Mid Cap Fund")
Touchstone Mid Cap Value Fund ("Mid Cap Value Fund")
Touchstone Premium Yield Equity Fund ("Premi um Yield Equity Fund")
Touchstone Sands Capital Select Growth Fund ("Sands Capital Select Growth Fund")
Touchstone Short Duration Fixed Income Fund ("Short Duration Fixed Income Fund")
Touchstone Small Cap Core Fund ("Small Cap Core Fund")
Touchstone Small Cap Value Opportunities Fund ("Small Cap Value Opportunities Fund")
Touchstone Ultra Short Duration Fixed Income Fund ("Ultra Short Duration Fixed Income Fund")
Each Fund is registered as a diversified portfolio of the Trust with the exception of the Focused Equity Fund, Global Real Estate Fund, Healthcare and Biotechnology Fund, International Fixed Income Fund, Sands Capital Select Growth Fund and Small Cap Core Fund, each of which is non-diversified.
The Funds are registered to offer different classes of shares: Class A shares, Class C shares, Class Y shares, Class Z shares, and Institutional Class shares. The assets of each Fund are segregated, and a shareholder's interest is limited to the Fund in which shares are held. The Funds' prospectuses provides a description of each Fund's investment objectives, policies, and strategies along with information on the classes of shares currently being offered.
Effective December 18, 2009, the Touchstone Long/Short Equity Fund changed its name to the Touchstone Market Neutral Equity Fund.
2. Significant Accounting Policies
The following is a summary of the Funds' significant accounting policies:
Security valuation — The Funds' portfolio securities are valued as of the close of the regular session of trading on the New York Stock Exchange (currently 4:00 p.m., Eastern time). Portfolio securities traded on stock exchanges are valued at the last sale price and portfolio securities quoted by NASDAQ are valued at the NASDAQ Official Closing Price (NOCP). Securities not traded on a particular day, or for which the last sale price is not readily available, are valued at their last broker-quoted bid prices as obtained from one or more of the major market makers for such securities by an independent pricing service. Debt securities for which market quotations are readily available are valued at their most recent bid prices as obtained from one or more of the major market makers for such securities by an independent pricing service. Money market instruments
112
Notes to Financial Statements (Continued)
and other debt securities with a remaining maturity of less than 60 days are valued at amortized cost, which approximates market value. Securities for which market quotations or the NOCP are not readily available are valued based on fair value as determined by or under the direction of the Board of Trustees. Shares of open end mutual funds in which the Funds invest are valued at their respective net asset values as reported by the underlying funds. The prices for foreign securities are reported in local currency and converted to U.S. dollars using currency exchange rates.
For securities that principally trade on a foreign market or exchange, a significant gap in time can exist between the time of a particular security's last trade and the time at which a Fund calculates its net asset value. The closing prices of such securities may no longer reflect their market value at the time the Fund calculates its net asset value if an event that could materially affect the value of those securities (a "Significant Event") has occurred between the time of the security's last close and the time that the Fund calculates its net asset value. A Significant Event may relate to a single issuer or to an entire market sector. If the advisor or sub-advisor of a Fund becomes aware of a Significant Event that has occurred with respect to a security or group of securities after the closing of the exchange or market on which the security or securities principally trade, but before the time at which the Fund calculates its net asset value, it may request that a Fair Value Committee Meeting be called. In addition, the Funds' administrator or sub-administrator monitors price movements among certain selected indices, securities and/or baskets of securities that may be an indicator that the closing prices received earlier from foreign exchanges or markets may not reflect market value at the time the Fund calculates its net asset value. If price movements in a monitored index or security exceed levels established by the Advisor, the Sub-Administrator notifies the Advisor or Sub-Advisor for any Fund holding the relevant securities that such limits have been exceeded. In such event, the Advisor makes the determination whether a Fair Value Committee meeting should be called based on the information provided.
The Funds have adopted Financial Accounting Standards Board ("FASB") ASC 820 "Fair Value Measurements". This standard establishes a single authoritative definition of fair value, sets out a framework for measuring fair value and requires additional disclosures about fair value measurements. Fair Value Measurements applies to fair value measurements already required or permitted by existing standards. The changes to current generally accepted accounting principles (GAAP) from the application of this standard relate to the definition of fair value, the methods used to measure fair value, and the expanded disclosures about fair value measurements.
Various inputs are used in determining the value of the Funds investments. These inputs are summarized in the three broad levels listed below:
• Level 1 – quoted prices in active markets for identical securities
• Level 2 – other significant observable inputs (including quoted prices for similar securities, interest rates, prepayment speeds, credit risk, etc.)
• Level 3 – significant unobservable inputs (including the Fund's own assumptions in determining the fair value of investments)
The inputs or methodology used for valuing securities are not necessarily an indication of the risk associated with investing in those securities. For example, money market securities are valued using amortized cost, in accordance with rules under the Investment Company Act of 1940. Generally, amortized cost approximates the current fair value of a security, but since the value is not obtained from a quoted price in an active market, such securities are reflected as Level 2.
113
Notes to Financial Statements (Continued)
The aggregate value by input level, as of September 30, 2010, for each Fund's investments, as well as a reconciliation of assets for which significant unobservable inputs (Level 3) were used in determining value, is included in each Fund's Portfolio of Investments, which also includes a breakdown of the Fund's investments by geographic/industry concentration. The Funds did not hold any Level 3 categorized securities during the year ended or at September 30, 2010.
Securities sold short — The Funds, except for the Government Money Market Fund, periodically engage in selling securities short, which obligates a Fund to replace a security borrowed by purchasing the same security at the current market value. A Fund would incur a loss if the price of the security increases between the date of the short sale and the date on which the Fund replaces the borrowed security. A Fund would realize a gain if the price of the security declines between those dates.
Foreign currency translation — The books and records of the Funds are maintained in U.S. dollars and translated into U.S. dollars on the following basis:
(1) market value of investment securities, assets and liabilities at the current rate of exchange on the valuation date; and
(2) purchases and sales of investment securities, income and expenses at the relevant rates of exchange prevailing on the respective dates of such transactions.
The Funds do not isolate that portion of gains and losses on investments in equity securities that is due to changes in the foreign exchange rates from that which is due to changes in market prices of equity securities.
Forward foreign currency contracts — A forward foreign currency contract is an agreement between two parties to buy and sell a specific currency at a price that is set on the date of the contract. The forward contract calls for delivery of the currency on a future date that is specified in the contract. Risks related to the use of forwards include the possible failure of counterparties to meet the terms of the forward agreement, the failure of the counterparties to timely post collateral, the risk that currency movements will not occur thereby reducing the Fund's total return, and the potential for losses in excess of the Fund's initial investment.
The market value of a forward foreign currency contract fluctuates with changes in foreign currency exchange rates. Forward foreign currency contracts are marked to market daily and the change in value is recorded by a Fund as an unrealized gain or loss. Realized gains or losses, equal to the difference between the value of the contract at the time it was opened and the value at the time it was closed, are recorded upon delivery or receipt of the currency.
During the year ended September 30, 2010 the Funds used forward foreign currency contracts to enhance potential gains, hedge against anticipated currency exchange rates, maintain diversity and liquidity of the portfolio and adjust exposure to foreign currencies.
New accounting pronouncements — In January 2010, the FASB issued new guidance as an amendment to fair value measurements and disclosures. The new guidance adds new requirements for disclosure about transfers into and out of Level 1 and Level 2 fair value measurements and separate disclosures about purchases, sales, issuances, and settlements relating to Level 3 measurements. The guidance also clarifies existing fair value disclosures about the level of disaggregation and about inputs and valuation techniques in Level 2 and Level 3 fair value measurements. The amendment is effective for interim and annual reporting periods beginning after December 15, 2009, except for Level 3 reconciliation disclosures which are effective for interim and annual periods beginning after December 15, 2010. The Funds do not expect the implications of this guidance to have a materi al impact on its financial statements.
114
Notes to Financial Statements (Continued)
Derivative instruments and hedging activities — The following table sets forth the fair value of the Trust's derivative contracts by primary risk exposure as of September 30, 2010:
| Fair Value of Derivative Investments As of September 30, 2010 | |||||||||||||||||||||||||||
| Asset Derivatives | Liability Derivatives | ||||||||||||||||||||||||||
| Derivatives not accounted for as hedging instruments under ASC 815 | Statement of Assets and Liabilities Location | Fund | Unrealized Appreciation | Statement of Assets and Liabilities Location | Fund | Unrealized Depreciation | |||||||||||||||||||||
| Core Plus Fixed | Core Plus Fixed | ||||||||||||||||||||||||||
| Income Fund | $ | 7,177 | Income Fund | $ | 44,397 | ||||||||||||||||||||||
| Unrealized | Emerging Markets | Unrealized | Emerging Markets | ||||||||||||||||||||||||
| appreciation | Equity Fund | $ | 10,274 | depreciation | Equity Fund | $ | — | ||||||||||||||||||||
| on foreign | Global Real Estate | on foreign | Global Real Estate | ||||||||||||||||||||||||
| Forward foreign | currency | Fund | $ | 30 | currency | Fund | $ | 202 | |||||||||||||||||||
| currency exchange | exchange | International Fixed | exchange | International Fixed | |||||||||||||||||||||||
| contracts | contracts | Income Fund | $ | 63,663 | contracts | Income Fund | $ | 43,349 | |||||||||||||||||||
For the year ended September 30, 2010, the average quarterly balance of outstanding derivative financial instruments was as follows:
| Core Plus Fixed Income Fund | Emerging Markets Equity Fund | Global Real Estate Fund | International Fixed Income Fund | ||||||||||||||||
| Foreign currency exchange contracts: | |||||||||||||||||||
| Average number of contracts purchased | 3 | 1 | 7 | 6 | |||||||||||||||
| Average number of contracts sold | 9 | — | 1 | 4 | |||||||||||||||
| Average U.S. dollar amount | $ | 168,497 | $ | 219,191 | $ | 13,884 | $ | 1,789,479 | |||||||||||
| Average U.S. dollar amount | $ | 810,684 | $ | — | $ | 16,894 | $ | 2,515,703 | |||||||||||
| The Effect of Derivative Instruments on the Statement of Operations for the Year Ended September 30, 2010 | |||||||||||||||||||
| Derivatives not accounted for as hedging instruments under ASC 815 | Location of Gain or (Loss) on Derivatives on the Statements of Operations | Fund | Realized Gain or (Loss) on Derivatives | Change in Unrealized Appreciation (Depreciation) on Derivatives | |||||||||||||||
| Core Plus Fixed | |||||||||||||||||||
| Income Fund | $ | (88,139 | ) | $ | (37,220 | ) | |||||||||||||
| Emerging Markets | |||||||||||||||||||
| Equity Fund | $ | (15,753 | ) | $ | 10,274 | ||||||||||||||
| Global Equity Fund | $ | (4,037 | ) | $ | — | ||||||||||||||
| Net realized gains (losses) | Global Real Estate | ||||||||||||||||||
| from foreign currency | Fund | $ | (1,016 | ) | $ | (172 | ) | ||||||||||||
| transactions, Net change | Healthcare & | ||||||||||||||||||
| Forward foreign | in unrealized appreciation | Biotechnology Fund | $ | (157 | ) | $ | — | ||||||||||||
| currency exchange | (depreciation) on foreign | International Fixed | |||||||||||||||||
| contracts | currency transactions | Income Fund | $ | 850,648 | $ | 20,314 | |||||||||||||
Portfolio securities loaned — Each Fund may lend its portfolio securities. Lending portfolio securities exposes a Fund to the risk that the borrower may fail to return the loaned securities or may not be able to provide
115
Notes to Financial Statements (Continued)
additional collateral or that the Fund may experience delays in recovery of the loaned securities or loss of rights in the collateral if the borrower fails financially. To minimize these risks, the borrower must agree to maintain cash collateral with the Funds' custodian in an amount at least equal to the market value of the loaned securities. The cash collateral is reinvested by the Funds' custodian into an approved investment vehicles. As of September 30, 2010, the following Funds loaned securities and received collateral as follows:
| Fair Value of Securities Loaned | Value of Collateral Received | ||||||||||
| Emerging Markets Equity Fund | $ | 1,629,252 | $ | 1,669,388 | |||||||
| Global Equity Fund | $ | 53,482 | $ | 50,050 | |||||||
| Global Real Estate Fund | $ | 45,350 | $ | 46,305 | |||||||
| Healthcare and Biotechnology Fund | $ | 1,667,739 | $ | 1,735,431 | |||||||
| Market Neutral Equity Fund | $ | 37,228 | $ | 37,699 | |||||||
| Mid Cap Fund | $ | 9,170,268 | $ | 9,417,147 | |||||||
| Mid Cap Value Fund | $ | 1,473,549 | $ | 1,507,083 | |||||||
| Sands Capital Select Growth Fund | $ | 14,785,563 | $ | 15,443,326 | |||||||
| Small Cap Core Fund | $ | 14,400,517 | $ | 14,930,317 | |||||||
| Small Cap Value Opportunities Fund | $ | 4,789,459 | $ | 4,991,256 | |||||||
All collateral received as cash and securities is received, held and administered by the Funds' custodian for the benefit of the Funds in the applicable custody account or other account established for the purpose of holding collateral. Pursuant to the Funds' securities lending agreement, and according to normal operating procedures, the custodian segregated an additional $6,545 in collateral the following business day for securities on loan in the Global Equity Fund as of September 30, 2010.
Funds participating in securities lending receive compensation in the form of fees, or retain a portion of interest or dividends on the investment of any cash received as collateral. The Funds also continue to receive interest or dividends on the securities loaned. The loans are secured by collateral valued at least equal, at all times, to the fair value of the securities loaned plus accrued interest. Unrealized gain or loss on the fair value of the securities loaned that may occur during the term of the loan is recognized by the Funds. The Funds have the right under the lending agreement to recover the securities from the borrower on demand.
Delayed delivery transactions — The Funds may purchase or sell securities on a when-issued or delayed delivery basis. These transactions involve a commitment by the Funds to purchase or sell securities for a predetermined price or yield, with payment and delivery taking place beyond the customary settlement period. When delayed delivery purchases are outstanding, the Funds will set aside liquid assets in an amount sufficient to meet the purchase price. When purchasing a security on a delayed delivery basis, the Funds assume the rights and risks of ownership of the security, including the risk of price and yield fluctuations, and take such fluctuations into account when determining net asset value. The Funds may dispose of or renegotiate a delayed delivery transaction after it is entered into, and may sell when-issued securities before they are delivered, whic h may result in a capital gain or loss. When the Funds have sold a security on a delayed delivery basis, the Funds do not participate in future gains and losses with respect to the security.
Repurchase agreements — Repurchase agreements, which are collateralized by U.S. Government obligations, are valued at cost, which together with accrued interest approximates market value. At the time each Fund enters into a repurchase agreement, the seller agrees that the value of the underlying collateral securities, including accrued interest, will at all times be equal to or exceed the face amount of the repurchase agreement.
116
Notes to Financial Statements (Continued)
Share valuation — The net asset value per share of each class of shares of each Fund is calculated daily by dividing the total value of a Fund's assets attributable to that class, less liabilities attributable to that class, by the number of outstanding shares of that class.
The maximum offering price per share of Class A shares of the Funds (except Core Plus Fixed Income Fund and International Fixed Income Fund) is equal to the net asset value per share plus a sales load equal to 6.10% of the net asset value (or 5.75% of the offering price). The maximum offering price per share of Class A shares of the Core Plus Fixed Income Fund and International Fixed Income Fund is equal to the net asset value per share plus a sales load equal to 4.99% of the net asset value (or 4.75% of the offering price).The maximum offering price per share of Class C, Class Y, Class Z, and Institutional Class shares of the Funds is equal to the net asset value per share.
The redemption price per share of each class of shares of the Funds is equal to the net asset value per share. However, Class C shares of the Funds are subject to a contingent deferred sales load of 1.00% of the original purchase price if redeemed within a one-year period from the date of purchase.
Investment income — Dividend income is recorded on the ex-dividend date except that certain dividends from foreign securities are recorded as soon as the Trust is informed of the ex-dividend date. Interest income, which includes the amortization of premium and accretion of discount, if any, is recorded on an accrual basis. Dividend and interest income is recorded net of foreign taxes where recovery of such taxes is not assured.
Distributions to shareholders — The Capital Appreciation Fund, Emerging Markets Equity Fund, Focused Equity Fund, Global Equity Fund, Healthcare and Biotechnology Fund, Market Neutral Equity Fund, Mid Cap Fund, Small Cap Core Fund and Small Cap Value Opportunities Fund declare and distribute net investment income, if any, annually, as a dividend to shareholders. The Global Real Estate Fund, Large Cap Relative Value Fund, Mid Cap Value Fund and Sands Capital Select Growth Fund declare and distribute net investment income, if any, quarterly, as a dividend to shareholders. The Core Plus Fixed Income Fund, International Fixed Income Fund and Premium Yield Equity Fund declare and distribute net investment income, if any, monthly as a dividend to shareholders. The Intermediate Fixed Income Fund, Short Duration Fixed Income Fund, and Ultra Short Duration Fixed Incom e Fund declare net investment income daily and distribute it monthly, as a dividend to shareholders. Any net realized capital gains on sales of securities for all Funds are distributed to shareholders at least annually. Income distributions and capital gain distributions are determined in accordance with income tax regulations.
Allocations — Investment income earned, realized capital gains and losses, and unrealized appreciation and depreciation for the Funds are allocated daily to each class of shares based upon its proportionate share of total net assets of the Fund. Class specific expenses are charged directly to the class incurring the expense. Common expenses, which are not attributable to a specific class, are allocated daily to each class of shares based upon its proportionate share of total net assets of the Fund. Expenses not directly billed to a Fund are allocated proportionally among all Funds daily in relation to net assets of each Fund or another reasonable measure.
Security transactions — Security transactions are accounted for on the trade date. Securities sold are determined on a specific identification basis.
Estimates — The preparation of financial statements in conformity with U.S. GAAP requires management to make estimates and assumptions that affect the reported amounts of assets and liabilities and disclosure of contingent assets and liabilities at the date of the financial statements and the reported amounts of income and expenses during the reporting period. Actual results could differ from those estimates.
117
Notes to Financial Statements (Continued)
3. Investment Transactions
Investment transactions (excluding short-term investments and U.S. Government securities) were as follows for the year ended September 30, 2010:
| Capital Appreciation Fund | Core Plus Fixed Income Fund | Emerging Markets Equity Fund | Focused Equity Fund* | ||||||||||||||||
| Purchases of investment securities | $ | 7,146,071 | $ | 15,192,478 | $ | 131,412,779 | $ | 4,203,987 | |||||||||||
| Proceeds from sales and maturities | $ | 1,564,116 | $ | 3,518,136 | $ | 3,471,169 | $ | 2,362,564 | |||||||||||
| Global Equity Fund | Global Real Estate Fund | Healthcare and Biotechnology Fund | Intermediate Fixed Income Fund | ||||||||||||||||
| Purchases of investment securities | $ | 6,868,278 | $ | 7,487,730 | $ | 53,091,862 | $ | 14,724,717 | |||||||||||
| Proceeds from sales and maturities | $ | 2,243,477 | $ | 3,677,767 | $ | 66,549,906 | $ | 12,946,460 | |||||||||||
| International Fixed Income Fund | Large Cap Relative Value Fund | Market Neutral Equity Fund | Mid Cap Fund | ||||||||||||||||
| Purchases of investment securities | $ | 19,509,475 | $ | 3,488,725 | $ | 115,383,587 | $ | 183,493,449 | |||||||||||
| Proceeds from sales and maturities | $ | 10,934,216 | $ | 73,706 | $ | 81,855,235 | $ | 246,855,769 | |||||||||||
| Mid Cap Value Fund | Premium Yield Equity Fund | Sands Capital Select Growth Fund | Short Duration Fixed Income Fund | ||||||||||||||||
| Purchases of investment securities | $ | 42,840,885 | $ | 23,112,064 | $ | 270,854,377 | $ | 3,919,296 | |||||||||||
| Proceeds from sales and maturities | $ | 3,819,142 | $ | 9,053,305 | $ | 135,128,573 | $ | 2,574,061 | |||||||||||
| Small Cap Core Fund | Small Cap Value Opportunities Fund | Ultra Short Duration Fixed Income Fund | |||||||||||||
| Purchases of investment securities | $ | 107,564,679 | $ | 112,268,014 | $ | 41,443,812 | |||||||||
| Proceeds from sales and maturities | $ | 14,725,373 | $ | 139,963,993 | $ | 31,547,096 | |||||||||
* Represents the period from commencement of operations (December 31, 2009) through September 30, 2010
4. Transactions with Affiliates
Certain officers of the Trust are also officers of the Advisor (Touchstone Advisors, Inc.), the Underwriter (Touchstone Securities, Inc.) and/or JPMorgan Chase Bank, N.A. ("JPMorgan" and the Sub-Administrator and Transfer Agent to the Funds). The Advisor and Underwriter are each wholly owned, indirect subsidiaries of The Western and Southern Life Insurance Company (Western-Southern).
118
Notes to Financial Statements (Continued)
As of September 30, 2010, the following Funds were owned by Western-Southern and subsidiaries:
| Capital Appreciation Fund | 52.5 | % | |||||
| Core Plus Fixed Income Fund | 22.8 | % | |||||
| Focused Equity Fund | 55.6 | % | |||||
| Global Equity Fund | 64.2 | % | |||||
| Global Real Estate Fund | 82.1 | % | |||||
| International Fixed Income Fund | 84.6 | % | |||||
| Large Cap Relative Value Fund | 87.4 | % | |||||
| Market Neutral Equity Fund | 92.8 | % | |||||
| Mid Cap Value Fund | 98.4 | % | |||||
| Premium Yield Equity Fund | 44.4 | % | |||||
MANAGEMENT & EXPENSE LIMITATIONS AGREEMENTS
The Advisor provides general investment supervisory services for the Funds, under terms of an Advisory Agreement. Under the Advisory Agreement, the Funds pay the Advisor a fee, which is computed and accrued daily and paid monthly, at an annual rate based on average daily net assets as shown in the table below.
| Capital Appreciation Fund | 0.75% on the first $25 million 0.70% on assets greater than $25 million to $250 million 0.65% of such assets in excess of $250 million | ||||||
| Core Plus Fixed Income Fund | 0.45% on the first $100 million 0.425% on assets greater than $100 million to $250 million 0.40% of such assets in excess of $250 million | ||||||
| Emerging Markets Equity Fund | 1.10% on the first $200 million 1.05% on assets greater than $200 million to $400 million 0.95% of such assets in excess of $400 million | ||||||
| Focused Equity Fund | 0.70% on the first $100 million 0.65% on assets greater than $100 million to $500 million 0.60% of such assets in excess of $500 million | ||||||
| Global Equity Fund | 0.85% on the first $50 million 0.80% on assets greater than $50 million to $500 million 0.75% of such assets in excess of $500 million | ||||||
| Global Real Estate Fund | 0.80% | ||||||
| Healthcare and Biotechnology Fund | 1.00% | ||||||
| Intermediate Fixed Income Fund | 0.40% | ||||||
| International Fixed Income Fund | 0.55% on the first $100 million 0.50% on assets greater than $100 million to $250 million 0.45% of such assets in excess of $250 million | ||||||
| Large Cap Relative Value Fund | 0.70% on the first $100 million 0.65% of such assets in excess of $100 million | ||||||
| Market Neutral Equity Fund | 1.30% | ||||||
| Mid Cap Fund | 0.80% | ||||||
| Mid Cap Value Fund | 0.85% on the first $100 million 0.80% on assets greater than $100 million to $400 million 0.75% of such assets in excess of $400 million | ||||||
| Premium Yield Equity Fund | 0.70% on the first $100 million 0.65% of such assets in excess of $100 million | ||||||
| Sands Capital Select Growth Fund | 0.85% | ||||||
| Short Duration Fixed Income Fund | 0.25% | ||||||
| Small Cap Core Fund | 0.85% | ||||||
| Small Cap Value Opportunities Fund | 0.95% | ||||||
| Ultra Short Duration Fixed Income Fund | 0.25% | ||||||
119
Notes to Financial Statements (Continued)
The Advisor entered into an Expense Limitation Agreement to contractually limit operating expenses of the Funds. The maximum operating expense limit in any year with respect to the Funds is based on a percentage of the average daily net assets of the Funds. The Advisor has agreed to waive advisory fees and reimburse expenses in order to maintain expense limitations for the Funds as follows until at least January 27, 2011:
| Class A | Class C | Class Y | Class Z | Institutional Class | |||||||||||||||||||
| Capital Appreciation Fund | 1.19 | % | 1.94 | % | 0.94 | % | — | 0.79 | % | ||||||||||||||
| Core Plus Fixed Income Fund | 0.95 | % | 1.70 | % | 0.70 | % | — | 0.50 | % | ||||||||||||||
| Emerging Markets Equity Fund | 1.74 | % | 2.49 | % | 1.49 | % | — | 1.34 | % | ||||||||||||||
| Focused Equity Fund | 1.20 | % | 1.95 | % | 0.95 | % | — | 0.80 | % | ||||||||||||||
| Global Equity Fund | 1.34 | % | 2.09 | % | 1.09 | % | — | 0.94 | % | ||||||||||||||
| Global Real Estate Fund | 1.39 | % | 2.14 | % | 1.14 | % | — | 0.99 | % | ||||||||||||||
| Healthcare and Biotechnology Fund | 1.55 | % | 2.30 | % | — | — | — | ||||||||||||||||
| Intermediate Fixed Income Fund | — | — | — | — | 0.40 | % | |||||||||||||||||
| International Fixed Income Fund | 1.09 | % | 1.84 | % | 0.84 | % | — | 0.69 | % | ||||||||||||||
| Large Cap Relative Value Fund | 1.19 | % | 1.94 | % | 0.94 | % | — | 0.79 | % | ||||||||||||||
| Mid Cap Fund | 1.21 | % | 1.96 | % | 0.96 | % | 1.21 | % | — | ||||||||||||||
| Mid Cap Value Fund | 1.29 | % | 2.04 | % | 1.04 | % | — | 0.89 | % | ||||||||||||||
| Premium Yield Equity Fund | 1.20 | % | 1.95 | % | 0.95 | % | — | — | |||||||||||||||
| Short Duration Fixed Income Fund | — | — | 0.49 | % | 0.74 | % | — | ||||||||||||||||
| Small Cap Core Fund | 1.34 | % | 2.09 | % | 1.09 | % | — | 0.94 | % | ||||||||||||||
| Small Cap Value Opportunities Fund | — | — | — | 1.50 | % | — | |||||||||||||||||
| Ultra Short Duration Fixed Income Fund | — | — | — | 0.69 | % | — | |||||||||||||||||
For Market Neutral Equity Fund, effective April 1, 2010, the Advisor has agreed to waive advisory fees and reimburse expenses in order to maintain expense limitations to 1.50% for Class A shares, 2.25% for Class C shares and 1.25% for Class Y shares. These expense limitations will remain in effect until at least April 1, 2011. Prior to April 1, 2010, the expense limitations were 1.75% for Class A shares, 2.50% for Class C and 1.50% for Class Y.
The Advisor has agreed to limit certain Funds' other operating expenses ("Other Expenses") to the following levels. These expense limitations will remain in effect until at least January 27, 2011.
| Class Y | Class Z | ||||||||||
| Sands Capital Select Growth Fund | 0.25 | % | 0.25 | % | |||||||
In addition to the base advisory fee shown above, for the Sands Capital Select Growth Fund, a performance fee adjustment will be added to or subtracted from the base advisory fee depending on the performance of the Fund in relation to the investment performance of the Fund's benchmark index, for the preceding twelve month period, as follows:
| Base Advisory Fees | Annual Adjustment Rate | Benchmark Index | Benchmark Threshold | ||||||||||||||||
| Sands Capital Select Growth Fund | 0.85 | % | +/-0.15% | Russell 1000 Growth Index | +/-2.50% | ||||||||||||||
For the year ended September 30, 2010, the Advisor's base fee was increased by $619,710 as a result of the performance fee adjustment.
120
Notes to Financial Statements (Continued)
During the year ended September 30, 2010, the Advisor waived investment advisory fees, administration fees and/or reimbursed expenses of the Funds as follows:
| Investment Advisory Fees Waived | Administration Fees Waived | Other Operating Expenses Reimbursed | |||||||||||||
| Capital Appreciation Fund | $ | 41,747 | $ | 10,026 | $ | 6,830 | |||||||||
| Core Plus Fixed Income Fund | $ | 49,203 | $ | 25,937 | $ | 16,901 | |||||||||
| Emerging Markets Equity Fund | $ | 67,912 | $ | 82,561 | $ | 24,646 | |||||||||
| Focused Equity Fund* | $ | 48,640 | $ | 3,500 | $ | 1,958 | |||||||||
| Global Equity Fund | $ | 66,932 | $ | 6,866 | $ | 2,242 | |||||||||
| Global Real Estate Fund | $ | 75,873 | $ | 6,995 | $ | 2,135 | |||||||||
| Healthcare and Biotechnology Fund | $ | 26,908 | $ | 60,595 | $ | 98,169 | |||||||||
| Intermediate Fixed Income Fund | $ | 94,430 | $ | 218,106 | $ | — | |||||||||
| International Fixed Income Fund | $ | 56,830 | $ | 15,028 | $ | 2,619 | |||||||||
| Large Cap Relative Value Fund | $ | 51,867 | $ | 7,141 | $ | 2,965 | |||||||||
| Market Neutral Equity Fund | $ | 79,417 | $ | 22,196 | $ | 2,760 | |||||||||
| Mid Cap Fund | $ | — | $ | 221,033 | $ | — | |||||||||
| Mid Cap Value Fund | $ | 58,632 | $ | 12,875 | $ | 1,749 | |||||||||
| Premium Yield Equity Fund | $ | — | $ | 63,774 | $ | 25,421 | |||||||||
| Sands Capital Select Growth Fund | $ | — | $ | 319,792 | $ | — | |||||||||
| Short Duration Fixed Income Fund | $ | 60,711 | $ | 85,530 | $ | — | |||||||||
| Small Cap Core Fund | $ | — | $ | 97,893 | $ | 26,132 | |||||||||
| Small Cap Value Opportunities Fund | $ | 18,934 | $ | 145,724 | $ | — | |||||||||
| Ultra Short Duration Fixed Income Fund | $ | — | $ | 176,133 | $ | — | |||||||||
* Represents the period from commencement of operations (December 31, 2009) through September 30, 2010
The Advisor has entered into investment sub-advisory agreements with the following parties:
| AGF Investments America, Inc. Emerging Markets Equity Fund Aronson + Johnson + Oritz Market Neutral Equity Fund Augustus Asset Managers Limited International Fixed Income Fund Bedlam Asset Management PLC Global Equity Fund Bradford & Marzec LLC Core Plus Fixed Income Fund Cornerstone Real Estate Advisers LLC Global Real Estate Fund EARNEST Partners LLC Large Cap Relative Value Fund Farr, Miller & Washington LLC Capital Appreciation Fund Fort Washington Investment Advisors, Inc. Focused Equity Fund Ultra Short Duration Fixed Income Fund | JKMilne Asset Management Intermediate Fixed Income Fund Lee Munder Capital Group LLC Mid Cap Value Fund The London Company Small Cap Core Fund Longfellow Investment Management Co. Short Duration Fixed Income Fund Miller/Howard Investments, Inc. Premium Yield Equity Fund Sands Capital Management, LLC Sands Capital Select Growth Fund Turner Investment Partners, Inc. Healthcare and Biotechnology Fund Mid Cap Fund Small Cap Value Opportunities Fund | ||||||
121
Notes to Financial Statements (Continued)
The Advisor, not the Funds, pays sub-advisory fees to each Sub-Advisor.
ADMINISTRATION AGREEMENT
The Advisor entered into an Administration and Accounting Services Agreement with the Trust, whereby the Advisor is responsible for supplying executive and regulatory compliance services, supervises the preparation of tax returns, and coordinates the preparation of reports to shareholders and reports to, and filings with, the Securities and Exchange Commission and state securities authorities, materials for meetings of the Board of Trustees, calculating the daily net asset value per share and maintaining the financial books and records of each Fund. For its services, the Advisor receives an annual fee of 0.20% of the aggregate average daily net assets of the Trust, Touchstone Investment Trust (excluding Institutional Money Market Fund), Touchstone Strategic Trust, and Touchstone Tax-Free Trust up to and including $6 billion; 0.16% of the next $4 billion of aggregate average daily net assets; and 0.12% of the aggregate average daily net asset s of all such assets in excess of $10 billion. The fee is allocated among the Funds on the basis of relative daily net assets.
The Advisor has engaged JPMorgan as the Sub-Administrator to the Trust. JPMorgan provides administrative and accounting services to the Trust and is compensated directly by the Advisor, not the Trust.
TRANSFER AGENT AGREEMENT
Under the terms of the Transfer Agent Agreement between the Trust and JPMorgan, JPMorgan maintains the records of each shareholder's account, answers shareholders' inquiries concerning their accounts, processes purchases and redemptions of each Fund's shares, acts as dividend and distribution disbursing agent and performs other shareholder service functions. For these services, JPMorgan receives a monthly fee per shareholder account from each Fund. In addition, each Fund pays JPMorgan out-of-pocket expenses including, but not limited to, postage and supplies.
For the year ended September 30, 2010, the following Funds reimbursed the Advisor for amounts paid to third parties that provide sub-transfer agency and other administrative services to the Funds. These amounts are included in transfer agent fees on the Statements of Operations:
| Amount | |||||||
| Capital Appreciation Fund | $ | 56 | |||||
| Core Plus Fixed Income Fund | $ | 215 | |||||
| Emerging Markets Equity Fund | $ | 2,990 | |||||
| Focused Equity Fund* | $ | 101 | |||||
| Global Equity Fund | $ | 62 | |||||
| Global Real Estate Fund | $ | 11 | |||||
| Healthcare and Biotechnology Fund | $ | 48,551 | |||||
| Intermediate Fixed Income Fund | $ | 1,165 | |||||
| International Fixed Income Fund | $ | 51 | |||||
| Large Cap Relative Value Fund | $ | 51 | |||||
| Market Neutral Equity Fund | $ | 194 | |||||
| Mid Cap Fund | $ | 3,916 | |||||
| Mid Cap Value Fund | $ | 137 | |||||
| Premium Yield Equity Fund | $ | 3,159 | |||||
| Sands Capital Select Growth Fund | $ | 240,479 | |||||
| Short Duration Fixed Income Fund | $ | 33,821 | |||||
| Small Cap Core Fund | $ | 1,583 | |||||
| Small Cap Value Opportunities Fund | $ | 89,558 | |||||
| Ultra Short Duration Fixed Income Fund | $ | 79,096 | |||||
* Represents the period from commencement of operations (December 31, 2009) through September 30, 2010.
122
Notes to Financial Statements (Continued)
PLANS OF DISTRIBUTION
The Trust has adopted a Distribution and Shareholder Services Plan for Class A shares of the Capital Appreciation Fund, Core Plus Fixed Income Fund, Emerging Markets Equity Fund, Focused Equity Fund, Global Equity Fund, Global Real Estate Fund, Healthcare and Biotechnology Fund, International Fixed Income Fund, Large Cap Relative Value Fund, Market Neutral Equity Fund, Mid Cap Fund, Mid Cap Value Fund, Premium Yield Equity Fund, and Small Cap Core Fund (Class A Plan) under which each Fund may directly or indirectly bear expenses relating to the distribution of Class A shares of the Trust and for shareholder services provided to Class A shares. The Fund will incur and/or reimburse expenses for distribution and shareholder service of Class A shares at an annual rate not to exceed 0.25% of the average daily net assets of Class A shares.
The Trust has adopted a Distribution and Shareholder Services Plan for Class C shares of the Capital Appreciation Fund, Core Plus Fixed Income Fund, Emerging Markets Equity Fund, Focused Equity Fund, Global Equity Fund, Global Real Estate Fund, Healthcare and Biotechnology Fund, International Fixed Income Fund, Large Cap Relative Value Fund, Market Neutral Equity Fund, Mid Cap Fund, Mid Cap Value Fund, Premium Yield Equity Fund, and Small Cap Core Fund (Class C Plan) under which each Fund may directly or indirectly bear expenses relating to the distribution of Class C shares of the Trust and for shareholder services provided to Class C shares. The Fund will incur and/or reimburse expenses for distribution and shareholder services of Class C shares at an annual rate not to exceed 0.75% and 0.25%, respectively, of the average daily net assets of Class C shares. The combination of these fees is not to exceed 1.00% of the average daily net asset s of Class C shares.
The Trust has adopted a Shareholder Services Plan for Class Z shares of the Mid Cap Fund, Sands Capital Select Growth Fund, Short Duration Fixed Income Fund, Small Cap Value Opportunities Fund, and Ultra Short Duration Fixed Income Fund (Class Z Plan) under which each Fund may directly or indirectly bear expenses for shareholder services provided. The Fund will incur and/or reimburse expense for shareholder service of Class Z shares at an annual rate not to exceed 0.25% of the average daily net assets of Class Z shares.
UNDERWRITING AGREEMENT
The Underwriter is the Funds' principal underwriter and, as such, acts as exclusive agent for distribution of the Funds' shares. Under the terms of the Underwriting Agreement between the Trust and Underwriter, the Underwriter earned the following from underwriting and broker commissions on the sale of shares of the following Funds for the year ended September 30, 2010:
| Amount | |||||||
| Capital Appreciation Fund | $ | 3,689 | |||||
| Core Plus Fixed Income Fund | $ | 4,093 | |||||
| Emerging Markets Equity Fund | $ | 19,608 | |||||
| Focused Equity Fund* | $ | 5,542 | |||||
| Global Equity Fund | $ | 520 | |||||
| Global Real Estate Fund | $ | 391 | |||||
| Healthcare and Biotechnology Fund | $ | 3,133 | |||||
| International Fixed Income Fund | $ | 860 | |||||
| Large Cap Relative Value Fund | $ | 1,157 | |||||
| Market Neutral Equity Fund | $ | 2,081 | |||||
| Mid Cap Fund | $ | 215 | |||||
| Mid Cap Value Fund | $ | 590 | |||||
| Premium Yield Equity Fund | $ | 5,739 | |||||
| Small Cap Core Fund | $ | 20,228 | |||||
* Represents the period from commencement of operations (December 31, 2009) through September 30, 2010.
123
Notes to Financial Statements (Continued)
In addition, the Underwriter collected contingent deferred sales charges on the redemption of Class C shares of the following Funds for the year ended September 30, 2010:
| Amount | |||||||
| Capital Appreciation Fund | $ | 25 | |||||
| Core Plus Fixed Income Fund | $ | 105 | |||||
| Emerging Markets Equity Fund | $ | 1,252 | |||||
| Global Equity Fund | $ | 25 | |||||
| Global Real Estate Fund | $ | 25 | |||||
| Healthcare and Biotechnology Fund | $ | 11 | |||||
| International Fixed Income Fund | $ | 425 | |||||
| Large Cap Relative Value Fund | $ | 25 | |||||
| Market Neutral Equity Fund | $ | 75 | |||||
| Mid Cap Value Fund | $ | 25 | |||||
| Premium Yield Equity Fund | $ | 1,425 | |||||
| Small Cap Core Fund | $ | 1,077 | |||||
* Represents the period from commencement of operations (December 31, 2009) through September 30, 2010.
COMPLIANCE SERVICES AGREEMENT
Under the terms of the Compliance Services Agreement between the Trust and JPMorgan, JPMorgan provides certain compliance services to the Trust and provides administrative support services to the Funds' Compliance Program and Chief Compliance Officer. For these services, JPMorgan receives a quarterly fee from each Fund.
AFFILIATED INVESTMENTS
Each Fund may invest in the Touchstone Institutional Money Market Fund, subject to compliance with several conditions set forth in an order received by the Trust from the Securities and Exchange Commission. To the extent that the other Touchstone Funds are invested in the Touchstone Institutional Money Market Fund, the Advisor and Administrator will be paid additional fees from the Touchstone Institutional Money Market Fund that will not be waived or reimbursed.
A summary of each Fund's investment, as applicable, in the Touchstone Institutional Money Market Fund for the year ended September 30, 2010, is as follows:
| Share Activity | |||||||||||||||||||||||||||
| Balance 09/30/09 | Purchases | Sales | Balance 09/30/10 | Dividends | Value 09/30/10 | ||||||||||||||||||||||
| Capital Appreciation Fund | — | 6,819,397 | (6,467,618 | ) | 351,779 | $ | 1,524 | $ | 351,779 | ||||||||||||||||||
| Core Plus Fixed Income Fund | — | 25,406,561 | (23,839,195 | ) | 1,567,366 | $ | 3,648 | $ | 1,567,366 | ||||||||||||||||||
| Emerging Markets Equity Fund | — | 112,456,984 | (105,597,443 | ) | 6,859,541 | $ | 9,388 | $ | 6,859,541 | ||||||||||||||||||
| Focused Equity Fund* | — | 4,399,912 | (4,363,172 | ) | 36,740 | $ | 249 | $ | 36,740 | ||||||||||||||||||
| Global Equity Fund | — | 6,348,985 | (6,258,940 | ) | 90,045 | $ | 814 | $ | 90,045 | ||||||||||||||||||
| Global Real Estate Fund | — | 6,035,940 | (5,907,725 | ) | 128,215 | $ | 475 | $ | 128,215 | ||||||||||||||||||
| Healthcare and Biotechnology Fund | — | 32,229,807 | (31,788,694 | ) | 441,113 | $ | 2,918 | $ | 441,113 | ||||||||||||||||||
| Intermediate Fixed Income Fund | 6,229,472 | 51,855,113 | (53,690,978 | ) | 4,393,607 | $ | 11,454 | $ | 4,393,607 | ||||||||||||||||||
| International Fixed Income Fund | — | 10,550,877 | (10,309,316 | ) | 241,561 | $ | 1,824 | $ | 241,561 | ||||||||||||||||||
| Large Cap Relative Value Fund | — | 3,638,702 | (3,521,026 | ) | 117,676 | $ | 555 | $ | 117,676 | ||||||||||||||||||
| Market Neutral Equity Fund | — | 26,512,117 | (25,523,425 | ) | 988,692 | $ | 1,975 | $ | 988,692 | ||||||||||||||||||
| Mid Cap Fund | 1,005,405 | 73,852,869 | (74,293,580 | ) | 564,694 | $ | 5,431 | $ | 564,694 | ||||||||||||||||||
| Mid Cap Value Fund | — | 14,254,243 | (13,699,596 | ) | 554,647 | $ | 873 | $ | 554,647 | ||||||||||||||||||
| Premium Yield Equity Fund | 399,062 | 16,013,263 | (15,249,712 | ) | 1,162,613 | $ | 3,598 | $ | 1,162,613 | ||||||||||||||||||
| Sands Capital Select Growth Fund | 19,564,025 | 176,856,039 | (166,335,713 | ) | 30,084,351 | $ | 30,712 | $ | 30,084,351 | ||||||||||||||||||
124
Notes to Financial Statements (Continued)
| Share Activity | |||||||||||||||||||||||||||
| Balance 09/30/09 | Purchases | Sales | Balance 09/30/10 | Dividends | Value 09/30/10 | ||||||||||||||||||||||
| Short Duration Fixed Income Fund | 403,523 | 19,718,472 | (19,488,282 | ) | 633,713 | $ | 2,627 | $ | 633,713 | ||||||||||||||||||
| Small Cap Core Fund | — | 84,463,466 | (82,767,200 | ) | 1,696,266 | $ | 5,225 | $ | 1,696,266 | ||||||||||||||||||
| Small Cap Value Opportunities Fund | 913,866 | 36,633,986 | (36,670,525 | ) | 877,327 | $ | 3,709 | $ | 877,327 | ||||||||||||||||||
| Ultra Short Duration Fixed Income Fund | 9,126,534 | 215,763,820 | (190,537,326 | ) | 34,353,028 | $ | 50,033 | $ | 34,353,028 | ||||||||||||||||||
* Represents the period from commencement of operations (December 31, 2009) through September 30, 2010.
5. Capital Share Transactions
Proceeds and payments on capital shares as shown in the Statements of Changes in Net Assets are the result of the following capital share transactions for the periods shown:
| Capital Appreciation Fund | Core Plus Fixed Income Fund | Emerging Markets Equity Fund | Focused Equity Fund(A) | ||||||||||||||||
| Year Ended September 30, 2010 | Year Ended September 30, 2010 | Year Ended September 30, 2010 | Period Ended September 30, 2010 | ||||||||||||||||
| Class A | |||||||||||||||||||
| Shares issued | 267,286 | 514,144 | 935,779 | 87,159 | |||||||||||||||
| Shares reinvested | — | 4,924 | — | — | |||||||||||||||
| Shares redeemed | (10,100 | ) | (56,102 | ) | (120,057 | ) | (12,811 | ) | |||||||||||
| Net increase in shares outstanding | 257,186 | 462,966 | 815,722 | 74,348 | |||||||||||||||
| Shares outstanding, beginning of period | — | — | — | — | |||||||||||||||
| Shares outstanding, end of period | 257,186 | 462,966 | 815,722 | 74,348 | |||||||||||||||
| Class C | |||||||||||||||||||
| Shares issued | 37,123 | 187,138 | 301,020 | 18,599 | |||||||||||||||
| Shares reinvested | — | 2,540 | — | — | |||||||||||||||
| Shares redeemed | (3,690 | ) | (10,089 | ) | (15,645 | ) | (1,385 | ) | |||||||||||
| Net increase in shares outstanding | 33,433 | 179,589 | 285,375 | 17,214 | |||||||||||||||
| Shares outstanding, beginning of period | — | — | — | — | |||||||||||||||
| Shares outstanding, end of period | 33,433 | 179,589 | 285,375 | 17,214 | |||||||||||||||
| Class Y | |||||||||||||||||||
| Shares issued | 16,888 | 96,107 | 1,141,030 | 18,300 | |||||||||||||||
| Shares reinvested | 12 | 1,514 | — | — | |||||||||||||||
| Shares redeemed | (4,490 | ) | (19,217 | ) | (71,873 | ) | — | ||||||||||||
| Net increase in shares outstanding | 12,410 | 78,404 | 1,069,157 | 18,300 | |||||||||||||||
| Shares outstanding, beginning of period | — | — | — | — | |||||||||||||||
| Shares outstanding, end of period | 12,410 | 78,404 | 1,069,157 | 18,300 | |||||||||||||||
| Institutional Class | |||||||||||||||||||
| Shares issued | 270,250 | 1,563,997 | 10,327,778 | 166,432 | |||||||||||||||
| Shares reinvested | 708 | 28,843 | — | — | |||||||||||||||
| Shares redeemed | (250 | ) | (25,169 | ) | (481,205 | ) | (96,432 | ) | |||||||||||
| Net increase in shares outstanding | 270,708 | 1,567,671 | 9,846,573 | 70,000 | |||||||||||||||
| Shares outstanding, beginning of period | — | — | — | — | |||||||||||||||
| Shares outstanding, end of period | 270,708 | 1,567,671 | 9,846,573 | 70,000 | |||||||||||||||
(A) Represents the period from commencement of operations (December 31, 2009) through September 30, 2010.
125
Notes to Financial Statements (Continued)
| Global Equity Fund | Global Real Estate Fund | Healthcare and Biotechnology Fund | |||||||||||||||||
| Year Ended September 30, 2010 | Year Ended September 30, 2010 | Year Ended September 30, 2010 | Year Ended September 30, 2009 | ||||||||||||||||
| Class A | |||||||||||||||||||
| Shares issued | 217,437 | 170,489 | 251,091 | 1,168,902 | |||||||||||||||
| Shares reinvested | — | 415 | — | — | |||||||||||||||
| Shares redeemed | (43,120 | ) | (94,047 | ) | (1,164,642 | ) | (2,530,036 | ) | |||||||||||
| Net increase (decrease) in shares outstanding | 174,317 | 76,857 | (913,551 | ) | (1,361,134 | ) | |||||||||||||
| Shares outstanding, beginning of period | — | — | 2,675,621 | 4,036,755 | |||||||||||||||
| Shares outstanding, end of period | 174,317 | 76,857 | 1,762,070 | 2,675,621 | |||||||||||||||
| Class C | |||||||||||||||||||
| Shares issued | 10,250 | 10,745 | 5,448 | 49,549 | |||||||||||||||
| Shares reinvested | — | 177 | — | — | |||||||||||||||
| Shares redeemed | (250 | ) | (250 | ) | (97,007 | ) | (167,013 | ) | |||||||||||
| Net increase (decrease) in shares outstanding | 10,000 | 10,672 | (91,559 | ) | (117,464 | ) | |||||||||||||
| Shares outstanding, beginning of period | — | — | 280,351 | 397,815 | |||||||||||||||
| Shares outstanding, end of period | 10,000 | 10,672 | 188,792 | 280,351 | |||||||||||||||
| Class Y | |||||||||||||||||||
| Shares issued | 13,548 | 11,172 | — | — | |||||||||||||||
| Shares reinvested | — | 231 | — | — | |||||||||||||||
| Shares redeemed | (250 | ) | (250 | ) | — | — | |||||||||||||
| Net increase in shares outstanding | 13,298 | 11,153 | — | — | |||||||||||||||
| Shares outstanding, beginning of period | — | — | — | — | |||||||||||||||
| Shares outstanding, end of period | 13,298 | 11,153 | — | — | |||||||||||||||
| Institutional Class | |||||||||||||||||||
| Shares issued | 288,959 | 272,604 | — | — | |||||||||||||||
| Shares reinvested | 64 | 6,130 | — | — | |||||||||||||||
| Shares redeemed | (250 | ) | (250 | ) | — | — | |||||||||||||
| Net increase in shares outstanding | 288,773 | 278,484 | — | — | |||||||||||||||
| Shares outstanding, beginning of period | — | — | — | — | |||||||||||||||
| Shares outstanding, end of period | 288,773 | 278,484 | — | — | |||||||||||||||
126
Notes to Financial Statements (Continued)
| Intermediate Fixed Income Fund | International Fixed Income Fund | ||||||||||||||
| Year Ended September 30, 2010 | Year Ended September 30, 2009 | Year Ended September 30, 2010 | |||||||||||||
| Class A | |||||||||||||||
| Shares issued | — | — | 116,964 | ||||||||||||
| Shares reinvested | — | — | 296 | ||||||||||||
| Shares redeemed | — | — | (1,284 | ) | |||||||||||
| Net increase in shares outstanding | — | — | 115,976 | ||||||||||||
| Shares outstanding, beginning of period | — | — | — | ||||||||||||
| Shares outstanding, end of period | — | — | 115,976 | ||||||||||||
| Class C | |||||||||||||||
| Shares issued | — | — | 41,491 | ||||||||||||
| Shares reinvested | — | — | 70 | ||||||||||||
| Shares redeemed | — | — | (5,756 | ) | |||||||||||
| Net increase in shares outstanding | — | — | 35,805 | ||||||||||||
| Shares outstanding, beginning of period | — | — | — | ||||||||||||
| Shares outstanding, end of period | — | — | 35,805 | ||||||||||||
| Class Y | |||||||||||||||
| Shares issued | — | — | 23,352 | ||||||||||||
| Shares reinvested | — | — | 134 | ||||||||||||
| Shares redeemed | — | — | (6,475 | ) | |||||||||||
| Net increase (decrease) in shares outstanding | — | — | 17,011 | ||||||||||||
| Shares outstanding, beginning of period | — | — | — | ||||||||||||
| Shares outstanding, end of period | — | — | 17,011 | ||||||||||||
| Institutional Class | |||||||||||||||
| Shares issued | 1,195,486 | 11,553,991 | 672,244 | ||||||||||||
| Shares reinvested | 7,956 | 41,342 | 9,128 | ||||||||||||
| Shares redeemed | (1,169,060 | ) | (1,442,295 | ) | (251 | ) | |||||||||
| Net increase in shares outstanding | 34,382 | 10,153,038 | 681,121 | ||||||||||||
| Shares outstanding, beginning of period | 11,880,237 | 1,727,199 | — | ||||||||||||
| Shares outstanding, end of period | 11,914,619 | 11,880,237 | 681,121 | ||||||||||||
127
Notes to Financial Statements (Continued)
| Large Cap Relative Value Fund | Market Neutral Equity Fund | ||||||||||
| Year Ended September 30, 2010 | Year Ended September 30, 2010 | ||||||||||
| Class A | |||||||||||
| Shares issued | 44,770 | 138,722 | |||||||||
| Shares reinvested | 22 | — | |||||||||
| Shares redeemed | (1,924 | ) | (76,024 | ) | |||||||
| Net increase in shares outstanding | 42,868 | 62,698 | |||||||||
| Shares outstanding, beginning of period | — | — | |||||||||
| Shares outstanding, end of period | 42,868 | 62,698 | |||||||||
| Class C | |||||||||||
| Shares issued | 21,740 | 18,133 | |||||||||
| Shares reinvested | — | — | |||||||||
| Shares redeemed | (520 | ) | (770 | ) | |||||||
| Net increase in shares outstanding | 21,220 | 17,363 | |||||||||
| Shares outstanding, beginning of period | — | — | |||||||||
| Shares outstanding, end of period | 21,220 | 17,363 | |||||||||
| Class Y | |||||||||||
| Shares issued | 10,267 | 3,325,020 | |||||||||
| Shares reinvested | 17 | — | |||||||||
| Shares redeemed | (250 | ) | (2,801 | ) | |||||||
| Net increase in shares outstanding | 10,034 | 3,322,219 | |||||||||
| Shares outstanding, beginning of period | — | — | |||||||||
| Shares outstanding, end of period | 10,034 | 3,322,219 | |||||||||
| Institutional Class | |||||||||||
| Shares issued | 270,789 | — | |||||||||
| Shares reinvested | 568 | — | |||||||||
| Shares redeemed | (250 | ) | — | ||||||||
| Net increase in shares outstanding | 271,107 | — | |||||||||
| Shares outstanding, beginning of period | — | — | |||||||||
| Shares outstanding, end of period | 271,107 | — | |||||||||
128
Notes to Financial Statements (Continued)
| Mid Cap Fund | Mid Cap Value Fund | ||||||||||||||
| Year Ended September 30, 2010 | Year Ended September 30, 2009 | Year Ended September 30, 2010 | |||||||||||||
| Class A | |||||||||||||||
| Shares issued | 25,374 | 36,964 | 46,216 | ||||||||||||
| Shares reinvested | 168 | 132 | 155 | ||||||||||||
| Shares redeemed | (11,881 | ) | (8,835 | ) | (17,067 | ) | |||||||||
| Net increase in shares outstanding | 13,661 | 28,261 | 29,304 | ||||||||||||
| Shares outstanding, beginning of period | 40,383 | 12,122 | — | ||||||||||||
| Shares outstanding, end of period | 54,044 | 40,383 | 29,304 | ||||||||||||
| Class C | |||||||||||||||
| Shares issued | 6,152 | 18,403 | 11,460 | ||||||||||||
| Shares reinvested | — | 21 | 41 | ||||||||||||
| Shares redeemed | (1,501 | ) | (5,595 | ) | (250 | ) | |||||||||
| Net increase in shares outstanding | 4,651 | 12,829 | 11,251 | ||||||||||||
| Shares outstanding, beginning of period | 15,119 | 2,290 | — | ||||||||||||
| Shares outstanding, end of period | 19,770 | 15,119 | 11,251 | ||||||||||||
| Class Y (A) | |||||||||||||||
| Shares issued | 404,386 | 6,376,276 | 50,041 | ||||||||||||
| Shares reinvested | 5,228 | 14,265 | 173 | ||||||||||||
| Shares redeemed | (5,629,235 | ) | (23,577,005 | ) | (251 | ) | |||||||||
| Net increase (decrease) in shares outstanding | (5,219,621 | ) | (17,186,464 | ) | 49,963 | ||||||||||
| Shares outstanding, beginning of period | 14,961,272 | 32,147,736 | — | ||||||||||||
| Shares outstanding, end of period | 9,741,651 | 14,961,272 | 49,963 | ||||||||||||
| Class Z | |||||||||||||||
| Shares issued | 106,514 | 96,295 | — | ||||||||||||
| Shares reinvested | 814 | 1,206 | — | ||||||||||||
| Shares redeemed | (217,842 | ) | (185,516 | ) | — | ||||||||||
| Net increase (decrease) in shares outstanding | (110,514 | ) | (88,015 | ) | — | ||||||||||
| Shares outstanding, beginning of period | 162,319 | 250,334 | — | ||||||||||||
| Shares outstanding, end of period | 51,805 | 162,319 | — | ||||||||||||
| Institutional Class | |||||||||||||||
| Shares issued | — | — | 3,338,313 | ||||||||||||
| Shares reinvested | — | — | 2,777 | ||||||||||||
| Shares redeemed | — | — | (250 | ) | |||||||||||
| Net increase in shares outstanding | — | — | 3,340,840 | ||||||||||||
| Shares outstanding, beginning of period | — | — | — | ||||||||||||
| Shares outstanding, end of period | — | — | 3,340,840 | ||||||||||||
(A) Effective January 28, 2010, Institutional Class shares of the Mid Cap Fund were changed to Class Y shares.
129
Notes to Financial Statements (Continued)
| Premium Yield Equity Fund | Sands Capital Select Growth Fund | ||||||||||||||||||
| Year Ended September 30, 2010 | Year Ended September 30, 2009 | Year Ended September 30, 2010 | Year Ended September 30, 2009 | ||||||||||||||||
| Class A | |||||||||||||||||||
| Shares issued | 471,835 | 756,905 | — | — | |||||||||||||||
| Shares reinvested | 95,669 | 108,456 | — | — | |||||||||||||||
| Shares redeemed | (458,430 | ) | (81,899 | ) | — | — | |||||||||||||
| Net increase in shares outstanding | 109,074 | 783,462 | — | — | |||||||||||||||
| Shares outstanding, beginning of period | 3,351,980 | 2,568,518 | — | — | |||||||||||||||
| Shares outstanding, end of period | 3,461,054 | 3,351,980 | — | — | |||||||||||||||
| Class C | |||||||||||||||||||
| Shares issued | 578,905 | 489,270 | — | — | |||||||||||||||
| Shares reinvested | 12,488 | 4,467 | — | — | |||||||||||||||
| Shares redeemed | (91,688 | ) | (9,098 | ) | — | — | |||||||||||||
| Net increase in shares outstanding | 499,705 | 484,639 | — | — | |||||||||||||||
| Shares outstanding, beginning of period | 559,610 | 74,971 | — | — | |||||||||||||||
| Shares outstanding, end of period | 1,059,315 | 559,610 | — | — | |||||||||||||||
| Class Y | |||||||||||||||||||
| Shares issued | 1,890,153 | 92,780 | 5,629,008 | 4,413,386 | |||||||||||||||
| Shares reinvested | 27,395 | 757 | — | — | |||||||||||||||
| Shares redeemed | (227,888 | ) | (744 | ) | (3,303,760 | ) | (12,186,105 | ) | |||||||||||
| Net increase (decrease) in shares outstanding | 1,689,660 | 92,793 | 2,325,248 | (7,772,719 | ) | ||||||||||||||
| Shares outstanding, beginning of period | 93,096 | 303 | 11,300,167 | 19,072,886 | |||||||||||||||
| Shares outstanding, end of period | 1,782,756 | 93,096 | 13,625,415 | 11,300,167 | |||||||||||||||
| Class Z | |||||||||||||||||||
| Shares issued | — | — | 32,185,209 | 30,043,839 | |||||||||||||||
| Shares reinvested | — | — | — | — | |||||||||||||||
| Shares redeemed | — | — | (16,070,720 | ) | (37,614,532 | ) | |||||||||||||
| Net increase (decrease) in shares outstanding | — | — | 16,114,489 | (7,570,693 | ) | ||||||||||||||
| Shares outstanding, beginning of period | — | — | 45,996,065 | 53,566,758 | |||||||||||||||
| Shares outstanding, end of period | — | — | 62,110,554 | 45,996,065 | |||||||||||||||
130
Notes to Financial Statements (Continued)
| Short Duration Fixed Income Fund | Small Cap Core Fund | ||||||||||||||
| Year Ended September 30, 2010 | Year Ended September 30, 2009(A) | Year Ended September 30, 2010 | |||||||||||||
| Class A | |||||||||||||||
| Shares issued | — | — | 5,137,874 | ||||||||||||
| Shares reinvested | — | — | — | ||||||||||||
| Shares redeemed | — | — | (825,614 | ) | |||||||||||
| Net increase in shares outstanding | — | — | 4,312,260 | ||||||||||||
| Shares outstanding, beginning of period | — | — | — | ||||||||||||
| Shares outstanding, end of period | — | — | 4,312,260 | ||||||||||||
| Class C | |||||||||||||||
| Shares issued | — | — | 475,489 | ||||||||||||
| Shares reinvested | — | — | — | ||||||||||||
| Shares redeemed | — | — | (21,338 | ) | |||||||||||
| Net increase in shares outstanding | — | — | 454,151 | ||||||||||||
| Shares outstanding, beginning of period | — | — | — | ||||||||||||
| Shares outstanding, end of period | — | — | 454,151 | ||||||||||||
| Class Y | |||||||||||||||
| Shares issued | 92,642 | 59,186 | 3,255,338 | ||||||||||||
| Shares reinvested | 1,055 | 323 | — | ||||||||||||
| Shares redeemed | (76,251 | ) | (6 | ) | (380,556 | ) | |||||||||
| Net increase in shares outstanding | 17,446 | 59,503 | 2,874,782 | ||||||||||||
| Shares outstanding, beginning of period | 59,503 | — | — | ||||||||||||
| Shares outstanding, end of period | 76,949 | 59,503 | 2,874,782 | ||||||||||||
| Class Z | |||||||||||||||
| Shares issued | 754,949 | 493,806 | — | ||||||||||||
| Shares reinvested | 115,755 | 148,522 | — | ||||||||||||
| Shares redeemed | (914,126 | ) | (1,141,404 | ) | — | ||||||||||
| Net decrease in shares outstanding | (43,422 | ) | (499,076 | ) | — | ||||||||||
| Shares outstanding, beginning of period | 4,400,531 | 4,899,607 | — | ||||||||||||
| Shares outstanding, end of period | 4,357,109 | 4,400,531 | — | ||||||||||||
| Institutional Class | |||||||||||||||
| Shares issued | — | — | 1,166,686 | ||||||||||||
| Shares reinvested | — | — | 894 | ||||||||||||
| Shares redeemed | — | — | (275,955 | ) | |||||||||||
| Net increase in shares outstanding | — | — | 891,625 | ||||||||||||
| Shares outstanding, beginning of period | — | — | — | ||||||||||||
| Shares outstanding, end of period | — | — | 891,625 | ||||||||||||
(A) Class Y represents the period from commencement of operations (May 4, 2009) through September 30, 2009.
131
Notes to Financial Statements (Continued)
| Small Cap Value Opportunities Fund | Ultra Short Duration Fixed Income Fund | ||||||||||||||||||
| Year Ended September 30, 2010 | Year Ended September 30, 2009 | Year Ended September 30, 2010 | Year Ended September 30, 2009 | ||||||||||||||||
| Class Z | |||||||||||||||||||
| Shares issued | 763,694 | 1,203,675 | 20,014,092 | 4,070,270 | |||||||||||||||
| Shares reinvested | — | 24,829 | 278,613 | 409,229 | |||||||||||||||
| Shares redeemed | (2,768,817 | ) | (3,440,717 | ) | (7,070,449 | ) | (8,006,654 | ) | |||||||||||
| Net increase (decrease) in shares outstanding | (2,005,123 | ) | (2,212,213 | ) | 13,222,256 | (3,527,155 | ) | ||||||||||||
| Shares outstanding, beginning of period | 6,338,261 | 8,550,474 | 11,236,157 | 14,763,312 | |||||||||||||||
| Shares outstanding, end of period | 4,333,138 | 6,338,261 | 24,458,413 | 11,236,157 | |||||||||||||||
6. Federal Tax Information
Federal income tax — It is each Fund's policy to continue to comply with the special provisions of the Internal Revenue Code applicable to regulated investment companies. As provided therein, in any fiscal year in which a Fund so qualifies and distributes at least 90% of its investment company taxable income, the Fund (but not the shareholders) will be relieved of federal income tax on the income distributed. Accordingly, no provision for income taxes has been made.
In order to avoid imposition of the excise tax applicable to regulated investment companies, it is also each Fund's intention to declare and pay as dividends in each calendar year at least 98% of its investment company taxable income (earned during the calendar year) and 98% of its net realized capital gains (earned during the twelve months ending October 31) plus undistributed amounts from prior years.
The tax character of distributions paid for the periods ended September 30, 2010 and 2009 was as follows:
| Capital Appreciation Fund | Core Plus Fixed Income Fund | Emerging Markets Equity Fund | Focused Equity Fund | Global Equity Fund | |||||||||||||||||||
| Year Ended Sept. 30, 2010 | Year Ended Sept. 30, 2010 | Year Ended Sept. 30, 2010 | Period Ended Sept. 30, 2010* | Year Ended Sept. 30, 2010 | |||||||||||||||||||
| From ordinary income | $ | 7,703 | $ | 496,281 | $ | — | $ | — | $ | 661 | |||||||||||||
| Global Real Estate Fund | Healthcare and Biotechnology Fund | Intermediate Fixed Income Fund | |||||||||||||||||||||
| Year Ended Sept. 30, 2010 | Year Ended Sept. 30, 2010 | Year Ended Sept. 30, 2009 | Year Ended Sept. 30, 2010 | Year Ended Sept. 30, 2009 | |||||||||||||||||||
| From ordinary income | $ | 90,201 | $ | — | $ | — | $ | 3,085,391 | $ | 855,228 | |||||||||||||
132
Notes to Financial Statements (Continued)
| International Fixed Income Fund | Large Cap Relative Value Fund | Market Neutral Equity Fund | Mid Cap Fund | ||||||||||||||||||||
| Year Ended Sept. 30, 2010 | Year Ended Sept. 30, 2010 | Year Ended Sept. 30, 2010 | Year Ended Sept. 30, 2010 | Year Ended Sept. 30, 2009 | |||||||||||||||||||
| From ordinary income | $ | 122,627 | $ | 13,296 | $ | — | $ | 1,064,323 | $ | 1,033,371 | |||||||||||||
| In excess of ordinary income | — | — | — | 138,568 | — | ||||||||||||||||||
| From long-term capital gains | — | — | — | — | 551,095 | ||||||||||||||||||
| $ | 122,627 | $ | 13,296 | $ | — | $ | 1,202,891 | $ | 1,584,466 | ||||||||||||||
| Mid Cap Value Fund | Premium Yield Equity Fund | Sands Capital Select Growth Fund | |||||||||||||||||||||
| Year Ended Sept. 30, 2010 | Year Ended Sept. 30, 2010 | Year Ended Sept. 30, 2009 | Year Ended Sept. 30, 2010 | Year Ended Sept. 30, 2009 | |||||||||||||||||||
| From ordinary income | $ | 67,277 | $ | 1,013,991 | $ | 583,029 | $ | — | $ | — | |||||||||||||
| From tax return of capital | — | — | 77,806 | — | — | ||||||||||||||||||
| $ | 67,277 | $ | 1,013,991 | $ | 660,835 | $ | — | $ | — | ||||||||||||||
| Short Duration Fixed Income Fund | Small Cap Core Fund | Small Cap Value Opportunities Fund | |||||||||||||||||||||
| Year Ended Sept. 30, 2010 | Year Ended Sept. 30, 2009 | Year Ended Sept. 30, 2010 | Year Ended Sept. 30, 2010 | Year Ended Sept. 30, 2009 | |||||||||||||||||||
| From ordinary income | $ | 1,328,163 | $ | 1,479,571 | $ | 9,676 | $ | — | $ | 105,644 | |||||||||||||
| From long-term capital gains | — | — | — | — | 135,276 | ||||||||||||||||||
| From tax return of capital | — | — | — | — | 49,414 | ||||||||||||||||||
| $ | 1,328,163 | $ | 1,479,571 | $ | 9,676 | $ | — | $ | 290,334 | ||||||||||||||
| Ultra Short Duration Fixed Income Fund | |||||||||||
| Year Ended Sept. 30, 2010 | Year Ended Sept. 30, 2009 | ||||||||||
| From ordinary income | $ | 3,337,850 | $ | 4,095,134 | |||||||
| $ | 3,337,850 | $ | 4,095,134 | ||||||||
The following information is computed on a tax basis for each item as of September 30, 2010:
| Capital Appreciation Fund | Core Plus Fixed Income Fund | Emerging Markets Equity Fund | Focused Equity Fund | Global Equity Fund | |||||||||||||||||||
| Tax cost of portfolio investments | $ | 6,122,367 | $ | 23,860,195 | $ | 136,820,392 | $ | 1,917,586 | $ | 4,767,424 | |||||||||||||
| Gross unrealized appreciation | 275,932 | 775,721 | 17,969,998 | 143,502 | 483,051 | ||||||||||||||||||
| Gross unrealized depreciation | (301,672 | ) | (26,082 | ) | (977,207 | ) | (72,642 | ) | (196,677 | ) | |||||||||||||
| Net unrealized appreciation (depreciation) | (25,740 | ) | 749,639 | 16,992,791 | 70,860 | 286,374 | |||||||||||||||||
| Net unrealized appreciation (depreciation) on foreign currency and translation of other assets and liabilities denominated in foreign curency | — | (36,484 | ) | 689 | — | 345 | |||||||||||||||||
| Accumulated capital and other losses | — | (87,040 | ) | (71,151 | ) | — | (4,354 | ) | |||||||||||||||
| Undistributed ordinary income | 215,881 | 203,885 | 841,830 | 62,536 | 51,340 | ||||||||||||||||||
| Other temporary differences | (4,554 | ) | (74,746 | ) | (16,729 | ) | (8,934 | ) | (4,555 | ) | |||||||||||||
| Accumulated earnings | $ | 185,587 | $ | 755,254 | $ | 17,747,430 | $ | 124,462 | $ | 329,150 | |||||||||||||
133
Notes to Financial Statements (Continued)
| Global Real Estate Fund | Healthcare and Biotechnology Fund | Intermediate Fixed Income Fund | International Fixed Income Fund | Large Cap Relative Value Fund | |||||||||||||||||||
| Tax cost of portfolio investments | $ | 4,187,447 | $ | 25,671,450 | $ | 102,661,250 | $ | 8,668,327 | $ | 3,534,475 | |||||||||||||
| Gross unrealized appreciation | 303,990 | 4,578,104 | 5,760,855 | 490,336 | 477,889 | ||||||||||||||||||
| Gross unrealized depreciation | (49,546 | ) | (2,216,628 | ) | (4,289 | ) | (108,401 | ) | (144,087 | ) | |||||||||||||
| Net unrealized appreciation | 254,444 | 2,361,476 | 5,756,566 | 381,935 | 333,802 | ||||||||||||||||||
| Net unrealized appreciation (depreciation) on foreign currency and translation of other assets and liabilities denominated in foreign curency | (26 | ) | — | — | 26,743 | — | |||||||||||||||||
| Accumulated capital and other losses | — | (9,361,607 | ) | (713,351 | ) | — | — | ||||||||||||||||
| Undistributed ordinary income | 228,414 | — | 266,677 | 754,673 | 23,164 | ||||||||||||||||||
| Undistributed capital gains | 3,734 | — | — | — | — | ||||||||||||||||||
| Other temporary differences | (23,385 | ) | — | (259,815 | ) | (100,742 | ) | (4,555 | ) | ||||||||||||||
| Accumulated earnings (deficit) | $ | 463,181 | $ | (7,000,131 | ) | $ | 5,050,077 | $ | 1,062,609 | $ | 352,411 | ||||||||||||
| Market Neutral Equity Fund | Mid Cap Fund | Mid Cap Value Fund | Premium Yield Equity Fund | Sands Capital Select Growth Fund | |||||||||||||||||||
| Tax cost of portfolio investments | $ | 30,089,853 | $ | 117,215,308 | $ | 41,360,162 | $ | 39,180,238 | $ | 561,005,845 | |||||||||||||
| Gross unrealized appreciation | 3,484,539 | 18,712,523 | 1,197,058 | 4,259,349 | 138,680,033 | ||||||||||||||||||
| Gross unrealized depreciation | (2,211,071 | ) | (1,385,462 | ) | (476,855 | ) | (2,293,769 | ) | (13,304,788 | ) | |||||||||||||
| Net unrealized appreciation | 1,273,468 | 17,327,061 | 720,203 | 1,965,580 | 125,375,245 | ||||||||||||||||||
| Net unrealized depreciation on securities sold short | (1,087,774 | ) | — | — | — | — | |||||||||||||||||
| Net unrealized appreciation (depreciation) on foreign currency and translation of other assets and liabilities denominated in foreign curency | — | — | — | (7 | ) | — | |||||||||||||||||
| Accumulated capital and other losses | (408,205 | ) | (191,401,645 | ) | — | (8,852,440 | ) | (83,012,800 | ) | ||||||||||||||
| Undistributed ordinary income | — | — | 350,401 | 94,001 | — | ||||||||||||||||||
| Undistributed capital gains | — | — | 1,624 | — | — | ||||||||||||||||||
| Other temporary differences | (9,165 | ) | — | (38,687 | ) | (75,867 | ) | — | |||||||||||||||
| Accumulated earnings (deficit) | $ | (231,676 | ) | $ | (174,074,584 | ) | $ | 1,033,541 | $ | (6,868,733 | ) | $ | 42,362,445 | ||||||||||
| Short Duration Fixed Income Fund | Small Cap Core Fund | Small Cap Value Opportunities Fund | Ultra Short Duration Fixed Income Fund | ||||||||||||||||
| Tax cost of portfolio investments | $ | 43,584,565 | $ | 109,441,436 | $ | 58,513,183 | $ | 237,181,097 | |||||||||||
| Gross unrealized appreciation | 1,122,891 | 8,357,502 | 12,246,868 | 1,425,645 | |||||||||||||||
| Gross unrealized depreciation | (38,579 | ) | (3,811,260 | ) | (558,779 | ) | (521,724 | ) | |||||||||||
| Net unrealized appreciation | 1,084,312 | 4,546,242 | 11,688,089 | 903,921 | |||||||||||||||
| Accumulated capital and other losses | (5,486,664 | ) | — | (48,848,288 | ) | (14,558,920 | ) | ||||||||||||
| Undistributed ordinary income | 181,826 | 173,060 | — | 515,527 | |||||||||||||||
| Undistributed capital gains | — | 2,858 | — | — | |||||||||||||||
| Other temporary differences | (102,104 | ) | (4,555 | ) | — | (378,105 | ) | ||||||||||||
| Accumulated earnings (deficit) | $ | (4,322,630 | ) | $ | 4,717,605 | $ | (37,160,199 | ) | $ | (13,517,577 | ) | ||||||||
134
Notes to Financial Statements (Continued)
The difference between the tax cost of portfolio investments and the financial statement cost is primarily due to wash sale loss deferrals, the tax treatment of real estate investment trusts, Passive Foreign Investment Companies and book/tax differences on securities contributed in-kind.
As of September 30, 2010, the Funds had the following capital loss carryforwards for federal income tax purposes.
| Fund | Amount | Expires Sept. 30, | |||||||||
| Healthcare and Biotechnology Fund | $ | 5,781,344 | 2017 | ||||||||
| 3,580,263 | 2018 | ||||||||||
| $ | 9,361,607 | ||||||||||
| Intermediate Fixed Income Fund | $ | 86,389 | 2015 | ||||||||
| 683 | 2017 | ||||||||||
| 626,279 | 2018 | ||||||||||
| $ | 713,351 | ||||||||||
| Market Neutral Equity Fund | $ | 3,708 | 2018 | ||||||||
| Mid Cap Fund | $ | 120,581,352 | 2017 | ||||||||
| 70,820,293 | 2018 | ||||||||||
| $ | 191,401,645 | ||||||||||
| Premium Yield Equity Fund | $ | 3,084,301 | 2017 | ||||||||
| 5,768,139 | 2018 | ||||||||||
| $ | 8,852,440 | ||||||||||
| Sands Capital Select Growth Fund | $ | 5,719,519 | 2011 | ||||||||
| 2,692,298 | 2014 | ||||||||||
| 4,416,747 | 2015 | ||||||||||
| 3,797,319 | 2017 | ||||||||||
| 66,386,917 | 2018 | ||||||||||
| $ | 83,012,800 | ||||||||||
| Short Duration Fixed Income Fund | $ | 1,994,293 | 2012 | ||||||||
| 96,050 | 2013 | ||||||||||
| 1,027,850 | 2014 | ||||||||||
| 852,134 | 2015 | ||||||||||
| 295,319 | 2016 | ||||||||||
| 1,193,230 | 2017 | ||||||||||
| 7,423 | 2018 | ||||||||||
| $ | 5,466,299 | ||||||||||
| Small Cap Value Opportunities Fund | $ | 30,983,605 | 2017 | ||||||||
| 17,864,683 | 2018 | ||||||||||
| $ | 48,848,288 | ||||||||||
| Ultra Short Duration Fixed Income Fund | $ | 6,699,046 | 2012 | ||||||||
| 371,187 | 2014 | ||||||||||
| 164,819 | 2015 | ||||||||||
| 3,223,694 | 2017 | ||||||||||
| 3,334,355 | 2018 | ||||||||||
| $ | 13,793,101 | ||||||||||
135
Notes to Financial Statements (Continued)
The capital loss carryforwards may be utilized in future years to offset net realized capital gains, if any, prior to distributing such gains to shareholders.
The Sands Capital Select Growth Fund had $12,218,351 of capital losses expire unutilized during the year ended September 30, 2010.
From November 1, 2009 to September 30, 2010, the following Funds incurred the following net losses ("Post-October losses"). The Funds intend to elect to defer these losses and treat them as arising on October 1, 2010:
| Fund | Amount | ||||||
| Core Plus Fixed Income Fund | $ | 87,040 | |||||
| Emerging Markets Equity Fund | 71,151 | ||||||
| Global Equity Fund | 4,354 | ||||||
| Market Neutral Equity Fund | 404,497 | ||||||
| Short Duration Fixed Income Fund | 20,365 | ||||||
| Ultra Short Duration Fixed Income Fund | 765,819 | ||||||
Certain reclassifications, the result of permanent differences between financial statement and income tax reporting requirements have been made to the components of capital. These reclassifications have no impact on the net assets or net asset value per share of the Funds and are designed to present the Funds' capital accounts on a tax basis. The following reclassifications which are primarily attributed to the tax treatment of net investment loss, foreign currency gain/loss, paydown gain/loss, expiration of capital loss carryforwards, real estate investment trusts, securities contributed in-kind, Passive Foreign Investment Companies and stock issuance costs have been made to the following Funds for the year ended September 30, 2010:
| Paid-in Capital | Accumulated Net Investment Income (Loss) | Accumulated Net Realized Gains (Losses) | |||||||||||||
| Capital Appreciation Fund | $ | (947 | ) | $ | 947 | $ | — | ||||||||
| Core Plus Fixed Income Fund | $ | (947 | ) | $ | (51,778 | ) | $ | 52,725 | |||||||
| Emerging Markets Equity Fund | $ | (947 | ) | $ | (88,641 | ) | $ | 89,588 | |||||||
| Focused Equity Fund | $ | (161 | ) | $ | 161 | $ | — | ||||||||
| Global Equity Fund | $ | (947 | ) | $ | (4,737 | ) | $ | 5,684 | |||||||
| Global Real Estate Fund | $ | (947 | ) | $ | 10,884 | $ | (9,937 | ) | |||||||
| Healthcare and Biotechnology Fund | $ | (30,639 | ) | $ | 30,694 | $ | (55 | ) | |||||||
| Intermediate Fixed Income Fund | $ | (2,667 | ) | $ | (1,955 | ) | $ | 4,622 | |||||||
| International Fixed Income Fund | $ | (947 | ) | $ | 628,355 | $ | (627,408 | ) | |||||||
| Large Cap Relative Value Fund | $ | (947 | ) | $ | 947 | $ | — | ||||||||
| Market Neutral Equity Fund | $ | (122,859 | ) | $ | 123,172 | $ | (313 | ) | |||||||
| Mid Cap Fund | $ | (138,568 | ) | $ | 154,933 | $ | (16,365 | ) | |||||||
| Mid Cap Value Fund | $ | (947 | ) | $ | (703 | ) | $ | 1,650 | |||||||
| Premium Yield Equity Fund | $ | 6,004 | $ | (425 | ) | $ | (5,579 | ) | |||||||
| Sands Capital Select Growth Fund | $ | (16,018,503 | ) | $ | 3,800,152 | $ | 12,218,351 | ||||||||
| Short Duration Fixed Income Fund | $ | — | $ | 119,234 | $ | (119,234 | ) | ||||||||
| Small Cap Core Fund | $ | (947 | ) | $ | (26,365 | ) | $ | 27,312 | |||||||
| Small Cap Value Opportunities Fund | $ | (13,272 | ) | $ | 38,915 | $ | (25,643 | ) | |||||||
| Ultra Short Duration Fixed Income Fund | $ | 1 | $ | 785,776 | $ | (785,777 | ) | ||||||||
The Funds have analyzed their tax positions taken on Federal income tax returns for all open tax years (tax years ended September 30, 2007 through 2010) and have concluded that no provision for income tax is required in their financial statements.
136
Notes to Financial Statements (Continued)
7. Commitments and Contingencies
The Funds indemnify the Trust's officers and Trustees for certain liabilities that might arise from their performance of their duties to the Funds. Additionally, in the normal course of business, the Funds enter into contracts that contain a variety of representations and warranties and which provide general indemnifications. The Funds' maximum exposure under these arrangements is unknown, as this would involve future claims that may be made against the Funds that have not yet occurred. However, based on experience, the Funds expect the risk of loss to be remote.
8. Concentrations/Risks
Certain Funds invest a high percentage of their assets in specific sectors of the market in order to achieve a potentially greater investment return. As a result, the Funds may be more susceptible to economic, political, and regulatory developments in a particular sector of the market, positive or negative, and may experience increased volatility on the Fund's net asset value and magnified effect on the total return.
9. Subsequent Events
Effective November 15, 2010, the Sands Capital Select Growth Fund began offering Class A and Class C shares.
During a meeting of the Board of Trustees held November 18, 2010, the Trustees unanimously approved (subject to shareholder approval) a reorganization providing for the transfer of all assets and liabilities of the Healthcare and Biotechnology Fund to the Touchstone Large Cap Growth Fund, a series of Touchstone Strategic Trust (Large Cap Growth Fund), in exchange for shares of the Large Cap Growth Fund and the subsequent liquidation of the Healthcare and Biotechnology Fund.
Also, at the November 18, 2010 meeting, the Trustees approved the following to be effective on or around December 6, 2010: Sands Capital Select Growth Fund and the Small Cap Value Opportunities Fund will change the base advisory fee to include breakpoints. The Small Cap Value Opportunities Fund will change sub-advisors from Turner Investment Partners, Inc. to DePrince, Race & Zollo, Inc; and change the name of the fund to the Touchstone Small Cap Value Fund.
| Sands Capital Select Growth Fund | 0.85% on the first $1 billion 0.80% on assets greater than $1 billion to $1.5 billion 0.75% on assets greater than $1.5 billion to $2 billion 0.70% of such assets in excess of $2 billion | ||||||
| Small Cap Value Opportunities Fund | 0.95% on the first $100 million 0.90% of such assets in excess of $100 million | ||||||
There were no other subsequent events that would have a material impact on the Funds' financial statements or require disclosure in the notes to the financial statements.
137
Portfolio of Investments
Capital Appreciation Fund – September 30, 2010
| Common Stocks — 94.4% | Shares | Market Value | |||||||||
| Information Technology — 23.1% | |||||||||||
| Accenture PLC - Class A | 4,465 | $ | 189,718 | ||||||||
| Cisco Systems, Inc.* | 7,895 | 172,900 | |||||||||
| Dell, Inc.* | 11,650 | 150,984 | |||||||||
| Google, Inc. - Class A* | 410 | 215,574 | |||||||||
| Microsoft Corp. | 11,065 | 270,982 | |||||||||
| Nokia Corp. ADR | 13,210 | 132,496 | |||||||||
| Paychex, Inc. | 4,095 | 112,571 | |||||||||
| QUALCOMM, Inc. | 3,580 | 161,530 | |||||||||
| 1,406,755 | |||||||||||
| Health Care — 19.1% | |||||||||||
| Abbott Laboratories | 2,580 | 134,779 | |||||||||
| Celgene Corp.* | 775 | 44,648 | |||||||||
| Gilead Sciences, Inc.* | 2,560 | 91,161 | |||||||||
| Johnson & Johnson | 3,985 | 246,911 | |||||||||
| Medtronic, Inc. | 6,895 | 231,534 | |||||||||
| Patterson Cos., Inc. | 6,395 | 183,217 | |||||||||
| Stryker Corp. | 3,380 | 169,169 | |||||||||
| Waters Corp.* | 905 | 64,056 | |||||||||
| 1,165,475 | |||||||||||
| Consumer Staples — 18.4% | |||||||||||
| Colgate-Palmolive Co. | 2,065 | 158,716 | |||||||||
| CVS Caremark Corp. | 7,440 | 234,137 | |||||||||
| PepsiCo, Inc. | 3,415 | 226,892 | |||||||||
| Procter & Gamble Co. (The) | 3,635 | 217,991 | |||||||||
| Sysco Corp. | 4,045 | 115,363 | |||||||||
| Wal-Mart Stores, Inc. | 3,115 | 166,715 | |||||||||
| 1,119,814 | |||||||||||
| Industrials — 9.0% | |||||||||||
| Danaher Corp. | 3,815 | 154,927 | |||||||||
| Donaldson Co., Inc. | 1,705 | 80,357 | |||||||||
| Rockwell Collins, Inc. | 1,530 | 89,123 | |||||||||
| United Technologies Corp. | 3,180 | 226,511 | |||||||||
| 550,918 | |||||||||||
| Financials — 8.1% | |||||||||||
| Bank of America Corp. | 15,505 | 203,271 | |||||||||
| Goldman Sachs Group, Inc. (The) | 785 | 113,495 | |||||||||
| JPMorgan Chase & Co. | 4,600 | 175,122 | |||||||||
| 491,888 | |||||||||||
| Consumer Discretionary — 8.0% | |||||||||||
| O'Reilly Automotive, Inc.* | 3,320 | 176,624 | |||||||||
| Staples, Inc. | 8,235 | 172,276 | |||||||||
| Yum! Brands, Inc. | 2,945 | 135,647 | |||||||||
| 484,547 | |||||||||||
| Energy — 6.3% | |||||||||||
| Exxon Mobil Corp. | 3,350 | 206,997 | |||||||||
| Schlumberger Ltd. | 2,835 | 174,664 | |||||||||
| 381,661 | |||||||||||
| Shares | Market Value | ||||||||||
| Materials — 2.4% | |||||||||||
| Monsanto Co. | 3,000 | $ | 143,790 | ||||||||
| Total Common Stocks | $ | 5,744,848 | |||||||||
| Investment Fund — 5.8% | |||||||||||
| Touchstone Institutional Money Market Fund^ | 351,779 | 351,779 | |||||||||
| Total Investment Securities — 100.2% (Cost $6,122,311) | $ | 6,096,627 | |||||||||
| Liabilities in Excess of Other Assets — (0.2%) | (9,954 | ) | |||||||||
| Net Assets — 100.0% | $ | 6,086,673 | |||||||||
* Non-income producing security.
^ Affiliated Fund, sub-advised by Fort Washington Investment Advisors, Inc. See Note 4.
Portfolio Abbreviations:
ADR – American Depositary Receipt
PLC – Public Limited Company
Other Information:
The inputs or methodology used for valuing securities may not be an indication of the risk associated with investing in those securities. For more information on valuation inputs, and their aggregation into the levels used in the table below, please refer to the security valuation section in the accompanying notes to financial statements.
Valuation Inputs at Reporting Date:
| Description | Level 1 | Level 2 | Level 3 | Total | |||||||||||||||
| Common Stocks | $ | 5,744,848 | $ | — | $ | — | $ | 5,744,848 | |||||||||||
| Investment Fund | 351,779 | — | — | 351,779 | |||||||||||||||
| $ | 6,096,627 | ||||||||||||||||||
See accompanying notes to financial statements.
138
Portfolio of Investments
Core Plus Fixed Income Fund – September 30, 2010
| Principal Amount | Market Value | ||||||||||
| Corporate Bonds — 45.6% Financials — 22.1% | |||||||||||
| $ | 30,000 | Ameriprise Financial, Inc., 7.300%, 6/28/19 | $ | 37,183 | |||||||
| 30,000 | Ameriprise Financial, Inc., 5.300%, 3/15/20 | 33,146 | |||||||||
| 205,000 | Bank of America Corp., 4.500%, 4/1/15 | 215,095 | |||||||||
| 25,000 | Bank of America Corp., 7.375%, 5/15/14 | 28,734 | |||||||||
| 30,000 | Bank of America Corp., 5.750%, 12/1/17 | 32,075 | |||||||||
| 31,000 | Bank of America Corp., 8.000%, 12/31/49 (a) | 31,978 | |||||||||
| 100,000 | Barclays Bank PLC, 6.750%, 5/22/19 | 118,837 | |||||||||
| 80,000 | Brandywine Operating Partnership LP, 7.500%, 5/15/15 | 89,677 | |||||||||
| 90,000 | Cantor Fitzgerald LP, 144a, 7.875%, 10/15/19 | 94,485 | |||||||||
| 40,000 | Capital One Capital V, 10.250%, 8/15/39 | 43,300 | |||||||||
| 20,000 | Capital One Financial Corp., 7.375%, 5/23/14 | 23,347 | |||||||||
| 17,000 | CB Richard Ellis Services, Inc., 11.625%, 6/15/17 | 19,677 | |||||||||
| 200,000 | Citigroup, Inc., 8.500%, 5/22/19 | 247,268 | |||||||||
| 65,000 | CommonWealth REIT, 5.875%, 9/15/20 | 64,684 | |||||||||
| 65,000 | Credit Suisse AG, 5.400%, 1/14/20 | 69,339 | |||||||||
| 15,000 | Developers Diversified Realty Corp., 9.625%, 3/15/16 | 16,735 | |||||||||
| 15,000 | Developers Diversified Realty Corp., 7.500%, 4/1/17 | 15,586 | |||||||||
| 20,000 | Digital Realty Trust LP, 144a, 5.875%, 2/1/20 | 21,262 | |||||||||
| 100,000 | Digital Realty Trust LP, 144a, 4.500%, 7/15/15 | 103,243 | |||||||||
| 31,000 | Equinix, Inc., 8.125%, 3/1/18 | 33,093 | |||||||||
| 25,000 | Fidelity National Financial, Inc., 6.600%, 5/15/17 | 25,797 | |||||||||
| 120,000 | Fifth Third Bancorp, 4.500%, 6/1/18 | 118,716 | |||||||||
| 20,000 | General Electric Capital Corp. MTN, 0.731%, 1/8/16 (a) | 18,554 | |||||||||
| 100,000 | General Electric Capital Corp. MTN, 3.500%, 6/29/15 | 104,623 | |||||||||
| 25,000 | Genworth Financial, Inc., 7.700%, 6/15/20 | 26,470 | |||||||||
| 110,000 | Glencore Funding LLC, 144a, 6.000%, 4/15/14 | 114,112 | |||||||||
| 45,000 | Goldman Sachs Group, Inc., 5.375%, 3/15/20 | 47,431 | |||||||||
| 40,000 | Goldman Sachs Group, Inc. MTN, 6.000%, 5/1/14 | 44,626 | |||||||||
| 120,000 | Healthcare Realty Trust, Inc., 6.500%, 1/17/17 | 129,982 | |||||||||
| 35,000 | Host Hotels & Resorts LP, Ser O, 6.375%, 3/15/15 | 35,831 | |||||||||
| 25,000 | Icahn Enterprises LP/Icahn Enterprises Finance Corp., 8.000%, 1/15/18 | 25,125 | |||||||||
| Principal Amount | Market Value | ||||||||||
| $ | 15,000 | International Lease Finance Corp., 144a, 8.625%, 9/15/15 | $ | 16,050 | |||||||
| 65,000 | Jefferies Group, Inc., 8.500%, 7/15/19 | 75,472 | |||||||||
| 25,000 | Jefferies Group, Inc., 6.875%, 4/15/21 | 26,222 | |||||||||
| 25,000 | Jefferies Group, Inc., 6.250%, 1/15/36 | 22,954 | |||||||||
| 85,000 | JP Morgan Chase & Co., 6.300%, 4/23/19 | 98,503 | |||||||||
| 90,000 | KeyCorp MTN, 3.750%, 8/13/15 | 91,827 | |||||||||
| 65,000 | Kilroy Realty LP, 144a, 6.625%, 6/1/20 | 65,940 | |||||||||
| 140,000 | KKR Group Finance Co., 144a, 6.375%, 9/29/20 | 142,981 | |||||||||
| 65,000 | Lazard Group LLC, 7.125%, 5/15/15 | 70,911 | |||||||||
| 90,000 | Liberty Mutual Group, Inc., 144a, 10.750%, 6/15/58 (a) | 106,200 | |||||||||
| 25,000 | Lincoln National Corp., 4.300%, 6/15/15 | 26,505 | |||||||||
| 20,000 | Lincoln National Corp., 8.750%, 7/1/19 | 25,727 | |||||||||
| 215,000 | Lloyds TSB Bank PLC MTN, 144a, 6.500%, 9/14/20 | 217,072 | |||||||||
| 40,000 | Mack-Cali Realty LP, 7.750%, 8/15/19 | 47,604 | |||||||||
| 25,000 | Macquarie Group Ltd., 144a, 7.300%, 8/1/14 | 28,267 | |||||||||
| 50,000 | Macquarie Group Ltd., 144a, 7.625%, 8/13/19 | 58,215 | |||||||||
| 75,000 | MetLife, Inc., 6.750%, 6/1/16 | 89,532 | |||||||||
| 105,000 | MetLife, Inc., 10.750%, 8/1/39 | 136,238 | |||||||||
| 100,000 | Morgan Stanley MTN, 5.625%, 9/23/19 | 104,115 | |||||||||
| 75,000 | NASDAQ OMX Group, Inc., 5.550%, 1/15/20 | 79,703 | |||||||||
| 45,000 | National Retail Properties, Inc., 6.875%, 10/15/17 | 51,031 | |||||||||
| 135,000 | National Rural Utilities Cooperative Finance Corp., 10.375%, 11/1/18 | 193,322 | |||||||||
| 15,000 | Nationwide Mutual Insurance Co., 144a, 9.375%, 8/15/39 | 17,713 | |||||||||
| 15,000 | Pacific Life Insurance Co., 144a, 9.250%, 6/15/39 | 18,954 | |||||||||
| 75,000 | Principal Financial Group, Inc., 7.875%, 5/15/14 | 88,856 | |||||||||
| 15,000 | ProLogis, 7.375%, 10/30/19 | 15,138 | |||||||||
| 25,000 | ProLogis, 7.625%, 8/15/14 | 27,018 | |||||||||
| 130,000 | Raymond James Financial, Inc., 8.600%, 8/15/19 | 155,758 | |||||||||
| 60,000 | Regions Financial Corp., 5.750%, 6/15/15 | 61,036 | |||||||||
| 40,000 | Regions Financial Corp., 7.750%, 11/10/14 | 43,329 | |||||||||
| 110,000 | Royal Bank of Scotland PLC (The), 5.625%, 8/24/20 | 115,331 | |||||||||
| 40,000 | Senior Housing Properties Trust, 6.750%, 4/15/20 | 41,700 | |||||||||
| 125,000 | Simon Property Group LP, 10.350%, 4/1/19 | 174,719 | |||||||||
| 50,000 | SLM Corp. MTN, 8.000%, 3/25/20 | 49,616 | |||||||||
| 150,000 | Standard Chartered PLC, 144a, 3.850%, 4/27/15 | 156,456 | |||||||||
139
Core Plus Fixed Income Fund (Continued)
| Principal Amount | Market Value | ||||||||||
| Corporate Bonds — 45.6% (Continued) | |||||||||||
| $ | 100,000 | SunTrust Bank, 7.250%, 3/15/18 | $ | 113,726 | |||||||
| 85,000 | Tanger Properties LP, 6.125%, 6/1/20 | 92,792 | |||||||||
| 20,000 | Terremark Worldwide, Inc., 12.000%, 6/15/17 | 22,850 | |||||||||
| 115,000 | Validus Holdings Ltd., 8.875%, 1/26/40 | 125,485 | |||||||||
| 45,000 | Willis North America, Inc., 7.000%, 9/29/19 | 49,466 | |||||||||
| 20,000 | Willis North America, Inc., 6.200%, 3/28/17 | 21,311 | |||||||||
| 65,000 | Zions Bancorp., 7.750%, 9/23/14 | 68,874 | |||||||||
| 5,264,530 | |||||||||||
| Utilities — 4.3% | |||||||||||
| 30,000 | AES Corp., 7.750%, 10/15/15 | 32,100 | |||||||||
| 125,000 | Ameren Corp., 8.875%, 5/15/14 | 144,804 | |||||||||
| 110,000 | CenterPoint Energy, Inc., 6.500%, 5/1/18 | 127,677 | |||||||||
| 33,000 | Copano Energy LLC/Copano Energy Finance Corp., 8.125%, 3/1/16 | 33,660 | |||||||||
| 100,000 | Dominion Resources, Inc., 8.875%, 1/15/19 | 136,027 | |||||||||
| 80,000 | Duquesne Light Holdings, Inc., 144a, 6.400%, 9/15/20 | 81,367 | |||||||||
| 15,000 | Dynegy Holdings, Inc., 7.750%, 6/1/19 | 10,275 | |||||||||
| 25,000 | El Paso Pipeline Partners Operating Co. LLC, 6.500%, 4/1/20 | 26,988 | |||||||||
| 90,000 | Energy Transfer Partners LP, 9.700%, 3/15/19 | 119,399 | |||||||||
| 65,000 | Nevada Power Co., 6.500%, 8/1/18 | 78,650 | |||||||||
| 38,000 | NRG Energy, Inc., 7.250%, 2/1/14 | 38,997 | |||||||||
| 45,000 | Plains All American Pipeline LP, 8.750%, 5/1/19 | 57,114 | |||||||||
| 30,000 | Plains All American Pipeline LP/PAA Finance Corp., 3.950%, 9/15/15 | 31,469 | |||||||||
| 8,000 | Regency Energy Partners LP/Regency Energy Finance Corp., 9.375%, 6/1/16 | 8,820 | |||||||||
| 65,000 | Sempra Energy, 9.800%, 2/15/19 | 90,621 | |||||||||
| 1,017,968 | |||||||||||
| Consumer Discretionary — 3.6% | |||||||||||
| 60,000 | Advance Auto Parts, Inc., 5.750%, 5/1/20 | 64,713 | |||||||||
| 12,000 | AMC Entertainment, Inc., 8.750%, 6/1/19 | 12,645 | |||||||||
| 55,000 | Comcast Corp., 6.450%, 3/15/37 | 61,098 | |||||||||
| 25,000 | DISH DBS Corp., 6.625%, 10/1/14 | 26,125 | |||||||||
| 20,000 | Exide Technologies, Ser B, 10.500%, 3/15/13 | 20,450 | |||||||||
| 12,000 | GameStop Corp., 8.000%, 10/1/12 | 12,285 | |||||||||
| 45,000 | GeoEye, Inc., 9.625%, 10/1/15 | 49,106 | |||||||||
| 49,000 | Goodyear Tire & Rubber, 10.500%, 5/15/16 | 55,493 | |||||||||
| 25,000 | Intelsat Subsidiary Holding Co. SA, 8.500%, 1/15/13 | 25,281 | |||||||||
| 40,000 | Lennar Corp., 6.950%, 6/1/18 | 37,100 | |||||||||
| 75,000 | NBC Universal, Inc., 144a, 5.950%, 4/1/41 | 77,146 | |||||||||
| Principal Amount | Market Value | ||||||||||
| $ | 45,000 | Nebraska Book Co., Inc., 10.000%, 12/1/11 | $ | 45,562 | |||||||
| 30,000 | NetFlix, Inc., 8.500%, 11/15/17 | 33,450 | |||||||||
| 20,000 | News America, Inc., 6.900%, 8/15/39 | 23,569 | |||||||||
| 30,000 | Pokagon Gaming Auth., 144a, 10.375%, 6/15/14 | 31,312 | |||||||||
| 10,000 | Royal Caribbean Cruises Ltd., 6.875%, 12/1/13 | 10,525 | |||||||||
| 5,000 | Scientific Games International, Inc., 9.250%, 6/15/19 | 5,313 | |||||||||
| 35,000 | Seneca Gaming Corp., Ser B, 7.250%, 5/1/12 | 34,475 | |||||||||
| 7,000 | Starwood Hotels & Resorts Worldwide, Inc., 7.875%, 10/15/14 | 7,840 | |||||||||
| 10,000 | Starwood Hotels & Resorts Worldwide, Inc., 7.875%, 5/1/12 | 10,725 | |||||||||
| 20,000 | Sun Media Corp., 7.625%, 2/15/13 | 20,100 | |||||||||
| 80,000 | Time Warner Cable, Inc., 8.750%, 2/14/19 | 105,648 | |||||||||
| 45,000 | Time Warner, Inc., 6.100%, 7/15/40 | 48,457 | |||||||||
| 15,000 | Toys R Us Property Co. I LLC, 10.750%, 7/15/17 | 16,950 | |||||||||
| 10,000 | Videotron Ltee, 6.875%, 1/15/14 | 10,150 | |||||||||
| 20,000 | Wyndham Worldwide Corp., 7.375%, 3/1/20 | 21,375 | |||||||||
| 866,893 | |||||||||||
| Energy — 3.0% | |||||||||||
| 50,000 | Berry Petroleum Co., 10.250%, 6/1/14 | 56,375 | |||||||||
| 30,000 | Bill Barrett Corp., 9.875%, 7/15/16 | 32,775 | |||||||||
| 40,000 | BP Capital Markets PLC, 4.500%, 10/1/20 | 40,905 | |||||||||
| 40,000 | Chesapeake Energy Corp., 6.625%, 8/15/20 | 41,800 | |||||||||
| 40,000 | Cie Generale de Geophysique-Veritas, 7.500%, 5/15/15 | 40,700 | |||||||||
| 32,000 | Comstock Resources, Inc., 8.375%, 10/15/17 | 33,000 | |||||||||
| 28,000 | Denbury Resources, Inc., 8.250%, 2/15/20 | 30,555 | |||||||||
| 34,000 | Encore Acquisition Co., 9.500%, 5/1/16 | 37,952 | |||||||||
| 20,000 | Geokinetics Holdings USA, Inc., 144a, 9.750%, 12/15/14 | 17,500 | |||||||||
| 10,000 | Linn Energy LLC/Linn Energy Finance Corp., 144a, 8.625%, 4/15/20 | 10,600 | |||||||||
| 35,000 | Mariner Energy, Inc., 7.500%, 4/15/13 | �� | 36,269 | ||||||||
| 55,000 | Nexen, Inc., 7.500%, 7/30/39 | 67,579 | |||||||||
| 65,000 | Petrobras International Finance Co., 7.875%, 3/15/19 | 81,062 | |||||||||
| 39,000 | Plains Exploration & Production Co., 7.750%, 6/15/15 | 40,901 | |||||||||
| 70,000 | Pride International, Inc., 8.500%, 6/15/19 | 81,200 | |||||||||
| 15,000 | QEP Resources, Inc., 6.875%, 3/1/21 | 16,238 | |||||||||
| 38,000 | Quicksilver Resources, Inc., 11.750%, 1/1/16 | 44,555 | |||||||||
| 709,966 | |||||||||||
140
Core Plus Fixed Income Fund (Continued)
| Principal Amount | Market Value | ||||||||||
| Corporate Bonds — 45.6% (Continued) Telecommunication Services — 2.9% | |||||||||||
| $ | 65,000 | British Telecommunications PLC, 9.875%, 12/15/30 | $ | 90,504 | |||||||
| 80,000 | Cellco Partnership/Verizon Wireless Capital LLC, 8.500%, 11/15/18 | 108,930 | |||||||||
| 34,000 | Frontier Communications Corp., 7.875%, 1/15/27 | 34,340 | |||||||||
| 40,000 | NII Capital Corp., 8.875%, 12/15/19 | 44,450 | |||||||||
| 53,000 | Qwest Communications International, Inc., Ser B, 7.500%, 2/15/14 | 54,060 | |||||||||
| 60,000 | Qwest Corp., 8.875%, 3/15/12 | 65,850 | |||||||||
| 90,000 | Rogers Communications, Inc., 7.500%, 3/15/15 | 110,017 | |||||||||
| 41,000 | Sprint Nextel Corp., 8.375%, 8/15/17 | 44,485 | |||||||||
| 75,000 | Telecom Italia Capital SA, 7.175%, 6/18/19 | 88,027 | |||||||||
| 30,000 | Verizon Communications, Inc., 8.950%, 3/1/39 | 43,988 | |||||||||
| 20,000 | Windstream Corp., 7.000%, 3/15/19 | 19,600 | |||||||||
| 704,251 | |||||||||||
| Industrials — 2.6% | |||||||||||
| 40,000 | ARAMARK Corp., 8.500%, 2/1/15 | 41,600 | |||||||||
| 10,000 | ARAMARK Corp., 5.000%, 6/1/12 | 10,025 | |||||||||
| 64,000 | Avis Budget Car Rental LLC/Avis Budget Finance, Inc., 7.750%, 5/15/16 | 62,880 | |||||||||
| 10,000 | Avis Budget Car Rental LLC/Avis Budget Finance, Inc., 9.625%, 3/15/18 | 10,575 | |||||||||
| 10,000 | BE Aerospace, Inc., 6.875%, 10/1/20 | 10,200 | |||||||||
| 15,000 | Bombardier, Inc., 144a, 7.750%, 3/15/20 | 16,200 | |||||||||
| 50,000 | Bristow Group, Inc., 6.125%, 6/15/13 | 50,625 | |||||||||
| 45,000 | Canadian Pacific Railway Co., 7.250%, 5/15/19 | 55,685 | |||||||||
| 15,000 | Case New Holland, Inc., 7.750%, 9/1/13 | 16,294 | |||||||||
| 42,000 | FTI Consulting, Inc., 7.625%, 6/15/13 | 42,735 | |||||||||
| 45,000 | FTI Consulting, Inc., 144a, 6.750%, 10/1/20 | 45,337 | |||||||||
| 20,000 | Kansas City Southern Railway, 13.000%, 12/15/13 | 24,225 | |||||||||
| 100,000 | Meccanica Holdings USA, 144a, 6.250%, 7/15/19 | 110,906 | |||||||||
| 40,000 | Pall Corp., 5.000%, 6/15/20 | 43,421 | |||||||||
| 26,000 | RailAmerica, Inc., 9.250%, 7/1/17 | 28,502 | |||||||||
| 20,000 | Roper Industries, Inc., 6.250%, 9/1/19 | 23,148 | |||||||||
| 20,000 | SPX Corp., 144a, 6.875%, 9/1/17 | 21,200 | |||||||||
| 613,558 | |||||||||||
| Materials — 2.2% | |||||||||||
| 5,000 | Ball Corp., 6.750%, 9/15/20 | 5,300 | |||||||||
| 25,000 | Buckeye Technologies, Inc., 8.500%, 10/1/13 | 25,313 | |||||||||
| 42,000 | Cellu Tissue Holdings, Inc., 11.500%, 6/1/14 | 49,350 | |||||||||
| 53,000 | Clearwater Paper Corp., 10.625%, 6/15/16 | 59,625 | |||||||||
| 59,000 | Domtar Corp., 10.750%, 6/1/17 | 73,455 | |||||||||
| Principal Amount | Market Value | ||||||||||
| $ | 25,000 | International Paper Co., 9.375%, 5/15/19 | $ | 32,432 | |||||||
| 30,000 | Masco Corp., 7.125%, 3/15/20 | 30,733 | |||||||||
| 60,000 | Massey Energy Co., 6.875%, 12/15/13 | 61,500 | |||||||||
| 30,000 | Nalco Co., 8.875%, 11/15/13 | 30,675 | |||||||||
| 18,000 | Rock-Tenn Co., 9.250%, 3/15/16 | 19,755 | |||||||||
| 30,000 | Solutia, Inc., 8.750%, 11/1/17 | 32,775 | |||||||||
| 10,000 | Solutia, Inc., 7.875%, 3/15/20 | 10,688 | |||||||||
| 30,000 | Southern Copper Corp., 6.750%, 4/16/40 | 32,754 | |||||||||
| 17,000 | Steel Dynamics, Inc., 6.750%, 4/1/15 | 17,382 | |||||||||
| 30,000 | Teck Resources Ltd., 10.250%, 5/15/16 | 36,450 | |||||||||
| 518,187 | |||||||||||
| Health Care — 1.9% | |||||||||||
| 35,000 | Biomet, Inc., 10.000%, 10/15/17 | 38,631 | |||||||||
| 70,000 | Boston Scientific Corp., 4.500%, 1/15/15 | 71,609 | |||||||||
| 20,000 | Boston Scientific Corp., 6.000%, 1/15/20 | 21,331 | |||||||||
| 43,000 | CHS/Community Health Systems, Inc., 8.875%, 7/15/15 | 45,687 | |||||||||
| 30,000 | Coventry Health Care, Inc., 6.300%, 8/15/14 | 32,121 | |||||||||
| 20,000 | DaVita, Inc., 6.625%, 3/15/13 | 20,325 | |||||||||
| 25,000 | HCA, Inc., 7.250%, 9/15/20 | 26,750 | |||||||||
| 55,000 | HCA, Inc., 9.250%, 11/15/16 | 59,537 | |||||||||
| 50,000 | Life Technologies Corp., 6.000%, 3/1/20 | 56,641 | |||||||||
| 20,000 | Mylan, Inc., 144a, 7.625%, 7/15/17 | 21,275 | |||||||||
| 50,000 | Omnicare, Inc., 6.125%, 6/1/13 | 49,938 | |||||||||
| 443,845 | |||||||||||
| Information Technology — 1.5% | |||||||||||
| 50,000 | BMC Software, Inc., 7.250%, 6/1/18 | 60,373 | |||||||||
| 15,000 | Brocade Communications Systems, Inc., 6.875%, 1/15/20 | 15,750 | |||||||||
| 130,000 | CC Holdings, 144a, 7.750%, 5/1/17 | 143,650 | |||||||||
| 11,000 | Crown Castle International Corp., 9.000%, 1/15/15 | 12,127 | |||||||||
| 55,000 | Seagate Technology International, 144a, 10.000%, 5/1/14 | 64,900 | |||||||||
| 25,000 | Stream Global Services, Inc., 11.250%, 10/1/14 | 24,625 | |||||||||
| 40,000 | Xerox Corp., 6.750%, 12/15/39 | 47,307 | |||||||||
| 368,732 | |||||||||||
| Consumer Staples — 1.5% | |||||||||||
| 30,000 | Alliance One International, Inc., 10.000%, 7/15/16 | 32,475 | |||||||||
| 25,000 | Altria Group, Inc., 9.700%, 11/10/18 | 33,840 | |||||||||
| 45,000 | Bunge Ltd. Finance Corp., 8.500%, 6/15/19 | 54,390 | |||||||||
| 25,000 | CVS Caremark Corp., 6.600%, 3/15/19 | 30,338 | |||||||||
| 128,584 | CVS Pass-Through Trust, 144a, 7.507%, 1/10/32 | 150,875 | |||||||||
| 53,000 | Stater Brothers Holdings, 8.125%, 6/15/12 | 53,066 | |||||||||
| 354,984 | |||||||||||
| Total Corporate Bonds | $ | 10,862,914 | |||||||||
141
Core Plus Fixed Income Fund (Continued)
| Principal Amount | Market Value | ||||||||||
| U.S. Government Mortgage-Backed Obligations — 19.9% | |||||||||||
| $ | 44,762 | FHLMC, Pool #G03871, 5.500%, 2/1/38 | $ | 47,811 | |||||||
| 212,027 | FHLMC, Pool #G02558, 6.000%, 1/1/37 | 228,442 | |||||||||
| 56,166 | FHLMC, Pool #G04346, 6.000%, 5/1/38 | 60,686 | |||||||||
| 111,844 | FHLMC Gold, Pool #G01838, 5.000%, 7/1/35 | 118,334 | |||||||||
| 197,422 | FHLMC Gold, Pool #G01665, 5.500%, 3/1/34 | 211,873 | |||||||||
| 89,886 | FHLMC Gold, Pool #G05888, 5.500%, 10/1/39 | 96,006 | |||||||||
| 195,148 | FHLMC Gold, Pool #G04123, 6.000%, 3/1/38 | 209,586 | |||||||||
| 25,693 | FHLMC Gold, Pool #G02419, 6.500%, 10/1/36 | 28,059 | |||||||||
| 53,235 | FHLMC Gold, Pool #G03633, 6.500%, 12/1/37 | 58,052 | |||||||||
| 8,587 | FHLMC Gold, Pool #G05680, 6.500%, 4/1/39 | 9,364 | |||||||||
| 647,396 | FNMA, Pool #735925, 5.000%, 10/1/35 | 684,356 | |||||||||
| 638,862 | FNMA, Pool #745275, 5.000%, 2/1/36 | 675,335 | |||||||||
| 639,927 | FNMA, Pool #995023, 5.500%, 8/1/37 | 684,360 | |||||||||
| 170,379 | FNMA, Pool #889684, 5.500%, 8/1/37 | 182,209 | |||||||||
| 228,974 | FNMA, Pool #929317, 5.500%, 3/1/38 | 244,402 | |||||||||
| 77,109 | FNMA, Pool #831811, 6.000%, 9/1/36 | 83,565 | |||||||||
| 175,697 | FNMA, Pool #888222, 6.000%, 2/1/37 | 189,765 | |||||||||
| 185,790 | FNMA, Pool #911586, 6.000%, 4/1/37 | 201,448 | |||||||||
| 13,421 | FNMA, Pool #995196, 6.000%, 7/1/38 | 14,495 | |||||||||
| 99,576 | FNMA, Pool #995226, 6.000%, 11/1/38 | 107,145 | |||||||||
| 151,500 | GNMA, Pool #712690, 5.000%, 4/15/39 | 162,119 | |||||||||
| 407,036 | GNMA, Pool #698387, 5.000%, 7/15/39 | 435,452 | |||||||||
| Total U.S. Government Mortgage-Backed Obligations | $ | 4,732,864 | |||||||||
| U.S. Treasury Obligations — 13.3% | |||||||||||
| 715,000 | U.S. Treasury Note, 4.875%, 6/30/12 | 771,362 | |||||||||
| 1,775,000 | U.S. Treasury Note, 1.875%, 4/30/14 | 1,840,592 | |||||||||
| 140,000 | U.S. Treasury Note, 3.500%, 5/15/20 | 151,966 | |||||||||
| 415,000 | U.S. Treasury Note, 3.500%, 2/15/39 | 401,512 | |||||||||
| Total U.S. Treasury Obligations | $ | 3,165,432 | |||||||||
| Commercial Mortgage-Backed Securities — 9.4% | |||||||||||
| 210,000 | Banc of America Commercial Mortgage, Inc., Ser 2008-1, Class A4, 6.339%, 2/10/51 (a) | 230,187 | |||||||||
| 67,249 | Banc of America Funding Corp., Ser 2004-A, Class 2A1, 4.531%, 5/20/34 (a) | 67,349 | |||||||||
| 107,581 | Banc of America Funding Corp., Ser 2005-G, Class A3, 5.210%, 10/20/35 (a) | 102,050 | |||||||||
| 152,000 | Bear Stearns Commercial Mortgage Securities, Ser 2007-PW17, Class A4, 5.694%, 6/11/50 (a) | 164,083 | |||||||||
| Principal Amount | Market Value | ||||||||||
| $ | 155,000 | Bear Stearns Commercial Mortgage Securities, Ser 2007-T28, Class A4, 5.742%, 9/11/42 (a) | $ | 171,994 | |||||||
| 111,000 | Citigroup Commercial Mortgage Trust, Ser 2007-C6, Class A4, 5.887%, 12/10/49 (a) | 118,834 | |||||||||
| 150,000 | Commercial Mortgage Pass Through Certificates, Ser 2007-C9, Class A4, 6.009%, 12/10/49 (a) | 163,272 | |||||||||
| 111,830 | Deutsche ALT-A Securities, Inc. Alternate Loan Trust, Ser 2005-1, Class 1A1, 0.756%, 2/25/35 (a) | 84,149 | |||||||||
| 176,000 | Greenwich Capital Commercial Funding Corp., Ser 2007-GG9, Class A4, 5.444%, 3/10/39 | 185,523 | |||||||||
| 31,022 | GSR Mortgage Loan Trust, Ser 2004-9, Class 4A1, 2.910%, 8/25/34 (a) | 29,502 | |||||||||
| 36,643 | GSR Mortgage Loan Trust, Ser 2005-4F, Class 6A1, 6.500%, 2/25/35 | 37,548 | |||||||||
| 182,000 | JP Morgan Chase Commercial Mortgage Securities Corp., Ser 2006-LDP9, Class A3, 5.336%, 5/15/47 | 189,281 | |||||||||
| 145,000 | JP Morgan Chase Commercial Mortgage Securities Corp., Ser 2007-CB18, Class A4, 5.440%, 6/12/47 | 151,987 | |||||||||
| 171,000 | JP Morgan Chase Commercial Mortgage Securities Corp., Ser 2007-CB20, Class A4, 5.794%, 2/12/51 (a) | 183,981 | |||||||||
| 25,000 | JP Morgan Mortgage Trust, Ser 2003-A2, Class 2A3, 4.694%, 11/25/33 (a) | 25,231 | |||||||||
| 73,000 | JP Morgan Mortgage Trust, Ser 2005-A2, Class 5A2, 4.309%, 4/25/35 (a) | 73,642 | |||||||||
| 37,571 | Residential Asset Mortgage Products, Inc., Ser 2004-SL1, Class A7, 7.000%, 11/25/31 | 38,188 | |||||||||
| 24,046 | Structured Adjustable Rate Mortgage Loan Trust, Ser 2004-12, Class 6A, 2.986%, 9/25/34 (a) | 22,260 | |||||||||
| 104,325 | Wells Fargo Mortgage Backed Securities Trust, Ser 2005-AR8, Class 3A2, 2.886%, 6/25/35 (a) | 98,657 | |||||||||
| 80,811 | Wells Fargo Mortgage Backed Securities Trust, Ser 2007-5, Class 1A1, 5.500%, 5/25/37 | 80,449 | |||||||||
| 16,296 | Wells Fargo Mortgage Backed Securities Trust, Ser 2007-5, Class 2A3, 5.500%, 5/25/22 | 16,368 | |||||||||
| Total Commercial Mortgage-Backed Securities | $ | 2,234,535 | |||||||||
| Sovereign Government Obligations — 7.2% | |||||||||||
| 235,000 | Australia Government Bond, Ser 125, 6.250%, 6/15/14 | 237,792 | |||||||||
| 472,000 | Australia Government Bond, Ser 118, 6.500%, 5/15/13 | 475,551 | |||||||||
142
Core Plus Fixed Income Fund (Continued)
| Principal Amount | Market Value | ||||||||||
| Sovereign Government Obligations — 7.2% (Continued) | |||||||||||
| $ | 297,000 | Canadian Government Bond, 3.500%, 6/1/20 | $ | 306,612 | |||||||
| 40,000 | Corp. Andina de Fomento, 8.125%, 6/4/19 | 49,793 | |||||||||
| 195,000 | New Zealand Government Bond, Ser 1217, 6.000%, 12/15/17 | 153,868 | |||||||||
| 335,000 | New Zealand Government Bond, Ser 521, 6.000%, 5/15/21 | 264,582 | |||||||||
| 132,000 | United Kingdom Gilt, 4.500%, 3/7/19 | 234,056 | |||||||||
| Total Sovereign Government Obligations | $ | 1,722,254 | |||||||||
| Asset-Backed Securities — 1.3% | |||||||||||
| 12,979 | Countrywide Asset-Backed Certificates, Ser 2004-15, Class AF4, 4.614%, 12/25/32 (a) | 12,871 | |||||||||
| 132,000 | Merrill Lynch Mortgage Trust, Ser 2007-C1, Class A4, 6.020%, 6/12/50 (a) | 141,165 | |||||||||
| 76,272 | Morgan Stanley Home Equity Loan Trust, Ser 2007-2, Class A1, 0.356%, 4/25/37 (a) | 69,560 | |||||||||
| 100,000 | Newcastle Investment Trust, Ser 2010-MH1, Class M1, 144a, 6.000%, 7/10/35 | 100,873 | |||||||||
| Total Asset-Backed Securities | $ | 324,469 | |||||||||
Shares | Market Value | ||||||||||
| Investment Fund — 6.6% | |||||||||||
| 1,567,366 | Touchstone Institutional Money Market Fund^ | $ | 1,567,366 | ||||||||
| Total Investment Securities — 103.3% (Cost $23,860,105) | $ | 24,609,834 | |||||||||
| Liabilities in Excess of Other Assets — (3.3%) | (781,904 | ) | |||||||||
| Net Assets — 100.0% | $ | 23,827,930 | |||||||||
(a) Variable rate security – the rate reflected is the rate in effect as of September 30, 2010.
^ Affiliated Fund, sub-advised by Fort Washington Investment Advisors, Inc. See Note 4.
Portfolio Abbreviations:
FHLMC – Federal Home Loan Mortgage Corp.
FNMA – Federal National Mortgage Association
GNMA – Government National Mortgage Association
MTN – Medium Term Note
PLC – Public Limited Company
REIT – Real Estate Investment Trust
144a – This is a restricted security that was sold in a transaction exempt from Rule 144a of the Securities Act of 1933. This security may be sold in transactions exempt from registration, normally to qualified institutional buyers. At September 30, 2010, these securities were valued at $2,062,911 or 8.7% of net assets.
Other Information:
The inputs or methodology used for valuing securities may not be an indication of the risk associated with investing in those securities. For more information on valuation inputs, and their aggregation into the levels used in the table below, please refer to the security valuation section in the accompanying notes to financial statements.
Valuation Inputs at Reporting Date:
| Description | Level 1 | Level 2 | Level 3 | Total | |||||||||||||||
| Corporate Bonds | $ | — | $ | 10,862,914 | $ | — | $ | 10,862,914 | |||||||||||
| U.S. Government Mortgage-Backed Obligations | — | 4,732,864 | — | 4,732,864 | |||||||||||||||
| U.S. Treasury Obligations | — | 3,165,432 | — | 3,165,432 | |||||||||||||||
| Commercial Mortgage-Backed Securities | — | 2,234,535 | — | 2,234,535 | |||||||||||||||
| Sovereign Government Obligations | — | 1,722,254 | — | 1,722,254 | |||||||||||||||
| Investment Fund | 1,567,366 | — | — | 1,567,366 | |||||||||||||||
| Asset-Backed Securities | — | 324,469 | — | 324,469 | |||||||||||||||
| $ | 24,609,834 | ||||||||||||||||||
| Level 1 | Level 2 | Level 3 | Total | ||||||||||||||||
| Other Financial Instruments* | |||||||||||||||||||
| Forward Currency Contracts | $ | — | $ | (37,220 | ) | $ | — | $ | (37,220 | ) | |||||||||
* Other financial instruments are derivative instruments not reflected in total investments. Amounts shown represent unrealized depreciation.
See accompanying notes to financial statements.
143
Core Plus Fixed Income Fund (Continued)
Forward Foreign Currency Exchange Contracts
| Contract To | Unrealized Appreciation/ | ||||||||||||||||||||||
| Value Date | Receive | Deliver | (Depreciation) | ||||||||||||||||||||
| 11/12/2010 | AUD | 185,000 | USD | 178,296 | $ | (350 | ) | ||||||||||||||||
| 11/12/2010 | AUD | 54,000 | USD | 47,831 | 4,111 | ||||||||||||||||||
| 10/05/2010 | CAD | 53,864 | USD | 52,525 | (174 | ) | |||||||||||||||||
| 10/05/2010 | GBP | 17,025 | USD | 26,960 | (216 | ) | |||||||||||||||||
| 11/12/2010 | USD | 58,122 | AUD | 62,000 | (1,514 | ) | |||||||||||||||||
| 11/12/2010 | USD | 90,982 | AUD | 100,060 | (5,263 | ) | |||||||||||||||||
| 11/12/2010 | USD | 512,985 | AUD | 566,602 | (32,013 | ) | |||||||||||||||||
| 12/15/2010 | USD | 25,656 | CAD | 26,316 | 123 | ||||||||||||||||||
| 12/15/2010 | USD | 126,413 | CAD | 130,000 | 280 | ||||||||||||||||||
| 11/23/2010 | USD | 26,930 | GBP | 17,012 | 215 | ||||||||||||||||||
| 11/23/2010 | USD | 208,475 | GBP | 131,200 | 2,448 | ||||||||||||||||||
| 11/17/2010 | USD | 99,280 | NZD | 136,000 | (144 | ) | |||||||||||||||||
| 11/17/2010 | USD | 299,738 | NZD | 416,465 | (4,723 | ) | |||||||||||||||||
| $ | (37,220 | ) | |||||||||||||||||||||
144
Portfolio of Investments
Emerging Markets Equity Fund – September 30, 2010
| Common Stocks — 89.5% | Shares | Market Value | |||||||||
| Financials — 21.5% | |||||||||||
| Akbank TAS (Turkey) | 463,059 | $ | 2,832,997 | ||||||||
| Banco Bradesco SA (Preference) (Brazil) | 141,555 | 2,831,100 | |||||||||
| Bank Mandiri Tbk PT (Indonesia) | 3,061,515 | 2,469,794 | |||||||||
| Busan Bank (South Korea) | 139,660 | 1,720,871 | |||||||||
| China Overseas Land & Investment Ltd. (Hong Kong) | 1,004,524 | 2,125,867 | |||||||||
| CIMB Group Holdings Bhd (Malaysia) | 799,300 | 2,115,413 | |||||||||
| First Pacific Co. (Hong Kong) | 2,849,364 | 2,589,046 | |||||||||
| Grupo Financiero Banorte SAB de CV - Class O (Mexico) | 305,327 | 1,158,152 | |||||||||
| Industrial & Commercial Bank of China (China) | 1,987,093 | 1,480,296 | |||||||||
| JPM Bharat Forge Ltd Pnote (Netherlands)* | 62,000 | 500,167 | |||||||||
| JPM Bharat Heavy Electricals Pnote, Series 0005 (Netherlands)* | 15,372 | 847,880 | |||||||||
| JPM ITC Ltd Pnote, Series 000H (Netherlands)* | 114,000 | 452,347 | |||||||||
| JPM Oil & Natural Gas Corp. Ltd Pnote, Series 000J (Netherlands)* | 13,700 | 428,089 | |||||||||
| JPM Piramal Healthcare Ltd Pnote, Series 0003 (Netherlands)* | 19,300 | 214,540 | |||||||||
| Kasikornbank PCL (Thailand) | 614,600 | 2,511,051 | |||||||||
| Keppel Land Ltd. (Singapore) | 635,166 | 1,956,066 | |||||||||
| Land and Houses PCL (Thailand) | 6,243,000 | 1,522,181 | |||||||||
| Shinhan Financial Group Co. Ltd. (South Korea) | 29,790 | 1,140,393 | |||||||||
| Standard Bank Group Ltd. (South Africa) | 105,360 | 1,677,840 | |||||||||
| Wharf Holdings Ltd. (Hong Kong) | 353,425 | 2,273,005 | |||||||||
| 32,847,095 | |||||||||||
| Materials — 16.8% | |||||||||||
| China BlueChemical Ltd. (China) | 2,742,316 | 1,993,422 | |||||||||
| Cia de Minas Buenaventura SA ADR (Peru) | 43,646 | 1,971,926 | |||||||||
| Eldorado Gold Corp. (Canada) | 185,605 | 3,491,056 | |||||||||
| Fresnillo PLC (United Kingdom) | 118,516 | 2,312,316 | |||||||||
| Gerdau SA (Preference) (Brazil) | 119,388 | 1,608,069 | |||||||||
| Impala Platinum Holdings Ltd. (South Africa) | 63,612 | 1,642,719 | |||||||||
| POSCO (South Korea) | 3,063 | 1,386,107 | |||||||||
| Randgold Resources Ltd. ADR (Jersey, C.I.) | 31,611 | 3,207,252 | |||||||||
| Siam Cement PCL (Thailand) | 80,700 | 978,504 | |||||||||
| Siam Cement PCL (Non-Voting) (Thailand) | 80,900 | 887,634 | |||||||||
| Southern Copper Corp. (United States) | 43,700 | 1,534,744 | |||||||||
| Vale SA ADR (Brazil) | 53,123 | 1,661,156 | |||||||||
| Vale SA (Preference) (Brazil) | 62,629 | 1,716,005 | |||||||||
| Yamana Gold, Inc. (Canada) | 120,387 | 1,372,475 | |||||||||
| 25,763,385 | |||||||||||
| Consumer Discretionary — 14.7% | |||||||||||
| Cafe de Coral Holdings Ltd. (Hong Kong) | 577,768 | 1,641,968 | |||||||||
| Consorcio ARA SAB de CV (Mexico) | 1,223,122 | 798,808 | |||||||||
| Daphne International Holdings Ltd. (Hong Kong) | 2,092,117 | 2,472,623 | |||||||||
| Foschini Ltd. (South Africa) | 192,813 | 2,295,693 | |||||||||
| Giant Manufacturing Co. Ltd. (Taiwan) | 486,278 | 1,828,903 | |||||||||
| Shares | Market Value | ||||||||||
| Grupo Televisa SA ADR (Mexico) | 57,299 | $ | 1,084,097 | ||||||||
| Hankook Tire Co. Ltd. (South Korea) | 81,550 | 2,356,564 | |||||||||
| JD Group Ltd. (South Africa) | 244,221 | 1,672,696 | |||||||||
| Lojas Americanas SA (Preference) (Brazil) | 242,243 | 2,190,495 | |||||||||
| Lojas Renner SA (Brazil) | 110,982 | 3,771,552 | |||||||||
| Ports Design Ltd. (Hong Kong) | 755,647 | 2,089,050 | |||||||||
| Shangri-La Asia Ltd. (Hong Kong) | 114,212 | 259,959 | |||||||||
| 22,462,408 | |||||||||||
| Energy — 9.2% | |||||||||||
| CNOOC Ltd. (Hong Kong) | 1,088,611 | 2,110,198 | |||||||||
| PetroChina Co. Ltd. - Class H (China) | 551,389 | 641,724 | |||||||||
| Petroleo Brasileiro SA (Preference) (Brazil) | 207,589 | 3,359,212 | |||||||||
| PTT Exploration & Production PCL (Thailand) | 253,800 | 1,246,003 | |||||||||
| Reliance Industries Ltd. GDR 144A, (India) | 31,500 | 1,404,900 | |||||||||
| Tenaris SA ADR (Luxembourg) † | 52,181 | 2,004,794 | |||||||||
| Thai Oil PCL (Thailand) | 884,500 | 1,537,311 | |||||||||
| Tupras Turkiye Petrol Rafine (Turkey) | 67,518 | 1,820,333 | |||||||||
| 14,124,475 | |||||||||||
| Consumer Staples — 8.2% | |||||||||||
| British American Tobacco Malaysia Bhd (Malaysia) | 103,800 | 1,630,134 | |||||||||
| Fomento Economico Mexicano SAB de CV ADR (Mexico) | 17,557 | 890,667 | |||||||||
| Kimberly-Clark de Mexico SAB de CV - Class A (Mexico) | 286,391 | 1,837,435 | |||||||||
| Massmart Holdings Ltd. (South Africa) | 119,235 | 2,528,307 | |||||||||
| SABMiller PLC (United Kingdom) | 48,229 | 1,542,155 | |||||||||
| Tingyi Cayman Islands Holding Corp. (China) | 952,193 | 2,626,282 | |||||||||
| Wal-Mart de Mexico SAB de CV (Mexico) | 567,543 | 1,427,679 | |||||||||
| 12,482,659 | |||||||||||
| Information Technology — 6.4% | |||||||||||
| ASM Pacific Technology Ltd. (Hong Kong) | 231,100 | 2,061,146 | |||||||||
| Infosys Technologies Ltd. ADR (India) | 30,681 | 2,065,138 | |||||||||
| Samsung Electronics Co. Ltd. (South Korea) | 2,274 | 1,549,571 | |||||||||
| Taiwan Semiconductor Manufacturing Co. Ltd. (Taiwan) | 737,500 | 1,463,598 | |||||||||
| VTech Holdings Ltd. (Hong Kong) † | 268,057 | 2,739,700 | |||||||||
| 9,879,153 | |||||||||||
| Industrials — 4.5% | |||||||||||
| All America Latina Logistica SA (Brazil) | 214,049 | 2,183,502 | |||||||||
| Trakya Cam Sanayi AS (Turkey)* | 1,137,727 | 2,280,881 | |||||||||
| Weichai Power Co. Ltd. - Class H (China) | 233,471 | 2,467,456 | |||||||||
| 6,931,839 | |||||||||||
| Telecommunication Services — 4.2% | |||||||||||
| America Movil SAB de CV, Series L ADR (Mexico) | 31,781 | 1,694,881 | |||||||||
| MTN Group Ltd. (South Africa) | 102,882 | 1,859,780 | |||||||||
| Telekomunikasi Indonesia Tbk PT (Indonesia) | 1,635,116 | 1,685,497 | |||||||||
| Turkcell Iletisim Hizmet AS (Turkey) | 166,678 | 1,123,439 | |||||||||
| 6,363,597 | |||||||||||
145
Emerging Markets Equity Fund (Continued)
| Common Stocks — 89.5% (Continued) | Shares | Market Value | |||||||||
| Utilities — 2.8% | |||||||||||
| Cez AS (Czech Republic) | 39,810 | $ | 1,782,555 | ||||||||
| Cia Energetica de Minas Gerais (Preference) (Brazil) | 107,073 | 1,740,253 | |||||||||
| Enersis SA (Chile) | 1,524,900 | 718,861 | |||||||||
| 4,241,669 | |||||||||||
| Health Care — 1.2% | |||||||||||
| Teva Pharmaceutical Industries Ltd. ADR (Israel) | 34,481 | 1,818,873 | |||||||||
| Total Common Stocks | $ | 136,915,153 | |||||||||
| Investment Funds — 5.6% | |||||||||||
| Invesco Liquid Assets Portfolio** | 1,669,388 | 1,669,388 | |||||||||
| Touchstone Institutional Money Market Fund^ | 6,859,541 | 6,859,541 | |||||||||
| Total Investment Funds | $ | 8,528,929 | |||||||||
| Number of Warrants | |||||||||||
| Warrants — 5.5% | |||||||||||
| Credit Suisse/Nassau, expiring 11/18/11* | 22,200 | 1,224,495 | |||||||||
| Credit Suisse/Nassau, expiring 9/15/14* | 439,972 | 1,745,789 | |||||||||
| Credit Suisse/Nassau, expiring 9/15/14* | 58,568 | 1,830,095 | |||||||||
| CS Bharat Forge LTD/Nassau, expiring 6/24/13* | 211,816 | 1,708,764 | |||||||||
| JP Morgan Structured Products BV, expiring 9/9/14* | 228,166 | 1,859,958 | |||||||||
| Total Warrants | $ | 8,369,101 | |||||||||
| Total Investment Securities — 100.6% (Cost $136,820,016) | $ | 153,813,183 | |||||||||
| Liabilities in Excess of Other Assets — (0.6%) | (868,998 | ) | |||||||||
| Net Assets — 100.0% | $ | 152,944,185 | |||||||||
* Non-income producing security.
† All or a portion of the security is on loan. The total value of the securities on loan as of September 30, 2010, was $1,629,252.
** Represents collateral for securities loaned.
^ Affiliated Fund, sub-advised by Fort Washington Investment Advisors, Inc. See Note 4.
Portfolio Abbreviations:
ADR – American Depositary Receipt
GDR – Global Depositary Receipt
PCL – Public Company Limited
PLC – Public Limited Company
144a – This is a restricted security that was sold in a transaction exempt from Rule 144a of the Securities Act of 1933. This security may be sold in transactions exempt from registration, normally to qualified institutional buyers. At September 30, 2010, these securities were valued at $1,404,900 or 0.9% of net assets.
Other Information:
The inputs or methodology used for valuing securities may not be an indication of the risk associated with investing in those securities. For more information on valuation inputs, and their aggregation into the levels used in the table below, please refer to the security valuation section in the accompanying notes to financial statements.
Valuation Inputs at Reporting Date:
| Description | Level 1 | Level 2 | Level 3 | Total | |||||||||||||||
| Common Stocks | $ | 136,915,153 | $ | — | $ | — | $ | 136,915,153 | |||||||||||
| Investment Funds | 8,528,929 | — | — | 8,528,929 | |||||||||||||||
| Warrants | 8,369,101 | — | — | 8,369,101 | |||||||||||||||
| $ | 153,813,183 | ||||||||||||||||||
| Level 1 | Level 2 | Level 3 | Total | ||||||||||||||||
| Other Financial Instruments* | |||||||||||||||||||
| Forward Currency Contracts | $ | — | $ | 10,274 | $ | — | $ | 10,274 | |||||||||||
* Other financial instruments are derivative instruments not reflected in total investments. Amounts shown represent unrealized appreciation.
See accompanying notes to financial statements.
Forward Foreign Currency Exchange Contracts
| Contract To | Unrealized | ||||||||||||||||||||||
| Value Date | Receive | Deliver | Appreciation | ||||||||||||||||||||
| 10/01/2010 | CZK | 6,455,528 | USD | 353,340 | $ | 4,403 | |||||||||||||||||
| 10/01/2010 | ZAR | 3,617,719 | USD | 513,152 | 5,871 | ||||||||||||||||||
| $ | 10,274 | ||||||||||||||||||||||
146
Portfolio of Investments
Focused Equity Fund – September 30, 2010
| Common Stocks — 99.1% | Shares | Market Value | |||||||||
| Information Technology — 19.6% | |||||||||||
| Arrow Electronics, Inc.* | 2,598 | $ | 69,444 | ||||||||
| Dell, Inc.* | 4,525 | 58,644 | |||||||||
| Hewlett-Packard Co. | 2,095 | 88,137 | |||||||||
| Microsoft Corp. | 2,722 | 66,662 | |||||||||
| Nokia Corp. ADR | 10,331 | 103,620 | |||||||||
| 386,507 | |||||||||||
| Financials — 18.2% | |||||||||||
| Allstate Corp. | 2,743 | 86,542 | |||||||||
| Bank of America Corp. | 9,319 | 122,172 | |||||||||
| Goldman Sachs Group, Inc. (The) | 612 | 88,483 | |||||||||
| SEI Investments Co. | 2,990 | 60,816 | |||||||||
| 358,013 | |||||||||||
| Health Care — 16.9% | |||||||||||
| Baxter International, Inc. | 1,066 | 50,859 | |||||||||
| Genzyme Corp.* | 591 | 41,837 | |||||||||
| Omnicare, Inc. | 2,638 | 62,995 | |||||||||
| UnitedHealth Group, Inc. | 1,997 | 70,115 | |||||||||
| WellPoint, Inc.* | 1,905 | 107,899 | |||||||||
| 333,705 | |||||||||||
| Consumer Discretionary — 16.5% | |||||||||||
| Comcast Corp. - Class A | 2,194 | 39,668 | |||||||||
| DineEquity, Inc.* | 648 | 29,147 | |||||||||
| International Speedway Corp. - Class A | 1,475 | 35,990 | |||||||||
| JC Penney Co., Inc. | 2,387 | 64,879 | |||||||||
| Time Warner Cable, Inc. | 2,868 | 154,843 | |||||||||
| 324,527 | |||||||||||
| Industrials — 7.6% | |||||||||||
| AGCO Corp.* | 2,344 | 91,439 | |||||||||
| Norfolk Southern Corp. | 774 | 46,061 | |||||||||
| Unifirst Corp./MA | 280 | 12,362 | |||||||||
| 149,862 | |||||||||||
| Consumer Staples — 7.6% | |||||||||||
| CVS Caremark Corp. | 1,699 | 53,468 | |||||||||
| Heineken NV ADR | 1,658 | 43,008 | |||||||||
| Kraft Foods, Inc. - Class A | 1,729 | 53,357 | |||||||||
| 149,833 | |||||||||||
| Energy — 5.5% | |||||||||||
| Hess Corp. | 1,220 | 72,126 | |||||||||
| Noble Corp. | 1,078 | 36,426 | |||||||||
| 108,552 | |||||||||||
| Telecommunication Services — 4.4% | |||||||||||
| Deutsche Telekom AG ADR | 1,928 | 26,279 | |||||||||
| Telus Corp. - Class A | 1,407 | 59,586 | |||||||||
| 85,865 | |||||||||||
| Materials — 2.8% | |||||||||||
| Cemex SAB de CV ADR* | 6,452 | 54,842 | |||||||||
| Total Common Stocks | $ | 1,951,706 | |||||||||
| Shares | Market Value | ||||||||||
| Investment Fund — 1.9% | |||||||||||
| Touchstone Institutional Money Market Fund^ | 36,740 | $ | 36,740 | ||||||||
| Total Investment Securities — 101.0% (Cost $1,902,246) | $ | 1,988,446 | |||||||||
| Liabilities in Excess of Other Assets — (1.0%) | (18,474 | ) | |||||||||
| Net Assets — 100.0% | $ | 1,969,972 | |||||||||
* Non-income producing security.
^ Affiliated Fund, sub-advised by Fort Washington Investment Advisors, Inc. See Note 4.
Portfolio Abbreviations:
ADR – American Depositary Receipt
Other Information:
The inputs or methodology used for valuing securities may not be an indication of the risk associated with investing in those securities. For more information on valuation inputs, and their aggregation into the levels used in the table below, please refer to the security valuation section in the accompanying notes to financial statements.
Valuation Inputs at Reporting Date:
| Description | Level 1 | Level 2 | Level 3 | Total | |||||||||||||||
| Common Stocks | $ | 1,951,706 | $ | — | $ | — | $ | 1,951,706 | |||||||||||
| Investment Fund | 36,740 | — | — | 36,740 | |||||||||||||||
| $ | 1,988,446 | ||||||||||||||||||
See accompanying notes to financial statements.
147
Portfolio of Investments
Global Equity Fund – September 30, 2010
| Preferred Stocks — 1.1% | Shares | Market Value | |||||||||
| Consumer Staples — 1.1% | |||||||||||
| Henkel AG & Co. KGaA (Germany) | 1,064 | $ | 57,150 | ||||||||
| Common Stocks — 93.6% Materials — 23.0% | |||||||||||
| Agnico-Eagle Mines Ltd. (Canada) | 2,632 | 186,951 | |||||||||
| CF Industries Holdings, Inc. (United States) | 1,509 | 144,109 | |||||||||
| Fresnillo PLC (United Kingdom) | 5,313 | 103,660 | |||||||||
| Goldcorp, Inc. (Canada) | 2,113 | 91,958 | |||||||||
| Monsanto Co. (United States) | 1,666 | 79,851 | |||||||||
| Newmont Mining Corp. (United States) | 1,848 | 116,073 | |||||||||
| Symrise AG (Germany) | 1,530 | 42,518 | |||||||||
| Syngenta AG (Switzerland) | 694 | 172,467 | |||||||||
| Yamana Gold, Inc. (Canada) | 12,003 | 136,834 | |||||||||
| Yara International ASA (Norway) | 2,620 | 118,501 | |||||||||
| 1,192,922 | |||||||||||
| Consumer Staples — 16.7% | |||||||||||
| Australian Agricultural Co. Ltd. (Australia)* | 60,256 | 89,690 | |||||||||
| Carlsberg A/S - Class B (Denmark) | 1,078 | 112,398 | |||||||||
| Cott Corp. (Canada)* | 9,642 | 75,690 | |||||||||
| Davide Campari-Milano SpA (Italy) | 8,694 | 52,001 | |||||||||
| Foster's Group Ltd. (Australia) | 22,460 | 133,074 | |||||||||
| Hain Celestial Group, Inc. (The) (United States)* | 1,521 | 36,474 | |||||||||
| Kimberly-Clark Corp. (United States) | 871 | 56,659 | |||||||||
| Koninklijke Ahold NV (Netherlands) | 8,960 | 120,779 | |||||||||
| Sara Lee Corp. (United States) | 11,021 | 148,012 | |||||||||
| Thai Beverage PCL (Thailand) | 209,000 | 43,704 | |||||||||
| 868,481 | |||||||||||
| Industrials — 16.3% | |||||||||||
| Ansaldo STS SpA (Italy) | 8,512 | 110,122 | |||||||||
| Central Japan Railway Co. (Japan) | 16 | 117,681 | |||||||||
| Cia de Concessoes Rodoviarias (Brazil) | 3,900 | 99,920 | |||||||||
| Doosan Heavy Industries and Construction Co. Ltd. (South Korea) | 1,515 | 112,803 | |||||||||
| G4S PLC (United Kingdom) | 14,941 | 59,757 | |||||||||
| Invensys PLC (United Kingdom) | 16,338 | 76,611 | |||||||||
| Japan Steel Works Ltd. (Japan) | 8,600 | 80,973 | |||||||||
| Kansas City Southern (United States)* | 2,294 | 85,818 | |||||||||
| Shaw Group, Inc. (United States)* | 3,043 | 102,123 | |||||||||
| 845,808 | |||||||||||
| Health Care — 11.0% | |||||||||||
| Bayer AG (Germany) | 1,097 | 76,494 | |||||||||
| Bristol-Myers Squibb Co. (United States) | 6,340 | 171,878 | |||||||||
| Novartis AG (Switzerland) | 1,720 | 98,633 | |||||||||
| Sanofi-Aventis SA (France) | 1,753 | 116,800 | |||||||||
| Varian Medical Systems, Inc. (United States)* | 1,763 | 106,662 | |||||||||
| 570,467 | |||||||||||
| Shares | Market Value | ||||||||||
| Telecommunication Services — 9.2% | |||||||||||
| Bezeq Israeli Telecommunication Corp. Ltd. (Israel) | 51,211 | $ | 127,662 | ||||||||
| Hutchison Telecommunications Hong Kong Holdings Ltd. (Hong Kong) | 536,000 | 147,836 | |||||||||
| Mobile Telesystems OJSC ADR (Russia) | 1,932 | 41,016 | |||||||||
| SK Telecom Co. Ltd. ADR (South Korea) | 5,333 | 93,168 | |||||||||
| Swisscom AG (Switzerland) | 161 | 64,931 | |||||||||
| 474,613 | |||||||||||
| Consumer Discretionary — 6.8% | |||||||||||
| Genting Bhd (Malaysia) | 44,000 | 141,393 | |||||||||
| Television Broadcasts Ltd. (Hong Kong) | 27,000 | 154,159 | |||||||||
| TomTom NV (Netherlands)* † | 7,813 | 54,267 | |||||||||
| 349,819 | |||||||||||
| Information Technology — 5.9% | |||||||||||
| Check Point Software Technologies Ltd. (Israel)* | 3,167 | 116,957 | |||||||||
| Nokia OYJ (Finland) | 10,890 | 109,414 | |||||||||
| Yahoo! Japan Corp. (Japan) | 237 | 81,877 | |||||||||
| 308,248 | |||||||||||
| Financials — 2.4% | |||||||||||
| Bank of Yokohama Ltd. (The) (Japan) | 17,000 | 79,420 | |||||||||
| Kinnevik Investment AB - Class B (Sweden) | 2,174 | 46,026 | |||||||||
| 125,446 | |||||||||||
| Energy — 2.3% | |||||||||||
| Cairn Energy PLC (United Kingdom)* | 10,400 | 74,106 | |||||||||
| PA Resources AB (Sweden)* | 63,130 | 46,643 | |||||||||
| 120,749 | |||||||||||
| Total Common Stocks | $ | 4,856,553 | |||||||||
| Investment Funds — 2.7% | |||||||||||
| Invesco Liquid Assets Portfolio** | 50,050 | 50,050 | |||||||||
| Touchstone Institutional Money Market Fund^ | 90,045 | 90,045 | |||||||||
| Total Investment Funds | $ | 140,095 | |||||||||
| Total Investment Securities — 97.4% (Cost $4,740,549) | $ | 5,053,798 | |||||||||
| Other Assets in Excess of Liabilities — 2.6% | 136,901 | ||||||||||
| Net Assets — 100.0% | $ | 5,190,699 | |||||||||
* Non-income producing security.
† All or a portion of the security is on loan. The total value of the securities on loan as of September 30, 2010, was $53,482.
** Represents collateral for securities loaned.
^ Affiliated Fund, sub-advised by Fort Washington Investment Advisors, Inc. See Note 4.
148
Global Equity Fund (Continued)
Portfolio Abbreviations:
ADR – American Depositary Receipt
PLC – Public Limited Company
Other Information:
The inputs or methodology used for valuing securities may not be an indication of the risk associated with investing in those securities. For more information on valuation inputs, and their aggregation into the levels used in the table below, please refer to the security valuation section in the accompanying notes to financial statements.
Valuation Inputs at Reporting Date:
| Description | Level 1 | Level 2 | Level 3 | Total | |||||||||||||||
| Common Stocks | $ | 4,856,553 | $ | — | $ | — | $ | 4,856,553 | |||||||||||
| Investment Funds | 140,095 | — | — | 140,095 | |||||||||||||||
| Preferred Stocks | 57,150 | — | — | 57,150 | |||||||||||||||
| $ | 5,053,798 | ||||||||||||||||||
See accompanying notes to financial statements.
149
Portfolio of Investments
Global Real Estate Fund – September 30, 2010
| Common Stocks — 97.8% | Shares | Market Value | |||||||||
| Financials — 97.8% | |||||||||||
| Allgreen Properties Ltd. (Singapore) | 33,000 | $ | 29,610 | ||||||||
| Alstria Office REIT-AG (Germany) | 2,677 | 37,188 | |||||||||
| AMB Property Corp. REIT (United States) | 630 | 16,676 | |||||||||
| AvalonBay Communities, Inc. REIT (United States) | 370 | 38,454 | |||||||||
| BioMed Realty Trust, Inc. REIT (United States) | 790 | 14,157 | |||||||||
| Boston Properties, Inc. REIT (United States) | 1,235 | 102,653 | |||||||||
| British Land Co. PLC REIT (United Kingdom) | 7,192 | 52,535 | |||||||||
| Camden Property Trust REIT (United States) | 1,275 | 61,162 | |||||||||
| Canadian Apartment Properties REIT (Canada) | 2,015 | 33,293 | |||||||||
| Canadian Real Estate Investment Trust REIT (Canada) | 1,147 | 34,837 | |||||||||
| CapitaLand Ltd. (Singapore) | 33,350 | 102,959 | |||||||||
| CapitaMalls Asia Ltd. (Singapore) | 13,000 | 21,352 | |||||||||
| Cedar Shopping Centers, Inc. REIT (United States) | 1,760 | 10,701 | |||||||||
| CFS Retail Property Trust REIT (Australia) | 18,610 | 34,086 | |||||||||
| Charter Hall Retail REIT (Australia) | 12,046 | 33,416 | |||||||||
| Cheung Kong Holdings Ltd. (Hong Kong) | 2,000 | 30,314 | |||||||||
| China Overseas Land & Investment Ltd. (Hong Kong) | 26,600 | 56,293 | |||||||||
| China Resources Land Ltd. (Hong Kong) | 9,730 | 19,789 | |||||||||
| City Developments Ltd. (Singapore) | 2,120 | 20,570 | |||||||||
| Citycon OYJ (Finland) | 4,793 | 20,452 | |||||||||
| Cofinimmo REIT (Belgium) | 206 | 27,344 | |||||||||
| Commonwealth Property Office Fund REIT (Australia) | 24,130 | 21,457 | |||||||||
| Coresite Realty Corp. (United States)* | 960 | 15,734 | |||||||||
| Corio NV REIT (Netherlands) | 400 | 27,347 | |||||||||
| Corporate Office Properties Trust SBI MD REIT (United States) | 860 | 32,087 | |||||||||
| Crombie Real Estate Investment Trust REIT (Canada) | 1,755 | 21,884 | |||||||||
| Derwent London PLC REIT (United Kingdom) | 1,380 | 32,604 | |||||||||
| Development Securities PLC (United Kingdom) | 4,130 | 14,938 | |||||||||
| DiamondRock Hospitality Co. REIT (United States)* | 2,350 | 22,302 | |||||||||
| Digital Realty Trust, Inc. REIT (United States) † | 743 | 45,843 | |||||||||
| Douglas Emmett, Inc. REIT (United States) | 2,540 | 44,475 | |||||||||
| Duke Realty Corp. REIT (United States) | 3,200 | 37,088 | |||||||||
| DuPont Fabros Technology, Inc. REIT (United States) | 1,460 | 36,719 | |||||||||
| Entertainment Properties Trust REIT (United States) | 480 | 20,726 | |||||||||
| Equity Residential REIT (United States) | 2,085 | 99,183 | |||||||||
| Eurocommercial Properties NV REIT (Netherlands) | 1,085 | 50,290 | |||||||||
| Extendicare Real Estate Investment Trust REIT (Canada) | 2,384 | 23,750 | |||||||||
| Federal Realty Investment Trust REIT (United States) | 510 | 41,647 | |||||||||
| Shares | Market Value | ||||||||||
| Fortune Real Estate Investment Trust REIT (Singapore) | 44,000 | $ | 22,003 | ||||||||
| Frasers Centrepoint Trust REIT (Singapore) | 20,000 | 22,508 | |||||||||
| General Growth Properties, Inc. REIT (United States) | 1,660 | 25,896 | |||||||||
| Goodman Group REIT (Australia) | 106,080 | 66,133 | |||||||||
| GPT Group REIT (Australia) | 20,838 | 59,214 | |||||||||
| Great Portland Estates PLC REIT (United Kingdom) | 3,050 | 16,353 | |||||||||
| Hammerson PLC REIT (United Kingdom) | 3,257 | 20,174 | |||||||||
| HCP, Inc. REIT (United States) | 2,320 | 83,474 | |||||||||
| Health Care REIT, Inc. (United States) | 1,230 | 58,228 | |||||||||
| Helical Bar PLC (United Kingdom) | 3,890 | 18,186 | |||||||||
| Henderson Land Development Co. Ltd. (Hong Kong) | 3,000 | 21,363 | |||||||||
| Hongkong Land Holdings Ltd. (Hong Kong) | 11,165 | 69,335 | |||||||||
| Host Hotels & Resorts, Inc. REIT (United States) | 4,303 | 62,307 | |||||||||
| Hufvudstaden AB - Class A (Sweden) | 2,221 | 23,939 | |||||||||
| Hysan Development Co. Ltd. (Hong Kong) | 7,000 | 25,081 | |||||||||
| Japan Excellent, Inc. REIT (Japan) | 5 | 25,006 | |||||||||
| Japan Real Estate Investment Corp. REIT (Japan) | 2 | 18,184 | |||||||||
| Kenedix Realty Investment Corp. REIT (Japan) | 6 | 22,712 | |||||||||
| Kerry Properties Ltd. (Hong Kong) | 12,330 | 67,062 | |||||||||
| Kimco Realty Corp. REIT (United States) | 1,495 | 23,546 | |||||||||
| Klepierre REIT (France) | 929 | 35,828 | |||||||||
| Land Securities Group PLC REIT (United Kingdom) | 5,280 | 53,125 | |||||||||
| Macerich Co. REIT (United States) | 494 | 21,217 | |||||||||
| Mid-America Apartment Communities, Inc. REIT (United States) | 520 | 30,306 | |||||||||
| Mirvac Group REIT (Australia) | 25,700 | 33,038 | |||||||||
| Mitsubishi Estate Co., Ltd. (Japan) | 7,100 | 115,498 | |||||||||
| Mitsui Fudosan Co., Ltd. (Japan) | 5,200 | 87,705 | |||||||||
| Morguard Real Estate Investment Trust REIT (Canada) | 3,353 | 44,809 | |||||||||
| Nationwide Health Properties, Inc. REIT (United States) | 1,460 | 56,458 | |||||||||
| Nippon Building Fund, Inc. REIT (Japan) | 2 | 17,513 | |||||||||
| Norwegian Property ASA (Norway)* | 6,397 | 11,040 | |||||||||
| Post Properties, Inc. REIT (United States) | 1,040 | 29,037 | |||||||||
| ProLogis REIT (United States) | 3,412 | 40,193 | |||||||||
| Public Storage REIT (United States) | 1,535 | 148,956 | |||||||||
| Regency Centers Corp. REIT (United States) | 1,795 | 70,849 | |||||||||
| RioCan Real Estate Investment Trust REIT (Canada) | 1,428 | 31,810 | |||||||||
| Segro PLC REIT (United Kingdom) | 4,785 | 20,521 | |||||||||
| Shenzhen Investment Ltd. (Hong Kong) | 85,170 | 30,626 | |||||||||
| Shimao Property Holdings Ltd. (Hong Kong) | 9,510 | 15,812 | |||||||||
| Simon Property Group, Inc. REIT (United States) | 1,596 | 148,013 | |||||||||
| SL Green Realty Corp. REIT (United States) | 590 | 37,365 | |||||||||
| Societe de la Tour Eiffel REIT (France) | 252 | 19,984 | |||||||||
| Sponda OYJ (Finland) | 3,514 | 17,054 | |||||||||
150
Global Real Estate Fund (Continued)
| Common Stocks — 97.8% (Continued) | Shares | Market Value | |||||||||
| Sumitomo Realty & Development Co., Ltd. (Japan) | 2,675 | $ | 55,275 | ||||||||
| Sun Hung Kai Properties Ltd. (Hong Kong) | 14,830 | 256,123 | |||||||||
| Sunstone Hotel Investors, Inc. REIT (United States)* | 3,410 | 30,929 | |||||||||
| UDR, Inc. REIT (United States) | 1,925 | 40,656 | |||||||||
| Unibail-Rodamco SE REIT (France) | 634 | 140,578 | |||||||||
| United Urban Investment Corp. REIT (Japan) | 3 | 20,664 | |||||||||
| Vastned Retail NV REIT (Netherlands) | 433 | 29,470 | |||||||||
| Ventas, Inc. REIT (United States) | 1,265 | 65,236 | |||||||||
| Vornado Realty Trust REIT (United States) | 1,180 | 100,925 | |||||||||
| Westfield Group REIT (Australia) | 16,920 | 200,500 | |||||||||
| Wharf Holdings Ltd. (Hong Kong) | 11,450 | 73,639 | |||||||||
| 4,267,371 | |||||||||||
| Total Common Stocks | $ | 4,267,371 | |||||||||
| Investment Funds — 4.0% | |||||||||||
| Invesco Liquid Assets Portfolio** | 46,305 | 46,305 | |||||||||
| Touchstone Institutional Money Market Fund^ | 128,215 | 128,215 | |||||||||
| Total Investment Funds | $ | 174,520 | |||||||||
| Total Investment Securities — 101.8% (Cost $4,123,401) | $ | 4,441,891 | |||||||||
| Liabilities in Excess of Other Assets — (1.8%) | (77,182 | ) | |||||||||
| Net Assets — 100.0% | $ | 4,364,709 | |||||||||
* Non-income producing security.
† All or a portion of the security is on loan. The total value of the securities on loan as of September 30, 2010, was $45,350.
** Represents collateral for securities loaned.
^ Affiliated Fund, sub-advised by Fort Washington Investment Advisors, Inc. See Note 4.
Portfolio Abbreviations:
PLC – Public Limited Company
REIT – Real Estate Investment Trust
Other Information:
The inputs or methodology used for valuing securities may not be an indication of the risk associated with investing in those securities. For more information on valuation inputs, and their aggregation into the levels used in the table below, please refer to the security valuation section in the accompanying notes to financial statements.
Valuation Inputs at Reporting Date:
| Description | Level 1 | Level 2 | Level 3 | Total | |||||||||||||||
| Common Stocks | $ | 4,267,371 | $ | — | $ | — | $ | 4,267,371 | |||||||||||
| Investment Funds | 174,520 | — | — | 174,520 | |||||||||||||||
| $ | 4,441,891 | ||||||||||||||||||
| Level 1 | Level 2 | Level 3 | Total | ||||||||||||||||
| Other Financial Instruments* | |||||||||||||||||||
| Forward Currency Contracts | $ | — | $ | (172 | ) | $ | — | $ | (172 | ) | |||||||||
* Other financial instruments are derivative instruments not reflected in total investments. Amounts shown represent unrealized depreciation.
See accompanying notes to financial statements.
151
Global Real Estate Fund (Continued)
Forward Foreign Currency Exchange Contracts
| Contract To | Unrealized Appreciation/ | ||||||||||||||||||||||
| Value Date | Receive | Deliver | (Depreciation) | ||||||||||||||||||||
| 10/05/2010 | AUD | 1,474 | USD | 1,432 | $ | (7 | ) | ||||||||||||||||
| 10/05/2010 | AUD | 1,909 | USD | 1,854 | (9 | ) | |||||||||||||||||
| 10/05/2010 | AUD | 4,936 | USD | 4,794 | (23 | ) | |||||||||||||||||
| 10/05/2010 | AUD | 961 | USD | 934 | (4 | ) | |||||||||||||||||
| 10/05/2010 | AUD | 567 | USD | 550 | (3 | ) | |||||||||||||||||
| 10/05/2010 | AUD | 590 | USD | 573 | (3 | ) | |||||||||||||||||
| 10/05/2010 | AUD | 813 | USD | 790 | (4 | ) | |||||||||||||||||
| 10/04/2010 | EUR | 454 | USD | 619 | — | ||||||||||||||||||
| 10/04/2010 | EUR | 565 | USD | 770 | — | ||||||||||||||||||
| 10/04/2010 | EUR | 1,631 | USD | 2,223 | 1 | ||||||||||||||||||
| 10/04/2010 | EUR | 1,006 | USD | 1,371 | — | ||||||||||||||||||
| 10/04/2010 | EUR | 417 | USD | 568 | — | ||||||||||||||||||
| 10/04/2010 | EUR | 14,620 | USD | 19,943 | (12 | ) | |||||||||||||||||
| 10/04/2010 | EUR | 489 | USD | 666 | — | ||||||||||||||||||
| 10/04/2010 | EUR | 449 | USD | 611 | — | ||||||||||||||||||
| 10/04/2010 | GBP | 947 | USD | 1,496 | (8 | ) | |||||||||||||||||
| 10/04/2010 | GBP | 454 | USD | 717 | (4 | ) | |||||||||||||||||
| 10/04/2010 | GBP | 4,149 | USD | 6,552 | (34 | ) | |||||||||||||||||
| 10/04/2010 | GBP | 964 | USD | 1,523 | (8 | ) | |||||||||||||||||
| 10/04/2010 | GBP | 240 | USD | 379 | (2 | ) | |||||||||||||||||
| 10/04/2010 | GBP | 210 | USD | 332 | (2 | ) | |||||||||||||||||
| 10/04/2010 | GBP | 278 | USD | 439 | (2 | ) | |||||||||||||||||
| 10/04/2010 | GBP | 240 | USD | 379 | (2 | ) | |||||||||||||||||
| 10/04/2010 | HKD | 5,549 | USD | 715 | — | ||||||||||||||||||
| 10/04/2010 | HKD | 3,843 | USD | 495 | — | ||||||||||||||||||
| 10/04/2010 | NOK | 1,745 | USD | 299 | (2 | ) | |||||||||||||||||
| 10/04/2010 | SEK | 4,156 | USD | 619 | (2 | ) | |||||||||||||||||
| 10/04/2010 | SGD | 4,104 | USD | 3,121 | — | ||||||||||||||||||
| 10/04/2010 | SGD | 1,191 | USD | 906 | — | ||||||||||||||||||
| 10/04/2010 | USD | 4,319 | EUR | 3,166 | 3 | ||||||||||||||||||
| 10/04/2010 | USD | 4,953 | GBP | 3,137 | 26 | ||||||||||||||||||
| 10/04/2010 | USD | 26,006 | JPY | 2,174,615 | (44 | ) | |||||||||||||||||
| 10/04/2010 | USD | 8,382 | JPY | 700,892 | (14 | ) | |||||||||||||||||
| 10/05/2010 | USD | 23,916 | SGD | 31,468 | (13 | ) | |||||||||||||||||
| $ | (172 | ) | |||||||||||||||||||||
152
Portfolio of Investments
Healthcare and Biotechnology Fund – September 30, 2010
| Common Stocks — 94.7% | Shares | Market Value | |||||||||
| Health Care — 94.7% | |||||||||||
| Abbott Laboratories | 37,720 | $ | 1,970,493 | ||||||||
| Alexion Pharmaceuticals, Inc.* | 3,960 | 254,866 | |||||||||
| Allergan, Inc. | 12,120 | 806,344 | |||||||||
| AMERIGROUP Corp.* | 16,770 | 712,222 | |||||||||
| AmerisourceBergen Corp. | 13,400 | 410,844 | |||||||||
| Ardea Biosciences, Inc.* | 4,180 | 96,140 | |||||||||
| Baxter International, Inc. | 16,500 | 787,215 | |||||||||
| Bruker Corp.* | 21,070 | 295,612 | |||||||||
| CareFusion Corp.* | 11,030 | 273,985 | |||||||||
| Celgene Corp.* | 5,830 | 335,866 | |||||||||
| Cooper Cos., Inc. (The) | 13,270 | 613,339 | |||||||||
| DaVita, Inc.* | 3,550 | 245,057 | |||||||||
| Dr. Reddy's Laboratories Ltd. ADR † | 13,650 | 439,803 | |||||||||
| Edwards Lifesciences Corp.* | 1,150 | 77,107 | |||||||||
| Emergency Medical Services Corp. - Class A* | 12,400 | 660,300 | |||||||||
| Endo Pharmaceuticals Holdings, Inc.* | 12,920 | 429,461 | |||||||||
| Express Scripts, Inc.* | 23,060 | 1,123,022 | |||||||||
| Genzyme Corp.* | 3,870 | 273,957 | |||||||||
| Healthsouth Corp.* | 13,790 | 264,768 | |||||||||
| Henry Schein, Inc.* | 12,450 | 729,321 | |||||||||
| Hill-Rom Holdings, Inc. | 3,920 | 140,689 | |||||||||
| Hospira, Inc.* | 16,770 | 956,058 | |||||||||
| Human Genome Sciences, Inc.* | 12,810 | 381,610 | |||||||||
| ICON PLC ADR* | 17,860 | 386,133 | |||||||||
| Intuitive Surgical, Inc.* | 3,520 | 998,765 | |||||||||
| McKesson Corp. | 15,750 | 973,035 | |||||||||
| Medco Health Solutions, Inc.* | 23,600 | 1,228,616 | |||||||||
| Merck & Co., Inc. | 38,670 | 1,423,443 | |||||||||
| Onyx Pharmaceuticals, Inc.* | 24,580 | 648,420 | |||||||||
| Orthofix International NV* | 8,910 | 279,952 | |||||||||
| Parexel International Corp.* | 18,090 | 418,422 | |||||||||
| Pfizer, Inc. | 111,219 | 1,909,630 | |||||||||
| Pharmasset, Inc.* | 8,170 | 241,015 | |||||||||
| Quality Systems, Inc. † | 3,620 | 240,042 | |||||||||
| Shire PLC ADR | 11,780 | 792,558 | |||||||||
| Thermo Fisher Scientific, Inc.* | 6,660 | 318,881 | |||||||||
| Thoratec Corp.* | 3,630 | 134,237 | |||||||||
| United Therapeutics Corp.* | 7,860 | 440,239 | |||||||||
| Universal Health Services, Inc. - Class B | 19,010 | 738,729 | |||||||||
| Volcano Corp.* | 5,340 | 138,733 | |||||||||
| Waters Corp.* | 5,180 | 366,640 | |||||||||
| Watson Pharmaceuticals, Inc.* | 12,810 | 541,991 | |||||||||
| WellPoint, Inc.* | 4,820 | 273,005 | |||||||||
| Total Common Stocks | $ | 24,770,565 | |||||||||
| Foreign Common Stock — 4.2% Health Care — 4.2% | |||||||||||
| Valeant Pharmaceuticals International, Inc. † | 43,346 | 1,085,817 | |||||||||
| Shares | Market Value | ||||||||||
| Investment Funds — 8.3% | |||||||||||
| Invesco Liquid Assets Portfolio** | 1,735,431 | $ | 1,735,431 | ||||||||
| Touchstone Institutional Money Market Fund^ | 441,113 | 441,113 | |||||||||
| Total Investment Funds | $ | 2,176,544 | |||||||||
| Total Investment Securities — 107.2% (Cost $25,568,610) | $ | 28,032,926 | |||||||||
| Liabilities in Excess of Other Assets — (7.2%) | (1,871,327 | ) | |||||||||
| Net Assets — 100.0% | $ | 26,161,599 | |||||||||
* Non-income producing security.
† All or a portion of the security is on loan. The total value of the securities on loan as of September 30, 2010, was $1,667,739.
** Represents collateral for securities loaned.
^ Affiliated Fund, sub-advised by Fort Washington Investment Advisors, Inc. See Note 4.
Portfolio Abbreviations:
ADR – American Depositary Receipt
PLC – Public Limited Company
Other Information:
The inputs or methodology used for valuing securities may not be an indication of the risk associated with investing in those securities. For more information on valuation inputs, and their aggregation into the levels used in the table below, please refer to the security valuation section in the accompanying notes to financial statements.
Valuation Inputs at Reporting Date:
| Description | Level 1 | Level 2 | Level 3 | Total | |||||||||||||||
| Common Stocks | $ | 25,856,382 | $ | — | $ | — | $ | 25,856,382 | |||||||||||
| Investment Funds | 2,176,544 | — | — | 2,176,544 | |||||||||||||||
| $ | 28,032,926 | ||||||||||||||||||
See accompanying notes to financial statements.
153
Portfolio of Investments
Intermediate Fixed Income Fund – September 30, 2010
| Principal Amount | Market Value | ||||||||||
| Corporate Bonds — 56.4% Financials — 23.2% | |||||||||||
| $ | 75,000 | ACE Ina Holdings, Inc., 5.700%, 2/15/17 | $ | 84,048 | |||||||
| 370,000 | Allstate Life Global Funding Trusts, 5.375%, 4/30/13 | 408,890 | |||||||||
| 50,000 | Ally Financial, Inc., 2.200%, 12/19/12 | 51,690 | |||||||||
| 25,000 | American Express Bank FSB, 5.500%, 4/16/13 | 27,211 | |||||||||
| 200,000 | American Express Co., 7.000%, 3/19/18 | 240,877 | |||||||||
| 150,000 | American Express Co., 4.875%, 7/15/13 | 162,294 | |||||||||
| 210,000 | American International Group, Inc., 5.450%, 5/18/17 | 213,675 | |||||||||
| 125,000 | Ameriprise Financial, Inc., 5.650%, 11/15/15 | 141,763 | |||||||||
| 200,000 | Bank of America Corp., 5.750%, 12/1/17 | 213,831 | |||||||||
| 30,000 | Bank of America Corp., 5.750%, 8/15/16 | 32,224 | |||||||||
| 800,000 | Bank of America Corp., 3.700%, 9/1/15 | 808,232 | |||||||||
| 200,000 | Bank of America Corp. MTN, 5.650%, 5/1/18 | 211,901 | |||||||||
| 45,000 | Bank One Corp., 5.900%, 11/15/11 | 47,440 | |||||||||
| 500,000 | Barclays Bank PLC MTN, 5.000%, 9/22/16 | 547,064 | |||||||||
| 40,000 | Barclays Bank PLC, 6.750%, 5/22/19 | 47,535 | |||||||||
| 200,000 | Barclays Bank PLC, 5.450%, 9/12/12 | 216,629 | |||||||||
| 325,000 | BB&T Corp., 4.750%, 10/1/12 | 344,167 | |||||||||
| 915,000 | BB&T Corp., 6.850%, 4/30/19 | 1,112,493 | |||||||||
| 150,000 | Bear Stearns Cos. LLC, 5.700%, 11/15/14 | 169,131 | |||||||||
| 30,000 | Bear Stearns Cos. LLC, 6.400%, 10/2/17 | 34,943 | |||||||||
| 500,000 | Berkshire Hathaway Finance Corp., 5.000%, 8/15/13 | 553,202 | |||||||||
| 375,000 | Berkshire Hathaway, Inc., 3.200%, 2/11/15 | 397,695 | |||||||||
| 1,500,000 | Boston Properties LP, 5.875%, 10/15/19 | 1,675,954 | |||||||||
| 345,000 | Capital One Bank USA NA, 8.800%, 7/15/19 | 440,932 | |||||||||
| 350,000 | Capital One Financial Corp., 5.700%, 9/15/11 | 364,778 | |||||||||
| 175,000 | Citigroup, Inc., 5.850%, 8/2/16 | 189,171 | |||||||||
| 500,000 | Citigroup, Inc., 2.875%, 12/9/11 | 514,453 | |||||||||
| 250,000 | Citigroup, Inc., 6.125%, 11/21/17 | 273,087 | |||||||||
| 545,000 | Citigroup, Inc., 5.000%, 9/15/14 | 566,059 | |||||||||
| 40,000 | CME Group, Inc., 5.750%, 2/15/14 | 45,378 | |||||||||
| 200,000 | Deutsche Bank AG, 6.000%, 9/1/17 | 230,550 | |||||||||
| 475,000 | Fifth Third Bancorp, 6.250%, 5/1/13 | 520,087 | |||||||||
| 275,000 | General Electric Capital Corp., 5.400%, 2/15/17 | 302,884 | |||||||||
| 175,000 | General Electric Capital Corp., 5.625%, 5/1/18 | 194,246 | |||||||||
| 1,900,000 | General Electric Capital Corp. MTN, 5.450%, 1/15/13 | 2,066,423 | |||||||||
| 400,000 | General Electric Capital Corp. MTN, 6.000%, 6/15/12 | 431,690 | |||||||||
| 110,000 | Genworth Financial, Inc., 5.750%, 6/15/14 | 113,881 | |||||||||
| Principal Amount | Market Value | ||||||||||
| $ | 35,000 | Goldman Sachs Group, Inc., 6.150%, 4/1/18 | $ | 38,822 | |||||||
| 315,000 | Goldman Sachs Group, Inc., 3.700%, 8/1/15 | 322,280 | |||||||||
| 500,000 | Goldman Sachs Group, Inc., 5.625%, 1/15/17 | 529,470 | |||||||||
| 255,000 | HCP, Inc., 5.650%, 12/15/13 | 274,048 | |||||||||
| 485,000 | HSBC Finance Corp., 5.500%, 1/19/16 | 532,647 | |||||||||
| 500,000 | Jefferies Group, Inc., 8.500%, 7/15/19 | 580,554 | |||||||||
| 275,000 | JP Morgan Chase & Co., 5.375%, 10/1/12 | 297,553 | |||||||||
| 385,000 | JP Morgan Chase & Co., 5.125%, 9/15/14 | 422,127 | |||||||||
| 230,000 | KeyBank NA, 3.200%, 6/15/12 | 240,427 | |||||||||
| 100,000 | KeyBank NA, 5.800%, 7/1/14 | 109,030 | |||||||||
| 530,000 | Keycorp, 6.500%, 5/14/13 | 580,849 | |||||||||
| 470,000 | Kimco Realty Corp., 5.700%, 5/1/17 | 515,627 | |||||||||
| 85,000 | M&I Marshall & Ilsley Bank, 4.850%, 6/16/15 | 82,568 | |||||||||
| 215,000 | Merrill Lynch & Co., Inc., 6.400%, 8/28/17 | 235,276 | |||||||||
| 20,000 | MetLife, Inc., 5.000%, 6/15/15 | 22,196 | |||||||||
| 170,000 | MetLife, Inc., 6.125%, 12/1/11 | 179,747 | |||||||||
| 170,000 | Morgan Stanley, 4.750%, 4/1/14 | 177,543 | |||||||||
| 125,000 | Morgan Stanley, 5.500%, 1/26/20 | 128,481 | |||||||||
| 290,000 | PNC Funding Corp., 2.300%, 6/22/12 | 298,736 | |||||||||
| 1,200,000 | PNC Funding Corp., 5.625%, 2/1/17 | 1,310,248 | |||||||||
| 125,000 | Principal Life Income Funding Trusts, 5.100%, 4/15/14 | 136,351 | |||||||||
| 535,000 | ProLogis, 7.625%, 8/15/14 | 578,183 | |||||||||
| 30,000 | Prudential Financial, Inc., 4.750%, 9/17/15 | 32,444 | |||||||||
| 125,000 | Prudential Financial, Inc. MTN, 4.750%, 4/1/14 | 134,205 | |||||||||
| 535,000 | Regency Centers LP, 6.750%, 1/15/12 | 560,959 | |||||||||
| 25,000 | Simon Property Group LP, 5.750%, 12/1/15 | 28,468 | |||||||||
| 200,000 | SunTrust Bank, Inc., 5.250%, 11/5/12 | 211,495 | |||||||||
| 300,000 | SunTrust Bank, Inc., 6.375%, 4/1/11 | 308,048 | |||||||||
| 150,000 | Toyota Motor Credit Corp., 3.200%, 6/17/15 | 159,127 | |||||||||
| 100,000 | Travelers Cos., Inc., 5.500%, 12/1/15 | 114,087 | |||||||||
| 1,000,000 | Travelers Cos., Inc., 5.900%, 6/2/19 | 1,163,536 | |||||||||
| 250,000 | Union Planters Corp., 4.375%, 12/1/10 | 251,015 | |||||||||
| 185,000 | Wachovia Bank NA, 5.000%, 8/15/15 | 204,583 | |||||||||
| 375,000 | Wachovia Corp., 5.750%, 2/1/18 | 427,343 | |||||||||
| 170,000 | Wells Fargo & Co., 4.950%, 10/16/13 | 184,073 | |||||||||
| 25,368,654 | |||||||||||
| Utilities — 9.0% | |||||||||||
| 20,000 | Arizona Public Service Co., 8.750%, 3/1/19 | 26,276 | |||||||||
| 1,300,000 | Boardwalk Pipelines LLC, 5.750%, 9/15/19 | 1,441,764 | |||||||||
| 150,000 | Consolidated Edison Co. of NY, Ser 08-A, 5.850%, 4/1/18 | 177,742 | |||||||||
| 930,000 | Consolidated Natural Gas Co., Ser A, 5.000%, 12/1/14 | 1,042,395 | |||||||||
154
Intermediate Fixed Income Fund (Continued)
| Principal Amount | Market Value | ||||||||||
| Corporate Bonds — 56.4% (Continued) | |||||||||||
| $ | 100,000 | Detroit Edison Co., Ser G, 5.600%, 6/15/18 | $ | 113,930 | |||||||
| 740,000 | DTE Energy Co., 6.350%, 6/1/16 | 865,644 | |||||||||
| 425,000 | Duke Energy Carolinas, 6.250%, 1/15/12 | 454,868 | |||||||||
| 100,000 | Duke Energy Carolinas LLC, 5.300%, 10/1/15 | 116,333 | |||||||||
| 860,000 | Energy Transfer Partners LP, 5.950%, 2/1/15 | 955,449 | |||||||||
| 650,000 | Enterprise Products Operating LLC, Ser O, 9.750%, 1/31/14 | 796,028 | |||||||||
| 25,000 | Exelon Corp., 4.900%, 6/15/15 | 27,401 | |||||||||
| 520,000 | Exelon Generation Co. LLC, 5.200%, 10/1/19 | 578,468 | |||||||||
| 100,000 | Florida Power Corp., 5.100%, 12/1/15 | 115,074 | |||||||||
| 250,000 | FPL Group Capital, Inc., 5.625%, 9/1/11 | 260,827 | |||||||||
| 115,000 | Georgia Power Co., Ser Z, 5.250%, 12/15/15 | 132,264 | |||||||||
| 125,000 | KeySpan Corp., 7.625%, 11/15/10 | 125,965 | |||||||||
| 660,000 | Metropolitan Edison Co., 7.700%, 1/15/19 | 827,039 | |||||||||
| 20,000 | Midamerican Energy Holdings Co., 5.750%, 4/1/18 | 23,275 | |||||||||
| 310,000 | Midamerican Energy Holdings Co., Ser D, 5.000%, 2/15/14 | 340,004 | |||||||||
| 110,000 | National Rural Utilities Cooperative Finance Corp. MTN, 7.250%, 3/1/12 | 119,710 | |||||||||
| 125,000 | NSTAR Electric Co., 4.875%, 4/15/14 | 138,955 | |||||||||
| 175,000 | PacifiCorp, 6.900%, 11/15/11 | 186,552 | |||||||||
| 180,000 | Public Service Co. of Colorado, Ser 10, 7.875%, 10/1/12 | 203,490 | |||||||||
| 140,000 | Public Service Electric & Gas Co. MTN, 5.375%, 9/1/13 | 156,265 | |||||||||
| 130,000 | Southern Cal Edison, Ser 05-A, 5.000%, 1/15/16 | 148,688 | |||||||||
| 260,000 | TransCanada PipeLines, 6.500%, 8/15/18 | 317,849 | |||||||||
| 100,000 | TransCanada PipeLines Ltd., 4.875%, 1/15/15 | 112,353 | |||||||||
| 9,804,608 | |||||||||||
| Consumer Staples — 5.8% | |||||||||||
| 275,000 | Archer-Daniels-Midland Co., 5.450%, 3/15/18 | 320,365 | |||||||||
| 200,000 | Avon Products, Inc., 4.200%, 7/15/18 | 215,126 | |||||||||
| 150,000 | Bottling Group LLC, 4.625%, 11/15/12 | 161,468 | |||||||||
| 100,000 | Coca-Cola Co., 5.750%, 3/15/11 | 102,358 | |||||||||
| 275,000 | Coca-Cola Co., 5.350%, 11/15/17 | 323,736 | |||||||||
| 200,000 | Coca-Cola Enterprises, Inc., 7.125%, 8/1/17 | 254,758 | |||||||||
| 25,000 | ConAgra Foods, Inc., 7.000%, 4/15/19 | 31,194 | |||||||||
| 25,000 | CVS Caremark Corp., 6.600%, 3/15/19 | 30,338 | |||||||||
| 690,000 | Dr Pepper Snapple Group, Inc., 6.820%, 5/1/18 | 853,699 | |||||||||
| 35,000 | General Mills, Inc., 5.650%, 2/15/19 | 40,993 | |||||||||
| 500,000 | General Mills, Inc., 5.200%, 3/17/15 | 572,151 | |||||||||
| Principal Amount | Market Value | ||||||||||
| $ | 150,000 | Kimberly-Clark Corp., 6.125%, 8/1/17 | $ | 183,141 | |||||||
| 900,000 | Kraft Foods, Inc., 6.250%, 6/1/12 | 977,938 | |||||||||
| 25,000 | Kraft Foods, Inc., 6.500%, 8/11/17 | 29,952 | |||||||||
| 30,000 | Kroger Co., 6.400%, 8/15/17 | 35,863 | |||||||||
| 200,000 | PepsiCo, Inc., 5.150%, 5/15/12 | 213,673 | |||||||||
| 40,000 | Procter & Gamble Co., 4.700%, 2/15/19 | 45,521 | |||||||||
| 921,000 | Safeway, Inc., 6.250%, 3/15/14 | 1,056,890 | |||||||||
| 20,000 | Safeway, Inc., 5.800%, 8/15/12 | 21,625 | |||||||||
| 500,000 | Sara Lee Corp., 3.875%, 6/15/13 | 531,159 | |||||||||
| 120,000 | Sysco Corp., 4.200%, 2/12/13 | 128,995 | |||||||||
| 150,000 | Unilever Capital Corp., 7.125%, 11/1/10 | 150,730 | |||||||||
| 6,281,673 | |||||||||||
| Industrials — 4.0% | |||||||||||
| 385,000 | 3M Co., 4.375%, 8/15/13 | 424,141 | |||||||||
| 385,000 | Boeing Capital Corp., 5.800%, 1/15/13 | 426,182 | |||||||||
| 250,000 | Canadian National Railway Co., 4.400%, 3/15/13 | 269,225 | |||||||||
| 195,000 | Caterpillar Financial Services Corp., 7.150%, 2/15/19 | 251,218 | |||||||||
| 150,000 | Caterpillar Financial Services Corp. MTN, 4.600%, 1/15/14 | 164,498 | |||||||||
| 130,000 | Dover Corp., 4.875%, 10/15/15 | 148,973 | |||||||||
| 150,000 | General Dynamics Corp., 4.250%, 5/15/13 | 163,113 | |||||||||
| 275,000 | General Electric Co., 5.250%, 12/6/17 | 309,513 | |||||||||
| 150,000 | Honeywell International, Inc., 6.125%, 11/1/11 | 158,321 | |||||||||
| 150,000 | John Deere Capital Corp., 7.000%, 3/15/12 | 163,141 | |||||||||
| 500,000 | Northrop Grumman Corp., 3.700%, 8/1/14 | 536,232 | |||||||||
| 140,000 | Parker Hannifin Corp., 5.500%, 5/15/18 | 164,770 | |||||||||
| 500,000 | Southwest Airlines Co., 6.500%, 3/1/12 | 529,756 | |||||||||
| 250,000 | Stanford University, 4.750%, 5/1/19 | 285,487 | |||||||||
| 250,000 | United Parcel Service, Inc., 5.500%, 1/15/18 | 296,136 | |||||||||
| 100,000 | United Technologies Corp., 4.875%, 5/1/15 | 114,573 | |||||||||
| 4,405,279 | |||||||||||
| Energy — 3.2% | |||||||||||
| 750,000 | Anadarko Petroleum Corp., 6.375%, 9/15/17 | 826,466 | |||||||||
| 225,000 | Apache Corp., 6.250%, 4/15/12 | 243,382 | |||||||||
| 500,000 | ConocoPhillips, 4.400%, 5/15/13 | 542,661 | |||||||||
| 650,000 | Marathon Oil Corp., 7.500%, 2/15/19 | 832,322 | |||||||||
| 425,000 | Occidental Petroleum Corp., 4.125%, 6/1/16 | 475,035 | |||||||||
| 150,000 | SeaRiver Maritime, Inc., 0.000%, 9/1/12 | 143,215 | |||||||||
| 320,000 | Shell International Finance BV, 4.000%, 3/21/14 | 346,691 | |||||||||
| 25,000 | Valero Energy Corp., 9.375%, 3/15/19 | 31,926 | |||||||||
| 3,441,698 | |||||||||||
155
Intermediate Fixed Income Fund (Continued)
| Principal Amount | Market Value | ||||||||||
| Corporate Bonds — 56.4% (Continued) Information Technology — 2.6% | |||||||||||
| $ | 150,000 | Cisco Systems, Inc., 5.500%, 2/22/16 | $ | 176,947 | |||||||
| 40,000 | Cisco Systems, Inc., 4.450%, 1/15/20 | 43,951 | |||||||||
| 40,000 | Dell, Inc., 5.875%, 6/15/19 | 46,416 | |||||||||
| 500,000 | Hewlett-Packard Co., 4.500%, 3/1/13 | 541,134 | |||||||||
| 200,000 | IBM Corp., 5.700%, 9/14/17 | 238,897 | |||||||||
| 235,000 | Oracle Corp., 4.950%, 4/15/13 | 258,864 | |||||||||
| 160,000 | Oracle Corp., 3.750%, 7/8/14 | 174,369 | |||||||||
| 150,000 | Pitney Bowes, Inc., 3.875%, 6/15/13 | 156,993 | |||||||||
| 1,000,000 | Xerox Corp., 6.400%, 3/15/16 | 1,164,297 | |||||||||
| 2,801,868 | |||||||||||
| Consumer Discretionary — 2.4% | |||||||||||
| 20,000 | Comcast Corp., 5.875%, 2/15/18 | 23,076 | |||||||||
| 150,000 | Costco Wholesale Corp., 5.500%, 3/15/17 | 178,178 | |||||||||
| 150,000 | Emerson Electric Co., 5.000%, 12/15/14 | 171,262 | |||||||||
| 500,000 | Johnson Controls, Inc., 5.500%, 1/15/16 | 566,589 | |||||||||
| 100,000 | Lowe's Cos., Inc., 5.400%, 10/15/16 | 117,888 | |||||||||
| 175,000 | McDonald's Corp., 6.000%, 4/15/11 | 180,059 | |||||||||
| 125,000 | Omnicom Group, Inc., 5.900%, 4/15/16 | 144,134 | |||||||||
| 20,000 | Staples, Inc., 7.750%, 4/1/11 | 20,651 | |||||||||
| 5,000 | Target Corp., 6.350%, 1/15/11 | 5,085 | |||||||||
| 185,000 | Target Corp., 5.875%, 7/15/16 | 221,529 | |||||||||
| 30,000 | Time Warner Cable, Inc., 6.200%, 7/1/13 | 33,796 | |||||||||
| 20,000 | Time Warner Cable, Inc., 8.250%, 4/1/19 | 25,822 | |||||||||
| 350,000 | Wal-Mart Stores, Inc., 4.250%, 4/15/13 | 379,760 | |||||||||
| 25,000 | Wal-Mart Stores, Inc., 5.800%, 2/15/18 | 30,075 | |||||||||
| 150,000 | Wal-Mart Stores, Inc., 4.500%, 7/1/15 | 170,526 | |||||||||
| 180,000 | Walt Disney Co., 5.500%, 3/15/19 | 214,746 | |||||||||
| 150,000 | Walt Disney Co. MTN, 6.375%, 3/1/12 | 161,864 | |||||||||
| 2,645,040 | |||||||||||
| Materials — 2.1% | |||||||||||
| 350,000 | Alcoa, Inc., 6.000%, 7/15/13 | 380,754 | |||||||||
| 740,000 | Dow Chemical Co., 5.900%, 2/15/15 | 825,160 | |||||||||
| 400,000 | Dow Chemical Co., 4.850%, 8/15/12 | 423,338 | |||||||||
| 450,000 | EI du Pont de Nemours & Co., 3.625%, 1/15/21 | 457,168 | |||||||||
| 200,000 | Praxair, Inc., 5.375%, 11/1/16 | 235,790 | |||||||||
| 2,322,210 | |||||||||||
| Telecommunication Services — 2.1% | |||||||||||
| 110,000 | AT&T, Inc., 5.625%, 6/15/16 | 127,774 | |||||||||
| 145,000 | AT&T, Inc., 5.500%, 2/1/18 | 168,179 | |||||||||
| 75,000 | AT&T, Inc., 5.875%, 8/15/12 | 81,631 | |||||||||
| 140,000 | BellSouth Corp., 5.200%, 9/15/14 | 157,436 | |||||||||
| 225,000 | New Cingular Wireless Services, Inc., 8.125%, 5/1/12 | 249,966 | |||||||||
| 305,000 | Verizon Communications, Inc., 5.500%, 2/15/18 | 350,951 | |||||||||
| 175,000 | Verizon Global Funding Corp., 4.375%, 6/1/13 | 189,630 | |||||||||
| Principal Amount | Market Value | ||||||||||
| $ | 690,000 | Vodafone Group PLC, 3.375%, 11/24/15 | $ | 723,778 | |||||||
| 100,000 | Vodafone Group PLC, 5.625%, 2/27/17 | 114,435 | |||||||||
| 100,000 | Vodafone Group PLC, 5.500%, 6/15/11 | 103,344 | |||||||||
| 2,267,124 | |||||||||||
| Health Care — 2.0% | |||||||||||
| 150,000 | Abbott Laboratories, 5.600%, 11/30/17 | 178,899 | |||||||||
| 205,000 | Abbott Laboratories, 5.875%, 5/15/16 | 246,333 | |||||||||
| 100,000 | Aetna, Inc., 6.000%, 6/15/16 | 117,327 | |||||||||
| 175,000 | AstraZeneca PLC, 5.900%, 9/15/17 | 210,647 | |||||||||
| 120,000 | Baxter International, Inc., 5.900%, 9/1/16 | 144,582 | |||||||||
| 150,000 | Genentech, Inc., 4.750%, 7/15/15 | 169,726 | |||||||||
| 230,000 | Johnson & Johnson, 5.150%, 8/15/12 | 249,461 | |||||||||
| 100,000 | Medtronic, Inc., Ser B, 4.750%, 9/15/15 | 114,099 | |||||||||
| 300,000 | Pfizer, Inc., 6.200%, 3/15/19 | 369,376 | |||||||||
| 115,000 | UnitedHealth Group, Inc., 5.000%, 8/15/14 | 126,847 | |||||||||
| 25,000 | WellPoint, Inc., 5.000%, 1/15/11 | 25,291 | |||||||||
| 120,000 | Wyeth, 5.500%, 2/1/14 | 136,182 | |||||||||
| 125,000 | Wyeth, 5.450%, 4/1/17 | 145,612 | |||||||||
| 2,234,382 | |||||||||||
| Total Corporate Bonds | $ | 61,572,536 | |||||||||
| U.S. Treasury Obligations — 26.3% | |||||||||||
| 500,000 | U.S. Treasury Bond, 11.250%, 2/15/15 | 717,461 | |||||||||
| 800,000 | U.S. Treasury Bond, 8.750%, 5/15/17 | 1,148,687 | |||||||||
| 600,000 | U.S. Treasury Bond, 4.500%, 8/15/39 | 687,000 | |||||||||
| 560,000 | U.S. Treasury Bond, 4.375%, 5/15/40 | 628,953 | |||||||||
| 2,055,000 | U.S. Treasury Note, 1.000%, 9/30/11 | 2,069,369 | |||||||||
| 250,000 | U.S. Treasury Note, 1.375%, 4/15/12 | 253,994 | |||||||||
| 2,000,000 | U.S. Treasury Note, 1.500%, 7/15/12 | 2,040,468 | |||||||||
| 8,000,000 | U.S. Treasury Note, 0.375%, 8/31/12 | 7,994,064 | |||||||||
| 250,000 | U.S. Treasury Note, 4.125%, 8/31/12 | 267,764 | |||||||||
| 500,000 | U.S. Treasury Note, 2.750%, 10/31/13 | 531,719 | |||||||||
| 1,500,000 | U.S. Treasury Note, 1.875%, 2/28/14 | 1,554,962 | |||||||||
| 170,000 | U.S. Treasury Note, 1.750%, 3/31/14 | 175,525 | |||||||||
| 10,500,000 | U.S. Treasury Note, 2.625%, 8/15/20 | 10,598,437 | |||||||||
| Total U.S. Treasury Obligations | $ | 28,668,403 | |||||||||
| U.S. Government Agency Obligations — 9.1% | |||||||||||
| 2,500,000 | FFCB, 1.750%, 2/21/13 | 2,554,710 | |||||||||
| 340,000 | FFCB, 5.125%, 8/25/16 | 404,726 | |||||||||
| 555,000 | FHLB, 1.500%, 1/16/13 | 565,799 | |||||||||
| 1,775,000 | FHLB, 3.625%, 10/18/13 | 1,926,209 | |||||||||
| 465,000 | FHLB, Ser VB15, 5.000%, 12/21/15 | 540,756 | |||||||||
| 275,000 | FHLB, Ser 656, 5.375%, 5/18/16 | 328,250 | |||||||||
| 900,000 | FHLMC, 4.125%, 12/21/12 | 968,948 | |||||||||
| 400,000 | FHLMC, 4.500%, 1/15/14 | 445,651 | |||||||||
| 400,000 | FHLMC, 5.125%, 10/18/16 | 472,192 | |||||||||
| 500,000 | FNMA, 1.250%, 8/20/13 | 505,850 | |||||||||
| 250,000 | FNMA, 2.500%, 5/15/14 | 262,357 | |||||||||
| 150,000 | FNMA, 4.125%, 4/15/14 | 166,068 | |||||||||
| 500,000 | FNMA, 4.375%, 9/15/12 | 537,134 | |||||||||
| 125,000 | FNMA, 4.625%, 10/15/13 | 139,030 | |||||||||
156
Intermediate Fixed Income Fund (Continued)
| Principal Amount | Market Value | ||||||||||
| U.S. Government Agency Obligations — 9.1% (Continued) | |||||||||||
| $ | 150,000 | Tennessee Valley Auth., Ser C, 4.750%, 8/1/13 | $ | 166,109 | |||||||
| Total U.S. Government Agency Obligations | $ | 9,983,789 | |||||||||
| Sovereign Government Obligations — 3.5% | |||||||||||
| 460,000 | African Development Bank, Ser GLOB, 2.750%, 2/25/11 | 464,564 | |||||||||
| 100,000 | Asian Development Bank, 4.500%, 9/4/12 | 107,422 | |||||||||
| 200,000 | European Investment Bank, 3.375%, 6/12/13 | 213,393 | |||||||||
| 200,000 | European Investment Bank, 4.625%, 5/15/14 | 224,376 | |||||||||
| 250,000 | Export-Import Bank of Korea, 5.500%, 10/17/12 | 267,431 | |||||||||
| 180,000 | Hydro Quebec, Ser IU, 7.500%, 4/1/16 | 229,617 | |||||||||
| 150,000 | Inter-American Development Bank, 4.375%, 9/20/12 | 160,781 | |||||||||
| 125,000 | Korea Development Bank, 5.500%, 11/13/12 | 134,070 | |||||||||
| 110,000 | Korea Electric Power Corp., 7.750%, 4/1/13 | 123,641 | |||||||||
| 200,000 | Malaysia, 7.500%, 7/15/11 | 210,052 | |||||||||
| 350,000 | Oesterreichische Kontrollbank AG, 3.125%, 10/14/11 | 359,877 | |||||||||
| 250,000 | Province of Ontario Canada, 4.750%, 1/19/16 | 285,454 | |||||||||
| 200,000 | Province of Quebec Canada, 4.600%, 5/26/15 | 226,571 | |||||||||
| 500,000 | Republic of Chile, 5.500%, 1/15/13 | 545,735 | |||||||||
| 225,000 | Republic of Korea, 4.875%, 9/22/14 | 246,497 | |||||||||
| Total Sovereign Government Obligations | $ | 3,799,481 | |||||||||
Shares | Market Value | ||||||||||
| Investment Fund — 4.0% | |||||||||||
| 4,393,607 | Touchstone Institutional Money Market Fund^ | $ | 4,393,607 | ||||||||
| Total Investment Securities — 99.3% (Cost $102,661,250) | $ | 108,417,816 | |||||||||
| Other Assets in Excess of Liabilities — 0.7% | 720,593 | ||||||||||
| Net Assets — 100.0% | $ | 109,138,409 | |||||||||
^ Affiliated Fund, sub-advised by Fort Washington Investment Advisors, Inc. See Note 4.
Portfolio Abbreviations:
FFCB – Federal Farm Credit Bank
FNMA – Federal National Mortgage Association
FHLB – Federal Home Loan Bank
FHLMC – Federal Home Loan Mortgage Corp.
MTN – Medium Term Note
PLC – Public Limited Company
Other Information:
The inputs or methodology used for valuing securities may not be an indication of the risk associated with investing in those securities. For more information on valuation inputs, and their aggregation into the levels used in the table below, please refer to the security valuation section in the accompanying notes to financial statements.
Valuation Inputs at Reporting Date:
| Description | Level 1 | Level 2 | Level 3 | Total | |||||||||||||||
| Corporate Bonds | $ | — | $ | 61,572,536 | $ | — | $ | 61,572,536 | |||||||||||
| U.S. Treasury Obligations | — | 28,668,403 | — | 28,668,403 | |||||||||||||||
| U.S. Government Agency Obligations | — | 9,983,789 | — | 9,983,789 | |||||||||||||||
| Investment Fund | 4,393,607 | — | — | 4,393,607 | |||||||||||||||
| Sovereign Government Obligations | — | 3,799,481 | — | 3,799,481 | |||||||||||||||
| $ | 108,417,816 | ||||||||||||||||||
See accompanying notes to financial statements.
157
Portfolio of Investments
International Fixed Income Fund – September 30, 2010
| Principal Amount | Market Value | ||||||||||
| Sovereign Government Obligations — 61.9% | |||||||||||
| $ | 30,000,000 | Asian Development Bank, 2.350%, 6/21/27 | $ | 393,259 | |||||||
| 232,000 | Australia Government Bond, Ser 129, 5.500%, 12/15/13 | 228,548 | |||||||||
| 200,000 | Austria Government Bond, 144a, 5.000%, 7/15/12 | 291,370 | |||||||||
| 250,000 | Belgium Government Bond, Ser 56, 3.500%, 3/28/15 | 361,353 | |||||||||
| 400,000 | Brazilian Government International Bond, 12.500%, 1/5/22 | 290,189 | |||||||||
| 130,000 | Bundesrepublik Deutschland, Ser 05, 4.000%, 1/4/37 | 212,341 | |||||||||
| 150,000 | Bundesrepublik Deutschland, Ser 03, 4.750%, 7/4/34 | 268,028 | |||||||||
| 270,000 | Canadian Government Bond, 5.000%, 6/1/14 | 292,911 | |||||||||
| 100,000 | Canadian Government Bond, 5.000%, 6/1/37 | 125,134 | |||||||||
| 2,600,000 | Czech Republic Government Bond, Ser 58, 5.700%, 5/25/24 | 175,126 | |||||||||
| 10,000,000 | Development Bank of Japan, 1.400%, 6/20/12 | 122,031 | |||||||||
| 16,000,000 | Development Bank of Japan, 1.700%, 9/20/22 | 201,313 | |||||||||
| 215,000 | European Investment Bank, 6.000%, 12/7/28 | 429,532 | |||||||||
| 200,000 | Finland Government Bond, 5.375%, 7/4/13 | 304,065 | |||||||||
| 250,000 | France Government Bond OAT, 5.000%, 10/25/16 | 397,950 | |||||||||
| 100,000 | Hellenic Republic Government Bond, Ser 5Y, 4.000%, 8/20/13 | 114,949 | |||||||||
| 1,500,000,000 | Indonesia Treasury Bond, Ser FR49, 9.000%, 9/15/13 | 176,975 | |||||||||
| 250,000 | Ireland Government Bond, 4.600%, 4/18/16 | 319,791 | |||||||||
| 170,000 | Italy Buoni Poliennali Del Tesoro, 3.000%, 4/15/15 | 234,218 | |||||||||
| 170,000 | Italy Buoni Poliennali Del Tesoro, 4.500%, 2/1/20 | 245,410 | |||||||||
| 1,100,000 | Kingdom of Norway, Ser 471, 5.000%, 5/15/15 | 206,307 | |||||||||
| 500,000 | Malaysia Government Bond, Ser 1/01, 3.833%, 9/28/11 | 163,357 | |||||||||
| 200,000 | New Zealand Government Bond, Ser 1217, 6.000%, 12/15/17 | 157,813 | |||||||||
| 150,000 | United Kingdom Gilt, 5.000%, 9/7/14 | 267,759 | |||||||||
| Total Sovereign Government Obligations | $ | 5,979,729 | |||||||||
| Principal Amount | Market Value | ||||||||||
| Corporate Bonds — 20.1% Financials — 20.1% | |||||||||||
| $ | 60,000 | Bank Nederlandse Gemeenten, 6.250%, 1/20/14 | $ | 58,713 | |||||||
| 200,000 | Fortis Bank Nederland NV, 3.000%, 4/17/12 | 279,039 | |||||||||
| 100,000 | International Power Finance Jersey II Ltd., 3.250%, 7/20/13 | 145,050 | |||||||||
| 30,000,000 | Japan Finance Organization for Municipalities, 1.550%, 2/21/12 | 365,384 | |||||||||
| 100,000 | Kreditanstalt fuer Wiederaufbau, 3.250%, 6/27/13 | 143,257 | |||||||||
| 150,000 | Kreditanstalt fuer Wiederaufbau, 3.625%, 1/20/20 | 221,869 | |||||||||
| 200,000 | LCR Finance PLC, Reg S, 4.500%, 12/7/28 | 337,870 | |||||||||
| 1,400,000 | Realkredit Danmark A/S, Ser 10S, 2.000%, 1/1/12 | 257,863 | |||||||||
| 100,000 | Swedbank Hypotek AB, 2.500%, 1/21/13 | 138,276 | |||||||||
| Total Corporate Bonds | $ | 1,947,321 | |||||||||
| Foreign Bonds — 9.1% | |||||||||||
| 2,000 | Cap Gemini SA, 1.000%, 1/1/12* | 119,802 | |||||||||
| 100,000 | China Petroleum & Chemical Corp., 0.000%, 4/24/14 | 14,306 | |||||||||
| 50,000 | ITV PLC, 4.000%, 11/9/16 | 95,236 | |||||||||
| 30,000,000 | Japan Expressway Holding and Debt Repayment Agency, 2.850%, 3/18/39 | 404,652 | |||||||||
| 100,000 | Rafflesia Capital Ltd., 1.250%, 10/4/11 (a) | 136,655 | |||||||||
| 100,000 | Seadrill Ltd., 3.625%, 11/8/12 | 111,000 | |||||||||
| Total Foreign Bonds | $ | 881,651 | |||||||||
Shares | Market Value | ||||||||||
| Investment Fund — 2.5% | |||||||||||
| 241,561 | Touchstone Institutional Money Market Fund^ | $ | 241,561 | ||||||||
| Total Investment Securities — 93.6% (Cost $8,668,327) | $ | 9,050,262 | |||||||||
| Other Assets in Excess of Liabilities — 6.4% | 616,042 | ||||||||||
| Net Assets — 100.0% | $ | 9,666,304 | |||||||||
158
International Fixed Income Fund (Continued)
* Non-income producing security.
(a) Variable rate security – the rate reflected is the rate in effect as of September 30, 2010.
^ Affiliated Fund, sub-advised by Fort Washington Investment Advisors, Inc. See Note 4.
Portfolio Abbreviations:
PLC – Public Limited Company
Reg S – Security sold outside United States without registration under the Securities Act of 1933.
144a – This is a restricted security that was sold in a transaction exempt from Rule 144a of the Securities Act of 1933. This security may be sold in transactions exempt from registration, normally to qualified institutional buyers. At September 30, 2010, these securities were valued at $291,370 or 3.0% of net assets.
Other Information:
The inputs or methodology used for valuing securities may not be an indication of the risk associated with investing in those securities. For more information on valuation inputs, and their aggregation into the levels used in the table below, please refer to the security valuation section in the accompanying notes to financial statements.
Valuation Inputs at Reporting Date:
| Description | Level 1 | Level 2 | Level 3 | Total | |||||||||||||||
| Sovereign Government Obligations | $ | — | $ | 5,979,729 | $ | — | $ | 5,979,729 | |||||||||||
| Corporate Bonds | — | 1,947,321 | — | 1,947,321 | |||||||||||||||
| Foreign Bonds | 119,802 | 761,849 | — | 881,651 | |||||||||||||||
| Investment Fund | 241,561 | — | — | 241,561 | |||||||||||||||
| $ | 9,050,262 | ||||||||||||||||||
| Level 1 | Level 2 | Level 3 | Total | ||||||||||||||||
| Other Financial Instruments* | |||||||||||||||||||
| Forward Currency Contracts | $ | — | $ | 20,314 | $ | — | $ | 20,314 | |||||||||||
* Other financial instruments are derivative instruments not reflected in total investments. Amounts shown represent unrealized appreciation.
See accompanying notes to financial statements.
Forward Foreign Currency Exchange Contracts
| Contract To | Unrealized Appreciation/ | ||||||||||||||||||||||
| Value Date | Receive | Deliver | (Depreciation) | ||||||||||||||||||||
| 10/25/2010 | AUD | 260,000 | GBP | 157,172 | $ | 3,780 | |||||||||||||||||
| 10/25/2010 | CHF | 170,000 | JPY | 14,490,494 | (586 | ) | |||||||||||||||||
| 10/25/2010 | EUR | 540,019 | JPY | 60,469,190 | 11,579 | ||||||||||||||||||
| 10/25/2010 | IDR | 1,350,000,000 | USD | 149,834 | 883 | ||||||||||||||||||
| 10/25/2010 | JPY | 21,806,550 | AUD | 270,000 | 979 | ||||||||||||||||||
| 10/25/2010 | JPY | 13,080,900 | NZD | 210,000 | 2,911 | ||||||||||||||||||
| 10/25/2010 | JPY | 117,137,800 | USD | 1,366,772 | 36,671 | ||||||||||||||||||
| 10/25/2010 | KRW | 167,000,000 | USD | 143,718 | 2,615 | ||||||||||||||||||
| 10/25/2010 | MXN | 200,000 | USD | 15,633 | 212 | ||||||||||||||||||
| 10/25/2010 | MYR | 476,000 | USD | 153,193 | 779 | ||||||||||||||||||
| 10/25/2010 | PLN | 790,690 | EUR | 200,000 | (1,030 | ) | |||||||||||||||||
| 10/25/2010 | RON | 240,000 | USD | 73,220 | 3,254 | ||||||||||||||||||
| 10/25/2010 | USD | 425,899 | CAD | 438,932 | (529 | ) | |||||||||||||||||
| 10/25/2010 | USD | 891,247 | EUR | 682,169 | (38,577 | ) | |||||||||||||||||
| 10/25/2010 | USD | 339,784 | GBP | 218,000 | (2,627 | ) | |||||||||||||||||
| $ | 20,314 | ||||||||||||||||||||||
159
Portfolio of Investments
Large Cap Relative Value Fund – September 30, 2010
| Common Stocks — 97.6% | Shares | Market Value | |||||||||
| Financials — 17.6% | |||||||||||
| Aflac, Inc. | 1,500 | $ | 77,565 | ||||||||
| Bank of America Corp. | 5,200 | 68,172 | |||||||||
| Chubb Corp. | 1,600 | 91,184 | |||||||||
| Goldman Sachs Group, Inc. (The) | 500 | 72,290 | |||||||||
| JPMorgan Chase & Co. | 1,900 | 72,333 | |||||||||
| Morgan Stanley | 2,000 | 49,360 | |||||||||
| Northern Trust Corp. | 1,100 | 53,064 | |||||||||
| Travelers Cos., Inc. (The) | 1,800 | 93,780 | |||||||||
| Wells Fargo & Co. | 3,900 | 98,007 | |||||||||
| 675,755 | |||||||||||
| Consumer Discretionary — 15.3% | |||||||||||
| Carnival Corp. | 1,500 | 57,315 | |||||||||
| Comcast Corp. - Class A | 3,200 | 57,856 | |||||||||
| Darden Restaurants, Inc. | 2,300 | 98,394 | |||||||||
| Johnson Controls, Inc. | 2,500 | 76,250 | |||||||||
| Target Corp. | 1,100 | 58,784 | |||||||||
| TJX Cos., Inc. | 2,100 | 93,723 | |||||||||
| Walt Disney Co. (The) | 2,200 | 72,842 | |||||||||
| Yum! Brands, Inc. | 1,600 | 73,696 | |||||||||
| 588,860 | |||||||||||
| Energy — 14.3% | |||||||||||
| Apache Corp. | 700 | 68,432 | |||||||||
| Chesapeake Energy Corp. | 1,700 | 38,505 | |||||||||
| ConocoPhillips | 1,200 | 68,916 | |||||||||
| Exxon Mobil Corp. | 1,664 | 102,818 | |||||||||
| Occidental Petroleum Corp. | 1,800 | 140,940 | |||||||||
| Schlumberger Ltd. | 1,200 | 73,932 | |||||||||
| Transocean Ltd.* | 900 | 57,861 | |||||||||
| 551,404 | |||||||||||
| Information Technology — 14.1% | |||||||||||
| Automatic Data Processing, Inc. | 1,600 | 67,248 | |||||||||
| Corning, Inc. | 5,000 | 91,400 | |||||||||
| Flextronics International Ltd.* | 14,800 | 89,392 | |||||||||
| Intel Corp. | 5,700 | 109,611 | |||||||||
| International Business Machines Corp. | 900 | 120,726 | |||||||||
| Xerox Corp. | 6,000 | 62,100 | |||||||||
| 540,477 | |||||||||||
| Industrials — 13.2% | |||||||||||
| Boeing Co. (The) | 1,300 | 86,502 | |||||||||
| Cummins, Inc. | 1,700 | 153,986 | |||||||||
| General Dynamics Corp. | 1,500 | 94,215 | |||||||||
| Norfolk Southern Corp. | 1,500 | 89,265 | |||||||||
| Union Pacific Corp. | 1,000 | 81,800 | |||||||||
| 505,768 | |||||||||||
| Health Care — 9.1% | |||||||||||
| Beckman Coulter, Inc. | 1,200 | 58,548 | |||||||||
| CR Bard, Inc. | 500 | 40,715 | |||||||||
| Express Scripts, Inc.* | 2,400 | 116,880 | |||||||||
| Shares | Market Value | ||||||||||
| UnitedHealth Group, Inc. | 1,700 | $ | 59,687 | ||||||||
| WellPoint, Inc.* | 1,300 | 73,632 | |||||||||
| 349,462 | |||||||||||
| Utilities — 4.9% | |||||||||||
| Duke Energy Corp. | 2,500 | 44,275 | |||||||||
| Exelon Corp. | 1,600 | 68,128 | |||||||||
| Southern Co. | 2,100 | 78,204 | |||||||||
| 190,607 | |||||||||||
| Materials — 4.7% | |||||||||||
| Freeport-McMoRan Copper & Gold, Inc. | 2,100 | 179,319 | |||||||||
| Telecommunication Services — 2.5% | |||||||||||
| American Tower Corp. - Class A* | 1,900 | 97,394 | |||||||||
| Consumer Staples — 1.9% | |||||||||||
| Kimberly-Clark Corp. | 1,100 | 71,555 | |||||||||
| Total Common Stocks | $ | 3,750,601 | |||||||||
| Investment Fund — 3.1% | |||||||||||
| Touchstone Institutional Money Market Fund^ | 117,676 | 117,676 | |||||||||
| Total Investment Securities — 100.7% (Cost $3,534,370) | $ | 3,868,277 | |||||||||
| Liabilities in Excess of Other Assets — (0.7%) | (27,795 | ) | |||||||||
| Net Assets — 100.0% | $ | 3,840,482 | |||||||||
* Non-income producing security.
^ Affiliated Fund, sub-advised by Fort Washington Investment Advisors, Inc. See Note 4.
Other Information:
The inputs or methodology used for valuing securities may not be an indication of the risk associated with investing in those securities. For more information on valuation inputs, and their aggregation into the levels used in the table below, please refer to the security valuation section in the accompanying notes to financial statements.
Valuation Inputs at Reporting Date:
| Description | Level 1 | Level 2 | Level 3 | Total | |||||||||||||||
| Common Stocks | $ | 3,750,601 | $ | — | $ | — | $ | 3,750,601 | |||||||||||
| Investment Fund | 117,676 | — | — | 117,676 | |||||||||||||||
| $ | 3,868,277 | ||||||||||||||||||
See accompanying notes to financial statements.
160
Portfolio of Investments
Market Neutral Equity Fund – September 30, 2010
| Common Stocks — 91.4% | Shares | Market Value | |||||||||
| Financials — 20.3% | |||||||||||
| Ameriprise Financial, Inc. | 2,200 | $ | 104,126 | ||||||||
| BancFirst Corp. | 2,200 | 89,012 | |||||||||
| Bank of Hawaii Corp. | 1,900 | 85,348 | |||||||||
| Bank of the Ozarks, Inc. | 4,100 | 152,069 | |||||||||
| Chubb Corp. | 3,000 | 170,970 | |||||||||
| City National Corp. | 1,900 | 100,833 | |||||||||
| CME Group, Inc. | 300 | 78,135 | |||||||||
| Cohen & Steers, Inc. | 7,900 | 171,430 | |||||||||
| Commerce Bancshares, Inc. | 4,100 | 154,119 | |||||||||
| Community Bank System, Inc. | 4,600 | 105,846 | |||||||||
| Compass Diversified Holdings | 6,600 | 106,656 | |||||||||
| Cullen/Frost Bankers, Inc. | 3,000 | 161,610 | |||||||||
| Dime Community Bancshares | 4,900 | 67,865 | |||||||||
| Eaton Vance Corp. | 3,800 | 110,352 | |||||||||
| Erie Indemnity Co. - Class A | 3,600 | 201,816 | |||||||||
| Everest Re Group Ltd. | 1,100 | 95,117 | |||||||||
| Federal Realty Investment Trust REIT | 3,000 | 244,980 | |||||||||
| First Citizens BancShares, Inc. - Class A | 500 | 92,635 | |||||||||
| First Niagara Financial Group, Inc. | 8,200 | 95,530 | |||||||||
| FNB Corp./PA | 13,700 | 117,272 | |||||||||
| Franklin Resources, Inc. | 2,700 | 288,630 | |||||||||
| Hudson City Bancorp, Inc. | 15,300 | 187,578 | |||||||||
| Infinity Property & Casualty Corp. | 2,200 | 107,294 | |||||||||
| International Bancshares Corp. | 11,500 | 194,235 | |||||||||
| Jones Lang LaSalle, Inc. | 2,500 | 215,675 | |||||||||
| Life Partners Holdings, Inc. | 6,600 | 125,598 | |||||||||
| Meadowbrook Insurance Group, Inc. | 9,800 | 87,906 | |||||||||
| Moody's Corp. | 4,400 | 109,912 | |||||||||
| National Health Investors, Inc. REIT | 5,100 | 224,706 | |||||||||
| NBT Bancorp, Inc. | 4,400 | 97,108 | |||||||||
| NewAlliance Bancshares, Inc. | 18,000 | 227,160 | |||||||||
| NYSE Euronext | 3,300 | 94,281 | |||||||||
| optionsXpress Holdings, Inc.* | 5,700 | 87,552 | |||||||||
| Platinum Underwriters Holdings Ltd. | 2,500 | 108,800 | |||||||||
| ProAssurance Corp.* | 3,000 | 172,770 | |||||||||
| Provident Financial Services, Inc. | 12,300 | 152,028 | |||||||||
| Public Storage REIT | 1,900 | 184,376 | |||||||||
| Realty Income Corp. REIT | 3,600 | 121,392 | |||||||||
| RenaissanceRe Holdings Ltd. | 1,900 | 113,924 | |||||||||
| RLI Corp. | 2,500 | 141,550 | |||||||||
| Safety Insurance Group, Inc. | 2,500 | 105,050 | |||||||||
| Saul Centers, Inc. REIT | 3,300 | 138,435 | |||||||||
| T Rowe Price Group, Inc. | 4,100 | 205,266 | |||||||||
| Taubman Centers, Inc. REIT | 5,400 | 240,894 | |||||||||
| Trustmark Corp. | 5,700 | 123,918 | |||||||||
| UMB Financial Corp. | 3,600 | 127,836 | |||||||||
| Waddell & Reed Financial, Inc. - Class A | 3,000 | 82,080 | |||||||||
| WesBanco, Inc. | 9,800 | 160,132 | |||||||||
| 6,731,807 | |||||||||||
| Information Technology — 19.3% | |||||||||||
| ACI Worldwide, Inc.* | 4,600 | 102,994 | |||||||||
| Activision Blizzard, Inc. | 19,700 | 213,154 | |||||||||
| Amdocs Ltd.* | 5,200 | 149,032 | |||||||||
| Shares | Market Value | ||||||||||
| CA, Inc. | 7,100 | $ | 149,952 | ||||||||
| CACI International, Inc. - Class A* | 1,900 | 85,994 | |||||||||
| CGI Group, Inc. - Class A* | 7,900 | 118,737 | |||||||||
| Check Point Software Technologies Ltd.* | 4,900 | 180,957 | |||||||||
| Cymer, Inc.* | 2,700 | 100,116 | |||||||||
| DST Systems, Inc. | 4,400 | 197,296 | |||||||||
| Electronics for Imaging, Inc.* | 12,600 | 152,712 | |||||||||
| Factset Research Systems, Inc. | 2,200 | 178,486 | |||||||||
| Fiserv, Inc.* | 3,600 | 193,752 | |||||||||
| Harris Corp. | 2,500 | 110,725 | |||||||||
| IAC/InterActiveCorp* | 8,800 | 231,176 | |||||||||
| Integrated Device Technology, Inc.* | 17,000 | 99,450 | |||||||||
| Intersil Corp. - Class A | 2,100 | 24,549 | |||||||||
| Intuit, Inc.* | 2,500 | 109,525 | |||||||||
| Lam Research Corp.* | 2,500 | 104,625 | |||||||||
| Lawson Software, Inc.* | 11,500 | 97,405 | |||||||||
| Logitech International SA* | 6,800 | 118,320 | |||||||||
| LoopNet, Inc.* | 11,500 | 136,160 | |||||||||
| LSI Corp.* | 22,200 | 101,232 | |||||||||
| Manhattan Associates, Inc.* | 3,600 | 105,660 | |||||||||
| MAXIMUS, Inc. | 1,600 | 98,528 | |||||||||
| MICROS Systems, Inc.* | 3,300 | 139,689 | |||||||||
| Microsoft Corp. | 3,600 | 88,164 | |||||||||
| MIPS Technologies, Inc.* | 16,700 | 162,491 | |||||||||
| Net 1 UEPS Technologies, Inc.* | 15,000 | 173,400 | |||||||||
| Plantronics, Inc. | 2,700 | 91,206 | |||||||||
| QLogic Corp.* | 6,000 | 105,840 | |||||||||
| Quest Software, Inc.* | 4,600 | 113,114 | |||||||||
| Research In Motion Ltd.* | 3,500 | 170,415 | |||||||||
| Rofin-Sinar Technologies, Inc.* | 4,600 | 116,748 | |||||||||
| Rogers Corp.* | 4,100 | 129,068 | |||||||||
| SRA International, Inc. - Class A* | 11,000 | 216,920 | |||||||||
| Symantec Corp.* | 9,300 | 141,081 | |||||||||
| TeleTech Holdings, Inc.* | 4,900 | 72,716 | |||||||||
| Teradata Corp.* | 4,400 | 169,664 | |||||||||
| Texas Instruments, Inc. | 7,900 | 214,406 | |||||||||
| TIBCO Software, Inc.* | 8,500 | 150,790 | |||||||||
| TNS, Inc.* | 9,800 | 166,110 | |||||||||
| United Online, Inc. | 15,900 | 90,948 | |||||||||
| ValueClick, Inc.* | 14,800 | 193,584 | |||||||||
| Varian Semiconductor Equipment Associates, Inc.* | 3,600 | 103,608 | |||||||||
| Visa, Inc. - Class A | 1,400 | 103,964 | |||||||||
| Websense, Inc.* | 4,100 | 72,734 | |||||||||
| Zebra Technologies Corp. - Class A* | 7,400 | 248,936 | |||||||||
| 6,396,133 | |||||||||||
| Industrials — 12.1% | |||||||||||
| Applied Industrial Technologies, Inc. | 6,300 | 192,780 | |||||||||
| Dover Corp. | 2,200 | 114,862 | |||||||||
| Dun & Bradstreet Corp. | 3,600 | 266,904 | |||||||||
| Encore Wire Corp. | 5,200 | 106,652 | |||||||||
| Ennis, Inc. | 7,100 | 127,019 | |||||||||
| EnPro Industries, Inc.* | 3,600 | 112,608 | |||||||||
| Equifax, Inc. | 3,900 | 121,680 | |||||||||
161
Market Neutral Equity Fund (Continued)
| Common Stocks — 91.4% (Continued) | Shares | Market Value | |||||||||
| Gardner Denver, Inc. | 2,500 | $ | 134,200 | ||||||||
| Graco, Inc. | 3,000 | 95,190 | |||||||||
| Heartland Express, Inc. | 6,600 | 98,142 | |||||||||
| JB Hunt Transport Services, Inc. | 4,100 | 142,270 | |||||||||
| KBR, Inc. | 4,400 | 108,416 | |||||||||
| L-3 Communications Holdings, Inc. | 1,600 | 115,632 | |||||||||
| Lennox International, Inc. | 2,500 | 104,225 | |||||||||
| Lockheed Martin Corp. | 2,200 | 156,816 | |||||||||
| Nordson Corp. | 2,200 | 162,118 | |||||||||
| Northrop Grumman Corp. | 4,900 | 297,087 | |||||||||
| R.R. Donnelley & Sons Co. | 5,500 | 93,280 | |||||||||
| Raven Industries, Inc. | 2,700 | 102,303 | |||||||||
| Raytheon Co. | 2,700 | 123,417 | |||||||||
| Rollins, Inc. | 4,400 | 102,872 | |||||||||
| Simpson Manufacturing Co., Inc. | 3,800 | 97,964 | |||||||||
| SPX Corp. | 1,600 | 101,248 | |||||||||
| Teledyne Technologies, Inc.* | 3,000 | 119,460 | |||||||||
| Toro Co. | 4,300 | 241,789 | |||||||||
| Viad Corp. | 4,900 | 94,766 | |||||||||
| W.W. Grainger, Inc. | 1,400 | 166,754 | |||||||||
| WABCO Holdings, Inc.* | 3,600 | 150,984 | |||||||||
| Waste Connections, Inc.* | 3,800 | 150,708 | |||||||||
| 4,002,146 | |||||||||||
| Health Care — 10.9% | |||||||||||
| AMERIGROUP Corp.* | 2,500 | 106,175 | |||||||||
| AmerisourceBergen Corp. | 3,000 | 91,980 | |||||||||
| Amgen, Inc.* | 3,800 | 209,418 | |||||||||
| Amsurg Corp.* | 5,700 | 99,636 | |||||||||
| Angiodynamics, Inc.* | 9,300 | 141,732 | |||||||||
| Biogen Idec, Inc.* | 2,500 | 140,300 | |||||||||
| Cardiome Pharma Corp.* | 11,500 | 70,150 | |||||||||
| CR Bard, Inc. | 2,200 | 179,146 | |||||||||
| Exelixis, Inc.* | 22,200 | 87,024 | |||||||||
| Geron Corp.* † | 18,600 | 102,858 | |||||||||
| Gilead Sciences, Inc.* | 3,000 | 106,830 | |||||||||
| Health Net, Inc.* | 4,900 | 133,231 | |||||||||
| Healthspring, Inc.* | 4,900 | 126,616 | |||||||||
| Hill-Rom Holdings, Inc. | 3,000 | 107,670 | |||||||||
| ICU Medical, Inc.* | 4,400 | 164,076 | |||||||||
| IDEXX Laboratories, Inc.* | 1,600 | 98,752 | |||||||||
| Invacare Corp. | 3,600 | 95,436 | |||||||||
| LifePoint Hospitals, Inc.* | 3,000 | 105,180 | |||||||||
| Magellan Health Services, Inc.* | 3,800 | 179,512 | |||||||||
| Medco Health Solutions, Inc.* | 2,200 | 114,532 | |||||||||
| Medicines Co. (The)* | 11,500 | 163,300 | |||||||||
| Natus Medical, Inc.* | 5,700 | 83,049 | |||||||||
| PerkinElmer, Inc. | 4,600 | 106,444 | |||||||||
| Quidel Corp.* | 5,700 | 62,643 | |||||||||
| Res-Care, Inc.* | 5,900 | 78,293 | |||||||||
| Techne Corp. | 2,500 | 154,325 | |||||||||
| Teleflex, Inc. | 1,900 | 107,882 | |||||||||
| UnitedHealth Group, Inc. | 3,300 | 115,863 | |||||||||
| Shares | Market Value | ||||||||||
| Universal American Financial Corp. | 5,700 | $ | 84,075 | ||||||||
| Waters Corp.* | 1,600 | 113,248 | |||||||||
| Zimmer Holdings, Inc.* | 1,600 | 83,728 | |||||||||
| 3,613,104 | |||||||||||
| Consumer Discretionary — 10.2% | |||||||||||
| Aeropostale, Inc.* | 5,200 | 120,900 | |||||||||
| AutoZone, Inc.* | 1,100 | 251,801 | |||||||||
| Cato Corp. (The) - Class A | 6,600 | 176,616 | |||||||||
| Cherokee, Inc. | 7,100 | 129,504 | |||||||||
| Coach, Inc. | 7,000 | 300,720 | |||||||||
| Deckers Outdoor Corp.* | 2,500 | 124,900 | |||||||||
| DIRECTV - Class A* | 7,600 | 316,388 | |||||||||
| Drew Industries, Inc.* | 3,800 | 79,268 | |||||||||
| Finish Line, Inc. (The) - Class A | 8,500 | 118,235 | |||||||||
| Hibbett Sports, Inc.* | 5,200 | 129,740 | |||||||||
| ITT Educational Services, Inc.* | 1,100 | 77,297 | |||||||||
| Liberty Global, Inc. - Class A* | 3,800 | 117,078 | |||||||||
| Lincoln Educational Services Corp.* | 6,600 | 95,106 | |||||||||
| McDonald's Corp. | 1,400 | 104,314 | |||||||||
| Meredith Corp. | 2,700 | 89,937 | |||||||||
| Netflix, Inc.* | 1,100 | 178,376 | |||||||||
| Papa John's International, Inc.* | 6,300 | 166,194 | |||||||||
| Polaris Industries, Inc. | 2,200 | 143,220 | |||||||||
| Rent-A-Center, Inc. - Class A | 4,400 | 98,472 | |||||||||
| Tim Hortons, Inc. | 5,500 | 200,255 | |||||||||
| Time Warner, Inc. | 5,700 | 174,705 | |||||||||
| Weight Watchers International, Inc. | 3,300 | 102,927 | |||||||||
| Winnebago Industries, Inc.* | 7,700 | 80,234 | |||||||||
| 3,376,187 | |||||||||||
| Energy — 7.8% | |||||||||||
| Apache Corp. | 800 | 78,208 | |||||||||
| Basic Energy Services, Inc.* | 10,400 | 88,608 | |||||||||
| Chevron Corp. | 2,500 | 202,625 | |||||||||
| Complete Production Services, Inc.* | 6,000 | 122,700 | |||||||||
| ConocoPhillips | 3,000 | 172,290 | |||||||||
| CVR Energy, Inc.* | 6,800 | 56,100 | |||||||||
| Dawson Geophysical Co.* | 5,400 | 143,910 | |||||||||
| Exterran Holdings, Inc.* | 4,100 | 93,111 | |||||||||
| Exxon Mobil Corp. | 1,600 | 98,864 | |||||||||
| FMC Technologies, Inc.* | 1,600 | 109,264 | |||||||||
| Gulf Island Fabrication, Inc. | 1,900 | 34,580 | |||||||||
| Hess Corp. | 1,900 | 112,328 | |||||||||
| Imperial Oil Ltd. | 4,900 | 185,318 | |||||||||
| Knightsbridge Tankers Ltd. | 5,500 | 103,950 | |||||||||
| Marathon Oil Corp. | 9,100 | 301,210 | |||||||||
| Murphy Oil Corp. | 2,500 | 154,800 | |||||||||
| Nexen, Inc. | 5,200 | 104,520 | |||||||||
| Patterson-UTI Energy, Inc. | 14,700 | 251,076 | |||||||||
| Pioneer Drilling Co.* | 15,000 | 95,700 | |||||||||
| Unit Corp.* | 2,500 | 93,225 | |||||||||
| 2,602,387 | |||||||||||
162
Market Neutral Equity Fund (Continued)
| Common Stocks — 91.4% (Continued) | Shares | Market Value | |||||||||
| Utilities — 4.5% | |||||||||||
| DPL, Inc. | 3,300 | $ | 86,229 | ||||||||
| Edison International | 6,300 | 216,657 | |||||||||
| El Paso Electric Co.* | 9,500 | 225,910 | |||||||||
| Energen Corp. | 4,600 | 210,312 | |||||||||
| Entergy Corp. | 1,400 | 107,142 | |||||||||
| Exelon Corp. | 3,000 | 127,740 | |||||||||
| Mirant Corp.* | 6,200 | 61,752 | |||||||||
| New Jersey Resources Corp. | 6,000 | 235,320 | |||||||||
| Public Service Enterprise Group, Inc. | 7,100 | 234,868 | |||||||||
| 1,505,930 | |||||||||||
| Consumer Staples — 3.1% | |||||||||||
| Brown-Forman Corp. - Class B | 2,700 | 166,428 | |||||||||
| Campbell Soup Co. | 4,100 | 146,575 | |||||||||
| Dean Foods Co.* | 18,600 | 189,906 | |||||||||
| Energizer Holdings, Inc.* | 3,000 | 201,690 | |||||||||
| Herbalife Ltd. | 3,300 | 199,155 | |||||||||
| Philip Morris International, Inc. | 2,500 | 140,050 | |||||||||
| 1,043,804 | |||||||||||
| Materials — 2.9% | |||||||||||
| Agrium, Inc. | 1,400 | 104,986 | |||||||||
| AptarGroup, Inc. | 2,200 | 100,474 | |||||||||
| Cabot Corp. | 3,800 | 123,766 | |||||||||
| Cytec Industries, Inc. | 1,900 | 107,122 | |||||||||
| Minerals Technologies, Inc. | 3,900 | 229,788 | |||||||||
| Schnitzer Steel Industries, Inc. - Class A | 2,200 | 106,216 | |||||||||
| Sherwin-Williams Co. (The) | 1,400 | 105,196 | |||||||||
| Southern Copper Corp. | 2,700 | 94,824 | |||||||||
| 972,372 | |||||||||||
| Telecommunication Services — 0.3% | |||||||||||
| NTELOS Holdings Corp. | 5,500 | 93,060 | |||||||||
| Total Common Stocks | $ | 30,336,930 | |||||||||
| Investment Funds — 3.1% | |||||||||||
| Invesco Liquid Assets Portfolio** | 37,699 | 37,699 | |||||||||
| Touchstone Institutional Money Market Fund^ | 988,692 | 988,692 | |||||||||
| Total Investment Funds | $ | 1,026,391 | |||||||||
| Total Long Positions (Cost $30,083,173) | $ | 31,363,321 | |||||||||
| Securities Sold Short — (91.6%) | |||||||||||
| Common Stocks — (91.6%) | |||||||||||
| Telecommunication Services — (0.3%) | |||||||||||
| Clearwire Corp. - Class A* | (14,800 | ) | (119,732 | ) | |||||||
| Consumer Staples — (3.3%) | |||||||||||
| Alberto-Culver Co. | (7,100 | ) | (267,315 | ) | |||||||
| Avon Products, Inc. | (2,500 | ) | (80,275 | ) | |||||||
| Bunge Ltd. | (1,400 | ) | (82,824 | ) | |||||||
| Church & Dwight Co., Inc. | (1,400 | ) | (90,916 | ) | |||||||
| Costco Wholesale Corp. | (1,900 | ) | (122,531 | ) | |||||||
| Shares | Market Value | ||||||||||
| Estee Lauder Cos., Inc. (The) - Class A | (1,600 | ) | $ | (101,168 | ) | ||||||
| Green Mountain Coffee Roasters, Inc.* | (3,300 | ) | (102,927 | ) | |||||||
| Hain Celestial Group, Inc. (The)* | (6,000 | ) | (143,880 | ) | |||||||
| Smithfield Foods, Inc.* | (5,700 | ) | (95,931 | ) | |||||||
| (1,087,767 | ) | ||||||||||
| Materials — (4.1%) | |||||||||||
| Alcoa, Inc. | (7,700 | ) | (93,247 | ) | |||||||
| Balchem Corp. | (6,600 | ) | (203,676 | ) | |||||||
| Commercial Metals Co. | (6,000 | ) | (86,940 | ) | |||||||
| Deltic Timber Corp. | (2,200 | ) | (98,560 | ) | |||||||
| Dow Chemical Co. (The) | (4,600 | ) | (126,316 | ) | |||||||
| Martin Marietta Materials, Inc. | (2,500 | ) | (192,425 | ) | |||||||
| Schweitzer-Mauduit International, Inc. | (1,900 | ) | (110,789 | ) | |||||||
| Sensient Technologies Corp. | (4,100 | ) | (125,009 | ) | |||||||
| Stepan Co. | (1,900 | ) | (112,309 | ) | |||||||
| Vulcan Materials Co. | (5,700 | ) | (210,444 | ) | |||||||
| (1,359,715 | ) | ||||||||||
| Utilities — (4.4%) | |||||||||||
| Black Hills Corp. | (3,000 | ) | (93,600 | ) | |||||||
| CenterPoint Energy, Inc. | (6,600 | ) | (103,752 | ) | |||||||
| DTE Energy Co. | (2,200 | ) | (101,046 | ) | |||||||
| Empire District Electric Co. (The) | (10,700 | ) | (215,605 | ) | |||||||
| Integrys Energy Group, Inc. | (1,900 | ) | (98,914 | ) | |||||||
| Pepco Holdings, Inc. | (11,800 | ) | (219,480 | ) | |||||||
| Progress Energy, Inc. | (4,900 | ) | (217,658 | ) | |||||||
| Southern Co. | (7,100 | ) | (264,404 | ) | |||||||
| WGL Holdings, Inc. | (3,800 | ) | (143,564 | ) | |||||||
| (1,458,023 | ) | ||||||||||
| Energy — (8.0%) | |||||||||||
| Anadarko Petroleum Corp. | (4,100 | ) | (233,905 | ) | |||||||
| Bristow Group, Inc.* | (3,300 | ) | (119,064 | ) | |||||||
| Cameron International Corp.* | (6,800 | ) | (292,128 | ) | |||||||
| Enbridge, Inc. | (1,900 | ) | (99,370 | ) | |||||||
| EQT Corp. | (3,300 | ) | (118,998 | ) | |||||||
| Forest Oil Corp.* | (7,900 | ) | (234,630 | ) | |||||||
| General Maritime Corp. | (22,200 | ) | (109,002 | ) | |||||||
| Gulfmark Offshore, Inc. - Class A* | (2,500 | ) | (76,800 | ) | |||||||
| Helix Energy Solutions Group, Inc.* | (15,600 | ) | (173,784 | ) | |||||||
| Overseas Shipholding Group, Inc. | (4,100 | ) | (140,712 | ) | |||||||
| Petrohawk Energy Corp.* | (6,600 | ) | (106,524 | ) | |||||||
| Plains Exploration & Production Co.* | (7,100 | ) | (189,357 | ) | |||||||
| Pride International, Inc.* | (3,600 | ) | (105,948 | ) | |||||||
| Range Resources Corp. | (3,300 | ) | (125,829 | ) | |||||||
| Spectra Energy Corp. | (6,300 | ) | (142,065 | ) | |||||||
| Tidewater, Inc. | (1,900 | ) | (85,139 | ) | |||||||
| TransCanada Corp. | (5,700 | ) | (211,584 | ) | |||||||
| Transocean Ltd.* | (1,400 | ) | (90,006 | ) | |||||||
| (2,654,845 | ) | ||||||||||
| Consumer Discretionary — (10.1%) | |||||||||||
| Amazon.com, Inc.* | (800 | ) | (125,648 | ) | |||||||
| BorgWarner, Inc.* | (2,200 | ) | (115,764 | ) | |||||||
163
Market Neutral Equity Fund (Continued)
| Securities Sold Short — (91.6%) (Continued) | Shares | Market Value | |||||||||
| Callaway Golf Co. | (17,800 | ) | $ | (124,600 | ) | ||||||
| CarMax, Inc.* | (4,600 | ) | (128,156 | ) | |||||||
| Carter's, Inc.* | (4,900 | ) | (129,017 | ) | |||||||
| Collective Brands, Inc.* | (7,700 | ) | (124,278 | ) | |||||||
| Core-Mark Holding Co., Inc.* | (6,800 | ) | (210,528 | ) | |||||||
| Gaylord Entertainment Co.* | (6,000 | ) | (183,000 | ) | |||||||
| hhgregg, Inc.* | (3,300 | ) | (81,708 | ) | |||||||
| Home Depot, Inc. | (3,300 | ) | (104,544 | ) | |||||||
| Iconix Brand Group, Inc.* | (6,000 | ) | (105,000 | ) | |||||||
| JC Penney Co., Inc. | (5,700 | ) | (154,926 | ) | |||||||
| John Wiley & Sons, Inc. - Class A | (3,000 | ) | (122,580 | ) | |||||||
| Kohl's Corp.* | (1,600 | ) | (84,288 | ) | |||||||
| MDC Holdings, Inc. | (4,900 | ) | (142,247 | ) | |||||||
| MGM Mirage* | (8,800 | ) | (99,264 | ) | |||||||
| Monro Muffler Brake, Inc. | (2,200 | ) | (101,442 | ) | |||||||
| NIKE, Inc. - Class B | (1,400 | ) | (112,196 | ) | |||||||
| Orient-Express Hotels Ltd. - Class A* | (9,000 | ) | (100,350 | ) | |||||||
| Peet's Coffee & Tea, Inc.* | (2,200 | ) | (75,306 | ) | |||||||
| Regis Corp. | (7,700 | ) | (147,301 | ) | |||||||
| Stewart Enterprises, Inc. - Class A | (18,000 | ) | (97,020 | ) | |||||||
| Thomson Reuters Corp. | (2,500 | ) | (93,825 | ) | |||||||
| Vail Resorts, Inc.* | (4,400 | ) | (165,088 | ) | |||||||
| Walt Disney Co. (The) | (9,000 | ) | (297,990 | ) | |||||||
| World Wrestling Entertainment, Inc. - Class A | (8,200 | ) | (114,062 | ) | |||||||
| (3,340,128 | ) | ||||||||||
| Health Care — (11.1%) | |||||||||||
| Alere, Inc.* | (3,600 | ) | (111,348 | ) | |||||||
| athenahealth, Inc.* | (1,300 | ) | (42,926 | ) | |||||||
| Auxilium Pharmaceuticals, Inc.* | (3,800 | ) | (94,164 | ) | |||||||
| Bio-Reference Labs, Inc.* | (4,100 | ) | (85,526 | ) | |||||||
| Brookdale Senior Living, Inc.* | (4,400 | ) | (71,764 | ) | |||||||
| Cerner Corp.* | (1,400 | ) | (117,586 | ) | |||||||
| Charles River Laboratories International, Inc.* | (5,500 | ) | (182,325 | ) | |||||||
| Conceptus, Inc.* | (7,100 | ) | (97,625 | ) | |||||||
| Covance, Inc.* | (2,200 | ) | (102,938 | ) | |||||||
| Edwards Lifesciences Corp.* | (4,400 | ) | (295,020 | ) | |||||||
| Emeritus Corp.* | (5,700 | ) | (97,242 | ) | |||||||
| Genoptix, Inc.* | (6,000 | ) | (85,200 | ) | |||||||
| HMS Holdings Corp.* | (1,600 | ) | (94,304 | ) | |||||||
| Hospira, Inc.* | (2,700 | ) | (153,927 | ) | |||||||
| Human Genome Sciences, Inc.* | (3,300 | ) | (98,307 | ) | |||||||
| Immunogen, Inc.* | (9,000 | ) | (56,430 | ) | |||||||
| Landauer, Inc. | (3,000 | ) | (187,890 | ) | |||||||
| MAKO Surgical Corp.* | (19,400 | ) | (185,852 | ) | |||||||
| MedAssets, Inc.* | (1,500 | ) | (31,560 | ) | |||||||
| Mednax, Inc.* | (2,500 | ) | (133,250 | ) | |||||||
| NuVasive, Inc.* | (2,200 | ) | (77,308 | ) | |||||||
| Qiagen NV* | (11,200 | ) | (198,688 | ) | |||||||
| Quality Systems, Inc. | (1,400 | ) | (92,834 | ) | |||||||
| ResMed, Inc.* | (3,300 | ) | (108,273 | ) | |||||||
| SIGA Technologies, Inc.* | (11,500 | ) | (97,290 | ) | |||||||
| Stryker Corp. | (1,600 | ) | (80,080 | ) | |||||||
| Theravance, Inc.* | (7,100 | ) | (142,710 | ) | |||||||
| Shares | Market Value | ||||||||||
| Thoratec Corp.* | (2,200 | ) | $ | (81,356 | ) | ||||||
| VCA Antech, Inc.* | (5,700 | ) | (120,213 | ) | |||||||
| Vertex Pharmaceuticals, Inc.* | (2,700 | ) | (93,339 | ) | |||||||
| Vivus, Inc.* | (11,200 | ) | (74,928 | ) | |||||||
| West Pharmaceutical Services, Inc. | (3,800 | ) | (130,378 | ) | |||||||
| XenoPort, Inc.* | (11,500 | ) | (81,765 | ) | |||||||
| (3,704,346 | ) | ||||||||||
| Industrials — (13.3%) | |||||||||||
| ABM Industries, Inc. | (4,600 | ) | (99,314 | ) | |||||||
| Aegean Marine Petroleum Network, Inc. | (6,000 | ) | (99,840 | ) | |||||||
| American Superconductor Corp.* | (3,000 | ) | (93,300 | ) | |||||||
| AMR Corp.* | (14,800 | ) | (92,796 | ) | |||||||
| Boeing Co. (The) | (1,400 | ) | (93,156 | ) | |||||||
| Caterpillar, Inc. | (1,400 | ) | (110,152 | ) | |||||||
| Clean Harbors, Inc.* | (1,600 | ) | (108,400 | ) | |||||||
| CoStar Group, Inc.* | (2,200 | ) | (107,162 | ) | |||||||
| Covanta Holding Corp. | (4,600 | ) | (72,450 | ) | |||||||
| Danaher Corp. | (3,300 | ) | (134,013 | ) | |||||||
| DigitalGlobe, Inc.* | (4,100 | ) | (124,640 | ) | |||||||
| EnerNOC, Inc.* | (2,700 | ) | (84,807 | ) | |||||||
| GATX Corp. | (4,400 | ) | (129,008 | ) | |||||||
| General Electric Co. | (11,200 | ) | (182,000 | ) | |||||||
| Goodrich Corp. | (1,900 | ) | (140,087 | ) | |||||||
| Kennametal, Inc. | (3,600 | ) | (111,348 | ) | |||||||
| Manpower, Inc. | (3,000 | ) | (156,600 | ) | |||||||
| Mine Safety Appliances Co. | (5,200 | ) | (140,920 | ) | |||||||
| Mobile Mini, Inc.* | (10,900 | ) | (167,206 | ) | |||||||
| Moog, Inc. - Class A* | (3,000 | ) | (106,530 | ) | |||||||
| Otter Tail Corp. | (11,200 | ) | (228,368 | ) | |||||||
| Pall Corp. | (2,500 | ) | (104,100 | ) | |||||||
| Precision Castparts Corp. | (1,100 | ) | (140,085 | ) | |||||||
| Ritchie Bros Auctioneers, Inc. | (7,400 | ) | (153,698 | ) | |||||||
| Roper Industries, Inc. | (3,000 | ) | (195,540 | ) | |||||||
| Steelcase, Inc. - Class A | (12,000 | ) | (99,960 | ) | |||||||
| Stericycle, Inc.* | (1,400 | ) | (97,272 | ) | |||||||
| Sterling Construction Co., Inc.* | (5,200 | ) | (64,376 | ) | |||||||
| Terex Corp.* | (4,400 | ) | (100,848 | ) | |||||||
| Titan International, Inc. | (10,100 | ) | (137,057 | ) | |||||||
| Titan Machinery, Inc.* | (6,400 | ) | (104,320 | ) | |||||||
| TransDigm Group, Inc. | (2,500 | ) | (155,125 | ) | |||||||
| United Stationers, Inc.* | (1,900 | ) | (101,669 | ) | |||||||
| UTi Worldwide, Inc. | (7,100 | ) | (114,168 | ) | |||||||
| Waste Management, Inc. | (4,100 | ) | (146,534 | ) | |||||||
| Watsco, Inc. | (2,200 | ) | (122,496 | ) | |||||||
| (4,419,345 | ) | ||||||||||
| Information Technology — (16.8%) | |||||||||||
| Altera Corp. | (3,800 | ) | (114,608 | ) | |||||||
| Apple, Inc.* | (500 | ) | (141,875 | ) | |||||||
| Aspen Technology, Inc.* | (12,300 | ) | (127,551 | ) | |||||||
| Automatic Data Processing, Inc. | (4,100 | ) | (172,323 | ) | |||||||
| Blackboard, Inc.* | (2,700 | ) | (97,308 | ) | |||||||
| Cadence Design Systems, Inc.* | (15,300 | ) | (116,739 | ) | |||||||
164
Market Neutral Equity Fund (Continued)
| Securities Sold Short — (91.6%) (Continued) | Shares | Market Value | |||||||||
| Cavium Networks, Inc.* | (5,200 | ) | $ | (149,552 | ) | ||||||
| Citrix Systems, Inc.* | (2,700 | ) | (184,248 | ) | |||||||
| Cognizant Technology Solutions Corp. - Class A* | (2,700 | ) | (174,069 | ) | |||||||
| CommVault Systems, Inc.* | (4,100 | ) | (106,723 | ) | |||||||
| Compellent Technologies, Inc.* | (5,200 | ) | (94,536 | ) | |||||||
| Concur Technologies, Inc.* | (3,000 | ) | (148,320 | ) | |||||||
| Constant Contact, Inc.* | (6,300 | ) | (135,009 | ) | |||||||
| Cree, Inc.* | (1,400 | ) | (76,006 | ) | |||||||
| eBay, Inc.* | (3,800 | ) | (92,720 | ) | |||||||
| Equinix, Inc.* | (2,700 | ) | (276,345 | ) | |||||||
| FEI Co.* | (4,900 | ) | (95,893 | ) | |||||||
| Informatica Corp.* | (3,000 | ) | (115,230 | ) | |||||||
| Marvell Technology Group Ltd.* | (4,600 | ) | (80,546 | ) | |||||||
| Maxwell Technologies, Inc.* | (5,200 | ) | (75,972 | ) | |||||||
| Mellanox Technologies Ltd.* | (6,600 | ) | (129,624 | ) | |||||||
| Microchip Technology, Inc. | (3,300 | ) | (103,785 | ) | |||||||
| Micron Technology, Inc.* | (11,200 | ) | (80,752 | ) | |||||||
| NetApp, Inc.* | (3,300 | ) | (164,307 | ) | |||||||
| NetSuite, Inc.* | (5,700 | ) | (134,349 | ) | |||||||
| OSI Systems, Inc.* | (3,300 | ) | (119,856 | ) | |||||||
| Pegasystems, Inc. | (2,500 | ) | (77,625 | ) | |||||||
| Rackspace Hosting, Inc.* | (1,900 | ) | (49,362 | ) | |||||||
| SAIC, Inc.* | (13,100 | ) | (209,338 | ) | |||||||
| Salesforce.com, Inc.* | (1,900 | ) | (212,420 | ) | |||||||
| SAVVIS, Inc.* | (8,200 | ) | (172,856 | ) | |||||||
| Sina Corp.* | (2,700 | ) | (136,566 | ) | |||||||
| Sourcefire, Inc.* | (4,400 | ) | (126,896 | ) | |||||||
| SuccessFactors, Inc.* | (9,800 | ) | (246,078 | ) | |||||||
| Sycamore Networks, Inc. | (5,200 | ) | (168,532 | ) | |||||||
| Terremark Worldwide, Inc.* | (14,500 | ) | (149,930 | ) | |||||||
| THQ, Inc.* | (26,800 | ) | (107,736 | ) | |||||||
| TiVo, Inc.* | (8,200 | ) | (74,292 | ) | |||||||
| Ultimate Software Group, Inc.* | (6,000 | ) | (231,840 | ) | |||||||
| Universal Display Corp.* | (6,000 | ) | (141,000 | ) | |||||||
| Western Digital Corp.* | (5,700 | ) | (161,823 | ) | |||||||
| (5,574,540 | ) | ||||||||||
| Financials — (20.2%) | |||||||||||
| Alexandria Real Estate Equities, Inc. REIT | (1,400 | ) | (98,000 | ) | |||||||
| AMB Property Corp. REIT | (4,100 | ) | (108,527 | ) | |||||||
| Arthur J Gallagher & Co. | (4,100 | ) | (108,117 | ) | |||||||
| Associated Banc-Corp. | (18,000 | ) | (237,420 | ) | |||||||
| BancorpSouth, Inc. | (10,700 | ) | (151,726 | ) | |||||||
| Bank of America Corp. | (6,800 | ) | (89,148 | ) | |||||||
| Cathay General Bancorp | (7,900 | ) | (93,931 | ) | |||||||
| Cincinnati Financial Corp. | (8,800 | ) | (253,880 | ) | |||||||
| Citigroup, Inc.* | (26,500 | ) | (103,350 | ) | |||||||
| CommonWealth REIT | (4,100 | ) | (104,960 | ) | |||||||
| Cousins Properties, Inc. REIT | (12,308 | ) | (87,879 | ) | |||||||
| Developers Diversified Realty Corp. REIT | (9,000 | ) | (100,980 | ) | |||||||
| Digital Realty Trust, Inc. REIT | (1,600 | ) | (98,720 | ) | |||||||
| Discover Financial Services | (5,500 | ) | (91,740 | ) | |||||||
| First Horizon National Corp.* | (14,989 | ) | (171,030 | ) | |||||||
| Shares | Market Value | ||||||||||
| First Industrial Realty Trust, Inc. REIT* | (19,700 | ) | $ | (99,879 | ) | ||||||
| FirstMerit Corp. | (4,600 | ) | (84,272 | ) | |||||||
| Genworth Financial, Inc. - Class A* | (8,200 | ) | (100,204 | ) | |||||||
| Gleacher & Co., Inc.* | (34,700 | ) | (55,867 | ) | |||||||
| Goldman Sachs Group, Inc. (The) | (800 | ) | (115,664 | ) | |||||||
| Hilltop Holdings, Inc.* | (20,500 | ) | (196,390 | ) | |||||||
| Iberiabank Corp. | (4,400 | ) | (219,912 | ) | |||||||
| Interactive Brokers Group, Inc. - Class A* | (7,100 | ) | (122,191 | ) | |||||||
| Investors Real Estate Trust REIT | (25,200 | ) | (211,176 | ) | |||||||
| Jefferies Group, Inc. | (7,300 | ) | (165,637 | ) | |||||||
| Kilroy Realty Corp. REIT | (6,300 | ) | (208,782 | ) | |||||||
| Kimco Realty Corp. REIT | (7,100 | ) | (111,825 | ) | |||||||
| Markel Corp.* | (300 | ) | (103,377 | ) | |||||||
| MB Financial, Inc. | (4,600 | ) | (74,612 | ) | |||||||
| Morgan Stanley | (2,700 | ) | (66,636 | ) | |||||||
| New York Community Bancorp, Inc. | (10,700 | ) | (173,875 | ) | |||||||
| Northern Trust Corp. | (1,900 | ) | (91,656 | ) | |||||||
| Old Republic International Corp. | (11,200 | ) | (155,120 | ) | |||||||
| OneBeacon Insurance Group Ltd. - Class A | (7,900 | ) | (112,891 | ) | |||||||
| PacWest Bancorp | (5,200 | ) | (99,112 | ) | |||||||
| People's United Financial, Inc. | (8,500 | ) | (111,265 | ) | |||||||
| Pico Holdings, Inc.* | (2,200 | ) | (65,692 | ) | |||||||
| Pinnacle Financial Partners, Inc.* | (15,900 | ) | (146,121 | ) | |||||||
| Regions Financial Corp. | (9,600 | ) | (69,792 | ) | |||||||
| State Street Corp. | (2,500 | ) | (94,150 | ) | |||||||
| Sterling Bancshares, Inc. | (39,400 | ) | (211,578 | ) | |||||||
| Stifel Financial Corp.* | (2,700 | ) | (124,983 | ) | |||||||
| Sunstone Hotel Investors, Inc. REIT* | (9,000 | ) | (81,630 | ) | |||||||
| SunTrust Banks, Inc. | (4,900 | ) | (126,567 | ) | |||||||
| Susquehanna Bancshares, Inc. | (11,500 | ) | (97,060 | ) | |||||||
| Synovus Financial Corp. | (68,900 | ) | (169,494 | ) | |||||||
| TFS Financial Corp. | (26,200 | ) | (240,778 | ) | |||||||
| Umpqua Holdings Corp. | (6,300 | ) | (71,442 | ) | |||||||
| United Community Banks, Inc.* | (25,200 | ) | (56,448 | ) | |||||||
| Valley National Bancorp | (6,800 | ) | (87,720 | ) | |||||||
| Whitney Holding Corp. | (24,600 | ) | (200,982 | ) | |||||||
| Wilmington Trust Corp. | (16,700 | ) | (149,966 | ) | |||||||
| Zions Bancorporation | (5,500 | ) | (117,480 | ) | |||||||
| (6,691,634 | ) | ||||||||||
| Total Common Stocks | $ | (30,410,075 | ) | ||||||||
| Total Securities Sold Short ($29,356,048) | $ | (30,410,075 | ) | ||||||||
| Total Investment Securities — 2.9% (Cost $727,125) | $ | 953,246 | |||||||||
| Cash Collateral for Securities Sold Short — 97.6% | 32,390,608 | ||||||||||
| Liabilities in Excess of Other Assets — (0.5%) | (160,399 | ) | |||||||||
| Net Assets — 100.0% | $ | 33,183,455 | |||||||||
165
Market Neutral Equity Fund (Continued)
* Non-income producing security.
† All or a portion of the security is on loan. The total value of the securities on loan as of September 30, 2010, was $37,228.
** Represents collateral for securities loaned.
^ Affiliated Fund, sub-advised by Fort Washington Investment Advisors, Inc. See Note 4.
Portfolio Abbreviations:
REIT – Real Estate Investment Trust
Other Information:
The inputs or methodology used for valuing securities may not be an indication of the risk associated with investing in those securities. For more information on valuation inputs, and their aggregation into the levels used in the table below, please refer to the security valuation section in the accompanying notes to financial statements.
Valuation Inputs at Reporting Date:
| Description | Level 1 | Level 2 | Level 3 | Total | |||||||||||||||
| Collateral for Securities Sold Short | $ | — | $ | 32,390,608 | $ | — | $ | 32,390,608 | |||||||||||
| Investment Funds | 1,026,391 | — | — | 1,026,391 | |||||||||||||||
| Common Stocks | (73,145 | ) | — | — | (73,145 | ) | |||||||||||||
| $ | 33,343,854 | ||||||||||||||||||
See accompanying notes to financial statements.
166
Portfolio of Investments
Mid Cap Fund – September 30, 2010
| Common Stocks — 99.6% | Shares | Market Value | |||||||||
| Information Technology — 16.3% | |||||||||||
| Autodesk, Inc.* | 45,600 | $ | 1,457,832 | ||||||||
| Avago Technologies Ltd.* | 64,800 | 1,458,648 | |||||||||
| Cadence Design Systems, Inc.* | 210,070 | 1,602,834 | |||||||||
| Check Point Software Technologies Ltd.* | 65,590 | 2,422,239 | |||||||||
| Fidelity National Information Services, Inc. | 63,650 | 1,726,825 | |||||||||
| IAC/InterActiveCorp* | 88,450 | 2,323,581 | |||||||||
| Intuit, Inc.* | 28,310 | 1,240,261 | |||||||||
| Micron Technology, Inc.* † | 88,520 | 638,229 | |||||||||
| NetApp, Inc.* | 33,650 | 1,675,434 | |||||||||
| Nuance Communications, Inc.* | 41,060 | 642,178 | |||||||||
| Rovi Corp.* | 47,280 | 2,383,385 | |||||||||
| Tellabs, Inc. | 181,070 | 1,348,972 | |||||||||
| Teradyne, Inc.* † | 132,660 | 1,477,832 | |||||||||
| 20,398,250 | |||||||||||
| Financials — 16.1% | |||||||||||
| AllianceBernstein Holding LP † | 35,670 | 942,045 | |||||||||
| Arch Capital Group Ltd.* | 27,820 | 2,331,316 | |||||||||
| Assured Guaranty Ltd. | 36,370 | 622,291 | |||||||||
| Brandywine Realty Trust REIT | 129,670 | 1,588,458 | |||||||||
| City National Corp. | 32,120 | 1,704,608 | |||||||||
| Comerica, Inc. | 39,610 | 1,471,511 | |||||||||
| Digital Realty Trust, Inc. REIT † | 38,460 | 2,372,982 | |||||||||
| Douglas Emmett, Inc. REIT | 108,710 | 1,903,512 | |||||||||
| Essex Property Trust, Inc. REIT | 13,610 | 1,489,478 | |||||||||
| IntercontinentalExchange, Inc.* | 8,910 | 933,055 | |||||||||
| Jones Lang LaSalle, Inc. | 14,740 | 1,271,620 | |||||||||
| Marshall & Ilsley Corp. | 280,133 | 1,972,136 | |||||||||
| SunTrust Banks, Inc. | 60,250 | 1,556,258 | |||||||||
| 20,159,270 | |||||||||||
| Consumer Discretionary — 14.0% | |||||||||||
| Autoliv, Inc. | 35,040 | 2,289,163 | |||||||||
| DISH Network Corp. - Class A | 70,710 | 1,354,804 | |||||||||
| Dollar Tree, Inc.* | 44,280 | 2,159,093 | |||||||||
| Hasbro, Inc. | 48,270 | 2,148,498 | |||||||||
| Lear Corp.* | 32,000 | 2,525,760 | |||||||||
| Scripps Networks Interactive, Inc. - Class A | 33,620 | 1,599,640 | |||||||||
| Stanley Black & Decker, Inc. | 34,850 | 2,135,608 | |||||||||
| Starwood Hotels & Resorts Worldwide, Inc. | 40,950 | 2,151,922 | |||||||||
| Wynn Resorts Ltd. | 12,750 | 1,106,317 | |||||||||
| 17,470,805 | |||||||||||
| Materials — 9.4% | |||||||||||
| Carpenter Technology Corp. | 40,265 | 1,357,333 | |||||||||
| Cliffs Natural Resources, Inc. | 34,830 | 2,226,334 | |||||||||
| Cytec Industries, Inc. | 46,100 | 2,599,118 | |||||||||
| Lubrizol Corp. | 22,190 | 2,351,474 | |||||||||
| Scotts Miracle-Gro Co. (The) - Class A | 35,390 | 1,830,725 | |||||||||
| Walter Energy, Inc. | 16,820 | 1,367,298 | |||||||||
| 11,732,282 | |||||||||||
| Shares | Market Value | ||||||||||
| Health Care — 9.4% | |||||||||||
| Alexion Pharmaceuticals, Inc.* | 26,070 | $ | 1,677,865 | ||||||||
| AmerisourceBergen Corp. | 40,740 | 1,249,088 | |||||||||
| DaVita, Inc.* | 26,100 | 1,801,683 | |||||||||
| Dendreon Corp.* † | 37,150 | 1,529,837 | |||||||||
| Humana, Inc.* | 42,530 | 2,136,707 | |||||||||
| Pharmaceutical Product Development, Inc. | 51,400 | 1,274,206 | |||||||||
| Valeant Pharmaceuticals International, Inc. † | 82,010 | 2,054,351 | |||||||||
| 11,723,737 | |||||||||||
| Industrials — 9.4% | |||||||||||
| AMETEK, Inc. | 46,040 | 2,199,331 | |||||||||
| Cooper Industries PLC | 32,090 | 1,570,164 | |||||||||
| Goodrich Corp. | 21,550 | 1,588,881 | |||||||||
| Joy Global, Inc. | 29,550 | 2,077,956 | |||||||||
| McDermott International, Inc.* | 105,250 | 1,555,595 | |||||||||
| Textron, Inc. | 34,100 | 701,096 | |||||||||
| W.W. Grainger, Inc. | 16,910 | 2,014,150 | |||||||||
| 11,707,173 | |||||||||||
| Consumer Staples — 8.5% | |||||||||||
| Green Mountain Coffee Roasters, Inc.* † | 81,060 | 2,528,262 | |||||||||
| Herbalife Ltd. | 38,210 | 2,305,974 | |||||||||
| Mead Johnson Nutrition Co. - Class A | 38,310 | 2,180,222 | |||||||||
| Sara Lee Corp. | 137,440 | 1,845,819 | |||||||||
| Whole Foods Market, Inc.* † | 48,430 | 1,797,237 | |||||||||
| 10,657,514 | |||||||||||
| Energy — 8.1% | |||||||||||
| Concho Resources, Inc.* | 34,960 | 2,313,303 | |||||||||
| Ensco PLC ADR | 41,450 | 1,854,059 | |||||||||
| Newfield Exploration Co.* | 22,245 | 1,277,753 | |||||||||
| Oil States International, Inc.* | 37,660 | 1,753,073 | |||||||||
| Plains All American Pipeline LP | 23,630 | 1,486,563 | |||||||||
| QEP Resources, Inc. | 49,660 | 1,496,752 | |||||||||
| 10,181,503 | |||||||||||
| Utilities — 4.5% | |||||||||||
| Northeast Utilities | 69,890 | 2,066,647 | |||||||||
| Questar Corp. | 120,590 | 2,113,943 | |||||||||
| TECO Energy, Inc. | 86,630 | 1,500,432 | |||||||||
| 5,681,022 | |||||||||||
| Telecommunication Services — 3.9% | |||||||||||
| SBA Communications Corp. - Class A* | 67,850 | 2,734,355 | |||||||||
| Windstream Corp. | 172,060 | 2,114,617 | |||||||||
| 4,848,972 | |||||||||||
| Total Common Stocks | $ | 124,560,528 | |||||||||
167
Mid Cap Fund (Continued)
| Shares | Market Value | ||||||||||
| Investment Funds — 8.0% | |||||||||||
| Invesco Liquid Assets Portfolio** | 9,417,147 | $ | 9,417,147 | ||||||||
| Touchstone Institutional Money Market Fund^ | 564,694 | 564,694 | |||||||||
| Total Investment Funds | $ | 9,981,841 | |||||||||
| Total Investment Securities — 107.6% (Cost $116,115,967) | $ | 134,542,369 | |||||||||
| Liabilities in Excess of Other Assets — (7.6%) | (9,463,002 | ) | |||||||||
| Net Assets — 100.0% | $ | 125,079,367 | |||||||||
* Non-income producing security.
† All or a portion of the security is on loan. The total value of the securities on loan as of September 30, 2010, was $9,170,268.
** Represents collateral for securities loaned.
^ Affiliated Fund, sub-advised by Fort Washington Investment Advisors, Inc. See Note 4.
Portfolio Abbreviations:
ADR – American Depositary Receipt
PLC – Public Limited Company
REIT – Real Estate Investment Trust
Other Information:
The inputs or methodology used for valuing securities may not be an indication of the risk associated with investing in those securities. For more information on valuation inputs, and their aggregation into the levels used in the table below, please refer to the security valuation section in the accompanying notes to financial statements.
Valuation Inputs at Reporting Date:
| Description | Level 1 | Level 2 | Level 3 | Total | |||||||||||||||
| Common Stocks | $ | 124,560,528 | $ | — | $ | — | $ | 124,560,528 | |||||||||||
| Investment Funds | 9,981,841 | — | — | 9,981,841 | |||||||||||||||
| $ | 134,542,369 | ||||||||||||||||||
See accompanying notes to financial statements.
168
Portfolio of Investments
Mid Cap Value Fund – September 30, 2010
| Common Stocks — 98.3% | Shares | Market Value | |||||||||
| Financials — 23.2% | |||||||||||
| Ameriprise Financial, Inc. | 11,668 | $ | 552,246 | ||||||||
| Boston Properties, Inc. REIT | 6,869 | 570,951 | |||||||||
| Comerica, Inc. | 16,435 | 610,560 | |||||||||
| Endurance Specialty Holdings Ltd. | 15,505 | 617,099 | |||||||||
| Federated Investors, Inc. - Class B † | 27,517 | 626,287 | |||||||||
| Fifth Third Bancorp | 46,647 | 561,163 | |||||||||
| Host Hotels & Resorts, Inc. REIT | 39,814 | 576,507 | |||||||||
| Liberty Property Trust REIT | 19,367 | 617,807 | |||||||||
| PartnerRe Ltd. | 8,013 | 642,482 | |||||||||
| People's United Financial, Inc. | 42,816 | 560,462 | |||||||||
| ProAssurance Corp.* | 10,410 | 599,512 | |||||||||
| Reinsurance Group of America, Inc. | 11,831 | 571,319 | |||||||||
| Synovus Financial Corp. † | 193,751 | 476,628 | |||||||||
| Unum Group | 25,562 | 566,198 | |||||||||
| Willis Group Holdings PLC | 18,541 | 571,434 | |||||||||
| Zions Bancorporation † | 32,900 | 702,744 | |||||||||
| 9,423,399 | |||||||||||
| Industrials — 12.8% | |||||||||||
| Avery Dennison Corp. | 15,781 | 585,791 | |||||||||
| Cintas Corp. | 25,361 | 698,696 | |||||||||
| Dover Corp. | 11,833 | 617,801 | |||||||||
| Flowserve Corp. | 3,979 | 435,382 | |||||||||
| Fluor Corp. | 12,114 | 600,006 | |||||||||
| PACCAR, Inc. | 12,082 | 581,748 | |||||||||
| Pitney Bowes, Inc. | 26,170 | 559,515 | |||||||||
| Spirit Aerosystems Holdings, Inc. - Class A* | 27,865 | 555,349 | |||||||||
| Towers Watson & Co. - Class A | 11,386 | 559,964 | |||||||||
| 5,194,252 | |||||||||||
| Consumer Discretionary — 10.5% | |||||||||||
| American Eagle Outfitters, Inc. | 47,064 | 704,077 | |||||||||
| BorgWarner, Inc.* | 9,089 | 478,263 | |||||||||
| Darden Restaurants, Inc. | 12,996 | 555,969 | |||||||||
| Harley-Davidson, Inc. | 21,554 | 612,996 | |||||||||
| International Game Technology | 34,964 | 505,230 | |||||||||
| Interpublic Group of Cos., Inc.* | 53,898 | 540,597 | |||||||||
| Nordstrom, Inc. | 11,439 | 425,531 | |||||||||
| PetSmart, Inc. | 13,053 | 456,855 | |||||||||
| 4,279,518 | |||||||||||
| Utilities — 10.4% | |||||||||||
| AGL Resources, Inc. | 15,404 | 590,897 | |||||||||
| American Water Works Co., Inc. | 27,120 | 631,082 | |||||||||
| Consolidated Edison, Inc. | 8,121 | 391,595 | |||||||||
| Edison International | 13,190 | 453,604 | |||||||||
| Great Plains Energy, Inc. | 31,167 | 589,056 | |||||||||
| Portland General Electric Co. | 23,620 | 479,014 | |||||||||
| SCANA Corp. | 12,267 | 494,606 | |||||||||
| Xcel Energy, Inc. | 24,939 | 572,849 | |||||||||
| 4,202,703 | |||||||||||
| Energy — 10.1% | |||||||||||
| EQT Corp. | 15,692 | 565,854 | |||||||||
| Murphy Oil Corp. | 9,490 | 587,621 | |||||||||
| Shares | Market Value | ||||||||||
| Nabors Industries Ltd.* | 33,372 | $ | 602,698 | ||||||||
| Newfield Exploration Co.* | 10,005 | 574,687 | |||||||||
| Pioneer Natural Resources Co. | 8,472 | 550,934 | |||||||||
| Range Resources Corp. | 15,354 | 585,448 | |||||||||
| Spectra Energy Corp. | 27,660 | 623,733 | |||||||||
| 4,090,975 | |||||||||||
| Information Technology — 8.7% | |||||||||||
| Adobe Systems, Inc.* | 16,975 | 443,896 | |||||||||
| Analog Devices, Inc. | 19,403 | 608,866 | |||||||||
| Brocade Communications Systems, Inc.* | 92,164 | 538,238 | |||||||||
| Diebold, Inc. | 18,595 | 578,119 | |||||||||
| Molex, Inc. † | 30,410 | 636,481 | |||||||||
| Synopsys, Inc.* | 29,343 | 726,826 | |||||||||
| 3,532,426 | |||||||||||
| Health Care — 7.8% | |||||||||||
| AmerisourceBergen Corp. | 20,221 | 619,976 | |||||||||
| Cooper Cos., Inc. (The) | 7,422 | 343,045 | |||||||||
| Henry Schein, Inc.* | 10,601 | 621,007 | |||||||||
| Hologic, Inc.* | 33,764 | 540,562 | |||||||||
| Quest Diagnostics, Inc. | 9,548 | 481,887 | |||||||||
| Teleflex, Inc. | 9,684 | 549,857 | |||||||||
| 3,156,334 | |||||||||||
| Consumer Staples — 7.6% | |||||||||||
| Constellation Brands, Inc. - Class A* | 30,211 | 534,432 | |||||||||
| Dean Foods Co.* | 35,570 | 363,170 | |||||||||
| Del Monte Foods Co. | 40,415 | 529,840 | |||||||||
| Kroger Co. (The) | 22,780 | 493,415 | |||||||||
| McCormick & Co., Inc. | 11,943 | 502,084 | |||||||||
| Molson Coors Brewing Co. - Class B | 14,449 | 682,282 | |||||||||
| 3,105,223 | |||||||||||
| Materials — 7.2% | |||||||||||
| Allegheny Technologies, Inc. | 14,621 | 679,145 | |||||||||
| Huntsman Corp. | 51,752 | 598,253 | |||||||||
| Nucor Corp. | 12,558 | 479,716 | |||||||||
| Owens-Illinois, Inc.* | 20,360 | 571,302 | |||||||||
| Packaging Corp of America | 25,400 | 588,518 | |||||||||
| 2,916,934 | |||||||||||
| Total Common Stocks | $ | 39,901,764 | |||||||||
| Investment Funds — 5.4% | |||||||||||
| Invesco Liquid Assets Portfolio** | 1,507,083 | 1,507,083 | |||||||||
| iShares Russell Midcap Value Index Fund | 2,895 | 116,871 | |||||||||
| Touchstone Institutional Money Market Fund^ | 554,647 | 554,647 | |||||||||
| Total Investment Funds | $ | 2,178,601 | |||||||||
| Total Investment Securities — 103.7% (Cost $41,321,923) | $ | 42,080,365 | |||||||||
| Liabilities in Excess of Other Assets — (3.7%) | (1,506,187 | ) | |||||||||
| Net Assets — 100.0% | $ | 40,574,178 | |||||||||
169
Mid Cap Value Fund (Continued)
† All or a portion of the security is on loan. The total value of the securities on loan as of September 30, 2010, was $1,473,549.
* Non-income producing security.
** Represents collateral for securities loaned.
^ Affiliated Fund, sub-advised by Fort Washington Investment Advisors, Inc. See Note 4.
Portfolio Abbreviations:
PLC – Public Limited Company
REIT – Real Estate Investment Trust
Other Information:
The inputs or methodology used for valuing securities may not be an indication of the risk associated with investing in those securities. For more information on valuation inputs, and their aggregation into the levels used in the table below, please refer to the security valuation section in the accompanying notes to financial statements.
Valuation Inputs at Reporting Date:
| Description | Level 1 | Level 2 | Level 3 | Total | |||||||||||||||
| Common Stocks | $ | 39,901,764 | $ | — | $ | — | $ | 39,901,764 | |||||||||||
| Investment Funds | 2,178,601 | — | — | 2,178,601 | |||||||||||||||
| $ | 42,080,365 | ||||||||||||||||||
See accompanying notes to financial statements.
170
Portfolio of Investments
Premium Yield Equity Fund – September 30, 2010
| Common Stocks — 97.9% | Shares | Market Value | |||||||||
| Energy — 18.7% | |||||||||||
| Enerplus Resources Fund | 58,068 | $ | 1,495,251 | ||||||||
| Kinder Morgan Management LLC* | 45,195 | 2,722,999 | |||||||||
| Southern Union Co. | 49,673 | 1,195,132 | |||||||||
| Spectra Energy Corp. | 50,372 | 1,135,889 | |||||||||
| Statoil ASA ADR | 52,051 | 1,092,030 | |||||||||
| 7,641,301 | |||||||||||
| Health Care — 17.5% | |||||||||||
| Abbott Laboratories | 27,705 | 1,447,309 | |||||||||
| Bristol-Myers Squibb Co. | 26,585 | 720,719 | |||||||||
| Eli Lilly & Co. | 23,087 | 843,368 | |||||||||
| GlaxoSmithKline PLC ADR | 20,988 | 829,446 | |||||||||
| Johnson & Johnson | 20,988 | 1,300,416 | |||||||||
| Merck & Co., Inc. | 34,981 | 1,287,651 | |||||||||
| Pfizer, Inc. | 41,277 | 708,726 | |||||||||
| 7,137,635 | |||||||||||
| Utilities — 16.3% | |||||||||||
| American Water Works Co., Inc. | 67,583 | 1,572,656 | |||||||||
| National Grid PLC ADR | 24,486 | 1,046,532 | |||||||||
| NiSource, Inc. | 82,554 | 1,436,440 | |||||||||
| Northeast Utilities | 25,886 | 765,449 | |||||||||
| ONEOK, Inc. | 26,585 | 1,197,388 | |||||||||
| Pepco Holdings, Inc. | 34,981 | 650,647 | |||||||||
| 6,669,112 | |||||||||||
| Financials — 15.2% | |||||||||||
| Alexandria Real Estate Equities, Inc. REIT | 13,293 | 930,510 | |||||||||
| Allstate Corp. | 27,985 | 882,927 | |||||||||
| Bank of Montreal | 10,494 | 606,028 | |||||||||
| Cincinnati Financial Corp. | 29,384 | 847,728 | |||||||||
| Digital Realty Trust, Inc. REIT | 16,091 | 992,815 | |||||||||
| HCP, Inc. REIT | 25,186 | 906,192 | |||||||||
| NYSE Euronext | 35,680 | 1,019,378 | |||||||||
| 6,185,578 | |||||||||||
| Telecommunication Services — 10.1% | |||||||||||
| AT&T, Inc. | 36,380 | 1,040,468 | |||||||||
| BCE, Inc. | 13,293 | 432,022 | |||||||||
| Tele Norte Leste Participacoes SA ADR | 41,277 | 581,180 | |||||||||
| Telefonica SA ADR | 15,392 | 1,141,317 | |||||||||
| Windstream Corp. | 76,258 | 937,211 | |||||||||
| 4,132,198 | |||||||||||
| Information Technology — 7.8% | |||||||||||
| Intel Corp. | 62,965 | 1,210,817 | |||||||||
| Microchip Technology, Inc. | 33,581 | 1,056,122 | |||||||||
| Taiwan Semiconductor Manufacturing Co. Ltd. ADR | 90,390 | 916,555 | |||||||||
| 3,183,494 | |||||||||||
| Consumer Discretionary — 5.6% | |||||||||||
| Cinemark Holdings, Inc. | 25,326 | 407,749 | |||||||||
| Genuine Parts Co. | 22,388 | 998,281 | |||||||||
| McDonald's Corp. | 11,893 | 886,147 | |||||||||
| 2,292,177 | |||||||||||
| Shares | Market Value | ||||||||||
| Consumer Staples — 4.7% | |||||||||||
| H.J. Heinz Co. | 16,931 | $ | 802,022 | ||||||||
| Procter & Gamble Co. (The) | 18,890 | 1,132,833 | |||||||||
| 1,934,855 | |||||||||||
| Industrials — 2.0% | |||||||||||
| R.R. Donnelley & Sons Co. | 47,574 | 806,855 | |||||||||
| Total Common Stocks | $ | 39,983,205 | |||||||||
| Investment Fund — 2.8% | |||||||||||
| Touchstone Institutional Money Market Fund^ | 1,162,613 | 1,162,613 | |||||||||
| Total Investment Securities — 100.7% (Cost $39,156,618) | $ | 41,145,818 | |||||||||
| Liabilities in Excess of Other Assets — (0.7%) | (294,042 | ) | |||||||||
| Net Assets — 100.0% | $ | 40,851,776 | |||||||||
* Non-income producing security.
^ Affiliated Fund, sub-advised by Fort Washington Investment Advisors, Inc. See Note 4.
Portfolio Abbreviations:
ADR – American Depositary Receipt
PLC – Public Limited Company
REIT – Real Estate Investment Trust
Other Information:
The inputs or methodology used for valuing securities may not be an indication of the risk associated with investing in those securities. For more information on valuation inputs, and their aggregation into the levels used in the table below, please refer to the security valuation section in the accompanying notes to financial statements.
Valuation Inputs at Reporting Date:
| Description | Level 1 | Level 2 | Level 3 | Total | |||||||||||||||
| Common Stocks | $ | 39,983,205 | $ | — | $ | — | $ | 39,983,205 | |||||||||||
| Investment Fund | 1,162,613 | — | — | 1,162,613 | |||||||||||||||
| $ | 41,145,818 | ||||||||||||||||||
See accompanying notes to financial statements.
171
Portfolio of Investments
Sands Capital Select Growth Fund – September 30, 2010
| Common Stocks — 97.0% | Shares | Market Value | |||||||||
| Information Technology — 34.9% | |||||||||||
| Apple, Inc.* | 144,300 | $ | 40,945,125 | ||||||||
| ASML Holding NV - Class G † | 404,100 | 12,013,893 | |||||||||
| F5 Networks, Inc.* | 82,600 | 8,574,706 | |||||||||
| FLIR Systems, Inc.* | 323,500 | 8,313,950 | |||||||||
| Google, Inc. - Class A* | 62,200 | 32,704,138 | |||||||||
| QUALCOMM, Inc. | 958,500 | 43,247,520 | |||||||||
| Salesforce.com, Inc.* | 417,500 | 46,676,500 | |||||||||
| Visa, Inc. - Class A | 514,100 | 38,177,066 | |||||||||
| 230,652,898 | |||||||||||
| Health Care — 19.4% | |||||||||||
| Alexion Pharmaceuticals, Inc.* | 128,072 | 8,242,714 | |||||||||
| Allergan, Inc. | 423,500 | 28,175,455 | |||||||||
| Genzyme Corp.* | 326,600 | 23,120,014 | |||||||||
| Illumina, Inc.* | 478,200 | 23,527,440 | |||||||||
| Intuitive Surgical, Inc.* | 92,600 | 26,274,324 | |||||||||
| Varian Medical Systems, Inc.* † | 315,000 | 19,057,500 | |||||||||
| 128,397,447 | |||||||||||
| Consumer Discretionary — 18.8% | |||||||||||
| Amazon.com, Inc.* | 326,000 | 51,201,560 | |||||||||
| Las Vegas Sands Corp.* † | 461,800 | 16,093,730 | |||||||||
| NIKE, Inc. - Class B | 282,200 | 22,615,508 | |||||||||
| Staples, Inc. | 861,900 | 18,030,948 | |||||||||
| Starbucks Corp. | 638,500 | 16,332,830 | |||||||||
| 124,274,576 | |||||||||||
| Energy — 12.3% | |||||||||||
| FMC Technologies, Inc.* | 373,200 | 25,485,828 | |||||||||
| National-Oilwell Varco, Inc. | 707,700 | 31,471,419 | |||||||||
| Schlumberger Ltd. | 391,000 | 24,089,510 | |||||||||
| 81,046,757 | |||||||||||
| Financials — 6.3% | |||||||||||
| Charles Schwab Corp. (The) | 1,306,300 | 18,157,570 | |||||||||
| CME Group, Inc. | 8,185 | 2,131,783 | |||||||||
| IntercontinentalExchange, Inc.* | 206,000 | 21,572,320 | |||||||||
| 41,861,673 | |||||||||||
| Industrials — 3.3% | |||||||||||
| CH Robinson Worldwide, Inc. | 82,696 | 5,782,105 | |||||||||
| W.W. Grainger, Inc. | 133,900 | 15,948,829 | |||||||||
| 21,730,934 | |||||||||||
| Materials — 2.0% | |||||||||||
| Praxair, Inc. | 142,800 | 12,889,128 | |||||||||
| Total Common Stocks | $ | 640,853,413 | |||||||||
| Investment Funds — 6.9% | |||||||||||
| Invesco Liquid Assets Portfolio** | 15,443,326 | 15,443,326 | |||||||||
| Touchstone Institutional Money Market Fund^ | 30,084,351 | 30,084,351 | |||||||||
| Total Investment Funds | $ | 45,527,677 | |||||||||
| Market Value | |||||||
| Total Investment Securities — 103.9% (Cost $525,782,529) | $ | 686,381,090 | |||||
| Liabilities in Excess of Other Assets — (3.9%) | (25,719,771 | ) | |||||
| Net Assets — 100.0% | $ | 660,661,319 | |||||
* Non-income producing security.
† All or a portion of the security is on loan. The total value of the securities on loan as of September 30, 2010, was $14,785,563.
** Represents collateral for securities loaned.
^ Affiliated Fund, sub-advised by Fort Washington Investment Advisors, Inc. See Note 4.
Other Information:
The inputs or methodology used for valuing securities may not be an indication of the risk associated with investing in those securities. For more information on valuation inputs, and their aggregation into the levels used in the table below, please refer to the security valuation section in the accompanying notes to financial statements.
Valuation Inputs at Reporting Date:
| Description | Level 1 | Level 2 | Level 3 | Total | |||||||||||||||
| Common Stocks | $ | 640,853,413 | $ | — | $ | — | $ | 640,853,413 | |||||||||||
| Investment Funds | 45,527,677 | — | — | 45,527,677 | |||||||||||||||
| $ | 686,381,090 | ||||||||||||||||||
See accompanying notes to financial statements.
172
Portfolio of Investments
Short Duration Fixed Income Fund – September 30, 2010
| Principal Amount | Market Value | ||||||||||
| Asset-Backed Securities — 28.5% | |||||||||||
| $ | 480,000 | American Express Credit Account Master Trust, Ser 2005-4, Class A, 0.327%, 1/15/15 (a) | $ | 479,096 | |||||||
| 310,000 | American Express Credit Account Master Trust, Ser 2010-1, Class A, 0.507%, 11/16/15 (a) | 310,000 | |||||||||
| 215,000 | AmeriCredit Automobile Receivables Trust, Ser 2010-3, Class A3, 1.140%, 4/8/15 | 215,150 | |||||||||
| 188,643 | Bank of America Auto Trust, Ser 2008-1A, Class A3A, 144a, 4.970%, 9/20/12 | 191,723 | |||||||||
| 235,000 | Cabela's Master Credit Card Trust, Ser 2006-3A, Class A1, 144a, 5.260%, 10/15/14 | 244,711 | |||||||||
| 175,000 | CarMax Auto Owner Trust, Ser 2006-2, Class B, 5.310%, 4/16/12 | 175,298 | |||||||||
| 87,210 | CenterPoint Energy Transition Bond Co. LLC, Ser 2005-A, Class A2, 4.970%, 8/1/14 | 90,759 | |||||||||
| 270,000 | Chase Issuance Trust, Ser 2007-A17, Class A, 5.120%, 10/15/14 | 293,790 | |||||||||
| 430,000 | Chase Issuance Trust, Ser 2008-A11, Class A11, 5.400%, 7/15/15 | 482,554 | |||||||||
| 305,000 | Chase Issuance Trust, Ser 2009-A3, Class A3, 2.400%, 6/17/13 | 309,106 | |||||||||
| 173,060 | Chase Manhattan Auto Owner Trust, Ser 2006-B, Class A4, 5.110%, 4/15/14 | 173,373 | |||||||||
| 325,000 | Chrysler Financial Auto Securitization Trust, Ser 2009-A, Class A3, 2.820%, 1/15/16 | 331,115 | |||||||||
| 405,000 | Citibank Omni Master Trust, Ser 2009-A17, Class A17, 144a, 4.900%, 11/15/18 | 438,294 | |||||||||
| 314,030 | CNH Equipment Trust, Ser 2008-B, Class A3B, 1.657%, 7/16/12 (a) | 314,593 | |||||||||
| 150,000 | CNH Equipment Trust, Ser 2008-B, Class A4A, 5.600%, 11/17/14 | 156,620 | |||||||||
| 212,134 | CNH Equipment Trust, Ser 2009-A, Class A3, 5.280%, 11/15/12 | 217,006 | |||||||||
| 325,000 | CNH Equipment Trust, Ser 2009-B, Class A4, 5.170%, 10/15/14 | 343,804 | |||||||||
| 274,869 | College & University Facility Loan Trust, Ser 2, Class D, 4.000%, 6/1/18 | 274,869 | |||||||||
| 425,000 | Discover Card Master Trust, Ser 2008-A3, Class A3, 5.100%, 10/15/13 | 435,696 | |||||||||
| 240,000 | Ford Credit Auto Lease Trust, Ser 2010-A, Class A3, 144a, 1.620%, 11/15/13 | 241,886 | |||||||||
| Principal Amount | Market Value | ||||||||||
| $ | 45,470 | Ford Credit Auto Owner Trust, Ser 2007-B, Class A3A, 5.150%, 11/15/11 | $ | 45,800 | |||||||
| 140,000 | Ford Credit Auto Owner Trust, Ser 2009-B, Class A4, 4.500%, 7/15/14 | 150,878 | |||||||||
| 390,000 | GE Capital Credit Card Master Note Trust, Ser 2009-2, Class A, 3.690%, 7/15/15 | 408,978 | |||||||||
| 320,000 | GE Capital Credit Card Master Note Trust, Ser 2009-3, Class A, 2.540%, 9/15/14 | 325,728 | |||||||||
| 405,000 | GE Capital Credit Card Master Note Trust, Ser 2010-3, Class A, 2.210%, 6/15/16 | 414,935 | |||||||||
| 300,000 | GE Equipment Midticket LLC, Ser 2009-1, Class A3, 2.340%, 6/17/13 | 303,520 | |||||||||
| 240,000 | GE Equipment Midticket LLC, Ser 2010-1, Class A3, 144a, 0.940%, 7/14/14 | 239,990 | �� | ||||||||
| 348,357 | Harley-Davidson Motorcycle Trust, Ser 2006-1, Class A2, 144a, 5.040%, 10/15/12 | 351,237 | |||||||||
| 300,000 | Harley-Davidson Motorcycle Trust, Ser 2009-2, Class A4, 3.320%, 2/15/17 | 311,506 | |||||||||
| 185,272 | IMC Home Equity Loan Trust, Ser 1997-5, Class A9, 7.310%, 11/20/28 | 182,965 | |||||||||
| 141,992 | John Deere Owner Trust, Ser 2007-A, Class A4, 5.070%, 4/15/14 | 142,258 | |||||||||
| 440,000 | Nissan Auto Lease Trust, Ser 2009-A, Class A4, 3.510%, 11/17/14 | 449,178 | |||||||||
| 320,000 | Nissan Auto Lease Trust, Ser 2010-A, Class A3, 1.390%, 1/15/16 | 322,107 | |||||||||
| 371,397 | PG&E Energy Recovery Funding LLC, Ser 2005-1, Class A4, 4.370%, 6/25/14 | 384,660 | |||||||||
| 75,392 | PG&E Energy Recovery Funding LLC, Ser 2005-2, Class A2, 5.030%, 3/25/14 | 78,211 | |||||||||
| 103,619 | RSB Bondco LLC, Ser 2007-A, Class A1, 5.470%, 10/1/14 | 108,616 | |||||||||
| 285,000 | Santander Drive Auto Receivables Trust, Ser 2010-1, Class A3, 1.840%, 11/17/14 | 285,997 | |||||||||
| 440,000 | Tax Liens Securitization Trust, Ser 2010-1A, Class 1A2, 144a, 2.000%, 4/15/18 | 439,696 | |||||||||
| 375,000 | Volkswagen Auto Lease Trust, Ser 2009-A, Class A3, 3.410%, 4/16/12 | 380,957 | |||||||||
| 82,295 | Volkswagen Auto Loan Enhanced Trust, Ser 2008-1, Class A3, 4.500%, 7/20/12 | 83,150 | |||||||||
| 435,000 | Volvo Financial Equipment LLC, Ser 2010-1A, Class A2, 144a, 1.060%, 6/15/12 | 435,993 | |||||||||
173
Short Duration Fixed Income Fund (Continued)
| Principal Amount | Market Value | ||||||||||
| Asset-Backed Securities — 28.5% (Continued) | |||||||||||
| $ | 260,000 | World Financial Network Credit Card Master Trust, Ser 2009-A, Class A, 4.600%, 9/15/15 | $ | 269,077 | |||||||
| 180,000 | World Financial Network Credit Card Master Trust, Ser 2009-B, Class A, 3.790%, 5/15/16 | 186,648 | |||||||||
| 205,000 | World Financial Network Credit Card Master Trust, Ser 2009-D, Class A, 4.660%, 5/15/17 | 218,910 | |||||||||
| 345,000 | World Omni Auto Receivables Trust, Ser 2007-B, Class A4, 5.390%, 5/15/13 | 356,093 | |||||||||
| Total Asset-Backed Securities | $ | 12,596,531 | |||||||||
| Corporate Bonds — 27.1% Financials — 15.5% | |||||||||||
| 350,000 | American Express Bank, 0.407%, 6/12/12 (a) | 346,490 | |||||||||
| 150,000 | Bank of New York Mellon Corp. MTN, 5.125%, 11/1/11 | 157,300 | |||||||||
| 315,000 | Bank of New York Mellon Corp. MTN, 4.950%, 11/1/12 | 341,641 | |||||||||
| 215,000 | Barclays Bank PLC, 2.500%, 1/23/13 | 219,669 | |||||||||
| 315,000 | Credit Suisse USA, Inc., 6.125%, 11/15/11 | 333,279 | |||||||||
| 225,000 | FIA Card Services N.A. MTN, 6.625%, 6/15/12 | 239,703 | |||||||||
| 235,000 | General Electric Capital Corp. MTN, 0.446%, 8/15/11 (a) | 235,059 | |||||||||
| 280,000 | Goldman Sachs Group, Inc., 6.875%, 1/15/11 | 284,981 | |||||||||
| 275,000 | Hudson United Bank, 7.000%, 5/15/12 | 291,595 | |||||||||
| 215,000 | ING USA Global Funding Trust, 4.500%, 10/1/10 | 215,000 | |||||||||
| 320,000 | Jefferies Group, Inc., 7.750%, 3/15/12 | 345,027 | |||||||||
| 335,000 | John Deere Capital Corp., Ser CORE, 2.000%, 4/15/11 | 334,722 | |||||||||
| 285,000 | Manufacturers & Traders Trust Co., 1.790%, 4/1/13 (a) | 281,912 | |||||||||
| 60,000 | Merrill Lynch & Co., Inc. MTN, 6.150%, 4/25/13 | 65,564 | |||||||||
| 300,000 | MetLife of Connecticut Institutional Funding Ltd. MTN, 0.776%, 12/8/11 (a) | 292,306 | |||||||||
| 255,000 | Morgan Stanley MTN, 5.625%, 1/9/12 | 268,539 | |||||||||
| 270,000 | National City Bank of Kentucky, 6.300%, 2/15/11 | 275,523 | |||||||||
| 120,000 | New York Life Global Funding, 144a, 5.250%, 10/16/12 | 130,330 | |||||||||
| 365,000 | Northern Trust Corp., 5.300%, 8/29/11 | 380,922 | |||||||||
| 450,000 | PNC Funding Corp., 2.300%, 6/22/12 | 463,555 | |||||||||
| 260,000 | SunTrust Bank, Inc., 6.375%, 4/1/11 | 266,975 | |||||||||
| Principal Amount | Market Value | ||||||||||
| $ | 300,000 | TD Ameritrade Holding Corp., 2.950%, 12/1/12 | $ | 308,318 | |||||||
| 500,000 | Wells Fargo & Co. MTN, 3.980%, 10/29/10 | 501,231 | |||||||||
| 264,545 | WHC-IRS Trust, 6.980%, 5/15/15 | 282,145 | |||||||||
| 6,861,786 | |||||||||||
| Industrials — 2.6% | |||||||||||
| 225,000 | Cooper US, Inc., 5.250%, 11/15/12 | 244,391 | |||||||||
| 175,786 | Federal Express Corp. 1995 Pass Through Trust, Ser B2, 7.110%, 1/2/14 | 176,401 | |||||||||
| 135,006 | Petrodrill Five Ltd., Ser 5, 4.390%, 4/15/16 | 142,100 | |||||||||
| 160,424 | Petrodrill Four Ltd., Ser 4, 4.240%, 1/15/16 | 170,307 | |||||||||
| 225,000 | Ryder System, Inc. MTN, 5.950%, 5/2/11 | 231,088 | |||||||||
| 166,432 | Systems 2001 AT LLC, 144a, 6.664%, 9/15/13 | 183,608 | |||||||||
| 1,147,895 | |||||||||||
| Health Care — 2.4% | |||||||||||
| 325,000 | Baxter FinCo BV, 4.750%, 10/15/10 | 325,241 | |||||||||
| 330,000 | Express Scripts, Inc., 5.250%, 6/15/12 | 352,292 | |||||||||
| 360,000 | Hospira, Inc., 5.550%, 3/30/12 | 386,247 | |||||||||
| 1,063,780 | |||||||||||
| Telecommunication Services — 1.5% | |||||||||||
| 203,335 | BellSouth Telecommunications, Inc., 6.300%, 12/15/15 | 221,935 | |||||||||
| 240,000 | New Cingular Wireless Services, Inc., 8.125%, 5/1/12 | 266,630 | |||||||||
| 175,000 | Verizon New England, Inc., 6.500%, 9/15/11 | 184,000 | |||||||||
| 672,565 | |||||||||||
| Energy — 1.4% | |||||||||||
| 250,000 | Baker Hughes, Inc., 6.500%, 11/15/13 | 289,585 | |||||||||
| 316,659 | Rowan Cos., Inc., 2.800%, 10/20/13 | 317,083 | |||||||||
| 606,668 | |||||||||||
| Consumer Staples — 1.3% | |||||||||||
| 338,634 | CVS Pass-Through Trust, 144a, 6.117%, 1/10/13 | 359,840 | |||||||||
| 215,000 | Kroger Co., 6.800%, 4/1/11 | 221,324 | |||||||||
| 581,164 | |||||||||||
| Information Technology — 0.8% | |||||||||||
| 150,000 | Analog Devices, Inc., 5.000%, 7/1/14 | 164,845 | |||||||||
| 200,000 | Hewlett-Packard Co., 2.250%, 5/27/11 | 202,622 | |||||||||
| 367,467 | |||||||||||
174
Short Duration Fixed Income Fund (Continued)
| Principal Amount | Market Value | ||||||||||
| Corporate Bonds — 27.1% (Continued) Consumer Discretionary — 0.6% | |||||||||||
| $ | 245,000 | Comcast Cable Communications LLC, 6.750%, 1/30/11 | $ | 249,763 | |||||||
| Materials — 0.5% | |||||||||||
| 185,000 | Dow Chemical Co. (The), 7.600%, 5/15/14 | 216,088 | |||||||||
| Utilities — 0.5% | |||||||||||
| 190,000 | National Rural Utilities Cooperative Finance Corp. MTN, 7.250%, 3/1/12 | 206,772 | |||||||||
| Total Corporate Bonds | $ | 11,973,948 | |||||||||
| U.S. Government Mortgage-Backed Obligations — 16.2% | |||||||||||
| 1,082 | FHLMC, Pool #G10446, 6.500%, 2/1/11 | 1,091 | |||||||||
| 88,084 | FHLMC, Pool #D94598, 6.500%, 4/1/21 | 96,829 | |||||||||
| 21,597 | FHLMC, Pool #E97227, 7.000%, 9/1/14 | 21,822 | |||||||||
| 111,520 | FHLMC, Pool #C66916, 7.000%, 5/1/32 | 125,963 | |||||||||
| 104,826 | FHLMC, Pool #G30085, 7.500%, 10/1/17 | 116,998 | |||||||||
| 339,614 | FHLMC REMICS, Ser 2510, Class TA, 4.000%, 6/15/32 | 363,847 | |||||||||
| 88,561 | FHLMC REMICS, Ser 2892, Class A, 5.000%, 5/15/21 | 89,448 | |||||||||
| 37,987 | FHLMC REMICS, Ser 3178, Class MA, 6.000%, 10/15/26 | 37,988 | |||||||||
| 537 | FNMA, Pool #250477, 6.000%, 1/1/11 | 542 | |||||||||
| 19,966 | FNMA, Pool #313429, 7.000%, 3/1/12 | 20,529 | |||||||||
| 42,649 | FNMA, Pool #323441, 7.000%, 12/1/13 | 43,762 | |||||||||
| 136,840 | FNMA, Pool #546474, 7.000%, 1/1/15 | 143,633 | |||||||||
| 7,427 | FNMA, Pool #334593, 7.000%, 5/1/24 | 8,434 | |||||||||
| 117,833 | FNMA, Pool #323832, 7.500%, 7/1/29 | 134,230 | |||||||||
| 160,701 | FNMA, Pool #665773, 7.500%, 6/1/31 | 182,886 | |||||||||
| 22 | FNMA, Pool #N 6222, 9.000%, 4/1/16 | 22 | |||||||||
| 142,879 | FNMA REMICS, Ser 2003-66, Class AP, 3.500%, 11/25/32 | 147,757 | |||||||||
| 315,600 | FNMA REMICS, Ser 2003-19, Class ME, 4.000%, 1/25/33 | 331,596 | |||||||||
| 485,421 | FNMA REMICS, Ser 2003-42, Class CA, 4.000%, 5/25/33 | 519,363 | |||||||||
| 513,219 | FNMA REMICS, Ser 2003-119, Class PU, 4.000%, 11/25/33 | 541,931 | |||||||||
| 235,601 | GNMA, Ser 2004-43, Class A, 2.822%, 12/16/19 | 237,646 | |||||||||
| 300,229 | GNMA, Ser 2004-97, Class AB, 3.084%, 4/16/22 | 304,944 | |||||||||
| 12,634 | GNMA, Pool #G2 8426, 3.125%, 11/20/18 (a) | 13,034 | |||||||||
| 13,942 | GNMA, Ser 2004-9, Class A, 3.360%, 8/16/22 | 13,940 | |||||||||
| Principal Amount | Market Value | ||||||||||
| $ | 172,379 | GNMA, Ser 2006-19, Class A, 3.387%, 6/16/30 | $ | 175,070 | |||||||
| 212,917 | GNMA, Ser 2006-39, Class A, 3.772%, 6/16/25 | 217,427 | |||||||||
| 94,810 | GNMA, Ser 2004-6, Class B, 3.949%, 7/16/33 | 98,666 | |||||||||
| 287,948 | GNMA, Ser 2005-76, Class A, 3.963%, 5/16/30 | 300,271 | |||||||||
| 182,587 | GNMA, Ser 2005-79, Class A, 3.998%, 10/16/33 | 185,797 | |||||||||
| 242,041 | GNMA, Ser 2005-12, Class A, 4.044%, 5/16/21 | 246,240 | |||||||||
| 308,610 | GNMA, Ser 2003-43, Class B, 4.374%, 4/16/33 | 322,866 | |||||||||
| 574,683 | GNMA, Ser 2002-72, Class AB, 4.500%, 10/20/32 | 626,619 | |||||||||
| 380,000 | GNMA, Ser 2004-78, Class C, 4.658%, 4/16/29 | 407,584 | |||||||||
| 430,000 | GNMA, Ser 2004-12, Class BA, 4.807%, 8/16/32 | 458,742 | |||||||||
| 2,819 | GNMA, Pool #G2 2707, 5.500%, 1/20/14 | 2,989 | |||||||||
| 2,658 | GNMA, Pool #G2 2802, 5.500%, 7/20/14 | 2,818 | |||||||||
| 38,716 | GNMA, Pool #G2 2843, 5.500%, 11/20/14 | 41,046 | |||||||||
| 46,083 | GNMA, Pool #578189, 6.000%, 2/15/32 | 50,569 | |||||||||
| 8,678 | GNMA, Pool #462486, 6.500%, 1/15/13 | 9,422 | |||||||||
| 31,196 | GNMA, Pool #569337, 6.500%, 4/15/22 | 34,492 | |||||||||
| 91,854 | GNMA, Pool #780604, 7.000%, 7/15/12 | 95,364 | |||||||||
| 60,025 | GNMA, Pool #G2 814, 8.000%, 8/20/17 | 66,234 | |||||||||
| 25,954 | GNMA, Pool #780327, 8.000%, 11/15/17 | 28,696 | |||||||||
| 63,134 | GNMA, Pool #780322, 8.000%, 11/15/22 | 73,059 | |||||||||
| 56,065 | GNMA, Pool #344233, 8.000%, 2/15/23 | 65,409 | |||||||||
| 122,566 | GNMA, Pool #345123, 8.000%, 12/15/23 | 142,994 | |||||||||
| Total U.S. Government Mortgage-Backed Obligations | $ | 7,150,609 | |||||||||
| Commercial Mortgage-Backed Securities — 11.1% | |||||||||||
| 125,000 | American Tower Trust, Ser 2007-1A, Class AFX, 144a, 5.420%, 4/15/37 | 137,360 | |||||||||
| 335,000 | Banc of America Commercial Mortgage, Inc., Ser 2002-2, Class A3, 5.118%, 7/11/43 | 349,329 | |||||||||
| 220,745 | Community Program Loan Trust, Ser 1987-A, Class A4, 4.500%, 10/1/18 | 221,822 | |||||||||
| 124,153 | Credit Suisse First Boston Mortgage Securities Corp., Ser 2001-CF2, Class A4, 6.505%, 2/15/34 | 124,394 | |||||||||
| 282,896 | First Union National Bank Commercial Mortgage, Ser 2001-C2, Class A2, 6.663%, 1/12/43 | 286,538 | |||||||||
| 252,002 | First Union National Bank Commercial Mortgage, Ser 2001-C4, Class A2, 6.223%, 12/12/33 | 261,427 | |||||||||
175
Short Duration Fixed Income Fund (Continued)
| Principal Amount | Market Value | ||||||||||
| Commercial Mortgage-Backed Securities — 11.1% (Continued) | |||||||||||
| $ | 124,485 | GE Capital Commercial Mortgage Corp., Ser 2001-1, Class A2, 6.531%, 5/15/33 | $ | 126,192 | |||||||
| 360,000 | GE Capital Commercial Mortgage Corp., Ser 2001-3, Class A2, 6.070%, 6/10/38 | 374,471 | |||||||||
| 335,000 | GMAC Commercial Mortgage Securities, Inc., Ser 2003-C1, Class A2, 4.079%, 5/10/36 | 351,137 | |||||||||
| 300,000 | Greenwich Capital Commercial Funding Corp., Ser 2004-GG1, Class A5, 4.883%, 6/10/36 | 305,362 | |||||||||
| 320,000 | JP Morgan Chase Commercial Mortgage Securities Corp., Ser 2003-CB6, Class A2, 5.255%, 7/12/37 (a) | 345,701 | |||||||||
| 253,352 | LB-UBS Commercial Mortgage Trust, Ser 2001-C2, Class A2, 6.653%, 11/15/27 | 256,986 | |||||||||
| 291,531 | LB-UBS Commercial Mortgage Trust, Ser 2002-C1, Class A4, 6.462%, 3/15/31 | 308,094 | |||||||||
| 394,676 | LB-UBS Commercial Mortgage Trust, Ser 2002-C7, Class A3, 4.659%, 12/15/26 | 408,920 | |||||||||
| 105,308 | LB-UBS Commercial Mortgage Trust, Ser 2003-C5, Class A3, 4.254%, 7/15/27 | 109,818 | |||||||||
| 315,000 | LB-UBS Commercial Mortgage Trust, Ser 2003-C7, Class A3, 4.559%, 9/15/27 (a) | 317,963 | |||||||||
| 263,021 | Merrill Lynch Mortgage Investors, Inc., Ser 1998-C1, Class A3, 6.720%, 11/15/26 (a) | 291,508 | |||||||||
| 203,791 | Morgan Stanley Capital I, Ser 2007-HQ11, Class A1, 5.246%, 2/12/44 | 207,288 | |||||||||
| 138,987 | Wells Fargo Mortgage Backed Securities Trust, Ser 2006-16, Class A12, 5.000%, 11/25/36 | 138,924 | |||||||||
| Total Commercial Mortgage-Backed Securities | $ | 4,923,234 | |||||||||
| U.S. Government Agency Obligations — 7.4% | |||||||||||
| 260,000 | FNMA, 5.250%, 8/1/12 | 280,486 | |||||||||
| 279,591 | SBA, Ser P10A, 4.504%, 2/1/14 | 294,109 | |||||||||
| 278,223 | SBA, Ser 2008-10B, Class 1, 4.580%, 3/1/18 | 298,986 | |||||||||
| 150,828 | SBA, Ser 2005-P10A, Class 1, 4.638%, 2/10/15 | 159,207 | |||||||||
| 220,697 | SBA, Ser 2003-20E, Class 1, 4.640%, 5/1/23 | 236,601 | |||||||||
| 242,909 | SBA, Ser 2004-20B, Class 1, 4.720%, 2/1/24 | 261,646 | |||||||||
| 198,251 | SBA, Ser 2002-20J, Class 1, 4.750%, 10/1/22 | 212,552 | |||||||||
| Principal Amount | Market Value | ||||||||||
| $ | 235,717 | SBA, Ser 2005-20G, Class 1, 4.750%, 7/1/25 | $ | 256,334 | |||||||
| 260,279 | SBA, Ser 2007-10E, Class 1, 5.250%, 9/1/17 | 281,663 | |||||||||
| 264,064 | SBA, Ser 2006-P10A, Class 1, 5.408%, 2/10/16 | 287,474 | |||||||||
| 213,722 | SBA, Ser 98-L, 5.800%, 12/1/18 | 231,274 | |||||||||
| 194,635 | SBA, Ser 20C, 6.070%, 3/1/22 | 217,714 | |||||||||
| 225,193 | SBA, 6.140%, 1/1/22 | 250,066 | |||||||||
| Total U.S. Government Agency Obligations | $ | 3,268,112 | |||||||||
| U.S. Treasury Obligations — 6.5% | |||||||||||
| 425,000 | U.S. Treasury Note, 0.875%, 2/28/11 | 426,195 | |||||||||
| 300,000 | U.S. Treasury Note, 4.125%, 8/31/12 | 321,317 | |||||||||
| 800,000 | U.S. Treasury Note, 2.750%, 10/31/13 | 850,751 | |||||||||
| 400,000 | U.S. Treasury Note, 1.875%, 4/30/14 | 414,781 | |||||||||
| 800,000 | U.S. Treasury Note, 2.625%, 4/30/16 | 848,562 | |||||||||
| Total U.S. Treasury Obligations | $ | 2,861,606 | |||||||||
| Taxable Municipal Bonds — 2.9% California — 0.4% | |||||||||||
| 180,000 | Southern California Public Power Auth. Rev, Ser 2010-B 3.326%, 7/1/14 | 183,078 | |||||||||
| Louisiana — 0.3% | |||||||||||
| 111,853 | Louisiana Public Facilities Auth., Ser 2008 Class A 4.500%, 2/1/14 | 113,443 | |||||||||
| Maine — 0.5% | |||||||||||
| 200,000 | Maine State Housing Auth. Rev, Ser 2010 1.728%, 6/15/12 | 199,836 | |||||||||
| Pennsylvania — 1.7% | |||||||||||
| 750,000 | Commonwealth Fing Auth. PA Rev, Ser A 3.860%, 6/1/11 | 764,767 | |||||||||
| Total Taxable Municipal Bonds | $ | 1,261,124 | |||||||||
Shares | Market Value | ||||||||||
| Investment Fund — 1.4% | |||||||||||
| 633,713 | Touchstone Institutional Money Market Fund^ | $ | 633,713 | ||||||||
| Total Investment Securities — 101.1% (Cost $43,581,729) | $ | 44,668,877 | |||||||||
| Liabilities in Excess of Other Assets — (1.1%) | (490,566 | ) | |||||||||
| Net Assets — 100.0% | $ | 44,178,311 | |||||||||
176
Short Duration Fixed Income Fund (Continued)
(a) Variable rate security – the rate reflected is the rate in effect as of September 30, 2010.
^ Affiliated Fund, sub-advised by Fort Washington Investment Advisors, Inc. See Note 4.
Portfolio Abbreviations:
FHLMC – Federal Home Loan Mortgage Corp.
FNMA – Federal National Mortgage Association
GNMA – Government National Mortgage Association
MTN – Medium Term Note
PLC – Public Limited Company
REMIC – Real Estate Mortgage Investment Conduit
SBA – Small Business Administration
144a – This is a restricted security that was sold in a transaction exempt from Rule 144a of the Securities Act of 1933. This security may be sold in transactions exempt from registration, normally to qualified institutional buyers. At September 30, 2010, these securities were valued at $3,394,668 or 7.7% of net assets.
Other Information:
The inputs or methodology used for valuing securities may not be an indication of the risk associated with investing in those securities. For more information on valuation inputs, and their aggregation into the levels used in the table below, please refer to the security valuation section in the accompanying notes to financial statements.
Valuation Inputs at Reporting Date:
| Description | Level 1 | Level 2 | Level 3 | Total | |||||||||||||||
| Asset-Backed Securities | $ | — | $ | 12,596,531 | $ | — | $ | 12,596,531 | |||||||||||
| Corporate Bonds | — | 11,973,948 | — | 11,973,948 | |||||||||||||||
| U.S. Government Mortgage- Backed Obligations | — | 7,150,609 | — | 7,150,609 | |||||||||||||||
| Commercial Mortgage- Backed Securities | — | 4,923,234 | — | 4,923,234 | |||||||||||||||
| U.S. Government Agency Obligations — 3,268,112 — 3,268,112 U.S. Treasury Obligations | — | 2,861,606 | — | 2,861,606 | |||||||||||||||
| Taxable Municipal Bonds | — | 1,261,124 | — | 1,261,124 | |||||||||||||||
| Investment Fund | 633,713 | — | — | 633,713 | |||||||||||||||
| $ | 44,668,877 | ||||||||||||||||||
See accompanying notes to financial statements.
177
Portfolio of Investments
Small Cap Core Fund – September 30, 2010
| Common Stocks — 98.1% | Shares | Market Value | |||||||||
| Financials — 20.7% | |||||||||||
| Alleghany Corp.* | 6,993 | $ | 2,119,089 | ||||||||
| Eaton Vance Corp. | 62,367 | 1,811,138 | |||||||||
| First Industrial Realty Trust, Inc. REIT* † | 130,157 | 659,896 | |||||||||
| Hatteras Financial Corp. REIT | 81,331 | 2,315,494 | |||||||||
| Investors Title Co. | 4,100 | 139,400 | |||||||||
| MBIA, Inc.* † | 293,107 | 2,945,725 | |||||||||
| Montpelier Re Holdings Ltd. | 181,065 | 3,136,046 | |||||||||
| Tejon Ranch Co.* | 88,893 | 1,926,311 | |||||||||
| UDR, Inc. REIT | 107,998 | 2,280,918 | |||||||||
| Wesco Financial Corp. | 3,363 | 1,204,458 | |||||||||
| White Mountains Insurance Group Ltd. | 6,492 | 2,002,522 | |||||||||
| 20,540,997 | |||||||||||
| Industrials — 20.4% | |||||||||||
| Alexander & Baldwin, Inc. | 98,891 | 3,445,363 | |||||||||
| Brink's Co. (The) | 78,589 | 1,807,547 | |||||||||
| Corrections Corp. of America* | 152,676 | 3,768,044 | |||||||||
| Force Protection, Inc.* | 456,299 | 2,299,747 | |||||||||
| Knoll, Inc. | 135,520 | 2,101,915 | |||||||||
| Old Dominion Freight Line, Inc.* | 122,301 | 3,108,891 | |||||||||
| Tredegar Corp. | 193,746 | 3,677,299 | |||||||||
| 20,208,806 | |||||||||||
| Consumer Discretionary — 13.4% | |||||||||||
| Cabela's, Inc.* † | 202,625 | 3,845,822 | |||||||||
| CarMax, Inc.* | 71,377 | 1,988,563 | |||||||||
| Hasbro, Inc. | 54,225 | 2,413,555 | |||||||||
| Service Corp. International | 369,347 | 3,183,771 | |||||||||
| Sturm Ruger & Co., Inc. † | 140,845 | 1,921,126 | |||||||||
| 13,352,837 | |||||||||||
| Information Technology — 12.2% | |||||||||||
| Advent Software, Inc.* † | 45,690 | 2,384,561 | |||||||||
| AOL, Inc.* | 113,521 | 2,809,645 | |||||||||
| Micrel, Inc. † | 187,409 | 1,847,853 | |||||||||
| Synaptics, Inc.* † | 67,824 | 1,908,567 | |||||||||
| ValueClick, Inc.* | 239,956 | 3,138,625 | |||||||||
| 12,089,251 | |||||||||||
| Materials — 10.2% | |||||||||||
| Albemarle Corp. | 66,996 | 3,136,083 | |||||||||
| Martin Marietta Materials, Inc. † | 28,946 | 2,227,974 | |||||||||
| NewMarket Corp. | 41,661 | 4,736,022 | |||||||||
| 10,100,079 | |||||||||||
| Consumer Staples — 9.9% | |||||||||||
| Constellation Brands, Inc. - Class A* | 123,859 | 2,191,066 | |||||||||
| Energizer Holdings, Inc.* | 31,602 | 2,124,602 | |||||||||
| Pricesmart, Inc. | 117,168 | 3,413,104 | |||||||||
| Universal Corp. | 53,545 | 2,146,619 | |||||||||
| 9,875,391 | |||||||||||
| Energy — 6.7% | |||||||||||
| Atwood Oceanics, Inc.* | 123,033 | 3,746,355 | |||||||||
| Kinder Morgan Management LLC* † | 47,879 | 2,884,710 | |||||||||
| 6,631,065 | |||||||||||
| Shares | Market Value | ||||||||||
| Health Care — 4.6% | |||||||||||
| Owens & Minor, Inc. | 67,268 | $ | 1,914,447 | ||||||||
| Tenet Healthcare Corp.* | 561,064 | 2,648,222 | |||||||||
| 4,562,669 | |||||||||||
| Total Common Stocks | $ | 97,361,095 | |||||||||
| Investment Funds — 16.7% | |||||||||||
| Invesco Liquid Assets Portfolio** | 14,930,317 | 14,930,317 | |||||||||
| Touchstone Institutional Money Market Fund^ | 1,696,266 | 1,696,266 | |||||||||
| Total Investment Funds | $ | 16,626,583 | |||||||||
| Total Investment Securities — 114.8% (Cost $109,151,224) | $ | 113,987,678 | |||||||||
| Liabilities in Excess of Other Assets — (14.8%) | (14,709,696 | ) | |||||||||
| Net Assets — 100.0% | $ | 99,277,982 | |||||||||
* Non-income producing security.
† All or a portion of the security is on loan. The total value of the securities on loan as of September 30, 2010, was $14,400,517.
** Represents collateral for securities loaned.
^ Affiliated Fund, sub-advised by Fort Washington Investment Advisors, Inc. See Note 4.
Portfolio Abbreviations:
REIT – Real Estate Investment Trust
Other Information:
The inputs or methodology used for valuing securities may not be an indication of the risk associated with investing in those securities. For more information on valuation inputs, and their aggregation into the levels used in the table below, please refer to the security valuation section in the accompanying notes to financial statements.
Valuation Inputs at Reporting Date:
| Description | Level 1 | Level 2 | Level 3 | Total | |||||||||||||||
| Common Stocks | $ | 97,361,095 | $ | — | $ | — | $ | 97,361,095 | |||||||||||
| Investment Funds | 16,626,583 | — | — | 16,626,583 | |||||||||||||||
| $ | 113,987,678 | ||||||||||||||||||
See accompanying notes to financial statements.
178
Portfolio of Investments
Small Cap Value Opportunities Fund – September 30, 2010
| Common Stocks — 99.7% | Shares | Market Value | |||||||||
| Financials — 35.2% | |||||||||||
| Acadia Realty Trust REIT | 33,030 | $ | 627,570 | ||||||||
| Anworth Mortgage Asset Corp. REIT | 81,590 | 581,737 | |||||||||
| BioMed Realty Trust, Inc. REIT | 60,360 | 1,081,651 | |||||||||
| Boston Private Financial Holdings, Inc. | 140,950 | 921,813 | |||||||||
| Brandywine Realty Trust REIT | 55,560 | 680,610 | |||||||||
| Cardtronics, Inc.* | 72,450 | 1,117,904 | |||||||||
| Cash America International, Inc. | 11,580 | 405,300 | |||||||||
| CNO Financial Group, Inc.* | 148,850 | 824,629 | |||||||||
| DiamondRock Hospitality Co. REIT* | 66,830 | 634,217 | |||||||||
| DuPont Fabros Technology, Inc. REIT | 34,680 | 872,202 | |||||||||
| Evercore Partners, Inc. - Class A | 36,220 | 1,036,254 | |||||||||
| First Midwest Bancorp, Inc. | 77,040 | 888,271 | |||||||||
| Government Properties Income Trust REIT | 29,580 | 789,786 | |||||||||
| Hercules Technology Growth Capital, Inc. | 74,220 | 750,364 | |||||||||
| Kilroy Realty Corp. REIT | 25,220 | 835,791 | |||||||||
| LaSalle Hotel Properties REIT | 35,090 | 820,755 | |||||||||
| Mid-America Apartment Communities, Inc. REIT | 17,230 | 1,004,164 | |||||||||
| National Penn Bancshares, Inc. | 146,460 | 915,375 | |||||||||
| Nelnet, Inc. - Class A | 47,360 | 1,083,597 | |||||||||
| Platinum Underwriters Holdings Ltd. | 19,730 | 858,650 | |||||||||
| ProAssurance Corp.* | 4,460 | 256,851 | |||||||||
| Signature Bank* | 25,750 | 1,000,130 | |||||||||
| Sterling Bancshares, Inc. | 122,700 | 658,899 | |||||||||
| Susquehanna Bancshares, Inc. | 37,580 | 317,175 | |||||||||
| SVB Financial Group* | 23,100 | 977,592 | |||||||||
| Tower Group, Inc. | 21,940 | 512,299 | |||||||||
| Washington Real Estate Investment Trust REIT | 30,380 | 963,957 | |||||||||
| Webster Financial Corp. | 55,500 | 974,580 | |||||||||
| Western Alliance Bancorp* | 43,850 | 293,795 | |||||||||
| 22,685,918 | |||||||||||
| Consumer Discretionary — 13.9% | |||||||||||
| 99 Cents Only Stores* | 62,760 | 1,184,909 | |||||||||
| ArvinMeritor, Inc.* | 64,380 | 1,000,465 | |||||||||
| Dress Barn, Inc.* | 12,910 | 306,613 | |||||||||
| Jakks Pacific, Inc.* † | 59,650 | 1,052,226 | |||||||||
| Libbey, Inc.* | 40,050 | 527,458 | |||||||||
| Men's Wearhouse, Inc. (The) | 23,890 | 568,343 | |||||||||
| Pier 1 Imports, Inc.* | 98,040 | 802,948 | |||||||||
| RC2 Corp.* | 42,110 | 882,205 | |||||||||
| Ruby Tuesday, Inc.* | 87,920 | 1,043,610 | |||||||||
| Sally Beauty Holdings, Inc.* † | 110,570 | 1,238,384 | |||||||||
| Shutterfly, Inc.* | 13,280 | 345,147 | |||||||||
| 8,952,308 | |||||||||||
| Information Technology — 13.1% | |||||||||||
| Coherent, Inc.* | 13,030 | 521,330 | |||||||||
| Compuware Corp.* | 71,460 | 609,554 | |||||||||
| EarthLink, Inc. | 142,150 | 1,292,143 | |||||||||
| Entegris, Inc.* | 74,010 | 345,627 | |||||||||
| Mentor Graphics Corp.* | 105,130 | 1,111,224 | |||||||||
| Novatel Wireless, Inc.* | 60,150 | 473,982 | |||||||||
| Shares | Market Value | ||||||||||
| Omnivision Technologies, Inc.* | 39,200 | $ | 903,168 | ||||||||
| Teradyne, Inc.* † | 61,490 | 684,999 | |||||||||
| TIBCO Software, Inc.* | 55,750 | 989,005 | |||||||||
| TriQuint Semiconductor, Inc.* | 73,830 | 708,768 | |||||||||
| ValueClick, Inc.* | 63,970 | 836,728 | |||||||||
| 8,476,528 | |||||||||||
| Industrials — 10.1% | |||||||||||
| Aircastle Ltd. | 74,190 | 629,131 | |||||||||
| Alaska Air Group, Inc.* | 15,350 | 783,310 | |||||||||
| Albany International Corp. - Class A | 37,190 | 703,635 | |||||||||
| Atlas Air Worldwide Holdings, Inc.* | 14,030 | 705,709 | |||||||||
| Esterline Technologies Corp.* | 16,150 | 924,264 | |||||||||
| Genesee & Wyoming, Inc. - Class A* | 17,410 | 755,420 | |||||||||
| Ladish Co., Inc.* | 26,390 | 821,521 | |||||||||
| Titan International, Inc. | 24,110 | 327,173 | |||||||||
| Woodward Governor Co. | 26,410 | 856,212 | |||||||||
| 6,506,375 | |||||||||||
| Materials — 9.6% | |||||||||||
| Coeur d'Alene Mines Corp.* † | 46,430 | 924,886 | |||||||||
| Ferro Corp.* | 83,060 | 1,070,643 | |||||||||
| Globe Specialty Metals, Inc.* | 82,660 | 1,160,546 | |||||||||
| Kraton Performance Polymers, Inc.* | 34,090 | 925,544 | |||||||||
| Novagold Resources, Inc.* † | 89,950 | 786,163 | |||||||||
| Rockwood Holdings, Inc.* | 33,060 | 1,040,398 | |||||||||
| RTI International Metals, Inc.* | 10,070 | 308,343 | |||||||||
| 6,216,523 | |||||||||||
| Energy — 5.9% | |||||||||||
| Berry Petroleum Co. - Class A | 25,910 | 822,124 | |||||||||
| Complete Production Services, Inc.* | 47,470 | 970,761 | |||||||||
| Petroleum Development Corp.* | 36,290 | 1,001,604 | |||||||||
| Teekay Tankers Ltd. - Class A † | �� | 28,360 | 368,964 | ||||||||
| Venoco, Inc.* † | 32,460 | 637,190 | |||||||||
| 3,800,643 | |||||||||||
| Utilities — 5.1% | |||||||||||
| Avista Corp. | 34,360 | 717,437 | |||||||||
| Cleco Corp. | 30,300 | 897,486 | |||||||||
| Nicor, Inc. | 19,090 | 874,704 | |||||||||
| NorthWestern Corp. | 28,860 | 822,510 | |||||||||
| 3,312,137 | |||||||||||
| Health Care — 4.3% | |||||||||||
| AMERIGROUP Corp.* | 22,360 | 949,629 | |||||||||
| Medicis Pharmaceutical Corp. - Class A | 25,590 | 758,743 | |||||||||
| Par Pharmaceutical Cos., Inc.* | 9,360 | 272,189 | |||||||||
| Viropharma, Inc.* | 54,460 | 811,999 | |||||||||
| 2,792,560 | |||||||||||
| Consumer Staples — 2.5% | |||||||||||
| Andersons, Inc. (The) | 17,860 | 676,894 | |||||||||
| B&G Foods, Inc. - Class A | 83,590 | 912,803 | |||||||||
| 1,589,697 | |||||||||||
| Total Common Stocks | $ | 64,332,689 | |||||||||
179
Small Cap Value Opportunities Fund (Continued)
| Shares | Market Value | ||||||||||
| Investment Funds — 9.1% | |||||||||||
| Invesco Liquid Assets Portfolio** | 4,991,256 | $ | 4,991,256 | ||||||||
| Touchstone Institutional Money Market Fund^ | 877,327 | 877,327 | |||||||||
| Total Investment Funds | $ | 5,868,583 | |||||||||
| Total Investment Securities — 108.8% (Cost $58,152,457) | $ | 70,201,272 | |||||||||
| Liabilities in Excess of Other Assets — (8.8%) | (5,648,408 | ) | |||||||||
| Net Assets — 100.0% | $ | 64,552,864 | |||||||||
* Non-income producing security.
† All or a portion of the security is on loan. The total value of the securities on loan as of September 30, 2010, was $4,789,459.
** Represents collateral for securities loaned.
^ Affiliated Fund, sub-advised by Fort Washington Investment Advisors, Inc. See Note 4.
Portfolio Abbreviations:
REIT – Real Estate Investment Trust
Other Information:
The inputs or methodology used for valuing securities may not be an indication of the risk associated with investing in those securities. For more information on valuation inputs, and their aggregation into the levels used in the table below, please refer to the security valuation section in the accompanying notes to financial statements.
Valuation Inputs at Reporting Date:
| Description | Level 1 | Level 2 | Level 3 | Total | |||||||||||||||
| Common Stocks | $ | 64,332,689 | $ | — | $ | — | $ | 64,332,689 | |||||||||||
| Investment Funds | 5,868,583 | — | — | 5,868,583 | |||||||||||||||
| $ | 70,201,272 | ||||||||||||||||||
See accompanying notes to financial statements.
180
Portfolio of Investments
Ultra Short Duration Fixed Income Fund – September 30, 2010
| Principal Amount | Market Value | ||||||||||
| U.S. Government Mortgage-Backed Obligations — 33.0% | |||||||||||
| $ | 2,525,602 | FHLMC, Pool #781515, 2.625%, 4/1/34 (a) | $ | 2,635,539 | |||||||
| 1,034,071 | FHLMC, Pool #1L1288, 2.625%, 5/1/36 (a) | 1,081,572 | |||||||||
| 559,408 | FHLMC, Pool #848088, 2.626%, 4/1/35 (a) | 581,831 | |||||||||
| 380,021 | FHLMC, Pool #1H2524, 2.642%, 8/1/35 (a) | 399,208 | |||||||||
| 683,596 | FHLMC, Pool #847795, 2.773%, 4/1/35 (a) | 713,792 | |||||||||
| 2,328,811 | FHLMC, Pool #1Q0187, 3.387%, 12/1/36 (a) | 2,457,686 | |||||||||
| 1,478,061 | FHLMC, Pool #1L0087, 5.033%, 6/1/35 (a) | 1,556,998 | |||||||||
| 1,004,502 | FHLMC, Pool #1Q0669, 5.420%, 11/1/37 (a) | 1,064,641 | |||||||||
| 831,106 | FHLMC, Pool #1G1471, 5.434%, 1/1/37 (a) | 882,799 | |||||||||
| 1,349,000 | FHLMC, Pool #1J1813, 5.808%, 8/1/37 (a) | 1,437,116 | |||||||||
| 1,015,321 | FHLMC, Pool #1K1238, 5.809%, 7/1/36 (a) | 1,080,518 | |||||||||
| 7,871 | FHLMC, Pool #E64944, 7.000%, 7/1/11 | 8,095 | |||||||||
| 157,183 | FHLMC, Pool #G11072, 7.500%, 12/1/15 | 169,607 | |||||||||
| 3,926 | FHLMC, Pool #B15413, 8.000%, 3/1/11 | 3,957 | |||||||||
| 2,130,954 | FHLMC REMICS, Ser 2770, Class FH, 0.657%, 3/15/34 (a) | 2,134,400 | |||||||||
| 49,603 | FHLMC REMICS, Ser 2925, Class CF, 0.757%, 1/15/35 (a) | 49,550 | |||||||||
| 2,376,652 | FHLMC REMICS, Ser 2571, Class FN, 0.907%, 8/15/32 (a) | 2,382,184 | |||||||||
| 251,996 | FHLMC REMICS, Ser 3033, Class BY, 2.509%, 9/15/35 (a) | 251,701 | |||||||||
| 1,256,872 | FHLMC REMICS, Ser 2628, Class BG, 3.500%, 7/15/16 | 1,274,095 | |||||||||
| 935,577 | FHLMC REMICS, Ser 2611, Class KC, 3.500%, 1/15/17 | 944,862 | |||||||||
| 707,914 | FHLMC REMICS, Ser 2590, Class UL, 3.750%, 3/15/32 | 752,760 | |||||||||
| 248,209 | FHLMC REMICS, Ser 2632, Class NE, 4.000%, 6/15/13 | 250,079 | |||||||||
| 187,553 | FHLMC REMICS, Ser 2682, Class HG, 4.000%, 4/15/17 | 191,041 | |||||||||
| 813,848 | FHLMC REMICS, Ser 2594, Class YA, 4.000%, 4/15/23 | 873,008 | |||||||||
| 724,339 | FHLMC REMICS, Ser 2586, Class WA, 4.000%, 12/15/32 | 752,373 | |||||||||
| 882,486 | FHLMC REMICS, Ser 2833, Class NA, 4.500%, 5/15/17 | 897,611 | |||||||||
| 158,388 | FHLMC REMICS, Ser 2705, Class LB, 4.500%, 9/15/26 | 158,713 | |||||||||
| Principal Amount | Market Value | ||||||||||
| $ | 431,672 | FHLMC REMICS, Ser 2575, Class LM, 4.500%, 5/15/32 | $ | 447,228 | |||||||
| 326,802 | FHLMC REMICS, Ser 2547, Class HB, 5.000%, 8/15/16 | 329,085 | |||||||||
| 392,195 | FHLMC REMICS, Ser 3073, Class LA, 5.000%, 12/15/17 | 395,362 | |||||||||
| 375,965 | FHLMC REMICS, Ser 2904, Class CM, 5.000%, 1/15/18 | 383,618 | |||||||||
| 904,035 | FHLMC REMICS, Ser 2904, Class CA, 5.000%, 4/15/19 | 955,958 | |||||||||
| 797,050 | FHLMC REMICS, Ser 2892, Class A, 5.000%, 5/15/21 | 805,028 | |||||||||
| 110,641 | FHLMC REMICS, Ser 2660, Class PB, 5.000%, 8/15/26 | 110,651 | |||||||||
| 541,386 | FHLMC REMICS, Ser 3196, Class PA, 5.250%, 8/15/11 | 550,886 | |||||||||
| 852,571 | FHLMC REMICS, Ser 3215, Class EP, 5.375%, 9/15/11 | 875,102 | |||||||||
| 378,759 | FHLMC REMICS, Ser 3197, Class AB, 5.500%, 8/15/13 | 388,870 | |||||||||
| 332,077 | FHLMC REMICS, Ser 3178, Class PA, 5.500%, 10/15/27 | 337,593 | |||||||||
| 1,285,408 | FHLMC REMICS, Ser 3242, Class NC, 5.750%, 12/15/28 | 1,313,341 | |||||||||
| 81,939 | FHLMC REMICS, Ser 3178, Class MA, 6.000%, 10/15/26 | 81,941 | |||||||||
| 344,966 | FNMA, Pool #784365, 1.990%, 5/1/34 (a) | 356,669 | |||||||||
| 1,969,098 | FNMA, Pool #827787, 1.990%, 5/1/35 (a) | 2,040,377 | |||||||||
| 969,286 | FNMA, Pool #810896, 1.998%, 1/1/35 (a) | 1,007,105 | |||||||||
| 490,882 | FNMA, Pool #806765, 1.999%, 11/1/34 (a) | 510,366 | |||||||||
| 4,183,221 | FNMA, Pool #813844, 2.131%, 1/1/35 (a) | 4,354,336 | |||||||||
| 895,279 | FNMA, Pool #813714, 2.331%, 1/1/35 (a) | 925,799 | |||||||||
| 272,875 | FNMA, Pool #681842, 2.500%, 2/1/33 (a) | 284,599 | |||||||||
| 673,222 | FNMA, Pool #681898, 2.500%, 4/1/33 (a) | 704,694 | |||||||||
| 697,178 | FNMA, Pool #725245, 2.581%, 2/1/34 (a) | 729,545 | |||||||||
| 237,068 | FNMA, Pool #809897, 2.598%, 3/1/35 (a) | 248,361 | |||||||||
| 423,220 | FNMA, Pool #735539, 2.672%, 4/1/35 (a) | 442,380 | |||||||||
| 295,168 | FNMA, Pool #804001, 2.704%, 10/1/34 (a) | 309,151 | |||||||||
| 357,625 | FNMA, Pool #828480, 2.711%, 6/1/35 (a) | 377,359 | |||||||||
| 2,746,978 | FNMA, Pool #825395, 2.715%, 7/1/35 (a) | 2,874,799 | |||||||||
| 591,364 | FNMA, Pool #813170, 2.953%, 1/1/35 (a) | 621,622 | |||||||||
| 295,292 | FNMA, Pool #743207, 2.978%, 10/1/33 (a) | 309,256 | |||||||||
| 413,844 | FNMA, Pool #1B2629, 3.055%, 11/1/34 (a) | 430,459 | |||||||||
| 2,182,629 | FNMA, Pool #922674, 3.070%, 4/1/36 (a) | 2,298,428 | |||||||||
| 846,876 | FNMA, Pool #679742, 3.110%, 1/1/40 (a) | 891,508 | |||||||||
| 263,219 | FNMA, Pool #888548, 4.333%, 5/1/35 (a) | 276,311 | |||||||||
| 1,767,730 | FNMA, Pool #839239, 4.929%, 9/1/35 (a) | 1,878,886 | |||||||||
| 709,187 | FNMA, Pool #888179, 5.202%, 2/1/37 (a) | 749,582 | |||||||||
| 1,202,705 | FNMA, Pool #995284, 5.500%, 3/1/20 | 1,301,969 | |||||||||
| 438,178 | FNMA, Pool #745467, 5.652%, 4/1/36 (a) | 467,553 | |||||||||
181
Ultra Short Duration Fixed Income Fund (Continued)
| Principal Amount | Market Value | ||||||||||
| U.S. Government Mortgage-Backed Obligations — 33.0% (Continued) | |||||||||||
| $ | 547,336 | FNMA, Pool #950385, 5.762%, 8/1/37 (a) | $ | 583,760 | |||||||
| 1,948,278 | FNMA, Pool #735439, 6.000%, 9/1/19 | 2,107,934 | |||||||||
| 56,871 | FNMA, Pool #519992, 7.000%, 10/1/14 | 60,921 | |||||||||
| 63,212 | FNMA, Pool #535219, 7.500%, 3/1/15 | 68,561 | |||||||||
| 52,955 | FNMA, Pool #534851, 7.500%, 4/1/15 | 57,436 | |||||||||
| 262,078 | FNMA, Pool #555646, 7.500%, 9/1/16 | 278,044 | |||||||||
| 337 | FNMA, Pool #535635, 8.500%, 6/1/12 | 351 | |||||||||
| 3,115,953 | FNMA REMICS, Ser 2003-81, Class FE, 0.756%, 9/25/33 (a) | 3,127,888 | |||||||||
| 2,452,600 | FNMA REMICS, Ser 2004-96, Class LF, 1.256%, 12/25/34 (a) | 2,454,201 | |||||||||
| 1,673,390 | FNMA REMICS, Ser 2004-W3, Class A4, 3.375%, 5/25/34 | 1,672,262 | |||||||||
| 285,600 | FNMA REMICS, Ser 2003-34, Class AD, 4.000%, 1/25/32 | 290,233 | |||||||||
| 361,378 | FNMA REMICS, Ser 2003-19, Class ME, 4.000%, 1/25/33 | 379,694 | |||||||||
| 616,913 | FNMA REMICS, Ser 2003-33, Class AU, 4.000%, 3/25/33 | 650,875 | |||||||||
| 973,058 | FNMA REMICS, Ser 2003-119, Class PU, 4.000%, 11/25/33 | 1,027,496 | |||||||||
| 454,785 | FNMA REMICS, Ser 2003-33, Class AM, 4.250%, 5/25/33 | 490,187 | |||||||||
| 315,705 | FNMA REMICS, Ser 2003-81, Class NY, 4.500%, 9/25/16 | 323,957 | |||||||||
| 422,967 | FNMA REMICS, Ser 2003-25, Class CE, 4.500%, 3/25/17 | 429,888 | |||||||||
| 61,175 | FNMA REMICS, Ser 2003-106, Class WC, 4.500%, 8/25/18 | 61,173 | |||||||||
| 2,347,706 | FNMA REMICS, Ser 2008-35, Class IO, 4.500%, 4/25/23 (b) | 233,125 | |||||||||
| 786,159 | FNMA REMICS, Ser 2008-95, Class AD, 4.500%, 12/25/23 | 838,873 | |||||||||
| 529,960 | FNMA REMICS, Ser 2003-129, Class PW, 4.500%, 7/25/33 | 552,310 | |||||||||
| 1,052,175 | FNMA REMICS, Ser 2006-26, Class QA, 5.500%, 6/25/26 | 1,065,077 | |||||||||
| 182,433 | FNMA REMICS, Ser 2006-2, Class GH, 5.500%, 6/25/32 | 184,021 | |||||||||
| 541,642 | FNMA REMICS, Ser 2007-9, Class YA, 5.500%, 3/25/37 | 559,478 | |||||||||
| 330,962 | FNMA REMICS, Ser 2006-73, Class PJ, 6.000%, 2/25/28 | 332,371 | |||||||||
| 116,595 | FNMA REMICS, Ser 2006-3, Class NA, 6.000%, 4/25/28 | 116,587 | |||||||||
| 841,278 | GNMA, Pool #G2 80889, 2.000%, 4/20/34 (a) | 859,992 | |||||||||
| 53,649 | GNMA, Pool #G2 8366, 3.375%, 6/20/18 (a) | 55,346 | |||||||||
| 4,088 | GNMA, Pool #G2 8462, 3.375%, 2/20/19 (a) | 4,225 | |||||||||
| Principal Amount | Market Value | ||||||||||
| $ | 1,277,855 | GNMA, Pool #G2 80826, 3.500%, 2/20/34 (a) | $ | 1,329,707 | |||||||
| 1,865 | GNMA, Pool #G2 8404, 3.625%, 9/20/18 (a) | 1,929 | |||||||||
| 1,178,927 | GNMA, Pool #G2 81016, 3.625%, 8/20/34 (a) | 1,219,053 | |||||||||
| 18,145 | GNMA, Pool #G2 8103, 4.000%, 2/20/16 (a) | 18,761 | |||||||||
| 28,262 | GNMA, Pool #G2 8287, 4.000%, 11/20/17 (a) | 29,273 | |||||||||
| 33,189 | GNMA, Pool #G2 8297, 4.000%, 12/20/17 (a) | 34,375 | |||||||||
| 63,051 | GNMA, Pool #G2 8333, 4.000%, 3/20/18 (a) | 65,189 | |||||||||
| 36,485 | GNMA, Pool #G2 8345, 4.000%, 4/20/18 (a) | 37,692 | |||||||||
| 22,522 | GNMA, Pool #G2 8405, 4.000%, 9/20/18 (a) | 23,330 | |||||||||
| 20,465 | GNMA, Pool #G2 8489, 4.000%, 4/20/19 (a) | 21,142 | |||||||||
| Total U.S. Government Mortgage-Backed Obligations | $ | 77,998,230 | |||||||||
| Commercial Mortgage-Backed Securities — 25.5% | |||||||||||
| 419,932 | American Home Mortgage Investment Trust, Ser 2005-2, Class 5A3, 5.077%, 9/25/35 | 425,813 | |||||||||
| 1,961,556 | Banc of America Commercial Mortgage, Inc., Ser 2001-1, Class A2, 6.503%, 4/15/36 | 1,984,969 | |||||||||
| 678,046 | Banc of America Commercial Mortgage, Inc., Ser 2005-3, Class ASB, 4.589%, 7/10/43 | 708,732 | |||||||||
| 781,181 | Banc of America Funding Corp., Ser 2005-2, Class 1A2, 5.500%, 4/25/35 | 787,365 | |||||||||
| 380,521 | Banc of America Mortgage Securities, Inc., Ser 2004-3, Class 1A23, 4.500%, 4/25/34 | 380,935 | |||||||||
| 1,683,473 | Bank of America-First Union NB Commercial Mortgage, Ser 2001-3, Class A2, 5.464%, 4/11/37 | 1,722,850 | |||||||||
| 184,665 | BCRR Trust, Ser 2010-LEAF, Class 21A, 144a, 4.230%, 9/22/35 | 184,837 | |||||||||
| 1,969,360 | BCRR Trust, Ser 2010-LEAF, Class 42A, 144a, 4.230%, 7/22/33 | 1,969,360 | |||||||||
| 2,500,000 | BCRR Trust, Ser 2010-LEAF, Class 8A, 144a, 4.230%, 10/22/32 | 2,500,391 | |||||||||
| 1,061,805 | BCRR Trust, Ser 2010-LEAF, Class 9A, 144a, 4.230%, 2/22/34 | 1,062,303 | |||||||||
| 1,956,775 | Bear Stearns Commercial Mortgage Securities, Ser 2004-PWR5, Class A2, 4.254%, 7/11/42 | 1,969,825 | |||||||||
182
Ultra Short Duration Fixed Income Fund (Continued)
| Principal Amount | Market Value | ||||||||||
| Commercial Mortgage-Backed Securities — 25.5% (Continued) | |||||||||||
| $ | 1,446,200 | Bear Stearns Commercial Mortgage Securities, Ser 2004-T16, Class A4, 4.320%, 2/13/46 | $ | 1,462,495 | |||||||
| 529,954 | Bear Stearns Commercial Mortgage Securities, Ser 2006-PW12, Class A1, 5.546%, 9/11/38 (a) | 532,851 | |||||||||
| 623,935 | Cendant Mortgage Corp., Ser 2003-3P, Class A1, 144a, 5.500%, 4/25/20 | 625,290 | |||||||||
| 1,372,585 | Cendant Mortgage Corp., Ser 2003-7P, Class A2, 144a, 4.870%, 6/25/17 (a) | 1,421,081 | |||||||||
| 2,000,000 | Citicorp Mortgage Securities, Inc., Ser 2003-11, Class 1A4, 5.250%, 12/25/33 | 2,062,106 | |||||||||
| 221,765 | Citicorp Mortgage Securities, Inc., Ser 2003-11, Class 2A2, 5.000%, 12/25/33 | 222,744 | |||||||||
| 483,156 | Commercial Mortgage Acceptance Corp., Ser 1999-C1, Class H, 144a, 6.790%, 6/15/31 | 492,494 | |||||||||
| 530,726 | Commercial Mortgage Asset Trust, Ser 1999-C1, Class A3, 6.640%, 1/17/32 | 531,158 | |||||||||
| 1,675,000 | Commercial Mortgage Pass Through Certificates, Ser 2004-LB3A, Class A3, 5.090%, 7/10/37 (a) | 1,712,241 | |||||||||
| 791,699 | Countrywide Home Loan Mortgage Pass Through Trust, Ser 2003-24, Class A2, 4.500%, 7/25/33 | 798,493 | |||||||||
| 392,212 | Credit Suisse First Boston Mortgage Securities Corp., Ser 1997-C2, Class D, 7.270%, 1/17/35 | 400,215 | |||||||||
| 553,430 | Credit Suisse First Boston Mortgage Securities Corp., Ser 2002-CKN2, Class A2, 5.939%, 4/15/37 | 555,055 | |||||||||
| 1,123,658 | Credit Suisse First Boston Mortgage Securities Corp., Ser 2004-C3, Class A3, 4.302%, 7/15/36 | 1,122,831 | |||||||||
| 537,042 | First Union-Lehman Brothers-Bank of America, Ser 1998-C2, Class C, 6.730%, 11/18/35 | 542,484 | |||||||||
| 1,699,218 | GE Capital Commercial Mortgage Corp., Ser 2004-C3, Class A2, 4.433%, 7/10/39 | 1,718,394 | |||||||||
| 982,736 | GMAC Commercial Mortgage Securities, Inc., Ser 2001-C2, Class A2, 6.700%, 4/15/34 | 1,001,345 | |||||||||
| 1,579,804 | GMAC Commercial Mortgage Securities, Inc., Ser 2004-C2, Class A2, 4.760%, 8/10/38 | 1,603,496 | |||||||||
| 2,000,000 | Greenwich Capital Commercial Funding Corp., Ser 2004-GG1, Class A5, 4.883%, 6/10/36 | 2,035,747 | |||||||||
| Principal Amount | Market Value | ||||||||||
| $ | 596,356 | JP Morgan Chase Commercial Mortgage Securities Corp., Ser 2002-CIB5, Class A1, 4.372%, 10/12/37 | $ | 608,548 | |||||||
| 381,636 | JP Morgan Chase Commercial Mortgage Securities Corp., Ser 2003-PM1A, Class A2, 4.262%, 8/12/40 (a) | 381,437 | |||||||||
| 1,500,000 | JP Morgan Chase Commercial Mortgage Securities Corp., Ser 2003-PM1A, Class A3, 5.169%, 8/12/40 (a) | 1,563,104 | |||||||||
| 1,360,701 | JP Morgan Chase Commercial Mortgage Securities Corp., Ser 2004-C3, Class A2, 4.223%, 1/15/42 | 1,371,140 | |||||||||
| 870,000 | JP Morgan Chase Commercial Mortgage Securities Corp., Ser 2004-CBX, Class A4, 4.529%, 1/12/37 | 886,940 | |||||||||
| 324,466 | JP Morgan Chase Commercial Mortgage Securities Corp., Ser 2005-LDP4, Class A2, 4.790%, 10/15/42 | 324,249 | |||||||||
| 600,000 | JP Morgan Commercial Mortgage Finance Corp., Ser 2000-C9, Class G, 144a, 6.250%, 10/15/32 | 605,490 | |||||||||
| 875,741 | LB Commercial Conduit Mortgage Trust, Ser 1998-C1, Class D, 6.980%, 2/18/30 | 880,449 | |||||||||
| 341,723 | LB Commercial Conduit Mortgage Trust, Ser 1998-C4, Class F, 144a, 6.000%, 10/15/35 | 344,114 | |||||||||
| 709,281 | LB-UBS Commercial Mortgage Trust, Ser 2000-C5, Class A2, 6.510%, 12/15/26 | 710,270 | |||||||||
| 965,235 | LB-UBS Commercial Mortgage Trust, Ser 2002-C2, Class A3, 5.386%, 6/15/26 | 989,256 | |||||||||
| 1,610,319 | LB-UBS Commercial Mortgage Trust, Ser 2003-C7, Class A2, 4.064%, 9/15/27 (a) | 1,611,029 | |||||||||
| 2,294,826 | LB-UBS Commercial Mortgage Trust, Ser 2003-C8, Class A3, 4.830%, 11/15/27 | 2,389,375 | |||||||||
| 603,455 | MASTR Alternative Loans Trust, Ser 2003-3, Class 2A1, 8.500%, 5/25/33 | 624,323 | |||||||||
| 445,731 | MASTR Asset Securitization Trust, Ser 2004-4, Class 2A2, 0.706%, 4/25/34 (a) | 441,432 | |||||||||
| 1,000,000 | Merrill Lynch Mortgage Trust, Ser 2003-KEY1, Class A3, 4.893%, 11/12/35 | 1,017,773 | |||||||||
183
Ultra Short Duration Fixed Income Fund (Continued)
| Principal Amount | Market Value | ||||||||||
| Commercial Mortgage-Backed Securities — 25.5% (Continued) | |||||||||||
| $ | 1,942,556 | Merrill Lynch Mortgage Trust, Ser 2004-BPC1, Class A2, 4.071%, 10/12/41 | $ | 1,943,092 | |||||||
| 964,262 | Merrill Lynch Mortgage Trust, Ser 2004-MKB1, Class A2, 4.353%, 2/12/42 | 967,347 | |||||||||
| 2,255,190 | Popular ABS Mortgage Pass-Through Trust, Ser 2006-E, Class A1, 0.346%, 1/25/37 (a) | 2,244,985 | |||||||||
| 6,581 | Prime Mortgage Trust, Ser 2003-3, Class A1, 5.250%, 1/25/34 | 6,709 | |||||||||
| 694,480 | Prudential Mortgage Capital Funding LLC, Ser 2001-ROCK, Class A2, 6.605%, 5/10/34 | 704,557 | |||||||||
| 533,072 | Residential Funding Mortgage Securities II, Inc., Ser 2003-HS3, Class AI3, 4.470%, 7/25/18 | 533,147 | |||||||||
| 400,377 | Salomon Brothers Mortgage Securities VII, Inc., Ser 2000-C3, Class A2, 6.592%, 12/18/33 | 399,896 | |||||||||
| 886,613 | Wachovia Bank Commercial Mortgage Trust, Ser 2003-C9, Class A3, 4.608%, 12/15/35 | 921,765 | |||||||||
| 2,300,000 | Wachovia Bank Commercial Mortgage Trust, Ser 2004-C11, Class A4, 5.030%, 1/15/41 | 2,400,724 | |||||||||
| 583,680 | Wachovia Bank Commercial Mortgage Trust, Ser 2004-C12, Class A2, 5.001%, 7/15/41 | 593,526 | |||||||||
| 1,154,078 | Wells Fargo Mortgage Backed Securities Trust, Ser 2003-17, Class 1A10, 5.250%, 1/25/14 | 1,182,873 | |||||||||
| 645,281 | Wells Fargo Mortgage Backed Securities Trust, Ser 2005-3, Class A11, 5.500%, 5/25/35 | 667,236 | |||||||||
| 555,949 | Wells Fargo Mortgage Backed Securities Trust, Ser 2006-16, Class A12, 5.000%, 11/25/36 | 555,697 | |||||||||
| Total Commercial Mortgage-Backed Securities | $ | 60,408,383 | |||||||||
| Asset-Backed Securities — 12.5% | |||||||||||
| 807,503 | AmeriCredit Automobile Receivables Trust, Ser 2008-AF, Class A3, 5.680%, 12/12/12 | 822,389 | |||||||||
| 1,425,704 | Bank of America Auto Trust, Ser 2008-1A, Class A3A, 144a, 4.970%, 9/20/12 | 1,448,983 | |||||||||
| 228,911 | Bank of America Auto Trust, Ser 2009-2A, Class A2, 144a, 1.160%, 2/15/12 | 229,089 | |||||||||
| Principal Amount | Market Value | ||||||||||
| $ | 1,725,000 | Capital One Prime Auto Receivables Trust, Ser 2007-2, Class A4, 5.060%, 6/15/14 | $ | 1,767,419 | |||||||
| 2,160,127 | Chase Manhattan Auto Owner Trust, Ser 2006-B, Class A4, 5.110%, 4/15/14 | 2,164,027 | |||||||||
| 1,700,000 | Citibank Credit Card Issuance Trust, Ser 2005-A7, Class A7, 4.750%, 10/22/12 | 1,704,094 | |||||||||
| 1,920,107 | CNH Equipment Trust, Ser 2009-C, Class A2, 0.950%, 8/15/12 | 1,921,738 | |||||||||
| 229,888 | Daimler Chrysler Auto Trust, Ser 2006-C, Class A4, 4.980%, 11/8/11 | 230,109 | |||||||||
| 663,987 | Ford Credit Auto Owner Trust, Ser 2008-A, Class A3A, 3.960%, 4/15/12 | 671,265 | |||||||||
| 1,750,000 | Greenwich Capital Commercial Funding Corp., Ser 2003-C1, Class A3, 3.858%, 7/5/35 | 1,807,868 | |||||||||
| 1,308,885 | Greenwich Capital Commercial Funding Corp., Ser 2003-C2, Class A3, 4.533%, 1/5/36 | 1,354,415 | |||||||||
| 2,002,521 | Greenwich Capital Commercial Funding Corp., Ser 2004-FL2A, Class B, 144a, 0.498%, 11/5/19 (a) | 1,979,426 | |||||||||
| 470,000 | GS Mortgage Securities Corp. II, Ser 2001-ROCK, Class C, 144a, 6.878%, 5/3/18 | 481,886 | |||||||||
| 725,000 | GS Mortgage Securities Corp. II, Ser 2001-ROCK, Class E, 144a, 7.108%, 5/3/18 (a) | 743,475 | |||||||||
| 500,000 | Hilton Hotel Pool Trust, Ser 2000-HLTA, Class F, 144a, 7.750%, 10/3/15 | 500,074 | |||||||||
| 2,447,398 | Household Automotive Trust, Ser 2007-1, Class A4, 5.330%, 11/17/13 | 2,492,101 | |||||||||
| 421,790 | Madison Avenue Manufactured Housing Contract, Ser 2002-A, Class A1, 0.606%, 3/25/32 (a) | 420,776 | |||||||||
| 2,248,000 | Prudential Securities Secured Financing Corp., Ser 2000-C1, Class D, 7.985%, 5/17/32 (a) | 2,246,823 | |||||||||
| 639,545 | Residential Asset Securities Corp., Ser 2006-KS5, Class A2, 0.366%, 7/25/36 (a) | 638,150 | |||||||||
| 878,159 | Structured Asset Investment Loan Trust, Ser 2005-1, Class A5, 144a, 0.606%, 2/25/35 (a) | 865,026 | |||||||||
| 2,200,000 | Tax Liens Securitization Trust, Ser 2010-1A, Class 1A1, 144a, 0.880%, 4/15/18 | 2,199,255 | |||||||||
| 418,177 | Wells Fargo Home Equity Trust, Ser 2006-1, Class A3, 0.406%, 5/25/36 (a) | 406,112 | |||||||||
184
Ultra Short Duration Fixed Income Fund (Continued)
| Principal Amount | Market Value | ||||||||||
| Asset-Backed Securities — 12.5% (Continued) | |||||||||||
| $ | 690,886 | World Omni Auto Receivables Trust, Ser 2007-A, Class A4, 0.257%, 11/15/12 (a) | $ | 689,510 | |||||||
| 1,725,000 | World Omni Auto Receivables Trust, Ser 2007-B, Class A4, 5.390%, 5/15/13 | 1,780,467 | |||||||||
| Total Asset-Backed Securities | $ | 29,564,477 | |||||||||
| Corporate Bonds — 8.2% Financials — 4.3% | |||||||||||
| 1,600,000 | General Electric Capital Corp., 5.000%, 11/15/11 | 1,675,867 | |||||||||
| 2,940,000 | Goson Project, Ser 1999, 0.400%, 8/1/23 (a) | 2,940,000 | |||||||||
| 2,000,000 | HSBC Finance Corp., 6.375%, 10/15/11 | 2,106,222 | |||||||||
| 3,000,000 | Mercantile-Safe Deposit & Trust Co., 5.700%, 11/15/11 | 3,135,726 | |||||||||
| 275,000 | WEA Finance LLC/WT Finance Australia, 144a, 4.375%, 11/15/10 | 276,102 | |||||||||
| 10,133,917 | |||||||||||
| Utilities — 2.8% | |||||||||||
| 2,000,000 | AGL Capital Corp., 7.125%, 1/14/11 | 2,034,250 | |||||||||
| 1,000,000 | DPL, Inc., 6.875%, 9/1/11 | 1,053,154 | |||||||||
| 595,000 | KCP&L Greater Missouri Operations Co., 7.950%, 2/1/11 | 607,604 | |||||||||
| 1,335,000 | Peoples Energy Corp., Ser A, 6.900%, 1/15/11 | 1,357,472 | |||||||||
| 580,000 | Southwest Gas Corp., 8.375%, 2/15/11 | 594,961 | |||||||||
| 1,000,000 | Virginia Electric and Power Co., 4.500%, 12/15/10 | 1,007,658 | |||||||||
| 6,655,099 | |||||||||||
| Energy — 0.9% | |||||||||||
| 1,000,000 | Premcor Refining Group, Inc. (The), 6.125%, 5/1/11 | 1,021,600 | |||||||||
| 1,000,000 | Valero Energy Corp., 6.875%, 4/15/12 | 1,074,034 | |||||||||
| 2,095,634 | |||||||||||
| Industrials — 0.2% | |||||||||||
| 500,000 | Allied Waste North America, Inc., 6.500%, 11/15/10 | 503,288 | |||||||||
| Total Corporate Bonds | $ | 19,387,938 | |||||||||
| U.S. Government Agency Obligations — 3.7% | |||||||||||
| 1,000,000 | FNMA, 6.250%, 2/1/11 | 1,018,265 | |||||||||
| 7,800,000 | Overseas Private Investment Corp., Ser B, 0.240%, 3/15/17 (a) | 7,800,000 | |||||||||
| Total U.S. Government Agency Obligations | $ | 8,818,265 | |||||||||
| Principal Amount | Market Value | ||||||||||
| Taxable Municipal Bonds — 3.2% Connecticut — 0.4% | |||||||||||
| $ | 1,000,000 | Waterbury Taxable Pension, Ser 2009 2.707%, 12/1/10 | $ | 1,001,710 | |||||||
| New Mexico — 0.9% | |||||||||||
| 2,000,000 | NM Edl Asst Rev, Ser 2010 A-2 (Gtd St Lns) 0.928%, 12/22/10 (a) | 1,998,840 | |||||||||
| Ohio — 0.7% | |||||||||||
| 1,750,000 | Medina Co OH IDR (Mack Inds), Ser 1998 (LOC: JP Morgan Chase Bank) 0.420%, 10/9/10 (a) | 1,750,000 | |||||||||
| Pennsylvania — 1.2% | |||||||||||
| 2,750,000 | Commonwealth Fing Auth. PA Rev, Ser A 3.860%, 6/1/11 | 2,804,147 | |||||||||
| Total Taxable Municipal Bonds | $ | 7,554,697 | |||||||||
Shares | Market Value | ||||||||||
| Investment Fund — 14.5% | |||||||||||
| 34,353,028 | Touchstone Institutional Money Market Fund^ | $ | 34,353,028 | ||||||||
| Total Investment Securities — 100.6% (Cost $237,181,095) | $ | 238,085,018 | |||||||||
| Liabilities in Excess of Other Assets — (0.6%) | (1,435,115 | ) | |||||||||
| Net Assets — 100.0% | $ | 236,649,903 | |||||||||
(a) Variable rate security – the rate reflected is the rate in effect as of September 30, 2010.
(b) IO – Interest Only
^ Affiliated Fund, sub-advised by Fort Washington Investment Advisors, Inc. See Note 4.
Portfolio Abbreviations:
FHLMC – Federal Home Loan Mortgage Corp.
FNMA – Federal National Mortgage Association
GNMA – Government National Mortgage Association
IDR – Industrial Development Revenue
185
Ultra Short Duration Fixed Income Fund (Continued)
144a – This is a restricted security that was sold in a transaction exempt from Rule 144a of the Securities Act of 1933. This security may be sold in transactions exempt from registration, normally to qualified institutional buyers. At September 30, 2010, these securities were valued at $17,928,676 or 7.6% of net assets.
Other Information:
The inputs or methodology used for valuing securities may not be an indication of the risk associated with investing in those securities. For more information on valuation inputs, and their aggregation into the levels used in the table below, please refer to the security valuation section in the accompanying notes to financial statements.
Valuation Inputs at Reporting Date:
| Description | Level 1 | Level 2 | Level 3 | Total | |||||||||||||||
| U.S. Government Mortgage- Backed Obligations | $ | — | $ | 77,998,230 | $ | — | $ | 77,998,230 | |||||||||||
| Commercial Mortgage- Backed Securities | — | 60,408,383 | — | 60,408,383 | |||||||||||||||
| Investment Fund | 34,353,028 | — | — | 34,353,028 | |||||||||||||||
| Asset-Backed Securities | — | 29,564,477 | — | 29,564,477 | |||||||||||||||
| Corporate Bonds | — | 19,387,938 | — | 19,387,938 | |||||||||||||||
| U.S. Government Agency Obligations | — | 8,818,265 | — | 8,818,265 | |||||||||||||||
| Taxable Municipal Bonds | — | 7,554,697 | — | 7,554,697 | |||||||||||||||
| $ | 238,085,018 | ||||||||||||||||||
See accompanying notes to financial statements.
186
Report of Independent Registered Public Accounting Firm
To the Board of Trustees and Shareholders of Touchstone Funds Group Trust
We have audited the accompanying statements of assets and liabilities, including the portfolios of investments, of Touchstone Funds Group Trust, comprised of Touchstone Capital Appreciation Fund, Touchstone Core Plus Fixed Income Fund, Touchstone Emerging Markets Equity Fund, Touchstone Focused Equity Fund, Touchstone Global Equity Fund, Touchstone Global Real Estate Fund, Touchstone Healthcare & Biotechnology Fund, Touchstone Intermediate Fixed Income Fund, Touchstone International Fixed Income Fund, Touchstone Large Cap Relative Value Fund, Touchstone Market Neutral Equity Fund (formerly Touchstone Long/Short Equity Fund), Touchstone Mid Cap Fund, Touchstone Mid Cap Value Fund, Touchstone Premium Yield Equity Fund, Touchstone Sands Capital Select Growth Fund, Touchstone Short Duration Fixed Income Fund, Touchstone Small Cap Core Fund, Touchstone Small Cap Value Opportunities Fund, and Touchstone Ultra Short Duration Fixed Income Fund ( the "Funds") as of September 30, 2010, and the related statements of operations for the year or period then ended, and the statements of changes in net assets and the financial highlights for each of the years or periods indicated therein. These financial statements and financial highlights are the responsibility of the Funds' management. Our responsibility is to express an opinion on these financial statements and financial highlights based on our audits.
We conducted our audits in accordance with the standards of the Public Company Accounting Oversight Board (United States). Those standards require that we plan and perform the audits to obtain reasonable assurance about whether the financial statements are free of material misstatement. We were not engaged to perform an audit of the Funds' internal control over financial reporting. Our audits included consideration of internal control over financial reporting as a basis for designing audit procedures that are appropriate in the circumstances, but not for the purpose of expressing an opinion on the effectiveness of the Funds' internal control over financial reporting. Accordingly, we express no such opinion. An audit also includes examining, on a test basis, evidence supporting the amounts and disclosures in the financial statements, assessing the accounting principles used and significant estimates made by management, and evaluating the over all financial statement presentation. Our procedures included confirmation of securities owned as of September 30, 2010, by correspondence with the custodian and brokers or by other appropriate auditing procedures where replies from brokers were not received. We believe that our audits provide a reasonable basis for our opinion.
In our opinion, the financial statements and financial highlights referred to above present fairly, in all material respects, the financial position of each of the respective Funds comprising Touchstone Funds Group Trust at September 30, 2010, the results of their operations for the year or period then ended, and the changes in their net assets and the financial highlights for each of the years or periods in the period then ended indicated above, in conformity with accounting principles generally accepted in the United States.

Cincinnati, Ohio
November 29, 2010
187
Other Items (Unaudited)
Supplemental Tax Information
The information set forth below is for each Fund's fiscal year as required by federal income tax laws. Shareholders, however, must report distributions on a calendar year basis for income tax purposes, which may include distributions for portions of two fiscal years of a fund. Accordingly, the information needed by shareholders for income tax purposes will be sent to them in January of each year. Please consult your tax advisor for proper treatment of this information.
For corporate shareholders, the following ordinary dividends paid during the year ended September 30, 2009 qualify for the corporate dividends received deduction:
| Capital Appreciation Fund | 35 | % | |||||
| Global Equity Fund | 14 | % | |||||
| Global Real Estate Fund | 10 | % | |||||
| Large Cap Relative Value Fund | 100 | % | |||||
| Mid Cap Fund | 95 | % | |||||
| Mid Cap Value Fund | 38 | % | |||||
| Premium Yield Equity Fund | 49 | % | |||||
| Small Cap Core Fund | 100 | % | |||||
For the fiscal year ended September 30, 2010, certain dividends paid by each Fund may be subject to a maximum tax rate of 15%, as provided for by the Jobs and Growth Tax Relief Reconciliation Act of 2003. The Funds intend to designate up to the following maximum amounts to be taxed at a maximum rate of 15%. Complete information will be computed and reported in conjunction with your 2010 Form 1099-DIV.
| Fund | Maximum QDI | ||||||
| Capital Appreciation Fund | $ | 7,703 | |||||
| Global Equity Fund | $ | 661 | |||||
| Global Real Estate Fund | $ | 28,638 | |||||
| Large Cap Relative Value Fund | $ | 13,296 | |||||
| Mid Cap Fund | $ | 1,202,891 | |||||
| Mid Cap Value Fund | $ | 33,145 | |||||
| Premium Yield Equity Fund | $ | 942,791 | |||||
| Small Cap Core Fund | $ | 9,676 | |||||
Proxy Voting Disclosure
The Sub-Advisor is responsible for exercising the voting rights associated with the securities purchased and held by the Funds. A description of the policies and procedures that the Sub-Advisor uses in fulfilling this responsibility and information regarding how those proxies were voted during the twelve month period ended June 30, are available without charge upon request by calling toll free 1.800.543.0407. These items are also available on the Securities and Exchange Commission's (the Commission) website at http://www.sec.gov.
Quarterly Portfolio Disclosure
The Trust files a complete listing of portfolio holdings for each Fund as of the end of the first and third quarters of each fiscal year on Form N-Q. The complete listing (i) is available on the Commission's website; (ii) may be reviewed and copied at the Commission's Public Reference Room in Washington, DC; and (iii) will be made available to shareholders upon request by calling 1.800.543.0407. Information on the operation of the Public Reference Room may be obtained by calling 1-800-SEC-0330.
188
Other Items (Continued)
Schedule of Shareholder Expenses
As a shareholder of the Funds, you incur two types of costs: (1) transaction costs, including reinvested dividends or other distributions; and (2) ongoing costs, including investment advisory fees; distribution (12b-1) fees; and other Fund expenses. This example is intended to help you understand your ongoing costs (in dollars) of investing in the Funds and to compare these costs with the ongoing costs of investing in other mutual funds.
The example is based on an investment of $1,000 invested at the beginning of the period and held for the entire period (April 1, 2010 through September 30, 2010).
Actual Expenses
The first line of the table below provides information about actual account values and actual expenses. You may use the information in this line, together with the amount you invested, to estimate the expenses that you paid over the period. Simply divide your account value by $1,000 (for example, an $8,600 account value divided by $1,000 = 8.6), then multiply the result by the number in the first line under the heading entitled "Expenses Paid During the Six Months Ended September 30, 2010" to estimate the expenses you paid on your account during this period.
Hypothetical Example for Comparison Purposes
The second line of the table below provides information about hypothetical account values and hypothetical expenses based on the Funds' actual expense ratio and an assumed rate of return of 5% per year before expenses, which is not the Funds' actual return. The hypothetical account values and expenses may not be used to estimate the actual ending account balance or expenses you paid for the period. You may use this information to compare the ongoing costs of investing in the Funds and other funds. To do so, compare this 5% hypothetical example with the 5% hypothetical examples that appear in the shareholder reports of the other funds.
| Net Expense Ratio Annualized September 30, 2010 | Beginning Account Value April 1, 2010 | Ending Account Value September 30, 2010 | Expenses Paid During the Six Months Ended September 30, 2010* | ||||||||||||||||
| Touchstone Capital Appreciation Fund | |||||||||||||||||||
| Class A Actual | 1.19 | % | $ | 1,000.00 | $ | 939.80 | $ | 5.79 | |||||||||||
| Class A Hypothetical | 1.19 | % | $ | 1,000.00 | $ | 1,019.10 | $ | 6.02 | |||||||||||
| Class C Actual | 1.94 | % | $ | 1,000.00 | $ | 936.00 | $ | 9.42 | |||||||||||
| Class C Hypothetical | 1.94 | % | $ | 1,000.00 | $ | 1,015.34 | $ | 9.80 | |||||||||||
| Class Y Actual | 0.94 | % | $ | 1,000.00 | $ | 940.70 | $ | 4.57 | |||||||||||
| Class Y Hypothetical | 0.94 | % | $ | 1,000.00 | $ | 1,020.36 | $ | 4.76 | |||||||||||
| Institutional Class Actual | 0.79 | % | $ | 1,000.00 | $ | 940.70 | $ | 3.84 | |||||||||||
| Institutional Class Hypothetical | 0.79 | % | $ | 1,000.00 | $ | 1,021.11 | $ | 4.00 | |||||||||||
| Touchstone Core Plus Fixed Income Fund | |||||||||||||||||||
| Class A Actual | 0.95 | % | $ | 1,000.00 | $ | 1,056.70 | $ | 4.90 | |||||||||||
| Class A Hypothetical | 0.95 | % | $ | 1,000.00 | $ | 1,020.31 | $ | 4.81 | |||||||||||
| Class C Actual | 1.70 | % | $ | 1,000.00 | $ | 1,052.20 | $ | 8.75 | |||||||||||
| Class C Hypothetical | 1.70 | % | $ | 1,000.00 | $ | 1,016.55 | $ | 8.59 | |||||||||||
| Class Y Actual | 0.70 | % | $ | 1,000.00 | $ | 1,057.80 | $ | 3.61 | |||||||||||
| Class Y Hypothetical | 0.70 | % | $ | 1,000.00 | $ | 1,021.56 | $ | 3.55 | |||||||||||
| Institutional Class Actual | 0.50 | % | $ | 1,000.00 | $ | 1,058.90 | $ | 2.58 | |||||||||||
| Institutional Class Hypothetical | 0.50 | % | $ | 1,000.00 | $ | 1,022.56 | $ | 2.54 | |||||||||||
189
Other Items (Continued)
Schedule of Shareholder Expenses (Continued)
| Net Expense Ratio Annualized September 30, 2010 | Beginning Account Value April 1, 2010 | Ending Account Value September 30, 2010 | Expenses Paid During the Six Months Ended September 30, 2010* | ||||||||||||||||
| Touchstone Emerging Markets Equity Fund | |||||||||||||||||||
| Class A Actual | 1.74 | % | $ | 1,000.00 | $ | 1,098.80 | $ | 9.15 | |||||||||||
| Class A Hypothetical | 1.74 | % | $ | 1,000.00 | $ | 1,016.34 | $ | 8.80 | |||||||||||
| Class C Actual | 2.49 | % | $ | 1,000.00 | $ | 1,095.80 | $ | 13.08 | |||||||||||
| Class C Hypothetical | 2.49 | % | $ | 1,000.00 | $ | 1,012.58 | $ | 12.56 | |||||||||||
| Class Y Actual | 1.49 | % | $ | 1,000.00 | $ | 1,100.40 | $ | 7.85 | |||||||||||
| Class Y Hypothetical | 1.49 | % | $ | 1,000.00 | $ | 1,017.60 | $ | 7.54 | |||||||||||
| Institutional Class Actual | 1.34 | % | $ | 1,000.00 | $ | 1,102.10 | $ | 7.06 | |||||||||||
| Institutional Class Hypothetical | 1.34 | % | $ | 1,000.00 | $ | 1,018.35 | $ | 6.78 | |||||||||||
| Touchstone Focused Equity Fund | |||||||||||||||||||
| Class A Actual | 1.33 | % | $ | 1,000.00 | $ | 1,000.90 | $ | 6.67 | |||||||||||
| Class A Hypothetical | 1.33 | % | $ | 1,000.00 | $ | 1,018.40 | $ | 6.73 | |||||||||||
| Class C Actual | 2.18 | % | $ | 1,000.00 | $ | 997.30 | $ | 10.92 | |||||||||||
| Class C Hypothetical | 2.18 | % | $ | 1,000.00 | $ | 1,014.14 | $ | 11.01 | |||||||||||
| Class Y Actual | 1.09 | % | $ | 1,000.00 | $ | 1,001.80 | $ | 5.47 | |||||||||||
| Class Y Hypothetical | 1.09 | % | $ | 1,000.00 | $ | 1,019.60 | $ | 5.52 | |||||||||||
| Institutional Class Actual | 0.89 | % | $ | 1,000.00 | $ | 1,002.70 | $ | 4.47 | |||||||||||
| Institutional Class Hypothetical | 0.89 | % | $ | 1,000.00 | $ | 1,020.61 | $ | 4.51 | |||||||||||
| Touchstone Global Equity Fund | |||||||||||||||||||
| Class A Actual | 1.34 | % | $ | 1,000.00 | $ | 1,034.00 | $ | 6.83 | |||||||||||
| Class A Hypothetical | 1.34 | % | $ | 1,000.00 | $ | 1,018.35 | $ | 6.78 | |||||||||||
| Class C Actual | 2.12 | % | $ | 1,000.00 | $ | 1,030.20 | $ | 10.79 | |||||||||||
| Class C Hypothetical | 2.12 | % | $ | 1,000.00 | $ | 1,014.44 | $ | 10.71 | |||||||||||
| Class Y Actual | 1.11 | % | $ | 1,000.00 | $ | 1,034.90 | $ | 5.66 | |||||||||||
| Class Y Hypothetical | 1.11 | % | $ | 1,000.00 | $ | 1,019.50 | $ | 5.62 | |||||||||||
| Institutional Class Actual | 0.94 | % | $ | 1,000.00 | $ | 1,036.90 | $ | 4.80 | |||||||||||
| Institutional Class Hypothetical | 0.94 | % | $ | 1,000.00 | $ | 1,020.36 | $ | 4.76 | |||||||||||
| Touchstone Global Real Estate Fund | |||||||||||||||||||
| Class A Actual | 1.39 | % | $ | 1,000.00 | $ | 1,092.80 | $ | 7.29 | |||||||||||
| Class A Hypothetical | 1.39 | % | $ | 1,000.00 | $ | 1,018.10 | $ | 7.03 | |||||||||||
| Class C Actual | 2.14 | % | $ | 1,000.00 | $ | 1,089.10 | $ | 11.21 | |||||||||||
| Class C Hypothetical | 2.14 | % | $ | 1,000.00 | $ | 1,014.34 | $ | 10.81 | |||||||||||
| Class Y Actual | 1.14 | % | $ | 1,000.00 | $ | 1,094.40 | $ | 5.99 | |||||||||||
| Class Y Hypothetical | 1.14 | % | $ | 1,000.00 | $ | 1,019.35 | $ | 5.77 | |||||||||||
| Institutional Class Actual | 0.99 | % | $ | 1,000.00 | $ | 1,096.00 | $ | 5.20 | |||||||||||
| Institutional Class Hypothetical | 0.99 | % | $ | 1,000.00 | $ | 1,020.10 | $ | 5.01 | |||||||||||
190
Other Items (Continued)
Schedule of Shareholder Expenses (Continued)
| Net Expense Ratio Annualized September 30, 2010 | Beginning Account Value April 1, 2010 | Ending Account Value September 30, 2010 | Expenses Paid During the Six Months Ended September 30, 2010* | ||||||||||||||||
| Touchstone Healthcare and Biotechnology Fund | |||||||||||||||||||
| Class A Actual | 1.55 | % | $ | 1,000.00 | $ | 958.00 | $ | 7.61 | |||||||||||
| Class A Hypothetical | 1.55 | % | $ | 1,000.00 | $ | 1,017.30 | $ | 7.84 | |||||||||||
| Class C Actual | 2.30 | % | $ | 1,000.00 | $ | 954.00 | $ | 11.27 | |||||||||||
| Class C Hypothetical | 2.30 | % | $ | 1,000.00 | $ | 1,013.54 | $ | 11.61 | |||||||||||
| Touchstone Intermediate Fixed Income Fund | |||||||||||||||||||
| Institutional Class Actual | 0.40 | % | $ | 1,000.00 | $ | 1,054.60 | $ | 2.06 | |||||||||||
| Institutional Class Hypothetical | 0.40 | % | $ | 1,000.00 | $ | 1,023.06 | $ | 2.03 | |||||||||||
| Touchstone International Fixed Income Fund | |||||||||||||||||||
| Class A Actual | 1.09 | % | $ | 1,000.00 | $ | 1,136.60 | $ | 5.84 | |||||||||||
| Class A Hypothetical | 1.09 | % | $ | 1,000.00 | $ | 1,019.60 | $ | 5.52 | |||||||||||
| Class C Actual | 1.84 | % | $ | 1,000.00 | $ | 1,133.40 | $ | 9.84 | |||||||||||
| Class C Hypothetical | 1.84 | % | $ | 1,000.00 | $ | 1,015.84 | $ | 9.30 | |||||||||||
| Class Y Actual | 0.84 | % | $ | 1,000.00 | $ | 1,137.90 | $ | 4.50 | |||||||||||
| Class Y Hypothetical | 0.84 | % | $ | 1,000.00 | $ | 1,020.86 | $ | 4.26 | |||||||||||
| Institutional Class Actual | 0.69 | % | $ | 1,000.00 | $ | 1,138.70 | $ | 3.70 | |||||||||||
| Institutional Class Hypothetical | 0.69 | % | $ | 1,000.00 | $ | 1,021.61 | $ | 3.50 | |||||||||||
| Touchstone Large Cap Relative Value Fund | |||||||||||||||||||
| Class A Actual | 1.19 | % | $ | 1,000.00 | $ | 968.60 | $ | 5.87 | |||||||||||
| Class A Hypothetical | 1.19 | % | $ | 1,000.00 | $ | 1,019.10 | $ | 6.02 | |||||||||||
| Class C Actual | 1.94 | % | $ | 1,000.00 | $ | 965.10 | $ | 9.56 | |||||||||||
| Class C Hypothetical | 1.94 | % | $ | 1,000.00 | $ | 1,015.34 | $ | 9.80 | |||||||||||
| Class Y Actual | 0.94 | % | $ | 1,000.00 | $ | 969.50 | $ | 4.64 | |||||||||||
| Class Y Hypothetical | 0.94 | % | $ | 1,000.00 | $ | 1,020.36 | $ | 4.76 | |||||||||||
| Institutional Class Actual | 0.79 | % | $ | 1,000.00 | $ | 970.40 | $ | 3.90 | |||||||||||
| Institutional Class Hypothetical | 0.79 | % | $ | 1,000.00 | $ | 1,021.11 | $ | 4.00 | |||||||||||
| Touchstone Market Neutral Equity Fund | |||||||||||||||||||
| Class A Actual | 3.59 | % | $ | 1,000.00 | $ | 1,007.20 | $ | 18.06 | |||||||||||
| Class A Hypothetical | 3.59 | % | $ | 1,000.00 | $ | 1,007.07 | $ | 18.06 | |||||||||||
| Class C Actual | 4.11 | % | $ | 1,000.00 | $ | 1,003.10 | $ | 20.64 | |||||||||||
| Class C Hypothetical | 4.11 | % | $ | 1,000.00 | $ | 1,004.46 | $ | 20.65 | |||||||||||
| Class Y Actual | 3.32 | % | $ | 1,000.00 | $ | 1,008.30 | $ | 16.71 | |||||||||||
| Class Y Hypothetical | 3.32 | % | $ | 1,000.00 | $ | 1,008.42 | $ | 16.72 | |||||||||||
191
Other Items (Continued)
Schedule of Shareholder Expenses (Continued)
| Net Expense Ratio Annualized September 30, 2010 | Beginning Account Value April 1, 2010 | Ending Account Value September 30, 2010 | Expenses Paid During the Six Months Ended September 30, 2010* | ||||||||||||||||
| Touchstone Mid Cap Fund | |||||||||||||||||||
| Class A Actual | 1.24 | % | $ | 1,000.00 | $ | 990.60 | $ | 6.19 | |||||||||||
| Class A Hypothetical | 1.24 | % | $ | 1,000.00 | $ | 1,018.85 | $ | 6.28 | |||||||||||
| Class C Actual | 1.96 | % | $ | 1,000.00 | $ | 987.40 | $ | 9.76 | |||||||||||
| Class C Hypothetical | 1.96 | % | $ | 1,000.00 | $ | 1,015.24 | $ | 9.90 | |||||||||||
| Class Y Actual | 0.96 | % | $ | 1,000.00 | $ | 992.20 | $ | 4.79 | |||||||||||
| Class Y Hypothetical | 0.96 | % | $ | 1,000.00 | $ | 1,020.26 | $ | 4.86 | |||||||||||
| Class Z Actual | 1.21 | % | $ | 1,000.00 | $ | 990.60 | $ | 6.04 | |||||||||||
| Class Z Hypothetical | 1.21 | % | $ | 1,000.00 | $ | 1,019.00 | $ | 6.12 | |||||||||||
| Touchstone Mid Cap Value Fund | |||||||||||||||||||
| Class A Actual | 1.29 | % | $ | 1,000.00 | $ | 1,028.70 | $ | 6.56 | |||||||||||
| Class A Hypothetical | 1.29 | % | $ | 1,000.00 | $ | 1,018.60 | $ | 6.53 | |||||||||||
| Class C Actual | 2.04 | % | $ | 1,000.00 | $ | 1,025.00 | $ | 10.36 | |||||||||||
| Class C Hypothetical | 2.04 | % | $ | 1,000.00 | $ | 1,014.84 | $ | 10.30 | |||||||||||
| Class Y Actual | 1.04 | % | $ | 1,000.00 | $ | 1,030.30 | $ | 5.29 | |||||||||||
| Class Y Hypothetical | 1.04 | % | $ | 1,000.00 | $ | 1,019.85 | $ | 5.27 | |||||||||||
| Institutional Class Actual | 0.89 | % | $ | 1,000.00 | $ | 1,031.50 | $ | 4.53 | |||||||||||
| Institutional Class Hypothetical | 0.89 | % | $ | 1,000.00 | $ | 1,020.61 | $ | 4.51 | |||||||||||
| Touchstone Premium Yield Equity Fund | |||||||||||||||||||
| Class A Actual | 1.20 | % | $ | 1,000.00 | $ | 1,018.70 | $ | 6.07 | |||||||||||
| Class A Hypothetical | 1.20 | % | $ | 1,000.00 | $ | 1,019.05 | $ | 6.07 | |||||||||||
| Class C Actual | 1.95 | % | $ | 1,000.00 | $ | 1,016.30 | $ | 9.86 | |||||||||||
| Class C Hypothetical | 1.95 | % | $ | 1,000.00 | $ | 1,015.29 | $ | 9.85 | |||||||||||
| Class Y Actual | 0.95 | % | $ | 1,000.00 | $ | 1,020.10 | $ | 4.81 | |||||||||||
| Class Y Hypothetical | 0.95 | % | $ | 1,000.00 | $ | 1,020.31 | $ | 4.81 | |||||||||||
| Touchstone Sands Capital Select Growth Fund | |||||||||||||||||||
| Class Y Actual | 1.24 | % | $ | 1,000.00 | $ | 1,057.40 | $ | 6.40 | |||||||||||
| Class Y Hypothetical | 1.24 | % | $ | 1,000.00 | $ | 1,018.85 | $ | 6.28 | |||||||||||
| Class Z Actual | 1.49 | % | $ | 1,000.00 | $ | 1,054.50 | $ | 7.67 | |||||||||||
| Class Z Hypothetical | 1.49 | % | $ | 1,000.00 | $ | 1,017.60 | $ | 7.54 | |||||||||||
| Touchstone Short Duration Fixed Income Fund | |||||||||||||||||||
| Class Y Actual | 0.49 | % | $ | 1,000.00 | $ | 1,019.30 | $ | 2.48 | |||||||||||
| Class Y Hypothetical | 0.49 | % | $ | 1,000.00 | $ | 1,022.61 | $ | 2.48 | |||||||||||
| Class Z Actual | 0.74 | % | $ | 1,000.00 | $ | 1,017.00 | $ | 3.74 | |||||||||||
| Class Z Hypothetical | 0.74 | % | $ | 1,000.00 | $ | 1,021.36 | $ | 3.75 | |||||||||||
192
Other Items (Continued)
Schedule of Shareholder Expenses (Continued)
| Net Expense Ratio Annualized September 30, 2010 | Beginning Account Value April 1, 2010 | Ending Account Value September 30, 2010 | Expenses Paid During the Six Months Ended September 30, 2010* | ||||||||||||||||
| Touchstone Small Cap Core Fund | |||||||||||||||||||
| Class A Actual | 1.34 | % | $ | 1,000.00 | $ | 1,014.80 | $ | 6.77 | |||||||||||
| Class A Hypothetical | 1.34 | % | $ | 1,000.00 | $ | 1,018.35 | $ | 6.78 | |||||||||||
| Class C Actual | 2.09 | % | $ | 1,000.00 | $ | 1,011.40 | $ | 10.54 | |||||||||||
| Class C Hypothetical | 2.09 | % | $ | 1,000.00 | $ | 1,014.59 | $ | 10.56 | |||||||||||
| Class Y Actual | 1.09 | % | $ | 1,000.00 | $ | 1,016.60 | $ | 5.51 | |||||||||||
| Class Y Hypothetical | 1.09 | % | $ | 1,000.00 | $ | 1,019.60 | $ | 5.52 | |||||||||||
| Institutional Class Actual | 0.94 | % | $ | 1,000.00 | $ | 1,016.60 | $ | 4.75 | |||||||||||
| Institutional Class Hypothetical | 0.94 | % | $ | 1,000.00 | $ | 1,020.36 | $ | 4.76 | |||||||||||
| Touchstone Small Cap Value Opportunities Fund | |||||||||||||||||||
| Class Z Actual | 1.50 | % | $ | 1,000.00 | $ | 1,009.50 | $ | 7.56 | |||||||||||
| Class Z Hypothetical | 1.50 | % | $ | 1,000.00 | $ | 1,017.55 | $ | 7.59 | |||||||||||
| Touchstone Ultra Short Duration Fixed Income Fund | |||||||||||||||||||
| Class Z Actual | 0.69 | % | $ | 1,000.00 | $ | 1,008.20 | $ | 3.47 | |||||||||||
| Class Z Hypothetical | 0.69 | % | $ | 1,000.00 | $ | 1,021.61 | $ | 3.50 | |||||||||||
* Expenses are equal to the Fund's annualized expense ratio, multiplied by the average account value over the period, multiplied by [number of days in most recent fiscal half-year/365 [or 366]] (to reflect one-half year period).
193
Management of the Trust (Unaudited)
Listed below is basic information regarding the Trustees and principal officers of the Trust. The Trust's Statement of Additional Information includes additional information about the Trustees and is available, without charge, upon request by calling 1.800.543.0407.
Interested Trustees1:
| Name Address Age | Position(s) Held with Trust | Term of Office2 And Length of Time Served | Principal Occupation(s) During Past 5 Years | Number of Funds Overseen in the Touchstone Fund Complex3 | Other Directorships Held4 | ||||||||||||||||||
| Jill T. McGruder Touchstone Advisors, Inc 303 Broadway Cincinnati, OH Year of Birth: 1955 | Trustee and President | Until retirement at age 75 or until she resigns or is removed Trustee since 1999 | President and CEO of IFS Financial Services, Inc. (a holding company). | 43 | Director of LaRosa's (a restaurant chain), Capital Analysts Incorporated (an investment advisor and broker-dealer), IFS Financial Services, Inc. (a holding company), Integrity and National Integrity Life Insurance Co., Touchstone Securities (the Trust's distributor), Touchstone Advisors (the Trust's investment advisor and administrator) and W&S Financial Group Distributors (a distribution company). | ||||||||||||||||||
Independent Trustees:
| Phillip R. Cox 105 East Fourth Street Cincinnati, OH Year of Birth: 1947 | Trustee | Until retirement at age 75 or until he resigns or is removed Trustee since 1999 | President and Chief Executive Officer of Cox Financial Corp. (a financial services company). | 43 | Director of Cincinnati Bell (a communications company), Bethesda Inc. (a hospital), Timken Co. (a manufacturing company), Diebold (a technology solutions company), and Ohio Business Alliance for Higher Education. Director of Duke Energy from 1994-2008. | ||||||||||||||||||
| H. Jerome Lerner c/o Touchstone Advisors, Inc. 303 Broadway Cincinnati, OH Year of Birth: 1938 | Trustee | Until retirement at age 75 or until he resigns or is removed Trustee since 1989 | Principal of HJL Enterprises (a privately held investment company). | 43 | None | ||||||||||||||||||
194
Management of the Trust (Continued)
Independent Trustees (Continued):
| Name Address Age | Position(s) Held with Trust | Term of Office2 And Length of Time Served | Principal Occupation(s) During Past 5 Years | Number of Funds Overseen in the Touchstone Fund Complex3 | Other Directorships Held4 | ||||||||||||||||||
| Donald C. Siekmann c/o Touchstone Advisors, Inc. 303 Broadway Cincinnati, OH Year of Birth: 1938 | Trustee | Until retirement at age 75 or until he resigns or is removed Trustee since 2005 | Executive for Duro Bag Manufacturing Co. (a bag manufacturer) from 2002-2008. | 43 | None | ||||||||||||||||||
| John P. Zanotti c/o Touchstone Advisors, Inc. 303 Broadway Cincinnati, OH Year of Birth: 1948 | Trustee | Until retirement at age 75 or until he resigns or is removed Trustee since 2002 | CEO, Chairman and Director of Avaton, Inc. (a wireless entertainment company) until 2006. President of Cincinnati Biomedical (a life science and economic development company) from 2003-2007. Chairman of Integrated Media Technologies (a media company) | 43 | Director of Q Med (a health care management company) from 2004-2007. | ||||||||||||||||||
| Susan J. Hickenlooper c/o Touchstone Advisors, Inc. 303 Broadway Cincinnati, OH Year of Birth: 1946 | Trustee | Until retirement at age 75 or until he resigns or is removed Trustee since 2009 | Trustee of Episcopal Retirement Homes Foundation | 43 | Trustee of Gateway Trust (a charitable organization) from 2006-2008, Trustee of Cincinnati Parks Foundation (a charitable organization). | ||||||||||||||||||
1 Ms. McGruder, as a director of the Advisor and the Trust's Distributor, and an officer of affiliates of the Advisor and the Trust's Distributor, is an "interested person" of the Trust within the meaning of Section 2(a)(19) of the 1940 Act.
2 Each Trustee is elected to serve until the age of 75 or until he or she sooner resigns or is removed.
3 The Touchstone Fund Complex consists of 19 series of the Trust, 3 series of Touchstone Tax-Free Trust, 1 series of Touchstone Institutional Funds Trust, 4 series of Touchstone Investment Trust, 5 series of Touchstone Strategic Trust, and 11 variable annuity series of Touchstone Variable Series Trust.
4 Each Trustee is also a Trustee of Touchstone Funds Group Trust, Touchstone Institutional Funds Trust, Touchstone Investment Trust, Touchstone Strategic Trust, and Touchstone Variable Series Trust.
195
Management of the Trust (Continued)
Principal Officers1:
| Name Address Age | Position(s) Held with Trust | Term of Office2 And Length of Time Served | Principal Occupation(s) During Past 5 Years | Number of Funds Overseen in the Touchstone Fund Complex2 | Other Directorships Held | ||||||||||||||||||
| Jill T. McGruder Touchstone Advisors, Inc. 303 Broadway Cincinnati, OH Year of Birth: 1955 | President | Until resignation, removal or disqualification President since 2004; President from 2000-2002 | See biography above. | 43 | See biography above. | ||||||||||||||||||
| Brian E. Hirsch Touchstone Advisors, Inc. 303 Broadway Cincinnati, OH Year of Birth: 1956 | Vice President | Until resignation, removal or disqualification Vice President since 2003 | Senior Vice President of Compliance and Fund Administration of IFS Financial Services, Inc. | 43 | None | ||||||||||||||||||
| Steven M. Graziano Touchstone Advisors, Inc. 303 Broadway Cincinnati, OH Year of Birth: 1954 | Vice President | Until resignation, removal or disqualification Vice President since 2009 | President of Touchstone Advisors, Inc.; Executive Vice President of Pioneer Investment Management, Head of Retail Distribution and Strategic Marketing 2007-2008; Executive Vice President of Pioneer Investment Management, Chief Marketing Officer 2002-2007. | 43 | None | ||||||||||||||||||
| Timothy D. Paulin Touchstone Advisors, Inc. 303 Broadway Cincinnati, OH Year of Birth: 1963 | Vice President | Until resignation, removal or disqualification Vice President since 2010 | Vice President of Investment Research; Principal of Klein Decisions | 43 | None | ||||||||||||||||||
| Joseph Melcher Touchstone Advisors, Inc. 303 Broadway Cincinnati, OH Year of Birth: 1973 | Chief Compliance Officer | Until resignation, removal or disqualification Chief Compliance Officer since 2010 | Vice President of Compliance of IFS Financial Services (a holding company); Assistant Vice President of Compliance of IFS Financial Services 2005-2010. | 43 | None | ||||||||||||||||||
| Terrie A. Wiedenheft Touchstone Advisors, Inc. 303 Broadway Cincinnati, OH Year of Birth: 1962 | Controller and Treasurer | Until resignation, removal or disqualification Controller since 2000 Treasurer since 2003 | Chief Financial Officer and Senior Vice President of IFS Financial Services, Inc. | 43 | None | ||||||||||||||||||
| Jay S. Fitton JPMorgan. 303 Broadway Cincinnati, OH Year of Birth: 1970 | Secretary | Until resignation, removal or disqualification Secretary since 2006. Assistant Secretary from 2002-2006 | Assistant Vice President and Senior Counsel at JPMorgan Chase Bank, N.A. | 43 | None | ||||||||||||||||||
1 Each officer also holds the same office with Touchstone Funds Group Trust, Touchstone Institutional Funds Trust, Touchstone Investment Trust, Touchstone Tax-Free Trust, and Touchstone Variable Series Trust.
2 The Touchstone Fund Complex consists of 19 series of the Trust, 3 series of Touchstone Tax-Free Trust, 1 series of Touchstone Institutional Funds Trust, 4 series of Touchstone Investment Trust, 5 series of Touchstone Strategic Trust, and 11 variable annuity series of Touchstone Variable Series Trust.
196
PRIVACY PROTECTION POLICY
We Respect Your Privacy
Thank you for your decision to invest with us. Touchstone and its affiliates have always placed a high value on the trust and confidence our clients place in us. We believe that confidence must be earned and validated through time. In today's world, when technology allows the sharing of information at light speeds, trust must be reinforced by our sincere pledge to take the steps necessary to ensure that the information you share with us is treated with respect and confidentiality.
Our Pledge to Our Clients
• We collect only the information we need to service your account and administer our business.
• We are committed to keeping your information confidential and we place strict limits and controls on the use and sharing of your information.
• We make every effort to ensure the accuracy of your information.
We Collect the Following Nonpublic Personal Information About You:
• Information we receive from you on or in applications or other forms, correspondence, or conversations, including, but not limited to, your name, address, phone number, social security number, assets, income and date of birth; and
• Information about your transactions with us, our affiliates, or others, including, but not limited to, your account number and balance, payment history, parties to transactions, cost basis information, and other financial information.
Categories of Information We Disclose and Parties to Whom We Disclose
We do not disclose any nonpublic personal information about our current or former clients to nonaffiliated third parties, except as required or permitted by law.
We Place Strict Limits and Controls on the Use and Sharing of Your Information
• We restrict access to nonpublic personal information about you to authorized employees who need the information to administer your business.
• We maintain physical, electronic and procedural safeguards that comply with federal standards to protect this information.
• We do not disclose any nonpublic personal information about our current or former clients to anyone, except as required or permitted by law or as described in this document.
• We will not sell your personal information to anyone.
We May Provide Information to Service Your Account
Sometimes it is necessary to provide information about you to various companies such as transfer agents, custodians, broker-dealers and marketing service firms to facilitate the servicing of your account. These organizations have a legitimate business need to see some of your personal information in order for us to provide service to you. We may disclose to these various companies the information that we collect as described above. We require that these companies, including our own subsidiaries and affiliates, strictly maintain the confidentiality of this information and abide by all applicable laws. Companies within our corporate family that may receive this information are financial service providers and insurance companies. We do not permit these associated companies to sell the information for their own purposes, and we never sell our customer information.
This policy is applicable to the following affiliated companies: Touchstone Funds Group Trust, Touchstone Investment Trust, Touchstone Strategic Trust, Touchstone Tax-Free Trust, Touchstone Variable Series Trust, Touchstone Institutional Funds Trust, Touchstone Securities, Inc.,* Capital Analysts Incorporated and W&S Brokerage Services, Inc.
* Touchstone Securities, Inc. serves as the underwriter to the Touchstone Funds.
A Member of Western & Southern Financial Group®
The Privacy Protection Policy is not part of the Annual Report.
197
This page intentionally left blank.
This page intentionally left blank.

303 Broadway, Suite 1100
Cincinnati, OH 45202-4203

Touchstone Investments
Distributor
Touchstone Securities, Inc.*
303 Broadway
Cincinnati, Ohio 45202-4203
800.638.8194
www.touchstoneinvestments.com
Investment Advisor
Touchstone Advisors, Inc.*
303 Broadway
Cincinnati, Ohio 45202-4203
Transfer Agent
JPMorgan Chase Bank, N.A.
P.O. Box 5354
Cincinnati, Ohio 45201-5354
Shareholder Service
800.543.0407
* A Member of Western & Southern Financial Group
TSF-56-TFGT-AR-1010
Item 2. Code of Ethics.
At the end of the period covered by this report, the registrant has adopted a code of ethics that applies to its principal executive officer and principal financial officer.
Item 3. Audit Committee Financial Expert.
The registrant’s Board of Trustees has determined that the registrant has at least one audit committee financial expert serving on its audit committee. Mr. Donald Siekmann is the registrant’s audit committee financial expert and is an independent trustee within the meaning of the Investment Company Act of 1940, as amended (the “1940 Act”).
Item 4. Principal Accountant Fees and Services.
(a) Audit Fees. Audit fees totaled approximately $278,400 for the September 30, 2010 fiscal year and approximately $146,880 for the September 30, 2009. 2010 fees include $268,400 of fees associated with the annual audit and filing of form N-1A and Form N-SAR, and $10,000 of fees associated with additonal fiings for Form N-1A and Form N-14. 2009 fees include $124,880 of fees associated with the annual audit and filing for Form N-1A and Form N-SAR, and $22,000 of fees associated with additional filings of Form N-1A and Form N-14.
(b) Audit-Related Fees. Audit-related fees totaled approximately $0 for the September 30, 2010 fiscal year and $15,000 for the September 30, 2009 fiscal year and consisted of limited internal control testing in fiscal year 2009 of the Trust’s fund accountant and transfer agent.
(c) Tax Fees. Tax fees totaled approximately $113,600 for the September 30, 2010 fiscal year and $56,200 for the September 30, 2009 fiscal year. Fees for Federal excise tax returns distributions for the 10 TFGT funds that commenced operations on October 1, 2009 totaled $15,000 in fiscal 2010.
(d) All Other Fees. There were no fees for all other services to the registrant during the September 30, 2010 or September 30, 2009 fiscal years.
(e) (1) Audit Committee Pre-Approval Policies. The Audit Committee’s pre-approval policies describe the types of audit, audit-related, tax and other services that have the general pre-approval of the Audit Committee. The pre-approval policies provide that annual audit service fees, tax services not specifically granted pre-approval, services exceeding pre-approved cost levels and other services that have not received general pre-approval will be subject to specific pre-approval by the Audit Committee. The pre-approval policies further provide that the Committee may grant general pre-approval to other audit services (statutory audits and services associated with SEC registration statements, periodic reports and other documents filed with the SEC or other documents issued in connection with securities offerings), audit-related services (accounting consultations related to accounting, financial reporting or disclosure matters not classified as “audit services,” assistance with understanding and implementing new accounting and financial reporting guidance from rulemaking authorities, agreed-upon or expanded audit procedures related to accounting and/or billing records required to respond to or comply with financial, accounting or regulatory reporting matters and assistance with internal control reporting requirements under Form N-SAR and Form N-CSR), tax services that have historically been provided by the auditor that the Committee believes would not impair the independence of the auditor and are consistent with the SEC’s rules on auditor independence and permissible non-audit services
classified as “all other services” that are routine and recurring services.
(e)(2) All services described in paragraphs (b) through (d) of Item 4 were approved by the Audit Committee.
(f) Not applicable
(g) The aggregate non-audit fees for services to the registrant, its investment adviser (excluding its sub-advisor) and any entity controlling, controlled by or under common control with the advisor that provides ongoing services to the registrant were approximately $128,600 for the fiscal year ended September 30, 2010 and $56,200 for the fiscal year ended September 30, 2009.
(h) Not applicable
Item 5. Audit Committee of Listed Registrants.
Not applicable
Item 6. Schedule of Investments.
The Schedule of Investments in securities of unaffiliated issuers is included in the Annual Report.
Item 7. Disclosure of Proxy Voting Policies and Procedures for Closed-End Management Investment Companies.
Not applicable.
Item 8. Portfolio Managers of Closed-End Management Investment Companies.
Not applicable.
Item 9. Purchases of Equity Securities by Closed-End Management Investment Company and Affiliated Purchasers.
Not applicable.
Item 10. Submission of Matters to a Vote of Security Holders.
The Governance Committee will consider shareholder recommendations for nomination to the Board only in the event that there is a vacancy on the Board. Shareholders who wish to submit recommendations for nominations to the Board to fill the vacancy must submit their recommendations in writing to John P. Zanotti, Chairman of the Governance Committee, c/o Touchstone, 303 Broadway, Suite 1100, Cincinnati, OH 45202. Shareholders should include appropriate information on the background and qualifications of any person recommended to the Governance Committee (e.g., a resume), as well as the candidate’s contact information and a written consent from the candidate to serve if nominated and elected. Shareholder recommendations for nominations to the Board will be accepted on an ongoing basis and such recommendations will be kept on file for consideration in the event of a future vacancy on the Board.
Item 11. Controls and Procedures.
(a) Based on an evaluation of the registrant’s disclosure controls and procedures (as defined in Rule 30a-3(c) under the 1940 Act) the registrant’s principal executive officer and principal financial officer have concluded that the registrant’s disclosure controls and procedures are effective as of a date within 90 days of the filing date of this report.
(b) There were no changes in the registrant’s internal control over financial reporting (as defined in Rule 30a-3(d) under the 1940 Act) that occurred during the registrant’s second fiscal half-year that have materially affected, or are reasonably likely to materially affect, the registrant’s internal control over financial reporting.
Item 12. Exhibits.
(a)(1) The Code of Ethics for Senior Financial Officers was filed on December 9, 2005 with Registrant’s N-CSR for the September 30, 2005 fiscal year and is hereby incorporated by reference.
(a)(2) Certifications required by Item 12(a)(2) of Form N-CSR are filed herewith.
(b) Certification required by Item 11(b) of Form N-CSR is filed herewith.
SIGNATURES
Pursuant to the requirements of the Securities Exchange Act of 1934 and the Investment Company Act of 1940, the registrant has duly caused this report to be signed on its behalf by the undersigned, thereunto duly authorized.
(Registrant) Touchstone Funds Group Trust
By (Signature and Title) |
|
|
|
/s/ Jill T. McGruder |
|
Jill T. McGruder |
|
President |
|
|
|
Date: December 3, 2010 |
|
Pursuant to the requirements of the Securities Exchange Act of 1934 and the Investment Company Act of 1940, this report has been signed below by the following persons on behalf of the registrant and in the capacities and on the dates indicated.
By (Signature and Title) |
|
|
|
/s/ Jill T. McGruder |
|
Jill T. McGruder |
|
President |
|
|
|
Date: December 3, 2010 |
|
|
|
/s/ Terrie A. Wiedenheft |
|
Terrie A. Wiedenheft |
|
Controller & Treasurer |
|
|
|
Date: December 3, 2010 |
|