UNITED STATES
SECURITIES AND EXCHANGE COMMISSION
Washington, D.C. 20549
FORM N-CSR
CERTIFIED SHAREHOLDER REPORT OF REGISTERED
MANAGEMENT INVESTMENT COMPANIES
Investment Company Act file number | 811-8104 | |||||||
| ||||||||
Touchstone Funds Group Trust | ||||||||
(Exact name of registrant as specified in charter) | ||||||||
| ||||||||
303 Broadway, Suite 1100, Cincinnati, Ohio |
| 45202 | ||||||
(Address of principal executive offices) |
| (Zip code) | ||||||
| ||||||||
Jill T. McGruder, 303 Broadway, Suite 1100, Cincinnati, Ohio 45202 | ||||||||
(Name and address of agent for service) | ||||||||
| ||||||||
Registrant’s telephone number, including area code: | (513) 878-4066 |
| ||||||
| ||||||||
Date of fiscal year end: | 09/30 |
| ||||||
| ||||||||
Date of reporting period: | 9/30/11 |
| ||||||
Form N-CSR is to be used by management investment companies to file reports with the Commission not later than 10 days after the transmission to stockholders of any report that is required to be transmitted to stockholders under Rule 30e-1 under the Investment Company Act of 1940 (17 CFR 270.30e-1). The Commission may use the information provided on Form N-CSR in its regulatory, disclosure review, inspection and policymaking roles.
A registrant is required to disclose the information specified by Form N-CSR, and the Commission will make this information public. A registrant is not required to respond to the collection of information contained in Form N-CSR unless the Form displays a currently valid Office of Management and Budget ("OMB") control number. Please direct comments concerning the accuracy of the information collection burden estimate and any suggestions for reducing the burden to Secretary, Securities and Exchange Commission, 450 Fifth Street, NW, Washington, DC 20549-0609. The OMB has reviewed this collection of information under the clearance requirements of 44 U.S.C. § 3507.
Item 1. Reports to Stockholders.
Touchstone Funds Group Trust Annual Report
September 30, 2011
Annual Report
Touchstone Funds Group Trust
Touchstone Capital Appreciation Fund
Touchstone Emerging Markets Equity Fund
Touchstone Emerging Markets Equity Fund II
Touchstone Focused Equity Fund
Touchstone Global Equity Fund
Touchstone Global Real Estate Fund
Touchstone Intermediate Fixed Income Fund
Touchstone International Fixed Income Fund
Touchstone Large Cap Relative Value Fund
Touchstone Market Neutral Equity Fund
Touchstone Merger Arbitrage Fund
Touchstone Mid Cap Fund
Touchstone Mid Cap Value Fund
Touchstone Premium Yield Equity Fund
Touchstone Sands Capital Select Growth Fund
Touchstone Short Duration Fixed Income Fund
Touchstone Small Cap Core Fund
Touchstone Small Cap Value Fund
(formerly Touchstone Small Cap Value Opportunities Fund)
Touchstone Total Return Bond Fund
(formerly Touchstone Core Plus Fixed Income Fund)
Touchstone Ultra Short Duration Fixed Income Fund

Table of Contents
| Page | |||||||
| Letter from the President | 3-4 | ||||||
| Management's Discussion of Fund Performance (Unaudited) | 5-59 | ||||||
| Tabular Presentation of Portfolios of Investments (Unaudited) | 60-64 | ||||||
| Statements of Assets and Liabilities | 65-74 | ||||||
| Statements of Operations | 75-82 | ||||||
| Statements of Changes in Net Assets | 83-93 | ||||||
| Financial Highlights | 94-130 | ||||||
| Notes to Financial Statements | 131-162 | ||||||
| Portfolios of Investments: | |||||||
| Touchstone Capital Appreciation Fund | 163 | ||||||
| Touchstone Emerging Markets Equity Fund | 164-165 | ||||||
| Touchstone Emerging Markets Equity Fund II | 166-167 | ||||||
| Touchstone Focused Equity Fund | 168 | ||||||
| Touchstone Global Equity Fund | 169-170 | ||||||
| Touchstone Global Real Estate Fund | 171-172 | ||||||
| Touchstone Intermediate Fixed Income Fund | 173-176 | ||||||
| Touchstone International Fixed Income | 177-179 | ||||||
| Touchstone Large Cap Relative Value Fund | 180 | ||||||
| Touchstone Market Neutral Equity Fund | 181-186 | ||||||
| Touchstone Merger Arbitrage Fund | 187-188 | ||||||
| Touchstone Mid Cap Fund | 189-190 | ||||||
| Touchstone Mid Cap Value Fund | 191-192 | ||||||
| Touchstone Premium Yield Equity Fund | 193 | ||||||
| Touchstone Sands Capital Select Growth Fund | 194 | ||||||
| Touchstone Short Duration Fixed Income Fund | 195-199 | ||||||
| Touchstone Small Cap Core Fund | 200 | ||||||
| Touchstone Small Cap Value Fund | 201-202 | ||||||
| Touchstone Total Return Bond Fund | 203-206 | ||||||
| Touchstone Ultra Short Duration Fixed Income Fund | 207-213 | ||||||
| Report of Independent Registered Public Accounting Firm | 214 | ||||||
| Other Items (Unaudited) | 215-230 | ||||||
| Management of the Trust (Unaudited) | 231-233 | ||||||
| Privacy Protection Policy | 234 | ||||||
2
Letter from the President
Dear Shareholder:
We are pleased to provide you with the Touchstone Funds Group Trust Annual Report. Inside you will find key financial information, as well as manager commentaries for the Funds, for the twelve months ended September 30, 2011.
The last twelve months have been a challenging environment for the markets. The U.S. equity markets had a positive year, exhibiting slight gains for the year ended September 30, 2011. From an investment style and market capitalization perspective, U.S. growth equities outpaced their value counterparts, with large cap leading the way. The U.S. equity markets outperformed both the developed and emerging international markets for the year. Interest rates remain low, it is recognized that interest rates could stay low for a while longer.
In the third quarter, U.S. and world equity markets suffered their worst losses since the 2008-09 financial crisis, while treasury yields fell to their lowest levels since that period. For many investors, the key issues impacting markets are whether the U.S. economy is headed for a "double dip" recession, what can policymakers do to avert one; and can the financial crisis in Europe be contained.
It is thought that the U.S. economy is not on the brink of recession. The equity market is pricing in a mild recession already but certainly not a severe recession along the lines of 2008-2009. It is generally believed, however, that risks have increased and the outcome will be dictated by policy responses in the U.S. and Europe. The myriad of forces at play, which have been building throughout this year, could reach a climax soon depending on the outcome of U.S. budget deliberations and actions European policymakers take to halt financial contagion.
We are pleased to announce that on August 9th, we launched the Touchstone Merger Arbitrage Fund, sub-advised by Longfellow Investment Management Co. The volatile equity markets and low interest rate environment are particularly well suited to the merger arbitrage strategy. The Fund primarily invests in securities of companies that are involved in publicly announced mergers and other corporate reorganizations. Merger arbitrage is an investment strategy that seeks to capture the "arbitrage spread" represented by the difference between the market price for the securities of the company that is being purchased and the value that is offered for these securities by the acquiring company. This new Fund complements our other alternative investment funds including the Touchstone Market Neutral Equity Fund and the Touchstone Global Real Estate Fund.
In spite of the challenging markets over the last twelve months, a number of the Touchstone Funds generated solid performance and excellent rankings from Lipper Analytical Services. The Touchstone Premium Yield Equity Fund was in the top 3% ranking of performance for the one-year period ended September 30, 2011. The Touchstone High Yield Fund was ranked in the top quintile of performance by Lipper Analytical Services for the one-year and five-year periods ended September 30, 2011. One of our newer funds, the Touchstone Small Cap Core Fund, was in the top quintile ranking of performance for the one-year period ended September 30, 2011. The Touchstone Sands Capital Select Growth Fund continued its excellent performance, finishing in the top 1% ranking of performance by Lipper Analytical Services for the one-year, three-year, and ten-year periods and the top 3% ranking of performance for the five-year period.
Also of note, on April 19th, EARNEST Partners was named the sub-advisor of the Touchstone Total Return Bond Fund, which was formerly known as the Touchstone Core Plus Fixed Income Fund before that date. On July 29th, the existing assets of the EARNEST Partners Fixed Income Trust were merged into the Touchstone Total Return Bond Fund. The Fund invests directly in bonds and seeks to maximize total return by investing in market sectors and securities that are considered undervalued for their risk characteristics.
3
Letter from the President (Continued)
Touchstone is committed to helping investors achieve their financial goals by providing access to a distinctive selection of institutional asset managers who are known and respected for proficiency in their specific area of expertise. We hope that you will find the enclosed commentaries helpful.
We greatly appreciate your continued support. Thank you for including Touchstone as part of your investment plan.
Sincerely,

Jill T. McGruder
President
Touchstone Funds Group Trust
4
Management's Discussion of Fund Performance (Unaudited)
Touchstone Capital Appreciation Fund
Sub-Advised by Farr, Miller & Washington
Investment Philosophy and Process
The Touchstone Capital Appreciation Fund seeks long-term capital appreciation. The Fund invests, under normal market conditions, at least 80 percent of its net assets (including borrowings for investment purposes) in common stocks of large capitalization U.S. companies that are believed to be trading at attractive valuations.
Fund Performance and Market Overview
The total return of the Touchstone Capital Appreciation Fund was -3.17% for the year ended September 30, 2011, which was calculated excluding the maximum sales charge. The total return of the Russell 1000® Growth Index was 3.78% and the S&P 500 Index was 1.14% for the same period.
The Touchstone Capital Appreciation Fund underperformed its benchmarks over the past 12 month period; however, the Fund outperformed both of its benchmarks in 3Q11 during a very weak market. Unfortunately, this outperformance was not enough to offset the underperformance experienced by the Fund during the first three quarters of the period, a period where the market rallied sharply based on the belief that global economies would experience a "V" shaped economic recovery. Needless to say, the Fund's portfolio of large-cap, stable growth companies did not keep up during a rally that generally favored higher beta sectors and stocks. The recent underperformance has left the stocks in the Fund trading at very reasonable valuations, as there continues to be little to no premium being awarded for quality at this point.
Portfolio Review
During the past 12 months, the Fund benefited from its underweight position in the Materials and Industrials sectors. Accenture PLC continued to shine in the Information Technology sector. O'Reilly Automotive Inc. (Consumer Discretionary) continued to perform well as cash-strapped consumers are fixing their old cars as opposed to buying new ones. Colgate-Palmolive Co. (Consumer Discretionary) benefited from the defensive nature of its business while also posting solid emerging market growth, while Monsanto Company's (Materials), company-specific issues continued to improve while the global agricultural markets boomed. Other stock contributors included Johnson & Johnson (Health Care), and Procter & Gamble Co. (Consumer Staples).
For the year, the Fund's performance was hurt primarily by stocks in the Financials sector. The Fund began gradually moving into the highest quality financial stocks with the stocks trading, in many cases, near book value. Clearly this decision was made too early. The largest detractors to performance were Goldman Sachs Group Inc., Lazard Ltd., and JPMorgan Chase & Co. The stocks now trade at substantial discounts to book value based on concerns about the slowing U.S. economy, the European debt crisis, and regulatory concerns. We believe that significant long-term value can be found in these stocks for patient, long-term investors.
Strategy and Outlook
We believe that the Fund continues to be conservatively postured vs. its benchmark, the Russell 1000® Growth Index. Over one-third of the Fund is currently invested in the less economically sensitive Consumer Staples and Health Care sectors. We continue to add to positions in large-cap, blue-chip companies trading at what appear to be very attractive relative valuations. Proceeds for these purchases are generally coming from stocks that have outperformed and are now trading at rich valuations. The market is currently fluctuating based on the latest piece of news out of Europe. Global economic growth is likely to remain muted for many quarters to come. However, high-quality, blue-chip U.S. stocks are trading at what appear to be very reasonable valuations. The Fund remains defensive but appears to offer investors the chance for upside when the economy improves due to the large number of high-quality companies that have been punished in the recent market downdraft. We continue to believe that the Fund is well-positioned for this uncertain environment.
5
Management's Discussion of Fund Performance (Continued)
Comparison of the Change in Value of a $10,000 Investment in the Touchstone Capital
Appreciation Fund - Class A*, the Russell 1000® Growth Index and the S&P 500 Index
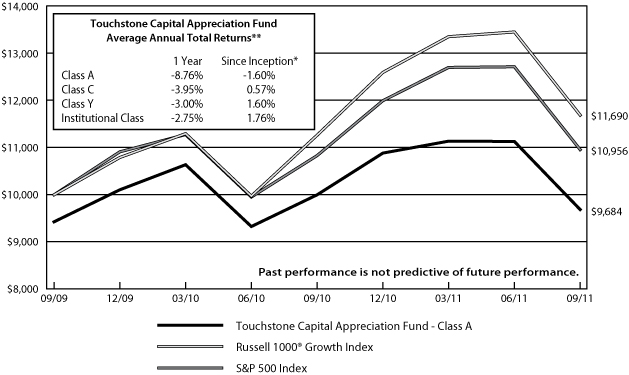
* The chart above represents performance for Class A shares only, which will vary from the performance of Class C shares, Class Y shares and Institutional Class shares based on the differences in loads and fees paid by shareholders in the different classes. The Fund commenced operations on September 30, 2009.
** The total returns shown above are adjusted for maximum applicable sales charges.
The performance of the above Fund does not reflect the deduction of taxes that a shareholder would pay on Fund distributions or the redemption of Fund shares.
6
Management's Discussion of Fund Performance (Continued)
Touchstone Emerging Markets Equity Fund
Sub-Advised by AGF Investments America, Inc.
Investment Philosophy and Process
The Touchstone Emerging Markets Equity Fund seeks capital appreciation by primarily investing in equity securities of companies in emerging markets. It seeks to invest in businesses believed to be mispriced by the market and that are expected to generate positive and sustainable earnings growth.
Fund Performance and Market Overview
The total return of the Touchstone Emerging Markets Equity Fund was -15.45% for the year ended September 30, 2011, which was calculated excluding the maximum sales charge. The total return of the MSCI Emerging Markets Index was -15.89% for the same period.
The escalating sovereign debt crisis in Europe and a deterioration in prospects for global economic growth led to widespread volatility and risk aversion selling among investors during the year. Emerging markets were particularly vulnerable, underperforming developed markets amid near-term growth concerns in major economies like Brazil, China, and India, and political instability in the Middle East. Softening global demand led to price declines in commodities such as copper and crude oil. Gold ascended to a record high in August before retreating slightly as the U.S. dollar recovered.
In Asia, China and India led declines across the region. While China's employment and retail spending levels remained resilient, economic growth concerns prevailed amid further deceleration in construction, manufacturing and industrial production. The People's Bank of China (PBOC) raised interest rates by 25 basis points in July for the third time this year, but is expected to maintain a neutral stance as headline inflation eased in August. South Korea, Indonesia, Malaysia and the Philippines all held interest rates unchanged in September as lower expected exports to Europe and the U.S. could adversely impact domestic growth. Despite an unexpected interest rate hike of 50 basis points in July, India's inflation accelerated to the highest level in more than one year to 9.8 percent on the benchmark wholesale price index, stoking expectations of further tightening, even in the midst of risks to global growth.
Declines in Europe, the Middle East and Africa (EMEA) were most pronounced in Eastern European countries such as Hungary and Poland, while civil uprising in the Middle East contributed to losses in Egypt and Turkey earlier in the year. Turkey was one of the first countries to implement monetary loosening in the face of global uncertainty, with a 50 basis point interest rate cut in August, and a rating upgrade of the country's debt led to relative outperformance in the third quarter. Falling oil prices continued to impact the energy-dominated Russian equity market. South Africa left its benchmark lending rate unchanged at a 30-year low in September as unemployment rose to almost 26 percent during the quarter, mainly from losses in the manufacturing and mining sectors. The country's growth forecast for this year was lowered to 3.2 percent.
Losses in Latin American equity markets were compounded by substantial depreciation of regional currencies relative to the U.S. dollar in September. Downgrades to global growth forecasts continued to have a negative impact on commodity prices. Brazil underperformed on external growth concerns, while the central bank announced a surprise interest rate cut of 50 basis points to offset expected reduction in fiscal spending. The domestic economy showed no signs of weakness as employment conditions and wage growth remained favorable, contributing to robust consumer confidence and strong retail spending. Growth in Mexico is expected to remain positive but below potential due to a possible slowdown in the U.S., while inflation remains benign. Peru outperformed in the third quarter, recovering from losses earlier in the year as political uncertainty eased, and Gross Domestic Product (GDP) growth exceeded estimates by reaching 6.5 percent as of July, resulting in the country's first fiscal surplus in three years.
7
Management's Discussion of Fund Performance (Continued)
Portfolio Review
The Financials, Materials, and Information Technology sectors represented the most significant contributors to positive relative returns during the year, while the Telecommunication Services sector detracted from performance.
An underweight allocation and positive security selection contributed to relative returns as Financials was one of the worst performing sectors from global growth concerns and potential exposure to European debt. Credicorp Ltd., Peru's largest financial services company and a recent addition to the Fund, contributed despite extreme trading volatility. Hong Kong based First Pacific Co. Ltd., an investment management company and conglomerate with business interests in telecommunications, consumer food products, infrastructure and natural resources, also contributed, as the company provides exposure to growth prospects in the Philippines and Indonesia. Kasikornbank Public Company Ltd., a leading provider of personal and commercial banking services in Thailand, reported a 42 percent increase in second quarter profit from strong loan growth and higher interest margins. No exposure to banks in China such as Bank of China Ltd. and China Construction Bank Corp., and insurance companies China Life Insurance Co. and Ping An Insurance Co. of China Ltd., was also positive for performance. Detractors to performance within the sector were primarily in real estate. Keppel Land Ltd. of Singapore, and Hong Kong companies Wharf Holdings Ltd. and China Overseas Land & Investment Ltd., declined as property transaction volumes continued to weaken due to tight credit restrictions in China and overall uncertainty in domestic growth across Asia.
The Materials sector contributed to performance as gold producers benefitted from a sharp rise in gold prices as risk aversion was heightened among investors. Fresnillo PLC reported record growth in silver production of 7.2 percent and a rise of 20.6 percent in gold output in the second quarter from the start of a new mine in Saucito. Eldorado Gold Corp. reported growth in second-quarter profit from higher gold prices, up to $74.9 million compared to $55.7 million in the second quarter last year, and indicated that the dividend yield would be raised. Other contributors included Yamana Gold Inc., an intermediate gold producer with production and exploration properties throughout Brazil and Argentina, and Chinese fertilizer company China BlueChemical Ltd..
Security selection was the primary driver of return for the Fund in the Information Technology sector, as Fund holdings in Asia, ASM Pacific Technology Ltd. and VTECH Holdings Ltd., outperformed the broader sector. Net profit for ASM during the first quarter surged almost 45 percent compared to the same period last year on higher asset turnover across leading segments, and substantial growth in new order bookings also contributed to record cash on hand. Revenue in the first quarter rose 11.8 percent for VTECH Holdings as the company maintains a leading position as a manufacturer of competitively priced electronic products.
The Telecommunication Services sector outperformed, however, a relative underweight allocation and security selection detracted from the Fund's performance. No exposure to benchmark name China Mobile Ltd. detracted, while political and global macro uncertainty hurt companies in Turkey, such as Turkcell Iletisim Hizmetleri A.S., one of Europe's leading telecom providers. The company continued to record positive net subscriber growth despite a competitive price environment, as EBITDA (earnings before interest, taxes, depreciation and amortization) margin has grown by an annualized 2.1 percent compared to the previous quarter.
From a regional perspective, an overweight allocation to Hong Kong/China, India and Thailand was positive for performance, while underweight South Korea and Taiwan detracted from performance in Asia. Within the EMEA region, an overweight to South Africa and Czech Republic, and no exposure to Russia contributed, while an overweight to Turkey detracted. In Latin America, an overweight to Peru and underweight to Chile and Brazil contributed, while overweight to Mexico detracted.
8
Management's Discussion of Fund Performance (Continued)
During the recent quarter, positions in Aveng Ltd. of South Africa and Tripod Technology Corp. from Taiwan were added within the Fund. Aveng is a holding company that operates through subsidiaries in the construction and engineering industries, and is active in cement and steel production and property development. The company boasts a very healthy balance sheet, with almost 33 percent of total assets in cash and almost no debt. Despite increasing margin pressure within the industry, the company is an efficient operator that has achieved increases in EBITDA margin while ROIC (return on invested capital) has tripled to 45 percent in the past year. The company also meets our critical CFROI (cash flow return on investment) criteria for inclusion into the Fund, with a consistent CFROI between the 9 to 12 percent range. While the company is poised to benefit from increasing long-term infrastructure spending and rising mining activities in South Africa, its Australian operations appear to be undervalued in the market, thus providing upside potential in the long-term.
Tripod Technology Corp. is a leader in the global Printed Circuit Board (PCB) sector, which provides essential platform components in the electronics industry. Tripod not only offers exposure to growing consumer demand for electronic products as mobile devices evolve, but also possesses the attributes of a highly competitive company through technological advantage, healthy financial position and growth potential. The company maintains an efficient cost structure and is cautious on capital expenditures, and its focus on profitability is demonstrated in its stable and sustainable profit margin and Return on Equity (ROE), even in the face of rising labor and raw material costs. Return on assets (ROA) are also strong as Tripod continues to invest for expansion into China, and with a dominant market share across various segments of the PCB market, the company is well-positioned to benefit from future consolidation within the industry.
Positions in Credicorp Ltd., Mahindra & Mahindra Ltd., and Turkiye Garanti Bankasi A.S. were also added to the Fund. Credicorp, the largest financial services conglomerate in Peru with a dominant position in most segments of the industry, has consistently delivered returns in excess of the company's cost of equity over the past 7 years. It is currently trading at what we believe represents an attractive valuation. Credicorp is strategically and financially well positioned to continue to capitalize on a banking sector that offers one of the highest growth potentials in Latin America, driven by strong expected Gross Domestic Product (GDP) growth and very low banking penetration. Mahindra & Mahindra is the largest manufacturer of utility vehicles and tractors in India, and provides exposure to increasing construction and infrastructure spending. The company is also diversified, with operational exposure in leisure, technology, and financial services. With what we believe to be a strong historical track record of high free cashflow and stable to increasing dividend payout, Mahindra has demonstrated resilience throughout the market cycle and is poised to benefit from potentially rising margins in the rapidly growing agriculture segment. Turkiye Garanti Bankasi is one of the four largest private sector banks in Turkey, a country whose financial system is well-regulated and offers structural growth potential, low credit penetration levels, and historically low interest rates. Garanti has a strong franchise and brand recognition, led by a strong management team, and is a leader in a number of strategies, particularly in low-cost demand deposits. The bank also maintains a healthy capital and liquidity position, which should provide incremental risk-adjusted returns to the Fund.
A position in retailer Woolworths Holdings Ltd. of South Africa was added during the period. The company had a strong track record of maintaining earnings margins of above 8 percent over the last few years and a superior CFROI profile above industry peers, providing support for future growth prospects. Based on positive secular trends in growing middle class incomes and spending in South Africa, and with a management team that demonstrated a focus on economic profits, we were encouraged by the total return growth prospects of this investment which included an attractive dividend yield.
Over the year, we exited positions in Cafe de Coral Holdings Ltd. and Land and Houses Public Company Ltd. Cafe de Coral is a Hong Kong-based operator of fast-food and specialty restaurant chains whose businesses
9
Management's Discussion of Fund Performance (Continued)
include institutional catering and food manufacturing. Despite growth in same store sales volume and pricing power from relatively stable market share in its existing operations, the company faced increasing margin pressures from rising raw material and labor costs. But, of greater concern was future earnings profitability, as the company focused on expansion plans into China. Prospects for accretive sales and earnings growth were diminished by a slower than expected expansion process into the mainland. The company is thus experiencing a much higher execution risk. This, coupled with higher costs, jeopardizes the ability to earn high returns or the trend of increasing returns as the capital expenditures seem to drag on. With the uncertainty of operating in relatively new and unknown locations for the company, we felt the risks far outweighed any potential returns in the near-term, and therefore decided to pursue other opportunities within the Fund.
The position in Land and Houses PCL of Thailand was sold, amid growing concerns regarding the company's earnings growth prospects this year. Headwinds from rising construction and raw materials costs presented obstacles to the sustainability of profit margins as further operational efficiencies were becoming more difficult to achieve. With general inflationary pressures eroding homebuyer affordability and discretionary incomes, and with mortgage rates set to rise in Thailand, top-line growth is expected to decelerate even as the company shifts its land strategy and development focus to condominiums. A disturbing trend of rising inventory levels and increasing price competition within the industry is expected to adversely affect the company's working capital position and profitability in the near-term. The position in Standard Bank Group Ltd. of South Africa was also sold. While macroeconomic fundamentals remain intact for the company's operating environment, Standard Bank has recently reported declining returns on a consecutive basis. Analysis indicated that it was unlikely that the company would be able to achieve previous levels of earnings growth. With uncertainty surrounding capital allocation and a lack of visibility on future guidance from management, the decision was made to pursue other investment opportunities at this time.
Exposure to Piramal Healthcare Ltd., one of India's largest pharmaceutical and healthcare companies, was decreased. The business model of Piramal fundamentally changed when it sold its largest operating division, representing 49 percent of consolidated sales, to Abbott Laboratories last year. The Healthcare Solutions unit, which sells retail-ready pharmaceuticals and generic medicines in India, Sri Lanka and Nepal, represented Piramal's primary source of growth. With no clear articulation of a growth strategy by management for either the deployment of the sale proceeds or for the remaining business unit, the investment thesis for the company was fundamentally changed.
PT Indofood Sukses Makmur Tbk, a Consumer Staples sector holding from Indonesia, was sold. The position was originally added as a result of a mandatory corporate action announced in June 2010 by First Pacific Company Ltd., one of the Fund's existing holdings. PT Indofood is a spin-off that is now separately listed. Based on the Fund's disciplined investment approach, this security by itself did not meet the criteria for buying and/or holding within the Fund's portfolio. The position in Grupo Televisa S.A., the largest media company in the Spanish-speaking world, was also removed from the Fund's portfolio. The stock had reached full valuation based on in-depth fundamental and discounted cashflow analysis, and there were limited positive catalysts for future upside in the medium term. We became concerned with the company's strategy of deploying cash towards potential investment opportunities, which increased the risk of erosion of internal returns. The company recently announced that it was spending over $1.5 billion for a 50 percent stake in Grupo Iusacell S.A., Mexico's third largest wireless carrier, in order to achieve higher growth beyond its traditional television production and broadcasting businesses. But following direct communication with the management team on several occasions, it was concluded that their knowledge of the cellular business was limited and the addition of such a new business would lower future returns on capital employed. Aside from on-going regulatory pricing disputes facing the company, there was insufficient justification to continue to hold the position based on expected future cashflow returns, its potential growth rate, and compared to relative opportunities within the sector.
10
Management's Discussion of Fund Performance (Continued)
The position in Shangri-La Asia Ltd. was also sold, as the leading luxury hotel property owner and manager in Asia was considered a restructuring story and we were interested in the ability of management to generate high returns based on the development of an asset-light model. However, the implementation of this model over the past 12-18 months has been slow. The company has also been heavily involved in an aggressive expansion program, which places a burden on the company's balance sheet; we expect this to be a drag on returns over the next couple of years. At the macro level, occupancy rates have recovered slowly across the Asian region post the 2008-2009 recession but we believe that Shangri-La in particular has lost its competitive positioning in terms of developing this asset-light model faster than its peers and ultimately achieving higher returns. Following several meetings with management during 2010, we ultimately did not feel confident that the company would be able to achieve economic profits over the three- to five-year investment horizon.
During the year, the Fund remained overweight the Consumer Discretionary, Consumer Staples and Materials sectors, and underweight the Financials, Information Technology and Energy sectors.
Strategy and Outlook
Severe risk aversion and heightened volatility in global equity markets appear to be sentiment-driven rather than based on fundamentals. Fears of a global recession now appear to be unwarranted, although current leading indicators point to an inevitable moderation in growth rates for most Emerging Markets (EM) countries. As inflationary pressures continue to subside, we expect further easing if not outright reversal in tightening measures, and authorities continue to demonstrate a willingness to adopt a more proactive stance to supporting long-term growth.
As developed markets continue to struggle to achieve growth under restrictive austerity measures and rising debt burdens, Emerging Markets continue to exhibit strong domestic economic fundamentals and healthy government and corporate balance sheets that should help to offset any potential external weakness. For long-term investors, we believe that the recent correction in valuations represents a compelling opportunity to take advantage of mispricing to invest in sound businesses with what we believe to be strong, sustainable earnings growth.
Based on individual stock selection, we adhere to the Fund's disciplined investment process that includes controlling risk at the company and Fund levels, particularly in challenging market environments. We remain focused on finding what are believed to be attractively valued long-term investment opportunities by selecting companies that have a track record of generating positive and sustainable economic profits, thus seeking to provide investors with consistent long-term risk-adjusted returns.
11
Management's Discussion of Fund Performance (Continued)
Comparison of the Change in Value of a $10,000 Investment in the Touchstone Emerging
Markets Equity Fund - Class A* and the MSCI Emerging Markets Index
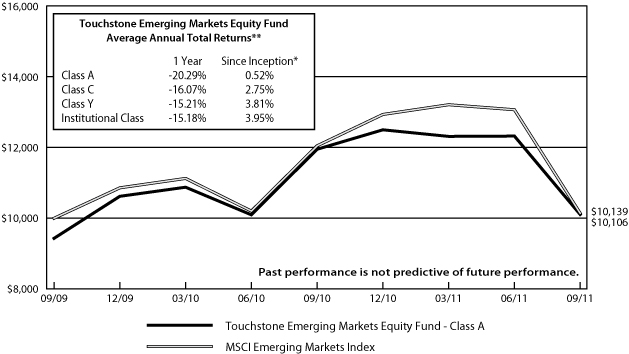
* The chart above represents performance for Class A shares only, which will vary from the performance of Class C shares, Class Y shares and Institutional Class shares based on the differences in loads and fees paid by shareholders in the different classes. The Fund commenced operations on September 30, 2009.
** The total returns shown above are adjusted for maximum applicable sales charges.
The performance of the above Fund does not reflect the deduction of taxes that a shareholder would pay on Fund distributions or the redemption of Fund shares.
12
Management's Discussion of Fund Performance (Continued)
Touchstone Emerging Markets Equity Fund II
Sub-Advised by AGF Investments America, Inc.
Investment Philosophy and Process
The Fund seeks capital appreciation by primarily investing in equity securities of companies in emerging markets. It invests primarily in medium to large capitalization companies in seeking to achieve its investment goal.
Fund Performance and Market Overview
The total return of the Touchstone Emerging Markets Equity Fund II was -20.50% since its inception on April 18, 2011, to the period ended September 30, 2011, which was calculated excluding the maximum sales charge. The total return of the MSCI Emerging Markets Index was -24.07% for the same period.
The escalating sovereign debt crisis in Europe and a deterioration in prospects for global economic growth led to widespread volatility and risk aversion selling among investors. Emerging markets underperformed developed markets amid near-term growth concerns and softening demand for commodities such as copper and crude oil. Gold ascended to a record high in August before retreating slightly as the U.S. dollar recovered.
Portfolio Review
Since inception of the Touchstone Emerging Markets Fund II, it outperformed its benchmark. The Materials, Financials and Energy sectors represented the most significant contributors to positive relative returns during the period. Materials was the top contributing sector to relative return in the Fund as gold producers benefitted from a sharp rise in gold prices during the period as risk aversion was heightened among investors. Randgold Resources Ltd. announced that its Tongon mine in the Ivory Coast will reach a target output of 272,000 ounces of gold this year and will maintain that level for at least nine years. Eldorado Gold Corp. reported growth in second-quarter profit from higher gold prices, up to $74.9 million compared to $55.7 million in the second quarter last year, and indicated that the dividend yield would be raised. Another contributor was Yamana Gold Inc., an intermediate gold producer with production and exploration properties throughout Brazil and Argentina. Compania de Minas Buenaventura S.A., Peru's largest precious-metals miner, approved a U.S. $4.8 billion gold and copper project in northern Peru after the newly elected president Ollanta Humala pledged to respect contracts and lure more mining investment. This followed earlier comments that mining royalties would be raised to tighten state control over natural resources as a new mining tax was approved in September. Fresnillo PLC, which reported record growth in silver production of 7.2 percent and a rise of 20.6 percent in gold output in the second quarter from the start of a new mine in Saucito, also contributed to performance.
In the Financials sector, Credicorp Ltd., Peru's largest financial services company and a recent addition to the Fund, contributed despite extreme trading volatility during the period as the broader equity market recovered from declining political uncertainty and strong domestic growth. Hong Kong based First Pacific Co. Ltd., an investment management company and conglomerate with business interests in telecommunications, consumer food products, infrastructure and natural resources, also contributed to performance, as the company provides exposure to growth prospects in the Philippines and Indonesia. Kasikornbank Public Company Ltd., a leading provider of personal and commercial banking services in Thailand, reported a 42 percent increase in second quarter profit from strong loan growth and higher interest margins. Detractors to performance within the sector were primarily in real estate. Keppel Land Ltd. of Singapore, and Hong Kong companies Wharf Holdings Ltd. and China Overseas Land & Investment Ltd. declined as property transaction volumes continued to weaken due to tight credit restrictions in China and overall uncertainty in domestic growth across Asia.
Energy was among the worst performing sectors as oil prices continued to weaken and investors reduced exposure to cyclical investments. A relative underweight allocation in the Fund was positive, and no exposure
13
Management's Discussion of Fund Performance (Continued)
to Russian energy company Gazprom also contributed. Performance detractors within the sector included Tenaris S.A., the world's largest producer of seamless steel tubes used in the petroleum and mechanical industries, and Thai Oil PCL, as crude oil prices retreated from slower expected global growth.
From a regional perspective, an overweight allocation to Hong Kong/China and India, and underweight to South Korea and Taiwan were positive, while an overweight to Singapore and Thailand detracted in Asia. Within the Europe, Middle East and Africa (EMEA) region, an overweight to South Africa and no exposure to Russia contributed to performance, while an overweight to the Czech Republic was negative for performance. In Latin America, an overweight to Peru and underweight to Brazil contributed, while an overweight to Mexico detracted.
During the period, we added positions in Credicorp Ltd., Mahindra & Mahindra Ltd., Turkiye Garanti Bankasi A.S. and Aveng Ltd. to the Fund's portfolio. Credicorp Ltd., the largest financial services conglomerate in Peru with a dominant position in most segments of the industry, has consistently delivered returns in excess of the company's cost of equity over the past seven years. Currently trading at what we believe represents an attractive valuation, Credicorp is strategically and financially well positioned to continue to capitalize on a banking sector that offers one of the highest growth potentials in Latin America, driven by strong expected Gross Domestic Product (GDP) growth and very low banking penetration. Mahindra & Mahindra Ltd. is the largest manufacturer of utility vehicles and tractors in India, and provides exposure to increasing construction and infrastructure spending. The company is also diversified, with operational exposure in leisure, technology, and financial services. With a strong historical track record of high, free cashflow and stable to increasing dividend payout, Mahindra has demonstrated resilience throughout the market cycle and is poised to benefit from potentially rising margins in the rapidly growing agriculture segment. Turkiye Garanti Bankasi A.S. is one of the four largest private sector banks in Turkey, a country whose financial system is well-regulated and offers structural growth potential, low credit penetration levels and historically low interest rates. Turkiye Garanti has a strong franchise and brand recognition, led by a strong management team, and is a leader in a number of strategies, particularly in low-cost demand deposits. The bank also maintains a healthy capital and liquidity position, which should provide incremental risk-adjusted returns to the Fund.
Aveng Ltd. is a holding company that operates through subsidiaries in the construction and engineering industries, and is active in cement and steel production and property development. The company boasts a very healthy balance sheet, with almost 33 percent of total assets in cash and almost no debt. Despite increasing margin pressure within the industry, the company is an efficient operator that has achieved increases in EBITDA (earnings before interest, taxes, depreciation and amortization) margin while ROIC (return on invested capital) has tripled to 45 percent in the past year. The company also meets our critical CFROI (cash flow return on investment) criteria for inclusion into the Fund, with a consistent CFROI between a 9 to 12 percent range. While the company is poised to benefit from increasing long-term infrastructure spending and rising mining activities in South Africa, its Australian operations appear to be undervalued in the market, thus should provide upside potential in the long term. The position in Standard Bank Group Ltd. of South Africa was removed during the period. While macroeconomic fundamentals remain intact for the company's operating environment, Standard Bank has recently reported declining returns on a consecutive basis. Analysis indicated that it was unlikely that the company would be able to achieve previous levels of earnings growth. With uncertainty surrounding capital allocation and a lack of visibility on future guidance from management, the decision was made to pursue other investment opportunities at this time. At the end of the period, the Fund remained overweight in the Materials, Consumer Discretionary and Consumer Staples sectors, and underweight in the Information Technology, Industrials and Financials sectors.
Strategy and Outlook
Severe risk aversion and heightened volatility in global equity markets appear to be sentiment-driven rather than based on fundamentals. Fears of a global recession now appear to be unwarranted, although current leading
14
Management's Discussion of Fund Performance (Continued)
indicators point to an inevitable moderation in growth rates for most emerging market countries. As inflationary pressures continue to subside, we expect further easing if not outright reversal in tightening measures, and authorities continue to demonstrate a willingness to adopt a more proactive stance to supporting long-term growth.
As developed markets continue to struggle to achieve growth under restrictive austerity measures and rising debt burdens, emerging markets continue to exhibit strong domestic economic fundamentals and healthy government and corporate balance sheets that should help to offset any potential external weakness. For long-term investors, the recent correction in valuations could represent a compelling opportunity to take advantage of mispricing to invest in sound businesses with what we believe to be strong sustainable earnings growth.
Based on individual stock selection, we adhere to the Fund's disciplined investment process that includes controlling risk at the company and Fund levels, particularly in challenging market environments. We remain focused on finding what are believed to be attractively valued, long-term investment opportunities by selecting companies that have a track record of generating positive and sustainable economic profits, thus seeking to provide investors with what we feel are consistent long-term risk-adjusted returns.
Comparison of the Change in Value of a $10,000 Investment in the Touchstone Emerging
Markets Equity Fund II - Class A* and the MSCI Emerging Markets Index
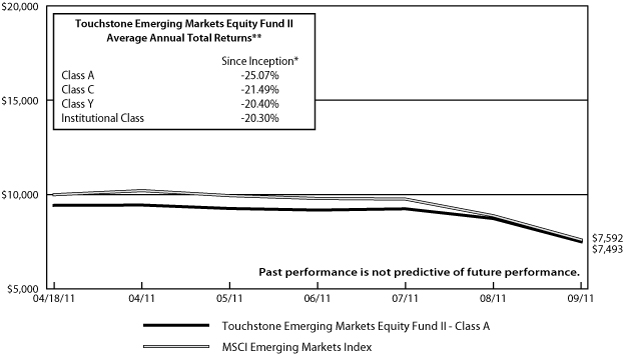
* The chart above represents performance for Class A shares only, which will vary from the performance of Class C shares, Class Y shares and Institutional Class shares based on the differences in loads and fees paid by shareholders in the different classes. The Fund commenced operations on April 18, 2011.
** The total returns shown above are adjusted for maximum applicable sales charges.
The performance of the above Fund does not reflect the deduction of taxes that a shareholder would pay on Fund distributions or the redemption of Fund shares.
15
Management's Discussion of Fund Performance (Continued)
Touchstone Focused Equity Fund
Sub-Advised by Fort Washington Investment Advisors Inc.
Investment Philosophy and Process
The Touchstone Focused Equity Fund seeks capital appreciation by investing in equity securities of companies of any size.
Fund Performance and Market Overview
The total return of the Touchstone Focused Equity Fund was -11.95% for the twelve month period ended September 30, 2011, which was calculated excluding the maximum sales charge. The total return of the Russell 3000® Index was 0.55% for the same period. The Touchstone Focused Equity Fund underperformed its benchmark.
The Touchstone Focused Equity Fund experienced an extremely difficult final two quarters of the fiscal year ended September 30, 2011. We believe this underperformance is temporary, as the market is presently trading more on irrational emotion than fundamentals. We have multiple observations that lead us to this conclusion and believe the Touchstone Focused Equity Fund is well positioned for the long term.
Equity investors dealt with an extremely volatile and tumultuous market during the second and third quarters of 2011. Heightened fears of sovereign debt issues in Europe coupled with the message from the Federal Reserve in the U.S. that we should expect slow growth for several years shook the foundation of equity markets globally. With the positive effects of "QE2" (Quantitative Easing 2) eroding throughout 2011, the equity markets have shifted their focus in favor of companies that are large cap, pay a high dividend and have very stable and predictable business models.
Portfolio Review
Within the Fund, holdings in the Health Care, Industrials, Consumer Discretionary, and Telecommunication Services sectors outperformed their sector peers. The companies that created the most value during the year were Time Warner Cable Inc. (Consumer Discretionary sector), Arrow Electronics Inc. (Information Technology sector), Fidelity National Financial Inc. (Financials sector), RailAmerica Inc. (Industrials sector), Hess Corp. (Energy sector), Kddi Corp. (Telecommunication Services sector), and UnitedHealth Group Inc. (Health Care sector). The majority of the underperformance occurred in the Financials, Information Technology, Energy and Materials sectors. Top detractors included Bank of America Corp. (Financials sector), Nokia Corp. (Information Technology sector), and Hewlett-Packard Co. (Information Technology sector). Other companies detracting from performance included Cemex S.A.B. de C.V. (Materials sector), Goldman Sachs Group Inc. (Financials sector), Encana Corp. (Energy sector), and Allstate Corp. (Financials sector).
Throughout the course of the last 12 months, the Fund shifted its overweight from larger companies to small and mid-sized businesses (market capitalization levels below $10 billion). This allocation decision detracted from performance. However, we continue to find significant value in small and mid-sized companies and as a result that segment currently comprises nearly 50% of the Fund.
While we remain strong believers in our process, we have made several structural changes to how the Fund is positioned. Since September of last year, we have made significant additions to our weights in the Financial and Industrials sectors. The Fund is also currently overweight to the Information Technology and Telecommunication Services sectors. The sectors with the largest reductions in weight were Health Care, Consumer Staples, and Consumer Discretionary. The Fund remains significantly underweighted in the Consumer Staples, Health Care, and Utilities sectors. Each change was made in an effort to improve the risk/reward profile of the Fund.
16
Management's Discussion of Fund Performance (Continued)
The last two quarters have been difficult from a performance standpoint, but we believe in our work and we also believe the overall current value of the Fund's portfolio positions is attractive. Owing to the nature of the markets at the present time and some acute challenges we have had in a few positions, we believe this temporary setback in performance will be offset as the markets return to more of a fundamental view. Our view is long term, focused on getting the "what" right but recognizing the "when" may not necessarily work in our favor each 12 week period. With this perspective, we can focus on a consistent application of the investment process.
There are many signals that point to an irrational market. This period requires patience. Decisions based on short-term market movements can compound issues in the long term. For example, right now the market is giving credit to International Business Machines Corporation (IBM) for maintaining its returns on capital at the current state or higher for the next 20 years. Twenty years is the same length that investors give Procter & Gamble Company credit in terms of maintaining its overall returns on capital. We find this surprising since the rate of change in the Information Technology sector is vastly different from the household product business. We believe investors are so nervous about the state of Europe, China or the U.S. that they are seeking comfort right now regardless of valuation. We observe the same behavior in many "safe" stocks right now. Such mispricings cannot be sustained into perpetuity.
Strategy and Outlook
All this said, we are concerned about Europe, China and the United States. Europe (excluding the Financials sector) is within 15% of replacement cost. Europe has historically generated returns in excess of the cost of capital, and so these valuation levels give us some comfort that investors have priced in the troubles to a large degree. The only question at replacement cost is if Europe is the next Japan. We don't think so. Japan has a structural demand problem which is not the case in Europe. Europe lacks a proper institutional structure. In our view, the European situation is a fixable problem. Japan is dealing with a balance sheet recession which is tough to get out of versus Europe is dealing with a question of political will. Therefore, we assume for Europe that politicians will do the right thing in addressing structural and confidence issues in that economic region. Based on this, combined with our analysis at the company level, we started a new position in a European telecom services company, France Telecom.
With the U.S., a "double dip" is not our base case mainly because bank credit conditions (excluding mortgages) are not tightening, inventory levels are low in corporate America, and there is no significant imbalance in autos and housing. The market, in our view, is pricing in a low growth environment which is our base case scenario. This is what we have positioned the Fund's portfolio for in the future. Also, we believe the fiscal situation is fixable if our leaders focus on reducing entitlements — not on cutting items such as defense (excluding the supplemental) — and increase the amount of capital going to Research & Development, infrastructure and education. The next important data point on this front is with the "super committee's" (Joint Congressional Select Committee on Deficit Reduction) decision due by late November.
With regard to China, we are concerned as it appears to us that China has overinvested in fixed assets and now needs to make the hand-off to the consumption side in order to maintain a healthy growth rate for the economy. What makes us nervous is China has invested more as a percentage of Gross Domestic Product (GDP) in fixed assets than Japan, Taiwan and Korea in their economic booms, and Taiwan was the only one that successfully made the hand-off to the consumption side in a smooth fashion. What is notable about Taiwan is that they had the weakest fixed asset boom among all of these countries mentioned. Also, we are concerned whether investors properly understand the urbanization trend which is a big part of the bull case for China. For now, we are avoiding metal and mining companies along with many industrial businesses that obtain a significant portion of their growth rate from China until we can dismiss our initial theories on this "investor-loved" part of the world.
17
Management's Discussion of Fund Performance (Continued)
In closing, investors may stay irrational for some time and therefore continue to price high dividend paying names along with the IBMs and Exxons of the world at full value. Bottom line, we are continuing to search for attractively valued businesses and therefore not just buying a name regardless of valuation because we believe it perceptively has less risk in the short term. Additionally, we have increased our cash position (as of early October) in order to be prepared for any negative impact from the "super committee" outcome, a Greek default or weakness from China.
Comparison of the Change in Value of a $10,000 Investment in the Touchstone Focused
Equity Fund - Class A* and the Russell 3000® Index
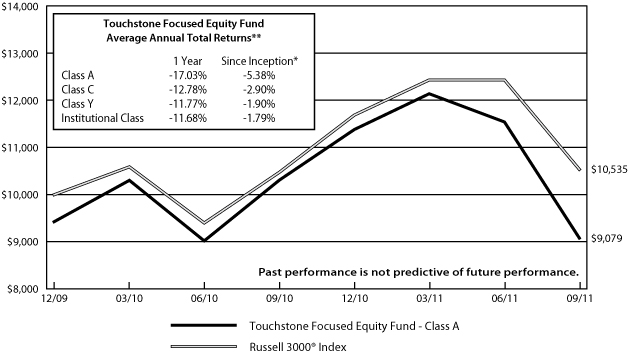
* The chart above represents performance for Class A shares only, which will vary from the performance of Class C shares, Class Y shares and Institutional Class shares based on the differences in loads and fees paid by shareholders in the different classes. The Fund commenced operations on December 31, 2009.
** The total returns shown above are adjusted for maximum applicable sales charges.
The performance of the above Fund does not reflect the deduction of taxes that a shareholder would pay on Fund distributions or the redemption of Fund shares.
18
Management's Discussion of Fund Performance (Continued)
Touchstone Global Equity Fund
Sub-Advised by Bedlam Asset Management PLC
Investment Philosophy and Process
The Touchstone Global Equity Fund seeks capital appreciation by primarily investing in U.S. and foreign equity securities including those of emerging market countries without regard to market capitalizations.
Performance and Market Overview
The total return of the Touchstone Global Equity Fund was -5.87% for the year ended September 30, 2011, which was calculated excluding the maximum sales charge. The total return of the MSCI All Country World Index was -5.54% for the same period.
The year fell neatly into two halves; in the first half, the Fund lagged the Index. This was due to being light in overvalued, momentum-driven, cyclical stocks, and to the weighting in Japan and nuclear plays when the Japanese tsunami hit in March. Since that time, the Fund has outperformed its benchmark, helped by the underweight position in Financials and the overweight positions in the defensive sectors of Consumer Staples, Health Care and Telecommunication Services.
While losses in value are never satisfactory, the Fund's bias towards reasonably-priced growth has provided downside protection in the latter part of the year. Markets weakened dramatically in the three months up to September as the political paralysis in Europe highlighted the difficulties — and costs — arising from the need to recapitalize most of Europe's banks in the wake of the sovereign debt crisis that has gripped the eurozone. To put this cost into context, banks in the region have $2.1 trillion exposed to the PIIGS (Portugal, Italy, Ireland, Greece, Spain), equivalent to some 73 percent of their equity, while the exposure of the UK, Swiss and U.S. banks amounts to almost half of their equity capital. The cost of covering this exposure and the PIIGS' debt due to be refinanced in 2012 could amount to more than $1 trillion. The Fund has only 3 percent invested in companies in the Financials sector — and no exposure to banks in the western world. Just 8 percent of holdings are domiciled in the eurozone. All companies held in the region are exporters who will benefit from the inevitable weakening of the currency.
Portfolio Review
By sector, the main contribution to return was generated by Materials. In the first half of the year agricultural chemicals were particularly strong. Poor weather conditions led to expectations of reduced yields and higher grain prices. U.S.-listed fertilizer company CF Industries Holdings Ltd. was the strongest performer, as low U.S. gas prices boosted margins. Crop protection and seed companies Syngenta AG and Monsanto Co. also rose strongly on the bullish outlook. Monsanto was sold early in the period on valuation grounds. Other positions were trimmed in late June, when several stocks in the sector had reached new highs. Precious metals miners account for the other holdings in the sector. Vast amounts of money are required to protect Europe's banks from sovereign distress, while it is increasingly likely that the U.S. Federal Reserve will embark on more quantitative easing before calendar year-end. With the world's policy makers as far as ever from fiscal and monetary discipline, the rise in bullion prices is understandable and likely to continue. The Fund's holdings in the sector — particularly Yamana Gold Inc. and Fresnillo PLC — have been significant contributors to performance.
Holdings in the Fund's Health Care sector continued to rise in value. The deleterious effects of patent expiration (mainly in the U.S.) and price pressure (mainly in Europe) are more than discounted in share prices. Meanwhile, drug pipelines are improving and managements are getting to grips with their often bloated costs. Stand-out Fund performers where Bristol-Myers Squibb Co. and Bayer AG, on positive expectations for their stroke prevention drugs Eliquis and Xarelto. Bayer was sold at target price. Unlike other holdings in
19
Management's Discussion of Fund Performance (Continued)
the sector, it also has chemical interests which are at risk of disappointing as the economy turns down. The Telecommunication Services sector's contribution was driven by demand for smartphones and data services. Hutchison Telecommunications Hong Kong Holdings Ltd. in Hong Kong and Bezeq Group in Israel were the main beneficiaries. Both companies operate in small economies with technologically savvy consumers and limited regulation. Increased regulatory pressure and risks of contagion from the unrest among Israel's neighbors led to the sale of Bezeq in the first half of the year.
The Fund's Energy sector holdings were the main detractors from performance. Most weakened in the summer months as fears of another economic contraction pushed down oil and gas prices. The majority of the Fund's positions are exposed to gas. Despite the sell-off, long term fundamentals remain positive. With much of the world now rejecting nuclear power in the wake of Japan's disaster in March, gas remains the only clean source of base-load power generation. The only pure oil play held is Cairn Energy PLC. Poor exploration results and delays to the divestment of the group's Indian subsidiary have depressed the stock for much of the year. Shareholders will receive most of the proceeds of the sale, while the current price assumes no exploration success. The main stock-specific disappointment came from brewer Carlsberg A.S. Regulatory changes in Russia and pressures on the Russian consumer has depressed the stock price. While Russia accounts for a significant portion of group sales, restructuring in Western Europe should provide a bigger uplift to profits in the longer term.
Strategy and Outlook
In tandem with a likely announcement on bank recapitalization in the eurozone, a further expansion of the Federal Reserve's (the Fed) balance sheet can be expected before the end of this year. In the absence of increased buying by the Fed of U.S. Treasuries, private U.S. savings are facing a huge crowding by the public sector. This is a major headwind for U.S. credit growth and, by definition, employment. Although the holdings of U.S. Treasuries by central banks has remained at a steady 48 percent between the second quarter of 2009 and first quarter of 2011, this hides the fact that holdings by foreign central banks actually fell from 39 percent to 34 percent. If foreign central banks continue their buyers' strike, we expect the Fed to step up to the plate and announce Quantitative Easing 3 (QE3), thereby alleviating the crowding out of the private sector by an ever-larger government. These developments will add further support to the gold price. Despite bullion's 16 percent tumble in the quarter to September, the price is still 7 percent above its end-June level, versus a 14 percent fall in the S&P 500.
A significant anomaly generated by the combination of the Fed's "Operation Twist" and the looming slowdown, is that the real yield on the 30-year U.S. Government bond is now negative, at -1 percent. This has only happened twice before, most recently briefly in 2008, and previously in the late 1970s when a period of high inflation pushed it to -4 percent. Over the next twelve months the real yield may well fall even lower. However, at these levels, investing in government bonds would likely cause a loss of money over the next five years. It also highlights the frantic search by investors for income. In a low growth environment, it is sensible to assume that an increasing portion of investor returns will be achieved through dividends.
The wild gyrations across equity markets are already generating many disconnects between falling equity prices and improving company fundamentals. One example is in the global liquefied natural gas (LNG) market. Despite sharp drops in the share prices of many gas producers, Asian demand remains stronger than ever as the shift away from nuclear accelerates. The Asian gas price has risen by almost 30 percent since June and has doubled from its level before the Japanese earthquake. It is now at parity with the oil price versus a typical 20 percent discount. LNG demand has ramped up as the nuclear build-out continues to be scaled back, most notably by both Japan and Korea. Thus, despite a stagnant economy, Japanese demand is likely to grow. In addition China, Taiwan, Singapore and India have continued to be significant purchasers, pushing the growth in LNG demand to 4-5 percent. The Fund retains its 11 percent weighting to Energy, of which 9 percent is in gas exploration and production (E&P) companies.
20
Management's Discussion of Fund Performance (Continued)
Comparison of the Change in Value of a $10,000 Investment in the Touchstone Global
Equity Fund - Class A* and the MSCI All Country World Index
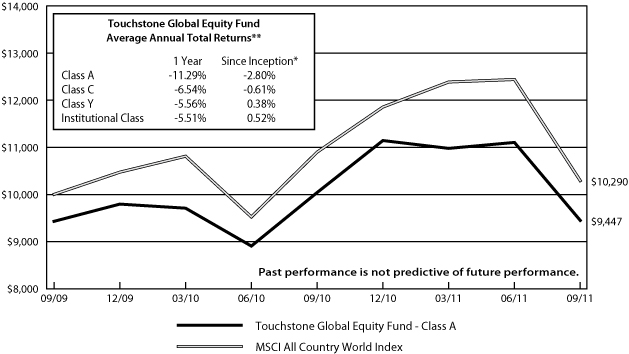
* The chart above represents performance for Class A shares only, which will vary from the performance of Class C shares, Class Y shares and Institutional Class shares based on the differences in loads and fees paid by shareholders in the different classes. The Fund commenced operations on September 30, 2009.
** The total returns shown above are adjusted for maximum applicable sales charges.
The performance of the above Fund does not reflect the deduction of taxes that a shareholder would pay on Fund distributions or the redemption of Fund shares.
21
Management's Discussion of Fund Performance (Continued)
Touchstone Global Real Estate Fund
Sub-Advised by Cornerstone Real Estate Advisers LLC
Investment Philosophy and Process
The Touchstone Global Real Estate Fund seeks capital appreciation by primarily investing in common stocks and other equity securities of U.S. and foreign real estate companies. Fund management utilizes a core research approach that combines top-down macroeconomic, capital and property market analysis with bottom-up understanding of local real estate and operational capacity to evaluate both property sectors and individual companies.
Fund Performance and Market Overview
The Touchstone Global Real Estate Fund underperformed its benchmark, the FTSE EPRA/NAREIT Developed Total Return Index, during the trailing twelve month period ended September 30, 2011. The Fund returned -7.47% (excluding the maximum sales charge) versus -6.88% for the benchmark.
Global equity markets experienced an emphatic reversal and moved downward starting in August, which resulted in a very difficult third quarter that erased gains achieved in the previous three quarters. Most major global equity indices ended in negative territory for the 12-month period. This reversal and downward move coincided with the debt ceiling overhang and credit downgrade in the U.S. and the continued problems with European sovereign debt. Moreover, as economic data grew progressively weaker throughout the quarter, investors began to consider greater odds of a recession in 2012 placing future earnings growth in question.
Despite the generally favorable real estate fundamentals throughout the world, global real estate securities were not immune to the selling pressure. Contagion fears of Europe's sovereign debt crisis into the banking sector reminded many investors of the global financial crisis in 2008, which resulted in an exit out of equities in general, and particularly the financial sector including real estate. As a result, global real estate securities underperformed other major global equity indices for the trailing 12-month period ended September 30, 2011.
Portfolio Review
Within the Index, North America was the strongest region supported by Canada, which was one of the top performing countries in the Index. The U.S. was one of the few other countries to post a positive return. Europe and Asia both underperformed the Index. Within Europe, Switzerland was by far the best performing country, followed by the United Kingdom. In Asia, Japan was the only country to record a positive return and was driven by currency appreciation. Hong Kong and Singapore both have had a difficult trailing year.
The sharp correction in global real estate securities valuations has resulted in the stocks looking more attractive relative to underlying fundamentals. Although we have modestly reduced our rent growth assumptions in most markets due to a weaker global economic outlook, fundamentals for commercial real estate remain relatively strong, with no new supply and modest demand growth, allowing most real estate companies to maintain and increase earnings and dividends over the next few years. In most markets, market rental levels and real estate values are at appropriate levels following downward adjustments over the past few years. Finally, unlike the global financial crisis of 2008, real estate companies globally have lower financial leverage and have fewer near term debt maturities. Accordingly, we believe the current environment represents an attractive entry point for investors with a longer-term view.
The Fund benefited from strong stock selection during the year particularly in the U.S., Hong Kong, and Singapore. The biggest contributors to performance in the U.S. were General Growth Properties, Inc., Simon Property Group, Inc., Camden Property Trust, and Post Properties, Inc. The Fund had held an effective
22
Management's Discussion of Fund Performance (Continued)
underweight position in General Growth Properties in the first half of 2011. The company's valuation did not adequately reflect the challenges facing an unproven CEO coming out of bankruptcy protection. We increased the Fund's position in the stock following a large implied cap rate spread relative to its peers. These timely position changes worked to our advantage throughout the year. Simon Property Group enjoys not only a high quality regional mall portfolio but it maintains a large outlet component that is currently the most preferred retail distribution channel. Additionally, Simon Property Group has a very strong balance sheet and a management team with a stellar reputation that has an uncanny ability to manage investors. As a result, we held a relatively large overweight position in Simon Property Group throughout 2011, which contributed positively to performance. As for Camden Property Trust and Post Properties, we believed that Apartment rents in the U.S. would experience rapid growth in late 2010 and throughout 2011 due to favorable demographics, a shift in consumer sentiment toward renting versus owning, a stabilizing employment market and no new supply coming on line until 2012 at the earliest. What's more, our research indicated that lower-barrier to entry Sunbelt markets would experience similar growth patterns to those expected in coastal markets. As such, we expected the valuation gap between Sunbelt Apartment REITs, Camden Property Trust and Post Properties, to close relative to their coastal peers as investors sought additional exposure to the favorable multifamily fundamentals. As this trend started to gain traction throughout the year the Apartment sector was able to outperform the broader Real Estate Investment Trust (REIT) universe by a wide margin led by the less expensive Sunbelt names we owned.
In Hong Kong, Hysan Development Co. Ltd. and Sino Land Co. Ltd. were the largest contributors to performance. Due to concerns about the residential market, we opted to hold an overweight position in commercially focused companies such as Hysan, while maintain an underweight position in some of the more volatile residential focused companies such as Sino Land. This strategy drove outperformance. Hysan is a Hong Kong office and retail landlord with a concentrated portfolio in Causeway Bay, one of Hong Kong's premier retail districts. Due to strong retail sales in Hong Kong driven by China tourism, Hysan's portfolio is doing well. The company is also in the process of revitalizing its portfolio with a new project completion expected next year. The stock performed very well over the last couple years and we have since sold the stock as its valuation became expensive relative to alternatives.
In Singapore, Allgreen Properties Ltd. and Fortune REIT were the notable contributors to performance. We held Allgreen, a smaller residential company, for quite some time due to its attractive valuations. Part of the reason for the valuation discount was due to management's slow speed in project launches. We expected the discount to narrow as the company began to execute. During the year, the major shareholder of the company recognized the imbedded value and made an offer to privatize the company with a bid at a 40% premium, which contributed positively to our performance. The Fund's overweight in Fortune REIT and its stable performance also contributed positively to the Fund's performance. Fortune is a Hong Kong retail focused and Hong Kong/Singapore dual-listed REIT. The good results in Hong Kong retail sales ensured solid performance from retail focused landlords.
Some of the detractors to performance during the year were portfolio positions in China, Japan, and the Netherlands. During the year, the Fund maintained a position in China favoring commercial real estate and firms which had strong central government support. Our investment in China was based on the fact that the Chinese economy has been strong and stocks' valuations are attractive. Moreover, the Chinese growth story is a multi-decade urbanization story which has long-term fundamental implications. However, despite the long-term trend, there are near-term cycles. Fast rising residential prices prompted government measures to cool down the market. These property market specific measures, coupled with banks' tightening of liquidity, weighed down market sentiment. We had expected our exposure to commercial real estate and national firms would outperform on a relative basis, it did not. This was reflected in both Hong Kong Land Holdings Ltd. and China Overseas Land & Investment Ltd., as the companies underperformed.
23
Management's Discussion of Fund Performance (Continued)
The Fund maintained an underweight position in Japan throughout the year, which detracted from performance. In particular, Japan had a sizable outperformance in the fourth quarter of 2010 as a result of aggressive monetary easing policy by the Bank of Japan, increased global funds flow into the country driven by a "catch up" theme, and a strengthening Japanese Yen. Also, in the third quarter of 2011, Japan proved to be defensive and outperformed the Index because the market never fully recovered from the significant declines following the Fukushima disaster in March and was perceived to be cheap. In addition to the allocation in Japan detracting from results, top ten holding Mitsubishi Estate Co. hindered performance over the trailing one year period.
In the Netherlands, while the portfolio profited from the selection of strong defensive names and a quality selection bias with companies like Eurocommericial, N.V., these factors and our retail preference in the country resulted in an overweight allocation. This contributed negatively to performance as a result of a weaker Euro and strong relative performance of the North America region against the Index.
Although Sun Hung Kai Properties Ltd. turned out to be a key contributor to outperformance during the third quarter, the stock's valuation reflected concerns regarding the firm's residential holdings and detracted from relative returns for the trailing twelve months.
In the U.S., management's decision to overweight Host Hotels and Resorts, Inc. contributed negatively to performance. Macroeconomic concerns surrounding the possibility of a global economic slowdown and the European sovereign debt crisis resulted in negative investor sentiment toward companies that are levered to economic activity and consumer discretionary spending.
Strategy and Outlook
The Fund's strategy is grounded in fundamental research with the ability to adapt to changing market conditions. Our philosophy and process are focused on understanding management's business and financial strategies; their ability to unlock value and growth from their properties and markets given where we are in the economic, property market, and capital market cycles. The process is managed using a proprietary multifactor ranking model that considers quantitative and qualitative rankings for top-down and bottom-up factors which drive potential returns. The model allows appropriate adaptation to dynamic market conditions.
24
Management's Discussion of Fund Performance (Continued)
Comparison of the Change in Value of a $10,000 Investment in the Touchstone Global
Real Estate Fund - Class A* and the FTSE EPRA/NAREIT Developed Index
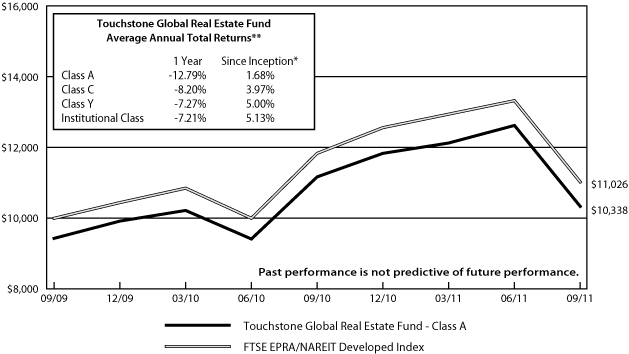
* The chart above represents performance for Class A shares only, which will vary from the performance of Class C shares, Class Y shares and Institutional Class shares based on the differences in loads and fees paid by shareholders in the different classes. The Fund commenced operations on September 30, 2009.
** The total returns shown above are adjusted for maximum applicable sales charges.
The performance of the above Fund does not reflect the deduction of taxes that a shareholder would pay on Fund distributions or the redemption of Fund shares.
25
Management's Discussion of Fund Performance (Continued)
Touchstone Intermediate Fixed Income Fund
Sub-Advised by JKMilne Asset Management
Investment Philosophy and Process
The Touchstone Intermediate Fixed Income Fund seeks to provide high current income with reasonable risk to capital. Fund management targets these goals by investing in U.S. Government obligations and other investment grade fixed income securities, including corporate debt obligations, mortgage-backed securities, commercial mortgage-backed securities and asset-backed securities. The Fund seeks fixed income securities of issuers that are believed to offer attractive income and/or capital appreciation potential with a reasonable level of risk. It invests in fixed income obligations of different issuers, maturities and structures depending on their assessment of the relative valuation of the securities' sector, as well as the security itself.
Fund Performance and Market Overview
The Touchstone Intermediate Fixed Income Fund underperformed its benchmark, the Barclays Capital Intermediate Government/Credit Bond Index, during the trailing twelve month period ended September 30, 2011. The Fund returned 2.59% versus 3.40% for the benchmark.
Global bond markets remained volatile for most of the trailing year. Although the fourth quarter of 2010 resulted in higher interest rates and improved credit fundamentals, early 2011 saw global financial turmoil. The rebel uprisings in the Middle East resulted in higher oil prices. The earthquake and tsunami in Japan resulted in a temporary disruption in the supply of goods. Then sovereign financial problems in Europe, particularly Greece, Italy and Spain, led to fears of a global recession. The U.S. economy suffered from slow growth, zero job growth, and low consumer confidence, all of which was compounded by higher gasoline prices and a sluggish housing market. Interest rates for U.S. Treasury securities fell across all maturities due to these events; however, corporations were under pressure as future profits remained in question due to the global economy.
Fixed income investors continue to seek yield as U.S. Treasury yields remain historically low. The overall duration of the Fund was longer than that of the underlying benchmark for the majority of the quarter in response to falling interest rates. The investment strategy is to own a broadly diversified basket of bonds that reflects the strategic goals of the Fund. Macroeconomic information such as monetary and fiscal policy and secular trends are reflected in asset allocations within the Fund.
Portfolio Review
The Fund is widely diversified in its holdings and credit exposure. The portfolio participated in U.S. Treasury notes and bonds, investment grade corporate bonds, Treasury Inflation Protected Securities (TIPS), and agency mortgage-backed securities. These and other sectors were rebalanced to capitalize on the most advantageous markets with positive outlooks in a volatile market and by a struggling economy.
With these macroeconomic events in mind, the Fund will maintain its current position of being long to even duration, versus the underlying benchmark, in anticipation of continued short-term low interest rates with the expectation of uncertain economic events that would increase volatility; while being overweight various spread sectors in an effort to enhance the Fund's yield. New corporate issuance was higher in the third quarter of 2011 versus a year earlier, which has improved liquidity in the sector, but new issuance has decreased from the previous quarter.
The Fund was structured at quarter end with 27.7 percent in U.S. Treasury notes and bonds, 5.4 percent in U.S. Government agency securities, 54.1 percent in investment grade corporate bonds, 11.0 percent in agency
26
Management's Discussion of Fund Performance (Continued)
mortgage-backed securities and approximately 1.8 percent in readily available invested cash. As a reference point, the Fund's benchmark is comprised of 65.2 percent in U.S. Government securities whereas the current Fund's portfolio is composed of a total U.S. Government allocation of 33.1 percent. The expectation is to continue to hold investment grade corporate bonds with strong balance sheets and global brand strength over the upcoming calendar quarter.
Strategy and Outlook
The outlook for the intermediate fixed income markets remains volatile as the world economies search for financial stability. The key data improvement for the global economies remains to what extent modest growth will create jobs. The current outlook for U.S. Gross Domestic Product (GDP) growth, a measure of economic strength, is to improve to an annualized rate year-over-year 2012 of 2.0 to 2.5 percent. The Fund's strategy is to continue to be conservative by investing in diverse bond issuers, industries, and sectors likely to do well under the forecast above. Interest rates are expected to remain at historic lows, particularly for short-term maturities, into 2013.
Comparison of the Change in Value of a $10,000 Investment in the Touchstone
Intermediate Fixed Income Fund - Institutional Class and the Barclays Capital
Intermediate U.S. Government/Credit Index
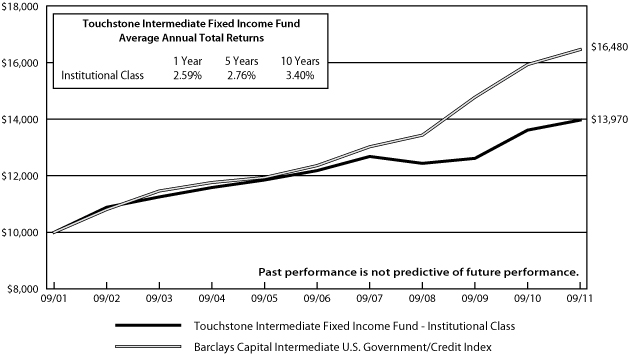
The initial public offering of the Institutional Class shares commenced on December 6, 1991.
The performance of the above Fund does not reflect the deduction of taxes that a shareholder would pay on Fund distributions or the redemption of Fund shares.
27
Management's Discussion of Fund Performance (Continued)
Touchstone International Fixed Income Fund
Sub-Advised by GAM International Management Ltd.
Investment Philosophy and Process
The Touchstone International Fixed Income Fund seeks total return by investing primarily in fixed income securities of issuers located outside the United States. Fund management selects foreign country and currency compositions based on an evaluation of various macroeconomic factors including relative interest rates, exchange rates, monetary and fiscal policies, economic growth, employment, trade and current account balances. Management invests core holdings in developed market government bonds and currencies with tactical allocations to alpha-generating sectors: investment grade corporate bonds, emerging market bonds, high yield bonds and convertible bonds. Currencies are actively managed in order to manage risk and enhance returns.
Fund Performance and Market Overview
The total return of the Touchstone International Fixed Income Fund was 1.67% for the year ended September 30, 2011, which was calculated excluding the maximum sales charge. The total return of the Citigroup World Government Bond Index ex U.S. was 4.14% for the same period.
Over the past twelve months the market entered a period of heightened volatility as a result of significant changes in economic sentiment. The fourth quarter of 2010 saw a sell-off in bond markets on the back of a surge in risk assets, with the S&P 500 Index up 10.8 percent, to a bond market rally from late second quarter and third quarter of 2011. Even within core Europe we saw spread volatility, with spreads on 10-year French Government Bonds versus German Bunds effectively double over the twelve month period.
Portfolio Review
The Fund had been positioned at the start of 2011 for a stronger growth environment to drive risk assets higher in the short term — as a result the Fund had less duration than the benchmark and held emerging market and convertible exposure accordingly. It was anticipated that the currency markets would provide opportunities during 2011 as extraordinary policy measures fade such as Quantitative Easing 2 (QE2) and fundamental drivers began to reassert themselves. Despite worries over fiscal deficits and improving economic data, government bonds delivered strong local currency returns across most of the major bond markets, with the exception of Japan, during the first quarter of 2011. Country selection was the key driver of returns in the first quarter, with a significant overweight to the eurozone and under-weight exposure in Japan contributing to performance as the eurozone returned almost twice the level of the overall benchmark. The Fund's eurozone allocation favored higher quality core countries and underweighted the periphery (e.g. Greece, Portugal, Spain).
Bond Markets in the second quarter saw reasonable returns for long-dated bonds, especially in the U.S., Canada, Switzerland, Sweden, New Zealand and Poland, despite the previous quarter being a relatively bearish period for bonds. Weakening of the dollar and general bond market performance contributed to Fund performance, as well as the Citigroup World Government Bond Index ex-U.S. Detractors to performance included the underweight to Australian and New Zealand currencies, lower duration, the slight overweight exposure to bonds domiciled in Ireland and convertible securities, generally (as stocks declined). Our macro-economic outlook for the third quarter was one of moderate, volatile growth but growth nevertheless. This was very much counter to the prevailing negativity generated by the lack of decisive political leadership in both the U.S. and the eurozone, which undermined business sentiment and combined with typical low summer trading volumes to create an environment dominated by fear and volatility.
28
Management's Discussion of Fund Performance (Continued)
The third quarter performance for the Fund was affected by the strategic allocation to emerging market currencies which declined even more than other risk assets. In addition, off-Index investments in convertible bonds contributed negatively as the equity malaise caused convertible bond price declines. Similarly, the high yield market was affected with greater net selling from the asset class than corporate dynamics seemed to justify.
Strategy and Outlook
The outlook for international bonds for the final quarter of 2011 and going forward into next year is extremely varied. There are challenges both in the developed as well as the emerging economies — where many have higher interest rates as the authorities there try to cope with rising inflation. This has lead to double headwinds for the developed world, creating a very difficult environment for the global economy going forward.
The situation in Greece continues to deteriorate; economic growth is almost entirely absent. Without economic growth there is no doubt that Greece will have to restructure in some shape or form and that will likely be the catalyst for further market volatility. We have been trying to position the Fund in a manner that the draw-downs from such an event will be limited and that any opportunities the market presents can be capitalized on.
Comparison of the Change in Value of a $10,000 Investment in the Touchstone
International Fixed Income Fund - Class A* and the Citigroup World Government Bond
Index ex-US

* The chart above represents performance for Class A shares only, which will vary from the performance of Class C shares, Class Y shares and Institutional Class shares based on the differences in loads and fees paid by shareholders in the different classes. The Fund commenced operations on September 30, 2009.
** The total returns shown above are adjusted for maximum applicable sales charges.
The performance of the above Fund does not reflect the deduction of taxes that a shareholder would pay on Fund distributions or the redemption of Fund shares.
29
Management's Discussion of Fund Performance (Continued)
Touchstone Large Cap Relative Value Fund
Sub-Advised by EARNEST Partners LLC
Investment Philosophy and Process
The Touchstone Large Cap Relative Value Fund seeks capital appreciation by investing in stocks of large capitalization companies. The Fund seeks to identify stocks based on their financial characteristics and current environment including valuation measures, market trends, operating trends, growth measures, and profitability measures.
Fund Performance and Market Overview
The total return of the Touchstone Large Cap Relative Value Fund was -5.11% for the year ended September 30, 2011, which was calculated excluding the maximum sales charge. The total return of the Russell 1000® Value Index was -1.89% for the same period.
U.S. equity markets declined slightly for the 12-month period ended September, ending the third quarter with five consecutive months in negative territory. International markets generally lagged the U.S. due to increased risk aversion among investors, including an exodus from emerging markets.
Europe continues to be a focal point for global markets. Greece remains at the forefront, as yields on the country's debt have soared as investors price in a high probability of default. Greece is being forced to implement even more severe austerity measures to bring the deficit down to targeted levels. Partly as a result, unemployment has surpassed 16 percent. The European Central Bank (ECB), along with the International Monetary Fund (IMF) and European Union officials, continue to pledge support, but member nations have not yet finalized an agreement on the parameters of additional support. The ECB remains sensitive to contagion in the region, and so it began purchasing Italian and Spanish sovereign debt in the open market to keep borrowing costs in check. Financial stocks languished during the period as investors grew increasingly concerned about possible exposures to both sovereign and corporate debt in southern Europe.
In the U.S., economic growth remains stagnant. U.S. Gross Domestic Product (GDP) grew at an annual rate of less than 1 percent in the first half of 2011. Unemployment remains above 9 percent, pressuring consumer confidence and spending. Adding pressure to the unemployment rate, both government and private employers continue to announce layoffs. Governmental institutions like the U.S. Postal Service, which is the third largest employer in the U.S., plans to reduce staff as a result of declining volumes and to increase efficiency. Many corporations have announced staff reductions to keep costs low in light of decelerating global growth. After much debate, the U.S. increased its debt ceiling during the quarter. Due to the intensity and length of the debate, Standard & Poor's (S&P) executed an unprecedented move of lowering the long-term sovereign credit rating on the U.S. from AAA to AA+. The other two primary rating agencies have kept the U.S. at the highest credit level. Despite the downgrade, demand for U.S. Treasuries has continued to increase, pushing yields lower. The yield on the 30-year Treasury bond fell to under 3 percent. The yield on the 10-year note fell below 2 percent for the first time in over 50 years. The decrease in yields across the curve is a further indication that many investors are shedding risk and moving into less volatile assets, and despite the recent downgrade, U.S. government debt is still regarded as one of the safest investments in the world.
During the third quarter of 2011, the Federal Reserve (the Fed) took additional steps to stimulate the economy. In August, it announced that it would keep short-term interest rates "exceptionally low" until at least 2013. Then, in September, it announced plans to purchase $400 billion of U.S. Treasury securities on the longer end of the yield curve (6- to 30-years) and sell an equivalent amount of securities with maturities of 3 years or less. Although the proposed action is not anticipated to expand the Fed's balance sheet, the expectation is that
30
Management's Discussion of Fund Performance (Continued)
these actions will provide further stimulus to the economy by keeping long-term yields low, encouraging borrowing, and forcing investors to seek out higher yielding investments.
Portfolio Review
The Touchstone Large Cap Value Fund declined in the period as macro concerns continued to weigh on the equity markets. Investors rotated into companies believed to be defensive, such as those in the Utilities and Consumer Staples sectors, and away from companies that have greater long-term profit potential but are more sensitive to short-term economic perceptions. The Fund's relative underweight to defensive stocks, and relative overweight to companies operating in areas such as energy exploration/production and investment banking, detracted from relative performance. Still, stock selection was strong in a number of sectors. Kimberly-Clark Corp. (Consumer Staples) is the largest global provider of consumer paper products with brands including Huggies, Pull-Ups, Kleenex, Scott and Cottenelle. International growth in consumption (expanding emerging-market middle class and evolving behavioral patterns) provides a runway for growth. Further, continued penetration of the higher margin personal care products into the emerging markets is boosting profitability. The company has so far been able to manage the impact of input price inflation by reducing selling, general and administration expenses (SG&A) and selectively raising prices.
Shares of Intel Corp. (Information Technology) also performed well for the year, rising 15 percent. Intel is the global leader in microprocessors and integrated circuits used in computers, servers and communication applications. Strength in its Data Center and Enterprise Server businesses, as well as in the emerging markets, is offsetting softness in the developed market and consumer segments. Further, continued enhancements in manufacturing capabilities are reducing costs, thus improving margins. Intel is well positioned to benefit from continued server adoption by companies growing their "cloud" presence — and is strengthening its position in the mobile device segment with a Google partnership aimed at optimizing performance of the Android operating system on Intel-based devices.
The Financials and Energy sectors were two of the worst performing sectors for the period and detracted from Fund performance. Northern Trust Corp. (Financials) provides investment management, banking, fund administration and fiduciary services to both institutions and high net worth individuals world-wide. Northern is sensitive to interest rates, as much of its revenues are earned on the spread between deposits and loans. Additionally, the firm has invested resources during the downturn in order to grow its international custody business, impacting profits in the near-term. Those short-term headwinds have pressured the stock. Longer term, the company remains well positioned to grow given its strong, trusted brand and high barriers to entry in its markets. Investor attention on the financial crises in Europe has created volatility in the overall sector although Northern Trust operates a steady, underlying business and maintains a strong balance sheet.
Transocean Ltd. (Energy), the world's largest deepwater drilling contractor, fell 24 percent for the period. The company should continue to benefit as increasingly scarce energy resources dictate more remote/deep water drilling and rising demand for expert drillers. Shares have traded down due to the decline in oil prices and higher-than-expected rig expenses and downtimes related to refits and upgrades. However, exploration and production (E&P) companies' budget activity, based on long-term price forecasts, have not changed significantly. Day rates are improving (from $400k-$450k/day in 2010 to $500k-$520k currently) as global offshore activity in Brazil, West Africa, the North Sea and Australia are all healthy. Shares are trading at a discount to their historical average while generating $1.5 billion in cash annually.
Strategy and Outlook
In spite of recent market declines, corporate profits remain a bright spot. Corporate profits rose an annualized 4 percent from the first quarter of 2011 to the second quarter of 2011, maintaining positive year-over-year growth. Corporations have generated earnings growth through cost reductions and improved productivity, as
31
Management's Discussion of Fund Performance (Continued)
well as through increased international sales, particularly to emerging markets. As a result, investors are particularly concerned about signs that emerging market economies are beginning to slow. For example, the manufacturing sector in China declined for the third consecutive month in September. As a result, many companies have now turned to acquisitions to generate further growth. Because corporate balance sheets are strong, interest rates are low, and market valuations have declined, merger and acquisition activity is likely to pick up further over the balance of the year.
Comparison of the Change in Value of a $10,000 Investment in the Touchstone Large
Cap Relative Value Fund - Class A* and the Russell 1000® Value Index
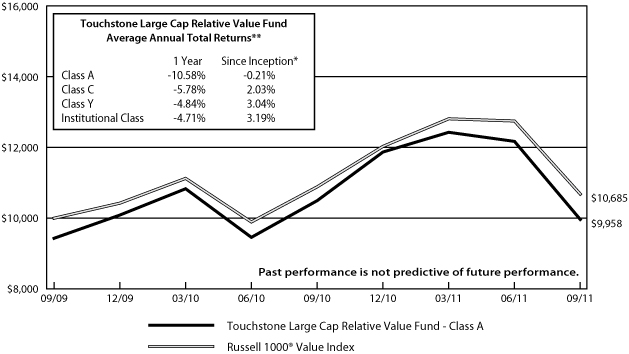
* The chart above represents performance for Class A shares only, which will vary from the performance of Class C shares, Class Y shares and Institutional Class shares based on the differences in loads and fees paid by shareholders in the different classes. The Fund commenced operations on September 30, 2009.
** The total returns shown above are adjusted for maximum applicable sales charges.
The performance of the above Fund does not reflect the deduction of taxes that a shareholder would pay on Fund distributions or the redemption of Fund shares.
32
Management's Discussion of Fund Performance (Continued)
Touchstone Market Neutral Equity Fund
Sub-Advised by Aronson Johnson Ortiz
Investment Philosophy and Process
The Touchstone Market Neutral Equity Fund seeks to achieve long-term capital appreciation and to provide positive returns regardless of the direction of the stock markets. It invests long in equity securities believed to be undervalued, and takes short positions in securities believed to be overvalued.
Fund Performance and Market Overview
The Touchstone Market Neutral Equity Fund significantly outperformed its benchmark, the Citigroup 3-Month Treasury Bill Index, during the trailing twelve month period ended September 30, 2011. While the total return (excluding the maximum sales charge) for the Fund was 1.75%, the benchmark returned 0.11%.
The Touchstone Market Neutral Equity Fund is always sector-neutral long versus short, with only limited industry bets, driven solely by our bottom-up stock selection. Since our stock-picking is, in turn, guided by our multi-factor valuation model, we look to the measures underlying our model to explain what worked during the period.
Portfolio Review
Our stock selection was effective on both the long and short sides of the Fund, with all three pillars of attractiveness — value, management, and momentum — contributing positively to the bottom line. Within the management category, contribution came from our focus on strong corporate performance (as measured by return on assets and long-term growth) and our assessment of management's outlook (as quantified by share repurchase). Momentum helped in the form of price momentum and stability. And despite the current anti-value market, we were able to eke out a bit of added value from our price/sales measure. Reviewing the Fund's portfolio from a different angle shows stock selection was particularly successful in the Consumer Discretionary, Energy, and Financials sectors.
On a more granular level, our most rewarding position was a bet against Computer Sciences Corp., which we initially sold short in February (and more than doubled that short position in May) due to its weakening earnings momentum. Our bet against Pharmasset, Inc. was our least successful position. Pharmasset ranked poorly across our value and management measures, but the stock shot up in price when the results of its successful clinical drug trials were made public. That said, diversifying the Funds' holdings by limiting position sizes lessens the relative impact of any one name on the overall Fund performance.
Strategy and Outlook
We remain firm in our conviction that superior results can be achieved through a consistent, systematic approach that focuses on low-priced companies with strong management and earnings power.
33
Management's Discussion of Fund Performance (Continued)
Comparison of the Change in Value of a $10,000 Investment in the Touchstone Market
Neutral Equity Fund - Class A* and the Citigroup 3-Month Treasury Bill Index
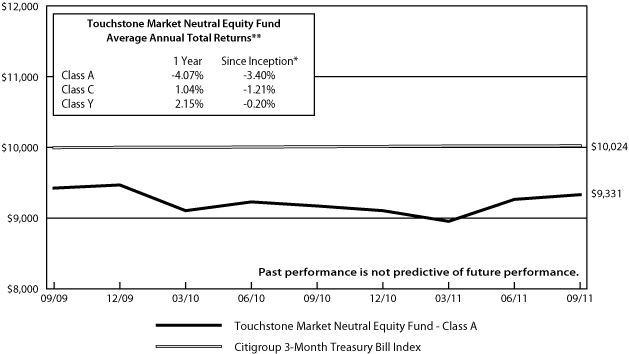
* The chart above represents performance for Class A shares only, which will vary from the performance of Class C shares, Class Y shares and Institutional Class shares based on the differences in loads and fees paid by shareholders in the different classes. The Fund commenced operations on September 30, 2009.
** The total returns shown above are adjusted for maximum applicable sales charges.
The performance of the above Fund does not reflect the deduction of taxes that a shareholder would pay on Fund distributions or the redemption of Fund shares.
34
Management's Discussion of Fund Performance (Continued)
Touchstone Merger Arbitrage Fund
Sub-Advised by Longfellow Investment Management Company
Investment Philosophy and Process
The Touchstone Merger Arbitrage Fund primarily invests in securities of companies that are involved in publicly announced mergers and other corporate reorganizations. Merger arbitrage is an investment strategy that seeks to capture the "arbitrage spread" represented by the difference between the market price of the securities of the company that is being purchased and the value that is offered for these securities by the acquiring company. The Fund emphasizes risk management via a thorough understanding of proposed financing terms, the size of the transaction, anti-trust concerns, regulatory approvals, and shareholder voting requirements. The Fund also limits assets under management in an effort to meaningfully invest in the entire market-capitalization spectrum, with an emphasis on small- and mid-sized deals.
Fund Performance and Market Overview
Launched on August 9, 2011, the Touchstone Merger Arbitrage Fund outperformed its benchmark, the BofA Merrill Lynch 3-Month U.S. Treasury Bill Index, during the remainder of the third quarter. From inception through September 30, 2011, the Fund returned 0.30% (excluding the maximum sales charge) while the benchmark was flat.
Catalysts for market volatility during the period included a downgrade of the U.S. Government by Standard & Poor's, continued domestic economic weakness and outlook, and concerns with the European debt situation. In addition to the poor economic data, the Federal Reserve (the Fed) announced that while they would not extend the Quantitative Easing 2 (QE2) program of buying more Treasuries, further rate increases would be on hold until at least mid-2013. Late in the quarter, the Fed announced a program to sell their shorter Treasury holdings and purchase longer Treasuries. These developments encouraged investors to reduce risk and equities recorded one of the worst performances ever in 3Q11, with the S&P 500 Index falling 13.87 percent. This fragile environment impacted the Fund as the spreads on existing positions widened because of the increased uncertainty.
Portfolio Review
The Fund will invest in many transactions each quarter, typically 40-50 deals. Each investment generally contributes a small amount to the overall return of the Fund, with some transactions having a larger effect. Since inception, the Fund participated in five transactions which drove relative outperformance.
Afexa Life Sciences, Inc. contributed to performance as the company received a competing offer which drove the stock higher. In addition, the Fund's positions in Nalco Holding Co. and Paetec Holding Corp. also added to positive returns because they were purchased at favorable spreads during the market volatility.
Two other positions added to positive relative returns as they neared completion. The Continucare Corporation/Metropolitan Health Networks, Inc. merger cleared all regulatory hurdles and closed at the end of the quarter. In addition, Varian Semiconductor Equipment's cash merger with Applied Materials, Inc. gained momentum as Varian Semiconductors' shareholders voted to approve the merger at a special stockholders meeting.
Offsetting these positives were positions in Dollar Thrifty Automotive Group and Advanced Analogic Technologies. Dollar Thrifty Automotive was initially being pursued by two parties; Hertz Global Holdings, Inc. and Avis Budget Group, Inc. Avis's withdrawal from the bidding process and the heightened economic growth concerns weighed on the cyclical stock price. No definitive merger agreement has been signed because they are trying to resolve any antitrust concerns. Although Dollar Thrifty Automotive was a laggard during the period, Longfellow expects the parties to come to an agreement at a price higher than the current market once the antitrust issues are resolved.
35
Management's Discussion of Fund Performance (Continued)
Skyworks Solutions, Inc. signed a definitive merger agreement to acquire Advanced Analogic Technologies in a cash and stock transaction in May. In September, after Advanced Analogic Technologies quarterly earnings release, Skyworks Solutions claimed they had breached the contract and filed an arbitration petition against the company to terminate the merger. Advanced Analogic Technologies is actively fighting these allegations and Longfellow does not expect Skyworks Solutions will be able to completely walk away from the transaction, but there is potential for a merger price revision.
Strategy and Outlook
Longfellow Investment Management Co.'s economic outlook calls for slow growth with interest rates remaining low until 2013. Merger activity slowed in August because of the headline risk and market volatility. As markets calmed later in the third quarter and early in the fourth quarter of 2011, activity resumed at a meaningful pace. Strategic deal activity should remain healthy given the abundance of cash on potential acquirer's balance sheets and their need to grow revenues. Private Equity/Leveraged Buyout (LBO) activity will continue because, despite the difficulties in the leveraged loan and high yield markets, LBO investors have significant amounts to deploy. Deal spreads widened in the third quarter and are well above their recent levels. The investment team expects this to help contribute to future returns.
Comparison of the Change in Value of a $10,000 Investment in the Touchstone Merger
Arbitrage Fund - Class A* and the BofA Merrill Lynch 3-Month U.S. Treasury Bill Index
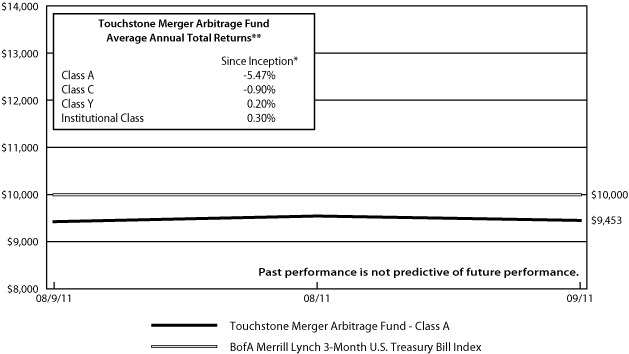
* The chart above represents performance for Class A shares only, which will vary from the performance of Class C shares, Class Y shares and Institutional Class shares based on the differences in loads and fees paid by shareholders in the different classes. The Fund commenced operations on August 9, 2011.
** The total returns shown above are adjusted for maximum applicable sales charges.
The performance of the above Fund does not reflect the deduction of taxes that a shareholder would pay on Fund distributions or the redemption of Fund shares.
36
Management's Discussion of Fund Performance (Continued)
Touchstone Mid Cap Fund
Sub-Advised by Turner Investment Partners Inc.
Investment Philosophy and Process
The Touchstone Mid Cap Fund seeks long-term capital appreciation by primarily investing in stocks of medium capitalization companies that are believed to have the potential for long-term growth and that appear to be attractively priced. It emphasizes companies operating in a broad range of industries based on a fundamental analysis of each company with consideration to such characteristics as price-to-cash flow, price-to-earnings, and price-to-book value ratios. The Fund looks for companies with quality management teams that can take advantage of unique product opportunities, with an emphasis on companies that may be positioned to generate and sustain long-term growth.
Fund Performance and Market Review
With equity markets under pressure due to macroeconomic fears, the Touchstone Mid Cap Fund still managed to outperform its benchmark, the Russell Midcap® Index, during the trailing twelve month period ended September 30, 2011. The Fund returned 3.87% (excluding the maximum sales charge) versus -0.88% for the benchmark.
Several issues contributed to market volatility. Domestically these included the political debate over the U.S. national debt ceiling at a time when Standard and Poor's downgraded the United States, as well as high unemployment and weak economic outlook. In addition, global fears of a European sovereign debt crisis, slowing growth, and turmoil in the Middle East also contributed to investor fears.
Portfolio Review
The Fund's relative performance was aided by holdings in the Consumer Staples and Information Technology sectors. The Consumer Staples sector was the best performing sector in the Russell Midcap® Index for the one year period and strong stock selection was the main reason for the Fund's relative outperformance. Conversely, the Materials and Consumer Discretionary sectors detracted from relative results. The Materials sector was impacted by declining commodity prices while the Fund's Consumer Discretionary holdings were hurt by concerns of a global economic slowdown.
The Consumer Staples sector was lifted higher largely due to holdings Green Mountain Coffee Roasters Inc., Herbalife Ltd., and Whole Foods Market, Inc. In our view, the market is paying up for strong earnings growth exemplified by these stocks. Shares of Green Mountain traded 197% higher as the company is benefiting from partnerships with Dunkin Brands Group, Inc. and Starbucks Corp. to sell their k-cups to a broader audience. These distribution deals further solidify Green Mountain's leadership position in the single-serve coffee market, estimated to be 80% of U.S. sales and climbing. The company should continue to experience strong growth as it is estimated that the single-serve coffee industry will likely reach $4 billion in total sales in 2011. Herbalife, the dietary supplement distributor, also advanced as the company is benefiting from global obesity fears. The maker of energy drinks and nutritional supplements posted strong earnings and raised their forecast to reflect a recovery in the weight loss industry. While the company should see continued growth in the U.S., we are excited about their global expansion into emerging markets. Upscale food retailer Whole Foods Market also posted strong results. The company continues to experience strong demand for their organic foods aided by an improving economy. Whole Foods recently reported a strong pick-up in the number of customer visits, first-time customers, and spending per visit, all key measures of growth for the company.
The Information Technology sector was an area of strength for the Fund from a relative performance perspective. Two holdings to note that posted strong double digit returns were IAC/InteractiveCorp. and Avago Technologies Limited. Shares for IAC/Interactive traded higher as the parent company of sites such as
37
Management's Discussion of Fund Performance (Continued)
Match.com and Evite.com posted strong results aided by the growing popularity for online dating. The company continues to build-out its arsenal of internet-related businesses, which we feel should see nice growth moving ahead. Avago, which provides optical semiconductor components primarily to the communications and industrial end markets, reported strong earnings and raised its earnings outlook. The Singapore-based company is executing well in all aspects of its businesses with particular strength recently in the wireless-end market. It appears that the company has been selected to provide power amplifiers for the newly designed Apple iPhone. This would be a tremendous opportunity for the Avago as demand for smartphones soars.
The Materials sector was an area of weakness for the Fund due to declining commodity prices. Shares of Cytec Industries, Inc. the manufacturer and seller of chemicals and materials to the aerospace, adhesives, mining, automotive and construction industries, were down as the company expected to see weaker demand for its largest business. The company's engineered materials business was expected to slow in the back half of 2011 due to typical seasonality slowing and also due to the slowing growth for the global economy. We elected to sell the stock from the portfolio. Shares of Molycorp, Inc., the producer of rare earth products, including oxides, metals, alloys and magnets, traded lower for the period. Its rare earths inputs are used in a range of applications, including clean energy technologies, such as hybrid and electric vehicles and wind power turbines; multiple high-tech uses, numerous defense applications and advanced water treatment technology. The company came under pressure as demand estimates decreased for rare earth elements and reports surfaced that the Chinese may be speculating on rare earth metals. We continue to own Molycorp.
While the Consumer Discretionary sector was one of few sectors in the Russell Midcap® Index to post absolute gains for the one year period, the portfolio's holdings could not keep pace. Two holdings to note that detracted from results were Scripps Networks Interactive, Inc. and Starwood Hotels & Resorts Worldwide, Inc. The U.S. television company that runs the Food Network, Scripps, was down for the period due to the overall concerns with the slowing economy. We continue to own the stock in the Fund as the company recently completed a deal with Britain's cable TV company UKTV, which should provide the company with good growth opportunities outside the U.S. Starwood Hotels was down as investors feared that slower economic growth will limit demand for travel. We are taking a longer-term view with Starwood as we believe is well positioned in the faster growing emerging markets regions, which are holding up relatively well when compared to the developed market economies. Additionally, the Fund's underweight position to specialty retail stocks impaired relative results as these stocks were up approximately 18% in the Index for the one year period.
Strategy and Outlook
We believe our two-pronged investment approach emphasizing companies with business momentum and/or undervalued assets is well-suited for a time when earnings visibility is poor. In managing the Fund's portfolio, our focus, as always, remains on owning stocks that we think have either undervalued assets or strong prospective earnings power. We favor stocks that focus on controlling their debt levels that are also supported by above-average levels of cash on their balance sheets. From a sector view, the Fund is currently overweight the Consumer Staples and Information Technology sectors. Within the Consumer Staples sector, we favor specialty food/candy companies and food distributors. In the Information Technology sector, we continue to favor electronic production equipment and internet/software service companies. The Fund is currently underweight the Consumer Discretionary and Financials sectors. Within Consumer Discretionary, the Fund is underweight apparel/footwear retail companies and lacks exposure to specialty stores. Within the Financials sector, the Fund is underweight regional banks and lacks exposure to investment managers.
We believe that markets have overreacted and a global recession will likely not materialize for a few key reasons. First, the Treasury yield curve, which has historically been one of the most reliable economic indicators, is flashing no signs of a pending recession. The yield curve remains positively sloped, with 10-year yields more than 1.67 percentage points higher than two-year yields. Second, we believe that lower commodity prices will
38
Management's Discussion of Fund Performance (Continued)
spur growth in emerging markets. Thirdly, we expect the U.S. to avoid a recession and maintain slow but positive GDP growth in the near term and much better growth in the intermediate to long term. Finally, corporate earnings continue to be solid, corporate balance sheets are in a position of strength, and the global economy continues to operate below capacity. If earnings growth continues, we think the market can shake loose its current burdens and end the year on a positive note, positioned for a strong 2012.
Comparison of the Change in Value of a $10,000 Investment in the Touchstone
Mid Cap Fund - Class Y* and the Russell Midcap® Index
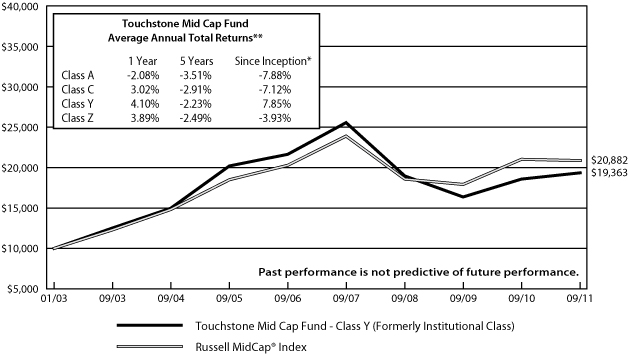
* The chart above represents performance for the Class Y shares only, which will vary from the performance of Class A shares, Class C shares and Class Z shares based on the differences in loads and fees paid by shareholders in the different classes. The initial public offering of the Class Y shares commenced on January 2, 2003. The initial public offering of Class A shares and Class C commenced on May 14, 2007 and the initial public offering of Class Z shares commenced on April 24, 2006. The Class A, Class C and Class Z performance information is calculated using the historical performance of Class Y.
** The average annual total returns shown above are adjusted for maximum applicable sales charges.
The performance of the above Fund does not reflect the deduction of taxes that a shareholder would pay on Fund distributions or the redemption of Fund shares.
39
Management's Discussion of Fund Performance (Continued)
Touchstone Mid Cap Value Fund
Sub-Advised by Lee Munder Capital Group LLC
Investment Philosophy and Process
The Touchstone Mid Cap Value Fund seeks capital appreciation by primarily investing in common stocks of medium capitalization companies. The Fund seeks to identify companies believed to be selling at a discount to their inherent value utilizing a classic value approach.
Fund Performance and Market Overview
The total return of the Touchstone Mid Cap Value Fund was -5.72% for the twelve month period ended September 30, 2011, which was calculated excluding the maximum sales charge. The total return of the Russell Midcap® Value Index was -2.36% for the same period. The Touchstone Mid Cap Value Fund underperformed the benchmark.
Portfolio Review
While performance was strong in both absolute and relative terms through the first six months of the period, as the economic backdrop worsened and markets weakened over more recent months, the Fund's performance suffered as well, particularly through the sell-off and extreme volatility in the June to August period. The market has been rewarding companies with near-term visibility, and since our approach centers on taking advantage of companies that are inexpensive for transitory reasons — and therefore often lack that near-term visibility — the recent environment has been a headwind for the strategy.
A combination of macro factors and company-specific performance has driven the Fund's return comparisons over the past year. The rally over last winter and the market's preference for earnings visibility through the recent turmoil have clearly been key top down influences on the Fund's results over the full year.
Among industry sectors, stock selection was strongest in the last 12 months in the Information Technology and Utilities sectors and weakest in the Financials and Consumer Discretionary sectors. In terms of overall positioning, the Fund's underweight to the Financials sector and overweight to the Health Care sector benefited performance. However, the Fund's overweight to the Materials sector and underweight to the Utilities sector detracted from results.
The Fund's holdings in the software and semiconductor groups, specifically Symantec Corp., Synopsys Inc., and Analog Devices Inc., contributed meaningfully to performance in the Information Technology sector. In the Utilities sector, AGL Resources Inc., SCANA Corp., and Xcel Energy Inc. were among the Fund's top performers for the one-year period. Other notable outperformers were natural gas producers Range Resources Corp. and EQT Corp.
On the negative side, bank stocks, including Comerica Inc., Zions Bancorporation, and TCF Financial Corp., were sources of absolute and relative weakness over the last 12 months. Also, with REITs (Real Estate Investment Trusts) holding up relatively well, especially in recent months, the Fund's notable underweight to REITs was a drag on performance in the Financials sector. As an offset, Financials sector performance was bolstered over the last year by strong stock selection in insurance names, most notably from ProAssurance Corp. and Willis Group Holdings PLC. Within the Consumer Discretionary sector, underperformance was driven by leisure-related holdings Royal Caribbean Cruises Ltd. and WMS Industries Inc., media/advertising name Interpublic Group of Cos., and from pockets of weakness in retail, including Gap Inc. and Urban Outfitters Inc.
40
Management's Discussion of Fund Performance (Continued)
Strategy and Outlook
The Touchstone Mid Cap Value strategy is a classic value-driven philosophy based on the belief that leading businesses selling at a discount to fair value have the potential to generate excess returns. The strategy focuses on stocks that are temporarily out of favor in the market; specifically, companies with higher returns on capital, free cash flow and strong balance sheets. Emphasis is placed on those companies having the cash flow characteristics as well as the balance sheet strength necessary to buffer the company from any prolonged weakness. Our companies often dominate a particular industry niche and generally have significant barriers to entry. As a result, we believe they are able to perpetuate a higher return on capital over time. The entire process utilizes fundamental bottom-up security selection, while risk control measures help to ensure security and sector diversification.
Comparison of the Change in Value of a $10,000 Investment in the Touchstone
Mid Cap Value Fund - Class A* and the Russell Midcap® Value Index
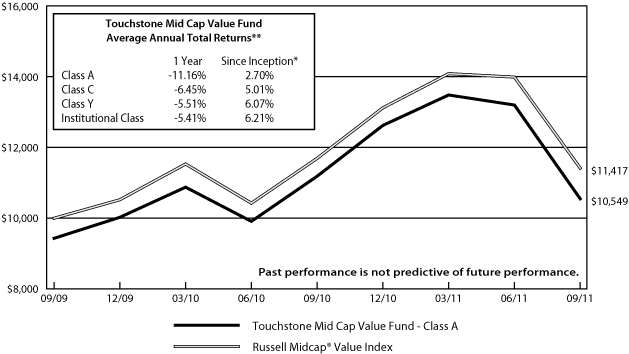
* The chart above represents performance for Class A shares only, which will vary from the performance of Class C shares, Class Y shares and Institutional Class shares based on the differences in loads and fees paid by shareholders in the different classes. The Fund commenced operations on September 30, 2009.
** The total returns shown above are adjusted for maximum applicable sales charges.
The performance of the above Fund does not reflect the deduction of taxes that a shareholder would pay on Fund distributions or the redemption of Fund shares.
41
Management's Discussion of Fund Performance (Continued)
Touchstone Premium Yield Equity Fund
Sub-Advised by Miller/Howard Investments Inc.
Investment Philosophy and Process
The Touchstone Premium Yield Equity Fund seeks long-term growth of capital and high current income by focusing on dividend-paying equity securities of U.S. companies believed to possess attractive long-term return potential primarily due to lower than average valuations and improving business outlooks.
Fund Performance and Market Overview
The total return of the Touchstone Premium Yield Equity Fund was 7.43% for the twelve month period ended September 30, 2011 which was calculated excluding the maximum sales charge. The total return of the Russell 3000® Value Index was -2.22% for the same period. The total return of the Dow Jones U.S. Select Dividend Index was 7.22% for the same period. The Touchstone Premium Yield Equity Fund outperformed both of its benchmarks. With tremors in the financial markets and earthquakes around the world, we continued to seek to invest in solid durable companies with dividend policies that recognize shareholders, the true owners of the enterprise.
The tragedy in Japan highlighted our main interest in core eternal verities that are central to organized social life and economies. We try to keep our focus on the basic needs of human beings and the infrastructure required to deliver the goods and services these basic needs demand.
In sideways markets, income-focused portfolios can help to dampen volatility. Recently, pressures on corporations to return some of their growing mountains of cash to investors are increasing. Every new Federal Reserve (Fed) action or statement just reinforces the tensions in this income-scarce environment.
Portfolio Review
The Fund was overweight in the Utilities sector as compared to the Russell 3000® Value Index and, although the sector was positive for the past 12 months, strong stock selection made this a top contributor to the Fund. The Fund continues to be underweight to the Index in the Financials sector which contributed positively to performance along with good stock selection.
Oneok Inc. (Utilities sector) was a top contributor over the past 12 months. NiSource Inc. (Utilities sector) was also a top contributor and we think the stock is a strong candidate for Mergers & Acquisitions (M&A), but even without an event the company is stronger than it has been in years, with regulatory cases behind it, a good dividend that may finally begin to rise, and a valuation slightly above book value. This is a classic case of the "get paid to wait" variety. American Water Works Co. (Utilities sector) again showed up near the top of the Fund's performance, as the company raised guidance and we believe all arrows are pointing the right way for rate increases. Intel Corp. (Information Technology sector) also helped the Fund. The company's operations are doing well despite a softer market in personal computers.
For the previous 12 months, we were overweight in the Health Care sector as compared to the Russell 3000® Value Index and, while the sector was slightly positive, weaker stock selection didn't provide much of a boost to the Fund. The Fund was overweight in the Telecommunication Services sector and despite moderately positive sector performance, stock selection proved slightly weak. Overall, both areas, because of our weightings, still had a net positive impact on the Fund.
The detractors seemed to be mainly those most affected by macro factors. Telefónica S.A. (Telecommunication Services sector) was knocked down as a "Euro" stock and a Spanish stock, but Telefonica S.A. is also one-half an emerging market stock (Brazil, mainly); while that is helpful to its business growth profile, it did not help the stock at all. Since we think financial conditions of the Spanish government or short-term slowdowns in Latin America are not especially relevant to the long-term intrinsic value of the company, we added to our position in the third quarter of 2011 at prices that we believe reflect the lowest valuation and highest dividend yield ever for this company. Revenues were up 24% at the end of the second quarter of 2011.
42
Management's Discussion of Fund Performance (Continued)
Some of the Fund's notable holdings in the past 12 months included International Paper Co. (Materials sector), Hospitality Properties Trust (Financials sector), Pepco Holdings Inc. (Utilities sector), and Valley National Bancorp (Financials sector). Sells of note included Southern Union Co. (after a very favorable takeover offer) (Energy sector), Procter & Gamble Co., (Consumer Staples sector), Taiwan Semiconductor Manufacturing Co. Ltd. (Information Technology sector), and McDonald's Corp. (Consumer Discretionary sector).
Strategy and Outlook
We think the economic and corporate worlds have hit a kind of stasis point, where there won't be much aggregate growth or change in the complexion of consumer or business activity. There is much work to do to recover an organically healthy and sustainable economy, and we're not convinced of the political will to get there. In the meantime, the focus remains on companies with recurring revenues that can grow, selected companies with good yields that are natural resource (or essential service) related, companies that can benefit from global demographic changes, and companies that may be the object of M&A activity.
Comparison of the Change in Value of a $10,000 Investment in the
Touchstone Premium Yield Equity Fund - Class A* , the Russell 3000® Value Index
and the Dow Jones U.S. Select Dividend Index
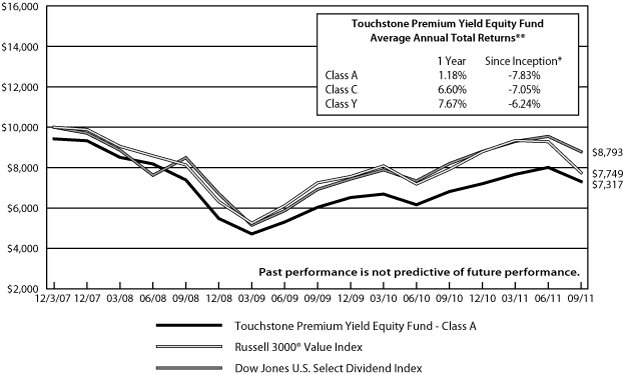
* The chart above represents performance for Class A shares only, which will vary from the performance of Class C shares and Class Y shares based on the differences in loads and fees paid by shareholders in the different classes. The initial public offering of Class A shares and Class C shares commenced on December 3, 2007. The initial public offering of Class Y shares commenced on August 12, 2008. The Class Y performance information is calculated using the historical performance of Class A.
** The total returns shown above are adjusted for maximum applicable sales charges.
The performance of the above Fund does not reflect the deduction of taxes that a shareholder would pay on Fund distributions or the redemption of Fund shares.
43
Management's Discussion of Fund Performance (Continued)
Touchstone Sands Capital Select Growth Fund
Sub-Advised by Sands Capital Management LLC
Investment Philosophy and Process
The Touchstone Sands Capital Select Growth Fund primarily invests in common stocks of large capitalization U.S. companies that are believed to have above-average potential for revenue or earnings growth. The Fund invests in 25 to 30 companies that are generally high-quality seasoned and growing businesses, spread across an array of attractive and growing industries. Sands Capital generally seeks stocks with sustainable above average earnings growth and capital appreciation potential. In addition, Sands Capital looks for companies that have a significant competitive advantage, a leadership position or proprietary niche, a clear mission in an understandable business, financial strength, and are valued rationally in relation to comparable companies, the market, and the business prospects for that particular company.
Fund Performance and Market Overview
The Touchstone Sands Capital Select Growth Fund significantly outperformed its benchmark, the Russell 1000® Growth Index, during the trailing twelve month period ended September 30, 2011. The Fund returned 7.93% (excluding the maximum sales charge) versus 3.78% for the benchmark.
For nearly 20 years, we have constructed our portfolios based on our six key investment criteria: sustainable above-average earnings growth, leadership position, significant competitive advantages, clear mission and value-added focus, financial strength, and rational valuation relative to the market and business prospects. Our investment views are driven primarily by the bottom-up, fundamental analysis we do to identify leading growth businesses for our clients. While we remain keenly aware of the potential impact of macroeconomic events, we do not attempt to back into investment ideas based on macro views of the global economy.
We believe the Fund is favorably positioned in the current environment. Relative to historical averages, large-cap and in particular large growth-oriented businesses are attractively valued. The businesses we own continue to reinvest and take share from weaker competitors. We see this happening across the Fund's portfolio, as competitors are not able to match the level of Research & Development (R&D), marketing, and Capital Expenditure (CAPEX) spending of these leading businesses. Through the third quarter of 2011, the Fund's portfolio companies managed to grow revenues and earnings 30% and 31%, respectively, on a weighted average basis over the trailing twelve months.
Portfolio Review
Outperformance for the trailing twelve month period can primarily be attributed to security selection. The Fund's Consumer Discretionary and Health Care sector holdings have led the way from both a selection and allocation perspective. Not owning any Consumer Staples sector stocks hindered returns. Sector allocation, however, is a residual decision in Sands' process as they primarily focus on owning high quality growth businesses.
From a selection standpoint, the largest individual contributors to the Fund's return relative to the benchmark for the period (in descending order) were Amazon.com, Inc., Apple, Inc., Alexion Pharmaceuticals, Inc., National Oilwell Varco, Inc., and Starbucks Corp. The largest detractors from relative performance were Netflix, Inc., F5 Networks, Inc., OpenTable, Inc., Cree, Inc., and Illumina, Inc. Both Amazon and Apple were among the Fund's top holdings during the period.
Strategy and Outlook
While the global economy is clearly slowing in the short term, we see a number of attractive pockets of long-term growth and innovation. Specifically, there are growth opportunities in segments that benefit from the rise of the emerging market middle-class, the secular trend toward e-commerce, the proliferation of smartphones and other
44
Management's Discussion of Fund Performance (Continued)
connected mobile devices, the growing demand for minimally invasive surgery, and the advancement of offshore rig technology to meet global demand for energy, among others.
We remain "macro aware" and carefully consider the risks of a "double-dip" recession in the U.S., slowing growth in emerging markets, as well as the sovereign debt issues in Europe. However, our focus is on our long-term investment strategy built around finding and owning sustainable growth businesses over a long-term time horizon. We continue to stay disciplined within our investment strategy, sticking with industry leaders that have clear competitive advantages and strong balance sheets. These types of businesses are built to not only "weather storms" but also to "create their own weather" by innovating new products or services to drive sustainable above average growth.
In these volatile times investors increasingly focus on the quality of, and outlook for, corporate earnings. At the same time they are looking for businesses that are able to grow organically. We purposely limit the Fund's portfolio to 30 businesses so that we remain focused on owning only leaders. Over the long term, but especially during periods of economic uncertainty, we believe that owning these leading, innovative, well capitalized businesses will generate above average returns for our shareholders.
Comparison of the Change in Value of a $10,000 Investment in the Touchstone Sands
Capital Select Growth Fund - Class Y*, Touchstone Sands Capital Select
Growth Fund - Class Z* and the Russell 1000® Growth Index
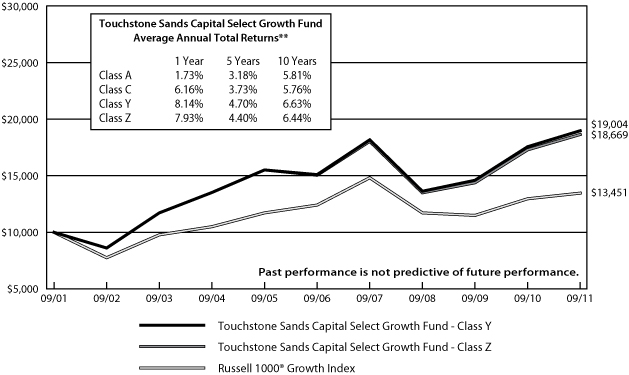
* The initial public offering of Class Y shares and Class Z shares commenced on August 27, 2004 and August 11, 2000, respectively. The initial public offering of Class A shares and Class C shares commenced on November 15, 2010. The Class A, Class C, and Class Y performance information is calculated using the historical performance of Class Z.
** The total returns shown above are adjusted for maximum applicable sales charges.
The performance of the above Fund does not reflect the deduction of taxes that a shareholder would pay on Fund distributions or the redemption of Fund shares.
45
Management's Discussion of Fund Performance (Continued)
Touchstone Short Duration Fixed Income Fund
Sub-Advised by Longfellow Investment Management Company
Investment Philosophy and Process
The Touchstone Short Duration Fixed Income Fund seeks to provide above market income, liquidity and risk-adjusted total return. Fund management targets these goals using a low risk approach, selecting a core group of securities from better yielding sectors within the government and corporate markets, and enhancing liquidity and yield by combining very short maturities with fixed rate issues in a barbell structure. The Fund avoids higher risk strategies, including exposure to non-dollar currencies and lower quality credits. While the Fund may invest in securities with any maturity or duration, interest rate risk is managed by maintaining an effective duration that is comparable to or less than that of three year U.S. Treasury Notes.
Fund Performance and Market Overview
The Touchstone Short Duration Fixed Income Fund performed in-line with its benchmark, the Barclays Capital 1-3 Year U.S. Treasury Index, during the trailing twelve month period ended September 30, 2011. The Fund returned 1.22% versus 1.23% for the benchmark.
Over the twelve month period, short-term rates declined as the yield on the Index declined 0.42% to 0.30%. The Federal Reserve (the Fed) maintained their accommodative stance and kept short-term rates at historically low levels while economic growth slowed in the first half of 2011. Given the significant concerns with domestic growth and European debt issues, investors sought refuge in U.S. Treasuries especially during the final quarter.
Portfolio Review
Small changes to portfolio allocations were made over the year. We increased the allocation to auto and credit card asset backed securities as stranded cost or rate reduction utility paper continued to paydown with minimal new issuance. The corporate sector was reduced in both the Industrials and Financials sectors as bonds matured but were reinvested elsewhere. We increased the allocation to mortgages, both commercial and agency pass-throughs, as spreads widened, particularly in the second half of the year.
The Fund began the fiscal year with a yield-to-maturity (YTM) of 1.52%, which actually increased over the year to 1.80%. The largest increase occurred in the most recent quarter, as spreads widened significantly across most sectors, particularly corporates and mortgages. Asset backed securities continued to perform well and widened only minimally.
The Fund began the year with a substantial yield advantage over the Index as well, which was reduced by the negative paydown effect from mortgage, asset backed securities, and other amortizing securities such as SBAs (Small Business Administration securitizations). Additionally, the advantage was further reduced by the spread widening in many sectors in the final quarter.
Strategy and Outlook
The September 30, 2011 effective portfolio duration was 1.7 years, which was less than the Index duration of 1.9 years. While the Fed is clearly on hold until at least mid-2013 and we do not expect it to change its short term interest policy, we will look for opportunities to add yield in spread product rather than significantly extending portfolio duration. The Fund's portfolio currently has a yield-to-maturity advantage over the benchmark. We expect this benefit to continue to produce excess performance.
46
Management's Discussion of Fund Performance (Continued)
Comparison of the Change in Value of a $10,000 Investment in the
Touchstone Short Duration Fixed Income Fund - Class Z* and
the Barclays Capital 1-3 Year U.S. Treasury Index

* The initial public offering of Class Z shares commenced on March 1, 1994 and the public offering of Class Y shares commenced on May 4, 2009. Class Y performance information is calculated using the historical performance of Class Z.
The performance of the above Fund does not reflect the deduction of taxes that a shareholder would pay on Fund distributions or the redemption of Fund shares.
47
Management's Discussion of Fund Performance (Continued)
Touchstone Small Cap Core Fund
Sub-Advised by The London Company
Investment Philosophy and Process
The Touchstone Small Cap Core Fund seeks long-term capital appreciation by primarily investing in common stocks of companies with small market capitalizations. Fund management utilizes a bottom-up security selection process that screens potential investments against a proprietary quantitative model for return on capital, earnings to value ratio, free cash flow and return on equity. Their goal is to purchase generally profitable, financially stable companies that consistently generate high returns on unleveraged operating capital, are run by shareholder-oriented management, and are trading at a discount to their private market value.
Fund Performance and Market Overview
The total return of the Touchstone Small Cap Core Fund was 2.82% for the twelve month period ended September 30, 2011, which was calculated excluding the maximum sales charge. The total return of the Russell 2000® Index was -3.53% for the same period. The Touchstone Small Cap Core Fund outperformed the benchmark.
The general malaise in the market intensified this quarter as fear spiked and confidence, what little remained, vanished. The brief rally that ended the second quarter quickly gave way to further selling over the past three months, resulting in increased trepidation and apathy towards equities. A number of issues have contributed to the soured outlook, including the debt ceiling debacle, a downbeat forecast from the Federal Reserve (the Fed), Greece and the European sovereign credit crisis, continued high unemployment, meek housing data, and warning signs of slowing growth in China to just name a few, with little clarity on how we will manage through them. This uncertainty is wreaking havoc on investor sentiment and consequently, equity returns.
Portfolio Review
During the period, the top three performing sectors for the Russell 2000® Index were Utilities, Consumer Staples, and Health Care. All of these sectors outperformed the Index and the Fund's overweight position in the Consumer Staples sector contributed to relative performance. The Fund's underweight position in the Utilities and Health Care sectors hindered relative performance. The bottom three performing sectors for the Russell 2000® Index were Materials, Industrials, and Financials, which all underperformed the Index. The Fund's overweight position in all three sectors detracted from relative performance.
Outperformance was primarily driven by stock selection. In particular, the Fund experienced strong stock selection in the Consumer Staples, Financials, and Materials sectors, offset somewhat by stock selection in the Information Technology and Health Care sectors.
The top five contributors to performance were PriceSmart Inc., NewMarket Corp., Sturm Ruger & Co., Nu Skin Enterprises Inc., and White Mountains Insurance Group Ltd.
PriceSmart Inc. (Consumer Staples sector) continued to put up impressive same store sales growth with comparisons to the previous quarter running up in the mid to high teens. This feat is especially impressive in light of some of the macro issues facing the global economy today. The company is still in the early stages of what we believe will be a sustainable growth story.
NewMarket Corp. (Materials sector) is a manufacturer of lubricant fuel additives. One of the main demand drivers for the company's products is total miles driven. The competitive environment the company faces is very stable, and management has done an admirable job controlling costs and passing through price increases.
48
Management's Discussion of Fund Performance (Continued)
Management has been actively repurchasing shares and increasing the dividend at a double digit price. We believe there is further upside in the stock.
Sturm Ruger & Co. (Consumer Discretionary sector) was a strong performer after consistently exceeding Wall Street's estimates for both top and bottom line. We believe the company is taking share from competitors, and performing well with 34% of sales coming from products that were introduced in the last two years. Even though the stock has outperformed, it still trades at less than 7X EBITDA (Earnings Before Interest, Taxes, Depreciation, and Amortization) and remains attractively valued.
Nu Skin Enterprises Inc. (Consumer Staples sector) had revenue and distributor growth of 8 to 9% during the second quarter of this year. The company is benefiting from emerging market growth and the successful deployment of a new product cycle, allowing it to increase its guidance for 2012. Management has returned excess cash to shareholders via buybacks and an attractive dividend. Nu Skin Enterprises Inc. has established an earnings per share target of $4.00 for 2015, but we believe it could hit the target earlier.
White Mountains Insurance Group Ltd. (Financials sector) has benefited from a better pricing environment, as well as some portfolio restructuring activities it has undertaken to unlock value. During the quarter, the company announced the sale of a subsidiary at a premium to tangible book value. The company has since undertaken two Dutch auctions to support the stock.
The top five detractors to performance for the period were AOL Inc., Capella Education Co., MBIA Inc., Tredegar Corp., and Eaton Vance Corp.
We entered AOL Inc. (Information Technology sector) in 2010, attracted by its strong balance sheet, good cash flow, pedigreed management, and potential to capitalize on the increasing use of Internet based advertising. As we progressed through the year, the company made several expensive acquisitions, and as a result, we lost confidence in management's capital allocation skills. This decline in confidence, as well as stop loss reasons, contributed to exiting the stock during the later part of the year.
MBIA Inc. (Financials sector) is a monoline insurer of the timely interest and principal payments for both municipal bonds and structured products. We believe the municipal insurance business, where the company is able to collect insurance premiums up front and invest the proceeds with a relatively low likelihood of paying out claims, is an attractive business. We believe the sum of the parts of the company is worth well more than where the stock currently trades.
Tredegar Corp. (Industrials sector) is a manufacturer of plastic films used in diapers and feminine hygiene products, and of aluminum extrusions used in construction. The stock sold off late in the period due to concerns about the slowing economy. However, the film business is fairly stable over the full cycle and the extrusions business is already depressed. The stock is a good value at current valuations.
Eaton Vance Corp. (Financials sector) is a premier asset manager possessing some very attractive attributes. The closed end fund business represents about 20% of its business and is, in a sense, a captive business for the company. In addition, the company's products tend to be more defensive in nature and it should benefit in the current environment. The company recently announced an increased buyback and we believe it should be bought.
Strategy and Outlook
Despite negative absolute returns and increased volatility, The Fund has performed well respective to peers and industry benchmarks. We believe that our ability to protect capital in weak markets coupled with solid stock selection continues to add value and significant outperformance versus the respective indices. For the
49
Management's Discussion of Fund Performance (Continued)
year, small cap companies ranking in the top quintile based on return on capital lost on average 9% compared to 25% for those in the bottom quintile. Equity investors are rewarding higher quality, larger companies with lower beta and less leverage.
The lack of confidence across the economy and within the markets is striking, and is only being exacerbated by the dearth of leadership from our elected officials. This is reflected in historically low approval ratings for Congress as well as depressed consumer sentiment surveys. The Federal Reserve, novel in its creativity, has continued its unwavering effort in aiding this stagnant economy. The latest approach is a form of quantitative easing without expanding the balance sheet. The $400 billion 'twist' reinvests shorter-term assets into longer-term securities, which is expected to help flatten the yield curve by lowering longer-term rates. The problem is that all the monetary easing accomplished over the past couple of years has not inspired consumers to spend or corporations to hire.
Fed Chairman Ben Bernanke has been insistent on printing money to spur economic growth and fight deflation. These efforts are not working, in part, because liquidity is not the problem. The U.S. economy is still deleveraging and there remains too much capital tied up in unproductive real estate. This is compounded by our current lack of confidence in Congress to balance our budget and right size our entitlement programs. Moreover, the increased regulations and uncertainty on taxes and healthcare costs is depressing the willingness of corporations to hire thus contributing to even lower demand for goods and services. This was recently verified in a survey by the Wall Street Journal showing the number of CEO's expecting to increase hiring over the next six months decreased to 24% this quarter from 51% just a quarter ago. Unfortunately, the events of this past quarter have further depressed growth expectations on a global basis and created a negative overhang towards risky assets.
On the bright side, the stock market is fully aware of all this and has successfully discounted equity prices to reflect all assumed truths. And the truth may not be as bleak as the stock prices are indicating. The S&P 500 is now off 17% from its April high and the Russell 2000® Index is off 25% as of September 30, 2011. Corporate America is producing more with less, and fundamentally performing pretty well. Earnings growth is still occurring and the companies themselves are awash in cash. Inventory levels and leverage are not what they were in 2008, suggesting that a complete halt of business activity is not likely to repeat itself. Valuations are reasonable if not attractive, with the trailing price-to-earnings ratios near thirty year lows and the relationship with bonds reaching all-time highs. The spread in P/E multiples between equities and bonds and the earnings yield versus 10-year treasury yield are both at historic highs.
In summary, the current issues hampering sentiment will eventually pass and we believe investors will seek higher yielding securities at the expense of bonds — pensions, endowments, and other income oriented funds will demand it. Growth is scarce and expectations going forward will likely be revised down. Yet, our temperament toward equities is still favorable. We realize this is not easy given the aforementioned concerns, but looking at the business fundamentals, current interest rate environment, and future inflation expectations versus valuations and the other alternatives available, it is hard not to greatly prefer stocks over the next three to five years. Uncertainty will keep the markets oscillating and investors guessing, which favors active managers who have shown the ability to add value through stock selection. The current market conditions are ideal for our style, and will likely remain so for years to come. The London Company remains fully committed to our disciplined process so we can seek to protect investors' capital and seek great investment opportunities to the best of our ability.
50
Management's Discussion of Fund Performance (Continued)
Comparison of the Change in Value of a $10,000 Investment in the Touchstone
Small Cap Core Fund - Class A* and the Russell 2000® Index
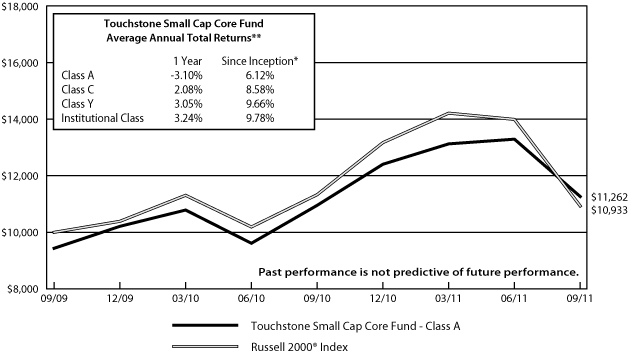
* The chart above represents performance for Class A shares only, which will vary from the performance of Class C shares, Class Y shares and Institutional Class shares based on the differences in loads and fees paid by shareholders in the different classes. The Fund commenced operations on September 30, 2009.
** The total returns shown above are adjusted for maximum applicable sales charges.
The performance of the above Fund does not reflect the deduction of taxes that a shareholder would pay on Fund distributions or the redemption of Fund shares.
51
Management's Discussion of Fund Performance (Continued)
Touchstone Small Cap Value Fund
Sub-Advised by DePrince, Race & Zollo, Inc.
Investment Philosophy and Process
The Touchstone Small Cap Value Fund seeks long-term capital appreciation by primarily investing in common stocks of small-cap companies that appear to be trading below their perceived value. The Fund utilizes a bottom-up security selection process that consists of three equally balanced factors: dividend yield, low valuation, and a fundamental catalyst.
Fund Performance and Market Overview
The total return of the Touchstone Small Cap Value Fund was -5.75% for the twelve month period ended September 30, 2011, which was calculated excluding the maximum sales charge. The total return of the Russell 2000® Value Index was -5.99% for the same period. The Touchstone Small Cap Value Fund outperformed its benchmark.
U.S equities experienced extreme volatility this year as headline events dramatically influenced investor sentiment. Markets were driven by mixed reports on the economic recovery, the supply-chain impact of the Japanese tsunami, turmoil in the Middle East, persistent sovereign debt concerns in Europe, the end of the Federal Reserve's second round of quantitative easing, and the political stalemate in Washington that resulted in the nation's first-ever credit downgrade.
Overall, high quality, dividend-paying companies performed well during the year, which attributed to the Fund's broad based sector attribution. Fund performance was stock specific.
Portfolio Review
The Fund's overweight in the Industrials sector was one of the largest detractors to performance. This economically sensitive sector sold off as investor sentiment grew increasingly cautious. The Fund's stock selection in this area is focused on companies that have internal catalysts to weather the downturn. The Fund's underweight in the Energy sector due to lofty relative valuations was a headwind to performance. Soaring energy prices in the fourth quarter of 2010 led to the sale of most of the Fund's positions as the companies reached our relative valuation targets. The Fund's security selection in the Financials sector also detracted from performance. We are finding interesting stories in non-bank Financials, but remain comfortable with our underweight in the sector as growth opportunities continue to be difficult for the banking industry.
The Fund's underweight in the Information Technology sector was a top contributor to relative performance. The sector traded lower on consumer spending concerns. We opportunistically added to our exposure during the sell off with a focus on high-quality companies flush with cash, such as Adtran Inc. Stock selection in the Materials sector was also a top contributor to relative performance, boosted by the premium takeover bid of Arch Chemicals Inc.
As investors sought more defensive positions, stock selection within the Consumer Discretionary and Consumer Staples sectors were additional contributors to relative performance.
Within the Industrials sector, Resources Connection Inc., Knight Transportation Inc. and Universal Forest Products Inc. detracted from performance. Resources Connection Inc., a temporary staffing services provider, traded lower due to margin compression from competitive pricing in the industry. However, their revenues are beating expectations and management believes the pricing issues are temporary as placement trends improve. The company has net cash on the balance sheet and recently issued a share buyback program, supporting our confidence in the fundamentals. Knight Transportation Inc., a leading trucking company, reported improving
52
Management's Discussion of Fund Performance (Continued)
revenues on stronger demand, but traded to a historical relative valuation low after high diesel prices impacted their bottom line. We recently met with management, and they confirmed volumes are improving and price increases are being successfully implemented. The company also announced a share buyback program in May, reiterating their dedication to shareholder value. Universal Forest Products Inc., a wood products manufacturer for home improvement stores, traded lower earlier in the year on macro concerns. However, the company was a top contributor in August after reporting better-than-expected earnings despite a weak retail environment. Management continues to streamline its operations and has improved its balance sheet over the past few years by reducing head count, closing underperforming branches and repaying long-term debt.
Within the Energy sector, Tsakos Energy Navigation Ltd. and Penn Virginia Corp. were a drag on performance. Tsakos Energy Navigation Ltd., an oil tanker company, traded lower as global oil demand has been weaker than expected and the industry remains over supplied, keeping vessel rates at historic lows. However, their non-traditional and product tankers are increasing their exposure to a more favorable supply/demand outlook and away from the currently weak crude tanker market. The Fund continues to hold Tsakos Energy Navigation Ltd. Penn Virginia Corp., an oil and natural gas company, underperformed after production reports from their new Marcellus Shale oil field fell short of expectations. The Fund's position size in Penn Virginia Corp. has been decreased as we reassess the company's fundamental prospects.
Within the Financials sector, Chesapeake Lodging Trust, a hotel REIT (Real Estate Investment Trust), traded lower on a cautious consumer and fears of a potential recession. 80% of their revenues are tied to business travel, which has been strong and is typically booked in advance, providing earnings visibility into next year. Greenhill & Co. and Duff & Phelps Corp., two financial advisory firms, traded lower as Mergers & Acquisitions (M&A) activity retreated mid-year amid concerns of an economic slowdown. Greenhill & Co's balance sheet is flush and the company should benefit as the record level of cash on corporate balance sheets propels M&A activity. Duff & Phelps Corp. was sold during the year.
Jones Group Inc., a Consumer Discretionary sector company and leader in the global apparel and footwear industry with brands such as Nine West, Anne Klein and Gloria Vanderbilt, traded lower in the second quarter after one Wall Street analyst downgraded the stock based on concerns about mid-priced apparel companies. We opportunistically added to the position as we recently met with their CFO and continued to believe in the company's prospects. Their recent acquisition of Europe's largest luxury shoe retailer, Kurt Geiger, was also not reflected in the stock price. Adherence to our investment discipline and conviction in Jones Group Inc.'s fundamentals were rewarded in July after the company reported a solid quarter with better sales and margin performance.
Within the Consumer Discretionary sector, Chico's FAS Inc. and bebe Stores Inc., two high quality women's apparel companies, were top contributors. Chico's FAS Inc.'s new management team led the company to better-than-expected earnings and same-store-sales trends. Shares were up nearly 25% before we exited the position in May. bebe Stores beat earnings expectations on higher gross margins and improved SG&A (Selling, General and Administrative expenses). The company continues to see product momentum and positive same-store-sales growth while maintaining flat inventories.
Arch Chemicals Inc., a U.S. biocides maker within the Materials sector, was one of the top performing stocks year to date. Shares soared before we exited the position in July after the company agreed to a premium takeover bid by Swiss chemicals producer, Lonza Group. Olin Corp., a specialty chemical company, was also a top performer that benefitted from pricing increases and margin expansion.
Within the defensive sectors, Black Hills Corp., UIL Holdings Corp., and Portland General Electric Co. were all top contributors from the Utilities sector. Black Hills Corp., a regulated gas utility, reported significantly better-than-expected results from their core utility business and posted improved cost control measures in
53
Management's Discussion of Fund Performance (Continued)
their coal mining segment. Sanderson Farms Inc., a chicken products producer in the Consumer Staples sector, performed well after implementing price increases. The company also benefitted from a pullback in commodity prices, which reduced their feed costs.
Sterling Bancshares was a top contributor within the Financials sector before exiting the Fund in March after agreeing to a premium takeover bid by Comerica Inc.
Strategy and Outlook
We remain cautiously pessimistic as uncertainty surrounding the economic recovery and instability overseas provides little confidence in earnings visibility for next year. Expectations are currently being reset as management teams provide a tentative 2012 outlook. The dramatic sell off in the third quarter brought stock valuations down to historically low levels last seen during the market bottom of 2008-2009, which has allowed us to add new positions. We believe corporate balance sheets are in a much better position to weather the downturn than before, which should support increased consolidation and M&A activity once macro uncertainty subsides.
We believe small-cap investors will favor high quality, dividend-paying companies with improving fundamentals. We continue to focus on companies with cash on their balance sheet and pricing power to maintain healthy profit margins. Additionally, with record levels of cash on hand, companies have more resources to initiate share buybacks, increase their dividend or make strategic acquisitions — all of which favor our investment process.
The trading activity within the Fund's portfolio has increased, but the Fund's overall exposures have remained relatively unchanged. Through our bottom-up stock selection process, we continue to maintain a defensive posture while gradually increasing our early cyclical exposure. Looking ahead, our commitment to undervalued, above-average dividend paying stocks with improving fundamentals should prove rewarding as investors focus on the opportunity for 2012. We believe investors will be seeking out companies that can implement internal initiatives that will offset economic pressures.
54
Management's Discussion of Fund Performance (Continued)
Comparison of the Change in Value of a $10,000 Investment in the Touchstone
Small Cap Value Fund - Class A* and the Russell 2000® Value Index
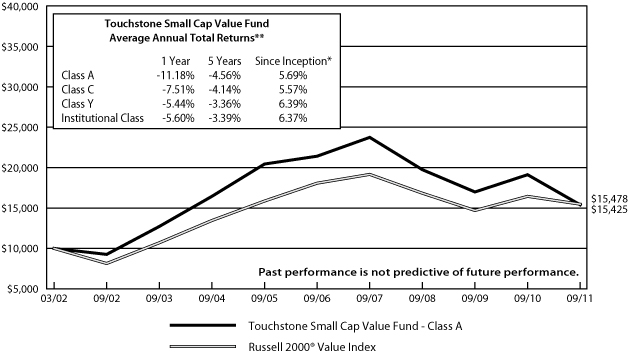
* The chart above represents performance for the Class A shares only, which will vary from the performance of Class C shares, Class Y shares and Institutional Class shares based on the differences in loads and fees paid by shareholders in the different classes. The initial public offering of Class Z shares commenced on March 4, 2002. On June 10, 2011, Class Z shares were converted to Class A shares and performance for periods prior to the date of conversion represents the performance of Class Z shares. The initial public offering of the Class C, Class Y, and Institutional Class shares commenced on March 1, 2011. The Class A, Class C, Class Y, and Institutional Class performance information is calculated using the historical performance of Class Z.
** The total returns shown above are adjusted for maximum applicable sales charges.
The performance of the above Fund does not reflect the deduction of taxes that a shareholder would pay on Fund distributions or the redemption of Fund shares.
55
Management's Discussion of Fund Performance (Continued)
Touchstone Total Return Bond Fund
Sub-Advised by EARNEST Partners LLC
Investment Process and Philosophy
The Touchstone Total Return Bond Fund seeks current income. Capital appreciation is a secondary goal.
Fund Performance and Market Overview
The total return of the Touchstone Total Return Bond Fund was 6.10% for the year ended September 30, 2011, which was calculated excluding the maximum sales charge. The total return of the Barclays Capital U.S. Aggregate Bond Index was 5.26% for the same period.
The Touchstone Total Return Bond Fund outperformed its benchmark Index for the year. Over what amounted to a rollercoaster for interest rates and investor sentiment, sticking to the Fund's time-tested process of focusing on sectors and securities, while ignoring the temptation to guess about the economy and interest rates, paid off. Bond market yields were up in the fourth quarter of 2010 but came down hard in the third quarter of 2011, closing just 0.21 percent lower than where they began a year earlier. Investors continue to struggle with a fuzzy economic outlook coupled with stagnant and high unemployment, a continuing weak housing market and a sovereign debt crisis in Europe. At home, debate over increasing the debt ceiling of the United States ended with a downgrade of the U.S.'s credit quality from AAA to AA+ by Standard & Poor's. Our belief is that ratings for the U.S. matter little, a view apparently shared by many, as Treasury yields promptly plummeted while all other asset classes and sectors were weaker.
Portfolio Review
The Fund was well positioned to take advantage of the rally in rates with its duration- and curve-neutral approach to managing interest rate risk. While some investors feared that the end of the Federal Reserve's "Quantitative Easing 2" (QE2) program on June 30, 2011 would lead to higher interest rates, the Fund stayed the course. The use of U.S. Treasury STRIPS (separate trading of registered interest and principal securities) to hold down longer duration was well rewarded with the Fund's Treasury position up for the year. Other U.S. Agency-related positions were also up in the double-digits for the year. The Fund's U.S. agency mortgage-backed securities also performed well. While the government continues to deliberate on the best way to help struggling homeowners with some plans calling for a mass refinancing of all high-rate debt, risk was taken off the table by underweighting single-family Mortgage-Backed Securities (MBS) and overweighting multi-family MBS such as Ginnie Mae project loans and Fannie Mae Delegated Underwriting and Servicing (FN DUS) issues, which have prepayment protections the single-family issues do not. While the performance of the Fund's credit-sensitive sectors lagged its U.S. government issues, all of the issues met expectations. One story that has been a particular success is Ford Motor Credit. The holding matured this year and has been replaced because the company's credit situation is continuing to improve. While the parent company is certainly performing well, we have always believed the real value is in the wholly owned finance subsidiary.
Strategy and Outlook
The Fund remains underweight U.S. Treasury debt and may take advantage of wider spreads to swap into more favored spread sectors. Though it's underweight U.S. Treasuries, overall commitment to U.S. government-related debt will still be kept, proximal to that of the benchmark, with much of the Fund's agency debt having the same "full faith and credit" backing of Uncle Sam that Treasuries have. We are starting to add Ginnie Mae Home Equity Conversion Mortgages (HECMs) to the Fund. HECMs are a Ginnie Mae pool designed to help retirees with their cash flow needs by letting them borrow against their home equity. The coupon is compounded until
56
Management's Discussion of Fund Performance (Continued)
certain events occur such as the sale of the home or the loan-to-value ratio reaching a certain point, at which time the investors are paid off. We believe these are attractive alternatives to more common single-family pools with all of their prepayment and extension risk.
These are trying times in the capital markets but we believe the Fund's process is well designed to navigate them. We will continue to look for opportunities that provide a solid combination of capital preservation and yield.
Comparison of the Change in Value of a $10,000 Investment in the Touchstone
Total Return Bond Fund - Class Y* and the Barclays Capital U.S. Aggregate Bond Index

* The chart above represents performance for Class Y shares only, which will vary from the performance of Class A shares, Class C shares and Institutional Class shares based on the differences in loads and fees paid by shareholders in the different classes. Class Y shares began operations on November 15, 1991, Class A shares began operations on August 16, 2010, and Class C and Institutional Class shares began operations on August 1, 2011. The Class A, Class C and Institutional Class performance information is calculated using the historical performance of Class Y. Performance information prior to August 1, 2011 represents that of the former Institutional Class of the EARNEST Partners Fixed Income Trust (the "EARNEST Trust"), a series of the Nottingham Investment Trust II. On August 1, 2011, the EARNEST Trust was reorganized into the Fund. See footnote 9 in the accompanying Notes to Financial Statements.
** The total returns shown above are adjusted for maximum applicable sales charges.
The performance of the above Fund does not reflect the deduction of taxes that a shareholder would pay on Fund distributions or the redemption of Fund shares.
57
Management's Discussion of Fund Performance (Continued)
Touchstone Ultra Short Duration Fixed Income Fund
Sub-Advised by Fort Washington Investment Advisors Inc.
Investment Philosophy and Process
The Fund seeks maximum total return consistent with the preservation of capital by primarily investing in a diversified portfolio of fixed income securities of different maturities, including U.S. Treasury securities, U.S. government agency and U.S. government-sponsored enterprise securities, corporate bonds, mortgage-backed securities, commercial mortgage-backed securities, asset-backed securities, and municipal bonds. While the Fund may invest in securities with any maturity or duration, interest rate risk is managed by maintaining an effective duration of one year or less under normal market conditions.
Fund Performance and Market Overview
The total return of the Touchstone Ultra Short Duration Fixed Income Fund was 1.12% for the year ended September 30, 2011. The total return of the BofA Merrill Lynch 3-Month U.S. Treasury Bill Index was 0.14% for the same period. The Fund's performance was driven primarily by the stable return profile of its concentration in structured securities, namely Mortgage-Backed Securities, Commercial Mortgage-Backed Securities and Asset-Backed Securities (MBS, CMBS and ABS). The Fund does not rely heavily on corporate bonds for alpha generation.
The corporate bond market performed very well in the first half of the fiscal year as many companies posted record earnings and the economic outlook remained positive. However, a revival of problems in Europe, the specter of a Greek default and the potential for a European banking crisis, led to significantly higher risk premiums on corporate bonds in the second half of the fiscal year. Funds with exposure to financials, particularly European financials, were hit particularly hard. Spreads on structured securities, the focus of the Fund, remained relatively stable during the period.
Consumer confidence, which rebounded earlier in the year, is back down near historical lows and seems overly tied to the euro-zone crisis, perhaps underscoring the globalization of our economy. At the August Federal Open Market Committee (FOMC) meeting, the Federal Reserve Board (the Fed) announced that it would maintain a low level of rates into 2013 — an extraordinarily long forecast underscoring the seriousness of the economic malaise. With a Greek default seeming unavoidable, the Fed warned the markets again in September by stating, "there are significant downside risks to the economic outlook, including strains in global financial markets." Operation Twist was also announced, a program designed to lower long-term interest rates, promote lending and force investors into riskier assets.
Portfolio Review
On a relative basis, the Fund performed well for the quarter. Interestingly, annual returns for funds that focus on MBS and structured products were much better than those that focus on corporate bonds, 1.03 percent vs. 0.39 percent, respectively. All sub-sectors in which the Fund invested were accretive to performance. Agency pass-through securities paced returns followed by CMBS and non-agency MBS. Residential MBS exposure, which began the year at 38 percent, has declined to 26 percent — a historical low, reflecting our concern over mortgage refinancing risk. The Fund's corporate securities, benefitting from active management, delivered returns significantly higher than the average corporate-oriented fund.
Strategy and Outlook
We believe that the economic recovery in the U.S. will be gradual, characterized by "fits and starts." The de-levering process of the U.S. consumer and the overhang of distressed housing inventory will likely take several more years to rectify, keeping unemployment high and growth slow, but not negative. Europe will more than likely continue to complicate forecasts and add to market volatility. We believe this is a favorable
58
Management's Discussion of Fund Performance (Continued)
environment for the Fund's structured security-oriented investment strategy that relies more heavily on the income component of return and allows it to avoid some of the volatility associated with corporate and government bonds that have more binary performance profiles. The ultra short space should continue to be "well bid" as traditional short-term investors seek yield by investing in non-traditional asset classes.
We continue to see the most compelling opportunities in CMBS where we believe we can still find high quality, short maturity securities yielding 2-3 percent. The current allocation target for this sector is 25 percent — near the high end of the strategic range. Agency adjustable-rate mortgages (ARMs) and non-agency collateralized mortgage obligations (CMOs) have the next largest target allocations at 14 percent and 12 percent, respectively. These MBS sectors tend to exhibit less refinancing sensitivity than other MBS sectors (pass-through securities and agency CMOs). We will continue to opportunistically trade corporate securities, capturing rate moves and opportunities arising from spread volatility, while maintaining a low beta and avoiding significant exposure to financials.
The Touchstone Ultra Short Duration Fixed Income Fund currently maintains a duration of 0.64 years — midway through the traditional operating range of 0.5 to 0.8 years. With the Federal Reserve telegraphing an accommodative posture, we may opportunistically extend duration for the next several quarters into the higher end of the Fund's operating range. We will seek to continue to focus on high quality, non-government securities in an effort to maximize alpha, and add to the core income-producing agency segments of the Fund's portfolio opportunistically.
Comparison of the Change in Value of a $10,000 Investment in the Touchstone
Ultra Short Duration Fixed Income Fund - Class Z* and the BofA Merrill Lynch
3-Month U.S. Treasury Bill Index
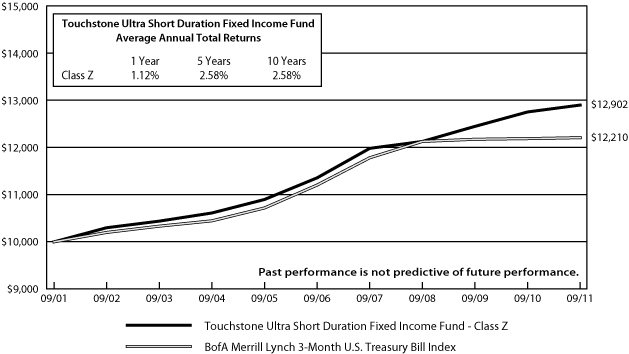
* The initial public offering of Class Z shares commenced on March 1, 1994.
The performance of the above Fund does not reflect the deduction of taxes that a shareholder would pay on Fund distributions or the redemption of Fund shares.
59
Tabular Presentation of Portfolios of Investments (Unaudited)
September 30, 2011
The illustrations below provide each Fund's sector allocation. We hope it will be useful to shareholders as it summarizes key information about each Fund's investments.
Touchstone Capital Appreciation Fund
| Sector Allocation* | (% of Net Assets) | ||||||
| Information Technology | 21.4 | % | |||||
| Health Care | 19.6 | ||||||
| Consumer Staples | 15.7 | ||||||
| Industrials | 11.7 | ||||||
| Consumer Discretionary | 10.0 | ||||||
| Energy | 9.0 | ||||||
| Financials | 8.0 | ||||||
| Materials | 3.0 | ||||||
| Investment Funds | 1.9 | ||||||
| Other Assets/Liabilities (Net) | (0.3 | ) | |||||
| Total | 100.0 | % | |||||
Touchstone Emerging Markets Equity Fund
| Sector Allocation* | (% of Net Assets) | ||||||
| Financials | 18.1 | % | |||||
| Consumer Discretionary | 15.7 | ||||||
| Materials | 15.3 | ||||||
| Energy | 10.9 | ||||||
| Consumer Staples | 10.1 | ||||||
| Information Technology | 9.5 | ||||||
| Telecommunication Services | 6.6 | ||||||
| Industrials | 5.9 | ||||||
| Utilities | 4.0 | ||||||
| Health Care | 1.2 | ||||||
| Investment Funds | 7.0 | ||||||
| Other Assets/Liabilities (Net) | (4.3 | ) | |||||
| Total | 100.0 | % | |||||
Touchstone Emerging Markets Equity Fund II
| Sector Allocation* | (% of Net Assets) | ||||||
| Financials | 20.1 | % | |||||
| Materials | 17.9 | ||||||
| Consumer Discretionary | 10.0 | ||||||
| Energy | 9.7 | ||||||
| Information Technology | 9.1 | ||||||
| Consumer Staples | 7.8 | ||||||
| Telecommunication Services | 5.4 | ||||||
| Utilities | 4.4 | ||||||
| Industrials | 2.5 | ||||||
| Health Care | 1.3 | ||||||
| Equity Linked Notes | 8.5 | ||||||
| Investment Funds | 0.1 | ||||||
| Other Assets/Liabilities (Net) | 3.2 | ||||||
| Total | 100.0 | % | |||||
Touchstone Focused Equity Fund
| Sector Allocation* | (% of Net Assets) | ||||||
| Financials | 22.4 | % | |||||
| Information Technology | 22.2 | ||||||
| Industrials | 14.3 | ||||||
| Consumer Discretionary | 12.6 | ||||||
| Energy | 8.0 | ||||||
| Health Care | 6.5 | ||||||
| Telecommunication Services | 5.9 | ||||||
| Consumer Staples | 2.9 | ||||||
| Materials | 1.3 | ||||||
| Investment Funds | 12.2 | ||||||
| Other Assets/Liabilities (Net) | (8.3 | ) | |||||
| Total | 100.0 | % | |||||
60
Tabular Presentation of Portfolios of Investments (Continued)
Touchstone Global Equity Fund
| Sector Allocation* | (% of Net Assets) | ||||||
| Materials | 19.6 | % | |||||
| Consumer Staples | 17.8 | ||||||
| Health Care | 12.5 | ||||||
| Industrials | 11.3 | ||||||
| Energy | 10.7 | ||||||
| Telecommunication Services | 7.5 | ||||||
| Information Technology | 6.5 | ||||||
| Consumer Discretionary | 6.0 | ||||||
| Financials | 4.5 | ||||||
| Investment Funds | 1.8 | ||||||
| Other Assets/Liabilities (Net) | 1.8 | ||||||
| Total | 100.0 | % | |||||
Touchstone Global Real Estate Fund
| Sector Allocation* | (% of Net Assets) | ||||||
| Financials | 98.5 | % | |||||
| Investment Funds | 4.1 | ||||||
| Other Assets/Liabilities (Net) | (2.6 | ) | |||||
| Total | 100.0 | % | |||||
Touchstone Intermediate Fixed Income Fund
| Credit Quality | (% of Investment Securities) | ||||||
| U.S. Treasury | 27.7 | % | |||||
| U.S. Agency | 15.9 | ||||||
| AAA/Aaa | 3.0 | ||||||
| AA/Aa | 8.5 | ||||||
| A/A | 23.6 | ||||||
| BBB/Baa | 21.3 | ||||||
| Total | 100.0 | % | |||||
Touchstone International Fixed Income Fund
| Credit Quality | (% of Investment Securities) | ||||||
| AAA/Aaa | 58.0 | % | |||||
| AA/Aa | 14.9 | ||||||
| A/A | 8.4 | ||||||
| BBB/Baa | 8.0 | ||||||
| BB/Ba | 5.3 | ||||||
| B/B | 2.6 | ||||||
| NR | 2.8 | ||||||
| Total | 100.0 | % | |||||
Touchstone Large Cap Relative Value Fund
| Sector Allocation* | (% of Net Assets) | ||||||
| Financials | 15.9 | % | |||||
| Consumer Discretionary | 15.9 | ||||||
| Energy | 15.6 | ||||||
| Information Technology | 15.0 | ||||||
| Industrials | 13.0 | ||||||
| Health Care | 7.9 | ||||||
| Utilities | 5.6 | ||||||
| Telecommunication Services | 2.8 | ||||||
| Materials | 2.7 | ||||||
| Consumer Staples | 2.1 | ||||||
| Investment Funds | 3.7 | ||||||
| Other Assets/Liabilities (Net) | (0.2 | ) | |||||
| Total | 100.0 | % | |||||
61
Tabular Presentation of Portfolios of Investments (Continued)
Touchstone Market Neutral Equity Fund
| Sector Allocation* | (% of Net Assets) | ||||||
| Long Positions | |||||||
| Information Technology | 20.9 | % | |||||
| Financials | 13.6 | ||||||
| Health Care | 12.7 | ||||||
| Consumer Discretionary | 12.4 | ||||||
| Industrials | 9.6 | ||||||
| Energy | 7.9 | ||||||
| Materials | 3.3 | ||||||
| Utilities | 3.0 | ||||||
| Consumer Staples | 2.0 | ||||||
| Telecommunication Services | 0.6 | ||||||
| Investment Funds | 0.7 | ||||||
| Cash Collateral for Securities Sold Short | 99.3 | ||||||
| Other Assets/Liabilities (Net) | (0.2 | ) | |||||
| 185.8 | |||||||
| Short Positions | |||||||
| Information Technology | (18.1 | ) | |||||
| Financials | (15.0 | ) | |||||
| Health Care | (12.0 | ) | |||||
| Consumer Discretionary | (12.0 | ) | |||||
| Industrials | (10.7 | ) | |||||
| Energy | (7.5 | ) | |||||
| Materials | (4.2 | ) | |||||
| Utilities | (3.6 | ) | |||||
| Consumer Staples | (2.7 | ) | |||||
| (85.8 | ) | ||||||
| Total | 100.0 | % | |||||
Touchstone Merger Arbitrage Fund
| Sector Allocation* | (% of Net Assets) | ||||||
| Long Positions | |||||||
| Health Care | 16.2 | % | |||||
| Information Technology | 13.2 | ||||||
| Financials | 12.6 | ||||||
| Industrials | 11.2 | ||||||
| Utilities | 10.1 | ||||||
| Materials | 9.2 | ||||||
| Energy | 5.3 | ||||||
| Consumer Discretionary | 2.2 | ||||||
| Telecommunication Services | 1.9 | ||||||
| Consumer Staples | 1.1 | ||||||
| Investment Funds | 26.1 | ||||||
| Cash Collateral for Securities Sold Short | 14.2 | ||||||
| Other Assets/Liabilities (Net) | (11.7 | ) | |||||
| 111.6 | |||||||
| Short Positions | |||||||
| Utilities | (3.4 | ) | |||||
| Materials | (2.3 | ) | |||||
| Financials | (2.0 | ) | |||||
| Telecommunication Services | (1.9 | ) | |||||
| Consumer Discretionary | (1.1 | ) | |||||
| Energy | (0.8 | ) | |||||
| Health Care | (0.1 | ) | |||||
| (11.6 | ) | ||||||
| Total | 100.0 | % | |||||
Touchstone Mid Cap Fund
| Sector Allocation* | (% of Net Assets) | ||||||
| Information Technology | 19.6 | % | |||||
| Financials | 12.7 | ||||||
| Industrials | 11.7 | ||||||
| Health Care | 11.6 | ||||||
| Consumer Discretionary | 11.5 | ||||||
| Consumer Staples | 11.2 | ||||||
| Utilities | 7.7 | ||||||
| Energy | 5.3 | ||||||
| Materials | 5.1 | ||||||
| Telecommunication Services | 2.2 | ||||||
| Investment Funds | 5.7 | ||||||
| Other Assets/Liabilities (Net) | (4.3 | ) | |||||
| Total | 100.0 | % | |||||
Touchstone Mid Cap Value Fund
| Sector Allocation* | (% of Net Assets) | ||||||
| Financials | 22.2 | % | |||||
| Utilities | 11.9 | ||||||
| Industrials | 11.5 | ||||||
| Consumer Discretionary | 10.9 | ||||||
| Health Care | 10.5 | ||||||
| Information Technology | 9.2 | ||||||
| Materials | 8.8 | ||||||
| Energy | 6.8 | ||||||
| Consumer Staples | 6.0 | ||||||
| Investment Funds | 6.0 | ||||||
| Other Assets/Liabilities (Net) | (3.8 | ) | |||||
| Total | 100.0 | % | |||||
62
Tabular Presentation of Portfolios of Investments (Continued)
Touchstone Premium Yield Equity Fund
| Sector Allocation* | (% of Net Assets) | ||||||
| Energy | 20.1 | % | |||||
| Health Care | 18.8 | ||||||
| Utilities | 18.8 | ||||||
| Financials | 13.2 | ||||||
| Telecommunication Services | 11.7 | ||||||
| Information Technology | 7.3 | ||||||
| Materials | 3.4 | ||||||
| Industrials | 2.3 | ||||||
| Consumer Staples | 1.9 | ||||||
| Consumer Discretionary | 1.1 | ||||||
| Investment Funds | 1.2 | ||||||
| Other Assets/Liabilities (Net) | 0.2 | ||||||
| Total | 100.0 | % | |||||
Touchstone Sands Capital Select Growth Fund
| Sector Allocation* | (% of Net Assets) | ||||||
| Information Technology | 37.7 | % | |||||
| Consumer Discretionary | 21.9 | ||||||
| Health Care | 15.6 | ||||||
| Energy | 10.5 | ||||||
| Financials | 4.9 | ||||||
| Industrials | 4.6 | ||||||
| Materials | 2.5 | ||||||
| Investment Funds | 4.6 | ||||||
| Other Assets/Liabilities (Net) | (2.3 | ) | |||||
| Total | 100.0 | % | |||||
Touchstone Short Duration Fixed Income Fund
| Credit Quality | (% of Investment Securities) | ||||||
| U.S. Treasury | 4.9 | % | |||||
| U.S. Agency | 23.6 | ||||||
| AAA/Aaa | 47.7 | ||||||
| AA/Aa | 8.7 | ||||||
| A/A | 6.9 | ||||||
| BBB/Baa | 8.2 | ||||||
| Total | 100.0 | % | |||||
Touchstone Small Cap Core Fund
| Sector Allocation* | (% of Net Assets) | ||||||
| Financials | 24.8 | % | |||||
| Industrials | 18.4 | ||||||
| Consumer Discretionary | 13.5 | ||||||
| Consumer Staples | 12.7 | ||||||
| Information Technology | 9.2 | ||||||
| Materials | 9.0 | ||||||
| Energy | 7.3 | ||||||
| Health Care | 3.8 | ||||||
| Investment Funds | 7.3 | ||||||
| Other Assets/Liabilities (Net) | (6.0 | ) | |||||
| Total | 100.0 | % | |||||
Touchstone Small Cap Value Fund
| Sector Allocation* | (% of Net Assets) | ||||||
| Financials | 25.6 | % | |||||
| Industrials | 20.8 | ||||||
| Consumer Discretionary | 15.8 | ||||||
| Information Technology | 8.7 | ||||||
| Materials | 7.3 | ||||||
| Utilities | 5.8 | ||||||
| Energy | 3.8 | ||||||
| Consumer Staples | 3.7 | ||||||
| Health Care | 3.6 | ||||||
| Telecommunication Services | 1.4 | ||||||
| Investment Funds | 10.4 | ||||||
| Other Assets/Liabilities (Net) | (6.9 | ) | |||||
| Total | 100.0 | % | |||||
Touchstone Total Return Bond Fund
| Credit Quality | (% of Investment Securities) | ||||||
| U.S. Treasury | 16.5 | % | |||||
| U.S. Agency | 53.8 | ||||||
| AAA/Aaa | 6.6 | ||||||
| AA/Aa | 2.3 | ||||||
| A/A | 5.9 | ||||||
| BBB/Baa | 9.1 | ||||||
| BB/Ba | 3.5 | ||||||
| B/B | 2.3 | ||||||
| Total | 100.0 | % | |||||
63
Tabular Presentation of Portfolios of Investments (Continued)
Touchstone Ultra Short Duration Fixed Income Fund
| Credit Quality | (% of Investment Securities) | ||||||
| U.S. Agency | 19.9 | % | |||||
| AAA/Aaa | 48.3 | ||||||
| AA/Aa | 7.5 | ||||||
| A/A | 4.0 | ||||||
| BBB/Baa | 20.3 | ||||||
| Total | 100.0 | % | |||||
* Source: Bloomberg
64
Statements of Assets and Liabilities
September 30, 2011
| Touchstone Capital Appreciation Fund | Touchstone Emerging Markets Equity Fund | Touchstone Emerging Markets Equity Fund II | Touchstone Focused Equity Fund | ||||||||||||||||
| Assets | |||||||||||||||||||
| Investment securities: | |||||||||||||||||||
| At cost | $ | 7,566,833 | $ | 519,912,120 | $ | 5,555,203 | $ | 133,810,178 | |||||||||||
| Affiliated securities, at fair value | $ | 136,043 | $ | 10,965,632 | $ | 4,558 | $ | 4,009,511 | |||||||||||
| Non-affiliated securities, at fair value | 6,995,678 | 435,842,804 | 4,415,552 | 98,004,493 | |||||||||||||||
| At fair value (A) | $ | 7,131,721 | $ | 446,808,436 | $ | 4,420,110 | $ | 102,014,004 | |||||||||||
| Cash | — | 168,246 | — | — | |||||||||||||||
| Foreign currency, at cost of $0, $788,157, $62,201 and $0, respectively | — | 789,863 | 61,204 | — | |||||||||||||||
| Dividends and interest receivable | 2,906 | 361,881 | 3,018 | 63,539 | |||||||||||||||
| Receivable for capital shares sold | — | 1,247,935 | — | 86,772 | |||||||||||||||
| Receivable for securities sold | — | 236,051 | 97,738 | 108,238 | |||||||||||||||
| Receivable for securities lending income | — | 7,301 | — | 3,185 | |||||||||||||||
| Receivable from Advisor | 10,172 | — | 34,610 | 58,637 | |||||||||||||||
| Tax reclaims receivable | — | 2,803 | — | — | |||||||||||||||
| Other assets | 2,321 | 41,205 | 9,814 | 22,038 | |||||||||||||||
| Total Assets | 7,147,120 | 449,663,721 | 4,626,494 | 102,356,413 | |||||||||||||||
| Liabilities | |||||||||||||||||||
| Payable upon return of securities loaned | — | 19,179,142 | — | 7,446,706 | |||||||||||||||
| Payable for capital shares redeemed | — | 645,715 | — | 84,265 | |||||||||||||||
| Payable for securities purchased | — | 1,075,179 | 21,111 | 533,404 | |||||||||||||||
| Payable for professional services | 21,952 | 33,402 | 23,880 | 19,578 | |||||||||||||||
| Payable for shareholder reporting fees | 7,332 | 9,126 | 2,277 | 7,130 | |||||||||||||||
| Payable for offering costs | — | — | 4,235 | — | |||||||||||||||
| Payable for pricing fees | 936 | 6,065 | 2,999 | 1,012 | |||||||||||||||
| Payable to Custodian | 343 | 77,974 | 4,683 | 7,444 | |||||||||||||||
| Payable to Advisor | — | 405,881 | — | — | |||||||||||||||
| Payable to other affiliates | 2,239 | 22,842 | 1,170 | 46,986 | |||||||||||||||
| Payable to Trustees | 2,292 | 2,292 | 2,077 | 2,292 | |||||||||||||||
| Other accrued expenses and liabilities | 1,217 | 7,839 | 222 | 53,001 | |||||||||||||||
| Total Liabilities | 36,311 | 21,465,457 | 62,654 | 8,201,818 | |||||||||||||||
| Net Assets | $ | 7,110,809 | $ | 428,198,264 | $ | 4,563,840 | $ | 94,154,595 | |||||||||||
| Net assets consist of: | |||||||||||||||||||
| Paid-in capital | $ | 7,490,447 | $ | 493,266,975 | $ | 5,736,638 | $ | 123,218,211 | |||||||||||
| Accumulated net investment income | 29,512 | 4,283,779 | 34,166 | 424,294 | |||||||||||||||
| Accumulated net realized gains (losses) on investments and foreign currency transactions | 25,962 | 3,781,754 | (69,956 | ) | 2,308,264 | ||||||||||||||
| Net unrealized appreciation (depreciation) on investments | (435,112 | ) | (73,103,684 | ) | (1,135,093 | ) | (31,796,174 | ) | |||||||||||
| Net unrealized appreciation (depreciation) on foreign currency and translation of other assets and liabilities denominated in foreign currency | — | (30,560 | ) | (1,915 | ) | — | |||||||||||||
| Net Assets | $ | 7,110,809 | $ | 428,198,264 | $ | 4,563,840 | $ | 94,154,595 | |||||||||||
| Pricing of Class A Shares | |||||||||||||||||||
| Net assets attributable to Class A shares | $ | 3,745,518 | $ | 26,592,491 | $ | 416,661 | $ | 80,740,712 | |||||||||||
| Shares of beneficial interest outstanding (unlimited number of shares authorized, no par value) | 376,222 | 2,488,179 | 52,398 | 8,500,139 | |||||||||||||||
| Net asset value and redemption price per share | $ | 9.96 | $ | 10.69 | $ | 7.95 | $ | 9.50 | |||||||||||
| Maximum offering price per share | $ | 10.57 | $ | 11.34 | $ | 8.44 | $ | 10.08 | |||||||||||
65
Statements of Assets and Liabilities (Continued)
| Touchstone Capital Appreciation Fund | Touchstone Emerging Markets Equity Fund | Touchstone Emerging Markets Equity Fund II | Touchstone Focused Equity Fund | ||||||||||||||||
| Pricing of Class C Shares | |||||||||||||||||||
| Net assets attributable to Class C shares | $ | 420,746 | $ | 5,417,032 | $ | 16,574 | $ | 178,712 | |||||||||||
| Shares of beneficial interest outstanding (unlimited number of shares authorized, no par value) | 42,783 | 514,170 | 2,090 | 19,057 | |||||||||||||||
| Net asset value, offering price and redemption price per share* | $ | 9.83 | $ | 10.54 | $ | 7.93 | $ | 9.38 | |||||||||||
| Pricing of Class Y Shares | |||||||||||||||||||
| Net assets attributable to Class Y shares | $ | 149,451 | $ | 151,532,109 | $ | 200,324 | $ | 12,383,300 | |||||||||||
| Shares of beneficial interest outstanding (unlimited number of shares authorized, no par value) | 15,002 | 14,107,904 | 25,160 | 1,289,821 | |||||||||||||||
| Net asset value, offering price and redemption price per share | $ | 9.96 | $ | 10.74 | $ | 7.96 | $ | 9.60 | |||||||||||
| Pricing of Institutional Class Shares | |||||||||||||||||||
| Net assets attributable to Institutional Class shares | $ | 2,795,094 | $ | 244,656,632 | $ | 3,930,281 | $ | 851,871 | |||||||||||
| Shares of beneficial interest outstanding (unlimited number of shares authorized, no par value) | 280,695 | 22,734,934 | 493,268 | 91,822 | |||||||||||||||
| Net asset value, offering price and redemption price per share | $ | 9.96 | $ | 10.76 | $ | 7.97 | $ | 9.28 | |||||||||||
| (A) Includes market value of securities on loan of: | $ | — | $ | 18,137,165 | $ | — | $ | 6,877,531 | |||||||||||
* Redemption price per share varies by length of time shares are held.
See accompanying notes to financial statements.
66
Statements of Assets and Liabilities (Continued)
| Touchstone Global Equity Fund | Touchstone Global Real Estate Fund | Touchstone Intermediate Fixed Income Fund | Touchstone International Fixed Income Fund | ||||||||||||||||
| Assets | |||||||||||||||||||
| Investment securities: | |||||||||||||||||||
| At cost | $ | 4,101,472 | $ | 6,037,048 | $ | 94,032,152 | $ | 11,124,834 | |||||||||||
| Affiliated securities, at fair value | $ | 68,887 | $ | 100,471 | $ | 1,733,395 | $ | — | |||||||||||
| Non-affiliated securities, at fair value | 3,718,977 | 5,301,392 | 96,358,172 | 11,106,822 | |||||||||||||||
| At fair value (A) | $ | 3,787,864 | $ | 5,401,863 | $ | 98,091,567 | $ | 11,106,822 | |||||||||||
| Foreign currency, at cost of $1,736, $518, $0 and $356,537, respectively | 2,927 | 518 | — | 351,783 | |||||||||||||||
| Unrealized appreciation on forward foreign currency contracts | — | — | — | 525,443 | |||||||||||||||
| Dividends and interest receivable | 7,291 | 13,622 | 876,708 | 144,369 | |||||||||||||||
| Receivable for capital shares sold | — | — | 129,223 | 300 | |||||||||||||||
| Receivable for securities sold | 90,435 | 517 | — | 120,756 | |||||||||||||||
| Receivable for securities lending income | — | 11 | — | — | |||||||||||||||
| Receivable from Advisor | 10,186 | 4,442 | — | 5,133 | |||||||||||||||
| Tax reclaims receivable | 3,205 | 521 | — | 3,252 | |||||||||||||||
| Other assets | 6,691 | 5,688 | 3,812 | 16,443 | |||||||||||||||
| Total Assets | 3,908,599 | 5,427,182 | 99,101,310 | 12,274,301 | |||||||||||||||
| Liabilities | |||||||||||||||||||
| Bank overdraft | — | — | — | 6,290 | |||||||||||||||
| Unrealized depreciation on forward foreign currency contracts | — | — | — | 301,073 | |||||||||||||||
| Dividends payable | — | — | 241,907 | — | |||||||||||||||
| Payable upon return of securities loaned | — | 116,355 | — | — | |||||||||||||||
| Payable for capital shares redeemed | — | 617 | 189,600 | 6,055 | |||||||||||||||
| Payable for securities purchased | 1,542 | 518 | — | 111,000 | |||||||||||||||
| Payable for professional services | 26,759 | 28,400 | 23,390 | 28,777 | |||||||||||||||
| Payable for shareholder reporting fees | 7,386 | 7,337 | 1,671 | 7,318 | |||||||||||||||
| Payable for pricing fees | 7,053 | 476 | 6,224 | 21,229 | |||||||||||||||
| Payable to Custodian | 2,114 | 3,308 | 7,662 | 747 | |||||||||||||||
| Payable to Advisor | — | — | 15,771 | — | |||||||||||||||
| Payable to other affiliates | 1,111 | 949 | 928 | 1,258 | |||||||||||||||
| Payable to Trustees | 2,292 | 2,292 | 2,292 | 2,292 | |||||||||||||||
| Other accrued expenses and liabilities | 1,243 | 869 | 2,139 | 636 | |||||||||||||||
| Total Liabilities | 49,500 | 161,121 | 491,584 | 486,675 | |||||||||||||||
| Net Assets | $ | 3,859,099 | $ | 5,266,061 | $ | 98,609,726 | $ | 11,787,626 | |||||||||||
| Net assets consist of: | |||||||||||||||||||
| Paid-in capital | $ | 3,779,387 | $ | 5,670,139 | $ | 93,258,172 | $ | 11,605,116 | |||||||||||
| Accumulated net investment income (loss) | 24,850 | 1,093 | 6,968 | (5,963 | ) | ||||||||||||||
| Accumulated net realized gains (losses) on investments and foreign currency transactions | 368,361 | 230,071 | 1,285,171 | (6,517 | ) | ||||||||||||||
| Net unrealized appreciation (depreciation) on investments | (313,608 | ) | (635,185 | ) | 4,059,415 | (18,012 | ) | ||||||||||||
| Net unrealized appreciation (depreciation) on foreign currency and translation of other assets and liabilities denominated in foreign currency | 109 | (57 | ) | — | 213,002 | ||||||||||||||
| Net Assets | $ | 3,859,099 | $ | 5,266,061 | $ | 98,609,726 | $ | 11,787,626 | |||||||||||
| Pricing of Class A Shares | |||||||||||||||||||
| Net assets attributable to Class A shares | $ | 635,515 | $ | 2,037,771 | $ | — | $ | 2,554,868 | |||||||||||
| Shares of beneficial interest outstanding (unlimited number of shares authorized, no par value) | 64,447 | 208,881 | — | 243,487 | |||||||||||||||
| Net asset value and redemption price per share | $ | 9.86 | $ | 9.76 | $ | — | $ | 10.49 | |||||||||||
| Maximum offering price per share | $ | 10.46 | $ | 10.36 | $ | — | $ | 11.01 | |||||||||||
67
Statements of Assets and Liabilities (Continued)
| Touchstone Global Equity Fund | Touchstone Global Real Estate Fund | Touchstone Intermediate Fixed Income Fund | Touchstone International Fixed Income Fund | ||||||||||||||||
| Pricing of Class C Shares | |||||||||||||||||||
| Net assets attributable to Class C shares | $ | 100,866 | $ | 116,296 | $ | — | $ | 580,873 | |||||||||||
| Shares of beneficial interest outstanding (unlimited number of shares authorized, no par value) | 10,306 | 11,870 | — | 55,416 | |||||||||||||||
| Net asset value, offering price and redemption price per share* | $ | 9.79 | $ | 9.80 | $ | — | $ | 10.48 | |||||||||||
| Pricing of Class Y Shares | |||||||||||||||||||
| Net assets attributable to Class Y shares | $ | 197,086 | $ | 118,163 | $ | — | $ | 721,100 | |||||||||||
| Shares of beneficial interest outstanding (unlimited number of shares authorized, no par value) | 19,849 | 12,013 | — | 68,809 | |||||||||||||||
| Net asset value, offering price and redemption price per share | $ | 9.93 | $ | 9.84 | $ | — | $ | 10.48 | |||||||||||
| Pricing of Institutional Class Shares | |||||||||||||||||||
| Net assets attributable to Institutional Class shares | $ | 2,925,632 | $ | 2,993,831 | $ | 98,609,726 | $ | 7,930,785 | |||||||||||
| Shares of beneficial interest outstanding (unlimited number of shares authorized, no par value) | 294,921 | 301,704 | 10,809,942 | 756,511 | |||||||||||||||
| Net asset value, offering price and redemption price per share | $ | 9.92 | $ | 9.92 | $ | 9.12 | $ | 10.48 | |||||||||||
| (A) Includes market value of securities on loan of: | $ | — | $ | 112,715 | $ | — | $ | — | |||||||||||
* Redemption price per share varies by length of time shares are held.
See accompanying notes to financial statements.
68
Statements of Assets and Liabilities (Continued)
| Touchstone Large Cap Relative Value Fund | Touchstone Market Neutral Equity Fund | Touchstone Merger Arbitrage Fund | Touchstone Mid Cap Fund | ||||||||||||||||
| Assets | |||||||||||||||||||
| Investment securities: | |||||||||||||||||||
| At cost | $ | 6,953,468 | $ | 40,896,319 | $ | 7,311,802 | $ | 79,709,519 | |||||||||||
| Affiliated securities, at fair value | $ | 232,307 | $ | 294,473 | $ | 1,619,183 | $ | 900,109 | |||||||||||
| Non-affiliated securities, at fair value | 6,000,759 | 37,775,424 | 5,673,321 | 82,392,814 | |||||||||||||||
| At fair value (A) | $ | 6,233,066 | $ | 38,069,897 | $ | 7,292,504 | $ | 83,292,923 | |||||||||||
| Cash collateral for securities sold short | — | 43,581,634 | 952,527 | — | |||||||||||||||
| Dividends and interest receivable | 7,964 | 31,108 | 2,739 | 57,071 | |||||||||||||||
| Receivable for capital shares sold | — | 15,997 | 50,847 | 8,313 | |||||||||||||||
| Receivable for securities sold | — | — | 155,261 | 746,691 | |||||||||||||||
| Receivable for securities lending income | — | — | — | 487 | |||||||||||||||
| Receivable from Advisor | 8,109 | — | 9,800 | — | |||||||||||||||
| Other assets | 7,757 | 9,718 | 1,100 | 12,316 | |||||||||||||||
| Total Assets | 6,256,896 | 81,708,354 | 8,464,778 | 84,117,801 | |||||||||||||||
| Liabilities | |||||||||||||||||||
| Short positions, at cost of $0, $42,654,642, $802,176, and $0, respectively | — | 37,675,153 | 775,365 | — | |||||||||||||||
| Dividends for securities sold short | — | 40,053 | 3,146 | — | |||||||||||||||
| Payable upon return of securities loaned | — | — | — | 3,691,083 | |||||||||||||||
| Payable for capital shares redeemed | 738 | — | — | 142,732 | |||||||||||||||
| Payable for securities purchased | — | — | 970,469 | 303,142 | |||||||||||||||
| Payable for professional services | 24,375 | 20,630 | 18,025 | 26,028 | |||||||||||||||
| Payable for shareholder reporting fees | 8,259 | 5,478 | 4,751 | 7,701 | |||||||||||||||
| Payable for offering costs | — | — | 1,352 | — | |||||||||||||||
| Payable for pricing fees | 727 | 3,225 | 218 | 552 | |||||||||||||||
| Payable to Custodian | 122 | 31,554 | 40 | 2,039 | |||||||||||||||
| Payable to Advisor | — | 25,582 | — | 39,522 | |||||||||||||||
| Payable to other affiliates | 1,676 | 2,355 | 737 | 5,642 | |||||||||||||||
| Payable to Trustees | 2,292 | 2,292 | 1,082 | 2,292 | |||||||||||||||
| Other accrued expenses and liabilities | 754 | 315 | 150 | 3,044 | |||||||||||||||
| Total Liabilities | 38,943 | 37,806,637 | 1,775,335 | 4,223,777 | |||||||||||||||
| Net Assets | $ | 6,217,953 | $ | 43,901,717 | $ | 6,689,443 | $ | 79,894,024 | |||||||||||
| Net assets consist of: | |||||||||||||||||||
| Paid-in capital | $ | 6,697,030 | $ | 42,801,142 | $ | 6,680,885 | $ | 243,474,547 | |||||||||||
| Accumulated net investment income (loss) | — | (8,388 | ) | (1,883 | ) | 37,908 | |||||||||||||
| Accumulated net realized gains (losses) on investments and foreign currency transactions | 241,325 | (1,044,104 | ) | 2,928 | (167,201,835 | ) | |||||||||||||
| Net unrealized appreciation (depreciation) on investments | (720,402 | ) | 2,153,067 | 7,513 | 3,583,404 | ||||||||||||||
| Net Assets | $ | 6,217,953 | $ | 43,901,717 | $ | 6,689,443 | $ | 79,894,024 | |||||||||||
| Pricing of Class A Shares | |||||||||||||||||||
| Net assets attributable to Class A shares | $ | 660,928 | $ | 3,382,901 | $ | 259,622 | $ | 698,031 | |||||||||||
| Shares of beneficial interest outstanding (unlimited number of shares authorized, no par value) | 63,137 | 341,777 | 25,902 | 53,052 | |||||||||||||||
| Net asset value and redemption price per share | $ | 10.47 | $ | 9.90 | $ | 10.02 | $ | 13.16 | |||||||||||
| Maximum offering price per share | $ | 11.11 | $ | 10.50 | $ | 10.63 | $ | 13.96 | |||||||||||
69
Statements of Assets and Liabilities (Continued)
| Touchstone Large Cap Relative Value Fund | Touchstone Market Neutral Equity Fund | Touchstone Merger Arbitrage Fund | Touchstone Mid Cap Fund | ||||||||||||||||
| Pricing of Class C Shares | |||||||||||||||||||
| Net assets attributable to Class C shares | $ | 265,885 | $ | 183,780 | $ | 254,310 | $ | 476,499 | |||||||||||
| Shares of beneficial interest outstanding (unlimited number of shares authorized, no par value) | 25,595 | 18,832 | 25,415 | 36,760 | |||||||||||||||
| Net asset value, offering price and redemption price per share* | $ | 10.39 | $ | 9.76 | $ | 10.01 | $ | 12.96 | |||||||||||
| Pricing of Class Y Shares | |||||||||||||||||||
| Net assets attributable to Class Y shares | $ | 2,415,329 | $ | 40,335,036 | $ | 1,159,968 | $ | 77,785,128 | |||||||||||
| Shares of beneficial interest outstanding (unlimited number of shares authorized, no par value) | 231,761 | 4,050,446 | 115,733 | 5,908,153 | |||||||||||||||
| Net asset value, offering price and redemption price per share | $ | 10.42 | $ | 9.96 | $ | 10.02 | $ | 13.17 | |||||||||||
| Pricing of Class Z Shares | |||||||||||||||||||
| Net assets attributable to Class Y shares | $ | — | $ | — | $ | — | $ | 934,366 | |||||||||||
| Shares of beneficial interest outstanding (unlimited number of shares authorized, no par value) | — | — | — | 71,455 | |||||||||||||||
| Net asset value, offering price and redemption price per share | $ | — | $ | — | $ | — | $ | 13.08 | |||||||||||
| Pricing of Institutional Class Shares | |||||||||||||||||||
| Net assets attributable to Institutional Class shares | $ | 2,875,811 | $ | — | $ | 5,015,543 | $ | — | |||||||||||
| Shares of beneficial interest outstanding (unlimited number of shares authorized, no par value) | 275,929 | — | 500,250 | — | |||||||||||||||
| Net asset value, offering price and redemption price per share | $ | 10.42 | $ | — | $ | 10.03 | $ | — | |||||||||||
| (A) Includes market value of securities on loan of: | $ | — | $ | — | $ | — | $ | 3,507,465 | |||||||||||
* Redemption price per share varies by length of time shares are held.
See accompanying notes to financial statements.
70
Statements of Assets and Liabilities (Continued)
| Touchstone Mid Cap Value Fund | Touchstone Premium Yield Equity Fund | Touchstone Sands Capital Select Growth Fund | Touchstone Short Duration Fixed Income Fund | ||||||||||||||||
| Assets | |||||||||||||||||||
| Investment securities: | |||||||||||||||||||
| At cost | $ | 56,229,102 | $ | 38,288,223 | $ | 1,219,526,611 | $ | 40,628,180 | |||||||||||
| Affiliated securities, at fair value | $ | 978,214 | $ | 483,397 | $ | 34,986,163 | $ | 202,113 | |||||||||||
| Non-affiliated securities, at fair value | 47,856,978 | 39,673,372 | 1,329,749,561 | 40,997,127 | |||||||||||||||
| At fair value (A) | $ | 48,835,192 | $ | 40,156,769 | $ | 1,364,735,724 | $ | 41,199,240 | |||||||||||
| Dividends and interest receivable | 110,643 | 107,218 | 421,272 | 244,877 | |||||||||||||||
| Receivable for capital shares sold | 9,439 | 67,639 | 9,624,226 | 86,956 | |||||||||||||||
| Receivable for securities sold | 202,791 | — | — | — | |||||||||||||||
| Receivable for securities lending income | 1,041 | — | 3,741 | — | |||||||||||||||
| Receivable from Advisor | — | — | — | 24,134 | |||||||||||||||
| Tax reclaims receivable | — | 4,366 | — | — | |||||||||||||||
| Other assets | 13,819 | 16,266 | 101,380 | 11,946 | |||||||||||||||
| Total Assets | 49,172,925 | 40,352,258 | 1,374,886,343 | 41,567,153 | |||||||||||||||
| Liabilities | |||||||||||||||||||
| Dividends payable | — | — | — | 83,721 | |||||||||||||||
| Payable upon return of securities loaned | 1,567,248 | — | 26,034,381 | — | |||||||||||||||
| Payable for capital shares redeemed | 41 | 68,683 | 2,283,383 | 124,951 | |||||||||||||||
| Payable for securities purchased | 487,179 | — | 9,675,498 | — | |||||||||||||||
| Payable for professional services | 21,962 | 18,436 | 32,739 | 26,986 | |||||||||||||||
| Payable for shareholder reporting fees | 7,099 | 5,825 | 37,345 | 5,265 | |||||||||||||||
| Payable for pricing fees | 548 | 293 | 340 | 7,047 | |||||||||||||||
| Payable to Custodian | 1,323 | 4,522 | 8,849 | 658 | |||||||||||||||
| Payable to Advisor | 21,255 | 18,521 | 954,157 | — | |||||||||||||||
| Payable to other affiliates | 1,805 | 13,920 | 1,602,374 | 38,943 | |||||||||||||||
| Payable to Trustees | 2,292 | 2,292 | 2,292 | 2,292 | |||||||||||||||
| Other accrued expenses and liabilities | 595 | 1,001 | 71,054 | 3,195 | |||||||||||||||
| Total Liabilities | 2,111,347 | 133,493 | 40,702,412 | 293,058 | |||||||||||||||
| Net Assets | $ | 47,061,578 | $ | 40,218,765 | $ | 1,334,183,931 | $ | 41,274,095 | |||||||||||
| Net assets consist of: | |||||||||||||||||||
| Paid-in capital | $ | 51,466,417 | $ | 44,699,487 | $ | 1,286,924,104 | $ | 46,274,568 | |||||||||||
| Accumulated net investment income | 34,420 | 81,863 | — | 32,564 | |||||||||||||||
| Accumulated net realized gains (losses) on investments and foreign currency transactions | 2,954,651 | (6,431,131 | ) | (97,949,286 | ) | (5,604,097 | ) | ||||||||||||
| Net unrealized appreciation (depreciation) on investments | (7,393,910 | ) | 1,868,546 | 145,209,113 | 571,060 | ||||||||||||||
| Net Assets | $ | 47,061,578 | $ | 40,218,765 | $ | 1,334,183,931 | $ | 41,274,095 | |||||||||||
| Pricing of Class A Shares | |||||||||||||||||||
| Net assets attributable to Class A shares | $ | 2,363,871 | $ | 28,739,177 | $ | 21,211,316 | $ | — | |||||||||||
| Shares of beneficial interest outstanding (unlimited number of shares authorized, no par value) | 217,707 | 4,248,339 | 2,258,488 | — | |||||||||||||||
| Net asset value and redemption price per share | $ | 10.86 | $ | 6.76 | $ | 9.39 | $ | — | |||||||||||
| Maximum offering price per share | $ | 11.52 | $ | 7.17 | $ | 9.96 | $ | — | |||||||||||
| Pricing of Class C Shares | |||||||||||||||||||
| Net assets attributable to Class C shares | $ | 204,494 | $ | 7,499,464 | $ | 8,660,018 | $ | — | |||||||||||
| Shares of beneficial interest outstanding (unlimited number of shares authorized, no par value) | 18,902 | 1,109,789 | 928,288 | — | |||||||||||||||
| Net asset value, offering price and redemption price per share* | $ | 10.82 | $ | 6.76 | $ | 9.33 | $ | — | |||||||||||
71
Statements of Assets and Liabilities (Continued)
| Touchstone Mid Cap Value Fund | Touchstone Premium Yield Equity Fund | Touchstone Sands Capital Select Growth Fund | Touchstone Short Duration Fixed Income Fund | ||||||||||||||||
| Pricing of Class Y Shares | |||||||||||||||||||
| Net assets attributable to Class Y shares | $ | 4,684,886 | $ | 3,980,124 | $ | 392,463,863 | $ | 1,163,582 | |||||||||||
| Shares of beneficial interest outstanding (unlimited number of shares authorized, no par value) | 430,171 | 589,371 | 41,073,872 | 118,615 | |||||||||||||||
| Net asset value, offering price and redemption price per share | $ | 10.89 | $ | 6.75 | $ | 9.56 | $ | 9.81 | |||||||||||
| Pricing of Class Z Shares | |||||||||||||||||||
| Net assets attributable to Class Y shares | $ | — | $ | — | $ | 911,848,734 | $ | 40,110,513 | |||||||||||
| Shares of beneficial interest outstanding (unlimited number of shares authorized, no par value) | — | — | 97,107,322 | 4,088,643 | |||||||||||||||
| Net asset value, offering price and redemption price per share | $ | — | $ | — | $ | 9.39 | $ | 9.81 | |||||||||||
| Pricing of Institutional Class Shares | |||||||||||||||||||
| Net assets attributable to Institutional Class shares | $ | 39,808,327 | $ | — | $ | — | $ | — | |||||||||||
| Shares of beneficial interest outstanding (unlimited number of shares authorized, no par value) | 3,644,444 | — | — | — | |||||||||||||||
| Net asset value, offering price and redemption price per share | $ | 10.92 | $ | — | $ | — | $ | — | |||||||||||
| (A) Includes market value of securities on loan of: | $ | 1,483,928 | $ | — | $ | 24,642,088 | $ | — | |||||||||||
* Redemption price per share varies by length of time shares are held.
See accompanying notes to financial statements.
72
Statements of Assets and Liabilities (Continued)
| Touchstone Small Cap Core Fund | Touchstone Small Cap Value Fund | Touchstone Total Return Bond Fund | Touchstone Ultra Short Duration Fixed Income Fund | ||||||||||||||||
| Assets | |||||||||||||||||||
| Investment securities: | |||||||||||||||||||
| At cost | $ | 170,051,156 | $ | 48,723,014 | $ | 29,807,065 | $ | 354,023,850 | |||||||||||
| Affiliated securities, at fair value | $ | 3,316,617 | $ | 1,778,524 | $ | 1,678,743 | $ | 45,836,225 | |||||||||||
| Non-affiliated securities, at fair value | 161,981,075 | 38,971,370 | 29,456,583 | 308,102,127 | |||||||||||||||
| At fair value (A) | $ | 165,297,692 | $ | 40,749,894 | $ | 31,135,326 | $ | 353,938,352 | |||||||||||
| Cash | — | — | — | 1,031 | |||||||||||||||
| Dividends and interest receivable | 264,166 | 57,869 | 248,179 | 1,930,222 | |||||||||||||||
| Receivable for capital shares sold | 440,812 | 12,706 | 156,546 | 2,320,161 | |||||||||||||||
| Receivable for securities sold | 453,659 | 327,809 | — | — | |||||||||||||||
| Receivable for securities lending income | 9,378 | 2,380 | — | — | |||||||||||||||
| Receivable from Advisor | — | — | 2,258 | — | |||||||||||||||
| Other assets | 28,830 | 13,731 | 7,409 | 27,248 | |||||||||||||||
| Total Assets | 166,494,537 | 41,164,389 | 31,549,718 | 358,217,014 | |||||||||||||||
| Liabilities | |||||||||||||||||||
| Dividends payable | — | — | — | 593,979 | |||||||||||||||
| Payable upon return of securities loaned | 8,021,530 | 2,200,244 | — | — | |||||||||||||||
| Payable for capital shares redeemed | 162,787 | 27,194 | — | 5,391,783 | |||||||||||||||
| Payable for securities purchased | 2,122,423 | 659,491 | — | 5,522,605 | |||||||||||||||
| Payable for professional services | 20,265 | 25,921 | 6,100 | 25,630 | |||||||||||||||
| Payable for shareholder reporting fees | 14,128 | 1,803 | 4,800 | 6,645 | |||||||||||||||
| Payable for pricing fees | 823 | 383 | 7,355 | 8,028 | |||||||||||||||
| Payable to Custodian | 4,697 | 922 | 1,746 | 1,326 | |||||||||||||||
| Payable to Advisor | 69,167 | 28,017 | — | 93,571 | |||||||||||||||
| Payable to other affiliates | 46,882 | 83,478 | 5,198 | 435,422 | |||||||||||||||
| Payable to Trustees | 2,292 | 2,292 | 4,256 | 2,292 | |||||||||||||||
| Other accrued expenses and liabilities | 17,401 | 4,437 | 663 | 4,349 | |||||||||||||||
| Total Liabilities | 10,482,395 | 3,034,182 | 30,118 | 12,085,630 | |||||||||||||||
| Net Assets | $ | 156,012,142 | $ | 38,130,207 | $ | 31,519,600 | $ | 346,131,384 | |||||||||||
| Net assets consist of: | |||||||||||||||||||
| Paid-in capital | $ | 158,931,723 | $ | 75,480,996 | $ | 33,539,081 | $ | 362,479,368 | |||||||||||
| Accumulated net investment income | 31,004 | 213,882 | 211,650 | 283,674 | |||||||||||||||
| Accumulated net realized gains (losses) on investments and foreign currency transactions | 1,802,879 | (29,591,551 | ) | (3,559,392 | ) | (16,546,160 | ) | ||||||||||||
| Net unrealized appreciation (depreciation) on investments | (4,753,464 | ) | (7,973,120 | ) | 1,328,261 | (85,498 | ) | ||||||||||||
| Net Assets | $ | 156,012,142 | $ | 38,130,207 | $ | 31,519,600 | $ | 346,131,384 | |||||||||||
| Pricing of Class A Shares* | |||||||||||||||||||
| Net assets attributable to Class A shares | $ | 43,074,298 | $ | 37,384,815 | $ | 4,737,284 | $ | — | |||||||||||
| Shares of beneficial interest outstanding (unlimited number of shares authorized, no par value) | 3,606,776 | 2,698,576 | 467,507 | — | |||||||||||||||
| Net asset value and redemption price per share | $ | 11.94 | $ | 13.85 | $ | 10.13 | $ | — | |||||||||||
| Maximum offering price per share | $ | 12.67 | $ | 14.69 | $ | 10.64 | $ | — | |||||||||||
73
Statements of Assets and Liabilities (Continued)
| Touchstone Small Cap Core Fund | Touchstone Small Cap Value Fund | Touchstone Total Return Bond Fund | Touchstone Ultra Short Duration Fixed Income Fund | ||||||||||||||||
| Pricing of Class C Shares | |||||||||||||||||||
| Net assets attributable to Class C shares | $ | 11,738,535 | $ | 2,006 | $ | 2,586,891 | $ | — | |||||||||||
| Shares of beneficial interest outstanding (unlimited number of shares authorized, no par value) | 995,846 | 145 | 255,674 | — | |||||||||||||||
| Net asset value, offering price and redemption price per share** | $ | 11.79 | $ | 13.82 | *** | $ | 10.12 | $ | — | ||||||||||
| Pricing of Class Y Shares* | |||||||||||||||||||
| Net assets attributable to Class Y shares | $ | 58,164,403 | $ | 2,022 | $ | 17,809,511 | $ | — | |||||||||||
| Shares of beneficial interest outstanding (unlimited number of shares authorized, no par value) | 4,847,227 | 146 | 1,754,723 | — | |||||||||||||||
| Net asset value, offering price and redemption price per share | $ | 12.00 | $ | 13.89 | *** | $ | 10.15 | $ | — | ||||||||||
| Pricing of Class Z Shares | |||||||||||||||||||
| Net assets attributable to Class Y shares | $ | — | $ | — | $ | — | $ | 346,131,384 | |||||||||||
| Shares of beneficial interest outstanding (unlimited number of shares authorized, no par value) | — | — | — | 36,123,396 | |||||||||||||||
| Net asset value, offering price and redemption price per share | $ | — | $ | — | $ | — | $ | 9.58 | |||||||||||
| Pricing of Institutional Class Shares | |||||||||||||||||||
| Net assets attributable to Institutional Class shares | $ | 43,034,906 | $ | 741,364 | $ | 6,385,914 | $ | — | |||||||||||
| Shares of beneficial interest outstanding (unlimited number of shares authorized, no par value) | 3,589,684 | 53,494 | 629,766 | — | |||||||||||||||
| Net asset value, offering price and redemption price per share | $ | 11.99 | $ | 13.86 | $ | 10.14 | $ | — | |||||||||||
| (A) Includes market value of securities on loan of: | $ | 7,518,033 | $ | 2,109,595 | $ | — | $ | — | |||||||||||
* Effective August 1, 2011, Investor Class shares of Total Return Bond Fund were renamed Class A shares and Institutional Class shares were renamed Class Y shares.
** Redemption price per share varies by length of time shares are held.
*** Amount does not calculate due to rounding.
See accompanying notes to financial statements.
74
Statements of Operations
For the Year Ended September 30, 2011
| Touchstone Capital Appreciation Fund | Touchstone Emerging Markets Equity Fund | Touchstone Emerging Markets Equity Fund II (A) | Touchstone Focused Equity Fund | ||||||||||||||||
| Investment Income | |||||||||||||||||||
| Dividends from affiliated securities | $ | 908 | $ | 26,280 | $ | 412 | $ | 9,060 | |||||||||||
| Dividends from non-affiliated securities (B) | 121,581 | 9,501,364 | 68,314 | 1,279,773 | |||||||||||||||
| Interest | — | 75,519 | 3,602 | — | |||||||||||||||
| Income from securities loaned | 53 | 30,819 | — | 45,595 | |||||||||||||||
| Total Investment Income | 122,542 | 9,633,982 | 72,328 | 1,334,428 | |||||||||||||||
| Expenses | |||||||||||||||||||
| Investment advisory fees | 56,306 | 3,623,734 | 26,378 | 534,289 | |||||||||||||||
| Distribution expenses, Class A | 9,500 | 72,669 | 272 | 161,347 | |||||||||||||||
| Distribution expenses, Class C | 4,523 | 64,148 | 75 | 2,063 | |||||||||||||||
| Administration fees | 15,015 | 669,795 | 4,796 | 152,092 | |||||||||||||||
| Professional fees | 21,939 | 50,155 | 31,667 | 21,120 | |||||||||||||||
| Transfer Agent fees, Class A | 4,426 | 39,863 | 1,982 | 128,871 | |||||||||||||||
| Transfer Agent fees, Class C | 376 | 6,569 | 1,946 | 329 | |||||||||||||||
| Transfer Agent fees, Class Y | 67 | 28,389 | 1,976 | 2,935 | |||||||||||||||
| Transfer Agent fees, Institutional Class | 8 | 2,522 | 1,943 | 38 | |||||||||||||||
| Reports to shareholders, Class A | 7,006 | 12,683 | 2,089 | 30,364 | |||||||||||||||
| Reports to shareholders, Class C | 6,648 | 6,339 | 2,085 | 3,667 | |||||||||||||||
| Reports to shareholders, Class Y | 6,603 | 14,942 | 2,091 | 3,972 | |||||||||||||||
| Reports to shareholders, Institutional Class | 6,596 | 7,016 | 2,090 | 3,628 | |||||||||||||||
| Networking fees, Class A | 1,184 | 13,922 | 18 | 109,319 | |||||||||||||||
| Networking fees, Class C | 24 | 5,049 | 6 | 84 | |||||||||||||||
| Networking fees, Class Y | — | 1,215 | 52 | 18 | |||||||||||||||
| Networking fees, Institutional Class | — | 22 | — | — | |||||||||||||||
| Registration fees, Class A | 9,878 | 16,110 | — | 13,941 | |||||||||||||||
| Registration fees, Class C | 8,034 | 7,957 | — | 3,437 | |||||||||||||||
| Registration fees, Class Y | 8,278 | 17,525 | 1,771 | 6,587 | |||||||||||||||
| Registration fees, Institutional Class | 3,438 | 21,967 | — | 3,459 | |||||||||||||||
| Trustees' fees and expenses | 9,079 | 9,161 | 6,207 | 8,977 | |||||||||||||||
| Postage and supplies | 5,984 | 14,626 | 2,946 | 41,439 | |||||||||||||||
| Custodian fees | 189 | 369,062 | 15,225 | 19,864 | |||||||||||||||
| Compliance fees and expenses | 1,766 | 1,688 | 872 | 1,338 | |||||||||||||||
| Pricing fees | 609 | 8,517 | 3,000 | 459 | |||||||||||||||
| Offering costs | — | — | 4,235 | — | |||||||||||||||
| Other expenses | — | 5,519 | 19 | — | |||||||||||||||
| Total Expenses | 187,476 | 5,091,164 | 113,741 | 1,253,637 | |||||||||||||||
| Fees waived by the Administrator | (15,015 | ) | (273,189 | ) | (4,796 | ) | (152,092 | ) | |||||||||||
| Fees waived and/or expenses reimbursed by the Advisor | (92,490 | ) | — | (76,025 | ) | (213,901 | ) | ||||||||||||
| Net Expenses | 79,971 | 4,817,975 | 32,920 | 887,644 | |||||||||||||||
| Net Investment Income | 42,571 | 4,816,007 | 39,408 | 446,784 | |||||||||||||||
| Realized and Unrealized Gains (Losses) on Investments | |||||||||||||||||||
| Net realized gains (losses) from security transactions | 26,019 | 3,834,919 | (69,956 | ) | 2,342,938 | ||||||||||||||
| Net realized losses from foreign currency transactions | — | (369,000 | ) | (5,386 | ) | — | |||||||||||||
| Net change in unrealized appreciation/depreciation on investments | (409,428 | ) | (90,096,851 | ) | (1,135,093 | ) | (31,882,374 | ) | |||||||||||
| Net change in unrealized appreciation/depreciation on foreign currency transactions | — | (31,249 | ) | (1,915 | ) | — | |||||||||||||
| Net Realized and Unrealized Losses on Investments | (383,409 | ) | (86,662,181 | ) | (1,212,350 | ) | (29,539,436 | ) | |||||||||||
| Change in Net Assets Resulting from Operations | $ | (340,838 | ) | $ | (81,846,174 | ) | $ | (1,172,942 | ) | $ | (29,092,652 | ) | |||||||
(A) Represents the period from commencement of operations (April 18, 2011) through September 30, 2011.
| (B) Net of foreign tax withholding of: | $ | — | $ | 524,865 | $ | 3,768 | $ | 20,367 | |||||||||||
See accompanying notes to financial statements.
75
Statements of Operations (Continued)
| Touchstone Global Equity Fund | Touchstone Global Real Estate Fund | Touchstone Intermediate Fixed Income Fund | Touchstone International Fixed Income Fund | ||||||||||||||||
| Investment Income | |||||||||||||||||||
| Dividends from affiliated securities | $ | 302 | $ | 148 | $ | 7,283 | $ | 655 | |||||||||||
| Dividends from non-affiliated securities (A) | 80,663 | 175,565 | — | — | |||||||||||||||
| Interest (B) | — | — | 3,353,552 | 313,697 | |||||||||||||||
| Income from securities loaned | 781 | 805 | — | — | |||||||||||||||
| Total Investment Income | 81,746 | 176,518 | 3,360,835 | 314,352 | |||||||||||||||
| Expenses | |||||||||||||||||||
| Investment advisory fees | 39,076 | 37,973 | 409,263 | 58,274 | |||||||||||||||
| Distribution expenses, Class A | 2,373 | 2,540 | — | 4,114 | |||||||||||||||
| Distribution expenses, Class C | 1,142 | 1,322 | — | 4,552 | |||||||||||||||
| Administration fees | 9,194 | 9,493 | 204,633 | 21,191 | |||||||||||||||
| Professional fees | 30,408 | 32,033 | 34,353 | 28,264 | |||||||||||||||
| Transfer Agent fees, Class A | 1,991 | 913 | — | 1,790 | |||||||||||||||
| Transfer Agent fees, Class C | 13 | 13 | — | 97 | |||||||||||||||
| Transfer Agent fees, Class Y | 120 | 21 | — | 198 | |||||||||||||||
| Transfer Agent fees, Institutional Class | 8 | 10 | 2,430 | 13 | |||||||||||||||
| Reports to shareholders, Class A | 6,479 | 6,678 | — | 7,066 | |||||||||||||||
| Reports to shareholders, Class C | 6,446 | 6,413 | — | 6,858 | |||||||||||||||
| Reports to shareholders, Class Y | 6,472 | 6,424 | — | 6,835 | |||||||||||||||
| Reports to shareholders, Institutional Class | 6,454 | 6,413 | 11,283 | 6,801 | |||||||||||||||
| Networking fees, Class A | 488 | 42 | — | 39 | |||||||||||||||
| Networking fees, Class C | — | 11 | — | 14 | |||||||||||||||
| Networking fees, Class Y | — | — | — | 8 | |||||||||||||||
| Networking fees, Institutional Class | — | — | 103 | — | |||||||||||||||
| Registration fees, Class A | 6,577 | 3,602 | — | 3,433 | |||||||||||||||
| Registration fees, Class C | 2,812 | 3,077 | — | 3,479 | |||||||||||||||
| Registration fees, Class Y | 3,047 | 2,853 | — | 3,345 | |||||||||||||||
| Registration fees, Institutional Class | 2,914 | 2,813 | 3,625 | 2,647 | |||||||||||||||
| Trustees' fees and expenses | 9,078 | 9,078 | 9,023 | 9,079 | |||||||||||||||
| Postage and supplies | 4,949 | 4,698 | 1,324 | 5,024 | |||||||||||||||
| Custodian fees | 3,619 | 29,722 | 8,726 | 3,913 | |||||||||||||||
| Compliance fees and expenses | 1,763 | 1,763 | 1,974 | 1,678 | |||||||||||||||
| Pricing fees | 7,369 | 5,274 | 25,436 | 7,030 | |||||||||||||||
| Other expenses | — | — | 3,039 | — | |||||||||||||||
| Total Expenses | 152,792 | 173,179 | 715,212 | 185,742 | |||||||||||||||
| Fees waived by the Administrator | (9,194 | ) | (9,493 | ) | (204,633 | ) | (21,191 | ) | |||||||||||
| Fees waived and/or expenses reimbursed by the Advisor | (95,032 | ) | (110,858 | ) | (101,432 | ) | (78,613 | ) | |||||||||||
| Net Expenses | 48,566 | 52,828 | 409,147 | 85,938 | |||||||||||||||
| Net Investment Income | 33,180 | 123,690 | 2,951,688 | 228,414 | |||||||||||||||
| Realized and Unrealized Gains (Losses) on Investments | |||||||||||||||||||
| Net realized gains from security transactions | 426,999 | 341,338 | 1,209,268 | 12,108 | |||||||||||||||
| Net realized gains (losses) from foreign currency transactions | (4,368 | ) | 31 | — | 95,068 | ||||||||||||||
| Net change in unrealized appreciation/depreciation on investments | (626,857 | ) | (953,675 | ) | (1,697,151 | ) | (399,947 | ) | |||||||||||
| Net change in unrealized appreciation/depreciation on foreign currency transactions | (236 | ) | (31 | ) | — | 186,259 | |||||||||||||
| Net Realized and Unrealized Losses on Investments | (204,462 | ) | (612,337 | ) | (487,883 | ) | (106,512 | ) | |||||||||||
| Change in Net Assets Resulting from Operations | $ | (171,282 | ) | $ | (488,647 | ) | $ | 2,463,805 | $ | 121,902 | |||||||||
| (A) Net of foreign tax withholding of: | $ | 5,067 | $ | 5,382 | $ | — | $ | — | |||||||||||
| (B) Net of foreign tax withholding of: | $ | — | $ | — | $ | 1,391 | $ | 4,261 | |||||||||||
See accompanying notes to financial statements.
76
Statements of Operations (Continued)
| Touchstone Large Cap Relative Value Fund | Touchstone Market Neutral Equity Fund | Touchstone Merger Arbitrage Fund (A) | Touchstone Mid Cap Fund | ||||||||||||||||
| Investment Income | |||||||||||||||||||
| Dividends from affiliated securities | $ | 623 | $ | 1,421 | $ | 280 | $ | 2,149 | |||||||||||
| Dividends from non-affiliated securities (B) | 116,520 | 335,231 | 5,638 | 1,345,442 | |||||||||||||||
| Income from securities loaned | 12 | 743 | — | 20,630 | |||||||||||||||
| Total Investment Income | 117,155 | 337,395 | 5,918 | 1,368,221 | |||||||||||||||
| Expenses | |||||||||||||||||||
| Investment advisory fees | 43,416 | 476,063 | 8,113 | 898,808 | |||||||||||||||
| Distribution expenses, Class A | 2,540 | 4,410 | 16 | 2,002 | |||||||||||||||
| Distribution expenses, Class C | 3,191 | 1,919 | 59 | 4,279 | |||||||||||||||
| Administration fees | 12,405 | 73,241 | 1,537 | 224,704 | |||||||||||||||
| Shareholder servicing fees | — | — | — | 2,019 | |||||||||||||||
| Professional fees | 20,002 | 23,584 | 18,025 | 25,461 | |||||||||||||||
| Transfer Agent fees, Class A | 3,084 | 2,305 | 100 | 1,381 | |||||||||||||||
| Transfer Agent fees, Class C | 55 | 84 | 48 | 457 | |||||||||||||||
| Transfer Agent fees, Class Y | 675 | 707 | 36 | 4,312 | |||||||||||||||
| Transfer Agent fees, Class Z | — | — | — | 945 | |||||||||||||||
| Transfer Agent fees, Institutional Class | 17 | — | 26 | — | |||||||||||||||
| Reports to shareholders, Class A | 6,604 | 7,928 | 1,224 | 7,125 | |||||||||||||||
| Reports to shareholders, Class C | 6,505 | 7,057 | 1,206 | 7,125 | |||||||||||||||
| Reports to shareholders, Class Y | 7,486 | 7,192 | 1,203 | 9,688 | |||||||||||||||
| Reports to shareholders, Class Z | — | — | — | 7,485 | |||||||||||||||
| Reports to shareholders, Institutional Class | 6,486 | — | 1,203 | — | |||||||||||||||
| Networking fees, Class A | 26 | 73 | — | 102 | |||||||||||||||
| Networking fees, Class C | 42 | 114 | — | 158 | |||||||||||||||
| Networking fees, Class Y | — | — | — | 68 | |||||||||||||||
| Networking fees, Class Z | — | — | — | 737 | |||||||||||||||
| Registration fees, Class A | 5,334 | 5,297 | — | 5,469 | |||||||||||||||
| Registration fees, Class C | 2,421 | 3,315 | — | 4,759 | |||||||||||||||
| Registration fees, Class Y | 2,558 | 3,274 | — | 3,613 | |||||||||||||||
| Registration fees, Class Z | — | — | — | 10,484 | |||||||||||||||
| Registration fees, Institutional Class | 2,509 | — | — | — | |||||||||||||||
| Trustees' fees and expenses | 9,079 | 9,086 | 1,082 | 9,964 | |||||||||||||||
| Dividend expense on securities sold short | — | 481,777 | 4,950 | — | |||||||||||||||
| Postage and supplies | 2,224 | 4,657 | 981 | 3,205 | |||||||||||||||
| Custodian fees | 162 | 21,031 | 40 | 2,169 | |||||||||||||||
| Compliance fees and expenses | 1,669 | 1,686 | 455 | 728 | |||||||||||||||
| Pricing fees | 712 | 12,687 | 218 | 1,313 | |||||||||||||||
| Offering costs | — | — | 1,352 | — | |||||||||||||||
| Other expenses | — | 587 | 12 | 3,725 | |||||||||||||||
| Total Expenses | 139,202 | 1,148,074 | 41,886 | 1,242,285 | |||||||||||||||
| Fees waived by the Administrator | (12,405 | ) | (73,241 | ) | (1,537 | ) | (156,505 | ) | |||||||||||
| Fees waived and/or expenses reimbursed by the Advisor | (67,764 | ) | (128,586 | ) | (25,319 | ) | — | ||||||||||||
| Net Expenses | 59,033 | 946,247 | 15,030 | 1,085,780 | |||||||||||||||
| Net Investment Income (Loss) | 58,122 | (608,852 | ) | (9,112 | ) | 282,441 | |||||||||||||
77
Statements of Operations (Continued)
| Touchstone Large Cap Relative Value Fund | Touchstone Market Neutral Equity Fund | Touchstone Merger Arbitrage Fund (A) | Touchstone Mid Cap Fund | ||||||||||||||||
| Realized and Unrealized Gains (Losses) on Investments | |||||||||||||||||||
| Net realized gains (losses) from security transactions | $ | 245,061 | $ | (596,750 | ) | $ | 10,082 | $ | 25,256,142 | ||||||||||
| Net change in unrealized appreciation/depreciation on investments | (1,054,309 | ) | 1,926,946 | 7,513 | (14,842,998 | ) | |||||||||||||
| Net Realized and Unrealized Gains (Losses) on Investments | (809,248 | ) | 1,330,196 | 17,595 | 10,413,144 | ||||||||||||||
| Change in Net Assets Resulting from Operations | $ | (751,126 | ) | $ | 721,344 | $ | 8,483 | $ | 10,695,585 | ||||||||||
(A) Represents the period from commencement of operations (August 9, 2011) through September 30, 2011.
| (B) Net of foreign tax withholding of: | $ | — | $ | 827 | $ | — | $ | 12,390 | |||||||||||
See accompanying notes to financial statements.
78
Statements of Operations (Continued)
| Touchstone Mid Cap Value Fund | Touchstone Premium Yield Equity Fund | Touchstone Sands Capital Select Growth Fund (A) | Touchstone Short Duration Fixed Income Fund | ||||||||||||||||
| Investment Income | |||||||||||||||||||
| Dividends from affiliated securities | $ | 1,271 | $ | 2,377 | $ | 39,331 | $ | 1,962 | |||||||||||
| Dividends from non-affiliated securities (B) | 1,054,940 | 1,864,586 | 5,322,239 | — | |||||||||||||||
| Interest | — | — | — | 1,229,193 | |||||||||||||||
| Income from securities loaned | 18,728 | — | 32,149 | — | |||||||||||||||
| Total Investment Income | 1,074,939 | 1,866,963 | 5,393,719 | 1,231,155 | |||||||||||||||
| Expenses | |||||||||||||||||||
| Investment advisory fees | 433,330 | 311,527 | 10,239,402 | 107,773 | |||||||||||||||
| Distribution expenses, Class A | 5,643 | 66,156 | 20,742 | — | |||||||||||||||
| Distribution expenses, Class C | 1,812 | 77,714 | 33,418 | — | |||||||||||||||
| Administration fees | 101,961 | 89,008 | 2,142,251 | 86,219 | |||||||||||||||
| Shareholder servicing fees | — | — | 1,888,170 | 99,394 | |||||||||||||||
| Professional fees | 19,581 | 24,717 | 116,798 | 20,345 | |||||||||||||||
| Transfer Agent fees, Class A | 2,445 | 5,364 | 7,823 | — | |||||||||||||||
| Transfer Agent fees, Class C | 70 | 4,321 | 4,620 | — | |||||||||||||||
| Transfer Agent fees, Class Y | 856 | 3,539 | 125,709 | 1,289 | |||||||||||||||
| Transfer Agent fees, Class Z | — | — | 495,033 | 29,569 | |||||||||||||||
| Transfer Agent fees, Institutional Class | 369 | — | — | — | |||||||||||||||
| Reports to shareholders, Class A | 7,501 | 8,658 | 5,100 | — | |||||||||||||||
| Reports to shareholders, Class C | 6,819 | 8,194 | 4,331 | — | |||||||||||||||
| Reports to shareholders, Class Y | 7,206 | 8,063 | 11,446 | 3,481 | |||||||||||||||
| Reports to shareholders, Class Z | — | — | 134,644 | 8,218 | |||||||||||||||
| Reports to shareholders, Institutional Class | 7,018 | — | — | — | |||||||||||||||
| Networking fees, Class A | 50 | 967 | 2,022 | — | |||||||||||||||
| Networking fees, Class C | 10 | 722 | 1,529 | — | |||||||||||||||
| Networking fees, Class Y | 2 | 98 | 7,524 | — | |||||||||||||||
| Networking fees, Class Z | — | — | 276,592 | 3,225 | |||||||||||||||
| Registration fees, Class A | 5,793 | 9,893 | 5,150 | — | |||||||||||||||
| Registration fees, Class C | 3,298 | 7,955 | 3,265 | — | |||||||||||||||
| Registration fees, Class Y | 5,086 | 13,209 | 29,137 | 6,362 | |||||||||||||||
| Registration fees, Class Z | — | — | 82,478 | 14,355 | |||||||||||||||
| Registration fees, Institutional Class | 4,637 | — | — | — | |||||||||||||||
| Trustees' fees and expenses | 9,091 | 10,049 | 10,331 | 10,048 | |||||||||||||||
| Postage and supplies | 3,159 | 4,203 | 10,757 | 1,420 | |||||||||||||||
| Custodian fees | 1,510 | 4,524 | 17,308 | 1,004 | |||||||||||||||
| Compliance fees and expenses | 1,682 | 1,562 | 760 | 1,435 | |||||||||||||||
| Pricing fees | 1,230 | 886 | 926 | 24,863 | |||||||||||||||
| Other expenses | 594 | 1,500 | 18,519 | 645 | |||||||||||||||
| Total Expenses | 630,753 | 662,829 | 15,695,785 | 419,645 | |||||||||||||||
| Fees waived by the Administrator | (101,961 | ) | (89,008 | ) | (923,778 | ) | (86,219 | ) | |||||||||||
| Fees waived and/or expenses reimbursed by the Advisor | (59,631 | ) | (7,098 | ) | — | (17,857 | ) | ||||||||||||
| Net Expenses | 469,161 | 566,723 | 14,772,007 | 315,569 | |||||||||||||||
| Net Investment Income (Loss) | 605,778 | 1,300,240 | (9,378,288 | ) | 915,586 | ||||||||||||||
79
Statements of Operations (Continued)
| Touchstone Mid Cap Value Fund | Touchstone Premium Yield Equity Fund | Touchstone Sands Capital Select Growth Fund (A) | Touchstone Short Duration Fixed Income Fund | ||||||||||||||||
| Realized and Unrealized Gains (Losses) on Investments | |||||||||||||||||||
| Net realized gains from security transactions | $ | 3,255,733 | $ | 2,415,041 | $ | 20,212,078 | $ | 100,015 | |||||||||||
| Net realized gains from foreign currency transactions | — | 322 | — | — | |||||||||||||||
| Net change in unrealized appreciation/depreciation on investments | (8,152,352 | ) | (120,654 | ) | (15,389,448 | ) | (516,088 | ) | |||||||||||
| Net change in unrealized appreciation/depreciation on foreign currency transactions | — | 7 | — | — | |||||||||||||||
| Net Realized and Unrealized Gains (Losses) on Investments | (4,896,619 | ) | 2,294,716 | 4,822,630 | (416,073 | ) | |||||||||||||
| Change in Net Assets Resulting from Operations | $ | (4,290,841 | ) | $ | 3,594,956 | $ | (4,555,658 | ) | $ | 499,513 | |||||||||
(A) Class A and Class C represent the period from commencement of operations (November 15, 2010) through September 30, 2011.
| (B) Net of foreign tax withholding of: | $ | — | $ | 25,295 | $ | — | $ | — | |||||||||||
See accompanying notes to financial statements.
80
Statements of Operations (Continued)
| Touchstone Total Return Bond Fund | Touchstone | ||||||||||||||||||||||
| Touchstone Small Cap Core Fund | Touchstone Small Cap Value Fund (A) | For the Period Ended September 30, 2011 (B) | For the Year Ended March 31, 2011 | Ultra Short Duration Fixed Income Fund | |||||||||||||||||||
| Investment Income | |||||||||||||||||||||||
| Dividends from affiliated securities | $ | 6,328 | $ | 3,138 | $ | 346 | $ | — | $ | 61,561 | |||||||||||||
| Dividends from non-affiliated securities | 1,968,584 | 1,633,864 | — | 21 | — | ||||||||||||||||||
| Interest | — | — | 523,641 | 828,148 | 5,657,325 | ||||||||||||||||||
| Income from securities loaned | 52,448 | 13,631 | — | — | — | ||||||||||||||||||
| Total Investment Income | 2,027,360 | 1,650,633 | 523,987 | 828,169 | 5,718,886 | ||||||||||||||||||
| Expenses | |||||||||||||||||||||||
| Investment advisory fees | 1,352,814 | 542,517 | 38,912 | 76,647 | 688,037 | ||||||||||||||||||
| Distribution expenses, Class A | 174,423 | 33,886 | 1,545 | 8 | — | ||||||||||||||||||
| Distribution expenses, Class C | 110,499 | 14 | 4,275 | — | — | ||||||||||||||||||
| Administration fees | 318,312 | 114,215 | 13,294 | 59,181 | 550,435 | ||||||||||||||||||
| Shareholder servicing fees | — | 108,678 | — | — | 636,620 | ||||||||||||||||||
| Professional fees | 25,956 | 31,526 | �� | 13,579 | 32,422 | 35,311 | |||||||||||||||||
| Transfer Agent fees | — | — | — | 24,020 | — | ||||||||||||||||||
| Transfer Agent fees, Class A | 184,892 | 22,003 | 830 | — | — | ||||||||||||||||||
| Transfer Agent fees, Class C | 10,663 | 2,281 | 427 | — | — | ||||||||||||||||||
| Transfer Agent fees, Class Y | 28,111 | 3,331 | 8,188 | — | — | ||||||||||||||||||
| Transfer Agent fees, Class Z | — | — | — | — | 98,644 | ||||||||||||||||||
| Transfer Agent fees, Institutional Class | 603 | 2,291 | 54 | — | — | ||||||||||||||||||
| Reports to shareholders | — | — | — | 66 | — | ||||||||||||||||||
| Reports to shareholders, Class A | 36,232 | 6,888 | 1,270 | — | — | ||||||||||||||||||
| Reports to shareholders, Class C | 7,245 | 2,053 | 1,259 | — | — | ||||||||||||||||||
| Reports to shareholders, Class Y | 7,877 | 2,053 | 1,260 | — | — | ||||||||||||||||||
| Reports to shareholders, Class Z | — | — | — | — | 21,202 | ||||||||||||||||||
| Reports to shareholders, Institutional Class | 5,595 | 2,053 | 1,228 | — | — | ||||||||||||||||||
| Networking fees, Class A | 45,834 | 9,396 | 323 | — | — | ||||||||||||||||||
| Networking fees, Class C | 17,204 | — | 294 | — | — | ||||||||||||||||||
| Networking fees, Class Y | 1,627 | — | 34 | — | — | ||||||||||||||||||
| Networking fees, Class Z | — | — | — | — | 11,783 | ||||||||||||||||||
| Networking fees, Institutional Class | — | — | — | — | — | ||||||||||||||||||
| Registration fees | — | — | 8,737 | 22,581 | — | ||||||||||||||||||
| Registration fees, Class A | 17,873 | 1,088 | — | — | — | ||||||||||||||||||
| Registration fees, Class C | 9,288 | 407 | — | — | — | ||||||||||||||||||
| Registration fees, Class Y | 16,286 | 407 | — | — | — | ||||||||||||||||||
| Registration fees, Class Z | — | 33,957 | — | — | 68,569 | ||||||||||||||||||
| Registration fees, Institutional Class | 12,362 | 407 | — | — | — | ||||||||||||||||||
| Trustees' fees and expenses | 9,121 | 9,947 | 6,824 | 3,360 | 10,005 | ||||||||||||||||||
| Postage and supplies | 34,444 | 4,731 | 7,227 | — | 2,592 | ||||||||||||||||||
| Custodian fees | 22,668 | 3,638 | 2,230 | 4,956 | 5,396 | ||||||||||||||||||
| Compliance fees and expenses | 1,236 | 1,309 | 8,228 | 21,250 | 1,138 | ||||||||||||||||||
| Pricing fees | 626 | 1,278 | 10,350 | — | 23,317 | ||||||||||||||||||
| Other expenses | 3,006 | 578 | 16 | 31,343 | 6,729 | ||||||||||||||||||
| Total Expenses | 2,454,797 | 940,932 | 130,384 | 275,834 | 2,159,778 | ||||||||||||||||||
| Fees waived by the Administrator | (318,312 | ) | (100,441 | ) | (13,294 | ) | — | (258,722 | ) | ||||||||||||||
| Fees waived and/or expenses reimbursed by the Advisor | (161,991 | ) | — | (58,144 | ) | (208,164 | ) | — | |||||||||||||||
| Net Expenses | 1,974,494 | 840,491 | 58,946 | 67,670 | 1,901,056 | ||||||||||||||||||
| Net Investment Income | 52,866 | 810,142 | 465,041 | 760,499 | 3,817,830 | ||||||||||||||||||
81
Statements of Operations (Continued)
| Touchstone Total Return Bond Fund | Touchstone | ||||||||||||||||||||||
| Touchstone Small Cap Core Fund | Touchstone Small Cap Value Fund (A) | For the Period Ended September 30, 2011 (B) | For the Year Ended March 31, 2011 | Ultra Short Duration Fixed Income Fund | |||||||||||||||||||
| Realized and Unrealized Gains (Losses) on Investments | |||||||||||||||||||||||
| Net realized gains (losses) from security transactions | $ | 2,090,097 | $ | 19,710,768 | $ | (32,688 | ) | $ | 124,235 | $ | 198,188 | ||||||||||||
| Net change in unrealized appreciation/depreciation on investments | (9,589,918 | ) | (20,021,935 | ) | 655,036 | 292,070 | (989,421 | ) | |||||||||||||||
| Net Realized and Unrealized Gains (Losses) on Investments | (7,499,821 | ) | (311,167 | ) | 622,348 | 416,305 | (791,233 | ) | |||||||||||||||
| Change in Net Assets Resulting from Operations | $ | (7,446,955 | ) | $ | 498,975 | $ | 1,087,389 | $ | 1,176,804 | $ | 3,026,597 | ||||||||||||
(A) Class A, Class C, Class Y and Institutional Class represent the period from commencement of operations (March 1, 2011) through September 30, 2011. Effective June 10, 2011, Class Z shares converted to Class A shares.
(B) Effective August 1, 2011, the Fund changed its fiscal year end from March 31 to September 30 and Investor Class shares and Institutional Class shares were renamed Class A and Class Y shares, respectively. See footnote 9 in the Notes to Financial Statements.
See accompanying notes to financial statements.
82
Statements of Changes in Net Assets
| Touchstone Capital Appreciation Fund | Touchstone Emerging Markets Equity Fund | ||||||||||||||||||
| Year Ended September 30, 2011 | Year Ended September 30, 2010 | Year Ended September 30, 2011 | Year Ended September 30, 2010 | ||||||||||||||||
| From Operations | |||||||||||||||||||
| Net investment income | $ | 42,571 | $ | 29,449 | $ | 4,816,007 | $ | 480,915 | |||||||||||
| Net realized gains from security transactions | 26,019 | 188,578 | 3,834,919 | 361,300 | |||||||||||||||
| Net realized losses from foreign currency transactions | — | — | (369,000 | ) | (89,588 | ) | |||||||||||||
| Net change in unrealized appreciation/depreciation on investments | (409,428 | ) | (25,684 | ) | (90,096,851 | ) | 16,993,167 | ||||||||||||
| Net change in unrealized appreciation/depreciation from foreign currency transactions | — | — | (31,249 | ) | 689 | ||||||||||||||
| Change in Net Assets Resulting from Operations | (340,838 | ) | 192,343 | (81,846,174 | ) | 17,746,483 | |||||||||||||
| Distributions to Shareholders | |||||||||||||||||||
| From net investment income, Class A | (9,445 | ) | — | (37,637 | ) | — | |||||||||||||
| From net investment income, Class C | (26 | ) | — | — | — | ||||||||||||||
| From net investment income, Class Y | (947 | ) | (129 | ) | (105,853 | ) | — | ||||||||||||
| From net investment income, Institutional Class | (25,334 | ) | (7,574 | ) | (412,012 | ) | — | ||||||||||||
| From net realized gains, Class A | (87,062 | ) | — | (43,040 | ) | — | |||||||||||||
| From net realized gains, Class C | (12,556 | ) | — | (10,387 | ) | — | |||||||||||||
| From net realized gains, Class Y | (3,928 | ) | — | (83,966 | ) | — | |||||||||||||
| From net realized gains, Institutional Class | (85,089 | ) | — | (267,192 | ) | — | |||||||||||||
| Decrease in Net Assets from Distributions to Shareholders | (224,387 | ) | (7,703 | ) | (960,087 | ) | — | ||||||||||||
| From Capital Share Transactions | |||||||||||||||||||
| Class A | |||||||||||||||||||
| Proceeds from shares sold | 1,660,684 | 2,826,917 | 45,412,360 | 10,689,819 | |||||||||||||||
| Reinvested distributions | 66,251 | — | 76,185 | — | |||||||||||||||
| Payments for shares redeemed | (381,312 | ) | (105,717 | ) | (23,746,786 | ) | (1,353,192 | ) | |||||||||||
| Change in Net Assets from Class A Share Transactions | 1,345,623 | 2,721,200 | 21,741,759 | 9,336,627 | |||||||||||||||
| Class C | |||||||||||||||||||
| Proceeds from shares sold | 112,610 | 387,455 | 5,128,192 | 3,375,452 | |||||||||||||||
| Reinvested distributions | 12,056 | — | 9,846 | — | |||||||||||||||
| Payments for shares redeemed | (19,726 | ) | (39,304 | ) | (2,139,533 | ) | (177,973 | ) | |||||||||||
| Change in Net Assets from Class C Share Transactions | 104,940 | 348,151 | 2,998,505 | 3,197,479 | |||||||||||||||
| Class Y | |||||||||||||||||||
| Proceeds from shares sold | 23,500 | 172,799 | 177,114,328 | 13,519,919 | |||||||||||||||
| Reinvested distributions | 4,875 | 129 | 185,769 | — | |||||||||||||||
| Payments for shares redeemed | — | (47,635 | ) | (11,790,779 | ) | (789,864 | ) | ||||||||||||
| Change in Net Assets from Class Y Share Transactions | 28,375 | 125,293 | 165,509,318 | 12,730,055 | |||||||||||||||
| Institutional Class | |||||||||||||||||||
| Proceeds from shares sold | — | 2,702,500 | 173,718,140 | 115,334,491 | |||||||||||||||
| Reinvested distributions | 110,423 | 7,574 | 675,282 | — | |||||||||||||||
| Payments for shares redeemed | — | (2,685 | ) | (6,582,664 | ) | (5,400,950 | ) | ||||||||||||
| Change in Net Assets from Institutional Class Share Transactions | 110,423 | 2,707,389 | 167,810,758 | 109,933,541 | |||||||||||||||
| Total Increase in Net Assets | 1,024,136 | 6,086,673 | 275,254,079 | 152,944,185 | |||||||||||||||
| Net Assets | |||||||||||||||||||
| Beginning of period | 6,086,673 | — | 152,944,185 | — | |||||||||||||||
| End of period | $ | 7,110,809 | $ | 6,086,673 | $ | 428,198,264 | $ | 152,944,185 | |||||||||||
| Accumulated Net Investment Income | $ | 29,512 | $ | 22,693 | $ | 4,283,779 | $ | 392,274 | |||||||||||
See accompanying notes to financial statements.
83
Statements of Changes in Net Assets (Continued)
| Touchstone Emerging Markets Equity Fund II | Touchstone Focused Equity Fund | ||||||||||||||
| Period Ended September 30, 2011 (A) | Year Ended September 30, 2011 | Period Ended September 30, 2010 (B) | |||||||||||||
| From Operations | |||||||||||||||
| Net investment income | $ | 39,408 | $ | 446,784 | $ | 14,018 | |||||||||
| Net realized gains (losses) from security transactions | (69,956 | ) | 2,342,938 | 24,083 | |||||||||||
| Net realized losses from foreign currency transactions | (5,386 | ) | — | — | |||||||||||
| Net change in unrealized appreciation/depreciation on investments | (1,135,093 | ) | (31,882,374 | ) | 86,200 | ||||||||||
| Net change in unrealized appreciation/depreciation from foreign currency transactions | (1,915 | ) | — | — | |||||||||||
| Change in Net Assets Resulting from Operations | (1,172,942 | ) | (29,092,652 | ) | 124,301 | ||||||||||
| Distributions to Shareholders | |||||||||||||||
| From net investment income, Class A | — | (6,175 | ) | — | |||||||||||
| From net investment income, Class C | — | (682 | ) | — | |||||||||||
| From net investment income, Institutional Class | — | (29,812 | ) | — | |||||||||||
| From net realized gains, Class A | — | (6,831 | ) | — | |||||||||||
| From net realized gains, Class C | — | (1,492 | ) | — | |||||||||||
| From net realized gains, Class Y | — | (44,364 | ) | — | |||||||||||
| From net realized gains, Institutional Class | — | (6,070 | ) | — | |||||||||||
| Decrease in Net Assets from Distributions to Shareholders | — | (95,426 | ) | — | |||||||||||
| From Capital Share Transactions | |||||||||||||||
| Class A | |||||||||||||||
| Proceeds from shares sold | 491,662 | 120,060,690 | 916,448 | ||||||||||||
| Reinvested distributions | — | 12,845 | — | ||||||||||||
| Payments for shares redeemed | (6,938 | ) | (14,618,995 | ) | (137,021 | ) | |||||||||
| Change in Net Assets from Class A Share Transactions | 484,724 | 105,454,540 | 779,427 | ||||||||||||
| Class C | |||||||||||||||
| Proceeds from shares sold | 20,500 | 185,089 | 191,017 | ||||||||||||
| Reinvested distributions | — | 2,173 | — | ||||||||||||
| Payments for shares redeemed | — | (173,454 | ) | (14,936 | ) | ||||||||||
| Change in Net Assets from Class C Share Transactions | 20,500 | 13,808 | 176,081 | ||||||||||||
| Class Y | |||||||||||||||
| Proceeds from shares sold | 506,617 | 18,934,147 | 187,471 | ||||||||||||
| Reinvested distributions | — | 1,474 | — | ||||||||||||
| Payments for shares redeemed | (207,739 | ) | (3,300,545 | ) | — | ||||||||||
| Change in Net Assets from Class Y Share Transactions | 298,878 | 15,635,076 | 187,471 | ||||||||||||
| Institutional Class | |||||||||||||||
| Proceeds from shares sold | 4,932,680 | 1,125,000 | 1,700,000 | ||||||||||||
| Reinvested distributions | — | 35,882 | — | ||||||||||||
| Payments for shares redeemed | — | (891,605 | ) | (997,308 | ) | ||||||||||
| Change in Net Assets from Institutional Class Share Transactions | 4,932,680 | 269,277 | 702,692 | ||||||||||||
| Total Increase in Net Assets | 4,563,840 | 92,184,623 | 1,969,972 | ||||||||||||
| Net Assets | |||||||||||||||
| Beginning of period | — | 1,969,972 | — | ||||||||||||
| End of period | $ | 4,563,840 | $ | 94,154,595 | $ | 1,969,972 | |||||||||
| Accumulated Net Investment Income | $ | 34,166 | $ | 424,294 | $ | 14,179 | |||||||||
(A) Represents the period from commencement of operations (April 18, 2011) through September 30, 2011.
(B) Represents the period from commencement of operations (December 31, 2009) through September 30, 2010.
See accompanying notes to financial statements.
84
Statements of Changes in Net Assets (Continued)
| Touchstone Global Equity Fund | Touchstone Global Real Estate Fund | ||||||||||||||||||
| Year Ended September 30, 2011 | Year Ended September 30, 2010 | Year Ended September 30, 2011 | Year Ended September 30, 2010 | ||||||||||||||||
| From Operations | |||||||||||||||||||
| Net investment income | $ | 33,180 | $ | 41,332 | $ | 123,690 | $ | 95,911 | |||||||||||
| Net realized gains (losses) from security transactions | 426,999 | (20,378 | ) | 341,338 | 138,925 | ||||||||||||||
| Net realized gains (losses) from foreign currency transactions | (4,368 | ) | (5,684 | ) | 31 | (865 | ) | ||||||||||||
| Net change in unrealized appreciation/depreciation on investments | (626,857 | ) | 313,249 | (953,675 | ) | 318,490 | |||||||||||||
| Net change in unrealized appreciation/depreciation from foreign currency transactions | (236 | ) | 345 | (31 | ) | (26 | ) | ||||||||||||
| Change in Net Assets Resulting from Operations | (171,282 | ) | 328,864 | (488,647 | ) | 552,435 | |||||||||||||
| Distributions to Shareholders | |||||||||||||||||||
| From net investment income, Class A | (6,391 | ) | — | (43,335 | ) | (11,322 | ) | ||||||||||||
| From net investment income, Class C | — | — | (4,244 | ) | (2,628 | ) | |||||||||||||
| From net investment income, Class Y | (1,051 | ) | — | (5,585 | ) | (3,504 | ) | ||||||||||||
| From net investment income, Institutional Class | (31,387 | ) | (661 | ) | (140,094 | ) | (72,747 | ) | |||||||||||
| From net realized gains, Class A | (7,311 | ) | — | (43,479 | ) | — | |||||||||||||
| From net realized gains, Class C | (1,016 | ) | — | (5,042 | ) | — | |||||||||||||
| From net realized gains, Class Y | (1,580 | ) | — | (5,269 | ) | — | |||||||||||||
| From net realized gains, Institutional Class | (29,420 | ) | — | (131,564 | ) | — | |||||||||||||
| Decrease in Net Assets from Distributions to Shareholders | (78,156 | ) | (661 | ) | (378,612 | ) | (90,201 | ) | |||||||||||
| From Capital Share Transactions | |||||||||||||||||||
| Class A | |||||||||||||||||||
| Proceeds from shares sold | 559,641 | 2,163,712 | 2,394,721 | 1,809,940 | |||||||||||||||
| Reinvested distributions | 13,101 | — | 39,565 | 4,131 | |||||||||||||||
| Payments for shares redeemed | (1,803,215 | ) | (434,302 | ) | (958,256 | ) | (918,136 | ) | |||||||||||
| Change in Net Assets from Class A Share Transactions | (1,230,473 | ) | 1,729,410 | 1,476,030 | 895,935 | ||||||||||||||
| Class C | |||||||||||||||||||
| Proceeds from shares sold | 2,723 | 102,506 | 3,658 | 107,708 | |||||||||||||||
| Reinvested distributions | 1,016 | — | 10,112 | 1,801 | |||||||||||||||
| Payments for shares redeemed | — | (2,578 | ) | — | (2,579 | ) | |||||||||||||
| Change in Net Assets from Class C Share Transactions | 3,739 | 99,928 | 13,770 | 106,930 | |||||||||||||||
| Class Y | |||||||||||||||||||
| Proceeds from shares sold | 72,000 | 135,007 | 68,805 | 112,416 | |||||||||||||||
| Reinvested distributions | 2,632 | — | 12,019 | 2,338 | |||||||||||||||
| Payments for shares redeemed | (78 | ) | (2,585 | ) | (64,842 | ) | (2,587 | ) | |||||||||||
| Change in Net Assets from Class Y Share Transactions | 74,554 | 132,422 | 15,982 | 112,167 | |||||||||||||||
| Institutional Class | |||||||||||||||||||
| Proceeds from shares sold | 18,219 | 2,902,660 | — | 2,728,086 | |||||||||||||||
| Reinvested distributions | 60,807 | 661 | 282,243 | 62,162 | |||||||||||||||
| Payments for shares redeemed | (9,008 | ) | (2,585 | ) | (19,414 | ) | (2,805 | ) | |||||||||||
| Change in Net Assets from Institutional Class Share Transactions | 70,018 | 2,900,736 | 262,829 | 2,787,443 | |||||||||||||||
| Total Increase (Decrease) in Net Assets | (1,331,600 | ) | 5,190,699 | 901,352 | 4,364,709 | ||||||||||||||
| Net Assets | |||||||||||||||||||
| Beginning of period | 5,190,699 | — | 4,364,709 | — | |||||||||||||||
| End of period | $ | 3,859,099 | $ | 5,190,699 | $ | 5,266,061 | $ | 4,364,709 | |||||||||||
| Accumulated Net Investment Income | $ | 24,850 | $ | 35,934 | $ | 1,093 | $ | 16,594 | |||||||||||
See accompanying notes to financial statements.
85
Statements of Changes in Net Assets (Continued)
| Touchstone Intermediate Fixed Income Fund | Touchstone International Fixed Income Fund | ||||||||||||||||||
| Year Ended September 30, 2011 | Year Ended September 30, 2010 | Year Ended September 30, 2011 | Year Ended September 30, 2010 | ||||||||||||||||
| From Operations | |||||||||||||||||||
| Net investment income | $ | 2,951,688 | $ | 3,092,916 | $ | 228,414 | $ | 122,984 | |||||||||||
| Net realized gains (losses) from security transactions | 1,209,268 | 1,261,788 | 12,108 | (90,113 | ) | ||||||||||||||
| Net realized gains from foreign currency transactions | — | — | 95,068 | 742,740 | |||||||||||||||
| Net change in unrealized appreciation/depreciation on investments | (1,697,151 | ) | 4,058,725 | (399,947 | ) | 381,935 | |||||||||||||
| Net change in unrealized appreciation/depreciation from foreign currency transactions | — | — | 186,259 | 26,743 | |||||||||||||||
| Change in Net Assets Resulting from Operations | 2,463,805 | 8,413,429 | 121,902 | 1,184,289 | |||||||||||||||
| Distributions to Shareholders | |||||||||||||||||||
| From net investment income, Class A | — | — | (133,401 | ) | (4,889 | ) | |||||||||||||
| From net investment income, Class C | — | — | (34,790 | ) | (1,083 | ) | |||||||||||||
| From net investment income, Class Y | — | — | (46,142 | ) | (1,666 | ) | |||||||||||||
| From net investment income, Institutional Class | (3,044,360 | ) | (3,085,391 | ) | (743,823 | ) | (114,989 | ) | |||||||||||
| From net realized gains, Class A | — | — | (7,028 | ) | — | ||||||||||||||
| From net realized gains, Class C | — | — | (1,865 | ) | — | ||||||||||||||
| From net realized gains, Class Y | — | — | (2,365 | ) | — | ||||||||||||||
| From net realized gains, Institutional Class | — | — | (32,587 | ) | — | ||||||||||||||
| Decrease in Net Assets from Distributions to Shareholders | (3,044,360 | ) | (3,085,391 | ) | (1,002,001 | ) | (122,627 | ) | |||||||||||
| From Capital Share Transactions | |||||||||||||||||||
| Class A | |||||||||||||||||||
| Proceeds from shares sold | — | — | 2,912,442 | 1,245,905 | |||||||||||||||
| Reinvested distributions | — | — | 128,026 | 3,105 | |||||||||||||||
| Payments for shares redeemed | — | — | (1,627,808 | ) | (13,119 | ) | |||||||||||||
| Change in Net Assets from Class A Share Transactions | — | — | 1,412,660 | 1,235,891 | |||||||||||||||
| Class C | |||||||||||||||||||
| Proceeds from shares sold | — | — | 353,277 | 435,129 | |||||||||||||||
| Reinvested distributions | — | — | 36,366 | 732 | |||||||||||||||
| Payments for shares redeemed | — | — | (176,267 | ) | (61,506 | ) | |||||||||||||
| Change in Net Assets from Class C Share Transactions | — | — | 213,376 | 374,355 | |||||||||||||||
| Class Y | |||||||||||||||||||
| Proceeds from shares sold | — | — | 1,754,869 | 243,298 | |||||||||||||||
| Reinvested distributions | — | — | 48,682 | 1,369 | |||||||||||||||
| Payments for shares redeemed | — | — | (1,225,137 | ) | (65,259 | ) | |||||||||||||
| Change in Net Assets from Class Y Share Transactions | — | — | 578,414 | 179,408 | |||||||||||||||
| Institutional Class | |||||||||||||||||||
| Proceeds from shares sold | 8,288,109 | 10,603,276 | 27,361 | 6,724,021 | |||||||||||||||
| Reinvested distributions | 328,509 | 70,548 | 789,049 | 93,468 | |||||||||||||||
| Payments for shares redeemed | (18,564,746 | ) | (10,588,435 | ) | (19,439 | ) | (2,501 | ) | |||||||||||
| Change in Net Assets from Institutional Class Share Transactions | (9,948,128 | ) | 85,389 | 796,971 | 6,814,988 | ||||||||||||||
| Total Increase (Decrease) in Net Assets | (10,528,683 | ) | 5,413,427 | 2,121,322 | 9,666,304 | ||||||||||||||
| Net Assets | |||||||||||||||||||
| Beginning of period | 109,138,409 | 103,724,982 | 9,666,304 | — | |||||||||||||||
| End of period | $ | 98,609,726 | $ | 109,138,409 | $ | 11,787,626 | $ | 9,666,304 | |||||||||||
| Accumulated Net Investment Income (Loss) | $ | 6,968 | $ | 6,862 | $ | (5,963 | ) | $ | 628,712 | ||||||||||
See accompanying notes to financial statements.
86
Statements of Changes in Net Assets (Continued)
| Touchstone Large Cap Relative Value Fund | Touchstone Market Neutral Equity Fund | ||||||||||||||||||
| Year Ended September 30, 2011 | Year Ended September 30, 2010 | Year Ended September 30, 2011 | Year Ended September 30, 2010 | ||||||||||||||||
| From Operations | |||||||||||||||||||
| Net investment income (loss) | $ | 58,122 | $ | 29,177 | $ | (608,852 | ) | $ | (132,337 | ) | |||||||||
| Net realized gains (losses) from security transactions | 245,061 | 1,676 | (596,750 | ) | (448,319 | ) | |||||||||||||
| Net change in unrealized appreciation/depreciation on investments | (1,054,309 | ) | 333,907 | 1,926,946 | 226,121 | ||||||||||||||
| Change in Net Assets Resulting from Operations | (751,126 | ) | 364,760 | 721,344 | (354,535 | ) | |||||||||||||
| Distributions to Shareholders | |||||||||||||||||||
| From net investment income, Class A | (8,077 | ) | (671 | ) | — | — | |||||||||||||
| From net investment income, Class C | (541 | ) | — | — | — | ||||||||||||||
| From net investment income, Class Y | (12,074 | ) | (375 | ) | — | — | |||||||||||||
| From net investment income, Institutional Class | (57,889 | ) | (12,250 | ) | — | — | |||||||||||||
| From net realized gains, Class A | (238 | ) | — | — | — | ||||||||||||||
| From net realized gains, Class C | (120 | ) | — | — | — | ||||||||||||||
| From net realized gains, Class Y | (51 | ) | — | — | — | ||||||||||||||
| From net realized gains, Institutional Class | (1,372 | ) | — | — | — | ||||||||||||||
| Decrease in Net Assets from Distributions to Shareholders | (80,362 | ) | (13,296 | ) | — | — | |||||||||||||
| From Capital Share Transactions | |||||||||||||||||||
| Class A | |||||||||||||||||||
| Proceeds from shares sold | 1,357,188 | 478,479 | 3,389,554 | 1,378,205 | |||||||||||||||
| Reinvested distributions | 8,315 | 234 | — | — | |||||||||||||||
| Payments for shares redeemed | (1,172,139 | ) | (20,601 | ) | (711,849 | ) | (742,866 | ) | |||||||||||
| Change in Net Assets from Class A Share Transactions | 193,364 | 458,112 | 2,677,705 | 635,339 | |||||||||||||||
| Class C | |||||||||||||||||||
| Proceeds from shares sold | 84,858 | 224,349 | 127,080 | 179,574 | |||||||||||||||
| Reinvested distributions | 661 | — | — | — | |||||||||||||||
| Payments for shares redeemed | (31,669 | ) | (5,682 | ) | (112,854 | ) | (7,513 | ) | |||||||||||
| Change in Net Assets from Class C Share Transactions | 53,850 | 218,667 | 14,226 | 172,061 | |||||||||||||||
| Class Y | |||||||||||||||||||
| Proceeds from shares sold | 3,564,715 | 102,690 | 7,781,351 | 32,758,376 | |||||||||||||||
| Reinvested distributions | 12,124 | 185 | — | — | |||||||||||||||
| Payments for shares redeemed | (674,355 | ) | (2,693 | ) | (476,364 | ) | (27,786 | ) | |||||||||||
| Change in Net Assets from Class Y Share Transactions | 2,902,484 | 100,182 | 7,304,987 | 32,730,590 | |||||||||||||||
| Institutional Class | |||||||||||||||||||
| Proceeds from shares sold | — | 2,708,680 | — | — | |||||||||||||||
| Reinvested distributions | 59,261 | 6,070 | — | — | |||||||||||||||
| Payments for shares redeemed | — | (2,693 | ) | — | — | ||||||||||||||
| Change in Net Assets from Institutional Class Share Transactions | 59,261 | 2,712,057 | — | — | |||||||||||||||
| Total Increase in Net Assets | 2,377,471 | 3,840,482 | 10,718,262 | 33,183,455 | |||||||||||||||
| Net Assets | |||||||||||||||||||
| Beginning of period | 3,840,482 | — | 33,183,455 | — | |||||||||||||||
| End of period | $ | 6,217,953 | $ | 3,840,482 | $ | 43,901,717 | $ | 33,183,455 | |||||||||||
| Accumulated Net Investment Income (Loss) | $ | — | $ | 16,828 | $ | (8,388 | ) | $ | (9,165 | ) | |||||||||
See accompanying notes to financial statements.
87
Statements of Changes in Net Assets (Continued)
| Touchstone Merger Arbitrage Fund | Touchstone Mid Cap Fund | ||||||||||||||
| Period Ended September 30, 2011 (A) | Year Ended September 30, 2011 | Year Ended September 30, 2010 | |||||||||||||
| From Operations | |||||||||||||||
| Net investment income (loss) | $ | (9,112 | ) | $ | 282,441 | $ | 1,008,789 | ||||||||
| Net realized gains from security transactions | 10,082 | 25,256,142 | 23,865,581 | ||||||||||||
| Net change in unrealized appreciation/depreciation on investments | 7,513 | (14,842,998 | ) | (6,883,713 | ) | ||||||||||
| Change in Net Assets Resulting from Operations | 8,483 | 10,695,585 | 17,990,657 | ||||||||||||
| Distributions to Shareholders | |||||||||||||||
| From net investment income, Class A | — | — | (2,244 | ) | |||||||||||
| From net investment income, Class Y | — | (273,246 | ) | (1,190,969 | ) | ||||||||||
| From net investment income, Class Z | — | — | (9,678 | ) | |||||||||||
| Decrease in Net Assets from Distributions to Shareholders | — | (273,246 | ) | (1,202,891 | ) | ||||||||||
| From Capital Share Transactions | |||||||||||||||
| Class A | |||||||||||||||
| Proceeds from shares sold | 260,434 | 231,656 | 315,759 | ||||||||||||
| Reinvested distributions | — | — | 1,943 | ||||||||||||
| Payments for shares redeemed | — | (238,503 | ) | (136,363 | ) | ||||||||||
| Change in Net Assets from Class A Share Transactions | 260,434 | (6,847 | ) | 181,339 | |||||||||||
| Class C | |||||||||||||||
| Proceeds from shares sold | 254,776 | 309,661 | 74,942 | ||||||||||||
| Payments for shares redeemed | — | (58,829 | ) | (17,589 | ) | ||||||||||
| Change in Net Assets from Class C Share Transactions | 254,776 | 250,832 | 57,353 | ||||||||||||
| Class Y | |||||||||||||||
| Proceeds from shares sold | 1,163,250 | 16,486,326 | 4,737,552 | ||||||||||||
| Reinvested distributions | — | 10,151 | 60,646 | ||||||||||||
| Payments for shares redeemed | — | (72,682,133 | ) | (66,295,717 | ) | ||||||||||
| Change in Net Assets from Class Y Share Transactions | 1,163,250 | (56,185,656 | ) | (61,497,519 | ) | ||||||||||
| Class Z | |||||||||||||||
| Proceeds from shares sold | — | 2,449,859 | 1,292,972 | ||||||||||||
| Reinvested distributions | — | — | 9,404 | ||||||||||||
| Payments for shares redeemed | — | (2,115,870 | ) | (2,500,722 | ) | ||||||||||
| Change in Net Assets from Class Z Share Transactions | — | 333,989 | (1,198,346 | ) | |||||||||||
| Institutional Class | |||||||||||||||
| Proceeds from shares sold | 5,002,500 | — | — | ||||||||||||
| Change in Net Assets from Institutional Class Share Transactions | 5,002,500 | — | — | ||||||||||||
| Total Increase (Decrease) in Net Assets | 6,689,443 | (45,185,343 | ) | (45,669,407 | ) | ||||||||||
| Net Assets | |||||||||||||||
| Beginning of period | — | 125,079,367 | 170,748,774 | ||||||||||||
| End of period | $ | 6,689,443 | $ | 79,894,024 | $ | 125,079,367 | |||||||||
| Accumulated Net Investment Income (Loss) | $ | (1,883 | ) | $ | 37,908 | $ | 185,791 | ||||||||
(A) Represents the period from commencement of operations (August 9, 2011) through September 30, 2011.
See accompanying notes to financial statements.
88
Statements of Changes in Net Assets (Continued)
| Touchstone Mid Cap Value Fund | Touchstone Premium Yield Equity Fund | ||||||||||||||||||
| Year Ended September 30, 2011 | Year Ended September 30, 2010 | Year Ended September 30, 2011 | Year Ended September 30, 2010 | ||||||||||||||||
| From Operations | |||||||||||||||||||
| Net investment income | $ | 605,778 | $ | 102,980 | $ | 1,300,240 | $ | 1,046,941 | |||||||||||
| Net realized gains from security transactions | 3,255,733 | 238,449 | 2,415,041 | 50,767 | |||||||||||||||
| Net realized gains from foreign currency transactions | — | — | 322 | — | |||||||||||||||
| Net change in unrealized appreciation/depreciation on investments | (8,152,352 | ) | 758,442 | (120,654 | ) | 2,562,610 | |||||||||||||
| Net change in unrealized appreciation/depreciation from foreign currency transactions | — | — | 7 | (7 | ) | ||||||||||||||
| Change in Net Assets Resulting from Operations | (4,290,841 | ) | 1,099,871 | 3,594,956 | 3,660,311 | ||||||||||||||
| Distributions to Shareholders | |||||||||||||||||||
| From net investment income, Class A | (18,796 | ) | (1,976 | ) | (783,294 | ) | (667,836 | ) | |||||||||||
| From net investment income, Class C | (470 | ) | (432 | ) | (179,677 | ) | (122,960 | ) | |||||||||||
| From net investment income, Class Y | (28,493 | ) | (2,739 | ) | (332,573 | ) | (223,195 | ) | |||||||||||
| From net investment income, Institutional Class | (555,638 | ) | (62,130 | ) | — | — | |||||||||||||
| From net realized gains, Class A | (8,176 | ) | — | — | — | ||||||||||||||
| From net realized gains, Class C | (1,773 | ) | — | — | — | ||||||||||||||
| From net realized gains, Class Y | (8,159 | ) | — | — | — | ||||||||||||||
| From net realized gains, Institutional Class | (526,560 | ) | — | — | — | ||||||||||||||
| Decrease in Net Assets from Distributions to Shareholders | (1,148,065 | ) | (67,277 | ) | (1,295,544 | ) | (1,013,991 | ) | |||||||||||
| From Capital Share Transactions | |||||||||||||||||||
| Class A | |||||||||||||||||||
| Proceeds from shares sold | 4,384,562 | 510,831 | 7,308,051 | 2,968,118 | |||||||||||||||
| Reinvested distributions | 26,888 | 1,628 | 781,388 | 586,882 | |||||||||||||||
| Payments for shares redeemed | (1,823,276 | ) | (180,663 | ) | (2,520,094 | ) | (2,878,322 | ) | |||||||||||
| Change in Net Assets from Class A Share Transactions | 2,588,174 | 331,796 | 5,569,345 | 676,678 | |||||||||||||||
| Class C | |||||||||||||||||||
| Proceeds from shares sold | 112,061 | 115,187 | 1,961,365 | 3,646,302 | |||||||||||||||
| Reinvested distributions | 2,243 | 432 | 149,469 | 76,606 | |||||||||||||||
| Payments for shares redeemed | (11,357 | ) | (2,665 | ) | (1,763,905 | ) | (575,335 | ) | |||||||||||
| Change in Net Assets from Class C Share Transactions | 102,947 | 112,954 | 346,929 | 3,147,573 | |||||||||||||||
| Class Y | |||||||||||||||||||
| Proceeds from shares sold | 5,312,984 | 531,122 | 8,576,183 | 11,881,432 | |||||||||||||||
| Reinvested distributions | 37,124 | 1,817 | 274,614 | 168,237 | |||||||||||||||
| Payments for shares redeemed | (193,562 | ) | (2,681 | ) | (17,699,494 | ) | (1,417,237 | ) | |||||||||||
| Change in Net Assets from Class Y Share Transactions | 5,156,546 | 530,258 | (8,848,697 | ) | 10,632,432 | ||||||||||||||
| Institutional Class | |||||||||||||||||||
| Proceeds from shares sold | 2,992,360 | 38,539,982 | — | — | |||||||||||||||
| Reinvested distributions | 1,115,061 | 29,266 | — | — | |||||||||||||||
| Payments for shares redeemed | (28,782 | ) | (2,672 | ) | — | — | |||||||||||||
| Change in Net Assets from Institutional Class Share Transactions | 4,078,639 | 38,566,576 | — | — | |||||||||||||||
| Total Increase (Decrease) in Net Assets | 6,487,400 | 40,574,178 | (633,011 | ) | 17,103,003 | ||||||||||||||
| Net Assets | |||||||||||||||||||
| Beginning of period | 40,574,178 | — | 40,851,776 | 23,748,773 | |||||||||||||||
| End of period | $ | 47,061,578 | $ | 40,574,178 | $ | 40,218,765 | $ | 40,851,776 | |||||||||||
| Accumulated Net Investment Income | $ | 34,420 | $ | 35,000 | $ | 81,863 | $ | 28,330 | |||||||||||
See accompanying notes to financial statements.
89
Statements of Changes in Net Assets (Continued)
| Touchstone Sands Capital Select Growth Fund | Touchstone Short Duration Fixed Income Fund | ||||||||||||||||||
| Year Ended September 30, 2011 (A) | Year Ended September 30, 2010 | Year Ended September 30, 2011 | Year Ended September 30, 2010 | ||||||||||||||||
| From Operations | |||||||||||||||||||
| Net investment income (loss) | $ | (9,378,288 | ) | $ | (3,800,152 | ) | $ | 915,586 | $ | 1,260,873 | |||||||||
| Net realized gains from security transactions | 20,212,078 | 23,075,415 | 100,015 | 91,449 | |||||||||||||||
| Net change in unrealized appreciation/depreciation on investments | (15,389,448 | ) | 76,755,229 | (516,088 | ) | 73,170 | |||||||||||||
| Change in Net Assets Resulting from Operations | (4,555,658 | ) | 96,030,492 | 499,513 | 1,425,492 | ||||||||||||||
| Distributions to Shareholders | |||||||||||||||||||
| From net investment income, Class Y | — | — | (38,278 | ) | (19,058 | ) | |||||||||||||
| From net investment income, Class Z | — | — | (1,139,078 | ) | (1,309,105 | ) | |||||||||||||
| Decrease in Net Assets from Distributions to Shareholders | — | — | (1,177,356 | ) | (1,328,163 | ) | |||||||||||||
| From Capital Share Transactions | |||||||||||||||||||
| Class A | |||||||||||||||||||
| Proceeds from shares sold | 27,620,462 | — | — | — | |||||||||||||||
| Payments for shares redeemed | (3,991,793 | ) | — | — | — | ||||||||||||||
| Change in Net Assets from Class A Share Transactions | 23,628,669 | — | — | — | |||||||||||||||
| Class C | |||||||||||||||||||
| Proceeds from shares sold | 9,740,865 | — | — | — | |||||||||||||||
| Payments for shares redeemed | (155,138 | ) | — | — | — | ||||||||||||||
| Change in Net Assets from Class C Share Transactions | 9,585,727 | — | — | — | |||||||||||||||
| Class Y | |||||||||||||||||||
| Proceeds from shares sold | 353,708,625 | 45,593,062 | 2,313,962 | 922,720 | |||||||||||||||
| Reinvested distributions | — | — | 3,293 | 10,514 | |||||||||||||||
| Payments for shares redeemed | (58,056,051 | ) | (26,763,035 | ) | (1,903,448 | ) | (758,186 | ) | |||||||||||
| Change in Net Assets from Class Y Share Transactions | 295,652,574 | 18,830,027 | 413,807 | 175,048 | |||||||||||||||
| Class Z | |||||||||||||||||||
| Proceeds from shares sold | 680,698,491 | 257,169,126 | 7,952,507 | 7,512,315 | |||||||||||||||
| Reinvested distributions | — | — | 1,140,674 | 1,152,025 | |||||||||||||||
| Payments for shares redeemed | (331,487,191 | ) | (127,486,213 | ) | (11,733,361 | ) | (9,099,002 | ) | |||||||||||
| Change in Net Assets from Class Z Share Transactions | 349,211,300 | 129,682,913 | (2,640,180 | ) | (434,662 | ) | |||||||||||||
| Total Increase (Decrease) in Net Assets | 673,522,612 | 244,543,432 | (2,904,216 | ) | (162,285 | ) | |||||||||||||
| Net Assets | |||||||||||||||||||
| Beginning of period | 660,661,319 | 416,117,887 | 44,178,311 | 44,340,596 | |||||||||||||||
| End of period | $ | 1,334,183,931 | $ | 660,661,319 | $ | 41,274,095 | $ | 44,178,311 | |||||||||||
| Accumulated Net Investment Income | $ | — | $ | — | $ | 32,564 | $ | 79,721 | |||||||||||
(A) Class A and Class C represent the period from commencement of operations (November 15, 2010) through September 30, 2011.
See accompanying notes to financial statements.
90
Statements of Changes in Net Assets (Continued)
| Touchstone Small Cap Core Fund | Touchstone Small Cap Value Fund | ||||||||||||||||||
| Year Ended September 30, 2011 | Year Ended September 30, 2010 | Year Ended September 30, 2011 (A) | Year Ended September 30, 2010 | ||||||||||||||||
| From Operations | |||||||||||||||||||
| Net investment income | $ | 52,866 | $ | 204,546 | $ | 810,142 | $ | 1,786 | |||||||||||
| Net realized gains (losses) from security transactions | 2,090,097 | (314,666 | ) | 19,710,768 | 11,410,624 | ||||||||||||||
| Net change in unrealized appreciation/depreciation on investments | (9,589,918 | ) | 4,836,454 | (20,021,935 | ) | (3,524,275 | ) | ||||||||||||
| Change in Net Assets Resulting from Operations | (7,446,955 | ) | 4,726,334 | 498,975 | 7,888,135 | ||||||||||||||
| Distributions to Shareholders | |||||||||||||||||||
| From net investment income, Class A | (41,566 | ) | — | (127,653 | ) | — | |||||||||||||
| From net investment income, Class C | (275 | ) | — | (19 | ) | — | |||||||||||||
| From net investment income, Class Y | (88,965 | ) | — | (94 | ) | — | |||||||||||||
| From net investment income, Class Z | — | — | (593,961 | ) | — | ||||||||||||||
| From net investment income, Institutional Class | (46,227 | ) | (9,676 | ) | (3,526 | ) | — | ||||||||||||
| From net realized gains, Class A | (1,431 | ) | — | — | — | ||||||||||||||
| From net realized gains, Class C | (178 | ) | — | — | — | ||||||||||||||
| From net realized gains, Class Y | (925 | ) | — | — | — | ||||||||||||||
| From net realized gains, Institutional Class | (332 | ) | — | — | — | ||||||||||||||
| Decrease in Net Assets from Distributions to Shareholders | (179,899 | ) | (9,676 | ) | (725,253 | ) | — | ||||||||||||
| From Capital Share Transactions | |||||||||||||||||||
| Class A | |||||||||||||||||||
| Proceeds from shares sold | 49,502,790 | 57,444,349 | 51,383,529 | — | |||||||||||||||
| Reinvested distributions | 41,411 | — | 124,666 | — | |||||||||||||||
| Payments for shares redeemed | (54,781,287 | ) | (9,088,619 | ) | (7,027,740 | ) | — | ||||||||||||
| Change in Net Assets from Class A Share Transactions | (5,237,086 | ) | 48,355,730 | 44,480,455 | — | ||||||||||||||
| Class C | |||||||||||||||||||
| Proceeds from shares sold | 9,636,367 | 5,255,017 | 2,500 | — | |||||||||||||||
| Reinvested distributions | 390 | — | 19 | — | |||||||||||||||
| Payments for shares redeemed | (2,502,825 | ) | (229,528 | ) | — | — | |||||||||||||
| Change in Net Assets from Class C Share Transactions | 7,133,932 | 5,025,489 | 2,519 | — | |||||||||||||||
| Class Y | |||||||||||||||||||
| Proceeds from shares sold | 48,551,714 | 35,903,813 | 22,500 | — | |||||||||||||||
| Reinvested distributions | 82,193 | — | 94 | — | |||||||||||||||
| Payments for shares redeemed | (22,803,876 | ) | (4,138,193 | ) | (15,998 | ) | — | ||||||||||||
| Change in Net Assets from Class Y Share Transactions | 25,830,031 | 31,765,620 | 6,596 | — | |||||||||||||||
| Class Z | |||||||||||||||||||
| Proceeds from shares sold | — | — | 7,143,600 | 10,847,236 | |||||||||||||||
| Reinvested distributions | — | — | 582,090 | — | |||||||||||||||
| Payments for shares redeemed | — | — | (79,340,060 | ) | (38,228,648 | ) | |||||||||||||
| Change in Net Assets from Class Z Share Transactions | — | — | (71,614,370 | ) | (27,381,412 | ) | |||||||||||||
| Institutional Class | |||||||||||||||||||
| Proceeds from shares sold | 45,250,009 | 12,486,385 | 924,895 | — | |||||||||||||||
| Reinvested distributions | 46,227 | 9,676 | 3,526 | — | |||||||||||||||
| Payments for shares redeemed | (8,662,099 | ) | (3,081,576 | ) | — | — | |||||||||||||
| Change in Net Assets from Institutional Class Share Transactions | 36,634,137 | 9,414,485 | 928,421 | — | |||||||||||||||
| Total Increase (Decrease) in Net Assets | 56,734,160 | 99,277,982 | (26,422,657 | ) | (19,493,277 | ) | |||||||||||||
| Net Assets | |||||||||||||||||||
| Beginning of period | 99,277,982 | — | 64,552,864 | 84,046,141 | |||||||||||||||
| End of period | $ | 156,012,142 | $ | 99,277,982 | $ | 38,130,207 | $ | 64,552,864 | |||||||||||
| Accumulated Net Investment Income | $ | 31,004 | $ | 168,505 | $ | 213,882 | $ | 56,761 | |||||||||||
(A) Class A, Class C, Class Y and Institutional Class represent the period from commencement of operations (March 1, 2011) through September 30, 2011. Effective June 10, 2011, Class Z shares converted to Class A shares.
See accompanying notes to financial statements.
91
Statements of Changes in Net Assets (Continued)
| Touchstone Total Return Bond Fund(+) | |||||||||||||||
| Period Ended September 30, 2011* | Year Ended March 31, 2011 | Year Ended March 31, 2010 | |||||||||||||
| From Operations | |||||||||||||||
| Net investment income | $ | 465,041 | $ | 760,499 | $ | 795,777 | |||||||||
| Net realized gains (losses) from security transactions | (32,688 | ) | 124,235 | (299,727 | ) | ||||||||||
| Net change in unrealized appreciation/depreciation on investments | 655,036 | 292,070 | 2,314,114 | ||||||||||||
| Change in Net Assets Resulting from Operations | 1,087,389 | 1,176,804 | 2,810,164 | ||||||||||||
| Distributions to Shareholders | |||||||||||||||
| From net investment income, Class A | (32,331 | ) | (204 | ) | — | ||||||||||
| From net investment income, Class C | (17,889 | ) | — | — | |||||||||||
| From net investment income, Class Y | (382,064 | ) | (796,480 | ) | (848,236 | ) | |||||||||
| From net investment income, Institutional Class | (56,657 | ) | — | — | |||||||||||
| Decrease in Net Assets from Distributions to Shareholders | (488,941 | ) | (796,684 | ) | (848,236 | ) | |||||||||
| From Capital Share Transactions | |||||||||||||||
| Class A* | |||||||||||||||
| Proceeds from shares sold | 1,404,720 | 7,000 | — | ||||||||||||
| Reinvested distributions | 26,290 | 204 | — | ||||||||||||
| Proceeds from shares issued in connection with merger** | 3,333,082 | — | — | ||||||||||||
| Payments for shares redeemed | (62,433 | ) | — | — | |||||||||||
| Change in Net Assets from Class A Share Transactions | 4,701,659 | 7,204 | — | ||||||||||||
| Class C | |||||||||||||||
| Proceeds from shares sold | 107,577 | — | — | ||||||||||||
| Reinvested distributions | 15,634 | — | — | ||||||||||||
| Proceeds from shares issued in connection with merger** | 2,488,799 | — | — | ||||||||||||
| Payments for shares redeemed | (49,260 | ) | — | — | |||||||||||
| Change in Net Assets from Class C Share Transactions | 2,562,750 | — | — | ||||||||||||
| Class Y* | |||||||||||||||
| Proceeds from shares sold | 1,548,765 | 2,061,368 | 3,565,320 | ||||||||||||
| Reinvested distributions | 379,097 | 768,862 | 831,554 | ||||||||||||
| Proceeds from shares issued in connection with merger** | 617,477 | — | — | ||||||||||||
| Payments for shares redeemed | (1,731,835 | ) | (3,575,575 | ) | (2,557,127 | ) | |||||||||
| Change in Net Assets from Class Y Share Transactions | 813,504 | (745,345 | ) | 1,839,747 | |||||||||||
| Institutional Class | |||||||||||||||
| Proceeds from shares sold | — | — | — | ||||||||||||
| Reinvested distributions | 56,657 | — | — | ||||||||||||
| Proceeds from shares issued in connection with merger** | 6,267,909 | — | — | ||||||||||||
| Payments for shares redeemed | — | — | — | ||||||||||||
| Change in Net Assets from Institutional Class Share Transactions | 6,324,566 | — | — | ||||||||||||
| Total Increase (Decrease) in Net Assets | 15,000,927 | (358,021 | ) | 3,801,675 | |||||||||||
| Net Assets | |||||||||||||||
| Beginning of period | 16,518,673 | 16,876,694 | 13,075,019 | ||||||||||||
| End of period | $ | 31,519,600 | $ | 16,518,673 | $ | 16,876,694 | |||||||||
| Accumulated Net Investment Income | $ | 211,650 | $ | — | $ | — | |||||||||
(+) Touchstone Total Return Bond Fund acquired all of the assets and liabilities of EARNEST Partners Fixed Income Trust ("Predecessor Fund") in a reorganization on August 1, 2011. The Predecessor Fund's performance and financial history have been adopted by Touchstone Total Return Bond Fund and will be used going forward. As a result, the information prior to August 1, 2011 reflects that of the Predecessor Fund.
* Effective August 1, 2011, the Fund changed its fiscal year end from March 31 to September 30 and Investor Class shares and Institutional Class shares were renamed Class A and Class Y shares, respectively. See footnote 9 in the Notes to Financial Statements.
** See footnote 9 in the notes to financial statements.
See accompanying notes to financial statements.
92
Statements of Changes in Net Assets (Continued)
| Touchstone Ultra Short Duration Fixed Income Fund | |||||||||||
| Year Ended September 30, 2011 | Year Ended September 30, 2010 | ||||||||||
| From Operations | |||||||||||
| Net investment income | $ | 3,817,830 | $ | 2,565,502 | |||||||
| Net realized gains from security transactions | 198,188 | 194,688 | |||||||||
| Net change in unrealized appreciation/depreciation on investments | (989,421 | ) | 606,191 | ||||||||
| Change in Net Assets Resulting from Operations | 3,026,597 | 3,366,381 | |||||||||
| Distributions to Shareholders | |||||||||||
| From net investment income, Class Z | (5,857,004 | ) | (3,337,850 | ) | |||||||
| Decrease in Net Assets from Distributions to Shareholders | (5,857,004 | ) | (3,337,850 | ) | |||||||
| From Capital Share Transactions | |||||||||||
| Class Z | |||||||||||
| Proceeds from shares sold | 342,321,287 | 193,844,586 | |||||||||
| Reinvested distributions | 5,111,991 | 2,696,793 | |||||||||
| Payments for shares redeemed | (235,121,390 | ) | (68,472,264 | ) | |||||||
| Change in Net Assets from Class Z Share Transactions | 112,311,888 | 128,069,115 | |||||||||
| Total Increase in Net Assets | 109,481,481 | 128,097,646 | |||||||||
| Net Assets | |||||||||||
| Beginning of period | 236,649,903 | 108,552,257 | |||||||||
| End of period | $ | 346,131,384 | $ | 236,649,903 | |||||||
| Accumulated Net Investment Income | $ | 283,674 | $ | 137,423 | |||||||
See accompanying notes to financial statements.
93
Financial Highlights
Touchstone Capital Appreciation Fund — Class A
Per Share Data for a Share Outstanding Throughout the Period
| Year Ended September 30, | |||||||||||
| 2011 | 2010 (A) | ||||||||||
| Net asset value at beginning of period | $ | 10.61 | $ | 10.00 | |||||||
| Income (loss) from investment operations: | |||||||||||
| Net investment income | 0.04 | 0.03 | |||||||||
| Net realized and unrealized gains (losses) on investments | (0.35 | ) | 0.58 | ||||||||
| Total from investment operations | (0.31 | ) | 0.61 | ||||||||
| Less distributions: | |||||||||||
| Dividends from net investment income | (0.03 | ) | — | ||||||||
| Distributions from net realized gains | (0.31 | ) | — | ||||||||
| Total distributions | (0.34 | ) | — | ||||||||
| Net asset value at end of period | $ | 9.96 | $ | 10.61 | |||||||
| Total return (B) | (3.17 | %) | 6.10 | % | |||||||
| Net assets at end of period (000s) | $ | 3,746 | $ | 2,728 | |||||||
| Ratio of net expenses to average net assets | 1.19 | % | 1.19 | % | |||||||
| Ratio of gross expenses to average net assets | 2.32 | % | 2.38 | % | |||||||
| Ratio of net investment income to average net assets | 0.44 | % | 0.38 | % | |||||||
| Portfolio turnover rate | 16 | % | 33 | % | |||||||
Touchstone Capital Appreciation Fund — Class C
Per Share Data for a Share Outstanding Throughout the Period
| Year Ended September 30, | |||||||||||
| 2011 | 2010 (A) | ||||||||||
| Net asset value at beginning of period | $ | 10.53 | $ | 10.00 | |||||||
| Income (loss) from investment operations: | |||||||||||
| Net investment loss | (0.03 | ) | (0.03 | ) | |||||||
| Net realized and unrealized gains (losses) on investments | (0.36 | ) | 0.56 | ||||||||
| Total from investment operations | (0.39 | ) | 0.53 | ||||||||
| Less distributions: | |||||||||||
| Dividends from net investment income | (0.00 | ) (C) | — | ||||||||
| Distributions from net realized gains | (0.31 | ) | — | ||||||||
| Total distributions | (0.31 | ) | — | ||||||||
| Net asset value at end of period | $ | 9.83 | $ | 10.53 | |||||||
| Total return (B) | (3.95 | %) | 5.30 | % | |||||||
| Net assets at end of period (000s) | $ | 421 | $ | 352 | |||||||
| Ratio of net expenses to average net assets | 1.94 | % | 1.94 | % | |||||||
| Ratio of gross expenses to average net assets | 5.81 | % | 2.99 | % | |||||||
| Ratio of net investment loss to average net assets | (0.31 | %) | (0.37 | %) | |||||||
| Portfolio turnover rate | 16 | % | 33 | % | |||||||
(A) The Fund commenced operations on October 1, 2009.
(B) Total returns shown exclude the effect of applicable sales loads.
(C) Amount rounds to less than $0.005 per share.
See accompanying notes to financial statements.
94
Financial Highlights (Continued)
Touchstone Capital Appreciation Fund — Class Y
Per Share Data for a Share Outstanding Throughout the Period
| Year Ended September 30, | |||||||||||
| 2011 | 2010 (A) | ||||||||||
| Net asset value at beginning of period | $ | 10.63 | $ | 10.00 | |||||||
| Income (loss) from investment operations: | |||||||||||
| Net investment income | 0.07 | 0.06 | |||||||||
| Net realized and unrealized gains (losses) on investments | (0.36 | ) | 0.58 | ||||||||
| Total from investment operations | (0.29 | ) | 0.64 | ||||||||
| Less distributions: | |||||||||||
| Dividends from net investment income | (0.07 | ) | (0.01 | ) | |||||||
| Distributions from net realized gains | (0.31 | ) | — | ||||||||
| Total distributions | (0.38 | ) | (0.01 | ) | |||||||
| Net asset value at end of period | $ | 9.96 | $ | 10.63 | |||||||
| Total return | (3.00 | %) | 6.42 | % | |||||||
| Net assets at end of period (000s) | $ | 149 | $ | 132 | |||||||
| Ratio of net expenses to average net assets | 0.94 | % | 0.94 | % | |||||||
| Ratio of gross expenses to average net assets | 11.62 | % | 2.20 | % | |||||||
| Ratio of net investment income to average net assets | 0.69 | % | 0.62 | % | |||||||
| Portfolio turnover rate | 16 | % | 33 | % | |||||||
Touchstone Capital Appreciation Fund — Institutional Class
Per Share Data for a Share Outstanding Throughout the Period
| Year Ended September 30, | |||||||||||
| 2011 | 2010 (A) | ||||||||||
| Net asset value at beginning of period | $ | 10.62 | $ | 10.00 | |||||||
| Income (loss) from investment operations: | |||||||||||
| Net investment income | 0.09 | 0.09 | |||||||||
| Net realized and unrealized gains (losses) on investments | (0.35 | ) | 0.56 | ||||||||
| Total from investment operations | (0.26 | ) | 0.65 | ||||||||
| Less distributions: | |||||||||||
| Dividends from net investment income | (0.09 | ) | (0.03 | ) | |||||||
| Distributions from net realized gains | (0.31 | ) | — | ||||||||
| Total distributions | (0.40 | ) | (0.03 | ) | |||||||
| Net asset value at end of period | $ | 9.96 | $ | 10.62 | |||||||
| Total return | (2.75 | %) | 6.48 | % | |||||||
| Net assets at end of period (000s) | $ | 2,795 | $ | 2,875 | |||||||
| Ratio of net expenses to average net assets | 0.79 | % | 0.79 | % | |||||||
| Ratio of gross expenses to average net assets | 1.80 | % | 1.94 | % | |||||||
| Ratio of net investment income to average net assets | 0.84 | % | 0.79 | % | |||||||
| Portfolio turnover rate | 16 | % | 33 | % | |||||||
(A) The Fund commenced operations on October 1, 2009.
See accompanying notes to financial statements.
95
Financial Highlights (Continued)
Touchstone Emerging Markets Equity Fund — Class A
Per Share Data for a Share Outstanding Throughout the Period
| Year Ended September 30, | |||||||||||
| 2011 | 2010 (A) | ||||||||||
| Net asset value at beginning of period | $ | 12.68 | $ | 10.00 | |||||||
| Income (loss) from investment operations: | |||||||||||
| Net investment income | 0.10 | 0.03 | |||||||||
| Net realized and unrealized gains (losses) on investments | (2.05 | ) | 2.65 | ||||||||
| Total from investment operations | (1.95 | ) | 2.68 | ||||||||
| Less distributions: | |||||||||||
| Dividends from net investment income | (0.02 | ) | — | ||||||||
| Distributions from net realized gains | (0.02 | ) | — | ||||||||
| Total distributions | (0.04 | ) | — | ||||||||
| Net asset value at end of period | $ | 10.69 | $ | 12.68 | |||||||
| Total return (B) | (15.45 | %) | 26.80 | % | |||||||
| Net assets at end of period (000s) | $ | 26,592 | $ | 10,343 | |||||||
| Ratio of net expenses to average net assets | 1.74 | % | 1.74 | % | |||||||
| Ratio of gross expenses to average net assets | 1.95 | % | 2.25 | % | |||||||
| Ratio of net investment income to average net assets | 0.98 | % | 0.76 | % | |||||||
| Portfolio turnover rate | 18 | % | 8 | % | |||||||
Touchstone Emerging Markets Equity Fund — Class C
Per Share Data for a Share Outstanding Throughout the Period
| Year Ended September 30, | |||||||||||
| 2011 | 2010 (A) | ||||||||||
| Net asset value at beginning of period | $ | 12.58 | $ | 10.00 | |||||||
| Income (loss) from investment operations: | |||||||||||
| Net investment income (loss) | 0.03 | (0.00 | ) (C) | ||||||||
| Net realized and unrealized gains (losses) on investments | (2.05 | ) | 2.58 | ||||||||
| Total from investment operations | (2.02 | ) | 2.58 | ||||||||
| Less distributions: | |||||||||||
| Distributions from net realized gains | (0.02 | ) | — | ||||||||
| Total distributions | (0.02 | ) | — | ||||||||
| Net asset value at end of period | $ | 10.54 | $ | 12.58 | |||||||
| Total return (B) | (16.07 | %) | 25.80 | % | |||||||
| Net assets at end of period (000s) | $ | 5,417 | $ | 3,590 | |||||||
| Ratio of net expenses to average net assets | 2.49 | % | 2.49 | % | |||||||
| Ratio of gross expenses to average net assets | 2.82 | % | 2.99 | % | |||||||
| Ratio of net investment income (loss) to average net assets | 0.21 | % | (0.03 | %) | |||||||
| Portfolio turnover rate | 18 | % | 8 | % | |||||||
(A) The Fund commenced operations on October 1, 2009.
(B) Total returns shown exclude the effect of applicable sales loads.
(C) Amount rounds to less than $0.005 per share.
See accompanying notes to financial statements.
96
Financial Highlights (Continued)
Touchstone Emerging Markets Equity Fund — Class Y
Per Share Data for a Share Outstanding Throughout the Period
| Year Ended September 30, | |||||||||||
| 2011 | 2010 (A) | ||||||||||
| Net asset value at beginning of period | $ | 12.72 | $ | 10.00 | |||||||
| Income (loss) from investment operations: | |||||||||||
| Net investment income | 0.11 | 0.01 | |||||||||
| Net realized and unrealized gains (losses) on investments | (2.05 | ) | 2.71 | ||||||||
| Total from investment operations | (1.94 | ) | 2.72 | ||||||||
| Less distributions: | |||||||||||
| Dividends from net investment income | (0.02 | ) | — | ||||||||
| Distributions from net realized gains | (0.02 | ) | — | ||||||||
| Total distributions | (0.04 | ) | — | ||||||||
| Net asset value at end of period | $ | 10.74 | $ | 12.72 | |||||||
| Total return | (15.21 | %) | 27.10 | % | |||||||
| Net assets at end of period (000s) | $ | 151,532 | $ | 13,597 | |||||||
| Ratio of net expenses to average net assets | 1.48 | % | 1.49 | % | |||||||
| Ratio of gross expenses to average net assets | 1.48 | % | 2.10 | % | |||||||
| Ratio of net investment income to average net assets | 1.50 | % | 0.86 | % | |||||||
| Portfolio turnover rate | 18 | % | 8 | % | |||||||
Touchstone Emerging Markets Equity Fund — Institutional Class
Per Share Data for a Share Outstanding Throughout the Period
| Year Ended September 30, | |||||||||||
| 2011 | 2010 (A) | ||||||||||
| Net asset value at beginning of period | $ | 12.74 | $ | 10.00 | |||||||
| Income (loss) from investment operations: | |||||||||||
| Net investment income | 0.13 | 0.05 | |||||||||
| Net realized and unrealized gains (losses) on investments | (2.06 | ) | 2.69 | ||||||||
| Total from investment operations | (1.93 | ) | 2.74 | ||||||||
| Less distributions: | |||||||||||
| Dividends from net investment income | (0.03 | ) | — | ||||||||
| Distributions from net realized gains | (0.02 | ) | — | ||||||||
| Total distributions | (0.05 | ) | — | ||||||||
| Net asset value at end of period | $ | 10.76 | $ | 12.74 | |||||||
| Total return | (15.18 | %) | 27.40 | % | |||||||
| Net assets at end of period (000s) | $ | 244,657 | $ | 125,414 | |||||||
| Ratio of net expenses to average net assets | 1.34 | % | 1.34 | % | |||||||
| Ratio of gross expenses to average net assets | 1.43 | % | 1.74 | % | |||||||
| Ratio of net investment income to average net assets | 1.51 | % | 1.26 | % | |||||||
| Portfolio turnover rate | 18 | % | 8 | % | |||||||
(A) The Fund commenced operations on October 1, 2009.
See accompanying notes to financial statements.
97
Financial Highlights (Continued)
Touchstone Emerging Markets Equity Fund II — Class A
Per Share Data for a Share Outstanding Throughout the Period
| Period Ended September 30, 2011 (A) | |||||||
| Net asset value at beginning of period | $ | 10.00 | |||||
| Income (loss) from investment operations: | |||||||
| Net investment income | 0.03 | ||||||
| Net realized and unrealized losses on investments | (2.08 | ) | |||||
| Total from investment operations | (2.05 | ) | |||||
| Net asset value at end of period | $ | 7.95 | |||||
| Total return (B) | (20.50 | %) (C) | |||||
| Net assets at end of period (000s) | $ | 417 | |||||
| Ratio of net expenses to average net assets | 1.74 | % (D) | |||||
| Ratio of gross expenses to average net assets | 8.56 | % (D) | |||||
| Ratio of net investment income to average net assets | 1.34 | % (D) | |||||
| Portfolio turnover rate | 112 | % (C) | |||||
Touchstone Emerging Markets Equity Fund II — Class C
Per Share Data for a Share Outstanding Throughout the Period
| Period Ended September 30, 2011 (A) | |||||||
| Net asset value at beginning of period | $ | 10.00 | |||||
| Income (loss) from investment operations: | |||||||
| Net investment income | 0.02 | ||||||
| Net realized and unrealized losses on investments | (2.09 | ) | |||||
| Total from investment operations | (2.07 | ) | |||||
| Net asset value at end of period | $ | 7.93 | |||||
| Total return (B) | (20.70 | %) (C) | |||||
| Net assets at end of period (000s) | $ | 17 | |||||
| Ratio of net expenses to average net assets | 2.49 | % (D) | |||||
| Ratio of gross expenses to average net assets | 60.21 | % (D) | |||||
| Ratio of net investment income to average net assets | 0.69 | % (D) | |||||
| Portfolio turnover rate | 112 | % (C) | |||||
(A) Represents the period from commencement of operations (April 18, 2011) through September 30, 2011.
(B) Total returns shown exclude the effect of applicable sales loads.
(C) Not annualized.
(D) Annualized.
See accompanying notes to financial statements.
98
Financial Highlights (Continued)
Touchstone Emerging Markets Equity Fund II — Class Y
Per Share Data for a Share Outstanding Throughout the Period
| Period Ended September 30, 2011 (A) | |||||||
| Net asset value at beginning of period | $ | 10.00 | |||||
| Income (loss) from investment operations: | |||||||
| Net investment income | 0.11 | ||||||
| Net realized and unrealized losses on investments | (2.15 | ) | |||||
| Total from investment operations | (2.04 | ) | |||||
| Net asset value at end of period | $ | 7.96 | |||||
| Total return | (20.40 | %) (B) | |||||
| Net assets at end of period (000s) | $ | 200 | |||||
| Ratio of net expenses to average net assets | 1.49 | % (C) | |||||
| Ratio of gross expenses to average net assets | 6.83 | % (C) | |||||
| Ratio of net investment income to average net assets | 1.53 | % (C) | |||||
| Portfolio turnover rate | 112 | % (B) | |||||
Touchstone Emerging Markets Equity Fund II — Institutional Class
Per Share Data for a Share Outstanding Throughout the Period
| Period Ended September 30, 2011 (A) | |||||||
| Net asset value at beginning of period | $ | 10.00 | |||||
| Income (loss) from investment operations: | |||||||
| Net investment income | 0.07 | ||||||
| Net realized and unrealized losses on investments | (2.10 | ) | |||||
| Total from investment operations | (2.03 | ) | |||||
| Net asset value at end of period | $ | 7.97 | |||||
| Total return | (20.30 | %) (B) | |||||
| Net assets at end of period (000s) | $ | 3,930 | |||||
| Ratio of net expenses to average net assets | 1.34 | % (C) | |||||
| Ratio of gross expenses to average net assets | 4.16 | % (C) | |||||
| Ratio of net investment income to average net assets | 1.67 | % (C) | |||||
| Portfolio turnover rate | 112 | % (B) | |||||
(A) Represents the period from commencement of operations (April 18, 2011) through September 30, 2011.
(B) Not annualized.
(C) Annualized.
See accompanying notes to financial statements.
99
Financial Highlights (Continued)
Touchstone Focused Equity Fund — Class A
Per Share Data for a Share Outstanding Throughout the Period
| Year Ended September 30, 2011 | Period Ended September 30, 2010 (A) | ||||||||||
| Net asset value at beginning of period | $ | 10.95 | $ | 10.00 | |||||||
| Income (loss) from investment operations: | |||||||||||
| Net investment income | 0.10 | 0.02 | |||||||||
| Net realized and unrealized gains (losses) on investments | (1.38 | ) | 0.93 | ||||||||
| Total from investment operations | (1.28 | ) | 0.95 | ||||||||
| Less distributions: | |||||||||||
| Dividends from net investment income | (0.08 | ) | — | ||||||||
| Distributions from net realized gains | (0.09 | ) | — | ||||||||
| Total distributions | (0.17 | ) | — | ||||||||
| Net asset value at end of period | $ | 9.50 | $ | 10.95 | |||||||
| Total return (B) | (11.95 | %) | 9.40 | % (C) | |||||||
| Net assets at end of period (000s) | $ | 80,741 | $ | 814 | |||||||
| Ratio of net expenses to average net assets | 1.20 | % | 1.20 | % (D) | |||||||
| Ratio of gross expenses to average net assets | 1.70 | % | 4.65 | % (D) | |||||||
| Ratio of net investment income to average net assets | 0.56 | % | 0.46 | % (D) | |||||||
| Portfolio turnover rate | 44 | % | 101 | % (C) | |||||||
Touchstone Focused Equity Fund — Class C
Per Share Data for a Share Outstanding Throughout the Period
| Year Ended September 30, 2011 | Period Ended September 30, 2010 (A) | ||||||||||
| Net asset value at beginning of period | $ | 10.88 | $ | 10.00 | |||||||
| Income (loss) from investment operations: | |||||||||||
| Net investment loss | (0.05 | ) | (0.01 | ) | |||||||
| Net realized and unrealized gains (losses) on investments | (1.32 | ) | 0.89 | ||||||||
| Total from investment operations | (1.37 | ) | 0.88 | ||||||||
| Less distributions: | |||||||||||
| Dividends from net investment income | (0.04 | ) | — | ||||||||
| Distributions from net realized gains | (0.09 | ) | — | ||||||||
| Total distributions | (0.13 | ) | — | ||||||||
| Net asset value at end of period | $ | 9.38 | $ | 10.88 | |||||||
| Total return (B) | (12.78 | %) | 8.90 | % (C) | |||||||
| Net assets at end of period (000s) | $ | 179 | $ | 187 | |||||||
| Ratio of net expenses to average net assets | 1.95 | % | 1.95 | % (D) | |||||||
| Ratio of gross expenses to average net assets | 5.90 | % | 5.45 | % (D) | |||||||
| Ratio of net investment loss to average net assets | (0.52 | %) | (0.24 | %) (D) | |||||||
| Portfolio turnover rate | 44 | % | 101 | % (C) | |||||||
(A) Represents the period from commencement of operations (December 31, 2009) through September 30, 2010.
(B) Total returns shown exclude the effect of applicable sales loads.
(C) Not annualized.
(D) Annualized.
See accompanying notes to financial statements.
100
Financial Highlights (Continued)
Touchstone Focused Equity Fund — Class Y
Per Share Data for a Share Outstanding Throughout the Period
| Year Ended September 30, 2011 | Period Ended September 30, 2010 (A) | ||||||||||
| Net asset value at beginning of period | $ | 10.96 | $ | 10.00 | |||||||
| Income (loss) from investment operations: | |||||||||||
| Net investment income | 0.02 | 0.04 | |||||||||
| Net realized and unrealized gains (losses) on investments | (1.29 | ) | 0.92 | ||||||||
| Total from investment operations | (1.27 | ) | 0.96 | ||||||||
| Less distributions: | |||||||||||
| Dividends from net investment income | — | — | |||||||||
| Distributions from net realized gains | (0.09 | ) | — | ||||||||
| Total distributions | (0.09 | ) | — | ||||||||
| Net asset value at end of period | $ | 9.60 | $ | 10.96 | |||||||
| Total return | (11.77 | %) | 9.60 | % (B) | |||||||
| Net assets at end of period (000s) | $ | 12,383 | $ | 201 | |||||||
| Ratio of net expenses to average net assets | 0.95 | % | 0.95 | % (C) | |||||||
| Ratio of gross expenses to average net assets | 1.18 | % | 4.62 | % (C) | |||||||
| Ratio of net investment income to average net assets | 0.79 | % | 0.81 | % (C) | |||||||
| Portfolio turnover rate | 44 | % | 101 | % (B) | |||||||
Touchstone Focused Equity Fund — Institutional Class
Per Share Data for a Share Outstanding Throughout the Period
| Year Ended September 30, 2011 | Period Ended September 30, 2010 (A) | ||||||||||
| Net asset value at beginning of period | $ | 10.97 | $ | 10.00 | |||||||
| Income (loss) from investment operations: | |||||||||||
| Net investment income | 0.10 | 0.17 | |||||||||
| Net realized and unrealized gains (losses) on investments | (1.28 | ) | 0.80 | ||||||||
| Total from investment operations | (1.18 | ) | 0.97 | ||||||||
| Less distributions: | |||||||||||
| Dividends from net investment income | (0.42 | ) | — | ||||||||
| Distributions from net realized gains | (0.09 | ) | — | ||||||||
| Total distributions | (0.51 | ) | — | ||||||||
| Net asset value at end of period | $ | 9.28 | $ | 10.97 | |||||||
| Total return | (11.68 | %) | 9.70 | % (B) | |||||||
| Net assets at end of period (000s) | $ | 852 | $ | 768 | |||||||
| Ratio of net expenses to average net assets | 0.80 | % | 0.80 | % (C) | |||||||
| Ratio of gross expenses to average net assets | 2.12 | % | 3.66 | % (C) | |||||||
| Ratio of net investment income to average net assets | 0.50 | % | 0.99 | % (C) | |||||||
| Portfolio turnover rate | 44 | % | 101 | % (B) | |||||||
(A) Represents the period from commencement of operations (December 31, 2009) through September 30, 2010.
(B) Not annualized.
(C) Annualized.
See accompanying notes to financial statements.
101
Financial Highlights (Continued)
Touchstone Global Equity Fund — Class A
Per Share Data for a Share Outstanding Throughout the Period
| Year Ended September 30, | |||||||||||
| 2011 | 2010 (A) | ||||||||||
| Net asset value at beginning of period | $ | 10.65 | $ | 10.00 | |||||||
| Income (loss) from investment operations: | |||||||||||
| Net investment income | 0.08 | 0.04 | |||||||||
| Net realized and unrealized gains (losses) on investments | (0.68 | ) | 0.61 | ||||||||
| Total from investment operations | (0.60 | ) | 0.65 | ||||||||
| Less distributions: | |||||||||||
| Dividends from net investment income | (0.09 | ) | — | ||||||||
| Distributions from net realized gains | (0.10 | ) | — | ||||||||
| Total distributions | (0.19 | ) | — | ||||||||
| Net asset value at end of period | $ | 9.86 | $ | 10.65 | |||||||
| Total return (B) | (5.87 | %) | 6.50 | % | |||||||
| Net assets at end of period (000s) | $ | 636 | $ | 1,857 | |||||||
| Ratio of net expenses to average net assets | 1.34 | % | 1.34 | % | |||||||
| Ratio of gross expenses to average net assets | 4.13 | % | 3.75 | % | |||||||
| Ratio of net investment income to average net assets | 0.18 | % | 1.56 | % | |||||||
| Portfolio turnover rate | 64 | % | 68 | % | |||||||
Touchstone Global Equity Fund — Class C
Per Share Data for a Share Outstanding Throughout the Period
| Year Ended September 30, | |||||||||||
| 2011 | 2010 (A) | ||||||||||
| Net asset value at beginning of period | $ | 10.57 | $ | 10.00 | |||||||
| Income (loss) from investment operations: | |||||||||||
| Net investment income (loss) | (0.02 | ) | 0.00 | (C) | |||||||
| Net realized and unrealized gains (losses) on investments | (0.66 | ) | 0.57 | ||||||||
| Total from investment operations | (0.68 | ) | 0.57 | ||||||||
| Less distributions: | |||||||||||
| Distributions from net realized gains | (0.10 | ) | — | ||||||||
| Total distributions | (0.10 | ) | — | ||||||||
| Net asset value at end of period | $ | 9.79 | $ | 10.57 | |||||||
| Total return (B) | (6.54 | %) | 5.70 | % | |||||||
| Net assets at end of period (000s) | $ | 101 | $ | 106 | |||||||
| Ratio of net expenses to average net assets | 2.09 | % | 2.09 | % | |||||||
| Ratio of gross expenses to average net assets | 11.43 | % | 4.28 | % | |||||||
| Ratio of net investment income (loss) to average net assets | (0.23 | %) | 0.02 | % | |||||||
| Portfolio turnover rate | 64 | % | 68 | % | |||||||
(A) The Fund commenced operations on October 1, 2009.
(B) Total returns shown exclude the effect of applicable sales loads.
(C) Amount rounds to less than $0.005 per share.
See accompanying notes to financial statements.
102
Financial Highlights (Continued)
Touchstone Global Equity Fund — Class Y
Per Share Data for a Share Outstanding Throughout the Period
| Year Ended September 30, | |||||||||||
| 2011 | 2010 (A) | ||||||||||
| Net asset value at beginning of period | $ | 10.68 | $ | 10.00 | |||||||
| Income (loss) from investment operations: | |||||||||||
| Net investment income | 0.06 | 0.09 | |||||||||
| Net realized and unrealized gains (losses) on investments | (0.64 | ) | 0.59 | ||||||||
| Total from investment operations | (0.58 | ) | 0.68 | ||||||||
| Less distributions: | |||||||||||
| Dividends from net investment income | (0.07 | ) | — | ||||||||
| Distributions from net realized gains | (0.10 | ) | — | ||||||||
| Total distributions | (0.17 | ) | — | ||||||||
| Net asset value at end of period | $ | 9.93 | $ | 10.68 | |||||||
| Total return | (5.56 | %) | 6.70 | % | |||||||
| Net assets at end of period (000s) | $ | 197 | $ | 142 | |||||||
| Ratio of net expenses to average net assets | 1.09 | % | 1.09 | % | |||||||
| Ratio of gross expenses to average net assets | 7.29 | % | 3.38 | % | |||||||
| Ratio of net investment income to average net assets | 0.76 | % | 1.05 | % | |||||||
| Portfolio turnover rate | 64 | % | 68 | % | |||||||
Touchstone Global Equity Fund — Institutional Class
Per Share Data for a Share Outstanding Throughout the Period
| Year Ended September 30, | |||||||||||
| 2011 | 2010 (A) | ||||||||||
| Net asset value at beginning of period | $ | 10.69 | $ | 10.00 | |||||||
| Income (loss) from investment operations: | |||||||||||
| Net investment income | 0.10 | 0.11 | |||||||||
| Net realized and unrealized gains (losses) on investments | (0.66 | ) | 0.58 | ||||||||
| Total from investment operations | (0.56 | ) | 0.69 | ||||||||
| Less distributions: | |||||||||||
| Dividends from net investment income | (0.11 | ) | (0.00 | ) (B) | |||||||
| Distributions from net realized gains | (0.10 | ) | — | ||||||||
| Total distributions | (0.21 | ) | (0.00 | ) | |||||||
| Net asset value at end of period | $ | 9.92 | $ | 10.69 | |||||||
| Total return | (5.51 | %) | 6.93 | % | |||||||
| Net assets at end of period (000s) | $ | 2,926 | $ | 3,086 | |||||||
| Ratio of net expenses to average net assets | 0.94 | % | 0.94 | % | |||||||
| Ratio of gross expenses to average net assets | 2.60 | % | 3.11 | % | |||||||
| Ratio of net investment income to average net assets | 0.91 | % | 1.18 | % | |||||||
| Portfolio turnover rate | 64 | % | 68 | % | |||||||
(A) The Fund commenced operations on October 1, 2009.
(B) Amount rounds to less than $0.005 per share.
See accompanying notes to financial statements.
103
Financial Highlights (Continued)
Touchstone Global Real Estate Fund — Class A
Per Share Data for a Share Outstanding Throughout the Period
| Year Ended September 30, | |||||||||||
| 2011 | 2010 (A) | ||||||||||
| Net asset value at beginning of period | $ | 11.46 | $ | 10.00 | |||||||
| Income (loss) from investment operations: | |||||||||||
| Net investment income | 0.35 | 0.36 | |||||||||
| Net realized and unrealized gains (losses) on investments | (1.10 | ) | 1.45 | ||||||||
| Total from investment operations | (0.75 | ) | 1.81 | ||||||||
| Less distributions: | |||||||||||
| Dividends from net investment income | (0.48 | ) | (0.35 | ) | |||||||
| Distributions from net realized gains | (0.47 | ) | — | ||||||||
| Total distributions | (0.95 | ) | (0.35 | ) | |||||||
| Net asset value at end of period | $ | 9.76 | $ | 11.46 | |||||||
| Total return (B) | (7.47 | %) | 18.54 | % | |||||||
| Net assets at end of period (000s) | $ | 2,038 | $ | 881 | |||||||
| Ratio of net expenses to average net assets | 1.39 | % | 1.39 | % | |||||||
| Ratio of gross expenses to average net assets | 3.55 | % | 4.27 | % | |||||||
| Ratio of net investment income to average net assets | 2.30 | % | 2.94 | % | |||||||
| Portfolio turnover rate | 85 | % | 107 | % | |||||||
Touchstone Global Real Estate Fund — Class C
Per Share Data for a Share Outstanding Throughout the Period
| Year Ended September 30, | |||||||||||
| 2011 | 2010 (A) | ||||||||||
| Net asset value at beginning of period | $ | 11.50 | $ | 10.00 | |||||||
| Income (loss) from investment operations: | |||||||||||
| Net investment income | 0.20 | 0.17 | |||||||||
| Net realized and unrealized gains (losses) on investments | (1.05 | ) | 1.58 | ||||||||
| Total from investment operations | (0.85 | ) | 1.75 | ||||||||
| Less distributions: | |||||||||||
| Dividends from net investment income | (0.38 | ) | (0.25 | ) | |||||||
| Distributions from net realized gains | (0.47 | ) | — | ||||||||
| Total distributions | (0.85 | ) | (0.25 | ) | |||||||
| Net asset value at end of period | $ | 9.80 | $ | 11.50 | |||||||
| Total return (B) | (8.20 | %) | 17.75 | % | |||||||
| Net assets at end of period (000s) | $ | 116 | $ | 123 | |||||||
| Ratio of net expenses to average net assets | 2.14 | % | 2.14 | % | |||||||
| Ratio of gross expenses to average net assets | 11.08 | % | 4.60 | % | |||||||
| Ratio of net investment income to average net assets | 1.58 | % | 1.60 | % | |||||||
| Portfolio turnover rate | 85 | % | 107 | % | |||||||
(A) The Fund commenced operations on October 1, 2009.
(B) Total returns shown exclude the effect of applicable sales loads.
See accompanying notes to financial statements.
104
Financial Highlights (Continued)
Touchstone Global Real Estate Fund — Class Y
Per Share Data for a Share Outstanding Throughout the Period
| Year Ended September 30, | |||||||||||
| 2011 | 2010 (A) | ||||||||||
| Net asset value at beginning of period | $ | 11.53 | $ | 10.00 | |||||||
| Income (loss) from investment operations: | |||||||||||
| Net investment income | 0.32 | 0.28 | |||||||||
| Net realized and unrealized gains (losses) on investments | (1.06 | ) | 1.58 | ||||||||
| Total from investment operations | (0.74 | ) | 1.86 | ||||||||
| Less distributions: | |||||||||||
| Dividends from net investment income | (0.48 | ) | (0.33 | ) | |||||||
| Distributions from net realized gains | (0.47 | ) | — | ||||||||
| Total distributions | (0.95 | ) | (0.33 | ) | |||||||
| Net asset value at end of period | $ | 9.84 | $ | 11.53 | |||||||
| Total return | (7.27 | %) | 18.90 | % | |||||||
| Net assets at end of period (000s) | $ | 118 | $ | 129 | |||||||
| Ratio of net expenses to average net assets | 1.14 | % | 1.14 | % | |||||||
| Ratio of gross expenses to average net assets | 9.49 | % | 3.62 | % | |||||||
| Ratio of net investment income to average net assets | 2.59 | % | 2.61 | % | |||||||
| Portfolio turnover rate | 85 | % | 107 | % | |||||||
Touchstone Global Real Estate Fund — Institutional Class
Per Share Data for a Share Outstanding Throughout the Period
| Year Ended September 30, | |||||||||||
| 2011 | 2010 (A) | ||||||||||
| Net asset value at beginning of period | $ | 11.61 | $ | 10.00 | |||||||
| Income (loss) from investment operations: | |||||||||||
| Net investment income | 0.33 | 0.29 | |||||||||
| Net realized and unrealized gains (losses) on investments | (1.07 | ) | 1.59 | ||||||||
| Total from investment operations | (0.74 | ) | 1.88 | ||||||||
| Less distributions: | |||||||||||
| Dividends from net investment income | (0.48 | ) | (0.27 | ) | |||||||
| Distributions from net realized gains | (0.47 | ) | — | ||||||||
| Total distributions | (0.95 | ) | (0.27 | ) | |||||||
| Net asset value at end of period | $ | 9.92 | $ | 11.61 | |||||||
| Total return | (7.21 | %) | 19.12 | % | |||||||
| Net assets at end of period (000s) | $ | 2,994 | $ | 3,232 | |||||||
| Ratio of net expenses to average net assets | 0.99 | % | 0.99 | % | |||||||
| Ratio of gross expenses to average net assets | 3.15 | % | 3.34 | % | |||||||
| Ratio of net investment income to average net assets | 2.73 | % | 2.75 | % | |||||||
| Portfolio turnover rate | 85 | % | 107 | % | |||||||
(A) The Fund commenced operations on October 1, 2009.
See accompanying notes to financial statements.
105
Financial Highlights (Continued)
Touchstone Intermediate Fixed Income Fund — Institutional Class
Per Share Data for a Share Outstanding Throughout Each Period
| Year Ended September 30, | |||||||||||||||||||||||
| 2011 | 2010 | 2009 | 2008 | 2007 | |||||||||||||||||||
| Net asset value at beginning of period | $ | 9.16 | $ | 8.73 | $ | 8.90 | $ | 9.51 | $ | 9.58 | |||||||||||||
| Income (loss) from investment operations: | |||||||||||||||||||||||
| Net investment income | 0.26 | 0.25 | 0.30 | 0.44 | 0.45 | ||||||||||||||||||
| Net realized and unrealized gains (losses) on investments | (0.03 | ) | 0.43 | (0.17 | ) | (0.60 | ) | (0.07 | ) | ||||||||||||||
| Total from investment operations | 0.23 | 0.68 | 0.13 | (0.16 | ) | 0.38 | |||||||||||||||||
| Less distributions: | |||||||||||||||||||||||
| Dividends from net investment income | (0.27 | ) | (0.25 | ) | (0.30 | ) | (0.45 | ) | (0.45 | ) | |||||||||||||
| Distributions from net realized gains | — | — | — | — | — | ||||||||||||||||||
| Total distributions | (0.27 | ) | (0.25 | ) | (0.30 | ) | (0.45 | ) | (0.45 | ) | |||||||||||||
| Net asset value at end of period | $ | 9.12 | $ | 9.16 | $ | 8.73 | $ | 8.90 | $ | 9.51 | |||||||||||||
| Total return | 2.59 | % | 7.92 | % | 1.44 | % | (1.95 | %) | 4.07 | % | |||||||||||||
| Net assets at end of period (000's) | $ | 98,610 | $ | 109,138 | $ | 103,725 | $ | 15,377 | $ | 19,485 | |||||||||||||
| Ratio of net expenses to average net assets | 0.40 | % | 0.40 | % | 0.52 | % | 0.85 | % | 0.87 | % | |||||||||||||
| Ratio of gross expenses to average net assets | 0.70 | % | 0.69 | % | 0.83 | % | 1.15 | % | 0.99 | % | |||||||||||||
| Ratio of net investment income to average net assets | 2.89 | % | 2.84 | % | 3.12 | % | 4.61 | % | 4.72 | % | |||||||||||||
| Portfolio turnover rate | 69 | % | 71 | % | 125 | % | 62 | % | 71 | % | |||||||||||||
See accompanying notes to financial statements.
106
Financial Highlights (Continued)
Touchstone International Fixed Income Fund — Class A
Per Share Data for a Share Outstanding Throughout the Period
| Year Ended September 30, | |||||||||||
| 2011 | 2010 (A) | ||||||||||
| Net asset value at beginning of period | $ | 11.38 | $ | 10.00 | |||||||
| Income from investment operations: | |||||||||||
| Net investment income | 0.14 | 0.12 | |||||||||
| Net realized and unrealized gains on investments | 0.02 | 1.38 | |||||||||
| Total from investment operations | 0.16 | 1.50 | |||||||||
| Less distributions: | |||||||||||
| Dividends from net investment income | (1.00 | ) | (0.12 | ) | |||||||
| Distributions from net realized gains | (0.05 | ) | — | ||||||||
| Total distributions | (1.05 | ) | (0.12 | ) | |||||||
| Net asset value at end of period | $ | 10.49 | $ | 11.38 | |||||||
| Total return (B) | 1.67 | % | 15.15 | % | |||||||
| Net assets at end of period (000s) | $ | 2,555 | $ | 1,319 | |||||||
| Ratio of net expenses to average net assets | 1.09 | % | 1.09 | % | |||||||
| Ratio of gross expenses to average net assets | 2.18 | % | 2.47 | % | |||||||
| Ratio of net investment income to average net assets | 2.06 | % | 1.39 | % | |||||||
| Portfolio turnover rate | 64 | % | 160 | % | |||||||
Touchstone International Fixed Income Fund — Class C
Per Share Data for a Share Outstanding Throughout the Period
| Year Ended September 30, | |||||||||||
| 2011 | 2010 (A) | ||||||||||
| Net asset value at beginning of period | $ | 11.37 | $ | 10.00 | |||||||
| Income (loss) from investment operations: | |||||||||||
| Net investment income | 0.13 | 0.05 | |||||||||
| Net realized and unrealized gains (losses) on investments | (0.05 | ) | 1.37 | ||||||||
| Total from investment operations | 0.08 | 1.42 | |||||||||
| Less distributions: | |||||||||||
| Dividends from net investment income | (0.92 | ) | (0.05 | ) | |||||||
| Distributions from net realized gains | (0.05 | ) | — | ||||||||
| Total distributions | (0.97 | ) | (0.05 | ) | |||||||
| Net asset value at end of period | $ | 10.48 | $ | 11.37 | |||||||
| Total return (B) | 0.94 | % | 14.29 | % | |||||||
| Net assets at end of period (000s) | $ | 581 | $ | 407 | |||||||
| Ratio of net expenses to average net assets | 1.84 | % | 1.84 | % | |||||||
| Ratio of gross expenses to average net assets | 4.53 | % | 3.16 | % | |||||||
| Ratio of net investment income to average net assets | 1.14 | % | 0.59 | % | |||||||
| Portfolio turnover rate | 64 | % | 160 | % | |||||||
(A) The Fund commenced operations on October 1, 2009.
(B) Total returns shown exclude the effect of applicable sales loads.
See accompanying notes to financial statements.
107
Financial Highlights (Continued)
Touchstone International Fixed Income Fund — Class Y
Per Share Data for a Share Outstanding Throughout the Period
| Year Ended September 30, | |||||||||||
| 2011 | 2010 (A) | ||||||||||
| Net asset value at beginning of period | $ | 11.37 | $ | 10.00 | |||||||
| Income (loss) from investment operations: | |||||||||||
| Net investment income | 0.20 | (B) | 0.16 | ||||||||
| Net realized and unrealized gains (losses) on investments | (0.01 | ) | 1.37 | ||||||||
| Total from investment operations | 0.19 | 1.53 | |||||||||
| Less distributions: | |||||||||||
| Dividends from net investment income | (1.03 | ) | (0.16 | ) | |||||||
| Distributions from net realized gains | (0.05 | ) | — | ||||||||
| Total distributions | (1.08 | ) | (0.16 | ) | |||||||
| Net asset value at end of period | $ | 10.48 | $ | 11.37 | |||||||
| Total return | 1.97 | % | 15.41 | % | |||||||
| Net assets at end of period (000s) | $ | 721 | $ | 193 | |||||||
| Ratio of net expenses to average net assets | 0.84 | % | 0.84 | % | |||||||
| Ratio of gross expenses to average net assets | 2.91 | % | 2.50 | % | |||||||
| Ratio of net investment income to average net assets | 1.92 | % | 1.52 | % | |||||||
| Portfolio turnover rate | 64 | % | 160 | % | |||||||
Touchstone International Fixed Income Fund — Institutional Class
Per Share Data for a Share Outstanding Throughout the Period
| Year Ended September 30, | |||||||||||
| 2011 | 2010 (A) | ||||||||||
| Net asset value at beginning of period | $ | 11.37 | $ | 10.00 | |||||||
| Income (loss) from investment operations: | |||||||||||
| Net investment income | 0.23 | 0.17 | |||||||||
| Net realized and unrealized gains (losses) on investments | (0.02 | ) | 1.37 | ||||||||
| Total from investment operations | 0.21 | 1.54 | |||||||||
| Less distributions: | |||||||||||
| Dividends from net investment income | (1.05 | ) | (0.17 | ) | |||||||
| Distributions from net realized gains | (0.05 | ) | — | ||||||||
| Total distributions | (1.10 | ) | (0.17 | ) | |||||||
| Net asset value at end of period | $ | 10.48 | $ | 11.37 | |||||||
| Total return | 2.11 | % | 15.59 | % | |||||||
| Net assets at end of period (000s) | $ | 7,931 | $ | 7,746 | |||||||
| Ratio of net expenses to average net assets | 0.69 | % | 0.69 | % | |||||||
| Ratio of gross expenses to average net assets | 1.41 | % | 1.64 | % | |||||||
| Ratio of net investment income to average net assets | 2.25 | % | 1.67 | % | |||||||
| Portfolio turnover rate | 64 | % | 160 | % | |||||||
(A) The Fund commenced operations on October 1, 2009.
(B) Calculated using average share method.
See accompanying notes to financial statements.
108
Financial Highlights (Continued)
Touchstone Large Cap Relative Value Fund — Class A
Per Share Data for a Share Outstanding Throughout the Period
| Year Ended September 30, | |||||||||||
| 2011 | 2010 (A) | ||||||||||
| Net asset value at beginning of period | $ | 11.11 | $ | 10.00 | |||||||
| Income (loss) from investment operations: | |||||||||||
| Net investment income | 0.04 | 0.05 | |||||||||
| Net realized and unrealized gains (losses) on investments | (0.59 | ) | 1.08 | ||||||||
| Total from investment operations | (0.55 | ) | 1.13 | ||||||||
| Less distributions: | |||||||||||
| Dividends from net investment income | (0.08 | ) | (0.02 | ) | |||||||
| Distributions from net realized gains | (0.01 | ) | — | ||||||||
| Total distributions | (0.09 | ) | (0.02 | ) | |||||||
| Net asset value at end of period | $ | 10.47 | $ | 11.11 | |||||||
| Total return (B) | (5.11 | %) | 11.34 | % | |||||||
| Net assets at end of period (000s) | $ | 661 | $ | 476 | |||||||
| Ratio of net expenses to average net assets | 1.19 | % | 1.19 | % | |||||||
| Ratio of gross expenses to average net assets | 3.29 | % | 3.22 | % | |||||||
| Ratio of net investment income to average net assets | 0.61 | % | 0.52 | % | |||||||
| Portfolio turnover rate | 22 | % | 2 | % | |||||||
Touchstone Large Cap Relative Value Fund — Class C
Per Share Data for a Share Outstanding Throughout the Period
| Year Ended September 30, | |||||||||||
| 2011 | 2010 (A) | ||||||||||
| Net asset value at beginning of period | $ | 11.05 | $ | 10.00 | |||||||
| Income (loss) from investment operations: | |||||||||||
| Net investment loss | (0.01 | ) | (0.02 | ) | |||||||
| Net realized and unrealized gains (losses) on investments | (0.62 | ) | 1.07 | ||||||||
| Total from investment operations | (0.63 | ) | 1.05 | ||||||||
| Less distributions: | |||||||||||
| Dividends from net investment income | (0.02 | ) | — | ||||||||
| Distributions from net realized gains | (0.01 | ) | — | ||||||||
| Total distributions | (0.03 | ) | — | ||||||||
| Net asset value at end of period | $ | 10.39 | $ | 11.05 | |||||||
| Total return (B) | (5.78 | %) | 10.50 | % | |||||||
| Net assets at end of period (000s) | $ | 266 | $ | 235 | |||||||
| Ratio of net expenses to average net assets | 1.94 | % | 1.94 | % | |||||||
| Ratio of gross expenses to average net assets | 5.31 | % | 3.69 | % | |||||||
| Ratio of net investment loss to average net assets | (0.08 | %) | (0.24 | %) | |||||||
| Portfolio turnover rate | 22 | % | 2 | % | |||||||
(A) The Fund commenced operations on October 1, 2009.
(B) Total returns shown exclude the effect of applicable sales loads.
See accompanying notes to financial statements.
109
Financial Highlights (Continued)
Touchstone Large Cap Relative Value Fund — Class Y
Per Share Data for a Share Outstanding Throughout the Period
| Year Ended September 30, | |||||||||||
| 2011 | 2010 (A) | ||||||||||
| Net asset value at beginning of period | $ | 11.12 | $ | 10.00 | |||||||
| Income (loss) from investment operations: | |||||||||||
| Net investment income | 0.15 | 0.09 | |||||||||
| Net realized and unrealized gains (losses) on investments | (0.66 | ) | 1.07 | ||||||||
| Total from investment operations | (0.51 | ) | 1.16 | ||||||||
| Less distributions: | |||||||||||
| Dividends from net investment income | (0.18 | ) | (0.04 | ) | |||||||
| Distributions from net realized gains | (0.01 | ) | — | ||||||||
| Total distributions | (0.19 | ) | (0.04 | ) | |||||||
| Net asset value at end of period | $ | 10.42 | $ | 11.12 | |||||||
| Total return | (4.84 | %) | 11.58 | % | |||||||
| Net assets at end of period (000s) | $ | 2,415 | $ | 112 | |||||||
| Ratio of net expenses to average net assets | 0.94 | % | 0.94 | % | |||||||
| Ratio of gross expenses to average net assets | 2.01 | % | 2.77 | % | |||||||
| Ratio of net investment income to average net assets | 1.05 | % | 0.78 | % | |||||||
| Portfolio turnover rate | 22 | % | 2 | % | |||||||
Touchstone Large Cap Relative Value Fund — Institutional Class
Per Share Data for a Share Outstanding Throughout the Period
| Year Ended September 30, | |||||||||||
| 2011 | 2010 (A) | ||||||||||
| Net asset value at beginning of period | $ | 11.13 | $ | 10.00 | |||||||
| Income (loss) from investment operations: | |||||||||||
| Net investment income | 0.13 | 0.10 | |||||||||
| Net realized and unrealized gains (losses) on investments | (0.62 | ) | 1.08 | ||||||||
| Total from investment operations | (0.49 | ) | 1.18 | ||||||||
| Less distributions: | |||||||||||
| Dividends from net investment income | (0.21 | ) | (0.05 | ) | |||||||
| Distributions from net realized gains | (0.01 | ) | — | ||||||||
| Total distributions | (0.22 | ) | (0.05 | ) | |||||||
| Net asset value at end of period | $ | 10.42 | $ | 11.13 | |||||||
| Total return | (4.71 | %) | 11.76 | % | |||||||
| Net assets at end of period (000s) | $ | 2,876 | $ | 3,018 | |||||||
| Ratio of net expenses to average net assets | 0.79 | % | 0.79 | % | |||||||
| Ratio of gross expenses to average net assets | 1.74 | % | 2.48 | % | |||||||
| Ratio of net investment income to average net assets | 1.08 | % | 0.93 | % | |||||||
| Portfolio turnover rate | 22 | % | 2 | % | |||||||
(A) The Fund commenced operations on October 1, 2009.
See accompanying notes to financial statements.
110
Financial Highlights (Continued)
Touchstone Market Neutral Equity Fund — Class A
Per Share Data for a Share Outstanding Throughout the Period
| Year Ended September 30, | |||||||||||
| 2011 | 2010 (A) | ||||||||||
| Net asset value at beginning of period | $ | 9.73 | $ | 10.00 | |||||||
| Income (loss) from investment operations: | |||||||||||
| Net investment loss | (0.03 | ) | (0.13 | ) | |||||||
| Net realized and unrealized gains (losses) on investments | 0.20 | (0.14 | ) | ||||||||
| Total from investment operations | 0.17 | (0.27 | ) | ||||||||
| Net asset value at end of period | $ | 9.90 | $ | 9.73 | |||||||
| Total return (B) | 1.75 | % | (2.70 | %) | |||||||
| Net assets at end of period (000s) | $ | 3,383 | $ | 610 | |||||||
| Ratio of net expenses to average net assets (including dividend expense on securities sold short) | 2.80 | % | 2.79 | % | |||||||
| Ratio of net expenses to average net assets (excluding dividend expense on securities sold short) | 1.50 | % | 1.61 | % | |||||||
| Ratio of gross expenses to average net assets (including dividend expense on securities sold short) | 4.13 | % | 3.89 | % | |||||||
| Ratio of gross expenses to average net assets (excluding dividend expense on securities sold short) | 2.83 | % | 2.70 | % | |||||||
| Ratio of net investment loss to average net assets | (2.04 | %) | (1.38 | %) | |||||||
| Portfolio turnover rate | 125 | % | 377 | % | |||||||
Touchstone Market Neutral Equity Fund — Class C
Per Share Data for a Share Outstanding Throughout the Period
| Year Ended September 30, | |||||||||||
| 2011 | 2010 (A) | ||||||||||
| Net asset value at beginning of period | $ | 9.66 | $ | 10.00 | |||||||
| Income (loss) from investment operations: | |||||||||||
| Net investment loss | (0.26 | ) | (0.16 | ) | |||||||
| Net realized and unrealized gains (losses) on investments | 0.36 | (0.18 | ) | ||||||||
| Total from investment operations | 0.10 | (0.34 | ) | ||||||||
| Net asset value at end of period | $ | 9.76 | $ | 9.66 | |||||||
| Total return (B) | 1.04 | % | (3.40 | %) | |||||||
| Net assets at end of period (000s) | $ | 184 | $ | 168 | |||||||
| Ratio of net expenses to average net assets (including dividend expense on securities sold short) | 3.57 | % | 3.40 | % | |||||||
| Ratio of net expenses to average net assets (excluding dividend expense on securities sold short) | 2.25 | % | 2.37 | % | |||||||
| Ratio of gross expenses to average net assets (including dividend expense on securities sold short) | 9.53 | % | 4.48 | % | |||||||
| Ratio of gross expenses to average net assets (excluding dividend expense on securities sold short) | 8.21 | % | 3.44 | % | |||||||
| Ratio of net investment loss to average net assets | (2.64 | %) | (2.18 | %) | |||||||
| Portfolio turnover rate | 125 | % | 377 | % | |||||||
(A) The Fund commenced operations on October 1, 2009.
(B) Total returns shown exclude the effect of applicable sales loads.
See accompanying notes to financial statements.
111
Financial Highlights (Continued)
Touchstone Market Neutral Equity Fund — Class Y
Per Share Data for a Share Outstanding Throughout the Period
| Year Ended September 30, | |||||||||||
| 2011 | 2010 (A) | ||||||||||
| Net asset value at beginning of period | $ | 9.75 | $ | 10.00 | |||||||
| Income (loss) from investment operations: | |||||||||||
| Net investment loss | (0.14 | ) | (0.04 | ) | |||||||
| Net realized and unrealized gains (losses) on investments | 0.35 | (0.21 | ) | ||||||||
| Total from investment operations | 0.21 | (0.25 | ) | ||||||||
| Net asset value at end of period | $ | 9.96 | $ | 9.75 | |||||||
| Total return | 2.15 | % | (2.50 | %) | |||||||
| Net assets at end of period (000s) | $ | 40,335 | $ | 32,406 | |||||||
| Ratio of net expenses to average net assets (including dividend expense on securities sold short) | 2.57 | % | 2.48 | % | |||||||
| Ratio of net expenses to average net assets (excluding dividend expense on securities sold short) | 1.25 | % | 1.38 | % | |||||||
| Ratio of gross expenses to average net assets (including dividend expense on securities sold short) | 3.05 | % | 3.39 | % | |||||||
| Ratio of gross expenses to average net assets (excluding dividend expense on securities sold short) | 1.73 | % | 2.29 | % | |||||||
| Ratio of net investment loss to average net assets | (1.64 | %) | (1.15 | %) | |||||||
| Portfolio turnover rate | 125 | % | 377 | % | |||||||
(A) The Fund commenced operations on October 1, 2009.
See accompanying notes to financial statements.
112
Financial Highlights (Continued)
Touchstone Merger Arbitrage Fund — Class A
Per Share Data for a Share Outstanding Throughout the Period
| Period Ended September 30, 2011 (A) | |||||||
| Net asset value at beginning of period | $ | 10.00 | |||||
| Income (loss) from investment operations: | |||||||
| Net investment loss | (0.00 | ) (B) | |||||
| Net realized and unrealized gains on investments | 0.02 | ||||||
| Total from investment operations | 0.02 | ||||||
| Net asset value at end of period | $ | 10.02 | |||||
| Total return (C) | 0.30 | % (D) | |||||
| Net assets at end of period (000s) | $ | 260 | |||||
| Ratio of net expenses to average net assets (including dividend expense on securities sold short) | 3.33 | % (E) | |||||
| Ratio of net expenses to average net assets (excluding dividend expense on securities sold short) | 1.69 | % (E) | |||||
| Ratio of gross expenses to average net assets (including dividend expense on securities sold short) | 28.67 | % (E) | |||||
| Ratio of gross expenses to average net assets (excluding dividend expense on securities sold short) | 27.03 | % (E) | |||||
| Ratio of net investment loss to average net assets | (1.97 | %) (E) | |||||
| Portfolio turnover rate | 311 | % (D) | |||||
Touchstone Merger Arbitrage Fund — Class C
Per Share Data for a Share Outstanding Throughout the Period
| Period Ended September 30, 2011 (A) | |||||||
| Net asset value at beginning of period | $ | 10.00 | |||||
| Income (loss) from investment operations: | |||||||
| Net investment loss | (0.01 | ) | |||||
| Net realized and unrealized gains on investments | 0.02 | ||||||
| Total from investment operations | 0.01 | ||||||
| Net asset value at end of period | $ | 10.01 | |||||
| Total return (C) | 0.10 | % (D) | |||||
| Net assets at end of period (000s) | $ | 254 | |||||
| Ratio of net expenses to average net assets (including dividend expense on securities sold short) | 4.23 | % (E) | |||||
| Ratio of net expenses to average net assets (excluding dividend expense on securities sold short) | 2.43 | % (E) | |||||
| Ratio of gross expenses to average net assets (including dividend expense on securities sold short) | 29.58 | % (E) | |||||
| Ratio of gross expenses to average net assets (excluding dividend expense on securities sold short) | 27.78 | % (E) | |||||
| Ratio of net investment loss to average net assets | (2.74 | %) (E) | |||||
| Portfolio turnover rate | 311 | % (D) | |||||
(A) Represents the period from commencement of operations (August 9, 2011) through September 30, 2011.
(B) Amount rounds to less than $0.005 per share.
(C) Total returns shown exclude the effect of applicable sales loads.
(D) Not annualized.
(E) Annualized.
See accompanying notes to financial statements.
113
Financial Highlights (Continued)
Touchstone Merger Arbitrage Fund — Class Y
Per Share Data for a Share Outstanding Throughout the Period
| Period Ended September 30, 2011 (A) | |||||||
| Net asset value at beginning of period | $ | 10.00 | |||||
| Income (loss) from investment operations: | |||||||
| Net investment loss | (0.01 | ) | |||||
| Net realized and unrealized gains on investments | 0.03 | ||||||
| Total from investment operations | 0.02 | ||||||
| Net asset value at end of period | $ | 10.02 | |||||
| Total return | 0.20 | % (B) | |||||
| Net assets at end of period (000s) | $ | 1,160 | |||||
| Ratio of net expenses to average net assets (including dividend expense on securities sold short) | 2.74 | % (C) | |||||
| Ratio of net expenses to average net assets (excluding dividend expense on securities sold short) | 1.43 | % (C) | |||||
| Ratio of gross expenses to average net assets (including dividend expense on securities sold short) | 8.22 | % (C) | |||||
| Ratio of gross expenses to average net assets (excluding dividend expense on securities sold short) | 6.91 | % (C) | |||||
| Ratio of net investment loss to average net assets | (1.65 | %) (C) | |||||
| Portfolio turnover rate | 311 | % (B) | |||||
Touchstone Merger Arbitrage Fund — Institutional Class
Per Share Data for a Share Outstanding Throughout the Period
| Period Ended September 30, 2011 (A) | |||||||
| Net asset value at beginning of period | $ | 10.00 | |||||
| Income (loss) from investment operations: | |||||||
| Net investment loss | (0.02 | ) | |||||
| Net realized and unrealized gains on investments | 0.05 | ||||||
| Total from investment operations | 0.03 | ||||||
| Net asset value at end of period | $ | 10.03 | |||||
| Total return | 0.30 | % (B) | |||||
| Net assets at end of period (000s) | $ | 5,016 | |||||
| Ratio of net expenses to average net assets (including dividend expense on securities sold short) | 1.86 | % (C) | |||||
| Ratio of net expenses to average net assets (excluding dividend expense on securities sold short) | 1.28 | % (C) | |||||
| Ratio of gross expenses to average net assets (including dividend expense on securities sold short) | 4.83 | % (C) | |||||
| Ratio of gross expenses to average net assets (excluding dividend expense on securities sold short) | 4.25 | % (C) | |||||
| Ratio of net investment loss to average net assets | (1.13 | %) (C) | |||||
| Portfolio turnover rate | 311 | % (B) | |||||
(A) Represents the period from commencement of operations (August 9, 2011) through September 30, 2011.
(B) Not annualized.
(C) Annualized.
See accompanying notes to financial statements.
114
Financial Highlights (Continued)
Touchstone Mid Cap Fund — Class A
Per Share Data for a Share Outstanding Throughout Each Period
| Year Ended September 30, | Period Ended September 30, | ||||||||||||||||||||||
| 2011 | 2010 | 2009 | 2008 | 2007 (A) | |||||||||||||||||||
| Net asset value at beginning of period | $ | 12.67 | $ | 11.20 | $ | 13.07 | $ | 17.86 | $ | 18.14 | |||||||||||||
| Income (loss) from investment operations: | |||||||||||||||||||||||
| Net investment income (loss) | (0.02 | ) | 0.29 | 0.04 | (0.02 | ) | (0.00 | ) (B) | |||||||||||||||
| Net realized and unrealized gains (losses) on investments | 0.51 | 1.24 | (1.85 | ) | (4.60 | ) | (0.28 | ) | |||||||||||||||
| Total from investment operations | 0.49 | 1.53 | (1.81 | ) | (4.62 | ) | (0.28 | ) | |||||||||||||||
| Less distributions: | |||||||||||||||||||||||
| Dividends from net investment income | — | (0.06 | ) | (0.03 | ) | — | — | ||||||||||||||||
| Distributions from net realized gains | — | — | (0.03 | ) | (0.17 | ) | — | ||||||||||||||||
| Total distributions | — | (0.06 | ) | (0.06 | ) | (0.17 | ) | — | |||||||||||||||
| Net asset value at end of period | $ | 13.16 | $ | 12.67 | $ | 11.20 | $ | 13.07 | $ | 17.86 | |||||||||||||
| Total return (C) | 3.87 | % | 13.72 | % | (13.81 | %) | (26.11 | %) | (1.54 | %) (D) | |||||||||||||
| Net assets at end of period (000s) | $ | 698 | $ | 685 | $ | 453 | $ | 159 | $ | 210 | |||||||||||||
| Ratio of net expenses to average net assets | 1.21 | % | 1.21 | % | 1.15 | % | 1.15 | % | 0.94 | % (E) | |||||||||||||
| Ratio of gross expenses to average net assets | 3.05 | % | 2.84 | % | 3.84 | % | 4.09 | % | 14.21 | % (E) | |||||||||||||
| Ratio of net investment income (loss) to average net assets | (0.02 | %) | 0.34 | % | 0.39 | % | (0.16 | %) | (0.09 | %) (E) | |||||||||||||
| Portfolio turnover rate | 97 | % | 132 | % | 187 | % | 157 | % | 193 | % (D) | |||||||||||||
Touchstone Mid Cap Fund — Class C
Per Share Data for a Share Outstanding Throughout Each Period
| Year Ended September 30, | Period Ended September 30, | ||||||||||||||||||||||
| 2011 | 2010 | 2009 | 2008 | 2007 (A) | |||||||||||||||||||
| Net asset value at beginning of period | $ | 12.58 | $ | 11.19 | $ | 13.12 | $ | 17.84 | $ | 18.14 | |||||||||||||
| Loss from investment operations: | |||||||||||||||||||||||
| Net investment loss | (0.07 | ) | (0.04 | ) | (0.03 | ) | (0.15 | ) | (0.02 | ) | |||||||||||||
| Net realized and unrealized gains (losses) on investments | 0.45 | 1.43 | (1.87 | ) | (4.40 | ) | (0.28 | ) | |||||||||||||||
| Total from investment operations | 0.38 | 1.39 | (1.90 | ) | (4.55 | ) | (0.30 | ) | |||||||||||||||
| Less distributions: | |||||||||||||||||||||||
| Distributions from net realized gains | — | — | (0.03 | ) | (0.17 | ) | — | ||||||||||||||||
| Net asset value at end of period | $ | 12.96 | $ | 12.58 | $ | 11.19 | $ | 13.12 | $ | 17.84 | |||||||||||||
| Total return (C) | 3.02 | % | 12.42 | % | (14.47 | %) | (25.74 | %) | (1.65 | %) (D) | |||||||||||||
| Net assets at end of period (000s) | $ | 476 | $ | 249 | $ | 169 | $ | 30 | $ | 36 | |||||||||||||
| Ratio of net expenses to average net assets | 1.96 | % | 1.94 | % | 1.90 | % | 1.90 | % | 1.35 | % (E) | |||||||||||||
| Ratio of gross expenses to average net assets | 4.95 | % | 4.57 | % | 6.99 | % | 31.40 | % | 28.68 | % (E) | |||||||||||||
| Ratio of net investment loss to average net assets | (0.80 | %) | (0.40 | %) | (0.38 | %) | (0.91 | %) | (0.51 | %) (E) | |||||||||||||
| Portfolio turnover rate | 97 | % | 132 | % | 187 | % | 157 | % | 193 | % (D) | |||||||||||||
(A) Represents the period from commencement of operations (May 14, 2007) through September 30, 2007.
(B) Amount rounds to less than $0.005 per share.
(C) Total returns shown exclude the effect of applicable sales loads.
(D) Not annualized.
(E) Annualized.
See accompanying notes to financial statements.
115
Financial Highlights (Continued)
Touchstone Mid Cap Fund — Class Y
Per Share Data for a Share Outstanding Throughout Each Period
| Year Ended September 30, | |||||||||||||||||||||||
| 2011 | 2010 | 2009 | 2008 | 2007 | |||||||||||||||||||
| Net asset value at beginning of period | $ | 12.68 | $ | 11.25 | $ | 13.14 | $ | 17.91 | $ | 15.28 | |||||||||||||
| Income (loss) from investment operations: | |||||||||||||||||||||||
| Net investment income | 0.05 | 0.08 | 0.07 | 0.01 | 0.11 | ||||||||||||||||||
| Net realized and unrealized gains (losses) on investments | 0.47 | 1.44 | (1.88 | ) | (4.61 | ) | 2.65 | ||||||||||||||||
| Total from investment operations | 0.52 | 1.52 | (1.81 | ) | (4.60 | ) | 2.76 | ||||||||||||||||
| Less distributions: | |||||||||||||||||||||||
| Dividends from net investment income | (0.03 | ) | (0.09 | ) | (0.05 | ) | — | (0.13 | ) | ||||||||||||||
| Distributions from net realized gains | — | — | (0.03 | ) | (0.17 | ) | — | ||||||||||||||||
| Total distributions | (0.03 | ) | (0.09 | ) | (0.08 | ) | (0.17 | ) | (0.13 | ) | |||||||||||||
| Net asset value at end of period | $ | 13.17 | $ | 12.68 | $ | 11.25 | $ | 13.14 | $ | 17.91 | |||||||||||||
| Total return | 4.10 | % | 13.58 | % | (13.68 | %) | (25.92 | %) | 18.13 | % | |||||||||||||
| Net assets at end of period (000s) | $ | 77,785 | $ | 123,493 | $ | 168,313 | $ | 422,356 | $ | 482,047 | |||||||||||||
| Ratio of net expenses to average net assets | 0.96 | % | 0.94 | % | 0.90 | % | 0.90 | % | 0.90 | % | |||||||||||||
| Ratio of gross expenses to average net assets | 1.06 | % | 1.07 | % | 1.05 | % | 1.03 | % | 1.06 | % | |||||||||||||
| Ratio of net investment income to average net assets | 0.26 | % | 0.71 | % | 0.61 | % | 0.09 | % | 0.39 | % | |||||||||||||
| Portfolio turnover rate | 97 | % | 132 | % | 187 | % | 157 | % | 193 | % | |||||||||||||
Touchstone Mid Cap Fund — Class Z
Per Share Data for a Share Outstanding Throughout Each Period
| Year Ended September 30, | |||||||||||||||||||||||
| 2011 | 2010 | 2009 | 2008 | 2007 | |||||||||||||||||||
| Net asset value at beginning of period | $ | 12.59 | $ | 11.18 | $ | 13.05 | $ | 17.85 | $ | 15.26 | |||||||||||||
| Income (loss) from investment operations: | |||||||||||||||||||||||
| Net investment income (loss) | (0.00 | ) (A) | 0.02 | 0.03 | (0.08 | ) | 0.09 | ||||||||||||||||
| Net realized and unrealized gains (losses) on investments | 0.49 | 1.45 | (1.84 | ) | (4.55 | ) | 2.62 | ||||||||||||||||
| Total from investment operations | 0.49 | 1.47 | (1.81 | ) | (4.63 | ) | 2.71 | ||||||||||||||||
| Less distributions: | |||||||||||||||||||||||
| Dividends from net investment income | — | (0.06 | ) | (0.03 | ) | — | (0.12 | ) | |||||||||||||||
| Distributions from net realized gains | — | — | (0.03 | ) | (0.17 | ) | — | ||||||||||||||||
| Total distributions | — | (0.06 | ) | (0.06 | ) | (0.17 | ) | (0.12 | ) | ||||||||||||||
| Net asset value at end of period | $ | 13.08 | $ | 12.59 | $ | 11.18 | $ | 13.05 | $ | 17.85 | |||||||||||||
| Total return | 3.89 | % | 13.20 | % | (13.83 | %) | (26.18 | %) | 17.84 | % | |||||||||||||
| Net assets at end of period (000s) | $ | 934 | $ | 652 | $ | 1,814 | $ | 3,267 | $ | 15,203 | |||||||||||||
| Ratio of net expenses to average net assets | 1.21 | % | 1.19 | % | 1.15 | % | 1.15 | % | 1.14 | % | |||||||||||||
| Ratio of gross expenses to average net assets | 3.68 | % | 2.14 | % | 2.22 | % | 1.48 | % | 1.25 | % | |||||||||||||
| Ratio of net investment income (loss) to average net assets | (0.09 | %) | 0.45 | % | 0.39 | % | (0.27 | %) | 0.12 | % | |||||||||||||
| Portfolio turnover rate | 97 | % | 132 | % | 187 | % | 157 | % | 193 | % | |||||||||||||
(A) Amount rounds to less than $0.005 per share.
See accompanying notes to financial statements.
116
Financial Highlights (Continued)
Touchstone Mid Cap Value Fund — Class A
Per Share Data for a Share Outstanding Throughout the Period
| Year Ended September 30, | |||||||||||
| 2011 | 2010 (A) | ||||||||||
| Net asset value at beginning of period | $ | 11.76 | $ | 10.00 | |||||||
| Income (loss) from investment operations: | |||||||||||
| Net investment income | 0.09 | 0.12 | |||||||||
| Net realized and unrealized gains (losses) on investments | (0.72 | ) | 1.74 | ||||||||
| Total from investment operations | (0.63 | ) | 1.86 | ||||||||
| Less distributions: | |||||||||||
| Dividends from net investment income | (0.11 | ) | (0.10 | ) | |||||||
| Distributions from net realized gains | (0.16 | ) | — | ||||||||
| Total distributions | (0.27 | ) | (0.10 | ) | |||||||
| Net asset value at end of period | $ | 10.86 | $ | 11.76 | |||||||
| Total return (B) | (5.72 | %) | 18.70 | % | |||||||
| Net assets at end of period (000s) | $ | 2,364 | $ | 345 | |||||||
| Ratio of net expenses to average net assets | 1.29 | % | 1.29 | % | |||||||
| Ratio of gross expenses to average net assets | 2.07 | % | 3.07 | % | |||||||
| Ratio of net investment income to average net assets | 0.86 | % | 1.07 | % | |||||||
| Portfolio turnover rate | 59 | % | 45 | % | |||||||
Touchstone Mid Cap Value Fund — Class C
Per Share Data for a Share Outstanding Throughout the Period
| Year Ended September 30, | |||||||||||
| 2011 | 2010 (A) | ||||||||||
| Net asset value at beginning of period | $ | 11.74 | $ | 10.00 | |||||||
| Income (loss) from investment operations: | |||||||||||
| Net investment income | 0.03 | 0.03 | |||||||||
| Net realized and unrealized gains (losses) on investments | (0.75 | ) | 1.75 | ||||||||
| Total from investment operations | (0.72 | ) | 1.78 | ||||||||
| Less distributions: | |||||||||||
| Dividends from net investment income | (0.04 | ) | (0.04 | ) | |||||||
| Distributions from net realized gains | (0.16 | ) | — | ||||||||
| Total distributions | (0.20 | ) | (0.04 | ) | |||||||
| Net asset value at end of period | $ | 10.82 | $ | 11.74 | |||||||
| Total return (B) | (6.45 | %) | 17.88 | % | |||||||
| Net assets at end of period (000s) | $ | 204 | $ | 132 | |||||||
| Ratio of net expenses to average net assets | 2.04 | % | 2.04 | % | |||||||
| Ratio of gross expenses to average net assets | 7.74 | % | 3.86 | % | |||||||
| Ratio of net investment income to average net assets | 0.10 | % | 0.27 | % | |||||||
| Portfolio turnover rate | 59 | % | 45 | % | |||||||
(A) The Fund commenced operations on October 1, 2009.
(B) Total returns shown exclude the effect of applicable sales loads.
See accompanying notes to financial statements.
117
Financial Highlights (Continued)
Touchstone Mid Cap Value Fund — Class Y
Per Share Data for a Share Outstanding Throughout the Period
| Year Ended September 30, | |||||||||||
| 2011 | 2010 (A) | ||||||||||
| Net asset value at beginning of period | $ | 11.79 | $ | 10.00 | |||||||
| Income (loss) from investment operations: | |||||||||||
| Net investment income | 0.12 | 0.14 | |||||||||
| Net realized and unrealized gains (losses) on investments | (0.72 | ) | 1.76 | ||||||||
| Total from investment operations | (0.60 | ) | 1.90 | ||||||||
| Less distributions: | |||||||||||
| Dividends from net investment income | (0.14 | ) | (0.11 | ) | |||||||
| Distributions from net realized gains | (0.16 | ) | — | ||||||||
| Total distributions | (0.30 | ) | (0.11 | ) | |||||||
| Net asset value at end of period | $ | 10.89 | $ | 11.79 | |||||||
| Total return | (5.51 | %) | 19.07 | % | |||||||
| Net assets at end of period (000s) | $ | 4,685 | $ | 589 | |||||||
| Ratio of net expenses to average net assets | 1.04 | % | 1.04 | % | |||||||
| Ratio of gross expenses to average net assets | 1.58 | % | 3.19 | % | |||||||
| Ratio of net investment income to average net assets | 1.20 | % | 1.40 | % | |||||||
| Portfolio turnover rate | 59 | % | 45 | % | |||||||
Touchstone Mid Cap Value Fund — Institutional Class
Per Share Data for a Share Outstanding Throughout the Period
| Year Ended September 30, | |||||||||||
| 2011 | 2010 (A) | ||||||||||
| Net asset value at beginning of period | $ | 11.83 | $ | 10.00 | |||||||
| Income (loss) from investment operations: | |||||||||||
| Net investment income | 0.16 | 0.10 | |||||||||
| Net realized and unrealized gains (losses) on investments | (0.75 | ) | 1.82 | ||||||||
| Total from investment operations | (0.59 | ) | 1.92 | ||||||||
| Less distributions: | |||||||||||
| Dividends from net investment income | (0.16 | ) | (0.09 | ) | |||||||
| Distributions from net realized gains | (0.16 | ) | — | ||||||||
| Total distributions | (0.32 | ) | (0.09 | ) | |||||||
| Net asset value at end of period | $ | 10.92 | $ | 11.83 | |||||||
| Total return | (5.41 | %) | 19.25 | % | |||||||
| Net assets at end of period (000s) | $ | 39,808 | $ | 39,509 | |||||||
| Ratio of net expenses to average net assets | 0.89 | % | 0.89 | % | |||||||
| Ratio of gross expenses to average net assets | 1.15 | % | 1.93 | % | |||||||
| Ratio of net investment income to average net assets | 1.21 | % | 1.66 | % | |||||||
| Portfolio turnover rate | 59 | % | 45 | % | |||||||
(A) The Fund commenced operations on October 1, 2009.
See accompanying notes to financial statements.
118
Financial Highlights (Continued)
Touchstone Premium Yield Equity Fund — Class A
Per Share Data for a Share Outstanding Throughout Each Period
| Year Ended September 30, | Period Ended September 30, | ||||||||||||||||||
| 2011 | 2010 | 2009 | 2008 (A) | ||||||||||||||||
| Net asset value at beginning of period | $ | 6.48 | $ | 5.93 | $ | 7.56 | $ | 10.00 | |||||||||||
| Income (loss) from investment operations: | |||||||||||||||||||
| Net investment income | 0.21 | 0.21 | 0.22 | 0.33 | |||||||||||||||
| Net realized and unrealized gains (losses) on investments | 0.28 | 0.54 | (1.64 | ) | (2.44 | ) | |||||||||||||
| Total from investment operations | 0.49 | 0.75 | (1.42 | ) | (2.11 | ) | |||||||||||||
| Less distributions: | |||||||||||||||||||
| Dividends from net investment income | (0.21 | ) | (0.20 | ) | (0.21 | ) | (0.32 | ) | |||||||||||
| Distributions from return of capital | — | — | — | (0.01 | ) | ||||||||||||||
| Total distributions | (0.21 | ) | (0.20 | ) | (0.21 | ) | (0.33 | ) | |||||||||||
| Net asset value at end of period | $ | 6.76 | $ | 6.48 | $ | 5.93 | $ | 7.56 | |||||||||||
| Total return (B) | 7.43 | % | 12.82 | % | (18.40 | %) | (21.48 | %) (C) | |||||||||||
| Net assets at end of period (000s) | $ | 28,739 | $ | 22,441 | $ | 19,879 | $ | 19,411 | |||||||||||
| Ratio of net expenses to average net assets | 1.20 | % | 1.20 | % | 1.20 | % | 1.20 | % (D) | |||||||||||
| Ratio of gross expenses to average net assets | 1.35 | % | 1.40 | % | 1.55 | % | 1.53 | % (D) | |||||||||||
| Ratio of net investment income to average net assets | 3.02 | % | 3.30 | % | 3.97 | % | 4.68 | % (D) | |||||||||||
| Portfolio turnover rate | 54 | % | 29 | % | 30 | % | 181 | % (C) | |||||||||||
Touchstone Premium Yield Equity Fund — Class C
Per Share Data for a Share Outstanding Throughout Each Period
| Year Ended September 30, | Period Ended September 30, | ||||||||||||||||||
| 2011 | 2010 | 2009 | 2008 (A) | ||||||||||||||||
| Net asset value at beginning of period | $ | 6.49 | $ | 5.93 | $ | 7.56 | $ | 10.00 | |||||||||||
| Income (loss) from investment operations: | |||||||||||||||||||
| Net investment income | 0.16 | 0.16 | 0.10 | 0.29 | |||||||||||||||
| Net realized and unrealized gains (losses) on investments | 0.27 | 0.55 | (1.55 | ) | (2.45 | ) | |||||||||||||
| Total from investment operations | 0.43 | 0.71 | (1.45 | ) | (2.16 | ) | |||||||||||||
| Less distributions: | |||||||||||||||||||
| Dividends from net investment income | (0.16 | ) | (0.15 | ) | (0.18 | ) | (0.27 | ) | |||||||||||
| Distributions from return of capital | — | — | — | (0.01 | ) | ||||||||||||||
| Total distributions | (0.16 | ) | (0.15 | ) | (0.18 | ) | (0.28 | ) | |||||||||||
| Net asset value at end of period | $ | 6.76 | $ | 6.49 | $ | 5.93 | $ | 7.56 | |||||||||||
| Total return (B) | 6.60 | % | 12.11 | % | (18.96 | %) | (21.95 | %) (C) | |||||||||||
| Net assets at end of period (000s) | $ | 7,499 | $ | 6,870 | $ | 3,319 | $ | 567 | |||||||||||
| Ratio of net expenses to average net assets | 1.95 | % | 1.95 | % | 1.95 | % | 1.94 | % (D) | |||||||||||
| Ratio of gross expenses to average net assets | 2.28 | % | 2.23 | % | 3.08 | % | 5.31 | % (D) | |||||||||||
| Ratio of net investment income to average net assets | 2.27 | % | 2.60 | % | 2.80 | % | 3.93 | % (D) | |||||||||||
| Portfolio turnover rate | 54 | % | 29 | % | 30 | % | 181 | % (C) | |||||||||||
(A) Represents the period from commencement of operations (December 3, 2007) through September 30, 2008.
(B) Total returns shown exclude the effect of applicable sales loads.
(C) Not annualized.
(D) Annualized.
See accompanying notes to financial statements.
119
Financial Highlights (Continued)
Touchstone Premium Yield Equity Fund — Class Y
Per Share Data for a Share Outstanding Throughout Each Period
| Year Ended September 30, | Period Ended September 30, | ||||||||||||||||||
| 2011 | 2010 | 2009 | 2008 (A) | ||||||||||||||||
| Net asset value at beginning of period | $ | 6.47 | $ | 5.92 | $ | 7.55 | $ | 8.30 | |||||||||||
| Income (loss) from investment operations: | |||||||||||||||||||
| Net investment income | 0.20 | 0.22 | 0.22 | 0.04 | |||||||||||||||
| Net realized and unrealized gains (losses) on investments | 0.30 | 0.54 | (1.62 | ) | (0.73 | ) | |||||||||||||
| Total from investment operations | 0.50 | 0.76 | (1.40 | ) | (0.69 | ) | |||||||||||||
| Less distributions: | |||||||||||||||||||
| Dividends from net investment income | (0.22 | ) | (0.21 | ) | (0.23 | ) | (0.05 | ) | |||||||||||
| Distributions from return of capital | — | — | — | (0.01 | ) | ||||||||||||||
| Total distributions | (0.22 | ) | (0.21 | ) | (0.23 | ) | (0.06 | ) | |||||||||||
| Net asset value at end of period | $ | 6.75 | $ | 6.47 | $ | 5.92 | $ | 7.55 | |||||||||||
| Total return | 7.67 | % | 13.14 | % | (18.22 | %) | (8.37 | %) (B) | |||||||||||
| Net assets at end of period (000s) | $ | 3,980 | $ | 11,540 | $ | 551 | $ | 2 | |||||||||||
| Ratio of net expenses to average net assets | 0.95 | % | 0.95 | % | 0.95 | % | 0.90 | % (C) | |||||||||||
| Ratio of gross expenses to average net assets | 1.25 | % | 1.53 | % | 13.70 | % | 453.70 | % (C) | |||||||||||
| Ratio of net investment income to average net assets | 3.16 | % | 3.77 | % | 2.97 | % | 3.16 | % (C) | |||||||||||
| Portfolio turnover rate | 54 | % | 29 | % | 30 | % | 181 | % (B) | |||||||||||
(A) Represents the period from commencement of operations (August 12, 2008) through September 30, 2008.
(B) Not annualized.
(C) Annualized.
See accompanying notes to financial statements.
120
Financial Highlights (Continued)
Touchstone Sands Capital Select Growth Fund — Class A
Per Share Data for a Share Outstanding Throughout the Period
| Period Ended September 30, 2011 (A) | |||||||
| Net asset value at beginning of period | $ | 9.39 | |||||
| Income (loss) from investment operations: | |||||||
| Net investment loss | (0.03 | ) | |||||
| Net realized and unrealized gains on investments | 0.03 | ||||||
| Total from investment operations | 0.00 | ||||||
| Net asset value at end of period | $ | 9.39 | |||||
| Total return (B) | 0.00 | % (C) | |||||
| Net assets at end of period (000s) | $ | 21,211 | |||||
| Ratio of net expenses to average net assets | 1.45 | % (D) | |||||
| Ratio of gross expenses to average net assets | 1.64 | % (D) | |||||
| Ratio of net investment loss to average net assets | (0.94 | %) (D) | |||||
| Portfolio turnover rate | 19 | % (C) | |||||
Touchstone Sands Capital Select Growth Fund — Class C
Per Share Data for a Share Outstanding Throughout the Period
| Period Ended September 30, 2011 (A) | |||||||
| Net asset value at beginning of period | $ | 9.39 | |||||
| Income (loss) from investment operations: | |||||||
| Net investment loss | (0.06 | ) | |||||
| Net realized and unrealized gains on investments | 0.00 | (E) | |||||
| Total from investment operations | (0.06 | ) | |||||
| Net asset value at end of period | $ | 9.33 | |||||
| Total return (B) | (0.64 | %) (C) | |||||
| Net assets at end of period (000s) | $ | 8,660 | |||||
| Ratio of net expenses to average net assets | 2.20 | % (D) | |||||
| Ratio of gross expenses to average net assets | 2.56 | % (D) | |||||
| Ratio of net investment loss to average net assets | (1.69 | %) (D) | |||||
| Portfolio turnover rate | 19 | % (C) | |||||
(A) Represents the period from commencement of operations (November 15, 2010) through September 30, 2011.
(B) Total returns shown exclude the effect of applicable sales loads.
(C) Not annualized.
(D) Annualized.
(E) Amount rounds to less than $0.005 per share.
See accompanying notes to financial statements.
121
Financial Highlights (Continued)
Touchstone Sands Capital Select Growth Fund — Class Y
Per Share Data for a Share Outstanding Throughout Each Period
| Year Ended September 30, | |||||||||||||||||||||||
| 2011 | 2010 | 2009 | 2008 | 2007 | |||||||||||||||||||
| Net asset value at beginning of period | $ | 8.83 | $ | 7.34 | $ | 6.86 | $ | 9.15 | $ | 7.60 | |||||||||||||
| Income (loss) from investment operations: | |||||||||||||||||||||||
| Net investment loss | (0.14 | ) | (0.07 | ) | (0.03 | ) | (0.06 | ) | (0.05 | ) | |||||||||||||
| Net realized and unrealized gains (losses) on investments | 0.87 | 1.56 | 0.51 | (2.23 | ) | 1.60 | |||||||||||||||||
| Total from investment operations | 0.73 | 1.49 | 0.48 | (2.29 | ) | 1.55 | |||||||||||||||||
| Net asset value at end of period | $ | 9.56 | $ | 8.83 | $ | 7.34 | $ | 6.86 | $ | 9.15 | |||||||||||||
| Total return | 8.14 | % | 20.44 | % | 7.00 | % | (25.03 | %) | 20.39 | % | |||||||||||||
| Net assets at end of period (000s) | $ | 392,464 | $ | 120,333 | $ | 82,918 | $ | 130,920 | $ | 213,672 | |||||||||||||
| Ratio of net expenses to average net assets | 1.20 | % | 1.22 | % | 0.98 | % | 1.16 | % | 1.03 | % | |||||||||||||
| Ratio of gross expenses to average net assets | 1.23 | % | 1.28 | % | 1.05 | % | 1.19 | % | 1.03 | % | |||||||||||||
| Ratio of net investment loss to average net assets | (0.68 | %) | (0.52 | %) | (0.48 | %) | (0.59 | %) | (0.67 | %) | |||||||||||||
| Portfolio turnover rate | 19 | % | 27 | % | 50 | % | 39 | % | 24 | % | |||||||||||||
Touchstone Sands Capital Select Growth Fund — Class Z
Per Share Data for a Share Outstanding Throughout Each Period
| Year Ended September 30, | |||||||||||||||||||||||
| 2011 | 2010 | 2009 | 2008 | 2007 | |||||||||||||||||||
| Net asset value at beginning of period | $ | 8.70 | $ | 7.24 | $ | 6.79 | $ | 9.08 | $ | 7.57 | |||||||||||||
| Income (loss) from investment operations: | |||||||||||||||||||||||
| Net investment loss | (0.07 | ) | (0.04 | ) | (0.04 | ) | (0.06 | ) | (0.09 | ) | |||||||||||||
| Net realized and unrealized gains (losses) on investments | 0.76 | 1.50 | 0.49 | (2.23 | ) | 1.60 | |||||||||||||||||
| Total from investment operations | 0.69 | 1.46 | 0.45 | (2.29 | ) | 1.51 | |||||||||||||||||
| Net asset value at end of period | $ | 9.39 | $ | 8.70 | $ | 7.24 | $ | 6.79 | $ | 9.08 | |||||||||||||
| Total return | 7.93 | % | 20.17 | % | 6.63 | % | (25.22 | %) | 19.95 | % | |||||||||||||
| Net assets at end of period (000s) | $ | 911,849 | $ | 540,329 | $ | 333,200 | $ | 363,955 | $ | 380,025 | |||||||||||||
| Ratio of net expenses to average net assets | 1.42 | % | 1.47 | % | 1.23 | % | 1.41 | % | 1.29 | % | |||||||||||||
| Ratio of gross expenses to average net assets | 1.52 | % | 1.53 | % | 1.32 | % | 1.43 | % | 1.35 | % | |||||||||||||
| Ratio of net investment loss to average net assets | (0.93 | %) | (0.79 | %) | (0.74 | %) | (0.85 | %) | (0.92 | %) | |||||||||||||
| Portfolio turnover rate | 19 | % | 27 | % | 50 | % | 39 | % | 24 | % | |||||||||||||
See accompanying notes to financial statements.
122
Financial Highlights (Continued)
Touchstone Short Duration Fixed Income Fund — Class Y
Per Share Data for a Share Outstanding Throughout Each Period
| Year Ended September 30, | Period Ended September 30, | ||||||||||||||
| 2011 | 2010 | 2009 (A) | |||||||||||||
| Net asset value at beginning of period | $ | 9.97 | $ | 9.95 | $ | 9.79 | |||||||||
| Income from investment operations: | |||||||||||||||
| Net investment income | 0.23 | 0.32 | 0.13 | ||||||||||||
| Net realized and unrealized gains (losses) on investments | (0.10 | ) | 0.03 | 0.16 | |||||||||||
| Total from investment operations | 0.13 | 0.35 | 0.29 | ||||||||||||
| Less distributions: | |||||||||||||||
| Dividends from net investment income | (0.29 | ) | (0.33 | ) | (0.13 | ) | |||||||||
| Net asset value at end of period | $ | 9.81 | $ | 9.97 | $ | 9.95 | |||||||||
| Total return | 1.37 | % | 3.61 | % | 3.02 | % (B) | |||||||||
| Net assets at end of period (000's) | $ | 1,164 | $ | 767 | $ | 592 | |||||||||
| Ratio of net expenses to average net assets | 0.49 | % | 0.49 | % | 0.48 | % (C) | |||||||||
| Ratio of gross expenses to average net assets | 1.43 | % | 3.98 | % | 1.49 | % (C) | |||||||||
| Ratio of net investment income to average net assets | 2.31 | % | 3.22 | % | 3.03 | % (C) | |||||||||
| Portfolio turnover rate | 48 | % | 45 | % | 79 | % (B) | |||||||||
Touchstone Short Duration Fixed Income Fund — Class Z
Per Share Data for a Share Outstanding Throughout Each Period
| Year Ended September 30, | |||||||||||||||||||||||
| 2011 | 2010 | 2009 | 2008 | 2007 | |||||||||||||||||||
| Net asset value at beginning of period | $ | 9.96 | $ | 9.94 | $ | 9.59 | $ | 9.81 | $ | 9.76 | |||||||||||||
| Income (loss) from investment operations: | |||||||||||||||||||||||
| Net investment income | 0.21 | 0.29 | 0.32 | 0.45 | 0.45 | ||||||||||||||||||
| Net realized and unrealized gains (losses) on investments | (0.09 | ) | 0.04 | 0.35 | (0.22 | ) | 0.05 | ||||||||||||||||
| Total from investment operations | 0.12 | 0.33 | 0.67 | 0.23 | 0.50 | ||||||||||||||||||
| Less distributions: | |||||||||||||||||||||||
| Dividends from net investment income | (0.27 | ) | (0.31 | ) | (0.32 | ) | (0.45 | ) | (0.45 | ) | |||||||||||||
| Net asset value at end of period | $ | 9.81 | $ | 9.96 | $ | 9.94 | $ | 9.59 | $ | 9.81 | |||||||||||||
| Total return | 1.22 | % | 3.36 | % | 7.13 | % | 2.36 | % | 5.19 | % | |||||||||||||
| Net assets at end of period (000's) | $ | 40,111 | $ | 43,411 | $ | 43,749 | $ | 46,989 | $ | 59,192 | |||||||||||||
| Ratio of net expenses to average net assets | 0.74 | % | 0.74 | % | 0.74 | % | 0.74 | % | 0.74 | % | |||||||||||||
| Ratio of gross expenses to average net assets | 0.96 | % | 1.04 | % | 0.96 | % | 0.94 | % | 0.82 | % | |||||||||||||
| Ratio of net investment income to average net assets | 2.12 | % | 2.94 | % | 3.24 | % | 4.60 | % | 4.62 | % | |||||||||||||
| Portfolio turnover rate | 48 | % | 45 | % | 79 | % | 25 | % | 21 | % | |||||||||||||
(A) Represents the period from commencement of operations (May 4, 2009) through September 30, 2009.
(B) Not annualized.
(C) Annualized.
See accompanying notes to financial statements.
123
Financial Highlights (Continued)
Touchstone Small Cap Core Fund — Class A
Per Share Data for a Share Outstanding Throughout the Period
| Year Ended September 30, | |||||||||||
| 2011 | 2010 (A) | ||||||||||
| Net asset value at beginning of period | $ | 11.62 | $ | 10.00 | |||||||
| Income (loss) from investment operations: | |||||||||||
| Net investment income (loss) | (0.02 | ) | 0.02 | ||||||||
| Net realized and unrealized gains on investments | 0.35 | 1.60 | |||||||||
| Total from investment operations | 0.33 | 1.62 | |||||||||
| Less distributions: | |||||||||||
| Dividends from net investment income | (0.01 | ) | — | ||||||||
| Distributions from net realized gains | (0.00 | ) (B) | — | ||||||||
| Total distributions | (0.01 | ) | — | ||||||||
| Net asset value at end of period | $ | 11.94 | $ | 11.62 | |||||||
| Total return (C) | 2.82 | % | 16.20 | % | |||||||
| Net assets at end of period (000s) | $ | 43,074 | $ | 50,110 | |||||||
| Ratio of net expenses to average net assets | 1.34 | % | 1.34 | % | |||||||
| Ratio of gross expenses to average net assets | 1.79 | % | 1.55 | % | |||||||
| Ratio of net investment income (loss) to average net assets | (0.10 | %) | 0.32 | % | |||||||
| Portfolio turnover rate | 37 | % | 29 | % | |||||||
Touchstone Small Cap Core Fund — Class C
Per Share Data for a Share Outstanding Throughout the Period
| Year Ended September 30, | |||||||||||
| 2011 | 2010 (A) | ||||||||||
| Net asset value at beginning of period | $ | 11.55 | $ | 10.00 | |||||||
| Income (loss) from investment operations: | |||||||||||
| Net investment loss | (0.08 | ) | (0.02 | ) | |||||||
| Net realized and unrealized gains on investments | 0.32 | 1.57 | |||||||||
| Total from investment operations | 0.24 | 1.55 | |||||||||
| Less distributions: | |||||||||||
| Dividends from net investment income | (0.00 | ) (B) | — | ||||||||
| Distributions from net realized gains | (0.00 | ) (B) | — | ||||||||
| Total distributions | (0.00 | ) (B) | — | ||||||||
| Net asset value at end of period | $ | 11.79 | $ | 11.55 | |||||||
| Total return (C) | 2.08 | % | 15.50 | % | |||||||
| Net assets at end of period (000s) | $ | 11,739 | $ | 5,245 | |||||||
| Ratio of net expenses to average net assets | 2.09 | % | 2.09 | % | |||||||
| Ratio of gross expenses to average net assets | 2.51 | % | 2.57 | % | |||||||
| Ratio of net investment loss to average net assets | (0.80 | %) | (0.43 | %) | |||||||
| Portfolio turnover rate | 37 | % | 29 | % | |||||||
(A) The Fund commenced operations on October 1, 2009.
(B) Amount rounds to less than $0.005 per share.
(C) Total returns shown exclude the effect of applicable sales loads.
See accompanying notes to financial statements.
124
Financial Highlights (Continued)
Touchstone Small Cap Core Fund — Class Y
Per Share Data for a Share Outstanding Throughout the Period
| Year Ended September 30, | |||||||||||
| 2011 | 2010 (A) | ||||||||||
| Net asset value at beginning of period | $ | 11.67 | $ | 10.00 | |||||||
| Income (loss) from investment operations: | |||||||||||
| Net investment income | 0.02 | 0.03 | |||||||||
| Net realized and unrealized gains on investments | 0.34 | 1.64 | |||||||||
| Total from investment operations | 0.36 | 1.67 | |||||||||
| Less distributions: | |||||||||||
| Dividends from net investment income | (0.03 | ) | — | ||||||||
| Distributions from net realized gains | (0.00 | ) (B) | — | ||||||||
| Total distributions | (0.03 | ) | — | ||||||||
| Net asset value at end of period | $ | 12.00 | $ | 11.67 | |||||||
| Total return | 3.05 | % | 16.70 | % | |||||||
| Net assets at end of period (000s) | $ | 58,164 | $ | 33,536 | |||||||
| Ratio of net expenses to average net assets | 1.09 | % | 1.09 | % | |||||||
| Ratio of gross expenses to average net assets | 1.21 | % | 1.31 | % | |||||||
| Ratio of net investment income to average net assets | 0.21 | % | 0.61 | % | |||||||
| Portfolio turnover rate | 37 | % | 29 | % | |||||||
Touchstone Small Cap Core Fund — Institutional Class
Per Share Data for a Share Outstanding Throughout the Period
| Year Ended September 30, | |||||||||||
| 2011 | 2010 (A) | ||||||||||
| Net asset value at beginning of period | $ | 11.65 | $ | 10.00 | |||||||
| Income (loss) from investment operations: | |||||||||||
| Net investment income | 0.03 | 0.06 | |||||||||
| Net realized and unrealized gains on investments | 0.35 | 1.61 | |||||||||
| Total from investment operations | 0.38 | 1.67 | |||||||||
| Less distributions: | |||||||||||
| Dividends from net investment income | (0.04 | ) | (0.02 | ) | |||||||
| Distributions from net realized gains | (0.00 | ) (B) | — | ||||||||
| Total distributions | (0.04 | ) | (0.02 | ) | |||||||
| Net asset value at end of period | $ | 11.99 | $ | 11.65 | |||||||
| Total return | 3.24 | % | 16.74 | % | |||||||
| Net assets at end of period (000s) | $ | 43,035 | $ | 10,386 | |||||||
| Ratio of net expenses to average net assets | 0.94 | % | 0.94 | % | |||||||
| Ratio of gross expenses to average net assets | 1.16 | % | 1.32 | % | |||||||
| Ratio of net investment income to average net assets | 0.36 | % | 0.66 | % | |||||||
| Portfolio turnover rate | 37 | % | 29 | % | |||||||
(A) The Fund commenced operations on October 1, 2009.
(B) Amount rounds to less than $0.005 per share.
See accompanying notes to financial statements.
125
Financial Highlights (Continued)
Touchstone Small Cap Value Fund — Class A
Per Share Data for a Share Outstanding Throughout the Period
| Period Ended September 30, 2011 (A)(B) | |||||||
| Net asset value at beginning of period | $ | 17.36 | |||||
| Income from investment operations: | |||||||
| Net investment income | 0.22 | ||||||
| Net realized and unrealized losses on investments | (3.57 | ) | |||||
| Total from investment operations | (3.35 | ) | |||||
| Less distributions: | |||||||
| Dividends from net investment income | (0.16 | ) | |||||
| Total distributions | (0.16 | ) | |||||
| Net asset value at end of period | $ | 13.85 | |||||
| Total return (C) | (19.37 | %) (D) | |||||
| Net assets at end of period (000s) | $ | 37,385 | |||||
| Ratio of net expenses to average net assets | 1.43 | % (E) | |||||
| Ratio of gross expenses to average net assets | 1.72 | % (E) | |||||
| Ratio of net investment income to average net assets | 1.97 | % (E) | |||||
| Portfolio turnover rate | 206 | % (D) | |||||
Touchstone Small Cap Value Fund — Class C
Per Share Data for a Share Outstanding Throughout the Period
| Period Ended September 30, 2011 (A) | |||||||
| Net asset value at beginning of period | $ | 17.36 | |||||
| Income from investment operations: | |||||||
| Net investment income | 0.09 | ||||||
| Net realized and unrealized losses on investments | (3.50 | ) | |||||
| Total from investment operations | (3.41 | ) | |||||
| Less distributions: | |||||||
| Dividends from net investment income | (0.13 | ) | |||||
| Total distributions | (0.13 | ) | |||||
| Net asset value at end of period | $ | 13.82 | |||||
| Total return (C) | (19.77 | %) (D) | |||||
| Net assets at end of period (000s) | $ | 2 | |||||
| Ratio of net expenses to average net assets | 2.18 | % (E) | |||||
| Ratio of gross expenses to average net assets | 342.41 | % (E) | |||||
| Ratio of net investment income to average net assets | 0.95 | % (E) | |||||
| Portfolio turnover rate | 206 | % (D) | |||||
(A) Represents the period from commencement of operations (March 1, 2011) through September 30, 2011.
(B) Effective June 10, 2011, Class Z shares converted to Class A shares.
(C) Total returns shown exclude the effect of applicable sales loads.
(D) Not annualized.
(E) Annualized.
See accompanying notes to financial statements.
126
Financial Highlights (Continued)
Touchstone Small Cap Value Fund — Class Y
Per Share Data for a Share Outstanding Throughout the Period
| Period Ended September 30, 2011 (A) | |||||||
| Net asset value at beginning of period | $ | 17.36 | |||||
| Income from investment operations: | |||||||
| Net investment income | 0.71 | ||||||
| Net realized and unrealized losses on investments | (4.00 | ) | |||||
| Total from investment operations | (3.29 | ) | |||||
| Less distributions: | |||||||
| Dividends from net investment income | (0.18 | ) | |||||
| Total distributions | (0.18 | ) | |||||
| Net asset value at end of period | $ | 13.89 | |||||
| Total return | (19.10 | %) (B) | |||||
| Net assets at end of period (000s) | $ | 2 | |||||
| Ratio of net expenses to average net assets | 1.18 | % (C) | |||||
| Ratio of gross expenses to average net assets | 70.29 | % (C) | |||||
| Ratio of net investment income to average net assets | 2.05 | % (C) | |||||
| Portfolio turnover rate | 206 | % (B) | |||||
Touchstone Small Cap Value Fund — Institutional Class
Per Share Data for a Share Outstanding Throughout the Period
| Period Ended September 30, 2011 (A) | |||||||
| Net asset value at beginning of period | $ | 17.36 | |||||
| Income from investment operations: | |||||||
| Net investment income | 0.20 | ||||||
| Net realized and unrealized losses on investments | (3.51 | ) | |||||
| Total from investment operations | (3.31 | ) | |||||
| Less distributions: | |||||||
| Dividends from net investment income | (0.19 | ) | |||||
| Total distributions | (0.19 | ) | |||||
| Net asset value at end of period | $ | 13.86 | |||||
| Total return | (19.23 | %) (B) | |||||
| Net assets at end of period (000s) | $ | 741 | |||||
| Ratio of net expenses to average net assets | 1.03 | % (C) | |||||
| Ratio of gross expenses to average net assets | 3.59 | % (C) | |||||
| Ratio of net investment income to average net assets | 2.12 | % (C) | |||||
| Portfolio turnover rate | 206 | % (B) | |||||
(A) Represents the period from commencement of operations (March 1, 2011) through September 30, 2011.
(B) Not annualized.
(C) Annualized.
See accompanying notes to financial statements.
127
Financial Highlights (Continued)
Touchstone Total Return Bond Fund — Class A+
Per Share Data for a Share Outstanding Throughout the Period++
| Period Ended September 30, 2011 (A) | Period Ended March 31, 2011 (B) | ||||||||||
| Net asset value at beginning of period | $ | 9.90 | $ | 10.15 | |||||||
| Income (loss) from investment operations: | |||||||||||
| Net investment income | 0.24 | 0.28 | |||||||||
| Net realized and unrealized gains (losses) on investments | 0.24 | (0.14 | ) * | ||||||||
| Total from investment operations | 0.48 | 0.14 | |||||||||
| Less distributions: | |||||||||||
| Dividends from net investment income | (0.25 | ) | (0.39 | ) | |||||||
| Total distributions | (0.25 | ) | (0.39 | ) | |||||||
| Net asset value at end of period | $ | 10.13 | $ | 9.90 | |||||||
| Total return (C) | 5.02 | % (D) | 1.31 | % (D)** | |||||||
| Net assets at end of period (000s) | $ | 4,737 | $ | 7 | |||||||
| Ratio of net expenses to average net assets | 0.90 | % (E) | 0.65 | % (E)*** | |||||||
| Ratio of gross expenses to average net assets | 1.69 | % (E) | 1.75 | % (E)*** | |||||||
| Ratio of net investment income to average net assets | 4.40 | % (E) | 4.16 | % (E) | |||||||
| Portfolio turnover rate | 7 | % (D) | 27 | % (D) | |||||||
Touchstone Total Return Bond Fund — Class C
Per Share Data for a Share Outstanding Throughout the Period
| Period Ended September 30, 2011 (F) | |||||||
| Net asset value at beginning of period | $ | 10.04 | |||||
| Income (loss) from investment operations: | |||||||
| Net investment income | 0.06 | ||||||
| Net realized and unrealized gains (losses) on investments | 0.09 | ||||||
| Total from investment operations | 0.15 | ||||||
| Less distributions: | |||||||
| Dividends from net investment income | (0.07 | ) | |||||
| Total distributions | (0.07 | ) | |||||
| Net asset value at end of period | $ | 10.12 | |||||
| Total return (B) | 1.51 | % (D) | |||||
| Net assets at end of period (000s) | $ | 2,587 | |||||
| Ratio of net expenses to average net assets | 1.65 | % (E) | |||||
| Ratio of gross expenses to average net assets | 2.55 | % (E) | |||||
| Ratio of net investment income to average net assets | 3.75 | % (E) | |||||
| Portfolio turnover rate | 7 | % (D) | |||||
(+) Touchstone Total Return Bond Fund acquired all of the assets and liabilities of EARNEST Partners Fixed Income Trust ("Predecessor Fund") in a reorganization on August 1, 2011. The Predecessor Fund's performance and financial history have been adopted by Touchstone Total Return Bond Fund and will be used going forward. As a result, the information prior to August 1, 2011 reflects that of the Predecessor Fund.
++ Per share data prior to August 1, 2011 reflects a 1.01491:1 stock split. All per share amounts prior to that date have been adjusted to reflect the stock split.
(A) Effective August 1, 2011, the Fund changed its fiscal year end from March 31 to September 30 and Investor Class shares were renamed Class A shares. See footnote 9 in the Notes to Financial Statements.
(B) Class A shares commenced operations on August 16, 2010.
(C) Total returns shown exclude the effect of applicable sales loads.
(D) Not annualized.
(E) Annualized.
(F) Class C shares commenced operations on August 1, 2011.
* This amount per share is a loss for the Class A shares because of the short time period since the Commencement of Operations on August 16, 2010 relative to the full fiscal year in which the Class Y shares were in operation. The loss during this period is offset by the gain in the Class Y shares during the full fiscal year to create a gain in the Realized and Unrealized Gain on Investments on the Statement of Operations for the period ended March 31, 2011.
** Includes adjustments in accordance with accounting principles generally accepted in the United States of America, and, consequently, the net asset value for financial reporting purposes and the returns based upon those net asset values may differ from the net asset values and returns for shareholder transactions.
*** The expense ratios listed reflect total expenses prior to any waivers (gross expense ratio) and after any waivers (net expense ratio).
See accompanying notes to financial statements.
128
Financial Highlights (Continued)
Touchstone Total Return Bond Fund — Class Y+
Per Share Data for a Share Outstanding Throughout the Period++
| Period Ended September 30, | Year Ended March 31, | ||||||||||||||||||||||||||
| 2011 (A) | 2011 | 2010 | 2009 | 2008 | 2007 | ||||||||||||||||||||||
| Net asset value at beginning of period | $ | 9.86 | $ | 9.66 | $ | 8.48 | $ | 9.20 | $ | 9.29 | $ | 9.12 | |||||||||||||||
| Income (loss) from investment operations: | |||||||||||||||||||||||||||
| Net investment income | 0.24 | 0.45 | 0.48 | 0.48 | 0.46 | 0.43 | |||||||||||||||||||||
| Net realized and unrealized gains (losses) on investments | 0.30 | 0.21 | 1.21 | (0.73 | ) | (0.09 | ) | 0.18 | |||||||||||||||||||
| Total from investment operations | 0.54 | 0.66 | 1.69 | (0.25 | ) | 0.37 | 0.61 | ||||||||||||||||||||
| Less distributions: | |||||||||||||||||||||||||||
| Dividends from net investment income | (0.25 | ) | (0.46 | ) | (0.51 | ) | (0.47 | ) | (0.46 | ) | (0.44 | ) | |||||||||||||||
| Total distributions | (0.25 | ) | (0.46 | ) | (0.51 | ) | (0.47 | ) | (0.46 | ) | (0.44 | ) | |||||||||||||||
| Net asset value at end of period | $ | 10.15 | $ | 9.86 | $ | 9.66 | $ | 8.48 | $ | 9.20 | $ | 9.29 | |||||||||||||||
| Total return | 5.29 | % (C) | 6.97 | % * | 20.28 | % * | (2.79 | %) * | 4.16 | % * | 6.84 | % * | |||||||||||||||
| Net assets at end of period (000s) | $ | 17,810 | $ | 16,512 | $ | 16,877 | $ | 13,075 | $ | 34,652 | $ | 44,403 | |||||||||||||||
| Ratio of net expenses to average net assets | 0.48 | % (D) | 0.40 | % ** | 0.40 | % ** | 0.40 | % ** | 0.40 | % ** | 0.40 | % ** | |||||||||||||||
| Ratio of gross expenses to average net assets | 1.13 | % (D) | 1.62 | % ** | 1.56 | % ** | 1.14 | % ** | 0.94 | % ** | 0.95 | % ** | |||||||||||||||
| Ratio of net investment income to average net assets | 4.35 | % (D) | 4.46 | % | 5.10 | % | 5.23 | % | 4.86 | % | 4.66 | % | |||||||||||||||
| Portfolio turnover rate | 7 | % (C) | 27 | % | 29 | % | 24 | % | 19 | % | 27 | % | |||||||||||||||
Touchstone Total Return Bond Fund — Institutional Class
Per Share Data for a Share Outstanding Throughout the Period
| Period Ended September 30, 2011 (B) | |||||||
| Net asset value at beginning of period | $ | 10.06 | |||||
| Income (loss) from investment operations: | |||||||
| Net investment income | 0.08 | ||||||
| Net realized and unrealized gains (losses) on investments | 0.09 | ||||||
| Total from investment operations | 0.17 | ||||||
| Less distributions: | |||||||
| Dividends from net investment income | (0.09 | ) | |||||
| Total distributions | (0.09 | ) | |||||
| Net asset value at end of period | $ | 10.14 | |||||
| Total return | 1.70 | % (C) | |||||
| Net assets at end of period (000s) | $ | 6,386 | |||||
| Ratio of net expenses to average net assets | 0.50 | % (D) | |||||
| Ratio of gross expenses to average net assets | 1.21 | % (D) | |||||
| Ratio of net investment income to average net assets | 4.89 | % (D) | |||||
| Portfolio turnover rate | 7 | % (C) | |||||
(+) Touchstone Total Return Bond Fund acquired all of the assets and liabilities of EARNEST Partners Fixed Income Trust ("Predecessor Fund") in a reorganization on August 1, 2011. The Predecessor Fund's performance and financial history have been adopted by Touchstone Total Return Bond Fund and will be used going forward. As a result, the information prior to August 1, 2011 reflects that of the Predecessor Fund.
++ Per share data prior to August 1, 2011 reflects a 0.87567:1 stock split. All per share amounts prior to that date have been adjusted to reflect the stock split.
(A) Effective August 1, 2011, the Fund changed its fiscal year end from March 31 to September 30 and Institutional Class shares were renamed Class Y shares. See footnote 9 in the Notes to Financial Statements.
(B) Institutional Class shares commenced operations on August 1, 2011.
(C) Not annualized.
(D) Annualized.
* Includes adjustments in accordance with accounting principles generally accepted in the United States of America, and, consequently, the net asset value for financial reporting purposes and the returns based upon those net asset values may differ from the net asset values and returns for shareholder transactions.
** The expense ratios listed reflect total expenses prior to any waivers and reimbursements (gross expense ratio) and after any waivers and reimbursements (net expense ratio).
See accompanying notes to financial statements.
129
Financial Highlights (Continued)
Touchstone Ultra Short Duration Fixed Income Fund — Class Z
Per Share Data for a Share Outstanding Throughout Each Period
| Year Ended September 30, | |||||||||||||||||||||||
| 2011 | 2010 | 2009 | 2008 | 2007 | |||||||||||||||||||
| Net asset value at beginning of period | $ | 9.68 | $ | 9.66 | $ | 9.74 | $ | 10.08 | $ | 10.06 | |||||||||||||
| Income (loss) from investment operations: | |||||||||||||||||||||||
| Net investment income | 0.15 | 0.18 | 0.32 | 0.47 | 0.53 | ||||||||||||||||||
| Net realized and unrealized gains (losses) on investments | (0.04 | ) | 0.06 | (0.07 | ) | (0.34 | ) | 0.01 | |||||||||||||||
| Total from investment operations | 0.11 | 0.24 | 0.25 | 0.13 | 0.54 | ||||||||||||||||||
| Less distributions from net investment income | (0.21 | ) | (0.22 | ) | (0.33 | ) | (0.47 | ) | (0.52 | ) | |||||||||||||
| Net asset value at end of period | $ | 9.58 | $ | 9.68 | $ | 9.66 | $ | 9.74 | $ | 10.08 | |||||||||||||
| Total return | 1.12 | % | 2.49 | % | 2.60 | % | 1.26 | % | 5.48 | % | |||||||||||||
| Net assets at end of period (000's) | $ | 346,131 | $ | 236,650 | $ | 108,552 | $ | 143,837 | $ | 146,045 | |||||||||||||
| Ratio of net expenses to average net assets | 0.69 | % | 0.69 | % | 0.69 | % | 0.69 | % | 0.69 | % | |||||||||||||
| Ratio of gross expenses to average net assets | 0.78 | % | 0.81 | % | 0.85 | % | 0.82 | % | 0.75 | % | |||||||||||||
| Ratio of net investment income to average net assets | 1.39 | % | 1.69 | % | 3.41 | % | 4.72 | % | 5.25 | % | |||||||||||||
| Portfolio turnover rate | 144 | % | 119 | % | 15 | % | 56 | % | 26 | % | |||||||||||||
See accompanying notes to financial statements.
130
Notes to Financial Statements
September 30, 2011
1. Organization
The Touchstone Funds Group Trust (the "Trust"), is registered under the Investment Company Act of 1940, as amended, (the "1940 Act"), as an open-end management investment company. The Trust was established as a Delaware statutory trust under a Declaration of Trust dated October 25, 1993. The Trust consists of the following twenty funds, individually, a "Fund", and collectively, the "Funds":
Touchstone Capital Appreciation Fund ("Capital Appreciation Fund")
Touchstone Emerging Markets Equity Fund ("Emerging Markets Equity Fund")
Touchstone Emerging Markets Equity Fund II ("Emerging Markets Equity Fund II")
Touchstone Focused Equity Fund ("Focused Equity Fund")
Touchstone Global Equity Fund ("Global Equity Fund")
Touchstone Global Real Estate Fund ("Global Real Estate Fund")
Touchstone Intermediate Fixed Income Fund ("Intermediate Fixed Income Fund")
Touchstone International Fixed Income Fund ("International Fixed Income Fund")
Touchstone Large Cap Relative Value Fund ("Large Cap Relative Value Fund")
Touchstone Market Neutral Equity Fund ("Market Neutral Equity Fund")
Touchstone Merger Arbitrage Fund ("Merger Arbitrage Fund")
Touchstone Mid Cap Fund ("Mid Cap Fund")
Touchstone Mid Cap Value Fund ("Mid Cap Value Fund")
Touchstone Premium Yield Equity Fund ("Premium Yield Equity Fund")
Touchstone Sands Capital Select Growth Fund ("Sands Capital Select Growth Fund")
Touchstone Short Duration Fixed Income Fund ("Short Duration Fixed Income Fund")
Touchstone Small Cap Core Fund ("Small Cap Core Fund")
Touchstone Small Cap Value Fund ("Small Cap Value Fund")
Touchstone Total Return Bond Fund ("Total Return Bond Fund")
Touchstone Ultra Short Duration Fixed Income Fund ("Ultra Short Duration Fixed Income Fund")
Each Fund is an open-end, diversified, management investment company, with the exception of the Focused Equity Fund, Global Real Estate Fund, International Fixed Income Fund, Merger Arbitrage Fund, Sands Capital Select Growth Fund and Small Cap Core Fund, each of which is an open-end, non-diversified management investment company.
The Declaration of Trust permits the Trust to issue an unlimited number of shares of beneficial interest of each Fund. The Funds are registered to offer different classes of shares: Class A shares, Class C shares, Class Y shares, Class Z shares, and Institutional Class shares. The assets of each Fund are segregated, and a shareholder's interest is limited to the Fund in which shares are held. The Funds' prospectuses provide a description of each Fund's investment objectives, policies, and strategies along with information on the classes of shares currently being offered.
Effective December 6, 2010, the Touchstone Small Cap Value Opportunities Fund changed its name to the Touchstone Small Cap Value Fund.
Effective April 19, 2011, the Touchstone Core Plus Fixed Income Fund changed its name to the Touchstone Total Return Bond Fund. On August 1, 2011, EARNEST Partners Fixed Income Trust (the "Predecessor Fund"), a series of the Nottingham Investment Trust II, was reorganized into the Total Return Bond Fund.
131
Notes to Financial Statements (Continued)
2. Significant Accounting Policies
The following is a summary of the Funds' significant accounting policies:
Security valuation and fair value measurements — All investments in securities are recorded at their estimated fair value. The Funds use various methods to measure fair value of their portfolio securities on a recurring basis. U.S. GAAP establishes a hierarchy that prioritizes inputs to valuation methods. These inputs are summarized in the three broad levels listed below:
• Level 1 – quoted prices in active markets for identical securities
• Level 2 – other significant observable inputs (including quoted prices for similar securities, interest rates, prepayment speeds, credit risk, etc.)
• Level 3 – significant unobservable inputs (including the Fund's own assumptions in determining the fair value of investments)
The inputs or methodology used for valuing securities are not necessarily an indication of the risk associated with investing in those securities. For example, money market instruments are valued using amortized cost, in accordance with rules under the 1940 Act. Generally, amortized cost approximates the current fair value of a security, but since the value is not obtained from a quoted price in an active market, such securities are reflected as Level 2.
The aggregate value by input level, as of September 30, 2011, for each Fund's investments, as well as a reconciliation of assets for which significant unobservable inputs (Level 3) were used in determining value, if applicable, is included in each Fund's Portfolio of Investments, which also includes a breakdown of the Fund's investments by geographic/industry concentration.
During the year ended September 30, 2011, there were no significant transfers between Levels 1 and 2 except as shown in the Portfolios of Investments for the Emerging Markets Equity Fund, the Global Equity Fund, and the Global Real Estate Fund.
The Funds' portfolio securities are valued as of the close of the regular session of trading on the New York Stock Exchange (currently 4:00 p.m., Eastern time). Portfolio securities traded on stock exchanges are valued at the last sale price, and to the extent these securities are actively traded, they are categorized in Level 1 of the fair value hierarchy. Portfolio securities quoted by NASDAQ are valued at the NASDAQ Official Closing Price ("NOCP"). Securities not traded on a particular day, or for which the last sale price is not readily available, are valued at their last broker-quoted bid prices as obtained from one or more of the major market makers for such securities by an independent pricing service and are categorized in Level 2. Debt securities for which market quotations are readily available are valued at their most recent bid prices as obtained from one or more of the major market makers for such securities by an independent pricing service and are categorized in Level 2. Money market instruments and other debt securities with a remaining maturity of less than 60 days are valued at amortized cost, which approximates market value and are categorized in Level 2. Securities for which market quotations or the NOCP are not readily available are valued based on fair value as determined by or under the direction of the Board of Trustees and are categorized in Level 3. Shares of open end mutual funds in which the Funds invest are valued at their respective net asset values as reported by the underlying funds and are categorized in Level 1. The prices for foreign securities are reported in local currency and converted to U.S. dollars using currency exchange rates.
For securities that principally trade on a foreign market or exchange, a significant gap in time can exist between the time of a particular security's last trade and the time at which a Fund calculates its net asset value. The closing prices of such securities may no longer reflect their market value at the time the Fund calculates its net
132
Notes to Financial Statements (Continued)
asset value if an event that could materially affect the value of those securities (a "Significant Event") has occurred between the time of the security's last close and the time that the Fund calculates its net asset value.
A Significant Event may relate to a single issuer or to an entire market sector. If the Advisor or Sub-Advisor of a Fund becomes aware of a Significant Event that has occurred with respect to a security or group of securities after the closing of the exchange or market on which the security or securities principally trade, but before the time at which the Fund calculates its net asset value, it may request that a Fair Value Committee Meeting be called. In addition, the Funds' Administrator or Sub-Administrator monitors price movements among certain selected indices, securities and/or baskets of securities that may be an indicator that the closing prices received earlier from foreign exchanges or markets may not reflect market value at the time the Fund calculates its net asset value. If price movements in a monitored index or security exceed levels established by the Advisor, the Sub-Administrator notifies the Advisor or Sub-Advisor for any Fund holding the relevant securities that such limits have been exceeded. In such event, the Advisor makes the determination whether a Fair Value Committee meeting should be called based on the information provided. These securities are categorized in Level 2.
New accounting pronouncements — In May 2011, the Financial Accounting Standards Board (FASB) issued Accounting Standards Update (ASU) No. 2011-04 "Amendments to Achieve Common Fair Value Measurement and Disclosure Requirements in GAAP and the International Financial Reporting Standards (IFRS)." ASU 2011-04 includes common requirements for measurement of and disclosure about fair value between U.S. GAAP and IFRS. ASU 2011-04 will require reporting entities to categorize within Level 3 of the fair value hierarchy: quantitative information about the unobservable inputs used in the fair value measurement, the valuation processes used by the reporting entity and a narrative description of the sensitivity of the fair value measurement to changes in unobservable inputs and the interrelationships between those unobservable inputs. In addition, ASU 2011-04 will require reporting entities to make disclosures about amounts and reasons for all transfers in and out of Level 1 and Level 2 fair value measurements. The new and revised disclosures are effective for fiscal years beginning after December 15, 2011 and for interim periods within those fiscal years. Management is currently evaluating the implications of ASU 2011-04 and its impact on the financial statements.
Securities sold short — The Funds periodically engage in selling securities short, which obligates a Fund to replace a security borrowed by purchasing the same security at the current market value. A Fund would incur a loss if the price of the security increases between the date of the short sale and the date on which the Fund replaces the borrowed security. A Fund would realize a gain if the price of the security declines between those dates.
Foreign currency translation — The books and records of the Funds are maintained in U.S. dollars and translated into U.S. dollars on the following basis:
(1) market value of investment securities, assets and liabilities at the current rate of exchange on the valuation date; and
(2) purchases and sales of investment securities, income and expenses at the relevant rates of exchange prevailing on the respective dates of such transactions.
The Funds do not isolate that portion of gains and losses on investments in equity securities that is due to changes in the foreign exchange rates from that which is due to changes in market prices of equity securities.
Forward foreign currency contracts — A forward foreign currency contract is an agreement between two parties to buy and sell a specific currency at a price that is set on the date of the contract. The forward contract calls for delivery of the currency on a future date that is specified in the contract. Risks related to the use of forwards include the possible failure of counterparties to meet the terms of the forward agreement, the failure
133
Notes to Financial Statements (Continued)
of the counterparties to timely post collateral, the risk that currency movements will not occur thereby reducing the Fund's total return, and the potential for losses in excess of the Fund's initial investment.
The market value of a forward foreign currency contract fluctuates with changes in foreign currency exchange rates. Forward foreign currency contracts are marked to market daily and the change in value is recorded by a Fund as an unrealized gain or loss. Realized gains or losses, equal to the difference between the value of the contract at the time it was opened and the value at the time it was closed, are recorded upon delivery or receipt of the currency.
During the year ended September 30, 2011, the Funds used forward foreign currency contracts to enhance potential gains, hedge against anticipated currency exchange rates, maintain diversity and liquidity of the portfolio and adjust exposure to foreign currencies.
Derivative instruments and hedging activities — The following table sets forth the fair value of the Funds' derivative financial instruments by primary risk exposure as of September 30, 2011:
| Fair Value of Derivative Investments As of September 30, 2011 | |||||||||||||||
| Asset Derivatives | Liability Derivatives | ||||||||||||||
| Fund | Derivatives not accounted for as hedging instruments under ASC 815 | Unrealized Appreciation* | Unrealized Depreciation** | ||||||||||||
| International Fixed Income Fund | Forward foreign currency exchange contracts | $ | 525,443 | $ | 301,073 | ||||||||||
* Statements of Assets and Liabilities Location: Unrealized appreciation on forward foreign currency contracts
** Statements of Assets and Liabilities Location: Unrealized depreciation on forward foreign currency contracts
For the year ended September 30, 2011, the average quarterly balance of outstanding derivative financial instruments was as follows:
| Global Equity Fund | Global Real Estate Fund | International Fixed Income Fund | |||||||||||||
| Forward foreign currency exchange contracts: | |||||||||||||||
| Average number of contracts | 1 | 3 | 59 | ||||||||||||
| Average U.S. dollar amount purchased | $ | 22,514 | $ | 47,918 | $ | 15,646,683 | |||||||||
| Average U.S. dollar amount sold | $ | 22,220 | $ | 47,916 | $ | 15,600,685 | |||||||||
| The Effect of Derivative Investments on the Statement of Operations for the Year Ended September 30, 2011 | |||||||||||||||
| Fund | Derivatives not accounted for as hedging instruments under ASC 815 | Realized Gain or (Loss) on Derivatives* | Change in Unrealized Appreciation (Depreciation) on Derivatives** | ||||||||||||
| Emerging Markets Equity Fund | Forward foreign currency exchange contracts | $ | (510,953 | ) | $ | (10,274 | ) | ||||||||
| Global Equity Fund | Forward foreign currency exchange contracts | $ | 1,231 | $ | — | ||||||||||
| Global Real Estate Fund | Forward foreign currency exchange contracts | $ | (786 | ) | $ | 172 | |||||||||
| International Fixed Income Fund | Forward foreign currency exchange contracts | $ | (11,648 | ) | $ | 204,056 | |||||||||
* Statements of Operations Location: Net realized gains (losses) from foreign currency transactions
** Statements of Operations Location: Net change in unrealized appreciation/depreciation on foreign currency transactions
134
Notes to Financial Statements (Continued)
Portfolio securities loaned — Each Fund may lend its portfolio securities. Lending portfolio securities exposes a Fund to the risk that the borrower may fail to return the loaned securities or may not be able to provide additional collateral or that the Fund may experience delays in recovery of the loaned securities or loss of rights in the collateral if the borrower fails financially. To minimize these risks, the borrower must agree to maintain cash collateral with the Funds' custodian in an amount at least equal to the market value of the loaned securities. The cash collateral is reinvested by the Funds' custodian into an approved investment vehicle.
As of September 30, 2011, the following Funds loaned securities and received collateral as follows:
| Fund | Fair Value of Securities Loaned | Value of Collateral Received | |||||||||
| Emerging Markets Equity Fund | $ | 18,137,165 | $ | 19,179,142 | |||||||
| Focused Equity Fund | $ | 6,877,531 | $ | 7,446,706 | |||||||
| Global Real Estate Fund | $ | 112,715 | $ | 116,355 | |||||||
| Mid Cap Fund | $ | 3,507,465 | $ | 3,691,083 | |||||||
| Mid Cap Value Fund | $ | 1,483,928 | $ | 1,567,248 | |||||||
| Sands Capital Select Growth Fund | $ | 24,642,088 | $ | 26,034,381 | |||||||
| Small Cap Core Fund | $ | 7,518,033 | $ | 8,021,530 | |||||||
| Small Cap Value Fund | $ | 2,109,595 | $ | 2,200,244 | |||||||
All collateral received as cash is received, held and administered by the Funds' custodian for the benefit of the Funds in the applicable custody account or other account established for the purpose of holding collateral.
Funds participating in securities lending receive compensation in the form of fees, or retain a portion of interest or dividends on the investment of any cash received as collateral. The Funds also continue to receive interest or dividends on the securities loaned. The loaned securities are secured by collateral valued at least equal, at all times, to the fair value of the securities loaned plus accrued interest.
Unrealized gain or loss on the fair value of the securities loaned that may occur during the term of the loan is recognized by the Funds. The Funds have the right under the lending agreement to recover the securities from the borrower on demand.
Delayed delivery transactions — Each Fund may purchase or sell securities on a when-issued or delayed delivery basis. These transactions involve a commitment by the Fund to purchase or sell securities for a predetermined price or yield, with payment and delivery taking place beyond the customary settlement period. When delayed delivery purchases are outstanding, the Fund will set aside liquid assets in an amount sufficient to meet the purchase price. When purchasing a security on a delayed delivery basis, the Fund assumes the rights and risks of ownership of the security, including the risk of price and yield fluctuations, and takes such fluctuations into account when determining net asset value. The Fund may dispose of or renegotiate a delayed delivery transaction after it is entered into, and may sell when-issued securities before they are delivered, which may result in a capital gain or loss. When the Fund has sold a security on a delayed delivery basis, the Fund does not participate in future gains and losses with respect to the security.
Share valuation — The net asset value per share of each class of shares of each Fund is calculated daily by dividing the total value of a Fund's assets attributable to that class, less liabilities attributable to that class, by the number of outstanding shares of that class.
The maximum offering price per share of Class A shares of the Funds (except International Fixed Income Fund and Total Return Bond Fund) is equal to the net asset value per share plus a sales load equal to 6.10% of the net asset value (or 5.75% of the offering price). The maximum offering price per share of Class A shares
135
Notes to Financial Statements (Continued)
of the International Fixed Income Fund and Total Return Bond Fund is equal to the net asset value per share plus a sales load equal to 4.99% of the net asset value (or 4.75% of the offering price). The maximum offering price per share of Class C, Class Y, Class Z, and Institutional Class shares of the Funds is equal to the net asset value per share.
The redemption price per share of each class of shares of the Funds is equal to the net asset value per share. However, Class C shares of the Funds are subject to a contingent deferred sales load of 1.00% of the original purchase price if redeemed within a one-year period from the date of purchase.
Investment income — Dividend income from securities is recognized on the ex-dividend date, net of foreign withholding taxes, if any, which are reduced by any amounts reclaimable by the Funds, where applicable. Interest income from securities is recorded on the basis of interest accrued, premium amortized and discount accreted. Realized gains and losses resulting from principal paydowns on mortgage-backed and asset-backed securities are included in interest income. Market discounts, original issue discount ("OID") and market premiums on debt securities are accreted/amortized to interest income over the life of the security with a corresponding adjustment in the cost basis of that security. In addition, it is the Funds' policy to accrue for foreign capital gains taxes, if applicable, on certain foreign securities held by the Funds. An estimated foreign capital gains tax is recorded daily on net unrealized gains on these securities and is payable upon the sale of such securities when a gain is realized.
Distributions to shareholders — The Capital Appreciation Fund, Emerging Markets Equity Fund, Emerging Markets Equity Fund II, Focused Equity Fund, Global Equity Fund, Market Neutral Equity Fund, Merger Arbitrage Fund, Mid Cap Fund, and Small Cap Core Fund declare and distribute net investment income, if any, annually, as a dividend to shareholders. The Global Real Estate Fund, Large Cap Relative Value Fund, Mid Cap Value Fund, Sands Capital Select Growth Fund, and Small Cap Value Fund declare and distribute net investment income, if any, quarterly, as a dividend to shareholders. Prior to March 31, 2011, the Small Cap Value Fund declared and distributed net investment income annually. The International Fixed Income Fund, Premium Yield Equity Fund and Total Return Bond Fund declare and distribute net investment income, if any, monthly as a dividend to shareholders. The Intermediate Fixed Income Fund, Short Duration Fixed Income Fund, and Ultra Short Duration Fixed Income Fund declare net investment income daily and distribute it monthly, as a dividend to shareholders. Any net realized capital gains on sales of securities for all Funds are distributed to shareholders at least annually. Income distributions and capital gain distributions are determined in accordance with income tax regulations.
Allocations — Investment income earned, realized capital gains and losses, and unrealized appreciation and depreciation for the Funds are allocated daily to each class of shares based upon its proportionate share of total net assets of the Fund. Class specific expenses are charged directly to the class incurring the expense. Common expenses, which are not attributable to a specific class, are allocated daily to each class of shares based upon their proportionate share of total net assets of the Fund. Expenses not directly billed to a Fund are allocated proportionally among all Funds daily in relation to net assets of each Fund or another reasonable measure.
Security transactions — Security transactions are reflected for financial reporting purposes as of the trade date, which may cause the NAV as stated in the accompanying financial statements to be different than the NAV applied to Fund share transactions. Realized gains and losses on sales of portfolio securities are calculated using the identified cost basis.
Estimates — The preparation of financial statements in conformity with U.S. GAAP requires management to make estimates and assumptions that affect the reported amounts of assets and liabilities and disclosure of
136
Notes to Financial Statements (Continued)
contingent assets and liabilities at the date of the financial statements and the reported amounts of income and expenses during the reporting period. Actual results could differ from those estimates.
3. Investment Transactions
Investment transactions (excluding short-term investments and U.S. Government securities) were as follows for the year ended September 30, 2011:
| Capital Appreciation Fund | Emerging Markets Equity Fund | Emerging Markets Equity Fund II* | Focused Equity Fund | ||||||||||||||||
| Purchases of investment securities | $ | 2,748,952 | $ | 416,085,861 | $ | 8,094,550 | $ | 150,214,969 | |||||||||||
| Proceeds from sales and maturities | $ | 1,464,852 | $ | 65,310,772 | $ | 2,474,111 | $ | 32,106,192 | |||||||||||
| Global Equity Fund | Global Real Estate Fund | Intermediate Fixed Income Fund | International Fixed Income Fund | ||||||||||||||||
| Purchases of investment securities | $ | 2,889,180 | $ | 5,581,532 | $ | 7,707,508 | $ | 9,038,256 | |||||||||||
| Proceeds from sales and maturities | $ | 3,974,092 | $ | 4,179,743 | $ | 22,883,060 | $ | 6,490,149 | |||||||||||
| Large Cap Relative Value Fund | Market Neutral Equity Fund | Merger Arbitrage Fund** | Mid Cap Fund | ||||||||||||||||
| Purchases of investment securities | $ | 4,358,068 | $ | 30,815,625 | $ | 8,219,554 | $ | 108,792,341 | |||||||||||
| Proceeds from sales and maturities | $ | 1,415,441 | $ | 21,770,071 | $ | 2,386,666 | $ | 165,628,977 | |||||||||||
| Mid Cap Value Fund | Premium Yield Equity Fund | Sands Capital Select Growth Fund | Short Duration Fixed Income Fund | ||||||||||||||||
| Purchases of investment securities | $ | 40,944,101 | $ | 23,483,288 | $ | 857,020,496 | $ | 17,579,704 | |||||||||||
| Proceeds from sales and maturities | $ | 30,327,670 | $ | 27,093,392 | $ | 229,065,710 | $ | 20,164,046 | |||||||||||
| Small Cap Core Fund | Small Cap Value Fund | Total Return Bond Fund*** | Ultra Short Duration Fixed Income Fund | ||||||||||||||||
| Purchases of investment securities | $ | 122,058,878 | $ | 114,788,265 | $ | 17,539,162 | $ | 374,741,368 | |||||||||||
| Proceeds from sales and maturities | $ | 59,656,871 | $ | 142,915,989 | $ | 288,073 | $ | 343,680,411 | |||||||||||
* Represents the period from commencement of operations (April 18, 2011) through September 30, 2011.
** Represents the period from commencement of operations (August 9, 2011) through September 30, 2011.
*** Represents the period from April 1, 2011 through September 30, 2011.
4. Transactions with Affiliates and Other Related Parties
Certain officers of the Trust are also officers of the Advisor (Touchstone Advisors, Inc.), the Underwriter (Touchstone Securities, Inc.) and/or JPMorgan Chase Bank, N.A. ("JPMorgan") the Sub-Administrator and Transfer Agent to the Funds. The Advisor and Underwriter are each wholly owned, indirect subsidiaries of The Western and Southern Life Insurance Company ("Western-Southern").
137
Notes to Financial Statements (Continued)
As of September 30, 2011, the following Funds were owned by Western-Southern and subsidiaries:
| Capital Appreciation Fund | 43.6 | % | |||||
| Emerging Markets Equity Fund II | 86.1 | % | |||||
| Global Equity Fund | 78.5 | % | |||||
| Global Real Estate Fund | 62.9 | % | |||||
| International Fixed Income Fund | 70.1 | % | |||||
| Large Cap Relative Value Fund | 51.3 | % | |||||
| Market Neutral Equity Fund | 72.4 | % | |||||
| Merger Arbitrage Fund | 75.4 | % | |||||
| Mid Cap Value Fund | 80.2 | % | |||||
| Premium Yield Equity Fund | 48.4 | % | |||||
| Total Return Bond Fund | 18.2 | % | |||||
MANAGEMENT & EXPENSE LIMITATIONS AGREEMENTS
The Advisor provides general investment supervisory services for the Funds, under terms of an Advisory Agreement. Under the Advisory Agreement, the Funds pay the Advisor a fee, which is computed and accrued daily and paid monthly, at an annual rate based on average daily net assets as shown in the table below.
| Capital Appreciation Fund | 0.75% on the first $25 million 0.70% on assets greater than $25 million to $250 million 0.65% of such assets in excess of $250 million | ||||||
| Emerging Markets Equity Fund | 1.10% on the first $200 million 1.05% on assets greater than $200 million to $400 million 0.95% of such assets in excess of $400 million | ||||||
| Emerging Markets Equity Fund II | 1.10% on the first $200 million 1.05% on assets greater than $200 million to $400 million 0.95% of such assets in excess of $400 million | ||||||
| Focused Equity Fund | 0.70% on the first $100 million 0.65% on assets greater than $100 million to $500 million 0.60% of such assets in excess of $500 million | ||||||
| Global Equity Fund | 0.85% on the first $50 million 0.80% on assets greater than $50 million to $500 million 0.75% of such assets in excess of $500 million | ||||||
| Global Real Estate Fund | 0.80% | ||||||
| Intermediate Fixed Income Fund | 0.40% | ||||||
| International Fixed Income Fund | 0.55% on the first $100 million 0.50% on assets greater than $100 million to $250 million 0.45% of such assets in excess of $250 million | ||||||
| Large Cap Relative Value Fund | 0.70% on the first $100 million 0.65% of such assets in excess of $100 million | ||||||
| Market Neutral Equity Fund | 1.30% | ||||||
| Merger Arbitrage Fund | 1.05% | ||||||
| Mid Cap Fund | 0.80% | ||||||
| Mid Cap Value Fund | 0.85% on the first $100 million 0.80% on assets greater than $100 million to $400 million 0.75% of such assets in excess of $400 million | ||||||
| Premium Yield Equity Fund | 0.70% on the first $100 million 0.65% of such assets in excess of $100 million | ||||||
| Sands Capital Select Growth Fund* | 0.85% on the first $1 billion 0.80% on assets greater than $1 billion to $1.5 billion 0.75% on assets greater than $1.5 billion to $2 billion 0.70% of such assets in excess of $2 billion | ||||||
138
Notes to Financial Statements (Continued)
| Short Duration Fixed Income Fund | 0.25% | ||||||
| Small Cap Core Fund | 0.85% | ||||||
| Small Cap Value Fund* | 0.95% on the first $100 million 0.90% of such assets in excess of $100 million | ||||||
| Total Return Bond Fund** | 0.35% | ||||||
| Ultra Short Duration Fixed Income Fund | 0.25% | ||||||
* Prior to December 6, 2010, the fees for the Sands Capital Select Growth Fund and the Small Cap Value Fund were 0.85% and 0.95%, respectively.
** Prior to the reorganization of Total Return Bond Fund on August 1, 2011, EARNEST Partners LLC served as investment advisor to the Predecessor Fund. The Predecessor Fund paid EARNEST Partners LLC a managemet fee equal to 0.45% of average daily net assets.
In addition to the base advisory fee shown above for the Sands Capital Select Growth Fund, a performance fee adjustment will be added to or subtracted from the base advisory fee depending on the performance of the Fund in relation to the investment performance of the Fund's benchmark index, for the preceding twelve month period, as follows:
| Benchmark Index | Benchmark Threshold | Annual Adjustment Rate | Highest/Lowest Possible Advisory Fee | ||||||||||||||||
| Sands Capital Select Growth Fund | Russell 1000 Growth Index | +/-2.50% | +/-0.15% | 1.00%/0.55% | |||||||||||||||
For the year ended September 30, 2011, the Advisor's base fee was increased by $1,109,832 as a result of the performance fee adjustment.
The Advisor has entered into investment sub-advisory agreements with the following parties:
| AGF Investments America, Inc. Emerging Markets Equity Fund Emerging Markets Equity Fund II Aronson Johnson Ortiz Market Neutral Equity Fund Bedlam Asset Management PLC Global Equity Fund Cornerstone Real Estate Advisers LLC Global Real Estate Fund DePrince, Race & Zollo, Inc. Small Cap Value Fund* EARNEST Partners LLC Large Cap Relative Value Fund Total Return Bond Fund** Farr, Miller & Washington LLC Capital Appreciation Fund Fort Washington Investment Advisors, Inc.*** Focused Equity Fund Ultra Short Duration Fixed Income Fund | GAM International Management Limited International Fixed Income Fund JKMilne Asset Management Intermediate Fixed Income Fund Lee Munder Capital Group, LLC Mid Cap Value Fund The London Company Small Cap Core Fund Longfellow Investment Management Co. Merger Arbitrage Fund Short Duration Fixed Income Fund Miller/Howard Investments, Inc. Premium Yield Equity Fund Sands Capital Management, LLC Sands Capital Select Growth Fund Turner Investment Partners, Inc. Mid Cap Fund | ||||||
* Prior to December 6, 2010, the Fund's sub-advisor was Turner Investment Partners, Inc.
139
Notes to Financial Statements (Continued)
** Effective as of the date of the Fund's reorganization, August 1, 2011. See footnote 9.
*** Affiliate of the Advisor
The Advisor, not the Funds, pays sub-advisory fees to each Sub-Advisor.
The Advisor entered into an Expense Limitation Agreement to contractually limit operating expenses of the Funds. The maximum operating expense limit in any year with respect to the Funds is based on a percentage of the average daily net assets of the Funds. The Advisor has agreed to waive advisory fees, administration fees and reimburse expenses in order to maintain expense limitations, excluding dividend expense on securities sold short, for the Funds as follows:
| Class A | Class C | Class Y | Class Z | Institutional Class | |||||||||||||||||||
| Capital Appreciation Fund | 1.19 | % | 1.94 | % | 0.94 | % | — | 0.79 | % | ||||||||||||||
| Emerging Markets Equity Fund | 1.74 | % | 2.49 | % | 1.49 | % | — | 1.34 | % | ||||||||||||||
| Emerging Markets Equity Fund II | 1.74 | % | 2.49 | % | 1.49 | % | — | 1.34 | % | ||||||||||||||
| Focused Equity Fund | 1.20 | % | 1.95 | % | 0.95 | % | — | 0.80 | % | ||||||||||||||
| Global Equity Fund | 1.34 | % | 2.09 | % | 1.09 | % | — | 0.94 | % | ||||||||||||||
| Global Real Estate Fund | 1.39 | % | 2.14 | % | 1.14 | % | — | 0.99 | % | ||||||||||||||
| Intermediate Fixed Income Fund | — | — | — | — | 0.40 | % | |||||||||||||||||
| International Fixed Income Fund | 1.09 | % | 1.84 | % | 0.84 | % | — | 0.69 | % | ||||||||||||||
| Large Cap Relative Value Fund | 1.19 | % | 1.94 | % | 0.94 | % | — | 0.79 | % | ||||||||||||||
| Market Neutral Equity Fund | 1.50 | % | 2.25 | % | 1.25 | % | — | — | |||||||||||||||
| Merger Arbitrage Fund | 1.68 | % | 2.43 | % | 1.43 | % | — | 1.28 | % | ||||||||||||||
| Mid Cap Fund | 1.21 | % | 1.96 | % | 0.96 | % | 1.21 | % | — | ||||||||||||||
| Mid Cap Value Fund | 1.29 | % | 2.04 | % | 1.04 | % | — | 0.89 | % | ||||||||||||||
| Premium Yield Equity Fund | 1.20 | % | 1.95 | % | 0.95 | % | — | — | |||||||||||||||
| Short Duration Fixed Income Fund | — | — | 0.49 | % | 0.74 | % | — | ||||||||||||||||
| Small Cap Core Fund | 1.34 | % | 2.09 | % | 1.09 | % | — | 0.94 | % | ||||||||||||||
| Small Cap Value Fund | 1.43 | % | 2.18 | % | 1.18 | % | — | 1.03 | % | ||||||||||||||
| Total Return Bond Fund* | 0.90 | % | 1.65 | % | 0.65 | % | — | 0.50 | % | ||||||||||||||
| Ultra Short Duration Fixed Income Fund | — | — | — | 0.69 | % | — | |||||||||||||||||
* Prior to the reorganization of Total Return Bond Fund on August 1, 2011, EARNEST Partners LLC contractually agreed to limit expenses of the Predecessor Fund to 0.40% of average daily net assets.
These expense limitations will remain in effect until at least January 27, 2012, except for the Emerging Markets Equity Fund II, which will remain in effect until at least April 30, 2012, and for Merger Arbitrage Fund, Small Cap Value Fund, and Total Return Bond Fund, each of which will remain in effect until at least January 27, 2013.
The Advisor has agreed to limit certain Funds' other operating expenses ("Other Expenses") to the following levels. These expense limitations will remain in effect until at least January 27, 2012.
| Class A | Class C | Class Y | Class Z | ||||||||||||||||
| Sands Capital Select Growth Fund | 0.25 | % | 0.25 | % | 0.25 | % | 0.25 | % | |||||||||||
140
Notes to Financial Statements (Continued)
During the year ended September 30, 2011, the Advisor waived investment advisory fees and administration fees and/or reimbursed expenses of the Funds as follows:
| Investment Advisory Fees Waived | Administration Fees Waived | Other Operating Expenses Reimbursed | |||||||||||||
| Capital Appreciation Fund | $ | 56,306 | $ | 15,015 | $ | 36,184 | |||||||||
| Emerging Markets Equity Fund | $ | — | $ | 273,189 | $ | — | |||||||||
| Emerging Markets Equity Fund II* | $ | 26,378 | $ | 4,796 | $ | 49,647 | |||||||||
| Focused Equity Fund | $ | 50,491 | $ | 152,092 | $ | 163,410 | |||||||||
| Global Equity Fund | $ | 39,076 | $ | 9,194 | $ | 55,956 | |||||||||
| Global Real Estate Fund | $ | 37,973 | $ | 9,493 | $ | 72,885 | |||||||||
| Intermediate Fixed Income Fund | $ | 101,432 | $ | 204,633 | $ | — | |||||||||
| International Fixed Income Fund | $ | 58,274 | $ | 21,191 | $ | 20,339 | |||||||||
| Large Cap Relative Value Fund | $ | 43,416 | $ | 12,405 | $ | 24,348 | |||||||||
| Market Neutral Equity Fund | $ | 122,257 | $ | 73,241 | $ | 6,329 | |||||||||
| Merger Arbitrage Fund** | $ | 8,113 | $ | 1,537 | $ | 17,206 | |||||||||
| Mid Cap Fund | $ | — | $ | 156,505 | $ | — | |||||||||
| Mid Cap Value Fund | $ | 52,176 | $ | 101,961 | $ | 7,455 | |||||||||
| Premium Yield Equity Fund | $ | — | $ | 89,008 | $ | 7,098 | |||||||||
| Sands Capital Select Growth Fund | $ | — | $ | 923,778 | $ | — | |||||||||
| Short Duration Fixed Income Fund | $ | — | $ | 86,219 | $ | 17,857 | |||||||||
| Small Cap Core Fund | $ | — | $ | 318,312 | $ | 161,991 | |||||||||
| Small Cap Value Fund | $ | — | $ | 100,441 | $ | — | |||||||||
| Total Return Bond Fund*** | $ | 38,912 | $ | 13,294 | $ | 19,232 | |||||||||
| Ultra Short Duration Fixed Income Fund | $ | — | $ | 258,722 | $ | — | |||||||||
* Represents the period from commencement of operations (April 18, 2011) through September 30, 2011.
** Represents the period from commencement of operations (August 9, 2011) through September 30, 2011.
*** Represents the period from April 1, 2011 through September 30, 2011.
ADMINISTRATION AGREEMENT
The Advisor entered into an Administration and Accounting Services Agreement with the Trust, whereby the Advisor is responsible for supplying executive and regulatory compliance services, supervises the preparation of tax returns, and coordinates the preparation of reports to shareholders and reports to, and filings with, the Securities and Exchange Commission and state securities authorities, materials for meetings of the Board of Trustees, calculating the daily net asset value per share and maintaining the financial books and records of each Fund. For its services, the Advisor receives an annual fee of 0.20% of the aggregate average daily net assets of the Trust, Touchstone Investment Trust (excluding Institutional Money Market Fund), Touchstone Strategic Trust, and Touchstone Tax-Free Trust up to and including $6 billion; 0.16% of the next $4 billion of aggregate average daily net assets; and 0.12% of the aggregate average daily net assets of all such assets in excess of $10 billion. The fee is allocated among the Funds on the basis of relative daily net assets.
The Advisor has engaged JPMorgan as the Sub-Administrator to the Trust. JPMorgan provides administrative and accounting services to the Trust and is compensated directly by the Advisor, not the Trust.
TRANSFER AGENT AGREEMENT
Under the terms of the Transfer Agent Agreement between the Trust and JPMorgan, JPMorgan maintains the records of each shareholder's account, answers shareholders' inquiries concerning their accounts, processes purchases and redemptions of each Fund's shares, acts as dividend and distribution disbursing agent and
141
Notes to Financial Statements (Continued)
performs other shareholder service functions. For these services, JPMorgan receives a monthly fee per shareholder account from each Fund. In addition, each Fund pays JPMorgan out-of-pocket expenses including, but not limited to, postage and supplies.
For the year ended September 30, 2011, the following Funds reimbursed the Advisor for amounts paid to third parties that provide sub-transfer agency and other administrative services to the Funds. These amounts are included in transfer agent fees on the Statements of Operations:
| Amount | |||||||
| Capital Appreciation Fund | $ | 628 | |||||
| Emerging Markets Equity Fund | $ | 48,611 | |||||
| Emerging Markets Equity Fund II* | $ | 691 | |||||
| Focused Equity Fund | $ | 2,681 | |||||
| Global Equity Fund | $ | 1,131 | |||||
| Global Real Estate Fund | $ | 315 | |||||
| Intermediate Fixed Income Fund | $ | 1,322 | |||||
| International Fixed Income Fund | $ | 678 | |||||
| Large Cap Relative Value Fund | $ | 1,969 | |||||
| Market Neutral Equity Fund | $ | 2,970 | |||||
| Merger Arbitrage Fund** | $ | — | |||||
| Mid Cap Fund | $ | 3,164 | |||||
| Mid Cap Value Fund | $ | 2,624 | |||||
| Premium Yield Equity Fund | $ | 8,037 | |||||
| Sands Capital Select Growth Fund | $ | 605,358 | |||||
| Short Duration Fixed Income Fund | $ | 26,961 | |||||
| Small Cap Core Fund | $ | 35,882 | |||||
| Small Cap Value Fund | $ | 13,500 | |||||
| Total Return Bond Fund*** | $ | 479 | |||||
| Ultra Short Duration Fixed Income Fund | $ | 92,347 | |||||
* Represents the period from commencement of operations (April 18, 2011) through September 30, 2011.
** Represents the period from commencement of operations (August 9, 2011) through September 30, 2011.
*** Represents the period from April 1, 2011 through September 30, 2011.
PLANS OF DISTRIBUTION
The Trust has adopted a Distribution and Shareholder Services Plan for Class A shares of the Capital Appreciation Fund, Emerging Markets Equity Fund, Emerging Markets Equity Fund II, Focused Equity Fund, Global Equity Fund, Global Real Estate Fund, International Fixed Income Fund, Large Cap Relative Value Fund, Market Neutral Equity Fund, Merger Arbitrage Fund, Mid Cap Fund, Mid Cap Value Fund, Premium Yield Equity Fund, Sands Capital Select Growth Fund, Small Cap Core Fund, Small Cap Value Fund and Total Return Bond Fund (Class A Plan) under which each Fund may directly or indirectly bear expenses relating to the distribution of Class A shares of the Trust and for shareholder services provided to Class A shares. The Fund will incur and/or reimburse expenses for distribution and shareholder services of Class A shares at an annual rate not to exceed 0.25% of the average daily net assets of Class A shares.
The Trust has adopted a Distribution and Shareholder Services Plan for Class C shares of the Capital Appreciation Fund, Emerging Markets Equity Fund, Emerging Markets Equity Fund II, Focused Equity Fund, Global Equity Fund, Global Real Estate Fund, International Fixed Income Fund, Large Cap Relative Value Fund, Market Neutral Equity Fund, Merger Arbitrage Fund, Mid Cap Fund, Mid Cap Value Fund, Premium Yield Equity Fund, Sands Capital Select Growth Fund, Small Cap Core Fund, Small Cap Value
142
Notes to Financial Statements (Continued)
Fund and Total Return Bond Fund (Class C Plan) under which each Fund may directly or indirectly bear expenses relating to the distribution of Class C shares of the Trust and for shareholder services provided to Class C shares. The Fund will incur and/or reimburse expenses for distribution and shareholder services of Class C shares at an annual rate not to exceed 0.75% and 0.25%, respectively, of the average daily net assets of Class C shares. The combination of these fees is not to exceed 1.00% of the average daily net assets of Class C shares.
The Trust has adopted a Shareholder Services Plan for Class Z shares of the Mid Cap Fund, Sands Capital Select Growth Fund, Short Duration Fixed Income Fund, and Ultra Short Duration Fixed Income Fund (Class Z Plan) under which each Fund may directly or indirectly bear expenses for shareholder services provided. The Fund will incur and/or reimburse expense for shareholder services of Class Z shares at an annual rate not to exceed 0.25% of the average daily net assets of Class Z shares. Prior to June 10, 2011, the Small Cap Value Fund was also included in the Class Z Plan. On June 10, 2011, Class Z shares were converted to Class A shares.
UNDERWRITING AGREEMENT
The Underwriter is the Funds' principal underwriter and, as such, acts as exclusive agent for distribution of the Funds' shares. Under the terms of the Underwriting Agreement between the Trust and Underwriter, the Underwriter earned the following from underwriting and broker commissions on the sale of shares of the following Funds during the year ended September 30, 2011:
| Amount | |||||||
| Capital Appreciation Fund | $ | 1,522 | |||||
| Emerging Markets Equity Fund | $ | 38,964 | |||||
| Emerging Markets Equity Fund II* | $ | 933 | |||||
| Focused Equity Fund | $ | 1,219 | |||||
| Global Equity Fund | $ | 598 | |||||
| Global Real Estate Fund | $ | 366 | |||||
| International Fixed Income Fund | $ | 6,173 | |||||
| Large Cap Relative Value Fund | $ | 1,088 | |||||
| Market Neutral Equity Fund | $ | 402 | |||||
| Merger Arbitrage Fund** | $ | 544 | |||||
| Mid Cap Fund | $ | 613 | |||||
| Mid Cap Value Fund | $ | 1,204 | |||||
| Premium Yield Equity Fund | $ | 7,703 | |||||
| Sands Capital Select Growth Fund | $ | 50,798 | |||||
| Small Cap Core Fund | $ | 23,918 | |||||
| Small Cap Value Fund | $ | 246 | |||||
| Total Return Bond Fund*** | $ | 539 | |||||
* Represents the period from commencement of operations (April 18, 2011) through September 30, 2011.
** Represents the period from commencement of operations (August 9, 2011) through September 30, 2011.
*** Represents the period from April 1, 2011 through September 30, 2011.
In addition, the Underwriter collected contingent deferred sales charges on the redemption of Class C shares of the following Funds during the year ended September 30, 2011:
| Amount | |||||||
| Emerging Markets Equity Fund | $ | 2,117 | |||||
| International Fixed Income Fund | $ | 1,410 | |||||
| Market Neutral Equity Fund | $ | 469 | |||||
143
Notes to Financial Statements (Continued)
| Amount | |||||||
| Mid Cap Fund | $ | 79 | |||||
| Premium Yield Equity Fund | $ | 441 | |||||
| Sands Capital Select Growth Fund | $ | 247 | |||||
| Small Cap Core Fund | $ | 4,360 | |||||
| Total Return Bond Fund* | $ | 22 | |||||
* Represents the period from April 1, 2011 through September 30, 2011.
COMPLIANCE SERVICES AGREEMENT
Under the terms of the Compliance Services Agreement between the Trust and JPMorgan, JPMorgan provides certain compliance services to the Trust and provides administrative support services to the Funds' Compliance Program and Chief Compliance Officer. For these services, JPMorgan receives an annual fee from each Fund.
AFFILIATED INVESTMENTS
Each Fund may invest in the Touchstone Institutional Money Market Fund, subject to compliance with several conditions set forth in an order received by the Trust from the Securities and Exchange Commission. To the extent that the other Touchstone Funds are invested in the Touchstone Institutional Money Market Fund, the Advisor and Administrator will be paid additional fees from the Touchstone Institutional Money Market Fund that will not be waived or reimbursed.
A summary of each Fund's investment, as applicable, in the Touchstone Institutional Money Market Fund for the year ended September 30, 2011, is as follows:
| Share Activity | |||||||||||||||||||||||||||
| Balance 09/30/10 | Purchases | Sales | Balance 09/30/11 | Dividends | Value 09/30/11 | ||||||||||||||||||||||
| Capital Appreciation Fund | 351,779 | 2,753,950 | (2,969,686 | ) | 136,043 | $ | 908 | $ | 136,043 | ||||||||||||||||||
| Emerging Markets Equity Fund | 6,859,541 | 245,046,788 | (240,940,697 | ) | 10,965,632 | $ | 26,280 | $ | 10,965,632 | ||||||||||||||||||
| Emerging Markets Equity Fund II* | — | 6,136,699 | (6,132,141 | ) | 4,558 | $ | 412 | $ | 4,558 | ||||||||||||||||||
| Focused Equity Fund | 36,740 | 95,019,161 | (91,046,390 | ) | 4,009,511 | $ | 9,060 | $ | 4,009,511 | ||||||||||||||||||
| Global Equity Fund | 90,045 | 2,374,448 | (2,395,606 | ) | 68,887 | $ | 302 | $ | 68,887 | ||||||||||||||||||
| Global Real Estate Fund | 128,215 | 3,722,672 | (3,750,416 | ) | 100,471 | $ | 148 | $ | 100,471 | ||||||||||||||||||
| Intermediate Fixed Income Fund | 4,393,607 | 33,261,603 | (35,921,815 | ) | 1,733,395 | $ | 7,283 | $ | 1,733,395 | ||||||||||||||||||
| International Fixed Income Fund | 241,561 | 5,633,861 | (5,875,422 | ) | — | $ | 655 | $ | — | ||||||||||||||||||
| Large Cap Relative Value Fund | 117,676 | 5,755,164 | (5,640,533 | ) | 232,307 | $ | 623 | $ | 232,307 | ||||||||||||||||||
| Market Neutral Equity Fund | 988,692 | 30,224,838 | (30,919,057 | ) | 294,473 | $ | 1,421 | $ | 294,473 | ||||||||||||||||||
| Merger Arbitrage Fund** | — | 7,248,536 | (5,629,353 | ) | 1,619,183 | $ | 280 | $ | 1,619,183 | ||||||||||||||||||
| Mid Cap Fund | 564,694 | 65,854,940 | (65,519,525 | ) | 900,109 | $ | 2,149 | $ | 900,109 | ||||||||||||||||||
| Mid Cap Value Fund | 554,647 | 15,010,624 | (14,587,057 | ) | 978,214 | $ | 1,271 | $ | 978,214 | ||||||||||||||||||
| Premium Yield Equity Fund | 1,162,613 | 23,295,752 | (23,974,968 | ) | 483,397 | $ | 2,377 | $ | 483,397 | ||||||||||||||||||
| Sands Capital Select Growth Fund | 30,084,351 | 349,588,917 | (344,687,105 | ) | 34,986,163 | $ | 39,331 | $ | 34,986,163 | ||||||||||||||||||
| Short Duration Fixed Income Fund | 633,713 | 20,874,307 | (21,305,907 | ) | 202,113 | $ | 1,962 | $ | 202,113 | ||||||||||||||||||
| Small Cap Core Fund | 1,696,266 | 92,465,230 | (90,844,879 | ) | 3,316,617 | $ | 6,328 | $ | 3,316,617 | ||||||||||||||||||
| Small Cap Value Fund | 877,327 | 39,980,105 | (39,078,908 | ) | 1,778,524 | $ | 3,138 | $ | 1,778,524 | ||||||||||||||||||
| Total Return Bond Fund*** | — | 3,749,108 | (2,070,365 | ) | 1,678,743 | $ | 346 | $ | 1,678,743 | ||||||||||||||||||
| Ultra Short Duration Fixed Income Fund | 34,353,028 | 367,508,904 | (356,025,707 | ) | 45,836,225 | $ | 61,561 | $ | 45,836,225 | ||||||||||||||||||
* Represents the period from commencement of operations (April 18, 2011) through September 30, 2011.
** Represents the period from commencement of operations (August 9, 2011) through September 30, 2011.
*** Represents the period from April 1, 2011 through September 30, 2011.
144
Notes to Financial Statements (Continued)
5. Capital Share Transactions
Proceeds and payments on capital shares as shown in the Statements of Changes in Net Assets are the result of the following capital share transactions for the periods shown:
| Capital Appreciation Fund | Emerging Markets Equity Fund | ||||||||||||||||||
| Year Ended September 30, 2011 | Year Ended September 30, 2010 | Year Ended September 30, 2011 | Year Ended September 30, 2010 | ||||||||||||||||
| Class A | |||||||||||||||||||
| Shares issued | 147,734 | 267,286 | 3,547,839 | 935,779 | |||||||||||||||
| Shares reinvested | 6,016 | — | 5,820 | — | |||||||||||||||
| Shares redeemed | (34,714 | ) | (10,100 | ) | (1,881,202 | ) | (120,057 | ) | |||||||||||
| Change in shares outstanding | 119,036 | 257,186 | 1,672,457 | 815,722 | |||||||||||||||
| Shares outstanding, beginning of period | 257,186 | — | 815,722 | — | |||||||||||||||
| Shares outstanding, end of period | 376,222 | 257,186 | 2,488,179 | 815,722 | |||||||||||||||
| Class C | |||||||||||||||||||
| Shares issued | 10,049 | 37,123 | 400,532 | 301,020 | |||||||||||||||
| Shares reinvested | 1,106 | — | 766 | — | |||||||||||||||
| Shares redeemed | (1,805 | ) | (3,690 | ) | (172,503 | ) | (15,645 | ) | |||||||||||
| Change in shares outstanding | 9,350 | 33,433 | 228,795 | 285,375 | |||||||||||||||
| Shares outstanding, beginning of period | 33,433 | — | 285,375 | — | |||||||||||||||
| Shares outstanding, end of period | 42,783 | 33,433 | 514,170 | 285,375 | |||||||||||||||
| Class Y | |||||||||||||||||||
| Shares issued | 2,151 | 16,888 | 13,976,009 | 1,141,030 | |||||||||||||||
| Shares reinvested | 441 | 12 | 14,126 | — | |||||||||||||||
| Shares redeemed | — | (4,490 | ) | (951,388 | ) | (71,873 | ) | ||||||||||||
| Change in shares outstanding | 2,592 | 12,410 | 13,038,747 | 1,069,157 | |||||||||||||||
| Shares outstanding, beginning of period | 12,410 | — | 1,069,157 | — | |||||||||||||||
| Shares outstanding, end of period | 15,002 | 12,410 | 14,107,904 | 1,069,157 | |||||||||||||||
| Institutional Class | |||||||||||||||||||
| Shares issued | — | 270,250 | 13,367,607 | 10,327,778 | |||||||||||||||
| Shares reinvested | 9,987 | 708 | 51,241 | — | |||||||||||||||
| Shares redeemed | — | (250 | ) | (530,487 | ) | (481,205 | ) | ||||||||||||
| Change in shares outstanding | 9,987 | 270,708 | 12,888,361 | 9,846,573 | |||||||||||||||
| Shares outstanding, beginning of period | 270,708 | — | 9,846,573 | — | |||||||||||||||
| Shares outstanding, end of period | 280,695 | 270,708 | 22,734,934 | 9,846,573 | |||||||||||||||
145
Notes to Financial Statements (Continued)
| Emerging Markets Equity Fund II | Focused Equity Fund | ||||||||||||||
| Period Ended September 30, 2011 (A) | Year Ended September 30, 2011 | Period Ended September 30, 2010 (B) | |||||||||||||
| Class A | |||||||||||||||
| Shares issued | 53,132 | 9,710,959 | 87,159 | ||||||||||||
| Shares reinvested | — | 1,085 | — | ||||||||||||
| Shares redeemed | (734 | ) | (1,286,253 | ) | (12,811 | ) | |||||||||
| Change in shares outstanding | 52,398 | 8,425,791 | 74,348 | ||||||||||||
| Shares outstanding, beginning of period | — | 74,348 | — | ||||||||||||
| Shares outstanding, end of period | 52,398 | 8,500,139 | 74,348 | ||||||||||||
| Class C | |||||||||||||||
| Shares issued | 2,090 | 15,937 | 18,599 | ||||||||||||
| Shares reinvested | — | 185 | — | ||||||||||||
| Shares redeemed | — | (14,279 | ) | (1,385 | ) | ||||||||||
| Change in shares outstanding | 2,090 | 1,843 | 17,214 | ||||||||||||
| Shares outstanding, beginning of period | — | 17,214 | — | ||||||||||||
| Shares outstanding, end of period | 2,090 | 19,057 | 17,214 | ||||||||||||
| Class Y | |||||||||||||||
| Shares issued | 51,417 | 1,555,186 | 18,300 | ||||||||||||
| Shares reinvested | — | 125 | — | ||||||||||||
| Shares redeemed | (26,257 | ) | (283,790 | ) | — | ||||||||||
| Change in shares outstanding | 25,160 | 1,271,521 | 18,300 | ||||||||||||
| Shares outstanding, beginning of period | — | 18,300 | — | ||||||||||||
| Shares outstanding, end of period | 25,160 | 1,289,821 | 18,300 | ||||||||||||
| Institutional Class | |||||||||||||||
| Shares issued | 493,268 | 91,822 | 166,432 | ||||||||||||
| Shares reinvested | — | 3,084 | — | ||||||||||||
| Shares redeemed | — | (73,084 | ) | (96,432 | ) | ||||||||||
| Change in shares outstanding | 493,268 | 21,822 | 70,000 | ||||||||||||
| Shares outstanding, beginning of period | — | 70,000 | — | ||||||||||||
| Shares outstanding, end of period | 493,268 | 91,822 | 70,000 | ||||||||||||
(A) Represents the period from commencement of operations (April 18, 2011) through September 30, 2011.
(B) Represents the period from commencement of operations (December 31, 2009) through September 30, 2010.
146
Notes to Financial Statements (Continued)
| Global Equity Fund | Global Real Estate Fund | ||||||||||||||||||
| Year Ended September 30, 2011 | Year Ended September 30, 2010 | Year Ended September 30, 2011 | Year Ended September 30, 2010 | ||||||||||||||||
| Class A | |||||||||||||||||||
| Shares issued | 48,813 | 217,437 | 212,378 | 170,489 | |||||||||||||||
| Shares reinvested | 1,145 | — | 3,515 | 415 | |||||||||||||||
| Shares redeemed | (159,828 | ) | (43,120 | ) | (83,869 | ) | (94,047 | ) | |||||||||||
| Change in shares outstanding | (109,870 | ) | 174,317 | 132,024 | 76,857 | ||||||||||||||
| Shares outstanding, beginning of period | 174,317 | — | 76,857 | — | |||||||||||||||
| Shares outstanding, end of period | 64,447 | 174,317 | 208,881 | 76,857 | |||||||||||||||
| Class C | |||||||||||||||||||
| Shares issued | 215 | 10,250 | 302 | 10,745 | |||||||||||||||
| Shares reinvested | 91 | — | 896 | 177 | |||||||||||||||
| Shares redeemed | — | (250 | ) | — | (250 | ) | |||||||||||||
| Change in shares outstanding | 306 | 10,000 | 1,198 | 10,672 | |||||||||||||||
| Shares outstanding, beginning of period | 10,000 | — | 10,672 | — | |||||||||||||||
| Shares outstanding, end of period | 10,306 | 10,000 | 11,870 | 10,672 | |||||||||||||||
| Class Y | |||||||||||||||||||
| Shares issued | 6,328 | 13,548 | 5,583 | 11,172 | |||||||||||||||
| Shares reinvested | 230 | — | 1,066 | 231 | |||||||||||||||
| Shares redeemed | (7 | ) | (250 | ) | (5,789 | ) | (250 | ) | |||||||||||
| Change in shares outstanding | 6,551 | 13,298 | 860 | 11,153 | |||||||||||||||
| Shares outstanding, beginning of period | 13,298 | — | 11,153 | — | |||||||||||||||
| Shares outstanding, end of period | 19,849 | 13,298 | 12,013 | 11,153 | |||||||||||||||
| Institutional Class | |||||||||||||||||||
| Shares issued | 1,629 | 288,959 | — | 272,604 | |||||||||||||||
| Shares reinvested | 5,286 | 64 | 24,853 | 6,130 | |||||||||||||||
| Shares redeemed | (767 | ) | (250 | ) | (1,633 | ) | (250 | ) | |||||||||||
| Change in shares outstanding | 6,148 | 288,773 | 23,220 | 278,484 | |||||||||||||||
| Shares outstanding, beginning of period | 288,773 | — | 278,484 | — | |||||||||||||||
| Shares outstanding, end of period | 294,921 | 288,773 | 301,704 | 278,484 | |||||||||||||||
147
Notes to Financial Statements (Continued)
| Intermediate Fixed Income Fund | International Fixed Income Fund | ||||||||||||||||||
| Year Ended September 30, 2011 | Year Ended September 30, 2010 | Year Ended September 30, 2011 | Year Ended September 30, 2010 | ||||||||||||||||
| Class A | |||||||||||||||||||
| Shares issued | — | — | 269,862 | 116,964 | |||||||||||||||
| Shares reinvested | — | — | 12,042 | 296 | |||||||||||||||
| Shares redeemed | — | — | (154,393 | ) | (1,284 | ) | |||||||||||||
| Change in shares outstanding | — | — | 127,511 | 115,976 | |||||||||||||||
| Shares outstanding, beginning of period | — | — | 115,976 | — | |||||||||||||||
| Shares outstanding, end of period | — | — | 243,487 | 115,976 | |||||||||||||||
| Class C | |||||||||||||||||||
| Shares issued | — | — | 33,150 | 41,491 | |||||||||||||||
| Shares reinvested | — | — | 3,439 | 70 | |||||||||||||||
| Shares redeemed | — | — | (16,978 | ) | (5,756 | ) | |||||||||||||
| Change in shares outstanding | — | — | 19,611 | 35,805 | |||||||||||||||
| Shares outstanding, beginning of period | — | — | 35,805 | — | |||||||||||||||
| Shares outstanding, end of period | — | — | 55,416 | 35,805 | |||||||||||||||
| Class Y | |||||||||||||||||||
| Shares issued | — | — | 162,319 | 23,352 | |||||||||||||||
| Shares reinvested | — | — | 4,664 | 134 | |||||||||||||||
| Shares redeemed | — | — | (115,185 | ) | (6,475 | ) | |||||||||||||
| Change in shares outstanding | — | — | 51,798 | 17,011 | |||||||||||||||
| Shares outstanding, beginning of period | — | — | 17,011 | — | |||||||||||||||
| Shares outstanding, end of period | — | — | 68,809 | 17,011 | |||||||||||||||
| Institutional Class | |||||||||||||||||||
| Shares issued | 912,234 | 1,195,486 | 2,438 | 672,244 | |||||||||||||||
| Shares reinvested | 36,161 | 7,956 | 74,760 | 9,128 | |||||||||||||||
| Shares redeemed | (2,053,072 | ) | (1,169,060 | ) | (1,808 | ) | (251 | ) | |||||||||||
| Change in shares outstanding | (1,104,677 | ) | 34,382 | 75,390 | 681,121 | ||||||||||||||
| Shares outstanding, beginning of period | 11,914,619 | 11,880,237 | 681,121 | — | |||||||||||||||
| Shares outstanding, end of period | 10,809,942 | 11,914,619 | 756,511 | 681,121 | |||||||||||||||
148
Notes to Financial Statements (Continued)
| Large Cap Relative Value Fund | Market Neutral Equity Fund | ||||||||||||||||||
| Year Ended September 30, 2011 | Year Ended September 30, 2010 | Year Ended September 30, 2011 | Year Ended September 30, 2010 | ||||||||||||||||
| Class A | |||||||||||||||||||
| Shares issued | 110,035 | 44,770 | 351,400 | 138,722 | |||||||||||||||
| Shares reinvested | 664 | 22 | — | — | |||||||||||||||
| Shares redeemed | (90,430 | ) | (1,924 | ) | (72,321 | ) | (76,024 | ) | |||||||||||
| Change in shares outstanding | 20,269 | 42,868 | 279,079 | 62,698 | |||||||||||||||
| Shares outstanding, beginning of period | 42,868 | — | 62,698 | — | |||||||||||||||
| Shares outstanding, end of period | 63,137 | 42,868 | 341,777 | 62,698 | |||||||||||||||
| Class C | |||||||||||||||||||
| Shares issued | 6,820 | 21,740 | 13,156 | 18,133 | |||||||||||||||
| Shares reinvested | 53 | — | — | — | |||||||||||||||
| Shares redeemed | (2,498 | ) | (520 | ) | (11,687 | ) | (770 | ) | |||||||||||
| Change in shares outstanding | 4,375 | 21,220 | 1,469 | 17,363 | |||||||||||||||
| Shares outstanding, beginning of period | 21,220 | — | 17,363 | — | |||||||||||||||
| Shares outstanding, end of period | 25,595 | 21,220 | 18,832 | 17,363 | |||||||||||||||
| Class Y | |||||||||||||||||||
| Shares issued | 275,185 | 10,267 | 776,631 | 3,325,020 | |||||||||||||||
| Shares reinvested | 1,065 | 17 | — | — | |||||||||||||||
| Shares redeemed | (54,523 | ) | (250 | ) | (48,404 | ) | (2,801 | ) | |||||||||||
| Change in shares outstanding | 221,727 | 10,034 | 728,227 | 3,322,219 | |||||||||||||||
| Shares outstanding, beginning of period | 10,034 | — | 3,322,219 | — | |||||||||||||||
| Shares outstanding, end of period | 231,761 | 10,034 | 4,050,446 | 3,322,219 | |||||||||||||||
| Institutional Class | |||||||||||||||||||
| Shares issued | — | 270,789 | — | — | |||||||||||||||
| Shares reinvested | 4,822 | 568 | — | — | |||||||||||||||
| Shares redeemed | — | (250 | ) | — | — | ||||||||||||||
| Change in shares outstanding | 4,822 | 271,107 | — | — | |||||||||||||||
| Shares outstanding, beginning of period | 271,107 | — | — | — | |||||||||||||||
| Shares outstanding, end of period | 275,929 | 271,107 | — | — | |||||||||||||||
149
Notes to Financial Statements (Continued)
| Merger Arbitrage Fund | Mid Cap Fund | ||||||||||||||
| Period Ended September 30, 2011 (A) | Year Ended September 30, 2011 | Year Ended September 30, 2010 | |||||||||||||
| Class A | |||||||||||||||
| Shares issued | 25,902 | 15,088 | 25,374 | ||||||||||||
| Shares reinvested | — | — | 168 | ||||||||||||
| Shares redeemed | — | (16,080 | ) | (11,881 | ) | ||||||||||
| Change in shares outstanding | 25,902 | (992 | ) | 13,661 | |||||||||||
| Shares outstanding, beginning of period | — | 54,044 | 40,383 | ||||||||||||
| Shares outstanding, end of period | 25,902 | 53,052 | 54,044 | ||||||||||||
| Class C | |||||||||||||||
| Shares issued | 25,415 | 21,061 | 6,152 | ||||||||||||
| Shares redeemed | — | (4,071 | ) | (1,501 | ) | ||||||||||
| Change in shares outstanding | 25,415 | 16,990 | 4,651 | ||||||||||||
| Shares outstanding, beginning of period | — | 19,770 | 15,119 | ||||||||||||
| Shares outstanding, end of period | 25,415 | 36,760 | 19,770 | ||||||||||||
| Class Y (B) | |||||||||||||||
| Shares issued | 115,733 | 1,122,323 | 404,386 | ||||||||||||
| Shares reinvested | — | 711 | 5,228 | ||||||||||||
| Shares redeemed | — | (4,956,532 | ) | (5,629,235 | ) | ||||||||||
| Change in shares outstanding | 115,733 | (3,833,498 | ) | (5,219,621 | ) | ||||||||||
| Shares outstanding, beginning of period | — | 9,741,651 | 14,961,272 | ||||||||||||
| Shares outstanding, end of period | 115,733 | 5,908,153 | 9,741,651 | ||||||||||||
| Class Z | |||||||||||||||
| Shares issued | — | 161,305 | 106,514 | ||||||||||||
| Shares reinvested | — | — | 814 | ||||||||||||
| Shares redeemed | — | (141,655 | ) | (217,842 | ) | ||||||||||
| Change in shares outstanding | — | 19,650 | (110,514 | ) | |||||||||||
| Shares outstanding, beginning of period | — | 51,805 | 162,319 | ||||||||||||
| Shares outstanding, end of period | — | 71,455 | 51,805 | ||||||||||||
| Institutional Class | |||||||||||||||
| Shares issued | 500,250 | — | — | ||||||||||||
| Shares reinvested | — | — | — | ||||||||||||
| Shares redeemed | — | — | — | ||||||||||||
| Change in shares outstanding | 500,250 | — | — | ||||||||||||
| Shares outstanding, beginning of period | — | — | — | ||||||||||||
| Shares outstanding, end of period | 500,250 | — | — | ||||||||||||
(A) Represents the period from commencement of operations (August 9, 2011) through September 30, 2011.
(B) Effective January 28, 2010, Institutional Class shares of the Mid Cap Fund were changed to Class Y shares.
150
Notes to Financial Statements (Continued)
| Mid Cap Value Fund | Premium Yield Equity Fund | ||||||||||||||||||
| Year Ended September 30, 2011 | Year Ended September 30, 2010 | Year Ended September 30, 2011 | Year Ended September 30, 2010 | ||||||||||||||||
| Class A | |||||||||||||||||||
| Shares issued | 328,003 | 46,216 | 1,028,857 | 471,835 | |||||||||||||||
| Shares reinvested | 2,099 | 155 | 111,470 | 95,669 | |||||||||||||||
| Shares redeemed | (141,699 | ) | (17,067 | ) | (353,042 | ) | (458,430 | ) | |||||||||||
| Change in shares outstanding | 188,403 | 29,304 | 787,285 | 109,074 | |||||||||||||||
| Shares outstanding, beginning of period | 29,304 | — | 3,461,054 | 3,351,980 | |||||||||||||||
| Shares outstanding, end of period | 217,707 | 29,304 | 4,248,339 | 3,461,054 | |||||||||||||||
| Class C | |||||||||||||||||||
| Shares issued | 8,338 | 11,460 | 282,510 | 578,905 | |||||||||||||||
| Shares reinvested | 175 | 41 | 21,323 | 12,488 | |||||||||||||||
| Shares redeemed | (862 | ) | (250 | ) | (253,359 | ) | (91,688 | ) | |||||||||||
| Change in shares outstanding | 7,651 | 11,251 | 50,474 | 499,705 | |||||||||||||||
| Shares outstanding, beginning of period | 11,251 | — | 1,059,315 | 559,610 | |||||||||||||||
| Shares outstanding, end of period | 18,902 | 11,251 | 1,109,789 | 1,059,315 | |||||||||||||||
| Class Y | |||||||||||||||||||
| Shares issued | 392,127 | 50,041 | 1,243,678 | 1,890,153 | |||||||||||||||
| Shares reinvested | 2,997 | 173 | 40,162 | 27,395 | |||||||||||||||
| Shares redeemed | (14,916 | ) | (251 | ) | (2,477,225 | ) | (227,888 | ) | |||||||||||
| Change in shares outstanding | 380,208 | 49,963 | (1,193,385 | ) | 1,689,660 | ||||||||||||||
| Shares outstanding, beginning of period | 49,963 | — | 1,782,756 | 93,096 | |||||||||||||||
| Shares outstanding, end of period | 430,171 | 49,963 | 589,371 | 1,782,756 | |||||||||||||||
| Institutional Class | |||||||||||||||||||
| Shares issued | 219,249 | 3,338,313 | — | — | |||||||||||||||
| Shares reinvested | 86,758 | 2,777 | — | — | |||||||||||||||
| Shares redeemed | (2,403 | ) | (250 | ) | — | — | |||||||||||||
| Change in shares outstanding | 303,604 | 3,340,840 | — | — | |||||||||||||||
| Shares outstanding, beginning of period | 3,340,840 | — | — | — | |||||||||||||||
| Shares outstanding, end of period | 3,644,444 | 3,340,840 | — | — | |||||||||||||||
151
Notes to Financial Statements (Continued)
| Sands Capital Select Growth Fund | Short Duration Fixed Income Fund | ||||||||||||||||||
| Year Ended September 30, 2011 (A) | Year Ended September 30, 2010 | Year Ended September 30, 2011 | Year Ended September 30, 2010 | ||||||||||||||||
| Class A | |||||||||||||||||||
| Shares issued | 2,652,990 | — | — | — | |||||||||||||||
| Shares redeemed | (394,502 | ) | — | — | — | ||||||||||||||
| Change in shares outstanding | 2,258,488 | — | — | — | |||||||||||||||
| Shares outstanding, beginning of period | — | — | — | — | |||||||||||||||
| Shares outstanding, end of period | 2,258,488 | — | — | — | |||||||||||||||
| Class C | |||||||||||||||||||
| Shares issued | 944,384 | — | — | — | |||||||||||||||
| Shares redeemed | (16,096 | ) | — | — | — | ||||||||||||||
| Change in shares outstanding | 928,288 | — | — | — | |||||||||||||||
| Shares outstanding, beginning of period | — | — | — | — | |||||||||||||||
| Shares outstanding, end of period | 928,288 | — | — | — | |||||||||||||||
| Class Y | |||||||||||||||||||
| Shares issued | 33,079,380 | 5,629,008 | 234,596 | 92,642 | |||||||||||||||
| Shares reinvested | — | — | 334 | 1,055 | |||||||||||||||
| Shares redeemed | (5,630,923 | ) | (3,303,760 | ) | (193,264 | ) | (76,251 | ) | |||||||||||
| Change in shares outstanding | 27,448,457 | 2,325,248 | 41,666 | 17,446 | |||||||||||||||
| Shares outstanding, beginning of period | 13,625,415 | 11,300,167 | 76,949 | 59,503 | |||||||||||||||
| Shares outstanding, end of period | 41,073,872 | 13,625,415 | 118,615 | 76,949 | |||||||||||||||
| Class Z | |||||||||||||||||||
| Shares issued | 66,676,446 | 32,185,209 | 804,768 | 754,949 | |||||||||||||||
| Shares reinvested | — | — | 115,476 | 115,755 | |||||||||||||||
| Shares redeemed | (31,679,678 | ) | (16,070,720 | ) | (1,188,710 | ) | (914,126 | ) | |||||||||||
| Change in shares outstanding | 34,996,768 | 16,114,489 | (268,466 | ) | (43,422 | ) | |||||||||||||
| Shares outstanding, beginning of period | 62,110,554 | 45,996,065 | 4,357,109 | 4,400,531 | |||||||||||||||
| Shares outstanding, end of period | 97,107,322 | 62,110,554 | 4,088,643 | 4,357,109 | |||||||||||||||
(A) Class A and Class C represent the period from commencement of operations (November 15, 2010) through September 30, 2011.
152
Notes to Financial Statements (Continued)
| Small Cap Core Fund | Small Cap Value Fund | ||||||||||||||||||
| Year Ended September 30, 2011 | Year Ended September 30, 2010 | Year Ended September 30, 2011 (A) | Year Ended September 30, 2010 | ||||||||||||||||
| Class A | |||||||||||||||||||
| Shares issued | 3,722,461 | 5,137,874 | 3,136,386 | — | |||||||||||||||
| Shares reinvested | 3,123 | — | 8,773 | — | |||||||||||||||
| Shares redeemed | (4,431,068 | ) | (825,614 | ) | (446,583 | ) | — | ||||||||||||
| Change in shares outstanding | (705,484 | ) | 4,312,260 | 2,698,576 | — | ||||||||||||||
| Shares outstanding, beginning of period | 4,312,260 | — | — | — | |||||||||||||||
| Shares outstanding, end of period | 3,606,776 | 4,312,260 | 2,698,576 | — | |||||||||||||||
| Class C | |||||||||||||||||||
| Shares issued | 731,910 | 475,489 | 144 | — | |||||||||||||||
| Shares reinvested | 29 | — | 1 | — | |||||||||||||||
| Shares redeemed | (190,244 | ) | (21,338 | ) | — | — | |||||||||||||
| Change in shares outstanding | 541,695 | 454,151 | 145 | — | |||||||||||||||
| Shares outstanding, beginning of period | 454,151 | — | — | — | |||||||||||||||
| Shares outstanding, end of period | 995,846 | 454,151 | 145 | — | |||||||||||||||
| Class Y | |||||||||||||||||||
| Shares issued | 3,641,810 | 3,255,338 | 1,266 | — | |||||||||||||||
| Shares reinvested | 6,188 | — | 6 | — | |||||||||||||||
| Shares redeemed | (1,675,553 | ) | (380,556 | ) | (1,126 | ) | — | ||||||||||||
| Change in shares outstanding | 1,972,445 | 2,874,782 | 146 | — | |||||||||||||||
| Shares outstanding, beginning of period | 2,874,782 | — | — | — | |||||||||||||||
| Shares outstanding, end of period | 4,847,227 | 2,874,782 | 146 | — | |||||||||||||||
| Class Z | |||||||||||||||||||
| Shares issued | — | — | 426,387 | 763,694 | |||||||||||||||
| Shares reinvested | — | — | 32,993 | — | |||||||||||||||
| Shares redeemed | — | — | (4,792,518 | ) | (2,768,817 | ) | |||||||||||||
| Change in shares outstanding | — | — | (4,333,138 | ) | (2,005,123 | ) | |||||||||||||
| Shares outstanding, beginning of period | — | — | 4,333,138 | 6,338,261 | |||||||||||||||
| Shares outstanding, end of period | — | — | — | 4,333,138 | |||||||||||||||
| Institutional Class | |||||||||||||||||||
| Shares issued | 3,337,526 | 1,166,686 | 53,246 | — | |||||||||||||||
| Shares reinvested | 3,485 | 894 | 248 | — | |||||||||||||||
| Shares redeemed | (642,952 | ) | (275,955 | ) | — | — | |||||||||||||
| Change in shares outstanding | 2,698,059 | 891,625 | 53,494 | — | |||||||||||||||
| Shares outstanding, beginning of period | 891,625 | — | — | — | |||||||||||||||
| Shares outstanding, end of period | 3,589,684 | 891,625 | 53,494 | — | |||||||||||||||
(A) Class A, Class C, Class Y and Institutional Class represent the period from commencement of operations (March 1, 2011) through September 30, 2011. Class Z shares were converted to Class A shares on June 10, 2011.
153
Notes to Financial Statements (Continued)
| Total Return Bond Fund | Ultra Short Duration Fixed Income Fund | ||||||||||||||||||||||
| Period Ended September 30, 2011 | Year Ended March 31, 2011 | Year Ended March 31, 2010 | Year Ended September 30, 2011 | Year Ended September 30, 2010 | |||||||||||||||||||
| Class A | |||||||||||||||||||||||
| Shares issued (A) | 138,426 | 693 | — | — | — | ||||||||||||||||||
| Shares reinvested (A) | 2,604 | 21 | — | — | — | ||||||||||||||||||
| Shares issued in connection with merger (B) | 331,907 | — | — | — | — | ||||||||||||||||||
| Shares redeemed (A) | (6,144 | ) | — | — | — | — | |||||||||||||||||
| Change in shares outstanding | 466,793 | 714 | — | — | — | ||||||||||||||||||
| Shares outstanding, beginning of period | 714 | — | — | — | — | ||||||||||||||||||
| Shares outstanding, end of period | 467,507 | 714 | — | — | — | ||||||||||||||||||
| Class C | |||||||||||||||||||||||
| Shares issued | 10,620 | — | — | — | — | ||||||||||||||||||
| Shares reinvested | 1,550 | — | — | — | — | ||||||||||||||||||
| Shares issued in connection with merger (B) | 248,384 | — | — | — | — | ||||||||||||||||||
| Shares redeemed | (4,880 | ) | — | — | — | — | |||||||||||||||||
| Change in shares outstanding | 255,674 | — | — | — | — | ||||||||||||||||||
| Shares outstanding, beginning of period | — | — | — | — | — | ||||||||||||||||||
| Shares outstanding, end of period | 255,674 | — | — | — | — | ||||||||||||||||||
| Class Y | |||||||||||||||||||||||
| Shares issued (C) | 153,969 | 208,057 | 398,594 | — | — | ||||||||||||||||||
| Shares reinvested (C) | 36,959 | 77,602 | 88,868 | — | — | ||||||||||||||||||
| Shares issued in connection with merger (B) | 61,451 | — | — | — | — | ||||||||||||||||||
| Shares redeemed (C) | (171,732 | ) | (358,757 | ) | (283,576 | ) | — | — | |||||||||||||||
| Change in shares outstanding | 80,647 | (73,098 | ) | 203,886 | — | — | |||||||||||||||||
| Shares outstanding, beginning of period | 1,674,076 | 1,747,174 | 1,543,288 | — | — | ||||||||||||||||||
| Shares outstanding, end of period | 1,754,723 | 1,674,076 | 1,747,174 | — | — | ||||||||||||||||||
| Class Z | |||||||||||||||||||||||
| Shares issued | — | — | — | 35,550,281 | 20,014,092 | ||||||||||||||||||
| Shares reinvested | — | — | — | 530,809 | 278,613 | ||||||||||||||||||
| Shares redeemed | — | — | — | (24,416,107 | ) | (7,070,449 | ) | ||||||||||||||||
| Change in shares outstanding | — | — | — | 11,664,983 | 13,222,256 | ||||||||||||||||||
| Shares outstanding, beginning of period | — | — | — | 24,458,413 | 11,236,157 | ||||||||||||||||||
| Shares outstanding, end of period | — | — | — | 36,123,396 | 24,458,413 | ||||||||||||||||||
| Institutional Class | |||||||||||||||||||||||
| Shares issued | — | — | — | — | — | ||||||||||||||||||
| Shares reinvested | 5,606 | — | — | — | — | ||||||||||||||||||
| Shares issued in connection with merger (B) | 624,160 | — | — | — | — | ||||||||||||||||||
| Shares redeemed | — | — | — | — | — | ||||||||||||||||||
| Change in shares outstanding | 629,766 | — | — | — | — | ||||||||||||||||||
| Shares outstanding, beginning of period | — | — | — | — | — | ||||||||||||||||||
| Shares outstanding, end of period | 629,766 | — | — | — | — | ||||||||||||||||||
(A) Share amounts prior to August 1, 2011 have been adjusted to reflect a 1.01491:1 stock split.
(B) See footnote 9 in the notes to financial statements.
(C) Share amounts prior to August 1, 2011 have been adjusted to reflect a 0.87567:1 stock split.
154
Notes to Financial Statements (Continued)
6. Federal Tax Information
Federal income tax — It is each Fund's policy to continue to comply with the special provisions of the Internal Revenue Code applicable to regulated investment companies. As provided therein, in any fiscal year in which a Fund so qualifies and distributes at least 90% of its investment company taxable income, the Fund (but not the shareholders) will be relieved of federal income tax on the income distributed. Accordingly, no provision for income taxes has been made.
In order to avoid imposition of the excise tax applicable to regulated investment companies, it is also each Fund's intention to declare and pay as dividends in each calendar year at least 98% of its investment company taxable income (earned during the calendar year) and 98.2% of its net realized capital gains (earned during the twelve months ending October 31) plus undistributed amounts from prior years.
The tax character of distributions paid for the years ended September 30, 2011 and 2010 was as follows:
| Capital Appreciation Fund | Emerging Markets Equity Fund | ||||||||||||||||||
| Year Ended September 30, 2011 | Year Ended September 30, 2010 | Year Ended September 30, 2011 | Year Ended September 30, 2010 | ||||||||||||||||
| From ordinary income | $ | 224,387 | $ | 7,703 | $ | 917,181 | $ | — | |||||||||||
| From long-term capital gains | — | — | 42,906 | — | |||||||||||||||
| $ | 224,387 | $ | 7,703 | $ | 960,087 | $ | — | ||||||||||||
| Emerging Markets Equity Fund II | Focused Equity Fund | ||||||||||||||||||
| Period Ended September 30, 2011* | Year Ended September 30, 2011 | Year Ended September 30, 2010** | |||||||||||||||||
| From ordinary income | $ | — | $ | 95,426 | $ | — | |||||||||||||
| Global Equity Fund | Global Real Estate Fund | ||||||||||||||||||
| Year Ended September 30, 2011 | Year Ended September 30, 2010 | Year Ended September 30, 2011 | Year Ended September 30, 2010 | ||||||||||||||||
| From ordinary income | $ | 54,811 | $ | 661 | $ | 358,116 | $ | 90,201 | |||||||||||
| From long-term capital gains | 23,345 | — | 20,496 | — | |||||||||||||||
| $ | 78,156 | $ | 661 | $ | 378,612 | $ | 90,201 | ||||||||||||
| Intermediate Fixed Income Fund | International Fixed Income Fund | ||||||||||||||||||
| Year Ended September 30, 2011 | Year Ended September 30, 2010 | Year Ended September 30, 2011 | Year Ended September 30, 2010 | ||||||||||||||||
| From ordinary income | $ | 3,044,360 | $ | 3,085,391 | $ | 994,275 | $ | 122,627 | |||||||||||
| From long-term capital gains | — | — | 7,726 | — | |||||||||||||||
| $ | 3,044,360 | $ | 3,085,391 | $ | 1,002,001 | $ | 122,627 | ||||||||||||
| Large Cap Relative Value Fund | Market Neutral Equity Fund | ||||||||||||||||||
| Year Ended September 30, 2011 | Year Ended September 30, 2010 | Year Ended September 30, 2011 | Year Ended September 30, 2010 | ||||||||||||||||
| From ordinary income | $ | 78,312 | $ | 13,296 | $ | — | $ | — | |||||||||||
| From long-term capital gains | 2,050 | — | — | — | |||||||||||||||
| $ | 80,362 | $ | 13,296 | $ | — | $ | — | ||||||||||||
155
Notes to Financial Statements (Continued)
| Merger Arbitrage Fund | Mid Cap Fund | ||||||||||||||||||
| Period Ended September 30, 2011*** | Year Ended September 30, 2011 | Year Ended September 30, 2010 | |||||||||||||||||
| From ordinary income | $ | — | $ | 242,148 | $ | 1,064,323 | |||||||||||||
| In excess of ordinary income | — | 31,098 | 138,568 | ||||||||||||||||
| $ | — | $ | 273,246 | $ | 1,202,891 | ||||||||||||||
| Mid Cap Value Fund | Premium Yield Equity Fund | ||||||||||||||||||
| Year Ended September 30, 2011 | Year Ended September 30, 2010 | Year Ended September 30, 2011 | Year Ended September 30, 2010 | ||||||||||||||||
| From ordinary income | $ | 1,058,579 | $ | 67,277 | $ | 1,206,945 | $ | 1,013,991 | |||||||||||
| In excess of ordinary income | — | — | 88,599 | — | |||||||||||||||
| From long-term capital gains | 89,486 | — | — | — | |||||||||||||||
| $ | 1,148,065 | $ | 67,277 | $ | 1,295,544 | $ | 1,013,991 | ||||||||||||
| Sands Capital Select Growth Fund | Short Duration Fixed Income Fund | ||||||||||||||||||
| Year Ended September 30, 2011 | Year Ended September 30, 2010 | Year Ended September 30, 2011 | Year Ended September 30, 2010 | ||||||||||||||||
| From ordinary income | $ | — | $ | — | $ | 1,177,356 | $ | 1,328,163 | |||||||||||
| Small Cap Core Fund | Small Cap Value Fund | ||||||||||||||||||
| Year Ended September 30, 2011 | Year Ended September 30, 2010 | Year Ended September 30, 2011 | Year Ended September 30, 2010 | ||||||||||||||||
| From ordinary income | $ | 179,119 | $ | 9,676 | $ | 725,253 | $ | — | |||||||||||
| From long-term capital gains | 780 | — | — | — | |||||||||||||||
| $ | 179,899 | $ | 9,676 | $ | 725,253 | $ | — | ||||||||||||
| Total Return Bond Fund | Ultra Short Duration Fixed Income Fund | ||||||||||||||||||
| Period Ended September 30, 2011**** | Year Ended March 31, 2011***** | Year Ended September 30, 2011 | Year Ended September 30, 2010 | ||||||||||||||||
| From ordinary income | $ | 1,129,969 | $ | 796,684 | $ | 5,857,004 | $ | 3,337,850 | |||||||||||
| In excess of ordinary income | 78,220 | — | — | — | |||||||||||||||
| From long-term capital gains | 271,911 | — | — | — | |||||||||||||||
| From tax return of capital | 29,134 | — | — | — | |||||||||||||||
| $ | 1,509,234 | $ | 796,684 | $ | 5,857,004 | $ | 3,337,850 | ||||||||||||
* Represents the period from commencement of operations (April 18, 2011) through September 30, 2011.
** Represents the period from commencement of operations (December 31, 2009) through September 30, 2010.
*** Represents the period from commencement of operations (August 9, 2011) through September 30, 2011.
**** Represents the period from April 1, 2011 through September 30, 2011.
***** Represents activity of the Predecessor Fund for periods prior to August 1, 2011. See note 9.
156
Notes to Financial Statements (Continued)
The following information is computed on a tax basis for each item as of September 30, 2011:
| Capital Appreciation Fund | Emerging Markets Equity Fund | Emerging Markets Equity Fund II | Focused Equity Fund | Global Equity Fund | |||||||||||||||||||
| Tax cost of portfolio investments | $ | 7,566,889 | $ | 519,935,946 | $ | 5,588,253 | $ | 133,817,730 | $ | 4,104,326 | |||||||||||||
| Gross unrealized appreciation | 415,494 | 9,950,821 | 26,153 | 919,780 | 280,422 | ||||||||||||||||||
| Gross unrealized depreciation | (850,662 | ) | (83,078,331 | ) | (1,194,296 | ) | (32,723,506 | ) | (596,884 | ) | |||||||||||||
| Net unrealized appreciation (depreciation) | (435,168 | ) | (73,127,510 | ) | (1,168,143 | ) | (31,803,726 | ) | (316,462 | ) | |||||||||||||
| Net unrealized appreciation (depreciation) on foreign currency and translation of other assets and liabilities denominated in foreign currency | — | (30,560 | ) | (1,915 | ) | — | (1,067 | ) | |||||||||||||||
| Accumulated capital and other losses | — | (366,598 | ) | (36,906 | ) | — | (3,586 | ) | |||||||||||||||
| Undistributed ordinary income | 39,160 | 5,369,343 | 34,166 | 2,669,823 | 124,431 | ||||||||||||||||||
| Undistributed capital gains | 16,370 | 3,092,612 | — | 78,600 | 276,396 | ||||||||||||||||||
| Other temporary differences | — | (5,998 | ) | — | (8,313 | ) | — | ||||||||||||||||
| Accumulated earnings (deficit) | $ | (379,638 | ) | $ | (65,068,711 | ) | $ | (1,172,798 | ) | $ | (29,063,616 | ) | $ | 79,712 | |||||||||
| Global Real Estate Fund | Intermediate Fixed Income Fund | International Fixed Income Fund | Large Cap Relative Value Fund | Market Neutral Equity Fund | |||||||||||||||||||
| Tax cost of portfolio investments | $ | 6,047,540 | $ | 93,529,109 | $ | 11,124,834 | $ | 6,961,925 | $ | 41,232,128 | |||||||||||||
| Gross unrealized appreciation | 125,441 | 4,755,164 | 424,253 | 428,917 | 1,354,360 | ||||||||||||||||||
| Gross unrealized depreciation | (771,118 | ) | (192,706 | ) | (442,265 | ) | (1,157,776 | ) | (4,516,591 | ) | |||||||||||||
| Net unrealized appreciation (depreciation) | (645,677 | ) | 4,562,458 | (18,012 | ) | (728,859 | ) | (3,162,231 | ) | ||||||||||||||
| Net unrealized appreciation (depreciation) on securities sold short | — | — | — | — | 4,979,489 | ||||||||||||||||||
| Net unrealized appreciation (depreciation) on foreign currency and translation of other assets and liabilities denominated in foreign currency | (57 | ) | — | (14,982 | ) | — | — | ||||||||||||||||
| Accumulated capital and other losses | — | — | (6,517 | ) | — | (668,375 | ) | ||||||||||||||||
| Undistributed ordinary income | 141,180 | 248,875 | 280,024 | — | — | ||||||||||||||||||
| Undistributed capital gains | 100,476 | 782,128 | — | 249,782 | — | ||||||||||||||||||
| Other temporary differences | — | (241,907 | ) | (58,003 | ) | — | (48,308 | ) | |||||||||||||||
| Accumulated earnings (deficit) | $ | (404,078 | ) | $ | 5,351,554 | $ | 182,510 | $ | (479,077 | ) | $ | 1,100,575 | |||||||||||
| Merger Arbitrage Fund | Mid Cap Fund | Mid Cap Value Fund | Premium Yield Equity Fund | Sands Capital Select Growth Fund | |||||||||||||||||||
| Tax cost of portfolio investments | $ | 7,313,685 | $ | 80,103,143 | $ | 56,341,042 | $ | 38,474,885 | $ | 1,251,248,921 | |||||||||||||
| Gross unrealized appreciation | 144,644 | 11,614,439 | 1,234,770 | 3,763,523 | 246,193,921 | ||||||||||||||||||
| Gross unrealized depreciation | (165,825 | ) | (8,424,659 | ) | (8,740,620 | ) | (2,081,639 | ) | (132,707,118 | ) | |||||||||||||
| Net unrealized appreciation (depreciation) | (21,181 | ) | 3,189,780 | (7,505,850 | ) | 1,681,884 | 113,486,803 | ||||||||||||||||
| Net unrealized appreciation (depreciation) on securities sold short | 26,811 | — | — | — | — | ||||||||||||||||||
| Accumulated capital and other losses | — | (166,770,303 | ) | — | (6,162,606 | ) | (66,226,976 | ) | |||||||||||||||
| Undistributed ordinary income | 2,928 | — | 2,637,916 | — | — | ||||||||||||||||||
| Undistributed capital gains | — | — | 463,095 | — | — | ||||||||||||||||||
| Accumulated earnings (deficit) | $ | 8,558 | $ | (163,580,523 | ) | $ | (4,404,839 | ) | $ | (4,480,722 | ) | $ | 47,259,827 | ||||||||||
157
Notes to Financial Statements (Continued)
| Short Duration Fixed Income Fund | Small Cap Core Fund | Small Cap Value Fund | Total Return Bond Fund | Ultra Short Duration Fixed Income Fund | |||||||||||||||||||
| Tax cost of portfolio investments | $ | 40,628,180 | $ | 170,920,949 | $ | 49,346,124 | $ | 29,807,502 | $ | 354,029,204 | |||||||||||||
| Gross unrealized appreciation | 760,409 | 13,155,321 | 241,880 | 1,867,440 | 1,360,471 | ||||||||||||||||||
| Gross unrealized depreciation | (189,349 | ) | (18,778,578 | ) | (8,838,110 | ) | (539,616 | ) | (1,451,323 | ) | |||||||||||||
| Net unrealized appreciation (depreciation) | 571,060 | (5,623,257 | ) | (8,596,230 | ) | 1,327,824 | (90,852 | ) | |||||||||||||||
| Accumulated capital and other losses | (5,604,098 | ) | — | (28,942,389 | ) | (1,603,522 | ) | (16,540,805 | ) | ||||||||||||||
| Undistributed ordinary income | 116,286 | 31,004 | 187,830 | — | 877,652 | ||||||||||||||||||
| Undistributed capital gains | — | 2,672,672 | — | — | — | ||||||||||||||||||
| Other temporary differences | (83,721 | ) | — | — | (1,743,783 | ) | (593,979 | ) | |||||||||||||||
| Accumulated earnings (deficit) | $ | (5,000,473 | ) | $ | (2,919,581 | ) | $ | (37,350,789 | ) | $ | (2,019,481 | ) | $ | (16,347,984 | ) | ||||||||
The difference between the tax cost of portfolio investments and the financial statement cost is primarily due to wash sale loss deferrals, investments in passive foreign investment companies, regulated investment companies, and real estate investment trusts.
As of September 30, 2011, the Funds had the following capital loss carryforwards for federal income tax purposes.
| Fund | Amount | Expires September 30, | |||||||||
| Emerging Markets Equity Fund II | $ | 36,906 | |||||||||
| Market Neutral Equity Fund | $ | 3,708 | 2018 | ||||||||
| 444,722 | 2019 | ||||||||||
| $ | 448,430 | ||||||||||
| Mid Cap Fund | $ | 95,969,511 | 2017 | ||||||||
| 70,800,792 | 2018 | ||||||||||
| $ | 166,770,303 | ||||||||||
| Premium Yield Equity Fund | $ | 399,204 | 2017 | ||||||||
| 5,763,402 | 2018 | ||||||||||
| $ | 6,162,606 | ||||||||||
| Sands Capital Select Growth Fund | $ | 66,226,976 | 2018 | ||||||||
| Short Duration Fixed Income Fund | $ | 1,994,293 | 2012 | ||||||||
| 96,050 | 2013 | ||||||||||
| 1,027,850 | 2014 | ||||||||||
| 852,134 | 2015 | ||||||||||
| 295,319 | 2016 | ||||||||||
| 1,193,230 | 2017 | ||||||||||
| 7,423 | 2018 | ||||||||||
| 2,269 | 2019 | ||||||||||
| $ | 5,468,568 | ||||||||||
| Small Cap Value Fund | $ | 11,088,960 | 2017 | ||||||||
| 17,853,429 | 2018 | ||||||||||
| $ | 28,942,389 | ||||||||||
158
Notes to Financial Statements (Continued)
| Fund | Amount | Expires September 30, | |||||||||
| Total Return Bond Fund* | $ | 419,427 | 2012 | ||||||||
| 323,224 | 2013 | ||||||||||
| 3,990 | 2014 | ||||||||||
| 421,662 | 2015 | ||||||||||
| 368,721 | 2016 | ||||||||||
| 38,121 | 2017 | ||||||||||
| 28,377 | 2018 | ||||||||||
| $ | 1,603,522 | ||||||||||
| Ultra Short Duration Fixed Income Fund | $ | 6,699,046 | 2012 | ||||||||
| 371,187 | 2014 | ||||||||||
| 164,819 | 2015 | ||||||||||
| 3,223,694 | 2017 | ||||||||||
| 3,334,355 | 2018 | ||||||||||
| 933,830 | 2019 | ||||||||||
| $ | 14,726,931 | ||||||||||
* Represents activity of the Predecessor Fund for periods prior to August 1, 2011. See note 9.
The capital loss carryforwards may be utilized in future years to offset net realized capital gains, if any, prior to distributing such gains to shareholders.
During the year ended September 30, 2011, the following Funds utilized capital loss carryforwards:
| Fund | Amount | ||||||
| Intermediate Fixed Income Fund | $ | 713,351 | |||||
| Mid Cap Fund | $ | 24,611,841 | |||||
| Premium Yield Equity Fund | $ | 2,685,097 | |||||
| Sands Capital Select Growth Fund | $ | 16,711,072 | |||||
| Small Cap Value Fund | $ | 19,894,645 | |||||
| Total Return Bond Fund | $ | 78,220 | |||||
The Total Return Bond Fund had $63,401 of capital losses expire unutilized during the period ended September 30, 2011.
From November 1, 2010 to September 30, 2011, the following Funds incurred net capital losses ("Post-October losses"). The Funds intend to elect to defer these losses and treat them as arising on October 1, 2011:
| Fund | Amount | ||||||
| Emerging Markets Equity Fund | $ | 366,598 | |||||
| Global Equity Fund | $ | 3,586 | |||||
| International Fixed Income Fund | $ | 6,517 | |||||
| Market Neutral Equity Fund | $ | 219,945 | |||||
| Short Duration Fixed Income Fund | $ | 135,530 | |||||
| Ultra Short Duration Fixed Income Fund | $ | 1,813,874 | |||||
Certain reclassifications, the result of permanent differences between financial statement and income tax reporting requirements, have been made to the components of capital. These reclassifications have no impact
159
Notes to Financial Statements (Continued)
on the net assets or net asset value per share of the Funds and are designed to present the Funds' capital accounts on a tax basis. The following reclassifications which are primarily attributed to the tax treatment of net investment loss, foreign currency gain/loss, paydown gain/loss, expiration of capital loss carryforwards, real estate investment trusts, securities contributed in-kind, Passive Foreign Investment Companies, stock issuance costs, distributions in excess of ordinary earnings, net gains/losses on publicly traded partnerships and limited partnerships, and net gains/losses of regulated investment companies have been made to the following Funds for the year ended September 30, 2011:
| Paid-In Capital | Accumulated Net Investment Income (Loss) | Accumulated Net Realized Gains (Losses) | |||||||||||||
| Emerging Markets Equity Fund | $ | 9,880 | $ | (369,000 | ) | $ | 359,120 | ||||||||
| Emerging Markets Equity Fund II | $ | (144 | ) | $ | (5,242 | ) | $ | 5,386 | |||||||
| Global Equity Fund | $ | — | $ | (5,435 | ) | $ | 5,435 | ||||||||
| Global Real Estate Fund | $ | — | $ | 54,067 | $ | (54,067 | ) | ||||||||
| Intermediate Fixed Income Fund | $ | (882,032 | ) | $ | 92,778 | $ | 789,254 | ||||||||
| International Fixed Income Fund | $ | — | $ | 95,067 | $ | (95,067 | ) | ||||||||
| Large Cap Relative Value Fund | $ | — | $ | 3,631 | $ | (3,631 | ) | ||||||||
| Market Neutral Equity Fund | $ | (610,907 | ) | $ | 609,629 | $ | 1,278 | ||||||||
| Merger Arbitrage Fund | $ | (75 | ) | $ | 7,229 | $ | (7,154 | ) | |||||||
| Mid Cap Fund | $ | (71,722 | ) | $ | (157,078 | ) | $ | 228,800 | |||||||
| Mid Cap Value Fund | $ | (526 | ) | $ | (2,961 | ) | $ | 3,487 | |||||||
| Premium Yield Equity Fund | $ | (88,599 | ) | $ | 48,837 | $ | 39,762 | ||||||||
| Sands Capital Select Growth Fund | $ | (9,453,040 | ) | $ | 9,378,288 | $ | 74,752 | ||||||||
| Short Duration Fixed Income Fund | $ | — | $ | 214,613 | $ | (214,613 | ) | ||||||||
| Small Cap Core Fund | $ | 10,332 | $ | (13,334 | ) | $ | 3,002 | ||||||||
| Small Cap Value Fund | $ | (35,688 | ) | $ | 72,232 | $ | (36,544 | ) | |||||||
| Total Return Bond Fund | $ | 1,574,388 | $ | 233,025 | $ | (1,807,413 | ) | ||||||||
| Ultra Short Duration Fixed Income Fund | $ | — | $ | 2,185,425 | $ | (2,185,425 | ) | ||||||||
The Funds have analyzed their tax positions taken on Federal income tax returns for all open tax years (tax years ended September 30, 2008 through 2011) and have concluded that no provision for income tax is required in their financial statements.
The Regulated Investment Company Modernization Act of 2010 (the "Act") was enacted on December 22, 2010. The Act makes changes to several tax rules impacting the Funds. In general, the provisions of the Act will be effective for the Funds' fiscal year ending September 30, 2012. Although the Act provides several benefits, including the unlimited carryover of future capital losses, there may be a greater likelihood that all or a portion of each fund's pre-enactment capital loss carryovers may expire without being utilized due to the fact that post-enactment capital losses get utilized before pre-enactment capital loss carryovers. Relevant information regarding the impact of the Act on the Funds, if any, will be contained within the "Federal Tax Information" section of the financial statement notes for the fiscal year ending September 30, 2012.
7. Commitments and Contingencies
The Funds indemnify the Trust's officers and Trustees for certain liabilities that might arise from their performance of their duties to the Funds. Additionally, in the normal course of business, the Funds enter into contracts that contain a variety of representations and warranties and which provide general indemnifications. The Funds' maximum exposure under these arrangements is unknown, as this would involve future claims that may be made against the Funds that have not yet occurred. However, based on experience, the Funds expect the risk of loss to be remote.
160
Notes to Financial Statements (Continued)
8. Concentrations/Risks
Certain Funds invest a high percentage of their assets in specific sectors of the market in order to achieve a potentially greater investment return. As a result, the Funds may be more susceptible to economic, political, and regulatory developments in a particular sector of the market, positive or negative, and may experience increased volatility on the Fund's net asset value and magnified effect on the total return.
9. Fund Mergers
On July 27, 2011, a Special Meeting of Shareholders was held to approve or disapprove an Agreement and Plan of Reorganization providing for the transfer of all assets and liabilities of the EARNEST Partners Fixed Income Trust (a series of The Nottingham Investment Trust II) to the Total Return Bond Fund, in exchange for shares of the Total Return Bond Fund and the subsequent liquidation of the EARNEST Partners Fixed Income Trust. The Agreement and Plan of Reorganization was approved and the merger took place on August 1, 2011.
The merger was approved as follows:
| Number of Votes | |||||||||||||||
| For | Against | Abstain | |||||||||||||
| EARNEST Partners Fixed Income Trust | 1,223,066 | 467 | 0 | ||||||||||||
The following is a summary of shares outstanding, net assets, net asset value per share, unrealized appreciation (depreciation) and realized gain (loss) immediately before and after the reorganization:
| Before Reorganization | After Reorganization | ||||||||||||||
| Class A | EARNEST Partners Fixed Income Trust | Total Return Bond Fund | Total Return Bond Fund | ||||||||||||
| Shares | 928 | (A) | 331,907 | 332,835 | |||||||||||
| Net Assets | $ | 9,313 | $ | 3,333,082 | $ | 3,342,395 | |||||||||
| Net Asset Value | 10.04 | (A) | 10.04 | 10.04 | |||||||||||
| Unrealized Appreciation (Depreciation) | $ | 370 | $ | 53,560 | $ | 53,930 | |||||||||
| Accumulated Net Realized Gain (Loss) | $ | (390 | ) | $ | (29,791 | ) | $ | (29,791 | ) | ||||||
| Class C | |||||||||||||||
| Shares | — | 248,384 | 248,384 | ||||||||||||
| Net Assets | $ | — | $ | 2,488,799 | $ | 2,488,799 | |||||||||
| Net Asset Value | — | 10.02 | 10.02 | ||||||||||||
| Unrealized Appreciation (Depreciation) | $ | — | $ | 21,852 | $ | 21,852 | |||||||||
| Accumulated Net Realized Gain (Loss) | $ | — | $ | (16,910 | ) | $ | (16,910 | ) | |||||||
| Class Y | |||||||||||||||
| Shares | 1,648,324 | (B) | 61,451 | 1,709,775 | |||||||||||
| Net Assets | $ | 16,562,612 | $ | 617,477 | $ | 17,180,089 | |||||||||
| Net Asset Value | 10.05 | (B) | 10.05 | 10.05 | |||||||||||
| Unrealized Appreciation (Depreciation) | $ | 783,137 | $ | 608 | $ | 783,745 | |||||||||
| Accumulated Net Realized Gain (Loss) | $ | (1,712,437 | ) | $ | (1,942 | ) | $ | (1,942 | ) | ||||||
| Institutional Class | |||||||||||||||
| Shares | — | 624,160 | 624,160 | ||||||||||||
| Net Assets | $ | — | $ | 6,267,909 | $ | 6,267,909 | |||||||||
| Net Asset Value | — | 10.04 | 10.04 | ||||||||||||
| Unrealized Appreciation (Depreciation) | $ | — | $ | 153,082 | $ | 153,082 | |||||||||
| Accumulated Net Realized Gain (Loss) | $ | — | $ | 115,563 | $ | 115,563 | |||||||||
(A) Reflects a 1.01491:1 stock split which occurred on the date of reorganization, August 1, 2011.
(B) Reflects a 0.87567:1 stock split which occurred on the date of reorganization, August 1, 2011.
161
Notes to Financial Statements (Continued)
10. Subsequent Events
During a meeting of the Board of Trustees held June 22, 2011, the Trustees unanimously approved a change in the Sub-Administrator and Transfer Agent to the Funds. Effective on or about December 3, 2011, Bank of New York Mellon will assume responsibility for these services.
Touchstone Investments and Old Mutual Asset Management announced on October 4, 2011 that Touchstone Advisors, Inc., a wholly owned subsidiary of Western & Southern Financial Group, has entered into a definitive agreement with Old Mutual Asset Management, the U.S. based global asset management business of Old Mutual plc, and its subsidiary Old Mutual Capital, Inc. for Touchstone to acquire selected assets of Old Mutual Asset Management's U.S. mutual fund business.
Consummation of the transaction is subject to certain conditions and approvals and is expected to be completed early in the second quarter of 2012. Upon the completion of the transaction, seventeen Old Mutual Funds will be reorganized into Touchstone Funds with Old Mutual Asset Management's affiliated investment managers continuing as sub-advisors to a significant majority of the Funds.
There were no other subsequent events that necessitated recognition or disclosures.
162
Portfolio of Investments
Touchstone Capital Appreciation Fund – September 30, 2011
| Common Stocks — 98.4% | Shares | Fair Value | |||||||||
| Information Technology — 21.4% | |||||||||||
| Accenture PLC - Class A | 5,340 | $ | 281,311 | ||||||||
| Cisco Systems, Inc. | 13,955 | 216,163 | |||||||||
| Google, Inc. - Class A* | 490 | 252,046 | |||||||||
| Microsoft Corp. | 13,230 | 329,295 | |||||||||
| NetApp, Inc.* | 3,100 | 105,214 | |||||||||
| Paychex, Inc. | 4,895 | 129,081 | |||||||||
| QUALCOMM, Inc. | 4,280 | 208,137 | |||||||||
| 1,521,247 | |||||||||||
| Health Care — 19.6% | |||||||||||
| Abbott Laboratories | 3,085 | 157,767 | |||||||||
| Celgene Corp.* | 2,065 | 127,865 | |||||||||
| Gilead Sciences, Inc.* | 3,060 | 118,728 | |||||||||
| Johnson & Johnson | 4,765 | 303,578 | |||||||||
| Medtronic, Inc. | 8,245 | 274,064 | |||||||||
| Patterson Cos., Inc. | 7,645 | 218,876 | |||||||||
| Stryker Corp. | 4,040 | 190,405 | |||||||||
| 1,391,283 | |||||||||||
| Consumer Staples — 15.7% | |||||||||||
| Colgate-Palmolive Co. | 2,470 | 219,040 | |||||||||
| CVS Caremark Corp. | 8,895 | 298,694 | |||||||||
| PepsiCo, Inc. | 4,085 | 252,862 | |||||||||
| Procter & Gamble Co. (The) | 2,375 | 150,052 | |||||||||
| Wal-Mart Stores, Inc. | 3,725 | 193,327 | |||||||||
| 1,113,975 | |||||||||||
| Industrials — 11.7% | |||||||||||
| Danaher Corp. | 4,560 | 191,246 | |||||||||
| Donaldson Co., Inc. | 2,975 | 163,030 | |||||||||
| FedEx Corp. | 1,705 | 115,395 | |||||||||
| Rockwell Collins, Inc. | 1,830 | 96,551 | |||||||||
| United Technologies Corp. | 3,800 | 267,368 | |||||||||
| 833,590 | |||||||||||
| Consumer Discretionary — 10.0% | |||||||||||
| Lowe's Cos., Inc. | 7,175 | 138,765 | |||||||||
| O'Reilly Automotive, Inc.* | 3,970 | 264,521 | |||||||||
| Staples, Inc. | 9,845 | 130,938 | |||||||||
| Yum! Brands, Inc. | 3,520 | 173,853 | |||||||||
| 708,077 | |||||||||||
| Energy — 9.0% | |||||||||||
| Chevron Corp. | 1,615 | 149,420 | |||||||||
| Exxon Mobil Corp. | 4,005 | 290,883 | |||||||||
| Schlumberger Ltd. | 3,390 | 202,485 | |||||||||
| 642,788 | |||||||||||
| Financials — 8.0% | |||||||||||
| Goldman Sachs Group, Inc. (The) | 2,140 | 202,337 | |||||||||
| JPMorgan Chase & Co. | 8,000 | 240,960 | |||||||||
| Lazard Ltd. - Class A | 5,980 | 126,178 | |||||||||
| 569,475 | |||||||||||
| Shares | Fair Value | ||||||||||
| Materials — 3.0% | |||||||||||
| Monsanto Co. | 3,585 | $ | 215,243 | ||||||||
| Total Common Stocks | $ | 6,995,678 | |||||||||
| Investment Fund — 1.9% | |||||||||||
| Touchstone Institutional Money Market Fund^ | 136,043 | 136,043 | |||||||||
| Total Investment Securities — 100.3% (Cost $7,566,833) | $ | 7,131,721 | |||||||||
| Liabilities in Excess of Other Assets — (0.3%) | (20,912 | ) | |||||||||
| Net Assets — 100.0% | $ | 7,110,809 | |||||||||
* Non-income producing security.
^ Affiliated Fund, sub-advised by Fort Washington Investment Advisors, Inc. See Note 4.
Portfolio Abbreviations:
PLC – Public Limited Company
Other Information:
The inputs or methodology used for valuing securities may not be an indication of the risk associated with investing in those securities. For more information on valuation inputs, and their aggregation into the levels used in the table below, please refer to the security valuation section in the accompanying notes to financial statements.
Valuation Inputs at Reporting Date:
| Description | Level 1 | Level 2 | Level 3 | Total | |||||||||||||||
| Common Stocks | $ | 6,995,678 | $ | — | $ | — | $ | 6,995,678 | |||||||||||
| Investment Fund | 136,043 | — | — | 136,043 | |||||||||||||||
| $ | 7,131,721 | ||||||||||||||||||
See accompanying notes to financial statements.
163
Portfolio of Investments
Touchstone Emerging Markets Equity Fund – September 30, 2011
| Common Stocks — 97.3% | Shares | Fair Value | |||||||||
| Financials — 18.1% | |||||||||||
| Akbank TAS (Turkey) | 1,005,886 | $ | 3,945,234 | ||||||||
| Banco Bradesco SA (Preference) (Brazil) | 472,174 | 6,918,438 | |||||||||
| Bank Mandiri Tbk PT (Indonesia) | 9,216,085 | 6,515,691 | |||||||||
| BS Financial Group, Inc. (South Korea)* | 520,870 | 5,679,135 | |||||||||
| China Overseas Land & Investment Ltd. (Hong Kong) † | 3,342,015 | 4,773,325 | |||||||||
| CIMB Group Holdings Bhd (Malaysia) | 2,232,100 | 4,837,462 | |||||||||
| Credicorp Ltd. (United States) | 72,593 | 6,693,075 | |||||||||
| First Pacific Co. (Hong Kong) | 7,874,006 | 6,949,751 | |||||||||
| Grupo Financiero Banorte SAB de CV - Class O (Mexico) | 1,273,785 | 3,764,836 | |||||||||
| Industrial & Commercial Bank of China - Class H (China) | 8,600,698 | 4,153,194 | |||||||||
| Kasikornbank PCL (Thailand) | 1,762,000 | 6,689,848 | |||||||||
| Keppel Land Ltd. (Singapore) | 2,120,865 | 4,142,583 | |||||||||
| Shinhan Financial Group Co. Ltd. (South Korea) | 118,520 | 4,132,392 | |||||||||
| Turkiye Garanti Bankasi AS (Turkey) | 535,040 | 2,070,499 | |||||||||
| Wharf Holdings Ltd. (Hong Kong) | 1,280,156 | 6,315,870 | |||||||||
| 77,581,333 | |||||||||||
| Consumer Discretionary — 15.7% | |||||||||||
| Bharat Forge Ltd. (India) | 893,438 | 4,875,334 | |||||||||
| Consorcio ARA SAB de CV (Mexico) | 2,758,689 | 781,749 | |||||||||
| Daphne International Holdings Ltd. (Hong Kong) | 8,170,466 | 7,243,568 | |||||||||
| Foschini Ltd. (South Africa) | 647,479 | 6,789,138 | |||||||||
| Giant Manufacturing Co. Ltd. (Taiwan) | 1,647,078 | 6,063,041 | |||||||||
| Hankook Tire Co. Ltd. (South Korea) | 184,480 | 6,209,119 | |||||||||
| JD Group Ltd. (South Africa) | 503,880 | 2,374,805 | |||||||||
| Lojas Americanas SA (Preference) (Brazil) | 810,763 | 6,144,594 | |||||||||
| Lojas Renner SA (Brazil) | 363,932 | 9,751,307 | |||||||||
| Mahindra & Mahindra Ltd. (India) | 379,202 | 6,194,235 | |||||||||
| Ports Design Ltd. (Hong Kong) | 2,538,427 | 3,878,027 | |||||||||
| Woolworths Holdings Ltd. (South Africa) | 1,561,264 | 6,740,990 | |||||||||
| 67,045,907 | |||||||||||
| Materials — 15.3% | |||||||||||
| China BlueChemical Ltd. (China) | 8,373,350 | 6,397,980 | |||||||||
| Cia de Minas Buenaventura SA ADR (Peru) | 150,747 | 5,689,192 | |||||||||
| Eldorado Gold Corp. (Canada) | 426,567 | 7,347,585 | |||||||||
| Fresnillo PLC (United Kingdom) | 298,991 | 7,309,456 | |||||||||
| Gerdau SA (Preference) (Brazil) | 511,439 | 3,612,238 | |||||||||
| Impala Platinum Holdings Ltd. (South Africa) | 212,099 | 4,285,753 | |||||||||
| POSCO (South Korea) | 9,209 | 2,837,885 | |||||||||
| Randgold Resources Ltd. ADR (Jersey, C.I.) † | 84,136 | 8,137,634 | |||||||||
| Siam Cement PCL (Thailand) | 245,100 | 2,443,177 | |||||||||
| Siam Cement PCL (Non-Voting) (Thailand) | 270,098 | 2,261,576 | |||||||||
| Southern Copper Corp. (United States) | 130,383 | 3,258,271 | |||||||||
| Vale SA ADR (Brazil) | 177,160 | 4,039,248 | |||||||||
| Vale SA (Preference) (Brazil) | 209,353 | 4,364,652 | |||||||||
| Yamana Gold, Inc. (Canada) | 263,377 | 3,614,239 | |||||||||
| 65,598,886 | |||||||||||
| Shares | Fair Value | ||||||||||
| Energy — 10.9% | |||||||||||
| CNOOC Ltd. (Hong Kong) | 3,650,316 | $ | 5,869,326 | ||||||||
| Oil & Natural Gas Corp. Ltd. (India) | 1,096,922 | 5,939,735 | |||||||||
| PetroChina Co. Ltd. - Class H (China) | 3,707,390 | 4,490,749 | |||||||||
| Petroleo Brasileiro SA (Preference) (Brazil) | 716,645 | 7,279,840 | |||||||||
| PTT Exploration & Production PCL (Thailand) | 1,170,800 | 5,224,991 | |||||||||
| eliance Industries Ltd. (India) | 271,248 | 4,450,304 | |||||||||
| Tenaris SA ADR (Luxembourg) † | 186,784 | 4,753,653 | |||||||||
| Thai Oil PCL (Thailand) | 2,391,400 | 3,869,180 | |||||||||
| Tupras Turkiye Petrol Rafine (Turkey) | 225,069 | 4,614,792 | |||||||||
| 46,492,570 | |||||||||||
| Consumer Staples — 10.1% | |||||||||||
| British American Tobacco Malaysia Bhd (Malaysia) | 347,200 | 4,844,633 | |||||||||
| Fomento Economico Mexicano SAB de CV ADR (Mexico) | 57,563 | 3,731,233 | |||||||||
| ITC Ltd. (India) | 1,814,561 | 7,309,663 | |||||||||
| Kimberly-Clark de Mexico SAB de CV - Class A (Mexico) | 1,031,795 | 5,263,710 | |||||||||
| Massmart Holdings Ltd. (South Africa) | 171,510 | 2,935,847 | |||||||||
| SABMiller PLC (United Kingdom) | 189,331 | 6,177,685 | |||||||||
| Tingyi Cayman Islands Holding Corp. (China) | 3,167,372 | 7,764,097 | |||||||||
| Wal-Mart de Mexico SAB de CV (Mexico) | 2,260,717 | 5,183,766 | |||||||||
| 43,210,634 | |||||||||||
| Information Technology — 9.5% | |||||||||||
| ASM Pacific Technology Ltd. (Hong Kong) † | 763,419 | 7,451,928 | |||||||||
| Infosys Ltd. (India) | 101,750 | 5,228,756 | |||||||||
| Samsung Electronics Co. Ltd. (South Korea) | 9,337 | 6,519,621 | |||||||||
| Taiwan Semiconductor Manufacturing Co. Ltd. (Taiwan) | 3,494,100 | 7,864,387 | |||||||||
| Tripod Technology Corp. (Taiwan) | 2,048,450 | 5,335,942 | |||||||||
| VTech Holdings Ltd. (Hong Kong) † | 912,590 | 8,467,752 | |||||||||
| 40,868,386 | |||||||||||
| Telecommunication Services — 6.6% | |||||||||||
| America Movil SAB de CV, Series L ADR (Mexico) | 228,510 | 5,045,501 | |||||||||
| Bharti Airtel Ltd. (India) | 964,553 | 7,409,623 | |||||||||
| MTN Group Ltd. (South Africa) | 344,240 | 5,623,740 | |||||||||
| Telekomunikasi Indonesia Tbk PT (Indonesia) | 7,987,488 | 6,812,338 | |||||||||
| Turkcell Iletisim Hizmet AS (Turkey)* | 749,031 | 3,399,103 | |||||||||
| 28,290,305 | |||||||||||
| Industrials — 5.9% | |||||||||||
| All America Latina Logistica SA (Brazil) | 737,168 | 3,312,894 | |||||||||
| Aveng Ltd. (South Africa) | 1,252,793 | 5,336,476 | |||||||||
| Bharat Heavy Electricals Ltd. (India) | 123,775 | 4,127,329 | |||||||||
| Trakya Cam Sanayi AS (Turkey) | 3,720,557 | 6,097,569 | |||||||||
| Weichai Power Co. Ltd. - Class H (China) † | 1,407,602 | 6,395,189 | |||||||||
| 25,269,457 | |||||||||||
164
Touchstone Emerging Markets Equity Fund (Continued)
| Common Stocks — 97.3% (Continued) | Shares | Fair Value | |||||||||
| Utilities — 4.0% | |||||||||||
| Cez AS (Czech Republic) | 163,146 | $ | 6,251,223 | ||||||||
| Cia Energetica de Minas Gerais (Preference) (Brazil) | 354,865 | 5,180,718 | |||||||||
| Enersis SA (Chile) | 16,178,188 | 5,607,650 | |||||||||
| 17,039,591 | |||||||||||
| Health Care — 1.2% | |||||||||||
| Teva Pharmaceutical Industries Ltd. ADR (Israel) | 141,499 | 5,266,593 | |||||||||
| Total Common Stocks | $ | 416,663,662 | |||||||||
| Number of Rights | |||||||||||
| Rights — 0.0% | |||||||||||
| Lojas Americanas SA, expiring 10/28/11* | 165 | — | |||||||||
| Investment Funds — 7.0% | |||||||||||
| Invesco Liquid Assets Portfolio** | 19,179,142 | 19,179,142 | |||||||||
| Touchstone Institutional Money Market Fund^ | 10,965,632 | 10,965,632 | |||||||||
| Total Investment Funds | $ | 30,144,774 | |||||||||
| Total Investment Securities — 104.3% (Cost $519,912,120) | $ | 446,808,436 | |||||||||
| Liabilities in Excess of Other Assets — (4.3%) | (18,610,172 | ) | |||||||||
| Net Assets — 100.0% | $ | 428,198,264 | |||||||||
Portfolio Abbreviations:
ADR – American Depositary Receipt
PLC – Public Limited Company
* Non-income producing security.
† All or a portion of the security is on loan. The total value of the securities on loan as of September 30, 2011, was $18,137,165.
** Represents collateral for securities loaned.
^ Affiliated Fund, sub-advised by Fort Washington Investment Advisors, Inc. See Note 4.
Other Information:
The inputs or methodology used for valuing securities may not be an indication of the risk associated with investing in those securities. For more information on valuation inputs, and their aggregation into the levels used in the table below, please refer to the security valuation section in the accompanying notes to financial statements.
Valuation Inputs at Reporting Date:
| Description | Level 1 | Level 2 | Level 3 | Total | |||||||||||||||
| Common Stocks | $ | 124,742,616 | $ | 291,921,046 | $ | — | $ | 416,663,662 | |||||||||||
| Investment Funds | 30,144,774 | — | — | 30,144,774 | |||||||||||||||
| Rights | — | — | — | — | |||||||||||||||
| $ | 446,808,436 | ||||||||||||||||||
At September 30, 2011, securities valued at $218,287,179 were transferred from Level 1 to Level 2 pursuant to the Fund's fair valuation policy.
See accompanying notes to financial statements.
165
Portfolio of Investments
Touchstone Emerging Markets Equity Fund II – September 30, 2011
| Common Stocks — 88.2% | Shares | Fair Value | |||||||||
| Financials — 20.1% | |||||||||||
| Akbank TAS (Turkey) | 11,787 | $ | 46,230 | ||||||||
| Banco Bradesco SA (Preference) (Brazil) | 5,335 | 78,170 | |||||||||
| Bank Mandiri Tbk PT (Indonesia) | 103,659 | 73,286 | |||||||||
| BS Financial Group, Inc. (South Korea)* | 6,108 | 66,597 | |||||||||
| China Overseas Land & Investment Ltd. (Hong Kong) | 38,862 | 55,506 | |||||||||
| CIMB Group Holdings Bhd (Malaysia) | 26,631 | 57,715 | |||||||||
| Credicorp Ltd. (United States) | 996 | 91,831 | |||||||||
| First Pacific Co. (Hong Kong) | 94,190 | 83,134 | |||||||||
| Grupo Financiero Banorte SAB de CV - Class O (Mexico) | 15,734 | 46,504 | |||||||||
| Industrial & Commercial Bank of China - Class H (China) | 101,175 | 48,856 | |||||||||
| Kasikornbank PCL (Thailand) | 21,170 | 80,377 | |||||||||
| Keppel Land Ltd. (Singapore) | 24,502 | 47,859 | |||||||||
| Shinhan Financial Group Co. Ltd. (South Korea) | 1,329 | 46,338 | |||||||||
| Turkiye Garanti Bankasi AS (Turkey) | 5,998 | 23,211 | |||||||||
| Wharf Holdings Ltd. (Hong Kong) | 14,821 | 73,121 | |||||||||
| 918,735 | |||||||||||
| Materials — 17.9% | |||||||||||
| China BlueChemical Ltd. (China) | 96,703 | 73,890 | |||||||||
| Cia de Minas Buenaventura SA ADR (Peru) | 2,123 | 80,122 | |||||||||
| Eldorado Gold Corp. (Canada) | 6,026 | 103,797 | |||||||||
| Fresnillo PLC (United Kingdom) | 3,912 | 95,637 | |||||||||
| Gerdau SA (Preference) (Brazil) | 6,664 | 47,067 | |||||||||
| Impala Platinum Holdings Ltd. (South Africa) | 2,349 | 47,465 | |||||||||
| POSCO (South Korea) | 109 | 33,590 | |||||||||
| Randgold Resources Ltd. ADR (Jersey, C.I.) | 1,014 | 98,074 | |||||||||
| Siam Cement PCL (Non-Voting) (Thailand) | 6,276 | 52,550 | |||||||||
| Southern Copper Corp. (United States) | 1,611 | 40,259 | |||||||||
| Vale SA (Preference) (Brazil) | 4,790 | 99,863 | |||||||||
| Yamana Gold, Inc. (Canada) | 3,155 | 43,295 | |||||||||
| 815,609 | |||||||||||
| Consumer Discretionary — 10.0% | |||||||||||
| Foschini Ltd. (South Africa) | 6,983 | 73,220 | |||||||||
| Hankook Tire Co. Ltd. (South Korea) | 2,211 | 74,417 | |||||||||
| Lojas Americanas SA (Preference) (Brazil) | 9,668 | 73,272 | |||||||||
| Lojas Renner SA (Brazil) | 4,243 | 113,688 | |||||||||
| Ports Design Ltd. (Hong Kong) | 29,219 | 44,639 | |||||||||
| Woolworths Holdings Ltd. (South Africa) | 17,458 | 75,377 | |||||||||
| 454,613 | |||||||||||
| Energy — 9.7% | |||||||||||
| CNOOC Ltd. (Hong Kong) | 42,522 | 68,371 | |||||||||
| PetroChina Co. Ltd. - Class H (China) | 44,247 | 53,596 | |||||||||
| Petroleo Brasileiro SA (Preference) (Brazil) | 8,667 | 88,041 | |||||||||
| PTT Exploration & Production PCL (Thailand) | 9,239 | 41,231 | |||||||||
| Reliance Industries Ltd. GDR 144A, (India) | 1,442 | 46,540 | |||||||||
| Tenaris SA ADR (Luxembourg) | 2,130 | 54,209 | |||||||||
| Thai Oil PCL (Thailand) | 26,721 | 43,234 | |||||||||
| Tupras Turkiye Petrol Rafine (Turkey) | 2,448 | 50,194 | |||||||||
| 445,416 | |||||||||||
| Shares | Fair Value | ||||||||||
| Information Technology — 9.1% | |||||||||||
| ASM Pacific Technology Ltd. (Hong Kong) | 9,112 | $ | 88,945 | ||||||||
| Infosys Technologies Ltd. ADR (India) | 1,156 | 59,037 | |||||||||
| Samsung Electronics Co. Ltd. (South Korea) | 109 | 76,109 | |||||||||
| Taiwan Semiconductor Manufacturing Co. Ltd. (Taiwan) | 41,231 | 92,801 | |||||||||
| VTech Holdings Ltd. (Hong Kong) | 10,779 | 100,016 | |||||||||
| 416,908 | |||||||||||
| Consumer Staples — 7.8% | |||||||||||
| Fomento Economico Mexicano SAB de CV ADR (Mexico) | 614 | 39,799 | |||||||||
| Kimberly-Clark de Mexico SAB de CV - Class A (Mexico) | 11,593 | 59,142 | |||||||||
| Massmart Holdings Ltd. (South Africa) | 1,866 | 31,942 | |||||||||
| SABMiller PLC (United Kingdom) | 2,182 | 71,197 | |||||||||
| Tingyi Cayman Islands Holding Corp. (China) | 37,366 | 91,595 | |||||||||
| Wal-Mart de Mexico SAB de CV (Mexico) | 26,505 | 60,775 | |||||||||
| 354,450 | |||||||||||
| Telecommunication Services — 5.4% | |||||||||||
| America Movil SAB de CV, Series L ADR (Mexico) | 2,521 | 55,664 | |||||||||
| MTN Group Ltd. (South Africa) | 4,143 | 67,683 | |||||||||
| Telekomunikasi Indonesia Tbk PT (Indonesia) | 96,979 | 82,711 | |||||||||
| Turkcell Iletisim Hizmet AS (Turkey)* | 9,041 | 41,028 | |||||||||
| 247,086 | |||||||||||
| Utilities — 4.4% | |||||||||||
| Cez AS (Czech Republic) | 1,881 | 72,074 | |||||||||
| Cia Energetica de Minas Gerais (Preference) (Brazil) | 4,053 | 59,170 | |||||||||
| Enersis SA (Chile) | 196,310 | 68,045 | |||||||||
| 199,289 | |||||||||||
| Industrials — 2.5% | |||||||||||
| All America Latina Logistica SA (Brazil) | 8,803 | 39,561 | |||||||||
| Aveng Ltd. (South Africa) | 305 | 1,299 | |||||||||
| Weichai Power Co. Ltd. - Class H (China) | 16,412 | 74,565 | |||||||||
| 115,425 | |||||||||||
| Health Care — 1.3% | |||||||||||
| Teva Pharmaceutical Industries Ltd. ADR (Israel) | 1,647 | 61,301 | |||||||||
| Total Common Stocks | $ | 4,028,832 | |||||||||
| Number of Rights | |||||||||||
| Rights — 0.0% | |||||||||||
| Lojas Americanas SA, expiring 10/28/11* | 1 | — | |||||||||
166
Touchstone Emerging Markets Equity Fund II (Continued)
| Number of Rights | Fair Value | ||||||||||
| Equity Linked Notes — 8.5% | |||||||||||
| Bharat Heavy Electricals Maturity 11/18/11 (Issuer Credit Suisse)(India)* | 1,440 | $ | 48,210 | ||||||||
| Bharti Airtel Ltd Maturity 9/9/14 (Issuer JPMorgan) (India)* | 12,067 | 93,136 | |||||||||
| ITC Ltd Maturity 9/15/14 (Issuer Credit Suisse)(India)* | 23,422 | 94,693 | |||||||||
| Mahindra & Mahindra Ltd. Maturity 10/15/14 (Issuer JPMorgan)(India)* | 4,975 | 81,748 | |||||||||
| Oil & Natural Gas Corp Ltd. Maturity 8/25/14 (Issuer JPMorgan)(India)* | 12,687 | 68,933 | |||||||||
| Total Equity Linked Notes | $ | 386,720 | |||||||||
| Shares | |||||||||||
| Investment Fund — 0.1% | |||||||||||
| Touchstone Institutional Money Market Fund^ | 4,558 | 4,558 | |||||||||
| Total Investment Securities — 96.8% (Cost $5,555,203) | $ | 4,420,110 | |||||||||
| Other Assets in Excess of Liabilities — 3.2% | 143,730 | ||||||||||
| Net Assets — 100.0% | $ | 4,563,840 | |||||||||
* Non-income producing security.
^ Affiliated Fund, sub-advised by Fort Washington Investment Advisors, Inc. See Note 4.
Portfolio Abbreviations:
ADR – American Depositary Receipt
GDR – Global Depositary Receipt
PLC – Public Limited Company
144a – This is a restricted security that was sold in a transaction exempt from Rule 144a of the Securities Act of 1933. This security may be sold in transactions exempt from registration, normally to qualified institutional buyers. At September 30, 2011, these securities were valued at $46,540 or 1.0% of net assets. These securities were deemed liquid pursuant to procedures approved by the Board of Trustees.
Other Information:
The inputs or methodology used for valuing securities may not be an indication of the risk associated with investing in those securities. For more information on valuation inputs, and their aggregation into the levels used in the table below, please refer to the security valuation section in the accompanying notes to financial statements.
Valuation Inputs at Reporting Date:
| Description | Level 1 | Level 2 | Level 3 | Total | |||||||||||||||
| Common Stocks | $ | 1,560,687 | $ | 2,468,145 | $ | — | $ | 4,028,832 | |||||||||||
| Equity Linked Notes | 386,720 | — | — | 386,720 | |||||||||||||||
| Investment Funds | 4,558 | — | — | 4,558 | |||||||||||||||
| Rights | — | — | — | — | |||||||||||||||
| $ | 4,420,110 | ||||||||||||||||||
See accompanying notes to financial statements.
167
Portfolio of Investments
Touchstone Focused Equity Fund – September 30, 2011
| Common Stocks — 96.1% | Shares | Fair Value | |||||||||
| Financials — 22.4% | |||||||||||
| Allstate Corp. | 221,706 | $ | 5,252,215 | ||||||||
| Bank of America Corp. | 660,894 | 4,044,671 | |||||||||
| Barclays PLC ADR † | 187,661 | 1,835,325 | |||||||||
| Fidelity National Financial, Inc. - Class A | 294,209 | 4,466,093 | |||||||||
| Goldman Sachs Group, Inc. (The) | 43,923 | 4,152,920 | |||||||||
| SEI Investments Co. | 85,667 | 1,317,558 | |||||||||
| 21,068,782 | |||||||||||
| Information Technology — 22.2% | |||||||||||
| Adobe Systems, Inc.* | 64,614 | 1,561,720 | |||||||||
| Arrow Electronics, Inc.* | 56,474 | 1,568,848 | |||||||||
| Hewlett-Packard Co. | 135,093 | 3,032,838 | |||||||||
| Ingram Micro, Inc. - Class A* | 311,609 | 5,026,253 | |||||||||
| Insight Enterprises, Inc.* | 214,666 | 3,250,043 | |||||||||
| Lexmark International, Inc. - Class A* | 120,394 | 3,254,250 | |||||||||
| Nokia Corp. ADR † | 568,483 | 3,217,614 | |||||||||
| 20,911,566 | |||||||||||
| Industrials — 14.3% | |||||||||||
| AGCO Corp.* | 14,204 | 491,032 | |||||||||
| Alliant Techsystems, Inc. | 59,222 | 3,228,191 | |||||||||
| Oshkosh Corp.* | 112,666 | 1,773,363 | |||||||||
| RailAmerica, Inc.* | 170,519 | 2,221,862 | |||||||||
| Raytheon Co. | 62,580 | 2,557,645 | |||||||||
| Universal Forest Products, Inc. | 134,392 | 3,232,128 | |||||||||
| 13,504,221 | |||||||||||
| Consumer Discretionary — 12.6% | |||||||||||
| International Speedway Corp. - Class A | 61,004 | 1,393,331 | |||||||||
| RadioShack Corp. | 173,449 | 2,015,477 | |||||||||
| Skechers U.S.A., Inc. - Class A* | 95,628 | 1,341,661 | |||||||||
| Speedway Motorsports, Inc. | 203,511 | 2,458,413 | |||||||||
| Time Warner Cable, Inc. | 52,085 | 3,264,167 | |||||||||
| WMS Industries, Inc.* | 80,862 | 1,422,363 | |||||||||
| 11,895,412 | |||||||||||
| Energy — 8.0% | |||||||||||
| Encana Corp. | 191,677 | 3,682,115 | |||||||||
| Noble Corp.* | 63,845 | 1,873,851 | |||||||||
| North American Energy Partners Inc.* | 347,866 | 2,024,580 | |||||||||
| 7,580,546 | |||||||||||
| Health Care — 6.5% | |||||||||||
| UnitedHealth Group, Inc. | 23,252 | 1,072,382 | |||||||||
| WellPoint, Inc. | 76,794 | 5,013,113 | |||||||||
| 6,085,495 | |||||||||||
| Telecommunication Services — 5.9% | |||||||||||
| France Telecom SA ADR † | 74,940 | 1,226,768 | |||||||||
| KDDI Corp. ADR | 255,296 | 4,373,220 | |||||||||
| 5,599,988 | |||||||||||
| Consumer Staples — 2.9% | |||||||||||
| CVS Caremark Corp. | 81,359 | 2,732,035 | |||||||||
| Shares | Fair Value | ||||||||||
| Materials — 1.3% | |||||||||||
| Cemex SAB de CV ADR* † | 373,336 | $ | 1,179,742 | ||||||||
| Total Common Stocks | $ | 90,557,787 | |||||||||
| Investment Funds — 12.2% | |||||||||||
| Invesco Liquid Assets Portfolio** | 7,446,706 | 7,446,706 | |||||||||
| Touchstone Institutional Money Market Fund^ | 4,009,511 | 4,009,511 | |||||||||
| Total Investment Funds | $ | 11,456,217 | |||||||||
| Total Investment Securities — 108.3% (Cost $133,810,178) | $ | 102,014,004 | |||||||||
| Liabilities in Excess of Other Assets — (8.3%) | (7,859,409 | ) | |||||||||
| Net Assets — 100.0% | $ | 94,154,595 | |||||||||
† All or a portion of the security is on loan. The total value of the securities on loan as of September 30, 2011, was $6,877,531.
* Non-income producing security.
** Represents collateral for securities loaned.
^ Affiliated Fund, sub-advised by Fort Washington Investment Advisors, Inc. See Note 4.
Portfolio Abbreviations:
ADR – American Depositary Receipt
PLC – Public Limited Company
Other Information:
The inputs or methodology used for valuing securities may not be an indication of the risk associated with investing in those securities. For more information on valuation inputs, and their aggregation into the levels used in the table below, please refer to the security valuation section in the accompanying notes to financial statements.
Valuation Inputs at Reporting Date:
| Description | Level 1 | Level 2 | Level 3 | Total | |||||||||||||||
| Common Stocks | $ | 90,557,787 | $ | — | $ | — | $ | 90,557,787 | |||||||||||
| Investment Funds | 11,456,217 | — | — | 11,456,217 | |||||||||||||||
| $ | 102,014,004 | ||||||||||||||||||
See accompanying notes to financial statements.
168
Portfolio of Investments
Touchstone Global Equity Fund – September 30, 2011
| Preferred Stocks — 2.5% | Shares | Fair Value | |||||||||
| Consumer Staples — 2.5% | |||||||||||
| Henkel AG & Co. KGaA (Germany) | 1,819 | $ | 96,720 | ||||||||
| Common Stocks — 93.9% Materials — 19.6% | |||||||||||
| Agnico-Eagle Mines Ltd. (Canada) | 1,993 | 118,623 | |||||||||
| CF Industries Holdings, Inc. (United States) | 341 | 42,076 | |||||||||
| Fresnillo PLC (United Kingdom) | 5,113 | 124,998 | |||||||||
| Goldcorp, Inc. (Canada) | 1,982 | 90,459 | |||||||||
| Symrise AG (Germany) | 3,481 | 80,455 | |||||||||
| Syngenta AG (Switzerland)* | 319 | 82,898 | |||||||||
| Yamana Gold, Inc. (Canada) | 11,646 | 159,084 | |||||||||
| Yara International ASA (Norway) | 1,557 | 59,401 | |||||||||
| 757,994 | |||||||||||
| Consumer Staples — 15.3% | |||||||||||
| Australian Agricultural Co. Ltd. (Australia)* | 61,102 | 80,268 | |||||||||
| Carlsberg A/S - Class B (Denmark) | 1,387 | 82,193 | |||||||||
| Cott Corp. (Canada)* | 8,863 | 60,357 | |||||||||
| Koninklijke Ahold NV (Netherlands) | 5,945 | 69,914 | |||||||||
| Oriflame Cosmetics SA (Luxembourg) | 1,947 | 70,453 | |||||||||
| Sara Lee Corp. (United States) | 9,142 | 149,472 | |||||||||
| Treasury Wine Estates Ltd. (Australia) | 21,202 | 79,402 | |||||||||
| 592,059 | |||||||||||
| Health Care — 12.5% | |||||||||||
| Bristol-Myers Squibb Co. (United States) | 3,596 | 112,842 | |||||||||
| Celgene Corp. (United States)* | 1,480 | 91,642 | |||||||||
| Novartis AG (Switzerland) | 1,666 | 93,066 | |||||||||
| Pfizer, Inc. (United States) | 6,640 | 117,395 | |||||||||
| Sanofi-Aventis SA (France) | 1,024 | 67,355 | |||||||||
| 482,300 | |||||||||||
| Industrials — 11.3% | |||||||||||
| Central Japan Railway Co. (Japan) | 8 | 69,814 | |||||||||
| G4S PLC (United Kingdom) | 18,568 | 76,826 | |||||||||
| Invensys PLC (United Kingdom) | 22,779 | 79,351 | |||||||||
| Kansas City Southern (United States)* | 1,677 | 83,783 | |||||||||
| Mills Estruturas e Servicos de Engenharia SA (Brazil) | 5,700 | 53,385 | |||||||||
| Smiths Group PLC (United Kingdom) | 4,720 | 72,841 | |||||||||
| 436,000 | |||||||||||
| Energy — 10.7% | |||||||||||
| BG Group PLC (United Kingdom) | 4,130 | 79,042 | |||||||||
| Cairn Energy PLC (United Kingdom)* | 19,417 | 84,212 | |||||||||
| Santos Ltd. (Australia) | 4,400 | 47,619 | |||||||||
| Southwestern Energy Co. (United States)* | 2,200 | 73,326 | |||||||||
| Ultra Petroleum Corp. (United States)* | 2,619 | 72,599 | |||||||||
| Woodside Petroleum Ltd. (Australia) | 1,780 | 55,151 | |||||||||
| 411,949 | |||||||||||
| Telecommunication Services — 7.5% | |||||||||||
| Hutchison Telecommunications Hong Kong Holdings Ltd. (Hong Kong) | 348,000 | 121,441 | |||||||||
| Mobile Telesystems OJSC ADR (Russia) | 4,055 | 49,877 | |||||||||
| Shares | Fair Value | ||||||||||
| Softbank Corp. (Japan) | 2,300 | $ | 67,298 | ||||||||
| Swisscom AG (Switzerland) | 125 | 50,854 | |||||||||
| 289,470 | |||||||||||
| Information Technology — 6.5% | |||||||||||
| Check Point Software Technologies Ltd. (Israel)* | 1,979 | 104,412 | |||||||||
| Symantec Corp. (United States)* | 4,030 | 65,689 | |||||||||
| Yahoo! Japan Corp. (Japan) | 256 | 79,510 | |||||||||
| 249,611 | |||||||||||
| Consumer Discretionary — 6.0% | |||||||||||
| DreamWorks Animation SKG, Inc. - Class A (United States)* | 2,100 | 38,178 | |||||||||
| Genting Bhd (Malaysia) | 30,300 | 85,693 | |||||||||
| Shuffle Master, Inc. (United States)* | 5,417 | 45,557 | |||||||||
| Television Broadcasts Ltd. (Hong Kong) | 11,000 | 60,004 | |||||||||
| 229,432 | |||||||||||
| Financials — 4.5% | |||||||||||
| F&C Asset Management PLC (United Kingdom) | 39,937 | 40,443 | |||||||||
| Kinnevik Investment AB - Class B (Sweden) | 3,989 | 73,810 | |||||||||
| SBI Holdings, Inc. (Japan) | 685 | 59,189 | |||||||||
| 173,442 | |||||||||||
| Total Common Stocks | $ | 3,622,257 | |||||||||
| Investment Fund — 1.8% | |||||||||||
| Touchstone Institutional Money Market Fund^ | 68,887 | 68,887 | |||||||||
| Total Investment Securities — 98.2% (Cost $4,101,472) | $ | 3,787,864 | |||||||||
| Other Assets in Excess of Liabilities — 1.8% | 71,235 | ||||||||||
| Net Assets — 100.0% | $ | 3,859,099 | |||||||||
* Non-income producing security.
^ Affiliated Fund, sub-advised by Fort Washington Investment Advisors, Inc. See Note 4.
Portfolio Abbreviations:
ADR – American Depositary Receipt
PLC – Public Limited Company
169
Touchstone Global Equity Fund (Continued)
Other Information:
The inputs or methodology used for valuing securities may not be an indication of the risk associated with investing in those securities. For more information on valuation inputs, and their aggregation into the levels used in the table below, please refer to the security valuation section in the accompanying notes to financial statements.
Valuation Inputs at Reporting Date:
| Description | Level 1 | Level 2 | Level 3 | Total | |||||||||||||||
| Common Stocks | $ | 1,528,755 | $ | 2,093,502 | $ | — | $ | 3,622,257 | |||||||||||
| Preferred Stocks | — | 96,720 | — | 96,720 | |||||||||||||||
| Investment Funds | 68,887 | — | — | 68,887 | |||||||||||||||
| $ | 3,787,864 | ||||||||||||||||||
At September 30, 2011, securities valued at $1,618,784 were transferred from Level 1 to Level 2 pursuant to the Fund's fair valuation policy.
See accompanying notes to financial statements.
170
Portfolio of Investments
Touchstone Global Real Estate Fund – September 30, 2011
| Common Stocks — 98.5% | Shares | Fair Value | |||||||||
| Financials — 98.5% | |||||||||||
| Alexandria Real Estate Equities, Inc. REIT (United States) | 1,000 | $ | 61,390 | ||||||||
| Alstria Office REIT-AG REIT (Germany) | 5,679 | 66,635 | |||||||||
| Ascendas Real Estate Investment Trust REIT (Singapore) | 39,800 | 61,373 | |||||||||
| AvalonBay Communities, Inc. REIT (United States) | 1,160 | 132,298 | |||||||||
| Boston Properties, Inc. REIT (United States) | 1,515 | 134,986 | |||||||||
| BRE Properties, Inc. REIT (United States) | 1,460 | 61,816 | |||||||||
| British Land Co. PLC REIT (United Kingdom) | 12,522 | 92,235 | |||||||||
| Camden Property Trust REIT (United States) | 845 | 46,695 | |||||||||
| Canadian Apartment Properties REIT (Canada) | 2,705 | 54,467 | |||||||||
| Canadian Real Estate Investment Trust REIT (Canada) | 1,553 | 52,863 | |||||||||
| CapitaLand Ltd. (Singapore) | 42,300 | 78,924 | |||||||||
| CFS Retail Property Trust REIT (Australia) | 26,410 | 44,318 | |||||||||
| Charter Hall Retail REIT (Australia) | 9,500 | 28,546 | |||||||||
| Chartwell Seniors Housing Real Estate Investment Trust REIT (Canada) | 5,511 | 39,706 | |||||||||
| China Overseas Land & Investment Ltd. (Hong Kong) | 52,600 | 75,127 | |||||||||
| City Developments Ltd. (Singapore) | 3,500 | 25,376 | |||||||||
| Citycon OYJ (Finland) | 7,823 | 26,755 | |||||||||
| Corio NV REIT (Netherlands) | 1,153 | 53,127 | |||||||||
| CubeSmart REIT (United States) | 2,220 | 18,937 | |||||||||
| DDR Corp. REIT (United States) | 4,700 | 51,230 | |||||||||
| Derwent London PLC REIT (United Kingdom) | 2,630 | 58,615 | |||||||||
| Development Securities PLC (United Kingdom) | 4,170 | 12,313 | |||||||||
| Digital Realty Trust, Inc. REIT (United States) † | 1,493 | 82,354 | |||||||||
| Douglas Emmett, Inc. REIT (United States) | 3,060 | 52,326 | |||||||||
| DuPont Fabros Technology, Inc. REIT (United States) † | 1,600 | 31,504 | |||||||||
| Equity Residential REIT (United States) | 2,495 | 129,416 | |||||||||
| Essex Property Trust, Inc. REIT (United States) | 320 | 38,413 | |||||||||
| Eurocommercial Properties NV REIT (Netherlands) | 1,093 | 42,071 | |||||||||
| Fortune Real Estate Investment Trust REIT (Singapore) | 99,000 | 42,944 | |||||||||
| General Growth Properties, Inc. REIT (United States) | 2,960 | 35,816 | |||||||||
| Glimcher Realty Trust REIT (United States) | 1,980 | 14,018 | |||||||||
| Global Logistic Properties Ltd. (Singapore)* | 39,250 | 49,221 | |||||||||
| Goodman Group REIT (Australia) | 153,380 | 84,036 | |||||||||
| GPT Group REIT (Australia) | 32,138 | 96,663 | |||||||||
| Great Portland Estates PLC REIT (United Kingdom) | 6,540 | 34,461 | |||||||||
| Hang Lung Properties Ltd. (Hong Kong) | 14,900 | 44,332 | |||||||||
| HCP, Inc. REIT (United States) | 3,360 | 117,802 | |||||||||
| Shares | Fair Value | ||||||||||
| Health Care REIT, Inc. REIT (United States) | 2,290 | $ | 107,172 | ||||||||
| Helical Bar PLC (United Kingdom) | 5,090 | 15,376 | |||||||||
| Hongkong Land Holdings Ltd. (Hong Kong) | 16,565 | 73,393 | |||||||||
| Host Hotels & Resorts, Inc. REIT (United States) | 6,613 | 72,346 | |||||||||
| Hufvudstaden AB - Class A (Sweden) | 3,355 | 32,394 | |||||||||
| Japan Prime Realty Investment Corp. REIT (Japan) | 15 | 38,517 | |||||||||
| Keppel Land Ltd. (Singapore) | 15,000 | 29,299 | |||||||||
| Kerry Properties Ltd. (Hong Kong) | 13,030 | 41,590 | |||||||||
| Kimco Realty Corp. REIT (United States) | 5,625 | 84,544 | |||||||||
| Klepierre REIT (France) | 1,039 | 29,125 | |||||||||
| Land Securities Group PLC REIT (United Kingdom) | 7,340 | 72,949 | |||||||||
| Link REIT (The) REIT (Hong Kong) | 10,300 | 32,542 | |||||||||
| Macerich Co. REIT (United States) | 504 | 21,485 | |||||||||
| Mirvac Group REIT (Australia) | 46,800 | 51,452 | |||||||||
| Mitsubishi Estate Co., Ltd. (Japan) | 7,600 | 123,277 | |||||||||
| Mitsui Fudosan Co., Ltd. (Japan) | 10,400 | 164,291 | |||||||||
| Morguard Real Estate Investment Trust REIT (Canada) | 3,007 | 42,441 | |||||||||
| Nomura Real Estate Office Fund, Inc. REIT (Japan) | 6 | 36,589 | |||||||||
| Post Properties, Inc. REIT (United States) | 960 | 33,350 | |||||||||
| ProLogis, Inc. REIT (United States) | 3,198 | 77,551 | |||||||||
| PSP Swiss Property AG (Switzerland)* | 394 | 35,360 | |||||||||
| Public Storage REIT (United States) | 1,335 | 148,652 | |||||||||
| RioCan Real Estate Investment Trust REIT (Canada) | 2,014 | 49,970 | |||||||||
| Senior Housing Properties Trust REIT (United States) | 2,390 | 51,481 | |||||||||
| Shenzhen Investment Ltd. (Hong Kong) | 113,170 | 20,720 | |||||||||
| Shimao Property Holdings Ltd. (Hong Kong) | 36,000 | 27,040 | |||||||||
| Simon Property Group, Inc. REIT (United States) | 2,916 | 320,702 | |||||||||
| Sino Land Co., Ltd. (Hong Kong) | 32,000 | 42,259 | |||||||||
| SL Green Realty Corp. REIT (United States) | 730 | 42,449 | |||||||||
| Stockland REIT (Australia) | 29,400 | 81,834 | |||||||||
| Sumitomo Realty & Development Co., Ltd. (Japan) | 4,800 | 92,271 | |||||||||
| Sun Hung Kai Properties Ltd. (Hong Kong) | 19,380 | 222,328 | |||||||||
| UDR, Inc. REIT (United States) | 2,220 | 49,151 | |||||||||
| Unibail-Rodamco SE REIT (France) | 885 | 157,917 | |||||||||
| Vastned Retail NV REIT (Netherlands) | 364 | 17,269 | |||||||||
| Ventas, Inc. REIT (United States) | 2,422 | 119,647 | |||||||||
| Vornado Realty Trust REIT (United States) | 1,460 | 108,945 | |||||||||
| Weingarten Realty Investors REIT (United States) | 2,160 | 45,727 | |||||||||
| Westfield Group REIT (Australia) | 19,320 | 143,271 | |||||||||
| Wharf Holdings Ltd. (Hong Kong) | 11,199 | 55,252 | |||||||||
| Total Common Stocks | $ | 5,185,037 | |||||||||
171
Touchstone Global Real Estate Fund (Continued)
| Shares | Fair Value | ||||||||||
| Investment Funds — 4.1% | |||||||||||
| Invesco Liquid Assets Portfolio** | 116,355 | $ | 116,355 | ||||||||
| Touchstone Institutional Money Market Fund^ | 100,471 | 100,471 | |||||||||
| Total Investment Funds | $ | 216,826 | |||||||||
| Total Investment Securities — 102.6% (Cost $6,037,048) | $ | 5,401,863 | |||||||||
| Liabilities in Excess of Other Assets — (2.6%) | (135,802 | ) | |||||||||
| Net Assets — 100.0% | $ | 5,266,061 | |||||||||
* Non-income producing security.
† All or a portion of the security is on loan. The total value of the securities on loan as of September 30, 2011, was $112,715.
** Represents collateral for securities loaned.
^ Affiliated Fund, sub-advised by Fort Washington Investment Advisors, Inc. See Note 4.
Portfolio Abbreviations:
PLC – Public Limited Company
REIT – Real Estate Investment Trust
Other Information:
The inputs or methodology used for valuing securities may not be an indication of the risk associated with investing in those securities. For more information on valuation inputs, and their aggregation into the levels used in the table below, please refer to the security valuation section in the accompanying notes to financial statements.
Valuation Inputs at Reporting Date:
| Description | Level 1 | Level 2 | Level 3 | Total | |||||||||||||||
| Common Stocks | $ | 2,531,651 | $ | 2,653,386 | $ | — | $ | 5,185,037 | |||||||||||
| Investment Funds | 216,826 | — | — | 216,826 | |||||||||||||||
| $ | 5,401,863 | ||||||||||||||||||
At September 30, 2011, securities valued at $2,202,060 were transferred from Level 1 to Level 2 pursuant to the Fund's fair valuation policy.
See accompanying notes to financial statements.
172
Portfolio of Investments
Touchstone Intermediate Fixed Income Fund – September 30, 2011
| Principal Amount | Fair Value | ||||||||||
| Corporate Bonds — 51.5% Financials — 22.8% | |||||||||||
| $ | 75,000 | ACE Ina Holdings, Inc., 5.700%, 2/15/17 | $ | 83,939 | |||||||
| 510,000 | Aflac, Inc., 8.500%, 5/15/19 | 620,795 | |||||||||
| 370,000 | Allstate Life Global Funding Trusts, 5.375%, 4/30/13 | 392,129 | |||||||||
| 25,000 | American Express Bank FSB, 5.500%, 4/16/13 | 26,392 | |||||||||
| 150,000 | American Express Co., 4.875%, 7/15/13 | 157,534 | |||||||||
| 200,000 | American Express Co., 7.000%, 3/19/18 | 236,605 | |||||||||
| 210,000 | American International Group, Inc., 5.450%, 5/18/17 | 201,091 | |||||||||
| 125,000 | Ameriprise Financial, Inc., 5.650%, 11/15/15 | 141,134 | |||||||||
| 200,000 | Bank of America Corp., 5.750%, 12/1/17 | 187,572 | |||||||||
| 30,000 | Bank of America Corp., 5.750%, 8/15/16 | 27,767 | |||||||||
| 200,000 | Bank of America Corp. MTN, 5.650%, 5/1/18 | 189,907 | |||||||||
| 800,000 | Bank of America NA, 5.300%, 3/15/17 | 722,527 | |||||||||
| 40,000 | Barclays Bank PLC, 6.750%, 5/22/19 | 43,214 | |||||||||
| 500,000 | Barclays Bank PLC, Ser 1, 5.000%, 9/22/16 | 501,122 | |||||||||
| 200,000 | Barclays Bank PLC, 5.450%, 9/12/12 | 205,005 | |||||||||
| 325,000 | BB&T Corp., 4.750%, 10/1/12 | 334,936 | |||||||||
| 915,000 | BB&T Corp., 6.850%, 4/30/19 | 1,131,114 | |||||||||
| 45,000 | Bear Stearns Cos. LLC, 5.300%, 10/30/15++ | 48,581 | |||||||||
| 150,000 | Bear Stearns Cos. LLC, 5.700%, 11/15/14++ | 161,763 | |||||||||
| 30,000 | Bear Stearns Cos. LLC, 6.400%, 10/2/17++ | 34,062 | |||||||||
| 500,000 | Berkshire Hathaway Finance Corp., 5.000%, 8/15/13 | 536,742 | |||||||||
| 375,000 | Berkshire Hathaway, Inc., 3.200%, 2/11/15 | 394,264 | |||||||||
| 1,500,000 | Boston Properties LP, 5.875%, 10/15/19 | 1,646,341 | |||||||||
| 345,000 | Capital One Bank USA NA, 8.800%, 7/15/19 | 406,450 | |||||||||
| 175,000 | Citigroup, Inc., 5.850%, 8/2/16 | 187,103 | |||||||||
| 250,000 | Citigroup, Inc., 6.125%, 11/21/17 | 267,143 | |||||||||
| 545,000 | Citigroup, Inc., 5.000%, 9/15/14 | 534,514 | |||||||||
| 40,000 | CME Group, Inc., 5.750%, 2/15/14 | 43,930 | |||||||||
| 200,000 | Deutsche Bank AG, 6.000%, 9/1/17 | 220,316 | |||||||||
| 475,000 | Fifth Third Bancorp, 6.250%, 5/1/13 | 502,934 | |||||||||
| 275,000 | General Electric Capital Corp., 5.400%, 2/15/17 | 299,793 | |||||||||
| 1,900,000 | General Electric Capital Corp. MTN, 5.450%, 1/15/13 | 1,995,479 | |||||||||
| 175,000 | General Electric Capital Corp. MTN, 5.625%, 5/1/18 | 191,308 | |||||||||
| 110,000 | Genworth Financial, Inc., 5.750%, 6/15/14 | 108,449 | |||||||||
| 315,000 | Goldman Sachs Group, Inc., 5.350%, 1/15/16 | 325,935 | |||||||||
| 35,000 | Goldman Sachs Group, Inc., 6.150%, 4/1/18 | 36,270 | |||||||||
| 500,000 | Goldman Sachs Group, Inc., 5.625%, 1/15/17 | 485,034 | |||||||||
| 255,000 | HCP, Inc., 5.650%, 12/15/13 | 267,826 | |||||||||
| 485,000 | HSBC Finance Corp., 5.500%, 1/19/16 | 506,227 | |||||||||
| 500,000 | Jefferies Group, Inc., 8.500%, 7/15/19 | 556,090 | |||||||||
| 385,000 | JP Morgan Chase & Co., 5.125%, 9/15/14 | 405,461 | |||||||||
| Principal Amount | Fair Value | ||||||||||
| $ | 275,000 | JP Morgan Chase & Co., 5.375%, 10/1/12 | $ | 286,166 | |||||||
| 100,000 | KeyBank NA, 5.800%, 7/1/14 | 107,802 | |||||||||
| 530,000 | Keycorp, 6.500%, 5/14/13 | 565,334 | |||||||||
| 470,000 | Kimco Realty Corp., 5.700%, 5/1/17 | 502,328 | |||||||||
| 215,000 | Merrill Lynch & Co., Inc., 6.400%, 8/28/17 | 208,452 | |||||||||
| 20,000 | MetLife, Inc., 5.000%, 6/15/15 | 21,910 | |||||||||
| 125,000 | Morgan Stanley, 5.500%, 1/26/20 | 114,741 | |||||||||
| 660,000 | Morgan Stanley, 4.750%, 4/1/14 | 627,211 | |||||||||
| 1,200,000 | PNC Funding Corp., 5.625%, 2/1/17 | 1,302,874 | |||||||||
| 125,000 | Principal Life Income Funding Trusts, 5.100%, 4/15/14 | 134,712 | |||||||||
| 535,000 | ProLogis, 7.625%, 8/15/14 | 582,850 | |||||||||
| 30,000 | Prudential Financial, Inc., 4.750%, 9/17/15 | 31,318 | |||||||||
| 125,000 | Prudential Financial, Inc. MTN, 4.750%, 4/1/14 | 130,398 | |||||||||
| 25,000 | Simon Property Group LP, 5.750%, 12/1/15 | 27,586 | |||||||||
| 200,000 | SunTrust Bank, Inc., 5.250%, 11/5/12 | 207,908 | |||||||||
| 150,000 | Toyota Motor Credit Corp., 3.200%, 6/17/15 | 157,383 | |||||||||
| 1,000,000 | Travelers Cos., Inc. (The), 5.900%, 6/2/19 | 1,165,214 | |||||||||
| 100,000 | Travelers Cos., Inc. (The), 5.500%, 12/1/15 | 112,196 | |||||||||
| 185,000 | Wachovia Bank NA, 5.000%, 8/15/15 | 197,081 | |||||||||
| 375,000 | Wachovia Corp., 5.750%, 2/1/18 | 422,508 | |||||||||
| 170,000 | Wells Fargo & Co., 4.950%, 10/16/13 | 179,671 | |||||||||
| 22,450,441 | |||||||||||
| Utilities — 7.5% | |||||||||||
| 20,000 | Arizona Public Service Co., 8.750%, 3/1/19 | 25,118 | |||||||||
| 800,000 | Boardwalk Pipelines LLC, 5.750%, 9/15/19 | 892,846 | |||||||||
| 150,000 | Consolidated Edison Co. of NY, Ser 08-A, 5.850%, 4/1/18 | 181,144 | |||||||||
| 930,000 | Consolidated Natural Gas Co., Ser A, 5.000%, 12/1/14 | 1,021,835 | |||||||||
| 100,000 | Detroit Edison Co. (The), Ser G, 5.600%, 6/15/18 | 120,860 | |||||||||
| 740,000 | DTE Energy Co., 6.350%, 6/1/16 | 852,210 | |||||||||
| 100,000 | Duke Energy Carolinas LLC, 5.300%, 10/1/15 | 114,668 | |||||||||
| 550,000 | Energy Transfer Partners LP, 6.700%, 7/1/18 | 615,618 | |||||||||
| 650,000 | Enterprise Products Operating LLC, Ser O, 9.750%, 1/31/14 | 760,599 | |||||||||
| 25,000 | Exelon Corp., 4.900%, 6/15/15 | 27,060 | |||||||||
| 520,000 | Exelon Generation Co. LLC, 5.200%, 10/1/19 | 561,276 | |||||||||
| 115,000 | Georgia Power Co., Ser Z, 5.250%, 12/15/15 | 130,717 | |||||||||
| 360,000 | Metropolitan Edison Co., 7.700%, 1/15/19 | 455,634 | |||||||||
| 310,000 | Midamerican Energy Holdings Co., Ser D, 5.000%, 2/15/14 | 333,811 | |||||||||
| 20,000 | Midamerican Energy Holdings Co., 5.750%, 4/1/18 | 23,058 | |||||||||
| 550,000 | NextEra Energy Capital Holdings, Inc., 2.550%, 11/15/13 | 559,603 | |||||||||
173
Touchstone Intermediate Fixed Income Fund (Continued)
| Principal Amount | Fair Value | ||||||||||
| Corporate Bonds — 51.5% (Continued) | |||||||||||
| $ | 125,000 | NSTAR Electric Co., 4.875%, 4/15/14 | $ | 136,345 | |||||||
| 180,000 | Public Service Co. of Colorado, Ser 10, 7.875%, 10/1/12 | 192,418 | |||||||||
| 140,000 | Public Service Electric & Gas Co. MTN, 5.375%, 9/1/13 | 150,828 | |||||||||
| 130,000 | Southern Cal Edison, Ser 05-A, 5.000%, 1/15/16 | 147,924 | |||||||||
| 100,000 | TransCanada PipeLines Ltd., 4.875%, 1/15/15 | 110,085 | |||||||||
| 7,413,657 | |||||||||||
| Consumer Staples — 4.6% | |||||||||||
| 275,000 | Archer-Daniels-Midland Co., 5.450%, 3/15/18 | 322,506 | |||||||||
| 200,000 | Avon Products, Inc., 4.200%, 7/15/18 | 211,991 | |||||||||
| 550,000 | Coca-Cola Enterprises, Inc., 2.125%, 9/15/15 | 553,050 | |||||||||
| 25,000 | ConAgra Foods, Inc., 7.000%, 4/15/19 | 30,107 | |||||||||
| 25,000 | CVS Caremark Corp., 6.600%, 3/15/19 | 30,409 | |||||||||
| 500,000 | General Mills, Inc., 5.200%, 3/17/15 | 560,573 | |||||||||
| 35,000 | General Mills, Inc., 5.650%, 2/15/19 | 41,444 | |||||||||
| 500,000 | Kimberly-Clark Corp., 6.125%, 8/1/17 | 599,178 | |||||||||
| 25,000 | Kraft Foods, Inc., 6.500%, 8/11/17 | 29,664 | |||||||||
| 329,000 | Kraft Foods, Inc., 6.250%, 6/1/12 | 340,643 | |||||||||
| 30,000 | Kroger Co. (The), 6.400%, 8/15/17 | 35,571 | |||||||||
| 40,000 | Procter & Gamble Co. (The), 4.700%, 2/15/19 | 46,915 | |||||||||
| 921,000 | Safeway, Inc., 6.250%, 3/15/14 | 1,025,039 | |||||||||
| 20,000 | Safeway, Inc., 6.350%, 8/15/17 | 23,136 | |||||||||
| 500,000 | Sara Lee Corp., 3.875%, 6/15/13 | 518,898 | |||||||||
| 120,000 | Sysco Corp., 4.200%, 2/12/13 | 125,491 | |||||||||
| 4,494,615 | |||||||||||
| Consumer Discretionary — 2.8% | |||||||||||
| 20,000 | Comcast Corp., 5.875%, 2/15/18 | 23,171 | |||||||||
| 150,000 | Costco Wholesale Corp., 5.500%, 3/15/17 | 177,395 | |||||||||
| 550,000 | eBay, Inc., 0.875%, 10/15/13 | 551,890 | |||||||||
| 150,000 | Emerson Electric Co., 5.000%, 12/15/14 | 167,068 | |||||||||
| 500,000 | Johnson Controls, Inc., 5.500%, 1/15/16 | 561,383 | |||||||||
| 100,000 | Lowe's Cos., Inc., 5.400%, 10/15/16 | 115,678 | |||||||||
| 125,000 | Omnicom Group, Inc., 5.900%, 4/15/16 | 138,408 | |||||||||
| 185,000 | Target Corp., 5.875%, 7/15/16 | 219,845 | |||||||||
| 20,000 | Time Warner Cable, Inc., 8.250%, 4/1/19 | 25,044 | |||||||||
| 30,000 | Time Warner Cable, Inc., 6.200%, 7/1/13 | 32,408 | |||||||||
| 25,000 | Wal-Mart Stores, Inc., 5.800%, 2/15/18 | 30,351 | |||||||||
| 150,000 | Wal-Mart Stores, Inc., 4.500%, 7/1/15 | 168,172 | |||||||||
| 350,000 | Wal-Mart Stores, Inc., 4.250%, 4/15/13 | 369,652 | |||||||||
| 180,000 | Walt Disney Co. (The), 5.500%, 3/15/19 | 214,075 | |||||||||
| 2,794,540 | |||||||||||
| Industrials — 2.7% | |||||||||||
| 250,000 | Canadian National Railway Co., 4.400%, 3/15/13 | 262,624 | |||||||||
| Principal Amount | Fair Value | ||||||||||
| $ | 195,000 | Caterpillar Financial Services Corp., 7.150%, 2/15/19 | $ | 250,644 | |||||||
| 150,000 | Caterpillar Financial Services Corp. MTN, 4.600%, 1/15/14 | 161,938 | |||||||||
| 130,000 | Dover Corp., 4.875%, 10/15/15 | 146,278 | |||||||||
| 150,000 | General Dynamics Corp., 4.250%, 5/15/13 | 158,430 | |||||||||
| 275,000 | General Electric Co., 5.250%, 12/6/17 | 305,543 | |||||||||
| 140,000 | Parker Hannifin Corp., 5.500%, 5/15/18 | 166,939 | |||||||||
| 500,000 | Southwest Airlines Co., 6.500%, 3/1/12 | 510,413 | |||||||||
| 250,000 | Stanford University, 4.750%, 5/1/19 | 290,265 | |||||||||
| 250,000 | United Parcel Service, Inc., 5.500%, 1/15/18 | 300,099 | |||||||||
| 100,000 | United Technologies Corp., 4.875%, 5/1/15 | 112,185 | |||||||||
| 2,665,358 | |||||||||||
| Telecommunication Services — 2.5% | |||||||||||
| 145,000 | AT&T, Inc., 5.500%, 2/1/18 | 167,371 | |||||||||
| 110,000 | AT&T, Inc., 5.625%, 6/15/16 | 125,405 | |||||||||
| 75,000 | AT&T, Inc., 5.875%, 8/15/12 | 78,138 | |||||||||
| 140,000 | BellSouth Corp., 5.200%, 9/15/14 | 153,725 | |||||||||
| 550,000 | Telefonica Emisiones SAU, 2.582%, 4/26/13 | 532,251 | |||||||||
| 305,000 | Verizon Communications, Inc., 5.500%, 2/15/18 | 353,670 | |||||||||
| 175,000 | Verizon Global Funding Corp., 4.375%, 6/1/13 | 184,659 | |||||||||
| 690,000 | Vodafone Group PLC, 3.375%, 11/24/15 | 724,722 | |||||||||
| 100,000 | Vodafone Group PLC, 5.625%, 2/27/17 | 114,600 | |||||||||
| 2,434,541 | |||||||||||
| Information Technology — 2.2% | |||||||||||
| 150,000 | Cisco Systems, Inc., 5.500%, 2/22/16 | 172,946 | |||||||||
| 40,000 | Cisco Systems, Inc., 4.450%, 1/15/20 | 44,228 | |||||||||
| 40,000 | Dell, Inc., 5.875%, 6/15/19 | 45,553 | |||||||||
| 200,000 | IBM Corp., 7.625%, 10/15/18 | 265,259 | |||||||||
| 235,000 | Oracle Corp., 4.950%, 4/15/13 | 250,090 | |||||||||
| 160,000 | Oracle Corp., 3.750%, 7/8/14 | 172,312 | |||||||||
| 150,000 | Pitney Bowes, Inc., 3.875%, 6/15/13 | 155,414 | |||||||||
| 1,000,000 | Xerox Corp., 6.400%, 3/15/16 | 1,106,757 | |||||||||
| 2,212,559 | |||||||||||
| Materials — 2.2% | |||||||||||
| 260,000 | Alcoa, Inc., 6.150%, 8/15/20 | 263,375 | |||||||||
| 400,000 | Dow Chemical Co. (The), 4.850%, 8/15/12 | 411,841 | |||||||||
| 740,000 | Dow Chemical Co. (The), 5.900%, 2/15/15 | 816,875 | |||||||||
| 450,000 | EI du Pont de Nemours & Co., 3.625%, 1/15/21 | 469,720 | |||||||||
| 200,000 | Praxair, Inc., 5.375%, 11/1/16 | 234,530 | |||||||||
| 2,196,341 | |||||||||||
| Health Care — 2.2% | |||||||||||
| 150,000 | Abbott Laboratories, 5.600%, 11/30/17 | 178,263 | |||||||||
| 205,000 | Abbott Laboratories, 5.875%, 5/15/16 | 241,324 | |||||||||
174
Touchstone Intermediate Fixed Income Fund (Continued)
| Principal Amount | Fair Value | ||||||||||
| Corporate Bonds — 51.5% (Continued) | |||||||||||
| $ | 100,000 | Aetna, Inc., 6.000%, 6/15/16 | $ | 115,274 | |||||||
| 175,000 | AstraZeneca PLC, 5.900%, 9/15/17 | 209,083 | |||||||||
| 120,000 | Baxter International, Inc., 5.900%, 9/1/16 | 141,774 | |||||||||
| 150,000 | Genentech, Inc., 4.750%, 7/15/15 | 168,312 | |||||||||
| 230,000 | Johnson & Johnson, 5.150%, 8/15/12 | 238,363 | |||||||||
| 100,000 | Medtronic, Inc., Ser B, 4.750%, 9/15/15 | 112,328 | |||||||||
| 300,000 | Pfizer, Inc., 6.200%, 3/15/19 | 375,941 | |||||||||
| 115,000 | UnitedHealth Group, Inc., 5.000%, 8/15/14 | 125,974 | |||||||||
| 125,000 | Wyeth, 5.450%, 4/1/17 | 145,981 | |||||||||
| 120,000 | Wyeth, 5.500%, 2/1/14 | 132,106 | |||||||||
| 2,184,723 | |||||||||||
| Energy — 2.0% | |||||||||||
| 750,000 | Anadarko Petroleum Corp., 6.375%, 9/15/17 | 841,368 | |||||||||
| 225,000 | Apache Corp., 6.250%, 4/15/12 | 231,134 | |||||||||
| 500,000 | ConocoPhillips, 4.400%, 5/15/13 | 526,502 | |||||||||
| 320,000 | Shell International Finance BV, 4.000%, 3/21/14 | 344,921 | |||||||||
| 25,000 | Valero Energy Corp., 9.375%, 3/15/19 | 32,037 | |||||||||
| 1,975,962 | |||||||||||
| Total Corporate Bonds | $ | 50,822,737 | |||||||||
| U.S. Treasury Obligations — 27.6% | |||||||||||
| 500,000 | U.S. Treasury Bond, 11.250%, 2/15/15 | 678,945 | |||||||||
| 800,000 | U.S. Treasury Bond, 8.750%, 5/15/17 | 1,134,938 | |||||||||
| 600,000 | U.S. Treasury Note, 0.375%, 8/31/12 | 601,102 | |||||||||
| 350,000 | U.S. Treasury Note, 1.375%, 1/15/13 | 355,154 | |||||||||
| 500,000 | U.S. Treasury Note, 2.750%, 10/31/13 | 525,156 | |||||||||
| 1,500,000 | U.S. Treasury Note, 1.875%, 2/28/14 | 1,553,907 | |||||||||
| 170,000 | U.S. Treasury Note, 1.750%, 3/31/14 | 175,804 | |||||||||
| 3,000,000 | U.S. Treasury Note, 4.250%, 11/15/14 | 3,350,859 | |||||||||
| 4,050,000 | U.S. Treasury Note, 1.250%, 10/31/15 | 4,135,747 | |||||||||
| 1,500,000 | U.S. Treasury Note, 1.000%, 8/31/16 | 1,503,750 | |||||||||
| 10,340,000 | U.S. Treasury Note, 2.125%, 8/15/21 | 10,522,604 | |||||||||
| 2,500,000 | United States Treasury Inflation Indexed Bonds, 0.500%, 4/15/15 | 2,711,926 | |||||||||
| Total U.S. Treasury Obligations | $ | 27,249,892 | |||||||||
| U.S. Government Mortgage-Backed Obligations — 10.6% | |||||||||||
| 3,139,079 | FHLMC, Pool #C03490, 4.500%, 8/1/40 | 3,325,396 | |||||||||
| 2,616,936 | FHLMC, Pool #G06087, 5.000%, 9/1/40 | 2,809,962 | |||||||||
| 4,022,583 | FNMA, Pool #AE5440, 4.500%, 10/1/40 | 4,272,948 | |||||||||
| Total U.S. Government Mortgage-Backed Obligations | $ | 10,408,306 | |||||||||
| U.S. Government Agency Obligations — 5.4% | |||||||||||
| 2,500,000 | FFCB, 1.750%, 2/21/13 | 2,543,540 | |||||||||
| 340,000 | FFCB, 5.125%, 8/25/16 | 401,144 | |||||||||
| 465,000 | FHLB, Ser VB15, 5.000%, 12/21/15 | 538,503 | |||||||||
| 275,000 | FHLB, Ser 656, 5.375%, 5/18/16 | 326,345 | |||||||||
| Principal Amount | Fair Value | ||||||||||
| $ | 400,000 | FHLMC, 4.500%, 1/15/14 | $ | 436,368 | |||||||
| 400,000 | FHLMC, 5.125%, 10/18/16 | 473,689 | |||||||||
| 250,000 | FNMA, 2.500%, 5/15/14 | 262,133 | |||||||||
| 150,000 | FNMA, 4.125%, 4/15/14 | 163,317 | |||||||||
| 125,000 | FNMA, 4.625%, 10/15/13 | 135,500 | |||||||||
| Total U.S. Government Agency Obligations | $ | 5,280,539 | |||||||||
| Sovereign Government Obligations — 2.1% | |||||||||||
| 100,000 | Asian Development Bank, 4.500%, 9/4/12 | 103,575 | |||||||||
| 250,000 | Export-Import Bank of Korea, 5.500%, 10/17/12 | 258,240 | |||||||||
| 180,000 | Hydro Quebec, Ser IU, 7.500%, 4/1/16 | 223,548 | |||||||||
| 125,000 | Korea Development Bank, 5.500%, 11/13/12 | 129,472 | |||||||||
| 110,000 | Korea Electric Power Corp., 7.750%, 4/1/13 | 118,550 | |||||||||
| 250,000 | Province of Ontario Canada, 4.750%, 1/19/16 | 284,662 | |||||||||
| 200,000 | Province of Quebec Canada, 4.600%, 5/26/15 | 224,495 | |||||||||
| 500,000 | Republic of Chile, 5.500%, 1/15/13 | 526,110 | |||||||||
| 225,000 | Republic of Korea, 4.875%, 9/22/14 | 238,491 | |||||||||
| Total Sovereign Government Obligations | $ | 2,107,143 | |||||||||
| Commercial Mortgage-Backed Security — 0.5% | |||||||||||
| 450,000 | Citigroup Commercial Mortgage Trust, Ser 2006-C5, Class A4, 5.431%, 10/15/49 | 489,555 | |||||||||
| Investment Fund — 1.8% | |||||||||||
| 1,733,395 | Touchstone Institutional Money Market Fund^ | 1,733,395 | |||||||||
| Total Investment Securities — 99.5% (Cost $94,032,152) | $ | 98,091,567 | |||||||||
| Other Assets in Excess of Liabilities — 0.5% | 518,159 | ||||||||||
| Net Assets — 100.0% | $ | 98,609,726 | |||||||||
^ Affiliated Fund, sub-advised by Fort Washington Investment Advisors, Inc. See Note 4.
++ The issuers and/or sponsors of certain asset-backed securities may no longer exist; however, the securities held by the Fund are separate legal entities organized as trusts and publicly traded. The Fund receives principal and interest payments directly from these trusts.
175
Touchstone Intermediate Fixed Income Fund (Continued)
Portfolio Abbreviations:
FFCB – Federal Farm Credit Bank
FNMA – Federal National Mortgage Association
FHLB – Federal Home Loan Bank
FHLMC – Federal Home Loan Mortgage Corp.
LLC – Limited Liability Company
MTN – Medium Term Note
PLC – Public Limited Company
Other Information:
The inputs or methodology used for valuing securities may not be an indication of the risk associated with investing in those securities. For more information on valuation inputs, and their aggregation into the levels used in the table below, please refer to the security valuation section in the accompanying notes to financial statements.
Valuation Inputs at Reporting Date:
| Description | Level 1 | Level 2 | Level 3 | Total | |||||||||||||||
| Corporate Bonds | $ | — | $ | 50,822,737 | $ | — | $ | 50,822,737 | |||||||||||
| U.S. Treasury Obligations | — | 27,249,892 | — | 27,249,892 | |||||||||||||||
| U.S. Government Mortgage-Backed Obligations | — | 10,408,306 | — | 10,408,306 | |||||||||||||||
| U.S. Government Agency Obligations | — | 5,280,539 | — | 5,280,539 | |||||||||||||||
| Sovereign Government Obligations | — | 2,107,143 | — | 2,107,143 | |||||||||||||||
| Investment Fund | 1,733,395 | — | — | 1,733,395 | |||||||||||||||
| Commercial Mortgage-Backed Securities | — | 489,555 | — | 489,555 | |||||||||||||||
| $ | 98,091,567 | ||||||||||||||||||
See accompanying notes to financial statements.
176
Portfolio of Investments
Touchstone International Fixed Income Fund – September 30, 2011
| Principal Amount | Fair Value | ||||||||||
| Sovereign Government Obligations — 53.7% | |||||||||||
| $ | 20,000,000 | Asian Development Bank, 2.350%, 6/21/27 | $ | 284,628 | |||||||
| 250,000 | Belgium Government Bond, Ser 56, 3.500%, 3/28/15 | 345,666 | |||||||||
| 400,000 | Brazilian Government International Bond, 12.500%, 1/5/22 | 249,967 | |||||||||
| 130,000 | Bundesrepublik Deutschland, Ser 05, 4.000%, 1/4/37 | 216,206 | |||||||||
| 150,000 | Bundesrepublik Deutschland, Ser 03, 4.750%, 7/4/34 | 271,768 | |||||||||
| 270,000 | Canadian Government Bond, 5.000%, 6/1/14 | 284,650 | |||||||||
| 10,000,000 | Development Bank of Japan, 1.400%, 6/20/12 | 130,666 | |||||||||
| 16,000,000 | Development Bank of Japan, 1.700%, 9/20/22 | 218,765 | |||||||||
| 200,000 | European Financial Stability Facility, 2.750%, 7/18/16 | 273,614 | |||||||||
| 215,000 | European Investment Bank, 6.000%, 12/7/28 | 435,801 | |||||||||
| 115,000 | European Union, 2.750%, 9/21/21 | 153,308 | |||||||||
| 85,000 | European Union, 3.500%, 6/4/21 | 120,952 | |||||||||
| 250,000 | France Government Bond OAT, 5.000%, 10/25/16 | 386,143 | |||||||||
| 1,500,000,000 | Indonesia Treasury Bond, Ser FR49, 9.000%, 9/15/13 | 181,848 | |||||||||
| 170,000 | Italy Buoni Poliennali Del Tesoro, 3.000%, 4/15/15 | 215,504 | |||||||||
| 172,000 | Italy Buoni Poliennali Del Tesoro, 4.750%, 8/1/23 | 208,184 | |||||||||
| 700,000 | Italy Buoni Poliennali del Tesoro Coupon Strip, 0.000%, 5/1/29 | 294,126 | |||||||||
| 1,200,000 | Mexican Bonos, Ser M, 7.000%, 6/19/14 | 91,116 | |||||||||
| 1,900,000 | Mexican Bonos, Ser M 10, 7.750%, 12/14/17 | 152,294 | |||||||||
| 380,000 | Netherlands Government Bond, 1.750%, 1/15/13 | 516,304 | |||||||||
| 200,000 | Netherlands Government Bond, 144a, 2.500%, 1/15/17 | 279,726 | |||||||||
| 700,572 | South Africa Government Bond, Ser R211, 2.500%, 1/31/17 | 91,002 | |||||||||
| 1,500,000 | South Africa Government Bond, Ser R207, 7.250%, 1/15/20 | 174,548 | |||||||||
| 3,000,000 | Sweden Government Bond, Ser 1049, 4.500%, 8/12/15 | 488,956 | |||||||||
| 130,000 | United Kingdom Gilt, 8.000%, 12/7/15 | 259,628 | |||||||||
| Total Sovereign Government Obligations | $ | 6,325,370 | |||||||||
| Principal Amount | Fair Value | ||||||||||
| Corporate Bonds — 34.9% Financials — 28.1% | |||||||||||
| $ | 41,000,000 | Bayerische Landesbank, 1.400%, 4/22/13 | $ | 538,285 | |||||||
| 100,000 | HGI Group Ltd., 6.500%, 5/2/12 | 157,400 | |||||||||
| 50,000 | International Power Finance Jersey II Ltd., 3.250%, 7/20/13 | 70,625 | |||||||||
| 50,000 | International Power Finance Jersey III Ltd., Ser IPR, 4.750%, 6/5/15 | 69,366 | |||||||||
| 30,000,000 | Japan Finance Organization for Municipalities, Ser INTL, 1.550%, 2/21/12 | 390,714 | |||||||||
| 100,000 | Kreditanstalt fuer Wiederaufbau, Ser DTE, 3.250%, 6/27/13 | 137,458 | |||||||||
| 4,000,000 | Kreditanstalt fuer Wiederaufbau, 2.600%, 6/20/37 | 58,716 | |||||||||
| 150,000 | Kreditanstalt fuer Wiederaufbau, 3.375%, 1/18/21 | 215,875 | |||||||||
| 41,000,000 | Landwirtschaftliche Rentenbank, 1.375%, 4/25/13 | 540,613 | |||||||||
| 200,000 | LCR Finance PLC, Reg S, 4.500%, 12/7/28 | 353,465 | |||||||||
| 200,000 | Merrill Lynch & Co., Inc., 1.840%, 5/30/14 (a) | 232,446 | |||||||||
| 1,400,000 | Realkredit Danmark A/S, Ser 10S, 2.000%, 1/1/12 | 252,364 | |||||||||
| 1,000,000 | Stadshypotek AB, Ser 1576, 6.000%, 3/18/15 | 162,052 | |||||||||
| 100,000 | Swedbank Hypotek AB, 2.500%, 1/21/13 | 135,233 | |||||||||
| 3,314,612 | |||||||||||
| Industrials — 4.0% | |||||||||||
| 100,000 | Noble Group Ltd., Reg S, 8.500%, 5/30/13 | 103,000 | |||||||||
| 100,000 | Rexel SA, 7.000%, 12/17/18 | 125,936 | |||||||||
| 200,000 | Xefin Lux SCA, Reg S, 8.000%, 6/1/18 | 237,806 | |||||||||
| 466,742 | |||||||||||
| Materials — 1.5% | |||||||||||
| 100,000 | CSN Islands VIII Corp., Reg S, 9.750%, 12/16/13 | 110,000 | |||||||||
| 50,000 | Smurfit Kappa Funding PLC, Ser EUR, 7.750%, 4/1/15 | 63,973 | |||||||||
| 173,973 | |||||||||||
| Information Technology — 0.8% | |||||||||||
| 200,000 | Cap Gemini SA, Ser CAP, 3.500%, 1/1/14 | 100,267 | |||||||||
| Telecommunication Services — 0.5% | |||||||||||
| 50,000 | Ziggo Finance BV, Reg S, 6.125%, 11/15/17 | 64,978 | |||||||||
| Total Corporate Bonds | $ | 4,120,572 | |||||||||
177
Touchstone International Fixed Income Fund (Continued)
| Principal Amount | Fair Value | ||||||||||
| Sovereign Bond — 4.3% | |||||||||||
| $ | 38,000,000 | Eksportfinans ASA, 1.600%, 3/20/14 | $ | 508,326 | |||||||
| Foreign Bond — 1.3% | |||||||||||
| 1,100,000 | China Petroleum & Chemical Corp., Ser SINO, 0.000%, 4/24/14 (a) | 152,554 | |||||||||
| Total Investment Securities — 94.2% (Cost $11,124,834) | $ | 11,106,822 | |||||||||
| Other Assets in Excess of Liabilities — 5.8% | 680,804 | ||||||||||
| Net Assets — 100.0% | $ | 11,787,626 | |||||||||
(a) Zero Coupon security – The rate reported was the effective yield as of September 30, 2011.
Portfolio Abbreviations:
PLC – Public Limited Company
Reg S – Security sold outside United States without registration under the Securities Act of 1933.
144a – This is a restricted security that was sold in a transaction exempt from Rule 144a of the Securities Act of 1933. This security may be sold in transactions exempt from registration, normally to qualified institutional buyers. At September 30, 2011, these securities were valued at $279,726 or 2.4% of net assets. These securities were deemed liquid pursuant to procedures approved by the Board of Trustees.
Other Information:
The inputs or methodology used for valuing securities may not be an indication of the risk associated with investing in those securities. For more information on valuation inputs, and their aggregation into the levels used in the table below, please refer to the security valuation section in the accompanying notes to financial statements.
Valuation Inputs at Reporting Date:
| Description | Level 1 | Level 2 | Level 3 | Total | |||||||||||||||
| Sovereign Government Obligations | $ | — | $ | 6,325,370 | $ | — | $ | 6,325,370 | |||||||||||
| Corporate Bonds | — | 4,120,572 | — | 4,120,572 | |||||||||||||||
| Sovereign Bond | — | 508,326 | — | 508,326 | |||||||||||||||
| Foreign Bonds | — | 152,554 | — | 152,554 | |||||||||||||||
| $ | 11,106,822 | ||||||||||||||||||
| Level 1 | Level 2 | Level 3 | Total | ||||||||||||||||
| Other Financial Instruments* | |||||||||||||||||||
| Forward Currency Contracts | $ | — | $ | 224,370 | $ | — | $ | 224,370 | |||||||||||
* Other financial instruments are derivative instruments not reflected in total investments. Amounts shown represent unrealized appreciation.
See accompanying notes to financial statements.
178
Touchstone International Fixed Income Fund (Continued)
Forward Foreign Currency Exchange Contracts
| Contract To | Unrealized Appreciation/ | ||||||||||||||||||
| Counterparty | Value Date | Receive | Deliver | (Depreciation) | |||||||||||||||
| Brown Brothers Harriman | 10/04/2011 | BRL | 402,250 | USD | 250,000 | (36,066 | ) | ||||||||||||
| Brown Brothers Harriman | 10/04/2011 | JPY | 20,255,500 | USD | 250,000 | 12,615 | |||||||||||||
| Brown Brothers Harriman | 10/04/2011 | USD | 250,000 | BRL | 398,000 | 38,326 | |||||||||||||
| Brown Brothers Harriman | 10/04/2011 | USD | 250,000 | JPY | 19,186,750 | 1,241 | |||||||||||||
| Brown Brothers Harriman | 10/06/2011 | CAD | 189,000 | USD | 181,373 | (1,022 | ) | ||||||||||||
| Brown Brothers Harriman | 10/06/2011 | EUR | 702,000 | USD | 941,873 | (1,383 | ) | ||||||||||||
| Brown Brothers Harriman | 10/06/2011 | GBP | 320,000 | USD | 498,496 | 503 | |||||||||||||
| Brown Brothers Harriman | 10/06/2011 | USD | 193,128 | CAD | 189,000 | 12,777 | |||||||||||||
| Brown Brothers Harriman | 10/06/2011 | USD | 1,010,354 | EUR | 702,000 | 69,863 | |||||||||||||
| Brown Brothers Harriman | 10/06/2011 | USD | 520,872 | GBP | 320,000 | 21,873 | |||||||||||||
| Brown Brothers Harriman | 10/06/2011 | USD | 210,532 | ZAR | 1,480,000 | 27,295 | |||||||||||||
| Brown Brothers Harriman | 10/06/2011 | ZAR | 1,480,000 | USD | 184,100 | (863 | ) | ||||||||||||
| Brown Brothers Harriman | 10/14/2011 | AUD | 226,000 | CAD | 227,853 | 1,024 | |||||||||||||
| Brown Brothers Harriman | 10/14/2011 | AUD | 260,000 | GBP | 172,220 | (17,272 | ) | ||||||||||||
| Brown Brothers Harriman | 10/14/2011 | CAD | 200,000 | CHF | 172,196 | 796 | |||||||||||||
| Brown Brothers Harriman | 10/14/2011 | CHF | 170,000 | JPY | 16,339,550 | (24,284 | ) | ||||||||||||
| Brown Brothers Harriman | 10/14/2011 | CHF | 47,000 | USD | 55,562 | (3,699 | ) | ||||||||||||
| Brown Brothers Harriman | 10/14/2011 | COP | 361,987,641 | JPY | 16,407,000 | (25,303 | ) | ||||||||||||
| Brown Brothers Harriman | 10/14/2011 | EUR | 540,000 | JPY | 60,690,060 | (63,553 | ) | ||||||||||||
| Brown Brothers Harriman | 10/14/2011 | EUR | 550,000 | USD | 770,017 | (33,209 | ) | ||||||||||||
| Brown Brothers Harriman | 10/14/2011 | GBP | 125,000 | SEK | 1,307,388 | 4,466 | |||||||||||||
| Brown Brothers Harriman | 10/14/2011 | HKD | 1,500,000 | EUR | 137,666 | 8,218 | |||||||||||||
| Brown Brothers Harriman | 10/14/2011 | IDR | 1,350,000,000 | USD | 156,922 | (3,481 | ) | ||||||||||||
| Brown Brothers Harriman | 10/14/2011 | JPY | 41,116,086 | AUD | 486,000 | 63,479 | |||||||||||||
| Brown Brothers Harriman | 10/14/2011 | JPY | 46,315,488 | GBP | 359,000 | 40,793 | |||||||||||||
| Brown Brothers Harriman | 10/14/2011 | JPY | 32,561,052 | NZD | 492,000 | 47,403 | |||||||||||||
| Brown Brothers Harriman | 10/14/2011 | JPY | 33,000,000 | SEK | 2,702,703 | 34,217 | |||||||||||||
| Brown Brothers Harriman | 10/14/2011 | JPY | 142,075,000 | USD | 1,769,611 | 72,667 | |||||||||||||
| Brown Brothers Harriman | 10/14/2011 | KRW | 167,000,000 | USD | 156,881 | (15,221 | ) | ||||||||||||
| Brown Brothers Harriman | 10/14/2011 | MXN | 200,000 | USD | 16,881 | (2,475 | ) | ||||||||||||
| Brown Brothers Harriman | 10/14/2011 | MYR | 476,000 | USD | 157,444 | (8,408 | ) | ||||||||||||
| Brown Brothers Harriman | 10/14/2011 | NOK | 1,354,081 | EUR | 179,000 | (9,239 | ) | ||||||||||||
| Brown Brothers Harriman | 10/14/2011 | NZD | 363,901 | USD | 300,000 | (22,774 | ) | ||||||||||||
| Brown Brothers Harriman | 10/14/2011 | PLN | 803,140 | EUR | 200,000 | (25,710 | ) | ||||||||||||
| Brown Brothers Harriman | 10/14/2011 | USD | 56,231 | CHF | 47,000 | 4,368 | |||||||||||||
| Brown Brothers Harriman | 10/14/2011 | USD | 997,500 | EUR | 700,000 | 59,745 | |||||||||||||
| Brown Brothers Harriman | 10/26/2011 | HKD | 1,594,000 | USD | 204,688 | 57 | |||||||||||||
| Brown Brothers Harriman | 11/04/2011 | USD | 181,242 | CAD | 189,000 | 1,022 | |||||||||||||
| Brown Brothers Harriman | 11/04/2011 | USD | 941,645 | EUR | 702,000 | 1,354 | |||||||||||||
| Brown Brothers Harriman | 11/04/2011 | USD | 498,344 | GBP | 320,000 | (531 | ) | ||||||||||||
| Brown Brothers Harriman | 11/04/2011 | USD | 183,309 | ZAR | 1,480,000 | 874 | |||||||||||||
| Brown Brothers Harriman | 01/12/2012 | CHF | 100,000 | EUR | 82,210 | 467 | |||||||||||||
| Brown Brothers Harriman | 01/12/2012 | MXN | 5,000,000 | JPY | 28,015,500 | (6,580 | ) | ||||||||||||
| $ | 224,370 | ||||||||||||||||||
179
Portfolio of Investments
Touchstone Large Cap Relative Value Fund – September 30, 2011
| Common Stocks — 96.5% | Shares | Fair Value | |||||||||
| Financials — 15.9% | |||||||||||
| Aflac, Inc. | 2,500 | $ | 87,375 | ||||||||
| Bank of America Corp. | 8,800 | 53,856 | |||||||||
| Chubb Corp. | 2,600 | 155,974 | |||||||||
| Goldman Sachs Group, Inc. (The) | 1,000 | 94,550 | |||||||||
| JPMorgan Chase & Co. | 3,100 | 93,372 | |||||||||
| Morgan Stanley | 5,800 | 78,300 | |||||||||
| Northern Trust Corp. | 3,500 | 122,430 | |||||||||
| Travelers Cos., Inc. (The) | 3,000 | 146,190 | |||||||||
| Wells Fargo & Co. | 6,500 | 156,780 | |||||||||
| 988,827 | |||||||||||
| Consumer Discretionary — 15.9% | |||||||||||
| Carnival Corp. | 2,500 | 75,750 | |||||||||
| Comcast Corp. - Class A | 5,400 | 112,860 | |||||||||
| Darden Restaurants, Inc. | 3,900 | 166,725 | |||||||||
| Johnson Controls, Inc. | 4,200 | 110,754 | |||||||||
| Target Corp. | 1,800 | 88,272 | |||||||||
| TJX Cos., Inc. | 3,500 | 194,145 | |||||||||
| Walt Disney Co. (The) | 3,700 | 111,592 | |||||||||
| Yum! Brands, Inc. | 2,600 | 128,414 | |||||||||
| 988,512 | |||||||||||
| Energy — 15.6% | |||||||||||
| Apache Corp. | 1,200 | 96,288 | |||||||||
| Chesapeake Energy Corp. | 2,900 | 74,095 | |||||||||
| Devon Energy Corp. | 2,100 | 116,424 | |||||||||
| Exxon Mobil Corp. | 2,864 | 208,013 | |||||||||
| Newfield Exploration Co.* | 1,700 | 67,473 | |||||||||
| Occidental Petroleum Corp. | 2,900 | 207,350 | |||||||||
| Schlumberger Ltd. | 2,100 | 125,433 | |||||||||
| Transocean Ltd. | 1,600 | 76,384 | |||||||||
| 971,460 | |||||||||||
| Information Technology — 15.0% | |||||||||||
| Automatic Data Processing, Inc. | 2,700 | 127,305 | |||||||||
| Corning, Inc. | 8,400 | 103,824 | |||||||||
| Flextronics International Ltd.* | 24,800 | 139,624 | |||||||||
| Intel Corp. | 9,500 | 202,635 | |||||||||
| International Business Machines Corp. | 1,500 | 262,545 | |||||||||
| Xerox Corp. | 13,800 | 96,186 | |||||||||
| 932,119 | |||||||||||
| Industrials — 13.0% | |||||||||||
| Boeing Co. (The) | 2,300 | 139,173 | |||||||||
| Cummins, Inc. | 2,900 | 236,814 | |||||||||
| General Dynamics Corp. | 2,600 | 147,914 | |||||||||
| Norfolk Southern Corp. | 2,400 | 146,448 | |||||||||
| Union Pacific Corp. | 1,700 | 138,839 | |||||||||
| 809,188 | |||||||||||
| Health Care — 7.9% | |||||||||||
| CR Bard, Inc. | 800 | 70,032 | |||||||||
| Express Scripts, Inc.* | 4,100 | 151,987 | |||||||||
| Shares | Fair Value | ||||||||||
| UnitedHealth Group, Inc. | 2,900 | $ | 133,748 | ||||||||
| WellPoint, Inc. | 2,100 | 137,088 | |||||||||
| 492,855 | |||||||||||
| Utilities — 5.6% | |||||||||||
| Duke Energy Corp. | 4,200 | 83,958 | |||||||||
| Exelon Corp. | 2,700 | 115,047 | |||||||||
| Southern Co. | 3,500 | 148,295 | |||||||||
| 347,300 | |||||||||||
| Telecommunication Services — 2.8% | |||||||||||
| American Tower Corp. - Class A* | 3,200 | 172,160 | |||||||||
| Materials — 2.7% | |||||||||||
| Freeport-McMoRan Copper & Gold, Inc. | 5,600 | 170,520 | |||||||||
| Consumer Staples — 2.1% | |||||||||||
| Kimberly-Clark Corp. | 1,800 | 127,818 | |||||||||
| Total Common Stocks | $ | 6,000,759 | |||||||||
| Investment Fund — 3.7% | |||||||||||
| Touchstone Institutional Money Market Fund^ | 232,307 | 232,307 | |||||||||
| Total Investment Securities — 100.2% (Cost $6,953,468) | $ | 6,233,066 | |||||||||
| Liabilities in Excess of Other Assets — (0.2%) | (15,113 | ) | |||||||||
| Net Assets — 100.0% | $ | 6,217,953 | |||||||||
* Non-income producing security.
^ Affiliated Fund, sub-advised by Fort Washington Investment Advisors, Inc. See Note 4.
Other Information:
The inputs or methodology used for valuing securities may not be an indication of the risk associated with investing in those securities. For more information on valuation inputs, and their aggregation into the levels used in the table below, please refer to the security valuation section in the accompanying notes to financial statements.
Valuation Inputs at Reporting Date:
| Description | Level 1 | Level 2 | Level 3 | Total | |||||||||||||||
| Common Stocks | $ | 6,000,759 | $ | — | $ | — | $ | 6,000,759 | |||||||||||
| Investment Fund | 232,307 | — | — | 232,307 | |||||||||||||||
| $ | 6,233,066 | ||||||||||||||||||
See accompanying notes to financial statements.
180
Portfolio of Investments
Touchstone Market Neutral Equity Fund – September 30, 2011
| Common Stocks — 86.0% | Shares | Fair Value | |||||||||
| Information Technology — 20.9% | |||||||||||
| ACI Worldwide, Inc.* | 5,400 | $ | 148,716 | ||||||||
| Activision Blizzard, Inc. | 32,700 | 389,130 | |||||||||
| Actuate Corp.* | 30,400 | 167,808 | |||||||||
| Adobe Systems, Inc.* | 10,000 | 241,700 | |||||||||
| Alliance Data Systems Corp.* | 1,200 | 111,240 | |||||||||
| Amdocs Ltd.* | 11,600 | 314,592 | |||||||||
| Arris Group, Inc.* | 17,900 | 184,370 | |||||||||
| Blackbaud, Inc. | 4,700 | 104,669 | |||||||||
| BMC Software, Inc.* | 6,000 | 231,360 | |||||||||
| CA, Inc. | 14,100 | 273,681 | |||||||||
| CACI International, Inc. - Class A* | 6,000 | 299,640 | |||||||||
| CGI Group, Inc. - Class A* | 8,300 | 156,123 | |||||||||
| Comtech Telecommunications Corp. | 6,000 | 168,540 | |||||||||
| EPIQ Systems, Inc. | 13,000 | 162,890 | |||||||||
| Factset Research Systems, Inc. | 700 | 62,279 | |||||||||
| Fair Isaac Corp. | 8,400 | 183,372 | |||||||||
| Fidelity National Information Services, Inc. | 13,100 | 318,592 | |||||||||
| Fiserv, Inc.* | 2,800 | 142,156 | |||||||||
| Formfactor, Inc.* | 29,900 | 186,277 | |||||||||
| Global Payments, Inc. | 2,400 | 96,936 | |||||||||
| GT Advanced Technologies, Inc.* | 17,500 | 122,850 | |||||||||
| IAC / InterActiveCorp* | 7,300 | 288,715 | |||||||||
| Imation Corp.* | 27,600 | 201,756 | |||||||||
| LSI Corp.* | 51,900 | 268,842 | |||||||||
| Manhattan Associates, Inc.* | 6,400 | 211,712 | |||||||||
| Methode Electronics, Inc. | 19,800 | 147,114 | |||||||||
| Micrel, Inc. | 7,400 | 70,078 | |||||||||
| Microsoft Corp. | 3,300 | 82,137 | |||||||||
| Monolithic Power Systems, Inc.* | 15,500 | 157,790 | |||||||||
| MTS Systems Corp. | 4,700 | 144,008 | |||||||||
| Net 1 UEPS Technologies, Inc.* | 24,100 | 156,650 | |||||||||
| NeuStar, Inc. - Class A* | 13,000 | 326,820 | |||||||||
| Plantronics, Inc. | 5,700 | 162,165 | |||||||||
| Pulse Electronics Corp. | 14,900 | 42,614 | |||||||||
| QLogic Corp.* | 4,500 | 57,060 | |||||||||
| Quest Software, Inc.* | 12,000 | 190,560 | |||||||||
| Research In Motion Ltd.* | 2,300 | 46,690 | |||||||||
| Richardson Electronics Ltd. | 6,200 | 84,382 | |||||||||
| SAIC, Inc.* | 10,800 | 127,548 | |||||||||
| Symantec Corp.* | 23,100 | 376,530 | |||||||||
| Synopsys, Inc.* | 7,700 | 187,572 | |||||||||
| TeleTech Holdings, Inc.* | 5,200 | 79,248 | |||||||||
| Total System Services, Inc. | 4,500 | 76,185 | |||||||||
| Tyler Technologies, Inc.* | 7,400 | 187,072 | |||||||||
| Unisys Corp.* | 8,300 | 130,227 | |||||||||
| United Online, Inc. | 47,800 | 249,994 | |||||||||
| ValueClick, Inc.* | 15,600 | 242,736 | |||||||||
| Websense, Inc.* | 14,600 | 252,580 | |||||||||
| Western Union Co. | 12,500 | 191,125 | |||||||||
| XO Group, Inc.* | 27,100 | 221,407 | |||||||||
| Xyratex Ltd. | 14,800 | 137,196 | |||||||||
| 9,165,434 | |||||||||||
| Shares | Fair Value | ||||||||||
| Financials — 13.6% | |||||||||||
| ACE Ltd. | 4,300 | $ | 260,580 | ||||||||
| Artio Global Investors, Inc. | 30,600 | 243,576 | |||||||||
| Banco Latinoamericano de Comercio Exterior SA - Class E | 7,200 | 109,656 | |||||||||
| Bank of the Ozarks, Inc. | 7,800 | 163,254 | |||||||||
| Chemical Financial Corp. | 8,900 | 136,259 | |||||||||
| Columbia Banking System, Inc. | 7,300 | 104,536 | |||||||||
| Commerce Bancshares, Inc. | 2,700 | 93,825 | |||||||||
| Dime Community Bancshares | 9,400 | 95,222 | |||||||||
| Erie Indemnity Co. - Class A | 3,800 | 270,484 | |||||||||
| Ezcorp, Inc. - Class A* | 4,100 | 117,014 | |||||||||
| FBL Financial Group, Inc. - Class A | 2,900 | 77,198 | |||||||||
| First Citizens BancShares, Inc. - Class A | 500 | 71,770 | |||||||||
| Franklin Resources, Inc. | 1,600 | 153,024 | |||||||||
| Hanover Insurance Group, Inc. (The) | 3,700 | 131,350 | |||||||||
| Home Bancshares, Inc. | 6,100 | 129,442 | |||||||||
| Huntington Bancshares, Inc. | 37,400 | 179,520 | |||||||||
| International Bancshares Corp. | 6,400 | 84,160 | |||||||||
| Janus Capital Group, Inc. | 23,100 | 138,600 | |||||||||
| KeyCorp | 23,400 | 138,762 | |||||||||
| Marsh & McLennan Cos., Inc. | 4,200 | 111,468 | |||||||||
| Meadowbrook Insurance Group, Inc. | 10,300 | 91,773 | |||||||||
| Moody's Corp. | 3,600 | 109,620 | |||||||||
| NASDAQ OMX Group, Inc. (The)* | 3,800 | 87,932 | |||||||||
| National Financial Partners Corp.* | 12,900 | 141,126 | |||||||||
| National Health Investors, Inc. REIT | 6,900 | 290,697 | |||||||||
| Old National Bancorp | 15,400 | 143,528 | |||||||||
| Oriental Financial Group, Inc. | 21,100 | 204,037 | |||||||||
| People's United Financial, Inc. | 15,900 | 181,260 | |||||||||
| PNC Financial Services Group, Inc. | 2,500 | 120,475 | |||||||||
| Popular, Inc.* | 58,100 | 87,150 | |||||||||
| PS Business Parks, Inc. REIT | 4,500 | 222,930 | |||||||||
| Public Storage REIT | 2,900 | 322,915 | |||||||||
| Retail Opportunity Investments Corp. REIT | 14,000 | 155,120 | |||||||||
| T Rowe Price Group, Inc. | 4,300 | 205,411 | |||||||||
| Tower Group, Inc. | 7,400 | 169,164 | |||||||||
| Umpqua Holdings Corp. | 25,500 | 224,145 | |||||||||
| Waddell & Reed Financial, Inc. - Class A | 3,200 | 80,032 | |||||||||
| Washington Federal, Inc. | 10,800 | 137,592 | |||||||||
| WesBanco, Inc. | 10,300 | 178,293 | |||||||||
| 5,962,900 | |||||||||||
| Health Care — 12.7% | |||||||||||
| Aetna, Inc. | 9,300 | 338,055 | |||||||||
| Allos Therapeutics, Inc.* | 53,400 | 98,256 | |||||||||
| AMAG Pharmaceuticals, Inc.* | 6,400 | 94,464 | |||||||||
| AmerisourceBergen Corp. | 9,100 | 339,157 | |||||||||
| Auxilium Pharmaceuticals, Inc.* | 9,800 | 146,902 | |||||||||
| Charles River Laboratories International, Inc.* | 9,900 | 283,338 | |||||||||
| CIGNA Corp. | 4,300 | 180,342 | |||||||||
| Community Health Systems, Inc.* | 15,600 | 259,584 | |||||||||
| Greatbatch, Inc.* | 13,200 | 264,132 | |||||||||
| Halozyme Therapeutics, Inc.* | 25,000 | 153,500 | |||||||||
| Health Net, Inc.* | 13,400 | 317,714 | |||||||||
181
Touchstone Market Neutral Equity Fund (Continued)
| Common Stocks — 86.0% (Continued) | Shares | Fair Value | |||||||||
| Hi-Tech Pharmacal Co., Inc.* | 3,300 | $ | 110,880 | ||||||||
| Immunomedics, Inc.* | 39,600 | 126,720 | |||||||||
| Kensey Nash Corp.* | 6,500 | 159,250 | |||||||||
| Luminex Corp.* | 11,400 | 252,738 | |||||||||
| Magellan Health Services, Inc.* | 5,000 | 241,500 | |||||||||
| McKesson Corp. | 2,500 | 181,750 | |||||||||
| Medco Health Solutions, Inc.* | 2,300 | 107,847 | |||||||||
| Myriad Genetics, Inc.* | 15,900 | 297,966 | |||||||||
| Nordion, Inc. | 24,400 | 215,208 | |||||||||
| PDL BioPharma, Inc. | 19,000 | 105,450 | |||||||||
| Quidel Corp.* | 15,800 | 258,646 | |||||||||
| Targacept, Inc.* | 9,800 | 147,000 | |||||||||
| Techne Corp. | 2,000 | 136,020 | |||||||||
| Thoratec Corp.* | 6,200 | 202,368 | |||||||||
| WellCare Health Plans, Inc.* | 4,100 | 155,718 | |||||||||
| WellPoint, Inc. | 4,300 | 280,704 | |||||||||
| XenoPort, Inc.* | 18,400 | 108,560 | |||||||||
| 5,563,769 | |||||||||||
| Consumer Discretionary — 12.4% | |||||||||||
| Aaron's, Inc. | 9,900 | 249,975 | |||||||||
| Aeropostale, Inc.* | 20,600 | 222,686 | |||||||||
| American Public Education, Inc.* | 5,700 | 193,800 | |||||||||
| ANN INC* | 6,100 | 139,324 | |||||||||
| Apollo Group, Inc. - Class A* | 4,400 | 174,284 | |||||||||
| AutoZone, Inc.* | 700 | 223,433 | |||||||||
| Bebe Stores, Inc. | 18,300 | 122,976 | |||||||||
| Capella Education Co.* | 7,500 | 212,850 | |||||||||
| Coach, Inc. | 6,600 | 342,078 | |||||||||
| DIRECTV Group, Inc. - Class A* | 9,400 | 397,150 | |||||||||
| Discovery Communications, Inc. - Class A* | 5,100 | 191,862 | |||||||||
| Goodyear Tire & Rubber Co. (The)* | 16,400 | 165,476 | |||||||||
| HOT Topic, Inc. | 16,600 | 126,658 | |||||||||
| International Game Technology | 13,800 | 200,514 | |||||||||
| ITT Educational Services, Inc.* | 2,600 | 149,708 | |||||||||
| Ltd. Brands, Inc. | 3,900 | 150,189 | |||||||||
| Men's Wearhouse, Inc. (The) | 4,600 | 119,968 | |||||||||
| Movado Group, Inc. | 10,700 | 130,326 | |||||||||
| Nutrisystem, Inc. | 13,200 | 159,852 | |||||||||
| Papa John's International, Inc.* | 7,500 | 228,000 | |||||||||
| RadioShack Corp. | 13,500 | 156,870 | |||||||||
| Scholastic Corp. | 6,700 | 187,801 | |||||||||
| Strayer Education, Inc. | 2,700 | 207,009 | |||||||||
| Sturm Ruger & Co., Inc. | 7,700 | 200,046 | |||||||||
| True Religion Apparel, Inc.* | 7,700 | 207,592 | |||||||||
| Vail Resorts, Inc. | 7,800 | 294,762 | |||||||||
| Wyndham Worldwide Corp. | 10,000 | 285,100 | |||||||||
| 5,440,289 | |||||||||||
| Industrials — 9.6% | |||||||||||
| Alliant Techsystems, Inc. | 5,400 | 294,354 | |||||||||
| Apogee Enterprises, Inc. | 33,200 | 285,188 | |||||||||
| Applied Industrial Technologies, Inc. | 8,500 | 230,860 | |||||||||
| Chicago Bridge & Iron Co. NV | 3,700 | 105,931 | |||||||||
| Copart, Inc.* | 4,000 | 156,480 | |||||||||
| Shares | Fair Value | ||||||||||
| Dun & Bradstreet Corp. | 1,400 | $ | 85,764 | ||||||||
| Dycom Industries, Inc.* | 11,800 | 180,540 | |||||||||
| EMCOR Group, Inc.* | 7,300 | 148,409 | |||||||||
| Equifax, Inc. | 4,100 | 126,034 | |||||||||
| Fluor Corp. | 3,300 | 153,615 | |||||||||
| Foster Wheeler AG* | 10,500 | 186,795 | |||||||||
| Gardner Denver, Inc. | 2,600 | 165,230 | |||||||||
| Graco, Inc. | 1,400 | 47,796 | |||||||||
| JB Hunt Transport Services, Inc. | 4,300 | 155,316 | |||||||||
| Kansas City Southern* | 3,100 | 154,876 | |||||||||
| KBR, Inc. | 11,600 | 274,108 | |||||||||
| Knoll, Inc. | 6,900 | 94,530 | |||||||||
| L-3 Communications Holdings, Inc. | 1,700 | 105,349 | |||||||||
| Layne Christensen Co.* | 4,100 | 94,710 | |||||||||
| Lockheed Martin Corp. | 4,000 | 290,560 | |||||||||
| Raytheon Co. | 5,300 | 216,611 | |||||||||
| Toro Co. | 4,500 | 221,715 | |||||||||
| URS Corp.* | 4,000 | 118,640 | |||||||||
| WABCO Holdings, Inc.* | 2,700 | 102,222 | |||||||||
| Werner Enterprises, Inc. | 10,600 | 220,798 | |||||||||
| 4,216,431 | |||||||||||
| Energy — 7.9% | |||||||||||
| Chevron Corp. | 2,000 | 185,040 | |||||||||
| ConocoPhillips | 3,500 | 221,620 | |||||||||
| CVR Energy, Inc.* | 2,300 | 48,622 | |||||||||
| Exxon Mobil Corp. | 3,100 | 225,153 | |||||||||
| Gulf Island Fabrication, Inc. | 5,100 | 105,468 | |||||||||
| Helix Energy Solutions Group, Inc.* | 8,100 | 106,110 | |||||||||
| Hess Corp. | 4,100 | 215,086 | |||||||||
| Marathon Oil Corp. | 6,300 | 135,954 | |||||||||
| Marathon Petroleum Corp. | 3,150 | 85,239 | |||||||||
| Matrix Service Co.* | 16,400 | 139,564 | |||||||||
| Murphy Oil Corp. | 6,700 | 295,872 | |||||||||
| Oceaneering International, Inc. | 6,400 | 226,176 | |||||||||
| Patterson-UTI Energy, Inc. | 15,400 | 267,036 | |||||||||
| Pioneer Drilling Co.* | 10,700 | 76,826 | |||||||||
| Superior Energy Services, Inc.* | 3,300 | 86,592 | |||||||||
| Tesoro Corp.* | 6,800 | 132,396 | |||||||||
| Tetra Technologies, Inc.* | 19,800 | 152,856 | |||||||||
| Unit Corp.* | 7,100 | 262,132 | |||||||||
| Vaalco Energy, Inc.* | 33,600 | 163,296 | |||||||||
| Valero Energy Corp. | 18,500 | 328,930 | |||||||||
| 3,459,968 | |||||||||||
| Materials — 3.3% | |||||||||||
| Airgas, Inc. | 4,500 | 287,190 | |||||||||
| Cabot Corp. | 3,400 | 84,252 | |||||||||
| Eastman Chemical Co. | 2,400 | 164,472 | |||||||||
| Freeport-McMoRan Copper & Gold, Inc. | 5,300 | 161,385 | |||||||||
| HB Fuller Co. | 13,400 | 244,148 | |||||||||
| Minerals Technologies, Inc. | 2,600 | 128,102 | |||||||||
| Myers Industries, Inc. | 21,100 | 214,165 | |||||||||
| Packaging Corp of America | 6,300 | 146,790 | |||||||||
| Schweitzer-Mauduit International, Inc. | 700 | 39,109 | |||||||||
| 1,469,613 | |||||||||||
182
Touchstone Market Neutral Equity Fund (Continued)
| Common Stocks — 86.0% (Continued) | Shares | Fair Value | |||||||||
| Utilities — 3.0% | |||||||||||
| Alliant Energy Corp. | 5,900 | $ | 228,212 | ||||||||
| China Natural Gas, Inc.* § | 9,400 | 18,048 | |||||||||
| Edison International | 6,600 | 252,450 | |||||||||
| Entergy Corp. | 4,800 | 318,192 | |||||||||
| Public Service Enterprise Group, Inc. | 6,700 | 223,579 | |||||||||
| Sempra Energy | 5,800 | 298,700 | |||||||||
| 1,339,181 | |||||||||||
| Consumer Staples — 2.0% | |||||||||||
| Cal-Maine Foods, Inc. | 2,800 | 88,004 | |||||||||
| Dr Pepper Snapple Group, Inc. | 4,200 | 162,876 | |||||||||
| Herbalife Ltd. | 4,600 | 246,560 | |||||||||
| Lancaster Colony Corp. | 3,900 | 237,939 | |||||||||
| Smart Balance, Inc.* | 28,300 | 166,970 | |||||||||
| 902,349 | |||||||||||
| Telecommunication Services — 0.6% | |||||||||||
| Cbeyond, Inc.* | 16,600 | 117,196 | |||||||||
| NTELOS Holdings Corp. | 7,800 | 138,294 | |||||||||
| 255,490 | |||||||||||
| Total Common Stocks | $ | 37,775,424 | |||||||||
| Investment Fund — 0.7% | |||||||||||
| Touchstone Institutional Money Market Fund^ | 294,473 | 294,473 | |||||||||
| Total Long Positions (Cost $40,896,319) | $ | 38,069,897 | |||||||||
| Securities Sold Short — (85.8%) | |||||||||||
| Common Stocks — (85.8%) | |||||||||||
| Consumer Staples — (2.7%) | |||||||||||
| Archer-Daniels-Midland Co. | (5,600 | ) | (138,936 | ) | |||||||
| Bunge Ltd. | (2,500 | ) | (145,725 | ) | |||||||
| Imperial Sugar Co. | (20,400 | ) | (131,376 | ) | |||||||
| Molson Coors Brewing Co. - Class B | (4,900 | ) | (194,089 | ) | |||||||
| Sanderson Farms, Inc. | (7,200 | ) | (342,000 | ) | |||||||
| United Natural Foods, Inc.* | (3,300 | ) | (122,232 | ) | |||||||
| Wal-Mart Stores, Inc. | (2,300 | ) | (119,370 | ) | |||||||
| (1,193,728 | ) | ||||||||||
| Utilities — (3.6%) | |||||||||||
| Atlantic Power Corp. | (16,400 | ) | (232,716 | ) | |||||||
| Consolidated Edison, Inc. | (6,100 | ) | (347,822 | ) | |||||||
| Enbridge, Inc. | (4,000 | ) | (127,720 | ) | |||||||
| Northwest Natural Gas Co. | (4,500 | ) | (198,450 | ) | |||||||
| ONEOK, Inc. | (2,900 | ) | (191,516 | ) | |||||||
| Westar Energy, Inc. | (12,900 | ) | (340,818 | ) | |||||||
| WGL Holdings, Inc. | (3,100 | ) | (121,117 | ) | |||||||
| (1,560,159 | ) | ||||||||||
| Materials — (4.2%) | |||||||||||
| Balchem Corp. | (7,100 | ) | (264,901 | ) | |||||||
| Eagle Materials, Inc. | (15,600 | ) | (259,740 | ) | |||||||
| International Flavors & Fragrances, Inc. | (6,300 | ) | (354,186 | ) | |||||||
| Shares | Fair Value | ||||||||||
| Kraton Performance Polymers, Inc.* | (7,900 | ) | $ | (127,822 | ) | ||||||
| Kronos Worldwide, Inc. | (6,200 | ) | (99,696 | ) | |||||||
| Martin Marietta Materials, Inc. | (3,900 | ) | (246,558 | ) | |||||||
| STR Holdings, Inc.* | (19,200 | ) | (155,712 | ) | |||||||
| Texas Industries, Inc. | (2,800 | ) | (88,872 | ) | |||||||
| Vulcan Materials Co. | (9,300 | ) | (256,308 | ) | |||||||
| (1,853,795 | ) | ||||||||||
| Energy — (7.5%) | |||||||||||
| Abraxas Petroleum Corp.* | (27,600 | ) | (72,864 | ) | |||||||
| Cameco Corp. | (9,100 | ) | (166,712 | ) | |||||||
| Carrizo Oil & Gas, Inc.* | (8,100 | ) | (174,555 | ) | |||||||
| Cimarex Energy Co. | (1,700 | ) | (94,690 | ) | |||||||
| Cobalt International Energy, Inc.* | (28,500 | ) | (219,735 | ) | |||||||
| Continental Resources, Inc.* | (1,900 | ) | (91,903 | ) | |||||||
| El Paso Corp. | (6,300 | ) | (110,124 | ) | |||||||
| Encana Corp. | (7,700 | ) | (147,917 | ) | |||||||
| Forest Oil Corp.* | (16,700 | ) | (240,480 | ) | |||||||
| FX Energy, Inc.* | (48,200 | ) | (199,066 | ) | |||||||
| Georesources, Inc.* | (5,000 | ) | (88,950 | ) | |||||||
| Golar LNG Ltd. | (4,500 | ) | (143,010 | ) | |||||||
| Gulfport Energy Corp.* | (5,800 | ) | (140,244 | ) | |||||||
| Hyperdynamics Corp.* | (61,300 | ) | (226,810 | ) | |||||||
| Newfield Exploration Co.* | (2,400 | ) | (95,256 | ) | |||||||
| Northern Oil and Gas, Inc.* | (9,600 | ) | (186,144 | ) | |||||||
| Pioneer Natural Resources Co. | (1,600 | ) | (105,232 | ) | |||||||
| Resolute Energy Corp.* | (10,500 | ) | (119,280 | ) | |||||||
| SandRidge Energy, Inc.* | (16,100 | ) | (89,516 | ) | |||||||
| Seadrill Ltd. | (7,800 | ) | (214,734 | ) | |||||||
| Swift Energy Co.* | (2,800 | ) | (68,152 | ) | |||||||
| TransCanada Corp. | (7,400 | ) | (299,626 | ) | |||||||
| (3,295,000 | ) | ||||||||||
| Industrials — (10.7%) | |||||||||||
| ABM Industries, Inc. | (15,200 | ) | (289,712 | ) | |||||||
| Alexander & Baldwin, Inc. | (4,700 | ) | (171,691 | ) | |||||||
| American Science & Engineering, Inc. | (3,400 | ) | (207,570 | ) | |||||||
| Brady Corp. - Class A | (7,300 | ) | (192,939 | ) | |||||||
| Canadian Pacific Railway Ltd. | (3,500 | ) | (168,315 | ) | |||||||
| Caterpillar, Inc. | (1,500 | ) | (110,760 | ) | |||||||
| DigitalGlobe, Inc.* | (13,300 | ) | (258,419 | ) | |||||||
| EnerNOC, Inc.* | (20,200 | ) | (181,800 | ) | |||||||
| GATX Corp. | (5,400 | ) | (167,346 | ) | |||||||
| General Electric Co. | (5,500 | ) | (83,820 | ) | |||||||
| Geo Group, Inc. (The)* | (15,000 | ) | (278,400 | ) | |||||||
| IHS, Inc. - Class A* | (4,100 | ) | (306,721 | ) | |||||||
| Interface, Inc. - Class A | (9,400 | ) | (111,484 | ) | |||||||
| KAR Auction Services, Inc.* | (12,600 | ) | (152,586 | ) | |||||||
| Kforce, Inc.* | (15,600 | ) | (153,036 | ) | |||||||
| Lennox International, Inc. | (3,200 | ) | (82,496 | ) | |||||||
| Pall Corp. | (2,100 | ) | (89,040 | ) | |||||||
| Precision Castparts Corp. | (2,200 | ) | (342,012 | ) | |||||||
| Republic Airways Holdings, Inc.* | (34,700 | ) | (98,201 | ) | |||||||
| Ritchie Bros Auctioneers, Inc. | (13,200 | ) | (266,508 | ) | |||||||
| Stericycle, Inc.* | (3,700 | ) | (298,664 | ) | |||||||
183
Touchstone Market Neutral Equity Fund (Continued)
| Securities Sold Short — (85.8%) (Continued) | Shares | Fair Value | |||||||||
| UTi Worldwide, Inc. | (12,300 | ) | $ | (160,392 | ) | ||||||
| Waste Management, Inc. | (10,200 | ) | (332,112 | ) | |||||||
| Westport Innovations Inc.* | (6,000 | ) | (173,580 | ) | |||||||
| (4,677,604 | ) | ||||||||||
| Health Care — (12.0%) | |||||||||||
| Bio-Reference Labs, Inc.* | (6,000 | ) | (110,460 | ) | |||||||
| Brookdale Senior Living, Inc.* | (20,900 | ) | (262,086 | ) | |||||||
| Cerner Corp.* | (5,400 | ) | (370,008 | ) | |||||||
| Conceptus, Inc.* | (24,800 | ) | (259,656 | ) | |||||||
| DENTSPLY International, Inc. | (3,700 | ) | (113,553 | ) | |||||||
| Edwards Lifesciences Corp.* | (4,200 | ) | (299,376 | ) | |||||||
| Emeritus Corp.* | (17,000 | ) | (239,700 | ) | |||||||
| Healthsouth Corp.* | (19,400 | ) | (289,642 | ) | |||||||
| HeartWare International, Inc.* | (3,300 | ) | (212,553 | ) | |||||||
| HMS Holdings Corp.* | (9,000 | ) | (219,510 | ) | |||||||
| Landauer, Inc. | (5,300 | ) | (262,562 | ) | |||||||
| MAKO Surgical Corp.* | (7,200 | ) | (246,384 | ) | |||||||
| Merit Medical Systems, Inc.* | (7,100 | ) | (93,294 | ) | |||||||
| Mettler-Toledo International, Inc.* | (1,600 | ) | (223,936 | ) | |||||||
| NuVasive, Inc.* | (10,500 | ) | (179,235 | ) | |||||||
| NxStage Medical, Inc.* | (7,100 | ) | (148,106 | ) | |||||||
| Optimer Pharmaceuticals, Inc.* | (16,900 | ) | (233,896 | ) | |||||||
| Pharmasset, Inc.* | (1,000 | ) | (82,370 | ) | |||||||
| Qiagen NV* | (5,700 | ) | (78,831 | ) | |||||||
| Quality Systems, Inc. | (3,100 | ) | (300,700 | ) | |||||||
| Seattle Genetics, Inc.* | (12,200 | ) | (232,532 | ) | |||||||
| SIGA Technologies, Inc.* | (23,800 | ) | (77,826 | ) | |||||||
| St. Jude Medical, Inc. | (5,500 | ) | (199,045 | ) | |||||||
| Sunrise Senior Living, Inc.* | (48,600 | ) | (225,018 | ) | |||||||
| Theravance, Inc.* | (9,300 | ) | (187,302 | ) | |||||||
| Volcano Corp.* | (4,600 | ) | (136,298 | ) | |||||||
| (5,283,879 | ) | ||||||||||
| Consumer Discretionary — (12.0%) | |||||||||||
| Amazon.com, Inc.* | (1,100 | ) | (237,853 | ) | |||||||
| Brown Shoe Co., Inc. | (22,000 | ) | (156,640 | ) | |||||||
| Cabela's, Inc.* | (6,600 | ) | (135,234 | ) | |||||||
| Callaway Golf Co. | (23,000 | ) | (118,910 | ) | |||||||
| CarMax, Inc.* | (13,600 | ) | (324,360 | ) | |||||||
| Carnival Corp. | (10,800 | ) | (327,240 | ) | |||||||
| Cinemark Holdings, Inc. | (6,100 | ) | (115,168 | ) | |||||||
| Core-Mark Holding Co., Inc.* | (6,500 | ) | (199,095 | ) | |||||||
| Cracker Barrel Old Country Store, Inc. | (5,200 | ) | (208,416 | ) | |||||||
| Dollar General Corp.* | (4,100 | ) | (154,816 | ) | |||||||
| Fred's, Inc. - Class A | (18,200 | ) | (194,012 | ) | |||||||
| Gaylord Entertainment Co.* | (3,800 | ) | (73,492 | ) | |||||||
| G-III Apparel Group Ltd.* | (5,700 | ) | (130,302 | ) | |||||||
| Hanesbrands, Inc.* | (12,100 | ) | (302,621 | ) | |||||||
| Imax Corp.* | (7,400 | ) | (107,152 | ) | |||||||
| Johnson Controls, Inc. | (3,800 | ) | (100,206 | ) | |||||||
| K12, Inc.* | (5,200 | ) | (132,392 | ) | |||||||
| KB Home | (26,000 | ) | (152,360 | ) | |||||||
| K-Swiss, Inc. - Class A* | (10,300 | ) | (43,775 | ) | |||||||
| Lumber Liquidators Holdings, Inc.* | (11,300 | ) | (170,630 | ) | |||||||
| Shares | Fair Value | ||||||||||
| MDC Holdings, Inc. | (14,300 | ) | $ | (242,242 | ) | ||||||
| Meritage Homes Corp.* | (2,600 | ) | (39,364 | ) | |||||||
| Orient-Express Hotels Ltd. - Class A* | (9,500 | ) | (65,645 | ) | |||||||
| PEP Boys-Manny Moe & Jack | (15,000 | ) | (148,050 | ) | |||||||
| Royal Caribbean Cruises Ltd. | (8,300 | ) | (179,612 | ) | |||||||
| Ruby Tuesday, Inc.* | (31,900 | ) | (228,404 | ) | |||||||
| Ryland Group, Inc. | (18,500 | ) | (197,025 | ) | |||||||
| Skechers U.S.A., Inc. - Class A* | (14,100 | ) | (197,823 | ) | |||||||
| Standard Pacific Corp.* | (50,800 | ) | (125,476 | ) | |||||||
| Stein Mart, Inc. | (34,400 | ) | (215,000 | ) | |||||||
| Walt Disney Co. (The) | (3,600 | ) | (108,576 | ) | |||||||
| Winnebago Industries, Inc.* | (16,800 | ) | (116,256 | ) | |||||||
| (5,248,147 | ) | ||||||||||
| Financials — (15.0%) | |||||||||||
| Argo Group International Holdings Ltd. | (6,900 | ) | (195,753 | ) | |||||||
| Aspen Insurance Holdings Ltd. | (9,900 | ) | (228,096 | ) | |||||||
| Associated Banc-Corp. | (11,400 | ) | (106,020 | ) | |||||||
| BioMed Realty Trust, Inc. REIT | (8,000 | ) | (132,560 | ) | |||||||
| Capitol Federal Financial, Inc. | (28,200 | ) | (297,792 | ) | |||||||
| Cincinnati Financial Corp. | (9,300 | ) | (244,869 | ) | |||||||
| Corporate Office Properties Trust REIT | (8,100 | ) | (176,418 | ) | |||||||
| Cullen/Frost Bankers, Inc. | (3,300 | ) | (151,338 | ) | |||||||
| First Financial Bankshares, Inc. | (9,900 | ) | (258,984 | ) | |||||||
| Flagstone Reinsurance Holdings SA | (30,300 | ) | (234,825 | ) | |||||||
| Greenlight Capital Re Ltd. - Class A* | (12,900 | ) | (267,546 | ) | |||||||
| Hilltop Holdings, Inc.* | (21,600 | ) | (155,736 | ) | |||||||
| Hudson City Bancorp, Inc. | (29,100 | ) | (164,706 | ) | |||||||
| Iberiabank Corp. | (5,900 | ) | (277,654 | ) | |||||||
| Jefferies Group, Inc. | (24,100 | ) | (299,081 | ) | |||||||
| KBW, Inc. | (19,100 | ) | (263,389 | ) | |||||||
| Markel Corp.* | (300 | ) | (107,139 | ) | |||||||
| Morgan Stanley | (4,600 | ) | (62,100 | ) | |||||||
| National Retail Properties, Inc. REIT | (11,100 | ) | (298,257 | ) | |||||||
| Navigators Group, Inc. (The)* | (2,600 | ) | (112,320 | ) | |||||||
| New York Community Bancorp, Inc. | (14,700 | ) | (174,930 | ) | |||||||
| Northwest Bancshares, Inc. | (23,300 | ) | (277,503 | ) | |||||||
| Old Republic International Corp. | (33,100 | ) | (295,252 | ) | |||||||
| Oritani Financial Corp. | (14,100 | ) | (181,326 | ) | |||||||
| PartnerRe Ltd. | (3,700 | ) | (193,399 | ) | |||||||
| Platinum Underwriters Holdings Ltd. | (8,500 | ) | (261,375 | ) | |||||||
| Plum Creek Timber Co., Inc. REIT | (8,600 | ) | (298,506 | ) | |||||||
| Stifel Financial Corp.* | (2,500 | ) | (66,400 | ) | |||||||
| Synovus Financial Corp. | (72,700 | ) | (77,789 | ) | |||||||
| TCF Financial Corp. | (19,100 | ) | (174,956 | ) | |||||||
| TFS Financial Corp.* | (16,600 | ) | (134,958 | ) | |||||||
| Weyerhaeuser Co. REIT | (21,900 | ) | (340,545 | ) | |||||||
| Wintrust Financial Corp. | (3,300 | ) | (85,173 | ) | |||||||
| (6,596,695 | ) | ||||||||||
| Information Technology — (18.1%) | |||||||||||
| AOL, Inc.* | (16,900 | ) | (202,800 | ) | |||||||
| Aspen Technology, Inc.* | (9,400 | ) | (143,538 | ) | |||||||
| Avid Technology, Inc.* | (16,600 | ) | (128,484 | ) | |||||||
| BroadSoft, Inc.* | (7,200 | ) | (218,520 | ) | |||||||
184
Touchstone Market Neutral Equity Fund (Continued)
| Securities Sold Short — (85.8%) (Continued) | Shares | Fair Value | |||||||||
| Cabot Microelectronics Corp.* | (3,800 | ) | $ | (130,682 | ) | ||||||
| Cavium, Inc.* | (9,300 | ) | (251,193 | ) | |||||||
| Citrix Systems, Inc.* | (1,900 | ) | (103,607 | ) | |||||||
| Cognizant Technology Solutions Corp. - Class A* | (2,700 | ) | (169,290 | ) | |||||||
| Computer Sciences Corp. | (7,800 | ) | (209,430 | ) | |||||||
| comScore, Inc.* | (16,200 | ) | (273,294 | ) | |||||||
| Concur Technologies, Inc.* | (3,200 | ) | (119,104 | ) | |||||||
| Corning, Inc. | (9,100 | ) | (112,476 | ) | |||||||
| Cree, Inc.* | (2,000 | ) | (51,960 | ) | |||||||
| DemandTec, Inc.* | (43,400 | ) | (283,836 | ) | |||||||
| Digital River, Inc.* | (4,400 | ) | (91,212 | ) | |||||||
| Electronic Arts, Inc.* | (6,100 | ) | (124,745 | ) | |||||||
| Equinix, Inc.* | (700 | ) | (62,181 | ) | |||||||
| Fairchild Semiconductor International, Inc.* | (9,600 | ) | (103,680 | ) | |||||||
| FEI Co.* | (5,300 | ) | (158,788 | ) | |||||||
| Fortinet, Inc.* | (9,300 | ) | (156,240 | ) | |||||||
| FSI International, Inc.* | (27,700 | ) | (52,353 | ) | |||||||
| Informatica Corp.* | (5,300 | ) | (217,035 | ) | |||||||
| Ixia* | (24,000 | ) | (184,080 | ) | |||||||
| Kemet Corp.* | (16,700 | ) | (119,405 | ) | |||||||
| Limelight Networks, Inc.* | (117,900 | ) | (278,244 | ) | |||||||
| LogMeIn, Inc.* | (4,100 | ) | (136,161 | ) | |||||||
| Microchip Technology, Inc. | (9,800 | ) | (304,878 | ) | |||||||
| Micron Technology, Inc.* | (11,800 | ) | (59,472 | ) | |||||||
| MKS Instruments, Inc. | (4,600 | ) | (99,866 | ) | |||||||
| National Instruments Corp. | (8,600 | ) | (196,596 | ) | |||||||
| NetSuite, Inc.* | (4,200 | ) | (113,442 | ) | |||||||
| Rackspace Hosting, Inc.* | (2,000 | ) | (68,280 | ) | |||||||
| RightNow Technologies, Inc.* | (8,500 | ) | (280,925 | ) | |||||||
| Rosetta Stone, Inc.* | (8,200 | ) | (75,030 | ) | |||||||
| Rovi Corp.* | (4,300 | ) | (184,814 | ) | |||||||
| Salesforce.com, Inc.* | (2,900 | ) | (331,412 | ) | |||||||
| Sina Corp.* | (2,200 | ) | (157,542 | ) | |||||||
| Smith Micro Software, Inc.* | (116,900 | ) | (177,688 | ) | |||||||
| Sourcefire, Inc.* | (4,600 | ) | (123,096 | ) | |||||||
| SuccessFactors, Inc.* | (14,700 | ) | (337,953 | ) | |||||||
| Sycamore Networks, Inc. | (9,500 | ) | (171,475 | ) | |||||||
| Synchronoss Technologies, Inc.* | (7,700 | ) | (191,807 | ) | |||||||
| TriQuint Semiconductor, Inc.* | (22,500 | ) | (112,950 | ) | |||||||
| Ultimate Software Group, Inc.* | (4,600 | ) | (214,912 | ) | |||||||
| Universal Display Corp.* | (5,700 | ) | (273,258 | ) | |||||||
| Viasat, Inc.* | (8,400 | ) | (279,804 | ) | |||||||
| VMware, Inc. - Class A* | (1,600 | ) | (128,608 | ) | |||||||
| (7,966,146 | ) | ||||||||||
| Total Common Stocks | $ | (37,675,153 | ) | ||||||||
| Total Securities Sold Short (Cost ($42,654,642)) | $ | (37,675,153 | ) | ||||||||
| Total Investment Securities — 0.9% (Cost ($1,758,323)) | $ | 394,744 | |||||||||
| Cash Collateral for Securities Sold Short — 99.3% | 43,581,634 | ||||||||||
| Liabilities in Excess of Other Assets — (0.2)% | (74,661 | ) | |||||||||
| Net Assets — 100.0% | $ | 43,901,717 | |||||||||
* Non-income producing security.
^ Affiliated Fund, sub-advised by Fort Washington Investment Advisors, Inc. See Note 4.
§ Security is being fair value by a valuation committee under the direction of the Board of Trustees. At September 30, 2011, the value of this security amounted to $18,048 or 0.04% of net assets.
Portfolio Abbreviations:
REIT – Real Estate Investment Trust
Other Information:
The inputs or methodology used for valuing securities may not be an indication of the risk associated with investing in those securities. For more information on valuation inputs, and their aggregation into the levels used in the table below, please refer to the security valuation section in the accompanying notes to financial statements.
Valuation Inputs at Reporting Date:
| Description | Level 1 | Level 2 | Level 3 | Total | |||||||||||||||
| Collateral for Securities Sold Short | $ | — | $ | 43,581,634 | $ | — | $ | 43,581,634 | |||||||||||
| Investment Fund | 294,473 | — | — | 294,473 | |||||||||||||||
| Common Stocks | 82,223 | — | 18,048 | 100,271 | |||||||||||||||
| $ | 43,976,378 | ||||||||||||||||||
185
Touchstone Market Neutral Equity Fund (Continued)
Level 3 Rollforward Disclosure
The following is a rollforward of the Fund's investments that were valued using unobservable inputs for the year ended September 30, 2011:
Measurements Using Unobservable Inputs (Level 3)
| Assets | Common Stock | Total | |||||||||
| Beginning balance | $ | — | $ | — | |||||||
| Purchases | 133,156 | 133,156 | |||||||||
| Issuances | — | — | |||||||||
| Sales | (48,437 | ) | (48,437 | ) | |||||||
| Settlements | — | — | |||||||||
| Accrued discounts (premiums) | — | — | |||||||||
| Total realized gain (loss) | (34,852 | ) | (34,852 | ) | |||||||
| Net change in unrealized appreciation/depreciation | (31,819 | ) | (31,819 | ) | |||||||
| Net transfers into Level 3 | — | — | |||||||||
| Net transfers out of Level 3 | — | — | |||||||||
| Ending balance | $ | 18,048 | $ | 18,048 | |||||||
The change in unrealized appreciation/depreciation relating to the Level 3 investments held at September 30, 2011 was ($31,819).
See accompanying notes to financial statements.
186
Portfolio of Investments
Touchstone Merger Arbitrage Fund – September 30, 2011
| Preferred Stocks — 2.6% | Shares | Fair Value | |||||||||
| Financials — 2.6% | |||||||||||
| Countrywide Capital V | 5,600 | $ | 107,520 | ||||||||
| GMAC Capital Trust I, Series 2 | 3,500 | 63,875 | |||||||||
| Total Preferred Stocks | $ | 171,395 | |||||||||
| Common Stocks — 80.4% | |||||||||||
| Health Care — 16.2% | |||||||||||
| Afexa Life Sciences, Inc.* | 86,700 | 71,154 | |||||||||
| Allied Healthcare International, Inc.* | 31,100 | 119,424 | |||||||||
| American Medical Alert Corp.* | 16,200 | 135,917 | |||||||||
| Caliper Life Sciences, Inc.* | 15,900 | 166,473 | |||||||||
| Cephalon, Inc.* | 2,150 | 173,504 | |||||||||
| Continucare Corp.* | 19,900 | 126,962 | |||||||||
| Emdeon, Inc. - Class A* | 3,840 | 72,154 | |||||||||
| Kinetic Concepts, Inc.* | 1,150 | 75,774 | |||||||||
| Orchid Cellmark, Inc.* | 51,740 | 138,663 | |||||||||
| 1,080,025 | |||||||||||
| Information Technology — 13.2% | |||||||||||
| Advanced Analogic Technologies, Inc.* | 18,650 | 80,755 | |||||||||
| Blackboard, Inc.* | 1,650 | 73,689 | |||||||||
| Motorola Mobility Holdings, Inc.* | 3,900 | 147,342 | |||||||||
| Ness Technologies, Inc.* | 10,000 | 76,600 | |||||||||
| Netlogic Microsystems, Inc.* | 2,900 | 139,519 | |||||||||
| Renaissance Learning, Inc. | 4,440 | 74,503 | |||||||||
| S1 Corp.* | 8,750 | 80,238 | |||||||||
| Varian Semiconductor Equipment Associates, Inc.* | 2,500 | 152,874 | |||||||||
| Zarlink Semiconductor, Inc.* | 14,580 | 54,967 | |||||||||
| 880,487 | |||||||||||
| Financials — 10.0% | |||||||||||
| Abington Bancorp, Inc. | 9,400 | 67,680 | |||||||||
| Brooklyn Federal Bancorp, Inc.* | 70,053 | 53,941 | |||||||||
| Center Financial Corp.* | 13,600 | 63,784 | |||||||||
| FPIC Insurance Group, Inc.* | 3,750 | 156,900 | |||||||||
| Harleysville Group, Inc. | 2,300 | 135,378 | |||||||||
| Penn Millers Holding Corp.* | 9,500 | 190,855 | |||||||||
| 668,538 | |||||||||||
| Industrials — 11.2% | |||||||||||
| Ameron International Corp. | 2,500 | 212,350 | |||||||||
| APAC Customer Services, Inc.* | 7,750 | 66,030 | |||||||||
| Dollar Thrifty Automotive Group, Inc.* | 2,150 | 121,045 | |||||||||
| Goodrich Corp. | 1,900 | 229,292 | |||||||||
| ITT Corp. | 1,250 | 52,500 | |||||||||
| M&F Worldwide Corp.* | 2,700 | 66,474 | |||||||||
| 747,691 | |||||||||||
| Utilities — 10.1% | |||||||||||
| Central Vermont Public Service Corp. | 5,050 | 177,811 | |||||||||
| DPL, Inc. | 6,900 | 207,965 | |||||||||
| Nicor, Inc. | 2,900 | 159,529 | |||||||||
| Progress Energy, Inc. | 2,450 | 126,714 | |||||||||
| 672,019 | |||||||||||
| Shares | Fair Value | ||||||||||
| Materials — 9.2% | |||||||||||
| Arch Chemicals, Inc. | 4,500 | $ | 211,140 | ||||||||
| Nalco Holding Co. | 5,600 | 195,888 | |||||||||
| Peregrine Metals Ltd.* | 24,800 | 49,937 | |||||||||
| Temple-Inland, Inc. | 5,100 | 159,987 | |||||||||
| 616,952 | |||||||||||
| Energy — 5.3% | |||||||||||
| Global Industries Ltd.* | 19,000 | 150,480 | |||||||||
| Southern Union Co. | 3,750 | 152,137 | |||||||||
| TGC Industries, Inc.* | 12,270 | 53,988 | |||||||||
| 356,605 | |||||||||||
| Consumer Discretionary — 2.2% | |||||||||||
| Lowe's Cos., Inc. | 3,100 | 59,954 | |||||||||
| McCormick & Schmick's Seafood Restaurants, Inc.* | 12,400 | 85,808 | |||||||||
| 145,762 | |||||||||||
| Telecommunication Services — 1.9% | |||||||||||
| PAETEC Holding Corp.* | 24,300 | 128,547 | |||||||||
| Consumer Staples — 1.1% | |||||||||||
| BJ's Wholesale Club, Inc.* | 1,500 | 76,860 | |||||||||
| Total Common Stocks | $ | 5,373,486 | |||||||||
| Number of Rights | |||||||||||
| Rights — 0.0% | |||||||||||
| XO Holdings, Inc., expiring 12/31/12 | 40,500 | — | |||||||||
| Investment Funds — 26.1% | |||||||||||
| Blackrock Credit Allocation Income Trust III, Inc. | 13,000 | 128,440 | |||||||||
| Touchstone Institutional Money Market Fund^ | 1,619,183 | 1,619,183 | |||||||||
| Total Investment Funds | $ | 1,747,623 | |||||||||
| Total Long Positions (Cost $7,311,802) | $ | 7,292,504 | |||||||||
| Securities Sold Short — (11.6)% | |||||||||||
| Shares | |||||||||||
| Common Stocks — (11.6)% | |||||||||||
| Health Care — (0.1)% | |||||||||||
| Metropolitan Health Networks, Inc.* | (823 | ) | (3,736 | ) | |||||||
| Energy — (0.8)% | |||||||||||
| Dawson Geophysical Co.* | (2,306 | ) | (54,375 | ) | |||||||
| Consumer Discretionary — (1.1)% | |||||||||||
| Home Depot, Inc. | (2,325 | ) | (76,423 | ) | |||||||
| Telecommunication Services — (1.9)% | |||||||||||
| Windstream Corp. | (11,178 | ) | (130,335 | ) | |||||||
187
Touchstone Merger Arbitrage Fund (Continued)
| Securities Sold Short — (13.3)% (Continued) | Shares | Fair Value | |||||||||
| Materials — (2.3)% | |||||||||||
| Ecolab, Inc. | (2,745 | ) | $ | (134,203 | ) | ||||||
| Stillwater Mining Co.* | (2,017 | ) | (17,145 | ) | |||||||
| (151,348 | ) | ||||||||||
| Utilities — (3.4)% | |||||||||||
| AGL Resources, Inc. | (2,430 | ) | (98,998 | ) | |||||||
| Duke Energy Corp. | (6,400 | ) | (127,936 | ) | |||||||
| (226,934 | ) | ||||||||||
| Financials — (2.0)% | |||||||||||
| Nara Bancorp, Inc.* | (10,600 | ) | (64,342 | ) | |||||||
| Susquehanna Bancshares, Inc. | (12,408 | ) | (67,872 | ) | |||||||
| (132,214 | ) | ||||||||||
| Total Common Stocks | $ | (775,365 | ) | ||||||||
| Total Securities Sold Short (Cost ($802,176)) | $ | (775,365 | ) | ||||||||
| Total Investment Securities — 97.5% (Cost $6,509,626) | $ | 6,517,139 | |||||||||
| Cash Collateral for Securities Sold Short — 14.2% | $ | 952,527 | |||||||||
| Liabilities in Excess of Other Assets — (11.7%) | (780,223 | ) | |||||||||
| Net Assets — 100.0% | $ | 6,689,443 | |||||||||
* Non-income producing security.
^ Affiliated Fund, sub-advised by Fort Washington Investment Advisors, Inc. See Note 4.
Other Information:
The inputs or methodology used for valuing securities may not be an indication of the risk associated with investing in those securities. For more information on valuation inputs, and their aggregation into the levels used in the table below, please refer to the security valuation section in the accompanying notes to financial statements.
Valuation Inputs at Reporting Date:
| Description | Level 1 | Level 2 | Level 3 | Total | |||||||||||||||
| Common Stocks | $ | 4,598,121 | $ | — | $ | — | $ | 4,598,121 | |||||||||||
| Investment Funds | 128,440 | 1,619,183 | — | 1,747,623 | |||||||||||||||
| Collateral for Securities Sold Short | — | 952,527 | — | 952,527 | |||||||||||||||
| Preferred Stocks | — | 171,395 | — | 171,395 | |||||||||||||||
| $ | 7,469,666 | ||||||||||||||||||
See accompanying notes to financial statements.
188
Portfolio of Investments
Touchstone Mid Cap Fund – September 30, 2011
| Common Stocks — 98.6% | Shares | Fair Value | |||||||||
| Information Technology — 19.6% | |||||||||||
| Alliance Data Systems Corp.* | 20,880 | $ | 1,935,576 | ||||||||
| Autodesk, Inc.* | 40,410 | 1,122,590 | |||||||||
| Avago Technologies Ltd. | 42,690 | 1,398,951 | |||||||||
| Cadence Design Systems, Inc.* | 182,150 | 1,683,066 | |||||||||
| Check Point Software Technologies Ltd.* | 34,990 | 1,846,072 | |||||||||
| Citrix Systems, Inc.* | 17,590 | 959,183 | |||||||||
| IAC / InterActiveCorp* | 57,390 | 2,269,774 | |||||||||
| Intuit, Inc.* | 20,730 | 983,431 | |||||||||
| MercadoLibre, Inc. | 13,310 | 715,413 | |||||||||
| Rovi Corp.* | 20,290 | 872,064 | |||||||||
| SanDisk Corp.* | 19,680 | 794,088 | |||||||||
| Teradyne, Inc.* | 45,530 | 501,285 | |||||||||
| VeriFone Systems, Inc.* | 17,330 | 606,897 | |||||||||
| 15,688,390 | |||||||||||
| Financials — 12.7% | |||||||||||
| Arch Capital Group Ltd.* | 29,020 | 948,229 | |||||||||
| Boston Properties, Inc. REIT | 4,270 | 380,457 | |||||||||
| Digital Realty Trust, Inc. REIT † | 26,010 | 1,434,712 | |||||||||
| Discover Financial Services | 63,300 | 1,452,102 | |||||||||
| Douglas Emmett, Inc. REIT | 54,480 | 931,608 | |||||||||
| Essex Property Trust, Inc. REIT | 11,060 | 1,327,642 | |||||||||
| IntercontinentalExchange, Inc.* | 11,930 | 1,410,842 | |||||||||
| Leucadia National Corp. | 21,300 | 483,084 | |||||||||
| Marsh & McLennan Cos., Inc. | 47,810 | 1,268,877 | |||||||||
| SVB Financial Group* | 12,910 | 477,670 | |||||||||
| 10,115,223 | |||||||||||
| Industrials — 11.7% | |||||||||||
| Air Lease Corp.* † | 43,330 | 831,936 | |||||||||
| Goodrich Corp. | 21,480 | 2,592,206 | |||||||||
| Joy Global, Inc. | 18,880 | 1,177,734 | |||||||||
| Kansas City Southern* | 33,460 | 1,671,662 | |||||||||
| McDermott International, Inc.* | 64,100 | 689,716 | |||||||||
| United Continental Holdings, Inc.* | 32,930 | 638,184 | |||||||||
| W.W. Grainger, Inc. | 11,570 | 1,730,178 | |||||||||
| 9,331,616 | |||||||||||
| Health Care — 11.6% | |||||||||||
| Alexion Pharmaceuticals, Inc.* | 29,370 | 1,881,442 | |||||||||
| AmerisourceBergen Corp. | 33,920 | 1,264,198 | |||||||||
| DaVita, Inc.* | 18,180 | 1,139,341 | |||||||||
| SXC Health Solutions Corp.* | 26,560 | 1,479,392 | |||||||||
| United Therapeutics Corp.* | 8,430 | 316,041 | |||||||||
| Valeant Pharmaceuticals International, Inc. | 40,090 | 1,488,141 | |||||||||
| Vertex Pharmaceuticals, Inc.* | 12,060 | 537,152 | |||||||||
| Watson Pharmaceuticals, Inc.* | 17,060 | 1,164,345 | |||||||||
| 9,270,052 | |||||||||||
| Consumer Discretionary — 11.5% | |||||||||||
| Autoliv, Inc. | 8,720 | 422,920 | |||||||||
| Chico's FAS, Inc. | 64,900 | 741,807 | |||||||||
| DISH Network Corp. - Class A* | 49,300 | 1,235,458 | |||||||||
| Expedia, Inc. | 48,420 | 1,246,815 | |||||||||
| Lear Corp. | 35,030 | 1,502,787 | |||||||||
| Shares | Fair Value | ||||||||||
| Scripps Networks Interactive, Inc. - Class A | 11,310 | $ | 420,393 | ||||||||
| Stanley Black & Decker, Inc. | 7,800 | 382,980 | |||||||||
| Starwood Hotels & Resorts Worldwide, Inc. | 14,670 | 569,489 | |||||||||
| Tim Hortons, Inc. † | 31,070 | 1,437,920 | |||||||||
| Wynn Resorts Ltd. | 10,480 | 1,206,038 | |||||||||
| 9,166,607 | |||||||||||
| Consumer Staples — 11.2% | |||||||||||
| Green Mountain Coffee Roasters, Inc.* | 38,750 | 3,601,425 | |||||||||
| Herbalife Ltd. | 39,130 | 2,097,368 | |||||||||
| Mead Johnson Nutrition Co. - Class A | 23,480 | 1,616,128 | |||||||||
| Whole Foods Market, Inc. | 24,840 | 1,622,301 | |||||||||
| 8,937,222 | |||||||||||
| Utilities — 7.7% | |||||||||||
| American Water Works Co., Inc. | 58,870 | 1,776,697 | |||||||||
| Consolidated Edison, Inc. | 23,320 | 1,329,706 | |||||||||
| Northeast Utilities | 48,110 | 1,618,902 | |||||||||
| TECO Energy, Inc. | 81,740 | 1,400,206 | |||||||||
| 6,125,511 | |||||||||||
| Energy — 5.3% | |||||||||||
| Concho Resources, Inc.* | 11,200 | 796,768 | |||||||||
| Ensco PLC ADR | 26,810 | 1,083,928 | |||||||||
| Oil States International, Inc.* | 19,120 | 973,590 | |||||||||
| QEP Resources, Inc. | 39,400 | 1,066,558 | |||||||||
| Whiting Petroleum Corp.* | 9,760 | 342,381 | |||||||||
| 4,263,225 | |||||||||||
| Materials — 5.1% | |||||||||||
| Ashland, Inc. | 15,700 | 692,998 | |||||||||
| Carpenter Technology Corp. | 28,350 | 1,272,632 | |||||||||
| Cliffs Natural Resources, Inc. | 12,500 | 639,625 | |||||||||
| Molycorp, Inc.* † | 22,920 | 753,380 | |||||||||
| Rockwood Holdings, Inc.* | 9,200 | 309,948 | |||||||||
| Walter Energy, Inc. | 6,810 | 408,668 | |||||||||
| 4,077,251 | |||||||||||
| Telecommunication Services — 2.2% | |||||||||||
| SBA Communications Corp. - Class A* | 20,480 | 706,151 | |||||||||
| Windstream Corp. † | 87,520 | 1,020,483 | |||||||||
| 1,726,634 | |||||||||||
| Total Common Stocks | $ | 78,701,731 | |||||||||
| Investment Funds — 5.7% | |||||||||||
| Invesco Liquid Assets Portfolio ** | 3,691,083 | 3,691,083 | |||||||||
| Touchstone Institutional Money Market Fund^ | 900,109 | 900,109 | |||||||||
| Total Investment Funds | $ | 4,591,192 | |||||||||
| Total Investment Securities — 104.3% (Cost $79,709,519) | $ | 83,292,923 | |||||||||
| Liabilities in Excess of Other Assets — (4.3%) | (3,398,899 | ) | |||||||||
| Net Assets — 100.0% | $ | 79,894,024 | |||||||||
189
Touchstone Mid Cap Fund (Continued)
* Non-income producing security.
† All or a portion of the security is on loan. The total value of the securities on loan as of September 30, 2011, was $3,507,465.
** Represents collateral for securities loaned.
^ Affiliated Fund, sub-advised by Fort Washington Investment Advisors, Inc. See Note 4.
Portfolio Abbreviations:
ADR – American Depositary Receipt
PLC – Public Limited Company
REIT – Real Estate Investment Trust
Other Information:
The inputs or methodology used for valuing securities may not be an indication of the risk associated with investing in those securities. For more information on valuation inputs, and their aggregation into the levels used in the table below, please refer to the security valuation section in the accompanying notes to financial statements.
Valuation Inputs at Reporting Date:
| Description | Level 1 | Level 2 | Level 3 | Total | |||||||||||||||
| Common Stocks | $ | 78,701,731 | $ | — | $ | — | $ | 78,701,731 | |||||||||||
| Investment Funds | 4,591,192 | — | — | 4,591,192 | |||||||||||||||
| $ | 83,292,923 | ||||||||||||||||||
See accompanying notes to financial statements.
190
Portfolio of Investments
Touchstone Mid Cap Value Fund – September 30, 2011
| Common Stocks — 97.8% | Shares | Fair Value | |||||||||
| Financials — 22.2% | |||||||||||
| Ameriprise Financial, Inc. | 14,038 | $ | 552,536 | ||||||||
| Comerica, Inc. | 33,712 | 774,365 | |||||||||
| Digital Realty Trust, Inc. REIT † | 12,530 | 691,155 | |||||||||
| Endurance Specialty Holdings Ltd. | 18,328 | 625,901 | |||||||||
| Federated Investors, Inc. - Class B † | 34,983 | 613,252 | |||||||||
| Fifth Third Bancorp | 101,034 | 1,020,443 | |||||||||
| Host Hotels & Resorts, Inc. REIT | 51,027 | �� | 558,235 | ||||||||
| Liberty Property Trust REIT | 26,322 | 766,233 | |||||||||
| PartnerRe Ltd. | 10,728 | 560,753 | |||||||||
| ProAssurance Corp. | 8,837 | 636,441 | |||||||||
| Reinsurance Group of America, Inc. | 14,564 | 669,216 | |||||||||
| Synovus Financial Corp. | 161,787 | 173,112 | |||||||||
| TCF Financial Corp. | 66,105 | 605,522 | |||||||||
| Unum Group | 35,902 | 752,506 | |||||||||
| Willis Group Holdings PLC | 21,123 | 725,997 | |||||||||
| Zions Bancorporation | 51,041 | 718,147 | |||||||||
| 10,443,814 | |||||||||||
| Utilities — 11.9% | |||||||||||
| AGL Resources, Inc. | 25,399 | 1,034,755 | |||||||||
| Edison International | 16,395 | 627,109 | |||||||||
| Great Plains Energy, Inc. | 53,585 | 1,034,191 | |||||||||
| Portland General Electric Co. | 21,902 | 518,858 | |||||||||
| SCANA Corp. | 21,675 | 876,754 | |||||||||
| TECO Energy, Inc. | 40,903 | 700,668 | |||||||||
| Xcel Energy, Inc. | 31,734 | 783,513 | |||||||||
| 5,575,848 | |||||||||||
| Industrials — 11.5% | |||||||||||
| Avery Dennison Corp. | 24,998 | 626,950 | |||||||||
| Cintas Corp. | 24,053 | 676,852 | |||||||||
| Dover Corp. | 14,819 | 690,565 | |||||||||
| Flowserve Corp. | 7,894 | 584,156 | |||||||||
| Fluor Corp. | 12,915 | 601,193 | |||||||||
| Republic Services, Inc. | 35,102 | 984,962 | |||||||||
| Spirit Aerosystems Holdings, Inc. - Class A* | 27,403 | 437,078 | |||||||||
| Towers Watson & Co. - Class A | 13,513 | 807,807 | |||||||||
| 5,409,563 | |||||||||||
| Consumer Discretionary — 10.9% | |||||||||||
| American Eagle Outfitters, Inc. | 54,561 | 639,455 | |||||||||
| Gap, Inc. (The) | 38,068 | 618,224 | |||||||||
| Harley-Davidson, Inc. | 14,919 | 512,169 | |||||||||
| International Game Technology | 24,970 | 362,814 | |||||||||
| Interpublic Group of Cos., Inc. | 76,297 | 549,339 | |||||||||
| Newell Rubbermaid, Inc. | 68,999 | 819,018 | |||||||||
| Royal Caribbean Cruises Ltd. | 24,864 | 538,057 | |||||||||
| Urban Outfitters, Inc.* | 18,390 | 410,465 | |||||||||
| WMS Industries, Inc.* | 39,090 | 687,593 | |||||||||
| 5,137,134 | |||||||||||
| Health Care — 10.5% | |||||||||||
| AmerisourceBergen Corp. | 14,672 | 546,825 | |||||||||
| HCA Holdings, Inc.* | 24,910 | 502,186 | |||||||||
| HealthSouth Corp.* | 36,782 | 549,155 | |||||||||
| Shares | Fair Value | ||||||||||
| Hologic, Inc.* | 41,842 | $ | 636,417 | ||||||||
| Patterson Cos., Inc. | 23,321 | 667,680 | |||||||||
| Quest Diagnostics, Inc. | 14,229 | 702,344 | |||||||||
| STERIS Corp. | 23,853 | 698,177 | |||||||||
| Teleflex, Inc. | 12,166 | 654,166 | |||||||||
| 4,956,950 | |||||||||||
| Information Technology — 9.2% | |||||||||||
| Adobe Systems, Inc.* | 30,314 | 732,690 | |||||||||
| Analog Devices, Inc. | 20,852 | 651,625 | |||||||||
| Brocade Communications Systems, Inc.* | 162,229 | 700,829 | |||||||||
| Molex, Inc. † | 34,544 | 703,661 | |||||||||
| Symantec Corp.* | 40,816 | 665,301 | |||||||||
| Synopsys, Inc.* | 36,714 | 894,353 | |||||||||
| 4,348,459 | |||||||||||
| Materials — 8.8% | |||||||||||
| Alcoa, Inc. | 35,793 | 342,539 | |||||||||
| Allegheny Technologies, Inc. | 23,091 | 854,136 | |||||||||
| Bemis Co., Inc. | 21,181 | 620,815 | |||||||||
| Huntsman Corp. | 44,568 | 430,973 | |||||||||
| Nucor Corp. | 20,532 | 649,632 | |||||||||
| Owens-Illinois, Inc.* | 41,012 | 620,101 | |||||||||
| Packaging Corp of America | 26,129 | 608,806 | |||||||||
| 4,127,002 | |||||||||||
| Energy — 6.8% | |||||||||||
| EQT Corp. | 11,124 | 593,577 | |||||||||
| Murphy Oil Corp. | 12,283 | 542,417 | |||||||||
| Nabors Industries Ltd.* | 31,295 | 383,677 | |||||||||
| Newfield Exploration Co.* | 12,975 | 514,978 | |||||||||
| Pioneer Natural Resources Co. | 9,203 | 605,281 | |||||||||
| Range Resources Corp. | 9,966 | 582,612 | |||||||||
| 3,222,542 | |||||||||||
| Consumer Staples — 6.0% | |||||||||||
| Constellation Brands, Inc. - Class A* | 34,517 | 621,306 | |||||||||
| Kroger Co. (The) | 33,937 | 745,257 | |||||||||
| Molson Coors Brewing Co. - Class B | 21,004 | 831,968 | |||||||||
| Sysco Corp. | 23,467 | 607,795 | |||||||||
| 2,806,326 | |||||||||||
| Total Common Stocks | $ | 46,027,638 | |||||||||
| Investment Funds — 6.0% | |||||||||||
| Invesco Liquid Assets Portfolio ** | 1,567,248 | 1,567,248 | |||||||||
| iShares Russell Midcap Value Index Fund | 6,797 | 262,092 | |||||||||
| Touchstone Institutional Money Market Fund^ | 978,214 | 978,214 | |||||||||
| Total Investment Funds | $ | 2,807,554 | |||||||||
| Total Investment Securities — 103.8% (Cost $56,229,102) | $ | 48,835,192 | |||||||||
| Liabilities in Excess of Other Assets — (3.8%) | (1,773,614 | ) | |||||||||
| Net Assets — 100.0% | $ | 47,061,578 | |||||||||
191
Touchstone Mid Cap Value Fund (Continued)
† All or a portion of the security is on loan. The total value of the securities on loan as of September 30, 2011, was $1,483,928.
* Non-income producing security.
** Represents collateral for securities loaned.
^ Affiliated Fund, sub-advised by Fort Washington Investment Advisors, Inc. See Note 4.
Portfolio Abbreviations:
PLC – Public Limited Company
REIT – Real Estate Investment Trust
Other Information:
The inputs or methodology used for valuing securities may not be an indication of the risk associated with investing in those securities. For more information on valuation inputs, and their aggregation into the levels used in the table below, please refer to the security valuation section in the accompanying notes to financial statements.
Valuation Inputs at Reporting Date:
| Description | Level 1 | Level 2 | Level 3 | Total | |||||||||||||||
| Common Stocks | $ | 46,027,638 | $ | — | $ | — | $ | 46,027,638 | |||||||||||
| Investment Funds | 2,807,554 | — | — | 2,807,554 | |||||||||||||||
| $ | 48,835,192 | ||||||||||||||||||
See accompanying notes to financial statements.
192
Portfolio of Investments
Touchstone Premium Yield Equity Fund – September 30, 2011
| Common Stocks — 98.6% | Shares | Fair Value | |||||||||
| Energy — 20.1% | |||||||||||
| Enerplus Corp. | 53,212 | $ | 1,305,823 | ||||||||
| Kinder Morgan Management LLC* | 3 | 149 | |||||||||
| Kinder Morgan, Inc. | 93,625 | 2,423,951 | |||||||||
| Provident Energy Ltd. | 46,158 | 376,649 | |||||||||
| Seadrill Ltd. | 40,642 | 1,118,874 | |||||||||
| Spectra Energy Corp. | 46,158 | 1,132,256 | |||||||||
| Statoil ASA ADR | 47,696 | 1,027,849 | |||||||||
| Williams Cos., Inc. (The) | 28,208 | 686,583 | |||||||||
| 8,072,134 | |||||||||||
| Health Care — 18.8% | |||||||||||
| Abbott Laboratories | 35,645 | 1,822,885 | |||||||||
| Bristol-Myers Squibb Co. | 24,362 | 764,480 | |||||||||
| Eli Lilly & Co. | 21,154 | 782,063 | |||||||||
| GlaxoSmithKline PLC ADR | 30,388 | 1,254,721 | |||||||||
| Johnson & Johnson | 19,233 | 1,225,335 | |||||||||
| Merck & Co., Inc. | 32,054 | 1,048,486 | |||||||||
| Pfizer, Inc. | 37,825 | 668,746 | |||||||||
| 7,566,716 | |||||||||||
| Utilities — 18.8% | |||||||||||
| American Water Works Co., Inc. | 61,928 | 1,868,987 | |||||||||
| National Grid PLC ADR | 22,437 | 1,112,875 | |||||||||
| NiSource, Inc. | 101,036 | 2,160,150 | |||||||||
| Northeast Utilities | 23,721 | 798,212 | |||||||||
| ONEOK, Inc. | 24,362 | 1,608,866 | |||||||||
| 7,549,090 | |||||||||||
| Financials — 13.2% | |||||||||||
| Annaly Capital Management, Inc. REIT | 46,927 | 780,396 | |||||||||
| Bank of Montreal | 9,617 | 537,110 | |||||||||
| Cincinnati Financial Corp. | 26,925 | 708,935 | |||||||||
| Digital Realty Trust, Inc. REIT | 14,746 | 813,389 | |||||||||
| HCP, Inc. REIT | 29,359 | 1,029,327 | |||||||||
| Hospitality Properties Trust REIT | 45,241 | 960,466 | |||||||||
| Valley National Bancorp | 46,157 | 488,803 | |||||||||
| 5,318,426 | |||||||||||
| Telecommunication Services — 11.7% | |||||||||||
| AT&T, Inc. | 33,337 | 950,771 | |||||||||
| BCE, Inc. | 12,179 | 456,225 | |||||||||
| Telefonica SA ADR | 65,337 | 1,249,244 | |||||||||
| Vodafone Group PLC ADR | 48,720 | 1,249,668 | |||||||||
| Windstream Corp. | 69,879 | 814,789 | |||||||||
| 4,720,697 | |||||||||||
| Information Technology — 7.3% | |||||||||||
| Intel Corp. | 57,695 | 1,230,634 | |||||||||
| Maxim Integrated Products, Inc. | 32,309 | 753,769 | |||||||||
| Microchip Technology, Inc. | 30,770 | 957,255 | |||||||||
| 2,941,658 | |||||||||||
| Materials — 3.4% | |||||||||||
| International Paper Co. | 29,746 | 691,594 | |||||||||
| MeadWestvaco Corp. | 27,953 | 686,526 | |||||||||
| 1,378,120 | |||||||||||
| Shares | Fair Value | ||||||||||
| Industrials — 2.3% | |||||||||||
| R.R. Donnelley & Sons Co. | 64,108 | $ | 905,205 | ||||||||
| Consumer Staples — 1.9% | |||||||||||
| H.J. Heinz Co. | 15,515 | 783,197 | |||||||||
| Consumer Discretionary — 1.1% | |||||||||||
| Cinemark Holdings, Inc. | 23,206 | 438,129 | |||||||||
| Total Common Stocks | $ | 39,673,372 | |||||||||
| Investment Fund — 1.2% | |||||||||||
| Touchstone Institutional Money Market Fund^ | 483,397 | 483,397 | |||||||||
| Total Investment Securities — 99.8% (Cost $38,288,223) | $ | 40,156,769 | |||||||||
| Other Assets in Excess of Liabilities — 0.2% | 61,996 | ||||||||||
| Net Assets — 100.0% | $ | 40,218,765 | |||||||||
* Non-income producing security.
^ Affiliated Fund, sub-advised by Fort Washington Investment Advisors, Inc. See Note 4.
Portfolio Abbreviations:
ADR – American Depositary Receipt
LLC – Limited Liability Company
PLC – Public Limited Company
REIT – Real Estate Investment Trust
Other Information:
The inputs or methodology used for valuing securities may not be an indication of the risk associated with investing in those securities. For more information on valuation inputs, and their aggregation into the levels used in the table below, please refer to the security valuation section in the accompanying notes to financial statements.
Valuation Inputs at Reporting Date:
| Description | Level 1 | Level 2 | Level 3 | Total | |||||||||||||||
| Common Stocks | $ | 39,673,372 | $ | — | $ | — | $ | 39,673,372 | |||||||||||
| Investment Fund | 483,397 | — | — | 483,397 | |||||||||||||||
| $ | 40,156,769 | ||||||||||||||||||
See accompanying notes to financial statements.
193
Portfolio of Investments
Touchstone Sands Capital Select Growth Fund – September 30, 2011
| Common Stocks — 97.7% | Shares | Fair Value | |||||||||
| Information Technology — 37.7% | |||||||||||
| Apple, Inc.* | 265,000 | $ | 101,012,700 | ||||||||
| ASML Holding NV ADR | 984,000 | 33,987,360 | |||||||||
| F5 Networks, Inc.* | 458,000 | 32,540,900 | |||||||||
| Google, Inc. - Class A* | 114,000 | 58,639,320 | |||||||||
| OpenTable, Inc.* † | 223,000 | 10,260,230 | |||||||||
| QUALCOMM, Inc. | 1,647,000 | 80,093,610 | |||||||||
| Salesforce.com, Inc.* | 766,000 | 87,538,480 | |||||||||
| Visa, Inc. - Class A | 1,148,000 | 98,406,560 | |||||||||
| 502,479,160 | |||||||||||
| Consumer Discretionary — 21.9% | |||||||||||
| Amazon.com, Inc.* | 544,000 | 117,629,120 | |||||||||
| Las Vegas Sands Corp.* | 848,000 | 32,512,320 | |||||||||
| Netflix, Inc.* | 192,000 | 21,726,720 | |||||||||
| NIKE, Inc. - Class B | 518,000 | 44,294,180 | |||||||||
| Priceline.com, Inc.* | 72,000 | 32,361,120 | |||||||||
| Starbucks Corp. | 1,172,000 | 43,703,880 | |||||||||
| 292,227,340 | |||||||||||
| Health Care — 15.6% | |||||||||||
| Alexion Pharmaceuticals, Inc.* | 815,000 | 52,208,900 | |||||||||
| Allergan, Inc. | 544,000 | 44,814,720 | |||||||||
| Illumina, Inc.* | 1,019,000 | 41,697,480 | |||||||||
| Intuitive Surgical, Inc.* | 151,000 | 55,006,280 | |||||||||
| Regeneron Pharmaceuticals, Inc.* † | 258,000 | 15,015,600 | |||||||||
| 208,742,980 | |||||||||||
| Energy — 10.5% | |||||||||||
| FMC Technologies, Inc.* | 928,000 | 34,892,800 | |||||||||
| National-Oilwell Varco, Inc. | 643,000 | 32,934,460 | |||||||||
| Schlumberger Ltd. | 717,000 | 42,826,410 | |||||||||
| Southwestern Energy Co.* | 889,000 | 29,630,370 | |||||||||
| 140,284,040 | |||||||||||
| Financials — 4.9% | |||||||||||
| Charles Schwab Corp. (The) | 2,399,000 | 27,036,730 | |||||||||
| IntercontinentalExchange, Inc.* | 321,000 | 37,961,460 | |||||||||
| 64,998,190 | |||||||||||
| Industrials — 4.6% | |||||||||||
| CH Robinson Worldwide, Inc. | 353,000 | 24,169,910 | |||||||||
| W.W. Grainger, Inc. | 246,000 | 36,786,840 | |||||||||
| 60,956,750 | |||||||||||
| Materials — 2.5% | |||||||||||
| Praxair, Inc. | 364,000 | 34,026,720 | |||||||||
| Total Common Stocks | $ | 1,303,715,180 | |||||||||
| Shares | Fair Value | ||||||||||
| Investment Funds — 4.6% | |||||||||||
| Invesco Liquid Assets Portfolio ** | 26,034,381 | $ | 26,034,381 | ||||||||
| Touchstone Institutional Money Market Fund^ | 34,986,163 | 34,986,163 | |||||||||
| Total Investment Funds | $ | 61,020,544 | |||||||||
| Total Investment Securities — 102.3% (Cost $1,219,526,611) | $ | 1,364,735,724 | |||||||||
| Liabilities in Excess of Other Assets — (2.3%) | (30,551,793 | ) | |||||||||
| Net Assets — 100.0% | $ | 1,334,183,931 | |||||||||
* Non-income producing security.
† All or a portion of the security is on loan. The total value of the securities on loan as of September 30, 2011, was $24,642,088.
** Represents collateral for securities loaned.
^ Affiliated Fund, sub-advised by Fort Washington Investment Advisors, Inc. See Note 4.
Portfolio Abbreviations:
ADR — American Depositary Receipt
Other Information:
The inputs or methodology used for valuing securities may not be an indication of the risk associated with investing in those securities. For more information on valuation inputs, and their aggregation into the levels used in the table below, please refer to the security valuation section in the accompanying notes to financial statements.
Valuation Inputs at Reporting Date:
| Description | Level 1 | Level 2 | Level 3 | Total | |||||||||||||||
| Common Stocks | $ | 1,303,715,180 | $ | — | $ | — | $ | 1,303,715,180 | |||||||||||
| Investment Funds | 61,020,544 | — | — | 61,020,544 | |||||||||||||||
| $ | 1,364,735,724 | ||||||||||||||||||
See accompanying notes to financial statements.
194
Portfolio of Investments
Touchstone Short Duration Fixed Income Fund – September 30, 2011
| Principal Amount | Fair Value | ||||||||||
| Asset-Backed Securities — 33.9% | |||||||||||
| $ | 480,000 | American Express Credit Account Master Trust, Ser 2005-4, Class A, 0.299%, 1/15/15 (a) | $ | 479,975 | |||||||
| 310,000 | American Express Credit Account Master Trust, Ser 2010-1, Class A, 0.479%, 11/16/15 (a) | 310,707 | |||||||||
| 125,000 | American Tower Trust, Ser 2007-1A, Class AFX, 144a, 5.420%, 4/15/37 | 133,498 | |||||||||
| 215,000 | AmeriCredit Automobile Receivables Trust, Ser 2010-3, Class A3, 1.140%, 4/8/15 | 215,582 | |||||||||
| 385,000 | AmeriCredit Automobile Receivables Trust, Ser 2011-4, Class A3, 1.170%, 5/9/16 | 384,374 | |||||||||
| 235,000 | Cabela's Master Credit Card Trust, Ser 2006-3A, Class A1, 144a, 5.260%, 10/15/14 | 234,497 | |||||||||
| 270,000 | Chase Issuance Trust, Ser 2007-A17, Class A, 5.120%, 10/15/14 | 282,664 | |||||||||
| 430,000 | Chase Issuance Trust, Ser 2008-A11, Class A11, 5.400%, 7/15/15 | 466,210 | |||||||||
| 141,755 | Chrysler Financial Auto Securitization Trust, Ser 2009-A, Class A3, 2.820%, 1/15/16 | 143,075 | |||||||||
| 295,000 | Citibank Omni Master Trust, Ser 2009-A12, Class A12, 144a, 3.350%, 8/15/16 | 300,348 | |||||||||
| 200,000 | Citibank Omni Master Trust, Ser 2009-A13, Class A13, 144a, 5.350%, 8/15/18 | 219,186 | |||||||||
| 405,000 | Citibank Omni Master Trust, Ser 2009-A17, Class A17, 144a, 4.900%, 11/15/18 | 440,958 | |||||||||
| 70,569 | CNH Equipment Trust, Ser 2008-B, Class A4A, 5.600%, 11/17/14 | 71,208 | |||||||||
| 299,056 | CNH Equipment Trust, Ser 2009-B, Class A4, 5.170%, 10/15/14 | 307,278 | |||||||||
| 215,000 | CNH Equipment Trust, Ser 2010-A, Class A4, 2.490%, 1/15/16 | 220,689 | |||||||||
| 218,181 | College & University Facility Loan Trust, Ser 2, Class D, 4.000%, 6/1/18 | 218,181 | |||||||||
| 89,704 | Community Program Loan Trust, Ser 1987-A, Class A4, 4.500%, 10/1/18 | 90,103 | |||||||||
| 165,339 | FDIC Structured Sale Guaranteed Notes, Ser 2010-C1, Class A, 144a, 2.980%, 12/6/20 | 171,582 | |||||||||
| 356,303 | FDIC Structured Sale Guaranteed Notes, Ser 2010-S3, Class A, 144a, 2.740%, 12/3/20 | 366,547 | |||||||||
| 140,000 | Ford Credit Auto Owner Trust, Ser 2009-B, Class A4, 4.500%, 7/15/14 | 146,047 | |||||||||
| Principal Amount | Fair Value | ||||||||||
| $ | 277,249 | GATX Corp. 2008-2 Pass Through Trust, 9.000%, 11/15/13 | $ | 317,450 | |||||||
| 220,000 | GE Capital Credit Card Master Note Trust, Ser 2009-2, Class A, 3.690%, 7/15/15 | 225,209 | |||||||||
| 405,000 | GE Capital Credit Card Master Note Trust, Ser 2010-3, Class A, 2.210%, 6/15/16 | 414,132 | |||||||||
| 71,946 | GE Equipment Midticket LLC, Ser 2009-1, Class A3, 2.340%, 6/17/13 | 72,264 | |||||||||
| 240,000 | GE Equipment Midticket LLC, Ser 2010-1, Class A3, 144a, 0.940%, 7/14/14 | 240,150 | |||||||||
| 240,000 | GE Equipment Small Ticket LLC, Ser 2011-1A, Class A3, 144a, 1.450%, 1/21/18 | 241,699 | |||||||||
| 280,000 | Great America Leasing Receivables, Ser 2009-1, Class A4, 144a, 3.190%, 12/15/13 | 286,455 | |||||||||
| 320,000 | Great America Leasing Receivables, Ser 2011-1, Class A3, 144a, 1.690%, 2/15/14 | 321,748 | |||||||||
| 210,000 | Greenwich Capital Commercial Funding Corp., Ser 2004-GG1, Class A7, 5.317%, 6/10/36 (a) | 222,202 | |||||||||
| 300,000 | Harley-Davidson Motorcycle Trust, Ser 2009-2, Class A4, 3.320%, 2/15/17 | 305,274 | |||||||||
| 275,000 | Harley-Davidson Motorcycle Trust, Ser 2010-1, Class A4, 1.530%, 9/15/15 | 276,710 | |||||||||
| 360,000 | Harley-Davidson Motorcycle Trust, Ser 2011-1, Class A3, 0.960%, 5/16/16 | 359,828 | |||||||||
| 400,000 | Huntington Auto Trust, Ser 2009-1A, Class A4, 144a, 5.730%, 1/15/14 | 411,200 | |||||||||
| 353,605 | MMAF Equipment Finance LLC, Ser 2009-AA, Class A3, 144a, 2.370%, 11/15/13 | 355,409 | |||||||||
| 423,800 | Nissan Auto Lease Trust, Ser 2010-A, Class A3, 1.390%, 1/15/16 | 425,070 | |||||||||
| 143,278 | PG&E Energy Recovery Funding LLC, Ser 2005-1, Class A4, 4.370%, 6/25/14 | 145,596 | |||||||||
| 21,975 | PG&E Energy Recovery Funding LLC, Ser 2005-2, Class A2, 5.030%, 3/25/14 | 22,293 | |||||||||
| 61,686 | RSB Bondco LLC, Ser 2007-A, Class A1, 5.470%, 10/1/14 | 63,065 | |||||||||
| 450,000 | Santander Consumer Acquired Receivables Trust, Ser 2011-WO, Class A3, 144a, 1.400%, 10/15/14 | 451,470 | |||||||||
| 420,000 | Santander Drive Auto Receivables Trust, Ser 2010-1, Class A3, 1.840%, 11/17/14 | 423,082 | |||||||||
| 164,246 | Santander Drive Auto Receivables Trust, Ser 2010-3, Class A2, 0.930%, 6/17/13 | 164,315 | |||||||||
195
Touchstone Short Duration Fixed Income Fund (Continued)
| Principal Amount | Fair Value | ||||||||||
| Asset-Backed Securities — 33.9% (Continued) | |||||||||||
| $ | 325,000 | Santander Drive Auto Receivables Trust, Ser 2011-1, Class A3, 1.280%, 1/15/15 | $ | 325,383 | |||||||
| 198,000 | Sonic Capital LLC, Ser 2011-1A, Class A2, 144a, 5.438%, 5/20/41 | 201,465 | |||||||||
| 232,803 | Tax Liens Securitization Trust, Ser 2010-1A, Class 1A2, 144a, 2.000%, 4/15/18 | 232,617 | |||||||||
| 106,963 | Tax Liens Securitization Trust, Ser 2010-1A, Class 2A2, 144a, 2.000%, 4/15/18 | 106,877 | |||||||||
| 305,000 | Volkswagen Auto Lease Trust, Ser 2010-A, Class A3, 0.990%, 11/20/13 | 305,812 | |||||||||
| 255,000 | Westlake Automobile Receivables Trust, Ser 2011-1A, Class A3, 144a, 1.490%, 6/16/14 | 255,008 | |||||||||
| 260,000 | World Financial Network Credit Card Master Trust, Ser 2009-A, Class A, 4.600%, 9/15/15 | 261,180 | |||||||||
| 410,000 | World Financial Network Credit Card Master Trust, Ser 2009-B, Class A, 3.790%, 5/15/16 | 418,824 | |||||||||
| 370,000 | World Financial Network Credit Card Master Trust, Ser 2009-D, Class A, 4.660%, 5/15/17 | 391,589 | |||||||||
| 385,000 | World Financial Network Credit Card Master Trust, Ser 2010-A, Class A, 3.960%, 4/15/19 | 414,605 | |||||||||
| 118,271 | World Omni Auto Receivables Trust, Ser 2007-B, Class A4, 5.390%, 5/15/13 | 119,267 | |||||||||
| Total Asset-Backed Securities | $ | 13,979,957 | |||||||||
| Corporate Bonds — 20.6% Financials — 11.7% | |||||||||||
| 350,000 | American Express Bank, 0.375%, 6/12/12 (a) | 348,875 | |||||||||
| 150,000 | Bank of New York Mellon Corp. (The), 5.125%, 11/1/11 | 150,474 | |||||||||
| 315,000 | Bank of New York Mellon Corp. MTN, 4.950%, 11/1/12 | 328,567 | |||||||||
| 215,000 | Barclays Bank PLC, 2.500%, 1/23/13 | 213,544 | |||||||||
| 195,000 | CME Group, Inc., 5.750%, 2/15/14 | 214,160 | |||||||||
| 305,000 | Credit Suisse/New York NY, 5.000%, 5/15/13 | 315,226 | |||||||||
| 225,000 | FIA Card Services NA MTN, 6.625%, 6/15/12 | 228,802 | |||||||||
| 225,000 | General Electric Capital Corp. MTN, 0.422%, 7/27/12 (a) | 224,781 | |||||||||
| 275,000 | Hudson United Bank, 7.000%, 5/15/12 | 284,289 | |||||||||
| 320,000 | Jefferies Group, Inc., 7.750%, 3/15/12 | 327,771 | |||||||||
| 285,000 | Manufacturers & Traders Trust Co., 1.872%, 4/1/13 (a) | 284,708 | |||||||||
| Principal Amount | Fair Value | ||||||||||
| $ | 60,000 | Merrill Lynch & Co., Inc. MTN, 6.150%, 4/25/13 | $ | 60,029 | |||||||
| 300,000 | MetLife of Connecticut Institutional Funding Ltd. MTN, 0.499%, 12/8/11 (a) | 299,633 | |||||||||
| 205,000 | Morgan Stanley, 5.300%, 3/1/13 | 206,712 | |||||||||
| 215,000 | National Australia Bank Ltd., 144a, 1.700%, 12/10/13 | 213,156 | |||||||||
| 120,000 | New York Life Global Funding, 144a, 5.250%, 10/16/12 | 125,621 | |||||||||
| 450,000 | PNC Funding Corp., 2.300%, 6/22/12 | 456,188 | |||||||||
| 300,000 | TD Ameritrade Holding Corp., 2.950%, 12/1/12 | 304,572 | |||||||||
| 218,636 | Whc-Irs Trust, 6.980%, 5/15/15 | 238,193 | |||||||||
| 4,825,301 | |||||||||||
| Industrials — 3.5% | |||||||||||
| 235,000 | Amphenol Corp., 4.750%, 11/15/14 | 249,147 | |||||||||
| 225,000 | Cooper US, Inc., 5.250%, 11/15/12 | 235,527 | |||||||||
| 300,000 | Equifax, Inc., 4.450%, 12/1/14 | 319,629 | |||||||||
| 137,948 | Federal Express Corp. 1995 Pass Through Trust, Ser B2, 7.110%, 1/2/14 | 146,225 | |||||||||
| 112,506 | Petrodrill Five Ltd., Ser 5, 4.390%, 4/15/16 | 120,426 | |||||||||
| 131,259 | Petrodrill Four Ltd., Ser 4, 4.240%, 1/15/16 | 139,007 | |||||||||
| 200,000 | Roper Industries, Inc., 6.625%, 8/15/13 | 216,603 | |||||||||
| 1,426,564 | |||||||||||
| Telecommunication Services — 1.0% | |||||||||||
| 171,330 | BellSouth Telecommunications, Inc., 6.300%, 12/15/15 | 182,616 | |||||||||
| 240,000 | New Cingular Wireless Services, Inc., 8.125%, 5/1/12 | 249,686 | |||||||||
| 432,302 | |||||||||||
| Energy — 1.0% | |||||||||||
| 170,000 | Noble Energy, Inc., 5.250%, 4/15/14 | 185,045 | |||||||||
| 226,182 | Rowan Cos., Inc., 2.800%, 10/20/13 | 230,165 | |||||||||
| 415,210 | |||||||||||
| Health Care — 0.8% | |||||||||||
| 330,000 | Express Scripts, Inc., 5.250%, 6/15/12 | 338,851 | |||||||||
| Consumer Staples — 0.8% | |||||||||||
| 307,200 | CVS Pass-Through Trust, 144a, 6.117%, 1/10/13 | 319,489 | |||||||||
| Consumer Discretionary — 0.5% | |||||||||||
| 200,000 | Staples, Inc., 7.375%, 10/1/12 | 212,049 | |||||||||
| Materials — 0.5% | |||||||||||
| 185,000 | Dow Chemical Co. (The), 7.600%, 5/15/14 | 210,118 | |||||||||
196
Touchstone Short Duration Fixed Income Fund (Continued)
| Principal Amount | Fair Value | ||||||||||
| Corporate Bonds — 20.6% (Continued) Information Technology — 0.4% | |||||||||||
| $ | 150,000 | Analog Devices, Inc., 5.000%, 7/1/14 | $ | 163,957 | |||||||
| Utilities — 0.4% | |||||||||||
| 158,000 | National Rural Utilities Cooperative Finance Corp., MTN, 7.250%, 3/1/12 | 162,177 | |||||||||
| Total Corporate Bonds | $ | 8,506,018 | |||||||||
| Commercial Mortgage-Backed Securities — 14.9% | |||||||||||
| 237,650 | Banc of America Commercial Mortgage, Inc., Ser 2002-2, Class A3, 5.118%, 7/11/43 | 239,413 | |||||||||
| 375,000 | Banc of America Commercial Mortgage, Inc., Ser 2005-1, Class A4, 5.234%, 11/10/42 (a) | 386,599 | |||||||||
| 284,159 | Banc of America Commercial Mortgage, Inc., Ser 2005-2, Class A4, 4.783%, 7/10/43 (a) | 286,998 | |||||||||
| 325,000 | Banc of America Commercial Mortgage, Inc., Ser 2005-6, Class A4, 5.367%, 9/10/47 (a) | 357,430 | |||||||||
| 375,000 | Banc of America Commercial Mortgage, Inc., Ser 2006-4, Class A4, 5.634%, 7/10/46 | 405,757 | |||||||||
| 400,000 | Citigroup/Deutsche Bank Commercial Mortgage Trust, Ser 2006-CD3, Class A4, 5.658%, 10/15/48 | 420,628 | |||||||||
| 400,000 | Commercial Mortgage Pass Through Certificates, Ser 2004-LB2A, Class A4, 4.715%, 3/10/39 | 418,872 | |||||||||
| 180,000 | Credit Suisse Mortgage Capital Certificates, Ser 2006-C3, Class A3, 6.011%, 6/15/38 (a) | 192,213 | |||||||||
| 37,163 | First Union National Bank Commercial Mortgage, Ser 2001-C4, Class A2, 6.223%, 12/12/33 | 37,133 | |||||||||
| 38,638 | GE Capital Commercial Mortgage Corp., Ser 2001-3, Class A2, 6.070%, 6/10/38 | 38,608 | |||||||||
| 175,000 | GE Capital Commercial Mortgage Corp., Ser 2003-C2, Class A4, 5.145%, 7/10/37 | 182,438 | |||||||||
| 335,000 | GMAC Commercial Mortgage Securities, Inc., Ser 2003-C1, Class A2, 4.079%, 5/10/36 | 344,390 | |||||||||
| 320,000 | JP Morgan Chase Commercial Mortgage Securities Corp., Ser 2003-CB6, Class A2, 5.255%, 7/12/37 (a) | 335,773 | |||||||||
| 324,030 | JP Morgan Chase Commercial Mortgage Securities Corp., Ser 2005-LDP3, Class A3, 4.959%, 8/15/42 | 331,012 | |||||||||
| Principal Amount | Fair Value | ||||||||||
| $ | 213,355 | LB-UBS Commercial Mortgage Trust, Ser 2002-C1, Class A4, 6.462%, 3/15/31++ | $ | 215,419 | |||||||
| 149,052 | LB-UBS Commercial Mortgage Trust, Ser 2002-C7, Class A3, 4.659%, 12/15/26++ | 149,898 | |||||||||
| 85,573 | LB-UBS Commercial Mortgage Trust, Ser 2003-C5, Class A3, 4.254%, 7/15/27++ | 87,045 | |||||||||
| 315,000 | LB-UBS Commercial Mortgage Trust, Ser 2003-C7, Class A3, 4.559%, 9/15/27 (a)++ | 315,192 | |||||||||
| 380,000 | LB-UBS Commercial Mortgage Trust, Ser 2006-C1, Class A4, 5.156%, 2/15/31++ | 410,829 | |||||||||
| 223,376 | Merrill Lynch Mortgage Investors, Inc., Ser 1998-C1, Class A3, 6.720%, 11/15/26 (a) | 242,337 | |||||||||
| 290,000 | Morgan Stanley Capital I, Ser 2004-IQ7, Class A4, 5.546%, 6/15/38 (a) | 310,285 | |||||||||
| 415,000 | Wachovia Bank Commercial Mortgage Trust, Ser 2003-C3, Class A2, 4.867%, 2/15/35 | 427,250 | |||||||||
| Total Commercial Mortgage-Backed Securities | $ | 6,135,519 | |||||||||
| U.S. Government Mortgage-Backed Obligations — 13.9% | |||||||||||
| 65,144 | FHLMC, Pool #D94598, 6.500%, 4/1/21 | 72,055 | |||||||||
| 4,581 | FHLMC, Pool #E97227, 7.000%, 9/1/14 | 4,626 | |||||||||
| 109,381 | FHLMC, Pool #C66916, 7.000%, 5/1/32 | 126,570 | |||||||||
| 375,475 | FHLMC, Pool #G01840, 5.000%, 7/1/35 | 404,755 | |||||||||
| 79,119 | FHLMC, Pool #G30085, 7.500%, 10/1/17 | 91,065 | |||||||||
| 253,609 | FHLMC REMICS, Ser 2510, Class TA, 4.000%, 6/15/32 | 269,133 | |||||||||
| 269,624 | FNMA, Pool #AL0302, 5.000%, 4/1/24 | 290,546 | |||||||||
| 239,698 | FNMA, Pool #735484, 5.000%, 5/1/35 | 258,794 | |||||||||
| 2,093 | FNMA, Pool #313429, 7.000%, 3/1/12 | 2,116 | |||||||||
| 13,762 | FNMA, Pool #323441, 7.000%, 12/1/13 | 14,002 | |||||||||
| 77,121 | FNMA, Pool #546474, 7.000%, 1/1/15 | 79,453 | |||||||||
| 6,112 | FNMA, Pool #334593, 7.000%, 5/1/24 | 7,065 | |||||||||
| 97,889 | FNMA, Pool #323832, 7.500%, 7/1/29 | 113,906 | |||||||||
| 152,943 | FNMA, Pool #665773, 7.500%, 6/1/31 | 177,572 | |||||||||
| 6 | FNMA, Pool #N 6222, 9.000%, 4/1/16 | 6 | |||||||||
| 102,320 | FNMA REMICS, Ser 2003-66, Class AP, 3.500%, 11/25/32 | 107,011 | |||||||||
| 222,126 | FNMA REMICS, Ser 2003-19, Class ME, 4.000%, 1/25/33 | 232,367 | |||||||||
| 371,801 | FNMA REMICS, Ser 2003-42, Class CA, 4.000%, 5/25/33 | 399,028 | |||||||||
| 398,931 | FNMA REMICS, Ser 2003-119, Class PU, 4.000%, 11/25/33 | 416,844 | |||||||||
| 179,325 | GNMA, Pool #G2 894160, 2.091%, 6/20/61 (a) | 188,880 | |||||||||
197
Touchstone Short Duration Fixed Income Fund (Continued)
| Principal Amount | Fair Value | ||||||||||
| U.S. Government Mortgage-Backed Obligations — 13.9% (Continued) | |||||||||||
| $ | 112,702 | GNMA, Ser 2004-43, Class A, 2.822%, 12/16/19 | $ | 113,102 | |||||||
| 8,701 | GNMA, Pool #G2 8426, 3.000%, 11/20/18 (a) | 9,066 | |||||||||
| 177,630 | GNMA, Ser 2004-97, Class AB, 3.084%, 4/16/22 | 179,184 | |||||||||
| 22,317 | GNMA, Ser 2006-39, Class A, 3.772%, 6/16/25 | 22,342 | |||||||||
| 63,041 | GNMA, Ser 2004-6, Class B, 3.949%, 7/16/33 | 64,878 | |||||||||
| 194,914 | GNMA, Ser 2005-76, Class A, 3.963%, 5/16/30 | 201,209 | |||||||||
| 105,915 | GNMA, Ser 2003-43, Class B, 4.374%, 4/16/33 | 107,912 | |||||||||
| 473,899 | GNMA, Ser 2002-72, Class AB, 4.500%, 10/20/32 | 521,474 | |||||||||
| 234,520 | GNMA, Ser 2004-78, Class C, 4.658%, 4/16/29 | 241,637 | |||||||||
| 165,172 | GNMA, Ser 2004-12, Class BA, 4.807%, 8/16/32 | 169,666 | |||||||||
| 1,798 | GNMA, Pool #G2 2707, 5.500%, 1/20/14 | 1,943 | |||||||||
| 1,517 | GNMA, Pool #G2 2802, 5.500%, 7/20/14 | 1,640 | |||||||||
| 26,657 | GNMA, Pool #G2 2843, 5.500%, 11/20/14 | 28,817 | |||||||||
| 45,048 | GNMA, Pool #578189, 6.000%, 2/15/32 | 50,491 | |||||||||
| 4,810 | GNMA, Pool #462486, 6.500%, 1/15/13 | 4,988 | |||||||||
| 27,667 | GNMA, Pool #569337, 6.500%, 4/15/22 | 31,377 | |||||||||
| 30,752 | GNMA, Pool #780604, 7.000%, 7/15/12 | 31,004 | |||||||||
| 43,987 | GNMA, Pool #G2 814, 8.000%, 8/20/17 | 49,268 | |||||||||
| 19,498 | GNMA, Pool #780327, 8.000%, 11/15/17 | 21,947 | |||||||||
| 51,908 | GNMA, Pool #780322, 8.000%, 11/15/22 | 60,188 | |||||||||
| 45,415 | GNMA, Pool #344233, 8.000%, 2/15/23 | 53,272 | |||||||||
| 116,675 | GNMA, Pool #345123, 8.000%, 12/15/23 | 136,860 | |||||||||
| 390,332 | NCUA Guaranteed Notes, Ser 2010-C1, Class A1, 1.600%, 10/29/20 | 394,227 | |||||||||
| Total U.S. Government Mortgage-Backed Obligations | $ | 5,752,286 | |||||||||
| U.S. Government Agency Obligations — 7.9% | |||||||||||
| 260,000 | FNMA, 5.250%, 8/1/12 | 270,733 | |||||||||
| 235,143 | SBA, Pool #506207, 1.000%, 11/25/14 (a) | 235,236 | |||||||||
| 145,251 | SBA, Pool #507442, 3.625%, 5/25/16 (a) | 149,536 | |||||||||
| 270,794 | SBA, Ser P10A, 4.504%, 2/1/14 | 283,311 | |||||||||
| 165,238 | SBA, Ser 2008-10B, Class 1, 4.580%, 3/1/18 | 176,515 | |||||||||
| 94,262 | SBA, Ser 2005-P10A, Class 1, 4.638%, 2/10/15 | 100,549 | |||||||||
| Principal Amount | Fair Value | ||||||||||
| $ | 191,991 | SBA, Ser 2003-20E, Class 1, 4.640%, 5/1/23 | $ | 207,354 | |||||||
| 217,754 | SBA, Ser 2004-20B, Class 1, 4.720%, 2/1/24 | 236,231 | |||||||||
| 173,670 | SBA, Ser 2002-20J, Class 1, 4.750%, 10/1/22 | 187,623 | |||||||||
| 208,113 | SBA, Ser 2005-20G, Class 1, 4.750%, 7/1/25 | 226,776 | |||||||||
| 167,936 | SBA, Ser 2007-10E, Class 1, 5.250%, 9/1/17 | 180,055 | |||||||||
| 155,988 | SBA, Ser 2006-P10A, Class 1, 5.408%, 2/10/16 | 169,849 | |||||||||
| 265,318 | SBA, Ser 2007-P10B, Class 1, 5.788%, 8/10/17 | 294,544 | |||||||||
| 160,400 | SBA, Ser 98-L, 5.800%, 12/1/18 | 173,794 | |||||||||
| 150,596 | SBA, Ser 20C, 6.070%, 3/1/22 | 166,597 | |||||||||
| 185,830 | SBA, 6.140%, 1/1/22 | 206,066 | |||||||||
| Total U.S. Government Agency Obligations | $ | 3,264,769 | |||||||||
| U.S. Treasury Obligations — 4.9% | |||||||||||
| 100,000 | U.S. Treasury Note, 1.875%, 4/30/14 | 103,805 | |||||||||
| 800,000 | U.S. Treasury Note, 2.625%, 4/30/16 | 863,625 | |||||||||
| 425,000 | U.S. Treasury Note, 1.500%, 6/30/16 | 436,721 | |||||||||
| 550,000 | U.S. Treasury Note, 3.250%, 3/31/17 | 613,594 | |||||||||
| Total U.S. Treasury Obligations | $ | 2,017,745 | |||||||||
| Municipal Bonds — 3.2% California — 0.5% | |||||||||||
| 180,000 | Southern California Public Power Auth. Rev, Ser 2010-B 3.326%, 7/1/14 | 185,016 | |||||||||
| Connecticut — 1.0% | |||||||||||
| 425,000 | State of Connecticut UTGO, Ser 2011 A Class A 1.080%, 5/15/18 (a) | 425,251 | |||||||||
| District of Columbia — 0.5% | |||||||||||
| 210,000 | District of Columbia UTGO, Ser 2010 Class A 2.585%, 6/1/13 | 214,786 | |||||||||
| Louisiana — 0.0% | |||||||||||
| 7,421 | Louisiana Public Facilities Auth., Ser 2008 Class A 4.500%, 2/1/14 | 7,513 | |||||||||
| Maine — 0.5% | |||||||||||
| 200,000 | Maine State Housing Auth. Rev, Ser 2010 1.728%, 6/15/12 | 200,230 | |||||||||
| Michigan — 0.7% | |||||||||||
| 300,000 | Michigan Strategic Fund Rev, Ser 2001 3.200%, 8/1/27 (a) | 308,037 | |||||||||
| Total Municipal Bonds | $ | 1,340,833 | |||||||||
198
Touchstone Short Duration Fixed Income Fund (Continued)
| Principal Amount | Fair Value | ||||||||||
| Investment Fund — 0.5% | |||||||||||
| $ | 202,113 | Touchstone Institutional Money Market Fund^ | $ | 202,113 | |||||||
| Total Investment Securities — 99.8% (Cost $40,628,180) | $ | 41,199,240 | |||||||||
| Other Assets in Excess of Liabilities — 0.2% | 74,855 | ||||||||||
| Net Assets — 100.0% | $ | 41,274,095 | |||||||||
(a) Variable rate security – the rate reflected is the rate in effect as of September 30, 2011.
^ Affiliated Fund, sub-advised by Fort Washington Investment Advisors, Inc. See Note 4.
++ The issuers and/or sponsors of certain asset-backed securities may no longer exist; however, the securities held by the Fund are separate legal entities organized as trusts and publicly traded. The Fund receives principal and interest payments directly from these trusts.
Portfolio Abbreviations:
FNMA – Federal National Mortgage Association
FHLMC – Federal Home Loan Mortgage Corp.
GNMA – Government National Mortgage Association
LLC – Limited Liability Company
MTN – Medium Term Note
PLC – Public Limited Company
REMIC – Real Estate Mortgage Investment Conduit
SBA – Small Business Adminstration
UTGO – Unlimited Tax General Obligation
144a – This is a restricted security that was sold in a transaction exempt from Rule 144a of the Securities Act of 1933. This security may be sold in transactions exempt from registration, normally to qualified institutional buyers. At September 30, 2011, these securities were valued at $5,628,980 or 13.6% of net assets. These securities were deemed liquid pursuant to procedures approved by the Board of Trustees.
Other Information:
The inputs or methodology used for valuing securities may not be an indication of the risk associated with investing in those securities. For more information on valuation inputs, and their aggregation into the levels used in the table below, please refer to the security valuation section in the accompanying notes to financial statements.
Valuation Inputs at Reporting Date:
| Description | Level 1 | Level 2 | Level 3 | Total | |||||||||||||||
| Asset-Backed Securities | $ | — | $ | 13,979,957 | $ | — | $ | 13,979,957 | |||||||||||
| Corporate Bonds | — | 8,506,018 | — | 8,506,018 | |||||||||||||||
| Commercial Mortgage- Backed Securities | — | 6,135,519 | — | 6,135,519 | |||||||||||||||
| U.S. Government Mortgage- Backed Obligations | — | 5,752,286 | — | 5,752,286 | |||||||||||||||
| U.S. Government Agency Obligations | — | 3,264,769 | — | 3,264,769 | |||||||||||||||
| U.S. Treasury Obligations | — | 2,017,745 | — | 2,017,745 | |||||||||||||||
| Municipal Bonds | — | 1,340,833 | — | 1,340,833 | |||||||||||||||
| Investment Funds | 202,113 | — | — | 202,113 | |||||||||||||||
| $ | 41,199,240 | ||||||||||||||||||
See accompanying notes to financial statements.
199
Portfolio of Investments
Touchstone Small Cap Core Fund – September 30, 2011
| Common Stocks — 98.7% | Shares | Fair Value | |||||||||
| Financials — 24.8% | |||||||||||
| Alleghany Corp.* | 10,314 | $ | 2,975,589 | ||||||||
| Eaton Vance Corp. | 353,125 | 7,864,094 | |||||||||
| First Industrial Realty Trust, Inc. REIT* | 323,578 | 2,588,624 | |||||||||
| Hatteras Financial Corp. REIT | 161,747 | 4,069,554 | |||||||||
| MBIA, Inc.* † | 563,118 | 4,093,868 | |||||||||
| Montpelier Re Holdings Ltd. | 296,981 | 5,250,624 | |||||||||
| Tejon Ranch Co.* | 161,532 | 3,855,769 | |||||||||
| UDR, Inc. REIT | 167,596 | 3,710,575 | |||||||||
| White Mountains Insurance Group Ltd. | 10,716 | 4,348,017 | |||||||||
| 38,756,714 | |||||||||||
| Industrials — 18.4% | |||||||||||
| Alexander & Baldwin, Inc. | 174,354 | 6,369,152 | |||||||||
| Corrections Corp. of America* | 261,657 | 5,936,997 | |||||||||
| Kaman Corp. | 154,355 | 4,298,787 | |||||||||
| Knoll, Inc. | 127,612 | 1,748,284 | |||||||||
| Old Dominion Freight Line, Inc.* | 203,621 | 5,898,900 | |||||||||
| Tredegar Corp. | 299,755 | 4,445,367 | |||||||||
| 28,697,487 | |||||||||||
| Consumer Discretionary — 13.5% | |||||||||||
| American Eagle Outfitters, Inc. | 188,271 | 2,206,536 | |||||||||
| Cabela's, Inc.* | 326,904 | 6,698,263 | |||||||||
| Capella Education Co.* † | 55,330 | 1,570,266 | |||||||||
| Hasbro, Inc. | 49,535 | 1,615,336 | |||||||||
| Service Corp. International | 626,858 | 5,742,019 | |||||||||
| Sturm Ruger & Co., Inc. | 122,250 | 3,176,055 | |||||||||
| 21,008,475 | |||||||||||
| Consumer Staples — 12.7% | |||||||||||
| Energizer Holdings, Inc.* | 51,025 | 3,390,101 | |||||||||
| Nu Skin Enterprises, Inc. | 183,069 | 7,417,956 | |||||||||
| Pricesmart, Inc. | 143,253 | 8,927,527 | |||||||||
| 19,735,584 | |||||||||||
| Information Technology — 9.2% | |||||||||||
| Advent Software, Inc.* | 173,287 | 3,613,034 | |||||||||
| Micrel, Inc. | 515,503 | 4,881,813 | |||||||||
| ValueClick, Inc.* | 377,398 | 5,872,313 | |||||||||
| 14,367,160 | |||||||||||
| Materials — 9.0% | |||||||||||
| Albemarle Corp. | 98,473 | 3,978,309 | |||||||||
| Martin Marietta Materials, Inc. † | 39,385 | 2,489,920 | |||||||||
| NewMarket Corp. | 49,874 | 7,574,364 | |||||||||
| 14,042,593 | |||||||||||
| Energy — 7.3% | |||||||||||
| Atwood Oceanics, Inc.* | 193,935 | 6,663,607 | |||||||||
| Kinder Morgan Management LLC* | 81,616 | 4,790,043 | |||||||||
| 11,453,650 | |||||||||||
| Health Care — 3.8% | |||||||||||
| Owens & Minor, Inc. | 69,744 | 1,986,309 | |||||||||
| Tenet Healthcare Corp.* | 947,112 | 3,911,573 | |||||||||
| 5,897,882 | |||||||||||
| Total Common Stocks | $ | 153,959,545 | |||||||||
| Shares | Fair Value | ||||||||||
| Investment Funds — 7.3% | |||||||||||
| Invesco Liquid Assets Portfolio ** | 8,021,530 | $ | 8,021,530 | ||||||||
| Touchstone Institutional Money Market Fund^ | 3,316,617 | 3,316,617 | |||||||||
| Total Investment Funds | $ | 11,338,147 | |||||||||
| Total Investment Securities — 106.0% (Cost $170,051,156) | $ | 165,297,692 | |||||||||
| Liabilities in Excess of Other Assets — (6.0%) | (9,285,550 | ) | |||||||||
| Net Assets — 100.0% | $ | 156,012,142 | |||||||||
* Non-income producing security.
† All or a portion of the security is on loan. The total value of the securities on loan as of September 30, 2011, was $7,518,033.
** Represents collateral for securities loaned.
^ Affiliated Fund, sub-advised by Fort Washington Investment Advisors, Inc. See Note 4.
Portfolio Abbreviations:
LLC – Limited Liability Company
REIT – Real Estate Investment Trust
Other Information:
The inputs or methodology used for valuing securities may not be an indication of the risk associated with investing in those securities. For more information on valuation inputs, and their aggregation into the levels used in the table below, please refer to the security valuation section in the accompanying notes to financial statements.
Valuation Inputs at Reporting Date:
| Description | Level 1 | Level 2 | Level 3 | Total | |||||||||||||||
| Common Stocks | $ | 153,959,545 | $ | — | $ | — | $ | 153,959,545 | |||||||||||
| Investment Funds | 11,338,147 | — | — | 11,338,147 | |||||||||||||||
| $ | 165,297,692 | ||||||||||||||||||
See accompanying notes to financial statements.
200
Portfolio of Investments
Touchstone Small Cap Value Fund – September 30, 2011
| Common Stocks — 96.5% | Shares | Fair Value | |||||||||
| Financials — 25.6% | |||||||||||
| American Assets Trust, Inc. REIT | 16,039 | $ | 287,900 | ||||||||
| Anworth Mortgage Asset Corp. REIT | 48,100 | 327,080 | |||||||||
| Brookline Bancorp, Inc. | 59,550 | 459,131 | |||||||||
| Capitol Federal Financial, Inc. | 82,647 | 872,752 | |||||||||
| Chesapeake Lodging Trust REIT | 70,815 | 854,737 | |||||||||
| Dime Community Bancshares | 16,680 | 168,968 | |||||||||
| Evercore Partners, Inc. - Class A | 17,325 | 395,010 | |||||||||
| Flagstone Reinsurance Holdings SA | 117,090 | 907,447 | |||||||||
| Greenhill & Co., Inc. † | 31,200 | 892,008 | |||||||||
| Hanover Insurance Group, Inc. (The) | 12,930 | 459,015 | |||||||||
| Healthcare Realty Trust, Inc. REIT | 38,474 | 648,287 | |||||||||
| Hercules Technology Growth Capital, Inc. | 54,975 | 468,387 | |||||||||
| Iberiabank Corp. | 14,611 | 687,594 | |||||||||
| KBW, Inc. | 37,020 | 510,506 | |||||||||
| Medical Properties Trust, Inc. REIT | 54,041 | 483,667 | |||||||||
| Sterling Bancorp/NY - Class N | 44,615 | 323,905 | |||||||||
| UMB Financial Corp. | 13,660 | 438,213 | |||||||||
| Washington Federal, Inc. | 45,380 | 578,141 | |||||||||
| 9,762,748 | |||||||||||
| Industrials — 20.8% | |||||||||||
| ABM Industries, Inc. | 40,615 | 774,122 | |||||||||
| Apogee Enterprises, Inc. | 44,708 | 384,042 | |||||||||
| Brady Corp. - Class A | 21,130 | 558,466 | |||||||||
| Curtiss-Wright Corp. | 17,335 | 499,768 | |||||||||
| G&K Services, Inc. - Class A | 10,760 | 274,810 | |||||||||
| Harsco Corp. | 36,940 | 716,267 | |||||||||
| Kaydon Corp. | 27,790 | 797,017 | |||||||||
| Knight Transportation, Inc. | 78,110 | 1,039,644 | |||||||||
| Lennox International, Inc. | 21,450 | 552,981 | |||||||||
| McGrath Rentcorp | 23,359 | 555,711 | |||||||||
| Otter Tail Corp. | 18,060 | 330,498 | |||||||||
| Resources Connection, Inc. | 101,395 | 991,643 | |||||||||
| Universal Forest Products, Inc. | 18,230 | 438,431 | |||||||||
| 7,913,400 | |||||||||||
| Consumer Discretionary — 15.8% | |||||||||||
| Bebe Stores, Inc. | 48,920 | 328,742 | |||||||||
| Cooper Tire & Rubber Co. | 32,310 | 351,856 | |||||||||
| Fred's, Inc. - Class A | 42,639 | 454,532 | |||||||||
| Hillenbrand, Inc. | 34,730 | 639,032 | |||||||||
| Jones Group, Inc. (The) | 98,992 | 911,716 | |||||||||
| MDC Holdings, Inc. † | 16,390 | 277,647 | |||||||||
| Meredith Corp. † | 39,685 | 898,468 | |||||||||
| RadioShack Corp. | 58,967 | 685,197 | |||||||||
| Regis Corp. | 46,600 | 656,594 | |||||||||
| Stewart Enterprises, Inc. - Class A | 44,590 | 265,311 | |||||||||
| Wendy's Co. (The) | 118,300 | 542,997 | |||||||||
| 6,012,092 | |||||||||||
| Information Technology — 8.7% | |||||||||||
| ADTRAN, Inc. | 5,570 | 147,382 | |||||||||
| Cohu, Inc. | 44,276 | 437,447 | |||||||||
| Intersil Corp. - Class A | 87,890 | 904,388 | |||||||||
| Shares | Fair Value | ||||||||||
| Methode Electronics, Inc. | 53,000 | $ | 393,790 | ||||||||
| Micrel, Inc. | 93,085 | 881,515 | |||||||||
| MKS Instruments, Inc. | 24,700 | 536,237 | |||||||||
| 3,300,759 | |||||||||||
| Materials — 7.3% | |||||||||||
| A Schulman, Inc. | 28,155 | 478,354 | |||||||||
| AK Steel Holding Corp. † | 64,960 | 424,838 | |||||||||
| Commercial Metals Co. | 61,240 | 582,392 | |||||||||
| Eagle Materials, Inc. | 40,950 | 681,818 | |||||||||
| HB Fuller Co. | 34,665 | 631,596 | |||||||||
| 2,798,998 | |||||||||||
| Utilities — 5.8% | |||||||||||
| Allete, Inc. | 13,535 | 495,787 | |||||||||
| American States Water Co. | 4,970 | 168,632 | |||||||||
| Black Hills Corp. | 12,094 | 370,560 | |||||||||
| California Water Service Group | 22,480 | 398,121 | |||||||||
| Northwest Natural Gas Co. | 17,430 | 768,663 | |||||||||
| 2,201,763 | |||||||||||
| Energy — 3.8% | |||||||||||
| Bristow Group, Inc. | 19,665 | 834,386 | |||||||||
| Penn Virginia Corp. | 50,840 | 283,179 | |||||||||
| Tsakos Energy Navigation Ltd. | 62,340 | 347,857 | |||||||||
| 1,465,422 | |||||||||||
| Consumer Staples — 3.7% | |||||||||||
| Cal-Maine Foods, Inc. † | 5,640 | 177,265 | |||||||||
| Fresh Del Monte Produce, Inc. | 9,935 | 230,492 | |||||||||
| Sanderson Farms, Inc. † | 12,749 | 605,578 | |||||||||
| Snyders-Lance, Inc. | 17,980 | 374,883 | |||||||||
| Tootsie Roll Industries, Inc. | 1,015 | 24,482 | |||||||||
| 1,412,700 | |||||||||||
| Health Care — 3.6% | |||||||||||
| Owens & Minor, Inc. | 21,030 | 598,934 | |||||||||
| STERIS Corp. | 26,440 | 773,899 | |||||||||
| 1,372,833 | |||||||||||
| Telecommunication Services — 1.4% | |||||||||||
| NTELOS Holdings Corp. | 29,916 | 530,411 | |||||||||
| Total Common Stocks | $ | 36,771,126 | |||||||||
| Investment Funds — 10.4% | |||||||||||
| Invesco Liquid Assets Portfolio ** | 2,200,244 | 2,200,244 | |||||||||
| Touchstone Institutional Money Market Fund^ | 1,778,524 | 1,778,524 | |||||||||
| Total Investment Funds | $ | 3,978,768 | |||||||||
| Total Investment Securities — 106.9% (Cost $48,723,014) | $ | 40,749,894 | |||||||||
| Liabilities in Excess of Other Assets — (6.9%) | (2,619,687 | ) | |||||||||
| Net Assets — 100.0% | $ | 38,130,207 | |||||||||
201
Touchstone Small Cap Value Fund (Continued)
† All or a portion of the security is on loan. The total value of the securities on loan as of September 30, 2011, was $2,109,595.
** Represents collateral for securities loaned.
^ Affiliated Fund, sub-advised by Fort Washington Investment Advisors, Inc. See Note 4.
Portfolio Abbreviations:
REIT – Real Estate Investment Trust
Other Information:
The inputs or methodology used for valuing securities may not be an indication of the risk associated with investing in those securities. For more information on valuation inputs, and their aggregation into the levels used in the table below, please refer to the security valuation section in the accompanying notes to financial statements.
Valuation Inputs at Reporting Date:
| Description | Level 1 | Level 2 | Level 3 | Total | |||||||||||||||
| Common Stocks | $ | 36,771,126 | $ | — | $ | — | $ | 36,771,126 | |||||||||||
| Investment Funds | 3,978,768 | — | — | 3,978,768 | |||||||||||||||
| $ | 40,749,894 | ||||||||||||||||||
See accompanying notes to financial statements.
202
Portfolio of Investments
Touchstone Total Return Bond Fund – September 30, 2011
| Principal Amount | Fair Value | ||||||||||
| U.S. Government Agency Obligations — 26.7% | |||||||||||
| $ | 194,000 | Alter Barge Line, Inc., 6.000%, 3/1/26 | $ | 248,547 | |||||||
| 76,340 | Astro Offshore Corp., 6.000%, 12/20/19 | 86,945 | |||||||||
| 125,000 | Canal Barge Co., Inc., 4.500%, 11/12/34 | 146,480 | |||||||||
| 7,548 | FHA Reilly, 6.840%, 6/1/14 | 7,268 | |||||||||
| 30,257 | FHA USGI, 7.430%, 8/1/23 | 29,954 | |||||||||
| 450,000 | FHLMC, 3.750%, 3/27/19 | 508,371 | |||||||||
| 214,000 | Matson Navigation Co., Inc., 5.337%, 9/4/28 | 248,349 | |||||||||
| 178,564 | Rowan Cos., Inc., 2.800%, 10/20/13 | 181,709 | |||||||||
| 42,901 | SBA, Ser 2003-10B, Class 1, 3.390%, 3/1/13 | 43,452 | |||||||||
| 232,859 | SBA, Ser 2009-20D, Class 1, 4.310%, 4/1/29 | 250,017 | |||||||||
| 249,567 | SBA, Ser 2009-20E, Class 1, 4.430%, 5/1/29 | 271,728 | |||||||||
| 191,178 | SBA, Ser 2005-10E, Class 1, 4.540%, 9/1/15 | 200,118 | |||||||||
| 176,341 | SBA, Ser 2005-20B, Class 1, 4.625%, 2/1/25 | 191,368 | |||||||||
| 241,910 | SBA, Ser 2009-20C, Class 1, 4.660%, 3/1/29 | 262,411 | |||||||||
| 179,855 | SBA, Ser 2003-20D, Class 1, 4.760%, 4/1/23 | 194,631 | |||||||||
| 125,961 | SBA, Ser 2004-20D, Class 1, 4.770%, 4/1/24 | 136,764 | |||||||||
| 123,843 | SBA, Ser 2009-20F, Class 1, 4.950%, 6/1/29 | 135,305 | |||||||||
| 411,614 | SBA, Ser 2008-20A, Class 1, 5.170%, 1/1/28 | 453,479 | |||||||||
| 214,731 | SBA, Ser 2007-20L, Class 1, 5.290%, 12/1/27 | 237,311 | |||||||||
| 21,270 | SBA, Ser B, 5.300%, 3/1/12 | 21,561 | |||||||||
| 299,466 | SBA, Ser 2002-20H, Class 1, 5.310%, 8/1/22 | 327,220 | |||||||||
| 219,118 | SBA, Ser 2007-20E, Class 1, 5.310%, 5/1/27 | 242,337 | |||||||||
| 273,627 | SBA, Ser 2007-20A, Class 1, 5.320%, 1/1/27 | 303,373 | |||||||||
| 299,356 | SBA, 5.340%, 11/1/21 | 325,930 | |||||||||
| 203,694 | SBA, Ser 2006-20B, Class 1, 5.350%, 2/1/26 | 223,527 | |||||||||
| 385,440 | SBA, Ser 2006-20K, Class 1, 5.360%, 11/1/26 | 427,068 | |||||||||
| 143,669 | SBA, Ser 2008-20D, Class 1, 5.370%, 4/1/28 | 158,707 | |||||||||
| 108,671 | SBA, Ser 2005-20L, Class 1, 5.390%, 12/1/25 | 120,317 | |||||||||
| 152,044 | SBA, Ser 2008-20C, Class 1, 5.490%, 3/1/28 | 168,927 | |||||||||
| 90,945 | SBA, Ser 2008-20E, Class 1, 5.490%, 5/1/28 | 101,773 | |||||||||
| 126,471 | SBA, Ser 2007-20I, Class 1, 5.560%, 9/1/27 | 140,813 | |||||||||
| Principal Amount | Fair Value | ||||||||||
| $ | 159,924 | SBA, Ser 2008-20I, Class 1, 5.600%, 9/1/28 | $ | 179,948 | |||||||
| 269,005 | SBA, Ser 2006-20H, Class 1, 5.700%, 8/1/26 | 300,915 | |||||||||
| 142,000 | SBA, Ser 2007-20G, Class 1, 5.820%, 7/1/27 | 160,254 | |||||||||
| 88,341 | SBA, Ser 98-B, 6.150%, 2/1/18 | 95,895 | |||||||||
| 157,195 | SBA, Ser 2001-20A, Class 1, 6.290%, 1/1/21 | 173,264 | |||||||||
| 30,749 | SBA, Ser 95-L, 6.450%, 12/1/15 | 33,031 | |||||||||
| 22,936 | SBA, Ser 97-A, 7.150%, 1/1/17 | 25,180 | |||||||||
| 223,733 | SBA, Ser 2000-20K, Class 1, 7.220%, 11/1/20 | 248,967 | |||||||||
| 84,478 | SBA, Ser 99-I, 7.300%, 9/1/19 | 94,013 | |||||||||
| 11,310 | SBA, 7.400%, 8/1/12 | 11,653 | |||||||||
| 193,175 | Sterling Equipment, Inc., 6.125%, 9/28/19 | 209,440 | |||||||||
| 300,000 | Tennessee Valley Auth., 4.650%, 6/15/35 | 352,562 | |||||||||
| 113,000 | Vessel Management Services, Inc., 5.125%, 4/16/35 | 131,024 | |||||||||
| Total U.S. Government Agency Obligations | $ | 8,411,906 | |||||||||
| Corporate Bonds — 18.4% Financials — 8.1% | |||||||||||
| 350,000 | Ally Financial, Inc., 6.875%, 8/28/12 | 354,598 | |||||||||
| 325,000 | Ford Motor Credit Co. LLC, 5.625%, 9/15/15 | 326,922 | |||||||||
| 200,000 | General Electric Capital Corp. MTN, 5.625%, 5/1/18 | 218,638 | |||||||||
| 135,000 | National Rural Utilities Cooperative Finance Corp., 10.375%, 11/1/18 | 193,976 | |||||||||
| 150,000 | Private Export Funding Corp., 4.300%, 12/15/21 | 171,885 | |||||||||
| 500,000 | Provident Cos., Inc., 7.000%, 7/15/18 | 563,632 | |||||||||
| 475,000 | USB Capital IX, 3.500%, 12/31/49 (a) | 334,880 | |||||||||
| 475,000 | Wachovia Capital Trust III, 5.570%, 12/31/49 (a) | 389,500 | |||||||||
| 2,554,031 | |||||||||||
| Industrials — 1.9% | |||||||||||
| 263,698 | Continental Airlines, Inc., 7.707%, 4/2/21 | 271,609 | |||||||||
| 300,000 | CSX Transportation, Inc., 6.550%, 6/15/13 | 326,355 | |||||||||
| 597,964 | |||||||||||
| Utilities — 4.6% | |||||||||||
| 400,000 | Commonwealth Edison Co., 5.900%, 3/15/36 | 479,153 | |||||||||
| 140,000 | Nevada Power Co., 6.500%, 8/1/18 | 168,793 | |||||||||
| 375,000 | Nevada Power Co., 5.875%, 1/15/15 | 418,993 | |||||||||
| 400,000 | NextEra Energy Capital Holdings, Inc., 6.350%, 10/1/66 (a) | 384,000 | |||||||||
| 1,450,939 | |||||||||||
203
Touchstone Total Return Bond Fund (Continued)
| Principal Amount | Fair Value | ||||||||||
| Corporate Bonds — 18.4% (Continued) Consumer Staples — 2.2% | |||||||||||
| $ | 447,029 | American Airlines 2011-1 Class B Pass Through Trust, 144a, 7.000%, 1/31/18 | $ | 366,564 | |||||||
| 175,866 | CVS Caremark Corp., 6.036%, 12/10/28 | 185,090 | |||||||||
| 125,992 | CVS Pass-Through Trust, 144a, 7.507%, 1/10/32 | 148,476 | |||||||||
| 700,130 | |||||||||||
| Energy — 0.6% | |||||||||||
| 33,000 | Chesapeake Energy Corp., 6.625%, 8/15/20 | 33,990 | |||||||||
| 150,000 | Chesapeake Energy Corp., 6.875%, 11/15/20 | 156,750 | |||||||||
| 190,740 | |||||||||||
| Consumer Discretionary — 1.0% | |||||||||||
| 325,000 | Pulte Group, Inc., 5.250%, 1/15/14 | 309,563 | |||||||||
| Total Corporate Bonds | $ | 5,803,367 | |||||||||
| U.S. Government Mortgage-Backed Obligations — 21.7% | |||||||||||
| 34,802 | FHLMC, Pool #G03871, 5.500%, 2/1/38 | 38,181 | |||||||||
| 151,828 | FHLMC, Pool #G02558, 6.000%, 1/1/37 | 167,091 | |||||||||
| 44,369 | FHLMC, Pool #G04346, 6.000%, 5/1/38 | 49,301 | |||||||||
| 142,628 | FHLMC Gold, Pool #G01665, 5.500%, 3/1/34 | 155,407 | |||||||||
| 68,153 | FHLMC Gold, Pool #G05888, 5.500%, 10/1/39 | 74,238 | |||||||||
| 140,289 | FHLMC Gold, Pool #G04123, 6.000%, 3/1/38 | 154,085 | |||||||||
| 305,122 | FNMA, Pool #AE8886, 3.500%, 12/1/25 | 319,083 | |||||||||
| 255,416 | FNMA, Pool #AD1608, 4.000%, 2/1/25 | 269,728 | |||||||||
| 131,860 | FNMA, Pool #AB1152, 4.000%, 6/1/25 | 139,248 | |||||||||
| 98,398 | FNMA, Pool #AE8073, 4.000%, 12/1/40 | 103,681 | |||||||||
| 67,917 | FNMA, Pool #AE8068, 4.000%, 12/1/40 | 71,637 | |||||||||
| 91,852 | FNMA, Pool #AH6574, 4.000%, 3/1/41 | 96,883 | |||||||||
| 131,902 | FNMA, Pool #AA3414, 4.500%, 3/1/39 | 140,112 | |||||||||
| 143,758 | FNMA, Pool #AD1656, 4.500%, 3/1/40 | 152,706 | |||||||||
| 196,865 | FNMA, Pool #AD0786, 4.501%, 1/1/20 | 216,982 | |||||||||
| 172,456 | FNMA, Pool #AD0910, 4.601%, 4/1/20 | 192,606 | |||||||||
| 146,455 | FNMA, Pool #AD0342, 4.640%, 10/1/19 | 163,827 | |||||||||
| 240,145 | FNMA, Pool #465711, 4.680%, 8/1/28 | 262,338 | |||||||||
| 146,287 | FNMA, Pool #AD0166, 4.875%, 8/1/19 | 162,706 | |||||||||
| 152,696 | FNMA, Pool #958736, 4.940%, 5/1/19 | 171,745 | |||||||||
| 262,242 | FNMA, Pool #745275, 5.000%, 2/1/36 | 283,134 | |||||||||
| 99,572 | FNMA, Pool #926050, 5.000%, 4/1/38 | 107,225 | |||||||||
| 46,626 | FNMA, Pool #AE9108, 5.000%, 12/1/40 | 50,239 | |||||||||
| 122,446 | FNMA, Pool #874210, 5.260%, 1/1/25 | 140,723 | |||||||||
| 252,185 | FNMA, Pool #745418, 5.500%, 4/1/36 | 275,331 | |||||||||
| 124,986 | FNMA, Pool #889684, 5.500%, 8/1/37 | 136,458 | |||||||||
| 181,361 | FNMA, Pool #929317, 5.500%, 3/1/38 | 198,234 | |||||||||
| 215,434 | FNMA, Pool #995018, 5.500%, 6/1/38 | 234,769 | |||||||||
| Principal Amount | Fair Value | ||||||||||
| $ | 56,897 | FNMA, Pool #888829, 5.832%, 6/1/37 | $ | 64,253 | |||||||
| 57,303 | FNMA, Pool #831811, 6.000%, 9/1/36 | 63,388 | |||||||||
| 127,594 | FNMA, Pool #888222, 6.000%, 2/1/37 | 140,521 | |||||||||
| 153,517 | FNMA, Pool #911586, 6.000%, 4/1/37 | 169,405 | |||||||||
| 272,052 | FNMA, Pool #889507, 6.000%, 5/1/38 | 298,594 | |||||||||
| 9,762 | FNMA, Pool #995196, 6.000%, 7/1/38 | 10,751 | |||||||||
| 60,568 | FNMA, Pool #190391, 6.000%, 9/1/38 | 66,477 | |||||||||
| 72,115 | FNMA, Pool #995226, 6.000%, 11/1/38 | 79,264 | |||||||||
| 108,794 | FNMA, Pool #931293, 6.000%, 6/1/39 | 121,427 | |||||||||
| 127,598 | GNMA, Ser 2009-114, Class A, 3.103%, 12/16/38 | 132,229 | |||||||||
| 212,423 | GNMA, Ser 2009-4, Class A, 3.813%, 11/16/37 | 222,428 | |||||||||
| 325,000 | GNMA, Ser 2009-27, Class B, 4.353%, 2/16/41 | 358,087 | |||||||||
| 122,545 | GNMA, Pool #712690, 5.000%, 4/15/39 | 135,019 | |||||||||
| 136,880 | GNMA, Pool #G2 4441, 5.000%, 5/20/39 | 146,621 | |||||||||
| 280,218 | GNMA, Pool #G2 3665, 5.500%, 1/20/35 | 312,298 | |||||||||
| Total U.S. Government Mortgage-Backed Obligations | $ | 6,848,460 | |||||||||
| U.S. Treasury Obligations — 16.5% | |||||||||||
| 165,000 | U.S. Treasury Bond, 4.750%, 2/15/41 | 225,457 | |||||||||
| 1,650,000 | U.S. Treasury Note, 0.750%, 3/31/13 | 1,662,953 | |||||||||
| 1,125,000 | U.S. Treasury Note, 2.625%, 11/15/20 | 1,203,047 | |||||||||
| 496,000 | U.S. Treasury Note, 3.625%, 2/15/21 | 572,996 | |||||||||
| 1,000,000 | U.S. Treasury STRIPS, 3.400%, 8/15/25 (b) | 686,790 | |||||||||
| 700,000 | U.S. Treasury STRIPS, 3.340%, 8/15/30 (b) | 396,172 | |||||||||
| 930,000 | U.S. Treasury STRIPS, 3.200%, 8/15/35 (b) | 441,191 | |||||||||
| Total U.S. Treasury Obligations | $ | 5,188,606 | |||||||||
| Commercial Mortgage-Backed Securities — 3.9% | |||||||||||
| 146,000 | Citigroup Commercial Mortgage Trust, Ser 2007-C6, Class A4, 5.697%, 12/10/49 (a) | 157,275 | |||||||||
| 505,000 | Citigroup/Deutsche Bank Commercial Mortgage Trust, Ser 2006-CD3, Class AJ, 5.688%, 10/15/48 | 265,734 | |||||||||
| 200,000 | JP Morgan Chase Commercial Mortgage Securities Corp., Ser 2005-LDP4, Class AM, 4.999%, 10/15/42 (a) | 201,331 | |||||||||
| 300,000 | JP Morgan Chase Commercial Mortgage Securities Corp., Ser 2006-CB17, Class A3, 5.450%, 12/12/43 | 301,497 | |||||||||
| 320,000 | Merrill Lynch / Countrywide Commercial Mortgage Trust, Ser 2006-3, Class AM, 5.456%, 7/12/46 (a) | 297,010 | |||||||||
| Total Commercial Mortgage-Backed Securities | $ | 1,222,847 | |||||||||
204
Touchstone Total Return Bond Fund (Continued)
| Principal Amount | Fair Value | ||||||||||
| Asset-Backed Securities — 2.3% | |||||||||||
| $ | 182,518 | Burlington Northern and Santa Fe Railway Co. 2000-2 Pass Through Trust, Ser 98-C, 6.230%, 7/2/18 | $ | 202,635 | |||||||
| 134,074 | Burlington Northern and Santa Fe Railway Co. 2004-1 Pass Through Trust, 4.575%, 1/15/21 | 145,505 | |||||||||
| 157,951 | Federal Express Corp. 1998 Pass Through Trust, Ser 981B, 6.845%, 1/15/19 | 173,746 | |||||||||
| 100,392 | Federal Express Corp. 1999 Pass Through Trust, Ser 991A, 7.650%, 1/15/22 | 120,574 | |||||||||
| 75,980 | Union Pacific Railroad Co. 2001 Pass Through Trust, Ser 2001-1, 6.630%, 1/27/22 | 88,407 | |||||||||
| Total Asset-Backed Securities | $ | 730,867 | |||||||||
| Collateralized Mortgage Obligations — 1.8% | |||||||||||
| 141,000 | FHLMC Multifamily Structured Pass Through Certificates, Ser K009, Class A2, 3.808%, 8/25/20 | 151,966 | |||||||||
| 234,000 | FHLMC Multifamily Structured Pass Through Certificates, Ser K012, Class A2, 4.186%, 12/25/20 (a) | 258,880 | |||||||||
| 135,000 | FHLMC Multifamily Structured Pass Through Certificates, Ser K701, Class A2, 3.882%, 11/25/17 (a) | 145,864 | |||||||||
| Total Collateralized Mortgage Obligations | $ | 556,710 | |||||||||
| Sovereign Government Obligations — 1.4% | |||||||||||
| 19,512 | Ecuador Government AID Bond, 7.050%, 5/1/15 | 21,914 | |||||||||
| 325,000 | Israel Government AID Bond, 5.500%, 9/18/33 | 416,817 | |||||||||
| Total Sovereign Government Obligations | $ | 438,731 | |||||||||
| Mortgage-Backed Security — 0.8% | |||||||||||
| 237,270 | Federal Agricultural Mortgage Corp., Ser AM-1003, Class 1, 6.770%, 4/25/13 (a) | 255,089 | |||||||||
| Investment Fund — 5.3% | |||||||||||
| 1,678,743 | Touchstone Institutional Money Market Fund^ | 1,678,743 | |||||||||
| Total Investment Securities — 98.8% (Cost $29,807,065) | $ | 31,135,326 | |||||||||
| Other Assets in Excess of Liabilities — 1.2% | 384,274 | ||||||||||
| Net Assets — 100.0% | $ | 31,519,600 | |||||||||
(a) Variable rate security – the rate reflected is the rate in effect as of September 30, 2011.
(b) Zero Coupon security – The rate reported was the effective yield as of September 30, 2011.
^ Affiliated Fund, sub-advised by Fort Washington Investment Advisors, Inc. See Note 4.
Portfolio Abbreviations:
FNMA – Federal National Mortgage Association
FHA – Federal Housing Authority
FHLMC – Federal Home Loan Mortgage Corp.
GNMA – Government National Mortgage Association
LLC – Limited Liability Company
MTN – Medium Term Note
SBA – Small Business Administration
STRIPS – Separately Traded Registered Interest and Principal of Securities
144a – This is a restricted security that was sold in a transaction exempt from Rule 144a of the Securities Act of 1933. This security may be sold in transactions exempt from registration, normally to qualified institutional buyers. At September 30, 2011, these securities were valued at $515,040 or 1.6% of net assets. These securities were deemed liquid pursuant to procedures approved by the Board of Trustees.
205
Touchstone Total Return Bond Fund (Continued)
Other Information:
The inputs or methodology used for valuing securities may not be an indication of the risk associated with investing in those securities. For more information on valuation inputs, and their aggregation into the levels used in the table below, please refer to the security valuation section in the accompanying notes to financial statements.
Valuation Inputs at Reporting Date:
| Description | Level 1 | Level 2 | Level 3 | Total | |||||||||||||||
| U.S. Government Agency Obligations | $ | — | $ | 8,411,906 | $ | — | $ | 8,411,906 | |||||||||||
| Corporate Bonds | — | 5,803,367 | — | 5,803,367 | |||||||||||||||
| U.S. Government Mortgage- Backed Obligations | — | 6,848,460 | — | 6,848,460 | |||||||||||||||
| U.S. Treasury Obligations | — | 5,188,606 | — | 5,188,606 | |||||||||||||||
| Investment Fund | 1,678,743 | — | — | 1,678,743 | |||||||||||||||
| Commercial Mortgage- Backed Securities | — | 1,222,847 | — | 1,222,847 | |||||||||||||||
| Asset-Backed Securities | — | 730,867 | — | 730,867 | |||||||||||||||
| Collateralized Mortgage Obligations | — | 556,710 | — | 556,710 | |||||||||||||||
| Sovereign Government Obligations | — | 438,731 | — | 438,731 | |||||||||||||||
| Mortgage- Backed Securities | — | 255,089 | — | 255,089 | |||||||||||||||
| $ | 31,135,326 | ||||||||||||||||||
See accompanying notes to financial statements.
206
Portfolio of Investments
Touchstone Ultra Short Duration Fixed Income Fund – September 30, 2011
| Principal Amount | Fair Value | ||||||||||
| Commercial Mortgage-Backed Securities — 30.4% | |||||||||||
| $ | 1,053,839 | American Home Mortgage Investment Trust, Ser 2005-2, Class 5A3, 5.077%, 9/25/35 | $ | 1,066,063 | |||||||
| 2,300,000 | Banc of America Merrill Lynch Commercial Mortgage, Inc., Ser 2002-2, Class C, 5.315%, 7/11/43 | 2,307,855 | |||||||||
| 3,181,444 | Banc of America Merrill Lynch Commercial Mortgage, Inc., Ser 2003-2, Class A3, 4.873%, 3/11/41 (a) | 3,240,008 | |||||||||
| 3,097,260 | Banc of America Merrill Lynch Commercial Mortgage, Inc., Ser 2004-6, Class A3, 4.512%, 12/10/42 | 3,116,126 | |||||||||
| 1,610,236 | Banc of America Merrill Lynch Commercial Mortgage, Inc., Ser 2005-2, Class A4, 4.783%, 7/10/43 (a) | 1,626,321 | |||||||||
| 448,092 | Banc of America Merrill Lynch Commercial Mortgage, Inc., Ser 2005-3, Class ASB, 4.589%, 7/10/43 | 461,454 | |||||||||
| 595,763 | Banc of America Merrill Lynch Commercial Mortgage, Inc., Ser 2005-4, Class A2, 4.764%, 7/10/45 | 595,457 | |||||||||
| 3,384,563 | Banc of America Merrill Lynch Commercial Mortgage, Inc., Ser 2006-2, Class A2, 5.713%, 5/10/45 | 3,382,800 | |||||||||
| 2,887,823 | Banc of America Merrill Lynch Commercial Mortgage, Inc., Ser 2007-1, Class A2, 5.381%, 1/15/49 | 2,891,508 | |||||||||
| 4,855,671 | Bear Stearns Commercial Mortgage Securities, Ser 2002-PBW1, Class A2, 4.720%, 11/11/35 (a)++ | 4,936,397 | |||||||||
| 1,172,855 | Bear Stearns Commercial Mortgage Securities, Ser 2004-PWR4, Class A2, 5.286%, 6/11/41 (a)++ | 1,211,310 | |||||||||
| 3,500,000 | Bear Stearns Commercial Mortgage Securities, Ser 2007-T26, Class A2, 5.330%, 1/12/45++ | 3,521,731 | |||||||||
| 451,568 | Cendant Mortgage Corp., Ser 2003-7P, Class A2, 144a, 4.856%, 6/25/17 (a) | 454,292 | |||||||||
| 440,645 | Cendant Mortgage Corp., Ser 2003-8, Class 2A3, 4.873%, 10/25/33 (a) | 443,133 | |||||||||
| 188,425 | Chase Mortgage Finance Corp., Ser 2004-S2, Class 2A2, 5.500%, 11/25/14 | 188,156 | |||||||||
| 437,145 | Citicorp Mortgage Securities, Inc., Ser 2003-10, Class A2, 4.500%, 11/25/18 | 440,615 | |||||||||
| 330,985 | Citicorp Mortgage Securities, Inc., Ser 2003-11, Class 1A4, 5.250%, 12/25/33 | 330,603 | |||||||||
| Principal Amount | Fair Value | ||||||||||
| $ | 609,441 | Citicorp Mortgage Securities, Inc., Ser 2005-1, Class 1A10, 5.750%, 2/25/35 | $ | 610,260 | |||||||
| 3,400,000 | Commercial Mortgage Pass Through Certificates, Ser 2001-J2A, Class B, 144a, 6.304%, 7/16/34 | 3,391,358 | |||||||||
| 1,237,422 | Commercial Mortgage Pass Through Certificates, Ser 2004-LB2A, Class A3, 4.221%, 3/10/39 | 1,240,457 | |||||||||
| 463,660 | Commercial Mortgage Pass Through Certificates, Ser 2007-FL14, Class A1, 144a, 0.319%, 6/15/22 (a) | 444,223 | |||||||||
| 303,869 | Countrywide Home Loan Mortgage Pass Through Trust, Ser 2003-34, Class A5, 4.500%, 9/25/33 | 305,130 | |||||||||
| 217,639 | Countrywide Home Loan Mortgage Pass Through Trust, Ser 2003-J4, Class 1A2, 4.750%, 6/25/33 | 219,876 | |||||||||
| 1,180,900 | Credit Suisse First Boston Mortgage Securities Corp., Ser 1998-C2, Class D, 7.130%, 11/15/30 | 1,206,406 | |||||||||
| 1,000,000 | Credit Suisse First Boston Mortgage Securities Corp., Ser 2001-CK6, Class B, 6.582%, 8/15/36 | 998,271 | |||||||||
| 2,500,000 | Credit Suisse First Boston Mortgage Securities Corp., Ser 2002-CP5, Class A2, 4.940%, 12/15/35 | 2,565,552 | |||||||||
| 151,672 | Credit Suisse First Boston Mortgage Securities Corp., Ser 2003-27, Class 5A1, 5.250%, 11/25/33 | 151,747 | |||||||||
| 1,195,963 | Credit Suisse First Boston Mortgage Securities Corp., Ser 2004-4, Class 3A9, 5.250%, 8/25/34 | 1,207,868 | |||||||||
| 2,441,712 | Credit Suisse Mortgage Capital Certificates, Ser 2006-C3, Class A2, 6.011%, 6/15/38 (a) | 2,438,391 | |||||||||
| 3,340,472 | Credit Suisse Mortgage Capital Certificates, Ser 2007-C5, Class A2, 5.589%, 9/15/40 | 3,393,595 | |||||||||
| 1,000,000 | GE Capital Commercial Mortgage Corp., Ser 2001-3, Class B, 6.260%, 6/10/38 | 998,984 | |||||||||
| 82,623 | GMAC Commercial Mortgage Securities, Inc., Ser 2001-C2, Class A2, 6.700%, 4/15/34 | 82,501 | |||||||||
| 527,510 | GMAC Commercial Mortgage Securities, Inc., Ser 2004-C2, Class A2, 4.760%, 8/10/38 | 527,201 | |||||||||
| 2,353,579 | GMAC Mortgage Corp. Loan Trust, Ser 2004-JR1, Class A8, 5.250%, 12/25/14 | 2,379,158 | |||||||||
207
Touchstone Ultra Short Duration Fixed Income Fund (Continued)
| Principal Amount | Fair Value | ||||||||||
| Commercial Mortgage-Backed Securities — 30.4% (Continued) | |||||||||||
| $ | 2,750,000 | JP Morgan Chase Commercial Mortgage Securities Corp., Ser 2002-C3, Class B, 5.146%, 7/12/35 (a) | $ | 2,791,517 | |||||||
| 291,198 | JP Morgan Chase Commercial Mortgage Securities Corp., Ser 2002-CIB5, Class A1, 4.372%, 10/12/37 | 291,991 | |||||||||
| 2,750,000 | JP Morgan Chase Commercial Mortgage Securities Corp., Ser 2002-CIB5, Class B, 5.308%, 10/12/37 | 2,809,293 | |||||||||
| 1,023,802 | JP Morgan Chase Commercial Mortgage Securities Corp., Ser 2003-PM1A, Class A3, 5.169%, 8/12/40 (a) | 1,043,903 | |||||||||
| 896,578 | JP Morgan Chase Commercial Mortgage Securities Corp., Ser 2004-CBX, Class A4, 4.529%, 1/12/37 | 895,914 | |||||||||
| 640,639 | JP Morgan Chase Commercial Mortgage Securities Corp., Ser 2004-LN2, Class A1, 4.475%, 7/15/41 | 644,617 | |||||||||
| 2,475,000 | JP Morgan Chase Commercial Mortgage Securities Corp., Ser 2005-LDP4, Class A3A2, 4.903%, 10/15/42 | 2,502,794 | |||||||||
| 388,137 | JP Morgan Chase Commercial Mortgage Securities Corp., Ser 2006-LDP9, Class A1S, 5.284%, 5/15/47 | 388,288 | |||||||||
| 168,746 | JP Morgan Commercial Mortgage Finance Corp., Ser 2000-C9, Class G, 144a, 6.250%, 10/15/32 | 168,449 | |||||||||
| 1,362,803 | JP Morgan Mortgage Trust, Ser 2005-A3, Class 11A1, 4.471%, 6/25/35 (a) | 1,376,587 | |||||||||
| 510,260 | LB Commercial Conduit Mortgage Trust, Ser 1998-C1, Class D, 6.980%, 2/18/30++ | 519,915 | |||||||||
| 114,376 | LB Commercial Conduit Mortgage Trust, Ser 1998-C4, Class F, 144a, 6.000%, 10/15/35++ | 114,258 | |||||||||
| 3,200,000 | LB Commercial Conduit Mortgage Trust, Ser 2007-C3, Class A2, 5.840%, 7/15/44 (a)++ | 3,246,422 | |||||||||
| 164,751 | LB-UBS Commercial Mortgage Trust, Ser 2002-C2, Class A3, 5.386%, 6/15/26++ | 164,841 | |||||||||
| 661,192 | LB-UBS Commercial Mortgage Trust, Ser 2003-C7, Class A2, 4.064%, 9/15/27 (a)++ | 661,342 | |||||||||
| Principal Amount | Fair Value | ||||||||||
| $ | 1,240,166 | LB-UBS Commercial Mortgage Trust, Ser 2003-C8, Class A3, 4.830%, 11/15/27++ | $ | 1,255,316 | |||||||
| 670,106 | LB-UBS Commercial Mortgage Trust, Ser 2004-C7, Class A4, 4.395%, 10/15/29++ | 671,599 | |||||||||
| 2,227,679 | LB-UBS Commercial Mortgage Trust, Ser 2005-C7, Class A2, 5.103%, 11/15/30++ | 2,226,209 | |||||||||
| 513,096 | LB-UBS Commercial Mortgage Trust, Ser 2006-C4, Class A2, 5.868%, 6/15/32 (a)++ | 512,686 | |||||||||
| 419,805 | Merrill Lynch / Countrywide Commercial Mortgage Trust, Ser 2006-2, Class A2, 5.878%, 6/12/46 (a) | 419,408 | |||||||||
| 243,663 | Merrill Lynch Mortgage Trust, Ser 2003-KEY1, Class A3, 4.893%, 11/12/35 | 249,895 | |||||||||
| 3,650,000 | Morgan Stanley Capital I, Ser 2007-IQ15, Class A2, 6.040%, 6/11/49 (a) | 3,714,915 | |||||||||
| 229,440 | Morgan Stanley Dean Witter Capital I, Ser 2001-TOP3, Class A4, 6.390%, 7/15/33 | 229,301 | |||||||||
| 2,540,000 | Morgan Stanley Dean Witter Capital I, Ser 2001-TOP5, Class E, 144a, 7.148%, 10/15/35 (a) | 2,536,980 | |||||||||
| 4,160,000 | Morgan Stanley Dean Witter Capital I, Ser 2003-HQ2, Class B, 5.040%, 3/12/35 | 4,265,186 | |||||||||
| 1,435,436 | PHH Mortgage Capital LLC, Ser 2006-2, Class A2, 6.072%, 7/18/36 (a) | 1,435,188 | |||||||||
| 319,228 | PHH Mortgage Capital LLC, Ser 2006-3, Class A4, 5.764%, 10/18/36 (a) | 317,519 | |||||||||
| 635,322 | Popular ABS Mortgage Pass-Through Trust, Ser 2006-E, Class A1, 0.325%, 1/25/37 (a) | 630,965 | |||||||||
| 1,633,714 | Residential Asset Mortgage Products, Inc., Ser 2003-RZ3, Class A6, 3.400%, 3/25/33 | 1,609,333 | |||||||||
| 673,280 | Residential Funding Mortgage Securities I, Ser 2004-S9, Class 1A6, 5.500%, 12/25/34 | 681,523 | |||||||||
| 2,252,000 | Salomon Brothers Mortgage Securities VII, Inc., Ser 2001-C2, Class G, 7.222%, 11/13/36 (a) | 2,247,646 | |||||||||
| 191,758 | Wachovia Bank Commercial Mortgage Trust, Ser 2003-C9, Class A3, 4.608%, 12/15/35 | 194,124 | |||||||||
| 2,300,000 | Wachovia Bank Commercial Mortgage Trust, Ser 2004-C11, Class A4, 5.030%, 1/15/41 | 2,354,236 | |||||||||
| 2,825,483 | Wachovia Bank Commercial Mortgage Trust, Ser 2005-C17, Class APB, 5.037%, 3/15/42 | 2,915,893 | |||||||||
208
Touchstone Ultra Short Duration Fixed Income Fund (Continued)
| Principal Amount | Fair Value | ||||||||||
| Commercial Mortgage-Backed Securities — 30.4% (Continued) | |||||||||||
| $ | 50,893 | Wachovia Bank Commercial Mortgage Trust, Ser 2006-C27, Class A2, 5.624%, 7/15/45 | $ | 50,830 | |||||||
| 1,909,499 | Wachovia Bank Commercial Mortgage Trust, Ser 2007-C33, Class A2, 6.051%, 2/15/51 (a) | 1,927,605 | |||||||||
| 580,909 | Wells Fargo Mortgage Backed Securities Trust, Ser 2003-11, Class 1A11, 4.750%, 10/25/18 | 580,640 | |||||||||
| 794,389 | Wells Fargo Mortgage Backed Securities Trust, Ser 2003-13, Class A5, 4.500%, 11/25/18 | 803,798 | |||||||||
| 820,820 | Wells Fargo Mortgage Backed Securities Trust, Ser 2003-17, Class 1A10, 5.250%, 1/25/14 | 829,889 | |||||||||
| 2,417,263 | Wells Fargo Mortgage Backed Securities Trust, Ser 2003-M, Class A1, 4.692%, 12/25/33 (a) | 2,399,351 | |||||||||
| 158,708 | Wells Fargo Mortgage Backed Securities Trust, Ser 2005-3, Class A11, 5.500%, 5/25/35 | 157,767 | |||||||||
| Total Commercial Mortgage-Backed Securities | $ | 105,212,740 | |||||||||
| �� | Corporate Bonds — 20.6% Energy — 7.8% | ||||||||||
| 6,535,000 | Encana Corp., 6.300%, 11/1/11 | 6,561,127 | |||||||||
| 3,000,000 | Energy Transfer Partners LP, 5.650%, 8/1/12 | 3,092,160 | |||||||||
| 1,450,000 | Enterprise Products Operating LLC, Ser M, 5.650%, 4/1/13 | 1,533,762 | |||||||||
| 2,500,000 | Enterprise Products Operating LLC, 7.625%, 2/15/12 | 2,552,888 | |||||||||
| 3,520,000 | NuStar Pipeline Operating Partnership LP, 7.750%, 2/15/12 | 3,594,782 | |||||||||
| 3,235,000 | Plains All American Pipeline LP / PAA Finance Corp., 4.250%, 9/1/12 | 3,325,580 | |||||||||
| 3,000,000 | Transcontinental Gas Pipe Line Co. LLC, Ser B, 8.875%, 7/15/12 | 3,173,874 | |||||||||
| 3,000,000 | Valero Energy Corp., 6.875%, 4/15/12 | 3,089,985 | |||||||||
| 26,924,158 | |||||||||||
| Utilities — 3.6% | |||||||||||
| 2,000,000 | Hawaiian Electric Industries, Inc., Ser MTND, 5.250%, 3/7/13 | 2,094,844 | |||||||||
| 5,905,000 | KCP&L Greater Missouri Operations Co., 11.875%, 7/1/12 | 6,350,686 | |||||||||
| 300,000 | Ohio Power Co., 5.750%, 9/1/13 | 322,071 | |||||||||
| 1,000,000 | Ohio Power Co., Ser F, 5.500%, 2/15/13 | 1,049,449 | |||||||||
| 2,500,000 | SCANA Corp., 6.250%, 2/1/12 | 2,537,912 | |||||||||
| 12,354,962 | |||||||||||
| Principal Amount | Fair Value | ||||||||||
| Industrials — 3.2% | |||||||||||
| $ | 2,900,000 | Allied Waste North America, Inc., 6.875%, 6/1/17 | $ | 3,099,375 | |||||||
| 2,000,000 | Avery Dennison Corp., 4.875%, 1/15/13 | 2,081,070 | |||||||||
| 433,000 | Canadian National Railway Co., 6.375%, 10/15/11 | 433,745 | |||||||||
| 3,685,000 | CSX Corp., 6.300%, 3/15/12 | 3,770,968 | |||||||||
| 1,585,000 | Federal Express Corp., 9.650%, 6/15/12 | 1,677,391 | |||||||||
| 11,062,549 | |||||||||||
| Materials — 1.6% | |||||||||||
| 2,750,000 | Teck Resources Ltd., 10.250%, 5/15/16 | 3,232,900 | |||||||||
| 2,190,000 | Xstrata Canada Corp., 7.250%, 7/15/12 | 2,284,643 | |||||||||
| 5,517,543 | |||||||||||
| Consumer Discretionary — 1.6% | |||||||||||
| 2,550,000 | DIRECTV Holdings LLC / DIRECTV Financing Co., Inc., 7.625%, 5/15/16 | 2,741,250 | |||||||||
| 2,540,000 | Time Warner Entertainment Co. LP, 10.150%, 5/1/12 | 2,668,846 | |||||||||
| 5,410,096 | |||||||||||
| Financials — 1.3% | |||||||||||
| 1,235,000 | American Express Bank FSB, 5.500%, 4/16/13 | 1,303,787 | |||||||||
| 1,245,000 | Devin F & Janis L McCarthy, Ser 1997, 0.450%, 7/2/17 (a) | 1,245,000 | |||||||||
| 621,000 | HSBC Finance Corp., Ser NOT1, 5.000%, 3/15/12 | 626,691 | |||||||||
| 800,000 | HSBC Finance Corp., MTN, 5.750%, 7/15/13 | 822,737 | |||||||||
| 635,000 | WCI Finance LLC / WEA Finance LLC, 144a, 5.400%, 10/1/12 | 654,643 | |||||||||
| 4,652,858 | |||||||||||
| Telecommunication Services — 1.2% | |||||||||||
| 2,655,000 | AT&T Corp., 7.300%, 11/15/11 | 2,673,943 | |||||||||
| 1,635,000 | Comcast Cable Holdings LLC, 9.800%, 2/1/12 | 1,679,116 | |||||||||
| 4,353,059 | |||||||||||
| Consumer Staples — 0.3% | |||||||||||
| 1,015,000 | Laurel Grocery Co. LLC, Ser 1999, 0.450%, 12/1/14 (a) | 1,015,000 | |||||||||
| Total Corporate Bonds | $ | 71,290,225 | |||||||||
| U.S. Government Mortgage-Backed Obligations — 20.5% | |||||||||||
| 302,934 | FHLMC, Pool #1H2524, 2.483%, 8/1/35 (a) | 319,900 | |||||||||
| 475,163 | FHLMC, Pool #848088, 2.494%, 4/1/35 (a) | 501,288 | |||||||||
| 776,534 | FHLMC, Pool #1K1238, 2.498%, 7/1/36 (a) | 814,979 | |||||||||
209
Touchstone Ultra Short Duration Fixed Income Fund (Continued)
| Principal Amount | Fair Value | ||||||||||
| U.S. Government Mortgage-Backed Obligations — 20.5% (Continued) | |||||||||||
| $ | 2,101,782 | FHLMC, Pool #781515, 2.500%, 4/1/34 (a) | $ | 2,214,128 | |||||||
| 733,387 | FHLMC, Pool #1L1288, 2.500%, 5/1/36 (a) | 766,327 | |||||||||
| 608,829 | FHLMC, Pool #847795, 2.524%, 4/1/35 (a) | 639,022 | |||||||||
| 735,027 | FHLMC, Pool #1Q0080, 2.549%, 1/1/36 (a) | 775,461 | |||||||||
| 1,467,198 | FHLMC, Pool #1Q0119, 2.647%, 9/1/36 (a) | 1,554,660 | |||||||||
| 1,972,662 | FHLMC, Pool #1Q0187, 2.722%, 12/1/36 (a) | 2,091,760 | |||||||||
| 1,314,544 | FHLMC, Pool #1B7189, 3.261%, 3/1/36 (a) | 1,388,496 | |||||||||
| 1,787,892 | FHLMC, Pool #J10895, 4.000%, 10/1/19 | 1,900,618 | |||||||||
| 673,401 | FHLMC, Pool #1Q0669, 4.438%, 11/1/37 (a) | 710,038 | |||||||||
| 888,544 | FHLMC, Pool #1L0087, 5.057%, 6/1/35 (a) | 944,453 | |||||||||
| 575,132 | FHLMC, Pool #1G1471, 5.227%, 1/1/37 (a) | 610,123 | |||||||||
| 1,017,231 | FHLMC, Pool #1J1813, 5.701%, 8/1/37 (a) | 1,082,287 | |||||||||
| 87,354 | FHLMC, Pool #G11072, 7.500%, 12/1/15 | 95,013 | |||||||||
| 1,744,331 | FHLMC REMICS, Ser 2770, Class FH, 0.629%, 3/15/34 (a) | 1,746,072 | |||||||||
| 1,179,361 | FHLMC REMICS, Ser 2571, Class FN, 0.879%, 8/15/32 (a) | 1,181,884 | |||||||||
| 344,771 | FHLMC REMICS, Ser 2628, Class BG, 3.500%, 7/15/16 | 346,092 | |||||||||
| 590,809 | FHLMC REMICS, Ser 2590, Class UL, 3.750%, 3/15/32 | 626,248 | |||||||||
| 71,255 | FHLMC REMICS, Ser 2682, Class HG, 4.000%, 4/15/17 | 71,744 | |||||||||
| 613,146 | FHLMC REMICS, Ser 2594, Class YA, 4.000%, 4/15/23 | 651,732 | |||||||||
| 440,392 | FHLMC REMICS, Ser 2586, Class WA, 4.000%, 12/15/32 | 453,645 | |||||||||
| 44,121 | FHLMC REMICS, Ser 2833, Class NA, 4.500%, 5/15/17 | 44,118 | |||||||||
| 226,019 | FHLMC REMICS, Ser 2575, Class LM, 4.500%, 5/15/32 | 231,827 | |||||||||
| 65,391 | FHLMC REMICS, Ser 2904, Class CM, 5.000%, 1/15/18 | 65,616 | |||||||||
| 552,872 | FHLMC REMICS, Ser 2904, Class CA, 5.000%, 4/15/19 | 577,290 | |||||||||
| 117,220 | FHLMC REMICS, Ser 3197, Class AB, 5.500%, 8/15/13 | 118,326 | |||||||||
| 614,834 | FHLMC REMICS, Ser 3104, Class BA, 5.500%, 6/15/24 | 639,144 | |||||||||
| 358,009 | FHLMC REMICS, Ser 3242, Class NC, 5.750%, 12/15/28 | 359,502 | |||||||||
| Principal Amount | Fair Value | ||||||||||
| $ | 3,878,796 | FNMA, Pool #813844, 1.936%, 1/1/35 (a) | $ | 4,060,711 | |||||||
| 900,146 | FNMA, Pool #810896, 1.982%, 1/1/35 (a) | 945,298 | |||||||||
| 1,788,884 | FNMA, Pool #827787, 2.048%, 5/1/35 (a) | 1,870,637 | |||||||||
| 320,075 | FNMA, Pool #784365, 2.050%, 5/1/34 (a) | 334,059 | |||||||||
| 458,354 | FNMA, Pool #806765, 2.050%, 11/1/34 (a) | 480,060 | |||||||||
| 869,712 | FNMA, Pool #813714, 2.203%, 1/1/35 (a) | 898,812 | |||||||||
| 174,254 | FNMA, Pool #681842, 2.375%, 2/1/33 (a) | 181,822 | |||||||||
| 621,400 | FNMA, Pool #681898, 2.375%, 4/1/33 (a) | 652,422 | |||||||||
| 203,546 | FNMA, Pool #809897, 2.375%, 3/1/35 (a) | 213,787 | |||||||||
| 620,239 | FNMA, Pool #725245, 2.391%, 2/1/34 (a) | 650,304 | |||||||||
| 246,174 | FNMA, Pool #804001, 2.404%, 10/1/34 (a) | 258,468 | |||||||||
| 3,087,434 | FNMA, Pool #725490, 2.431%, 4/1/34 (a) | 3,247,169 | |||||||||
| 491,230 | FNMA, Pool #813170, 2.450%, 1/1/35 (a) | 517,053 | |||||||||
| 2,488,240 | FNMA, Pool #825395, 2.466%, 7/1/35 (a) | 2,617,383 | |||||||||
| 368,079 | FNMA, Pool #735539, 2.491%, 4/1/35 (a) | 387,146 | |||||||||
| 258,363 | FNMA, Pool #743207, 2.506%, 10/1/33 (a) | 272,345 | |||||||||
| 282,135 | FNMA, Pool #828480, 2.605%, 6/1/35 (a) | 298,565 | |||||||||
| 352,436 | FNMA, Pool #1B2629, 2.616%, 11/1/34 (a) | 368,716 | |||||||||
| 1,819,054 | FNMA, Pool #922674, 2.677%, 4/1/36 (a) | 1,934,393 | |||||||||
| 3,291,709 | FNMA, Pool #AL0478, 2.698%, 4/1/36 (a) | 3,475,488 | |||||||||
| 710,705 | FNMA, Pool #679742, 2.961%, 1/1/40 (a) | 751,175 | |||||||||
| 189,682 | FNMA, Pool #888548, 3.508%, 5/1/35 (a) | 199,378 | |||||||||
| 3,230,892 | FNMA, Pool #AE0727, 4.000%, 10/1/20 | 3,443,865 | |||||||||
| 648,260 | FNMA, Pool #745790, 4.567%, 8/1/36 (a) | 685,208 | |||||||||
| 1,299,879 | FNMA, Pool #839239, 4.950%, 9/1/35 (a) | 1,370,402 | |||||||||
| 407,686 | FNMA, Pool #888179, 4.996%, 2/1/37 (a) | 430,652 | |||||||||
| 838,806 | FNMA, Pool #995284, 5.500%, 3/1/20 | 910,185 | |||||||||
| 349,620 | FNMA, Pool #745467, 5.600%, 4/1/36 (a) | 373,855 | |||||||||
| 389,251 | FNMA, Pool #950385, 5.776%, 8/1/37 (a) | 414,933 | |||||||||
| 1,406,345 | FNMA, Pool #735439, 6.000%, 9/1/19 | 1,528,172 | |||||||||
| 37,735 | FNMA, Pool #519992, 7.000%, 10/1/14 | 40,212 | |||||||||
| 39,096 | FNMA, Pool #535219, 7.500%, 3/1/15 | 42,499 | |||||||||
| 23,240 | FNMA, Pool #534851, 7.500%, 4/1/15 | 25,263 | |||||||||
| 179,629 | FNMA, Pool #555646, 7.500%, 9/1/16 | 190,977 | |||||||||
| 53 | FNMA, Pool #535635, 8.500%, 6/1/12 | 54 | |||||||||
| 2,276,329 | FNMA REMICS, Ser 2003-81, Class FE, 0.735%, 9/25/33 (a) | 2,283,751 | |||||||||
| 1,327,461 | FNMA REMICS, Ser 2004-96, Class LF, 1.235%, 12/25/34 (a) | 1,332,305 | |||||||||
| 20,584 | FNMA REMICS, Ser 2003-34, Class AD, 4.000%, 1/25/32 | 20,599 | |||||||||
| 254,346 | FNMA REMICS, Ser 2003-19, Class ME, 4.000%, 1/25/33 | 266,072 | |||||||||
| 454,347 | FNMA REMICS, Ser 2003-33, Class AU, 4.000%, 3/25/33 | 477,043 | |||||||||
| 756,370 | FNMA REMICS, Ser 2003-119, Class PU, 4.000%, 11/25/33 | 790,332 | |||||||||
| 358,613 | FNMA REMICS, Ser 2003-33, Class AM, 4.250%, 5/25/33 | 391,801 | |||||||||
| 87,069 | FNMA REMICS, Ser 2003-81, Class NY, 4.500%, 9/25/16 | 87,685 | |||||||||
| 22,918 | FNMA REMICS, Ser 2003-25, Class CE, 4.500%, 3/25/17 | 22,914 | |||||||||
210
Touchstone Ultra Short Duration Fixed Income Fund (Continued)
| Principal Amount | Fair Value | ||||||||||
| U.S. Government Mortgage-Backed Obligations — 20.5% (Continued) | |||||||||||
| $ | 1,609,538 | FNMA REMICS, Ser 2008-35, Class IO, 4.500%, 4/25/23 (b) | $ | 119,492 | |||||||
| 552,830 | FNMA REMICS, Ser 2008-95, Class AD, 4.500%, 12/25/23 | 589,682 | |||||||||
| 245,192 | FNMA REMICS, Ser 2003-129, Class PW, 4.500%, 7/25/33 | 249,746 | |||||||||
| 2,847,859 | FNMA REMICS, Ser 2003-51, Class PH, 5.500%, 10/25/31 | 2,910,242 | |||||||||
| 299,568 | FNMA REMICS, Ser 2007-9, Class YA, 5.500%, 3/25/37 | 306,063 | |||||||||
| 745,107 | GNMA, Pool #G2 80889, 1.750%, 4/20/34 (a) | 768,090 | |||||||||
| 1,156,581 | GNMA, Pool #G2 80826, 2.500%, 2/20/34 (a) | 1,198,810 | |||||||||
| 1,049,143 | GNMA, Pool #G2 81016, 2.625%, 8/20/34 (a) | 1,089,154 | |||||||||
| 44,081 | GNMA, Pool #G2 8366, 3.000%, 6/20/18 (a) | 45,911 | |||||||||
| 2,898 | GNMA, Pool #G2 8462, 3.000%, 2/20/19 (a) | 3,011 | |||||||||
| 13,156 | GNMA, Pool #G2 8103, 4.000%, 2/20/16 (a) | 13,718 | |||||||||
| 24,779 | GNMA, Pool #G2 8287, 4.000%, 11/20/17 (a) | 25,927 | |||||||||
| 27,394 | GNMA, Pool #G2 8297, 4.000%, 12/20/17 (a) | 28,663 | |||||||||
| 49,552 | GNMA, Pool #G2 8333, 4.000%, 3/20/18 (a) | 51,666 | |||||||||
| 30,426 | GNMA, Pool #G2 8345, 4.000%, 4/20/18 (a) | 31,821 | |||||||||
| 17,990 | GNMA, Pool #G2 8405, 4.000%, 9/20/18 (a) | 18,884 | |||||||||
| 18,044 | GNMA, Pool #G2 8489, 4.000%, 4/20/19 (a) | 18,872 | |||||||||
| Total U.S. Government Mortgage-Backed Obligations | $ | 70,735,515 | |||||||||
| Asset-Backed Securities — 11.6% | |||||||||||
| 2,147,469 | AmeriCredit Automobile Receivables Trust, Ser 2007-AX, Class A4, 0.281%, 10/6/13 (a) | 2,140,392 | |||||||||
| 2,500,000 | AmeriCredit Automobile Receivables Trust, Ser 2009-1, Class B, 9.790%, 4/15/14 | 2,729,624 | |||||||||
| 921,959 | AmeriCredit Prime Automobile Receivable, Ser 2007-2M, Class A4A, 5.350%, 3/8/16 | 942,315 | |||||||||
| 636,988 | Bank of America Auto Trust, Ser 2009-1A, Class A3, 144a, 2.670%, 7/15/13 | 639,884 | |||||||||
| Principal Amount | Fair Value | ||||||||||
| $ | 641,688 | Bank of America Auto Trust, Ser 2010-1A, Class A3, 144a, 1.390%, 3/15/14 | $ | 644,086 | |||||||
| 386,452 | BCRR Trust, Ser 2010-LEAF, Class 42A, 144a, 4.230%, 7/22/33 | 386,292 | |||||||||
| 3,200,000 | Chrysler Financial Auto Securitization Trust, Ser 2007-A, Class B, 144a, 6.250%, 5/8/14 | 3,244,107 | |||||||||
| 981,383 | Chrysler Financial Auto Securitization Trust, Ser 2009-A, Class A3, 2.820%, 1/15/16 | 990,520 | |||||||||
| 1,615,506 | Citigroup Mortgage Loan Trust, Inc., Ser 2005-WF1, Class A3, 5.000%, 11/25/34 (a) | 1,611,678 | |||||||||
| 2,239,206 | CPS Auto Trust, Ser 2010-A, Class A, 144a, 2.890%, 3/15/16 | 2,242,500 | |||||||||
| 2,720,948 | DT Auto Owner Trust, Ser 2009-1, Class A1, 144a, 2.980%, 10/15/15 | 2,740,178 | |||||||||
| 2,825,000 | Ford Credit Auto Owner Trust, Ser 2007-B, Class B, 5.690%, 11/15/12 | 2,865,218 | |||||||||
| 2,454,520 | Great America Leasing Receivables, Ser 2009-1, Class A3, 144a, 2.540%, 3/15/13 | 2,471,019 | |||||||||
| 1,935,984 | Greenwich Capital Commercial Funding Corp., Ser 2003-C2, Class A3, 4.533%, 1/5/36 | 1,954,759 | |||||||||
| 696,033 | Harley-Davidson Motorcycle Trust, Ser 2009-3, Class A3, 1.740%, 9/15/13 | 698,235 | |||||||||
| 2,711,052 | LAI Vehicle Lease Securitization Trust, Ser 2010-A, Class A, 144a, 2.550%, 9/15/16 | 2,706,924 | |||||||||
| 220,482 | MASTR Alternative Loans Trust, Ser 2003-3, Class 2A1, 8.500%, 5/25/33 | 220,689 | |||||||||
| 695,524 | Residential Accredit Loans, Inc., Ser 2003-QS10, Class A7, 5.500%, 5/25/33 | 718,593 | |||||||||
| 1,788,862 | Residential Asset Securitization Trust, Ser 2003-A8, Class A1, 3.750%, 10/25/18 | 1,812,309 | |||||||||
| 2,577,506 | Santander Consumer Acquired Receivables Trust, Ser 2011-WO, Class A2, 144a, 0.910%, 11/15/13 | 2,577,811 | |||||||||
| 1,079,897 | Santander Drive Auto Receivables Trust, Ser 2010-1, Class A2, 1.360%, 3/15/13 | 1,081,252 | |||||||||
| 3,340,000 | Santander Drive Auto Receivables Trust, Ser 2010-B, Class A3, 144a, 1.310%, 2/17/14 | 3,345,802 | |||||||||
| 423,078 | Structured Asset Investment Loan Trust, Ser 2005-1, Class A5, 144a, 0.585%, 2/25/35 (a) | 416,502 | |||||||||
| 248,046 | Wells Fargo Home Equity Trust, Ser 2006-1, Class A3, 0.385%, 5/25/36 (a) | 242,172 | |||||||||
211
Touchstone Ultra Short Duration Fixed Income Fund (Continued)
| Principal Amount | Fair Value | ||||||||||
| Asset-Backed Securities — 11.6% (Continued) | |||||||||||
| $ | 591,356 | World Omni Auto Receivables Trust, Ser 2007-B, Class A4, 5.390%, 5/15/13 | $ | 596,336 | |||||||
| Total Asset-Backed Securities | $ | 40,019,197 | |||||||||
| Municipal Bonds — 4.6% Alabama — 0.9% | |||||||||||
| 3,300,000 | Chatom IDB Rev, Ser 2007 Class A 0.750%, 11/1/11 (a) | 3,299,769 | |||||||||
| California — 0.3% | |||||||||||
| 1,000,000 | CA PCR Fing Auth. Rev. Class A 1.450%, 11/1/11 (a) | 1,000,000 | |||||||||
| Illinois — 0.7% | |||||||||||
| 2,500,000 | Winnebago Co IL Indl Dev (LOC: FHLB) 0.220%, 10/3/11 (a) | 2,500,000 | |||||||||
| New Mexico — 0.5% | |||||||||||
| 1,630,000 | NM Edl Asst Rev, Ser 2010 A-2 (Gtd St Lns) 1.005%, 12/22/11 (a) | 1,630,831 | |||||||||
| Ohio — 0.5% | |||||||||||
| 1,750,000 | Medina Co OH IDR (Mack Inds), Ser 1998 (LOC: JP Morgan Chase Bank) 0.300%, 10/6/11 (a) | 1,750,000 | |||||||||
| Oklahoma — 1.0% | |||||||||||
| 3,500,000 | JJB Properties LLC Rev (LOC - Arvest Bank) 0.220%, 10/3/11 (a) | 3,500,000 | |||||||||
| Texas — 0.7% | |||||||||||
| 2,250,000 | North TX Tollway Auth. Rev. Class A 2.441%, 9/1/13 | 2,311,470 | |||||||||
| Total Municipal Bonds | $ | 15,992,070 | |||||||||
| U.S. Government Agency Obligation — 1.1% | |||||||||||
| 3,850,000 | Overseas Private Investment Corp., Ser B, 0.080%, 3/15/17 (a) | 3,850,000 | |||||||||
| Certificates of Deposit — 0.3% | |||||||||||
| 1,000,000 | Bank of Nova Scotia, 0.750%, 10/15/12 | 1,002,380 | |||||||||
| Investment Fund — 13.2% | |||||||||||
| 45,836,225 | Touchstone Institutional Money Market Fund^ | 45,836,225 | |||||||||
| Total Investment Securities — 102.3% (Cost $354,023,850) | $ | 353,938,352 | |||||||||
| Liabilities in Excess of Other Assets — (2.3%) | (7,806,968 | ) | |||||||||
| Net Assets — 100.0% | $ | 346,131,384 | |||||||||
(a) Variable rate security – the rate reflected is the rate in effect as of September 30, 2011.
(b) IO – Interest Only
^ Affiliated Fund, sub-advised by Fort Washington Investment Advisors, Inc. See Note 4.
++ The issuers and/or sponsors of certain asset-backed securities may no longer exist; however, the securities held by the Fund are separate legal entities organized as trusts and publicly traded. The Fund receives principal and interest payments directly from these trusts.
Portfolio Abbreviations:
FNMA – Federal National Mortgage Association
FHLB – Federal Home Loan Bank
FHLMC – Federal Home Loan Mortgage Corp.
GNMA – Government National Mortgage Association
IDB – Industrial Development Bond
IDR – Industrial Development Revenue
LLC – Limited Liability Company
LOC – Letter of Credit
MTN – Medium Term Note
PCR – Pollution Control Revenue
REMIC – Real Estate Mortgage Investment Conduit
144a – This is a restricted security that was sold in a transaction exempt from Rule 144a of the Securities Act of 1933. This security may be sold in transactions exempt from registration, normally to qualified institutional buyers. At September 30, 2011, these securities were valued at $29,179,308 or 8.4% of net assets. These securities were deemed liquid pursuant to procedures approved by the Board of Trustees.
212
Touchstone Ultra Short Duration Fixed Income Fund (Continued)
Other Information:
The inputs or methodology used for valuing securities may not be an indication of the risk associated with investing in those securities. For more information on valuation inputs, and their aggregation into the levels used in the table below, please refer to the security valuation section in the accompanying notes to financial statements.
Valuation Inputs at Reporting Date:
| Description | Level 1 | Level 2 | Level 3 | Total | |||||||||||||||
| Commercial Mortgage- Backed Securities | $ | — | $ | 105,212,740 | $ | — | $ | 105,212,740 | |||||||||||
| Corporate Bonds | — | 71,290,225 | — | 71,290,225 | |||||||||||||||
| U.S. Government Mortgage- Backed Obligations | — | 70,735,515 | — | 70,735,515 | |||||||||||||||
| Investment Fund | 45,836,225 | — | — | 45,836,225 | |||||||||||||||
| Asset-Backed Securities | — | 40,019,197 | — | 40,019,197 | |||||||||||||||
| Municipal Bonds | — | 15,992,070 | — | 15,992,070 | |||||||||||||||
| U.S. Government Agency Obligations | — | 3,850,000 | — | 3,850,000 | |||||||||||||||
| Certificates of Deposit | — | 1,002,380 | — | 1,002,380 | |||||||||||||||
| $ | 353,938,352 | ||||||||||||||||||
See accompanying notes to financial statements.
213
Report of Independent Registered Public Accounting Firm
To the Board of Trustees and Shareholders of Touchstone Funds Group Trust
We have audited the accompanying statements of assets and liabilities, including the portfolios of investments, of Touchstone Funds Group Trust, comprised of Touchstone Capital Appreciation Fund, Touchstone Emerging Markets Equity Fund, Touchstone Emerging Markets Equity Fund II, Touchstone Focused Equity Fund, Touchstone Global Equity Fund, Touchstone Global Real Estate Fund, Touchstone Intermediate Fixed Income Fund, Touchstone International Fixed Income Fund, Touchstone Large Cap Relative Value Fund, Touchstone Market Neutral Equity Fund, Touchstone Merger Arbitrage Fund, Touchstone Mid Cap Fund, Touchstone Mid Cap Value Fund, Touchstone Premium Yield Equity Fund, Touchstone Sands Capital Select Growth Fund, Touchstone Short Duration Fixed Income Fund, Touchstone Small Cap Core Fund, Touchstone Small Cap Value Fund (formerly Touchstone Small Cap Value Opportunities Fund), and Touchstone Ultra Short Duration Fixed Income Fund (the "Funds") as of September 30, 2011, and the related statements of operations for the year or period then ended, and the statements of changes in net assets and the financial highlights for each of the years or periods indicated therein. We have audited the accompanying statement of assets and liabilities, including the portfolio of investments, of the Touchstone Total Return Bond Fund (formerly the Touchstone Core Plus Fixed Income Fund) as of September 30, 2011, and the related statements of operations, changes in net assets and financial highlights for the period then ended. These financial statements and financial highlights are the responsibility of the Funds' management. Our responsibility is to express an opinion on these financial statements and financial highlights based on our audits. The statement of operations for the year ended March 31, 2011, the statements of changes in net assets for each of the two years ended March 31, 2011 and the financial highlights for each of the five years ended March 31, 2011 of Touchstone Total Return Bond Fund (the "Former Earnest Partners Fixed Income Trust") were audited by other auditors whose report dated May 31, 2011, expressed an unqualified opinion on those financial statements and financial highlights.
We conducted our audits in accordance with the standards of the Public Company Accounting Oversight Board (United States). Those standards require that we plan and perform the audits to obtain reasonable assurance about whether the financial statements are free of material misstatement. We were not engaged to perform an audit of the Funds' internal control over financial reporting. Our audits included consideration of internal control over financial reporting as a basis for designing audit procedures that are appropriate in the circumstances, but not for the purpose of expressing an opinion on the effectiveness of the Funds' internal control over financial reporting. Accordingly, we express no such opinion. An audit also includes examining, on a test basis, evidence supporting the amounts and disclosures in the financial statements, assessing the accounting principles used and significant estimates made by management, and evaluating the overall financial statement presentation. Our procedures included confirmation of securities owned as of September 30, 2011, by correspondence with the custodian and brokers or by other appropriate auditing procedures where replies from brokers were not received. We believe that our audits provide a reasonable basis for our opinion.
In our opinion, the financial statements and financial highlights referred to above present fairly, in all material respects, the financial position of each of the respective Funds comprising Touchstone Funds Group Trust at September 30, 2011, the results of their operations for the year or period then ended, and the changes in their net assets and the financial highlights for each of the years or periods in the period then ended indicated above, in conformity with accounting principles generally accepted in the United States.

Cincinnati, Ohio
November 29, 2011
214
Other Items (Unaudited)
Supplemental Tax Information
The information set forth below is for each Fund's fiscal year as required by federal income tax laws. Shareholders, however, must report distributions on a calendar year basis for income tax purposes, which may include distributions for portions of two fiscal years of a fund. Accordingly, the information needed by shareholders for income tax purposes will be sent to them in January of each year. Please consult your tax advisor for proper treatment of this information.
For the fiscal year ended September 30, 2011, certain dividends paid by each Fund may be subject to a maximum tax rate of 15%, as provided for by the Jobs and Growth Tax Relief Reconciliation Act of 2003. The Funds intend to designate the maximum amounts allowable to be taxed at a maximum rate of 15%. Complete information will be computed and reported in conjunction with your 2011 Form 1099-DIV.
For the year ended September 30, 2011, the percentage of dividends paid that qualify for the 70% dividends received deductions for corporate shareholders, foreign taxes which are expected to be passed through to shareholders for foreign tax credits, gross income derived from sources within foreign countries, and long-term capital gain dividends for the purpose of the dividend paid deduction on its Federal income tax return were as follows:
| Fund | 70% Dividends Received Deduction | Foreign Tax Credit | Foreign Source Income | Long Term Capital Gains | |||||||||||||||
| Capital Appreciation Fund | 37 | % | $ | — | $ | — | $ | — | |||||||||||
| Emerging Markets Equity Fund | 2 | % | $ | 516,776 | $ | 9,948,286 | $ | 42,906 | |||||||||||
| Emerging Markets Equity Fund II | — | $ | 3,662 | $ | 74,039 | $ | — | ||||||||||||
| Focused Equity Fund | 43 | % | $ | — | $ | — | $ | — | |||||||||||
| Global Equity Fund | 15 | % | $ | 4,947 | $ | 74,356 | $ | 23,345 | |||||||||||
| Global Real Estate Fund | 6 | % | $ | 5,234 | $ | 114,854 | $ | 20,496 | |||||||||||
| International Fixed Income Fund | — | $ | 4,261 | $ | 393,951 | $ | 7,726 | ||||||||||||
| Large Cap Relative Value Fund | 100 | % | $ | — | $ | — | $ | 2,050 | |||||||||||
| Mid Cap Fund | 100 | % | $ | — | $ | — | $ | — | |||||||||||
| Mid Cap Value Fund | 30 | % | $ | — | $ | — | $ | 89,486 | |||||||||||
| Premium Yield Equity Fund | 80 | % | $ | — | $ | — | $ | — | |||||||||||
| Small Cap Core Fund | 100 | % | $ | — | $ | — | $ | 2,866 | |||||||||||
| Small Cap Value Fund | 100 | % | $ | — | $ | — | $ | — | |||||||||||
| Total Return Bond Fund | — | $ | — | $ | — | $ | 283,640 | ||||||||||||
Proxy Voting
The Sub-Advisors are responsible for exercising the voting rights associated with the securities purchased and held by the Funds. A description of the policies and procedures that the Sub-Advisors use in fulfilling this responsibility and information regarding how those proxies were voted during the twelve month period ended June 30 are available without charge upon request by calling toll free 1.800.543.0407. These items are also available on the Securities and Exchange Commission's (the Commission) website at http://www.sec.gov.
Quarterly Portfolio Disclosure
The Trust files a complete listing of portfolio holdings for each Fund as of the end of the first and third quarters of each fiscal year on Form N-Q. The complete listing (i) is available on the Commission's website; (ii) may be reviewed and copied at the Commission's Public Reference Room in Washington, DC; and (iii) will
215
Other Items (Continued)
be made available to shareholders upon request by calling 1.800.543.0407. Information on the operation of the Public Reference Room may be obtained by calling 1-800-SEC-0330.
Schedule of Shareholder Expenses
As a shareholder of the Funds, you incur two types of costs: (1) transaction costs, including reinvested dividends or other distributions; and (2) ongoing costs, including investment advisory fees; distribution (12b-1) fees; and other Fund expenses. This example is intended to help you understand your ongoing costs (in dollars) of investing in the Funds and to compare these costs with the ongoing costs of investing in other mutual funds.
The example is based on an investment of $1,000 invested at the beginning of the period and held for the entire period (April 1, 2011 through September 30, 2011).
Actual Expenses
The first line of the table below provides information about actual account values and actual expenses. You may use the information in this line, together with the amount you invested, to estimate the expenses that you paid over the period. Simply divide your account value by $1,000 (for example, an $8,600 account value divided by $1,000 = 8.6), then multiply the result by the number in the first line under the heading entitled "Expenses Paid During the Six Months Ended September 30, 2011" to estimate the expenses you paid on your account during this period.
Hypothetical Example for Comparison Purposes
The second line of the table below provides information about hypothetical account values and hypothetical expenses based on the Funds' actual expense ratio and an assumed rate of return of 5% per year before expenses, which is not the Funds' actual return. The hypothetical account values and expenses may not be used to estimate the actual ending account balance or expenses you paid for the period. You may use this information to compare the ongoing costs of investing in the Funds and other funds. To do so, compare this 5% hypothetical example with the 5% hypothetical examples that appear in the shareholder reports of the other funds.
216
Other Items (Continued)
Schedule of Shareholder Expenses (Continued)
| Net Expense Ratio Annualized September 30, 2011 | Beginning Account Value April 1, 2011 | Ending Account Value September 30, 2011 | Expenses Paid During the Six Months Ended September 30, 2011* | ||||||||||||||||
| Touchstone Capital Appreciation Fund | |||||||||||||||||||
| Class A Actual | 1.19 | % | $ | 1,000.00 | $ | 869.20 | $ | 5.58 | |||||||||||
| Class A Hypothetical | 1.19 | % | $ | 1,000.00 | $ | 1,019.10 | $ | 6.02 | |||||||||||
| Class C Actual | 1.94 | % | $ | 1,000.00 | $ | 864.60 | $ | 9.07 | |||||||||||
| Class C Hypothetical | 1.94 | % | $ | 1,000.00 | $ | 1,015.34 | $ | 9.80 | |||||||||||
| Class Y Actual | 0.94 | % | $ | 1,000.00 | $ | 869.20 | $ | 4.40 | |||||||||||
| Class Y Hypothetical | 0.94 | % | $ | 1,000.00 | $ | 1,020.36 | $ | 4.76 | |||||||||||
| Institutional Class Actual | 0.79 | % | $ | 1,000.00 | $ | 870.70 | $ | 3.70 | |||||||||||
| Institutional Class Hypothetical | 0.79 | % | $ | 1,000.00 | $ | 1,021.11 | $ | 4.00 | |||||||||||
| Touchstone Emerging Markets Equity Fund | |||||||||||||||||||
| Class A Actual | 1.74 | % | $ | 1,000.00 | $ | 820.40 | $ | 7.94 | |||||||||||
| Class A Hypothetical | 1.74 | % | $ | 1,000.00 | $ | 1,016.34 | $ | 8.80 | |||||||||||
| Class C Actual | 2.49 | % | $ | 1,000.00 | $ | 817.70 | $ | 11.35 | |||||||||||
| Class C Hypothetical | 2.49 | % | $ | 1,000.00 | $ | 1,012.58 | $ | 12.56 | |||||||||||
| Class Y Actual | 1.51 | % | $ | 1,000.00 | $ | 821.10 | $ | 6.89 | |||||||||||
| Class Y Hypothetical | 1.51 | % | $ | 1,000.00 | $ | 1,017.50 | $ | 7.64 | |||||||||||
| Institutional Class Actual | 1.34 | % | $ | 1,000.00 | $ | 822.00 | $ | 6.12 | |||||||||||
| Institutional Class Hypothetical | 1.34 | % | $ | 1,000.00 | $ | 1,018.35 | $ | 6.78 | |||||||||||
| Touchstone Emerging Markets Equity Fund II | |||||||||||||||||||
| Class A Actual | 1.74 | % | $ | 1,000.00 | $ | 795.00 | $ | 7.06 | |||||||||||
| Class A Hypothetical | 1.74 | % | $ | 1,000.00 | $ | 1,014.74 | $ | 7.92 | |||||||||||
| Class C Actual | 2.49 | % | $ | 1,000.00 | $ | 793.00 | $ | 10.09 | |||||||||||
| Class C Hypothetical | 2.49 | % | $ | 1,000.00 | $ | 1,011.35 | $ | 11.32 | |||||||||||
| Class Y Actual | 1.49 | % | $ | 1,000.00 | $ | 796.00 | $ | 6.05 | |||||||||||
| Class Y Hypothetical | 1.49 | % | $ | 1,000.00 | $ | 1,015.87 | $ | 6.79 | |||||||||||
| Institutional Class Actual | 1.34 | % | $ | 1,000.00 | $ | 797.00 | $ | 5.44 | |||||||||||
| Institutional Class Hypothetical | 1.34 | % | $ | 1,000.00 | $ | 1,016.55 | $ | 6.11 | |||||||||||
| Touchstone Focused Equity Fund | |||||||||||||||||||
| Class A Actual | 1.20 | % | $ | 1,000.00 | $ | 747.40 | $ | 5.26 | |||||||||||
| Class A Hypothetical | 1.20 | % | $ | 1,000.00 | $ | 1,019.05 | $ | 6.07 | |||||||||||
| Class C Actual | 1.95 | % | $ | 1,000.00 | $ | 744.30 | $ | 8.53 | |||||||||||
| Class C Hypothetical | 1.95 | % | $ | 1,000.00 | $ | 1,015.29 | $ | 9.85 | |||||||||||
| Class Y Actual | 0.95 | % | $ | 1,000.00 | $ | 748.20 | $ | 4.16 | |||||||||||
| Class Y Hypothetical | 0.95 | % | $ | 1,000.00 | $ | 1,020.31 | $ | 4.81 | |||||||||||
| Institutional Class Actual | 0.80 | % | $ | 1,000.00 | $ | 748.40 | $ | 3.51 | |||||||||||
| Institutional Class Hypothetical | 0.80 | % | $ | 1,000.00 | $ | 1,021.06 | $ | 4.05 | |||||||||||
217
Other Items (Continued)
Schedule of Shareholder Expenses (Continued)
| Net Expense Ratio Annualized September 30, 2011 | Beginning Account Value April 1, 2011 | Ending Account Value September 30, 2011 | Expenses Paid During the Six Months Ended September 30, 2011* | ||||||||||||||||
| Touchstone Global Equity Fund | |||||||||||||||||||
| Class A Actual | 1.34 | % | $ | 1,000.00 | $ | 860.40 | $ | 6.25 | |||||||||||
| Class A Hypothetical | 1.34 | % | $ | 1,000.00 | $ | 1,018.35 | $ | 6.78 | |||||||||||
| Class C Actual | 2.09 | % | $ | 1,000.00 | $ | 857.30 | $ | 9.73 | |||||||||||
| Class C Hypothetical | 2.09 | % | $ | 1,000.00 | $ | 1,014.59 | $ | 10.56 | |||||||||||
| Class Y Actual | 1.09 | % | $ | 1,000.00 | $ | 862.00 | $ | 5.09 | |||||||||||
| Class Y Hypothetical | 1.09 | % | $ | 1,000.00 | $ | 1,019.60 | $ | 5.52 | |||||||||||
| Institutional Class Actual | 0.94 | % | $ | 1,000.00 | $ | 862.60 | $ | 4.39 | |||||||||||
| Institutional Class Hypothetical | 0.94 | % | $ | 1,000.00 | $ | 1,020.36 | $ | 4.76 | |||||||||||
| Touchstone Global Real Estate Fund | |||||||||||||||||||
| Class A Actual | 1.39 | % | $ | 1,000.00 | $ | 852.10 | $ | 6.45 | |||||||||||
| Class A Hypothetical | 1.39 | % | $ | 1,000.00 | $ | 1,018.10 | $ | 7.03 | |||||||||||
| Class C Actual | 2.14 | % | $ | 1,000.00 | $ | 848.70 | $ | 9.92 | |||||||||||
| Class C Hypothetical | 2.14 | % | $ | 1,000.00 | $ | 1,014.34 | $ | 10.81 | |||||||||||
| Class Y Actual | 1.14 | % | $ | 1,000.00 | $ | 852.60 | $ | 5.29 | |||||||||||
| Class Y Hypothetical | 1.14 | % | $ | 1,000.00 | $ | 1,019.35 | $ | 5.77 | |||||||||||
| Institutional Class Actual | 0.99 | % | $ | 1,000.00 | $ | 853.00 | $ | 4.60 | |||||||||||
| Institutional Class Hypothetical | 0.99 | % | $ | 1,000.00 | $ | 1,020.10 | $ | 5.01 | |||||||||||
| Touchstone Intermediate Fixed Income Fund | |||||||||||||||||||
| Institutional Class Actual | 0.40 | % | $ | 1,000.00 | $ | 1,035.10 | $ | 2.04 | |||||||||||
| Institutional Class Hypothetical | 0.40 | % | $ | 1,000.00 | $ | 1,023.06 | $ | 2.03 | |||||||||||
| Touchstone International Fixed Income Fund | |||||||||||||||||||
| Class A Actual | 1.09 | % | $ | 1,000.00 | $ | 1,019.00 | $ | 5.52 | |||||||||||
| Class A Hypothetical | 1.09 | % | $ | 1,000.00 | $ | 1,019.60 | $ | 5.52 | |||||||||||
| Class C Actual | 1.84 | % | $ | 1,000.00 | $ | 1,015.50 | $ | 9.30 | |||||||||||
| Class C Hypothetical | 1.84 | % | $ | 1,000.00 | $ | 1,015.84 | $ | 9.30 | |||||||||||
| Class Y Actual | 0.84 | % | $ | 1,000.00 | $ | 1,020.50 | $ | 4.25 | |||||||||||
| Class Y Hypothetical | 0.84 | % | $ | 1,000.00 | $ | 1,020.86 | $ | 4.26 | |||||||||||
| Institutional Class Actual | 0.69 | % | $ | 1,000.00 | $ | 1,021.30 | $ | 3.50 | |||||||||||
| Institutional Class Hypothetical | 0.69 | % | $ | 1,000.00 | $ | 1,021.61 | $ | 3.50 | |||||||||||
218
Other Items (Continued)
Schedule of Shareholder Expenses (Continued)
| Net Expense Ratio Annualized September 30, 2011 | Beginning Account Value April 1, 2011 | Ending Account Value September 30, 2011 | Expenses Paid During the Six Months Ended September 30, 2011* | ||||||||||||||||
| Touchstone Large Cap Relative Value Fund | |||||||||||||||||||
| Class A Actual | 1.19 | % | $ | 1,000.00 | $ | 801.10 | $ | 5.37 | |||||||||||
| Class A Hypothetical | 1.19 | % | $ | 1,000.00 | $ | 1,019.10 | $ | 6.02 | |||||||||||
| Class C Actual | 1.94 | % | $ | 1,000.00 | $ | 797.50 | $ | 8.74 | |||||||||||
| Class C Hypothetical | 1.94 | % | $ | 1,000.00 | $ | 1,015.34 | $ | 9.80 | |||||||||||
| Class Y Actual | 0.94 | % | $ | 1,000.00 | $ | 801.70 | $ | 4.25 | |||||||||||
| Class Y Hypothetical | 0.94 | % | $ | 1,000.00 | $ | 1,020.36 | $ | 4.76 | |||||||||||
| Institutional Class Actual | 0.79 | % | $ | 1,000.00 | $ | 802.40 | $ | 3.57 | |||||||||||
| Institutional Class Hypothetical | 0.79 | % | $ | 1,000.00 | $ | 1,021.11 | $ | 4.00 | |||||||||||
| Touchstone Market Neutral Equity Fund | |||||||||||||||||||
| Class A Actual | 2.81 | % | $ | 1,000.00 | $ | 1,042.10 | $ | 14.39 | |||||||||||
| Class A Hypothetical | 2.81 | % | $ | 1,000.00 | $ | 1,010.98 | $ | 14.17 | |||||||||||
| Class C Actual | 3.53 | % | $ | 1,000.00 | $ | 1,038.30 | $ | 18.04 | |||||||||||
| Class C Hypothetical | 3.53 | % | $ | 1,000.00 | $ | 1,007.37 | $ | 17.76 | |||||||||||
| Class Y Actual | �� | 2.54 | % | $ | 1,000.00 | $ | 1,044.00 | $ | 13.01 | ||||||||||
| Class Y Hypothetical | 2.54 | % | $ | 1,000.00 | $ | 1,012.33 | $ | 12.81 | |||||||||||
| Touchstone Merger Arbitrage Fund | |||||||||||||||||||
| Class A Actual | 3.34 | % | $ | 1,000.00 | $ | 1,003.00 | $ | 4.86 | |||||||||||
| Class A Hypothetical | 3.34 | % | $ | 1,000.00 | $ | 1,002.41 | $ | 4.86 | |||||||||||
| Class C Actual | 4.23 | % | $ | 1,000.00 | $ | 1,001.00 | $ | 6.15 | |||||||||||
| Class C Hypothetical | 4.23 | % | $ | 1,000.00 | $ | 1,001.12 | $ | 6.15 | |||||||||||
| Class Y Actual | 2.74 | % | $ | 1,000.00 | $ | 1,002.00 | $ | 3.98 | |||||||||||
| Class Y Hypothetical | 2.74 | % | $ | 1,000.00 | $ | 1,003.28 | $ | 3.99 | |||||||||||
| Institutional Class Actual | 1.86 | % | $ | 1,000.00 | $ | 1,003.00 | $ | 2.70 | |||||||||||
| Institutional Class Hypothetical | 1.86 | % | $ | 1,000.00 | $ | 1,004.56 | $ | 2.71 | |||||||||||
| Touchstone Mid Cap Fund | |||||||||||||||||||
| Class A Actual | 1.21 | % | $ | 1,000.00 | $ | 840.40 | $ | 5.58 | |||||||||||
| Class A Hypothetical | 1.21 | % | $ | 1,000.00 | $ | 1,019.00 | $ | 6.12 | |||||||||||
| Class C Actual | 1.96 | % | $ | 1,000.00 | $ | 836.70 | $ | 9.02 | |||||||||||
| Class C Hypothetical | 1.96 | % | $ | 1,000.00 | $ | 1,015.24 | $ | 9.90 | |||||||||||
| Class Y Actual | 0.96 | % | $ | 1,000.00 | $ | 841.50 | $ | 4.43 | |||||||||||
| Class Y Hypothetical | 0.96 | % | $ | 1,000.00 | $ | 1,020.26 | $ | 4.86 | |||||||||||
| Class Z Actual | 1.21 | % | $ | 1,000.00 | $ | 840.60 | $ | 5.58 | |||||||||||
| Class Z Hypothetical | 1.21 | % | $ | 1,000.00 | $ | 1,019.00 | $ | 6.12 | |||||||||||
219
Other Items (Continued)
Schedule of Shareholder Expenses (Continued)
| Net Expense Ratio Annualized September 30, 2011 | Beginning Account Value April 1, 2011 | Ending Account Value September 30, 2011 | Expenses Paid During the Six Months Ended September 30, 2011* | ||||||||||||||||
| Touchstone Mid Cap Value Fund | |||||||||||||||||||
| Class A Actual | 1.29 | % | $ | 1,000.00 | $ | 782.10 | $ | 5.76 | |||||||||||
| Class A Hypothetical | 1.29 | % | $ | 1,000.00 | $ | 1,018.60 | $ | 6.53 | |||||||||||
| Class C Actual | 2.04 | % | $ | 1,000.00 | $ | 779.20 | $ | 9.10 | |||||||||||
| Class C Hypothetical | 2.04 | % | $ | 1,000.00 | $ | 1,014.84 | $ | 10.30 | |||||||||||
| Class Y Actual | 1.04 | % | $ | 1,000.00 | $ | 783.00 | $ | 4.65 | |||||||||||
| Class Y Hypothetical | 1.04 | % | $ | 1,000.00 | $ | 1,019.85 | $ | 5.27 | |||||||||||
| Institutional Class Actual | 0.89 | % | $ | 1,000.00 | $ | 783.00 | $ | 3.98 | |||||||||||
| Institutional Class Hypothetical | 0.89 | % | $ | 1,000.00 | $ | 1,020.61 | $ | 4.51 | |||||||||||
| Touchstone Premium Yield Equity Fund | |||||||||||||||||||
| Class A Actual | 1.20 | % | $ | 1,000.00 | $ | 952.70 | $ | 5.87 | |||||||||||
| Class A Hypothetical | 1.20 | % | $ | 1,000.00 | $ | 1,019.05 | $ | 6.07 | |||||||||||
| Class C Actual | 1.95 | % | $ | 1,000.00 | $ | 951.10 | $ | 9.54 | |||||||||||
| Class C Hypothetical | 1.95 | % | $ | 1,000.00 | $ | 1,015.29 | $ | 9.85 | |||||||||||
| Class Y Actual | 0.95 | % | $ | 1,000.00 | $ | 955.00 | $ | 4.66 | |||||||||||
| Class Y Hypothetical | 0.95 | % | $ | 1,000.00 | $ | 1,020.31 | $ | 4.81 | |||||||||||
| Touchstone Sands Capital Select Growth Fund | |||||||||||||||||||
| Class A Actual | 1.95 | % | $ | 1,000.00 | $ | 899.40 | $ | 9.28 | |||||||||||
| Class A Hypothetical | 1.95 | % | $ | 1,000.00 | $ | 1,015.29 | $ | 9.85 | |||||||||||
| Class C Actual | 2.96 | % | $ | 1,000.00 | $ | 895.40 | $ | 14.06 | |||||||||||
| Class C Hypothetical | 2.96 | % | $ | 1,000.00 | $ | 1,010.23 | $ | 14.92 | |||||||||||
| Class Y Actual | 1.20 | % | $ | 1,000.00 | $ | 901.00 | $ | 5.72 | |||||||||||
| Class Y Hypothetical | 1.20 | % | $ | 1,000.00 | $ | 1,019.05 | $ | 6.07 | |||||||||||
| Class Z Actual | 1.43 | % | $ | 1,000.00 | $ | 899.40 | $ | 6.81 | |||||||||||
| Class Z Hypothetical | 1.43 | % | $ | 1,000.00 | $ | 1,017.90 | $ | 7.23 | |||||||||||
| Touchstone Short Duration Fixed Income Fund | |||||||||||||||||||
| Class Y Actual | 0.49 | % | $ | 1,000.00 | $ | 1,010.30 | $ | 2.47 | |||||||||||
| Class Y Hypothetical | 0.49 | % | $ | 1,000.00 | $ | 1,022.61 | $ | 2.48 | |||||||||||
| Class Z Actual | 0.74 | % | $ | 1,000.00 | $ | 1,009.10 | $ | 3.73 | |||||||||||
| Class Z Hypothetical | 0.74 | % | $ | 1,000.00 | $ | 1,021.36 | $ | 3.75 | |||||||||||
220
Other Items (Continued)
Schedule of Shareholder Expenses (Continued)
| Net Expense Ratio Annualized September 30, 2011 | Beginning Account Value April 1, 2011 | Ending Account Value September 30, 2011 | Expenses Paid During the Six Months Ended September 30, 2011* | ||||||||||||||||
| Touchstone Small Cap Core Fund | |||||||||||||||||||
| Class A Actual | 1.34 | % | $ | 1,000.00 | $ | 857.80 | $ | 6.24 | |||||||||||
| Class A Hypothetical | 1.34 | % | $ | 1,000.00 | $ | 1,018.35 | $ | 6.78 | |||||||||||
| Class C Actual | 2.09 | % | $ | 1,000.00 | $ | 855.00 | $ | 9.72 | |||||||||||
| Class C Hypothetical | 2.09 | % | $ | 1,000.00 | $ | 1,014.59 | $ | 10.56 | |||||||||||
| Class Y Actual | 1.09 | % | $ | 1,000.00 | $ | 859.00 | $ | 5.08 | |||||||||||
| Class Y Hypothetical | 1.09 | % | $ | 1,000.00 | $ | 1,019.60 | $ | 5.52 | |||||||||||
| Institutional Class Actual | 0.94 | % | $ | 1,000.00 | $ | 860.10 | $ | 4.38 | |||||||||||
| Institutional Class Hypothetical | 0.94 | % | $ | 1,000.00 | $ | 1,020.36 | $ | 4.76 | |||||||||||
| Touchstone Small Cap Value Fund | |||||||||||||||||||
| Class A Actual | 1.43 | % | $ | 1,000.00 | $ | 782.60 | $ | 6.39 | |||||||||||
| Class A Hypothetical | 1.43 | % | $ | 1,000.00 | $ | 1,017.90 | $ | 7.23 | |||||||||||
| Class C Actual | 2.14 | % | $ | 1,000.00 | $ | 779.40 | $ | 9.55 | |||||||||||
| Class C Hypothetical | 2.14 | % | $ | 1,000.00 | $ | 1,014.34 | $ | 10.81 | |||||||||||
| Class Y Actual | 1.18 | % | $ | 1,000.00 | $ | 785.00 | $ | 5.28 | |||||||||||
| Class Y Hypothetical | 1.18 | % | $ | 1,000.00 | $ | 1,019.15 | $ | 5.97 | |||||||||||
| Institutional Class Actual | 1.03 | % | $ | 1,000.00 | $ | 783.60 | $ | 4.61 | |||||||||||
| Institutional Class Hypothetical | 1.03 | % | $ | 1,000.00 | $ | 1,019.90 | $ | 5.22 | |||||||||||
| Touchstone Total Return Bond Fund | |||||||||||||||||||
| Class A Actual | 0.90 | % | $ | 1,000.00 | $ | 1,050.20 | $ | 4.63 | |||||||||||
| Class A Hypothetical | 0.90 | % | $ | 1,000.00 | $ | 1,020.56 | $ | 4.56 | |||||||||||
| Class C Actual | 1.65 | % | $ | 1,000.00 | $ | 1,047.60 | $ | 2.82 | |||||||||||
| Class C Hypothetical | 1.65 | % | $ | 1,000.00 | $ | 1,005.60 | $ | 2.77 | |||||||||||
| Class Y Actual | 0.48 | % | $ | 1,000.00 | $ | 1,052.90 | $ | 2.47 | |||||||||||
| Class Y Hypothetical | 0.48 | % | $ | 1,000.00 | $ | 1,022.66 | $ | 2.43 | |||||||||||
| Institutional Class Actual | 0.50 | % | $ | 1,000.00 | $ | 1,053.20 | $ | 0.86 | |||||||||||
| Institutional Class Hypothetical | 0.50 | % | $ | 1,000.00 | $ | 1,007.52 | $ | 0.84 | |||||||||||
| Touchstone Ultra Short Duration Fixed Income Fund | |||||||||||||||||||
| Class Z Actual | 0.74 | % | $ | 1,000.00 | $ | 1,006.70 | $ | 3.72 | |||||||||||
| Class Z Hypothetical | 0.74 | % | $ | 1,000.00 | $ | 1,021.36 | $ | 3.75 | |||||||||||
* Expenses are equal to the Fund's annualized expense ratio, multiplied by the average account value over the period, multiplied by [number of days in most recent fiscal half-year/365 [or 366]] (to reflect one-half year period).
221
Other Items (Continued)
Advisory Agreement Approval Disclosure
At a meeting held on February 17, 2011, the Board of Trustees (the "Board" or "Trustees") of the Touchstone Funds Group Trust (the "Trust"), and by a separate vote, the Independent Trustees of the Trust, approved an amendment to the Investment Advisory Agreement between the Trust and the Advisor adding the Touchstone Emerging Markets Equity Fund II (the "Fund") and also initially approved the Sub-Advisory Agreement with respect to the Fund between the Advisor and AGF Investments America Inc. (the "Sub-Advisor").
In determining whether to approve the amendment to the Investment Advisory Agreement and the Sub-Advisory Agreement, the Advisor furnished information necessary for a majority of the Independent Trustees to make the determination that approval of the amendment to the Investment Advisory Agreement and the Sub-Advisory Agreement was in the best interests of the Fund and its shareholders. The Board also took into account information provided to the Board in its meetings throughout the year with respect to the services provided by the Advisor and the Sub-Advisor to another Touchstone Fund managed by the Sub-Advisor on which the Fund would be modeled (the "Model Touchstone Fund"). In addition, the Board took into consideration certain information and materials that the Board had received and considered in connection with its approval of the renewal in November 2010 of the Investment Advisory and Sub-Advisory Agreements with respect to the Model Touchstone Fund. Those approvals, on which the Board voted at its meeting held in person on November 18, 2010, followed a lengthy process during which the Board considered a variety of factors. The information considered by the Board included: (1) a comparison of the Fund's proposed advisory fee and other fees and anticipated total expense ratio with those of comparable funds; (2) performance information for the Model Touchstone Fund managed by the Sub-Advisor; (3) the Advisor's and its affiliates' estimated revenues and costs of providing services to the Fund; and (4) information about the Advisor's and Sub-Advisor's personnel.
Prior to voting, the Independent Trustees reviewed the proposed approval of the amendment to the Investment Advisory Agreement and the Sub-Advisory Agreement with management and with experienced independent legal counsel and received materials from such counsel discussing the legal standards for their consideration of the proposed approval of the amendment to the Investment Advisory Agreement and the Sub-Advisory Agreement. The Independent Trustees also reviewed the proposed approval of the amendment to the Investment Advisory Agreement and the Sub-Advisory Agreement in a private session with independent legal counsel at which no representatives of management were present.
In approving the amendment to the Investment Advisory Agreement, the Board considered various factors, among them: (1) the nature, extent and quality of services to be provided to the Fund, including the personnel who would be providing such services; (2) the Advisor's anticipated compensation and profitability; (3) the level of the Fund's proposed advisory fees and expenses; (4) anticipated economies of scale; and (5) the terms of the Investment Advisory Agreement. The Board's analysis of these factors is set forth below. The Independent Trustees were advised by independent legal counsel throughout the process.
Nature, Extent and Quality of Advisor's Services. The Board considered the level and depth of knowledge of the Advisor, including the professional experience and qualifications of senior personnel. The Board discussed the Advisor's effectiveness in monitoring the performance of sub-advisors, including the Sub-Advisor, and the Advisor's timeliness in responding to any performance issues. In evaluating the quality of services to be provided by the Advisor, the Board took into account its familiarity with the Advisor's senior management through Board meetings, discussions and reports during the preceding year. The Board also took into account the Advisor's compliance policies and procedures. The quality of administrative and other services of comparable funds managed by the Advisor, including the Advisor's role in coordinating the activities of those funds' other service providers, was also considered. The Board also considered the Advisor's relationship with its affiliates and the resources available to them, as well as any potential conflicts of interest. The Trustees
222
Other Items (Continued)
concluded that they were satisfied with the nature, extent and quality of services to be provided to the Fund by the Advisor under the Investment Advisory Agreement.
Advisor's Compensation and Profitability. The Board took into consideration the financial condition and anticipated level of profitability of the Advisor and its affiliates and the direct and indirect benefits to be derived by the Advisor and its affiliates from the Advisor's relationship with the Fund. The Board noted that the Advisor had contractually agreed to waive fees and/or reimburse expenses in order to limit the Fund's total operating expenses for a period following the date on which the Fund commenced operations. The Board also noted that the Advisor would pay the Sub-Advisor's sub-advisory fee out of the advisory fee the Advisor would receive from the Fund. The Board reviewed the anticipated level of profitability of the Advisor's relationship with the Fund and whether the Advisor has the financial wherewithal to provide a high level of services to the Fund, noting the ongoing commitment of the Advisor's parent company with respect to providing support and resources as needed. The Board also considered that the Fund's prospective distributor, an affiliate of the Advisor, would receive Rule 12b-1 distribution fees from the Fund and would receive a portion of the sales charges on sales or redemptions of certain classes of shares. The Board also noted that the Advisor would derive benefits to its reputation and other benefits from its association with the Fund.
The Board recognized that the Advisor should be entitled to earn a reasonable level of profits in exchange for the level of services it would provide to the Fund and the entrepreneurial risk that it would assume as Advisor. Based upon their review, the Trustees concluded that the Advisor's and its affiliates' anticipated level of profitability, if any, from their relationship with the Fund was reasonable and not excessive.
Expenses and Performance. The Board compared the Fund's proposed advisory fee and total expense ratio net of applicable fee waivers and/or expense reimbursements with those of comparable funds. The Board noted that the advisory fee proposed for the Fund was above the Expense Group Median while the Fund's total expenses, net of fee waivers and/or reimbursements was below the Expense Group Median. The Board took into consideration the performance of the Model Touchstone Fund on which the Fund would be modeled. The Board noted that the portfolio management team that currently manages the Model Touchstone Fund is expected to manage the Fund as well. The Board also noted that the Board reviews on a quarterly basis detailed information about the Model Touchstone Fund's performance results, portfolio composition and investment strategies. In addition, the Board took into consideration certain differences between how the Model Touchstone Fund is managed and how the Fund will be managed as well as the impact these differences are expected to have on the Fund's performance.
The Board noted that the Advisor had contractually agreed to waive a portion of its fees and/or reimburse certain Fund expenses in order to limit the Fund's operating expenses to targeted levels. The Board further noted that the sub-advisory fees under the Sub-Advisory Agreement would be paid by the Advisor out of the advisory fee it receives from the Fund and noted the impact of such sub-advisory fee on the profitability of the Advisor. In reviewing the proposed expense ratios and the performance of the Model Touchstone Fund, the Board also took into account the nature, extent and quality of the services to be provided to the Fund by the Advisor and its affiliates. Based upon their review, the Trustees concluded that the proposed advisory fee was reasonable in light of the high quality of services to be received by the Fund from the Advisor.
Economies of Scale. The Board considered the effect of the Fund's potential growth and size on its performance and expenses. The Board took into account management's discussion of the proposed advisory fee structure. The Board noted that the proposed advisory fee schedule contains breakpoints that would reduce the advisory fee at specified asset levels. The Board also noted that if the Fund's assets increase over time, the Fund might realize other economies of scale if assets increase proportionally more than certain other expenses. The Board also considered the fact that under the Investment Advisory Agreement, the proposed advisory fee payable to
223
Other Items (Continued)
the Advisor by the Fund would be reduced by the total sub-advisory fee paid by the Advisor to the Sub-Advisor.
Conclusion. In considering the approval of the amendment to the Investment Advisory Agreement, the Board, including the Independent Trustees, did not identify any single factor as controlling, and each Trustee attributed different weights to the various factors. The Trustees evaluated all information available to them. The Board reached the following conclusions regarding the amendment to the Investment Advisory Agreement, among others: (a) the Advisor had demonstrated that it possesses the capability and resources to perform the duties required of it under the Investment Advisory Agreement; (b) the Advisor maintains an appropriate compliance program; (c) the Fund's proposed advisory fee is reasonable in relation to the fees of similar funds and the services to be provided by the Advisor. Based on their conclusions, the Trustees determined that approval of the amendment to the Investment Advisory Agreement was in the best interests of the Fund and its shareholders.
In initially approving the Fund's Sub-Advisory Agreement, the Board considered various factors, among them: (1) the nature, extent and quality of services to be provided to the Fund, including the personnel who would be providing such services; (2) the Sub-Advisor's proposed compensation; (3) the Sub-Advisor's past performance with respect to its management of the Model Touchstone Fund; and (4) the terms of the Sub-Advisory Agreement. The Board's analysis of these factors is set forth below. The Independent Trustees were advised by independent legal counsel throughout the process.
Nature, Extent and Quality of Services Provided; Investment Personnel. The Board considered information provided by the Advisor regarding the services to be provided by the Sub-Advisor. The Board noted that, on a periodic basis, the Board meets with the portfolio managers of the Sub-Advisor to discuss their performance and investment processes and strategies with respect to the Model Touchstone Fund. The Board considered the Sub-Advisor's level of knowledge and investment style. The Board reviewed the experience and credentials of the investment personnel who would be responsible for managing the investment of portfolio securities with respect to the Fund. The Board also noted its familiarity with the Sub-Advisor, owing to the Sub-Advisor's management of the Model Touchstone Fund. The Board also considered the Sub-Advisor's regulatory and compliance history. The Board noted that the Advisor's compliance monitoring includes quarterly reviews of compliance reports and annual compliance reviews of the Sub-Advisor and that compliance issues, if any, are reported to the Board.
Sub-Advisor's Compensation. The Board took into consideration the financial condition of the Sub-Advisor and any direct and indirect benefits to be derived by the Sub-Advisor and its affiliates from the Sub-Advisor's relationship with the Fund. In considering the anticipated level of profitability to the Sub-Advisor and its affiliates of the Sub-Advisor's relationship with the Fund, the Board noted the proposed contractual undertaking of the Advisor to maintain expense limitations for the Fund and also noted that the sub-advisory fee under the Sub-Advisory Agreement would be paid by the Advisor out of the advisory fee that it would receive from the Fund under the Investment Advisory Agreement, and that the sub-advisory fee is negotiated at arm's length. As a consequence, the anticipated level of profitability to the Sub-Advisor of its relationship with the Fund was not a substantial factor in the Board's deliberations. For similar reasons, the Board did not consider potential economies of scale in the Sub-Advisor's management of the Fund to be a substantial factor in its consideration, although the Board noted that the proposed sub-advisory fee schedule contains breakpoints that would reduce the sub-advisory fee rate on Fund assets above specified levels.
Sub-Advisory Fee and Fund Performance. The Board considered that the Fund would pay an advisory fee to the Advisor and that the Advisor would pay a sub-advisory fee to the Sub-Advisor. The Board also compared the Sub-Advisor's proposed sub-advisory fee to the sub-advisory fees paid to sub-advisors for managing comparable funds, noting that the proposed sub-advisory fee was at the Expense Group Median. The Board
224
Other Items (Continued)
considered the amount of the advisory fee to be retained by the Advisor and the amount to be paid to the Sub-Advisor, with respect to the various services to be provided by the Advisor and the Sub-Advisor. The Board also noted that the Advisor negotiated the sub-advisory fee with the Sub-Advisor at arm's length.
The Board considered the Sub-Advisor's long-term performance record in managing the Model Touchstone Fund, certain differences between how the Sub-Advisor manages the Model Touchstone Fund and how it will manage the Fund as well as the impact these differences are expected to have on the Fund's performance. The Board also took into account that the portfolio management team that currently manages the Model Touchstone Fund is expected to manage the Fund as well. The Board also noted the Advisor's expertise and resources in monitoring the performance, investment style and risk-adjusted performance of the Sub-Advisor with respect to the Model Touchstone Fund. The Board was mindful of the Advisor's focus on the performance of sub-advisors, including the Sub-Advisor, and the Advisor's ways of addressing underperformance. Based upon their review, the Trustees concluded that the Fund's proposed sub-advisory fee was reasonable in light of the high quality of services to be received by the Fund from the Sub-Advisor.
Conclusion. In considering the initial approval of the Sub-Advisory Agreement with respect to the Fund, the Board, including the Independent Trustees, did not identify any single factor as controlling, and each Trustee attributed different weights to the various factors. The Board reached the following conclusions regarding the Sub-Advisory Agreement, among others: (a) the Sub-Advisor is qualified to manage the Fund's assets in accordance with the Fund's investment objectives and policies; (b) the Sub-Advisor maintains an appropriate compliance program; (c) the Fund's proposed advisory fee is reasonable in relation to the fees of similar funds and to the services to be provided by the Advisor and the Sub-Advisor; and (d) the Sub-Advisor's proposed investment strategies are appropriate for pursuing the investment objectives of the Fund. Based on its conclusions, the Board determined that approval of the Sub-Advisory Agreement was in the best interests of the Fund and its shareholders.
At a meeting held on May 19, 2011, the Board of Trustees (the "Board" or "Trustees") of the Touchstone Funds Group Trust (the "Trust"), and by a separate vote, the Independent Trustees of the Trust, approved an amendment to the Investment Advisory Agreement between the Trust and the Advisor adding the Touchstone Merger Arbitrage Fund (the "Fund") and also initially approved the Sub-Advisory Agreement with respect to the Fund between the Advisor and Longfellow Investment Management Co. (the "Sub-Advisor").
In determining whether to approve the amendment to the Investment Advisory Agreement and the Sub-Advisory Agreement, the Advisor furnished information necessary for a majority of the Independent Trustees to make the determination that approval of the amendment to the Investment Advisory Agreement and the Sub-Advisory Agreement was in the best interests of the Fund and its shareholders. The Board also took into account information provided to the Board in its meetings throughout the year with respect to the services provided by the Advisor and the Sub-Advisor to other Touchstone Funds. In addition, the Board took into consideration certain information and materials that the Board had received and considered in connection with its approval of the renewal in November 2010 of the Investment Advisory and Sub-Advisory Agreements with respect to other Touchstone Funds. Those approvals, on which the Board voted at its meeting held in person on November 18, 2010, followed a lengthy process during which the Board considered a variety of factors. The information considered by the Board included: (1) a comparison of the Fund's proposed advisory fee and other fees and anticipated total expense ratio with those of comparable funds; (2) performance information for a comparable investment strategy managed by the Sub-Advisor; (3) the Advisor's and its affiliates' estimated revenues and costs of providing services to the Fund; and (4) information about the Advisor's and Sub-Advisor's personnel.
Prior to voting, the Independent Trustees reviewed the proposed approval of the amendment to the Investment Advisory Agreement and the Sub-Advisory Agreement with management and with experienced independent
225
Other Items (Continued)
legal counsel and received materials from such counsel discussing the legal standards for their consideration of the proposed approval of the amendment to the Investment Advisory Agreement and the Sub-Advisory Agreement. The Independent Trustees also reviewed the proposed approval of the amendment to the Investment Advisory Agreement and the Sub-Advisory Agreement in a private session with independent legal counsel at which no representatives of management were present.
In approving the amendment to the Investment Advisory Agreement, the Board considered various factors, among them: (1) the nature, extent and quality of services to be provided to the Fund, including the personnel who would be providing such services; (2) the Advisor's anticipated compensation and profitability; (3) the level of the Fund's proposed advisory fees and expenses; (4) anticipated economies of scale; and (5) the terms of the Investment Advisory Agreement. The Board's analysis of these factors is set forth below. The Independent Trustees were advised by independent legal counsel throughout the process.
Nature, Extent and Quality of Advisor's Services. The Board considered the level and depth of knowledge of the Advisor, including the professional experience and qualifications of senior personnel. The Board discussed the Advisor's effectiveness in monitoring the performance of sub-advisors, including the Sub-Advisor, and the Advisor's timeliness in responding to any performance issues. In evaluating the quality of services to be provided by the Advisor, the Board took into account its familiarity with the Advisor's senior management through Board meetings, discussions and reports during the preceding year. The Board also took into account the Advisor's compliance policies and procedures. The quality of administrative and other services of comparable funds managed by the Advisor, including the Advisor's role in coordinating the activities of those funds' other service providers, was also considered. The Board also considered the Advisor's relationship with its affiliates and the resources available to them, as well as any potential conflicts of interest. The Trustees concluded that they were satisfied with the nature, extent and quality of services to be provided to the Fund by the Advisor under the Investment Advisory Agreement.
Advisor's Compensation and Profitability. The Board took into consideration the financial condition and anticipated level of profitability of the Advisor and its affiliates and the direct and indirect benefits to be derived by the Advisor and its affiliates from the Advisor's relationship with the Fund. The Board noted that the Advisor had contractually agreed to waive fees and/or reimburse expenses in order to limit the Fund's total operating expenses for a period following the date on which the Fund commenced operations. The Board also noted that the Advisor would pay the Sub-Advisor's sub-advisory fee out of the advisory fee the Advisor would receive from the Fund. The Board reviewed the anticipated level of profitability of the Advisor's relationship with the Fund and whether the Advisor has the financial wherewithal to provide a high level of services to the Fund, noting the ongoing commitment of the Advisor's parent company with respect to providing support and resources as needed. The Board also considered that the Fund's prospective distributor, an affiliate of the Advisor, would receive Rule 12b-1 distribution fees from the Fund and would receive a portion of the sales charges on sales or redemptions of certain classes of shares. The Board also noted that the Advisor would derive benefits to its reputation and other benefits from its association with the Fund.
The Board recognized that the Advisor should be entitled to earn a reasonable level of profits in exchange for the level of services it would provide to the Fund and the entrepreneurial risk that it would assume as Advisor. Based upon their review, the Trustees concluded that the Advisor's and its affiliates' anticipated level of profitability, if any, from their relationship with the Fund was reasonable and not excessive.
Expenses and Performance. The Board compared the Fund's proposed advisory fee and total expense ratio net of applicable fee waivers and/or expense reimbursements with those of comparable funds. The Board noted that the advisory fee proposed for the Fund falls within the range of advisory fees paid by certain comparable funds. The Board also noted that the Fund's estimated total expenses for its Class A shares, net of reimbursements, were within the range of total expenses paid by certain comparable funds. The Board also
226
Other Items (Continued)
considered the performance of a separately managed account that is managed by the Sub-Advisor using the same merger arbitrage strategy that the Sub-Advisor will use in managing the Fund.
The Board noted that the Advisor had contractually agreed to waive a portion of its fees and/or reimburse certain Fund expenses in order to limit the Fund's operating expenses to targeted levels. The Board further noted that the sub-advisory fees under the Sub-Advisory Agreement would be paid by the Advisor out of the advisory fee it receives from the Fund and noted the impact of such sub-advisory fee on the profitability of the Advisor. In reviewing the proposed expense ratios, the Board also took into account the nature, extent and quality of the services to be provided to the Fund by the Advisor and its affiliates. Based upon their review, the Trustees concluded that the proposed advisory fee was reasonable in light of the high quality of services to be received by the Fund from the Advisor.
Economies of Scale. The Board considered the effect of the Fund's potential growth and size on its performance and expenses. The Board took into account management's discussion of the proposed advisory fee structure. The Board noted that the proposed advisory fee schedule did not contain breakpoints. The Board concluded that, given the Fund's limited capacity of approximately $500 million, adding breakpoints to the advisory fee at specified asset levels would not be appropriate at this time. The Board also noted that if the Fund's assets increase over time, the Fund might realize other economies of scale if assets increase proportionally more than certain other expenses. The Board also considered the fact that under the Investment Advisory Agreement, the proposed advisory fee payable to the Advisor by the Fund would be reduced by the total sub-advisory fee paid by the Advisor to the Sub-Advisor.
Conclusion. In considering the approval of the amendment to the Investment Advisory Agreement, the Board, including the Independent Trustees, did not identify any single factor as controlling, and each Trustee attributed different weights to the various factors. The Trustees evaluated all information available to them. The Board reached the following conclusions regarding the amendment to the Investment Advisory Agreement, among others: (a) the Advisor had demonstrated that it possesses the capability and resources to perform the duties required of it under the Investment Advisory Agreement; (b) the Advisor maintains an appropriate compliance program; (c) the Fund's proposed advisory fee is reasonable in relation to the fees of similar funds and the services to be provided by the Advisor. Based on their conclusions, the Trustees determined that approval of the amendment to the Investment Advisory Agreement was in the best interests of the Fund and its shareholders.
In initially approving the Fund's Sub-Advisory Agreement, the Board considered various factors, among them: (1) the nature, extent and quality of services to be provided to the Fund, including the personnel who would be providing such services; (2) the Sub-Advisor's proposed compensation; (3) the Sub-Advisor's past performance with respect to its management of funds and accounts with investment strategies similar to those of the Fund; and (4) the terms of the Sub-Advisory Agreement. The Board's analysis of these factors is set forth below. The Independent Trustees were advised by independent legal counsel throughout the process.
Nature, Extent and Quality of Services Provided; Investment Personnel. The Board considered information provided by the Advisor regarding the services to be provided by the Sub-Advisor. The Board considered the Sub-Advisor's level of knowledge and investment style. The Board reviewed the experience and credentials of the investment personnel who would be responsible for managing the investment of portfolio securities with respect to the Fund. The Board also noted its familiarity with the Sub-Advisor, owing to the Sub-Advisor's management of another Touchstone Fund. The Board also considered the Sub-Advisor's regulatory and compliance history. The Board noted that the Advisor's compliance monitoring includes quarterly reviews of compliance reports and annual compliance reviews of the Sub-Advisor and that compliance issues, if any, are reported to the Board.
227
Other Items (Continued)
Sub-Advisor's Compensation. The Board took into consideration the financial condition of the Sub-Advisor and any direct and indirect benefits to be derived by the Sub-Advisor and its affiliates from the Sub-Advisor's relationship with the Fund. In considering the anticipated level of profitability to the Sub-Advisor and its affiliates of the Sub-Advisor's relationship with the Fund, the Board noted the proposed contractual undertaking of the Advisor to maintain expense limitations for the Fund and also noted that the sub-advisory fee under the Sub-Advisory Agreement would be paid by the Advisor out of the advisory fee that it would receive from the Fund under the Investment Advisory Agreement, and that the sub-advisory fee is negotiated at arm's length. As a consequence, the anticipated level of profitability to the Sub-Advisor of its relationship with the Fund was not a substantial factor in the Board's deliberations. For similar reasons, the Board did not consider potential economies of scale in the Sub-Advisor's management of the Fund to be a substantial factor in its consideration, although the Board noted that the proposed sub-advisory fee schedule contains a breakpoint that would reduce the sub-advisory fee rate on Fund assets above a specified level.
Sub-Advisory Fee and Fund Performance. The Board considered that the Fund would pay an advisory fee to the Advisor and that the Advisor would pay a sub-advisory fee to the Sub-Advisor. In considering the sub-advisory fee, the Board also considered the amount of the advisory fee to be retained by the Advisor and the amount to be paid to the Sub-Advisor, with respect to the various services to be provided by the Advisor and the Sub-Advisor. The Board also noted that the Advisor negotiated the sub-advisory fee with the Sub-Advisor at arm's length. The Board considered the Sub-Advisor's long-term performance record with respect to the investment strategies that it would utilize in managing the Fund. Among other performance information presented to the Board, the Trustees noted that the Sub-Advisor's merger arbitrage separately managed account had outperformed its benchmark, the Bank of America Merrill Lynch 3-Month Treasury Bill Index, for the one-, three-, five- and ten-year and since-inception periods through December 31, 2010. The Board also noted that the Sub-Advisor's portfolio management team that would manage the Fund has extensive experience managing the merger arbitrage strategy. The Board was mindful of the Advisor's focus on the performance of sub-advisors, including the Sub-Advisor, and the Advisor's ways of addressing underperformance. Based upon their review, the Trustees concluded that the Fund's proposed sub-advisory fee was reasonable in light of the high quality of services to be received by the Fund from the Sub-Advisor.
Conclusion. In considering the initial approval of the Sub-Advisory Agreement with respect to the Fund, the Board, including the Independent Trustees, did not identify any single factor as controlling, and each Trustee attributed different weights to the various factors. The Board reached the following conclusions regarding the Sub-Advisory Agreement, among others: (a) the Sub-Advisor is qualified to manage the Fund's assets in accordance with the Fund's investment objectives and policies; (b) the Sub-Advisor maintains an appropriate compliance program; (c) the Fund's proposed advisory fee is reasonable in relation to the fees of similar funds and to the services to be provided by the Advisor and the Sub-Advisor; and (d) the Sub-Advisor's proposed investment strategies are appropriate for pursuing the investment objectives of the Fund. Based on its conclusions, the Board determined that approval of the Sub-Advisory Agreement was in the best interests of the Fund and its shareholders.
At meetings held on April 12, 2011 and May 19, 2011, the Board of Trustees (the "Board" or "Trustees") of the Touchstone Funds Group Trust (the "Trust"), and by a separate vote, the Independent Trustees of the Trust, initially approved an Interim Sub-Advisory Agreement and Sub-Advisory Agreement, respectively, with respect to the Total Return Bond Fund (the "Fund") between the Advisor and EARNEST Partners LLC (the "Sub-Advisor"). The Interim Sub-Advisory Agreement and Sub-Advisory Agreement are referred to individually as a Sub-Advisory Agreement and collectively as the Sub-Advisory Agreements. Representatives of management informed the Trustees that, if approved by the Board, the proposed Sub-Advisory Agreements coupled with certain proposed changes to the Fund's investment strategies were expected to facilitate the proposed
228
Other Items (Continued)
reorganization of another mutual fund that is currently managed by the Sub-Advisor (the "EARNEST Fund") into the Fund later in the year, provided the shareholders of the EARNEST Fund approved the reorganization.
In determining whether to approve the Sub-Advisory Agreements, the Advisor furnished information necessary for a majority of the Independent Trustees to make the determination that approval of the Sub-Advisory Agreements was in the best interests of the Fund and its shareholders. The Board also took into account information provided to the Board in its meetings throughout the year with respect to the services provided by the Sub-Advisor to another Touchstone Fund. In addition, the Board took into consideration certain information and materials that the Board had received and considered in connection with its approval of the renewal in November 2010 of the sub-advisory agreement with the Sub-Advisor with respect to the other Touchstone Fund that it manages. This approval, on which the Board voted at its meeting held in person on November 18, 2010, followed a lengthy process during which the Board considered a variety of factors. The information considered by the Board included: (1) a comparison of the Fund's proposed advisory fee and other fees and anticipated total expense ratio with those of comparable funds; (2) performance information for the EARNEST Fund; (3) any direct and indirect benefits to be derived by the Sub-Advisor and its affiliates from the Sub-Advisor's relationship with the Fund; and (4) information about the Sub-Advisor's personnel.
Prior to voting, the Independent Trustees reviewed the proposed approval of the Sub-Advisory Agreements with management and with experienced independent legal counsel and received materials from such counsel discussing the legal standards for their consideration of the proposed approval of the Sub-Advisory Agreements. The Independent Trustees also reviewed the proposed approval of the Sub-Advisory Agreements in a private session with independent legal counsel at which no representatives of management were present.
In initially approving each Sub-Advisory Agreement, the Board considered various factors, among them: (1) the nature, extent and quality of services to be provided to the Fund, including the personnel who would be providing such services; (2) the Sub-Advisor's proposed compensation; (3) the Sub-Advisor's past performance managing the EARNEST Fund; and (4) the terms of the Sub-Advisory Agreement. The Board's analysis of these factors is set forth below. The Independent Trustees were advised by independent legal counsel throughout the process.
Nature, Extent and Quality of Services Provided; Investment Personnel. The Board considered information provided by the Advisor regarding the services to be provided by the Sub-Advisor. The Board considered the Sub-Advisor's level of knowledge and investment style. The Board reviewed the experience and credentials of the investment personnel who would be responsible for managing the investment of portfolio securities with respect to the Fund. The Board also noted its familiarity with the Sub-Advisor, owing to the Sub-Advisor's management of another Touchstone Fund. The Board also considered the Sub-Advisor's regulatory and compliance history. The Board noted that the Advisor's compliance monitoring includes quarterly reviews of compliance reports and annual compliance reviews of the Sub-Advisor and that compliance issues, if any, are reported to the Board.
Sub-Advisor's Compensation. The Board took into consideration the financial condition of the Sub-Advisor and any direct and indirect benefits to be derived by the Sub-Advisor and its affiliates from the Sub-Advisor's relationship with the Fund. In considering the anticipated level of profitability to the Sub-Advisor and its affiliates of the Sub-Advisor's relationship with the Fund, the Board noted the proposed contractual undertaking of the Advisor to lower expense limitations for the Fund and also noted that the sub-advisory fee under each Sub-Advisory Agreement would be paid by the Advisor out of the proposed reduced advisory fee that it would receive from the Fund under the Investment Advisory Agreement, and that the sub-advisory fee is negotiated at arm's length. As a consequence, the anticipated level of profitability to the Sub-Advisor of its relationship with the Fund was not a substantial factor in the Board's deliberations. For similar reasons, the Board did not consider potential economies of scale in the Sub-Advisor's management of the Fund to be a
229
Other Items (Continued)
substantial factor in its consideration, although the Board noted that the proposed sub-advisory fee schedule contains a breakpoint that would reduce the sub-advisory fee rate on Fund assets above a specified level.
Sub-Advisory Fee and Fund Performance. The Board considered that the Fund would pay a reduced advisory fee to the Advisor and that the Advisor would pay a sub-advisory fee to the Sub-Advisor. The Board also compared the Sub-Advisor's proposed sub-advisory fee to the sub-advisory fees paid to sub-advisors for managing comparable funds, noting that the proposed sub-advisory fee was below the Expense Group Median. The Board considered the amount of the proposed advisory fee to be retained by the Advisor and the amount to be paid to the Sub-Advisor, with respect to the various services to be provided by the Advisor and the Sub-Advisor. The Board also noted that the Advisor negotiated the sub-advisory fee with the Sub-Advisor at arm's length.
The Board considered the Sub-Advisor's long-term performance record in managing the EARNEST Fund, noting that it had outperformed its benchmark, the Barclays Capital Aggregate Bond Index, for the one-, five- and ten-year periods ended December 31, 2010. The Board also noted the Advisor's expertise and resources in monitoring the performance, investment style and risk-adjusted performance of the Sub-Advisor with respect to another Touchstone Fund. The Board was mindful of the Advisor's focus on the performance of sub-advisors, including the Sub-Advisor, and the Advisor's ways of addressing underperformance. Based upon their review, the Trustees concluded that the Fund's proposed sub-advisory fee was reasonable in light of the high quality of services to be received by the Fund from the Sub-Advisor.
Conclusion. In considering the initial approval of each Sub-Advisory Agreement, the Board, including the Independent Trustees, did not identify any single factor as controlling, and each Trustee attributed different weights to the various factors. The Board reached the following conclusions regarding each Sub-Advisory Agreement, among others: (a) the Sub-Advisor is qualified to manage the Fund's assets in accordance with the Fund's investment objectives and policies; (b) the Sub-Advisor maintains an appropriate compliance program; (c) the Fund's proposed advisory fee is reasonable in relation to the fees of similar funds and to the services to be provided by the Advisor and the Sub-Advisor; and (d) the Sub-Advisor's proposed investment strategies are appropriate for pursuing the investment objectives of the Fund. Based on its conclusions, the Board determined that approval of each Sub-Advisory Agreement was in the best interests of the Fund and its shareholders.
230
Management of the Trust (Unaudited)
Listed below is basic information regarding the Trustees and principal officers of the Trust. The Trust's Statement of Additional Information includes additional information about the Trustees and is available, without charge, upon request by calling 1.800.543.0407.
Interested Trustees1:
| Name Address Age | Position(s) Held with Trust | Term of Office2 And Length of Time Served | Principal Occupation(s) During Past 5 Years | Number of Funds Overseen in the Touchstone Fund Complex3 | Other Directorships Held4 | ||||||||||||||||||
| Jill T. McGruder1 Touchstone Advisors, Inc 303 Broadway Cincinnati, OH Year of Birth: 1955 | Trustee and President | Until retirement at age 75 or until she resigns or is removed Trustee since 1999 | President and CEO of IFS Financial Services, Inc. (a holding company). | 43 | Director of LaRosa's (a restaurant chain), Capital Analysts Incorporated (an investment advisor and broker-dealer), IFS Financial Services, Inc. (a holding company), Integrity and National Integrity Life Insurance Co., Touchstone Securities (the Trust's distributor), Touchstone Advisors (the Trust's investment advisor and administrator) and W&S Financial Group Distributors (a distribution company). | ||||||||||||||||||
| Independent Trustees: | |||||||||||||||||||||||
| Phillip R. Cox 105 East Fourth Street Cincinnati, OH Year of Birth: 1947 | Trustee | Until retirement at age 75 or until he resigns or is removed Trustee since 1999 | President and Chief Executive Officer of Cox Financial Corp. (a financial services company). | 43 | Director of Cincinnati Bell (a communications company), Bethesda Inc. (a hospital), Timken Co. (a manufacturing company), Diebold (a technology solutions company), and Ohio Business Alliance for Higher Education. Director of Duke Energy from 1994-2008. | ||||||||||||||||||
| H. Jerome Lerner c/o Touchstone Advisors, Inc. 303 Broadway Cincinnati, OH Year of Birth: 1938 | Trustee | Until retirement at age 75 or until he resigns or is removed Trustee since 1989 | Principal of HJL Enterprises (a privately held investment company). | 43 | None | ||||||||||||||||||
231
Management of the Trust (Continued)
Independent Trustees (Continued):
| Name Address Age | Position(s) Held with Trust | Term of Office2 And Length of Time Served | Principal Occupation(s) During Past 5 Years | Number of Funds Overseen in the Touchstone Fund Complex3 | Other Directorships Held4 | ||||||||||||||||||
| Donald C. Siekmann c/o Touchstone Advisors, Inc. 303 Broadway Cincinnati, OH Year of Birth: 1938 | Trustee | Until retirement at age 75 or until he resigns or is removed Trustee since 2005 | Executive for Duro Bag Manufacturing Co. (a bag manufacturer) from 2002-2008. | 43 | None | ||||||||||||||||||
| John P. Zanotti c/o Touchstone Advisors, Inc. 303 Broadway Cincinnati, OH Year of Birth: 1948 | Trustee | Until retirement at age 75 or until he resigns or is removed Trustee since 2002 | CEO, Chairman and Director of Avaton, Inc. (a wireless entertainment company) until 2006. President of Cincinnati Biomedical (a life science and economic development company) from 2003-2007. Chairman of Integrated Media Technologies (a media company) | 43 | Director of Q Med (a health care management company) from 2004-2007. | ||||||||||||||||||
| Susan J. Hickenlooper c/o Touchstone Advisors, Inc. 303 Broadway Cincinnati, OH Year of Birth: 1946 | Trustee | Until retirement at age 75 or until he resigns or is removed Trustee since 2009 | Trustee of Episcopal Retirement Homes Foundation | 43 | Trustee of Gateway Trust from 2006-2008, Trustee of Cincinnati Parks Foundation (a charitable organization). | ||||||||||||||||||
1 Ms. McGruder, as a director of the Advisor and the Trust's Distributor, and an officer of affiliates of the Advisor and the Trust's Distributor, is an "interested person" of the Trust within the meaning of Section 2(a)(19) of the 1940 Act.
2 Each Trustee is elected to serve until the age of 75 or until he or she sooner resigns or is removed.
3 The Touchstone Fund Complex consists of 20 series of the Trust, 3 series of Touchstone Tax-Free Trust, 1 series of Touchstone Institutional Funds Trust, 4 series of Touchstone Investment Trust, 4 series of Touchstone Strategic Trust, and 11 variable annuity series of Touchstone Variable Series Trust.
4 Each Trustee is also a Trustee of Touchstone Funds Group Trust, Touchstone Institutional Funds Trust, Touchstone Investment Trust, Touchstone Strategic Trust, and Touchstone Variable Series Trust.
232
Management of the Trust (Continued)
Principal Officers1:
| Name Address Age | Position(s) Held with Trust | Term of Office2 And Length of Time Served | Principal Occupation(s) During Past 5 Years | Number of Funds Overseen in the Touchstone Fund Complex3 | Other Directorships Held | ||||||||||||||||||
| Jill T. McGruder Touchstone Advisors, Inc. 303 Broadway Cincinnati, OH Year of Birth: 1955 | President | Until resignation, removal or disqualification President since 2004; President from 2000-2002 | See biography above. | 43 | See biography above. | ||||||||||||||||||
| Brian E. Hirsch Touchstone Advisors, Inc. 303 Broadway Cincinnati, OH Year of Birth: 1956 | Vice President | Until resignation, removal or disqualification Vice President since 2003 | Senior Vice President of Compliance and Fund Administration of IFS Financial Services, Inc. | 43 | None | ||||||||||||||||||
| Steven M. Graziano Touchstone Advisors, Inc. 303 Broadway Cincinnati, OH Year of Birth: 1954 | Vice President | Until resignation, removal or disqualification Vice President since 2009 | President of Touchstone Advisors, Inc.; Executive Vice President of Pioneer Investment Management, Head of Retail Distribution and Strategic Marketing 2007-2008; Executive Vice President of Pioneer Investment Management, Chief Marketing Officer 2002-2007. | 43 | None | ||||||||||||||||||
| Timothy D. Paulin Touchstone Advisors, Inc. 303 Broadway Cincinnati, OH Year of Birth: 1963 | Vice President | Until resignation, removal or disqualification Vice President since 2010 | Vice President of Investment Research; Principal of Klein Decisions | 43 | None | ||||||||||||||||||
| Joseph Melcher Touchstone Advisors, Inc. 303 Broadway Cincinnati, OH Year of Birth: 1973 | Chief Compliance Officer | Until resignation, removal or disqualification Chief Compliance Officer since 2010 | Vice President of Compliance of IFS Financial Services (a holding company); Assistant Vice President of Compliance of IFS Financial Services 2005-2010. | 43 | None | ||||||||||||||||||
| Terrie A. Wiedenheft Touchstone Advisors, Inc. 303 Broadway Cincinnati, OH Year of Birth: 1962 | Controller and Treasurer | Until resignation, removal or disqualification Controller since 2000 Treasurer since 2003 | Chief Financial Officer and Senior Vice President of IFS Financial Services, Inc. | 43 | None | ||||||||||||||||||
| Jay S. Fitton JPMorgan. 303 Broadway Cincinnati, OH Year of Birth: 1970 | Secretary | Until resignation, removal or disqualification Secretary since 2006. Assistant Secretary from 2002-2006 | Assistant Vice President and Senior Counsel at JPMorgan Chase Bank, N.A. | 43 | None | ||||||||||||||||||
1 Each officer also holds the same office with Touchstone Funds Group Trust, Touchstone Institutional Funds Trust, Touchstone Investment Trust, Touchstone Tax-Free Trust, and Touchstone Variable Series Trust.
2 Each Trustee is elected to serve until the age of 75 or until he or she sooner resigns or is removed.
3 The Touchstone Fund Complex consists of 20 series of the Trust, 3 series of Touchstone Tax-Free Trust, 1 series of Touchstone Institutional Funds Trust, 4 series of Touchstone Investment Trust, 4 series of Touchstone Strategic Trust, and 11 variable annuity series of Touchstone Variable Series Trust.
233
PRIVACY PROTECTION POLICY
We Respect Your Privacy
Thank you for your decision to invest with us. Touchstone and its affiliates have always placed a high value on the trust and confidence our clients place in us. We believe that confidence must be earned and validated through time. In today's world, when technology allows the sharing of information at light speeds, trust must be reinforced by our sincere pledge to take the steps necessary to ensure that the information you share with us is treated with respect and confidentiality.
Our Pledge to Our Clients
• We collect only the information we need to service your account and administer our business.
• We are committed to keeping your information confidential and we place strict limits and controls on the use and sharing of your information.
• We make every effort to ensure the accuracy of your information.
We Collect the Following Nonpublic Personal Information About You:
• Information we receive from you on or in applications or other forms, correspondence, or conversations, including, but not limited to, your name, address, phone number, social security number, assets, income and date of birth; and
• Information about your transactions with us, our affiliates, or others, including, but not limited to, your account number and balance, payment history, parties to transactions, cost basis information, and other financial information.
Categories of Information We Disclose and Parties to Whom We Disclose
We do not disclose any nonpublic personal information about our current or former clients to nonaffiliated third parties, except as required or permitted by law.
We Place Strict Limits and Controls on the Use and Sharing of Your Information
• We restrict access to nonpublic personal information about you to authorized employees who need the information to administer your business.
• We maintain physical, electronic and procedural safeguards that comply with federal standards to protect this information.
• We do not disclose any nonpublic personal information about our current or former clients to anyone, except as required or permitted by law or as described in this document.
• We will not sell your personal information to anyone.
We May Provide Information to Service Your Account
Sometimes it is necessary to provide information about you to various companies such as transfer agents, custodians, broker-dealers and marketing service firms to facilitate the servicing of your account. These organizations have a legitimate business need to see some of your personal information in order for us to provide service to you. We may disclose to these various companies the information that we collect as described above. We require that these companies, including our own subsidiaries and affiliates, strictly maintain the confidentiality of this information and abide by all applicable laws. Companies within our corporate family that may receive this information are financial service providers and insurance companies. We do not permit these associated companies to sell the information for their own purposes, and we never sell our customer information.
This policy is applicable to the following affiliated companies: Touchstone Funds Group Trust, Touchstone Investment Trust, Touchstone Strategic Trust, Touchstone Tax-Free Trust, Touchstone Variable Series Trust, Touchstone Institutional Funds Trust, Touchstone Securities, Inc.,* Capital Analysts Incorporated and W&S Brokerage Services, Inc.
* Touchstone Securities, Inc. serves as the underwriter to the Touchstone Funds.
A Member of Western & Southern Financial Group®
The Privacy Protection Policy is not part of the Annual Report.
234
This page intentionally left blank.

303 Broadway, Suite 1100
Cincinnati, OH 45202-4203

Touchstone Investments
Distributor
Touchstone Securities, Inc.*
303 Broadway
Cincinnati, Ohio 45202-4203
800.638.8194
www.touchstoneinvestments.com
Investment Advisor
Touchstone Advisors, Inc.*
303 Broadway
Cincinnati, Ohio 45202-4203
Transfer Agent
JPMorgan Chase Bank, N.A.
P.O. Box 5354
Cincinnati, Ohio 45201-5354
Shareholder Service
800.543.0407
* A Member of Western & Southern Financial Group
TSF-56-TFGT-AR-1110
Item 2. Code of Ethics.
At the end of the period covered by this report, the registrant has adopted a code of ethics that applies to its principal executive officer and principal financial officer.
Item 3. Audit Committee Financial Expert.
The registrant’s Board of Trustees has determined that the registrant has at least one audit committee financial expert serving on its audit committee. Mr. Donald Siekmann is the registrant’s audit committee financial expert and is an independent trustee within the meaning of the Investment Company Act of 1940, as amended (the “1940 Act”).
Item 4. Principal Accountant Fees and Services.
(a) Audit Fees. Audit fees totaled approximately $307,600 for the September 30, 2011 fiscal year and approximately $278,400 for the September 30, 2010. 2011 fees include $287,600 of fees associated with the annual audit and filing of form N-1A and Form N-SAR, and $20,000 of fees associated with additonal fiings for Form N-1A and Form N-14. 2010 fees include $268,400 of fees associated with the annual audit and filing of form N-1A and Form N-SAR, and $10,000 of fees associated with additonal fiings for Form N-1A and Form N-14.
(b) Audit-Related Fees. Audit-related fees totaled approximately $0 for the September 30, 2011 fiscal year and $0 for the September 30, 2010 fiscal year.
(c) Tax Fees. Tax fees totaled approximately $116,400 for the September 30, 2011 fiscal year and $113,600 for the September 30, 2010 fiscal year. Fees for Federal excise tax returns distributions for the 10 TFGT funds that commenced operations on October 1, 2009 totaled $15,000 in fiscal 2010.
(d) All Other Fees. There were no fees for all other services to the registrant during the September 30, 2011 or September 30, 2010 fiscal years.
(e) (1) Audit Committee Pre-Approval Policies. The Audit Committee’s pre-approval policies describe the types of audit, audit-related, tax and other services that have the general pre-approval of the Audit Committee. The pre-approval policies provide that annual audit service fees, tax services not specifically granted pre-approval, services exceeding pre-approved cost levels and other services that have not received general pre-approval will be subject to specific pre-approval by the Audit Committee. The pre-approval policies further provide that the Committee may grant general pre-approval to other audit services (statutory audits and services associated with SEC registration statements, periodic reports and other documents filed with the SEC or other documents issued in connection with securities offerings), audit-related services (accounting consultations related to accounting, financial reporting or disclosure matters not classified as “audit services,” assistance with understanding and implementing new accounting and financial reporting guidance from rulemaking authorities, agreed-upon or expanded audit procedures related to accounting and/or billing records required to respond to or comply with financial, accounting or regulatory reporting matters and assistance with internal control reporting requirements under Form N-SAR and Form N-CSR), tax services that have historically been provided by the auditor that the Committee believes would not impair the independence of the auditor and are consistent with the SEC’s rules on auditor independence and permissible non-audit services classified as “all other services” that are routine and recurring services.
(e)(2) All services described in paragraphs (b) through (d) of Item 4 were not subject to pre-approval by the Audit Committee.
(f) Not applicable
(g) The aggregate non-audit fees for services to the registrant, its investment adviser (excluding its sub-advisor) and any entity controlling, controlled by or under common control with the advisor that provides ongoing services to the registrant were approximately $116,400 for the fiscal year ended September 30, 2011 and $128,600 for the fiscal year ended September 30, 2010.
(h) Not applicable
Item 5. Audit Committee of Listed Registrants.
Not applicable
Item 6. Schedule of Investments.
(a) The Schedule of Investments in securities of unaffiliated issuers is included in the Annual Report.
(b) Not Applicable.
Item 7. Disclosure of Proxy Voting Policies and Procedures for Closed-End Management Investment Companies.
Not applicable.
Item 8. Portfolio Managers of Closed-End Management Investment Companies.
Not applicable.
Item 9. Purchases of Equity Securities by Closed-End Management Investment Company and Affiliated Purchasers.
Not applicable.
Item 10. Submission of Matters to a Vote of Security Holders.
The Governance Committee will consider shareholder recommendations for nomination to the Board only in the event that there is a vacancy on the Board. Shareholders who wish to submit recommendations for nominations to the Board to fill the vacancy must submit their recommendations in writing to John P. Zanotti, Chairman of the Governance Committee, c/o Touchstone, 303 Broadway, Suite 1100, Cincinnati, OH 45202. Shareholders should include appropriate information on the background and qualifications of any person recommended to the Governance Committee (e.g., a resume), as well as the candidate’s contact information and a written consent from the candidate to serve if nominated and elected. Shareholder recommendations for nominations to the Board will be accepted on an ongoing basis and such recommendations will be kept on file for consideration in the event of a future vacancy on the Board.
Item 11. Controls and Procedures.
(a) Based on an evaluation of the registrant’s disclosure controls and procedures (as defined in Rule 30a-3(c) under the 1940 Act) the registrant’s principal executive officer and principal financial officer have concluded that the registrant’s disclosure controls and procedures are effective as of a date within 90 days of the filing date of this report.
(b) There were no changes in the registrant’s internal control over financial reporting (as defined in Rule 30a-3(d) under the 1940 Act) that occurred during the registrant’s second fiscal half-year that have materially affected, or are reasonably likely to materially affect, the registrant’s internal control over financial reporting.
Item 12. Exhibits.
(a)(1) | The Code of Ethics for Senior Financial Officers was filed on December 9, 2005 with Registrant’s N-CSR for the September 30, 2005 fiscal year and is hereby incorporated by reference. |
|
|
(a)(2) | Certifications required by Item 12(a)(2) of Form N-CSR are filed herewith. |
|
|
(b) | Certification required by Item 11(b) of Form N-CSR is filed herewith. |
SIGNATURES
Pursuant to the requirements of the Securities Exchange Act of 1934 and the Investment Company Act of 1940, the registrant has duly caused this report to be signed on its behalf by the undersigned, thereunto duly authorized.
(Registrant) Touchstone Funds Group Trust
By (Signature and Title)
/s/ Jill T. McGruder |
|
Jill T. McGruder
President
Date: December 9, 2011
Pursuant to the requirements of the Securities Exchange Act of 1934 and the Investment Company Act of 1940, this report has been signed below by the following persons on behalf of the registrant and in the capacities and on the dates indicated.
By (Signature and Title)
/s/ Jill T. McGruder |
|
Jill T. McGruder
President
Date: December 9, 2011
/s/ Terrie A. Wiedenheft |
|
Terrie A. Wiedenheft
Controller & Treasurer
Date: December 9, 2011