UNITED STATES
SECURITIES AND EXCHANGE COMMISSION
Washington, D.C. 20549
FORM N-CSR
CERTIFIED SHAREHOLDER REPORT OF REGISTERED MANAGEMENT INVESTMENT COMPANIES
Investment Company Act file number 811-08104
Touchstone Funds Group Trust
(Exact name of registrant as specified in charter)
303 Broadway, Suite 1100
Cincinnati, Ohio 45202-4203
(Address of principal executive offices) (Zip code)
Jill T. McGruder
303 Broadway, Suite 1100
Cincinnati, Ohio 45202-4203
(Name and address of agent for service)
Registrant's telephone number, including area code: 800-638-8194
Date of fiscal year end: September 30
Date of reporting period: September 30, 2016
Form N-CSR is to be used by management investment companies to file reports with the Commission not later than 10 days after the transmission to stockholders of any report that is required to be transmitted to stockholders under Rule 30e-1 under the Investment Company Act of 1940 (17 CFR 270.30e-1). The Commission may use the information provided on Form N-CSR in its regulatory, disclosure review, inspection, and policymaking roles.
A registrant is required to disclose the information specified by Form N-CSR, and the Commission will make this information public. A registrant is not required to respond to the collection of information contained in Form N-CSR unless the Form displays a currently valid Office of Management and Budget ("OMB") control number. Please direct comments concerning the accuracy of the information collection burden estimate and any suggestions for reducing the burden to Secretary, Securities and Exchange Commission, 450 Fifth Street, NW, Washington, DC 20549-0609. The OMB has reviewed this collection of information under the clearance requirements of 44 U.S.C. § 3507.
Item 1. Reports to Stockholders.
The Report to Shareholders is attached herewith.
September 30, 2016
Annual Report
Touchstone Funds Group Trust
Touchstone Arbitrage Fund
Touchstone Emerging Markets Small Cap Fund
(formerly known as Touchstone Emerging Markets Equity Fund)
Touchstone Merger Arbitrage Fund
Touchstone Mid Cap Fund
Touchstone Mid Cap Value Fund
Touchstone Premium Yield Equity Fund
Touchstone Sands Capital Select Growth Fund
Touchstone Small Cap Fund
Touchstone Small Cap Value Fund
Touchstone Total Return Bond Fund
Touchstone Ultra Short Duration Fixed Income Fund

Table of Contents
This report identifies the Funds' investments on September 30, 2016. These holdings are subject to change. Not all investments in each Fund performed the same, nor is there any guarantee that these investments will perform as well in the future. Market forecasts provided in this report may not occur.
| 2 |
Dear Fellow Shareholder:
We are pleased to provide you with the Touchstone Funds Group Trust Annual Report. Inside you will find key financial information, as well as manager commentaries, for the 12 months ended September 30, 2016.
The fiscal year was eventful and featured the U.S. Federal Reserve Board’s (Fed’s) first interest rate hike in a decade, volatility in energy and commodity prices and the United Kingdom’s (U.K.’s) historic decision to leave the European Union (an action dubbed “Brexit”). The U.S. economy maintained its moderate but steady growth. Strong gains in the labor market buoyed consumer confidence and spending, but overall GDP growth was restrained by continued weakness in business investment. Outside of the U.S., the economic landscape was less positive. Growth in Europe and Japan remained anemic despite monetary policy intervention from central banks. Investor concern over a slowdown in China’s economy led to further declines in commodity prices, weakness for emerging markets and increased volatility in capital markets during late 2015 and early 2016.
Dovish statements by the Fed and an apparent bottoming in commodity prices proved to be an inflection point for risk assets. From mid-February to the end of the fiscal year, markets enjoyed a broad rally, powering through the U.K.’s Brexit vote in late June and uncertainty surrounding the U.S. presidential election. Equities recaptured ground lost during the sell-off of early 2016 and ended with positive returns for the fiscal year. Though emerging and non-U.S. developed stocks posted gains, they lagged the U.S. market, perhaps reflecting the relatively greater strength of the U.S. economy.
Bond markets also enjoyed solid gains during the fiscal year. The Fed raised interest rates in December 2015, but thereafter maintained a dovish stance toward the pace of future rate hikes. Along with continued quantitative easing in Europe and Japan, this drove interest rates to historic lows and left trillions of dollars of bonds with negative yields. Credit spreads widened in the first half of the fiscal year, but as risk assets gained momentum in February, corporate bonds outperformed Treasuries. Desperately seeking income in a world of ultra-low interest rates, investors flocked to the additional yield of non-investment grade bonds in particular, generating strong gains for High Yield bonds.
For so many investors, an appropriate investment horizon is measured in years or decades, rather than weeks or months. Our belief is that achieving such distant goals requires a similarly long-term approach to investing. Unfortunately, this long-term mentality can easily be sidetracked by the powerful emotions that accompany short-term market movements. Working with a financial advisor can help investors commit to a disciplined approach across market cycles in an effort to reach their ultimate investing goals.
We appreciate the opportunity to be part of your investment plan both today and in the years ahead.
Sincerely,

Jill T. McGruder
President
Touchstone Funds Group Trust
| 3 |
Management's Discussion of Fund Performance (Unaudited)
Touchstone Arbitrage Fund
Sub-Advised by Longfellow Investment Management Co.
Investment Philosophy
The Touchstone Arbitrage Fund seeks to achieve positive absolute returns regardless of market conditions over the long term by investing primarily in securities of companies that are involved in publicly announced mergers, takeover, tender offers, debt restructurings, minority purchases, leveraged buyouts, spin-offs, liquidations and other corporate reorganizations.
Fund Performance
The Touchstone Arbitrage Fund (Class A Shares) outperformed its benchmark, the BofA Merrill Lynch 3-Month U.S. Treasury Bill Index, for the 12-month period ended September 30, 2016. The Fund’s total return was 5.61 percent (excluding the maximum sales charge) while the benchmark’s total return was 0.27 percent.
Market Environment
The prior 12 months have been marked by a continuation of strong gains across risk assets. Given uncertainties surrounding the macro environment, the market remained prone to short-lived bouts of elevated volatility. This was exhibited in the commodity-related declines in October and November 2015, the market’s early 2016 sell-off following the December 2015 rate increase and a short-lived sell-off tied to Brexit (Britain’s exit from the European Union) in June 2016.
The market rallied into the third quarter in September of calendar year 2016 following a short-lived spike in volatility in the aftermath of the U.K.’s Brexit referendum. Risk-assets led the way during this period with notable outperformance from small-cap equities relative to larger capitalization stocks. Macro headlines continued to be dominated by the “will they or won’t they” debate around the direction in U.S. interest rates along with the upcoming Presidential election. After the U.S. Federal Reserve Board (Fed) remained on hold in its September meeting, Chairwoman Yellen’s press conference and subsequent Fed Governor speeches seemed to set the table for a potential rate increase in either the November or December meetings. Even with such a hike, the Fed’s expectations for the path of future interest rates continued to move lower and suggests a very moderate tightening cycle in the years ahead.
After excluding deal outliers (e.g., regulatory uncertainty, antitrust concerns, financing issues), we do not see a broad dispersion of annualized spreads across sectors. In terms of deal activity, pockets of regional banks, semiconductors and biotechnology were the busiest industries in the Fund’s investable universe. Though the number of deals initiated remains low, the overall dollar volume of deals continued to be at relatively elevated levels. Mega-cap deals have re-emerged as financing availability remains robust. We continued to see strategic buyers entering the market driven by the blend of synergy opportunities and low financing costs.
Portfolio Review
Though macro trends contributed to the performance of the broader equity markets, they did not have a discernible impact on the Fund over the last year. Rates remained near all-time lows, though they have risen off of their post-Brexit bottom. That said, this slight increase in yields has not yet driven deal spreads higher. The Fund was not invested in any broken deals during its fiscal year, avoiding high profile terminations such as Baker Hughes Inc./Halliburton Co., Pfizer Inc./Allergan PLC and Office Depot Inc./Staples Inc.
While the strategy positioning is constantly in flux due to new deals being added and completed deals being removed, there were no significant changes to the overall positioning of the Fund. The Fund participated in 129 new deals and had 118 deals close during the year.
| 4 |
Management's Discussion of Fund Performance (Unaudited) (Continued)
The Fund benefitted from the announcement of a definitive merger agreement that called for American Financial Group Inc. (AFG) to acquire all of the outstanding common shares of National Interstate Corp. that were not currently owned by AFG’s subsidiary, Great American Insurance Company (GAIC). American Financial Group’s protracted pursuit of National Interstate stretches back to 2014, but appears to be on target for a closing sometime before the end of 2016.
The Fund also enjoyed a tailwind from the bidding war that erupted between Anbang Insurance Group Co. Ltd. and Marriott International Inc. as they battled to gain control of Starwood Hotels & Resorts Worldwide Inc. Marriott emerged as the eventual winner towards the end of 2015, and this deal closed in September of 2016.
Shire PLC completed its acquisition of Baxalta Inc., which benefited the Fund. With the deal closing, the combined company created the leading global biotechnology company focused on serving patients with rare diseases and other highly specialized conditions. The deal spread remained wide throughout the first half of calendar year 2016 based on the fear that potential government intervention on the taxation rules for spin-offs would cause the deal to fall apart. This never came to pass, and the merger closed as expected in June.
During the second quarter of fiscal year 2016, Cvent Inc. announced a definitive agreement to be acquired by Vista Equity Partners LLC. The deal spread widened in the third quarter after Cvent Inc. received a request for additional information from the Department of Justice. Given Vista’s ownership of Lanyon Solutions Inc., the approach for Cvent raises potential anti-trust issues, but we believe the deal will ultimately pass regulatory scrutiny and the Fund remains invested in the position.
In a continuing saga, Abbott Laboratories’ acquisition of Alere, Inc. was delayed due to Alere’s postponed annual report submission to the U.S. Securities and Exchange Commission (SEC) and the receipt of a subpoena from the Department of Justice related to sales practices that raise questions about U.S. Foreign Corrupt Practices Act violations. Abbott was aware of the investigation in advance of its pursuit of Alere, and we do not expect this to constitute a material adverse clause or to ultimately disrupt the completion of the deal. Additionally, Abbott has been slow to obtain anti-trust approval, prompting Alere to seek a court order that would compel Abbott to seek antitrust clearances ahead of the April 2017 expiration of the merger agreement. While the deal spread widened during the course of the fiscal year, we believe that this widening will reverse ahead of a 2017 deal close.
Lam Research Corp. and KLA-Tencor Corp.’s deal to merge came under fire from various regulatory bodies including China, South Korea and the Department of Justice in the United States. Both companies are involved in the semiconductor industry and, after its recent rulings, the Department of Justice appears to be indicating that it is not in favor of further consolidation in this industry. We believe that, while the risks to the deal remain high, the deal spread has widened to reflect the risk, leaving little additional downside to a deal break.
Outlook
Historically low short-term interest rates have depressed deal spreads and will continue to act as a headwind to the merger arbitrage strategy. Reflecting this low rate environment, spreads remain broadly in a mid-single digit range on an annualized basis, but we believe have the potential to increase should the Fed start to normalize interest rates.
However, we remain confident that the Fund’s strategy offers an attractive risk-reward profile over an entire market cycle. Historically, we have found that there has been a positive correlation between year-over-year gains in the S&P 500® Index and subsequent deal activity over the following one to two quarters. We believe this relationship should support an increase in deal activity during the fourth quarter of 2016 and into 2017. Additional environmental factors such as ample access to capital, slow global growth and strong corporate balance
| 5 |
Management's Discussion of Fund Performance (Unaudited) (Continued)
sheets are expected to further support incremental strategic merger & acquisition (M&A) activity. On balance, we see a backdrop that remains supportive for continued deal activity.
Overall, we believe the Fund is well positioned to provide positive absolute returns, low realized volatility and low sensitivity to underlying price movements within the broader equity market. The Fund’s allocation is focused on maximizing the portfolio’s return while remaining nimble as new opportunities become available. We remain opportunistic about putting incremental capital to work should deal spreads widen on the back of heightened macro-economic uncertainty or if attractive entry-points arise in the Fund’s deal universe for other reasons. We continue to believe that the strategy offers an attractive risk-reward profile and serves as a valuable diversification tool. We also believe the idiosyncratic nature of each of the positions in the Fund creates a portfolio with a low overall correlation to the broad equity and fixed income indices.
| 6 |
Management's Discussion of Fund Performance (Unaudited) (Continued)
Comparison of the Change in Value of a $10,000 Investment in the
Touchstone Arbitrage Fund - Class A* and the
BofA Merrill Lynch 3-Month U.S. Treasury Bill Index
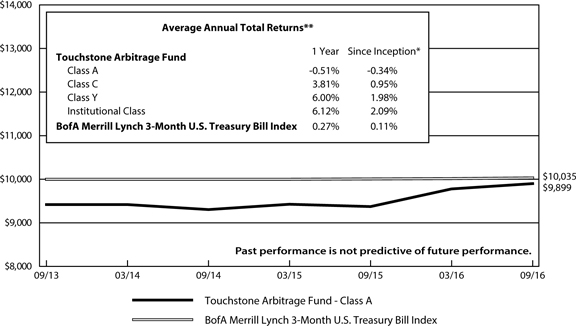
| * | The chart above represents performance of Class A shares only, which will vary from the performance of Class C shares, Class Y shares and Institutional Class shares based on the differences in sales loads and fees paid by shareholders in the different classes. The inception date of the Fund was September 30, 2013. The returns of the index listed above are based on the inception date of the Fund. |
| ** | The average annual total returns shown above are adjusted for maximum sales loads and fees, if applicable. The maximum offering price per share of Class A shares is equal to the net assets value (“NAV”) per share plus a sales load equal to 6.10% of the NAV (or 5.75% of the offering price). Class C shares are subject to a contingent deferred sales charge (“CDSC”) of 1.00%. The CDSC will be assessed on an amount equal to the lesser of (1) the NAV at the time of purchase of the shares being redeemed or (2) the NAV of such shares being redeemed, if redeemed within a one-year period from the date of purchase. Class Y shares and Institutional Class shares are not subject to sales charges. |
The performance of the above Fund does not reflect the deduction of taxes that a shareholder would pay on Fund distributions or the redemption of Fund shares.
Note To Chart
BofA Merrill Lynch 3-Month U.S. Treasury Bill Index is an unmanaged index of Treasury securities maturing in 90 days that assumes reinvestment of all income.
| 7 |
Management's Discussion of Fund Performance (Unaudited)
Touchstone Emerging Markets Small Cap Fund
Sub-Advised by Copper Rock Capital Partners LLC
On April 19, 2016, Copper Rock was appointed sub-advisor to the Touchstone Emerging Markets Equity Fund. Concurrent with this change, the Fund was renamed the Touchstone Emerging Markets Small Cap Fund and its Principal Investment Strategies, Principal Risks and benchmark index were changed.
Investment Philosophy
The Touchstone Emerging Markets Small Cap Fund seeks capital appreciation by primarily investing in equity securities of emerging markets small-cap companies diversified across sectors and industries.The Fund’s investment process seeks to add value through bottom-up stock selection and in-depth fundamental research and searches for companies believed to have strong management, superior earnings growth prospects and attractive relative valuations.
Fund Performance
The Touchstone Emerging Markets Small Cap Fund (Class A Shares) underperformed its benchmarks, the MSCI Emerging Markets Small Cap Index and the MSCI Emerging Markets Index, for the 12-month period ended September 30, 2016. The Fund’s total return was 10.01 percent (calculated excluding the maximum sales charge) while the total returns of its benchmarks were 12.65 percent and 16.78 percent, respectively.
Market Environment
After the markets posted generally positive results during the final quarter of 2015, strong market movements resulting from a combination of macroeconomic concerns characterized the first quarter of 2016. While the overarching themes were slowing global growth, volatile oil prices, poor holiday retail sales and a lack of consumer confidence, the quarter could be divided into two distinct periods of performance. During the first half of the quarter, investor fears led to a severe sell-off which had a negative effect across broad market capitalizations, but was even more pronounced within the small-cap space. The latter part of the quarter was marked by a sharp rally, which was led by the mining and metals industries as well as oil and value equities. Positive U.S. economic indicators – including labor force participation and employment data – along with renewed confidence in the U.S. and European capital markets helped support the recovery.
The second quarter of 2016 began with the continued recovery in oil and mining stocks. In April and May, sovereign interest rates within the developed markets declined with some rates moving into negative territory. In May, global capital markets began to behave more normally as stock prices followed earnings and strong fundamentals. In June, performance was mixed again and the market was indiscriminate in what it rewarded. The month also presented a myriad of political events including Britain’s vote to exit the European Union (Brexit), the second-round elections in Spain and early positioning for general elections in the U.S., France and Germany. These events also introduced electoral sentiment that was increasingly important to the market. Late in the quarter, equity markets were volatile and mixed leading up to Brexit, which quickly extended to other markets as investors grew concerned about a renewed slowdown in global trade and a downtick in credit quality. Although Brexit created a mostly negative outlook for the United Kingdom (U.K.) and its major trading partners, it was modestly positive for emerging markets.
During the third quarter of 2016, an array of factors helped drive the positive turnaround in emerging market equities. In particular, there was resurgence in China’s gross domestic product as the country’s conversion to a services economy was reconfirmed and propelled by the increase in discretionary spending. Commodity prices also increased, which benefited emerging market commodity exporters. Furthermore, several governments repaired their balance sheets, and Brazil’s market in particular benefited modestly from a presidential change. Finally, the U.S. Federal Reserve Board’s decision to delay an interest rate increase on the heels of the U.K.’s referendum
| 8 |
Management's Discussion of Fund Performance (Unaudited) (Continued)
to exit the European Union, as well as slow overall growth in the U.S. and abroad, were positive catalysts for emerging markets during the quarter.
Portfolio Review
During the year, the Fund’s allocations to stocks in China, Brazil and Taiwan were the largest contributors to performance by country. At the sector level, the Fund’s performance benefited most from the Financials, Information Technology and Energy sectors. The Health Care sector was the lone detractor while the Industrials and Telecommunications Services sectors were among the laggards. Among stocks, Geely Automobile Holdings Ltd. (Consumer Discretionary sector), Sunny Optical Technology (Group) Company Ltd. (Information Technology sector) and Elite Material Company Ltd. (Information Technology sector) made the biggest positive contributions. The largest detracting stocks included BNK Financial Group Inc. (Financials sector), Eclat Textile Company Ltd. (Consumer Discretionary sector) and Chlitina Holding Ltd. (Consumer Staples sector).
Outlook
Emerging market equities have benefited from the rather dovish policy on interest rates in the U.S. and around the globe, as we continue to see negative rates in many of the major developed markets. Low interest rates have helped countries repair balance sheets and drive reinvestment, but many countries continue to face traditional emerging market risks, such as currency, macroeconomic and political risks. While these types of risks are inherent to investing in emerging markets, the small-cap segment of the market remains generally more immune to these risks than the large-cap segment. As such, we seek high-quality, attractively valued companies that have been overlooked and, more importantly, can grow within their local economies as market leaders.
| 9 |
Management's Discussion of Fund Performance (Unaudited) (Continued)
Comparison of the Change in Value of a $10,000 Investment in the
Touchstone Emerging Markets Small Cap Fund - Class A*, the
MSCI Emerging Markets Small Cap Index and the
MSCI Emerging Markets Index
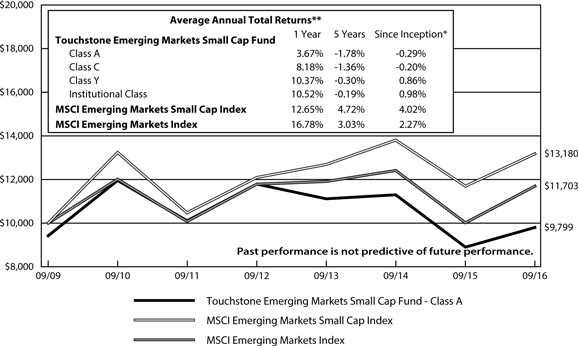
| * | The chart above represents performance of Class A shares only, which will vary from the performance of Class C shares, Class Y shares and Institutional Class shares based on the differences in sales loads and fees paid by shareholders in the different classes. The inception date of the Fund was September 30, 2009. The returns of the indexes listed above are based on the inception date of the Fund. |
| ** | The average annual total returns shown above are adjusted for maximum sales loads and fees, if applicable. The maximum offering price per share of Class A shares is equal to the net assets value (“NAV”) per share plus a sales load equal to 6.10% of the NAV (or 5.75% of the offering price). Class C shares are subject to a contingent deferred sales charge (“CDSC”) of 1.00%. The CDSC will be assessed on an amount equal to the lesser of (1) the NAV at the time of purchase of the shares being redeemed or (2) the NAV of such shares being redeemed, if redeemed within a one-year period from the date of purchase. Class Y shares and Institutional Class shares are not subject to sales charges. |
The performance of the above Fund does not reflect the deduction of taxes that a shareholder would pay on Fund distributions or the redemption of Fund shares.
Notes To Chart
MSCI Emerging Markets Small Cap Index is a free float-adjusted market capitalization index that is designed to measure equity market performance of small companies from emerging markets.
MSCI Emerging Markets Index is a free float-adjusted market capitalization index that is designed to measure equity market performance of emerging markets.
Source: MSCI. MSCI makes no express or implied warranties or representations and shall have no liability whatsoever with respect to any MSCI data contained herein. The MSCI data may not be further redistributed or used to create indices or financial products. This report is not approved or produced by MSCI.
| 10 |
Management's Discussion of Fund Performance (Unaudited)
Touchstone Merger Arbitrage Fund
Sub-Advised by Longfellow Investment Management Co.
Investment Philosophy
The Touchstone Merger Arbitrage Fund seeks to achieve positive absolute returns regardless of market conditions over the long term by investing primarily in securities of companies that are involved in publicly announced mergers and other corporate reorganizations. Merger arbitrage is an investment strategy that seeks to capture the “arbitrage spread” represented by the difference between the market price of the securities of the company being purchased and the value that is offered for these securities by the acquiring company. The Fund selects securities based on proposed financing terms, the size of the transaction, anti-trust concerns, regulatory approvals and shareholder voting requirements.
Fund Performance
The Touchstone Merger Arbitrage Fund (Class A Shares) outperformed its benchmark, the BofA Merrill Lynch 3-Month U.S. Treasury Bill Index, for the 12-month period ended September 30, 2016. The Fund’s total return was 4.37 percent (excluding the maximum sales charge) while the benchmark’s total return was 0.27 percent.
Market Environment
The prior 12 months have been marked by a continuation of strong gains across risk assets. Given uncertainties surrounding the macro environment, the market remained prone to short-lived bouts of elevated volatility. This was exhibited in the commodity-related declines in October and November 2015, the market’s early 2016 sell-off following the December 2015 rate increase and a short-lived sell-off tied to Brexit (Britain’s exit from the European Union) in June 2016.
The market rallied into the third quarter in September of calendar year 2016 following a short-lived spike in volatility in the aftermath of the U.K.’s Brexit referendum. Risk-assets led the way during this period with notable outperformance from small-cap equities relative to larger capitalization stocks. Macro headlines continued to be dominated by the “will they or won’t they” debate around the direction in U.S. interest rates along with the upcoming Presidential election. After the U.S. Federal Reserve Board (Fed) remained on hold in its September meeting, Chairwoman Yellen’s press conference and subsequent Fed Governor speeches seemed to set the table for a potential rate increase in either the November or December meetings. Even with such a hike, the Fed’s expectations for the path of future interest rates continued to move lower and suggests a very moderate tightening cycle in the years ahead.
After excluding deal outliers (e.g., regulatory uncertainty, antitrust concerns, financing issues), we do not see a broad dispersion of annualized spreads across sectors. In terms of deal activity, pockets of regional banks, semiconductors and biotechnology were the busiest industries in the Fund’s investable universe. Though the number of deals initiated remains low, the overall dollar volume of deals continued to be at relatively elevated levels. Mega-cap deals have re-emerged as financing availability remains robust. We continued to see strategic buyers entering the market driven by the blend of synergy opportunities and low financing costs.
Portfolio Review
Though macro trends contributed to the performance of the broader equity markets, they did not have a discernible impact on the Fund over the last year. Rates remained near all-time lows, though they have risen off of their post-Brexit bottom. That said, this slight increase in yields has not yet driven deal spreads higher. The Fund was not invested in any broken deals during its fiscal year, avoiding high profile terminations such as Baker Hughes Inc./Halliburton Co., Pfizer Inc./Allergan PLC and Office Depot Inc./Staples Inc. While the strategy
| 11 |
Management's Discussion of Fund Performance (Unaudited) (Continued)
positioning is constantly in flux due to new deals being added and completed deals being removed, there were no significant changes to the overall positioning of the Fund. The Fund participated in 145 new deals and had 133 deals close during the year.
The Fund benefitted from the announcement of a definitive merger agreement that called for American Financial Group Inc. (AFG) to acquire all of the outstanding common shares of National Interstate Corp. that were not currently owned by AFG’s subsidiary, Great American Insurance Company (GAIC). American Financial Group’s protracted pursuit of National Interstate stretches back to 2014, but appears to be on target for a closing sometime before the end of 2016.
The Fund also enjoyed a tailwind from the bidding war that erupted between Anbang Insurance Group Co. Ltd. and Marriott International Inc. as they battled to gain control of Starwood Hotels & Resorts Worldwide Inc. Marriott emerged as the eventual winner towards the end of 2015, and this deal closed in September of 2016.
Shire PLC completed its acquisition of Baxalta Inc., which benefited the Fund. With the deal closing, the combined company created the leading global biotechnology company focused on serving patients with rare diseases and other highly specialized conditions. The deal spread remained wide throughout the first half of calendar year 2016 based on the fear that potential government intervention on the taxation rules for spin-offs would cause the deal to fall apart. This never came to pass, and the merger closed as expected in June.
During the second quarter of fiscal year 2016, Cvent Inc. announced a definitive agreement to be acquired by Vista Equity Partners LLC. The deal spread widened in the third quarter after Cvent Inc. received a request for additional information from the Department of Justice. Given Vista’s ownership of Lanyon Solutions Inc., the approach for Cvent raises potential anti-trust issues, but we believe the deal will ultimately pass regulatory scrutiny and the Fund remains invested in the position.
In a continuing saga, Abbott Laboratories’ acquisition of Alere, Inc. was delayed due to Alere’s postponed annual report submission to the U.S. Securities and Exchange Commission (SEC) and the receipt of a subpoena from the Department of Justice related to sales practices that raise questions about U.S. Foreign Corrupt Practices Act violations. Abbott was aware of the investigation in advance of its pursuit of Alere, and we do not expect this to constitute a material adverse clause or to ultimately disrupt the completion of the deal. Additionally, Abbott has been slow to obtain anti-trust approval, prompting Alere to seek a court order that would compel Abbott to seek antitrust clearances ahead of the April 2017 expiration of the merger agreement. While the deal spread widened during the course of the fiscal year, we believe that this widening will reverse ahead of a 2017 deal close.
Lam Research Corp. and KLA-Tencor Corp.’s deal to merge came under fire from various regulatory bodies including China, South Korea and the Department of Justice in the United States. Both companies are involved in the semiconductor industry and, after its recent rulings, the Department of Justice appears to be indicating that it is not in favor of further consolidation in this industry. We believe that, while the risks to the deal remain high, the deal spread has widened to reflect the risk, leaving little additional downside to a deal break.
Outlook
Historically low short-term interest rates have depressed deal spreads and will continue to act as a headwind to the merger arbitrage strategy. Reflecting this low rate environment, spreads remain broadly in a mid-single digit range on an annualized basis, but we believe have the potential to increase should the Fed start to normalize interest rates.
However, we remain confident that the Fund’s strategy offers an attractive risk-reward profile over an entire market cycle. Historically, we have found that there has been a positive correlation between year-over-year
| 12 |
Management's Discussion of Fund Performance (Unaudited) (Continued)
gains in the S&P 500 Index and subsequent deal activity over the following one to two quarters. We believe this relationship should support an increase in deal activity during the fourth quarter of 2016 and into 2017. Additional environmental factors such as ample access to capital, slow global growth and strong corporate balance sheets are expected to further support incremental strategic merger & acquisition (M&A) activity. On balance, we see a backdrop that remains supportive for continued deal activity.
Overall, we believe the Fund is well positioned to provide positive absolute returns, low realized volatility and low sensitivity to underlying price movements within the broader equity market. The Fund’s allocation is focused on maximizing the portfolio’s return while remaining nimble as new opportunities become available. We remain opportunistic about putting incremental capital to work should deal spreads widen on the back of heightened macro-economic uncertainty or if attractive entry-points arise in the Fund’s deal universe for other reasons. We continue to believe that the strategy offers an attractive risk-reward profile and serves as a valuable diversification tool. We also believe the idiosyncratic nature of each of the positions in the Fund creates a portfolio with a low overall correlation to the broad equity and fixed income indices.
| 13 |
Management's Discussion of Fund Performance (Unaudited) (Continued)
Comparison of the Change in Value of a $10,000 Investment in the
Touchstone Merger Arbitrage Fund - Class A* and the
BofA Merrill Lynch 3-Month U.S. Treasury Bill Index
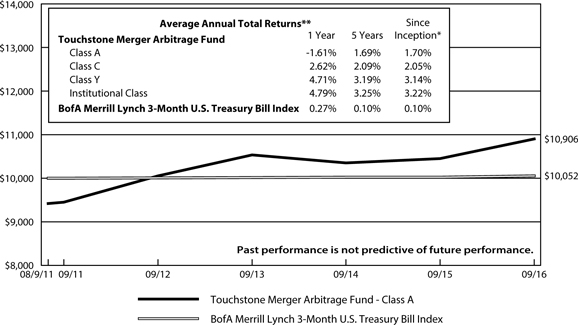
| * | The chart above represents performance of Class A shares only, which will vary from the performance of Class C shares, Class Y shares and Institutional Class shares based on the differences in sales loads and fees paid by shareholders in the different classes. The inception date of the Fund was August 9, 2011. The returns of the index listed above are based on the inception date of the Fund. |
| ** | The average annual total returns shown above are adjusted for maximum sales loads and fees, if applicable. The maximum offering price per share of Class A shares is equal to the net assets value (“NAV”) per share plus a sales load equal to 6.10% of the NAV (or 5.75% of the offering price). Class C shares are subject to a contingent deferred sales charge (“CDSC”) of 1.00%. The CDSC will be assessed on an amount equal to the lesser of (1) the NAV at the time of purchase of the shares being redeemed or (2) the NAV of such shares being redeemed, if redeemed within a one-year period from the date of purchase. Class Y shares and Institutional Class shares are not subject to sales charges. |
The performance of the above Fund does not reflect the deduction of taxes that a shareholder would pay on Fund distributions or the redemption of Fund shares.
Note to Chart
BofA Merrill Lynch 3-Month U.S. Treasury Bill Index is an unmanaged index of Treasury securities maturing in 90 days that assumes reinvestment of all income.
| 14 |
Management's Discussion of Fund Performance (Unaudited)
Touchstone Mid Cap Fund
Sub-Advised by The London Company
Investment Philosophy
The Touchstone Mid Cap Fund seeks long-term capital growth by investing primarily in common stocks of mid-cap U.S.-listed companies. The Fund utilizes a bottom-up security selection process that screens potential investments against a proprietary quantitative model for return on capital, earnings-to-enterprise value ratio, and free cash flow yield. Its goal is to purchase financially stable companies that consistently generate high returns on unleveraged operating capital, are run by shareholder-oriented managements and are trading at a discount to their respective private market values.
Fund Performance
The Touchstone Mid Cap Fund (Class A Shares) underperformed its benchmark, the Russell Midcap® Index, for the 12-month period ended September 30, 2016. The Fund’s total return was 11.58 percent (excluding the maximum sales charge) while the benchmark’s total return was 14.25 percent.
Market Environment
For the one-year period, equity markets were generally robust. However, the path was not straight nor the market leadership steady. Equity returns were strong during the beginning and end of the period, though there was weakness early in 2016. From a factor perspective, the performance of growth stocks versus value stocks oscillated during the twelve months, with investors favoring growth stocks at the end of the one-year period. Economic developments were mixed, yet they were generally more positive than negative. The U.S. election process has been unpredictable and has likely caused some short-term volatility. Global risks also shifted during the period, as investors worried about oil prices, overall debt levels, China’s economy and Britain’s decision to exit the European Union (Brexit). Global gross domestic product (GDP) growth remained tepid and low interest rates helped keep equities in favor. Within the benchmark, all sectors finished in positive territory with leadership from the Materials, Information Technology and Real Estate sectors. The Consumer Discretionary sector’s gain was significantly less than all other sectors.
Portfolio Review
Within the Fund, sector allocation had a negative impact on relative performance, while stock selection contributed positively. At the sector level, the Fund’s overweight to Materials and an underweight to Health Care contributed to relative performance, which was partially offset by an overweight to Consumer Discretionary and an underweight to Real Estate.
Among the individual stocks that contributed to Fund performance were Copart Inc. (Industrials sector), Albemarle Corp. (Materials sector), Symantec Corp. (Information Technology sector), MBIA Inc. (Financials sector) and DollarTree Inc. (Consumer Discretionary sector). Copart, a provider of online auctions and vehicle remarketing services, outperformed as a result of solid industry sales, cost reductions and share gains. Lower gas prices also translated into more miles driven, and, as a result, accident frequency increased. Further, the average age of vehicles on the road has risen and technology in new cars has increased the cost of repairs. All of these factors benefited the stock during the period. Albemarle, a specialty chemical company, traded higher after the company announced improvement in its lithium and catalysts businesses. We sold the Fund’s position after the stock had a strong rally in early 2016. Symantec, a provider of security products and solutions, reported a solid start to its fiscal year and the stock rallied on the news. The company is now solely focused on the security market after the sale of Veritas and acquisition of Blue Coat Systems Inc., and operating margins have been strong. MBIA, a financial services company, outperformed after the passage of PROMESA (The Puerto Rico Oversight, Management and Economic Stability Act), which will allow Puerto Rico more flexibility in refinancing its
| 15 |
Management's Discussion of Fund Performance (Unaudited) (Continued)
obligations. We sold the Fund’s position on strength due to its smaller market cap and relatively small size in the Fund’s portfolio. DollarTree, a discount variety store chain, continued to generate industry-leading operating margins in its legacy stores and also started to show improvement at its acquired Family Dollar Stores Inc. However, we believe there is significant room for improvement at these stores, which should lead to higher margins over time.
Among the individual stocks that detracted from performance were Tempur-Sealy International Inc., H&R Block Inc., CarMax Inc. (all three from the Consumer Discretionary sector), Tenet Healthcare Corp. (Health Care sector) and VOYA Financial Inc. (Financials sector). Mattress manufacturer Tempur-Sealy was volatile during the year, but declined most recently due to weaker than expected quarterly results surrounding online competitors offering cheaper options. However, we remain attracted to the company’s industry-leading brands, strong relationship with retailers, current cost reductions and management’s incentives to improve margins while driving growth. Tax preparer H&R Block declined early in the year after reporting a weaker than anticipated tax season. Further, tax preparers across the industry faced share loss and deflationary pressures from Turbo Tax’s aggressive free online policy. Despite the weakness, we believe H&R Block still exhibits strong returns on capital and operating margins. CarMax underperformed despite strength in auto sales overall. CarMax specifically focuses on used car sales, which have been negatively impacted by aggressive promotions for new cars. In addition, weakness in subprime customers has concerned investors. We remain attracted to the company’s differentiated store format and room to open new stores across the country. Tenet Healthcare, a healthcare services company, declined due to slow growth and the company’s highly leveraged balance sheet. Weakness could also be attributed to the Health Care sector as a whole, which was down in 2016. Recent results, however, point to stabilization in admissions and we remain attracted to the company’s stable cash flow and strong geographic footprint. VOYA Financial moved lower after reporting a weaker than expected quarter, stemming from disappointing investment management results related to energy holdings. Despite the challenging equity environment, we expect valuations will rise as the company eliminates its closed block annuity business.
The Fund initiated new positions in Progressive Corp. (Financials sector), Citrix Systems Inc. (Information Technology sector) and Penske Automotive Group Inc. (Consumer Discretionary sector). Progressive, an insurance provider, has a strong brand and conservative underwriting philosophy which provides the company with a wide moat in the volatile insurance market. We believe Progressive’s market share gains and pricing power warrant multiple expansions to coincide with its book value growth. Citrix Systems, a software company, has strong returns on capital and free cash flow growth, in addition to shareholder-oriented capital allocation. Penske Automotive Group is an operator of retail automotive franchises. Penske outperformed despite a decline in same-store sales within its core auto business. The company significantly increased its ownership in its growing truck leasing division, with the insider purchase coming from the chief executive officer Roger Penske, which sent shares higher.
The Fund added to its positions in Ball Corp. (Materials sector) and Energizer Holdings Inc. (Consumer Staples sector), as both are high conviction names that have pricing power and strong free cash flow.
The Fund sold its positions in MBIA Inc. (Financials sector), Albemarle Corp. (Materials sector), NetApp Inc. (Information Technology sector), H&R Block Inc. and Cabela’s Inc. (both from the Consumer Discretionary sector). We trimmed the Fund’s position in Dollar Tree Stores Inc. (Consumer Discretionary sector) due to its large size in the Fund’s portfolio.
Outlook
Based on recent economic news, the U.S. economy appears stable with low single-digit GDP growth. Further, the labor market continues to expand while housing and manufacturing are improving. While interest rates may move slightly higher over the next few months, we believe rates will remain low relative to history for some time, which should be positive for equity markets. That said, the U.S. economic recovery has been lengthy
| 16 |
Management's Discussion of Fund Performance (Unaudited) (Continued)
and equity markets are not cheap based on traditional metrics. However, we are still finding high-conviction investment ideas with a focus on limiting downside risk in each holding. Specifically, we believe downside risk is mitigated by remaining focused on those companies with pricing power, high levels of cash generation and prudent capital allocation.
Our strategy focuses on stocks from a bottom-up standpoint. We seek companies with strong returns on capital and the flexibility to enhance shareholder value using the balance sheet. Low interest rates and relatively high equity risk premiums enable companies to increase shareholder value by adjusting the capital structure of the company. We expect investors to reward companies that wisely deploy capital including higher dividends, share repurchases and mergers and acquisitions transactions. Going forward, we believe the Fund is positioned well for a slow growth environment that rewards strong capital allocation.
| 17 |
Management's Discussion of Fund Performance (Unaudited) (Continued)
Comparison of the Change in Value of a $10,000 Investment in the Touchstone
Mid Cap Fund - Class A* and the Russell Midcap® Index
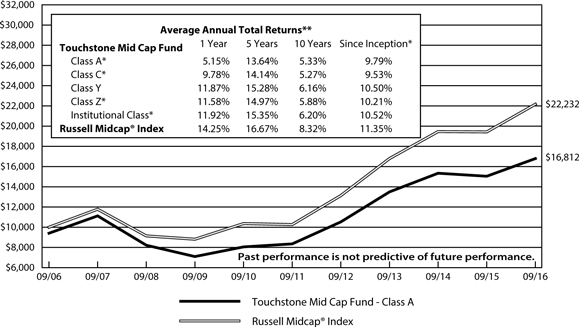
| * | The chart above represents performance of Class A shares only, which will vary from the performance of Class C shares, Class Y shares, Class Z shares and Institutional Class shares based on the differences in sales loads and fees paid by shareholders in the different classes. The inception date of Class A shares, Class C shares, Class Y shares, Class Z shares and Institutional Class shares was May 14, 2007, May 14, 2007, January 2, 2003, April 24, 2006 and January 27, 2012, respectively. Class A shares, Class C shares, Class Z shares and Institutional Class shares performance was calculated using the historical performance of Class Y shares for the periods prior to May 14, 2007, May 14, 2007, April 24, 2006 and January 27, 2012, respectively. The returns have been restated for sales loads and fees applicable to Class A, Class C, Class Z and Institutional Class shares. The returns of the index listed above are based on the inception date of the Fund. |
| ** | The average annual total returns shown above are adjusted for maximum sales loads and fees, if applicable. The maximum offering price per share of Class A shares is equal to the net assets value (“NAV”) per share plus a sales load equal to 6.10% of the NAV (or 5.75% of the offering price). Class C shares are subject to a contingent deferred sales charge (“CDSC”) of 1.00%. The CDSC will be assessed on an amount equal to the lesser of (1) the NAV at the time of purchase of the shares being redeemed or (2) the NAV of such shares being redeemed, if redeemed within a one-year period from the date of purchase. Class Y shares, Class Z shares and Institutional Class shares are not subject to sales charges. |
The performance of the above Fund does not reflect the deduction of taxes that a shareholder would pay on Fund distributions or the redemption of Fund shares.
Note to Chart
Russell Midcap® Index measures the performance of the 800 smallest companies in the Russell 1000® Index.
The Frank Russell Company (FRC) is the source and owner of the Index data contained or reflected in this material and all trademarks and copyrights related thereto. The material may contain confidential information and unauthorized use, disclosure, copying, dissemination or redistribution is strictly prohibited. This is a Touchstone Investments presentation of the data, and FRC is not responsible for the formatting or configuration of this material or for any inaccuracy in the presentation thereof.
| 18 |
Management's Discussion of Fund Performance (Unaudited)
Touchstone Mid Cap Value Fund
Sub-Advised by LMCG Investments, LLC
Investment Philosophy
The Touchstone Mid Cap Value Fund seeks capital appreciation by investing primarily in common stocks of medium capitalization companies. The Fund seeks to identify companies believed to be selling at a discount to their inherent value.
Fund Performance
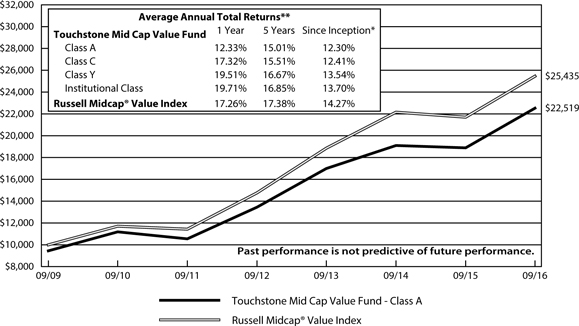
The Touchstone Mid Cap Value Fund (Class A Shares) outperformed its benchmark, the Russell Midcap® Value Index, for the 12-month period ended September 30, 2016. The Fund’s total return was 19.20 percent (excluding the maximum sales charge) while the benchmark’s total return was 17.26 percent.
Market Environment
The first half of the 12-month period closed amid a slowing global economic backdrop, an interest rate increase imposed by the U.S. Federal Reserve Board (Fed), a stronger U.S. dollar and a rocky ride for commodities and cyclical stocks. Company balance sheet strength also proved to be particularly important during this time, along with quality in terms of earnings and returns on equity. The start of 2016 opened with growing investor concerns about the health of the global economy, with many investors pricing in a global recession. However, midway through the first quarter of 2016, sentiment reversed as a result of better-than-expected economic news in China and commentary from the Fed that suggested a slower path to increasing interest rates. Investors interpreted the Fed’s commentary as bearish for the U.S. dollar, which benefited cyclical and commodity-related stocks.
Most recently, the impact of the narrowly decided vote by Great Britain to exit the European Union (Brexit) shocked the market during the last few weeks of June, but the overall tone was relatively muted during the final months of the period. This, along with optimistic comments from the European Central Bank and the Fed, drove the rotation out of higher quality, more defensive stocks and into smaller, lower quality stocks with higher beta1.
During the 12-month period, from a style standpoint within the mid-cap value universe, value stocks outperformed growth stocks for the period.
Portfolio Review
The Fund’s strongest contributors to performance were reported in the Materials, Energy and Health Care sectors. Primary detractors were from the Information Technology and Industrials sectors.
Stock selection drove performance in the Materials sector, with particular strength in the Fund’s chemicals holdings, including Albemarle Corp., Cabot Corp. and FMC Corp. Stock selection within the Energy sector also contributed to performance, and the Fund portfolio’s underweight to the sector was also additive. The Fund’s zero exposure to energy equipment and services companies particularly benefited the Fund’s portfolio.
The Fund’s overweight to the Health Care sector detracted from performance; however, positive stock selection outweighed the shortfall. Much of the outperformance in the sector was driven by Abbot Laboratories’ acquisition of portfolio holding St. Jude Medical Inc. at a significant premium during the second quarter of 2016. The Fund’s zero exposure to pharmaceutical companies also contributed to returns on a relative basis.
Stock selection across several industries within the Information Technology sector detracted from performance, although an overweight position helped to mitigate the shortfall. Diebold Inc. (an ATM manufacturer) and IAC/InterActiveCorp (a media and Internet company) struggled during the period; however, we continued to
| 19 |
Management's Discussion of Fund Performance (Unaudited) (Continued)
hold both companies in the Fund’s portfolio. Within the Industrials sector, stock selection in the commercial services and supplies industry detracted from performance. Stericyle Inc. (a medical and pharmaceutical waste management company) and AerCap Holdings N.V. (an aircraft leasing company) were the biggest laggards in the sector for the period. The Fund was underweight Real Estate Investment Trusts (REITs) and the Utilities sector given valuation concerns.
Outlook
From a macroeconomic standpoint, we believe an improving global economic environment would benefit the Fund on a relative basis. In the short term, these sectors historically have performed opposite of the direction of interest rates. Given how low interest rates have been globally, we believe any positive economic news could cause rates to move higher and cause these bond-proxy sectors to underperform.
Looking ahead, our greatest concern is that the market environment will continue to reward growth and visibility, irrespective of valuation and quality. However, we will not deviate from our process of buying high-quality companies that are temporarily out of favor and believe that buying growth and visibility, irrespective of valuation, is a risky strategy. We will continue to seek attractively valued investment opportunities with favorable risk-reward profiles.
The Fund utilizes a classic value-driven philosophy based on the belief that leading businesses selling at a discount to fair value have the potential to generate excess returns. The strategy focuses on stocks that are temporarily out of favor in the market, specifically, companies with higher returns on capital, free cash flow and strong balance sheets. Emphasis is placed on those companies having the cash flow characteristics as well as the balance sheet strength necessary to buffer the company from any prolonged weakness. The companies we select often dominate a particular industry niche and generally have significant barriers to entry. As a result, we believe they are able to perpetuate a higher return on capital over time. The Fund’s overall investment process utilizes fundamental bottom-up security selection, while risk-control measures ensure security and sector diversification.
1 Beta is a measure of the volatility of a portfolio relative to its benchmark.
| 20 |
Management's Discussion of Fund Performance (Unaudited) (Continued)
Comparison of the Change in Value of a $10,000 Investment in the
Touchstone Mid Cap Value Fund - Class A* and the Russell Midcap® Value Index
| * | The chart above represents performance of Class A shares only, which will vary from the performance of Class C shares, Class Y shares and Institutional Class shares based on the differences in sales loads and fees paid by shareholders in the different classes. The inception date of the Fund was September 30, 2009. The returns of the index listed above are based on the inception date of the Fund. |
| ** | The average annual total returns shown above are adjusted for maximum sales loads and fees, if applicable. The maximum offering price per share of Class A shares is equal to the net assets value (“NAV”) per share plus a sales load equal to 6.10% of the NAV (or 5.75% of the offering price). Class C shares are subject to a contingent deferred sales charge (“CDSC”) of 1.00%. The CDSC will be assessed on an amount equal to the lesser of (1) the NAV at the time of purchase of the shares being redeemed or (2) the NAV of such shares being redeemed, if redeemed within a one-year period from the date of purchase. Class Y shares and Institutional Class shares are not subject to sales charges. |
The performance of the above Fund does not reflect the deduction of taxes that a shareholder would pay on Fund distributions or the redemption of Fund shares.
Note to Chart
Russell Midcap® Value Index measures the performance of those Russell Midcap companies with lower price-to-book ratios and lower forecasted growth values.
The Frank Russell Company (FRC) is the source and owner of the data contained or reflected in this material and all trademarks and copyrights related thereto. The material may contain confidential information and unauthorized use, disclosure, copying, dissemination or redistribution is strictly prohibited. This is a Touchstone Investments presentation of the data, and FRC is not responsible for the formatting or configuration of this material or for any inaccuracy in the presentation thereof.
| 21 |
Management's Discussion of Fund Performance (Unaudited)
Touchstone Premium Yield Equity Fund
Sub-Advised by Miller/Howard Investments, Inc.
Investment Philosophy
The Touchstone Premium Yield Equity Fund seeks long-term growth of capital and high current income by focusing on dividend-paying equity securities of U.S. and foreign companies believed to possess attractive long-term return potential primarily due to lower than average valuations and improving business outlooks.
Fund Performance
The Touchstone Premium Yield Equity Fund (Class A Shares) outperformed the Russell 3000® Value Index but underperformed the Dow Jones U.S. Select Dividend Index for the 12-month period ended September 30, 2016. The Fund’s total return was 16.80 percent (excluding the maximum sales charge) while the returns of its benchmarks were 16.38 percent and 22.24 percent, respectively.
Market Environment
U.S. economic data was varied during the year as lower capacity utilization, mixed manufacturing data and weak money supply pointed to a softer economy, while an improving labor market and stronger consumer sentiment were constructive. Earnings reports were largely lackluster, but not alarming, and an earnings recession in cyclical business occurred, likely triggered by weakness in commodity prices.
Monetary policy was the key theme during the year as the European Central Bank, Bank of England and Bank of Japan continued their monetary easing campaigns. The ample global liquidity supported the equity markets and the U.S. and emerging markets were the top performers. In December 2015, the U.S. Federal Reserve Board (Fed) raised interest rates by 25 basis points, and the results were not as dire as many market participants anticipated. For the rest of the year the market speculated when the next rise would be. The Fed communicated it would hold off on an interest rate increase until economic data improves, but communicated a high likelihood that an increase will occur in the near future.
In the quarter ended June 30, 2016, Great Britain voted to leave the European Union, also known as Brexit. It was a surprise outcome that triggered a spike in investor fear and a stock market sell-off, the worst ever two-day paper loss for stock markets globally. Despite the ensuing uncertainties, the capital markets quickly recovered and U.S. stocks recovered for the quarter.
Over the last year, there was a change in investor preference from growth stocks to value. General investor appetite toward dividend income stocks improved, which some argue was partly because of relief at having survived the Fed’s first interest rate increase. Despite the marginal increase in U.S. interest rates, investors continued their search for yield, bidding up the valuations of “bond-proxy” sectors such as Utilities and Real Estate.
Energy commodity prices faced a severe correction and increased volatility over the last year. WestTexas Intermediate (WTI) crude prices hit multi-year lows in both January and again in February 2016. Natural gas prices also followed a similar downward path as crude oil, hitting a bottom in the first quarter of 2016. The Energy sector faced lower drilling and production, soft earnings and, in some cases, fears of bankruptcy. However, energy prices rebounded throughout the balance of the year as rig counts decreased and production moderated, helping supply and demand to balance. The firming of hydrocarbon prices and improving investor sentiment led to a rally in the energy sector and supporting industries, such as oil field services and engineering and construction.
Portfolio Review
During the 12-month period, there was a clear trend that the highest dividend quintiles were the best performing group in the Russell 3000® Value Index, outperforming the overall market. This favored the Fund’s investment
| 22 |
Management's Discussion of Fund Performance (Unaudited) (Continued)
process of investing in stocks that yield more than the Index and increase their dividends over time. The Fund’s overweight allocation to high-yielding stocks was one of the largest relative contributors to Fund performance. Large-cap stocks outperformed small- and mid-cap stocks during the period. The Fund was overweight large-cap and underweight small- and mid-cap companies. Stock selection within large-cap was a top contributor.
As the lowest beta1 stocks within the Russell 3000® Value Index had the highest returns, the Fund’s overweight allocation to the two lowest beta quintiles added to returns.
For the year, stock selection hurt relative performance, while sector allocation helped. The Fund’s underweight allocation to the Financials sector and overweight to the Real Estate sector were top contributors. Stock selection in both sectors was also strong. The Fund’s stock selection within the Energy sector was the largest detractor to relative returns, driven by its exposure to midstream pipeline operators and zero exposure to more conservative integrated oil and gas companies.
From a stock selection standpoint, top relative contributors to performance during the period included Spectra Energy Corp. and ONEOK Inc. (both from the Energy sector), Digital Realty Trust Inc. (Real Estate sector) and Qualcomm Inc. and Microchip Technology Inc. (both from the Information Technology sector).
Among the individual stocks that detracted from performance during the period included Williams Cos. Inc. and Kinder Morgan Inc. (both from the Energy sector), Seagate Technology PLC (Information Technology sector) and Viacom Inc. and GameStop Corp. (both from the Consumer Discretionary sector).
The following stocks were added to the Fund during the period. The Toronto-Dominion Bank (Financials sector) is a high-quality Canadian bank with a long history of dividend growth, low exposure to energy lending and growth opportunities in its wealth management business and U.S. operations. JM Smucker Co. (Consumer Staples sector) reported excellent quarterly earnings and revenue. Its recent acquisitions have been accretive and we believe will contribute to a higher growth rate. United Parcel Service Inc. (Industrials sector) showed improving earnings, favorable cost inputs and a positive mix change. The company has a high yield relative to its history and we believe it is attractively valued. L Brands Inc. (Consumer Discretionary sector) was oversold despite an excellent quarterly report and dividend increase. We believe that it is a high-quality retailer that is trading at a reasonable valuation and has an attractive yield. We found Qualcomm Inc. (Information Technology sector) attractive on a number of counts: low valuation and a high yield among them. Uncertainty over the decline of royalty payments on the company’s patents is subsiding, while new corporate initiatives set it on a positive track. Wells Fargo & Co. (Financials sector), a high-quality super-regional bank, has an attractive loan book and we believe it is positioned to benefit from wider spreads when interest rates rise. PacWest Bancorp (Financials sector) is poised to benefit from an improving loan growth environment and wider potential net interest margins from higher anticipated interest rates. We have a favorable view of its acquisition of Square 1 Financial Inc. and the low cost of funding from its deposits. Abbott Laboratories (Health Care sector) possesses many strong franchises and we believe its recent acquisition of St. Jude Medical Inc. should help it compete more effectively with other medical device competitors. Abbott trades at a discount to its pre-acquisition price and has been shifting its portfolio to faster growing businesses that are more international. Though at the lower end of the strategy’s yield guidelines, Abbott has an uninterrupted commitment to quarterly dividends that date back to 1924; its solid leadership has delivered strong returns for shareholders since 1980. Johnson Controls International PLC (Consumer Discretionary sector) announced a significant merger with Tyco International Ltd. in January and a simultaneous spinoff of noncore automotive businesses. We believe the restructuring lays the groundwork for synergies and a recurring revenue powerhouse in the area of residential and commercial fire protection, HVAC, energy efficiency and security, with numerous cross-selling opportunities between the legacy-building efficiency business andTyco’s security business. Western Digital Corp. (Information Technology sector), a hard disk drive and flash memory manufacturer, raised its revenue and earnings forecast for the third consecutive quarter. Western Digital carries a manageable level of debt following its consolidating purchase of
| 23 |
Management's Discussion of Fund Performance (Unaudited) (Continued)
competitor SanDisk Corp., a company strong in the next generation of memory storage. International Business Machines Corp (IBM). (Information Technology sector), the oldest tech company, was purchased at a high yield and an attractive valuation. Most IBM businesses now show signs of stabilization, and cloud-based offerings should provide the revenue growth sorely needed to reinvigorate earnings. We believe that even a modest turnaround could spur unusual upside potential for a company of its size. Plains GP Holdings LP (Energy sector) is backed by strong cash flows and levered to a nascent recovery in crude oil prices and production. We previously held the company but sold it in the second quarter of 2016 in advance of an expected dividend cut. Viacom Inc. (Consumer Discretionary sector) was bought as the odds of a management change increased, opportunities for asset monetization improved and a low valuation was present.
During the period, GameStop Corp. (Consumer Discretionary sector) was sold because of concerns over out-year dividend growth due to mounting pressures from direct to consumer digital video game downloads that we believe could worsen before stabilizing. Kinder Morgan Inc. (Energy sector) was sold after management announced plans to cut its dividend amid concerns of company funding issues. The RMR Group Inc. (Real Estate sector) was spun off at the end of 2015 from Fund holding Senior Housing Property Trust (SNH) and we chose to liquidate the small position. NiSource Inc. (Utilities sector) was fully valued and the Utilities sector stocks have been trading at a high valuation. Seagate Technology PLC (Information Technology sector) disappointed in its flash memory development, which had not been fast enough to overcome PC deterioration; we also exited to make room for more attractive investments. Maxim Integrated Products Inc. (Information Technology sector) was sold on diminishing potential for merger & acquisition (M&A), and also to raise cash for new technology stock purchases. Ares Capital Corp. (Financials sector) was sold due to pressures on its 2016 and 2017 estimates, following the winding down of General Electric Capital Corp. Williams Companies Inc. (Energy sector) was sold due to fears of a dividend cut. Moreover, there were concerns over declining volumes through its Master Limited Partnership (MLP), Williams Partners (not held in the Fund’s portfolio) pipelines, and potential counter-party risk with customers. STMicroelectronics NV (Information Technology sector) was sold after we trimmed it in fourth quarter 2015 due to missed earnings estimates and disappointing management guidance. American Water Works Co. Inc. (Utilities sector), a long-time portfolio holding, hit our valuation target. We also chose to redeploy the capital to better investment opportunities. Care Capital Properties Inc. (Real Estate sector), a spinoff from Ventas Inc., was sold because it was a small position. People’s United Financial Inc. (Financials sector) was sold because the stock’s valuation is high relative to its history. Estimates are coming down after an earnings-per-share (EPS) miss because of lower than expected fees and higher than forecasted expenses. HCP Inc. (Real Estate sector), a healthcare real estate investment trust (REIT), was sold because of a reduced growth outlook due to reduced tenancy prospects. Plains GP Holdings LP (Energy sector) is sensitive to the ongoing decline in domestic crude oil production. It was sold because this, coupled with the partnership’s high cost of capital, led to suggestions that the Plains family may seek strategic alternatives, including a merger of the two partnership entities and a possible distribution cut, either in the independent MLP or as part of a merger with the General Partner. While we move to the sidelines, we continue to monitor things closely. Plains possesses an unrivaled suite of assets that transports 20 percent of all U.S. crude production and management gets high marks, though the company is operating under still-tough conditions. Microsoft Corp. (Information Technology sector) had strong price appreciation which brought the yield below a level appropriate for the Fund. JM Smucker Co. (Consumer Staples sector) had too low of a dividend that could not keep pace with price appreciation, plus growth induced by recent acquisitions is subsiding and its low yield was no longer a fit. Senior Housing Properties Trust (Real Estate sector) was trading at a high valuation. Moreover, we had concerns about the increasingly competitive and over-supplied senior housing market. Host Hotels & Resorts Inc. (Real Estate sector) suffered from the drag of a strong U.S. dollar on tourism and foreign business travel to the U.S., increasing supply of new hotel rooms in major markets leading to lowered expectations for revenue per available room, and economic uncertainty. Viacom Inc. (Consumer Discretionary sector) was sold because the likelihood of M&A activity declined and fears over the safety of the dividend increased.
| 24 |
Management's Discussion of Fund Performance (Unaudited) (Continued)
Outlook
What’s most interesting about leadership this past quarter—the Information Technology sector outperformed the S&P 500 Index — is that technology remains inexpensive relative to the broad-market benchmark. While this does not guarantee outperformance, the mix outside traditional dividend-paying sectors—which includes solid yields, good cash dividend coverage, solid balance sheets and secular business trends (including consolidation)—suggests that the absence or underweight of Utilities and Consumer Staples sectors in the Fund’s portfolio is likely to last a while longer, depending on valuation changes. We believe the strange combination of low economic growth and the risk potential for rising interest rates from the Fed argues in favor of earnings and dividend growth just as much as current yield itself in this environment.
There is a lot of uncertainty in the world right now and shifting towards conservative balance sheets and cash flows, even at the cost of some current yield, seems prudent. We started making some shifts at the beginning of 2016, and may well make a few more. While we like current income, right now we are looking to emphasize stocks that offer dividend growth, such as consumer stocks that could benefit from a better employment environment and rising wages.
Dividend stocks have performed well since the Fed finally raised interest rates late last year. We find it interesting that dividend stocks started outperforming right after the rate increase. The idea that a moderate interest rate increase was good for dividend stocks supports our research indicating that marginal changes in interest rates do not have much impact on dividend stocks. What we think matters is reliable income generation and growth of that income over time. For this reason and, due to the diversification of the strategy, we believe the Fund is positioned well for a variety of market environments, including dividend-paying stocks continuing to be favored by the market.
Dividend paying investments may not experience the same price appreciation as non-dividend paying instruments, dividend-issuing companies may choose not to pay a dividend or the dividend may be less than what is anticipated.
1Beta is a measure of the volatility of a portfolio relative to its benchmark.
| 25 |
Management's Discussion of Fund Performance (Unaudited) (Continued)
Comparison of the Change in Value of a $10,000 Investment in the
Touchstone Premium Yield Equity Fund - Class A*, the Russell 3000® Value Index and the
Dow Jones U.S. Select Dividend Index

| * | The chart above represents performance of Class A shares only, which will vary from the performance of Class C shares and Class Y shares based on the differences in sales loads and fees paid by shareholders in the different classes. The inception date of Class A shares, Class C shares and Class Y shares was December 3, 2007, December 3, 2007 and August 12, 2008, respectively. Class Y shares performance was calculated using the historical performance of Class A shares for the periods prior to August 12, 2008. The returns have been restated for sales loads and fees applicable to Class Y shares. The returns of the indexes listed above are based on the inception date of the Fund. |
| ** | The average annual total returns shown above are adjusted for maximum sales loads and fees, if applicable. The maximum offering price per share of Class A shares is equal to the net asset value (“NAV”) per share plus a sales load equal to 6.10% of the NAV (or 5.75% of the offering price). Class C shares are subject to a contingent deferred sales charge (“CDSC”) of 1.00%. The CDSC will be assessed on an amount equal to the lesser of (1) the NAV at the time of purchase of the shares being redeemed or (2) the NAV of such shares being redeemed, if redeemed within a one-year period from the date of purchase. Class Y shares are not subject to sales charges. |
The performance of the above Fund does not reflect the deduction of taxes that a shareholder would pay on Fund distributions or the redemption of Fund shares.
Notes to Chart
Russell 3000® Value Index measures the performance of those Russell 3000 companies with lower price-to-book ratios and lower forecasted growth values.
Dow Jones U.S. Select Dividend Index measures 100 leading U.S. dividend-paying companies.
Frank Russell Company (FRC) is the source and owner of the data contained or reflected in this material and all trademarks and copyrights related thereto. The material may contain confidential information and unauthorized use, disclosure, copying, dissemination or redistribution is strictly prohibited. This is a Touchstone Investments presentation of the data, and FRC is not responsible for the formatting or configuration of this material or for any inaccuracy in the presentation thereof.
| 26 |
Management's Discussion of Fund Performance (Unaudited)
Touchstone Sands Capital Select Growth Fund
Sub-Advised by Sands Capital Management, LLC
Investment Philosophy
The Touchstone Sands Capital Select Growth Fund primarily invests in common stocks of large capitalization U.S. companies that are believed to have above-average potential for revenue or earnings growth. The Fund invests in 25 to 35 companies. Sands Capital generally seeks stocks with sustainable above-average earnings growth and capital appreciation potential. In addition, Sands Capital looks for companies that have a significant competitive advantage, a leadership position or proprietary niche, a clear mission in an understandable business, financial strength and are valued rationally in relation to comparable companies, the market and the business prospects for that particular company.
Fund Performance
The Touchstone Sands Capital Select Growth Fund (Class A Shares) underperformed its benchmark, the Russell 1000® Growth Index, for the 12-month period ended September 30, 2016. The Fund’s total return was 7.17 percent (calculated excluding the maximum sales charge) while the total return of the benchmark was 13.76 percent.
Market Environment
The past 12 months have been a challenge for faint-hearted investors. The macroeconomic challenges that began in 2014 persisted into 2016, albeit rooted in slightly different causes. Though the U.S. dollar’s strength abated, Chinese economic data stabilized and global oil prices, based on West Texas Intermediate crude oil prices, retraced into the $40+ per barrel range. In December, the first U.S. Federal Reserve Board (Fed) rate hike since 2006 sent shock waves through the market that resulted in the worst start of the year in history. In June, the United Kingdom’s referendum to leave the European Union, or “Brexit,” ushered in a new wave of uncertainty and, with it, renewed trading volatility. During this period, market participants flooded into perceived safe haven investments, shunning the more growth-oriented end of the investment spectrum.
Absent any new acute macroeconomic shocks, the third quarter of 2016 marked a renewed focus on individual business fundamentals. The broad U.S. equity market (as measured by the S&P 500® Index) rebounded during the period, led largely by Information Technology, a traditional growth equity sector. The market is not without its risks and top-of-mind for many investors include the outcome of the heated November election in the U.S. and speculation regarding the next Fed rate hike. However, we were encouraged in the third quarter to see stock prices driven by fundamental factors such as earnings growth, and we maintain our conviction in owning companies that have the ability to grow their revenues and earnings faster than the market.
Portfolio Review
The top five relative contributors during the period were Alibaba Group Holding Ltd., Facebook Inc. and Visa Inc. (all from the Information Technology sector), Amazon.com Inc. (Consumer Discretionary sector) and Edwards Lifesciences Corp. (Health Care sector). We continued to believe that Amazon has built two increasingly dominant businesses in both its retail and web services operations. Amazon Web Services (AWS), the company’s Infrastructure as a Service (IaaS) offering, provides organizations with on-demand access to computing, storage and other services through its cloud platform. AWS continued to innovate and attract new enterprise customers and workloads, and we believe the recurring nature of revenues should result in sequential growth. Further, Salesforce.com Inc. designated AWS as its preferred public cloud architecture, and large enterprises such as General Electric Co. Oil & Gas, Kellogg Company and Lionsgate Entertainment Corp. are using SAP business-critical applications on the AWS platform. Amazon’s retail business continues to execute well, delivering its highest level of profitability since 2011 and unexpected upside in its international business. We believe Amazon’s two
| 27 |
Management's Discussion of Fund Performance (Unaudited) (Continued)
core franchises still feature a considerable growth runway, and niche offerings like Fresh and Prime Now should continue to diversify the company’s earnings growth potential.
The top five relative detractors from performance were Chipotle Mexican Grill Inc. and Netflix Inc. (both from the Consumer Discretionary sector), LendingClub Corp. (Financials sector) and Alexion Pharmaceuticals Inc. and Regeneron Pharmaceuticals Inc. (both from the Health Care sector). The stock price of Chipotle Mexican Grill suffered following several E. coli outbreaks in late 2015 and early 2016. We maintained our conviction in the long-term growth potential of the brand during this challenging period for the company, and the recovery appears to be underway. The loyalty program launched at the beginning of July, Chiptopia, is successfully driving store traffic, and we continue to believe that management is acting properly to regain customer sales. We have been encouraged by Chipotle’s guidance for new store openings, with a directed effort toward markets where the restaurant has less of a presence. Chipotle is a prime example of our willingness to accept short-term volatility in exchange for long-term wealth creation. Though a major headwind, we believe the food safety issues should prove to be but a temporary setback in Chipotle’s long-term growth story.
We diligently monitor and continually evaluate the long-term growth prospects for the Fund’s portfolio companies while simultaneously seeking opportunities to add compelling new businesses. In the past year we initiated positions in four companies: Edwards Lifesciences Corp. and Incyte Corp. (both from the Health Care sector), Netflix Inc. and Under Armour Inc. (both from the Consumer Discretionary sector). Over the same time period we eliminated six positions: ARM Holdings PLC, ASML Holding NV and LinkedIn Corp. (all from the Information Technology sector), Nike Inc. (Consumer Discretionary sector), Whole Foods Market Inc. (Consumer Staples sector) and FMC Technologies Inc. (Energy sector).
Outlook
We view secular trends, innovation and company-specific competitive advantages as key to driving growth through a variety of economic environments. For a business to possess the above-average earnings growth potential we require, it is often a key innovator or vital facilitator within an attractive industry that is benefiting from positive secular change. Secular trends are distinct from short-term economic factors as they tend to persist through market cycles and can provide powerful structural tailwinds that enhance the sustainability of a business’s growth for many years. We believe our long-term investment horizon allows us to capture the benefit of these characteristics and realize the ultimate earnings power of a company, while weathering volatility over shorter periods. Furthermore, our approach—active, concentrated and benchmark-agnostic—enables us to have outsized exposure to companies within this sphere that are the best fits with our six investment criteria.
The Fund’s sector allocations are a residual of our bottom-up, fundamental approach. Our six investment criteria typically lead us to innovative businesses that are creating new or disrupting existing markets, and/or benefiting from powerful secular tailwinds. Our approach to investment research, portfolio construction and risk management results in a portfolio that we believe is naturally diversified across industries and businesses at different stages of their respective growth lifecycles. We expect to continue to have higher weights in key growth sectors, including consumer, life sciences and technology, and lower weights in highly-cyclical sectors such as Energy, Industrials and Financials.
We believe the majority of businesses in the Fund’s portfolio benefit from one or more secular trends. However, we have identified four broad trends that together comprise a majority of the portfolio:
| · | Retail Revolution – E-commerce: E-commerce is the fastest growing segment of retail sales, but only accounts for about seven percent of the total worldwide retail market. As a proportion of total retail sales, e-commerce is expected to nearly double by 2019. Brands now have the ability to directly interact with consumers through novel mediums such as social media and lifestyle apps, and become embedded in their daily routines. Tools such as Amazon Prime and Visa Checkout reduce the friction associated with online payment. |
| 28 |
Management's Discussion of Fund Performance (Unaudited) (Continued)
| · | Union of Healthcare and Technology: Major areas of unmet need continue to exist in the treatment of disease. However, improved understanding of disease biology and new approaches to treatment are enabling more productive drug development. Additionally, we expect genomic sequencing and healthcare information systems to facilitate precision medicine, enabling physicians to provide more targeted care. We are also witnessing the rise of minimally invasive surgical technologies, which have quality of life advantages for the patient and efficiency benefits for providers, leading them to increasingly become the standard of care. |
| · | Software-as-a-Service (SaaS): In our view, information technology spending is shifting toward innovations that make enterprises more agile and efficient. Cloud-based software is a key facilitator of this shift. Fast deployment, scalability, easy and frequent updates and lower total cost of ownership create a compelling customer value proposition. SaaS businesses tend to benefit from revenue visibility, “sticky” clientele, margin leverage opportunities and low customer acquisition costs. |
| · | Data-Driven Decision Making: We believe companies with large, proprietary pools of consumer data and tools that use this data to create unique content have sizable monetization opportunities. Advertising is already well on its way toward transformation, as access to consumer data is enabling companies to create targeted, more effective ads. At the micro level, companies are beginning to use predictive analytics to generate insights from their own pools of data. |
We believe the Fund owns companies that are positioned to deliver strong business results and earnings growth over our five- to ten-year investment horizon. Our focus on the sustainability of a business’s future earnings growth typically steers us toward companies we believe are benefiting from secular trends that should provide powerful growth tailwinds throughout economic cycles. We have high conviction in the long-term growth estimates for the Fund’s portfolio companies and believe they can deliver the growth necessary to support above average relative and absolute returns over the next several years.
| 29 |
Management's Discussion of Fund Performance (Unaudited) (Continued)
Comparison of the Change in Value of a $10,000 Investment in the
Touchstone Sands Capital Select Growth Fund - Class A* and the Russell 1000® Growth Index
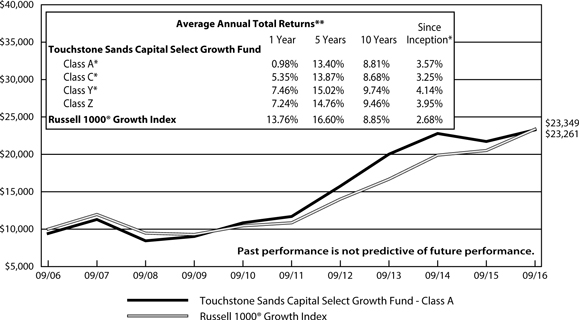
| * | The chart above represents performance of Class A shares only, which will vary from the performance of Class C shares, Class Y shares and Class Z shares based on the differences in sales loads and fees paid by shareholders in the different classes. The inception date of Class A shares, Class C shares, Class Y shares and Class Z shares was November 15, 2010, November 15, 2010, August 27, 2004 and August 11, 2000, respectively. Class A shares, Class C shares and Class Y shares performance was calculated using the historical performance of Class Z shares for the periods prior to November 15, 2010, November 15, 2010 and August 27, 2004, respectively. The returns have been restated for sales loads and fees applicable to Class A, Class C and Class Y shares. The returns of the index listed above are based on the inception date of the Fund. |
| ** | The average annual total returns shown above are adjusted for maximum sales loads and fees, if applicable. The maximum offering price per share of Class A shares is equal to the net asset value (“NAV”) per share plus a sales load equal to 6.10% of the NAV (or 5.75% of the offering price). Class C shares are subject to a contingent deferred sales charge (“CDSC”) of 1.00%. The CDSC will be assessed on an amount equal to the lesser of (1) the NAV at the time of purchase of the shares being redeemed or (2) the NAV of such shares being redeemed, if redeemed within a one-year period from date of purchase. Class Y shares and Class Z shares are not subject to sales charges. |
The performance of the above Fund does not reflect the deduction of taxes that a shareholder would pay on Fund distributions or the redemption of Fund shares.
Note to Chart
Russell 1000® Growth Index measures the performance of those Russell 1000 companies with higher price-to-book ratios and higher forecasted growth values.
The Frank Russell Company (FRC) is the source and owner of the data contained or reflected in this material and all trademarks and copyrights related thereto. The material may contain confidential information and unauthorized use, disclosure, copying, dissemination or redistribution is strictly prohibited. This is a Touchstone Investments presentation of the data, and FRC is not responsible for the formatting or configuration of this material or for any inaccuracy in the presentation thereof.
| 30 |
Management's Discussion of Fund Performance (Unaudited)
Touchstone Small Cap Fund
Sub-Advised by The London Company
Investment Philosophy
The Touchstone Small Cap Fund seeks capital appreciation by investing primarily in common stocks of U.S. companies with small market capitalizations. The Fund utilizes a bottom-up security selection process that screens potential investments against a proprietary quantitative model for return on capital, earnings-to-enterprise value ratio, and free cash flow yield. The goal is to purchase financially stable companies that are believed to consistently generate high returns on unleveraged operating capital, are run by shareholder-oriented management and are trading at a discount to their respective private market values.
Fund Performance
The Touchstone Small Cap Fund (Class A Shares) underperformed its benchmark, the Russell 2000® Index, for the 12-month period ended September 30, 2016. The Fund’s total return was 3.74 percent (excluding the maximum sales charge) while the benchmark’s total return was 15.47 percent.
Market Environment
For the one-year period, equity markets were generally robust. However, the path was not straight nor the market leadership steady. Equity returns were strong during the beginning and end of the period, though there was weakness early in 2016. From a factor perspective, the performance of growth stocks versus value stocks oscillated during the twelve months, with investors typically favoring growth stocks at the end of the one-year period. Economic developments were mixed, yet they were generally more positive than negative. The U.S. election process has been unpredictable and has likely caused some short-term volatility. Global risks also shifted during the period, as investors worried about oil prices, overall debt levels, China’s economy and Britain’s decision to exit the European Union (Brexit). Global gross domestic product (GDP) growth remained tepid and low interest rates helped keep equities in favor. Within the benchmark, Materials and Information Technology were the leading sectors, while the Energy and Consumer Discretionary sectors lagged.
Portfolio Review
Within the Fund, sector allocation and stock selection had a negative impact on the Fund. At the sector level, the Fund’s underweight to Information Technology and overweight to Consumer Discretionary detracted from performance, which was partially offset by an overweight to Materials and an underweight to Health Care.
Among the individual stocks that contributed to Fund performance during the period were First Industrial Realty Trust (Financials sector), Energizer Holdings Inc. (Consumer Staples sector), Superior Energy Services Inc. (Energy sector), New Market Corp. (Materials sector) and Penske Automotive Group Inc. (Consumer Discretionary sector). First Industrial Realty Trust, a real estate investment trust (REIT), continued to improve its occupancy rates as well as strengthen its balance sheet. Higher dividend-yielding sectors did well, which also benefited First Industrial during the quarter. We reduced its weight in the Fund during the period as a result of the company’s higher valuation and turnover of its chief executive officer. Energizer Holdings, a consumer goods company built on the Energizer and Eveready brands, moved higher after the company posted stronger than expected results in recent quarters. The company’s battery sales and volume have stabilized and we expect industry dynamics to continue to improve, particularly since competitor Duracell is now owned by Berkshire Hathaway Inc. Superior Energy, an oilfield services and equipment company, bounced back during the period after experiencing a difficult 2014 and 2015. The rebound in oil prices as well as stabilization in the services market helped drive the stock higher. The company maintained a strong balance sheet, which provided downside protection. NewMarket, a petroleum additives company, has risen steadily over the last twelve months. The company has a solid history of price increases and higher margins. Though volume and pricing were relatively flat during the year, cost
| 31 |
Management's Discussion of Fund Performance (Unaudited) (Continued)
savings helped drive earnings and cash flow. Further, the company continued to return significant amounts of cash to shareholders via dividends and share repurchases. Penske Automotive Group is an operator of retail automotive franchises. Penske outperformed despite a decline in same-store sales within its core auto business. The company significantly increased its ownership in its growing truck leasing division, with the insider purchase coming from the chief executive officer Roger Penske, which sent the stock higher.
Among the individual stocks that detracted from Fund performance were Tempur-Sealy International Inc., Vista Outdoor Inc. (both from the Consumer Discretionary sector), Tenet Healthcare Corp. (Health Care sector), Corrections Corp. of America (Financials sector) and Atwood Oceanics Inc. (Energy sector). Mattress manufacturer Tempur-Sealy was volatile during the period, but declined most recently due to weaker than expected quarterly results surrounding online competitors offering cheaper options. However, we remain attracted to the company’s industry-leading brands, strong relationship with retailers, current cost reductions and management’s incentives to improve margins while driving growth. Vista Outdoor, a designer and manufacturer of outdoor sports and recreation products, reported weaker than expected quarterly results and the stock moved lower. The weakness reflected a shift in spending in firearms (shotguns, in particular), a shift in timing of international sales and the liquidation of a couple of large retailers. We believe the issues are largely temporary and believe the stock trades at an attractive discount to intrinsic value. Tenet Healthcare, a healthcare services company, declined due to the company’s highly leveraged balance sheet and slow growth. Weakness was also attributed to the Health Care sector as a whole, which was down in 2016. Recent results, however, point to stabilization in admissions and we remain attracted to the company’s stable cash flow and strong geographic footprint. Corrections Corp., an owner and manager of private prisons and detention centers, declined significantly due to concerns about the potential loss of some of its government clients. In particular, the Justice Department announced that the Federal Bureau of Prisons would be phasing out its use of private prisons over the next three to five years, and the Department of Homeland Security began to review private prisons as well. Atwood Oceanics, like much of the Energy sector, was pressured by the decline in energy prices and the associated reductions in capital spending. The company still owes money on drill ships under construction and cash flow is tight. We sold the stock during the first quarter of 2016 based on these concerns.
During the quarter, the Fund initiated positions in Penske Automotive Group Inc. (Consumer Discretionary sector) and Armstrong World Industries Inc. (Industrials sector). Armstrong World Industries, a global producer of flooring and ceiling systems, operates in an oligopolistic industry with high barriers to entry. Armstrong also has tremendous pricing power and competitive advantages due to exclusive long-term contracts with distributors.
The Fund added to its existing positions in Alexander & Baldwin Inc., Kaman Corp., GATX Inc. (all three from the Industrials sector) and Tempur Sealy International Inc. (Consumer Discretionary sector). The Fund trimmed its positions in First Industrial Realty Trust (Financials sector), Sturm Ruger & Co. Inc., Cabela’s Inc. (both from the Consumer Discretionary sector). The Fund sold its positions in Atwood Oceanics Inc. (Energy sector), Waddell & Reed Financial Inc. (Financials sector), MRC Global Inc. (Industrials sector), Dana Holding Corp. (Consumer Discretionary sector), Corrections Corp. of America (Financials sector) and American Eagle Outfitters (Consumer Discretionary sector).
Outlook
Based on recent economic news, the U.S. economy appears stable with low single-digit gross domestic product (GDP) growth. Further, the labor market continues to expand while housing and manufacturing are improving. While interest rates may move slightly higher over the next few months, we believe rates will remain low relative to history for some time, which should be positive for equity markets. That said, the U.S. economic recovery has been lengthy and equity markets are not cheap based on traditional metrics. However, we are still finding high-conviction investment ideas with a focus on limiting downside risk in each holding. Specifically, we believe
| 32 |
Management's Discussion of Fund Performance (Unaudited) (Continued)
downside risk is mitigated by remaining focused on those companies with pricing power, high levels of cash generation and prudent capital allocation.
Our strategy focuses on stocks from a bottom-up standpoint. We seek companies with strong returns on capital and the flexibility to enhance shareholder value using the balance sheet. Low interest rates and relatively high equity risk premiums enable companies to increase shareholder value by adjusting the capital structure of the company. We expect investors to reward companies that wisely deploy capital including higher dividends, share repurchases and mergers and acquisitions transactions. Going forward, we believe the Fund is positioned well for a slow growth environment that rewards strong capital allocation.
| 33 |
Management's Discussion of Fund Performance (Unaudited) (Continued)
Comparison of the Change in Value of a $10,000 Investment in the
Touchstone Small Cap Fund - Class A* and the
Russell 2000® Index
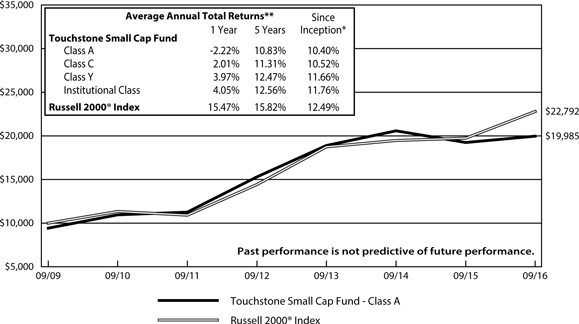
| * | The chart above represents performance of Class A shares only, which will vary from the performance of Class C shares, Class Y shares and Institutional Class shares based on the differences in sales loads and fees paid by shareholders in the different classes. The inception date of the Fund was September 30, 2009. The returns of the index listed above are based on the inception date of the Fund. |
| ** | The average annual total returns shown above are adjusted for maximum sales loads and fees, if applicable. The maximum offering price per share of Class A shares is equal to the net assets value (“NAV”) per share plus a sales load equal to 6.10% of the NAV (or 5.75% of the offering price). Class C shares are subject to a contingent deferred sales charge (“CDSC”) of 1.00%. The CDSC will be assessed on an amount equal to the lesser of (1) the NAV at the time of purchase of the shares being redeemed or (2) the NAV of such shares being redeemed, if redeemed within a one-year period from the date of purchase. Class Y shares and Institutional Class shares are not subject to sales charges. |
The performance of the above Fund does not reflect the deduction of taxes that a shareholder would pay on Fund distributions or the redemption of Fund shares.
Note to Chart
Russell 2000® Index measures the performance of the small-cap segment of the U.S. equity universe.
The Frank Russell Company (FRC) is the source and owner of the data contained or reflected in this material and all trademarks and copyrights related thereto. The material may contain confidential information and unauthorized use, disclosure, copying, dissemination or redistribution is strictly prohibited. This is a Touchstone Investments presentation of the data, and FRC is not responsible for the formatting or configuration of this material or for any inaccuracy in the presentation thereof.
| 34 |
Management's Discussion of Fund Performance (Unaudited)
Touchstone Small Cap Value Fund
Sub-Advised by LMCG Investments, LLC
Effective July 1, 2016, LMCG Investments, LLC was appointed sub-advisor to the Touchstone Small Cap Value Fund. LMCG manages the Fund in accordance with its small cap value strategy, however there were no changes to the Fund’s investment goal or principal risks.
Investment Philosophy
The Touchstone Small Cap Value Fund seeks long-term capital growth by investing primarily in common stocks of small capitalization companies. The Fund seeks to identify companies believed to be selling at a discount to their intrinsic value.
Fund Performance
The Touchstone Small Cap Value Fund (Class A Shares) underperformed its benchmark, the Russell 2000® Value Index, for the 12-month period ended September 30, 2016. The Fund’s total return was 15.63 percent (excluding the maximum sales charge) while the benchmark’s total return was 18.81 percent.
Market Environment
The first half of the 12-month period closed amid a slowing global economic backdrop, an interest rate increase imposed by the U.S. Federal Reserve Board (Fed), a stronger U.S. dollar and a rocky ride for commodities and cyclical stocks. Company balance sheet strength also proved to be particularly important during this time, along with quality in terms of earnings and returns on equity. The start of 2016 opened with growing investor concerns about the health of the global economy, with many investors pricing in a global recession. However, midway through the first quarter of 2016, sentiment reversed as a result of better-than-expected economic news in China and commentary from the Fed that suggested a slower path to increasing interest rates. Investors interpreted the Fed’s commentary as bearish for the U.S. dollar, which benefited cyclical and commodity-related stocks.
Most recently, the impact of the narrowly decided vote by Great Britain to exit the European Union (Brexit) shocked the market during the last few weeks of June, but the overall tone was relatively muted during the final months of the period. This, along with optimistic comments from the European Central Bank and the Fed, drove the rotation out of higher quality, more defensive stocks and into smaller, lower quality stocks with higher beta1.
During the 12-month period, mid-cap, small-cap and large-cap stocks all posted similar returns. From a style standpoint within the small-cap universe, value stocks outperformed growth stocks for the period.
Portfolio Review
The Fund’s strongest contributors to performance were reported in the Energy, Materials and Real Estate sectors. Primary detractors were from the Consumer Staples, Consumer Discretionary and Utilities sectors.
Stock selection drove performance in the Energy sector, with particular strength in the Fund’s positions in Patterson-UTI Energy Inc. and U.S. Silica Holdings Inc. Stock selection within the Real Estate sector also contributed to performance. The Fund’s position in Corporate Office Properties, a Real Estate Investment Trust (REIT), was the sector’s leading contributor. The Fund’s overweight to the Materials sector particularly benefited the Fund’s portfolio.
The Fund’s underweight to the Consumer Staples sector along with negative stock selection detracted from performance. The Fund’s Food, Beverage & Tobacco holdings, including Treehouse Foods Inc. and Hain Celestial
| 35 |
Management's Discussion of Fund Performance (Unaudited) (Continued)
Group Inc, accounted for nearly all of the underperformance in the sector. The Fund’s underweight to Household & Personal Products companies also detracted from returns on a relative basis. The Fund’s underperformance in the Consumer Discretionary sector was due entirely to its overweight and stock selection within retailers, where stock selection decisions in Tailored Brands Inc., Chico’s FAS Inc. and The Buckle Inc. detracted the most from relative performance. Finally, the Fund’s Utilities sector holdings and its underweight to the sector overall detracted from performance. The Fund was underweight in Real Estate Investment Trusts (REITs) and the Utilities sector given valuation concerns.
Outlook
From a macroeconomic standpoint, we believe an improving global economic environment would benefit the Fund on a relative basis. In the short term, these sectors have historically performed opposite of the direction in interest rates. Given how low interest rates have been globally, we believe any positive economic news could cause rates to move higher and cause these bond-proxy sectors to underperform.
Looking ahead, our greatest concern is that the market environment will continue to reward growth and visibility, irrespective of valuation and quality. However, we will not deviate from our process of buying high-quality companies that are temporarily out of favor and believe that buying growth and visibility, irrespective of valuation, is a risky strategy. We will continue to seek attractively valued investment opportunities with favorable risk/reward profiles.
The Fund utilizes a classic value-driven philosophy based on the belief that leading businesses selling at a discount to fair value have the potential to generate excess returns. The strategy focuses on stocks that are temporarily out of favor in the market, specifically, companies with higher returns on capital, free cash flow and strong balance sheets. Emphasis is placed on those companies having the cash flow characteristics as well as the balance sheet strength necessary to buffer the company from any prolonged weakness. The companies in the Fund’s portfolio often dominate a particular industry niche and generally have significant barriers to entry. As a result, we believe they are able to perpetuate a higher return on capital over time. The Fund’s overall investment process utilizes fundamental bottom-up security selection, while risk-control measures ensure security and sector diversification.
1Beta is a measure of the volatility of a portfolio relative to its benchmark.
| 36 |
Management's Discussion of Fund Performance (Unaudited) (Continued)
Comparison of the Change in Value of a $10,000 Investment in the
Touchstone Small Cap Value Fund - Class A* and the
Russell 2000® Value Index
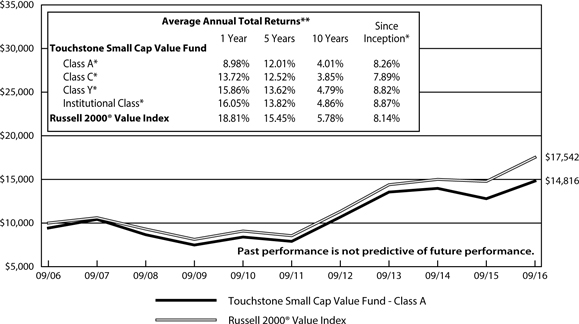
| * | The chart above represents performance of Class A shares only, which will vary from the performance of Class C shares, Class Y shares and Institutional Class shares based on the differences in sales loads and fees paid by shareholders in the different classes. The inception date of Class A shares, Class C shares, Class Y shares, Class Z shares and Institutional Class shares was March 1, 2011, March 1, 2011, March 1, 2011, March 4, 2002 and March 1, 2011, respectively. On June 10, 2011, Class Z shares were converted to Class A shares. Class A shares, Class C shares, Class Y shares and Institutional Class shares performance was calculated using the historical performance of Class Z shares for the periods prior to March 1, 2011. The returns have been restated for sales loads and fees applicable to Class A, Class C, Class Y and Institutional Class shares. The returns of the index listed above are based on the inception date of the Fund. |
| ** | The average annual total returns shown above are adjusted for maximum sales loads and fees, if applicable. The maximum offering price per share of Class A shares is equal to the net assets value (“NAV”) per share plus a sales load equal to 6.10% of the NAV (or 5.75% of the offering price). Class C shares are subject to a contingent deferred sales charge (“CDSC”) of 1.00%. The CDSC will be assessed on an amount equal to the lesser of (1) the NAV at the time of purchase of the shares being redeemed or (2) the NAV of such shares being redeemed, if redeemed within a one-year period from the date of purchase. Class Y shares and Institutional Class shares are not subject to sales charges. |
The performance of the above Fund does not reflect the deduction of taxes that a shareholder would pay on Fund distributions or the redemption of Fund shares.
Note to Chart
Russell 2000® Value Index measures the performance of those Russell 2000 companies with lower price-to-book ratios and lower forecasted growth values.
The Frank Russell Company (FRC) is the source and owner of the data contained or reflected in this material and all trademarks and copyrights related thereto. The material may contain confidential information and unauthorized use, disclosure, copying, dissemination or redistribution is strictly prohibited. This is a Touchstone Investments presentation of the data, and FRC is not responsible for the formatting or configuration of this material or for any inaccuracy in the presentation thereof.
| 37 |
Management's Discussion of Fund Performance (Unaudited)
Touchstone Total Return Bond Fund
Sub-Advised by EARNEST Partners LLC
Investment Philosophy
The Touchstone Total Return Bond Fund seeks current income. Capital appreciation is a secondary goal. The Fund invests primarily in fixed income securities or sectors that are considered undervalued for their risk characteristics.
Fund Performance
The Touchstone Total Return Bond Fund (Class A Shares) underperformed its benchmark, the Bloomberg Barclays U.S. Aggregate Bond Index for the 12-month period ended September 30, 2016. The Fund’s total return was 4.57 percent (excluding the maximum sales charge) while the benchmark’s total return was 5.19 percent.
Market Environment
During the last 12 months, economic data was relatively volatile on a month-to-month basis but remarkably consistent when aggregated and viewed as a whole over the course of the year. Though strong U.S. job growth continued during the period, the unemployment rate fell only slightly as more workers were drawn back into the labor force, increasing the participation rate. In aggregate, the labor market tightened and drove wage increases. The solid labor market, strong home values and tepid inflation helped create an environment of confident consumers who increased their spending. While market participants across asset classes believed this could trigger higher economic growth, this scenario did not manifest as gross domestic product (GDP) growth fell during the year due to high inventories and continued weakness in business investment.
Outside of the U.S., global central banking actions, economic growth in China and Britain’s decision to exit the European Union (Brexit) dominated the macroeconomic picture. Global central banks engaged in unprecedented levels of monetary easing, sending a significant amount of global bond yields into negative territory. Higher market volatility was driven by declining growth rates for China’s economy and the historic Brexit vote, the ultimate impact of which remains largely unknown.
During the period, the month-to-month volatility mentioned above, an irreconcilable combination of economic data points and challenging global forces kept the U.S. Federal Reserve Board (Fed) largely on the sidelines. The Fed raised interest rates in December 2015, and it was widely expected that more rate increases would follow in 2016. Instead, the Fed left rates unchanged during the period and consistently pushed down expectations for the path of future rate hikes. While short rates increased, the 10-year Treasury yield and other long rates declined, flattening the yield curve.
Portfolio Review
Declining interest rates and steady economic data created a healthy environment for fixed income investments. As such, the Bloomberg Barclays U.S. Aggregate Bond Index outperformed similar duration U.S. Treasuries during the period. In the persistently low rate environment, spread sectors performed well due to investor demand for their income advantage over government bonds. The stable economic data provided a favorable backdrop for credit-sensitive securities, such as U.S. Corporate Bonds, Commercial Mortgage-Backed Securities (CMBS), and Asset-Backed Securities (ABS). Relative to Treasuries, higher quality spread sectors such as Mortgage-Backed Securities (MBS) and Agency Multi-Family MBS also outperformed due to the low interest rate environment, the strength of the housing market and robust occupancy/rent fundamentals.
The low interest rate environment helped create additional demand for spread products, which was the primary tailwind to Fund performance. Conversely, strong performance within U.S. Corporate Bonds in an environment
| 38 |
Management's Discussion of Fund Performance (Unaudited) (Continued)
of declining revenues, increasing debt loads and low economic growth was the primary headwind and detractor of Fund performance due in part to the Fund’s slight underweight to that sector. Additionally, the Fund tends to invest in bonds with less spread duration than the sector overall. While this was beneficial when credit spreads were widening during calendar year 2015, the Fund’s corporate allocation lagged amid the strong tightening of credit spreads in 2016. In general, the Fund did not decline as much in the sell-offs of 2015 and therefore had less need and room to recover.
The Fund does not make active interest rate bets. Its duration was approximately matched to that of the benchmark during the period.
Outlook
Due to the continued tightening of spreads during the period, bond investors may become more aware of corporate earnings and economic growth in the months ahead. As such, we believe these higher valuations in credit-sensitive sectors may need to be justified with stronger fundamentals. The tightening experienced thus far in 2016 could reverse if revenues continue to contract, GDP growth remains tepid and earnings growth remains reliant on buybacks fueled by debt issuance. This could be a tailwind for the Fund if credit-sensitive spread sectors are avoided in favor of higher quality spread sectors. The Fund’s credit-sensitive bonds could also perform relatively well in this type of environment. Looking ahead, we believe the Fund is well positioned across the changing interest rate and economic growth environments of a full investment cycle.
| 39 |
Management's Discussion of Fund Performance (Unaudited) (Continued)
Comparison of the Change in Value of a $10,000 Investment in the
Touchstone Total Return Bond Fund - Class A* and the
Bloomberg Barclays U.S. Aggregate Bond Index

| * | The chart above represents performance of Class A shares only, which will vary from the performance of Class C shares, Class Y shares and Institutional Class shares based on the differences in sales loads and fees paid by shareholders in the different classes. The inception date of Class A shares, Class C shares, Class Y shares and Institutional Class shares was August 16, 2010, August 1, 2011, November 15, 1991 and August 1, 2011, respectively. Class A shares, Class C shares and Institutional Class shares performance was calculated using the historical performance of Class Y shares for the periods prior to August 16, 2010, August 1, 2011 and August 1, 2011, respectively. The returns have been restated for sales loads and fees applicable to Class A, Class C and Institutional Class shares. The returns of the index listed above are based on the inception date of the Fund. |
| ** | The average annual total returns shown above are adjusted for maximum sales loads and fees, if applicable. The maximum offering price per share of Class A shares is equal to the net asset value (“NAV”) per share plus a sales load equal to 4.99% of the NAV (or 4.75% of the offering price). Class C shares are subject to a contingent deferred sales charge (“CDSC”) of 1.00%. The CDSC will be assessed on an amount equal to the lesser of (1) the NAV at the time of purchase of the shares being redeemed or (2) the NAV of such shares being redeemed, if redeemed within a one-year period from date of purchase. Class Y shares and Institutional Class shares are not subject to sales charges. |
The performance of the above Fund does not reflect the deduction of taxes that a shareholder would pay on Fund distributions or the redemption of Fund shares.
Note to Chart
Bloomberg Barclays U.S. Aggregate Bond Index is an unmanaged index comprised of U.S. investment grade, fixed rate bond market securities, including government, government agency, corporate and mortgage-backed securities between one and ten years.
| 40 |
Management's Discussion of Fund Performance (Unaudited)
Touchstone Ultra Short Duration Fixed Income Fund
Sub-Advised by Fort Washington Investment Advisors, Inc.
Investment Philosophy
The Touchstone Ultra Short Duration Fixed Income Fund seeks maximum total return consistent with the preservation of capital by primarily investing in a diversified portfolio of fixed income securities of different maturities, including U.S. Treasury securities, U.S. government agency and U.S. government-sponsored enterprise securities, corporate bonds, mortgage-backed securities, commercial mortgage-backed securities, asset-backed securities, municipal bonds and cash equivalent securities including repurchase agreements and commercial paper. While the Fund may invest in securities of any maturity or duration, interest rate risk is managed by maintaining an effective duration of one year or less under normal market conditions.
Fund Performance
The Touchstone Ultra Short Duration Fixed Income Fund (Class A Shares) outperformed its benchmarks, the BofA Merrill Lynch 3-Month U.S. Treasury Bill Index and the BofA Merrill Lynch 1-Year U.S. Treasury Note Index for the 12-month period ended September 30, 2016. The Fund’s total return was 1.35 percent (excluding the maximum sales charge) while the total returns of its benchmarks were 0.27 percent and 0.54 percent, respectively.
Market Environment
The Fund’s fiscal year was characterized by increased volatility in both interest rates and credit spreads. This volatility was driven by several macroeconomic trends, including a sharp decline in commodity prices, economic weakness in China and emerging markets, Britain’s vote to exit the European Union (Brexit), and money market fund reform.
During the first half of the period, a slowdown in Chinese and emerging market growth began to weigh heavily on commodity prices. With lower expected demand out of China and a high supply from continued production by the U.S. and the Organization of Petroleum Exporting Countries (OPEC), crude oil was hit particularly hard and prices dropped dramatically. Within the U.S., solid economic growth and a strengthening labor market provided support for the U.S. Federal Reserve Board (Fed) to raise interest rates in December.
By early 2016, “risk-off” sentiment was pervasive, as the market seemed to finally recognize the gravity of falling commodity prices and weakness in Asia and emerging markets. A strong flight to quality ensued, pushing U.S. Treasury yields lower and widening credit spreads. In an effort to assuage the markets, the Fed stated that it was not in a rush to continue raising interest rates. Meanwhile, China took measures to bolster the yuan and Saudi Arabia began discussing a freeze in oil production, which caused oil prices to bottom and begin to recover. The bottoming of commodity prices seemed to be an inflection point for investor sentiment. While gross domestic product (GDP) growth remained soft, accommodative central bank policy and improved investor sentiment sparked a rally in risk assets.
By mid-year 2016, risk premiums had regained much of their previously lost ground, bolstered by recovering energy prices and economic stability overseas. A weak jobs report in May and the Brexit vote in June helped ensure that the Fed would need more time and data before resuming rate increases. This spurred a further rally in risk assets.
More specific to short duration securities, money market reform has considerably changed the landscape in the front end of the yield curve. During the past year, over $1 trillion in assets have moved out of prime money market funds (which now have floating net asset values, liquidity gates and fees) and into government money market funds (which have stable $1 net asset values and no gates or fees). The resulting demand for very short
| 41 |
Management's Discussion of Fund Performance (Unaudited) (Continued)
duration government securities has kept those rates low while corporations have been forced to offer higher commercial paper rates and seek alternative funding in the markets. The Fund has benefited from this technical dislocation by increasing exposure to high-quality, short-term corporate bonds and commercial paper.
Portfolio Review
Outperformance was primarily driven by the Fund’s favorable sector exposures (limited exposure to government securities and emphasis on structured securities) and security selection. With the labor market on solid footing and job growth continuing, consumer confidence remains near post-crisis highs, benefiting the consumer-oriented residential mortgage-backed securities (RMBS) and asset-backed securities (ABS) held by the Fund.
Credit spreads in the short duration markets were reflective of the broader fixed income market, but short duration securities did not enjoy the same move lower in interest rates that intermediate term bonds did. In fact, very short rates moved notably higher during the year. For non-U.S. Treasury securities, this increase in rates was offset by tighter spreads. The Fund employs a strategy that places greater emphasis on structured securities, such as commercial mortgage-backed securities (CMBS), ABS and Agency ABS, which seek to generate returns by investing a portion of its assets in high-quality, higher yielding spread sectors with higher liquidity premiums. Its focus on securities with low spread duration (or low price sensitivity to changes in spreads) helped to mitigate the higher volatility that is typically found in these sectors.
Sector allocations saw few meaningful changes during the fiscal year. CMBS exposure increased. Though CMBS is one of the highest-returning sub-sectors, supply remains limited and bonds with attractive risk-return profiles in this sector are difficult to source. A technical dislocation driven by money market fund reform produced attractive opportunities in very short duration corporate bonds. The Fund increased its exposure in these securities to take advantage of the mispricing. Cash exposure declined as a result of the increased allocations to CMBS and corporate bonds. The Fund’s exposure to Agency mortgage-backed securities (MBS) was at a historically low level due to the dearth of value in that market. As of the end of the fiscal year, the Corporate Bond and ABS sectors were the two most significant Fund weights.
The Fund’s interest rate risk also declined during the year. By reducing longer key rate duration and maintaining significant floating rate exposure, the Fund’s sensitivity to changing rates is lower which we believe will be beneficial in a rising interest rate environment.
Outlook
The Fund remained moderately underweight in duration and overweight in the non-Treasury sectors. In our view, domestic economic fundamentals are still supportive of credit risk, and we believe that any Asian/European idiosyncratic risks will not materially weaken U.S. economic prospects. We believe consumer, residential mortgage and commercial real estate fundamentals remain on sound footing, but corporate fundamentals have softened. As a result, the risk profile of the Fund’s corporate bond holdings has been reduced and is at a historically low level.
The short duration position reflects concern about recent volatility, low spreads and relatively low interest rates. While it is difficult to predict changes in rates, the Fed has voiced its desire to continue to increase interest rates in an effort to remove extraordinarily accommodative monetary policies. Given that the market is not positioned for increasing inflation or multiple Fed rate hikes, we believe that the yield curve could experience greater volatility going forward.
Volatility and wider spreads - a “risk off” market - tend to favor the Fund’s investment strategy. As long as U.S. economic fundamentals remain on sound footing, risk premiums could continue to oscillate as the markets react to the many extraneous influences, creating opportunities to deploy cash at more attractive levels. Against this backdrop of reasonable domestic economic growth with the potential for continued volatility, the Fund’s
| 42 |
Management's Discussion of Fund Performance (Unaudited) (Continued)
current strategy of targeting shorter duration securities with a concentrated maturity distribution, and overweighting non-government securities with select exposure to ABS sectors, should perform well. We believe the duration positioning should help to buffer the effects of a flatter curve and higher rates, while economic conditions should continue to support credit fundamentals in the non-government sectors.
| 43 |
Management's Discussion of Fund Performance (Unaudited) (Continued)
Comparison of the Change in Value of a $10,000 Investment in the
Touchstone Ultra Short Duration Fixed Income Fund - Class A*,
the BofA Merrill Lynch 3-Month U.S. Treasury Bill Index
and the BofA Merrill Lynch 1-Year U.S. Treasury Note Index
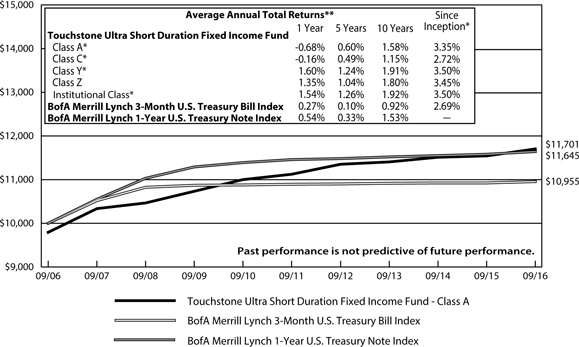
| * | The chart above represents performance of Class A shares only, which will vary from the performance of Class C shares, Class Y shares, Institutional Class shares and Class Z shares based on the differences in sales loads and fees paid by shareholders in the different classes. The inception date of Class A shares, Class C shares, Class Y shares, Class Z shares and Institutional Class shares was April 12, 2012, April 12, 2012, April 12, 2012, March 1, 1994 and April 12, 2012, respectively. Class A shares, Class C shares, Class Y shares and Institutional Class shares performance was calculated using the historical performance of Class Z shares for the periods prior to April 12, 2012. The returns have been restated for sales loads and fees applicable to Class A, Class C, Class Y and Institutional Class shares. The returns of the indexes listed above are based on the inception date of the Fund. |
| ** | The average annual total returns shown above are adjusted for maximum sales loads and fees, if applicable. The maximum offering price per share of Class A shares is equal to the net asset value (“NAV”) per share plus a sales load equal to 2.04% of the NAV (or 2.00% of the offering price). Class C shares are subject to a contingent deferred sales charge (“CDSC”) of 1.00%. The CDSC will be assessed on an amount equal to the lesser of (1) the NAV at the time of purchase of the shares being redeemed or (2) the NAV of such shares being redeemed, if redeemed within a one-year period from date of purchase. Class Y shares, Class Z shares, and Institutional Class shares are not subject to sales charges. |
The performance of the above Fund does not reflect the deduction of taxes that a shareholder would pay on Fund distributions or the redemption of Fund shares.
Notes to Chart
BofA Merrill Lynch 3-Month U.S. Treasury Bill Index is an unmanaged index of Treasury securities maturing in 90 days that assumes reinvestment of all income.
BofA Merrill Lynch 1-Year U.S. Treasury Note Index is an unmanaged index comprised of a single issue purchased at the beginning of the month and held for a full month. The issue selected at each month-end rebalancing is the outstanding two-year Treasury Note Bill that matures closest to, but, not beyond one year from the rebalancing date.
| 44 |
Tabular Presentation of Portfolios of Investments (Unaudited)
September 30, 2016
The tables below provide each Fund’s geographic allocation, sector allocation or credit quality. We hope it will be useful to shareholders as it summarizes key information about each Fund’s investments.
| Touchstone Arbitrage Fund | ||||
| Sector Allocation* | (% of Net Assets) | |||
| Long Positions | ||||
| Common Stocks | ||||
| Information Technology | 21.4 | % | ||
| Health Care | 18.3 | |||
| Financials | 13.7 | |||
| Consumer Discretionary | 11.3 | |||
| Consumer Staples | 7.7 | |||
| Utilities | 6.6 | |||
| Industrials | 3.0 | |||
| Real Estate | 2.7 | |||
| Materials | 1.2 | |||
| Energy | 1.0 | |||
| Corporate Bonds | 7.1 | |||
| Exchange Traded Funds | 2.3 | |||
| Commercial Mortgage-Backed | 1.0 | |||
| Security | ||||
| Preferred Stock | 0.2 | |||
| Purchased Put Options | 0.0 | |||
| Investment Funds | 8.2 | |||
| Cash Collateral for Securities Sold | 23.9 | |||
| Short and Written Options | ||||
| Other Assets/Liabilities (Net) | 1.3 | |||
| 130.9 | ||||
| Short Positions | ||||
| Common Stocks | ||||
| Financials | (9.5 | ) | ||
| Health Care | (6.6 | ) | ||
| Information Technology | (3.6 | ) | ||
| Consumer Discretionary | (3.0 | ) | ||
| Real Estate | (2.7 | ) | ||
| Utilities | (1.5 | ) | ||
| Materials | (0.6 | ) | ||
| Exchange Traded Funds | (3.4 | ) | ||
| Written Put Options | (0.0 | ) | ||
| Written Call Options | (0.0 | ) | ||
| (30.9 | ) | |||
| Total | 100.0 | % | ||
| Touchstone Emerging Markets Small Cap Fund | ||||
| Geographic Allocation | (% of Net Assets) | |||
| Common Stocks | ||||
| South Korea | 17.4 | % | ||
| Taiwan | 15.4 | |||
| Cayman Islands | 15.1 | |||
| India | 9.4 | |||
| South Africa | 6.6 | |||
| Brazil | 5.3 | |||
| Thailand | 5.0 | |||
| China | 4.1 | |||
| Indonesia | 3.3 | |||
| Mexico | 2.8 | |||
| Philippines | 2.5 | |||
| Malaysia | 2.3 | |||
| Hungary | 2.2 | |||
| Poland | 2.0 | |||
| Hong Kong | 1.5 | |||
| United States | 1.3 | |||
| Jersey | 1.2 | |||
| United Kingdom | 1.0 | |||
| Bermuda | 0.9 | |||
| Russia | 0.7 | |||
| Exchange Traded Fund | 1.0 | |||
| Investment Funds | 1.4 | |||
| Other Assets/Liabilities (Net) | (2.4 | ) | ||
| Total | 100.0 | % | ||
* Sector Classifications are based upon the Global Industry Classification Standard (GICS®).
| 45 |
Tabular Presentation of Portfolios of Investments (Unaudited) (Continued)
| Touchstone Merger Arbitrage Fund | ||||
| Sector Allocation* | (% of Net Assets) | |||
| Long Positions | ||||
| Common Stocks | ||||
| Information Technology | 17.8 | % | ||
| Health Care | 13.5 | |||
| Financials | 11.5 | |||
| Consumer Discretionary | 9.5 | |||
| Consumer Staples | 6.1 | |||
| Utilities | 4.8 | |||
| Industrials | 2.0 | |||
| Real Estate | 1.8 | |||
| Energy | 1.0 | |||
| Materials | 0.9 | |||
| Corporate Bonds | 17.1 | |||
| Commercial Mortgage-Backed | 2.1 | |||
| Securities | ||||
| Exchange Traded Funds | 3.3 | |||
| Preferred Stock | 0.3 | |||
| Warrant | 0.1 | |||
| Purchased Put Options | 0.0 | |||
| Investment Fund | 26.1 | |||
| Cash Collateral for Securities Sold | 7.5 | |||
| Short and Written Options | ||||
| Other Assets/Liabilities (Net) | (0.4 | ) | ||
| 125.0 | ||||
| Short Positions | ||||
| Common Stocks | ||||
| Financials | (6.7 | ) | ||
| Health Care | (4.7 | ) | ||
| Information Technology | (3.2 | ) | ||
| Consumer Discretionary | (2.3 | ) | ||
| Real Estate | (1.8 | ) | ||
| Utilities | (1.1 | ) | ||
| Materials | (0.5 | ) | ||
| Exchange Traded Funds | (4.6 | ) | ||
| Written Put Options | (0.1 | ) | ||
| Written Call Options | (0.0 | ) | ||
| (25.0 | ) | |||
| Total | 100.0 | % | ||
| Touchstone Mid Cap Fund | ||||
| Sector Allocation* | (% of Net Assets) | |||
| Consumer Discretionary | 25.8 | % | ||
| Information Technology | 16.9 | |||
| Industrials | 15.9 | |||
| Financials | 14.0 | |||
| Materials | 13.8 | |||
| Consumer Staples | 9.7 | |||
| Health Care | 1.5 | |||
| Investment Funds | 8.2 | |||
| Other Assets/Liabilities (Net) | (5.8 | ) | ||
| Total | 100.0 | % | ||
| Touchstone Mid Cap Value Fund | ||||
| Sector Allocation* | (% of Net Assets) | |||
| Financials | 20.8 | % | ||
| Industrials | 11.9 | |||
| Information Technology | 11.6 | |||
| Health Care | 11.1 | |||
| Consumer Discretionary | 9.0 | |||
| Utilities | 8.8 | |||
| Energy | 7.8 | |||
| Real Estate | 7.6 | |||
| Materials | 6.9 | |||
| Consumer Staples | 5.5 | |||
| Investment Funds | 3.1 | |||
| Other Assets/Liabilities (Net) | (4.1 | ) | ||
| Total | 100.0 | % | ||
* Sector Classifications are based upon the Global Industry Classification Standard (GICS®).
| 46 |
Tabular Presentation of Portfolios of Investments (Unaudited) (Continued)
| Touchstone Premium Yield Equity Fund | ||||
| Sector Allocation* | (% of Net Assets) | |||
| Health Care | 19.9 | % | ||
| Information Technology | 14.7 | |||
| Real Estate | 12.8 | |||
| Energy | 11.0 | |||
| Financials | 8.3 | |||
| Telecommunication Services | 8.0 | |||
| Industrials | 7.0 | |||
| Consumer Discretionary | 6.7 | |||
| Materials | 4.3 | |||
| Consumer Staples | 3.1 | |||
| Investment Fund | 4.1 | |||
| Other Assets/Liabilities (Net) | 0.1 | |||
| Total | 100.0 | % | ||
| Touchstone Small Cap Fund | ||||
| Sector Allocation* | (% of Net Assets) | |||
| Industrials | 26.0 | % | ||
| Consumer Discretionary | 24.8 | |||
| Materials | 11.6 | |||
| Real Estate | 10.2 | |||
| Consumer Staples | 8.3 | |||
| Financials | 7.4 | |||
| Energy | 4.5 | |||
| Information Technology | 3.9 | |||
| Health Care | 2.1 | |||
| Investment Funds | 11.2 | |||
| Other Assets/Liabilities (Net) | (10.0 | ) | ||
| Total | 100.0 | % | ||
| Touchstone Sands Capital Select Growth Fund | ||||
| Sector Allocation* | (% of Net Assets) | |||
| Information Technology | 48.3 | % | ||
| Health Care | 22.1 | |||
| Consumer Discretionary | 19.8 | |||
| Financials | 3.5 | |||
| Materials | 2.4 | |||
| Energy | 2.0 | |||
| Investment Funds | 7.0 | |||
| Other Assets/Liabilities (Net) | (5.1 | ) | ||
| Total | 100.0 | % | ||
| Touchstone Small Cap Value Fund | ||||
| Sector Allocation* | (% of Net Assets) | |||
| Financials | 26.2 | % | ||
| Industrials | 21.0 | |||
| Information Technology | 13.4 | |||
| Consumer Discretionary | 9.5 | |||
| Health Care | 5.2 | |||
| Materials | 5.1 | |||
| Utilities | 4.6 | |||
| Consumer Staples | 4.5 | |||
| Real Estate | 4.4 | |||
| Energy | 3.4 | |||
| Telecommunication Services | 0.7 | |||
| Exchange Traded Fund | 0.1 | |||
| Investment Funds | 0.7 | |||
| Other Assets/Liabilities (Net) | 1.2 | |||
| Total | 100.0 | % | ||
* Sector Classifications are based upon the Global Industry Classification Standard (GICS®).
| 47 |
Tabular Presentation of Portfolios of Investments (Unaudited) (Continued)
| Touchstone Total Return Bond Fund | ||||
| Credit Quality* (% of Investment Securities) | ||||
| AAA/Aaa | 56.7 | % | ||
| AA/Aa | 8.4 | |||
| A/A | 9.7 | |||
| BBB/Baa | 14.1 | |||
| BB/Ba | 2.9 | |||
| B/B | 0.8 | |||
| CCC | 0.5 | |||
| Not Rated | 6.9 | |||
| Total | 100.0 | % | ||
| Touchstone Ultra Short Duration Fixed Income Fund | ||||
| Credit Quality* (% of Investment Securities) | ||||
| AAA/Aaa | 28.9 | % | ||
| AA/Aa | 13.1 | |||
| A/A | 17.8 | |||
| BBB/Baa | 26.4 | |||
| BB/Ba | 0.1 | |||
| CCC | 0.3 | |||
| Not Rated | 13.4 | |||
| Total | 100.0 | % | ||
* Credit quality ratings are from Standard & Poor's (“S&P”) and Moody's Investors Service (“Moody's”). If agency ratings differ, the higher rating will be used. Where no rating has been assigned, it may be for reasons unrelated to the creditworthiness of the issuer.
| 48 |
Touchstone Arbitrage Fund – September 30, 2016
| Market | ||||||||
| Shares | Value | |||||||
| Common Stocks — 86.9% | ||||||||
| Information Technology — 21.4% | ||||||||
| Alphabet, Inc. - Class C* | 1,004 | $ | 780,399 | |||||
| AVG Technologies NV (Netherlands)* | 89,769 | 2,245,123 | ||||||
| Cvent, Inc.*†† | 57,410 | 1,820,471 | ||||||
| Dell Technologies, Inc. - VMware Inc. - Class V* | 15,983 | 763,988 | ||||||
| Fleetmatics Group PLC (Ireland)*†† | 90,102 | 5,404,318 | ||||||
| InContact, Inc.*†† | 388,175 | 5,426,687 | ||||||
| KLA-Tencor Corp.†† | 75,990 | 5,297,263 | ||||||
| LinkedIn Corp. - Class A*†† | 28,806 | 5,505,403 | ||||||
| NetSuite, Inc.* | 29,601 | 3,276,535 | ||||||
| Rackspace Hosting, Inc.* | 73,510 | 2,329,532 | ||||||
| 32,849,719 | ||||||||
| Health Care — 18.3% | ||||||||
| Alere, Inc.*†† | 64,585 | 2,792,655 | ||||||
| Cepheid* | 87,580 | 4,614,590 | ||||||
| Cynapsus Therapeutics, Inc. (Canada)* | 85,190 | 3,426,342 | ||||||
| Envision Healthcare Holdings, Inc.* | 215,652 | 4,802,570 | ||||||
| Quintiles IMS Holdings, Inc.* | 37,202 | 3,015,594 | ||||||
| Raptor Pharmaceutical Corp.* | 515,000 | 4,619,550 | ||||||
| St Jude Medical, Inc.†† | 60,580 | 4,831,861 | ||||||
| 28,103,162 | ||||||||
| Financials — 13.7% | ||||||||
| American Capital Ltd.* | 281,841 | 4,765,931 | ||||||
| Astoria Financial Corp.†† | 343,230 | 5,011,158 | ||||||
| Cardinal Financial Corp. | 170,870 | 4,457,998 | ||||||
| National Interstate Corp.†† | 60,889 | 1,980,719 | ||||||
| PrivateBancorp, Inc.†† | 104,650 | 4,805,528 | ||||||
| 21,021,334 | ||||||||
| Consumer Discretionary — 11.3% | ||||||||
| Carmike Cinemas, Inc.* | 134,629 | 4,401,022 | ||||||
| CST Brands, Inc. | 109,780 | 5,279,320 | ||||||
| Media General, Inc.* | 180,000 | 3,317,400 | ||||||
| Starz - Class A*†† | 140,260 | 4,374,710 | ||||||
| 17,372,452 | ||||||||
| Consumer Staples — 7.7% | ||||||||
| SABMiller PLC ADR | 20,000 | 1,161,800 | ||||||
| SABMiller PLC (United Kingdom) | 100,400 | 5,848,217 | ||||||
| WhiteWave Foods Co.* | 89,322 | 4,861,796 | ||||||
| 11,871,813 | ||||||||
| Utilities — 6.6% | ||||||||
| ITC Holdings Corp. | 97,810 | 4,546,209 | ||||||
| Piedmont Natural Gas Co., Inc.†† | 94,124 | 5,651,205 | ||||||
| 10,197,414 | ||||||||
| Industrials — 3.0% | ||||||||
| Virgin America, Inc.*†† | 85,930 | 4,598,114 | ||||||
| Real Estate — 2.7% | ||||||||
| Post Properties, Inc. REIT | 61,685 | 4,079,229 | ||||||
| Materials — 1.2% | ||||||||
| AEP Industries, Inc. | 16,800 | 1,837,416 | ||||||
| Energy — 1.0% | ||||||||
| Bankers Petroleum Ltd. (Canada)* | 883,600 | 1,481,703 | ||||||
| Total Common Stocks | $ | 133,412,356 | ||||||
| Principal | ||||||||
| Amount | ||||||||
| Corporate Bonds — 7.1% | ||||||||
| Consumer Discretionary — 2.2% | ||||||||
| $ | 250,000 | HD Supply, Inc., 7.500%, 7/15/20 | 259,650 | |||||
| 760,000 | Landry's Holdings II, Inc., 144a, | |||||||
| 10.250%, 1/1/18 | 776,112 | |||||||
| 760,000 | Landry's, Inc., 144a, 9.375%, 5/1/20 | 797,126 | ||||||
| 725,000 | LIN Television Corp., 5.875%, 11/15/22 | 759,437 | ||||||
| 675,000 | Lions Gate Entertainment Corp. | |||||||
| (Canada), 5.250%, 8/1/18 | 717,188 | |||||||
| 100,000 | Nexstar Broadcasting, Inc., | |||||||
| 6.875%, 11/15/20 | 103,875 | |||||||
| 3,413,388 | ||||||||
| Information Technology — 1.5% | ||||||||
| 2,325,000 | EMC Corp., 1.875%, 6/1/18 | 2,288,200 | ||||||
| Financials — 1.0% | ||||||||
| 1,620,000 | PNC Preferred Funding Trust II, 144a, | |||||||
| 2.073%, 3/29/49(A)(B) | 1,547,100 | |||||||
| Energy — 0.8% | ||||||||
| 480,000 | Devon Energy Corp., | |||||||
| 1.390%, 12/15/16(A) | 479,408 | |||||||
| 750,000 | Targa Resources Partners LP / Targa | |||||||
| Resources Partners Finance Corp., | ||||||||
| 5.000%, 1/15/18 | 776,250 | |||||||
| 1,255,658 | ||||||||
| Materials — 0.7% | ||||||||
| 1,000,000 | Glencore Canada Corp. (Canada), | |||||||
| 5.500%, 6/15/17† | 1,022,500 | |||||||
| Industrials — 0.6% | ||||||||
| 750,000 | Beverage Packaging Holdings | |||||||
| Luxembourg II SA / Beverage | ||||||||
| Packaging Holdings II Is | ||||||||
| (Luxembourg), 144a, | ||||||||
| 5.625%, 12/15/16 | 748,200 | |||||||
| 135,000 | USG Corp., 144a, 7.875%, 3/30/20 | 140,738 | ||||||
| 888,938 | ||||||||
| Consumer Staples — 0.3% | ||||||||
| 541,000 | Elizabeth Arden, Inc., 7.375%, 3/15/21 | 560,611 | ||||||
| Total Corporate Bonds | $ | 10,976,395 | ||||||
| 49 |
Touchstone Arbitrage Fund (Continued)
| Market | ||||||||
| Shares | Value | |||||||
| Exchange Traded Funds — 2.3% | ||||||||
| Consumer Discretionary Select Sector SPDR Fund | 224 | $ | 17,929 | |||||
| Financial Select Sector SPDR Fund | 9,348 | 180,416 | ||||||
| Real Estate Select Sector SPDR Fund | 1,300 | 42,601 | ||||||
| SPDR S&P 500 ETF Trust | 14,000 | 3,028,200 | ||||||
| Technology Select Sector SPDR Fund | 4,535 | 216,682 | ||||||
| Total Exchange Traded Funds | $ | 3,485,828 | ||||||
| Principal | ||||||||
| Amount | ||||||||
| Commercial Mortgage-Backed Security — 1.0% | ||||||||
| $ | 1,500,000 | CFCRE 2015-RUM Mortgage Trust, Ser | ||||||
| 2015-RUM, Class C, 144a, | ||||||||
| 3.274%, 7/15/30(A) | 1,472,053 | |||||||
| Shares | ||||||||
| Preferred Stock — 0.2% | ||||||||
| Utilities — 0.2% | ||||||||
| Dayton Power & Light Co. (The), 3.90% | 2,963 | $ | 297,782 | |||||
| Number | ||||||||
| of | ||||||||
| Contracts | ||||||||
| Purchased Put Options — 0.0% | ||||||||
| SPDR S&P 500 ETF Trust., Strike @ 197.00, Exp 10/16 | 63 | 756 | ||||||
| SPDR S&P 500 ETF Trust., Strike @ 208.00, Exp 10/16 | 172 | 11,008 | ||||||
| SPDR S&P 500 ETF Trust., Strike @ 218.00, Exp 10/16 | 109 | 33,681 | ||||||
| Total Purchased Put Options | 45,445 | |||||||
| Shares | ||||||||
| Investment Funds — 8.2% | ||||||||
| Dreyfus Government Cash | ||||||||
| Management, Institutional Shares, | �� | |||||||
| 0.30%∞Ω | 12,469,547 | 12,469,547 | ||||||
| Invesco Government & Agency | ||||||||
| Portfolio, Institutional Class, | ||||||||
| 0.31%**∞Ω | 164,688 | 164,688 | ||||||
| Total Investment Funds | $ | 12,634,235 | ||||||
| Total Long Positions | ||||||||
| (Cost $162,239,265) | $ | 162,324,094 | ||||||
| Market | ||||||||
| Shares | Value | |||||||
| Securities Sold Short — (30.9%) | ||||||||
| Common Stocks — (27.5%) | ||||||||
| Financials — (9.5%) | ||||||||
| Ares Capital Corp. | (136,128 | ) | $ | (2,109,984 | ) | |||
| Canadian Imperial Bank of Commerce (Canada) | (38,270 | ) | (2,967,073 | ) | ||||
| New York Community Bancorp, Inc. | (343,230 | ) | (4,884,163 | ) | ||||
| United Bankshares, Inc. | (121,317 | ) | (4,570,011 | ) | ||||
| (14,531,231 | ) | |||||||
| Health Care — (6.6%) | ||||||||
| Abbott Laboratories | (52,753 | ) | (2,230,924 | ) | ||||
| Amsurg Corp.* | (72,026 | ) | (4,829,343 | ) | ||||
| IMS Health Holdings, Inc.* | (96,876 | ) | (3,036,094 | ) | ||||
| (10,096,361 | ) | |||||||
| Information Technology — (3.6%) | ||||||||
| Alphabet, Inc.Class A* | (969 | ) | (779,134 | ) | ||||
| Lam Research Corp. | (37,995 | ) | (3,598,507 | ) | ||||
| VMware, Inc. - Class A* | (15,917 | ) | (1,167,512 | ) | ||||
| (5,545,153 | ) | |||||||
| Consumer Discretionary — (3.0%) | ||||||||
| AMC Entertainment Holdings, Inc. - Class A | (43,694 | ) | (1,358,447 | ) | ||||
| Lions Gate Entertainment Corp. (Canada) | (95,152 | ) | (1,902,089 | ) | ||||
| Nexstar Broadcasting Group, Inc. - Class A | (22,482 | ) | (1,297,436 | ) | ||||
| (4,557,972 | ) | |||||||
| Real Estate — (2.7%) | ||||||||
| Mid-America Apartment Communities, Inc., REIT | (43,795 | ) | (4,116,292 | ) | ||||
| Utilities — (1.5%) | ||||||||
| Fortis, Inc. (Canada) | (73,633 | ) | (2,372,050 | ) | ||||
| Materials — (0.6%) | ||||||||
| Berry Plastics Group, Inc.* | (21,008 | ) | (921,201 | ) | ||||
| Total Common Stocks | $ | (42,140,260 | ) | |||||
| Exchange Traded Funds — (3.4%) | ||||||||
| Consumer Staples Select Sector SPDR Fund | (111 | ) | (5,906 | ) | ||||
| Energy Select Sector SPDR Fund | (3,021 | ) | (213,313 | ) | ||||
| iShares US Telecommunications ETF | (1,318 | ) | (42,466 | ) | ||||
| Materials Select Sector SPDR Fund | (72 | ) | (3,438 | ) | ||||
| SPDR S&P 500 ETF Trust | (22,000 | ) | (4,758,600 | ) | ||||
| Utilities Select Sector SPDR Fund | (4,067 | ) | (199,242 | ) | ||||
| Total Exchange Traded Funds | $ | (5,222,965 | ) | |||||
| Total Securities Sold Short | ||||||||
| (Proceeds $46,315,118) | $ | (47,363,225 | ) | |||||
| 50 |
Touchstone Arbitrage Fund (Continued)
| Number | ||||||||
| of | Market | |||||||
| Contracts | Value | |||||||
| Written Options — (0.0%) | ||||||||
| Written Put Options — (0.0%) | ||||||||
| SPDR S&P 500 ETF Trust., Strike @ 216.00, Exp 09/16 | (58 | ) | $ | (116 | ) | |||
| SPDR S&P 500 ETF Trust., Strike @ 202.00, Exp 10/16 | (126 | ) | (3,024 | ) | ||||
| SPDR S&P 500 ETF Trust., Strike @ 212.00, Exp 10/16 | (218 | ) | (25,288 | ) | ||||
| SPDR S&P 500 ETF Trust., Strike @ 216.00, Exp 10/16 | (80 | ) | (9,760 | ) | ||||
| $ | (38,188 | ) | ||||||
| Written Call Options — (0.0%) | ||||||||
| Fleetmatics Group PLC, Strike @ 60.00, Exp 10/16 | (519 | ) | (20,760 | ) | ||||
| Whitewave Foods, Strike @ 57.50, Exp 10/16 | (389 | ) | (5,835 | ) | ||||
| (26,595 | ) | |||||||
| Total Written Options | ||||||||
| (Premiums received $93,336) | $ | (64,783 | ) | |||||
| Total — 74.8% | $ | 114,896,086 | ||||||
| Cash Collateral for Securities | ||||||||
| Sold Short and Written Options — 23.9% | 36,608,741 | |||||||
| Other Assets in Excess of Liabilities — 1.3% | 2,003,753 | |||||||
| Net Assets — 100.0% | $ | 153,508,580 | ||||||
| (A) | Variable rate security - Rate reflected is the rate in effect as of September 30, 2016. |
| (B) | Perpetual Bond - A Bond with no definite maturity date. |
| * | Non-income producing security. |
| ** | Represents collateral for securities loaned. |
| † | All or a portion of the security is on loan. The total market value of the securities on loan as of September30, 2016 was $158,488. |
| †† | All or a portion of these securities are held as collateral for securities sold short and written options. The total value of the securities held as collateral as of September 30, 2016 was $52,640,647. |
| ∞ | Open-End Fund. |
| Ω | Represents the 7-day SEC yield as of September 30, 2016. |
Portfolio Abbreviations:
ADR - American Depositary Receipt
CAD - Canadian Dollar
ETF - Exchange Traded Fund
GBP - Great British Pound
PLC - Public Limited Company
REIT - Real Estate Investment Trust
SPDR - Standard & Poor's Depositary Receipt
USD - United States Dollar
144a - This is a restricted security that was sold in a transaction qualifying for the exemption under Rule 144A of the Securities Act of 1933. This security may be sold in transactions exempt from registration, normally to qualified institutional buyers. At September 30, 2016, these securities were valued at $5,481,329 or 3.6% of net assets. These securities were deemed liquid pursuant to procedures approved by the Board of Trustees.
Other Information:
The inputs or methodology used for valuing securities may not be an indication of the risk associated with investing in those securities. For more information on valuation inputs, and their aggregation into the levels used in the table below, please refer to the security valuation section in the accompanying Notes to Financial Statements.
| 51 |
Touchstone Arbitrage Fund (Continued)
Valuation inputs at Reporting Date:
| Description | Level 1 | Level 2 | Level 3 | Total | ||||||||||||
| Assets: | ||||||||||||||||
| Common Stocks | ||||||||||||||||
| Information Technology | $ | 32,849,719 | $ | — | $ | — | $ | 32,849,719 | ||||||||
| Health Care | 28,103,162 | — | — | 28,103,162 | ||||||||||||
| Financials | 21,021,334 | — | — | 21,021,334 | ||||||||||||
| Consumer Discretionary | 17,372,452 | — | — | 17,372,452 | ||||||||||||
| Consumer Staples | 6,023,596 | 5,848,217 | — | 11,871,813 | ||||||||||||
| Utilities | 10,197,414 | — | — | 10,197,414 | ||||||||||||
| Industrials | 4,598,114 | — | — | 4,598,114 | ||||||||||||
| Real Estate | 4,079,229 | — | — | 4,079,229 | ||||||||||||
| Materials | 1,837,416 | — | — | 1,837,416 | ||||||||||||
| Energy | 1,481,703 | — | — | 1,481,703 | ||||||||||||
| Corporate Bonds | — | 10,976,395 | — | 10,976,395 | ||||||||||||
| Exchange Traded Funds | 3,485,828 | — | — | 3,485,828 | ||||||||||||
| Commercial Mortgage-Backed Security | — | 1,472,053 | — | 1,472,053 | ||||||||||||
| Preferred Stock | 297,782 | — | — | 297,782 | ||||||||||||
| Purchased Options Equity Contracts | 45,445 | — | — | 45,445 | ||||||||||||
| Investment Funds | 12,634,235 | — | — | 12,634,235 | ||||||||||||
| Other Financial Instruments** | ||||||||||||||||
| Forward Foreign Currency Contract | — | 80,668 | — | 80,668 | ||||||||||||
| Total Assets | $ | 144,027,429 | $ | 18,377,333 | $ | — | $ | 162,404,762 | ||||||||
Valuation inputs at Reporting Date:
| Description | Level 1 | Level 2 | Level 3 | Total | ||||||||||||
| Liabilities: | ||||||||||||||||
| Securities Sold Short | ||||||||||||||||
| Common Stocks | $ | (42,140,260 | ) | $ | — | $ | — | $ | (42,140,260 | ) | ||||||
| Exchange Traded Funds | (5,222,965 | ) | — | — | (5,222,965 | ) | ||||||||||
| Other Financial Instruments** | ||||||||||||||||
| Written Options Equity Contracts | (64,783 | ) | — | — | (64,783 | ) | ||||||||||
| Forward Foreign Currency Contract | — | (11,839 | ) | — | (11,839 | ) | ||||||||||
| Total Liabilities | $ | (47,428,008 | ) | $ | (11,839 | ) | $ | — | $ | (47,439,847 | ) | |||||
| Total | $ | 96,599,421 | $ | 18,365,494 | $ | — | $ | 114,964,915 | ||||||||
** Other Financial Instruments are derivative instruments not reflected in total investments. Amounts shown represent market value for written option equity contracts and unrealized appreciation (depreciation) on forward foreign currency contracts.
Transactions in written options for the year ended September 30, 2016.
| Number of | Premiums | |||||||
| Contracts | Received | |||||||
| Beginning balance, September 30, 2015 | 840 | $ | 157,041 | |||||
| Call Options Written | 2,724 | 111,992 | ||||||
| Put Options Written | 3,522 | 444,474 | ||||||
| Call Options Closed | (126 | ) | (7,237 | ) | ||||
| Put Options Closed | (1,931 | ) | (286,265 | ) | ||||
| Call Options Expired | (966 | ) | (21,099 | ) | ||||
| Put Options Expired | (1,867 | ) | (226,569 | ) | ||||
| Call Options Exercised | (724 | ) | (67,095 | ) | ||||
| Put Options Exercised | (82 | ) | (11,906 | ) | ||||
| Ending balance, September 30, 2016 | 1,390 | $ | 93,336 | |||||
Forward Foreign Currency Contracts
| Unrealized | ||||||||||||||
| Contract to | Appreciation/ | |||||||||||||
| Counterparty | Expiration Date | Receive | Deliver | (Depreciation) | ||||||||||
| Brown Brothers Harriman | 10/14/2016 | USD | 7,105,274 | GBP | 5,418,000 | $ | 80,668 | |||||||
| Brown Brothers Harriman | 10/21/2016 | USD | 1,470,105 | CAD | 1,943,920 | (11,839 | ) | |||||||
| $ | 68,829 | |||||||||||||
See accompanying Notes to Financial Statements.
| 52 |
Touchstone Emerging Markets Small Cap Fund – September 30, 2016
| Market | ||||||||
| Shares | Value | |||||||
| Common Stocks — 100.0% | ||||||||
| South Korea — 17.4% | ||||||||
| Consumer Discretionary — 2.8% | ||||||||
| Innocean Worldwide, Inc. | 1,218 | $ | 81,219 | |||||
| Jcontentree Corp.* | 19,666 | 66,254 | ||||||
| Loen Entertainment, Inc.* | 1,305 | 92,683 | ||||||
| Consumer Staples — 2.6% | ||||||||
| Able C&C Co. Ltd. | 2,734 | 59,762 | ||||||
| BGF retail Co. Ltd. | 580 | 101,927 | ||||||
| NongShim Co. Ltd. | 236 | 67,285 | ||||||
| Financials — 2.8% | ||||||||
| Dongbu Insurance Co. Ltd. | 1,957 | 121,667 | ||||||
| Hyundai Marine & Fire Insurance Co. Ltd. | 3,639 | 120,139 | ||||||
| Health Care — 2.0% | ||||||||
| Osstem Implant Co. Ltd.*† | 1,421 | 79,010 | ||||||
| Value Added Technologies Co. Ltd. | 2,731 | 93,781 | ||||||
| Industrials — 2.3% | ||||||||
| Hyundai Development Co.-Engineering & Construction | 2,602 | 121,970 | ||||||
| LS Corp. | 1,501 | 79,744 | ||||||
| Information Technology — 2.1% | ||||||||
| Koh Young Technology, Inc. | 2,804 | 116,762 | ||||||
| Silicon Works Co. Ltd. | 2,532 | 68,926 | ||||||
| Materials — 2.8% | ||||||||
| Korea Petrochemical Ind Co. Ltd. | 598 | 116,963 | ||||||
| Soulbrain Co. Ltd. | 2,346 | 130,549 | ||||||
| Total South Korea | 1,518,641 | |||||||
| Taiwan — 15.4% | ||||||||
| Consumer Discretionary — 2.6% | ||||||||
| Basso Industry Corp. | 40,000 | 127,550 | ||||||
| Taiwan Paiho Ltd. | 27,000 | 96,780 | ||||||
| Consumer Staples — 1.6% | ||||||||
| Grape King Bio Ltd. | 17,000 | 141,417 | ||||||
| Health Care — 1.3% | ||||||||
| Bioteque Corp. | 23,000 | 116,774 | ||||||
| Industrials — 1.1% | ||||||||
| Shin Zu Shing Co. Ltd. | 29,000 | 96,246 | ||||||
| Information Technology — 7.5% | ||||||||
| Elite Material Co. Ltd. | 55,000 | 150,657 | ||||||
| Inventec Corp. | 135,000 | 110,825 | ||||||
| King Yuan Electronics Co. Ltd. | 99,000 | 88,022 | ||||||
| Micro-Star International Co. Ltd. | 35,000 | 91,249 | ||||||
| Primax Electronics Ltd. | 78,000 | 114,806 | ||||||
| Vanguard International Semiconductor Corp. | 54,000 | 101,453 | ||||||
| Materials — 1.3% | ||||||||
| China General Plastics Corp. | 169,320 | 112,442 | ||||||
| Total Taiwan | 1,348,221 | |||||||
| Cayman Islands — 15.1% | ||||||||
| Consumer Discretionary — 9.1% | ||||||||
| China Lodging Group Ltd. ADR | 3,186 | 143,657 | ||||||
| Fu Shou Yuan International Group Ltd. | 47,889 | 27,699 | ||||||
| Geely Automobile Holdings Ltd. | 190,000 | 171,086 | ||||||
| Gourmet Master Co. Ltd. | 15,700 | 156,271 | ||||||
| Tarena International, Inc. ADR | 7,168 | 103,793 | ||||||
| Tianneng Power International Ltd. | 114,000 | 97,735 | ||||||
| Xtep International Holdings Ltd. | 218,000 | 102,151 | ||||||
| Industrials — 1.2% | ||||||||
| Bizlink Holding, Inc. | 20,031 | 104,946 | ||||||
| Information Technology — 3.1% | ||||||||
| Sunny Optical Technology Group Co. Ltd. | 27,000 | 134,153 | ||||||
| Tongda Group Holdings Ltd. | 560,000 | 137,355 | ||||||
| Materials — 1.7% | ||||||||
| Lee & Man Paper Manufacturing Ltd. | 160,000 | 146,162 | ||||||
| Total Cayman Islands | 1,325,008 | |||||||
| India — 9.4% | ||||||||
| Consumer Discretionary — 1.0% | ||||||||
| Exide Industries Ltd. | 32,038 | 88,229 | ||||||
| Energy — 1.7% | ||||||||
| Hindustan Petroleum Corp. Ltd. | 22,644 | 144,384 | ||||||
| Financials — 2.6% | ||||||||
| Bharat Financial Inclusion Ltd.* | 8,966 | 118,960 | ||||||
| Shriram Transport Finance Co. Ltd. | 6,302 | 110,188 | ||||||
| Health Care — 1.3% | ||||||||
| Torrent Pharmaceuticals Ltd. | 4,529 | 110,602 | ||||||
| Materials — 1.3% | ||||||||
| Hindalco Industries Ltd. | 49,260 | 113,364 | ||||||
| Utilities — 1.5% | ||||||||
| Indraprastha Gas Ltd. | 11,450 | 133,888 | ||||||
| Total India | 819,615 | |||||||
| South Africa — 6.6% | ||||||||
| Consumer Discretionary — 2.3% | ||||||||
| Foschini Group Ltd. (The) | 8,863 | 89,942 | ||||||
| Super Group Ltd.* | 34,830 | 107,796 | ||||||
| Consumer Staples — 2.1% | ||||||||
| AVI Ltd. | 14,000 | 95,850 | ||||||
| Clicks Group Ltd. | 9,291 | 86,075 | ||||||
| 53 |
Touchstone Emerging Markets Small Cap Fund (Continued)
| Market | ||||||||
| Shares | Value | |||||||
| Common Stocks — 100.0% (Continued) | ||||||||
| South Africa — (Continued) | ||||||||
| Financials — 1.3% | ||||||||
| Capitec Bank Holdings Ltd. | 2,507 | $ | 117,476 | |||||
| Health Care — 0.9% | ||||||||
| Netcare Ltd. | 33,177 | 81,308 | ||||||
| Total South Africa | 578,447 | |||||||
| Brazil — 5.3% | ||||||||
| Consumer Staples — 3.1% | ||||||||
| Hypermarcas SA | 15,000 | 129,745 | ||||||
| Raia Drogasil SA | 7,000 | 143,911 | ||||||
| Health Care — 1.4% | ||||||||
| Qualicorp SA | 21,400 | 125,946 | ||||||
| Real Estate — 0.8% | ||||||||
| Iguatemi Empresa de Shopping Centers SA | 7,500 | 68,263 | ||||||
| Total Brazil | 467,865 | |||||||
| Thailand — 5.0% | ||||||||
| Consumer Discretionary — 0.7% | ||||||||
| Minor International PCL | 56,000 | 63,253 | ||||||
| Financials — 1.4% | ||||||||
| Krungthai Card PCL | 27,900 | 119,168 | ||||||
| Information Technology — 1.1% | ||||||||
| KCE Electronics PCL | 32,200 | 98,833 | ||||||
| Real Estate — 1.8% | ||||||||
| Ananda Development PCL | 509,800 | 71,422 | ||||||
| AP Thailand PCL | 399,500 | 83,832 | ||||||
| Total Thailand | 436,508 | |||||||
| China — 4.1% | ||||||||
| Industrials — 1.2% | ||||||||
| Beijing Capital International Airport Co. Ltd. - Class H | 94,000 | 107,153 | ||||||
| Information Technology — 1.4% | ||||||||
| TravelSky Technology Ltd. - Class H | 50,000 | 119,340 | ||||||
| Real Estate — 1.5% | ||||||||
| Guangzhou R&F Properties Co. Ltd. - Class H | 83,200 | 131,843 | ||||||
| Total China | 358,336 | |||||||
| Indonesia — 3.3% | ||||||||
| Financials — 1.3% | ||||||||
| Bank Tabungan Negara Persero Tbk PT | 782,600 | 115,419 | ||||||
| Health Care — 1.1% | ||||||||
| Mitra Keluarga Karyasehat Tbk PT | 438,100 | 93,824 | ||||||
| Industrials — 0.9% | ||||||||
| Waskita Karya Persero Tbk PT | 403,900 | 81,270 | ||||||
| Total Indonesia | 290,513 | |||||||
| Mexico — 2.8% | ||||||||
| Consumer Discretionary — 1.1% | ||||||||
| Alsea SAB de CV | 29,600 | 100,159 | ||||||
| Industrials — 1.7% | ||||||||
| Grupo Aeroportuario del Sureste SAB de CV - Class B | 5,225 | 76,430 | ||||||
| Promotora y Operadora de Infraestructura SAB de CV | 6,755 | 72,721 | ||||||
| Total Mexico | 249,310 | |||||||
| Philippines — 2.5% | ||||||||
| Financials — 1.4% | ||||||||
| Metro Pacific Investments Corp. | 845,400 | 123,903 | ||||||
| Industrials — 1.1% | ||||||||
| Cebu Air, Inc. | 40,010 | 93,328 | ||||||
| Total Philippines | 217,231 | |||||||
| Malaysia — 2.3% | ||||||||
| Industrials — 2.3% | ||||||||
| AirAsia Bhd | 148,600 | 100,418 | ||||||
| Westports Holdings Bhd | 93,000 | 98,723 | ||||||
| Total Malaysia | 199,141 | |||||||
| Hungary — 2.2% | ||||||||
| Health Care — 1.1% | ||||||||
| Richter Gedeon Nyrt | 4,901 | 99,563 | ||||||
| Telecommunication Services — 1.1% | ||||||||
| Magyar Telekom Telecommuni- cations PLC | 56,877 | 93,348 | ||||||
| Total Hungary | 192,911 | |||||||
| Poland — 2.0% | ||||||||
| Financials — 1.1% | ||||||||
| KRUK SA | 1,575 | 98,028 | ||||||
| Information Technology — 0.9% | ||||||||
| Asseco Poland SA | 5,077 | 74,015 | ||||||
| Total Poland | 172,043 | |||||||
| Hong Kong — 1.5% | ||||||||
| Real Estate — 1.5% | ||||||||
| Shenzhen Investment Ltd. | 268,000 | 128,636 | ||||||
| 54 |
Touchstone Emerging Markets Small Cap Fund (Continued)
| Market | ||||||||
| Shares | Value | |||||||
| Common Stocks — 100.0% (Continued) | ||||||||
| United States — 1.3% | ||||||||
| Health Care — 1.3% | ||||||||
| China Biologic Products, Inc.* | 917 | $ | 114,148 | |||||
| Jersey — 1.2% | ||||||||
| Information Technology — 1.2% | ||||||||
| WNS Holdings Ltd. ADR* | 3,577 | 107,131 | ||||||
| United Kingdom — 1.0% | ||||||||
| Materials — 1.0% | ||||||||
| Evraz PLC* | 43,505 | 90,812 | ||||||
| Bermuda — 0.9% | ||||||||
| Consumer Discretionary — 0.9% | ||||||||
| SMI Holdings Group Ltd.† | 760,000 | 75,860 | ||||||
| Russia — 0.7% | ||||||||
| Telecommunication Services — 0.7% | ||||||||
| Sistema PJSC FC GDR | 8,404 | 62,358 | ||||||
| Total Common Stocks | $ | 8,752,735 | ||||||
| Exchange Traded Fund — 1.0% | ||||||||
| iShares MSCI Emerging Markets Small-Cap ETF | 2,011 | 89,188 | ||||||
| Investment Funds — 1.4% | ||||||||
| Dreyfus Government Cash Management, Institutional Shares, 0.30%∞Ω | 11 | 11 | ||||||
| Invesco Government & Agency Portfolio, Institutional Class, 0.31%**∞Ω | 118,751 | 118,751 | ||||||
| Total Investment Funds | $ | 118,762 | ||||||
| Total Investment Securities —102.4% | ||||||||
| (Cost $8,179,091) | $ | 8,960,685 | ||||||
| Liabilities in Excess of Other Assets — (2.4%) | (209,040 | ) | ||||||
| Net Assets — 100.0% | $ | 8,751,645 | ||||||
| * | Non-income producing security. |
| ** | Represents collateral for securities loaned. |
| † | All or a portion of the security is on loan. The total market value of the securities on loan as of September 30, 2016 was $110,216. |
| ∞ | Open-End Fund. |
| Ω | Represents the 7-day SEC yield as of September 30, 2016. |
Portfolio Abbreviations:
ADR - American Depositary Receipt
ETF - Exchange Traded Fund
GDR - Global Depositary Receipt
PCL - Public Company Limited
PLC - Public Limited Company
Other Information:
The inputs or methodology used for valuing securities may not be an indication of the risk associated with investing in those securities. For more information on valuation inputs, and their aggregation into the levels used in the table below, please refer to the security valuation section in the accompanying Notes to Financial Statements.
Valuation inputs at Reporting Date:
| Description | Level 1 | Level 2 | Level 3 | Total | ||||||||||||
| Common Stocks | ||||||||||||||||
| South Korea | $ | 67,285 | $ | 1,451,356 | $ | — | $ | 1,518,641 | ||||||||
| Taiwan | — | 1,348,221 | — | 1,348,221 | ||||||||||||
| Cayman Islands | 403,721 | 921,287 | — | 1,325,008 | ||||||||||||
| India | — | 819,615 | — | 819,615 | ||||||||||||
| South Africa | 371,029 | 207,418 | — | 578,447 | ||||||||||||
| Brazil | 467,865 | — | — | 467,865 | ||||||||||||
| Thailand | — | 436,508 | — | 436,508 | ||||||||||||
| China | — | 358,336 | — | 358,336 | ||||||||||||
| Indonesia | — | 290,513 | — | 290,513 | ||||||||||||
| Mexico | 249,310 | — | — | 249,310 | ||||||||||||
| Philippines | — | 217,231 | — | 217,231 | ||||||||||||
| Malaysia | 98,723 | 100,418 | — | 199,141 | ||||||||||||
| Hungary | 192,911 | — | — | 192,911 | ||||||||||||
| Poland | 98,028 | 74,015 | — | 172,043 | ||||||||||||
| Hong Kong | — | 128,636 | — | 128,636 | ||||||||||||
| United States | 114,148 | — | — | 114,148 | ||||||||||||
| Jersey | 107,131 | — | — | 107,131 | ||||||||||||
| United Kingdom | — | 90,812 | — | 90,812 | ||||||||||||
| Bermuda | — | 75,860 | — | 75,860 | ||||||||||||
| Russia | 62,358 | — | — | 62,358 | ||||||||||||
| Exchange Traded Fund | 89,188 | — | — | 89,188 | ||||||||||||
| Investment Funds | 118,762 | — | — | 118,762 | ||||||||||||
| Total | $ | 2,440,459 | $ | 6,520,226 | $ | — | $ | 8,960,685 | ||||||||
See accompanying Notes to Financial Statements.
| 55 |
Touchstone Merger Arbitrage Fund – September 30, 2016
| Market | ||||||||
| Shares | Value | |||||||
| Common Stocks — 68.9% | ||||||||
| Information Technology — 17.8% | ||||||||
| Alphabet, Inc. - Class C* | 1,294 | $ | 1,005,813 | |||||
| AVG Technologies NV (Netherlands)* | 83,805 | 2,095,963 | ||||||
| Cvent, Inc.*†† | 55,710 | 1,766,564 | ||||||
| Dell Technologies, Inc. - VMware Inc. - Class V* | 16,223 | 775,459 | ||||||
| Fleetmatics Group PLC (Ireland)*†† | 78,618 | 4,715,508 | ||||||
| InContact, Inc.*†† | 328,875 | 4,597,672 | ||||||
| KLA-Tencor Corp.†† | 85,660 | 5,971,359 | ||||||
| LinkedIn Corp. - Class A*†† | 28,471 | 5,441,378 | ||||||
| NetSuite, Inc.* | 26,078 | 2,886,574 | ||||||
| Rackspace Hosting, Inc.* | 62,825 | 1,990,924 | ||||||
| Silicon Graphics International Corp.* | 409,267 | 3,151,356 | ||||||
| 34,398,570 | ||||||||
| Health Care — 13.5% | ||||||||
| Alere, Inc.*†† | 74,660 | 3,228,298 | ||||||
| Cepheid* | 75,970 | 4,002,859 | ||||||
| Cynapsus Therapeutics, Inc (Canada).*†† | 73,825 | 2,969,242 | ||||||
| Envision Healthcare Holdings, Inc.* | 184,272 | 4,103,737 | ||||||
| Quintiles IMS Holdings, Inc.* | 30,695 | 2,488,137 | ||||||
| Raptor Pharmaceutical Corp.* | 443,598 | 3,979,074 | ||||||
| St Jude Medical, Inc.†† | 66,284 | 5,286,812 | ||||||
| 26,058,159 | ||||||||
| Financials — 11.5% | ||||||||
| American Capital Ltd.* | 240,793 | 4,071,810 | ||||||
| Astoria Financial Corp.†† | 313,270 | 4,573,742 | ||||||
| Cardinal Financial Corp. | 141,264 | 3,685,578 | ||||||
| Hennessy Capital Acquisition Corp. II* | 175,000 | 1,715,000 | ||||||
| National Interstate Corp.†† | 107,032 | 3,481,751 | ||||||
| PrivateBancorp, Inc.†† | 99,140 | 4,552,509 | ||||||
| 22,080,390 | ||||||||
| Consumer Discretionary — 9.5% | ||||||||
| Carmike Cinemas, Inc.*†† | 118,297 | 3,867,129 | ||||||
| CST Brands, Inc. | 93,900 | 4,515,651 | ||||||
| Media General, Inc.* | 208,090 | 3,835,099 | ||||||
| Skullcandy, Inc.* | 302,948 | 1,920,690 | ||||||
| Starz - Class A*†† | 131,560 | 4,103,356 | ||||||
| 18,241,925 | ||||||||
| Consumer Staples — 6.1% | ||||||||
| SABMiller PLC ADR | 20,000 | 1,161,800 | ||||||
| SABMiller PLC (United Kingdom) | 105,600 | 6,151,113 | ||||||
| WhiteWave Foods Co.*†† | 79,875 | 4,347,596 | ||||||
| 11,660,509 | ||||||||
| Utilities — 4.8% | ||||||||
| ITC Holdings Corp. | 83,940 | 3,901,531 | ||||||
| Piedmont Natural Gas Co., Inc.†† | 89,018 | 5,344,641 | ||||||
| 9,246,172 | ||||||||
| Industrials — 2.0% | ||||||||
| Virgin America, Inc.*†† | 73,615 | 3,939,139 | ||||||
| Real Estate — 1.8% | ||||||||
| Post Properties, Inc. REIT | 52,910 | 3,498,938 | ||||||
| Energy — 1.0% | ||||||||
| Bankers Petroleum Ltd. (Canada)* | 1,130,000 | 1,894,889 | ||||||
| Materials — 0.9% | ||||||||
| AEP Industries, Inc. | 16,360 | 1,789,293 | ||||||
| Total Common Stocks | $ | 132,807,984 | ||||||
| Principal | ||||||||
| Amount | ||||||||
| Corporate Bonds — 17.1% | ||||||||
| Consumer Discretionary — 7.1% | ||||||||
| $ | 4,000,000 | Glencore Canada Corp. (Canada), | ||||||
| 5.500%, 6/15/17 | 4,090,000 | |||||||
| 1,865,000 | HD Supply, Inc., 7.500%, 7/15/20 | 1,936,989 | ||||||
| 990,000 | Landry's Holdings II, Inc., 144a, | |||||||
| 10.250%, 1/1/18 | 1,010,988 | |||||||
| 990,000 | Landry's, Inc., 144a, 9.375%, 5/1/20 | 1,038,362 | ||||||
| 900,000 | LIN Television Corp., 5.875%, 11/15/22 | 942,750 | ||||||
| 800,000 | Lions Gate Entertainment Corp. | |||||||
| (Canada), 5.250%, 8/1/18 | 850,000 | |||||||
| 150,000 | Nexstar Broadcasting, Inc., | |||||||
| 6.875%, 11/15/20 | 155,812 | |||||||
| 3,500,000 | Time Warner Cable, LLC, | |||||||
| 5.850%, 5/1/17 | 3,587,395 | |||||||
| 13,612,296 | ||||||||
| Financials — 4.0% | ||||||||
| 4,000,000 | Ally Financial, Inc., 3.600%, 5/21/18 | 4,060,000 | ||||||
| 3,845,000 | PNC Preferred Funding Trust II, 144a, | |||||||
| 2.073%, 3/29/49(A)(B) | 3,671,975 | |||||||
| 7,731,975 | ||||||||
| Information Technology — 2.1% | ||||||||
| 4,050,000 | EMC Corp., 1.875%, 6/1/18 | 3,985,897 | ||||||
| Health Care — 1.5% | ||||||||
| 2,750,000 | inVentiv Health, Inc., 144a, | |||||||
| 9.000%, 1/15/18 | 2,823,906 | |||||||
| Energy — 1.0% | ||||||||
| 1,000,000 | Devon Energy Corp., | |||||||
| 1.390%, 12/15/16(A) | 998,767 | |||||||
| 975,000 | Targa Resources Partners LP / Targa | |||||||
| Resources Partners Finance Corp., | ||||||||
| 5.000%, 1/15/18 | 1,009,125 | |||||||
| 2,007,892 | ||||||||
| Industrials — 0.7% | ||||||||
| 1,295,000 | Beverage Packaging Holdings | |||||||
| Luxembourg II SA / Beverage | ||||||||
| Packaging Holdings II Is | ||||||||
| (Luxembourg), 144a, | ||||||||
| 5.625%, 12/15/16 | 1,291,892 | |||||||
| 150,000 | USG Corp., 144a, 7.875%, 3/30/20 | 156,375 | ||||||
| 1,448,267 | ||||||||
| 56 |
Touchstone Merger Arbitrage Fund (Continued)
| Principal | Market | |||||||
| Amount | Value | |||||||
| Corporate Bonds — 17.1% (Continued) | ||||||||
| Consumer Staples — 0.5% | ||||||||
| $ | 907,000 | Elizabeth Arden, Inc., 7.375%, 3/15/21 | $ | 939,879 | ||||
| Materials — 0.2% | ||||||||
| 365,000 | Glencore Finance Canada Ltd. | |||||||
| (Canada), 144a, 5.800%, 11/15/16 | 366,278 | |||||||
| Total Corporate Bonds | $ | 32,916,390 | ||||||
| Commercial Mortgage-Backed Securities — 2.1% | ||||||||
| 2,750,000 | CFCRE Commercial Mortgage Trust, | |||||||
| Ser 2015-RUM, Class C, 144a, | ||||||||
| 3.274%, 7/15/30(A) | 2,698,764 | |||||||
| 1,320,000 | GSCCRE Commercial Mortgage Trust, | |||||||
| Ser 2015-HULA, Class C, 144a, | ||||||||
| 3.274%, 8/15/32(A) | 1,310,679 | |||||||
| Total Commercial | ||||||||
| Mortgage-Backed Securities | $ | 4,009,443 | ||||||
| Shares | ||||||||
| Exchange Traded Funds — 3.3% | ||||||||
| Consumer Discretionary Select Sector SPDR Fund | 294 | 23,532 | ||||||
| Financial Select Sector SPDR Fund | 12,316 | 237,699 | ||||||
| Real Estate Select Sector SPDR Fund | 1,713 | 56,135 | ||||||
| SPDR S&P 500 ETF Trust | 26,400 | 5,710,320 | ||||||
| Technology Select Sector SPDR Fund | 5,976 | 285,533 | ||||||
| Total Exchange Traded Funds | $ | 6,313,219 | ||||||
| Preferred Stock — 0.3% | ||||||||
| Utilities — 0.3% | ||||||||
| Dayton Power & Light Co. (The), 3.90% | 5,569 | 559,685 | ||||||
| Warrant — 0.1% | ||||||||
| Financials — 0.1% | ||||||||
| Hennessy Capital Acquisition Corp. II, Expiration 09/11/20, Price $11.50* | 437,500 | 175,000 | ||||||
| Number | ||||||||
| of | ||||||||
| Contracts | ||||||||
| Purchased Put Options — 0.0% | ||||||||
| SPDR S&P 500 ETF Trust., Strike @ 197.00, Exp 10/16 | 84 | 1,008 | ||||||
| SPDR S&P 500 ETF Trust., Strike @ 208.00, Exp 10/16 | 222 | 14,208 | ||||||
| SPDR S&P 500 ETF Trust., Strike @ 218.00, Exp 10/16 | 138 | 42,642 | ||||||
| Total Purchased Put Options | 57,858 | |||||||
| Market | ||||||||
| Shares | Value | |||||||
| Investment Fund — 26.1% | ||||||||
| Dreyfus Government Cash Management, Institutional Shares, 0.30%∞Ω | 50,362,878 | $ | 50,362,878 | |||||
| Total Long Positions | ||||||||
| (Cost $226,901,663) | $ | 227,202,457 | ||||||
| Securities Sold Short —(24.9%) | ||||||||
| Common Stocks — (20.3%) | ||||||||
| Financials — (6.7%) | ||||||||
| Ares Capital Corp. | (116,306 | ) | (1,802,743 | ) | ||||
| Canadian Imperial Bank of Commerce (Canada) | (36,257 | ) | (2,811,005 | ) | ||||
| New York Community Bancorp, Inc. | (313,270 | ) | (4,457,832 | ) | ||||
| United Bankshares, Inc. | (100,300 | ) | (3,778,301 | ) | ||||
| (12,849,881 | ) | |||||||
| Health Care — (4.7%) | ||||||||
| Abbott Laboratories | (57,721 | ) | (2,441,021 | ) | ||||
| Amsurg Corp.* | (61,551 | ) | (4,126,995 | ) | ||||
| IMS Health Holdings, Inc.* | (79,938 | ) | (2,505,257 | ) | ||||
| (9,073,273 | ) | |||||||
| Information Technology — (3.2%) | ||||||||
| Alphabet, Inc. - Class A* | (1,249 | ) | (1,004,271 | ) | ||||
| Lam Research Corp. | (42,830 | ) | (4,056,429 | ) | ||||
| VMware, Inc. - Class A* | (16,157 | ) | (1,185,116 | ) | ||||
| (6,245,816 | ) | |||||||
| Consumer Discretionary — (2.3%) | ||||||||
| AMC Entertainment Holdings, Inc. - Class A | (38,398 | ) | (1,193,794 | ) | ||||
| Lions Gate Entertainment Corp. (Canada) | (89,254 | ) | (1,784,188 | ) | ||||
| Nexstar Broadcasting Group, Inc. - Class A | (25,991 | ) | (1,499,941 | ) | ||||
| (4,477,923 | ) | |||||||
| Real Estate — (1.8%) | ||||||||
| Mid-America Apartment Communities, Inc., REIT | (37,570 | ) | (3,531,204 | ) | ||||
| Utilities — (1.1%) | ||||||||
| Fortis, Inc. (Canada) | (63,045 | ) | (2,030,963 | ) | ||||
| Materials — (0.5%) | ||||||||
| Berry Plastics Group, Inc.* | (20,462 | ) | (897,259 | ) | ||||
| Total Common Stocks | $ | (39,106,319 | ) | |||||
| 57 |
Touchstone Merger Arbitrage Fund (Continued)
| Market | ||||||||
| Shares | Value | |||||||
| Exchange Traded Funds — (4.6%) | ||||||||
| Consumer Staples Select Sector SPDR Fund | (146 | ) | $ | (7,769 | ) | |||
| Energy Select Sector SPDR Fund | (3,981 | ) | (281,098 | ) | ||||
| iShares US Telecommunications ETF | (1,737 | ) | (55,966 | ) | ||||
| Materials Select Sector SPDR Fund | (96 | ) | (4,584 | ) | ||||
| SPDR S&P 500 ETF Trust | (38,400 | ) | (8,305,920 | ) | ||||
| Utilities Select Sector SPDR Fund | (5,359 | ) | (262,537 | ) | ||||
| Total Exchange Traded Funds | $ | (8,917,874 | ) | |||||
| Total Securities Sold Short | ||||||||
| (Proceeds $46,794,156) | $ | (48,024,193 | ) | |||||
| Number | ||||||||
| of | ||||||||
| Contracts | ||||||||
| Written Options — (0.1%) | ||||||||
| Written Put Options — (0.1%) | ||||||||
| SPDR S&P 500 ETF Trust., Strike @ 216.00, Exp 09/16 | (90 | ) | (180 | ) | ||||
| SPDR S&P 500 ETF Trust., Strike @ 202.00, Exp 10/16 | (168 | ) | (4,032 | ) | ||||
| SPDR S&P 500 ETF Trust., Strike @ 212.00, Exp 10/16 | (276 | ) | (32,016 | ) | ||||
| SPDR S&P 500 ETF Trust., Strike @ 216.00, Exp 10/16 | (120 | ) | (14,640 | ) | ||||
| (50,868 | ) | |||||||
| Written Call Options — (0.0%) | ||||||||
| Fleetmatics Group PLC, Strike @ 60.00, Exp 10/16 | (450 | ) | (18,000 | ) | ||||
| Whitewave Foods Co., Strike @ 57.50, Exp 10/16 | (337 | ) | (5,055 | ) | ||||
| $ | (23,055 | ) | ||||||
| Total Written Options | ||||||||
| (Premiums received $120,236) | $ | (73,923 | ) | |||||
| Total — 92.9% | 179,104,341 | |||||||
| Cash Collateral for Securities | ||||||||
| Sold Short and Written Options — 7.5% | 14,426,614 | |||||||
| Liabilities in Excess of Other Assets — (0.4%) | (769,117 | ) | ||||||
| Net Assets — 100.0% | $ | 192,761,838 | ||||||
| (A) | Variable rate security - Rate reflected is the rate in effect as of September 30, 2016. |
| (B) | Perpetual Bond - A Bond with no definite maturity date. |
| * | Non-income producing security. |
| †† | All or a portion of these securities are held as collateral for securities sold short and written options. The total value of the securities held as collateral as of September 30, 2016 was $64,917,149. |
| ∞ | Open-End Fund. |
| Ω | Represents the 7-day SEC yield as of September 30, 2016. |
Portfolio Abbreviations:
ADR - American Depositary Receipt
CAD - Canadian Dollar
ETF - Exchange Traded Fund
GBP - Great British Pound
LLC - Limited Liability Company
PLC - Public Limited Company
REIT - Real Estate Investment Trust
SPDR - Standard & Poor's Depositary Receipt
USD - United States Dollar
144a - This is a restricted security that was sold in a transaction qualifying for the exemption under Rule 144A of the Securities Act of 1933. This security may be sold in transactions exempt from registration, normally to qualified institutional buyers. At September 30, 2016, these securities were valued at $14,369,219 or 7.5% of net assets. These securities were deemed liquid pursuant to procedures approved by the Board of Trustees.
Other Information:
The inputs or methodology used for valuing securities may not be an indication of the risk associated with investing in those securities. For more information on valuation inputs, and their aggregation into the levels used in the table below, please refer to the security valuation section in the accompanying Notes to Financial Statements.
| 58 |
Touchstone Merger Arbitrage Fund (Continued)
Valuation inputs at Reporting Date:
| Description | Level 1 | Level 2 | Level 3 | Total | ||||||||||||
| Assets: | ||||||||||||||||
| Common Stocks | ||||||||||||||||
| Information Technology | $ | 34,398,570 | $ | — | $ | — | $ | 34,398,570 | ||||||||
| Health Care | 26,058,159 | — | — | 26,058,159 | ||||||||||||
| Financials | 22,080,390 | — | — | 22,080,390 | ||||||||||||
| Consumer Discretionary | 18,241,925 | — | — | 18,241,925 | ||||||||||||
| Consumer Staples | 5,509,396 | 6,151,113 | — | 11,660,509 | ||||||||||||
| Utilities | 9,246,172 | — | — | 9,246,172 | ||||||||||||
| Industrials | 3,939,139 | — | — | 3,939,139 | ||||||||||||
| Real Estate | 3,498,938 | — | — | 3,498,938 | ||||||||||||
| Energy | 1,894,889 | — | — | 1,894,889 | ||||||||||||
| Materials | 1,789,293 | — | — | 1,789,293 | ||||||||||||
| Corporate Bonds | — | 32,916,390 | — | 32,916,390 | ||||||||||||
| Commercial Mortgage-Backed Securities | — | 4,009,443 | — | 4,009,443 | ||||||||||||
| Exchange Traded Funds | 6,313,219 | — | — | 6,313,219 | ||||||||||||
| Preferred Stock | 559,685 | — | — | 559,685 | ||||||||||||
| Warrant | 175,000 | — | — | 175,000 | ||||||||||||
| Purchased Options Equity Contracts | 57,858 | — | — | 57,858 | ||||||||||||
| Investment Fund | 50,362,878 | — | — | 50,362,878 | ||||||||||||
| Other Financial Instruments** | ||||||||||||||||
| Forward Foreign Currency Contract | — | 84,152 | — | 84,152 | ||||||||||||
| Total Assets | $ | 184,125,511 | $ | 43,161,098 | $ | — | $ | 227,286,609 | ||||||||
| Liabilities: | ||||||||||||||||
| Securities Sold Short | ||||||||||||||||
| Common Stocks | $ | (39,106,319 | ) | $ | — | $ | — | $ | (39,106,319 | ) | ||||||
| Exchange Traded Funds | (8,917,874 | ) | — | — | (8,917,874 | ) | ||||||||||
| Other Financial Instruments** | ||||||||||||||||
| Written Options Equity Contracts | (73,923 | ) | — | — | (73,923 | ) | ||||||||||
| Forward Foreign Currency Contract | — | (15,140 | ) | — | (15,140 | ) | ||||||||||
| Total Liabilities | $ | (48,098,116 | ) | $ | (15,140 | ) | $ | — | $ | (48,113,256 | ) | |||||
| Total | $ | 136,027,395 | $ | 43,145,958 | $ | — | $ | 179,173,353 | ||||||||
** Other Financial Instruments are derivative instruments not reflected in total investments. Amounts shown represent market value for written option equity contracts and unrealized appreciation (depreciation) on forward foreign currency contracts.
| 59 |
Touchstone Merger Arbitrage Fund (Continued)
Transactions in written options for the year ended September 30, 2016.
| Number of | Premiums | |||||||
| Contracts | Received | |||||||
| Beginning balance, September 30, 2015 | 1,475 | $ | 275,757 | |||||
| Call Options Written | 2,736 | 145,483 | ||||||
| Put Options Written | 5,000 | 650,992 | ||||||
| Call Options Closed | (120 | ) | (9,535 | ) | ||||
| Put Options Closed | (2,888 | ) | (433,573 | ) | ||||
| Call Options Expired | (887 | ) | (19,483 | ) | ||||
| Put Options Expired | (2,759 | ) | (367,658 | ) | ||||
| Call Options Exercised | (942 | ) | (102,194 | ) | ||||
| Put Options Exercised | (174 | ) | (19,553 | ) | ||||
| Ending balance, September 30, 2016 | 1,441 | $ | 120,236 | |||||
Forward Foreign Currency Contracts
| Unrealized | ||||||||||||||
| Contract to | Appreication/ | |||||||||||||
| Counterparty | Expiration Date | Receive | Deliver | (Depreciation) | ||||||||||
| Brown Brothers Harriman | 10/14/2016 | USD | 7,412,146 | GBP | 5,652,000 | $ | 84,152 | |||||||
| Brown Brothers Harriman | 10/21/2016 | USD | 1,880,057 | CAD | 2,486,000 | (15,140 | ) | |||||||
| $ | 69,012 | |||||||||||||
See accompanying Notes to Financial Statements.
| 60 |
Touchstone Mid Cap Fund – September 30, 2016
| Market | ||||||||
| Shares | Value | |||||||
| Common Stocks — 97.6% | ||||||||
| Consumer Discretionary — 25.8% | ||||||||
| CarMax, Inc.*† | 458,280 | $ | 24,449,238 | |||||
| Deckers Outdoor Corp.* | 201,840 | 12,019,572 | ||||||
| Dollar Tree, Inc.* | 288,100 | 22,739,733 | ||||||
| Hasbro, Inc. | 293,920 | 23,316,674 | ||||||
| Penske Automotive Group, Inc.† | 512,214 | 24,678,471 | ||||||
| PulteGroup, Inc. | 1,252,920 | 25,108,517 | ||||||
| Tempur Sealy International, Inc.*† | 411,160 | 23,329,218 | ||||||
| Whirlpool Corp. | 133,340 | 21,622,414 | ||||||
| 177,263,837 | ||||||||
| Information Technology — 16.9% | ||||||||
| Amphenol Corp. - Class A | 530,890 | 34,465,379 | ||||||
| Citrix Systems, Inc.* | 323,940 | 27,606,167 | ||||||
| Paychex, Inc. | 528,400 | 30,578,508 | ||||||
| Symantec Corp. | 916,800 | 23,011,680 | ||||||
| 115,661,734 | ||||||||
| Industrials — 15.9% | ||||||||
| Cintas Corp. | 374,170 | 42,131,542 | ||||||
| Copart, Inc.* | 477,310 | 25,564,724 | ||||||
| Dover Corp. | 298,171 | 21,957,312 | ||||||
| Old Dominion Freight Line, Inc.* | 286,710 | 19,671,173 | ||||||
| 109,324,751 | ||||||||
| Financials — 14.0% | ||||||||
| Alleghany Corp.* | 60,390 | 31,705,957 | ||||||
| M&T Bank Corp. | 215,280 | 24,994,008 | ||||||
| Progressive Corp. (The) | 780,740 | 24,593,310 | ||||||
| Voya Financial, Inc. | 498,220 | 14,358,700 | ||||||
| 95,651,975 | ||||||||
| Materials — 13.8% | ||||||||
| Ball Corp. | 417,740 | 34,233,793 | ||||||
| NewMarket Corp. | 77,810 | 33,405,389 | ||||||
| Vulcan Materials Co. | 236,290 | 26,873,262 | ||||||
| 94,512,444 | ||||||||
| Consumer Staples — 9.7% | ||||||||
| Brown-Forman Corp. - Class B | 441,020 | 20,921,989 | ||||||
| Edgewell Personal Care Co.* | 225,030 | 17,894,386 | ||||||
| Energizer Holdings, Inc. | 362,671 | 18,119,043 | ||||||
| PriceSmart, Inc. | 115,930 | 9,710,297 | ||||||
| 66,645,715 | ||||||||
| Health Care — 1.5% | ||||||||
| Tenet Healthcare Corp.* | 450,500 | 10,208,330 | ||||||
| Total Common Stocks | $ | 669,268,786 | ||||||
| Investment Funds — 8.2% | ||||||||
| Dreyfus Government Cash Management, Institutional Shares, 0.30%∞Ω | 15,490,432 | 15,490,432 | ||||||
| Invesco Government & Agency Portfolio, Institutional Class, 0.31%**∞Ω | 41,064,072 | 41,064,072 | ||||||
| Total Investment Funds | $ | 56,554,504 | ||||||
| Total Investment Securities —105.8% | ||||||||
| (Cost $657,791,204) | $ | 725,823,290 | ||||||
| Liabilities in Excess of Other Assets — (5.8%) | (39,808,267 | ) | ||||||
| Net Assets — 100.0% | $ | 686,015,023 | ||||||
| * | Non-income producing security. |
| ** | Represents collateral for securities loaned. |
| † | All or a portion of the security is on loan. The total market value of the securities on loan as of September 30, 2016 was $41,122,934. |
| ∞ | Open-End Fund. |
| Ω | Represents the 7-day SEC yield as of September 30, 2016. |
Other Information:
The inputs or methodology used for valuing securities may not be an indication of the risk associated with investing in those securities. For more information on valuation inputs, and their aggregation into the levels used in the table below, please refer to the security valuation section in the accompanying Notes to Financial Statements.
Valuation inputs at Reporting Date:
| Description | Level 1 | Level 2 | Level 3 | Total | ||||||||||||
| Common Stocks | $ | 669,268,786 | $ | — | $ | — | $ | 669,268,786 | ||||||||
| Investment Funds | 56,554,504 | — | — | 56,554,504 | ||||||||||||
| Total | $ | 725,823,290 | $ | — | $ | — | $ | 725,823,290 | ||||||||
See accompanying Notes to Financial Statements.
| 61 |
Touchstone Mid Cap Value Fund – September 30, 2016
| Market | ||||||||
| Shares | Value | |||||||
| Common Stocks — 101.0% | ||||||||
| Financials — 20.8% | ||||||||
| Allstate Corp. (The) | 131,503 | $ | 9,097,378 | |||||
| Ameriprise Financial, Inc. | 68,176 | 6,801,920 | ||||||
| Blackstone Mortgage Trust, Inc. - Class A, REIT | 292,887 | 8,625,522 | ||||||
| E*TRADE Financial Corp.* | 283,107 | 8,244,076 | ||||||
| Hancock Holding Co. | 229,105 | 7,429,875 | ||||||
| Hanover Insurance Group, Inc. (The) | 67,140 | 5,063,699 | ||||||
| Hartford Financial Services Group, Inc. (The) | 195,327 | 8,363,902 | ||||||
| M&T Bank Corp. | 65,565 | 7,612,096 | ||||||
| Reinsurance Group of America, Inc. | 74,310 | 8,021,021 | ||||||
| SunTrust Banks, Inc. | 122,054 | 5,345,965 | ||||||
| SVB Financial Group* | 57,815 | 6,390,870 | ||||||
| TCF Financial Corp. | 363,467 | 5,273,906 | ||||||
| Unum Group | 233,954 | 8,260,916 | ||||||
| Zions Bancorporation | 341,916 | 10,606,234 | ||||||
| 105,137,380 | ||||||||
| Industrials — 11.9% | ||||||||
| Aercap Holdings N.V. (Netherlands)* | 219,821 | 8,460,910 | ||||||
| Clean Harbors, Inc.* | 83,510 | 4,006,810 | ||||||
| Dover Corp. | 80,899 | 5,957,402 | ||||||
| Fluor Corp. | 89,810 | 4,609,049 | ||||||
| KAR Auction Services, Inc. | 200,508 | 8,653,925 | ||||||
| Parker-Hannifin Corp. | 42,149 | 5,290,964 | ||||||
| Regal-Beloit Corp. | 123,131 | 7,325,063 | ||||||
| Stericycle, Inc.* | 105,227 | 8,432,892 | ||||||
| Xylem, Inc. | 135,938 | 7,129,948 | ||||||
| 59,866,963 | ||||||||
| Information Technology — 11.6% | ||||||||
| Cadence Design Systems, Inc.* | 324,178 | 8,276,264 | ||||||
| CSRA, Inc. | 297,654 | 8,006,893 | ||||||
| Diebold, Inc. | 235,611 | 5,840,797 | ||||||
| Fidelity National Information Services, Inc. | 119,567 | 9,210,246 | ||||||
| IAC/InterActiveCorp. | 74,558 | 4,657,638 | ||||||
| Microchip Technology, Inc. | 114,594 | 7,120,871 | ||||||
| Qorvo, Inc.* | 145,801 | 8,126,948 | ||||||
| Synopsys, Inc.* | 121,764 | 7,226,693 | ||||||
| 58,466,350 | ||||||||
| Health Care — 11.1% | ||||||||
| AmerisourceBergen Corp. | 83,801 | 6,769,445 | ||||||
| Amsurg Corp.* | 122,675 | 8,225,359 | ||||||
| Charles River Laboratories International, Inc.* | 77,750 | 6,479,685 | ||||||
| Cooper Cos, Inc. (The) | 39,041 | 6,998,490 | ||||||
| DENTSPLY SIRONA, Inc. | 119,567 | 7,105,867 | ||||||
| Patterson Cos., Inc. | 135,316 | 6,216,417 | ||||||
| Quest Diagnostics, Inc. | 93,250 | 7,891,748 | ||||||
| St. Jude Medical, Inc. | 78,537 | 6,264,111 | ||||||
| 55,951,122 | ||||||||
| Consumer Discretionary — 9.0% | ||||||||
| American Eagle Outfitters, Inc. | 268,933 | 4,803,143 | ||||||
| Aramark | 138,797 | 5,278,450 | ||||||
| BorgWarner, Inc. | 211,242 | 7,431,494 | ||||||
| Dollar General Corp. | 94,127 | 6,587,949 | ||||||
| Harley-Davidson, Inc. | 119,028 | 6,259,683 | ||||||
| LKQ Corp.* | 178,501 | 6,329,645 | ||||||
| Nordstrom, Inc.† | 83,013 | 4,306,714 | ||||||
| Ralph Lauren Corp. | 44,884 | 4,539,568 | ||||||
| 45,536,646 | ||||||||
| Utilities — 8.8% | ||||||||
| DTE Energy Co. | 105,932 | 9,922,650 | ||||||
| Edison International | 118,821 | 8,584,817 | ||||||
| Great Plains Energy, Inc. | 221,893 | 6,055,460 | ||||||
| Pinnacle West Capital Corp. | 100,917 | 7,668,683 | ||||||
| Portland General Electric Co. | 119,526 | 5,090,612 | ||||||
| PPL Corp. | 202,124 | 6,987,427 | ||||||
| 44,309,649 | ||||||||
| Energy — 7.8% | ||||||||
| Anadarko Petroleum Corp. | 133,700 | 8,471,232 | ||||||
| EQT Corp. | 119,235 | 8,658,846 | ||||||
| Newfield Exploration Co.* | 209,045 | 9,085,096 | ||||||
| Pioneer Natural Resources Co. | 43,309 | 8,040,316 | ||||||
| Spectra Energy Corp. | 123,380 | 5,274,495 | ||||||
| 39,529,985 | ||||||||
| Real Estate — 7.6% | ||||||||
| Alexandria Real Estate Equities, Inc., REIT | 82,847 | 9,011,268 | ||||||
| American Campus Communities, Inc., REIT | 180,946 | 9,204,723 | ||||||
| Brixmor Property Group, Inc., REIT | 293,509 | 8,156,615 | ||||||
| Equinix, Inc., REIT | 17,034 | 6,136,498 | ||||||
| Host Hotels & Resorts, Inc., REIT | 385,516 | 6,002,484 | ||||||
| 38,511,588 | ||||||||
| Materials — 6.9% | ||||||||
| Albemarle Corp. | 91,095 | 7,787,712 | ||||||
| Allegheny Technologies, Inc.† | 231,591 | 4,184,849 | ||||||
| Bemis Co., Inc. | 125,618 | 6,407,774 | ||||||
| FMC Corp. | 107,880 | 5,214,919 | ||||||
| Olin Corp. | 250,283 | 5,135,807 | ||||||
| Scotts Miracle-Gro Co. (The) - Class A | 72,569 | 6,042,821 | ||||||
| 34,773,882 | ||||||||
| Consumer Staples — 5.5% | ||||||||
| Darling Ingredients, Inc.* | 433,715 | 5,859,490 | ||||||
| Hain Celestial Group, Inc. (The)* | 177,341 | 6,309,793 | ||||||
| Ingredion, Inc. | 50,811 | 6,760,912 | ||||||
| TreeHouse Foods, Inc.* | 104,150 | 9,080,838 | ||||||
| 28,011,033 | ||||||||
| Total Common Stocks | $ | 510,094,598 | ||||||
| 62 |
Touchstone Mid Cap Value Fund (Continued)
| Market | ||||||||
| Shares | Value | |||||||
| Investment Funds — 3.1% | ||||||||
| Dreyfus Government Cash Management, Institutional Shares, 0.30%∞Ω | 8,477,302 | $ | 8,477,302 | |||||
| Invesco Government & Agency Portfolio, Institutional Class, 0.31%**∞Ω | 6,925,787 | 6,925,787 | ||||||
| Total Investment Funds | $ | 15,403,089 | ||||||
| Total Investment Securities —104.1% | ||||||||
| (Cost $469,795,903) | $ | 525,497,687 | ||||||
| Liabilities in Excess of Other Assets — (4.1%) | (20,575,660 | ) | ||||||
| Net Assets — 100.0% | $ | 504,922,027 | ||||||
| * | Non-income producing security. |
| ** | Represents collateral for securities loaned. |
| † | All or a portion of the security is on loan. The total market value of the securities on loan as of September 30, 2016 was $6,851,937. |
| ∞ | Open-End Fund. |
| Ω | Represents the 7-day SEC yield as of September 30, 2016. |
Portfolio Abbreviations:
REIT - Real Estate Investment Trust
Other Information:
The inputs or methodology used for valuing securities may not be an indication of the risk associated with investing in those securities. For more information on valuation inputs, and their aggregation into the levels used in the table below, please refer to the security valuation section in the accompanying Notes to Financial Statements.
Valuation inputs at Reporting Date:
| Description | Level 1 | Level 2 | Level 3 | Total | ||||||||||||
| Common Stocks | $ | 510,094,598 | $ | — | $ | — | $ | 510,094,598 | ||||||||
| Investment Funds | 15,403,089 | — | — | 15,403,089 | ||||||||||||
| Total | $ | 525,497,687 | $ | — | $ | — | $ | 525,497,687 | ||||||||
See accompanying Notes to Financial Statements.
| 63 |
Touchstone Premium Yield Equity Fund – September 30, 2016
| Market | ||||||||
| Shares | Value | |||||||
| Common Stocks — 95.8% | ||||||||
| Health Care — 19.9% | ||||||||
| Abbott Laboratories | 75,602 | $ | 3,197,209 | |||||
| AbbVie, Inc. | 83,857 | 5,288,861 | ||||||
| GlaxoSmithKline PLC, ADR | 101,151 | 4,362,643 | ||||||
| Johnson & Johnson | 38,019 | 4,491,184 | ||||||
| Merck & Co., Inc. | 88,752 | 5,539,012 | ||||||
| Novartis AG, ADR | 33,935 | 2,679,508 | ||||||
| Pfizer, Inc. | 140,306 | 4,752,164 | ||||||
| 30,310,581 | ||||||||
| Information Technology — 14.7% | ||||||||
| Cisco Systems, Inc. | 155,335 | 4,927,226 | ||||||
| International Business Machines Corp. | 18,996 | 3,017,515 | ||||||
| Microchip Technology, Inc. | 75,048 | 4,663,483 | ||||||
| QUALCOMM, Inc. | 91,036 | 6,235,966 | ||||||
| Western Digital Corp. | 62,226 | 3,638,354 | ||||||
| 22,482,544 | ||||||||
| Real Estate — 12.8% | ||||||||
| Digital Realty Trust, Inc., REIT | 40,865 | 3,968,809 | ||||||
| Hospitality Properties Trust, REIT | 104,740 | 3,112,873 | ||||||
| Lamar Advertising Co., REIT | 45,857 | 2,994,921 | ||||||
| Omega Healthcare Investors, Inc., REIT | 40,787 | 1,445,899 | ||||||
| Ventas, Inc., REIT | 46,334 | 3,272,570 | ||||||
| Weyerhaeuser Co., REIT | 146,838 | 4,690,006 | ||||||
| 19,485,078 | ||||||||
| Energy — 11.0% | ||||||||
| ONEOK, Inc. | 110,585 | 5,682,963 | ||||||
| Pembina Pipeline Corp. (Canada) | 45,681 | 1,391,443 | ||||||
| Plains GP Holdings LP - Class A | 347,633 | 4,498,371 | ||||||
| Spectra Energy Corp. | 122,782 | 5,248,931 | ||||||
| 16,821,708 | ||||||||
| Financials — 8.3% | ||||||||
| Bank of Montreal (Canada) | 41,113 | 2,695,779 | ||||||
| CME Group, Inc. | 27,082 | 2,830,611 | ||||||
| PacWest Bancorp | 38,357 | 1,645,899 | ||||||
| Toronto-Dominion Bank (The) (Canada) | 69,501 | 3,085,844 | ||||||
| Wells Fargo & Co. | 56,381 | 2,496,551 | ||||||
| 12,754,684 | ||||||||
| Telecommunication Services — 8.0% | ||||||||
| AT&T, Inc. | 109,635 | 4,452,277 | ||||||
| BCE, Inc. (Canada) | 28,061 | 1,295,857 | ||||||
| Verizon Communications, Inc. | 36,871 | 1,916,555 | ||||||
| Vodafone Group PLC, ADR | 154,023 | 4,489,770 | ||||||
| 12,154,459 | ||||||||
| Industrials — 7.0% | ||||||||
| Covanta Holding Corp. | 69,805 | 1,074,299 | ||||||
| Eaton Corp. PLC (Ireland) | 39,808 | 2,615,784 | ||||||
| General Electric Co. | 143,849 | 4,260,807 | ||||||
| United Parcel Service, Inc. - Class B | 25,451 | 2,783,321 | ||||||
| 10,734,211 | ||||||||
| Consumer Discretionary — 6.7% | ||||||||
| Coach, Inc. | 99,193 | 3,626,496 | ||||||
| Johnson Controls International PLC (Ireland) | 85,393 | 3,973,336 | ||||||
| L Brands, Inc. | 37,524 | 2,655,573 | ||||||
| 10,255,405 | ||||||||
| Materials — 4.3% | ||||||||
| Domtar Corp. | 79,289 | 2,944,001 | ||||||
| LyondellBasell Industries N.V. - Class A (Netherlands) | 44,702 | 3,605,663 | ||||||
| 6,549,664 | ||||||||
| Consumer Staples — 3.1% | ||||||||
| Procter & Gamble Co. (The) | 52,419 | 4,704,605 | ||||||
| Total Common Stocks | $ | 146,252,939 | ||||||
| Investment Fund — 4.1% | ||||||||
| Dreyfus Government Cash Management, Institutional Shares, 0.30%∞Ω | 6,192,657 | 6,192,657 | ||||||
| Total Investment Securities —99.9% | ||||||||
| (Cost $138,837,574) | $ | 152,445,596 | ||||||
| Other Assets in Excess of Liabilities — 0.1% | 195,562 | |||||||
| Net Assets — 100.0% | $ | 152,641,158 | ||||||
| ∞ | Open-End Fund. |
| Ω | Represents the 7-day SEC yield as of September 30, 2016. |
Portfolio Abbreviations:
ADR - American Depositary Receipt
PLC - Public Limited Company
REIT - Real Estate Investment Trust
Other Information:
The inputs or methodology used for valuing securities may not be an indication of the risk associated with investing in those securities. For more information on valuation inputs, and their aggregation into the levels used in the table below, please refer to the security valuation section in the accompanying Notes to Financial Statements.
Valuation inputs at Reporting Date:
| Description | Level 1 | Level 2 | Level 3 | Total | ||||||||||||
| Common Stocks | $ | 146,252,939 | $ | — | $ | — | $ | 146,252,939 | ||||||||
| Investment Fund | 6,192,657 | — | — | 6,192,657 | ||||||||||||
| Total | $ | 152,445,596 | $ | — | $ | — | $ | 152,445,596 | ||||||||
See accompanying Notes to Financial Statements.
| 64 |
Touchstone Sands Capital Select Growth Fund – September 30, 2016
| Market | ||||||||
| Shares | Value | |||||||
| Common Stocks — 98.1% | ||||||||
| Information Technology — 48.3% | ||||||||
| Adobe Systems, Inc.* | 1,346,134 | $ | 146,109,384 | |||||
| Alibaba Group Holding Ltd. ADR* | 1,365,867 | 144,495,070 | ||||||
| Alphabet, Inc. - Class A* | 169,300 | 136,127,358 | ||||||
| Alphabet, Inc. - Class C* | 63,500 | 49,357,915 | ||||||
| Baidu, Inc. ADR* | 540,780 | 98,459,815 | ||||||
| Facebook, Inc. - Class A* | 1,918,880 | 246,134,738 | ||||||
| Mobileye N.V. (Netherlands)*† | 1,305,648 | 55,581,435 | ||||||
| Palo Alto Networks, Inc.* | 600,400 | 95,661,732 | ||||||
| Salesforce.com, Inc.* | 2,948,612 | 210,324,494 | ||||||
| Splunk, Inc.* | 1,300,844 | 76,333,526 | ||||||
| Visa, Inc. - Class A | 3,686,199 | 304,848,657 | ||||||
| 1,563,434,124 | ||||||||
| Health Care — 22.1% | ||||||||
| Alexion Pharmaceuticals, Inc.* | 712,230 | 87,276,664 | ||||||
| athenahealth, Inc.*† | 428,051 | 53,985,792 | ||||||
| Biogen, Inc.* | 237,590 | 74,372,800 | ||||||
| BioMarin Pharmaceutical, Inc.* | 968,681 | 89,622,366 | ||||||
| Cerner Corp.* | 1,064,331 | 65,722,439 | ||||||
| Edwards Lifesciences Corp.* | 778,677 | 93,877,299 | ||||||
| Illumina, Inc.* | 580,396 | 105,434,737 | ||||||
| Incyte Corp.* | 579,062 | 54,599,756 | ||||||
| Regeneron Pharmaceuticals, Inc.* | 222,431 | 89,421,711 | ||||||
| 714,313,564 | ||||||||
| Consumer Discretionary — 19.8% | ||||||||
| Amazon.com, Inc.* | 254,000 | 212,676,740 | ||||||
| Chipotle Mexican Grill, Inc.* | 189,500 | 80,253,250 | ||||||
| Netflix, Inc.* | 1,027,000 | 101,210,850 | ||||||
| Priceline Group, Inc. (The)* | 127,300 | 187,320,677 | ||||||
| Under Armour, Inc. - Class A*† | 840,000 | 32,491,200 | ||||||
| Under Armour, Inc. - Class C* | 846,019 | 28,646,203 | ||||||
| 642,598,920 | ||||||||
| Financials — 3.5% | ||||||||
| Charles Schwab Corp. (The) | 2,658,000 | 83,913,060 | ||||||
| LendingClub Corp.*† | 4,559,000 | 28,174,620 | ||||||
| 112,087,680 | ||||||||
| Materials — 2.4% | ||||||||
| Monsanto Co. | 773,500 | 79,051,700 | ||||||
| Energy — 2.0% | ||||||||
| Schlumberger Ltd. (Curacao) | 838,482 | 65,938,224 | ||||||
| Total Common Stocks | $ | 3,177,424,212 | ||||||
| Investment Funds — 7.0% | ||||||||
| Dreyfus Government Cash Management, Institutional Shares, 0.30%∞Ω | 123,874,168 | 123,874,168 | ||||||
| Invesco Government & Agency Portfolio, Institutional Class, 0.31%**∞Ω | 101,299,820 | 101,299,820 | ||||||
| Total Investment Funds | $ | 225,173,988 | ||||||
| Total Investment Securities —105.1% | ||||||||
| (Cost $1,991,125,559) | $ | 3,402,598,200 | ||||||
| Liabilities in Excess of Other Assets — (5.1%) | (164,560,595 | ) | ||||||
| Net Assets — 100.0% | $ | 3,238,037,605 | ||||||
| * | Non-income producing security. |
| ** | Represents collateral for securities loaned. |
| † | All or a portion of the security is on loan. The total market value of the securities on loan as of September 30, 2016 was $100,594,535. |
| ∞ | Open-End Fund. |
| Ω | Represents the 7-day SEC yield as of September 30, 2016. |
Portfolio Abbreviation:
ADR - American Depositary Receipt
Other Information:
The inputs or methodology used for valuing securities may not be an indication of the risk associated with investing in those securities. For more information on valuation inputs, and their aggregation into the levels used in the table below, please refer to the security valuation section in the accompanying Notes to Financial Statements.
Valuation inputs at Reporting Date:
| Description | Level 1 | Level 2 | Level 3 | Total | ||||||||||||
| Common Stocks | $ | 3,177,424,212 | $ | — | $ | — | $ | 3,177,424,212 | ||||||||
| Investment Funds | 225,173,988 | — | — | 225,173,988 | ||||||||||||
| Total | $ | 3,402,598,200 | $ | — | $ | — | $ | 3,402,598,200 | ||||||||
See accompanying Notes to Financial Statements.
| 65 |
Touchstone Small Cap Fund – September 30, 2016
| Market | ||||||||
| Shares | Value | |||||||
| Common Stocks — 98.8% | ||||||||
| Industrials — 26.0% | ||||||||
| Armstrong World Industries, Inc.* | 444,570 | $ | 18,369,632 | |||||
| GATX Corp.† | 515,520 | 22,966,418 | ||||||
| Kaman Corp. | 472,858 | 20,767,923 | ||||||
| Landstar System, Inc. | 283,240 | 19,282,979 | ||||||
| Matson, Inc. | 449,575 | 17,929,051 | ||||||
| Orbital ATK, Inc. | 465,802 | 35,508,086 | ||||||
| USG Corp.* | 852,700 | 22,042,295 | ||||||
| 156,866,384 | ||||||||
| Consumer Discretionary — 24.8% | ||||||||
| Cabela's, Inc.* | 311,926 | 17,134,095 | ||||||
| Deckers Outdoor Corp.* | 259,690 | 15,464,540 | ||||||
| Penske Automotive Group, Inc.† | 595,000 | 28,667,100 | ||||||
| Service Corp. International | 1,031,420 | 27,373,887 | ||||||
| Sturm Ruger & Co., Inc.† | 194,862 | 11,255,229 | ||||||
| Tempur Sealy International, Inc.*† | 518,180 | 29,401,533 | ||||||
| Vista Outdoor, Inc.* | 510,890 | 20,364,075 | ||||||
| 149,660,459 | ||||||||
| Materials — 11.6% | ||||||||
| NewMarket Corp. | 96,593 | 41,469,307 | ||||||
| Olin Corp. | 1,018,340 | 20,896,337 | ||||||
| Tredegar Corp. | 401,260 | 7,459,423 | ||||||
| 69,825,067 | ||||||||
| Real Estate — 10.2% | ||||||||
| Alexander & Baldwin, Inc. | 742,458 | 28,525,236 | ||||||
| First Industrial Realty Trust, Inc. REIT | 908,351 | 25,633,665 | ||||||
| Tejon Ranch Co.* | 309,851 | 7,535,576 | ||||||
| 61,694,477 | ||||||||
| Consumer Staples — 8.3% | ||||||||
| Energizer Holdings, Inc. | 526,980 | 26,327,921 | ||||||
| PriceSmart, Inc. | 280,605 | 23,503,475 | ||||||
| 49,831,396 | ||||||||
| Financials — 7.4% | ||||||||
| Eaton Vance Corp. | 340,939 | 13,313,668 | ||||||
| MBIA, Inc.* | 1,350,954 | 10,523,932 | ||||||
| White Mountains Insurance Group Ltd. | 25,089 | 20,823,870 | ||||||
| 44,661,470 | ||||||||
| Energy — 4.5% | ||||||||
| Superior Energy Services, Inc. | 983,990 | 17,613,421 | ||||||
| World Fuel Services Corp. | 202,294 | 9,358,120 | ||||||
| 26,971,541 | ||||||||
| Information Technology — 3.9% | ||||||||
| DST Systems, Inc. | 201,610 | 23,773,851 | ||||||
| Health Care — 2.1% | ||||||||
| Tenet Healthcare Corp.* | 569,837 | 12,912,506 | ||||||
| Total Common Stocks | $ | 596,197,151 | ||||||
| Investment Funds — 11.2% | ||||||||
| Dreyfus Government Cash Management, Institutional Shares, 0.30%∞Ω | 3,398 | 3,398 | ||||||
| Invesco Government & Agency Portfolio, Institutional Class, 0.31%**∞Ω | 67,474,423 | 67,474,423 | ||||||
| Total Investment Funds | $ | 67,477,821 | ||||||
| Total Investment Securities —110.0% | ||||||||
| (Cost $528,142,370) | $ | 663,674,972 | ||||||
| Liabilities in Excess of Other Assets — (10.0%) | (60,155,525 | ) | ||||||
| Net Assets — 100.0% | $ | 603,519,447 | ||||||
| * | Non-income producing security. |
| ** | Represents collateral for securities loaned. |
| † | All or a portion of the security is on loan. The total market value of the securities on loan as of September 30, 2016 was $67,507,093. |
| ∞ | Open-End Fund. |
| Ω | Represents the 7-day SEC yield as of September 30, 2016. |
Portfolio Abbreviation:
REIT - Real Estate Investment Trust
Other Information:
The inputs or methodology used for valuing securities may not be an indication of the risk associated with investing in those securities. For more information on valuation inputs, and their aggregation into the levels used in the table below, please refer to the security valuation section in the accompanying Notes to Financial Statements.
Valuation inputs at Reporting Date:
| Description | Level 1 | Level 2 | Level 3 | Total | ||||||||||||
| Common Stocks | $ | 596,197,151 | $ | — | $ | — | $ | 596,197,151 | ||||||||
| Investment Funds | 67,477,821 | — | — | 67,477,821 | ||||||||||||
| Total | $ | 663,674,972 | $ | — | $ | — | $ | 663,674,972 | ||||||||
See accompanying Notes to Financial Statements.
| 66 |
Touchstone Small Cap Value Fund – September 30, 2016
| Market | ||||||||
| Shares | Value | |||||||
| Common Stocks — 98.0% | ||||||||
| Financials — 26.2% | ||||||||
| BankUnited, Inc. | 58,194 | $ | 1,757,459 | |||||
| Blackstone Mortgage Trust, Inc. - Class A REIT | 122,880 | 3,618,816 | ||||||
| Boston Private Financial Holdings, Inc. | 84,034 | 1,078,156 | ||||||
| Eagle Bancorp, Inc.* | 33,506 | 1,652,851 | ||||||
| Employers Holdings, Inc. | 33,532 | 1,000,260 | ||||||
| Endurance Specialty Holdings Ltd. (Bermuda) | 15,640 | 1,023,638 | ||||||
| Federated Investors, Inc. - Class B | 28,788 | 852,988 | ||||||
| First Horizon National Corp. | 143,147 | 2,180,129 | ||||||
| Hancock Holding Co. | 80,463 | 2,609,415 | ||||||
| Hanover Insurance Group, Inc. (The) | 31,555 | 2,379,878 | ||||||
| Hercules Capital, Inc. | 176,551 | 2,394,032 | ||||||
| Horace Mann Educators Corp. | 85,232 | 3,123,753 | ||||||
| IBERIABANK Corp. | 36,365 | 2,440,819 | ||||||
| Infinity Property & Casualty Corp. | 23,770 | 1,964,115 | ||||||
| MB Financial, Inc. | 56,231 | 2,139,027 | ||||||
| PacWest Bancorp | 47,844 | 2,052,986 | ||||||
| ServisFirst Bancshares, Inc. | 42,823 | 2,222,942 | ||||||
| SLM Corp.* | 310,099 | 2,316,440 | ||||||
| Sterling Bancorp | 213,128 | 3,729,740 | ||||||
| TCF Financial Corp. | 133,298 | 1,934,154 | ||||||
| Univest Corp. of Pennsylvania | 83,935 | 1,960,722 | ||||||
| Validus Holdings Ltd. (Bermuda) | 45,057 | 2,244,740 | ||||||
| 46,677,060 | ||||||||
| Industrials — 21.0% | ||||||||
| Actuant Corp. - Class A | 58,410 | 1,357,446 | ||||||
| Altra Industrial Motion Corp. | 35,053 | 1,015,485 | ||||||
| Clean Harbors, Inc.* | 37,421 | 1,795,460 | ||||||
| EMCOR Group, Inc. | 40,715 | 2,427,428 | ||||||
| EnPro Industries, Inc. | 36,393 | 2,067,850 | ||||||
| Generac Holdings, Inc.* | 50,571 | 1,835,727 | ||||||
| Hexcel Corp. | 42,396 | 1,878,143 | ||||||
| Huron Consulting Group, Inc.* | 42,600 | 2,545,776 | ||||||
| ITT, Inc. | 42,999 | 1,541,084 | ||||||
| Korn/Ferry International | 83,795 | 1,759,695 | ||||||
| Matthews International Corp. - Class A | 26,842 | 1,630,920 | ||||||
| Multi-Color Corp. | 14,641 | 966,306 | ||||||
| Regal Beloit Corp. | 31,525 | 1,875,422 | ||||||
| Standex International Corp. | 22,516 | 2,091,061 | ||||||
| Team, Inc.* | 59,425 | 1,943,792 | ||||||
| Teledyne Technologies, Inc.* | 10,607 | 1,144,814 | ||||||
| Tetra Tech, Inc. | 64,174 | 2,276,252 | ||||||
| TriMas Corp.* | 92,156 | 1,715,023 | ||||||
| TriNet Group, Inc.* | 110,625 | 2,392,819 | ||||||
| Triumph Group, Inc. | 44,695 | 1,246,097 | ||||||
| Watts Water Technologies, Inc. - Class A | 29,137 | 1,889,243 | ||||||
| 37,395,843 | ||||||||
| Information Technology — 13.4% | ||||||||
| Blackhawk Network Holdings, Inc.* | 68,195 | 2,057,443 | ||||||
| BroadSoft, Inc.* | 29,897 | 1,391,705 | ||||||
| CACI International, Inc. - Class A* | 17,861 | 1,802,175 | ||||||
| Coherent, Inc.* | 15,803 | 1,746,864 | ||||||
| CSRA, Inc. | 84,924 | 2,284,456 | ||||||
| Diebold, Inc. | 89,040 | 2,207,302 | ||||||
| Ixia* | 220,975 | 2,762,188 | ||||||
| MACOM Technology Solutions Holdings, Inc.* | 52,275 | 2,213,324 | ||||||
| MKS Instruments, Inc. | 28,956 | 1,439,982 | ||||||
| PTC, Inc.* | 64,052 | 2,838,144 | ||||||
| Semtech Corp.* | 74,862 | 2,075,923 | ||||||
| Virtusa Corp.* | 41,849 | 1,032,833 | ||||||
| 23,852,339 | ||||||||
| Consumer Discretionary — 9.5% | ||||||||
| American Eagle Outfitters, Inc. | 86,102 | 1,537,782 | ||||||
| Arctic Cat, Inc.† | 32,362 | 501,287 | ||||||
| Buffalo Wild Wings, Inc.* | 8,602 | 1,210,645 | ||||||
| Callaway Golf Co. | 121,124 | 1,406,250 | ||||||
| Dorman Products, Inc.* | 18,507 | 1,182,597 | ||||||
| DSW, Inc. - Class A | 75,928 | 1,555,005 | ||||||
| Ethan Allen Interiors, Inc. | 21,615 | 675,901 | ||||||
| Express, Inc.* | 41,379 | 487,858 | ||||||
| Horizon Global Corp.* | 89,465 | 1,783,037 | ||||||
| Murphy USA, Inc.* | 38,975 | 2,781,256 | ||||||
| Oxford Industries, Inc. | 21,450 | 1,452,165 | ||||||
| Steven Madden Ltd.* | 37,286 | 1,288,604 | ||||||
| Tailored Brands, Inc. | 68,180 | 1,070,426 | ||||||
| 16,932,813 | ||||||||
| Health Care — 5.2% | ||||||||
| Amsurg Corp.* | 42,411 | 2,843,658 | ||||||
| Charles River Laboratories International, Inc.* | 26,868 | 2,239,179 | ||||||
| HealthSouth Corp. | 68,758 | 2,789,512 | ||||||
| PerkinElmer, Inc. | 25,680 | 1,440,905 | ||||||
| 9,313,254 | ||||||||
| Materials — 5.1% | ||||||||
| Allegheny Technologies, Inc. | 96,373 | 1,741,460 | ||||||
| Berry Plastics Group, Inc.* | 36,286 | 1,591,141 | ||||||
| Ingevity Corp.* | 21,234 | 978,887 | ||||||
| Innophos Holdings, Inc. | 32,789 | 1,279,755 | ||||||
| Olin Corp. | 89,933 | 1,845,425 | ||||||
| Silgan Holdings, Inc. | 33,061 | 1,672,556 | ||||||
| 9,109,224 | ||||||||
| Utilities — 4.6% | ||||||||
| Great Plains Energy, Inc. | 93,562 | 2,553,307 | ||||||
| IDACORP, Inc. | 20,659 | 1,617,187 | ||||||
| NorthWestern Corp. | 16,515 | 950,108 | ||||||
| Portland General Electric Co. | 71,075 | 3,027,084 | ||||||
| 8,147,686 | ||||||||
| Consumer Staples — 4.5% | ||||||||
| Darling Ingredients, Inc.* | 140,588 | 1,899,344 | ||||||
| Hain Celestial Group, Inc. (The)* | 58,052 | 2,065,490 | ||||||
| Snyder's-Lance, Inc. | 36,810 | 1,236,080 | ||||||
| TreeHouse Foods, Inc.* | 33,173 | 2,892,354 | ||||||
| 8,093,268 | ||||||||
| 67 |
Touchstone Small Cap Value Fund (Continued)
| Market | ||||||||
| Shares | Value | |||||||
| Common Stocks — 98.0% (Continued) | ||||||||
| Real Estate — 4.4% | ||||||||
| Corporate Office Properties Trust REIT | 91,062 | $ | 2,581,608 | |||||
| Education Realty Trust, Inc. REIT | 51,927 | 2,240,131 | ||||||
| Equity One, Inc. REIT | 59,285 | 1,814,714 | ||||||
| Lexington Realty Trust REIT | 124,164 | 1,278,889 | ||||||
| 7,915,342 | ||||||||
| Energy — 3.4% | ||||||||
| Callon Petroleum Co.* | 103,963 | 1,632,219 | ||||||
| Carrizo Oil & Gas, Inc.* | 46,461 | 1,887,246 | ||||||
| Synergy Resources Corp.* | 217,566 | 1,507,732 | ||||||
| World Fuel Services Corp. | 23,139 | 1,070,410 | ||||||
| 6,097,607 | ||||||||
| Telecommunication Services — 0.7% | ||||||||
| Cogent Communications Holdings, Inc. | 32,222 | 1,186,092 | ||||||
| Total Common Stocks | $ | 174,720,528 | ||||||
| Exchange Traded Fund — 0.1% | ||||||||
| iShares Russell 2000 Value ETF | 1,707 | 178,808 | ||||||
| Investment Funds — 0.7% | ||||||||
| Dreyfus Government Cash Management, Institutional Shares, 0.30%∞Ω | 1,080,846 | 1,080,846 | ||||||
| Invesco Government & Agency Portfolio, Institutional Class, 0.31%**∞Ω | 98,825 | 98,825 | ||||||
| Total Investment Funds | $ | 1,179,671 | ||||||
| Total Investment Securities —98.8% | ||||||||
| (Cost $174,135,976) | $ | 176,079,007 | ||||||
| Other Assets in Excess of Liabilities — 1.2% | 2,198,132 | |||||||
| Net Assets — 100.0% | $ | 178,277,139 | ||||||
| * | Non-income producing security. |
| ** | Represents collateral for securities loaned. |
| † | All or a portion of the security is on loan. The total market value of the securities on loan as of September 30, 2016 was $103,783. |
| ∞ | Open-End Fund. |
| Ω | Represents the 7-day SEC yield as of September 30, 2016. |
Portfolio Abbreviation:
ETF - Exchange Traded Fund
REIT - Real Estate Investment Trust
Other Information:
The inputs or methodology used for valuing securities may not be an indication of the risk associated with investing in those securities. For more information on valuation inputs, and their aggregation into the levels used in the table below, please refer to the security valuation section in the accompanying Notes to Financial Statements.
Valuation inputs at Reporting Date:
| Description | Level 1 | Level 2 | Level 3 | Total | ||||||||||||
| Common Stocks | $ | 174,720,528 | $ | — | $ | — | $ | 174,720,528 | ||||||||
| Exchange Traded Fund | 178,808 | — | — | 178,808 | ||||||||||||
| Investment Funds | 1,179,671 | — | — | 1,179,671 | ||||||||||||
| Total | $ | 176,079,007 | $ | — | $ | — | $ | 176,079,007 | ||||||||
See accompanying Notes to Financial Statements.
| 68 |
Touchstone Total Return Bond Fund – September 30, 2016
| Principal | Market | |||||||
| Amount | Value | |||||||
| Corporate Bonds — 32.7% | ||||||||
| Industrials — 10.3% | ||||||||
| $ | 1,406,247 | American Airlines 2011-1 Class B Pass | ||||||
| Through Trust, 144a, | ||||||||
| 7.000%, 1/31/18 | $ | 1,469,528 | ||||||
| 54,047 | Burlington Northern and Santa Fe | |||||||
| Railway Co. 1998-C Pass Through | ||||||||
| Trust, 6.230%, 7/2/18 | 56,058 | |||||||
| 78,282 | Burlington Northern and Santa Fe | |||||||
| Railway Co. 2004-1 Pass Through | ||||||||
| Trust, 4.575%, 1/15/21 | 82,788 | |||||||
| 337,614 | Burlington Northern and Santa Fe | |||||||
| Railway Co. 2005-3 Pass Through | ||||||||
| Trust, 4.830%, 1/15/23 | 358,728 | |||||||
| 1,044,179 | Burlington Northern and Santa Fe | |||||||
| Railway Co. 2005-4 Pass Through | ||||||||
| Trust, 4.967%, 4/1/23 | 1,130,525 | |||||||
| 1,417,922 | Continental Airlines 2000-2 Class A-1 | |||||||
| Pass Through Trust, 7.707%, 4/2/21 | 1,545,535 | |||||||
| 1,545,952 | CSX Transportation, Inc., | |||||||
| 6.251%, 1/15/23 | 1,819,748 | |||||||
| 1,536,047 | Delta Air Lines 2010-2 Class A Pass | |||||||
| Through Trust, 4.950%, 5/23/19 | 1,616,690 | |||||||
| 879,137 | Federal Express Corp. 1998 Pass | |||||||
| Through Trust, 6.845%, 1/15/19 | 927,489 | |||||||
| 555,900 | Federal Express Corp. 1999 Pass | |||||||
| Through Trust, 7.650%, 1/15/22 | 649,569 | |||||||
| 1,500,000 | GATX Corp., 3.250%, 3/30/25 | 1,509,042 | ||||||
| 524,000 | General Electric Co. MTN, | |||||||
| 3.450%, 5/15/24 | 568,546 | |||||||
| 600,000 | Kansas City Southern, 3.000%, 5/15/23 | 611,279 | ||||||
| 1,225,000 | Kansas City Southern, 3.125%, 6/1/26 | 1,243,840 | ||||||
| 1,941,000 | Norfolk Southern Corp., | |||||||
| 2.903%, 2/15/23 | 2,010,166 | |||||||
| 1,402,000 | Republic Services, Inc., | |||||||
| 5.250%, 11/15/21 | 1,616,791 | |||||||
| 1,282,261 | Southwest Airlines Co. 2007-1 Pass | |||||||
| Through Trust, 6.150%, 8/1/22 | 1,445,749 | |||||||
| 48,493 | Union Pacific Railroad Co. 2001 Pass | |||||||
| Through Trust, 6.630%, 1/27/22 | 54,586 | |||||||
| 1,024,876 | Union Pacific Railroad Co. 2003 Pass | |||||||
| Through Trust, 4.698%, 1/2/24 | 1,098,768 | |||||||
| 660,500 | Union Pacific Railroad Co. 2006 Pass | |||||||
| Through Trust, 5.866%, 7/2/30 | 769,783 | |||||||
| 1,372,000 | United Rentals North America, Inc., | |||||||
| 5.750%, 11/15/24 | 1,423,450 | |||||||
| 1,300,000 | Waste Management, Inc., | |||||||
| 2.400%, 5/15/23 | 1,312,977 | |||||||
| 23,321,635 | ||||||||
| Financials — 7.9% | ||||||||
| 2,008,000 | American Express Co., | |||||||
| 2.650%, 12/2/22 | 2,054,965 | |||||||
| 1,351,000 | Delphi Financial Group, Inc., | |||||||
| 7.875%, 1/31/20 | 1,550,321 | |||||||
| 2,000,000 | Fishers Lane Associates LLC, 144a, | |||||||
| 3.666%, 8/5/30 | 2,101,492 | |||||||
| 2,050,000 | Ford Motor Credit Co. LLC, | |||||||
| 4.375%, 8/6/23 | 2,203,811 | |||||||
| 1,386,000 | GE Capital International Funding Co. | |||||||
| (Ireland), 3.373%, 11/15/25 | 1,499,676 | |||||||
| 1,501,000 | National Rural Utilities Cooperative | |||||||
| Finance Corp., 3.400%, 11/15/23 | 1,610,681 | |||||||
| 1,500,000 | Provident Cos., Inc., 7.000%, 7/15/18 | 1,632,811 | ||||||
| 1,398,000 | Torchmark Corp., 3.800%, 9/15/22 | 1,484,869 | ||||||
| 2,000,000 | USB Capital IX, 3.500%, 10/29/49(A)(B) | 1,712,500 | ||||||
| 2,000,000 | Wachovia Capital Trust III, | |||||||
| 5.570%, 3/29/49(A)(B) | 1,994,800 | |||||||
| 17,845,926 | ||||||||
| Utilities — 5.1% | ||||||||
| 1,348,328 | Bruce Mansfield Unit 1, 2007 Pass | |||||||
| Through Trust, 6.850%, 6/1/34 | 687,647 | |||||||
| 550,000 | California Water Service Co., | |||||||
| 5.500%, 12/1/40 | 689,555 | |||||||
| 1,311,000 | Commonwealth Edison Co., | |||||||
| 5.900%, 3/15/36 | 1,721,575 | |||||||
| 1,780,000 | Dominion Resources, Inc., | |||||||
| 3.138%, 9/30/66(A) | 1,406,200 | |||||||
| 275,000 | Duke Energy Progress LLC, | |||||||
| 6.300%, 4/1/38 | 382,653 | |||||||
| 1,700,000 | Entergy Louisiana LLC, | |||||||
| 4.440%, 1/15/26 | 1,917,138 | |||||||
| 733,137 | Kiowa Power Partners LLC, 144a, | |||||||
| 5.737%, 3/30/21 | 774,434 | |||||||
| 2,000,000 | NextEra Energy Capital Holdings, Inc., | |||||||
| 6.350%, 10/1/66(A) | 1,653,760 | |||||||
| 1,983,000 | South Carolina Electric & Gas Co., | |||||||
| 4.600%, 6/15/43 | 2,245,466 | |||||||
| 11,478,428 | ||||||||
| Energy — 4.4% | ||||||||
| 1,000,000 | Apache Corp., 3.250%, 4/15/22 | 1,026,142 | ||||||
| 1,253,000 | Chesapeake Energy Corp., | |||||||
| 6.625%, 8/15/20 | 1,179,386 | |||||||
| 1,530,000 | Newfield Exploration Co., | |||||||
| 5.750%, 1/30/22 | 1,579,725 | |||||||
| 1,551,000 | Petrobras Global Finance BV (Cayman | |||||||
| Islands), 3.500%, 2/6/17 | 1,555,033 | |||||||
| 1,500,000 | Petroleos Mexicanos (Mexico), | |||||||
| 4.875%, 1/24/22 | 1,530,000 | |||||||
| 400,000 | Spectra Energy Partners LP, | |||||||
| 3.500%, 3/15/25 | 404,648 | |||||||
| 1,650,000 | Tennessee Valley Authority, | |||||||
| 4.650%, 6/15/35 | 2,094,974 | |||||||
| 500,000 | Texas Eastern Transmission LP, | |||||||
| 7.000%, 7/15/32 | 624,288 | |||||||
| 9,994,196 | ||||||||
| Consumer Discretionary — 1.9% | ||||||||
| 500,000 | American Airlines 2016-3 Class AA | |||||||
| Pass Through Trust, | ||||||||
| 3.000%, 10/15/28 | 501,740 | |||||||
| 69 |
Touchstone Total Return Bond Fund (Continued)
| Principal | Market | |||||||
| Amount | Value | |||||||
| Corporate Bonds — 32.7% (Continued) | ||||||||
| Consumer Discretionary — (Continued) | ||||||||
| $ | 694,180 | Continental Airlines 2012-2 Class A | ||||||
| Pass Through Trust, | ||||||||
| 4.000%, 10/29/24 | $ | 742,772 | ||||||
| 990,000 | PulteGroup, Inc., 7.875%, 6/15/32 | 1,143,450 | ||||||
| 1,300,000 | Royal Caribbean Cruises Ltd. (Liberia), | |||||||
| 5.250%, 11/15/22 | 1,413,750 | |||||||
| 466,000 | Service Corp. International, | |||||||
| 5.375%, 5/15/24 | 493,960 | |||||||
| 4,295,672 | ||||||||
| Consumer Staples — 1.7% | ||||||||
| 1,914,804 | CVS Pass-Through Trust, | |||||||
| 6.036%, 12/10/28 | 2,221,274 | |||||||
| 1,500,000 | Kroger Co. (The), 3.850%, 8/1/23 | 1,626,006 | ||||||
| 3,847,280 | ||||||||
| Telecommunication Services — 0.8% | ||||||||
| 1,500,000 | Verizon Communications, Inc., | |||||||
| 6.000%, 4/1/41 | 1,889,589 | |||||||
| Health Care — 0.6% | ||||||||
| 1,400,000 | HCA, Inc., 4.250%, 10/15/19 | 1,459,500 | ||||||
| Total Corporate Bonds | $ | 74,132,226 | ||||||
| U.S. Government Agency Obligations — 23.9% | ||||||||
| 31,270 | Astro Offshore Corp., | |||||||
| 6.000%, 12/20/19 | 32,791 | |||||||
| 1,156,000 | Canal Barge Co., Inc., 4.500%, 11/12/34 | 1,290,497 | ||||||
| 472,173 | EJM Airport LLC, 6.271%, 5/15/20 | 511,248 | ||||||
| 1,800,000 | Hashemite Kingdom of Jordan | |||||||
| Government AID Bond, | ||||||||
| 3.000%, 6/30/25 | 1,947,055 | |||||||
| 534,000 | Matson Navigation Co., Inc., | |||||||
| 5.337%, 9/4/28 | 609,295 | |||||||
| 1,421,250 | Petroleos Mexicanos (Mexico), | |||||||
| 2.290%, 2/15/24 | 1,449,638 | |||||||
| 1,800,000 | Private Export Funding Corp., | |||||||
| 2.450%, 7/15/24 | 1,873,667 | |||||||
| 6,448 | Small Business Administration | |||||||
| Participation Certificates, | ||||||||
| 6.150%, 2/1/18 | 6,656 | |||||||
| 235,182 | Small Business Administration | |||||||
| Participation Certificates, Ser | ||||||||
| 2001-20A, Class 1, 6.290%, 1/1/21 | 248,753 | |||||||
| 50,219 | Small Business Administration | |||||||
| Participation Certificates, Ser | ||||||||
| 2001-20K, Class 1, 5.340%, 11/1/21 | 53,419 | |||||||
| 145,820 | Small Business Administration | |||||||
| Participation Certificates, Ser | ||||||||
| 2002-20H, Class 1, 5.310%, 8/1/22 | 156,494 | |||||||
| 131,230 | Small Business Administration | |||||||
| Participation Certificates, Ser | ||||||||
| 2003-20B, Class 1, 4.840%, 2/1/23 | 139,390 | |||||||
| 46,603 | Small Business Administration | |||||||
| Participation Certificates, Ser | ||||||||
| 2003-20D, Class 1, 4.760%, 4/1/23 | 49,463 | |||||||
| 37,641 | Small Business Administration | |||||||
| Participation Certificates, Ser | ||||||||
| 2004-20D, Class 1, 4.770%, 4/1/24 | 40,127 | |||||||
| 329,455 | Small Business Administration | |||||||
| Participation Certificates, Ser | ||||||||
| 2004-20K, Class 1, 4.880%, 11/1/24 | 352,455 | |||||||
| 179,826 | Small Business Administration | |||||||
| Participation Certificates, Ser | ||||||||
| 2005-20B, Class 1, 4.625%, 2/1/25 | 192,811 | |||||||
| 138,893 | Small Business Administration | |||||||
| Participation Certificates, Ser | ||||||||
| 2005-20H, Class 1, 5.110%, 8/1/25 | 150,645 | |||||||
| 952,317 | Small Business Administration | |||||||
| Participation Certificates, Ser | ||||||||
| 2006-20B, Class 1, 5.350%, 2/1/26 | 1,042,995 | |||||||
| 273,723 | Small Business Administration | |||||||
| Participation Certificates, Ser | ||||||||
| 2006-20H, Class 1, 5.700%, 8/1/26 | 306,129 | |||||||
| 768,789 | Small Business Administration | |||||||
| Participation Certificates, Ser | ||||||||
| 2006-20K, Class 1, 5.360%, 11/1/26 | 844,550 | |||||||
| 851,563 | Small Business Administration | |||||||
| Participation Certificates, Ser | ||||||||
| 2006-20L, Class 1, 5.120%, 12/1/26 | 926,989 | |||||||
| 821,086 | Small Business Administration | |||||||
| Participation Certificates, Ser | ||||||||
| 2007-20A, Class 1, 5.320%, 1/1/27 | 902,685 | |||||||
| 907,025 | Small Business Administration | |||||||
| Participation Certificates, Ser | ||||||||
| 2007-20E, Class 1, 5.310%, 5/1/27 | 999,712 | |||||||
| 369,963 | Small Business Administration | |||||||
| Participation Certificates, Ser | ||||||||
| 2007-20F, Class 1, 5.710%, 6/1/27 | 414,879 | |||||||
| 960,868 | Small Business Administration | |||||||
| Participation Certificates, Ser | ||||||||
| 2007-20L, Class 1, 5.290%, 12/1/27 | 1,054,893 | |||||||
| 585,952 | Small Business Administration | |||||||
| Participation Certificates, Ser | ||||||||
| 2008-20A, Class 1, 5.170%, 1/1/28 | 650,270 | |||||||
| 625,891 | Small Business Administration | |||||||
| Participation Certificates, Ser | ||||||||
| 2008-20K, Class 1, 6.770%, 11/1/28 | 719,313 | |||||||
| 1,287,466 | Small Business Administration | |||||||
| Participation Certificates, Ser | ||||||||
| 2009-20B, Class 1, 4.760%, 2/1/29 | 1,417,913 | |||||||
| 1,509,754 | Small Business Administration | |||||||
| Participation Certificates, Ser | ||||||||
| 2009-20C, Class 1, 4.660%, 3/1/29 | 1,655,079 | |||||||
| 218,060 | Small Business Administration | |||||||
| Participation Certificates, Ser | ||||||||
| 2009-20D, Class 1, 4.310%, 4/1/29 | 236,517 | |||||||
| 1,413,207 | Small Business Administration | |||||||
| Participation Certificates, Ser | ||||||||
| 2009-20E, Class 1, 4.430%, 5/1/29 | 1,543,441 | |||||||
| 70 |
Touchstone Total Return Bond Fund (Continued)
| Principal | Market | |||||||
| Amount | Value | |||||||
| U.S. Government Agency Obligations — 23.9% (Continued) | ||||||||
| $ | 780,977 | Small Business Administration | ||||||
| Participation Certificates, Ser | ||||||||
| 2009-20F, Class 1, 4.950%, 6/1/29 | $ | 865,254 | ||||||
| 1,068,337 | Small Business Administration | |||||||
| Participation Certificates, Ser | ||||||||
| 2009-20J, Class 1, 3.920%, 10/1/29 | 1,150,009 | |||||||
| 1,211,689 | Small Business Administration | |||||||
| Participation Certificates, Ser | ||||||||
| 2010-20F, Class 1, 3.880%, 6/1/30 | 1,312,757 | |||||||
| 1,656,638 | Small Business Administration | |||||||
| Participation Certificates, Ser | ||||||||
| 2010-20I, Class 1, 3.210%, 9/1/30 | 1,753,374 | |||||||
| 1,015,148 | Small Business Administration | |||||||
| Participation Certificates, Ser | ||||||||
| 2012-10C, Class 1, 1.240%, 5/1/22 | 1,006,637 | |||||||
| 4,344,797 | Small Business Administration | |||||||
| Participation Certificates, Ser | ||||||||
| 2013-20C, Class 1, 2.220%, 3/1/33 | 4,407,463 | |||||||
| 2,115,148 | Small Business Administration | |||||||
| Participation Certificates, Ser | ||||||||
| 2013-20E, Class 1, 2.070%, 5/1/33 | 2,131,045 | |||||||
| 2,659,183 | Small Business Administration | |||||||
| Participation Certificates, Ser | ||||||||
| 2013-20G, Class 1, 3.150%, 7/1/33 | 2,818,595 | |||||||
| 2,686,047 | Small Business Administration | |||||||
| Participation Certificates, Ser | ||||||||
| 2014-20H, Class 1, 2.880%, 8/1/34 | 2,785,023 | |||||||
| 2,191,594 | Small Business Administration | |||||||
| Participation Certificates, Ser | ||||||||
| 2014-20K, Class 1, 2.800%, 11/1/34 | 2,266,318 | |||||||
| 3,993,494 | Small Business Administration | |||||||
| Participation Certificates, Ser | ||||||||
| 2015-20E, Class 1, 2.770%, 5/1/35 | 4,103,225 | |||||||
| 3,196,654 | Small Business Administration | |||||||
| Participation Certificates, Ser | ||||||||
| 2015-20I, Class 1, 2.820%, 9/1/35 | 3,314,029 | |||||||
| 91,435 | Sterling Equipment, 6.125%, 9/28/19 | 99,178 | ||||||
| 1,456,437 | Tagua Leasing LLC, 1.581%, 11/16/24 | 1,443,804 | ||||||
| 1,000,000 | Totem Ocean Trailer Express, Inc., | |||||||
| 6.365%, 4/15/28 | 1,193,641 | |||||||
| 1,435,000 | Vessel Management Services, Inc., | |||||||
| 5.125%, 4/16/35 | 1,681,817 | |||||||
| Total U.S. Government Agency Obligations | $ | 54,151,938 | ||||||
| U.S. Government Mortgage-Backed Obligations — 17.4% | ||||||||
| 243,891 | FHLMC, Pool #A89148, | |||||||
| 4.000%, 10/1/39 | 262,692 | |||||||
| 1,775,314 | FHLMC, Pool #W30008, | |||||||
| 7.645%, 5/1/25 | 2,157,411 | |||||||
| 213,465 | FNMA, Pool #465711, 4.680%, 8/1/28 | 248,716 | ||||||
| 1,556,998 | FNMA, Pool #469616, 3.500%, 11/1/21 | 1,684,163 | ||||||
| 111,196 | FNMA, Pool #874210, 5.260%, 1/1/25 | 125,588 | ||||||
| 189,384 | FNMA, Pool #888829, 5.832%, 6/1/37 | 225,727 | ||||||
| 280,704 | FNMA, Pool #958736, 4.940%, 5/1/19 | 302,823 | ||||||
| 163,229 | FNMA, Pool #AB1152, 4.000%, 6/1/25 | 173,178 | ||||||
| 342,196 | FNMA, Pool #AD0101, 4.890%, 7/1/19 | 370,812 | ||||||
| 337,858 | FNMA, Pool #AD0166, 4.839%, 8/1/19 | 366,368 | ||||||
| 959,950 | FNMA, Pool #AD0342, 4.656%, 10/1/19 | 1,037,497 | ||||||
| 938,254 | FNMA, Pool #AD0786, 4.501%, 1/1/20 | 1,016,375 | ||||||
| 449,146 | FNMA, Pool #AD0910, 4.603%, 4/1/20 | 487,238 | ||||||
| 166,062 | FNMA, Pool #AD1608, 4.000%, 2/1/25 | 176,122 | ||||||
| 384,398 | FNMA, Pool #AE0209, 4.380%, 6/1/20 | 417,069 | ||||||
| 1,052,890 | FNMA, Pool #AE0446, 4.014%, 9/1/20 | 1,136,047 | ||||||
| 542,237 | FNMA, Pool #AE2771, 3.500%, 8/1/26 | 574,619 | ||||||
| 318,088 | FNMA, Pool #AE8886, 3.500%, 12/1/25 | 335,315 | ||||||
| 216,489 | FNMA, Pool #AH1519, 3.500%, 12/1/25 | 228,200 | ||||||
| 2,432,720 | FNMA, Pool #AH8854, 4.500%, 4/1/41 | 2,675,663 | ||||||
| 391,864 | FNMA, Pool #AI1856, 4.500%, 5/1/41 | 433,935 | ||||||
| 1,798,622 | FNMA, Pool #AM0157, 2.680%, 2/1/22 | 1,879,241 | ||||||
| 1,880,019 | FNMA, Pool #AM0566, 1.940%, 9/1/19 | 1,893,055 | ||||||
| 2,273,237 | FNMA, Pool #AP7488, 3.500%, 9/1/42 | 2,407,110 | ||||||
| 1,194,469 | FNMA, Pool #AT0924, 2.000%, 3/1/28 | 1,201,229 | ||||||
| 3,401,492 | FNMA, Pool #AU1628, 3.000%, 7/1/43 | 3,543,297 | ||||||
| 2,598,574 | FNMA, Pool #AX7699, 3.500%, 2/1/45 | 2,741,258 | ||||||
| 2,833,669 | FNMA, Pool #BC0153, 4.000%, 1/1/46 | 3,046,333 | ||||||
| 3,002,055 | FNMA, Pool #BC0300, 3.500%, 3/1/46 | 3,166,893 | ||||||
| 1,064,604 | GNMA, Pool #5276, 3.000%, 1/20/27 | 1,120,524 | ||||||
| 1,497,831 | GNMA, Pool #710077, 4.700%, 5/20/61 | 1,558,931 | ||||||
| 333,356 | GNMA, Pool #751408, 4.826%, 6/20/61 | 364,677 | ||||||
| 613,098 | GNMA, Pool #751409, 4.626%, 7/20/61 | 640,829 | ||||||
| 347,479 | GNMA, Pool #752631, | |||||||
| 4.500%, 10/20/40 | 379,689 | |||||||
| 609,661 | GNMA, Pool #756686, 4.697%, 9/20/61 | 640,189 | ||||||
| 414,553 | GNMA, Pool #757327, 4.295%, 7/20/61 | 430,981 | ||||||
| Total U.S. Government Mortgage-Backed Obligations | $ | 39,449,794 | ||||||
| Municipal Bonds — 7.1% | ||||||||
| California — 2.3% | ||||||||
| 1,225,000 | CA State City of San Francisco Public | |||||||
| Utilities Commission Water | ||||||||
| Revenue, Build America Bonds, | ||||||||
| 6.950%, 11/1/50 | 1,892,576 | |||||||
| 1,510,000 | CA State East Bay Municipal Utility | |||||||
| District Water System Revenue, | ||||||||
| Build America Bonds Sub, | ||||||||
| 5.874%, 6/1/40 | 2,061,527 | |||||||
| 1,310,315 | CA State HFA Residential Mortgage | |||||||
| Rev, Ser A, 2.900%, 2/1/42 | 1,320,404 | |||||||
| 5,274,507 | ||||||||
| Florida — 0.5% | ||||||||
| 1,105,830 | FL State HFC Rev, Homeownership | |||||||
| Mortgage Special Project, | ||||||||
| 2.800%, 7/1/41 | 1,119,376 | |||||||
| 71 |
Touchstone Total Return Bond Fund (Continued)
| Principal | Market | |||||||
| Amount | Value | |||||||
| Municipal Bonds — 7.1% (Continued) | ||||||||
| Missouri — 0.4% | ||||||||
| $ | 980,000 | MO State Housing Development | ||||||
| Commission, Special | ||||||||
| Homeownership Loan Program, Ser | ||||||||
| C, 2.650%, 11/1/40 | $ | 981,137 | ||||||
| Ohio — 1.0% | ||||||||
| 2,245,000 | Ohio Housing Finance Agency, Ser 1, | |||||||
| 2.650%, 11/1/41 | 2,250,388 | |||||||
| Texas — 1.6% | ||||||||
| 1,770,000 | TX State Dallas Area Rapid Transit, | |||||||
| Build America Bonds, | ||||||||
| 5.999%, 12/1/44 | 2,586,855 | |||||||
| 915,000 | TX State Texas Dept of Housing & | |||||||
| Community Affairs, Ser A, | ||||||||
| 2.800%, 3/1/36 | 925,138 | |||||||
| 3,511,993 | ||||||||
| Virginia — 0.4% | ||||||||
| 989,707 | VA State Housing Development | |||||||
| Authority, Pass Thru Ser B, | ||||||||
| 2.750%, 4/25/42 | 1,006,423 | |||||||
| Washington — 0.9% | ||||||||
| 1,515,000 | WA State of Washington, Build | |||||||
| America Bonds Ser D, UTGO, | ||||||||
| 5.481%, 8/1/39 | 2,047,704 | |||||||
| Total Municipal Bonds | $ | 16,191,528 | ||||||
| Agency Collateralized Mortgage Obligations — 6.9% | ||||||||
| 1,020,000 | FREMF Mortgage Trust, Ser 2011-K702, | |||||||
| Class B, 144a, 4.931%, 4/25/44(A) | 1,059,444 | |||||||
| 1,000,000 | FREMF Mortgage Trust, Ser 2012-K19, | |||||||
| Class B, 144a, 4.173%, 5/25/45(A) | 1,077,725 | |||||||
| 925,000 | FREMF Mortgage Trust, Ser 2012-K706, | |||||||
| Class B, 144a, 4.167%, 11/25/44(A) | 961,589 | |||||||
| 1,035,000 | FREMF Mortgage Trust, Ser 2012-K710, | |||||||
| Class B, 144a, 3.952%, 6/25/47(A) | 1,071,433 | |||||||
| 1,798,918 | FRESB Mortgage Trust, Ser 2016-SB17, | |||||||
| Class A5H, 2.160%, 6/25/21(A) | 1,815,288 | |||||||
| 1,029,702 | GNMA, Ser 2011-147, Class A, | |||||||
| 2.174%, 7/16/38 | 1,032,384 | |||||||
| 2,748,616 | GNMA, Ser 2012-53, Class AC, | |||||||
| 2.381%, 12/16/43 | 2,776,823 | |||||||
| 1,446,920 | GNMA, Ser 2013-40, Class AC, | |||||||
| 1.584%, 1/16/46 | 1,425,143 | |||||||
| 2,540,000 | GNMA, Ser 2015-32, Class HG, | |||||||
| 3.000%, 9/16/49(A) | 2,541,759 | |||||||
| 2,009,000 | GNMA, Ser 2015-73, Class B, | |||||||
| 2.700%, 10/16/55(A) | 2,029,278 | |||||||
| Total Agency Collateralized Mortgage Obligations | $ | 15,790,866 | ||||||
| Commercial Mortgage-Backed Securities — 3.8% | ||||||||
| 2,435,000 | Citigroup Commercial Mortgage Trust, | |||||||
| Ser 2007-C6, Class A4, | ||||||||
| 5.901%, 12/10/49(A) | 2,479,161 | |||||||
| 2,057,451 | Citigroup Commercial Mortgage Trust, | |||||||
| Ser 2008-C7, Class A4, | ||||||||
| 6.333%, 12/10/49(A) | 2,121,682 | |||||||
| 505,000 | Citigroup/Deutsche Bank Commercial | |||||||
| Mortgage Trust, Ser 2006-CD3, | ||||||||
| Class AJ, 5.688%, 10/15/48 | 290,806 | |||||||
| 1,620,617 | Citigroup/Deutsche Bank Commercial | |||||||
| Mortgage Trust, Ser 2007-CD4, | ||||||||
| Class A4, 5.322%, 12/11/49 | 1,627,536 | |||||||
| 2,122,764 | GS Mortgage Securities Corp. II, Ser | |||||||
| 2007-GG10, Class A4, | ||||||||
| 5.988%, 8/10/45(A) | 2,154,791 | |||||||
| Total Commercial Mortgage-Backed Securities | $ | 8,673,976 | ||||||
| U.S. Treasury Obligations — 3.2% | ||||||||
| 3,146,000 | U.S. Treasury Strip, Principal, | |||||||
| 0.000%, 8/15/35# | 2,065,145 | |||||||
| 3,695,000 | U.S. Treasury Strip, Principal, | |||||||
| 0.000%, 5/15/40# | 2,134,701 | |||||||
| 5,650,000 | U.S. Treasury Strip, Principal, | |||||||
| 0.000%, 5/15/43# | 2,982,279 | |||||||
| Total U.S. Treasury Obligations | $ | 7,182,125 | ||||||
| Asset-Backed Securities — 2.1% | ||||||||
| 1,571,126 | 321 Henderson Receivables I LLC, Ser | |||||||
| 2012-1A, Class A, 144a, | ||||||||
| 4.210%, 2/16/65 | 1,695,433 | |||||||
| 1,079,112 | 321 Henderson Receivables I LLC, Ser | |||||||
| 2012-2A, Class A, 144a, | ||||||||
| 3.840%, 10/15/59 | 1,126,511 | |||||||
| 419,859 | FPL Recovery Funding LLC, Ser | |||||||
| 2007-A, Class A4, 5.256%, 8/1/21 | 445,216 | |||||||
| 1,325,000 | JCP&L Transition Funding LLC, Ser | |||||||
| 2006-A, Class A4, 5.610%, 6/5/23 | 1,493,258 | |||||||
| Total Asset-Backed Securities | $ | 4,760,418 | ||||||
| 72 |
Touchstone Total Return Bond Fund (Continued)
| Market | ||||||||
| Shares | Value | |||||||
| Investment Fund — 6.5% | ||||||||
| 14,727,741 | Dreyfus Government Cash | |||||||
| Management, Institutional Shares, | ||||||||
| 0.30%∞Ω | $ | 14,727,741 | ||||||
| Total Investment Securities — 103.6% | ||||||||
| (Cost $230,101,176) | $ | 235,060,612 | ||||||
| Liabilities in Excess of Other | ||||||||
| Assets — (3.6%) | (8,116,739 | ) | ||||||
| Net Assets — 100.0% | $ | 226,943,873 | ||||||
| # | Strip Security - Separate trading of Registered Interest and Principal. Holders of a principal strip security are entitled to the portion of the payment representing principal only. |
| (A) | Variable rate security - Rate reflected is the rate in effect as of September 30, 2016. |
| (B) | Perpetual Bond - A Bond with no definite maturity date. |
| ∞ | Open-End Fund. |
| Ω | Represents the 7-day SEC yield as of September 30, 2016. |
Portfolio Abbreviations:
FHLMC - Federal Home Loan Mortgage Corporation
FNMA - Federal National Mortgage Association
FREMF - Finnish Real Estate Management Federation
FRESB - Freddie Mac Multifamily Securitization Small Balance Loan
GNMA - Government National Mortgage Association
HFA - Housing Finance Authority/Agency
HFC - Housing Finance Corporation
LLC - Limited Liability Company
LP - Limited Partnership
MTN - Medium Term Note
UTGO - Unlimited Tax General Obligation
144a - This is a restricted security that was sold in a transaction qualifying for the exemption under Rule 144A of the Securities Act of 1933. This security may be sold in transactions exempt from registration, normally to qualified institutional buyers. At September 30, 2016, these securities were valued at $11,337,589 or 5.0% of net assets. These securities were deemed liquid pursuant to procedures approved by the Board of Trustees.
Other Information:
The inputs or methodology used for valuing securities may not be an indication of the risk associated with investing in those securities. For more information on valuation inputs, and their aggregation into the levels used in the table below, please refer to the security valuation section in the accompanying Notes to Financial Statements.
Valuation inputs at Reporting Date:
| Description | Level 1 | Level 2 | Level 3 | Total | ||||||||||||
| Corporate Bonds | $ | — | $ | 74,132,226 | $ | — | $ | 74,132,226 | ||||||||
| U.S. Government Agency Obligations | — | 54,151,938 | — | 54,151,938 | ||||||||||||
| U.S. Government Mortgage-Backed Obligations | — | 39,449,794 | — | 39,449,794 | ||||||||||||
| Municipal Bonds | — | 16,191,528 | — | 16,191,528 | ||||||||||||
| Agency Collateralized Mortgage Obligations | — | 15,790,866 | — | 15,790,866 | ||||||||||||
| Commercial Mortgage-Backed Securities | — | 8,673,976 | — | 8,673,976 | ||||||||||||
| U.S. Treasury Obligations | — | 7,182,125 | — | 7,182,125 | ||||||||||||
| Asset-Backed Securities | — | 4,760,418 | — | 4,760,418 | ||||||||||||
| Investment Fund | 14,727,741 | — | — | 14,727,741 | ||||||||||||
| Total | $ | 14,727,741 | $ | 220,332,871 | $ | — | $ | 235,060,612 | ||||||||
See accompanying Notes to Financial Statements.
| 73 |
Touchstone Ultra Short Duration Fixed Income Fund – September 30, 2016
| Principal | Market | |||||||
| Amount | Value | |||||||
| Corporate Bonds — 37.7% | ||||||||
| Financials — 19.3% | ||||||||
| $ | 5,389,000 | Air Lease Corp., 5.625%, 4/1/17 | $ | 5,480,893 | ||||
| 2,500,000 | American Express Credit Corp. MTN, | |||||||
| 2.375%, 3/24/17 | 2,515,025 | |||||||
| 4,080,000 | AvalonBay Communities, Inc. MTN, | |||||||
| 5.700%, 3/15/17 | 4,156,141 | |||||||
| 3,000,000 | Bank of America Corp., | |||||||
| 3.875%, 3/22/17 | 3,034,656 | |||||||
| 2,000,000 | Bank of America Corp., | |||||||
| 5.420%, 3/15/17 | 2,034,510 | |||||||
| 2,704,000 | Bank of America NA, 6.100%, 6/15/17 | 2,791,258 | ||||||
| 926,000 | Bear Stearns Cos. LLC (The), | |||||||
| 5.550%, 1/22/17 | 938,132 | |||||||
| 800,000 | Brandywine Operating Partnership LP, | |||||||
| 5.700%, 5/1/17 | 817,494 | |||||||
| 400,000 | Camden Property Trust, | |||||||
| 5.700%, 5/15/17 | 410,173 | |||||||
| 5,000,000 | Canadian Imperial Bank of | |||||||
| Commerce/New York NY, | ||||||||
| 1.186%, 5/10/17(A) | 5,000,260 | |||||||
| 3,460,000 | Capital One Bank USA NA, | |||||||
| 1.150%, 11/21/16 | 3,461,010 | |||||||
| 1,500,000 | Capital One Bank USA NA, | |||||||
| 1.200%, 2/13/17 | 1,498,953 | |||||||
| 2,700,000 | Capital One Bank USA NA, | |||||||
| 1.300%, 6/5/17 | 2,699,617 | |||||||
| 1,600,000 | Citigroup, Inc., 1.300%, 11/15/16 | 1,600,309 | ||||||
| 1,800,000 | Citigroup, Inc., 1.800%, 2/5/18 | 1,804,538 | ||||||
| 4,800,000 | Credit Suisse/New York (Switzerland) | |||||||
| MTN, 1.315%, 5/26/17(A) | 4,801,229 | |||||||
| 1,250,000 | DDR Corp., 7.500%, 4/1/17 | 1,286,652 | ||||||
| 1,600,000 | Equity Commonwealth, | |||||||
| 6.250%, 6/15/17 | 1,613,555 | |||||||
| 2,712,000 | Fifth Third Bancorp, 5.450%, 1/15/17 | 2,742,510 | ||||||
| 500,000 | Fifth Third Bank/Cincinnati OH, | |||||||
| 1.150%, 11/18/16 | 500,006 | |||||||
| 6,400,000 | Goldman Sachs Group, Inc. (The) | |||||||
| MTN, 1.254%, 3/29/17(A) | 6,386,451 | |||||||
| 860,000 | HCP, Inc., 5.625%, 5/1/17 | 880,188 | ||||||
| 1,340,000 | Highwoods Realty LP, 5.850%, 3/15/17 | 1,364,081 | ||||||
| 1,790,000 | Highwoods Realty LP, 7.500%, 4/15/18 | 1,935,407 | ||||||
| 3,200,000 | HSBC Bank USA NA/New York NY, | |||||||
| 6.000%, 8/9/17 | 3,321,235 | |||||||
| 6,425,000 | Huntington National Bank (The), | |||||||
| 1.300%, 11/20/16 | 6,427,133 | |||||||
| 1,300,000 | JPMorgan Chase & Co., | |||||||
| 6.125%, 6/27/17 | 1,343,784 | |||||||
| 1,000,000 | Lloyds Bank PLC, 1.750%, 5/14/18 | 1,002,955 | ||||||
| 1,100,000 | Lloyds Bank PLC, 2.000%, 8/17/18 | 1,104,812 | ||||||
| 2,800,000 | Mizuho Bank Ltd., 144a, | |||||||
| 1.550%, 10/17/17 | 2,799,381 | |||||||
| 1,450,000 | Morgan Stanley MTN, 6.250%, 8/28/17 | 1,510,261 | ||||||
| 9,935,000 | Mountain Agency, Inc. (The), | |||||||
| 1.040%, 12/1/23(A) | 9,935,000 | |||||||
| 5,400,000 | PNC Bank NA, 1.150%, 11/1/16 | 5,400,000 | ||||||
| 2,365,000 | PNC Financial Services Group, Inc. | |||||||
| (The), 5.625%, 2/1/17 | 2,399,030 | |||||||
| 500,000 | Post Apartment Homes LP, | |||||||
| 4.750%, 10/15/17 | 515,870 | |||||||
| 1,990,000 | Progress Industrial Properties, Inc., | |||||||
| 2.100%, 1/1/22(A) | 1,990,000 | |||||||
| 865,000 | Prologis LP, 4.000%, 1/15/18 | 886,971 | ||||||
| 2,800,000 | Royal Bank of Canada/New York NY, | |||||||
| 1.193%, 7/28/17(A) | 2,800,862 | |||||||
| 2,210,000 | Simon Property Group LP, 144a, | |||||||
| 1.500%, 2/1/18 | 2,216,841 | |||||||
| 9,150,000 | Toronto-Dominion Bank/NY, | |||||||
| 1.107%, 2/10/17(A) | 9,156,249 | |||||||
| 3,765,000 | Ventas Realty LP, 1.250%, 4/17/17 | 3,763,392 | ||||||
| 800,000 | Western Union Co. (The), | |||||||
| 5.930%, 10/1/16 | 800,000 | |||||||
| 2,600,000 | XLIT Ltd., 2.300%, 12/15/18 | 2,630,901 | ||||||
| 119,757,725 | ||||||||
| Consumer Discretionary — 3.3% | ||||||||
| 6,250,000 | Blue Hen Hotel LLC, 1.400%, 9/1/27(A) | 6,250,000 | ||||||
| 470,000 | ERAC USA Finance LLC, 144a, | |||||||
| 6.200%, 11/1/16 | 471,773 | |||||||
| 1,000,000 | Ford Motor Credit Co. LLC, | |||||||
| 4.250%, 2/3/17 | 1,009,593 | |||||||
| 3,300,000 | Hasbro, Inc., 6.300%, 9/15/17 | 3,450,718 | ||||||
| 325,000 | Hyundai Capital America, 144a, | |||||||
| 4.000%, 6/8/17 | 330,599 | |||||||
| 1,800,000 | Marriott International, Inc. MD, | |||||||
| 6.375%, 6/15/17 | 1,860,037 | |||||||
| 3,100,000 | Volkswagen International Finance N.V., | |||||||
| 144a, 2.375%, 3/22/17 | 3,112,363 | |||||||
| 3,700,000 | Volkswagen International Finance NV, | |||||||
| 144a, 1.125%, 11/18/16 | 3,699,911 | |||||||
| 20,184,994 | ||||||||
| Industrials — 2.8% | ||||||||
| 2,325,000 | Crane Co., 2.750%, 12/15/18 | 2,370,235 | ||||||
| 1,000,000 | L-3 Communications Corp., | |||||||
| 1.500%, 5/28/17 | 1,000,754 | |||||||
| 298,000 | L-3 Communications Corp., | |||||||
| 3.950%, 11/15/16 | 298,972 | |||||||
| 1,550,000 | Norfolk Southern Corp., | |||||||
| 7.700%, 5/15/17 | 1,612,245 | |||||||
| 958,000 | SBA Tower Trust, 144a, | |||||||
| 2.898%, 10/15/19 | 971,463 | |||||||
| 3,555,000 | SBA Tower Trust, 144a, | |||||||
| 2.933%, 12/15/17 | 3,574,742 | |||||||
| 7,200,000 | Temple-Inland, Inc., 6.625%, 1/15/18 | 7,642,375 | ||||||
| 17,470,786 | ||||||||
| Utilities — 2.5% | ||||||||
| 350,000 | CenterPoint Energy, Inc., | |||||||
| 5.950%, 2/1/17 | 355,200 | |||||||
| 939,000 | Exelon Corp., 1.550%, 6/9/17 | 939,707 | ||||||
| 5,900,000 | Kentucky Power Co., 144a, | |||||||
| 6.000%, 9/15/17 | 6,146,402 | |||||||
| 715,000 | New York State Electric & Gas Corp., | |||||||
| 144a, 6.150%, 12/15/17 | 742,948 | |||||||
| 74 |
Touchstone Ultra Short Duration Fixed Income Fund (Continued)
| Principal | Market | |||||||
| Amount | Value | |||||||
| Corporate Bonds — 37.7% (Continued) | ||||||||
| Utilities — (Continued) | ||||||||
| $ | 1,400,000 | NiSource Finance Corp., | ||||||
| 5.250%, 9/15/17 | $ | 1,447,453 | ||||||
| 1,178,000 | Oklahoma Gas & Electric Co., | |||||||
| 6.500%, 7/15/17 | 1,219,596 | |||||||
| 700,000 | Oncor Electric Delivery Co. LLC, | |||||||
| 5.000%, 9/30/17 | 725,602 | |||||||
| 550,000 | PECO Energy Co., 1.200%, 10/15/16 | 550,020 | ||||||
| 800,000 | PPL UK Distribution Holdings Ltd. / | |||||||
| Western Power Distribution Ltd., | ||||||||
| 144a, 7.250%, 12/15/17 | 827,653 | |||||||
| 900,000 | South Carolina Electric & Gas Co., | |||||||
| 5.250%, 11/1/18 | 969,752 | |||||||
| 451,000 | Southern Electric Generating Co., | |||||||
| 144a, 2.200%, 12/1/18 | 460,369 | |||||||
| 1,255,000 | West Penn Power Co., 144a, | |||||||
| 5.950%, 12/15/17 | 1,313,056 | |||||||
| 15,697,758 | ||||||||
| Energy — 2.4% | ||||||||
| 1,800,000 | BP Capital Markets PLC, | |||||||
| 1.846%, 5/5/17 | 1,807,821 | |||||||
| 3,992,000 | Cameron International Corp., | |||||||
| 1.150%, 12/15/16 | 3,993,250 | |||||||
| 775,000 | Cameron International Corp., | |||||||
| 1.400%, 6/15/17 | 774,998 | |||||||
| 800,000 | Questar Pipeline Co., 5.830%, 2/1/18 | 842,818 | ||||||
| 1,500,000 | Ras Laffan Liquefied Natural Gas Co., | |||||||
| 6.750%, 9/30/19 | 1,708,350 | |||||||
| 384,480 | Ras Laffan Liquefied Natural Gas Co. | |||||||
| Ltd. II (Qatar), 144a, 5.298%, 9/30/20 | 410,459 | |||||||
| 400,000 | Shell International Finance BV, | |||||||
| 5.200%, 3/22/17 | 408,148 | |||||||
| 4,800,000 | Valero Energy Corp., 6.125%, 6/15/17 | 4,969,973 | ||||||
| 14,915,817 | ||||||||
| Health Care — 1.8% | ||||||||
| 4,800,000 | Amgen, Inc., 1.191%, 5/22/17(A) | 4,803,341 | ||||||
| 2,800,000 | Bayer US Finance LLC, 144a, | |||||||
| 0.907%, 10/7/16(A) | 2,800,050 | |||||||
| 1,955,000 | Catholic Health Initiatives, | |||||||
| 1.600%, 11/1/17 | 1,958,808 | |||||||
| 1,850,000 | Mylan, Inc., 1.350%, 11/29/16 | 1,850,936 | ||||||
| 11,413,135 | ||||||||
| Consumer Staples — 1.8% | ||||||||
| 4,370,000 | Bunge Ltd. Finance Corp., | |||||||
| 3.200%, 6/15/17 | 4,426,452 | |||||||
| 700,000 | Kroger Co. (The), 2.200%, 1/15/17 | 702,100 | ||||||
| 500,000 | Reynolds American, Inc., | |||||||
| 2.300%, 8/21/17 | 504,267 | |||||||
| 1,000,000 | RJ Reynolds Tobacco Co./NC, | |||||||
| 2.300%, 8/21/17 | 1,008,534 | |||||||
| 4,292,000 | SABMiller Holdings, Inc., 144a, | |||||||
| 2.450%, 1/15/17 | 4,304,867 | |||||||
| 10,946,220 | ||||||||
| Telecommunication Services — 1.7% | ||||||||
| 4,000,000 | BellSouth Corp., 144a, 4.400%, 4/26/17 | 4,073,200 | ||||||
| 2,710,000 | Cox Communications, Inc., 144a, | |||||||
| 5.875%, 12/1/16 | 2,728,954 | |||||||
| 3,900,000 | Scripps Networks Interactive, Inc., | |||||||
| 2.700%, 12/15/16 | 3,909,200 | |||||||
| 10,711,354 | ||||||||
| Information Technology — 1.7% | ||||||||
| 3,200,000 | Diamond 1 Finance Corp. / Diamond | |||||||
| 2 Finance Corp., 144a, | ||||||||
| 3.480%, 6/1/19 | 3,291,104 | |||||||
| 2,040,000 | Fidelity National Information Services, | |||||||
| Inc., 1.450%, 6/5/17 | 2,040,677 | |||||||
| 4,850,000 | Hewlett Packard Enterprise Co., 144a, | |||||||
| 2.450%, 10/5/17 | 4,888,848 | |||||||
| 10,220,629 | ||||||||
| Real Estate — 0.3% | ||||||||
| 1,620,000 | Weingarten Realty Investors REIT MTN, | |||||||
| 5.542%, 12/15/16 | 1,631,717 | |||||||
| Materials — 0.1% | ||||||||
| 300,000 | Domtar Corp., 10.750%, 6/1/17 | 317,255 | ||||||
| Total Corporate Bonds | $ | 233,267,390 | ||||||
| Asset-Backed Securities — 35.2% | ||||||||
| 2,243,008 | American Credit Acceptance | |||||||
| Receivables Trust, Ser 2015-3, Class | ||||||||
| A, 144a, 1.950%, 9/12/19 | 2,249,394 | |||||||
| 2,376,210 | American Homes 4 Rent, Ser | |||||||
| 2014-SFR1, Class A, 144a, | ||||||||
| 1.531%, 6/17/31(A) | 2,368,758 | |||||||
| 3,709,632 | AmeriCredit Automobile Receivables, | |||||||
| Ser 2013-2, Class C, 1.790%, 3/8/19 | 3,716,264 | |||||||
| 3,780,000 | AmeriCredit Automobile Receivables | |||||||
| Trust, Ser 2013-4, Class C, | ||||||||
| 2.720%, 9/9/19 | 3,813,964 | |||||||
| 4,635,000 | AmeriCredit Automobile Receivables | |||||||
| Trust, Ser 2014-1, Class D, | ||||||||
| 2.540%, 6/8/20 | 4,695,299 | |||||||
| 5,700,000 | Ascentium Equipment Receivables | |||||||
| Trust, Ser 2016-1A, Class A2, 144a, | ||||||||
| 1.750%, 11/13/18 | 5,733,319 | |||||||
| 883,112 | Bayview Financial Acquisition Trust, | |||||||
| Ser 2004-C, Class M1, | ||||||||
| 1.174%, 5/28/44(A) | 883,090 | |||||||
| 298,854 | Bayview Financial Acquisition Trust, | |||||||
| Ser 2004-D, Class M1, | ||||||||
| 1.154%, 8/28/44(A) | 298,863 | |||||||
| 516,911 | Bear Stearns Asset Backed Securities I | |||||||
| Trust, Ser 2004-BO1, Class M2, | ||||||||
| 1.275%, 10/25/34(A) | 516,659 | |||||||
| 3,875,844 | BlueVirgo Trust, Ser 2015-1A, Class | |||||||
| NOTE, 144a, 3.000%, 12/15/22 | 3,916,889 | |||||||
| 100,310 | California Republic Auto Receivables | |||||||
| Trust, Ser 2014-3, Class A3, | ||||||||
| 1.090%, 11/15/18 | 100,330 | |||||||
| 75 |
Touchstone Ultra Short Duration Fixed Income Fund (Continued)
| Principal | Market | |||||||
| Amount | Value | |||||||
| Asset-Backed Securities — 35.2% (Continued) | ||||||||
| $ | 5,000,000 | Capital Auto Receivables Asset Trust, | ||||||
| Ser 2013-4, Class A4, | ||||||||
| 1.470%, 7/20/18 | $ | 5,006,893 | ||||||
| 2,254,887 | Carfinance Capital Auto Trust, Ser | |||||||
| 2013-1A, Class B, 144a, | ||||||||
| 2.750%, 11/15/18 | 2,264,290 | |||||||
| 1,120,138 | CarFinance Capital Auto Trust, Ser | |||||||
| 2015-1A, Class A, 144a, | ||||||||
| 1.750%, 6/15/21 | 1,122,314 | |||||||
| 1,305,308 | Carnow Auto Receivables Trust, Ser | |||||||
| 2015-1A, Class A, 144a, | ||||||||
| 1.690%, 1/15/20 | 1,306,460 | |||||||
| 661,094 | Carrington Mortgage Loan Trust, Ser | |||||||
| 2005-OPT2, Class M2, | ||||||||
| 1.200%, 5/25/35(A) | 660,005 | |||||||
| 2,447,918 | Cazenovia Creek Funding I LLC, Ser | |||||||
| 2015-1A, Class A, 144a, | ||||||||
| 2.000%, 12/10/23 | 2,430,704 | |||||||
| 762,143 | CCG Receivables Trust, Ser 2014-1, | |||||||
| Class A2, 144a, 1.060%, 11/15/21 | 761,402 | |||||||
| 163,092 | CFC LLC, Ser 2014-1A, Class A, 144a, | |||||||
| 1.460%, 12/17/18 | 163,093 | |||||||
| 286,976 | Cifc Funding 2007-II Ltd., Ser 2007-2A, | |||||||
| Class A1J, 144a, 1.020%, 4/15/21(A) | 286,833 | |||||||
| 2,468,049 | CNH Equipment Trust, Ser 2014-C, | |||||||
| Class A3, 1.050%, 11/15/19 | 2,466,742 | |||||||
| 31,147 | College & University Facility Loan | |||||||
| Trust, Ser 2 Class D, 4.000%, 6/1/18 | 31,147 | |||||||
| 1,099,589 | Countrywide Asset-Backed | |||||||
| Certificates, Ser 2004-12, Class MV3, | ||||||||
| 1.515%, 3/25/35(A) | 1,095,579 | |||||||
| 756,967 | Credit-Based Asset Servicing and | |||||||
| Securitization LLC, Ser 2006-SC1, | ||||||||
| Class A, 144a, 0.795%, 5/25/36(A) | 750,361 | |||||||
| 496,937 | Dell Equipment Finance Trust, Ser | |||||||
| 2014-1, Class C, 144a, | ||||||||
| 1.800%, 6/22/20 | 497,168 | |||||||
| 1,567,644 | Dell Equipment Finance Trust, Ser | |||||||
| 2015-1, Class A2, 144a, | ||||||||
| 1.010%, 7/24/17 | 1,567,449 | |||||||
| 2,725,000 | Dell Equipment Finance Trust, Ser | |||||||
| 2015-1, Class D, 144a, | ||||||||
| 2.840%, 9/22/20 | 2,721,311 | |||||||
| 2,211,611 | Dell Equipment Finance Trust, Ser | |||||||
| 2016-1, Class A1, 144a, | ||||||||
| 0.850%, 7/24/17 | 2,211,621 | |||||||
| 3,000,000 | Dell Equipment Finance Trust, Ser | |||||||
| 2016-1, Class A2, 144a, | ||||||||
| 1.430%, 9/24/18 | 3,006,004 | |||||||
| 616,749 | DT Auto Owner Trust, Ser 2015-2A, | |||||||
| Class A, 144a, 1.240%, 9/17/18 | 616,680 | |||||||
| �� | 1,166,441 | Elara HGV Timeshare Issuer LLC, Ser | ||||||
| 2014-A, Class A, 144a, | ||||||||
| 2.530%, 2/25/27 | 1,174,872 | |||||||
| 1,415,409 | Exeter Automobile Receivables Trust, | |||||||
| Ser 2015-1A, Class A, 144a, | ||||||||
| 1.600%, 6/17/19 | 1,415,521 | |||||||
| 168,895 | First Investors Auto Owner Trust, Ser | |||||||
| 2013-1A, Class B, 144a, | ||||||||
| 1.810%, 10/15/18 | 168,927 | |||||||
| 4,450,000 | First Investors Auto Owner Trust, Ser | |||||||
| 2014-1A, Class B, 144a, | ||||||||
| 2.260%, 1/15/20 | 4,469,251 | |||||||
| 2,600,000 | First Investors Auto Owner Trust, Ser | |||||||
| 2016-2A, Class A1, 144a, | ||||||||
| 1.530%, 11/16/20 | 2,601,092 | |||||||
| 1,010,672 | Flagship Credit Auto Trust, Ser 2013-1, | |||||||
| Class B, 144a, 2.760%, 9/17/18 | 1,011,524 | |||||||
| 1,291,203 | Flagship Credit Auto Trust, Ser 2013-2, | |||||||
| Class A, 144a, 1.940%, 1/15/19 | 1,292,581 | |||||||
| 4,075,222 | Flagship Credit Auto Trust, Ser 2016-3, | |||||||
| Class A1, 144a, 1.610%, 12/15/19 | 4,080,041 | |||||||
| 672,698 | FNA 2014-1 Trust, Ser 2014-1A, Class | |||||||
| A, 144a, 1.296%, 12/10/22 | 665,971 | |||||||
| 2,606,492 | FNA 2015-1 Trust, Ser 2015-1, Class A, | |||||||
| 144a, 3.240%, 12/10/23 | 2,599,535 | |||||||
| 1,186,349 | GE Equipment Small Ticket LLC Series, | |||||||
| Ser 2014-1A, Class A3, 144a, | ||||||||
| 0.950%, 9/25/17 | 1,185,551 | |||||||
| 4,537,842 | GLS Auto Receivables Trust, Ser | |||||||
| 2016-1A, Class A, 144a, | ||||||||
| 2.730%, 10/15/20 | 4,568,327 | |||||||
| 1,265,761 | GreatAmerica Leasing Receivables | |||||||
| Funding LLC Series, Ser 2015-1, | ||||||||
| Class A2, 144a, 1.120%, 6/20/17 | 1,265,861 | |||||||
| 456,965 | GreatAmerica Leasing Receivables | |||||||
| Funding LLC Series, Ser 2016-1, | ||||||||
| Class A1, 144a, 0.780%, 2/21/17 | 456,777 | |||||||
| 6,455,000 | GreatAmerica Leasing Receivables | |||||||
| Funding LLC Series, Ser 2016-1, | ||||||||
| Class A2, 144a, 1.570%, 5/21/18 | 6,464,896 | |||||||
| 3,230,738 | Jasper CLO Ltd., Ser 2005-1A, Class C, | |||||||
| 144a, 1.659%, 8/1/17(A) | 3,229,391 | |||||||
| 2,800,000 | Leaf Receivables Funding 11 LLC, Ser | |||||||
| 2016-1, Class A2, 144a, | ||||||||
| 1.720%, 7/15/18 | 2,803,223 | |||||||
| 2,759,559 | LEAF Receivables Funding 9 LLC, Ser | |||||||
| 2013-1, Class A4, 144a, | ||||||||
| 1.980%, 9/15/21 | 2,763,008 | |||||||
| 2,355,000 | MAPS CLO Fund II Ltd., Ser 2007-2A, | |||||||
| Class B, 144a, 1.596%, 7/20/22(A) | 2,274,826 | |||||||
| 576,001 | MMAF Equipment Finance LLC, Ser | |||||||
| 2012-AA, Class A4, 144a, | ||||||||
| 1.350%, 10/10/18 | 576,618 | |||||||
| 2,758,081 | Morgan Stanley ABS Capital I, Inc. | |||||||
| Trust, Ser 2006-NC1, Class A4, | ||||||||
| 0.825%, 12/25/35(A) | 2,712,936 | |||||||
| 76 |
Touchstone Ultra Short Duration Fixed Income Fund (Continued)
| Principal | Market | |||||||
| Amount | Value | |||||||
| Asset-Backed Securities — 35.2% (Continued) | ||||||||
| $ | 6,655,000 | Navitas Equipment Receivables LLC, | ||||||
| Ser 2016-1, Class A1, 144a, | ||||||||
| 1.100%, 9/15/17 | $ | 6,655,063 | ||||||
| 6,600,000 | Navitas Equipment Receivables LLC, | |||||||
| Ser 2016-1, Class A2, 144a, | ||||||||
| 2.200%, 6/15/21 | 6,602,919 | |||||||
| 50,000 | New Mexico Educational Assistance | |||||||
| Foundation, Ser 2010, Class A2, | ||||||||
| 1.492%, 12/1/28(A) | 50,003 | |||||||
| 5,142,783 | OneMain Direct Auto Receivables | |||||||
| Trust, Ser 2016-1A, Class A, 144a, | ||||||||
| 2.040%, 1/15/21 | 5,163,523 | |||||||
| 2,710,229 | Orange Lake Timeshare Trust, Ser | |||||||
| 2012-AA, Class A, 144a, | ||||||||
| 3.450%, 3/10/27 | 2,744,811 | |||||||
| 1,210,052 | Orange Lake Timeshare Trust, Ser | |||||||
| 2014-AA, Class A, 144a, | ||||||||
| 2.290%, 7/9/29 | 1,203,974 | |||||||
| 554,717 | Park Place Securities, Inc. Asset Backed | |||||||
| Pass Through Certificates, Ser | ||||||||
| 2005-WHQ3, Class M2, | ||||||||
| 1.200%, 6/25/35(A) | 553,829 | |||||||
| 827,589 | Prestige Auto Receivables Trust, Ser | |||||||
| 2014-1A, Class A3, 144a, | ||||||||
| 1.520%, 4/15/20 | 828,097 | |||||||
| 168,127 | RAMP Trust, Ser 2003-RZ3, Class A6, | |||||||
| 3.900%, 3/25/33(B) | 170,745 | |||||||
| 690,003 | Rockwall CDO Ltd., Ser 2006-1A, Class | |||||||
| A1LB, 144a, 1.257%, 8/1/21(A) | 689,769 | |||||||
| 746,308 | Santander Drive Auto Receivables | |||||||
| Trust, Ser 2012-5, Class C, | ||||||||
| 2.700%, 8/15/18 | 747,631 | |||||||
| 370,721 | Santander Drive Auto Receivables | |||||||
| Trust, Ser 2012-AA, Class C, 144a, | ||||||||
| 1.780%, 11/15/18 | 371,163 | |||||||
| 4,790,000 | Santander Drive Auto Receivables | |||||||
| Trust, Ser 2012-AA, Class D, 144a, | ||||||||
| 2.460%, 12/17/18 | 4,825,867 | |||||||
| 2,847,452 | Santander Drive Auto Receivables | |||||||
| Trust, Ser 2013-1, Class C, | ||||||||
| 1.760%, 1/15/19 | 2,852,093 | |||||||
| 8,000,000 | Santander Drive Auto Receivables | |||||||
| Trust, Ser 2013-1, Class D, | ||||||||
| 2.270%, 1/15/19 | 8,060,993 | |||||||
| 3,829,850 | Santander Drive Auto Receivables | |||||||
| Trust, Ser 2013-2, Class C, | ||||||||
| 1.950%, 3/15/19 | 3,839,928 | |||||||
| 3,727,000 | Santander Drive Auto Receivables | |||||||
| Trust, Ser 2014-4, Class C, | ||||||||
| 2.600%, 11/16/20 | 3,768,051 | |||||||
| 6,340,000 | Santander Drive Auto Receivables | |||||||
| Trust, Ser 2015-1, Class B, | ||||||||
| 1.970%, 11/15/19 | 6,360,985 | |||||||
| 2,362,839 | Schiller Park CLO Ltd., Ser 2007-1A, | |||||||
| Class A2, 144a, 0.955%, 4/25/21(A) | 2,355,994 | |||||||
| 1,131,254 | Sierra Timeshare Receivables Funding | |||||||
| LLC, Ser 2011-3A, Class A, 144a, | ||||||||
| 3.370%, 7/20/28 | 1,133,404 | |||||||
| 649,454 | Sierra Timeshare Receivables Funding | |||||||
| LLC, Ser 2012-1A, Class A, 144a, | ||||||||
| 2.840%, 11/20/28 | 650,830 | |||||||
| 3,076,294 | Sierra Timeshare Receivables Funding | |||||||
| LLC, Ser 2012-3A, Class A, 144a, | ||||||||
| 1.870%, 8/20/29 | 3,055,978 | |||||||
| 1,425,243 | Sierra Timeshare Receivables Funding | |||||||
| LLC, Ser 2013-1A, Class A, 144a, | ||||||||
| 1.590%, 11/20/29 | 1,419,434 | |||||||
| 1,105,935 | Sierra Timeshare Receivables Funding | |||||||
| LLC, Ser 2014-1A, Class A, 144a, | ||||||||
| 2.070%, 3/20/30 | 1,100,275 | |||||||
| 829,321 | Sierra Timeshare Receivables Funding | |||||||
| LLC, Ser 2014-2A, Class A, 144a, | ||||||||
| 2.050%, 6/20/31 | 829,811 | |||||||
| 2,257,819 | Sierra Timeshare Receivables Funding | |||||||
| LLC, Ser 2014-3A, Class A, 144a, | ||||||||
| 2.300%, 10/20/31 | 2,262,351 | |||||||
| 2,565,970 | Sierra Timeshare Receivables Funding | |||||||
| LLC, Ser 2015-2A, Class A, 144a, | ||||||||
| 2.430%, 6/20/32 | 2,571,455 | |||||||
| 3,986,656 | SpringCastle America Funding LLC, | |||||||
| Ser 2014-AA, Class A, 144a, | ||||||||
| 2.700%, 5/25/23 | 3,999,593 | |||||||
| 2,748,645 | Tidewater Auto Receivables Trust, Ser | |||||||
| 2016-AA, Class A2, 144a, | ||||||||
| 2.300%, 9/15/19 | 2,750,709 | |||||||
| 237,372 | United Auto Credit Securitization | |||||||
| Trust, Ser 2016-1, Class A, 144a, | ||||||||
| 2.000%, 10/15/17 | 237,532 | |||||||
| 4,750,000 | United Auto Credit Securitization | |||||||
| Trust, Ser 2016-2, Class A, 144a, | ||||||||
| 1.670%, 9/10/18 | 4,751,368 | |||||||
| 3,828,494 | Welk Resorts LLC, Ser 2013-AA, Class | |||||||
| A, 144a, 3.100%, 3/15/29 | 3,866,917 | |||||||
| 1,629,052 | Westgate Resorts LLC, Ser 2013-1A, | |||||||
| Class A, 144a, 2.250%, 8/20/25 | 1,628,034 | |||||||
| 2,664,470 | Westgate Resorts LLC, Ser 2015-1A, | |||||||
| Class A, 144a, 2.750%, 5/20/27 | 2,648,691 | |||||||
| 2,674,703 | Westgate Resorts LLC, Ser 2016-1A, | |||||||
| Class A, 144a, 3.500%, 12/20/28 | 2,676,836 | |||||||
| 6,075,000 | Westlake Automobile Receivables | |||||||
| Trust, Ser 2014-2A, Class C, 144a, | ||||||||
| 2.240%, 4/15/20 | 6,095,331 | |||||||
| 531,293 | Westlake Automobile Receivables | |||||||
| Trust, Ser 2015-1A, Class A2, 144a, | ||||||||
| 1.170%, 3/15/18 | 531,229 | |||||||
| 2,409,272 | Westlake Automobile Receivables | |||||||
| Trust, Ser 2015-2A, Class A2A, 144a, | ||||||||
| 1.280%, 7/16/18 | 2,409,484 | |||||||
| 77 |
Touchstone Ultra Short Duration Fixed Income Fund (Continued)
| Principal | Market | |||||||
| Amount | Value | |||||||
| Asset-Backed Securities — 35.2% (Continued) | ||||||||
| $ | 834,191 | Westlake Automobile Receivables | ||||||
| Trust, Ser 2016-1A, Class A2A, 144a, | ||||||||
| 1.820%, 1/15/19 | $ | 836,536 | ||||||
| 4,301,171 | Westlake Automobile Receivables | |||||||
| Trust, Ser 2016-1A, Class A2B, 144a, | ||||||||
| 1.574%, 1/15/19(A) | 4,313,739 | |||||||
| 5,365,000 | Westlake Automobile Receivables | |||||||
| Trust, Ser 2016-2A, Class A2, 144a, | ||||||||
| 1.570%, 6/17/19 | 5,369,590 | |||||||
| Total Asset-Backed Securities | $ | 218,024,179 | ||||||
| Commercial Mortgage-Backed Securities — 9.4% | ||||||||
| 9,305,469 | BAMLL Re-REMIC Trust, Ser 2014-FRR7, | |||||||
| Class A, 144a, 2.774%, 10/26/44(A) | 9,303,204 | |||||||
| 5,182,000 | CD Mortgage Trust, Ser 2006-CD3, | |||||||
| Class AM, 5.648%, 10/15/48 | 5,186,421 | |||||||
| 5,645,000 | CDGJ Commercial Mortgage Trust, Ser | |||||||
| 2014-BXCH, Class B, 144a, | ||||||||
| 2.374%, 12/15/27(A) | 5,626,445 | |||||||
| 4,991,000 | COMM Mortgage Trust, Ser | |||||||
| 2012-9W57, Class A, 144a, | ||||||||
| 2.365%, 2/10/29 | 5,001,428 | |||||||
| 3,537,904 | COMM Mortgage Trust, Ser | |||||||
| 2014-SAVA, Class A, 144a, | ||||||||
| 1.675%, 6/15/34(A) | 3,541,088 | |||||||
| 391,335 | DBRR Trust, Ser 2013-EZ3, Class A, | |||||||
| 144a, 1.636%, 12/18/49(A) | 391,201 | |||||||
| 1,172,698 | DBUBS Mortgage Trust, Ser | |||||||
| 2011-LC2A, Class A1FL, 144a, | ||||||||
| 1.869%, 7/12/44(A) | 1,170,198 | |||||||
| 7,649,709 | EQTY Mortgage Trust, Ser 2014-INNS, | |||||||
| Class A, 144a, 1.367%, 5/8/31(A) | 7,628,115 | |||||||
| 40,561 | FDIC Guaranteed Notes, Ser 2010-C1, | |||||||
| Class A, 144a, 2.980%, 12/6/20 | 41,025 | |||||||
| 4,965,000 | Hyatt Hotel Portfolio Trust, Ser | |||||||
| 2015-HYT, Class A, 144a, | ||||||||
| 1.781%, 11/15/29(A) | 4,968,895 | |||||||
| 6,050,000 | JP Morgan Chase Commercial | |||||||
| Mortgage Securities Trust, Ser | ||||||||
| 2014-INN, Class D, 144a, | ||||||||
| 2.874%, 6/15/29(A) | 5,922,034 | |||||||
| 2,800,000 | PFP 2015-2 Ltd., Ser 2015-2, Class A, | |||||||
| 144a, 1.980%, 7/14/34(A) | 2,788,330 | |||||||
| 16,121,596 | UBS-Citigroup Commercial Mortgage | |||||||
| Trust, Ser 2011-C1, Class XA, 144a, | ||||||||
| 2.290%, 1/10/45(A)(C) | 1,467,085 | |||||||
| 5,000,000 | Wells Fargo Commercial Mortgage | |||||||
| Trust, Ser 2014-TISH, Class B, 144a, | ||||||||
| 1.874%, 2/15/27(A) | 5,009,180 | |||||||
| Total Commercial Mortgage-Backed Securities | $ | 58,044,649 | ||||||
| U.S. Government Mortgage-Backed Obligations — 6.7% | ||||||||
| 162,820 | FHLMC, Pool #1B1580, | |||||||
| 3.086%, 3/1/34(A) | 171,744 | |||||||
| 154,889 | FHLMC, Pool #1B2629, | |||||||
| 2.625%, 11/1/34(A) | 164,574 | |||||||
| 468,261 | FHLMC, Pool #1B7189, | |||||||
| 3.555%, 3/1/36(A) | 499,700 | |||||||
| 141,582 | FHLMC, Pool #1G1471, | |||||||
| 2.552%, 1/1/37(A) | 150,646 | |||||||
| 817,727 | FHLMC, Pool #1H1354, | |||||||
| 2.671%, 11/1/36(A) | 865,445 | |||||||
| 94,154 | FHLMC, Pool #1H2524, | |||||||
| 2.781%, 8/1/35(A) | 99,543 | |||||||
| 489,273 | FHLMC, Pool #1J1813, | |||||||
| 3.175%, 8/1/37(A) | 519,184 | |||||||
| 353,996 | FHLMC, Pool #1K1238, | |||||||
| 2.778%, 7/1/36(A) | 374,852 | |||||||
| 203,306 | FHLMC, Pool #1L0087, | |||||||
| 2.755%, 6/1/35(A) | 214,884 | |||||||
| 446,506 | FHLMC, Pool #1L0147, | |||||||
| 2.801%, 7/1/35(A) | 475,914 | |||||||
| 279,848 | FHLMC, Pool #1L1288, | |||||||
| 2.822%, 5/1/36(A) | 295,558 | |||||||
| 249,027 | FHLMC, Pool #1Q0080, | |||||||
| 2.773%, 1/1/36(A) | 262,842 | |||||||
| 535,569 | FHLMC, Pool #1Q0119, | |||||||
| 3.080%, 9/1/36(A) | 569,890 | |||||||
| 1,302,593 | FHLMC, Pool #1Q0187, | |||||||
| 2.759%, 12/1/36(A) | 1,376,884 | |||||||
| 700,821 | FHLMC, Pool #1Q0339, | |||||||
| 2.896%, 4/1/37(A) | 743,172 | |||||||
| 197,345 | FHLMC, Pool #1Q0669, | |||||||
| 2.767%, 11/1/37(A) | 208,023 | |||||||
| 697,408 | FHLMC, Pool #1Q1303, | |||||||
| 2.686%, 11/1/36(A) | 737,944 | |||||||
| 840,784 | FHLMC, Pool #781515, | |||||||
| 2.824%, 4/1/34(A) | 887,665 | |||||||
| 349,656 | FHLMC, Pool #782760, | |||||||
| 2.698%, 11/1/36(A) | 370,723 | |||||||
| 305,061 | FHLMC, Pool #847795, | |||||||
| 2.686%, 4/1/35(A) | 321,709 | |||||||
| 187,803 | FHLMC, Pool #848088, | |||||||
| 2.728%, 4/1/35(A) | 198,735 | |||||||
| 579,275 | FHLMC, Pool #848539, | |||||||
| 2.846%, 4/1/37(A) | 618,554 | |||||||
| 1,567,611 | FHLMC, Pool #848583, | |||||||
| 2.784%, 1/1/36(A) | 1,657,106 | |||||||
| 21,454 | FHLMC, Pool #A92646, 5.500%, 6/1/40 | 24,663 | ||||||
| 20,222 | FHLMC, Pool #C03505, 5.500%, 6/1/40 | 22,712 | ||||||
| 71,401 | FHLMC, Pool #C66916, 7.000%, 5/1/32 | 82,330 | ||||||
| 16,136 | FHLMC, Pool #D94598, 6.500%, 4/1/21 | 18,127 | ||||||
| 65,765 | FHLMC, Pool #G01840, 5.000%, 7/1/35 | 73,628 | ||||||
| 772,503 | FHLMC, Pool #G11769, | |||||||
| 5.000%, 10/1/20 | 809,433 | |||||||
| 489,624 | FHLMC, Pool #G11773, | |||||||
| 5.000%, 10/1/20 | 513,062 | |||||||
| 5,452 | FHLMC, Pool #G30085, | |||||||
| 7.500%, 10/1/17 | 5,534 | |||||||
| 78 |
Touchstone Ultra Short Duration Fixed Income Fund (Continued)
| Principal | Market | |||||||
| Amount | Value | |||||||
| U.S. Government Mortgage-Backed Obligations — 6.7% (Continued) | ||||||||
| $ | 277,168 | FHLMC, Pool #J10895, | ||||||
| 4.000%, 10/1/19 | $ | 285,723 | ||||||
| 207,099 | FNMA, Pool #254868, 5.000%, 9/1/33 | 231,067 | ||||||
| 98,826 | FNMA, Pool #256272, 5.500%, 6/1/26 | 111,247 | ||||||
| 164,342 | FNMA, Pool #256852, 6.000%, 8/1/27 | 188,130 | ||||||
| 36,303 | FNMA, Pool #323832, 7.500%, 7/1/29 | 43,522 | ||||||
| 2,697 | FNMA, Pool #334593, 7.000%, 5/1/24 | 2,957 | ||||||
| 174,050 | FNMA, Pool #555380, | |||||||
| 2.733%, 4/1/33(A) | 182,191 | |||||||
| 60,933 | FNMA, Pool #665773, 7.500%, 6/1/31 | 62,871 | ||||||
| 119,346 | FNMA, Pool #679742, | |||||||
| 2.972%, 1/1/40(A) | 123,386 | |||||||
| 82,592 | FNMA, Pool #681842, | |||||||
| 2.678%, 2/1/33(A) | 86,866 | |||||||
| 200,535 | FNMA, Pool #681898, | |||||||
| 2.698%, 4/1/33(A) | 209,428 | |||||||
| 221,604 | FNMA, Pool #725245, | |||||||
| 2.556%, 2/1/34(A) | 233,477 | |||||||
| 227,863 | FNMA, Pool #725424, 5.500%, 4/1/34 | 259,106 | ||||||
| 1,389,523 | FNMA, Pool #725490, | |||||||
| 2.730%, 4/1/34(A) | 1,483,441 | |||||||
| 121,750 | FNMA, Pool #735439, 6.000%, 9/1/19 | 125,144 | ||||||
| 40,812 | FNMA, Pool #735484, 5.000%, 5/1/35 | 45,555 | ||||||
| 168,929 | FNMA, Pool #735539, | |||||||
| 2.783%, 4/1/35(A) | 178,076 | |||||||
| 97,240 | FNMA, Pool #743207, | |||||||
| 2.442%, 10/1/33(A) | 101,627 | |||||||
| 71,195 | FNMA, Pool #745467, | |||||||
| 2.834%, 4/1/36(A) | 75,260 | |||||||
| 72,875 | FNMA, Pool #745790, | |||||||
| 2.666%, 8/1/36(A) | 76,674 | |||||||
| 493,430 | FNMA, Pool #761411, 4.500%, 5/1/19 | 506,199 | ||||||
| 123,106 | FNMA, Pool #784365, | |||||||
| 2.425%, 5/1/34(A) | 128,841 | |||||||
| 254,225 | FNMA, Pool #791978, | |||||||
| 2.392%, 9/1/34(A) | 264,675 | |||||||
| 91,856 | FNMA, Pool #804001, | |||||||
| 2.575%, 10/1/34(A) | 96,623 | |||||||
| 61,374 | FNMA, Pool #809897, | |||||||
| 2.812%, 3/1/35(A) | 65,164 | |||||||
| 266,524 | FNMA, Pool #813170, | |||||||
| 2.539%, 1/1/35(A) | 280,316 | |||||||
| 1,343,392 | FNMA, Pool #815323, | |||||||
| 2.452%, 1/1/35(A) | 1,399,887 | |||||||
| 258,400 | FNMA, Pool #820364, | |||||||
| 2.197%, 4/1/35(A) | 266,537 | |||||||
| 708,611 | FNMA, Pool #827787, | |||||||
| 2.427%, 5/1/35(A) | 742,238 | |||||||
| 101,441 | FNMA, Pool #828480, | |||||||
| 2.980%, 6/1/35(A) | 108,741 | |||||||
| 157,990 | FNMA, Pool #839239, | |||||||
| 2.882%, 9/1/35(A) | 165,870 | |||||||
| 125,082 | FNMA, Pool #888179, | |||||||
| 2.741%, 2/1/37(A) | 132,164 | |||||||
| 86,289 | FNMA, Pool #888548, | |||||||
| 2.647%, 5/1/35(A) | 91,225 | |||||||
| 137,538 | FNMA, Pool #889060, 6.000%, 1/1/38 | 159,482 | ||||||
| 133,966 | FNMA, Pool #889061, 6.000%, 1/1/38 | 156,936 | ||||||
| 8,391 | FNMA, Pool #889382, 5.500%, 4/1/38 | 9,621 | ||||||
| 499,256 | FNMA, Pool #922674, | |||||||
| 2.928%, 4/1/36(A) | 525,649 | |||||||
| 277,721 | FNMA, Pool #931676, 5.500%, 1/1/19 | 287,112 | ||||||
| 214,384 | FNMA, Pool #950385, | |||||||
| 1.876%, 8/1/37(A) | 220,085 | |||||||
| 72,871 | FNMA, Pool #960376, 5.500%, 12/1/37 | 82,029 | ||||||
| 26,518 | FNMA, Pool #995284, 5.500%, 3/1/20 | 26,888 | ||||||
| 630,833 | FNMA, Pool #AA1150, 4.000%, 4/1/23 | 651,232 | ||||||
| 13,034 | FNMA, Pool #AD0941, 5.500%, 4/1/40 | 15,143 | ||||||
| 103,655 | FNMA, Pool #AE0363, 5.000%, 7/1/37 | 116,435 | ||||||
| 361,066 | FNMA, Pool #AE0727, 4.000%, 10/1/20 | 372,634 | ||||||
| 150,099 | FNMA, Pool #AE5441, 5.000%, 10/1/40 | 166,981 | ||||||
| 234,188 | FNMA, Pool #AI6588, 4.000%, 7/1/26 | 248,630 | ||||||
| 235,828 | FNMA, Pool #AI8506, 4.000%, 8/1/26 | 250,465 | ||||||
| 231,757 | FNMA, Pool #AL0211, 5.000%, 4/1/41 | 258,711 | ||||||
| 39,333 | FNMA, Pool #AL0302, 5.000%, 4/1/24 | 42,194 | ||||||
| 1,469,602 | FNMA, Pool #AL0478, | |||||||
| 2.718%, 4/1/36(A) | 1,556,619 | |||||||
| 379,876 | FNMA, Pool #AL0543, 5.000%, 7/1/41 | 423,793 | ||||||
| 225,024 | FNMA, Pool #AL1105, 4.500%, 12/1/40 | 249,676 | ||||||
| 103,022 | FNMA, Pool #AL2591, 5.500%, 5/1/38 | 110,774 | ||||||
| 953,239 | FNMA, Pool #AL5275, | |||||||
| 2.357%, 9/1/37(A) | 980,398 | |||||||
| 4,723,069 | FNMA, Pool #AL7396, | |||||||
| 2.424%, 2/1/37(A) | 4,941,511 | |||||||
| 14,059 | GNMA, Pool #344233, 8.000%, 2/15/23 | 15,282 | ||||||
| 63,252 | GNMA, Pool #345123, | |||||||
| 8.000%, 12/15/23 | 69,664 | |||||||
| 6,878 | GNMA, Pool #569337, 6.500%, 4/15/22 | 7,416 | ||||||
| 17,293 | GNMA, Pool #780322, | |||||||
| 8.000%, 11/15/22 | 19,390 | |||||||
| 578 | GNMA, Pool #780327, | |||||||
| 8.000%, 11/15/17 | 584 | |||||||
| 646,429 | GNMA, Pool #80826, | |||||||
| 2.000%, 2/20/34(A) | 671,508 | |||||||
| 308,956 | GNMA, Pool #80889, | |||||||
| 2.125%, 4/20/34(A) | 320,891 | |||||||
| 514,659 | GNMA, Pool #81016, | |||||||
| 1.875%, 8/20/34(A) | 535,888 | |||||||
| 2,035 | GNMA, Pool #814, 8.000%, 8/20/17 | 2,049 | ||||||
| 1,106,776 | GNMA, Pool #82760, | |||||||
| 2.000%, 3/20/41(A) | 1,146,807 | |||||||
| 1,976 | GNMA, Pool #8426, | |||||||
| 3.000%, 11/20/18(A) | 1,990 | |||||||
| 1,179,214 | GNMA, Pool #MA2392, | |||||||
| 2.000%, 11/20/44(A) | 1,208,104 | |||||||
| 4,115,984 | GNMA, Pool #MA2466, | |||||||
| 2.000%, 12/20/44(A) | 4,218,130 | |||||||
| Total U.S. Government Mortgage-Backed Obligations | $ | 41,759,709 | ||||||
| 79 |
Touchstone Ultra Short Duration Fixed Income Fund (Continued)
| Principal | Market | |||||||
| Amount | Value | |||||||
| Municipal Bonds — 3.8% | ||||||||
| California — 0.8% | ||||||||
| $ | 2,340,000 | CA St Enterprise Dev Authority, Txbl | ||||||
| Variable J Harris Indl Wt, (LOC: City | ||||||||
| National Bank), 144a, 1.060%, | ||||||||
| 9/1/41 | $ | 2,340,000 | ||||||
| 730,000 | CA St Infrastructure & Economic Dev | |||||||
| Bank, Txbl Studio Moulding, Ser B, | ||||||||
| (LOC: Comerica Bank), 1.990%, | ||||||||
| 12/1/28 | 730,000 | |||||||
| 255,000 | CA St Infrastructure & Economic Dev | |||||||
| Bank, Txbl Tobinworld Pj, Ser B, | ||||||||
| (LOC: Comerica Bank), 1.990%, | ||||||||
| 11/1/36 | 255,000 | |||||||
| 1,885,000 | CA St Infrastructure & Economic Dev | |||||||
| Bank, Variable Canyon Plastics Inc P, | ||||||||
| (LOC: Bank Of West (The), 1.190%, | ||||||||
| 12/1/39 | 1,885,000 | |||||||
| 5,210,000 | ||||||||
| Connecticut — 0.1% | ||||||||
| 425,000 | State of Connecticut, Ser A, UTGO, | |||||||
| 1.760%, 5/15/18(A) | 427,159 | |||||||
| Florida — 0.8% | ||||||||
| 5,000,000 | State Brd of Admin Fin Corp., Txbl Ser | |||||||
| A, 2.163%, 7/1/19 | 5,093,650 | |||||||
| Massachusetts — 0.7% | ||||||||
| 4,450,000 | MA St Edu Fin Auth, Ser B 1, 2.277%, | |||||||
| 1/1/31(A) | 4,450,044 | |||||||
| Minnesota — 0.3% | ||||||||
| 1,000,000 | Saint Paul MN Hsg & Redev Auth, Txbl | |||||||
| Ref Healthpartners Oblig, 1.400%, | ||||||||
| 7/1/17 | 1,001,950 | |||||||
| 1,095,000 | Saint Paul MN Hsg & Redev Auth, Txbl | |||||||
| Ref Healthpartners Oblig, 1.838%, | ||||||||
| 7/1/18 | 1,102,107 | |||||||
| 2,104,057 | ||||||||
| New York — 0.6% | ||||||||
| 3,600,000 | Brookhaven NY IDA, Variable | |||||||
| Intercounty Asso, (LOC: Capital One | ||||||||
| NA), 0.980%, 1/1/25 | 3,600,000 | |||||||
| Ohio — 0.3% | ||||||||
| 1,540,000 | Akron OH COP, Muni Baseball | |||||||
| Stadium, 1.750%, 12/1/16 | 1,541,263 | |||||||
| South Carolina — 0.2% | ||||||||
| 230,000 | Spartanburg SC Wtrwks Rev, Txbl Ref | |||||||
| Sys Ser B, 1.219%, 12/1/16 | 229,975 | |||||||
| 535,000 | Spartanburg SC Wtrwks Rev, Txbl Ref | |||||||
| Sys Ser B, 1.519%, 12/1/17 | 537,445 | |||||||
| 280,000 | Spartanburg SC Wtrwks Rev, Txbl Ref | |||||||
| Sys Ser B, 1.785%, 12/1/18 | 283,108 | |||||||
| 1,050,528 | ||||||||
| Total Municipal Bonds | $ | 23,476,701 | ||||||
| Non-Agency Collateralized Mortgage Obligations — 3.5% | ||||||||
| 3,154,195 | Bear Stearns ARM Trust, Ser 2003-1, | |||||||
| Class 5A1, 2.730%, 4/25/33(A)†† | 3,142,911 | |||||||
| 373,051 | Bear Stearns ARM Trust, Ser 2004-1, | |||||||
| Class 13A3, 3.274%, 4/25/34(A)†† | 361,229 | |||||||
| 266,840 | Bear Stearns Asset Backed Securities | |||||||
| Trust, Ser 2003-AC7, Class A2, | ||||||||
| 5.750%, 1/25/34(B)†† | 273,966 | |||||||
| 105,516 | Community Program Loan Trust, Ser | |||||||
| 1987-A, Class A5, 4.500%, 4/1/29 | 104,870 | |||||||
| 1,268,190 | CSMC Trust, Ser 2012-CIM1, Class A1, | |||||||
| 144a, 3.380%, 2/25/42(A) | 1,273,600 | |||||||
| 93,238 | FDIC Structured Sale Guaranteed | |||||||
| Notes, Ser 2010-S3, Class A, 144a, | ||||||||
| 2.740%, 12/3/20 | 94,680 | |||||||
| 218,206 | JP Morgan Mortgage Trust, Ser | |||||||
| 2006-A4, Class 2A2, | ||||||||
| 2.812%, 6/25/36(A) | 196,474 | |||||||
| 24,031 | Merrill Lynch Mortgage Investors | |||||||
| Trust, Ser 2003-A1, Class 2A, | ||||||||
| 3.184%, 12/25/32(A) | 23,722 | |||||||
| 251,536 | Merrill Lynch Mortgage Investors | |||||||
| Trust, Ser 2004-1, Class 1A, | ||||||||
| 2.640%, 12/25/34(A) | 247,509 | |||||||
| 2,750,371 | Mill City Mortgage Trust, Ser 2015-1, | |||||||
| Class A1, 144a, 2.230%, 6/25/56(A) | 2,754,198 | |||||||
| 1,469,990 | People's Choice Home Loan Securities | |||||||
| Trust Series, Ser 2005-1, Class M3, | ||||||||
| 1.394%, 1/25/35(A) | 1,471,052 | |||||||
| 1,167,909 | RFMSI Trust, Ser 2007-SA1, Class 1A1, | |||||||
| 3.208%, 2/25/37(A) | 978,634 | |||||||
| 3,860,704 | Springleaf Mortgage Loan Trust, Ser | |||||||
| 2013-1A, Class M5, 144a, | ||||||||
| 2.378%, 6/25/58(A) | 3,854,438 | |||||||
| 5,856,393 | Springleaf Mortgage Loan Trust, Ser | |||||||
| 2013-3A, Class A, 144a, | ||||||||
| 1.870%, 9/25/57(A) | 5,856,448 | |||||||
| 238,975 | Wells Fargo Mortgage Backed | |||||||
| Securities Trust, Ser 2003-G, Class | ||||||||
| A1, 2.894%, 6/25/33(A) | 239,517 | |||||||
| 556,340 | Wells Fargo Mortgage Backed | |||||||
| Securities Trust, Ser 2003-M, Class | ||||||||
| A1, 2.810%, 12/25/33(A) | 557,156 | |||||||
| Total Non-Agency Collateralized Mortgage Obligations | $ | 21,430,404 | ||||||
| U.S. Government Agency Obligations—1.3% | ||||||||
| 583,000 | Government Trust Certificate, | |||||||
| 0.000%, 10/1/16# | 583,000 | |||||||
| 80 |
Touchstone Ultra Short Duration Fixed Income Fund (Continued)
| Principal | Market | |||||||
| Amount | Value | |||||||
| U.S. Government Agency Obligations — 1.3% (Continued) | ||||||||
| $ | 2,100,000 | Overseas Private Investment Corp., | ||||||
| 0.800%, 10/15/33(A) | $ | 2,100,000 | ||||||
| 5,000,000 | Overseas Private Investment Corp., | |||||||
| 0.830%, 7/20/22(A) | 5,000,000 | |||||||
| 31,190 | Small Business Administration | |||||||
| Participation Certificates, Ser | ||||||||
| 2002-20A, Class 1, 6.140%, 1/1/22 | 33,510 | |||||||
| 46,412 | Small Business Administration | |||||||
| Participation Certificates, Ser | ||||||||
| 2003-20E, Class 1, 4.640%, 5/1/23 | 49,184 | |||||||
| 209,300 | Small Business Administration Pools, | |||||||
| 507682, 0.900%, 1/25/26(A) | 208,658 | |||||||
| 169,531 | Small Business Administration Pools, | |||||||
| 508374, 1.000%, 4/25/28(A) | 169,405 | |||||||
| Total U.S. Government Agency Obligations | $ | 8,143,757 | ||||||
| Agency Collateralized Mortgage Obligations — 0.8% | ||||||||
| 125,522,266 | FHLMC Multifamily Structured Pass | |||||||
| Through Certificates, Ser K504 Class | ||||||||
| X1, 0.329%, 9/25/20(A)(C) | 796,527 | |||||||
| 46,718 | FHLMC REMIC, Ser 2510 Class TA, | |||||||
| 4.000%, 6/15/32 | 47,978 | |||||||
| 494,605 | FHLMC REMIC, Ser 2770 Class FH, | |||||||
| 0.924%, 3/15/34(A) | 494,723 | |||||||
| 132,336 | FHLMC REMIC, Ser 3414 Class MB, | |||||||
| 4.250%, 12/15/19 | 135,331 | |||||||
| 237,727 | FHLMC REMIC, Ser 4459 Class NG, | |||||||
| 6.500%, 10/15/24 | 239,859 | |||||||
| 282,037 | FNMA REMIC, Ser 2003-119, Class PU, | |||||||
| 4.000%, 11/25/33 | 288,868 | |||||||
| 97,099 | FNMA REMIC, Ser 2003-33, Class AM, | |||||||
| 4.250%, 5/25/33 | 104,918 | |||||||
| 90,438 | FNMA REMIC, Ser 2003-42, Class CA, | |||||||
| 4.000%, 5/25/33 | 95,466 | |||||||
| 401,820 | FNMA REMIC, Ser 2003-81, Class FE, | |||||||
| 1.025%, 9/25/33(A) | 403,098 | |||||||
| 76,934 | FNMA REMIC, Ser 2008-35, Class IO, | |||||||
| 4.500%, 4/25/23(C) | 1,212 | |||||||
| 141,397 | FNMA REMIC, Ser 2010-13, Class WD, | |||||||
| 4.250%, 3/25/25 | 145,926 | |||||||
| 34,863 | FNMA REMIC, Ser 2010-54, Class NA, | |||||||
| 4.500%, 10/25/39 | 35,186 | |||||||
| 116,681 | FNMA REMIC, Ser 2011-52, Class AH, | |||||||
| 2.750%, 10/25/18 | 117,897 | |||||||
| 399,711 | FNMA REMIC, Ser 2012-102, Class NA, | |||||||
| 1.500%, 9/25/27 | 396,499 | |||||||
| 142,031 | FNMA REMIC Trust, Ser 2001-W4, Class | |||||||
| AF5, 6.114%, 2/25/32(B) | 174,127 | |||||||
| 159,268 | GNMA, Ser 2002-72, Class AB, | |||||||
| 4.500%, 10/20/32 | 172,103 | |||||||
| 18,257,181 | GNMA, Ser 2011-142, Class IO, | |||||||
| 0.810%, 9/16/46(A)(C) | 584,177 | |||||||
| 180,883 | GNMA, Ser 2011-161, Class A, | |||||||
| 1.738%, 1/16/34 | 180,869 | |||||||
| 132,277 | GNMA, Ser 2011-57, Class BA, | |||||||
| 3.000%, 5/20/40 | 136,252 | |||||||
| 101,071 | GNMA, Ser 2011-78, Class AB, | |||||||
| 2.450%, 2/16/39 | 101,116 | |||||||
| 6,879,017 | GNMA, Ser 2011-78, Class IX, | |||||||
| 0.477%, 8/16/46(A)(C) | 190,280 | |||||||
| 236,177 | GNMA, Ser 2012-27, Class A, | |||||||
| 1.614%, 7/16/39 | 233,672 | |||||||
| 997,756 | GNMA, Ser 2013-121, Class KX, | |||||||
| 0.620%, 10/16/44(A)(C) | 169,231 | |||||||
| Total Agency Collateralized Mortgage Obligations | $ | 5,245,315 | ||||||
| Commercial Paper — 0.4% | ||||||||
| 2,600,000 | MDU Resourses Group, Inc., 0.600%, | |||||||
| 10/3/16(D) | 2,599,870 | |||||||
| Shares | ||||||||
| Investment Fund — 0.0% | ||||||||
| 16,628 | Dreyfus Government Cash | |||||||
| Management, Institutional Shares, | ||||||||
| 0.30%∞Ω | 16,628 | |||||||
| Total Investment Securities —98.8% | ||||||||
| (Cost $613,474,342) | $ | 612,008,602 | ||||||
| Other Assets in Excess of Liabilities — 1.2% | 7,376,050 | |||||||
| Net Assets — 100.0% | $ | 619,384,652 | ||||||
| (A) | Variable rate security - Rate reflected is the rate in effect as of September 30, 2016. |
| (B) | Step Bond - A bond that pays an initial interest rate for the first period and then a higher interest rate for the following periods until maturity. The interest rate shown reflects the rate in effect as of September 30, 2016. |
| (C) | Interest only security. This type of security represents the right to receive the monthly interest payments on an underlying pool of mortgages. Payments of principal on the pool reduce the value of the “interest only” holding. |
| (D) | Rate reflects yield at the time of purchase. |
| # | Zero coupon bond - Rate shown reflects effective yield to maturity at time of purchase. |
| 81 |
Touchstone Ultra Short Duration Fixed Income Fund (Continued)
| †† | The issuers and/or sponsors of certain mortgage-backed securities may no longer exist; however, the securities held by the Fund are separate legal entities organized as trusts and publicly traded. The Fund receives principal and interest payments directly from these trusts. |
| ∞ | Open-End Fund. |
| Ω | Represents the 7-day SEC yield as of September 30, 2016. |
Portfolio Abbreviations:
ARM - Adjustable Rate Mortgage
CDO - Collateralized Debt Obligations
COP - Certificate of Participation
CLO - Collateralized Loan Obligations
FDIC - Federal Deposit Insurance Corporation
FHLMC - Federal Home Loan Mortgage Corporation
FNMA - Federal National Mortgage Association
GNMA - Government National Mortgage Association
IDA - Industrial Development Agency
LLC - Limited Liability Company
LOC - Letter of Credit
LP - Limited Partnership
MTN - Medium Term Note
PLC - Public Limited Company
REIT - Real Estate Investment Trust
REMIC - Real Estate Mortgage Investment Conduit
UTGO - Unlimited Tax General Obligation
144a - This is a restricted security that was sold in a transaction qualifying for the exemption under Rule 144A of the Securities Act of 1933. This security may be sold in transactions exempt from registration, normally to qualified institutional buyers. At September 30, 2016, these securities were valued at $283,818,722 or 45.8% of net assets. These securities were deemed liquid pursuant to procedures approved by the Board of Trustees.
Other Information:
The inputs or methodology used for valuing securities may not be an indication of the risk associated with investing in those securities. For more information on valuation inputs, and their aggregation into the levels used in the table below, please refer to the security valuation section in the accompanying Notes to Financial Statements.
Valuation inputs at Reporting Date:
| Description | Level 1 | Level 2 | Level 3 | Total | ||||||||||||
| Corporate Bonds | $ | — | $ | 233,267,390 | $ | — | $ | 233,267,390 | ||||||||
| Asset-Backed Securities | — | 218,024,179 | — | 218,024,179 | ||||||||||||
| Commercial Mortgage-Backed Securities | — | 58,044,649 | — | 58,044,649 | ||||||||||||
| U.S. Government Mortgage-Backed Obligations | — | 41,759,709 | — | 41,759,709 | ||||||||||||
| Municipal Bonds | — | 23,476,701 | — | 23,476,701 | ||||||||||||
| Non-Agency Collateralized Mortgage Obligations | — | 21,430,404 | — | 21,430,404 | ||||||||||||
| U.S. Government Agency Obligations | — | 8,143,757 | — | 8,143,757 | ||||||||||||
| Agency Collateralized Mortgage Obligations | — | 5,245,315 | — | 5,245,315 | ||||||||||||
| Commercial Paper | — | 2,599,870 | — | 2,599,870 | ||||||||||||
| Investment Fund | 16,628 | — | — | 16,628 | ||||||||||||
| Total | $ | 16,628 | $ | 611,991,974 | $ | — | $ | 612,008,602 | ||||||||
See accompanying Notes to Financial Statements.
| 82 |
This page intentionally left blank.
| 83 |
Statements of Assets and Liabilities
September 30, 2016
| Touchstone | ||||||||||||||||
| Emerging | Touchstone | Touchstone | ||||||||||||||
| Touchstone | Markets Small | Merger | Mid | |||||||||||||
| Arbitrage | Cap | Arbitrage | Cap | |||||||||||||
| Fund | Fund | Fund | Fund | |||||||||||||
| Assets | ||||||||||||||||
| Investments, at cost | $ | 162,239,265 | $ | 8,179,091 | $ | 226,901,663 | $ | 657,791,204 | ||||||||
| Investments, at market value (A) | $ | 162,324,094 | $ | 8,960,685 | $ | 227,202,457 | $ | 725,823,290 | ||||||||
| Cash | 3,089,966 | — | 2,598,222 | 1,248 | ||||||||||||
| Foreign Currency (B) | — | 81,256 | — | — | ||||||||||||
| Cash collateral for securities sold short and written options | 36,608,741 | — | 14,426,614 | — | ||||||||||||
| Unrealized appreciation on forward foreign currency contracts | 80,668 | — | 84,152 | — | ||||||||||||
| Dividends and interest receivable | 224,972 | 10,884 | 636,240 | 386,698 | ||||||||||||
| Receivable for capital shares sold | 2,331,790 | 5,023 | 125,532 | 2,594,700 | ||||||||||||
| Receivable for investments sold | 5,690,959 | 11,454 | 6,117,003 | — | ||||||||||||
| Receivable for securities sold short | 2,078,292 | — | 1,776,271 | — | ||||||||||||
| Receivable for securities lending income | 6,488 | 368 | — | 8,114 | ||||||||||||
| Tax reclaim receivable | 2,896 | — | 6,764 | — | ||||||||||||
| Other assets | 22,489 | 18,221 | 19,250 | 30,929 | ||||||||||||
| Total Assets | 212,461,355 | 9,087,891 | 252,992,505 | 728,844,979 | ||||||||||||
| Liabilities | ||||||||||||||||
| Bank overdrafts | — | 21,195 | — | — | ||||||||||||
| Foreign Currency(B) | 165 | — | 160 | — | ||||||||||||
| Written options, at market value(C) | 64,783 | — | 73,923 | — | ||||||||||||
| Securities sold short(D) | 47,363,225 | — | 48,024,193 | — | ||||||||||||
| Dividend and interest payable on securities sold short | 47,599 | — | 82,191 | — | ||||||||||||
| Unrealized depreciation on forward foreign currency contracts | 11,839 | — | 15,140 | — | ||||||||||||
| Payable for return of collateral for securities on loan | 164,688 | 118,751 | — | 41,064,072 | ||||||||||||
| Deferred foreign capital gains tax(E) | — | 18,178 | — | — | ||||||||||||
| Payable for capital shares redeemed | 115,063 | 21,358 | 211,633 | 1,009,431 | ||||||||||||
| Payable for investments purchased | 10,965,311 | 59,512 | 11,540,784 | — | ||||||||||||
| Payable to Investment Advisor | 127,592 | 30,151 | 167,266 | 414,841 | ||||||||||||
| Payable to other affiliates | 23,906 | 234 | 39,151 | 120,430 | ||||||||||||
| Payable to Trustees | 3,910 | 3,910 | 3,910 | 3,910 | ||||||||||||
| Payable for professional services | 19,516 | 17,789 | 20,764 | 27,862 | ||||||||||||
| Payable to Transfer Agent | 20,725 | 4,238 | 27,289 | 140,206 | ||||||||||||
| Payable for reports to shareholders | 15,185 | 11,189 | 14,175 | 44,792 | ||||||||||||
| Other accrued expenses and liabilities | 9,268 | 29,741 | 10,088 | 4,412 | ||||||||||||
| Total Liabilities | 58,952,775 | 336,246 | 60,230,667 | 42,829,956 | ||||||||||||
| Net Assets | $ | 153,508,580 | $ | 8,751,645 | $ | 192,761,838 | $ | 686,015,023 | ||||||||
| Net assets consist of: | ||||||||||||||||
| Par value | $ | 147,916 | $ | 9,427 | $ | 173,823 | $ | 263,950 | ||||||||
| Paid-in capital | 149,727,541 | 107,383,181 | 188,322,861 | 720,199,700 | ||||||||||||
| Accumulated net investment income (loss) | (131,773 | ) | (120,063 | ) | (123,559 | ) | 3,651,860 | |||||||||
| Accumulated net realized gains (losses) on investments, foreign currency transactions, written options and securities sold short | 4,630,791 | (99,284,790 | ) | 5,202,630 | (106,132,573 | ) | ||||||||||
| Net unrealized appreciation (depreciation) on investments, foreign currency transactions, written options and securities sold short | (865,895 | ) | 763,890 | (813,917 | ) | 68,032,086 | ||||||||||
| Net Assets | $ | 153,508,580 | $ | 8,751,645 | $ | 192,761,838 | $ | 686,015,023 | ||||||||
| (A) Includes market value of securities on loan of: | $ | 158,488 | $ | 110,216 | $ | — | $ | 41,122,934 | ||||||||
| (B) Cost of foreign currency: | $ | (166 | ) | $ | 80,762 | $ | (161 | ) | $ | — | ||||||
| (C) Premiums received from written options: | $ | 93,336 | $ | — | $ | 120,236 | $ | — | ||||||||
| (D) Proceeds received for securities sold short: | $ | 46,315,118 | $ | — | $ | 46,794,156 | $ | — | ||||||||
| (E) See Note 2 in Notes to Financial Statements. | ||||||||||||||||
See accompanying Notes to Financial Statements.
| 84 |
Statements of Assets and Liabilities (Continued)
| Touchstone | Touchstone | Touchstone | Touchstone | |||||||||||
| Mid Cap | Premium | Sands Capital | Small | |||||||||||
| Value | Yield Equity | Select Growth | Cap | |||||||||||
| Fund | Fund | Fund | Fund | |||||||||||
| $ | 469,795,903 | $ | 138,837,574 | $ | 1,991,125,559 | $ | 528,142,370 | |||||||
| $ | 525,497,687 | $ | 152,445,596 | $ | 3,402,598,200 | $ | 663,674,972 | |||||||
| 27,895 | 500 | — | — | |||||||||||
| — | — | — | — | |||||||||||
| — | — | — | — | |||||||||||
| — | — | — | — | |||||||||||
| 951,380 | 256,656 | 440,741 | 502,870 | |||||||||||
| 1,194,128 | 501,905 | 2,331,496 | 539,820 | |||||||||||
| — | — | 1,281,125 | 18,461,013 | |||||||||||
| — | — | — | — | |||||||||||
| 6,032 | — | 39,734 | 12,140 | |||||||||||
| 172 | 30,053 | — | 906 | |||||||||||
| 22,415 | 14,616 | 47,863 | 21,181 | |||||||||||
| 527,699,709 | 153,249,326 | 3,406,739,159 | 683,212,902 | |||||||||||
| — | — | 1,271,186 | 235,596 | |||||||||||
| — | — | — | — | |||||||||||
| — | — | — | — | |||||||||||
| — | — | — | — | |||||||||||
| — | — | — | — | |||||||||||
| — | — | — | — | |||||||||||
| 6,925,787 | — | 101,299,820 | 67,474,423 | |||||||||||
| — | — | — | — | |||||||||||
| 14,438,800 | 419,627 | 37,174,659 | 721,444 | |||||||||||
| 943,203 | — | 24,731,355 | 10,590,686 | |||||||||||
| 313,910 | 79,115 | 1,667,640 | 429,114 | |||||||||||
| 29,274 | 40,597 | 1,552,251 | 94,470 | |||||||||||
| 3,910 | 3,910 | 3,910 | 3,910 | |||||||||||
| 20,918 | 15,342 | 85,215 | 25,809 | |||||||||||
| 71,757 | 32,938 | 741,845 | 86,040 | |||||||||||
| 24,494 | 14,191 | 151,136 | 27,876 | |||||||||||
| 5,629 | 2,448 | 22,537 | 4,087 | |||||||||||
| 22,777,682 | 608,168 | 168,701,554 | 79,693,455 | |||||||||||
| $ | 504,922,027 | $ | 152,641,158 | $ | 3,238,037,605 | $ | 603,519,447 | |||||||
| $ | 287,023 | $ | 174,428 | $ | 1,963,761 | $ | 367,883 | |||||||
| 436,629,440 | 142,020,123 | 1,524,945,283 | 529,086,456 | |||||||||||
| 52,237 | 208,614 | (17,640,732 | ) | 1,744,841 | ||||||||||
| 12,251,543 | (3,370,029 | ) | 317,296,652 | (63,212,335 | ) | |||||||||
| 55,701,784 | 13,608,022 | 1,411,472,641 | 135,532,602 | |||||||||||
| $ | 504,922,027 | $ | 152,641,158 | $ | 3,238,037,605 | $ | 603,519,447 | |||||||
| $ | 6,851,937 | $ | — | $ | 100,594,535 | $ | 67,507,093 | |||||||
| $ | — | $ | — | $ | — | $ | — | |||||||
| $ | — | $ | — | $ | — | $ | — | |||||||
| $ | — | $ | — | $ | — | $ | — | |||||||
| 85 |
Statements of Assets and Liabilities (Continued)
| Touchstone | ||||||||||||||||
| Emerging | Touchstone | Touchstone | ||||||||||||||
| Touchstone | Markets | Merger | Mid | |||||||||||||
| Arbitrage | Small Cap | Arbitrage | Cap | |||||||||||||
| Fund | Fund | Fund | Fund | |||||||||||||
| Pricing of Class A Shares | ||||||||||||||||
| Net assets applicable to Class A shares | $ | 10,002,769 | $ | 2,376,388 | $ | 15,711,456 | $ | 53,044,323 | ||||||||
| Shares of beneficial interest outstanding | ||||||||||||||||
| (unlimited number of shares authorized, $0.01 par value) | 969,880 | 255,679 | 1,427,889 | 2,047,177 | ||||||||||||
| Net asset value price per share* | $ | 10.31 | $ | 9.29 | $ | 11.00 | $ | 25.91 | ||||||||
| Maximum sales charge - Class A shares | 5.75 | % | 5.75 | % | 5.75 | % | 5.75 | % | ||||||||
| Maximum offering price per share | ||||||||||||||||
| (100%/(100%-maximum sales charge) of net asset value | ||||||||||||||||
| adjusted to the nearest cent) - Class A shares | $ | 10.94 | $ | 9.86 | $ | 11.67 | $ | 27.49 | ||||||||
| Pricing of Class C Shares | ||||||||||||||||
| Net assets applicable to Class C shares | $ | 7,929,905 | $ | 912,006 | $ | 14,299,978 | $ | 59,431,090 | ||||||||
| Shares of beneficial interest outstanding | ||||||||||||||||
| (unlimited number of shares authorized, $0.01 par value) | 784,287 | 100,177 | 1,349,628 | 2,400,678 | ||||||||||||
| Net asset value and offering price per share** | $ | 10.11 | $ | 9.10 | $ | 10.60 | $ | 24.76 | ||||||||
| Pricing of Class Y Shares | ||||||||||||||||
| Net assets applicable to Class Y shares | $ | 121,793,531 | $ | 4,796,166 | $ | 85,840,883 | $ | 476,830,746 | ||||||||
| Shares of beneficial interest outstanding | ||||||||||||||||
| (unlimited number of shares authorized, $0.01 par value) | 11,715,707 | 514,589 | 7,715,927 | 18,240,885 | ||||||||||||
| Net asset value, offering price and redemption price per share | $ | 10.40 | $ | 9.32 | $ | 11.13 | $ | 26.14 | ||||||||
| Pricing of Class Z Shares | ||||||||||||||||
| Net assets applicable to Class Z shares | $ | — | $ | — | $ | — | $ | 18,933,762 | ||||||||
| Shares of beneficial interest outstanding | ||||||||||||||||
| (unlimited number of shares authorized, $0.01 par value) | — | — | — | 735,261 | ||||||||||||
| Net asset value, offering price and redemption price per share | $ | — | $ | — | $ | — | $ | 25.75 | ||||||||
| Pricing of Institutional Class Shares | ||||||||||||||||
| Net assets applicable to Institutional Class Shares | $ | 13,782,375 | $ | 667,085 | $ | 76,909,521 | $ | 77,775,102 | ||||||||
| Shares of beneficial interest outstanding | ||||||||||||||||
| (unlimited number of shares authorized, $0.01 par value) | 1,321,696 | 72,210 | 6,888,806 | 2,971,026 | ||||||||||||
| Net asset value, offering price and redemption price per share | $ | 10.43 | $ | 9.24 | $ | 11.16 | $ | 26.18 | ||||||||
* There is no sales load on subscriptions of $1 million or more. Redemptions that were part of a $1 million or more subscription may be subject to a contingent deferred sales load if redeemed within a one-year period from the date of purchase.
** Redemption price per share varies by length of time shares are held due to the terms of the contingent deferred sales charge.
See accompanying Notes to Financial Statements.
| 86 |
Statements of Assets and Liabilities (Continued)
| Touchstone | Touchstone | Touchstone | Touchstone | |||||||||||
| Mid Cap | Premium | Sands Capital | Small | |||||||||||
| Value | Yield Equity | Select | Cap | |||||||||||
| Fund | Fund | Growth Fund | Fund | |||||||||||
| $ | 21,866,670 | $ | 26,907,020 | $ | 138,315,453 | $ | 37,942,126 | |||||||
| 1,249,997 | 3,069,579 | 8,569,123 | 2,336,485 | |||||||||||
| $ | 17.49 | $ | 8.77 | $ | 16.14 | $ | 16.24 | |||||||
| 5.75 | % | 5.75 | % | 5.75 | % | 5.75 | % | |||||||
| $ | 18.56 | $ | 9.31 | $ | 17.12 | $ | 17.23 | |||||||
| $ | 4,087,838 | $ | 25,780,759 | $ | 111,951,253 | $ | 14,956,816 | |||||||
| 237,267 | 2,944,865 | 7,290,636 | 956,793 | |||||||||||
| $ | 17.23 | $ | 8.75 | $ | 15.36 | $ | 15.63 | |||||||
| $ | 292,978,290 | $ | 99,953,379 | $ | 2,209,840,941 | $ | 295,198,006 | |||||||
| 16,671,831 | 11,428,397 | 132,346,226 | 17,952,303 | |||||||||||
| $ | 17.57 | $ | 8.75 | $ | 16.70 | $ | 16.44 | |||||||
| $ | — | $ | — | $ | 777,929,958 | $ | — | |||||||
| — | — | 48,170,122 | — | |||||||||||
| $ | — | $ | — | $ | 16.15 | $ | — | |||||||
| $ | 185,989,229 | $ | — | $ | — | $ | 255,422,499 | |||||||
| 10,543,155 | — | — | 15,542,684 | |||||||||||
| $ | 17.64 | $ | — | $ | — | $ | 16.43 | |||||||
| 87 |
Statements of Assets and Liabilities (Continued)
| Touchstone | Touchstone | |||||||||||
| Small | Touchstone | Ultra Short | ||||||||||
| Cap Value | Total Return | Duration Fixed | ||||||||||
| Fund | Bond Fund | Income Fund | ||||||||||
| Assets | ||||||||||||
| Investments, at cost | $ | 174,135,976 | $ | 230,101,176 | $ | 613,474,342 | ||||||
| Investments, at market value (A) | $ | 176,079,007 | $ | 235,060,612 | $ | 612,008,602 | ||||||
| Cash | 2,021 | — | 7,267,535 | |||||||||
| Dividends and interest receivable | 246,956 | 1,731,385 | 2,282,939 | |||||||||
| Receivable for capital shares sold | 171,692 | 688,961 | 6,641,817 | |||||||||
| Receivable for investments sold | 2,595,011 | — | 3,544,258 | |||||||||
| Receivable from securities lending income | 801 | — | — | |||||||||
| Other assets | 52,177 | 23,482 | 56,521 | |||||||||
| Total Assets | 179,147,665 | 237,504,440 | 631,801,672 | |||||||||
| Liabilities | ||||||||||||
| Bank overdrafts | — | 12,211 | — | |||||||||
| Distributions payable | — | — | 84,251 | |||||||||
| Payable for return of collateral for securities on loan | 98,825 | — | — | |||||||||
| Payable for capital shares redeemed | 198,297 | 9,900,671 | 2,341,862 | |||||||||
| Payable for investments purchased | 349,626 | 500,000 | 9,399,376 | |||||||||
| Payable to Investment Advisor | 128,235 | 54,259 | 112,398 | |||||||||
| Payable to other affiliates | 234 | 21,217 | 305,107 | |||||||||
| Payable to Trustees | 3,910 | 3,910 | 3,910 | |||||||||
| Payable for professional services | 14,971 | 18,331 | 26,473 | |||||||||
| Payable to Transfer Agent | 56,731 | 25,191 | 86,621 | |||||||||
| Payable for reports to shareholders | 13,849 | 11,580 | 25,006 | |||||||||
| Other accrued expenses and liabilities | 5,848 | 13,197 | 32,016 | |||||||||
| Total Liabilities | 870,526 | 10,560,567 | 12,417,020 | |||||||||
| Net Assets | $ | 178,277,139 | $ | 226,943,873 | $ | 619,384,652 | ||||||
| Net assets consist of: | ||||||||||||
| Par value | $ | 80,309 | $ | 218,459 | $ | 664,818 | ||||||
| Paid-in capital | 187,720,258 | 223,876,701 | 645,004,381 | |||||||||
| Accumulated net investment income | 39,218 | 138,900 | 314,261 | |||||||||
| Accumulated net realized losses on investments | (11,505,677 | ) | (2,249,623 | ) | (25,133,068 | ) | ||||||
| Net unrealized appreciation (depreciation) on investments | 1,943,031 | 4,959,436 | (1,465,740 | ) | ||||||||
| Net Assets | $ | 178,277,139 | $ | 226,943,873 | $ | 619,384,652 | ||||||
| (A) Includes market value of securities on loan of: | $ | 103,783 | $ | — | $ | — | ||||||
See accompanying Notes to Financial Statements.
| 88 |
Statements of Assets and Liabilities (Continued)
| Touchstone | Touchstone | |||||||||||
| Small | Touchstone | Ultra Short | ||||||||||
| Cap Value | Total Return | Duration Fixed | ||||||||||
| Fund | Bond Fund | Income Fund | ||||||||||
| Pricing of Class A Shares | ||||||||||||
| Net assets applicable to Class A shares | $ | 150,081,339 | $ | 8,639,360 | $ | 16,945,768 | ||||||
| Shares of beneficial interest outstanding | ||||||||||||
| (unlimited number of shares authorized, $0.01 par value) | 6,761,312 | 832,575 | 1,818,879 | |||||||||
| Net asset value price per share* | $ | 22.20 | $ | 10.38 | $ | 9.32 | ||||||
| Maximum sales charge - Class A shares | 5.75 | % | 4.75 | % | 2.00 | % | ||||||
| Maximum offering price per share | ||||||||||||
| (100%/(100%-maximum sales charge) of net asset value adjusted to the nearest cent) - Class A shares | $ | 23.55 | $ | 10.90 | $ | 9.51 | ||||||
| Pricing of Class C Shares | ||||||||||||
| Net assets applicable to Class C shares | $ | 1,376,370 | $ | 2,812,948 | $ | 7,960,773 | ||||||
| Shares of beneficial interest outstanding | ||||||||||||
| (unlimited number of shares authorized, $0.01 par value) | 62,697 | 271,493 | 854,472 | |||||||||
| Net asset value and offering price per share** | $ | 21.95 | $ | 10.36 | $ | 9.32 | ||||||
| Pricing of Class Y Shares | ||||||||||||
| Net assets applicable to Class Y shares | $ | 3,079,699 | $ | 49,483,652 | $ | 206,313,263 | ||||||
| Shares of beneficial interest outstanding | ||||||||||||
| (unlimited number of shares authorized, $0.01 par value) | 138,506 | 4,762,506 | 22,144,692 | |||||||||
| Net asset value, offering price and redemption price per share | $ | 22.24 | $ | 10.39 | $ | 9.32 | ||||||
| Pricing of Class Z Shares | ||||||||||||
| Net assets applicable to Class Z shares | $ | — | $ | — | $ | 245,252,289 | ||||||
| Shares of beneficial interest outstanding | ||||||||||||
| (unlimited number of shares authorized, $0.01 par value) | — | — | 26,324,223 | |||||||||
| Net asset value, offering price and redemption price per share | $ | — | $ | — | $ | 9.32 | ||||||
| Pricing of Institutional Class Shares | ||||||||||||
| Net assets applicable to Institutional Class Shares | $ | 23,739,731 | $ | 166,007,913 | $ | 142,912,559 | ||||||
| Shares of beneficial interest outstanding | ||||||||||||
| (unlimited number of shares authorized, $0.01 par value) | 1,068,389 | 15,979,371 | 15,339,559 | |||||||||
| Net asset value, offering price and redemption price per share | $ | 22.22 | $ | 10.39 | $ | 9.32 | ||||||
* There is no sales load on subscriptions of $1 million or more. Redemptions that were part of a $1 million or more subscription may be subject to a contingent deferred sales load if redeemed within a one-year period from the date of purchase.
** Redemption price per share varies by length of time shares are held due to the terms of the contingent deferred sales charge.
See accompanying Notes to Financial Statements.
| 89 |
For the Year Ended September 30, 2016
| Touchstone | ||||||||||||||||
| Emerging | Touchstone | Touchstone | ||||||||||||||
| Touchstone | Markets Small | Merger | Mid | |||||||||||||
| Arbitrage | Cap | Arbitrage | Cap | |||||||||||||
| Fund | Fund | Fund | Fund | |||||||||||||
| Investment Income | ||||||||||||||||
| Dividends (A) | $ | 1,938,600 | $ | 492,337 | $ | 2,544,802 | $ | 11,777,116 | ||||||||
| Interest | 249,005 | — | 1,011,566 | — | ||||||||||||
| Income from securities loaned | 19,976 | 6,110 | — | 55,375 | ||||||||||||
| Total Investment Income | 2,207,581 | 498,447 | 3,556,368 | 11,832,491 | ||||||||||||
| Expenses | ||||||||||||||||
| Investment advisory fees | 1,327,181 | 405,474 | 2,103,187 | 5,567,483 | ||||||||||||
| Administration fees | 183,277 | 56,131 | 290,440 | 1,028,047 | ||||||||||||
| Compliance fees and expenses | 2,849 | 2,849 | 2,849 | 2,849 | ||||||||||||
| Custody fees | 29,756 | 187,625 | 39,812 | 17,908 | ||||||||||||
| Professional fees | 32,040 | 80,616 | 33,710 | 51,240 | ||||||||||||
| Transfer Agent fees, Class A | 13,201 | 9,337 | 19,146 | 58,643 | ||||||||||||
| Transfer Agent fees, Class C | 5,824 | 3,328 | 15,000 | 77,599 | ||||||||||||
| Transfer Agent fees, Class Y | 82,683 | 16,705 | 77,365 | 505,259 | ||||||||||||
| Transfer Agent fees, Class Z | — | — | — | 29,848 | ||||||||||||
| Transfer Agent fees, Institutional Class | 228 | 4,290 | 3,693 | 12,009 | ||||||||||||
| Registration Fees, Class A | 16,209 | 15,402 | 15,208 | 16,414 | ||||||||||||
| Registration Fees, Class C | 7,518 | 10,277 | 10,248 | 17,452 | ||||||||||||
| Registration Fees, Class Y | 18,589 | 15,582 | 16,048 | 42,196 | ||||||||||||
| Registration Fees, Class Z | — | — | — | 16,917 | ||||||||||||
| Registration Fees, Institutional Class | 3,195 | 13,088 | 10,094 | 8,448 | ||||||||||||
| Dividend expense on securities sold short | 1,170,758 | — | 1,271,415 | — | ||||||||||||
| Interest expense on securities sold short | 248,849 | — | 402,797 | — | ||||||||||||
| Reports to Shareholders, Class A | 6,363 | 6,333 | 5,888 | 11,305 | ||||||||||||
| Reports to Shareholders, Class C | 6,184 | 6,081 | 6,627 | 13,667 | ||||||||||||
| Reports to Shareholders, Class Y | 13,905 | 5,962 | 7,321 | 68,691 | ||||||||||||
| Reports to Shareholders, Class Z | — | — | — | 8,671 | ||||||||||||
| Reports to Shareholders, Institutional Class | 5,582 | 5,831 | 5,518 | 6,080 | ||||||||||||
| Shareholder servicing fees, Class Z | — | — | — | 53,918 | ||||||||||||
| Distribution expenses, Class A | 23,329 | 6,384 | 47,945 | 143,874 | ||||||||||||
| Distribution and shareholder servicing expenses, Class C | 85,969 | 11,149 | 166,933 | 612,840 | ||||||||||||
| Trustee fees | 16,289 | 16,289 | 16,289 | 16,289 | ||||||||||||
| Other expenses | 17,374 | 40,128 | 23,757 | 46,507 | ||||||||||||
| Total Expenses | 3,317,152 | 918,861 | 4,591,290 | 8,434,154 | ||||||||||||
| Fees waived and/or reimbursed by the Advisor and/or Affiliates(B) | (35,383 | ) | (371,480 | ) | (8,474 | ) | (657,760 | ) | ||||||||
| Net Expenses | 3,281,769 | 547,381 | 4,582,816 | 7,776,394 | ||||||||||||
| Net Investment Income (Loss) | (1,074,188 | ) | (48,934 | ) | (1,026,448 | ) | 4,056,097 | |||||||||
| Realized and Unrealized Gains (Losses) on Investments | ||||||||||||||||
| Net realized gains (losses) on investments | 5,978,550 | (50,451,125 | ) | 7,596,517 | 17,791,453 | |||||||||||
| Net realized gains on foreign currency transactions | 447,353 | 27,799 | 443,744 | — | ||||||||||||
| Net realized gains on written options | 397,435 | — | 612,699 | — | ||||||||||||
| Net realized gains (losses) on securities sold short | 293,161 | — | (741,626 | ) | — | |||||||||||
| Net change in unrealized appreciation (depreciation) on investments(C) | 2,267,134 | 60,484,561 | 2,974,617 | 55,983,037 | ||||||||||||
| Net change in unrealized appreciation (depreciation) on foreign currency transactions | 68,830 | 40,839 | 69,013 | — | ||||||||||||
| Net change in unrealized appreciation (depreciation) on written options | 350,312 | — | 611,306 | — | ||||||||||||
| Net change in unrealized appreciation (depreciation) on securities sold short | (1,771,364 | ) | — | (1,351,616 | ) | — | ||||||||||
| Net Realized and Unrealized Gains on Investments | 8,031,411 | 10,102,074 | 10,214,654 | 73,774,490 | ||||||||||||
| Change in Net Assets Resulting from Operations | $ | 6,957,223 | $ | 10,053,140 | $ | 9,188,206 | $ | 77,830,587 | ||||||||
| (A) Net of foreign tax withholding of: | $ | 2,581 | $ | 42,694 | $ | 2,945 | $ | — | ||||||||
| (B) See Note 4 in Notes to Financial Statements. | ||||||||||||||||
| (C) Includes change in deferred foreign capital gains tax of: | $ | — | $ | 18,178 | $ | — | $ | — | ||||||||
| See accompanying Notes to Financial Statements. | ||||||||||||||||
| 90 |
Statements of Operations (Continued)
| Touchstone | Touchstone | Touchstone | ||||||||||||
| Mid Cap | Premium | Sands Capital | Touchstone | |||||||||||
| Value | Yield Equity | Select Growth | Small Cap | |||||||||||
| Fund | Fund | Fund | Fund | |||||||||||
| $ | 6,935,177 | $ | 5,640,050 | $ | 9,293,302 | $ | 8,874,619 | |||||||
| — | — | — | — | |||||||||||
| 32,120 | — | 1,020,366 | 130,431 | |||||||||||
| 6,967,297 | 5,640,050 | 10,313,668 | 9,005,050 | |||||||||||
| 3,084,251 | 1,023,138 | 22,940,604 | 5,543,019 | |||||||||||
| 551,588 | 217,084 | 5,843,408 | 945,574 | |||||||||||
| 2,849 | 2,849 | 2,849 | 2,849 | |||||||||||
| 18,385 | 11,051 | 93,379 | 23,317 | |||||||||||
| 34,279 | 27,127 | 165,629 | 45,449 | |||||||||||
| 14,825 | 36,407 | 166,971 | 70,238 | |||||||||||
| 3,001 | 24,111 | 119,276 | 18,447 | |||||||||||
| 254,411 | 98,969 | 2,279,631 | 307,588 | |||||||||||
| — | — | 1,503,954 | — | |||||||||||
| 43,272 | — | — | 55,100 | |||||||||||
| 15,291 | 16,408 | 18,342 | 15,702 | |||||||||||
| 9,420 | 13,944 | 16,368 | 13,043 | |||||||||||
| 22,022 | 19,415 | 111,617 | 39,017 | |||||||||||
| — | — | 44,086 | — | |||||||||||
| 16,282 | — | — | 19,315 | |||||||||||
| — | — | — | — | |||||||||||
| — | — | — | — | |||||||||||
| 6,795 | 8,182 | 18,180 | 8,417 | |||||||||||
| 6,121 | 8,041 | 17,063 | 7,473 | |||||||||||
| 36,891 | 17,515 | 195,254 | 50,195 | |||||||||||
| — | — | 99,989 | — | |||||||||||
| 9,340 | — | — | 7,139 | |||||||||||
| — | — | 2,290,399 | — | |||||||||||
| 26,125 | 71,610 | 454,827 | 125,074 | |||||||||||
| 24,180 | 277,012 | 1,394,841 | 181,733 | |||||||||||
| 16,289 | 16,289 | 16,289 | 16,289 | |||||||||||
| 36,877 | 20,133 | 199,580 | 42,176 | |||||||||||
| 4,232,494 | 1,909,285 | 37,992,536 | 7,537,154 | |||||||||||
| (476,709 | ) | (138,887 | ) | (831,974 | ) | (92,604 | ) | |||||||
| 3,755,785 | 1,770,398 | 37,160,562 | 7,444,550 | |||||||||||
| 3,211,512 | 3,869,652 | (26,846,894 | ) | 1,560,500 | ||||||||||
| 14,992,172 | (1,237,607 | ) | 461,133,830 | (60,975,970 | ) | |||||||||
| — | — | — | — | |||||||||||
| — | — | — | — | |||||||||||
| — | — | — | — | |||||||||||
| 48,991,829 | 20,365,252 | (201,305,875 | ) | 89,708,679 | ||||||||||
| — | — | — | — | |||||||||||
| — | — | — | — | |||||||||||
| — | — | — | — | |||||||||||
| 63,984,001 | 19,127,645 | 259,827,955 | 28,732,709 | |||||||||||
| $ | 67,195,513 | $ | 22,997,297 | $ | 232,981,061 | $ | 30,293,209 | |||||||
| $ | — | $ | 66,456 | $ | 54,986 | $ | 55 | |||||||
| $ | — | $ | — | $ | — | $ | — | |||||||
| 91 |
Statements of Operations (Continued)
| Touchstone | ||||||||||||
| Touchstone | Touchstone | Ultra Short | ||||||||||
| Small Cap | Total Return | Duration | ||||||||||
| Value | Bond | Fixed Income | ||||||||||
| Fund | Fund | Fund | ||||||||||
| Investment Income | ||||||||||||
| Dividends (A) | $ | 1,826,567 | $ | 24,100 | $ | 1,209 | ||||||
| Interest | — | 6,349,509 | 10,277,781 | |||||||||
| Income from securities loaned | 27,069 | 378 | — | |||||||||
| Total Investment Income | 1,853,636 | 6,373,987 | 10,278,990 | |||||||||
| Expenses | ||||||||||||
| Investment advisory fees | 685,757 | 713,723 | 1,444,677 | |||||||||
| Administration fees | 110,483 | 295,685 | 837,913 | |||||||||
| Compliance fees and expenses | 2,849 | 2,849 | 2,849 | |||||||||
| Custody fees | 14,176 | 9,303 | 40,161 | |||||||||
| Professional fees | 24,766 | 31,081 | 44,519 | |||||||||
| Transfer Agent fees, Class A | 103,919 | 10,077 | 9,131 | |||||||||
| Transfer Agent fees, Class C | 3,261 | 2,189 | 6,289 | |||||||||
| Transfer Agent fees, Class Y | 7,221 | 47,171 | 176,344 | |||||||||
| Transfer Agent fees, Class Z | — | — | 196,147 | |||||||||
| Transfer Agent fees, Institutional Class | 176 | 64,779 | 5,351 | |||||||||
| Registration Fees, Class A | 15,845 | 11,172 | 15,464 | |||||||||
| Registration Fees, Class C | 7,849 | 8,466 | 18,945 | |||||||||
| Registration Fees, Class Y | 7,896 | 21,428 | 20,147 | |||||||||
| Registration Fees, Class Z | — | — | 32,138 | |||||||||
| Registration Fees, Institutional Class | 5,015 | 16,687 | 15,496 | |||||||||
| Reports to Shareholders, Class A | 12,097 | 5,519 | 5,970 | |||||||||
| Reports to Shareholders, Class C | 6,471 | 5,648 | 5,833 | |||||||||
| Reports to Shareholders, Class Y | 6,367 | 6,021 | 13,146 | |||||||||
| Reports to Shareholders, Class Z | — | — | 20,349 | |||||||||
| Reports to Shareholders, Institutional Class | 11,693 | 6,485 | 5,616 | |||||||||
| Shareholder servicing fees, Class Z | — | — | 589,721 | |||||||||
| Distribution expenses, Class A | 119,477 | 14,804 | 26,422 | |||||||||
| Distribution and shareholder servicing expenses, Class C | 14,158 | 25,100 | 64,649 | |||||||||
| Trustee fees | 16,289 | 16,289 | 16,289 | |||||||||
| Other expenses | 18,436 | 40,516 | 109,514 | |||||||||
| Total Expenses | 1,194,201 | 1,354,992 | 3,723,080 | |||||||||
| Fees waived and/or reimbursed by the Advisor and/or Affiliates(B) | (234,463 | ) | (235,052 | ) | (552,999 | ) | ||||||
| Net Expenses | 959,738 | 1,119,940 | 3,170,081 | |||||||||
| Net Investment Income | 893,898 | 5,254,047 | 7,108,909 | |||||||||
| Realized and Unrealized Gains (Losses) on Investments | ||||||||||||
| Net realized gains (losses) on investments | (6,960,047 | ) | (45,495 | ) | 10,953 | |||||||
| Net change in unrealized appreciation (depreciation) on investments | 14,496,319 | 4,436,944 | 1,127,268 | |||||||||
| Net Realized and Unrealized Gains on Investments | 7,536,272 | 4,391,449 | 1,138,221 | |||||||||
| Change in Net Assets Resulting from Operations | $ | 8,430,170 | $ | 9,645,496 | $ | 8,247,130 | ||||||
| (A) Net of foreign tax withholding of: | $ | 976 | $ | — | $ | — | ||||||
| (B) See Note 4 in Notes to Financial Statements. | ||||||||||||
See accompanying Notes to Financial Statements.
| 92 |
This page intentionally left blank.
| 93 |
Statements of Changes in Net Assets
| Touchstone | Touchstone | |||||||||||||||
| Arbitrage | Emerging Markets | |||||||||||||||
| Fund | Small Cap Fund | |||||||||||||||
| For the | For the | For the | For the | |||||||||||||
| Year Ended | Year Ended | Year Ended | Year Ended | |||||||||||||
| September 30, | September 30, | September 30, | September 30, | |||||||||||||
| 2016 | 2015 | 2016 | 2015 | |||||||||||||
| From Operations | ||||||||||||||||
| Net investment income (loss) | $ | (1,074,188 | ) | $ | (938,277 | ) | $ | (48,934 | ) | $ | 3,303,542 | |||||
| Net realized gains (losses) on investments, foreign currency transactions, written options and securities sold short | 7,116,499 | 1,964,712 | (50,423,326 | ) | (8,542,947 | ) | ||||||||||
| Net change in unrealized appreciation (depreciation) on investments, foreign currency transactions, written options and securities sold short | 914,912 | 284,658 | 60,525,400 | (67,458,307 | ) | |||||||||||
| Change in Net Assets from Operations | 6,957,223 | 1,311,093 | 10,053,140 | (72,697,712 | ) | |||||||||||
| Distributions to Shareholders from: | ||||||||||||||||
| Net investment income, Class A | (17,509 | ) | — | (188,269 | ) | (24,587 | ) | |||||||||
| Net investment income, Class C | (6,332 | ) | — | (82,074 | ) | — | ||||||||||
| Net investment income, Class Y | (287,174 | ) | — | (620,411 | ) | (871,078 | ) | |||||||||
| Net investment income, Class Z | — | — | — | — | ||||||||||||
| Net investment income, Institutional Class | (31,972 | ) | — | (1,728,009 | ) | (2,505,846 | ) | |||||||||
| Net realized gains, Class A | (154,157 | ) | (33,828 | ) | — | — | ||||||||||
| Net realized gains, Class C | (131,554 | ) | (16,826 | ) | — | — | ||||||||||
| Net realized gains, Class Y | (1,293,949 | ) | (167,228 | ) | — | — | ||||||||||
| Net realized gains, Institutional Class | (133,669 | ) | (70,593 | ) | — | — | ||||||||||
| Total Distributions | (2,056,316 | ) | (288,475 | ) | (2,618,763 | ) | (3,401,511 | ) | ||||||||
| Net Increase (Decrease) from Share Transactions(A) | 23,078,874 | (72,683,275 | ) | (258,177,711 | ) | (12,246,077 | ) | |||||||||
| Total Increase (Decrease) in Net Assets | 27,979,781 | (71,660,657 | ) | (250,743,334 | ) | (88,345,300 | ) | |||||||||
| Net Assets | ||||||||||||||||
| Beginning of period | 125,528,799 | 197,189,456 | 259,494,979 | 347,840,279 | ||||||||||||
| End of period | $ | 153,508,580 | $ | 125,528,799 | $ | 8,751,645 | $ | 259,494,979 | ||||||||
| Accumulated Net Investment Income (Loss) | $ | (131,773 | ) | $ | 3,548 | $ | (120,063 | ) | $ | 2,568,970 | ||||||
(A) For details on share transactions by class, see Statements of Changes in Net Assets - Capital Stock Activity in pages 100-102.
See accompanying Notes to Financial Statements.
| 94 |
Statements of Changes in Net Assets (Continued)
| Touchstone | Touchstone | Touchstone | ||||||||||||||||||||
| Merger Arbitrage | Mid Cap | Mid Cap | ||||||||||||||||||||
| Fund | Fund | Value Fund | ||||||||||||||||||||
| For the | For the | For the | For the | For the | For the | |||||||||||||||||
| Year Ended | Year Ended | Year Ended | Year Ended | Year Ended | Year Ended | |||||||||||||||||
| September 30, | September 30, | September 30, | September 30, | September 30, | September 30, | |||||||||||||||||
| 2016 | 2015 | 2016 | 2015 | 2016 | 2015 | |||||||||||||||||
| $ | (1,026,448 | ) | $ | (2,534,206 | ) | $ | 4,056,097 | $ | 460,582 | $ | 3,211,512 | $ | 3,025,444 | |||||||||
| 7,911,334 | 1,857,492 | 17,791,453 | 12,577,383 | 14,992,172 | 21,967,422 | |||||||||||||||||
| 2,303,320 | 4,479,870 | 55,983,037 | (49,885,177 | ) | 48,991,829 | (27,750,574 | ) | |||||||||||||||
| 9,188,206 | 3,803,156 | 77,830,587 | (36,847,212 | ) | 67,195,513 | (2,757,708 | ) | |||||||||||||||
| — | — | — | — | (69,498 | ) | (48,181 | ) | |||||||||||||||
| — | — | — | — | — | — | |||||||||||||||||
| — | — | (302,705 | ) | (609,061 | ) | (1,918,693 | ) | (1,725,242 | ) | |||||||||||||
| — | — | (1,361 | ) | — | — | — | ||||||||||||||||
| — | — | (61,198 | ) | (258,983 | ) | (1,444,479 | ) | (1,326,235 | ) | |||||||||||||
| — | (270,079 | ) | — | — | (466,658 | ) | (376,327 | ) | ||||||||||||||
| — | (136,421 | ) | — | — | (117,202 | ) | (76,516 | ) | ||||||||||||||
| — | (654,494 | ) | — | — | (12,371,938 | ) | (7,781,541 | ) | ||||||||||||||
| — | (505,070 | ) | — | — | (6,757,290 | ) | (5,200,105 | ) | ||||||||||||||
| — | (1,566,064 | ) | (365,264 | ) | (868,044 | ) | (23,145,758 | ) | (16,534,147 | ) | ||||||||||||
| (28,687,623 | ) | (220,660,915 | ) | (91,734,050 | ) | 292,015,815 | 118,340,157 | (1,870,672 | ) | |||||||||||||
| (19,499,417 | ) | (218,423,823 | ) | (14,268,727 | ) | 254,300,559 | 162,389,912 | (21,162,527 | ) | |||||||||||||
| 212,261,255 | 430,685,078 | 700,283,750 | 445,983,191 | 342,532,115 | 363,694,642 | |||||||||||||||||
| $ | 192,761,838 | $ | 212,261,255 | $ | 686,015,023 | $ | 700,283,750 | $ | 504,922,027 | $ | 342,532,115 | |||||||||||
| $ | (123,559 | ) | $ | (837,461 | ) | $ | 3,651,860 | $ | (38,973 | ) | $ | 52,237 | $ | 80,839 | ||||||||
| 95 |
Statements of Changes in Net Assets (Continued)
| Touchstone | ||||||||||||||||
| Touchstone | Sands Capital | |||||||||||||||
| Premium Yield | Select Growth | |||||||||||||||
| Equity Fund | Fund | |||||||||||||||
| For the | For the | For the | For the | |||||||||||||
| Year Ended | Year Ended | Year Ended | Year Ended | |||||||||||||
September 30, | September 30, | September 30, | September 30, | |||||||||||||
| 2016 | 2015 | 2016 | 2015 | |||||||||||||
| From Operations | ||||||||||||||||
| Net investment income (loss) | $ | 3,869,652 | $ | 5,109,522 | $ | (26,846,894 | ) | $ | (30,444,851 | ) | ||||||
| Net realized gain (losses) on investments | (1,237,607 | ) | 10,215,915 | 461,133,830 | 448,220,268 | |||||||||||
| Net change in unrealized appreciation (depreciation) on investments | 20,365,252 | (36,402,981 | ) | (201,305,875 | ) | (606,231,963 | ) | |||||||||
| Change in Net Assets from Operations | 22,997,297 | (21,077,544 | ) | 232,981,061 | (188,456,546 | ) | ||||||||||
| Distributions to Shareholders from: | ||||||||||||||||
| Net investment income, Class A | (732,361 | ) | (1,240,585 | ) | — | — | ||||||||||
| Net investment income, Class C | (504,463 | ) | (681,106 | ) | — | — | ||||||||||
| Net investment income, Class Y | (2,622,164 | ) | (3,439,427 | ) | — | — | ||||||||||
| Net investment income, Institutional Class | — | — | — | — | ||||||||||||
| Net realized gains, Class A | (2,086,246 | ) | (2,197,270 | ) | (19,790,200 | ) | (14,093,187 | ) | ||||||||
| Net realized gains, Class C | (2,029,563 | ) | (1,531,929 | ) | (15,311,943 | ) | (10,111,362 | ) | ||||||||
| Net realized gains, Class Y | (6,140,759 | ) | (5,137,668 | ) | (278,000,457 | ) | (183,460,195 | ) | ||||||||
| Net realized gains, Class Z | — | — | (112,244,362 | ) | (90,266,864 | ) | ||||||||||
| Net realized gains, Institutional Class | — | — | — | — | ||||||||||||
| Total Distributions | (14,115,556 | ) | (14,227,985 | ) | (425,346,962 | ) | (297,931,608 | ) | ||||||||
| Net Increase (Decrease) from Share Transactions(A) | (24,439,466 | ) | 17,989,598 | (1,455,227,653 | ) | (897,050,296 | ) | |||||||||
| Total Increase (Decrease) in Net Assets | (15,557,725 | ) | (17,315,931 | ) | (1,647,593,554 | ) | (1,383,438,450 | ) | ||||||||
| Net Assets | ||||||||||||||||
| Beginning of period | 168,198,883 | 185,514,814 | 4,885,631,159 | 6,269,069,609 | ||||||||||||
| End of period | $ | 152,641,158 | $ | 168,198,883 | $ | 3,238,037,605 | $ | 4,885,631,159 | ||||||||
| Accumulated Net Investment Income (Loss) | $ | 208,614 | $ | 163,737 | $ | (17,640,732 | ) | $ | (21,615,887 | ) | ||||||
(A) For details on share transactions by class, see Statements of Changes in Net Assets - Capital Stock Activity on pages 102-104.
See accompanying Notes to Financial Statements.
| 96 |
Statements of Changes in Net Assets (Continued)
| Touchstone | Touchstone | Touchstone | ||||||||||||||||||||
| Small Cap | Small Cap | Total Return | ||||||||||||||||||||
| Fund | Value Fund | Bond Fund | ||||||||||||||||||||
| For the | For the | For the | For the | For the | For the | |||||||||||||||||
| Year Ended | Year Ended | Year Ended | Year Ended | Year Ended | Year Ended | |||||||||||||||||
| September 30, | September 30, | September 30, | September 30, | September 30, | September 30, | |||||||||||||||||
| 2016 | 2015 | 2016 | 2015 | 2016 | 2015 | |||||||||||||||||
| $ | 1,560,500 | $ | 7,960,852 | $ | 893,898 | $ | 1,208,039 | $ | 5,254,047 | $ | 4,225,533 | |||||||||||
| (60,975,970 | ) | 83,192,630 | (6,960,047 | ) | 3,657,420 | (45,495 | ) | 656,088 | ||||||||||||||
| 89,708,679 | (141,878,468 | ) | 14,496,319 | (9,186,442 | ) | 4,436,944 | (786,185 | ) | ||||||||||||||
| 30,293,209 | (50,724,986 | ) | 8,430,170 | (4,320,983 | ) | 9,645,496 | 4,095,436 | |||||||||||||||
| (459,982 | ) | (4,964 | ) | (438,953 | ) | (456,935 | ) | (155,483 | ) | (152,519 | ) | |||||||||||
| (26,741 | ) | — | (8,814 | ) | (14,424 | ) | (47,330 | ) | (38,190 | ) | ||||||||||||
| (3,110,979 | ) | (146,568 | ) | (59,822 | ) | (139,413 | ) | (1,269,095 | ) | (808,571 | ) | |||||||||||
| (2,961,769 | ) | (212,904 | ) | (378,488 | ) | (583,324 | ) | (4,538,220 | ) | (4,108,293 | ) | |||||||||||
| (6,403,253 | ) | (4,610,591 | ) | (865,953 | ) | (1,209,646 | ) | — | — | |||||||||||||
| (2,276,849 | ) | (2,081,129 | ) | (49,306 | ) | (80,833 | ) | — | — | |||||||||||||
| (33,435,598 | ) | (23,363,113 | ) | (150,398 | ) | (346,677 | ) | — | — | |||||||||||||
| — | — | — | — | — | — | |||||||||||||||||
| (29,370,263 | ) | (29,583,949 | ) | (792,852 | ) | (1,174,928 | ) | — | — | |||||||||||||
| (78,045,434 | ) | (60,003,218 | ) | (2,744,586 | ) | (4,006,180 | ) | (6,010,128 | ) | (5,107,573 | ) | |||||||||||
| (68,552,191 | ) | 40,547,715 | 116,149,710 | (8,100,551 | ) | 40,563,136 | 41,178,974 | |||||||||||||||
| (116,304,416 | ) | (70,180,489 | ) | 121,835,294 | (16,427,714 | ) | 44,198,504 | 40,166,837 | ||||||||||||||
| 719,823,863 | 790,004,352 | 56,441,845 | 72,869,559 | 182,745,369 | 142,578,532 | |||||||||||||||||
| $ | 603,519,447 | $ | 719,823,863 | $ | 178,277,139 | $ | 56,441,845 | $ | 226,943,873 | $ | 182,745,369 | |||||||||||
| $ | 1,744,841 | $ | 6,559,385 | $ | 39,218 | $ | 39,687 | $ | 138,900 | $ | 32,933 | |||||||||||
| 97 |
Statements of Changes in Net Assets (Continued)
| Touchstone | ||||||||
| Ultra Short | ||||||||
| Duration Fixed | ||||||||
| Income Fund | ||||||||
| For the | For the | |||||||
| Year Ended | Year Ended | |||||||
| September 30, | September 30, | |||||||
| 2016 | 2015 | |||||||
| From Operations | ||||||||
| Net investment income | $ | 7,108,909 | $ | 3,959,419 | ||||
| Net realized gains (losses) on investments | 10,953 | (68,741 | ) | |||||
| Net change in unrealized appreciation (depreciation) on investments | 1,127,268 | (1,301,049 | ) | |||||
| Change in Net Assets from Operations | 8,247,130 | 2,589,629 | ||||||
| Distributions to Shareholders from: | ||||||||
| Net investment income, Class A | (138,872 | ) | (120,421 | ) | ||||
| Net investment income, Class C | (73,201 | ) | (73,655 | ) | ||||
| Net investment income, Class Y | (3,408,667 | ) | (3,184,693 | ) | ||||
| Net investment income, Class Z | (3,136,351 | ) | (4,319,849 | ) | ||||
| Net investment income, Institutional Class | (1,706,659 | ) | (801,753 | ) | ||||
| Total Distributions | (8,463,750 | ) | (8,500,371 | ) | ||||
| Net Increase (Decrease) from Share Transactions(A) | 46,236,958 | (140,181,440 | ) | |||||
| Total Increase (Decrease) in Net Assets | 46,020,338 | (146,092,182 | ) | |||||
| Net Assets | ||||||||
| Beginning of period | 573,364,314 | 719,456,496 | ||||||
| End of period | $ | 619,384,652 | $ | 573,364,314 | ||||
| Accumulated Net Investment Income | $ | 314,261 | $ | 462,446 | ||||
(A) For details on share transactions by class, see Statements of Changes in Net Assets - Capital Stock Activity on page 105.
See accompanying Notes to Financial Statements.
| 98 |
This page intentionally left blank.
| 99 |
Statements of Changes in Net Assets - Capital Stock Activity
| Touchstone Emerging | ||||||||||||||||||||||||||||||||
| Touchstone Arbitrage Fund | Markets Small Cap Fund | |||||||||||||||||||||||||||||||
| For the Year | For the Year | For the Year | For the Year | |||||||||||||||||||||||||||||
| Ended | Ended | Ended | Ended | |||||||||||||||||||||||||||||
| September 30, 2016 | September 30, 2015 | September 30, 2016 | September 30, 2015 | |||||||||||||||||||||||||||||
| Shares | Dollars | Shares | Dollars | Shares | Dollars | Shares | Dollars | |||||||||||||||||||||||||
| Class A | ||||||||||||||||||||||||||||||||
| Proceeds from Shares issued | 636,422 | $ | 6,496,133 | 697,405 | $ | 6,923,936 | 61,377 | $ | 526,287 | 186,600 | $ | 2,072,169 | ||||||||||||||||||||
| Reinvestment of distributions | 17,213 | 171,655 | 3,414 | 33,622 | 21,437 | 180,076 | 2,103 | 23,322 | ||||||||||||||||||||||||
| Cost of Shares redeemed | (1,765,938 | ) | (17,730,722 | ) | (920,226 | ) | (9,124,998 | ) | (157,406 | ) | (1,384,545 | ) | (313,089 | ) | (3,477,526 | ) | ||||||||||||||||
| Change from Class A Share Transactions | (1,112,303 | ) | (11,062,934 | ) | (219,407 | ) | (2,167,440 | ) | (74,592 | ) | (678,182 | ) | (124,386 | ) | (1,382,035 | ) | ||||||||||||||||
| Class C | ||||||||||||||||||||||||||||||||
| Proceeds from Shares issued | 227,699 | 2,258,773 | 237,911 | 2,335,338 | 11,480 | 105,215 | 24,930 | 277,830 | ||||||||||||||||||||||||
| Reinvestment of distributions | 13,631 | 133,742 | 1,654 | 16,175 | 9,925 | 82,074 | — | — | ||||||||||||||||||||||||
| Cost of Shares redeemed | (344,365 | ) | (3,436,570 | ) | (484,282 | ) | (4,756,438 | ) | (96,415 | ) | (840,648 | ) | (101,198 | ) | (1,098,754 | ) | ||||||||||||||||
| Change from Class C Share Transactions | (103,035 | ) | (1,044,055 | ) | (244,717 | ) | (2,404,925 | ) | (75,010 | ) | (653,359 | ) | (76,268 | ) | (820,924 | ) | ||||||||||||||||
| Class Y | ||||||||||||||||||||||||||||||||
| Proceeds from Shares issued | 5,014,120 | 51,434,095 | 4,068,067 | 40,496,482 | 642,770 | 5,876,947 | 1,430,819 | 15,269,883 | ||||||||||||||||||||||||
| Reinvestment of distributions | 155,458 | 1,559,811 | 16,744 | 165,594 | 73,578 | 618,052 | 79,179 | 870,970 | ||||||||||||||||||||||||
| Cost of Shares redeemed | (2,203,090 | ) | (22,478,967 | ) | (7,205,496 | ) | (71,751,279 | ) | (7,901,441 | ) | (72,245,185 | ) | (2,896,992 | ) | (31,709,119 | ) | ||||||||||||||||
| Change from Class Y Share Transactions | 2,966,488 | 30,514,939 | (3,120,685 | ) | (31,089,203 | ) | (7,185,093 | ) | (65,750,186 | ) | (1,386,994 | ) | (15,568,266 | ) | ||||||||||||||||||
| Class Z | ||||||||||||||||||||||||||||||||
| Proceeds from Shares issued | — | — | — | — | — | — | — | — | ||||||||||||||||||||||||
| Reinvestment of distributions | — | — | — | — | — | — | — | — | ||||||||||||||||||||||||
| Cost of Shares redeemed | — | — | — | — | — | — | — | — | ||||||||||||||||||||||||
| Change from Class Z Share Transactions | — | — | — | — | — | — | — | — | ||||||||||||||||||||||||
| Institutional Class | ||||||||||||||||||||||||||||||||
| Proceeds from Shares issued | 1,249,780 | 12,808,253 | 220,191 | 2,220,455 | 453,173 | 3,882,643 | 4,709,785 | 52,209,046 | ||||||||||||||||||||||||
| Reinvestment of distributions | 16,462 | 165,641 | 7,123 | 70,593 | 197,701 | 1,644,874 | 227,026 | 2,497,286 | ||||||||||||||||||||||||
| Cost of Shares redeemed | (816,893 | ) | (8,302,970 | ) | (3,968,913 | ) | (39,312,755 | ) | (20,875,902 | ) | (196,623,501 | ) | (4,751,637 | ) | (49,181,184 | ) | ||||||||||||||||
| Change from Institutional Class Share Transactions | 449,349 | 4,670,924 | (3,741,599 | ) | (37,021,707 | ) | (20,225,028 | ) | (191,095,984 | ) | 185,174 | 5,525,148 | ||||||||||||||||||||
| Change from Share Transactions | 2,200,499 | $ | 23,078,874 | (7,326,408 | ) | $ | (72,683,275 | ) | (27,559,723 | ) | $ | (258,177,711 | ) | (1,402,474 | ) | $ | (12,246,077 | ) | ||||||||||||||
See accompanying Notes to Financial Statements.
| 100 |
Statements of Changes in Net Assets - Capital Stock Activity (Continued)
| Touchstone Merger Arbitrage Fund | Touchstone Mid Cap Fund | |||||||||||||||||||||||||||||
| For the Year | For the Year | For the Year | For the Year | |||||||||||||||||||||||||||
| Ended | Ended | Ended | Ended | |||||||||||||||||||||||||||
| September 30, 2016 | September 30, 2015 | September 30, 2016 | September 30, 2015 | |||||||||||||||||||||||||||
| Shares | Dollars | Shares | Dollars | Shares | Dollars | Shares | Dollars | |||||||||||||||||||||||
| 395,192 | $ | 4,243,218 | 317,995 | $ | 3,355,747 | 690,963 | $ | 16,958,049 | 1,699,189 | $ | 43,125,179 | |||||||||||||||||||
| — | — | 24,939 | 261,605 | — | — | — | — | |||||||||||||||||||||||
| (1,041,709 | ) | (11,242,430 | ) | (7,506,278 | ) | (78,939,832 | ) | (1,344,791 | ) | (32,261,785 | ) | (497,769 | ) | (12,575,317 | ) | |||||||||||||||
| (646,517 | ) | (6,999,212 | ) | (7,163,344 | ) | (75,322,480 | ) | (653,828 | ) | (15,303,736 | ) | 1,201,420 | 30,549,862 | |||||||||||||||||
| 25,575 | 269,111 | 21,898 | 225,663 | 493,383 | 11,515,804 | 1,235,605 | 30,223,772 | |||||||||||||||||||||||
| — | — | 13,289 | 136,208 | — | — | — | — | |||||||||||||||||||||||
| (521,358 | ) | (5,450,169 | ) | (1,671,980 | ) | (17,160,505 | ) | (813,813 | ) | (18,986,298 | ) | (318,653 | ) | (7,658,547 | ) | |||||||||||||||
| (495,783 | ) | (5,181,058 | ) | (1,636,793 | ) | (16,798,634 | ) | (320,430 | ) | (7,470,494 | ) | 916,952 | 22,565,225 | |||||||||||||||||
| 1,400,121 | 15,261,513 | 1,632,792 | 17,296,230 | 7,186,523 | 176,426,122 | 13,034,302 | 335,664,826 | |||||||||||||||||||||||
| — | — | 59,302 | 626,234 | 9,378 | 226,837 | 14,093 | 358,948 | |||||||||||||||||||||||
| (2,032,901 | ) | (22,066,584 | ) | (10,245,967 | ) | (108,541,694 | ) | (9,559,803 | ) | (239,131,360 | ) | (3,623,295 | ) | (91,336,205 | ) | |||||||||||||||
| (632,780 | ) | (6,805,071 | ) | (8,553,873 | ) | (90,619,230 | ) | (2,363,902 | ) | (62,478,401 | ) | 9,425,100 | 244,687,569 | |||||||||||||||||
| — | — | — | — | 653,874 | 15,736,708 | 794,664 | 19,940,900 | |||||||||||||||||||||||
| — | — | — | — | 57 | 1,361 | — | — | |||||||||||||||||||||||
| — | — | — | — | (728,737 | ) | (17,272,179 | ) | (477,159 | ) | (11,756,957 | ) | |||||||||||||||||||
| — | — | — | — | (74,806 | ) | (1,534,110 | ) | 317,505 | 8,183,943 | |||||||||||||||||||||
| 718,753 | 7,858,014 | 1,842,775 | 19,481,278 | 1,263,355 | 32,341,689 | 443,808 | 11,248,537 | |||||||||||||||||||||||
| — | — | 43,999 | 465,514 | 1,800 | 43,567 | 7,316 | 186,413 | |||||||||||||||||||||||
| (1,610,541 | ) | (17,560,296 | ) | (5,434,586 | ) | (57,867,363 | ) | (1,556,379 | ) | (37,332,565 | ) | (1,004,121 | ) | (25,405,734 | ) | |||||||||||||||
| (891,788 | ) | (9,702,282 | ) | (3,547,812 | ) | (37,920,571 | ) | (291,224 | ) | (4,947,309 | ) | (552,997 | ) | (13,970,784 | ) | |||||||||||||||
| (2,666,868 | ) | $ | (28,687,623 | ) | (20,901,822 | ) | $ | (220,660,915 | ) | (3,704,190 | ) | $ | (91,734,050 | ) | 11,307,980 | $ | 292,015,815 | |||||||||||||
| 101 |
Statements of Changes in Net Assets - Capital Stock Activity (Continued)
| Touchstone Mid Cap Value Fund | Touchstone Premium Yield Equity Fund | |||||||||||||||||||||||||||||||
| For the Year | For the Year | For the Year | For the Year | |||||||||||||||||||||||||||||
| Ended | Ended | Ended | Ended | |||||||||||||||||||||||||||||
| September 30, 2016 | September 30, 2015 | September 30, 2016 | September 30, 2015 | |||||||||||||||||||||||||||||
| Shares | Dollars | Shares | Dollars | Shares | Dollars | Shares | Dollars | |||||||||||||||||||||||||
| Class A | ||||||||||||||||||||||||||||||||
| Proceeds from Shares issued | 895,554 | $ | 15,389,896 | 154,790 | $ | 2,609,534 | 893,980 | $ | 7,265,127 | 1,698,528 | $ | 16,405,724 | ||||||||||||||||||||
| Reinvestment of distributions | 33,498 | 513,921 | 24,707 | 405,472 | 321,003 | 2,457,627 | 334,440 | 3,162,900 | ||||||||||||||||||||||||
| Cost of Shares redeemed | (167,163 | ) | (2,768,421 | ) | (536,569 | ) | (9,007,319 | ) | (2,501,557 | ) | (20,481,758 | ) | (2,197,894 | ) | (20,728,402 | ) | ||||||||||||||||
| Change from Class A Share Transactions | 761,889 | 13,135,396 | (357,072 | ) | (5,992,313 | ) | (1,286,574 | ) | (10,759,004 | ) | (164,926 | ) | (1,159,778 | ) | ||||||||||||||||||
| Class C | ||||||||||||||||||||||||||||||||
| Proceeds from Shares issued | 159,177 | 2,622,368 | 33,065 | 553,321 | 240,470 | 1,977,576 | 1,092,280 | 10,483,333 | ||||||||||||||||||||||||
| Reinvestment of distributions | 7,245 | 108,314 | 4,467 | 72,235 | 297,727 | 2,267,553 | 202,879 | 1,912,977 | ||||||||||||||||||||||||
| Cost of Shares redeemed | (42,291 | ) | (668,664 | ) | (46,335 | ) | (771,881 | ) | (1,395,315 | ) | (11,204,814 | ) | (620,690 | ) | (5,816,648 | ) | ||||||||||||||||
| Change from Class C Share Transactions | 124,131 | 2,062,018 | (8,803 | ) | (146,325 | ) | (857,118 | ) | (6,959,685 | ) | 674,469 | 6,579,662 | ||||||||||||||||||||
| Class Y | ||||||||||||||||||||||||||||||||
| Proceeds from Shares issued | 5,770,403 | 98,377,196 | 3,429,721 | 58,072,725 | 5,449,973 | 44,567,862 | 5,230,685 | 49,314,434 | ||||||||||||||||||||||||
| Reinvestment of distributions | 912,703 | 14,062,747 | 565,498 | 9,334,998 | 1,055,348 | 8,111,513 | 809,706 | 7,630,116 | ||||||||||||||||||||||||
| Cost of Shares redeemed | (3,240,894 | ) | (52,471,504 | ) | (3,569,354 | ) | (60,449,696 | ) | (7,288,142 | ) | (59,400,152 | ) | (4,787,404 | ) | (44,374,836 | ) | ||||||||||||||||
| Change from Class Y Share Transactions | 3,442,212 | 59,968,439 | 425,865 | 6,958,027 | (782,821 | ) | (6,720,777 | ) | 1,252,987 | 12,569,714 | ||||||||||||||||||||||
| Class Z | ||||||||||||||||||||||||||||||||
| Proceeds from Shares issued | — | — | — | — | — | — | — | — | ||||||||||||||||||||||||
| Reinvestment of distributions | — | — | — | — | — | — | — | — | ||||||||||||||||||||||||
| Cost of Shares redeemed | — | — | — | — | — | — | — | — | ||||||||||||||||||||||||
| Change from Class Z Share Transactions | — | — | — | — | — | — | — | — | ||||||||||||||||||||||||
| Institutional Class | ||||||||||||||||||||||||||||||||
| Proceeds from Shares issued | 6,959,601 | 115,342,356 | 2,461,723 | 41,633,362 | — | — | — | — | ||||||||||||||||||||||||
| Reinvestment of distributions | 300,454 | 4,672,213 | 269,644 | 4,472,681 | — | — | — | — | ||||||||||||||||||||||||
| Cost of Shares redeemed | (4,592,736 | ) | (76,840,265 | ) | (2,879,594 | ) | (48,796,104 | ) | — | — | — | — | ||||||||||||||||||||
| Change from Institutional Class Share Transactions | 2,667,319 | 43,174,304 | (148,227 | ) | (2,690,061 | ) | — | — | — | — | ||||||||||||||||||||||
| Change from Share Transactions | 6,995,551 | $ | 118,340,157 | (88,237 | ) | $ | (1,870,672 | ) | (2,926,513 | ) | $ | (24,439,466 | ) | 1,762,530 | $ | 17,989,598 | ||||||||||||||||
See accompanying Notes to Financial Statements.
| 102 |
Statements of Changes in Net Assets - Capital Stock Activity (Continued)
| Touchstone Sands Capital Select Growth Fund | Touchstone Small Cap Fund | |||||||||||||||||||||||||||||
| For the Year | For the Year | For the Year | For the Year | |||||||||||||||||||||||||||
| Ended | Ended | Ended | Ended | |||||||||||||||||||||||||||
| September 30, 2016 | September 30, 2015 | September 30, 2016 | September 30, 2015 | |||||||||||||||||||||||||||
| Shares | Dollars | Shares | Dollars | Shares | Dollars | Shares | Dollars | |||||||||||||||||||||||
| 1,781,144 | $ | 27,608,651 | 3,641,024 | $ | 65,559,498 | 403,980 | $ | 6,570,669 | 1,922,057 | $ | 37,461,873 | |||||||||||||||||||
| 1,013,500 | 16,469,382 | 632,172 | 11,233,693 | 407,403 | 6,419,574 | 225,866 | 4,210,298 | |||||||||||||||||||||||
| (8,227,919 | ) | (127,495,191 | ) | (6,220,356 | ) | (111,540,350 | ) | (1,995,355 | ) | (32,579,500 | ) | (1,559,188 | ) | (31,246,980 | ) | |||||||||||||||
| (5,433,275 | ) | (83,417,158 | ) | (1,947,160 | ) | (34,747,159 | ) | (1,183,972 | ) | (19,589,257 | ) | 588,735 | 10,425,191 | |||||||||||||||||
| 331,830 | 5,104,448 | 517,357 | 8,977,978 | 22,915 | 359,013 | 48,757 | 913,444 | |||||||||||||||||||||||
| 719,512 | 11,188,418 | 427,832 | 7,358,711 | 137,154 | 2,078,131 | 100,136 | 1,817,469 | |||||||||||||||||||||||
| (4,053,250 | ) | (59,099,723 | ) | (2,219,652 | ) | (38,545,926 | ) | (460,139 | ) | (7,288,098 | ) | (242,220 | ) | (4,700,467 | ) | |||||||||||||||
| (3,001,908 | ) | (42,806,857 | ) | (1,274,463 | ) | (22,209,237 | ) | (300,070 | ) | (4,850,954 | ) | (93,327 | ) | (1,969,554 | ) | |||||||||||||||
| 27,425,606 | 434,736,619 | 59,278,345 | 1,111,054,923 | 6,097,043 | 95,431,681 | 6,507,540 | 132,883,759 | |||||||||||||||||||||||
| 11,303,725 | 189,677,066 | 6,959,585 | 127,012,426 | 2,083,885 | 33,271,220 | 874,337 | 16,458,603 | |||||||||||||||||||||||
| (94,962,088 | ) | (1,498,045,256 | ) | (64,334,704 | ) | (1,186,531,629 | ) | (8,854,273 | ) | (145,834,007 | ) | (3,686,636 | ) | (73,725,190 | ) | |||||||||||||||
| (56,232,757 | ) | (873,631,571 | ) | 1,903,226 | 51,535,720 | (673,345 | ) | (17,131,106 | ) | 3,695,241 | 75,617,172 | |||||||||||||||||||
| 5,906,679 | 92,270,499 | 13,122,014 | 236,143,567 | — | — | — | — | |||||||||||||||||||||||
| 6,855,766 | 111,406,290 | 5,044,388 | 89,638,768 | — | — | — | — | |||||||||||||||||||||||
| (43,009,825 | ) | (659,048,856 | ) | (66,561,196 | ) | (1,217,411,955 | ) | — | — | — | — | |||||||||||||||||||
| (30,247,380 | ) | (455,372,067 | ) | (48,394,794 | ) | (891,629,620 | ) | — | — | — | — | |||||||||||||||||||
| — | — | — | — | 6,414,250 | 104,506,111 | 5,353,309 | 107,676,224 | |||||||||||||||||||||||
| — | — | — | — | 1,130,473 | 18,036,138 | 978,565 | 18,399,911 | |||||||||||||||||||||||
| — | — | — | — | (8,849,233 | ) | (149,523,123 | ) | (8,489,308 | ) | (169,601,229 | ) | |||||||||||||||||||
| — | — | — | — | (1,304,510 | ) | (26,980,874 | ) | (2,157,434 | ) | (43,525,094 | ) | |||||||||||||||||||
| (94,915,320 | ) | $ | (1,455,227,653 | ) | (49,713,191 | ) | $ | (897,050,296 | ) | (3,461,897 | ) | $ | (68,552,191 | ) | 2,033,215 | $ | 40,547,715 | |||||||||||||
| 103 |
Statements of Changes in Net Assets - Capital Stock Activity (Continued)
| Touchstone Small Cap Value Fund | Touchstone Total Return Bond Fund | |||||||||||||||||||||||||||||||
| For the Year | For the Year | For the Year | For the Year | |||||||||||||||||||||||||||||
| Ended | Ended | Ended | Ended | |||||||||||||||||||||||||||||
| September 30, 2016 | September 30, 2015 | September 30, 2016 | September 30, 2015 | |||||||||||||||||||||||||||||
| Shares | Dollars | Shares | Dollars | Shares | Dollars | Shares | Dollars | |||||||||||||||||||||||||
| Class A | ||||||||||||||||||||||||||||||||
| Proceeds from Shares issued | 5,882,525 | $ | 130,027,094 | 39,094 | $ | 943,019 | 404,980 | $ | 4,176,299 | 464,998 | $ | 4,794,879 | ||||||||||||||||||||
| Reinvestment of distributions | 62,383 | 1,249,310 | 68,652 | 1,602,761 | 10,799 | 110,510 | 12,299 | 126,552 | ||||||||||||||||||||||||
| Cost of Shares redeemed | (405,894 | ) | (8,670,985 | ) | (253,395 | ) | (6,025,281 | ) | (147,362 | ) | (1,505,459 | ) | (416,177 | ) | (4,311,114 | ) | ||||||||||||||||
| Change from Class A Share Transactions | 5,539,014 | 122,605,419 | (145,649 | ) | (3,479,501 | ) | 268,417 | 2,781,350 | 61,120 | 610,317 | ||||||||||||||||||||||
| Class C | ||||||||||||||||||||||||||||||||
| Proceeds from Shares issued | 8,467 | 169,445 | 8,200 | 194,538 | 139,295 | 1,417,759 | 120,723 | 1,244,614 | ||||||||||||||||||||||||
| Reinvestment of distributions | 1,924 | 37,527 | 2,405 | 55,586 | 3,370 | 34,456 | 2,936 | 30,186 | ||||||||||||||||||||||||
| Cost of Shares redeemed | (17,559 | ) | (366,361 | ) | (35,009 | ) | (814,026 | ) | (103,849 | ) | (1,057,076 | ) | (50,965 | ) | (526,214 | ) | ||||||||||||||||
| Change from Class C Share Transactions | (7,168 | ) | (159,389 | ) | (24,404 | ) | (563,902 | ) | 38,816 | 395,139 | 72,694 | 748,586 | ||||||||||||||||||||
| Class Y | ||||||||||||||||||||||||||||||||
| Proceeds from Shares issued | 20,965 | 429,261 | 32,469 | 756,310 | 1,932,957 | 19,881,344 | 4,023,444 | 41,258,943 | ||||||||||||||||||||||||
| Reinvestment of distributions | 8,366 | 165,828 | 17,660 | 413,841 | 79,717 | 817,213 | 53,383 | 549,588 | ||||||||||||||||||||||||
| Cost of Shares redeemed | (109,569 | ) | (2,278,011 | ) | (222,703 | ) | (5,207,182 | ) | (1,145,680 | ) | (11,760,046 | ) | (2,075,281 | ) | (21,366,189 | ) | ||||||||||||||||
| Change from Class Y Share Transactions | (80,238 | ) | (1,682,922 | ) | (172,574 | ) | (4,037,031 | ) | 866,994 | 8,938,511 | 2,001,546 | 20,442,342 | ||||||||||||||||||||
| Class Z | ||||||||||||||||||||||||||||||||
| Proceeds from Shares issued | — | — | — | — | — | — | — | — | ||||||||||||||||||||||||
| Reinvestment of distributions | — | — | — | — | — | — | — | — | ||||||||||||||||||||||||
| Cost of Shares redeemed | — | — | — | — | — | — | — | — | ||||||||||||||||||||||||
| Change from Class Z Share Transactions | — | — | — | — | — | — | — | — | ||||||||||||||||||||||||
| Institutional Class | ||||||||||||||||||||||||||||||||
| Proceeds from Shares issued | 153,488 | 3,135,912 | 181,436 | 4,287,336 | 6,930,518 | 71,129,405 | 5,199,931 | 53,765,978 | ||||||||||||||||||||||||
| Reinvestment of distributions | 58,793 | 1,171,340 | 75,308 | 1,758,252 | 418,347 | 4,287,777 | 392,536 | 4,041,700 | ||||||||||||||||||||||||
| Cost of Shares redeemed | (429,978 | ) | (8,920,650 | ) | (254,262 | ) | (6,065,705 | ) | (4,589,373 | ) | (46,969,046 | ) | (3,744,321 | ) | (38,429,949 | ) | ||||||||||||||||
| Change from Institutional Class Share Transactions | (217,697 | ) | (4,613,398 | ) | 2,482 | (20,117 | ) | 2,759,492 | 28,448,136 | 1,848,146 | 19,377,729 | |||||||||||||||||||||
| Change from Share Transactions | 5,233,911 | $ | 116,149,710 | (340,145 | ) | $ | (8,100,551 | ) | 3,933,719 | $ | 40,563,136 | 3,983,506 | $ | 41,178,974 | ||||||||||||||||||
See accompanying Notes to Financial Statements.
| 104 |
Statements of Changes in Net Assets - Capital Stock Activity (Continued)
| Touchstone Ultra Short Duration Fixed Income Fund | ||||||||||||||
| For the Year | For the Year | |||||||||||||
| Ended | Ended | |||||||||||||
| September 30, 2016 | September 30, 2015 | |||||||||||||
| Shares | Dollars | Shares | Dollars | |||||||||||
| 1,455,659 | $ | 13,554,444 | 527,290 | $ | 4,935,752 | |||||||||
| 13,073 | 121,660 | 10,396 | 97,320 | |||||||||||
| (795,071 | ) | (7,399,901 | ) | (518,482 | ) | (4,862,453 | ) | |||||||
| 673,661 | 6,276,203 | 19,204 | 170,619 | |||||||||||
| 445,090 | 4,142,012 | 243,405 | 2,278,894 | |||||||||||
| 5,126 | 47,688 | 5,658 | 52,983 | |||||||||||
| (484,982 | ) | (4,514,193 | ) | (557,428 | ) | (5,221,331 | ) | |||||||
| (34,766 | ) | (324,493 | ) | (308,365 | ) | (2,889,454 | ) | |||||||
| 16,170,047 | 150,487,329 | 9,248,000 | 86,579,336 | |||||||||||
| 238,789 | 2,222,199 | 192,324 | 1,800,488 | |||||||||||
| (15,767,661 | ) | (146,728,963 | ) | (13,958,645 | ) | (130,807,171 | ) | |||||||
| 641,175 | 5,980,565 | (4,518,321 | ) | (42,427,347 | ) | |||||||||
| 14,233,209 | 132,476,170 | 14,410,836 | 134,971,031 | |||||||||||
| 333,217 | 3,101,505 | 456,110 | 4,270,605 | |||||||||||
| (20,909,389 | ) | (194,733,929 | ) | (24,898,995 | ) | (233,301,872 | ) | |||||||
| (6,342,963 | ) | (59,156,254 | ) | (10,032,049 | ) | (94,060,236 | ) | |||||||
| 20,434,716 | 190,239,052 | 3,274,706 | 30,697,794 | |||||||||||
| 159,277 | 1,481,955 | 64,983 | 608,313 | |||||||||||
| (10,553,125 | ) | (98,260,070 | ) | (3,445,073 | ) | (32,281,129 | ) | |||||||
| 10,040,868 | 93,460,937 | (105,384 | ) | (975,022 | ) | |||||||||
| 4,977,975 | $ | 46,236,958 | (14,944,915 | ) | $ | (140,181,440 | ) | |||||||
| 105 |
Touchstone Arbitrage Fund—Class A
Selected Data for a Share Outstanding Throughout Each Period
| Year Ended September 30, | ||||||||||||
| 2016 | 2015 | 2014(A) | ||||||||||
| Net asset value at beginning of period | $ | 9.93 | $ | 9.87 | $ | 10.00 | ||||||
| Income (loss) from investments operations: | ||||||||||||
| Net investment loss(B) | (0.11 | ) | (0.08 | ) | (0.10 | ) | ||||||
| Net realized and unrealized gains (losses) on investments | 0.66 | 0.16 | (0.03 | ) | ||||||||
| Total from investment operations | 0.55 | 0.08 | (0.13 | ) | ||||||||
| Distributions from: | ||||||||||||
| Net investment income | (0.02 | ) | — | — | ||||||||
| Realized capital gains | (0.15 | ) | (0.02 | ) | — | |||||||
| Total distributions | (0.17 | ) | (0.02 | ) | — | |||||||
| Net asset value at end of period | $ | 10.31 | $ | 9.93 | $ | 9.87 | ||||||
| Total return(C) | 5.61 | % | 0.77 | % | (1.30 | %) | ||||||
| Ratios and supplemental data: | ||||||||||||
| Net assets at end of period (000's) | $ | 10,003 | $ | 20,672 | $ | 22,725 | ||||||
| Ratio to average net assets: | ||||||||||||
| Net expenses (including dividend and interest expense on securities sold short)(D) | 2.80 | % | 2.42 | % | 2.51 | % | ||||||
| Gross expenses (including dividend and interest expense on securities sold short)(E) | 3.03 | % | 2.44 | % | 2.51 | % | ||||||
| Net investment loss | (1.06 | %) | (0.83 | %) | (1.01 | %) | ||||||
| Portfolio turnover rate | 451 | % | 276 | % | 293 | % | ||||||
Touchstone Arbitrage Fund—Class C
Selected Data for a Share Outstanding Throughout Each Period
| Year Ended September 30, | ||||||||||||
| 2016 | 2015 | 2014(A) | ||||||||||
| Net asset value at beginning of period | $ | 9.80 | $ | 9.82 | $ | 10.00 | ||||||
| Income (loss) from investments operations: | ||||||||||||
| Net investments loss(B) | (0.18 | ) | (0.15 | ) | (0.17 | ) | ||||||
| Net realized and unrealized gains (losses) on investments | 0.65 | 0.15 | (0.01 | ) | ||||||||
| Total from investment operations | 0.47 | — | (0.18 | ) | ||||||||
| Distributions from: | ||||||||||||
| Net investment income | (0.01 | ) | — | — | ||||||||
| Realized capital gains | (0.15 | ) | (0.02 | ) | — | |||||||
| Total distributions | (0.16 | ) | (0.02 | ) | — | |||||||
| Net asset value at end of period | $ | 10.11 | $ | 9.80 | $ | 9.82 | ||||||
| Total return(C) | 4.81 | % | (0.05 | %) | (1.80 | %) | ||||||
| Ratios and supplemental data: | ||||||||||||
| Net assets at end of period (000's) | $ | 7,930 | $ | 8,694 | $ | 11,113 | ||||||
| Ratio to average net assets: | ||||||||||||
| Net expenses (including dividend and interest expense on securities sold short)(D) | 3.55 | % | 3.14 | % | 3.27 | % | ||||||
| Gross expenses (including dividend and interest expense on securities sold short)(E) | 3.62 | % | 3.14 | % | 3.29 | % | ||||||
| Net investment loss | (1.81 | %) | (1.55 | %) | (1.77 | %) | ||||||
| Portfolio turnover rate | 451 | % | 276 | % | 293 | % | ||||||
| (A) | Represents the period from commencement of operations (October 1, 2013) through September 30, 2014. |
| (B) | The net investment loss per share is based on average shares outstanding for the period. |
| (C) | Total returns shown exclude the effect of applicable sales loads. If these charges were included, the returns would be lower. |
| (D) | The ratio of net expenses to average net assets excluding dividend and interest expense on securities sold short for Class A is 1.68%, 1.68% and 1.67% and for Class C is 2.43%, 2.40% and 2.43% for the years ended September 30, 2016, 2015 and 2014, respectively. |
| (E) | The ratio of gross expenses to average net assets excluding dividend and interest expense on securities sold short for Class A is 1.91%, 1.70% and 1.67% and for Class C is 2.50%, 2.40% and 2.45% for the years ended September 30, 2016, 2015 and 2014, respectively. |
See accompanying Notes to Financial Statements.
| 106 |
Financial Highlights (Continued)
Touchstone Arbitrage Fund—Class Y
Selected Data for a Share Outstanding Throughout Each Period
| Year Ended September 30, | ||||||||||||
| 2016 | 2015 | 2014(A) | ||||||||||
| Net asset value at beginning of period | $ | 9.99 | $ | 9.91 | $ | 10.00 | ||||||
| Income (loss) from investment operations: | ||||||||||||
| Net investment loss(B) | (0.08 | ) | (0.05 | ) | (0.07 | ) | ||||||
| Net realized and unrealized gains (losses) on investments | 0.67 | 0.15 | (0.02 | ) | ||||||||
| Total from investment operations | 0.59 | 0.10 | (0.09 | ) | ||||||||
| Distributions from: | ||||||||||||
| Net investment income | (0.03 | ) | — | — | ||||||||
| Realized capital gains | (0.15 | ) | (0.02 | ) | — | |||||||
| Total distributions | (0.18 | ) | (0.02 | ) | — | |||||||
| Net asset value at end of period | $ | 10.40 | $ | 9.99 | $ | 9.91 | ||||||
| Total return | 6.00 | % | 0.97 | % | (0.90 | %) | ||||||
| Ratios and supplemental data: | ||||||||||||
| Net assets at end of period (000's) | $ | 121,794 | $ | 87,427 | $ | 117,589 | ||||||
| Ratio to average net assets: | ||||||||||||
| Net expenses (including dividend and interest expense on securities sold short)(C) | 2.51 | % | 2.10 | % | 2.19 | % | ||||||
| Gross expenses (including dividend and interest expense on securities sold short(D) | 2.51 | % | 2.10 | % | 2.19 | % | ||||||
| Net investment loss | (0.77 | %) | (0.51 | %) | (0.69 | %) | ||||||
| Portfolio turnover rate | 451 | % | 276 | % | 293 | % | ||||||
Touchstone Arbitrage Fund—Institutional Class
Selected Data for a Share Outstanding Throughout Each Period
| Year Ended September 30, | ||||||||||||
| 2016 | 2015 | 2014(A) | ||||||||||
| Net asset value at beginning of period | $ | 10.01 | $ | 9.92 | $ | 10.00 | ||||||
| Income (loss) from investment operations: | ||||||||||||
| Net investment loss(B) | (0.07 | ) | (0.04 | ) | (0.06 | ) | ||||||
| Net realized and unrealized gains (losses) on investments | 0.68 | 0.15 | (0.02 | ) | ||||||||
| Total from investment operations | 0.61 | 0.11 | (0.08 | ) | ||||||||
| Distributions from: | ||||||||||||
| Net investment income | (0.04 | ) | — | — | ||||||||
| Realized capital gains | (0.15 | ) | (0.02 | ) | — | |||||||
| Total distributions | (0.19 | ) | (0.02 | ) | — | |||||||
| Net asset value at end of period | $ | 10.43 | $ | 10.01 | $ | 9.92 | ||||||
| Total return | 6.12 | % | 1.06 | % | (0.80 | %) | ||||||
| Ratios and supplemental data: | ||||||||||||
| Net assets at end of period (000's) | $ | 13,782 | $ | 8,735 | $ | 47,763 | ||||||
| Ratio to average net assets: | ||||||||||||
| Net expenses (including dividend and interest expense on securities sold short)(C) | 2.40 | % | 2.02 | % | 2.12 | % | ||||||
| Gross expenses (including dividend and interest expense on securities sold short)(D) | 2.48 | % | 2.03 | % | 2.12 | % | ||||||
| Net investment loss | (0.66 | %) | (0.43 | %) | (0.62 | %) | ||||||
| Portfolio turnover rate | 451 | % | 276 | % | 293 | % | ||||||
| (A) | Represents the period from commencement of operations (October 1, 2013) through September 30, 2014. |
| (B) | The net investment loss per share is based on average shares outstanding for the period. |
| (C) | The ratio of net expenses to average net assets excluding dividend and interest expense on securities sold short for Class Y is 1.39%, 1.36% and 1.35% and for Institutional Class is 1.28%, 1.28% and 1.28% for the years ended September 30, 2016, 2015 and 2014, respectively. |
| (D) | The ratio of gross expenses to average net assets excluding dividend and interest expense on securities sold short for Class Y is 1.39%, 1.36% and 1.35% and for Institutional Class is 1.36%, 1.29% and 1.28% for the years ended September 30, 2016, 2015 and 2014, respectively. |
See accompanying Notes to Financial Statements.
| 107 |
Financial Highlights (Continued)
Touchstone Emerging Markets Small Cap Fund—Class A
Selected Data for a Share Outstanding Throughout Each Period
| Year Ended September 30, | ||||||||||||||||||||
| 2016 | 2015 | 2014 | 2013 | 2012 | ||||||||||||||||
| Net asset value at beginning of period | $ | 9.15 | $ | 11.67 | $ | 11.52 | $ | 12.24 | $ | 10.69 | ||||||||||
| Income (loss) from investment operations: | ||||||||||||||||||||
| Net investment income (loss) | (0.03 | )(A) | 0.07 | (A) | 0.09 | (A) | 0.09 | (A) | 0.11 | |||||||||||
| Net realized and unrealized gains (losses) on investments | 0.87 | (2.53 | ) | 0.09 | (0.80 | ) | 1.68 | |||||||||||||
| Total from investment operations | 0.84 | (2.46 | ) | 0.18 | (0.71 | ) | 1.79 | |||||||||||||
| Distributions from: | ||||||||||||||||||||
| Net investment income | (0.70 | ) | (0.06 | ) | (0.03 | ) | (0.01 | ) | (0.15 | ) | ||||||||||
| Realized capital gains | — | — | — | — | (0.09 | ) | ||||||||||||||
| Total distributions | (0.70 | ) | (0.06 | ) | (0.03 | ) | (0.01 | ) | (0.24 | ) | ||||||||||
| Net asset value at end of period | $ | 9.29 | $ | 9.15 | $ | 11.67 | $ | 11.52 | $ | 12.24 | ||||||||||
| Total return(B) | 10.01 | % | (21.18 | %) | 1.61 | % | (5.69 | %) | 16.71 | % | ||||||||||
| Ratios and supplemental data: | ||||||||||||||||||||
| Net assets at end of period (000's) | $ | 2,376 | $ | 3,022 | $ | 5,307 | $ | 9,843 | $ | 34,369 | ||||||||||
| Ratio to average net assets: | ||||||||||||||||||||
| Net expenses | 1.69 | % | 1.69 | % | 1.69 | % | 1.69 | % | 1.72 | % | ||||||||||
| Gross expenses | 3.51 | % | 2.41 | % | 2.20 | % | 1.93 | % | 1.99 | % | ||||||||||
| Net investment income (loss) | (0.40 | %) | 0.66 | % | 0.75 | % | 0.71 | % | 0.94 | % | ||||||||||
| Portfolio turnover rate | 68 | % | 28 | % | 38 | % | 25 | % | 33 | %(C) | ||||||||||
Touchstone Emerging Markets Small Cap Fund—Class C
Selected Data for a Share Outstanding Throughout Each Period
| Year Ended September 30, | ||||||||||||||||||||
| 2016 | 2015 | 2014 | 2013 | 2012 | ||||||||||||||||
| Net asset value at beginning of period | $ | 8.94 | $ | 11.43 | $ | 11.33 | $ | 12.13 | $ | 10.54 | ||||||||||
| Income gain (loss) from investment operations: | (0.10 | )(A) | (0.01 | )(A) | (— | )(A)(D) | (— | )(A)(D) | 0.04 | |||||||||||
| Net investment income (loss) | ||||||||||||||||||||
| Net realized and unrealized gains (losses) on investments | 0.86 | (2.48 | ) | 0.10 | (0.80 | ) | 1.64 | |||||||||||||
| Total from investment operations | 0.76 | (2.49 | ) | 0.10 | (0.80 | ) | 1.68 | |||||||||||||
| Distributions from: | — | (D) | ||||||||||||||||||
| Net investment income | (0.60 | ) | — | — | — | |||||||||||||||
| Realized capital gains | — | — | — | — | (0.09 | ) | ||||||||||||||
| Total distributions | (0.60 | ) | — | — | — | (0.09 | ) | |||||||||||||
| Net asset value at end of period | $ | 9.10 | $ | 8.94 | $ | 11.43 | $ | 11.33 | $ | 12.13 | ||||||||||
| Total return(B) | 9.18 | % | (21.79 | %) | 0.88 | % | (6.44 | %) | 15.84 | % | ||||||||||
| Ratios and supplemental data: | ||||||||||||||||||||
| Net assets at end of period (000's) | $ | 912 | $ | 1,566 | $ | 2,874 | $ | 3,719 | $ | 4,903 | ||||||||||
| Ratio to average net assets: | ||||||||||||||||||||
| Net expenses | 2.44 | % | 2.44 | % | 2.44 | % | 2.44 | % | 2.47 | % | ||||||||||
| Gross expenses | 4.80 | % | 3.19 | % | 3.03 | % | 2.84 | % | 2.85 | % | ||||||||||
| Net investment income (loss) | (1.15 | %) | (0.09 | %) | (0.00 | %)(D) | (0.04 | %) | 0.19 | % | ||||||||||
| Portfolio turnover rate | 68 | % | 28 | % | 38 | % | 25 | % | 33 | %(C) | ||||||||||
| (A) | The net investment income (loss) per share is based on average shares outstanding for the period. |
| (B) | Total returns shown exclude the effect of applicable sales loads. If these charges were included, the returns would be lower. |
| (C) | Portfolio turnover excludes the purchases and sales of the Touchstone Emerging Markets Equity Fund II acquired on September 17, 2012. If these transactions were included, portfolio turnover would have been higher. |
| (D) | Less than $0.005 per share or 0.005%. |
See accompanying Notes to Financial Statements.
| 108 |
Financial Highlights (Continued)
Touchstone Emerging Markets Small Cap Fund—Class Y
Selected Data for a Share Outstanding Throughout Each Period
| Year Ended September 30, | ||||||||||||||||||||
| 2016 | 2015 | 2014 | 2013 | 2012 | ||||||||||||||||
| Net asset value at beginning of period | $ | 9.10 | $ | 11.63 | $ | 11.54 | $ | 12.27 | $ | 10.74 | ||||||||||
| Income (loss) from investment operations: | (0.01 | )(A) | 0.10 | (A) | 0.12 | (A) | 0.13 | (A) | ||||||||||||
| Net investment income (loss) | 0.14 | |||||||||||||||||||
| Net realized and unrealized gains (losses) on investments | 0.88 | (2.52 | ) | 0.10 | (0.81 | ) | 1.70 | |||||||||||||
| Total from investment operations | 0.87 | (2.42 | ) | 0.22 | (0.68 | ) | 1.84 | |||||||||||||
| Distributions from: | ||||||||||||||||||||
| Net investment income | (0.65 | ) | (0.11 | ) | (0.13 | ) | (0.05 | ) | (0.22 | ) | ||||||||||
| Realized capital gains | — | — | — | — | (0.09 | ) | ||||||||||||||
| Total distributions | (0.65 | ) | (0.11 | ) | (0.13 | ) | (0.05 | ) | (0.31 | ) | ||||||||||
| Net asset value at end of period | $ | 9.32 | $ | 9.10 | $ | 11.63 | $ | 11.54 | $ | 12.27 | ||||||||||
| Total return | 10.37 | % | (20.98 | %) | 1.99 | % | (5.45 | %) | 17.12 | % | ||||||||||
| Ratios and supplemental data: | ||||||||||||||||||||
| Net assets at end of period (000's) | $ | 4,796 | $ | 70,066 | $ | 105,641 | $ | 138,451 | $ | 219,717 | ||||||||||
| Ratio to average net assets: | ||||||||||||||||||||
| Net expenses | 1.44 | % | 1.40 | % | 1.38 | % | 1.37 | % | 1.41 | % | ||||||||||
| Gross expenses | 2.27 | % | 1.40 | % | 1.38 | % | 1.35 | % | 1.44 | % | ||||||||||
| Net investment income (loss) | (0.15 | %) | 0.95 | % | 1.06 | % | 1.04 | % | 1.25 | % | ||||||||||
| Portfolio turnover rate | 68 | % | 28 | % | 38 | % | 25 | % | 33 | %(B) | ||||||||||
Touchstone Emerging Markets Small Cap Fund—Institutional Class
Selected Data for a Share Outstanding Throughout Each Period
| Year Ended September 30, | ||||||||||||||||||||
| 2016 | 2015 | 2014 | 2013 | 2012 | ||||||||||||||||
| Net asset value at beginning of period | $ | 9.11 | $ | 11.64 | $ | 11.55 | $ | 12.28 | $ | 10.76 | ||||||||||
| Income (loss) from investment operations: | ||||||||||||||||||||
| Net investment income (loss) | (— | )(A)(C) | 0.12 | (A) | 0.13 | (A) | 0.14 | (A) | 0.18 | |||||||||||
| Net realized and unrealized gains (losses) on investments | 0.88 | (2.53 | ) | 0.11 | (0.81 | ) | 1.67 | |||||||||||||
| Total from investment operations | 0.88 | (2.41 | ) | 0.24 | (0.67 | ) | 1.85 | |||||||||||||
| Distributions from: | ||||||||||||||||||||
| Net investment income | (0.75 | ) | (0.12 | ) | (0.15 | ) | (0.06 | ) | (0.24 | ) | ||||||||||
| Realized capital gains | — | — | — | — | (0.09 | ) | ||||||||||||||
| Total distributions | (0.75 | ) | (0.12 | ) | (0.15 | ) | (0.06 | ) | (0.33 | ) | ||||||||||
| Net asset value at end of period | $ | 9.24 | $ | 9.11 | $ | 11.64 | $ | 11.55 | $ | 12.28 | ||||||||||
| Total return | 10.52 | % | (20.87 | %) | 2.13 | % | (5.43 | %) | 17.28 | % | ||||||||||
| Ratios and supplemental data: | ||||||||||||||||||||
| Net assets at end of period (000's) | $ | 667 | $ | 184,841 | $ | 234,019 | $ | 218,523 | $ | 271,186 | ||||||||||
| Ratio to average net assets: | ||||||||||||||||||||
| Net expenses | 1.29 | % | 1.29 | % | 1.29 | % | 1.29 | % | 1.32 | % | ||||||||||
| Gross expenses | 2.16 | % | 1.33 | % | 1.31 | % | 1.29 | % | 1.37 | % | ||||||||||
| Net investment income (loss) | (0.00 | %)(C) | 1.06 | % | 1.15 | % | 1.11 | % | 1.34 | % | ||||||||||
| Portfolio turnover rate | 68 | % | 28 | % | 38 | % | 25 | % | 33 | %(B) | ||||||||||
| (A) | The net investment income (loss) per share is based on average shares outstanding for the period. |
| (B) | Portfolio turnover excludes the purchases and sales of the Touchstone Emerging Markets Equity Fund II acquired on September 17, 2012. If these transactions were included, portfolio turnover would have been higher. |
| (C) | Less than $0.005 per share or 0.005%. |
See accompanying Notes to Financial Statements.
| 109 |
Financial Highlights (Continued)
Touchstone Merger Arbitrage Fund—Class A
Selected Data for a Share Outstanding Throughout Each Period
| Year Ended September 30, | ||||||||||||||||||||
| 2016 | 2015 | 2014 | 2013 | 2012 | ||||||||||||||||
| Net asset value at beginning of period | $ | 10.54 | $ | 10.49 | $ | 11.05 | $ | 10.65 | $ | 10.02 | ||||||||||
| Income (loss) from investment operations: | ||||||||||||||||||||
| Net investment income (loss)(A) | (0.08 | ) | (0.11 | ) | (0.13 | ) | 0.07 | (0.09 | ) | |||||||||||
| Net realized and unrealized gains (losses) on investments | 0.54 | 0.21 | (0.05 | ) | 0.44 | 0.73 | ||||||||||||||
| Total from investment operations | 0.46 | 0.10 | (0.18 | ) | 0.51 | 0.64 | ||||||||||||||
| Distributions from: | ||||||||||||||||||||
| Net investment income | — | — | (0.05 | ) | — | (— | )(B) | |||||||||||||
| Realized capital gains | — | (0.05 | ) | (0.33 | ) | (0.11 | ) | (0.01 | ) | |||||||||||
| Total distributions | — | (0.05 | ) | (0.38 | ) | (0.11 | ) | (0.01 | ) | |||||||||||
| Net asset value at end of period | $ | 11.00 | $ | 10.54 | $ | 10.49 | $ | 11.05 | $ | 10.65 | ||||||||||
| Total return(C) | 4.37 | % | 0.92 | % | (1.75 | %) | 4.84 | % | 6.35 | % | ||||||||||
| Ratios and supplemental data: | ||||||||||||||||||||
| Net assets at end of period (000's) | $ | 15,711 | $ | 21,858 | $ | 96,916 | $ | 275,858 | $ | 150,148 | ||||||||||
| Ratio to average net assets: | ||||||||||||||||||||
| Net expenses (including dividend and interest expense on securities sold short)(D) | 2.52 | % | 2.47 | % | 2.52 | % | 2.27 | % | 1.96 | % | ||||||||||
| Gross expenses (including dividend and interest expense on securities sold short)(E) | 2.55 | % | 2.47 | % | 2.52 | % | 2.27 | % | 1.97 | % | ||||||||||
| Net investment income (loss) | (0.74 | %) | (0.99 | %) | (1.25 | %) | 0.65 | % | (0.90 | %) | ||||||||||
| Portfolio turnover rate | 400 | % | 227 | % | 271 | % | 288 | % | 307 | % | ||||||||||
| (A) | The net investment income (loss) per share is based on average shares outstanding for the period. |
| (B) | Less than $0.005 per share. |
| (C) | Total returns shown exclude the effect of applicable sales loads. If these charges were included, the returns would be lower. |
| (D) | The ratio of net expenses to average net assets excluding dividend and interest expense on securities sold short is 1.68%, 1.60%, 1.57%, 1.64% and 1.65% for the years ended September 30, 2016, 2015, 2014, 2013 and 2012, respectively. |
| (E) | The ratio of gross expenses to average net assets excluding dividend and interest expense on securities sold short is 1.71%, 1.60%, 1.57%, 1.64% and 1.66% for the years ended September 30, 2016, 2015, 2014, 2013 and 2012, respectively. |
See accompanying Notes to Financial Statements.
| 110 |
Financial Highlights (Continued)
Touchstone Merger Arbitrage Fund—Class C
Selected Data for a Share Outstanding Throughout Each Period
| Year Ended September 30, | ||||||||||||||||||||
| 2016 | 2015 | 2014 | 2013 | 2012 | ||||||||||||||||
| Net asset value at beginning of period | $ | 10.22 | $ | 10.26 | $ | 10.85 | $ | 10.54 | $ | 10.01 | ||||||||||
| Income (loss) from investment operations: | ||||||||||||||||||||
| Net investment loss(A) | (0.16 | ) | (0.18 | ) | (0.22 | ) | (0.01 | ) | (0.17 | ) | ||||||||||
| Net realized and unrealized gains (losses) on investments | 0.54 | 0.19 | (0.04 | ) | 0.43 | 0.71 | ||||||||||||||
| Total from investment operations | 0.38 | 0.01 | (0.26 | ) | 0.42 | 0.54 | ||||||||||||||
| Distributions from: | ||||||||||||||||||||
| Net investment income | — | — | — | — | (— | )(B) | ||||||||||||||
| Realized capital gains | — | (0.05 | ) | (0.33 | ) | (0.11 | ) | (0.01 | ) | |||||||||||
| Total distributions | — | (0.05 | ) | (0.33 | ) | (0.11 | ) | (0.01 | ) | |||||||||||
| Net asset value at end of period | $ | 10.60 | $ | 10.22 | $ | 10.26 | $ | 10.85 | $ | 10.54 | ||||||||||
| Total return(C) | 3.62 | % | 0.06 | % | (2.51 | %) | 3.93 | % | 5.56 | % | ||||||||||
| Ratios and supplemental data: | ||||||||||||||||||||
| Net assets at end of period (000's) | $ | 14,300 | $ | 18,868 | $ | 35,737 | $ | 50,001 | $ | 25,739 | ||||||||||
| Ratio to average net assets: | ||||||||||||||||||||
| Net expenses (including dividend and interest expense on securities sold short)(D) | 3.27 | % | 3.26 | % | 3.32 | % | 3.05 | % | 2.74 | % | ||||||||||
| Gross expenses (including dividend and interest expense on securities sold short)(E) | 3.28 | % | 3.26 | % | 3.32 | % | 3.05 | % | 2.75 | % | ||||||||||
| Net investment loss | (1.49 | %) | (1.79 | %) | (2.05 | %) | (0.13 | %) | (1.68 | %) | ||||||||||
| Portfolio turnover rate | 400 | % | 227 | % | 271 | % | 288 | % | 307 | % | ||||||||||
| (A) | The net investment loss per share is based on average shares outstanding for the period. |
| (B) | Less than $0.005 per share. |
| (C) | Total returns shown exclude the effect of applicable sales loads. If these charges were included, the returns would be lower. |
| (D) | The ratio of net expenses to average net assets excluding dividend and interest expense on securities sold short is 2.43%, 2.39%, 2.37%, 2.42%, and 2.43% for the years ended September 30, 2016, 2015, 2014, 2013 and 2012, respectively. |
| (E) | The ratio of gross expenses to average net assets excluding dividend and interest expense on securities sold short is 2.44%, 2.39%, 2.37%, 2.42% and 2.44% for the years ended September 30, 2016, 2015, 2014, 2013 and 2012, respectively. |
See accompanying Notes to Financial Statements.
| 111 |
Financial Highlights (Continued)
Touchstone Merger Arbitrage Fund—Class Y
Selected Data for a Share Outstanding Throughout Each Period
| Year Ended September 30, | ||||||||||||||||||||
| 2016 | 2015 | 2014 | 2013 | 2012 | ||||||||||||||||
| Net asset value at beginning of period | $ | 10.62 | $ | 10.55 | $ | 11.10 | $ | 10.68 | $ | 10.02 | ||||||||||
| Income (loss) from investment operations: | ||||||||||||||||||||
| Net investment income (loss)(A) | (0.05 | ) | (0.08 | ) | (0.10 | ) | 0.10 | (0.07 | ) | |||||||||||
| Net realized and unrealized gains (losses) on investments | 0.56 | 0.20 | (0.05 | ) | 0.43 | 0.74 | ||||||||||||||
| Total from investment operations | 0.51 | 0.12 | (0.15 | ) | 0.53 | 0.67 | ||||||||||||||
| Distributions from: | ||||||||||||||||||||
| Net investment income | — | — | (0.07 | ) | — | (— | )(B) | |||||||||||||
| Realized capital gains | — | (0.05 | ) | (0.33 | ) | (0.11 | ) | (0.01 | ) | |||||||||||
| Total distributions | — | (0.05 | ) | (0.40 | ) | (0.11 | ) | (0.01 | ) | |||||||||||
| Net asset value at end of period | $ | 11.13 | $ | 10.62 | $ | 10.55 | $ | 11.10 | $ | 10.68 | ||||||||||
| Total return | 4.71 | % | 1.10 | % | (1.41 | %) | 5.01 | % | 6.75 | % | ||||||||||
| Ratios and supplemental data: | ||||||||||||||||||||
| Net assets at end of period (000's) | $ | 85,841 | $ | 88,677 | $ | 178,305 | $ | 192,095 | $ | 90,741 | ||||||||||
| Ratio to average net assets: | ||||||||||||||||||||
| Net expenses (including dividend and interest expense on securities sold short)(C) | 2.21 | % | 2.20 | % | 2.24 | % | 2.02 | % | 1.68 | % | ||||||||||
| Gross expenses (including dividend and interest expense on securities sold short)(D) | 2.21 | % | 2.20 | % | 2.24 | % | 2.01 | % | 1.70 | % | ||||||||||
| Net investment income (loss) | (0.43 | %) | (0.73 | %) | (0.97 | %) | 0.90 | % | (0.62 | %) | ||||||||||
| Portfolio turnover rate | 400 | % | 227 | % | 271 | % | 288 | % | 307 | % | ||||||||||
| (A) | The net investment income (loss) per share is based on average shares outstanding for the period. |
| (B) | Less than $0.005 per share. |
| (C) | The ratio of net expenses to average net assets excluding dividend and interest expense on securities sold short is 1.37%, 1.33%, 1.29%, 1.39% and 1.37% for the years ended September 30, 2016, 2015, 2014, 2013 and 2012, respectively. |
| (D) | The ratio of gross expenses to average net assets excluding dividend and interest expense on securities sold short is 1.37%, 1.33%, 1.29%, 1.38% and 1.39% for the years ended September 30, 2016, 2015, 2014, 2013 and 2012, respectively. |
See accompanying Notes to Financial Statements.
| 112 |
Financial Highlights (Continued)
Touchstone Merger Arbitrage Fund—Institutional Class
Selected Data for a Share Outstanding Throughout Each Period
| Year Ended September 30, | ||||||||||||||||||||
| 2016 | 2015 | 2014 | 2013 | 2012 | ||||||||||||||||
| Net asset value at beginning of period | $ | 10.65 | $ | 10.57 | $ | 11.13 | $ | 10.69 | $ | 10.03 | ||||||||||
| Income (loss) from investment operations: | ||||||||||||||||||||
| Net investment income (loss)(A) | (0.04 | ) | (0.07 | ) | (0.10 | ) | 0.11 | (0.06 | ) | |||||||||||
| Net realized and unrealized gains (losses) on investments | 0.55 | 0.20 | (0.05 | ) | 0.44 | 0.73 | ||||||||||||||
| Total from investment operations | 0.51 | 0.13 | (0.15 | ) | 0.55 | 0.67 | ||||||||||||||
| Distributions from: | ||||||||||||||||||||
| Net investment income | — | — | (0.08 | ) | — | (— | )(B) | |||||||||||||
| Realized capital gains | — | (0.05 | ) | (0.33 | ) | (0.11 | ) | (0.01 | ) | |||||||||||
| Total distributions | — | (0.05 | ) | (0.41 | ) | (0.11 | ) | (0.01 | ) | |||||||||||
| Net asset value at end of period | $ | 11.16 | $ | 10.65 | $ | 10.57 | $ | 11.13 | $ | 10.69 | ||||||||||
| Total return | 4.79 | % | 1.19 | % | (1.44 | %) | 5.20 | % | 6.75 | % | ||||||||||
| Ratios and supplemental data: | ||||||||||||||||||||
| Net assets at end of period (000's) | $ | 76,910 | $ | 82,858 | $ | 119,727 | $ | 170,930 | $ | 79,164 | ||||||||||
| Ratio to average net assets: | ||||||||||||||||||||
| Net expenses (including dividend and interest expense on securities sold short)(C) | 2.12 | % | 2.13 | % | 2.21 | % | 1.91 | % | 1.59 | % | ||||||||||
| Gross expenses (including dividend and interest expense on securities sold short)(D) | 2.12 | % | 2.13 | % | 2.20 | % | 1.92 | % | 1.62 | % | ||||||||||
| Net investment income (loss) | (0.34 | %) | (0.66 | %) | (0.94 | %) | 1.01 | % | (0.53 | %) | ||||||||||
| Portfolio turnover rate | 400 | % | 227 | % | 271 | % | 288 | % | 307 | % | ||||||||||
| (A) | The net investment income (loss) per share is based on average shares outstanding for the period. |
| (B) | Less than $0.005 per share. |
| (C) | The ratio of net expenses to average net assets excluding dividend and interest expense on securities sold short is 1.28%, 1.26%, 1.26%, 1.28% and 1.28% for the years ended September 30, 2016, 2015, 2014, 2013 and 2012, respectively. |
| (D) | The ratio of gross expenses to average net assets excluding dividend and interest expense on securities sold short is 1.28%, 1.26%, 1.25%, 1.29% and 1.31% for the years ended September 30, 2016, 2015, 2014, 2013 and 2012, respectively. |
See accompanying Notes to Financial Statements.
| 113 |
Financial Highlights (Continued)
Touchstone Mid Cap Fund—Class A
Selected Data for a Share Outstanding Throughout Each Period
| Year Ended September 30, | ||||||||||||||||||||
| 2016 | 2015 | 2014 | 2013 | 2012 | ||||||||||||||||
| Net asset value at beginning of period | $ | 23.22 | $ | 23.68 | $ | 20.87 | $ | 16.55 | $ | 13.16 | ||||||||||
| Income (loss) from investment operations: | ||||||||||||||||||||
| Net investment income (loss) | 0.12 | (0.02 | )(A) | — | (B) | 0.12 | (A) | 0.10 | (A) | |||||||||||
| Net realized and unrealized gains (losses) on investments | 2.57 | (0.44 | ) | 2.83 | 4.51 | 3.31 | ||||||||||||||
| Total from investment operations | 2.69 | (0.46 | ) | 2.83 | 4.63 | 3.41 | ||||||||||||||
| Distributions from: | ||||||||||||||||||||
| Net investment income | — | — | (0.02 | ) | (0.31 | ) | (0.02 | ) | ||||||||||||
| Net asset value at end of period | $ | 25.91 | $ | 23.22 | $ | 23.68 | $ | 20.87 | $ | 16.55 | ||||||||||
| Total return(C) | 11.58 | % | (1.94 | %) | 13.57 | % | 28.43 | % | 25.95 | % | ||||||||||
| Ratios and supplemental data: | ||||||||||||||||||||
| Net assets at end of period (000's) | $ | 53,044 | $ | 62,717 | $ | 35,513 | $ | 43,611 | $ | 905 | ||||||||||
| Ratio to average net assets: | ||||||||||||||||||||
| Net expenses | 1.24 | % | 1.24 | % | 1.23 | % | 1.21 | % | 1.21 | % | ||||||||||
| Gross expenses | 1.35 | % | 1.35 | % | 1.40 | % | 1.50 | % | 3.50 | % | ||||||||||
| Net investment income (loss) | 0.43 | % | (0.07 | %) | 0.01 | % | 0.61 | % | 0.66 | % | ||||||||||
| Portfolio turnover rate | 19 | % | 17 | % | 26 | % | 20 | % | 152 | % | ||||||||||
Touchstone Mid Cap Fund—Class C
Selected Data for a Share Outstanding Throughout Each Period
| Year Ended September 30, | ||||||||||||||||||||
| 2016 | 2015 | 2014 | 2013 | 2012 | ||||||||||||||||
| Net asset value at beginning of period | $ | 22.35 | $ | 22.97 | $ | 20.37 | $ | 16.21 | $ | 12.96 | ||||||||||
| Income (loss) from investment operations: | ||||||||||||||||||||
| Net investment loss | (0.12 | ) | (0.20 | )(A) | (0.15 | ) | (0.03 | )(A) | (0.01 | )(A) | ||||||||||
| Net realized and unrealized gains (losses) on investments | 2.53 | (0.42 | ) | 2.75 | 4.42 | 3.26 | ||||||||||||||
| Total from investment operations | 2.41 | (0.62 | ) | 2.60 | 4.39 | 3.25 | ||||||||||||||
| Distributions from: | ||||||||||||||||||||
| Net investment income | — | — | — | (0.23 | ) | — | ||||||||||||||
| Net asset value at end of period | $ | 24.76 | $ | 22.35 | $ | 22.97 | $ | 20.37 | $ | 16.21 | ||||||||||
| Total return(C) | 10.78 | % | (2.70 | %) | 12.76 | % | 27.43 | % | 25.08 | % | ||||||||||
| Ratios and supplemental data: | ||||||||||||||||||||
| Net assets at end of period (000's) | $ | 59,431 | $ | 60,815 | $ | 41,433 | $ | 25,018 | $ | 962 | ||||||||||
| Ratio to average net assets: | ||||||||||||||||||||
| Net expenses | 1.99 | % | 1.99 | % | 1.98 | % | 1.96 | % | 1.96 | % | ||||||||||
| Gross expenses | 2.13 | % | 2.12 | % | 2.16 | % | 2.37 | % | 4.62 | % | ||||||||||
| Net investment loss | (0.32 | %) | (0.82 | %) | (0.75 | %) | (0.14 | %) | (0.09 | %) | ||||||||||
| Portfolio turnover rate | 19 | % | 17 | % | 26 | % | 20 | % | 152 | % | ||||||||||
| (A) | The net investment income (loss) per share is based on average shares outstanding for the period. |
| (B) | Less than $0.005 per share. |
| (C) | Total return shown exclude the effect of applicable sales loads. If these charges were included, the returns would be lower. |
See accompanying Notes to Financial Statements.
| 114 |
Financial Highlights (Continued)
Touchstone Mid Cap Fund—Class Y
Selected Data for a Share Outstanding Throughout Each Period
| Year Ended September 30, | ||||||||||||||||||||
| 2016 | 2015 | 2014 | 2013 | 2012 | ||||||||||||||||
| Net asset value at beginning of period | $ | 23.38 | $ | 23.83 | $ | 20.98 | $ | 16.60 | $ | 13.17 | ||||||||||
| Income (loss) from investment operations: | ||||||||||||||||||||
| Net investment income | 0.18 | 0.05 | (A) | 0.06 | 0.17 | (A) | 0.15 | (A) | ||||||||||||
| Net realized and unrealized gains (losses) on investments | 2.59 | (0.45 | ) | 2.84 | 4.53 | 3.31 | ||||||||||||||
| Total from investment operations | 2.77 | (0.40 | ) | 2.90 | 4.70 | 3.46 | ||||||||||||||
| Distributions from: | ||||||||||||||||||||
| Net investment income | (0.01 | ) | (0.05 | ) | (0.05 | ) | (0.32 | ) | (0.03 | ) | ||||||||||
| Net asset value at end of period | $ | 26.14 | $ | 23.38 | $ | 23.83 | $ | 20.98 | $ | 16.60 | ||||||||||
| Total return | 11.87 | % | (1.69 | %) | 13.83 | % | 28.78 | % | 26.29 | % | ||||||||||
| Ratios and supplemental data: | ||||||||||||||||||||
| Net assets at end of period (000's) | $ | 476,831 | $ | 481,735 | $ | 266,446 | $ | 181,276 | $ | 47,419 | ||||||||||
| Ratio to average net assets: | ||||||||||||||||||||
| Net expenses | 0.99 | % | 0.99 | % | 0.98 | % | 0.95 | % | 0.92 | % | ||||||||||
| Gross expenses | 1.07 | % | 1.11 | % | 1.06 | % | 1.09 | % | 1.08 | % | ||||||||||
| Net investment income | 0.68 | % | 0.18 | % | 0.26 | % | 0.87 | % | 0.95 | % | ||||||||||
| Portfolio turnover rate | 19 | % | 17 | % | 26 | % | 20 | % | 152 | % | ||||||||||
Touchstone Mid Cap Fund—Class Z
Selected Data for a Share Outstanding Throughout Each Period
| Year Ended September 30, | ||||||||||||||||||||
| 2016 | 2015 | 2014 | 2013 | 2012 | ||||||||||||||||
| Net asset value at beginning of period | $ | 23.08 | $ | 23.54 | $ | 20.73 | $ | 16.45 | $ | 13.08 | ||||||||||
| Income (loss) from investment operations: | ||||||||||||||||||||
| Net investment income (loss) | 0.12 | (0.02 | )(A) | 0.01 | 0.12 | (A) | 0.10 | (A) | ||||||||||||
| Net realized and unrealized gains (losses) on investments | 2.55 | (0.44 | ) | 2.81 | 4.48 | 3.28 | ||||||||||||||
| Total from investment operations | 2.67 | (0.46 | ) | 2.82 | 4.60 | 3.38 | ||||||||||||||
| Distributions from: | ||||||||||||||||||||
| Net investment income | (— | )(B) | — | (0.01 | ) | (0.32 | ) | (0.01 | ) | |||||||||||
| Net asset value at end of period | $ | 25.75 | $ | 23.08 | $ | 23.54 | $ | 20.73 | $ | 16.45 | ||||||||||
| Total return | 11.58 | % | (1.95 | %) | 13.58 | % | 28.45 | % | 25.89 | % | ||||||||||
| Ratios and supplemental data: | ||||||||||||||||||||
| Net assets at end of period (000's) | $ | 18,934 | $ | 18,693 | $ | 11,593 | $ | 12,858 | $ | 267 | ||||||||||
| Ratio to average net assets: | ||||||||||||||||||||
| Net expenses | 1.24 | % | 1.24 | % | 1.23 | % | 1.21 | % | 1.21 | % | ||||||||||
| Gross expenses | 1.46 | % | 1.44 | % | 1.55 | % | 1.55 | % | 3.67 | % | ||||||||||
| Net investment income (loss) | 0.43 | % | (0.07 | %) | 0.01 | % | 0.61 | % | 0.66 | % | ||||||||||
| Portfolio turnover rate | 19 | % | 17 | % | 26 | % | 20 | % | 152 | % | ||||||||||
| (A) | The net investment income (loss) per share is based on average shares outstanding for the period. |
| (B) | Less than $0.005 per share. |
See accompanying Notes to Financial Statements.
| 115 |
Financial Highlights (Continued)
Touchstone Mid Cap Fund—Institutional Class
Selected Data for a Share Outstanding Throughout The Period
| Period | ||||||||||||||||||||
| Ended | ||||||||||||||||||||
| Year Ended September 30, | September 30, | |||||||||||||||||||
| 2016 | 2015 | 2014 | 2013 | 2012(A) | ||||||||||||||||
| Net asset value at beginning of period | $ | 23.40 | $ | 23.85 | $ | 20.99 | $ | 16.61 | $ | 15.36 | ||||||||||
| Income (loss) from investment operations: | ||||||||||||||||||||
| Net investment income | 0.19 | 0.06 | (B) | 0.08 | 0.19 | (B) | 0.10 | (B) | ||||||||||||
| Net realized and unrealized gains (losses) on investments | 2.61 | (0.44 | ) | 2.84 | 4.52 | 1.15 | ||||||||||||||
| Total from investment operations | 2.80 | (0.38 | ) | 2.92 | 4.71 | 1.25 | ||||||||||||||
| Distributions from: | ||||||||||||||||||||
| Net investment income | (0.02 | ) | (0.07 | ) | (0.06 | ) | (0.33 | ) | — | |||||||||||
| Net asset value at end of period | $ | 26.18 | $ | 23.40 | $ | 23.85 | $ | 20.99 | $ | 16.61 | ||||||||||
| Total return | 11.92 | % | (1.62 | %) | 13.91 | % | 28.85 | % | 8.14 | %(C) | ||||||||||
| Ratios and supplemental data: | ||||||||||||||||||||
| Net assets at end of period (000's) | $ | 77,775 | $ | 76,324 | $ | 90,998 | $ | 74,170 | $ | 12,231 | ||||||||||
| Ratio to average net assets: | ||||||||||||||||||||
| Net expenses | 0.92 | % | 0.92 | % | 0.91 | % | 0.89 | % | 0.89 | %(D) | ||||||||||
| Gross expenses | 0.99 | % | 1.00 | % | 1.01 | % | 1.07 | % | 1.38 | %(D) | ||||||||||
| Net investment income | 0.75 | % | 0.25 | % | 0.33 | % | 0.93 | % | 0.98 | %(D) | ||||||||||
| Portfolio turnover rate | 19 | % | 17 | % | 26 | % | 20 | % | 152 | % | ||||||||||
| (A) | Represents the period from commencement of operations (January 27, 2012) through September 30, 2012. |
| (B) | The net investment income per share is based on average shares outstanding for the period. |
| (C | Not annualized. |
| (D) | Annualized. |
See accompanying Notes to Financial Statements.
| 116 |
Financial Highlights (Continued)
Touchstone Mid Cap Value Fund—Class A
Selected Data for a Share Outstanding Throughout Each Period
| Year Ended September 30, | ||||||||||||||||||||
| 2016 | 2015 | 2014 | 2013 | 2012 | ||||||||||||||||
| Net asset value at beginning of period | $ | 15.70 | $ | 16.60 | $ | 16.09 | $ | 12.98 | $ | 10.86 | ||||||||||
| Income (loss) from investment operations: | ||||||||||||||||||||
| Net investment income | 0.09 | (A) | 0.12 | 0.05 | 0.10 | 0.09 | ||||||||||||||
| Net realized and unrealized gains (losses) on investments | 2.76 | (0.28 | ) | 1.85 | 3.26 | 2.78 | ||||||||||||||
| Total from investment operations | 2.85 | (0.16 | ) | 1.90 | 3.36 | 2.87 | ||||||||||||||
| Distributions from: | ||||||||||||||||||||
| Net investment income | (0.10 | ) | (0.10 | ) | (0.05 | ) | (0.10 | ) | (0.09 | ) | ||||||||||
| Realized capital gains | (0.96 | ) | (0.64 | ) | (1.34 | ) | (0.15 | ) | (0.66 | ) | ||||||||||
| Total distributions | (1.06 | ) | (0.74 | ) | (1.39 | ) | (0.25 | ) | (0.75 | ) | ||||||||||
| Net asset value at end of period | $ | 17.49 | $ | 15.70 | $ | 16.60 | $ | 16.09 | $ | 12.98 | ||||||||||
| Total return(B) | 19.20 | % | (1.14 | %) | 12.49 | % | 26.26 | % | 27.55 | % | ||||||||||
| Ratios and supplemental data: | ||||||||||||||||||||
| Net assets at end of period (000's) | $ | 21,867 | $ | 7,663 | $ | 14,029 | $ | 5,307 | $ | 3,409 | ||||||||||
| Ratio to average net assets: | ||||||||||||||||||||
| Net expenses | 1.27 | % | 1.29 | % | 1.29 | % | 1.29 | % | 1.29 | % | ||||||||||
| Gross expenses | 1.59 | % | 1.66 | % | 1.58 | % | 1.75 | % | 1.97 | % | ||||||||||
| Net investment income | 0.56 | % | 0.55 | % | 0.41 | % | 0.73 | % | 0.77 | % | ||||||||||
| Portfolio turnover rate | 45 | % | 54 | % | 85 | %(C) | 68 | % | 42 | % | ||||||||||
Touchstone Mid Cap Value Fund—Class C
Selected Data for a Share Outstanding Throughout Each Period
| Year Ended September 30, | ||||||||||||||||||||
| 2016 | 2015 | 2014 | 2013 | 2012 | ||||||||||||||||
| Net asset value at beginning of period | $ | 15.49 | $ | 16.42 | $ | 16.00 | $ | 12.92 | $ | 10.82 | ||||||||||
| Income (loss) from investment operations: | ||||||||||||||||||||
| Net investment income (loss) | (0.03 | )(A) | (0.04 | ) | (0.04 | ) | (— | )(D) | — | (D) | ||||||||||
| Net realized and unrealized gains (losses) on investments | 2.73 | (0.25 | ) | 1.80 | 3.24 | 2.77 | ||||||||||||||
| Total from investment operations | 2.70 | (0.29 | ) | 1.76 | 3.24 | 2.77 | ||||||||||||||
| Distributions from: | ||||||||||||||||||||
| Net investment income | — | — | — | (0.01 | ) | (0.01 | ) | |||||||||||||
| Realized capital gains | (0.96 | ) | (0.64 | ) | (1.34 | ) | (0.15 | ) | (0.66 | ) | ||||||||||
| Total distributions | (0.96 | ) | (0.64 | ) | (1.34 | ) | (0.16 | ) | (0.67 | ) | ||||||||||
| Net asset value at end of period | $ | 17.23 | $ | 15.49 | $ | 16.42 | $ | 16.00 | $ | 12.92 | ||||||||||
| Total return(B) | 18.32 | % | (1.91 | %) | 11.62 | % | 25.32 | % | 26.64 | % | ||||||||||
| Ratios and supplemental data: | �� | |||||||||||||||||||
| Net assets at end of period (000's) | $ | 4,088 | $ | 1,752 | $ | 2,002 | $ | 719 | $ | 292 | ||||||||||
| Ratio to average net assets: | ||||||||||||||||||||
| Net expenses | 2.02 | % | 2.04 | % | 2.04 | % | 2.04 | % | 2.04 | % | ||||||||||
| Gross expenses | 2.75 | % | 2.83 | % | 3.05 | % | 4.17 | % | 7.90 | % | ||||||||||
| Net investment income (loss) | (0.19 | %) | (0.20 | %) | (0.34 | %) | (0.02 | %) | 0.02 | % | ||||||||||
| Portfolio turnover rate | 45 | % | 54 | % | 85 | %(C) | 68 | % | 42 | % | ||||||||||
| (A) | The net investment income (loss) per share is based on average shares outstanding for the period. |
| (B) | Total returns shown exclude the effect of applicable sales loads. If these charges were included, the returns would be lower. |
| (C) | Portfolio turnover excludes the purchases and sales of the Touchstone Mid Cap Value Opportunities Fund acquired on March 21, 2014. If these transactions were included, portfolio turnover would have been higher. |
| (D) | Less than $0.005 per share. |
See accompanying Notes to Financial Statements.
| 117 |
Financial Highlights (Continued)
Touchstone Mid Cap Value Fund—Class Y
Selected Data for a Share Outstanding Throughout Each Period
| Year Ended September 30, | ||||||||||||||||||||
| 2016 | 2015 | 2014 | 2013 | 2012 | ||||||||||||||||
| Net asset value at beginning of period | $ | 15.76 | $ | 16.67 | $ | 16.15 | $ | 13.03 | $ | 10.89 | ||||||||||
| Income (loss) from investment operations: | ||||||||||||||||||||
| Net investment income | 0.13 | (A) | 0.14 | 0.07 | 0.15 | 0.11 | ||||||||||||||
| Net realized and unrealized gains (losses) on investments | 2.78 | (0.27 | ) | 1.88 | 3.26 | 2.81 | ||||||||||||||
| Total from investment operations | 2.91 | (0.13 | ) | 1.95 | 3.41 | 2.92 | ||||||||||||||
| Distributions from: | ||||||||||||||||||||
| Net investment income | (0.14 | ) | (0.14 | ) | (0.09 | ) | (0.14 | ) | (0.12 | ) | ||||||||||
| Realized capital gains | (0.96 | ) | (0.64 | ) | (1.34 | ) | (0.15 | ) | (0.66 | ) | ||||||||||
| Total distributions | (1.10 | ) | (0.78 | ) | (1.43 | ) | (0.29 | ) | (0.78 | ) | ||||||||||
| Net asset value at end of period | $ | 17.57 | $ | 15.76 | $ | 16.67 | $ | 16.15 | $ | 13.03 | ||||||||||
| Total return | 19.51 | % | (0.91 | %) | 12.77 | % | 26.53 | % | 27.97 | % | ||||||||||
| Ratios and supplemental data: | ||||||||||||||||||||
| Net assets at end of period (000's) | $ | 292,978 | $ | 208,525 | $ | 213,404 | $ | 15,782 | $ | 13,785 | ||||||||||
| Ratio to average net assets: | ||||||||||||||||||||
| Net expenses | 1.03 | % | 1.04 | % | 1.04 | % | 1.04 | % | 1.04 | % | ||||||||||
| Gross expenses | 1.13 | % | 1.13 | % | 1.14 | % | 1.37 | % | 1.46 | % | ||||||||||
| Net investment income | 0.81 | % | 0.81 | % | 0.66 | % | 0.98 | % | 1.02 | % | ||||||||||
| Portfolio turnover rate | 45 | % | 54 | % | 85 | %(B) | 68 | % | 42 | % | ||||||||||
Touchstone Mid Cap Value Fund—Institutional Class
Selected Data for a Share Outstanding Throughout Each Period
| Year Ended September 30, | ||||||||||||||||||||
| 2016 | 2015 | 2014 | 2013 | 2012 | ||||||||||||||||
| Net asset value at beginning of period | $ | 15.82 | $ | 16.73 | $ | 16.20 | $ | 13.07 | $ | 10.92 | ||||||||||
| Income (loss) from investment operations: | ||||||||||||||||||||
| Net investment income | 0.16 | (A) | 0.17 | 0.13 | 0.16 | 0.13 | ||||||||||||||
| Net realized and unrealized gains (losses) on investments | 2.78 | (0.27 | ) | 1.85 | 3.28 | 2.82 | ||||||||||||||
| Total from investment operations | 2.94 | (0.10 | ) | 1.98 | 3.44 | 2.95 | ||||||||||||||
| Distributions from: | ||||||||||||||||||||
| Net investment income | (0.16 | ) | (0.17 | ) | (0.11 | ) | (0.16 | ) | (0.14 | ) | ||||||||||
| Realized capital gains | (0.96 | ) | (0.64 | ) | (1.34 | ) | (0.15 | ) | (0.66 | ) | ||||||||||
| Total distributions | (1.12 | ) | (0.81 | ) | (1.45 | ) | (0.31 | ) | (0.80 | ) | ||||||||||
| Net asset value at end of period | $ | 17.64 | $ | 15.82 | $ | 16.73 | $ | 16.20 | $ | 13.07 | ||||||||||
| Total return | 19.71 | % | (0.76 | %) | 12.90 | % | 26.71 | % | 28.17 | % | ||||||||||
| Ratios and supplemental data: | ||||||||||||||||||||
| Net assets at end of period (000's) | $ | 185,989 | $ | 124,592 | $ | 134,259 | $ | 144,965 | $ | 75,240 | ||||||||||
| Ratio to average net assets: | ||||||||||||||||||||
| Net expenses | 0.89 | % | 0.89 | % | 0.89 | % | 0.89 | % | 0.89 | % | ||||||||||
| Gross expenses | 1.03 | % | 1.03 | % | 1.04 | % | 1.09 | % | 1.12 | % | ||||||||||
| Net investment income | 0.94 | % | 0.96 | % | 0.81 | % | 1.13 | % | 1.17 | % | ||||||||||
| Portfolio turnover rate | 45 | % | 54 | % | 85 | %(B) | 68 | % | 42 | % | ||||||||||
| (A) | The net investment income per share is based on average shares outstanding for the period. |
| (B) | Portfolio turnover excludes the purchases and sales of the Touchstone Mid Cap Value Opportunities Fund acquired on March 21, 2014. If these transactions were included, portfolio turnover would have been higher. |
See accompanying Notes to Financial Statements.
| 118 |
Financial Highlights (Continued)
Touchstone Premium Yield Equity Fund—Class A
Selected Data for a Share Outstanding Throughout Each Period
| Year Ended September 30, | ||||||||||||||||||||
| 2016 | 2015 | 2014 | 2013 | 2012 | ||||||||||||||||
| Net asset value at beginning of period | $ | 8.27 | $ | 9.98 | $ | 8.92 | $ | 8.11 | $ | 6.76 | ||||||||||
| Income (loss) from investment operations: | ||||||||||||||||||||
| Net investment income | 0.22 | 0.24 | 0.40 | (A) | 0.24 | 0.24 | ||||||||||||||
| Net realized and unrealized gains (losses) on investments | 1.04 | (1.25 | ) | 1.07 | 0.80 | 1.36 | ||||||||||||||
| Total from investment operations | 1.26 | (1.01 | ) | 1.47 | 1.04 | 1.60 | ||||||||||||||
| Distributions from: | ||||||||||||||||||||
| Net investment income | (0.21 | ) | (0.25 | ) | (0.41 | ) | (0.23 | ) | (0.24 | ) | ||||||||||
| Realized capital gains | (0.55 | ) | (0.45 | ) | — | — | — | |||||||||||||
| Return of capital | — | — | — | — | (0.01 | ) | ||||||||||||||
| Total distributions | (0.76 | ) | (0.70 | ) | (0.41 | ) | (0.23 | ) | (0.25 | ) | ||||||||||
| Net asset value at end of period | $ | 8.77 | $ | 8.27 | $ | 9.98 | $ | 8.92 | $ | 8.11 | ||||||||||
| Total return(B) | 16.80 | % | (10.79 | %) | 16.79 | % | 12.97 | % | 23.98 | % | ||||||||||
| Ratios and supplemental data: | ||||||||||||||||||||
| Net assets at end of period (000's) | $ | 26,907 | $ | 36,023 | $ | 45,124 | $ | 86,171 | $ | 68,780 | ||||||||||
| Ratio to average net assets: | ||||||||||||||||||||
| Net expenses | 1.20 | % | 1.20 | % | 1.20 | % | 1.20 | % | 1.20 | % | ||||||||||
| Gross expenses | 1.34 | % | 1.25 | % | 1.29 | % | 1.29 | % | 1.30 | % | ||||||||||
| Net investment income | 2.57 | % | 2.57 | % | 4.24 | %(A) | 2.74 | % | 3.26 | % | ||||||||||
| Portfolio turnover rate | 38 | % | 31 | % | 26 | % | 56 | % | 16 | % | ||||||||||
Touchstone Premium Yield Equity Fund—Class C
Selected Data for a Share Outstanding Throughout Each Period
| Year Ended September 30, | ||||||||||||||||||||
| 2016 | 2015 | 2014 | 2013 | 2012 | ||||||||||||||||
| Net asset value at beginning of period | $ | 8.26 | $ | 9.97 | $ | 8.90 | $ | 8.10 | $ | 6.76 | ||||||||||
| Income (loss) from investment operations: | ||||||||||||||||||||
| Net investment income | 0.15 | 0.17 | 0.33 | (A) | 0.16 | 0.18 | ||||||||||||||
| Net realized and unrealized gains (losses) on investments | 1.04 | (1.24 | ) | 1.07 | 0.80 | 1.35 | ||||||||||||||
| Total from investment operations | 1.19 | (1.07 | ) | 1.40 | 0.96 | 1.53 | ||||||||||||||
| Distributions from: | ||||||||||||||||||||
| Net investment income | (0.15 | ) | (0.19 | ) | (0.33 | ) | (0.16 | ) | (0.18 | ) | ||||||||||
| Realized capital gains | (0.55 | ) | (0.45 | ) | — | — | — | |||||||||||||
| Return of capital | — | — | — | — | (0.01 | ) | ||||||||||||||
| Total distributions | (0.70 | ) | (0.64 | ) | (0.33 | ) | (0.16 | ) | (0.19 | ) | ||||||||||
| Net asset value at end of period | $ | 8.75 | $ | 8.26 | $ | 9.97 | $ | 8.90 | $ | 8.10 | ||||||||||
| Total return(B) | 15.81 | % | (11.45 | %) | 15.99 | % | 12.03 | % | 22.93 | % | ||||||||||
| Ratios and supplemental data: | ||||||||||||||||||||
| Net assets at end of period (000's) | $ | 25,781 | $ | 31,405 | $ | 31,190 | $ | 24,009 | $ | 15,680 | ||||||||||
| Ratio to average net assets: | ||||||||||||||||||||
| Net expenses | 1.95 | % | 1.95 | % | 1.95 | % | 1.95 | % | 1.95 | % | ||||||||||
| Gross expenses | 2.05 | % | 2.00 | % | 2.02 | % | 2.08 | % | 2.14 | % | ||||||||||
| Net investment income | 1.82 | % | 1.82 | % | 3.49 | %(A) | 1.99 | % | 2.51 | % | ||||||||||
| Portfolio turnover rate | 38 | % | 31 | % | 26 | % | 56 | % | 16 | % | ||||||||||
| (A) | Reflects the impact of a corporate action event that resulted in a one-time increase to net investment income. If the corporate action event had not occurred, the Class A and Class C net investment income per share and ratio of net investment income to average net assets would have been lower by $0.16 and 1.70%, respectively. |
| (B) | Total returns shown exclude the effect of applicable sales loads. If these charges were included, the returns would be lower. |
See accompanying Notes to Financial Statements.
| 119 |
Financial Highlights (Continued)
Touchstone Premium Yield Equity Fund—Class Y
Selected Data for a Share Outstanding Throughout Each Period
| Year Ended September 30, | ||||||||||||||||||||
| 2016 | 2015 | 2014 | 2013 | 2012 | ||||||||||||||||
| Net asset value at beginning of period | $ | 8.25 | $ | 9.97 | $ | 8.90 | $ | 8.10 | $ | 6.75 | ||||||||||
| Income (loss) from investment operations: | ||||||||||||||||||||
| Net investment income | 0.23 | 0.26 | 0.43 | (A) | 0.25 | 0.27 | ||||||||||||||
| Net realized and unrealized gains (losses) on investments | 1.05 | (1.25 | ) | 1.07 | 0.80 | 1.35 | ||||||||||||||
| Total from investment operations | 1.28 | (0.99 | ) | 1.50 | 1.05 | 1.62 | ||||||||||||||
| Distributions from: | ||||||||||||||||||||
| Net investment income | (0.23 | ) | (0.28 | ) | (0.43 | ) | (0.25 | ) | (0.26 | ) | ||||||||||
| Realized capital gains | (0.55 | ) | (0.45 | ) | — | — | — | |||||||||||||
| Return of capital | — | — | — | — | (0.01 | ) | ||||||||||||||
| Total distributions | (0.78 | ) | (0.73 | ) | (0.43 | ) | (0.25 | ) | (0.27 | ) | ||||||||||
| Net asset value at end of period | $ | 8.75 | $ | 8.25 | $ | 9.97 | $ | 8.90 | $ | 8.10 | ||||||||||
| Total return | 17.13 | % | (10.58 | %) | 17.13 | % | 13.14 | % | 24.31 | % | ||||||||||
| Ratios and supplemental data: | ||||||||||||||||||||
| Net assets at end of period (000's) | $ | 99,953 | $ | 100,772 | $ | 109,201 | $ | 66,644 | $ | 33,185 | ||||||||||
| Ratio to average net assets: | ||||||||||||||||||||
| Net expenses | 0.95 | % | 0.95 | % | 0.95 | % | 0.95 | % | 0.95 | % | ||||||||||
| Gross expenses | 1.03 | % | 0.97 | % | 0.96 | % | 1.04 | % | 1.18 | % | ||||||||||
| Net investment income | 2.82 | % | 2.82 | % | 4.49 | %(A) | 2.99 | % | 3.51 | % | ||||||||||
| Portfolio turnover rate | 38 | % | 31 | % | 26 | % | 56 | % | 16 | % | ||||||||||
| (A) | Reflects the impact of a corporate action event that resulted in a one-time increase to net investment income. If the corporate action event had not occurred, the Class Y net investment income per share and ratio of net investment income to average net assets would have been lower by $0.16 and 1.70%, respectively. |
See accompanying Notes to Financial Statements.
| 120 |
Financial Highlights (Continued)
Touchstone Sands Capital Select Growth Fund—Class A
Selected Data for a Share Outstanding Throughout Each Period
| Year Ended September 30, | ||||||||||||||||||||
| 2016 | 2015 | 2014 | 2013 | 2012 | ||||||||||||||||
| Net asset value at beginning of period | $ | 16.48 | $ | 18.15 | $ | 16.08 | $ | 12.65 | $ | 9.39 | ||||||||||
| Income (loss) from investment operations: | ||||||||||||||||||||
| Net investment loss | (0.28 | ) | (0.15 | ) | (0.29 | ) | (0.05 | ) | (0.09 | )(A) | ||||||||||
| Net realized and unrealized gains (losses) on investments | 1.47 | (0.64 | ) | 2.49 | 3.48 | 3.35 | ||||||||||||||
| Total from investment operations | 1.19 | (0.79 | ) | 2.20 | 3.43 | 3.26 | ||||||||||||||
| Distributions from: | ||||||||||||||||||||
| Realized capital gains | (1.53 | ) | (0.88 | ) | (0.13 | ) | — | — | ||||||||||||
| Net asset value at end of period | $ | 16.14 | $ | 16.48 | $ | 18.15 | $ | 16.08 | $ | 12.65 | ||||||||||
| Total return(B) | 7.17 | % | (4.70 | %) | 13.73 | % | 27.11 | % | 34.72 | % | ||||||||||
| Ratios and supplemental data: | ||||||||||||||||||||
| Net assets at end of period (000's) | $ | 138,315 | $ | 230,783 | $ | 289,506 | $ | 416,396 | $ | 186,384 | ||||||||||
| Ratio to average net assets: | ||||||||||||||||||||
| Net expenses | 1.07 | % | 1.10 | % | 1.31 | % | 1.28 | % | 1.37 | % | ||||||||||
| Gross expenses | 1.09 | % | 1.10 | % | 1.33 | % | 1.37 | % | 1.47 | % | ||||||||||
| Net investment loss | (0.81 | %) | (0.65 | %) | (0.91 | %) | (0.62 | %) | (0.74 | %) | ||||||||||
| Portfolio turnover rate | 46 | % | 29 | % | 30 | % | 37 | % | 19 | % | ||||||||||
Touchstone Sands Capital Select Growth Fund—Class C
Selected Data for a Share Outstanding Throughout Each Period
| Year Ended September 30, | ||||||||||||||||||||
| 2016 | 2015 | 2014 | 2013 | 2012 | ||||||||||||||||
| Net asset value at beginning of period | $ | 15.86 | $ | 17.62 | $ | 15.74 | $ | 12.47 | $ | 9.33 | ||||||||||
| Income (loss) from investment operations: | ||||||||||||||||||||
| Net investment loss | (0.52 | ) | (0.30 | ) | (0.32 | ) | (0.13 | ) | (0.17 | )(A) | ||||||||||
| Net realized and unrealized gains (losses) on investments | 1.55 | (0.58 | ) | 2.33 | 3.40 | 3.31 | ||||||||||||||
| Total from investment operations | 1.03 | (0.88 | ) | 2.01 | 3.27 | 3.14 | ||||||||||||||
| Distributions from: | ||||||||||||||||||||
| Realized capital gains | (1.53 | ) | (0.88 | ) | (0.13 | ) | — | — | ||||||||||||
| Net asset value at end of period | $ | 15.36 | $ | 15.86 | $ | 17.62 | $ | 15.74 | $ | 12.47 | ||||||||||
| Total return(B) | 6.32 | % | (5.38 | %) | 12.89 | % | 26.14 | % | 33.66 | % | ||||||||||
| Ratios and supplemental data: | ||||||||||||||||||||
| Net assets at end of period (000's) | $ | 111,951 | $ | 163,237 | $ | 203,865 | $ | 198,584 | $ | 88,931 | ||||||||||
| Ratio to average net assets: | ||||||||||||||||||||
| Net expenses | 1.82 | % | 1.85 | % | 2.06 | % | 2.03 | % | 2.12 | % | ||||||||||
| Gross expenses | 1.84 | % | 1.85 | % | 2.09 | % | 2.14 | % | 2.22 | % | ||||||||||
| Net investment loss | (1.56 | %) | (1.40 | %) | (1.65 | %) | (1.37 | %) | (1.49 | %) | ||||||||||
| Portfolio turnover rate | 46 | % | 29 | % | 30 | % | 37 | % | 19 | % | ||||||||||
| (A) | The net investment loss per share is based on average shares outstanding for the period. |
| (B) | Total returns shown exclude the effect of applicable sales loads. If these charges were included, the returns would be lower. |
See accompanying Notes to Financial Statements.
| 121 |
Financial Highlights (Continued)
Touchstone Sands Capital Select Growth Fund—Class Y
Selected Data for a Share Outstanding Throughout Each Period
| Year Ended September 30, | ||||||||||||||||||||
| 2016 | 2015 | 2014 | 2013 | 2012 | ||||||||||||||||
| Net asset value at beginning of period | $ | 16.96 | $ | 18.61 | $ | 16.44 | $ | 12.90 | $ | 9.56 | ||||||||||
| Income (loss) from investment operations: | ||||||||||||||||||||
| Net investment loss | (0.11 | ) | (0.08 | ) | (0.10 | ) | (0.02 | ) | (0.06 | )(A) | ||||||||||
| Net realized and unrealized gains (losses) on investments | 1.38 | (0.69 | ) | 2.40 | 3.56 | 3.40 | ||||||||||||||
| Total from investment operations | 1.27 | (0.77 | ) | 2.30 | 3.54 | 3.34 | ||||||||||||||
| Distributions from: | ||||||||||||||||||||
| Realized capital gains | (1.53 | ) | (0.88 | ) | (0.13 | ) | — | — | ||||||||||||
| Net asset value at end of period | $ | 16.70 | $ | 16.96 | $ | 18.61 | $ | 16.44 | $ | 12.90 | ||||||||||
| Total return | 7.46 | % | (4.46 | %) | 14.04 | % | 27.44 | % | 34.94 | % | ||||||||||
| Ratios and supplemental data: | ||||||||||||||||||||
| Net assets at end of period (000's) | $ | 2,209,841 | $ | 3,198,758 | $ | 3,473,661 | $ | 2,684,731 | $ | 1,215,124 | ||||||||||
| Ratio to average net assets: | ||||||||||||||||||||
| Net expenses | 0.82 | % | 0.83 | % | 1.06 | % | 1.03 | % | 1.11 | % | ||||||||||
| Gross expenses | 0.82 | % | 0.83 | % | 1.03 | % | 1.06 | % | 1.18 | % | ||||||||||
| Net investment loss | (0.56 | %) | (0.39 | %) | (0.66 | %) | (0.37 | %) | (0.49 | %) | ||||||||||
| Portfolio turnover rate | 46 | % | 29 | % | 30 | % | 37 | % | 19 | % | ||||||||||
Touchstone Sands Capital Select Growth Fund—Class Z
Selected Data for a Share Outstanding Throughout Each Period
| Year Ended September 30, | ||||||||||||||||||||
| 2016 | 2015 | 2014 | 2013 | 2012 | ||||||||||||||||
| Net asset value at beginning of period | $ | 16.49 | $ | 18.15 | $ | 16.08 | $ | 12.65 | $ | 9.39 | ||||||||||
| Income (loss) from investment operations: | ||||||||||||||||||||
| Net investment loss | (0.29 | ) | (0.19 | ) | (0.17 | ) | (0.10 | ) | (0.08 | )(A) | ||||||||||
| Net realized and unrealized gains (losses) on investments | 1.48 | (0.59 | ) | 2.37 | 3.53 | 3.34 | ||||||||||||||
| Total from investment operations | 1.19 | (0.78 | ) | 2.20 | 3.43 | 3.26 | ||||||||||||||
| Distributions from: | ||||||||||||||||||||
| Realized capital gains | (1.53 | ) | (0.88 | ) | (0.13 | ) | — | — | ||||||||||||
| Net asset value at end of period | $ | 16.15 | $ | 16.49 | $ | 18.15 | $ | 16.08 | $ | 12.65 | ||||||||||
| Total return | 7.24 | % | (4.70 | %) | 13.73 | % | 27.11 | % | 34.72 | % | ||||||||||
| Ratios and supplemental data: | ||||||||||||||||||||
| Net assets at end of period (000's) | $ | 777,930 | $ | 1,292,853 | $ | 2,302,038 | $ | 2,140,884 | $ | 1,836,957 | ||||||||||
| Ratio to average net assets: | ||||||||||||||||||||
| Net expenses | 1.04 | % | 1.08 | % | 1.31 | % | 1.28 | % | 1.32 | % | ||||||||||
| Gross expenses | 1.11 | % | 1.13 | % | 1.35 | % | 1.37 | % | 1.39 | % | ||||||||||
| Net investment loss | (0.79 | %) | (0.64 | %) | (0.90 | %) | (0.62 | %) | (0.70 | %) | ||||||||||
| Portfolio turnover rate | 46 | % | 29 | % | 30 | % | 37 | % | 19 | % | ||||||||||
| (A) | The net investment loss per share is based on average shares outstanding for the period. |
See accompanying Notes to Financial Statements.
| 122 |
Financial Highlights (Continued)
Touchstone Small Cap Fund—Class A
Selected Data for a Share Outstanding Throughout Each Period
| Year Ended September 30, | ||||||||||||||||||||
| 2016 | 2015 | 2014 | 2013 | 2012 | ||||||||||||||||
| Net asset value at beginning of period | $ | 17.73 | $ | 20.55 | $ | 19.44 | $ | 16.02 | $ | 11.94 | ||||||||||
| Income (loss) from investment operations: | ||||||||||||||||||||
| Net investment income (loss) | — | (A) | 0.15 | (B) | (0.09 | )(C) | 0.44 | 0.05 | ||||||||||||
| Net realized and unrealized gains (losses) on investments | 0.59 | (1.38 | ) | 1.80 | 3.28 | 4.20 | ||||||||||||||
| Total from investment operations | 0.59 | (1.23 | ) | 1.71 | 3.72 | 4.25 | ||||||||||||||
| Distributions from: | ||||||||||||||||||||
| Net investment income | (0.13 | ) | (—) | (A) | (0.31 | ) | (0.18 | ) | (— | )(A) | ||||||||||
| Realized capital gains | (1.95 | ) | (1.59 | ) | (0.29 | ) | (0.12 | ) | (0.17 | ) | ||||||||||
| Total distributions | (2.08 | ) | (1.59 | ) | (0.60 | ) | (0.30 | ) | (0.17 | ) | ||||||||||
| Net asset value at end of period | $ | 16.24 | $ | 17.73 | $ | 20.55 | $ | 19.44 | $ | 16.02 | ||||||||||
| Total return(D) | 3.74 | % | (6.36 | %) | 8.80 | % | 23.60 | % | 35.86 | % | ||||||||||
| Ratios and supplemental data: | ||||||||||||||||||||
| Net assets at end of period (000's) | $ | 37,942 | $ | 62,423 | $ | 60,246 | $ | 122,394 | $ | 84,539 | ||||||||||
| Ratio to average net assets: | ||||||||||||||||||||
| Net expenses | 1.38 | % | 1.38 | % | 1.36 | % | 1.34 | % | 1.34 | % | ||||||||||
| Gross expenses | 1.45 | % | 1.42 | % | 1.43 | % | 1.53 | % | 1.58 | % | ||||||||||
| Net investment income (loss) | 0.00 | %(A) | 0.75 | %(B) | (0.45 | %) | 2.47 | % | 0.37 | % | ||||||||||
| Portfolio turnover rate | 17 | % | 42 | % | 17 | % | 15 | % | 11 | % | ||||||||||
Touchstone Small Cap Fund—Class C
Selected Data for a Share Outstanding Throughout Each Period
| Year Ended September 30, | ||||||||||||||||||||
| 2016 | 2015 | 2014 | 2013 | 2012 | ||||||||||||||||
| Net asset value at beginning of period | $ | 17.16 | $ | 20.07 | $ | 19.01 | $ | 15.69 | $ | 11.79 | ||||||||||
| Income (loss) from investment operations: | ||||||||||||||||||||
| Net investment income (loss) | (0.16 | ) | — | (A)(B) | (0.24 | )(C) | 0.30 | (0.01 | ) | |||||||||||
| Net realized and unrealized gains (losses) on investments | 0.60 | (1.32 | ) | 1.75 | 3.22 | 4.08 | ||||||||||||||
| Total from investment operations | 0.44 | (1.32 | ) | 1.51 | 3.52 | 4.07 | ||||||||||||||
| Distributions from: | ||||||||||||||||||||
| Net investment income | (0.02 | ) | — | (0.16 | ) | (0.08 | ) | (— | )(A) | |||||||||||
| Realized capital gains | (1.95 | ) | (1.59 | ) | (0.29 | ) | (0.12 | ) | (0.17 | ) | ||||||||||
| Total distributions | (1.97 | ) | (1.59 | ) | (0.45 | ) | (0.20 | ) | (0.17 | ) | ||||||||||
| Net asset value at end of period | $ | 15.63 | $ | 17.16 | $ | 20.07 | $ | 19.01 | $ | 15.69 | ||||||||||
| Total return(D) | 2.92 | % | (7.01 | %) | 7.96 | % | 22.69 | % | 34.78 | % | ||||||||||
| Ratios and supplemental data: | ||||||||||||||||||||
| Net assets at end of period (000's) | $ | 14,957 | $ | 21,562 | $ | 27,104 | $ | 28,685 | $ | 24,278 | ||||||||||
| Ratio to average net assets: | ||||||||||||||||||||
| Net expenses | 2.13 | % | 2.13 | % | 2.12 | % | 2.09 | % | 2.09 | % | ||||||||||
| Gross expenses | 2.23 | % | 2.17 | % | 2.17 | % | 2.24 | % | 2.30 | % | ||||||||||
| Net investment income (loss) | (0.75 | %) | 0.00 | %(A)(B) | (1.20 | %) | 1.72 | % | (0.38 | %) | ||||||||||
| Portfolio turnover rate | 17 | % | 42 | % | 17 | % | 15 | % | 11 | % | ||||||||||
| (A) | Less than $0.005 per share or 0.005%. |
| (B) | Reflects the impact of a corporate action event that resulted in a one-time increase to net investment income. If the corporate action event had not occurred, the Class A and Class C net investment income per share and ratio of net investment income to average net assets would have been lower by $0.13 and 0.65%, respectively. |
| (C) | The net investment loss per share is based on average shares outstanding for the period. |
| (D) | Total returns shown exclude the effect of applicable sales loads. If these charges were included, the returns would be lower. |
See accompanying Notes to Financial Statements.
| 123 |
Financial Highlights (Continued)
Touchstone Small Cap Fund—Class Y
Selected Data for a Share Outstanding Throughout Each Period
| Year Ended September 30, | ||||||||||||||||||||
| 2016 | 2015 | 2014 | 2013 | 2012 | ||||||||||||||||
| Net asset value at beginning of period | $ | 17.93 | $ | 20.72 | $ | 19.59 | $ | 16.13 | $ | 12.00 | ||||||||||
| Income (loss) from investment operations: | ||||||||||||||||||||
| Net investment income (loss) | 0.05 | 0.18 | (A) | (0.03 | )(B) | 0.46 | 0.07 | |||||||||||||
| Net realized and unrealized gains (losses) on investments | 0.58 | (1.37 | ) | 1.81 | 3.34 | 4.24 | ||||||||||||||
| Total from investment operations | 0.63 | (1.19 | ) | 1.78 | 3.80 | 4.31 | ||||||||||||||
| Distributions from: | ||||||||||||||||||||
| Net investment income | (0.17 | ) | (0.01 | ) | (0.36 | ) | (0.22 | ) | (0.01 | ) | ||||||||||
| Realized capital gains | (1.95 | ) | (1.59 | ) | (0.29 | ) | (0.12 | ) | (0.17 | ) | ||||||||||
| Total distributions | (2.12 | ) | (1.60 | ) | (0.65 | ) | (0.34 | ) | (0.18 | ) | ||||||||||
| Net asset value at end of period | $ | 16.44 | $ | 17.93 | $ | 20.72 | $ | 19.59 | $ | 16.13 | ||||||||||
| Total return | 3.97 | % | (6.11 | %) | 9.12 | % | 24.01 | % | 36.23 | % | ||||||||||
| Ratios and supplemental data: | ||||||||||||||||||||
| Net assets at end of period (000's) | $ | 295,198 | $ | 333,971 | $ | 309,367 | $ | 258,024 | $ | 168,987 | ||||||||||
| Ratio to average net assets: | ||||||||||||||||||||
| Net expenses | 1.13 | % | 1.11 | % | 1.06 | % | 1.03 | % | 1.04 | % | ||||||||||
| Gross expenses | 1.14 | % | 1.11 | % | 1.08 | % | 1.14 | % | 1.17 | % | ||||||||||
| Net investment income (loss) | 0.25 | % | 1.02 | %(A) | (0.15 | %) | 2.78 | % | 0.66 | % | ||||||||||
| Portfolio turnover rate | 17 | % | 42 | % | 17 | % | 15 | % | 11 | % | ||||||||||
Touchstone Small Cap Fund—Institutional Class
Selected Data for a Share Outstanding Throughout Each Period
| Year Ended September 30, | ||||||||||||||||||||
| 2016 | 2015 | 2014 | 2013 | 2012 | ||||||||||||||||
| Net asset value at beginning of period | $ | 17.92 | $ | 20.69 | $ | 19.57 | $ | 16.11 | $ | 11.99 | ||||||||||
| Income (loss) from investment operations: | ||||||||||||||||||||
| Net investment income (loss) | 0.07 | 0.24 | (A) | (0.02 | )(B) | 0.49 | 0.06 | |||||||||||||
| Net realized and unrealized gains (losses) on investments | 0.57 | (1.41 | ) | 1.81 | 3.32 | 4.26 | ||||||||||||||
| Total from investment operations | 0.64 | (1.17 | ) | 1.79 | 3.81 | 4.32 | ||||||||||||||
| Distributions from: | ||||||||||||||||||||
| Net investment income | (0.18 | ) | (0.01 | ) | (0.38 | ) | (0.23 | ) | (0.03 | ) | ||||||||||
| Realized capital gains | (1.95 | ) | (1.59 | ) | (0.29 | ) | (0.12 | ) | (0.17 | ) | ||||||||||
| Total distributions | (2.13 | ) | (1.60 | ) | (0.67 | ) | (0.35 | ) | (0.20 | ) | ||||||||||
| Net asset value at end of period | $ | 16.43 | $ | 17.92 | $ | 20.69 | $ | 19.57 | $ | 16.11 | ||||||||||
| Total return | 4.05 | % | (6.01 | %) | 9.17 | % | 24.13 | % | 36.32 | % | ||||||||||
| Ratios and supplemental data: | ||||||||||||||||||||
| Net assets at end of period (000's) | $ | 255,422 | $ | 301,868 | $ | 393,287 | $ | 395,770 | $ | 247,876 | ||||||||||
| Ratio to average net assets: | ||||||||||||||||||||
| Net expenses | 1.04 | % | 1.04 | % | 1.01 | % | 0.94 | % | 0.94 | % | ||||||||||
| Gross expenses | 1.04 | % | 1.04 | % | 1.04 | % | 1.07 | % | 1.09 | % | ||||||||||
| Net investment income (loss) | 0.34 | % | 1.10 | %(A) | (0.10 | %) | 2.87 | % | 0.77 | % | ||||||||||
| Portfolio turnover rate | 17 | % | 42 | % | 17 | % | 15 | % | 11 | % | ||||||||||
| (A) | Reflects the impact of a corporate action event that resulted in a one-time increase to net investment income. If the corporate action event had not occurred, the Class Y and Institutional Class net investment income per share and ratio of net investment income to average net assets would have been lower by $0.13 and 0.65%, respectively. |
| (B) | The net investment loss per share is based on average shares outstanding for the period. |
See accompanying Notes to Financial Statements.
| 124 |
Financial Highlights (Continued)
Touchstone Small Cap Value Fund—Class A
Selected Data for a Share Outstanding Throughout Each Period
| Year Ended September 30, | ||||||||||||||||||||
| 2016 | 2015 | 2014 | 2013 | 2012 | ||||||||||||||||
| Net asset value at beginning of period | $ | 20.17 | $ | 23.23 | $ | 22.79 | $ | 18.33 | $ | 13.85 | ||||||||||
| Income (loss) from investment operations: | ||||||||||||||||||||
| Net investment income | 0.23 | 0.36 | 0.36 | 0.41 | 0.21 | (A) | ||||||||||||||
| Net realized and unrealized gains (losses) on investments | 2.80 | (2.15 | ) | 0.39 | 4.45 | 4.60 | ||||||||||||||
| Total from investment operations | 3.03 | (1.79 | ) | 0.75 | 4.86 | 4.81 | ||||||||||||||
| Distributions from: | ||||||||||||||||||||
| Net investment income | (0.27 | ) | (0.35 | ) | (0.31 | ) | (0.40 | ) | (0.33 | ) | ||||||||||
| Realized capital gains | (0.73 | ) | (0.92 | ) | — | — | — | |||||||||||||
| Total distributions | (1.00 | ) | (1.27 | ) | (0.31 | ) | (0.40 | ) | (0.33 | ) | ||||||||||
| Net asset value at end of period | $ | 22.20 | $ | 20.17 | $ | 23.23 | $ | 22.79 | $ | 18.33 | ||||||||||
| Total return(B) | 15.63 | % | (8.32 | %) | 3.19 | % | 26.82 | % | 34.87 | % | ||||||||||
| Ratios and supplemental data: | ||||||||||||||||||||
| Net assets at end of period (000's) | $ | 150,081 | $ | 24,659 | $ | 31,773 | 34,826 | $ | $ | 32,115 | ||||||||||
| Ratio to average net assets: | ||||||||||||||||||||
| Net expenses | 1.38 | % | 1.38 | % | 1.43 | % | 1.43 | % | 1.43 | % | ||||||||||
| Gross expenses | 1.67 | % | 1.60 | % | 1.67 | % | 1.78 | % | 1.77 | % | ||||||||||
| Net investment income | 1.05 | % | 1.51 | % | 1.44 | % | 1.98 | % | 1.26 | % | ||||||||||
| Portfolio turnover rate | 155 | % | 112 | % | 100 | %(C)(D) | 98 | % | 109 | % | ||||||||||
Touchstone Small Cap Value Fund—Class C
Selected Data for a Share Outstanding Throughout Each Period
| Year Ended September 30, | ||||||||||||||||||||
| 2016 | 2015 | 2014 | 2013 | 2012 | ||||||||||||||||
| Net asset value at beginning of period | $ | 19.98 | $ | 23.00 | $ | 22.61 | $ | 18.23 | $ | 13.82 | ||||||||||
| Income (loss) from investment operations: | ||||||||||||||||||||
| Net investment income | 0.06 | 0.17 | 0.16 | 0.29 | 0.09 | (A) | ||||||||||||||
| Net realized and unrealized gains (losses) on investments | 2.77 | (2.10 | ) | 0.40 | 4.39 | 4.58 | ||||||||||||||
| Total from investment operations | 2.83 | (1.93 | ) | 0.56 | 4.68 | 4.67 | ||||||||||||||
| Distributions from: | ||||||||||||||||||||
| Net investment income | (0.13 | ) | (0.17 | ) | (0.17 | ) | (0.30 | ) | (0.26 | ) | ||||||||||
| Realized capital gains | (0.73 | ) | (0.92 | ) | — | — | — | |||||||||||||
| Total distributions | (0.86 | ) | (1.09 | ) | (0.17 | ) | (0.30 | ) | (0.26 | ) | ||||||||||
| Net asset value at end of period | $ | 21.95 | $ | 19.98 | $ | 23.00 | $ | 22.61 | $ | 18.23 | ||||||||||
| Total return(B) | 14.72 | % | (9.01 | %) | 2.46 | % | 25.90 | % | 33.95 | % | ||||||||||
| Ratios and supplemental data: | ||||||||||||||||||||
| Net assets at end of period (000's) | $ | 1,376 | $ | 1,396 | $ | 2,169 | $ | 841 | $ | 104 | ||||||||||
| Ratio to average net assets: | ||||||||||||||||||||
| Net expenses | 2.13 | % | 2.13 | % | 2.18 | % | 2.18 | % | 2.18 | % | ||||||||||
| Gross expenses | 3.39 | % | 3.13 | % | 3.25 | % | 5.19 | % | 28.35 | % | ||||||||||
| Net investment income | 0.30 | % | 0.76 | % | 0.69 | % | 1.23 | % | 0.51 | % | ||||||||||
| Portfolio turnover rate | 155 | % | 112 | % | 100 | %(C)(D) | 98 | % | 109 | % | ||||||||||
| (A) | The net investment income per share is based on average shares outstanding for the period. |
| (B) | Total returns shown exclude the effect of applicable sales loads. If these charges were included, the returns would be lower. |
| (C) | Portfolio turnover rate excludes securities received from a subscription-in-kind. |
| (D) | Portfolio turnover excludes the purchases and sales of the Touchstone Small Company Value Fund acquired on March 21, 2014. If these transactions were included, portfolio turnover would have been higher. |
See accompanying Notes to Financial Statements.
| 125 |
Financial Highlights (Continued)
Touchstone Small Cap Value Fund—Class Y
Selected Data for a Share Outstanding Throughout Each Period
| Year Ended September 30, | ||||||||||||||||||||
| 2016 | 2015 | 2014 | 2013 | 2012 | ||||||||||||||||
| Net asset value at beginning of period | $ | 20.20 | $ | 23.25 | $ | 22.82 | $ | 18.36 | $ | 13.89 | ||||||||||
| Income (loss) from investment operations: | ||||||||||||||||||||
| Net investment income | 0.24 | 0.42 | 0.35 | 0.48 | 0.26 | (A) | ||||||||||||||
| Net realized and unrealized gains (losses) on investments | 2.84 | (2.14 | ) | 0.46 | 4.44 | 4.59 | ||||||||||||||
| Total from investment operations | 3.08 | (1.72 | ) | 0.81 | 4.92 | 4.85 | ||||||||||||||
| Distributions from: | ||||||||||||||||||||
| Net investment income | (0.31 | ) | (0.41 | ) | (0.38 | ) | (0.46 | ) | (0.38 | ) | ||||||||||
| Realized capital gains | (0.73 | ) | (0.92 | ) | — | — | — | |||||||||||||
| Total distributions | (1.04 | ) | (1.33 | ) | (0.38 | ) | (0.46 | ) | (0.38 | ) | ||||||||||
| Net asset value at end of period | $ | 22.24 | $ | 20.20 | $ | 23.25 | $ | 22.82 | $ | 18.36 | ||||||||||
| Total return | 15.86 | % | (8.08 | %) | 3.47 | % | 27.11 | % | 35.19 | % | ||||||||||
| Ratios and supplemental data: | ||||||||||||||||||||
| Net assets at end of period (000's) | $ | 3,080 | $ | 4,419 | $ | 9,097 | $ | 769 | $ | 222 | ||||||||||
| Ratio to average net assets: | ||||||||||||||||||||
| Net expenses | 1.13 | % | 1.13 | % | 1.18 | % | 1.18 | % | 1.18 | % | ||||||||||
| Gross expenses | 1.70 | % | 1.44 | % | 1.65 | % | 3.45 | % | 22.47 | % | ||||||||||
| Net investment income | 1.30 | % | 1.76 | % | 1.70 | % | 2.23 | % | 1.51 | % | ||||||||||
| Portfolio turnover rate | 155 | % | 112 | % | 100 | %(B)(C) | 98 | % | 109 | % | ||||||||||
Touchstone Small Cap Value Fund—Institutional Class
Selected Data for a Share Outstanding Throughout Each Period
| Year Ended September 30, | ||||||||||||||||||||
| 2016 | 2015 | 2014 | 2013 | 2012 | ||||||||||||||||
| Net asset value at beginning of period | $ | 20.19 | $ | 23.24 | $ | 22.81 | $ | 18.35 | $ | 13.86 | ||||||||||
| Income (loss) from investment operations: | ||||||||||||||||||||
| Net investment income | 0.30 | 0.45 | 0.40 | 0.48 | 0.29 | (A) | ||||||||||||||
| Net realized and unrealized gains (losses) on investments | 2.80 | (2.13 | ) | 0.44 | 4.47 | 4.60 | ||||||||||||||
| Total from investment operations | 3.10 | (1.68 | ) | 0.84 | 4.95 | 4.89 | ||||||||||||||
| Distributions from: | ||||||||||||||||||||
| Net investment income | (0.34 | ) | (0.45 | ) | (0.41 | ) | (0.49 | ) | (0.40 | ) | ||||||||||
| Realized capital gains | (0.73 | ) | (0.92 | ) | — | — | — | |||||||||||||
| Total distributions | (1.07 | ) | (1.37 | ) | (0.41 | ) | (0.49 | ) | (0.40 | ) | ||||||||||
| Net asset value at end of period | $ | 22.22 | $ | 20.19 | $ | 23.24 | $ | 22.81 | $ | 18.35 | ||||||||||
| Total return | 16.05 | % | (7.93 | %) | 3.59 | % | 27.30 | % | 35.56 | % | ||||||||||
| Ratios and supplemental data: | ||||||||||||||||||||
| Net assets at end of period (000's) | $ | 23,740 | $ | 25,968 | $ | 29,831 | $ | 2,665 | $ | 1,160 | ||||||||||
| Ratio to average net assets: | ||||||||||||||||||||
| Net expenses | 0.98 | % | 0.98 | % | 1.03 | % | 1.03 | % | 1.03 | % | ||||||||||
| Gross expenses | 1.22 | % | 1.19 | % | 1.30 | % | 1.83 | % | 1.87 | % | ||||||||||
| Net investment income | 1.45 | % | 1.91 | % | 1.84 | % | 2.38 | % | 1.66 | % | ||||||||||
| Portfolio turnover rate | 155 | % | 112 | % | 100 | %(B)(C) | 98 | % | 109 | % | ||||||||||
| (A) | The net investment income per share is based on average shares outstanding for the period. |
| (B) | Portfolio turnover rate excludes securities received from a subscription-in-kind. |
| (C) | Portfolio turnover excludes the purchases and sales of the Touchstone Small Company Value Fund acquired on March 21, 2014. If these transactions were included, portfolio turnover would have been higher. |
See accompanying Notes to Financial Statements.
| 126 |
Financial Highlights (Continued)
Touchstone Total Return Bond Fund—Class A
Selected Data for a Share Outstanding Throughout Each Period
| Year Ended September 30, | ||||||||||||||||||||
| 2016 | 2015 | 2014 | 2013 | 2012 | ||||||||||||||||
| Net asset value at beginning of period | $ | 10.19 | $ | 10.23 | $ | 10.07 | $ | 10.50 | $ | 10.13 | ||||||||||
| Income (loss) from investment operations: | ||||||||||||||||||||
| Net investment income | 0.24 | 0.22 | 0.23 | 0.21 | 0.23 | |||||||||||||||
| Net realized and unrealized gains (losses) on investments | 0.22 | 0.01 | 0.22 | (0.36 | ) | 0.41 | ||||||||||||||
| Total from investment operations | 0.46 | 0.23 | 0.45 | (0.15 | ) | 0.64 | ||||||||||||||
| Distributions from: | ||||||||||||||||||||
| Net investment income | (0.27 | ) | (0.27 | ) | (0.29 | ) | (0.27 | ) | (0.27 | ) | ||||||||||
| Realized capital gains | — | — | — | (0.01 | ) | — | ||||||||||||||
| Total distributions | (0.27 | ) | (0.27 | ) | (0.29 | ) | (0.28 | ) | (0.27 | ) | ||||||||||
| Net asset value at end of period | $ | 10.38 | $ | 10.19 | $ | 10.23 | $ | 10.07 | $ | 10.50 | ||||||||||
| Total return(A) | 4.57 | % | 2.24 | % | 4.53 | % | (1.48 | %) | 6.42 | % | ||||||||||
| Ratios and supplemental data: | ||||||||||||||||||||
| Net assets at end of period (000's) | $ | 8,639 | $ | 5,749 | $ | 5,144 | $ | 12,167 | $ | 10,210 | ||||||||||
| Ratio to average net assets: | ||||||||||||||||||||
| Net expenses | 0.87 | % | 0.90 | % | 0.90 | % | 0.90 | % | 0.90 | % | ||||||||||
| Gross expenses | 1.25 | % | 1.26 | % | 1.25 | % | 1.10 | % | 1.22 | % | ||||||||||
| Net investment income | 2.26 | % | 2.10 | % | 2.32 | % | 2.07 | % | 2.26 | % | ||||||||||
| Portfolio turnover rate | 12 | % | 19 | % | 5 | % | 35 | % | 79 | %(B) | ||||||||||
Touchstone Total Return Bond Fund—Class C
Selected Data for a Share Outstanding Throughout Each Period
| Year Ended September 30, | ||||||||||||||||||||
| 2016 | 2015 | 2014 | 2013 | 2012 | ||||||||||||||||
| Net asset value at beginning of period | $ | 10.18 | $ | 10.21 | $ | 10.05 | $ | 10.49 | $ | 10.12 | ||||||||||
| Income (loss) from investment operations: | ||||||||||||||||||||
| Net investment income | 0.15 | 0.14 | 0.15 | 0.11 | 0.14 | |||||||||||||||
| Net realized and unrealized gains (losses) on investments | 0.22 | 0.02 | 0.22 | (0.35 | ) | 0.42 | ||||||||||||||
| Total from investment operations | 0.37 | 0.16 | 0.37 | (0.24 | ) | 0.56 | ||||||||||||||
| Distributions from: | ||||||||||||||||||||
| Net investment income | (0.19 | ) | (0.19 | ) | (0.21 | ) | (0.19 | ) | (0.19 | ) | ||||||||||
| Realized capital gains | — | — | — | (0.01 | ) | — | ||||||||||||||
| Total distributions | (0.19 | ) | (0.19 | ) | (0.21 | ) | (0.20 | ) | (0.19 | ) | ||||||||||
| Net asset value at end of period | $ | 10.36 | $ | 10.18 | $ | 10.21 | $ | 10.05 | $ | 10.49 | ||||||||||
| Total return(A) | 3.70 | % | 1.60 | % | 3.75 | % | (2.33 | %) | 5.63 | % | ||||||||||
| Ratios and supplemental data: | ||||||||||||||||||||
| Net assets at end of period (000's) | $ | 2,813 | $ | 2,368 | $ | 1,634 | $ | 2,455 | $ | 3,257 | ||||||||||
| Ratio to average net assets: | ||||||||||||||||||||
| Net expenses | 1.62 | % | 1.65 | % | 1.65 | % | 1.65 | % | 1.65 | % | ||||||||||
| Gross expenses | 2.19 | % | 2.27 | % | 2.47 | % | 2.10 | % | 2.03 | % | ||||||||||
| Net investment income | 1.51 | % | 1.35 | % | 1.57 | % | 1.32 | % | 1.51 | % | ||||||||||
| Portfolio turnover rate | 12 | % | 19 | % | 5 | % | 35 | % | 79 | %(B) | ||||||||||
| (A) | Total returns shown exclude the effect of applicable sales loads. If these charges were included, the returns would be lower. |
| (B) | Portfolio turnover excludes the purchases and sales of the Old Mutual Barrow Hanley Core Bond Fund acquired on April 16, 2012. If these transactions were included, portfolio turnover would have been higher. |
See accompanying Notes to Financial Statements.
| 127 |
Financial Highlights (Continued)
Touchstone Total Return Bond Fund—Class Y
Selected Data for a Share Outstanding Throughout Each Period
| Year Ended September 30, | ||||||||||||||||||||
| 2016 | 2015 | 2014 | 2013 | 2012 | ||||||||||||||||
| Net asset value at beginning of period | $ | 10.20 | $ | 10.24 | $ | 10.08 | $ | 10.52 | $ | 10.15 | ||||||||||
| Income (loss) from investment operations: | ||||||||||||||||||||
| Net investment income | 0.26 | 0.25 | 0.26 | 0.23 | 0.25 | |||||||||||||||
| Net realized and unrealized gains (losses) on investments | 0.23 | 0.01 | 0.22 | (0.36 | ) | 0.42 | ||||||||||||||
| Total from investment operations | 0.49 | 0.26 | 0.48 | (0.13 | ) | 0.67 | ||||||||||||||
| Distributions from: | ||||||||||||||||||||
| Net investment income | (0.30 | ) | (0.30 | ) | (0.32 | ) | (0.30 | ) | (0.30 | ) | ||||||||||
| Realized capital gains | — | — | — | (0.01 | ) | — | ||||||||||||||
| Total distributions | (0.30 | ) | (0.30 | ) | (0.32 | ) | (0.31 | ) | (0.30 | ) | ||||||||||
| Net asset value at end of period | $ | 10.39 | $ | 10.20 | $ | 10.24 | $ | 10.08 | $ | 10.52 | ||||||||||
| Total return | 4.82 | % | 2.51 | % | 4.84 | % | (1.32 | %) | 6.72 | % | ||||||||||
| Ratios and supplemental data: | ||||||||||||||||||||
| Net assets at end of period (000's) | $ | 49,484 | $ | 39,751 | $ | 19,397 | $ | 19,635 | $ | 29,716 | ||||||||||
| Ratio to average net assets: | ||||||||||||||||||||
| Net expenses | 0.62 | % | 0.65 | % | 0.61 | % | 0.62 | % | 0.58 | % | ||||||||||
| Gross expenses | 0.71 | % | 0.70 | % | 0.68 | % | 0.71 | % | 0.70 | % | ||||||||||
| Net investment income | 2.51 | % | 2.35 | % | 2.61 | % | 2.34 | % | 2.59 | % | ||||||||||
| Portfolio turnover rate | 12 | % | 19 | % | 5 | % | 35 | % | 79 | %(A) | ||||||||||
Touchstone Total Return Bond Fund — Institutional Class
Selected Data for a Share Outstanding Throughout Each Period
| Year Ended September 30, | ||||||||||||||||||||
| 2016 | 2015 | 2014 | 2013 | 2012 | ||||||||||||||||
| Net asset value at beginning of period | $ | 10.20 | $ | 10.24 | $ | 10.08 | $ | 10.51 | $ | 10.14 | ||||||||||
| Income (loss) from investment operations: | ||||||||||||||||||||
| Net investment income | 0.28 | 0.26 | 0.27 | 0.25 | 0.22 | |||||||||||||||
| Net realized and unrealized gains (losses) on investments | 0.22 | 0.01 | 0.22 | (0.36 | ) | 0.46 | ||||||||||||||
| Total from investment operations | 0.50 | 0.27 | 0.49 | (0.11 | ) | 0.68 | ||||||||||||||
| Distributions from: | ||||||||||||||||||||
| Net investment income | (0.31 | ) | (0.31 | ) | (0.33 | ) | (0.31 | ) | (0.31 | ) | ||||||||||
| Realized capital gains | — | — | — | (0.01 | ) | — | ||||||||||||||
| Total distributions | (0.31 | ) | (0.31 | ) | (0.33 | ) | (0.32 | ) | (0.31 | ) | ||||||||||
| Net asset value at end of period | $ | 10.39 | $ | 10.20 | $ | 10.24 | $ | 10.08 | $ | 10.51 | ||||||||||
| Total return | 4.94 | % | 2.65 | % | 4.96 | % | (1.09 | %) | 6.81 | % | ||||||||||
| Ratios and supplemental data: | ||||||||||||||||||||
| Net assets at end of period (000's) | $ | 166,008 | $ | 134,877 | $ | 116,404 | $ | 133,051 | $ | 148,341 | ||||||||||
| Ratio to average net assets: | ||||||||||||||||||||
| Net expenses | 0.50 | % | 0.50 | % | 0.50 | % | 0.50 | % | 0.50 | % | ||||||||||
| Gross expenses | 0.60 | % | 0.61 | % | 0.60 | % | 0.60 | % | 0.67 | % | ||||||||||
| Net investment income | 2.63 | % | 2.50 | % | 2.72 | % | 2.47 | % | 2.66 | % | ||||||||||
| Portfolio turnover rate | 12 | % | 19 | % | 5 | % | 35 | % | 79 | %(A) | ||||||||||
| (A) | Portfolio turnover excludes the purchases and sales of the Old Mutual Barrow Hanley Core Bond Fund acquired on April 16, 2012. If these transactions were included, portfolio turnover would have been higher. |
See accompanying Notes to Financial Statements.
| 128 |
Financial Highlights (Continued)
Touchstone Ultra Short Duration Fixed Income Fund—Class A
Selected Data for a Share Outstanding Throughout Each Period
| Period | ||||||||||||||||||||
| Ended | ||||||||||||||||||||
| Year Ended September 30, | September 30, | |||||||||||||||||||
| 2016 | 2015 | 2014 | 2013 | 2012(A) | ||||||||||||||||
| Net asset value at beginning of period | $ | 9.32 | $ | 9.41 | $ | 9.45 | $ | 9.56 | $ | 9.57 | ||||||||||
| Income (loss) from investment operations: | ||||||||||||||||||||
| Net investment income | 0.10 | 0.06 | 0.06 | 0.09 | 0.09 | |||||||||||||||
| Net realized and unrealized gains (losses) on investments | 0.02 | (0.03 | ) | 0.03 | (0.04 | ) | (0.01 | ) | ||||||||||||
| Total from investment operations | 0.12 | 0.03 | 0.09 | 0.05 | 0.08 | |||||||||||||||
| Distributions from: | ||||||||||||||||||||
| Net investment income | (0.12 | ) | (0.12 | ) | (0.13 | ) | (0.16 | ) | (0.09 | ) | ||||||||||
| Net asset value at end of period | $ | 9.32 | $ | 9.32 | $ | 9.41 | $ | 9.45 | $ | 9.56 | ||||||||||
| Total return(B) | 1.35 | % | 0.31 | % | 0.92 | % | 0.48 | % | 0.85 | %(C) | ||||||||||
| Ratios and supplemental data: | ||||||||||||||||||||
| Net assets at end of period (000's) | $ | 16,946 | $ | 10,675 | $ | 10,596 | $ | 32,088 | $ | 34,228 | ||||||||||
| Ratio to average net assets: | ||||||||||||||||||||
| Net expenses | 0.69 | % | 0.69 | % | 0.69 | % | 0.69 | % | 0.69 | %(D) | ||||||||||
| Gross expenses | 0.97 | % | 0.99 | % | 0.93 | % | 0.83 | % | 1.19 | %(D) | ||||||||||
| Net investment income | 1.09 | % | 0.54 | % | 0.79 | % | 0.85 | % | 1.40 | %(D) | ||||||||||
| Portfolio turnover rate | 169 | % | 132 | % | 142 | % | 107 | %(E) | 169 | %(F) | ||||||||||
Touchstone Ultra Short Duration Fixed Income Fund—Class C
Selected Data for a Share Outstanding Throughout Each Period
| Period | ||||||||||||||||||||
| Ended | ||||||||||||||||||||
| Year Ended September 30, | September 30, | |||||||||||||||||||
| 2016 | 2015 | 2014 | 2013 | 2012(A) | ||||||||||||||||
| Net asset value at beginning of period | $ | 9.32 | $ | 9.41 | $ | 9.45 | $ | 9.56 | $ | 9.57 | ||||||||||
| Income (loss) from investment operations: | — | (G) | 0.02 | 0.04 | 0.05 | |||||||||||||||
| Net investment income | 0.06 | |||||||||||||||||||
| Net realized and unrealized gains (losses) on investments | 0.02 | (0.02 | ) | 0.02 | (0.04 | ) | 0.01 | |||||||||||||
| Total from investment operations | 0.08 | (0.02 | ) | 0.04 | — | 0.06 | ||||||||||||||
| Distributions from: | ||||||||||||||||||||
| Net investment income | (0.08 | ) | (0.07 | ) | (0.08 | ) | (0.11 | ) | (0.07 | ) | ||||||||||
| Net asset value at end of period | $ | 9.32 | $ | 9.32 | $ | 9.41 | $ | 9.45 | $ | 9.56 | ||||||||||
| Total return(B) | 0.84 | % | (0.19 | %) | 0.42 | % | (0.02 | %) | 0.62 | %(C) | ||||||||||
| Ratios and supplemental data: | ||||||||||||||||||||
| Net assets at end of period (000's) | $ | 7,961 | $ | 8,291 | $ | 11,272 | $ | 13,568 | $ | 11,517 | ||||||||||
| Ratio to average net assets: | ||||||||||||||||||||
| Net expenses | 1.19 | % | 1.19 | % | 1.19 | % | 1.19 | % | 1.19 | %(D) | ||||||||||
| Gross expenses | 1.54 | % | 1.48 | % | 1.44 | % | 1.39 | % | 1.68 | %(D) | ||||||||||
| Net investment income | 0.59 | % | 0.04 | % | 0.29 | % | 0.35 | % | 0.90 | %(D) | ||||||||||
| Portfolio turnover rate | 169 | % | 132 | % | 142 | % | 107 | %(E) | 169 | %(F) | ||||||||||
| (A) | Represents the period from commencement of operations (April 16, 2012) through September 30, 2012. |
| (B) | Total returns shown exclude the effect of applicable sales loads. If these charges were included, the returns would be lower. |
| (C) | Not annualized. |
| (D) | Annualized. |
| (E) | Portfolio turnover excludes the purchases and sales of the Touchstone Short Duration Fixed Income Fund acquired on May 17, 2013. If these transactions were included, portfolio turnover would have been higher. |
| (F) | Portfolio turnover excludes the purchases and sales of the Old Mutual Dwight Short Term Fixed Income Fund and Fifth Third Short Term Bond Fund acquired on April 16, 2012 and September 10, 2012, respectively. If these transactions were included, portfolio turnover would have been higher. |
| (G) | Less than $0.005 per share. |
See accompanying Notes to Financial Statements.
| 129 |
Financial Highlights (Continued)
Touchstone Ultra Short Duration Fixed Income Fund—Class Y
Selected Data for a Share Outstanding Throughout Each Period
| Period | ||||||||||||||||||||
| Ended | ||||||||||||||||||||
| Year Ended September 30, | September 30, | |||||||||||||||||||
| 2016 | 2015 | 2014 | 2013 | 2012(A) | ||||||||||||||||
| Net asset value at beginning of period | $ | 9.32 | $ | 9.41 | $ | 9.45 | $ | 9.56 | $ | 9.57 | ||||||||||
| Income (loss) from investment operations: | ||||||||||||||||||||
| Net investment income | 0.13 | 0.07 | 0.10 | 0.12 | 0.08 | |||||||||||||||
| Net realized and unrealized gains (losses) on investments | 0.02 | (0.02 | ) | 0.01 | (0.05 | ) | 0.01 | |||||||||||||
| Total from investment operations | 0.15 | 0.05 | 0.11 | 0.07 | 0.09 | |||||||||||||||
| Distributions from: | ||||||||||||||||||||
| Net investment income | (0.15 | ) | (0.14 | ) | (0.15 | ) | (0.18 | ) | (0.10 | ) | ||||||||||
| Net asset value at end of period | $ | 9.32 | $ | 9.32 | $ | 9.41 | $ | 9.45 | $ | 9.56 | ||||||||||
| Total return | 1.60 | % | 0.56 | % | 1.17 | % | 0.74 | % | 0.97 | %(B) | ||||||||||
| Ratios and supplemental data: | ||||||||||||||||||||
| Net assets at end of period (000's) | $ | 206,313 | $ | 200,456 | $ | 244,885 | $ | 249,250 | $ | 190,515 | ||||||||||
| Ratio to average net assets: | ||||||||||||||||||||
| Net expenses | 0.44 | % | 0.44 | % | 0.44 | % | 0.44 | % | 0.44 | %(C) | ||||||||||
| Gross expenses | 0.53 | % | 0.52 | % | 0.49 | % | 0.51 | % | 0.55 | %(C) | ||||||||||
| Net investment income | 1.34 | % | 0.79 | % | 1.04 | % | 1.10 | % | 1.65 | %(C) | ||||||||||
| Portfolio turnover rate | 169 | % | 132 | % | 142 | % | 107 | %(D) | 169 | %(E) | ||||||||||
Touchstone Ultra Short Duration Fixed Income Fund—Class Z
Selected Data for a Share Outstanding Throughout Each Period
| Year Ended September 30, | ||||||||||||||||||||
| 2016 | 2015 | 2014 | 2013 | 2012 | ||||||||||||||||
| Net asset value at beginning of period | $ | 9.32 | $ | 9.41 | $ | 9.45 | $ | 9.56 | $ | 9.58 | ||||||||||
| Income (loss) from investment operations: | ||||||||||||||||||||
| Net investment income | 0.10 | 0.05 | 0.08 | 0.09 | 0.14 | |||||||||||||||
| Net realized and unrealized gains (losses) on investment | 0.02 | (0.02 | ) | 0.01 | (0.04 | ) | 0.06 | |||||||||||||
| Total from investment operations | 0.12 | 0.03 | 0.09 | 0.05 | 0.20 | |||||||||||||||
| Distributions from: | ||||||||||||||||||||
| Net investment income | (0.12 | ) | (0.12 | ) | (0.13 | ) | (0.16 | ) | (0.22 | ) | ||||||||||
| Net asset value at end of period | $ | 9.32 | $ | 9.32 | $ | 9.41 | $ | 9.45 | $ | 9.56 | ||||||||||
| Total return | 1.35 | % | 0.31 | % | 0.91 | % | 0.52 | % | 2.10 | % | ||||||||||
| Ratios and supplemental data: | ||||||||||||||||||||
| Net assets at end of period (000's) | $ | 245,252 | $ | 304,553 | $ | 401,851 | $ | 381,554 | $ | 338,669 | ||||||||||
| Ratio to average net assets: | ||||||||||||||||||||
| Net expenses | 0.69 | % | 0.69 | % | 0.69 | % | 0.65 | % | 0.64 | % | ||||||||||
| Gross expenses | 0.79 | % | 0.76 | % | 0.76 | % | 0.73 | % | 0.73 | % | ||||||||||
| Net Investment Income | 1.09 | % | 0.54 | % | 0.79 | % | 0.89 | % | 1.45 | % | ||||||||||
| Portfolio turnover rate | 169 | % | 132 | % | 142 | % | 107 | %(D) | 169 | %(E) | ||||||||||
| (A) | Represents the period from commencement of operations (April 16, 2012) through September 30, 2012. |
| (B) | Not annualized. |
| (C) | Annualized. |
| (D) | Portfolio turnover excludes the purchases and sales of the Touchstone Short Duration Fixed Income Fund acquired on May 17, 2013. If these transactions were included, portfolio turnover would have been higher. |
| (E) | Portfolio turnover excludes the purchases and sales of the Old Mutual Dwight Short Term Fixed Income Fund and Fifth Third Short Term Bond Fund acquired on April 16, 2012 and September 10, 2012, respectively. If these transactions were included, portfolio turnover would have been higher. |
See accompanying Notes to Financial Statements.
| 130 |
Financial Highlights (Continued)
Touchstone Ultra Short Duration Fixed Income Fund—Institutional Class
Selected Data for a Share Outstanding Throughout Each Period
| Period | ||||||||||||||||||||
| Ended | ||||||||||||||||||||
| Year Ended September 30, | September 30, | |||||||||||||||||||
| 2016 | 2015 | 2014 | 2013 | 2012(A) | ||||||||||||||||
| Net asset value at beginning of period | $ | 9.32 | $ | 9.41 | $ | 9.45 | $ | 9.56 | $ | 9.57 | ||||||||||
| Income (loss) from investment operations: | ||||||||||||||||||||
| Net investment income | 0.13 | 0.08 | 0.10 | 0.14 | 0.09 | |||||||||||||||
| Net realized and unrealized gains (losses) on investments | 0.02 | (0.02 | ) | 0.01 | (0.07 | ) | — | (B) | ||||||||||||
| Total from investment operations | 0.15 | 0.06 | 0.11 | 0.07 | 0.09 | |||||||||||||||
| Distributions from: | ||||||||||||||||||||
| Net investment income | (0.15 | ) | (0.15 | ) | (0.15 | ) | (0.18 | ) | (0.10 | ) | ||||||||||
| Net asset value at end of period | $ | 9.32 | $ | 9.32 | $ | 9.41 | $ | 9.45 | $ | 9.56 | ||||||||||
| Total return | 1.54 | % | 0.61 | % | 1.22 | % | 0.78 | % | 0.99 | %(C) | ||||||||||
| Ratios and supplemental data: | ||||||||||||||||||||
| Net assets at end of period (000's) | $ | 142,913 | $ | 49,389 | $ | 50,853 | $ | 59,662 | $ | 6,697 | ||||||||||
| Ratio to average net assets: | ||||||||||||||||||||
| Net expenses | 0.39 | % | 0.39 | % | 0.39 | % | 0.39 | % | 0.39 | %(D) | ||||||||||
| Gross expenses | 0.46 | % | 0.48 | % | 0.48 | % | 0.52 | % | 1.23 | %(D) | ||||||||||
| Net investment income | 1.39 | % | 0.84 | % | 1.09 | % | 1.15 | % | 1.70 | %(D) | ||||||||||
| Portfolio turnover rate | 169 | % | 132 | % | 142 | % | 107 | %(E) | 169 | %(F) | ||||||||||
| (A) | Represents the period from commencement of operations (April 16, 2012) through September 30, 2012. |
| (B) | Less than $0.005 per share. |
| (C) | Not annualized. |
| (D) | Annualized. |
| (E) | Portfolio turnover excludes the purchases and sales of the Touchstone Short Duration Fixed Income Fund acquired on May 17, 2013. If these transactions were included, portfolio turnover would have been higher. |
| (F) | Portfolio turnover excludes the purchases and sales of the Old Mutual Dwight Short Term Fixed Income Fund and Fifth Third Short Term Bond Fund acquired on April 16, 2012 and September 10, 2012, respectively. If these transactions were included, portfolio turnover would have been higher. |
See accompanying Notes to Financial Statements.
| 131 |
September 30, 2016
1. Organization
The Touchstone Funds Group Trust (the “Trust”) is registered under the Investment Company Act of 1940, as amended (the “1940 Act”), as an open-end management investment company. The Trust was established as a Delaware statutory trust pursuant to an Agreement and Declaration of Trust dated October 25, 1993. The Trust consists of eleven funds (individually, a “Fund,” and collectively, the “Funds”):
Touchstone Arbitrage Fund (“Arbitrage Fund”)
Touchstone Emerging Markets Small Cap Fund (“Emerging Markets Small Cap Fund”) (formerly known as Touchstone Emerging Markets Equity Fund)
Touchstone Merger Arbitrage Fund (“Merger Arbitrage Fund”)
Touchstone Mid Cap Fund (“Mid Cap Fund”)
Touchstone Mid Cap Value Fund (“Mid Cap Value Fund”)
Touchstone Premium Yield Equity Fund (“Premium Yield Equity Fund”)
Touchstone Sands Capital Select Growth Fund (“Sands Capital Select Growth Fund”)
Touchstone Small Cap Fund (“Small Cap Fund”)
Touchstone Small Cap Value Fund (“Small Cap Value Fund”)
Touchstone Total Return Bond Fund (“Total Return Bond Fund”)
Touchstone Ultra Short Duration Fixed Income Fund (“Ultra Short Duration Fixed Income Fund”)
Each Fund is diversified, with the exception of the Arbitrage Fund, the Merger Arbitrage Fund, the Sands Capital Select Growth Fund and the Small Cap Fund, which are non-diversified.
The Agreement and Declaration of Trust permits the Trust to issue an unlimited number of shares of beneficial interest of each Fund. The table below indicates the classes of shares that each Fund is registered to offer:
| Institutional | |||||
| Class A | Class C | Class Y | Class Z | Class | |
| Arbitrage Fund | X | X | X | X | |
| Emerging Markets Small Cap Fund | X | X | X | X | |
| Merger Arbitrage Fund | X | X | X | X | |
| Mid Cap Fund | X | X | X | X | X |
| Mid Cap Value Fund | X | X | X | X | |
| Premium Yield Equity Fund | X | X | X | ||
| Sands Capital Select Growth Fund | X | X | X | X | |
| Small Cap Fund | X | X | X | X | |
| Small Cap Value Fund | X | X | X | X | |
| Total Return Bond Fund | X | X | X | X | |
| Ultra Short Duration Fixed Income Fund | X | X | X | X | X |
The assets of each Fund are segregated, and a shareholder’s interest is limited to the Fund in which shares are held. The Funds’ prospectus provides a description of each Fund’s investment goals, policies, and strategies along with information on the classes of shares currently being offered.
| 132 |
Notes to Financial Statements (Continued)
2. Significant Accounting Policies
The following is a summary of the Funds’ significant accounting policies:
Each Fund is an investment company that follows the accounting and reporting guidance of Accounting Standards Codification Topic 946 applicable to investment companies.
Security valuation and fair value measurements — U.S. generally accepted accounting principles (“U.S. GAAP”) define fair value as the price the Funds would receive to sell an asset or pay to transfer a liability in an orderly transaction between market participants at the measurement date. All investments in securities are recorded at their estimated fair value. The Funds define the term “market value”, as used throughout this report, as the estimated fair value. The Funds use various methods to measure fair value of their portfolio securities on a recurring basis. U.S. GAAP fair value measurement standards require disclosure of a hierarchy that prioritizes inputs to valuation methods.
These inputs are summarized in the three broad levels listed below:
| · | Level 1 – | quoted prices in active markets for identical securities |
| · | Level 2 – | other significant observable inputs (including quoted prices for similar securities, interest rates, prepayment speeds, credit risk, etc.) |
| · | Level 3 – | significant unobservable inputs (including a Fund’s own assumptions in determining the fair value of investments) |
The inputs or methodology used for valuing securities are not necessarily an indication of the risk associated with investing in those securities.
The aggregate value by input level, as of September 30, 2016, for each Fund’s investments, as well as a reconciliation of assets for which significant unobservable inputs (Level 3) were used in determining value, if applicable, is included in the Fund’s Portfolio of Investments, which also includes a breakdown of the Fund’s investments by geographic, portfolio or sector allocation. The Funds did not hold any Level 3 categorized securities during the year ended September 30, 2016.
Changes in valuation techniques may result in transfers into or out of an investment’s assigned level within the hierarchy. All transfers in and out of the levels are recognized at the value at the end of the period. During the year ended September 30, 2016, there were no transfers between Levels 1, 2 and 3 for all Funds.
The Funds’ portfolio securities are valued as of the close of the regular session of trading on the New York Stock Exchange (“NYSE”) (currently 4:00 p.m., Eastern Time). Portfolio securities traded on stock exchanges are valued at the last reported sale price, official close price, or last bid price if no sales are reported. Portfolio securities quoted by NASDAQ are valued at the NASDAQ Official Closing Price (“NOCP”) or from the primary exchange on which the security trades. To the extent these securities are actively traded, they are categorized in Level 1 of the fair value hierarchy. Options are valued at the last quoted sales price. If there is no such reported sale on the valuation date, long option positions are valued at the most recent bid price, and short option positions are valued at the most recent ask price and are categorized in Level 1. Shares of mutual funds in which the Funds invest are valued at their respective net asset values (“NAV”) as reported by the underlying funds (“Underlying Funds”) and are categorized in Level 1.
Debt securities held by the Funds are valued at their evaluated bid by an independent pricing service or at their last broker-quoted bid prices as obtained from one or more of the major market makers for such securities. Independent pricing services use information provided by market makers or estimates of market values through accepted market modeling conventions. Observable inputs to the models may include prepayment speeds, pricing spread, yield, trade information, dealer quotes, market color, cash flow models, the securities’ terms
| 133 |
Notes to Financial Statements (Continued)
and conditions, among others, and are generally categorized in Level 2. Debt securities with remaining maturities of 60 days or less may be valued at amortized cost, provided such amount approximates market value and are categorized in Level 2. While this method provides consistency in valuation (and may only be used if it approximates market value), it may result in periods during which value, as determined by amortized cost, is higher or lower than the price that would be received if the Fund sold the investment.
Foreign currency exchange contracts are valued at the mean between the bid and ask prices and are determined as of the close of regular trading on the NYSE. Interpolated values are derived when the settlement date of the contract is an interim date for which quotations are not available and categorized in Level 2.
Securities mainly traded on a non-U.S. exchange or denominated in foreign currencies are generally valued according to the preceding closing values on that exchange, translated to U.S. dollars using currency exchange rates as of the close of regular trading on the NYSE, and are generally categorized in Level 1. However, if an event that may change the value of a security occurs after the time that the closing value on the non-U.S. exchange was determined, but before the close of regular trading on the NYSE, the security may be priced based on fair value and generally categorized in Level 2. This may cause the value of the security, if held on the books of a Fund to be different from the closing value on the non-U.S. exchange and may affect the calculation of that Fund’s NAV.
The Funds may use fair value pricing under the following circumstances, among others:
| · | If the value of a security has been materially affected by events occurring before the Funds’ pricing time but after the close of the primary markets on which the security is traded. |
| · | If the exchange on which a portfolio security is principally traded closes early or if trading in a particular portfolio security was halted during the day and did not resume prior to the Funds’ NAV calculation. |
| · | If a security is so thinly traded that reliable market quotations are unavailable due to infrequent trading. |
| · | If the validity of market quotations is not reliable. |
Securities held by the Funds that do not have readily available market quotations, significant observable inputs, or securities for which the available market quotations are not reliable, are priced at their estimated fair value using procedures approved by the Funds’ Board of Trustees and are generally categorized in Level 3.
Investment companies — The Funds may invest in securities of other investment companies, including exchange-traded funds (“ETFs”), open-end funds and closed-end funds. Open-end funds are investment companies that issue new shares continuously and redeem shares daily. Closed-end funds are investment companies that typically issue a fixed number of shares that trade on a securities exchange or over-the-counter. An ETF is an investment company that typically seeks to track the performance of an index by holding in its portfolio shares of all the companies, or a representative sample of the companies, that are components of a particular index. ETF shares are traded on a securities exchange based on their market value. The risks of investment in other investment companies typically reflect the risks of the types of securities in which the other investment companies invest. Investments in ETFs and closed-end funds are subject to the additional risk that their shares may trade at a premium or discount to their NAV. When a Fund invests in another investment company, shareholders of the Fund indirectly bear their proportionate share of the other investment company’s fees and expenses, including operating, registration, trustee, licensing, and marketing, as well as their share of the Fund’s fees and expenses.
Securities sold short — The Funds may engage in selling securities short, which obligates a Fund to replace a security borrowed by purchasing the same security at the current market value. A Fund would incur a loss if the price of the security increases between the date of the short sale and the date on which the Fund replaces the borrowed security. A Fund would realize a gain if the price of the security declines between those dates. As of September 30, 2016, the Arbitrage Fund and Merger Arbitrage Fund held securities sold short with a
| 134 |
Notes to Financial Statements (Continued)
fair value of $47,363,225 and $48,024,193, respectively, and had securities with a fair value of $52,640,647 and $64,917,149, respectively, held as collateral and cash collateral of $36,608,741 and $14,426,614, respectively, for both securities sold short and written options.
Options — The Funds may write or purchase financial option contracts primarily to hedge against changes in the value of equity securities (or securities that the Funds intend to purchase), against fluctuations in fair value caused by changes in prevailing market interest rates or foreign currency exchange rates and against changes in overall equity market volatility. In addition, the Funds may utilize options in an attempt to generate gains from option premiums or to reduce overall portfolio risk. The Funds’ option strategy primarily focuses on the use of writing and/or purchasing call or put options on equity indexes. When the Funds write or purchase an option, an amount equal to the premium received or paid by the Funds is recorded as a liability or an asset and is subsequently adjusted to the current market value of the option written or purchased. Premiums received or paid from writing or purchasing options which expire unexercised are treated by the Funds on the expiration date as realized gains or losses. The difference between the premium and the amount paid or received on effecting a closing purchase or sale transaction, including brokerage commissions, is also treated as a realized gain or loss. If an option is exercised, the premium paid or received is added to the cost of the purchase or proceeds from the sale in determining whether the Funds have realized a gain or loss on investment transactions. The Funds, as writers of an option, may have no control over whether the underlying securities may be sold (call) or purchased (put) and as a result bear the market risk of an unfavorable change in the price of the security underlying the written option. The Funds, as purchasers of an option, bear the risk that the counterparties to the option may not have the ability to meet the terms of the option contracts. There is minimal counterparty credit risk involved in entering into option contracts since they are exchange-traded instruments and the exchange’s clearinghouse, as counterparty to all exchange-traded options, guarantees the options against default. As of September 30, 2016, the Arbitrage Fund and Merger Arbitrage Fund held written options with a fair value of $64,783 and $73,923 respectively, and had securities with a fair value of $52,640,647 and $64,917,149, respectively, held as collateral and cash collateral of $36,608,741 and $14,426,614, respectively, for both securities sold short and written options. The Arbitrage Fund and Merger Arbitrage Fund also held purchased options with a fair value of $45,445 and $57,858, as of September 30, 2016.
Warrants — The Funds can invest in warrants and stock purchase rights of companies of any market capitalization. A warrant gives the company the right to buy stock, typically from the issuer. The warrant specifies the amount of underlying stock, the purchase (or “exercise”) price, and the date the warrant expires. Certain warrants may permit, without legal obligation, net settlement for stock or cash. The Funds have no obligation to exercise the warrant and buy the stock.
Foreign currency translation — The books and records of the Funds are maintained in U.S. dollars and translated into U.S. dollars on the following basis:
(1) market value of investment securities, assets and liabilities at the current rate of exchange on the valuation date; and
(2) purchases and sales of investment securities, income, and expenses at the relevant rates of exchange prevailing on the respective dates of such transactions.
The Funds do not isolate that portion of gains and losses on investments in equity securities that is due to changes in the foreign exchange rates from that which is due to changes in market prices of equity securities.
Forward foreign currency contracts — A forward foreign currency contract is an agreement between two parties to buy and sell a specific currency at a price that is set on the date of the contract. The forward contract calls for delivery of the currency on a future date that is specified in the contract. Risks related to the use of forwards include the possible failure of counterparties to meet the terms of the forward agreement, the failure of the
| 135 |
Notes to Financial Statements (Continued)
counterparties to timely post collateral, the risk that currency movements will not occur thereby reducing the Fund’s total return, and the potential for losses in excess of the Fund’s initial investment.
The market value of a forward foreign currency contract fluctuates with changes in foreign currency exchange rates. Forward foreign currency contracts are marked to market daily and the change in value is recorded by a Fund as an unrealized gain or loss. Realized gains or losses, equal to the difference between the value of the contract at the time it was opened and the value at the time it was closed, are recorded upon delivery or receipt of the currency.
During the year ended September 30, 2016, the Arbitrage Fund and the Merger Arbitrage Fund used forward foreign currency contracts to enhance potential gains, hedge against anticipated currency exchange rates, maintain diversity and liquidity of the portfolio and/or adjust exposure to foreign currencies.
Real Estate Investment Trusts – The Funds may invest in real estate investment trusts (“REITs”) that involve risks not associated with investing in stocks. Risks include declines in the value of real estate, general and economic conditions, changes in the value of the underlying property and defaults by borrowers. The value of assets in the real estate industry may go through cycles of relative underperformance and outperformance in comparison to equity securities markets in general. Dividend income is recorded using management’s estimate of the income included in distributions received from REIT investments. The actual amounts of income, return of capital and capital gains are only determined by each REIT after its fiscal year-end and may differ from the estimated amount. Estimates of income are adjusted in the Funds to the actual amounts when the amounts are determined.
Master Limited Partnership – The Funds may invest in Master Limited Partnership (“MLP”) common units that represent limited partnership interests in the MLP. Common units are generally listed and traded on U.S. securities exchanges or over-the-counter (“OTC”) with their value fluctuating predominantly based on the success of the MLP. Unlike owners of common stock of a corporation, owners of MLP common units have limited voting rights and have no ability to annually elect directors. MLPs generally distribute all available cash flow (cash flow from operations less maintenance capital expenditures) in the form of quarterly distributions. Common unit holders have first priority to receive quarterly cash distributions up to the minimum quarterly distribution and have arrearage rights. Distributions received from MLPs generally are comprised of income and return of capital. Investment income and return of capital are recorded based on estimates made at the time distributions are received. The actual amounts of income and return of capital are only determined by each MLP after its fiscal year-end and may differ from the estimated amount. Estimates of income are adjusted in the Funds to the actual amounts when the amounts are determined. In the event of liquidation, common unit holders have preference over subordinated units, but not debt holders or preferred unit holders, to the remaining assets of the MLP.
Pay-In-Kind (“PIK”) Bonds – PIK bonds are securities that, at the issuer’s option, pay interest in either cash or additional securities for a specified period. PIK bonds, like zero coupon bonds, are designed to give an issuer flexibility in managing cash flow. PIK bonds are expected to reflect the market value of the underlying debt plus an amount representing accrued interest since the last payment. PIK bonds are usually less volatile than zero coupon bonds, but more volatile than cash pay securities.
Derivative instruments and hedging activities — The Arbitrage Fund and the Merger Arbitrage Fund may enter into an International Swaps and Derivatives Associations, Inc. Master Agreement (“ISDA Master Agreement” or “MNA”) or similar agreement with certain counterparties. An ISDA Master Agreement is a bilateral agreement between a Fund and a counterparty that governs OTC derivatives and foreign exchange contracts, and typically contains, among other things, collateral posting terms and master netting provisions in the event of a default or termination. Under an ISDA Master Agreement, a party may, under certain circumstances, offset with the counterparty certain derivative financial instrument’s payables or receivables with collateral held or posted and
| 136 |
Notes to Financial Statements (Continued)
create one single net payment. The provisions of the ISDA Master Agreement typically permit a single net payment in the event of default (close-out netting). These default events include bankruptcy or insolvency of the counterparty. Note, however, that bankruptcy or insolvency laws of a particular jurisdiction may impose restrictions on or prohibitions against the right of offset.
When entering into a derivative transaction, a Fund may be required to post and maintain collateral or margin (including both initial and maintenance margin). Collateral and margin requirements differ by type of derivative. Margin requirements are established by the broker or clearing house for exchange traded and centrally cleared derivatives (financial futures contracts, options, and centrally cleared swaps). Brokers can ask for margining in excess of the clearing house’s minimum in certain circumstances. Collateral terms are contract specific for OTC derivatives (foreign currency exchange contracts, options, and swaps). For derivatives traded under an ISDA Master Agreement, the collateral requirements are typically calculated by netting the marked-to-market amount for each transaction under such agreement and comparing that amount to the value of any collateral currently pledged by the Fund and the counterparty. For financial reporting purposes, cash collateral that has been pledged to cover obligations of the Fund and cash collateral received from the counterparty, if any, is reported separately on the Statements of Assets and Liabilities as cash pledged as collateral and cash received as collateral, respectively. Non-cash collateral pledged by the Fund, if any, is noted in the Portfolio of Investments. To the extent amounts due to the Fund from its counterparties are not fully collateralized, contractually or otherwise, the Fund bears the risk of loss from counterparty non-performance.
Certain ISDA Master Agreements allow counterparties to OTC derivatives transactions to terminate derivative contracts prior to maturity in the event a Fund’s net assets decline by a stated percentage or the Fund fails to meet the terms of its ISDA Master Agreement, which would cause the Fund (counterparty) to accelerate payment of any net liability owed to the counterparty (Fund).
For financial reporting purposes, a Fund does not offset derivative assets and derivative liabilities that are subject to netting arrangements in the Statements of Assets and Liabilities.
As of September 30, 2016, the Arbitrage and Merger Arbitrage Funds’ assets and liabilities that were subject to a MNA on a gross basis were as follows:
| Assets | Liabilities | |||||||
| Arbitrage Fund | ||||||||
| Written Options | $ | — | $ | (64,783 | ) | |||
| Merger Arbitrage Fund | ||||||||
| Written Options | — | (73,923 | ) | |||||
| Forward Foreign Currency Contracts | 84,152 | (15,140 | ) | |||||
The following table presents the Merger Arbitrage Fund’s assets net of amounts available for offset under a MNA and net of the related collateral pledged to the Fund as of September 30, 2016:
| Gross | ||||||||||||||||||||||||
| Amount | ||||||||||||||||||||||||
| Available | ||||||||||||||||||||||||
| for Offset in | ||||||||||||||||||||||||
| Gross | Statement | Non- | ||||||||||||||||||||||
| Amount of | of Assets | Cash | Cash | |||||||||||||||||||||
| Derivative | Recognized | and | Collateral | Collateral | Net | |||||||||||||||||||
| Fund | Counterparty | Type | Assets | Liabilities | Received | Received | Amount(A) | |||||||||||||||||
| Merger Arbitrage Fund | Brown Brothers Harriman | Forward Foreign Currency Contracts | $ | 84,152 | $ | (15,140 | ) | $ | — | $ | — | $ | 69,012 | |||||||||||
(A) Net amount represents the net amount receivable from the counterparty in the event of default.
| 137 |
Notes to Financial Statements (Continued)
The following table presents the Arbitrage and Merger Arbitrage Funds’ liabilities net of amounts available for offset under MNA and of the related collateral pledged by the Fund as of September 30, 2016:
| Gross | ||||||||||||||||||||||||
| Amount | ||||||||||||||||||||||||
| Available | ||||||||||||||||||||||||
| for Offset in | ||||||||||||||||||||||||
| Gross | Statement | Non- | ||||||||||||||||||||||
| Amount of | of Assets | Cash | Cash | |||||||||||||||||||||
| Recognized | and | Collateral | Collateral | Net | ||||||||||||||||||||
| Fund | Counterparty | Derivative Type | Liabilities | Liabilities | Pledged | Pledged | Amount(A) | |||||||||||||||||
| Arbitrage Fund | Pershing LLC | Written Options | $ | 64,783 | $ | — | $ | (14,778 | ) | $ | (50,005 | ) | $ | — | ||||||||||
| Merger Arbitrage Fund | Pershing LLC | Written Options | 73,923 | — | (51,750 | ) | (22,173 | ) | — | |||||||||||||||
| Brown Brothers Harriman | Forward Foreign Currency Contracts | 15,140 | (15,140 | ) | — | — | — | |||||||||||||||||
(A) Net amount represents the net amount payable due to the counterparty in the event of default.
The following table sets forth the fair value of the Arbitrage and Merger Arbitrage Funds’ derivative financial instruments by primary risk exposure as of September 30, 2016:
| Fair Value of Derivative Investments | ||||||||||
| As of September 30, 2016 | ||||||||||
| Derivatives not accounted for as hedging | Asset | Liability | ||||||||
| Fund | instruments under ASC 815 | Derivatives | Derivatives | |||||||
| Arbitrage Fund | Purchased Options-Equity Contracts* | $ | 45,445 | $ | — | |||||
| Written Options-Equity Contracts** | — | (64,783 | ) | |||||||
| Forward Foreign Currency Contracts*** | 80,668 | (11,839 | ) | |||||||
| Merger Arbitrage Fund | Purchased Options- Equity contracts* | 57,858 | — | |||||||
| Written Options-Equity Contracts** | — | (73,923 | ) | |||||||
| Forward Foreign Currency Contracts*** | 84,152 | (15,140 | ) | |||||||
* Statements of Assets and Liabilities Location: Investments, at market value.
** Statements of Assets and Liabilities Location: Written options, at market value.
*** Statements of Assets and Liabilities Location: Unrealized appreciation on forward foreign currency contracts and Unrealized depreciation on forward foreign currency contracts, respectively.
The following table sets forth the effect of the Funds’ derivative financial instruments by primary risk exposure on the Statements of Operations for the year ended September 30, 2016:
| The Effect of Derivative Investments on the Statement of Operations | ||||||||||
| For the Year Ended September 30, 2016 | ||||||||||
| Change in | ||||||||||
| Unrealized | ||||||||||
| Realized Gain | Appreciation | |||||||||
| Derivatives not accounted for as hedging | (Loss) | (Depreciation) | ||||||||
| Fund | instruments under ASC 815 | on Derivatives | on Derivatives | |||||||
| Arbitrage Fund | Purchased Options-Equity Contracts* | $ | (209,597 | ) | $ | 198,893 | ||||
| Written Options-Equity Contracts** | 397,435 | 350,312 | ||||||||
| Forward Foreign Currency Contracts*** | 647,555 | 68,829 | ||||||||
| Merger Arbitrage Fund | Purchased Options-Equity Contracts* | (348,638 | ) | 361,638 | ||||||
| Written Options-Equity Contracts** | 612,699 | 611,306 | ||||||||
| Forward Foreign Currency Contracts*** | 676,830 | 69,012 | ||||||||
* Statements of Operations Location: Net realized gains (losses) on investments and net change in unrealized appreciation (depreciation) on investments, respectively.
| 138 |
Notes to Financial Statements (Continued)
** Statements of Operations Location: Net realized gains on written options and net change in unrealized appreciation (depreciation) on written options, respectively.
*** Statements of Operations Location: Net realized gains on foreign currency transactions and net change in unrealized appreciation (depreciation) on foreign currency transactions, respectively.
For the year ended September 30, 2016, the average quarterly balances of outstanding derivative financial instruments was as follows:
| Merger | ||||||||
| Arbitrage | Arbitrage | |||||||
| Fund | Fund | |||||||
| Equity contracts: | ||||||||
| Purchased Options - Cost | $ | 151,526 | $ | 255,127 | ||||
| Written Options - Premiums received | $ | 100,783 | $ | 165,463 | ||||
| Forward foreign currency contracts: | ||||||||
| Average number of contracts | 2 | 2 | ||||||
| Average U.S. dollar amount sold | $ | 4,778,072 | $ | 5,358,723 | ||||
Portfolio securities loaned — The Funds may lend their portfolio securities. Lending portfolio securities exposes the Funds to the risk that the borrower may fail to return the loaned securities or may not be able to provide additional collateral or that the Funds may experience delays in recovery of the loaned securities or loss of rights in the collateral if the borrower fails financially. To minimize these risks, the borrower must agree to maintain cash collateral with the Funds’ custodian. The loaned securities are secured by collateral valued at least equal, at all times, to the market value of the loaned securities plus accrued interest, if any. When the collateral falls below specified amounts, the lending agent will use its best effort to obtain additional collateral on the next business day to meet required amounts under the security lending agreement. The cash collateral is reinvested by the Funds’ custodian into an approved investment vehicle. The approved investment vehicle is subject to market risk.
As of September 30, 2016, the following Funds loaned securities and received collateral as follows:
| Market | Market | |||||||||||||
| Value of | Value of | |||||||||||||
| Securities | Collateral | |||||||||||||
| Fund | Security Type | Loaned* | Received** | Net Amount | ||||||||||
| Arbitrage Fund | Corporate Bonds | $ | 158,488 | $ | 164,688 | $ | 6,200 | |||||||
| Emerging Markets Small Cap Fund | Common Stocks | 110,216 | 118,751 | 8,535 | ||||||||||
| Mid Cap Fund | Common Stocks | 41,122,934 | 41,064,072 | (58,862 | ) | |||||||||
| Mid Cap Value Fund | Common Stocks | 6,851,937 | 6,925,787 | 73,850 | ||||||||||
| Sands Capital Select Growth Fund | Common Stocks | 100,594,535 | 101,299,820 | 705,285 | ||||||||||
| Small Cap Fund | Common Stocks | 67,507,093 | 67,474,423 | (32,670 | ) | |||||||||
| Small Cap Value Fund | Common Stocks | 103,783 | 98,825 | (4,958 | ) | |||||||||
* The remaining contractual maturity is overnight for all securities.
** Gross amount of recognized liabilities for securities lending is included in the Statements of Assets and Liabilities.
All cash collateral is received, held, and administered by the Funds’ custodian for the benefit of the lending Fund in its custody account or other account established for the purpose of holding collateral.
Funds participating in securities lending receive compensation in the form of fees. Securities lending income is derived from lending long securities from the Funds to creditworthy approved borrowers at rates that are determined based on daily trading volumes, float, short-term interest rates and market liquidity. When a Fund lends securities, it retains the interest or dividends on the investment of any cash received as collateral, and the Fund continues to receive interest or dividends on the loaned securities.
| 139 |
Notes to Financial Statements (Continued)
Unrealized gain or loss on the market value of the loaned securities that may occur during the term of the loan is recognized by the Fund. The Fund has the right under the lending agreement to recover any loaned securities from the borrower on demand.
When-issued or delayed delivery transactions — Each Fund may purchase or sell securities on a when-issued or delayed delivery basis. These transactions involve a commitment by the Fund to purchase or sell securities for a predetermined price or yield, with payment and delivery taking place beyond the customary settlement period. When delayed delivery purchases are outstanding, the Fund will set aside liquid assets in an amount sufficient to meet the purchase price. When purchasing a security on a delayed delivery basis, the Fund assumes the rights and risks of ownership of the security, including the risk of price and yield fluctuations, and takes such fluctuations into account when determining NAV. The Fund may dispose of or renegotiate a delayed delivery transaction after it is entered into, and may sell when-issued securities before they are delivered, which may result in a capital gain or loss. When the Fund has sold a security on a delayed delivery basis, the Fund does not participate in future gains and losses with respect to the security.
Share valuation — The NAV per share of each class of shares of each Fund is calculated daily by dividing the total value of a Fund’s assets attributable to that class, less liabilities attributable to that class, by the number of outstanding shares of that class.
The maximum offering price per share of Class A shares of the Funds (except the Total Return Bond Fund and Ultra Short Duration Fixed Income Fund) is equal to the NAV per share plus a sales load equal to 6.10% of the NAV (or 5.75% of the offering price). The maximum offering price per share of Class A shares of the Total Return Bond Fund is equal to the NAV per share plus a sales load equal to 4.99% of the NAV (or 4.75% of the offering price). The maximum offering price per share of Class A shares of the Ultra Short Duration Fixed Income Fund is equal to the NAV per share plus sales load equal to 2.04% of the NAV (or 2.00% of the offering price). There is no sales load on purchases of $1 million or more of Class A shares. The maximum offering price per share of Classes C, Y, Z, and Institutional Class shares of the Funds is equal to the NAV per share.
The redemption price per share of each class of shares of the Funds is generally equal to the NAV per share. However, Class A redemptions that were part of a no-load $1 million subscription may be subject to a contingent deferred sales charge (“CDSC”) of up to 1.00% if redeemed within a one-year period from the date of purchase. Additionally, purchases of Class C shares of the Funds are subject to a CDSC of 1.00%. The CDSC will be assessed on an amount equal to the lesser of (1) the NAV at the time of purchase of the shares being redeemed or (2) the NAV of such shares being redeemed, if redeemed within a one-year period from the date of purchase.
Investment income — Dividend income from securities is recognized on the ex-dividend date, net of foreign withholding taxes, if any, which are reduced by any amounts reclaimable by the Funds, where applicable. Interest income from securities is recorded on the basis of interest accrued, premium amortized and discount accreted. Realized gains and losses resulting from principal paydowns on mortgage-backed and asset-backed securities are included in interest income. Market discounts, original issue discount (“OID”) and market premiums on debt securities are accreted/amortized to interest income over the life of the security with a corresponding adjustment in the cost basis of that security. In addition, it is the Funds’ policy to accrue for foreign capital gains taxes, if applicable, on certain foreign securities held by the Funds. An estimated foreign capital gains tax is recorded daily on net unrealized gains on these securities and is payable upon the sale of such securities when a gain is realized.
Distributions to shareholders — Each Fund intends to distribute to its shareholders substantially all of its income and capital gains. The Arbitrage Fund, Emerging Markets Small Cap Fund, Merger Arbitrage Fund, Mid Cap Fund, and Small Cap Fund distribute their income, if any, annually, as a dividend to shareholders. The Mid Cap Value Fund, Sands Capital Select Growth Fund, and Small Cap Value Fund declare and distribute
| 140 |
Notes to Financial Statements (Continued)
their income, if any, quarterly, as a dividend to shareholders. The Premium Yield Equity Fund and Total Return Bond Fund declare and distribute their income, if any, monthly, as a dividend to shareholders. The Ultra Short Duration Fixed Income Fund declares its income, if any, daily, and distributes such income monthly, as a dividend to shareholders. Each Fund makes distributions of capital gains, if any, at least annually, net of applicable capital loss carryforwards. Income distributions and capital gain distributions are determined in accordance with income tax regulations. Recognition of the Funds’ net investment income from investments in Underlying Funds is affected by the timing of dividend declarations by the Underlying Funds.
Allocations — Investment income earned, realized capital gains and losses, and unrealized appreciation and depreciation for a Fund are allocated daily to each class of shares based upon its proportionate share of total net assets of the Fund. Class-specific expenses are charged directly to the class incurring the expense. Common expenses, which are not attributable to a specific class, are allocated daily to each class of shares based upon their proportionate share of total net assets of the Fund. Expenses not directly billed to a Fund are allocated proportionally among all the Funds in theTrust, and, if applicable,Touchstone Institutional FundsTrust,Touchstone Investment Trust, Touchstone Strategic Trust, Touchstone Tax-Free Trust, and Touchstone Variable Series Trust (collectively with theTrust, “Touchstone Fund Complex”), daily in relation to net assets of each Fund or another reasonable measure.
Security transactions — Security transactions are reflected for financial reporting purposes as of the trade date. Realized gains and losses on sales of portfolio securities are calculated using the identified cost basis.
Estimates — The preparation of financial statements in conformity with U.S. GAAP requires management to make estimates and assumptions that affect the reported amounts of assets and liabilities and disclosure of contingent assets and liabilities at the date of the financial statements and the reported amounts of income and expenses during the reporting period. Actual results could differ from those estimates.
3. Investment Transactions
Investment transactions (excluding short-term investments and U.S. Government securities) were as follows for the year ended September 30, 2016:
| Emerging | Merger | |||||||||||||||
| Arbitrage | Markets Small | Arbitrage | Mid Cap | |||||||||||||
| Fund | Cap Fund | Fund | Fund | |||||||||||||
| Purchases of investment securities | $ | 544,142,068 | $ | 30,284,805 | $ | 637,136,113 | $ | 135,109,326 | ||||||||
| Proceeds from sales and maturities | $ | 528,287,044 | $ | 288,485,275 | $ | 656,093,321 | $ | 230,919,569 | ||||||||
| Mid Cap | Premium Yield | Sands Capital | ||||||||||||||
| Value | Equity | Select Growth | Small Cap | |||||||||||||
| Fund | Fund | Fund | Fund | |||||||||||||
| Purchases of investment securities | $ | 274,433,362 | $ | 55,778,434 | $ | 1,846,501,973 | $ | 106,994,519 | ||||||||
| Proceeds from sales and maturities | $ | 170,165,585 | $ | 96,706,489 | $ | 3,769,491,260 | $ | 251,631,950 | ||||||||
| Small Cap | Total Return | Ultra Short | ||||||||||||||
| Value | Bond | Duration Fixed | ||||||||||||||
| Fund | Fund | Income Fund | ||||||||||||||
| Purchases of investment securities | $ | 235,605,019 | $ | 55,042,567 | $ | 735,849,353 | ||||||||||
| Proceeds from sales and maturities | $ | 123,608,731 | $ | 16,138,579 | $ | 694,114,368 | ||||||||||
For the year ended September 30, 2016, purchases and proceeds from sales and maturities in U.S. Government Securities were $13,602,878 and $6,463,561, respectively, for the Total Return Bond Fund and $93,490,437 and $95,951,420, respectively, for the Ultra Short Duration Fixed Income Fund.
| 141 |
Notes to Financial Statements (Continued)
4. Transactions with Affiliates and Other Related Parties
Certain officers of the Trust are also officers of Touchstone Advisors, Inc. (the “Advisor”), Touchstone Securities, Inc. (the “Underwriter”), or BNY Mellon Investment Servicing (U.S.) Inc. (“BNY Mellon”), the Sub-Administrator and Transfer Agent to the Funds. Such officers receive no compensation from the Trust. The Advisor and the Underwriter are each wholly-owned, indirect subsidiaries of Western & Southern Financial Group, Inc. (“Western & Southern”).
On behalf of the Funds, the Advisor pays each Independent Trustee a quarterly retainer plus additional retainers to the Lead Independent Trustee and the chairs of each standing committee. Interested Trustees do not receive compensation from the Funds. Each Independent Trustee also receives compensation for each board meeting and committee meeting attended. Each standing committee chair receives additional compensation for each committee meeting that he or she oversees. The Advisor is reimbursed by the Funds for the Independent Trustees’ compensation and out-of-pocket expenses relating to their services. The Funds accrued Trustee-related expenses of $179,179 for the year ended September 30, 2016.
MANAGEMENT & EXPENSE LIMITATION AGREEMENTS
The Advisor provides general investment supervisory services for the Funds, under terms of an advisory agreement (the “Advisory Agreement”). Under the Advisory Agreement, each Fund pays the Advisor a fee, which is computed and accrued daily and paid monthly, at an annual rate based on average daily net assets of each Fund as shown in the table below.
| Arbitrage Fund | 1.05% on the first $500 million |
| 1.00% on the next $500 million | |
| 0.95% on such assets over $1 billion | |
| Emerging Markets Small Cap Fund | 1.05% on the first $200 million |
| 1.00% on the next $200 million | |
| 0.90% on such assets over $400 million | |
| Merger Arbitrage Fund | 1.05% |
| Mid Cap Fund | 0.80% on the first $500 million |
| 0.75% on the next $500 million | |
| 0.70% on such assets over $1 billion | |
| Mid Cap Value Fund | 0.85% on the first $100 million |
| 0.80% on the next $300 million | |
| 0.75% on such assets over $400 million | |
| Premium Yield Equity Fund | 0.70% on the first $100 million |
| 0.65% on such assets over $100 million | |
| Sands Capital Select Growth Fund | 0.85% on the first $1 billion |
| 0.80% on the next $500 million | |
| 0.75% on the next $500 million | |
| 0.70% on such assets over $2 billion | |
| Small Cap Fund | 0.85% |
| Small Cap Value Fund | 0.90% |
| Total Return Bond Fund | 0.35% |
| Ultra Short Duration Fixed Income Fund | 0.25% |
In addition to the base advisory fee shown above for the Sands Capital Select Growth Fund, a performance fee adjustment will be added to or subtracted from the base advisory fee depending on the performance of the Fund in relation to the investment performance of the Fund’s benchmark index, for the preceding twelve month period, as follows:
| 142 |
Notes to Financial Statements (Continued)
| Annual | Highest / Lowest | |||||||||||
| Benchmark | Benchmark | Adjustment | Possible Advisory | |||||||||
| Index | Threshold | Rate | Fee | |||||||||
| Sands Capital Select Growth Fund | Russell1000® Growth Index | +/-2.50% | +/-0.15% | 1.00% / 0.55% | ||||||||
For the year ended September 30, 2016, the Advisor’s base fee was decreased by $7,518,953 as a result of the performance fee adjustment.
The Advisor has entered into investment sub-advisory agreements with the following parties (each, a “Sub-Advisor”):
| Copper Rock Capital Partners LLC | The London Company |
| Emerging Markets Small Cap Fund* | Mid Cap Fund |
| Small Cap Fund | |
| EARNEST Partners LLC | |
| Total Return Bond Fund | Longfellow Investment Management Co. |
| Arbitrage Fund | |
| Fort Washington Investment Advisors, Inc.** | Merger Arbitrage Fund |
| Ultra Short Duration Fixed Income Fund | |
| Miller/Howard Investments, Inc. | |
| Premium Yield Equity Fund | |
| LMCG Investments, LLC | |
| Mid Cap Value Fund | Sands Capital Management, LLC |
| Small Cap Value Fund*** | Sands Capital Select Growth Fund |
*Effective April 19, 2016, Copper Rock Capital Partners LLC became the sub-advisor of the Emerging Markets Small Cap Fund; for the period February 20, 2016 through April 18, 2016, Russell Implementation Services, Inc. was the interim sub-advisor; prior to February 20, 2016, AGF Investments America, Inc. was the sub-advisor.
**Affiliate of the Advisor and wholly-owned indirect subsidiary of Western & Southern.
***Effective July 1, 2016, LMCG Investments, Inc. became the sub-advisor for the Small Cap Value Fund; for the period May 20, 2016 through June 30, 2016, Russell Implementation Services, Inc was the interim sub-advisor of the Small Cap Value Fund; prior to May 20, 2016, DePrince, Race & Zollo, Inc was the sub-advisor.
The Advisor, not the Funds, pays sub-advisory fees to each Sub-Advisor.
The Advisor entered into an expense limitation agreement (the “Expense Limitation Agreement”) to contractually limit the annual operating expenses of the Funds, excluding: dividend and interest expenses relating to short sales; interest; taxes; brokerage commissions and other transaction costs; portfolio transactions and investment related expenses; other expenditures which are capitalized in accordance with U.S. GAAP; the cost of “Acquired Fund Fees and Expenses”, if any; and other extraordinary expenses not incurred in the ordinary course of business. The maximum annual operating expense limit in any year with respect to the Funds is based on a percentage of the average daily net assets of the Funds. The Advisor has agreed to separately waive class-level expenses, advisory fees and administration fees, and to reimburse expenses in order to maintain the following expense limitations for the Funds:
| 143 |
Notes to Financial Statements (Continued)
| Institutional | ||||||||||||||||||||
| Class A | Class C | Class Y | Class Z | Class | ||||||||||||||||
| Arbitrage Fund | 1.68 | % | 2.43 | % | 1.43 | % | — | 1.28 | % | |||||||||||
| Emerging Markets Small Cap Fund | 1.69 | % | 2.44 | % | 1.44 | % | — | 1.29 | % | |||||||||||
| Merger Arbitrage Fund | 1.68 | % | 2.43 | % | 1.43 | % | — | 1.28 | % | |||||||||||
| Mid Cap Fund | 1.24 | % | 1.99 | % | 0.99 | % | 1.24 | % | 0.92 | % | ||||||||||
| Mid Cap Value Fund* | 1.27 | % | 2.02 | % | 1.02 | % | — | 0.89 | % | |||||||||||
| Premium Yield Equity Fund | 1.20 | % | 1.95 | % | 0.95 | % | — | — | ||||||||||||
| Sands Capital Select Growth Fund | 0.25 | % | 0.25 | % | 0.25 | % | 0.25 | % | — | |||||||||||
| Small Cap Fund | 1.38 | % | 2.13 | % | 1.13 | % | — | 1.05 | % | |||||||||||
| Small Cap Value Fund | 1.38 | % | 2.13 | % | 1.13 | % | — | 0.98 | % | |||||||||||
| Total Return Bond Fund** | 0.85 | % | 1.60 | % | 0.60 | % | — | 0.50 | % | |||||||||||
| Ultra Short Duration Fixed Income Fund | 0.69 | % | 1.19 | % | 0.44 | % | 0.69 | % | 0.39 | % | ||||||||||
*Prior to January 29, 2016, the expense limitation for Classes A, C and Y shares were 1.29%, 2.04% and 1.04%, respectively.
**Prior to January 29, 2016, the expense limitation for Classes A, C and Y shares were 0.90%, 1.65% and 0.65%, respectively.
The Expense Limitation Agreement for Sands Capital Select Growth Fund limits other operating expenses to 0.25% for all classes of the Fund. Other operating expenses include all operating expenses of the fund except for investment advisory fees, administration fees, performance fees, distribution fees (12b-1), shareholder service fees and any expenses excluded in the Expense Limitation Agreement.
These expense limitations will remain in effect for all Funds through at least January 29, 2017, except for Emerging Markets Small Cap Fund which will remain in effect through April 18, 2017, but can be terminated by a vote of the Board of Trustees of the Trust if it deems the termination to be beneficial to the Funds’ shareholders.
During the year ended September 30, 2016, the Advisor or its affiliates waived investment advisory fees and administration fees or reimbursed expenses, including distribution fees of the Funds, as follows:
| Other | ||||||||||||||||
| Investment | Operating | |||||||||||||||
| Advisory | Administration | Expenses | ||||||||||||||
| Fees | Fees | Reimbursed/ | ||||||||||||||
| Waived | Waived | Waived | Total | |||||||||||||
| Arbitrage Fund | $ | — | $ | — | $ | 35,383 | $ | 35,383 | ||||||||
| Emerging Markets Small Cap Fund | 233,392 | 56,131 | 81,957 | 371,480 | ||||||||||||
| Merger Arbitrage Fund | — | — | 8,474 | 8,474 | ||||||||||||
| Mid Cap Fund | — | 211,004 | 446,756 | 657,760 | ||||||||||||
| Mid Cap Value Fund | — | 361,662 | 115,047 | 476,709 | ||||||||||||
| Premium Yield Equity Fund | — | — | 138,887 | 138,887 | ||||||||||||
| Sands Capital Select Growth Fund | — | — | 831,974 | 831,974 | ||||||||||||
| Small Cap Fund | — | — | 92,604 | 92,604 | ||||||||||||
| Small Cap Value Fund | 14,920 | 110,483 | 109,060 | 234,463 | ||||||||||||
| Total Return Bond Fund | — | 89,984 | 145,068 | 235,052 | ||||||||||||
| Ultra Short Duration Fixed Income Fund | — | 239,253 | 313,746 | 552,999 | ||||||||||||
Under the terms of the Expense Limitation Agreement, the Advisor is entitled to recover, subject to approval by the Funds’ Board, such amounts waived or reimbursed for a period of up to three years from the year in which the Advisor reduced its compensation or assumed expenses for the Funds. No recoupment will occur unless a Fund’s operating expenses are below the expense limitation amount in effect at the time of the waiver or reimbursement.
| 144 |
Notes to Financial Statements (Continued)
As of September 30, 2016, the Advisor may seek recoupment of previously waived fees and reimbursed expenses as follows:
| Expiration | Expiration | Expiration | ||||||||||||||
| Fund | September 30, 2017 | September 30, 2018 | September 30, 2019 | Total | ||||||||||||
| Arbitrage Fund | $ | 1,355 | $ | 2,350 | $ | 8,272 | $ | 11,977 | ||||||||
| Emerging Markets Small Cap Fund | 67,176 | 117,715 | 353,948 | 538,839 | ||||||||||||
| Mid Cap Fund | 380,034 | 632,713 | 545,460 | 1,558,207 | ||||||||||||
| Mid Cap Value Fund | 328,349 | 411,352 | 438,591 | 1,178,292 | ||||||||||||
| Premium Yield Equity Fund | 10,470 | 28,340 | 71,385 | 110,195 | ||||||||||||
| Sands Capital Select Growth Fund | 1,033,092 | 946,969 | 831,974 | 2,812,035 | ||||||||||||
| Small Cap Fund | 243,573 | — | 38,604 | 282,177 | ||||||||||||
| Small Cap Value Fund | 148,793 | 144,541 | 159,191 | 452,525 | ||||||||||||
| Total Return Bond Fund | 143,600 | 170,094 | 206,835 | 520,529 | ||||||||||||
| Ultra Short Duration Fixed Income Fund | 456,994 | 465,366 | 500,874 | 1,423,234 | ||||||||||||
The Advisor did not recoup any amounts it previously waived or reimbursed during the year ended September 30, 2016.
ADMINISTRATION AGREEMENT
The Advisor entered into an Administration Agreement with the Trust, whereby the Advisor is responsible for supplying executive and regulatory compliance services; supervising the preparation of tax returns; coordinating the preparation of reports to shareholders and reports to, and filings with the Securities and Exchange Commission (the “SEC”) and state securities authorities, as well as materials for meetings of the Board; calculating the daily NAV per share; and maintaining the financial books and records of each Fund.
For its services, the Advisor’s annual administrative fee is:
0.145% on the first $20 billion of the aggregate average daily net assets;
0.11% on the next $10 billion of aggregate average daily net assets;
0.09% on the next $10 billion of aggregate average daily net assets; and
0.07% on the aggregate average daily net assets over $40 billion.
The fee is computed and allocated among the Touchstone Fund Complex (excluding Touchstone Institutional Funds Trust) on the basis of relative daily net assets.
The Advisor has engaged BNY Mellon as the Sub-Administrator to theTrust. BNY Mellon provides administrative and accounting services to the Trust and is compensated directly by the Advisor, not the Trust.
TRANSFER AGENT AGREEMENT
Under the terms of the Transfer Agent Agreement between the Trust and BNY Mellon, BNY Mellon maintains the records of each shareholder’s account, answers shareholders’ inquiries concerning their accounts, processes purchases and redemptions of each Fund’s shares, acts as dividend and distribution disbursing agent, and performs other shareholder service functions. For these services, BNY Mellon receives a monthly fee from each Fund. In addition, each Fund pays out-of-pocket expenses incurred by BNY Mellon, including, but not limited to, postage and supplies.
The Funds may reimburse the Advisor for fees paid to intermediaries such as banks, broker-dealers, financial advisors or other financial institutions for sub-transfer agency, sub-administration and other services provided to investors whose shares of record are held in omnibus, other group accounts, retirement plans or accounts traded through registered securities clearing agents. These fees may vary based on, for example, the nature of
| 145 |
Notes to Financial Statements (Continued)
services provided, but generally range up to 0.15% of the assets of the class serviced or maintained by the intermediary or up to $22 per sub-account maintained by the intermediary.
PLANS OF DISTRIBUTION AND SHAREHOLDER SERVICING FEE ARRANGEMENTS
The Trust has adopted distribution plans pursuant to Rule 12b-1 under the 1940 Act for each class of shares it offers that is subject to 12b-1 distribution fees. The plans allow each Fund to pay distribution and other fees for the sale and distribution of its shares and for services provided to shareholders. The fees charged to the Funds are limited to the actual expenses incurred. Under the Class A plan, each Fund offering Class A shares pays an annual fee of up to 0.25% of average daily net assets that are attributable to Class A shares. Under the Class C plan, each Fund (except the Ultra Short Duration Fixed Income Fund) pays an annual fee of up to 1.00% of average daily net assets that are attributable to Class C shares (of which up to 0.75% is a distribution fee and up to 0.25% is a shareholder servicing fee). The Ultra Short Duration Fixed Income Fund has limited the amount of the 12b-1 fees for Class C shares to 0.75% of average daily net assets through January 29, 2017. Under the Class Z plan, each Fund offering Class Z shares pays an annual shareholder servicing fee of up to 0.25% of average daily net assets that are attributed to Class Z shares.
UNDERWRITING AGREEMENT
The Underwriter is the Funds’ principal underwriter and, as such, acts as exclusive agent for distribution of the Funds’ shares. Under the terms of the Underwriting Agreement between the Trust and the Underwriter, the Underwriter earned underwriting and broker commissions on the sale of Class A shares of the Funds. W&S Brokerage Services, Inc., an affiliate of the Underwriter and the Advisor, also earned broker commissions on the sale of Class A shares of the Funds. Listed below are the total underwriting and broker commissions earned by the Underwriter and its affiliate during the year ended September 30, 2016:
| Fund | Amount | |||
| Arbitrage Fund | $ | 4,183 | ||
| Emerging Markets Small Cap Fund | 1,834 | |||
| Merger Arbitrage Fund | 124 | |||
| Mid Cap Fund | 18,210 | |||
| Mid Cap Value Fund | 6,284 | |||
| Premium Yield Equity Fund | 5,448 | |||
| Sands Capital Select Growth Fund | 6,021 | |||
| Small Cap Fund | 2,045 | |||
| Small Cap Value Fund | 1,661 | |||
| Total Return Bond Fund | 2,545 | |||
| Ultra Short Duration Fixed Income Fund | 1,139 | |||
In addition, the Underwriter collected CDSC on the redemption of Class C shares of the Funds listed below during the year ended September 30, 2016:
| Fund | Amount | |||
| Emerging Markets Small Cap Fund | $ | 2 | ||
| Mid Cap Fund | 1,992 | |||
| Mid Cap Value Fund | 390 | |||
| Premium Yield Equity Fund | 133 | |||
| Sands Capital Select Growth Fund | 721 | |||
| Small Cap Fund | 130 | |||
| Total Return Bond Fund | 39 | |||
| Ultra Short Duration Fixed Income Fund | 306 | |||
| 146 |
Notes to Financial Statements (Continued)
INTERFUND TRANSACTIONS
The Funds may engage in purchase and sale transactions with funds that have a common investment advisor (or affiliated investment advisors), common Trustees and/or common Officers. During the year ended September 30, 2016 the Funds did not engage in any Rule 17a-7 transactions under the 1940 Act.
5. Federal Tax Information
Federal income tax — It is each Fund’s policy to continue to comply with the special provisions of the Internal Revenue Code applicable to regulated investment companies. As provided therein, in any fiscal year in which a Fund so qualifies and distributes at least 90% of its investment company taxable income, the Fund (but not the shareholders) will be relieved of federal income tax on the income distributed. It is each Fund’s policy to distribute all of its taxable income and accordingly, no provision for income taxes has been made.
In order to avoid imposition of the excise tax applicable to regulated investment companies, it is also each Fund’s intention to declare and pay as dividends in each calendar year at least 98% of its investment company taxable income (earned during the calendar year) and 98.2% of its net realized capital gains (earned during the twelve months ending October 31) plus undistributed amounts from prior years.
The tax character of distributions paid for the years ended September 30, 2016 and 2015 are as follows:
| Arbitrage | Emerging Markets | |||||||||||||||
| Fund | Small Cap Fund | |||||||||||||||
| Year Ended | Year Ended | Year Ended | Year Ended | |||||||||||||
| September 30, | September 30, | September 30, | September 30, | |||||||||||||
| 2016 | 2015 | 2016 | 2015 | |||||||||||||
| From ordinary income | $ | 1,713,725 | $ | — | $ | 2,618,763 | $ | 3,401,511 | ||||||||
| From long-term capital gains | 342,591 | 288,475 | — | — | ||||||||||||
| Total distributions | $ | 2,056,316 | $ | 288,475 | $ | 2,618,763 | $ | 3,401,511 | ||||||||
| Merger Arbitrage | Mid Cap | Mid Cap | ||||||||||||||||||||||
| Fund | Fund | Value Fund | ||||||||||||||||||||||
| Year Ended | Year Ended | Year Ended | Year Ended | Year Ended | Year Ended | |||||||||||||||||||
| September 30, | September 30, | September 30, | September 30, | September 30, | September 30, | |||||||||||||||||||
| 2016 | 2015 | 2016 | 2015 | 2016 | 2015 | |||||||||||||||||||
| From ordinary income | $ | — | $ | — | $ | 365,264 | $ | 868,044 | $ | 7,115,657 | $ | 11,660,373 | ||||||||||||
| From long-term capital gains | — | 1,566,064 | — | — | 16,030,101 | 4,873,774 | ||||||||||||||||||
| Total distributions | $ | — | $ | 1,566,064 | $ | 365,264 | $ | 868,044 | $ | 23,145,758 | $ | 16,534,147 | ||||||||||||
| Premium Yield | Sands Capital | Small Cap | ||||||||||||||||||||||
| Equity Fund | Select Growth Fund | Fund | ||||||||||||||||||||||
| Year Ended | Year Ended | Year Ended | Year Ended | Year Ended | Year Ended | |||||||||||||||||||
| September 30, | September 30, | September 30, | September 30, | September 30, | September 30, | |||||||||||||||||||
| 2016 | 2015 | 2016 | 2015 | 2016 | 2015 | |||||||||||||||||||
| From ordinary income | $ | 3,858,988 | $ | 5,326,219 | $ | — | $ | — | $ | 13,028,179 | $ | 4,878,943 | ||||||||||||
| From long-term capital gains | 10,256,568 | 8,901,766 | 425,346,962 | 297,931,608 | 65,017,255 | 55,124,275 | ||||||||||||||||||
| Total distributions | $ | 14,115,556 | $ | 14,227,985 | $ | 425,346,962 | $ | 297,931,608 | $ | 78,045,434 | $ | 60,003,218 | ||||||||||||
| Small Cap | Total Return | Ultra Short Duration | ||||||||||||||||||||||
| Value Fund | Bond Fund | Fixed Income Fund | ||||||||||||||||||||||
| Year Ended | Year Ended | Year Ended | Year Ended | Year Ended | Year Ended | |||||||||||||||||||
| September 30, | September 30, | September 30, | September 30, | September 30, | September 30, | |||||||||||||||||||
| 2016 | 2015 | 2016 | 2015 | 2016 | 2015 | |||||||||||||||||||
| From ordinary income | $ | 911,469 | $ | 1,186,997 | $ | 6,010,128 | $ | 5,107,573 | $ | 8,481,610 | $ | 8,549,313 | ||||||||||||
| From long-term capital gains | 1,833,117 | 2,819,183 | — | — | — | — | ||||||||||||||||||
| Total distributions | $ | 2,744,586 | $ | 4,006,180 | $ | 6,010,128 | $ | 5,107,573 | $ | 8,481,610 | $ | 8,549,313 | ||||||||||||
| 147 |
Notes to Financial Statements (Continued)
The following information is computed on a tax basis for each item as of September 30, 2016:
| Emerging | ||||||||||||
| Arbitrage | Markets Small Cap | Merger | ||||||||||
| Fund | Fund | Arbitrage Fund | ||||||||||
| Tax cost of portfolio investments | $ | 162,328,926 | $ | 8,272,903 | $ | 227,009,421 | ||||||
| Gross unrealized appreciation | 2,204,801 | 995,230 | 2,491,670 | |||||||||
| Gross unrealized depreciation | (2,209,633 | ) | (307,448 | ) | (2,298,634 | ) | ||||||
| Net unrealized appreciation (depreciation) on investments | (4,832 | ) | 687,782 | 193,036 | ||||||||
| Net unrealized appreciation (depreciation) on written options | 28,553 | — | 46,313 | |||||||||
| Net unrealized appreciation (depreciation) on securities sold short | (1,091,308 | ) | — | (1,230,037 | ) | |||||||
| Net unrealized appreciation (depreciation) on foreign currency transactions | 1 | 474 | 1 | |||||||||
| Net unrealized appreciation (depreciation) on deferred foreign capital gains tax | — | (18,178 | ) | — | ||||||||
| Capital loss carryforwards | — | (99,241,130 | ) | — | ||||||||
| Qualified late-year losses | — | (66,198 | ) | — | ||||||||
| Other temporary differences | (13,490 | ) | (3,713 | ) | (12,633 | ) | ||||||
| Undistributed ordinary income | 4,714,199 | — | 5,268,474 | |||||||||
| Accumulated earnings (deficit) | $ | 3,633,123 | $ | (98,640,963 | ) | $ | 4,265,154 | |||||
| Premium | Sands Capital | |||||||||||||||
| Mid Cap Value | Yield Equity | Select Growth | ||||||||||||||
| Mid Cap Fund | Fund | Fund | Fund | |||||||||||||
| Tax cost of portfolio investments | $ | 657,835,509 | $ | 472,776,051 | $ | 138,757,428 | $ | 2,022,299,967 | ||||||||
| Gross unrealized appreciation | 94,073,069 | 70,893,056 | 18,841,775 | 1,431,620,681 | ||||||||||||
| Gross unrealized depreciation | (26,085,288 | ) | (18,171,420 | ) | (5,153,607 | ) | (51,322,448 | ) | ||||||||
| Net unrealized appreciation (depreciation) on investments | 67,987,781 | 52,721,636 | 13,688,168 | 1,380,298,233 | ||||||||||||
| Capital loss carryforwards | (106,032,326 | ) | — | — | — | |||||||||||
| Qualified late-year losses | (55,942 | ) | — | (3,305,816 | ) | (17,640,732 | ) | |||||||||
| Undistributed ordinary income | 3,651,860 | 3,483,049 | 64,255 | — | ||||||||||||
| Undistributed capital gains | — | 11,800,879 | — | 348,471,060 | ||||||||||||
| Accumulated earnings (deficit) | $ | (34,448,627 | ) | $ | 68,005,564 | $ | 10,446,607 | $ | 1,711,128,561 | |||||||
| Ultra Short | ||||||||||||||||
| Total | Duration | |||||||||||||||
| Small Cap | Small Cap Value | Return Bond | Fixed Income | |||||||||||||
| Fund | Fund | Fund | Fund | |||||||||||||
| Tax cost of portfolio investments | $ | 531,357,222 | $ | 174,277,033 | $ | 230,101,183 | $ | 613,474,105 | ||||||||
| Gross unrealized appreciation | 147,178,237 | 8,266,433 | 7,286,062 | 1,862,911 | ||||||||||||
| Gross unrealized depreciation | (14,860,487 | ) | (6,464,459 | ) | (2,326,633 | ) | (3,328,414 | ) | ||||||||
| Net unrealized appreciation (depreciation) on investments | 132,317,750 | 1,801,974 | 4,959,429 | (1,465,503 | ) | |||||||||||
| Capital loss carryforwards | (59,997,483 | ) | (11,364,620 | ) | (2,249,616 | ) | (25,133,305 | ) | ||||||||
| Undistributed ordinary income | 1,744,841 | 39,218 | 138,900 | 398,512 | ||||||||||||
| Other temporary differences | — | — | — | (84,251 | ) | |||||||||||
| Accumulated earnings (deficit) | $ | 74,065,108 | $ | (9,523,428 | ) | $ | 2,848,713 | $ | (26,284,547 | ) | ||||||
| 148 |
Notes to Financial Statements (Continued)
The difference between the tax cost of portfolio investments and the financial statement cost is primarily due to wash sale loss deferrals, investments in passive foreign investment company (“PFIC”) adjustments, regulated investment companies adjustments, amortization adjustments on bonds, and real estate investment trusts adjustments.
As of September 30, 2016, the Funds had the following capital loss carryforwards for federal income tax purposes:
| No | No | |||||||||||||||||||||||
| Short Term Expiring In | Expiration | Expiration | ||||||||||||||||||||||
| 2017 | 2018 | 2019 | Short Term* | Long Term* | Total | |||||||||||||||||||
| Emerging Markets Small Cap Fund** | $ | — | $ | — | $ | — | $ | 18,417,148 | $ | 80,823,982 | $ | 99,241,130 | ||||||||||||
| Mid Cap Fund | 35,231,534 | 70,800,792 | — | — | — | 106,032,326 | ||||||||||||||||||
| Small Cap Fund | — | — | — | 13,307,122 | 46,690,361 | 59,997,483 | ||||||||||||||||||
| Small Cap Value Fund | — | 4,388,796 | — | 2,307,850 | 4,667,974 | 11,364,620 | ||||||||||||||||||
| Total Return Bond Fund | — | — | — | 397,485 | 1,852,131 | 2,249,616 | ||||||||||||||||||
| Ultra Short Duration Fixed Income Fund | 3,231,117 | 3,336,624 | 933,830 | 7,668,913 | 9,962,821 | 25,133,305 | ||||||||||||||||||
* The Regulated Investment Company Modernization Act of 2010 (the “Act”) was enacted on December 22, 2010. The Act made changes to several tax rules impacting the Funds. The provisions of the Act first became effective for the Funds’ fiscal year ended September 30, 2012 and are applicable to all subsequent fiscal years. Although the Act provides several benefits, including the unlimited carryover of future capital losses, there may be a greater likelihood that all or a portion of each Fund’s pre-enactment capital loss carryovers may expire without being utilized due to the fact that post-enactment capital losses must be utilized before pre-enactment capital loss carryovers may be utilized. Under the Act, new capital losses may now be carried forward indefinitely, and retain the character of the original loss as compared with pre-enactment law, where capital losses could be carried forward for up to eight years, and carried forward as short-term capital losses, irrespective of the character of the original loss.
** May be subject to limitation.
The capital loss carryforwards may be utilized in future years to offset net realized capital gains, if any, prior to distributing such gains to shareholders.
The following Funds had capital losses expiring in the current year as follows:
| Fund | Amount | |||
| Ultra Short Duration Fixed Income Fund | $ | 1,769,310 | ||
During the year ended September 30, 2016, the following Funds utilized capital loss carryforwards:
| Fund | Amount | |||
| Mid Cap Fund | $ | 17,815,675 | ||
Under current laws, certain capital losses realized after October 31 and ordinary losses realized after December 31 may be deferred (and certain ordinary losses after October and/or December 31 may be deferred) and treated as occurring on the first day of the following fiscal year. For the year ended September 30, 2016, the Funds elected to defer the following losses:
| Realized | ||||||||||||
| Capital | Ordinary | |||||||||||
| Fund | Losses | Losses | Total | |||||||||
| Emerging Markets Small Cap Fund | $ | — | $ | 66,198 | $ | 66,198 | ||||||
| Mid Cap Fund | 55,942 | — | 55,942 | |||||||||
| Premium Yield Equity Fund | 3,305,816 | — | 3,305,816 | |||||||||
| Sands Capital Select Growth Fund | — | 17,640,732 | 17,640,732 | |||||||||
The Funds have analyzed their tax positions taken on federal income tax returns for all open tax years (tax years ended September 30, 2013 through 2016) and have concluded that no provision for income tax is required in their financial statements.
| 149 |
Notes to Financial Statements (Continued)
Certain reclassifications, the result of permanent differences between financial statement and income tax reporting requirements, have been made to the components of capital. These reclassifications have no impact on the net assets or NAV per share of the Funds. The following reclassifications, which are primarily attributed to the tax treatment of net investment losses, current year overdistributions, deemed distributions on shareholder redemptions, foreign currency gains/losses, gains/losses and dividend expenses on short sales, paydown gains/losses on mortgage-backed securities, gains/losses on passive foreign investment companies, gains/losses on real estate investment trusts, reclassification of distributions, foreign capital gains tax, adjustments on preferred stock sold and expiration of prior year capital loss carryovers have been made to the following Funds for the year ended September 30, 2016:
| Accumulated | Accumulated | |||||||||||
| Paid-In | Net Investment | Net Realized | ||||||||||
| Fund | Capital | Income(Loss) | Gains(Losses) | |||||||||
| Arbitrage Fund | $ | — | $ | 1,281,854 | $ | (1,281,854 | ) | |||||
| Emerging Markets Small Cap Fund | (280,361 | ) | (21,336 | ) | 301,697 | |||||||
| Merger Arbitrage Fund | 59,246 | 1,740,350 | (1,799,596 | ) | ||||||||
| Mid Cap Value Fund | 77,386 | 192,556 | (269,942 | ) | ||||||||
| Premium Yield Equity Fund | (36,642 | ) | 34,213 | 2,429 | ||||||||
| Sands Capital Select Growth Fund | 36,487,213 | 30,822,049 | (67,309,262 | ) | ||||||||
| Small Cap Fund | 1 | 184,427 | (184,428 | ) | ||||||||
| Small Cap Value Fund | — | (8,290 | ) | 8,290 | ||||||||
| Total Return Bond Fund | — | 862,048 | (862,048 | ) | ||||||||
| Ultra Short Duration Fixed Income Fund | (1,769,310 | ) | 1,206,656 | 562,654 | ||||||||
6. Commitments and Contingencies
The Funds indemnify the Trust’s officers and Trustees for certain liabilities that might arise from their performance of their duties to the Funds. Additionally, in the normal course of business, the Funds enter into contracts that contain a variety of representations and warranties and which provide general indemnifications. The Funds’ maximum exposure under these arrangements is unknown, as this would involve future claims that may be made against the Funds.
7. Principal Risks
Risks Associated with Foreign Investments — Some of the Funds may invest in the securities of foreign issuers. Investing in securities issued by companies whose principal business activities are outside the U.S. may involve significant risks not present in domestic investments. For example, there is generally less publicly available information about foreign companies, particularly those not subject to the disclosure and reporting requirements of the U.S. securities laws. Foreign issuers are generally not bound by uniform accounting, auditing, and financial reporting requirements and standards of practice comparable to those applicable to domestic issuers. Investments in foreign securities also involve the risk of possible adverse changes in investment or exchange control regulations, expropriation or confiscatory taxation, limitations on the removal of funds or other assets of a Fund, political or financial instability or diplomatic and other developments which could affect such investments. Foreign stock markets, while growing in volume and sophistication, are generally not as developed as those in the U.S., and securities of some foreign issuers (particularly those located in developing countries) may be less liquid and more volatile than securities of comparable U.S. companies. In general, there is less overall governmental supervision and regulation of foreign securities markets, broker-dealers, and issuers than in the U.S.
Risks Associated with Concentration — Certain Funds may invest a high percentage of their assets in specific sectors of the market in order to achieve a potentially greater investment return. As a result, these Funds may
| 150 |
Notes to Financial Statements (Continued)
be more susceptible to economic, political, and regulatory developments in a particular sector of the market, positive or negative, and may experience increased volatility on the Funds’ NAVs and magnified effect on the total return.
Risks Associated with Credit — An issuer may be unable to make timely payments of either principal or interest. This may cause the issuer’s securities to decline in value. Credit risk is particularly relevant to those Funds that invest a significant amount of their assets in junk bonds or lower-rated securities
Risks Associated with Interest Rate Changes — As interest rates rise, the value of fixed-income securities a Fund owns will likely decrease. The price of debt securities is generally linked to the prevailing market interest rates. In general, when interest rates rise, the price of debt securities falls, and when interest rates fall, the price of debt securities rises. The price volatility of a debt security also depends on its maturity. Longer-term securities are generally more volatile, so the longer the average maturity or duration of these securities, the greater their price risk. Duration is a measure of the expected life, taking into account any prepayment or call features of the security, that is used to determine the price sensitivity of the security for a given change in interest rates. Specifically, duration is the change in the value of a fixed-income security that will result from a 1% change in interest rates, and generally is stated in years. For example, as a general rule a 1% rise in interest rates means a 1% fall in value for every year of duration. Maturity, on the other hand, is the date on which a fixed-income security becomes due for payment of principal. The negative impact on fixed income securities if interest rates increase as a result could negatively impact a Fund’s NAV.
Please see the Funds’ prospectus for complete discussion of these and other risks.
8. Litigation
In January 2012, the Old Mutual Mid-Cap Fund (which reorganized into the TS&W Mid-Cap Value Fund in March 2009, and was subsequently renamed the Touchstone Mid Cap Value Opportunities Fund in April 2012 and the Touchstone Mid Cap Value Fund in March 2014) was served with a summons and complaint in an action brought by Edward S. Weisfelner, as Trustee of the LB Creditor Trust, in the case captioned Weisfelner v. Fund 1(U.S. Bankr. S.D.N.Y. Adv. Pro. No. 10-4609) (the “Action”). The Action alleges that, under state law, all payments made to shareholders in the December 2007 leveraged buyout of Lyondell Chemical Company were made, by means of intentional and constructive fraudulent transfer and seeks to recover all those payments. The amount sought to be disgorged is $3,784,800, which is what the Fund received in payments in connection with the leveraged buyout. The Fund (along with thousands of other defendants) filed a joinder to the motion to dismiss and the court heard oral argument on the motion to dismiss in January 2015. In November 2015, the court dismissed the intentional fraudulent transfer claims and in July 2016, the court dismissed the remaining constructive fraudulent transfer claims. The plaintiff appealed the part of the motion to dismiss that was granted in November 2015, and on July 27, 2016, the District Court reversed the Bankruptcy Court’s dismissal order. As a result, part of the claims against the defendants (including the Fund) have been reinstated. The path the litigation will follow is uncertain at this time, including whether the parties will appeal the District Court’s and Bankruptcy Court’s rulings on the motion to dismiss. At this nascent stage of the litigation, it is not possible to assess the likely outcome. The Fund is currently assessing the case and has not yet determined the potential effect, if any, on its net asset value.
9. Subsequent Events
Subsequent events occurring after the date of this report have been evaluated for potential impact to this report through the date financial statements were issued. There were no subsequent events that necessitated recognition or disclosure in the Funds’ financial statement.
| 151 |
Report of Independent Registered Public Accounting Firm
To the Board of Trustees and Shareholders of Touchstone Funds Group Trust
We have audited the accompanying statements of assets and liabilities, including the portfolios of investments, of Touchstone Funds Group Trust (comprising, respectively, the Touchstone Arbitrage, Touchstone Emerging Markets Small Cap (formerly,Touchstone Emerging Markets Equity),Touchstone Merger Arbitrage,Touchstone Mid Cap, Touchstone Mid Cap Value, Touchstone Premium Yield Equity, Touchstone Sands Capital Select Growth,Touchstone Small Cap (formerly,Touchstone Small Cap Core),Touchstone Small Cap Value,Touchstone Total Return Bond, and Touchstone Ultra Short Duration Fixed Income Funds) (the “Funds”) as of September 30, 2016, and the related statements of operations for the year then ended, the statements of changes in net assets for each of the two years in the period then ended and the financial highlights for each of the years or periods indicated therein. These financial statements and financial highlights are the responsibility of the Funds’ management. Our responsibility is to express an opinion on these financial statements and financial highlights based on our audits.
We conducted our audits in accordance with the standards of the Public Company Accounting Oversight Board (United States). Those standards require that we plan and perform the audits to obtain reasonable assurance about whether the financial statements and financial highlights are free of material misstatement. We were not engaged to perform an audit of the Funds’ internal control over financial reporting. Our audits included consideration of internal control over financial reporting as a basis for designing audit procedures that are appropriate in the circumstances, but not for the purpose of expressing an opinion on the effectiveness of the Funds’ internal control over financial reporting. Accordingly, we express no such opinion. An audit also includes examining, on a test basis, evidence supporting the amounts and disclosures in the financial statements and financial highlights, assessing the accounting principles used and significant estimates made by management, and evaluating the overall financial statement presentation. Our procedures included confirmation of securities owned as of September 30, 2016, by correspondence with the custodian, transfer agent, and brokers or by other appropriate auditing procedures where replies from brokers were not received. We believe that our audits provide a reasonable basis for our opinion.
In our opinion, the financial statements and financial highlights referred to above present fairly, in all material respects, the financial position of each of the respective funds constituting Touchstone Funds Group Trust at September 30, 2016, the results of their operations for the year then ended, the changes in their net assets for each of the two years in the period then ended and the financial highlights for each of the years or periods indicated therein, in conformity with U.S generally accepted accounting principles.

Cincinnati, Ohio
November 18, 2016
| 152 |
Qualified Dividend Income
Under the Jobs and Growth Tax Relief Reconciliation Act of 2003 (the “Act”), the following percentages of ordinary dividends paid during the fiscal year ended September 30, 2016 are designated as “qualified dividend income,” as defined in the Act, and are subject to reduced tax rates in 2016. The Funds intend to pass through the maximum allowable percentage for Form 1099 Div.
| Arbitrage Fund | 21.71 | % | ||
| Emerging Markets Small Cap Fund | 98.26 | % | ||
| Mid Cap Fund | 100.00 | % | ||
| Mid Cap Value Fund | 73.87 | % | ||
| Premium Yield Equity Fund | 100.00 | % | ||
| Small Cap Fund | 81.18 | % | ||
| Small Cap Value Fund | 100.00 | % |
Dividend Received Deduction
For corporate shareholders, the following ordinary distributions paid during the current fiscal year ended September 30, 2016 qualify for the corporate dividends received deduction. The Funds intend to pass through the maximum allowable percentage.
| Arbitrage Fund | 19.50 | % | ||
| Emerging Markets Small Cap Fund | 0.01 | % | ||
| Mid Cap Fund | 100.00 | % | ||
| Mid Cap Value Fund | 73.67 | % | ||
| Premium Yield Equity Fund | 97.34 | % | ||
| Small Cap Fund | 44.87 | % | ||
| Small Cap Value Fund | 100.00 | % |
For the fiscal year ended September 30, 2016, the Arbitrage Fund, Mid Cap Value Fund, Premium Yield Equity Fund, Sands Capital Select Growth Fund, Small Cap Fund and Small Cap Value Fund designated $342,591, $16,030,101, $10,256,568, $492,656,224, $65,017,255 and $1,833,117, respectively, as long-term capital gains.
Proxy Voting Guidelines and Proxy Voting Records
The Sub-Advisors are responsible for exercising the voting rights associated with the securities purchased and held by the Funds. A description of the policies and procedures that the Sub-Advisors use in fulfilling this responsibility is available as an appendix to the most recent Statement of Additional Information, which can be obtained without charge by calling toll free 1.800.543.0407 or by visiting the Touchstone website at TouchstoneInvestments.com or on the Securities and Exchange Commission’s (the “Commission”) website sec.gov. Information regarding how those proxies were voted during the most recent twelve-month period ended June 30 is also available without charge by calling toll free 1.800.543.0407 or on the Commission’s website at sec.gov.
Quarterly Portfolio Disclosure
The Trust files a complete listing of portfolio holdings for each Fund as of the end of the first and third quarters of each fiscal year on Form N-Q. The complete listing (i) is available on the Commission’s website; (ii) may be reviewed and copied at the Commission’s Public Reference Room in Washington, DC; or (iii) will be made available to shareholders upon request by calling 1.800.543.0407. Information on the operation of the Public Reference Room may be obtained by calling 1.800.SEC.0330.
| 153 |
Other Items (Unaudited) (Continued)
Schedule of Shareholder Expenses
As a shareholder of the Funds, you incur two types of costs: (1) transaction costs, including reinvested dividends or other distributions; and (2) ongoing costs, including investment advisory fees; distribution (12b-1) fees; and other Fund expenses. This example is intended to help you understand your ongoing costs (in dollars) of investing in the Funds and to compare these costs with the ongoing costs of investing in other mutual funds. The example is based on an investment of $1,000 invested at the beginning of the period and held for the entire period (April 1, 2016 through September 30, 2016).
Actual Expenses
The first line for each share class of a Fund in the table below provides information about actual account values and actual expenses. You may use the information in this line, together with the amount you invested, to estimate the expenses that you paid over the period. Simply divide your account value by $1,000 (for example, an $8,600 account value divided by $1,000 = 8.6), then multiply the result by the number in the first line under the heading entitled “Expenses Paid During the Six Months Ended September 30, 2016” to estimate the expenses you paid on your account during this period.
Hypothetical Example for Comparison Purposes
The second line for each share class of a Fund in the table below provides information about hypothetical account values and hypothetical expenses based on the Funds’ actual expense ratio and an assumed rate of return of 5% per year before expenses, which is not the Funds’ actual return. The hypothetical account values and expenses may not be used to estimate the actual ending account balance or expenses you paid for the period. You may use this information to compare the ongoing costs of investing in the Funds and other funds. To do so, compare this 5% hypothetical example with the 5% hypothetical examples that appear in the shareholder reports of the other funds.
Please note that the expenses shown in the table below are meant to highlight your ongoing costs only and do not reflect any transactional costs, such as sales charges (loads), redemption fees, or exchange fees. Therefore, the second line for each share class of a Fund in the table below is useful in comparing ongoing costs only, and will not help you determine the relative total costs of owning different funds. In addition, if these transactional costs were included, your costs would have been higher.
| Expenses | ||||||||||||||||||
| Net Expense | Beginning | Ending | Paid During | |||||||||||||||
| Ratio | Account | Account | the Six Months | |||||||||||||||
| Annualized | Value | Value | Ended | |||||||||||||||
| September 30, | April 1, | September 30, | September 30, | |||||||||||||||
| 2016 | 2016 | 2016 | 2016* | |||||||||||||||
| Touchstone Arbitrage Fund | ||||||||||||||||||
| Class A | Actual | 3.14 | % | $ | 1,000.00 | $ | 1,011.80 | $ | 15.79 | ** | ||||||||
| Class A | Hypothetical | 3.14 | % | $ | 1,000.00 | $ | 1,009.30 | $ | 15.77 | ** | ||||||||
| Class C | Actual | 3.89 | % | $ | 1,000.00 | $ | 1,008.00 | $ | 19.53 | ** | ||||||||
| Class C | Hypothetical | 3.89 | % | $ | 1,000.00 | $ | 1,005.55 | $ | 19.50 | ** | ||||||||
| Class Y | Actual | 2.85 | % | $ | 1,000.00 | $ | 1,013.70 | $ | 14.35 | ** | ||||||||
| Class Y | Hypothetical | 2.85 | % | $ | 1,000.00 | $ | 1,010.75 | $ | 14.33 | ** | ||||||||
| Institutional Class | Actual | 2.74 | % | $ | 1,000.00 | $ | 1,013.60 | $ | 13.79 | ** | ||||||||
| Institutional Class | Hypothetical | 2.74 | % | $ | 1,000.00 | $ | 1,011.30 | $ | 13.78 | ** | ||||||||
| 154 |
Other Items (Unaudited) (Continued)
| Expenses | ||||||||||||||||||
| Net Expense | Beginning | Ending | Paid During | |||||||||||||||
| Ratio | Account | Account | the Six Months | |||||||||||||||
| Annualized | Value | Value | Ended | |||||||||||||||
| September 30, | April 1, | September 30, | September 30, | |||||||||||||||
| 2016 | 2016 | 2016 | 2016* | |||||||||||||||
| Touchstone Emerging Markets Small Cap Fund | ||||||||||||||||||
| Class A | Actual | 1.69 | % | $ | 1,000.00 | $ | 1,094.20 | $ | 8.85 | |||||||||
| Class A | Hypothetical | 1.69 | % | $ | 1,000.00 | $ | 1,016.55 | $ | 8.52 | |||||||||
| Class C | Actual | 2.44 | % | $ | 1,000.00 | $ | 1,089.80 | $ | 12.75 | |||||||||
| Class C | Hypothetical | 2.44 | % | $ | 1,000.00 | $ | 1,012.80 | $ | 12.28 | |||||||||
| Class Y | Actual | 1.44 | % | $ | 1,000.00 | $ | 1,096.50 | $ | 7.55 | |||||||||
| Class Y | Hypothetical | 1.44 | % | $ | 1,000.00 | $ | 1,017.80 | $ | 7.26 | |||||||||
| Institutional Class | Actual | 1.29 | % | $ | 1,000.00 | $ | 1,097.40 | $ | 6.76 | |||||||||
| Institutional Class | Hypothetical | 1.29 | % | $ | 1,000.00 | $ | 1,018.55 | $ | 6.51 | |||||||||
| Touchstone Merger Arbitrage Fund | ||||||||||||||||||
| Class A | Actual | 2.80 | % | $ | 1,000.00 | $ | 1,012.90 | $ | 14.09 | *** | ||||||||
| Class A | Hypothetical | 2.80 | % | $ | 1,000.00 | $ | 1,011.00 | $ | 14.08 | *** | ||||||||
| Class C | Actual | 3.55 | % | $ | 1,000.00 | $ | 1,008.60 | $ | 17.83 | *** | ||||||||
| Class C | Hypothetical | 3.55 | % | $ | 1,000.00 | $ | 1,007.25 | $ | 17.81 | *** | ||||||||
| Class Y | Actual | 2.48 | % | $ | 1,000.00 | $ | 1,013.70 | $ | 12.48 | *** | ||||||||
| Class Y | Hypothetical | 2.48 | % | $ | 1,000.00 | $ | 1,012.60 | $ | 12.48 | *** | ||||||||
| Institutional Class | Actual | 2.40 | % | $ | 1,000.00 | $ | 1,014.50 | $ | 12.09 | *** | ||||||||
| Institutional Class | Hypothetical | 2.40 | % | $ | 1,000.00 | $ | 1,013.00 | $ | 12.08 | *** | ||||||||
| Touchstone Mid Cap Fund | ||||||||||||||||||
| Class A | Actual | 1.24 | % | $ | 1,000.00 | $ | 1,058.80 | $ | 6.38 | |||||||||
| Class A | Hypothetical | 1.24 | % | $ | 1,000.00 | $ | 1,018.80 | $ | 6.26 | |||||||||
| Class C | Actual | 1.99 | % | $ | 1,000.00 | $ | 1,055.00 | $ | 10.22 | |||||||||
| Class C | Hypothetical | 1.99 | % | $ | 1,000.00 | $ | 1,015.05 | $ | 10.02 | |||||||||
| Class Y | Actual | 0.99 | % | $ | 1,000.00 | $ | 1,060.50 | $ | 5.10 | |||||||||
| Class Y | Hypothetical | 0.99 | % | $ | 1,000.00 | $ | 1,020.05 | $ | 5.00 | |||||||||
| Class Z | Actual | 1.24 | % | $ | 1,000.00 | $ | 1,058.80 | $ | 6.38 | |||||||||
| Class Z | Hypothetical | 1.24 | % | $ | 1,000.00 | $ | 1,018.80 | $ | 6.26 | |||||||||
| Institutional Class | Actual | 0.92 | % | $ | 1,000.00 | $ | 1,060.40 | $ | 4.74 | |||||||||
| Institutional Class | Hypothetical | 0.92 | % | $ | 1,000.00 | $ | 1,020.40 | $ | 4.65 | |||||||||
| Touchstone Mid Cap Value Fund | ||||||||||||||||||
| Class A | Actual | 1.27 | % | $ | 1,000.00 | $ | 1,092.40 | $ | 6.64 | |||||||||
| Class A | Hypothetical | 1.27 | % | $ | 1,000.00 | $ | 1,018.65 | $ | 6.41 | |||||||||
| Class C | Actual | 2.02 | % | $ | 1,000.00 | $ | 1,087.80 | $ | 10.54 | |||||||||
| Class C | Hypothetical | 2.02 | % | $ | 1,000.00 | $ | 1,014.90 | $ | 10.18 | |||||||||
| Class Y | Actual | 1.02 | % | $ | 1,000.00 | $ | 1,093.60 | $ | 5.34 | |||||||||
| Class Y | Hypothetical | 1.02 | % | $ | 1,000.00 | $ | 1,019.90 | $ | 5.15 | |||||||||
| Institutional Class | Actual | 0.89 | % | $ | 1,000.00 | $ | 1,094.60 | $ | 4.66 | |||||||||
| Institutional Class | Hypothetical | 0.89 | % | $ | 1,000.00 | $ | 1,020.55 | $ | 4.50 | |||||||||
| 155 |
Other Items (Unaudited) (Continued)
| Expenses | ||||||||||||||||||
| Net Expense | Beginning | Ending | Paid During | |||||||||||||||
| Ratio | Account | Account | the Six Months | |||||||||||||||
| Annualized | Value | Value | Ended | |||||||||||||||
| September 30, | April 1, | September 30, | September 30, | |||||||||||||||
| 2016 | 2016 | 2016 | 2016* | |||||||||||||||
| Touchstone Premium Yield Equity Fund | ||||||||||||||||||
| Class A | Actual | 1.20 | % | $ | 1,000.00 | $ | 1,109.10 | $ | 6.33 | |||||||||
| Class A | Hypothetical | 1.20 | % | $ | 1,000.00 | $ | 1,019.00 | $ | 6.06 | |||||||||
| Class C | Actual | 1.95 | % | $ | 1,000.00 | $ | 1,103.80 | $ | 10.26 | |||||||||
| Class C | Hypothetical | 1.95 | % | $ | 1,000.00 | $ | 1,015.25 | $ | 9.82 | |||||||||
| Class Y | Actual | 0.95 | % | $ | 1,000.00 | $ | 1,109.30 | $ | 5.01 | |||||||||
| Class Y | Hypothetical | 0.95 | % | $ | 1,000.00 | $ | 1,020.25 | $ | 4.80 | |||||||||
| Touchstone Sands Capital Select Growth Fund | ||||||||||||||||||
| Class A | Actual | 1.07 | % | $ | 1,000.00 | $ | 1,097.20 | $ | 5.61 | |||||||||
| Class A | Hypothetical | 1.07 | % | $ | 1,000.00 | $ | 1,019.65 | $ | 5.40 | |||||||||
| Class C | Actual | 1.82 | % | $ | 1,000.00 | $ | 1,092.50 | $ | 9.52 | |||||||||
| Class C | Hypothetical | 1.82 | % | $ | 1,000.00 | $ | 1,015.90 | $ | 9.17 | |||||||||
| Class Y | Actual | 0.82 | % | $ | 1,000.00 | $ | 1,098.70 | $ | 4.30 | |||||||||
| Class Y | Hypothetical | 0.82 | % | $ | 1,000.00 | $ | 1,020.90 | $ | 4.14 | |||||||||
| Class Z | Actual | 1.02 | % | $ | 1,000.00 | $ | 1,097.20 | $ | 5.35 | |||||||||
| Class Z | Hypothetical | 1.02 | % | $ | 1,000.00 | $ | 1,019.90 | $ | 5.15 | |||||||||
| Touchstone Small Cap Fund | ||||||||||||||||||
| Class A | Actual | 1.38 | % | $ | 1,000.00 | $ | 1,005.60 | $ | 6.92 | |||||||||
| Class A | Hypothetical | 1.38 | % | $ | 1,000.00 | $ | 1,018.10 | $ | 6.96 | |||||||||
| Class C | Actual | 2.13 | % | $ | 1,000.00 | $ | 1,001.90 | $ | 10.66 | |||||||||
| Class C | Hypothetical | 2.13 | % | $ | 1,000.00 | $ | 1,014.35 | $ | 10.73 | |||||||||
| Class Y | Actual | 1.13 | % | $ | 1,000.00 | $ | 1,006.70 | $ | 5.67 | |||||||||
| Class Y | Hypothetical | 1.13 | % | $ | 1,000.00 | $ | 1,019.35 | $ | 5.70 | |||||||||
| Institutional Class | Actual | 1.04 | % | $ | 1,000.00 | $ | 1,007.40 | $ | 5.22 | |||||||||
| Institutional Class | Hypothetical | 1.04 | % | $ | 1,000.00 | $ | 1,019.80 | $ | 5.25 | |||||||||
| Touchstone Small Cap Value Fund | ||||||||||||||||||
| Class A | Actual | 1.38 | % | $ | 1,000.00 | $ | 1,085.80 | $ | 7.20 | |||||||||
| Class A | Hypothetical | 1.38 | % | $ | 1,000.00 | $ | 1,018.10 | $ | 6.96 | |||||||||
| Class C | Actual | 2.13 | % | $ | 1,000.00 | $ | 1,081.50 | $ | 11.08 | |||||||||
| Class C | Hypothetical | 2.13 | % | $ | 1,000.00 | $ | 1,014.35 | $ | 10.73 | |||||||||
| Class Y | Actual | 1.13 | % | $ | 1,000.00 | $ | 1,086.70 | $ | 5.89 | |||||||||
| Class Y | Hypothetical | 1.13 | % | $ | 1,000.00 | $ | 1,019.35 | $ | 5.70 | |||||||||
| Institutional Class | Actual | 0.98 | % | $ | 1,000.00 | $ | 1,087.70 | $ | 5.11 | |||||||||
| Institutional Class | Hypothetical | 0.98 | % | $ | 1,000.00 | $ | 1,020.10 | $ | 4.95 | |||||||||
| 156 |
Other Items (Unaudited) (Continued)
| Expenses | ||||||||||||||||||
| Net Expense | Beginning | Ending | Paid During | |||||||||||||||
| Ratio | Account | Account | the Six Months | |||||||||||||||
| Annualized | Value | Value | Ended | |||||||||||||||
| September 30, | April 1, | September 30, | September 30, | |||||||||||||||
| 2016 | 2016 | 2016 | 2016* | |||||||||||||||
| Touchstone Total Return Bond Fund | ||||||||||||||||||
| Class A | Actual | 0.85 | % | $ | 1,000.00 | $ | 1,028.90 | $ | 4.31 | |||||||||
| Class A | Hypothetical | 0.85 | % | $ | 1,000.00 | $ | 1,020.75 | $ | 4.29 | |||||||||
| Class C | Actual | 1.60 | % | $ | 1,000.00 | $ | 1,024.10 | $ | 8.10 | |||||||||
| Class C | Hypothetical | 1.60 | % | $ | 1,000.00 | $ | 1,017.00 | $ | 8.07 | |||||||||
| Class Y | Actual | 0.60 | % | $ | 1,000.00 | $ | 1,029.10 | $ | 3.04 | |||||||||
| Class Y | Hypothetical | 0.60 | % | $ | 1,000.00 | $ | 1,022.00 | $ | 3.03 | |||||||||
| Institutional Class | Actual | 0.50 | % | $ | 1,000.00 | $ | 1,030.70 | $ | 2.54 | |||||||||
| Institutional Class | Hypothetical | 0.50 | % | $ | 1,000.00 | $ | 1,022.50 | $ | 2.53 | |||||||||
| Touchstone Ultra Short Duration Fixed Income Fund | ||||||||||||||||||
| Class A | Actual | 0.69 | % | $ | 1,000.00 | $ | 1,008.50 | $ | 3.46 | |||||||||
| Class A | Hypothetical | 0.69 | % | $ | 1,000.00 | $ | 1,021.55 | $ | 3.49 | |||||||||
| Class C | Actual | 1.19 | % | $ | 1,000.00 | $ | 1,006.00 | $ | 5.97 | |||||||||
| Class C | Hypothetical | 1.19 | % | $ | 1,000.00 | $ | 1,019.05 | $ | 6.01 | |||||||||
| Class Y | Actual | 0.44 | % | $ | 1,000.00 | $ | 1,009.80 | $ | 2.21 | |||||||||
| Class Y | Hypothetical | 0.44 | % | $ | 1,000.00 | $ | 1,022.80 | $ | 2.23 | |||||||||
| Class Z | Actual | 0.69 | % | $ | 1,000.00 | $ | 1,008.50 | $ | 3.46 | |||||||||
| Class Z | Hypothetical | 0.69 | % | $ | 1,000.00 | $ | 1,021.55 | $ | 3.49 | |||||||||
| Institutional Class | Actual | 0.39 | % | $ | 1,000.00 | $ | 1,009.00 | $ | 1.96 | |||||||||
| Institutional Class | Hypothetical | 0.39 | % | $ | 1,000.00 | $ | 1,023.05 | $ | 1.97 | |||||||||
| * | Expenses are equal to the Fund's annualized expense ratio, multiplied by the average account value over the period, multiplied by 183/366 (to reflect one-half year period). |
| ** | Excluding interest and dividend expenses on securities sold short, your actual cost of investment in Class A, Class C, Class Y and Institutional Class would be $8.45, $12.20, $7.00 and $6.44, respectively, and your hypothetical cost of investment in Class A, Class C, Class Y and Institutional Class would be $8.47, $12.23, $7.01, and $6.46, respectively. |
| *** | Excluding interest and dividend expenses on securities sold short, your actual cost of investment in Class A, Class C, Class Y and Institutional Class would be $8.45, $12.20, $6.85 and $6.45, respectively, and your hypothetical cost of investment in Class A, Class C, Class Y and Institutional Class would be $8.47, $12.23, $6.86, and $6.46, respectively. |
Basis for Board's Approval of Sub-Advisory Agreements and Interim Sub-Advisory
Touchstone Emerging Markets Small Cap Fund
At an in-person meeting held on February 11, 2016 (the “Meeting”), Touchstone Advisors, Inc. (the “Advisor”) proposed the replacement of the current sub-adviser of theTouchstone Emerging Markets Equity Fund, currently known asTouchstone Emerging Markets Small Cap Fund (the “Fund”), AGF Investments America Inc. (“AGF”), to the Board of Trustees (the “Board”) of Touchstone Funds Group Trust (the “Trust”). As discussed below, the Board approved replacing AGF with Copper Rock Capital Partners LLC (“Copper Rock”). In connection with this sub-advisor change, the Board also approved changes to the Fund’s investment policy and name.
The Advisor and Copper Rock provided the Board with various written materials in advance of the Meeting to assist with the Board’s consideration of Copper Rock as sub-advisor. The Advisor provided written and oral information stating the basis for its recommendation to engage Copper Rock and to transition the Fund to
| 157 |
Other Items (Unaudited) (Continued)
Copper Rock’s emerging markets small cap strategy. The information also included details regarding Copper Rock’s: (a) investment philosophy and investment process; (b) investment management services proposed to be provided to the Fund; (c) investment management personnel; (d) operating history, infrastructure and financial condition; (e) proposed sub-advisory fees that would be paid to Copper Rock by the Advisor; and (f) reputation, expertise and resources as an investment advisor. The Board then discussed the written materials that the Board received before the Meeting and all other information that the Board received at the Meeting.
The Board, including the Independent Trustees of the Trust, voting separately, unanimously determined that the proposal to approve the Sub-Advisory Agreement for the Fund would be in the best interests of the Fund. In approving the Sub-Advisory Agreement, the Board considered various factors, among them: (1) the nature, extent and quality of services to be provided to the Fund, including the personnel who would be providing such services; (2) Copper Rock’s proposed compensation; (3) the performance of the Fund and that of a composite of the accounts managed by Copper Rock that use the same emerging markets small cap strategy that Copper Rock proposes to use in managing the Fund; and (4) the terms of the Sub-Advisory Agreement. The Board’s consideration of these factors is summarized below. The Independent Trustees were advised by independent legal counsel throughout the process.
Nature, Extent and Quality of Services Provided; Investment Personnel. The Board considered information provided by the Advisor and Copper Rock regarding the services to be provided by Copper Rock. The Board considered Copper Rock’s level of knowledge and investment style. The Board reviewed the experience and credentials of the investment personnel who would be responsible for managing the investment of portfolio securities with respect to the Fund. The Board also took into consideration that the Advisor was satisfied with Copper Rock’s in-house risk and compliance teams. The Board also took into account Copper Rock’s management of the Touchstone International Small Cap Fund.
Copper Rock’s Compensation. The Board took into consideration the financial condition of Copper Rock and any direct and indirect benefits to be derived by Copper Rock’s relationship with the Fund. In considering the anticipated level of profitability to Copper Rock, the Board noted the proposed contractual undertaking of the Advisor to maintain the current levels of expense limitations for the Fund, that the sub-advisory fees under the Sub-Advisory Agreement would be paid by the Advisor out of the advisory fees that it receives from the Fund, and that the sub-advisory fees were negotiated at arm’s length between the Advisor and Copper Rock. As a consequence, the anticipated level of profitability to Copper Rock from its relationship with the Fund was not a substantial factor in the Board’s deliberations. For similar reasons, the Board did not consider potential economies of scale in Copper Rock’s management of the Fund to be a substantial factor in its consideration, although the Board noted that the proposed sub-advisory fee schedule contains breakpoints that would reduce the sub-advisory fee rate if Fund assets exceed specified levels.
Sub-Advisory Fees and Fund Performance. The Board considered that the Fund would pay an advisory fee to the Advisor and that the Advisor would pay a sub-advisory fee to Copper Rock out of the advisory fee. The Board also considered certain comparative fee information concerning the sub-advisory fee that was paid to AGF for managing the Fund.The Board also compared Copper Rock’s proposed sub-advisory fee to the sub-advisory fee paid to AGF, noting that the proposed sub-advisory fee schedule with Copper Rock was identical to the current sub-advisory fee schedule with AGF. The Board considered the amount of the advisory fee to be retained by the Advisor and the amount to be paid to Copper Rock, with respect to the various services to be provided by the Advisor and Copper Rock. The Board also noted that the Advisor negotiated the sub-advisory fee with Copper Rock at arm’s length. The Board also noted that identical expense caps were expected to remain in place for the Fund following the proposed sub-advisor change.
The Board also considered the performance of Copper Rock’s strategies and the Fund’s performance record under AGF’s management. The Board also reviewed Copper Rock’s investment performance, highlighting the
| 158 |
Other Items (Unaudited) (Continued)
firm’s strong performance in its emerging markets small-cap strategy relative to the MSCI Emerging Markets Small Cap Index. Based upon their review, the Trustees concluded that the Fund’s proposed sub-advisory fee was reasonable in light of the services to be provided by Copper Rock to the Fund.
Conclusion. The Board reached the following conclusions regarding the Sub-Advisory Agreement: (a) Copper Rock is qualified to manage the Fund’s assets in accordance with the Fund’s investment goal and policies; (b) Copper Rock maintains an appropriate and effective compliance program; (c) the Fund’s proposed sub-advisory fee is reasonable in relation to the services to be provided by Copper Rock; and (d) Copper Rock’s proposed investment strategies are appropriate for pursuing the Fund’s investment goal. In considering the approval of the Sub-Advisory Agreement, the Board, including the Independent Trustees, did not identify any single factor as controlling, and each Trustee attributed different weights to the various factors. Based on its conclusions, the Board determined that approval of the Sub-Advisory Agreement was in the best interests of the Fund and its shareholders.
In connection with the approval of Copper Rock as the sub-advisor to the Fund at the Meeting, the Advisor also proposed to the Board the appointment of Russell Implementation Services, Inc. (“Russell”), as the interim sub-advisor to the Fund. The Board approved the appointment of Russell as the interim sub-advisor, effective on or around February 20, 2016, until on or about April 18, 2016.
The Advisor and Russell provided the Board with various written materials in advance of the Meeting to assist with the Board’s consideration of Russell as the Fund’s interim sub-advisor. The Advisor provided written and oral information stating the basis for its recommendation to engage Russell as an interim sub-advisor. The information also included details regarding Russell’s: (a) investment philosophy and investment process; (b) investment management services proposed to be provided to the Fund; (c) investment management personnel; (d) operating history, infrastructure and financial condition; (e) proposed interim sub-advisory fee that would be paid to Russell by the Advisor; and (f) reputation, expertise and resources as an interim investment advisor. The Board then discussed the written materials that the Board received before the Meeting and all other information that the Board received at the Meeting.
The Board, including the Independent Trustees of the Trust, voting separately, unanimously determined that the proposal to approve the Interim Sub-Advisory Agreement for the Fund would be in the best interests of the shareholders and the Fund. In approving the Interim Sub-Advisory Agreement, the Board considered various factors, among them: (1) the nature, extent, and quality of services to be provided by Russell to the Fund, including the personnel who would be providing such services; (2) Russell’s proposed compensation; (3) Russell’s past performance; and (4) the terms of the Interim Sub-Advisory Agreement. The Board’s analysis of these factors is set forth below. The Independent Trustees were advised by independent legal counsel throughout the process.
Nature, Extent and Quality of Services Provided; Investment Personnel. The Board considered information provided by the Advisor regarding the services to be provided by Russell. The Board considered Russell’s level of knowledge and investment style. The Board reviewed the experience and credentials of the investment personnel who would be responsible for managing the investment of portfolio securities with respect to the Fund. The Board also took into consideration that the Advisor was satisfied with Russell’s in-house risk and compliance teams.
Russell’s Compensation. The Board took into consideration the financial condition of Russell and any direct and indirect benefits to be derived by Russell’s relationship with the Fund. In considering the anticipated level of profitability to Russell, the Board noted the proposed contractual undertaking of the Advisor to maintain expense limitations for the Fund and also noted that the interim sub-advisory fee under the Interim Sub-Advisory Agreement would be paid by the Advisor out of the advisory fee that it receives from the Fund, and that the interim sub-advisory fee was negotiated at arm’s length between the Advisor and Russell. As a consequence, the anticipated level of profitability to Russell from its relationship with the Fund was not a substantial factor
| 159 |
Other Items (Unaudited) (Continued)
in the Board’s deliberations. For similar reasons, the Board did not consider potential economies of scale in Russell’s management of the Fund to be a substantial factor in its consideration.
Interim Sub-Advisory Fee and Fund Performance. The Board considered that the Fund would pay an advisory fee to the Advisor and that the Advisor would pay an interim sub-advisory fee to Russell out of that advisory fee. The Board also considered certain comparative fee information concerning the sub-advisory fee that was paid to AGF for managing the Fund. The Board also compared Russell’s proposed interim sub-advisory fee to the sub-advisory fees paid to AGF, noting that the proposed interim sub-advisory fee schedule to Russell was substantially lower than AGF’s sub-advisory fee schedule. The Board considered the amount of the advisory fee to be retained by the Advisor and the amount to be paid to Russell, with respect to the various services to be provided by the Advisor and Russell. The Board also noted that the Advisor negotiated the interim sub-advisory fee with Russell at arm’s length.
The Board also considered Russell’s investment performance and the Fund’s performance record under AGF’s management. TheTrustees also noted that Russell has extensive experience providing transition services, including interim management, to the Touchstone Funds complex during sub-advisor transitions and that the Advisor was satisfied with Russell’s management of those funds. Based upon their review, the Trustees concluded that the Fund’s proposed interim sub-advisory fee was reasonable in light of the services to be received by the Fund from Russell.
Conclusion. The Board reached the following conclusions regarding the Interim Sub-Advisory Agreement: (a) Russell is qualified to manage the Fund’s assets in accordance with the Fund’s investment goal and policies; (b) Russell maintains an appropriate compliance program; (c) the Fund’s proposed interim sub-advisory fee is reasonable in relation to the fees of similar funds and the services to be provided by Russell; and (d) Russell’s proposed investment strategies are appropriate for pursuing the investment goal of the Fund. In considering the approval of the Interim Sub-Advisory Agreement, the Board, including the Independent Trustees, did not identify any single factor as controlling, and each Trustee attributed different weights to the various factors. Based on its conclusions, the Board determined that approval of the Interim Sub-Advisory Agreement was in the best interests of the Fund and its shareholders.
Touchstone Small Cap Value Fund
At an in-person meeting held on May 19, 2016 (the “Meeting”), the Advisor proposed the replacement of the current sub-adviser of the Touchstone Small Cap Value Fund (the “Fund”), DePrince Race and Zollo, Inc. (“DRZ”), to the Board of the Trust. As discussed below, the Board approved replacing DRZ with LMCG Investments, LLC (“LMCG”).
The Advisor and LMCG provided the Board with various written materials in advance of the Meeting to assist with the Board’s consideration of LMCG as sub-advisor. The Advisor provided written and oral information stating the basis for its recommendation to engage LMCG and to transition the Fund to LMCG’s small cap value strategy.The information also included details regarding LMCG’s: (a) investment philosophy and investment process; (b) investment management services proposed to be provided to the Fund; (c) investment management personnel; (d) operating history, infrastructure and financial condition; (e) proposed sub-advisory fees that would be paid to LMCG by the Advisor; and (f) reputation, expertise and resources as an investment advisor. The Board then discussed the written materials that the Board received before the Meeting and all other information that the Board received at the Meeting.
The Board, including the Independent Trustees of the Trust, voting separately, unanimously determined that the proposal to approve the Sub-Advisory Agreement for the Fund would be in the best interests of the Fund. In approving the Sub-Advisory Agreement, the Board considered various factors, among them: (1) the nature, extent and quality of services to be provided to the Fund, including the personnel who would be providing
| 160 |
Other Items (Unaudited) (Continued)
such services; (2) LMCG’s proposed compensation; (3) the performance of the Fund and that of a composite of the accounts managed by LMCG that use the same small cap value strategy that LMCG proposes to use in managing the Fund; and (4) the terms of the Sub-Advisory Agreement. The Board’s consideration of these factors is summarized below. The Independent Trustees were advised by independent legal counsel throughout the process.
Nature, Extent and Quality of Services Provided; Investment Personnel. The Board considered information provided by the Advisor and LMCG regarding the services to be provided by LMCG. The Board considered LMCG’s level of knowledge and investment style. The Board reviewed the experience and credentials of the investment personnel who would be responsible for managing the investment of portfolio securities with respect to the Fund. The Board also took into consideration that the Advisor was satisfied with LMCG’s in-house risk and compliance teams. The Board also took into account LMCG’s well-established record as investment sub-advisor to the Touchstone Mid Cap Value Fund.
LMCG’s Compensation. The Board took into consideration the financial condition of LMCG and any direct and indirect benefits to be derived by LMCG’s relationship with the Fund. In considering the anticipated level of profitability to LMCG, the Board noted the proposed contractual undertaking of the Advisor to maintain the current levels of expense limitations for the Fund, that the sub-advisory fees under the Sub-Advisory Agreement would be paid by the Advisor out of the advisory fee that it receives from the Fund, and that the sub-advisory fee was negotiated at arm’s length between the Advisor and LMCG. As a consequence, the anticipated level of profitability to LMCG from its relationship with the Fund was not a substantial factor in the Board’s deliberations. For similar reasons, the Board did not consider potential economies of scale in LMCG’s management of the Fund to be a substantial factor in its consideration.
Sub-Advisory Fees and Fund Performance. The Board considered that the Fund would pay an advisory fee to the Advisor and that the Advisor would pay a sub-advisory fee to LMCG out of the advisory fee. The Board also considered certain comparative fee information concerning the sub-advisory fee paid to DRZ for managing the Fund. The Board also compared LMCG’s proposed sub-advisory fee to the sub-advisory fee that was paid to DRZ, noting that the proposed sub-advisory fee schedule to be paid by the Advisor to LMCG was slightly lower than the sub-advisory fee paid to DRZ. The Board considered the amount of the advisory fee to be retained by the Advisor and the amount to be paid to LMCG, with respect to the various services to be provided by the Advisor and LMCG. The Board also noted that the Advisor negotiated the sub-advisory fee with LMCG at arm’s length. The Board also noted that identical expense caps were expected to remain in place for the Fund following the proposed sub-advisor change.
The Board also considered the performance of LMCG’s strategies and the Fund’s performance record under DRZ’s management. The Board also reviewed LMCG’s investment performance, highlighting the firm’s strong performance in its small cap value strategy relative to the Russell 2000® Value Index. Based upon their review, the Trustees concluded that the Fund’s proposed sub-advisory fee was reasonable in light of the services to be provided by LMCG to the Fund.
Conclusion. The Board reached the following conclusions regarding the Sub-Advisory Agreement: (a) LMCG is qualified to manage the Fund’s assets in accordance with the Fund’s investment goal and policies; (b) LMCG maintains an appropriate and effective compliance program; (c) the Fund’s proposed sub-advisory fee is reasonable in relation to the services to be provided by LMCG; and (d) LMCG’s proposed investment strategies are appropriate for pursuing the Fund’s investment goal. In considering the approval of the Sub-Advisory Agreement, the Board, including the IndependentTrustees, did not identify any single factor as controlling, and eachTrustee attributed different weights to the various factors. Based on its conclusions, the Board determined that approval of the Sub-Advisory Agreement was in the best interests of the Fund and its shareholders.
| 161 |
Other Items (Unaudited) (Continued)
In connection with the approval of LMCG as the sub-advisor to the Fund at the Meeting, the Advisor also proposed to the Board the appointment of Russell Implementation Services, Inc. (“Russell”), as the interim sub-advisor to the Fund. The Board approved the appointment of Russell as the interim sub-advisor, effective on or around May 21, 2016, until on or about June 30, 2016.
The Advisor and Russell provided the Board with various written materials in advance of the Meeting to assist with the Board’s consideration of Russell as the Fund’s interim sub-advisor. The Advisor provided written and oral information stating the basis for its recommendation to engage Russell as an interim sub-advisor. The information also included details regarding Russell’s: (a) investment philosophy and investment process; (b) investment management services proposed to be provided to the Fund; (c) investment management personnel; (d) operating history, infrastructure and financial condition; (e) proposed interim sub-advisory fee that would be paid to Russell by the Advisor; and (f) reputation, expertise and resources as an interim investment advisor. The Board then discussed the written materials that the Board received before the Meeting and all other information that the Board received at the Meeting.
The Board, including the Independent Trustees of the Trust, voting separately, unanimously determined that the proposal to approve the Interim Sub-Advisory Agreement for the Fund would be in the best interests of the shareholders and the Fund. In approving the Interim Sub-Advisory Agreement, the Board considered various factors, among them: (1) the nature, extent, and quality of services to be provided by Russell to the Fund, including the personnel who would be providing such services; (2) Russell’s proposed compensation; (3) Russell’s past performance; and (4) the terms of the Interim Sub-Advisory Agreement. The Board’s analysis of these factors is set forth below. The Independent Trustees were advised by independent legal counsel throughout the process.
Nature, Extent and Quality of Services Provided; Investment Personnel. The Board considered information provided by the Advisor regarding the services to be provided by Russell. The Board considered Russell’s level of knowledge and investment style. The Board reviewed the experience and credentials of the investment personnel who would be responsible for managing the investment of portfolio securities with respect to the Fund. The Board also took into consideration that the Advisor was satisfied with Russell’s in-house risk and compliance teams.
Russell’s Compensation. The Board took into consideration the financial condition of Russell and any direct and indirect benefits to be derived by Russell’s relationship with the Fund. In considering the anticipated level of profitability to Russell, the Board noted the proposed contractual undertaking of the Advisor to maintain expense limitations for the Fund and also noted that the interim sub-advisory fee under the Interim Sub-Advisory Agreement would be paid by the Advisor out of the advisory fee that it receives from the Fund, and that the interim sub-advisory fee was negotiated at arm’s length between the Advisor and Russell. As a consequence, the anticipated level of profitability to Russell from its relationship with the Fund was not a substantial factor in the Board’s deliberations. For similar reasons, the Board did not consider potential economies of scale in Russell’s management of the Fund to be a substantial factor in its consideration.
Interim Sub-Advisory Fee and Fund Performance. The Board considered that the Fund would pay an advisory fee to the Advisor and that the Advisor would pay an interim sub-advisory fee to Russell out of that advisory fee. The Board also considered certain comparative fee information concerning the sub-advisory fee that was paid to DRZ for managing the Fund. The Board also compared Russell’s proposed interim sub-advisory fee to the sub-advisory fees paid to DRZ, noting that the proposed interim sub-advisory fee schedule to Russell was substantially lower than DRZ’s sub-advisory fee schedule. The Board considered the amount of the advisory fee to be retained by the Advisor and the amount to be paid to Russell, with respect to the various services to be provided by the Advisor and Russell. The Board also noted that the Advisor negotiated the interim sub-advisory fee with Russell at arm’s length.
| 162 |
Other Items (Unaudited) (Continued)
The Board also considered Russell’s investment performance and the Fund’s performance record under DRZ’s management. The Trustees also noted that Russell has extensive experience providing transition services, including interim management, to the Touchstone Funds complex during sub-advisor transitions and that the Advisor was satisfied with Russell’s management of those funds. Based upon their review, the Trustees concluded that the Fund’s proposed interim sub-advisory fee was reasonable in light of the services to be received by the Fund from Russell.
Conclusion. The Board reached the following conclusions regarding the Interim Sub-Advisory Agreement: (a) Russell is qualified to manage the Fund’s assets in accordance with the Fund’s investment goal and policies; (b) Russell maintains an appropriate compliance program; (c) the Fund’s proposed interim sub-advisory fee is reasonable in relation to the fees of similar funds and the services to be provided by Russell; and (d) Russell’s proposed investment strategies are appropriate for pursuing the investment goal of the Fund. In considering the approval of the Interim Sub-Advisory Agreement, the Board, including the Independent Trustees, did not identify any single factor as controlling, and each Trustee attributed different weights to the various factors. Based on its conclusions, the Board determined that approval of the Interim Sub-Advisory Agreement was in the best interests of the Fund and its shareholders.
| 163 |
Management of the Trust (Unaudited)
Listed below is required information regarding the Trustees and principal officers of the Trust. The Trust’s Statement of Additional Information includes additional information about theTrustees and is available, without charge, upon request by calling 1.800.543.0407 or by visiting the Touchstone website at TouchstoneInvestments.com.
| Interested Trustee1: | ||||||||||
| Number | ||||||||||
| of Funds | ||||||||||
| Overseen | ||||||||||
| Term of | in the | |||||||||
| Name | Position(s) | Office And | Touchstone | Other | ||||||
| Address | Held with | Length of | Principal Occupation(s) | Fund | Directorships | |||||
| Age | Trust | Time Served | During Past 5 Years | Complex2 | Held During the Past 5 Years3 | |||||
Jill T. McGruder Touchstone Advisors, Inc. 303 Broadway Suite 1100 Cincinnati, OH 45202 Year of Birth: 1955 | Trustee and President | Until retirement at age 75 or until she resigns or is removed Trustee since 1999 | President and CEO of IFS Financial Services, Inc. (a holding company). | 41 | Director of LaRosa’s, Inc. (a restaurant chain) from 1999 to 2011; IFS Financial Services, Inc. (a holding company) from 1999 to the present; Integrity and National Integrity Life Insurance Co. from 2005 to the present; Touchstone Securities (the Trust’s distributor) from 1999 to the present; Touchstone Advisors (the Trust’s investment advisor and administrator) from 1999 to the present; W&S Brokerage Services (a brokerage company) from 1999 to the present; W&S Financial Group Distributors (a distribution company) from 1999 to the present; Every Child Succeeds (a social services agency) from 2007 to the present; Taft Museum of Art from 2007 to the present; and YWCA of Greater Cincinnati from 2012 to the present. | |||||
| Independent Trustees: | ||||||||||
Phillip R. Cox c/o Touchstone Advisors, Inc. 303 Broadway Suite 1100 Cincinnati, OH 45202 Year of Birth: 1947 | Trustee | Until retirement at age 75 or until he resigns or is removed Trustee since 1999 | President and Chief Executive Officer of Cox Financial Corp. (a financial services company) from 1971 to the present. | 41 | Director of Cincinnati Bell (a communications company) from 1994 to the present; Bethesda Inc. (a hospital) from 2005 to the present; Timken Co. (a manufacturing company) from 2004 to 2014; TimkenSteel from 2014 to the present; Diebold, Inc. (a technology solutions company) from 2004 to the present; and Ohio Business Alliance for Higher Education and the Economy from 2005 to the present. | |||||
William C. Gale c/o Touchstone Advisors, Inc. 303 Broadway Suite 1100 Cincinnati, OH 45202 Year of Birth: 1952 | Trustee | Until retirement at age 75 or until he resigns or is removed Trustee since 2013 | Retired; formerly Senior Vice President and Chief Financial Officer (from 2003 to January 2015) of Cintas Corporation (a business services company). | 41 | None. | |||||
| 164 |
Management of the Trust (Unaudited) (Continued)
| Independent Trustees (Continued): | ||||||||||
| Number | ||||||||||
| of Funds | ||||||||||
| Overseen | ||||||||||
| Term of | in the | |||||||||
| Name | Position(s) | Office And | Touchstone | Other | ||||||
| Address | Held with | Length of | Principal Occupation(s) | Fund | Directorships | |||||
| Age | Trust | Time Served | During Past 5 Years | Complex2 | Held During the Past 5 Years3 | |||||
Susan J. Hickenlooper c/o Touchstone Advisors, Inc. 303 Broadway Suite 1100 Cincinnati, OH 45202 Year of Birth: 1946 | Trustee | Until retirement at age 75 or until she resigns or is removed Trustee since 2009 | Retired; formerly Financial Analyst for Impact 100 (charitable organization) from November 2012 to 2013. | 41 | Trustee of Diocese of Southern Ohio from 2014 to the present; and Trustee of Episcopal Retirement Homes Foundation from 1998 to 2011 (a charitable organization). | |||||
Kevin A. Robie c/o Touchstone Advisors, Inc. 303 Broadway Suite 1100 Cincinnati, OH 45202 Year of Birth: 1956 | Trustee | Until retirement at age 75 or until he resigns or is removed Trustee since 2013 | Vice President of Portfolio Management at Soin International LLC (a private multinational holding company) from 2004 to the present. | 41 | Director of Buckeye EcoCare, Inc. (a lawn care company) from 2013 to the present; Trustee of Dayton Region New Market Fund, LLC (a private fund) from 2010 to the present; Trustee of the Entrepreneurs Center, Inc. (a small business incubator) from 2006 to the present; and Director of Interventional Imaging, Inc. (a medical device company) from 2004 to 2011. | |||||
Edward J. VonderBrink c/o Touchstone Advisors, Inc. 303 Broadway Suite 1100 Cincinnati, OH 45202 Year of Birth: 1944 | Trustee | Until retirement at age 75 or until he resigns or is removed Trustee since 2013 | Consultant, VonderBrink Consulting LLC from 2000 to the present. | 41 | Director of Streamline Health Solutions, Inc. (healthcare IT) from 2006 to 2015; Mercy Health from 2013 to the present; Mercy Health Foundation (healthcare nonprofit) from 2008 to the present; Al Neyer Inc. (a construction company) from 2013 to the present; and BASCO Shower Door from 2011 to the present. | |||||
| 1 | Ms. McGruder, as a director of the Advisor and the Distributor, and an officer of affiliates of the Advisor and the Distributor, is an “interested person” of the Trust within the meaning of Section 2(a) (19) of the 1940 Act. |
| 2 | As of September 30, 2016, the Touchstone Fund Complex consisted of 11 series of the Trust, 1 series of Touchstone Institutional Funds Trust, 2 series of Touchstone Investment Trust, 20 series of Touchstone Strategic Trust, 1 series of Touchstone Tax-Free Trust, and 6 variable annuity series of Touchstone Variable Series Trust. |
| 3 | Each Trustee is also a Trustee of Touchstone Institutional Funds Trust, Touchstone Investment Trust, Touchstone Strategic Trust, Touchstone Tax-Free Trust, and Touchstone Variable Series Trust. |
| 165 |
Management of the Trust (Unaudited) (Continued)
The following is a list of the Principal Officers of theTrusts, the length of time served, and principal occupations for the past five years.
| Principal Officers: | ||||||
| Term of | ||||||
| Name | Position(s) | Office And | ||||
| Address | Held with | Length of | Principal Occupation(s) | |||
| Age | Trust1 | Time Served | During the Past 5 Years | |||
Jill T. McGruder Touchstone Advisors, Inc. 303 Broadway Suite 1100 Cincinnati, OH 45202 Year of Birth: 1955 | President and Trustee | Until resignation, removal or disqualification President since 2006 | See biography above. | |||
Steven M. Graziano Touchstone Advisors, Inc. 303 Broadway Suite 1100 Cincinnati, OH 45202 Year of Birth: 1954 | Vice President | Until resignation, removal or disqualification Vice President since 2009 | President of Touchstone Advisors, Inc. | |||
Timothy D. Paulin Touchstone Advisors, Inc. 303 Broadway Suite 1100 Cincinnati, OH 45202 Year of Birth: 1963 | Vice President | Until resignation, removal or disqualification Vice President since 2010 | Senior Vice President of Investment Research and Product Management of Touchstone Advisors, Inc. | |||
Timothy S. Stearns Touchstone Advisors, Inc. 303 Broadway Suite 1100 Cincinnati, OH 45202 Year of Birth: 1963 | Chief Compliance Officer | Until resignation, removal or disqualification Chief Compliance Officer since 2013 | Chief Compliance Officer of Touchstone Advisors, Inc.; Chief Compliance Officer of Envestnet Asset Management, Inc. (2009 to 2013). | |||
Terrie A. Wiedenheft Touchstone Advisors, Inc. 303 Broadway Suite 1100 Cincinnati, OH 45202 Year of Birth: 1962 | Controller and Treasurer | Until resignation, removal or disqualification Controller and Treasurer since 2006 | Senior Vice President, Chief Financial Officer and Chief Operations Officer, of IFS Financial Services, Inc. (a holding company). | |||
Ellen Blanchard BNY Mellon Investment Servicing (US) Inc. 201 Washington St, 34th Fl. Boston, MA 02108 Year of Birth: 1973 | Secretary | Until resignation, removal or disqualification Secretary since 2015 | Director and Senior Counsel of BNY Mellon Investment Servicing (US) Inc. |
| 1 | Each officer also holds the same office with Touchstone Institutional Funds Trust, Touchstone Investment Trust, Touchstone Strategic Trust, Touchstone Tax-Free Trust and Touchstone Variable Series Trust. |
| 166 |
We Respect Your Privacy
Thank you for your decision to invest with us. Touchstone and its affiliates have always placed a high value on the trust and confidence our clients place in us. We believe that confidence must be earned and validated through time. In today’s world, when technology allows the sharing of information at light speeds, trust must be reinforced by our sincere pledge to take the steps necessary to ensure that the information you share with us is treated with respect and confidentiality.
Our Pledge to Our Clients
| · | We collect only the information we need to service your account and administer our business. |
| · | We are committed to keeping your information confidential and we place strict limits and controls on the use and sharing of your information. |
| · | We make every effort to ensure the accuracy of your information. |
We Collect the Following Nonpublic Personal Information About You:
| · | Information we receive from you on or in applications or other forms, correspondence, or conversations, including, but not limited to, your name, address, phone number, social security number, assets, income and date of birth; and |
| · | Information about your transactions with us, our affiliates, or others, including, but not limited to, your account number and balance, payment history, parties to transactions, cost basis information, and other financial information. |
Categories of Information We Disclose and Parties to Whom We Disclose
We do not disclose any nonpublic personal information about our current or former clients to nonaffiliated third parties, except as required or permitted by law.
We Place Strict Limits and Controls on the Use and Sharing of Your Information
| · | We restrict access to nonpublic personal information about you to authorized employees who need the information to administer your business. |
| · | We maintain physical, electronic and procedural safeguards that comply with federal standards to protect this information. |
| · | We do not disclose any nonpublic personal information about our current or former clients to anyone, except as required or permitted by law or as described in this document. |
| · | We will not sell your personal information to anyone. |
We May Provide Information to Service Your Account
Sometimes it is necessary to provide information about you to various companies such as transfer agents, custodians, broker-dealers and marketing service firms to facilitate the servicing of your account. These organizations have a legitimate business need to see some of your personal information in order for us to provide service to you. We may disclose to these various companies the information that we collect as described above. We require that these companies, including our own subsidiaries and affiliates, strictly maintain the confidentiality of this information and abide by all applicable laws. Companies within our corporate family that may receive this information are financial service providers and insurance companies. We do not permit these associated companies to sell the information for their own purposes, and we never sell our customer information.
This policy is applicable to the following affiliated companies: Touchstone Funds Group Trust, Touchstone Investment Trust, Touchstone Strategic Trust, Touchstone Tax-Free Trust, Touchstone Variable Series Trust, Touchstone Institutional Funds Trust, Touchstone Securities, Inc.,* and W&S Brokerage Services, Inc.
* Touchstone Securities, Inc. serves as the underwriter to the Touchstone Funds.
A Member of Western & Southern Financial Group®
The Privacy Protection Policy is not part of the Annual Report.
| 167 |


Go paperless, sign up today at:
www.touchstoneinvestments.com
Touchstone Investments
Distributor
Touchstone Securities, Inc.*
303 Broadway
Cincinnati, Ohio 45202-4203 800.638.8194
www.touchstoneinvestments.com
Investment Advisor
Touchstone Advisors, Inc.*
303 Broadway
Cincinnati, Ohio 45202-4203
Transfer Agent
BNY Mellon Investment Servicing (US) Inc.
4400 Computer Drive
Westborough, MA 01581
Shareholder Service
800.543.0407
* A Member of Western & Southern Financial Group
TSF-56-TFGT-AR-1610
Item 2. Code of Ethics.
| (a) | The registrant, as of the end of the period covered by this report, has adopted a code of ethics that applies to the registrant’s principal executive officer, principal financial officer, principal accounting officer or controller, or persons performing similar functions, regardless of whether these individuals are employed by the registrant or a third party. |
| (c) | There have been no amendments, during the period covered by this report, to a provision of the code of ethics that applies to the registrant’s principal executive officer, principal financial officer, principal accounting officer or controller, or persons performing similar functions, regardless of whether these individuals are employed by the registrant or a third party, and that relates to any element of the code of ethics description. |
| (d) | The registrant has not granted any waivers, including an implicit waiver, from a provision of the code of ethics that applies to the registrant’s principal executive officer, principal financial officer, principal accounting officer or controller, or persons performing similar functions, regardless of whether these individuals are employed by the registrant or a third party, that relates to one or more of the items set forth in paragraph (b) of this item’s instructions. |
Item 3. Audit Committee Financial Expert.
The registrant’s Board of Trustees has determined that the registrant has at least one audit committee financial expert serving on its audit committee. Mr. William Gale is the registrant’s audit committee financial expert and is an independent trustee within the meaning of the Investment Company Act of 1940, as amended (the “1940 Act”).
Item 4. Principal Accountant Fees and Services.
Audit Fees
| (a) | Audit fees for Touchstone Fund Group Trust totaled $185,450 and $195,000 in fiscal 2016 and 2015, respectively, including fees associated with the annual audits and filings of Form N1A and Form N-SAR. |
Audit-Related Fees
| (b) | There were no audit-related fees for the 2016 and 2015 fiscal years. |
Tax Fees
| (c) | The aggregate fees for tax compliance services totaled $88,440 and $85,990 in fiscal 2016 and 2015, respectively. |
Fees for both 2016 and 2015 relate to the preparation of federal income and excise tax returns review of capital gains distribution calculations and tax agent services.
All Other Fees
| (d) | The aggregate fees billed in each of the last two fiscal years for products and services provided by the principal accountant, other than the services reported in paragraphs (a) through (c) of this Item are for fiscal years 2016 and 2015 are $28,143 and $20,185, respectively. The fees relate to the PFIC analyzer, Global Withholding Tax Reporter subscriptions. |
| (e)(1) | Disclose the audit committee's pre-approval policies and procedures described in paragraph (c)(7) of Rule 2-01 of Regulation S-X. |
The Audit Committee’s pre-approval policies describe the types of audit, audit-related, tax and other services that have the general pre-approval of the Audit Committee. The pre-approval policies provide that annual audit service fees, tax services not specifically granted pre-approval, services exceeding pre-approved cost levels and other services that have not received general pre-approval will be subject to specific pre-approval by the Audit Committee. The pre-approval policies further provide that the Committee may grant general pre-approval to other audit services (statutory audits and services associated with SEC registration statements, periodic reports and other documents filed with the SEC or other documents issued in connection with securities offerings), audit-related services (accounting consultations related to accounting, financial reporting or disclosure matters not classified as “audit services,” assistance with understanding and implementing new accounting and financial reporting guidance from rulemaking authorities, agreed-upon or expanded audit procedures related to accounting and/or billing records required to respond to or comply with financial, accounting or regulatory reporting matters and assistance with internal control reporting requirements under Form N-SAR and Form N-CSR), tax services that have historically been provided by the auditor that the Committee believes would not impair the independence of the auditor and are consistent with the SEC’s rules on auditor independence and permissible non-audit services classified as “all other services” that are routine and recurring services.
| (e)(2) | All of the services described in paragraphs (b) through (d) of Item 4 were approved by the Audit Committee. |
| (f) | The percentage of hours expended on the principal accountant's engagement to audit the registrant's financial statements for the most recent fiscal year that were attributed to work performed by persons other than the principal accountant's full-time, permanent employees was less than fifty percent. |
| (g) | The aggregate non-audit fees billed by the registrant's accountant for services rendered to the registrant, and rendered to the registrant's investment adviser (not including any sub-adviser whose role is primarily portfolio management and is subcontracted with or overseen by another investment adviser), and any entity controlling, controlled by, or under common control with the adviser that provides ongoing services to the registrant for each of the last two fiscal years of the registrant was $116,583 for 2016 and $106,175 for 2015. |
| (h) | The registrant's audit committee of the board of trustees has considered whether the provision of non-audit services that were rendered to the registrant's investment adviser (not including any sub-adviser whose role is primarily portfolio management and is subcontracted with or overseen by another investment adviser), and any entity controlling, controlled by, or under common control with the investment adviser that provides ongoing services to the registrant that were not pre-approved pursuant to paragraph (c)(7)(ii) of Rule 2-01 of Regulation S-X is compatible with maintaining the principal accountant's independence. |
Item 5. Audit Committee of Listed Registrants.
Not applicable.
Item 6. Investments.
| (a) | Schedule of Investments in securities of unaffiliated issuers as of the close of the reporting period is included as part of the report to shareholders filed under Item 1 of this form. |
| (b) | Not applicable. |
Item 7. Disclosure of Proxy Voting Policies and Procedures for Closed-End Management Investment Companies.
Not applicable.
Item 8. Portfolio Managers of Closed-End Management Investment Companies.
Not applicable.
Item 9. Purchases of Equity Securities by Closed-End Management Investment Company and Affiliated Purchasers.
Not applicable.
Item 10. Submission of Matters to a Vote of Security Holders.
There have been no material changes to the procedures by which the shareholders may recommend nominees to the registrant’s board of trustees, where those changes were implemented after the registrant last provided disclosure in response to the requirements of Item 407(c)(2)(iv) of Regulation S-K (17 CFR 229.407) (as required by Item 22(b)(15) of Schedule 14A (17 CFR 240.14a-101)), or this Item.
Item 11. Controls and Procedures.
| (a) | The registrant’s principal executive and principal financial officers, or persons performing similar functions, have concluded that the registrant’s disclosure controls and procedures (as defined in Rule 30a-3(c) under the Investment Company Act of 1940, as amended (the “1940 Act”) (17 CFR 270.30a-3(c))) are effective, as of a date within 90 days of the filing date of the report that includes the disclosure required by this paragraph, based on their evaluation of these controls and procedures required by Rule 30a-3(b) under the 1940 Act (17 CFR 270.30a-3(b)) and Rules 13a-15(b) or 15d-15(b) under the Securities Exchange Act of 1934, as amended (17 CFR 240.13a-15(b) or 240.15d-15(b)). |
| (b) | There were no changes in the registrant’s internal control over financial reporting (as defined in Rule 30a-3(d) under the 1940 Act (17 CFR 270.30a-3(d))) that occurred during the registrant’s second fiscal quarter of the period covered by this report that has materially affected, or is reasonably likely to materially affect, the registrant’s internal control over financial reporting. |
Item 12. Exhibits.
| (a)(1) | Code of ethics, or any amendment thereto, that is the subject of disclosure required by Item 2 is attached hereto. |
| (a)(2) | Certifications pursuant to Rule 30a-2(a) under the 1940 Act and Section 302 of the Sarbanes-Oxley Act of 2002 are attached hereto. |
| (a)(3) | Not applicable. |
| (b) | Certifications pursuant to Rule 30a-2(b) under the 1940 Act and Section 906 of the Sarbanes-Oxley Act of 2002 are attached hereto. |
| (12.other) | Not applicable. |
SIGNATURES
Pursuant to the requirements of the Securities Exchange Act of 1934 and the Investment Company Act of 1940, the registrant has duly caused this report to be signed on its behalf by the undersigned, thereunto duly authorized.
(Registrant) Touchstone Funds Group Trust
By (Signature and Title)* /s/ Jill T. McGruder
Jill T. McGruder, President
(principal executive officer)
Date 11/28/2016
Pursuant to the requirements of the Securities Exchange Act of 1934 and the Investment Company Act of 1940, this report has been signed below by the following persons on behalf of the registrant and in the capacities and on the dates indicated.
By (Signature and Title)* /s/ Jill T. McGruder
Jill T. McGruder, President
(principal executive officer)
Date 11/28/2016
By (Signature and Title)* /s/ Terrie A. Wiedenheft
Terrie A. Wiedenheft, Controller and Treasurer
(principal financial officer)
Date 11/28/2016
* Print the name and title of each signing officer under his or her signature.