EXHIBIT 99.5
MANAGEMENT’S DISCUSSION & ANALYSIS
FOR THE PERIOD ENDED DECEMBER 31, 2004
Management’s Discussion and Analysis (MD&A) is intended to help you understand the dynamics of our business and the key factors underlying our financial results. It explains trends in our financial condition and results of our operations for the year ended December 31, 2004 compared with our operating results for the year ended December 31, 2003. It also compares our balance sheet as at December 31, 2004 to our balance sheet as at December 31, 2003. This MD&A should be read in conjunction with our Audited Consolidated Financial Statements for December 31, 2004.
‘The information in this MD&A is as of February 21, 2005 and in this MD&A ‘we’, ‘us’, and ‘our’ refers to Call-Net Enterprises Inc. (Call-Net). Additional information relating to our company, including our Annual Information Form (AIF), is available on SEDAR atwww.sedar.com.
FORWARD-LOOKING STATEMENTS
Securities laws encourage companies to disclose forward-looking information so that investors can get a better understanding of the company’s future prospects and make informed investment decisions. Statements that are not historical fact and are based on current expectations, estimates and assumptions are forward-looking statements.
This MD&A contains forward-looking statements about our business. Inherent in these statements are known and unknown risks, uncertainties, and other factors that may cause the results, performance or achievements of our Company to differ materially from those expressed or implied by such statements. Such factors include, among others, general economic and business conditions, demographic changes, regulation, major technology changes, timing of product introductions, competition and our ability to attract and retain key employees.
NON GAAP FINANCIAL MEASURES
Certain financial measures used in this MD&A do not have any standardized meaning under Canadian generally accepted accounting principles (GAAP). Below is a definition of each of the non-GAAP financial measures used in this MD&A. At the point where each non-GAAP financial measure is first discussed, a table has been provided to reconcile that financial information to the most directly comparable GAAP measure.
| | EBITDA |
| | Earnings before interest, taxes, depreciation and amortization (EBITDA) is a financial metric used to analyze operating results. We define EBITDA as revenue less carrier charges and operating costs. We use EBITDA as a benchmark of operating performance and as a performance threshold in the management incentive plan. We caution you that EBITDA as calculated by us may not be comparable to similarly titled amounts reported by other companies. |
| | |
| | FREE CASH FLOW |
| | We define free cash flow as EBITDA less financing costs (including interest expense on long-term debt, servicing fees, bank charges and any late payment charges), cash income taxes paid, net capital expenditures and the cash component of changes in deferred costs. We use free cash flow as a measure of our ability to maintain operations and service debt. |
| Call-Net Enterprises Inc. | Page 1 | 2004 & Q4 Managements Discussion & Analysis |
OVERVIEW
CALL-NET’S BUSINESS
We are a national, full-service, facilities-based telecommunications alternative to the long-established telephone companies, known as incumbent local exchange carriers, or ILECs. Primarily through our wholly-owned subsidiary Sprint Canada Inc. (Sprint Canada), we offer home phone, long distance, wireless, and dial-up Internet access services to residential customers targeting Canada’s largest metropolitan areas. We also offer local, long distance, data and Internet Protocol (IP) solutions (including access) to Canadian businesses and governments of all sizes.
We provide services to three types of customers: consumers, businesses and other telecommunications companies. Services to the first two are offered largely under the Sprint Canada brand, while services to the third group, sometimes called carriers, are delivered under the Call-Net brand.
BUSINESS STRATEGY
Our mission is to leverage proven technologies and outstanding people to deliver telecommunications services in a smart and simple way.
In order to deliver on that mission, our business plan identifies five areas of focus:
| | 1. | Identify, develop, and exploit profitable segments within the Canadian telecommunications marketplace |
| | 2. | Provide competitive services and solutions that optimize partner relationships, internal capabilities and the regulatory environment |
| | 3. | Hire, train and recognize outstanding people that exemplify our values |
| | 4. | Differentiate through superior sales and customer service |
| | 5. | Be financially prudent with respect to cash flow, capital expenditure and acquisitions. |
KEY PERFORMANCE DRIVERS
Our business success and financial performance will be driven principally by our success at identifying and managing the following performance drivers in our industry.
CUSTOMER DEMAND
Customer demand for telecommunications services is generally growing, although the growth rate varies, sometimes substantially, by product. For example, we believe that long distance usage, as measured by the number of long distance minutes, is growing despite the fact that industry long distance revenues are generally declining. In addition, the number of local lines in service in Canada has been growing, albeit quite modestly. Wireless service and high speed Internet services are currently growing at more substantial rates, generally greater than 10 per cent per year. Our company is less sensitive to the growth rate of any given telecommunications product or service because we have a very small share of the markets in which we operate. Underlying growth in demand for the products we sell helps, but we do not currently need to rely on industry growth to drive revenue growth.
COMPETITIVE INTENSITY AND INDUSTRY PRICING
The Canadian telecommunications industry is very competitive. The industry is dominated by a small number of very large incumbent firms that have benefited from historical advantages of scale resulting from the fact that they were able to build their networks and capital and customer bases while under protection as statutory monopolies. In spite of the steps taken over the past several years to deregulate the market for telecommunication services and the investments made by competitors in infrastructure to compete, the incumbent advantage has proven to be very difficult to overcome, with most competitors having failed over the past five years. Competition continues to be based primarily on price, although we are establishing ourselves based on our service capabilities as well. However, because of this price competition and because of technological changes discussed later, per-unit pricing in the telecommunications industry has been falling for several years in many product categories. We have been successful at bringing costs down at a rate that exceeds the rate of decline in per-unit pricing and so our profitability has been improving, and we must be careful to maintain profitability in the face of continued competition.
OPERATIONAL EFFICIENCY
In part because of falling prices, we must become ever more operationally efficient. Each year, we set objectives for reducing our carrier charges and improving operational efficiencies. We have generally met these objectives, improving our gross margins over the past two years while growing business volumes and keeping our network operations and corporate costs stable. We must continue to improve efficiencies in the future to be assured of having a successful, long-term enterprise.
| Call-Net Enterprises Inc. | Page 2 | 2004 & Q4 Managements Discussion & Analysis |
FAIR REGULATION
We continue to pursue regulatory reforms to lower carrier costs and remove operational barriers to competition in the telecommunications industry. While, in general, we are satisfied with the regulatory regime as currently constructed by the Canadian Radio-television and Telecommunications Commission (CRTC), we are engaged in a number of follow-up proceedings resulting from the price cap decisions to lower our access costs. Our business strategy does not depend on additional relief from the CRTC on access costs, but we do depend on the regulator to ensure that incumbents are implementing and respecting the decisions it makes.
QUARTERLY SUMMARY INFORMATION
In order to track our financial performance and condition, we pay particular attention to the measures summarized in the following table of quarterly information.
2004 Quarterly Information
| (in millions Canadian $) | | Q4 | | Q3 | | Q2 | | Q1 | |
| Revenue | | | 211.1 | | | 204.2 | | | 200.8 | | | 202.5 | |
| Gross profit | | | 109.2 | | | 101.1 | | | 100.3 | | | 107.4 | |
| Operating income | | | (11.5 | ) | | (7.8 | ) | | (13.3 | ) | | (10.3 | ) |
| Net income | | | (13.8 | ) | | (1.6 | ) | | (33.1 | ) | | (29.9 | ) |
| Earnings per share (EPS) | | | (0.39 | ) | | (0.05 | ) | | (0.93 | ) | | (0.84 | ) |
| EBITDA (1) | | | 31.9 | | | 24.1 | | | 22.4 | | | 26.5 | |
| Net capital expenditures | | | 14.9 | | | 15.9 | | | 10.2 | | | 14.0 | |
| Free cash flow (1) | | | 8.4 | | | (1.6 | ) | | 2.6 | | | 1.4 | |
| Local equivalent line count (2) | | | 464,900 | | | 371,300 | | | 336,800 | | | 301,600 | |
| Churn (3) | | | 2.1 | % | | 2.7 | % | | 2.1 | % | | 2.2 | % |
| (1) | See reconciliation in the ‘MD&A Summary Information’ table found on the final page of this document. |
| (2) | Includes primary rate interfaces (PRIs) quantified as 23 individual business lines (IBLs) |
| (3) | Equals monthly disconnections divided by the average number of lines per month. |
2003 Quarterly Information
| (in millions Canadian $) | | Q4 | | Q3 | | Q2 | | Q1 | |
| Revenue | | | 204.1 | | | 204.9 | | | 194.1 | | | 202.2 | |
| Gross profit | | | 107.3 | | | 96.4 | | | 95.7 | | | 96.0 | |
| Operating income | | | (13.7 | ) | | (15.8 | ) | | (23.0 | ) | | (15.7 | ) |
| Net income | | | (16.9 | ) | | (30.2 | ) | | 2.0 | | | 7.6 | |
| Earnings per share (EPS) | | | (0.48 | ) | | (1.15 | ) | | 0.08 | | | 0.32 | |
| EBITDA | | | 24.9 | | | 23.0 | | | 23.7 | | | 24.5 | |
| Net capital expenditures | | | 13.3 | | | 12.8 | | | 4.8 | | | 5.4 | |
| Free cash flow | | | 0.9 | | | (1.7 | ) | | 6.5 | | | 6.3 | |
| Local equivalent line count | | | 267,600 | | | 234,900 | | | 208,600 | | | 188,500 | |
| Churn | | | 2.7 | % | | 3.3 | % | | 3.6 | % | | 3.2 | % |
The factors affecting these metrics over the past eight quarters are discussed throughout this MD&A.
| Call-Net Enterprises Inc. | Page 3 | 2004 & Q4 Managements Discussion & Analysis |
CALL-NET’S 2004 RESULTS
2004 IN REVIEW
In 2004, we set out to return Call-Net to growth. After several years of declining revenue, brought about by persistent industry-wide declines in the per-unit pricing of the products and services we sell, as well as unprecedented changes in the structure of our industry, we hoped to be able to return to year-over-year growth in both revenue and EBITDA. We are pleased to report success on this front in 2004; marking another turning point in the evolution of our business.
Selected Financial Information | | For the years ended December 31 | |
| (in millions Canadian $) | | 2004 | | 2003 | | 2002 | |
| Revenue | | | 818.6 | | | 805.3 | | | 800.7 | |
Netincome (loss) | | | (78.4 | ) | | (37.5 | ) | | (151.1 | ) |
| Earnings (loss) per share (EPS) - basic | | | (2.20 | ) | | (1.36 | ) | | (N/A | ) |
| Total assets | | | 648.9 | | | 839.1 | | | 921.6 | |
| Long-term financial liabilities | | | 321.8 | | | 436.2 | | | 518.6 | |
| EBITDA | | | 104.9 | | | 96.1 | | | 46.6 | |
| Net capital expenditures | | | (55.0 | ) | | (36.3 | ) | | (71.7 | ) |
| Free cash flow | | | 10.8 | | | 12.0 | | | (105.7 | ) |
REVENUE IS GROWING
Revenue in 2004 was $818.6 million and includes the results of our acquisition of the Bell/360 customer base. Prior to the inclusion of the Bell/360 acquisition, our revenue was $811.0 million, up by $5.7 million, or approximately one per cent from 2003.
| • | Acquisitions have accelerated revenue growth and product diversification |
On May 25, 2004, we entered into an agreement with Bell Canada to acquire certain assets of 360networks Corporation including significant portions of its business customer base and specific network facilities in Ontario, Quebec and Atlantic Canada (the ’Bell/360 acquisition’). The closing of this transaction occurred on November 20, 2004, at which time more than 50 former employees of 360networks joined our company.
At closing, we entered into a two-year transitional services agreement with Bell Canada under which it will provide technical and operational services to the newly acquired customer base and in exchange be paid approximately 70 per cent of the total revenue subject to a minimum monthly amount of approximately $2.0 million. We will have an option at the end of the term of the agreement to acquire certain CLEC network assets used to service these customers. This CLEC network is one of the most significant telecommunications networks in Central and Atlantic Canada connecting over 1,000 office buildings.
The acquisition price for the business customer base totaled $17.6 million, representing three months of acquired revenue plus acquisition costs, and will be paid in four installments over the life of the transition services agreement. The $17.6 million was recorded as a customer relationship intangible asset and is being amortized over 30 months.
In the fourth quarter, revenue from the Bell/360 customer base accounted for approximately $7.6 million of our consolidated revenue and contributed approximately $1.2 million of recurring EBITDA. The Bell/360 customer base and the employees we acquired to support and grow this base are in the process of being integrated into our company. In December, the acquired customer base received its first invoices from Sprint Canada.
In 2005, we expect to be able to grow both the number of customers on this network and the total revenue on the network without compromising any of our other Business Services activities. Already, significant work is underway on a number of strong business opportunities.
| Call-Net Enterprises Inc. | Page 4 | 2004 & Q4 Managements Discussion & Analysis |
| • | Consumer and business services revenue continues to grow |
We operate two growth businesses; Consumer Services and Business Services. The revenues in each of these businesses grew in 2004; Consumer Services by 10 per cent and Business Services by six per cent. Growth was fueled by our ongoing migration into new products and services. In Consumer Services, this means bundled home phone service, while in Business Services, it means local and IP-enabled data services. Our Carrier Services business declined by 16 per cent in 2004 reflecting industry-wide weakness in this market.
| • | We continue to diversify our revenue base |
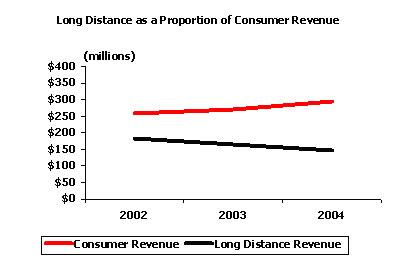
We have historically been a long distance services company and long distance services have been a very profitable product for us to sell. But several years ago we realized that being a long distance only company was not a viable long term strategy. Accordingly, we began to diversify our revenue base. In 2004, we saw our growth businesses - business and consumer - add significantly to the local and data services we offer, more than offsetting the decline in long distance revenues. In 2004, 52 per cent of our revenue came from long distance while 48 per cent came from these other products and services. The effects of this diversification are more dramatic at the divisional level, where in both Consumer Services and Business Services, long distance is no longer our largest product by revenue.
OUR NETWORK AND OPERATIONS ARE MORE EFFICIENTLY MANAGED
In 2004 we realized significant improvements in the efficiency of our network and in our various processes supporting both the provisioning and servicing of our customers. Our aim has been to create operational efficiencies with the dollar savings being reinvested to create growth.
| • | Carrier charges were less than 50 per cent of revenue |
In 2004, we were successful at keeping carrier charges below 50 per cent of revenue. As our local business grows, we are able to take advantage of scale economies in co-location operations and in back-haul. A co-location site and the associated back-haul is generally a fixed cost. As we add more customers in a co-location the per customer cost drops. Our increased scale also gives us the opportunity to make small changes in our network to replace leased with owned facilities. In 2004, we constructed Metro Area Networks (MANs) in Toronto and Ottawa, complementing MANs already existing in Montreal and Vancouver. These MANs allow us to bring our traffic to our switch sites over fibre that we own, rather than fibre leased from other telecommunications companies, reducing our carrier charges as a result. In addition, the cost of terminating calls in Canada, the United States and internationally continues to drop reflecting the overall decline in the costs of operating telecommunications companies world-wide. For example, in 2004 we had an 40 per cent increase in international traffic, but our total costs for terminating international traffic dropped by nine per cent.
| Call-Net Enterprises Inc. | Page 5 | 2004 & Q4 Managements Discussion & Analysis |
| • | Provisioning efficiency improved |
We have made significant investments in becoming smarter in our provisioning operations. Because of the growth rate of our local business, and because we are the only telecommunications company in Canada that has been significantly growing its local customer base, we have established a provisioning operation that rivals those of ILECs that may be 10 or 20 times our size. Because of our smaller size, however, it is important, that we become ever more efficient in provisioning so that this cost does not grow in step with our local revenues. In 2004 our total expenditures in provisioning were essentially unchanged from 2003. This despite the fact that we activated 40 per cent more customers in 2004 than 2003, and processed more than 150,000 moves, adds, and changes in the year. During business hours in 2004, our provisioning operation successfully completed an average of one provisioning order every 15 seconds.
| • | Network operating expenses remain stable |
While operating costs grew from $299.3 million in 2003 to $313.1 million in 2004, this growth was deliberate and limited to the ongoing investment in the growth of our Business Services and Consumer Services customer base. Expenses related to network operations and corporate services actually declined despite a 10 per cent increase in long distance minutes from 2003 to 2004 and a 76 per cent increase in the number of local line equivalents in service on the Call-Net network.
CONSUMER SERVICES IS GROWING AND DIVERSIFYING
Our revenue diversification has come in part from our successful penetration of the home phone service business in Canada. As we grow the number of customers in this part of our business, we also expect to grow the revenue per customer as we bundle home phone service with long distance, wireless and, in 2005, DSL service. In addition to providing top line revenue growth, this strategy allows us to diversify our consumer revenue stream so that we are less dependent on any one product.
| • | Continued profitable growth in local service lines |
We continued our success in adding local and home phone service customers, adding 92,500 net consumer lines and 98,500 net equivalent business lines for a total of 197,300 lines in the year. This brings our total number of local line equivalents to 464,900. Of the increase in net business local equivalent lines, 61,900 comes from the inclusion of the Bell/360 acquisition in the fourth quarter.
| Selected Key Performance Indicators | | For the years ended December 31 | |
| | 2004 | | 2003 | | 2002 | |
| Net local line additions | | | | | | | | | | |
| | Consumer home phone service | | | 104,800 | | | 65,000 | | | 79,900 | |
| | Business local line equivalents | | | 92,500 | | | 31,400 | | | 33,100 | |
| Total net additions | | | 197,300 | | | 96,400 | | | 113,000 | |
| Local lines | | | | | | | | | | |
| | Consumer home phone service lines | | | 310,800 | | | 206,000 | | | 141,000 | |
| | Business local line equivalents* | | | 154,100 | | | 61,600 | | | 30,200 | |
| Total local lines | | | 464,900 | | | 267,600 | | | 171,200 | |
| Average monthly churn** | | | 2.2 | % | | 3.0 | % | | 4.3 | % |
| Consumer customers | | | 578,000 | | | 645,125 | | | 584,536 | |
| Business customers | | | 20,000 | | | 11,400 | | | 6,300 | |
| * | Includes primary rate interfaces (PRIs) quantified as 23 individual business lines (IBLs) |
| ** | Equals monthly disconnections divided by the average number of lines per month. |
| • | Home phone service bundles continue to grow |
We have focused on selling product bundles to our consumer customers using home phone service as the foundation product, as a means of increasing customer loyalty, increasing our share of our customers’ monthly communications spend, and reducing customer churn. In the fourth quarter of 2004, 69 per cent of consumer services revenue came from customers who purchase more than one product from us, as compared to 50 per cent in the fourth quarter of 2003. Most of these customers purchase a bundle of home phone and long distance services with some taking a third product such as a wireless second line or dial-up Internet access.
Average revenue per line (ARPL) includes revenue from home phone and long distance services together with additional bundled revenues from services such as Fido® wireless and dial-up Internet, all divided by the average number of lines. The additional products and services added to the home phone bundle in 2004 have allowed us to offset declines in long distance revenue per line per month.
| Call-Net Enterprises Inc. | Page 6 | 2004 & Q4 Managements Discussion & Analysis |
We believe that our bundled home phone service business has many characteristics desirable in consumer telecommunications including: a relatively stable monthly spend consisting of basic service, features and long distance service, a healthy contribution to margin,; low churn, a reliable cost of acquisition and the potential for significant growth to the customer base.
Finally, our cost of acquisition and provisioning continues to fall. In the fourth quarter, we spent an average of $269 to acquire and provision a home phone service line, down from $315 in the fourth quarter of 2003. For the full year, 2004, our cost of acquisition averaged $304 per line. We have seen efficiency improvements in both selling and marketing and in provisioning new customers.
After a modest run up in the third quarter of 2004, fourth quarter overall churn returned to the levels of earlier in the year - about 2.1 per cent. Overall churn for the year was 2.2 per cent, down from 3.0 per cent last year.
Customer churn in home phone service in the quarter averaged 2.5 per cent, and allowed us to average 2.6 per cent consumer churn for the year. Over the past year, we have been able to reduce churn by focusing on customer retention and improving the credit profile of customers. In addition, two CRTC decisions, have helped. The extension of the ’no-winback’ period from three months to 12 months (Telelcom Decision CRTC 2004-04), and the direction that ILECs unbundle home phone service from their offerings (Telelcom Decision CRTC 2003-49). According to customer surveys done at the time of disconnect, the principal element of voluntary churn continues to be a desire to have high-speed Internet (via DSL) and home phone service provided by one supplier. We will address this with the launch of our own facilities-based high-speed Internet product in the second half of 2005.
| • | VoIP - planning for tomorrow, without sacrificing today |
In 2004, we launched a voice over Internet protocol (VoIP) service under the name Sprint Canada Internet Phone Service. Customer take-up of this offering is modest - consistent with our expectations. We have committed to try to deliver the highest quality VoIP service available because we believe that consumers buy service first and technology second. VoIP is an important investment for the future because we believe that consumer adoption of Internet phone services will continue to grow as the reliability of the service improves.
BUSINESS SERVICES ENHANCES FOCUS ON NEXT- GENERATION DATA AND LOCAL SERVICES
| • | IP Enabled Solutions continues to win converts |
After the launch ofIP Enabled Solutions in late 2003, we saw revenue growth in excess of 40 per cent in Internet protocol (IP) based services in 2004 as we began to focus on IP as a dominant networking solution. Our IP solution allows our customers to leverage the benefits of this technology through hybrid networks and has several advantages:
| | • | A single flexible network that encompasses a range of access types from xDSL to Ethernet allowing a customer to tailor a solution to precisely match the requirements of each site |
| | • | A migration path from legacy frame relay services that delivers more bandwidth, more flexibility and a platform for emerging converged IP applications |
| | • | An opportunity to simplify customers’ data solutions, moving from disparate services to a single IP platform. |
| • | Cross-border services are an important source of growth and profits |
We continue to succeed in our initiative with Sprint to win a greater share of the cross-border market. Our revenue from cross border initiatives grew by 32 per cent in 2004 and is now 15 percent of our Business Services revenue. Sprint and Sprint Canada offer a unique value proposition to North American business in the provision of seamless North American telecommunications services. We expect continued success in 2005.
| • | Local service bundles are attractive in the business market |
The small and medium enterprise (SME) market in Canada has been an important source of growth in local service bundles. Not only do we offer SMEs the benefits of local access and long distance services at reduced rates, but we also provide high-speed Internet access. In 2004, business local services revenue increased by $14.6 million, or 47 per cent and contributed to average churn levels of less than one per cent.
| Call-Net Enterprises Inc. | Page 7 | 2004 & Q4 Managements Discussion & Analysis |
FOURTH QUARTER 2004 OPERATING HIGHLIGHTS
Fourth Quarter Revenue by Product
| | | | For the three months ended December 31 | |
| (in millions Canadian $) | | 2004 | | 2003 | | Change | | % Change | |
| | Long distance services | | | 101.7 | | | 119.9 | | | (18.2 | ) | | (15.2 | )% |
| | Data services | | | 53.5 | | | 48.6 | | | 4.9 | | | 10.1 | % |
| | Local services | | | 52.8 | | | 34.1 | | | 18.7 | | | 54.8 | % |
| | Wireless services | | | 3.1 | | | 1.5 | | | 1.6 | | | 106.7 | % |
| Total revenue | | | 211.1 | | | 204.1 | | | 7.0 | | | 3.4 | % |
In the fourth quarter of 2004, our total revenue grew by $7.0 million, or three per cent, from the fourth quarter of 2003 to $211.1 million. Fourth quarter revenue includes the impact of the Bell/360 acquisition from the date of closing, which contributed approximately $7.6 million of revenue in the quarter.
Fourth Quarter Revenue by Business
| | | For the three months ended December 31, 2004 | |
| (in millions Canadian $) | | Total | | Consumer | | Business | | Carrier | |
| Long distance services | | | 101.7 | | | 33.7 | | | 37.7 | | | 30.3 | |
| Data services | | | 53.5 | | | 2.9 | | | 39.5 | | | 11.1 | |
| Local services | | | 52.8 | | | 35.9 | | | 14.7 | | | 2.2 | |
| Wireless services | | | 3.1 | | | 3.1 | | | - | | | - | |
Total revenue | | | 211.1 | | | 75.6 | | | 91.9 | | | 43.6 | |
We continue to grow non-long distance services, including local and home phone service as well as IP-based data offerings. As a result, the proportion of local, wireless and data revenue in our business mix continues to increase as long distance declines. Long distance comprised 48 per cent of total revenue in the quarter, down from 59 per cent in the fourth quarter of 2003.
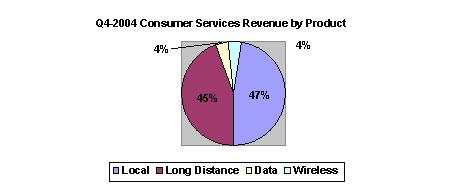
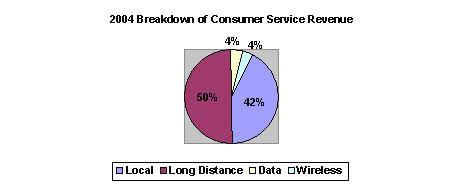
In our consumer services division, local or home phone service is now our biggest single product segment at 47 per cent of consumer revenue. Long distance services comprise 45 per cent of revenues, while the remaining eight per cent of revenue comes from dial-up and wireless services.
In the fourth quarter, we made a change to the allocation of the system access fee (SAF) charged to our consumer customers. Historically, 100 percent of this SAF had been allocated to long distance revenue. The SAF charge is more properly described as a customer charge, rather than a product charge, so we have changed the allocation of the SAF to one based on revenues from each product. We have applied this change retroactively in our consumer services division. As a result, in the fourth quarter $3.9 million long distance revenue was reallocated to local services ($3.3 million), data services ($0.3 million) and wireless services ($0.3 million).
| Call-Net Enterprises Inc. | Page 8 | 2004 & Q4 Managements Discussion & Analysis |
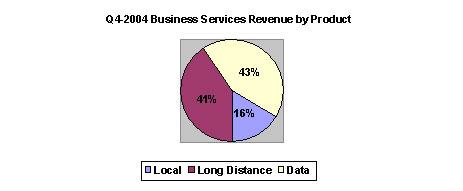
In our business services group, data service is our biggest single product segment at 43 per cent of business revenue. Long distance services comprise 41 per cent of revenues, while the remaining 16 per cent of revenue comes from local services.
In our carrier services division, long distance continues to be our biggest single product segment at 70 per cent of revenue. Data services comprise 25 per cent of revenues, while the remaining five per cent of revenue comes from local services.
Fourth Quarter Carrier Charges & Gross Margin
| | | | For the three months ended December 31 | |
| (in millions Canadian $) | | 2004 | | 2003 | | Change | | % Change | |
| Carrier charges | | | 101.9 | | | 96.8 | | | 5.1 | | | 5.3 | % |
| | % of revenue | | | 48.3 | % | | 47.4 | % | | 0.9 | % | | | |
| Gross margin | | | 109.2 | | | 107.3 | | | 1.9 | | | 1.8 | % |
| | % of revenue | | | 51.7 | % | | 52.6 | % | | (0.9 | )% | | | |
Carrier charges in the fourth quarter were $101.9 million, or 48 per cent of revenue. This is up by $5.1 million from the same quarter last year. The growth in carrier charges primarily reflects costs associated with growth in revenue.
In the fourth quarter we received a beneficial decision from the CRTC (Telecom Decision CRTC 2004-72) reducing primary inter-exchange carrier (PIC) charges by up to 90 per cent in some cases. This decision also has a retroactive component totaling $1.7 million that has been included in the fourth quarter as a credit against carrier charges.
Fourth Quarter Operating Costs
| | | | For the three months ended December 31 | |
| (in millions Canadian$) | | 2004 | | 2003 | | Change | | % Change | |
| | Consumer Services | | | 28.0 | | | 28.0 | | | - | | | 0.0 | % |
| | Business Services | | | 23.2 | | | 16.6 | | | 6.6 | | | 39.8 | % |
| | Carrier Services | | | 2.7 | | | 0.3 | | | 2.4 | | | 800.0 | % |
| | Network operations & corporate | | | 23.4 | | | 37.5 | | | (14.1 | ) | | (37.6 | )% |
| Total operating costs | | | 77.3 | | | 82.4 | | | (5.1 | ) | | (6.2 | )% |
| Call-Net Enterprises Inc. | Page 9 | 2004 & Q4 Managements Discussion & Analysis |
Operating costs fell in the quarter, reflecting the positive impact of our organizational realignment. We undertook the realignment in order to consolidate and streamline provisioning, reduce the number of levels of management and consolidate marketing and development activities across divisions. As a result of corporate reorganizations over the past year, changes in operating costs in business services and network operations reflect the movement of personnel between these divisions, rather than a significant change in the costs associated with these personnel. As a result, operating costs for these groups are not directly comparable across quarters. An apparent increase in the operating costs in carrier services in the fourth quarter reflects the reversal of a portion of our bad debt reserve in 2003.
Fourth Quarter EBITDA & Operating Profit (Loss)
| | | | For the three months ended December 31 | |
| (in millions Canadian $) | | 2004 | | 2003 | | Change | | % Change | |
| EBITDA | | | 31.9 | | | 24.9 | | | 7.0 | | | 28.1 | % |
| Depreciation & amortization | | | (36.9 | ) | | (38.6 | ) | | 1.7 | | | (4.4 | )% |
| Realignment & other charges | | | (6.5 | ) | | - | | | (6.5 | ) | | - | |
| Operating profit (loss) | | | (11.5 | ) | | (13.7 | ) | | 2.2 | | | (16.1 | )% |
| | EBITDA as a % of revenue | | | 15.1 | % | | 12.2 | % | | 2.9 | % | | | |
Fourth quarter EBITDA was $31.9 million. This is $7.0 million above the level of the same period in 2003, and is equivalent to approximately 15 per cent of revenue. Much of the increase in EBITDA reflects the positive impact of our realignment and the effect of the PIC decision referred to above. We recorded a charge of $6.5 million in the fourth quarter reflecting the severance costs associated with our realignment, announced on September 29, 2004. The realignment directly affected approximately 135 of our employees.
Home Phone Service Bundles
| | | | For the three months ended December 31 | |
| | | | 2004 | | 2003 | | Change | |
| Consumer home phone service lines | | | | | | | | | | |
| | Gross additions | | | 48,000 | | | 46,600 | | | 1,400 | |
| | Net additions | | | 25,500 | | | 30,600 | | | (5,100 | ) |
| | Churn | | | 2.5 | % | | 2.8 | % | | (0.3 | )% |
| | Average monthly revenue per line | | $ | 60.28 | | $ | 60.45 | | | ($0.17 | ) |
| Cost of acquisition (millions) | | | | | | | | | | |
| | Selling and marketing costs | | $ | 7.9 | | $ | 9.3 | | | ($1.4 | ) |
| | Activation costs | | | 5.0 | | | 5.4 | | | (0.4 | ) |
| Total cost of acquisition | | $ | 12.9 | | $ | 14.7 | | | ($1.8 | ) |
| | Cost of acquisition per line | | $ | 269 | | $ | 315 | | | ($46 | ) |
We had another good quarter in our home phone business in consumer services. We added 48,000 gross and 25,500 net new home phone service lines at a cost of acquisition of $269 per line. Our net line additions dropped by 5,100 from the level of the fourth quarter of 2003 as a result of higher disconnects in the home phone customer base. As our base of home phone service grows, a similar percentage churn level will result in a higher number of disconnects just as a result of the larger customer base. Churn in the quarter returned to the level we have been targeting of 2.5 per cent as a result of refocusing certain of our customer retention strategies and activities.
| Call-Net Enterprises Inc. | Page 10 | 2004 & Q4 Managements Discussion & Analysis |
2004 OPERATING RESULTS
For the full year, 2004, our total revenue grew by $13.3 million, or two per cent, to $818.6 million. 2004 revenue includes the impact of the Bell/360 acquisition from the date of closing, and contributed approximately $7.6 million of revenue in the fourth quarter and full year.
2004 Revenue by Product
| | | | For the 12 months ended December 31 | |
| (in millions Canadian $) | | 2004 | | 2003 | | Change | | % Change | |
| | Long distance services | | | 427.8 | | | 482.2 | | | (54.4 | ) | | (11.3 | )% |
| | Data services | | | 202.8 | | | 201.1 | | | 1.7 | | | 0.8 | % |
| | Local services | | | 177.7 | | | 120.4 | | | 57.3 | | | 47.6 | % |
| | Wireless services | | | 10.3 | | | 1.6 | | | 8.7 | | | 543.8 | % |
| Total revenue | | | 818.6 | | | 805.3 | | | 13.3 | | | 1.7 | % |
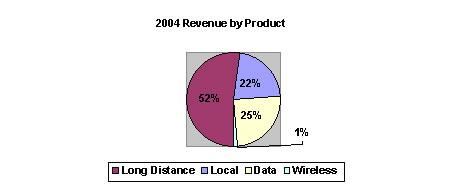
We continue to grow non-long distance services, including local, home phone and wireless service as well as IP-based data offerings. As a result, the proportion of long distance revenue in our business mix continues to decline. However, local, wireless and data services revenue grew by $67.7 million, or 21 per cent over 2003, more than offsetting the $54.4 million, or 11 per cent decline in long distance revenue. For the full year, long distance services revenue comprised 52 per cent of revenue.
2004 Revenue by Business
| | | | For the 12 months ended December 31, 2004 | |
| (in millions Canadian $) | | Total | | Consumer | | Business | | Carrier | |
| | Long distance services | | | 427.8 | | | 147.4 | | | 150.9 | | | 129.5 | |
| | Data services | | | 202.8 | | | 13.1 | | | 142.5 | | | 47.2 | |
| | Local services | | | 177.7 | | | 124.8 | | | 45.6 | | | 7.3 | |
| | Wireless services | | | 10.3 | | | 10.3 | | | - | | | - | |
| Total revenue | | | 818.6 | | | 295.6 | | | 339.0 | | | 184.0 | |
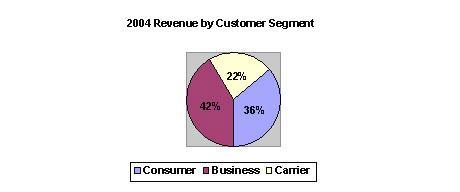
Our revenue is also well diversified by customer segment, with $295.6 million, or 36 per cent of our revenue coming from consumer services and 41 per cent and 23 percent coming from each of business and carrier services. Consistent with the recent past, year-over-year growth in our consumer and business services revenue has offset declines in carrier services revenue.
CONSUMER SERVICES
In the consumer segment, we provide home phone, long distance, dial-up Internet access and wireless services to residences and small office home office (SOHO) customers targeting five major urban areas that incorporates more than 33 different municipalities.
Over the past year, consumer revenue has grown by $26.6 million or 10 per cent to $295.6 million. In general, growth has been driven by our success in selling home phone and wireless service.
| Call-Net Enterprises Inc. | Page 11 | 2004 & Q4 Managements Discussion & Analysis |
2004 Consumer Services Revenue
| | | For the 12 months ended December 31 | |
| (in millions Canadian $) | | 2004 | | 2003 | | Change | | % Change | |
| Long distance services | | | 147.4 | | | 165.8 | | | (18.4 | ) | | (11.1 | )% |
| Data services | | | 13.1 | | | 17.0 | | | (3.9 | ) | | (22.9 | )% |
| Home phone services | | | 124.8 | | | 84.6 | | | 40.2 | | | 47.5 | % |
| Wireless services | | | 10.3 | | | 1.6 | | | 8.7 | | | 543.8 | % |
Consumer services revenue | | | 295.6 | | | 269.0 | | | 26.6 | | | 9.9 | % |
| Consumer services operating costs | | | 119.3 | | | 98.3 | | | 21.0 | | | 21.4 | % |
CONSUMER SERVICES LONG DISTANCE SERVICES REVENUE
In 2004, we made a change to the allocation of the system access fee charged to our consumer customers. Historically, 100 per cent of this SAF had been allocated to long distance revenue. This charge is more properly described as a customer charge, rather than a product charge, so we have changed the allocation of the SAF to one based on revenues from each product. We have applied this change retroactively in our consumer services division. In 2004, this change resulted in $13.8 million of revenue being reallocated from long distance services to local services ($11.6 million), data services ($1.2 million) and wireless services ($1.0 million). Historical periods have also been restated to reflect this change.
After changes relating to the allocation of SAF revenue, consumer long distance revenue was $147.4 million, down $18.4 million from last year. This decline is a result of declines in the average per minute charge for long distance services. The total volume of long distance minutes grew by approximately 16 per cent during 2004, driven by a large increase in North American calling under our North American unlimited plan. In 2004, long distance revenue now accounted for approximately 50 per cent of our total consumer services revenue; however, most of this revenue comes from customers who also buy home phone service from us. Sprint Canada-branded long distance only customers account for 15 per cent of our consumer revenue, while indirect long distance programs, including affinity programs, and alternative long distance products, comprise another 12 per cent.
The average revenue per minute (ARPM) of our per-minute long distance plans fell by almost 10 per cent in 2004. However, the growth in popularity in unlimited plans caused a significant increase in the number of minutes in these plans. For example, our consumer U.S. bound minute volumes grew by 38 per cent in 2004, driven by the popularity of the North American Unlimited Plan. The popularity of these unlimited plans caused our overall consumer ARPM to decline by 23 per cent in 2004. Due to continued improvements in the cost structure of our business and our on-going efforts at cost reduction, average cost per minute for consumer services declined by 34 per cent.
CONSUMER SERVICES HOME PHONE SERVICE REVENUE
Home phone, service revenue was $124.8 million in the year, an increase of 48 per cent or $40.2 million from 2003. The growth in customer count has been consistent and the average monthly home phone service revenue per customer has been stable. This stability has resulted from a number of factors offsetting one another, including the mix of wireless in the bundle, revenue promotions, as well as changes in revenue from features such as voice mail and calling line identification.
| Call-Net Enterprises Inc. | Page 12 | 2004 & Q4 Managements Discussion & Analysis |
CONSUMER SERVICES DATA REVENUE
Revenue from dial-up customers was $13.1 million for the year, a decline of $3.9 million, or 23 per cent from 2003. The number of subscribers stood at 51,700 at year-end, down 21 per cent from last year. We activated more than 26,000 new dial-up customers during the year, but this was offset by the continued migration of Canadian households to high-speed Internet services. We expect to begin to offset the decline in consumer data revenues in 2005 with the deployment of our own consumer high-speed Internet offering using DSL technology.
CONSUMER SERVICES WIRELESS REVENUE
Under our bundled wireless service offering using the Fido® brand, we activated 17,800 net new lines in the year and ended the year with 28,900 customers and 30,600 lines. Revenue from wireless services was $10.3 million, in this first full year of offering the service. Churn in wireless services was stable throughout the year at approximately 2.4 per cent.
CONSUMER SERVICES OPERATING COSTS
Operating costs in consumer services were $119.3 million, up $21.0 million, or 21 per cent from last year. The increase in operating costs year-over-year is primarily the result of the transfer of certain provisioning operations amounting to $11.1 million into consumer services. After adjusting for this change, Consumer Services operating costs were up by $9.9 million from last year. This increase resulted from an increase in marketing programs and investments in customer care.
BUSINESS SERVICES
We continue to focus on four initiatives in the business market in Canada:
| • | Maintaining and developing our working relationship with Sprint to offer multi-national corporations (MNCs) single-service, single-invoice, seamless North American network services; |
| | |
| • | Delivering ourIP Enabled Solutionsat substantial cost savings and time efficiencies to Canadian customers allowing them to integrate legacy systems with next-generation services in an efficient and cost-effective manner; |
| | |
| • | Continuing our Enhanced Voice Services (EVS) initiative by penetrating the call centre sector with complex interactive voice response (IVR) and advanced voice recognition (AVR) applications; and |
| | |
| • | Bundling long distance, local, and high-speed access for small and medium-sized enterprises (SME). |
To these four initiatives we have added a fifth; maximizing the value of the Bell/360 acquisition by fully integrating the people, products, and new customers, and by making the best possible use of the future opportunities afforded by the acquisition.
BUSINESS SERVICES REVENUE
In 2004, our Business Services revenue was $339.0 million, up $20.4 million from last year. The Bell/360 acquisition contributed approximately $7.6 million to growth, while the remaining $12.8 million was organic growth, split between local and data services.
2004 Business Services Revenue
| | | For the 12 months ended December 31 | |
| (in millions Canadian $) | | 2004 | | 2003 | | Change | | % Change | |
| Long distance services | | | 150.9 | | | 153.6 | | | (2.7 | ) | | (1.8 | )% |
| Data services | | | 142.5 | | | 134.0 | | | 8.5 | | | 6.3 | % |
| Local services | | | 45.6 | | | 31.0 | | | 14.6 | | | 47.1 | % |
Business Services revenue | | | 339.0 | | | 318.6 | | | 20.4 | | | 6.4 | % |
| Business Services operating costs | | | 78.2 | | | 63.2 | | | 15.0 | | | 23.7 | % |
BUSINESS SERVICES LONG DISTANCE REVENUE
Business Services long distance revenue declined by two per cent compared to last year. Revenue decline was the result of a nine per cent decrease in ARPM, partially offset by an eight per cent increase in minute volumes.
| Call-Net Enterprises Inc. | Page 13 | 2004 & Q4 Managements Discussion & Analysis |
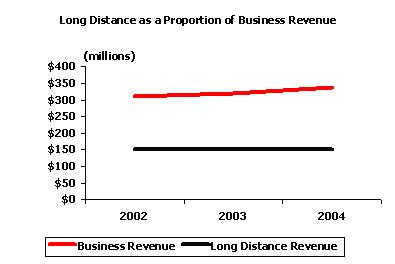
Long distance, as a percentage of business services revenue, continues to decline from a level of 48 per cent of business services revenue in 2003 to 45 per cent of revenue in this year.
BUSINESS SERVICES LOCAL REVENUE
Business local line equivalents grew by 92,500 lines, or 150 per cent, in 2004. Most of that growth came from the addition of the Bell/360 business customers who used approximately 61,900 local line equivalents at year-end. Revenue from business local services grew by 47 per cent from last year and contributed $14.6 million of the increase in revenue during the year.
BUSINESS SERVICES DATA REVENUE
Business data revenue also grew in the year 2004. We continue to have success in sellingIP Enabled Solutions and the growth of this offering has generally compensated for the decline in legacy data revenues. In 2004, we recorded $142.5 million of data revenue, up 6 per cent from 2003. The growth in data revenue in the year caused this product category in the fourth quarter to surpass long distance as the dominant product sold to our business customers.
BUSINESS SERVICES OPERATING COSTS
Business services operating costs totaled $78.2 million in 2004, an increase of $15.0 million over 2003. This increase is primarily the result of the transfer of certain provisioning operations, amounting to $7.0 million, into Business Services. This coupled with the Bell/360 acquisition, contributed approximately $3.0 million to operating costs. Adjusting for this transfer and acquisition, operating costs in Business Services grew by $5.0 million, reflecting an increase in people and marketing costs necessary to support increased volumes.
CARRIER SERVICES
Our strategy is to optimize the contribution from carrier services by focusing on profitability rather than revenue growth. The wholesale market has been under substantial pricing pressure for the past several years and the ongoing results of this division reflect this industry trend.
CARRIER SERVICES REVENUE
2004 Carrier Services Revenue
| | | For the 12 months ended December 31 | |
| (in millions Canadian $) | | 2004 | | 2003 | | Change | | % Change | |
| Long distance services | | | 129.5 | | | 162.8 | | | (33.3 | ) | | (20.5 | )% |
| Data services | | | 47.2 | | | 50.1 | | | (2.9 | ) | | (5.8 | )% |
| Local services | | | 7.3 | | | 4.8 | | | 2.5 | | | 52.1 | % |
Carrier services revenue | | | 184.0 | | | 217.7 | | | (33.7 | ) | | (15.5 | )% |
| Carrier services operating costs | | | 9.7 | | | 6.9 | | | 2.8 | | | 40.6 | % |
| Call-Net Enterprises Inc. | Page 14 | 2004 & Q4 Managements Discussion & Analysis |
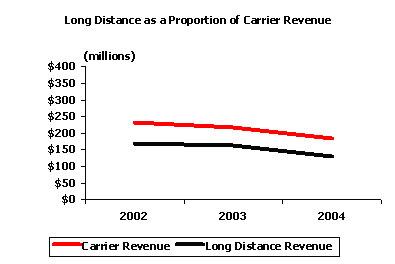
Carrier Services revenue in the year totaled $184.0 million; a 16 per cent decline from 2003. Long distance services led the decline, down 21 per cent from 2003. Minute volumes grew by 10 per cent in the year while ARPMs were down significantly, 27 per cent. Much of this ARPM decline can be attributed to changes in the mix of minutes. For example, in international traffic, where rates and costs are declining the fastest, we saw a 47 per cent increase in minute volume and a 45 per cent reduction in ARPM. In 2004, Carrier Services revenue comprised approximately 22 per cent of consolidated revenue and was 70 per cent long distance. Average costs per minute (ACPM), especially for international traffic, has been declining at similar rates to ARPMs.
CARRIER SERVICES OPERATING COSTS
Carrier Services operating costs were $9.7 million, up in the year relative to the $6.9 million recorded in the last year. The apparent increase in costs was largely a result of changes in 2003 to the provision for bad debt. Excluding this factor, operating costs were $0.6 million higher in 2004, the result of increased people costs.
CARRIER CHARGES & GROSS PROFIT
Carrier charges were $400.6 million in 2004, or 49 per cent of revenue, down from $409.9 million or 51 per cent of revenue in 2003. This $9.3 million improvement reflects, in part, targeted efforts at carrier cost reduction - a focus on network efficiencies and maximizing the benefits of the regulatory environment. In 2004, we set targets for savings from operational efficiencies and targets for regulatory cost savings based on our run rate at the beginning of the year. The success of these programs, combined with revenue growth, offset by declines in ARPM, resulted in the carrier charges improvement noted. None of the cost benefits of the recent CRTC decision (Telecom Decision CRTC 2005-6) on CDN services rates is reflected in 2004 results.
2004 Carrier Charges & Gross Profit
| | | | For the 12 months ended December 31 | |
| (in millions Canadian $) | | 2004 | | 2003 | | Change | | % Change | |
| Carrier charges | | | 400.6 | | | 409.9 | | | (9.3 | ) | | (2.3 | )% |
| | % of revenue | | | 48.9 | % | | 50.9 | % | | (2.0 | )% | | | |
| Gross profit | | | 418.0 | | | 395.4 | | | 22.6 | | | 5.7 | % |
| | Gross profit margin | | | 51.1 | % | | 49.1 | % | | 2.0 | % | | | |
The reduction in carrier charges translated into an increased gross profit and a higher gross margin. Gross profit was up by $22.6 million, $9.3 million of which came from a net reduction in carrier charges and $13.3 million of which came from revenue growth. On a consolidated basis, our profit margin from long distance services was unchanged from 2003, while there were gross margin increases in local, data and wireless services. The underlying profitability of our non-long distance services continues to improve as we gain economies of scale in local service, and as we make more effective use of the benefits of our hybrid network, leasing when appropriate and building when the economics warrant.
| Call-Net Enterprises Inc. | Page 15 | 2004 & Q4 Managements Discussion & Analysis |
OPERATING COSTS
Overall, in 2004 operating costs were $313.1 million, up $13.8 million from $299.3 million in 2003. Operating costs as a percentage of revenue were 38 per cent in 2004, as compared to 37 per cent of revenue in 2003. The increase in operating costs reflects investments in sales and customer care in both consumer and business services. The changes in consumer, business and carrier operating costs was discussed earlier.
2004 Operating Costs
| | | | For the 12 months ended December 31 | |
| (in millions Canadian $) | | 2004 | | 2003 | | Change | | % Change | |
| Consumer services | | | 119.3 | | | 98.3 | | | 21.0 | | | 21.4 | % |
| Business services | | | 78.2 | | | 63.2 | | | 15.0 | | | 23.7 | % |
| Carrier services | | | 9.7 | | | 6.9 | | | 2.8 | | | 40.6 | % |
| Network operations & corporate | | | 105.9 | | | 130.9 | | | (25.0 | ) | | (19.1 | )% |
| Total operating costs | | | 313.1 | | | 299.3 | | | 13.8 | | | 4.6 | % |
| | % of revenue | | | 38.2 | % | | 37.2 | % | | 1.0 | % | | | |
NETWORK OPERATIONS AND CORPORATE COSTS
Network operations and corporate costs in 2004 were $105.9 million, down from $130.9 million in 2003. Approximately $15.7 million of this reduction related to the movement of our provisioning operations from network operations to consumer and business services. The remaining reduction in costs is attributed to human resource costs, due in part to the organizational realignment and to lower incentive payments.
OPERATING PROFIT (LOSS)
EBITDA
Primarily as a result of the previously mentioned increase in gross profit, together with decreases in operating costs, EBITDA for 2004 was $104.9 million, an increase of $8.8 million or nine per cent from 2003.
2004 EBITDA & Operating Profit (Loss)
| | | For the 12 months ended December 31 | |
| (in millions $) | | 2004 | | 2003 | | Change | | % Change | |
Operating profit (loss) | | | (42.9 | ) | | (68.2 | ) | | 25.3 | | | (37.1 | )% |
| Depreciation & amortization | | | 146.6 | | | 157.3 | | | (10.7 | ) | | (6.8 | )% |
| Realignment & other charges | | | 1.2 | | | 7.0 | | | (5.8 | ) | | (82.9 | )% |
EBITDA | | | 104.9 | | | 96.1 | | | 8.8 | | | 9.2 | % |
Depreciation and amortization charges totaled $146.6 million, a seven per cent decrease from 2003. Depreciation and amortization has generally been falling as our ongoing capital spending program has declined.
We recorded a net expense of $1.2 million in the year for realignment and other charges. This expense was the result of a $7.8 million realignment charge reflecting the severance costs of employees directly affected by the realignment, offset by a $6.6 million gain resulting from the reversal of the provision taken in 2003, for maintenance costs associated with certain dark fibre. During 2004, we came to an agreement with the owner of the fibre whereby we abandoned these routes and allowed this party to abandon certain other routes on which we were collecting maintenance fees.
As a consequence of the above factors, operating loss was $42.9 million for the year, an improvement of $25.3 million, or 37 per cent from last year.
| Call-Net Enterprises Inc. | Page 16 | 2004 & Q4 Managements Discussion & Analysis |
OTHER EXPENSES
2004 Other Expenses
| | | For the 12 months ended December 31 | |
| (in millions Canadian $) | | 2004 | | 2003 | | Change | | % Change | |
| Loss on repurchase of long-term debt | | | (4.0 | ) | | - | | | (4.0 | ) | | - | |
| Reversal of change in control provision | | | 4.7 | | | - | | | 4.7 | | | - | |
| Net loss on the sale of capital assets | | | (0.9 | ) | | - | | | (0.9 | ) | | - | |
Sub-total | | | (0.2 | ) | | - | | | (0.2 | ) | | - | |
In 2004, we recorded several items that are non-recurring by nature. In the first quarter of 2004, we made market purchases for cancellation of approximately U.S.$76.4 million of long term debt ($100.8 million), recording a loss on repurchase of $4.0 million. The repurchases served to reduce our interest expense on long term debt by U.S.$8.1 million per year.
In the first quarter, we also recorded a gain of $4.7 million in connection with the elimination of a reserve established in connection with the application brought by Montreal Trust Company of Canada (now Compushare Investor Services), discussed in note 12 of the audited consolidated financial statements. Both the initial decision and subsequent appeal were ruled in our favour and the plaintiffs in the case did not seek leave to appeal further.
In the second quarter, we recorded a loss on the sale of assets. Capital equipment with a book value of $1.3 million was sold for proceeds of $0.4 million, resulting in a $0.9 million loss.
2004 Interest Expense, Other Income and Foreign Exchange Gains & Losses
| | | | For the 12 months ended December 31 | |
| (in millions Canadian $) | | 2004 | | 2003 | | Change | | % Change | |
| Interest expense | | | (32.7 | ) | | (43.2 | ) | | 10.5 | | | (24.3 | )% |
| Interest income & other expense | | | (13.4 | ) | | (5.7 | ) | | (7.7 | ) | | 135.1 | % |
| | Foreign exchange gain (loss) | | | 17.1 | | | 85.9 | | | (68.8 | ) | | (80.1 | )% |
Interest expense on long-term debt in the year was $32.7 million, down from $43.2 million in 2003. This $10.5 million reduction was a result of two factors: 1) the market purchase of U.S.$76.4 million (approximately $100.8 million) of senior secured notes in March 2004 and the consequent elimination of $8.8 million in interest costs associated with the repurchased notes; and 2) fluctuations in the Canadian dollar exchange rate, which resulted in $1.7 million less in Canadian dollar interest payments on our senior secured notes as these notes are denominated in U.S. dollars.
As a result of our accounts receivable securitization program, certain of our gains and losses related to bad debt are classified as gains or losses on securitization and appear as an ‘other’ expense. In 2004 these losses totaled $9.8 million, and comprised 73 per cent of the $13.4 million of net other expenses. Other expenses also grew in 2004 reflecting the first full year impact of the accounts receivable securitization program.
In 2004, we recorded a foreign exchange gain of $17.1 million as the result of the appreciation in the Canadian dollar against the U.S. dollar. Of this gain, $17.8 million related to a change in the principal amount of our long-term debt and the remaining $(0.7) million represented a net loss, during the year, on the foreign exchange related component of our operations. While the foreign exchange gain in 2004 is significant, it was much less than the $85.9 million gain recorded in 2003, itself the result of the strong Canadian dollar favourably impacting both operations and our balance sheet.
A one cent change in the value of the Canadian dollar against the U.S. dollar changes the principal amount of our long-term debt by approximately $3.3 million.
NET INCOME (LOSS)
As a consequence of the above factors, we recorded a net loss in the year of $78.4 million, or $2.20 per share, compared with a net loss of $37.5 million, or $1.36 per share in 2003. A 109 per cent increase in net loss translated into a 62 per cent increase in net loss per share as a consequence of an increase in the weighted average number of shares outstanding in 2004.
| Call-Net Enterprises Inc. | Page 17 | 2004 & Q4 Managements Discussion & Analysis |
2004 Net Income (Loss)
| | | For the 12 months ended December 31 | |
| (in millions Canadian $) | | 2004 | | 2003 | | Change | | % Change | |
Net income (loss) | | | (78.4 | ) | | (37.5 | ) | | (40.9 | ) | | 109.1 | % |
| Earnings per share - basic | | | (2.20 | ) | | (1.36 | ) | | (0.84 | ) | | 61.8 | % |
LIQUIDITY AND CAPITAL RESOURCES
Our plan is to remain cash flow positive, meaning that we will generate more than enough EBITDA to cover interest and other financing costs, capital expenditures and cash taxes. This should leave our cash balance relatively intact and allow us to keep these cash resources for general corporate purposes, opportunistic investments or acquisitions, or to further reduce our debt levels.
Cash, cash equivalents and short-term investments are generally invested in liquid Canadian and U.S. dollar denominated securities with maturities no greater than one year and having one of the two highest ratings by either the Standard and Poor’s Rating Group or Moody’s Investor Service, Inc.
CASH FLOW
CASH FLOW FROM OPERATING ACTIVITIES
Operating activities before changes in non-cash working capital provided $59.0 million of cash in 2004 compared with $41.2 million in 2003. This $17.8 million, or 43 per cent increase in operating cash flow was assisted by higher EBITDA of $8.8 million, and lower interest payments of $10.5 million, consistent with our strategy of growing profitability and giving us greater opportunities to re-invest in our business. Cash flow from operating activities grew relative to the last year as changes in non-cash working capital provided $25.3 million of cash. Over the past two years, changes in non-cash working capital have provided $30.3 million of cash. This change has resulted from a number of activities including proceeds from the sale of accounts receivable partly offset by the effect of normalizing our payment relationships with carrier suppliers to reduce the overall level of carrier disputes.
2004 Cash Flow from Operating Activities
| | | | For the 12 months ended December 31 | |
| (in millions Canadian $) | | 2004 | | 2003 | | Change | | % Change | |
| Net income (loss) | | | (78.4 | ) | | (37.5 | ) | | (40.9 | ) | | 109.1 | % |
| | Depreciation & amortization | | | 146.6 | | | 157.3 | | | (10.7 | ) | | (6.8 | )% |
| | Foreign exchange gain (loss) | | | (17.8 | ) | | (85.9 | ) | | 68.1 | | | (79.3 | )% |
| | Reversal of provisions | | | (4.7 | ) | | - | | | (4.7 | ) | | - | |
| | Loss on repurchase of debt | | | 4.0 | | | - | | | 4.0 | | | - | |
| | Future income taxes | | | 3.9 | | | 4.3 | | | (0.4 | ) | | (9.3 | )% |
| | Interest income & other expense | | | 2.7 | | | 3.0 | | | (0.3 | ) | | (10.0 | )% |
| | Loss on sale of assets | | | 0.9 | | | - | | | 0.9 | | | - | |
| | Realignment & other charges | | | 1.2 | | | - | | | 1.2 | | | - | |
| Operating cash flow | | | 58.4 | | | 41.2 | | | 17.2 | | | 41.8 | % |
| | Change in non-cash working capital | | | 28.4 | | | 2.5 | | | 25.9 | | | 1,036.0 | % |
| Cash flow from operating activities | | | 86.8 | | | 43.7 | | | 43.1 | | | 98.6 | % |
| | Per share - basic | | $ | 2.43 | | $ | 1.59 | | $ | 0.84 | | | 52.8 | % |
CASH FLOW FROM INVESTING ACTIVITIES
Overall, investment activities in 2004 generated $2.8 million of cash compared with a use of cash of $59.7 million in 2003. However, we have combined capital expenditures, acquisitions, dispositions, and changes in deferred costs, long-term assets and other, into investing cash flow. This measure reflects the net change in operating assets of the business, assets on which we expect to make operating returns. In total we spent slightly less in 2004 on operating assets than in 2003 ($56.0 million in 2004, as compared to $57.0 million in 2003). In order for us to meet our cash flow self sufficiency goals, we intend to keep this investment in operating assets in the range of seven to eight per cent of revenue.
| Call-Net Enterprises Inc. | Page 18 | 2004 & Q4 Managements Discussion & Analysis |
Capital investments of $55.4 million were made in 2004 to expand local services, improve existing systems, enhance cost efficiency, and accommodate new products. The increase of $11.3 million from 2003 reflects principally the increased scale of our local operations.
2004 Cash Flow from Investing Activities
| | | | For the 12 ended December 31 | |
| (in millions Canadian $) | | 2004 | | 2003 | | Change | | % Change | |
| Acquisition of capital assets | | | (55.4 | ) | | (44.1 | ) | | (11.3 | ) | | 25.6 | % |
| Change in deferred costs & other | | | (0.3 | ) | | (1.0 | ) | | 0.7 | | | (70.0 | )% |
| Increase in long term assets | | | (0.2 | ) | | - | | | (0.2 | ) | | - | |
| Net proceeds from disposals | | | 0.4 | | | 7.8 | | | (7.4 | ) | | (94.9 | )% |
| Acquisitions | | | (0.5 | ) | | (19.7 | ) | | 19.2 | | | (97.5 | )% |
| Investing cash flow | | | (56.0 | ) | | (57.0 | ) | | 1.0 | | | (1.8 | )% |
| | % of revenue | | | (6.8 | )% | | (7.1 | )% | | 0.3 | % | | | |
| Change in short-term investments | | | 58.8 | | | (2.7 | ) | | 61.5 | | | (2,277.8 | )% |
| Cash flow from investing activities | | | 2.8 | | | (59.7 | ) | | 62.5 | | | (104.7 | )% |
Most of the $62.5 million change in cash flow from investing activities between 2003 and 2004 is from changes in short-term investments which provided $61.5 million more cash in 2004 than in the prior year.
CASH FLOW FROM FINANCING ACTIVITIES
Financing activities consumed $107.2 million in 2004. This compares to 2003 when financing activities generated $38.4 million of cash. In 2004, financing activities were dominated by the repurchase of long term debt for $104.8 million, while in 2003 activities were dominated by the issuance of equity in the amount of $40.6 million. The combined effect of these two events was a $145.4 million swing between the two years. Excluding the effects of the equity issuance, and the debt repurchase cash flow from financing activities has been stable and limited to the costs incurred in connection with the retirement of the right-of-way liability.
2004 Cash Flow from Financing Activities
| | | For the 12 months ended December 31 | |
| (in millions Canadian $) | | 2004 | | 2003 | | Change | | % Change | |
| Change in right-of-way liability | | | (2.4 | ) | | (2.2 | ) | | (0.2 | ) | | 9.1 | % |
| Repurchase of long term debt | | | (104.8 | ) | | - | | | (104.8 | ) | | - | |
| Issuance of class B shares | | | - | | | 40.6 | | | (40.6 | ) | | (100.0 | )% |
Cash flow from financing activities | | | (107.2 | ) | | 38.4 | | | (145.6 | ) | | (379.2 | )% |
FREE CASH FLOW
In 2004, we had free cash flow of $10.8 million, which is $1.2 million, or 10 per cent, lower than 2003. Consistent with our strategy of reinvestment to the extent of discretionary cash flow availability, all of the $8.8 million improvement in EBITDA and the $7.4 million improvement in financing costs was reinvested in capital expenditures, which grew by $18.7 million.
| Call-Net Enterprises Inc. | Page 19 | 2004 & Q4 Managements Discussion & Analysis |
2004 Free Cash Flow
| | | | For the 12 months ended December 31 | |
| (in millions Canadian $) | | 2004 | | 2003 | | Change | | % Change | |
| EBITDA | | | 104.9 | | | 96.1 | | | 8.8 | | | 9.2 | % |
| Financing costs | | | (37.4 | ) | | (44.8 | ) | | 7.4 | | | (16.5 | )% |
| Cash income taxes paid | | | (1.4 | ) | | (2.0 | ) | | 0.6 | | | (30.0 | )% |
| Net capital expenditures | | | (55.0 | ) | | (36.3 | ) | | (18.7 | ) | | 51.5 | % |
| Cash component of change in deferred costs | | | (0.3 | ) | | (1.0 | ) | | 0.7 | | | (70.0 | )% |
| Free cash flow | | | 10.8 | | | 12.0 | | | (1.2 | ) | | (10.0 | )% |
| Change in non-cash working capital & other | | | 20.7 | | | (5.6 | ) | | 26.3 | | | (469.6 | )% |
| Acquisitions | | | (0.5 | ) | | (19.7 | ) | | 19.2 | | | (97.5 | )% |
| Increase in long-term investments | | | (0.2 | ) | | - | | | (0.2 | ) | | - | |
| Change in right-of-way liability | | | (2.4 | ) | | (2.2 | ) | | (0.2 | ) | | 9.1 | % |
| Repurchase of long-term debt | | | (104.8 | ) | | - | | | (104.8 | ) | | - | |
| Issuance of equity | | | - | | | 40.6 | | | (40.6 | ) | | (100.0 | %) |
| Change in cash, cash equivalents & short-term investments | | | (76.4 | ) | | 25.1 | | | (101.5 | ) | | (404.4 | )% |
| Increase (decrease) in short-term investments | | | 58.8 | | | (2.7 | ) | | 61.5 | | | (2,277.8 | )% |
| Change in cash & cash equivalents | | | (17.6 | ) | | 22.4 | | | (40.0 | ) | | (178.6 | )% |
FINANCIAL POSITION
At December 31, 2004, we had current assets of $126.7 million and current liabilities of $149.7 million. Net working capital was a negative $23.0 million, a decline from the positive $92.3 million at December 31, 2003. This $115.3 million change primarily reflects our decision to use $104.8 million of cash to repurchase notes in 2004.
2004 Working Capital Changes
| | | | For the 12 months ended December 31 | |
| (in millions Canadian $) | | 2004 | | 2003 | | Change | | % Change | |
| Accounts receivable & other current assets | | | 126.7 | | | 241.7 | | | (115.0 | ) | | (47.6 | )% |
| Accounts payable & accrued liabilities | | | 149.7 | | | 149.4 | | | 0.3 | | | 0.2 | % |
| Net working capital | | | (23.0 | ) | | 92.3 | | | (115.3 | ) | | (124.9 | )% |
| | Current ratio | | | 0.9 | | | 1.6 | | | (0.7 | ) | | (43.8 | )% |
| | Accounts receivable days sales outstanding | | | 32 | | | 32 | | | 0 | | | | |
In 2004, long-term debt (LTD) decreased by $118.6 million to $268.5 million resulting from positive effects of the repurchase of senior secured notes, which accounted for $100.8 million, and the strong Canadian dollar, which accounted for $17.8 million.
| Call-Net Enterprises Inc. | Page 20 | 2004 & Q4 Managements Discussion & Analysis |
Other long-term liabilities, which include the right-of-way liability, the long-term portion of Bell/360 acquisition account payable, lease exit costs and asset retirement obligations, have increased by $4.2 million to $53.3 million. Apart from the Bell/360 acquisition related changes, factors contributing to the year over year change include the accretion of the asset retirement obligation, offset partly by the reversal of the dark fibre maintenance charge, and the continuing amortization of our right-of-way liability.
2004 Capital Structure
| | | | For the 12 months ended December 31 | |
| (in millions Canadian $) | | 2004 | | 2003 | | Change | | % Change | |
| Long-term debt | | | 268.5 | | | 387.1 | | | (118.6 | ) | | (30.6 | )% |
| Right-of-way liability | | | 38.3 | | | 37.0 | | | 1.3 | | | 3.5 | % |
| Less: | | | | | | | | | | | | | |
| | Cash & short-term investments | | | 73.7 | | | 150.1 | | | (76.4 | ) | | (50.9 | )% |
| | Prepaid right-of-way | | | 5.9 | | | 6.9 | | | (1.0 | ) | | (14.5 | )% |
| Total net debt | | | 227.2 | | | 267.1 | | | (39.9 | ) | | (14.9 | )% |
| Total shareholders’ equity | | | 177.4 | | | 253.5 | | | (76.1 | ) | | (30.0 | )% |
| Total capitalization | | | 404.6 | | | 502.6 | | | (98.0 | ) | | (19.5 | )% |
| | Net debt to capitalization | | | 56.2 | % | | 53.1 | % | | 3.1 | % | | 5.8 | % |
| | Common & class B shares outstanding at end of period | | | 35.8 | | | 35.6 | | | 0.2 | | | 0.6 | % |
| | Options outstanding at end of period | | | 1.7 | | | 1.4 | | | 0.3 | | | 21.4 | % |
Our net debt to net capitalization ratio stood at 56 per cent at the end of the fourth quarter, as compared to 53 per cent at the end of 2003. The increase is because net debt declined by 15 per cent, while capitalization declined by 19 per cent. The increased decline in capitalization is the result of a decline in shareholders’ equity, driven primarily by our net loss of $78.4 million during 2004.
LIQUIDITY
LONG-TERM CONTRACTUAL OBLIGATIONS
2004 Long Term Contractual Obligations
| (in millions Canadian $) | | Total | | <1 Year | | 1-3 Years | | 4-5 years | | > 5 years | |
| Long-term debt | | | 268.5 | | | - | | | - | | | 268.5 | | | - | |
| | Interest payments on debt (1) | | | 114.1 | | | 28.5 | | | 57.1 | | | 28.5 | | | - | |
| Right-of-way liability | | | 77.6 | | | 5.3 | | | 10.3 | | | 10.8 | | | 51.2 | |
| Operating leases | | | 41.9 | | | 14.3 | | | 19.0 | | | 5.1 | | | 3.5 | |
| Network facilities | | | 62.6 | | | 21.2 | | | 26.9 | | | 14.3 | | | 0.2 | |
| Other long-term obligations | | | 125.8 | | | 36.7 | | | 37.4 | | | 14.8 | | | 35.4 | |
| | Total contractual obligations | | | 690.5 | | | 106.0 | | | 150.7 | | | 342.0 | | | 90.3 | |
| (1) | Converted to Canadian dollars at the year-end exchange rate of $1.2036 |
CAPITAL RESOURCES
We have certain commitments to capital expenditures and to payments in respect of acquisitions. In the normal course of business we make commitments to purchase capital equipment that will be invoiced in future periods. At year-end 2004, our commitments to purchase capital equipment that had not yet been received totaled $1.6 million. These commitments are expected to be realized in the first quarter of 2005.
On November 20, 2004, we purchased the Eastern Canadian business customers of 360networks from Bell Canada. Excluding transaction costs, the purchase price of this acquisition is expected to total $16.7 million and will be paid in four installments. Two of these installments, totaling $6.7 million, or 40 per cent of the purchase price, will be paid in 2005, while the remaining two installments, totaling $10 million, will be paid in 2006.
| Call-Net Enterprises Inc. | Page 21 | 2004 & Q4 Managements Discussion & Analysis |
OFF BALANCE SHEET ARRANGEMENTS
In 2003, we entered into a five-year accounts receivable securitization program whereby we sell, on an on-going basis, an undivided co-ownership interest in certain of our trade receivables to a securitization trust to a maximum of $55.0 million. At December 31, 2004, the program was fully utilized. We are exposed to certain risks of default on the amount of the receivables under securitization. We retain ongoing servicing responsibilities, and have a retained interest in the securitized receivables and rights to future excess cash flows generated by the trust. The sales are on a fully-serviced basis and we do not receive any fees for our on-going servicing responsibilities. In the event of a failure of debtors to pay when due, the trust and its investors have recourse to the retained interest of the trust, but have no recourse to our other assets.
During the year ended December 31, 2004, we recognized a loss of $9.8 million on the securitization of receivables. We measure the loss on securitization by applying the same methodology used to estimate our allowance for doubtful accounts. The result is a provision for anticipated credit losses of approximately one per cent of the accounts receivable balance.
RELATED PARTY TRANSACTIONS
We engage in significant sales and purchases of telecommunication services with Sprint, which maintains an approximate 6.6 per cent equity interest in our company. These transactions are made at market prices under normal trade terms and conditions. In addition, a royalty payment based on revenues is paid to Sprint, see note 11 of consolidated financial statements. Revenue, carrier charges and royalty costs transactions with Sprint and its affiliates for each of the periods in the three years ended December 31 are as follows:
2004 Transactions with Sprint
| (in millions $) | | 2004 | | 2003 | | Change | | % Change | |
| Revenue | | | 30.4 | | | 27.0 | | | 3.4 | | | 12.6 | % |
| Carrier charges | | | 42.4 | | | 44.0 | | | (1.6 | ) | | (3.6 | )% |
| Royalty costs | | | 19.7 | | | 19.5 | | | 0.2 | | | 1.0 | % |
We also engage in sales of telecommunication services with a company in which we maintain an approximate 7.5% equity interest and have a right to two board seats. These transactions were made at market prices under normal trade terms and conditions. Revenue derived from this company was $3.5 million in 2004 and $3.2 million in 2003.
Furthermore, we engage in sales of telecommunication services with companies to which various members of our company’s board of directors are related. These transactions were made at market prices under normal trade terms and conditions, and total less than $1.5 million.
OUTSTANDING SHARE DATA
Our authorized share capital consists of an unlimited number of common shares, class B non-voting shares and preferred shares.
The holders of the common shares are entitled to one vote for each share held at any meeting of our shareholders. The common shares are convertible, at the option of the common shareholders, at any time into class B non-voting shares on a share-for-share basis.
In certain circumstances, the class B non-voting shares are convertible, at the option of the class B shareholders, into common shares on a share-for-share basis.
The common shares and class B non-voting shares rankpari passu on a per share basis with respect to payment of dividends and the right to participate in a distribution of assets on winding up, dissolution or otherwise.
We are authorized to issue an unlimited number of the preferred shares. We issued Sprint one preferred share (of a value of $1.00) as part of the consideration for entering into a commercial agreement with us. The preferred shares are generally non-voting and have no right to dividends, but do entitle the holder to nominate and elect two directors to our board. The preferred shares also have a priority right over all other classes of shares to receive a return of capital equal to $1.00 per preferred share on winding up, dissolution or otherwise.
| | Outstanding as at | |
Authorized Share Capital | Dec 31 2004 | |
| Common shares | | | 4,302,011 | |
| Class B non-voting shares | | | 31,462,025 | |
Total | | | 35,764,036 | |
Preferred shares | | | 1 | |
| Call-Net Enterprises Inc. | Page 22 | 2004 & Q4 Managements Discussion & Analysis |
RISKS AND UNCERTAINTIES
FINANCING
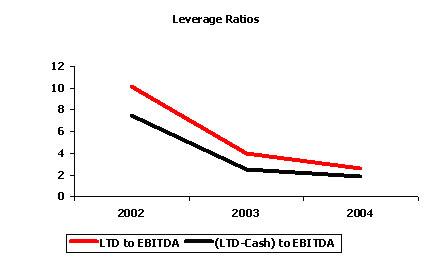
We are cash flow self sufficient, and have been for several years. However, our debt level relative to our EBITDA and our book capitalization is high in comparison to many Canadian telecommunications firms, although not higher than the Canadian universe of communications companies in general such as cable and broadcast media. While this leverage has given us access to important capital that we have used to build our business, we must manage our business so that this long term debt can be repaid or refinanced on or before maturity.
TECHNOLOGY CHANGES
There are several technologies that either will, or will have the capacity to, cause fundamental changes in the way our services are delivered. These technologies include voice over Internet protocol (VoIP), IP-based virtual private networks (IP-VPNs), as well as broadband wireless access (BWA). These technologies may result in significantly different cost structures for the users of the technologies and may consequently affect the long-term viability of our technologies. We have responded to this threat by ensuring that we too, have access to these new technologies both through our relationship with Sprint and by working closely with equipment manufacturers.
THREAT OF NEW ENTRANTS
Some of these technologies may allow competitors to enter our markets with similar products or services that have different cost structures. Some of these competitors may be larger with more access to financial resources than we have. In the face of this potential competition, we must be vigilant to protect our existing customer base and ensure that new customer acquisition continues to be a profitable enterprise.
NETWORK FAILURES
With an average of 99.999 per cent availability, our wireline network is very reliable. Generally, our long-haul network has built-in redundancy by virtue of its SONET ring configuration, so we are protected in most circumstances from incidents such as a fibre cut. However, the failure of our network or a component of our network would, in some circumstances result in an indefinite loss of service for our customers. In addition, we rely on business partners to complete certain calls. The failure of one of these carriers might also cause an interruption in service for our customers that would last until we could reroute the traffic to an alternative carrier.
RELIANCE ON PARTNERS
We rely on partners to deliver certain telecommunications services. We have a long-standing technology and services provisioning agreement with Sprint under which we have access to the brand-name, software updates, new product technologies and product enhancements to keep our interconnections seamless.
We also have a partnership agreement with Microcell Solutions Inc. under which we have been granted rights to use its wireless spectrum and its network to offer wireless services to our home phone service customers. In 2004, Microcell Solutions Inc. was acquired by Rogers Wireless, a subsidiary of Rogers Communications Inc. While the revenue from wireless customers is modest in comparison with the other products we sell, we do rely on having access to this product to complement our bundled home phone service offering for consumers. The loss of this agreement could adversely affect our consumer services strategy.
CRITICAL ACCOUNTING ESTIMATES AND POLICIES 2004
The preparation of financial statements in conformity with generally accepted accounting principles requires us to select accounting policies and make estimates and assumptions that affect the reported amounts of revenues and expenses during the period, the reported amounts of assets and liabilities, and the disclosure of contingent assets and liabilities at the date of the financial statements. The following discussion highlights the critical accounting policies and the main areas where estimates are required. See note 2 to the 2004 annual consolidated financial statements for a more comprehensive discussion of our significant accounting policies.
CRITICAL ACCOUNTING ESTIMATES
Revenue Recognition:Substantially all of our revenues are derived from long distance, data, local and wireless telecommunications services. Products and services are sold either stand-alone or together as a multiple service arrangement or a bundled solution. Components of multiple service arrangements are separately accounted for provided the delivered elements have stand-alone value to the customer and the fair value of any undelivered elements can be objectively and reliably determined.
We recognize revenue once persuasive evidence of an arrangement exists, delivery has occurred or services have been rendered, fees are fixed or determinable and collectability is reasonably assured. We record provisions against related revenue for service discounts, promotions, achievement credits and incentives related to telecommunication services. These revenue allowances are based on estimates derived from factors that include, but are not limited to, historical results, current economic trends and changes in demand. The provisions for revenue adjustments are recorded as a reduction of revenue when incurred or ratably over a contract period.
| Call-Net Enterprises Inc. | Page 23 | 2004 & Q4 Managements Discussion & Analysis |
Revenues from telecommunication services are recognized based on either customer usage as measured by our switches or by contractual agreement when provided. Revenues from the sale of goods are recognized when goods are delivered and accepted by customers.Where services to certain customers are provisioned through the use of subcontractor agents, revenue is recognized based on the fees charged to the customer provided that we are acting as the principal in the arrangement.
Allowance for Doubtful Accounts: We use a predictive model as well as specific assessment to determine the allowance required for doubtful accounts and to estimate the fair value of the retained interest in securitized receivables. An industry accepted predictive model that is representative of our own experience is applied to the accounts receivable for the consumer portion of the business. In other areas, a more detailed review of the accounts receivable balances and specific customer circumstances is performed at each month-end. Management experience and knowledge is used to determine overall reserve amounts in this area.
Carrier Charge Payable Reserves:Carrier charges are incurred for the transmission of voice and data over other carriers’ networks. These costs consist of both fixed payments and variable amounts based on actual usage and negotiated or regulated contract rates. We record carrier charges as incurred. Accordingly, at each balance sheet date, we record our best estimate of the carrier charge incurred but not billed based on internal usage reports and, for disputed amounts, a reserve based on an analysis of the probability of paying the disputed amount.
Impairment of Long-lived Assets: The carrying value of long-lived assets to be held and used, including capital assets and intangible assets with definite useful lives, is reviewed for impairment on an ongoing basis whenever events or changes in circumstances indicate that the carrying value may not be recoverable. Intangible assets with a definite useful life are also assessed for impairment at least annually. An impairment loss is recognized when the carrying value exceeds the projected undiscounted future cash flows expected from its use and disposal, and is measured as the amount by which the carrying value of the asset exceeds its fair value. At December 31, 2004, we determined that no major events or circumstances had occurred during the year that would indicate impairment.
Capitalized Costs:Direct and indirect labour costs incurred to develop or construct new assets or upgrade existing assets are capitalized. Indirect overhead costs, general and administrative costs and interest costs are not capitalized. Direct labour costs of $11.0 million and $10.4 million were capitalized in 2004 and 2003, respectively.
Accrued Liabilities:In the ordinary course of business activities we are required to make accounting estimates to report certain liabilities at the reporting date. Management experience and knowledge and any other sources of information available are used to make these estimates.
Stock-based Compensation: We have three stock-based compensation plans and account for stock-based compensation using the fair value method. The fair value of stock options is estimated at the grant date using the Black-Scholes options pricing model. This model requires the input of a number of assumptions including dividend yields, expected stock price volatility, expected life of the option and risk-free interest rates. Although the assumptions used reflect our best estimates, they involve uncertainties based on market conditions generally outside of our control. The estimated fair value of the options is amortized to expense on a straight line basis over the vesting period of the option. Stock-based compensation expense is recorded in operating costs in our statement of operations and deficit, and credited to contributed surplus on the balance sheet, until the award is exercised, at which time it is transferred to capital stock.
Stock-based awards that are settled or may be settled in cash or shares purchased on the open market at the option of employees or directors are recorded as liabilities. The measurement of the liability and compensation cost for these awards is based on the intrinsic value of the award, determined based on the market price of the underlying shares as applicable at each balance sheet date. Compensation cost determined is recognized over the vesting period of the award. We recognize compensation expense related to restricted stock units based on the market value of the underlying shares at the time of award. We also recognize compensation expense related to deferred share units in the amount of the participants’ remuneration as their services are provided. Changes in the payment obligation subsequent to vesting of the award and prior to the settlement date are recorded into operating costs in the consolidated statements of operations and deficit each period.
NEW ACCOUNTING POLICIES AND ACCOUNTING CHANGES
STOCK-BASED COMPENSATION AND OTHER STOCK-BASED PAYMENTS
Effective January 1, 2004, we adopted the changes made to CICA Section 3870, ‘Stock-Based Compensation and Other Stock-Based Payments’ requiring that all stock-based compensation awarded to both employees and non-employees be measured and recognized using the fair value method. Previously, we had elected to use the settlement method to account for stock option grants to employees. The main impact for us was to measure and recognize compensation expense using the fair value method relating to the award of stock options to employees that we had previously chosen to disclose on a pro forma basis within the notes to the financial statements. We adopted this change on a retroactive basis with restatement of prior periods to reflect the expensing of the fair value of stock options granted subsequent to January 1, 2002. The result of this change is reflected in operating expenses in the consolidated statements of operations and deficit. It contributed surplus and capital stock on the consolidated balance sheets.
| Call-Net Enterprises Inc. | Page 24 | 2004 & Q4 Managements Discussion & Analysis |
The effect of the prior-period restatements was an increase to net loss (net of tax of nil) for the year ended December 31, 2003 and nine months ended December 31, 2002 of $1.7 million and $1.2 million respectively, with corresponding increases to deficit of $2.9 million as at December 31, 2003. The impact of the restatement increased both basic and diluted loss per share by $0.06 and $0.05, respectively, for the same periods.
ASSET RETIREMENT OBLIGATIONS
Effective January 1, 2004, we retroactively adopted, with restatement of prior periods, the new CICA Handbook Section 3110, ‘Asset Retirement Obligations’ [ARO], which establishes standards for the recognition, measurement and disclosure of liabilities for asset retirement obligations and the associated retirement costs. This section applies to legal obligations associated with the retirement of tangible long-lived assets that result from their acquisition, lease, construction, development or normal operation. The offset to the initial ARO is an increase in the carrying amount of the related long-lived asset. Over time, the liability is accreted to its future value, and the asset is depreciated over the useful life of the related asset. The accretion expense related to the ARO is recorded in depreciation and amortization expense within the consolidated statement of operations and deficit. Upon settlement of the liability, an entity either settles the obligation for its recorded amount or incurs a gain or loss upon settlement. This standard was effective on a retroactive basis with restatement of prior periods.
We have reviewed our obligations and determined that we have AROs associated with retiring fibre optic cable and leasehold improvement assets at the maturity of the facility leases. As at January 1, 2004, the cumulative effect of the retroactive adjustment was an increase to fibre optic cable assets and leasehold improvements of $1.5 million, an increase to other long-term liabilities of $2.4 million, and an increase to opening deficit of $0.9 million. The prior period restatement increased depreciation expense and net loss for the year ended December 31, 2003 and nine months ended December 31, 2002 by $0.5 million and $0.4 million respectively. The impact of the restatement also increased both basic and diluted loss per share by $0.02 and $0.02, respectively, for the same periods.
IMPAIRMENT OF LONG-LIVED ASSETS
Effective January 1, 2004, we adopted, on a prospective basis, the guidance in CICA Section 3063, ’Impairment of Long-Lived Assets‘. Under Section 3063, an impairment loss is recognized on a long-lived asset held for use when its carrying value exceeds the undiscounted cash flows from its use and eventual disposition. The amount of the loss is measured by deducting the asset’s fair value (based on discounted cash flows) from its carrying value. Prior to the adoption of Section 3063, an impairment loss was measured by deducting the asset’s net recoverable value (based on undiscounted cash flows) from its carrying value. Adoption of Section 3063 did not have an impact on results of operations during the current year; however, it could impact the measurement of an impairment loss in the future.
REVENUE RECOGNITION
Effective January 1, 2004, we adopted the CICA’s Emerging Issues Committee Abstract 141, ‘Revenue Recognition’ [EIC 141]. EIC 141 incorporates the principles in the Securities and Exchange Commission’s [SEC] Staff Accounting Bulletin [SAB’ 101, ’Revenue Recognition in Financial Statements‘ which has been since superseded by SAB 104 ‘Revenue Recognition’. We have reviewed our policies and determined there was no impact as a result of us adopting this guidance.
Also effective January 1, 2004, we adopted, on a prospective basis, EIC 142, ‘Revenue Arrangements with Multiple Deliverables’ [EIC 142]. EIC 142 addresses how to determine whether an arrangement involving multiple deliverables contains more than one unit of accounting. EIC 142 also addresses how arrangement consideration should be measured and allocated to the separate units of accounting in the arrangement. We have reviewed our policies and determined there was no impact as a result of us adopting this guidance.
RECENTLY ISSUED ACCOUNTING PRONOUNCEMENTS
VENDOR REBATES
In January 2005, the CICA amended EIC-144, ‘Accounting by a customer (including a reseller) for certain consideration received from a vendor.’ The standard is effective retroactively for periods commencing on or after February 15, 2005. The standard requires companies to recognize the benefit of non-discretionary rebates for achieving specified cumulative purchasing levels, as a reduction of the cost of purchases over the relevant period, provided the rebate is probable and reasonably able to be estimated. Otherwise, the rebates would be recognized as purchasing milestones are achieved. We are assessing the impact of the new standard but do not expect it to have a material impact on the consolidated financial statements.
| Call-Net Enterprises Inc. | Page 25 | 2004 & Q4 Managements Discussion & Analysis |
MD&A SUMMARY INFORMATION
| | | | | | | | Three Months Ended | |
| (millions of Canadian dollars, except per share and minutes data) | Dec 31, | | Sept 30, | | June 30, | | Mar 31, | | Dec 31, | | Sept 30, | | June 30, | | Mar 31, | |
| | | | | | | | 2004 | | 2004 | | 2004 | | 2004 | | 2003 | | 2003 | | 2003 | | 2003 | |
| Consumer Home Phone Service Bundles | | | | | | | | | | | | | | | | | | | | | | | | |
| | Gross additions | | | 48,000 | | | 51,700 | | | 44,700 | | | 40,600 | | | 46,600 | | | 35,200 | | | 28,600 | | | 17,400 | |
| | Net additions | | | 25,500 | | | 26,800 | | | 27,300 | | | 25,200 | | | 30,600 | | | 18,300 | | | 12,600 | | | 3,600 | |
| | Churn | | | 2.5 | % | | 3.1 | % | | 2.4 | % | | 2.3 | % | | 2.8 | % | | 3.4 | % | | 3.5 | % | | 3.2 | % |
| | End of period lines | | 310,800 | | | 285,300 | | | 258,500 | | | 231,200 | | | 206,000 | | | 175,400 | | | 157,100 | | | 144,600 | |
| | Line growth (per quarter) | | | 8.9 | % | | 10.4 | % | | 11.8 | % | | 12.2 | % | | 17.4 | % | | 11.6 | % | | 8.6 | % | | 2.5 | % |
| | Average monthly revenue per line (ARPL) | | | 60.28 | | | 61.03 | | | 59.86 | | | 61.25 | | | 60.45 | | | 62.10 | | | 62.04 | | | 64.54 | |
| | | | Selling & marketing | | | 7.9 | | | 8.2 | | | 9.7 | | | 10.1 | | | 9.3 | | | 9.2 | | | 6.8 | | | 4.5 | |
| | | | Activation costs | | | 5.0 | | | 5.5 | | | 5.5 | | | 4.5 | | | 5.4 | | | 4.8 | | | 3.6 | | | 2.5 | |
| | | Total cost of acquisition ($M) | | | 12.9 | | | 13.7 | | | 15.2 | | | 14.6 | | | 14.7 | | | 14.0 | | | 10.4 | | | 7.0 | |
| | Cost of acquisition per line | | | 269 | | | 265 | | | 339 | | | 359 | | | 315 | | | 398 | | | 363 | | | 398 | |
| Long-Distance Minutes (in thousands of minutes) | | | | | | | | | | | | | | | | | | | | | | | | | |
| | Consumer Services | | | 418,450 | | | 391,818 | | | 397,920 | | | 400,990 | | | 390,739 | | | 366,248 | | | 305,650 | | | 325,471 | |
| | Business Services | | | 773,629 | | | 743,139 | | | 742,930 | | | 782,815 | | | 713,172 | | | 725,348 | | | 692,606 | | | 690,831 | |
| | Carrier Services | | | 1,241,533 | | | 1,259,324 | | | 1,257,978 | | | 1,261,622 | | | 1,250,727 | | | 1,102,970 | | | 1,086,160 | | | 1,138,578 | |
| Total Revenue | | | | | | | | | | | | | | | | | | | | | | | | | |
| | Consumer Services | | | | | | | | | | | | | | | | | | | | | | | | | |
| | | | | | Long distance | | | 33.7 | | | 36.0 | | | 37.7 | | | 40.0 | | | 42.5 | | | 44.0 | | | 37.8 | | | 41.5 | |
| | | | | | Data | | | 2.9 | | | 3.2 | | | 3.4 | | | 3.6 | | | 3.8 | | | 4.0 | | | 4.4 | | | 4.8 | |
| | | | | | Local | | | 35.9 | | | 33.1 | | | 29.0 | | | 26.8 | | | 24.1 | | | 21.7 | | | 19.6 | | | 19.2 | |
| | | | | | Wireless | | | 3.1 | | | 2.8 | | | 2.5 | | | 1.9 | | | 1.5 | | | 0.1 | | | 0.0 | | | 0.0 | |
| | | | | | | | | 75.6 | | | 75.1 | | | 72.6 | | | 72.3 | | | 71.9 | | | 69.8 | | | 61.8 | | | 65.5 | |
| | Business Services | | | | | | | | | | | | | | | | | | | | | | | | | |
| | | | | | Long distance | | | 37.7 | | | 36.2 | | | 37.5 | | | 39.5 | | | 37.8 | | | 38.5 | | | 38.3 | | | 39.0 | |
| | | | | | Data | | | 39.5 | | | 34.4 | | | 35.1 | | | 33.5 | | | 33.0 | | | 33.9 | | | 33.9 | | | 33.2 | |
| | | | | | Local | | | 14.7 | | | 11.2 | | | 10.4 | | | 9.3 | | | 8.8 | | | 8.3 | | | 7.4 | | | 6.5 | |
| | | | | | | | | 91.9 | | | 81.8 | | | 83.0 | | | 82.3 | | | 79.6 | | | 80.7 | | | 79.6 | | | 78.7 | |
| | Carrier Services | | | | | | | | | | | | | | | | | | | | | | | | | |
| | | | | | Long distance | | | 30.3 | | | 32.8 | | | 31.6 | | | 34.8 | | | 39.6 | | | 41.8 | | | 38.3 | | | 43.1 | |
| | | | | | Data | | | 11.1 | | | 12.6 | | | 11.7 | | | 11.8 | | | 11.8 | | | 11.5 | | | 13.1 | | | 13.7 | |
| | | | | | Local | | | 2.2 | | | 1.9 | | | 1.9 | | | 1.3 | | | 1.2 | | | 1.1 | | | 1.3 | | | 1.2 | |
| | | | | | | | | 43.6 | | | 47.3 | | | 45.2 | | | 47.9 | | | 52.6 | | | 54.4 | | | 52.7 | | | 58.0 | |
| | Total revenue | | | 211.1 | | | 204.2 | | | 200.8 | | | 202.5 | | | 204.1 | | | 204.9 | | | 194.1 | | | 202.2 | |
| Carrier Charges, Operating Costs, Operating Profit & Net Income | | | | | | | | | | | | | | | | | | | | | | | | | |
| | Carrier charges | | | 101.9 | | | 103.1 | | | 100.5 | | | 95.1 | | | 96.8 | | | 108.5 | | | 98.4 | | | 106.2 | |
| | Gross profit | | | 109.2 | | | 101.1 | | | 100.3 | | | 107.4 | | | 107.3 | | | 96.4 | | | 95.7 | | | 96.0 | |
| | Operating costs | | | | | | | | | | | | | | | | | | | | | | | | | |
| | | | | | Consumer Services | | | 28.0 | | | 28.8 | | | 31.2 | | | 31.3 | | | 28.0 | | | 26.6 | | | 23.2 | | | 20.5 | |
| | | | | | Business Services | | | 23.2 | | | 18.4 | | | 18.3 | | | 18.3 | | | 16.6 | | | 15.9 | | | 15.4 | | | 15.3 | |
| | | | | | Carrier Services | | | 2.7 | | | 2.6 | | | 2.2 | | | 2.2 | | | 0.3 | | | 1.2 | | | 2.6 | | | 2.8 | |
| | | | | | Corporate | | | 23.4 | | | 27.2 | | | 26.2 | | | 29.1 | | | 37.5 | | | 29.7 | | | 30.8 | | | 32.9 | |
| | | | | | | | | 77.3 | | | 77.0 | | | 77.9 | | | 80.9 | | | 82.4 | | | 73.4 | | | 72.0 | | | 71.5 | |
| | Operating loss | | | (11.5 | ) | | (7.8 | ) | | (13.3 | ) | | (10.3 | ) | | (13.7 | ) | | (15.8 | ) | | (23.0 | ) | | (15.7 | ) |
| | Depreciation & amortization | | | (36.9 | ) | | (37.2 | ) | | (35.7 | ) | | (36.8 | ) | | (38.6 | ) | | (38.8 | ) | | (39.7 | ) | | (40.2 | ) |
| | Realignment & other charges | | | (6.5 | ) | | 5.3 | | | - | | | - | | | - | | | - | | | (7.0 | ) | | | |
| | EBITDA | | | 31.9 | | | 24.1 | | | 22.4 | | | 26.5 | | | 24.9 | | | 23.0 | | | 23.7 | | | 24.5 | |
| | Net Income (loss) | | | (13.8 | ) | | (1.6 | ) | | (33.1 | ) | | (29.9 | ) | | (16.9 | ) | | (30.2 | ) | | 2.0 | | | 7.6 | |
| | Earnings per share, basic | | | (0.39 | ) | | (0.05 | ) | | (0.93 | ) | | (0.84 | ) | | (0.48 | ) | | (1.15 | ) | | 0.08 | | | 0.32 | |
| | Gross profit as a % of revenue | | | 51.7 | % | | 49.5 | % | | 50.0 | % | | 53.0 | % | | 52.6 | % | | 47.0 | % | | 49.3 | % | | 47.5 | % |
| | EBITDA as a % of revenue | | | 15.1 | % | | 11.8 | % | | 11.2 | % | | 13.1 | % | | 12.2 | % | | 11.2 | % | | 12.2 | % | | 12.1 | % |
| Free cash flow | | | | | | | | | | | | | | | | | | | | | | | | | |
| | Free cash flow | | | 8.4 | | | (1.6 | ) | | 2.6 | | | 1.4 | | | 0.9 | | | (1.7 | ) | | 6.5 | | | 6.3 | |
| | Change in non-cash working capital and other charges | | | (7.4 | ) | | 3.7 | | | (8.3 | ) | | 32.7 | | | (6.8 | ) | | 5.1 | | | 0.4 | | | (4.3 | ) |
| | Acquisitions | | | (0.5 | ) | | - | | | - | | | - | | | 0.3 | | | (20.0 | ) | | - | | | - | |
| | Increase in long-term investments | | | - | | | - | | | (0.2 | ) | | - | | | - | | | - | | | - | | | - | |
| | Proceeds from sale of accounts receivable | | | - | | | - | | | - | | | - | | | - | | | - | | | - | | | - | |
| | Change in right-of-way liability | | | (0.8 | ) | | (0.7 | ) | | (0.5 | ) | | (0.4 | ) | | (0.3 | ) | | (0.7 | ) | | (0.5 | ) | | (0.7 | ) |
| | Repurchase of long-term debt | | | - | | | - | | | - | | | (104.8 | ) | | - | | | - | | | - | | | - | |
| | Equity issued | | | - | | | - | | | - | | | - | | | 5.4 | | | 35.2 | | | - | | | - | |
| | Change in cash, cash equivalents & short term investments | | | (0.3 | ) | | 1.4 | | | (6.4 | ) | | (71.1 | ) | | (0.5 | ) | | 17.9 | | | 6.4 | | | 1.3 | |
| | Increase (decrease) in short-term investments | | | 11.3 | | | (0.8 | ) | | (17.7 | ) | | 66.0 | | | (0.1 | ) | | (17.2 | ) | | (30.5 | ) | | 45.1 | |
| | Change in cash and cash equivalents | | | 11.0 | | | 0.6 | | | (24.1 | ) | | (5.1 | ) | | (0.6 | ) | | 0.7 | | | (24.1 | ) | | 46.4 | |
| Call-Net Enterprises Inc. | Page 26 | 2004 & Q4 Managements Discussion & Analysis |
CONSOLIDATED FINANCIAL STATEMENTS
CALL-NET ENTERPRISES INC.
DECEMBER 31, 2004
AUDITORS' REPORT
To the Shareholders of
Call-Net Enterprises Inc.
We have audited the consolidated balance sheets of Call-Net Enterprises Inc. as at December 31, 2004 and the consolidated statements of operations and deficit and cash flows for the year ended December 31, 2004. These financial statements are the responsibility of the Company's management. Our responsibility is to express an opinion on these financial statements based on our audit.
We conducted our audit in accordance with Canadian generally accepted auditing standards. Those standards require that we plan and perform an audit to obtain reasonable assurance whether the financial statements are free of material misstatement. An audit includes examining, on a test basis, evidence supporting the amounts and disclosures in the financial statements. An audit also includes assessing the accounting principles used and significant estimates made by management, as well as evaluating the overall financial statement presentation.
In our opinion, these consolidated financial statements present fairly, in all material respects, the financial position of the Company as at December 31, 2004 and the results of its operations and its cash flows for the year ended December 31, 2004 in accordance with Canadian generally accepted accounting principles.
The consolidated financial statements as at December 31, 2003 and for each of the periods in the two years ended December 31, 2003, prior to adjustment for the changes in the Company’s accounting policies for Stock-based Compensation and Asset Retirement Obligations as described in note 2 to the financial statements, were audited by other auditors who expressed an opinion without reservation on those statements in their report dated February 13, 2004 (except for note 21 which was dated February 20, 2004). We have audited the adjustments to these financial statements and, in our opinion, such adjustments, in all material respects, are appropriate and have been properly applied.
/s/ KPMG, LLP
Chartered Accountants
Toronto, Canada
February 21, 2005
Call-Net Enterprises Inc.
CONSOLIDATED BALANCE SHEETS
As at December 31
[millions of Canadian dollars]
| | | 2004 | | 2003 | |
| | | | | | Restated | |
| | | | | | [notes 2, 7] | |
| ASSETS | | | | | | | |
| Cash and cash equivalents | | | 38.9 | | | 56.5 | |
| Short-term investments | | | 34.8 | | | 93.6 | |
| Cash, cash equivalents and short-term investments | | | 73.7 | | | 150.1 | |
| Accounts receivable[note 3] | | | 22.8 | | | 42.7 | |
| Other current assets[note 4] | | | 30.2 | | | 48.9 | |
| Total current assets | | | 126.7 | | | 241.7 | |
| Capital assets[note 5] | | | 458.3 | | | 516.7 | |
| Intangible assets[note 6a] | | | 52.2 | | | 68.1 | |
| Other assets[note 6b] | | | 11.7 | | | 12.6 | |
| Total assets | | | 648.9 | | | 839.1 | |
| LIABILITIES AND SHAREHOLDERS' EQUITY | | | | | | | |
| Accounts payable and accrued liabilities[note 7] | | | 149.7 | | | 149.4 | |
| Long-term debt[note 8a] | | | 268.5 | | | 387.1 | |
| Other long-term liabilities [note 8b] | | | 53.3 | | | 49.1 | |
| Commitments, guarantees and contingencies[notes 8, 11 and 12] | | | | | | | |
| Shareholders' equity | | | | | | | |
| Capital stock[note 9] | | | | | | | |
| | Common shares, unlimited authorized | | | 49.7 | | | 49.8 | |
| | Class B non-voting shares,unlimited authorized | | | 298.5 | | | 297.6 | |
| | Preferred shares, unlimited authorized | | | - | | | - | |
| | Contributed surplus [notes 2 and 9] | | | 4.4 | | | 2.9 | |
| Deficit | | | (175.2 | ) | | (96.8 | ) |
| Total shareholders' equity | | 177.4 | | | 253.5 | |
| Total liabilities and shareholders' equity | | | 648.9 | | | 839.1 | |
See accompanying notes
On behalf of the board of directors:
Lawrence G. Tapp | David A. Rattee |
| Chair | Director |
Call-Net Enterprises Inc.
CONSOLIDATED STATEMENTS OF OPERATIONS AND DEFICIT
Years ended December 31
[millions of Canadian dollars, except per share amount or otherwise indicated]
| | | | | | | | |
| | | | | | | | | | |
| | | | | | | Nine | | Three | |
| | | | | | | Months | | Months | |
| | | | | | | Ended | | Ended | |
| | | | | | | Dec 31, | | Mar 31, | |
| | | 2004 | | 2003 | | 2002 | | 2002 | |
| | | | | Restated | | Restated | | | |
| | | | | [note 2] | | [note 2] | | | |
Revenue | | | 818.6 | | | 805.3 | | | 598.9 | | | 201.8 | |
| Carrier charges | | | 400.6 | | | 409.9 | | | 335.7 | | | 116.8 | |
Gross profit | | | 418.0 | | | 395.4 | | | 263.2 | | | 85.0 | |
| Operating costs | | | 313.1 | | | 299.3 | | | 228.5 | | | 73.1 | |
Realignment, restructuring and other charges[note 15] | | | 1.2 | | | 7.0 | | | 30.5 | | | - | |
Depreciation and amortization[notes 5 and 6] | | | 146.6 | | | 157.3 | | | 120.7 | | | 41.8 | |
Operating loss | | | (42.9 | ) | | (68.2 | ) | | (116.5 | ) | | (29.9 | ) |
Net gain (loss) on sale of capital assets and rights[note 5] | | | (0.9 | ) | | - | | | 9.4 | | | - | |
Gain (loss) on repurchase of long-term debt[note 8(a)] | | | (4.0 | ) | | - | | | 93.1 | | | - | |
Reversal of change in control provision [note 12] | | | 4.7 | | | - | | | - | | | - | |
| Interest on long-term debt | | | (32.7 | ) | | (43.2 | ) | | (43.9 | ) | | (60.3 | ) |
| Interest and other expense | | | (13.4 | ) | | (5.7 | ) | | (2.9 | ) | | (0.8 | ) |
| Foreign exchange gain (loss) | | | 17.1 | | | 85.9 | | | 4.1 | | | (1.8 | ) |
Loss before taxes | | | (72.1 | ) | | (31.2 | ) | | (56.7 | ) | | (92.8 | ) |
Income tax benefit (expense)[note 10] | | | (6.3 | ) | | (6.3 | ) | | (2.6 | ) | | 1.0 | |
Net loss for the period | | | (78.4 | ) | | (37.5 | ) | | (59.3 | ) | | (91.8 | ) |
Deficit, beginning of period, as previously reported | | | (93.0 | ) | | (57.7 | ) | | - | | | (2,759.4 | ) |
Adjustment for stock-based compensation[note 2] | | | (2.9 | ) | | (1.2 | ) | | - | | | - | |
Adjustment for asset retirement obligations[note 2] | | | (0.9 | ) | | (0.4 | ) | | - | | | - | |
Deficit, beginning of period, as restated | | | (96.8 | ) | | (59.3 | ) | | - | | | (2,759.4 | ) |
Deficit, end of period | | | (175.2 | ) | | (96.8 | ) | | (59.3 | ) | | (2,851.2 | ) |
Basic and diluted loss per share[note 16] | | | (2.20 | ) | | (1.36 | ) | | (2.49 | ) | | (20.26 | ) |
See accompanying notes
Call-Net Enterprises Inc.
CONSOLIDATED STATEMENTS OF CASH FLOWS
Years ended December 31
[millions of Canadian dollars]
| | | | | | | | Pre- | |
| | | | | | | | | | | |
| | | | | | | | Nine | | Three | |
| | | | | | | | Months | | Months | |
| | | | | | | | Ended | | Ended | |
| | | | | | | | Dec 31, | | Mar 31, | |
| | | 2004 | | 2003 | | 2002 | | 2002 | |
| | | | | | Restated | | Restated | | | |
| | | | | | [notes 2 and 17] | | [note 2] | | | |
| OPERATING ACTIVITIES | | | | | | | | | | | | | |
| Net loss for the period | | | (78.4 | ) | | (37.5 | ) | | (59.3 | ) | | (91.8 | ) |
| Add (deduct) operating items not requiring cash: | | | | | | | | | | | | | |
| | Depreciation and amortization | | | 146.6 | | | 157.3 | | | 120.7 | | | 41.8 | |
| | Unrealized foreign exchange (gain) loss on long-term debt | | | (17.8 | ) | | (85.9 | ) | | (4.8 | ) | | 1.8 | |
| | Reversal of change in control provision[note 12] | | | (4.7 | ) | | - | | | - | | | - | |
| | Loss (gain) on repurchase of long-term debt[note 8(a)] | | | 4.0 | | | - | | | (93.1 | ) | | - | |
| | Income taxes[note 10] | | | 3.9 | | | 4.3 | | | - | | | (2.4 | ) |
| | Other non-cash operating expenses | | | 2.7 | | | 3.0 | | | 4.4 | | | (0.2 | ) |
| | Net losses on disposals and writedowns of capital assets[note 5] | | | 0.9 | | | - | | | 1.3 | | | - | |
| | Realignment, restructuring and other charges[note 15] | | | 1.2 | | | - | | | - | | | - | |
| Interest accretion on long-term debt | | | - | | | - | | | - | | | 35.7 | |
| Cash provided by (used in) operations before changes in non-cash working capital | | | 58.4 | | | 41.2 | | | (30.8 | ) | | (15.1 | ) |
| Net change in non-cash working capital balances related to operations[note 17] | | | 28.4 | | | 2.5 | | | 60.3 | | | (8.3 | ) |
| Cash provided by (used in) operating activities | | | 86.8 | | | 43.7 | | | 29.5 | | | (23.4 | ) |
| INVESTING ACTIVITIES | | | | | | | | | | | | | |
| (Increase) decrease in short-term investments | | | 58.8 | | | (2.7 | ) | | 12.3 | | | 217.2 | |
| Acquisition of capital assets[note 17] | | | (55.4 | ) | | (44.1 | ) | | (62.4 | ) | | (16.0 | ) |
| Increase in long-term investment[note 6] | | | (0.2 | ) | | - | | | - | | | - | |
| Net proceeds on disposal of capital assets and rights[note 5] | | | 0.4 | | | 7.8 | | | 6.7 | | | - | |
| Acquisitions[note 13] | | | (0.5 | ) | | (19.7 | ) | | (1.0 | ) | | - | |
| Increase in deferred costs | | | (0.3 | ) | | (1.0 | ) | | - | | | (2.6 | ) |
| Cash provided by (used in) investing activities | | | 2.8 | | | (59.7 | ) | | (44.4 | ) | | 198.6 | |
| FINANCING ACTIVITIES | | | | | | | | | | | | | |
| Decrease in right-of-way liability | | | (2.4 | ) | | (2.2 | ) | | (0.1 | ) | | (0.1 | ) |
| Issuance of common shares | | | - | | | 40.6 | | | - | | | - | |
| Repurchase of long-term debt[note 8(a)] | | | (104.8 | ) | | - | | | (29.7 | ) | | - | |
| Cash provided by (used in) financing activities | | | (107.2 | ) | | 38.4 | | | (29.8 | ) | | (0.1 | ) |
| Net increase (decrease) in cash and cash equivalents during the period | | | (17.6 | ) | | 22.4 | | | (44.7 | ) | | 175.1 | |
| Cash and cash equivalents, beginning of period[note 1] | | | 56.5 | | | 34.1 | | | 78.8 | | | 15.5 | |
| Cash and cash equivalents, end of period | | | 38.9 | | | 56.5 | | | 34.1 | | | 190.6 | |
See accompanying notes
Call-Net Enterprises Inc.
NOTES TO CONSOLIDATED FINANCIAL STATEMENTS
Year ended December 31, 2004
[millions of Canadian dollars, unless otherwise indicated]
Call-Net Enterprises Inc. [the ‘Company’], through its various subsidiaries, including Sprint Canada Inc., Call-Net Technology Services, Inc., Call-Net Communications Inc., Call-Net Carrier Services Inc. and AlternaCall Inc., is an alternative provider of long distance, data, local and wireless telecommunications services to business and residential customers. The consolidated financial statements of the Company have been prepared in accordance with Canadian generally accepted accounting principles [‘Canadian GAAP’]. These principles are also in conformity in all material respects with United States generally accepted accounting principles [‘U.S. GAAP’] except as described in note 20.
Financial Reorganization
On April 10, 2002, the Company completed a Plan of Arrangement pursuant to Section 192 of theCanada Business Corporations Act to surrender all of its $2.6 billion in principal amount of senior notes and senior discount notes in exchange for U.S.$377.0 of new 10.625 per cent senior secured notes due 2008, U.S.$81.9 in cash, and 80 per cent of the equity in the recapitalized company.
The Plan of Arrangement contemplated a series of steps leading to an overall capital reorganization of the Company. These included, among other things:
| (a) | the amendment of the Company’s authorized share capital to create three new classes of shares: common shares, class B non-voting shares and preferred shares, and the issuance of these common shares and class B non-voting shares in exchange for the pre-recapitalization shares; |
| | |
| (b) | the creation and issuance of the senior secured notes and the issuance of the common shares and the class B non-voting shares in exchange for the pre-recapitalization notes; |
| | |
| (c) | the cancellation of all pre-recapitalization notes, shares, options, entitlements and the termination of the pre-recapitalization stock option plan; |
| | |
| (d) | the consolidation of the common shares on a one for 20 basis and the consolidation of the class B non-voting shares on a one for 20 basis; |
| | |
| (e) | the adoption of the new Incentive Stock Option Plan [‘Option Plan’], Shareholders’ Rights Plan [‘Rights Plan’] and Restricted Stock Unit Plan [‘RSUP’]; and |
| | |
| (f) | the reduction and determination of the Company’s stated capital in accordance with the Plan of Arrangement. |
Fresh Start Accounting
Pursuant to the Plan of Arrangement, there was a substantial realignment of the equity and non-equity interests of the Company on April 10, 2002. For accounting purposes, the Company has used an effective date of April 1, 2002. The Company’s consolidated balance sheet as at April 1, 2002 was prepared on a fresh start basis after giving effect to the Plan of Arrangement in accordance with the Canadian Institute of Chartered Accountants [‘CICA’] Section 1625, ’Comprehensive Revaluation of Assets and Liabilities’. Under fresh start accounting, the Company’s assets and liabilities were recorded at management’s best estimate of their fair values and the deficit was eliminated by a reduction of capital stock. The book values
Call-Net Enterprises Inc.
NOTES TO CONSOLIDATED FINANCIAL STATEMENTS
Year ended December 31, 2004
[millions of Canadian dollars, unless otherwise indicated]
of assets and liabilities at April 1, 2002 approximated their fair values, with the exception of capital assets and future tax liabilities. Independent third party analysis was used by management to arrive at the fair value of capital assets. Future tax liabilities were valued based on the temporary differences and tax losses that were available to the Company.
The completion of the Company’s capital reorganization and comprehensive revaluation of assets and liabilities under fresh start accounting had the following effects:
| | | | | | | Writedowns | | Apr 1, 2002 | |
| | | | | Re- | | and | | Balance | |
| | | prior to re- | | capitalization | | fresh start | | after | |
| | | capitalization | | adjustments | | adjustments | | adjustments | |
ASSETS | | | | | | | | | | | | | |
| Cash and cash equivalents | | | 190.6 | | | (111.8 | )(1)(2)(3) | | - | | | 78.8 | |
| Short-term investments | | | 103.2 | | | - | | | - | | | 103.2 | |
| Accounts receivable | | | 110.6 | | | - | | | - | | | 110.6 | |
| Other current assets | | | 58.4 | | | (2.0 | )(3) | | - | | | 56.4 | |
| Capital assets | | | 736.2 | | | - | | | (89.7 | )(4) | | 646.5 | |
| Other assets | | | 166.1 | | | (45.9 | )(5) | | (0.1 | ) | | 120.1 | |
Total assets | | | 1,365.1 | | | (159.7 | ) | | (89.8 | ) | | 1,115.6 | |
LIABILITIES | | | | | | | | | | | | | |
| Accounts payable and accrued liabilities | | | 182.9 | | | (13.1 | )(6) | | - | | | 169.8 | |
| Future income tax liability | | | 34.4 | | | - | | | (34.4 | ) | | - | |
| Long-term liabilities | | | 2,662.9 | | | (2,023.4 | )(1) | | - | | | 639.5 | |
| SHAREHOLDERS' EQUITY (DEFICIENCY) | | | | | | | | | | | | | |
| Capital stock | | | - | | | 1,342.6 | (1)(2)(3) | | (1,036.3 | ) | | 306.3 | |
| Pre-recapitalization capital stock | | | 1,336.1 | | | (1,336.1 | )(1) | | - | | | - | |
| Deficit | | | (2,851.2 | ) | | 1,870.3 | (7) | | 980.9 | | | - | |
| Total liabilities and shareholders' equity (deficiency) | | | 1,365.1 | | | (159.7 | ) | | (89.8 | ) | | 1,115.6 | |
(1) | Under the Plan of Arrangement, the noteholders received a combination of: |
| | a. | U.S.$72.7 of cash on the effective date of the transaction in addition to U.S.$9.2 paid in February 2002. |
| | b. | shares equal to approximately 80 per cent of the equity of the recapitalized Company, and |
| | c. | U.S.$377.0 senior secured notes due 2008. |
| | Determined in each case on a pro rata basis, with respect to each noteholder, by the ratio equal to the dollar value of the accreted principal plus interest as of December 31, 2001 of the pre-recapitalization notes owned by such noteholder divided by the total pre-recapitalization note value. |
| | |
(2) | Immediately after the Plan of Arrangement, Sprint Communications Company L.P. [‘Sprint’] invested $25.0 in exchange for five per cent of the post-recapitalization equity of the Company. Sprint also received $4.9 for the royalty payment relating to the three months ended March 31, 2002. |
Call-Net Enterprises Inc.
NOTES TO CONSOLIDATED FINANCIAL STATEMENTS
Year ended December 31, 2004
[millions of Canadian dollars, unless otherwise indicated]
(3) | Costs directly incurred to effect the recapitalization that were paid in advance of the effective date of the transaction totaling $2.0 were transferred to capital stock. In addition, the opening cash and cash equivalents balance was adjusted for $16.5 of transaction costs to be paid on the completion of the transaction. |
| | |
(4) | Prior to the application of fresh start accounting, the Company performed an assessment for impairment of the carrying values of its long-lived assets. Based on this assessment, assets available for sale of $78.6 were written down to nil. The value of capital assets was further reduced by $11.1 as part of the implementation of fresh start accounting. |
| | |
(5) | The write-off of the unamortized balance of deferred financing costs, trademarks, as well as technology and product rights associated with the prior agreement with Sprint. |
| | |
(6) | Under the Plan of Arrangement, the accrued interest on all pre-recapitalization notes was eliminated and interest on the senior secured notes due 2008 was accrued for the period from January 1, 2002 to March 31, 2002. |
| | |
(7) | The Company used unrecorded tax loss carryforward balances of approximately $1,533 against the gain on retirement of the long-term debt. |
2. | SUMMARY OF SIGNIFICANT ACCOUNTING POLICIES |
Accounting Changes
Stock-Based Compensation and Other Stock-Based Payments
Effective January 1, 2004, the Company adopted the changes made to CICA Section 3870, ‘Stock-Based Compensation and Other Stock-Based Payments’ requiring that all stock-based compensation awarded to both employees and non-employees be measured and recognized using the fair value method. Previously, the Company had elected to use the settlement method to account for stock option grants to employees. The main impact for the Company was to measure and recognize compensation expense using the fair value method relating to the award of stock options to employees that the Company had previously chosen to disclose on a pro forma basis within the notes to the financial statements.The Company adopted this change on a retroactive basis with restatement of prior periods to reflect the expensing of the fair value of stock options granted subsequent to January 1, 2002. The result of this change is reflected in operating expenses in the consolidated statements of operations and deficit and contributed surplus and capital stock on the consolidated balance sheets. The effect of the prior-period restatements was an increase to net loss for the year ended December 31, 2003 and nine months ended December 31, 2002 of $1.7 and $1.2 respectively, with corresponding increases to deficit of $2.9 as at December 31, 2003. The impact of the restatement increased both basic and diluted loss per share by $0.06 and $0.05, respectively, for the same periods.
Asset Retirement Obligations
Effective January 1, 2004, the Company retroactively adopted, with restatement of prior periods, the new CICA Handbook Section 3110, ‘Asset Retirement Obligations’ [‘ARO’], which establishes standards for the
Call-Net Enterprises Inc.
NOTES TO CONSOLIDATED FINANCIAL STATEMENTS
Year ended December 31, 2004
[millions of Canadian dollars, unless otherwise indicated]
recognition, measurement and disclosure of liabilities for asset retirement obligations and the associated retirement costs. This section applies to legal obligations associated with the retirement of tangible long-lived assets that results from their acquisition, lease, construction, development or normal operation. The offset to the initial ARO is an increase in the carrying amount of the related long-lived asset. Over time, the liability is accreted to its future value, and the asset is depreciated over the useful life of the related asset. The accretion expense related to the ARO is recorded in depreciation and amortization expense within the consolidated statements of operations and deficit. Upon settlement of the liability, an entity either settles the obligation for its recorded amount or incurs a gain or loss upon settlement. This standard was effective on a retroactive basis with restatement of prior periods.
The Company has reviewed its obligations and determined that it has AROs associated with retiring fibre optic cable and leasehold improvement assets at the maturity of the facility leases. As at January 1, 2004, the cumulative effect of the retroactive adjustment was an increase to fibre optic cable assets and leasehold improvements of $1.5, an increase to other long-term liabilities of $2.4, and an increase to opening deficit of $0.9. The prior period restatement increased depreciation expense and net loss for the year ended December 31, 2003 and nine months ended December 31, 2002 by $0.5 and $0.4 respectively. The impact of the restatement also increased both basic and diluted loss per share by $0.02 and $0.02, respectively, for the same periods.
Impairment of Long-Lived Assets
Effective January 1, 2004, the Company adopted, on a prospective basis, the guidance in CICA Section 3063, ’Impairment of Long-Lived Assets‘. Under Section 3063, an impairment loss is recognized on a long-lived asset held for use when its carrying value exceeds the undiscounted cash flows from its use and eventual disposition. The amount of the loss is measured by deducting the asset’s fair value (based on discounted cash flows when quoted market prices are not available) from its carrying value. Prior to the adoption of Section 3063, an impairment loss was measured by deducting the asset’s net recoverable value (based on undiscounted cash flows) from its carrying value. Adoption of Section 3063 did not have an impact on results of operations during the current year, however, it could impact the measurement of an impairment loss in the future.
Revenue Recognition
Effective January 1, 2004, the Company adopted the CICA’s Emerging Issues Committee Abstract 141, ’Revenue Recognition‘ [‘EIC 141’]. EIC 141 incorporates the principles in the Securities and Exchange Commission’s [‘SEC’] Staff Accounting Bulletin [‘SAB’] 101, ’Revenue Recognition in Financial Statements‘ which has been since superceded by SAB 104 ‘Revenue Recognition’. The Company has reviewed its policies and determined there was no impact as a result of the Company adopting this guidance.
Also effective January 1, 2004, the Company adopted, on a prospective basis, EIC 142, ’Revenue Arrangements with Multiple Deliverables‘ [‘EIC 142’]. EIC 142 addresses how to determine whether an arrangement involving multiple deliverables contains more than one unit of accounting. EIC 142 also addresses how arrangement consideration should be measured and allocated to the separate units of accounting in the arrangement. The Company has reviewed its policies and determined there was no impact as a result of the Company adopting this guidance.
Call-Net Enterprises Inc.
NOTES TO CONSOLIDATED FINANCIAL STATEMENTS
Year ended December 31, 2004
[millions of Canadian dollars, unless otherwise indicated]
Recently Issued Accounting Pronouncements
Vendor Rebates
In January 2005, the CICA amended EIC-144, ‘Accounting by a customer (including a reseller) for certain consideration received from a vendor.’ The standard is effective retroactively for periods commencing on or after February 15, 2005. The standard requires companies to recognize the benefit of non-discretionary rebates for achieving specified cumulative purchasing levels, as a reduction of the cost of purchases over the relevant period, provided the rebate is probable and reasonably estimatable. Otherwise, the rebates would be recognized as purchasing milestones are achieved. The Company is assessing the impact of the new standard but does not expect it to have a material impact on the consolidated financial statements.
Principles of Consolidation
The consolidated financial statements include the accounts of the Company and its wholly-owned subsidiaries. All significant intercompany balances and transactions have been eliminated on consolidation.
Short-term Investments
Short-term investments are recorded at the lower of cost and market value. Short-term investments include investments with original maturities of 90 days or greater. Investments with maturities less than 90 days are classified as cash and cash equivalents.
Allowance for Doubtful Accounts
The Company uses a predictive model as well as specific assessment to determine the allowance required for doubtful accounts and to estimate the fair value of the retained interest in securitized receivables. An industry accepted predictive model that is representative of the Company’s own experience is applied to the accounts receivable for the consumer portion of the business. In other areas, a more detailed review of the accounts receivable balances and specific customer circumstances is performed at each month-end. Management experience and knowledge is used to determine overall reserve amounts in this area.
Sale of Receivables
Transfers of receivables in securitization transactions are recognized as sales when the Company is deemed to have surrendered control over the transferred receivables and consideration other than for its retained interest in the transferred receivables has been received. When the Company sells its receivables, it de-recognizes all receivables sold, recognizes at fair value the assets received and liabilities incurred, and records the gain or loss on sale in ’Interest and other income (expense)’. Such gain or loss depends in part on the allocation of the previous carrying amount of the receivables transferred which is allocated between the receivables sold and the Company’s retained interest in the receivables transferred based on their relative fair value at the date of transfer. The Company estimates the fair value of its retained interest based on the expected cash flows to be realized from the retained interest using management’s best estimates of the credit losses. Retained interests are initially recorded
Call-Net Enterprises Inc.
NOTES TO CONSOLIDATED FINANCIAL STATEMENTS
Year ended December 31, 2004
[millions of Canadian dollars, unless otherwise indicated]
at their allocated carrying amount. Any subsequent impairment in the value of the retained interest, other than a temporary decline, is recorded as a reduction to income.
Capital Assets
Capital assets are recorded at cost. Direct labour and overhead costs incurred to develop or construct new assets or upgrade existing assets are capitalized. Indirect overhead costs, general and administrative costs and interest costs are not capitalized. Depreciation on all assets commences when the assets are put into service. Depreciation and amortization are being provided based on the estimated useful lives of the assets on a straight-line basis as follows:
| Multiplex and telephone switch equipment | 10 years |
| Fibre optic cable | 20 years |
| Computer equipment and software | 3 years |
| Buildings | 15 to 40 years |
| Leasehold improvements | term of the lease |
| Furniture and fixtures | 5 years |
Capital assets associated with the Company’s network assets are subject to technological risks and market changes due to new products and changing customer needs. These changes may result in changes to the estimated useful lives of the related assets.
Fibre optic cable acquired under an indefeasible right of use [‘IRU‘] agreement is included in capital assets provided the criteria for capital treatment has been met.
Long-term Investments
Long-term investments are recorded at cost.A decline in the value of an investment that is considered to be other than a temporary impairment in value is charged against income in the period that such determination is made.
Intangible and Other Assets
Customer relationships and other assets are recorded at cost. Amortization of intangible and other assets is provided on a straight-line basis as follows:
| Customer relationships | 30 months to 8 years |
| Deferred costs | as related revenue is earned |
Call-Net Enterprises Inc.
NOTES TO CONSOLIDATED FINANCIAL STATEMENTS
Year ended December 31, 2004
[millions of Canadian dollars, unless otherwise indicated]
Impairment of long-lived assets
The carrying values of long-lived assets to be held and used, including capital assets and intangible assets with definite useful lives, are reviewed for impairment whenever events or changes in circumstances indicate that the carrying values may not be recoverable. Intangible assets with a definite useful life are also assessed for impairment at least annually. An impairment loss is recognized when the carrying value exceeds the projected undiscounted future cash flows expected from its use and disposal, and is measured as the amount by which the carrying value of the asset exceeds its fair value.
Revenue Recognition
Substantially all of the Company's revenues are derived from long distance, data, local, enhanced voice and wireless telecommunications services. Products and services are sold either stand-alone or together as a multiple service arrangement or a bundled solution. Components of multiple service arrangements are separately accounted for provided the delivered elements have stand-alone value to the customer and the fair value of any undelivered elements can be objectively and reliably determined.
The Company recognizes revenue once persuasive evidence of an arrangement exists, delivery has occurred or services have been rendered, fees are fixed or determinable and collectability is reasonably assured.The Company records provisions against related revenue for service discounts, promotions, achievement credits and incentives related to telecommunication services. These revenue allowances are based on estimates derived from factors that include, but are not limited to, historical results, current economic trends and changes in demand. The provisions for revenue adjustments are recorded as a reduction of revenue when incurred or ratably over a contract period.
Revenues from telecommunication services are recognized based on either customer usage as measured by the Company's switches or by contractual agreement when provided. Revenues from the sale of goods are recognized when goods are delivered and accepted by customers.
Where services to certain customers are provisioned through the use of subcontractor agents, revenue is recognized based on the fees charged to the customer provided that the Company is acting as the principal in the arrangement.
Expense Recognition
Carrier charges are incurred for the transmission of voice and data over other carriers’ networks. These costs consist of both fixed payments and variable amounts based on actual usage and negotiated or regulated contract rates. The Company records carrier charges as incurred. Accordingly, at each balance sheet date, the Company records its best estimate of the carrier charges incurred but not billed based on internal usage reports and, for disputed amounts, a reserve based on an analysis of the probability of paying the disputed amount.
Sales, marketing and other operating expenses are recognized as incurred. The Company expenses equipment subsidies related to the acquisition of new wireless service customers upon activation.
Call-Net Enterprises Inc.
NOTES TO CONSOLIDATED FINANCIAL STATEMENTS
Year ended December 31, 2004
[millions of Canadian dollars, unless otherwise indicated]
Stock-based Compensation
The Company has three stock-based compensation plans[note 9]. The Company accounts for stock-based compensation using the fair value method.The fair value of stock options is estimated at the grant date using the Black-Scholes options pricing model. This model requires the input of a number of assumptions including dividend yields, expected stock price volatility, expected life of the option and risk-free interest rates. Although the assumptions used reflect management’s best estimates, they involve uncertainties based on market conditions generally outside of the control of the Company.The estimated fair value of the options is amortized to expense on a straight-line basis over the vesting period of the option. Stock-based compensation expense is recorded in operating costs in the Company’s statement of operations and deficit, and credited to contributed surplus on the balance sheet, until the award is exercised, at which time it is transferred to capital stock.
Stock-based awards that are settled or may be settled in cash or shares purchased on the open market at the option of employees or directors, are recorded as liabilities. The measurement of the liability and compensation cost for these awards is based on the intrinsic value of the award, determined based on the market price of the underlying shares as applicable at each balance sheet date. Compensation cost determined is recognized over the vesting period of the award. Under the Restricted Stock Unit Plan [‘RSUP’], the Company recognizes compensation expense based on the current market value of the underlying shares. Under the Deferred Share Unit Plan [‘DSUP‘], compensation expense is recognized in the amount of the participants’ remuneration as their services are provided. Changes in the payment obligation subsequent to vesting of the award and prior to the settlement date are recorded into operating costs in the consolidated statements of operations and deficit each period.
Translation of Foreign Currencies
Foreign currency transactions entered into by the Company and the accounts of its foreign subsidiaries are translated into Canadian dollars using the temporal method. Under this method, monetary assets and liabilities in foreign currencies are translated into Canadian dollars at the year-end rate of exchange and any gains or losses are reflected in income. Capital and other non-monetary assets are translated at rates prevailing at the time of the transaction. Revenues and expenses are translated into Canadian dollars at the rate of exchange prevailing at the time of the transaction, except for depreciation and amortization, which are translated at exchange rates prevailing when the related assets were acquired. Long-term debt denominated in foreign currencies is translated into Canadian dollars at the year-end rate of exchange. Exchange gains or losses on translating this long-term debt are reflected in income.
Income Taxes
Income taxes are accounted for using the asset and liability method of tax allocation accounting. Temporary differences arising from the difference between the tax basis of an asset or liability and its carrying amount on the balance sheet are used to calculate future income tax liabilities or assets. Future income tax liabilities or assets are calculated using substantively enacted tax rates anticipated to apply in the periods that the temporary differences are expected to reverse. The effect of a change in income tax rates on future income tax liabilities or assets is recognized as income in the period that the change occurs. When necessary, a valuation allowance is recorded to reduce future income tax assets to an amount that is, in the opinion of management, more likely than not to be realized.
Call-Net Enterprises Inc.
NOTES TO CONSOLIDATED FINANCIAL STATEMENTS
Year ended December 31, 2004
[millions of Canadian dollars, unless otherwise indicated]
Earnings (Loss) Per Share
Basic earnings (loss) per common share is calculated by dividing the net income (loss) by the weighted-average number of common shares and class B non-voting shares outstanding during the period after recapitalization. Diluted earnings (loss) per common share is calculated by dividing the applicable net income (loss) by the sum of the weighted-average number of common shares and class B non-voting shares outstanding and all additional common shares that would have been outstanding if potentially dilutive common shares had been issued during the period. The treasury stock method is used to compute the dilutive effect of stock options and similar instruments.
Use of Estimates
The preparation of consolidated financial statements in conformity with generally accepted accounting principles requires management to make estimates and assumptions that affect the reported amounts of assets and liabilities and disclosure of contingent assets and liabilities at the date of the consolidated financial statements and the reported amounts of revenues and expenses during the year. Actual results could differ from those estimates. Significant estimates include allowances for doubtful accounts, provisions for accrued liabilities, and carrier cost accrual and dispute provisions.
Comparative Figures
Comparative consolidated financial statements for periods prior to April 1, 2002 have been presented pursuant to regulatory requirements. In reviewing the comparative consolidated financial statements, readers are reminded that they do not reflect the effects of the financial reorganization or the application of fresh start accounting described in note 1.
Certain prior years figures have been reclassified to conform to the current year presentation.
| | | 2004 | | 2003 | |
| Trade receivables | | | 27.5 | | | 46.5 | |
| Other | | | 0.6 | | | 2.4 | |
| Allowance for doubtful accounts | | | (5.3 | ) | | (6.2 | ) |
| | | | 22.8 | | | 42.7 | |
Accounts Receivable Securitization Program
In 2003, the Company entered into a five-year accounts receivable securitization program permitting it to sell on an on-going basis, an undivided co-ownership interest in certain of its trade receivables to a securitization trust (the ‘Trust’) to a maximum of $55.0, which was fully utilized as at December 31, 2004 (2003 - $10.0). The total amount transferred to the Trust as at December 31, 2004 was $82.3 (2003 - $56.0). The Company remains exposed to certain risks of default on the amount of the receivables under securitization. The Company retains ongoing servicing responsibilities, and has a retained interest in the securitized receivables and rights to future excess cash flows generated by the Trust. The sales are on a fully-serviced basis and the Company does not receive any fees for its on-going servicing responsibilities. The servicing liability as at December 31, 2004 was $0.3 (2003 - $0.3). The Trust and its investors have
Call-Net Enterprises Inc.
NOTES TO CONSOLIDATED FINANCIAL STATEMENTS
Year ended December 31, 2004
[millions of Canadian dollars, unless otherwise indicated]
no recourse on the Company’s other assets for failure of debtors to pay when due, other than the retained interest of the Trust.
During the year ended December, 2004, the Company recognized a loss of $9.8 (2003 - $3.6) on the securitization of receivables, and a loss on servicing of $nil (2003 - $0.3). The Company measures the loss on securitization by applying the same methodology used to estimate the allowance for doubtful accounts. The result is a provision for anticipated credit losses of approximately one per cent. The sensitivity of the current fair value of the retained interest to a 10 to 20 per cent adverse change in this assumption is not material.
Cash flows from the securitization for the year are as follows:
| | | 2004 | | 2003 | |
| Proceeds from new securitizations during the year | | | 45.0 | | | 10.0 | |
| Proceeds from collections reinvested during the year | | | 478.8 | | | 85.8 | |
| Proceeds from collections pertaining to the retained interest during the year | | | 215.9 | | | 162.2 | |
| | | 2004 | | 2003 | |
| Retained interest in securitized receivables | | | 24.8 | | | 41.2 | |
| Other | | | 5.4 | | | 7.7 | |
| | | | 30.2 | | | 48.9 | |
| | | 2004 | | 2003 | |
| | | | | | | Net | | | | | | Net | |
| | | | | Accumulated | | Book | | | | Accumulated | | Book | |
| | | Cost | | Depreciation | | Value | | Cost | | Depreciation | | Value | |
| Multiplex and telephone switch equipment | | | 491.4 | | | 197.6 | | | 293.8 | | | 467.4 | | | 128.8 | | | 338.6 | |
| Fibre optic cable | | | 109.8 | | | 19.9 | | | 89.9 | | | 107.2 | | | 12.9 | | | 94.3 | |
| Computer equipment and software | | | 175.1 | | | 121.7 | | | 53.4 | | | 144.8 | | | 87.1 | | | 57.7 | |
| Buildings | | | 14.1 | | | 1.1 | | | 13.0 | | | 14.1 | | | 0.7 | | | 13.4 | |
| Leasehold improvements | | | 12.2 | | | 9.5 | | | 2.7 | | | 12.0 | | | 6.3 | | | 5.7 | |
| Furniture and fixtures | | | 10.4 | | | 5.4 | | | 5.0 | | | 10.4 | | | 3.9 | | | 6.5 | |
| Land | | | 0.5 | | | - | | | 0.5 | | | 0.5 | | | - | | | 0.5 | |
| | | | 813.5 | | | 355.2 | | | 458.3 | | | 756.4 | | | 239.7 | | | 516.7 | |
Call-Net Enterprises Inc.
NOTES TO CONSOLIDATED FINANCIAL STATEMENTS
Year ended December 31, 2004
[millions of Canadian dollars, unless otherwise indicated]
Details of depreciation expense are as follows:
| | | | | | | | | Pre-recapitalization | |
| | | | | | | Nine Months Ended | | Three Months Ended | |
| | | 2004 | | 2003 | | Dec 31, 2002 | | Mar 31, 2002 | |
| Depreciation on capital assets | | | 116.4 | | | 129.7 | | | 102.2 | | | 33.2 | |
| Accretion expense on ARO liability | | | 0.2 | | | 0.2 | | | 0.2 | | | - | |
| | | | 116.6 | | | 129.9 | | | 102.4 | | | 33.2 | |
Included in capital assets are assets under construction and not yet being depreciated of $19.6 (2003 - $18.0).
Included in fibre optic cable assets are right-to-use fibres under IRU agreements with original terms extending to 20 years and net book value totalling $3.2 (2003 - $3.3).
In 2004, the Company disposed of network access servers having a net book value of $1.3 for proceeds of $0.4, for a loss on sale of $0.9.
In 2003, the Company entered into an agreement to provide an indefeasible right of use for fibre optic cable having a net book value of $0.5 for proceeds of $0.8, and to provide certain maintenance services. The Company also entered into an agreement to dispose of fibre optic cable having a net book value of $2.3 and to provide certain maintenance services. Related expenses to complete the agreement were $0.1 and proceeds were $3.6. The resulting gains on disposal of $0.3 and $1.2, respectively, will be recognized ratably over the 20-year term of the service agreements.
In 2003, the Company also disposed of a customer call centre and capital assets having a book value of $0.6 and related expenses of $0.3 for proceeds of $0.9, and equipment having a net book value of $0.3 for proceeds of $0.3, resulting in no net gain or loss.
In 2002, the Company reached an agreement to settle several contingencies relating to asset transfers made in previous years. As a result of this settlement, the Company received cash proceeds of $4.4 and has recorded a gain of $4.9. The Company also disposed of certain intangible rights under a licensing agreement for cash proceeds of $2.3, and a receivable of $2.2, resulting in a gain of $4.5.
Call-Net Enterprises Inc.
NOTES TO CONSOLIDATED FINANCIAL STATEMENTS
Year ended December 31, 2004
[millions of Canadian dollars, unless otherwise indicated]
6. | INTANGIBLE AND OTHER ASSETS |
| | |
(a) | Intangible Assets |
| | | 2004 | | 2003 | |
| | | | | Accumulated | | Net Book | | | | Accumulated | | Net Book | |
| | | Cost | | Amortization | | Value | | Cost | | Amortization | | Value | |
| Customer relationships | | | 126.7 | | | 74.5 | | | 52.2 | | | 113.8 | | | 45.7 | | | 68.1 | |
Details of amortization expense are as follows:
| | | | | | | | | Pre- | |
| | | | | | | | | recapitalization | |
| | | | | | | Nine Months | | Three Months | |
| | | | | | | Ended | | Ended | |
| | | | | | | Dec 31, | | Mar 31, | |
| | | 2004 | | 2003 | | 2002 | | 2002 | |
| Amortization of customer relationships | | | 30.0 | | | 27.4 | | | 18.3 | | | 8.6 | |
Amortization expense for the next five years is expected to be as follows:
| 2005 | | | 32.3 | |
| 2006 | | | 17.2 | |
| 2007 | | | 2.7 | |
| 2008 | | | - | |
| 2009 | | | - | |
| | | | 52.2 | |
In 2004, the Company acquired significant portions of 360networks Corporation’s customer base from Bell Canada[note 13] for $17.6 which was recorded as customer relationships intangible assets.
Also in 2004, the Company recorded a reduction of its customer relationships amounting to $3.9 relating to the utilization of previously unrecognized tax benefits that arose prior to the application of fresh start accounting[note 10].
In 2004, the Company recorded an impairment loss on its customer relationships amounting to $0.5 (cost of $1.2 and accumulated depreciation of $0.7) due to the loss of a customer group related to the Mosaic Performance Solutions Canada [‘MPS Canada’] Acquisition[note 13]. This impairment loss was recorded in amortization expense.
Also in 2004, the Company recorded other adjustments increasing the cost base of its customer relationships by $0.4.
Call-Net Enterprises Inc.
NOTES TO CONSOLIDATED FINANCIAL STATEMENTS
Year ended December 31, 2004
[millions of Canadian dollars, unless otherwise indicated]
During 2003, the Company acquired customer relationships valued at $13.7. In addition, the Company recorded a reduction of $4.3 to the customer relationships amount recorded at the time of fresh start accounting relating to the utilization of previously unrecognized tax benefits that arose prior to that date.
| | | 2004 | | 2003 | |
| Prepaid right-of-way | | | 5.9 | | | 6.9 | |
| Deferred costs and other assets | | | 5.2 | | | 5.3 | |
| Investment, at cost | | | 0.6 | | | 0.4 | |
| | | | 11.7 | | | 12.6 | |
Details of amortization expense are as follows:
| | | | | | | | | Pre- | |
| | | | | | | | | recapitalization | |
| | | | | | | Nine | | Three | |
| | | | | | | Months | | Months | |
| | | | | | | Ended | | Ended | |
| | | | | | | Dec 31, | | Mar 31, | |
| | | 2004 | | 2003 | | 2002 | | 2002 | |
| Amortization of deferred costs recorded as carrier charges | | | 1.3 | | | 2.3 | | | 3.3 | | | - | |
7. | ACCOUNTS PAYABLE AND ACCRUED LIABILITIES |
| | | 2004 | | 2003 | |
| Accrued liabilities and trade payables | | | 74.1 | | | 62.6 | |
| Carrier payables | | | 37.7 | | | 49.5 | |
| Commodity, capital and income tax liabilities | | | 18.8 | | | 19.6 | |
| Payroll related liabilities | | | 13.4 | | | 14.8 | |
| Other | | | 5.7 | | | 2.9 | |
| | | | 149.7 | | | 149.4 | |
Effective January 1, 2004, the Company reclassified the long-term portion of its deferred fibre maintenance charge and lease exit costs to long-term liabilities from accounts payable and accrued liabilities[note 8b]. The comparative figures have been restated to conform to this presentation.
Call-Net Enterprises Inc.
NOTES TO CONSOLIDATED FINANCIAL STATEMENTS
Year ended December 31, 2004
[millions of Canadian dollars, unless otherwise indicated]
| LONG-TERM DEBT AND OTHER LONG-TERM LIABILITIES |
| | |
(a) | Senior Secured Notes due 2008 |
| | | Interest Rate | | 2004 | | 2003 | |
| Senior secured notes due 2008 | | | 10.625 | % | | 268.5 | | | 387.1 | |
During the three months ended March 31, 2004, the Company purchased for cancellation a total of U.S.$76.4 (CDN$100.8) of the outstanding senior secured notes due 2008 at market prices. The total cost of this purchase to the Company was $104.8 resulting in a loss of $4.0.
During 2002, the Company purchased for cancellation a total of U.S.$77.5 of the outstanding U.S.$377.0 Senior Secured Notes due 2008 at market prices. The total cost of these purchases to the Company was $29.7 resulting in a gain of $93.1.
The Company’s remaining outstanding U.S.$223.1 senior secured notes mature on December 31, 2008. The senior secured notes were issued in 2002 at approximately par value and are collateralized by substantially all of the assets of the Company.
The senior secured notes bear interest at 10.625 per cent per annum from December 31, 2001, or from the most recent date to which interest has been paid or provided for, payable semi-annually on June 30 and December 31 in each year, commencing June 30, 2002. Interest will be computed on the basis of a 360-day year consisting of twelve 30-day months.
The senior secured notes are senior secured obligations of the Company and will rankpari passu in right of payment to any future senior unsecured debt and senior to the Company’s future subordinated secured debt. The senior secured notes are governed by a trust indenture which contains certain covenants which, among other things, restrict the ability of the Company to incur additional indebtedness, consummate certain sales of assets, make certain investments, engage in sale-leaseback transactions, pay dividends or repurchase the Company’s capital stock.
On or after January 1, 2006, the senior secured notes will be redeemable, at the Company’s option, in whole or in part, at any time or from time-to-time at the following redemption prices, plus accrued and unpaid interest to the redemption date: if redeemed during the 12-month period commencing on January 1, 2006 at 105.313 per cent, January 1, 2007 at 102.657 per cent and January 1, 2008 and thereafter at 100 per cent of the principal amount.
In the event of a change of control, the Company is required to offer to purchase all outstanding notes at a purchase price of 101 per cent of their principal amount plus accrued and unpaid interest to the date of purchase.
Call-Net Enterprises Inc.
NOTES TO CONSOLIDATED FINANCIAL STATEMENTS
Year ended December 31, 2004
[millions of Canadian dollars, unless otherwise indicated]
(b) | Other Long-Term Liabilities |
| | | Interest Rate | | 2004 | | 2003 | |
| Right-of-way liability (i) | | | 10.0 | % | | 38.3 | | | 37.0 | |
Customer list liability[note 13] | | | N/A | | | 10.0 | | | - | |
Lease exit costs[note 15] | | | N/A | | | 2.8 | | | 3.7 | |
| Asset retirement obligations (ii) | | | 10.0 | % | | 2.2 | | | 2.4 | |
Deferred fibre maintenance charge[note 15] | | | N/A | | | - | | | 6.0 | |
| | | | | | | 53.3 | | | 49.1 | |
Effective January 1, 2004, the Company reclassified the long-term portion of its deferred fibre maintenance charge and lease exit costs to long-term liabilities from accounts payable and accrued liabilities[note 7]. The comparative figures have been restated to conform to this presentation.
| (i) | Right-of-way Liability |
The right-of-way liability represents the net present value of payments to be made under right-of-way agreements with terms ranging from one to 20 years. The associated assets for the right-of-ways are recorded in capital assets.
The future payments for the next five years and thereafter are as follows:
| 2005 | | | 5.3 | |
| 2006 | | | 5.2 | |
| 2007 | | | 5.1 | |
| 2008 | | | 5.1 | |
| 2009 | | | 5.7 | |
| Thereafter | | | 51.2 | |
| Total future minimum payments | | | 77.6 | |
| Less imputed interest at 10% | | | (38.0 | ) |
| | | | 39.6 | |
| Less current portion included in accounts payable | | | (1.3 | ) |
| | | | 38.3 | |
Call-Net Enterprises Inc.
NOTES TO CONSOLIDATED FINANCIAL STATEMENTS
Year ended December 31, 2004
[millions of Canadian dollars, unless otherwise indicated]
| (ii) | Asset Retirement Obligations |
The undiscounted amount of the estimated cash flows required to settle the ARO is $10.3. The present value of the asset retirement obligation was calculated using a credit adjusted discount rate of 10 per cent over a weighted-average period of 50 years.
The following table details the changes in the asset retirement liability:
April 1, 2002 | | | 2.0 | |
| Accretion charges recorded in depreciation expense | | | 0.2 | |
December 31, 2002 | | | 2.2 | |
| Accretion charges recorded in depreciation expense | | | 0.2 | |
December 21, 2003 | | | 2.4 | |
| Accretion charges recorded in depreciation expense | | | 0.2 | |
| Revisions made to the original estimated cash flows | | | (0.4 | ) |
December 31, 2004 | | | 2.2 | |
Common Shares
The Company is authorized to issue an unlimited number of the common shares. The holders of the common shares are entitled to one vote for each share held at any meeting of shareholders of the Company. The common shares are convertible, at the option of the common shareholders at any time into class B non-voting shares on a share-for-share basis. The common shares may be subject to constraints on transfer to ensure the Company’s compliance with the foreign ownership provisions of theTelecommunications Act (Canada). The common shares rankpari passu with the class B non-voting shares on a per share basis with respect to the payment of dividends and the right to participate in a distribution of assets of the Company on winding up, dissolution or otherwise.
Class B Non-Voting Shares
The Company is authorized to issue an unlimited number of the class B non-voting shares. The holders of the class B non-voting shares are not entitled to vote at any meeting of shareholders of the Company except for votes affecting class B non-voting shares. The class B non-voting shares are convertible, at the option of the class B shareholders, at any time into common shares on a share-for-share basis, in certain circumstances. The class B non-voting shares rankpari passu with the common shares on a per share basis with respect to the payment of dividends and the right to participate in a distribution of assets of the Company on winding up, dissolution or otherwise.
Preferred Shares
The Company is authorized to issue an unlimited number of the preferred shares, although no preferred shares were issued in connection with the Plan of Arrangement. However, as part of the consideration for entering into a commercial agreement with the Company[note 11], Sprint was issued one preferred share
Call-Net Enterprises Inc.
NOTES TO CONSOLIDATED FINANCIAL STATEMENTS
Year ended December 31, 2004
[millions of Canadian dollars, unless otherwise indicated]
(for a value of one dollar) and is the only holder of preferred shares. There were no other preferred shares outstanding at December 31, 2004. The preferred shares are generally non-voting and have no right to dividends. Preferred shares entitle the holder to nominate and elect two directors of the Company. The preferred shares also have a priority right over all other classes of shares to receive a return of capital equal to one dollar per preferred share upon the liquidation, dissolution or winding up of the Company.
The following tables detail the changes in capital stock for the years ended December 31, 2004 and 2003, and the nine months ended December 31, 2002:
Number of Shares | | Common | | Class B | | Preferred | |
Balance, April 1, 2002 | | | 3,686,833 | | | 20,152,805 | | | 1 | |
| Converted during the nine months ended December 31, 2002 | | | 364,394 | | | (364,394 | ) | | - | |
Balance, December 31, 2002 | | | 4,051,227 | | | 19,788,411 | | | 1 | |
| Issued during the year | | | - | | | 11,500,000 | | | - | |
| Issued pursuant to restricted stock units | | | 239,499 | | | - | | | - | |
| Issued pursuant to stock options | | | 883 | | | - | | | - | |
| Converted during the year, net | | | (80,751 | ) | | 80,751 | | | - | |
| Fractional shares eliminated due to conversions during the year | | | (19 | ) | | (10 | ) | | - | |
Balance, December 31, 2003 | | | 4,210,839 | | | 31,369,152 | | | 1 | |
| Issued pursuant to restricted stock units | | | 173,000 | | | - | | | - | |
| Issued pursuant to stock options | | | 11,015 | | | - | | | - | |
Converted during the year, net | | | (92,873 | ) | | 92,873 | | | - | |
| Fractional shares eliminated due to conversions during the year | | | 30 | | | - | | | - | |
Balance, December 31, 2004 | | | 4,302,011 | | | 31,462,025 | | | 1 | |
Dollars | | Common | | Class B | | Preferred | |
Balance, April 1, 2002 | | | 45.8 | | | 260.5 | | | - | |
| Converted during the nine months ended December 31, 2002 | | | 4.5 | | | (4.5 | ) | | - | |
Balance, December 31, 2002 | | | 50.3 | | | 256.0 | | | - | |
| Issued during the year | | | - | | | 40.6 | | | - | |
| Issued pursuant to restricted stock units | | | 0.5 | | | - | | | - | |
| Converted during the year, net | | | (1.0 | ) | | 1.0 | | | - | |
Balance, December 31, 2003 | | | 49.8 | | | 297.6 | | | - | |
| Issued pursuant to restricted stock units | | | 0.7 | | | - | | | - | |
| Stock options exercised | | | 0.1 | | | - | | | - | |
| Converted during the year, net | | | (0.9 | ) | | 0.9 | | | - | |
Balance, December 31, 2004 | | | 49.7 | | | 298.5 | | | - | |
During 2003, the Company issued 11,500,000 class B non-voting shares at a price of $3.75 per share. Net proceeds to the Company after deducting fees and expenses were $40.6.
Contributed Surplus
The following table details the changes in contributed surplus for the years ended December 31, 2004 and 2003, and the nine months ended December 31, 2002:
Call-Net Enterprises Inc.
NOTES TO CONSOLIDATED FINANCIAL STATEMENTS
Year ended December 31, 2004
[millions of Canadian dollars, unless otherwise indicated]
Contributed Surplus | | Dollars | |
Balance, April 1, 2002 | | - | |
| Stock-based compensation expense for the nine months ended December 31, 2002 | | 1.2 | |
Balance, December 31, 2002 | | | 1.2 | |
| Stock-based compensation expense for the year | | | 1.7 | |
Balance, December 31, 2003 | | | 2.9 | |
| Stock-based compensation expense for the year | | | 1.5 | |
Balance, December 31, 2004 | | | 4.4 | |
Stock Options
Under the Option Plan, the Company currently has reserved a total maximum of 2,261,000 common and class B non-voting shares. Options granted under the Option Plan will be non-assignable and will expire no more than 10 years from their date of grant or as determined by the board of directors. The number of common shares and class B non-voting shares reserved for issuance in the aggregate to any one eligible person pursuant to the Option Plan shall not exceed five per cent of the aggregate outstanding common shares and class B non-voting shares. All shares reserved for issuance under the Option Plan are granted under the terms and conditions of the Plan of Arrangement. The Option Plan permits the granting or repricing of options at a price no less than the closing price of the applicable shares on the Toronto Stock Exchange on the business day preceding the date on which the option is granted, or re-priced, as the case may be. Vesting of the options occurs in three yearly installments of 33.3 per cent each. Vesting of those options carrying an exercise price of $8.50 is also dependent on the stock price reaching certain performance levels.
The following is a continuity of stock options outstanding for which common shares have been reserved:
Common Shares | | | |
| | | | | Weighted- | |
| | | | | Average | |
| | | Number | | Exercise Price | |
| | | Outstanding | | Per Share | |
Balance, April 1, 2002 | | | - | | | - | |
| Granted during the nine months ended December 31, 2002 | | | 1,016,150 | | | 8.27 | |
| Cancelled during the nine months ended December 31, 2002 | | | (89,900 | ) | | 8.50 | |
Balance, December 31, 2002 | | | 926,250 | | | 8.25 | |
| Granted during the year | | | 517,500 | | | 2.42 | |
| Exercised during the year | | | (883 | ) | | 0.65 | |
| Cancelled during the year | | | (86,800 | ) | | 6.99 | |
Balance, December 31, 2003 | | | 1,356,067 | | | 6.11 | |
| Granted during the year | | | 488,800 | | | 4.50 | |
| Exercised during the year | | | (11,015 | ) | | 1.71 | |
| Cancelled during the year | | | (173,868 | ) | | 6.16 | |
Balance, December 31, 2004 | | | 1,659,984 | | | 5.66 | |
Exercisable, December 31, 2004 | | | 161,347 | | | 2.21 | |
Call-Net Enterprises Inc.
NOTES TO CONSOLIDATED FINANCIAL STATEMENTS
Year ended December 31, 2004
[millions of Canadian dollars, unless otherwise indicated]
The following table summarizes information about the common shares stock options outstanding atDecember 31, 2004:
| | | Options Outstanding | | Options Exercisable | |
| | | | | Weighted - | | | | | | | | | |
| | | | | Average | | Weighted - | | | | Weighted - | | | |
| | | Number | | Remaining | | Average | | Number | | Average | | | |
| | | Outstanding | | Contractual | | Exercise | | Exercisable | | Exercise | | | |
Range of | | at Dec 31, | | Life in | | Price | | at Dec 31, | | Price | | Expiry | |
Exercise Prices | | 2004 | | Years | | Per Share | | 2004 | | Per Share | | Dates | |
| $0.65 to $0.80 | | | 28,184 | | | 4.6 | | $ | 0.66 | | | 18,195 | | $ | 0.66 | | | 2009 | |
| $1.80 | | | 331,100 | | | 5.2 | | $ | 1.80 | | | 109,554 | | $ | 1.80 | | | 2010 | |
| $2.34 | | | 12,000 | | | 6.8 | | $ | 2.34 | | | - | | | - | | | 2011 | |
| $2.64 | | | 5,600 | | | 6.8 | | $ | 2.64 | | | - | | | - | | | 2011 | |
| $3.90 | | | 11,200 | | | 6.6 | | $ | 3.90 | | | - | | | - | | | 2011 | |
| $4.02 | | | 5,000 | | | 6.3 | | $ | 4.02 | | | - | | | - | | | 2011 | |
| $4.35 | | | 94,000 | | | 5.6 | | $ | 4.35 | | | 31,332 | | $ | 4.35 | | | 2010 | |
| $4.60 | | | 432,000 | | | 6.2 | | $ | 4.60 | | | - | | | - | | | 2011 | |
| $5.15 | | | 6,800 | | | 5.8 | | $ | 5.15 | | | 2,266 | | $ | 5.15 | | | 2010 | |
| $8.50 | | | 734,100 | | | 4.3 | | $ | 8.50 | | | - | | | - | | | 2009 | |
During the year ended December 31, 2004, there were no stock options granted for which class B non-voting shares have been reserved. As at December 31, 2004, there were no class B non-voting shares stock options outstanding.
The weighted-average fair value for options granted during the year ended December 31, 2004 is $2.87 [2003 - $1.61, nine month period ended December 31, 2002 - $5.60]. The fair value of each option granted was estimated on the date of grant using the Black-Scholes option pricing model with the following assumptions:
| | | 2004 | | 2003 | | 2002 | |
| Risk free interest rate | | | 2.23 | % | | 3.35 | % | | 5.41 | % |
| Expected dividend yield | | | 0 | % | | 0 | % | | 0 | % |
| Expected volatility, common shares | | | 102.9 | % | | 107.9 | % | | 65.6 | % |
| Expected time until exercise, in years | | | 3.0 | | | 3.0 | | | 6.9 | |
The total compensation cost recognized for the year related to stock options is $1.5 [2003 - - $1.7, 2002 - $1.2]. The amounts transferred from contributed surplus to share capital are negligible in 2004 and 2003.
Shareholders’ Rights Plan
The Rights Plan was adopted to ensure that if a person or group is seeking to acquire beneficial ownership of 20 per cent or more of the common shares, or 20 per cent of the aggregate shares of the Company, the shareholders and the board of directors are given sufficient time to evaluate the transaction, negotiate with the proposed acquirer, encourage competing bids to emerge, and ensure that all alternatives to the transaction designed to maximize shareholder value have been considered. The term of the Rights Plan is until the termination of the Company’s 2007 annual shareholders meeting. Under the Rights Plan, one right was issued in respect of each share outstanding immediately following the
Call-Net Enterprises Inc.
NOTES TO CONSOLIDATED FINANCIAL STATEMENTS
Year ended December 31, 2004
[millions of Canadian dollars, unless otherwise indicated]
implementation of the Plan of Arrangement. In addition, one right will be issued in respect of each new share issued thereafter. When exercisable, each right will permit the holder to purchase shares with a market value of 200 dollars on payment of 100 dollars.
Restricted Stock Unit Plan
Restricted Stock Units [RSUs] are subject to vesting provisions, which may include, at the discretion of the board of directors, the achievement of performance criteria. RSU grants are settled by the delivery of shares to the participant or, at the participant’s option, the delivery of the cash equivalent market value of the shares based on the five trading day average of the closing price of the common shares on the Toronto Stock Exchange [‘TSX’]. If shares are to be delivered, the Company will have the option to deliver shares issued from treasury or shares purchased on the TSX by an independent administrator. The RSUP provides that the maximum number of shares deliverable to participants under the RSUP shall be 678,000 shares. The maximum term for any RSU is three years. The outstanding RSUs vest in three annual installments of 33.3 per cent each. The resulting compensation expense recorded for the year ended December 31, 2004 is insignificant [2003 - $1.6, nine months ended December 31, 2002 - $0.2, three months ended March 31, 2002 - nil].
The following is a continuity of RSUs outstanding for which common shares have been reserved:
| | | Number Outstanding | |
Balance, April 1, 2002 | | | - | |
| Granted during the nine months ended December 31, 2002 | | | 652,000 | |
| Cancelled during the nine months ended December 31, 2002 | | | (66,500 | ) |
Balance, December 31, 2002 | | | 585,500 | |
| Settled during the year | | | (239,499 | ) |
Balance, December 31, 2003 | | | 346,001 | |
| Settled during the year | | | (173,000 | ) |
| Cancelled during the year | | | (8,000 | ) |
Balance, December 31, 2004 | | | 165,001 | |
Deferred Share Unit Plan
Participants of the DSUP can elect to receive a portion of their annual compensation in the form of Deferred Share Units [‘DSUs’]. The number of DSUs received is calculated using the amount of compensation directed to the plan, divided by the share price, based on the five trading day average of the closing price of the common shares or class B non-voting shares as applicable on the TSX. DSUs are redeemable upon the departure of the participant from the Company by the delivery of common shares or class B non-voting shares as applicable, equal to the number of DSUs credited to the participant, or at the participant’s option, the delivery of cash equal to the number of DSUs credited to the participant’s account multiplied by the five day trading average of the closing price of the applicable shares on the TSX on the date of termination. If shares are to be delivered, the shares will be purchased on the TSX by an independent administrator. The resulting additional compensation expense recorded during the year ended December 31, 2004 is $0.2 [2003, nine months ended December 31, 2002 and three months ended March 31, 2002 - nil].
Call-Net Enterprises Inc.
NOTES TO CONSOLIDATED FINANCIAL STATEMENTS
Year ended December 31, 2004
[millions of Canadian dollars, unless otherwise indicated]
The following is a continuity of the DSUs outstanding for which common shares have been reserved:
| | | Number Outstanding | |
Balance, April 1 and December 31, 2002 | | | - | |
| Granted during the year | | | 8,892 | |
| Settled during the year | | | (1,694 | ) |
Balance, December 31, 2003 | | | 7,198 | |
| Granted during the year | | | 53,970 | |
Balance, December 31, 2004 | | | 61,168 | |
Pre-recapitalization Common Shares
The Company was authorized to issue an unlimited number of common shares. The holders of common shares were entitled to one vote for each share held at any meeting of shareholders of the Company. The common shares were subject to constraints on transfer to ensure the Company’s compliance with the foreign ownership provisions of theTelecommunications Act (Canada).
Pre-recapitalization Preferred Shares
The Company was authorized to issue in series an unlimited number of preferred shares of which none were outstanding at December 31, 2002 and 2001. The board of directors determined the rights and attributes when each series was issued.
Pre-recapitalization Class B Non-Voting Shares
The class B non-voting shares were created in October 1993 when each common share then outstanding was converted into one common share and one class B non-voting share.
The class B non-voting shares rankedpari passu with the common shares and class C non-voting shares on a per share basis with respect to the payment of dividends and the right to participate in a distribution of assets of the Company on winding up, dissolution or otherwise. The holders of class B non-voting shares were not entitled to vote at any meeting of shareholders of the Company.
Pre-recapitalization Class C Non-Voting Shares
The class C non-voting shares could not be held by parties other than Sprint, its affiliates and permitted associates. The class C non-voting shares rankedpari passu with common shares and class B non-voting shares on a per share basis with respect to the payment of dividends and the right to participate in a distribution of assets of the Company on winding up, dissolution or otherwise. The holders of class C non-voting shares were not entitled to vote at any meeting of shareholders of the Company. However, the holders of the class C non-voting shares were entitled to elect up to three directors of the Company as long as they maintained a significant equity interest in the Company.
The class C non-voting shares could be converted into class B non-voting shares (on a share-for-share basis) at any time or common shares and class B non-voting shares (on the basis of one-half common share and one-half class B non-voting share for each class C non-voting share) in certain circumstances.
Call-Net Enterprises Inc.
NOTES TO CONSOLIDATED FINANCIAL STATEMENTS
Year ended December 31, 2004
[millions of Canadian dollars, unless otherwise indicated]
Number of Pre-recapitalization Shares | | Common | | Class B | | Class C | |
Balance, December 31, 2000 and 2001 | | | 17,580,396 | | | 51,093,362 | | | 21,775,017 | |
| Issued pursuant to options | | | - | | | 142,218 | | | - | |
Cancelled pursuant to Plan of Arrangement[note 1] | | | (17,580,396 | ) | | (51,235,580 | ) | | (21,775,017 | ) |
Balance, December 31, 2002 | | | - | | | - | | | - | |
Dollars, pre-recapitalization | | Common | | Class B | | Class C | |
Balance, December 31, 2000 and 2001 | | | 124.8 | | | 863.5 | | | 347.8 | |
| Issued pursuant to options | | | - | | | - | | | - | |
Cancelled pursuant to Plan of Arrangement[note 1] | | | (124.8 | ) | | (863.5 | ) | | (347.8 | ) |
Balance, December 31, 2002 | | | - | | | - | | | - | |
2002 Transactions
All pre-recapitalization common shares, pre-recapitalization class B non-voting shares and pre-recapitalization class C non-voting shares were cancelled pursuant to the Plan of Arrangement[note 1].
The reconciliation of income tax computed at the statutory tax rates to the provision for income taxes is as follows:
| | | | | | | Pre- | |
| | | | | | | | | recapitalization | |
| | | | | | | Nine | | Three | |
| | | | | | | Months | | Months | |
| | | | | | | Ended | | Ended | |
| | | | | | | Dec 31, | | Mar 31, | |
| | | 2004 | | 2003 | | 2002 | | 2002 | |
| Income tax recovery based on the combined statutory rate of 36% [2003 - 37%; 2002 - 39%] | | | 26.0 | | | 11.5 | | | 22.1 | | | 36.2 | |
| Tax effect of items not taxable (deductible) for tax | | | (6.8 | ) | | 8.8 | | | 34.6 | | | (3.7 | ) |
| Unrecognized tax benefits of losses and temporary differences | | | (19.2 | ) | | (20.3 | ) | | (56.7 | ) | | (35.8 | ) |
| Realization of income tax assets not recognized on implementation of fresh start accounting | | | (3.9 | ) | | (4.3 | ) | | - | | | - | |
| Large corporations tax | | | (2.4 | ) | | (2.0 | ) | | (2.6 | ) | | 1.0 | |
| Reduction in future income tax liability resulting from substantively enacted tax rate reduction | | | - | | | - | | | - | | | 3.3 | |
| Income taxes benefit (expense) | | | (6.3 | ) | | (6.3 | ) | | (2.6 | ) | | 1.0 | |
Upon the implementation of the Plan of Arrangement and the application of fresh start accounting, a full valuation was recorded against the pre-recapitalization future income tax assets of the Company. If any tax benefits from this future income tax asset are subsequently realized, the benefit is recorded first as a
Call-Net Enterprises Inc.
NOTES TO CONSOLIDATED FINANCIAL STATEMENTS
Year ended December 31, 2004
[millions of Canadian dollars, unless otherwise indicated]
reduction of the intangible assets recorded upon the application of fresh start accounting and, if these assets are fully drawn down, as a capital transaction within contributed surplus. During the year ended December 31, 2004 and 2003, the Company utilized tax benefits that arose prior to fresh start accounting totaling $3.9 and $4.3, respectively, which has been recorded as a reduction to unamortized customer relationships[note 6].
Future income tax benefit consists of tax (benefits) liabilities arising from:
| | | | 2004 | | 2003 | |
| Benefits: | | | | | | | |
| | Taxable loss carryforwards | | | (408.1 | ) | | (383.8 | ) |
| | Tax values of capital assets in excess of accounting values | | | (27.5 | ) | | (41.7 | ) |
| | Tax values of other assets in excess of accounting values | | | (8.9 | ) | | (11.5 | ) |
| | Accounting values of liabilities in excess of tax values | | | (4.2 | ) | | (3.7 | ) |
| Total future tax benefit | | | (448.7 | ) | | (440.7 | ) |
| Liabilities: | | | | | | | |
| | Accounting values of capital assets in excess of tax values | | | 7.4 | | | 21.5 | |
| | Tax values of liabilities in excess of accounting values | | | 14.0 | | | 23.1 | |
| Total future income tax liability | | | 21.4 | | | 44.6 | |
| Net future income tax benefit | | | (427.3 | ) | | (396.1 | ) |
| Valuation allowance | | | 427.3 | | | 396.1 | |
| Net future income tax benefit | | | - | | | - | |
At December 31, 2004, the Company had approximately $1,031.8 in losses available for Canadian income tax purposes to reduce future years' taxable income. Of these losses, $878.6 relate to losses which arose prior to the application of fresh start accounting. Income tax losses will expire as follows:
| 2006 | | | 208.4 | |
| 2007 | | | 289.5 | |
| 2008 | | | 222.0 | |
| 2009 | | | 234.6 | |
| 2010 | | | 42.6 | |
| 2014 | | | 34.7 | |
| | | | 1,031.8 | |
At December 31, 2004, the Company had approximately $111.0 in losses available for U.S. income tax purposes to reduce future years' taxable income. Income tax losses will expire as follows:
| 2021 | | | 8.6 | |
| 2022 | | | 72.6 | |
| 2023 | | | 10.2 | |
| 2024 | | | 19.6 | |
| | | | 111.0 | |
Call-Net Enterprises Inc.
NOTES TO CONSOLIDATED FINANCIAL STATEMENTS
Year ended December 31, 2004
[millions of Canadian dollars, unless otherwise indicated]
11. | COMMITMENTS AND GUARANTEES |
The Company leases office space under operating leases that expire through 2013. The Company also has agreements with certain telephone companies that guarantee the long-term supply of network facilities and agreements relating to the operations and maintenance of the network. In addition, the Company enters into agreements with suppliers to provide services and products that include minimum spend commitments.
The future minimum payments under these agreements in aggregate and for each of the next five years and thereafter are as follows:
| | | Office | | Network | | Other Services | |
| | | Space | | Facilities | | & Products | |
| 2005 | | | 14.3 | | | 21.2 | | | 37.2 | |
| 2006 | | | 13.8 | | | 17.2 | | | 27.9 | |
| 2007 | | | 5.2 | | | 9.7 | | | 10.5 | |
| 2008 | | | 2.9 | | | 8.7 | | | 8.9 | |
| 2009 | | | 2.2 | | | 5.6 | | | 5.9 | |
| Thereafter | | | 3.5 | | | 0.2 | | | 35.4 | |
| | | | 41.9 | | | 62.6 | | | 125.8 | |
On November 20, 2004, the Company entered an agreement with Bell Canada to obtain certain operating and network services[note 13].
On April 10, 2002, the Company and Sprint executed an agreement [the ’Sprint Agreement’] that was contingent upon the approval and completion of the Plan of Arrangement. The term of the Sprint Agreement is for a period of 10 years commencing April 1, 2002. The Sprint Agreement requires Sprint or its affiliates to provide various products and services to the Company. In addition, the Company continues to have exclusive use of the Sprint trademark in Canada for these services. The Company and Sprint have agreed to treat each other with ‘preferred partner’ status. In connection with the granting of the technology license and the trademark license, the Company will pay a 2.5 per cent royalty to Sprint on substantially all revenue for the first five years and 2.0 per cent for the remaining five years of the term.
Periodically in the normal course of conducting its business, the Company enters into various dispositions of its excess fibre, land interests, switch equipment and other related assets. The terms of these agreements generally include representations and warranties concerning the assets being sold. As well, indemnities for breach of these representations and warranties may be provided to the purchaser, usually limited to the value of the particular transaction. Historically these payments have not been significant.
A review of the major dispositions of the Company and its predecessors has been conducted to establish a summary of the outstanding indemnities. Terms of agreements generally provide for a limitation of losses and to the best of its knowledge the Company considers the exposure under the indemnities it has provided are unlikely to result in claims representing a material amount.
Occasionally, in the normal course of business the Company provides guarantees of third party performance in respect of customer lease arrangements. As at December 31, 2004, the total of these obligations is $nil [2003 - $0.6].
Call-Net Enterprises Inc.
NOTES TO CONSOLIDATED FINANCIAL STATEMENTS
Year ended December 31, 2004
[millions of Canadian dollars, unless otherwise indicated]
Litigation
On March 1, 2002, the Company was notified of an appeal of the Superior Court of Ontario decision with respect to an application brought by Montreal Trust Company of Canada (now Computershare Investor Services Inc.) on April 27, 2000 concerning the payment of $30.0 held in trust under a ‘change in control agreement’ with certain senior management dated September 9, 1999. The Superior Court of Ontario ruled that no change of control had occurred. On February 20, 2004, the Court of Appeal of Ontario agreed with the trial judge and dismissed the appeal of an earlier decision regarding a ‘change in control agreement’. As at April 20, 2004, the 60-day period in which the appellants had to seek leave to appeal to the Supreme Court of Canada expired. The Company reversed a $4.7 provision related to this action during 2004.
In the ordinary course of business activities, the Company may be contingently liable for litigation and claims with customers, suppliers and former employees. Management believes that adequate provisions have been recorded in the accounts where required. Although it is not possible to estimate the potential costs and losses, if any, management believes that the ultimate resolution of such contingencies will not have a material adverse effect on the consolidated financial position of the Company.
Effective November 20, 2004, the Company acquired significant portions of 360networks Corporation’s business customer base in Ontario, Quebec and Atlantic Canada, from Bell Canada. The acquisition price for the business customer relationships is measured based on three times the average revenue of the acquired customer base in the two months pre- and post the closing date of the transaction, and will be paid over a two-year period. Taking acquisition costs into account, the total cost for the customer relationships intangible asset is $17.6. This is a preliminary estimate and is subject to adjustment in the first quarter of fiscal 2005. At December 31, 2004, $7.1 of the customer relationship liability was included within accrued liabilities and $10.0 was included in other long-term liabilities[note 8(b)].
Concurrently, the Company entered into a two-year transitional services agreement under which Bell Canada will provide technical and operational services to the newly acquired customer base and in exchange be paid approximately 70 per cent of the total retail revenue with a minimum monthly payment of approximately $2.0. The Company also has entered into an option agreement under which the Company has four months to determine which assets used to service the acquired customers it may wish to acquire from Bell Canada at the end of the transitional services agreement. As consideration for the option, the Company will pay up to $2.3, or 7.5 per cent of the expected $30.0 maximum price payable, for the assets in the second quarter of fiscal 2005.
On July 15, 2003, the Company acquired the business of MPS Canada, a reseller of private label long distance services, from its parent company Mosaic Group Inc. The assets acquired include working capital valued at $3.3, computer equipment, software, furniture and fixture assets valued at $2.7 and customer relationships valued at $13.7. This acquisition was accounted for as a business acquisition using the purchase method, and the results of operations were included in these consolidated financial statements from the date of acquisition. The purchase price was allocated to net identifiable assets acquired based on their estimated fair values. This business operates as eForce, a division of a subsidiary of the Company.
Call-Net Enterprises Inc.
NOTES TO CONSOLIDATED FINANCIAL STATEMENTS
Year ended December 31, 2004
[millions of Canadian dollars, unless otherwise indicated]
On September 27, 2002, the Company acquired 75 per cent of the non-voting shares and 24 per cent of the voting shares in Time iCR Inc., a provider of customized, managed and hosted call processing solutions, for $1.0. The assets and liabilities acquired were less than $2.6 and $2.6, respectively. The Company also had a call right under a contractual arrangement with a member of Time iCR’s management who owns 51 per cent of the outstanding voting rights of Time iCR Inc. As a result, while the Company did not have voting control of Time iCR Inc., the Company determined under generally accepted accounting principles it would consolidate its interest in Time iCR Inc. On February 13, 2004 the Company acquired the remaining 25 per cent non-voting shares and 76 per cent voting shares of Time iCR for $0.4. This acquisition has been accounted for as a business acquisition using the purchase method, and the results of operations were included in these consolidated financial statements from the dates of acquisition. The purchase price was allocated to the net identifiable assets acquired based on their estimated fair values.
14. | RELATED PARTY TRANSACTIONS |
In the normal course of business, for each of the periods in the three years ended December 31, the Company has engaged in significant sales and purchases of telecommunication services with Sprint Corporation, which maintains an approximate 6.6 per cent equity interest in the Company, through its subsidiary, Sprint. These transactions were made at market prices under normal trade terms and conditions. In addition, a royalty payment based on revenues is paid to Sprint[note 11]which is included within the consolidated statements of operations and deficit. At December 31, 2004, the net balance due to Sprint and its affiliates is $12.3 [2003 - $12.9]. Revenue, carrier charges and royalty costs transactions with Sprint and its affiliates for each of the periods in the three years ended December 31 are as follows:
| | | | | | | | | Pre- | |
| | | | | | | | | recapital- | |
| | | | | | | | | ization | |
| | | | | | | Nine | | Three | |
| | | | | | | Months | | Months | |
| | | | | | | Ended | | Ended | |
| | | | | | | Dec 31, | | Mar 31, | |
| | | 2004 | | 2003 | | 2002 | | 2002 | |
| Revenue | | | 30.4 | | | 27.0 | | | 14.9 | | | 5.5 | |
| Carrier charges | | | 42.4 | | | 44.0 | | | 33.7 | | | 11.4 | |
| Royalty costs | | | 19.7 | | | 19.5 | | | 19.5 | | | - | |
In the normal course of business, for each of the periods in the three years ended December 31, the Company has engaged in sales of telecommunication services with a related entity, in which the Company maintains an approximate 7.5 per cent equity interest and has a right to appoint two positions on its board. These transactions were made at market prices under normal trade terms and conditions. Revenue derived from this entity were $3.5 [2003 - $3.2; nine months ended December 31, 2002 - $1.8; three months ended March 31, 2002 - $0.6].
In the normal course of business, for each of the periods in the three years ended December 31, the Company has engaged in sales of telecommunication services with companies to which various members of the Company’s board of directors are related. These transactions were made at market prices under normal trade terms and conditions and total less than $1.5 in each of the periods presented.
Call-Net Enterprises Inc.
NOTES TO CONSOLIDATED FINANCIAL STATEMENTS
Year ended December 31, 2004
[millions of Canadian dollars, unless otherwise indicated]
15. | REALIGNMENT, RESTRUCTURING AND OTHER CHARGES |
| | | | | Pre- | |
| | | | | | | | | recapital- | |
| | | | | | | | | ization | |
| | | | | | | Nine | | Three | |
| | | | | | | Months | | Months | |
| | | | | | | Ended | | Ended | |
| | | | | | | Dec 31, | | Mar 31, | |
| | | 2004 | | 2003 | | 2002 | | 2002 | |
| Realignment charge (a) | | | 7.8 | | | - | | | - | | | - | |
| Non-recoverable fibre maintenance costs (b) | | | (6.6 | ) | | 7.0 | | | - | | | - | |
| Special charge (c) | | | - | | | - | | | 30.5 | | | - | |
| | | | 1.2 | | | 7.0 | | | 30.5 | | | - | |
| (a) | In 2004, the Company recorded a special charge of $7.8 for severance incurred as part of its plan to improve organizational effectiveness by consolidating its corporate, operations, marketing and provisioning functions and eliminating two executive positions. The details of the movement in the severance provision during the year is shown below. |
Severance Provision | | | | |
Balance, December 31, 2003 | | | - | |
| Special charges recorded during the year | | | 7.8 | |
| Payments made during the year | | | (2.6 | ) |
Balance, December 31, 2004 | | $ | 5.2 | |
| | As at December 31, 2004, $5.2 of this provision was included in accounts payable and accrued liabilities and is expected to be paid by March 31, 2005. |
| | |
| (b) | During 2003, the Company recorded a special charge of $7.0 for fibre maintenance costs that were expected to be incurred by the Company under contracts for up to 15 years in length without any foreseeable future economic benefit and for which the Company had determined there is no reasonable prospect of recovery. During 2004, the Company reversed $6.6 of this charge since an agreement was reached under which it abandoned both the fibre and the commitment. As at December 31, 2004, none of this charge remained in the Company’s liabilities. |
| | |
| (c) | In 2002, the Company recorded a special charge of $19.8 for severance, facility, lease and contract termination costs incurred as part of its plan to further streamline and focus on its operations. As well, during this period the Company recorded a special charge of $10.7 for a provision on redundant assets. |
| | |
| | All amounts except for the facility lease exit costs were drawn down by the end of 2003. The details of the movement in the lease exit provision during the year is shown below. The remaining balance will be paid over the terms of the related leases up to a maximum period of seven years. |
Call-Net Enterprises Inc.
NOTES TO CONSOLIDATED FINANCIAL STATEMENTS
Year ended December 31, 2004
[millions of Canadian dollars, unless otherwise indicated]
Lease Exit Costs | | | |
Balance, April 1, 2002 | | $ | 7.2 | |
| Payments made during the nine months ended December 31, 2002 | | | (0.4 | ) |
Balance, December 31, 2002 | | $ | 6.8 | |
| Payments made during the year | | | (2.1 | ) |
Balance, December 31, 2003 | | $ | 4.7 | |
| Payments made during the year | | | (0.9 | ) |
Balance, December 31, 2004 | | $ | 3.8 | |
| | As at December 31, 2004 and 2003, the current portion of $1.0 and $1.0, respectively, of the lease exit cost liability was included within accrued liabilities and $2.8 and $3.7 was included in other long-term liabilities, respectively[note 8(b)]. |
| | |
16. | EARNINGS (LOSS) PER SHARE |
Earnings (loss) per share have been calculated on the basis of income (loss) divided by the weighted average number of common shares and class B non-voting shares outstanding during the period after recapitalization [December 31, 2004 - 35,713,781; December 31, 2003 - 27,484,447; December 31, 2002 - 23,839,638]. Earnings (loss) per share for three months ended March 31, 2002 have been calculated on the basis of income (loss) divided by the weighted-average number of pre-recapitalization common shares, pre-recapitalization class B non-voting shares and pre-recapitalization class C non-voting shares outstanding during the year. The pre-recapitalization weighted-average number of shares outstanding has been restated to give effect to the 1:20 stock consolidation which occurred April 15, 2002 [March 31, 2002 - 4,529,550]. Due to a loss for all periods presented, no incremental shares from the potential exercise of stock options are included because the effect would be anti-dilutive. As at December 31, 2004, 2003 and 2002, the Company had 1,659,984, 1,356,067 and 926,250 stock options outstanding, which could be dilutive to future periods. For these same periods, it had 165,001, 346,001 and 585,500 RSUs and 61,168, 7,198 and nil DSUs which could be dilutive to future periods.
17. | CONSOLIDATED STATEMENTS OF CASH FLOWS |
Net Change in Non-Cash Working Capital Balances
| | | | | | | Pre- | |
| | | | | | | | | recapitali- | |
| | | | | | | | | zation | |
| | | | | | | Nine | | Three | |
| | | | | | | Months | | Months | |
| | | | | | | Ended | | Ended | |
| | | | | | | Dec 31, | | Mar 31, | |
| | | 2004 | | 2003 | | 2002 | | 2002 | |
| Accounts receivable | | | 19.9 | | | 47.8 | | | 24.0 | | | 23.1 | |
| Other current assets | | | 18.9 | | | (43.3 | ) | | 40.7 | | | 1.0 | |
| Accounts payable and accrued liabilities | | | (10.4 | ) | | (2.0 | ) | | (4.4 | ) | | (32.4 | ) |
Net change in non-cash working capital balances related to operations | | | 28.4 | | | 2.5 | | | 60.3 | | | (8.3 | ) |
Call-Net Enterprises Inc.
NOTES TO CONSOLIDATED FINANCIAL STATEMENTS
Year ended December 31, 2004
[millions of Canadian dollars, unless otherwise indicated]
Non-Cash Transactions
Acquisition of capital assets as shown in the consolidated statements of cash flows and changes in accounts payable and accrued liabilities were increased (reduced) by accrued amounts as follows:
| | | | | Pre- | |
| | | | | recapital- | |
| | | | | ization | |
| | | | | | | Nine | | Three | |
| | | | | | | Months | | Months | |
| | | | | | | Ended | | Ended | |
| | | | | | | Dec 31, | | Mar 31, | |
| | | 2004 | | 2003 | | 2002 | | 2002 | |
| Accrued amounts | | | (1.6 | ) | | (2.2 | ) | | 8.2 | | | (3.8 | ) |
During 2003, the Company entered into an agreement to swap fibre valued at $1.9 in exchange for consideration of fibre valued at the same amount. Accordingly, this transaction is not reflected in the consolidated statements of cash flows.
During 2002, the Company acquired capital assets of $13.2 in exchange for consideration of cash in trust of $13.2. Accordingly, this transaction is not reflected in the consolidated statements of cash flows.
Other Information
| | | | | | | Pre- | |
| | | | | | | recapital- | |
| | | | | | | ization | |
| | | | | | | Nine | | Three | |
| | | | | | | Months | | Months | |
| | | | | | | Ended | | Ended | |
| | | | | | | Dec 31, | | Mar 31, | |
| | | 2004 | | 2003 | | 2002 | | 2002 | |
| Cash received for interest | | | 3.9 | | | 4.2 | | | 3.4 | | | 6.2 | |
| Cash paid for interest | | | 39.0 | | | 46.8 | | | 52.3 | | | 18.3 | |
| Cash paid for capital and income taxes | | | 5.7 | | | 3.4 | | | 9.9 | | | 0.5 | |
Commencing in the fourth quarter of 2004, the Company presents proceeds from sales of accounts receivable within cash flows from operations on the statement of cash flows. Previously these had been classified as investing activities. The comparative figures have been restated to conform to the current year presentation.
18. | ADDITIONAL FINANCIAL INFORMATION |
| | |
[a] | Fair Values |
The carrying amounts and estimated fair values of the Company’s financial instruments as at December 31, 2004 and 2003 are substantially the same, except as noted below:
Call-Net Enterprises Inc.
NOTES TO CONSOLIDATED FINANCIAL STATEMENTS
Year ended December 31, 2004
[millions of Canadian dollars, unless otherwise indicated]
| | | 2004 | | 2003 | |
| | | Carrying | | Estimated | | Carrying | | Estimated | |
| | | Amount | | Fair Value | | Amount | | Fair Value | |
| Financial assets | | | | | | | | | | | | | |
Investment, at cost | | | 0.6 | | | 0.6 | | | 0.4 | | | 0.3 | |
| Financial liabilities | | | | | | | | | | | | | |
Long-term debt | | | 268.5 | | | 266.5 | | | 387.1 | | | 385.7 | |
The fair values of the Company’s financial instruments have been determined as outlined below. However, the estimated fair values do not necessarily represent amounts that the Company could potentially realize or be obligated to pay in a current market exchange between arm’s-length parties.
| | Cash and cash equivalents, short-term investments, accounts receivable, other current assets, accounts payable and accrued liabilities |
| | |
| | The carrying values of the Company’s cash and cash equivalents, short-term investments, accounts receivable, other current assets, and accounts payable and accrued liabilities approximate fair values due to their current nature. |
| | |
| | Investment |
| | |
| | The fair value of the Company’s investment is based on the closing price on The Canadian Venture Exchange. |
| | |
| | Long-term debt |
| | |
| | The Company’s debt trades over-the-counter and is not listed on an exchange. The fair value of the Company’s long-term debt is estimated based on current trading values. |
| | |
| | Other long-term liabilities |
| | |
| | The fair value of the Company’s other long-term liabilities is based predominately on discounted future cash flows and approximates carrying value. |
| | |
[b] | Other Disclosures |
| | |
| | Credit Risk |
| | |
| | Short-term investments are placed exclusively with entities having ratings of at least A-1, A-2, P-1 or P-2 by recognized debt rating agencies. |
| | |
| | The Company’s accounts receivable are not subject to any concentration of credit risk. The portfolio is diversified as to both geographic and industry concentrations. |
Call-Net Enterprises Inc.
NOTES TO CONSOLIDATED FINANCIAL STATEMENTS
Year ended December 31, 2004
[millions of Canadian dollars, unless otherwise indicated]
| | Currency Risk |
| | |
| | The Company is exposed to risk of currency fluctuation created by the U.S. dollar denominated debt obligation, which amounts to U.S.$317.9 that will be paid in principal and interest over the remaining term of this instrument. The principal amount of U.S.$223.1 matures on December 31, 2008. |
The Company is a facilities-based carrier of long distance, data, local, enhanced voice and wireless communications services. It offers different products or services to three market segments: (i) Consumer Services including residential and small office and home office customers (ii) Business Services, including small, medium and large business and government customers and (iii) Carrier Services including other providers and carriers of telecommunications services.
During the fourth quarter of 2004, the Company changed the allocation of the Consumer Services system access fees to allocate to all products based on revenues. Previously, the Consumer Services system access fees were included in long distance revenue only. Accordingly, segment information of previous periods has been restated to reflect this change. Substantially all of the Company’s assets are located in Canada, and revenues are derived from long distance, data and local telecommunications services provided in Canada. Assets, including the fibre optic cable network, are not segmented by business division as assets are shared by all segments. The Company did not have an economic dependence on any one customer in 2004 or for all prior periods.
Customer Segments
| | | | | | | | | Network, | | | |
| | | | | | | | | Operations, | | | |
| | | Consumer | | Business | | Carrier | | Corporate | | | |
| | | Services | | Services | | Services | | and other | | Total | |
Year ended December 31, 2004 | | | | | | | | | | | | | | | | |
Long distance | | | 147.4 | | | 150.9 | | | 129.5 | | | - | | | 427.8 | |
Data | | | 13.1 | | | 142.5 | | | 47.2 | | | - | | | 202.8 | |
Local | | | 124.8 | | | 45.6 | | | 7.3 | | | - | | | 177.7 | |
Wireless | | | 10.3 | | | - | | | - | | | - | | | 10.3 | |
Total revenues | | | 295.6 | | | 339.0 | | | 184.0 | | | - | | | 818.6 | |
Operating costs | | | (119.3 | ) | | (78.2 | ) | | (9.7 | ) | | (105.9 | ) | | (313.1 | ) |
| | | | 176.3 | | | 260.8 | | | 174.3 | | | (105.9 | ) | | 505.5 | |
Carrier costs | | | | | | | | | | | | | | | (400.6 | ) |
Realignment, restructuring and other charges | | | | | | | | | | | | | | | (1.2 | ) |
Depreciation and amortization | | | | | | | | | | | | | | | (146.6 | ) |
Operating loss | | | | | | | | | | | | | | | (42.9 | ) |
Call-Net Enterprises Inc.
NOTES TO CONSOLIDATED FINANCIAL STATEMENTS
Year ended December 31, 2004
[millions of Canadian dollars, unless otherwise indicated]
| | | | | | | | | Network, | | | |
| | | | | | | | | Operations, | | | |
| | | Consumer | | Business | | Carrier | | Corporate | | | |
| | | Services | | Services | | Services | | and other | | Total | |
| Year ended December 31, 2003 | | | | | | | | | | | | | | | | |
| Long distance | | | 165.8 | | | 153.6 | | | 162.8 | | | - | | | 482.2 | |
| Data | | | 17.0 | | | 134.0 | | | 50.1 | | | - | | | 201.1 | |
| Local | | | 84.6 | | | 31.0 | | | 4.8 | | | - | | | 120.4 | |
| Wireless | | | 1.6 | | | - | | | - | | | - | | | 1.6 | |
| Total revenues | | | 269.0 | | | 318.6 | | | 217.7 | | | - | | | 805.3 | |
| Operating costs | | | (98.3 | ) | | (63.2 | ) | | (6.9 | ) | | (130.9 | ) | | (299.3 | ) |
| | | | 170.7 | | | 255.4 | | | 210.8 | | | (130.9 | ) | | 506.0 | |
| Carrier costs | | | | | | | | | | | | | | | (409.9 | ) |
| Realignment, restructuring and other charges | | | | | | | | | | | | | | | (7.0 | ) |
| Depreciation and amortization | | | | | | | �� | | | | | | | | (157.3 | ) |
| Operating loss | | | | | | | | | | | | | | | (68.2 | ) |
| | | | | | | | | Network, | | | |
| | | | | | | | | Operations, | | | |
| | | Consumer | | Business | | Carrier | | Corporate | | | |
| | | Services | | Services | | Services | | and other | | Total | |
| Nine months ended December 31, 2002 | | | | | | | | | | | | | | | | |
| Long distance | | | 133.3 | | | 110.6 | | | 125.6 | | | - | | | 369.5 | |
| Data | | | 16.3 | | | 107.3 | | | 43.6 | | | - | | | 167.2 | |
| Local | | | 45.9 | | | 14.2 | | | 2.1 | | | - | | | 62.2 | |
| Wireless | | | - | | | - | | | - | | | - | | | - | |
| Total revenues | | | 195.5 | | | 232.1 | | | 171.3 | | | - | | | 598.9 | |
| Operating costs | | | (71.3 | ) | | (43.7 | ) | | (13.7 | ) | | (99.8 | ) | | (228.5 | ) |
| | | | 124.2 | | | 188.4 | | | 157.6 | | | (99.8 | ) | | 370.4 | |
| Carrier costs | | | | | | | | | | | | | | | (335.7 | ) |
| Realignment, restructuring and other charges | | | | | | | | | | | | | | | (30.5 | ) |
| Depreciation and amortization | | | | | | | | | | | | | | | (120.7 | ) |
| Operating loss | | | | | | | | | | | | | | | (116.5 | ) |
Call-Net Enterprises Inc.
NOTES TO CONSOLIDATED FINANCIAL STATEMENTS
Year ended December 31, 2004
[millions of Canadian dollars, unless otherwise indicated]
| | | | | | | | | Network, | | | |
| | | | | | | | | Operations, | | | |
| | | Consumer | | Business | | Carrier | | Corporate | | | |
| | | Services | | Services | | Services | | and other | | Total | |
| Three months ended March 31, 2002 | | | | | | | | | | | | | | | | |
| Long distance | | | 46.4 | | | 39.7 | | | 44.6 | | | - | | | 130.7 | |
| Data | | | 5.9 | | | 37.6 | | | 15.4 | | | - | | | 58.9 | |
| Local | | | 9.4 | | | 2.5 | | | 0.3 | | | - | | | 12.2 | |
| Wireless | | | - | | | - | | | - | | | - | | | - | |
| Total revenues | | | 61.7 | | | 79.8 | | | 60.3 | | | - | | | 201.8 | |
| Operating costs | | | (22.7 | ) | | (16.7 | ) | | (2.8 | ) | | (30.9 | ) | | (73.1 | ) |
| | | | 39.0 | | | 63.1 | | | 57.5 | | | (30.9 | ) | | 128.7 | |
| Carrier costs | | | | | | | | | | | | | | | (116.8 | ) |
| Depreciation and amortization | | | | | | | | | | | | | | | (41.8 | ) |
| Operating loss | | | | | | | | | | | | | | | (29.9 | ) |
20. | RECONCILIATION TO UNITED STATES GENERALLY ACCEPTED ACCOUNTING PRINCIPLES |
These consolidated financial statements have been prepared in accordance with Canadian GAAP, which differ in certain respects from U.S. GAAP. The significant adjustments which are described below would be required in the consolidated financial statements to comply with U.S. GAAP.
Call-Net Enterprises Inc.
NOTES TO CONSOLIDATED FINANCIAL STATEMENTS
Year ended December 31, 2004
[millions of Canadian dollars, unless otherwise indicated]
| | | 2004 | | 2003 | |
| | | | | Restated | |
| | | | | [notes 2, 7] | |
Balance Sheets - Assets | | | | | | | |
Canadian GAAP - Current Assets | | | 126.7 | | | 241.7 | |
| Investment available for sale (a) | | | 0.6 | | | 0.3 | |
U.S. GAAP - Current Assets | | | 127.3 | | | 242.0 | |
Canadian GAAP - Capital Assets | | | 458.3 | | | 516.7 | |
| Capitalized interest (c) | | | 4.9 | | | 5.9 | |
| Writedowns and fresh start adjustments (b) | | | 89.7 | | | 89.7 | |
| Writedown of assets held for sale (b) | | | (78.6 | ) | | (78.6 | ) |
| Depreciation of writedowns and fresh start adjustments (b) | | | (2.0 | ) | | (3.1 | ) |
| Disposal of writedowns and fresh start adjustments (b) | | | (1.7 | ) | | (1.7 | ) |
| Writedown of assets (b) | | | (17.5 | ) | | - | |
U.S. GAAP - Capital Assets | | | 453.1 | | | 528.9 | |
Canadian GAAP - Other Assets | | | 63.9 | | | 80.7 | |
| Investment available for sale (a) | | | (0.6 | ) | | (0.4 | ) |
| Writedowns and fresh start adjustments (b) | | | 8.2 | | | 4.3 | |
U.S. GAAP - Other Assets | | | 71.5 | | | 84.6 | |
U.S. GAAP - Total Assets | | | 651.9 | | | 855.5 | |
Balance Sheets - Liabilities | | | | | | | |
Canadian GAAP - Accounts Payable and Accrued Liabilities | | | 149.7 | | | 149.4 | |
| Disposal gain not recognized under fresh start accounting (b) | | | (0.9 | ) | | (0.9 | ) |
U.S. GAAP - Accounts Payable and Accrued Liabilities | | | 148.8 | | | 148.5 | |
Canadian GAAP - Future Income Tax Liability | | | - | | | - | |
| Future income tax liability (b) | | | 13.8 | | | 21.3 | |
U.S. GAAP - Future Income Tax Liability | | | 13.8 | | | 21.3 | |
Canadian GAAP - Long-term Debt | | | 268.5 | | | 387.1 | |
| Future interest payments on long-term debt (b) | | | 114.1 | | | 205.6 | |
U.S. GAAP - Long-term Debt | | | 382.6 | | | 592.7 | |
Canadian GAAP - Other long-term Liabilities | | | 53.3 | | | 49.1 | |
U.S. GAAP - Other long-term Liabilities | | | 53.3 | | | 49.1 | |
U.S. GAAP - Total Liabilities | | | 598.5 | | | 811.6 | |
Call-Net Enterprises Inc.
NOTES TO CONSOLIDATED FINANCIAL STATEMENTS
Year ended December 31, 2004
[millions of Canadian dollars, unless otherwise indicated]
| | | 2004 | | 2003 | |
| | | | | Restated | |
| | | | | [note 2] | |
Balance Sheets - Shareholders’ Equity | | | | | | | |
Canadian GAAP - Capital Stock | | | 352.6 | | | 350.3 | |
| Share purchase incentives | | | 4.6 | | | 4.6 | |
| Reduction in stated capital (e) | | | 10.7 | | | 10.7 | |
| Recapitalization adjustments (b) | | | (6.5 | ) | | (6.5 | ) |
| Writedowns and fresh start adjustments (b) | | | 1,036.3 | | | 1,036.3 | |
| Issue of capital stock (b) | | | 187.9 | | | 187.9 | |
U.S. GAAP - Capital Stock | | | 1,585.6 | | | 1,583.3 | |
Canadian GAAP - Deficit | | | (175.2 | ) | | (96.8 | ) |
| Share purchase incentives | | | (4.6 | ) | | (4.6 | ) |
| Reduction in stated capital (e) | | | (10.7 | ) | | (10.7 | ) |
| Writedowns and fresh start adjustments (b) | | | (1,671.8 | ) | | (1,671.8 | ) |
| Reduction of intangible assets (b) | | | 8.2 | | | 4.3 | |
| Depreciation not recognized under fresh start accounting (b) | | | (2.0 | ) | | (3.1 | ) |
| Income tax benefit related to future tax liability (b) | | | 22.5 | | | 14.7 | |
| Interest expense on long-term debt (b) | | | 121.0 | | | 88.2 | |
| Gain (loss) on repurchase of long-term debt (b) | | | 133.6 | | | 81.9 | |
| Foreign exchange gain on long-term debt (b) | | | 62.2 | | | 55.2 | |
| Loss on disposal and write-down of capital assets (b) | | | (18.3 | ) | | (0.8 | ) |
| Capitalized interest (c) | | | 4.9 | | | 5.9 | |
| Change in enacted tax rate (d) | | | (1.9 | ) | | (1.6 | ) |
U.S. GAAP - Deficit | | | (1,532.1 | ) | | (1,539.2 | ) |
Canadian GAAP - Other Comprehensive Income (Loss) | | | - | | | - | |
| Unrealized losses on investment available for sale | | | (0.1 | ) | | (0.2 | ) |
U.S. GAAP - Other Comprehensive Income (Loss) | | | (0.1 | ) | | (0.2 | ) |
Total U.S. GAAP Shareholders’ Equity (Deficiency) | | | 53.4 | | | 43.9 | |
Total U.S. GAAP Liabilities and Shareholders’ Equity (Deficiency) | | | 651.9 | | | 855.5 | |
Call-Net Enterprises Inc.
NOTES TO CONSOLIDATED FINANCIAL STATEMENTS
Year ended December 31, 2004
[millions of Canadian dollars, unless otherwise indicated]
Statements of Operations
| | | 2004 | | 2003 | | 2002 | |
| | | | | Restated | | Restated | |
| | | | | [note 2] | | [note 2] | |
Net income (loss) for the year ended December 31 based on Canadian GAAP | | | (78.4 | ) | | (37.5 | ) | | (151.1 | ) |
| Recapitalization and fresh start adjustments (b) | | | - | | | - | | | (93.8 | ) |
| Reduction of intangible assets (b) | | | 3.9 | | | 4.3 | | | - | |
| Gain on repurchase of long-term debt (b) | | | 51.7 | | | - | | | 81.9 | |
| Interest expense on long-term debt (b) | | | 32.8 | | | 44.6 | | | 43.6 | |
| Foreign exchange gain on long-term debt (b) | | | 7.0 | | | 51.3 | | | 3.9 | |
| Incremental loss on disposal and writedown regarding capitalized interest (c) | | | - | | | (0.2 | ) | | (4.6 | ) |
| Depreciation not recognized under fresh start accounting (b) | | | 1.1 | | | (1.5 | ) | | (1.6 | ) |
| Capitalized interest, net of depreciation (c) | | | (1.0 | ) | | (1.0 | ) | | (1.0 | ) |
| Loss on disposal of capital assets (b) | | | (17.5 | ) | | (0.8 | ) | | - | |
| Cumulative effect of accounting change for ARO | | | - | | | (0.4 | ) | | 0.4 | |
Net income (loss) before taxes and extraordinary items for the year ended December 31 based on U.S. GAAP | | | (0.4 | ) | | 58.8 | | | (122.3 | ) |
| Income tax benefit from future income tax liability (b) | | | 7.9 | | | 8.6 | | | 6.1 | |
| Change in enacted tax rate (d) | | | (0.3 | ) | | (1.6 | ) | | - | |
Net income (loss) before extraordinary items for the year ended December 31 based on U.S. GAAP | | | 7.2 | | | 65.8 | | | (116.2 | ) |
| Extraordinary item - gain on debt restructuring (b) | | | - | | | - | | | 1,292.5 | |
Net income (loss) after extraordinary items for the year ended December 31 based on U.S. GAAP | | | 7.2 | | | 65.8 | | | 1,176.3 | |
| Unrealized gain (loss) on investment available for sale | | | 0.1 | | | 0.1 | | | (0.1 | ) |
Comprehensive income (loss) for the year ended December 31 based on U.S. GAAP (f) | | | 7.3 | | | 65.9 | | | 1,176.2 | |
U.S. GAAP Earnings (Loss) Per Share - Basic | | | | | | | | | | |
| Net income (loss) before extraordinary items - basic | | | 0.20 | | | 2.40 | | | (6.09 | ) |
| Extraordinary item - basic | | | - | | | - | | | 67.75 | |
Net income (loss) - basic | | | 0.20 | | | 2.40 | | | 61.66 | |
U.S. GAAP Earnings (Loss) Per Share - Diluted | | | | | | | | | | |
| Net income (loss) before extraordinary items - diluted | | | 0.20 | | | 2.38 | | | (6.09 | ) |
| Extraordinary item - diluted | | | - | | | - | | | 67.71 | |
Net income (loss) - diluted | | | 0.20 | | | 2.38 | | | 61.62 | |
Call-Net Enterprises Inc.
NOTES TO CONSOLIDATED FINANCIAL STATEMENTS
Year ended December 31, 2004
[millions of Canadian dollars, unless otherwise indicated]
Statements of Cash Flows
| | | 2004 | | 2003 | | 2002 | |
Cash provided by (used in) operating activities based on Canadian GAAP | | | 86.8 | | | 43.7 | | | 6.1 | |
| Interest expense on long-term debt (b) | | | 32.8 | | | 44.6 | | | 43.6 | |
Cash provided by (used in) operating activities based on U.S. GAAP | | | 119.6 | | | 88.3 | | | 49.7 | |
Cash provided by (used in) investing activities based on Canadian and U.S. GAAP | | | 2.8 | | | (59.7 | ) | | 154.2 | |
Cash provided by (used in) financing activities based on Canadian GAAP | | | (107.2 | ) | | 38.4 | | | (29.9 | ) |
| Recapitalization adjustments (b) | | | - | | | - | | | (111.8 | ) |
| Interest expense on long-term debt (b) | | | (32.8 | ) | | (44.6 | ) | | (43.6 | ) |
Cash provided by (used in) financing activities based on U.S. GAAP | | | (140.0 | ) | | (6.2 | ) | | (185.3 | ) |
Net increase (decrease) in cash and cash equivalents for the 12 months ended December 31 based on U.S. GAAP | | | (17.6 | ) | | 22.4 | | | 18.6 | |
| (a) | Under Canadian GAAP, portfolio investments are accounted for at the lower of cost and market. Under U.S. GAAP, portfolio investments classified as available for sale are carried at market values with unrealized gains or losses reflected as a component of other comprehensive income. |
| | |
| (b) | Under Canadian GAAP, the Company’s capital reorganization and comprehensive revaluation of assets and liabilities is accounted for under fresh start accounting. U.S. GAAP does not recognize the recapitalization adjustments, writedowns and the elimination of the deficit made under fresh start accounting[note 1]. |
| | |
| | Under U.S. GAAP, the Company’s debt restructuring is accounted for in accordance with Statement of Financial Accounting Standards No. 15, ’Accounting by Debtors and Creditors for Troubled Debt Restructuring‘ [‘SFAS 15’]. The fair value of the equity interest granted to Sprint of $25.0 and the fair value of the equity interest granted to the noteholders of $163.1, reduced by direct issuance costs of $0.2, are added to capital stock. |
| | |
| | The net reduction in the value of other in-use capital assets of $11.1 (fair value increments of $89.7 and decrements of $100.8) made under Canadian GAAP under fresh start accounting did not apply under U.S. GAAP. In 2004, the Company wrote down the Cable and Wireless IRU for U.S. GAAP purposes in the amount of $17.5, which had been previously written down for Canadian GAAP under fresh start accounting. Under U.S. GAAP, an additional ($1.1) of depreciation would have been expensed during 2004 [2003 - $1.5; 2002 - $1.6]. |
| | |
| | Under Canadian GAAP, the first quarter of 2002 royalty payment to Sprint of $4.9 was accounted for under the restructuring. Under U.S. GAAP, the payment is included in the statement of operations of the current period. |
| | |
| | Under U.S. GAAP, the gain on debt restructuring is determined in accordance with SFAS 15. The fair value of the assets transferred to the noteholders include cash and an equity interest, net of issuance costs. The remaining direct costs of the Plan of Arrangement of $18.3 are deducted in measuring the gain on restructuring. Also included in the determination of the gain is the carrying amount of the pre-recapitalization notes cancelled, and accrued interest thereon, net of related deferred financing costs, |
Call-Net Enterprises Inc.
NOTES TO CONSOLIDATED FINANCIAL STATEMENTS
Year ended December 31, 2004
[millions of Canadian dollars, unless otherwise indicated]
| | and the carrying amount of the newly issued senior secured notes due 2008, accrued interest thereon, and future interest payments. |
| | |
| | Under U.S. GAAP, all cash payments under the terms of the senior secured notes are accounted for as reductions of the liability, and no interest expense is recognized over the remaining life of the debt. Under Canadian GAAP, interest expense is recognized in the statement of operations. |
| | |
| | Under Canadian GAAP, the future income tax liability was valued at nil under the application of fresh start accounting. Under U.S. GAAP, the value of the future income tax liability is not impacted by the debt restructuring. |
| | |
| | Under Canadian GAAP, the benefit of tax items that arose prior to the application of fresh start accounting of $3.9 [2003 - $4.3] are recorded through a reduction of unamortized customer relationships. Under U.S. GAAP, the reduction is not applied. |
| | |
| | Additional information regarding the Company’s financial reorganization is presented in note 1. |
| | |
| (c) | Under U.S. GAAP, interest expense to date of $4.9 [2003 - $5.9, 2002 - $7.1] would have been capitalized as part of the cost of constructing fibre optic cable and buildings and therefore included in the cost of the assets in determining the losses on disposal. Under Canadian GAAP, these amounts have been expensed. |
| | |
| (d) | Under Canadian GAAP, future income tax liabilities are valued using the income tax rates expected to apply when the liability is settled or the asset is realized based on substantively enacted income tax rates. Under U.S. GAAP, income tax rates applied are based on those completely enacted into law. |
| | |
| (e) | Canadian GAAP allows for the reduction of the stated capital of outstanding shares with a corresponding offset to deficit. This reclassification which the Company made in 1992 is not permitted by U.S. GAAP. |
| | |
| (f) | U.S. GAAP SFAS 130 requires the presentation of comprehensive income and its components. Comprehensive income includes all changes in equity during a period except shareholder transactions. |
| | |
| (g) | U.S. GAAP does not recognize the disclosure of any subtotal of the amount of cash, cash equivalents and short-term investments in the consolidated balance sheets. |
| | |
| (h) | U.S. GAAP does not recognize the disclosure of a subtotal of the cash flow from operations before net change in non-cash working capital items in the consolidated statements of cash flows. |
Call-Net Enterprises Inc.
NOTES TO CONSOLIDATED FINANCIAL STATEMENTS
Year ended December 31, 2004
[millions of Canadian dollars, unless otherwise indicated]
Additional Information
Selling, general and administration costs of $284.1 [2003 - $267.5; 2002 - $250.4], advertising costs of $14.6 [2003 - $14.2; 2002 - $18.4], lease rental costs of $14.5 [2003 - $15.0; 2002 - $15.0], and bad debt costs of ($0.1) [2003 - $0.9; 2002 - $16.6] were expensed as incurred during the year under both Canadian and U.S. GAAP.
Accounting Changes
The Financial Accounting Standards Board [the ’FASB‘] has issued Interpretation No. 46, ’Consolidation of Variable Interest Entities‘ [‘FIN 46‘]. FIN 46 clarifies the application of consolidation to those entities defined as ‘variable interest entities’ [‘VIEs’], which are certain entities in which equity investors do not have the characteristics of a ‘controlling financial interest’ or there is not sufficient equity at risk for the entity to finance its own activities without additional subordinated financial support. VIEs will be consolidated by the Company when it is determined that it will, as the primary beneficiary, absorb the majority of the VIEs expected losses and/or expected residual returns. The Company has reviewed this interpretation and determined there is no impact as a result of adopting FIN 46.
In December 2002, the FASB issued Statement of Financial Accounting Standards [‘SFAS’] No. 148, ‘Accounting for Stock-Based Compensation - Transition and Disclosure - an Amendment of FASB Statement No. 123’ [‘SFAS 148’], which amended the transitional provisions of SFAS No. 123, ‘Accounting for Stock-based Compensation’ [‘SFAS 123’], for companies electing to recognize employee stock-based compensation using the fair value based method. Effective January 1, 2004, the Company elected to expense employee stock-based compensation using the fair value method, with retroactive restatement of prior periods. Previously, the intrinsic value method had been used to account for allowed employee awards under U.S. GAAP. As all of the Company’s stock options were granted subsequent to January 1, 2002, the impact of adoption of the fair value method under U.S. GAAP was consistent with Canadian GAAP.
On February 3, 2005, the CRTC released a decision to lower the price of competitor digital network access (CDNA) facilities and services provided to competitive local exchange carriers. Based on the inventory of circuits and contracts in place with carriers as at December 31, 2004, this decision is expected to reduce carrier charges by more than $25.0 per annum. In addition, the decision was partially retroactive to June 2002. The retroactive portion is estimated to be approximately $1.0 to $2.0 which will reduce carrier charges in the first quarter of 2005.
39