United States
Securities and Exchange Commission
Washington, D.C. 20549
FORM 6-K
Report of Foreign Private Issuer
Pursuant to Rule 13a-16 or 15d-16
of the
Securities Exchange Act of 1934
For the month of
July 2021
Vale S.A.
Praia de Botafogo nº 186, 18º andar, Botafogo
22250-145 Rio de Janeiro, RJ, Brazil
(Address of principal executive office)
(Indicate by check mark whether the registrant files or will file annual reports under cover of Form 20-F or Form 40-F.)
(Check One) Form 20-F x Form 40-F ¨
(Indicate by check mark if the registrant is submitting the Form 6-K in paper as permitted by Regulation S-T Rule 101(b)(1))
(Check One) Yes ¨ No x
(Indicate by check mark if the registrant is submitting the Form 6-K in paper as permitted by Regulation S-T Rule 101(b)(7))
(Check One) Yes ¨ No x
(Indicate by check mark whether the registrant by furnishing the information contained in this Form is also thereby furnishing information to the Commission pursuant to Rule 12g3-2(b) under the Securities Exchange Act of 1934.)
(Check One) Yes ¨ No x
(If “Yes” is marked, indicate below the file number assigned to the registrant in connection with Rule 12g3-2(b). 82- .)
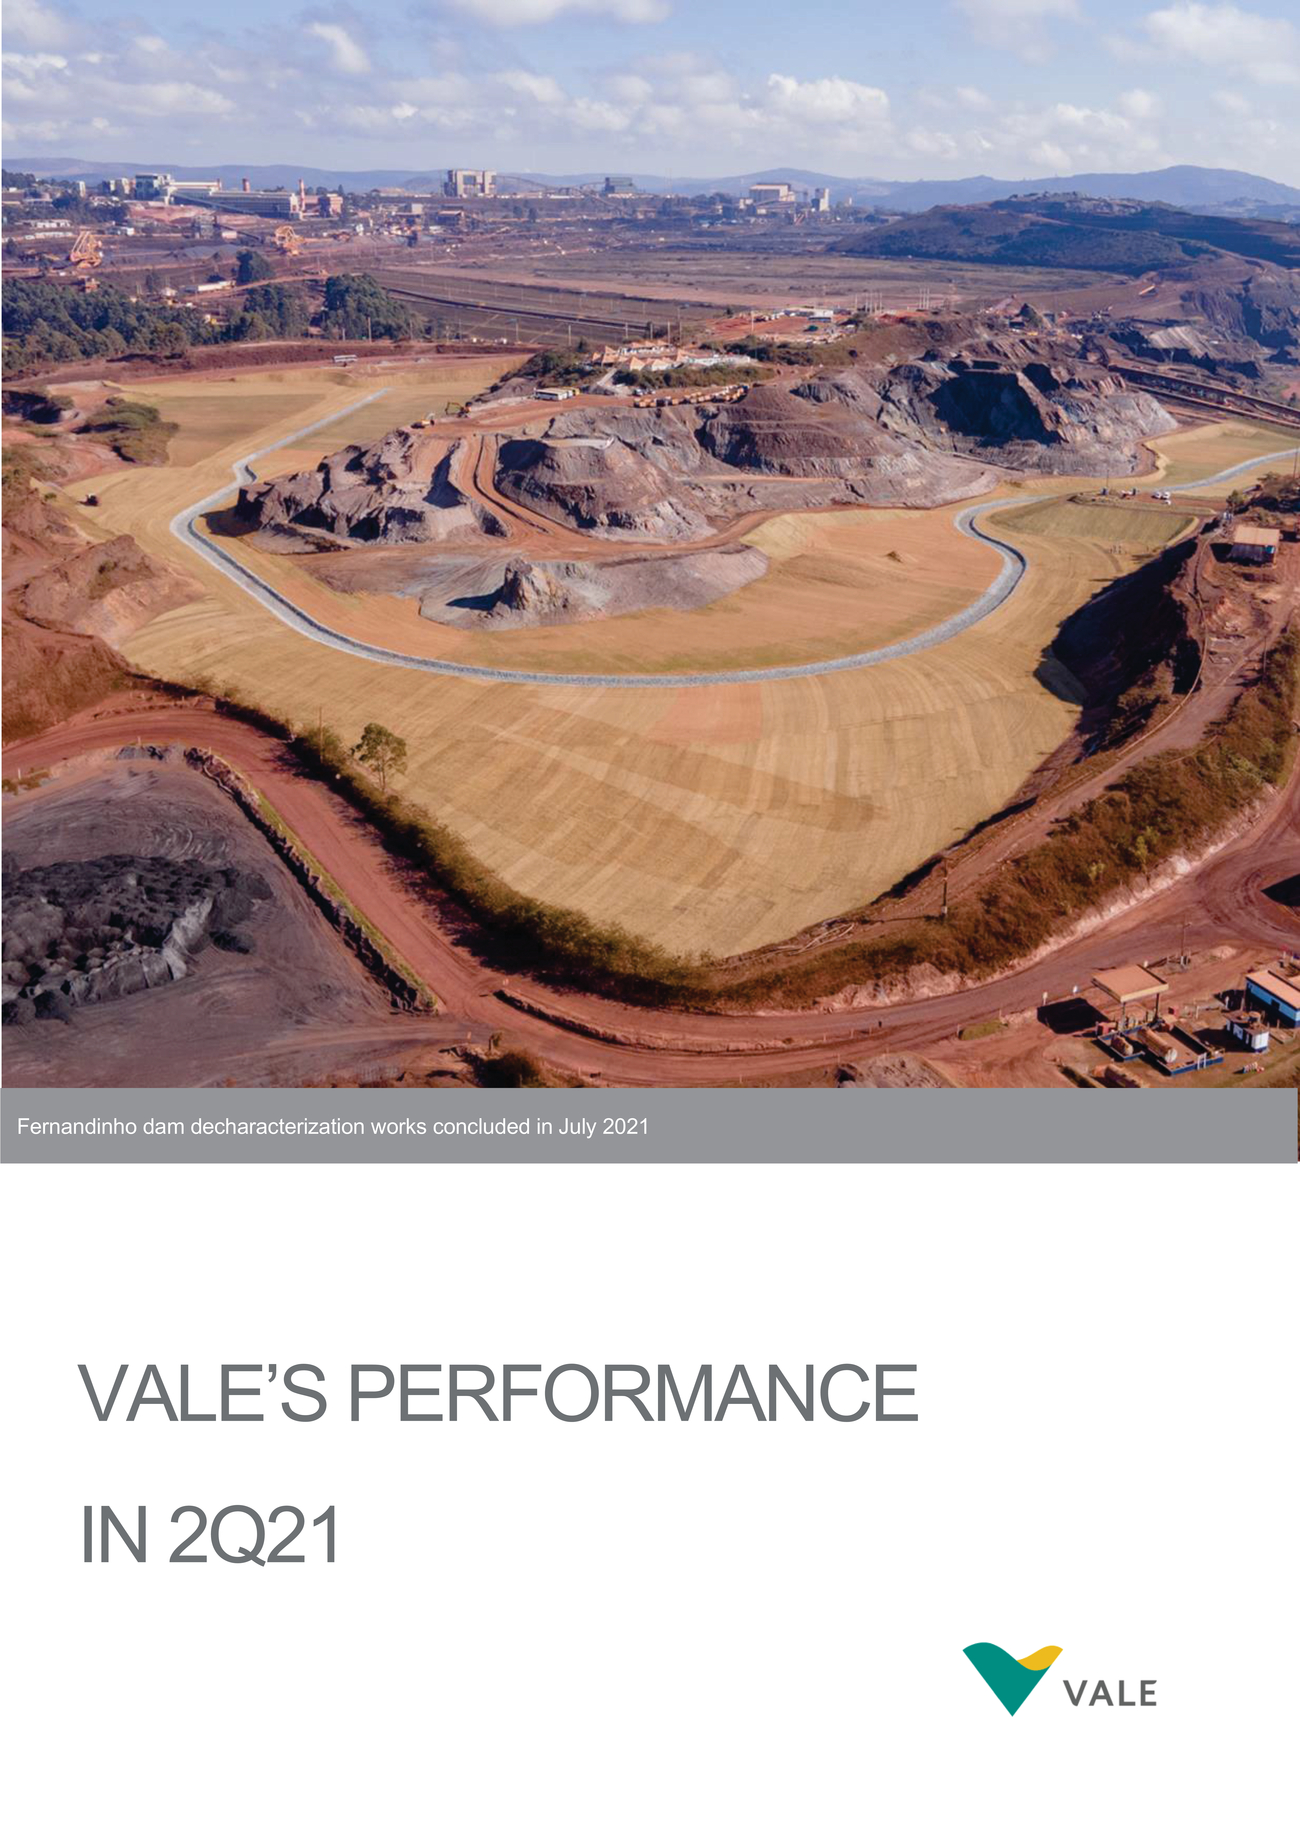 | Fernandinho dam decharacterization works concluded in July 2021 VALE’S PERFORMANCE IN 2Q21 |
 | www.vale.com vale.ri@vale.com Investor Relations Department Ivan Fadel André Werner Mariana Rocha Samir Bassil Conference call and webcast on Thursday, July 29th Portuguese (non-translated) at 10:00 a.m. Brasilia time English at noon Brasilia time (11:00 a.m. New York time, 4:00 p.m. London time). Brazil: (55 11) 3181-8565 or 4210-1803 USA: (1 412) 717-9627 or toll free (1 844) 204-8942 U.K.: (44 20) 3795-9972 Access code: VALE Except where otherwise indicated, the operational and financial information in this release is based on the consolidated figures in accordance with IFRS. Our quarterly financial statements are reviewed by the company’s independent auditors. The main subsidiaries that are consolidated are the following: Companhia Portuária da Baía de Sepetiba, Mineração Corumbaense Reunida S.A., Minerações Brasileiras Reunidas S.A. PT Vale Indonesia Tbk, Salobo Metais S.A, Vale Holdings B.V., Vale Canada Limited, Vale International S.A., Vale Manganês S.A., Vale Malaysia Minerals Sdn. Bhd., Vale Moçambique S.A., Vale Nouvelle-Calédonie SAS, Vale Oman Pelletizing Company LLC and Vale Oman Distribution Center LLC. This press release may include statements about Vale's current expectations about future events or results (forward-looking statements). Many of those forward-looking statements can be identified by the use of forward-looking words such as "anticipate," "believe," "could," "expect," "should," "plan," "intend," "estimate" “will” and "potential," amongothers. All forward-looking statements involve various risks and uncertainties. Vale cannot guarantee that thesestatements will prove correct. These risks and uncertainties include, among others, factors related to: (a) the countries where Vale operates, especially Brazil and Canada; (b) the global economy; (c) the capital markets; (d) the mining and metals prices and their dependence on global industrial production, which is cyclical by nature; and global competition in the markets in which Vale operates. Vale cautions you that actual results may differ materially from the plans, objectives, expectations, estimates and intentions expressed in this presentation. Vale undertakes no obligation to publicly update or revise any forward-looking statement, whether as a result of new information or future events or for any other reason. To obtain further information on factors that may lead to results different from those forecast by Vale, please consult the reports that Vale files with the U.S. Securities and Exchange Commission (SEC), the Brazilian Comissão de Valores Mobiliários (CVM) and, in particular, the factors discussed under “Forward-Looking Statements” and “Risk Factors” in Vale’s annual report on Form 20-F. Cautionary Note to U.S. Investors - The SEC permits mining companies, in their filings with the SEC, to disclose only those mineral deposits that a company can economically and legally extract or produce. We present certain information in this presentation, including ‘measured resources,’ ‘indicated resources,’ ‘inferred resources,’ ‘geologic resources’, which would not be permitted in an SEC filing. These materials are notproven or probable reserves, as defined by the SEC, and we cannot assure you that these materials will be converted into proven or probable reserves, as defined by the SEC. U.S. Investors should consider closely the disclosure in our Annual Report on Form 20-K, which may be obtained from us, from our website or at http://us.sec.gov/edgar.shtml. The information contained in this press release includes financial measures that are not prepared in accordance with IFRS. These non-IFRS measures differ from themostdirectly comparable measuresdetermined under IFRS, but we have not presentedareconciliation to themostdirectly comparable IFRS measures, because the non-IFRS measures are forward-looking and a reconciliation cannot be prepared without unreasonable effort. |
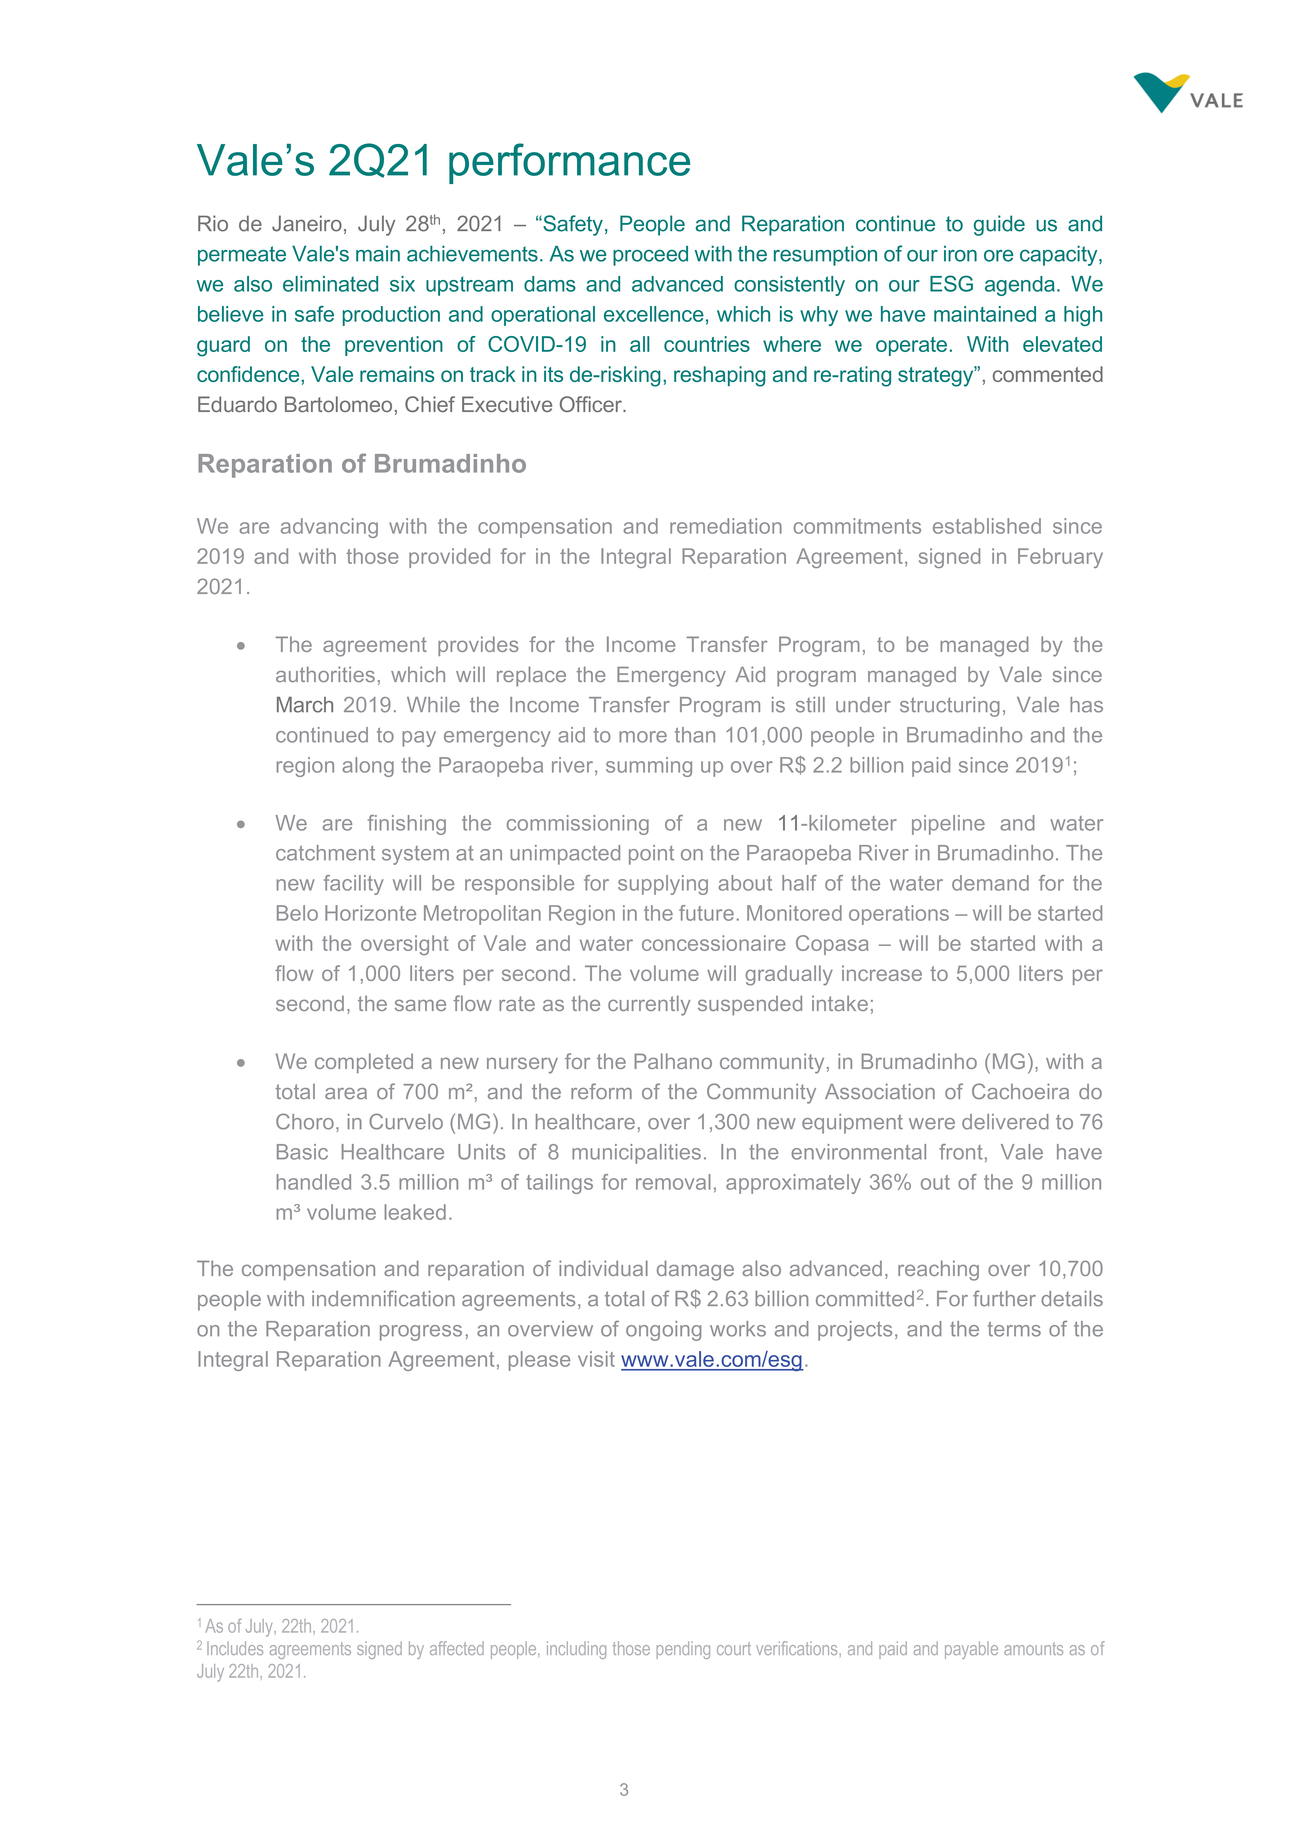 | Vale’s 2Q21 performance Rio de Janeiro, July 28th, 2021 – “Safety, People and Reparation continue to guide us and permeate Vale's main achievements. As we proceed with the resumption of our iron ore capacity, we also eliminated six upstream dams and advanced consistently on our ESG agenda. We believe in safe production and operational excellence, which is why we have maintained a high guard on the prevention of COVID-19 in all countries where we operate. With elevated confidence, Vale remains on track in its de-risking, reshaping and re-rating strategy”, commented Eduardo Bartolomeo, Chief Executive Officer. Reparation of Brumadinho We are advancing with the compensation and remediation commitments established since 2019 and with those provided for in the Integral Reparation Agreement, signed in February 2021. The agreement provides for the Income Transfer Program, to be managed by the authorities, which will replace the Emergency Aid program managed by Vale since March 2019. While the Income Transfer Program is still under structuring, Vale has continued to pay emergency aid to more than 101,000 people in Brumadinho and the region along the Paraopeba river, summing up over R$ 2.2 billion paid since 20191; We are finishing the commissioning of a new 11-kilometer pipeline and water catchment system at an unimpacted point on the Paraopeba River in Brumadinho. The new facility will be responsible for supplying about half of the water demand for the Belo Horizonte Metropolitan Region in the future. Monitored operations – will be started with the oversight of Vale and water concessionaire Copasa – will be started with a flow of 1,000 liters per second. The volume will gradually increase to 5,000 liters per second, the same flow rate as the currently suspended intake; We completed a new nursery for the Palhano community, in Brumadinho (MG), with a total area of 700 m², and the reform of the Community Association of Cachoeira do Choro, in Curvelo (MG). In healthcare, over 1,300 new equipment were delivered to 76 Basic Healthcare Units of 8 municipalities. In the environmental front, Vale have handled 3.5 million m³ of tailings for removal, approximately 36% out of the 9 million m³ volume leaked. The compensation and reparation of individual damage also advanced, reaching over 10,700 people with indemnification agreements, a total of R$ 2.63 billion committed2. For further details on the Reparation progress, an overview of ongoing works and projects, and the terms of the Integral Reparation Agreement, please visit www.vale.com/esg. 1 As of July, 22th, 2021. 2 Includes agreements signed by affected people, including those pending court verifications, and paid and payable amounts as of July 22th, 2021. |
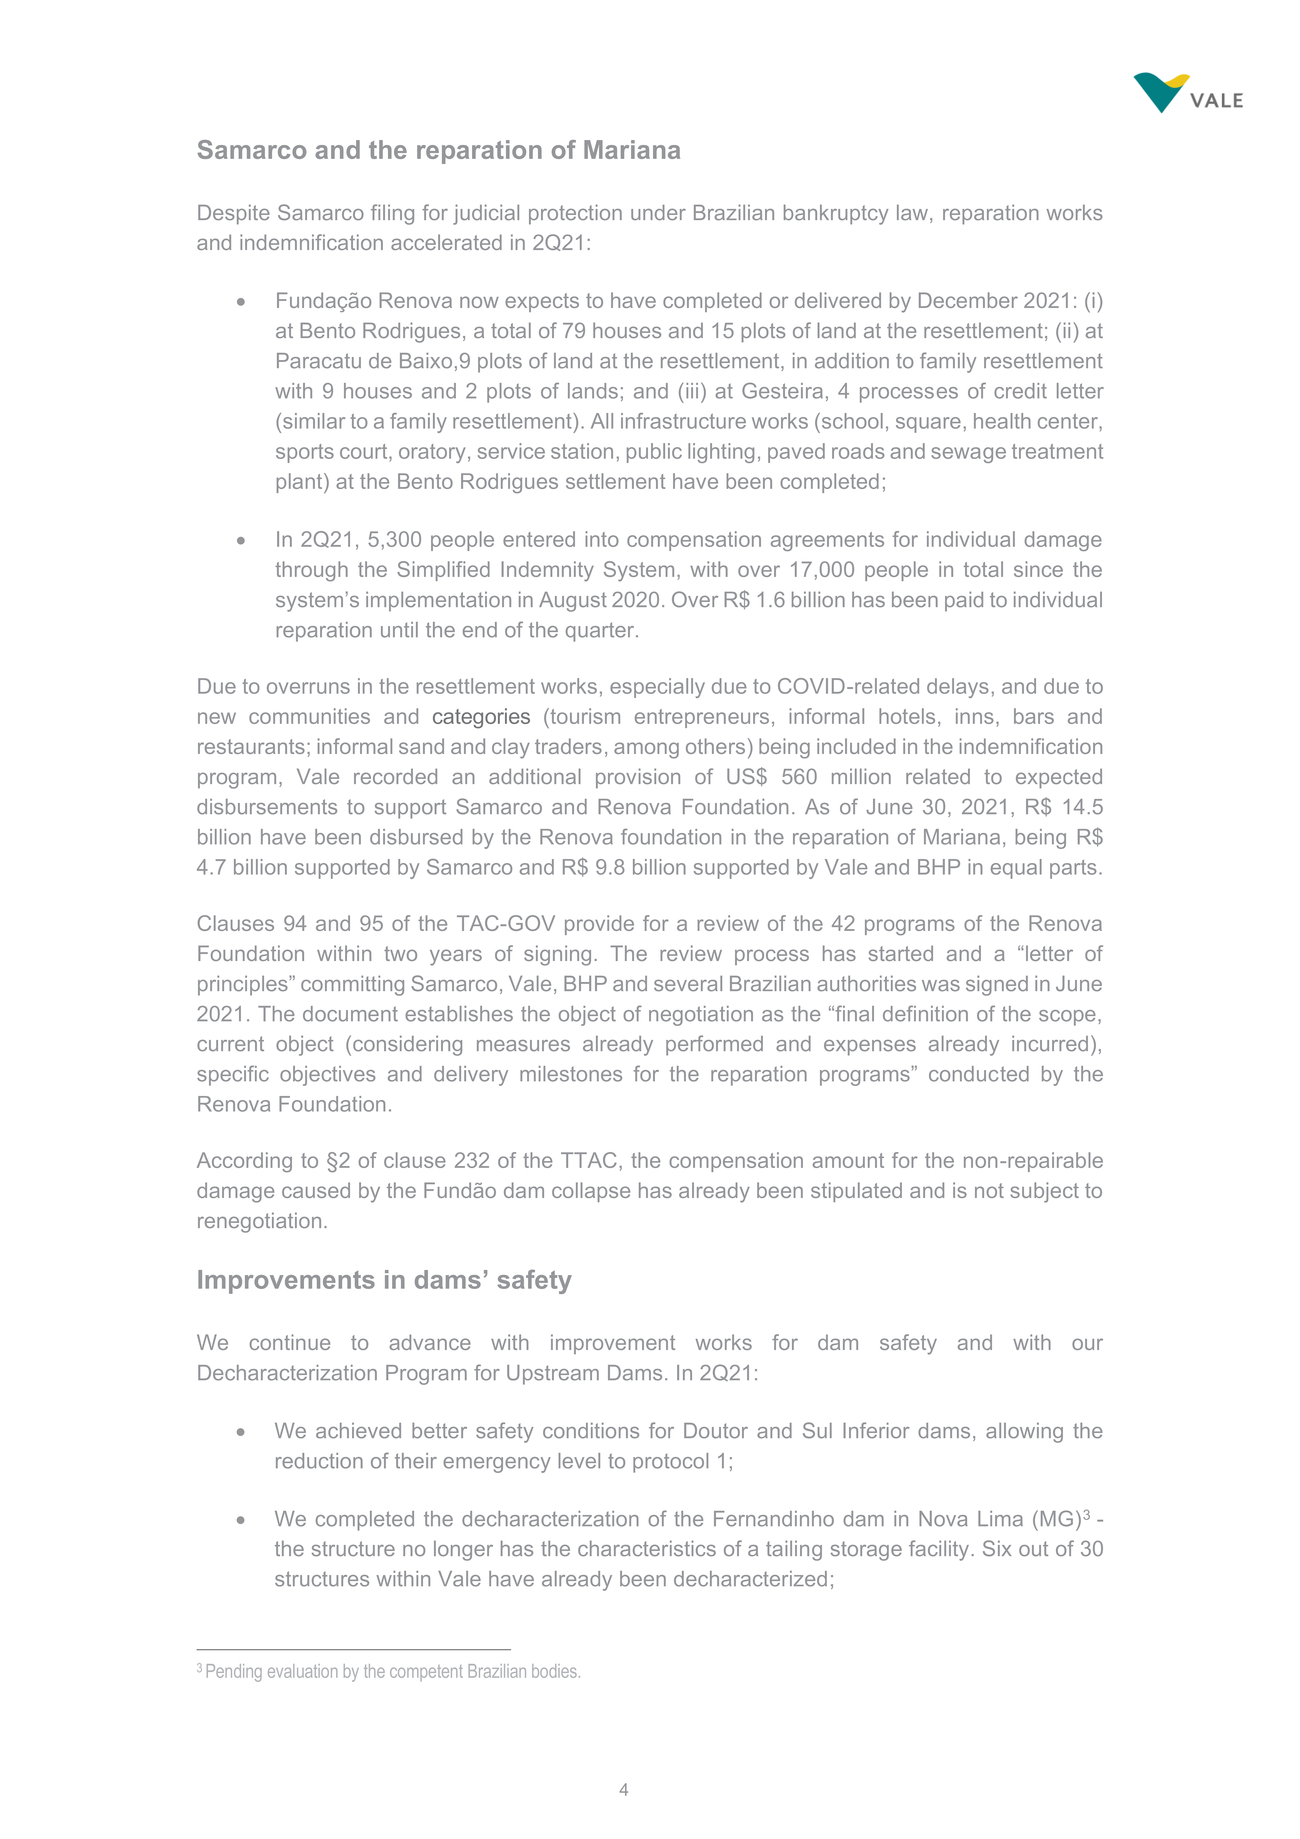 | Samarco and the reparation of Mariana Despite Samarco filing for judicial protection under Brazilian bankruptcy law, reparation works and indemnification accelerated in 2Q21: Fundação Renova now expects to have completed or delivered by December 2021: (i) at Bento Rodrigues, a total of 79 houses and 15 plots of land at the resettlement; (ii) at Paracatu de Baixo,9 plots of land at the resettlement, in addition to family resettlement with 9 houses and 2 plots of lands; and (iii) at Gesteira, 4 processes of credit letter (similar to a family resettlement). All infrastructure works (school, square, health center, sports court, oratory, service station, public lighting, paved roads and sewage treatment plant) at the Bento Rodrigues settlement have been completed; In 2Q21, 5,300 people entered into compensation agreements for individual damage through the Simplified Indemnity System, with over 17,000 people in total since the system’s implementation in August 2020. Over R$ 1.6 billion has been paid to individual reparation until the end of the quarter. Due to overruns in the resettlement works, especially due to COVID-related delays, and due to new communities and categories (tourism entrepreneurs, informal hotels, inns, bars and restaurants; informal sand and clay traders, among others) being included in the indemnification program, Vale recorded an additional provision of US$ 560 million related to expected disbursements to support Samarco and Renova Foundation. As of June 30, 2021, R$ 14.5 billion have been disbursed by the Renova foundation in the reparation of Mariana, being R$ billion supported by Samarco and R$ 9.8 billion supported by Vale and BHP in equal parts. Clauses 94 and 95 of the TAC-GOV provide for a review of the 42 programs of the Renova Foundation within two years of signing. The review process has started and a “letter of principles” committing Samarco, Vale, BHP and several Brazilian authorities was signed in June 2021. The document establishes the object of negotiation as the “final definition of the scope, current object (considering measures already performed and expenses already incurred), specific objectives and delivery milestones for the reparation programs” conducted by the Renova Foundation. According to §2 of clause 232 of the TTAC, the compensation amount for the non-repairable damage caused by the Fundão dam collapse has already been stipulated and is not subject to renegotiation. Improvements in dams’ safety We continue to advance with improvement works for dam safety and with our Decharacterization Program for Upstream Dams. In 2Q21: We achieved better safety conditions for Doutor and Sul Inferior dams, allowing the reduction of their emergency level to protocol 1; We completed the decharacterization of the Fernandinho dam in Nova Lima (MG)3 - the structure no longer has the characteristics of a tailing storage facility. Six out of 30 structures within Vale have already been decharacterized; 3 Pending evaluation by the competent Brazilian bodies. |
 | We initiated tailings removal activities at B3/B4 dam in Nova Lima (MG) and Sul Superior dam in Barão de Cocais (MG), two of the three dams currently at emergency level 3. These preliminary works use remotely operated equipment and will enable the advancement of decharacterization projects for both dams; In support of the decharacterization program, we concluded the construction of the containment structure downstream the Forquilhas I, II, III, IV and Grupo dams, near the Fábrica Mine, with the capacity to retain tailings in a hypothetical scenario of simultaneous collapse; We assigned an Independent Tailings Review Board (ITRB) to each Operating System in the Iron Ore business. The ITRB role is another important practice, in line with the requirements of the Global Industry Standard for Tailings Management (GISTM) and other international industry references. The ITRB provides independent technical review of the design, construction, operation, closure and management of tailings facilities. Each corridor ITRB held its first meeting in 1H21; We continue to advance with an in-depth assessment of processes and practices to ensure the enhancement of our Tailings & Dams Management System and progress towards our compliance with the GISTM requirements. Vale maintains its commitment to have no tailings dams in unsatisfactory critical safety conditions by 2025 and to de-characterize the remaining 24 upstream tailings storage facilities. For further information on Vale’s dam safety management, please visit www.vale.com/esg. Advancements in ESG practices In 2Q21, to advance with our Climate Agenda and support our leading journey towards a low-carbon mining, we announced investments of US$ 4-6 billion for greenhouse gas emission reduction by 2030 (which includes the previously announced US$ 2 billion to reach renewable energy self-sufficiency). Such capital allocation will ensure our commitment to reducing 33% of our scopes 1 & 2 emissions by 2030 and the achievement of carbon neutrality by 2050. In the quarter, we also had the start of operation of vessels equipped with rotor sails. That is part of Vale's portfolio of initiatives in shipping, which will contribute to achieving our commitment to reduce 15% of net Scope 3 emissions by 2035. In our Social Agenda, we defined a structured due diligence process on Human Rights, which will be rolled out within 3 to 5 years to all our operations and critical projects. The assessments’ results will be integrated into the company's corrective actions, with due monitoring and communication of treatment effectiveness. In Governance, the 2021 Annual General Meeting of Shareholders in April led to major advances in the Board of Directors independence: (i) Vale’s Board is now majorly comprised of independent members (8 out of the 13 Board members are independent); and (ii) the Chairman elected is also independent. For further information on those and other ESG initiatives and practices, please visit www.vale.com/esg. |
 | Resumption of iron ore production In 2Q21, we reached a capacity of 330 Mtpy. In the Northern System, Serra Leste achieved full capacity at 6 Mtpy; To guarantee the operational stability of the Timbopeba site and comply with the restrictions of workers' access to the flood zone of Xingu dam, we implemented an unmanned train operation covering a 16 km stretch to expedite Timbopeba site production, which is working well; We concluded the maintenance of ship loader 6 (CN6) at the Ponta da Madeira Maritime Terminal as scheduled, causing no impact on this year's expected shipments; We increased the high-silica sinter feed production by dry processing in Brucutu, taking advantage of a favorable market environment; Maravilhas III (Phase I) dam operations started in July following the issuance of a positive Stability Condition Declaration (“DCE”). As previously announced, together with Vargem Grande’s tailings filtration plant, which started its operation in March, it adds 4 Mtpy of production capacity to Vargem Grande complex as well as allow an improvement in the average quality of Vale's product portfolio and operational flexibility; We advanced with the three filtration plants under construction in Itabira and Brucutu, all with more than 70% physical progress. For additional information, please see our 2Q21 Production and Sales Report. Base Metals projects We achieved significant milestones for the portfolio of projects in the Base Metals business. In June, Reid Brook deposit at the Voisey's Bay Mine Expansion Project in Northern Labrador produced its first ore. The project involves developing two underground mines – Reid Brook and Eastern Deeps – and will reach an annual production rate of 40,000 tons of nickel in concentrate by 2025, with about 20,000 tons of copper and 2,600 tons of cobalt as by-products. The project is 66% complete, with executed capital expenditures of US$ 1,323 million and Eastern Deeps start-up expected for 2022. We also signed a Project Cooperation Framework Agreement (PCFA) for the Bahodopi Nickel Processing Facility in Indonesia with TISCO and Xinhai4. The parties will conclude the technical and financial requirements needed for the final investment decision to develop the 73,000-ton ferronickel facility in the next six months. Finally, we approved the investment of US$ 150 million to extend current mine activities in Thompson, Manitoba by ten years. With an extensive drilling program, mining can extend past 2040. This step is the first of a two-phase project, including critical infrastructure such as new ventilation raises and fans, increased backfill capacity and additional power distribution, which are forecast to improve current production by 30%. 4 Parties to the PCFA: PT Vale Indonesia Tbk (“PTVI”), Taiyuan Iron & Steel (Group) Co., Ltd (“TISCO”) and Shandong Xinhai Technology Co., Ltd (“Xinhai”) |
 | Update on Coal business In April, we concluded Moatize mine and plants maintenance, two months past the original schedule, with production now ramping-up in line with the plan to reach the annual production rate of 15Mtpy during the second semester of 2021. In June, following the Nacala Logistics Corridor Project Finance prepayment, Vale acquired Mitsui's stake in the coal mine and the corridor operations. Therefore, starting 3Q21, Vale is consolidating mine to port operations in its financial statements, and a substantial improvement in Coal EBITDA in 3Q21 will derive from the removal of the financial burden of the Project Finance on the operating costs of the business through the railway tariff. Following our Coal Business divestment plan, Vale is evaluating the alternatives presented up to this moment, ruled by the sense of a responsible divestment and the operational continuity of Moatize mine and Nacala Logistics Corridor. Sharing value creation In June, we distributed a dividend of approximately US$ 2.2 billion. In addition to the dividends paid, we proceeded with the buyback program announced in April, which was around 45% complete by the date of publishing of this report, with a total spend of US$ 2.6 billion to repurchase circa 122 million shares5. Considering March distribution of US$ 3.9 billion, Vale returned a total of US$ 8.1 billion to shareholders in the first half of 2021. Following our Shareholder Remuneration Policy, a minimum of US$ 5.3 billion will be distributed in September based on the results for the first half of the year, with the final amount to be discussed and approved by the Board of Directors in due time. Vale’s Performance in 2Q21 In 2Q21, Vale reported a record proforma adjusted EBITDA of US$ 11.239 billion, mainly driven by the higher iron ore and pellets realized prices and sales volumes, partially offset by certain costs and expenses that are linked to the iron ore price, such as purchases from third-parties and royalties, elevated freight costs and higher maintenance and services costs. 5 As reflected in our 2Q21 Interim Financial Statement, until June 30, 2021, the Company had bought-back approximately 93 million ordinary shares in the total amount of US$2.0 billion, approximately 34% of the April announced buyback program. |
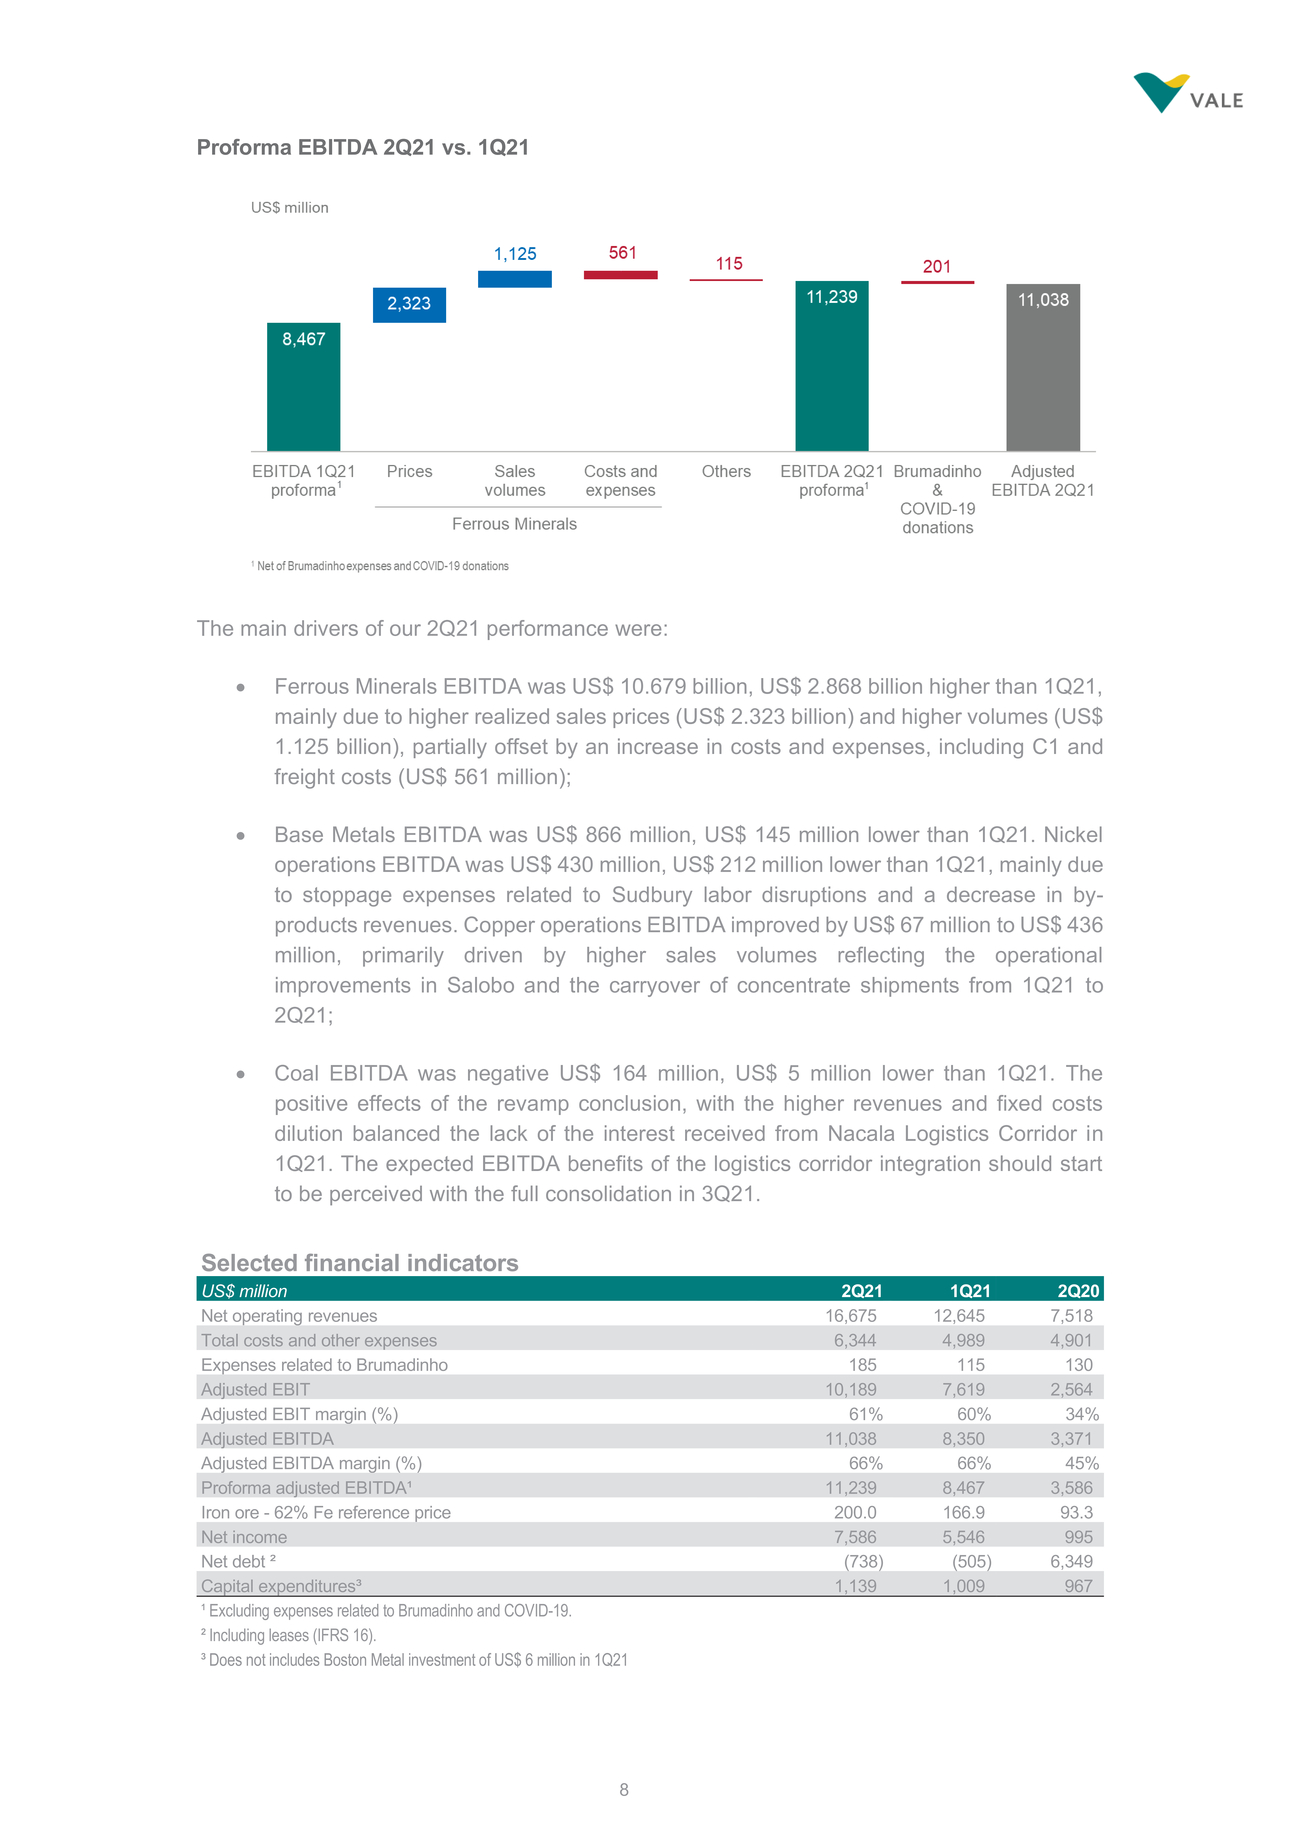 | Proforma EBITDA 2Q21 vs. 1Q21 The main drivers of our 2Q21 performance were: Ferrous Minerals EBITDA was US$ 10.679 billion, US$ 2.868 billion higher than 1Q21, mainly due to higher realized sales prices (US$ 2.323 billion) and higher volumes (US$ 1.125 billion), partially offset by an increase in costs and expenses, including C1 and freight costs (US$ 561 million); Base Metals EBITDA was US$ 866 million, US$ 145 million lower than 1Q21. Nickel operations EBITDA was US$ 430 million, US$ 212 million lower than 1Q21, mainly due to stoppage expenses related to Sudbury labor disruptions and a decrease in by-products revenues. Copper operations EBITDA improved by US$ 67 million to US$ 436 million, primarily driven by higher sales volumes reflecting the operational improvements in Salobo and the carryover of concentrate shipments from 1Q21 to 2Q21; Coal EBITDA was negative US$ 164 million, US$ 5 million lower than 1Q21. The positive effects of the revamp conclusion, with the higher revenues and fixed costs dilution balanced the lack of the interest received from Nacala Logistics Corridor in 1Q21. The expected EBITDA benefits of the logistics corridor integration should start to be perceived with the full consolidation in 3Q21. |
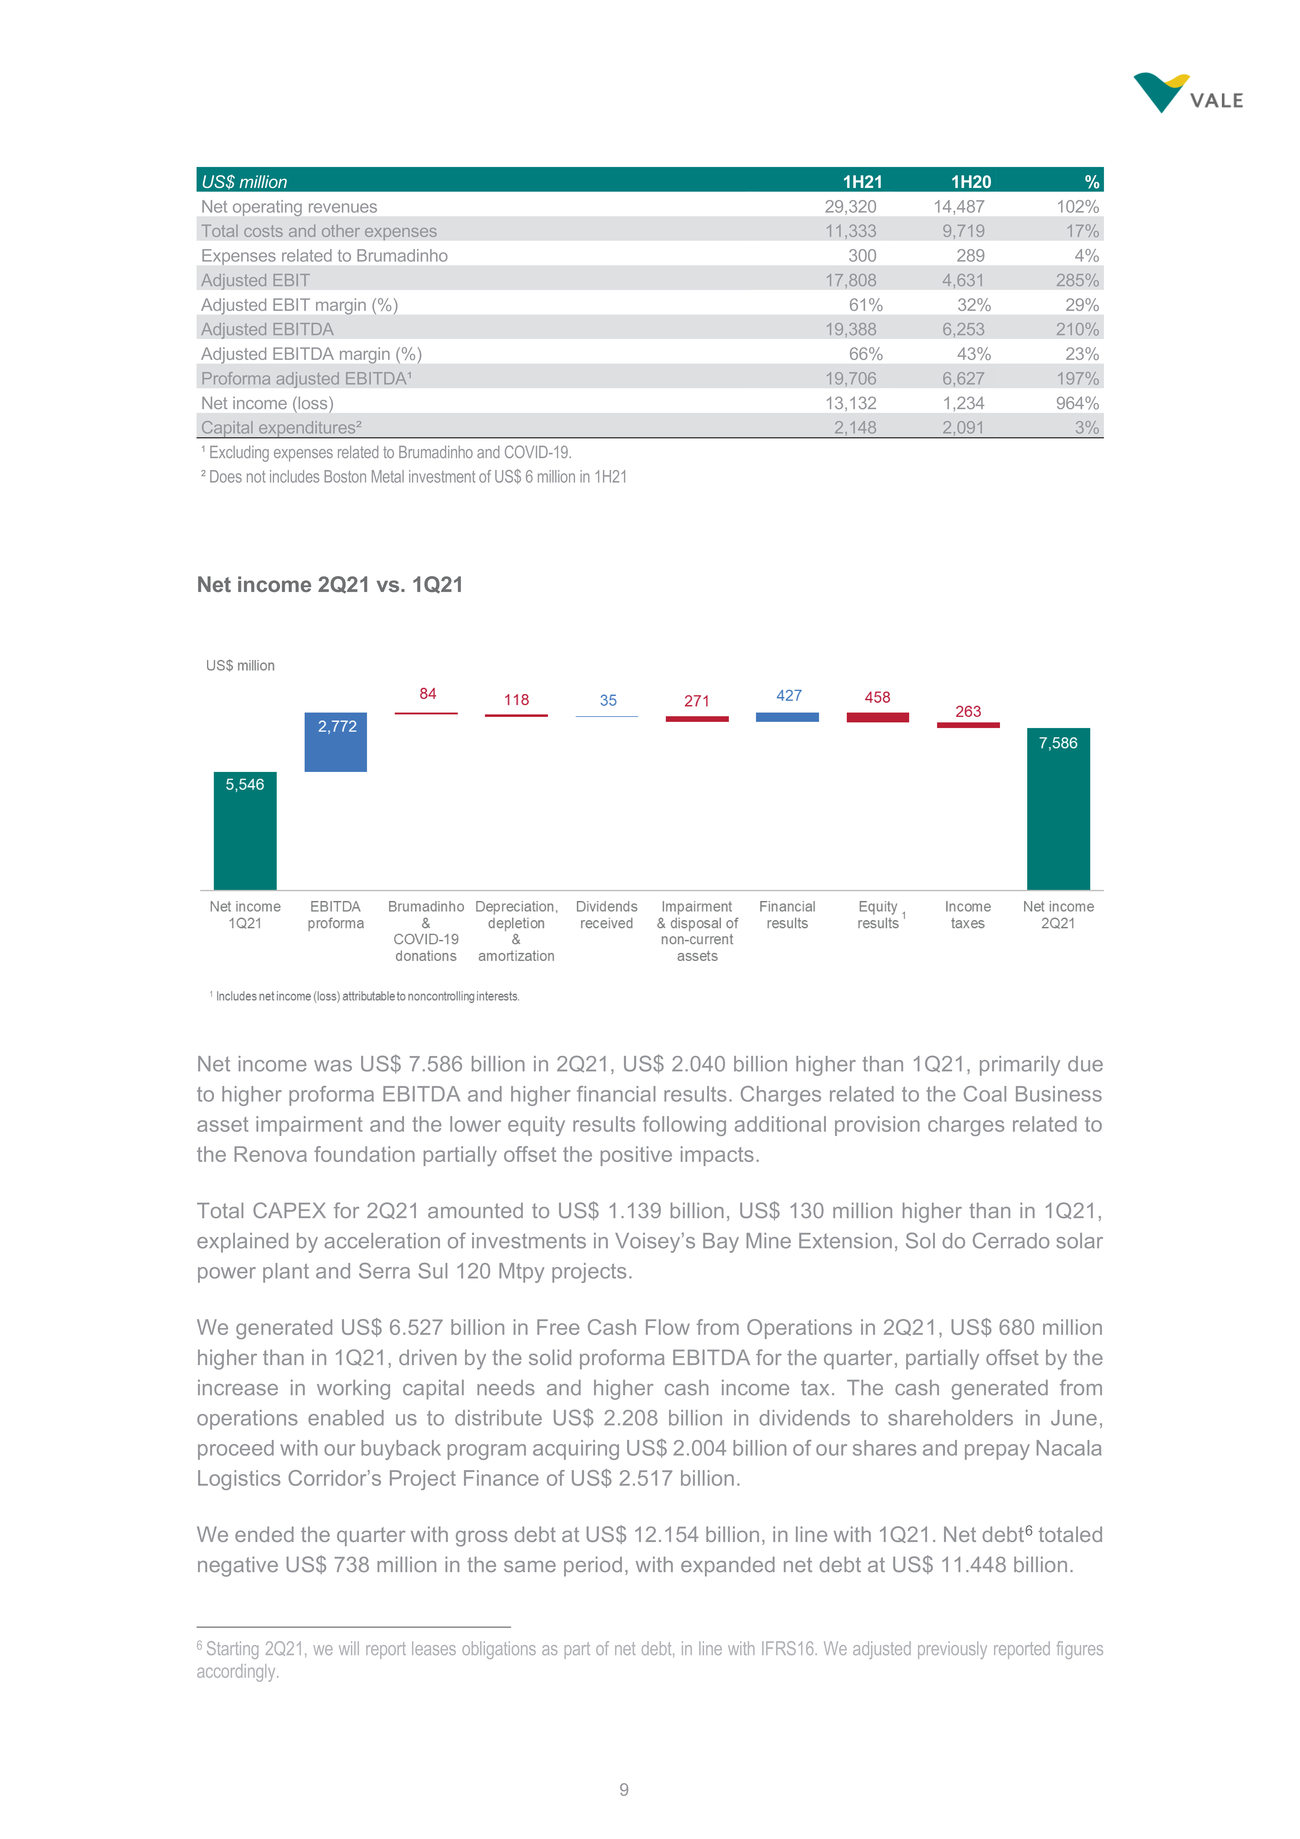 | Net income 2Q21 vs. 1Q21 Net income was US$ 7.586 billion in 2Q21, US$ 2.040 billion higher than 1Q21, primarily due to higher proforma EBITDA and higher financial results. Charges related to the Coal Business asset impairment and the lower equity results following additional provision charges related to the Renova foundation partially offset the positive impacts. Total CAPEX for 2Q21 amounted to US$ 1.139 billion, US$ 130 million higher than in 1Q21, explained by acceleration of investments in Voisey’s Bay Mine Extension, Sol do Cerrado solar power plant and Serra Sul 120 Mtpy projects. We generated US$ 6.527 billion in Free Cash Flow from Operations in 2Q21, US$ 680 million higher than in 1Q21, driven by the solid proforma EBITDA for the quarter, partially offset by the increase in working capital needs and higher cash income tax. The cash generated from operations enabled us to distribute US$ 2.208 billion in dividends to shareholders in June, proceed with our buyback program acquiring US$ 2.004 billion of our shares and prepay Nacala Logistics Corridor’s Project Finance of US$ 2.517 billion. We ended the quarter with gross debt at US$ 12.154 billion, in line with 1Q21. Net debt6 totaled negative US$ 738 million in the same period, with expanded net debt at US$ 11.448 billion. 6 Starting 2Q21, we will report leases obligations as part of net debt, in line with IFRS16. We adjusted previously reported figures accordingly. |
 | Performance of business segments in 2Q21 Ferrous Minerals EBITDA of US$ 10.679 billion in 2Q21 Ferrous Minerals record EBITDA, mainly driven by higher iron ore fines and pellets realized prices, 18% and 32% respectively, and higher iron ore fines and pellets sales volumes, 13% and 22%; Vale’s average CFR reference price was US$ 202.0/t, an increase of US$ 30.9/t compared with 1Q21. The impact of the higher 62% Fe reference price was partially offset by the lower average premiums and quality adjustments due to the greater share of sales of high silica products; Iron ore fines and pellets EBITDA breakeven cost was US$ 44.5/t, US$ 8.3/t higher than 1Q21. The higher breakeven was mainly a result of (i) US$ 4.7/t higher C1 costs, mainly due to higher 3rd party purchases, inflation and demurrage costs, and (ii) US$ 1.9/t higher freight costs. We now expect C1 costs ex-third-party purchases for 4Q21 (vs. 2Q21) to decrease around US$ 1.5/t, mainly due to higher dilution of fixed costs and normalization of demurrage costs. Base Metals EBITDA was US$ 866 million in 2Q21, US$ 145 million lower than 1Q21 Nickel business EBITDA was US$ 430 million in 2Q21, US$ 212 million lower than 1Q21, mainly due to labor disruptions in Sudbury, resulting in higher stoppage expenses (US$ 59 million), and lower by-products revenues (US$ 69 million); Copper business EBITDA was US$ 436 million in 2Q21, US$ 67 million higher than 1Q21, mainly due to higher copper sales volumes, as a result of operating performance improvements in Salobo, sales carryover from 1Q21 and higher by-products revenues. The positive effect was partially offset by higher maintenance costs of the fleet in Salobo and the mills in Sossego. |
 | Market overview Iron Ore Iron ore 62% Fe reference price averaged US$ 200.0/dmt in 2Q21, 20% higher than in 1Q21. Iron ore prices had a second round of increases in the end of 1Q21 and the maintenance of constrained iron ore supply, together with very strong economic activity from China and the demand recovery from ex-China, kept the market under supplied, lifting prices above US$ 200/t. Going forward on the year, on the supply side, volumes shall increase compared to 1H21 while iron ore demand might be impacted by production cuts due to environmental restrictions in China. MB65% index averaged US$ 232.9/dmt in 2Q21, 22% higher than 1Q21. Together with the hike of prices for medium grade ores, high grade ores were even further supported by steel prices, moving to record levels in all main steel producing regions. The current price spread between 65% and 62% grades stayed above US$ 30/t level during the entire 2Q21 reaching new historical highs. Even with higher input costs, steel margins kept at healthy territory showing correction signs only when China’s government adopted measurements against price speculation on the financial market. The potential of further restrictions over steel production in China due to environmental measures, while still under a highly demanded environment for steel shall keep its prices and margins at very high levels. Meanwhile, the environmental restrictions in China shall also affect coal mines in China, limiting its supply and supporting higher prices within the country. Ex-China, the increase of steel production shall also increase coal demand, and the combination of high steel margins and higher coke prices shall provide a very strong support for iron ore premiums along 2H21. China’s crude steel production totaled 560.2 Mt in 1H21, 11% higher than in 1H20. Steel production declined in June to 93.9 Mt (versus 99.5 Mt in May), with disruption of July of 100th-anniversary celebrations of the Chinese Communist Party and the comeback of regional production cut discussion. GDP growth recorded 7.9% YoY in 2Q21, with CAGR of GDP between 2Q21 and 2Q19 improving to 5.5% p.a. from 5% in 1Q, reflecting continued economic recovery during 2Q. Industrial activities remained the major driving force for 2Q21 GDP. Construction activities GDP slowed unexpectedly in 2Q21, which might be due to continued restrictions on property sectors and lagging infrastructure activities due to slow local bond issuance in 1H21. June macro data showed similar picture of Chinese economy, as industrial activities stayed in good shape, consumption continued recovering, yet property and infra activities were weaker than expected. Producer price index emerged since April and shot to 9% in May and may be closed to the peak according to historical experience. High raw materials prices have squeezed Chinese mills margins. Manufacturing PMI edged down to 50.9% in June, slightly down from 51.0% in May, indicating that the sector has continued to expand steadily though the growth slowed. Ex-China, steel sector operating conditions continue to improve with all the major markets already recovered to pre-pandemic levels (avg. Jan-Feb 2020). Steel demand is strong, although constrained supply chains is creating long lead times (in the US reaching 14 weeks) and limited availability for imports have contributed to record high steel prices. HRC prices reached US$ 1,400/t in Europe/Brazil and US$ 1,900/t in the US. Steel producers have recently indicated that this growth encouraged them to take on additional capacity (~7Mt in the US). The automotive sector faces semiconductor supply challenges, but on the positive side, it is only postponing short-term demand. A point to be noted is the resurgence of COVID-19 cases due to the Delta variant. |
 | Crude steel production in EU27 and UK increased 18% in 1H21 (versus 1H20), totaling 81.6 Mt, although still below 84.4 Mt in 1H19. In Europe, the steel-using sectors suffered severely from the first lockdown measures in 2020 but experienced a stronger than expected post-lockdown rebound in manufacturing activities due to depleted stocks, supportive government measures and recovering demand. EU’s automotive sector is still 19% below pre-pandemic levels. Market sentiment has been very positive with manufacturing PMI’s around 60 points as well as leading indicators for the construction sector. Consumption indicators have been steadily improving for the past months as the vaccines are rolled out followed by easing of lockdowns. In US, crude steel production totaled 42.0 Mt in 1H21, 15% higher than in 1H20, but below 44.5 Mt recorded in 1H19. After the closures of steel capacity in 2020, the quick rebound of demand translated into that steel prices soar and, as result, steel capacity utilization nationwide reached 83% (begging of July), similar to pre-pandemic, and way above the 68% at the same time last year. June's US manufacturing PMI rose to 62.1 as production output and new orders continued to strengthen, despite supply chain disruptions. Vehicle sales are up 2% relative to pre-pandemic levels. Construction sector is showing mixed sentiment and slowed down 8% MoM in May, which is reflecting the high prices of houses. Despite inflation has accelerated, Fed has not yet indicated whether it will push the breaks by increasing policy rate. In JKT, crude steel production totaled 94.6 Mt in 1H21, 11% higher than in 1H20, but still below 98.5 Mt recorded in 1H19, being boosted by robust demand from industries such as automobile and machinery and, in Japan, by expanding public works. As for developing economies, steel demand has been recovering fast since 2H20 and steel output has been steadily growing, with some countries (e.g. Brazil, Iran, India and Southeast Asia) already producing above pre-pandemic in 1H21 (versus 1H19). Construction sector has been strong and driving steel demand, especially in Brazil and Turkey. Coal Coking coal: The FOB Australia premium low vol (PLV) index averaged US$ 136.5/t in 2Q21, up from the previous quarter’s US$ 128.0/t. The index was mostly stable at US$ 110/t from April until mid-May before escalating to US$ 194.0/t in the second half of May. Price increased due to the tightening supply of spot cargoes from Australia. Meanwhile, the CFR China index steadily increased throughout the quarter, rising from US$ 218.1/t to US$ 258.2/t. China continued to step up purchases of Canada, USA and Russia origin coking coals to replace the absent Australia volumes, but tonnages of non-Australian coals remained limited. Safety inspections at China domestic mines and closures of Mongolia export borders due to the COVID-19 situation further amplified the shortage situation in China. The high CFR China price incentivized some traders to swap their US and Canada contracted coals with Australia coals, helping lift the FOB PLV index. Supply from Australia should improve by the end of 3Q21 with the production resumption of some suspended mines and completion of maintenance programs. There are no signals that China will start accepting Australian coal soon; however, PLV prices can remain supported as trade flows have somewhat rebalanced from the embargo and on solid ex-China demand. China’s domestic coal output should increase post the 100th-anniversary celebrations of the Chinese Communist Party in July. Mongolian imports should also return steadily as COVID-19 cases decline, helping alleviate the tight supply situation in China. We expect prices to remain well-supported in 3Q21 unless we see significant steel production cuts. |
 | Thermal coal: Richards Bay 6000 kcal NAR price averaged US$ 104.7/t in 2Q21, 15% higher than the previous quarter. High-CV prices rallied to long-term highs in June, such as Richards Bay 6000 kcal NAR price that hit US$ 118.9/t. Insufficient global supply to meet summer restocking demand, including extended rains in Indonesia and Atlantic miners' infrastructure constraints, fueled the price spike. Gas prices were also at multi-year highs, which led to gas-to-coal switching. In contrast, Australian mid-CV coal prices remained relatively subdued without Chinese buyers; the spread between the mid-CV and high-CV grades remained wide at 43% by the end of the quarter. The coal shortage intensified in China, with the production suspended at many mines ahead of the 100th-anniversary celebrations. The thermal coal market should stay elevated in 3Q21 on northern summer demand and fragile supply. Forecasts of a hotter-than-normal summer in NE Asia, a recovering industrial activity and high gas prices should keep thermal coal demand solid. Adding to the upside, China may again ease import quota restrictions, which would generally help sustain seaborne prices. Nickel LME nickel prices averaged US$ 17,359/t in 2Q21, 1% lower quarter over quarter and 42% higher than 2Q20. Total exchange inventories (LME and SHFE) decreased, closing at 238.6 kt at the end of 2Q21, down 12% in the quarter and 9% year over year. LME inventories stood at 232.5 kt at the end of 2Q21, a decrease of 27.8 kt in the quarter and 1.4 kt year over year. SHFE inventories decreased by 4.6 kt in the quarter and 22.9 kt year over year. Demand/Supply Global sales of electric vehicles (EV) are on track to increase by over 185% from 2Q20, led by robust growth in China and Europe and with North America expected to achieve the highest growth rate quarter over quarter. EV sales continue to gain market share, with the penetration rate up nearly 5% from 2Q20 and 2% quarter over quarter.2Q21 sales on the total automotive market is on track to increase 26% year over year and 5% quarter over quarter, boosted by solid numbers in the US as traveling resumed after a comprehensive vaccine rollout nationwide. The spread of the COVID-19 Delta variant and a stalling vaccine rollout threaten a reversion back to global lockdowns with Australia, albeit only 9% vaccinated, and Japan implementing restrictions, among others. Global stainless-steel production increased 29% from 2Q20 as the second quarter last year was plagued with COVID-19 related impacts. Quarter over quarter, global production increased 2% as a continued surge in Indonesia stainless steel production and a recovery in Europe was offset by decreases in Japan and the US. Nickel consumption in stainless increased 11% in the quarter and 35% year over year. As China and Indonesia captured market share from the established European market, scrap usage decreased. Visible Chinese stainless-steel inventories fell 28% from 2Q20 and 7% from 1Q21 as the global economy recovers from the pandemic. The aerospace industry is beginning to recover with aircraft deliveries from Boeing and Airbus up 167% from 2Q20 and 25% quarter over quarter. US traveler throughput surpassed 2019 levels in July as people reunited with families and friends for the national holiday. Commercial flights globally are now 75% of pre-COVID levels. |
 | The oil and gas industry has begun to recover as energy prices approach three-year highs. Global rig counts have increased 2% in the quarter and are relatively flat to 2Q20. Rig counts typically lag price adjustments by three to six months, with rig counts expected to rebound in the second half of 2021. 2Q21 nickel production increased 8% from 2Q20 and 5% from 1Q21 as operations recovered from pandemic-related closures. Booming Indonesian supply was slightly offset by production losses in the rest of the world with an accident at Nornickel, a closure in Myanmar and the ongoing strike at Vale's Sudbury operations. Chinese NPI production declined 15% in 2Q21, compared to 2Q20, while Indonesian NPI production increased 69% over the same period. Quarter over quarter Chinese NPI production was down 6%, while Indonesia NPI production increased 10%. Indonesia's first HPAL project, set to produce 36 ktpy for the battery market, started in April. Outlook While demand continues to recover and regional supply issues persist, we continue to see the market in a marginal surplus in 2021. Demand for nickel faces the impacts of global anti-inflationary measures, as the COVID-19 Delta variant lingers, and resilient stainless-steel production in China and Indonesia adapts to changing supply fundamentals. Growth in stainless steel production and a shift towards the electrification of the world economies will improve demand in the medium term. Strong government incentives and penalty programs continue to drive EV adoption rates as countries commit to low emission targets. This growth potential should favor high nickel content batteries chemistry due to its lower cost structure and higher energy density. The North American supply chain is particularly dependent on this market dynamic, as the commitment to green initiatives, including the development of the EV supply chain, has been inconsistent with governmental policy. Additions to both NPI and HPAL supply planned in Indonesia in the medium term may supply a large portion of the growth requirements for stainless steel and batteries. However, environmental concerns around the CO2 intensity of NPI and push for geographical diversification of the battery supple chains could cause volatility in the longer term. The most significant risk to lowering the CO2 emissions, in this case, is the lack of a viable alternative supply source from North America if the previously mentioned shortcomings are not resolved. Our long-term outlook for nickel remains very positive, driven by strong demand in the EV sector with the cost of ownership near or at parity with ICE vehicles and prevalence of nickel rich batteries. Additionally, as countries continue to set aggressive decarbonization goals, growth in EVs and the infrastructure needed to support them is crucial. Strength in markets previously heavily impacted by the pandemic, such as aerospace and energy, is improving accordingly with the success of the global COVID-19 vaccine rollout. The global pursuit of net-zero emission should positively impact the stainless steel, aerospace and energy markets in the long term. Copper The LME copper prices posted substantial gains in 2Q21, averaging US$ 9,700/t compared to US$ 8,504/t in 1Q21, a 14%, or nearly US$ 1,200/t, quarter over quarter increase. LME copper inventories at the end of 2Q21 stood at 211.5 kt, an increase of 67 kt from the end of the last quarter. SHFE inventories, including deliverable stocks, decreased by 34.6 kt to kt at the end of 2Q21. COMEX copper inventories fell by 19.7 kt, ending 2Q21 at 45.1 kt. Overall, copper exchange inventory increased by 12.8 kt, ending the quarter at 410.4 kt. |
 | Demand/Supply Global refined copper demand increased 2.2% in 2Q21 compared to 2Q20, with concentrate demand rising 3.4% over the same period. The US and European demand growth contributed most to the quarterly increase, offsetting weak Chinese demand. 2Q21 consumptions levels in Europe are now in line with those registered in 2019, pre-COVID. Manufacturing and construction activity remained robust in supporting copper consumption with Purchasing Manager Indexes showing all major regions are well in the expansion territory. Supply-chain disruptions and logistical bottlenecks seem to be easing on the production side, with global refined copper production increased 1.5% in 2Q21 vs. 2Q20. Nevertheless, concerns remain, particularly in Latin America, as union contract negotiations have not closed at important mines and other mines are still to start negotiations in the region. Furthermore, changing regulation and fiscal policies, such as tax increases on metal production, could impact mining investment in important producing countries. Outlook For 2021, we see the refined market in a deficit as demand strength is expected to continue through 2H21, with continued strength in US and Europe end-use markets. Reflecting these strong market fundamentals, copper cash prices spent most of May above $10,000/t. The concentrate market showed significant tightness in 1Q21, which resulted in spot treatments and refining charges (TCRCs) hitting multi-year lows. In 2Q21, TCRCs began to rebound slightly as more material became available and Chinese smelters limited purchases. Despite that, spot TCRCs ended 2Q nearly 40% below the 2021 benchmark of US$59.5/t (TR) and US$ 5.95 cents/Ib (RC). Additional support is coming from fiscal and monetary stimulus, mounting ESG pressures, and the accelerated transition towards sustainable energy, all of which is copper intensive. Our long-term outlook for copper remains very positive. Copper has a strong long-term growth profile, driven by industrialization, construction and electrical network infrastructure. Governments globally have set ambitious decarbonization targets, and coupled with falling costs of renewables, and stimulus investments in the green economy, long-term growth forecasts have been revised higher. This acceleration will lead to a pivot towards even more copper-intensive uses in renewable energy and transportation projects related to electric vehicles. On the supply side, growth continues to struggle given declining ore grades and the lack of major discoveries. While in the short term there are enough quality assets being developed to meet demand, significantly more quality assets will be required in the medium to long-term to replace existing operations ramping down or closing. Additionally, proposed increases to taxes and royalties in Chile and Peru are unlikely to impact existing production, but uncertainty and higher costs could defer investment, and we see some risk to longer-dated supply growth from key greenfield projects. |
 | Adjusted EBITDA |
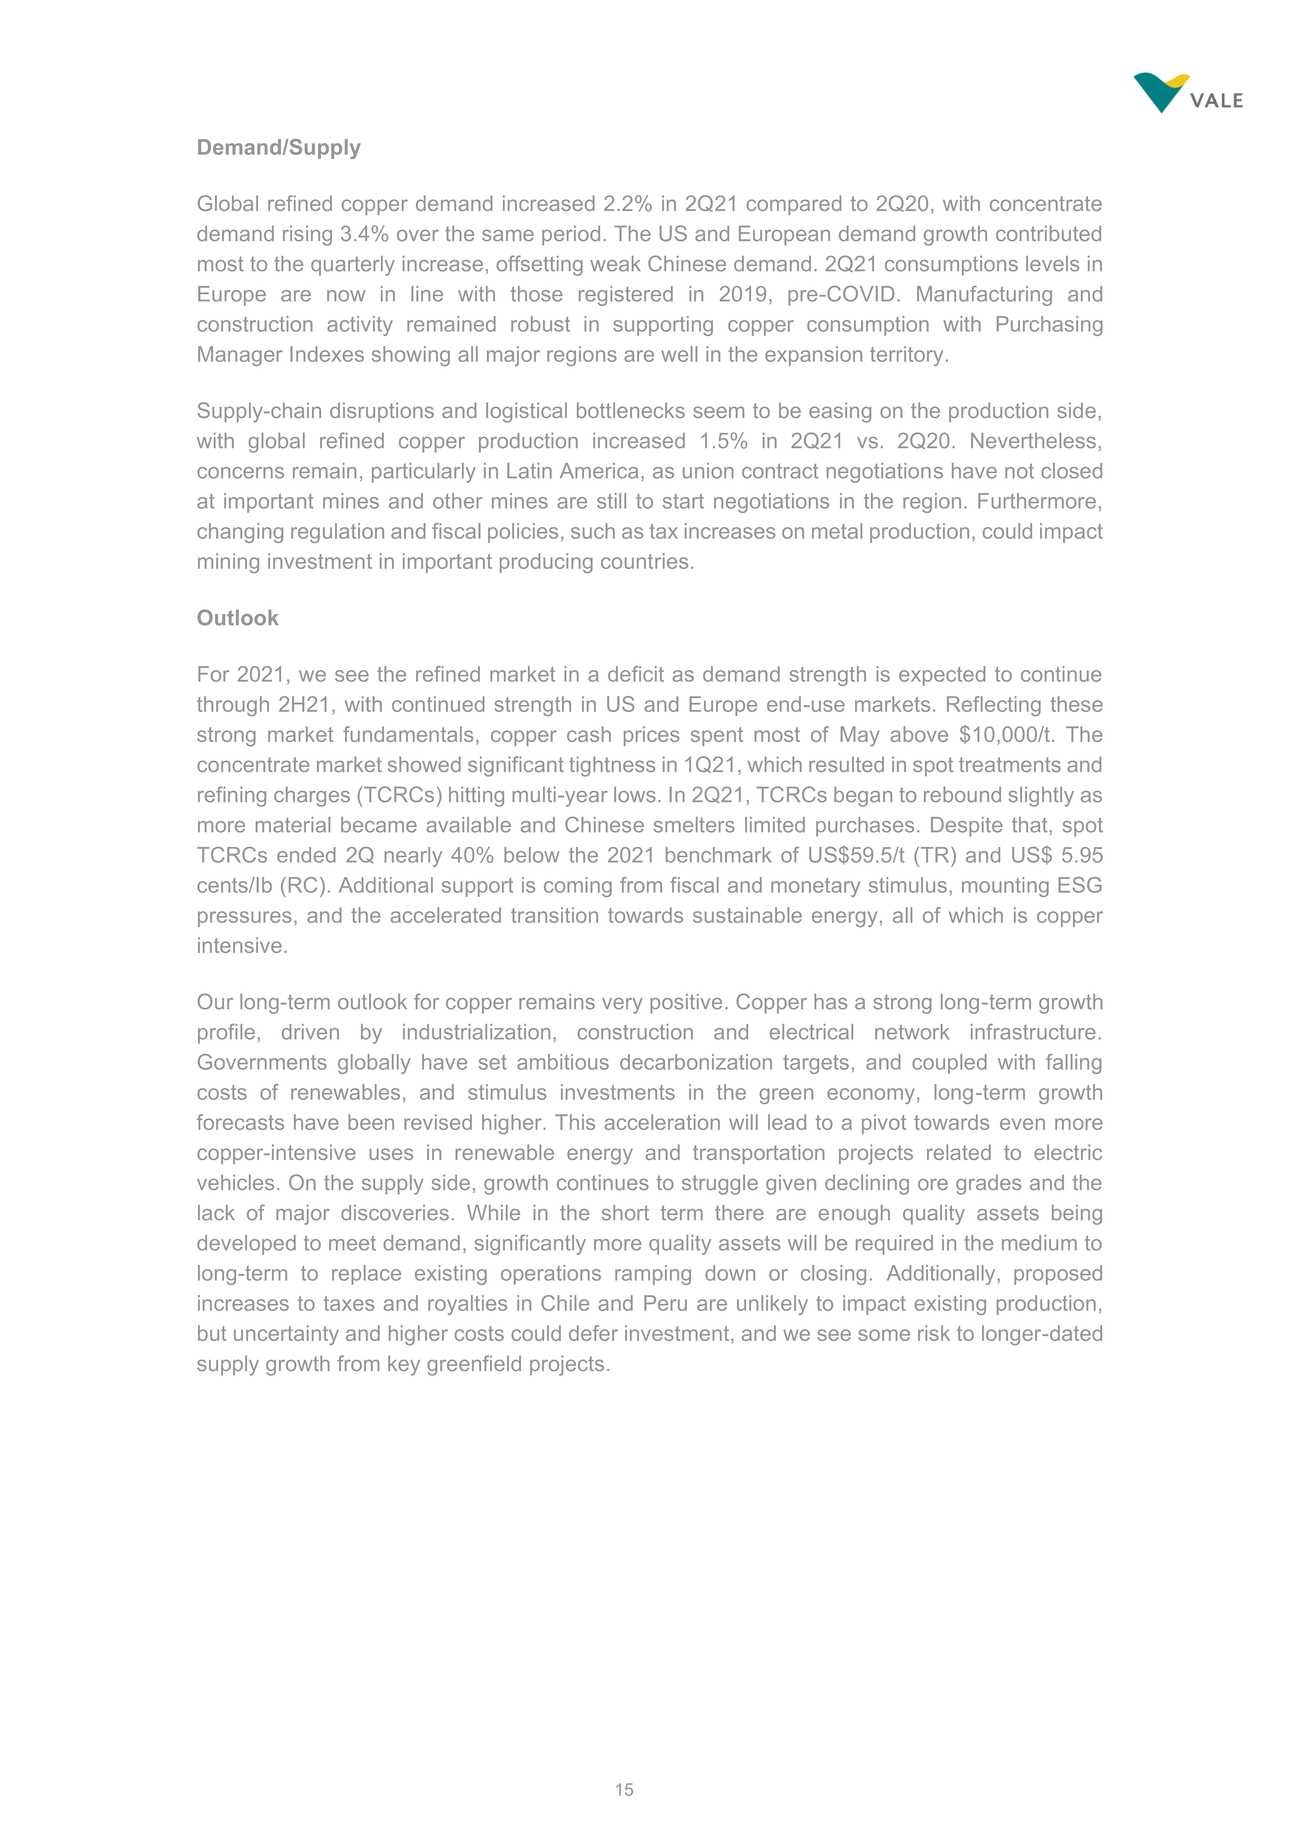
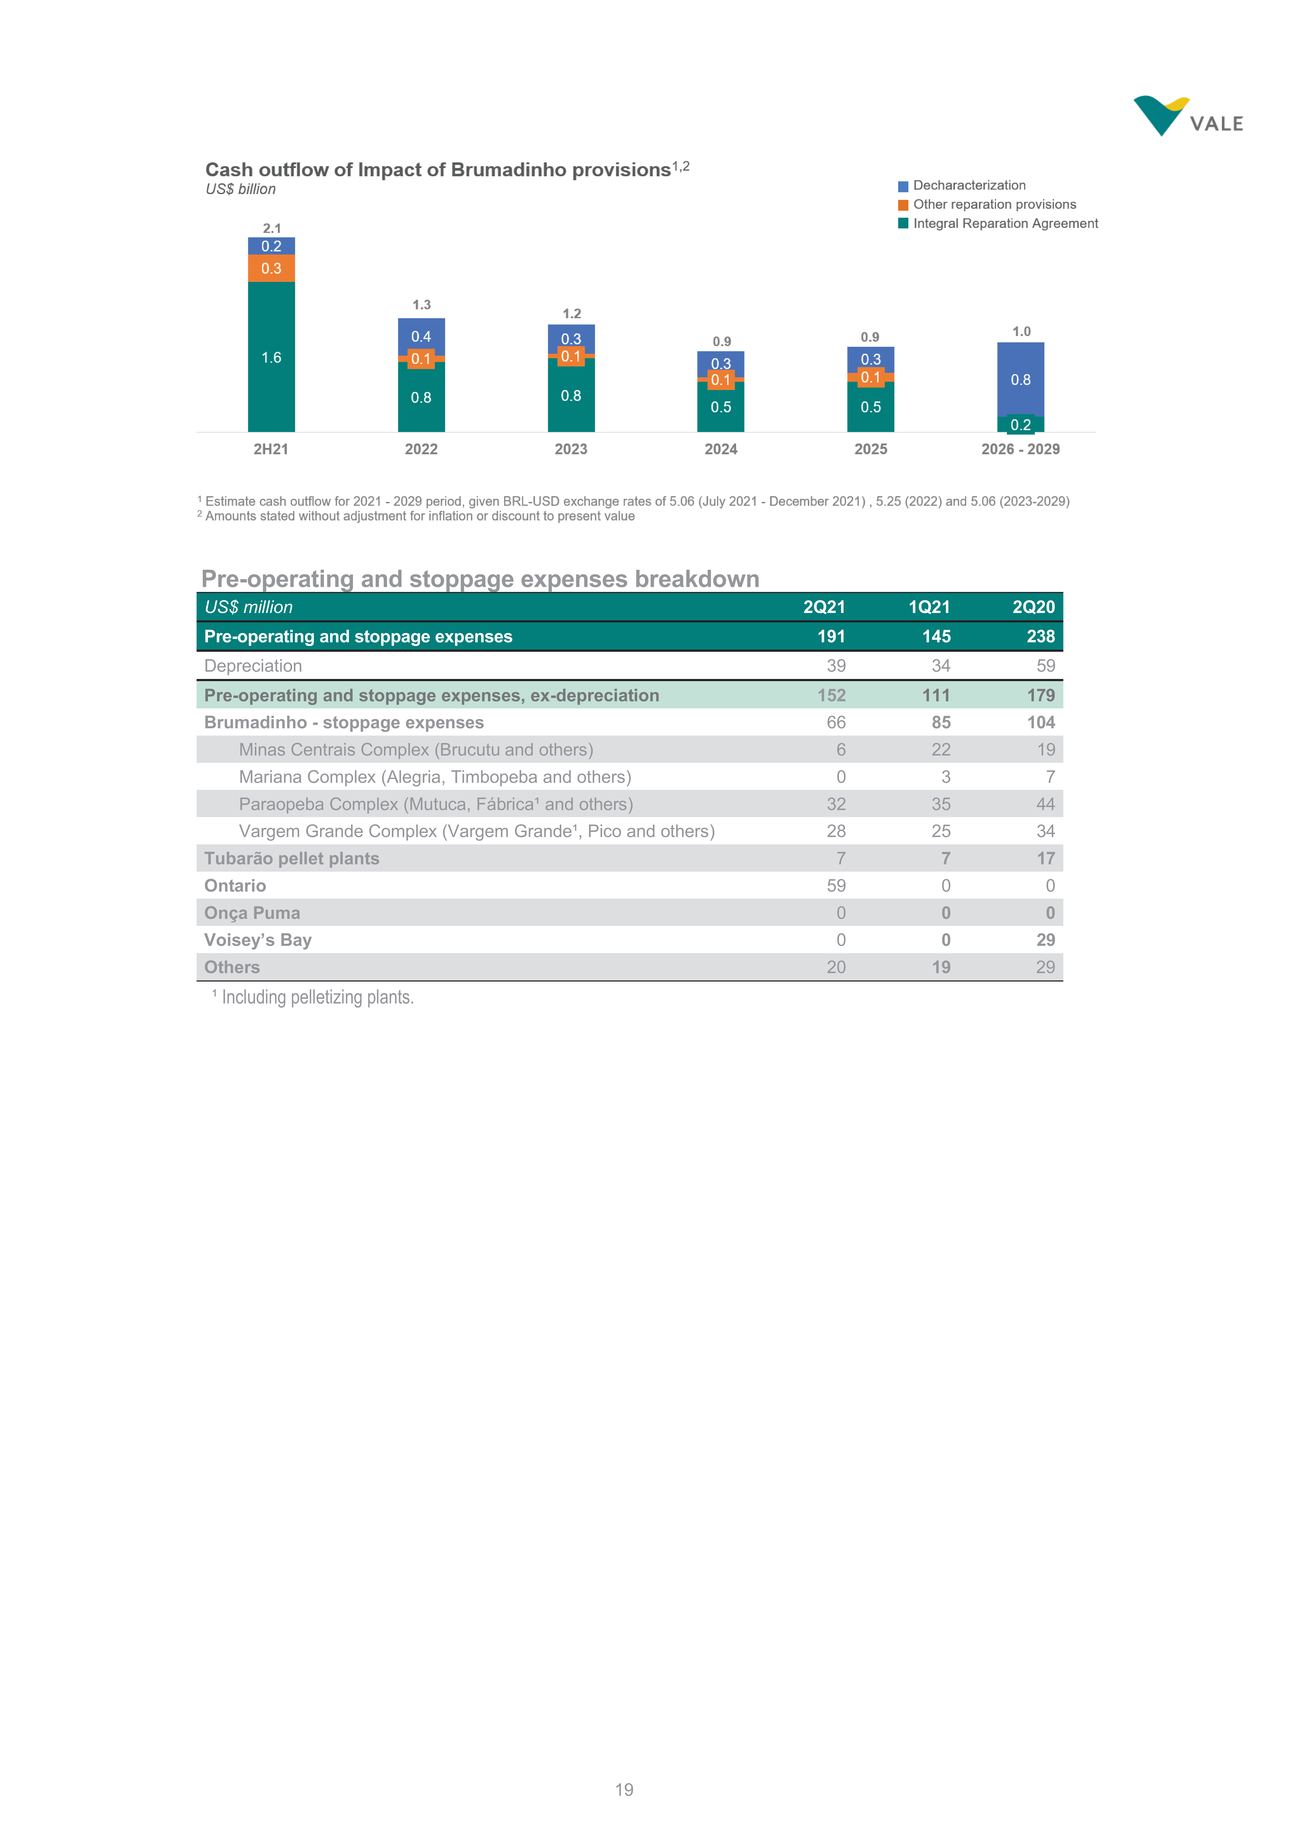
 | US$ million 2Q21 1Q21 2Q20 SG&A ex-depreciation 123 96 110 SG&A 133 105 124 Selling 25 18 20 R&D 141 100 90 Pre-operating and stoppage expenses 191 145 238 Depreciation 49 43 73 Operating expenses ex-depreciation 675 434 746 Pre-operating and stoppage expenses increased in 2Q21, owing mainly to the labour interruption in Ontario operations, partially compensated by the decrease of Minas Centrais stoppage expenses. Please, see the “Pre-operating and stoppage expenses breakdown” table below for details. Other operating expenses increased in 2Q21 due to provisions related to long-term incentive plans remuneration. |
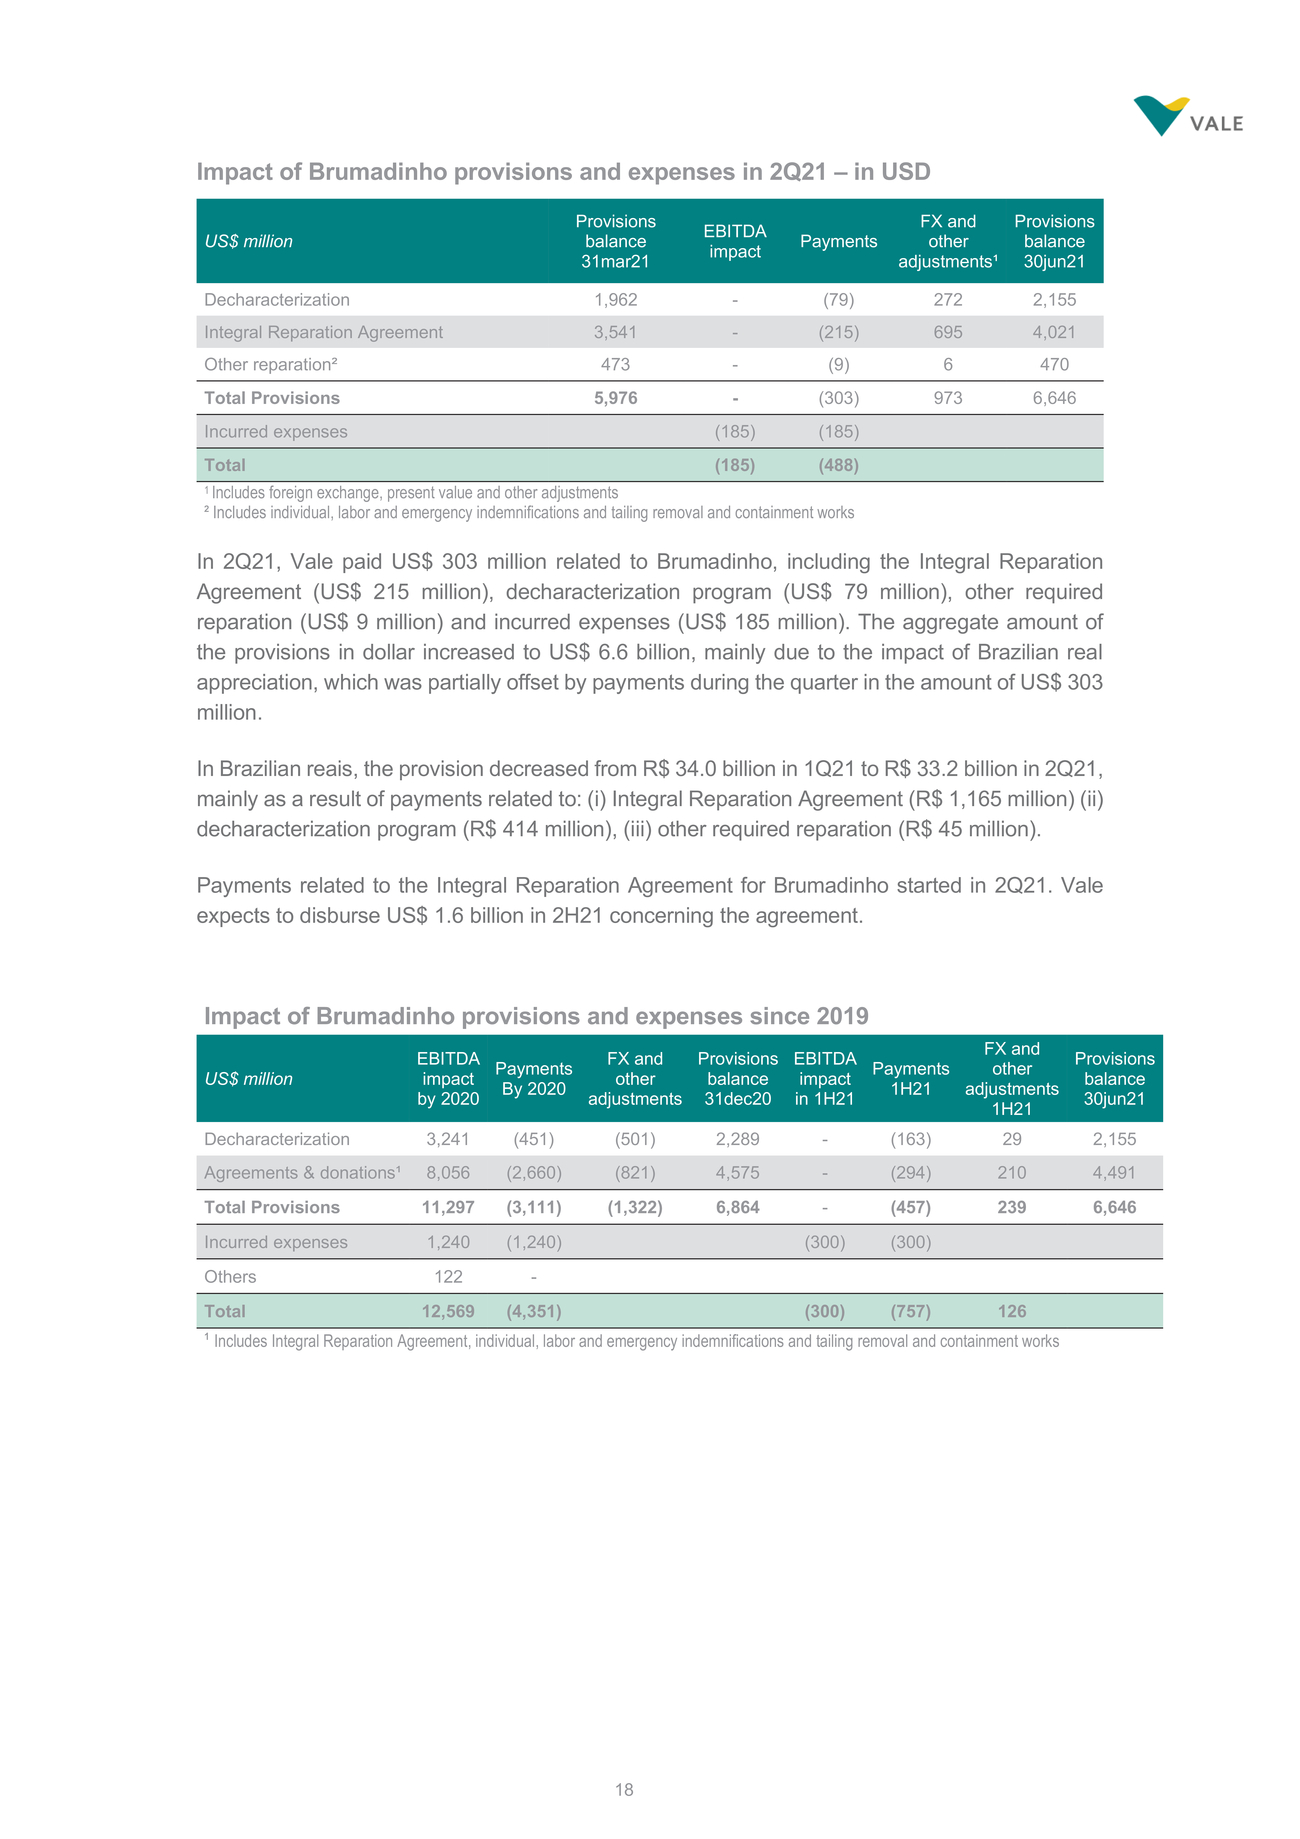 | Impact of Brumadinho provisions and expenses in 2Q21 – in USD In 2Q21, Vale paid US$ 303 million related to Brumadinho, including the Integral Reparation Agreement (US$ 215 million), decharacterization program (US$ 79 million), other required reparation (US$ 9 million) and incurred expenses (US$ 185 million). The aggregate amount of the provisions in dollar increased to US$ 6.6 billion, mainly due to the impact of Brazilian real appreciation, which was partially offset by payments during the quarter in the amount of US$ 303 million. In Brazilian reais, the provision decreased from R$ 34.0 billion in 1Q21 to R$ 33.2 billion in 2Q21, mainly as a result of payments related to: (i) Integral Reparation Agreement (R$ 1,165 million) (ii) decharacterization program (R$ 414 million), (iii) other required reparation (R$ 45 million). Payments related to the Integral Reparation Agreement for Brumadinho started in 2Q21. Vale expects to disburse US$ 1.6 billion in 2H21 concerning the agreement. |
 | [LOGO] |
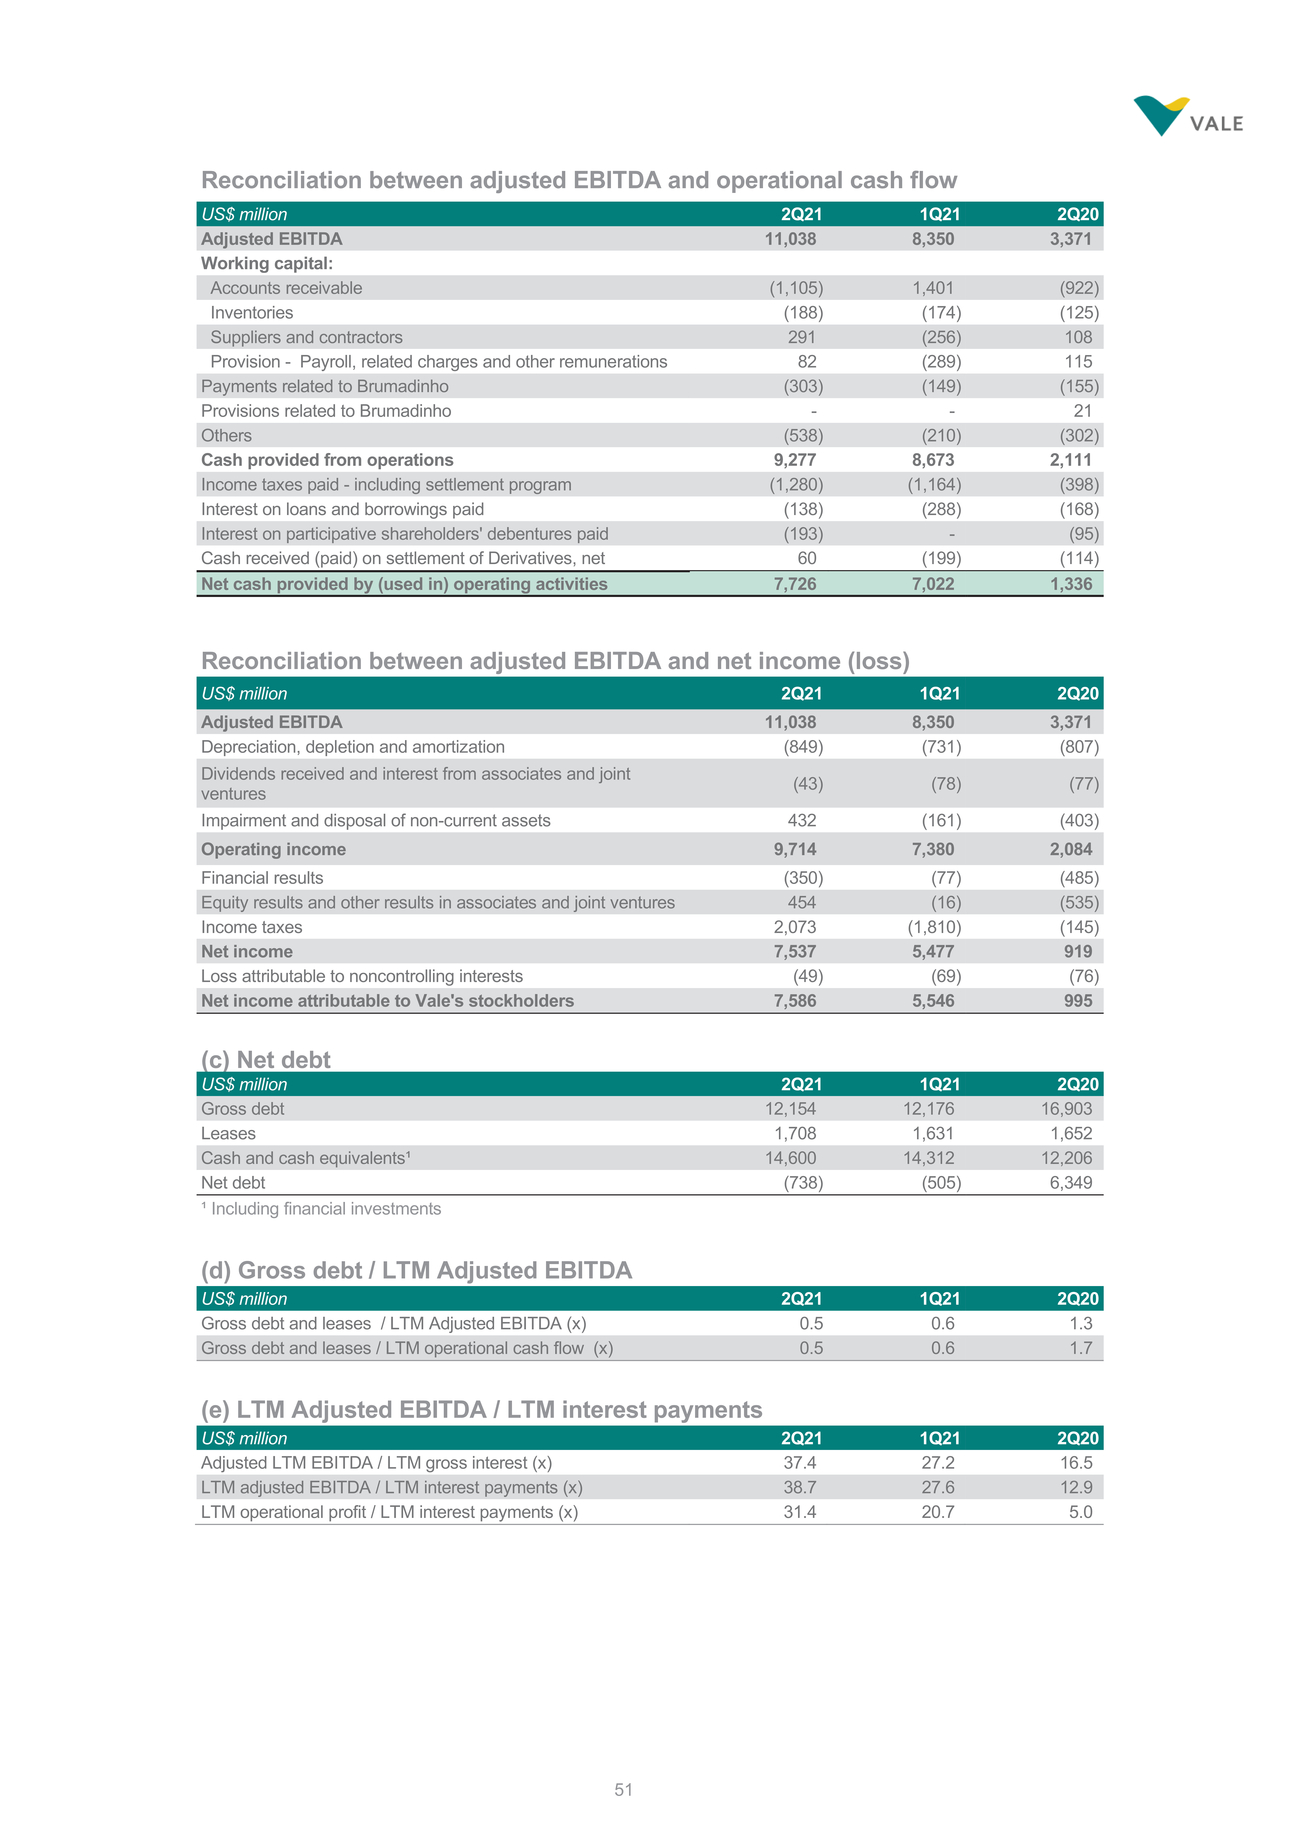
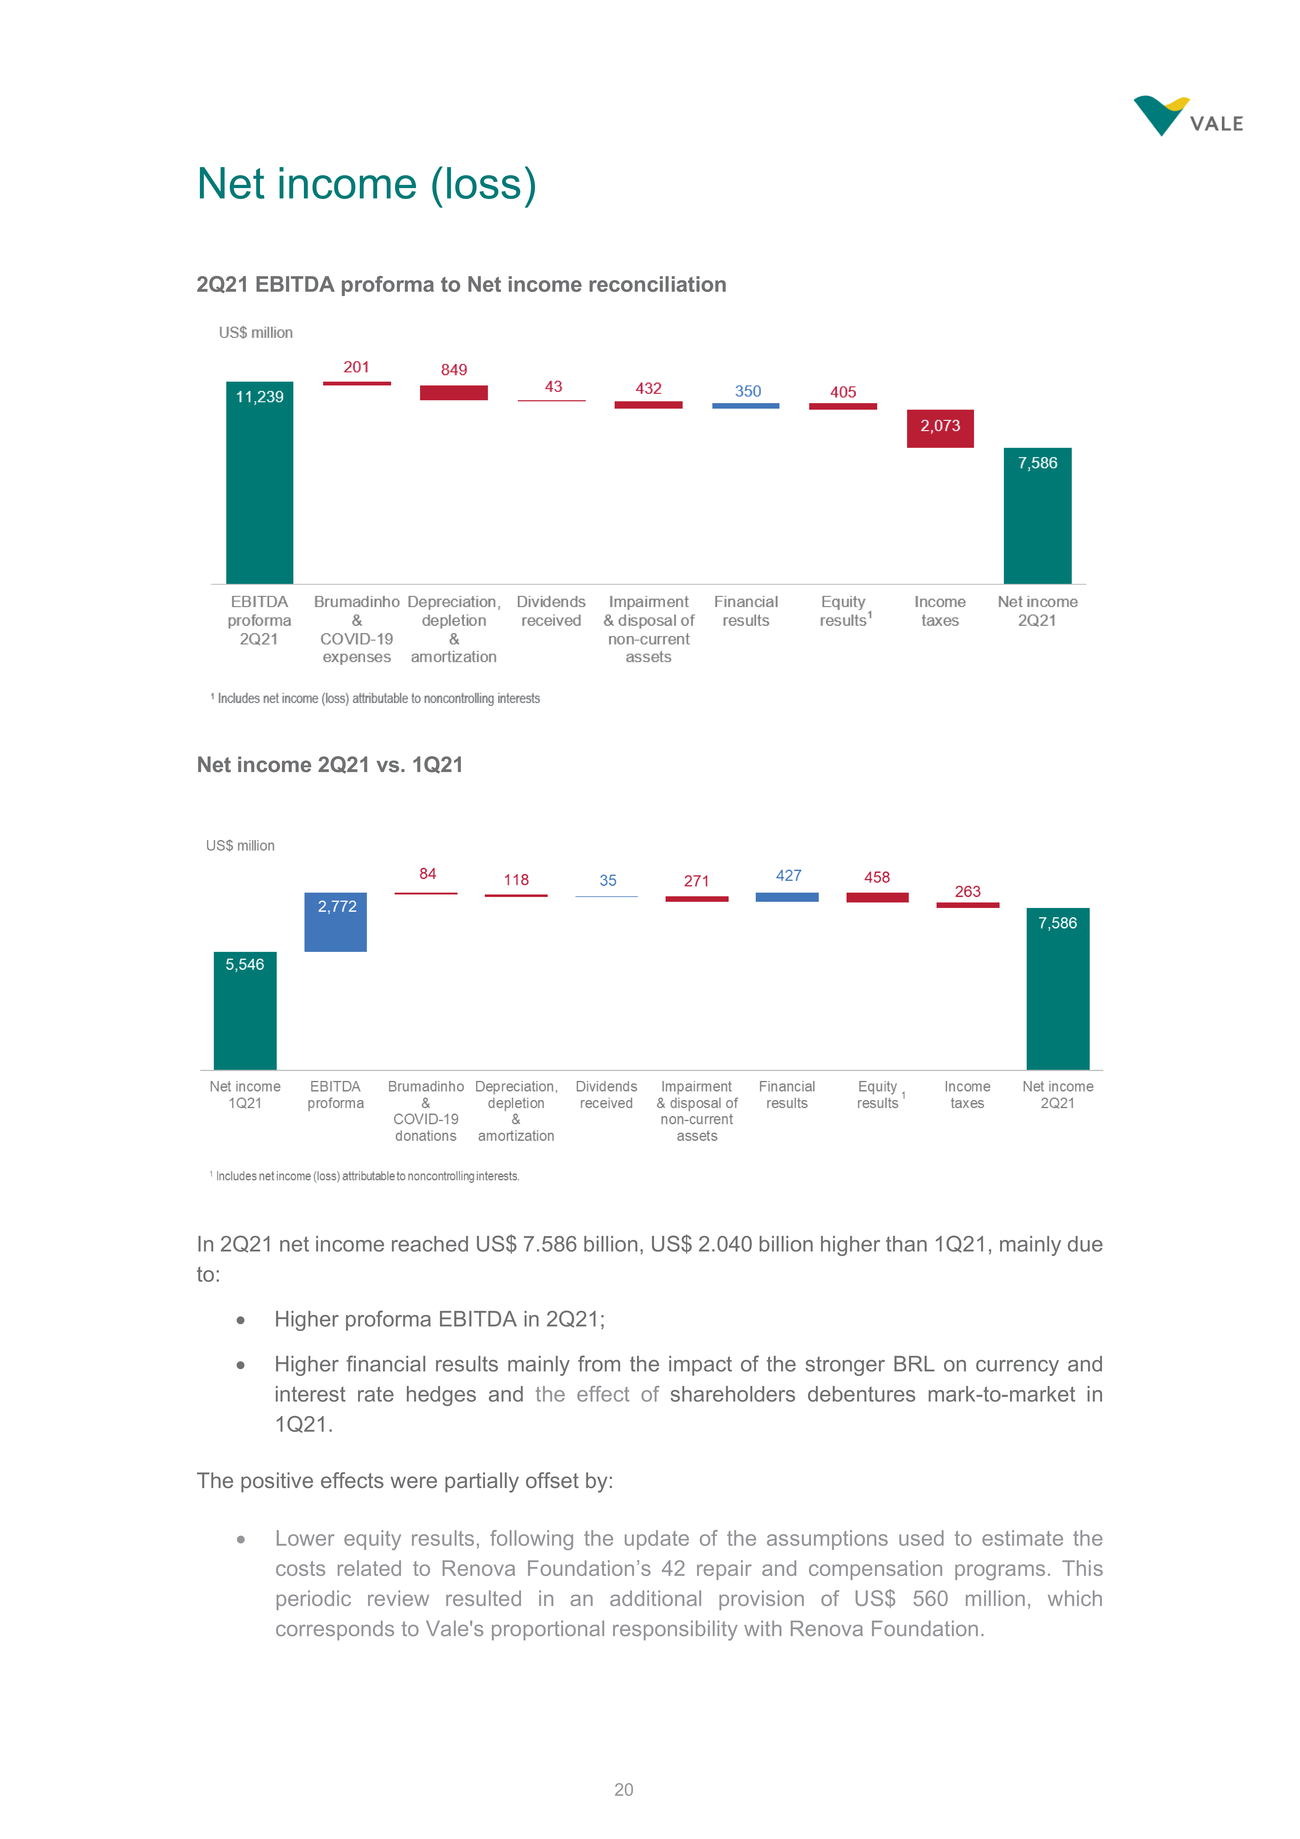 | Net income (loss) 2Q21 EBITDA proforma to Net income reconciliation Net income 2Q21 vs. 1Q21 In 2Q21 net income reached US$ 7.586 billion, US$ 2.040 billion higher than 1Q21, mainly due to: Higher proforma EBITDA in 2Q21; Higher financial results mainly from the impact of the stronger BRL on currency and interest rate hedges and the effect of shareholders debentures mark-to-market in 1Q21. The positive effects were partially offset by: Lower equity results, following the update of the assumptions used to estimate the costs related to Renova Foundation’s 42 repair and compensation programs. This periodic review resulted in an additional provision of US$ 560 million, which corresponds to Vale's proportional responsibility with Renova Foundation. |
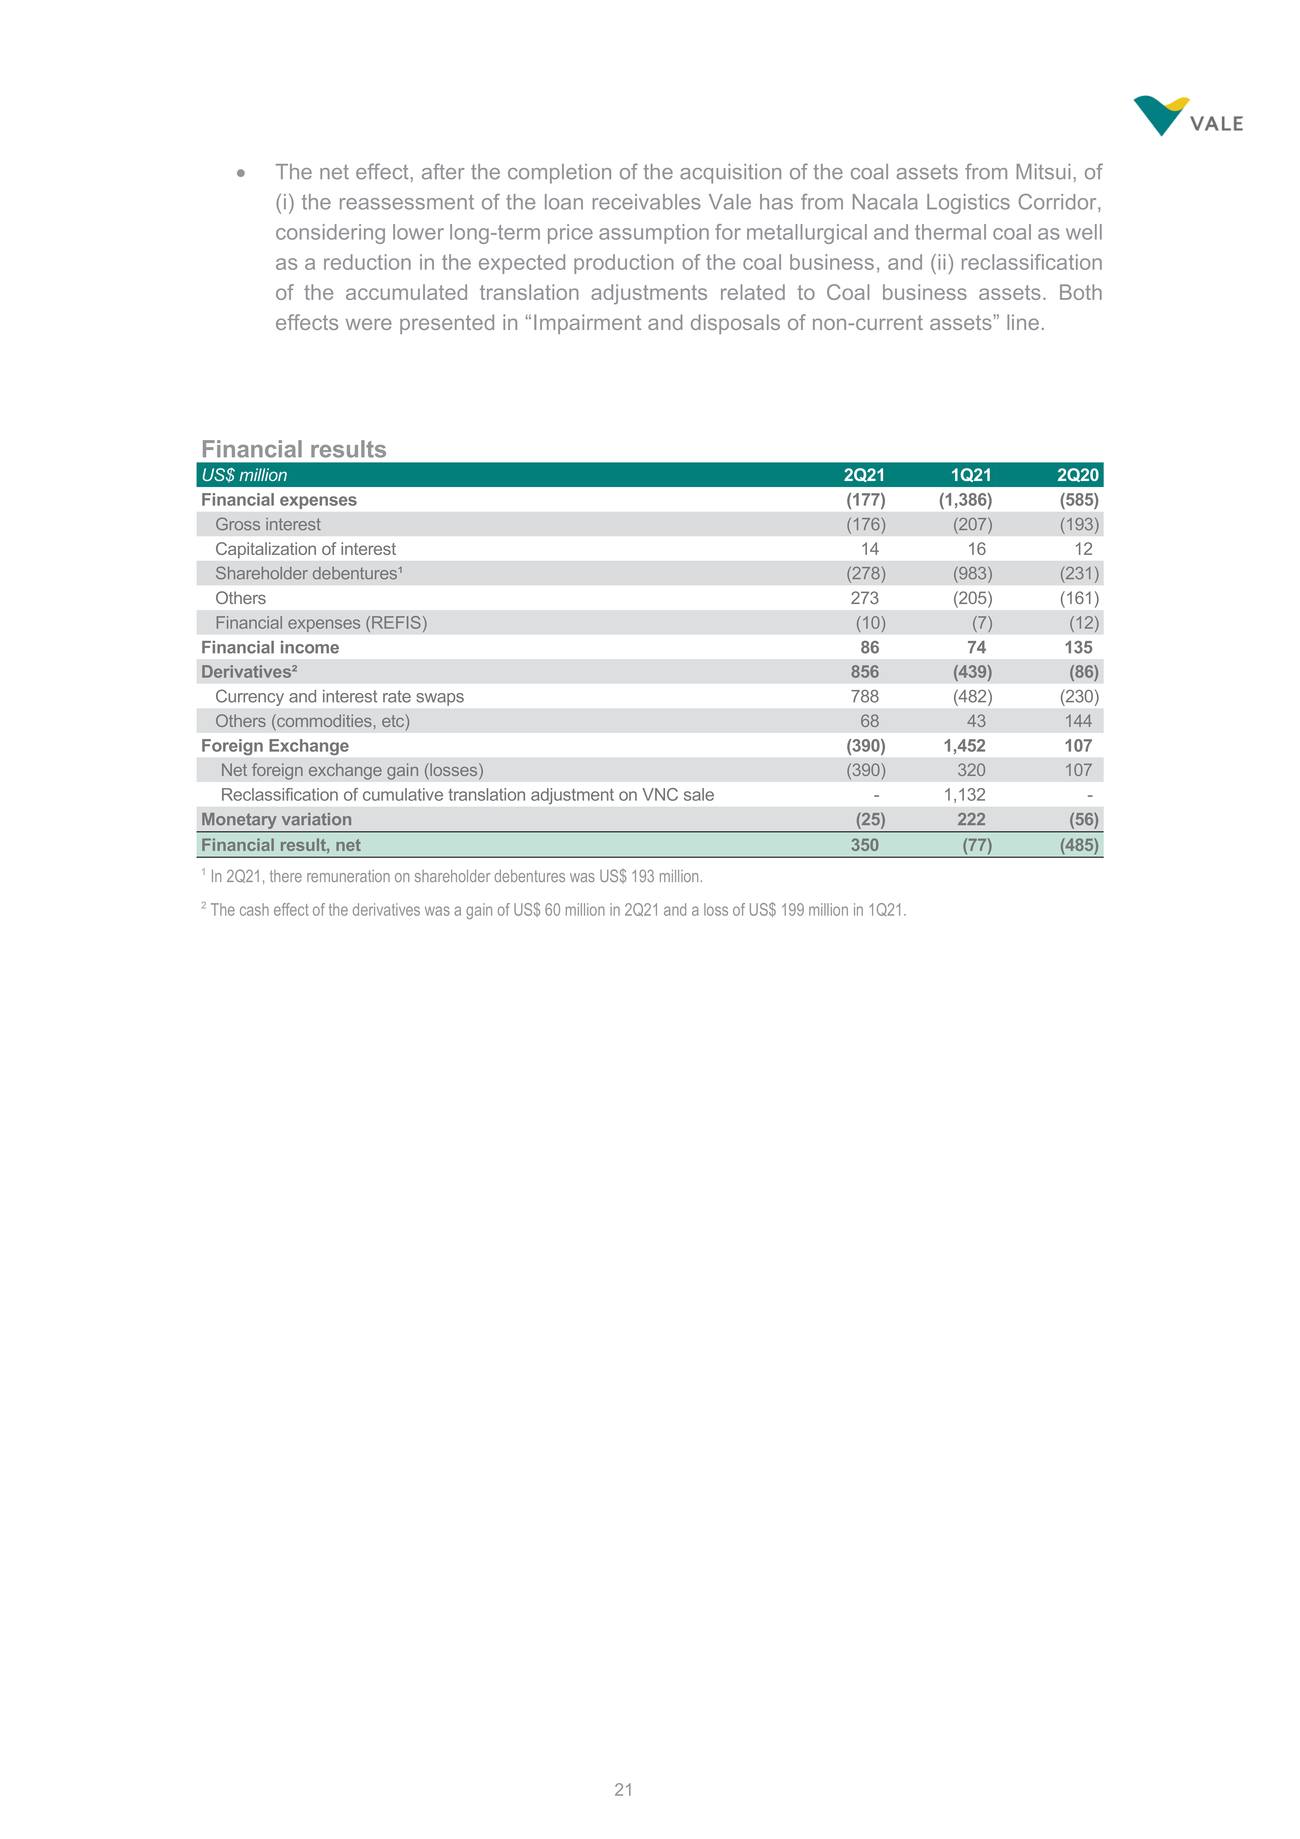 | The net effect, after the completion of the acquisition of the coal assets from Mitsui, of the reassessment of the loan receivables Vale has from Nacala Logistics Corridor, considering lower long-term price assumption for metallurgical and thermal coal as well as a reduction in the expected production of the coal business, and (ii) reclassification of the accumulated translation adjustments related to Coal business assets. Both effects were presented in “Impairment and disposals of non-current assets” line. |
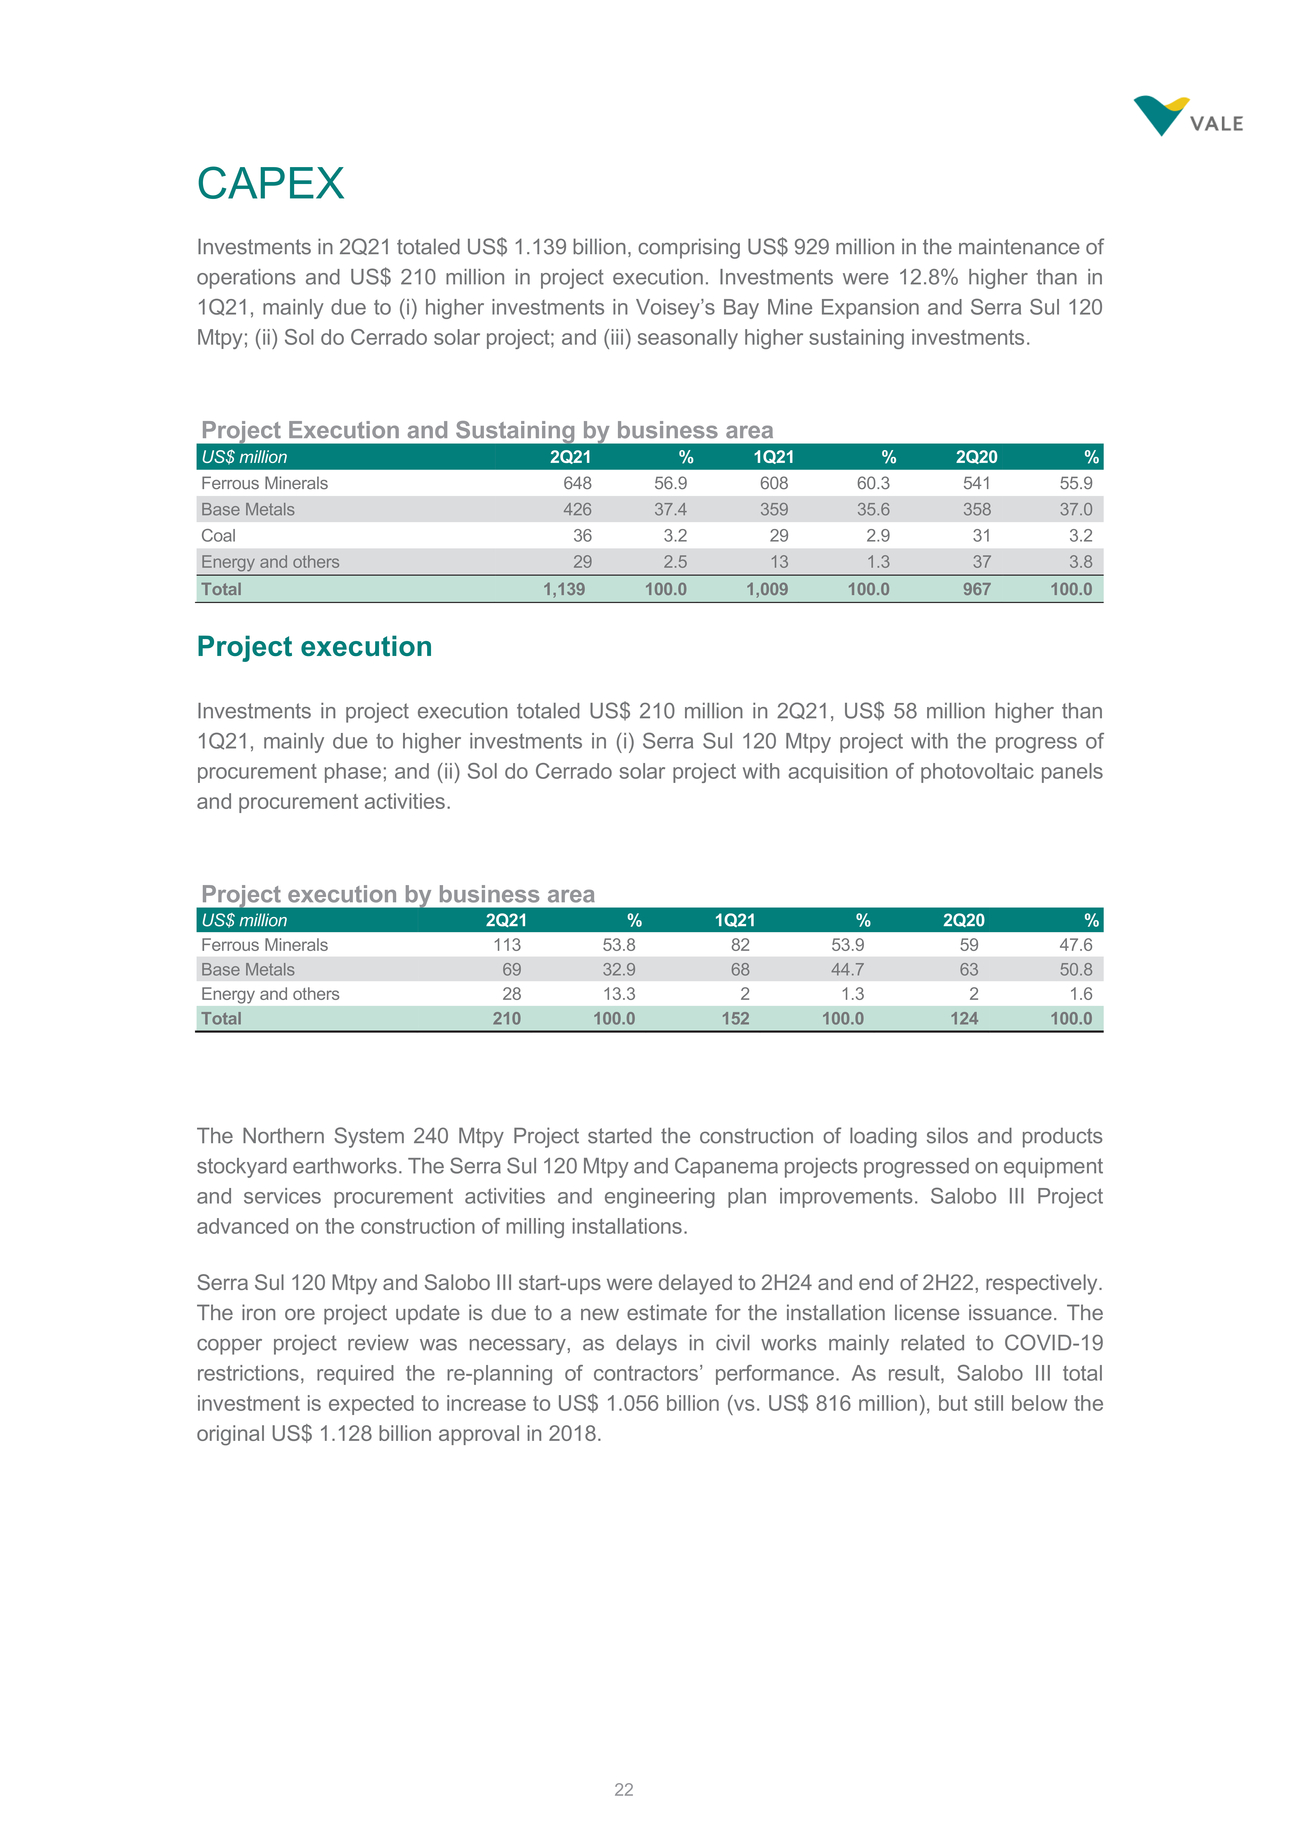 | CAPEX Investments in 2Q21 totaled US$ 1.139 billion, comprising US$ 929 million in the maintenance of operations and US$ 210 million in project execution. Investments were 12.8% higher than in 1Q21, mainly due to (i) higher investments in Voisey’s Bay Mine Expansion and Serra Sul 120 Mtpy; (ii) Sol do Cerrado solar project; and (iii) seasonally higher sustaining investments. Project execution Investments in project execution totaled US$ 210 million in 2Q21, US$ 58 million higher than 1Q21, mainly due to higher investments in (i) Serra Sul 120 Mtpy project with the progress of procurement phase; and (ii) Sol do Cerrado solar project with acquisition of photovoltaic panels and procurement activities. The Northern System 240 Mtpy Project started the construction of loading silos and products stockyard earthworks. The Serra Sul 120 Mtpy and Capanema projects progressed on equipment and services procurement activities and engineering plan improvements. Salobo III Project advanced on the construction of milling installations. Serra Sul 120 Mtpy and Salobo III start-ups were delayed to 2H24 and end of 2H22, respectively. The iron ore project update is due to a new estimate for the installation license issuance. The copper project review was necessary, as delays in civil works mainly related to COVID-19 restrictions, required the re-planning of contractors’ performance. As result, Salobo III total investment is expected to increase to US$ 1.056 billion (vs. US$ 816 million), but still below the original US$ 1.128 billion approval in 2018. |
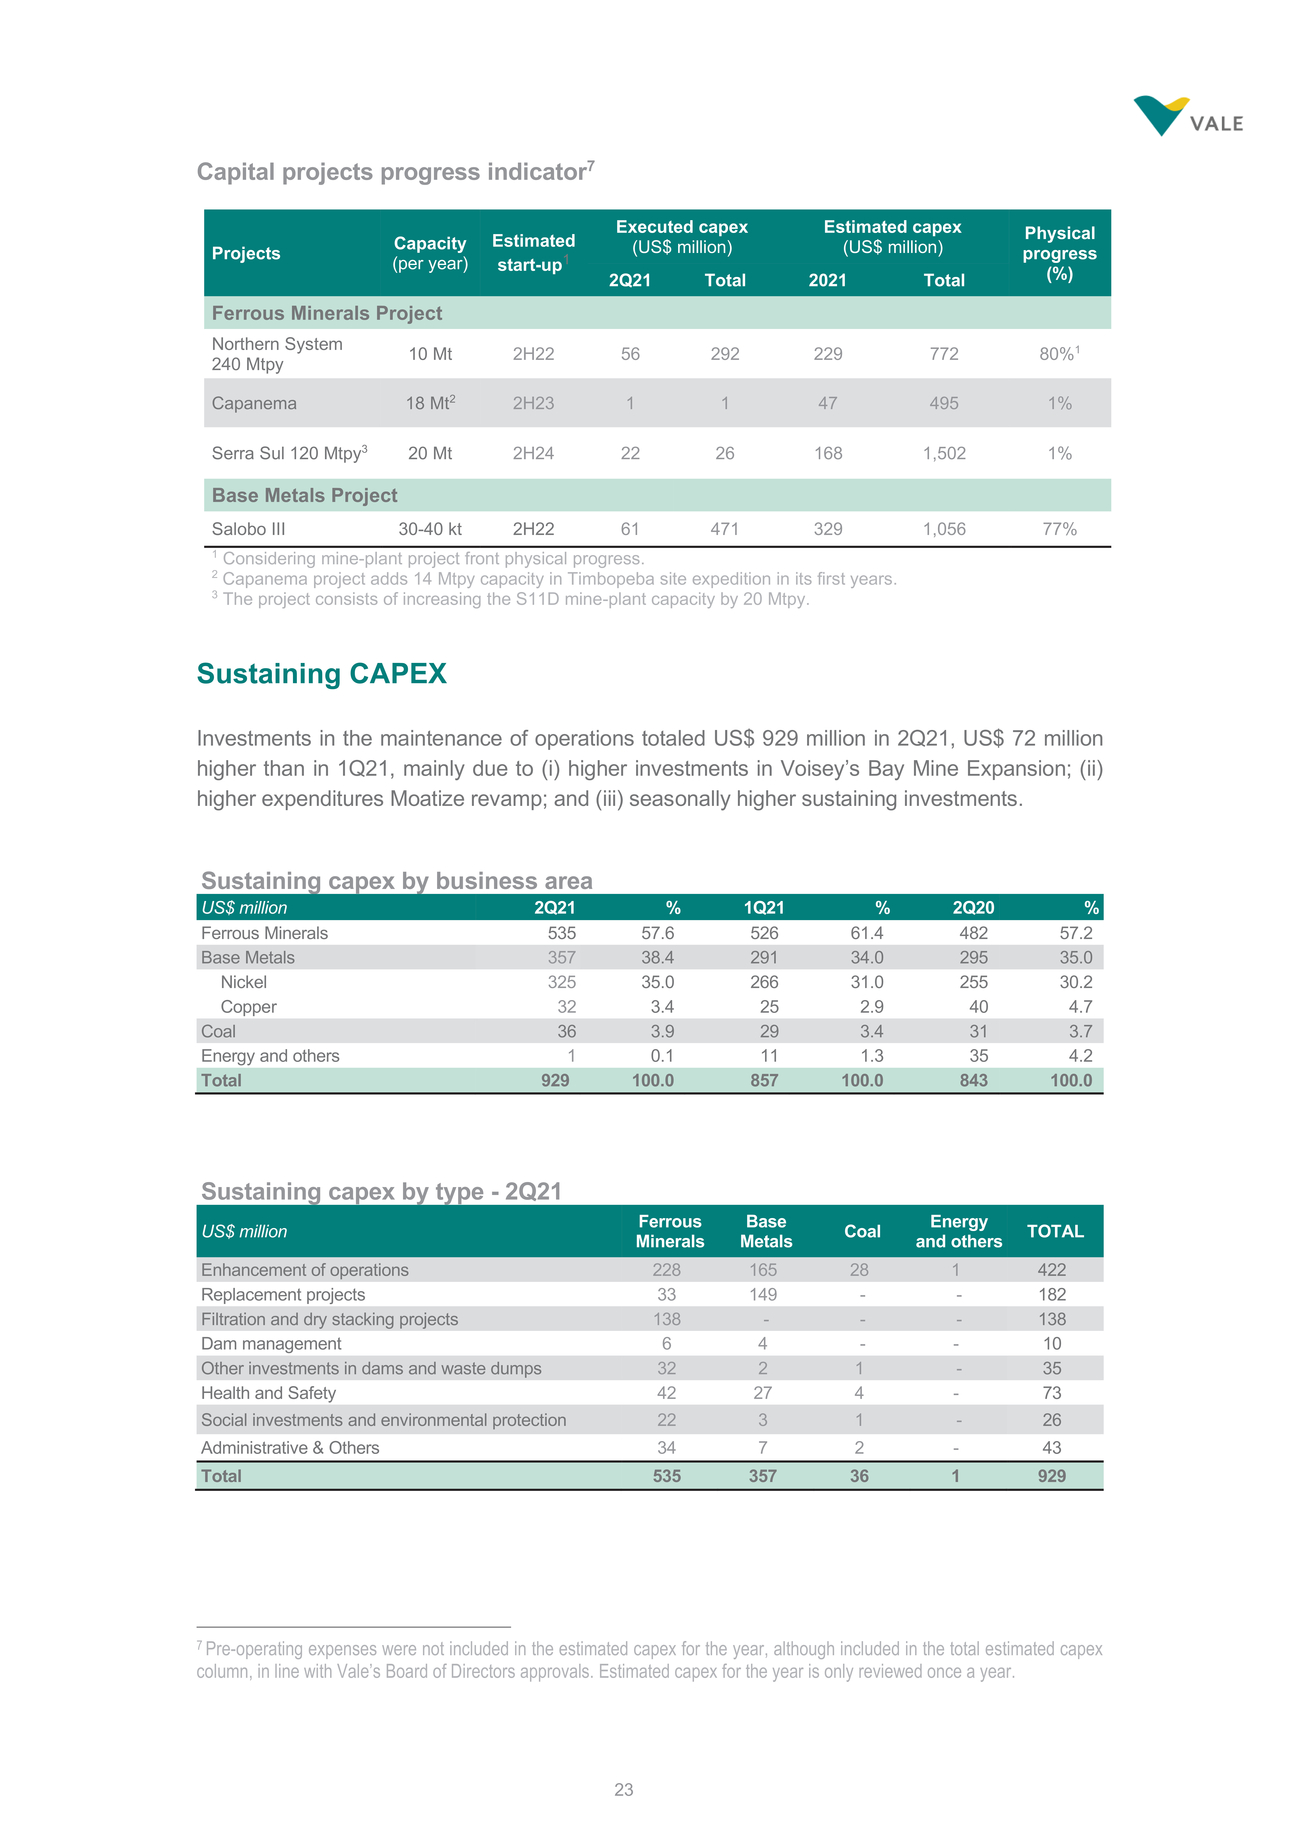 | Capital projects progress indicator7 Projects Capacity (per year) Estimated start-up1 Executed capex (US$ million) 2Q21 Total 2021Total Ferrous Minerals Project Northern System 240 Mtpy 10 Mt 2H22 56 292 229772 80%1 Capanema 18 Mt2 2H23 1 1 47495 1% Serra Sul 120 Mtpy3 20 Mt 2H24 22 26 1681,502 1% Base Metals Project Salobo III 30-40 kt 2H22 61 471 3291,056 77% 1 Considering mine-plant project front physical progress. 2 Capanema project adds 14 Mtpy capacity in Timbopeba site expedition in its first years. 3 The project consists of increasing the S11D mine-plant capacity by 20 Mtpy. Sustaining CAPEX Investments in the maintenance of operations totaled US$ 929 million in 2Q21, US$ 72 million higher than in 1Q21, mainly due to (i) higher investments in Voisey’s Bay Mine Expansion; (ii) higher expenditures Moatize revamp; and (iii) seasonally higher sustaining investments. 7 Pre-operating expenses were not included in the estimated capex for the year, although included in the total estimated capex column, in line with Vale’s Board of Directors approvals. Estimated capex for the year is only reviewed once a year. |
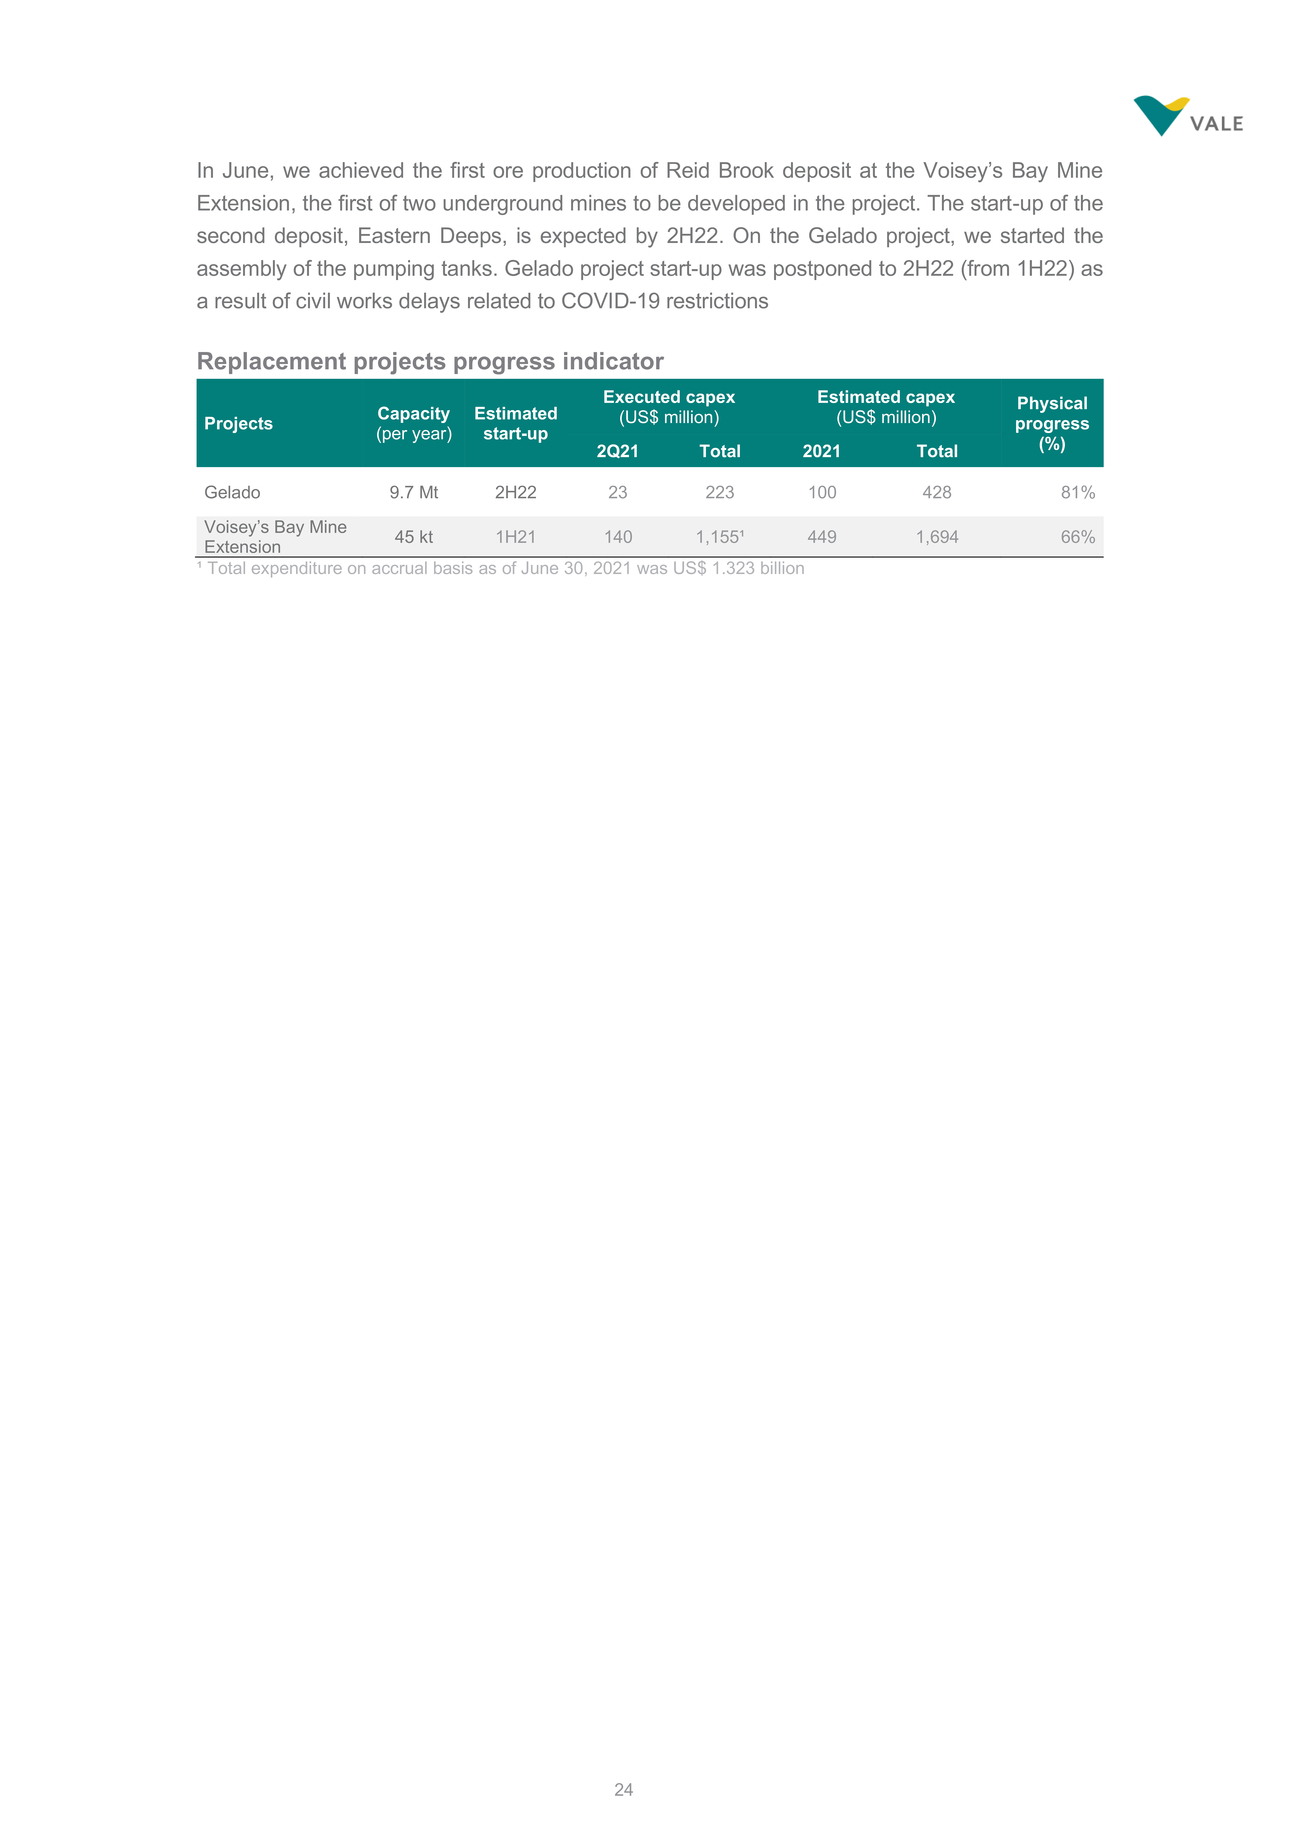 | In June, we achieved the first ore production of Reid Brook deposit at the Voisey’s Bay Mine Extension, the first of two underground mines to be developed in the project. The start-up of the second deposit, Eastern Deeps, is expected by 2H22. On the Gelado project, we started the assembly of the pumping tanks. Gelado project start-up was postponed to 2H22 (from 1H22) as a result of civil works delays related to COVID-19 restrictions Replacement projects progress indicator Projects Capacity (per year) Estimated start-up Executed capex (US$ million) 2Q21 Total 2021Total Gelado 9.7 Mt 2H22 23 223 100428 81% Voisey’s Bay Mine Extension 45 kt 1H21 140 1,155¹ 4491,694 66% ¹ Total expenditure on accrual basis as of June 30, 2021 was US$ 1.323 billion |
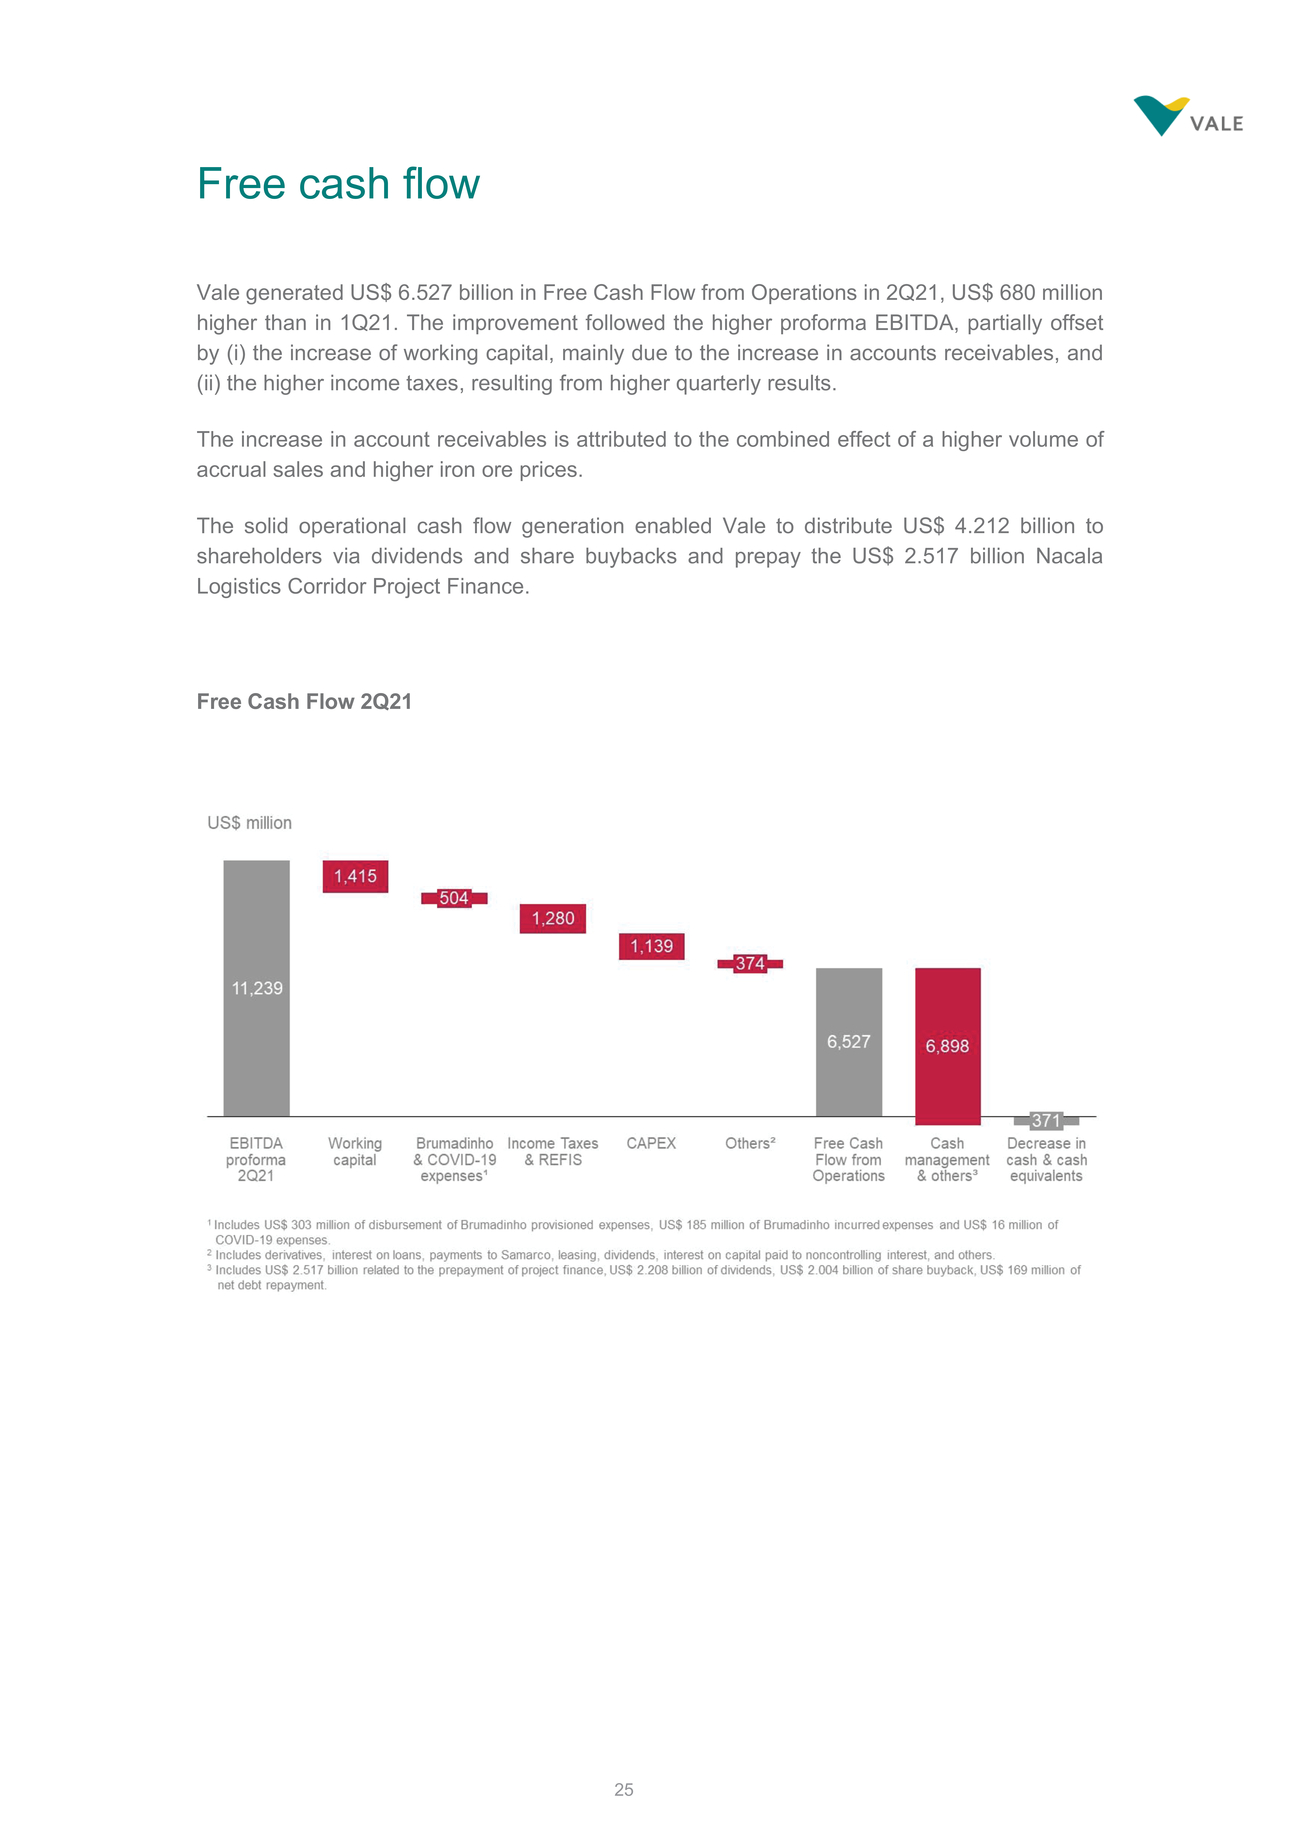 | Free cash flow Vale generated US$ 6.527 billion in Free Cash Flow from Operations in 2Q21, US$ 680 million higher than in 1Q21. The improvement followed the higher proforma EBITDA, partially offset by (i) the increase of working capital, mainly due to the increase in accounts receivables, and the higher income taxes, resulting from higher quarterly results. The increase in account receivables is attributed to the combined effect of a higher volume of accrual sales and higher iron ore prices. The solid operational cash flow generation enabled Vale to distribute US$ 4.212 billion to shareholders via dividends and share buybacks and prepay the US$ 2.517 billion Nacala Logistics Corridor Project Finance. Free Cash Flow 2Q21 |
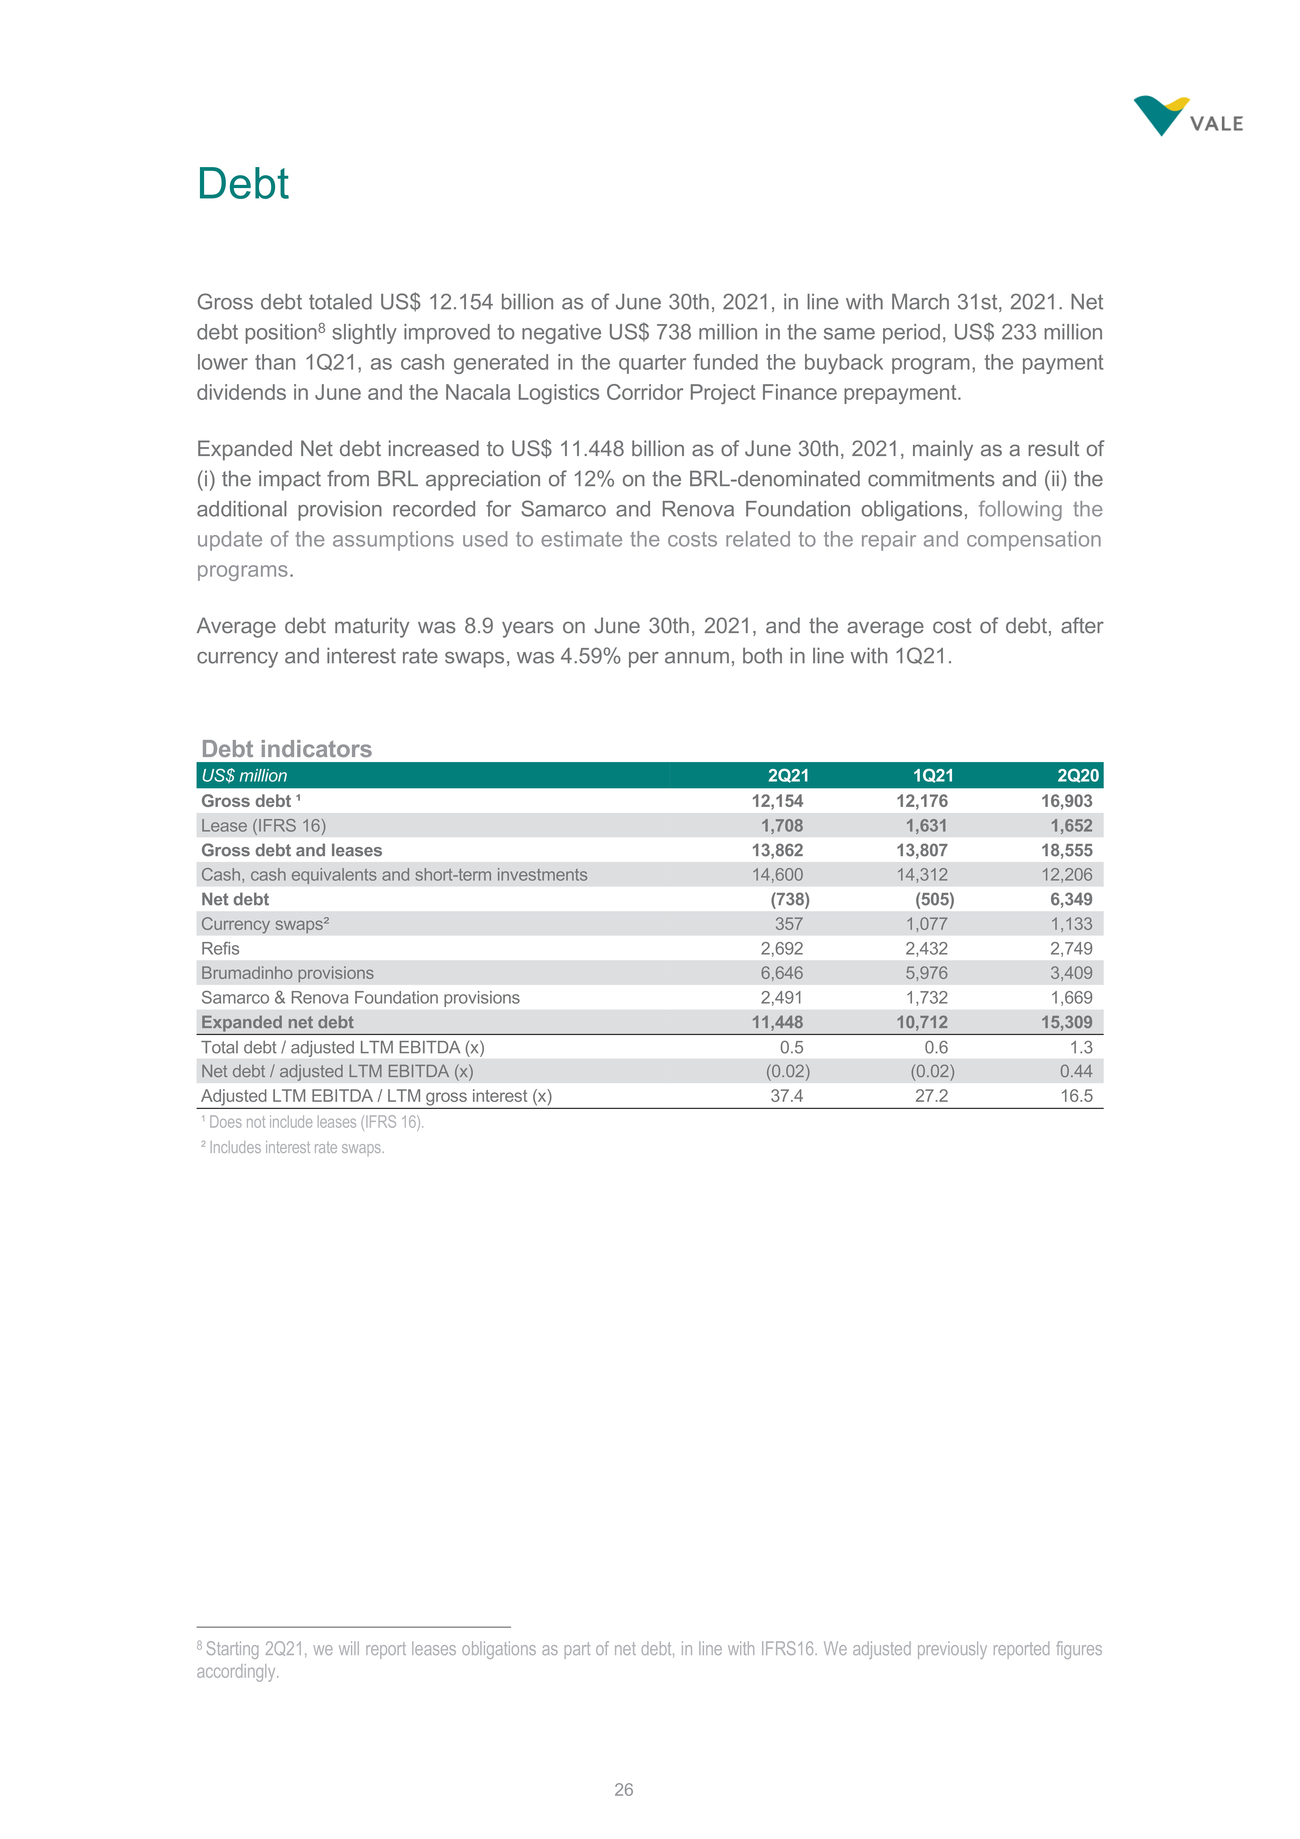 | Gross debt totaled US$ 12.154 billion as of June 30th, 2021, in line with March 31st, 2021. Net debt position8 slightly improved to negative US$ 738 million in the same period, US$ 233 million lower than 1Q21, as cash generated in the quarter funded the buyback program, the payment dividends in June and the Nacala Logistics Corridor Project Finance prepayment. Expanded Net debt increased to US$ 11.448 billion as of June 30th, 2021, mainly as a result of (i) the impact from BRL appreciation of 12% on the BRL-denominated commitments and (ii) the additional provision recorded for Samarco and Renova Foundation obligations, following the update of the assumptions used to estimate the costs related to the repair and compensation programs. Average debt maturity was 8.9 years on June 30th, 2021, and the average cost of debt, after currency and interest rate swaps, was 4.59% per annum, both in line with 1Q21. 8 Starting 2Q21, we will report leases obligations as part of net debt, in line with IFRS16. We adjusted previously reported figures accordingly. |
 | Segment information ― 2Q21, as per footnote of financial statements Expenses Pellets 1,947 (520) 2 - (13) 221,438 Others ferrous 98 (71) 1 (1) - -27 Mn & Alloys 52 (39) (1) - (4) -8 Base Metals 2,180 (1,188) (26) (39) (61) -866 Nickel² 1,492 (959) (25) (18) (60) -430 Copper³ 688 (229) (1) (21) (1) -436 ² Including copper, by-products from our nickel operations and marketing activities. ³ Including by-products from our copper operations. |
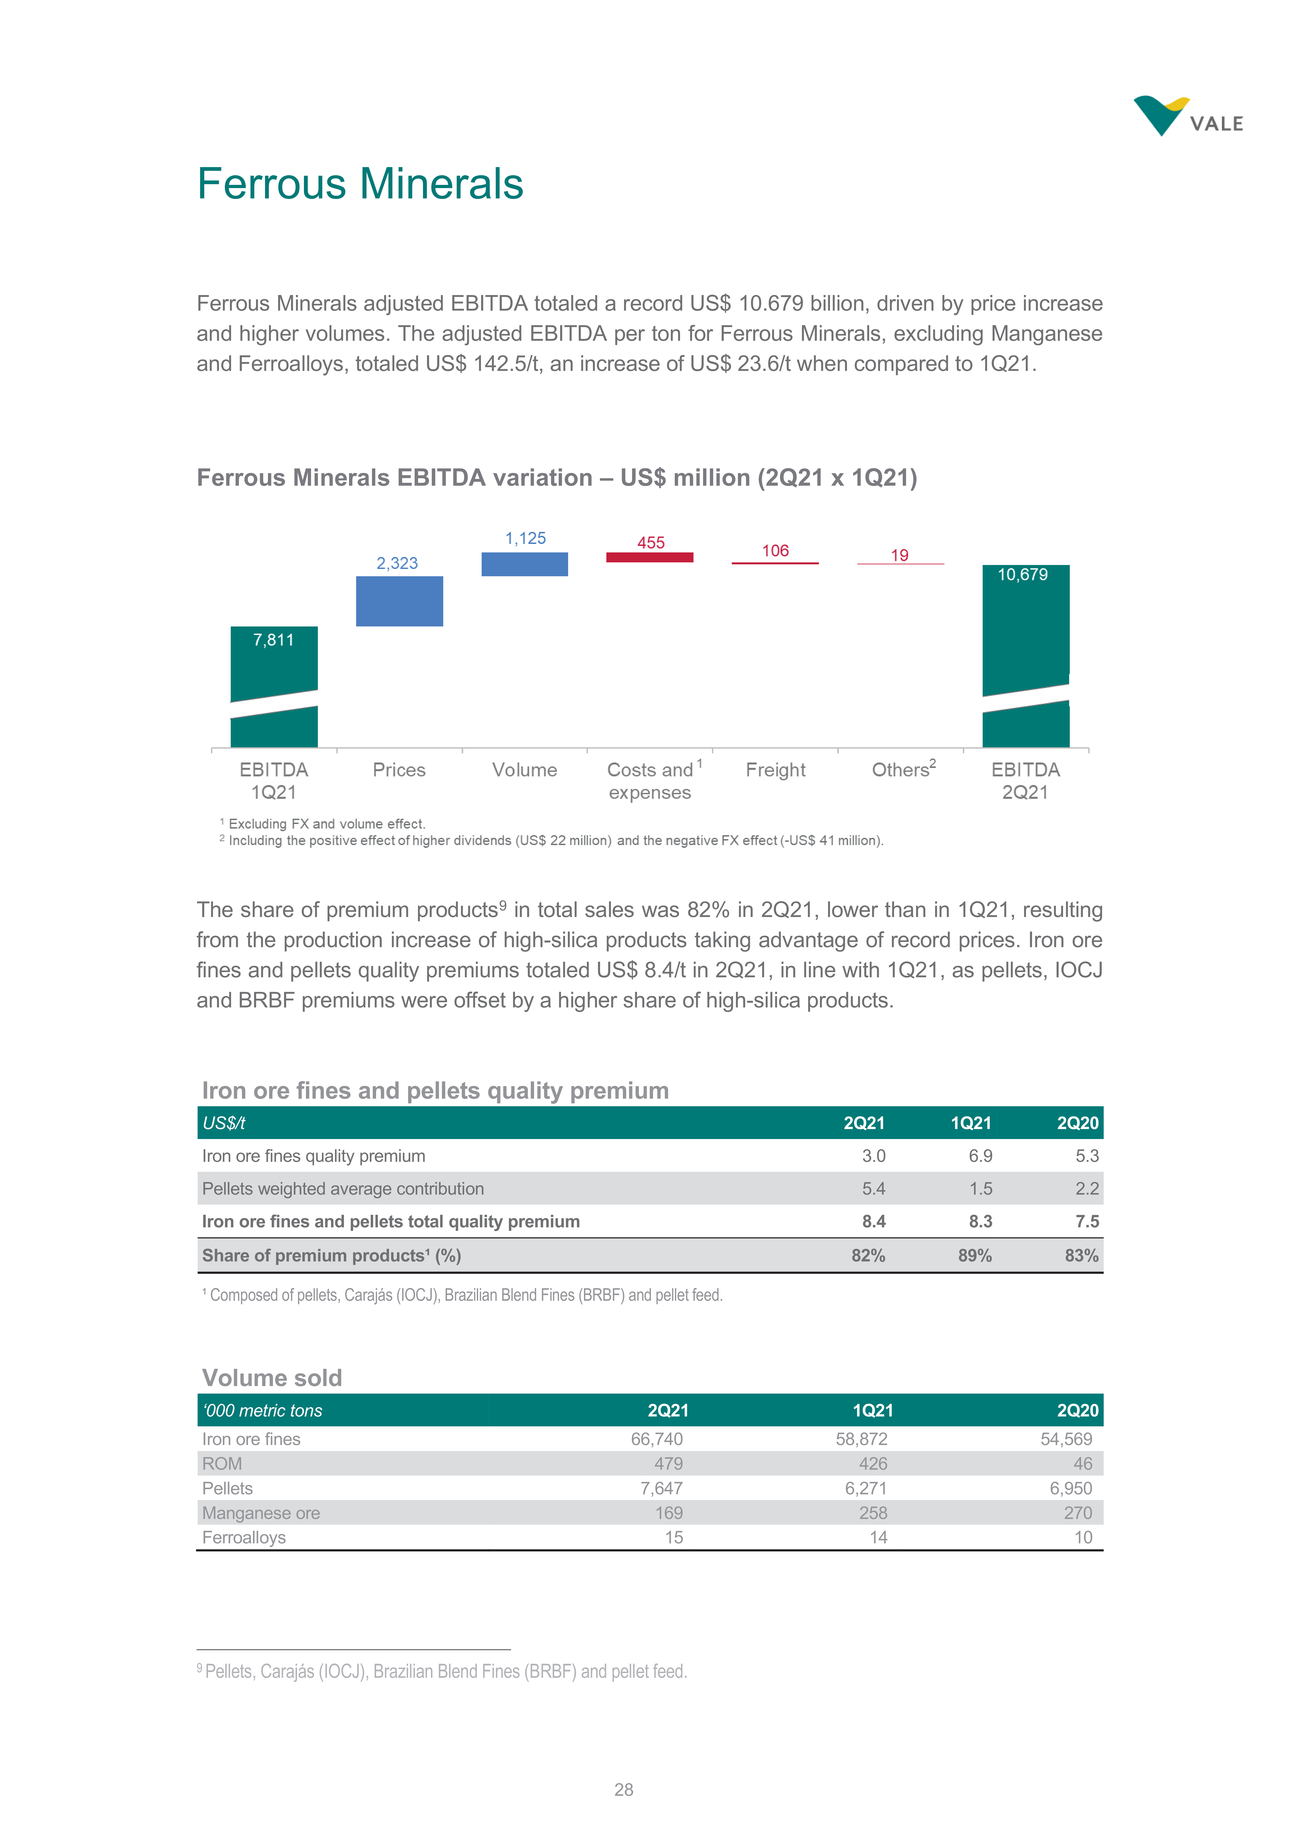 | Ferrous Minerals adjusted EBITDA totaled a record US$ 10.679 billion, driven by price increase and higher volumes. The adjusted EBITDA per ton for Ferrous Minerals, excluding Manganese and Ferroalloys, totaled US$ 142.5/t, an increase of US$ 23.6/t when compared to 1Q21. Ferrous Minerals EBITDA variation – US$ million (2Q21 x 1Q21) The share of premium products9 in total sales was 82% in 2Q21, lower than in 1Q21, resulting from the production increase of high-silica products taking advantage of record prices. Iron ore fines and pellets quality premiums totaled US$ 8.4/t in 2Q21, in line with 1Q21, as pellets, IOCJ and BRBF premiums were offset by a higher share of high-silica products. 9 Pellets, Carajás (IOCJ), Brazilian Blend Fines (BRBF) and pellet feed. |
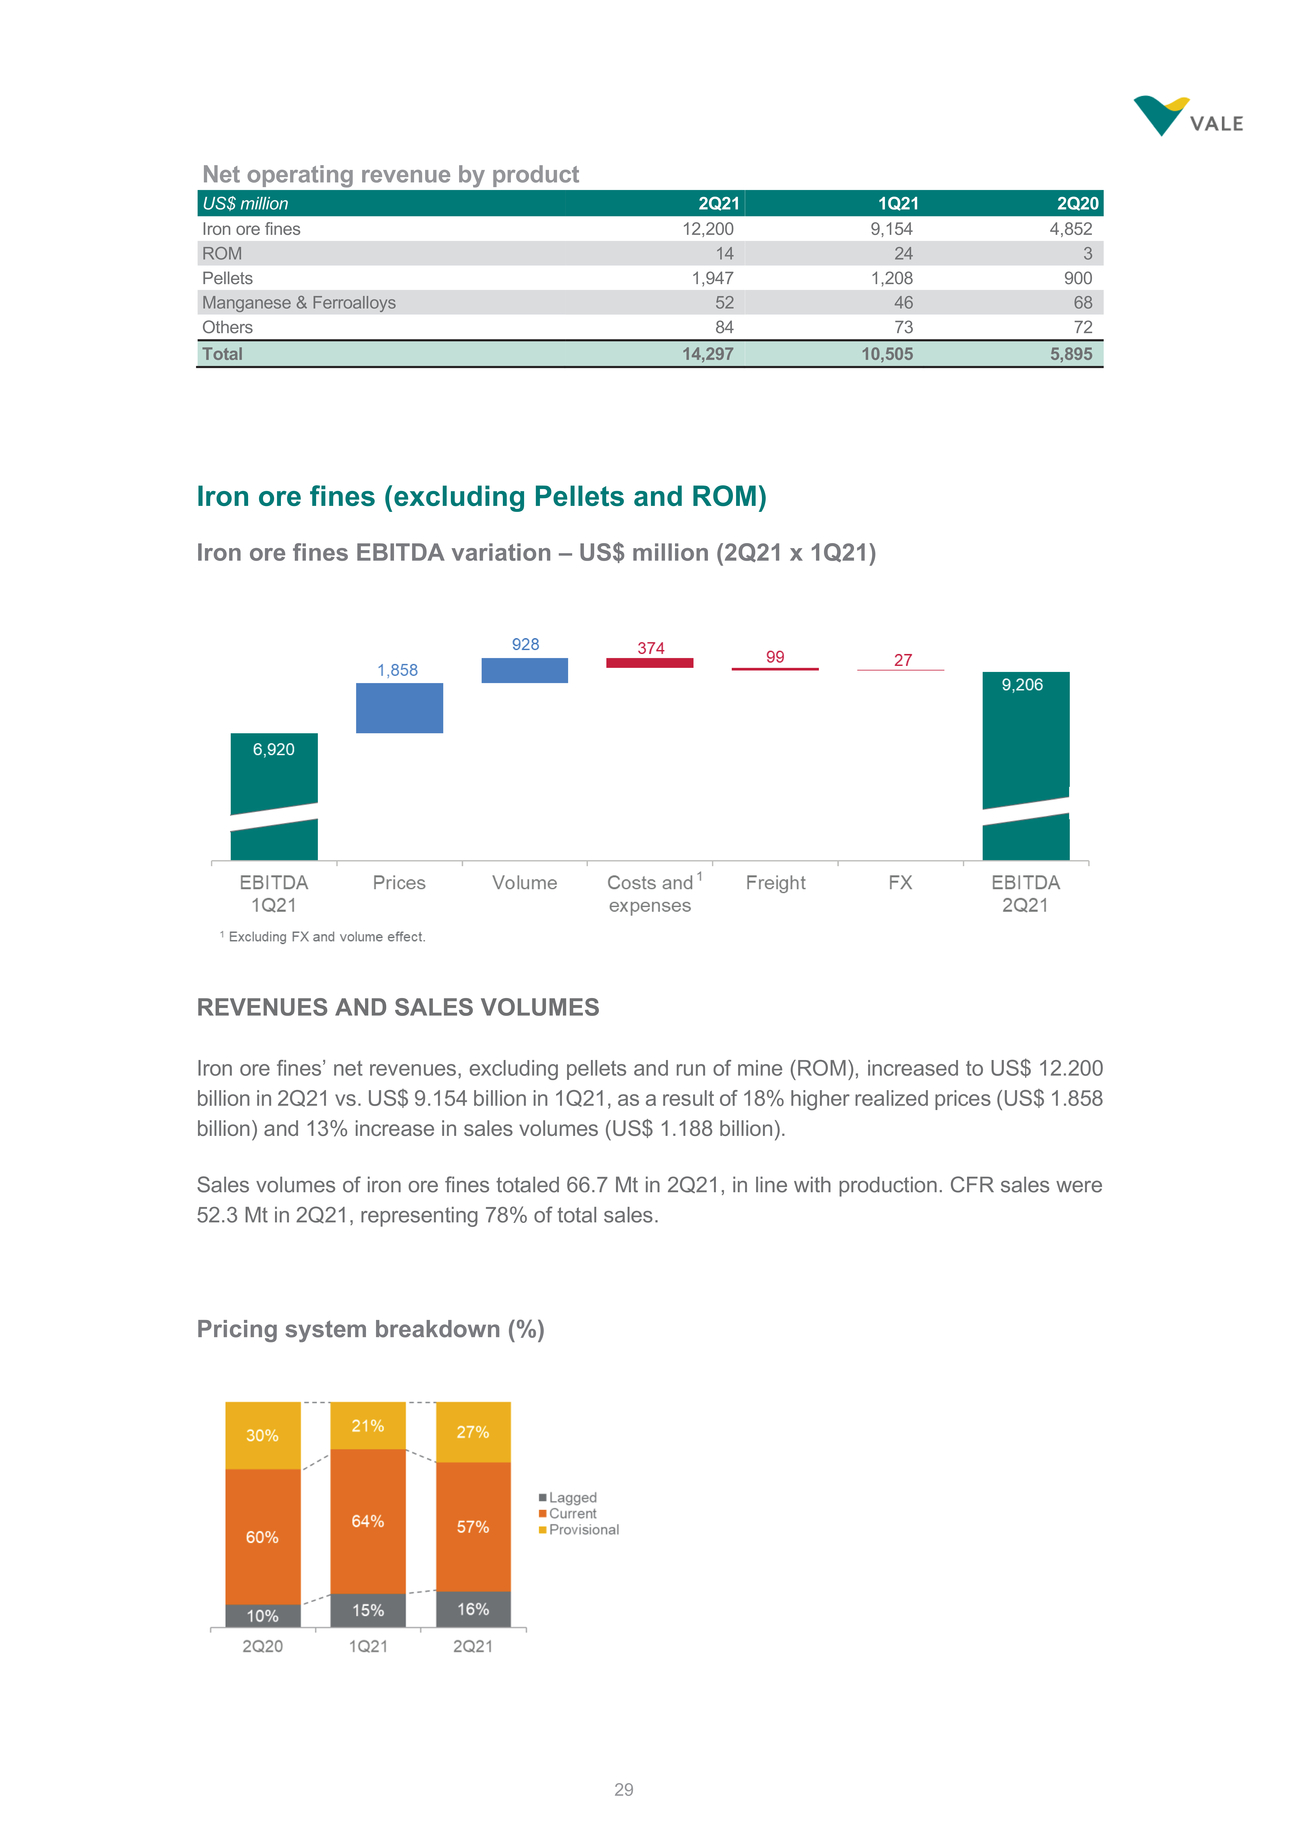 | Iron ore fines (excluding Pellets and ROM) Iron ore fines EBITDA variation – US$ million (2Q21 x 1Q21) REVENUES AND SALES VOLUMES Iron ore fines’ net revenues, excluding pellets and run of mine (ROM), increased to US$ 12.200 billion in 2Q21 vs. US$ 9.154 billion in 1Q21, as a result of 18% higher realized prices (US$ 1.858 billion) and 13% increase in sales volumes (US$ 1.188 billion). Sales volumes of iron ore fines totaled 66.7 Mt in 2Q21, in line with production. CFR sales were Mt in 2Q21, representing 78% of total sales. Pricing system breakdown (%) |
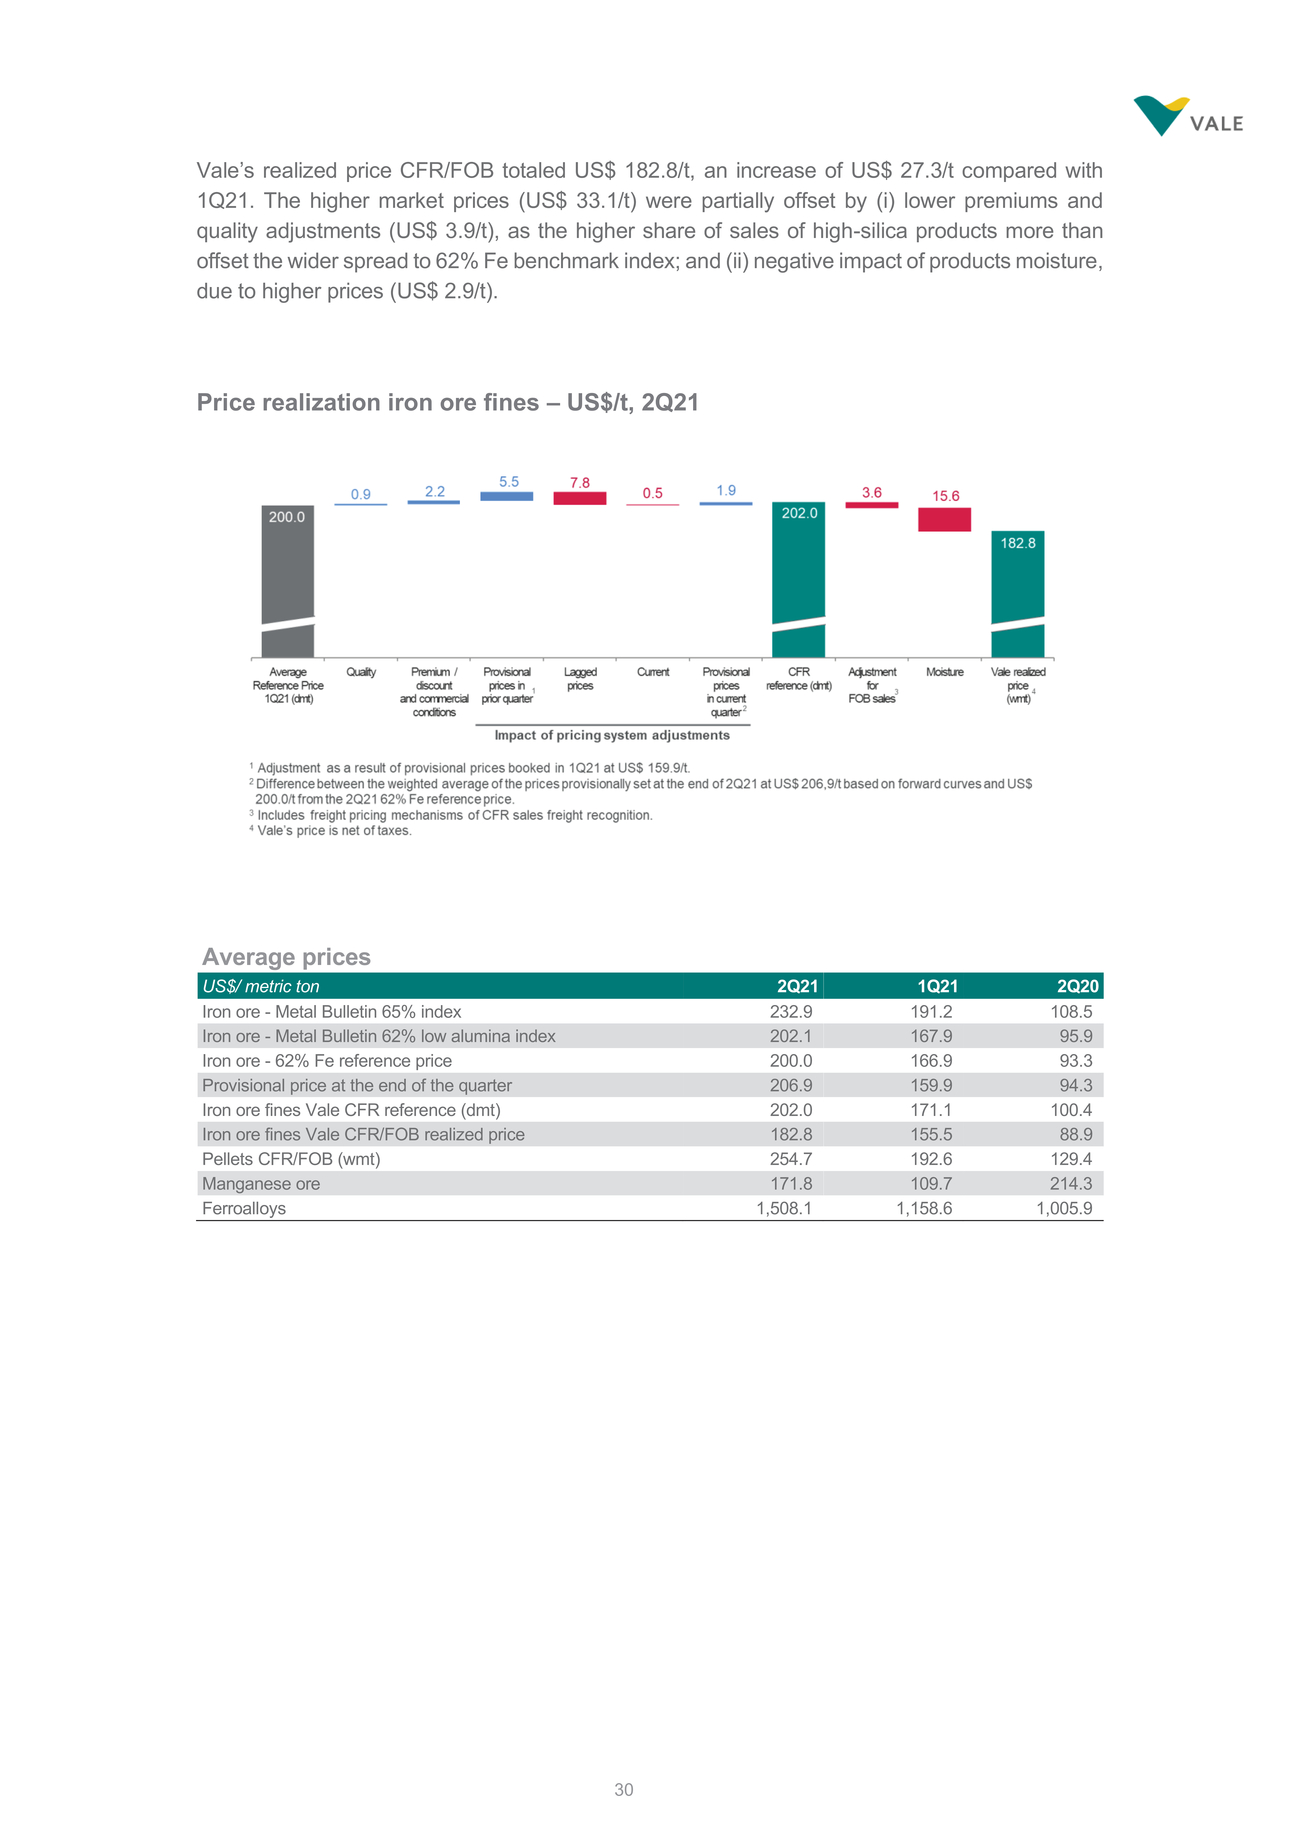 | Vale’s realized price CFR/FOB totaled US$ 182.8/t, an increase of US$ 27.3/t compared with 1Q21. The higher market prices (US$ 33.1/t) were partially offset by (i) lower premiums and quality adjustments (US$ 3.9/t), as the higher share of sales of high-silica products more than offset the wider spread to 62% Fe benchmark index; and (ii) negative impact of products moisture, due to higher prices (US$ 2.9/t). Price realization iron ore fines – US$/t, 2Q21 |
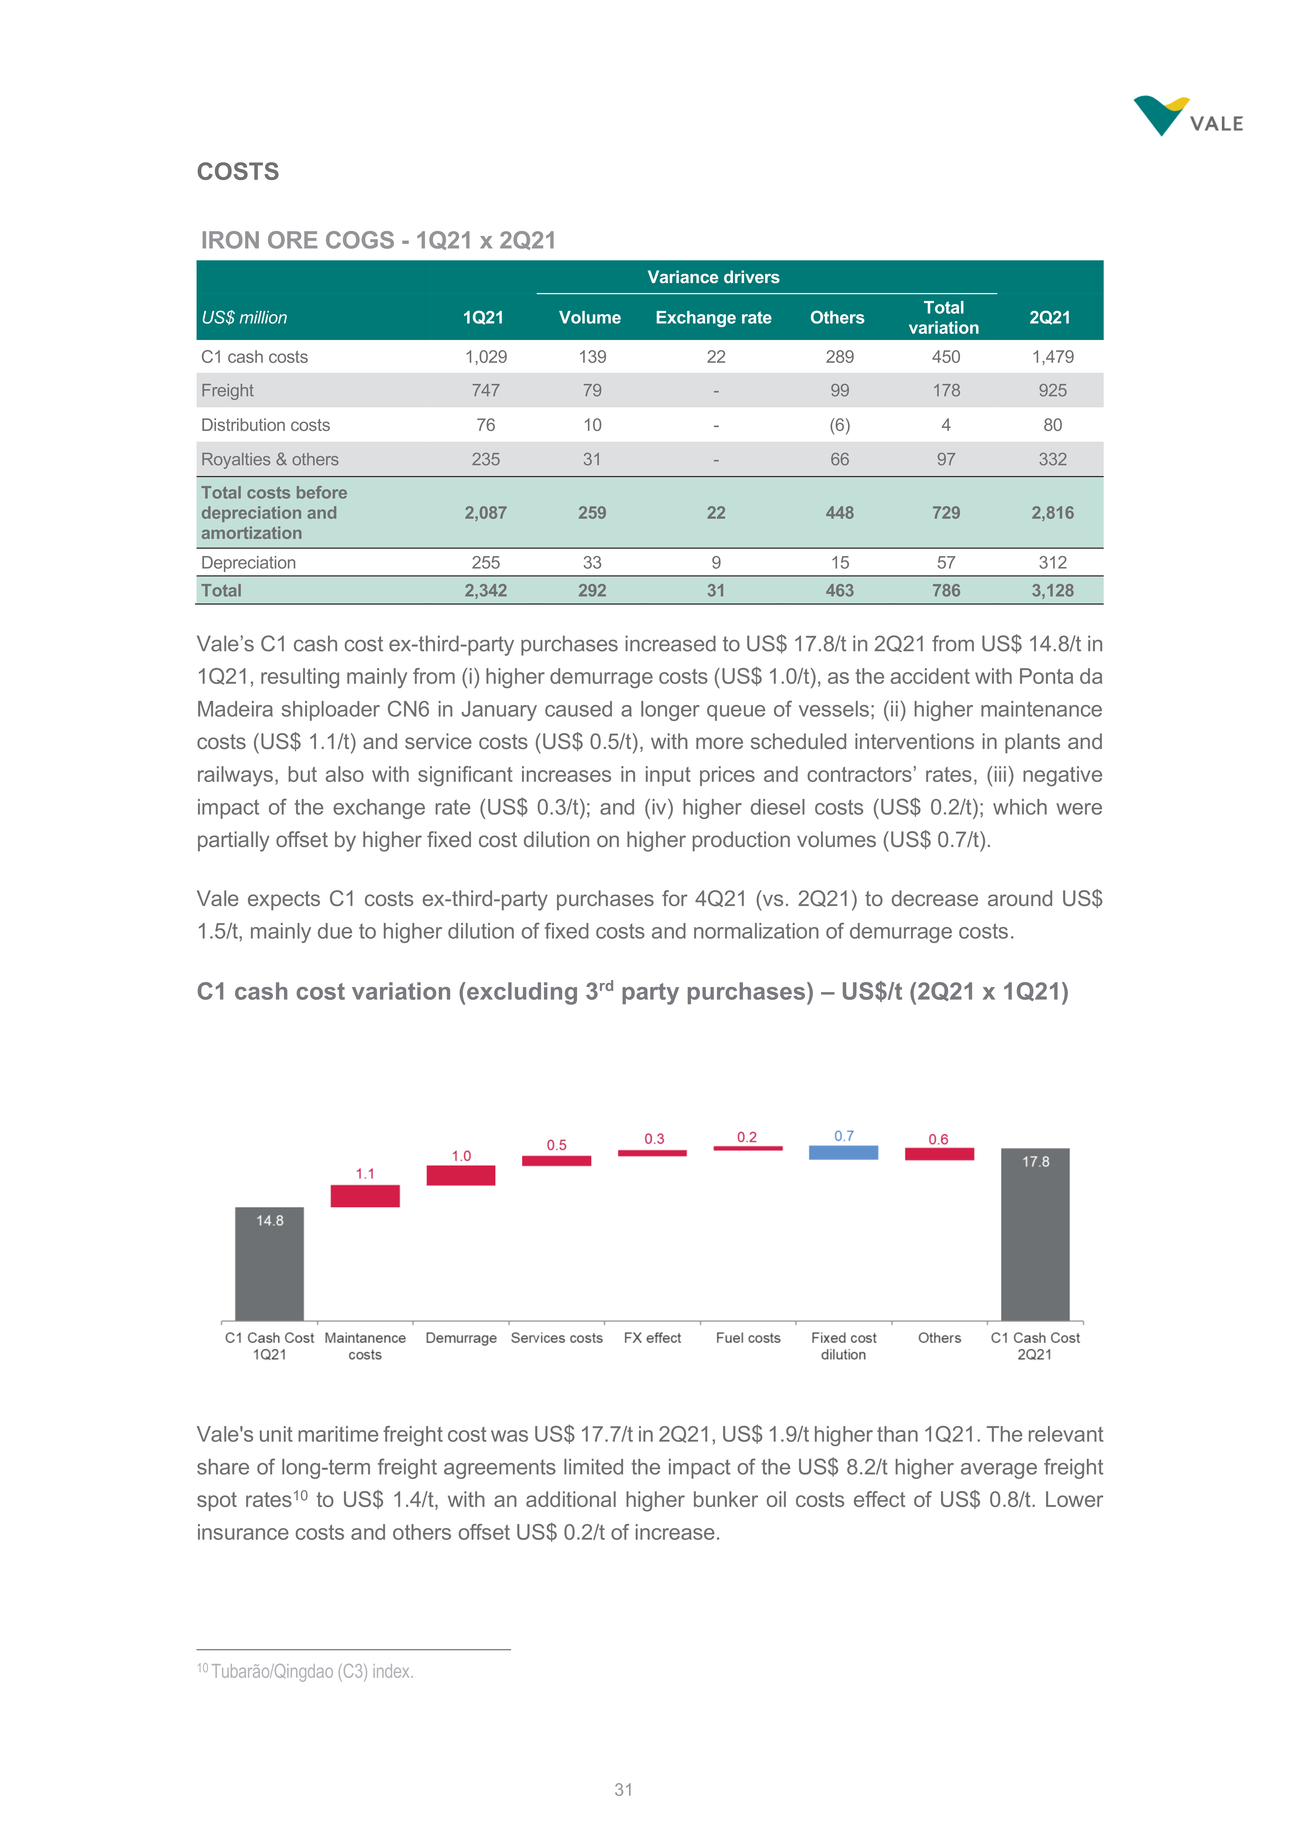 | COSTS Vale’s C1 cash cost ex-third-party purchases increased to US$ 17.8/t in 2Q21 from US$ 14.8/t in 1Q21, resulting mainly from (i) higher demurrage costs (US$ 1.0/t), as the accident with Ponta da Madeira shiploader CN6 in January caused a longer queue of vessels; (ii) higher maintenance costs (US$ 1.1/t) and service costs (US$ 0.5/t), with more scheduled interventions in plants and railways, but also with significant increases in input prices and contractors’ rates, (iii) negative impact of the exchange rate (US$ 0.3/t); and (iv) higher diesel costs (US$ 0.2/t); which were partially offset by higher fixed cost dilution on higher production volumes (US$ 0.7/t). Vale expects C1 costs ex-third-party purchases for 4Q21 (vs. 2Q21) to decrease around US$ 1.5/t, mainly due to higher dilution of fixed costs and normalization of demurrage costs. C1 cash cost variation (excluding 3rd party purchases) – US$/t (2Q21 x 1Q21) Vale's unit maritime freight cost was US$ 17.7/t in 2Q21, US$ 1.9/t higher than 1Q21. The relevant share of long-term freight agreements limited the impact of the US$ 8.2/t higher average freight spot rates10 to US$ 1.4/t, with an additional higher bunker oil costs effect of US$ 0.8/t. Lower insurance costs and others offset US$ 0.2/t of increase. 10 Tubarão/Qingdao (C3) index. |
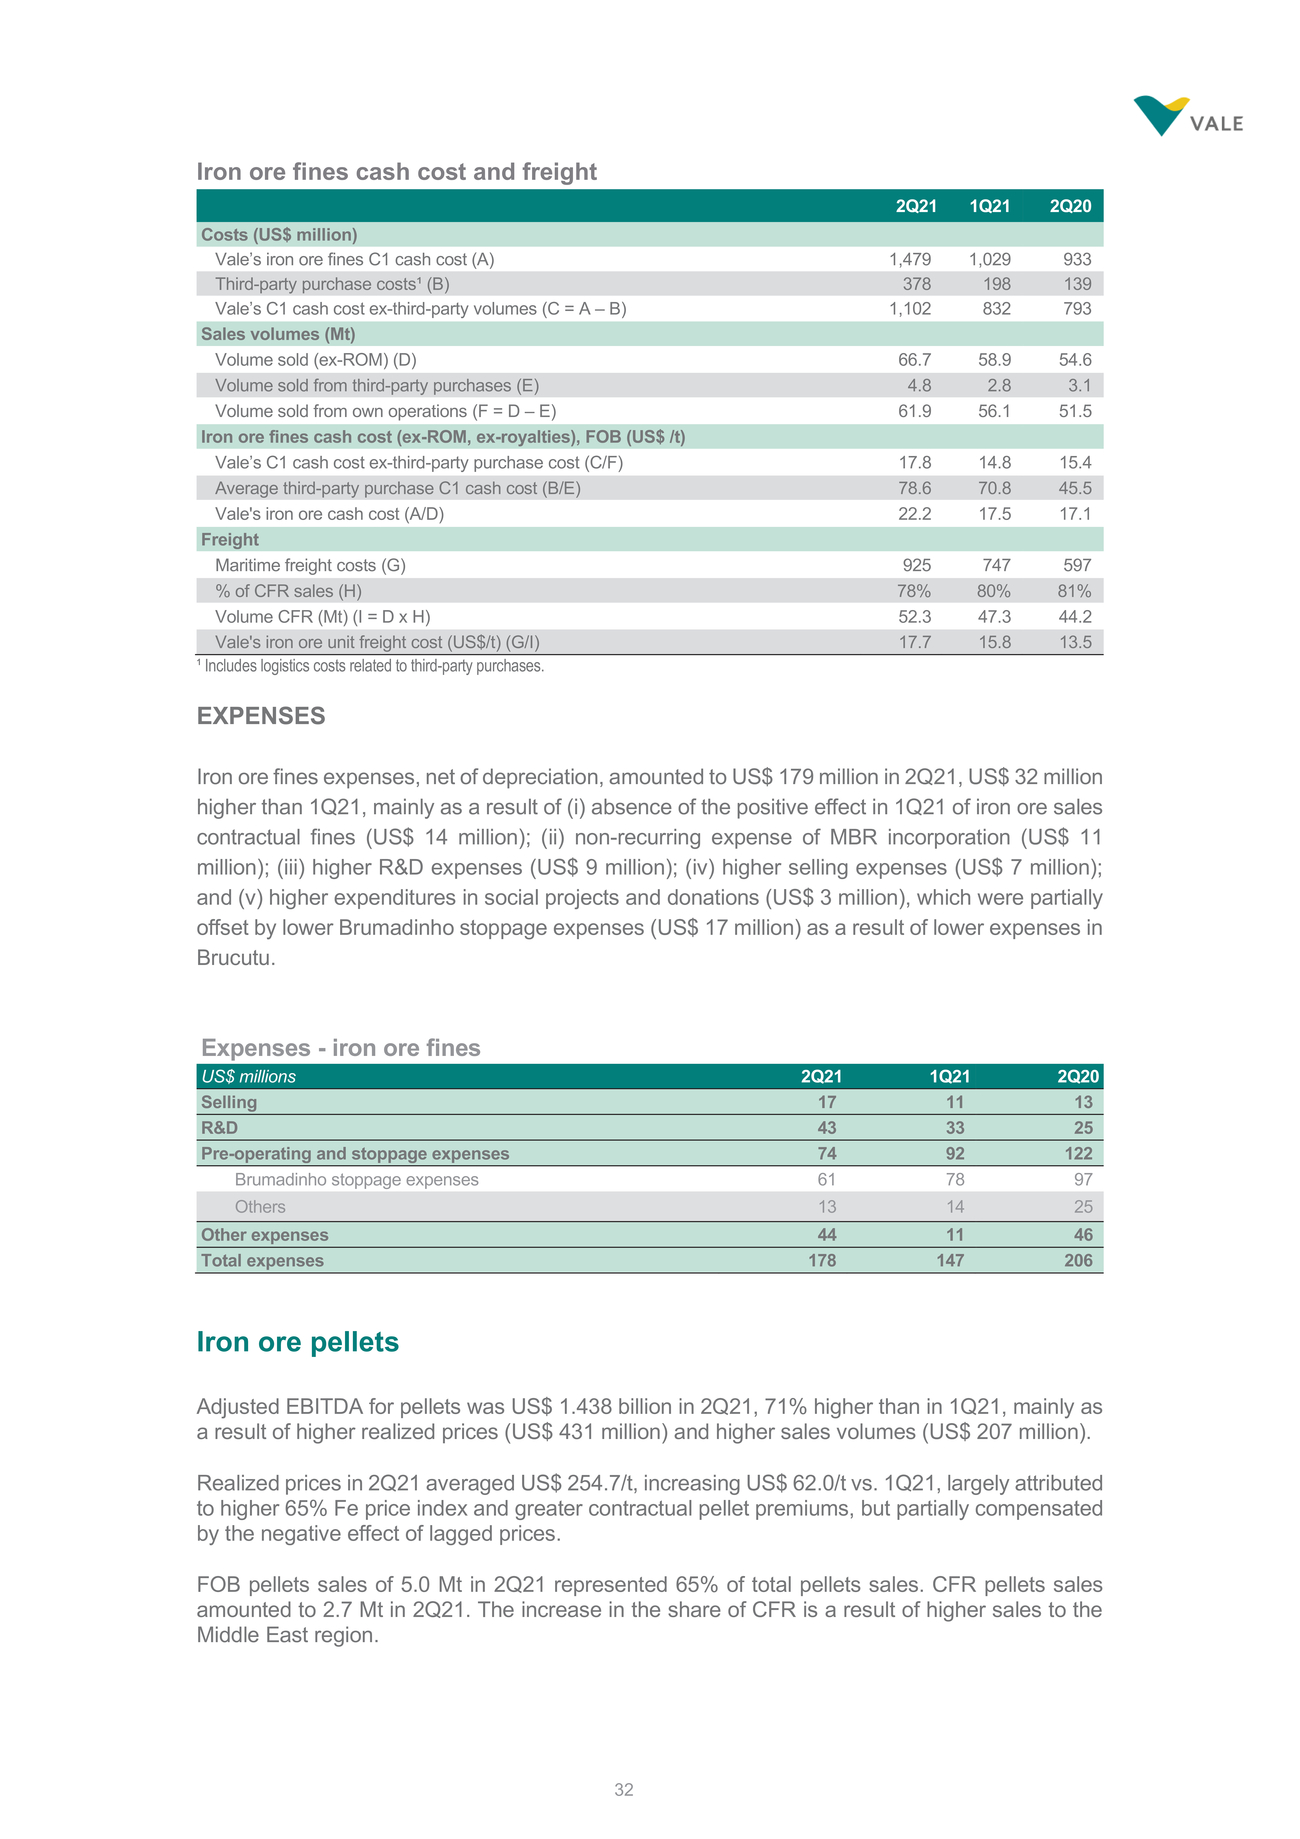 | ¹ Includes logistics costs related to third-party purchases. EXPENSES Iron ore fines expenses, net of depreciation, amounted to US$ 179 million in 2Q21, US$ 32 million higher than 1Q21, mainly as a result of (i) absence of the positive effect in 1Q21 of iron ore sales contractual fines (US$ 14 million); (ii) non-recurring expense of MBR incorporation (US$ 11 million); (iii) higher R&D expenses (US$ 9 million); (iv) higher selling expenses (US$ 7 million); and (v) higher expenditures in social projects and donations (US$ 3 million), which were partially offset by lower Brumadinho stoppage expenses (US$ 17 million) as a result of lower expenses in Brucutu. Expenses - iron ore fines Brumadinho stoppage expenses617897 Iron ore pellets Adjusted EBITDA for pellets was US$ 1.438 billion in 2Q21, 71% higher than in 1Q21, mainly as a result of higher realized prices (US$ 431 million) and higher sales volumes (US$ 207 million). Realized prices in 2Q21 averaged US$ 254.7/t, increasing US$ 62.0/t vs. 1Q21, largely attributed to higher 65% Fe price index and greater contractual pellet premiums, but partially compensated by the negative effect of lagged prices. FOB pellets sales of 5.0 Mt in 2Q21 represented 65% of total pellets sales. CFR pellets sales amounted to 2.7 Mt in 2Q21. The increase in the share of CFR is a result of higher sales to the Middle East region. |
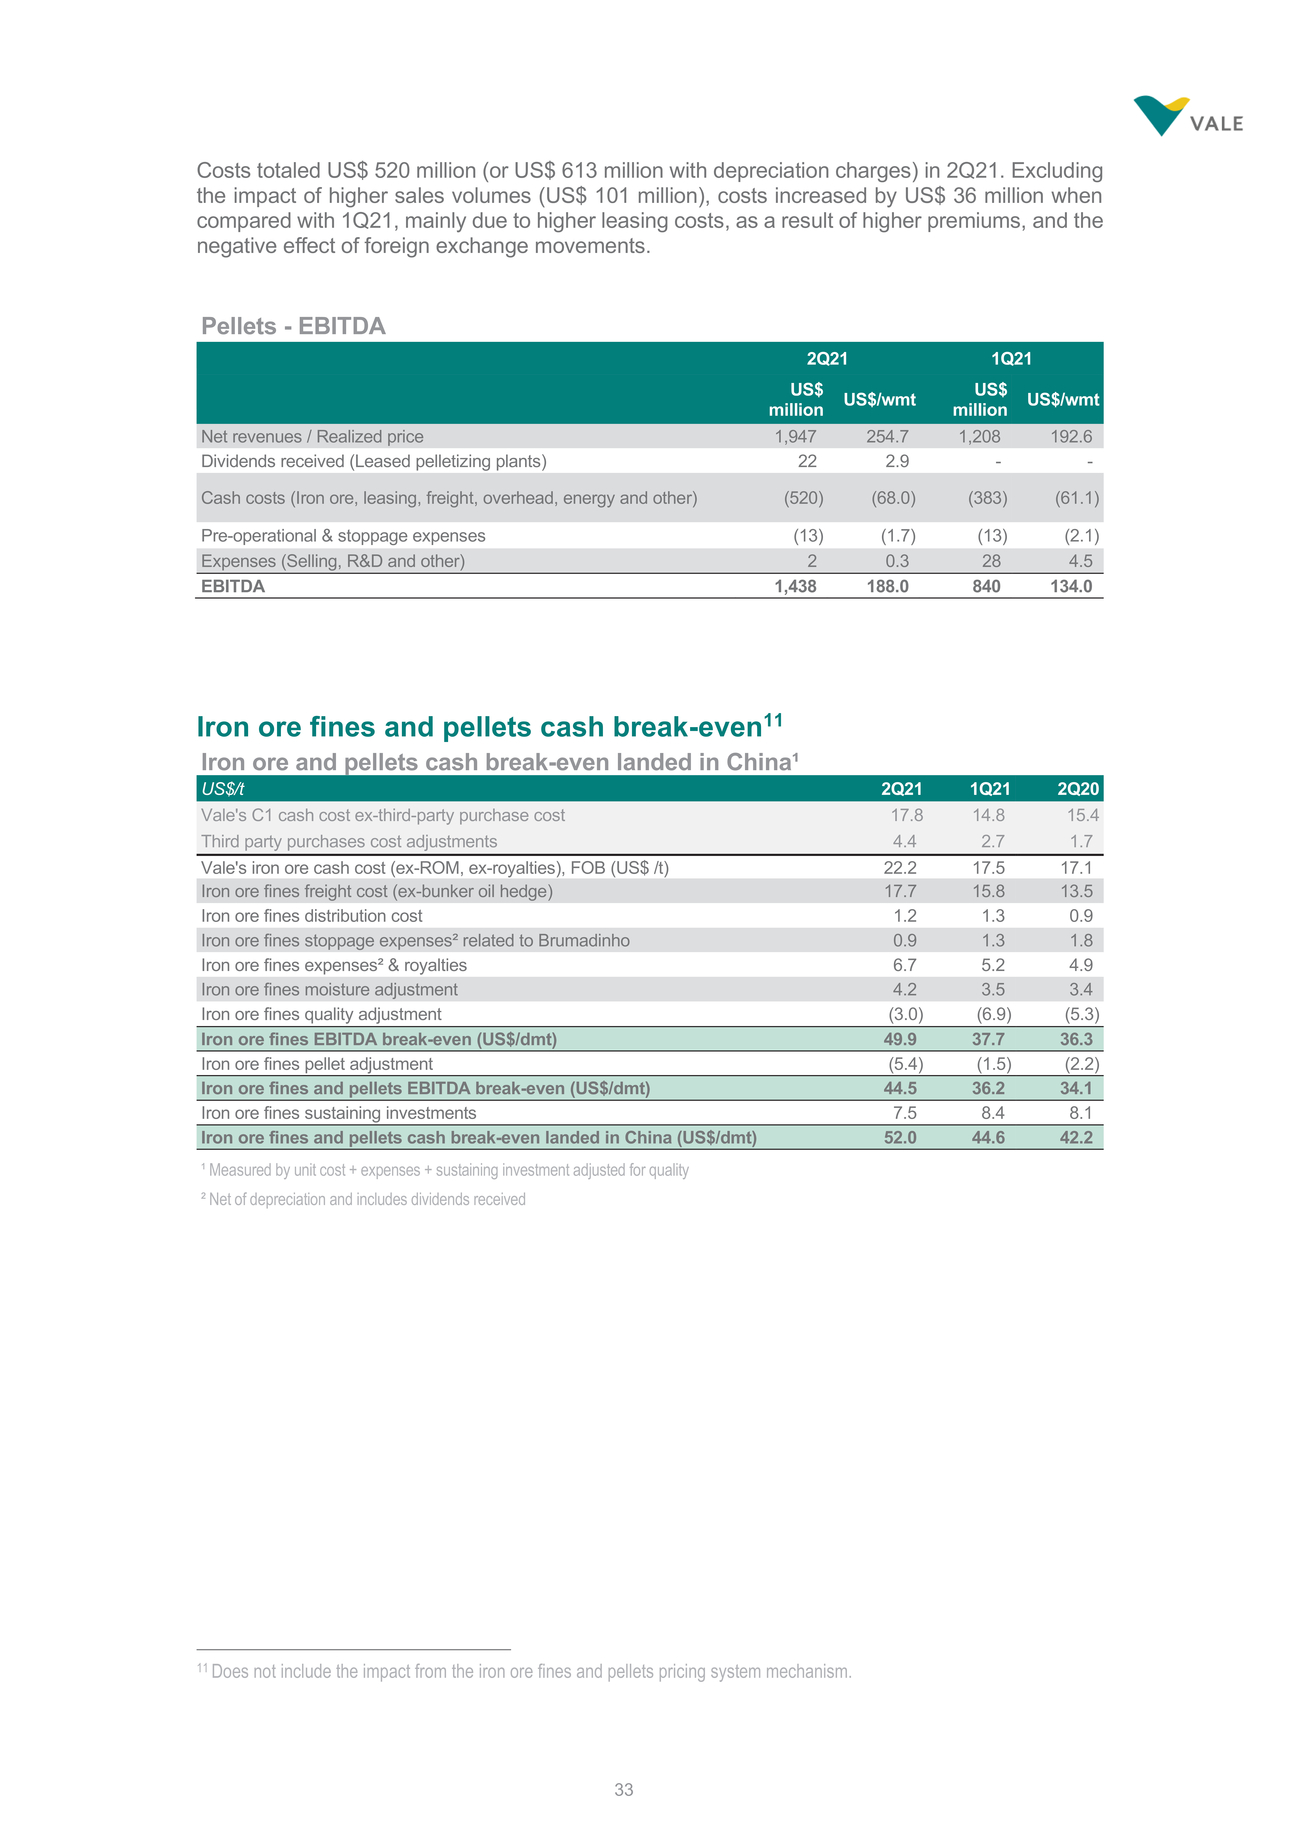 | Costs totaled US$ 520 million (or US$ 613 million with depreciation charges) in 2Q21. Excluding the impact of higher sales volumes (US$ 101 million), costs increased by US$ 36 million when compared with 1Q21, mainly due to higher leasing costs, as a result of higher premiums, and the negative effect of foreign exchange movements. Pellets - EBITDA 2Q211Q21 US$ million US$/wmtUS$ million US$/wmt Net revenues / Realized price1,947254.71,208192.6 Dividends received (Leased pelletizing plants)222.9--Cash costs (Iron ore, leasing, freight, overhead, energy and other)(520)(68.0)(383)(61.1) Pre-operational & stoppage expenses(13)(1.7)(13)(2.1) Expenses (Selling, R&D and other)20.3284.5 EBITDA1,438188.0840134.0 Iron ore fines and pellets cash break-even11 11 Does not include the impact from the iron ore fines and pellets pricing system mechanism. |
 | [LOGO] |
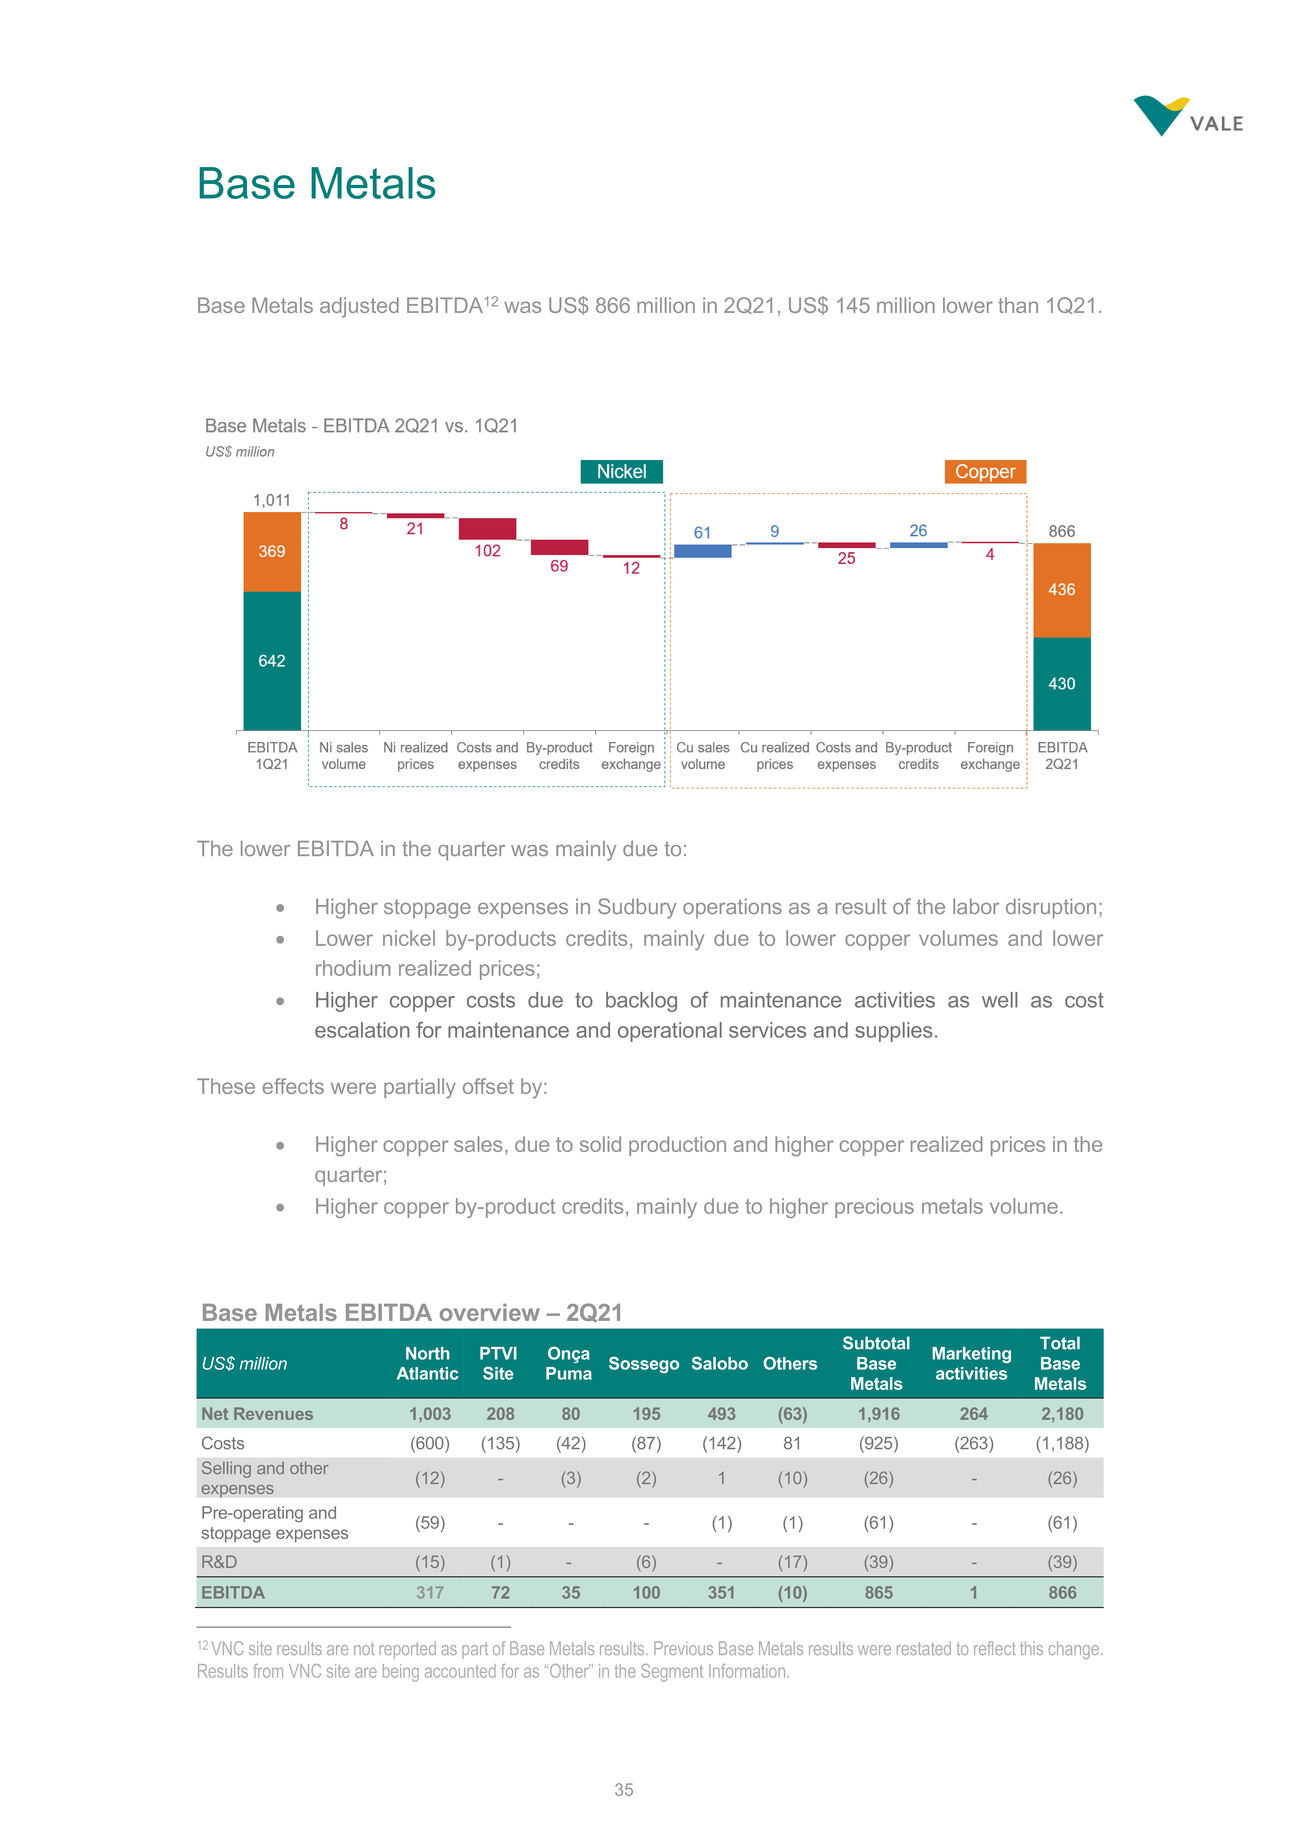 | Base Metals Base Metals adjusted EBITDA12 was US$ 866 million in 2Q21, US$ 145 million lower than 1Q21. The lower EBITDA in the quarter was mainly due to: Higher stoppage expenses in Sudbury operations as a result of the labor disruption; Lower nickel by-products credits, mainly due to lower copper volumes and lower rhodium realized prices; Higher copper costs due to backlog of maintenance activities as well as cost escalation for maintenance and operational services and supplies. These effects were partially offset by: Higher copper sales, due to solid production and higher copper realized prices in the quarter; Higher copper by-product credits, mainly due to higher precious metals volume. 12 VNC site results are not reported as part of Base Metals results. Previous Base Metals results were restated to reflect this change. Results from VNC site are being accounted for as “Other” in the Segment Information. |
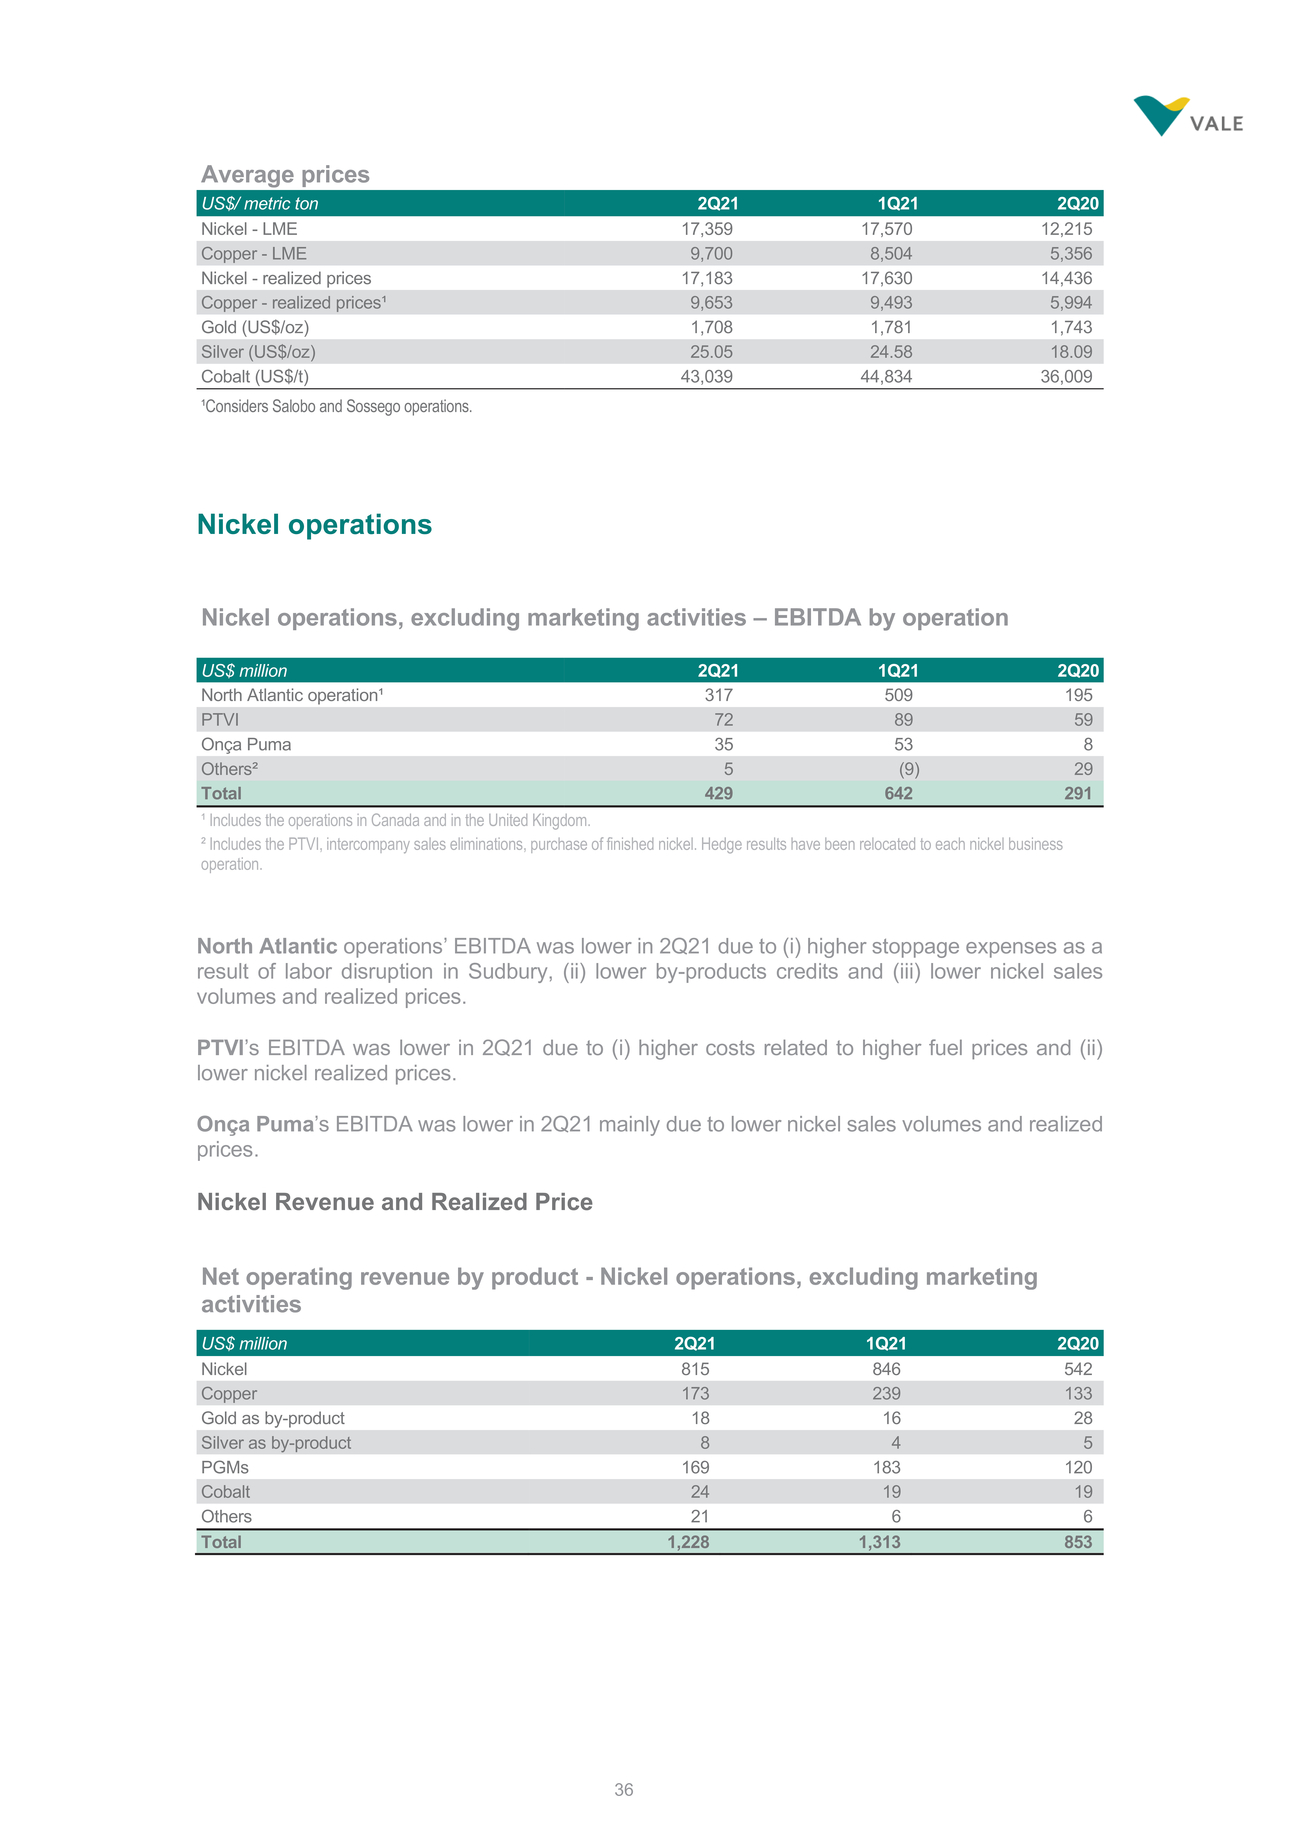 | Nickel operations North Atlantic operations’ EBITDA was lower in 2Q21 due to (i) higher stoppage expenses as a result of labor disruption in Sudbury, (ii) lower by-products credits and (iii) lower nickel sales volumes and realized prices. PTVI’s EBITDA was lower in 2Q21 due to (i) higher costs related to higher fuel prices and (ii) lower nickel realized prices. Onça Puma’s EBITDA was lower in 2Q21 mainly due to lower nickel sales volumes and realized prices. Nickel Revenue and Realized Price |
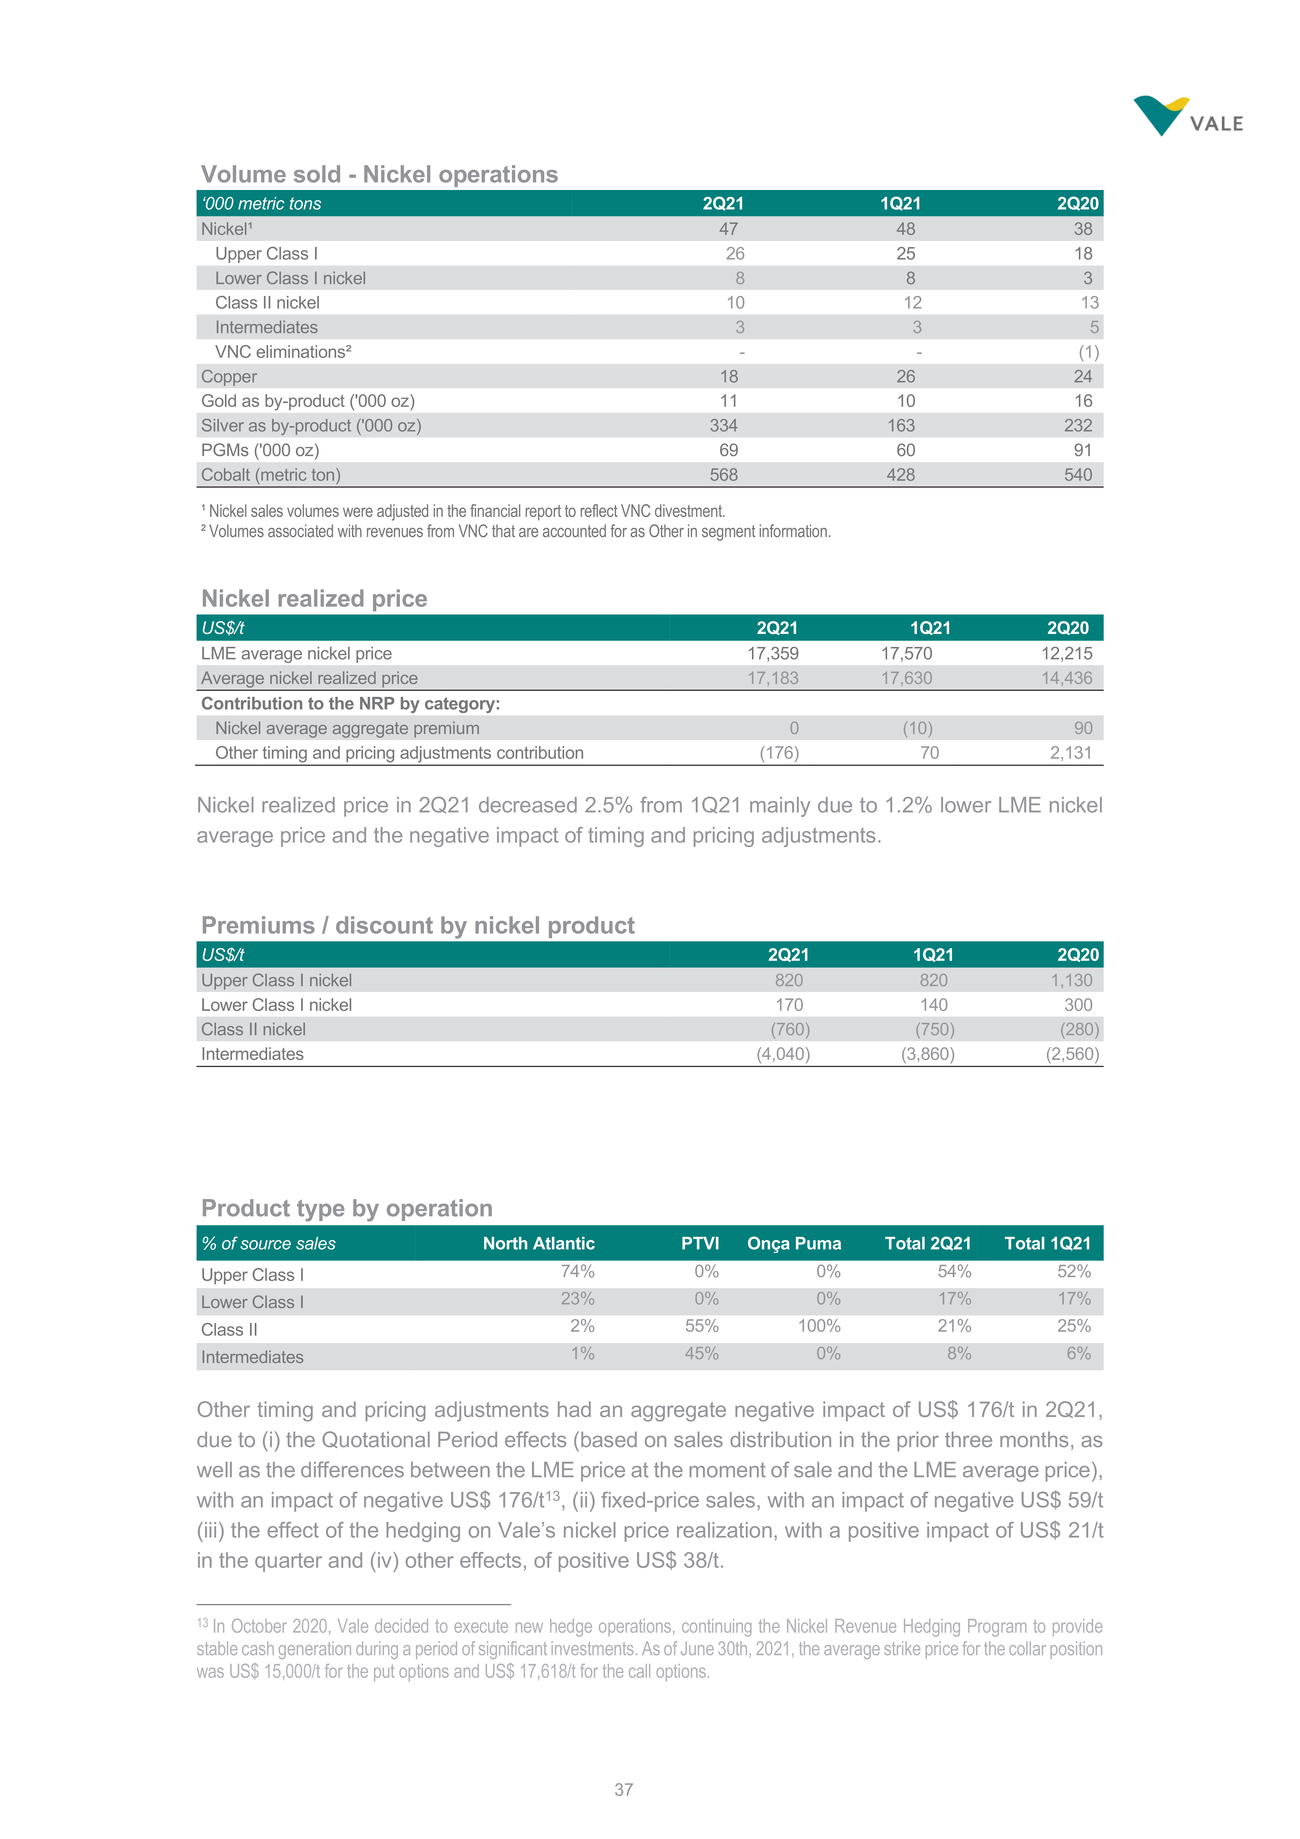 | Nickel realized price in 2Q21 decreased 2.5% from 1Q21 mainly due to 1.2% lower LME nickel average price and the negative impact of timing and pricing adjustments. Other timing and pricing adjustments had an aggregate negative impact of US$ 176/t in 2Q21, due to (i) the Quotational Period effects (based on sales distribution in the prior three months, as well as the differences between the LME price at the moment of sale and the LME average price), with an impact of negative US$ 176/t13, (ii) fixed-price sales, with an impact of negative US$ 59/t the effect of the hedging on Vale’s nickel price realization, with a positive impact of US$ 21/t in the quarter and (iv) other effects, of positive US$ 38/t. 13 In October 2020, Vale decided to execute new hedge operations, continuing the Nickel Revenue Hedging Program to provide stable cash generation during a period of significant investments. As of June 30th, 2021, the average strike price for the collar position was US$ 15,000/t for the put options and US$ 17,618/t for the call options. |
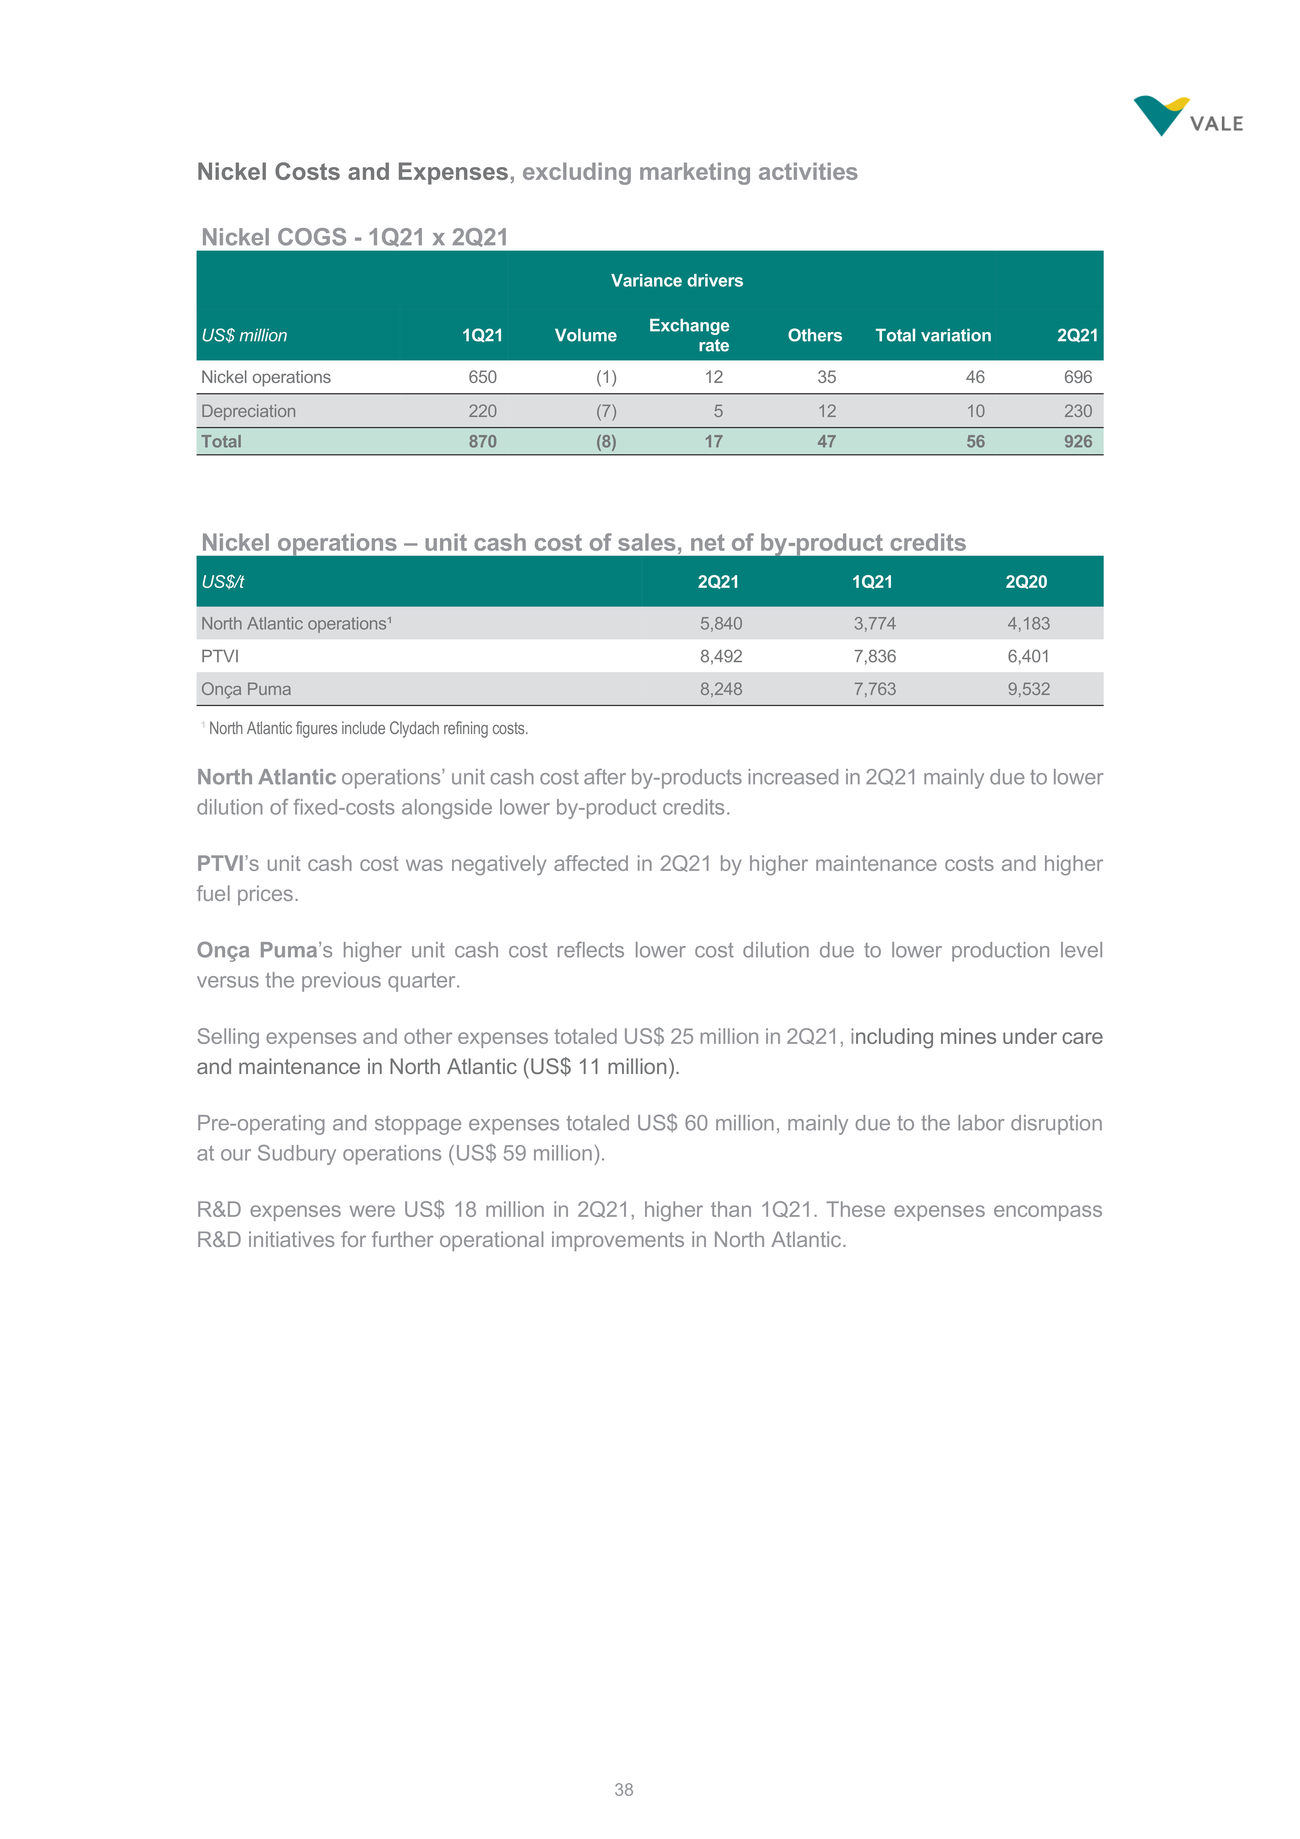 | Variance drivers US$ million 1Q21 Volume Exchange rate Others Total variation 2Q21 Nickel operations – unit cash cost of sales, net of by-product credits North Atlantic operations’ unit cash cost after by-products increased in 2Q21 mainly due to lower dilution of fixed-costs alongside lower by-product credits. PTVI’s unit cash cost was negatively affected in 2Q21 by higher maintenance costs and higher fuel prices. Onça Puma’s higher unit cash cost reflects lower cost dilution due to lower production level versus the previous quarter. Selling expenses and other expenses totaled US$ 25 million in 2Q21, including mines under care and maintenance in North Atlantic (US$ 11 million). Pre-operating and stoppage expenses totaled US$ 60 million, mainly due to the labor disruption at our Sudbury operations (US$ 59 million). R&D expenses were US$ 18 million in 2Q21, higher than 1Q21. These expenses encompass R&D initiatives for further operational improvements in North Atlantic. |
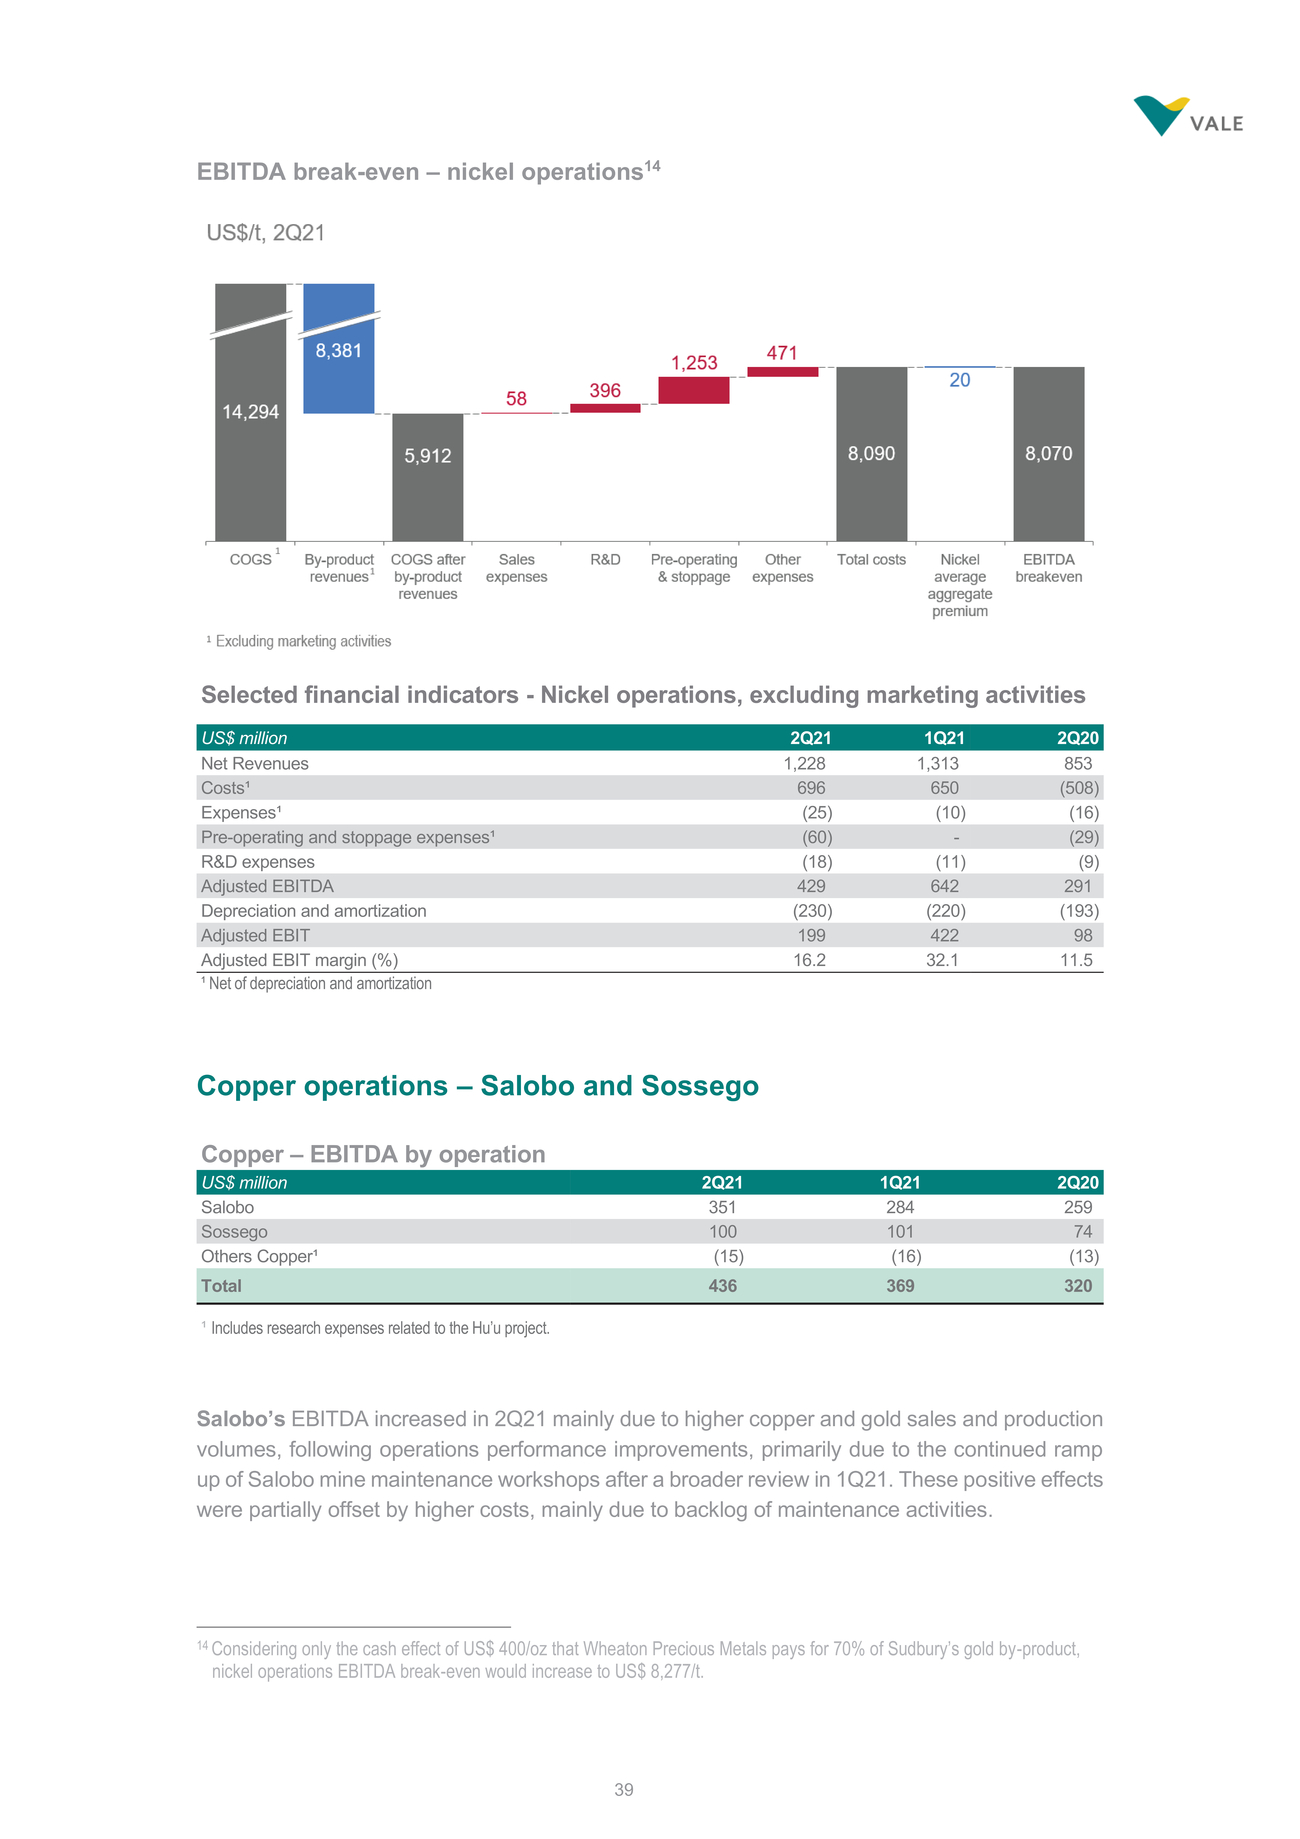 | EBITDA break-even – nickel operations14 Copper operations – Salobo and Sossego Salobo’s EBITDA increased in 2Q21 mainly due to higher copper and gold sales and production volumes, following operations performance improvements, primarily due to the continued ramp up of Salobo mine maintenance workshops after a broader review in 1Q21. These positive effects were partially offset by higher costs, mainly due to backlog of maintenance activities. 14 Considering only the cash effect of US$ 400/oz that Wheaton Precious Metals pays for 70% of Sudbury’s gold by-product, nickel operations EBITDA break-even would increase to US$ 8,277/t. |
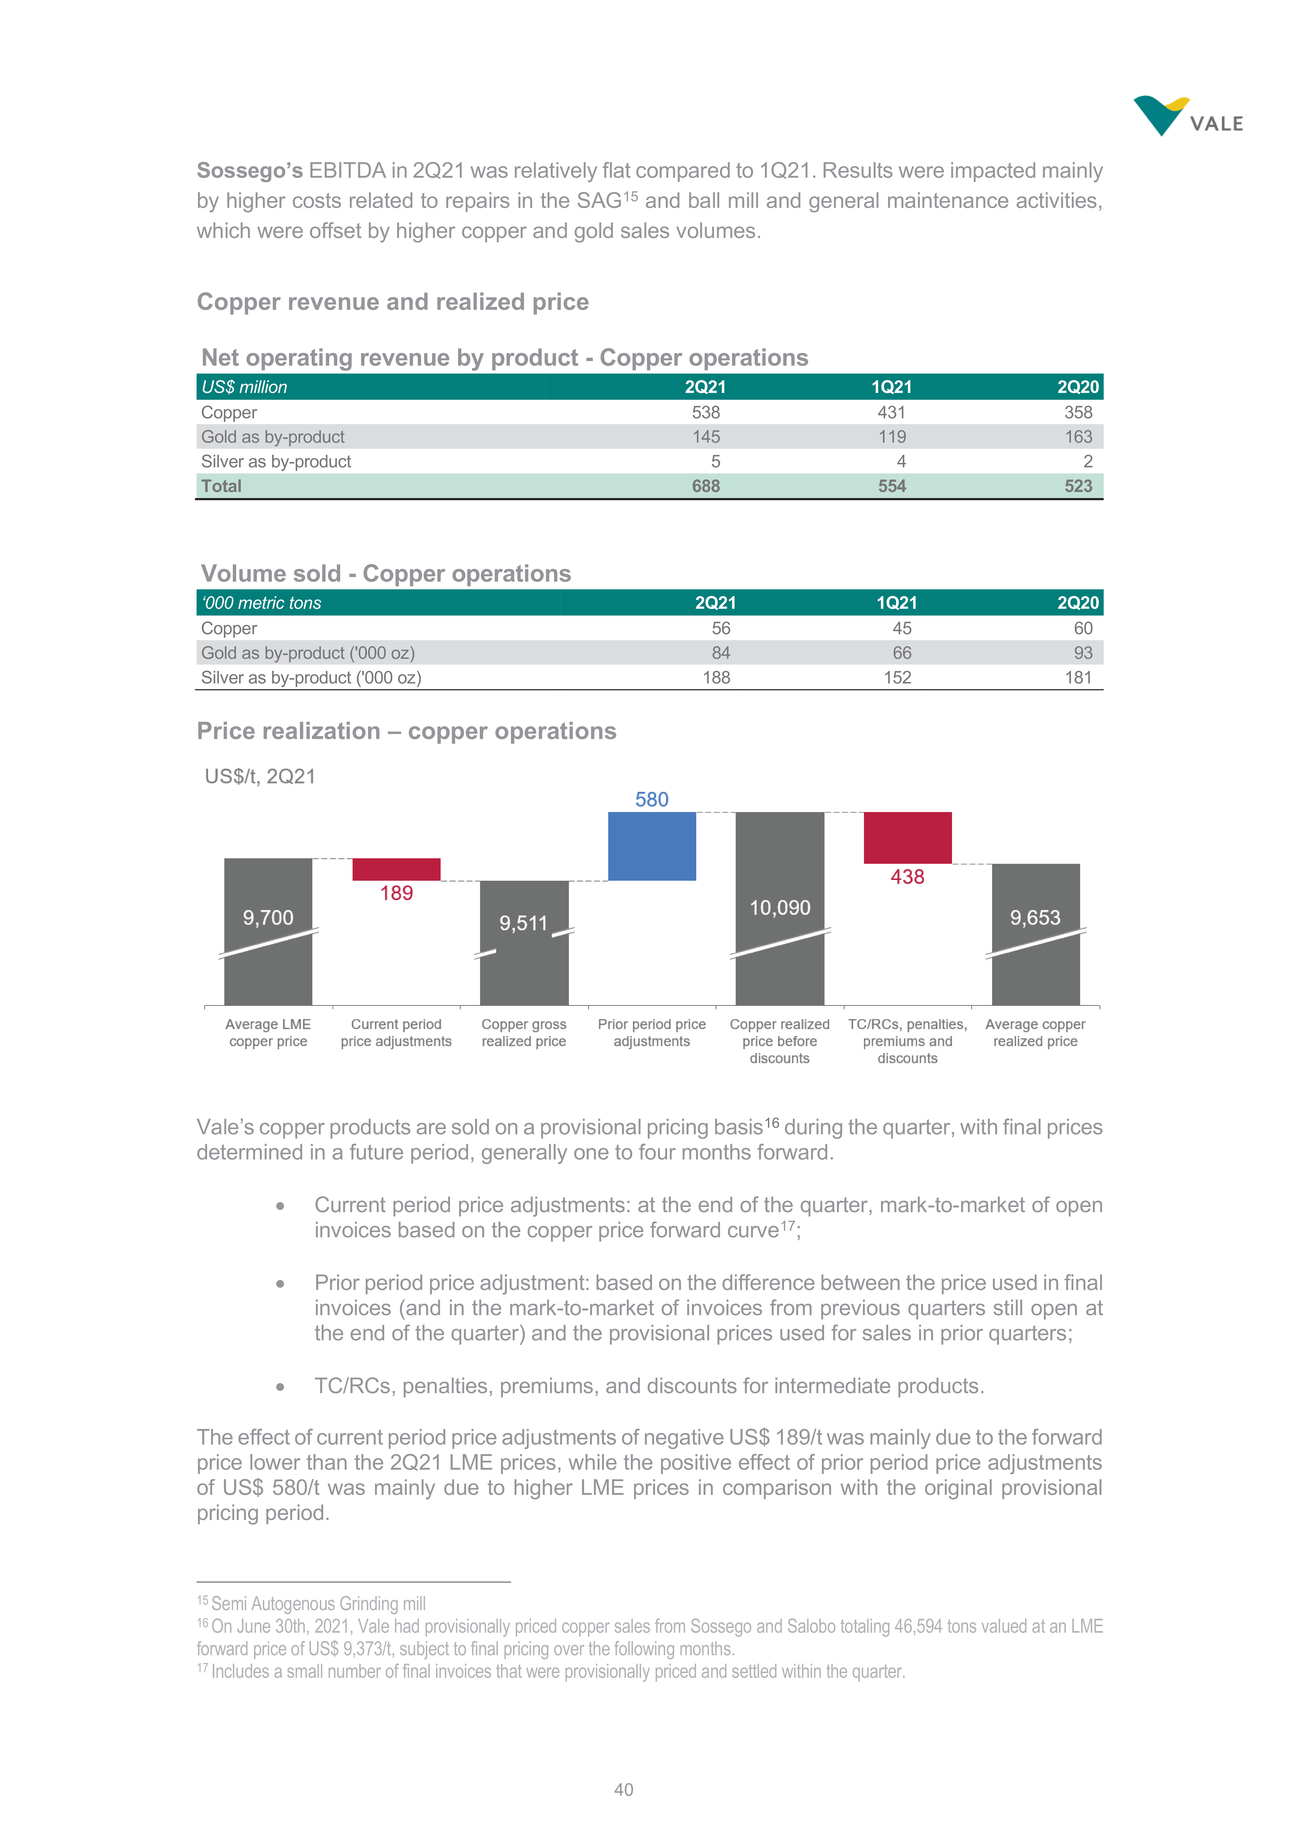 | Sossego’s EBITDA in 2Q21 was relatively flat compared to 1Q21. Results were impacted mainly by higher costs related to repairs in the SAG15 and ball mill and general maintenance activities, which were offset by higher copper and gold sales volumes. Copper revenue and realized price Price realization – copper operations Vale’s copper products are sold on a provisional pricing basis16 during the quarter, with final prices determined in a future period, generally one to four months forward. Current period price adjustments: at the end of the quarter, mark-to-market of open invoices based on the copper price forward curve17; Prior period price adjustment: based on the difference between the price used in final invoices (and in the mark-to-market of invoices from previous quarters still open at the end of the quarter) and the provisional prices used for sales in prior quarters; TC/RCs, penalties, premiums, and discounts for intermediate products. The effect of current period price adjustments of negative US$ 189/t was mainly due to the forward price lower than the 2Q21 LME prices, while the positive effect of prior period price adjustments of US$ 580/t was mainly due to higher LME prices in comparison with the original provisional pricing period. 15 Semi Autogenous Grinding mill 16 On June 30th, 2021, Vale had provisionally priced copper sales from Sossego and Salobo totaling 46,594 tons valued at an LME forward price of US$ 9,373/t, subject to final pricing over the following months. 17 Includes a small number of final invoices that were provisionally priced and settled within the quarter. |
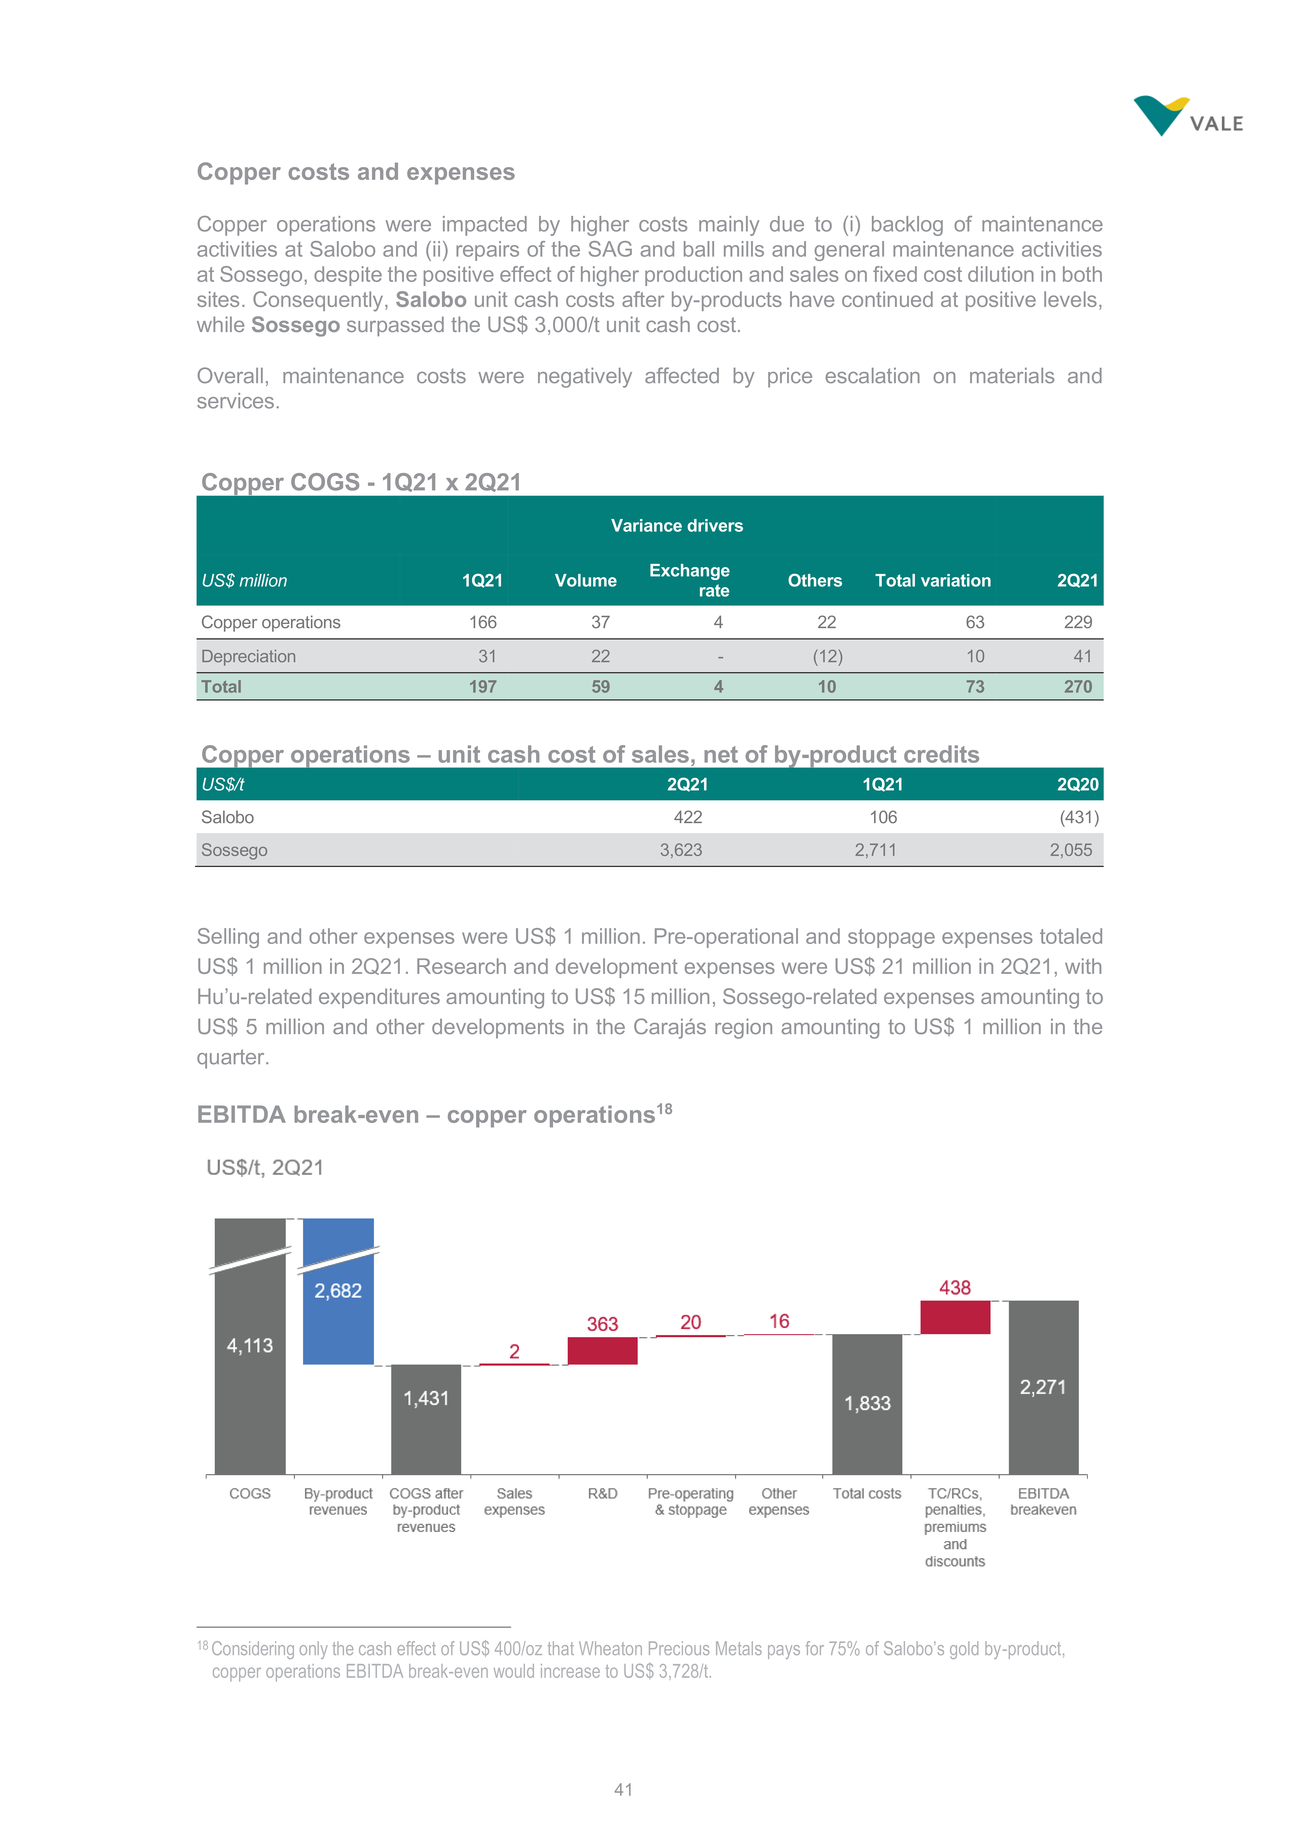 | Copper costs and expenses Copper operations were impacted by higher costs mainly due to (i) backlog of maintenance activities at Salobo and (ii) repairs of the SAG and ball mills and general maintenance activities at Sossego, despite the positive effect of higher production and sales on fixed cost dilution in both sites. Consequently, Salobo unit cash costs after by-products have continued at positive levels, while Sossego surpassed the US$ 3,000/t unit cash cost. Overall, maintenance costs were negatively affected by price escalation on materials and services. Copper COGS - 1Q21 x 2Q21 Copper operations 166 37 4 22 63 229 Depreciation 31 22 - (12) 10 41 Total 197 59 4 10 73 270 Selling and other expenses were US$ 1 million. Pre-operational and stoppage expenses totaled US$ 1 million in 2Q21. Research and development expenses were US$ 21 million in 2Q21, with Hu’u-related expenditures amounting to US$ 15 million, Sossego-related expenses amounting to US$ 5 million and other developments in the Carajás region amounting to US$ 1 million in the quarter. EBITDA break-even – copper operations18 18 Considering only the cash effect of US$ 400/oz that Wheaton Precious Metals pays for 75% of Salobo’s gold by-product, copper operations EBITDA break-even would increase to US$ 3,728/t. |
 | The realized price to be compared to the EBITDA break-even should be the copper realized price before discounts (US$ 10,090/t), given that TC/RCs, penalties and other discounts are already part of the EBITDA break-even build-up. |
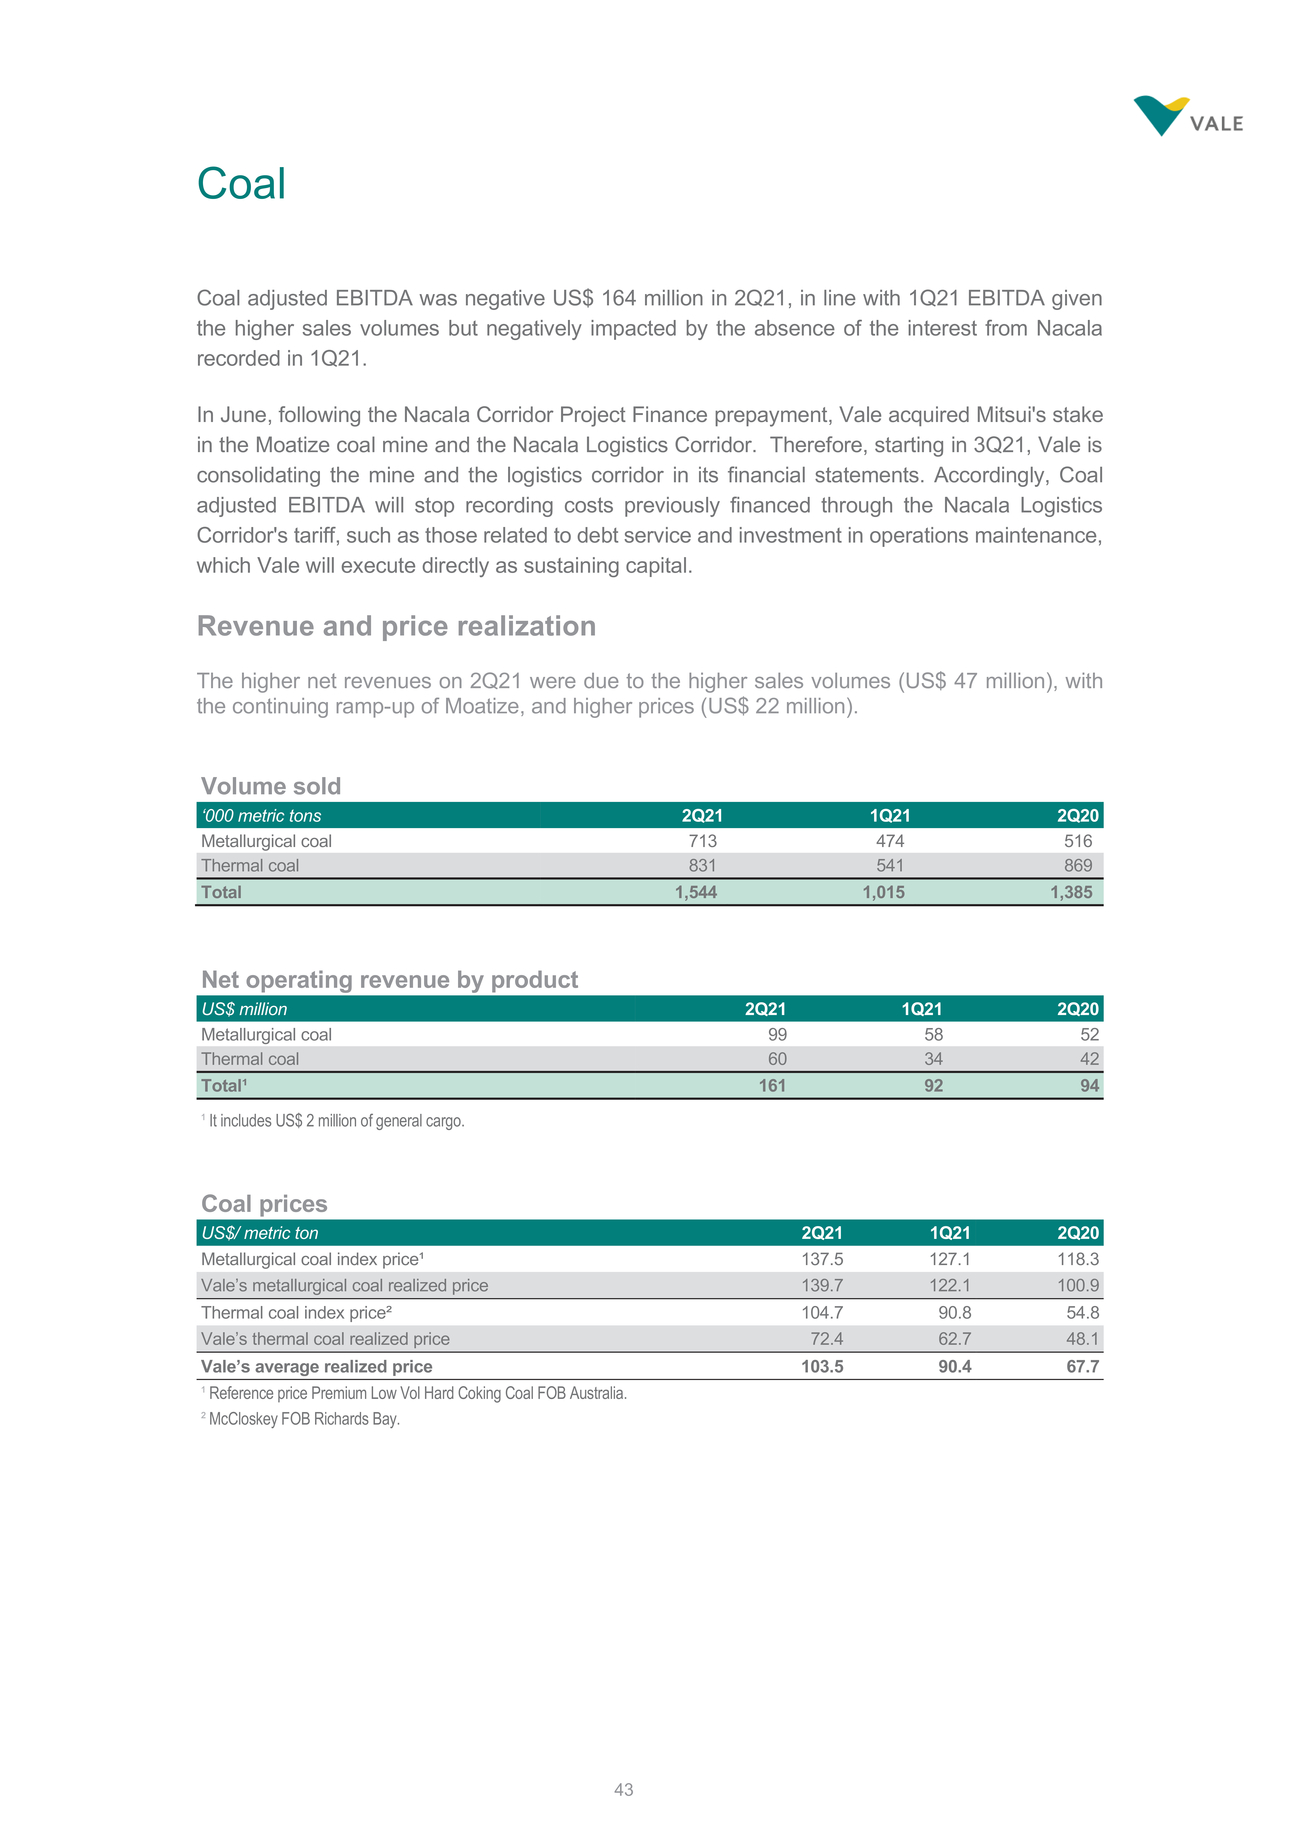 | Coal Coal adjusted EBITDA was negative US$ 164 million in 2Q21, in line with 1Q21 EBITDA given the higher sales volumes but negatively impacted by the absence of the interest from Nacala recorded in 1Q21. In June, following the Nacala Corridor Project Finance prepayment, Vale acquired Mitsui's stake in the Moatize coal mine and the Nacala Logistics Corridor. Therefore, starting in 3Q21, Vale is consolidating the mine and the logistics corridor in its financial statements. Accordingly, Coal adjusted EBITDA will stop recording costs previously financed through the Nacala Logistics Corridor's tariff, such as those related to debt service and investment in operations maintenance, which Vale will execute directly as sustaining capital. Revenue and price realization The higher net revenues on 2Q21 were due to the higher sales volumes (US$ 47 million), with the continuing ramp-up of Moatize, and higher prices (US$ 22 million). |
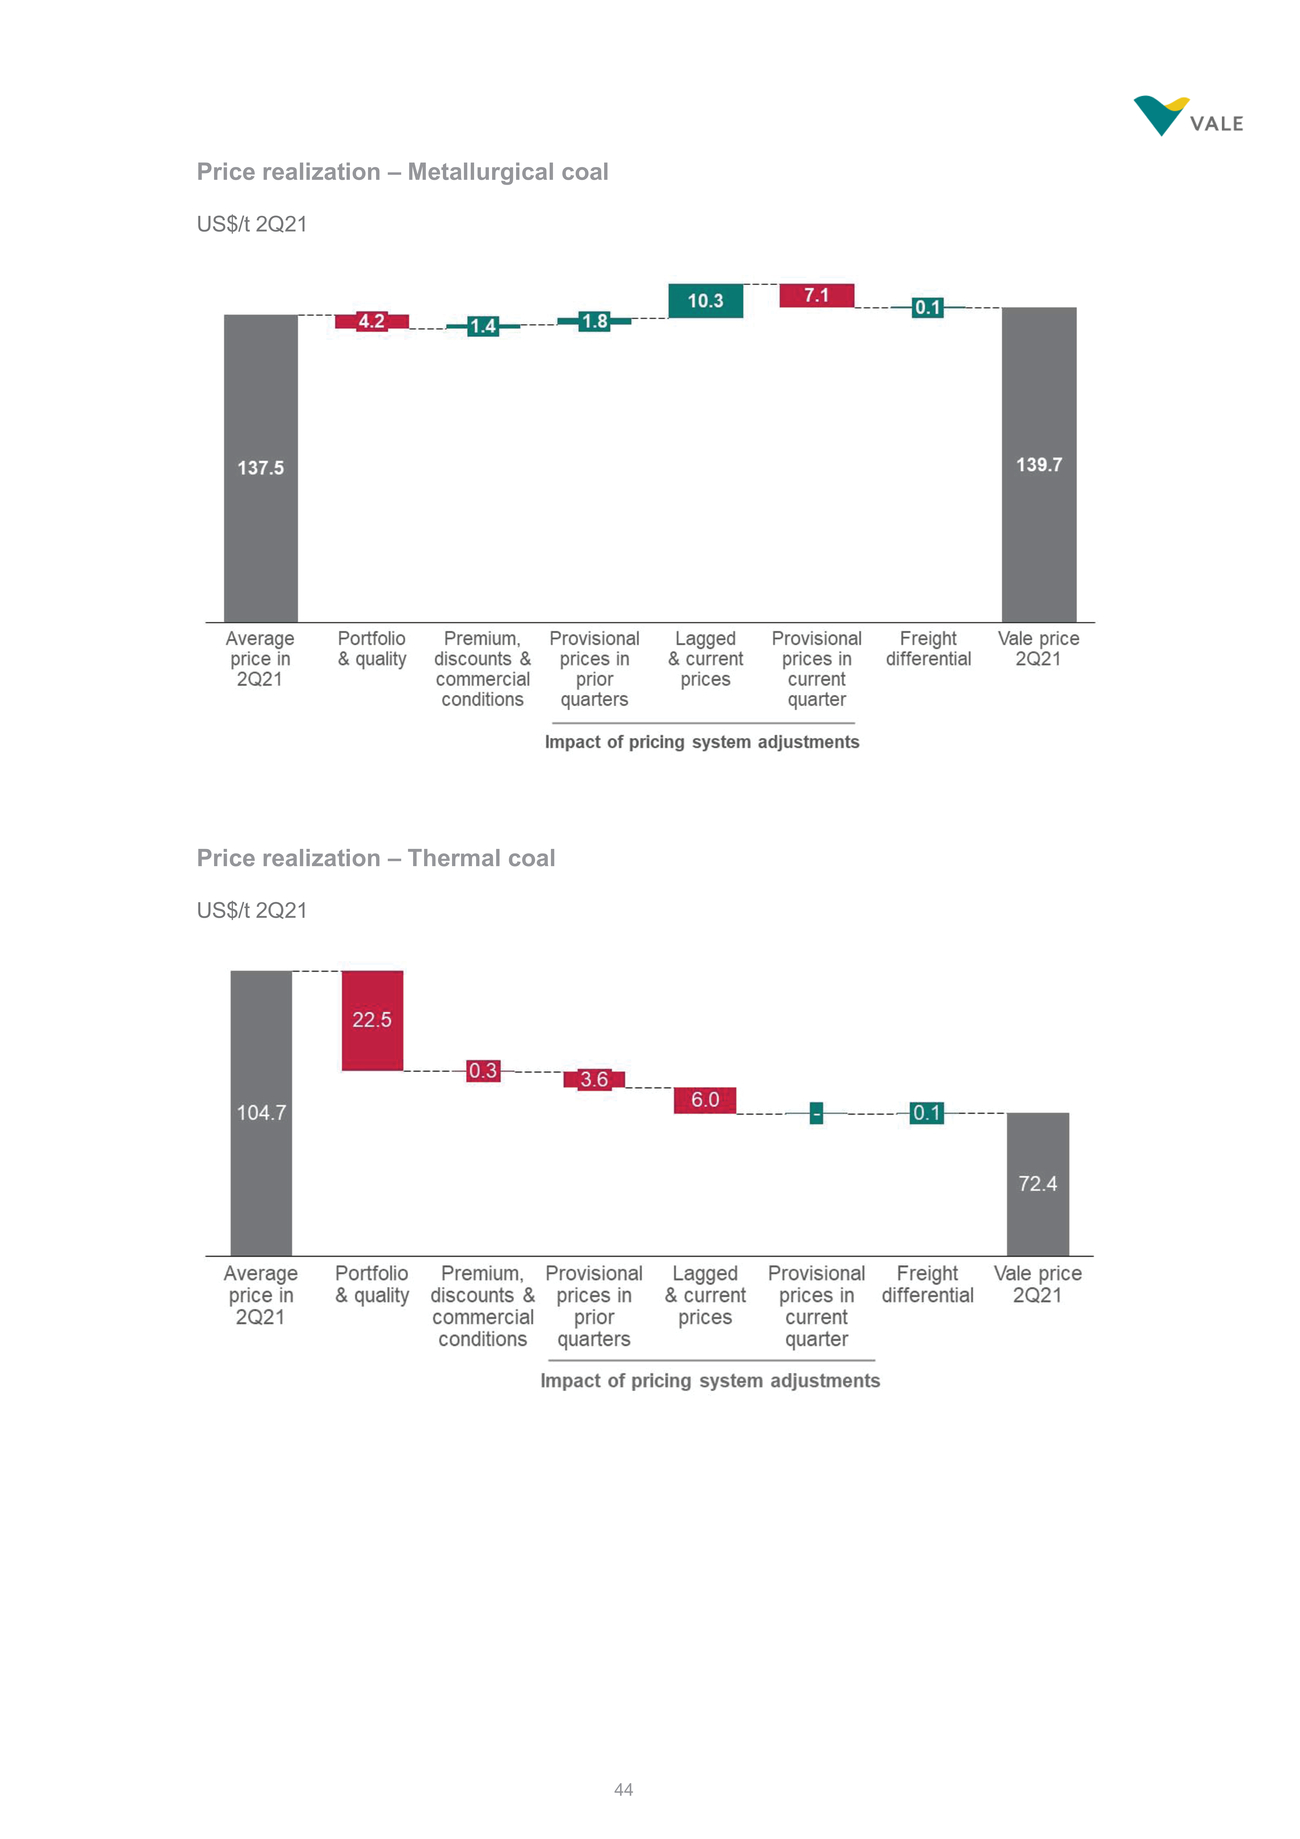 | Price realization – Metallurgical coal US$/t 2Q21 Price realization – Thermal coal US$/t 2Q21 |
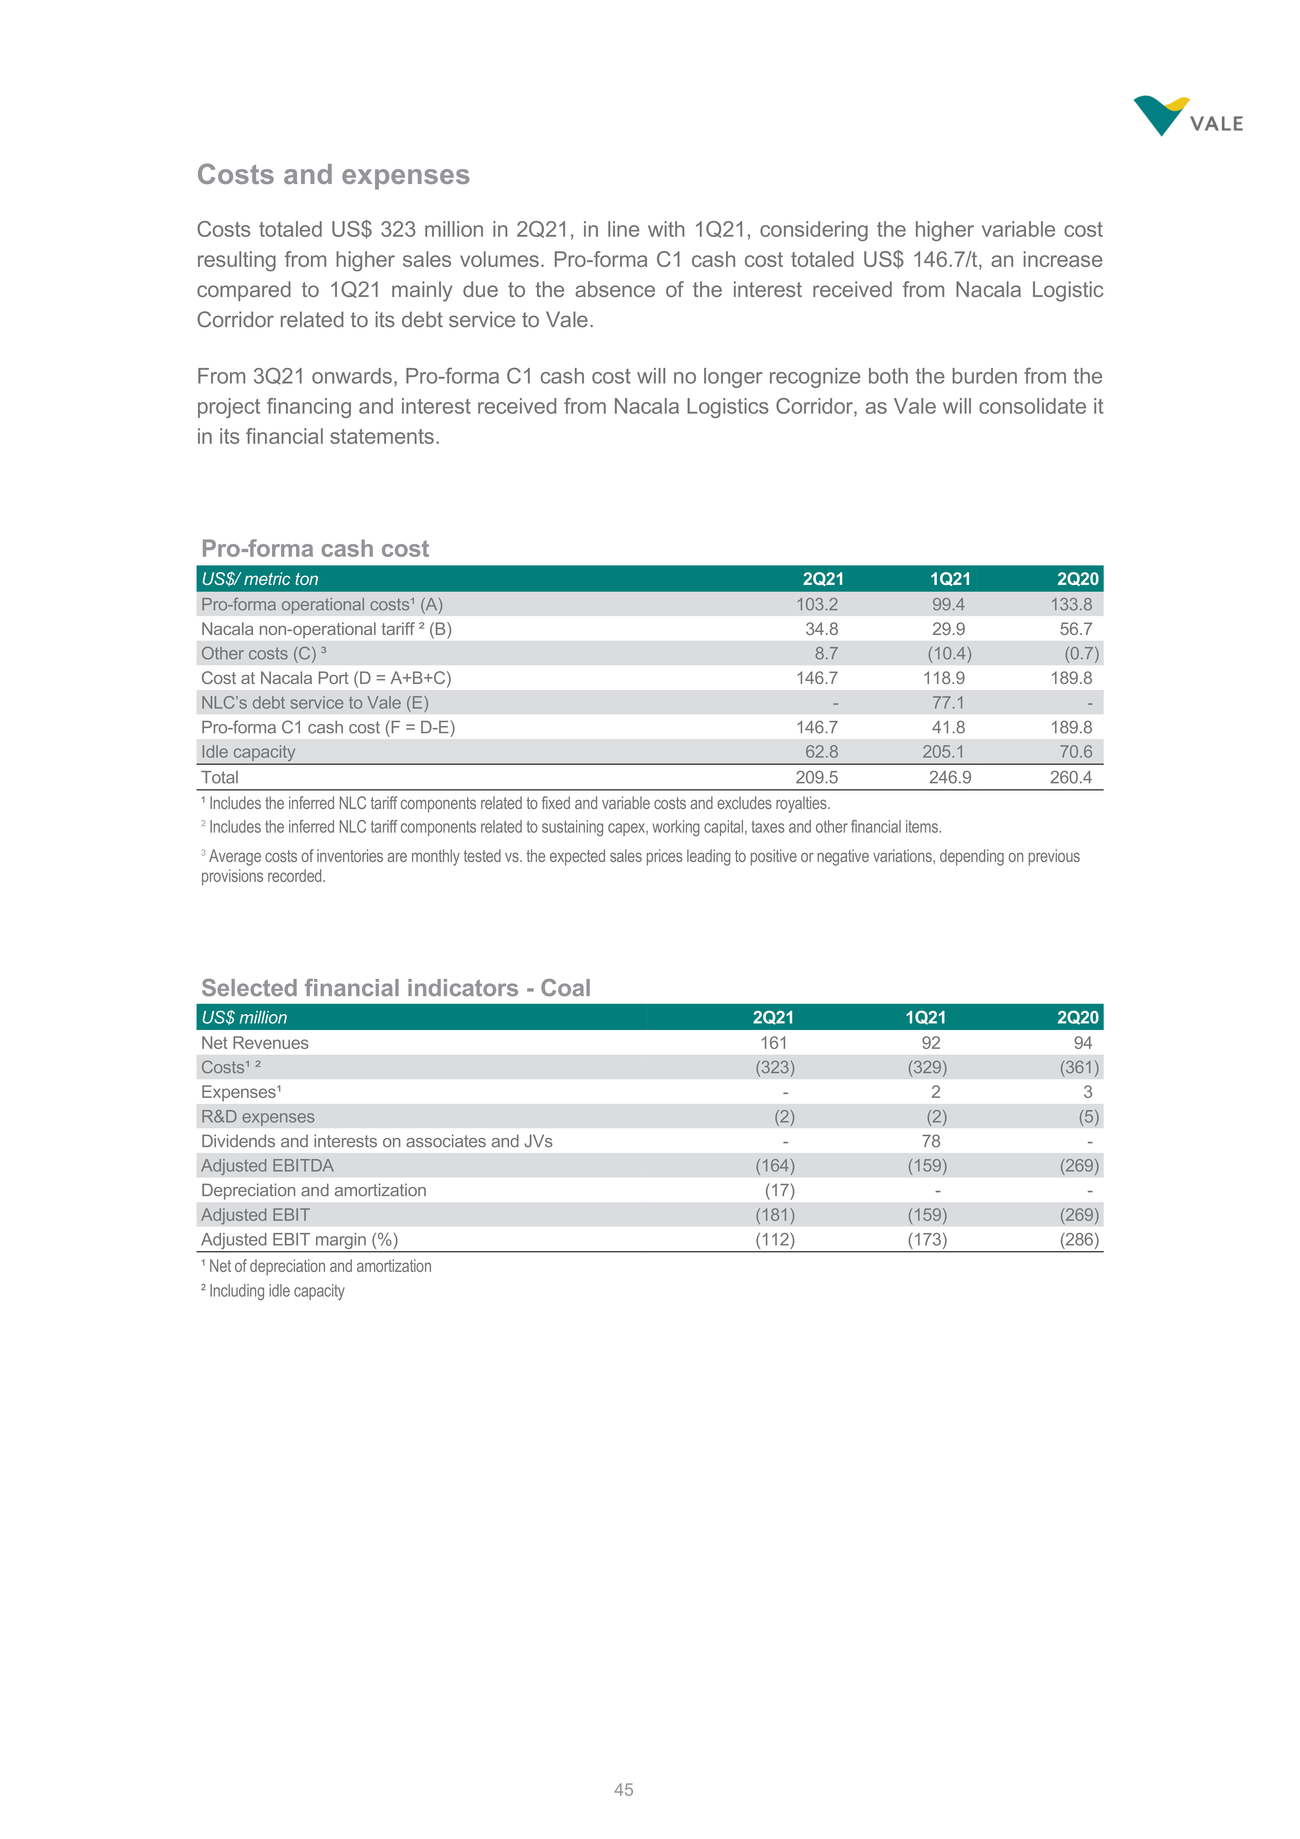 | Costs and expenses Costs totaled US$ 323 million in 2Q21, in line with 1Q21, considering the higher variable cost resulting from higher sales volumes. Pro-forma C1 cash cost totaled US$ 146.7/t, an increase compared to 1Q21 mainly due to the absence of the interest received from Nacala Logistic Corridor related to its debt service to Vale. From 3Q21 onwards, Pro-forma C1 cash cost will no longer recognize both the burden from the project financing and interest received from Nacala Logistics Corridor, as Vale will consolidate it in its financial statements. |
 | ANNEXES SIMPLIFIED FINANCIAL STATEMENTS |
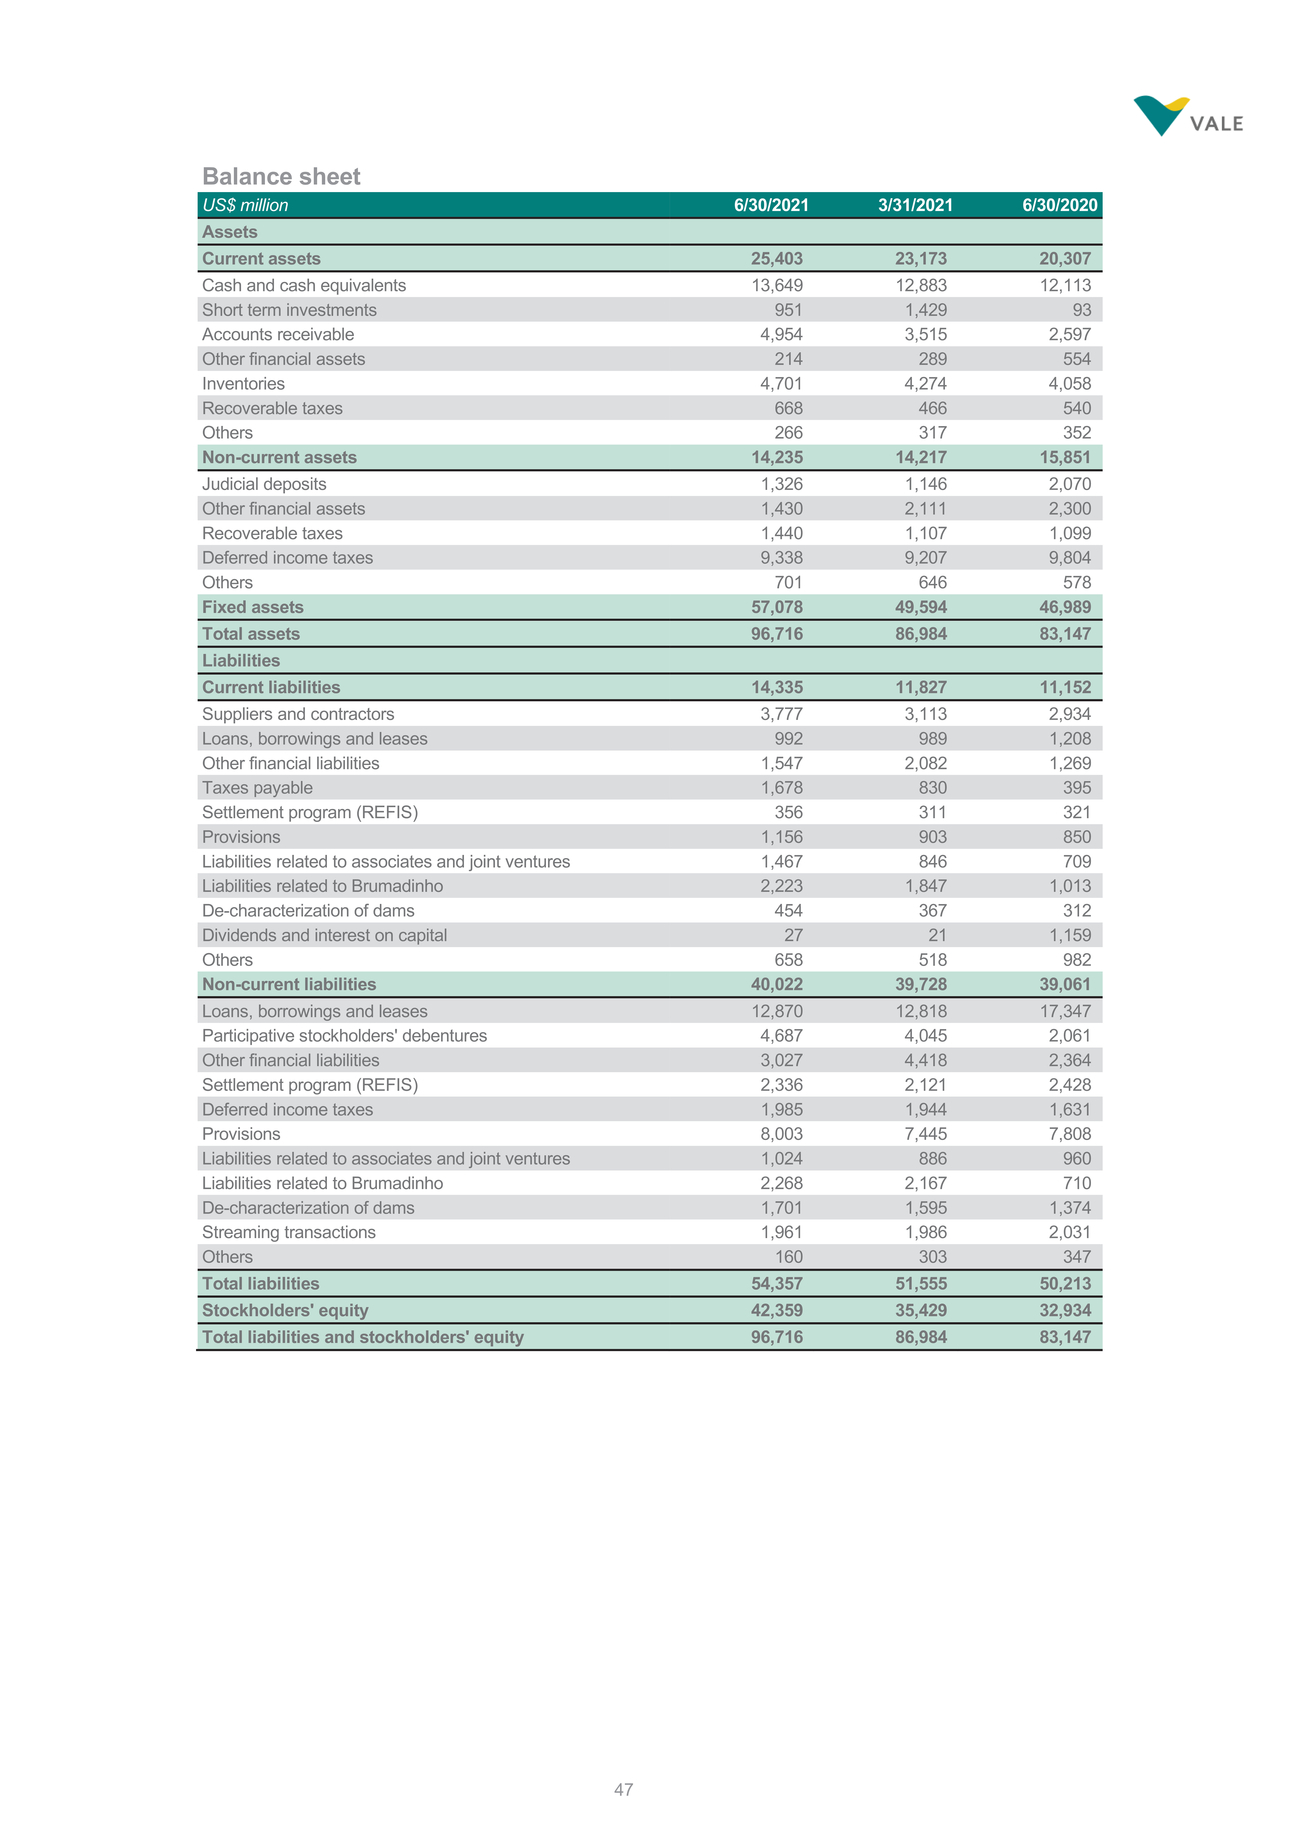 | US$ million 6/30/20213/31/20216/30/2020 Assets Current assets 25,40323,17320,307 Fixed assets 57,078 49,594 46,989 Total assets 96,716 86,984 83,147 Liabilities Current liabilities 14,335 11,827 11,152 Others 160 303 347 Total liabilities 54,357 51,555 50,213 Stockholders' equity 42,359 35,429 32,934 Total liabilities and stockholders' equity 96,716 86,984 83,147 |
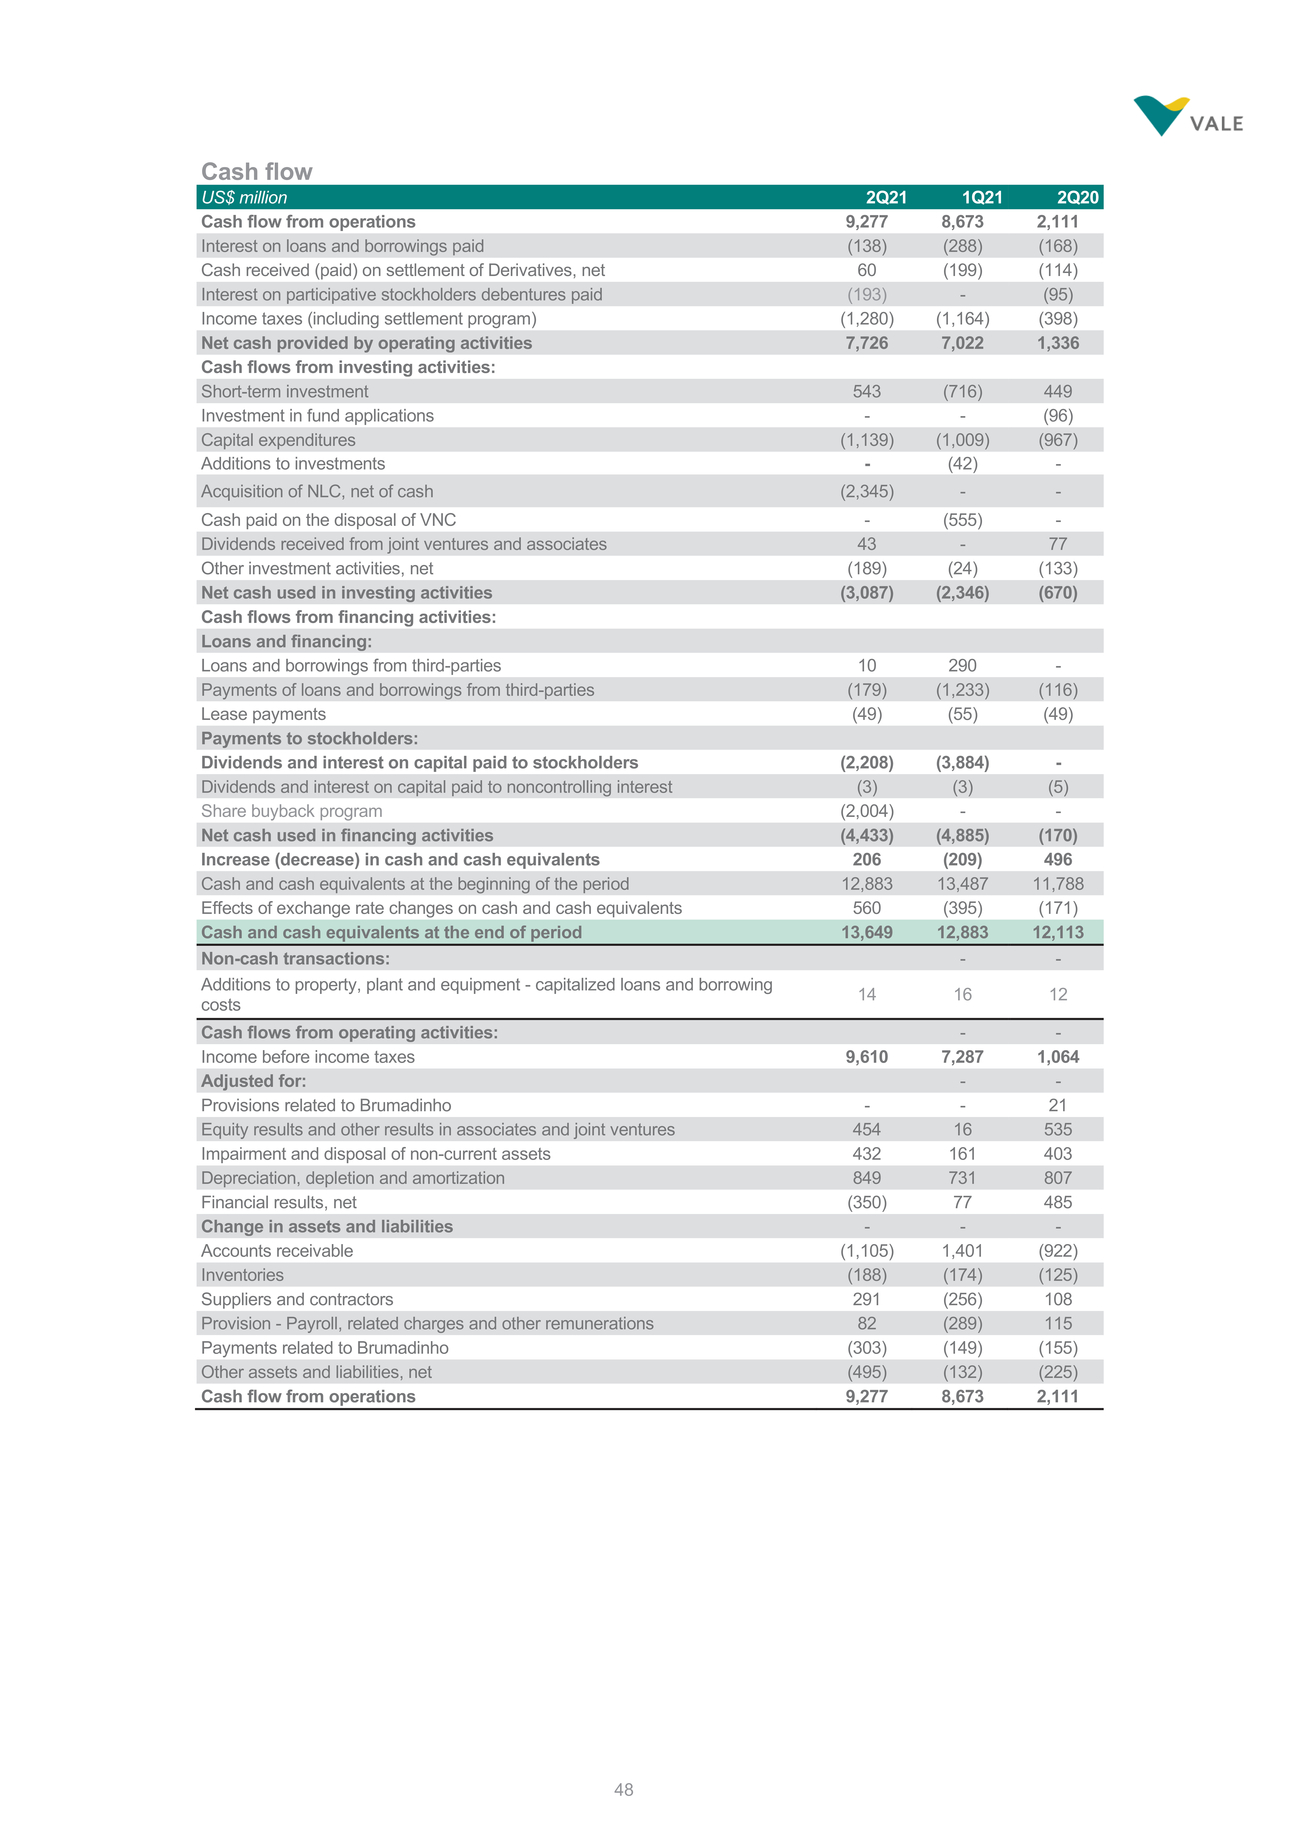 | Cash and cash equivalents at the end of period13,64912,88312,113 Non-cash transactions: --Cash flows from operating activities: -- |
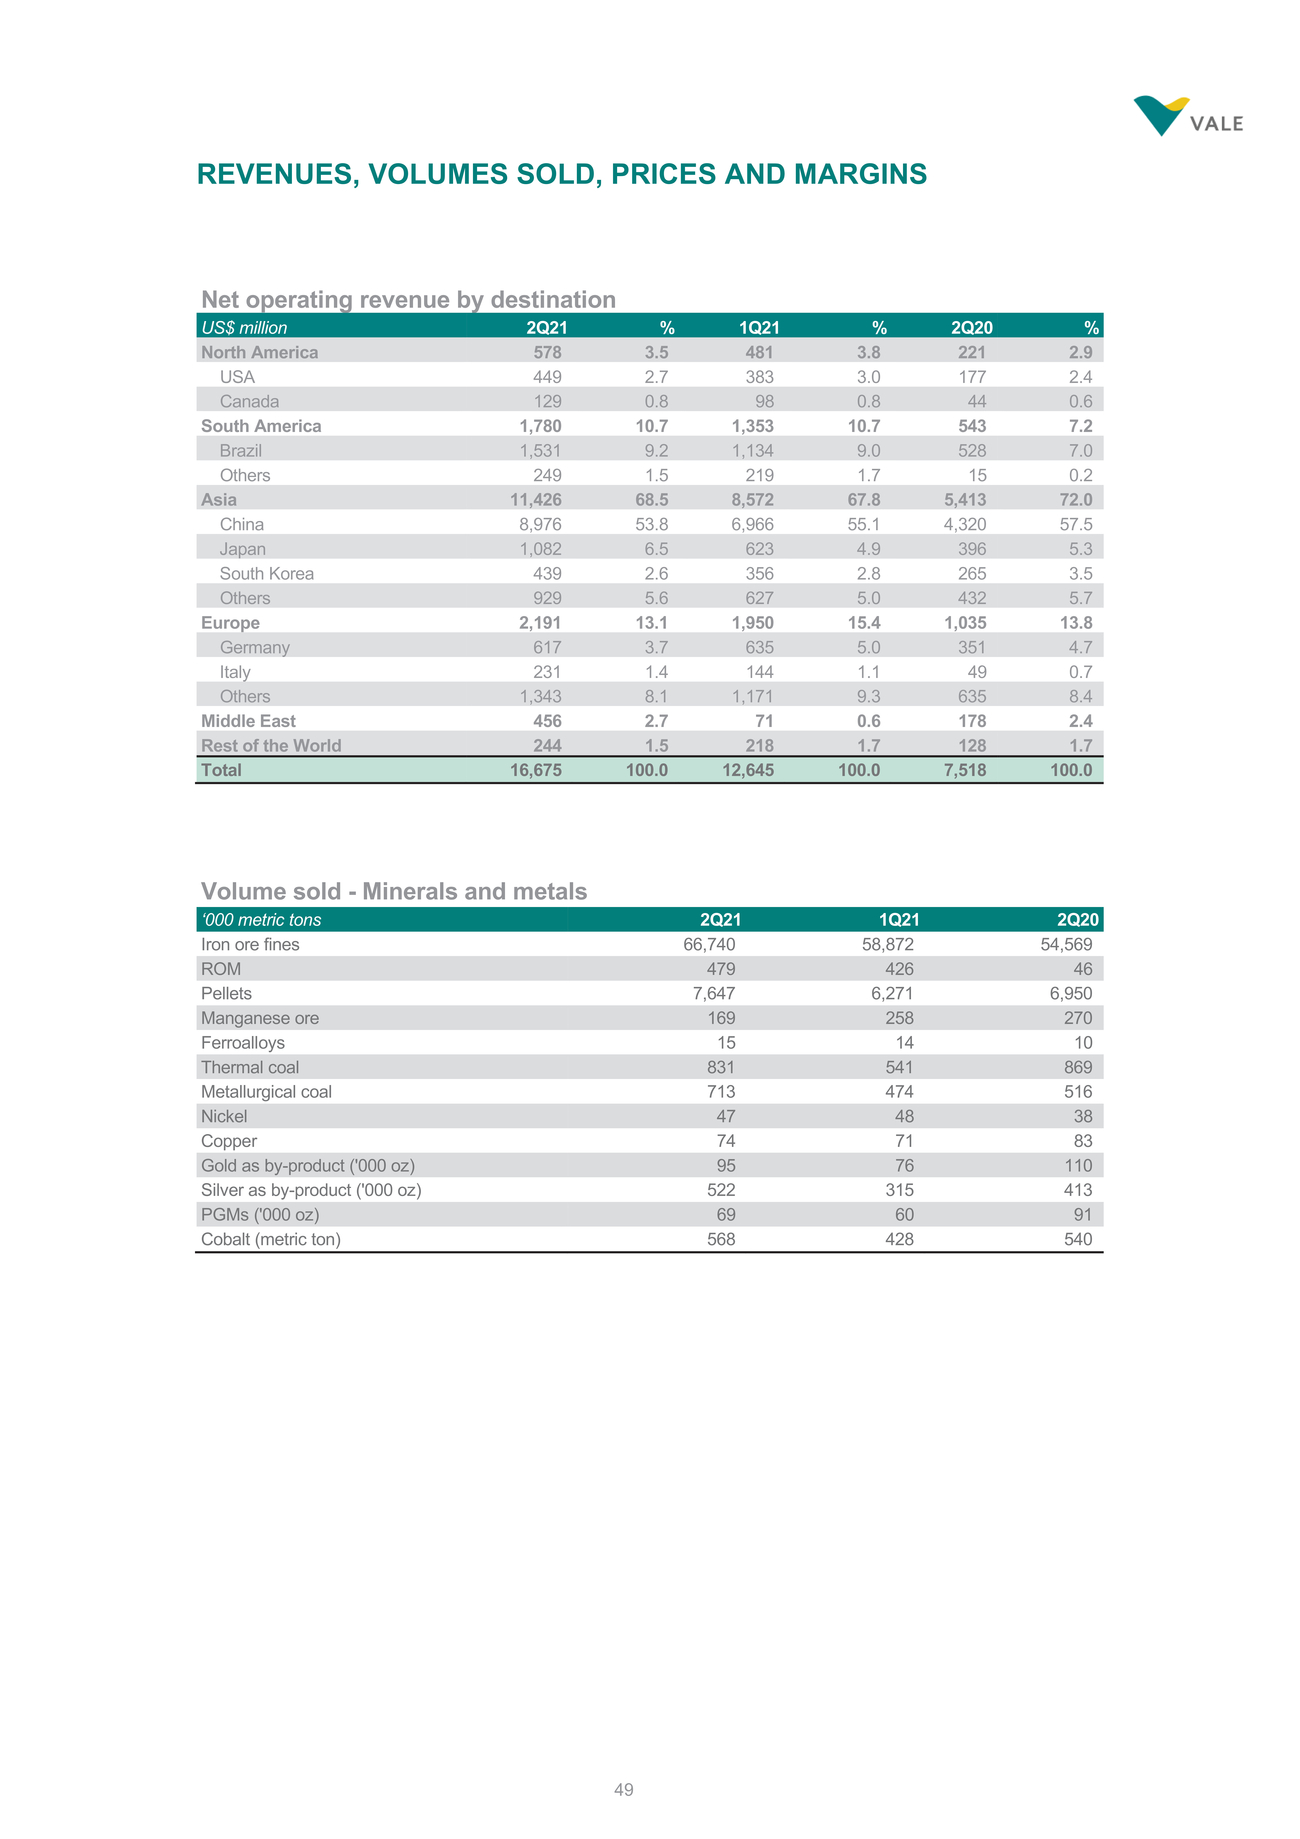 | REVENUES, VOLUMES SOLD, PRICES AND MARGINS |
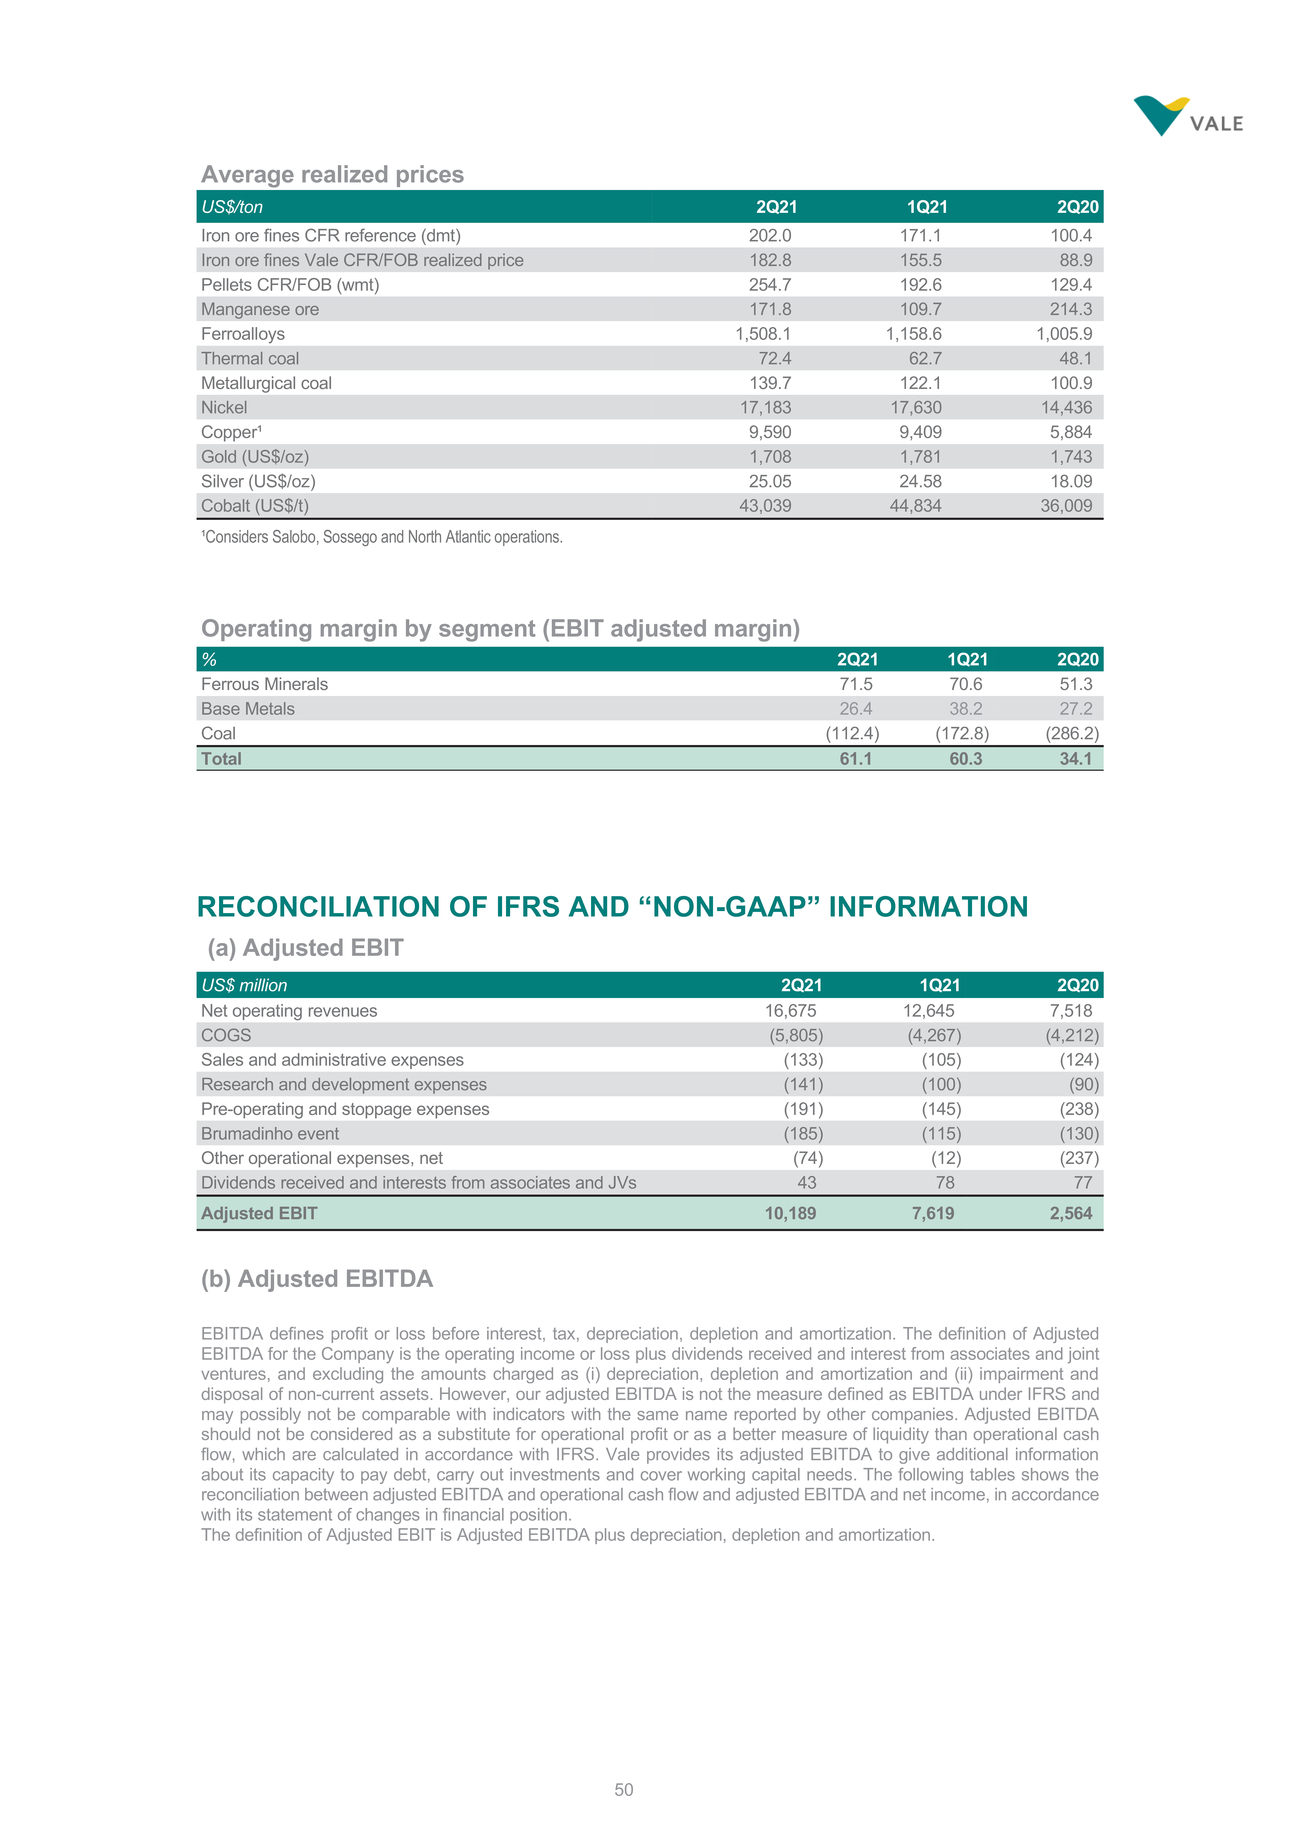 | RECONCILIATION OF IFRS AND “NON-GAAP” INFORMATION |
 | [LOGO] |
Signatures
Pursuant to the requirements of the Securities Exchange Act of 1934, the registrant has duly caused this report to be signed on its behalf by the undersigned, thereunto duly authorized.
| Vale S.A. (Registrant) | ||
| By: | /s/ Ivan Fadel | |
| Date: July 28, 2021 | Head of Investor Relations | |