Table of Contents
UNITED STATES
SECURITIES AND EXCHANGE COMMISSION
Washington, D.C. 20549
FORM N-CSR
CERTIFIED SHAREHOLDER REPORT OF
REGISTERED MANAGEMENT INVESTMENT COMPANIES
Investment Company Act file number 811-8326
MFS VARIABLE INSURANCE TRUST
(Exact name of registrant as specified in charter)
111 Huntington Avenue, Boston, Massachusetts 02199
(Address of principal executive offices) (Zip code)
Christopher R. Bohane
Massachusetts Financial Services Company
111 Huntington Avenue
Boston, Massachusetts 02199
(Name and address of agents for service)
Registrant’s telephone number, including area code: (617) 954-5000
Date of fiscal year end: December 31
Date of reporting period: June 30, 2017
Table of Contents
| ITEM 1. | REPORTS TO STOCKHOLDERS. |
Table of Contents
SEMIANNUAL REPORT
June 30, 2017

MFS® GROWTH SERIES
MFS® Variable Insurance Trust

VEG-SEM
Table of Contents
MFS® GROWTH SERIES
The report is prepared for the general information of contract owners. It is authorized for distribution to prospective investors only when preceded or accompanied by a current prospectus.
NOT FDIC INSURED • MAY LOSE VALUE • NO BANK OR CREDIT UNION GUARANTEE • NOT A DEPOSIT • NOT INSURED BY ANY FEDERAL GOVERNMENT AGENCY OR NCUA/NCUSIF
Table of Contents
MFS Growth Series
LETTER FROM THE EXECUTIVE CHAIRMAN

Dear Contract Owners:
Despite policy uncertainty accompanying a new presidential administration in the United States and unease over ongoing Brexit negotiations, most markets have proved resilient. U.S. share prices have reached new highs. The U.S. Federal Reserve has continued to gradually hike interest rates. However, rates in most developed markets remain very low, with major non-U.S. central banks just beginning to contemplate curbing accommodative monetary policies.
Globally, economic growth has shown signs of recovery, led by China, the U.S. and the eurozone. Despite better growth, there are few immediate signs of worrisome inflation as wage growth remains muted. Europe has benefited from diminishing event risks as establishment candidates won both the Dutch and French elections, averting a feared populist trend. Emerging market economies are recovering at a somewhat slower pace amid fears that restrictive U.S. trade policies could further hamper the restrained pace of global trade growth. Looking ahead, markets will have to contend with issues involving geopolitical hot spots on the Korean peninsula and in the Middle East, which could potentially lead to a clash of interests between the U.S. and other major powers such as China or Russia.
At MFS®, we believe time is an asset. A patient, long-term approach to investing can have a powerful impact on decision making and outcomes. Time arbitrage, as we call it, simply comes down to having the conviction and discipline to allow enough time for good investment ideas to play out. In our view, such an approach, along with the professional guidance of a financial advisor, will help you reach your investment objectives.
Respectfully,

Robert J. Manning
Executive Chairman
MFS Investment Management
August 16, 2017
The opinions expressed in this letter are subject to change and may not be relied upon for investment advice. No forecasts can be guaranteed.
1
Table of Contents
MFS Growth Series
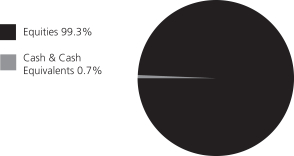
Portfolio structure
| Top ten holdings | ||||
| Facebook, Inc., “A” | 5.1% | |||
| Amazon.com, Inc. | 4.8% | |||
| Alphabet, Inc., “A” | 4.0% | |||
| Microsoft Corp. | 4.0% | |||
| Visa, Inc., “A” | 3.9% | |||
| Adobe Systems, Inc. | 3.1% | |||
| MasterCard, Inc., “A” | 2.8% | |||
| Alphabet, Inc., “C” | 2.6% | |||
| American Tower Corp., REIT | 2.4% | |||
| Thermo Fisher Scientific, Inc. | 2.4% |
| Equity sectors | ||||
| Technology | 26.9% | |||
| Health Care | 16.0% | |||
| Financial Services | 11.0% | |||
| Leisure | 10.4% | |||
| Special Products & Services | 8.4% | |||
| Retailing | 7.3% | |||
| Consumer Staples | 6.0% | |||
| Industrial Goods & Services | 4.3% | |||
| Autos & Housing | 2.8% | |||
| Utilities & Communications | 2.4% | |||
| Transportation | 1.9% | |||
| Basic Materials | 1.3% | |||
| Energy | 0.6% |
Cash & Cash Equivalents includes any cash, investments in money market funds, short-term securities, and other assets less liabilities. Please see the Statement of Assets and Liabilities for additional information related to the fund’s cash position and other assets and liabilities.
Percentages are based on net assets as of June 30, 2017.
The portfolio is actively managed and current holdings may be different.
2
Table of Contents
MFS Growth Series
Fund Expenses Borne by the Contract Holders during the Period,
January 1, 2017 through June 30, 2017
As a contract holder of the fund, you incur ongoing costs, including management fees; distribution and/or service (12b-1) fees; and other fund expenses. This example is intended to help you understand your ongoing costs (in dollars) of investing in the fund and to compare these costs with the ongoing costs of investing in other mutual funds.
The example is based on an investment of $1,000 invested at the beginning of the period and held for the entire period January 1, 2017 through June 30, 2017.
Actual Expenses
The first line for each share class in the following table provides information about actual account values and actual expenses. You may use the information in this line, together with the amount you invested, to estimate the expenses that you paid over the period. Simply divide your account value by $1,000 (for example, an $8,600 account value divided by $1,000 = 8.6), then multiply the result by the number in the first line under the heading entitled “Expenses Paid During Period” to estimate the expenses you paid on your account during this period.
Hypothetical Example for Comparison Purposes
The second line for each share class in the following table provides information about hypothetical account values and hypothetical expenses based on the fund’s actual expense ratio and an assumed rate of return of 5% per year before expenses, which is not the fund’s actual return. The hypothetical account values and expenses may not be used to estimate the actual ending account balance or expenses you paid for the period. You may use this information to compare the ongoing costs of investing in the fund and other funds. To do so, compare this 5% hypothetical example with the 5% hypothetical examples that appear in the shareholder reports of the other funds.
Please note that the expenses shown in the table are meant to highlight the fund’s ongoing costs only and do not take into account the fees and expenses imposed under the variable contracts through which your investment in the fund is made. Therefore, the second line for each share class in the table is useful in comparing ongoing costs associated with an investment in vehicles (such as the fund) which fund benefits under variable annuity and variable life insurance contracts and to qualified pension and retirement plans only, and will not help you determine the relative total costs of investing in the fund through variable annuity and variable life insurance contracts. If the fees and expenses imposed under the variable contracts were included, your costs would have been higher.
| Share Class | Annualized Expense Ratio | Beginning Account Value 1/01/17 | Ending Account Value 6/30/17 | Expenses Paid During Period (p) 1/01/17-6/30/17 | ||||||||||||||
| Initial Class | Actual | 0.76% | $1,000.00 | $1,172.60 | $4.09 | |||||||||||||
| Hypothetical (h) | 0.76% | $1,000.00 | $1,021.03 | $3.81 | ||||||||||||||
| Service Class | Actual | 1.00% | $1,000.00 | $1,171.15 | $5.38 | |||||||||||||
| Hypothetical (h) | 1.00% | $1,000.00 | $1,019.84 | $5.01 | ||||||||||||||
| (h) | 5% class return per year before expenses. |
| (p) | “Expenses Paid During Period” are equal to each class’s annualized expense ratio, as shown above, multiplied by the average account value over the period, multiplied by 181/365 (to reflect the one-half year period). |
3
Table of Contents
MFS Growth Series
PORTFOLIO OF INVESTMENTS – 6/30/17 (unaudited)
The Portfolio of Investments is a complete list of all securities owned by your fund. It is categorized by broad-based asset classes.
| Issuer | Shares/Par | Value ($) | ||||||
| COMMON STOCKS – 99.3% | ||||||||
| Aerospace – 0.6% | ||||||||
| Honeywell International, Inc. | 72,940 | $ | 9,722,173 | |||||
|
| |||||||
| Alcoholic Beverages – 1.8% | ||||||||
| Constellation Brands, Inc., “A” | 120,577 | $ | 23,359,382 | |||||
| Pernod Ricard S.A. | 32,444 | 4,344,805 | ||||||
|
| |||||||
| $ | 27,704,187 | |||||||
|
| |||||||
| Apparel Manufacturers – 1.1% | ||||||||
| NIKE, Inc., “B” | 288,013 | $ | 16,992,767 | |||||
|
| |||||||
| Biotechnology – 3.3% | ||||||||
| Biogen, Inc. (a) | 32,289 | $ | 8,761,943 | |||||
| Biomarin Pharmaceutical, Inc. (a) | 47,845 | 4,345,283 | ||||||
| Celgene Corp. (a) | 192,361 | 24,981,923 | ||||||
| Regeneron Pharmaceuticals, Inc. (a) | 24,982 | 12,269,659 | ||||||
|
| |||||||
| $ | 50,358,808 | |||||||
|
| |||||||
| Broadcasting – 1.4% | ||||||||
| Netflix, Inc. (a) | 146,392 | $ | 21,872,429 | |||||
|
| |||||||
| Brokerage & Asset Managers – 2.4% | ||||||||
| Blackstone Group LP | 63,847 | $ | 2,129,298 | |||||
| Charles Schwab Corp. | 357,569 | 15,361,164 | ||||||
| Intercontinental Exchange, Inc. | 283,251 | 18,671,906 | ||||||
|
| |||||||
| $ | 36,162,368 | |||||||
|
| |||||||
| Business Services – 6.5% | ||||||||
| Cognizant Technology Solutions Corp., “A” | 228,591 | $ | 15,178,442 | |||||
| Equifax, Inc. | 93,069 | 12,789,542 | ||||||
| Fidelity National Information Services, Inc. | 138,889 | 11,861,121 | ||||||
| Fiserv, Inc. (a) | 199,197 | 24,369,761 | ||||||
| FleetCor Technologies, Inc. (a) | 76,727 | 11,064,801 | ||||||
| Global Payments, Inc. | 105,032 | 9,486,490 | ||||||
| PayPal Holdings, Inc. (a) | 84,249 | 4,521,644 | ||||||
| Verisk Analytics, Inc., “A” (a) | 133,192 | 11,237,409 | ||||||
|
| |||||||
| $ | 100,509,210 | |||||||
|
| |||||||
| Cable TV – 1.7% | ||||||||
| Altice USA, Inc. (a) | 39,129 | $ | 1,263,867 | |||||
| Comcast Corp., “A” | 652,593 | 25,398,919 | ||||||
|
| |||||||
| $ | 26,662,786 | |||||||
|
| |||||||
| Chemicals – 0.7% | ||||||||
| Monsanto Co. | 92,223 | $ | 10,915,514 | |||||
|
| |||||||
| Computer Software – 10.0% | ||||||||
| Adobe Systems, Inc. (a) | 334,561 | $ | 47,320,308 | |||||
| Intuit, Inc. | 140,705 | 18,687,031 | ||||||
| Microsoft Corp. | 882,342 | 60,819,834 | ||||||
| PTC, Inc. (a) | 31,477 | 1,735,012 | ||||||
| Salesforce.com, Inc. (a) | 292,856 | 25,361,330 | ||||||
|
| |||||||
| $ | 153,923,515 | |||||||
|
| |||||||
| Computer Software – Systems – 1.9% | ||||||||
| Apple, Inc. | 200,689 | $ | 28,903,230 | |||||
|
| |||||||
| Issuer | Shares/Par | Value ($) | ||||||
| COMMON STOCKS – continued | ||||||||
| Construction – 2.9% | ||||||||
| Sherwin-Williams Co. | 68,233 | $ | 23,947,054 | |||||
| Vulcan Materials Co. | 156,950 | 19,882,426 | ||||||
|
| |||||||
| $ | 43,829,480 | |||||||
|
| |||||||
| Consumer Products – 1.5% | ||||||||
| Colgate-Palmolive Co. | 194,379 | $ | 14,409,315 | |||||
| Estee Lauder Cos., Inc., “A” | 94,248 | 9,045,923 | ||||||
|
| |||||||
| $ | 23,455,238 | |||||||
|
| |||||||
| Consumer Services – 1.8% | ||||||||
| Priceline Group, Inc. (a) | 14,860 | $ | 27,795,927 | |||||
|
| |||||||
| Electrical Equipment – 2.0% | ||||||||
| AMETEK, Inc. | 178,308 | $ | 10,800,116 | |||||
| Amphenol Corp., “A” | 152,796 | 11,279,401 | ||||||
| Fortive Corp. | 140,078 | 8,873,941 | ||||||
|
| |||||||
| $ | 30,953,458 | |||||||
|
| |||||||
| Electronics – 3.3% | ||||||||
| Analog Devices, Inc. | 57,565 | $ | 4,478,557 | |||||
| Broadcom Corp. | 110,653 | 25,787,681 | ||||||
| NVIDIA Corp. | 143,030 | 20,676,417 | ||||||
|
| |||||||
| $ | 50,942,655 | |||||||
|
| |||||||
| Energy – Independent – 0.6% | ||||||||
| Concho Resources, Inc. (a) | 20,264 | $ | 2,462,684 | |||||
| Pioneer Natural Resources Co. | 38,664 | 6,170,001 | ||||||
|
| |||||||
| $ | 8,632,685 | |||||||
|
| |||||||
| Entertainment – 0.3% | ||||||||
| Six Flags Entertainment Corp. | 67,411 | $ | 4,018,370 | |||||
|
| |||||||
| Food & Beverages – 1.5% | ||||||||
| Danone S.A. | 78,336 | $ | 5,888,115 | |||||
| Mondelez International, Inc. | 154,931 | 6,691,470 | ||||||
| Monster Worldwide, Inc. (a) | 198,641 | 9,868,485 | ||||||
|
| |||||||
| $ | 22,448,070 | |||||||
|
| |||||||
| Gaming & Lodging – 0.9% | ||||||||
| Marriott International, Inc., “A” | 131,197 | $ | 13,160,371 | |||||
|
| |||||||
| General Merchandise – 0.8% | ||||||||
| Costco Wholesale Corp. | 47,933 | $ | 7,665,925 | |||||
| Dollar Tree, Inc. (a) | 67,957 | 4,751,553 | ||||||
|
| |||||||
| $ | 12,417,478 | |||||||
|
| |||||||
| Health Maintenance Organizations – 1.0% | ||||||||
| UnitedHealth Group, Inc. | 84,828 | $ | 15,728,808 | |||||
|
| |||||||
| Insurance – 1.1% | ||||||||
| Aon PLC | 125,554 | $ | 16,692,404 | |||||
|
| |||||||
| Internet – 11.7% | ||||||||
| Alphabet, Inc., “A” (a) | 66,448 | $ | 61,775,377 | |||||
| Alphabet, Inc., “C” (a) | 44,421 | 40,366,695 | ||||||
| Facebook, Inc., “A” (a) | 515,657 | 77,853,894 | ||||||
|
| |||||||
| $ | 179,995,966 | |||||||
|
| |||||||
4
Table of Contents
MFS Growth Series
Portfolio of Investments (unaudited) – continued
| Issuer | Shares/Par | Value ($) | ||||||
| COMMON STOCKS – continued | ||||||||
| Leisure & Toys – 3.4% | ||||||||
| Activision Blizzard, Inc. | 455,525 | $ | 26,224,574 | |||||
| Electronic Arts, Inc. (a) | 240,123 | 25,385,804 | ||||||
|
| |||||||
| $ | 51,610,378 | |||||||
|
| |||||||
| Machinery & Tools – 1.6% | ||||||||
| Roper Technologies, Inc. | 79,134 | $ | 18,321,895 | |||||
| Xylem, Inc. | 122,471 | 6,788,568 | ||||||
|
| |||||||
| $ | 25,110,463 | |||||||
|
| |||||||
| Major Banks – 0.9% | ||||||||
| Goldman Sachs Group, Inc. | 27,929 | $ | 6,197,445 | |||||
| Morgan Stanley | 160,994 | 7,173,893 | ||||||
|
| |||||||
| $ | 13,371,338 | |||||||
|
| |||||||
| Medical & Health Technology & Services – 0.2% | ||||||||
| McKesson Corp. | 18,302 | $ | 3,011,411 | |||||
|
| |||||||
| Medical Equipment – 8.6% | ||||||||
| Abbott Laboratories | 209,928 | $ | 10,204,600 | |||||
| C.R. Bard, Inc. | 37,731 | 11,927,146 | ||||||
| Cooper Cos., Inc. | 8,095 | 1,938,105 | ||||||
| Danaher Corp. | 338,909 | 28,600,531 | ||||||
| Edwards Lifesciences Corp. (a) | 81,014 | 9,579,095 | ||||||
| Medtronic PLC | 264,900 | 23,509,875 | ||||||
| Stryker Corp. | 72,842 | 10,109,013 | ||||||
| Thermo Fisher Scientific, Inc. | 209,654 | 36,578,333 | ||||||
|
| |||||||
| $ | 132,446,698 | |||||||
|
| |||||||
| Other Banks & Diversified Financials – 6.7% | ||||||||
| Mastercard, Inc., “A” | 349,005 | $ | 42,386,657 | |||||
| Visa, Inc., “A” | 641,382 | 60,148,804 | ||||||
|
| |||||||
| $ | 102,535,461 | |||||||
|
| |||||||
| Pharmaceuticals – 2.9% | ||||||||
| Allergan PLC | 38,161 | $ | 9,276,557 | |||||
| Bristol-Myers Squibb Co. | 175,248 | 9,764,819 | ||||||
| Eli Lilly & Co. | 131,085 | 10,788,295 | ||||||
| Zoetis, Inc. | 236,157 | 14,731,474 | ||||||
|
| |||||||
| $ | 44,561,145 | |||||||
|
| |||||||
| Railroad & Shipping – 1.9% | ||||||||
| Canadian Pacific Railway Ltd. | 83,889 | $ | 13,490,190 | |||||
| Union Pacific Corp. | 139,292 | 15,170,292 | ||||||
|
| |||||||
| $ | 28,660,482 | |||||||
|
| |||||||
| Issuer | Shares/Par | Value ($) | ||||||
| COMMON STOCKS – continued | ||||||||
| Restaurants – 2.7% | ||||||||
| Aramark | 386,340 | $ | 15,832,213 | |||||
| Panera Bread Co., “A” (a) | 25,860 | 8,136,591 | ||||||
| Starbucks Corp. | 312,156 | 18,201,816 | ||||||
|
| |||||||
| $ | 42,170,620 | |||||||
|
| |||||||
| Specialty Chemicals – 0.6% | ||||||||
| Ecolab, Inc. | 47,437 | $ | 6,297,262 | |||||
| Univar, Inc. (a) | 79,317 | 2,316,056 | ||||||
|
| |||||||
| $ | 8,613,318 | |||||||
|
| |||||||
| Specialty Stores – 5.4% | ||||||||
| Amazon.com, Inc. (a) | 75,518 | $ | 73,101,424 | |||||
| Lululemon Athletica, Inc. (a) | 31,293 | 1,867,253 | ||||||
| Ross Stores, Inc. | 135,277 | 7,809,541 | ||||||
|
| |||||||
| $ | 82,778,218 | |||||||
|
| |||||||
| Telecommunications – Wireless – 2.4% | ||||||||
| American Tower Corp., REIT | 278,771 | $ | 36,886,979 | |||||
|
| |||||||
| Tobacco – 1.2% | ||||||||
| Philip Morris International, Inc. | 159,290 | $ | 18,708,610 | |||||
|
| |||||||
| Total Common Stocks (Identified Cost, $842,210,172) | $ | 1,524,263,018 | ||||||
|
| |||||||
| MONEY MARKET FUNDS – 0.7% | ||||||||
| MFS Institutional Money Market Portfolio, 0.98% (v) (Identified Cost, $10,894,049) | 10,895,137 | $ | 10,895,137 | |||||
|
| |||||||
| Total Investments (Identified Cost, $853,104,221) | $ | 1,535,158,155 | ||||||
|
| |||||||
| OTHER ASSETS, LESS LIABILITIES – (0.0)% | (207,724 | ) | ||||||
|
| |||||||
| NET ASSETS – 100.0% | $ | 1,534,950,431 | ||||||
|
| |||||||
| (a) | Non-income producing security. |
| (v) | Underlying affiliated fund that is available only to investment companies managed by MFS. The rate quoted for the MFS Institutional Money Market Portfolio is the annualized seven-day yield of the fund at period end. |
The following abbreviations are used in this report and are defined:
| PLC | Public Limited Company |
| REIT | Real Estate Investment Trust |
See Notes to Financial Statements
5
Table of Contents
MFS Growth Series
��
FINANCIAL STATEMENTS | STATEMENT OF ASSETS AND LIABILITIES (unaudited)
This statement represents your fund’s balance sheet, which details the assets and liabilities comprising the total value of the fund.
At 6/30/17 | ||||
Assets | ||||
Investments | ||||
Non-affiliated issuers, at value (identified cost, $842,210,172) | $1,524,263,018 | |||
Underlying affiliated funds, at value (identified cost, $10,894,049) | 10,895,137 | |||
Total investments, at value (identified cost, $853,104,221) | $1,535,158,155 | |||
Receivables for | ||||
Fund shares sold | 312,531 | |||
Dividends | 751,232 | |||
Other assets | 3,075 | |||
Total assets | $1,536,224,993 | |||
Liabilities | ||||
Payable to custodian | $20,342 | |||
Payables for fund shares reacquired | 1,061,124 | |||
Payable to affiliates | ||||
Investment adviser | 61,332 | |||
Shareholder servicing costs | 1,825 | |||
Distribution and/or service fees | 3,660 | |||
Payable for independent Trustees’ compensation | 1,228 | |||
Accrued expenses and other liabilities | 125,051 | |||
Total liabilities | $1,274,562 | |||
Net assets | $1,534,950,431 | |||
Net assets consist of | ||||
Paid-in capital | $740,839,487 | |||
Unrealized appreciation (depreciation) on investments and translation of assets and liabilities in foreign currencies | 682,053,882 | |||
Accumulated net realized gain (loss) on investments and foreign currency | 109,526,035 | |||
Undistributed net investment income | 2,531,027 | |||
Net assets | $1,534,950,431 | |||
Shares of beneficial interest outstanding | 33,962,923 |
| Net assets | Shares outstanding | Net asset value per share | ||||||||||
Initial Class | $1,269,510,786 | 27,930,582 | $45.45 | |||||||||
Service Class | 265,439,645 | 6,032,341 | 44.00 | |||||||||
See Notes to Financial Statements
6
Table of Contents
MFS Growth Series
FINANCIAL STATEMENTS | STATEMENT OF OPERATIONS (unaudited)
This statement describes how much your fund earned in investment income and accrued in expenses. It also describes any gains and/or losses generated by fund operations.
Six months ended 6/30/17 | ||||
Net investment income | ||||
Income | ||||
Dividends | $7,101,293 | |||
Dividends from underlying affiliated funds | 50,014 | |||
Interest | 6,283 | |||
Foreign taxes withheld | (32,463 | ) | ||
Total investment income | $7,125,127 | |||
Expenses | ||||
Management fee | $5,331,965 | |||
Distribution and/or service fees | 317,223 | |||
Shareholder servicing costs | 34,291 | |||
Administrative services fee | 125,087 | |||
Independent Trustees’ compensation | 12,927 | |||
Custodian fee | 36,196 | |||
Shareholder communications | 81,038 | |||
Audit and tax fees | 28,658 | |||
Legal fees | 7,759 | |||
Miscellaneous | 24,867 | |||
Total expenses | $6,000,011 | |||
Reduction of expenses by investment adviser | (57,135 | ) | ||
Net expenses | $5,942,876 | |||
Net investment income | $1,182,251 | |||
Realized and unrealized gain (loss) on investments and foreign currency | ||||
Realized gain (loss) (identified cost basis) | ||||
Investments: | ||||
Non-affiliated issuers | $50,876,524 | |||
Underlying affiliated funds | (1,021 | ) | ||
Foreign currency | 2,974 | |||
Net realized gain (loss) on investments and foreign currency | $50,878,477 | |||
Change in unrealized appreciation (depreciation) | ||||
Investments | $184,372,456 | |||
Translation of assets and liabilities in foreign currencies | (361 | ) | ||
Net unrealized gain (loss) on investments and foreign currency translation | $184,372,095 | |||
Net realized and unrealized gain (loss) on investments and foreign currency | $235,250,572 | |||
Change in net assets from operations | $236,432,823 |
See Notes to Financial Statements
7
Table of Contents
MFS Growth Series
FINANCIAL STATEMENTS | STATEMENTS OF CHANGES IN NET ASSETS
These statements describe the increases and/or decreases in net assets resulting from operations, any distributions, and any shareholder transactions.
| | Six months ended 6/30/17 (unaudited | ) | | Year ended 12/31/16 | | |||
Change in net assets | ||||||||
| From operations | ||||||||
Net investment income | $1,182,251 | $1,120,745 | ||||||
Net realized gain (loss) on investments and foreign currency | 50,878,477 | 59,891,110 | ||||||
Net unrealized gain (loss) on investments and foreign currency translation | 184,372,095 | (27,227,573 | ) | |||||
Change in net assets from operations | $236,432,823 | $33,784,282 | ||||||
| Distributions declared to shareholders | ||||||||
From net investment income | $— | $(536,744 | ) | |||||
From net realized gain on investments | — | (87,392,457 | ) | |||||
Total distributions declared to shareholders | $— | $(87,929,201 | ) | |||||
Change in net assets from fund share transactions | $(117,173,227 | ) | $(28,061,730 | ) | ||||
Total change in net assets | $119,259,596 | $(82,206,649 | ) | |||||
| Net assets | ||||||||
At beginning of period | 1,415,690,835 | 1,497,897,484 | ||||||
At end of period (including undistributed net investment income of $2,531,027 and | $1,534,950,431 | $1,415,690,835 |
See Notes to Financial Statements
8
Table of Contents
MFS Growth Series
FINANCIAL STATEMENTS | FINANCIAL HIGHLIGHTS
The financial highlights table is intended to help you understand the fund’s financial performance for the semiannual period and the past 5 fiscal years. Certain information reflects financial results for a single fund share. The total returns in the table represent the rate that an investor would have earned (or lost) on an investment in the fund share class (assuming reinvestment of all distributions) held for the entire period.
| Initial Class | Six months ended 6/30/17 | Years ended 12/31 | ||||||||||||||||||||||
| 2016 | 2015 | 2014 | 2013 | 2012 | ||||||||||||||||||||
| (unaudited) | ||||||||||||||||||||||||
Net asset value, beginning of period | $38.76 | $40.17 | $39.75 | $39.07 | $28.83 | $24.56 | ||||||||||||||||||
| Income (loss) from investment operations | ||||||||||||||||||||||||
Net investment income (d) | $0.04 | $0.05 | (c) | $0.03 | $0.07 | $0.04 | $0.13 | |||||||||||||||||
Net realized and unrealized gain (loss) on investments and | 6.65 | 1.01 | 2.73 | 3.33 | 10.53 | 4.14 | ||||||||||||||||||
Total from investment operations | $6.69 | $1.06 | $2.76 | $3.40 | $10.57 | $4.27 | ||||||||||||||||||
| Less distributions declared to shareholders | ||||||||||||||||||||||||
From net investment income | $— | $(0.02 | ) | $(0.07 | ) | $(0.04 | ) | $(0.08 | ) | $— | ||||||||||||||
From net realized gain on investments | — | (2.45 | ) | (2.27 | ) | (2.68 | ) | (0.25 | ) | — | ||||||||||||||
Total distributions declared to shareholders | $— | $(2.47 | ) | $(2.34 | ) | $(2.72 | ) | $(0.33 | ) | $— | ||||||||||||||
Net asset value, end of period (x) | $45.45 | $38.76 | $40.17 | $39.75 | $39.07 | $28.83 | ||||||||||||||||||
Total return (%) (k)(r)(s)(x) | 17.26 | (n) | 2.44 | (c) | 7.56 | 8.94 | 36.85 | 17.39 | ||||||||||||||||
| Ratios (%) (to average net assets) and Supplemental data: | ||||||||||||||||||||||||
Expenses before expense reductions (f) | 0.76 | (a) | 0.75 | (c) | 0.76 | 0.76 | 0.77 | 0.82 | ||||||||||||||||
Expenses after expense reductions (f) | 0.76 | (a) | 0.74 | (c) | 0.75 | 0.76 | 0.77 | 0.82 | ||||||||||||||||
Net investment income | 0.20 | (a) | 0.12 | (c) | 0.08 | 0.18 | 0.13 | 0.45 | ||||||||||||||||
Portfolio turnover | 9 | (n) | 24 | 31 | 36 | 43 | 52 | |||||||||||||||||
Net assets at end of period (000 omitted) | $1,269,511 | $1,179,822 | $1,273,204 | $1,263,935 | $1,308,361 | $1,007,422 | ||||||||||||||||||
| Service Class | Six months ended 6/30/17 | Years ended 12/31 | ||||||||||||||||||||||
| 2016 | 2015 | 2014 | 2013 | 2012 | ||||||||||||||||||||
| (unaudited) | ||||||||||||||||||||||||
Net asset value, beginning of period | $37.57 | $39.09 | $38.77 | $38.22 | $28.25 | $24.13 | ||||||||||||||||||
| Income (loss) from investment operations | ||||||||||||||||||||||||
Net investment income (loss) (d) | $(0.01 | ) | $(0.05 | )(c) | $(0.07 | ) | $(0.02 | ) | $(0.04 | ) | $0.07 | |||||||||||||
Net realized and unrealized gain (loss) on investments and | 6.44 | 0.98 | 2.66 | 3.25 | 10.30 | 4.05 | ||||||||||||||||||
Total from investment operations | $6.43 | $0.93 | $2.59 | $3.23 | $10.26 | $4.12 | ||||||||||||||||||
| Less distributions declared to shareholders | ||||||||||||||||||||||||
From net investment income | $— | $— | $— | $— | $(0.04 | ) | $— | |||||||||||||||||
From net realized gain on investments | — | (2.45 | ) | (2.27 | ) | (2.68 | ) | (0.25 | ) | — | ||||||||||||||
Total distributions declared to shareholders | $— | $(2.45 | ) | $(2.27 | ) | $(2.68 | ) | $(0.29 | ) | $— | ||||||||||||||
Net asset value, end of period (x) | $44.00 | $37.57 | $39.09 | $38.77 | $38.22 | $28.25 | ||||||||||||||||||
Total return (%) (k)(r)(s)(x) | 17.11 | (n) | 2.18 | (c) | 7.30 | 8.68 | 36.49 | 17.07 | ||||||||||||||||
| Ratios (%) (to average net assets) and Supplemental data: | ||||||||||||||||||||||||
Expenses before expense reductions (f) | 1.01 | (a) | 1.00 | (c) | 1.01 | 1.01 | 1.02 | 1.07 | ||||||||||||||||
Expenses after expense reductions (f) | 1.00 | (a) | 0.99 | (c) | 1.00 | 1.01 | 1.02 | 1.07 | ||||||||||||||||
Net investment income (loss) | (0.05 | )(a) | (0.13 | )(c) | (0.16 | ) | (0.06 | ) | (0.12 | ) | 0.26 | |||||||||||||
Portfolio turnover | 9 | (n) | 24 | 31 | 36 | 43 | 52 | |||||||||||||||||
Net assets at end of period (000 omitted) | $265,440 | $235,869 | $224,694 | $279,063 | $242,216 | $134,247 | ||||||||||||||||||
See Notes to Financial Statements
9
Table of Contents
MFS Growth Series
Financial Highlights – continued
| (a) | Annualized. |
| (c) | Amount reflects a one-time reimbursement of expenses by the custodian (or former custodian) without which net investment income and performance would be lower and expenses would be higher. |
| (d) | Per share data is based on average shares outstanding. |
| (f) | Ratios do not reflect reductions from fees paid indirectly, if applicable. |
| (k) | The total return does not reflect expenses that apply to separate accounts. Inclusion of these charges would reduce the total return figures for all periods shown. |
| (n) | Not annualized. |
| (r) | Certain expenses have been reduced without which performance would have been lower. |
| (s) | From time to time the fund may receive proceeds from litigation settlements, without which performance would be lower. |
| (x) | The net asset values and total returns have been calculated on net assets which include adjustments made in accordance with U.S. generally accepted accounting principles required at period end for financial reporting purposes. |
See Notes to Financial Statements
10
Table of Contents
MFS Growth Series
NOTES TO FINANCIAL STATEMENTS (unaudited)
| (1) | Business and Organization |
MFS Growth Series (the fund) is a diversified series of MFS Variable Insurance Trust (the trust). The trust is organized as a Massachusetts business trust and is registered under the Investment Company Act of 1940, as amended, as an open-end management investment company. The shareholders of each series of the trust are separate accounts of insurance companies, which offer variable annuity and/or life insurance products, and qualified retirement and pension plans.
The fund is an investment company and accordingly follows the investment company accounting and reporting guidance of the Financial Accounting Standards Board (FASB) Accounting Standards Codification Topic 946 Financial Services – Investment Companies.
| (2) | Significant Accounting Policies |
General – The preparation of financial statements in conformity with U.S. generally accepted accounting principles requires management to make estimates and assumptions that affect the reported amounts of assets and liabilities, and disclosure of contingent assets and liabilities at the date of the financial statements and the reported amounts of increases and decreases in net assets from operations during the reporting period. Actual results could differ from those estimates. In the preparation of these financial statements, management has evaluated subsequent events occurring after the date of the fund’s Statement of Assets and Liabilities through the date that the financial statements were issued.
In October 2016, the Securities and Exchange Commission (SEC) released its Final Rule on Investment Company Reporting Modernization (the “Rule”). The Rule, which introduces two new regulatory reporting forms for investment companies – Form N-PORT and Form N-CEN – also contains amendments to Regulation S-X which impact financial statement presentation, particularly the presentation of derivative investments. Although still evaluating the impacts of the Rule, management believes that many of the Regulation S-X amendments are consistent with the fund’s current financial statement presentation and expects that the fund will be able to comply with the Rule’s Regulation S-X amendments by the August 1, 2017 compliance date.
Balance Sheet Offsetting – The fund’s accounting policy with respect to balance sheet offsetting is that, absent an event of default by the counterparty or a termination of the agreement, the International Swaps and Derivatives Association (ISDA) Master Agreement does not result in an offset of reported amounts of financial assets and financial liabilities in the Statement of Assets and Liabilities across transactions between the fund and the applicable counterparty. The fund’s right to setoff may be restricted or prohibited by the bankruptcy or insolvency laws of the particular jurisdiction to which a specific master netting agreement counterparty is subject. Balance sheet offsetting disclosures, to the extent applicable to the fund, have been included in the fund’s Significant Accounting Policies note under the captions for each of the fund’s in-scope financial instruments and transactions.
Investment Valuations – Equity securities, including restricted equity securities, are generally valued at the last sale or official closing price on their primary market or exchange as provided by a third-party pricing service. Equity securities, for which there were no sales reported that day, are generally valued at the last quoted daily bid quotation on their primary market or exchange as provided by a third-party pricing service. Short-term instruments with a maturity at issuance of 60 days or less may be valued at amortized cost, which approximates market value. Open-end investment companies are generally valued at net asset value per share. Securities and other assets generally valued on the basis of information from a third-party pricing service may also be valued at a broker/dealer bid quotation. Values obtained from third-party pricing services can utilize both transaction data and market information such as yield, quality, coupon rate, maturity, type of issue, trading characteristics, and other market data. The values of foreign securities and other assets and liabilities expressed in foreign currencies are converted to U.S. dollars using the mean of bid and asked prices for rates provided by a third-party pricing service.
The Board of Trustees has delegated primary responsibility for determining or causing to be determined the value of the fund’s investments (including any fair valuation) to the adviser pursuant to valuation policies and procedures approved by the Board. If the adviser determines that reliable market quotations are not readily available, investments are valued at fair value as determined in good faith by the adviser in accordance with such procedures under the oversight of the Board of Trustees. Under the fund’s valuation policies and procedures, market quotations are not considered to be readily available for most types of debt instruments and floating rate loans and many types of derivatives. These investments are generally valued at fair value based on information from third-party pricing services. In addition, investments may be valued at fair value if the adviser determines that an investment’s value has been materially affected by events occurring after the close of the exchange or market on which the investment is principally traded (such as foreign exchange or market) and prior to the determination of the fund’s net asset value, or after the halting of trading of a specific security where trading does not resume prior to the close of the exchange or market on which the security is principally traded. Events that occur on a frequent basis after foreign markets close (such as developments in foreign markets and significant movements in the U.S. markets) and prior to the determination of the fund’s net asset value may be deemed to have a material effect on the value of securities traded in foreign markets. Accordingly, the fund’s foreign equity securities may often be valued at fair value. The adviser generally relies on third-party pricing services or other information (such as the correlation with price movements of similar securities in the same or other markets; the type, cost and investment characteristics of the security; the
11
Table of Contents
MFS Growth Series
Notes to Financial Statements (unaudited) – continued
business and financial condition of the issuer; and trading and other market data) to assist in determining whether to fair value and at what value to fair value an investment. The value of an investment for purposes of calculating the fund’s net asset value can differ depending on the source and method used to determine value. When fair valuation is used, the value of an investment used to determine the fund’s net asset value may differ from quoted or published prices for the same investment. There can be no assurance that the fund could obtain the fair value assigned to an investment if it were to sell the investment at the same time at which the fund determines its net asset value per share.
Various inputs are used in determining the value of the fund’s assets or liabilities. These inputs are categorized into three broad levels. In certain cases, the inputs used to measure fair value may fall into different levels of the fair value hierarchy. In such cases, an investment’s level within the fair value hierarchy is based on the lowest level of input that is significant to the fair value measurement. The fund’s assessment of the significance of a particular input to the fair value measurement in its entirety requires judgment, and considers factors specific to the investment. Level 1 includes unadjusted quoted prices in active markets for identical assets or liabilities. Level 2 includes other significant observable market-based inputs (including quoted prices for similar securities, interest rates, prepayment speed, and credit risk). Level 3 includes unobservable inputs, which may include the adviser’s own assumptions in determining the fair value of investments. The following is a summary of the levels used as of June 30, 2017 in valuing the fund’s assets or liabilities:
| Investments at Value | Level 1 | Level 2 | Level 3 | Total | ||||||||||||
| Equity Securities | $1,524,263,018 | $— | $— | $1,524,263,018 | ||||||||||||
| Mutual Funds | 10,895,137 | — | — | 10,895,137 | ||||||||||||
| Total Investments | $1,535,158,155 | $— | $— | $1,535,158,155 | ||||||||||||
For further information regarding security characteristics, see the Portfolio of Investments.
Of the level 1 investments presented above, equity investments amounting to $5,888,115 would have been considered level 2 investments at the beginning of the period. The primary reason for changes in the classifications between levels 1 and 2 occurs when foreign equity securities are fair valued using other observable market-based inputs in place of the closing exchange price due to events occurring after the close of the exchange or market on which the investment is principally traded. The fund’s foreign equity securities may often be valued using other observable market-based inputs. The fund’s policy is to recognize transfers between the levels as of the end of the period.
Foreign Currency Translation – Purchases and sales of foreign investments, income, and expenses are converted into U.S. dollars based upon currency exchange rates prevailing on the respective dates of such transactions or on the reporting date for foreign denominated receivables and payables. Gains and losses attributable to foreign currency exchange rates on sales of securities are recorded for financial statement purposes as net realized gains and losses on investments. Gains and losses attributable to foreign exchange rate movements on receivables, payables, income and expenses are recorded for financial statement purposes as foreign currency transaction gains and losses. That portion of both realized and unrealized gains and losses on investments that results from fluctuations in foreign currency exchange rates is not separately disclosed.
Security Loans – Under its Securities Lending Agency Agreement with the fund, State Street Bank and Trust Company (“State Street”), as lending agent, loans the securities of the fund to certain qualified institutions (the “Borrowers”) approved by the fund. Security loans can be terminated at the discretion of either the lending agent or the fund and the related securities must be returned within the earlier of the standard trade settlement period for such securities or within three business days. The loans are collateralized by cash and/or U.S. Treasury and federal agency obligations in an amount typically at least equal to the market value of the securities loaned. On loans collateralized by cash, the cash collateral is invested in a money market fund. The market value of the loaned securities is determined at the close of business of the fund and any additional required collateral is delivered to the fund on the next business day. State Street provides the fund with indemnification against Borrower default. In the event of Borrower default, State Street will, for the benefit of the fund, either purchase securities identical to those loaned or, when such purchase is commercially impracticable, pay the fund the market value of the loaned securities. In return, State Street assumes the fund’s rights to the related collateral. If the collateral value is less than the cost to purchase identical securities, State Street is responsible for the shortfall, but only to the extent that such shortfall is not due to a decline in collateral value resulting from collateral reinvestment for which the fund bears the risk of loss. A portion of the income generated upon investment of the collateral is remitted to the Borrowers, and the remainder is allocated between the fund and the lending agent. On loans collateralized by U.S. Treasury and/or federal agency obligations, a fee is received from the Borrower, and is allocated between the fund and the lending agent. Income from securities lending is included in “Interest” income in the Statement of Operations. The dividend and interest income earned on the securities loaned is accounted for in the same manner as other dividend and interest income. At June 30, 2017, there were no securities on loan or collateral outstanding.
Indemnifications – Under the fund’s organizational documents, its officers and Trustees may be indemnified against certain liabilities and expenses arising out of the performance of their duties to the fund. Additionally, in the normal course of business, the
12
Table of Contents
MFS Growth Series
Notes to Financial Statements (unaudited) – continued
fund enters into agreements with service providers that may contain indemnification clauses. The fund’s maximum exposure under these agreements is unknown as this would involve future claims that may be made against the fund that have not yet occurred.
Investment Transactions and Income – Investment transactions are recorded on the trade date. Interest income is recorded on the accrual basis. Dividends received in cash are recorded on the ex-dividend date. Certain dividends from foreign securities will be recorded when the fund is informed of the dividend if such information is obtained subsequent to the ex-dividend date. Dividend and interest payments received in additional securities are recorded on the ex-dividend or ex-interest date in an amount equal to the value of the security on such date.
The fund may receive proceeds from litigation settlements. Any proceeds received from litigation involving portfolio holdings are reflected in the Statement of Operations in realized gain/loss if the security has been disposed of by the fund or in unrealized gain/loss if the security is still held by the fund. Any other proceeds from litigation not related to portfolio holdings are reflected as other income in the Statement of Operations.
Tax Matters and Distributions – The fund intends to qualify as a regulated investment company, as defined under Subchapter M of the Internal Revenue Code, and to distribute all of its taxable income, including realized capital gains. As a result, no provision for federal income tax is required. The fund’s federal tax returns, when filed, will remain subject to examination by the Internal Revenue Service for a three year period. Management has analyzed the fund’s tax positions taken on federal and state tax returns for all open tax years and does not believe that there are any uncertain tax positions that require recognition of a tax liability. Foreign taxes, if any, have been accrued by the fund in the accompanying financial statements in accordance with the applicable foreign tax law. Foreign income taxes may be withheld by certain countries in which the fund invests. Additionally, capital gains realized by the fund on securities issued in or by certain foreign countries may be subject to capital gains tax imposed by those countries.
Distributions to shareholders are recorded on the ex-dividend date. Income and capital gain distributions are determined in accordance with income tax regulations, which may differ from U.S. generally accepted accounting principles. Certain capital accounts in the financial statements are periodically adjusted for permanent differences in order to reflect their tax character. These adjustments have no impact on net assets or net asset value per share. Temporary differences which arise from recognizing certain items of income, expense, gain or loss in different periods for financial statement and tax purposes will reverse at some time in the future. Distributions in excess of net investment income or net realized gains are temporary overdistributions for financial statement purposes resulting from differences in the recognition or classification of income or distributions for financial statement and tax purposes.
Book/tax differences primarily relate to wash sale loss deferrals.
The tax character of distributions declared to shareholders for the last fiscal year is as follows:
| Year ended 12/31/16 | ||||
| Ordinary income (including any short-term capital gains) | $536,744 | |||
| Long-term capital gains | 87,392,457 | |||
| Total distributions | $87,929,201 | |||
The federal tax cost and the tax basis components of distributable earnings were as follows:
| As of 6/30/17 | ||||
| Cost of investments | $855,045,786 | |||
| Gross appreciation | 681,508,627 | |||
| Gross depreciation | (1,396,258 | ) | ||
| Net unrealized appreciation (depreciation) | $680,112,369 | |||
| As of 12/31/16 | ||||
| Undistributed ordinary income | 1,348,776 | |||
| Undistributed long-term capital gain | 60,589,124 | |||
| Other temporary differences | 309 | |||
| Net unrealized appreciation (depreciation) | 495,739,912 | |||
The aggregate cost above includes prior fiscal year end tax adjustments, if applicable.
Multiple Classes of Shares of Beneficial Interest – The fund offers multiple classes of shares, which differ in their respective distribution and/or service fees. The fund’s income, realized and unrealized gain (loss), and common expenses are allocated to shareholders based on the daily net assets of each class. Dividends are declared separately for each class. Differences in per share
13
Table of Contents
MFS Growth Series
Notes to Financial Statements (unaudited) – continued
dividend rates are generally due to differences in separate class expenses. The fund’s distributions declared to shareholders as reported in the Statements of Changes in Net Assets are presented by class as follows:
| From net investment income | From net realized gain on investments | |||||||||||||||
| Six months ended 6/30/17 | Year ended 12/31/16 | Six months ended 6/30/17 | Year ended 12/31/16 | |||||||||||||
| Initial Class | $— | $536,744 | $— | $73,219,360 | ||||||||||||
| Service Class | — | — | — | 14,173,097 | ||||||||||||
| Total | $— | $536,744 | $— | $87,392,457 | ||||||||||||
| (3) | Transactions with Affiliates |
Investment Adviser – The fund has an investment advisory agreement with MFS to provide overall investment management and related administrative services and facilities to the fund. The management fee is computed daily and paid monthly at the following annual rates:
| First $1 billion of average daily net assets | 0.75% | |||
| Average daily net assets in excess of $1 billion | 0.65% |
MFS has agreed in writing to reduce its management fee by a specified amount if certain MFS mutual fund assets exceed thresholds agreed to by MFS and the fund’s Board of Trustees. For the six months ended June 30, 2017, this management fee reduction amounted to $57,135, which is included in the reduction of total expenses in the Statement of Operations. The management fee incurred for the six months ended June 30, 2017 was equivalent to an annual effective rate of 0.71% of the fund’s average daily net assets.
Distributor – MFS Fund Distributors, Inc. (MFD), a wholly-owned subsidiary of MFS, is the distributor of shares of the fund. The Trustees have adopted a distribution plan for the Service Class shares pursuant to Rule 12b-1 under the Investment Company Act of 1940.
The fund’s distribution plan provides that the fund will pay MFD distribution and/or service fees equal to 0.25% per annum of its average daily net assets attributable to Service Class shares as partial consideration for services performed and expenses incurred by MFD and financial intermediaries (including participating insurance companies that invest in the fund to fund variable annuity and variable life insurance contracts, sponsors of qualified retirement and pension plans that invest in the fund, and affiliates of these participating insurance companies and plan sponsors) in connection with the sale and distribution of the Service Class shares. MFD may subsequently pay all, or a portion, of the distribution and/or service fees to financial intermediaries.
Shareholder Servicing Agent – MFS Service Center, Inc. (MFSC), a wholly-owned subsidiary of MFS, receives a fee from the fund for its services as shareholder servicing agent. For the six months ended June 30, 2017, the fee was $31,683, which equated to 0.0043% annually of the fund’s average daily net assets. MFSC also receives payment from the fund for out-of-pocket expenses paid by MFSC on behalf of the fund. For the six months ended June 30, 2017, these costs amounted to $2,608.
Administrator – MFS provides certain financial, legal, shareholder communications, compliance, and other administrative services to the fund. Under an administrative services agreement, the fund reimburses MFS the costs incurred to provide these services. The fund is charged an annual fixed amount of $17,500 plus a fee based on average daily net assets. The administrative services fee incurred for the six months ended June 30, 2017 was equivalent to an annual effective rate of 0.0168% of the fund’s average daily net assets.
Trustees’ and Officers’ Compensation – The fund pays compensation to independent Trustees in the form of a retainer, attendance fees, and additional compensation to Board and Committee chairpersons. The fund does not pay compensation directly to Trustees or officers of the fund who are also officers of the investment adviser, all of whom receive remuneration for their services to the fund from MFS. Certain officers and Trustees of the fund are officers or directors of MFS, MFD, and MFSC.
Other – This fund and certain other funds managed by MFS (the funds) have entered into a service agreement (the ISO Agreement) which provides for payment of fees solely by the funds to Tarantino LLC in return for the provision of services of an Independent Senior Officer (ISO) for the funds. Frank L. Tarantino serves as the ISO and is an officer of the funds and the sole member of Tarantino LLC. The funds can terminate the ISO Agreement with Tarantino LLC at any time under the terms of the ISO Agreement. For the six months ended June 30, 2017, the fee paid by the fund under this agreement was $1,358 and is included in “Miscellaneous” expense in the Statement of Operations. MFS has agreed to bear all expenses associated with office space, other administrative support, and supplies provided to the ISO.
The fund invests in the MFS Institutional Money Market Portfolio which is managed by MFS and seeks current income consistent with preservation of capital and liquidity. This money market fund does not pay a management fee to MFS.
14
Table of Contents
MFS Growth Series
Notes to Financial Statements (unaudited) – continued
The fund is permitted to engage in purchase and sale transactions with funds and accounts for which MFS serves as investment adviser or sub-adviser (“cross-trades”) pursuant to a policy adopted by the Board of Trustees. This policy has been designed to ensure that cross-trades conducted by the fund comply with Rule 17a-7 under the Investment Company Act of 1940. Under this policy, cross-trades are effected at current market prices with no remuneration paid in connection with the transaction. During the six months ended June 30, 2017, the fund engaged in purchase and sale transactions pursuant to this policy, which amounted to $297,175 and $830,519, respectively. The sales transactions resulted in net realized gains (losses) of $(1,637).
| (4) | Portfolio Securities |
For the six months ended June 30, 2017, purchases and sales of investments, other than short-term obligations, aggregated $129,789,320 and $244,513,245, respectively.
| (5) | Shares of Beneficial Interest |
The fund’s Declaration of Trust permits the Trustees to issue an unlimited number of full and fractional shares of beneficial interest. Transactions in fund shares were as follows:
| Six months ended 6/30/17 | Year ended 12/31/16 | |||||||||||||||
| Shares | Amount | Shares | Amount | |||||||||||||
| Shares sold | ||||||||||||||||
Initial Class | 691,248 | $29,561,481 | 1,989,931 | $78,197,756 | ||||||||||||
Service Class | 500,047 | 20,637,304 | 1,439,886 | 54,565,058 | ||||||||||||
| 1,191,295 | $50,198,785 | 3,429,817 | $132,762,814 | |||||||||||||
| Shares issued to shareholders in reinvestment of distributions | ||||||||||||||||
Initial Class | — | $— | 1,821,123 | $72,808,498 | ||||||||||||
Service Class | — | — | 365,380 | 14,173,097 | ||||||||||||
| — | $— | 2,186,503 | $86,981,595 | |||||||||||||
| Shares reacquired | ||||||||||||||||
Initial Class | (3,200,215 | ) | $(136,455,093 | ) | (5,065,894 | ) | $(199,678,497 | ) | ||||||||
Service Class | (745,861 | ) | (30,916,919 | ) | (1,275,525 | ) | (48,127,642 | ) | ||||||||
| (3,946,076 | ) | $(167,372,012 | ) | (6,341,419 | ) | $(247,806,139 | ) | |||||||||
| Net change | ||||||||||||||||
Initial Class | (2,508,967 | ) | $(106,893,612 | ) | (1,254,840 | ) | $(48,672,243 | ) | ||||||||
Service Class | (245,814 | ) | (10,279,615 | ) | 529,741 | 20,610,513 | ||||||||||
| (2,754,781 | ) | $(117,173,227 | ) | (725,099 | ) | $(28,061,730 | ) | |||||||||
The fund is one of several mutual funds in which certain MFS funds may invest. The MFS funds do not invest in the underlying funds for the purpose of exercising management or control. At the end of the period, the MFS Moderate Allocation Portfolio, the MFS Growth Allocation Portfolio, and the MFS Conservative Allocation Portfolio were the owners of record of approximately 10%, 3%, and 2%, respectively, of the value of outstanding voting shares of the fund.
| (6) | Line of Credit |
The fund and certain other funds managed by MFS participate in a $1.25 billion unsecured committed line of credit, subject to a $1 billion sublimit, provided by a syndication of banks under a credit agreement. Borrowings may be made for temporary financing needs. Interest is charged to each fund, based on its borrowings, generally at a rate equal to the higher of the Overnight Federal Reserve funds rate or daily one month LIBOR plus an agreed upon spread. A commitment fee, based on the average daily, unused portion of the committed line of credit, is allocated among the participating funds at the end of each calendar quarter. In addition, the fund and other funds managed by MFS have established unsecured uncommitted borrowing arrangements with certain banks for temporary financing needs. Interest is charged to each fund, based on its borrowings, at a rate equal to the Overnight Federal Reserve funds rate plus an agreed upon spread. For the six months ended June 30, 2017, the fund’s commitment fee and interest expense were $5,062 and $0, respectively, and are included in “Miscellaneous” expense in the Statement of Operations.
15
Table of Contents
MFS Growth Series
Notes to Financial Statements (unaudited) – continued
| (7) | Transactions in Underlying Affiliated Funds – Affiliated Issuers |
An affiliated issuer may be considered one in which the fund owns 5% or more of the outstanding voting securities, or a company which is under common control. For the purposes of this report, the fund assumes the following to be an affiliated issuer:
| Underlying Affiliated Fund | Beginning Shares/Par Amount | Acquisitions Shares/Par Amount | Dispositions Shares/Par Amount | Ending Shares/Par Amount | ||||||||||||
| MFS Institutional Money Market Portfolio | 1,048,467 | 121,221,025 | (111,374,355 | ) | 10,895,137 | |||||||||||
| Underlying Affiliated Fund | Realized Gain (Loss) | Capital Gain Distributions | Dividend Income | Ending Value | ||||||||||||
| MFS Institutional Money Market Portfolio | $(1,021 | ) | $— | $50,014 | $10,895,137 | |||||||||||
16
Table of Contents
MFS Growth Series
RESULTS OF SHAREHOLDER MEETING (unaudited)
At a special meeting of shareholders of MFS Variable Insurance Trust, which was held on March 23, 2017, the following action was taken:
Item 1: To elect the following individuals as Trustees:
| Number of Dollars | ||||||||
| Nominee | For | Withheld Authority | ||||||
| Steven E. Buller | 11,311,922,492.61 | 518,570,973.54 | ||||||
| John A. Caroselli | 11,291,109,000.34 | 539,384,465.81 | ||||||
| Maureen R. Goldfarb | 11,233,211,779.66 | 597,281,686.49 | ||||||
| David H. Gunning | 11,179,077,201.17 | 651,416,264.98 | ||||||
| Michael Hegarty | 11,191,993,154.78 | 638,500,311.37 | ||||||
| John P. Kavanaugh | 11,242,238,261.44 | 588,255,204.71 | ||||||
| Robert J. Manning | 11,314,479,376.58 | 516,014,089.57 | ||||||
| Clarence Otis, Jr. | 11,208,873,448.85 | 621,620,017.30 | ||||||
| Maryanne L. Roepke | 11,263,427,105.03 | 567,066,361.12 | ||||||
| Robin A. Stelmach | 11,313,883,043.82 | 216,610,422.33 | ||||||
| Laurie J. Thomsen | 11,240,219,041.09 | 590,274,425.06 | ||||||
17
Table of Contents
MFS Growth Series
PROXY VOTING POLICIES AND INFORMATION
MFS votes proxies on behalf of the fund pursuant to proxy voting policies and procedures that are available without charge, upon request, by calling 1-800-225-2606, by visiting mfs.com (once you have selected “Individual Investor” as your role, click on “Individual Investor Home” in the top navigation and then select “Learn More About Proxy Voting” under the “I want to…” header on the left hand column of the page), or by visiting the SEC’s Web site at http://www.sec.gov.
Information regarding how the fund voted proxies relating to portfolio securities during the most recent twelve-month period ended June 30 is available by August 31 of each year without charge by visiting mfs.com (once you have selected “Individual Investor” as your role, click on “Individual Investor Home” in the top navigation and then select “Learn More About Proxy Voting” under the “I want to…” header on the left hand column of the page), or by visiting the SEC’s Web site at http://www.sec.gov.
QUARTERLY PORTFOLIO DISCLOSURE
The fund will file a complete schedule of portfolio holdings with the Securities and Exchange Commission (the Commission) for the first and third quarters of each fiscal year on Form N-Q. The fund’s Form N-Q is available on the EDGAR database on the Commission’s Internet Web site at http://www.sec.gov, and may be reviewed and copied at the:
Public Reference Room
Securities and Exchange Commission
100 F Street, NE, Room 1580
Washington, D.C. 20549
Information on the operation of the Public Reference Room may be obtained by calling the Commission at 1-800-SEC-0330. Copies of the fund’s Form N-Q also may be obtained, upon payment of a duplicating fee, by electronic request at the following e-mail address: publicinfo@sec.gov or by writing the Public Reference Section at the above address.
From time to time, MFS may post important information about the fund or the MFS funds on the MFS web site (mfs.com). This information is available on mfs.com by following these steps once you have selected “Individual Investor” as your role: (1) Click on the “Individual Investor Home” in the top navigation and then select the “Announcements” option within the “Market Outlooks” drop down, or (2) Click on “Products & Services” and “Variable Insurance Portfolios” and then select the fund’s name.
INFORMATION ABOUT FUND CONTRACTS AND LEGAL CLAIMS
The fund has entered into contractual arrangements with an investment adviser, administrator, distributor, shareholder servicing agent, 529 program manager (if applicable), and custodian who each provide services to the fund. Unless expressly stated otherwise, shareholders are not parties to, or intended beneficiaries of these contractual arrangements, and these contractual arrangements are not intended to create any shareholder right to enforce them against the service providers or to seek any remedy under them against the service providers, either directly or on behalf of the fund.
Under the Trust’s By-Laws and Declaration of Trust, any claims asserted against or on behalf of the MFS Funds, including claims against Trustees and Officers, must be brought in state and federal courts located within the Commonwealth of Massachusetts.
18
Table of Contents
Table of Contents
SEMIANNUAL REPORT
June 30, 2017

MFS® VALUE SERIES
MFS® Variable Insurance Trust

VLU-SEM
Table of Contents
MFS® VALUE SERIES
The report is prepared for the general information of contract owners. It is authorized for distribution to prospective investors only when preceded or accompanied by a current prospectus.
NOT FDIC INSURED • MAY LOSE VALUE • NO BANK OR CREDIT UNION GUARANTEE • NOT A DEPOSIT • NOT INSURED BY ANY FEDERAL GOVERNMENT AGENCY OR NCUA/NCUSIF
Table of Contents
MFS Value Series
LETTER FROM THE EXECUTIVE CHAIRMAN

Dear Contract Owners:
Despite policy uncertainty accompanying a new presidential administration in the United States and unease over ongoing Brexit negotiations, most markets have proved resilient. U.S. share prices have reached new highs. The U.S. Federal Reserve has continued to gradually hike interest rates. However, rates in most developed markets remain very low, with major non-U.S. central banks just beginning to contemplate curbing accommodative monetary policies.
Globally, economic growth has shown signs of recovery, led by China, the U.S. and the eurozone. Despite better growth, there are few immediate signs of worrisome inflation as wage growth remains muted. Europe has benefited from diminishing event risks as establishment candidates won both the Dutch and French elections, averting a feared populist trend. Emerging market economies are recovering at a somewhat slower pace amid fears that restrictive U.S. trade policies could further hamper the restrained pace of global trade growth. Looking ahead, markets will have to contend with issues involving geopolitical hot spots on the Korean peninsula and in the Middle East, which could potentially lead to a clash of interests between the U.S. and other major powers such as China or Russia.
At MFS®, we believe time is an asset. A patient, long-term approach to investing can have a powerful impact on decision making and outcomes. Time arbitrage, as we call it, simply comes down to having the conviction and discipline to allow enough time for good investment ideas to play out. In our view, such an approach, along with the professional guidance of a financial advisor, will help you reach your investment objectives.
Respectfully,

Robert J. Manning
Executive Chairman
MFS Investment Management
August 16, 2017
The opinions expressed in this letter are subject to change and may not be relied upon for investment advice. No forecasts can be guaranteed.
1
Table of Contents
MFS Value Series
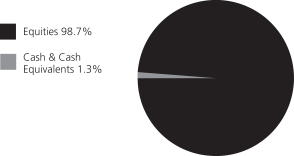
Portfolio structure
| Top ten holdings | ||||
| JPMorgan Chase & Co. | 4.6% | |||
| Philip Morris International, Inc. | 3.7% | |||
| Johnson & Johnson | 3.6% | |||
| Wells Fargo & Co. | 3.3% | |||
| Accenture PLC, “A” | 2.6% | |||
| Medtronic PLC | 2.5% | |||
| U.S. Bancorp | 2.2% | |||
| Johnson Controls International PLC | 2.2% | |||
| 3M Co. | 2.2% | |||
| Pfizer, Inc. | 2.1% |
| Equity sectors | ||||
| Financial Services | 29.6% | |||
| Health Care | 15.5% | |||
| Consumer Staples | 10.6% | |||
| Industrial Goods & Services | 9.9% | |||
| Special Products & Services | 5.4% | |||
| Basic Materials | 5.4% | |||
| Leisure | 5.2% | |||
| Energy | 4.7% | |||
| Transportation | 2.8% | |||
| Autos & Housing | 2.6% | |||
| Retailing | 2.5% | |||
| Utilities & Communications | 2.4% | |||
| Technology | 2.1% |
Cash & Cash Equivalents includes any cash, investments in money market funds, short-term securities, and other assets less liabilities. Please see the Statement of Assets and Liabilities for additional information related to the fund’s cash position and other assets and liabilities.
Percentages are based on net assets as of June 30, 2017.
The portfolio is actively managed and current holdings may be different.
2
Table of Contents
MFS Value Series
Fund Expenses Borne by the Contract Holders during the Period,
January 1, 2017 through June 30, 2017
As a contract holder of the fund, you incur ongoing costs, including management fees; distribution and/or service (12b-1) fees; and other fund expenses. This example is intended to help you understand your ongoing costs (in dollars) of investing in the fund and to compare these costs with the ongoing costs of investing in other mutual funds.
The example is based on an investment of $1,000 invested at the beginning of the period and held for the entire period January 1, 2017 through June 30, 2017.
Actual Expenses
The first line for each share class in the following table provides information about actual account values and actual expenses. You may use the information in this line, together with the amount you invested, to estimate the expenses that you paid over the period. Simply divide your account value by $1,000 (for example, an $8,600 account value divided by $1,000 = 8.6), then multiply the result by the number in the first line under the heading entitled “Expenses Paid During Period” to estimate the expenses you paid on your account during this period.
Hypothetical Example for Comparison Purposes
The second line for each share class in the following table provides information about hypothetical account values and hypothetical expenses based on the fund’s actual expense ratio and an assumed rate of return of 5% per year before expenses, which is not the fund’s actual return. The hypothetical account values and expenses may not be used to estimate the actual ending account balance or expenses you paid for the period. You may use this information to compare the ongoing costs of investing in the fund and other funds. To do so, compare this 5% hypothetical example with the 5% hypothetical examples that appear in the shareholder reports of the other funds.
Please note that the expenses shown in the table are meant to highlight the fund’s ongoing costs only and do not take into account the fees and expenses imposed under the variable contracts through which your investment in the fund is made. Therefore, the second line for each share class in the table is useful in comparing ongoing costs associated with an investment in vehicles (such as the fund) which fund benefits under variable annuity and variable life insurance contracts and to qualified pension and retirement plans only, and will not help you determine the relative total costs of investing in the fund through variable annuity and variable life insurance contracts. If the fees and expenses imposed under the variable contracts were included, your costs would have been higher.
| Share Class | Annualized Expense Ratio | Beginning Account Value 1/01/17 | Ending Account Value | Expenses Paid During Period (p) 1/01/17-6/30/17 | ||||||||||||||
| Initial Class | Actual | 0.73% | $1,000.00 | $1,091.01 | $3.78 | |||||||||||||
| Hypothetical (h) | 0.73% | $1,000.00 | $1,021.17 | $3.66 | ||||||||||||||
| Service Class | Actual | 0.98% | $1,000.00 | $1,089.30 | $5.08 | |||||||||||||
| Hypothetical (h) | 0.98% | $1,000.00 | $1,019.93 | $4.91 | ||||||||||||||
| (h) | 5% class return per year before expenses. |
| (p) | “Expenses Paid During Period” are equal to each class’s annualized expense ratio, as shown above, multiplied by the average account value over the period, multiplied by 181/365 (to reflect the one-half year period). |
3
Table of Contents
MFS Value Series
PORTFOLIO OF INVESTMENTS – 6/30/17 (unaudited)
The Portfolio of Investments is a complete list of all securities owned by your fund. It is categorized by broad-based asset classes.
| Issuer | Shares/Par | Value ($) | ||||||
| COMMON STOCKS – 98.7% | ||||||||
| Aerospace – 5.3% | ||||||||
| Honeywell International, Inc. | 313,121 | $ | 41,735,898 | |||||
| Lockheed Martin Corp. | 91,199 | 25,317,754 | ||||||
| Northrop Grumman Corp. | 116,239 | 29,839,714 | ||||||
| United Technologies Corp. | 227,215 | 27,745,224 | ||||||
|
| |||||||
| $ | 124,638,590 | |||||||
|
| |||||||
| Alcoholic Beverages – 1.0% | ||||||||
| Diageo PLC | 810,436 | $ | 23,945,199 | |||||
|
| |||||||
| Apparel Manufacturers – 0.4% | ||||||||
| Hanesbrands, Inc. | 434,359 | $ | 10,059,754 | |||||
|
| |||||||
| Automotive – 1.2% | ||||||||
| Delphi Automotive PLC | 277,015 | $ | 24,280,365 | |||||
| Harley-Davidson, Inc. | 78,196 | 4,224,148 | ||||||
|
| |||||||
| $ | 28,504,513 | |||||||
|
| |||||||
| Broadcasting – 2.0% | ||||||||
| Interpublic Group of Companies, Inc. | 475,532 | $ | 11,698,087 | |||||
| Omnicom Group, Inc. | 369,164 | 30,603,696 | ||||||
| Walt Disney Co. | 50,657 | 5,382,306 | ||||||
|
| |||||||
| $ | 47,684,089 | |||||||
|
| |||||||
| Brokerage & Asset Managers – 2.8% | ||||||||
| BlackRock, Inc. | 53,545 | $ | 22,617,943 | |||||
| Franklin Resources, Inc. | 213,794 | 9,575,833 | ||||||
| NASDAQ, Inc. | 342,003 | 24,449,795 | ||||||
| T. Rowe Price Group, Inc. | 113,546 | 8,426,249 | ||||||
|
| |||||||
| $ | 65,069,820 | |||||||
|
| |||||||
| Business Services – 5.4% | ||||||||
| Accenture PLC, “A” | 492,049 | $ | 60,856,620 | |||||
| Amdocs Ltd. | 90,677 | 5,845,040 | ||||||
| Cognizant Technology Solutions Corp., “A” | 143,107 | 9,502,305 | ||||||
| DXC Technology Co. | 71,893 | 5,515,631 | ||||||
| Equifax, Inc. | 77,748 | 10,684,130 | ||||||
| Fidelity National Information Services, Inc. | 265,345 | 22,660,463 | ||||||
| Fiserv, Inc. (a) | 91,345 | 11,175,147 | ||||||
|
| |||||||
| $ | 126,239,336 | |||||||
|
| |||||||
| Cable TV – 1.3% | ||||||||
| Comcast Corp., “A” | 788,968 | $ | 30,706,635 | |||||
|
| |||||||
| Chemicals – 4.9% | ||||||||
| 3M Co. | 243,291 | $ | 50,650,753 | |||||
| E.I. du Pont de Nemours & Co. | 112,629 | 9,090,287 | ||||||
| Monsanto Co. | 77,371 | 9,157,632 | ||||||
| PPG Industries, Inc. | 413,117 | 45,426,345 | ||||||
|
| |||||||
| $ | 114,325,017 | |||||||
|
| |||||||
| Computer Software – 0.2% | ||||||||
| Oracle Corp. | 99,998 | $ | 5,013,900 | |||||
|
| |||||||
| Computer Software – Systems – 0.6% | ||||||||
| International Business Machines Corp. | 92,387 | $ | 14,211,892 | |||||
|
| |||||||
| Issuer | Shares/Par | Value ($) | ||||||
| COMMON STOCKS – continued | ||||||||
| Construction – 1.4% | ||||||||
| Sherwin-Williams Co. | 52,961 | $ | 18,587,192 | |||||
| Stanley Black & Decker, Inc. | 93,760 | 13,194,845 | ||||||
|
| |||||||
| $ | 31,782,037 | |||||||
|
| |||||||
| Consumer Products – 1.1% | ||||||||
| Coty, Inc., “A” | 497,459 | $ | 9,332,331 | |||||
| Newell Brands, Inc. | 78,793 | 4,224,881 | ||||||
| Procter & Gamble Co. | 131,755 | 11,482,448 | ||||||
|
| |||||||
| $ | 25,039,660 | |||||||
|
| |||||||
| Containers – 0.5% | ||||||||
| Crown Holdings, Inc. (a) | 191,173 | $ | 11,405,381 | |||||
|
| |||||||
| Electrical Equipment – 2.2% | ||||||||
| Johnson Controls International PLC | 1,178,976 | $ | 51,120,399 | |||||
|
| |||||||
| Electronics – 1.3% | ||||||||
| Texas Instruments, Inc. | 390,810 | $ | 30,065,013 | |||||
|
| |||||||
| Energy – Independent – 1.5% | ||||||||
| EOG Resources, Inc. | 220,990 | $ | 20,004,015 | |||||
| Occidental Petroleum Corp. | 259,920 | 15,561,410 | ||||||
|
| |||||||
| $ | 35,565,425 | |||||||
|
| |||||||
| Energy – Integrated – 1.7% | ||||||||
| Chevron Corp. | 181,281 | $ | 18,913,047 | |||||
| Exxon Mobil Corp. | 262,160 | 21,164,177 | ||||||
|
| |||||||
| $ | 40,077,224 | |||||||
|
| |||||||
| Entertainment – 0.9% | ||||||||
| Time Warner, Inc. | 198,062 | $ | 19,887,405 | |||||
|
| |||||||
| Food & Beverages – 4.4% | ||||||||
| Archer Daniels Midland Co. | 195,919 | $ | 8,107,128 | |||||
| Danone S.A. | 143,128 | 10,758,197 | ||||||
| General Mills, Inc. | 342,132 | 18,954,113 | ||||||
| J.M. Smucker Co. | 79,410 | 9,396,585 | ||||||
| Nestle S.A. | 467,550 | 40,689,381 | ||||||
| PepsiCo, Inc. | 118,836 | 13,724,370 | ||||||
|
| |||||||
| $ | 101,629,774 | |||||||
|
| |||||||
| Food & Drug Stores – 1.6% | ||||||||
| CVS Health Corp. | 458,977 | $ | 36,929,289 | |||||
|
| |||||||
| General Merchandise – 0.2% | ||||||||
| Target Corp. | 104,469 | $ | 5,462,684 | |||||
|
| |||||||
| Health Maintenance Organizations – 0.7% | ||||||||
| Cigna Corp. | 80,175 | $ | 13,420,493 | |||||
| UnitedHealth Group, Inc. | 19,656 | 3,644,616 | ||||||
|
| |||||||
| $ | 17,065,109 | |||||||
|
| |||||||
| Insurance – 7.8% | ||||||||
| Aon PLC | 314,268 | $ | 41,781,931 | |||||
| Chubb Ltd. | 325,508 | 47,322,353 | ||||||
| MetLife, Inc. | 608,485 | 33,430,166 | ||||||
| Prudential Financial, Inc. | 134,723 | 14,568,945 | ||||||
4
Table of Contents
MFS Value Series
Portfolio of Investments (unaudited) – continued
| Issuer | Shares/Par | Value ($) | ||||||
| COMMON STOCKS – continued | ||||||||
| Insurance – continued | ||||||||
| Travelers Cos., Inc. | 357,484 | $ | 45,232,450 | |||||
|
| |||||||
| $ | 182,335,845 | |||||||
|
| |||||||
| Machinery & Tools – 2.4% | ||||||||
| Eaton Corp. PLC | 276,152 | $ | 21,492,910 | |||||
| Illinois Tool Works, Inc. | 140,806 | 20,170,460 | ||||||
| Ingersoll-Rand Co. Ltd., “A” | 154,193 | 14,091,698 | ||||||
|
| |||||||
| $ | 55,755,068 | |||||||
|
| |||||||
| Major Banks – 13.4% | ||||||||
| Bank of New York Mellon Corp. | 519,116 | $ | 26,485,298 | |||||
| Goldman Sachs Group, Inc. | 221,058 | 49,052,770 | ||||||
| JPMorgan Chase & Co. | 1,175,666 | 107,455,872 | ||||||
| PNC Financial Services Group, Inc. | 258,742 | 32,309,114 | ||||||
| State Street Corp. | 237,294 | 21,292,391 | ||||||
| Wells Fargo & Co. | 1,371,188 | 75,977,527 | ||||||
|
| |||||||
| $ | 312,572,972 | |||||||
|
| |||||||
| Medical & Health Technology & Services – 1.2% | ||||||||
| Express Scripts Holding Co. (a) | 180,090 | $ | 11,496,946 | |||||
| McKesson Corp. | 101,598 | 16,716,935 | ||||||
|
| |||||||
| $ | 28,213,881 | |||||||
|
| |||||||
| Medical Equipment – 6.4% | ||||||||
| Abbott Laboratories | 764,901 | $ | 37,181,838 | |||||
| Danaher Corp. | 297,051 | 25,068,134 | ||||||
| Medtronic PLC | 669,175 | 59,389,281 | ||||||
| Thermo Fisher Scientific, Inc. | 165,199 | 28,822,269 | ||||||
|
| |||||||
| $ | 150,461,522 | |||||||
|
| |||||||
| Oil Services – 1.5% | ||||||||
| Schlumberger Ltd. | 518,003 | $ | 34,105,318 | |||||
|
| |||||||
| Other Banks & Diversified Financials – 5.3% | ||||||||
| American Express Co. | 270,443 | $ | 22,782,118 | |||||
| Citigroup, Inc. | 740,343 | 49,514,140 | ||||||
| U.S. Bancorp | 990,051 | 51,403,448 | ||||||
|
| |||||||
| $ | 123,699,706 | |||||||
|
| |||||||
| Pharmaceuticals – 7.1% | ||||||||
| Johnson & Johnson | 634,602 | $ | 83,951,499 | |||||
| Merck & Co., Inc. | 344,056 | 22,050,549 | ||||||
| Novartis AG | 70,064 | 5,830,751 | ||||||
| Pfizer, Inc. | 1,475,608 | 49,565,673 | ||||||
| Roche Holding AG | 19,916 | 5,071,944 | ||||||
|
| |||||||
| $ | 166,470,416 | |||||||
|
| |||||||
| Printing & Publishing – 0.9% | ||||||||
| Moody’s Corp. | 136,651 | $ | 16,627,694 | |||||
| S&P Global, Inc. | 36,687 | 5,355,935 | ||||||
|
| |||||||
| $ | 21,983,629 | |||||||
|
| |||||||
| Issuer | Shares/Par | Value ($) | ||||||
| COMMON STOCKS – continued | ||||||||
| Railroad & Shipping – 1.3% | ||||||||
| Canadian National Railway Co. | 169,756 | $ | 13,758,724 | |||||
| Union Pacific Corp. | 156,459 | 17,039,950 | ||||||
|
| |||||||
| $ | 30,798,674 | |||||||
|
| |||||||
| Real Estate – 0.4% | ||||||||
| Public Storage, Inc., REIT | 43,776 | $ | 9,128,609 | |||||
|
| |||||||
| Specialty Stores – 0.2% | ||||||||
| Advance Auto Parts, Inc. | 42,222 | $ | 4,922,663 | |||||
|
| |||||||
| Telephone Services – 0.9% | ||||||||
| Verizon Communications, Inc. | 444,071 | $ | 19,832,211 | |||||
|
| |||||||
| Tobacco – 4.2% | ||||||||
| Altria Group, Inc. | 156,348 | $ | 11,643,236 | |||||
| Philip Morris International, Inc. | 728,059 | 85,510,529 | ||||||
|
| |||||||
| $ | 97,153,765 | |||||||
|
| |||||||
| Trucking – 1.5% | ||||||||
| United Parcel Service, Inc., “B” | 306,715 | $ | 33,919,612 | |||||
|
| |||||||
| Utilities – Electric Power – 1.6% | ||||||||
| Duke Energy Corp. | 354,081 | $ | 29,597,631 | |||||
| Xcel Energy, Inc. | 159,212 | 7,304,646 | ||||||
|
| |||||||
| $ | 36,902,277 | |||||||
|
| |||||||
| Total Common Stocks (Identified Cost, $1,343,986,339) | $ | 2,304,684,313 | ||||||
|
| |||||||
| MONEY MARKET FUNDS – 0.4% | ||||||||
| MFS Institutional Money Market Portfolio, 0.98% (v) (Identified Cost, $10,279,497) | 10,280,524 | $ | 10,280,524 | |||||
|
| |||||||
| Total Investments (Identified Cost, $1,354,265,836) | $ | 2,314,964,837 | ||||||
|
| |||||||
| OTHER ASSETS, LESS LIABILITIES – 0.9% | 21,077,940 | |||||||
|
| |||||||
| NET ASSETS – 100.0% | $ | 2,336,042,777 | ||||||
|
| |||||||
| (a) | Non-income producing security. |
| (v) | Underlying affiliated fund that is available only to investment companies managed by MFS. The rate quoted for the MFS Institutional Money Market Portfolio is the annualized seven-day yield of the fund at period end. |
The following abbreviations are used in this report and are defined:
| PLC | Public Limited Company |
| REIT | Real Estate Investment Trust |
See Notes to Financial Statements
5
Table of Contents
MFS Value Series
FINANCIAL STATEMENTS | STATEMENT OF ASSETS AND LIABILITIES (unaudited)
This statement represents your fund’s balance sheet, which details the assets and liabilities comprising the total value of the fund.
At 6/30/17 | ||||
Assets | ||||
Investments | ||||
Non-affiliated issuers, at value (identified cost, $1,343,986,339) | $2,304,684,313 | |||
Underlying affiliated funds, at value (identified cost, $10,279,497) | 10,280,524 | |||
Total investments, at value (identified cost, $1,354,265,836) | $2,314,964,837 | |||
Cash | 63,907 | |||
Foreign currency, at value (identified cost, $47) | 49 | |||
Receivables for | ||||
Investments sold | 20,024,792 | |||
Fund shares sold | 36,606 | |||
Dividends | 4,301,545 | |||
Other assets | 4,682 | |||
Total assets | $2,339,396,418 | |||
Liabilities | ||||
Payables for fund shares reacquired | $3,074,834 | |||
Payable to affiliates | ||||
Investment adviser | 89,953 | |||
Shareholder servicing costs | 1,532 | |||
Distribution and/or service fees | 18,569 | |||
Payable for independent Trustees’ compensation | 2,029 | |||
Accrued expenses and other liabilities | 166,724 | |||
Total liabilities | $3,353,641 | |||
Net assets | $2,336,042,777 | |||
Net assets consist of | ||||
Paid-in capital | $1,163,802,668 | |||
Unrealized appreciation (depreciation) on investments and translation of assets and liabilities in foreign currencies | 960,682,597 | |||
Accumulated net realized gain (loss) on investments and foreign currency | 153,098,960 | |||
Undistributed net investment income | 58,458,552 | |||
Net assets | $2,336,042,777 | |||
Shares of beneficial interest outstanding | 114,478,500 |
| Net assets | Shares outstanding | Net asset value per share | ||||||||||
Initial Class | $982,212,427 | 47,633,542 | $20.62 | |||||||||
Service Class | 1,353,830,350 | 66,844,958 | 20.25 | |||||||||
See Notes to Financial Statements
6
Table of Contents
MFS Value Series
FINANCIAL STATEMENTS | STATEMENT OF OPERATIONS (unaudited)
This statement describes how much your fund earned in investment income and accrued in expenses. It also describes any gains and/or losses generated by fund operations.
Six months ended 6/30/17 | ||||
Net investment income | ||||
Income | ||||
Dividends | $26,700,138 | |||
Dividends from underlying affiliated funds | 69,329 | |||
Interest | 12,278 | |||
Foreign taxes withheld | (272,654 | ) | ||
Total investment income | $26,509,091 | |||
Expenses | ||||
Management fee | $7,909,102 | |||
Distribution and/or service fees | 1,645,130 | |||
Shareholder servicing costs | 35,613 | |||
Administrative services fee | 189,158 | |||
Independent Trustees’ compensation | 21,466 | |||
Custodian fee | 57,981 | |||
Shareholder communications | 124,417 | |||
Audit and tax fees | 27,753 | |||
Legal fees | 11,806 | |||
Miscellaneous | 25,052 | |||
Total expenses | $10,047,478 | |||
Reduction of expenses by investment adviser | (87,524 | ) | ||
Net expenses | $9,959,954 | |||
Net investment income | $16,549,137 | |||
Realized and unrealized gain (loss) on investments and foreign currency | ||||
Realized gain (loss) (identified cost basis) | ||||
Investments: | ||||
Non-affiliated issuers | $71,121,623 | |||
Underlying affiliated funds | (2,127 | ) | ||
Foreign currency | 1,307 | |||
Net realized gain (loss) on investments and foreign currency | $71,120,803 | |||
Change in unrealized appreciation (depreciation) | ||||
Investments | $111,145,836 | |||
Translation of assets and liabilities in foreign currencies | 71,594 | |||
Net unrealized gain (loss) on investments and foreign currency translation | $111,217,430 | |||
Net realized and unrealized gain (loss) on investments and foreign currency | $182,338,233 | |||
Change in net assets from operations | $198,887,370 |
See Notes to Financial Statements
7
Table of Contents
MFS Value Series
FINANCIAL STATEMENTS | STATEMENTS OF CHANGES IN NET ASSETS
These statements describe the increases and/or decreases in net assets resulting from operations, any distributions, and any shareholder transactions.
| | Six months ended 6/30/17 (unaudited | ) | | Year ended 12/31/16 | | |||
Change in net assets | ||||||||
| From operations | ||||||||
Net investment income | $16,549,137 | $41,358,275 | ||||||
Net realized gain (loss) on investments and foreign currency | 71,120,803 | 91,628,213 | ||||||
Net unrealized gain (loss) on investments and foreign currency translation | 111,217,430 | 157,373,104 | ||||||
Change in net assets from operations | $198,887,370 | $290,359,592 | ||||||
| Distributions declared to shareholders | ||||||||
From net investment income | $— | $(43,606,764 | ) | |||||
From net realized gain on investments | — | (181,308,219 | ) | |||||
Total distributions declared to shareholders | $— | $(224,914,983 | ) | |||||
Change in net assets from fund share transactions | $(133,229,826 | ) | $72,375,793 | |||||
Total change in net assets | $65,657,544 | $137,820,402 | ||||||
| Net assets | ||||||||
At beginning of period | 2,270,385,233 | 2,132,564,831 | ||||||
At end of period (including undistributed net investment income of $58,458,552 and | $2,336,042,777 | $2,270,385,233 |
See Notes to Financial Statements
8
Table of Contents
MFS Value Series
FINANCIAL STATEMENTS | FINANCIAL HIGHLIGHTS
The financial highlights table is intended to help you understand the fund’s financial performance for semiannual period and the past 5 fiscal years. Certain information reflects financial results for a single fund share. The total returns in the table represent the rate that an investor would have earned (or lost) on an investment in the fund share class (assuming reinvestment of all distributions) held for the entire period.
| Initial Class | Six months 6/30/17 | Years ended 12/31 | ||||||||||||||||||||||
| 2016 | 2015 | 2014 | 2013 | 2012 | ||||||||||||||||||||
| (unaudited) | ||||||||||||||||||||||||
Net asset value, beginning of period | $18.90 | $18.39 | $20.34 | $19.28 | $14.40 | $12.68 | ||||||||||||||||||
| Income (loss) from investment operations | ||||||||||||||||||||||||
Net investment income (d) | $0.16 | $0.38 | (c) | $0.40 | $0.44 | $0.30 | $0.28 | |||||||||||||||||
Net realized and unrealized gain (loss) on | 1.56 | 2.16 | (0.67 | ) | 1.55 | 4.83 | 1.77 | |||||||||||||||||
Total from investment operations | $1.72 | $2.54 | $(0.27 | ) | $1.99 | $5.13 | $2.05 | |||||||||||||||||
| Less distributions declared to shareholders | ||||||||||||||||||||||||
From net investment income | $— | $(0.42 | ) | $(0.48 | ) | $(0.31 | ) | $(0.20 | ) | $(0.23 | ) | |||||||||||||
From net realized gain on investments | — | (1.61 | ) | (1.20 | ) | (0.62 | ) | (0.05 | ) | (0.10 | ) | |||||||||||||
Total distributions declared to shareholders | $— | $(2.03 | ) | $(1.68 | ) | $(0.93 | ) | $(0.25 | )�� | $(0.33 | ) | |||||||||||||
Net asset value, end of period (x) | $20.62 | $18.90 | $18.39 | $20.34 | $19.28 | $14.40 | ||||||||||||||||||
Total return (%) (k)(r)(s)(x) | 9.10 | (n) | 14.09 | (c) | (0.74 | ) | 10.51 | 35.89 | 16.26 | |||||||||||||||
| Ratios (%) (to average net assets) and Supplemental data: | ||||||||||||||||||||||||
Expenses before expense reductions (f) | 0.74 | (a) | 0.73 | (c) | 0.73 | 0.73 | 0.73 | 0.78 | ||||||||||||||||
Expenses after expense reductions (f) | 0.73 | (a) | 0.72 | (c) | 0.73 | 0.72 | 0.73 | 0.78 | ||||||||||||||||
Net investment income | 1.59 | (a) | 2.02 | (c) | 2.00 | 2.23 | 1.74 | 2.02 | ||||||||||||||||
Portfolio turnover | 5 | (n) | 15 | 13 | 13 | 15 | 16 | |||||||||||||||||
Net assets at end of period (000 omitted) | $982,212 | $968,078 | $964,811 | $1,118,647 | $1,090,381 | $988,594 | ||||||||||||||||||
| Service Class | Six months 6/30/17 | Years ended 12/31 | ||||||||||||||||||||||
| 2016 | 2015 | 2014 | 2013 | 2012 | ||||||||||||||||||||
| (unaudited) | ||||||||||||||||||||||||
Net asset value, beginning of period | $18.59 | $18.12 | $20.05 | $19.03 | $14.22 | $12.54 | ||||||||||||||||||
| Income (loss) from investment operations | ||||||||||||||||||||||||
Net investment income (d) | $0.13 | $0.33 | (c) | $0.34 | $0.38 | $0.25 | $0.24 | |||||||||||||||||
Net realized and unrealized gain (loss) on | 1.53 | 2.11 | (0.65 | ) | 1.52 | 4.78 | 1.74 | |||||||||||||||||
Total from investment operations | $1.66 | $2.44 | $(0.31 | ) | $1.90 | $5.03 | $1.98 | |||||||||||||||||
| Less distributions declared to shareholders | ||||||||||||||||||||||||
From net investment income | $— | $(0.36 | ) | $(0.42 | ) | $(0.26 | ) | $(0.17 | ) | $(0.20 | ) | |||||||||||||
From net realized gain on investments | — | (1.61 | ) | (1.20 | ) | (0.62 | ) | (0.05 | ) | (0.10 | ) | |||||||||||||
Total distributions declared to shareholders | $— | $(1.97 | ) | $(1.62 | ) | $(0.88 | ) | $(0.22 | ) | $(0.30 | ) | |||||||||||||
Net asset value, end of period (x) | $20.25 | $18.59 | $18.12 | $20.05 | $19.03 | $14.22 | ||||||||||||||||||
Total return (%) (k)(r)(s)(x) | 8.93 | (n) | 13.78 | (c) | (0.93 | ) | 10.20 | 35.59 | 15.88 | |||||||||||||||
| Ratios (%) (to average net assets) and Supplemental data: | ||||||||||||||||||||||||
Expenses before expense reductions (f) | 0.99 | (a) | 0.98 | (c) | 0.98 | 0.98 | 0.98 | 1.03 | ||||||||||||||||
Expenses after expense reductions (f) | 0.98 | (a) | 0.97 | (c) | 0.98 | 0.97 | 0.98 | 1.03 | ||||||||||||||||
Net investment income | 1.34 | (a) | 1.78 | (c) | 1.76 | 1.99 | 1.49 | 1.76 | ||||||||||||||||
Portfolio turnover | 5 | (n) | 15 | 13 | 13 | 15 | 16 | |||||||||||||||||
Net assets at end of period (000 omitted) | $1,353,830 | $1,302,307 | $1,167,754 | $1,481,882 | $1,404,019 | $1,022,722 | ||||||||||||||||||
See Notes to Financial Statements
9
Table of Contents
MFS Value Series
Financial Highlights – continued
| (a) | Annualized. |
| (c) | Amount reflects a one-time reimbursement of expenses by the custodian (or former custodian) without which net investment income and performance would be lower and expenses would be higher. |
| (d) | Per share data is based on average shares outstanding. |
| (f) | Ratios do not reflect reductions from fees paid indirectly, if applicable. |
| (k) | The total return does not reflect expenses that apply to separate accounts. Inclusion of these charges would reduce the total return figures for all periods shown. |
| (n) | Not annualized. |
| (r) | Certain expenses have been reduced without which performance would have been lower. |
| (s) | From time to time the fund may receive proceeds from litigation settlements, without which performance would be lower. |
| (x) | The net asset values and total returns have been calculated on net assets which include adjustments made in accordance with U.S. generally accepted accounting principles required at period end for financial reporting purposes. |
See Notes to Financial Statements
10
Table of Contents
MFS Value Series
NOTES TO FINANCIAL STATEMENTS (unaudited)
| (1) | Business and Organization |
MFS Value Series (the fund) is a diversified series of MFS Variable Insurance Trust (the trust). The trust is organized as a Massachusetts business trust and is registered under the Investment Company Act of 1940, as amended, as an open-end management investment company. The shareholders of each series of the trust are separate accounts of insurance companies, which offer variable annuity and/or life insurance products, and qualified retirement and pension plans.
The fund is an investment company and accordingly follows the investment company accounting and reporting guidance of the Financial Accounting Standards Board (FASB) Accounting Standards Codification Topic 946 Financial Services – Investment Companies.
| (2) | Significant Accounting Policies |
General – The preparation of financial statements in conformity with U.S. generally accepted accounting principles requires management to make estimates and assumptions that affect the reported amounts of assets and liabilities, and disclosure of contingent assets and liabilities at the date of the financial statements and the reported amounts of increases and decreases in net assets from operations during the reporting period. Actual results could differ from those estimates. In the preparation of these financial statements, management has evaluated subsequent events occurring after the date of the fund’s Statement of Assets and Liabilities through the date that the financial statements were issued.
In October 2016, the Securities and Exchange Commission (SEC) released its Final Rule on Investment Company Reporting Modernization (the “Rule”). The Rule, which introduces two new regulatory reporting forms for investment companies – Form N-PORT and Form N-CEN – also contains amendments to Regulation S-X which impact financial statement presentation, particularly the presentation of derivative investments. Although still evaluating the impacts of the Rule, management believes that many of the Regulation S-X amendments are consistent with the fund’s current financial statement presentation and expects that the fund will be able to comply with the Rule’s Regulation S-X amendments by the August 1, 2017 compliance date.
Balance Sheet Offsetting – The fund’s accounting policy with respect to balance sheet offsetting is that, absent an event of default by the counterparty or a termination of the agreement, the International Swaps and Derivatives Association (ISDA) Master Agreement does not result in an offset of reported amounts of financial assets and financial liabilities in the Statement of Assets and Liabilities across transactions between the fund and the applicable counterparty. The fund’s right to setoff may be restricted or prohibited by the bankruptcy or insolvency laws of the particular jurisdiction to which a specific master netting agreement counterparty is subject. Balance sheet offsetting disclosures, to the extent applicable to the fund, have been included in the fund’s Significant Accounting Policies note under the captions for each of the fund’s in-scope financial instruments and transactions.
Investment Valuations – Equity securities, including restricted equity securities, are generally valued at the last sale or official closing price on their primary market or exchange as provided by a third-party pricing service. Equity securities, for which there were no sales reported that day, are generally valued at the last quoted daily bid quotation on their primary market or exchange as provided by a third-party pricing service. Short-term instruments with a maturity at issuance of 60 days or less may be valued at amortized cost, which approximates market value. Open-end investment companies are generally valued at net asset value per share. Securities and other assets generally valued on the basis of information from a third-party pricing service may also be valued at a broker/dealer bid quotation. Values obtained from third-party pricing services can utilize both transaction data and market information such as yield, quality, coupon rate, maturity, type of issue, trading characteristics, and other market data. The values of foreign securities and other assets and liabilities expressed in foreign currencies are converted to U.S. dollars using the mean of bid and asked prices for rates provided by a third-party pricing service.
The Board of Trustees has delegated primary responsibility for determining or causing to be determined the value of the fund’s investments (including any fair valuation) to the adviser pursuant to valuation policies and procedures approved by the Board. If the adviser determines that reliable market quotations are not readily available, investments are valued at fair value as determined in good faith by the adviser in accordance with such procedures under the oversight of the Board of Trustees. Under the fund’s valuation policies and procedures, market quotations are not considered to be readily available for most types of debt instruments and floating rate loans and many types of derivatives. These investments are generally valued at fair value based on information from third-party pricing services. In addition, investments may be valued at fair value if the adviser determines that an investment’s value has been materially affected by events occurring after the close of the exchange or market on which the investment is principally traded (such as foreign exchange or market) and prior to the determination of the fund’s net asset value, or after the halting of trading of a specific security where trading does not resume prior to the close of the exchange or market on which the security is principally traded. Events that occur on a frequent basis after foreign markets close (such as developments in foreign markets and significant movements in the U.S. markets) and prior to the determination of the fund’s net asset value may be deemed to have a material effect on the value of securities traded in foreign markets. Accordingly, the fund’s foreign equity securities may often be valued at fair value. The adviser generally relies on third-party pricing services or other information (such as the correlation with price
movements of similar securities in the same or other markets; the type, cost and investment characteristics of the security; the
11
Table of Contents
MFS Value Series
Notes to Financial Statements (unaudited) – continued
business and financial condition of the issuer; and trading and other market data) to assist in determining whether to fair value and at what value to fair value an investment. The value of an investment for purposes of calculating the fund’s net asset value can differ depending on the source and method used to determine value. When fair valuation is used, the value of an investment used to determine the fund’s net asset value may differ from quoted or published prices for the same investment. There can be no assurance that the fund could obtain the fair value assigned to an investment if it were to sell the investment at the same time at which the fund determines its net asset value per share.
Various inputs are used in determining the value of the fund’s assets or liabilities. These inputs are categorized into three broad levels. In certain cases, the inputs used to measure fair value may fall into different levels of the fair value hierarchy. In such cases, an investment’s level within the fair value hierarchy is based on the lowest level of input that is significant to the fair value measurement. The fund’s assessment of the significance of a particular input to the fair value measurement in its entirety requires judgment, and considers factors specific to the investment. Level 1 includes unadjusted quoted prices in active markets for identical assets or liabilities. Level 2 includes other significant observable market-based inputs (including quoted prices for similar securities, interest rates, prepayment speed, and credit risk). Level 3 includes unobservable inputs, which may include the adviser’s own assumptions in determining the fair value of investments. The following is a summary of the levels used as of June 30, 2017 in valuing the fund’s assets or liabilities:
| Investments at Value | Level 1 | Level 2 | Level 3 | Total | ||||||||||||
| Equity Securities | $2,304,684,313 | $— | $— | $2,304,684,313 | ||||||||||||
| Mutual Funds | 10,280,524 | — | — | 10,280,524 | ||||||||||||
| Total Investments | $2,314,964,837 | $— | $— | $2,314,964,837 | ||||||||||||
For further information regarding security characteristics, see the Portfolio of Investments.
Of the level 1 investments presented above, equity investments amounting to $39,775,341 would have been considered level 2 investments at the beginning of the period. The primary reason for changes in the classifications between levels 1 and 2 occurs when foreign equity securities are fair valued using other observable market-based inputs in place of the closing exchange price due to events occurring after the close of the exchange or market on which the investment is principally traded. The fund’s foreign equity securities may often be valued using other observable market-based inputs. The fund’s policy is to recognize transfers between the levels as of the end of the period.
Foreign Currency Translation – Purchases and sales of foreign investments, income, and expenses are converted into U.S. dollars based upon currency exchange rates prevailing on the respective dates of such transactions or on the reporting date for foreign denominated receivables and payables. Gains and losses attributable to foreign currency exchange rates on sales of securities are recorded for financial statement purposes as net realized gains and losses on investments. Gains and losses attributable to foreign exchange rate movements on receivables, payables, income and expenses are recorded for financial statement purposes as foreign currency transaction gains and losses. That portion of both realized and unrealized gains and losses on investments that results from fluctuations in foreign currency exchange rates is not separately disclosed.
Security Loans – Under its Securities Lending Agency Agreement with the fund, State Street Bank and Trust Company (“State Street”), as lending agent, loans the securities of the fund to certain qualified institutions (the “Borrowers”) approved by the fund. Security loans can be terminated at the discretion of either the lending agent or the fund and the related securities must be returned within the earlier of the standard trade settlement period for such securities or within three business days. The loans are collateralized by cash and/or U.S. Treasury and federal agency obligations in an amount typically at least equal to the market value of the securities loaned. On loans collateralized by cash, the cash collateral is invested in a money market fund. The market value of the loaned securities is determined at the close of business of the fund and any additional required collateral is delivered to the fund on the next business day. State Street provides the fund with indemnification against Borrower default. In the event of Borrower default, State Street will, for the benefit of the fund, either purchase securities identical to those loaned or, when such purchase is commercially impracticable, pay the fund the market value of the loaned securities. In return, State Street assumes the fund’s rights to the related collateral. If the collateral value is less than the cost to purchase identical securities, State Street is responsible for the shortfall, but only to the extent that such shortfall is not due to a decline in collateral value resulting from collateral reinvestment for which the fund bears the risk of loss. A portion of the income generated upon investment of the collateral is remitted to the Borrowers, and the remainder is allocated between the fund and the lending agent. On loans collateralized by U.S. Treasury and/or federal agency obligations, a fee is received from the Borrower, and is allocated between the fund and the lending agent. Income from securities lending is included in “Interest” income in the Statement of Operations. The dividend and interest income earned on the securities loaned is accounted for in the same manner as other dividend and interest income. At June 30, 2017, there were no securities on loan or collateral outstanding.
Indemnifications – Under the fund’s organizational documents, its officers and Trustees may be indemnified against certain liabilities and expenses arising out of the performance of their duties to the fund. Additionally, in the normal course of business, the
12
Table of Contents
MFS Value Series
Notes to Financial Statements (unaudited) – continued
fund enters into agreements with service providers that may contain indemnification clauses. The fund’s maximum exposure under these agreements is unknown as this would involve future claims that may be made against the fund that have not yet occurred.
Investment Transactions and Income – Investment transactions are recorded on the trade date. Interest income is recorded on the accrual basis. Dividends received in cash are recorded on the ex-dividend date. Certain dividends from foreign securities will be recorded when the fund is informed of the dividend if such information is obtained subsequent to the ex-dividend date. Dividend payments received in additional securities are recorded on the ex-dividend date in an amount equal to the value of the security on such date.
The fund may receive proceeds from litigation settlements. Any proceeds received from litigation involving portfolio holdings are reflected in the Statement of Operations in realized gain/loss if the security has been disposed of by the fund or in unrealized gain/loss if the security is still held by the fund. Any other proceeds from litigation not related to portfolio holdings are reflected as other income in the Statement of Operations.
Tax Matters and Distributions – The fund intends to qualify as a regulated investment company, as defined under Subchapter M of the Internal Revenue Code, and to distribute all of its taxable income, including realized capital gains. As a result, no provision for federal income tax is required. The fund’s federal tax returns, when filed, will remain subject to examination by the Internal Revenue Service for a three year period. Management has analyzed the fund’s tax positions taken on federal and state tax returns for all open tax years and does not believe that there are any uncertain tax positions that require recognition of a tax liability. Foreign taxes, if any, have been accrued by the fund in the accompanying financial statements in accordance with the applicable foreign tax law. Foreign income taxes may be withheld by certain countries in which the fund invests. Additionally, capital gains realized by the fund on securities issued in or by certain foreign countries may be subject to capital gains tax imposed by those countries.
Distributions to shareholders are recorded on the ex-dividend date. Income and capital gain distributions are determined in accordance with income tax regulations, which may differ from U.S. generally accepted accounting principles. Certain capital accounts in the financial statements are periodically adjusted for permanent differences in order to reflect their tax character. These adjustments have no impact on net assets or net asset value per share. Temporary differences which arise from recognizing certain items of income, expense, gain or loss in different periods for financial statement and tax purposes will reverse at some time in the future. Distributions in excess of net investment income or net realized gains are temporary overdistributions for financial statement purposes resulting from differences in the recognition or classification of income or distributions for financial statement and tax purposes.
Book/tax differences primarily relate to wash sale loss deferrals.
The tax character of distributions declared to shareholders for the last fiscal year is as follows:
| Year ended | ||||
| 12/31/16 | ||||
| Ordinary income (including any short-term capital gains) | $45,729,481 | |||
| Long-term capital gains | 179,185,502 | |||
| Total distributions | $224,914,983 | |||
The federal tax cost and the tax basis components of distributable earnings were as follows:
| As of 6/30/17 | ||||
| Cost of investments | $1,364,335,403 | |||
| Gross appreciation | 962,376,974 | |||
| Gross depreciation | (11,747,540 | ) | ||
| Net unrealized appreciation (depreciation) | $950,629,434 | |||
| As of 12/31/16 | ||||
| Undistributed ordinary income | 43,631,255 | |||
| Undistributed long-term capital gain | 90,325,884 | |||
| Other temporary differences | (87,998 | ) | ||
| Net unrealized appreciation (depreciation) | 839,483,598 | |||
The aggregate cost above includes prior fiscal year end tax adjustments, if applicable.
Multiple Classes of Shares of Beneficial Interest – The fund offers multiple classes of shares, which differ in their respective distribution and/or service fees. The fund’s income, realized and unrealized gain (loss), and common expenses are allocated to shareholders based on the daily net assets of each class. Dividends are declared separately for each class. Differences in per share
13
Table of Contents
MFS Value Series
Notes to Financial Statements (unaudited) – continued
dividend rates are generally due to differences in separate class expenses. The fund’s distributions declared to shareholders as reported in the Statements of Changes in Net Assets are presented by class as follows:
| From net investment income | From net realized gain on investments | |||||||||||||||
| Six months ended 6/30/17 | Year ended 12/31/16 | Six months ended 6/30/17 | Year ended 12/31/16 | |||||||||||||
| Initial Class | $— | $20,323,713 | $— | $78,502,858 | ||||||||||||
| Service Class | — | 23,283,051 | — | 102,805,361 | ||||||||||||
| Total | $— | $43,606,764 | $— | $181,308,219 | ||||||||||||
| (3) | Transactions with Affiliates |
Investment Adviser – The fund has an investment advisory agreement with MFS to provide overall investment management and related administrative services and facilities to the fund. For the period January 1, 2017 through April 27, 2017, the management fee was computed daily and paid monthly at an annual rate of 0.75% of the fund’s average daily net assets up to $1 billion and 0.65% of average daily net assets in excess of $1 billion. The investment adviser had agreed in writing to reduce its management fee to 0.60% of average daily net assets in excess of $2.5 billion. This written agreement was terminated April 27, 2017. For the period January 1, 2017 through April 27, 2017, the fund’s average daily net assets did not exceed $2.5 billion and therefore, the management fee was not reduced in accordance with this agreement. Effective April 28, 2017, the management fee is computed daily and paid monthly at an annual rate of 0.75% of average daily net assets up to $1 billion, 0.65% of average daily net assets in excess of $1 billion up to $2.5 billion, and 0.60% of average daily net assets in excess of $2.5 billion. MFS has also agreed in writing to reduce its management fee by a specified amount if certain MFS mutual fund assets exceed thresholds agreed to by MFS and the fund’s Board of Trustees. For the six months ended June 30, 2017, this management fee reduction amounted to $87,524, which is included in the reduction of total expenses in the Statement of Operations. The management fee incurred for the six months ended June 30, 2017 was equivalent to an annual effective rate of 0.69% of the fund’s average daily net assets.
The investment adviser has agreed in writing to pay a portion of the fund’s total annual operating expenses, excluding interest, taxes, extraordinary expenses, brokerage and transaction costs, and investment-related expenses, such that total annual operating expenses do not exceed 0.90% of average daily net assets for the Initial Class shares and 1.15% of average daily net assets for the Service Class shares. This written agreement will continue until modified by the fund’s Board of Trustees, but such agreement will continue at least until April 30, 2019. For the six months ended June 30, 2017, the fund’s actual operating expenses did not exceed the limit and therefore, the investment adviser did not pay any portion of the fund’s expenses related to this agreement.
Distributor – MFS Fund Distributors, Inc. (MFD), a wholly-owned subsidiary of MFS, is the distributor of shares of the fund. The Trustees have adopted a distribution plan for the Service Class shares pursuant to Rule 12b-1 under the Investment Company Act of 1940.
The fund’s distribution plan provides that the fund will pay MFD distribution and/or service fees equal to 0.25% per annum of its average daily net assets attributable to Service Class shares as partial consideration for services performed and expenses incurred by MFD and financial intermediaries (including participating insurance companies that invest in the fund to fund variable annuity and variable life insurance contracts, sponsors of qualified retirement and pension plans that invest in the fund, and affiliates of these participating insurance companies and plan sponsors) in connection with the sale and distribution of the Service Class shares. MFD may subsequently pay all, or a portion, of the distribution and/or service fees to financial intermediaries.
Shareholder Servicing Agent – MFS Service Center, Inc. (MFSC), a wholly-owned subsidiary of MFS, receives a fee from the fund for its services as shareholder servicing agent. For the six months ended June 30, 2017, the fee was $33,415, which equated to 0.0029% annually of the fund’s average daily net assets. MFSC also receives payment from the fund for out-of-pocket expenses paid by MFSC on behalf of the fund. For the six months ended June 30, 2017, these costs amounted to $2,198.
Administrator – MFS provides certain financial, legal, shareholder communications, compliance, and other administrative services to the fund. Under an administrative services agreement, the fund reimburses MFS the costs incurred to provide these services. The fund is charged an annual fixed amount of $17,500 plus a fee based on average daily net assets. The administrative services fee incurred for the six months ended June 30, 2017 was equivalent to an annual effective rate of 0.0166% of the fund’s average daily net assets.
Trustees’ and Officers’ Compensation – The fund pays compensation to independent Trustees in the form of a retainer, attendance fees, and additional compensation to Board and Committee chairpersons. The fund does not pay compensation directly to Trustees or officers of the fund who are also officers of the investment adviser, all of whom receive remuneration for their services to the fund from MFS. Certain officers and Trustees of the fund are officers or directors of MFS, MFD, and MFSC.
14
Table of Contents
MFS Value Series
Notes to Financial Statements (unaudited) – continued
Other –This fund and certain other funds managed by MFS (the funds) have entered into a service agreement (the ISO Agreement) which provides for payment of fees solely by the funds to Tarantino LLC in return for the provision of services of an Independent Senior Officer (ISO) for the funds. Frank L. Tarantino serves as the ISO and is an officer of the funds and the sole member of Tarantino LLC. The funds can terminate the ISO Agreement with Tarantino LLC at any time under the terms of the ISO Agreement. For the six months ended June 30, 2017, the fee paid by the fund under this agreement was $2,189 and is included in “Miscellaneous” expense in the Statement of Operations. MFS has agreed to bear all expenses associated with office space, other administrative support, and supplies provided to the ISO.
The fund invests in the MFS Institutional Money Market Portfolio which is managed by MFS and seeks current income consistent with preservation of capital and liquidity. This money market fund does not pay a management fee to MFS.
The fund is permitted to engage in purchase and sale transactions with funds and accounts for which MFS serves as investment adviser or sub-adviser (“cross-trades”) pursuant to a policy adopted by the Board of Trustees. This policy has been designed to ensure that cross-trades conducted by the fund comply with Rule 17a-7 under the Investment Company Act of 1940. Under this policy, cross-trades are effected at current market prices with no remuneration paid in connection with the transaction. During the six months ended June 30, 2017, the fund engaged in purchase and sale transactions pursuant to this policy, which amounted to $743,369 and $1,524,020, respectively. The sales transactions resulted in net realized gains (losses) of $244,325.
| (4) | Portfolio Securities |
For the six months ended June 30, 2017, purchases and sales of investments, other than short-term obligations, aggregated $104,678,468 and $234,554,250, respectively.
| (5) | Shares of Beneficial Interest |
The fund’s Declaration of Trust permits the Trustees to issue an unlimited number of full and fractional shares of beneficial interest. Transactions in fund shares were as follows:
| Six months ended 6/30/17 | Year ended 12/31/16 | |||||||||||||||
| Shares | Amount | Shares | Amount | |||||||||||||
| Shares sold | ||||||||||||||||
Initial Class | 1,267,291 | $25,261,031 | 4,025,968 | $74,915,419 | ||||||||||||
Service Class | 2,547,408 | 49,232,634 | 9,184,966 | 167,110,176 | ||||||||||||
| 3,814,699 | $74,493,665 | 13,210,934 | $242,025,595 | |||||||||||||
| Shares issued to shareholders in reinvestment of distributions | ||||||||||||||||
Initial Class | — | $— | 5,382,711 | $98,826,571 | ||||||||||||
Service Class | — | — | 6,977,776 | 126,088,412 | ||||||||||||
| — | $— | 12,360,487 | $224,914,983 | |||||||||||||
| Shares reacquired | ||||||||||||||||
Initial Class | (4,848,675 | ) | $(96,173,353 | ) | (10,647,169 | ) | $(199,696,185 | ) | ||||||||
Service Class | (5,760,426 | ) | (111,550,138 | ) | (10,564,944 | ) | (194,868,600 | ) | ||||||||
| (10,609,101 | ) | $(207,723,491 | ) | (21,212,113 | ) | $(394,564,785 | ) | |||||||||
| Net change | ||||||||||||||||
Initial Class | (3,581,384 | ) | $(70,912,322 | ) | (1,238,490 | ) | $(25,954,195 | ) | ||||||||
Service Class | (3,213,018 | ) | (62,317,504 | ) | 5,597,798 | 98,329,988 | ||||||||||
| (6,794,402 | ) | $(133,229,826 | ) | 4,359,308 | $72,375,793 | |||||||||||
The fund is one of several mutual funds in which certain MFS funds may invest. The MFS funds do not invest in the underlying funds for the purpose of exercising management or control. At the end of the period, the MFS Moderate Allocation Portfolio, the MFS Growth Allocation Portfolio, and the MFS Conservative Allocation Portfolio were the owners of record of approximately 7%, 2%, and 2%, respectively, of the value of outstanding voting shares of the fund.
| (6) | Line of Credit |
The fund and certain other funds managed by MFS participate in a $1.25 billion unsecured committed line of credit, subject to a $1 billion sublimit, provided by a syndication of banks under a credit agreement. Borrowings may be made for temporary financing needs. Interest is charged to each fund, based on its borrowings, generally at a rate equal to the higher of the Overnight Federal Reserve funds rate or daily one month LIBOR plus an agreed upon spread. A commitment fee, based on the average daily, unused portion of the committed line of credit, is allocated among the participating funds at the end of each calendar quarter. In addition, the fund and other funds managed by MFS have established unsecured uncommitted borrowing arrangements with certain banks for temporary financing needs. Interest is charged to each fund, based on its borrowings, at a rate equal to the Overnight Federal Reserve funds rate plus an agreed upon spread. For the six months ended June 30, 2017, the fund’s commitment fee and interest expense were $7,718 and $0, respectively, and are included in “Miscellaneous” expense in the Statement of Operations.
15
Table of Contents
MFS Value Series
Notes to Financial Statements (unaudited) – continued
| (7) | Transactions in Underlying Affiliated Funds – Affiliated Issuers |
An affiliated issuer may be considered one in which the fund owns 5% or more of the outstanding voting securities, or a company which is under common control. For the purposes of this report, the fund assumes the following to be an affiliated issuer:
| Underlying Affiliated Fund | Beginning Shares/Par Amount | Acquisitions Shares/Par Amount | Dispositions Shares/Par Amount | Ending Shares/Par Amount | ||||||||||||
| MFS Institutional Money Market Portfolio | 9,388,614 | 133,681,730 | (132,789,820 | ) | 10,280,524 | |||||||||||
| Underlying Affiliated Fund | Realized Gain (Loss) | Capital Gain Distributions | Dividend Income | Ending Value | ||||||||||||
| MFS Institutional Money Market Portfolio | $(2,127 | ) | $— | $69,329 | $10,280,524 | |||||||||||
16
Table of Contents
MFS Value Series
RESULTS OF SHAREHOLDER MEETING (unaudited)
At a special meeting of shareholders of MFS Variable Insurance Trust, which was held on March 23, 2017, the following action was taken:
Item 1: To elect the following individuals as Trustees:
| Number of Dollars | ||||||||
| Nominee | For | Withheld Authority | ||||||
| Steven E. Buller | 11,311,922,492.61 | 518,570,973.54 | ||||||
| John A. Caroselli | 11,291,109,000.34 | 539,384,465.81 | ||||||
| Maureen R. Goldfarb | 11,233,211,779.66 | 597,281,686.49 | ||||||
| David H. Gunning | 11,179,077,201.17 | 651,416,264.98 | ||||||
| Michael Hegarty | 11,191,993,154.78 | 638,500,311.37 | ||||||
| John P. Kavanaugh | 11,242,238,261.44 | 588,255,204.71 | ||||||
| Robert J. Manning | 11,314,479,376.58 | 516,014,089.57 | ||||||
| Clarence Otis, Jr. | 11,208,873,448.85 | 621,620,017.30 | ||||||
| Maryanne L. Roepke | 11,263,427,105.03 | 567,066,361.12 | ||||||
| Robin A. Stelmach | 11,313,883,043.82 | 516,610,422.33 | ||||||
| Laurie J. Thomsen | 11,240,219,041.09 | 590,274,425.06 | ||||||
17
Table of Contents
MFS Value Series
PROXY VOTING POLICIES AND INFORMATION
MFS votes proxies on behalf of the fund pursuant to proxy voting policies and procedures that are available without charge, upon request, by calling 1-800-225-2606, by visiting mfs.com (once you have selected “Individual Investor” as your role, click on “Individual Investor Home” in the top navigation and then select “Learn More About Proxy Voting” under the “I want to…” header on the left hand column of the page), or by visiting the SEC’s Web site at http://www.sec.gov.
Information regarding how the fund voted proxies relating to portfolio securities during the most recent twelve-month period ended June 30 is available by August 31 of each year without charge by visiting mfs.com (once you have selected “Individual Investor” as your role, click on “Individual Investor Home” in the top navigation and then select “Learn More About Proxy Voting” under the “I want to…” header on the left hand column of the page), or by visiting the SEC’s Web site at http://www.sec.gov.
QUARTERLY PORTFOLIO DISCLOSURE
The fund will file a complete schedule of portfolio holdings with the Securities and Exchange Commission (the Commission) for the first and third quarters of each fiscal year on Form N-Q. The fund’s Form N-Q is available on the EDGAR database on the Commission’s Internet Web site at http://www.sec.gov, and may be reviewed and copied at the:
Public Reference Room
Securities and Exchange Commission
100 F Street, NE, Room 1580
Washington, D.C. 20549
Information on the operation of the Public Reference Room may be obtained by calling the Commission at 1-800-SEC-0330. Copies of the fund’s Form N-Q also may be obtained, upon payment of a duplicating fee, by electronic request at the following e-mail address: publicinfo@sec.gov or by writing the Public Reference Section at the above address.
From time to time, MFS may post important information about the fund or the MFS funds on the MFS web site (mfs.com). This information is available on mfs.com by following these steps once you have selected “Individual Investor” as your role: (1) Click on the “Individual Investor Home” in the top navigation and then select the “Announcements” option within the “Market Outlooks” drop down, or (2) Click on “Products & Services” and “Variable Insurance Portfolios” and then select the fund’s name.
INFORMATION ABOUT FUND CONTRACTS AND LEGAL CLAIMS
The fund has entered into contractual arrangements with an investment adviser, administrator, distributor, shareholder servicing agent, 529 program manager (if applicable), and custodian who each provide services to the fund. Unless expressly stated otherwise, shareholders are not parties to, or intended beneficiaries of these contractual arrangements, and these contractual arrangements are not intended to create any shareholder right to enforce them against the service providers or to seek any remedy under them against the service providers, either directly or on behalf of the fund.
Under the Trust’s By-Laws and Declaration of Trust, any claims asserted against or on behalf of the MFS Funds, including claims against Trustees and Officers, must be brought in state and federal courts located within the Commonwealth of Massachusetts.
18
Table of Contents
Table of Contents
SEMIANNUAL REPORT
June 30, 2017

MFS® MID CAP GROWTH SERIES
MFS® Variable Insurance Trust

VMG-SEM
Table of Contents
MFS® MID CAP GROWTH SERIES
The report is prepared for the general information of contract owners. It is authorized for distribution to prospective investors only when preceded or accompanied by a current prospectus.
NOT FDIC INSURED • MAY LOSE VALUE • NO BANK OR CREDIT UNION GUARANTEE • NOT A DEPOSIT • NOT INSURED BY ANY FEDERAL GOVERNMENT AGENCY OR NCUA/NCUSIF
Table of Contents
MFS Mid Cap Growth Series
LETTER FROM THE EXECUTIVE CHAIRMAN

Dear Contract Owners:
Despite policy uncertainty accompanying a new presidential administration in the United States and unease over ongoing Brexit negotiations, most markets have proved resilient. U.S. share prices have reached new highs. The U.S. Federal Reserve has continued to gradually hike interest rates. However, rates in most developed markets remain very low, with major non-U.S. central banks just beginning to contemplate curbing accommodative monetary policies.
Globally, economic growth has shown signs of recovery, led by China, the U.S. and the eurozone. Despite better growth, there are few immediate signs of worrisome inflation as wage growth remains muted. Europe has benefited from diminishing event risks as establishment candidates won both the Dutch and French elections, averting a feared populist trend. Emerging market economies are recovering at a somewhat slower pace amid fears that restrictive U.S. trade policies could further hamper the restrained pace of global trade growth. Looking ahead, markets will have to contend with issues involving geopolitical hot spots on the Korean peninsula and in the Middle East, which could potentially lead to a clash of interests between the U.S. and other major powers such as China or Russia.
At MFS®, we believe time is an asset. A patient, long-term approach to investing can have a powerful impact on decision making and outcomes. Time arbitrage, as we call it, simply comes down to having the conviction and discipline to allow enough time for good investment ideas to play out. In our view, such an approach, along with the professional guidance of a financial advisor, will help you reach your investment objectives.
Respectfully,

Robert J. Manning
Executive Chairman
MFS Investment Management
August 16, 2017
The opinions expressed in this letter are subject to change and may not be relied upon for investment advice. No forecasts can be guaranteed.
1
Table of Contents
MFS Mid Cap Growth Series
Portfolio structure
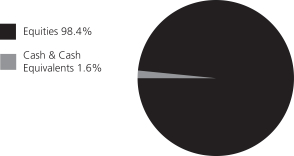
| Top ten holdings | ||||
| Bright Horizons Family Solutions, Inc. | 2.6% | |||
| Roper Technologies, Inc. | 2.5% | |||
| NVIDIA Corp. | 2.3% | |||
| Amphenol Corp., “A” | 2.2% | |||
| C.R. Bard, Inc. | 2.1% | |||
| PerkinElmer, Inc. | 2.1% | |||
| SBA Communications Corp., REIT | 1.9% | |||
| Electronic Arts, Inc. | 1.9% | |||
| Henry Schein, Inc. | 1.9% | |||
| AMETEK, Inc. | 1.7% |
| Equity sectors | ||||
| Technology | 14.8% | |||
| Industrial Goods & Services | 14.5% | |||
| Health Care | 14.1% | |||
| Special Products & Services | 12.8% | |||
| Leisure | 12.4% | |||
| Financial Services | 8.0% | |||
| Autos & Housing | 6.1% | |||
| Consumer Staples | 5.4% | |||
| Retailing | 3.5% | |||
| Basic Materials | 3.3% | |||
| Utilities & Communications | 1.9% | |||
| Transportation | 0.8% | |||
| Energy | 0.8% |
Cash & Cash Equivalents includes any cash, investments in money market funds, short-term securities, and other assets less liabilities. Please see the Statement of Assets and Liabilities for additional information related to the fund’s cash position and other assets and liabilities.
Percentages are based on net assets as of June 30, 2017.
The portfolio is actively managed and current holdings may be different.
2
Table of Contents
MFS Mid Cap Growth Series
Fund Expenses Borne by the Contract Holders during the Period,
January 1, 2017 through June 30, 2017
As a contract holder of the fund, you incur ongoing costs, including management fees; distribution and/or service (12b-1) fees; and other fund expenses. This example is intended to help you understand your ongoing costs (in dollars) of investing in the fund and to compare these costs with the ongoing costs of investing in other mutual funds.
The example is based on an investment of $1,000 invested at the beginning of the period and held for the entire period January 1, 2017 through June 30, 2017.
Actual Expenses
The first line for each share class in the following table provides information about actual account values and actual expenses. You may use the information in this line, together with the amount you invested, to estimate the expenses that you paid over the period. Simply divide your account value by $1,000 (for example, an $8,600 account value divided by $1,000 = 8.6), then multiply the result by the number in the first line under the heading entitled “Expenses Paid During Period” to estimate the expenses you paid on your account during this period.
Hypothetical Example for Comparison Purposes
The second line for each share class in the following table provides information about hypothetical account values and hypothetical expenses based on the fund’s actual expense ratio and an assumed rate of return of 5% per year before expenses, which is not the fund’s actual return. The hypothetical account values and expenses may not be used to estimate the actual ending account balance or expenses you paid for the period. You may use this information to compare the ongoing costs of investing in the fund and other funds. To do so, compare this 5% hypothetical example with the 5% hypothetical examples that appear in the shareholder reports of the other funds.
Please note that the expenses shown in the table are meant to highlight the fund’s ongoing costs only and do not take into account the fees and expenses imposed under the variable contracts through which your investment in the fund is made. Therefore, the second line for each share class in the table is useful in comparing ongoing costs associated with an investment in vehicles (such as the fund) which fund benefits under variable annuity and variable life insurance contracts and to qualified pension and retirement plans only, and will not help you determine the relative total costs of investing in the fund through variable annuity and variable life insurance contracts. If the fees and expenses imposed under the variable contracts were included, your costs would have been higher.
| Share Class | Annualized Expense Ratio | Beginning Account Value 1/01/17 | Ending Account Value 6/30/17 | Expenses Paid During Period (p) 1/01/17-6/30/17 | ||||||||||||||
| Initial Class | Actual | 0.81% | $1,000.00 | $1,148.24 | $4.31 | |||||||||||||
| Hypothetical (h) | 0.81% | $1,000.00 | $1,020.78 | $4.06 | ||||||||||||||
| Service Class | Actual | 1.06% | $1,000.00 | $1,146.83 | $5.64 | |||||||||||||
| Hypothetical (h) | 1.06% | $1,000.00 | $1,019.54 | $5.31 | ||||||||||||||
| (h) | 5% class return per year before expenses. |
| (p) | “Expenses Paid During Period” are equal to each class’s annualized expense ratio, as shown above, multiplied by the average account value over the period, multiplied by 181/365 (to reflect the one-half year period). |
3
Table of Contents
MFS Mid Cap Growth Series
PORTFOLIO OF INVESTMENTS – 6/30/17 (unaudited)
The Portfolio of Investments is a complete list of all securities owned by your fund. It is categorized by broad-based asset classes.
| Issuer | Shares/Par | Value ($) | ||||||
| COMMON STOCKS – 98.4% | ||||||||
| Aerospace – 1.7% | ||||||||
| Harris Corp. | 31,722 | $ | 3,460,236 | |||||
| Leidos Holdings, Inc. | 48,011 | 2,481,688 | ||||||
| TransDigm Group, Inc. | 3,194 | 858,771 | ||||||
|
| |||||||
| $ | 6,800,695 | |||||||
|
| |||||||
| Alcoholic Beverages – 1.7% | ||||||||
| Constellation Brands, Inc., “A” | 35,046 | $ | 6,789,462 | |||||
|
| |||||||
| Automotive – 0.7% | ||||||||
| LKQ Corp. (a) | 88,162 | $ | 2,904,938 | |||||
|
| |||||||
| Biotechnology – 2.6% | ||||||||
| Alexion Pharmaceuticals, Inc. (a) | 16,269 | $ | 1,979,449 | |||||
| Biomarin Pharmaceutical, Inc. (a) | 41,872 | 3,802,815 | ||||||
| Regeneron Pharmaceuticals, Inc. (a) | 9,179 | 4,508,174 | ||||||
|
| |||||||
| $ | 10,290,438 | |||||||
|
| |||||||
| Broadcasting – 1.3% | ||||||||
| Netflix, Inc. (a) | 34,627 | $ | 5,173,620 | |||||
|
| |||||||
| Brokerage & Asset Managers – 3.1% | ||||||||
| Blackstone Group LP | 88,112 | $ | 2,938,535 | |||||
| Intercontinental Exchange, Inc. | 56,770 | 3,742,278 | ||||||
| NASDAQ, Inc. | 79,187 | 5,661,079 | ||||||
|
| |||||||
| $ | 12,341,892 | |||||||
|
| |||||||
| Business Services – 8.3% | ||||||||
| CoStar Group, Inc. (a) | 4,644 | $ | 1,224,158 | |||||
| Equifax, Inc. | 41,864 | 5,752,951 | ||||||
| Fidelity National Information Services, Inc. | 45,655 | 3,898,937 | ||||||
| Fiserv, Inc. (a) | 51,071 | 6,248,026 | ||||||
| FleetCor Technologies, Inc. (a) | 24,952 | 3,598,328 | ||||||
| Global Payments, Inc. | 67,283 | 6,077,001 | ||||||
| Tyler Technologies, Inc. (a) | 7,627 | 1,339,835 | ||||||
| Verisk Analytics, Inc., “A” (a) | 50,416 | 4,253,598 | ||||||
|
| |||||||
| $ | 32,392,834 | |||||||
|
| |||||||
| Cable TV – 1.5% | ||||||||
| Altice USA, Inc. (a) | 24,030 | $ | 776,169 | |||||
| Charter Communications, Inc., “A” (a) | 15,368 | 5,176,711 | ||||||
|
| |||||||
| $ | 5,952,880 | |||||||
|
| |||||||
| Chemicals – 0.2% | ||||||||
| Ingevity Corp. (a) | 13,179 | $ | 756,475 | |||||
|
| |||||||
| Computer Software – 4.1% | ||||||||
| Autodesk, Inc. (a) | 60,265 | $ | 6,075,917 | |||||
| Cadence Design Systems, Inc. (a) | 163,952 | 5,490,753 | ||||||
| Cloudera, Inc. (a)(l) | 8,412 | 134,760 | ||||||
| PTC, Inc. (a) | 55,701 | 3,070,239 | ||||||
| Sabre Corp. | 51,356 | 1,118,020 | ||||||
|
| |||||||
| $ | 15,889,689 | |||||||
|
| |||||||
| Computer Software – Systems – 4.4% | ||||||||
| Guidewire Software, Inc. (a) | 23,572 | $ | 1,619,632 | |||||
| NICE Systems Ltd., ADR | 21,627 | 1,702,478 | ||||||
| Issuer | Shares/Par | Value ($) | ||||||
| COMMON STOCKS – continued | ||||||||
| Computer Software – Systems – continued | ||||||||
| Presidio, Inc. (a)(l) | 64,845 | $ | 927,932 | |||||
| ServiceNow, Inc. (a) | 30,029 | 3,183,074 | ||||||
| SS&C Technologies Holdings, Inc. | 143,708 | 5,519,824 | ||||||
| Vantiv, Inc., “A” (a) | 68,003 | 4,307,310 | ||||||
|
| |||||||
| $ | 17,260,250 | |||||||
|
| |||||||
| Construction – 5.4% | ||||||||
| Armstrong World Industries, Inc. (a) | 33,246 | $ | 1,529,316 | |||||
| Lennox International, Inc. | 24,647 | 4,526,175 | ||||||
| Pool Corp. | 38,101 | 4,479,535 | ||||||
| Siteone Landscape Supply, Inc. (a) | 80,376 | 4,184,374 | ||||||
| Vulcan Materials Co. | 50,015 | 6,335,900 | ||||||
|
| |||||||
| $ | 21,055,300 | |||||||
|
| |||||||
| Consumer Products – 1.9% | ||||||||
| Newell Brands, Inc. | 111,782 | $ | 5,993,751 | |||||
| Scotts Miracle-Gro Co. | 17,983 | 1,608,759 | ||||||
|
| |||||||
| $ | 7,602,510 | |||||||
|
| |||||||
| Consumer Services – 4.6% | ||||||||
| Bright Horizons Family Solutions, Inc. (a) | 133,446 | $ | 10,303,366 | |||||
| Nord Anglia Education, Inc. (a) | 111,832 | 3,642,368 | ||||||
| Priceline Group, Inc. (a) | 1,533 | 2,867,507 | ||||||
| ServiceMaster Global Holdings, Inc. (a) | 30,901 | 1,211,010 | ||||||
|
| |||||||
| $ | 18,024,251 | |||||||
|
| |||||||
| Containers – 1.5% | ||||||||
| CCL Industries, Inc. | 69,380 | $ | 3,510,195 | |||||
| Crown Holdings, Inc. (a) | 39,036 | 2,328,888 | ||||||
|
| |||||||
| $ | 5,839,083 | |||||||
|
| |||||||
| Electrical Equipment – 5.6% | ||||||||
| Acuity Brands, Inc. | 3,514 | $ | 714,326 | |||||
| AMETEK, Inc. | 112,431 | 6,809,946 | ||||||
| Amphenol Corp., “A” | 117,125 | 8,646,167 | ||||||
| Mettler-Toledo International, Inc. (a) | 9,814 | 5,775,932 | ||||||
|
| |||||||
| $ | 21,946,371 | |||||||
|
| |||||||
| Electronics – 5.1% | ||||||||
| Inphi Corp. (a) | 46,567 | $ | 1,597,248 | |||||
| M/A-COM Technology Solutions Holdings, Inc. (a) | 24,167 | 1,347,794 | ||||||
| Mellanox Technologies Ltd. (a) | 19,087 | 826,467 | ||||||
| Mercury Systems, Inc. (a) | 2,203 | 92,724 | ||||||
| Monolithic Power Systems, Inc. | 37,136 | 3,579,910 | ||||||
| NVIDIA Corp. | 61,775 | 8,930,194 | ||||||
| Silicon Laboratories, Inc. (a) | 55,899 | 3,820,697 | ||||||
|
| |||||||
| $ | 20,195,034 | |||||||
|
| |||||||
| Energy – Independent – 0.8% | ||||||||
| Energen Corp. (a) | 32,850 | $ | 1,621,804 | |||||
| Parsley Energy, Inc., “A” (a) | 52,597 | 1,459,567 | ||||||
|
| |||||||
| $ | 3,081,371 | |||||||
|
| |||||||
4
Table of Contents
MFS Mid Cap Growth Series
Portfolio of Investments (unaudited) – continued
| Issuer | Shares/Par | Value ($) | ||||||
| COMMON STOCKS – continued | ||||||||
| Entertainment – 0.9% | ||||||||
| Six Flags Entertainment Corp. | 61,802 | $ | 3,684,017 | |||||
|
| |||||||
| Food & Beverages – 1.8% | ||||||||
| Blue Buffalo Pet Products, Inc. (a) | 69,708 | $ | 1,590,039 | |||||
| Chr. Hansen Holding A.S. | 39,526 | 2,874,740 | ||||||
| Monster Worldwide, Inc. (a) | 48,207 | 2,394,924 | ||||||
|
| |||||||
| $ | 6,859,703 | |||||||
|
| |||||||
| Gaming & Lodging – 2.2% | ||||||||
| MGM Mirage | 132,989 | $ | 4,161,226 | |||||
| Paddy Power Betfair PLC | 16,393 | 1,746,517 | ||||||
| Vail Resorts, Inc. | 14,093 | 2,858,483 | ||||||
|
| |||||||
| $ | 8,766,226 | |||||||
|
| |||||||
| General Merchandise – 1.6% | ||||||||
| Dollar Tree, Inc. (a) | 44,451 | $ | 3,108,014 | |||||
| Five Below, Inc. (a) | 62,827 | 3,101,769 | ||||||
|
| |||||||
| $ | 6,209,783 | |||||||
|
| |||||||
| Insurance – 1.6% | ||||||||
| Aon PLC | 47,275 | $ | 6,285,211 | |||||
|
| |||||||
| Internet – 1.2% | ||||||||
| LogMeIn, Inc. | 32,891 | $ | 3,437,109 | |||||
| Wix.com Ltd. (a) | 16,538 | 1,151,045 | ||||||
|
| |||||||
| $ | 4,588,154 | |||||||
|
| |||||||
| Leisure & Toys – 2.9% | ||||||||
| Electronic Arts, Inc. (a) | 69,340 | $ | 7,330,625 | |||||
| Take-Two Interactive Software, Inc. (a) | 56,661 | 4,157,784 | ||||||
|
| |||||||
| $ | 11,488,409 | |||||||
|
| |||||||
| Machinery & Tools – 6.5% | ||||||||
| Colfax Corp. (a) | 64,254 | $ | 2,529,680 | |||||
| Flowserve Corp. | 62,624 | 2,907,632 | ||||||
| Roper Technologies, Inc. | 42,932 | 9,940,046 | ||||||
| SPX FLOW, Inc. (a) | 28,611 | 1,055,174 | ||||||
| WABCO Holdings, Inc. (a) | 44,706 | 5,700,462 | ||||||
| Xylem, Inc. | 57,123 | 3,166,328 | ||||||
|
| |||||||
| $ | 25,299,322 | |||||||
|
| |||||||
| Medical & Health Technology & Services – 2.7% | ||||||||
| Healthcare Services Group, Inc. | 66,379 | $ | 3,108,529 | |||||
| Henry Schein, Inc. (a) | 39,875 | 7,297,922 | ||||||
|
| |||||||
| $ | 10,406,451 | |||||||
|
| |||||||
| Medical Equipment – 8.8% | ||||||||
| C.R. Bard, Inc. | 26,193 | $ | 8,279,869 | |||||
| Cooper Cos., Inc. | 18,026 | 4,315,785 | ||||||
| DexCom, Inc. (a) | 25,433 | 1,860,424 | ||||||
| Edwards Lifesciences Corp. (a) | 25,197 | 2,979,293 | ||||||
| Integra LifeSciences Holdings Corp. (a) | 22,082 | 1,203,690 | ||||||
| PerkinElmer, Inc. | 119,606 | 8,149,953 | ||||||
| QIAGEN N.V. | 26,244 | 879,961 | ||||||
| Steris PLC | 44,232 | 3,604,908 | ||||||
| VWR Corp. (a) | 103,955 | 3,431,555 | ||||||
|
| |||||||
| $ | 34,705,438 | |||||||
|
| |||||||
| Issuer | Shares/Par | Value ($) | ||||||
| COMMON STOCKS – continued | ||||||||
| Other Banks & Diversified Financials – 2.5% | ||||||||
| First Republic Bank | 41,238 | $ | 4,127,924 | |||||
| Mastercard, Inc., “A” | 42,367 | 5,145,472 | ||||||
| Zions Bancorporation | 15,611 | 685,479 | ||||||
|
| |||||||
| $ | 9,958,875 | |||||||
|
| |||||||
| Pollution Control – 0.7% | ||||||||
| Clean Harbors, Inc. (a) | 47,816 | $ | 2,669,567 | |||||
|
| |||||||
| Railroad & Shipping – 0.8% | ||||||||
| Kansas City Southern Co. | 30,510 | $ | 3,192,872 | |||||
|
| |||||||
| Real Estate – 0.8% | ||||||||
| Extra Space Storage, Inc., REIT | 38,111 | $ | 2,972,658 | |||||
|
| |||||||
| Restaurants – 3.5% | ||||||||
| Aramark | 107,287 | $ | 4,396,621 | |||||
| Domino’s Pizza Group PLC | 294,446 | 1,127,110 | ||||||
| Domino’s Pizza, Inc. | 12,259 | 2,593,146 | ||||||
| Dunkin Brands Group, Inc. | 44,481 | 2,451,793 | ||||||
| Panera Bread Co., “A” (a) | 10,139 | 3,190,135 | ||||||
|
| |||||||
| $ | 13,758,805 | |||||||
|
| |||||||
| Specialty Chemicals – 1.6% | ||||||||
| Axalta Coating Systems Ltd. (a) | 100,729 | $ | 3,227,357 | |||||
| Univar, Inc. (a) | 100,128 | 2,923,738 | ||||||
|
| |||||||
| $ | 6,151,095 | |||||||
|
| |||||||
| Specialty Stores – 1.9% | ||||||||
| Lululemon Athletica, Inc. (a) | 23,542 | $ | 1,404,751 | |||||
| O’Reilly Automotive, Inc. (a) | 9,299 | 2,034,063 | ||||||
| Ross Stores, Inc. | 48,193 | 2,782,182 | ||||||
| Tractor Supply Co. | 22,772 | 1,234,470 | ||||||
|
| |||||||
| $ | 7,455,466 | |||||||
|
| |||||||
| Telecommunications – Wireless – 1.9% | ||||||||
| SBA Communications Corp., REIT (a) | 55,605 | $ | 7,501,115 | |||||
|
| |||||||
| Total Common Stocks (Identified Cost, $249,016,265) | $ | 386,250,260 | ||||||
|
| |||||||
| MONEY MARKET FUNDS – 1.7% | ||||||||
| MFS Institutional Money Market Portfolio, 0.98% (v) (Identified Cost, $6,663,943) | 6,664,598 | $ | 6,664,598 | |||||
|
| |||||||
| COLLATERAL FOR SECURITIES LOANED – 0.1% | ||||||||
| State Street Navigator Securities Lending Government Money Market Portfolio, 1% (j) (Identified Cost, $203,512) | 203,512 | $ | 203,512 | |||||
|
| |||||||
| Total Investments (Identified Cost, $255,883,720) | $ | 393,118,370 | ||||||
|
| |||||||
| OTHER ASSETS, LESS LIABILITIES – (0.2)% | (654,670 | ) | ||||||
|
| |||||||
| NET ASSETS – 100.0% | $ | 392,463,700 | ||||||
|
| |||||||
5
Table of Contents
MFS Mid Cap Growth Series
Portfolio of Investments (unaudited) – continued
| (a) | Non-income producing security. |
| (j) | The rate quoted is the annualized seven-day yield of the fund at period end. |
| (l) | A portion of this security is on loan. |
| (v) | Underlying affiliated fund that is available only to investment companies managed by MFS. The rate quoted for the MFS Institutional Money Market Portfolio is the annualized seven-day yield of the fund at period end. |
The following abbreviations are used in this report and are defined:
| ADR | American Depositary Receipt |
| PLC | Public Limited Company |
| REIT | Real Estate Investment Trust |
See Notes to Financial Statements
6
Table of Contents
MFS Mid Cap Growth Series
FINANCIAL STATEMENTS | STATEMENT OF ASSETS AND LIABILITIES (unaudited)
This statement represents your fund’s balance sheet, which details the assets and liabilities comprising the total value of the fund.
At 6/30/17 | ||||
Assets | ||||
Investments | ||||
Non-affiliated issuers, at value (identified cost, $249,219,777) | $386,453,772 | |||
Underlying affiliated funds, at value (identified cost, $6,663,943) | 6,664,598 | |||
Total investments, at value, including $198,416 of securities on loan (identified cost, $255,883,720) | $393,118,370 | |||
Foreign currency, at value (identified cost, $5,343) | 5,359 | |||
Receivables for | ||||
Fund shares sold | 56,678 | |||
Interest and dividends | 105,570 | |||
Other assets | 967 | |||
Total assets | $393,286,944 | |||
Liabilities | ||||
Payables for fund shares reacquired | $538,720 | |||
Collateral for securities loaned, at value | 203,512 | |||
Payable to affiliates | ||||
Investment adviser | 16,429 | |||
Shareholder servicing costs | 727 | |||
Distribution and/or service fees | 1,314 | |||
Payable for independent Trustees’ compensation | 456 | |||
Accrued expenses and other liabilities | 62,086 | |||
Total liabilities | $823,244 | |||
Net assets | $392,463,700 | |||
Net assets consist of | ||||
Paid-in capital | $210,322,488 | |||
Unrealized appreciation (depreciation) on investments and translation of assets and liabilities in foreign currencies | 137,236,363 | |||
Accumulated net realized gain (loss) on investments and foreign currency | 44,914,807 | |||
Accumulated net investment loss | (9,958 | ) | ||
Net assets | $392,463,700 | |||
Shares of beneficial interest outstanding | 43,520,376 |
| Net assets | Shares outstanding | Net asset value per share | ||||||||||
Initial Class | $297,130,578 | 32,519,719 | $9.14 | |||||||||
Service Class | 95,333,122 | 11,000,657 | 8.67 | |||||||||
See Notes to Financial Statements
7
Table of Contents
MFS Mid Cap Growth Series
FINANCIAL STATEMENTS | STATEMENT OF OPERATIONS (unaudited)
This statement describes how much your fund earned in investment income and accrued in expenses. It also describes any gains and/or losses generated by fund operations.
Six months ended 6/30/17 | ||||
Net investment loss | ||||
Income | ||||
Dividends | $1,252,747 | |||
Dividends from underlying affiliated funds | 16,655 | |||
Interest | 867 | |||
Foreign taxes withheld | (3,883 | ) | ||
Total investment income | $1,266,386 | |||
Expenses | ||||
Management fee | $1,453,997 | |||
Distribution and/or service fees | 114,472 | |||
Shareholder servicing costs | 10,780 | |||
Administrative services fee | 36,030 | |||
Independent Trustees’ compensation | 4,813 | |||
Custodian fee | 10,989 | |||
Shareholder communications | 20,771 | |||
Audit and tax fees | 27,727 | |||
Legal fees | 2,181 | |||
Miscellaneous | 11,554 | |||
Total expenses | $1,693,314 | |||
Reduction of expenses by investment adviser | (14,880 | ) | ||
Net expenses | $1,678,434 | |||
Net investment loss | $(412,048 | ) | ||
Realized and unrealized gain (loss) on investments and foreign currency | ||||
Realized gain (loss) (identified cost basis) | ||||
Investments: | ||||
Non-affiliated issuers | $22,368,560 | |||
Underlying affiliated funds | (486 | ) | ||
Foreign currency | 1,978 | |||
Net realized gain (loss) on investments and foreign currency | $22,370,052 | |||
Change in unrealized appreciation (depreciation) | ||||
Investments | $31,651,748 | |||
Translation of assets and liabilities in foreign currencies | 2,253 | |||
Net unrealized gain (loss) on investments and foreign currency translation | $31,654,001 | |||
Net realized and unrealized gain (loss) on investments and foreign currency | $54,024,053 | |||
Change in net assets from operations | $53,612,005 |
See Notes to Financial Statements
8
Table of Contents
MFS Mid Cap Growth Series
FINANCIAL STATEMENTS | STATEMENTS OF CHANGES IN NET ASSETS
These statements describe the increases and/or decreases in net assets resulting from operations, any distributions, and any shareholder transactions.
| | Six months ended 6/30/17 (unaudited | ) | | Year ended 12/31/16 | | |||
Change in net assets | ||||||||
From operations | ||||||||
Net investment income (loss) | $(412,048 | ) | $401,570 | |||||
Net realized gain (loss) on investments and foreign currency | 22,370,052 | 24,066,750 | ||||||
Net unrealized gain (loss) on investments and foreign currency translation | 31,654,001 | (6,122,501 | ) | |||||
Change in net assets from operations | $53,612,005 | $18,345,819 | ||||||
Distributions declared to shareholders | ||||||||
From net realized gain on investments | $— | $(30,751,813 | ) | |||||
Change in net assets from fund share transactions | $(42,902,810 | ) | $(17,601,424 | ) | ||||
Total change in net assets | $10,709,195 | $(30,007,418 | ) | |||||
Net assets | ||||||||
At beginning of period | 381,754,505 | 411,761,923 | ||||||
At end of period (including accumulated net investment loss of $9,958 and | $392,463,700 | $381,754,505 |
See Notes to Financial Statements
9
Table of Contents
MFS Mid Cap Growth Series
FINANCIAL STATEMENTS | FINANCIAL HIGHLIGHTS
The financial highlights table is intended to help you understand the fund’s financial performance for the semiannual period and the past 5 fiscal years. Certain information reflects financial results for a single fund share. The total returns in the table represent the rate that an investor would have earned (or lost) on an investment in the fund share class (assuming reinvestment of all distributions) held for the entire period.
| Initial Class | Six months ended | Years ended 12/31 | ||||||||||||||||||||||
| 2016 | 2015 | 2014 | 2013 | 2012 | ||||||||||||||||||||
| (unaudited) | ||||||||||||||||||||||||
Net asset value, beginning of period | $7.96 | $8.21 | $8.76 | $9.00 | $6.56 | $5.63 | ||||||||||||||||||
| Income (loss) from investment operations | ||||||||||||||||||||||||
Net investment income (loss) (d) | $(0.01 | ) | $0.01 | (c) | $(0.03 | ) | $(0.03 | ) | $(0.02 | ) | $(0.01 | ) | ||||||||||||
Net realized and unrealized gain (loss) on investments and | 1.19 | 0.41 | 0.39 | 0.80 | 2.49 | 0.94 | ||||||||||||||||||
Total from investment operations | $1.18 | $0.42 | $0.36 | $0.77 | $2.47 | $0.93 | ||||||||||||||||||
| Less distributions declared to shareholders | ||||||||||||||||||||||||
From net realized gain on investments | $— | $(0.67 | ) | $(0.91 | ) | $(1.01 | ) | $(0.03 | ) | $— | ||||||||||||||
Net asset value, end of period (x) | $9.14 | $7.96 | $8.21 | $8.76 | $9.00 | $6.56 | ||||||||||||||||||
Total return (%) (k)(r)(s)(x) | 14.82 | (n) | 4.91 | (c) | 4.61 | 8.86 | 37.72 | 16.52 | ||||||||||||||||
| Ratios (%) (to average net assets) and Supplemental data: | ||||||||||||||||||||||||
Expenses before expense reductions (f) | 0.81 | (a) | 0.75 | (c) | 0.81 | 0.81 | 0.81 | 0.89 | ||||||||||||||||
Expenses after expense reductions (f) | 0.81 | (a) | 0.74 | (c) | 0.80 | 0.80 | 0.81 | 0.89 | ||||||||||||||||
Net investment income (loss) | (0.15 | )(a) | 0.15 | (c) | (0.33 | ) | (0.34 | ) | (0.26 | ) | (0.10 | ) | ||||||||||||
Portfolio turnover | 13 | (n) | 37 | 37 | 49 | 62 | 65 | |||||||||||||||||
Net assets at end of period (000 omitted) | $297,131 | $294,226 | $324,754 | $363,788 | $393,212 | $359,488 | ||||||||||||||||||
| Service Class | Six months ended | Years ended 12/31 | ||||||||||||||||||||||
| 2016 | 2015 | 2014 | 2013 | 2012 | ||||||||||||||||||||
| (unaudited) | ||||||||||||||||||||||||
Net asset value, beginning of period | $7.56 | $7.85 | $8.43 | $8.72 | $6.38 | $5.48 | ||||||||||||||||||
| Income (loss) from investment operations | ||||||||||||||||||||||||
Net investment loss (d) | $(0.02 | ) | $(0.01 | )(c) | $(0.05 | ) | $(0.05 | ) | $(0.04 | ) | $(0.02 | ) | ||||||||||||
Net realized and unrealized gain (loss) on investments and | 1.13 | 0.39 | 0.38 | 0.77 | 2.41 | 0.92 | ||||||||||||||||||
Total from investment operations | $1.11 | $0.38 | $0.33 | $0.72 | $2.37 | $0.90 | ||||||||||||||||||
| Less distributions declared to shareholders | ||||||||||||||||||||||||
From net realized gain on investments | $— | $(0.67 | ) | $(0.91 | ) | $(1.01 | ) | $(0.03 | ) | $— | ||||||||||||||
Net asset value, end of period (x) | $8.67 | $7.56 | $7.85 | $8.43 | $8.72 | $6.38 | ||||||||||||||||||
Total return (%) (k)(r)(s)(x) | 14.68 | (n) | 4.62 | (c) | 4.43 | 8.56 | 37.22 | 16.42 | ||||||||||||||||
| Ratios (%) (to average net assets) and Supplemental data: | ||||||||||||||||||||||||
Expenses before expense reductions (f) | 1.06 | (a) | 0.99 | (c) | 1.06 | 1.06 | 1.06 | 1.14 | ||||||||||||||||
Expenses after expense reductions (f) | 1.06 | (a) | 0.99 | (c) | 1.05 | 1.05 | 1.06 | 1.14 | ||||||||||||||||
Net investment loss | (0.40 | )(a) | (0.08 | )(c) | (0.57 | ) | (0.59 | ) | (0.51 | ) | (0.35 | ) | ||||||||||||
Portfolio turnover | 13 | (n) | 37 | 37 | 49 | 62 | 65 | |||||||||||||||||
Net assets at end of period (000 omitted) | $95,333 | $87,529 | $87,008 | $88,899 | $90,854 | $76,779 | ||||||||||||||||||
See Notes to Financial Statements
10
Table of Contents
MFS Mid Cap Growth Series
Financial Highlights – continued
| (a) | Annualized. |
| (c) | Amount reflects a one-time reimbursement of expenses by the custodian (or former custodian) without which net investment income and performance would be lower and expenses would be higher. |
| (d) | Per share data is based on average shares outstanding. |
| (f) | Ratios do not reflect reductions from fees paid indirectly, if applicable. |
| (k) | The total return does not reflect expenses that apply to separate accounts. Inclusion of these charges would reduce the total return figures for all periods shown. |
| (n) | Not annualized. |
| (r) | Certain expenses have been reduced without which performance would have been lower. |
| (s) | From time to time the fund may receive proceeds from litigation settlements, without which performance would be lower. |
| (x) | The net asset values and total returns have been calculated on net assets which include adjustments made in accordance with U.S. generally accepted accounting principles required at period end for financial reporting purposes. |
See Notes to Financial Statements
11
Table of Contents
MFS Mid Cap Growth Series
NOTES TO FINANCIAL STATEMENTS (unaudited)
| (1) | Business and Organization |
MFS Mid Cap Growth Series (the fund) is a diversified series of MFS Variable Insurance Trust (the trust). The trust is organized as a Massachusetts business trust and is registered under the Investment Company Act of 1940, as amended, as an open-end management investment company. The shareholders of each series of the trust are separate accounts of insurance companies, which offer variable annuity and/or life insurance products, and qualified retirement and pension plans.
The fund is an investment company and accordingly follows the investment company accounting and reporting guidance of the Financial Accounting Standards Board (FASB) Accounting Standards Codification Topic 946 Financial Services – Investment Companies.
| (2) | Significant Accounting Policies |
General – The preparation of financial statements in conformity with U.S. generally accepted accounting principles requires management to make estimates and assumptions that affect the reported amounts of assets and liabilities, and disclosure of contingent assets and liabilities at the date of the financial statements and the reported amounts of increases and decreases in net assets from operations during the reporting period. Actual results could differ from those estimates. In the preparation of these financial statements, management has evaluated subsequent events occurring after the date of the fund’s Statement of Assets and Liabilities through the date that the financial statements were issued.
In October 2016, the Securities and Exchange Commission (SEC) released its Final Rule on Investment Company Reporting Modernization (the “Rule”). The Rule, which introduces two new regulatory reporting forms for investment companies – Form N-PORT and Form N-CEN – also contains amendments to Regulation S-X which impact financial statement presentation, particularly the presentation of derivative investments. Although still evaluating the impacts of the Rule, management believes that many of the Regulation S-X amendments are consistent with the fund’s current financial statement presentation and expects that the fund will be able to comply with the Rule’s Regulation S-X amendments by the August 1, 2017 compliance date.
Balance Sheet Offsetting – The fund’s accounting policy with respect to balance sheet offsetting is that, absent an event of default by the counterparty or a termination of the agreement, the International Swaps and Derivatives Association (ISDA) Master Agreement does not result in an offset of reported amounts of financial assets and financial liabilities in the Statement of Assets and Liabilities across transactions between the fund and the applicable counterparty. The fund’s right to setoff may be restricted or prohibited by the bankruptcy or insolvency laws of the particular jurisdiction to which a specific master netting agreement counterparty is subject. Balance sheet offsetting disclosures, to the extent applicable to the fund, have been included in the fund’s Significant Accounting Policies note under the captions for each of the fund’s in-scope financial instruments and transactions.
Investment Valuations – Equity securities, including restricted equity securities, are generally valued at the last sale or official closing price on their primary market or exchange as provided by a third-party pricing service. Equity securities, for which there were no sales reported that day, are generally valued at the last quoted daily bid quotation on their primary market or exchange as provided by a third-party pricing service. Short-term instruments with a maturity at issuance of 60 days or less may be valued at amortized cost, which approximates market value. Open-end investment companies are generally valued at net asset value per share. Securities and other assets generally valued on the basis of information from a third-party pricing service may also be valued at a broker/dealer bid quotation. Values obtained from third-party pricing services can utilize both transaction data and market information such as yield, quality, coupon rate, maturity, type of issue, trading characteristics, and other market data. The values of foreign securities and other assets and liabilities expressed in foreign currencies are converted to U.S. dollars using the mean of bid and asked prices for rates provided by a third-party pricing service.
The Board of Trustees has delegated primary responsibility for determining or causing to be determined the value of the fund’s investments (including any fair valuation) to the adviser pursuant to valuation policies and procedures approved by the Board. If the adviser determines that reliable market quotations are not readily available, investments are valued at fair value as determined in good faith by the adviser in accordance with such procedures under the oversight of the Board of Trustees. Under the fund’s valuation policies and procedures, market quotations are not considered to be readily available for most types of debt instruments and floating rate loans and many types of derivatives. These investments are generally valued at fair value based on information from third-party pricing services. In addition, investments may be valued at fair value if the adviser determines that an investment’s value has been materially affected by events occurring after the close of the exchange or market on which the investment is principally traded (such as foreign exchange or market) and prior to the determination of the fund’s net asset value, or after the halting of trading of a specific security where trading does not resume prior to the close of the exchange or market on which the security is principally traded. Events that occur on a frequent basis after foreign markets close (such as developments in foreign markets and significant movements in the U.S. markets) and prior to the determination of the fund’s net asset value may be deemed to have a material effect on the value of securities traded in foreign markets. Accordingly, the fund’s foreign equity securities may often be valued at fair value. The adviser generally relies on third-party pricing services or other information (such as the correlation with price movements of similar securities in the same or other markets; the type, cost and investment characteristics of the security; the business and financial condition of the issuer; and trading and other market data) to assist in determining whether to fair value and
12
Table of Contents
MFS Mid Cap Growth Series
Notes to Financial Statements (unaudited) – continued
at what value to fair value an investment. The value of an investment for purposes of calculating the fund’s net asset value can differ depending on the source and method used to determine value. When fair valuation is used, the value of an investment used to determine the fund’s net asset value may differ from quoted or published prices for the same investment. There can be no assurance that the fund could obtain the fair value assigned to an investment if it were to sell the investment at the same time at which the fund determines its net asset value per share.
Various inputs are used in determining the value of the fund’s assets or liabilities. These inputs are categorized into three broad levels. In certain cases, the inputs used to measure fair value may fall into different levels of the fair value hierarchy. In such cases, an investment’s level within the fair value hierarchy is based on the lowest level of input that is significant to the fair value measurement. The fund’s assessment of the significance of a particular input to the fair value measurement in its entirety requires judgment, and considers factors specific to the investment. Level 1 includes unadjusted quoted prices in active markets for identical assets or liabilities. Level 2 includes other significant observable market-based inputs (including quoted prices for similar securities, interest rates, prepayment speed, and credit risk). Level 3 includes unobservable inputs, which may include the adviser’s own assumptions in determining the fair value of investments. The following is a summary of the levels used as of June 30, 2017 in valuing the fund’s assets or liabilities:
| Investments at Value | Level 1 | Level 2 | Level 3 | Total | ||||||||||||
| Equity Securities | $386,250,260 | $— | $— | $386,250,260 | ||||||||||||
| Mutual Funds | 6,868,110 | — | — | 6,868,110 | ||||||||||||
| Total Investments | $393,118,370 | $— | $— | $393,118,370 | ||||||||||||
For further information regarding security characteristics, see the Portfolio of Investments.
Of the level 1 investments presented above, equity investments amounting to $1,127,110 would have been considered level 2 investments at the beginning of the period. The primary reason for changes in the classifications between levels 1 and 2 occurs when foreign equity securities are fair valued using other observable market-based inputs in place of the closing exchange price due to events occurring after the close of the exchange or market on which the investment is principally traded. The fund’s foreign equity securities may often be valued using other observable market-based inputs. The fund’s policy is to recognize transfers between the levels as of the end of the period.
Foreign Currency Translation – Purchases and sales of foreign investments, income, and expenses are converted into U.S. dollars based upon currency exchange rates prevailing on the respective dates of such transactions or on the reporting date for foreign denominated receivables and payables. Gains and losses attributable to foreign currency exchange rates on sales of securities are recorded for financial statement purposes as net realized gains and losses on investments. Gains and losses attributable to foreign exchange rate movements on receivables, payables, income and expenses are recorded for financial statement purposes as foreign currency transaction gains and losses. That portion of both realized and unrealized gains and losses on investments that results from fluctuations in foreign currency exchange rates is not separately disclosed.
Security Loans – Under its Securities Lending Agency Agreement with the fund, State Street Bank and Trust Company (“State Street”), as lending agent, loans the securities of the fund to certain qualified institutions (the “Borrowers”) approved by the fund. Security loans can be terminated at the discretion of either the lending agent or the fund and the related securities must be returned within the earlier of the standard trade settlement period for such securities or within three business days. The loans are collateralized by cash and/or U.S. Treasury and federal agency obligations in an amount typically at least equal to the market value of the securities loaned. On loans collateralized by cash, the cash collateral is invested in a money market fund. The market value of the loaned securities is determined at the close of business of the fund and any additional required collateral is delivered to the fund on the next business day. State Street provides the fund with indemnification against Borrower default. In the event of Borrower default, State Street will, for the benefit of the fund, either purchase securities identical to those loaned or, when such purchase is commercially impracticable, pay the fund the market value of the loaned securities. In return, State Street assumes the fund’s rights to the related collateral. If the collateral value is less than the cost to purchase identical securities, State Street is responsible for the shortfall, but only to the extent that such shortfall is not due to a decline in collateral value resulting from collateral reinvestment for which the fund bears the risk of loss. At period end, the fund had investment securities on loan, all of which were classified as equity securities in the fund’s Portfolio of Investments, with a fair value of $198,416. The fair value of the fund’s investment securities on loan and a related liability of $203,512 for cash collateral received on securities loaned are both presented gross in the Statement of Assets and Liabilities. The collateral received on securities loaned exceeded the value of securities on loan at period end. The liability for cash collateral for securities loaned is carried at fair value, which is categorized as level 2 within the fair value hierarchy. A portion of the income generated upon investment of the collateral is remitted to the Borrowers, and the remainder is allocated between the fund and the lending agent. On loans collateralized by U.S. Treasury and/or federal agency obligations, a fee is received from the Borrower, and is allocated between the fund and the lending agent. Income from securities lending is included in “Interest” income in the Statement of Operations. The dividend and interest income earned on the securities loaned is accounted for in the same manner as other dividend and interest income.
13
Table of Contents
MFS Mid Cap Growth Series
Notes to Financial Statements (unaudited) – continued
Indemnifications – Under the fund’s organizational documents, its officers and Trustees may be indemnified against certain liabilities and expenses arising out of the performance of their duties to the fund. Additionally, in the normal course of business, the fund enters into agreements with service providers that may contain indemnification clauses. The fund’s maximum exposure under these agreements is unknown as this would involve future claims that may be made against the fund that have not yet occurred.
Investment Transactions and Income – Investment transactions are recorded on the trade date. Interest income is recorded on the accrual basis. Dividends received in cash are recorded on the ex-dividend date. Certain dividends from foreign securities will be recorded when the fund is informed of the dividend if such information is obtained subsequent to the ex-dividend date. Dividend and interest payments received in additional securities are recorded on the ex-dividend or ex-interest date in an amount equal to the value of the security on such date.
The fund may receive proceeds from litigation settlements. Any proceeds received from litigation involving portfolio holdings are reflected in the Statement of Operations in realized gain/loss if the security has been disposed of by the fund or in unrealized gain/loss if the security is still held by the fund. Any other proceeds from litigation not related to portfolio holdings are reflected as other income in the Statement of Operations.
Tax Matters and Distributions – The fund intends to qualify as a regulated investment company, as defined under Subchapter M of the Internal Revenue Code, and to distribute all of its taxable income, including realized capital gains. As a result, no provision for federal income tax is required. The fund’s federal tax returns, when filed, will remain subject to examination by the Internal Revenue Service for a three year period. Management has analyzed the fund’s tax positions taken on federal and state tax returns for all open tax years and does not believe that there are any uncertain tax positions that require recognition of a tax liability. Foreign taxes, if any, have been accrued by the fund in the accompanying financial statements in accordance with the applicable foreign tax law. Foreign income taxes may be withheld by certain countries in which the fund invests. Additionally, capital gains realized by the fund on securities issued in or by certain foreign countries may be subject to capital gains tax imposed by those countries.
Distributions to shareholders are recorded on the ex-dividend date. Income and capital gain distributions are determined in accordance with income tax regulations, which may differ from U.S. generally accepted accounting principles. Certain capital accounts in the financial statements are periodically adjusted for permanent differences in order to reflect their tax character. These adjustments have no impact on net assets or net asset value per share. Temporary differences which arise from recognizing certain items of income, expense, gain or loss in different periods for financial statement and tax purposes will reverse at some time in the future. Distributions in excess of net investment income or net realized gains are temporary overdistributions for financial statement purposes resulting from differences in the recognition or classification of income or distributions for financial statement and tax purposes.
Book/tax differences primarily relate to wash sale loss deferrals.
The tax character of distributions declared to shareholders for the last fiscal year is as follows:
| Year ended 12/31/16 | ||||
| Long-term capital gains | $30,751,813 | |||
The federal tax cost and the tax basis components of distributable earnings were as follows:
| As of 6/30/17 | ||||
| Cost of investments | $256,384,595 | |||
| Gross appreciation | 139,020,867 | |||
| Gross depreciation | (2,287,092 | ) | ||
| Net unrealized appreciation (depreciation) | $136,733,775 | |||
| As of 12/31/16 | ||||
| Undistributed ordinary income | 402,090 | |||
| Undistributed long-term capital gain | 23,045,630 | |||
| Other temporary differences | (540 | ) | ||
| Net unrealized appreciation (depreciation) | 105,082,027 | |||
The aggregate cost above includes prior fiscal year end tax adjustments, if applicable.
Multiple Classes of Shares of Beneficial Interest – The fund offers multiple classes of shares, which differ in their respective distribution and/or service fees. The fund’s income, realized and unrealized gain (loss), and common expenses are allocated to
14
Table of Contents
MFS Mid Cap Growth Series
Notes to Financial Statements (unaudited) – continued
shareholders based on the daily net assets of each class. Dividends are declared separately for each class. Differences in per share dividend rates are generally due to differences in separate class expenses. The fund’s distributions declared to shareholders as reported in the Statements of Changes in Net Assets are presented by class as follows:
| From net realized gain on investments | ||||||||
| Six Months Ended 6/30/17 | Year Ended 12/31/16 | |||||||
| Initial Class | $— | $23,710,487 | ||||||
| Service Class | — | 7,041,326 | ||||||
| Total | $— | $30,751,813 | ||||||
| (3) | Transactions with Affiliates |
Investment Adviser – The fund has an investment advisory agreement with MFS to provide overall investment management and related administrative services and facilities to the fund. The management fee is computed daily and paid monthly at the following annual rates:
| First $1 billion of average daily net assets | 0.75% | |||
| Average daily net assets in excess of $1 billion | 0.70% |
MFS has agreed in writing to reduce its management fee by a specified amount if certain MFS mutual fund assets exceed thresholds agreed to by MFS and the fund’s Board of Trustees. For the six months ended June 30, 2017, this management fee reduction amounted to $14,880, which is included in the reduction of total expenses in the Statement of Operations. The management fee incurred for the six months ended June 30, 2017 was equivalent to an annual effective rate of 0.74% of the fund’s average daily net assets.
Distributor – MFS Fund Distributors, Inc. (MFD), a wholly-owned subsidiary of MFS, is the distributor of shares of the fund. The Trustees have adopted a distribution plan for the Service Class shares pursuant to Rule 12b-1 under the Investment Company Act of 1940.
The fund’s distribution plan provides that the fund will pay MFD distribution and/or service fees equal to 0.25% per annum of its average daily net assets attributable to Service Class shares as partial consideration for services performed and expenses incurred by MFD and financial intermediaries (including participating insurance companies that invest in the fund to fund variable annuity and variable life insurance contracts, sponsors of qualified retirement and pension plans that invest in the fund, and affiliates of these participating insurance companies and plan sponsors) in connection with the sale and distribution of the Service Class shares. MFD may subsequently pay all, or a portion, of the distribution and/or service fees to financial intermediaries.
Shareholder Servicing Agent – MFS Service Center, Inc. (MFSC), a wholly-owned subsidiary of MFS, receives a fee from the fund for its services as shareholder servicing agent. For the six months ended June 30, 2017, the fee was $9,625, which equated to 0.0050% annually of the fund’s average daily net assets. MFSC also receives payment from the fund for out-of-pocket expenses paid by MFSC on behalf of the fund. For the six months ended June 30, 2017, these costs amounted to $1,155.
Administrator – MFS provides certain financial, legal, shareholder communications, compliance, and other administrative services to the fund. Under an administrative services agreement, the fund reimburses MFS the costs incurred to provide these services. The fund is charged an annual fixed amount of $17,500 plus a fee based on average daily net assets. The administrative services fee incurred for the six months ended June 30, 2017 was equivalent to an annual effective rate of 0.0186% of the fund’s average daily net assets.
Trustees’ and Officers’ Compensation – The fund pays compensation to independent Trustees in the form of a retainer, attendance fees, and additional compensation to Board and Committee chairpersons. The fund does not pay compensation directly to Trustees or officers of the fund who are also officers of the investment adviser, all of whom receive remuneration for their services to the fund from MFS. Certain officers and Trustees of the fund are officers or directors of MFS, MFD, and MFSC.
Other – This fund and certain other funds managed by MFS (the funds) have entered into a service agreement (the ISO Agreement) which provides for payment of fees solely by the funds to Tarantino LLC in return for the provision of services of an Independent Senior Officer (ISO) for the funds. Frank L. Tarantino serves as the ISO and is an officer of the funds and the sole member of Tarantino LLC. The funds can terminate the ISO Agreement with Tarantino LLC at any time under the terms of the ISO Agreement. For the six months ended June 30, 2017, the fee paid by the fund under this agreement was $365 and is included in “Miscellaneous” expense in the Statement of Operations. MFS has agreed to bear all expenses associated with office space, other administrative support, and supplies provided to the ISO.
The fund invests in the MFS Institutional Money Market Portfolio which is managed by MFS and seeks current income consistent with preservation of capital and liquidity. This money market fund does not pay a management fee to MFS.
15
Table of Contents
MFS Mid Cap Growth Series
Notes to Financial Statements (unaudited) – continued
The fund is permitted to engage in purchase and sale transactions with funds and accounts for which MFS serves as investment adviser or sub-adviser (“cross-trades”) pursuant to a policy adopted by the Board of Trustees. This policy has been designed to ensure that cross-trades conducted by the fund comply with Rule 17a-7 under the Investment Company Act of 1940. Under this policy, cross-trades are effected at current market prices with no remuneration paid in connection with the transaction. During the six months ended June 30, 2017, the fund engaged in purchase and sale transactions pursuant to this policy, which amounted to $937,959 and $530,240, respectively. The sales transactions resulted in net realized gains (losses) of $(6,664).
| (4) | Portfolio Securities |
For the six months ended June 30, 2017, purchases and sales of investments, other than short-term obligations, aggregated $50,674,943 and $98,417,793, respectively.
| (5) | Shares of Beneficial Interest |
The fund’s Declaration of Trust permits the Trustees to issue an unlimited number of full and fractional shares of beneficial interest. Transactions in fund shares were as follows:
| Six months ended 6/30/17 | Year ended 12/31/16 | |||||||||||||||
| Shares | Amount | Shares | Amount | |||||||||||||
| Shares sold | ||||||||||||||||
Initial Class | 224,272 | $1,916,839 | 1,145,319 | $9,157,568 | ||||||||||||
Service Class | 913,265 | 7,450,486 | 2,367,351 | 18,135,281 | ||||||||||||
| 1,137,537 | $9,367,325 | 3,512,670 | $27,292,849 | |||||||||||||
| Shares issued to shareholders in reinvestment of distributions | ||||||||||||||||
Initial Class | — | $— | 2,909,262 | $23,710,487 | ||||||||||||
Service Class | — | — | 908,558 | 7,041,326 | ||||||||||||
| — | $— | 3,817,820 | $30,751,813 | |||||||||||||
| Shares reacquired | ||||||||||||||||
Initial Class | (4,647,033 | ) | $(40,111,578 | ) | (6,654,934 | ) | $(54,279,464 | ) | ||||||||
Service Class | (1,485,170 | ) | (12,158,557 | ) | (2,788,211 | ) | (21,366,622 | ) | ||||||||
| (6,132,203 | ) | $(52,270,135 | ) | (9,443,145 | ) | $(75,646,086 | ) | |||||||||
| Net change | ||||||||||||||||
Initial Class | (4,422,761 | ) | $(38,194,739 | ) | (2,600,353 | ) | $(21,411,409 | ) | ||||||||
Service Class | (571,905 | ) | (4,708,071 | ) | 487,698 | 3,809,985 | ||||||||||
| (4,994,666 | ) | $(42,902,810 | ) | (2,112,655 | ) | $(17,601,424 | ) | |||||||||
The fund is one of several mutual funds in which certain MFS funds may invest. The MFS funds do not invest in the underlying funds for the purpose of exercising management or control. At the end of the period, the MFS Moderate Allocation Portfolio, the MFS Growth Allocation Portfolio, and the MFS Conservative Allocation Portfolio were the owners of record of approximately 31%, 10%, and 6%, respectively, of the value of outstanding voting shares of the fund.
| (6) | Line of Credit |
The fund and certain other funds managed by MFS participate in a $1.25 billion unsecured committed line of credit, subject to a $1 billion sublimit, provided by a syndication of banks under a credit agreement. Borrowings may be made for temporary financing needs. Interest is charged to each fund, based on its borrowings, generally at a rate equal to the higher of the Overnight Federal Reserve funds rate or daily one month LIBOR plus an agreed upon spread. A commitment fee, based on the average daily, unused portion of the committed line of credit, is allocated among the participating funds at the end of each calendar quarter. In addition, the fund and other funds managed by MFS have established unsecured uncommitted borrowing arrangements with certain banks for temporary financing needs. Interest is charged to each fund, based on its borrowings, at a rate equal to the Overnight Federal Reserve funds rate plus an agreed upon spread. For the six months ended June 30, 2017, the fund’s commitment fee and interest expense were $1,338 and $0, respectively, and are included in “Miscellaneous” expense in the Statement of Operations.
16
Table of Contents
MFS Mid Cap Growth Series
Notes to Financial Statements (unaudited) – continued
| (7) | Transactions in Underlying Affiliated Funds – Affiliated Issuers |
An affiliated issuer may be considered one in which the fund owns 5% or more of the outstanding voting securities, or a company which is under common control. For the purposes of this report, the fund assumes the following to be an affiliated issuer:
| Underlying Affiliated Fund | Beginning Shares/Par Amount | Acquisitions Shares/Par Amount | Dispositions Shares/Par Amount | Ending Shares/Par Amount | ||||||||||||
| MFS Institutional Money Market Portfolio | 2,584,523 | 49,865,216 | (45,785,141 | ) | 6,664,598 | |||||||||||
| Underlying Affiliated Fund | Realized Gain (Loss) | Capital Gain Distributions | Dividend Income | Ending Value | ||||||||||||
| MFS Institutional Money Market Portfolio | $(486 | ) | $— | $16,655 | $6,664,598 | |||||||||||
17
Table of Contents
MFS Mid Cap Growth Series
RESULTS OF SHAREHOLDER MEETING (unaudited)
At a special meeting of shareholders of MFS Variable Insurance Trust, which was held on March 23, 2017, the following action was taken:
Item 1: To elect the following individuals as Trustees:
| Number of Dollars | ||||||||
| Nominee | For | Withheld Authority | ||||||
| Steven E. Buller | 11,311,922,492.61 | 518,570,973.54 | ||||||
| John A. Caroselli | 11,291,109,000.34 | 539,384,465.81 | ||||||
| Maureen R. Goldfarb | 11,233,211,779.66 | 597,281,686.49 | ||||||
| David H. Gunning | 11,179,077,201.17 | 651,416,264.98 | ||||||
| Michael Hegarty | 11,191,993,154.78 | 638,500,311.37 | ||||||
| John P. Kavanaugh | 11,242,238,261.44 | 588,255,204.71 | ||||||
| Robert J. Manning | 11,314,479,376.58 | 516,014,089.57 | ||||||
| Clarence Otis, Jr. | 11,208,873,448.85 | 621,620,017.30 | ||||||
| Maryanne L. Roepke | 11,263,427,105.03 | 567,066,361.12 | ||||||
| Robin A. Stelmach | 11,313,883,043.82 | 516,610,422.33 | ||||||
| Laurie J. Thomsen | 11,240,219,041.09 | 590,274,425.06 | ||||||
18
Table of Contents
MFS Mid Cap Growth Series
PROXY VOTING POLICIES AND INFORMATION
MFS votes proxies on behalf of the fund pursuant to proxy voting policies and procedures that are available without charge, upon request, by calling 1-800-225-2606, by visiting mfs.com (once you have selected “Individual Investor” as your role, click on “Individual Investor Home” in the top navigation and then select “Learn More About Proxy Voting” under the “I want to…” header on the left hand column of the page), or by visiting the SEC’s Web site at http://www.sec.gov.
Information regarding how the fund voted proxies relating to portfolio securities during the most recent twelve-month period ended June 30 is available by August 31 of each year without charge by visiting mfs.com (once you have selected “Individual Investor” as your role, click on “Individual Investor Home” in the top navigation and then select “Learn More About Proxy Voting” under the “I want to…” header on the left hand column of the page), or by visiting the SEC’s Web site at http://www.sec.gov.
QUARTERLY PORTFOLIO DISCLOSURE
The fund will file a complete schedule of portfolio holdings with the Securities and Exchange Commission (the Commission) for the first and third quarters of each fiscal year on Form N-Q. The fund’s Form N-Q is available on the EDGAR database on the Commission’s Internet Web site at http://www.sec.gov, and may be reviewed and copied at the:
Public Reference Room
Securities and Exchange Commission
100 F Street, NE, Room 1580
Washington, D.C. 20549
Information on the operation of the Public Reference Room may be obtained by calling the Commission at 1-800-SEC-0330. Copies of the fund’s Form N-Q also may be obtained, upon payment of a duplicating fee, by electronic request at the following e-mail address: publicinfo@sec.gov or by writing the Public Reference Section at the above address.
From time to time, MFS may post important information about the fund or the MFS funds on the MFS web site (mfs.com). This information is available on mfs.com by following these steps once you have selected “Individual Investor” as your role: (1) Click on the “Individual Investor Home” in the top navigation and then select the “Announcements” option within the “Market Outlooks” drop down, or (2) Click on “Products & Services” and “Variable Insurance Portfolios” and then select the fund’s name.
INFORMATION ABOUT FUND CONTRACTS AND LEGAL CLAIMS
The fund has entered into contractual arrangements with an investment adviser, administrator, distributor, shareholder servicing agent, 529 program manager (if applicable), and custodian who each provide services to the fund. Unless expressly stated otherwise, shareholders are not parties to, or intended beneficiaries of these contractual arrangements, and these contractual arrangements are not intended to create any shareholder right to enforce them against the service providers or to seek any remedy under them against the service providers, either directly or on behalf of the fund.
Under the Trust’s By-Laws and Declaration of Trust, any claims asserted against or on behalf of the MFS Funds, including claims against Trustees and Officers, must be brought in state and federal courts located within the Commonwealth of Massachusetts.
19
Table of Contents
Table of Contents
SEMIANNUAL REPORT
June 30, 2017

MFS® GLOBAL EQUITY SERIES
MFS® Variable Insurance Trust

VGE-SEM
Table of Contents
MFS® GLOBAL EQUITY SERIES
The report is prepared for the general information of contract owners. It is authorized for distribution to prospective investors only when preceded or accompanied by a current prospectus.
NOT FDIC INSURED • MAY LOSE VALUE • NO BANK OR CREDIT UNION GUARANTEE • NOT A DEPOSIT • NOT INSURED BY ANY FEDERAL GOVERNMENT AGENCY OR NCUA/NCUSIF
Table of Contents
MFS Global Equity Series
LETTER FROM THE EXECUTIVE CHAIRMAN

Dear Contract Owners:
Despite policy uncertainty accompanying a new presidential administration in the United States and unease over ongoing Brexit negotiations, most markets have proved resilient. U.S. share prices have reached new highs. The U.S. Federal Reserve has continued to gradually hike interest rates. However, rates in most developed markets remain very low, with major non-U.S. central banks just beginning to contemplate curbing accommodative monetary policies.
Globally, economic growth has shown signs of recovery, led by China, the U.S. and the eurozone. Despite better growth, there are few immediate signs of worrisome inflation as wage growth remains muted. Europe has benefited from diminishing event risks as establishment candidates won both the Dutch and French elections, averting a feared populist trend. Emerging market economies are recovering at a somewhat slower pace amid fears that restrictive U.S. trade policies could further hamper the restrained pace of global trade growth. Looking ahead, markets will have to contend with issues involving geopolitical hot spots on the Korean peninsula and in the Middle East, which could potentially lead to a clash of interests between the U.S. and other major powers such as China or Russia.
At MFS®, we believe time is an asset. A patient, long-term approach to investing can have a powerful impact on decision making and outcomes. Time arbitrage, as we call it, simply comes down to having the conviction and discipline to allow enough time for good investment ideas to play out. In our view, such an approach, along with the professional guidance of a financial advisor, will help you reach your investment objectives.
Respectfully,

Robert J. Manning
Executive Chairman
MFS Investment Management
August 16, 2017
The opinions expressed in this letter are subject to change and may not be relied upon for investment advice. No forecasts can be guaranteed.
1
Table of Contents
MFS Global Equity Series
Portfolio structure
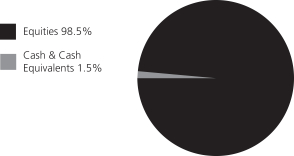
| Top ten holdings | ||||
| Thermo Fisher Scientific, Inc. | 2.9% | |||
| Bayer AG | 2.9% | |||
| Nestle S.A. | 2.7% | |||
| Medtronic PLC | 2.5% | |||
| Honeywell International, Inc. | 2.4% | |||
| Accenture PLC, “A” | 2.2% | |||
| Reckitt Benckiser Group PLC | 2.2% | |||
| Zimmer Biomet Holdings, Inc | 2.1% | |||
| Visa, Inc., “A” | 2.1% | |||
| Stryker Corp. | 2.0% | |||
| Equity sectors | ||||
| Health Care | 19.4% | |||
| Consumer Staples | 18.1% | |||
| Financial Services | 12.9% | |||
| Leisure | 10.6% | |||
| Industrial Goods & Services | 7.9% | |||
| Basic Materials | 6.8% | |||
| Technology | 6.0% | |||
| Transportation | 5.2% | |||
| Retailing | 4.8% | |||
| Special Products & Services | 4.6% | |||
| Autos & Housing | 1.1% | |||
| Energy | 1.1% | |||
| Issuer country weightings (x) | ||||
| United States | 55.2% | |||
| United Kingdom | 8.7% | |||
| Switzerland | 8.7% | |||
| France | 8.3% | |||
| Germany | 6.6% | |||
| Netherlands | 2.3% | |||
| Sweden | 1.9% | |||
| Canada | 1.8% | |||
| Japan | 1.3% | |||
| Other Countries | 5.2% | |||
| Currency exposure weightings (y) | ||||
| United States Dollar | 57.9% | |||
| Euro | 18.4% | |||
| British Pound Sterling | 8.7% | |||
| Swiss Franc | 8.7% | |||
| Swedish Krona | 1.9% | |||
| Japanese Yen | 1.3% | |||
| South Korean Won | 0.9% | |||
| Danish Krone | 0.8% | |||
| Brazilian Real | 0.5% | |||
| Other Currencies | 0.9% | |||
| (x) | Represents the portfolio’s exposure to issuer countries as a percentage of a portfolio’s net assets. For purposes of this presentation, United States includes Cash & Cash Equivalents. |
| (y) | Represents the portfolio’s exposure to a particular currency as a percentage of a portfolio’s net assets. For purposes of this presentation, United States Dollar includes Cash & Cash Equivalents. |
Cash & Cash Equivalents includes any cash, investments in money market funds, short-term securities, and other assets less liabilities. Please see the Statement of Assets and Liabilities for additional information related to the fund’s cash position and other assets and liabilities.
Percentages are based on net assets as of June 30, 2017.
The portfolio is actively managed and current holdings may be different.
2
Table of Contents
MFS Global Equity Series
Fund Expenses Borne by the Contract Holders during the Period,
January 1, 2017 through June 30, 2017
As a contract holder of the fund, you incur ongoing costs, including management fees; distribution and/or service (12b-1) fees; and other fund expenses. This example is intended to help you understand your ongoing costs (in dollars) of investing in the fund and to compare these costs with the ongoing costs of investing in other mutual funds.
The example is based on an investment of $1,000 invested at the beginning of the period and held for the entire period January 1, 2017 through June 30, 2017.
Actual Expenses
The first line for each share class in the following table provides information about actual account values and actual expenses. You may use the information in this line, together with the amount you invested, to estimate the expenses that you paid over the period. Simply divide your account value by $1,000 (for example, an $8,600 account value divided by $1,000 = 8.6), then multiply the result by the number in the first line under the heading entitled “Expenses Paid During Period” to estimate the expenses you paid on your account during this period.
Hypothetical Example for Comparison Purposes
The second line for each share class in the following table provides information about hypothetical account values and hypothetical expenses based on the fund’s actual expense ratio and an assumed rate of return of 5% per year before expenses, which is not the fund’s actual return. The hypothetical account values and expenses may not be used to estimate the actual ending account balance or expenses you paid for the period. You may use this information to compare the ongoing costs of investing in the fund and other funds. To do so, compare this 5% hypothetical example with the 5% hypothetical examples that appear in the shareholder reports of the other funds.
Please note that the expenses shown in the table are meant to highlight the fund’s ongoing costs only and do not take into account the fees and expenses imposed under the variable contracts through which your investment in the fund is made. Therefore, the second line for each share class in the table is useful in comparing ongoing costs associated with an investment in vehicles (such as the fund) which fund benefits under variable annuity and variable life insurance contracts and to qualified pension and retirement plans only, and will not help you determine the relative total costs of investing in the fund through variable annuity and variable life insurance contracts. If the fees and expenses imposed under the variable contracts were included, your costs would have been higher.
| Share Class | Annualized Expense Ratio | Beginning Account Value 1/01/17 | Ending Account Value 6/30/17 | Expenses Paid During Period (p) 1/01/17-6/30/17 | ||||||||||||||
| Initial Class | Actual | 0.97% | $1,000.00 | $1,157.07 | $5.19 | |||||||||||||
| Hypothetical (h) | 0.97% | $1,000.00 | $1,019.98 | $4.86 | ||||||||||||||
| Service Class | Actual | 1.22% | $1,000.00 | $1,155.76 | $6.52 | |||||||||||||
| Hypothetical (h) | 1.22% | $1,000.00 | $1,018.74 | $6.11 | ||||||||||||||
| (h) | 5% class return per year before expenses. |
| (p) | “Expenses Paid During Period” are equal to each class’s annualized expense ratio, as shown above, multiplied by the average account value over the period, multiplied by 181/365 (to reflect the one-half year period). |
3
Table of Contents
MFS Global Equity Series
PORTFOLIO OF INVESTMENTS – 6/30/17 (unaudited)
The Portfolio of Investments is a complete list of all securities owned by your fund. It is categorized by broad-based asset classes.
| Issuer | Shares/Par | Value ($) | ||||||
| COMMON STOCKS – 98.5% | ||||||||
| Aerospace – 4.2% | ||||||||
| Honeywell International, Inc. | 10,896 | $ | 1,452,328 | |||||
| MTU Aero Engines Holding AG | 2,896 | 408,496 | ||||||
| United Technologies Corp. | 5,354 | 653,777 | ||||||
|
| |||||||
| $ | 2,514,601 | |||||||
|
| |||||||
| Airlines – 0.8% | ||||||||
| Aena S.A. | 2,356 | $ | 459,741 | |||||
|
| |||||||
| Alcoholic Beverages – 6.1% | ||||||||
| AmBev S.A. | 54,668 | $ | 302,143 | |||||
| Carlsberg A.S., “B” | 4,514 | 482,230 | ||||||
| Diageo PLC | 39,181 | 1,157,645 | ||||||
| Heineken N.V. | 6,058 | 589,027 | ||||||
| Pernod Ricard S.A. | 8,437 | 1,129,858 | ||||||
|
| |||||||
| $ | 3,660,903 | |||||||
|
| |||||||
| Apparel Manufacturers – 3.4% | ||||||||
| Burberry Group PLC | 16,451 | $ | 355,896 | |||||
| Compagnie Financiere Richemont S.A. | 7,128 | 587,248 | ||||||
| LVMH Moet Hennessy Louis Vuitton SE | 4,502 | 1,122,489 | ||||||
|
| |||||||
| $ | 2,065,633 | |||||||
|
| |||||||
| Automotive – 1.1% | ||||||||
| Delphi Automotive PLC | 4,447 | $ | 389,779 | |||||
| Harley-Davidson, Inc. | 5,544 | 299,487 | ||||||
|
| |||||||
| $ | 689,266 | |||||||
|
| |||||||
| Broadcasting – 4.4% | ||||||||
| Omnicom Group, Inc. | 4,631 | $ | 383,910 | |||||
| Walt Disney Co. | 11,351 | 1,206,044 | ||||||
| WPP PLC | 51,158 | 1,075,420 | ||||||
|
| |||||||
| $ | 2,665,374 | |||||||
|
| |||||||
| Brokerage & Asset Managers – 1.5% | ||||||||
| Deutsche Boerse AG | 3,258 | $ | 343,906 | |||||
| Franklin Resources, Inc. | 12,403 | 555,531 | ||||||
|
| |||||||
| $ | 899,437 | |||||||
|
| |||||||
| Business Services – 4.6% | ||||||||
| Accenture PLC, “A” | 10,833 | $ | 1,339,826 | |||||
| Adecco S.A. | 5,882 | 447,177 | ||||||
| Brenntag AG | 4,217 | 244,097 | ||||||
| Cognizant Technology Solutions Corp., “A” | 6,195 | 411,348 | ||||||
| PayPal Holdings, Inc. (a) | 6,597 | 354,061 | ||||||
|
| |||||||
| $ | 2,796,509 | |||||||
|
| |||||||
| Cable TV – 1.8% | ||||||||
| British Sky Broadcasting Group PLC | 26,772 | $ | 346,600 | |||||
| Charter Communications, Inc., “A” (a) | 1,183 | 398,493 | ||||||
| Comcast Corp., “A” | 8,161 | 317,626 | ||||||
|
| |||||||
| $ | 1,062,719 | |||||||
|
| |||||||
| Chemicals – 2.8% | ||||||||
| 3M Co. | 4,959 | $ | 1,032,414 | |||||
| Monsanto Co. | 5,577 | 660,094 | ||||||
|
| |||||||
| $ | 1,692,508 | |||||||
|
| |||||||
| Issuer | Shares/Par | Value ($) | ||||||
| COMMON STOCKS – continued | ||||||||
| Computer Software – 2.6% | ||||||||
| Check Point Software Technologies Ltd. (a) | 5,192 | $ | 566,343 | |||||
| Oracle Corp. | 20,003 | 1,002,951 | ||||||
|
| |||||||
| $ | 1,569,294 | |||||||
|
| |||||||
| Consumer Products – 6.5% | ||||||||
| Colgate-Palmolive Co. | 9,619 | $ | 713,056 | |||||
| Coty, Inc., “A” | 46,155 | 865,868 | ||||||
| Essity AB (a) | 37,204 | 1,017,902 | ||||||
| Reckitt Benckiser Group PLC | 13,005 | 1,318,482 | ||||||
|
| |||||||
| $ | 3,915,308 | |||||||
|
| |||||||
| Electrical Equipment – 3.0% | ||||||||
| Amphenol Corp., “A” | 5,036 | $ | 371,758 | |||||
| Legrand S.A. | 7,329 | 512,712 | ||||||
| Schneider Electric S.A. | 8,978 | 689,801 | ||||||
| W.W. Grainger, Inc. | 1,186 | 214,109 | ||||||
|
| |||||||
| $ | 1,788,380 | |||||||
|
| |||||||
| Electronics – 2.0% | ||||||||
| Hoya Corp. | 7,300 | $ | 378,581 | |||||
| Microchip Technology, Inc. | 3,212 | 247,902 | ||||||
| Samsung Electronics Co. Ltd. | 265 | 550,544 | ||||||
|
| |||||||
| $ | 1,177,027 | |||||||
|
| |||||||
| Entertainment – 1.9% | ||||||||
| Time Warner, Inc. | 11,656 | $ | 1,170,379 | |||||
|
| |||||||
| Food & Beverages – 5.5% | ||||||||
| Danone S.A. | 14,375 | $ | 1,080,495 | |||||
| Kellogg Co. | 9,185 | 637,990 | ||||||
| Nestle S.A. | 18,440 | 1,604,774 | ||||||
|
| |||||||
| $ | 3,323,259 | |||||||
|
| |||||||
| Forest & Paper Products – 0.2% | ||||||||
| Svenska Cellulosa Aktiebolaget | 14,849 | $ | 112,363 | |||||
|
| |||||||
| Gaming & Lodging – 0.8% | ||||||||
| Marriott International, Inc., “A” | 2,280 | $ | 228,707 | |||||
| Sands China Ltd. | 24,400 | 111,727 | ||||||
| Wynn Resorts Ltd. | 1,028 | 137,875 | ||||||
|
| |||||||
| $ | 478,309 | |||||||
|
| |||||||
| Insurance – 0.3% | ||||||||
| Swiss Re Ltd. | 2,117 | $ | 193,508 | |||||
|
| |||||||
| Internet – 0.8% | ||||||||
| eBay, Inc. (a) | 14,422 | $ | 503,616 | |||||
|
| |||||||
| Machinery & Tools – 0.7% | ||||||||
| Kubota Corp. | 25,500 | $ | 427,928 | |||||
|
| |||||||
| Major Banks – 6.4% | ||||||||
| Bank of New York Mellon Corp. | 19,646 | $ | 1,002,339 | |||||
| Erste Group Bank AG | 6,427 | 246,094 | ||||||
| Goldman Sachs Group, Inc. | 2,669 | 592,251 | ||||||
| State Street Corp. | 13,262 | 1,189,999 | ||||||
| UBS AG | 49,663 | 841,096 | ||||||
|
| |||||||
| $ | 3,871,779 | |||||||
|
| |||||||
4
Table of Contents
MFS Global Equity Series
Portfolio of Investments (unaudited) – continued
| Issuer | Shares/Par | Value ($) | ||||||
| COMMON STOCKS – continued | ||||||||
| Medical Equipment – 13.6% | ||||||||
| Abbott Laboratories | 14,609 | $ | 710,144 | |||||
| Cooper Cos., Inc. | 2,684 | 642,603 | ||||||
| Dentsply Sirona, Inc. | 3,729 | 241,788 | ||||||
| Medtronic PLC | 17,058 | 1,513,898 | ||||||
| Sonova Holding AG | 1,694 | 275,061 | ||||||
| Stryker Corp. | 8,716 | 1,209,606 | ||||||
| Thermo Fisher Scientific, Inc. | 10,127 | 1,766,858 | ||||||
| Waters Corp. (a) | 3,099 | 569,720 | ||||||
| Zimmer Biomet Holdings, Inc. | 10,052 | 1,290,677 | ||||||
|
| |||||||
| $ | 8,220,355 | |||||||
|
| |||||||
| Network & Telecom – 0.6% | ||||||||
| Cisco Systems, Inc. | 12,166 | $ | 380,796 | |||||
|
| |||||||
| Oil Services – 1.1% | ||||||||
| National Oilwell Varco, Inc. | 4,812 | $ | 158,507 | |||||
| NOW, Inc. (a) | 2,859 | 45,973 | ||||||
| Schlumberger Ltd. | 6,951 | 457,654 | ||||||
|
| |||||||
| $ | 662,134 | |||||||
|
| |||||||
| Other Banks & Diversified Financials – 4.7% | ||||||||
| American Express Co. | 9,796 | $ | 825,215 | |||||
| Grupo Financiero Banorte S.A. de C.V. | 33,076 | 210,298 | ||||||
| Julius Baer Group Ltd. | 6,051 | 318,357 | ||||||
| Kasikornbank Co. Ltd. | 22,700 | 133,313 | ||||||
| Komercni Banka A.S. | 1,535 | 61,483 | ||||||
| Visa, Inc., “A” | 13,508 | 1,266,780 | ||||||
|
| |||||||
| $ | 2,815,446 | |||||||
|
| |||||||
| Pharmaceuticals – 5.8% | ||||||||
| Bayer AG | 13,310 | $ | 1,720,868 | |||||
| Johnson & Johnson | 1,921 | 254,129 | ||||||
| Merck KGaA | 4,321 | 521,900 | ||||||
| Roche Holding AG | 3,888 | 990,145 | ||||||
|
| |||||||
| $ | 3,487,042 | |||||||
|
| |||||||
| Railroad & Shipping – 2.9% | ||||||||
| Canadian National Railway Co. | 13,135 | $ | 1,064,592 | |||||
| Kansas City Southern Co. | 6,242 | 653,225 | ||||||
|
| |||||||
| $ | 1,717,817 | |||||||
|
| |||||||
| Restaurants – 1.7% | ||||||||
| Compass Group PLC | 31,363 | $ | 661,759 | |||||
| Whitbread PLC | 6,815 | 352,119 | ||||||
|
| |||||||
| $ | 1,013,878 | |||||||
|
| |||||||
| Issuer | Shares/Par | Value ($) | ||||||
| COMMON STOCKS – continued | ||||||||
| Specialty Chemicals – 3.8% | ||||||||
| Akzo Nobel N.V. | 9,310 | $ | 809,096 | |||||
| L’Air Liquide S.A. | 2,601 | 321,433 | ||||||
| Linde AG | 4,076 | 771,866 | ||||||
| Praxair, Inc. | 3,154 | 418,063 | ||||||
|
| |||||||
| $ | 2,320,458 | |||||||
|
| |||||||
| Specialty Stores – 1.4% | ||||||||
| AutoZone, Inc. (a) | 512 | $ | 292,076 | |||||
| Hermes International | 252 | 124,526 | ||||||
| Sally Beauty Holdings, Inc. (a) | 12,087 | 244,762 | ||||||
| Urban Outfitters, Inc. (a) | 9,023 | 167,286 | ||||||
|
| |||||||
| $ | 828,650 | |||||||
|
| |||||||
| Trucking – 1.5% | ||||||||
| United Parcel Service, Inc., “B” | 8,442 | $ | 933,601 | |||||
|
| |||||||
| Total Common Stocks (Identified Cost, $34,770,051) | $ | 59,418,018 | ||||||
|
| |||||||
| MONEY MARKET FUNDS – 1.5% | ||||||||
| MFS Institutional Money Market Portfolio, 0.98% (v) (Identified Cost, $869,695) | 869,782 | $ | 869,782 | |||||
|
| |||||||
| Total Investments (Identified Cost, $35,639,746) | $ | 60,287,800 | ||||||
|
| |||||||
| OTHER ASSETS, LESS LIABILITIES – 0.0% | 13,313 | |||||||
|
| |||||||
| NET ASSETS – 100.0% | $ | 60,301,113 | ||||||
|
| |||||||
| (a) | Non-income producing security. |
| (v) | Underlying affiliated fund that is available only to investment companies managed by MFS. The rate quoted for the MFS Institutional Money Market Portfolio is the annualized seven-day yield of the fund at period end. |
The following abbreviations are used in this report and are defined:
| PLC | Public Limited Company |
See Notes to Financial Statements
5
Table of Contents
MFS Global Equity Series
FINANCIAL STATEMENTS | STATEMENT OF ASSETS AND LIABILITIES (unaudited)
This statement represents your fund’s balance sheet, which details the assets and liabilities comprising the total value of the fund.
At 6/30/17 | ||||
Assets | ||||
Investments | ||||
Non-affiliated issuers, at value (identified cost, $34,770,051) | $59,418,018 | |||
Underlying affiliated funds, at value (identified cost, $869,695) | 869,782 | |||
Total investments, at value (identified cost, $35,639,746) | $60,287,800 | |||
Foreign currency, at value (identified cost, $13,264) | 13,231 | |||
Receivables for | ||||
Investments sold | 51,766 | |||
Fund shares sold | 78,103 | |||
Interest and dividends | 172,953 | |||
Receivable from investment adviser | 6,620 | |||
Other assets | 251 | |||
Total assets | $60,610,724 | |||
Liabilities | ||||
Payable to custodian | $1,024 | |||
Payables for | ||||
Investments purchased | 189,335 | |||
Fund shares reacquired | 70,696 | |||
Payable to affiliates | ||||
Shareholder servicing costs | 152 | |||
Distribution and/or service fees | 123 | |||
Payable for independent Trustees’ compensation | 116 | |||
Deferred country tax expense payable | 3,223 | |||
Accrued expenses and other liabilities | 44,942 | |||
Total liabilities | $309,611 | |||
Net assets | $60,301,113 | |||
Net assets consist of | ||||
Paid-in capital | $31,783,195 | |||
Unrealized appreciation (depreciation) on investments and translation of assets and liabilities in foreign currencies | 24,645,579 | |||
Accumulated net realized gain (loss) on investments and foreign currency | 2,991,644 | |||
Undistributed net investment income | 880,695 | |||
Net assets | $60,301,113 | |||
Shares of beneficial interest outstanding | 2,806,015 |
| Net assets | Shares outstanding | Net asset value per share | ||||||||||
Initial Class | $51,326,299 | 2,386,015 | $21.51 | |||||||||
Service Class | 8,974,814 | 420,000 | 21.37 | |||||||||
See Notes to Financial Statements
6
Table of Contents
MFS Global Equity Series
FINANCIAL STATEMENTS | STATEMENT OF OPERATIONS (unaudited)
This statement describes how much your fund earned in investment income and accrued in expenses. It also describes any gains and/or losses generated by fund operations.
Six months ended 6/30/17 | ||||
Net investment income | ||||
Income | ||||
Dividends | $719,389 | |||
Dividends from underlying affiliated funds | 1,897 | |||
Interest | 1,405 | |||
Foreign taxes withheld | (46,909 | ) | ||
Total investment income | $675,782 | |||
Expenses | ||||
Management fee | $249,654 | |||
Distribution and/or service fees | 9,800 | |||
Shareholder servicing costs | 5,963 | |||
Administrative services fee | 9,153 | |||
Independent Trustees’ compensation | 1,380 | |||
Custodian fee | 10,512 | |||
Shareholder communications | 8,237 | |||
Audit and tax fees | 28,732 | |||
Legal fees | 381 | |||
Miscellaneous | 7,982 | |||
Total expenses | $331,794 | |||
Reduction of expenses by investment adviser | (52,710 | ) | ||
Net expenses | $279,084 | |||
Net investment income | $396,698 | |||
Realized and unrealized gain (loss) on investments and foreign currency | ||||
Realized gain (loss) (identified cost basis) | ||||
Investments: | ||||
Non-affiliated issuers (net of $49 country tax) | $1,164,304 | |||
Underlying affiliated funds | (19 | ) | ||
Foreign currency | 426 | |||
Net realized gain (loss) on investments and foreign currency | $1,164,711 | |||
Change in unrealized appreciation (depreciation) | ||||
Investments (net of $2,289 increase in deferred country tax) | $6,489,122 | |||
Translation of assets and liabilities in foreign currencies | 5,871 | |||
Net unrealized gain (loss) on investments and foreign currency translation | $6,494,993 | |||
Net realized and unrealized gain (loss) on investments and foreign currency | $7,659,704 | |||
Change in net assets from operations | $8,056,402 |
See Notes to Financial Statements
7
Table of Contents
MFS Global Equity Series
FINANCIAL STATEMENTS | STATEMENTS OF CHANGES IN NET ASSETS
These statements describe the increases and/or decreases in net assets resulting from operations, any distributions, and any shareholder transactions.
| | Six months ended 6/30/17 (unaudited | ) | | Year ended 12/31/16 | | |||
Change in net assets | ||||||||
| From operations | ||||||||
Net investment income | $396,698 | $478,326 | ||||||
Net realized gain (loss) on investments and foreign currency | 1,164,711 | 2,227,024 | ||||||
Net unrealized gain (loss) on investments and foreign currency translation | 6,494,993 | 1,006,183 | ||||||
Change in net assets from operations | $8,056,402 | $3,711,533 | ||||||
| Distributions declared to shareholders | ||||||||
From net investment income | $— | $(501,605 | ) | |||||
From net realized gain on investments | — | (2,801,224 | ) | |||||
Total distributions declared to shareholders | $— | $(3,302,829 | ) | |||||
Change in net assets from fund share transactions | $455,338 | $(1,457,933 | ) | |||||
Total change in net assets | $8,511,740 | $(1,049,229 | ) | |||||
| Net assets | ||||||||
At beginning of period | 51,789,373 | 52,838,602 | ||||||
At end of period (including undistributed net investment income of $880,695 and | $60,301,113 | $51,789,373 |
See Notes to Financial Statements
8
Table of Contents
MFS Global Equity Series
FINANCIAL STATEMENTS | FINANCIAL HIGHLIGHTS
The financial highlights table is intended to help you understand the fund’s financial performance for the semiannual period and the past 5 fiscal years. Certain information reflects financial results for a single fund share. The total returns in the table represent the rate that an investor would have earned (or lost) on an investment in the fund share class (assuming reinvestment of all distributions) held for the entire period.
| Initial Class | Six months ended | Years ended 12/31 | ||||||||||||||||||||||
| 2016 | 2015 | 2014 | 2013 | 2012 | ||||||||||||||||||||
| (unaudited) | ||||||||||||||||||||||||
Net asset value, beginning of period | $18.59 | $18.39 | $19.59 | $19.18 | $15.14 | $12.71 | ||||||||||||||||||
| Income (loss) from investment operations | ||||||||||||||||||||||||
Net investment income (d) | $0.15 | $0.17 | $0.18 | $0.20 | $0.14 | $0.16 | ||||||||||||||||||
Net realized and unrealized gain (loss) on investments | 2.77 | 1.20 | (0.49 | ) | 0.54 | 4.05 | 2.76 | |||||||||||||||||
Total from investment operations | $2.92 | $1.37 | $(0.31 | ) | $0.74 | $4.19 | $2.92 | |||||||||||||||||
| Less distributions declared to shareholders | ||||||||||||||||||||||||
From net investment income | $— | $(0.18 | ) | $(0.21 | ) | $(0.14 | ) | $(0.15 | ) | $(0.16 | ) | |||||||||||||
From net realized gain on investments | — | (0.99 | ) | (0.68 | ) | (0.19 | ) | — | (0.33 | ) | ||||||||||||||
Total distributions declared to shareholders | $— | $(1.17 | ) | $(0.89 | ) | $(0.33 | ) | $(0.15 | ) | $(0.49 | ) | |||||||||||||
Net asset value, end of period (x) | $21.51 | $18.59 | $18.39 | $19.59 | $19.18 | $15.14 | ||||||||||||||||||
Total return (%) (k)(r)(s)(x) | 15.71 | (n) | 7.35 | (1.41 | ) | 3.87 | 27.81 | 23.34 | ||||||||||||||||
| Ratios (%) (to average net assets) and Supplemental data: | ||||||||||||||||||||||||
Expenses before expense reductions (f) | 1.16 | (a) | 1.19 | 1.26 | 1.28 | 1.31 | 1.30 | |||||||||||||||||
Expenses after expense reductions (f) | 0.97 | (a) | 0.99 | 1.00 | 1.09 | 1.15 | 1.15 | |||||||||||||||||
Net investment income | 1.46 | (a) | 0.93 | 0.91 | 1.06 | 0.82 | 1.15 | |||||||||||||||||
Portfolio turnover | 5 | (n) | 13 | 12 | 15 | 25 | 21 | |||||||||||||||||
Net assets at end of period (000 omitted) | $51,326 | $44,756 | $45,946 | $51,635 | $54,075 | $41,297 | ||||||||||||||||||
| Service Class | Six months ended 6/30/17 | Years ended 12/31 | ||||||||||||||||||||||
| 2016 | 2015 | 2014 | 2013 | 2012 | ||||||||||||||||||||
| (unaudited) | ||||||||||||||||||||||||
Net asset value, beginning of period | $18.49 | $18.30 | $19.50 | $19.10 | $15.09 | $12.68 | ||||||||||||||||||
| Income (loss) from investment operations | ||||||||||||||||||||||||
Net investment income (d) | $0.12 | $0.13 | $0.13 | $0.15 | $0.09 | $0.12 | ||||||||||||||||||
Net realized and unrealized gain (loss) on investments | 2.76 | 1.18 | (0.48 | ) | 0.54 | 4.05 | 2.75 | |||||||||||||||||
Total from investment operations | $2.88 | $1.31 | $(0.35 | ) | $0.69 | $4.14 | $2.87 | |||||||||||||||||
| Less distributions declared to shareholders | ||||||||||||||||||||||||
From net investment income | $— | $(0.13 | ) | $(0.17 | ) | $(0.10 | ) | $(0.13 | ) | $(0.13 | ) | |||||||||||||
From net realized gain on investments | — | (0.99 | ) | (0.68 | ) | (0.19 | ) | — | (0.33 | ) | ||||||||||||||
Total distributions declared to shareholders | $— | $(1.12 | ) | $(0.85 | ) | $(0.29 | ) | $(0.13 | ) | $(0.46 | ) | |||||||||||||
Net asset value, end of period (x) | $21.37 | $18.49 | $18.30 | $19.50 | $19.10 | $15.09 | ||||||||||||||||||
Total return (%) (k)(r)(s)(x) | 15.58 | (n) | 7.06 | (1.67 | ) | 3.63 | 27.52 | 22.98 | ||||||||||||||||
| Ratios (%) (to average net assets) and Supplemental data: | ||||||||||||||||||||||||
Expenses before expense reductions (f) | 1.41 | (a) | 1.44 | 1.51 | 1.53 | 1.56 | 1.54 | |||||||||||||||||
Expenses after expense reductions (f) | 1.22 | (a) | 1.24 | 1.25 | 1.34 | 1.40 | 1.40 | |||||||||||||||||
Net investment income | 1.23 | (a) | 0.70 | 0.67 | 0.80 | 0.54 | 0.87 | |||||||||||||||||
Portfolio turnover | 5 | (n) | 13 | 12 | 15 | 25 | 21 | |||||||||||||||||
Net assets at end of period (000 omitted) | $8,975 | $7,033 | $6,893 | $6,533 | $7,018 | $4,127 | ||||||||||||||||||
See Notes to Financial Statements
9
Table of Contents
MFS Global Equity Series
Financial Highlights – continued
| (a) | Annualized. |
| (d) | Per share data is based on average shares outstanding. |
| (f) | Ratios do not reflect reductions from fees paid indirectly, if applicable. |
| (k) | The total return does not reflect expenses that apply to separate accounts. Inclusion of these charges would reduce the total return figures for all periods shown. |
| (n) | Not annualized. |
| (r) | Certain expenses have been reduced without which performance would have been lower. |
| (s) | From time to time the fund may receive proceeds from litigation settlements, without which performance would be lower. |
| (x) | The net asset values and total returns have been calculated on net assets which include adjustments made in accordance with U.S. generally accepted accounting principles required at period end for financial reporting purposes. |
See Notes to Financial Statements
10
Table of Contents
MFS Global Equity Series
NOTES TO FINANCIAL STATEMENTS (unaudited)
| (1) | Business and Organization |
MFS Global Equity Series (the fund) is a diversified series of MFS Variable Insurance Trust (the trust). The trust is organized as a Massachusetts business trust and is registered under the Investment Company Act of 1940, as amended, as an open-end management investment company. The shareholders of each series of the trust are separate accounts of insurance companies, which offer variable annuity and/or life insurance products, and qualified retirement and pension plans.
The fund is an investment company and accordingly follows the investment company accounting and reporting guidance of the Financial Accounting Standards Board (FASB) Accounting Standards Codification Topic 946 Financial Services – Investment Companies.
| (2) | Significant Accounting Policies |
General – The preparation of financial statements in conformity with U.S. generally accepted accounting principles requires management to make estimates and assumptions that affect the reported amounts of assets and liabilities, and disclosure of contingent assets and liabilities at the date of the financial statements and the reported amounts of increases and decreases in net assets from operations during the reporting period. Actual results could differ from those estimates. In the preparation of these financial statements, management has evaluated subsequent events occurring after the date of the fund’s Statement of Assets and Liabilities through the date that the financial statements were issued. The fund invests in foreign securities. Investments in foreign securities are vulnerable to the effects of changes in the relative values of the local currency and the U.S. dollar and to the effects of changes in each country’s legal, political, and economic environment.
In October 2016, the Securities and Exchange Commission (SEC) released its Final Rule on Investment Company Reporting Modernization (the “Rule”). The Rule, which introduces two new regulatory reporting forms for investment companies – Form N-PORT and Form N-CEN – also contains amendments to Regulation S-X which impact financial statement presentation, particularly the presentation of derivative investments. Although still evaluating the impacts of the Rule, management believes that many of the Regulation S-X amendments are consistent with the fund’s current financial statement presentation and expects that the fund will be able to comply with the Rule’s Regulation S-X amendments by the August 1, 2017 compliance date.
Balance Sheet Offsetting – The fund’s accounting policy with respect to balance sheet offsetting is that, absent an event of default by the counterparty or a termination of the agreement, the International Swaps and Derivatives Association (ISDA) Master Agreement does not result in an offset of reported amounts of financial assets and financial liabilities in the Statement of Assets and Liabilities across transactions between the fund and the applicable counterparty. The fund’s right to setoff may be restricted or prohibited by the bankruptcy or insolvency laws of the particular jurisdiction to which a specific master netting agreement counterparty is subject. Balance sheet offsetting disclosures, to the extent applicable to the fund, have been included in the fund’s Significant Accounting Policies note under the captions for each of the fund’s in-scope financial instruments and transactions.
Investment Valuations – Equity securities, including restricted equity securities, are generally valued at the last sale or official closing price on their primary market or exchange as provided by a third-party pricing service. Equity securities, for which there were no sales reported that day, are generally valued at the last quoted daily bid quotation on their primary market or exchange as provided by a third-party pricing service. Short-term instruments with a maturity at issuance of 60 days or less may be valued at amortized cost, which approximates market value. Open-end investment companies are generally valued at net asset value per share. Securities and other assets generally valued on the basis of information from a third-party pricing service may also be valued at a broker/dealer bid quotation. Values obtained from third-party pricing services can utilize both transaction data and market information such as yield, quality, coupon rate, maturity, type of issue, trading characteristics, and other market data. The values of foreign securities and other assets and liabilities expressed in foreign currencies are converted to U.S. dollars using the mean of bid and asked prices for rates provided by a third-party pricing service.
The Board of Trustees has delegated primary responsibility for determining or causing to be determined the value of the fund’s investments (including any fair valuation) to the adviser pursuant to valuation policies and procedures approved by the Board. If the adviser determines that reliable market quotations are not readily available, investments are valued at fair value as determined in good faith by the adviser in accordance with such procedures under the oversight of the Board of Trustees. Under the fund’s valuation policies and procedures, market quotations are not considered to be readily available for most types of debt instruments and floating rate loans and many types of derivatives. These investments are generally valued at fair value based on information from third-party pricing services. In addition, investments may be valued at fair value if the adviser determines that an investment’s value has been materially affected by events occurring after the close of the exchange or market on which the investment is principally traded (such as foreign exchange or market) and prior to the determination of the fund’s net asset value, or after the halting of trading of a specific security where trading does not resume prior to the close of the exchange or market on which the security is principally traded. Events that occur on a frequent basis after foreign markets close (such as developments in foreign markets and significant movements in the U.S. markets) and prior to the determination of the fund’s net asset value may be deemed to have a
material effect on the value of securities traded in foreign markets. Accordingly, the fund’s foreign equity securities may often be
11
Table of Contents
MFS Global Equity Series
Notes to Financial Statements (unaudited) – continued
valued at fair value. The adviser generally relies on third-party pricing services or other information (such as the correlation with price movements of similar securities in the same or other markets; the type, cost and investment characteristics of the security; the business and financial condition of the issuer; and trading and other market data) to assist in determining whether to fair value and at what value to fair value an investment. The value of an investment for purposes of calculating the fund’s net asset value can differ depending on the source and method used to determine value. When fair valuation is used, the value of an investment used to determine the fund’s net asset value may differ from quoted or published prices for the same investment. There can be no assurance that the fund could obtain the fair value assigned to an investment if it were to sell the investment at the same time at which the fund determines its net asset value per share.
Various inputs are used in determining the value of the fund’s assets or liabilities. These inputs are categorized into three broad levels. In certain cases, the inputs used to measure fair value may fall into different levels of the fair value hierarchy. In such cases, an investment’s level within the fair value hierarchy is based on the lowest level of input that is significant to the fair value measurement. The fund’s assessment of the significance of a particular input to the fair value measurement in its entirety requires judgment, and considers factors specific to the investment. Level 1 includes unadjusted quoted prices in active markets for identical assets or liabilities. Level 2 includes other significant observable market-based inputs (including quoted prices for similar securities, interest rates, prepayment speed, and credit risk). Level 3 includes unobservable inputs, which may include the adviser’s own assumptions in determining the fair value of investments. The following is a summary of the levels used as of June 30, 2017 in valuing the fund’s assets or liabilities:
| Investments at Value | Level 1 | Level 2 | Level 3 | Total | ||||||||||||
| Equity Securities | $59,418,018 | $— | $— | $59,418,018 | ||||||||||||
| Mutual Funds | 869,782 | — | — | 869,782 | ||||||||||||
| Total Investments | $60,287,800 | $— | $— | $60,287,800 | ||||||||||||
For further information regarding security characteristics, see the Portfolio of Investments.
Of the level 1 investments presented above, equity investments amounting to $13,874,439 would have been considered level 2 investments at the beginning of the period. The primary reason for changes in the classifications between levels 1 and 2 occurs when foreign equity securities are fair valued using other observable market-based inputs in place of the closing exchange price due to events occurring after the close of the exchange or market on which the investment is principally traded. The fund’s foreign equity securities may often be valued using other observable market-based inputs. The fund’s policy is to recognize transfers between the levels as of the end of the period.
Foreign Currency Translation – Purchases and sales of foreign investments, income, and expenses are converted into U.S. dollars based upon currency exchange rates prevailing on the respective dates of such transactions or on the reporting date for foreign denominated receivables and payables. Gains and losses attributable to foreign currency exchange rates on sales of securities are recorded for financial statement purposes as net realized gains and losses on investments. Gains and losses attributable to foreign exchange rate movements on receivables, payables, income and expenses are recorded for financial statement purposes as foreign currency transaction gains and losses. That portion of both realized and unrealized gains and losses on investments that results from fluctuations in foreign currency exchange rates is not separately disclosed.
Security Loans – Under its Securities Lending Agency Agreement with the fund, State Street Bank and Trust Company (“State Street”), as lending agent, loans the securities of the fund to certain qualified institutions (the “Borrowers”) approved by the fund. Security loans can be terminated at the discretion of either the lending agent or the fund and the related securities must be returned within the earlier of the standard trade settlement period for such securities or within three business days. The loans are collateralized by cash and/or U.S. Treasury and federal agency obligations in an amount typically at least equal to the market value of the securities loaned. On loans collateralized by cash, the cash collateral is invested in a money market fund. The market value of the loaned securities is determined at the close of business of the fund and any additional required collateral is delivered to the fund on the next business day. State Street provides the fund with indemnification against Borrower default. In the event of Borrower default, State Street will, for the benefit of the fund, either purchase securities identical to those loaned or, when such purchase is commercially impracticable, pay the fund the market value of the loaned securities. In return, State Street assumes the fund’s rights to the related collateral. If the collateral value is less than the cost to purchase identical securities, State Street is responsible for the shortfall, but only to the extent that such shortfall is not due to a decline in collateral value resulting from collateral reinvestment for which the fund bears the risk of loss. A portion of the income generated upon investment of the collateral is remitted to the Borrowers, and the remainder is allocated between the fund and the lending agent. On loans collateralized by U.S. Treasury and/or federal agency obligations, a fee is received from the Borrower, and is allocated between the fund and the lending agent. Income from securities lending is included in “Interest” income in the Statement of Operations. The dividend and interest income earned on the securities loaned is accounted for in the same manner as other dividend and interest income. At June 30, 2017, there were no securities on loan or collateral outstanding.
12
Table of Contents
MFS Global Equity Series
Notes to Financial Statements (unaudited) – continued
Indemnifications – Under the fund’s organizational documents, its officers and Trustees may be indemnified against certain liabilities and expenses arising out of the performance of their duties to the fund. Additionally, in the normal course of business, the fund enters into agreements with service providers that may contain indemnification clauses. The fund’s maximum exposure under these agreements is unknown as this would involve future claims that may be made against the fund that have not yet occurred.
Investment Transactions and Income – Investment transactions are recorded on the trade date. Interest income is recorded on the accrual basis. Dividends received in cash are recorded on the ex-dividend date. Certain dividends from foreign securities will be recorded when the fund is informed of the dividend if such information is obtained subsequent to the ex-dividend date. Dividend and interest payments received in additional securities are recorded on the ex-dividend or ex-interest date in an amount equal to the value of the security on such date.
The fund may receive proceeds from litigation settlements. Any proceeds received from litigation involving portfolio holdings are reflected in the Statement of Operations in realized gain/loss if the security has been disposed of by the fund or in unrealized gain/loss if the security is still held by the fund. Any other proceeds from litigation not related to portfolio holdings are reflected as other income in the Statement of Operations.
Tax Matters and Distributions – The fund intends to qualify as a regulated investment company, as defined under Subchapter M of the Internal Revenue Code, and to distribute all of its taxable income, including realized capital gains. As a result, no provision for federal income tax is required. The fund’s federal tax returns, when filed, will remain subject to examination by the Internal Revenue Service for a three year period. Management has analyzed the fund’s tax positions taken on federal and state tax returns for all open tax years and does not believe that there are any uncertain tax positions that require recognition of a tax liability. Foreign taxes, if any, have been accrued by the fund in the accompanying financial statements in accordance with the applicable foreign tax law. Foreign income taxes may be withheld by certain countries in which the fund invests. Additionally, capital gains realized by the fund on securities issued in or by certain foreign countries may be subject to capital gains tax imposed by those countries.
Distributions to shareholders are recorded on the ex-dividend date. Income and capital gain distributions are determined in accordance with income tax regulations, which may differ from U.S. generally accepted accounting principles. Certain capital accounts in the financial statements are periodically adjusted for permanent differences in order to reflect their tax character. These adjustments have no impact on net assets or net asset value per share. Temporary differences which arise from recognizing certain items of income, expense, gain or loss in different periods for financial statement and tax purposes will reverse at some time in the future. Distributions in excess of net investment income or net realized gains are temporary overdistributions for financial statement purposes resulting from differences in the recognition or classification of income or distributions for financial statement and tax purposes.
Book/tax differences primarily relate to wash sale loss deferrals.
The tax character of distributions declared to shareholders for the last fiscal year is as follows:
| Year ended | ||||
| 12/31/16 | ||||
| Ordinary income (including any short-term capital gains) | $501,605 | |||
| Long-term capital gains | 2,801,224 | |||
| Total distributions | $3,302,829 | |||
The federal tax cost and the tax basis components of distributable earnings were as follows:
| As of 6/30/17 | ||||
| Cost of investments | $36,077,758 | |||
| Gross appreciation | 24,738,908 | |||
| Gross depreciation | (528,866 | ) | ||
| Net unrealized appreciation (depreciation) | $24,210,042 | |||
| As of 12/31/16 | ||||
| Undistributed ordinary income | 578,848 | |||
| Undistributed long-term capital gain | 2,170,094 | |||
| Other temporary differences | (6,057 | ) | ||
| Net unrealized appreciation (depreciation) | 17,718,631 | |||
The aggregate cost above includes prior fiscal year end tax adjustments, if applicable.
Multiple Classes of Shares of Beneficial Interest – The fund offers multiple classes of shares, which differ in their respective distribution and/or service fees. The fund’s income, realized and unrealized gain (loss), and common expenses are allocated to
13
Table of Contents
MFS Global Equity Series
Notes to Financial Statements (unaudited) – continued
shareholders based on the daily net assets of each class. Dividends are declared separately for each class. Differences in per share dividend rates are generally due to differences in separate class expenses. The fund’s distributions declared to shareholders as reported in the Statements of Changes in Net Assets are presented by class as follows:
| From net investment income | From net realized gain on investments | |||||||||||||||
| Six months ended 6/30/17 | Year ended 12/31/16 | Six months ended 6/30/17 | Year ended 12/31/16 | |||||||||||||
| Initial Class | $— | $451,831 | $— | $2,435,962 | ||||||||||||
| Service Class | — | 49,774 | — | 365,262 | ||||||||||||
| Total | $— | $501,605 | $— | $2,801,224 | ||||||||||||
| (3) | Transactions with Affiliates |
Investment Adviser – The fund has an investment advisory agreement with MFS to provide overall investment management and related administrative services and facilities to the fund. The management fee is computed daily and paid monthly at the following annual rates:
| First $1 billion of average daily net assets | 0.90% | |||
| Next $1.5 billion of average daily net assets | 0.75% | |||
| Average daily net assets in excess of $2.5 billion | 0.65% |
MFS has agreed in writing to reduce its management fee by a specified amount if certain MFS mutual fund assets exceed thresholds agreed to by MFS and the fund’s Board of Trustees. For the six months ended June 30, 2017, this management fee reduction amounted to $2,128, which is included in the reduction of total expenses in the Statement of Operations. The management fee incurred for the six months ended June 30, 2017 was equivalent to an annual effective rate of 0.89% of the fund’s average daily net assets.
The investment adviser has agreed in writing to pay a portion of the fund’s total annual operating expenses, excluding interest, taxes, extraordinary expenses, brokerage and transaction costs, and investment-related expenses, such that total annual operating expenses do not exceed 0.97% of average daily net assets for the Initial Class shares and 1.22% of average daily net assets for the Service Class shares. This written agreement will continue until modified by the fund’s Board of Trustees, but such agreement will continue at least until April 30, 2019. For the six months ended June 30, 2017, this reduction amounted to $50,582, which is included in the reduction of total expenses in the Statement of Operations.
Distributor – MFS Fund Distributors, Inc. (MFD), a wholly-owned subsidiary of MFS, is the distributor of shares of the fund. The Trustees have adopted a distribution plan for the Service Class shares pursuant to Rule 12b-1 under the Investment Company Act of 1940.
The fund’s distribution plan provides that the fund will pay MFD distribution and/or service fees equal to 0.25% per annum of its average daily net assets attributable to Service Class shares as partial consideration for services performed and expenses incurred by MFD and financial intermediaries (including participating insurance companies that invest in the fund to fund variable annuity and variable life insurance contracts, sponsors of qualified retirement and pension plans that invest in the fund, and affiliates of these participating insurance companies and plan sponsors) in connection with the sale and distribution of the Service Class shares. MFD may subsequently pay all, or a portion, of the distribution and/or service fees to financial intermediaries.
Shareholder Servicing Agent – MFS Service Center, Inc. (MFSC), a wholly-owned subsidiary of MFS, receives a fee from the fund for its services as shareholder servicing agent. For the six months ended June 30, 2017, the fee was $5,816, which equated to 0.0210% annually of the fund’s average daily net assets. MFSC also receives payment from the fund for out-of-pocket expenses paid by MFSC on behalf of the fund. For the six months ended June 30, 2017, these costs amounted to $147.
Administrator – MFS provides certain financial, legal, shareholder communications, compliance, and other administrative services to the fund. Under an administrative services agreement, the fund reimburses MFS the costs incurred to provide these services. The fund is charged an annual fixed amount of $17,500 plus a fee based on average daily net assets. The administrative services fee incurred for the six months ended June 30, 2017 was equivalent to an annual effective rate of 0.0330% of the fund’s average daily net assets.
Trustees’ and Officers’ Compensation – The fund pays compensation to independent Trustees in the form of a retainer, attendance fees, and additional compensation to Board and Committee chairpersons. The fund does not pay compensation directly to Trustees or officers of the fund who are also officers of the investment adviser, all of whom receive remuneration for their services to the fund from MFS. Certain officers and Trustees of the fund are officers or directors of MFS, MFD, and MFSC.
Other – This fund and certain other funds managed by MFS (the funds) have entered into a service agreement (the ISO Agreement) which provides for payment of fees solely by the funds to Tarantino LLC in return for the provision of services of an Independent
14
Table of Contents
MFS Global Equity Series
Notes to Financial Statements (unaudited) – continued
Senior Officer (ISO) for the funds. Frank L. Tarantino serves as the ISO and is an officer of the funds and the sole member of Tarantino LLC. The funds can terminate the ISO Agreement with Tarantino LLC at any time under the terms of the ISO Agreement. For the six months ended June 30, 2017, the fee paid by the fund under this agreement was $49 and is included in “Miscellaneous” expense in the Statement of Operations. MFS has agreed to bear all expenses associated with office space, other administrative support, and supplies provided to the ISO.
The fund invests in the MFS Institutional Money Market Portfolio which is managed by MFS and seeks current income consistent with preservation of capital and liquidity. This money market fund does not pay a management fee to MFS.
The fund is permitted to engage in purchase and sale transactions with funds and accounts for which MFS serves as investment adviser or sub-adviser (“cross-trades”) pursuant to a policy adopted by the Board of Trustees. This policy has been designed to ensure that cross-trades conducted by the fund comply with Rule 17a-7 under the Investment Company Act of 1940. Under this policy, cross-trades are effected at current market prices with no remuneration paid in connection with the transaction. During the six months ended June 30, 2017, the fund engaged in purchase transactions pursuant to this policy, which amounted to $53,210.
| (4) | Portfolio Securities |
For the six months ended June 30, 2017, purchases and sales of investments, other than short-term obligations, aggregated $3,659,827 and $2,866,203, respectively.
| (5) | Shares of Beneficial Interest |
The fund’s Declaration of Trust permits the Trustees to issue an unlimited number of full and fractional shares of beneficial interest. Transactions in fund shares were as follows:
| Six months ended 6/30/17 | Year ended 12/31/16 | |||||||||||||||
| Shares | Amount | Shares | Amount | |||||||||||||
| Shares sold | ||||||||||||||||
Initial Class | 213,575 | $4,343,204 | 329,895 | $6,200,474 | ||||||||||||
Service Class | 97,860 | 1,980,308 | 97,780 | 1,790,424 | ||||||||||||
| 311,435 | $6,323,512 | 427,675 | $7,990,898 | |||||||||||||
| Shares issued to shareholders in reinvestment of distributions | ||||||||||||||||
Initial Class | — | $— | 152,632 | $2,887,793 | ||||||||||||
Service Class | — | — | 22,041 | 415,036 | ||||||||||||
| — | $— | 174,673 | $3,302,829 | |||||||||||||
| Shares reacquired | ||||||||||||||||
Initial Class | (234,559 | ) | $(4,705,016 | ) | (573,782 | ) | $(10,611,983 | ) | ||||||||
Service Class | (58,146 | ) | (1,163,158 | ) | (116,232 | ) | (2,139,677 | ) | ||||||||
| (292,705) | $(5,868,174 | ) | (690,014 | ) | $(12,751,660 | ) | ||||||||||
| Net change | ||||||||||||||||
Initial Class | (20,984 | ) | $(361,812 | ) | (91,255 | ) | $(1,523,716 | ) | ||||||||
Service Class | 39,714 | 817,150 | 3,589 | 65,783 | ||||||||||||
| 18,730 | $455,338 | (87,666 | ) | $(1,457,933 | ) | |||||||||||
| (6) | Line of Credit |
The fund and certain other funds managed by MFS participate in a $1.25 billion unsecured committed line of credit, subject to a $1 billion sublimit, provided by a syndication of banks under a credit agreement. Borrowings may be made for temporary financing needs. Interest is charged to each fund, based on its borrowings, generally at a rate equal to the higher of the Overnight Federal Reserve funds rate or daily one month LIBOR plus an agreed upon spread. A commitment fee, based on the average daily, unused portion of the committed line of credit, is allocated among the participating funds at the end of each calendar quarter. In addition, the fund and other funds managed by MFS have established unsecured uncommitted borrowing arrangements with certain banks for temporary financing needs. Interest is charged to each fund, based on its borrowings, at a rate equal to the Overnight Federal Reserve funds rate plus an agreed upon spread. For the six months ended June 30, 2017, the fund’s commitment fee and interest expense were $192 and $0, respectively, and are included in “Miscellaneous” expense in the Statement of Operations.
15
Table of Contents
MFS Global Equity Series
Notes to Financial Statements (unaudited) – continued
| (7) | Transactions in Underlying Affiliated Funds – Affiliated Issuers |
An affiliated issuer may be considered one in which the fund owns 5% or more of the outstanding voting securities, or a company which is under common control. For the purposes of this report, the fund assumes the following to be an affiliated issuer:
| Underlying Affiliated Fund | Beginning Shares/Par Amount | Acquisitions Shares/Par Amount | Dispositions Shares/Par Amount | Ending Shares/Par Amount | ||||||||||||
| MFS Institutional Money Market Portfolio | 347,393 | 5,757,232 | (5,234,843 | ) | 869,782 | |||||||||||
| Underlying Affiliated Fund | Realized Gain (Loss) | Capital Gain Distributions | Dividend Income | Ending Value | ||||||||||||
| MFS Institutional Money Market Portfolio | $(19 | ) | $— | $1,897 | $869,782 | |||||||||||
16
Table of Contents
MFS Global Equity Series
RESULTS OF SHAREHOLDER MEETING (unaudited)
At a special meeting of shareholders of MFS Variable Insurance Trust, which was held on March 23, 2017, the following action was taken:
Item 1: To elect the following individuals as Trustees:
| Number of Dollars | ||||||||
| Nominee | For | Withheld Authority | ||||||
| Steven E. Buller | 11,311,922,492.61 | 518,570,973.54 | ||||||
| John A. Caroselli | 11,291,109,000.34 | 539,384,465.81 | ||||||
| Maureen R. Goldfarb | 11,233,211,779.66 | 597,281,686.49 | ||||||
| David H. Gunning | 11,179,077,201.17 | 651,416,264.98 | ||||||
| Michael Hegarty | 11,191,993,154.78 | 638,500,311.37 | ||||||
| John P. Kavanaugh | 11,242,238,261.44 | 588,255,204.71 | ||||||
| Robert J. Manning | 11,314,479,376.58 | 516,014,089.57 | ||||||
| Clarence Otis, Jr. | 11,208,873,448.85 | 621,620,017.30 | ||||||
| Maryanne L. Roepke | 11,263,427,105.03 | 567,066,361.12 | ||||||
| Robin A. Stelmach | 11,313,883,043.82 | 516,610,422.33 | ||||||
| Laurie J. Thomsen | 11,240,219,041.09 | 590,274,425.06 | ||||||
17
Table of Contents
MFS Global Equity Series
PROXY VOTING POLICIES AND INFORMATION
MFS votes proxies on behalf of the fund pursuant to proxy voting policies and procedures that are available without charge, upon request, by calling 1-800-225-2606, by visiting mfs.com (once you have selected “Individual Investor” as your role, click on “Individual Investor Home” in the top navigation and then select “Learn More About Proxy Voting” under the “I want to…” header on the left hand column of the page), or by visiting the SEC’s Web site at http://www.sec.gov.
Information regarding how the fund voted proxies relating to portfolio securities during the most recent twelve-month period ended June 30 is available by August 31 of each year without charge by visiting mfs.com (once you have selected “Individual Investor” as your role, click on “Individual Investor Home” in the top navigation and then select “Learn More About Proxy Voting” under the “I want to…” header on the left hand column of the page), or by visiting the SEC’s Web site at http://www.sec.gov.
QUARTERLY PORTFOLIO DISCLOSURE
The fund will file a complete schedule of portfolio holdings with the Securities and Exchange Commission (the Commission) for the first and third quarters of each fiscal year on Form N-Q. The fund’s Form N-Q is available on the EDGAR database on the Commission’s Internet Web site at http://www.sec.gov, and may be reviewed and copied at the:
Public Reference Room
Securities and Exchange Commission
100 F Street, NE, Room 1580
Washington, D.C. 20549
Information on the operation of the Public Reference Room may be obtained by calling the Commission at 1-800-SEC-0330. Copies of the fund’s Form N-Q also may be obtained, upon payment of a duplicating fee, by electronic request at the following e-mail address: publicinfo@sec.gov or by writing the Public Reference Section at the above address.
From time to time, MFS may post important information about the fund or the MFS funds on the MFS web site (mfs.com). This information is available on mfs.com by following these steps once you have selected “Individual Investor” as your role: (1) Click on the “Individual Investor Home” in the top navigation and then select the “Announcements” option within the “Market Outlooks” drop down, or (2) Click on “Products & Services” and “Variable Insurance Portfolios” and then select the fund’s name.
INFORMATION ABOUT FUND CONTRACTS AND LEGAL CLAIMS
The fund has entered into contractual arrangements with an investment adviser, administrator, distributor, shareholder servicing agent, 529 program manager (if applicable), and custodian who each provide services to the fund. Unless expressly stated otherwise, shareholders are not parties to, or intended beneficiaries of these contractual arrangements, and these contractual arrangements are not intended to create any shareholder right to enforce them against the service providers or to seek any remedy under them against the service providers, either directly or on behalf of the fund.
Under the Trust’s By-Laws and Declaration of Trust, any claims asserted against or on behalf of the MFS Funds, including claims against Trustees and Officers, must be brought in state and federal courts located within the Commonwealth of Massachusetts.
18
Table of Contents
Table of Contents
SEMIANNUAL REPORT
June 30, 2017

MFS® INVESTORS TRUST SERIES
MFS® Variable Insurance Trust

VGI-SEM
Table of Contents
MFS® INVESTORS TRUST SERIES
The report is prepared for the general information of contract owners. It is authorized for distribution to prospective investors only when preceded or accompanied by a current prospectus.
NOT FDIC INSURED • MAY LOSE VALUE • NO BANK OR CREDIT UNION GUARANTEE • NOT A DEPOSIT • NOT INSURED BY ANY FEDERAL GOVERNMENT AGENCY OR NCUA/NCUSIF
Table of Contents
MFS Investors Trust Series
LETTER FROM THE EXECUTIVE CHAIRMAN

Dear Contract Owners:
Despite policy uncertainty accompanying a new presidential administration in the United States and unease over ongoing Brexit negotiations, most markets have proved resilient. U.S. share prices have reached new highs. The U.S. Federal Reserve has continued to gradually hike interest rates. However, rates in most developed markets remain very low, with major non-U.S. central banks just beginning to contemplate curbing accommodative monetary policies.
Globally, economic growth has shown signs of recovery, led by China, the U.S. and the eurozone. Despite better growth, there are few immediate signs of worrisome inflation as wage growth remains muted. Europe has benefited from diminishing event risks as establishment candidates won both the Dutch and French elections, averting a feared populist trend. Emerging market economies are recovering at a somewhat slower pace amid fears that restrictive U.S. trade policies could further hamper the restrained pace of global trade growth. Looking ahead, markets will have to contend with issues involving geopolitical hot spots on the Korean peninsula and in the Middle East, which could potentially lead to a clash of interests between the U.S. and other major powers such as China or Russia.
At MFS®, we believe time is an asset. A patient, long-term approach to investing can have a powerful impact on decision making and outcomes. Time arbitrage, as we call it, simply comes down to having the conviction and discipline to allow enough time for good investment ideas to play out. In our view, such an approach, along with the professional guidance of a financial advisor, will help you reach your investment objectives.
Respectfully,

Robert J. Manning
Executive Chairman
MFS Investment Management
August 16, 2017
The opinions expressed in this letter are subject to change and may not be relied upon for investment advice. No forecasts can be guaranteed.
1
Table of Contents
MFS Investors Trust Series
Portfolio structure

| Top ten holdings | ||||
| JPMorgan Chase & Co. | 3.7% | |||
| Bank of America Corp. | 3.2% | |||
| Visa, Inc., “A” | 3.0% | |||
| Alphabet, Inc., “A” | 2.8% | |||
| Thermo Fisher Scientific, Inc. | 2.8% | |||
| American Tower Corp., REIT | 2.6% | |||
| Broadcom Corp. | 2.6% | |||
| Cognizant Technology Solutions Corp., “A” | 2.3% | |||
| Comcast Corp., “A” | 2.2% | |||
| Alphabet, Inc., “C” | 2.2% | |||
| Equity sectors | ||||
| Financial Services | 20.4% | |||
| Health Care | 15.9% | |||
| Technology | 12.4% | |||
| Consumer Staples | 10.5% | |||
| Leisure | 7.7% | |||
| Special Products & Services | 7.6% | |||
| Basic Materials | 4.4% | |||
| Retailing | 4.3% | |||
| Utilities & Communications | 4.2% | |||
| Industrial Goods & Services | 3.9% | |||
| Energy | 3.4% | |||
| Transportation | 2.1% | |||
| Autos & Housing | 1.3% | |||
Cash & Cash Equivalents includes any cash, investments in money market funds, short-term securities, and other assets less liabilities. Please see the Statement of Assets and Liabilities for additional information related to the fund’s cash position and other assets and liabilities.
Percentages are based on net assets as of June 30, 2017.
The portfolio is actively managed and current holdings may be different.
2
Table of Contents
MFS Investors Trust Series
Fund Expenses Borne by the Contract Holders during the Period,
January 1, 2017 through June 30, 2017
As a contract holder of the fund, you incur ongoing costs, including management fees; distribution and/or service (12b-1) fees; and other fund expenses. This example is intended to help you understand your ongoing costs (in dollars) of investing in the fund and to compare these costs with the ongoing costs of investing in other mutual funds.
The example is based on an investment of $1,000 invested at the beginning of the period and held for the entire period January 1, 2017 through June 30, 2017.
Actual Expenses
The first line for each share class in the following table provides information about actual account values and actual expenses. You may use the information in this line, together with the amount you invested, to estimate the expenses that you paid over the period. Simply divide your account value by $1,000 (for example, an $8,600 account value divided by $1,000 = 8.6), then multiply the result by the number in the first line under the heading entitled “Expenses Paid During Period” to estimate the expenses you paid on your account during this period.
Hypothetical Example for Comparison Purposes
The second line for each share class in the following table provides information about hypothetical account values and hypothetical expenses based on the fund’s actual expense ratio and an assumed rate of return of 5% per year before expenses, which is not the fund’s actual return. The hypothetical account values and expenses may not be used to estimate the actual ending account balance or expenses you paid for the period. You may use this information to compare the ongoing costs of investing in the fund and other funds. To do so, compare this 5% hypothetical example with the 5% hypothetical examples that appear in the shareholder reports of the other funds.
Please note that the expenses shown in the table are meant to highlight the fund’s ongoing costs only and do not take into account the fees and expenses imposed under the variable contracts through which your investment in the fund is made. Therefore, the second line for each share class in the table is useful in comparing ongoing costs associated with an investment in vehicles (such as the fund) which fund benefits under variable annuity and variable life insurance contracts and to qualified pension and retirement plans only, and will not help you determine the relative total costs of investing in the fund through variable annuity and variable life insurance contracts. If the fees and expenses imposed under the variable contracts were included, your costs would have been higher.
| Share Class | Annualized Expense Ratio | Beginning 1/01/17 | Ending Account Value 6/30/17 | Expenses Paid During Period (p) | ||||||||||||||
| Initial Class | Actual | 0.79% | $1,000.00 | $1,119.28 | $4.15 | |||||||||||||
| Hypothetical (h) | 0.79% | $1,000.00 | $1,020.88 | $3.96 | ||||||||||||||
| Service Class | Actual | 1.04% | $1,000.00 | $1,117.88 | $5.46 | |||||||||||||
| Hypothetical (h) | 1.04% | $1,000.00 | $1,019.64 | $5.21 | ||||||||||||||
| (h) | 5% class return per year before expenses. |
| (p) | “Expenses Paid During Period” are equal to each class’s annualized expense ratio, as shown above, multiplied by the average account value over the period, multiplied by 181/365 (to reflect the one-half year period). |
3
Table of Contents
MFS Investors Trust Series
PORTFOLIO OF INVESTMENTS – 6/30/17 (unaudited)
The Portfolio of Investments is a complete list of all securities owned by your fund. It is categorized by broad-based asset classes.
| Issuer | Shares/Par | Value ($) | ||||||
| COMMON STOCKS – 98.1% | ||||||||
| Aerospace – 2.6% | ||||||||
| Honeywell International, Inc. | 76,850 | $ | 10,243,336 | |||||
| United Technologies Corp. | 33,217 | 4,056,128 | ||||||
|
| |||||||
| $ | 14,299,464 | |||||||
|
| |||||||
| Alcoholic Beverages – 2.2% | ||||||||
| Diageo PLC | 158,666 | $ | 4,687,957 | |||||
| Pernod Ricard S.A. | 57,197 | 7,659,653 | ||||||
|
| |||||||
| $ | 12,347,610 | |||||||
|
| |||||||
| Apparel Manufacturers – 2.3% | ||||||||
| LVMH Moet Hennessy Louis Vuitton SE | 29,828 | $ | 7,437,053 | |||||
| NIKE, Inc., “B” | 86,006 | 5,074,354 | ||||||
|
| |||||||
| $ | 12,511,407 | |||||||
|
| |||||||
| Biotechnology – 1.1% | ||||||||
| Biogen, Inc. (a) | 21,334 | $ | 5,789,194 | |||||
|
| |||||||
| Broadcasting – 1.3% | ||||||||
| Interpublic Group of Companies, Inc. | 139,847 | $ | 3,440,236 | |||||
| Walt Disney Co. | 34,668 | 3,683,475 | ||||||
|
| |||||||
| $ | 7,123,711 | |||||||
|
| |||||||
| Brokerage & Asset Managers – 2.7% | ||||||||
| BlackRock, Inc. | 8,884 | $ | 3,752,691 | |||||
| Blackstone Group LP | 148,137 | 4,940,369 | ||||||
| NASDAQ, Inc. | 89,921 | 6,428,452 | ||||||
|
| |||||||
| $ | 15,121,512 | |||||||
|
| |||||||
| Business Services – 7.5% | ||||||||
| Accenture PLC, “A” | 89,850 | $ | 11,112,648 | |||||
| Amdocs Ltd. | 21,356 | 1,376,608 | ||||||
| Cognizant Technology Solutions Corp., “A” | 188,122 | 12,491,301 | ||||||
| DXC Technology Co. | 79,246 | 6,079,753 | ||||||
| Fidelity National Information Services, Inc. | 123,158 | 10,517,693 | ||||||
|
| |||||||
| $ | 41,578,003 | |||||||
|
| |||||||
| Cable TV – 2.3% | ||||||||
| Comcast Corp., “A” | 318,393 | $ | 12,391,856 | |||||
|
| |||||||
| Chemicals – 2.7% | ||||||||
| Monsanto Co. | 82,999 | $ | 9,823,761 | |||||
| PPG Industries, Inc. | 46,228 | 5,083,231 | ||||||
|
| |||||||
| $ | 14,906,992 | |||||||
|
| |||||||
| Computer Software – 0.8% | ||||||||
| Adobe Systems, Inc. (a) | 31,595 | $ | 4,468,797 | |||||
|
| |||||||
| Computer Software – Systems – 1.7% | ||||||||
| Apple, Inc. | 40,500 | $ | 5,832,810 | |||||
| Hewlett Packard Enterprise | 197,494 | 3,276,425 | ||||||
|
| |||||||
| $ | 9,109,235 | |||||||
|
| |||||||
| Construction – 1.3% | ||||||||
| Sherwin-Williams Co. | 20,334 | $ | 7,136,421 | |||||
|
| |||||||
| Issuer | Shares/Par | Value ($) | ||||||
| COMMON STOCKS – continued | ||||||||
| Consumer Products – 5.2% | ||||||||
| Colgate-Palmolive Co. | 94,760 | $ | 7,024,559 | |||||
| Coty, Inc., “A” | 197,269 | 3,700,766 | ||||||
| Estee Lauder Cos., Inc., “A” | 37,720 | 3,620,366 | ||||||
| Kimberly-Clark Corp. | 23,254 | 3,002,324 | ||||||
| Newell Brands, Inc. | 209,583 | 11,237,840 | ||||||
|
| |||||||
| $ | 28,585,855 | |||||||
|
| |||||||
| Containers – 1.7% | ||||||||
| Crown Holdings, Inc. (a) | 158,768 | $ | 9,472,099 | |||||
|
| |||||||
| Electrical Equipment – 0.8% | ||||||||
| AMETEK, Inc. | 71,938 | $ | 4,357,285 | |||||
|
| |||||||
| Electronics – 3.6% | ||||||||
| Broadcom Corp. | 61,603 | $ | 14,356,579 | |||||
| Texas Instruments, Inc. | 73,816 | 5,678,665 | ||||||
|
| |||||||
| $ | 20,035,244 | |||||||
|
| |||||||
| Energy – Independent – 1.5% | ||||||||
| EOG Resources, Inc. | 93,157 | $ | 8,432,572 | |||||
|
| |||||||
| Engineering – Construction – 0.5% | ||||||||
| Fluor Corp. | 64,110 | $ | 2,934,956 | |||||
|
| |||||||
| Entertainment – 2.3% | ||||||||
| Time Warner, Inc. | 74,595 | $ | 7,490,084 | |||||
| Twenty-First Century Fox, Inc. | 183,791 | 5,208,637 | ||||||
|
| |||||||
| $ | 12,698,721 | |||||||
|
| |||||||
| Food & Beverages – 3.1% | ||||||||
| Danone S.A. | 99,471 | $ | 7,476,725 | |||||
| Mondelez International, Inc. | 219,090 | 9,462,497 | ||||||
|
| |||||||
| $ | 16,939,222 | |||||||
|
| |||||||
| General Merchandise – 0.8% | ||||||||
| Costco Wholesale Corp. | 28,448 | $ | 4,549,689 | |||||
|
| |||||||
| Insurance – 1.3% | ||||||||
| Chubb Ltd. | 47,526 | $ | 6,909,330 | |||||
|
| |||||||
| Internet – 6.3% | ||||||||
| Alphabet, Inc., “A” (a) | 16,836 | $ | 15,652,093 | |||||
| Alphabet, Inc., “C” (a) | 13,516 | 12,282,395 | ||||||
| Facebook, Inc., “A” (a) | 45,977 | 6,941,607 | ||||||
|
| |||||||
| $ | 34,876,095 | |||||||
|
| |||||||
| Major Banks – 10.2% | ||||||||
| Bank of America Corp. | 731,433 | $ | 17,744,564 | |||||
| Goldman Sachs Group, Inc. | 49,093 | 10,893,737 | ||||||
| JPMorgan Chase & Co. | 224,872 | 20,553,301 | ||||||
| Morgan Stanley | 155,336 | 6,921,772 | ||||||
|
| |||||||
| $ | 56,113,374 | |||||||
|
| |||||||
| Medical & Health Technology & Services – 1.2% | ||||||||
| McKesson Corp. | 40,447 | $ | 6,655,149 | |||||
|
| |||||||
4
Table of Contents
MFS Investors Trust Series
Portfolio of Investments (unaudited) – continued
| Issuer | Shares/Par | Value ($) | ||||||
| COMMON STOCKS – continued | ||||||||
| Medical Equipment – 8.7% | ||||||||
| Abbott Laboratories | 127,504 | $ | 6,197,970 | |||||
| Danaher Corp. | 132,542 | 11,185,219 | ||||||
| Medtronic PLC | 116,800 | 10,366,000 | ||||||
| Stryker Corp. | 32,181 | 4,466,079 | ||||||
| Thermo Fisher Scientific, Inc. | 88,957 | 15,520,328 | ||||||
|
| |||||||
| $ | 47,735,596 | |||||||
|
| |||||||
| Natural Gas – Pipeline – 1.0% | ||||||||
| Enterprise Products Partners LP | 199,428 | $ | 5,400,510 | |||||
|
| |||||||
| Oil Services – 1.9% | ||||||||
| Schlumberger Ltd. | 155,929 | $ | 10,266,365 | |||||
|
| |||||||
| Other Banks & Diversified Financials – 6.2% | ||||||||
| Mastercard, Inc., “A” | 90,133 | $ | 10,946,653 | |||||
| U.S. Bancorp | 124,448 | 6,461,340 | ||||||
| Visa, Inc., “A” | 177,160 | 16,614,065 | ||||||
|
| |||||||
| $ | 34,022,058 | |||||||
|
| |||||||
| Pharmaceuticals – 5.0% | ||||||||
| Allergan PLC | 20,336 | $ | 4,943,478 | |||||
| Eli Lilly & Co. | 97,867 | 8,054,454 | ||||||
| Johnson & Johnson | 58,095 | 7,685,388 | ||||||
| Zoetis, Inc. | 107,716 | 6,719,324 | ||||||
|
| |||||||
| $ | 27,402,644 | |||||||
|
| |||||||
| Railroad & Shipping – 2.1% | ||||||||
| Canadian National Railway Co. | 142,606 | $ | 11,558,216 | |||||
|
| |||||||
| Restaurants – 1.9% | ||||||||
| Aramark | 93,935 | $ | 3,849,456 | |||||
| Starbucks Corp. | 111,561 | 6,505,122 | ||||||
|
| |||||||
| $ | 10,354,578 | |||||||
|
| |||||||
| Issuer | Shares/Par | Value ($) | ||||||
| COMMON STOCKS – continued | ||||||||
| Specialty Stores – 1.2% | ||||||||
| AutoZone, Inc. (a) | 3,511 | $ | 2,002,885 | |||||
| Ross Stores, Inc. | 79,924 | 4,614,013 | ||||||
|
| |||||||
| $ | 6,616,898 | |||||||
|
| |||||||
| Telecommunications – Wireless – 2.6% | ||||||||
| American Tower Corp., REIT | 110,136 | $ | 14,573,195 | |||||
|
| |||||||
| Utilities – Electric Power – 0.5% | ||||||||
| American Electric Power Co., Inc. | 43,053 | $ | 2,990,892 | |||||
|
| |||||||
| Total Common Stocks (Identified Cost, $332,355,762) | $ | 540,264,745 | ||||||
|
| |||||||
| MONEY MARKET FUNDS – 1.8% | ||||||||
| MFS Institutional Money Market Portfolio, 0.98% (v) (Identified Cost, $9,879,203) | 9,879,946 | $ | 9,879,946 | |||||
|
| |||||||
| Total Investments (Identified Cost, $342,234,965) | $ | 550,144,691 | ||||||
|
| |||||||
| OTHER ASSETS, LESS LIABILITIES – 0.1% | 800,268 | |||||||
|
| |||||||
| NET ASSETS – 100.0% | $ | 550,944,959 | ||||||
|
| |||||||
| (a) | Non-income producing security. |
| (v) | Underlying affiliated fund that is available only to investment companies managed by MFS. The rate quoted for the MFS Institutional Money Market Portfolio is the annualized seven-day yield of the fund at period end. |
The following abbreviations are used in this report and are defined:
| PLC | Public Limited Company |
| REIT | Real Estate Investment Trust |
See Notes to Financial Statements
5
Table of Contents
MFS Investors Trust Series
FINANCIAL STATEMENTS | STATEMENT OF ASSETS AND LIABILITIES (unaudited)
This statement represents your fund’s balance sheet, which details the assets and liabilities comprising the total value of the fund.
At 6/30/17 | ||||
Assets | ||||
Investments | ||||
Non-affiliated issuers, at value (identified cost, $332,355,762) | $540,264,745 | |||
Underlying affiliated funds, at value (identified cost, $9,879,203) | 9,879,946 | |||
Total investments, at value (identified cost, $342,234,965) | $550,144,691 | |||
Cash | 38,643 | |||
Foreign currency, at value (identified cost, $30) | 30 | |||
Receivables for | ||||
Fund shares sold | 816,754 | |||
Dividends | 457,127 | |||
Other assets | 1,155 | |||
Total assets | $551,458,400 | |||
Liabilities | ||||
Payables for fund shares reacquired | $450,630 | |||
Payable to affiliates | ||||
Investment adviser | 10,699 | |||
Shareholder servicing costs | 717 | |||
Distribution and/or service fees | 3,775 | |||
Payable for independent Trustees’ compensation | 464 | |||
Accrued expenses and other liabilities | 47,156 | |||
Total liabilities | $513,441 | |||
Net assets | $550,944,959 | |||
Net assets consist of | ||||
Paid-in capital | $299,435,467 | |||
Unrealized appreciation (depreciation) on investments and translation of assets and liabilities in foreign currencies | 207,909,726 | |||
Accumulated net realized gain (loss) on investments and foreign currency | 37,890,259 | |||
Undistributed net investment income | 5,709,507 | |||
Net assets | $550,944,959 | |||
Shares of beneficial interest outstanding | 19,371,832 |
| Net assets | Shares outstanding | Net asset value per share | ||||||||||
Initial Class | $275,743,106 | 9,634,967 | $28.62 | |||||||||
Service Class | 275,201,853 | 9,736,865 | 28.26 | |||||||||
See Notes to Financial Statements
6
Table of Contents
MFS Investors Trust Series
FINANCIAL STATEMENTS | STATEMENT OF OPERATIONS (unaudited)
This statement describes how much your fund earned in investment income and accrued in expenses. It also describes any gains and/or losses generated by fund operations.
Six months ended 6/30/17 | ||||
Net investment income | ||||
Income | ||||
Dividends | $4,312,125 | |||
Dividends from underlying affiliated funds | 26,657 | |||
Interest | 10,241 | |||
Foreign taxes withheld | (54,271 | ) | ||
Total investment income | $4,294,752 | |||
Expenses | ||||
Management fee | $1,967,791 | |||
Distribution and/or service fees | 314,490 | |||
Shareholder servicing costs | 23,170 | |||
Administrative services fee | 47,135 | |||
Independent Trustees’ compensation | 4,932 | |||
Custodian fee | 13,074 | |||
Shareholder communications | 58,398 | |||
Audit and tax fees | 27,020 | |||
Legal fees | 2,683 | |||
Miscellaneous | 10,623 | |||
Total expenses | $2,469,316 | |||
Reduction of expenses by investment adviser | (78,028 | ) | ||
Net expenses | $2,391,288 | |||
Net investment income | $1,903,464 | |||
Realized and unrealized gain (loss) on investments and foreign currency | ||||
Realized gain (loss) (identified cost basis) | ||||
Investments: | ||||
Non-affiliated issuers | $17,085,864 | |||
Underlying affiliated funds | (1,005 | ) | ||
Foreign currency | 4,738 | |||
Net realized gain (loss) on investments and foreign currency | $17,089,597 | |||
Change in unrealized appreciation (depreciation) | $39,700,630 | |||
Translation of assets and liabilities in foreign currencies | 446 | |||
Net unrealized gain (loss) on investments and foreign currency translation | $39,701,076 | |||
Net realized and unrealized gain (loss) on investments and foreign currency | $56,790,673 | |||
Change in net assets from operations | $58,694,137 |
See Notes to Financial Statements
7
Table of Contents
MFS Investors Trust Series
FINANCIAL STATEMENTS | STATEMENTS OF CHANGES IN NET ASSETS
These statements describe the increases and/or decreases in net assets resulting from operations, any distributions, and any shareholder transactions.
| | Six months ended 6/30/17 (unaudited | ) | | Year ended 12/31/16 | | |||
Change in net assets | ||||||||
| From operations | ||||||||
Net investment income | $1,903,464 | $3,752,660 | ||||||
Net realized gain (loss) on investments and foreign currency | 17,089,597 | 22,166,593 | ||||||
Net unrealized gain (loss) on investments and foreign currency translation | 39,701,076 | 13,188,293 | ||||||
Change in net assets from operations | $58,694,137 | $39,107,546 | ||||||
| Distributions declared to shareholders | ||||||||
From net investment income | $— | $(3,519,160 | ) | |||||
From net realized gain on investments | — | (53,002,448 | ) | |||||
Total distributions declared to shareholders | $— | $(56,521,608 | ) | |||||
Change in net assets from fund share transactions | $(7,286,924 | ) | $30,632,344 | |||||
Total change in net assets | $51,407,213 | $13,218,282 | ||||||
| Net assets | ||||||||
At beginning of period | 499,537,746 | 486,319,464 | ||||||
At end of period (including undistributed net investment income of $5,709,507 and | $550,944,959 | $499,537,746 |
See Notes to Financial Statements
8
Table of Contents
MFS Investors Trust Series
FINANCIAL STATEMENTS | FINANCIAL HIGHLIGHTS
The financial highlights table is intended to help you understand the fund’s financial performance for the semiannual period and the past 5 fiscal years. Certain information reflects financial results for a single fund share. The total returns in the table represent the rate that an investor would have earned (or lost) on an investment in the fund share class (assuming reinvestment of all distributions) held for the entire period.
| Initial Class | Six months 6/30/17 | Years ended 12/31 | ||||||||||||||||||||||
| 2016 | 2015 | 2014 | 2013 | 2012 | ||||||||||||||||||||
| (unaudited) | ||||||||||||||||||||||||
Net asset value, beginning of period | $25.57 | $26.58 | $30.41 | $29.95 | $22.93 | $19.41 | ||||||||||||||||||
| Income (loss) from investment operations | ||||||||||||||||||||||||
Net investment income (d) | $0.11 | $0.23 | (c) | $0.21 | $0.26 | $0.24 | $0.25 | |||||||||||||||||
Net realized and unrealized gain (loss) on investments | 2.94 | 2.01 | (0.42 | ) | 2.92 | 7.07 | 3.46 | |||||||||||||||||
Total from investment operations | $3.05 | $2.24 | $(0.21 | ) | $3.18 | $7.31 | $3.71 | |||||||||||||||||
| Less distributions declared to shareholders | ||||||||||||||||||||||||
From net investment income | $— | $(0.24 | ) | $(0.28 | ) | $(0.30 | ) | $(0.29 | ) | $(0.19 | ) | |||||||||||||
From net realized gain on investments | — | (3.01 | ) | (3.34 | ) | (2.42 | ) | — | — | |||||||||||||||
Total distributions declared to shareholders | $— | $(3.25 | ) | $(3.62 | ) | $(2.72 | ) | $(0.29 | ) | $(0.19 | ) | |||||||||||||
Net asset value, end of period (x) | $28.62 | $25.57 | $26.58 | $30.41 | $29.95 | $22.93 | ||||||||||||||||||
Total return (%) (k)(r)(s)(x) | 11.93 | (n) | 8.59 | (c) | 0.22 | 11.01 | 32.05 | 19.18 | ||||||||||||||||
| Ratios (%) (to average net assets) and Supplemental data: | ||||||||||||||||||||||||
Expenses before expense reductions (f) | 0.82 | (a) | 0.80 | (c) | 0.82 | 0.81 | 0.81 | 0.82 | ||||||||||||||||
Expenses after expense reductions (f) | 0.79 | (a) | 0.79 | (c) | 0.81 | 0.81 | 0.81 | 0.82 | ||||||||||||||||
Net investment income | 0.84 | (a) | 0.89 | (c) | 0.73 | 0.87 | 0.93 | 1.15 | ||||||||||||||||
Portfolio turnover | 9 | (n) | 20 | 17 | 25 | 19 | 28 | |||||||||||||||||
Net assets at end of period (000 omitted) | $275,743 | $270,796 | $293,203 | $356,389 | $405,682 | $455,295 | ||||||||||||||||||
| Service Class | Six months 6/30/17 | Years ended 12/31 | ||||||||||||||||||||||
| 2016 | 2015 | 2014 | 2013 | 2012 | ||||||||||||||||||||
| (unaudited) | ||||||||||||||||||||||||
Net asset value, beginning of period | $25.28 | $26.30 | $30.13 | $29.72 | $22.78 | $19.31 | ||||||||||||||||||
| Income (loss) from investment operations | ||||||||||||||||||||||||
Net investment income (d) | $0.08 | $0.16 | (c) | $0.14 | $0.19 | $0.18 | $0.20 | |||||||||||||||||
Net realized and unrealized gain (loss) on investments | 2.90 | 1.98 | (0.42 | ) | 2.88 | 7.02 | 3.43 | |||||||||||||||||
Total from investment operations | $2.98 | $2.14 | $(0.28 | ) | $3.07 | $7.20 | $3.63 | |||||||||||||||||
| Less distributions declared to shareholders | ||||||||||||||||||||||||
From net investment income | $— | $(0.15 | ) | $(0.21 | ) | $(0.24 | ) | $(0.26 | ) | $(0.16 | ) | |||||||||||||
From net realized gain on investments | — | (3.01 | ) | (3.34 | ) | (2.42 | ) | — | — | |||||||||||||||
Total distributions declared to shareholders | $— | $(3.16 | ) | $(3.55 | ) | $(2.66 | ) | $(0.26 | ) | $(0.16 | ) | |||||||||||||
Net asset value, end of period (x) | $28.26 | $25.28 | $26.30 | $30.13 | $29.72 | $22.78 | ||||||||||||||||||
Total return (%) (k)(r)(s)(x) | 11.79 | (n) | 8.32 | (c) | (0.05 | ) | 10.71 | 31.74 | 18.83 | |||||||||||||||
| Ratios (%) (to average net assets) and Supplemental data: | ||||||||||||||||||||||||
Expenses before expense reductions (f) | 1.07 | (a) | 1.04 | (c) | 1.07 | 1.06 | 1.06 | 1.07 | ||||||||||||||||
Expenses after expense reductions (f) | 1.04 | (a) | 1.04 | (c) | 1.06 | 1.06 | 1.06 | 1.07 | ||||||||||||||||
Net investment income | 0.60 | (a) | 0.64 | (c) | 0.47 | 0.63 | 0.67 | 0.93 | ||||||||||||||||
Portfolio turnover | 9 | (n) | 20 | 17 | 25 | 19 | 28 | |||||||||||||||||
Net assets at end of period (000 omitted) | $275,202 | $228,741 | $193,116 | $283,328 | $234,723 | $141,806 | ||||||||||||||||||
See Notes to Financial Statements
9
Table of Contents
MFS Investors Trust Series
Financial Highlights – continued
| (a) | Annualized. |
| (c) | Amount reflects a one-time reimbursement of expenses by the custodian (or former custodian) without which net investment income and performance would be lower and expenses would be higher. |
| (d) | Per share data is based on average shares outstanding. |
| (f) | Ratios do not reflect reductions from fees paid indirectly, if applicable. |
| (k) | The total return does not reflect expenses that apply to separate accounts. Inclusion of these charges would reduce the total return figures for all periods shown. |
| (n) | Not annualized. |
| (r) | Certain expenses have been reduced without which performance would have been lower. |
| (s) | From time to time the fund may receive proceeds from litigation settlements, without which performance would be lower. |
| (x) | The net asset values and total returns have been calculated on net assets which include adjustments made in accordance with U.S. generally accepted accounting principles required at period end for financial reporting purposes. |
See Notes to Financial Statements
10
Table of Contents
MFS Investors Trust Series
NOTES TO FINANCIAL STATEMENTS (unaudited)
| (1) | Business and Organization |
MFS Investors Trust Series (the fund) is a diversified series of MFS Variable Insurance Trust (the trust). The trust is organized as a Massachusetts business trust and is registered under the Investment Company Act of 1940, as amended, as an open-end management investment company. The shareholders of each series of the trust are separate accounts of insurance companies, which offer variable annuity and/or life insurance products, and qualified retirement and pension plans.
The fund is an investment company and accordingly follows the investment company accounting and reporting guidance of the Financial Accounting Standards Board (FASB) Accounting Standards Codification Topic 946 Financial Services – Investment Companies.
| (2) | Significant Accounting Policies |
General – The preparation of financial statements in conformity with U.S. generally accepted accounting principles requires management to make estimates and assumptions that affect the reported amounts of assets and liabilities, and disclosure of contingent assets and liabilities at the date of the financial statements and the reported amounts of increases and decreases in net assets from operations during the reporting period. Actual results could differ from those estimates. In the preparation of these financial statements, management has evaluated subsequent events occurring after the date of the fund’s Statement of Assets and Liabilities through the date that the financial statements were issued.
In October 2016, the Securities and Exchange Commission (SEC) released its Final Rule on Investment Company Reporting Modernization (the “Rule”). The Rule, which introduces two new regulatory reporting forms for investment companies – Form N-PORT and Form N-CEN – also contains amendments to Regulation S-X which impact financial statement presentation, particularly the presentation of derivative investments. Although still evaluating the impacts of the Rule, management believes that many of the Regulation S-X amendments are consistent with the fund’s current financial statement presentation and expects that the fund will be able to comply with the Rule’s Regulation S-X amendments by the August 1, 2017 compliance date.
Balance Sheet Offsetting – The fund’s accounting policy with respect to balance sheet offsetting is that, absent an event of default by the counterparty or a termination of the agreement, the International Swaps and Derivatives Association (ISDA) Master Agreement does not result in an offset of reported amounts of financial assets and financial liabilities in the Statement of Assets and Liabilities across transactions between the fund and the applicable counterparty. The fund’s right to setoff may be restricted or prohibited by the bankruptcy or insolvency laws of the particular jurisdiction to which a specific master netting agreement counterparty is subject. Balance sheet offsetting disclosures, to the extent applicable to the fund, have been included in the fund’s Significant Accounting Policies note under the captions for each of the fund’s in-scope financial instruments and transactions.
Investment Valuations – Equity securities, including restricted equity securities, are generally valued at the last sale or official closing price on their primary market or exchange as provided by a third-party pricing service. Equity securities, for which there were no sales reported that day, are generally valued at the last quoted daily bid quotation on their primary market or exchange as provided by a third-party pricing service. Short-term instruments with a maturity at issuance of 60 days or less may be valued at amortized cost, which approximates market value. Open-end investment companies are generally valued at net asset value per share. Securities and other assets generally valued on the basis of information from a third-party pricing service may also be valued at a broker/dealer bid quotation. Values obtained from third-party pricing services can utilize both transaction data and market information such as yield, quality, coupon rate, maturity, type of issue, trading characteristics, and other market data. The values of foreign securities and other assets and liabilities expressed in foreign currencies are converted to U.S. dollars using the mean of bid and asked prices for rates provided by a third-party pricing service.
The Board of Trustees has delegated primary responsibility for determining or causing to be determined the value of the fund’s investments (including any fair valuation) to the adviser pursuant to valuation policies and procedures approved by the Board. If the adviser determines that reliable market quotations are not readily available, investments are valued at fair value as determined in good faith by the adviser in accordance with such procedures under the oversight of the Board of Trustees. Under the fund’s valuation policies and procedures, market quotations are not considered to be readily available for most types of debt instruments and floating rate loans and many types of derivatives. These investments are generally valued at fair value based on information from third-party pricing services. In addition, investments may be valued at fair value if the adviser determines that an investment’s value has been materially affected by events occurring after the close of the exchange or market on which the investment is principally traded (such as foreign exchange or market) and prior to the determination of the fund’s net asset value, or after the halting of trading of a specific security where trading does not resume prior to the close of the exchange or market on which the security is principally traded. Events that occur on a frequent basis after foreign markets close (such as developments in foreign markets and significant movements in the U.S. markets) and prior to the determination of the fund’s net asset value may be deemed to have a material effect on the value of securities traded in foreign markets. Accordingly, the fund’s foreign equity securities may often be valued at fair value. The adviser generally relies on third-party pricing services or other information (such as the correlation with price movements of similar securities in the same or other markets; the type, cost and investment characteristics of the security; the
11
Table of Contents
MFS Investors Trust Series
Notes to Financial Statements (unaudited) – continued
business and financial condition of the issuer; and trading and other market data) to assist in determining whether to fair value and at what value to fair value an investment. The value of an investment for purposes of calculating the fund’s net asset value can differ depending on the source and method used to determine value. When fair valuation is used, the value of an investment used to determine the fund’s net asset value may differ from quoted or published prices for the same investment. There can be no assurance that the fund could obtain the fair value assigned to an investment if it were to sell the investment at the same time at which the fund determines its net asset value per share.
Various inputs are used in determining the value of the fund’s assets or liabilities. These inputs are categorized into three broad levels. In certain cases, the inputs used to measure fair value may fall into different levels of the fair value hierarchy. In such cases, an investment’s level within the fair value hierarchy is based on the lowest level of input that is significant to the fair value measurement. The fund’s assessment of the significance of a particular input to the fair value measurement in its entirety requires judgment, and considers factors specific to the investment. Level 1 includes unadjusted quoted prices in active markets for identical assets or liabilities. Level 2 includes other significant observable market-based inputs (including quoted prices for similar securities, interest rates, prepayment speed, and credit risk). Level 3 includes unobservable inputs, which may include the adviser’s own assumptions in determining the fair value of investments. The following is a summary of the levels used as of June 30, 2017 in valuing the fund’s assets or liabilities:
| Investments at Value | Level 1 | Level 2 | Level 3 | Total | ||||||||||||
| Equity Securities | $540,264,745 | $— | $— | $540,264,745 | ||||||||||||
| Mutual Funds | 9,879,946 | — | — | 9,879,946 | ||||||||||||
| Total Investments | $550,144,691 | $— | $— | $550,144,691 | ||||||||||||
For further information regarding security characteristics, see the Portfolio of Investments.
Of the level 1 investments presented above, equity investments amounting to $19,601,735 would have been considered level 2 investments at the beginning of the period. The primary reason for changes in the classifications between levels 1 and 2 occurs when foreign equity securities are fair valued using other observable market-based inputs in place of the closing exchange price due to events occurring after the close of the exchange or market on which the investment is principally traded. The fund’s foreign equity securities may often be valued using other observable market-based inputs. The fund’s policy is to recognize transfers between the levels as of the end of the period.
Foreign Currency Translation – Purchases and sales of foreign investments, income, and expenses are converted into U.S. dollars based upon currency exchange rates prevailing on the respective dates of such transactions or on the reporting date for foreign denominated receivables and payables. Gains and losses attributable to foreign currency exchange rates on sales of securities are recorded for financial statement purposes as net realized gains and losses on investments. Gains and losses attributable to foreign exchange rate movements on receivables, payables, income and expenses are recorded for financial statement purposes as foreign currency transaction gains and losses. That portion of both realized and unrealized gains and losses on investments that results from fluctuations in foreign currency exchange rates is not separately disclosed.
Security Loans – Under its Securities Lending Agency Agreement with the fund, State Street Bank and Trust Company (“State Street”), as lending agent, loans the securities of the fund to certain qualified institutions (the “Borrowers”) approved by the fund. Security loans can be terminated at the discretion of either the lending agent or the fund and the related securities must be returned within the earlier of the standard trade settlement period for such securities or within three business days. The loans are collateralized by cash and/or U.S. Treasury and federal agency obligations in an amount typically at least equal to the market value of the securities loaned. On loans collateralized by cash, the cash collateral is invested in a money market fund. The market value of the loaned securities is determined at the close of business of the fund and any additional required collateral is delivered to the fund on the next business day. State Street provides the fund with indemnification against Borrower default. In the event of Borrower default, State Street will, for the benefit of the fund, either purchase securities identical to those loaned or, when such purchase is commercially impracticable, pay the fund the market value of the loaned securities. In return, State Street assumes the fund’s rights to the related collateral. If the collateral value is less than the cost to purchase identical securities, State Street is responsible for the shortfall, but only to the extent that such shortfall is not due to a decline in collateral value resulting from collateral reinvestment for which the fund bears the risk of loss. A portion of the income generated upon investment of the collateral is remitted to the Borrowers, and the remainder is allocated between the fund and the lending agent. On loans collateralized by U.S. Treasury and/or federal agency obligations, a fee is received from the Borrower, and is allocated between the fund and the lending agent. Income from securities lending is included in “Interest” income in the Statement of Operations. The dividend and interest income earned on the securities loaned is accounted for in the same manner as other dividend and interest income. At June 30, 2017, there were no securities on loan or collateral outstanding.
12
Table of Contents
MFS Investors Trust Series
Notes to Financial Statements (unaudited) – continued
Indemnifications – Under the fund’s organizational documents, its officers and Trustees may be indemnified against certain liabilities and expenses arising out of the performance of their duties to the fund. Additionally, in the normal course of business, the fund enters into agreements with service providers that may contain indemnification clauses. The fund’s maximum exposure under these agreements is unknown as this would involve future claims that may be made against the fund that have not yet occurred.
Investment Transactions and Income – Investment transactions are recorded on the trade date. Interest income is recorded on the accrual basis. Dividends received in cash are recorded on the ex-dividend date. Certain dividends from foreign securities will be recorded when the fund is informed of the dividend if such information is obtained subsequent to the ex-dividend date. Dividend payments received in additional securities are recorded on the ex-dividend date in an amount equal to the value of the security on such date.
The fund may receive proceeds from litigation settlements. Any proceeds received from litigation involving portfolio holdings are reflected in the Statement of Operations in realized gain/loss if the security has been disposed of by the fund or in unrealized gain/loss if the security is still held by the fund. Any other proceeds from litigation not related to portfolio holdings are reflected as other income in the Statement of Operations.
Tax Matters and Distributions – The fund intends to qualify as a regulated investment company, as defined under Subchapter M of the Internal Revenue Code, and to distribute all of its taxable income, including realized capital gains. As a result, no provision for federal income tax is required. The fund’s federal tax returns, when filed, will remain subject to examination by the Internal Revenue Service for a three year period. Management has analyzed the fund’s tax positions taken on federal and state tax returns for all open tax years and does not believe that there are any uncertain tax positions that require recognition of a tax liability. Foreign taxes, if any, have been accrued by the fund in the accompanying financial statements in accordance with the applicable foreign tax law. Foreign income taxes may be withheld by certain countries in which the fund invests. Additionally, capital gains realized by the fund on securities issued in or by certain foreign countries may be subject to capital gains tax imposed by those countries.
Distributions to shareholders are recorded on the ex-dividend date. Income and capital gain distributions are determined in accordance with income tax regulations, which may differ from U.S. generally accepted accounting principles. Certain capital accounts in the financial statements are periodically adjusted for permanent differences in order to reflect their tax character. These adjustments have no impact on net assets or net asset value per share. Temporary differences which arise from recognizing certain items of income, expense, gain or loss in different periods for financial statement and tax purposes will reverse at some time in the future. Distributions in excess of net investment income or net realized gains are temporary overdistributions for financial statement purposes resulting from differences in the recognition or classification of income or distributions for financial statement and tax purposes.
Book/tax differences primarily relate to wash sale loss deferrals.
The tax character of distributions declared to shareholders for the last fiscal year is as follows:
| Year ended 12/31/16 | ||||
| Ordinary income (including any short-term capital gains) | $4,818,041 | |||
| Long-term capital gains | 51,703,567 | |||
| Total distributions | $56,521,608 | |||
The federal tax cost and the tax basis components of distributable earnings were as follows:
| As of 6/30/17 | ||||
| Cost of investments | $343,246,129 | |||
| Gross appreciation | 209,541,608 | |||
| Gross depreciation | (2,643,046 | ) | ||
| Net unrealized appreciation (depreciation) | $206,898,562 | |||
| As of 12/31/16 | ||||
| Undistributed ordinary income | 3,806,043 | |||
| Undistributed long-term capital gain | 21,821,187 | |||
| Other temporary differences | (9,807 | ) | ||
| Net unrealized appreciation (depreciation) | 167,197,932 | |||
The aggregate cost above includes prior fiscal year end tax adjustments, if applicable.
13
Table of Contents
MFS Investors Trust Series
Notes to Financial Statements (unaudited) – continued
Multiple Classes of Shares of Beneficial Interest – The fund offers multiple classes of shares, which differ in their respective distribution and/or service fees. The fund’s income, realized and unrealized gain (loss), and common expenses are allocated to shareholders based on the daily net assets of each class. Dividends are declared separately for each class. Differences in per share dividend rates are generally due to differences in separate class expenses. The fund’s distributions declared to shareholders as reported in the Statements of Changes in Net Assets are presented by class as follows:
| From net investment income | From net realized gain on investments | |||||||||||||||
| Six months ended 6/30/17 | Year ended 12/31/16 | Six months ended 6/30/17 | Year ended 12/31/16 | |||||||||||||
| Initial Class | $— | $2,326,257 | $— | $29,736,135 | ||||||||||||
| Service Class | — | 1,192,903 | — | 23,266,313 | ||||||||||||
| Total | $— | $3,519,160 | $— | $53,002,448 | ||||||||||||
| (3) | Transactions with Affiliates |
Investment Adviser – The fund has an investment advisory agreement with MFS to provide overall investment management and related administrative services and facilities to the fund. For the period January 1, 2017 through April 27, 2017, the management fee was computed daily and paid monthly at an annual rate of 0.75% of the fund’s average daily net assets up to $1 billion and 0.65% of average daily net assets in excess of $1 billion. The investment adviser had agreed in writing to reduce its management fee to 0.60% of average daily net assets in excess of $2.5 billion. This written agreement was terminated April 27, 2017. For the period January 1, 2017 through April 27,2017, the fund’s average daily net assets did not exceed $2.5 billion and therefore, the management fee was not reduced in accordance with this agreement. Effective April 28, 2017, the management fee is computed daily and paid monthly at an annual rate of 0.75% of average daily net assets up to $1 billion, 0.65% of average daily net assets in excess of $1 billion up to $2.5 billion, and 0.60% of average daily net assets in excess of $2.5 billion. MFS has also agreed in writing to reduce its management fee by a specified amount if certain MFS mutual fund assets exceed thresholds agreed to by MFS and the fund’s Board of Trustees. For the six months end June 30, 2017, this management fee reduction amounted to $20,147 which is included in the reduction of total expenses in the Statement of Operations. The management fee incurred for the six months ended June 30, 2017 was equivalent to an annual effective rate of 0.74% of the fund’s average daily net assets.
The investment adviser has agreed in writing to pay a portion of the fund’s total annual operating expenses, excluding interest, taxes, extraordinary expenses, brokerage and transaction costs, and investment-related expenses, such that total annual operating expenses do not exceed 0.79% of average daily net assets for the Initial Class shares and 1.04% of average daily net assets for the Service Class shares. This written agreement will continue until modified by the fund’s Board of Trustees, but such agreement will continue at least until April 30, 2019. For the six months ended June 30, 2017, this reduction amounted to $57,881, which is included in the reduction of total expenses in the Statement of Operations.
Distributor – MFS Fund Distributors, Inc. (MFD), a wholly-owned subsidiary of MFS, is the distributor of shares of the fund. The Trustees have adopted a distribution plan for the Service Class shares pursuant to Rule 12b-1 under the Investment Company Act of 1940.
The fund’s distribution plan provides that the fund will pay MFD distribution and/or service fees equal to 0.25% per annum of its average daily net assets attributable to Service Class shares as partial consideration for services performed and expenses incurred by MFD and financial intermediaries (including participating insurance companies that invest in the fund to fund variable annuity and variable life insurance contracts, sponsors of qualified retirement and pension plans that invest in the fund, and affiliates of these participating insurance companies and plan sponsors) in connection with the sale and distribution of the Service Class shares. MFD may subsequently pay all, or a portion, of the distribution and/or service fees to financial intermediaries.
Shareholder Servicing Agent – MFS Service Center, Inc. (MFSC), a wholly-owned subsidiary of MFS, receives a fee from the fund for its services as shareholder servicing agent. For the six months ended June 30, 2017, the fee was $22,344, which equated to 0.0085% annually of the fund’s average daily net assets. MFSC also receives payment from the fund for out-of-pocket expenses paid by MFSC on behalf of the fund. For the six months ended June 30, 2017, these costs amounted to $826.
Administrator – MFS provides certain financial, legal, shareholder communications, compliance, and other administrative services to the fund. Under an administrative services agreement, the fund reimburses MFS the costs incurred to provide these services. The fund is charged an annual fixed amount of $17,500 plus a fee based on average daily net assets. The administrative services fee incurred for the six months ended June 30, 2017 was equivalent to an annual effective rate of 0.0179% of the fund’s average daily net assets.
14
Table of Contents
MFS Investors Trust Series
Notes to Financial Statements (unaudited) – continued
Trustees’ and Officers’ Compensation – The fund pays compensation to independent Trustees in the form of a retainer, attendance fees, and additional compensation to Board and Committee chairpersons. The fund does not pay compensation directly to Trustees or officers of the fund who are also officers of the investment adviser, all of whom receive remuneration for their services to the fund from MFS. Certain officers and Trustees of the fund are officers or directors of MFS, MFD, and MFSC.
Other – This fund and certain other funds managed by MFS (the funds) have entered into a service agreement (the ISO Agreement) which provides for payment of fees solely by the funds to Tarantino LLC in return for the provision of services of an Independent Senior Officer (ISO) for the funds. Frank L. Tarantino serves as the ISO and is an officer of the funds and the sole member of Tarantino LLC. The funds can terminate the ISO Agreement with Tarantino LLC at any time under the terms of the ISO Agreement. For the six months ended June 30, 2017, the fee paid by the fund under this agreement was $474 and is included in “Miscellaneous” expense in the Statement of Operations. MFS has agreed to bear all expenses associated with office space, other administrative support, and supplies provided to the ISO.
The fund invests in the MFS Institutional Money Market Portfolio which is managed by MFS and seeks current income consistent with preservation of capital and liquidity. This money market fund does not pay a management fee to MFS.
The fund is permitted to engage in purchase and sale transactions with funds and accounts for which MFS serves as investment adviser or sub-adviser (“cross-trades”) pursuant to a policy adopted by the Board of Trustees. This policy has been designed to ensure that cross-trades conducted by the fund comply with Rule 17a-7 under the Investment Company Act of 1940. Under this policy, cross-trades are effected at current market prices with no remuneration paid in connection with the transaction. During the six months ended June 30, 2017, the fund engaged in purchase transactions pursuant to this policy, which amounted to $152,777.
| (4) | Portfolio Securities |
For the six months ended June 30, 2017, purchases and sales of investments, other than short-term obligations, aggregated $49,041,149 and $58,460,496, respectively.
| (5) | Shares of Beneficial Interest |
The fund’s Declaration of Trust permits the Trustees to issue an unlimited number of full and fractional shares of beneficial interest. Transactions in fund shares were as follows:
| Six months ended 6/30/17 | Year ended 12/31/16 | |||||||||||||||
| Shares | Amount | Shares | Amount | |||||||||||||
| Shares sold | ||||||||||||||||
Initial Class | 143,324 | $3,958,484 | 245,268 | $6,356,188 | ||||||||||||
Service Class | 1,290,575 | 35,053,539 | 1,897,837 | 48,438,271 | ||||||||||||
| 1,433,899 | $39,012,023 | 2,143,105 | $54,794,459 | |||||||||||||
| Shares issued to shareholders in reinvestment of distributions | ||||||||||||||||
Initial Class | — | $— | 1,272,318 | $32,062,392 | ||||||||||||
Service Class | — | — | 980,721 | 24,459,216 | ||||||||||||
| — | $— | 2,253,039 | $56,521,608 | |||||||||||||
| Shares reacquired | ||||||||||||||||
Initial Class | (1,100,562 | ) | $(30,030,986 | ) | (1,957,487 | ) | $(50,705,350 | ) | ||||||||
Service Class | (602,105 | ) | (16,267,961 | ) | (1,172,721 | ) | (29,978,373 | ) | ||||||||
| (1,702,667 | ) | $(46,298,947 | ) | (3,130,208 | ) | $(80,683,723 | ) | |||||||||
| Net change | ||||||||||||||||
Initial Class | (957,238 | ) | $(26,072,502 | ) | (439,901 | ) | $(12,286,770 | ) | ||||||||
Service Class | 688,470 | 18,785,578 | 1,705,837 | 42,919,114 | ||||||||||||
| (268,768 | ) | $(7,286,924 | ) | 1,265,936 | $30,632,344 | |||||||||||
| (6) | Line of Credit |
The fund and certain other funds managed by MFS participate in a $1.25 billion unsecured committed line of credit, subject to a $1 billion sublimit, provided by a syndication of banks under a credit agreement. Borrowings may be made for temporary financing needs. Interest is charged to each fund, based on its borrowings, generally at a rate equal to the higher of the Overnight Federal Reserve funds rate or daily one month LIBOR plus an agreed upon spread. A commitment fee, based on the average daily, unused portion of the committed line of credit, is allocated among the participating funds at the end of each calendar quarter. In addition, the fund and other funds managed by MFS have established unsecured uncommitted borrowing arrangements with certain banks for temporary financing needs. Interest is charged to each fund, based on its borrowings, at a rate equal to the Overnight Federal Reserve funds rate plus an agreed upon spread. For the six months ended June 30, 2017, the fund’s commitment fee and interest expense were $1,711 and $0, respectively, and are included in “Miscellaneous” expense in the Statement of Operations.
15
Table of Contents
MFS Investors Trust Series
Notes to Financial Statements (unaudited) – continued
| (7) | Transactions in Underlying Affiliated Funds – Affiliated Issuers |
An affiliated issuer may be considered one in which the fund owns 5% or more of the outstanding voting securities, or a company which is under common control. For the purposes of this report, the fund assumes the following to be an affiliated issuer:
| Underlying Affiliated Fund | Beginning Shares/Par Amount | Acquisitions Shares/Par Amount | Dispositions Shares/Par Amount | Ending Shares/Par Amount | ||||||||||
| MFS Institutional Money Market Portfolio | 4,003,442 | 28,655,536 | (22,779,032 | ) | 9,879,946 | |||||||||
| Underlying Affiliated Fund | Realized Gain (Loss) | Capital Gain Distributions | Dividend Income | Ending Value | ||||||||||
| MFS Institutional Money Market Portfolio | $(1,005) | $— | $26,657 | $9,879,946 | ||||||||||
16
Table of Contents
MFS Investors Trust Series
RESULTS OF SHAREHOLDER MEETING (unaudited)
At a special meeting of shareholders of MFS Variable Insurance Trust, which was held on March 23, 2017, the following action was taken:
Item 1: To elect the following individuals as Trustees:
| Number of Dollars | ||||||||
| Nominee | For | Withheld Authority | ||||||
| Steven E. Buller | 11,311,922,492.61 | 518,570,973.54 | ||||||
| John A. Caroselli | 11,291,109,000.34 | 539,384,465.81 | ||||||
| Maureen R. Goldfarb | 11,233,211,779.66 | 597,281,686.49 | ||||||
| David H. Gunning | 11,179,077,201.17 | 651,416,264.98 | ||||||
| Michael Hegarty | 11,191,993,154.78 | 638,500,311.37 | ||||||
| John P. Kavanaugh | 11,242,238,261.44 | 588,255,204.71 | ||||||
| Robert J. Manning | 11,314,479,376.58 | 516,014,089.57 | ||||||
| Clarence Otis, Jr. | 11,208,873,448.85 | 621,620,017.30 | ||||||
| Maryanne L. Roepke | 11,263,427,105.03 | 567,066,361.12 | ||||||
| Robin A. Stelmach | 11,313,883,043.82 | 516,610,422.33 | ||||||
| Laurie J. Thomsen | 11,240,219,041.09 | 590,274,425.06 | ||||||
17
Table of Contents
MFS Investors Trust Series
PROXY VOTING POLICIES AND INFORMATION
MFS votes proxies on behalf of the fund pursuant to proxy voting policies and procedures that are available without charge, upon request, by calling 1-800-225-2606, by visiting mfs.com (once you have selected “Individual Investor” as your role, click on “Individual Investor Home” in the top navigation and then select “Learn More About Proxy Voting” under the “I want to…” header on the left hand column of the page), or by visiting the SEC’s Web site at http://www.sec.gov.
Information regarding how the fund voted proxies relating to portfolio securities during the most recent twelve-month period ended June 30 is available by August 31 of each year without charge by visiting mfs.com (once you have selected “Individual Investor” as your role, click on “Individual Investor Home” in the top navigation and then select “Learn More About Proxy Voting” under the “I want to…” header on the left hand column of the page), or by visiting the SEC’s Web site at http://www.sec.gov.
QUARTERLY PORTFOLIO DISCLOSURE
The fund will file a complete schedule of portfolio holdings with the Securities and Exchange Commission (the Commission) for the first and third quarters of each fiscal year on Form N-Q. The fund’s Form N-Q is available on the EDGAR database on the Commission’s Internet Web site at http://www.sec.gov, and may be reviewed and copied at the:
Public Reference Room
Securities and Exchange Commission
100 F Street, NE, Room 1580
Washington, D.C. 20549
Information on the operation of the Public Reference Room may be obtained by calling the Commission at 1-800-SEC-0330. Copies of the fund’s Form N-Q also may be obtained, upon payment of a duplicating fee, by electronic request at the following e-mail address: publicinfo@sec.gov or by writing the Public Reference Section at the above address.
From time to time, MFS may post important information about the fund or the MFS funds on the MFS web site (mfs.com). This information is available on mfs.com by following these steps once you have selected “Individual Investor” as your role: (1) Click on the “Individual Investor Home” in the top navigation and then select the “Announcements” option within the “Market Outlooks” drop down, or (2) Click on “Products & Services” and “Variable Insurance Portfolios” and then select the fund’s name.
INFORMATION ABOUT FUND CONTRACTS AND LEGAL CLAIMS
The fund has entered into contractual arrangements with an investment adviser, administrator, distributor, shareholder servicing agent, 529 program manager (if applicable), and custodian who each provide services to the fund. Unless expressly stated otherwise, shareholders are not parties to, or intended beneficiaries of these contractual arrangements, and these contractual arrangements are not intended to create any shareholder right to enforce them against the service providers or to seek any remedy under them against the service providers, either directly or on behalf of the fund.
Under the Trust’s By-Laws and Declaration of Trust, any claims asserted against or on behalf of the MFS Funds, including claims against Trustees and Officers, must be brought in state and federal courts located within the Commonwealth of Massachusetts.
18
Table of Contents
Table of Contents
SEMIANNUAL REPORT
June 30, 2017

MFS® RESEARCH SERIES
MFS® Variable Insurance Trust

VFR-SEM
Table of Contents
MFS® RESEARCH SERIES
The report is prepared for the general information of contract owners. It is authorized for distribution to prospective investors only when preceded or accompanied by a current prospectus.
NOT FDIC INSURED • MAY LOSE VALUE • NO BANK OR CREDIT UNION GUARANTEE • NOT A DEPOSIT • NOT INSURED BY ANY FEDERAL GOVERNMENT AGENCY OR NCUA/NCUSIF
Table of Contents
MFS Research Series
LETTER FROM THE EXECUTIVE CHAIRMAN

Dear Contract Owners:
Despite policy uncertainty accompanying a new presidential administration in the United States and unease over ongoing Brexit negotiations, most markets have proved resilient. U.S. share prices have reached new highs. The U.S. Federal Reserve has continued to gradually hike interest rates. However, rates in most developed markets remain very low, with major non-U.S. central banks just beginning to contemplate curbing accommodative monetary policies.
Globally, economic growth has shown signs of recovery, led by China, the U.S. and the eurozone. Despite better growth, there are few immediate signs of worrisome inflation as wage growth remains muted. Europe has benefited from diminishing event risks as establishment candidates won both the Dutch and French elections, averting a feared populist trend. Emerging market economies are recovering at a somewhat slower pace amid fears that restrictive U.S. trade policies could further hamper the restrained pace of global trade growth. Looking ahead, markets will have to contend with issues involving geopolitical hot spots on the Korean peninsula and in the Middle East, which could potentially lead to a clash of interests between the U.S. and other major powers such as China or Russia.
At MFS®, we believe time is an asset. A patient, long-term approach to investing can have a powerful impact on decision making and outcomes. Time arbitrage, as we call it, simply comes down to having the conviction and discipline to allow enough time for good investment ideas to play out. In our view, such an approach, along with the professional guidance of a financial advisor, will help you reach your investment objectives.
Respectfully,

Robert J. Manning
Executive Chairman
MFS Investment Management
August 16, 2017
The opinions expressed in this letter are subject to change and may not be relied upon for investment advice. No forecasts can be guaranteed.
1
Table of Contents
MFS Research Series
Portfolio structure
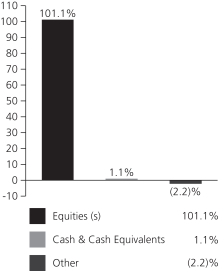
| Top ten holdings | ||||
| Citigroup, Inc. | 2.7% | |||
| Facebook, Inc., “A” | 2.5% | |||
| Alphabet, Inc., “A” | 2.4% | |||
| Visa, Inc., “A” | 2.4% | |||
| Amazon.com, Inc. | 2.2% | |||
| Pfizer, Inc. | 1.9% | |||
| Apple, Inc. | 1.7% | |||
| Honeywell International, Inc. | 1.6% | |||
| Philip Morris International, Inc. | 1.6% | |||
| Microsoft Corp. | 1.6% |
| Global equity sectors | ||||
| Technology | 22.6% | |||
| Financial Services | 17.7% | |||
| Health Care | 14.1% | |||
| Capital Goods | 13.6% | |||
| Consumer Cyclicals | 12.7% | |||
| Energy | 8.7% | |||
| Consumer Staples | 7.6% | |||
| Telecommunications/Cable Television (s) | 4.1% |
| (s) | Includes securities sold short. |
Cash & Cash Equivalents includes any cash, investments in money market funds, short-term securities, and other assets less liabilities. Please see the Statement of Assets and Liabilities for additional information related to the fund’s cash position and other assets and liabilities.
Other includes equivalent exposure from currency derivatives and/or any offsets to derivative positions and may be negative.
Percentages are based on net assets as of June 30, 2017.
The portfolio is actively managed and current holdings may be different.
2
Table of Contents
MFS Research Series
Fund Expenses Borne by the Contract Holders during the Period,
January 1, 2017 through June 30, 2017
As a contract holder of the fund, you incur ongoing costs, including management fees; distribution and/or service (12b-1) fees; and other fund expenses. This example is intended to help you understand your ongoing costs (in dollars) of investing in the fund and to compare these costs with the ongoing costs of investing in other mutual funds.
The example is based on an investment of $1,000 invested at the beginning of the period and held for the entire period January 1, 2017 through June 30, 2017.
Actual Expenses
The first line for each share class in the following table provides information about actual account values and actual expenses. You may use the information in this line, together with the amount you invested, to estimate the expenses that you paid over the period. Simply divide your account value by $1,000 (for example, an $8,600 account value divided by $1,000 = 8.6), then multiply the result by the number in the first line under the heading entitled “Expenses Paid During Period” to estimate the expenses you paid on your account during this period.
Hypothetical Example for Comparison Purposes
The second line for each share class in the following table provides information about hypothetical account values and hypothetical expenses based on the fund’s actual expense ratio and an assumed rate of return of 5% per year before expenses, which is not the fund’s actual return. The hypothetical account values and expenses may not be used to estimate the actual ending account balance or expenses you paid for the period. You may use this information to compare the ongoing costs of investing in the fund and other funds. To do so, compare this 5% hypothetical example with the 5% hypothetical examples that appear in the shareholder reports of the other funds.
Please note that the expenses shown in the table are meant to highlight the fund’s ongoing costs only and do not take into account the fees and expenses imposed under the variable contracts through which your investment in the fund is made. Therefore, the second line for each share class in the table is useful in comparing ongoing costs associated with an investment in vehicles (such as the fund) which fund benefits under variable annuity and variable life insurance contracts and to qualified pension and retirement plans only, and will not help you determine the relative total costs of investing in the fund through variable annuity and variable life insurance contracts. If the fees and expenses imposed under the variable contracts were included, your costs would have been higher.
| Share Class | Annualized Expense Ratio | Beginning Account Value 1/01/17 | Ending 6/30/17 | Expenses Paid During Period (p) 1/01/17-6/30/17 | ||||||||||||||
| Initial Class | Actual | 0.80% | $1,000.00 | $1,117.69 | $4.20 | |||||||||||||
| Hypothetical (h) | 0.80% | $1,000.00 | $1,020.83 | $4.01 | ||||||||||||||
| Service Class | Actual | 1.05% | $1,000.00 | $1,116.21 | $5.51 | |||||||||||||
| Hypothetical (h) | 1.05% | $1,000.00 | $1,019.59 | $5.26 | ||||||||||||||
| (h) | 5% class return per year before expenses. |
| (p) | “Expenses Paid During Period” are equal to each class’s annualized expense ratio, as shown above, multiplied by the average account value over the period, multiplied by 181/365 (to reflect the one-half year period). |
Notes to Expense Table
Expense ratios include 0.01% of investment related expenses from short sales (See Note 2 of the Notes to Financial Statements) that are outside of the expense limitation arrangement (See Note 3 of the Notes to Financial Statements).
3
Table of Contents
MFS Research Series
PORTFOLIO OF INVESTMENTS – 6/30/17 (unaudited)
The Portfolio of Investments is a complete list of all securities owned by your fund. It is categorized by broad-based asset classes.
| Issuer | Shares/Par | Value ($) | ||||||
| COMMON STOCKS – 99.0% | ||||||||
| Aerospace – 4.0% | ||||||||
| Honeywell International, Inc. | 75,260 | $ | 10,031,406 | |||||
| Leidos Holdings, Inc. | 62,864 | 3,249,440 | ||||||
| Northrop Grumman Corp. | 22,265 | 5,715,648 | ||||||
| United Technologies Corp. | 44,829 | 5,474,069 | ||||||
|
| |||||||
| $ | 24,470,563 | |||||||
|
| |||||||
| Alcoholic Beverages – 1.2% | ||||||||
| Constellation Brands, Inc., “A” | 25,069 | $ | 4,856,617 | |||||
| Molson Coors Brewing Co. | 32,621 | 2,816,497 | ||||||
|
| |||||||
| $ | 7,673,114 | |||||||
|
| |||||||
| Apparel Manufacturers – 2.0% | ||||||||
| Hanesbrands, Inc. | 113,851 | $ | 2,636,789 | |||||
| NIKE, Inc., “B” | 161,214 | 9,511,626 | ||||||
|
| |||||||
| $ | 12,148,415 | |||||||
|
| |||||||
| Automotive – 0.6% | ||||||||
| Delphi Automotive PLC | 40,284 | $ | 3,530,893 | |||||
|
| |||||||
| Biotechnology – 2.1% | ||||||||
| Biogen, Inc. (a) | 27,036 | $ | 7,336,489 | |||||
| Celgene Corp. (a) | 44,924 | 5,834,280 | ||||||
|
| |||||||
| $ | 13,170,769 | |||||||
|
| |||||||
| Brokerage & Asset Managers – 1.9% | ||||||||
| Blackstone Group LP | 180,723 | $ | 6,027,112 | |||||
| NASDAQ, Inc. | 81,193 | 5,804,488 | ||||||
|
| |||||||
| $ | 11,831,600 | |||||||
|
| |||||||
| Business Services – 5.3% | ||||||||
| Accenture PLC, “A” | 43,178 | $ | 5,340,255 | |||||
| Cognizant Technology Solutions Corp., “A” | 78,707 | 5,226,145 | ||||||
| DXC Technology Co. | 60,255 | 4,622,764 | ||||||
| Equifax, Inc. | 22,792 | 3,132,077 | ||||||
| Fidelity National Information Services, Inc. | 63,246 | 5,401,208 | ||||||
| Fiserv, Inc. (a) | 29,659 | 3,628,482 | ||||||
| Global Payments, Inc. | 58,098 | 5,247,411 | ||||||
|
| |||||||
| $ | 32,598,342 | |||||||
|
| |||||||
| Cable TV – 1.8% | ||||||||
| Altice USA, Inc. (a) | 55,704 | $ | 1,799,239 | |||||
| Comcast Corp., “A” | 232,609 | 9,053,142 | ||||||
|
| |||||||
| $ | 10,852,381 | |||||||
|
| |||||||
| Chemicals – 3.3% | ||||||||
| Celanese Corp. | 39,492 | $ | 3,749,371 | |||||
| CF Industries Holdings, Inc. | 45,108 | 1,261,220 | ||||||
| E.I. du Pont de Nemours & Co. | 61,768 | 4,985,295 | ||||||
| Monsanto Co. | 30,162 | 3,569,974 | ||||||
| PPG Industries, Inc. | 63,039 | 6,931,768 | ||||||
|
| |||||||
| $ | 20,497,628 | |||||||
|
| |||||||
| Issuer | Shares/Par | Value ($) | ||||||
| COMMON STOCKS – continued | ||||||||
| Computer Software – 2.0% | ||||||||
| Adobe Systems, Inc. (a) | 40,353 | $ | 5,707,529 | |||||
| Salesforce.com, Inc. (a) | 80,337 | 6,957,184 | ||||||
|
| |||||||
| $ | 12,664,713 | |||||||
|
| |||||||
| Computer Software – Systems – 2.7% | ||||||||
| Apple, Inc. (s) | 74,974 | $ | 10,797,756 | |||||
| Constellation Software, Inc. | 5,829 | 3,049,392 | ||||||
| SS&C Technologies Holdings, Inc. | 78,634 | 3,020,332 | ||||||
|
| |||||||
| $ | 16,867,480 | |||||||
|
| |||||||
| Construction – 1.0% | ||||||||
| Sherwin-Williams Co. | 17,969 | $ | 6,306,400 | |||||
|
| |||||||
| Consumer Products – 1.2% | ||||||||
| Coty, Inc., “A” | 172,383 | $ | 3,233,905 | |||||
| Newell Brands, Inc. | 75,587 | 4,052,975 | ||||||
|
| |||||||
| $ | 7,286,880 | |||||||
|
| |||||||
| Consumer Services – 1.1% | ||||||||
| Priceline Group, Inc. (a) | 3,578 | $ | 6,692,721 | |||||
|
| |||||||
| Containers – 0.6% | ||||||||
| Berry Global Group, Inc. (a) | 65,418 | $ | 3,729,480 | |||||
|
| |||||||
| Electrical Equipment – 1.1% | ||||||||
| Johnson Controls International PLC | 155,015 | $ | 6,721,450 | |||||
|
| |||||||
| Electronics – 2.0% | ||||||||
| Applied Materials, Inc. | 48,407 | $ | 1,999,693 | |||||
| Broadcom Corp. | 23,519 | 5,481,103 | ||||||
| Texas Instruments, Inc. | 65,347 | 5,027,145 | ||||||
|
| |||||||
| $ | 12,507,941 | |||||||
|
| |||||||
| Energy – Independent – 3.2% | ||||||||
| Energen Corp. (a) | 54,667 | $ | 2,698,910 | |||||
| EOG Resources, Inc. | 79,305 | 7,178,688 | ||||||
| EQT Corp. | 60,574 | 3,549,031 | ||||||
| Noble Energy, Inc. | 78,746 | 2,228,512 | ||||||
| Pioneer Natural Resources Co. | 24,727 | 3,945,934 | ||||||
|
| |||||||
| $ | 19,601,075 | |||||||
|
| |||||||
| Energy – Integrated – 0.5% | ||||||||
| Exxon Mobil Corp. | 34,453 | $ | 2,781,391 | |||||
|
| |||||||
| Entertainment – 1.7% | ||||||||
| TimeWarner, Inc. | 66,901 | $ | 6,717,529 | |||||
| Twenty-First Century Fox, Inc. | 130,806 | 3,707,042 | ||||||
|
| |||||||
| $ | 10,424,571 | |||||||
|
| |||||||
| Food & Beverages – 3.6% | ||||||||
| Blue Buffalo Pet Products, Inc. (a) | 99,223 | $ | 2,263,277 | |||||
| Cal-Maine Foods, Inc. (a)(l) | 64,176 | 2,541,369 | ||||||
| J.M. Smucker Co. | 17,190 | 2,034,093 | ||||||
| Mondelez International, Inc. | 103,160 | 4,455,480 | ||||||
| PepsiCo, Inc. | 73,515 | 8,490,247 | ||||||
| TreeHouse Foods, Inc. (a) | 31,485 | 2,572,010 | ||||||
|
| |||||||
| $ | 22,356,476 | |||||||
|
| |||||||
4
Table of Contents
MFS Research Series
Portfolio of Investments (unaudited) – continued
| Issuer | Shares/Par | Value ($) | ||||||
| COMMON STOCKS – continued | ||||||||
| General Merchandise – 1.6% | ||||||||
| CostcoWholesale Corp. | 40,290 | $ | 6,443,580 | |||||
| Dollar Tree, Inc. (a) | 53,492 | 3,740,160 | ||||||
|
| |||||||
| $ | 10,183,740 | |||||||
|
| |||||||
| Health Maintenance Organizations – 1.7% | ||||||||
| Cigna Corp. | 16,438 | $ | 2,751,557 | |||||
| UnitedHealth Group, Inc. | 40,298 | 7,472,055 | ||||||
|
| |||||||
| $ | 10,223,612 | |||||||
|
| |||||||
| Insurance – 2.5% | ||||||||
| Aon PLC | 65,879 | $ | 8,758,613 | |||||
| Chubb Ltd. | 44,733 | 6,503,284 | ||||||
|
| |||||||
| $ | 15,261,897 | |||||||
|
| |||||||
| Internet – 6.9% | ||||||||
| Alibaba Group Holding Ltd., ADR (a) | 24,234 | $ | 3,414,571 | |||||
| Alphabet, Inc., “A” (a) | 16,304 | 15,157,503 | ||||||
| Alphabet, Inc., “C” (a) | 5,966 | 5,421,483 | ||||||
| Facebook, Inc., “A” (a) | 102,981 | 15,548,071 | ||||||
| LogMeIn, Inc. | 32,443 | 3,390,293 | ||||||
|
| |||||||
| $ | 42,931,921 | |||||||
|
| |||||||
| Leisure & Toys – 0.7% | ||||||||
| Electronic Arts, Inc. (a) | 39,616 | $ | 4,188,204 | |||||
|
| |||||||
| Machinery & Tools – 1.5% | ||||||||
| Roper Technologies, Inc. | 31,462 | $ | 7,284,397 | |||||
| SPX FLOW, Inc. (a) | 58,352 | 2,152,022 | ||||||
|
| |||||||
| $ | 9,436,419 | |||||||
|
| |||||||
| Major Banks – 3.6% | ||||||||
| Bank of America Corp. | 168,971 | $ | 4,099,237 | |||||
| Morgan Stanley | 191,440 | 8,530,566 | ||||||
| PNC Financial Services Group, Inc. | 76,339 | 9,532,451 | ||||||
|
| |||||||
| $ | 22,162,254 | |||||||
|
| |||||||
| Medical & Health Technology & Services – 0.6% | ||||||||
| McKesson Corp. | 23,851 | $ | 3,924,444 | |||||
|
| |||||||
| Medical Equipment – 5.1% | ||||||||
| Danaher Corp. | 83,283 | $ | 7,028,252 | |||||
| Medtronic PLC | 103,302 | 9,168,052 | ||||||
| PerkinElmer, Inc. | 75,347 | 5,134,145 | ||||||
| Steris PLC | 25,639 | 2,089,579 | ||||||
| Stryker Corp. | 16,115 | 2,236,440 | ||||||
| Zimmer Biomet Holdings, Inc. | 44,560 | 5,721,504 | ||||||
|
| |||||||
| $ | 31,377,972 | |||||||
|
| |||||||
| Natural Gas – Distribution – 0.6% | ||||||||
| Sempra Energy | 35,295 | $ | 3,979,511 | |||||
|
| |||||||
| Natural Gas – Pipeline – 0.5% | ||||||||
| Enterprise Products Partners LP | 119,911 | $ | 3,247,190 | |||||
|
| |||||||
| Network & Telecom – 1.2% | ||||||||
| Cisco Systems, Inc. | 244,704 | $ | 7,659,235 | |||||
|
| |||||||
| Oil Services – 1.1% | ||||||||
| Halliburton Co. | 81,611 | $ | 3,485,606 | |||||
| Schlumberger Ltd. | 47,640 | 3,136,617 | ||||||
|
| |||||||
| $ | 6,622,223 | |||||||
|
| |||||||
| Issuer | Shares/Par | Value ($) | ||||||
| COMMON STOCKS – continued | ||||||||
| Other Banks & Diversified Financials – 8.2% | ||||||||
| Citigroup, Inc. (s) | 246,380 | $ | 16,477,894 | |||||
| Discover Financial Services | 58,049 | 3,610,067 | ||||||
| Northern Trust Corp. | 33,922 | 3,297,558 | ||||||
| U.S. Bancorp | 184,584 | 9,583,601 | ||||||
| Visa, Inc., “A” (s) | 158,438 | 14,858,316 | ||||||
| Wintrust Financial Corp. | 40,677 | 3,109,350 | ||||||
|
| |||||||
| $ | 50,936,786 | |||||||
|
| |||||||
| Pharmaceuticals – 4.6% | ||||||||
| Allergan PLC | 21,502 | $ | 5,226,921 | |||||
| Eli Lilly & Co. | 77,922 | 6,412,981 | ||||||
| Pfizer, Inc. | 341,326 | 11,465,140 | ||||||
| Zoetis, Inc. | 90,423 | 5,640,587 | ||||||
|
| |||||||
| $ | 28,745,629 | |||||||
|
| |||||||
| Railroad & Shipping – 1.5% | ||||||||
| Canadian Pacific Railway Ltd. | 21,781 | $ | 3,502,603 | |||||
| Union Pacific Corp. | 54,756 | 5,963,476 | ||||||
|
| |||||||
| $ | 9,466,079 | |||||||
|
| |||||||
| Real Estate – 1.5% | ||||||||
| Public Storage, Inc., REIT | 14,833 | $ | 3,093,126 | |||||
| Store Capital Corp., REIT | 286,123 | 6,423,461 | ||||||
|
| |||||||
| $ | 9,516,587 | |||||||
|
| |||||||
| Restaurants – 2.2% | ||||||||
| Aramark | 99,948 | $ | 4,095,869 | |||||
| Panera Bread Co., “A” (a) | 6,364 | 2,002,369 | ||||||
| Starbucks Corp. | 130,128 | 7,587,764 | ||||||
|
| |||||||
| $ | 13,686,002 | |||||||
|
| |||||||
| Specialty Stores – 3.5% | ||||||||
| Amazon.com, Inc. (a) | 14,237 | $ | 13,781,416 | |||||
| Ross Stores, Inc. | 60,123 | 3,470,901 | ||||||
| Tractor Supply Co. | 40,556 | 2,198,541 | ||||||
| Urban Outfitters, Inc. (a) | 104,768 | 1,942,398 | ||||||
|
| |||||||
| $ | 21,393,256 | |||||||
|
| |||||||
| Telecommunications – Wireless – 1.9% | ||||||||
| American Tower Corp., REIT | 61,606 | $ | 8,151,706 | |||||
| SBA Communications Corp., REIT (a) | 25,448 | 3,432,935 | ||||||
|
| |||||||
| $ | 11,584,641 | |||||||
|
| |||||||
| Telephone Services – 0.7% | ||||||||
| Verizon Communications, Inc. | 102,972 | $ | 4,598,730 | |||||
|
| |||||||
| Tobacco – 1.6% | ||||||||
| Philip Morris International, Inc. | 84,043 | $ | 9,870,850 | |||||
|
| |||||||
| Utilities – Electric Power – 2.8% | ||||||||
| American Electric Power Co., Inc. | 49,258 | $ | 3,421,953 | |||||
| CMS Energy Corp. | 103,758 | 4,798,807 | ||||||
| NextEra Energy, Inc. | 34,238 | 4,797,771 | ||||||
| Xcel Energy, Inc. | 99,045 | 4,544,185 | ||||||
|
| |||||||
| $ | 17,562,716 | |||||||
|
| |||||||
| Total Common Stocks (Identified Cost, $448,427,527) | $ | 613,274,181 | ||||||
|
| |||||||
5
Table of Contents
MFS Research Series
Portfolio of Investments (unaudited) – continued
| Issuer/Expiration Date/Strike Price | Number of Contracts | Value ($) | ||||||
| CALL OPTIONS PURCHASED – 0.3% | ||||||||
| Computer Software – 0.2% | ||||||||
| Microsoft Corp. – October 2017 @ $67.5 (Premiums Paid, $828,605) | 2,362 | $ | 980,230 | |||||
|
| |||||||
| Computer Software – Systems – 0.1% | ||||||||
| Apple Inc. – November 2017 @ $145 (Premiums Paid, $609,909) | 733 | $ | 593,730 | |||||
|
| |||||||
| Total Call Options Purchased (Premiums Paid, $1,438,514) | $ | 1,573,960 | ||||||
|
| |||||||
| Issuer | Shares/Par | |||||||
| MONEY MARKET FUNDS – 0.3% | ||||||||
| MFS Institutional Money Market Portfolio, 0.98% (v) (Identified Cost, $2,096,059) | 2,096,260 | $ | 2,096,260 | |||||
|
| |||||||
| COLLATERAL FOR SECURITIES LOANED – 0.0% | ||||||||
| State Street Navigator Securities Lending Government Money Market Portfolio, 1% (j) (Identified Cost, $146,520) | 146,520 | $ | 146,520 | |||||
|
| |||||||
| Total Investments (Identified Cost, $452,108,620) | $ | 617,090,921 | ||||||
|
| |||||||
| SECURITIES SOLD SHORT – (0.3)% | ||||||||
| Telecommunications – Wireless – (0.3)% | ||||||||
| Crown Castle International Corp, REIT (Proceeds Received, $1,375,557) | (16,616 | ) | $ | (1,664,591 | ) | |||
|
| |||||||
| OTHER ASSETS, LESS LIABILITIES – 0.7% | 4,269,730 | |||||||
|
| |||||||
| NET ASSETS – 100.0% | $ | 619,696,060 | ||||||
|
| |||||||
| (a) | Non-income producing security. |
| (j) | The rate quoted is the annualized seven-day yield of the fund at period end. |
| (l) | A portion of this security is on loan. |
| (s) | Security or a portion of the security was pledged to cover collateral requirements for securities sold short. |
| (v) | Underlying affiliated fund that is available only to investment companies managed by MFS. The rate quoted for the MFS Institutional Money Market Portfolio is the annualized seven-day yield of the fund at period end. |
At June 30, 2017, the fund had cash collateral of $70,448 and other liquid securities with an aggregate value of $3,346,468 to cover any commitments for securities sold short. Cash collateral is comprised of “Deposits with brokers” in the Statement of Assets and Liabilities.
The following abbreviations are used in this report and are defined:
| ADR | American Depositary Receipt |
| PLC | Public Limited Company |
| REIT | Real Estate Investment Trust |
See Notes to Financial Statements
6
Table of Contents
MFS Research Series
FINANCIAL STATEMENTS | STATEMENT OF ASSETS AND LIABILITIES (unaudited)
This statement represents your fund’s balance sheet, which details the assets and liabilities comprising the total value of the fund.
At 6/30/17 | ||||
Assets | ||||
Investments | ||||
Non-affiliated issuers, at value (identified cost, $450,012,561) | $614,994,661 | |||
Underlying affiliated funds, at value (identified cost, $2,096,059) | 2,096,260 | |||
Total investments, at value, including $145,055 of securities on loan (identified cost, $452,108,620) | $617,090,921 | |||
Deposits with brokers | 70,448 | |||
Receivables for | ||||
Investments sold | 7,374,552 | |||
Fund shares sold | 76,714 | |||
Interest and dividends | 562,162 | |||
Other assets | 1,431 | |||
Total assets | $625,176,228 | |||
Liabilities | ||||
Payable to custodian | $85,000 | |||
Payables for | ||||
Securities sold short, at value (proceeds received, $1,375,557) | 1,664,591 | |||
Investments purchased | 2,788,925 | |||
Fund shares reacquired | 693,845 | |||
Collateral for securities loaned, at value | 146,520 | |||
Payable to affiliates | ||||
Investment adviser | 17,693 | |||
Shareholder servicing costs | 1,027 | |||
Distribution and/or service fees | 3,086 | |||
Payable for independent Trustees’ compensation | 752 | |||
Accrued expenses and other liabilities | 78,729 | |||
Total liabilities | $5,480,168 | |||
Net assets | $619,696,060 | |||
Net assets consist of | ||||
Paid-in capital | $373,279,191 | |||
Unrealized appreciation (depreciation) on investments and translation of assets and liabilities in foreign currencies | 164,693,434 | |||
Accumulated net realized gain (loss) on investments and foreign currency | 71,878,501 | |||
Undistributed net investment income | 9,844,934 | |||
Net assets | $619,696,060 | |||
Shares of beneficial interest outstanding | 21,414,805 |
| Net assets | Shares outstanding | Net asset value per share | ||||||||||
Initial Class | $394,883,777 | 13,587,723 | $29.06 | |||||||||
Service Class | 224,812,283 | 7,827,082 | 28.72 | |||||||||
See Notes to Financial Statements
7
Table of Contents
MFS Research Series
FINANCIAL STATEMENTS | STATEMENT OF OPERATIONS (unaudited)
This statement describes how much your fund earned in investment income and accrued in expenses. It also describes any gains and/or losses generated by fund operations.
Six months ended 6/30/17 | ||||
Net investment income | ||||
Income | ||||
Dividends | $4,603,511 | |||
Dividends from underlying affiliated funds | 15,643 | |||
Interest | 8,235 | |||
Foreign taxes withheld | (4,531 | ) | ||
Total investment income | $4,622,858 | |||
Expenses | ||||
Management fee | $2,314,787 | |||
Distribution and/or service fees | 281,856 | |||
Shareholder servicing costs | 20,253 | |||
Administrative services fee | 54,593 | |||
Independent Trustees’ compensation | 8,059 | |||
Custodian fee | 17,349 | |||
Shareholder communications | 39,128 | |||
Audit and tax fees | 28,222 | |||
Legal fees | 3,393 | |||
Dividend and interest expense on securities sold short | 43,340 | |||
Miscellaneous | 16,777 | |||
Total expenses | $2,827,757 | |||
Reduction of expenses by investment adviser | (59,559 | ) | ||
Net expenses | $2,768,198 | |||
Net investment income | $1,854,660 | |||
Realized and unrealized gain (loss) on investments and foreign currency | ||||
Realized gain (loss) (identified cost basis) | ||||
Investments: | ||||
Non-affiliated issuers | $32,476,160 | |||
Underlying affiliated funds | 284 | |||
Foreign currency | 227 | |||
Net realized gain (loss) on investments and foreign currency | $32,476,671 | |||
Change in unrealized appreciation (depreciation) | ||||
Investments | $34,778,786 | |||
Securities sold short | (222,821 | ) | ||
Translation of assets and liabilities in foreign currencies | 147 | |||
Net unrealized gain (loss) on investments and foreign currency translation | $34,556,112 | |||
Net realized and unrealized gain (loss) on investments and foreign currency | $67,032,783 | |||
Change in net assets from operations | $68,887,443 |
See Notes to Financial Statements
8
Table of Contents
MFS Research Series
FINANCIAL STATEMENTS | STATEMENTS OF CHANGES IN NET ASSETS
These statements describe the increases and/or decreases in net assets resulting from operations, any distributions, and any shareholder transactions.
| | Six months ended 6/30/17 (unaudited | ) | | Year ended 12/31/16 | | |||
Change in net assets | ||||||||
| From operations | ||||||||
Net investment income | $1,854,660 | $7,873,516 | ||||||
Net realized gain (loss) on investments and foreign currency | 32,476,671 | 40,672,516 | ||||||
Net unrealized gain (loss) on investments and foreign currency translation | 34,556,112 | 2,950,417 | ||||||
Change in net assets from operations | $68,887,443 | $51,496,449 | ||||||
| Distributions declared to shareholders | ||||||||
From net investment income | $— | $(4,225,841 | ) | |||||
From net realized gain on investments | — | (62,130,911 | ) | |||||
Total distributions declared to shareholders | $— | $(66,356,752 | ) | |||||
Change in net assets from fund share transactions | $(55,788,475 | ) | $(15,425,163 | ) | ||||
Total change in net assets | $13,098,968 | $(30,285,466 | ) | |||||
| Net assets | ||||||||
At beginning of period | 606,597,092 | 636,882,558 | ||||||
At end of period (including undistributed net investment income of $9,844,934 and | $619,696,060 | $606,597,092 |
See Notes to Financial Statements
9
Table of Contents
MFS Research Series
FINANCIAL STATEMENTS | FINANCIAL HIGHLIGHTS
The financial highlights table is intended to help you understand the fund’s financial performance for the semiannual period and the past 5 fiscal years. Certain information reflects financial results for a single fund share. The total returns in the table represent the rate that an investor would have earned (or lost) on an investment in the fund share class (assuming reinvestment of all distributions) held for the entire period.
| Initial Class | Six months 6/30/17 | Years ended 12/31 | ||||||||||||||||||||||
| 2016 | 2015 | 2014 | 2013 | 2012 | ||||||||||||||||||||
| (unaudited) | ||||||||||||||||||||||||
Net asset value, beginning of period | $26.00 | $26.68 | $29.11 | $28.74 | $21.84 | $18.78 | ||||||||||||||||||
| Income (loss) from investment operations | ||||||||||||||||||||||||
Net investment income (d) | $0.10 | $0.36 | (c) | $0.21 | $0.19 | $0.20 | $0.22 | |||||||||||||||||
Net realized and unrealized gain (loss) on investments and foreign currency | 2.96 | 1.98 | (0.17 | )(g) | 2.68 | 6.84 | 3.01 | |||||||||||||||||
Total from investment operations | $3.06 | $2.34 | $0.04 | $2.87 | $7.04 | $3.23 | ||||||||||||||||||
| Less distributions declared to shareholders | ||||||||||||||||||||||||
From net investment income | $— | $(0.22 | ) | $(0.22 | ) | $(0.25 | ) | $(0.08 | ) | $(0.17 | ) | |||||||||||||
From net realized gain on investments | — | (2.80 | ) | (2.25 | ) | (2.25 | ) | (0.06 | ) | — | ||||||||||||||
Total distributions declared to shareholders | $— | $(3.02 | ) | $(2.47 | ) | $(2.50 | ) | $(0.14 | ) | $(0.17 | ) | |||||||||||||
Net asset value, end of period (x) | $29.06 | $26.00 | $26.68 | $29.11 | $28.74 | $21.84 | ||||||||||||||||||
Total return (%) (k)(r)(s)(x) | 11.77 | (n) | 8.74 | (c) | 0.80 | 10.20 | 32.35 | 17.22 | ||||||||||||||||
| Ratios (%) (to average net assets) and Supplemental data: | ||||||||||||||||||||||||
Expenses before expense reductions (f) | 0.82 | (a) | 0.80 | (c) | 0.82 | 0.80 | 0.81 | 0.88 | ||||||||||||||||
Expenses after expense reductions (f) | 0.80 | (a) | 0.79 | (c) | 0.81 | 0.80 | 0.81 | 0.88 | ||||||||||||||||
Net investment income | 0.69 | (a) | 1.36 | (c) | 0.72 | 0.67 | 0.80 | 1.06 | ||||||||||||||||
Portfolio turnover | 19 | (n) | 45 | 43 | 34 | 43 | 83 | |||||||||||||||||
Net assets at end of period (000 omitted) | $394,884 | $386,256 | $410,178 | $468,286 | $496,857 | $460,834 | ||||||||||||||||||
| Supplemental Ratios (%): | ||||||||||||||||||||||||
Ratio of expenses to average net assets after expense reductions excluding short sale expenses (f) | 0.79 | (a) | 0.78 | (c) | 0.80 | N/A | 0.80 | 0.87 | ||||||||||||||||
See Notes to Financial Statements
10
Table of Contents
MFS Research Series
Financial Highlights – continued
| Service Class | Six months 6/30/17 | Years ended 12/31 | ||||||||||||||||||||||
| 2016 | 2015 | 2014 | 2013 | 2012 | ||||||||||||||||||||
| (unaudited) | ||||||||||||||||||||||||
Net asset value, beginning of period | $25.73 | $26.42 | $28.84 | $28.49 | $21.70 | $18.67 | ||||||||||||||||||
| Income (loss) from investment operations | ||||||||||||||||||||||||
Net investment income (d) | $0.06 | $0.29 | (c) | $0.13 | $0.12 | $0.14 | $0.18 | |||||||||||||||||
Net realized and unrealized gain (loss) on investments and foreign currency | 2.93 | 1.96 | (0.16 | )(g) | 2.65 | 6.78 | 2.97 | |||||||||||||||||
Total from investment operations | $2.99 | $2.25 | $(0.03 | ) | $2.77 | $6.92 | $3.15 | |||||||||||||||||
| Less distributions declared to shareholders | ||||||||||||||||||||||||
From net investment income | $— | $(0.14 | ) | $(0.14 | ) | $(0.17 | ) | $(0.07 | ) | $(0.12 | ) | |||||||||||||
From net realized gain on investments | — | (2.80 | ) | (2.25 | ) | (2.25 | ) | (0.06 | ) | — | ||||||||||||||
Total distributions declared to shareholders | $— | $(2.94 | ) | $(2.39 | ) | $(2.42 | ) | $(0.13 | ) | $(0.12 | ) | |||||||||||||
Net asset value, end of period (x) | $28.72 | $25.73 | $26.42 | $28.84 | $28.49 | $21.70 | ||||||||||||||||||
Total return (%) (k)(r)(s)(x) | 11.62 | (n) | 8.49 | (c) | 0.53 | 9.94 | 32.00 | 16.90 | ||||||||||||||||
| Ratios (%) (to average net assets) and Supplemental data: | ||||||||||||||||||||||||
Expenses before expense reductions (f) | 1.07 | (a) | 1.05 | (c) | 1.07 | 1.05 | 1.06 | 1.11 | ||||||||||||||||
Expenses after expense reductions (f) | 1.05 | (a) | 1.04 | (c) | 1.06 | 1.05 | 1.05 | 1.11 | ||||||||||||||||
Net investment income | 0.44 | (a) | 1.11 | (c) | 0.47 | 0.42 | 0.56 | 0.82 | ||||||||||||||||
Portfolio turnover | 19 | (n) | 45 | 43 | 34 | 43 | 83 | |||||||||||||||||
Net assets at end of period (000 omitted) | $224,812 | $220,341 | $226,704 | $260,028 | $279,054 | $266,040 | ||||||||||||||||||
| Supplemental Ratios (%): | ||||||||||||||||||||||||
Ratio of expenses to average net assets after expense reductions excluding short sale expenses (f) | 1.04 | (a) | 1.03 | (c) | 1.05 | N/A | 1.05 | 1.11 | ||||||||||||||||
| (a) | Annualized. |
| (c) | Amount reflects a one-time reimbursement of expenses by the custodian (or former custodian) without which net investment income and performance would be lower and expenses would be higher. |
| (d) | Per share data is based on average shares outstanding. |
| (f) | Ratios do not reflect reductions from fees paid indirectly, if applicable. |
| (g) | The per share amount varies from the net realized and unrealized gain/loss for the period because of the timing of sales of fund shares and the per share amount of realized and unrealized gains and losses at such time. |
| (k) | The total return does not reflect expenses that apply to separate accounts. Inclusion of these charges would reduce the total return figures for all periods shown. |
| (n) | Not annualized. |
| (r) | Certain expenses have been reduced without which performance would have been lower. |
| (s) | From time to time the fund may receive proceeds from litigation settlements, without which performance would be lower. |
| (x) | The net asset values and total returns have been calculated on net assets which include adjustments made in accordance with U.S. generally accepted accounting principles required at period end for financial reporting purposes. |
See Notes to Financial Statements
11
Table of Contents
MFS Research Series
NOTES TO FINANCIAL STATEMENTS (unaudited)
| (1) | Business and Organization |
MFS Research Series (the fund) is a diversified series of MFS Variable Insurance Trust (the trust). The trust is organized as a Massachusetts business trust and is registered under the Investment Company Act of 1940, as amended, as an open-end management investment company. The shareholders of each series of the trust are separate accounts of insurance companies, which offer variable annuity and/or life insurance products, and qualified retirement and pension plans.
The fund is an investment company and accordingly follows the investment company accounting and reporting guidance of the Financial Accounting Standards Board (FASB) Accounting Standards Codification Topic 946 Financial Services – Investment Companies.
| (2) | Significant Accounting Policies |
General – The preparation of financial statements in conformity with U.S. generally accepted accounting principles requires management to make estimates and assumptions that affect the reported amounts of assets and liabilities, and disclosure of contingent assets and liabilities at the date of the financial statements and the reported amounts of increases and decreases in net assets from operations during the reporting period. Actual results could differ from those estimates. In the preparation of these financial statements, management has evaluated subsequent events occurring after the date of the fund’s Statement of Assets and Liabilities through the date that the financial statements were issued.
In October 2016, the Securities and Exchange Commission (SEC) released its Final Rule on Investment Company Reporting Modernization (the “Rule”). The Rule, which introduces two new regulatory reporting forms for investment companies – Form N-PORT and Form N-CEN – also contains amendments to Regulation S-X which impact financial statement presentation, particularly the presentation of derivative investments. Although still evaluating the impacts of the Rule, management believes that many of the Regulation S-X amendments are consistent with the fund’s current financial statement presentation and expects that the fund will be able to comply with the Rule’s Regulation S-X amendments by the August 1, 2017 compliance date.
Balance Sheet Offsetting – The fund’s accounting policy with respect to balance sheet offsetting is that, absent an event of default by the counterparty or a termination of the agreement, the International Swaps and Derivatives Association (ISDA) Master Agreement does not result in an offset of reported amounts of financial assets and financial liabilities in the Statement of Assets and Liabilities across transactions between the fund and the applicable counterparty. The fund’s right to setoff may be restricted or prohibited by the bankruptcy or insolvency laws of the particular jurisdiction to which a specific master netting agreement counterparty is subject. Balance sheet offsetting disclosures, to the extent applicable to the fund, have been included in the fund’s Significant Accounting Policies note under the captions for each of the fund’s in-scope financial instruments and transactions.
Investment Valuations – Equity securities, including restricted equity securities, are generally valued at the last sale or official closing price on their primary market or exchange as provided by a third-party pricing service. Equity securities, for which there were no sales reported that day, are generally valued at the last quoted daily bid quotation on their primary market or exchange as provided by a third-party pricing service. Equity securities held short, for which there were no sales reported for that day, are generally valued at the last quoted daily ask quotation on their primary market or exchange as provided by a third-party pricing service. Short-term instruments with a maturity at issuance of 60 days or less may be valued at amortized cost, which approximates market value. Exchange-traded options are generally valued at the last sale or official closing price on their primary exchange as provided by a third-party pricing service. Exchange-traded options for which there were no sales reported that day are generally valued at the last daily bid quotation on their primary exchange as provided by a third-party pricing service. Options not traded on an exchange are generally valued at a broker/dealer bid quotation. Foreign currency options are generally valued at valuations provided by a third-party pricing service. Open-end investment companies are generally valued at net asset value per share. Securities and other assets generally valued on the basis of information from a third-party pricing service may also be valued at a broker/dealer bid quotation. Values obtained from third-party pricing services can utilize both transaction data and market information such as yield, quality, coupon rate, maturity, type of issue, trading characteristics, and other market data. The values of foreign securities and other assets and liabilities expressed in foreign currencies are converted to U.S. dollars using the mean of bid and asked prices for rates provided by a third-party pricing service.
The Board of Trustees has delegated primary responsibility for determining or causing to be determined the value of the fund’s investments (including any fair valuation) to the adviser pursuant to valuation policies and procedures approved by the Board. If the adviser determines that reliable market quotations are not readily available, investments are valued at fair value as determined in good faith by the adviser in accordance with such procedures under the oversight of the Board of Trustees. Under the fund’s valuation policies and procedures, market quotations are not considered to be readily available for most types of debt instruments and floating rate loans and many types of derivatives. These investments are generally valued at fair value based on information from third-party pricing services. In addition, investments may be valued at fair value if the adviser determines that an investment’s value has been materially affected by events occurring after the close of the exchange or market on which the investment is principally traded (such as foreign exchange or market) and prior to the determination of the fund’s net asset value, or after the halting of trading of a specific security where trading does not resume prior to the close of the exchange or market on which the security is
12
Table of Contents
MFS Research Series
Notes to Financial Statements (unaudited) – continued
principally traded. Events that occur on a frequent basis after foreign markets close (such as developments in foreign markets and significant movements in the U.S. markets) and prior to the determination of the fund’s net asset value may be deemed to have a material effect on the value of securities traded in foreign markets. Accordingly, the fund’s foreign equity securities may often be valued at fair value. The adviser generally relies on third-party pricing services or other information (such as the correlation with price movements of similar securities in the same or other markets; the type, cost and investment characteristics of the security; the business and financial condition of the issuer; and trading and other market data) to assist in determining whether to fair value and at what value to fair value an investment. The value of an investment for purposes of calculating the fund’s net asset value can differ depending on the source and method used to determine value. When fair valuation is used, the value of an investment used to determine the fund’s net asset value may differ from quoted or published prices for the same investment. There can be no assurance that the fund could obtain the fair value assigned to an investment if it were to sell the investment at the same time at which the fund determines its net asset value per share.
Various inputs are used in determining the value of the fund’s assets or liabilities. These inputs are categorized into three broad levels. In certain cases, the inputs used to measure fair value may fall into different levels of the fair value hierarchy. In such cases, an investment’s level within the fair value hierarchy is based on the lowest level of input that is significant to the fair value measurement. The fund’s assessment of the significance of a particular input to the fair value measurement in its entirety requires judgment, and considers factors specific to the investment. Level 1 includes unadjusted quoted prices in active markets for identical assets or liabilities. Level 2 includes other significant observable market-based inputs (including quoted prices for similar securities, interest rates, prepayment speed, and credit risk). Level 3 includes unobservable inputs, which may include the adviser’s own assumptions in determining the fair value of investments. The following is a summary of the levels used as of June 30, 2017 in valuing the fund’s assets or liabilities:
| Investments at Value | Level 1 | Level 2 | Level 3 | Total | ||||||||||||
| Equity Securities | $614,848,141 | $— | $— | $614,848,141 | ||||||||||||
| Mutual Funds | 2,242,780 | — | — | 2,242,780 | ||||||||||||
| Total Investments | $617,090,921 | $— | $— | $617,090,921 | ||||||||||||
| Short Sales | $(1,664,591 | ) | $— | $— | $(1,664,591 | ) | ||||||||||
For further information regarding security characteristics, see the Portfolio of Investments.
Foreign Currency Translation – Purchases and sales of foreign investments, income, and expenses are converted into U.S. dollars based upon currency exchange rates prevailing on the respective dates of such transactions or on the reporting date for foreign denominated receivables and payables. Gains and losses attributable to foreign currency exchange rates on sales of securities are recorded for financial statement purposes as net realized gains and losses on investments. Gains and losses attributable to foreign exchange rate movements on receivables, payables, income and expenses are recorded for financial statement purposes as foreign currency transaction gains and losses. That portion of both realized and unrealized gains and losses on investments that results from fluctuations in foreign currency exchange rates is not separately disclosed.
Derivatives – The fund uses derivatives for different purposes, primarily to increase or decrease exposure to a particular market or segment of the market, or security, to increase or decrease interest rate or currency exposure, or as alternatives to direct investments. Derivatives are used for hedging or non-hedging purposes. While hedging can reduce or eliminate losses, it can also reduce or eliminate gains. When the fund uses derivatives as an investment to increase market exposure, or for hedging purposes, gains and losses from derivative instruments may be substantially greater than the derivative’s original cost.
The derivative instruments used by the fund were purchased options. The fund’s period end derivatives, as presented in the Portfolio of Investments, generally are indicative of the volume of its derivative activity during the period.
The following table presents, by major type of derivative contract, the fair value, on a gross basis, of the asset and liability components of derivatives held by the fund at June 30, 2017 as reported in the Statement of Assets and Liabilities:
| Fair Value (a) | ||||||
| Risk | Derivative Contracts | Asset Derivatives | ||||
| Equity | Purchased Equity Options | $1,573,960 | ||||
| (a) | The value of purchased options outstanding is included in total investments, at value, within the fund’s Statement of Assets and Liabilities. |
There is no realized gain (loss) from derivative transactions during the period.
The following table presents, by major type of derivative contract, the change in unrealized appreciation (depreciation) on derivatives held by the fund for the six months ended June 30, 2017 as reported in the Statement of Operations:
| Risk | Investments (Purchased Options) | |||
| Equity | $135,446 | |||
13
Table of Contents
MFS Research Series
Notes to Financial Statements (unaudited) – continued
Derivative counterparty credit risk is managed through formal evaluation of the creditworthiness of all potential counterparties. On certain, but not all, uncleared derivatives, the fund attempts to reduce its exposure to counterparty credit risk whenever possible by entering into an ISDA Master Agreement on a bilateral basis. The ISDA Master Agreement gives each party to the agreement the right to terminate all transactions traded under such agreement if there is a certain deterioration in the credit quality of the other party. Upon an event of default or a termination of the ISDA Master Agreement, the non-defaulting party has the right to close out all transactions traded under such agreement and to net amounts owed under each agreement to one net amount payable by one party to the other. This right to close out and net payments across all transactions traded under the ISDA Master Agreement could result in a reduction of the fund’s credit risk to such counterparty equal to any amounts payable by the fund under the applicable transactions, if any.
Collateral and margin requirements differ by type of derivative. Margin requirements are set by the clearing broker and the clearing house for cleared derivatives (e.g., futures contracts, cleared swaps, and exchange-traded options) while collateral terms are contract specific for uncleared derivatives (e.g., forward foreign currency exchange contracts, uncleared swap agreements, and uncleared options). For derivatives traded under an ISDA Master Agreement, which contains a collateral support annex, the collateral requirements are netted across all transactions traded under such agreement and one amount is posted from one party to the other to collateralize such obligations. Cash that has been segregated to cover the fund’s collateral or margin obligations under derivative contracts, if any, will be reported separately in the Statement of Assets and Liabilities as “Restricted cash” or “Deposits with brokers.” Securities pledged as collateral or margin for the same purpose, if any, are noted in the Portfolio of Investments. The fund may be required to make payments of interest on uncovered collateral or margin obligations with the broker. Any such payments are included in “Miscellaneous” expense in the Statement of Operations.
Purchased Options – The fund purchased call options for a premium. Purchased call options entitle the holder to buy a specified number of shares or units of a particular security, currency or index at a specified price at a specified date or within a specified period of time. Purchasing call options may hedge against an anticipated increase in the dollar cost of securities or currency to be acquired or increase the fund’s exposure to an underlying instrument.
The premium paid is initially recorded as an investment in the Statement of Assets and Liabilities. That investment is subsequently marked-to-market daily with the difference between the premium paid and the market value of the purchased option being recorded as unrealized appreciation or depreciation. Premiums paid for purchased call options which have expired are treated as realized losses on investments in the Statement of Operations. Upon the exercise or closing of a purchased call option, the premium paid is added to the cost of the security or financial instrument purchased.
Whether or not the option is exercised, the fund’s maximum risk of loss from purchasing an option is the amount of premium paid. All option contracts involve credit risk if the counterparty to the option contract fails to perform. For uncleared options, this risk is mitigated in cases where there is an ISDA Master Agreement between the fund and the counterparty providing for netting as described above and, where applicable, by the posting of collateral by the counterparty to the fund to cover the fund’s exposure to the counterparty under such ISDA Master Agreement.
Short Sales – The fund entered into short sales whereby it sells a security it does not own in anticipation of a decline in the value of that security. The fund will realize a gain if the security price decreases and a loss if the security price increases between the date of the short sale and the date on which the fund replaces the borrowed security. Losses from short sales can exceed the proceeds of the security sold; and they can also exceed the potential loss from an ordinary buy and sell transaction. The amount of any premium, dividends, or interest the fund may be required to pay in connection with a short sale will be recognized as a fund expense. During the six months ended June 30, 2017, this expense amounted to $43,340. The fund segregates cash or marketable securities in an amount that, when combined with the amount of proceeds from the short sale deposited with the broker, at least equals the current market value of the security sold short.
Security Loans – Under its Securities Lending Agency Agreement with the fund, State Street Bank and Trust Company (“State Street”), as lending agent, loans the securities of the fund to certain qualified institutions (the “Borrowers”) approved by the fund. Security loans can be terminated at the discretion of either the lending agent or the fund and the related securities must be returned within the earlier of the standard trade settlement period for such securities or within three business days. The loans are collateralized by cash and/or U.S. Treasury and federal agency obligations in an amount typically at least equal to the market value of the securities loaned. On loans collateralized by cash, the cash collateral is invested in a money market fund. The market value of the loaned securities is determined at the close of business of the fund and any additional required collateral is delivered to the fund on the next business day. State Street provides the fund with indemnification against Borrower default. In the event of Borrower default, State Street will, for the benefit of the fund, either purchase securities identical to those loaned or, when such purchase is commercially impracticable, pay the fund the market value of the loaned securities. In return, State Street assumes the fund’s rights to the related collateral. If the collateral value is less than the cost to purchase identical securities, State Street is responsible for the shortfall, but only to the extent that such shortfall is not due to a decline in collateral value resulting from collateral reinvestment for which the fund bears the risk of loss. At period end, the fund had investment securities on loan, all of which were classified as equity
14
Table of Contents
MFS Research Series
Notes to Financial Statements (unaudited) – continued
securities in the fund’s Portfolio of Investments, with a fair value of $145,055. The fair value of the fund’s investment securities on loan and a related liability of $146,520 for cash collateral received on securities loaned are both presented gross in the Statement of Assets and Liabilities. The collateral received on securities loaned exceeded the value of securities on loan at period end. The liability for cash collateral for securities loaned is carried at fair value, which is categorized as level 2 within the fair value hierarchy. A portion of the income generated upon investment of the collateral is remitted to the Borrowers, and the remainder is allocated between the fund and the lending agent. On loans collateralized by U.S. Treasury and/or federal agency obligations, a fee is received from the Borrower, and is allocated between the fund and the lending agent. Income from securities lending is included in “Interest” income in the Statement of Operations. The dividend and interest income earned on the securities loaned is accounted for in the same manner as other dividend and interest income.
Indemnifications – Under the fund’s organizational documents, its officers and Trustees may be indemnified against certain liabilities and expenses arising out of the performance of their duties to the fund. Additionally, in the normal course of business, the fund enters into agreements with service providers that may contain indemnification clauses. The fund’s maximum exposure under these agreements is unknown as this would involve future claims that may be made against the fund that have not yet occurred.
Investment Transactions and Income – Investment transactions are recorded on the trade date. Interest income is recorded on the accrual basis. Dividends received in cash are recorded on the ex-dividend date. Certain dividends from foreign securities will be recorded when the fund is informed of the dividend if such information is obtained subsequent to the ex-dividend date. Dividend and interest payments received in additional securities are recorded on the ex-dividend or ex-interest date in an amount equal to the value of the security on such date.
The fund may receive proceeds from litigation settlements. Any proceeds received from litigation involving portfolio holdings are reflected in the Statement of Operations in realized gain/loss if the security has been disposed of by the fund or in unrealized gain/loss if the security is still held by the fund. Any other proceeds from litigation not related to portfolio holdings are reflected as other income in the Statement of Operations.
Tax Matters and Distributions – The fund intends to qualify as a regulated investment company, as defined under Subchapter M of the Internal Revenue Code, and to distribute all of its taxable income, including realized capital gains. As a result, no provision for federal income tax is required. The fund’s federal tax returns, when filed, will remain subject to examination by the Internal Revenue Service for a three year period. Management has analyzed the fund’s tax positions taken on federal and state tax returns for all open tax years and does not believe that there are any uncertain tax positions that require recognition of a tax liability. Foreign taxes, if any, have been accrued by the fund in the accompanying financial statements in accordance with the applicable foreign tax law. Foreign income taxes may be withheld by certain countries in which the fund invests. Additionally, capital gains realized by the fund on securities issued in or by certain foreign countries may be subject to capital gains tax imposed by those countries.
Distributions to shareholders are recorded on the ex-dividend date. Income and capital gain distributions are determined in accordance with income tax regulations, which may differ from U.S. generally accepted accounting principles. Certain capital accounts in the financial statements are periodically adjusted for permanent differences in order to reflect their tax character. These adjustments have no impact on net assets or net asset value per share. Temporary differences which arise from recognizing certain items of income, expense, gain or loss in different periods for financial statement and tax purposes will reverse at some time in the future. Distributions in excess of net investment income or net realized gains are temporary overdistributions for financial statement purposes resulting from differences in the recognition or classification of income or distributions for financial statement and tax purposes.
Book/tax differences primarily relate to wash sale loss deferrals.
The tax character of distributions declared to shareholders for the last fiscal year is as follows:
| Year ended 12/31/16 | ||||
| Ordinary income (including any short-term capital gains) | $10,217,166 | |||
| Long-term capital gains | 56,139,586 | |||
| Total distributions | $66,356,752 | |||
15
Table of Contents
MFS Research Series
Notes to Financial Statements (unaudited) – continued
The federal tax cost and the tax basis components of distributable earnings were as follows:
| As of 6/30/17 | ||||
| Cost of investments | $453,828,007 | |||
| Gross appreciation | 170,680,715 | |||
| Gross depreciation | (7,417,801 | ) | ||
| Net unrealized appreciation (depreciation) | $163,262,914 | |||
| As of 12/31/16 | ||||
| Undistributed ordinary income | 9,202,663 | |||
| Undistributed long-term capital gain | 39,871,671 | |||
| Other temporary differences | (29,035 | ) | ||
| Net unrealized appreciation (depreciation) | 128,484,127 | |||
The aggregate cost above includes prior fiscal year end tax adjustments, if applicable.
Multiple Classes of Shares of Beneficial Interest – The fund offers multiple classes of shares, which differ in their respective distribution and/or service fees. The fund’s income, realized and unrealized gain (loss), and common expenses are allocated to shareholders based on the daily net assets of each class. Dividends are declared separately for each class. Differences in per share dividend rates are generally due to differences in separate class expenses. The fund’s distributions declared to shareholders as reported in the Statements of Changes in Net Assets are presented by class as follows:
| From net investment income | From net realized gain on investments | |||||||||||||||
| Six months ended 6/30/17 | Year ended 12/31/16 | Six months ended 6/30/17 | Year ended 12/31/16 | |||||||||||||
| Initial Class | $— | $3,069,680 | $— | $39,398,623 | ||||||||||||
| Service Class | — | 1,156,161 | — | 22,732,288 | ||||||||||||
| Total | $— | $4,225,841 | $— | $62,130,911 | ||||||||||||
| (3) | Transactions with Affiliates |
Investment Adviser – The fund has an investment advisory agreement with MFS to provide overall investment management and related administrative services and facilities to the fund. The management fee is computed daily and paid monthly at the following annual rates:
| First $1 billion of average daily net assets | 0.75% | |||
| Average daily net assets in excess of $1 billion | 0.65% |
MFS has agreed in writing to reduce its management fee by a specified amount if certain MFS mutual fund assets exceed thresholds agreed to by MFS and the fund’s Board of Trustees. For the six months ended June 30, 2017, this management fee reduction amounted to $23,686, which is included in the reduction of total expenses in the Statement of Operations. The management fee incurred for the six months ended June 30, 2017 was equivalent to an annual effective rate of 0.74% of the fund’s average daily net assets.
The investment adviser has agreed in writing to pay a portion of the fund’s total annual operating expenses, excluding interest, taxes, extraordinary expenses, brokerage and transaction costs, and investment-related expenses (such as short sale dividend and interest expenses incurred in connection with the fund’s investment activity), such that total annual operating expenses do not exceed 0.79% of average daily net assets for the Initial Class shares and 1.04% of average daily net assets for the Service Class shares. This written agreement will continue until modified by the fund’s Board of Trustees, but such agreement will continue at least until April 30, 2019. For the six months ended June 30, 2017, this reduction amounted to $35,873, which is included in the reduction of total expenses in the Statement of Operations.
Distributor – MFS Fund Distributors, Inc. (MFD), a wholly-owned subsidiary of MFS, is the distributor of shares of the fund. The Trustees have adopted a distribution plan for the Service Class shares pursuant to Rule 12b-1 under the Investment Company Act of 1940.
The fund’s distribution plan provides that the fund will pay MFD distribution and/or service fees equal to 0.25% per annum of its average daily net assets attributable to Service Class shares as partial consideration for services performed and expenses incurred by MFD and financial intermediaries (including participating insurance companies that invest in the fund to fund variable annuity and variable life insurance contracts, sponsors of qualified retirement and pension plans that invest in the fund, and affiliates of these participating insurance companies and plan sponsors) in connection with the sale and distribution of the Service Class shares. MFD may subsequently pay all, or a portion, of the distribution and/or service fees to financial intermediaries.
16
Table of Contents
MFS Research Series
Notes to Financial Statements (unaudited) – continued
Shareholder Servicing Agent – MFS Service Center, Inc. (MFSC), a wholly-owned subsidiary of MFS, receives a fee from the fund for its services as shareholder servicing agent. For the six months ended June 30, 2017, the fee was $18,812, which equated to 0.0061% annually of the fund’s average daily net assets. MFSC also receives payment from the fund for out-of-pocket expenses paid by MFSC on behalf of the fund. For the six months ended June 30, 2017, these costs amounted to $1,441.
Administrator – MFS provides certain financial, legal, shareholder communications, compliance, and other administrative services to the fund. Under an administrative services agreement, the fund reimburses MFS the costs incurred to provide these services. The fund is charged an annual fixed amount of $17,500 plus a fee based on average daily net assets. The administrative services fee incurred for the six months ended June 30, 2017 was equivalent to an annual effective rate of 0.0177% of the fund’s average daily net assets.
Trustees’ and Officers’ Compensation – The fund pays compensation to independent Trustees in the form of a retainer, attendance fees, and additional compensation to Board and Committee chairpersons. The fund does not pay compensation directly to Trustees or officers of the fund who are also officers of the investment adviser, all of whom receive remuneration for their services to the fund from MFS. Certain officers and Trustees of the fund are officers or directors of MFS, MFD, and MFSC.
Other – This fund and certain other funds managed by MFS (the funds) have entered into a service agreement (the ISO Agreement) which provides for payment of fees solely by the funds to Tarantino LLC in return for the provision of services of an Independent Senior Officer (ISO) for the funds. Frank L. Tarantino serves as the ISO and is an officer of the funds and the sole member of Tarantino LLC. The funds can terminate the ISO Agreement with Tarantino LLC at any time under the terms of the ISO Agreement. For the six months ended June 30, 2017, the fee paid by the fund under this agreement was $581 and is included in “Miscellaneous” expense in the Statement of Operations. MFS has agreed to bear all expenses associated with office space, other administrative support, and supplies provided to the ISO.
The fund invests in the MFS Institutional Money Market Portfolio which is managed by MFS and seeks current income consistent with preservation of capital and liquidity. This money market fund does not pay a management fee to MFS.
The fund is permitted to engage in purchase and sale transactions with funds and accounts for which MFS serves as investment adviser or sub-adviser (“cross-trades”) pursuant to a policy adopted by the Board of Trustees. This policy has been designed to ensure that cross-trades conducted by the fund comply with Rule 17a-7 under the Investment Company Act of 1940. Under this policy, cross-trades are effected at current market prices with no remuneration paid in connection with the transaction. During the six months ended June 30, 2017, the fund engaged in purchase transactions pursuant to this policy, which amounted to $326,133.
| (4) | Portfolio Securities |
For the six months ended June 30, 2017, purchases and sales of investments, other than short sales, purchased options transactions, and short-term obligations, aggregated $118,766,757 and $177,572,436, respectively.
| (5) | Shares of Beneficial Interest |
The fund’s Declaration of Trust permits the Trustees to issue an unlimited number of full and fractional shares of beneficial interest. Transactions in fund shares were as follows:
| Six months ended 6/30/17 | Year ended 12/31/16 | |||||||||||||||
| Shares | Amount | Shares | Amount | |||||||||||||
| Shares sold | ||||||||||||||||
Initial Class | 181,731 | $5,100,627 | 317,881 | $8,429,363 | ||||||||||||
Service Class | 290,230 | 8,006,124 | 785,388 | 20,743,069 | ||||||||||||
| 471,961 | $13,106,751 | 1,103,269 | $29,172,432 | |||||||||||||
| Shares issued to shareholders in reinvestment of distributions | ||||||||||||||||
Initial Class | — | $— | 1,631,514 | $42,468,303 | ||||||||||||
Service Class | — | — | 926,627 | 23,888,449 | ||||||||||||
| — | $— | 2,558,141 | $66,356,752 | |||||||||||||
| Shares reacquired | ||||||||||||||||
Initial Class | (1,448,802 | ) | $(40,404,636 | ) | (2,468,940 | ) | $(65,822,688 | ) | ||||||||
Service Class | (1,026,615 | ) | (28,490,590 | ) | (1,728,143 | ) | (45,131,659 | ) | ||||||||
| (2,475,417 | ) | $(68,895,226 | ) | (4,197,083 | ) | $(110,954,347 | ) | |||||||||
| Net change | ||||||||||||||||
Initial Class | (1,267,071 | ) | $(35,304,009 | ) | (519,545 | ) | $(14,925,022 | ) | ||||||||
Service Class | (736,385 | ) | (20,484,466 | ) | (16,128 | ) | (500,141 | ) | ||||||||
| (2,003,456 | ) | $(55,788,475 | ) | (535,673 | ) | $(15,425,163 | ) | |||||||||
17
Table of Contents
MFS Research Series
Notes to Financial Statements (unaudited) – continued
The fund is one of several mutual funds in which certain MFS funds may invest. The MFS funds do not invest in the underlying funds for the purpose of exercising management or control. At the end of the period, the MFS Moderate Allocation Portfolio, the MFS Growth Allocation Portfolio, and the MFS Conservative Allocation Portfolio were the owners of record of approximately 22%, 7%, and 6%, respectively, of the value of outstanding voting shares of the fund.
| (6) | Line of Credit |
The fund and certain other funds managed by MFS participate in a $1.25 billion unsecured committed line of credit, subject to a $1 billion sublimit, provided by a syndication of banks under a credit agreement. Borrowings may be made for temporary financing needs. Interest is charged to each fund, based on its borrowings, generally at a rate equal to the higher of the Overnight Federal Reserve funds rate or daily one month LIBOR plus an agreed upon spread. A commitment fee, based on the average daily, unused portion of the committed line of credit, is allocated among the participating funds at the end of each calendar quarter. In addition, the fund and other funds managed by MFS have established unsecured uncommitted borrowing arrangements with certain banks for temporary financing needs. Interest is charged to each fund, based on its borrowings, at a rate equal to the Overnight Federal Reserve funds rate plus an agreed upon spread. For the six months ended June 30, 2017, the fund’s commitment fee and interest expense were $2,154 and $0, respectively, and are included in “Miscellaneous” expense in the Statement of Operations.
| (7) | Transactions in Underlying Affiliated Funds – Affiliated Issuers |
An affiliated issuer may be considered one in which the fund owns 5% or more of the outstanding voting securities, or a company which is under common control. For the purposes of this report, the fund assumes the following to be an affiliated issuer:
| Underlying Affiliated Fund | Beginning Shares/Par Amount | Acquisitions Shares/Par Amount | Dispositions Shares/Par Amount | Ending Shares/Par Amount | ||||||||||||
| MFS Institutional Money Market Portfolio | 2,866,758 | 66,774,747 | (67,545,245 | ) | 2,096,260 | |||||||||||
| Underlying Affiliated Fund | Realized Gain (Loss) | Capital Gain Distributions | Dividend Income | Ending Value | ||||||||||||
| MFS Institutional Money Market Portfolio | $284 | $— | $15,643 | $2,096,260 | ||||||||||||
18
Table of Contents
MFS Research Series
RESULTS OF SHAREHOLDER MEETING (unaudited)
At a special meeting of shareholders of MFS Variable Insurance Trust, which was held on March 23, 2017, the following action was taken:
Item 1: To elect the following individuals as Trustees:
| Number of Dollars | ||||||||
| Nominee | For | Withheld Authority | ||||||
| Steven E. Buller | 11,311,922,492.61 | 518,570,973.54 | ||||||
| John A. Caroselli | 11,291,109,000.34 | 539,384,465.81 | ||||||
| Maureen R. Goldfarb | 11,233,211,779.66 | 597,281,686.49 | ||||||
| David H. Gunning | 11,179,077,201.17 | 651,416,264.98 | ||||||
| Michael Hegarty | 11,191,993,154.78 | 638,500,311.37 | ||||||
| John P. Kavanaugh | 11,242,238,261.44 | 588,255,204.71 | ||||||
| Robert J. Manning | 11,314,479,376.58 | 516,014,089.57 | ||||||
| Clarence Otis, Jr. | 11,208,873,448.85 | 621,620,017.30 | ||||||
| Maryanne L. Roepke | 11,263,427,105.03 | 567,066,361.12 | ||||||
| Robin A. Stelmach | 11,313,883,043.82 | 516,610,422.33 | ||||||
| Laurie J. Thomsen | 11,240,219,041.09 | 590,274,425.06 | ||||||
19
Table of Contents
MFS Research Series
PROXY VOTING POLICIES AND INFORMATION
MFS votes proxies on behalf of the fund pursuant to proxy voting policies and procedures that are available without charge, upon request, by calling 1-800-225-2606, by visiting mfs.com (once you have selected “Individual Investor” as your role, click on “Individual Investor Home” in the top navigation and then select “Learn More About Proxy Voting” under the “I want to…” header on the left hand column of the page), or by visiting the SEC’s Web site at http://www.sec.gov.
Information regarding how the fund voted proxies relating to portfolio securities during the most recent twelve-month period ended June 30 is available by August 31 of each year without charge by visiting mfs.com (once you have selected “Individual Investor” as your role, click on “Individual Investor Home” in the top navigation and then select “Learn More About Proxy Voting” under the “I want to…” header on the left hand column of the page), or by visiting the SEC’s Web site at http://www.sec.gov.
QUARTERLY PORTFOLIO DISCLOSURE
The fund will file a complete schedule of portfolio holdings with the Securities and Exchange Commission (the Commission) for the first and third quarters of each fiscal year on Form N-Q. The fund’s Form N-Q is available on the EDGAR database on the Commission’s Internet Web site at http://www.sec.gov, and may be reviewed and copied at the:
Public Reference Room
Securities and Exchange Commission
100 F Street, NE, Room 1580
Washington, D.C. 20549
Information on the operation of the Public Reference Room may be obtained by calling the Commission at 1-800-SEC-0330. Copies of the fund’s Form N-Q also may be obtained, upon payment of a duplicating fee, by electronic request at the following e-mail address: publicinfo@sec.gov or by writing the Public Reference Section at the above address.
From time to time, MFS may post important information about the fund or the MFS funds on the MFS web site (mfs.com). This information is available on mfs.com by following these steps once you have selected “Individual Investor” as your role: (1) Click on the “Individual Investor Home” in the top navigation and then select the “Announcements” option within the “Market Outlooks” drop down, or (2) Click on “Products & Services” and “Variable Insurance Portfolios” and then select the fund’s name.
INFORMATION ABOUT FUND CONTRACTS AND LEGAL CLAIMS
The fund has entered into contractual arrangements with an investment adviser, administrator, distributor, shareholder servicing agent, 529 program manager (if applicable), and custodian who each provide services to the fund. Unless expressly stated otherwise, shareholders are not parties to, or intended beneficiaries of these contractual arrangements, and these contractual arrangements are not intended to create any shareholder right to enforce them against the service providers or to seek any remedy under them against the service providers, either directly or on behalf of the fund.
Under the Trust’s By-Laws and Declaration of Trust, any claims asserted against or on behalf of the MFS Funds, including claims against Trustees and Officers, must be brought in state and federal courts located within the Commonwealth of Massachusetts.
20
Table of Contents
Table of Contents
SEMIANNUAL REPORT
June 30, 2017

MFS® NEW DISCOVERY SERIES
MFS® Variable Insurance Trust

VND-SEM
Table of Contents
MFS® NEW DISCOVERY SERIES
The report is prepared for the general information of contract owners. It is authorized for distribution to prospective investors only when preceded or accompanied by a current prospectus.
NOT FDIC INSURED • MAY LOSE VALUE • NO BANK OR CREDIT UNION GUARANTEE • NOT A DEPOSIT • NOT INSURED BY ANY FEDERAL GOVERNMENT AGENCY OR NCUA/NCUSIF
Table of Contents
MFS New Discovery Series
LETTER FROM THE EXECUTIVE CHAIRMAN

Dear Contract Owners:
Despite policy uncertainty accompanying a new presidential administration in the United States and unease over ongoing Brexit negotiations, most markets have proved resilient. U.S. share prices have reached new highs. The U.S. Federal Reserve has continued to gradually hike interest rates. However, rates in most developed markets remain very low, with major non-U.S. central banks just beginning to contemplate curbing accommodative monetary policies.
Globally, economic growth has shown signs of recovery, led by China, the U.S. and the eurozone. Despite better growth, there are few immediate signs of worrisome inflation as wage growth remains muted. Europe has benefited from diminishing event risks as establishment candidates won both the Dutch and French elections, averting a feared populist trend. Emerging market economies are recovering at a somewhat slower pace amid fears that restrictive U.S. trade policies could further hamper the restrained pace of global trade growth. Looking ahead, markets will have to contend with issues involving geopolitical hot spots on the Korean peninsula and in the Middle East, which could potentially lead to a clash of interests between the U.S. and other major powers such as China or Russia.
At MFS®, we believe time is an asset. A patient, long-term approach to investing can have a powerful impact on decision making and outcomes. Time arbitrage, as we call it, simply comes down to having the conviction and discipline to allow enough time for good investment ideas to play out. In our view, such an approach, along with the professional guidance of a financial advisor, will help you reach your investment objectives.
Respectfully,

Robert J. Manning
Executive Chairman
MFS Investment Management
August 16, 2017
The opinions expressed in this letter are subject to change and may not be relied upon for investment advice. No forecasts can be guaranteed.
1
Table of Contents
MFS New Discovery Series
Portfolio structure
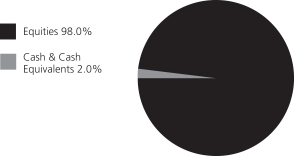
| Top ten holdings | ||||
| Bright Horizons Family Solutions, Inc. | 2.5% | |||
| Berry Plastics Group, Inc. | 2.2% | |||
| SS&C Technologies Holdings, Inc. | 1.8% | |||
| Steris PLC | 1.8% | |||
| NICE Systems Ltd., ADR | 1.6% | |||
| Live Nation, Inc. | 1.6% | |||
| Siteone Landscape Supply, Inc. | 1.6% | |||
| PerkinElmer, Inc. | 1.5% | |||
| GMS, Inc. | 1.3% | |||
| LogMeIn, Inc. | 1.3% |
| Equity sectors | ||||
| Technology | 20.5% | |||
| Health Care | 18.5% | |||
| Special Products & Services | 11.3% | |||
| Basic Materials | 8.6% | |||
| Autos & Housing | 8.0% | |||
| Leisure | 7.5% | |||
| Financial Services | 6.9% | |||
| Industrial Goods & Services | 6.8% | |||
| Consumer Staples | 3.9% | |||
| Retailing | 2.5% | |||
| Energy | 2.4% | |||
| Transportation | 1.1% |
Cash & Cash Equivalents includes any cash, investments in money market funds, short-term securities, and other assets less liabilities. Please see the Statement of Assets and Liabilities for additional information related to the fund’s cash position and other assets and liabilities.
Percentages are based on net assets as of June 30, 2017.
The portfolio is actively managed and current holdings may be different.
2
Table of Contents
MFS New Discovery Series
Fund Expenses Borne by the Contract Holders during the Period,
January 1, 2017 through June 30, 2017
As a contract holder of the fund, you incur ongoing costs, including management fees; distribution and/or service (12b-1) fees; and other fund expenses. This example is intended to help you understand your ongoing costs (in dollars) of investing in the fund and to compare these costs with the ongoing costs of investing in other mutual funds.
The example is based on an investment of $1,000 invested at the beginning of the period and held for the entire period January 1, 2017 through June 30, 2017.
Actual Expenses
The first line for each share class in the following table provides information about actual account values and actual expenses. You may use the information in this line, together with the amount you invested, to estimate the expenses that you paid over the period. Simply divide your account value by $1,000 (for example, an $8,600 account value divided by $1,000 = 8.6), then multiply the result by the number in the first line under the heading entitled “Expenses Paid During Period” to estimate the expenses you paid on your account during this period.
Hypothetical Example for Comparison Purposes
The second line for each share class in the following table provides information about hypothetical account values and hypothetical expenses based on the fund’s actual expense ratio and an assumed rate of return of 5% per year before expenses, which is not the fund’s actual return. The hypothetical account values and expenses may not be used to estimate the actual ending account balance or expenses you paid for the period. You may use this information to compare the ongoing costs of investing in the fund and other funds. To do so, compare this 5% hypothetical example with the 5% hypothetical examples that appear in the shareholder reports of the other funds.
Please note that the expenses shown in the table are meant to highlight the fund’s ongoing costs only and do not take into account the fees and expenses imposed under the variable contracts through which your investment in the fund is made. Therefore, the second line for each share class in the table is useful in comparing ongoing costs associated with an investment in vehicles (such as the fund) which fund benefits under variable annuity and variable life insurance contracts and to qualified pension and retirement plans only, and will not help you determine the relative total costs of investing in the fund through variable annuity and variable life insurance contracts. If the fees and expenses imposed under the variable contracts were included, your costs would have been higher.
| Share Class | Annualized Expense Ratio | Beginning Account Value 1/01/17 | Ending Account Value | Expenses Paid During Period (p) 1/01/17-6/30/17 | ||||||||||||||
| Initial Class | Actual | 0.94% | $1,000.00 | $1,110.01 | $4.92 | |||||||||||||
| Hypothetical (h) | 0.94% | $1,000.00 | $1,020.13 | $4.71 | ||||||||||||||
| Service Class | Actual | 1.19% | $1,000.00 | $1,108.59 | $6.22 | |||||||||||||
| Hypothetical (h) | 1.19% | $1,000.00 | $1,018.89 | $5.96 | ||||||||||||||
| (h) | 5% class return per year before expenses. |
| (p) | “Expenses Paid During Period” are equal to each class’s annualized expense ratio, as shown above, multiplied by the average account value over the period, multiplied by 181/365 (to reflect the one-half year period). |
3
Table of Contents
MFS New Discovery Series
PORTFOLIO OF INVESTMENTS – 6/30/17 (unaudited)
The Portfolio of Investments is a complete list of all securities owned by your fund. It is categorized by broad-based asset classes.
| Issuer | Shares/Par | Value ($) | ||||||
| COMMON STOCKS – 98.0% | ||||||||
| Aerospace – 1.6% | ||||||||
| HEICO Corp. | 59,966 | $ | 4,307,958 | |||||
| Leidos Holdings, Inc. | 125,886 | 6,507,047 | ||||||
|
| |||||||
| $ | 10,815,005 | |||||||
|
| |||||||
| Automotive – 1.1% | ||||||||
| Kar Auction Services, Inc. | 184,335 | $ | 7,736,540 | |||||
|
| |||||||
| Biotechnology – 3.7% | ||||||||
| ACADIA Pharmaceuticals, Inc. (a) | 67,372 | $ | 1,879,005 | |||||
| Alder Biopharmaceuticals, Inc. (a) | 55,357 | 633,838 | ||||||
| Amicus Therapeutics, Inc. (a) | 374,620 | 3,772,423 | ||||||
| Bio-Techne Corp. | 37,299 | 4,382,633 | ||||||
| Exact Sciences Corp. (a) | 71,826 | 2,540,486 | ||||||
| MiMedx Group, Inc. (a)(l) | 304,398 | 4,556,838 | ||||||
| Neurocrine Biosciences, Inc. (a) | 40,171 | 1,847,866 | ||||||
| Spark Therapeutics, Inc. (a) | 42,879 | 2,561,591 | ||||||
| Tesaro, Inc. (a) | 17,776 | 2,486,151 | ||||||
| VTV Therapeutics, Inc. (a) | 164,702 | 818,569 | ||||||
|
| |||||||
| $ | 25,479,400 | |||||||
|
| |||||||
| Brokerage & Asset Managers – 1.4% | ||||||||
| Hamilton Lane, Inc.,“A” | 215,635 | $ | 4,741,814 | |||||
| NASDAQ, Inc. | 70,317 | 5,026,962 | ||||||
|
| |||||||
| $ | 9,768,776 | |||||||
|
| |||||||
| Business Services – 7.1% | ||||||||
| CoStar Group, Inc. (a) | 13,220 | $ | 3,484,792 | |||||
| Global Payments, Inc. | 85,102 | 7,686,413 | ||||||
| Ringcentral, Inc. (a) | 207,368 | 7,579,300 | ||||||
| Travelport Worldwide Ltd. | 367,163 | 5,052,163 | ||||||
| Tyler Technologies, Inc. (a) | 20,417 | 3,586,654 | ||||||
| WNS (Holdings) Ltd., ADR (a) | 175,368 | 6,025,645 | ||||||
| Yext, Inc. (a)(l) | 501,312 | 6,682,489 | ||||||
| Zendesk, Inc. (a) | 315,003 | 8,750,783 | ||||||
|
| |||||||
| $ | 48,848,239 | |||||||
|
| |||||||
| Chemicals – 1.6% | ||||||||
| FMC Corp. | 45,091 | $ | 3,293,898 | |||||
| Ingevity Corp. (a) | 130,488 | 7,490,011 | ||||||
|
| |||||||
| $ | 10,783,909 | |||||||
|
| |||||||
| Computer Software – 4.9% | ||||||||
| 2U, Inc. (a) | 130,586 | $ | 6,127,095 | |||||
| Cadence Design Systems, Inc. (a) | 180,069 | 6,030,511 | ||||||
| MuleSoft, Inc., “A” (a)(l) | 111,763 | 2,787,369 | ||||||
| Okta, Inc. (a) | 70,295 | 1,602,726 | ||||||
| Paylocity Holding Corp. (a) | 122,997 | 5,557,005 | ||||||
| SecureWorks Corp. (a) | 213,104 | 1,979,736 | ||||||
| Twilio, Inc., “A” (a)(l) | 190,927 | 5,557,885 | ||||||
| Ultimate Software Group, Inc. (a) | 19,487 | 4,093,439 | ||||||
|
| |||||||
| $ | 33,735,766 | |||||||
|
| |||||||
| Computer Software – Systems – 8.8% | ||||||||
| Five9, Inc. (a) | 243,636 | $ | 5,243,047 | |||||
| Kinaxis, Inc. (a) | 61,259 | 3,814,043 | ||||||
| Issuer | Shares/Par | Value ($) | ||||||
| COMMON STOCKS – continued | ||||||||
| Computer Software – Systems – continued | ||||||||
| New Relic, Inc. (a) | 189,409 | $ | 8,146,481 | |||||
| NICE Systems Ltd., ADR | 141,469 | 11,136,440 | ||||||
| Proofpoint, Inc. (a) | 51,602 | 4,480,602 | ||||||
| Q2 Holdings, Inc. (a) | 174,079 | 6,432,219 | ||||||
| Rapid7, Inc. (a) | 235,422 | 3,962,152 | ||||||
| RealPage, Inc (a) | 150,141 | 5,397,569 | ||||||
| SS&C Technologies Holdings, Inc. | 321,818 | 12,361,029 | ||||||
|
| |||||||
| $ | 60,973,582 | |||||||
|
| |||||||
| Construction – 6.9% | ||||||||
| Foundation Building Materials, Inc. (a) | 323,979 | $ | 4,166,370 | |||||
| GMS, Inc. (a) | 327,812 | 9,211,517 | ||||||
| Lennox International, Inc. | 21,754 | 3,994,905 | ||||||
| Pool Corp. | 25,860 | 3,040,360 | ||||||
| Siteone Landscape Supply, Inc. (a) | 205,776 | 10,712,698 | ||||||
| Summit Materials, Inc., “A” (a) | 273,640 | 7,899,987 | ||||||
| Techtronic Industries Co. Ltd. | 621,500 | 2,857,764 | ||||||
| Trex Co., Inc. (a) | 80,310 | 5,433,775 | ||||||
|
| |||||||
| $ | 47,317,376 | |||||||
|
| |||||||
| Consumer Products – 0.5% | ||||||||
| E.L.F. Beauty, Inc. (a)(l) | 124,028 | $ | 3,374,802 | |||||
|
| |||||||
| Consumer Services – 3.0% | ||||||||
| Bright Horizons Family Solutions, Inc. (a) | 222,648 | $ | 17,190,652 | |||||
| Carriage Services, Inc. | 133,836 | 3,608,219 | ||||||
|
| |||||||
| $ | 20,798,871 | |||||||
|
| |||||||
| Containers – 2.2% | ||||||||
| Berry Global Group, Inc. (a) | 269,807 | $ | 15,381,697 | |||||
|
| |||||||
| Electrical Equipment – 0.9% | ||||||||
| WESCO International, Inc. (a) | 105,037 | $ | 6,018,620 | |||||
|
| |||||||
| Electronics – 4.7% | ||||||||
| Inphi Corp. (a) | 174,003 | $ | 5,968,303 | |||||
| M/A-COM Technology Solutions Holdings, Inc. (a) | 101,344 | 5,651,955 | ||||||
| Mellanox Technologies Ltd. (a) | 45,547 | 1,972,185 | ||||||
| Mercury Systems, Inc. (a) | 131,586 | 5,538,455 | ||||||
| Monolithic Power Systems, Inc. | 75,400 | 7,268,560 | ||||||
| Silicon Laboratories, Inc. (a) | 87,241 | 5,962,922 | ||||||
|
| |||||||
| $ | 32,362,380 | |||||||
|
| |||||||
| Entertainment – 1.6% | ||||||||
| Live Nation, Inc. (a) | 309,447 | $ | 10,784,228 | |||||
|
| |||||||
| Food & Beverages – 3.4% | ||||||||
| Blue Buffalo Pet Products, Inc. (a) | 234,615 | $ | 5,351,568 | |||||
| Cal-Maine Foods, Inc. (a)(l) | 135,555 | 5,367,978 | ||||||
| Flex Pharma, Inc. (a)(l) | 135,844 | 522,999 | ||||||
| Greencore Group PLC | 1,563,670 | 5,010,040 | ||||||
| Snyders-Lance, Inc. | 207,078 | 7,169,040 | ||||||
|
| |||||||
| $ | 23,421,625 | |||||||
|
| |||||||
4
Table of Contents
MFS New Discovery Series
Portfolio of Investments (unaudited) – continued
| Issuer | Shares/Par | Value ($) | ||||||
| COMMON STOCKS – continued | ||||||||
| Gaming & Lodging – 0.5% | ||||||||
| Vail Resorts, Inc. | 16,298 | $ | 3,305,723 | |||||
|
| |||||||
| General Merchandise – 1.1% | ||||||||
| Five Below, Inc. (a) | 93,086 | $ | 4,595,656 | |||||
| Ollie’s Bargain Outlet Holdings, Inc. (a) | 70,095 | 2,986,047 | ||||||
|
| |||||||
| $ | 7,581,703 | |||||||
|
| |||||||
| Internet – 2.1% | ||||||||
| GrubHub, Inc. (a) | 123,265 | $ | 5,374,354 | |||||
| LogMeIn, Inc. | 86,373 | 9,025,978 | ||||||
|
| |||||||
| $ | 14,400,332 | |||||||
|
| |||||||
| Machinery & Tools – 3.4% | ||||||||
| Gardner Denver Holdings, Inc. (a) | 260,187 | $ | 5,622,641 | |||||
| Ritchie Bros. Auctioneers, Inc. | 228,075 | 6,554,876 | ||||||
| SPX FLOW, Inc. (a) | 138,967 | 5,125,103 | ||||||
| WABCO Holdings, Inc. (a) | 45,955 | 5,859,722 | ||||||
|
| |||||||
| $ | 23,162,342 | |||||||
|
| |||||||
| Medical & Health Technology & Services – 4.2% | ||||||||
| Capital Senior Living Corp. (a) | 296,764 | $ | 4,513,780 | |||||
| Evolent Health, Inc.,“A” (a) | 149,289 | 3,784,476 | ||||||
| Healthcare Services Group, Inc. | 145,018 | 6,791,193 | ||||||
| INC Research Holdings, Inc., “A” (a) | 132,183 | 7,732,706 | ||||||
| Teladoc, Inc. (a) | 167,860 | 5,824,742 | ||||||
|
| |||||||
| $ | 28,646,897 | |||||||
|
| |||||||
| Medical Equipment – 9.5% | ||||||||
| DexCom, Inc. (a) | 75,502 | $ | 5,522,971 | |||||
| Insulet Corp. (a) | 53,790 | 2,759,965 | ||||||
| iRhythm Technologies, Inc. (a) | 89,269 | 3,793,040 | ||||||
| Masimo Corp. (a) | 37,609 | 3,429,189 | ||||||
| Merit Medical Systems, Inc. (a) | 185,416 | 7,073,620 | ||||||
| Nevro Corp. (a) | 65,341 | 4,863,331 | ||||||
| NxStage Medical, Inc. (a) | 272,153 | 6,822,876 | ||||||
| Obalon Therapeutics, Inc. (a)(l) | 177,541 | 1,759,431 | ||||||
| PerkinElmer, Inc. | 151,831 | 10,345,764 | ||||||
| Steris PLC | 148,810 | 12,128,015 | ||||||
| VWR Corp. (a) | 213,693 | 7,054,006 | ||||||
|
| |||||||
| $ | 65,552,208 | |||||||
|
| |||||||
| Oil Services – 2.4% | ||||||||
| Forum Energy Technologies, Inc. (a) | 208,135 | $ | 3,246,906 | |||||
| Keane Group, Inc. (a)(l) | 193,270 | 3,092,320 | ||||||
| Patterson-UTI Energy, Inc. | 166,697 | 3,365,612 | ||||||
| Solaris Oilfield Infrastructure, Inc., “A” (a) | 205,612 | 2,370,706 | ||||||
| U.S. Silica Holdings, Inc. | 131,505 | 4,667,113 | ||||||
|
| |||||||
| $ | 16,742,657 | |||||||
|
| |||||||
| Other Banks & Diversified Financials – 3.6% | ||||||||
| Bank of the Ozarks, Inc. | 134,822 | $ | 6,319,107 | |||||
| Pinnacle Financial Partners, Inc. | 68,188 | 4,282,206 | ||||||
| Preferred Bank | 55,643 | 2,975,231 | ||||||
| Texas Capital Bancshares, Inc. (a) | 64,745 | 5,011,263 | ||||||
| Wintrust Financial Corp. | 81,847 | 6,256,385 | ||||||
|
| |||||||
| $ | 24,844,192 | |||||||
|
| |||||||
| Issuer | Shares/Par | Value ($) | ||||||
| COMMON STOCKS – continued | ||||||||
| Pharmaceuticals – 1.1% | ||||||||
| Aratana Therapeutics, Inc. (a) | 370,498 | $ | 2,678,701 | |||||
| Collegium Pharmaceutical, Inc. (a)(l) | 250,447 | 3,133,092 | ||||||
| TherapeuticsMD, Inc. (a)(l) | 384,897 | 2,028,407 | ||||||
|
| |||||||
| $ | 7,840,200 | |||||||
|
| |||||||
| Pollution Control – 1.0% | ||||||||
| Clean Harbors, Inc. (a) | 119,939 | $ | 6,696,194 | |||||
|
| |||||||
| Railroad & Shipping – 0.3% | ||||||||
| StealthGas, Inc. (a) | 575,986 | $ | 1,871,955 | |||||
|
| |||||||
| Real Estate – 1.8% | ||||||||
| Big Yellow Group PLC, REIT | 279,066 | $ | 2,878,678 | |||||
| Life Storage, Inc., REIT | 71,758 | 5,317,268 | ||||||
| STAG Industrial, Inc., REIT | 161,020 | 4,444,152 | ||||||
|
| |||||||
| $ | 12,640,098 | |||||||
|
| |||||||
| Restaurants – 5.4% | ||||||||
| Dave & Buster’s, Inc. (a) | 51,630 | $ | 3,433,911 | |||||
| Domino’s Pizza Group PLC | 1,121,468 | 4,292,867 | ||||||
| Dunkin Brands Group, Inc. | 61,338 | 3,380,950 | ||||||
| Performance Food Group Co. (a) | 319,239 | 8,747,149 | ||||||
| U.S. Foods Holding Corp. (a) | 318,941 | 8,681,574 | ||||||
| Wingstop, Inc. | 159,264 | 4,921,258 | ||||||
| Zoe’s Kitchen, Inc. (a)(l) | 348,085 | 4,145,692 | ||||||
|
| |||||||
| $ | 37,603,401 | |||||||
|
| |||||||
| Special Products & Services – 1.2% | ||||||||
| Boyd Group Income Fund, IEU | 93,843 | $ | 6,957,900 | |||||
| Nexeo Solutions Holdings LLC (a)(z) | 134,847 | 1,119,230 | ||||||
|
| |||||||
| $ | 8,077,130 | |||||||
|
| |||||||
| Specialty Chemicals – 4.8% | ||||||||
| Axalta Coating Systems Ltd. (a) | 233,043 | $ | 7,466,698 | |||||
| Ferroglobe PLC | 348,054 | 4,159,246 | ||||||
| Ferroglobe R&W Trust (a) | 453,344 | 0 | ||||||
| Nexeo Solutions, Inc., EU (a) | 331,219 | 2,881,605 | ||||||
| PolyOne Corp. | 119,157 | 4,616,142 | ||||||
| RPM International, Inc. | 148,215 | 8,085,128 | ||||||
| Univar, Inc. (a) | 212,265 | �� | 6,198,138 | |||||
|
| |||||||
| $ | 33,406,957 | |||||||
|
| |||||||
| Specialty Stores – 1.4% | ||||||||
| Citi Trends, Inc. | 165,135 | $ | 3,504,165 | |||||
| Michaels Co., Inc. (a) | 224,620 | 4,159,962 | ||||||
| Urban Outfitters, Inc. (a) | 111,585 | 2,068,786 | ||||||
|
| |||||||
| $ | 9,732,913 | |||||||
|
| |||||||
| Trucking – 0.8% | ||||||||
| Swift Transportation Co. (a) | 218,587 | $ | 5,792,555 | |||||
|
| |||||||
| Total Common Stocks (Identified Cost, $546,194,314) | $ | 675,498,273 | ||||||
|
| |||||||
| MONEY MARKET FUNDS – 1.4% | ||||||||
| MFS Institutional Money Market Portfolio, 0.98% (v) (Identified Cost, $9,428,511) | 9,429,122 | $ | 9,429,122 | |||||
|
| |||||||
5
Table of Contents
MFS New Discovery Series
Portfolio of Investments (unaudited) – continued
| Issuer | Shares/Par | Value ($) | ||||||
| COLLATERAL FOR SECURITIES LOANED – 2.6% | ||||||||
| State Street Navigator Securities Lending Government Money Market Portfolio, 1% (j) (Identified Cost, $18,269,021) | 18,269,021 | $ | 18,269,021 | |||||
|
| |||||||
| Total Investments (Identified Cost, $573,891,846) | $ | 703,196,416 | ||||||
|
| |||||||
| OTHER ASSETS, LESS LIABILITIES – (2.0)% | (13,738,264 | ) | ||||||
|
| |||||||
| NET ASSETS – 100.0% | $ | 689,458,152 | ||||||
|
| |||||||
| (a) | Non-income producing security. |
| (j) | The rate quoted is the annualized seven-day yield of the fund at period end. |
| (l) | A portion of this security is on loan. |
| (v) | Underlying affiliated fund that is available only to investment companies managed by MFS. The rate quoted for the MFS Institutional Money Market Portfolio is the annualized seven-day yield of the fund at period end. |
| (z) | Restricted securities are not registered under the Securities Act of 1933 and are subject to legal restrictions on resale. These securities generally may be resold in transactions exempt from registration or to the public if the securities are subsequently registered. Disposal of these securities may involve time-consuming negotiations and prompt sale at an acceptable price may be difficult. The fund holds the following restricted securities: |
| Restricted Securities | Acquisition Date | Cost | Value | |||||||
| Nexeo Solutions Holdings LLC | 5/06/16 | $1,348,470 | $1,119,230 | |||||||
| % of Net assets | 0.2% | |||||||||
The following abbreviations are used in this report and are defined:
| ADR | American Depositary Receipt |
| EU | Equity Unit |
| IEU | International Equity Unit |
| PLC | Public Limited Company |
| REIT | Real Estate Investment Trust |
See Notes to Financial Statements
6
Table of Contents
MFS New Discovery Series
FINANCIAL STATEMENTS | STATEMENT OF ASSETS AND LIABILITIES (unaudited)
This statement represents your fund’s balance sheet, which details the assets and liabilities comprising the total value of the fund.
At 6/30/17 | ||||
Assets | ||||
Investments | ||||
Non-affiliated issuers, at value (identified cost, $564,463,335) | $693,767,294 | |||
Underlying affiliated funds, at value (identified cost, $9,428,511) | 9,429,122 | |||
Total investments, at value, including $17,892,013 of securities on loan (identified cost, $573,891,846) | $703,196,416 | |||
Receivables for | ||||
Investments sold | 10,055,680 | |||
Fund shares sold | 220,279 | |||
Interest and dividends | 328,701 | |||
Other assets | 1,509 | |||
Total assets | $713,802,585 | |||
Liabilities | ||||
Payables for | ||||
Investments purchased | $5,522,416 | |||
Fund shares reacquired | 434,043 | |||
Collateral for securities loaned, at value | 18,269,021 | |||
Payable to affiliates | ||||
Investment adviser | 15,458 | |||
Shareholder servicing costs | 1,690 | |||
Distribution and/or service fees | 5,352 | |||
Payable for independent Trustees’ compensation | 790 | |||
Accrued expenses and other liabilities | 95,663 | |||
Total liabilities | $24,344,433 | |||
Net assets | $689,458,152 | |||
Net assets consist of | ||||
Paid-in capital | $507,185,627 | |||
Unrealized appreciation (depreciation) on investments and translation of assets and liabilities in foreign currencies | 129,306,225 | |||
Accumulated net realized gain (loss) on investments and foreign currency | 54,546,009 | |||
Accumulated net investment loss | (1,579,709 | ) | ||
Net assets | $689,458,152 | |||
Shares of beneficial interest outstanding | 40,106,184 |
| Net assets | Shares outstanding | Net asset value per share | ||||||||||
Initial Class | $299,680,840 | 16,684,361 | $17.96 | |||||||||
Service Class | 389,777,312 | 23,421,823 | 16.64 | |||||||||
See Notes to Financial Statements
7
Table of Contents
MFS New Discovery Series
FINANCIAL STATEMENTS | STATEMENT OF OPERATIONS (unaudited)
This statement describes how much your fund earned in investment income and accrued in expenses. It also describes any gains and/or losses generated by fund operations.
Six months ended 6/30/17 | ||||
Net investment loss | ||||
Income | ||||
Dividends | $1,880,310 | |||
Income on securities loaned | 219,610 | |||
Dividends from underlying affiliated funds | 51,447 | |||
Foreign taxes withheld | (28,181 | ) | ||
Total investment income | $2,123,186 | |||
Expenses | ||||
Management fee | $3,077,804 | |||
Distribution and/or service fees | 483,080 | |||
Shareholder servicing costs | 26,022 | |||
Administrative services fee | 59,964 | |||
Independent Trustees’ compensation | 8,095 | |||
Custodian fee | 17,756 | |||
Shareholder communications | 94,585 | |||
Audit and tax fees | 28,849 | |||
Legal fees | 3,635 | |||
Miscellaneous | 14,599 | |||
Total expenses | $3,814,389 | |||
Reduction of expenses by investment adviser | (111,494 | ) | ||
Net expenses | $3,702,895 | |||
Net investment loss | $(1,579,709 | ) | ||
Realized and unrealized gain (loss) on investments and foreign currency | ||||
Realized gain (loss) (identified cost basis) | ||||
Investments: | ||||
Non-affiliated issuers | $46,112,369 | |||
Underlying affiliated funds | (1,116 | ) | ||
Foreign currency | (574 | ) | ||
Net realized gain (loss) on investments and foreign currency | $46,110,679 | |||
Change in unrealized appreciation (depreciation) | ||||
Investments | $26,858,639 | |||
Translation of assets and liabilities in foreign currencies | 3,451 | |||
Net unrealized gain (loss) on investments and foreign currency translation | $26,862,090 | |||
Net realized and unrealized gain (loss) on investments and foreign currency | $72,972,769 | |||
Change in net assets from operations | $71,393,060 |
See Notes to Financial Statements
8
Table of Contents
MFS New Discovery Series
FINANCIAL STATEMENTS | STATEMENTS OF CHANGES IN NET ASSETS
These statements describe the increases and/or decreases in net assets resulting from operations, any distributions, and any shareholder transactions.
| | Six months ended 6/30/17 (unaudited | ) | | Year ended 12/31/16 | | |||
Change in net assets | ||||||||
| From operations | ||||||||
Net investment loss | $(1,579,709 | ) | $(801,202 | ) | ||||
Net realized gain (loss) on investments and foreign currency | 46,110,679 | 15,018,300 | ||||||
Net unrealized gain (loss) on investments and foreign currency translation | 26,862,090 | 42,661,132 | ||||||
Change in net assets from operations | $71,393,060 | $56,878,230 | ||||||
| Distributions declared to shareholders | ||||||||
From net realized gain on investments | $— | $(30,806,227 | ) | |||||
Change in net assets from fund share transactions | $(55,186,779 | ) | $(53,937,710 | ) | ||||
Total change in net assets | $16,206,281 | $(27,865,707 | ) | |||||
| Net assets | ||||||||
At beginning of period | 673,251,871 | 701,117,578 | ||||||
At end of period (including accumulated net investment loss of $1,579,709 and | $689,458,152 | $673,251,871 |
See Notes to Financial Statements
9
Table of Contents
MFS New Discovery Series
FINANCIAL STATEMENTS | FINANCIAL HIGHLIGHTS
The financial highlights table is intended to help you understand the fund’s financial performance for the semiannual period and the past 5 fiscal years. Certain information reflects financial results for a single fund share. The total returns in the table represent the rate that an investor would have earned (or lost) on an investment in the fund share class (assuming reinvestment of all distributions) held for the entire period.
| Initial Class | Six months ended 6/30/17 | Years ended 12/31 | ||||||||||||||||||||||
| 2016 | 2015 | 2014 | 2013 | 2012 | ||||||||||||||||||||
| (unaudited) | ||||||||||||||||||||||||
Net asset value, beginning of period | $16.18 | $15.49 | $16.32 | $22.07 | $15.72 | $14.29 | ||||||||||||||||||
| Income (loss) from investment operations | ||||||||||||||||||||||||
Net investment income (loss) (d) | $(0.03 | ) | $0.00 | (c)(w) | $(0.08 | ) | $(0.09 | ) | $(0.08 | ) | $(0.05 | ) | ||||||||||||
Net realized and unrealized gain (loss) on | 1.81 | 1.40 | (0.22 | ) | (1.42 | ) | 6.59 | 3.00 | ||||||||||||||||
Total from investment operations | $1.78 | $1.40 | $(0.30 | ) | $(1.51 | ) | $6.51 | $2.95 | ||||||||||||||||
| Less distributions declared to shareholders | ||||||||||||||||||||||||
From net realized gain on investments | $— | $(0.71 | ) | $(0.53 | ) | $(4.24 | ) | $(0.16 | ) | $(1.52 | ) | |||||||||||||
Net asset value, end of period (x) | $17.96 | $16.18 | $15.49 | $16.32 | $22.07 | $15.72 | ||||||||||||||||||
Total return (%) (k)(r)(s)(x) | 11.00 | (n) | 9.05 | (c) | (1.89 | ) | (7.26 | ) | 41.52 | 21.22 | ||||||||||||||
| Ratios (%) (to average net assets) and Supplemental data: | ||||||||||||||||||||||||
Expenses before expense reductions (f) | 0.97 | (a) | 0.94 | (c) | 0.96 | 0.96 | 0.96 | 0.97 | ||||||||||||||||
Expenses after expense reductions (f) | 0.94 | (a) | 0.92 | (c) | 0.94 | 0.95 | 0.96 | 0.97 | ||||||||||||||||
Net investment income (loss) | (0.32 | )(a) | 0.02 | (c) | (0.48 | ) | (0.46 | ) | (0.44 | ) | (0.29 | ) | ||||||||||||
Portfolio turnover | 29 | (n) | 63 | 60 | 96 | 104 | 122 | |||||||||||||||||
Net assets at end of period (000 omitted) | $299,681 | $292,368 | $312,151 | $391,474 | $424,432 | $395,107 | ||||||||||||||||||
| Service Class | Six months ended 6/30/17 | Years ended 12/31 | ||||||||||||||||||||||
| 2016 | 2015 | 2014 | 2013 | 2012 | ||||||||||||||||||||
| (unaudited) | ||||||||||||||||||||||||
Net asset value, beginning of period | $15.01 | $14.45 | $15.30 | $21.02 | $15.01 | $13.74 | ||||||||||||||||||
| Income (loss) from investment operations | ||||||||||||||||||||||||
Net investment loss (d) | $(0.05 | ) | $(0.03 | )(c) | $(0.11 | ) | $(0.13 | ) | $(0.12 | ) | $(0.08 | ) | ||||||||||||
Net realized and unrealized gain (loss) on | 1.68 | 1.30 | (0.21 | ) | (1.35 | ) | 6.29 | 2.87 | ||||||||||||||||
Total from investment operations | $1.63 | $1.27 | $(0.32 | ) | $(1.48 | ) | $6.17 | $2.79 | ||||||||||||||||
| Less distributions declared to shareholders | ||||||||||||||||||||||||
From net realized gain on investments | $— | $(0.71 | ) | $(0.53 | ) | $(4.24 | ) | $(0.16 | ) | $(1.52 | ) | |||||||||||||
Net asset value, end of period (x) | $16.64 | $15.01 | $14.45 | $15.30 | $21.02 | $15.01 | ||||||||||||||||||
Total return (%) (k)(r)(s)(x) | 10.86 | (n) | 8.80 | (c) | (2.15 | ) | (7.49 | ) | 41.22 | 20.90 | ||||||||||||||
| Ratios (%) (to average net assets) and Supplemental data: | ||||||||||||||||||||||||
Expenses before expense reductions (f) | 1.22 | (a) | 1.19 | (c) | 1.21 | 1.21 | 1.21 | 1.22 | ||||||||||||||||
Expenses after expense reductions (f) | 1.19 | (a) | 1.17 | (c) | 1.19 | 1.20 | 1.21 | 1.22 | ||||||||||||||||
Net investment income (loss) | (0.57 | )(a) | (0.23 | )(c) | (0.73 | ) | (0.72 | ) | (0.69 | ) | (0.53 | ) | ||||||||||||
Portfolio turnover | 29 | (n) | 63 | 60 | 96 | 104 | 122 | |||||||||||||||||
Net assets at end of period (000 omitted) | $389,777 | $380,884 | $388,966 | $469,245 | $578,617 | $393,224 | ||||||||||||||||||
See Notes to Financial Statements
10
Table of Contents
MFS New Discovery Series
Financial Highlights – continued
| (a) | Annualized. |
| (c) | Amount reflects a one-time reimbursement of expenses by the custodian (or former custodian) without which net investment income and performance would be lower and expenses would be higher. |
| (d) | Per share data is based on average shares outstanding. |
| (f) | Ratios do not reflect reductions from fees paid indirectly, if applicable. |
| (k) | The total return does not reflect expenses that apply to separate accounts. Inclusion of these charges would reduce the total return figures for all periods shown. |
| (n) | Not annualized. |
| (r) | Certain expenses have been reduced without which performance would have been lower. |
| (s) | From time to time the fund may receive proceeds from litigation settlements, without which performance would be lower. |
| (w) | Per share amount was less than $0.01. |
| (x) | The net asset values and total returns have been calculated on net assets which include adjustments made in accordance with U.S. generally accepted accounting principles required at period end for financial reporting purposes. |
See Notes to Financial Statements
11
Table of Contents
MFS New Discovery Series
NOTES TO FINANCIAL STATEMENTS (unaudited)
| (1) | Business and Organization |
MFS New Discovery Series (the fund) is a diversified series of MFS Variable Insurance Trust (the trust). The trust is organized as a Massachusetts business trust and is registered under the Investment Company Act of 1940, as amended, as an open-end management investment company. The shareholders of each series of the trust are separate accounts of insurance companies, which offer variable annuity and/or life insurance products, and qualified retirement and pension plans.
The fund is an investment company and accordingly follows the investment company accounting and reporting guidance of the Financial Accounting Standards Board (FASB) Accounting Standards Codification Topic 946 Financial Services – Investment Companies.
| (2) | Significant Accounting Policies |
General – The preparation of financial statements in conformity with U.S. generally accepted accounting principles requires management to make estimates and assumptions that affect the reported amounts of assets and liabilities, and disclosure of contingent assets and liabilities at the date of the financial statements and the reported amounts of increases and decreases in net assets from operations during the reporting period. Actual results could differ from those estimates. In the preparation of these financial statements, management has evaluated subsequent events occurring after the date of the fund’s Statement of Assets and Liabilities through the date that the financial statements were issued.
In October 2016, the Securities and Exchange Commission (SEC) released its Final Rule on Investment Company Reporting Modernization (the “Rule”). The Rule, which introduces two new regulatory reporting forms for investment companies – Form N-PORT and Form N-CEN – also contains amendments to Regulation S-X which impact financial statement presentation, particularly the presentation of derivative investments. Although still evaluating the impacts of the Rule, management believes that many of the Regulation S-X amendments are consistent with the fund’s current financial statement presentation and expects that the fund will be able to comply with the Rule’s Regulation S-X amendments by the August 1, 2017 compliance date.
Balance Sheet Offsetting – The fund’s accounting policy with respect to balance sheet offsetting is that, absent an event of default by the counterparty or a termination of the agreement, the International Swaps and Derivatives Association (ISDA) Master Agreement does not result in an offset of reported amounts of financial assets and financial liabilities in the Statement of Assets and Liabilities across transactions between the fund and the applicable counterparty. The fund’s right to setoff may be restricted or prohibited by the bankruptcy or insolvency laws of the particular jurisdiction to which a specific master netting agreement counterparty is subject. Balance sheet offsetting disclosures, to the extent applicable to the fund, have been included in the fund’s Significant Accounting Policies note under the captions for each of the fund’s in-scope financial instruments and transactions.
Investment Valuations – Equity securities, including restricted equity securities, are generally valued at the last sale or official closing price on their primary market or exchange as provided by a third-party pricing service. Equity securities, for which there were no sales reported that day, are generally valued at the last quoted daily bid quotation on their primary market or exchange as provided by a third-party pricing service. Short-term instruments with a maturity at issuance of 60 days or less may be valued at amortized cost, which approximates market value. Open-end investment companies are generally valued at net asset value per share. Securities and other assets generally valued on the basis of information from a third-party pricing service may also be valued at a broker/dealer bid quotation. Values obtained from third-party pricing services can utilize both transaction data and market information such as yield, quality, coupon rate, maturity, type of issue, trading characteristics, and other market data. The values of foreign securities and other assets and liabilities expressed in foreign currencies are converted to U.S. dollars using the mean of bid and asked prices for rates provided by a third-party pricing service.
The Board of Trustees has delegated primary responsibility for determining or causing to be determined the value of the fund’s investments (including any fair valuation) to the adviser pursuant to valuation policies and procedures approved by the Board. If the adviser determines that reliable market quotations are not readily available, investments are valued at fair value as determined in good faith by the adviser in accordance with such procedures under the oversight of the Board of Trustees. Under the fund’s valuation policies and procedures, market quotations are not considered to be readily available for most types of debt instruments and floating rate loans and many types of derivatives. These investments are generally valued at fair value based on information from third-party pricing services. In addition, investments may be valued at fair value if the adviser determines that an investment’s value has been materially affected by events occurring after the close of the exchange or market on which the investment is principally traded (such as foreign exchange or market) and prior to the determination of the fund’s net asset value, or after the halting of trading of a specific security where trading does not resume prior to the close of the exchange or market on which the security is principally traded. Events that occur on a frequent basis after foreign markets close (such as developments in foreign markets and significant movements in the U.S. markets) and prior to the determination of the fund’s net asset value may be deemed to have a material effect on the value of securities traded in foreign markets. Accordingly, the fund’s foreign equity securities may often be valued at fair value. The adviser generally relies on third-party pricing services or other information (such as the correlation with price movements of similar securities in the same or other markets; the type, cost and investment characteristics of the security; the business and financial condition of the issuer; and trading and other market data) to assist in determining whether to fair value and
12
Table of Contents
MFS New Discovery Series
Notes to Financial Statements (unaudited) – continued
at what value to fair value an investment. The value of an investment for purposes of calculating the fund’s net asset value can differ depending on the source and method used to determine value. When fair valuation is used, the value of an investment used to determine the fund’s net asset value may differ from quoted or published prices for the same investment. There can be no assurance that the fund could obtain the fair value assigned to an investment if it were to sell the investment at the same time at which the fund determines its net asset value per share.
Various inputs are used in determining the value of the fund’s assets or liabilities. These inputs are categorized into three broad levels. In certain cases, the inputs used to measure fair value may fall into different levels of the fair value hierarchy. In such cases, an investment’s level within the fair value hierarchy is based on the lowest level of input that is significant to the fair value measurement. The fund’s assessment of the significance of a particular input to the fair value measurement in its entirety requires judgment, and considers factors specific to the investment. Level 1 includes unadjusted quoted prices in active markets for identical assets or liabilities. Level 2 includes other significant observable market-based inputs (including quoted prices for similar securities, interest rates, prepayment speed, and credit risk). Level 3 includes unobservable inputs, which may include the adviser’s own assumptions in determining the fair value of investments. The following is a summary of the levels used as of June 30, 2017 in valuing the fund’s assets or liabilities:
| Investments at Value | Level 1 | Level 2 | Level 3 | Total | ||||||||||||
| Equity Securities: | ||||||||||||||||
United States | $620,097,232 | $4,000,835 | $0 | $624,098,067 | ||||||||||||
Canada | 17,326,819 | — | — | 17,326,819 | ||||||||||||
United Kingdom | 12,181,584 | — | — | 12,181,584 | ||||||||||||
Israel | 11,136,440 | — | — | 11,136,440 | ||||||||||||
India | 6,025,644 | — | — | 6,025,644 | ||||||||||||
Hong Kong | 2,857,764 | — | — | 2,857,764 | ||||||||||||
Greece | 1,871,955 | — | — | 1,871,955 | ||||||||||||
Mutual Funds | 27,698,143 | — | — | 27,698,143 | ||||||||||||
| Total Investments | $699,195,581 | $4,000,835 | $0 | $703,196,416 | ||||||||||||
For further information regarding security characteristics, see the Portfolio of Investments. At June 30, 2017, the fund held one level 3 security valued at $0, which was also held and valued at $0 at December 31, 2016.
Of the level 2 investments presented above, equity investments amounting to $4,000,835 would have been considered level 1 investments at the beginning of the period. Of the level 1 investments presented above, equity investments amounting to $7,171,545 would have been considered level 2 investments at the beginning of the period. The primary reason for changes in the classifications between levels 1 and 2 occurs when foreign equity securities are fair valued using other observable market-based inputs in place of the closing exchange price due to events occurring after the close of the exchange or market on which the investment is principally traded. The fund’s foreign equity securities may often be valued using other observable market-based inputs. Other reasons for changes in classifications between levels 1 and 2 relate to using the last available market price as fair value in the absence of trading volume in current or prior periods. The fund’s policy is to recognize transfers between the levels as of the end of the period.
Foreign Currency Translation – Purchases and sales of foreign investments, income, and expenses are converted into U.S. dollars based upon currency exchange rates prevailing on the respective dates of such transactions or on the reporting date for foreign denominated receivables and payables. Gains and losses attributable to foreign currency exchange rates on sales of securities are recorded for financial statement purposes as net realized gains and losses on investments. Gains and losses attributable to foreign exchange rate movements on receivables, payables, income and expenses are recorded for financial statement purposes as foreign currency transaction gains and losses. That portion of both realized and unrealized gains and losses on investments that results from fluctuations in foreign currency exchange rates is not separately disclosed.
Security Loans – Under its Securities Lending Agency Agreement with the fund, State Street Bank and Trust Company (“State Street”), as lending agent, loans the securities of the fund to certain qualified institutions (the “Borrowers”) approved by the fund. Security loans can be terminated at the discretion of either the lending agent or the fund and the related securities must be returned within the earlier of the standard trade settlement period for such securities or within three business days. The loans are collateralized by cash and/or U.S. Treasury and federal agency obligations in an amount typically at least equal to the market value of the securities loaned. On loans collateralized by cash, the cash collateral is invested in a money market fund. The market value of the loaned securities is determined at the close of business of the fund and any additional required collateral is delivered to the fund on the next business day. State Street provides the fund with indemnification against Borrower default. In the event of Borrower default, State Street will, for the benefit of the fund, either purchase securities identical to those loaned or, when such purchase is commercially impracticable, pay the fund the market value of the loaned securities. In return, State Street assumes the fund’s rights to the related collateral. If the collateral value is less than the cost to purchase identical securities, State Street is responsible for the
13
Table of Contents
MFS New Discovery Series
Notes to Financial Statements (unaudited) – continued
shortfall, but only to the extent that such shortfall is not due to a decline in collateral value resulting from collateral reinvestment for which the fund bears the risk of loss. At period end, the fund had investment securities on loan, all of which were classified as equity securities in the fund’s Portfolio of Investments, with a fair value of $17,892,013. The fair value of the fund’s investment securities on loan and a related liability of $18,269,021 for cash collateral received on securities loaned are both presented gross in the Statement of Assets and Liabilities. The collateral received on securities loaned exceeded the value of securities on loan at period end. The liability for cash collateral for securities loaned is carried at fair value, which is categorized as level 2 within the fair value hierarchy. A portion of the income generated upon investment of the collateral is remitted to the Borrowers, and the remainder is allocated between the fund and the lending agent. On loans collateralized by U.S. Treasury and/or federal agency obligations, a fee is received from the Borrower, and is allocated between the fund and the lending agent. Income from securities lending is separately reported in the Statement of Operations. The dividend and interest income earned on the securities loaned is accounted for in the same manner as other dividend and interest income.
Indemnifications – Under the fund’s organizational documents, its officers and Trustees may be indemnified against certain liabilities and expenses arising out of the performance of their duties to the fund. Additionally, in the normal course of business, the fund enters into agreements with service providers that may contain indemnification clauses. The fund’s maximum exposure under these agreements is unknown as this would involve future claims that may be made against the fund that have not yet occurred.
Investment Transactions and Income – Investment transactions are recorded on the trade date. Interest income is recorded on the accrual basis. Dividends received in cash are recorded on the ex-dividend date. Certain dividends from foreign securities will be recorded when the fund is informed of the dividend if such information is obtained subsequent to the ex-dividend date. Dividend and interest payments received in additional securities are recorded on the ex-dividend or ex-interest date in an amount equal to the value of the security on such date.
The fund may receive proceeds from litigation settlements. Any proceeds received from litigation involving portfolio holdings are reflected in the Statement of Operations in realized gain/loss if the security has been disposed of by the fund or in unrealized gain/loss if the security is still held by the fund. Any other proceeds from litigation not related to portfolio holdings are reflected as other income in the Statement of Operations.
Tax Matters and Distributions – The fund intends to qualify as a regulated investment company, as defined under Subchapter M of the Internal Revenue Code, and to distribute all of its taxable income, including realized capital gains. As a result, no provision for federal income tax is required. The fund’s federal tax returns, when filed, will remain subject to examination by the Internal Revenue Service for a three year period. Management has analyzed the fund’s tax positions taken on federal and state tax returns for all open tax years and does not believe that there are any uncertain tax positions that require recognition of a tax liability. Foreign taxes, if any, have been accrued by the fund in the accompanying financial statements in accordance with the applicable foreign tax law. Foreign income taxes may be withheld by certain countries in which the fund invests. Additionally, capital gains realized by the fund on securities issued in or by certain foreign countries may be subject to capital gains tax imposed by those countries.
Distributions to shareholders are recorded on the ex-dividend date. Income and capital gain distributions are determined in accordance with income tax regulations, which may differ from U.S. generally accepted accounting principles. Certain capital accounts in the financial statements are periodically adjusted for permanent differences in order to reflect their tax character. These adjustments have no impact on net assets or net asset value per share. Temporary differences which arise from recognizing certain items of income, expense, gain or loss in different periods for financial statement and tax purposes will reverse at some time in the future. Distributions in excess of net investment income or net realized gains are temporary overdistributions for financial statement purposes resulting from differences in the recognition or classification of income or distributions for financial statement and tax purposes.
Book/tax differences primarily relate to net operating losses and wash sale loss deferrals.
The tax character of distributions declared to shareholders for the last fiscal year is as follows:
| Year ended 12/31/16 | ||||
| Ordinary income (including any short-term capital gains) | $13,356,581 | |||
| Long-term capital gains | 17,449,646 | |||
| Total distributions | $30,806,227 | |||
14
Table of Contents
MFS New Discovery Series
Notes to Financial Statements (unaudited) – continued
The federal tax cost and the tax basis components of distributable earnings were as follows:
| As of 6/30/17 | ||||
| Cost of investments | $579,419,194 | |||
| Gross appreciation | 157,159,941 | |||
| Gross depreciation | (33,382,719 | ) | ||
| Net unrealized appreciation (depreciation) | $123,777,222 | |||
| As of 12/31/16 | ||||
| Undistributed long-term capital gain | 13,953,434 | |||
| Other temporary differences | (1,796 | ) | ||
| Net unrealized appreciation (depreciation) | 96,927,827 | |||
The aggregate cost above includes prior fiscal year end tax adjustments, if applicable.
Multiple Classes of Shares of Beneficial Interest – The fund offers multiple classes of shares, which differ in their respective distribution and/or service fees. The fund’s income, realized and unrealized gain (loss), and common expenses are allocated to shareholders based on the daily net assets of each class. Dividends are declared separately for each class. Differences in per share dividend rates are generally due to differences in separate class expenses. The fund’s distributions declared to shareholders as reported in the Statements of Changes in Net Assets are presented by class as follows:
| From net realized gain on investments | ||||||||
| Six months ended 6/30/17 | Year ended 12/31/16 | |||||||
| Initial Class | $— | $12,970,432 | ||||||
| Service Class | — | 17,835,795 | ||||||
| Total | $— | $30,806,227 | ||||||
| (3) | Transactions with Affiliates |
Investment Adviser – The fund has an investment advisory agreement with MFS to provide overall investment management and related administrative services and facilities to the fund. The management fee is computed daily and paid monthly at the following annual rates:
| First $1 billion of average daily net assets | 0.90% | |||
| Average daily net assets in excess of $1 billion | 0.80% |
MFS has agreed in writing to reduce its management fee by a specified amount if certain MFS mutual fund assets exceed thresholds agreed to by MFS and the fund’s Board of Trustees. For the six months ended June 30, 2017, this management fee reduction amounted to $26,237, which is included in the reduction of total expenses in the Statement of Operations. The management fee incurred for the six months ended June 30, 2017 was equivalent to an annual effective rate of 0.89% of the fund’s average daily net assets.
The investment adviser has agreed in writing to pay a portion of the fund’s total annual operating expenses, excluding interest, taxes, extraordinary expenses, brokerage and transaction costs, and investment-related expenses, such that total annual operating expenses do not exceed 0.94% of average daily net assets for the Initial Class shares and 1.19% of average daily net assets for the Service Class shares. This written agreement will continue until modified by the fund’s Board of Trustees, but such agreement will continue at least until April 30, 2019. For the six months ended June 30, 2017, this reduction amounted to $85,257, which is included in the reduction of total expenses in the Statement of Operations.
Distributor – MFS Fund Distributors, Inc. (MFD), a wholly-owned subsidiary of MFS, is the distributor of shares of the fund. The Trustees have adopted a distribution plan for the Service Class shares pursuant to Rule 12b-1 under the Investment Company Act of 1940.
The fund’s distribution plan provides that the fund will pay MFD distribution and/or service fees equal to 0.25% per annum of its average daily net assets attributable to Service Class shares as partial consideration for services performed and expenses incurred by MFD and financial intermediaries (including participating insurance companies that invest in the fund to fund variable annuity and variable life insurance contracts, sponsors of qualified retirement and pension plans that invest in the fund, and affiliates of these participating insurance companies and plan sponsors) in connection with the sale and distribution of the Service Class shares. MFD may subsequently pay all, or a portion, of the distribution and/or service fees to financial intermediaries.
Shareholder Servicing Agent – MFS Service Center, Inc. (MFSC), a wholly-owned subsidiary of MFS, receives a fee from the fund for its services as shareholder servicing agent. For the six months ended June 30, 2017, the fee was $23,451, which equated to
15
Table of Contents
MFS New Discovery Series
Notes to Financial Statements (unaudited) – continued
0.0069% annually of the fund’s average daily net assets. MFSC also receives payment from the fund for out-of-pocket expenses paid by MFSC on behalf of the fund. For the six months ended June 30, 2017, these costs amounted to $2,571.
Administrator – MFS provides certain financial, legal, shareholder communications, compliance, and other administrative services to the fund. Under an administrative services agreement, the fund reimburses MFS the costs incurred to provide these services. The fund is charged an annual fixed amount of $17,500 plus a fee based on average daily net assets. The administrative services fee incurred for the six months ended June 30, 2017 was equivalent to an annual effective rate of 0.0175% of the fund’s average daily net assets.
Trustees’ and Officers’ Compensation – The fund pays compensation to independent Trustees in the form of a retainer, attendance fees, and additional compensation to Board and Committee chairpersons. The fund does not pay compensation directly to Trustees or officers of the fund who are also officers of the investment adviser, all of whom receive remuneration for their services to the fund from MFS. Certain officers and Trustees of the fund are officers or directors of MFS, MFD, and MFSC.
Other – This fund and certain other funds managed by MFS (the funds) have entered into a service agreement (the ISO Agreement) which provides for payment of fees solely by the funds to Tarantino LLC in return for the provision of services of an Independent Senior Officer (ISO) for the funds. Frank L. Tarantino serves as the ISO and is an officer of the funds and the sole member of Tarantino LLC. The funds can terminate the ISO Agreement with Tarantino LLC at any time under the terms of the ISO Agreement. For the six months ended June 30, 2017, the fee paid by the fund under this agreement was $642 and is included in “Miscellaneous” expense in the Statement of Operations. MFS has agreed to bear all expenses associated with office space, other administrative support, and supplies provided to the ISO.
The fund invests in the MFS Institutional Money Market Portfolio which is managed by MFS and seeks current income consistent with preservation of capital and liquidity. This money market fund does not pay a management fee to MFS.
The fund is permitted to engage in purchase and sale transactions with funds and accounts for which MFS serves as investment adviser or sub-adviser (“cross-trades”) pursuant to a policy adopted by the Board of Trustees. This policy has been designed to ensure that cross-trades conducted by the fund comply with Rule 17a-7 under the Investment Company Act of 1940. Under this policy, cross-trades are effected at current market prices with no remuneration paid in connection with the transaction. During the six months ended June 30, 2017, the fund engaged in sale transactions pursuant to this policy, which amounted to $1,703,359. The sales transactions resulted in net realized gains (losses) of $(1,972,153).
| (4) | Portfolio Securities |
For the six months ended June 30, 2017, purchases and sales of investments, other than short-term obligations, aggregated $195,161,193 and $253,020,141, respectively.
| (5) | Shares of Beneficial Interest |
The fund’s Declaration of Trust permits the Trustees to issue an unlimited number of full and fractional shares of beneficial interest. Transactions in fund shares were as follows:
| Six months ended 6/30/17 | Year ended 12/31/16 | |||||||||||||||
| Shares | Amount | Shares | Amount | |||||||||||||
| Shares sold | ||||||||||||||||
Initial Class | 321,026 | $5,514,787 | 1,066,459 | $16,342,493 | ||||||||||||
Service Class | 583,055 | 9,279,489 | 2,850,524 | 39,420,051 | ||||||||||||
| 904,081 | $14,794,276 | 3,916,983 | $55,762,544 | |||||||||||||
| Shares issued to shareholders in reinvestment of distributions | ||||||||||||||||
Initial Class | — | $— | 806,118 | $12,970,432 | ||||||||||||
Service Class | — | — | 1,193,828 | 17,835,795 | ||||||||||||
| — | $— | 1,999,946 | $30,806,227 | |||||||||||||
| Shares reacquired | ||||||||||||||||
Initial Class | (1,705,491 | ) | $(29,429,437 | ) | (3,952,877 | ) | $(60,803,571 | ) | ||||||||
Service Class | (2,536,352 | ) | (40,551,618 | ) | (5,580,054 | ) | (79,702,910 | ) | ||||||||
| (4,241,843 | ) | $(69,981,055 | ) | (9,532,931 | ) | $(140,506,481 | ) | |||||||||
| Net change | ||||||||||||||||
Initial Class | (1,384,465 | ) | $(23,914,650 | ) | (2,080,300 | ) | $(31,490,646 | ) | ||||||||
Service Class | (1,953,297 | ) | (31,272,129 | ) | (1,535,702 | ) | (22,447,064 | ) | ||||||||
| (3,337,762 | ) | $(55,186,779 | ) | (3,616,002 | ) | $(53,937,710 | ) | |||||||||
16
Table of Contents
MFS New Discovery Series
Notes to Financial Statements (unaudited) – continued
The fund is one of several mutual funds in which certain MFS funds may invest. The MFS funds do not invest in the underlying funds for the purpose of exercising management or control. At the end of the period, the MFS Moderate Allocation Portfolio, the MFS Conservative Allocation Portfolio, and the MFS Growth Allocation Portfolio were the owners of record of approximately 4%, 1%, and 1%, respectively, of the value of outstanding voting shares of the fund.
| (6) | Line of Credit |
The fund and certain other funds managed by MFS participate in a $1.25 billion unsecured committed line of credit, subject to a $1 billion sublimit, provided by a syndication of banks under a credit agreement. Borrowings may be made for temporary financing needs. Interest is charged to each fund, based on its borrowings, generally at a rate equal to the higher of the Overnight Federal Reserve funds rate or daily one month LIBOR plus an agreed upon spread. A commitment fee, based on the average daily, unused portion of the committed line of credit, is allocated among the participating funds at the end of each calendar quarter. In addition, the fund and other funds managed by MFS have established unsecured uncommitted borrowing arrangements with certain banks for temporary financing needs. Interest is charged to each fund, based on its borrowings, at a rate equal to the Overnight Federal Reserve funds rate plus an agreed upon spread. For the six months ended June 30, 2017, the fund’s commitment fee and interest expense were $2,364 and $0, respectively, and are included in “Miscellaneous” expense in the Statement of Operations.
| (7) | Transactions in Underlying Affiliated Funds – Affiliated Issuers |
An affiliated issuer may be considered one in which the fund owns 5% or more of the outstanding voting securities, or a company which is under common control. For the purposes of this report, the fund assumes the following to be an affiliated issuer:
| Underlying Affiliated Fund | Beginning Shares/Par Amount | Acquisitions Shares/Par Amount | Dispositions Shares/Par Amount | Ending Shares/Par Amount | ||||||||||||
| MFS Institutional Money Market Portfolio | 13,656,231 | 108,296,229 | (112,523,338 | ) | 9,429,122 | |||||||||||
| Underlying Affiliated Fund | Realized Gain (Loss) | Capital Gain Distributions | Dividend Income | Ending Value | ||||||||||||
| MFS Institutional Money Market Portfolio | $(1,116 | ) | $— | $51,447 | $9,429,122 | |||||||||||
17
Table of Contents
MFS New Discovery Series
RESULTS OF SHAREHOLDER MEETING (unaudited)
At a special meeting of shareholders of MFS Variable Insurance Trust, which was held on March 23, 2017, the following action was taken:
Item 1: To elect the following individuals as Trustees:
| Number of Dollars | ||||||||
| Nominee | For | Withheld Authority | ||||||
| Steven E. Buller | 11,311,922,492.61 | 518,570,973.54 | ||||||
| John A. Caroselli | 11,291,109,000.34 | 539,384,465.81 | ||||||
| Maureen R. Goldfarb | 11,233,211,779.66 | 597,281,686.49 | ||||||
| David H. Gunning | 11,179,077,201.17 | 651,416,264.98 | ||||||
| Michael Hegarty | 11,191,993,154.78 | 638,500,311.37 | ||||||
| John P. Kavanaugh | 11,242,238,261.44 | 588,255,204.71 | ||||||
| Robert J. Manning | 11,314,479,376.58 | 516,014,089.57 | ||||||
| Clarence Otis, Jr. | 11,208,873,448.85 | 621,620,017.30 | ||||||
| Maryanne L. Roepke | 11,263,427,105.03 | 567,066,361.12 | ||||||
| Robin A. Stelmach | 11,313,883,043.82 | 516,610,422.33 | ||||||
| Laurie J. Thomsen | 11,240,219,041.09 | 590,274,425.06 | ||||||
18
Table of Contents
MFS New Discovery Series
PROXY VOTING POLICIES AND INFORMATION
MFS votes proxies on behalf of the fund pursuant to proxy voting policies and procedures that are available without charge, upon request, by calling 1-800-225-2606, by visiting mfs.com (once you have selected “Individual Investor” as your role, click on “Individual Investor Home” in the top navigation and then select “Learn More About Proxy Voting” under the “I want to…” header on the left hand column of the page), or by visiting the SEC’s Web site at http://www.sec.gov.
Information regarding how the fund voted proxies relating to portfolio securities during the most recent twelve-month period ended June 30 is available by August 31 of each year without charge by visiting mfs.com (once you have selected “Individual Investor” as your role, click on “Individual Investor Home” in the top navigation and then select “Learn More About Proxy Voting” under the “I want to…” header on the left hand column of the page), or by visiting the SEC’s Web site at http://www.sec.gov.
QUARTERLY PORTFOLIO DISCLOSURE
The fund will file a complete schedule of portfolio holdings with the Securities and Exchange Commission (the Commission) for the first and third quarters of each fiscal year on Form N-Q. The fund’s Form N-Q is available on the EDGAR database on the Commission’s Internet Web site at http://www.sec.gov, and may be reviewed and copied at the:
Public Reference Room
Securities and Exchange Commission
100 F Street, NE, Room 1580
Washington, D.C. 20549
Information on the operation of the Public Reference Room may be obtained by calling the Commission at 1-800-SEC-0330. Copies of the fund’s Form N-Q also may be obtained, upon payment of a duplicating fee, by electronic request at the following e-mail address: publicinfo@sec.gov or by writing the Public Reference Section at the above address.
From time to time, MFS may post important information about the fund or the MFS funds on the MFS web site (mfs.com). This information is available on mfs.com by following these steps once you have selected “Individual Investor” as your role: (1) Click on the “Individual Investor Home” in the top navigation and then select the “Announcements” option within the “Market Outlooks” drop down, or (2) Click on “Products & Services” and “Variable Insurance Portfolios” and then select the fund’s name.
INFORMATION ABOUT FUND CONTRACTS AND LEGAL CLAIMS
The fund has entered into contractual arrangements with an investment adviser, administrator, distributor, shareholder servicing agent, 529 program manager (if applicable), and custodian who each provide services to the fund. Unless expressly stated otherwise, shareholders are not parties to, or intended beneficiaries of these contractual arrangements, and these contractual arrangements are not intended to create any shareholder right to enforce them against the service providers or to seek any remedy under them against the service providers, either directly or on behalf of the fund.
Under the Trust’s By-Laws and Declaration of Trust, any claims asserted against or on behalf of the MFS Funds, including claims against Trustees and Officers, must be brought in state and federal courts located within the Commonwealth of Massachusetts.
19
Table of Contents
Table of Contents
SEMIANNUAL REPORT
June 30, 2017

MFS® UTILITIES SERIES
MFS® Variable Insurance Trust

VUF-SEM
Table of Contents
MFS® UTILITIES SERIES
The report is prepared for the general information of contract owners. It is authorized for distribution to prospective investors only when preceded or accompanied by a current prospectus.
NOT FDIC INSURED • MAY LOSE VALUE • NO BANK OR CREDIT UNION GUARANTEE • NOT A DEPOSIT • NOT INSURED BY ANY FEDERAL GOVERNMENT AGENCY OR NCUA/NCUSIF
Table of Contents
MFS Utilities Series
LETTER FROM THE EXECUTIVE CHAIRMAN

Dear Contract Owners:
Despite policy uncertainty accompanying a new presidential administration in the United States and unease over ongoing Brexit negotiations, most markets have proved resilient. U.S. share prices have reached new highs. The U.S. Federal Reserve has continued to gradually hike interest rates. However, rates in most developed markets remain very low, with major non-U.S. central banks just beginning to contemplate curbing accommodative monetary policies.
Globally, economic growth has shown signs of recovery, led by China, the U.S. and the eurozone. Despite better growth, there are few immediate signs of worrisome inflation as wage growth remains muted. Europe has benefited from diminishing event risks as establishment candidates won both the Dutch and French elections, averting a feared populist trend. Emerging market economies are recovering at a somewhat slower pace amid fears that restrictive U.S. trade policies could further hamper the restrained pace of global trade growth. Looking ahead, markets will have to contend with issues involving geopolitical hot spots on the Korean peninsula and in the Middle East, which could potentially lead to a clash of interests between the U.S. and other major powers such as China or Russia.
At MFS®, we believe time is an asset. A patient, long-term approach to investing can have a powerful impact on decision making and outcomes. Time arbitrage, as we call it, simply comes down to having the conviction and discipline to allow enough time for good investment ideas to play out. In our view, such an approach, along with the professional guidance of a financial advisor, will help you reach your investment objectives.
Respectfully,

Robert J. Manning
Executive Chairman
MFS Investment Management
August 16, 2017
The opinions expressed in this letter are subject to change and may not be relied upon for investment advice. No forecasts can be guaranteed.
1
Table of Contents
MFS Utilities Series
Portfolio structure (i)
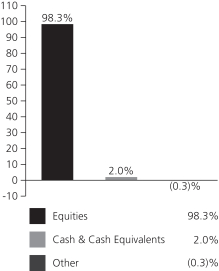
| Top ten holdings (i) | ||||
| Exelon Corp. | 6.5% | |||
| NextEra Energy, Inc. | 4.3% | |||
| PPL Corp. | 4.0% | |||
| EDP Renovaveis S.A. | 3.9% | |||
| Sempra Energy | 3.6% | |||
| Enel S.p.A. | 3.2% | |||
| PG&E Corp. | 2.9% | |||
| Com Hem Holding AB | 2.5% | |||
| American Electric Power Co., Inc. | 2.4% | |||
| Enterprise Products Partners LP | 2.3% | |||
| Top five industries (i) | ||||
| Utilities-Electric Power | 54.5% | |||
| Natural Gas-Pipeline | 15.4% | |||
| Telephone Services | 7.9% | |||
| Telecommunications – Wireless | 6.8% | |||
| Natural Gas-Distribution | 5.0% | |||
| Issuer country weightings (i)(x) | ||||
| United States | 68.0% | |||
| Portugal | 6.0% | |||
| Canada | 3.6% | |||
| Italy | 3.2% | |||
| Spain | 2.5% | |||
| Sweden | 2.5% | |||
| United Kingdom | 2.1% | |||
| France | 1.7% | |||
| Brazil | 1.6% | |||
| Other Countries | 8.8% | |||
| (i) | For purposes of this presentation, the components include the value of securities, and reflect the impact of the equivalent exposure of derivative positions, if any. These amounts may be negative from time to time. Equivalent exposure is a calculated amount that translates the derivative position into a reasonable approximation of the amount of the underlying asset that the portfolio would have to hold at a given point in time to have the same price sensitivity that results from the portfolio’s ownership of the derivative contract. When dealing with derivatives, equivalent exposure is a more representative measure of the potential impact of a position on portfolio performance than value. The bond component will include any accrued interest amounts. |
| (x) | Represents the portfolio’s exposure to issuer countries as a percentage of a portfolio’s net assets. For purposes of this presentation, United States includes Cash & Cash Equivalents and Other. |
Where the fund holds convertible bonds, these are treated as part of the equity portion of the portfolio.
Cash & Cash Equivalents includes any cash, investments in money market funds, short-term securities, and other assets less liabilities. Please see the Statement of Assets and Liabilities for additional information related to the fund’s cash position and other assets and liabilities.
Other includes equivalent exposure from currency derivatives and/or any offsets to derivative positions and may be negative.
Percentages are based on net assets as of June 30, 2017.
The portfolio is actively managed and current holdings may be different.
2
Table of Contents
MFS Utilities Series
Fund Expenses Borne by the Contract Holders during the Period,
January 1, 2017 through June 30, 2017
As a contract holder of the fund, you incur ongoing costs, including management fees; distribution and/or service (12b-1) fees; and other fund expenses. This example is intended to help you understand your ongoing costs (in dollars) of investing in the fund and to compare these costs with the ongoing costs of investing in other mutual funds.
The example is based on an investment of $1,000 invested at the beginning of the period and held for the entire period January 1, 2017 through June 30, 2017.
Actual Expenses
The first line for each share class in the following table provides information about actual account values and actual expenses. You may use the information in this line, together with the amount you invested, to estimate the expenses that you paid over the period. Simply divide your account value by $1,000 (for example, an $8,600 account value divided by $1,000 = 8.6), then multiply the result by the number in the first line under the heading entitled “Expenses Paid During Period” to estimate the expenses you paid on your account during this period.
Hypothetical Example for Comparison Purposes
The second line for each share class in the following table provides information about hypothetical account values and hypothetical expenses based on the fund’s actual expense ratio and an assumed rate of return of 5% per year before expenses, which is not the fund’s actual return. The hypothetical account values and expenses may not be used to estimate the actual ending account balance or expenses you paid for the period. You may use this information to compare the ongoing costs of investing in the fund and other funds. To do so, compare this 5% hypothetical example with the 5% hypothetical examples that appear in the shareholder reports of the other funds.
Please note that the expenses shown in the table are meant to highlight the fund’s ongoing costs only and do not take into account the fees and expenses imposed under the variable contracts through which your investment in the fund is made. Therefore, the second line for each share class in the table is useful in comparing ongoing costs associated with an investment in vehicles (such as the fund) which fund benefits under variable annuity and variable life insurance contracts and to qualified pension and retirement plans only, and will not help you determine the relative total costs of investing in the fund through variable annuity and variable life insurance contracts. If the fees and expenses imposed under the variable contracts were included, your costs would have been higher.
| Share Class | Annualized Expense Ratio | Beginning Account Value 1/01/17 | Ending Account Value 6/30/17 | Expenses Paid During Period (p) 1/01/17-6/30/17 | ||||||||||||||
| Initial Class | Actual | 0.78% | $1,000.00 | $1,099.96 | $4.06 | |||||||||||||
| Hypothetical (h) | 0.78% | $1,000.00 | $1,020.93 | $3.91 | ||||||||||||||
| Service Class | Actual | 1.03% | $1,000.00 | $1,098.22 | $5.36 | |||||||||||||
| Hypothetical (h) | 1.03% | $1,000.00 | $1,019.69 | $5.16 | ||||||||||||||
| (h) | 5% class return per year before expenses. |
| (p) | “Expenses Paid During Period” are equal to each class’s annualized expense ratio, as shown above, multiplied by the average account value over the period, multiplied by 181/365 (to reflect the one-half year period). |
3
Table of Contents
MFS Utilities Series
PORTFOLIO OF INVESTMENTS – 6/30/17 (unaudited)
The Portfolio of Investments is a complete list of all securities owned by your fund. It is categorized by broad-based asset classes.
| Issuer | Shares/Par | Value ($) | ||||||
| COMMON STOCKS – 93.3% | ||||||||
| Cable TV – 4.7% | ||||||||
| Altice USA, Inc. (a) | 408,470 | $ | 13,193,581 | |||||
| Charter Communications, Inc., “A” (a) | 59,741 | 20,123,756 | ||||||
| Comcast Corp., “A” | 786,522 | 30,611,436 | ||||||
| NOS, SGPS, S.A. | 1,885,091 | 11,441,340 | ||||||
|
| |||||||
| $ | 75,370,113 | |||||||
|
| |||||||
| Energy – Independent – 1.8% | ||||||||
| Enable Midstream Partners LP | 279,518 | $ | 4,455,517 | |||||
| EQT Corp. | 31,807 | 1,863,572 | ||||||
| Targa Resources Corp. | 261,251 | 11,808,545 | ||||||
| Western Gas Equity Partners LP | 251,641 | 10,825,596 | ||||||
|
| |||||||
| $ | 28,953,230 | |||||||
|
| |||||||
| Natural Gas – Distribution – 4.9% | ||||||||
| China Resources Gas Group Ltd. | 4,526,000 | $ | 15,449,077 | |||||
| Infraestructura Energetica Nova, S.A. de C.V | 1,076,312 | 5,737,761 | ||||||
| Sempra Energy | 521,945 | 58,849,299 | ||||||
|
| |||||||
| $ | 80,036,137 | |||||||
|
| |||||||
| Natural Gas – Pipeline – 15.4% | ||||||||
| Cheniere Energy, Inc. (a) | 361,619 | $ | 17,614,462 | |||||
| Enbridge, Inc. | 723,280 | 28,812,959 | ||||||
| Energy Transfer Partners LP | 1,712,653 | 34,920,995 | ||||||
| Enterprise Products Partners LP | 1,371,330 | 37,135,616 | ||||||
| EQT GP Holdings LP | 200,318 | 6,039,588 | ||||||
| EQT Midstream Partners LP | 295,898 | 22,082,868 | ||||||
| Kinder Morgan, Inc. | 510,979 | 9,790,358 | ||||||
| Plains All American Pipeline LP | 155,963 | 4,097,148 | ||||||
| Plains GP Holdings LP | 543,390 | 14,215,082 | ||||||
| SemGroup Corp., “A” | 195,865 | 5,288,355 | ||||||
| Shell Midstream Partners, LP | 268,961 | 8,149,518 | ||||||
| Tallgrass Energy GP LP | 369,859 | 9,405,514 | ||||||
| TransCanada Corp. | 449,129 | 21,410,514 | ||||||
| Williams Cos., Inc. | 531,744 | 16,101,208 | ||||||
| Williams Partners LP | 348,999 | 13,998,350 | ||||||
|
| |||||||
| $ | 249,062,535 | |||||||
|
| |||||||
| Telecommunications – Wireless – 6.2% | ||||||||
| Advanced Info Service PLC | 2,000,700 | $ | 10,454,055 | |||||
| American Tower Corp., REIT | 271,631 | 35,942,214 | ||||||
| Cellnex Telecom S.A.U. | 785,113 | 16,194,701 | ||||||
| KDDI Corp. | 446,300 | 11,804,779 | ||||||
| Millicom International Cellular S.A. | 14,815 | 875,039 | ||||||
| Mobile TeleSystems PJSC, ADR | 1,370,078 | 11,481,254 | ||||||
| SBA Communications Corp., REIT (a) | 30,099 | 4,060,355 | ||||||
| Vodafone Group PLC | 3,076,747 | 8,725,913 | ||||||
|
| |||||||
| $ | 99,538,310 | |||||||
|
| |||||||
| Telephone Services – 7.6% | ||||||||
| Bezeq – The Israel Telecommunication | ||||||||
| Corp. Ltd. | 4,195,796 | $ | 6,970,240 | |||||
| BT Group PLC | 1,271,704 | 4,882,034 | ||||||
| Com Hem Holding AB | 2,856,275 | 39,667,190 | ||||||
| Issuer | Shares/Par | Value ($) | ||||||
| COMMON STOCKS – continued | ||||||||
| Telephone Services – continued | ||||||||
| France Telecom S.A. | 835,278 | $ | 13,251,234 | |||||
| Hellenic Telecommunications Organization S.A. | 1,019,632 | 12,274,593 | ||||||
| PT XL Axiata Tbk (a) | 32,408,600 | 8,292,127 | ||||||
| Royal KPN N.V. | 5,344,520 | 17,097,981 | ||||||
| TDC A.S. | 1,975,005 | 11,485,356 | ||||||
| Telefonica Brasil S.A., ADR | 227,925 | 3,074,708 | ||||||
| Telesites S.A.B. de C.V. (a) | 2,649,053 | 1,944,232 | ||||||
| Verizon Communications, Inc. | 90,956 | 4,062,095 | ||||||
|
| |||||||
| $ | 123,001,790 | |||||||
|
| |||||||
| Utilities – Electric Power – 51.2% | ||||||||
| AES Corp. | 2,128,265 | $ | 23,645,023 | |||||
| Alupar Investimento S.A., IEU | 342,400 | 1,869,666 | ||||||
| Ameren Corp. | 254,752 | 13,927,292 | ||||||
| American Electric Power Co., Inc. | 560,570 | 38,942,798 | ||||||
| Avangrid, Inc. | 330,348 | 14,584,864 | ||||||
| Calpine Corp. (a) | 2,623,344 | 35,493,844 | ||||||
| China Longyuan Power Group | 12,486,000 | 9,083,693 | ||||||
| Covanta Holding Corp. (l) | 620,181 | 8,186,389 | ||||||
| DTE Energy Co. | 127,304 | 13,467,490 | ||||||
| Duke Energy Corp. | 325,924 | 27,243,987 | ||||||
| Dynegy, Inc. | 69,050 | 4,293,598 | ||||||
| Dynegy, Inc. (a) | 1,760,654 | 14,560,609 | ||||||
| Edison International | 248,067 | 19,396,359 | ||||||
| EDP Renovaveis S.A. | 7,925,842 | 63,032,542 | ||||||
| Emera, Inc. | 220,509 | 8,197,670 | ||||||
| Enel S.p.A. | 9,543,855 | 51,166,998 | ||||||
| Energias de Portugal S.A. | 6,786,661 | 22,192,208 | ||||||
| Engie Brasil Energia S.A. | 677,000 | 6,931,643 | ||||||
| Exelon Corp. | 2,917,726 | 105,242,379 | ||||||
| Great Plains Energy, Inc. | 316,245 | 9,259,654 | ||||||
| Iberdrola S.A. | 3,133,965 | 24,816,376 | ||||||
| Innogy SE | 224,451 | 8,835,331 | ||||||
| NextEra Energy Partners LP | 561,941 | 20,786,198 | ||||||
| NextEra Energy, Inc. | 498,789 | 69,895,303 | ||||||
| NRG Energy, Inc. | 1,609,027 | 27,707,445 | ||||||
| NRG Yield, Inc., “A” | 679,675 | 11,595,256 | ||||||
| NRG Yield, Inc., “C” | 620,037 | 10,912,651 | ||||||
| NTPC Ltd. | 1,241,030 | 3,051,815 | ||||||
| PG&E Corp. | 702,850 | 46,648,155 | ||||||
| PPL Corp. | 1,661,367 | 64,228,448 | ||||||
| Public Service Enterprise Group, Inc. | 352,919 | 15,179,046 | ||||||
| RWE AG | 408,097 | 8,131,251 | ||||||
| SSE PLC | 1,091,538 | 20,656,913 | ||||||
| Terna Participacoes S.A., IEU | 474,643 | 3,157,696 | ||||||
|
| |||||||
| $ | 826,320,590 | |||||||
|
| |||||||
| Utilities – Water – 1.5% | ||||||||
| Companhia de Saneamento Basico do | ||||||||
| Estado de Sao Paulo | 1,104,200 | $ | 10,552,377 | |||||
| SUEZ Environnement | 718,594 | 13,308,330 | ||||||
|
| |||||||
| $ | 23,860,707 | |||||||
|
| |||||||
| Total Common Stocks (Identified Cost, $1,331,044,697) | $ | 1,506,143,412 | ||||||
|
| |||||||
4
Table of Contents
MFS Utilities Series
Portfolio of Investments (unaudited) – continued
| Issuer | Shares/Par | Value ($) | ||||||
| PREFERRED STOCKS – 5.0% | ||||||||
| Energy – Independent – 0.8% | ||||||||
| Anadarko Petroleum Corp. (l) | 296,987 | $ | 12,202,899 | |||||
|
| |||||||
| Telecommunications – Wireless – 0.6% | ||||||||
| American Tower Corp. | 79,918 | $ | 9,688,459 | |||||
|
| |||||||
| Telephone Services – 0.3% | ||||||||
| Frontier Communications Corp. | 167,505 | $ | 4,931,347 | |||||
|
| |||||||
| Utilities – Electric Power – 3.3% | ||||||||
| Dominion Energy, Inc. | 257,695 | $ | 12,967,212 | |||||
| Dynegy, Inc. | 216,352 | 6,382,384 | ||||||
| Great Plains Energy, Inc. | 153,746 | 8,154,688 | ||||||
| NextEra Energy, Inc. | 326,102 | 17,612,769 | ||||||
| NextEra Energy, Inc. | 131,422 | 8,429,407 | ||||||
|
| |||||||
| $ | 53,546,460 | |||||||
|
| |||||||
| Total Preferred Stocks (Identified Cost, $97,077,803) | $ | 80,369,165 | ||||||
|
| |||||||
| Issuer | Shares/Par | Value ($) | ||||||
| MONEY MARKET FUNDS – 1.8% | ||||||||
| MFS Institutional Money Market Portfolio, 0.98% (v) (Identified Cost, $29,916,931) | 29,919,861 | $ | 29,919,861 | |||||
|
| |||||||
| COLLATERAL FOR SECURITIES LOANED – 0.3% | ||||||||
| State Street Navigator Securities Lending Government Money Market Portfolio, 1% (j) (Identified Cost, $4,713,072) | 4,713,072 | $ | 4,713,072 | |||||
|
| |||||||
| Total Investments (Identified Cost, $1,462,752,503) | $ | 1,621,145,510 | ||||||
|
| |||||||
| OTHER ASSETS, LESS LIABILITIES – (0.4)% | (6,371,999 | ) | ||||||
|
| |||||||
| NET ASSETS – 100.0% | $ | 1,614,773,511 | ||||||
|
| |||||||
| (a) | Non-income producing security. |
| (j) | The rate quoted is the annualized seven-day yield of the fund at period end. |
| (l) | A portion of this security is on loan. |
| (v) | Underlying affiliated fund that is available only to investment companies managed by MFS. The rate quoted for the MFS Institutional Money Market Portfolio is the annualized seven-day yield of the fund at period end. |
The following abbreviations are used in this report and are defined:
| ADR | American Depositary Receipt |
| IEU | International Equity Unit |
| PJSC | Public Joint Stock Company |
| PLC | Public Limited Company |
| REIT | Real Estate Investment Trust |
Abbreviations indicate amounts shown in currencies other than the U.S. dollar. All amounts are stated in U.S. dollars unless otherwise indicated. A list of abbreviations is shown below:
| CAD | Canadian Dollar |
| EUR | Euro |
| GBP | British Pound |
5
Table of Contents
MFS Utilities Series
Portfolio of Investments (unaudited) – continued
Derivative Contracts at 6/30/17
Forward Foreign Currency Exchange Contracts at 6/30/17
| Type | Currency | Counterparty | Contracts to Deliver/Receive | Settlement Date Range | In Exchange For | Contracts at Value | Unrealized (Depreciation) | |||||||||||||||||
| Asset Derivatives | ||||||||||||||||||||||||
| BUY | CAD | Barclays Bank PLC | 453,312 | 8/10/17 | $ | 342,462 | $ | 349,788 | $ | 7,326 | ||||||||||||||
| BUY | CAD | Deutsche Bank AG | 347,469 | 8/10/17 | 262,173 | 268,116 | 5,943 | |||||||||||||||||
| BUY | CAD | Goldman Sachs International | 441,895 | 8/10/17 | 334,318 | 340,978 | 6,660 | |||||||||||||||||
| BUY | CAD | JPMorgan Chase Bank N.A. | 152,781 | 8/10/17 | 117,309 | 117,890 | 581 | |||||||||||||||||
| BUY | CAD | Morgan Stanley Capital Services, Inc. | 1,071,031 | 8/10/17 | 812,228 | 826,436 | 14,208 | |||||||||||||||||
| BUY | EUR | BNP Paribas S.A. | 1,171,373 | 8/10/17 | 1,315,257 | 1,340,351 | 25,094 | |||||||||||||||||
| BUY | EUR | Citibank N.A. | 847 | 8/10/17 | 952 | 969 | 17 | |||||||||||||||||
| BUY | EUR | Deutsche Bank AG | 433,055 | 8/10/17 | 486,071 | 495,526 | 9,455 | |||||||||||||||||
| BUY | EUR | JPMorgan Chase Bank N.A. | 600,157 | 8/10/17 | 671,105 | 686,733 | 15,628 | |||||||||||||||||
| BUY | EUR | Morgan Stanley Capital Services, Inc. | 1,158,483 | 8/10/17 | 1,306,988 | 1,325,602 | 18,614 | |||||||||||||||||
| SELL | EUR | BNP Paribas S.A. | 305,927 | 8/10/17 | 350,063 | 350,059 | 4 | |||||||||||||||||
| BUY | GBP | BNP Paribas S.A. | 700,476 | 8/10/17 | 912,178 | 913,366 | 1,188 | |||||||||||||||||
| BUY | GBP | UBS AG | 25,875 | 8/10/17 | 33,041 | 33,739 | 698 | |||||||||||||||||
|
| |||||||||||||||||||||||
| $ | 105,416 | |||||||||||||||||||||||
|
| |||||||||||||||||||||||
| Liability Derivatives | ||||||||||||||||||||||||
| SELL | CAD | BNP Paribas S.A. | 127,690 | 8/10/17 | $ | 95,917 | $ | 98,529 | $ | (2,612 | ) | |||||||||||||
| SELL | CAD | Deutsche Bank AG | 685,111 | 8/10/17 | 518,228 | 528,650 | (10,422 | ) | ||||||||||||||||
| SELL | CAD | Goldman Sachs International | 2,435,390 | 8/10/17 | 1,810,570 | 1,879,212 | (68,642 | ) | ||||||||||||||||
| SELL | CAD | JPMorgan Chase Bank N.A. | 1,570,718 | 8/10/17 | 1,176,652 | 1,212,008 | (35,356 | ) | ||||||||||||||||
| SELL | CAD | Merrill Lynch International | 46,398,996 | 8/10/17 | 34,460,756 | 35,802,701 | (1,341,945 | ) | ||||||||||||||||
| SELL | EUR | Barclays Bank PLC | 2,837,000 | 7/19/17 | 3,124,975 | 3,242,602 | (117,627 | ) | ||||||||||||||||
| SELL | EUR | BNP Paribas S.A. | 7,183,864 | 7/19/17-8/10/17 | 8,042,114 | 8,217,203 | (175,089 | ) | ||||||||||||||||
| SELL | EUR | Citibank N.A. | 967,005 | 8/10/17 | 1,093,066 | 1,106,502 | (13,436 | ) | ||||||||||||||||
| SELL | EUR | Deutsche Bank AG | 3,650,000 | 8/10/17 | 4,099,684 | 4,176,536 | (76,852 | ) | ||||||||||||||||
| SELL | EUR | HSBC Bank | 4,282,128 | 8/10/17 | 4,842,016 | 4,899,852 | (57,836 | ) | ||||||||||||||||
| SELL | EUR | JPMorgan Chase Bank N.A. | 65,131,466 | 8/10/17 | 73,638,181 | 74,527,092 | (888,911 | ) | ||||||||||||||||
| SELL | EUR | Morgan Stanley Capital Services, Inc. | 61,757,525 | 7/19/17-8/10/17 | 69,112,409 | 70,597,542 | (1,485,133 | ) | ||||||||||||||||
| SELL | GBP | Merrill Lynch International | 18,387,743 | 8/10/17 | 23,739,037 | 23,976,169 | (237,132 | ) | ||||||||||||||||
|
| |||||||||||||||||||||||
| $ | (4,510,993 | ) | ||||||||||||||||||||||
|
| |||||||||||||||||||||||
At June 30, 2017, the fund had cash collateral of $3,300,000 to cover any commitments for certain derivative contracts. Cash collateral is comprised of “Restricted cash” on the Statement of Assets and Liabilities.
See Notes to Financial Statements
6
Table of Contents
MFS Utilities Series
FINANCIAL STATEMENTS | STATEMENT OF ASSETS AND LIABILITIES (unaudited)
This statement represents your fund’s balance sheet, which details the assets and liabilities comprising the total value of the fund.
At 6/30/17 | ||||
Assets | ||||
Investments | ||||
Non-affiliated issuers, at value (identified cost, $1,432,835,572) | $1,591,225,649 | |||
Underlying affiliated funds, at value (identified cost, $29,916,931) | 29,919,861 | |||
Total investments, at value, including $4,610,777 of securities on loan (identified cost, $1,462,752,503) | $1,621,145,510 | |||
Cash | 660,000 | |||
Restricted cash | 3,300,000 | |||
Foreign currency, at value (identified cost, $108,744) | 108,534 | |||
Receivables for | ||||
Forward foreign currency exchange contracts | 105,416 | |||
Investments sold | 6,340,399 | |||
Fund shares sold | 253,440 | |||
Interest and dividends | 3,522,156 | |||
Other assets | 3,520 | |||
Total assets | $1,635,438,975 | |||
Liabilities | ||||
Payables for | ||||
Forward foreign currency exchange contracts | $4,510,993 | |||
Investments purchased | 8,201,812 | |||
Fund shares reacquired | 2,719,451 | |||
Collateral for securities loaned, at value | 4,713,072 | |||
Payable to affiliates | ||||
Investment adviser | 65,680 | |||
Shareholder servicing costs | 1,773 | |||
Distribution and/or service fees | 14,373 | |||
Payable for independent Trustees’ compensation | 1,699 | |||
Deferred country tax expense payable | 190,665 | |||
Accrued expenses and other liabilities | 245,946 | |||
Total liabilities | $20,665,464 | |||
Net assets | $1,614,773,511 | |||
Net assets consist of | ||||
Paid-in capital | $1,409,987,717 | |||
Unrealized appreciation (depreciation) on investments and translation of assets and liabilities in foreign currencies | 153,790,263 | |||
Accumulated net realized gain (loss) on investments and foreign currency | (40,217,143 | ) | ||
Undistributed net investment income | 91,212,674 | |||
Net assets | $1,614,773,511 | |||
Shares of beneficial interest outstanding | 55,400,083 |
| Net assets | Shares outstanding | Net asset value per share | ||||||||||
Initial Class | $568,936,663 | 19,291,921 | $29.49 | |||||||||
Service Class | 1,045,836,848 | 36,108,162 | 28.96 | |||||||||
See Notes to Financial Statements
7
Table of Contents
MFS Utilities Series
FINANCIAL STATEMENTS | STATEMENT OF OPERATIONS (unaudited)
This statement describes how much your fund earned in investment income and accrued in expenses. It also describes any gains and/or losses generated by fund operations.
Six months ended 6/30/17 | ||||
Net investment income | ||||
Income | ||||
Dividends | $32,069,858 | |||
Dividends from underlying affiliated funds | 196,822 | |||
Interest | 57,224 | |||
Foreign taxes withheld | (1,213,842 | ) | ||
Total investment income | $31,110,062 | |||
Expenses | ||||
Management fee | $5,828,393 | |||
Distribution and/or service fees | 1,289,476 | |||
Shareholder servicing costs | 39,405 | |||
Administrative services fee | 133,653 | |||
Independent Trustees’ compensation | 16,916 | |||
Custodian fee | 101,284 | |||
Shareholder communications | 129,896 | |||
Audit and tax fees | 30,766 | |||
Legal fees | 8,601 | |||
Miscellaneous | 24,460 | |||
Total expenses | $7,602,850 | |||
Reduction of expenses by investment adviser | (61,198 | ) | ||
Net expenses | $7,541,652 | |||
Net investment income | $23,568,410 | |||
Realized and unrealized gain (loss) on investments and foreign currency | ||||
Realized gain (loss) (identified cost basis) | ||||
Investments: | ||||
Non-affiliated issuers | $5,718,318 | |||
Underlying affiliated funds | (3,511 | ) | ||
Foreign currency | (5,856,316 | ) | ||
Net realized gain (loss) on investments and foreign currency | $(141,509 | ) | ||
Change in unrealized appreciation (depreciation) | ||||
Investments (net of $190,665 increase in deferred country tax) | $135,285,827 | |||
Translation of assets and liabilities in foreign currencies | (7,827,881 | ) | ||
Net unrealized gain (loss) on investments and foreign currency translation | $127,457,946 | |||
Net realized and unrealized gain (loss) on investments and foreign currency | $127,316,437 | |||
Change in net assets from operations | $150,884,847 |
See Notes to Financial Statements
8
Table of Contents
MFS Utilities Series
FINANCIAL STATEMENTS | STATEMENTS OF CHANGES IN NET ASSETS
These statements describe the increases and/or decreases in net assets resulting from operations, any distributions, and any shareholder transactions.
| | Six months ended 6/30/17 (unaudited | ) | | Year ended 12/31/16 | | |||
Change in net assets | ||||||||
| From operations | ||||||||
Net investment income | $23,568,410 | $59,514,902 | ||||||
Net realized gain (loss) on investments and foreign currency | (141,509 | ) | (17,525,329 | ) | ||||
Net unrealized gain (loss) on investments and foreign currency translation | 127,457,946 | 127,664,837 | ||||||
Change in net assets from operations | $150,884,847 | $169,654,410 | ||||||
| Distributions declared to shareholders | ||||||||
From net investment income | $— | $(59,729,803 | ) | |||||
From net realized gain on investments | — | (36,926,325 | ) | |||||
Total distributions declared to shareholders | $— | $(96,656,128 | ) | |||||
Change in net assets from fund share transactions | $(91,554,216 | ) | $(46,897,011 | ) | ||||
Total change in net assets | $59,330,631 | $26,101,271 | ||||||
| Net assets | ||||||||
At beginning of period | 1,555,442,880 | 1,529,341,609 | ||||||
At end of period (including undistributed net investment income of $91,212,674 and | $1,614,773,511 | $1,555,442,880 |
See Notes to Financial Statements
9
Table of Contents
MFS Utilities Series
FINANCIAL STATEMENTS | FINANCIAL HIGHLIGHTS
The financial highlights table is intended to help you understand the fund’s financial performance for the semiannual period and the past 5 fiscal years. Certain information reflects financial results for a single fund share. The total returns in the table represent the rate that an investor would have earned (or lost) on an investment in the fund share class (assuming reinvestment of all distributions) held for the entire period.
| Initial Class | Six months ended 6/30/17 | Years ended 12/31 | ||||||||||||||||||||||
| 2016 | 2015 | 2014 | 2013 | 2012 | ||||||||||||||||||||
| (unaudited) | ||||||||||||||||||||||||
Net asset value, beginning of period | $26.81 | $25.56 | $33.97 | $31.88 | $27.61 | $26.08 | ||||||||||||||||||
| Income (loss) from investment operations | ||||||||||||||||||||||||
Net investment income (d) | $0.44 | $1.06 | (c) | $0.81 | $0.99 | $0.94 | $0.84 | |||||||||||||||||
Net realized and unrealized gain (loss) on investments and foreign currency | 2.24 | 1.91 | (5.56 | ) | 3.13 | 4.64 | 2.57 | |||||||||||||||||
Total from investment operations | $2.68 | $2.97 | $(4.75 | ) | $4.12 | $5.58 | $3.41 | |||||||||||||||||
| Less distributions declared to shareholders | ||||||||||||||||||||||||
From net investment income | $— | $(1.08 | ) | $(1.38 | ) | $(0.74 | ) | $(0.73 | ) | $(1.88 | ) | |||||||||||||
From net realized gain on investments | — | (0.64 | ) | (2.28 | ) | (1.29 | ) | (0.58 | ) | — | ||||||||||||||
Total distributions declared to shareholders | $— | $(1.72 | ) | $(3.66 | ) | $(2.03 | ) | $(1.31 | ) | $(1.88 | ) | |||||||||||||
Net asset value, end of period (x) | $29.49 | $26.81 | $25.56 | $33.97 | $31.88 | $27.61 | ||||||||||||||||||
Total return (%) (k)(r)(s)(x) | 10.00 | (n) | 11.47 | (c) | (14.54 | ) | 12.77 | 20.60 | 13.40 | |||||||||||||||
| Ratios (%) (to average net assets) and Supplemental data: | ||||||||||||||||||||||||
Expenses before expense reductions (f) | 0.79 | (a) | 0.77 | (c) | 0.79 | 0.79 | 0.80 | 0.82 | ||||||||||||||||
Expenses after expense reductions (f) | 0.78 | (a) | 0.77 | (c) | 0.78 | 0.78 | 0.80 | 0.82 | ||||||||||||||||
Net investment income | 3.11 | (a) | 3.89 | (c) | 2.59 | 2.87 | 3.07 | 3.11 | ||||||||||||||||
Portfolio turnover | 14 | (n) | 33 | 42 | 53 | 50 | 51 | |||||||||||||||||
Net assets at end of period (000 omitted) | $568,937 | $556,607 | $561,517 | $754,927 | $525,386 | $476,685 | ||||||||||||||||||
Service Class | Six months ended 6/30/17 | Years ended 12/31 | ||||||||||||||||||||||
| 2016 | 2015 | 2014 | 2013 | 2012 | ||||||||||||||||||||
| (unaudited) | ||||||||||||||||||||||||
Net asset value, beginning of period | $26.37 | $25.15 | $33.48 | $31.47 | $27.27 | $25.73 | ||||||||||||||||||
| Income (loss) from investment operations | ||||||||||||||||||||||||
Net investment income (d) | $0.40 | $0.97 | (c) | $0.72 | $0.92 | $0.85 | $0.71 | |||||||||||||||||
Net realized and unrealized gain (loss) on investments and foreign currency | 2.19 | 1.90 | (5.47 | ) | 3.05 | 4.58 | 2.59 | |||||||||||||||||
Total from investment operations | $2.59 | $2.87 | $(4.75 | ) | $3.97 | $5.43 | $3.30 | |||||||||||||||||
| Less distributions declared to shareholders | ||||||||||||||||||||||||
From net investment income | $— | $(1.01 | ) | $(1.30 | ) | $(0.67 | ) | $(0.65 | ) | $(1.76 | ) | |||||||||||||
From net realized gain on investments | — | (0.64 | ) | (2.28 | ) | (1.29 | ) | (0.58 | ) | — | ||||||||||||||
Total distributions declared to shareholders | $— | $(1.65 | ) | $(3.58 | ) | $(1.96 | ) | $(1.23 | ) | $(1.76 | ) | |||||||||||||
Net asset value, end of period (x) | $28.96 | $26.37 | $25.15 | $33.48 | $31.47 | $27.27 | ||||||||||||||||||
Total return (%) (k)(r)(s)(x) | 9.82 | (n) | 11.24 | (c) | (14.76 | ) | 12.47 | 20.30 | 13.13 | |||||||||||||||
| Ratios (%) (to average net assets) and Supplemental data: | ||||||||||||||||||||||||
Expenses before expense reductions (f) | 1.04 | (a) | 1.02 | (c) | 1.04 | 1.04 | 1.05 | 1.07 | ||||||||||||||||
Expenses after expense reductions (f) | 1.03 | (a) | 1.02 | (c) | 1.03 | 1.03 | 1.05 | 1.07 | ||||||||||||||||
Net investment income | 2.87 | (a) | 3.64 | (c) | 2.34 | 2.71 | 2.82 | 2.66 | ||||||||||||||||
Portfolio turnover | 14 | (n) | 33 | 42 | 53 | 50 | 51 | |||||||||||||||||
Net assets at end of period (000 omitted) | $1,045,837 | $998,836 | $967,824 | $1,252,327 | $978,732 | $837,196 | ||||||||||||||||||
See Notes to Financial Statements
10
Table of Contents
MFS Utilities Series
Financial Highlights – continued
| (a) | Annualized. |
| (c) | Amount reflects a one-time reimbursement of expenses by the custodian (or former custodian) without which net investment income and performance would be lower and expenses would be higher. |
| (d) | Per share data is based on average shares outstanding. |
| (f) | Ratios do not reflect reductions from fees paid indirectly, if applicable. |
| (k) | The total return does not reflect expenses that apply to separate accounts. Inclusion of these charges would reduce the total return figures for all periods shown. |
| (n) | Not annualized. |
| (r) | Certain expenses have been reduced without which performance would have been lower. |
| (s) | From time to time the fund may receive proceeds from litigation settlements, without which performance would be lower. |
| (x) | The net asset values and total returns have been calculated on net assets which include adjustments made in accordance with U.S. generally accepted accounting principles required at period end for financial reporting purposes. |
See Notes to Financial Statements
11
Table of Contents
MFS Utilities Series
NOTES TO FINANCIAL STATEMENTS (unaudited)
| (1) | Business and Organization |
MFS Utilities Series (the fund) is a diversified series of MFS Variable Insurance Trust (the trust). The trust is organized as a Massachusetts business trust and is registered under the Investment Company Act of 1940, as amended, as an open-end management investment company. The shareholders of each series of the trust are separate accounts of insurance companies, which offer variable annuity and/or life insurance products, and qualified retirement and pension plans.
The fund is an investment company and accordingly follows the investment company accounting and reporting guidance of the Financial Accounting Standards Board (FASB) Accounting Standards Codification Topic 946 Financial Services – Investment Companies.
| (2) | Significant Accounting Policies |
General – The preparation of financial statements in conformity with U.S. generally accepted accounting principles requires management to make estimates and assumptions that affect the reported amounts of assets and liabilities, and disclosure of contingent assets and liabilities at the date of the financial statements and the reported amounts of increases and decreases in net assets from operations during the reporting period. Actual results could differ from those estimates. In the preparation of these financial statements, management has evaluated subsequent events occurring after the date of the fund’s Statement of Assets and Liabilities through the date that the financial statements were issued. The fund invests primarily in issuers in the utility industry. Issuers in a single industry can react similarly to market, economic, political and regulatory conditions and developments. The fund invests in foreign securities. Investments in foreign securities are vulnerable to the effects of changes in the relative values of the local currency and the U.S. dollar and to the effects of changes in each country’s legal, political, and economic environment.
In October 2016, the Securities and Exchange Commission (SEC) released its Final Rule on Investment Company Reporting Modernization (the “Rule”). The Rule, which introduces two new regulatory reporting forms for investment companies – Form N-PORT and Form N-CEN – also contains amendments to Regulation S-X which impact financial statement presentation, particularly the presentation of derivative investments. Although still evaluating the impacts of the Rule, management believes that many of the Regulation S-X amendments are consistent with the fund’s current financial statement presentation and expects that the fund will be able to comply with the Rule’s Regulation S-X amendments by the August 1, 2017 compliance date.
Balance Sheet Offsetting – The fund’s accounting policy with respect to balance sheet offsetting is that, absent an event of default by the counterparty or a termination of the agreement, the International Swaps and Derivatives Association (ISDA) Master Agreement does not result in an offset of reported amounts of financial assets and financial liabilities in the Statement of Assets and Liabilities across transactions between the fund and the applicable counterparty. The fund’s right to setoff may be restricted or prohibited by the bankruptcy or insolvency laws of the particular jurisdiction to which a specific master netting agreement counterparty is subject. Balance sheet offsetting disclosures, to the extent applicable to the fund, have been included in the fund’s Significant Accounting Policies note under the captions for each of the fund’s in-scope financial instruments and transactions.
Investment Valuations – Equity securities, including restricted equity securities, are generally valued at the last sale or official closing price on their primary market or exchange as provided by a third-party pricing service. Equity securities, for which there were no sales reported that day, are generally valued at the last quoted daily bid quotation on their primary market or exchange as provided by a third-party pricing service. Short-term instruments with a maturity at issuance of 60 days or less may be valued at amortized cost, which approximates market value. Forward foreign currency exchange contracts are generally valued at the mean of bid and asked prices for the time period interpolated from rates provided by a third-party pricing service for proximate time periods. Open-end investment companies are generally valued at net asset value per share. Securities and other assets generally valued on the basis of information from a third-party pricing service may also be valued at a broker/dealer bid quotation. Values obtained from third-party pricing services can utilize both transaction data and market information such as yield, quality, coupon rate, maturity, type of issue, trading characteristics, and other market data. The values of foreign securities and other assets and liabilities expressed in foreign currencies are converted to U.S. dollars using the mean of bid and asked prices for rates provided by a third-party pricing service.
The Board of Trustees has delegated primary responsibility for determining or causing to be determined the value of the fund’s investments (including any fair valuation) to the adviser pursuant to valuation policies and procedures approved by the Board. If the adviser determines that reliable market quotations are not readily available, investments are valued at fair value as determined in good faith by the adviser in accordance with such procedures under the oversight of the Board of Trustees. Under the fund’s valuation policies and procedures, market quotations are not considered to be readily available for most types of debt instruments and floating rate loans and many types of derivatives. These investments are generally valued at fair value based on information from third-party pricing services. In addition, investments may be valued at fair value if the adviser determines that an investment’s value has been materially affected by events occurring after the close of the exchange or market on which the investment is principally traded (such as foreign exchange or market) and prior to the determination of the fund’s net asset value, or after the halting of trading of a specific security where trading does not resume prior to the close of the exchange or market on which the security is principally traded. Events that occur on a frequent basis after foreign markets close (such as developments in foreign markets and
12
Table of Contents
MFS Utilities Series
Notes to Financial Statements (unaudited) – continued
significant movements in the U.S. markets) and prior to the determination of the fund’s net asset value may be deemed to have a material effect on the value of securities traded in foreign markets. Accordingly, the fund’s foreign equity securities may often be valued at fair value. The adviser generally relies on third-party pricing services or other information (such as the correlation with price movements of similar securities in the same or other markets; the type, cost and investment characteristics of the security; the business and financial condition of the issuer; and trading and other market data) to assist in determining whether to fair value and at what value to fair value an investment. The value of an investment for purposes of calculating the fund’s net asset value can differ depending on the source and method used to determine value. When fair valuation is used, the value of an investment used to determine the fund’s net asset value may differ from quoted or published prices for the same investment. There can be no assurance that the fund could obtain the fair value assigned to an investment if it were to sell the investment at the same time at which the fund determines its net asset value per share.
Various inputs are used in determining the value of the fund’s assets or liabilities. These inputs are categorized into three broad levels. In certain cases, the inputs used to measure fair value may fall into different levels of the fair value hierarchy. In such cases, an investment’s level within the fair value hierarchy is based on the lowest level of input that is significant to the fair value measurement. The fund’s assessment of the significance of a particular input to the fair value measurement in its entirety requires judgment, and considers factors specific to the investment. Level 1 includes unadjusted quoted prices in active markets for identical assets or liabilities. Level 2 includes other significant observable market-based inputs (including quoted prices for similar securities, interest rates, prepayment speed, and credit risk). Level 3 includes unobservable inputs, which may include the adviser’s own assumptions in determining the fair value of investments. The following is a summary of the levels used as of June 30, 2017 in valuing the fund’s assets or liabilities:
| Investments at Value | Level 1 | Level 2 | Level 3 | Total | ||||||||||||
| Equity Securities: | ||||||||||||||||
United States | $1,059,524,997 | $10,675,982 | $— | $1,070,200,979 | ||||||||||||
Portugal | 96,666,091 | — | — | 96,666,091 | ||||||||||||
Canada | 58,421,144 | — | — | 58,421,144 | ||||||||||||
Italy | 51,166,997 | — | — | 51,166,997 | ||||||||||||
Spain | 41,011,077 | — | — | 41,011,077 | ||||||||||||
Sweden | 40,542,229 | — | — | 40,542,229 | ||||||||||||
United Kingdom | 34,264,860 | — | — | 34,264,860 | ||||||||||||
France | 26,559,563 | — | — | 26,559,563 | ||||||||||||
Brazil | 25,586,091 | — | — | 25,586,091 | ||||||||||||
Other Countries | 131,639,491 | 10,454,055 | — | 142,093,546 | ||||||||||||
| Mutual Funds | 34,632,933 | — | — | 34,632,933 | ||||||||||||
| Total Investments | $1,600,015,473 | $21,130,037 | $— | $1,621,145,510 | ||||||||||||
| Other Financial Instruments | ||||||||||||||||
| Forward Foreign Currency Exchange Contracts – Assets | $— | $105,416 | $— | $105,416 | ||||||||||||
| Forward Foreign Currency Exchange Contracts – Liabilities | — | (4,510,993 | ) | — | (4,510,993 | ) | ||||||||||
For further information regarding security characteristics, see the Portfolio of Investments.
Of the level 2 investments presented above, equity investments amounting to $10,675,982 would have been considered level 1 investments at the beginning of the period. Of the level 1 investments presented above, equity investments amounting to $154,267,157 would have been considered level 2 investments at the beginning of the period. The primary reason for changes in the classifications between levels 1 and 2 occurs when foreign equity securities are fair valued using other observable market-based inputs in place of the closing exchange price due to events occurring after the close of the exchange or market on which the investment is principally traded. The fund’s foreign equity securities may often be valued using other observable market-based inputs. The fund’s policy is to recognize transfers between the levels as of the end of the period.
Foreign Currency Translation – Purchases and sales of foreign investments, income, and expenses are converted into U.S. dollars based upon currency exchange rates prevailing on the respective dates of such transactions or on the reporting date for foreign denominated receivables and payables. Gains and losses attributable to foreign currency exchange rates on sales of securities are recorded for financial statement purposes as net realized gains and losses on investments. Gains and losses attributable to foreign exchange rate movements on receivables, payables, income and expenses are recorded for financial statement purposes as foreign currency transaction gains and losses. That portion of both realized and unrealized gains and losses on investments that results from fluctuations in foreign currency exchange rates is not separately disclosed.
13
Table of Contents
MFS Utilities Series
Notes to Financial Statements (unaudited) – continued
Derivatives – The fund uses derivatives for different purposes, primarily to increase or decrease exposure to a particular market or segment of the market, or security, to increase or decrease interest rate or currency exposure, or as alternatives to direct investments. Derivatives are used for hedging or non-hedging purposes. While hedging can reduce or eliminate losses, it can also reduce or eliminate gains. When the fund uses derivatives as an investment to increase market exposure, or for hedging purposes, gains and losses from derivative instruments may be substantially greater than the derivative’s original cost.
The derivative instruments used by the fund were forward foreign currency exchange contracts. The fund’s period end derivatives, as presented in the Portfolio of Investments and the associated Derivative Contract tables, generally are indicative of the volume of its derivative activity during the period.
The following table presents, by major type of derivative contract, the fair value, on a gross basis, of the asset and liability components of derivatives held by the fund at June 30, 2017 as reported in the Statement of Assets and Liabilities:
| Fair Value | ||||||||||
| Risk | Derivative Contracts | Asset Derivatives | Liability Derivatives | |||||||
| Foreign Exchange | Forward Foreign Currency Exchange | $105,416 | $(4,510,993 | ) | ||||||
The following table presents, by major type of derivative contract, the realized gain (loss) on derivatives held by the fund for the six months ended June 30, 2017 as reported in the Statement of Operations:
| Risk | Foreign Currency | |||
| Foreign Exchange | $(5,806,093 | ) | ||
The following table presents, by major type of derivative contract, the change in unrealized appreciation (depreciation) on derivatives held by the fund for the six months ended June 30, 2017 as reported in the Statement of Operations:
| Risk | Translation of Assets and Liabilities in Foreign Currencies | |||
| Foreign Exchange | $(7,861,292 | ) | ||
Derivative counterparty credit risk is managed through formal evaluation of the creditworthiness of all potential counterparties. On certain, but not all, uncleared derivatives, the fund attempts to reduce its exposure to counterparty credit risk whenever possible by entering into an ISDA Master Agreement on a bilateral basis. The ISDA Master Agreement gives each party to the agreement the right to terminate all transactions traded under such agreement if there is a certain deterioration in the credit quality of the other party. Upon an event of default or a termination of the ISDA Master Agreement, the non-defaulting party has the right to close out all transactions traded under such agreement and to net amounts owed under each agreement to one net amount payable by one party to the other. This right to close out and net payments across all transactions traded under the ISDA Master Agreement could result in a reduction of the fund’s credit risk to such counterparty equal to any amounts payable by the fund under the applicable transactions, if any.
Collateral and margin requirements differ by type of derivative. Margin requirements are set by the clearing broker and the clearing house for cleared derivatives (e.g., futures contracts, cleared swaps, and exchange-traded options) while collateral terms are contract specific for uncleared derivatives (e.g., forward foreign currency exchange contracts, uncleared swap agreements, and uncleared options). For derivatives traded under an ISDA Master Agreement, which contains a collateral support annex, the collateral requirements are netted across all transactions traded under such agreement and one amount is posted from one party to the other to collateralize such obligations. Cash that has been segregated to cover the fund’s collateral or margin obligations under derivative contracts, if any, will be reported separately in the Statement of Assets and Liabilities as “Restricted cash” or “Deposits with brokers.” Securities pledged as collateral or margin for the same purpose, if any, are noted in the Portfolio of Investments.
Forward Foreign Currency Exchange Contracts – The fund entered into forward foreign currency exchange contracts for the purchase or sale of a specific foreign currency at a fixed price on a future date. These contracts may be used to hedge the fund’s currency risk or for non-hedging purposes. For hedging purposes, the fund may enter into contracts to deliver or receive foreign currency that the fund will receive from or use in its normal investment activities. The fund may also use contracts to hedge against declines in the value of foreign currency denominated securities due to unfavorable exchange rate movements. For non-hedging purposes, the fund may enter into contracts with the intent of changing the relative exposure of the fund’s portfolio of securities to different currencies to take advantage of anticipated exchange rate changes.
Forward foreign currency exchange contracts are adjusted by the daily exchange rate of the underlying currency and any unrealized gains or losses are recorded as a receivable or payable for forward foreign currency exchange contracts until the contract settlement date. On contract settlement date, any gain or loss on the contract is recorded as realized gains or losses on foreign currency.
14
Table of Contents
MFS Utilities Series
Notes to Financial Statements (unaudited) – continued
Risks may arise upon entering into these contracts from unanticipated movements in the value of the contract and from the potential inability of counterparties to meet the terms of their contracts. Generally, the fund’s maximum risk due to counterparty credit risk is the unrealized gain on the contract due to the use of Continuous Linked Settlement, a multicurrency cash settlement system for the centralized settlement of foreign transactions. This risk is mitigated in cases where there is an ISDA Master Agreement between the fund and the counterparty providing for netting as described above and, where applicable, by the posting of collateral by the counterparty to the fund to cover the fund’s exposure to the counterparty under such ISDA Master Agreement.
Security Loans – Under its Securities Lending Agency Agreement with the fund, State Street Bank and Trust Company (“State Street”), as lending agent, loans the securities of the fund to certain qualified institutions (the “Borrowers”) approved by the fund. Security loans can be terminated at the discretion of either the lending agent or the fund and the related securities must be returned within the earlier of the standard trade settlement period for such securities or within three business days. The loans are collateralized by cash and/or U.S. Treasury and federal agency obligations in an amount typically at least equal to the market value of the securities loaned. On loans collateralized by cash, the cash collateral is invested in a money market fund. The market value of the loaned securities is determined at the close of business of the fund and any additional required collateral is delivered to the fund on the next business day. State Street provides the fund with indemnification against Borrower default. In the event of Borrower default, State Street will, for the benefit of the fund, either purchase securities identical to those loaned or, when such purchase is commercially impracticable, pay the fund the market value of the loaned securities. In return, State Street assumes the fund’s rights to the related collateral. If the collateral value is less than the cost to purchase identical securities, State Street is responsible for the shortfall, but only to the extent that such shortfall is not due to a decline in collateral value resulting from collateral reinvestment for which the fund bears the risk of loss. At period end, the fund had investment securities on loan, all of which were classified as equity securities in the fund’s Portfolio of Investments, with a fair value of $4,610,777. The fair value of the fund’s investment securities on loan and a related liability of $4,713,072 for cash collateral received on securities loaned are both presented gross in the Statement of Assets and Liabilities. The collateral received on securities loaned exceeded the value of securities on loan at period end. The liability for cash collateral for securities loaned is carried at fair value, which is categorized as level 2 within the fair value hierarchy. A portion of the income generated upon investment of the collateral is remitted to the Borrowers, and the remainder is allocated between the fund and the lending agent. On loans collateralized by U.S. Treasury and/or federal agency obligations, a fee is received from the Borrower, and is allocated between the fund and the lending agent. Income from securities lending is included in “Interest” income in the Statement of Operations. The dividend and interest income earned on the securities loaned is accounted for in the same manner as other dividend and interest income.
Indemnifications – Under the fund’s organizational documents, its officers and Trustees may be indemnified against certain liabilities and expenses arising out of the performance of their duties to the fund. Additionally, in the normal course of business, the fund enters into agreements with service providers that may contain indemnification clauses. The fund’s maximum exposure under these agreements is unknown as this would involve future claims that may be made against the fund that have not yet occurred.
Investment Transactions and Income – Investment transactions are recorded on the trade date. Interest income is recorded on the accrual basis. All premium and discount is amortized or accreted for financial statement purposes in accordance with U.S. generally accepted accounting principles. Dividends received in cash are recorded on the ex-dividend date. Certain dividends from foreign securities will be recorded when the fund is informed of the dividend if such information is obtained subsequent to the ex-dividend date. Dividend and interest payments received in additional securities are recorded on the ex-dividend or ex-interest date in an amount equal to the value of the security on such date.
The fund may receive proceeds from litigation settlements. Any proceeds received from litigation involving portfolio holdings are reflected in the Statement of Operations in realized gain/loss if the security has been disposed of by the fund or in unrealized gain/loss if the security is still held by the fund. Any other proceeds from litigation not related to portfolio holdings are reflected as other income in the Statement of Operations.
Tax Matters and Distributions – The fund intends to qualify as a regulated investment company, as defined under Subchapter M of the Internal Revenue Code, and to distribute all of its taxable income, including realized capital gains. As a result, no provision for federal income tax is required. The fund’s federal tax returns, when filed, will remain subject to examination by the Internal Revenue Service for a three year period. Management has analyzed the fund’s tax positions taken on federal and state tax returns for all open tax years and does not believe that there are any uncertain tax positions that require recognition of a tax liability. Foreign taxes, if any, have been accrued by the fund in the accompanying financial statements in accordance with the applicable foreign tax law. Foreign income taxes may be withheld by certain countries in which the fund invests. Additionally, capital gains realized by the fund on securities issued in or by certain foreign countries may be subject to capital gains tax imposed by those countries.
Distributions to shareholders are recorded on the ex-dividend date. Income and capital gain distributions are determined in accordance with income tax regulations, which may differ from U.S. generally accepted accounting principles. Certain capital accounts in the financial statements are periodically adjusted for permanent differences in order to reflect their tax character. These adjustments have no impact on net assets or net asset value per share. Temporary differences which arise from recognizing certain
15
Table of Contents
MFS Utilities Series
Notes to Financial Statements (unaudited) – continued
items of income, expense, gain or loss in different periods for financial statement and tax purposes will reverse at some time in the future. Distributions in excess of net investment income or net realized gains are temporary overdistributions for financial statement purposes resulting from differences in the recognition or classification of income or distributions for financial statement and tax purposes.
Book/tax differences primarily relate to wash sale loss deferrals, derivative transactions, and partnership adjustments.
The tax character of distributions declared to shareholders for the last fiscal year is as follows:
| Year ended 12/31/16 | ||||
| Ordinary income (including any short-term capital gains) | $59,729,879 | |||
| Long-term capital gains | 36,926,249 | |||
| Total distributions | $96,656,128 | |||
The federal tax cost and the tax basis components of distributable earnings were as follows:
| As of 6/30/17 | ||||
| Cost of investments | $1,471,026,597 | |||
| Gross appreciation | 269,712,743 | |||
| Gross depreciation | (119,593,830 | ) | ||
| Net unrealized appreciation (depreciation) | $150,118,913 | |||
| As of 12/31/16 | ||||
| Undistributed ordinary income | 71,583,133 | |||
| Capital loss carryforwards | (31,801,540 | ) | ||
| Other temporary differences | (523,067 | ) | ||
| Net unrealized appreciation (depreciation) | 14,642,421 | |||
The aggregate cost above includes prior fiscal year end tax adjustments, if applicable.
As of December 31, 2016, the fund had capital loss carryforwards available to offset future realized gains. These net capital losses may be carried forward indefinitely and their character is retained as short-term and/or long-term losses. Such losses are characterized as follows:
| Long-Term | $(31,801,540 | ) |
Multiple Classes of Shares of Beneficial Interest – The fund offers multiple classes of shares, which differ in their respective distribution and/or service fees. The fund’s income, realized and unrealized gain (loss), and common expenses are allocated to shareholders based on the daily net assets of each class. Dividends are declared separately for each class. Differences in per share dividend rates are generally due to differences in separate class expenses. The fund’s distributions declared to shareholders as reported in the Statements of Changes in Net Assets are presented by class as follows:
| From net investment income | From net realized gain on investments | |||||||||||||||
| Six months ended 6/30/17 | Year ended 12/31/16 | Six months ended 6/30/17 | Year ended 12/31/16 | |||||||||||||
| Initial Class | $— | $22,376,960 | $— | $13,202,553 | ||||||||||||
| Service Class | — | 37,352,843 | — | 23,723,772 | ||||||||||||
| Total | $— | $59,729,803 | $— | $36,926,325 | ||||||||||||
| (3) | Transactions with Affiliates |
Investment Adviser – The fund has an investment advisory agreement with MFS to provide overall investment management and related administrative services and facilities to the fund. The management fee is computed daily and paid monthly at the following annual rates:
| First $1 billion of average daily net assets | 0.75% | |||
| Next $2 billion of average daily net assets | 0.70% | |||
| Average daily net assets in excess of $3 billion | 0.65% |
MFS has agreed in writing to reduce its management fee by a specified amount if certain MFS mutual fund assets exceed thresholds agreed to by MFS and the fund’s Board of Trustees. For the six months ended June 30, 2017, this management fee reduction amounted to $61,198, which is included in the reduction of total expenses in the Statement of Operations. The management fee incurred for the six months ended June 30, 2017 was equivalent to an annual effective rate of 0.72% of the fund’s average daily net assets.
16
Table of Contents
MFS Utilities Series
Notes to Financial Statements (unaudited) – continued
Distributor – MFS Fund Distributors, Inc. (MFD), a wholly-owned subsidiary of MFS, is the distributor of shares of the fund. The Trustees have adopted a distribution plan for the Service Class shares pursuant to Rule 12b-1 under the Investment Company Act of 1940.
The fund’s distribution plan provides that the fund will pay MFD distribution and/or service fees equal to 0.25% per annum of its average daily net assets attributable to Service Class shares as partial consideration for services performed and expenses incurred by MFD and financial intermediaries (including participating insurance companies that invest in the fund to fund variable annuity and variable life insurance contracts, sponsors of qualified retirement and pension plans that invest in the fund, and affiliates of these participating insurance companies and plan sponsors) in connection with the sale and distribution of the Service Class shares. MFD may subsequently pay all, or a portion, of the distribution and/or service fees to financial intermediaries.
Shareholder Servicing Agent – MFS Service Center, Inc. (MFSC), a wholly-owned subsidiary of MFS, receives a fee from the fund for its services as shareholder servicing agent. For the six months ended June 30, 2017, the fee was $36,900, which equated to 0.0046% annually of the fund’s average daily net assets. MFSC also receives payment from the fund for out-of-pocket expenses paid by MFSC on behalf of the fund. For the six months ended June 30, 2017, these costs amounted to $2,505.
Administrator – MFS provides certain financial, legal, shareholder communications, compliance, and other administrative services to the fund. Under an administrative services agreement, the fund reimburses MFS the costs incurred to provide these services. The fund is charged an annual fixed amount of $17,500 plus a fee based on average daily net assets. The administrative services fee incurred for the six months ended June 30, 2017 was equivalent to an annual effective rate of 0.0167% of the fund’s average daily net assets.
Trustees’ and Officers’ Compensation – The fund pays compensation to independent Trustees in the form of a retainer, attendance fees, and additional compensation to Board and Committee chairpersons. The fund does not pay compensation directly to Trustees or officers of the fund who are also officers of the investment adviser, all of whom receive remuneration for their services to the fund from MFS. Certain officers and Trustees of the fund are officers or directors of MFS, MFD, and MFSC.
Other – This fund and certain other funds managed by MFS (the funds) have entered into a service agreement (the ISO Agreement) which provides for payment of fees solely by the funds to Tarantino LLC in return for the provision of services of an Independent Senior Officer (ISO) for the funds. Frank L. Tarantino serves as the ISO and is an officer of the funds and the sole member of Tarantino LLC. The funds can terminate the ISO Agreement with Tarantino LLC at any time under the terms of the ISO Agreement. For the six months ended June 30, 2017, the fee paid by the fund under this agreement was $1,439 and is included in “Miscellaneous” expense in the Statement of Operations. MFS has agreed to bear all expenses associated with office space, other administrative support, and supplies provided to the ISO.
The fund invests in the MFS Institutional Money Market Portfolio which is managed by MFS and seeks current income consistent with preservation of capital and liquidity. This money market fund does not pay a management fee to MFS.
The fund is permitted to engage in purchase and sale transactions with funds and accounts for which MFS serves as investment adviser or sub-adviser (“cross-trades”) pursuant to a policy adopted by the Board of Trustees. This policy has been designed to ensure that cross-trades conducted by the fund comply with Rule 17a-7 under the Investment Company Act of 1940. Under this policy, cross-trades are effected at current market prices with no remuneration paid in connection with the transaction. During the six months ended June 30, 2017, the fund engaged in purchase and sale transactions pursuant to this policy, which amounted to $336,347 and $2,028,259, respectively. The sales transactions resulted in net realized gains (losses) of $785,379.
| (4) | Portfolio Securities |
For the six months ended June 30, 2017, purchases and sales of investments, other than short-term obligations, aggregated $214,767,734 and $246,940,597, respectively.
| (5) | Shares of Beneficial Interest |
The fund’s Declaration of Trust permits the Trustees to issue an unlimited number of full and fractional shares of beneficial interest. Transactions in fund shares were as follows:
| Six months ended 6/30/17 | Year ended 12/31/16 | |||||||||||||||
| Shares | Amount | Shares | Amount | |||||||||||||
| Shares sold | ||||||||||||||||
Initial Class | 273,234 | $7,749,720 | 906,725 | $24,878,423 | ||||||||||||
Service Class | 1,360,418 | 37,743,772 | 4,514,067 | 119,819,942 | ||||||||||||
| 1,633,652 | $45,493,492 | 5,420,792 | $144,698,365 | |||||||||||||
17
Table of Contents
MFS Utilities Series
Notes to Financial Statements (unaudited) – continued
| Six months ended 6/30/17 | Year ended 12/31/16 | |||||||||||||||
| Shares | Amount | Shares | Amount | |||||||||||||
| Shares issued to shareholders in reinvestment of distributions | ||||||||||||||||
Initial Class | — | $— | 1,294,742 | $35,579,513 | ||||||||||||
Service Class | — | — | 2,257,916 | 61,076,615 | ||||||||||||
| — | $— | 3,552,658 | $96,656,128 | |||||||||||||
| Shares reacquired | ||||||||||||||||
Initial Class | (1,738,660 | ) | $(49,212,368 | ) | (3,412,304 | ) | $(91,825,699 | ) | ||||||||
Service Class | (3,132,230 | ) | (87,835,340 | ) | (7,368,351 | ) | (196,425,805 | ) | ||||||||
| (4,870,890 | ) | $(137,047,708 | ) | (10,780,655 | ) | $(288,251,504 | ) | |||||||||
| Net change | ||||||||||||||||
Initial Class | (1,465,426 | ) | $(41,462,648 | ) | (1,210,837 | ) | $(31,367,763 | ) | ||||||||
Service Class | (1,771,812 | ) | (50,091,568 | ) | (596,368 | ) | (15,529,248 | ) | ||||||||
| (3,237,238 | ) | $(91,554,216 | ) | (1,807,205 | ) | $(46,897,011 | ) | |||||||||
| (6) | Line of Credit |
The fund and certain other funds managed by MFS participate in a $1.25 billion unsecured committed line of credit, subject to a $1 billion sublimit, provided by a syndication of banks under a credit agreement. Borrowings may be made for temporary financing needs. Interest is charged to each fund, based on its borrowings, generally at a rate equal to the higher of the Overnight Federal Reserve funds rate or daily one month LIBOR plus an agreed upon spread. A commitment fee, based on the average daily, unused portion of the committed line of credit, is allocated among the participating funds at the end of each calendar quarter. In addition, the fund and other funds managed by MFS have established unsecured uncommitted borrowing arrangements with certain banks for temporary financing needs. Interest is charged to each fund, based on its borrowings, at a rate equal to the Overnight Federal Reserve funds rate plus an agreed upon spread. For the six months ended June 30, 2017, the fund’s commitment fee and interest expense were $5,419 and $0, respectively, and are included in “Miscellaneous” expense in the Statement of Operations.
| (7) | Transactions in Underlying Affiliated Funds – Affiliated Issuers |
An affiliated issuer may be considered one in which the fund owns 5% or more of the outstanding voting securities, or a company which is under common control. For the purposes of this report, the fund assumes the following to be an affiliated issuer:
| Underlying Affiliated Fund | Beginning Shares/Par Amount | Acquisitions Shares/Par Amount | Dispositions Shares/Par Amount | Ending Shares/Par Amount | ||||||||||||
| MFS Institutional Money Market Portfolio | 73,959,910 | 104,905,576 | (148,945,625 | ) | 29,919,861 | |||||||||||
| Underlying Affiliated Fund | Realized Gain (Loss) | Capital Gain Distributions | Dividend Income | Ending Value | ||||||||||||
| MFS Institutional Money Market Portfolio | $(3,511 | ) | $— | $196,822 | $29,919,861 | |||||||||||
18
Table of Contents
MFS Utilities Series
RESULTS OF SHAREHOLDER MEETING (unaudited)
At a special meeting of shareholders of MFS Variable Insurance Trust, which was held on March 23, 2017, the following action was taken:
Item 1: To elect the following individuals as Trustees:
| Number of Dollars | ||||||||
| Nominee | For | Withheld Authority | ||||||
| Steven E. Buller | 11,311,922,492.61 | 518,570,973.54 | ||||||
| John A. Caroselli | 11,291,109,000.34 | 539,384,465.81 | ||||||
| Maureen R. Goldfarb | 11,233,211,779.66 | 597,281,686.49 | ||||||
| David H. Gunning | 11,179,077,201.17 | 651,416,264.98 | ||||||
| Michael Hegarty | 11,191,993,154.78 | 638,500,311.37 | ||||||
| John P. Kavanaugh | 11,242,238,261.44 | 588,255,204.71 | ||||||
| Robert J. Manning | 11,314,479,376.58 | 516,014,089.57 | ||||||
| Clarence Otis, Jr. | 11,208,873,448.85 | 621,620,017.30 | ||||||
| Maryanne L. Roepke | 11,263,427,105.03 | 567,066,361.12 | ||||||
| Robin A. Stelmach | 11,313,883,043.82 | 516,610,422.33 | ||||||
| Laurie J. Thomsen | 11,240,219,041.09 | 590,274,425.06 | ||||||
19
Table of Contents
MFS Utilities Series
PROXY VOTING POLICIES AND INFORMATION
MFS votes proxies on behalf of the fund pursuant to proxy voting policies and procedures that are available without charge, upon request, by calling 1-800-225-2606, by visiting mfs.com (once you have selected “Individual Investor” as your role, click on “Individual Investor Home” in the top navigation and then select “Learn More About Proxy Voting” under the “I want to…” header on the left hand column of the page), or by visiting the SEC’s Web site at http://www.sec.gov.
Information regarding how the fund voted proxies relating to portfolio securities during the most recent twelve-month period ended June 30 is available by August 31 of each year without charge by visiting mfs.com (once you have selected “Individual Investor” as your role, click on “Individual Investor Home” in the top navigation and then select “Learn More About Proxy Voting” under the “I want to…” header on the left hand column of the page), or by visiting the SEC’s Web site at http://www.sec.gov.
QUARTERLY PORTFOLIO DISCLOSURE
The fund will file a complete schedule of portfolio holdings with the Securities and Exchange Commission (the Commission) for the first and third quarters of each fiscal year on Form N-Q. The fund’s Form N-Q is available on the EDGAR database on the Commission’s Internet Web site at http://www.sec.gov, and may be reviewed and copied at the:
Public Reference Room
Securities and Exchange Commission
100 F Street, NE, Room 1580
Washington, D.C. 20549
Information on the operation of the Public Reference Room may be obtained by calling the Commission at 1-800-SEC-0330. Copies of the fund’s Form N-Q also may be obtained, upon payment of a duplicating fee, by electronic request at the following e-mail address: publicinfo@sec.gov or by writing the Public Reference Section at the above address.
From time to time, MFS may post important information about the fund or the MFS funds on the MFS web site (mfs.com). This information is available on mfs.com by following these steps once you have selected “Individual Investor” as your role: (1) Click on the “Individual Investor Home” in the top navigation and then select the “Announcements” option within the “Market Outlooks” drop down, or (2) Click on “Products & Services” and “Variable Insurance Portfolios” and then select the fund’s name.
INFORMATION ABOUT FUND CONTRACTS AND LEGAL CLAIMS
The fund has entered into contractual arrangements with an investment adviser, administrator, distributor, shareholder servicing agent, 529 program manager (if applicable), and custodian who each provide services to the fund. Unless expressly stated otherwise, shareholders are not parties to, or intended beneficiaries of these contractual arrangements, and these contractual arrangements are not intended to create any shareholder right to enforce them against the service providers or to seek any remedy under them against the service providers, either directly or on behalf of the fund.
Under the Trust’s By-Laws and Declaration of Trust, any claims asserted against or on behalf of the MFS Funds, including claims against Trustees and Officers, must be brought in state and federal courts located within the Commonwealth of Massachusetts.
20
Table of Contents
Table of Contents
SEMIANNUAL REPORT
June 30, 2017

MFS® TOTAL RETURN BOND SERIES
MFS® Variable Insurance Trust

VFB-SEM
Table of Contents
MFS® TOTAL RETURN BOND SERIES
The report is prepared for the general information of contract owners. It is authorized for distribution to prospective investors only when preceded or accompanied by a current prospectus.
NOT FDIC INSURED • MAY LOSE VALUE • NO BANK OR CREDIT UNION GUARANTEE • NOT A DEPOSIT • NOT INSURED BY ANY FEDERAL GOVERNMENT AGENCY OR NCUA/NCUSIF
Table of Contents
MFS Total Return Bond Series
LETTER FROM THE EXECUTIVE CHAIRMAN

Dear Contract Owners:
Despite policy uncertainty accompanying a new presidential administration in the United States and unease over ongoing Brexit negotiations, most markets have proved resilient. U.S. share prices have reached new highs. The U.S. Federal Reserve has continued to gradually hike interest rates. However, rates in most developed markets remain very low, with major non-U.S. central banks just beginning to contemplate curbing accommodative monetary policies.
Globally, economic growth has shown signs of recovery, led by China, the U.S. and the eurozone. Despite better growth, there are few immediate signs of worrisome inflation as wage growth remains muted. Europe has benefited from diminishing event risks as establishment candidates won both the Dutch and French elections, averting a feared populist trend. Emerging market economies are recovering at a somewhat slower pace amid fears that restrictive U.S. trade policies could further hamper the restrained pace of global trade growth. Looking ahead, markets will have to contend with issues involving geopolitical hot spots on the Korean peninsula and in the Middle East, which could potentially lead to a clash of interests between the U.S. and other major powers such as China or Russia.
At MFS®, we believe time is an asset. A patient, long-term approach to investing can have a powerful impact on decision making and outcomes. Time arbitrage, as we call it, simply comes down to having the conviction and discipline to allow enough time for good investment ideas to play out. In our view, such an approach, along with the professional guidance of a financial advisor, will help you reach your investment objectives.
Respectfully,

Robert J. Manning
Executive Chairman
MFS Investment Management
August 16, 2017
The opinions expressed in this letter are subject to change and may not be relied upon for investment advice. No forecasts can be guaranteed.
1
Table of Contents
MFS Total Return Bond Series
Portfolio structure (i)
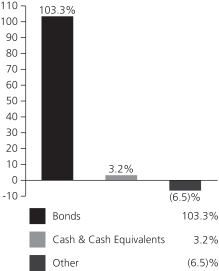
| Fixed income sectors (i) | ||||
| Investment Grade Corporates | 36.0% | |||
| U.S. Treasury Securities | 21.3% | |||
| Mortgage-Backed Securities | 19.6% | |||
| Commercial Mortgage-Backed Securities | 8.0% | |||
| High Yield Corporates | 6.9% | |||
| Collateralized Debt Obligations | 4.4% | |||
| Asset-Backed Securities | 3.3% | |||
| U.S. Government Agencies | 2.0% | |||
| Municipal Bonds | 0.9% | |||
| Emerging Markets Bonds | 0.8% | |||
| Residential Mortgage-Backed Securities | 0.1% |
| Composition including fixed income credit quality (a)(i) | ||||
| AAA | 12.4% | |||
| AA | 2.3% | |||
| A | 12.7% | |||
| BBB | 25.2% | |||
| BB | 5.9% | |||
| B | 1.6% | |||
| CCC (o) | 0.0% | |||
| CC (o) | 0.0% | |||
| C (o) | 0.0% | |||
| D (o) | 0.0% | |||
| U.S. Government | 14.9% | |||
| Federal Agencies | 21.6% | |||
| Not Rated | 6.7% | |||
| Cash & Cash Equivalents | 3.2% | |||
| Other | (6.5 | ) | ||
| Portfolio facts (i) | ||||
| Average Duration (d) | 5.9 | |||
| Average Effective Maturity (m) | 9.1 yrs. | |||
| (a) | For all securities other than those specifically described below, ratings are assigned to underlying securities utilizing ratings from Moody’s, Fitch, and Standard & Poor’s rating agencies and applying the following hierarchy: If all three agencies provide a rating, the middle rating (after dropping the highest and lowest ratings) is assigned; if two of the three agencies rate a security, the lower of the two is assigned. Ratings are shown in the S&P and Fitch scale (e.g., AAA). Securities rated BBB or higher are considered investment grade. All ratings are subject to change. U.S. Government includes securities issued by the U.S. Department of the Treasury. Federal Agencies includes rated and unrated U.S. Agency fixed-income securities, U.S. Agency mortgage-backed securities, and collateralized mortgage obligations of U.S. Agency mortgage-backed securities. Not Rated includes fixed income securities, including fixed income futures contracts, which have not been rated by any rating agency. The fund may or may not have held all of these instruments on this date. The fund is not rated by these agencies. |
| (d) | Duration is a measure of how much a bond’s price is likely to fluctuate with general changes in interest rates, e.g., if rates rise 1.00%, a bond with a 5-year duration is likely to lose about 5.00% of its value due to the interest rate move. |
| (i) | For purposes of this presentation, the components include the value of securities, and reflect the impact of the equivalent exposure of derivative positions, if any. These amounts may be negative from time to time. Equivalent exposure is a calculated amount that translates the derivative position into a reasonable approximation of the amount of the underlying asset that the portfolio would have to hold at a given point in time to have the same price sensitivity that results from the portfolio’s ownership of the derivative contract. When dealing with derivatives, equivalent exposure is a more representative measure of the potential impact of a position on portfolio performance than value. The bond component will include any accrued interest amounts. |
| (m) | In determining an instrument’s effective maturity for purposes of calculating the fund’s dollar-weighted average effective maturity, MFS uses the instrument’s stated maturity or, if applicable, an earlier date on which MFS believes it is probable that a maturity-shortening device (such as a put, pre-refunding or prepayment) will cause the instrument to be repaid. Such an earlier date can be substantially shorter than the instrument’s stated maturity. |
| (o) | Less than 0.1%. |
Where the fund holds convertible bonds, these are treated as part of the equity portion of the portfolio.
2
Table of Contents
MFS Total Return Bond Series
Portfolio Composition – continued
Cash & Cash Equivalents includes any cash, investments in money market funds, short-term securities, and other assets less liabilities. Please see the Statement of Assets and Liabilities for additional information related to the fund’s cash position and other assets and liabilities.
Other includes equivalent exposure from currency derivatives and/or any offsets to derivative positions and may be negative.
Percentages are based on net assets as of June 30, 2017.
The portfolio is actively managed and current holdings may be different.
3
Table of Contents
MFS Total Return Bond Series
Fund Expenses Borne by the Contract Holders during the Period, January 1, 2017 through June 30, 2017
As a contract holder of the fund, you incur ongoing costs, including management fees; distribution and/or service (12b-1) fees; and other fund expenses. This example is intended to help you understand your ongoing costs (in dollars) of investing in the fund and to compare these costs with the ongoing costs of investing in other mutual funds.
The example is based on an investment of $1,000 invested at the beginning of the period and held for the entire period January 1, 2017 through June 30, 2017.
Actual Expenses
The first line for each share class in the following table provides information about actual account values and actual expenses. You may use the information in this line, together with the amount you invested, to estimate the expenses that you paid over the period. Simply divide your account value by $1,000 (for example, an $8,600 account value divided by $1,000 = 8.6), then multiply the result by the number in the first line under the heading entitled “Expenses Paid During Period” to estimate the expenses you paid on your account during this period.
Hypothetical Example for Comparison Purposes
The second line for each share class in the following table provides information about hypothetical account values and hypothetical expenses based on the fund’s actual expense ratio and an assumed rate of return of 5% per year before expenses, which is not the fund’s actual return. The hypothetical account values and expenses may not be used to estimate the actual ending account balance or expenses you paid for the period. You may use this information to compare the ongoing costs of investing in the fund and other funds. To do so, compare this 5% hypothetical example with the 5% hypothetical examples that appear in the shareholder reports of the other funds.
Please note that the expenses shown in the table are meant to highlight the fund’s ongoing costs only and do not take into account the fees and expenses imposed under the variable contracts through which your investment in the fund is made. Therefore, the second line for each share class in the table is useful in comparing ongoing costs associated with an investment in vehicles (such as the fund) which fund benefits under variable annuity and variable life insurance contracts and to qualified pension and retirement plans only, and will not help you determine the relative total costs of investing in the fund through variable annuity and variable life insurance contracts. If the fees and expenses imposed under the variable contracts were included, your costs would have been higher.
| Share Class | Annualized Expense Ratio | Beginning Account Value 1/01/17 | Ending Account Value | Expenses Paid During Period (p) 1/01/17-6/30/17 | ||||||||||||||
| Initial Class | Actual | 0.53% | $1,000.00 | $1,029.03 | $2.67 | |||||||||||||
| Hypothetical (h) | 0.53% | $1,000.00 | $1,022.17 | $2.66 | ||||||||||||||
| Service Class | Actual | 0.78% | $1,000.00 | $1,027.20 | $3.92 | |||||||||||||
| Hypothetical (h) | 0.78% | $1,000.00 | $1,020.93 | $3.91 | ||||||||||||||
| (h) | 5% class return per year before expenses. |
| (p) | “Expenses Paid During Period” are equal to each class’s annualized expense ratio, as shown above, multiplied by the average account value over the period, multiplied by 181/365 (to reflect the one-half year period). |
4
Table of Contents
MFS Total Return Bond Series
PORTFOLIO OF INVESTMENTS – 6/30/17 (unaudited)
The Portfolio of Investments is a complete list of all securities owned by your fund. It is categorized by broad-based asset classes.
| Issuer | Shares/Par | Value ($) | ||||||
| BONDS – 96.1% | ||||||||
| Aerospace – 0.1% | ||||||||
| TransDigm, Inc., 6.5%, 7/15/2024 | $ | 2,970,000 | $ | 3,066,525 | ||||
|
| |||||||
| Asset-Backed & Securitized – 15.7% | ||||||||
| Allegro CLO Ltd., 2014-1A, “A2R”, FRN, 2.805%, 1/21/2027 (n) | $ | 9,218,037 | $ | 9,221,828 | ||||
| Allegro CLO Ltd., 2014-1A, “BR”, FRN, 3.555%, 1/21/2027 (n) | 8,514,497 | 8,582,493 | ||||||
| Ameriquest Mortgage Securities, Inc., “M1”, FRN, 1.686%, 10/25/2035 | 1,681,696 | 1,678,121 | ||||||
| ARI Fleet Lease Trust, 2016-A, “A2”, 1.82%, 7/15/2024 (n) | 3,978,763 | 3,982,132 | ||||||
| Babson CLO Ltd., 2013-IIA, “BR”, FRN, 3.408%, 1/18/2025 (n) | 3,228,778 | 3,236,170 | ||||||
| Babson CLO Ltd., 2014-IIA, “CR”, FRN, 3.358%, 10/17/2026 (n) | 3,680,000 | 3,680,137 | ||||||
| Babson Ltd., CLO, FRN, 2.256%, 4/20/2025 (n) | 9,870,445 | 9,880,340 | ||||||
| Ballyrock Ltd., CLO, FRN, 2.351%, 5/20/2025 (z) | 3,269,000 | 3,272,098 | ||||||
| Bayview Commercial Asset Trust, FRN, 0%, 4/25/2036 (i)(z) | 194,400 | 928 | ||||||
| Bayview Commercial Asset Trust, FRN, 0%, 12/25/2036 (i)(z) | 190,864 | 19 | ||||||
| Bayview Financial Revolving Mortgage Loan Trust, FRN, 2.822%, 12/28/2040 (z) | 105,151 | 81,822 | ||||||
| Bear Stearns Cos., Inc., “A2”, FRN, 1.666%, 12/25/2042 | 772,590 | 762,397 | ||||||
| Carlyle Global Market Strategies, 2013-3A, “A1A”, FRN, 2.278%, 7/15/2025 (z) | 4,591,876 | 4,594,944 | ||||||
| Cent CLO LP, 2014-16AR, “A1AR”, FRN, 2.419%, 8/01/2024 (n) | 5,045,352 | 5,041,339 | ||||||
| Cent CLO LP, 2014-21A, “A2AR”, FRN, 2.87%, 7/27/2026 (n) | 5,974,147 | 5,973,656 | ||||||
| Chesapeake Funding II LLC, 2016-1A, “A1”, 2.11%, 3/15/2028 (n) | 7,414,166 | 7,432,769 | ||||||
| Citigroup Commercial Mortgage Trust, 2014-GC25, “A4”, 3.635%, 10/10/2047 | 3,128,793 | 3,253,857 | ||||||
| Citigroup Commercial Mortgage Trust, 2015-GC27, “A5”, 3.137%, 2/10/2048 | 7,821,982 | 7,857,766 | ||||||
| Commercial Mortgage Asset Trust, FRN, 0.575%, 1/17/2032 (i)(z) | 64,678 | 20 | ||||||
| Commercial Mortgage Pass-Through Certificates, “A4”, 3.183%, 2/10/2048 | 7,671,000 | 7,763,774 | ||||||
| Commercial Mortgage Trust, “A4”, 3.147%, 8/15/2045 | 3,950,000 | 4,059,150 | ||||||
| Commercial Mortgage Trust, 2014-CR19, “A5”, 3.796%, 8/10/2047 | 8,605,908 | 9,036,722 | ||||||
| Commercial Mortgage Trust, 2014-UBS4, “A5”, 3.694%, 8/10/2047 | 8,091,000 | 8,396,322 | ||||||
| Commercial Mortgage Trust, 2015-CR22, “A5”, 3.309%, 3/10/2048 | 5,290,000 | 5,379,673 | ||||||
| Commercial Mortgage Trust, 2015-LC21, “A4”, 3.708%, 7/10/2048 | 10,000,000 | 10,426,272 | ||||||
| Issuer | Shares/Par | Value ($) | ||||||
| BONDS – continued | ||||||||
| Asset-Backed & Securitized – continued | ||||||||
| Commercial Mortgage Trust, 2015-PC1, “A5”, 3.902%, 7/10/2050 | $ | 2,888,848 | $ | 3,036,409 | ||||
| Commercial Mortgage Trust, 2016-COR1, “A4”, 3.091%, 10/10/2049 | 10,566,977 | 10,501,128 | ||||||
| Commercial Mortgage Trust, 2017-CD4, “A4”, FRN, 3.514%, 5/10/2050 | 10,486,481 | 10,842,434 | ||||||
| Credit Suisse Commercial Mortgage Trust, “A4”, FRN, 6.253%, 9/15/2039 | 1,000,015 | 998,881 | ||||||
| Credit Suisse Commercial Mortgage Trust, “C4”, FRN, 6.253%, 9/15/2039 | 6,667,307 | 6,661,026 | ||||||
| Credit-Based Asset Servicing & Securitization LLC, FRN, 3.896%, 12/25/2035 | 11,181 | 11,142 | ||||||
| CSAIL Commercial Mortgage Trust, 2015-C2, “A4”, 3.504%, 6/15/2057 | 2,695,346 | 2,761,805 | ||||||
| Cutwater Ltd., 2014-1A, “BR”, FRN, 3.619%, 7/15/2026 (n) | 3,135,000 | 3,122,274 | ||||||
| Drive Auto Receivables Trust, 2017-1, “C”, 2.84%, 4/15/2022 | 4,567,000 | 4,561,209 | ||||||
| Eaton Vance CLO Ltd., 2014-1A, “CR”, FRN, 3.408%, 7/15/2026 (n) | 4,129,934 | 4,129,901 | ||||||
| First Union National Bank Commercial Mortgage Trust, FRN, 2.477%, 1/12/2043 (i)(q)(z) | 38,172 | 184 | ||||||
| Flatiron CLO Ltd., 2013-1A, “A1R”, FRN, 2.318%, 1/17/2026 (n) | 6,322,926 | 6,317,074 | ||||||
| Ford Credit Auto Owner Trust, 2014-1, “A”, 2.26%, 11/15/2025 (n) | 4,559,000 | 4,600,835 | ||||||
| Ford Credit Auto Owner Trust, 2014-2, “A”, 2.31%, 4/15/2026 (n) | 10,726,000 | 10,829,804 | ||||||
| Galaxy CLO Ltd., 2013-16A, “CR”, FRN, 3.429%, 11/16/2025 (n) | 5,120,000 | 5,121,382 | ||||||
| GMF Floorplan Owner Revolving Trust, 2017-1, “A2”, FRN, 1.728%, 1/18/2022 (n) | 14,876,000 | 14,931,618 | ||||||
| Goldentree Loan Opportunities Ltd., 2014-8A, “B1R”, FRN, 2.708%, 4/19/2026 (n) | 2,622,067 | 2,621,922 | ||||||
| GS Mortgage Securities Trust, 2015-GC30, “A4”, 3.382%, 5/10/2050 | 7,904,407 | 8,063,304 | ||||||
| GS Mortgage Securities Trust, 2017-GS6, “A3”, 3.433%, 5/10/2050 | 16,765,206 | 17,145,265 | ||||||
| Hertz Fleet Lease Funding LP, 2014-1, FRN, 1.517%, 4/10/2028 (z) | 781,222 | 781,042 | ||||||
| JPMBB Commercial Mortgage Securities Trust, 2014-C26, 3.494%, 1/15/2048 | 9,314,291 | 9,591,099 | ||||||
| JPMBB Commercial Mortgage Securities Trust, 2015-C28, “A4”, 3.227%, 10/15/2048 | 12,188,428 | 12,320,262 | ||||||
| JPMorgan Chase Commercial Mortgage Securities Corp., “A3”, 4.171%, 8/15/2046 | 505,331 | 537,986 | ||||||
5
Table of Contents
MFS Total Return Bond Series
Portfolio of Investments (unaudited) – continued
| Issuer | Shares/Par | Value ($) | ||||||
| BONDS – continued | ||||||||
| Asset-Backed & Securitized – continued | ||||||||
| JPMorgan Chase Commercial Mortgage Securities Corp., FRN, 5.756%, 7/15/2042 (n)(q) | $ | 46,947 | $ | 12,202 | ||||
| JPMorgan Chase Commercial Mortgage Trust, 2007-LD11, “AM”, FRN, 6.104%, 6/15/2049 | 11,827,507 | 12,108,292 | ||||||
| JPMorgan Mortgage Trust, “A1”, FRN, 2.968%, 10/25/2033 | 230,355 | 226,060 | ||||||
| Lehman Brothers Commercial Conduit Mortgage Trust, FRN, 1.137%, 2/18/2030 (i) | 5,717 | 0 | ||||||
| Loomis, Sayles & Co., CLO, “A1”, FRN, 2.688%, 10/15/2027 (n) | 3,000,000 | 3,008,537 | ||||||
| Merrill Lynch Mortgage Investors Inc., “A”, FRN, 3.038%, 5/25/2036 | 517,337 | 501,722 | ||||||
| Merrill Lynch Mortgage Investors Inc., “A5”, FRN, 3.044%, 4/25/2035 | 308,977 | 295,052 | ||||||
| Morgan Stanley Bank of America/Merrill Lynch Trust, “A4”, 3.176%, 8/15/2045 | 5,000,000 | 5,153,822 | ||||||
| Morgan Stanley Capital I Trust, “AM”, FRN, 5.919%, 4/15/2049 | 1,460,851 | 1,478,601 | ||||||
| Morgan Stanley Capital I Trust, 2017-H1, “A5”, 3.53%, 6/15/2050 | 14,115,000 | 14,571,112 | ||||||
| Morgan Stanley Capital I, Inc., FRN, 1.273%, 11/15/2030 (i)(n) | 32,862 | 95 | ||||||
| Motor PLC, 2015-1A, “A1”, FRN, 1.816%, 6/25/2022 (n) | 1,043,249 | 1,043,356 | ||||||
| Nextgear Floorplan Master Owner Trust, 2015-1A, “A”, 1.8%, 7/15/2019 (n) | 6,772,000 | 6,772,521 | ||||||
| Nextgear Floorplan Master Owner Trust, 2015-2A, “A”, 2.38%, 10/15/2020 (n) | 7,586,000 | 7,620,396 | ||||||
| Nissan Master Owner Trust Receivables 2015, “A-2”, 1.44%, 1/15/2020 | 9,277,000 | 9,271,955 | ||||||
| Oaktree CLO Ltd., 2014-2A, “BR”, FRN, 3.706%, 10/20/2026 (z) | 1,450,000 | 1,451,441 | ||||||
| Preferred Term Securities XIX Ltd., CDO, FRN, 1.595%, 12/22/2035 (z) | 315,329 | 258,570 | ||||||
| Race Point CLO Ltd., 2013-8A, “AR”, FRN, 2.511%, 2/20/2030 (n) | 5,825,355 | 5,837,313 | ||||||
| Residential Funding Mortgage Securities, Inc., 5.32%, 12/25/2035 | 57,742 | 57,907 | ||||||
| Shackleton CLO Ltd., 2014-6A, “CR”, FRN, 3.408%, 7/17/2026 (n) | 4,768,394 | 4,773,262 | ||||||
| Silver Spring CLO Ltd., 2014-1A, “C2R”, 5.484%, 10/15/2026 (z) | 3,040,000 | 3,040,000 | ||||||
| Volkswagen Credit Auto Master Trust, 2014-1A, “A1”, FRN, 1.562%, 7/22/2019 (n) | 6,106,000 | 6,106,343 | ||||||
| Voya CLO Ltd., 2013-3A, “BR”, FRN, 3.308%, 1/18/2026 (n) | 6,005,000 | 6,005,048 | ||||||
| Wells Fargo Commercial Mortgage Trust, 2015-C28, “A4”, 3.54%, 5/15/2048 | 10,682,988 | 11,001,583 | ||||||
| Wells Fargo Commercial Mortgage Trust, 2016-LC25, “A4”, 3.64%, 12/15/2059 | 13,071,416 | 13,556,836 | ||||||
| Issuer | Shares/Par | Value ($) | ||||||
| BONDS – continued | ||||||||
| Asset-Backed & Securitized – continued | ||||||||
| West CLO Ltd., 2014-1A, “A2”, FRN, 3.258%, 7/18/2026 (z) | $ | 7,560,000 | $ | 7,594,534 | ||||
|
| |||||||
| $ | 384,829,295 | |||||||
|
| |||||||
| Automotive – 0.5% | ||||||||
| General Motors Co., 4.875%, 10/02/2023 | $ | 4,291,000 | $ | 4,598,553 | ||||
| General Motors Co., 5.2%, 4/01/2045 | 4,005,000 | 3,929,297 | ||||||
| General Motors Financial Co., Inc., 3.45%, 4/10/2022 | 2,500,000 | 2,540,995 | ||||||
|
| |||||||
| $ | 11,068,845 | |||||||
|
| |||||||
| Biotechnology – 0.6% | ||||||||
| Life Technologies Corp., 5%, 1/15/2021 | $ | 13,872,000 | $ | 14,861,087 | ||||
|
| |||||||
| Broadcasting – 0.1% | ||||||||
| Time Warner, Inc., 3.8%, 2/15/2027 | $ | 2,405,000 | $ | 2,421,258 | ||||
|
| |||||||
| Brokerage & Asset Managers – 1.3% | ||||||||
| Charles Schwab Corp., 3.2%, 3/02/2027 | $ | 9,227,000 | $ | 9,270,044 | ||||
| NYSE Euronext, 2%, 10/05/2017 | 3,115,000 | 3,119,610 | ||||||
| Raymond James Financial, 3.625%, 9/15/2026 | 1,278,000 | 1,279,163 | ||||||
| Raymond James Financial, 4.95%, 7/15/2046 | 8,424,000 | 9,141,851 | ||||||
| TD Ameritrade Holding Corp., 5.6%, 12/01/2019 | 3,959,000 | 4,279,152 | ||||||
| TD Ameritrade Holding Corp., 2.95%, 4/01/2022 | 1,773,000 | 1,814,302 | ||||||
| TD Ameritrade Holding Corp., 3.3%, 4/01/2027 | 3,034,000 | 3,030,180 | ||||||
|
| |||||||
| $ | 31,934,302 | |||||||
|
| |||||||
| Building – 1.0% | ||||||||
| Martin Marietta Materials, Inc., 4.25%, 7/02/2024 | $ | 8,330,000 | $ | 8,741,835 | ||||
| Martin Marietta Materials, Inc., 3.45%, 6/01/2027 | 1,407,000 | 1,399,665 | ||||||
| Masco Corp., 4.375%, 4/01/2026 | 6,170,000 | 6,581,539 | ||||||
| Mohawk Industries, Inc., 3.85%, 2/01/2023 | 2,668,000 | 2,754,649 | ||||||
| Standard Industries, Inc., 5.375%, 11/15/2024 (n) | 2,645,000 | 2,787,169 | ||||||
| Standard Industries, Inc., 6%, 10/15/2025 (n) | 2,645,000 | 2,830,150 | ||||||
|
| |||||||
| $ | 25,095,007 | |||||||
|
| |||||||
| Business Services – 0.7% | ||||||||
| Equinix, Inc., 4.875%, 4/01/2020 | $ | 4,055,000 | $ | 4,156,375 | ||||
| Equinix, Inc., 5.375%, 5/15/2027 | 2,426,000 | 2,586,723 | ||||||
| Fidelity National Information Services, Inc., 3.875%, 6/05/2024 | 258,000 | 270,240 | ||||||
| Fidelity National Information Services, Inc., 3%, 8/15/2026 | 7,885,000 | 7,635,172 | ||||||
| Fidelity National Information Services, Inc., 4.5%, 8/15/2046 | 2,575,000 | 2,641,476 | ||||||
|
| |||||||
| $ | 17,289,986 | |||||||
|
| |||||||
6
Table of Contents
MFS Total Return Bond Series
Portfolio of Investments (unaudited) – continued
| Issuer | Shares/Par | Value ($) | ||||||
| BONDS – continued | ||||||||
| Cable TV – 1.3% | ||||||||
| CCO Holdings LLC/CCO Holdings Capital Corp., 5.75%, 1/15/2024 | $ | 3,865,000 | $ | 4,072,744 | ||||
| Charter Communications Operating LLC/Charter Communications Operating Capital Corp., 4.908%, 7/23/2025 | 7,676,000 | 8,292,529 | ||||||
| Sirius XM Radio, Inc., 5.375%, 7/15/2026 (n) | 5,700,000 | 5,899,500 | ||||||
| Time Warner Cable, Inc., 4.5%, 9/15/2042 | 3,721,000 | 3,540,491 | ||||||
| Time Warner Entertainment Co. LP, 8.375%, 7/15/2033 | 290,000 | 398,144 | ||||||
| Videotron Ltd., 5%, 7/15/2022 | 8,605,000 | 9,099,788 | ||||||
|
| |||||||
| $ | 31,303,196 | |||||||
|
| |||||||
| Computer Software – 0.9% | ||||||||
| Microsoft Corp., 2%, 8/08/2023 | $ | 8,215,000 | $ | 8,005,337 | ||||
| Microsoft Corp., 4.1%, 2/06/2037 | 7,039,000 | 7,581,862 | ||||||
| VeriSign, Inc., 4.625%, 5/01/2023 | 6,600,000 | 6,765,000 | ||||||
|
| |||||||
| $ | 22,352,199 | |||||||
|
| |||||||
| Computer Software – Systems – 0.3% | ||||||||
| Apple, Inc., 4.375%, 5/13/2045 | $ | 4,792,000 | $ | 5,180,924 | ||||
| Apple, Inc., 4.25%, 2/09/2047 | 1,299,000 | 1,377,743 | ||||||
|
| |||||||
| $ | 6,558,667 | |||||||
|
| |||||||
| Conglomerates – 0.2% | ||||||||
| Johnson Controls International PLC, 5.7%, 3/01/2041 | $ | 2,075,000 | $ | 2,454,777 | ||||
| Johnson Controls International PLC, 4.625%, 7/02/2044 | 2,272,000 | 2,440,298 | ||||||
| Johnson Controls International PLC, 4.5%, 2/15/2047 | 1,063,000 | 1,129,859 | ||||||
|
| |||||||
| $ | 6,024,934 | |||||||
|
| |||||||
| Consumer Products – 1.2% | ||||||||
| Mattel, Inc., 5.45%, 11/01/2041 | $ | 4,191,000 | $ | 4,397,817 | ||||
| Reckitt Benckiser Treasury Services PLC, 3.625%, 9/21/2023 (n) | 6,765,000 | 7,110,651 | ||||||
| Reckitt Benckiser Treasury Services PLC, 2.75%, 6/26/2024 (n) | 19,110,000 | 18,947,852 | ||||||
|
| |||||||
| $ | 30,456,320 | |||||||
|
| |||||||
| Consumer Services – 0.7% | ||||||||
| ADT Corp., 6.25%, 10/15/2021 | $ | 7,105,000 | $ | 7,735,569 | ||||
| Priceline Group, Inc., 3.65%, 3/15/2025 | 3,610,000 | 3,704,456 | ||||||
| Visa, Inc., 2.8%, 12/14/2022 | 5,334,000 | 5,430,743 | ||||||
|
| |||||||
| $ | 16,870,768 | |||||||
|
| |||||||
| Containers – 0.4% | ||||||||
| Berry Plastics Corp., 5.125%, 7/15/2023 | $ | 2,905,000 | $ | 3,024,831 | ||||
| Sealed Air Corp., 5.125%, 12/01/2024 (n) | 6,910,000 | 7,410,975 | ||||||
|
| |||||||
| $ | 10,435,806 | |||||||
|
| |||||||
| Defense Electronics – 0.0% | ||||||||
| BAE Systems Holdings, Inc., 6.375%, 6/01/2019 (n) | $ | 500,000 | $ | 538,472 | ||||
|
| |||||||
| Issuer | Shares/Par | Value ($) | ||||||
| BONDS – continued | ||||||||
| Emerging Market Quasi-Sovereign – 0.6% | ||||||||
| State Grid Overseas Investment (2016) Ltd., 2.75%, 5/04/2022 (n) | $ | 15,191,000 | $ | 15,119,449 | ||||
|
| |||||||
| Energy – Integrated – 0.1% | ||||||||
| Shell International Finance B.V., 3.75%, 9/12/2046 | $ | 2,634,000 | $ | 2,492,581 | ||||
|
| |||||||
| Entertainment – 0.3% | ||||||||
| Six Flags Entertainment Corp., 4.875%, 7/31/2024 (n) | $ | 6,621,000 | $ | 6,661,521 | ||||
|
| |||||||
| Financial Institutions – 1.0% | ||||||||
| International Lease Finance Corp., 7.125%, 9/01/2018 (n) | $ | 1,190,000 | $ | 1,259,433 | ||||
| Nationstar Mortgage LLC/Capital Corp., 6.5%, 7/01/2021 | 8,810,000 | 9,008,225 | ||||||
| Navient Corp., 8%, 3/25/2020 | 5,448,000 | 6,088,140 | ||||||
| Navient Corp., 5%, 10/26/2020 | 6,643,000 | 6,892,113 | ||||||
|
| |||||||
| $ | 23,247,911 | |||||||
|
| |||||||
| Food & Beverages – 2.0% | ||||||||
| Anheuser-Busch InBev Finance, Inc., 2.65%, 2/01/2021 | $ | 8,068,000 | $ | 8,176,176 | ||||
| Anheuser-Busch InBev Finance, Inc., 4.9%, 2/01/2046 | 10,273,000 | 11,594,529 | ||||||
| Anheuser-Busch InBev Worldwide, Inc., 3.7%, 2/01/2024 | 2,400,000 | 2,511,046 | ||||||
| Anheuser-Busch InBev Worldwide, Inc., 3.75%, 1/15/2022 | 4,992,000 | 5,264,618 | ||||||
| Constellation Brands, Inc., 4.25%, 5/01/2023 | 6,224,000 | 6,626,039 | ||||||
| Constellation Brands, Inc., 4.75%, 12/01/2025 | 6,311,000 | 6,912,697 | ||||||
| Wm. Wrigley Jr. Co., 3.375%, 10/21/2020 (n) | 7,334,000 | 7,570,323 | ||||||
|
| |||||||
| $ | 48,655,428 | |||||||
|
| |||||||
| Food & Drug Stores – 0.3% | ||||||||
| CVS Health Corp., 5.125%, 7/20/2045 | $ | 5,294,000 | $ | 6,069,015 | ||||
|
| |||||||
| Forest & Paper Products – 0.1% | ||||||||
| Packaging Corp. of America, 3.65%, 9/15/2024 | $ | 3,490,000 | $ | 3,558,743 | ||||
|
| |||||||
| Gaming & Lodging – 0.2% | ||||||||
| GLP Capital LP/GLP Financing II, Inc., 5.375%, 11/01/2023 | $ | 4,350,000 | $ | 4,730,625 | ||||
|
| |||||||
| Insurance – 1.7% | ||||||||
| American International Group, Inc., 4.5%, 7/16/2044 | $ | 2,465,000 | $ | 2,506,607 | ||||
| American International Group, Inc., 3.75%, 7/10/2025 | 12,804,000 | 13,041,898 | ||||||
| American International Group, Inc., 3.9%, 4/01/2026 | 5,113,000 | 5,230,727 | ||||||
| American International Group, Inc., 4.7%, 7/10/2035 | 2,777,000 | 2,951,718 | ||||||
| Metropolitan Life Global Funding I, 3.45%, 12/18/2026 (n) | 5,297,000 | 5,429,330 | ||||||
| Pacific Lifecorp, 5.125%, 1/30/2043 (n) | 1,342,000 | 1,497,879 | ||||||
7
Table of Contents
MFS Total Return Bond Series
Portfolio of Investments (unaudited) – continued
| Issuer | Shares/Par | Value ($) | ||||||
| BONDS – continued | ||||||||
| Insurance – continued | ||||||||
| Principal Financial Group, Inc., 3.4%, 5/15/2025 | $ | 4,724,000 | $ | 4,821,300 | ||||
| Unum Group, 4%, 3/15/2024 | 6,546,000 | 6,761,095 | ||||||
|
| |||||||
| $ | 42,240,554 | |||||||
|
| |||||||
| Insurance – Health – 0.1% | ||||||||
| UnitedHealth Group, Inc., 3.35%, 7/15/2022 | $ | 1,624,000 | $ | 1,695,480 | ||||
|
| |||||||
| Insurance – Property & Casualty – 0.7% | ||||||||
| Allied World Assurance, 5.5%, 11/15/2020 | $ | 2,640,000 | $ | 2,860,205 | ||||
| Allied World Assurance Co. Holdings Ltd., 4.35%, 10/29/2025 | 6,835,000 | 6,939,152 | ||||||
| CNA Financial Corp., 5.875%, 8/15/2020 | 3,280,000 | 3,612,212 | ||||||
| Liberty Mutual Group, Inc., 4.85%, 8/01/2044 (n) | 3,359,000 | 3,603,905 | ||||||
| Swiss Re Ltd., 4.25%, 12/06/2042 (n) | 926,000 | 952,120 | ||||||
|
| |||||||
| $ | 17,967,594 | |||||||
|
| |||||||
| Local Authorities – 0.9% | ||||||||
| Philadelphia, PA, School District, “B”, 6.615%, 6/01/2030 | $ | 3,250,000 | $ | 3,953,528 | ||||
| Philadelphia, PA, School District, “B”, 6.765%, 6/01/2040 | 2,200,000 | 2,859,032 | ||||||
| State of California (Build America Bonds), 7.625%, 3/01/2040 | 860,000 | 1,310,262 | ||||||
| State of California (Build America Bonds), 7.6%, 11/01/2040 | 7,175,000 | 11,172,910 | ||||||
| University of California Limited Project Rev., “J”, 4.131%, 5/15/2045 | 2,260,000 | 2,334,670 | ||||||
|
| |||||||
| $ | 21,630,402 | |||||||
|
| |||||||
| Major Banks – 7.5% | ||||||||
| ABN AMRO Bank N.V., 4.8%, 4/18/2026 (n) | $ | 5,000,000 | $ | 5,309,155 | ||||
| Bank of America Corp., 5.625%, 7/01/2020 | 8,555,000 | 9,368,632 | ||||||
| Bank of America Corp., 5.875%, 1/05/2021 | 1,670,000 | 1,856,098 | ||||||
| Bank of America Corp., 4.125%, 1/22/2024 | 6,960,000 | 7,344,589 | ||||||
| Bank of America Corp., 3.875%, 8/01/2025 | 7,955,000 | 8,229,535 | ||||||
| Bank of America Corp., 4.45%, 3/03/2026 | 3,614,000 | 3,761,249 | ||||||
| Bank of America Corp., 4.443% to 1/20/2047, FRN to 1/20/2048 | 13,670,000 | 14,458,499 | ||||||
| Bank of America Corp., FRN, 6.5%, 10/29/2049 | 4,004,000 | 4,452,168 | ||||||
| Bank of America Corp., FRN, 6.1%, 12/29/2049 | 5,000,000 | 5,431,750 | ||||||
| Bank of New York Mellon Corp., 3.442 to 2/07/2027, FRN to 2/07/2028 | 6,436,000 | 6,531,124 | ||||||
| Credit Suisse Group AG, 6.5%, 8/08/2023 (n) | 1,899,000 | 2,134,096 | ||||||
| Issuer | Shares/Par | Value ($) | ||||||
| BONDS – continued | ||||||||
| Major Banks – continued | ||||||||
| Credit Suisse Group Fund Guernsey Ltd., 3.75%, 3/26/2025 | $ | 3,355,000 | $ | 3,389,734 | ||||
| DBS Bank Ltd., 3.625% to 9/21/2017, FRN to 9/21/2022 (n) | 4,108,000 | 4,121,187 | ||||||
| Goldman Sachs Group, Inc., 2.375%, 1/22/2018 | 2,091,000 | 2,100,276 | ||||||
| Goldman Sachs Group, Inc., 3.625%, 1/22/2023 | 11,855,000 | 12,235,759 | ||||||
| Goldman Sachs Group, Inc., 3.85%, 1/26/2027 | 5,290,000 | 5,381,559 | ||||||
| JPMorgan Chase & Co., 4.25%, 10/15/2020 | 1,385,000 | 1,470,708 | ||||||
| JPMorgan Chase & Co., 4.5%, 1/24/2022 | 947,000 | 1,025,458 | ||||||
| JPMorgan Chase & Co., 3.125%, 1/23/2025 | 374,000 | 371,811 | ||||||
| Lloyds Bank PLC, 3.75%, 1/11/2027 | 7,906,000 | 7,937,339 | ||||||
| Morgan Stanley, 5.5%, 7/28/2021 | 14,214,000 | 15,761,265 | ||||||
| Morgan Stanley, 5.95%, 12/28/2017 | 400,000 | 408,162 | ||||||
| Morgan Stanley, 3.75%, 2/25/2023 | 8,585,000 | 8,926,795 | ||||||
| Morgan Stanley, 4.3%, 1/27/2045 | 1,528,000 | 1,580,132 | ||||||
| Morgan Stanley, 3.125%, 7/27/2026 | 483,000 | 469,595 | ||||||
| Morgan Stanley, 4.375%, 1/22/2047 | 9,571,000 | 9,984,505 | ||||||
| Royal Bank of Scotland Group PLC, 6%, 12/19/2023 | 7,121,000 | 7,843,547 | ||||||
| Royal Bank of Scotland Group PLC, 7.5% to 8/10/2020, FRN to 12/29/2049 | 5,177,000 | 5,342,664 | ||||||
| Royal Bank of Scotland Group PLC, 8% to 8/10/2025, FRN to 12/29/2049 | 1,662,000 | 1,804,400 | ||||||
| Sumitomo Mitsui Financial Group, Inc., 2.442%, 10/19/2021 | 4,623,000 | 4,603,611 | ||||||
| UBS Group Funding (Jersey) Ltd., 4.125%, 9/24/2025 (n) | 4,836,000 | 5,069,264 | ||||||
| UBS Group Funding (Switzerland) AG, 4.253%, 3/23/2028 (n) | 5,292,000 | 5,528,711 | ||||||
| Wachovia Corp., 6.605%, 10/01/2025 | 1,764,000 | 2,111,434 | ||||||
| Wells Fargo & Co., 3.069%, 1/24/2023 | 8,635,000 | 8,755,968 | ||||||
|
| |||||||
| $ | 185,100,779 | |||||||
|
| |||||||
| Medical & Health Technology & Services – 0.9% | ||||||||
| Catholic Health Initiatives, 2.95%, 11/01/2022 | $ | 6,666,000 | $ | 6,517,888 | ||||
| Hackensack Meridian Health, Inc., 4.5%, 7/01/2057 | 5,360,000 | 5,668,934 | ||||||
| HCA, Inc., 5.25%, 6/15/2026 | 5,271,000 | 5,684,774 | ||||||
| Laboratory Corp. of America Holdings, 4.7%, 2/01/2045 | 2,518,000 | 2,594,968 | ||||||
| Thermo Fisher Scientific, Inc., 3%, 4/15/2023 | 1,817,000 | 1,831,750 | ||||||
|
| |||||||
| $ | 22,298,314 | |||||||
|
| |||||||
| Medical Equipment – 0.7% | ||||||||
| Abbott Laboratories, 3.4%, 11/30/2023 | $ | 3,834,000 | $ | 3,924,789 | ||||
| Medtronic, Inc., 4.625%, 3/15/2045 | 7,021,000 | 7,901,679 | ||||||
| Zimmer Holdings, Inc., 2.7%, 4/01/2020 | 5,792,000 | 5,844,806 | ||||||
|
| |||||||
| $ | 17,671,274 | |||||||
|
| |||||||
8
Table of Contents
MFS Total Return Bond Series
Portfolio of Investments (unaudited) – continued
| Issuer | Shares/Par | Value ($) | ||||||
| BONDS – continued | ||||||||
| Metals & Mining – 2.3% | ||||||||
| Barrick Gold Corp., 4.1%, 5/01/2023 | $ | 11,152,000 | $ | 12,065,126 | ||||
| Freeport-McMoRan, Inc., 6.875%, 2/15/2023 | 8,679,000 | 9,161,726 | ||||||
| Freeport-McMoRan, Inc., 3.875%, 3/15/2023 | 4,000,000 | 3,720,000 | ||||||
| Freeport-McMoRan, Inc., 5.4%, 11/14/2034 | 4,000,000 | 3,590,000 | ||||||
| Glencore Funding LLC, 4.125%, 5/30/2023 (n) | 4,095,000 | 4,201,839 | ||||||
| Glencore Funding LLC, 4%, 4/16/2025 (n) | 2,578,000 | 2,579,005 | ||||||
| Glencore Funding LLC, 4%, 3/27/2027 (n) | 7,000,000 | 6,887,279 | ||||||
| Kinross Gold Corp., 5.95%, 3/15/2024 | 6,437,000 | 7,110,890 | ||||||
| Steel Dynamics, Inc., 5.125%, 10/01/2021 | 5,864,000 | 6,022,211 | ||||||
|
| |||||||
| $ | 55,338,076 | |||||||
|
| |||||||
| Midstream – 2.2% | ||||||||
| Enbridge, Inc., 4.25%, 12/01/2026 | $ | 4,350,000 | $ | 4,533,348 | ||||
| Enbridge, Inc., 6% to 1/15/2027, FRN to 1/15/2077 | 4,584,000 | 4,813,200 | ||||||
| Kinder Morgan (Delaware), Inc., 7.75%, 1/15/2032 | 6,550,000 | 8,235,852 | ||||||
| Kinder Morgan Energy Partners LP, 6.375%, 3/01/2041 | 2,240,000 | 2,525,806 | ||||||
| Kinder Morgan Energy Partners LP, 4.3%, 5/01/2024 | 5,995,000 | 6,196,186 | ||||||
| Kinder Morgan Energy Partners LP, 5.4%, 9/01/2044 | 6,378,000 | 6,432,736 | ||||||
| Kinder Morgan Energy Partners LP, 7.4%, 3/15/2031 | 103,000 | 123,900 | ||||||
| Kinder Morgan, Inc., 5.625%, 11/15/2023 (n) | 3,000,000 | 3,319,347 | ||||||
| Sabine Pass Liquefaction LLC, 5.625%, 2/01/2021 | 8,270,000 | 9,003,326 | ||||||
| Sabine Pass Liquefaction LLC, 4.2%, 3/15/2028 (n) | 2,847,000 | 2,876,358 | ||||||
| Sabine Pass Liquefaction LLC, 5%, 3/15/2027 | 5,259,000 | 5,598,058 | ||||||
| Spectra Energy Capital LLC, 8%, 10/01/2019 | 613,000 | 682,996 | ||||||
|
| |||||||
| $ | 54,341,113 | |||||||
|
| |||||||
| Mortgage-Backed – 19.5% | ||||||||
| Fannie Mae, 2.71%, 11/01/2017 | $ | 347,089 | $ | 347,356 | ||||
| Fannie Mae, 5.5%, 11/01/2017 – 4/01/2040 | 13,473,837 | 15,053,423 | ||||||
| Fannie Mae, 3.089%, 12/01/2017 | 254,041 | 254,337 | ||||||
| Fannie Mae, 3.22%, 12/01/2017 | 471,655 | 471,202 | ||||||
| Fannie Mae, 3.99%, 4/01/2018 | 600,000 | 604,458 | ||||||
| Fannie Mae, 3.729%, 6/01/2018 | 2,153,778 | 2,175,239 | ||||||
| Fannie Mae, 5.286%, 6/01/2018 | 312,159 | 317,898 | ||||||
| Fannie Mae, 2.578%, 9/25/2018 | 3,359,802 | 3,373,026 | ||||||
| Fannie Mae, 5.18%, 3/01/2019 | 118,360 | 122,788 | ||||||
| Fannie Mae, 5.51%, 3/01/2019 | 177,990 | 185,378 | ||||||
| Issuer | Shares/Par | Value ($) | ||||||
| BONDS – continued | ||||||||
| Mortgage-Backed – continued | ||||||||
| Fannie Mae, 4.6%, 9/01/2019 | $ | 701,913 | $ | 739,812 | ||||
| Fannie Mae, 1.99%, 10/01/2019 | 2,560,485 | 2,561,680 | ||||||
| Fannie Mae, 4.45%, 10/01/2019 | 489,566 | 516,245 | ||||||
| Fannie Mae, 1.97%, 11/01/2019 | 1,004,607 | 1,005,713 | ||||||
| Fannie Mae, 2.03%, 11/01/2019 | 1,253,932 | 1,257,004 | ||||||
| Fannie Mae, 4.88%, 3/01/2020 | 12,845 | 13,339 | ||||||
| Fannie Mae, 5%, 6/01/2020 – 3/01/2042 | 9,973,251 | 10,909,213 | ||||||
| Fannie Mae, 5.19%, 9/01/2020 | 152,889 | 161,781 | ||||||
| Fannie Mae, 3.416%, 10/01/2020 | 1,357,236 | 1,409,535 | ||||||
| Fannie Mae, 2.14%, 5/01/2021 | 924,576 | 922,021 | ||||||
| Fannie Mae, 3.89%, 7/01/2021 | 1,139,393 | 1,212,387 | ||||||
| Fannie Mae, 2.56%, 10/01/2021 | 811,677 | 817,388 | ||||||
| Fannie Mae, 2.64%, 11/01/2021 | 1,210,795 | 1,236,356 | ||||||
| Fannie Mae, 2.75%, 3/01/2022 | 1,144,112 | 1,173,885 | ||||||
| Fannie Mae, 6%, 8/01/2022 – 3/01/2039 | 3,329,864 | 3,775,025 | ||||||
| Fannie Mae, 2.525%, 10/01/2022 | 1,828,422 | 1,857,996 | ||||||
| Fannie Mae, 2.68%, 3/01/2023 | 1,755,971 | 1,794,768 | ||||||
| Fannie Mae, 2.41%, 5/01/2023 | 2,045,598 | 2,062,298 | ||||||
| Fannie Mae, 2.55%, 5/01/2023 | 1,049,375 | 1,065,529 | ||||||
| Fannie Mae, 4.5%, 5/01/2024 – 6/01/2044 | 40,235,918 | 43,504,700 | ||||||
| Fannie Mae, 4%, 3/01/2025 – 5/01/2044 | 68,685,472 | 72,544,105 | ||||||
| Fannie Mae, 4.5%, 5/01/2025 | 85,768 | 90,093 | ||||||
| Fannie Mae, 3.5%, 9/01/2025 –1/01/2047 | 43,328,186 | 44,616,094 | ||||||
| Fannie Mae, 3.95%, 1/01/2027 | 361,550 | 383,259 | ||||||
| Fannie Mae, 3%, 4/01/2027 – 11/01/2046 | 30,829,166 | 31,112,957 | ||||||
| Fannie Mae, 6.5%, 7/01/2032 – 1/01/2033 | 6,705 | 7,623 | ||||||
| Fannie Mae, FRN, 2.683%, 12/25/2026 | 6,265,000 | 6,118,822 | ||||||
| Federal Home Loan Bank, 5%, 7/01/2035 | 2,707,678 | 2,968,447 | ||||||
| Freddie Mac, 3.154%, 2/25/2018 | 857,099 | 863,146 | ||||||
| Freddie Mac, 5%, 7/01/2018 – 7/01/2041 | 3,903,556 | 4,294,130 | ||||||
| Freddie Mac, 2.303%, 9/25/2018 | 8,971,000 | 9,038,251 | ||||||
| Freddie Mac, 2.323%, 10/25/2018 | 1,178,242 | 1,187,629 | ||||||
| Freddie Mac, 2.22%, 12/25/2018 | 1,200,000 | 1,208,192 | ||||||
| Freddie Mac, 2.13%, 1/25/2019 | 6,074,094 | 6,111,892 | ||||||
| Freddie Mac, 2.086%, 3/25/2019 | 7,200,000 | 7,246,307 | ||||||
| Freddie Mac, 5.5%, 6/01/2019 – 1/01/2038 | 580,991 | 649,463 | ||||||
| Freddie Mac, 4.186%, 8/25/2019 | 1,110,000 | 1,162,011 | ||||||
| Freddie Mac, 1.869%, 11/25/2019 | 6,121,000 | 6,134,984 | ||||||
| Freddie Mac, 4.251%, 1/25/2020 | 807,000 | 851,343 | ||||||
| Freddie Mac, 3.034%, 10/25/2020 | 2,606,000 | 2,689,079 | ||||||
| Freddie Mac, 2.856%, 1/25/2021 | 5,331,000 | 5,480,003 | ||||||
| Freddie Mac, 2.791%, 1/25/2022 | 4,439,000 | 4,558,747 | ||||||
| Freddie Mac, 2.716%, 6/25/2022 | 1,478,636 | 1,513,016 | ||||||
| Freddie Mac, 2.682%, 10/25/2022 | 3,049,000 | 3,105,078 | ||||||
| Freddie Mac, 3.32%, 2/25/2023 | 3,956,000 | 4,153,579 | ||||||
| Freddie Mac, 3.3%, 4/25/2023 – 10/25/2026 | 9,057,972 | 9,457,247 | ||||||
| Freddie Mac, 3.06%, 7/25/2023 | 4,230,000 | 4,378,224 | ||||||
| Freddie Mac, 3.531%, 7/25/2023 | 2,401,000 | 2,546,061 | ||||||
| Freddie Mac, 3.458%, 8/25/2023 | 7,000,000 | 7,395,849 | ||||||
9
Table of Contents
MFS Total Return Bond Series
Portfolio of Investments (unaudited) – continued
| Issuer | Shares/Par | Value ($) | ||||||
| BONDS – continued | ||||||||
| Mortgage-Backed – continued | ||||||||
| Freddie Mac, 2.67%, 12/25/2024 | $ | 2,784,000 | $ | 2,798,065 | ||||
| Freddie Mac, 2.811%, 1/25/2025 | 4,169,000 | 4,222,107 | ||||||
| Freddie Mac, 3.329%, 5/25/2025 | 6,457,000 | 6,758,348 | ||||||
| Freddie Mac, 4%, 7/01/2025 – 4/01/2044 | 6,104,642 | 6,430,863 | ||||||
| Freddie Mac, 4.5%, 7/01/2025 – 5/01/2042 | 8,452,598 | 9,081,346 | ||||||
| Freddie Mac, 2.745%, 1/25/2026 | 3,620,000 | 3,619,898 | ||||||
| Freddie Mac, 2.673%, 3/25/2026 | 4,000,000 | 3,971,792 | ||||||
| Freddie Mac, 3.5%, 8/01/2026 –12/01/2046 | 40,623,319 | 41,835,289 | ||||||
| Freddie Mac, 3.224%, 3/25/2027 | 5,184,000 | 5,336,077 | ||||||
| Freddie Mac, 6%, 8/01/2034 –7/01/2038 | 144,337 | 163,042 | ||||||
| Freddie Mac, 3%, 10/01/2042 –10/01/2046 | 23,887,890 | 23,944,334 | ||||||
| Freddie Mac, TBA, 4.5%, 7/13/2047 | 1,453,000 | 1,556,544 | ||||||
| Ginnie Mae, 5.5%, 5/15/2033 –1/20/2042 | 2,911,818 | 3,248,509 | ||||||
| Ginnie Mae, 6%, 1/20/2036 – 1/15/2039 | 313,523 | 356,143 | ||||||
| Ginnie Mae, 4.5%, 4/15/2039 –9/20/2041 | 14,458,386 | 15,588,812 | ||||||
| Ginnie Mae, 4%, 10/20/2040 –10/20/2042 | 3,789,877 | 4,017,163 | ||||||
| Ginnie Mae, 3.5%, 11/15/2040 –4/15/2042 | 3,711,921 | 3,860,312 | ||||||
|
| |||||||
| $ | 479,556,055 | |||||||
|
| |||||||
| Natural Gas – Distribution – 0.3% | ||||||||
| KeySpan Gas East Corp., 2.742%, 8/15/2026 (z) | $ | 8,200,000 | $ | 7,914,246 | ||||
|
| |||||||
| Network & Telecom – 0.9% | ||||||||
| AT&T, Inc., 4.5%, 5/15/2035 | $ | 8,154,000 | $ | 8,021,840 | ||||
| AT&T, Inc., 5.25%, 3/01/2037 | 10,586,000 | 11,278,081 | ||||||
| Verizon Communications, Inc., “A”, 5.012%, 4/15/2049 (n) | 2,791,000 | 2,818,650 | ||||||
|
| |||||||
| $ | 22,118,571 | |||||||
|
| |||||||
| Oil Services – 0.3% | ||||||||
| Odebrecht Offshore Drilling Finance Ltd., 6.75%, 10/01/2023 (n) | $ | 4,973,804 | $ | 1,666,224 | ||||
| Schlumberger Norge A.S., 1.25%, 8/01/2017 (n) | 5,189,000 | 5,188,216 | ||||||
|
| |||||||
| $ | 6,854,440 | |||||||
|
| |||||||
| Oils – 0.4% | ||||||||
| Marathon Petroleum Corp., 4.75%, 9/15/2044 | $ | 7,350,000 | $ | 6,982,875 | ||||
| Marathon Petroleum Corp., 5.85%, 12/15/2045 | 2,683,000 | 2,720,135 | ||||||
|
| |||||||
| $ | 9,703,010 | |||||||
|
| |||||||
| Other Banks & Diversified Financials – 2.4% | ||||||||
| Bank of Tokyo-Mitsubishi UFJ Ltd., 2.7%, 9/09/2018 (n) | $ | 5,269,000 | $ | 5,315,910 | ||||
| BBVA Bancomer S.A. de C.V., 6.75%, 9/30/2022 (n) | 2,570,000 | 2,920,163 | ||||||
| BPCE S.A., 4.5%, 3/15/2025 (n) | 5,771,000 | 5,932,069 | ||||||
| Issuer | Shares/Par | Value ($) | ||||||
| BONDS – continued | ||||||||
| Other Banks & Diversified Financials – continued | ||||||||
| Citigroup, Inc., 4.4%, 6/10/2025 | $ | 4,533,000 | $ | 4,722,937 | ||||
| Compass Bank, 2.875%, 6/29/2022 | 8,704,000 | 8,670,812 | ||||||
| Discover Bank, 7%, 4/15/2020 | 7,009,000 | 7,779,612 | ||||||
| Groupe BPCE S.A., 12.5% to 9/30/2019, FRN to 8/29/2049 (n) | 7,880,000 | 9,618,486 | ||||||
| ING Groep N.V., 3.95%, 3/29/2027 | 2,389,000 | 2,484,185 | ||||||
| Macquarie Bank Ltd., 6.125% to 3/08/2027, FRN to 12/31/2099 (n) | 1,240,000 | 1,267,900 | ||||||
| Santander UK PLC, 3.05%, 8/23/2018 | 2,885,000 | 2,921,146 | ||||||
| SunTrust Banks, Inc., 3.3%, 5/15/2026 | 439,000 | 429,063 | ||||||
| SunTrust Banks, Inc., 2.7%, 1/27/2022 | 6,147,000 | 6,159,835 | ||||||
|
| |||||||
| $ | 58,222,118 | |||||||
|
| |||||||
| Pharmaceuticals – 2.0% | ||||||||
| Actavis Funding SCS, 3%, 3/12/2020 | $ | 4,494,000 | $ | 4,589,358 | ||||
| Actavis Funding SCS, 3.8%, 3/15/2025 | 4,505,000 | 4,659,742 | ||||||
| Celgene Corp., 2.875%, 8/15/2020 | 10,192,000 | 10,422,115 | ||||||
| Forest Laboratories, Inc., 4.875%, 2/15/2021 (n) | 8,798,000 | 9,465,847 | ||||||
| Gilead Sciences, Inc., 4.8%, 4/01/2044 | 6,643,000 | 7,238,877 | ||||||
| Gilead Sciences, Inc., 2.35%, 2/01/2020 | 817,000 | 824,799 | ||||||
| Gilead Sciences, Inc., 4.75%, 3/01/2046 | 3,545,000 | 3,891,736 | ||||||
| Shire Acquisitions Investments Ireland Designated Activity Co., 2.875%, 9/23/2023 | 7,944,000 | 7,873,878 | ||||||
|
| |||||||
| $ | 48,966,352 | |||||||
|
| |||||||
| Real Estate – Apartment – 0.1% | ||||||||
| Mid-America Apartment Communities, Inc., REIT, 4.3%, 10/15/2023 | $ | 2,417,000 | $ | 2,558,356 | ||||
|
| |||||||
| Real Estate – Office – 0.1% | ||||||||
| Boston Properties LP, REIT, 3.7%, 11/15/2018 | $ | 2,937,000 | $ | 2,998,113 | ||||
|
| |||||||
| Real Estate – Retail – 0.6% | ||||||||
| Brixmor Operating Partnership LP, REIT, 3.875%, 8/15/2022 | $ | 4,811,000 | $ | 4,919,296 | ||||
| DDR Corp., REIT, 4.625%, 7/15/2022 | 2,365,000 | 2,476,172 | ||||||
| DDR Corp., REIT, 3.375%, 5/15/2023 | 6,575,000 | 6,370,682 | ||||||
|
| |||||||
| $ | 13,766,150 | |||||||
|
| |||||||
| Retailers – 0.6% | ||||||||
| Bed Bath & Beyond, Inc., 5.165%, 8/01/2044 | $ | 7,156,000 | $ | 6,298,718 | ||||
| Best Buy Co., Inc., 5.5%, 3/15/2021 | 7,906,000 | 8,604,274 | ||||||
|
| |||||||
| $ | 14,902,992 | |||||||
|
| |||||||
| Telecommunications – Wireless – 1.1% | ||||||||
| American Tower Corp., 3.55%, 7/15/2027 | $ | 12,018,000 | $ | 11,916,844 | ||||
| Crown Castle International Corp., 3.7%, 6/15/2026 | 2,419,000 | 2,439,714 | ||||||
| Crown Castle International Corp., 2.25%, 9/01/2021 | 2,264,000 | 2,227,330 | ||||||
| Crown Castle International Corp., 4%, 3/01/2027 | 984,000 | 1,012,813 | ||||||
| Crown Castle Towers LLC, 4.883%, 8/15/2040 (n) | 952,000 | 1,015,897 | ||||||
10
Table of Contents
MFS Total Return Bond Series
Portfolio of Investments (unaudited) – continued
| Issuer | Shares/Par | Value ($) | ||||||
| BONDS – continued | ||||||||
| Telecommunications – Wireless – continued | ||||||||
| SBA Tower Trust, 2.898%, 10/15/2044 (n) | $ | 4,229,000 | $ | 4,251,277 | ||||
| SFR Group S.A., 6%, 5/15/2022 (n) | 2,970,000 | 3,107,363 | ||||||
|
| |||||||
| $ | 25,971,238 | |||||||
|
| |||||||
| Tobacco – 0.5% | ||||||||
| Imperial Tobacco Finance PLC, 3.75%, 7/21/2022 (n) | $ | 7,775,000 | $ | 8,094,840 | ||||
| Reynolds American, Inc., 8.125%, 6/23/2019 | 3,344,000 | 3,729,613 | ||||||
|
| |||||||
| $ | 11,824,453 | |||||||
|
| |||||||
| Transportation – Services – 0.4% | ||||||||
| ERAC USA Finance LLC, 7%, 10/15/2037 (n) | $ | 6,986,000 | $ | 9,068,569 | ||||
| ERAC USA Finance LLC, 3.85%, 11/15/2024 (n) | 1,612,000 | 1,659,232 | ||||||
|
| |||||||
| $ | 10,727,801 | |||||||
|
| |||||||
| U.S. Government Agencies and Equivalents – 2.0% | ||||||||
| Small Business Administration, 4.625%, 2/01/2025 | $ | 44,345 | $ | 46,393 | ||||
| Small Business Administration, 5.11%, 4/01/2025 | 26,513 | 28,085 | ||||||
| Small Business Administration, 4.43%, 5/01/2029 | 496,015 | 527,564 | ||||||
| Small Business Administration, 3.25%, 11/01/2030 | 488,032 | 503,056 | ||||||
| Small Business Administration, 2.85%, 9/01/2031 | 1,031,164 | 1,047,249 | ||||||
| Small Business Administration, 2.37%, 8/01/2032 | 889,365 | 880,404 | ||||||
| Small Business Administration, 3.21%, 9/01/2030 | 4,701,162 | 4,839,763 | ||||||
| Small Business Administration, 2.13%, 1/01/2033 | 3,373,112 | 3,293,667 | ||||||
| Small Business Administration, 2.21%, 2/01/2033 | 858,863 | 844,431 | ||||||
| Small Business Administration, 2.22%, 3/01/2033 | 3,168,359 | 3,128,952 | ||||||
| Small Business Administration, 2.08%, 4/01/2033 | 4,719,906 | 4,596,824 | ||||||
| Small Business Administration, 2.45%, 6/01/2033 | 5,429,492 | 5,388,947 | ||||||
| Small Business Administration, 3.15%, 7/01/2033 | 7,853,109 | 8,112,814 | ||||||
| Small Business Administration, 3.16%, 8/01/2033 | 8,101,949 | 8,377,014 | ||||||
| Small Business Administration, 3.62%, 9/01/2033 | 7,271,417 | 7,672,222 | ||||||
| Small Business Administration, 4.93%, 1/01/2024 | 12,594 | 13,293 | ||||||
| Small Business Administration, 4.34%, 3/01/2024 | 25,030 | 25,931 | ||||||
| Small Business Administration, 4.99%, 9/01/2024 | 17,949 | 18,965 | ||||||
| Issuer | Shares/Par | Value ($) | ||||||
| BONDS – continued | ||||||||
| U.S. Government Agencies and Equivalents – continued | ||||||||
| Small Business Administration, 4.86%, 1/01/2025 | $ | 41,750 | $ | 43,895 | ||||
|
| |||||||
| $ | 49,389,469 | |||||||
|
| |||||||
| U.S. Treasury Obligations – 14.8% | ||||||||
| U.S. Treasury Bonds, 4.75%, 2/15/2037 | $ | 1,576,000 | $ | 2,099,651 | ||||
| U.S. Treasury Bonds, 4.375%, 2/15/2038 | 19,006,000 | 24,215,583 | ||||||
| U.S. Treasury Bonds, 4.5%, 8/15/2039 | 4,597,600 | 5,956,048 | ||||||
| U.S. Treasury Bonds, 3.125%, 11/15/2041 | 500,000 | 529,453 | ||||||
| U.S. Treasury Bonds, 3.125%, 2/15/2042 | 1,300,000 | 1,376,629 | ||||||
| U.S. Treasury Bonds, 2.875%, 5/15/2043 | 44,925,200 | 45,360,435 | ||||||
| U.S. Treasury Bonds, 2.5%, 2/15/2045 | 7,827,000 | 7,304,485 | ||||||
| U.S. Treasury Notes, 0.75%, 1/31/2018 | 133,370,000 | 133,040,843 | ||||||
| U.S. Treasury Notes, 2.875%, 3/31/2018 | 2,000,000 | 2,023,438 | ||||||
| U.S. Treasury Notes, 1.625%, 6/30/2019 (f) | 115,650,000 | 116,164,989 | ||||||
| U.S. Treasury Notes, 1%, 8/31/2019 | 5,600,000 | 5,551,218 | ||||||
| U.S. Treasury Notes, 3.375%, 11/15/2019 | 1,800,000 | 1,880,649 | ||||||
| U.S. Treasury Notes, 3.625%, 2/15/2020 | 4,200,000 | 4,428,539 | ||||||
| U.S. Treasury Notes, 2%, 11/15/2026 | 6,181,000 | 6,026,957 | ||||||
| U.S. Treasury Notes, 3%, 11/15/2045 | 7,735,000 | 7,966,748 | ||||||
|
| |||||||
| $ | 363,925,665 | |||||||
|
| |||||||
| Utilities – Electric Power – 3.5% | ||||||||
| AEP Transmission Co. LLC, 3.1%, 12/01/2026 | $ | 1,300,000 | $ | 1,296,312 | ||||
| Berkshire Hathaway Energy Co., 5.15%, 11/15/2043 | 6,436,000 | 7,562,570 | ||||||
| Constellation Energy Group, Inc., 5.15%, 12/01/2020 | 2,487,000 | 2,682,401 | ||||||
| Dominion Resources, Inc., 3.625%, 12/01/2024 | 6,901,000 | 7,070,178 | ||||||
| Dominion Resources, Inc., 3.9%, 10/01/2025 | 2,048,000 | 2,120,063 | ||||||
| EDP Finance B.V., 5.25%, 1/14/2021 (n) | 7,774,000 | 8,341,751 | ||||||
| EDP Finance B.V., 4.9%, 10/01/2019 (n) | 2,531,000 | 2,657,677 | ||||||
| EDP Finance BV, 3.625%, 7/15/2024 (n) | 2,252,000 | 2,223,485 | ||||||
| Enel Finance International N.V., 3.625%, 5/25/2027 (n) | 14,433,000 | 14,293,635 | ||||||
| Exelon Corp., 3.497%, 6/01/2022 | 2,048,000 | 2,092,321 | ||||||
| FirstEnergy Corp., 4.85%, 7/15/2047 | 8,703,000 | 8,829,254 | ||||||
| Great Plains Energy, Inc., 4.85%, 4/01/2047 | 3,667,000 | 3,773,306 | ||||||
| PPL Capital Funding, Inc., 5%, 3/15/2044 | 3,429,000 | 3,865,796 | ||||||
| PPL Corp., 3.5%, 12/01/2022 | 1,050,000 | 1,085,021 | ||||||
| PPL WEM Holdings PLC, 5.375%, 5/01/2021 (n) | 8,842,000 | 9,541,066 | ||||||
| Southern Co., 2.35%, 7/01/2021 | 7,039,000 | 6,987,714 | ||||||
| Southern Co., 4.4%, 7/01/2046 | 2,328,000 | 2,370,295 | ||||||
|
| |||||||
| $ | 86,792,845 | |||||||
|
| |||||||
| Total Bonds (Identified Cost, $2,324,019,446) | $ | 2,360,117,400 | ||||||
|
| |||||||
11
Table of Contents
MFS Total Return Bond Series
Portfolio of Investments (unaudited) – continued
| Issuer | Shares/Par | Value ($) | ||||||
| MONEY MARKET FUNDS – 3.4% | ||||||||
| MFS Institutional Money Market Portfolio, 0.98% (v) (Identified Cost, $82,569,747) | 82,577,997 | $ | 82,577,997 | |||||
|
| |||||||
| Total Investments (Identified Cost, $2,406,589,193) | $ | 2,442,695,397 | ||||||
|
| |||||||
| OTHER ASSETS, LESS LIABILITIES – 0.5% | 12,127,408 | |||||||
|
| |||||||
| NET ASSETS – 100.0% | $ | 2,454,822,805 | ||||||
|
| |||||||
| (f) | All or a portion of the security has been segregated as collateral for open futures contracts. |
| (i) | Interest only security for which the fund receives interest on notional principal (Par amount). Par amount shown is the notional principal and does not reflect the cost of the security. |
| (n) | Securities exempt from registration under Rule 144A of the Securities Act of 1933. These securities may be sold in the ordinary course of business in transactions exempt from registration, normally to qualified institutional buyers. At period end, the aggregate value of these securities was $387,977,974 representing 15.8% of net assets. |
| (q) | Interest received was less than stated coupon rate. |
| (v) | Underlying affiliated fund that is available only to investment companies managed by MFS. The rate quoted for the MFS Institutional Money Market Portfolio is the annualized seven-day yield of the fund at period end. |
| (z) | Restricted securities are not registered under the Securities Act of 1933 and are subject to legal restrictions on resale. These securities generally may be resold in transactions exempt from registration or to the public if the securities are subsequently registered. Disposal of these securities may involve time-consuming negotiations and prompt sale at an acceptable price may be difficult. The fund holds the following restricted securities: |
| Restricted Securities | Acquisition Date | Cost | Value | |||||||
| Ballyrock Ltd., CLO, FRN, 2.351%, 5/20/2025 | 5/10/16 | $3,246,014 | $3,272,098 | |||||||
| Bayview Commercial Asset Trust, FRN, 0%, 4/25/2036 | 2/28/06 | 909 | 928 | |||||||
| Bayview Commercial Asset Trust, FRN, 0%, 12/25/2036 | 10/25/06 | 4,835 | 19 | |||||||
| Bayview Financial Revolving Mortgage Loan Trust, FRN, 2.822%, 12/28/2040 | 3/01/06 | 105,151 | 81,822 | |||||||
| Carlyle Global Market Strategies, 2013-3A, “A1A”, FRN, 2.278%, 7/15/2025 | 11/02/16 | 4,587,615 | 4,594,944 | |||||||
| Commercial Mortgage Asset Trust, FRN, 0.575%, 1/17/2032 | 4/09/12 | 20 | 20 | |||||||
| First Union National Bank Commercial Mortgage Trust, FRN, 2.477%, 1/12/2043 | 4/09/12 | 185 | 184 | |||||||
| Hertz Fleet Lease Funding LP, 2014-1, FRN, 1.517%, 4/10/2028 | 3/25/14 | 781,222 | 781,042 | |||||||
| KeySpan Gas East Corp., 2.742%, 8/15/2026 | 8/02/16 | 8,200,000 | 7,914,246 | |||||||
| Oaktree CLO Ltd., 2014-2A, “BR”, FRN, 3.706%, 10/20/2026 | 2/17/17 | 1,450,000 | 1,451,441 | |||||||
| Preferred Term Securities XIX Ltd., CDO, FRN, 1.595%, 12/22/2035 | 3/28/11 | 222,648 | 258,570 | |||||||
| Silver Spring CLO Ltd., 2014-1A, “C2R”, 5.484%, 10/15/2026 | 6/21/17 | 3,039,972 | 3,040,000 | |||||||
| West CLO Ltd., 2014-1A, “A2”, FRN, 3.258%, 7/18/2026 | 7/21/16 | 7,473,768 | 7,594,534 | |||||||
| Total Restricted Securities | $28,989,848 | |||||||||
| % of Net assets | 1.2% | |||||||||
The following abbreviations are used in this report and are defined:
| CDO | Collateralized Debt Obligation |
| CLO | Collateralized Loan Obligation |
| FRN | Floating Rate Note. Interest rate resets periodically and the current rate may not be the rate reported at period end. |
| PLC | Public Limited Company |
| REIT | Real Estate Investment Trust |
| TBA | To Be Announced |
12
Table of Contents
MFS Total Return Bond Series
Portfolio of Investments (unaudited) – continued
Derivative Contracts at 6/30/17
Futures Contracts at 6/30/17
| Description | Currency | Contracts | Value | Expiration Date | Unrealized Appreciation (Depreciation) | |||||||||||||
| Asset Derivatives | ||||||||||||||||||
| Interest Rate Futures | ||||||||||||||||||
| U.S. Treasury Bond 30 yr (Long) | USD | 240 | $36,885,000 | September - 2017 | $268,386 | |||||||||||||
| U.S. Treasury Note 10 yr (Short) | USD | 100 | 13,481,250 | September - 2017 | 37,137 | |||||||||||||
|
| |||||||||||||||||
| $305,523 | ||||||||||||||||||
|
| |||||||||||||||||
| Liability Derivatives | ||||||||||||||||||
| Interest Rate Futures | ||||||||||||||||||
| U.S. Treasury Note 2 yr (Long) | USD | 600 | $129,665,626 | September - 2017 | $(198,992 | ) | ||||||||||||
| U.S. Treasury Note 5 yr (Long) | USD | 50 | 5,891,797 | September - 2017 | (12,773 | ) | ||||||||||||
|
| |||||||||||||||||
| $(211,765 | ) | |||||||||||||||||
|
| |||||||||||||||||
At June 30, 2017, the fund had liquid securities with an aggregate value of $1,115,944 to cover any commitments for certain derivative contracts.
See Notes to Financial Statements
13
Table of Contents
MFS Total Return Bond Series
FINANCIAL STATEMENTS | STATEMENT OF ASSETS AND LIABILITIES (unaudited)
This statement represents your fund’s balance sheet, which details the assets and liabilities comprising the total value of the fund.
At 6/30/17 | ||||
Assets | ||||
Investments | ||||
Non-affiliated issuers, at value (identified cost, $2,324,019,446) | $2,360,117,400 | |||
Underlying affiliated funds, at value (identified cost, $82,569,747) | 82,577,997 | |||
Total investments, at value (identified cost, $2,406,589,193) | $2,442,695,397 | |||
Cash | 1,637 | |||
Receivables for | ||||
Investments sold | 1,121,803 | |||
Fund shares sold | 168,414 | |||
Interest | 17,732,490 | |||
Other assets | 5,284 | |||
Total assets | $2,461,725,025 | |||
Liabilities | ||||
Payables for | ||||
Daily variation margin on open futures contracts | $162,346 | |||
Investments purchased | 3,039,972 | |||
TBA purchase commitments | 1,554,676 | |||
Fund shares reacquired | 1,858,840 | |||
Payable to affiliates | ||||
Investment adviser | 68,644 | |||
Shareholder servicing costs | 1,048 | |||
Distribution and/or service fees | 20,120 | |||
Payable for independent Trustees’ compensation | 2,248 | |||
Accrued expenses and other liabilities | 194,326 | |||
Total liabilities | $6,902,220 | |||
Net assets | $2,454,822,805 | |||
Net assets consist of | ||||
Paid-in capital | $2,344,348,198 | |||
Unrealized appreciation (depreciation) on investments | 36,199,962 | |||
Accumulated net realized gain (loss) on investments | (36,144,933 | ) | ||
Undistributed net investment income | 110,419,578 | |||
Net assets | $2,454,822,805 | |||
Shares of beneficial interest outstanding | 184,325,140 |
| Net assets | Shares outstanding | Net asset value per share | ||||||||||
Initial Class | $989,817,264 | 73,506,517 | $13.47 | |||||||||
Service Class | 1,465,005,541 | 110,818,623 | 13.22 | |||||||||
See Notes to Financial Statements
14
Table of Contents
MFS Total Return Bond Series
FINANCIAL STATEMENTS | STATEMENT OF OPERATIONS (unaudited)
This statement describes how much your fund earned in investment income and accrued in expenses. It also describes any gains and/or losses generated by fund operations.
Six months ended 6/30/17 | ||||
Net investment income | ||||
Income | ||||
Interest | $39,792,968 | |||
Dividends from underlying affiliated funds | 357,073 | |||
Foreign taxes withheld | (4,581 | ) | ||
Total investment income | $40,145,460 | |||
Expenses | ||||
Management fee | $6,082,733 | |||
Distribution and/or service fees | 1,820,675 | |||
Shareholder servicing costs | 32,534 | |||
Administrative services fee | 201,453 | |||
Independent Trustees’ compensation | 21,763 | |||
Custodian fee | 59,573 | |||
Shareholder communications | 107,933 | |||
Audit and tax fees | 37,525 | |||
Legal fees | 13,363 | |||
Miscellaneous | 35,098 | |||
Total expenses | $8,412,650 | |||
Reduction of expenses by investment adviser | (93,370 | ) | ||
Net expenses | $8,319,280 | |||
Net investment income | $31,826,180 | |||
Realized and unrealized gain (loss) on investments | ||||
Realized gain (loss) (identified cost basis) | ||||
Investments: | ||||
Non-affiliated issuers | $(8,334,697 | ) | ||
Underlying affiliated funds | (3,291 | ) | ||
Futures contracts | 2,851,830 | |||
Net realized gain (loss) on investments | $(5,486,158 | ) | ||
Change in unrealized appreciation (depreciation) | ||||
Investments | $41,431,916 | |||
Futures contracts | (332,833 | ) | ||
Net unrealized gain (loss) on investments | $41,099,083 | |||
Net realized and unrealized gain (loss) on investments | $35,612,925 | |||
Change in net assets from operations | $67,439,105 |
See Notes to Financial Statements
15
Table of Contents
MFS Total Return Bond Series
FINANCIAL STATEMENTS | STATEMENTS OF CHANGES IN NET ASSETS
These statements describe the increases and/or decreases in net assets resulting from operations, any distributions, and any shareholder transactions.
| | Six months ended 6/30/17 (unaudited | ) | | Year ended 12/31/16 | | |||
Change in net assets | ||||||||
| From operations | ||||||||
Net investment income | $31,826,180 | $71,318,322 | ||||||
Net realized gain (loss) on investments | (5,486,158 | ) | (515,549 | ) | ||||
Net unrealized gain (loss) on investments | 41,099,083 | 32,317,668 | ||||||
Change in net assets from operations | $67,439,105 | $103,120,441 | ||||||
| Distributions declared to shareholders | ||||||||
From net investment income | $— | $(83,143,405 | ) | |||||
Change in net assets from fund share transactions | $(56,611,749 | ) | $(145,738,645 | ) | ||||
Total change in net assets | $10,827,356 | $(125,761,609 | ) | |||||
| Net assets | ||||||||
At beginning of period | 2,443,995,449 | 2,569,757,058 | ||||||
At end of period (including undistributed net investment income of $110,419,578 and | $2,454,822,805 | $2,443,995,449 |
See Notes to Financial Statements
16
Table of Contents
MFS Total Return Bond Series
FINANCIAL STATEMENTS | FINANCIAL HIGHLIGHTS
The financial highlights table is intended to help you understand the fund’s financial performance for the semiannual period and the past 5 fiscal years. Certain information reflects financial results for a single fund share. The total returns in the table represent the rate that an investor would have earned (or lost) on an investment in the fund share class (assuming reinvestment of all distributions) held for the entire period.
| Initial Class | Six months ended 6/30/17 | Years ended 12/31 | ||||||||||||||||||||||
| 2016 | 2015 | 2014 | 2013 | 2012 | ||||||||||||||||||||
| (unaudited) | ||||||||||||||||||||||||
Net asset value, beginning of period | $13.09 | $13.00 | $13.50 | $13.13 | $13.49 | $13.01 | ||||||||||||||||||
| Income (loss) from investment operations | ||||||||||||||||||||||||
Net investment income (d) | $0.18 | $0.40 | (c) | $0.38 | $0.37 | $0.35 | $0.37 | |||||||||||||||||
Net realized and unrealized gain (loss) | 0.20 | 0.16 | (0.42 | ) | 0.40 | (0.49 | ) | 0.57 | ||||||||||||||||
Total from investment operations | $0.38 | $0.56 | $(0.04 | ) | $0.77 | $(0.14 | ) | $0.94 | ||||||||||||||||
| Less distributions declared to shareholders | ||||||||||||||||||||||||
From net investment income | $— | $(0.47 | ) | $(0.46 | ) | $(0.40 | ) | $(0.16 | ) | $(0.37 | ) | |||||||||||||
From net realized gain on investments | — | — | — | — | (0.06 | ) | (0.09 | ) | ||||||||||||||||
Total distributions declared to | $— | $(0.47 | ) | $(0.46 | ) | $(0.40 | ) | $(0.22 | ) | $(0.46 | ) | |||||||||||||
Net asset value, end of period (x) | $13.47 | $13.09 | $13.00 | $13.50 | $13.13 | $13.49 | ||||||||||||||||||
Total return (%) (k)(r)(s)(x) | 2.90 | (n) | 4.23 | (c) | (0.30 | ) | 5.85 | (1.03 | ) | 7.35 | ||||||||||||||
| Ratios (%) (to average net assets) and Supplemental data: | ||||||||||||||||||||||||
Expenses before expense reductions (f) | 0.54 | (a) | 0.53 | (c) | 0.54 | 0.53 | 0.54 | 0.56 | ||||||||||||||||
Expenses after expense reductions (f) | 0.53 | (a) | 0.52 | (c) | 0.53 | 0.52 | 0.53 | 0.56 | ||||||||||||||||
Net investment income | 2.76 | (a) | 2.98 | (c) | 2.83 | 2.74 | 2.65 | 2.76 | ||||||||||||||||
Portfolio turnover | 25 | (n) | 37 | 62 | 58 | 68 | 114 | |||||||||||||||||
Net assets at end of period | $989,817 | $986,877 | $1,030,563 | $1,172,957 | $1,208,132 | $850,417 | ||||||||||||||||||
See Notes to Financial Statements
17
Table of Contents
MFS Total Return Bond Series
Financial Highlights – continued
| Service Class | Six months ended 6/30/17 | Years ended 12/31 | ||||||||||||||||||||||
| 2016 | 2015 | 2014 | 2013 | 2012 | ||||||||||||||||||||
| (unaudited) | ||||||||||||||||||||||||
Net asset value, beginning of period | $12.87 | $12.78 | $13.28 | $12.92 | $13.30 | $12.85 | ||||||||||||||||||
| Income (loss) from investment operations | ||||||||||||||||||||||||
Net investment income (d) | $0.16 | $0.36 | (c) | $0.34 | $0.33 | $0.31 | $0.33 | |||||||||||||||||
Net realized and unrealized gain (loss) | 0.19 | 0.16 | (0.41 | ) | 0.39 | (0.48 | ) | 0.57 | ||||||||||||||||
Total from investment operations | $0.35 | $0.52 | $(0.07 | ) | $0.72 | $(0.17 | ) | $0.90 | ||||||||||||||||
| Less distributions declared to shareholders | ||||||||||||||||||||||||
From net investment income | $— | $(0.43 | ) | $(0.43 | ) | $(0.36 | ) | $(0.15 | ) | $(0.36 | ) | |||||||||||||
From net realized gain on investments | — | — | — | — | (0.06 | ) | (0.09 | ) | ||||||||||||||||
Total distributions declared to | $— | $(0.43 | ) | $(0.43 | ) | $(0.36 | ) | $(0.21 | ) | $(0.45 | ) | |||||||||||||
Net asset value, end of period (x) | $13.22 | $12.87 | $12.78 | $13.28 | $12.92 | $13.30 | ||||||||||||||||||
Total return (%) (k)(r)(s)(x) | 2.72 | (n) | 4.01 | (c) | (0.58 | ) | 5.62 | (1.29 | ) | 7.06 | ||||||||||||||
| Ratios (%) (to average net assets) and Supplemental data: | ||||||||||||||||||||||||
Expenses before expense reductions (f) | 0.79 | (a) | 0.78 | (c) | 0.79 | 0.78 | 0.79 | 0.81 | ||||||||||||||||
Expenses after expense reductions (f) | 0.78 | (a) | 0.77 | (c) | 0.78 | 0.77 | 0.78 | 0.81 | ||||||||||||||||
Net investment income | 2.51 | (a) | 2.73 | (c) | 2.58 | 2.48 | 2.39 | 2.48 | ||||||||||||||||
Portfolio turnover | 25 | (n) | 37 | 62 | 58 | 68 | 114 | |||||||||||||||||
Net assets at end of period | $1,465,006 | $1,457,118 | $1,539,194 | $1,850,948 | $1,836,589 | $1,646,291 | ||||||||||||||||||
| (a) | Annualized. |
| (c) | Amount reflects a one-time reimbursement of expenses by the custodian (or former custodian) without which net investment income and performance would be lower and expenses would be higher. |
| (d) | Per share data is based on average shares outstanding. |
| (f) | Ratios do not reflect reductions from fees paid indirectly, if applicable. |
| (k) | The total return does not reflect expenses that apply to separate accounts. Inclusion of these charges would reduce the total return figures for all periods shown. |
| (n) | Not annualized. |
| (r) | Certain expenses have been reduced without which performance would have been lower. |
| (s) | From time to time the fund may receive proceeds from litigation settlements, without which performance would be lower. |
| (x) | The net asset values and total returns have been calculated on net assets which include adjustments made in accordance with U.S. generally accepted accounting principles required at period end for financial reporting purposes. |
See Notes to Financial Statements
18
Table of Contents
MFS Total Return Bond Series
NOTES TO FINANCIAL STATEMENTS (unaudited)
| (1) | Business and Organization |
MFS Total Return Bond Series (the fund) is a diversified series of MFS Variable Insurance Trust (the trust). The trust is organized as a Massachusetts business trust and is registered under the Investment Company Act of 1940, as amended, as an open-end management investment company. The shareholders of each series of the trust are separate accounts of insurance companies, which offer variable annuity and/or life insurance products, and qualified retirement and pension plans.
The fund is an investment company and accordingly follows the investment company accounting and reporting guidance of the Financial Accounting Standards Board (FASB) Accounting Standards Codification Topic 946 Financial Services – Investment Companies.
| (2) | Significant Accounting Policies |
General – The preparation of financial statements in conformity with U.S. generally accepted accounting principles requires management to make estimates and assumptions that affect the reported amounts of assets and liabilities, and disclosure of contingent assets and liabilities at the date of the financial statements and the reported amounts of increases and decreases in net assets from operations during the reporting period. Actual results could differ from those estimates. In the preparation of these financial statements, management has evaluated subsequent events occurring after the date of the fund’s Statement of Assets and Liabilities through the date that the financial statements were issued. The fund invests in high-yield securities rated below investment grade. Investments in high-yield securities involve greater degrees of credit and market risk than investments in higher-rated securities and tend to be more sensitive to economic conditions.
In October 2016, the Securities and Exchange Commission (SEC) released its Final Rule on Investment Company Reporting Modernization (the “Rule”). The Rule, which introduces two new regulatory reporting forms for investment companies – Form N-PORT and Form N-CEN – also contains amendments to Regulation S-X which impact financial statement presentation, particularly the presentation of derivative investments. Although still evaluating the impacts of the Rule, management believes that many of the Regulation S-X amendments are consistent with the fund’s current financial statement presentation and expects that the fund will be able to comply with the Rule’s Regulation S-X amendments by the August 1, 2017 compliance date.
In March 2017, the FASB issued Accounting Standards Update 2017-08, Receivables – Nonrefundable Fees and Other Costs (Subtopic 310-20) – Premium Amortization on Purchased Callable Debt Securities (“ASU 2017-08”). For entities that hold callable debt securities at a premium, ASU 2017-08 requires that the premium be amortized to the earliest call date. ASU 2017-08 will be effective for fiscal years beginning after December 15, 2018, and interim periods within those fiscal years. Management is still evaluating the potential impacts of ASU 2017-08 but believes that adoption of ASU 2017-08 will not have a material effect on the fund’s overall financial position or its overall results of operations.
Balance Sheet Offsetting – The fund’s accounting policy with respect to balance sheet offsetting is that, absent an event of default by the counterparty or a termination of the agreement, the International Swaps and Derivatives Association (ISDA) Master Agreement does not result in an offset of reported amounts of financial assets and financial liabilities in the Statement of Assets and Liabilities across transactions between the fund and the applicable counterparty. The fund’s right to setoff may be restricted or prohibited by the bankruptcy or insolvency laws of the particular jurisdiction to which a specific master netting agreement counterparty is subject. Balance sheet offsetting disclosures, to the extent applicable to the fund, have been included in the fund’s Significant Accounting Policies note under the captions for each of the fund’s in-scope financial instruments and transactions.
Investment Valuations – Debt instruments and floating rate loans, including restricted debt instruments, are generally valued at an evaluated or composite bid as provided by a third-party pricing service. Short-term instruments with a maturity at issuance of 60 days or less may be valued at amortized cost, which approximates market value. Exchange-traded options are generally valued at the last sale or official closing price on their primary exchange as provided by a third-party pricing service. Exchange-traded options for which there were no sales reported that day are generally valued at the last daily bid quotation on their primary exchange as provided by a third-party pricing service. Options not traded on an exchange are generally valued at a broker/dealer bid quotation. Foreign currency options are generally valued at valuations provided by a third-party pricing service. Futures contracts are generally valued at last posted settlement price on their primary exchange as provided by a third-party pricing service. Futures contracts for which there were no trades that day for a particular position are generally valued at the closing bid quotation on their primary exchange as provided by a third-party pricing service. Open-end investment companies are generally valued at net asset value per share. Securities and other assets generally valued on the basis of information from a third-party pricing service may also be valued at a broker/dealer bid quotation. Values obtained from third-party pricing services can utilize both transaction data and market information such as yield, quality, coupon rate, maturity, type of issue, trading characteristics, and other market data. The values of foreign securities and other assets and liabilities expressed in foreign currencies are converted to U.S. dollars using the mean of bid and asked prices for rates provided by a third-party pricing service.
The Board of Trustees has delegated primary responsibility for determining or causing to be determined the value of the fund’s investments (including any fair valuation) to the adviser pursuant to valuation policies and procedures approved by the Board. If the
19
Table of Contents
MFS Total Return Bond Series
Notes to Financial Statements (unaudited) – continued
adviser determines that reliable market quotations are not readily available, investments are valued at fair value as determined in good faith by the adviser in accordance with such procedures under the oversight of the Board of Trustees. Under the fund’s valuation policies and procedures, market quotations are not considered to be readily available for most types of debt instruments and floating rate loans and many types of derivatives. These investments are generally valued at fair value based on information from third-party pricing services. In addition, investments may be valued at fair value if the adviser determines that an investment’s value has been materially affected by events occurring after the close of the exchange or market on which the investment is principally traded (such as foreign exchange or market) and prior to the determination of the fund’s net asset value, or after the halting of trading of a specific security where trading does not resume prior to the close of the exchange or market on which the security is principally traded. The adviser generally relies on third-party pricing services or other information (such as the correlation with price movements of similar securities in the same or other markets; the type, cost and investment characteristics of the security; the business and financial condition of the issuer; and trading and other market data) to assist in determining whether to fair value and at what value to fair value an investment. The value of an investment for purposes of calculating the fund’s net asset value can differ depending on the source and method used to determine value. When fair valuation is used, the value of an investment used to determine the fund’s net asset value may differ from quoted or published prices for the same investment. There can be no assurance that the fund could obtain the fair value assigned to an investment if it were to sell the investment at the same time at which the fund determines its net asset value per share.
Various inputs are used in determining the value of the fund’s assets or liabilities. These inputs are categorized into three broad levels. In certain cases, the inputs used to measure fair value may fall into different levels of the fair value hierarchy. In such cases, an investment’s level within the fair value hierarchy is based on the lowest level of input that is significant to the fair value measurement. The fund’s assessment of the significance of a particular input to the fair value measurement in its entirety requires judgment, and considers factors specific to the investment. Level 1 includes unadjusted quoted prices in active markets for identical assets or liabilities. Level 2 includes other significant observable market-based inputs (including quoted prices for similar securities, interest rates, prepayment speed, and credit risk). Level 3 includes unobservable inputs, which may include the adviser’s own assumptions in determining the fair value of investments. Other financial instruments are derivative instruments not reflected in total investments, such as futures contracts. The following is a summary of the levels used as of June 30, 2017 in valuing the fund’s assets or liabilities:
| Investments at Value | Level 1 | Level 2 | Level 3 | Total | ||||||||||||
| U.S. Treasury Bonds & U.S. Government Agency & Equivalents | $— | $413,315,134 | $— | $413,315,134 | ||||||||||||
| Non-U.S. Sovereign Debt | — | 15,119,449 | — | 15,119,449 | ||||||||||||
| Municipal Bonds | — | 21,630,402 | — | 21,630,402 | ||||||||||||
| U.S. Corporate Bonds | — | 831,559,136 | — | 831,559,136 | ||||||||||||
| Residential Mortgage-Backed Securities | — | 483,088,457 | — | 483,088,457 | ||||||||||||
| Commercial Mortgage-Backed Securities | — | 196,516,830 | — | 196,516,830 | ||||||||||||
| Asset-Backed Securities (including CDOs) | — | 184,780,065 | — | 184,780,065 | ||||||||||||
| Foreign Bonds | — | 214,107,927 | — | 214,107,927 | ||||||||||||
| Mutual Funds | 82,577,997 | — | — | 82,577,997 | ||||||||||||
| Total Investments | $82,577,997 | $2,360,117,400 | $— | $2,442,695,397 | ||||||||||||
| Other Financial Instruments | ||||||||||||||||
| Futures Contracts – Assets | $305,523 | $— | $— | $305,523 | ||||||||||||
| Futures Contracts – Liabilities | (211,765 | ) | — | — | (211,765 | ) | ||||||||||
For further information regarding security characteristics, see the Portfolio of Investments.
Derivatives – The fund uses derivatives for different purposes, primarily to increase or decrease exposure to a particular market or segment of the market, or security, to increase or decrease interest rate or currency exposure, or as alternatives to direct investments. Derivatives are used for hedging or non-hedging purposes. While hedging can reduce or eliminate losses, it can also reduce or eliminate gains. When the fund uses derivatives as an investment to increase market exposure, or for hedging purposes, gains and losses from derivative instruments may be substantially greater than the derivative’s original cost.
The derivative instruments used by the fund were purchased options and futures contracts. The fund’s period end derivatives, as presented in the Portfolio of Investments and the associated Derivative Contract tables, generally are indicative of the volume of its derivative activity during the period.
20
Table of Contents
MFS Total Return Bond Series
Notes to Financial Statements (unaudited) – continued
The following table presents, by major type of derivative contract, the fair value, on a gross basis, of the asset and liability components of derivatives held by the fund at June 30, 2017 as reported in the Statement of Assets and Liabilities:
| Fair Value (a) | ||||||||||
| Risk | Derivative Contracts | Asset Derivatives | Liability Derivatives | |||||||
| Interest Rate | Interest Rate Futures | $305,523 | $(211,765 | ) | ||||||
| (a) | The value of futures contracts includes cumulative appreciation (depreciation) as reported in the fund’s Portfolio of Investments. Only the current day net variation margin for futures contracts is separately reported within the fund’s Statement of Assets and Liabilities. |
The following table presents, by major type of derivative contract, the realized gain (loss) on derivatives held by the fund for the six months ended June 30, 2017 as reported in the Statement of Operations:
| Risk | Futures Contracts | Investments (Purchased Options) | ||||||
| Interest Rate | $2,851,830 | $— | ||||||
| Equity | — | (651,122 | ) | |||||
The following table presents, by major type of derivative contract, the change in unrealized appreciation (depreciation) on derivatives held by the fund for the six months ended June 30, 2017 as reported in the Statement of Operations:
| Risk | Futures Contracts | Investments (Purchased Options) | ||||||
| Interest Rate | $(332,833 | ) | $— | |||||
| Equity | — | 621,858 | ||||||
Derivative counterparty credit risk is managed through formal evaluation of the creditworthiness of all potential counterparties. On certain, but not all, uncleared derivatives, the fund attempts to reduce its exposure to counterparty credit risk whenever possible by entering into an ISDA Master Agreement on a bilateral basis. The ISDA Master Agreement gives each party to the agreement the right to terminate all transactions traded under such agreement if there is a certain deterioration in the credit quality of the other party. Upon an event of default or a termination of the ISDA Master Agreement, the non-defaulting party has the right to close out all transactions traded under such agreement and to net amounts owed under each agreement to one net amount payable by one party to the other. This right to close out and net payments across all transactions traded under the ISDA Master Agreement could result in a reduction of the fund’s credit risk to such counterparty equal to any amounts payable by the fund under the applicable transactions, if any.
Collateral and margin requirements differ by type of derivative. Margin requirements are set by the clearing broker and the clearing house for cleared derivatives (e.g., futures contracts, cleared swaps, and exchange-traded options) while collateral terms are contract specific for uncleared derivatives (e.g., forward foreign currency exchange contracts, uncleared swap agreements, and uncleared options). For derivatives traded under an ISDA Master Agreement, which contains a collateral support annex, the collateral requirements are netted across all transactions traded under such agreement and one amount is posted from one party to the other to collateralize such obligations. Cash that has been segregated to cover the fund’s collateral or margin obligations under derivative contracts, if any, will be reported separately in the Statement of Assets and Liabilities as “Restricted cash” or “Deposits with brokers.” Securities pledged as collateral or margin for the same purpose, if any, are noted in the Portfolio of Investments. The fund may be required to make payments of interest on uncovered collateral or margin obligations with the broker. Any such payments are included in “Miscellaneous” expense in the Statement of Operations.
Purchased Options – The fund purchased put options for a premium. Purchased put options entitle the holder to sell a specified number of shares or units of a particular security, currency or index at a specified price at a specified date or within a specified period of time. Purchasing put options may hedge against an anticipated decline in the value of portfolio securities or currency or decrease the fund’s exposure to an underlying instrument.
The premium paid is initially recorded as an investment in the Statement of Assets and Liabilities. That investment is subsequently marked-to-market daily with the difference between the premium paid and the market value of the purchased option being recorded as unrealized appreciation or depreciation. Premiums paid for purchased put options which have expired are treated as realized losses on investments in the Statement of Operations. Upon the exercise or closing of a purchased put option, the premium paid is offset against the proceeds on the sale of the underlying security or financial instrument in order to determine the realized gain or loss on investments.
Whether or not the option is exercised, the fund’s maximum risk of loss from purchasing an option is the amount of premium paid. All option contracts involve credit risk if the counterparty to the option contract fails to perform. For uncleared options, this risk is
21
Table of Contents
MFS Total Return Bond Series
Notes to Financial Statements (unaudited) – continued
mitigated in cases where there is an ISDA Master Agreement between the fund and the counterparty providing for netting as described above and, where applicable, by the posting of collateral by the counterparty to the fund to cover the fund’s exposure to the counterparty under such ISDA Master Agreement.
Futures Contracts – The fund entered into futures contracts which may be used to hedge against or obtain broad market exposure, interest rate exposure, currency exposure, or to manage duration. A futures contract represents a commitment for the future purchase or sale of an asset at a specified price on a specified date.
Upon entering into a futures contract, the fund is required to deposit with the broker, either in cash or securities, an initial margin in an amount equal to a certain percentage of the notional amount of the contract. Subsequent payments (variation margin) are made or received by the fund each day, depending on the daily fluctuations in the value of the contract, and are recorded for financial statement purposes as unrealized gain or loss by the fund until the contract is closed or expires at which point the gain or loss on futures contracts is realized.
The fund bears the risk of interest rates, exchange rates or securities prices moving unexpectedly, in which case, the fund may not achieve the anticipated benefits of the futures contracts and may realize a loss. While futures contracts may present less counterparty risk to the fund since the contracts are exchange traded and the exchange’s clearinghouse guarantees payments to the broker, there is still counterparty credit risk due to the insolvency of the broker. The fund’s maximum risk of loss due to counterparty credit risk is equal to the margin posted by the fund to the broker plus any gains or minus any losses on the outstanding futures contracts.
Dollar Roll Transactions – The fund enters into dollar roll transactions, with respect to mortgage-backed securities issued by Ginnie Mae, Fannie Mae, and Freddie Mac, in which the fund sells mortgage-backed securities to financial institutions and simultaneously agrees to purchase similar (same issuer, type and coupon) securities at a later date at an agreed-upon price. During the period between the sale and repurchase in a dollar roll transaction the fund will not be entitled to receive interest and principal payments on the securities sold but is compensated by interest earned on the proceeds of the initial sale and by a lower purchase price on the securities to be repurchased which enhances the fund’s total return. The fund accounts for dollar roll transactions as purchases and sales and realizes gains and losses on these transactions.
Indemnifications – Under the fund’s organizational documents, its officers and Trustees may be indemnified against certain liabilities and expenses arising out of the performance of their duties to the fund. Additionally, in the normal course of business, the fund enters into agreements with service providers that may contain indemnification clauses. The fund’s maximum exposure under these agreements is unknown as this would involve future claims that may be made against the fund that have not yet occurred.
Investment Transactions and Income – Investment transactions are recorded on the trade date. Interest income is recorded on the accrual basis. All premium and discount is amortized or accreted for financial statement purposes in accordance with U.S. generally accepted accounting principles. Interest payments received in additional securities are recorded on the ex-interest date in an amount equal to the value of the security on such date.
The fund may receive proceeds from litigation settlements. Any proceeds received from litigation involving portfolio holdings are reflected in the Statement of Operations in realized gain/loss if the security has been disposed of by the fund or in unrealized gain/loss if the security is still held by the fund. Any other proceeds from litigation not related to portfolio holdings are reflected as other income in the Statement of Operations.
The fund invests a significant portion of its assets in asset-backed and/or mortgage-backed securities. The value of these securities may depend, in part, on the issuer’s or borrower’s credit quality or ability to pay principal and interest when due and that value may fall if an issuer or borrower defaults on its obligation to pay principal or interest or if the instrument’s credit rating is downgraded by a credit rating agency. U.S. Government securities not supported as to the payment of principal or interest by the U.S. Treasury, such as those issued by Fannie Mae, Freddie Mac, and the Federal Home Loan Banks, are subject to greater credit risk than are U.S. Government securities supported by the U.S. Treasury, such as those issued by Ginnie Mae.
The fund purchased or sold debt securities on a when-issued or delayed delivery basis, or in a “To Be Announced” (TBA) or “forward commitment” transaction with delivery or payment to occur at a later date beyond the normal settlement period. At the time a fund enters into a commitment to purchase or sell a security, the transaction is recorded and the value of the security acquired is reflected in the fund’s net asset value. The price of such security and the date that the security will be delivered and paid for are fixed at the time the transaction is negotiated. The value of the security may vary with market fluctuations. TBA securities resulting from these transactions are included in the Portfolio of Investments. TBA purchase commitments are held at carrying amount, which approximates fair value and are categorized as level 2 within the fair value hierarchy. No interest accrues to the fund until payment takes place. At the time that a fund enters into this type of transaction, the fund is required to have sufficient cash and/or liquid securities to cover its commitments. Losses may arise due to changes in the value of the underlying securities or if the counterparty does not perform under the contract’s terms, or if the issuer does not issue the securities due to political, economic or other factors. Additionally, losses may arise due to declines in the value of the securities prior to settlement date.
22
Table of Contents
MFS Total Return Bond Series
Notes to Financial Statements (unaudited) – continued
To mitigate this risk of loss on TBA securities and other types of forward settling mortgage-backed securities, the fund whenever possible enters into a Master Securities Forward Transaction Agreement (“MSFTA”) on a bilateral basis with each of the counterparties with whom it undertakes a significant volume of transactions. The MSFTA gives each party to the agreement the right to terminate all transactions traded under such agreement if there is a certain deterioration in the credit quality of the other party. Upon an event of default or a termination of the MSFTA, the non-defaulting party has the right to close out all transactions traded under such agreement and to net amounts owed under each transaction to one net amount payable by one party to the other. This right to close out and net payments across all transactions traded under the MSFTA could result in a reduction of the fund’s credit risk to such counterparty equal to any amounts payable by the fund under the applicable transactions, if any.
For mortgage-backed securities traded under a MSFTA, the collateral and margining requirements are contract specific. Collateral amounts across all transactions traded under such agreement are netted and one amount is posted from one party to the other to collateralize such obligations. Cash that has been pledged to cover the fund’s collateral or margin obligations under a MSFTA, if any, will be reported separately on the Statement of Assets and Liabilities as restricted cash. Securities pledged as collateral or margin for the same purpose, if any, are noted in the Portfolio of Investments.
Tax Matters and Distributions – The fund intends to qualify as a regulated investment company, as defined under Subchapter M of the Internal Revenue Code, and to distribute all of its taxable income, including realized capital gains. As a result, no provision for federal income tax is required. The fund’s federal tax returns, when filed, will remain subject to examination by the Internal Revenue Service for a three year period. Management has analyzed the fund’s tax positions taken on federal and state tax returns for all open tax years and does not believe that there are any uncertain tax positions that require recognition of a tax liability. Foreign taxes, if any, have been accrued by the fund in the accompanying financial statements in accordance with the applicable foreign tax law. Foreign income taxes may be withheld by certain countries in which the fund invests. Additionally, capital gains realized by the fund on securities issued in or by certain foreign countries may be subject to capital gains tax imposed by those countries.
Distributions to shareholders are recorded on the ex-dividend date. Income and capital gain distributions are determined in accordance with income tax regulations, which may differ from U.S. generally accepted accounting principles. Certain capital accounts in the financial statements are periodically adjusted for permanent differences in order to reflect their tax character. These adjustments have no impact on net assets or net asset value per share. Temporary differences which arise from recognizing certain items of income, expense, gain or loss in different periods for financial statement and tax purposes will reverse at some time in the future. Distributions in excess of net investment income or net realized gains are temporary overdistributions for financial statement purposes resulting from differences in the recognition or classification of income or distributions for financial statement and tax purposes.
Book/tax differences primarily relate to amortization and accretion of debt securities.
The tax character of distributions declared to shareholders for the last fiscal year is as follows:
Year ended 12/31/16 | ||||
| Ordinary income (including any short-term capital gains) | $83,143,405 | |||
The federal tax cost and the tax basis components of distributable earnings were as follows:
| As of 6/30/17 | ||||
| Cost of investments | $2,418,786,522 | |||
| Gross appreciation | 44,354,196 | |||
| Gross depreciation | (20,445,321 | ) | ||
| Net unrealized appreciation (depreciation) | $23,908,875 | |||
| As of 12/31/16 | ||||
| Undistributed ordinary income | 78,599,532 | |||
| Capital loss carryforwards | (16,154,893 | ) | ||
| Other temporary differences | (477,264 | ) | ||
| Net unrealized appreciation (depreciation) | (18,931,873 | ) | ||
The aggregate cost above includes prior fiscal year end tax adjustments, if applicable.
As of December 31, 2016, the fund had capital loss carryforwards available to offset future realized gains. These net capital losses may be carried forward indefinitely and their character is retained as short-term and/or long-term losses. Such losses are characterized as follows:
| Short-Term | $(6,794,103 | ) | ||
| Long-Term | (9,360,790 | ) | ||
| Total | $(16,154,893 | ) |
23
Table of Contents
MFS Total Return Bond Series
Notes to Financial Statements (unaudited) – continued
Multiple Classes of Shares of Beneficial Interest – The fund offers multiple classes of shares, which differ in their respective distribution and/or service fees. The fund’s income, realized and unrealized gain (loss), and common expenses are allocated to shareholders based on the daily net assets of each class. Dividends are declared separately for each class. Differences in per share dividend rates are generally due to differences in separate class expenses. The fund’s distributions declared to shareholders as reported in the Statements of Changes in Net Assets are presented by class as follows:
| From net investment income | ||||||||
| Six months ended 6/30/17 | Year ended 12/31/16 | |||||||
| Initial Class | $— | $34,643,113 | ||||||
| Service Class | — | 48,500,292 | ||||||
| Total | $— | $83,143,405 | ||||||
(3) Transactions with Affiliates
Investment Adviser – The fund has an investment advisory agreement with MFS to provide overall investment management and related administrative services and facilities to the fund. For the period January 1, 2017 to April 27, 2017, the management fee was computed daily and paid monthly at an annual rate of 0.50% of the fund’s average daily net assets. Effective April 28, 2017, the management fee is computed daily and paid monthly at the following annual rates:
| First $2.5 billion of average daily net assets | 0.50% | |||
| Next $2.5 billion of average daily net assets | 0.45% | |||
| Average daily net assets in excess of $5 billion | 0.40% |
For the period January 1, 2017 to April 27, 2017, the investment adviser had agreed in writing to reduce its management fee to 0.45% of average daily net assets in excess of $2.5 billion to $5 billion and 0.40% of average daily net assets in excess of $5 billion. This written agreement terminated on April 27, 2017. For the period January 1, 2017 through April 27, 2017, the fund’s average daily net assets did not exceed $2.5 billion and therefore, the management fee was not reduced in accordance with this agreement. MFS also has agreed in writing to reduce its management fee by a specified amount if certain MFS mutual fund assets exceed thresholds agreed to by MFS and the fund’s Board of Trustees. For the six months ended June 30, 2017, this management fee reduction amounted to $93,370, which is included in the reduction of total expenses in the Statement of Operations. The management fee incurred for the six months ended June 30, 2017, was equivalent to an annual effective rate of 0.49% of the fund’s average daily net assets.
Distributor – MFS Fund Distributors, Inc. (MFD), a wholly-owned subsidiary of MFS, is the distributor of shares of the fund. The Trustees have adopted a distribution plan for the Service Class shares pursuant to Rule 12b-1 under the Investment Company Act of 1940.
The fund’s distribution plan provides that the fund will pay MFD distribution and/or service fees equal to 0.25% per annum of its average daily net assets attributable to Service Class shares as partial consideration for services performed and expenses incurred by MFD and financial intermediaries (including participating insurance companies that invest in the fund to fund variable annuity and variable life insurance contracts, sponsors of qualified retirement and pension plans that invest in the fund, and affiliates of these participating insurance companies and plan sponsors) in connection with the sale and distribution of the Service Class shares. MFD may subsequently pay all, or a portion, of the distribution and/or service fees to financial intermediaries.
Shareholder Servicing Agent – MFS Service Center, Inc. (MFSC), a wholly-owned subsidiary of MFS, receives a fee from the fund for its services as shareholder servicing agent. For the six months ended June 30, 2017, the fee was $31,205, which equated to 0.0026% annually of the fund’s average daily net assets. MFSC also receives payment from the fund for out-of-pocket expenses paid by MFSC on behalf of the fund. For the six months ended June 30, 2017, these costs amounted to $1,329.
Administrator – MFS provides certain financial, legal, shareholder communications, compliance, and other administrative services to the fund. Under an administrative services agreement, the fund reimburses MFS the costs incurred to provide these services. The fund is charged an annual fixed amount of $17,500 plus a fee based on average daily net assets. The administrative services fee incurred for the six months ended June 30, 2017 was equivalent to an annual effective rate of 0.0166% of the fund’s average daily net assets.
Trustees’ and Officers’ Compensation – The fund pays compensation to independent Trustees in the form of a retainer, attendance fees, and additional compensation to Board and Committee chairpersons. The fund does not pay compensation directly to Trustees or officers of the fund who are also officers of the investment adviser, all of whom receive remuneration for their services to the fund from MFS. Certain officers and Trustees of the fund are officers or directors of MFS, MFD, and MFSC.
Other – This fund and certain other funds managed by MFS (the funds) have entered into a service agreement (the ISO Agreement) which provides for payment of fees solely by the funds to Tarantino LLC in return for the provision of services of an Independent
24
Table of Contents
MFS Total Return Bond Series
Notes to Financial Statements (unaudited) – continued
Senior Officer (ISO) for the funds. Frank L. Tarantino serves as the ISO and is an officer of the funds and the sole member of Tarantino LLC. The funds can terminate the ISO Agreement with Tarantino LLC at any time under the terms of the ISO Agreement. For the six months ended June 30, 2017, the fee paid by the fund under this agreement was $2,260 and is included in “Miscellaneous” expense in the Statement of Operations. MFS has agreed to bear all expenses associated with office space, other administrative support, and supplies provided to the ISO.
The fund invests in the MFS Institutional Money Market Portfolio which is managed by MFS and seeks current income consistent with preservation of capital and liquidity. This money market fund does not pay a management fee to MFS.
The fund is permitted to engage in purchase and sale transactions with funds and accounts for which MFS serves as investment adviser or sub-adviser (“cross-trades”) pursuant to a policy adopted by the Board of Trustees. This policy has been designed to ensure that cross-trades conducted by the fund comply with Rule 17a-7 under the Investment Company Act of 1940. Under this policy, cross-trades are effected at current market prices with no remuneration paid in connection with the transaction. During the six months ended June 30, 2017, the fund engaged in purchase and sale transactions pursuant to this policy, which amounted to $52,618 and $70,175, respectively. The sales transactions resulted in net realized gains (losses) of $525.
| (4) | Portfolio Securities |
For the six months ended June 30, 2017, purchases and sales of investments, other than purchased option transactions and short-term obligations, were as follows:
| Purchases | Sales | |||||||
| U.S. Government securities | $218,423,957 | $140,556,825 | ||||||
| Investments (non-U.S. Government securities) | $401,280,291 | $445,683,228 | ||||||
| (5) | Shares of Beneficial Interest |
The fund’s Declaration of Trust permits the Trustees to issue an unlimited number of full and fractional shares of beneficial interest. Transactions in fund shares were as follows:
| Six months ended 6/30/17 | Year ended 12/31/16 | |||||||||||||||
| Shares | Amount | Shares | Amount | |||||||||||||
| Shares sold | ||||||||||||||||
Initial Class | 2,628,697 | $34,975,319 | 6,414,218 | $85,432,592 | ||||||||||||
Service Class | 5,110,610 | 66,319,991 | 8,175,261 | 107,465,158 | ||||||||||||
| 7,739,307 | $101,295,310 | 14,589,479 | $192,897,750 | |||||||||||||
| Shares issued to shareholders in reinvestment of distributions | ||||||||||||||||
Initial Class | — | $— | 2,516,578 | $33,797,646 | ||||||||||||
Service Class | — | — | 3,668,706 | 48,500,292 | ||||||||||||
| — | $ — | 6,185,284 | $82,297,938 | |||||||||||||
| Shares reacquired | ||||||||||||||||
Initial Class | (4,504,175 | ) | $(59,781,471 | ) | (12,811,239 | ) | $(171,229,874 | ) | ||||||||
Service Class | (7,522,957 | ) | (98,125,588 | ) | (19,020,186 | ) | (249,704,459 | ) | ||||||||
| (12,027,132 | ) | $(157,907,059 | ) | (31,831,425 | ) | $(420,934,333 | ) | |||||||||
| Net change | ||||||||||||||||
Initial Class | (1,875,478 | ) | $(24,806,152 | ) | (3,880,443 | ) | $(51,999,636 | ) | ||||||||
Service Class | (2,412,347 | ) | (31,805,597 | ) | (7,176,219 | ) | (93,739,009 | ) | ||||||||
| (4,287,825 | ) | $(56,611,749 | ) | (11,056,662 | ) | $(145,738,645 | ) | |||||||||
The fund is one of several mutual funds in which certain MFS funds may invest. The MFS funds do not invest in the underlying funds for the purpose of exercising management or control. At the end of the period, the MFS Moderate Allocation Portfolio and the MFS Conservative Allocation Portfolio were the owners of record of approximately 8% and 4%, respectively, of the value of outstanding voting shares of the fund. In addition, the MFS Growth Allocation Portfolio was the owner of record of less than 1% of the value of the outstanding voting shares of the fund.
(6) Line of Credit
The fund and certain other funds managed by MFS participate in a $1.25 billion unsecured committed line of credit, subject to a $1 billion sublimit, provided by a syndication of banks under a credit agreement. Borrowings may be made for temporary financing needs. Interest is charged to each fund, based on its borrowings, generally at a rate equal to the higher of the Overnight Federal Reserve funds rate or daily one month LIBOR plus an agreed upon spread. A commitment fee, based on the average daily, unused portion of the committed line of credit, is allocated among the participating funds at the end of each calendar quarter. In addition, the fund and other funds managed by MFS have established unsecured uncommitted borrowing arrangements with certain banks for temporary financing needs. Interest is charged to each fund, based on its borrowings, at a rate equal to the Overnight Federal
25
Table of Contents
MFS Total Return Bond Series
Notes to Financial Statements (unaudited) – continued
Reserve funds rate plus an agreed upon spread. For the six months ended June 30, 2017, the fund’s commitment fee and interest expense were $8,641 and $0, respectively, and are included in “Miscellaneous” expense in the Statement of Operations.
| (7) | Transactions in Underlying Affiliated Funds – Affiliated Issuers |
An affiliated issuer may be considered one in which the fund owns 5% or more of the outstanding voting securities, or a company which is under common control. For the purposes of this report, the fund assumes the following to be an affiliated issuer:
| Underlying Affiliated Fund | Beginning Shares/Par Amount | Acquisitions Shares/Par Amount | Dispositions Shares/Par Amount | Ending Shares/Par Amount | ||||||||||||
| MFS Institutional Money Market Portfolio | 132,647,161 | 370,817,856 | (420,887,020 | ) | 82,577,997 | |||||||||||
| Underlying Affiliated Fund | Realized Gain (Loss) | Capital Gain Distributions | Dividend Income | Ending Value | ||||||||||||
| MFS Institutional Money Market Portfolio | $(3,291 | ) | $— | $357,073 | $82,577,997 | |||||||||||
26
Table of Contents
MFS Total Return Bond Series
RESULTS OF SHAREHOLDER MEETING (unaudited)
At a special meeting of shareholders of MFS Variable Insurance Trust, which was held on March 23, 2017, the following action was taken:
Item 1: To elect the following individuals as Trustees:
| Number of Dollars | ||||||||
| Nominee | For | Withheld Authority | ||||||
| Steven E. Buller | 11,311,922,492.61 | 518,570,973.54 | ||||||
| John A. Caroselli | 11,291,109,000.34 | 539,384,465.81 | ||||||
| Maureen R. Goldfarb | 11,233,211,779.66 | 597,281,686.49 | ||||||
| David H. Gunning | 11,179,077,201.17 | 651,416,264.98 | ||||||
| Michael Hegarty | 11,191,993,154.78 | 638,500,311.37 | ||||||
| John P. Kavanaugh | 11,242,238,261.44 | 588,255,204.71 | ||||||
| Robert J. Manning | 11,314,479,376.58 | 516,014,089.57 | ||||||
| Clarence Otis, Jr. | 11,208,873,448.85 | 621,620,017.30 | ||||||
| Maryanne L. Roepke | 11,263,427,105.03 | 567,066,361.12 | ||||||
| Robin A. Stelmach | 11,313,883,043.82 | 516,610,422.33 | ||||||
| Laurie J. Thomsen | 11,240,219,041.09 | 590,274,425.06 | ||||||
27
Table of Contents
MFS Total Return Bond Series
PROXY VOTING POLICIES AND INFORMATION
MFS votes proxies on behalf of the fund pursuant to proxy voting policies and procedures that are available without charge, upon request, by calling 1-800-225-2606, by visiting mfs.com (once you have selected “Individual Investor” as your role, click on “Individual Investor Home” in the top navigation and then select “Learn More About Proxy Voting” under the “I want to…” header on the left hand column of the page), or by visiting the SEC’s Web site at http://www.sec.gov.
Information regarding how the fund voted proxies relating to portfolio securities during the most recent twelve-month period ended June 30 is available by August 31 of each year without charge by visiting mfs.com (once you have selected “Individual Investor” as your role, click on “Individual Investor Home” in the top navigation and then select “Learn More About Proxy Voting” under the “I want to…” header on the left hand column of the page), or by visiting the SEC’s Web site at http://www.sec.gov.
QUARTERLY PORTFOLIO DISCLOSURE
The fund will file a complete schedule of portfolio holdings with the Securities and Exchange Commission (the Commission) for the first and third quarters of each fiscal year on Form N-Q. The fund’s Form N-Q is available on the EDGAR database on the Commission’s Internet Web site at http://www.sec.gov, and may be reviewed and copied at the:
Public Reference Room
Securities and Exchange Commission
100 F Street, NE, Room 1580
Washington, D.C. 20549
Information on the operation of the Public Reference Room may be obtained by calling the Commission at 1-800-SEC-0330. Copies of the fund’s Form N-Q also may be obtained, upon payment of a duplicating fee, by electronic request at the following e-mail address: publicinfo@sec.gov or by writing the Public Reference Section at the above address.
From time to time, MFS may post important information about the fund or the MFS funds on the MFS web site (mfs.com). This information is available on mfs.com by following these steps once you have selected “Individual Investor” as your role: (1) Click on the “Individual Investor Home” in the top navigation and then select the “Announcements” option within the “Market Outlooks” drop down, or (2) Click on “Products & Services” and “Variable Insurance Portfolios” and then select the fund’s name.
INFORMATION ABOUT FUND CONTRACTS AND LEGAL CLAIMS
The fund has entered into contractual arrangements with an investment adviser, administrator, distributor, shareholder servicing agent, 529 program manager (if applicable), and custodian who each provide services to the fund. Unless expressly stated otherwise, shareholders are not parties to, or intended beneficiaries of these contractual arrangements, and these contractual arrangements are not intended to create any shareholder right to enforce them against the service providers or to seek any remedy under them against the service providers, either directly or on behalf of the fund.
Under the Trust’s By-Laws and Declaration of Trust, any claims asserted against or on behalf of the MFS Funds, including claims against Trustees and Officers, must be brought in state and federal courts located within the Commonwealth of Massachusetts.
28
Table of Contents
Table of Contents
SEMIANNUAL REPORT
June 30, 2017

MFS® TOTAL RETURN SERIES
MFS® Variable Insurance Trust

VTR-SEM
Table of Contents
MFS® TOTAL RETURN SERIES
The report is prepared for the general information of contract owners. It is
authorized for distribution to prospective investors only when preceded or accompanied by a current prospectus.
NOT FDIC INSURED • MAY LOSE VALUE • NO BANK OR CREDIT UNION GUARANTEE • NOT A DEPOSIT • NOT INSURED BY ANY FEDERAL GOVERNMENT AGENCY OR NCUA/NCUSIF
Table of Contents
MFS Total Return Series
LETTER FROM THE EXECUTIVE CHAIRMAN

Dear Contract Owners:
Despite policy uncertainty accompanying a new presidential administration in the United States and unease over ongoing Brexit negotiations, most markets have proved resilient. U.S. share prices have reached new highs. The U.S. Federal Reserve has continued to gradually hike interest rates. However, rates in most developed markets remain very low, with major non-U.S. central banks just beginning to contemplate curbing accommodative monetary policies.
Globally, economic growth has shown signs of recovery, led by China, the U.S. and the eurozone. Despite better growth, there are few immediate signs of worrisome inflation as wage growth remains muted. Europe has benefited from diminishing event risks as establishment candidates won both the Dutch and French elections, averting a feared populist trend. Emerging market economies are recovering at a somewhat slower pace amid fears that restrictive U.S. trade policies could further hamper the restrained pace of global trade growth. Looking ahead, markets will have to contend with issues involving geopolitical hot spots on the Korean peninsula and in the Middle East, which could potentially lead to a clash of interests between the U.S. and other major powers such as China or Russia.
At MFS®, we believe time is an asset. A patient, long-term approach to investing can have a powerful impact on decision making and outcomes. Time arbitrage, as we call it, simply comes down to having the conviction and discipline to allow enough time for good investment ideas to play out. In our view, such an approach, along with the professional guidance of a financial advisor, will help you reach your investment objectives.
Respectfully,

Robert J. Manning
Executive Chairman
MFS Investment Management
August 16, 2017
The opinions expressed in this letter are subject to change and may not be relied upon for investment advice. No forecasts can be guaranteed.
1
Table of Contents
MFS Total Return Series
Portfolio structure (i)
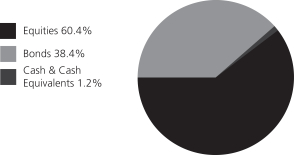
| Top ten holdings (i) | ||||
| JPMorgan Chase & Co. | 2.0% | |||
| U.S. Treasury Notes, 1.750%, 11/30/2021 | 2.0% | |||
| U.S. Treasury Notes, 1.625%, 6/30/2019 | 1.9% | |||
| Philip Morris International, Inc. | 1.9% | |||
| U.S. Treasury Bonds, 2.875%, 5/15/2043 | 1.8% | |||
| Fannie Mae, 3.5%, 11/01/2041 - 1/01/2047 | 1.7% | |||
| U.S. Treasury Notes, 2.750%, 2/15/2019 | 1.6% | |||
| Fannie Mae, 4%, 9/01/2040 - 2/01/2045 | 1.5% | |||
| U.S. Treasury Notes, 3.125%, 5/15/2019 | 1.3% | |||
| Johnson & Johnson | 1.2% | |||
| Composition including fixed income credit quality (a)(i) | ||||
| AAA | 2.8% | |||
| AA | 0.9% | |||
| A | 3.7% | |||
| BBB | 6.0% | |||
| BB | 0.1% | |||
| B (o) | 0.0% | |||
| CCC (o) | 0.0% | |||
| C | 0.1% | |||
| U.S. Government | 13.6% | |||
| Federal Agencies | 11.2% | |||
| Not Rated (o) | 0.0% | |||
| Non-Fixed Income | 60.4% | |||
| Cash & Cash Equivalents | 1.2% | |||
| Equity sectors | ||||
| Financial Services | 15.3% | |||
| Health Care | 8.8% | |||
| Consumer Staples | 6.2% | |||
| Industrial Goods & Services | 5.0% | |||
| Technology | 4.8% | |||
| Utilities & Communications | 3.4% | |||
| Leisure | 3.2% | |||
| Energy | 2.8% | |||
| Basic Materials | 2.7% | |||
| Special Products & Services | 2.2% | |||
| Retailing | 2.2% | |||
| Autos & Housing | 2.1% | |||
| Transportation | 1.7% | |||
| Fixed income sectors (i) | ||||
| U.S. Treasury Securities | 13.6% | |||
| Mortgage-Backed Securities | 11.1% | |||
| Investment Grade Corporates | 9.7% | |||
| Commercial Mortgage-Backed Securities | 1.3% | |||
| Collateralized Debt Obligations | 0.8% | |||
| Emerging Markets Bonds | 0.7% | |||
| Non-U.S. Government Bonds | 0.4% | |||
| Asset-Backed Securities | 0.4% | |||
| Municipal Bonds | 0.2% | |||
| High Yield Corporates | 0.1% | |||
| U.S. Government Agencies | 0.1% | |||
| Residential Mortgage Backed Securities (o) | 0.0% | |||
| (a) | For all securities other than those specifically described below, ratings are assigned to underlying securities utilizing ratings from Moody’s, Fitch, and Standard & Poor’s rating agencies and applying the following hierarchy: If all three agencies provide a rating, the middle rating (after dropping the highest and lowest ratings) is assigned; if two of the three agencies rate a security, the lower of the two is assigned. Ratings are shown in the S&P and Fitch scale (e.g., AAA). Securities rated BBB or higher are considered investment grade. All ratings are subject to change. U.S. Government includes securities issued by the U.S. Department of the Treasury. Federal Agencies includes rated and unrated U.S. Agency fixed-income securities, U.S. Agency mortgage-backed securities, and collateralized mortgage obligations of U.S. Agency mortgage-backed securities. Not Rated includes fixed income securities, including fixed income futures contracts, which have not been rated by any rating agency. Non-Fixed Income includes any equity securities (including convertible bonds and equity derivatives) and/or commodity-linked derivatives. The fund may or may not have held all of these instruments on this date. The fund is not rated by these agencies. |
| (i) | For purposes of this presentation, the components include the value of securities, and reflect the impact of the equivalent exposure of derivative positions, if any. These amounts may be negative from time to time. Equivalent exposure is a calculated amount that translates the derivative position into a reasonable approximation of the amount of the underlying asset that the portfolio would have to hold at a given point in time to have the same price sensitivity that results from the portfolio’s ownership of the derivative contract. When dealing with derivatives, equivalent exposure is a more representative measure of the potential impact of a position on portfolio performance than value. The bond component will include any accrued interest amounts. |
2
Table of Contents
MFS Total Return Series
Portfolio Composition – continued
| (o) | Less than 0.1%. |
Where the fund holds convertible bonds, these are treated as part of the equity portion of the portfolio.
Cash & Cash Equivalents includes any cash, investments in money market funds, short-term securities, and other assets less liabilities. Please see the Statement of Assets and Liabilities for additional information related to the fund’s cash position and other assets and liabilities.
Percentages are based on net assets as of June 30, 2017.
The portfolio is actively managed and current holdings may be different.
3
Table of Contents
MFS Total Return Series
Fund Expenses Borne by the Contract Holders during the Period,
January 1, 2017 through June 30, 2017
As a contract holder of the fund, you incur ongoing costs, including management fees; distribution and/or service (12b-1) fees; and other fund expenses. This example is intended to help you understand your ongoing costs (in dollars) of investing in the fund and to compare these costs with the ongoing costs of investing in other mutual funds.
The example is based on an investment of $1,000 invested at the beginning of the period and held for the entire period January 1, 2017 through June 30, 2017.
Actual Expenses
The first line for each share class in the following table provides information about actual account values and actual expenses. You may use the information in this line, together with the amount you invested, to estimate the expenses that you paid over the period. Simply divide your account value by $1,000 (for example, an $8,600 account value divided by $1,000 = 8.6), then multiply the result by the number in the first line under the heading entitled “Expenses Paid During Period” to estimate the expenses you paid on your account during this period.
Hypothetical Example for Comparison Purposes
The second line for each share class in the following table provides information about hypothetical account values and hypothetical expenses based on the fund’s actual expense ratio and an assumed rate of return of 5% per year before expenses, which is not the fund’s actual return. The hypothetical account values and expenses may not be used to estimate the actual ending account balance or expenses you paid for the period. You may use this information to compare the ongoing costs of investing in the fund and other funds. To do so, compare this 5% hypothetical example with the 5% hypothetical examples that appear in the shareholder reports of the other funds.
Please note that the expenses shown in the table are meant to highlight the fund’s ongoing costs only and do not take into account the fees and expenses imposed under the variable contracts through which your investment in the fund is made. Therefore, the second line for each share class in the table is useful in comparing ongoing costs associated with an investment in vehicles (such as the fund) which fund benefits under variable annuity and variable life insurance contracts and to qualified pension and retirement plans only, and will not help you determine the relative total costs of investing in the fund through variable annuity and variable life insurance contracts. If the fees and expenses imposed under the variable contracts were included, your costs would have been higher.
| Share Class | Annualized Expense Ratio | Beginning Account Value 1/01/17 | Ending Account Value | Expenses Paid During Period (p) 1/01/17-6/30/17 | ||||||||||||||
| Initial Class | Actual | 0.63% | $1,000.00 | $1,062.99 | $3.22 | |||||||||||||
| Hypothetical (h) | 0.63% | $1,000.00 | $1,021.67 | $3.16 | ||||||||||||||
| Service Class | Actual | 0.88% | $1,000.00 | $1,061.82 | $4.50 | |||||||||||||
| Hypothetical (h) | 0.88% | $1,000.00 | $1,020.43 | $4.41 | ||||||||||||||
| (h) | 5% class return per year before expenses. |
| (p) | “Expenses Paid During Period” are equal to each class’s annualized expense ratio, as shown above, multiplied by the average account value over the period, multiplied by 181/365 (to reflect the one-half year period). |
4
Table of Contents
MFS Total Return Series
PORTFOLIO OF INVESTMENTS – 6/30/17 (unaudited)
The Portfolio of Investments is a complete list of all securities owned by your fund. It is categorized by broad-based asset classes.
| Issuer | Shares/Par | Value ($) | ||||||
| COMMON STOCKS – 59.6% | ||||||||
| Aerospace – 2.8% | ||||||||
| Honeywell International, Inc. | 162,703 | $ | 21,686,677 | |||||
| L3 Technologies, Inc. | 25,199 | 4,210,249 | ||||||
| Lockheed Martin Corp. | 47,172 | 13,095,419 | ||||||
| Northrop Grumman Corp. | 63,943 | 16,414,808 | ||||||
| United Technologies Corp. | 171,450 | 20,935,760 | ||||||
|
| |||||||
| $ | 76,342,913 | |||||||
|
| |||||||
| Airlines – 0.4% | ||||||||
| Copa Holdings S.A., “A” | 48,229 | $ | 5,642,793 | |||||
| Delta Air Lines, Inc. | 78,050 | 4,194,407 | ||||||
|
| |||||||
| $ | 9,837,200 | |||||||
|
| |||||||
| Alcoholic Beverages – 0.3% | ||||||||
| Diageo PLC | 311,405 | $ | 9,200,794 | |||||
|
| |||||||
| Apparel Manufacturers – 0.3% | ||||||||
| Hanesbrands, Inc. | 104,465 | $ | 2,419,409 | |||||
| LVMH Moet Hennessy Louis Vuitton SE | 12,935 | 3,225,100 | ||||||
| NIKE, Inc., “B” | 62,667 | 3,697,353 | ||||||
|
| |||||||
| $ | 9,341,862 | |||||||
|
| |||||||
| Automotive – 0.9% | ||||||||
| Delphi Automotive PLC | 109,688 | $ | 9,614,153 | |||||
| General Motors Co. | 86,587 | 3,024,484 | ||||||
| Harley-Davidson, Inc. | 18,592 | 1,004,340 | ||||||
| Hyundai Motor Co. Ltd. | 24,880 | 3,468,391 | ||||||
| Kia Motors Corp. | 93,607 | 3,125,279 | ||||||
| LKQ Corp. (a) | 117,428 | 3,869,253 | ||||||
|
| |||||||
| $ | 24,105,900 | |||||||
|
| |||||||
| Biotechnology – 0.3% | ||||||||
| Celgene Corp. (a) | 36,753 | $ | 4,773,112 | |||||
| Gilead Sciences, Inc. | 32,962 | 2,333,050 | ||||||
|
| |||||||
| $ | 7,106,162 | |||||||
|
| |||||||
| Broadcasting – 0.5% | ||||||||
| Interpublic Group of Companies, Inc. | 112,918 | $ | 2,777,783 | |||||
| Omnicom Group, Inc. | 124,670 | 10,335,143 | ||||||
| Walt Disney Co. | 12,112 | 1,286,900 | ||||||
|
| |||||||
| $ | 14,399,826 | |||||||
|
| |||||||
| Brokerage & Asset Managers – 1.3% | ||||||||
| Apollo Global Management LLC, “A” | 119,325 | $ | 3,156,146 | |||||
| BlackRock, Inc. | 23,502 | 9,927,480 | ||||||
| Blackstone Group LP | 102,900 | 3,431,715 | ||||||
| Charles Schwab Corp. | 68,319 | 2,934,984 | ||||||
| Franklin Resources, Inc. | 119,286 | 5,342,820 | ||||||
| NASDAQ, Inc. | 84,765 | 6,059,850 | ||||||
| T. Rowe Price Group, Inc. | 65,479 | 4,859,197 | ||||||
|
| |||||||
| $ | 35,712,192 | |||||||
|
| |||||||
| Business Services – 2.2% | ||||||||
| Accenture PLC, “A” | 187,753 | $ | 23,221,291 | |||||
| Amdocs Ltd. | 22,595 | 1,456,474 | ||||||
| Issuer | Shares/Par | Value ($) | ||||||
| COMMON STOCKS – continued | ||||||||
| Business Services – continued | ||||||||
| Cognizant Technology Solutions Corp., “A” | 34,063 | $ | 2,261,783 | |||||
| DXC Technology Co. | 210,480 | 16,148,026 | ||||||
| Equifax, Inc. | 42,026 | 5,775,213 | ||||||
| Fidelity National Information Services, Inc. | 62,722 | 5,356,459 | ||||||
| Fiserv, Inc. (a) | 21,548 | 2,636,182 | ||||||
| Jones Lang LaSalle, Inc. | 30,366 | 3,795,750 | ||||||
|
| |||||||
| $ | 60,651,178 | |||||||
|
| |||||||
| Cable TV – 1.5% | ||||||||
| Charter Communications, Inc., “A” (a) | 27,783 | $ | 9,358,704 | |||||
| Comcast Corp., “A” | 794,886 | 30,936,963 | ||||||
|
| |||||||
| $ | 40,295,667 | |||||||
|
| |||||||
| Chemicals – 2.2% | ||||||||
| 3M Co. | 102,733 | $ | 21,387,983 | |||||
| Celanese Corp. | 48,214 | 4,577,437 | ||||||
| E.I. du Pont de Nemours & Co. | 59,233 | 4,780,695 | ||||||
| Monsanto Co. | 56,860 | 6,729,950 | ||||||
| PPG Industries, Inc. | 192,072 | 21,120,237 | ||||||
|
| |||||||
| $ | 58,596,302 | |||||||
|
| |||||||
| Computer Software – 1.2% | ||||||||
| CA, Inc. | 41,491 | $ | 1,430,195 | |||||
| Check Point Software Technologies Ltd. (a) | 68,460 | 7,467,617 | ||||||
| Intuit, Inc. | 15,736 | 2,089,898 | ||||||
| Microsoft Corp. | 163,361 | 11,260,474 | ||||||
| Oracle Corp. | 129,612 | 6,498,746 | ||||||
| Sabre Corp. | 152,130 | 3,311,870 | ||||||
|
| |||||||
| $ | 32,058,800 | |||||||
|
| |||||||
| Computer Software – Systems – 1.0% | ||||||||
| Apple, Inc. | 43,750 | $ | 6,300,875 | |||||
| Hewlett Packard Enterprise | 434,088 | 7,201,520 | ||||||
| International Business Machines Corp. | 84,813 | 13,046,784 | ||||||
| Seagate Technology PLC | 47,701 | 1,848,414 | ||||||
|
| |||||||
| $ | 28,397,593 | |||||||
|
| |||||||
| Construction – 1.0% | ||||||||
| Owens Corning | 196,186 | $ | 13,128,767 | |||||
| Sherwin-Williams Co. | 23,933 | 8,399,526 | ||||||
| Stanley Black & Decker, Inc. | 43,480 | 6,118,940 | ||||||
|
| |||||||
| $ | 27,647,233 | |||||||
|
| |||||||
| Consumer Products – 0.9% | ||||||||
| Coty, Inc., “A” | 262,858 | $ | 4,931,216 | |||||
| Kimberly-Clark Corp. | 29,032 | 3,748,322 | ||||||
| Newell Brands, Inc. | 76,214 | 4,086,595 | ||||||
| Procter & Gamble Co. | 92,307 | 8,044,555 | ||||||
| Reckitt Benckiser Group PLC | 31,251 | 3,168,310 | ||||||
|
| |||||||
| $ | 23,978,998 | |||||||
|
| |||||||
5
Table of Contents
MFS Total Return Series
Portfolio of Investments (unaudited) – continued
| Issuer | Shares/Par | Value ($) | ||||||
| COMMON STOCKS – continued | ||||||||
| Containers – 0.1% | ||||||||
| Crown Holdings, Inc. (a) | 45,085 | $ | 2,689,771 | |||||
|
| |||||||
| Electrical Equipment – 1.0% | ||||||||
| Johnson Controls International PLC | 499,336 | $ | 21,651,209 | |||||
| MSC Industrial Direct Co., Inc., “A” | 72,628 | 6,243,103 | ||||||
|
| |||||||
| $ | 27,894,312 | |||||||
|
| |||||||
| Electronics – 1.2% | ||||||||
| Broadcom Corp. | 15,920 | $ | 3,710,156 | |||||
| Intel Corp. | 117,702 | 3,971,265 | ||||||
| Maxim Integrated Products, Inc. | 79,864 | 3,585,894 | ||||||
| Taiwan Semiconductor Manufacturing Co. Ltd., ADR | 277,295 | 9,694,233 | ||||||
| Texas Instruments, Inc. | 152,670 | 11,744,903 | ||||||
|
| |||||||
| $ | 32,706,451 | |||||||
|
| |||||||
| Energy – Independent – 1.1% | ||||||||
| Anadarko Petroleum Corp. | 76,553 | $ | 3,470,913 | |||||
| Canadian Natural Resources Ltd. | 59,337 | 1,711,279 | ||||||
| EOG Resources, Inc. | 98,617 | 8,926,811 | ||||||
| EQT Corp. | 54,064 | 3,167,610 | ||||||
| Hess Corp. | 66,535 | 2,918,890 | ||||||
| Noble Energy, Inc. | 101,376 | 2,868,941 | ||||||
| Occidental Petroleum Corp. | 126,203 | 7,555,774 | ||||||
|
| |||||||
| $ | 30,620,218 | |||||||
|
| |||||||
| Energy – Integrated – 1.3% | ||||||||
| BP PLC | 1,328,810 | $ | 7,663,576 | |||||
| Chevron Corp. | 92,753 | 9,676,920 | ||||||
| Eni S.p.A. | 285,152 | 4,286,031 | ||||||
| Exxon Mobil Corp. | 147,294 | 11,891,045 | ||||||
| Galp Energia SGPS S.A., “B” | 177,628 | 2,689,145 | ||||||
|
| |||||||
| $ | 36,206,717 | |||||||
|
| |||||||
| Entertainment – 0.6% | ||||||||
| Time Warner, Inc. | 134,980 | $ | 13,553,342 | |||||
| Twenty-First Century Fox, Inc. | 105,006 | 2,975,870 | ||||||
|
| |||||||
| $ | 16,529,212 | |||||||
|
| |||||||
| Food & Beverages – 2.0% | ||||||||
| Archer Daniels Midland Co. | 46,713 | $ | 1,932,984 | |||||
| Coca-Cola European Partners PLC | 68,294 | 2,777,517 | ||||||
| Danone S.A. | 73,362 | 5,514,245 | ||||||
| General Mills, Inc. | 165,433 | 9,164,988 | ||||||
| J.M. Smucker Co. | 18,922 | 2,239,040 | ||||||
| Marine Harvest | 330,610 | 5,658,831 | ||||||
| Mondelez International, Inc. | 74,642 | 3,223,788 | ||||||
| Nestle S.A. | 165,675 | 14,418,165 | ||||||
| PepsiCo, Inc. | 28,424 | 3,282,688 | ||||||
| Tyson Foods, Inc., “A” | 103,018 | 6,452,017 | ||||||
|
| |||||||
| $ | 54,664,263 | |||||||
|
| |||||||
| Food & Drug Stores – 0.9% | ||||||||
| CVS Health Corp. | 264,807 | $ | 21,306,371 | |||||
| Kroger Co. | 149,285 | 3,481,326 | ||||||
|
| |||||||
| $ | 24,787,697 | |||||||
|
| |||||||
| Issuer | Shares/Par | Value ($) | ||||||
| COMMON STOCKS – continued | ||||||||
| Furniture & Appliances – 0.2% | ||||||||
| Whirlpool Corp. | 21,145 | $ | 4,051,805 | |||||
|
| |||||||
| Gaming & Lodging – 0.1% | ||||||||
| Marriott International, Inc., “A” | 26,414 | $ | 2,649,588 | |||||
|
| |||||||
| General Merchandise – 0.1% | ||||||||
| Target Corp. | 24,679 | $ | 1,290,465 | |||||
| Wal-Mart Stores, Inc. | 34,295 | 2,595,446 | ||||||
|
| |||||||
| $ | 3,885,911 | |||||||
|
| |||||||
| Health Maintenance Organizations – 0.4% | ||||||||
| Cigna Corp. | 40,142 | $ | 6,719,369 | |||||
| Humana, Inc. | 12,091 | 2,909,336 | ||||||
| UnitedHealth Group, Inc. | 4,640 | 860,349 | ||||||
|
| |||||||
| $ | 10,489,054 | |||||||
|
| |||||||
| Insurance – 3.8% | ||||||||
| Aon PLC | 121,930 | $ | 16,210,594 | |||||
| Chubb Ltd. | 154,685 | 22,488,105 | ||||||
| MetLife, Inc. | 461,148 | 25,335,471 | ||||||
| Prudential Financial, Inc. | 166,235 | 17,976,653 | ||||||
| Travelers Cos., Inc. | 123,030 | 15,566,986 | ||||||
| Zurich Insurance Group AG | 24,647 | 7,173,822 | ||||||
|
| |||||||
| $ | 104,751,631 | |||||||
|
| |||||||
| Internet – 0.7% | ||||||||
| Alphabet, Inc., “A” (a) | 4,129 | $ | 3,838,649 | |||||
| Facebook, Inc., “A” (a) | 107,054 | 16,163,013 | ||||||
|
| |||||||
| $ | 20,001,662 | |||||||
|
| |||||||
| Machinery & Tools – 1.2% | ||||||||
| Allison Transmission Holdings, Inc. | 64,093 | $ | 2,404,128 | |||||
| Cummins, Inc. | 7,337 | 1,190,208 | ||||||
| Deere & Co. | 30,183 | 3,730,317 | ||||||
| Eaton Corp. PLC | 115,671 | 9,002,674 | ||||||
| Illinois Tool Works, Inc. | 84,734 | 12,138,146 | ||||||
| Ingersoll-Rand Co. Ltd., “A” | 36,760 | 3,359,496 | ||||||
|
| |||||||
| $ | 31,824,969 | |||||||
|
| |||||||
| Major Banks – 6.8% | ||||||||
| Bank of America Corp. | 964,536 | $ | 23,399,643 | |||||
| Bank of New York Mellon Corp. | 305,791 | 15,601,457 | ||||||
| BNP Paribas | 33,737 | 2,429,872 | ||||||
| Goldman Sachs Group, Inc. | 91,608 | 20,327,815 | ||||||
| JPMorgan Chase & Co. | 597,203 | 54,584,354 | ||||||
| Morgan Stanley | 279,426 | 12,451,223 | ||||||
| PNC Financial Services Group, Inc. | 115,190 | 14,383,775 | ||||||
| Royal Bank of Canada | 41,256 | 2,995,578 | ||||||
| State Street Corp. | 130,256 | 11,687,871 | ||||||
| Sumitomo Mitsui Financial Group, Inc. | 88,600 | 3,449,472 | ||||||
| UBS AG | 271,743 | 4,602,259 | ||||||
| Wells Fargo & Co. | 328,543 | 18,204,568 | ||||||
|
| |||||||
| $ | 184,117,887 | |||||||
|
| |||||||
| Medical & Health Technology & Services – 0.5% | ||||||||
| Express Scripts Holding Co. (a) | 42,931 | $ | 2,740,715 | |||||
| HCA Healthcare, Inc. (a) | 22,731 | 1,982,143 | ||||||
6
Table of Contents
MFS Total Return Series
Portfolio of Investments (unaudited) – continued
| Issuer | Shares/Par | Value ($) | ||||||
| COMMON STOCKS – continued | ||||||||
| Medical & Health Technology & Services – continued | ||||||||
| McKesson Corp. | 51,720 | $ | 8,510,009 | |||||
|
| |||||||
| $ | 13,232,867 | |||||||
|
| |||||||
| Medical Equipment – 3.1% | ||||||||
| Abbott Laboratories | 438,580 | $ | 21,319,374 | |||||
| Danaher Corp. | 197,924 | 16,702,806 | ||||||
| Medtronic PLC | 254,169 | 22,557,499 | ||||||
| Thermo Fisher Scientific, Inc. | 104,364 | 18,208,387 | ||||||
| Zimmer Biomet Holdings, Inc. | 40,451 | 5,193,908 | ||||||
|
| |||||||
| $ | 83,981,974 | |||||||
|
| |||||||
| Metals & Mining – 0.3% | ||||||||
| Rio Tinto Ltd. | 172,034 | $ | 7,264,207 | |||||
|
| |||||||
| Natural Gas – Distribution – 0.2% | ||||||||
| Engie | 199,563 | $ | 3,012,106 | |||||
| Sempra Energy | 30,954 | 3,490,064 | ||||||
|
| |||||||
| $ | 6,502,170 | |||||||
|
| |||||||
| Natural Gas – Pipeline – 0.8% | ||||||||
| Enterprise Products Partners LP | 411,628 | $ | 11,146,886 | |||||
| Plains All American Pipeline LP | 160,930 | 4,227,631 | ||||||
| Williams Partners LP | 180,562 | 7,242,342 | ||||||
|
| |||||||
| $ | 22,616,859 | |||||||
|
| |||||||
| Network & Telecom – 0.7% | ||||||||
| Cisco Systems, Inc. | 475,583 | $ | 14,885,748 | |||||
| Motorola Solutions, Inc. | 30,763 | 2,668,383 | ||||||
|
| |||||||
| $ | 17,554,131 | |||||||
|
| |||||||
| Oil Services – 0.4% | ||||||||
| Schlumberger Ltd. | 172,291 | $ | 11,343,639 | |||||
|
| |||||||
| Other Banks & Diversified Financials – 2.3% | ||||||||
| American Express Co. | 63,731 | $ | 5,368,699 | |||||
| Citigroup, Inc. | 392,480 | 26,249,062 | ||||||
| Discover Financial Services | 96,796 | 6,019,743 | ||||||
| SunTrust Banks, Inc. | 52,397 | 2,971,958 | ||||||
| U.S. Bancorp | 376,267 | 19,535,783 | ||||||
| Visa, Inc., “A” | 33,969 | 3,185,613 | ||||||
|
| |||||||
| $ | 63,330,858 | |||||||
|
| |||||||
| Pharmaceuticals – 4.1% | ||||||||
| Allergan PLC | 10,855 | $ | 2,638,742 | |||||
| Bayer AG | 96,232 | 12,441,964 | ||||||
| Eli Lilly & Co. | 199,211 | 16,395,065 | ||||||
| Johnson & Johnson | 251,445 | 33,263,659 | ||||||
| Merck & Co., Inc. | 277,522 | 17,786,385 | ||||||
| Novartis AG | 15,805 | 1,315,298 | ||||||
| Pfizer, Inc. | 769,522 | 25,848,244 | ||||||
| Roche Holding AG | 4,536 | 1,155,169 | ||||||
|
| |||||||
| $ | 110,844,526 | |||||||
|
| |||||||
| Printing & Publishing – 0.3% | ||||||||
| Moody’s Corp. | 31,819 | $ | 3,871,736 | |||||
| S&P Global, Inc. | 8,992 | 1,312,742 | ||||||
| Transcontinental, Inc., “A” | 151,282 | 2,998,109 | ||||||
|
| |||||||
| $ | 8,182,587 | |||||||
|
| |||||||
| Issuer | Shares/Par | Value ($) | ||||||
| COMMON STOCKS – continued | ||||||||
| Railroad & Shipping – 0.9% | ||||||||
| Canadian National Railway Co. | 40,726 | $ | 3,300,842 | |||||
| Union Pacific Corp. | 199,689 | 21,748,129 | ||||||
|
| |||||||
| $ | 25,048,971 | |||||||
|
| |||||||
| Real Estate – 1.1% | ||||||||
| Annaly Mortgage Management, Inc., REIT | 195,456 | $ | 2,355,245 | |||||
| LaSalle Hotel Properties, REIT | 61,872 | 1,843,786 | ||||||
| Medical Properties Trust, Inc., REIT | 753,016 | 9,691,316 | ||||||
| Public Storage, Inc., REIT | 10,419 | 2,172,674 | ||||||
| Starwood Property Trust, Inc., REIT | 296,771 | 6,644,703 | ||||||
| Store Capital Corp., REIT | 189,040 | 4,243,948 | ||||||
| Washington Prime Group, Inc., REIT | 369,548 | 3,093,117 | ||||||
|
| |||||||
| $ | 30,044,789 | |||||||
|
| |||||||
| Restaurants – 0.2% | ||||||||
| Aramark | 99,986 | $ | 4,097,426 | |||||
| Starbucks Corp. | 39,594 | 2,308,726 | ||||||
|
| |||||||
| $ | 6,406,152 | |||||||
|
| |||||||
| Specialty Chemicals – 0.2% | ||||||||
| Axalta Coating Systems Ltd. (a) | 146,216 | $ | 4,684,761 | |||||
|
| |||||||
| Specialty Stores – 0.8% | ||||||||
| Advance Auto Parts, Inc. | 10,105 | $ | 1,178,142 | |||||
| Best Buy Co., Inc. | 154,499 | 8,857,428 | ||||||
| Gap, Inc. | 261,540 | 5,751,265 | ||||||
| Ross Stores, Inc. | 94,455 | 5,452,887 | ||||||
|
| |||||||
| $ | 21,239,722 | |||||||
|
| |||||||
| Telephone Services – 0.5% | ||||||||
| TDC A.S. | 379,767 | $ | 2,208,480 | |||||
| Verizon Communications, Inc. | 250,240 | 11,175,718 | ||||||
|
| |||||||
| $ | 13,384,198 | |||||||
|
| |||||||
| Tobacco – 2.7% | ||||||||
| Altria Group, Inc. | 276,181 | $ | 20,567,199 | |||||
| Japan Tobacco, Inc. | 45,500 | 1,596,697 | ||||||
| Philip Morris International, Inc. | 435,568 | 51,157,462 | ||||||
|
| |||||||
| $ | 73,321,358 | |||||||
|
| |||||||
| Trucking – 0.4% | ||||||||
| United Parcel Service, Inc., “B” | 107,641 | $ | 11,904,018 | |||||
|
| |||||||
| Utilities – Electric Power – 1.8% | ||||||||
| American Electric Power Co., Inc. | 77,074 | $ | 5,354,331 | |||||
| Duke Energy Corp. | 111,734 | 9,339,845 | ||||||
| Exelon Corp. | 348,615 | 12,574,543 | ||||||
| FirstEnergy Corp. | 88,117 | 2,569,492 | ||||||
| PPL Corp. | 269,151 | 10,405,378 | ||||||
| Public Service Enterprise Group, Inc. | 66,494 | 2,859,907 | ||||||
| SSE PLC | 112,944 | 2,137,419 | ||||||
| WEC Energy Group, Inc. | 45,743 | 2,807,705 | ||||||
| Xcel Energy, Inc. | 37,628 | 1,726,373 | ||||||
|
| |||||||
| $ | 49,774,993 | |||||||
|
| |||||||
| Total Common Stocks (Identified Cost, $1,127,993,709) | $ | 1,626,206,548 | ||||||
|
| |||||||
7
Table of Contents
MFS Total Return Series
Portfolio of Investments (unaudited) – continued
| Issuer | Shares/Par | Value ($) | ||||||
| BONDS – 38.2% | ||||||||
| Agency – Other – 0.1% | ||||||||
| Financing Corp., 9.65%, 11/02/2018 | $ | 1,275,000 | $ | 1,412,230 | ||||
|
| |||||||
| Apparel Manufacturers – 0.1% | ||||||||
| Coach, Inc., 4.125%, 7/15/2027 | $ | 1,735,000 | $ | 1,716,113 | ||||
|
| |||||||
| Asset-Backed & Securitized – 2.4% | ||||||||
| Bayview Financial Revolving Mortgage Loan Trust, FRN, 2.822%, 12/28/2040 (z) | $ | 2,148,869 | $ | 1,672,114 | ||||
| BlackRock Capital Finance LP, 7.75%, 9/25/2026 (z) | 19,368 | 1,973 | ||||||
| Cent CLO LP, 2013-17A, “A1”, FRN, 2.469%, 1/30/2025 (n) | 2,310,058 | 2,311,238 | ||||||
| Cent CLO LP, 2014-21A, “A1”, FRN, 2.38%, 7/27/2026 (n) | 2,944,489 | 2,948,969 | ||||||
| Chesapeake Funding II LLC, 2016-2A, “A2”, FRN, 2.158%, 6/15/2028 (z) | 3,296,353 | 3,310,903 | ||||||
| Commercial Mortgage Trust, 2015-LC21, “A4”, 3.708%, 7/10/2048 | 3,980,975 | 4,150,673 | ||||||
| Commercial Mortgage Trust, 2017-CD4, “A4”, FRN, 3.514%, 5/10/2050 | 4,708,829 | 4,868,665 | ||||||
| Credit Suisse Mortgage Capital Certificate, 5.695%, 9/15/2040 | 1,755,590 | 1,753,867 | ||||||
| CSAIL Commercial Mortgage Trust, 2015-C2, “A4”, 3.504%, 6/15/2057 | 2,316,427 | 2,373,543 | ||||||
| Dryden Senior Loan Fund, 2013-26A, “A”, CLO, FRN, 2.258%, 7/15/2025 (n) | 3,273,000 | 3,277,834 | ||||||
| Dryden Senior Loan Fund, 2014-34A, “AR”, FRN, 2.318%, 10/15/2026 (n) | 4,414,000 | 4,422,921 | ||||||
| Ford Credit Auto Owner Trust, 2014-1, “ A”, 2.26%, 11/15/2025 (n) | 1,735,000 | 1,750,921 | ||||||
| Ford Credit Auto Owner Trust, 2014-2, “ A”, 2.31%, 4/15/2026 (n) | 1,465,000 | 1,479,178 | ||||||
| Fortress Credit BSL Ltd., 2013-1A, “A”, FRN, 2.338%, 1/19/2025 (n) | 1,844,804 | 1,846,421 | ||||||
| GMAC Mortgage Corp. Loan Trust, 5.805%, 10/25/2036 | 640,464 | 619,060 | ||||||
| GS Mortgage Securities Trust, 2015-GC30, “A4”, 3.382%, 5/10/2050 | 4,243,101 | 4,328,398 | ||||||
| GS Mortgage Securities Trust, 2017-GS6, “A3”, 3.433%, 5/10/2050 | 2,128,142 | 2,176,386 | ||||||
| ING Investment Management Ltd., 2013-2A, “A1”, CLO, FRN, 2.306%, 4/25/2025 (n) | 2,971,000 | 2,972,364 | ||||||
| JPMBB Commercial Mortgage Securities Trust, 2014-C26, 3.494%, 1/15/2048 | 4,880,000 | 5,025,027 | ||||||
| JPMBB Commercial Mortgage Securities Trust, 2015-C28, “A4”, 3.227%, 10/15/2048 | 3,256,792 | 3,292,018 | ||||||
| Morgan Stanley Capital I Trust, 2017-H1, “A5”, 3.53%, 6/15/2050 | 1,456,742 | 1,503,815 | ||||||
| Morgan Stanley Capital I, Inc., FRN, 1.273%, 11/15/2030 (i)(n) | 1,517,872 | 4,397 | ||||||
| Mountain Hawk CLO Ltd., 2014-3A, “BR”, FRN, 2.958%, 4/18/2025 (z) | 4,534,203 | 4,534,171 | ||||||
| Residential Funding Mortgage Securities, Inc., 5.32%, 12/25/2035 | 1,227,173 | 1,230,692 | ||||||
| Issuer | Shares/Par | Value ($) | ||||||
| BONDS – continued | ||||||||
| Asset-Backed & Securitized – continued | ||||||||
| Wells Fargo Commercial Mortgage Trust, 2015-C28, “A4”, 3.54%, 5/15/2048 | $ | 4,315,766 | $ | 4,444,474 | ||||
|
| |||||||
| $ | 66,300,022 | |||||||
|
| |||||||
| Automotive – 0.1% | ||||||||
| General Motors Co., 6.75%, 4/01/2046 | $ | 1,124,000 | $ | 1,333,084 | ||||
| General Motors Financial Co., Inc., 3.2%, 7/06/2021 | 2,353,000 | 2,379,448 | ||||||
|
| |||||||
| $ | 3,712,532 | |||||||
|
| |||||||
| Brokerage & Asset Managers – 0.2% | ||||||||
| Intercontinental Exchange, Inc., 2.75%, 12/01/2020 | $ | 903,000 | $ | 919,978 | ||||
| Intercontinental Exchange, Inc., 4%, 10/15/2023 | 2,519,000 | 2,646,252 | ||||||
| Raymond James Financial, 4.95%, 7/15/2046 | 2,325,000 | 2,523,125 | ||||||
|
| |||||||
| $ | 6,089,355 | |||||||
|
| |||||||
| Business Services – 0.0% | ||||||||
| Fidelity National Information Services, Inc., 4.5%, 8/15/2046 | $ | 630,000 | $ | 646,264 | ||||
|
| |||||||
| Cable TV – 0.2% | ||||||||
| Comcast Corp., 4.6%, 8/15/2045 | $ | 2,249,000 | $ | 2,452,512 | ||||
| Time Warner Entertainment Co. LP, 8.375%, 7/15/2033 | 2,855,000 | 3,919,664 | ||||||
|
| |||||||
| $ | 6,372,176 | |||||||
|
| |||||||
| Chemicals – 0.0% | ||||||||
| Sherwin-Williams Co., 4.5%, 6/01/2047 | $ | 1,201,000 | $ | 1,258,441 | ||||
|
| |||||||
| Computer Software – 0.2% | ||||||||
| Microsoft Corp., 4.25%, 2/06/2047 | $ | 4,505,000 | $ | 4,877,356 | ||||
|
| |||||||
| Computer Software – Systems – 0.3% | ||||||||
| Apple, Inc., 2.85%, 2/23/2023 | $ | 3,502,000 | $ | 3,562,721 | ||||
| Apple, Inc., 3.35%, 2/09/2027 | 2,239,000 | 2,289,004 | ||||||
| Apple, Inc., 3.85%, 5/04/2043 | 1,303,000 | 1,302,638 | ||||||
|
| |||||||
| $ | 7,154,363 | |||||||
|
| |||||||
| Conglomerates – 0.1% | ||||||||
| General Electric Capital Corp., FRN, 1.775%, 1/09/2020 | $ | 1,939,000 | $ | 1,961,715 | ||||
|
| |||||||
| Consumer Products – 0.2% | ||||||||
| Newell Rubbermaid, Inc., 3.85%, 4/01/2023 | $ | 2,769,000 | $ | 2,907,281 | ||||
| Reckitt Benckiser Treasury Services PLC, 3.625%, 9/21/2023 (n) | 3,463,000 | 3,639,939 | ||||||
|
| |||||||
| $ | 6,547,220 | |||||||
|
| |||||||
| Consumer Services – 0.1% | ||||||||
| Visa, Inc., 3.15%, 12/14/2025 | $ | 3,594,000 | $ | 3,648,870 | ||||
|
| |||||||
| Emerging Market Quasi-Sovereign – 0.2% | ||||||||
| Petroleos Mexicanos, 3.125%, 1/23/2019 | $ | 1,277,000 | $ | 1,285,939 | ||||
| State Grid Overseas Investment (2014) Ltd., 2.75%, 5/07/2019 (z) | 2,591,000 | 2,614,840 | ||||||
| State Grid Overseas Investment (2016) Ltd., 2.75%, 5/04/2022 (n) | 1,893,000 | 1,884,084 | ||||||
|
| |||||||
| $ | 5,784,863 | |||||||
|
| |||||||
8
Table of Contents
MFS Total Return Series
Portfolio of Investments (unaudited) – continued
| Issuer | Shares/Par | Value ($) | ||||||
| BONDS – continued | ||||||||
| Emerging Market Sovereign – 0.1% | ||||||||
| United Mexican States, 4.75%, 3/08/2044 | $ | 2,089,000 | $ | 2,091,089 | ||||
|
| |||||||
| Energy – Integrated – 0.5% | ||||||||
| BP Capital Markets PLC, 4.5%, 10/01/2020 | $ | 1,054,000 | $ | 1,131,714 | ||||
| BP Capital Markets PLC, 4.742%, 3/11/2021 | 3,027,000 | 3,289,432 | ||||||
| Chevron Corp., 1.351%, 11/15/2017 | 5,248,000 | 5,252,177 | ||||||
| Shell International Finance B.V., 3.75%, 9/12/2046 | 2,854,000 | 2,700,769 | ||||||
|
| |||||||
| $ | 12,374,092 | |||||||
|
| |||||||
| Financial Institutions – 0.0% | ||||||||
| GE Capital International Funding Co., 3.373%, 11/15/2025 | $ | 1,258,000 | $ | 1,300,718 | ||||
|
| |||||||
| Food & Beverages – 0.4% | ||||||||
| Anheuser-Busch InBev S.A., 8%, 11/15/2039 | $ | 3,600,000 | $ | 5,520,611 | ||||
| Danone S.A., 2.947%, 11/02/2026 (n) | 3,438,000 | 3,322,995 | ||||||
| Diageo Capital PLC, 2.625%, 4/29/2023 | 1,270,000 | 1,281,156 | ||||||
| Wm. Wrigley Jr. Co., 2.4%, 10/21/2018 (n) | 756,000 | 761,103 | ||||||
|
| |||||||
| $ | 10,885,865 | |||||||
|
| |||||||
| Food & Drug Stores – 0.2% | ||||||||
| CVS Health Corp., 3.875%, 7/20/2025 | $ | 3,328,000 | $ | 3,460,275 | ||||
| Walgreens Boots Alliance, Inc., 4.5%, 11/18/2034 | 1,318,000 | 1,383,076 | ||||||
|
| |||||||
| $ | 4,843,351 | |||||||
|
| |||||||
| Insurance – 0.3% | ||||||||
| American International Group, Inc., 4.875%, 6/01/2022 | $ | 5,088,000 | $ | 5,582,833 | ||||
| American International Group, Inc., 4.125%, 2/15/2024 | 2,620,000 | 2,766,199 | ||||||
|
| |||||||
| $ | 8,349,032 | |||||||
|
| |||||||
| Insurance – Health – 0.2% | ||||||||
| UnitedHealth Group, Inc., 3.75%, 7/15/2025 | $ | 3,987,000 | $ | 4,199,316 | ||||
|
| |||||||
| Insurance – Property & Casualty – 0.2% | ||||||||
| Berkshire Hathaway, Inc., 3.125%, 3/15/2026 | $ | 1,162,000 | $ | 1,175,073 | ||||
| Liberty Mutual Group, Inc., 4.85%, 8/01/2044 (n) | 1,469,000 | 1,576,105 | ||||||
| Marsh & McLennan Cos., Inc., 4.8%, 7/15/2021 | 3,270,000 | 3,555,036 | ||||||
|
| |||||||
| $ | 6,306,214 | |||||||
|
| |||||||
| International Market Quasi-Sovereign – 0.4% | ||||||||
| KFW International Finance, Inc., 4.875%, 6/17/2019 | $ | 4,560,000 | $ | 4,847,380 | ||||
| Temasek Financial I Ltd., 2.375%, 1/23/2023 (n) | 6,400,000 | 6,322,065 | ||||||
|
| |||||||
| $ | 11,169,445 | |||||||
|
| |||||||
| Internet – 0.2% | ||||||||
| Baidu, Inc., 3.5%, 11/28/2022 | $ | 3,950,000 | $ | 4,035,762 | ||||
|
| |||||||
| Issuer | Shares/Par | Value ($) | ||||||
| BONDS – continued | ||||||||
| Local Authorities – 0.2% | ||||||||
| New Jersey Turnpike Authority Rev. (Build America Bonds), “F”, 7.414%, 1/01/2040 | $ | 3,685,000 | $ | 5,534,907 | ||||
|
| |||||||
| Major Banks – 2.1% | ||||||||
| ABN AMRO Bank N.V., 4.8%, 4/18/2026 (n) | $ | 2,400,000 | $ | 2,548,394 | ||||
| Bank of America Corp., 5.49%, 3/15/2019 | 2,989,000 | 3,145,716 | ||||||
| Bank of America Corp., 4.1%, 7/24/2023 | 3,870,000 | 4,096,863 | ||||||
| Bank of America Corp., 4.125%, 1/22/2024 | 5,102,000 | 5,383,921 | ||||||
| Bank of America Corp., 4.183%, 11/25/2027 | 2,500,000 | 2,542,713 | ||||||
| Credit Suisse Group AG, 6.5%, 8/08/2023 (n) | 1,300,000 | 1,460,940 | ||||||
| Goldman Sachs Group, Inc., 3.85%, 1/26/2027 | 3,359,000 | 3,417,138 | ||||||
| HSBC Holdings PLC, 6% to 5/22/2027, FRN to 11/22/2065 | 1,468,000 | 1,517,912 | ||||||
| ING Bank N.V., 5.8%, 9/25/2023 (n) | 3,438,000 | 3,882,159 | ||||||
| JPMorgan Chase & Co., 6.3%, 4/23/2019 | 3,410,000 | 3,670,077 | ||||||
| JPMorgan Chase & Co., 3.782% to 2/01/2027, FRN to 2/01/2028 | 3,438,000 | 3,515,757 | ||||||
| Morgan Stanley, 3.875%, 4/29/2024 | 3,188,000 | 3,313,253 | ||||||
| Morgan Stanley, 6.625%, 4/01/2018 | 4,287,000 | 4,439,231 | ||||||
| Morgan Stanley, 4%, 7/23/2025 | 1,206,000 | 1,258,744 | ||||||
| Morgan Stanley, 3.625%, 1/20/2027 | 3,421,000 | 3,445,597 | ||||||
| Royal Bank of Scotland Group PLC, 3.875%, 9/12/2023 | 3,418,000 | 3,490,151 | ||||||
| UBS Group Funding (Jersey) Ltd., 4.125%, 4/15/2026 (z) | 2,536,000 | 2,644,767 | ||||||
| UBS Group Funding (Switzerland) AG, 4.253%, 3/23/2028 (n) | 2,529,000 | 2,642,122 | ||||||
|
| |||||||
| $ | 56,415,455 | |||||||
|
| |||||||
| Medical & Health Technology & Services – 0.2% | ||||||||
| Becton, Dickinson and Co., 2.675%, 12/15/2019 | $ | 1,605,000 | $ | 1,624,652 | ||||
| Laboratory Corp. of America Holdings, 3.2%, 2/01/2022 | 660,000 | 673,572 | ||||||
| Laboratory Corp. of America Holdings, 4.7%, 2/01/2045 | 802,000 | 826,515 | ||||||
| Thermo Fisher Scientific, Inc., 2.95%, 9/19/2026 | 2,583,000 | 2,511,676 | ||||||
|
| |||||||
| $ | 5,636,415 | |||||||
|
| |||||||
| Medical Equipment – 0.3% | ||||||||
| Abbott Laboratories, 4.9%, 11/30/2046 | $ | 2,249,000 | $ | 2,477,134 | ||||
| Medtronic, Inc., 4.375%, 3/15/2035 | 2,886,000 | 3,152,280 | ||||||
| Zimmer Holdings, Inc., 3.55%, 4/01/2025 | 3,762,000 | 3,799,951 | ||||||
|
| |||||||
| $ | 9,429,365 | |||||||
|
| |||||||
| Metals & Mining – 0.1% | ||||||||
| Glencore Funding LLC, 4.125%, 5/30/2023 (n) | $ | 2,067,000 | $ | 2,120,928 | ||||
|
| |||||||
| Midstream – 0.6% | ||||||||
| APT Pipelines Ltd., 4.2%, 3/23/2025 (n) | $ | 3,780,000 | $ | 3,902,158 | ||||
| APT Pipelines Ltd., 4.25%, 7/15/2027 (n) | 280,000 | 286,643 | ||||||
9
Table of Contents
MFS Total Return Series
Portfolio of Investments (unaudited) – continued
| Issuer | Shares/Par | Value ($) | ||||||
| BONDS – continued | ||||||||
| Midstream – continued | ||||||||
| Enterprise Products Operating LP, 6.5%, 1/31/2019 | $ | 2,995,000 | $ | 3,194,647 | ||||
| Kinder Morgan Energy Partners LP, 4.15%, 2/01/2024 | 1,369,000 | 1,407,280 | ||||||
| Kinder Morgan Energy Partners LP, 7.4%, 3/15/2031 | 1,023,000 | 1,230,580 | ||||||
| Phillips 66 Partners LP, 4.9%, 10/01/2046 | 2,027,000 | 1,995,395 | ||||||
| Sabine Pass Liquefaction LLC, 5%, 3/15/2027 | 3,392,000 | 3,610,689 | ||||||
|
| |||||||
| $ | 15,627,392 | |||||||
|
| |||||||
| Mortgage-Backed – 11.1% | ||||||||
| Fannie Mae, 6%, 8/01/2017 - 7/01/2037 | $ | 7,826,734 | $ | 8,884,116 | ||||
| Fannie Mae, 5.5%, 11/01/2017 - 4/01/2040 | 15,095,962 | 16,811,761 | ||||||
| Fannie Mae, 3.8%, 2/01/2018 | 303,446 | 304,335 | ||||||
| Fannie Mae, 5%, 2/01/2018 - 3/01/2041 | 6,461,179 | 7,067,016 | ||||||
| Fannie Mae, 4.5%, 4/01/2018 - 6/01/2044 | 15,068,859 | 16,280,728 | ||||||
| Fannie Mae, 2.578%, 9/25/2018 | 1,782,935 | 1,789,953 | ||||||
| Fannie Mae, 4.6%, 9/01/2019 | 469,814 | 495,181 | ||||||
| Fannie Mae, 2.59%, 5/01/2023 | 467,561 | 475,715 | ||||||
| Fannie Mae, 2.7%, 7/01/2025 | 367,000 | 367,100 | ||||||
| Fannie Mae, 3.43%, 6/01/2026 | 591,266 | 620,229 | ||||||
| Fannie Mae, 3%, 4/01/2027 - 11/01/2046 | 12,062,160 | 12,225,823 | ||||||
| Fannie Mae, 6.5%, 6/01/2031 - 7/01/2037 | 2,435,331 | 2,762,314 | ||||||
| Fannie Mae, 4%, 9/01/2040 - 2/01/2045 | 31,462,342 | 33,216,959 | ||||||
| Fannie Mae, 3.5%, 11/01/2041 - 1/01/2047 | 43,585,579 | 44,896,988 | ||||||
| Fannie Mae, FRN, 2.683%, 12/25/2026 | 1,585,000 | 1,548,018 | ||||||
| Fannie Mae, TBA, 4%, 3/01/2047 | 8,382,200 | 8,811,460 | ||||||
| Freddie Mac, 6%, 10/01/2017 - 6/01/2037 | 3,079,093 | 3,472,699 | ||||||
| Freddie Mac, 5%, 12/01/2017 - 7/01/2039 | 3,598,380 | 3,917,386 | ||||||
| Freddie Mac, 3.154%, 2/25/2018 | 394,174 | 396,955 | ||||||
| Freddie Mac, 4.5%, 5/01/2018 - 5/01/2042 | 3,588,463 | 3,831,714 | ||||||
| Freddie Mac, 2.412%, 8/25/2018 | 1,775,181 | 1,787,614 | ||||||
| Freddie Mac, 5.5%, 1/01/2019 - 2/01/2037 | 2,374,326 | 2,636,857 | ||||||
| Freddie Mac, 5.085%, 3/25/2019 | 4,316,000 | 4,512,572 | ||||||
| Freddie Mac, 2.456%, 8/25/2019 | 500,000 | 506,391 | ||||||
| Freddie Mac, 1.869%, 11/25/2019 | 1,266,000 | 1,268,892 | ||||||
| Freddie Mac, 2.791%, 1/25/2022 | 1,485,000 | 1,525,060 | ||||||
| Freddie Mac, 2.716%, 6/25/2022 | 1,059,508 | 1,084,143 | ||||||
| Freddie Mac, 2.51%, 11/25/2022 | 1,272,000 | 1,283,974 | ||||||
| Freddie Mac, 3.111%, 2/25/2023 | 2,136,000 | 2,219,350 | ||||||
| Freddie Mac, 3.32%, 2/25/2023 | 618,000 | 648,866 | ||||||
| Freddie Mac, 3.25%, 4/25/2023 | 2,474,000 | 2,585,277 | ||||||
| Freddie Mac, 3.458%, 8/25/2023 | 2,553,000 | 2,697,372 | ||||||
| Freddie Mac, 0.882%, 4/25/2024 (i) | 6,165,318 | 307,961 | ||||||
| Freddie Mac, 3.171%, 10/25/2024 | 1,304,000 | 1,354,681 | ||||||
| Freddie Mac, 2.67%, 12/25/2024 | 1,561,000 | 1,568,886 | ||||||
| Freddie Mac, 3.329%, 5/25/2025 | 2,660,000 | 2,784,142 | ||||||
| Freddie Mac, 2.673%, 3/25/2026 | 2,597,000 | 2,578,686 | ||||||
| Freddie Mac, 3.3%, 10/25/2026 | 957,000 | 991,238 | ||||||
| Freddie Mac, 3.224%, 3/25/2027 | 979,000 | 1,007,720 | ||||||
| Issuer | Shares/Par | Value ($) | ||||||
| BONDS – continued | ||||||||
| Mortgage-Backed – continued | ||||||||
| Freddie Mac, 6.5%, 5/01/2034 - 9/01/2037 | $ | 1,567,654 | $ | 1,769,835 | ||||
| Freddie Mac, 4%, 11/01/2040 - 4/01/2044 | 9,584,687 | 10,115,702 | ||||||
| Freddie Mac, 3.5%, 2/01/2042 - 1/01/2047 | 28,318,206 | 29,186,614 | ||||||
| Freddie Mac, 3%, 3/01/2043 - 11/01/2046 | 19,467,861 | 19,535,492 | ||||||
| Freddie Mac, TBA, 4.5%, 9/01/2046 | 13,693,000 | 14,668,797 | ||||||
| Ginnie Mae, 6%, 9/15/2032 - 1/15/2038 | 3,089,013 | 3,528,260 | ||||||
| Ginnie Mae, 5.5%, 5/15/2033 - 10/15/2035 | 1,922,703 | 2,157,230 | ||||||
| Ginnie Mae, 4.5%, 7/20/2033 - 1/20/2041 | 4,747,022 | 5,133,584 | ||||||
| Ginnie Mae, 5%, 7/20/2033 - 12/15/2034 | 631,890 | 695,100 | ||||||
| Ginnie Mae, 4%, 1/20/2041 - 2/20/2042 | 5,124,235 | 5,439,276 | ||||||
| Ginnie Mae, 3.5%, 12/15/2041 - 7/20/2043 | 7,149,220 | 7,437,678 | ||||||
| Ginnie Mae, 0.658%, 2/16/2059 (i) | 7,780,000 | 534,719 | ||||||
|
| |||||||
| $ | 301,728,419 | |||||||
|
| |||||||
| Network & Telecom – 0.4% | ||||||||
| AT&T, Inc., 3%, 6/30/2022 | $ | 2,565,000 | $ | 2,566,326 | ||||
| AT&T, Inc., 3.4%, 5/15/2025 | 2,565,000 | 2,521,626 | ||||||
| AT&T, Inc., 5.45%, 3/01/2047 | 2,695,000 | 2,901,235 | ||||||
| Verizon Communications, Inc., 5.05%, 3/15/2034 | 3,101,000 | 3,282,920 | ||||||
|
| |||||||
| $ | 11,272,107 | |||||||
|
| |||||||
| Oils – 0.3% | ||||||||
| Marathon Petroleum Corp., 3.625%, 9/15/2024 | $ | 2,653,000 | $ | 2,680,700 | ||||
| Valero Energy Corp., 4.9%, 3/15/2045 | 4,866,000 | 5,069,355 | ||||||
|
| |||||||
| $ | 7,750,055 | |||||||
|
| |||||||
| Other Banks & Diversified Financials – 0.5% | ||||||||
| Banco de Credito del Peru, 5.375%, 9/16/2020 | $ | 2,967,000 | $ | 3,234,030 | ||||
| BBVA Bancomer S.A. de C.V., 6.75%, 9/30/2022 (n) | 2,890,000 | 3,283,763 | ||||||
| Citigroup, Inc., 2.5%, 9/26/2018 | 2,450,000 | 2,466,606 | ||||||
| Citizens Bank N.A., 2.25%, 3/02/2020 | 877,000 | 876,179 | ||||||
| Groupe BPCE S.A., 12.5% to 9/30/2019, FRN to 8/29/2049 (n) | 3,106,000 | 3,791,246 | ||||||
|
| |||||||
| $ | 13,651,824 | |||||||
|
| |||||||
| Pharmaceuticals – 0.5% | ||||||||
| Actavis Funding SCS, 3.8%, 3/15/2025 | $ | 1,429,000 | $ | 1,478,085 | ||||
| Celgene Corp., 2.875%, 8/15/2020 | 1,545,000 | 1,579,883 | ||||||
| Gilead Sciences, Inc., 3.7%, 4/01/2024 | 915,000 | 951,222 | ||||||
| Gilead Sciences, Inc., 3.5%, 2/01/2025 | 5,767,000 | 5,918,343 | ||||||
| Shire Acquisitions Investments Ireland Designated Activity Co., 3.2%, 9/23/2026 | 4,529,000 | 4,428,701 | ||||||
|
| |||||||
| $ | 14,356,234 | |||||||
|
| |||||||
| Retailers – 0.0% | ||||||||
| Home Depot, Inc., 5.95%, 4/01/2041 | $ | 989,000 | $ | 1,307,614 | ||||
|
| |||||||
10
Table of Contents
MFS Total Return Series
Portfolio of Investments (unaudited) – continued
| Issuer | Shares/Par | Value ($) | ||||||
| BONDS – continued | ||||||||
| Telecommunications – Wireless – 0.3% | ||||||||
| American Tower Trust I, REIT, 3.07%, 3/15/2023 (n) | $ | 3,560,000 | $ | 3,587,156 | ||||
| Crown Castle Towers LLC, 6.113%, 1/15/2020 (n) | 2,493,000 | 2,680,204 | ||||||
| Crown Castle Towers LLC, 4.883%, 8/15/2020 (n) | 1,270,000 | 1,355,241 | ||||||
|
| |||||||
| $ | 7,622,601 | |||||||
|
| |||||||
| Tobacco – 0.3% | ||||||||
| Imperial Tobacco Finance PLC, 2.95%, 7/21/2020 (z) | $ | 2,518,000 | $ | 2,560,542 | ||||
| Reynolds American, Inc., 5.85%, 8/15/2045 | 3,893,000 | 4,768,146 | ||||||
|
| |||||||
| $ | 7,328,688 | |||||||
|
| |||||||
| Transportation – Services – 0.1% | ||||||||
| ERAC USA Finance LLC, 7%, 10/15/2037 (n) | $ | 2,696,000 | $ | 3,499,694 | ||||
|
| |||||||
| U.S. Government Agencies and Equivalents – 0.1% | ||||||||
| Small Business Administration, 4.35%, 7/01/2023 | $ | 3,980 | $ | 4,132 | ||||
| Small Business Administration, 4.77%, 4/01/2024 | 234,802 | 246,385 | ||||||
| Small Business Administration, 5.18%, 5/01/2024 | 358,830 | 379,354 | ||||||
| Small Business Administration, 5.52%, 6/01/2024 | 17,540 | 18,641 | ||||||
| Small Business Administration, 4.99%, 9/01/2024 | 380,630 | 402,162 | ||||||
| Small Business Administration, 4.95%, 3/01/2025 | 12,309 | 13,003 | ||||||
| Small Business Administration, 5.11%, 8/01/2025 | 1,189,673 | 1,260,297 | ||||||
|
| |||||||
| $ | 2,323,974 | |||||||
|
| |||||||
| U.S. Treasury Obligations – 13.5% | ||||||||
| U.S. Treasury Bonds, 8%, 11/15/2021 | $ | 723,000 | $ | 911,121 | ||||
| U.S. Treasury Bonds, 6%, 2/15/2026 | 777,000 | 1,007,338 | ||||||
| U.S. Treasury Bonds, 6.75%, 8/15/2026 | 2,569,000 | 3,524,447 | ||||||
| U.S. Treasury Bonds, 5.375%, 2/15/2031 | 574,000 | 771,447 | ||||||
| U.S. Treasury Bonds, 4.5%, 2/15/2036 | 1,203,000 | 1,552,810 | ||||||
| U.S. Treasury Bonds, 5%, 5/15/2037 | 1,609,000 | 2,207,661 | ||||||
| U.S. Treasury Bonds, 4.5%, 8/15/2039 | 13,795,600 | 17,871,772 | ||||||
| U.S. Treasury Bonds, 2.875%, 5/15/2043 | 49,321,500 | 49,799,327 | ||||||
| U.S. Treasury Bonds, 2.5%, 2/15/2045 | 9,797,000 | 9,142,972 | ||||||
| U.S. Treasury Notes, 1.375%, 2/29/2020 | 2,412,000 | 2,403,519 | ||||||
| U.S. Treasury Notes, 1.75%, 11/30/2021 | 54,155,000 | 54,013,276 | ||||||
| U.S. Treasury Notes, 3.75%, 11/15/2018 | 3,807,000 | 3,930,728 | ||||||
| U.S. Treasury Notes, 2.75%, 2/15/2019 | 41,829,000 | 42,760,365 | ||||||
| U.S. Treasury Notes, 3.125%, 5/15/2019 | 33,754,000 | 34,843,107 | ||||||
| U.S. Treasury Notes, 1%, 6/30/2019 | 5,900,000 | 5,856,210 | ||||||
| U.S. Treasury Notes, 1.625%, 6/30/2019 | 51,423,000 | 51,651,987 | ||||||
| U.S. Treasury Notes, 3.5%, 5/15/2020 | 25,260,000 | 26,648,315 | ||||||
| U.S. Treasury Notes, 3.125%, 5/15/2021 | 17,180,000 | 18,075,233 | ||||||
| U.S. Treasury Notes, 2.5%, 8/15/2023 | 31,120,000 | 31,938,114 | ||||||
| Issuer | Shares/Par | Value ($) | ||||||
| BONDS – continued | ||||||||
| U.S. Treasury Obligations – continued | ||||||||
| U.S. Treasury Notes, 2%, 11/15/2026 | $ | 5,700,000 | $ | 5,557,945 | ||||
| U.S. Treasury Notes, 3%, 11/15/2045 | 3,638,000 | 3,746,998 | ||||||
|
| |||||||
| $ | 368,214,692 | |||||||
|
| |||||||
| Utilities – Electric Power – 0.9% | ||||||||
| Berkshire Hathaway Energy Co., 3.75%, 11/15/2023 | $ | 1,930,000 | $ | 2,030,163 | ||||
| Duke Energy Corp., 2.65%, 9/01/2026 | 397,000 | 377,044 | ||||||
| Enel Finance International N.V., 4.75%, 5/25/2047 (n) | 1,581,000 | 1,626,784 | ||||||
| Exelon Corp., 3.4%, 4/15/2026 | 3,438,000 | 3,426,407 | ||||||
| MidAmerican Funding LLC, 6.927%, 3/01/2029 | 903,000 | 1,191,466 | ||||||
| Oncor Electric Delivery Co., 7%, 9/01/2022 | 2,810,000 | 3,382,695 | ||||||
| PPL Capital Funding, Inc., 5%, 3/15/2044 | 870,000 | 980,823 | ||||||
| PPL Corp., 3.4%, 6/01/2023 | 2,940,000 | 3,021,444 | ||||||
| Progress Energy, Inc., 3.15%, 4/01/2022 | 3,893,000 | 3,974,181 | ||||||
| Southern Co., 3.25%, 7/01/2026 | 3,913,000 | 3,827,935 | ||||||
|
| |||||||
| $ | 23,838,942 | |||||||
|
| |||||||
| Total Bonds (Identified Cost, $1,011,605,961) | $ | 1,040,695,710 | ||||||
|
| |||||||
| PREFERRED STOCKS – 0.0% | ||||||||
| Automotive – 0.0% | ||||||||
| Hyundai Motor Co. Ltd. (Identified Cost, $1,175,416) | 11,533 | $ | 1,174,317 | |||||
|
| |||||||
| CONVERTIBLE PREFERRED STOCKS – 0.8% | ||||||||
| Food & Beverages – 0.3% | ||||||||
| Tyson Foods, Inc., 4.75% | 105,400 | $ | 7,144,012 | |||||
|
| |||||||
| Pharmaceuticals – 0.5% | ||||||||
| Allergan PLC, 5.5% | 16,401 | $ | 14,237,380 | |||||
|
| |||||||
| Total Convertible Preferred Stocks (Identified Cost, $21,274,081) | $ | 21,381,392 | ||||||
|
| |||||||
| MONEY MARKET FUNDS – 2.0% | ||||||||
| MFS Institutional Money Market Portfolio, 0.98% (v) (Identified Cost, $53,639,872) | 53,643,839 | $ | 53,643,839 | |||||
|
| |||||||
| Total Investments (Identified Cost, $2,215,689,039) | $ | 2,743,101,806 | ||||||
|
| |||||||
| OTHER ASSETS, LESS LIABILITIES – (0.6)% | (15,725,041 | ) | ||||||
|
| |||||||
| NET ASSETS – 100.0% | $ | 2,727,376,765 | ||||||
|
| |||||||
11
Table of Contents
MFS Total Return Series
Portfolio of Investments (unaudited) – continued
| (a) | Non-income producing security. |
| (i) | Interest only security for which the fund receives interest on notional principal (Par amount). Par amount shown is the notional principal and does not reflect the cost of the security. |
| (n) | Securities exempt from registration under Rule 144A of the Securities Act of 1933. These securities may be sold in the ordinary course of business in transactions exempt from registration, normally to qualified institutional buyers. At period end, the aggregate value of these securities was $75,187,966 representing 2.8% of net assets. |
| (v) | Underlying affiliated fund that is available only to investment companies managed by MFS. The rate quoted for the MFS Institutional Money Market Portfolio is the annualized seven-day yield of the fund at period end. |
| (z) | Restricted securities are not registered under the Securities Act of 1933 and are subject to legal restrictions on resale. These securities generally may be resold in transactions exempt from registration or to the public if the securities are subsequently registered. Disposal of these securities may involve time-consuming negotiations and prompt sale at an acceptable price may be difficult. The fund holds the following restricted securities: |
| Restricted Securities | Acquisition Date | Cost | Value | |||||||
| Bayview Financial Revolving Mortgage Loan Trust, FRN, 2.822%, 12/28/2040 | 3/01/06 | $2,148,869 | $1,672,114 | |||||||
| BlackRock Capital Finance LP, 7.75%, 9/25/2026 | 8/16/13 | 18,617 | 1,973 | |||||||
| Chesapeake Funding II LLC, 2016-2A, “A2”, FRN, 2.158%, 6/15/2028 | 6/14/16 | 3,296,353 | 3,310,903 | |||||||
| Imperial Tobacco Finance PLC, 2.95%, 7/21/2020 | 7/15/15 | 2,500,830 | 2,560,542 | |||||||
| Mountain Hawk CLO Ltd., 2014-3A, “BR”, FRN, 2.958%, 4/18/2025 | 4/04/17 | 4,534,203 | 4,534,171 | |||||||
| State Grid Overseas Investment (2014) Ltd., 2.75%, 5/07/2019 | 4/28/14 | 2,581,742 | 2,614,840 | |||||||
| UBS Group Funding (Jersey) Ltd., 4.125%, 4/15/2026 | 3/29/16 | 2,530,970 | 2,644,767 | |||||||
| Total Restricted Securities | $17,339,310 | |||||||||
| % of Net assets | 0.6% | |||||||||
The following abbreviations are used in this report and are defined:
| ADR | American Depositary Receipt |
| CLO | Collateralized Loan Obligation |
| FRN | Floating Rate Note. Interest rate resets periodically and the current rate may not be the rate reported at period end. |
| PLC | Public Limited Company |
| REIT | Real Estate Investment Trust |
| TBA | To Be Announced |
See Notes to Financial Statements
12
Table of Contents
MFS Total Return Series
FINANCIAL STATEMENTS | STATEMENT OF ASSETS AND LIABILITIES (unaudited)
This statement represents your fund’s balance sheet, which details the assets and liabilities comprising the total value of the fund.
At 6/30/17 | ||||
Assets | ||||
Investments | ||||
Non-affiliated issuers, at value (identified cost, $2,162,049,167) | $2,689,457,967 | |||
Underlying affiliated funds, at value (identified cost, $53,639,872) | 53,643,839 | |||
Total investments, at value (identified cost, $2,215,689,039) | $2,743,101,806 | |||
Cash | 556,299 | |||
Foreign currency, at value (identified cost, $88,004) | 87,700 | |||
Receivables for | ||||
Investments sold | 2,731,201 | |||
Fund shares sold | 144,926 | |||
Interest and dividends | 10,069,222 | |||
Receivable from investment adviser | 76,529 | |||
Other assets | 5,466 | |||
Total assets | $2,756,773,149 | |||
Liabilities | ||||
Payables for | ||||
Investments purchased | $3,389,513 | |||
TBA purchase commitments | 23,583,952 | |||
Fund shares reacquired | 2,186,627 | |||
Payable to affiliates | ||||
Shareholder servicing costs | 1,784 | |||
Distribution and/or service fees | 18,782 | |||
Payable for independent Trustees’ compensation | 2,171 | |||
Accrued expenses and other liabilities | 213,555 | |||
Total liabilities | $29,396,384 | |||
Net assets | $2,727,376,765 | |||
Net assets consist of | ||||
Paid-in capital | $2,011,312,351 | |||
Unrealized appreciation (depreciation) on investments and translation of assets and liabilities in foreign currencies | 527,407,775 | |||
Accumulated net realized gain (loss) on investments and foreign currency | 99,160,318 | |||
Undistributed net investment income | 89,496,321 | |||
Net assets | $2,727,376,765 | |||
Shares of beneficial interest outstanding | 111,653,058 |
| Net assets | Shares outstanding | Net asset value per share | ||||||||||
Initial Class | $1,359,185,531 | 55,153,036 | $24.64 | |||||||||
Service Class | 1,368,191,234 | 56,500,022 | 24.22 | |||||||||
See Notes to Financial Statements
13
Table of Contents
MFS Total Return Series
FINANCIAL STATEMENTS | STATEMENT OF OPERATIONS (unaudited)
This statement describes how much your fund earned in investment income and accrued in expenses. It also describes any gains and/or losses generated by fund operations.
Six months ended 6/30/17 | ||||
Net investment income | ||||
Income | ||||
Dividends | $21,526,829 | |||
Interest | 16,548,868 | |||
Dividends from underlying affiliated funds | 171,644 | |||
Foreign taxes withheld | (358,715 | ) | ||
Total investment income | $37,888,626 | |||
Expenses | ||||
Management fee | $8,889,176 | |||
Distribution and/or service fees | 1,650,118 | |||
Shareholder servicing costs | 44,241 | |||
Administrative services fee | 220,943 | |||
Independent Trustees’ compensation | 21,957 | |||
Custodian fee | 69,694 | |||
Shareholder communications | 126,002 | |||
Audit and tax fees | 36,597 | |||
Legal fees | 13,983 | |||
Miscellaneous | 32,985 | |||
Total expenses | $11,105,696 | |||
Reduction of expenses by investment adviser | (1,084,794 | ) | ||
Net expenses | $10,020,902 | |||
Net investment income | $27,867,724 | |||
Realized and unrealized gain (loss) on investments and foreign currency | ||||
Realized gain (loss) (identified cost basis) | ||||
Investments: | ||||
Non-affiliated issuers | $44,320,449 | |||
Underlying affiliated issuers | (8,478 | ) | ||
Foreign currency | (7,334 | ) | ||
Net realized gain (loss) on investments and foreign currency | $44,304,637 | |||
Change in unrealized appreciation (depreciation) | ||||
Investments | $90,545,051 | |||
Translation of assets and liabilities in foreign currencies | 29,021 | |||
Net unrealized gain (loss) on investments and foreign currency translation | $90,574,072 | |||
Net realized and unrealized gain (loss) on investments and foreign currency | $134,878,709 | |||
Change in net assets from operations | $162,746,433 |
See Notes to Financial Statements
14
Table of Contents
MFS Total Return Series
FINANCIAL STATEMENTS | STATEMENTS OF CHANGES IN NET ASSETS
These statements describe the increases and/or decreases in net assets resulting from operations, any distributions, and any shareholder transactions.
| | Six months ended 6/30/17 (unaudited | ) | | Year ended 12/31/16 | | |||
Change in net assets | ||||||||
| From operations | ||||||||
Net investment income | $27,867,724 | $57,870,022 | ||||||
Net realized gain (loss) on investments and foreign currency | 44,304,637 | 77,818,859 | ||||||
Net unrealized gain (loss) on investments and foreign currency translation | 90,574,072 | 87,821,008 | ||||||
Change in net assets from operations | $162,746,433 | $223,509,889 | ||||||
| Distributions declared to shareholders | ||||||||
From net investment income | $— | $(73,082,831 | ) | |||||
From net realized gain on investments | — | (85,822,677 | ) | |||||
Total distributions declared to shareholders | $— | $(158,905,508 | ) | |||||
Change in net assets from fund share transactions | $(71,915,900 | ) | $(42,925,554 | ) | ||||
Total change in net assets | $90,830,533 | $21,678,827 | ||||||
| Net assets | ||||||||
At beginning of period | 2,636,546,232 | 2,614,867,405 | ||||||
At end of period (including undistributed net investment income of $89,496,321 and | $2,727,376,765 | $2,636,546,232 |
See Notes to Financial Statements
15
Table of Contents
MFS Total Return Series
FINANCIAL STATEMENTS | FINANCIAL HIGHLIGHTS
The financial highlights table is intended to help you understand the fund’s financial performance for the semiannual period and the past 5 fiscal years. Certain information reflects financial results for a single fund share. The total returns in the table represent the rate that an investor would have earned (or lost) on an investment in the fund share class (assuming reinvestment of all distributions) held for the entire period.
| Initial Class | Six months 6/30/17 | Years ended 12/31 | ||||||||||||||||||||||
| 2016 | 2015 | 2014 | 2013 | 2012 | ||||||||||||||||||||
| (unaudited) | ||||||||||||||||||||||||
Net asset value, beginning of period | $23.18 | $22.60 | $24.31 | $23.44 | $20.05 | $18.53 | ||||||||||||||||||
| Income (loss) from investment operations | ||||||||||||||||||||||||
Net investment income (d) | $0.26 | $0.54 | (c) | $0.62 | $0.54 | $0.45 | $0.44 | |||||||||||||||||
Net realized and unrealized gain (loss) on investments | 1.20 | 1.51 | (0.77 | ) | 1.43 | 3.34 | 1.63 | |||||||||||||||||
Total from investment operations | $1.46 | $2.05 | $(0.15 | ) | $1.97 | $3.79 | $2.07 | |||||||||||||||||
| Less distributions declared to shareholders | ||||||||||||||||||||||||
From net investment income | $— | $(0.69 | ) | $(0.64 | ) | $(0.46 | ) | $(0.40 | ) | $(0.55 | ) | |||||||||||||
From net realized gain on investments | — | (0.78 | ) | (0.92 | ) | (0.64 | ) | — | — | |||||||||||||||
Total distributions declared to shareholders | $— | $(1.47 | ) | $(1.56 | ) | $(1.10 | ) | $(0.40 | ) | $(0.55 | ) | |||||||||||||
Net asset value, end of period (x) | $24.64 | $23.18 | $22.60 | $24.31 | $23.44 | $20.05 | ||||||||||||||||||
Total return (%) (k)(r)(s)(x) | 6.30 | (n) | 9.09 | (c) | (0.37 | ) | 8.50 | 19.05 | 11.26 | |||||||||||||||
| Ratios (%) (to average net assets) and Supplemental data: | ||||||||||||||||||||||||
| Expenses before expense reductions (f) | 0.71 | (a) | 0.71 | (c) | 0.79 | 0.78 | 0.79 | 0.80 | ||||||||||||||||
| Expenses after expense reductions (f) | 0.63 | (a) | 0.62 | (c) | 0.65 | 0.67 | 0.73 | 0.77 | ||||||||||||||||
| Net investment income | 2.21 | (a) | 2.33 | (c) | 2.57 | 2.24 | 2.05 | 2.26 | ||||||||||||||||
| Portfolio turnover | 15 | (n) | 35 | 41 | 32 | 53 | 22 | |||||||||||||||||
Net assets at end of period (000 omitted) | $1,359,186 | $1,359,943 | $1,423,284 | $1,662,709 | $1,826,378 | $1,440,525 | ||||||||||||||||||
| Service Class | Six months 6/30/17 | Years ended 12/31 | ||||||||||||||||||||||
| 2016 | 2015 | 2014 | 2013 | 2012 | ||||||||||||||||||||
| (unaudited) | ||||||||||||||||||||||||
Net asset value, beginning of period | $22.81 | $22.26 | $23.95 | $23.12 | $19.80 | $18.31 | ||||||||||||||||||
| Income (loss) from investment operations | ||||||||||||||||||||||||
Net investment income (d) | $0.23 | $0.47 | (c) | $0.55 | $0.47 | $0.39 | $0.39 | |||||||||||||||||
Net realized and unrealized gain (loss) on investments | 1.18 | 1.49 | (0.74 | ) | 1.41 | 3.29 | 1.60 | |||||||||||||||||
Total from investment operations | $1.41 | $1.96 | $(0.19 | ) | $1.88 | $3.68 | $1.99 | |||||||||||||||||
| Less distributions declared to shareholders | ||||||||||||||||||||||||
From net investment income | $— | $(0.63 | ) | $(0.58 | ) | $(0.41 | ) | $(0.36 | ) | $(0.50 | ) | |||||||||||||
From net realized gain on investments | — | (0.78 | ) | (0.92 | ) | (0.64 | ) | — | — | |||||||||||||||
Total distributions declared to shareholders | $— | $(1.41 | ) | $(1.50 | ) | $(1.05 | ) | $(0.36 | ) | $(0.50 | ) | |||||||||||||
Net asset value, end of period (x) | $24.22 | $22.81 | $22.26 | $23.95 | $23.12 | $19.80 | ||||||||||||||||||
Total return (%) (k)(r)(s)(x) | 6.18 | (n) | 8.81 | (c) | (0.58 | ) | 8.24 | 18.74 | 10.93 | |||||||||||||||
| Ratios (%) (to average net assets) and Supplemental data: | ||||||||||||||||||||||||
| Expenses before expense reductions (f) | 0.96 | (a) | 0.96 | (c) | 1.04 | 1.03 | 1.04 | 1.05 | ||||||||||||||||
| Expenses after expense reductions (f) | 0.88 | (a) | 0.87 | (c) | 0.90 | 0.92 | 0.98 | 1.02 | ||||||||||||||||
| Net investment income | 1.96 | (a) | 2.08 | (c) | 2.32 | 1.98 | 1.80 | 2.02 | ||||||||||||||||
| Portfolio turnover | 15 | (n) | 35 | 41 | 32 | 53 | 22 | |||||||||||||||||
Net assets at end of period (000 omitted) | $1,368,191 | $1,276,603 | $1,191,583 | $1,370,248 | $1,392,627 | $872,739 | ||||||||||||||||||
See Notes to Financial Statements
16
Table of Contents
MFS Total Return Series
Financial Highlights – continued
| (a) | Annualized. |
| (c) | Amount reflects a one-time reimbursement of expenses by the custodian (or former custodian) without which net investment income and performance would be lower and expenses would be higher. |
| (d) | Per share data is based on average shares outstanding. |
| (f) | Ratios do not reflect reductions from fees paid indirectly, if applicable. |
| (k) | The total return does not reflect expenses that apply to separate accounts. Inclusion of these charges would reduce the total return figures for all periods shown. |
| (n) | Not annualized. |
| (r) | Certain expenses have been reduced without which performance would have been lower. |
| (s) | From time to time the fund may receive proceeds from litigation settlements, without which performance would be lower. |
| (x) | The net asset values and total returns have been calculated on net assets which include adjustments made in accordance with U.S. generally accepted accounting principles required at period end for financial reporting purposes. |
See Notes to Financial Statements
17
Table of Contents
MFS Total Return Series
NOTES TO FINANCIAL STATEMENTS (unaudited)
| (1) | Business and Organization |
MFS Total Return Series (the fund) is a diversified series of MFS Variable Insurance Trust (the trust). The trust is organized as a Massachusetts business trust and is registered under the Investment Company Act of 1940, as amended, as an open-end management investment company. The shareholders of each series of the trust are separate accounts of insurance companies, which offer variable annuity and/or life insurance products, and qualified retirement and pension plans.
The fund is an investment company and accordingly follows the investment company accounting and reporting guidance of the Financial Accounting Standards Board (FASB) Accounting Standards Codification Topic 946 Financial Services – Investment Companies.
| (2) | Significant Accounting Policies |
General – The preparation of financial statements in conformity with U.S. generally accepted accounting principles requires management to make estimates and assumptions that affect the reported amounts of assets and liabilities, and disclosure of contingent assets and liabilities at the date of the financial statements and the reported amounts of increases and decreases in net assets from operations during the reporting period. Actual results could differ from those estimates. In the preparation of these financial statements, management has evaluated subsequent events occurring after the date of the fund’s Statement of Assets and Liabilities through the date that the financial statements were issued.
In October 2016, the Securities and Exchange Commission (SEC) released its Final Rule on Investment Company Reporting Modernization (the “Rule”). The Rule, which introduces two new regulatory reporting forms for investment companies – Form N-PORT and Form N-CEN – also contains amendments to Regulation S-X which impact financial statement presentation, particularly the presentation of derivative investments. Although still evaluating the impacts of the Rule, management believes that many of the Regulation S-X amendments are consistent with the fund’s current financial statement presentation and expects that the fund will be able to comply with the Rule’s Regulation S-X amendments by the August 1, 2017 compliance date.
In March 2017, the FASB issued Accounting Standards Update 2017-08, Receivables – Nonrefundable Fees and Other Costs (Subtopic 310-20) – Premium Amortization on Purchased Callable Debt Securities (“ASU 2017-08”). For entities that hold callable debt securities at a premium, ASU 2017-08 requires that the premium be amortized to the earliest call date. ASU 2017-08 will be effective for fiscal years beginning after December 15, 2018, and interim periods within those fiscal years. Management is still evaluating the potential impacts of ASU 2017-08 but believes that adoption of ASU 2017-08 will not have a material effect on the fund’s overall financial position or its overall results of operations.
Balance Sheet Offsetting – The fund’s accounting policy with respect to balance sheet offsetting is that, absent an event of default by the counterparty or a termination of the agreement, the International Swaps and Derivatives Association (ISDA) Master Agreement does not result in an offset of reported amounts of financial assets and financial liabilities in the Statement of Assets and Liabilities across transactions between the fund and the applicable counterparty. The fund’s right to setoff may be restricted or prohibited by the bankruptcy or insolvency laws of the particular jurisdiction to which a specific master netting agreement counterparty is subject. Balance sheet offsetting disclosures, to the extent applicable to the fund, have been included in the fund’s Significant Accounting Policies note under the captions for each of the fund’s in-scope financial instruments and transactions.
Investment Valuations – Equity securities, including restricted equity securities, are generally valued at the last sale or official closing price on their primary market or exchange as provided by a third-party pricing service. Equity securities, for which there were no sales reported that day, are generally valued at the last quoted daily bid quotation on their primary market or exchange as provided by a third-party pricing service. Debt instruments and floating rate loans, including restricted debt instruments, are generally valued at an evaluated or composite bid as provided by a third-party pricing service. Short-term instruments with a maturity at issuance of 60 days or less may be valued at amortized cost, which approximates market value. Open-end investment companies are generally valued at net asset value per share. Securities and other assets generally valued on the basis of information from a third-party pricing service may also be valued at a broker/dealer bid quotation. Values obtained from third-party pricing services can utilize both transaction data and market information such as yield, quality, coupon rate, maturity, type of issue, trading characteristics, and other market data. The values of foreign securities and other assets and liabilities expressed in foreign currencies are converted to U.S. dollars using the mean of bid and asked prices for rates provided by a third-party pricing service.
The Board of Trustees has delegated primary responsibility for determining or causing to be determined the value of the fund’s investments (including any fair valuation) to the adviser pursuant to valuation policies and procedures approved by the Board. If the adviser determines that reliable market quotations are not readily available, investments are valued at fair value as determined in good faith by the adviser in accordance with such procedures under the oversight of the Board of Trustees. Under the fund’s valuation policies and procedures, market quotations are not considered to be readily available for most types of debt instruments and floating rate loans and many types of derivatives. These investments are generally valued at fair value based on information from third-party pricing services. In addition, investments may be valued at fair value if the adviser determines that an investment’s value has been materially affected by events occurring after the close of the exchange or market on which the investment is principally
18
Table of Contents
MFS Total Return Series
Notes to Financial Statements (unaudited) – continued
traded (such as foreign exchange or market) and prior to the determination of the fund’s net asset value, or after the halting of trading of a specific security where trading does not resume prior to the close of the exchange or market on which the security is principally traded. Events that occur on a frequent basis after foreign markets close (such as developments in foreign markets and significant movements in the U.S. markets) and prior to the determination of the fund’s net asset value may be deemed to have a material effect on the value of securities traded in foreign markets. Accordingly, the fund’s foreign equity securities may often be valued at fair value. The adviser generally relies on third-party pricing services or other information (such as the correlation with price movements of similar securities in the same or other markets; the type, cost and investment characteristics of the security; the business and financial condition of the issuer; and trading and other market data) to assist in determining whether to fair value and at what value to fair value an investment. The value of an investment for purposes of calculating the fund’s net asset value can differ depending on the source and method used to determine value. When fair valuation is used, the value of an investment used to determine the fund’s net asset value may differ from quoted or published prices for the same investment. There can be no assurance that the fund could obtain the fair value assigned to an investment if it were to sell the investment at the same time at which the fund determines its net asset value per share.
Various inputs are used in determining the value of the fund’s assets or liabilities. These inputs are categorized into three broad levels. In certain cases, the inputs used to measure fair value may fall into different levels of the fair value hierarchy. In such cases, an investment’s level within the fair value hierarchy is based on the lowest level of input that is significant to the fair value measurement. The fund’s assessment of the significance of a particular input to the fair value measurement in its entirety requires judgment, and considers factors specific to the investment. Level 1 includes unadjusted quoted prices in active markets for identical assets or liabilities. Level 2 includes other significant observable market-based inputs (including quoted prices for similar securities, interest rates, prepayment speed, and credit risk). Level 3 includes unobservable inputs, which may include the adviser’s own assumptions in determining the fair value of investments. The following is a summary of the levels used as of June 30, 2017 in valuing the fund’s assets or liabilities:
| Investments at Value | Level 1 | Level 2 | Level 3 | Total | ||||||||||||
| Equity Securities | $1,648,762,257 | $— | $— | $1,648,762,257 | ||||||||||||
| U.S. Treasury Bonds & U.S. Government Agency & Equivalents | — | 371,950,896 | — | 371,950,896 | ||||||||||||
| Non-U.S. Sovereign Debt | — | 19,045,397 | — | 19,045,397 | ||||||||||||
| Municipal Bonds | — | 5,534,907 | — | 5,534,907 | ||||||||||||
| U.S. Corporate Bonds | — | 217,741,765 | — | 217,741,765 | ||||||||||||
| Residential Mortgage-Backed Securities | — | 303,580,144 | — | 303,580,144 | ||||||||||||
| Commercial Mortgage-Backed Securities | — | 33,921,263 | — | 33,921,263 | ||||||||||||
| Asset-Backed Securities (including CDOs) | — | 30,527,034 | — | 30,527,034 | ||||||||||||
| Foreign Bonds | — | 58,394,304 | — | 58,394,304 | ||||||||||||
| Mutual Funds | 53,643,839 | — | — | 53,643,839 | ||||||||||||
| Total Investments | $1,702,406,096 | $1,040,695,710 | $— | $2,743,101,806 | ||||||||||||
For further information regarding security characteristics, see the Portfolio of Investments.
Of the level 1 investments presented above, equity investments amounting to $59,021,935 would have been considered level 2 investments at the beginning of the period. The primary reason for changes in the classifications between levels 1 and 2 occurs when foreign equity securities are fair valued using other observable market-based inputs in place of the closing exchange price due to events occurring after the close of the exchange or market on which the investment is principally traded. The fund’s foreign equity securities may often be valued at fair value. The fund’s policy is to recognize transfers between the levels as of the end of the period.
Foreign Currency Translation – Purchases and sales of foreign investments, income, and expenses are converted into U.S. dollars based upon currency exchange rates prevailing on the respective dates of such transactions or on the reporting date for foreign denominated receivables and payables. Gains and losses attributable to foreign currency exchange rates on sales of securities are recorded for financial statement purposes as net realized gains and losses on investments. Gains and losses attributable to foreign exchange rate movements on receivables, payables, income and expenses are recorded for financial statement purposes as foreign currency transaction gains and losses. That portion of both realized and unrealized gains and losses on investments that results from fluctuations in foreign currency exchange rates is not separately disclosed.
Security Loans – Under its Securities Lending Agency Agreement with the fund, State Street Bank and Trust Company (“State Street”), as lending agent, loans the securities of the fund to certain qualified institutions (the “Borrowers”) approved by the fund. Security loans can be terminated at the discretion of either the lending agent or the fund and the related securities must be returned within the earlier of the standard trade settlement period for such securities or within three business days. The loans are collateralized by cash and/or U.S. Treasury and federal agency obligations in an amount typically at least equal to the market value of the securities loaned. On loans collateralized by cash, the cash collateral is invested in a money market fund. The market value of the loaned securities is determined at the close of business of the fund and any additional required collateral is delivered to the fund on
19
Table of Contents
MFS Total Return Series
Notes to Financial Statements (unaudited) – continued
the next business day. State Street provides the fund with indemnification against Borrower default. In the event of Borrower default, State Street will, for the benefit of the fund, either purchase securities identical to those loaned or, when such purchase is commercially impracticable, pay the fund the market value of the loaned securities. In return, State Street assumes the fund’s rights to the related collateral. If the collateral value is less than the cost to purchase identical securities, State Street is responsible for the shortfall, but only to the extent that such shortfall is not due to a decline in collateral value resulting from collateral reinvestment for which the fund bears the risk of loss. A portion of the income generated upon investment of the collateral is remitted to the Borrowers, and the remainder is allocated between the fund and the lending agent. On loans collateralized by U.S. Treasury and/or federal agency obligations, a fee is received from the Borrower, and is allocated between the fund and the lending agent. Income from securities lending is included in “Interest” income in the Statement of Operations. The dividend and interest income earned on the securities loaned is accounted for in the same manner as other dividend and interest income. At June 30, 2017, there were no securities on loan or collateral outstanding.
Dollar Roll Transactions – The fund enters into dollar roll transactions, with respect to mortgage-backed securities issued by Ginnie Mae, Fannie Mae, and Freddie Mac, in which the fund sells mortgage-backed securities to financial institutions and simultaneously agrees to purchase similar (same issuer, type and coupon) securities at a later date at an agreed-upon price. During the period between the sale and repurchase in a dollar roll transaction the fund will not be entitled to receive interest and principal payments on the securities sold but is compensated by interest earned on the proceeds of the initial sale and by a lower purchase price on the securities to be repurchased which enhances the fund’s total return. The fund accounts for dollar roll transactions as purchases and sales and realizes gains and losses on these transactions.
Indemnifications – Under the fund’s organizational documents, its officers and Trustees may be indemnified against certain liabilities and expenses arising out of the performance of their duties to the fund. Additionally, in the normal course of business, the fund enters into agreements with service providers that may contain indemnification clauses. The fund’s maximum exposure under these agreements is unknown as this would involve future claims that may be made against the fund that have not yet occurred.
Investment Transactions and Income – Investment transactions are recorded on the trade date. Interest income is recorded on the accrual basis. All premium and discount is amortized or accreted for financial statement purposes in accordance with U.S. generally accepted accounting principles. Dividends received in cash are recorded on the ex-dividend date. Certain dividends from foreign securities will be recorded when the fund is informed of the dividend if such information is obtained subsequent to the ex-dividend date. Dividend and interest payments received in additional securities are recorded on the ex-dividend or ex-interest date in an amount equal to the value of the security on such date.
The fund may receive proceeds from litigation settlements. Any proceeds received from litigation involving portfolio holdings are reflected in the Statement of Operations in realized gain/loss if the security has been disposed of by the fund or in unrealized gain/loss if the security is still held by the fund. Any other proceeds from litigation not related to portfolio holdings are reflected as other income in the Statement of Operations.
The fund invests a significant portion of its assets in asset-backed and/or mortgage-backed securities. The value of these securities may depend, in part, on the issuer’s or borrower’s credit quality or ability to pay principal and interest when due and that value may fall if an issuer or borrower defaults on its obligation to pay principal or interest or if the instrument’s credit rating is downgraded by a credit rating agency. U.S. Government securities not supported as to the payment of principal or interest by the U.S. Treasury, such as those issued by Fannie Mae, Freddie Mac, and the Federal Home Loan Banks, are subject to greater credit risk than are U.S. Government securities supported by the U.S. Treasury, such as those issued by Ginnie Mae.
The fund purchased or sold debt securities on a when-issued or delayed delivery basis, or in a “To Be Announced” (TBA) or “forward commitment” transaction with delivery or payment to occur at a later date beyond the normal settlement period. At the time a fund enters into a commitment to purchase or sell a security, the transaction is recorded and the value of the security acquired is reflected in the fund’s net asset value. The price of such security and the date that the security will be delivered and paid for are fixed at the time the transaction is negotiated. The value of the security may vary with market fluctuations. TBA securities resulting from these transactions are included in the Portfolio of Investments. TBA purchase commitments are held at carrying amount, which approximates fair value and are categorized as level 2 within the fair value hierarchy No interest accrues to the fund until payment takes place. At the time that a fund enters into this type of transaction, the fund is required to have sufficient cash and/or liquid securities to cover its commitments. Losses may arise due to changes in the value of the underlying securities or if the counterparty does not perform under the contract’s terms, or if the issuer does not issue the securities due to political, economic or other factors. Additionally, losses may arise due to declines in the value of the securities prior to settlement date.
To mitigate this risk of loss on TBA securities and other types of forward settling mortgage-backed securities, the fund whenever possible enters into a Master Securities Forward Transaction Agreement (“MSFTA”) on a bilateral basis with each of the counterparties with whom it undertakes a significant volume of transactions. The MSFTA gives each party to the agreement the right to terminate all transactions traded under such agreement if there is a certain deterioration in the credit quality of the other party. Upon an event of default or a termination of the MSFTA, the non-defaulting party has the right to close out all transactions traded
20
Table of Contents
MFS Total Return Series
Notes to Financial Statements (unaudited) – continued
under such agreement and to net amounts owed under each transaction to one net amount payable by one party to the other. This right to close out and net payments across all transactions traded under the MSFTA could result in a reduction of the fund’s credit risk to such counterparty equal to any amounts payable by the fund under the applicable transactions, if any.
For mortgage-backed securities traded under a MSFTA, the collateral and margining requirements are contract specific. Collateral amounts across all transactions traded under such agreement are netted and one amount is posted from one party to the other to collateralize such obligations. Cash that has been pledged to cover the fund’s collateral or margin obligations under a MSFTA, if any, will be reported separately on the Statement of Assets and Liabilities as restricted cash. Securities pledged as collateral or margin for the same purpose, if any, are noted in the Portfolio of Investments.
Tax Matters and Distributions – The fund intends to qualify as a regulated investment company, as defined under Subchapter M of the Internal Revenue Code, and to distribute all of its taxable income, including realized capital gains. As a result, no provision for federal income tax is required. The fund’s federal tax returns, when filed, will remain subject to examination by the Internal Revenue Service for a three year period. Management has analyzed the fund’s tax positions taken on federal and state tax returns for all open tax years and does not believe that there are any uncertain tax positions that require recognition of a tax liability. Foreign taxes, if any, have been accrued by the fund in the accompanying financial statements in accordance with the applicable foreign tax law. Foreign income taxes may be withheld by certain countries in which the fund invests. Additionally, capital gains realized by the fund on securities issued in or by certain foreign countries may be subject to capital gains tax imposed by those countries.
Distributions to shareholders are recorded on the ex-dividend date. Income and capital gain distributions are determined in accordance with income tax regulations, which may differ from U.S. generally accepted accounting principles. Certain capital accounts in the financial statements are periodically adjusted for permanent differences in order to reflect their tax character. These adjustments have no impact on net assets or net asset value per share. Temporary differences which arise from recognizing certain items of income, expense, gain or loss in different periods for financial statement and tax purposes will reverse at some time in the future. Distributions in excess of net investment income or net realized gains are temporary overdistributions for financial statement purposes resulting from differences in the recognition or classification of income or distributions for financial statement and tax purposes.
Book/tax differences primarily relate to amortization and accretion of debt securities and wash sale loss deferrals.
The tax character of distributions declared to shareholders for the last fiscal year is as follows:
| Year ended | ||||
| 12/31/16 | ||||
| Ordinary income (including any short-term capital gains) | $73,082,831 | |||
| Long-term capital gains | 85,822,677 | |||
| Total distributions | $158,905,508 | |||
The federal tax cost and the tax basis components of distributable earnings were as follows:
| As of 6/30/17 | ||||
| Cost of investments | $2,235,880,301 | |||
| Gross appreciation | 533,332,592 | |||
| Gross depreciation | (26,111,087 | ) | ||
| Net unrealized appreciation (depreciation) | $507,221,505 | |||
| As of 12/31/16 | ||||
| Undistributed ordinary income | 68,326,993 | |||
| Undistributed long-term capital gain | 67,839,033 | |||
| Other temporary differences | (34,013 | ) | ||
| Net unrealized appreciation (depreciation) | 417,185,968 | |||
The aggregate cost above includes prior fiscal year end tax adjustments, if applicable.
Multiple Classes of Shares of Beneficial Interest – The fund offers multiple classes of shares, which differ in their respective distribution and/or service fees. The fund’s income, realized and unrealized gain (loss), and common expenses are allocated to shareholders based on the daily net assets of each class. Dividends are declared separately for each class. Differences in per share
21
Table of Contents
MFS Total Return Series
Notes to Financial Statements (unaudited) – continued
dividend rates are generally due to differences in separate class expenses. The fund’s distributions declared to shareholders as reported in the Statements of Changes in Net Assets are presented by class as follows:
| From net investment income | From net realized gain on investments | |||||||||||||||
| Six months ended 6/30/17 | Year ended 12/31/16 | Six months ended 6/30/17 | Year ended 12/31/16 | |||||||||||||
| Initial Class | $— | $39,895,869 | $— | $44,853,063 | ||||||||||||
| Service Class | — | 33,186,962 | — | 40,969,614 | ||||||||||||
| Total | $— | $73,082,831 | $— | $85,822,677 | ||||||||||||
| (3) | Transactions with Affiliates |
Investment Adviser – The fund has an investment advisory agreement with MFS to provide overall investment management and related administrative services and facilities to the fund. The management fee is computed daily and paid monthly at the following annual rates:
| First $1 billion of average daily net assets | 0.70% | |||
| Next $1.5 billion of average daily net assets | 0.65% | |||
| Next $2.5 billion of average daily net assets | 0.60% | |||
| Average daily net assets in excess of $5 billion | 0.50% |
MFS has also agreed in writing to reduce its management fee by a specified amount if certain MFS mutual fund assets exceed
thresholds agreed to by MFS and the fund’s Board of Trustees. For the six months ended June 30, 2017, this management fee reduction amounted to $102,608, which is included in the reduction of total expenses in the Statement of Operations. The management fee incurred for the six months ended June 30, 2017 was equivalent to an annual effective rate of 0.66% of the fund’s average daily net assets.
The investment adviser has agreed in writing to pay a portion of the fund’s total annual operating expenses, excluding interest, taxes, extraordinary expenses, brokerage and transaction costs, and investment-related expenses, such that total annual operating expenses do not exceed 0.625% of average daily net assets for the Initial Class shares and 0.875% of average daily net assets for the Service Class shares. This written agreement will continue until modified by the fund’s Board of Trustees, but such agreement will continue at least until April 30, 2019. For the six months ended June 30, 2017, this reduction amounted to $982,186 which is included in the reduction of total expenses in the Statement of Operations.
Distributor – MFS Fund Distributors, Inc. (MFD), a wholly-owned subsidiary of MFS, is the distributor of shares of the fund. The Trustees have adopted a distribution plan for the Service Class shares pursuant to Rule 12b-1 under the Investment Company Act of 1940.
The fund’s distribution plan provides that the fund will pay MFD distribution and/or service fees equal to 0.25% per annum of its average daily net assets attributable to Service Class shares as partial consideration for services performed and expenses incurred by MFD and financial intermediaries (including participating insurance companies that invest in the fund to fund variable annuity and variable life insurance contracts, sponsors of qualified retirement and pension plans that invest in the fund, and affiliates of these participating insurance companies and plan sponsors) in connection with the sale and distribution of the Service Class shares. MFD may subsequently pay all, or a portion, of the distribution and/or service fees to financial intermediaries.
Shareholder Servicing Agent – MFS Service Center, Inc. (MFSC), a wholly-owned subsidiary of MFS, receives a fee from the fund for its services as shareholder servicing agent. For the six months ended June 30, 2017, the fee was $41,838, which equated to 0.0031% annually of the fund’s average daily net assets. MFSC also receives payment from the fund for out-of-pocket expenses paid by MFSC on behalf of the fund. For the six months ended June 30, 2017, these costs amounted to $2,403.
Administrator – MFS provides certain financial, legal, shareholder communications, compliance, and other administrative services to the fund. Under an administrative services agreement, the fund reimburses MFS the costs incurred to provide these services. The fund is charged an annual fixed amount of $17,500 plus a fee based on average daily net assets. The administrative services fee incurred for the six months ended June 30, 2017 was equivalent to an annual effective rate of 0.0165% of the fund’s average daily net assets.
Trustees’ and Officers’ Compensation – The fund pays compensation to independent Trustees in the form of a retainer, attendance fees, and additional compensation to Board and Committee chairpersons. The fund does not pay compensation directly to Trustees or officers of the fund who are also officers of the investment adviser, all of whom receive remuneration for their services to the fund from MFS. Certain officers and Trustees of the fund are officers or directors of MFS, MFD, and MFSC.
Other – This fund and certain other funds managed by MFS (the funds) have entered into a service agreement (the ISO Agreement) which provides for payment of fees solely by the funds to Tarantino LLC in return for the provision of services of an Independent Senior Officer (ISO) for the funds. Frank L. Tarantino serves as the ISO and is an officer of the funds and the sole member of
22
Table of Contents
MFS Total Return Series
Notes to Financial Statements (unaudited) – continued
Tarantino LLC. The funds can terminate the ISO Agreement with Tarantino LLC at any time under the terms of the ISO Agreement. For the six months ended June 30, 2017, the fee paid by the fund under this agreement was $2,482 and is included in “Miscellaneous” expense in the Statement of Operations. MFS has agreed to bear all expenses associated with office space, other administrative support, and supplies provided to the ISO.
The fund invests in the MFS Institutional Money Market Portfolio which is managed by MFS and seeks current income consistent with preservation of capital and liquidity. This money market fund does not pay a management fee to MFS.
The fund is permitted to engage in purchase and sale transactions with funds and accounts for which MFS serves as investment adviser or sub-adviser (“cross-trades”) pursuant to a policy adopted by the Board of Trustees. This policy has been designed to ensure that cross-trades conducted by the fund comply with Rule 17a-7 under the Investment Company Act of 1940. Under this policy, cross-trades are effected at current market prices with no remuneration paid in connection with the transaction. During the six months ended June 30, 2017, the fund engaged in purchase and sale transactions pursuant to this policy, which amounted to $1,472,787 and $146,218, respectively. The sales transactions resulted in net realized gains (losses) of $(26,722).
| (4) | Portfolio Securities |
For the six months ended June 30, 2017, purchases and sales of investments, other than short-term obligations, were as follows:
| Purchases | Sales | |||||||
| U.S. Government securities | $128,598,560 | $108,539,283 | ||||||
| Investments (non-U.S. Government securities) | $274,417,844 | $333,712,091 | ||||||
| (5) | Shares of Beneficial Interest |
The fund’s Declaration of Trust permits the Trustees to issue an unlimited number of full and fractional shares of beneficial interest. Transactions in fund shares were as follows:
| Six months ended 6/30/17 | Year ended 12/31/16 | |||||||||||||||
| Shares | Amount | Shares | Amount | |||||||||||||
| Shares sold | ||||||||||||||||
Initial Class | 843,290 | $20,233,693 | 1,919,426 | $44,541,690 | ||||||||||||
Service Class | 4,643,910 | 109,324,090 | 8,039,223 | 183,220,550 | ||||||||||||
| 5,487,200 | $129,557,783 | 9,958,649 | $227,762,240 | |||||||||||||
| Shares issued to shareholders in reinvestment of distributions | ||||||||||||||||
Initial Class | — | $— | 3,681,535 | $84,748,932 | ||||||||||||
Service Class | — | — | 3,271,133 | 74,156,576 | ||||||||||||
| — | $— | 6,952,668 | $158,905,508 | |||||||||||||
| Shares reacquired | ||||||||||||||||
Initial Class | (4,348,779 | ) | $(104,395,293 | ) | (9,906,610 | ) | $(228,366,952 | ) | ||||||||
Service Class | (4,111,887 | ) | (97,078,390 | ) | (8,875,969 | ) | (201,226,350 | ) | ||||||||
| (8,460,666 | ) | $(201,473,683 | ) | (18,782,579 | ) | $(429,593,302 | ) | |||||||||
| Net change | ||||||||||||||||
Initial Class | (3,505,489 | ) | $(84,161,600 | ) | (4,305,649 | ) | $(99,076,330 | ) | ||||||||
Service Class | 532,023 | 12,245,700 | 2,434,387 | 56,150,776 | ||||||||||||
| (2,973,466 | ) | $(71,915,900 | ) | (1,871,262 | ) | $(42,925,554 | ) | |||||||||
| (6) | Line of Credit |
The fund and certain other funds managed by MFS participate in a $1.25 billion unsecured committed line of credit, subject to a $1 billion sublimit, provided by a syndication of banks under a credit agreement. Borrowings may be made for temporary financing needs. Interest is charged to each fund, based on its borrowings, generally at a rate equal to the higher of the Overnight Federal Reserve funds rate or daily one month LIBOR plus an agreed upon spread. A commitment fee, based on the average daily, unused portion of the committed line of credit, is allocated among the participating funds at the end of each calendar quarter. In addition, the fund and other funds managed by MFS have established unsecured uncommitted borrowing arrangements with certain banks for temporary financing needs. Interest is charged to each fund, based on its borrowings, at a rate equal to the Overnight Federal Reserve funds rate plus an agreed upon spread. For the six months ended June 30, 2017, the fund’s commitment fee and interest expense were $9,081 and $0, respectively, and are included in “Miscellaneous” expense in the Statement of Operations.
23
Table of Contents
MFS Total Return Series
Notes to Financial Statements (unaudited) – continued
| (7) | Transactions in Underlying Affiliated Funds – Affiliated Issuers |
An affiliated issuer may be considered one in which the fund owns 5% or more of the outstanding voting securities, or a company which is under common control. For the purposes of this report, the fund assumes the following to be an affiliated issuer:
Underlying Affiliated Fund | Beginning Amount | Acquisitions Shares/Par Amount | Dispositions Shares/Par Amount | Ending Shares/Par Amount | ||||||||||||
| MFS Institutional Money Market Portfolio | 51,630,973 | 167,805,989 | (165,793,123 | ) | 53,643,839 | |||||||||||
| Underlying Affiliated Fund | Realized Gain (Loss) | Capital Gain Distributions | Dividend Income | Ending Value | ||||||||||||
| MFS Institutional Money Market Portfolio | $(8,478 | ) | $— | $171,644 | $53,643,839 | |||||||||||
24
Table of Contents
MFS Total Return Series
RESULTS OF SHAREHOLDER MEETING (unaudited)
At a special meeting of shareholders of MFS Variable Insurance Trust, which was held on March 23, 2017, the following action was taken:
Item 1: To elect the following individuals as Trustees:
| Number of Dollars | ||||||||
| Nominee | For | Withheld Authority | ||||||
| Steven E. Buller | 11,311,922,492.61 | 518,570,973.54 | ||||||
| John A. Caroselli | 11,291,109,000.34 | 539,384,465.81 | ||||||
| Maureen R. Goldfarb | 11,233,211,779.66 | 597,281,686.49 | ||||||
| David H. Gunning | 11,179,077,201.17 | 651,416,264.98 | ||||||
| Michael Hegarty | 11,191,993,154.78 | 638,500,311.37 | ||||||
| John P. Kavanaugh | 11,242,238,261.44 | 588,255,204.71 | ||||||
| Robert J. Manning | 11,314,479,376.58 | 516,014,089.57 | ||||||
| Clarence Otis, Jr. | 11,208,873,448.85 | 621,620,017.30 | ||||||
| Maryanne L. Roepke | 11,263,427,105.03 | 567,066,361.12 | ||||||
| Robin A. Stelmach | 11,313,883,043.82 | 516,610,422.33 | ||||||
| Laurie J. Thomsen | 11,240,219,041.09 | 590,274,425.06 | ||||||
25
Table of Contents
MFS Total Return Series
PROXY VOTING POLICIES AND INFORMATION
MFS votes proxies on behalf of the fund pursuant to proxy voting policies and procedures that are available without charge, upon request, by calling 1-800-225-2606, by visiting mfs.com (once you have selected “Individual Investor” as your role, click on “Individual Investor Home” in the top navigation and then select “Learn More About Proxy Voting” under the “I want to…” header on the left hand column of the page), or by visiting the SEC’s Web site at http://www.sec.gov.
Information regarding how the fund voted proxies relating to portfolio securities during the most recent twelve-month period ended June 30 is available by August 31 of each year without charge by visiting mfs.com (once you have selected “Individual Investor” as your role, click on “Individual Investor Home” in the top navigation and then select “Learn More About Proxy Voting” under the “I want to…” header on the left hand column of the page), or by visiting the SEC’s Web site at http://www.sec.gov.
QUARTERLY PORTFOLIO DISCLOSURE
The fund will file a complete schedule of portfolio holdings with the Securities and Exchange Commission (the Commission) for the first and third quarters of each fiscal year on Form N-Q. The fund’s Form N-Q is available on the EDGAR database on the Commission’s Internet Web site at http://www.sec.gov, and may be reviewed and copied at the:
Public Reference Room
Securities and Exchange Commission
100 F Street, NE, Room 1580
Washington, D.C. 20549
Information on the operation of the Public Reference Room may be obtained by calling the Commission at 1-800-SEC-0330. Copies of the fund’s Form N-Q also may be obtained, upon payment of a duplicating fee, by electronic request at the following e-mail address: publicinfo@sec.gov or by writing the Public Reference Section at the above address.
From time to time, MFS may post important information about the fund or the MFS funds on the MFS web site (mfs.com). This information is available on mfs.com by following these steps once you have selected “Individual Investor” as your role: (1) Click on the “Individual Investor Home” in the top navigation and then select the “Announcements” option within the “Market Outlooks” drop down, or (2) Click on “Products & Services” and “Variable Insurance Portfolios” and then select the fund’s name.
INFORMATION ABOUT FUND CONTRACTS AND LEGAL CLAIMS
The fund has entered into contractual arrangements with an investment adviser, administrator, distributor, shareholder servicing agent, 529 program manager (if applicable), and custodian who each provide services to the fund. Unless expressly stated otherwise, shareholders are not parties to, or intended beneficiaries of these contractual arrangements, and these contractual arrangements are not intended to create any shareholder right to enforce them against the service providers or to seek any remedy under them against the service providers, either directly or on behalf of the fund.
Under the Trust’s By-Laws and Declaration of Trust, any claims asserted against or on behalf of the MFS Funds, including claims against Trustees and Officers, must be brought in state and federal courts located within the Commonwealth of Massachusetts.
26
Table of Contents
Table of Contents
| ITEM 2. | CODE OF ETHICS. |
Effective January 1, 2017, the Registrant’s Code of Ethics (the “Code”) was amended to (i) clarify that the term “for profit” company as used in Section II.B of the Code excludes the investment adviser and its subsidiaries and pooled investment vehicles sponsored by the investment adviser or its subsidiaries, (ii) align the Code’s provisions regarding receipt of gifts and entertainment in Section II.B of the Code with the gifts and entertainment policy of the Funds’ investment adviser, and (iii) make other administrative changes. During the period covered by this report, the Registrant did not grant a waiver, including an implicit waiver, from any provision of the Code.
A copy of the amended Code effective as of January 1, 2017 is filed as an exhibit to this Form N-CSR.
| ITEM 3. | AUDIT COMMITTEE FINANCIAL EXPERT. |
Not applicable for semi-annual reports.
| ITEM 4. | PRINCIPAL ACCOUNTANT FEES AND SERVICES. |
Not applicable for semi-annual reports.
| ITEM 5. | AUDIT COMMITTEE OF LISTED REGISTRANTS. |
Not applicable to the Registrant.
| ITEM 6. | INVESTMENTS |
A schedule of investments for each series of the Registrant is included as part of the report to shareholders of such series under Item 1 of this Form N-CSR.
| ITEM 7. | DISCLOSURE OF PROXY VOTING POLICIES AND PROCEDURES FOR CLOSED-END MANAGEMENT INVESTMENT COMPANIES. |
Not applicable to the Registrant.
| ITEM 8. | PORTFOLIO MANAGERS OF CLOSED-END MANAGEMENT INVESTMENT COMPANIES. |
Not applicable to the Registrant.
| ITEM 9. | PURCHASES OF EQUITY SECURITIES BY CLOSED-END MANAGEMENT INVESTMENT COMPANY AND AFFILIATED PURCHASERS. |
Not applicable to the Registrant.
Table of Contents
| ITEM 10. | SUBMISSION OF MATTERS TO A VOTE OF SECURITY HOLDERS. |
There were no material changes to the procedures by which shareholders may send recommendations to the Board for nominees to the Registrant’s Board since the Registrant last provided disclosure as to such procedures in response to the requirements of Item 407 (c)(2)(iv) of Regulation S-K or this Item.
| ITEM 11. | CONTROLS AND PROCEDURES. |
| (a) | Based upon their evaluation of the effectiveness of the registrant’s disclosure controls and procedures (as defined in Rule 30a-3(c) under the Investment Company Act of 1940 (the “Act”)) as conducted within 90 days of the filing date of this report on Form N-CSR, the registrant’s principal financial officer and principal executive officer have concluded that those disclosure controls and procedures provide reasonable assurance that the material information required to be disclosed by the registrant on this report is recorded, processed, summarized and reported within the time periods specified in the Securities and Exchange Commission’s rules and forms. |
| (b) | There were no changes in the registrant’s internal controls over financial reporting (as defined in Rule 30a-3(d) under the Act) that occurred during the second fiscal quarter of the period covered by the report that have materially affected, or are reasonably likely to materially affect, the registrant’s internal control over financial reporting. |
| ITEM 12. | DISCLOSURE OF SECURITIES LENDING ACTIVITIES FOR CLOSED-END MANAGEMENT INVESTMENT COMPANIES. |
Not applicable to the Registrant.
| ITEM 13. | EXHIBITS. |
| (a) | File the exhibits listed below as part of this form. Letter or number the exhibits in the sequence indicated. |
| (1) | Any code of ethics, or amendment thereto, that is the subject of the disclosure required by Item 2, to the extent that the registrant intends to satisfy the Item 2 requirements through filing of an exhibit. Attached hereto. |
| (2) | A separate certification for each principal executive officer and principal financial officer of the registrant as required by Rule 30a-2(a) under the Act (17 CFR 270.30a-2): Attached hereto. |
| (b) | If the report is filed under Section 13(a) or 15(d) of the Exchange Act, provide the certifications required by Rule 30a-2(b) under the Act (17 CFR 270.30a-2(b)), Rule 13a-14(b) or Rule 15d-14(b) under the Exchange Act (17 CFR 240.13a-14(b) or 240.15d-14(b)) and Section 1350 of Chapter 63 of Title 18 of the United States Code (18 U.S.C. 1350) as an exhibit. A certification furnished pursuant to this paragraph will not be deemed “filed” for the purposes of Section 18 of the Exchange Act (15 U.S.C. 78r), or otherwise subject to the liability of that section. Such certification will not be deemed to be incorporated by reference into any filing under the Securities Act of 1933 or the Exchange Act, except to the extent that the registrant specifically incorporates it by reference: Attached hereto. |
Table of Contents
Notice
A copy of the Amended and Restated Declaration of Trust, as amended, of the Registrant is on file with the Secretary of State of The Commonwealth of Massachusetts and notice is hereby given that this instrument is executed on behalf of the Registrant by an officer of the Registrant as an officer and not individually and the obligations of or arising out of this instrument are not binding upon any of the Trustees or shareholders individually, but are binding only upon the assets and property of the respective constituent series of the Registrant.
Table of Contents
SIGNATURES
Pursuant to the requirements of the Securities Exchange Act of 1934 and the Investment Company Act of 1940, the registrant has duly caused this report to be signed on its behalf by the undersigned, thereunto duly authorized.
(Registrant) MFS VARIABLE INSURANCE TRUST
| By (Signature and Title)* | DAVID L. DILORENZO | |
| David L. DiLorenzo, President |
Date: August 16, 2017
Pursuant to the requirements of the Securities Exchange Act of 1934 and the Investment Company Act of 1940, this report has been signed below by the following persons on behalf of the registrant and in the capacities and on the dates indicated.
| By (Signature and Title)* | DAVID L. DILORENZO | |
| David L. DiLorenzo, President (Principal Executive Officer) |
Date: August 16, 2017
| By (Signature and Title)* | JAMES O. YOST | |
| James O. Yost, Treasurer (Principal Financial Officer and Accounting Officer) |
Date: August 16, 2017
| * | Print name and title of each signing officer under his or her signature. |