Exhibit 99.1
Second Quarter Report – 2017
(in United States dollars, tabular amounts in millions, except where noted)
MANAGEMENT’S DISCUSSION AND ANALYSIS
OF FINANCIAL CONDITION AND RESULTS OF OPERATIONS
FOR THE THREE AND SIX MONTHS ENDED JUNE 30, 2017
This Management’s Discussion and Analysis (“MD&A”) should be read in conjunction with the condensed interim consolidated financial statements of Goldcorp Inc. (“Goldcorp” or “the Company”) for the three and six months ended June 30, 2017 and related notes thereto which have been prepared in accordance with International Accounting Standard 34 – Interim Financial Reporting of International Financial Reporting Standards (“GAAP” or “IFRS”) as issued by the International Accounting Standards Board (“IASB”). All figures are in United States (“US”) dollars unless otherwise noted. References to C$ are to Canadian dollars. This MD&A has been prepared as of July 26, 2017.
TABLE OF CONTENTS
|
| | |
| | Page Number |
| Cautionary Statements | |
| Quarter Highlights | |
| Business Overview and Strategy | |
| Market Overview | |
| Quarterly Results | |
| Liquidity and Capital Resources | |
| Guidance | |
| Operational and Projects Review | |
| Non-GAAP Performance Measures | |
| Risks and Uncertainties | |
| Accounting Matters | |
| Controls and Procedures | |
| Mineral Reserves and Resources - Cerro Casale and Caspiche | |
Second Quarter Report – 2017
(in United States dollars, tabular amounts in millions, except where noted)
CAUTIONARY STATEMENT REGARDING FORWARD-LOOKING STATEMENTS
This MD&A contains “forward-looking statements” within the meaning of Section 27A of the United States Securities Act of 1933, as amended, Section 21E of the United States Exchange Act of 1934, as amended, the United States Private Securities Litigation Reform Act of 1995, or in releases made by the United States Securities and Exchange Commission, all as may be amended from time to time, and "forward-looking information" under the provisions of applicable Canadian securities legislation, concerning the business, operations and financial performance and condition of Goldcorp. Forward-looking statements include, but are not limited to, statements with respect to the number of Goldcorp shares to be issued, timing and anticipated receipt of court approvals for the Caspiche Transaction, the ability of the parties to satisfy conditions of and to complete the Caspiche Transaction within the times specified, the future price of gold, silver, copper, lead and zinc, the estimation of Mineral Reserves (as defined below) and Mineral Resources (as defined below), the realization of Mineral Reserve estimates, the timing and amount of estimated future production, costs of production, targeted cost reductions, capital expenditures, free cash flow, costs and timing of the development of new deposits, success of exploration activities, permitting time lines, hedging practices, currency exchange rate fluctuations, requirements for additional capital, government regulation of mining operations, environmental risks, unanticipated reclamation expenses, timing and possible outcome of pending litigation, title disputes or claims and limitations on insurance coverage. Generally, these forward-looking statements can be identified by the use of forward-looking terminology such as “plans”, “expects” , “is expected”, “budget”, “scheduled”, “estimates”, “forecasts”, “intends”, “anticipates”, “believes”, or variations or comparable language of such words and phrases or statements that certain actions, events or results “may”, “could”, “would”, "should", “might” or “will be taken”, “occur” or “be achieved” or the negative connotation thereof.
Forward-looking statements are necessarily based upon a number of factors and assumptions that, if untrue, could cause the actual results, performances or achievements of Goldcorp to be materially different from future results, performances or achievements expressed or implied by such statements. Such statements and information are based on numerous assumptions regarding present and future business strategies and the environment in which Goldcorp will operate in the future, including the price of gold, anticipated costs and ability to achieve goals. In respect of the forward-looking statements concerning the anticipated completion, including timing, of the Caspiche Transaction, Goldcorp has provided them in reliance on certain assumptions that it believes are reasonable at this time, including assumptions as to the approval by Goldcorp as the majority shareholder of Exeter Resource Corporation ("Exeter") of the subsequent acquisition transaction arrangement resolution; the ability of the parties to receive, in a timely manner, the necessary regulatory and court approvals; and the ability of the parties to satisfy, in a timely manner, the other conditions to the closing of the Caspiche Transaction. Certain important factors that could cause actual results, performances or achievements to differ materially from those in the forward-looking statements include, among others, gold price volatility, discrepancies between actual and estimated production, Mineral Reserves and Mineral Resources and metallurgical recoveries, mining operational and development risks, litigation risks, regulatory restrictions (including environmental regulatory restrictions and liability), changes in national and local government legislation, taxation, controls or regulations and/or change in the administration of laws, policies and practices, expropriation or nationalization of property and political or economic developments in Canada, the United States and other jurisdictions in which the Company does or may carry on business in the future, delays, suspension and technical challenges associated with capital projects, higher prices for fuel, steel, power, labour and other consumables, currency fluctuations, the speculative nature of gold exploration, the global economic climate, dilution, share price volatility, competition, loss of key employees, additional funding requirements and defective title to mineral claims or property. Although Goldcorp believes its expectations are based upon reasonable assumptions and has attempted to identify important factors that could cause actual actions, events or results to differ materially from those described in forward-looking statements, there may be other factors that cause actions, events or results not to be as anticipated, estimated or intended.
Forward-looking statements are subject to known and unknown risks, uncertainties and other important factors that may cause the actual results, level of activity, performance or achievements of Goldcorp to be materially different from those expressed or implied by such forward-looking statements, including but not limited to: the risk that the Caspiche Transaction may not close when planned or on the terms and conditions set forth in the Caspiche Transaction agreement; the failure to obtain the necessary regulatory and court approvals required in order to proceed with the Caspiche Transaction; the benefits expected from the Caspiche Transaction or the Cerro Casale Transaction not being realized; risks related to the integration of acquisitions; risks related to international operations, including economic and political instability in foreign jurisdictions in which Goldcorp operates; risks related to current global financial conditions; risks related to joint venture operations; actual results of current exploration activities; actual results of current reclamation activities; environmental risks; conclusions of economic evaluations; changes in project parameters as plans continue to be refined; future prices of gold, silver, copper, lead and zinc; possible variations in ore reserves, grade or recovery rates; failure of plant, equipment or processes to operate as anticipated; mine development and operating risks; accidents, labour disputes and other risks of the mining industry; risks associated with restructuring and cost-efficiency initiatives; delays in obtaining governmental approvals or financing or in the completion of development or construction activities; risks related to indebtedness and the service of such indebtedness, as well as those factors discussed in the section entitled "Description of the Business – Risk Factors” in Goldcorp’s most recent annual information form available on SEDAR at www.sedar.com and on EDGAR at www.sec.gov. Although Goldcorp has attempted to identify important factors that could cause actual results to differ materially from those contained in forward-looking statements, there may be other factors that cause results not to be as anticipated, estimated or intended. There can be no assurance that such statements will prove to be accurate, as actual results and future events could differ materially from those anticipated in such statements. Accordingly, readers should not place undue reliance on forward-looking statements. Forward-looking statements are made as of the date hereof and, accordingly, are subject to change after such date. Except as otherwise indicated by Goldcorp, these statements do not reflect the potential impact of any non-recurring or other special items or of any disposition, monetization, merger, acquisition, other business combination or other transaction that may be announced or that may occur after the date hereof. Forward-looking statements are provided for the purpose of providing information about management’s current expectations and plans and allowing investors and others to get a better understanding of Goldcorp's operating environment. Goldcorp does not intend or undertake to publicly update any forward-looking statements that are included in this document, whether as a result of new information, future events or otherwise, except in accordance with applicable securities laws.
Second Quarter Report – 2017
(in United States dollars, tabular amounts in millions, except where noted)
CAUTIONARY STATEMENT REGARDING CERTAIN MEASURES OF PERFORMANCE
This MD&A presents certain measures, including "total cash costs: by-product", "total cash costs: co-product", ‘‘all-in sustaining costs" and ‘‘adjusted operating cash flow’’, that are not recognized measures under IFRS. This data may not be comparable to data presented by other gold producers. For a reconciliation of these measures to the most directly comparable financial information presented in the consolidated financial statements prepared in accordance with IFRS, see Non-GAAP Financial Performance Measures in this MD&A. The Company believes that these generally accepted industry measures are realistic indicators of operating performance and are useful in performing year over year comparisons. However, these non-GAAP measures should be considered together with other data prepared in accordance with IFRS, and these measures, taken by themselves, are not necessarily indicative of operating costs or cash flow measures prepared in accordance with IFRS. This MD&A also contains information as to estimated future all-in sustaining costs. The estimates of future all-in sustaining costs are not based on total production cash costs calculated in accordance with IFRS, which forms the basis of the Company’s cash costs: by-product. The estimates of future all-in sustaining costs are anticipated to be adjusted to include sustaining capital expenditures, corporate administrative expense, exploration and evaluation costs and reclamation cost accretion and amortization, and exclude the effects of expansionary capital, tax payments, dividends and financing costs. Projected IFRS total production cash costs for the full year would require inclusion of the projected impact of future included and excluded items, including items that are not currently determinable, but may be significant, such as sustaining capital expenditures, reclamation cost accretion and amortization and tax payments. Due to the uncertainty of the likelihood, amount and timing of any such items, the Company does not have information available to provide a quantitative reconciliation of projected all-in sustaining costs to a total production cash costs projection.
CAUTIONARY NOTE REGARDING RESERVES AND RESOURCES
Scientific and technical information contained in this MD&A relating to Mineral Reserves and Mineral Resources was reviewed and approved by Gil Lawson, P.Eng., Vice President, Geology and Mine Planning for Goldcorp, and a “qualified person” as defined by Canadian Securities Administrators' National Instrument 43-101 – Standards of Disclosure for Mineral Projects (“NI 43-101”). Scientific and technical information in this MD&A relating to exploration results was reviewed and approved by Sally Goodman, PhD, PGeo, Director, Generative Geology for Goldcorp, and a "qualified person" as defined by NI 43-101. All Mineral Reserves and Mineral Resources have been calculated in accordance with the standards of the Canadian Institute of Mining, Metallurgy and Petroleum ("CIM") and NI 43-101, or the Australasian Code for Reporting of Exploration Results, Mineral Resources and Ore Reserves equivalent. All Mineral Resources are reported exclusive of Mineral Reserves. Mineral Resources that are not Mineral Reserves do not have demonstrated economic viability. Information on data verification performed on the mineral properties mentioned in this MD&A that are considered to be material mineral properties to the Company are contained in Goldcorp’s most recent annual information form and the current technical report for each of those properties, all available on SEDAR at www.sedar.com.
Cautionary Note to United States investors concerning estimates of measured, indicated and inferred resources: The Mineral Resource and Mineral Reserve estimates contained in this MD&A have been prepared in accordance with the requirements of the securities laws in effect in Canada, which differ from the requirements of United States securities laws and use terms that are not recognized by the United States Securities and Exchange Commission (“SEC”). Canadian reporting requirements for disclosure of mineral properties are governed by NI 43-101. The definitions used in NI 43-101 are incorporated by reference from the CIM Definition Standards adopted by CIM Council on May 10, 2014 (the “CIM Definition Standards”) . U.S. reporting requirements are governed by the SEC Industry Guide 7 (“Industry Guide 7”) under the United States Securities Act of 1933, as amended. These reporting standards have similar goals in terms of conveying an appropriate level of confidence in the disclosures being reported, but embody difference approaches and definitions. For example, the terms “Mineral Reserve”, “Proven Mineral Reserve” and “Probable Mineral Reserve” are Canadian mining terms as defined in in NI 43-101, and these definitions differ from the definitions in Industry Guide 7. Under Industry Guide 7 standards, a “final” or “bankable” feasibility study is required to report reserves and the primary environmental analysis or report must be filed with the appropriate governmental authority. Further, under Industry Guide 7, mineralization may not be classified as "reserve" unless the determination has been made that the mineralization could be economically and legally produced or extracted at the time the reserve determination is made.
While the terms “Mineral Resource”, “Measured Mineral Resource”, “Indicated Mineral Resource” and “Inferred Mineral Resource” are defined in and required to be disclosed by NI 43-101, these terms are not defined terms under Industry Guide 7 and are normally not permitted to be used in reports and registration statements filed with the SEC. United States readers are cautioned not to assume that any part or all of mineral deposits in these categories will ever be converted into reserves. In addition, “Inferred Mineral Resources” have a great amount of uncertainty as to their existence, and great uncertainty as to their economic and legal feasibility. A significant amount of exploration must be completed in order to determine whether an Inferred Mineral Resource may be upgraded to a higher category. Under Canadian regulations, estimates of Inferred Mineral Resources may not form the basis of feasibility or pre-feasibility studies, except in rare cases. United States readers are cautioned not to assume that all or any part of an Inferred Mineral Resource exists or is economically or legally mineable. Disclosure of “contained ounces” in a resource is permitted disclosure under Canadian regulations if such disclosure includes the grade or quality and the quantity for each category of Mineral Resource and Mineral Reserve; however, the SEC normally only permits issuers to report mineralization that does not constitute “reserves” by SEC standards as in place tonnage and grade without reference to unit measures.
Accordingly, information contained in this MD&A containing descriptions of the Goldcorp’s mineral deposits may not be comparable to similar information made public by United States companies subject to the reporting and disclosure requirements under the United States federal securities laws and the rules and regulations thereunder.
Second Quarter Report – 2017
(in United States dollars, tabular amounts in millions, except where noted)
FINANCIAL AND OPERATIONAL HIGHLIGHTS FOR THE THREE MONTHS ENDED JUNE 30, 2017
Net earnings for the second quarter of 2017 were $135 million, or $0.16 per share, compared to a net loss of $78 million, or $0.09 per share, for the second quarter of 2016. Operating cash flows for the second quarter of 2017 were $158 million. Adjusted operating cash flows were $320 million (1) for the second quarter of 2017 compared to $204 million for the same period in the prior year.
Gold production of 635,000 ounces at all-in sustaining costs ("AISC") of $800 per ounce, compared to 613,000 ounces at AISC of $1,067 for the second quarter of 2016 (1). 2017 guidance reconfirmed for gold production of 2.5 million ounces (+/- 5%). Cost guidance has been reduced for 2017 AISC to $825(2) per ounce (+/- 5%) from $850 per ounce, reflecting the progress the Company has made on its initiative to realize $250 million in sustainable annual efficiencies by 2018.
Program to implement $250 million of sustainable annual efficiencies by the middle of 2018 on track with $200 million expected to be achieved in 2017 across our portfolio. More than 100% of the targeted efficiencies have been identified, with the program likely to be extended and the efficiency target increased, after the Company achieves its current target.
Portfolio optimization continues to drive increasing net asset value (“NAV”) per share. The Company's strategy to deliver a 20% increase in gold production, a 20% increase in gold reserves and a 20% reduction in AISC over the next five years advanced with the formation of a 50/50 joint venture with Barrick Gold Corporation in the Maricunga district in Chile, the divestiture of $500 million of non-core assets in Mexico and Guatemala and solid execution on the Company's key growth projects.
| |
| (1) | The Company has included non-GAAP performance measures on an attributable (or Goldcorp's share) basis throughout this document. AISC per ounce and adjusted operating cash flows are non-GAAP financial performance measures with no standardized definition under IFRS. For further information and detailed reconciliations, please see pages 33-39 of this MD&A. |
| |
| (2) | Refer to footnote (4) on page 18 of this MD&A regarding the Company's projection of AISC. |
Second Quarter Report – 2017
(in United States dollars, tabular amounts in millions, except where noted)
BUSINESS OVERVIEW
Goldcorp is a leading gold producer focused on responsible mining practices, with production from a portfolio of long-life, high quality assets throughout the Americas that it believes positions the Company to deliver long-term value.
The Company’s principal producing mining properties are comprised of the Éléonore, Musselwhite, Porcupine and Red Lake mines in Canada; the Peñasquito mine in Mexico; the Cerro Negro mine in Argentina; and the Pueblo Viejo mine (40.0% interest) in the Dominican Republic.
The Company’s current sources of operating cash flows are primarily from the sale of gold, silver, lead, zinc and copper. Goldcorp's principal product is refined gold bullion sold primarily in the London spot market. As a result, Goldcorp is not dependent on a particular purchaser with regard to the sale of the gold bullion. In addition to gold, the Company also produces silver, copper, lead and zinc primarily from concentrate produced at the Peñasquito and Alumbrera mines, which is sold to third party smelters and refineries.
Goldcorp has an investment-grade credit rating, supported by a strong balance sheet, and remains 100% unhedged to gold sales, providing full exposure to gold prices.
STRATEGY
Goldcorp's vision is to create sustainable value for all of its stakeholders by focusing on growing NAV per share to generate long-term shareholder value. With a portfolio of large, long-life assets that provide economies of scale, coupled with low AISC and underpinned by a strong balance sheet, Goldcorp continues to optimize its portfolio of assets and reinvest in a pipeline of organic opportunities to drive increasing NAV per share.
The Company has outlined its 20/20/20 growth plan that is expected to deliver a 20% increase in gold production, a 20% increase in gold reserves and a 20% reduction in AISC over the next five years. In pursuit of this, Goldcorp is committed to being responsible stewards of the environment and building collaborative partnerships with communities, governments and all other stakeholders for mutual success.
With a solid balance sheet, Goldcorp believes it is well-positioned to weather gold price volatility. The Company's capital allocation strategy focuses on investing in its pipeline of organic growth opportunities, further debt reduction and returning capital to its shareholders by paying a sustainable dividend. Furthermore, Goldcorp has the flexibility to take advantage of corporate development opportunities in lower political risk jurisdictions that would be accretive to NAV per share, and leverage its exploration spending in the most efficient way possible through small toehold investments in junior mining companies.
CORPORATE DEVELOPMENTS
Acquisition of the Cerro Casale and Caspiche Projects
On June 9, 2017, the Company completed the acquisition of a 50% interest in the Cerro Casale project (the "Cerro Casale Transaction"). The transaction was executed in multiple steps, including the acquisition by Goldcorp of a 25% interest in the Cerro Casale project from each of Kinross Gold Corporation ("Kinross") and Barrick Gold Corporation ("Barrick"), which resulted in Barrick and Goldcorp each owning 50% of the project and subsequently forming a 50/50 joint operation. The Cerro Casale project is located in the Maricunga Gold Belt in the Atacama Region in northern Chile.
The Company also commenced an offer to acquire 100% of the issued and outstanding shares of Exeter Resource Corporation ("Exeter") and its Caspiche project (the "Caspiche Transaction"), which is also located in the Maricunga Gold Belt. As of June 30, 2017, the Company had acquired 83.2% of the issued and outstanding shares of Exeter and is expected to acquire the remaining ownership interest in the third quarter of 2017. After completing the acquisition of a 100% interest in Exeter, Goldcorp will contribute the Caspiche project into the joint operation with Barrick, which will result in Barrick and Goldcorp holding an indirect 50% interest in each of the Cerro Casale and Caspiche projects. The transactions are consistent with the Company's strategy of populating its pipeline with high-quality, long-dated optionality to drive increasing NAV per share.
Second Quarter Report – 2017
(in United States dollars, tabular amounts in millions, except where noted)
The key steps in the transactions were as follows:
| |
| • | Acquisition of Kinross' 25% interest in Cerro Casale and 100% interest in the Quebrada Seca exploration project for: (i) an initial cash payment of $260 million, (ii) the granting of a 1.25% royalty interest to Kinross on 25% of gross revenues derived from metal production from Cerro Casale and Quebrada Seca, with Kinross foregoing the first $10 million payable, (iii) a contingent payment of $40 million payable after a construction decision at Cerro Casale, and (iv) the assumption of a $20 million obligation to Barrick payable on commercial production at Cerro Casale. |
| |
| • | Acquisition of an additional 25% interest in Cerro Casale from Barrick for: (i) a deferred payment obligation of $260 million to be satisfied through the funding of 100% of the joint operation's expenditures (as described below), (ii) the granting of a 1.25% royalty interest to Barrick on 25% of gross revenues derived from metal production from Cerro Casale and Quebrada Seca, (iii) a contingent payment of $40 million payable after a construction decision at Cerro Casale, and (iv) the transfer to Barrick of a 50% interest in Quebrada Seca, followed by the joint contribution by Goldcorp and Barrick of 100% of Quebrada Seca to the joint operation. |
| |
| • | Acquisition of Exeter and its 100% owned Caspiche project through a supported takeover bid. Under the terms of the supported takeover bid, Exeter shareholders received 0.12 of a common share of Goldcorp for each Exeter common share held. At June 30, 2017, the Company had acquired 83.2% of the issued and outstanding common shares of Exeter for share consideration of approximately $131 million in Goldcorp common shares and expects to acquire the remaining 16.8% interest in the third quarter of 2017. |
| |
| • | Formation of a 50/50 joint operation with Barrick. The joint operation includes a 100% interest in each of the Cerro Casale and Quebrada Seca projects. In addition, the Caspiche project will be contributed to the joint operation after the 100% acquisition of Exeter is completed, which is expected in the third quarter of 2017. The parties have agreed that 50% of Caspiche’s acquisition cost, or approximately $80 million, will be credited against Goldcorp’s deferred payment obligation to Barrick. In addition, Goldcorp will be required to spend a minimum of $60 million in the two-year period following closing of the Cerro Casale Transaction, and a minimum of $80 million in each successive two-year period until the deferred payment obligation is satisfied. If Goldcorp does not spend the minimum in any two-year period, Goldcorp will instead be required to make a payment to Barrick equal to 50% of the shortfall, with a corresponding reduction in the deferred payment obligation. |
Goldcorp expects that the joint operation will allow for the consolidation of infrastructure to reduce capital and operating costs, reduce the environmental footprint and provide increased returns compared to two standalone projects. In June 2017, Goldcorp and Barrick formed a dedicated project team that will undertake 24 months of concept studies on the combined project, including analysis of synergies and infrastructure rationalization, in conjunction with community consultation and broad stakeholder engagement.
Divestitures
Aligned with the Company's strategy to optimize its portfolio through the divestiture of non-core assets and focus on large-scale camps, Goldcorp completed the sale of its Los Filos Mine in Mexico in April 2017 and its Cerro Blanco project in Guatemala, and entered into agreements in June 2017 to sell its Camino Rojo project in Mexico and its 21% interest in the San Nicolas copper-zinc project in Mexico, as described below.
Second Quarter Report – 2017
(in United States dollars, tabular amounts in millions, except where noted)
On April 7, 2017, the Company completed the sale of Los Filos to Leagold Mining Corporation (“Leagold”) for total consideration of $350 million, before working capital adjustments. The consideration was comprised of 25.3% of Leagold's issued and outstanding common shares, with a value of $71 million, $250 million in cash and a $29 million short-term promissory note that was due on the earlier of (i) 120 days from closing and (ii) the receipt by Leagold of approval from the Mexican competition commission of a subsequent tranche of its equity financing. Goldcorp also retained rights to certain tax receivables of approximately $100 million. In connection with the transaction, Goldcorp recognized a net gain of $43 million, consisting of an impairment reversal of $59 million recognized in the fourth quarter of 2016 and a subsequent impairment of $16 million recognized in the first quarter of 2017. In July 2017, Leagold received approval from the Mexican competition commission of a subsequent tranche of its equity financing and, as a result, Goldcorp’s equity interest was reduced to 22.9% and the $29 million short-term promissory note was repaid.
On May 31, 2017, the Company completed the sale of its 100% interest in the Cerro Blanco project to Bluestone Resources Inc. (“Bluestone”) for total consideration of $22 million, comprised of $18 million in cash and common shares of Bluestone representing 4.9% of Bluestone's issued and outstanding shares at the time of closing of the transaction. Goldcorp will receive an additional $15 million cash payment from Bluestone upon declaration of commercial production at Cerro Blanco and a 1% net smelter return royalty on production. In connection with the transaction, Goldcorp recognized a net gain of $13 million, consisting of a reversal of impairment of its Cerro Blanco project of $19 million during the first quarter of 2017 and a loss on disposal of $6 million on closing of the sale in May 2017.
On June 21, 2017, the Company entered into an agreement to sell its 100% interest in the Camino Rojo project, part of the Peñasquito segment, to Orla Mining Ltd. ("Orla"). Under the terms of the agreement, the Company will receive 19.9% of the issued and outstanding shares of Orla and a 2% net smelter return royalty on revenues from all metal production from the Camino Rojo oxide project. The Company also has the option to acquire up to 70% interest in future sulphide projects. The transaction is expected to close in the second half of 2017. The value of consideration received is expected to be credited to mining interests associated with Peñasquito, resulting in $nil gain or loss on disposition.
On June 29, 2017, the Company entered into an agreement with Teck Resources Limited to sell its 21% interest in the San Nicolas copper-zinc project, a stand-alone project in Mexico, for cash consideration of $50 million. The transaction is expected to close in the second half of 2017. The carrying value of San Nicolas was nominal at June 30, 2017; the resulting gain will be recognized when the transaction closes.
PROGRESS TOWARDS DELIVERING $250 MILLION OF SUSTAINABLE ANNUAL EFFICIENCIES
During the first half of 2017, the Company continued to execute its productivity and cost optimization program, with all operations participating in the delivery phase of the program. At Cerro Negro and Goldcorp’s corporate offices, voluntary and involuntary staff reductions and other cost savings initiatives have been implemented which contribute to $115 million per year in cost reductions. In the second quarter of 2017, Peñasquito began the process of rationalizing maintenance and supply contracts at the mine. Both Porcupine and Red Lake are on track to achieve productivity goals related to underground mine development and site-wide cost reductions. The Company's achievement of $200 million of annual efficiencies has been reflected in its reduced AISC guidance for 2017. Given the Company's substantial progress to date, the program is likely to be extended and the efficiency target increased, after the Company attains its current target, which the Company expects to achieve by the middle of 2018.
MARKET OVERVIEW
Gold
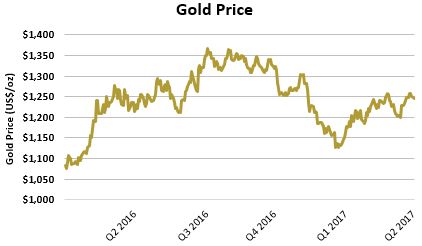
The market price of gold is the primary driver of Goldcorp's profitability. The price of gold can fluctuate widely and is affected by a number of macroeconomic factors, including the sale or purchase of gold by central banks and financial institutions, interest rates, exchange rates, inflation or deflation, global and regional supply and demand and the political and economic conditions of major gold-producing and gold-consuming countries throughout the world.
Second Quarter Report – 2017
(in United States dollars, tabular amounts in millions, except where noted)
During the second quarter of 2017 the gold market was characterized by broad range trading during which the metal twice attempted to break above $1,300 per ounce before falling back towards support levels around $1,220 per ounce each time. The price of gold began the quarter at $1,245 per ounce and closed, essentially unchanged, at $1,243 per ounce. The main economic feature of the quarter was a further interest rate hike by the US Federal Reserve on June 14, 2017, and it was this, and the threat of further rate hikes during the remainder of the year, that the Company believes kept the price capped. During the second quarter of 2017, the Company realized an average gold price of $1,256 per ounce, a 2% decrease compared to $1,277 per ounce in the second quarter of 2016, and $1,236 per ounce in the first quarter of 2017.
Currency Markets
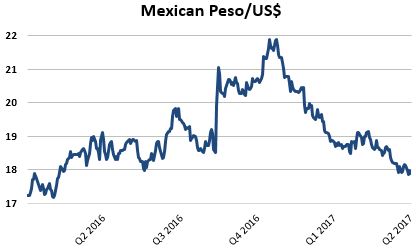
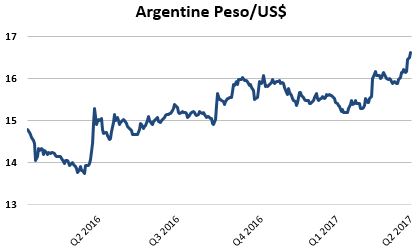
The results of Goldcorp's mining operations are affected by the US dollar exchange rates. The Company has exposure to the Canadian dollar at Éléonore, Musselwhite, Porcupine and Red Lake, exposure to the Mexican peso at Peñasquito, exposure to the Argentine peso at Cerro Negro, exposure to the Dominican Republic peso relating to its investment in Pueblo Viejo and limited exposure to the Guatemalan quetzal at Marlin. The Company's exposure to the Mexican peso and Guatemalan quetzal decreased in the second quarter of 2017 after the closing of the sale of the Los Filos mine in April and the closure of the Marlin mine at the end of May, respectively.
Fluctuations in the US dollar can cause volatility of costs reported in US dollars. In addition, monetary assets and liabilities that are denominated in non-US dollar currencies, such as cash and cash equivalents and value-added taxes, are subject to currency risk. Goldcorp is further exposed to currency risk through non-monetary assets and liabilities of entities whose taxable profit or tax loss are denominated in non-US dollar currencies. Changes in exchange rates give rise to temporary differences resulting in deferred tax liabilities with the resulting deferred tax charged or credited to income tax expense.
Goldcorp's financial risk management policy allows the hedging of foreign exchange exposure to reduce the risk associated with currency fluctuations. The Company enters into Mexican peso currency hedge contracts to purchase Mexican pesos at pre-determined US dollar amounts. These contracts are entered into to normalize operating expenses and capital expenditures at Peñasquito expressed in US dollar terms.
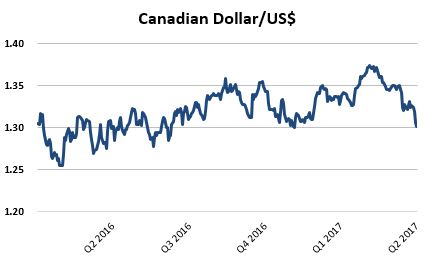
Currency markets continued to fluctuate in the second quarter of 2017 due to potential further interest rate increases in the US, fluctuations in oil prices and ongoing geopolitical developments. The Canadian dollar exhibited volatility during the second quarter of 2017 before finishing the quarter near its strongest level of 2017, due primarily to the Bank of Canada signaling its intent to increase interest rates. Early in the quarter, the Mexican peso weakened slightly before continuing its strengthening trend, mainly due to Mexican state election results and the perception of decreasing risk of a breakdown in trade relations with the United States.
Despite improvements in early 2017, the Argentine peso fell in value during the second quarter of 2017, due largely to the prospect of political instability and uncertainty surrounding elections taking place later in the year, as well as continued inflation above central bank targets.
Second Quarter Report – 2017
(in United States dollars, tabular amounts in millions, except where noted)
OVERVIEW OF QUARTERLY FINANCIAL AND OPERATING RESULTS
|
| | | | | | | | | | | | | | | | | | | | | | | | |
| | June 30 | March 31 | December 31 | September 30 |
| | 2017 |
| 2016 |
| 2017 |
| 2016 |
| 2016 |
| 2015 |
| 2016 |
| 2015 |
|
| Financial Results | | | | | | | | |
| Revenues | $ | 822 |
| $ | 753 |
| $ | 882 |
| $ | 944 |
| $ | 898 |
| $ | 1,072 |
| $ | 915 |
| $ | 1,098 |
|
| Net earnings (loss) | $ | 135 |
| $ | (78 | ) | $ | 170 |
| $ | 80 |
| $ | 101 |
| $ | (4,271 | ) | $ | 59 |
| $ | (191 | ) |
| Net earnings (loss) per share | | | | | | | | |
| – Basic and diluted | $ | 0.16 |
| $ | (0.09 | ) | $ | 0.20 |
| $ | 0.10 |
| $ | 0.12 |
| $ | (5.14 | ) | $ | 0.07 |
| $ | (0.23 | ) |
| Operating cash flow | $ | 158 |
| $ | 234 |
| $ | 227 |
| $ | 59 |
| $ | 239 |
| $ | 401 |
| $ | 267 |
| $ | 443 |
|
Adjusted operating cash flow (1) | $ | 320 |
| $ | 204 |
| $ | 315 |
| $ | 330 |
| $ | 306 |
| $ | 339 |
| $ | 401 |
| $ | 374 |
|
| Expenditures on mining interests (cash basis) | $ | 233 |
| $ | 177 |
| $ | 186 |
| $ | 182 |
| $ | 217 |
| $ | 251 |
| $ | 168 |
| $ | 249 |
|
| – Sustaining | $ | 133 |
| $ | 140 |
| $ | 113 |
| $ | 140 |
| $ | 145 |
| $ | 188 |
| $ | 112 |
| $ | 164 |
|
| – Expansionary | $ | 100 |
| $ | 37 |
| $ | 73 |
| $ | 42 |
| $ | 72 |
| $ | 63 |
| $ | 56 |
| $ | 85 |
|
| Dividends paid | $ | 16 |
| $ | 16 |
| $ | 15 |
| $ | 51 |
| $ | 16 |
| $ | 49 |
| $ | 14 |
| $ | 75 |
|
Operating Results (1) | | | | | | | | |
| Gold produced (thousands of ounces) | 635 |
| 613 |
| 655 |
| 784 |
| 761 |
| 909 |
| 715 |
| 922 |
|
Gold sold (thousands of ounces) | 649 |
| 616 |
| 646 |
| 799 |
| 768 |
| 918 |
| 686 |
| 942 |
|
| Silver produced (thousands of ounces) | 7,400 |
| 5,300 |
| 7,100 |
| 7,700 |
| 7,400 |
| 10,200 |
| 7,700 |
| 11,300 |
|
| Copper produced (thousands of pounds) | 7,900 |
| 14,400 |
| 9,700 |
| 17,200 |
| 20,400 |
| 21,400 |
| 16,900 |
| 12,300 |
|
| Lead produced (thousands of pounds) | 26,100 |
| 17,100 |
| 32,400 |
| 29,000 |
| 29,600 |
| 40,500 |
| 33,700 |
| 49,200 |
|
| Zinc produced (thousands of pounds) | 84,100 |
| 38,300 |
| 80,700 |
| 71,100 |
| 78,300 |
| 89,300 |
| 75,200 |
| 111,500 |
|
| Average realized gold price (per ounce) | $ | 1,256 |
| $ | 1,277 |
| $ | 1,236 |
| $ | 1,203 |
| $ | 1,181 |
| $ | 1,098 |
| $ | 1,333 |
| $ | 1,114 |
|
Cash costs: by-product (per ounce) (2) | $ | 510 |
| $ | 728 |
| $ | 540 |
| $ | 557 |
| $ | 481 |
| $ | 687 |
| $ | 554 |
| $ | 597 |
|
Cash costs: co-product (per ounce) (3) | $ | 644 |
| $ | 716 |
| $ | 701 |
| $ | 604 |
| $ | 619 |
| $ | 739 |
| $ | 657 |
| $ | 670 |
|
| All-in sustaining costs (per ounce) | $ | 800 |
| $ | 1,067 |
| $ | 800 |
| $ | 836 |
| $ | 747 |
| $ | 977 |
| $ | 812 |
| $ | 858 |
|
| |
| (1) | The Company has presented the non-GAAP performance measures on an attributable (or Goldcorp's share) basis in the table above. AISC and adjusted operating cash flows are non-GAAP financial performance measures with no standardized definition under IFRS. For further information and detailed reconciliations, please see pages 33-39 of this report. |
| |
| (2) | Total cash costs: by-product, per ounce, is calculated net of Goldcorp’s share of by-product sales revenues (by-product silver sales revenues for Cerro Negro, Marlin and Pueblo Viejo; by-product lead, zinc and copper sales revenues and 75% of silver sales revenues for Peñasquito at market silver prices, and 25% of silver sales revenues for Peñasquito at $4.13 per silver ounce (2016 – $4.09 per silver ounce) sold to Silver Wheaton Corp. and by-product copper sales revenues for Alumbrera). |
| |
| (3) | Total cash costs: co-product, per ounce, is calculated by allocating Goldcorp’s share of production costs to each co-product (Alumbrera (copper); Marlin (silver); Pueblo Viejo (silver and copper); Peñasquito (silver, lead and zinc)) based on the ratio of actual sales volumes multiplied by budget metal prices (see page 33). |
Second Quarter Report – 2017
(in United States dollars, tabular amounts in millions, except where noted)
REVIEW OF SECOND QUARTER FINANCIAL RESULTS
Three months ended June 30, 2017 compared to the three months ended June 30, 2016
Net earnings for the three months ended June 30, 2017 were $135 million, or $0.16 per share, compared to net loss of $78 million, or $0.09 per share, for the second quarter of 2016. The increase in net earnings in the second quarter of 2017 compared to the same period in 2016 was primarily due to higher gold, zinc and silver sales volumes and an increase in zinc realized prices, primarily at Peñasquito, partially offset by a decrease in earnings from mine operations due to the sale of Los Filos in April 2017.
Net earnings and earnings per share for the second quarter of 2017 and 2016 were affected by, among other things, the following non-cash or other items that management believes are not reflective of the performance of the underlying operations (items are denoted as (increases)/decreases to net earnings and net earnings per share):
|
| | | | | | | | | | | | | | | | | | |
| | Three months ended June 30, 2017 | Three months ended June 30, 2016 |
| (in millions, except per share) | Pre-tax | After-tax |
| Per share ($/share) |
| Pre-tax | After-tax | Per share
($/share) |
(Positive)/negative deferred tax effects of foreign exchange on tax assets and liabilities and losses (1) | $ | — |
| $ | (45 | ) | $ | (0.05 | ) | $ | — |
| $ | 60 |
| $ | 0.07 |
|
| Unrealized foreign exchange loss on Argentine peso denominated construction value-added tax receivable | $ | 6 |
| $ | 6 |
| $ | 0.01 |
| $ | — |
| $ | — |
| $ | — |
|
| Restructuring costs | $ | 2 |
| $ | 1 |
| $ | — |
| $ | 16 |
| $ | 11 |
| $ | 0.01 |
|
| |
| (1) | Positive deferred tax effects of foreign exchange on tax assets and liabilities and losses of $45 million in the three months ended June 30, 2017 (three months ended June 30, 2016 – negative deferred tax effects of $60 million) is primarily composed of a foreign exchange gain on the translation of current and deferred income tax assets and liabilities, arising primarily from acquisitions and dispositions, of $3 million (three months ended June 30, 2016 – foreign exchange loss of $69 million) and Argentine tax deductible foreign exchange losses on US dollar denominated debt in local currency of $42 million (three months ended June 30, 2016 – $9 million). |
Revenues
|
| | | | | | | | | |
| Three months ended June 30 | 2017 (1) | 2016 (1) | Change % |
| Gold | | | |
| | Revenue (millions) | $ | 624 |
| $ | 643 |
| (3 | )% |
| | Ounces sold (thousands) | 497 |
| 504 |
| (1 | )% |
| | Average realized price ($/ounce) | $ | 1,257 |
| $ | 1,277 |
| (2 | )% |
| Silver | | | |
| | Revenue (millions) | $ | 92 |
| $ | 73 |
| 26 | % |
| | Ounces sold (thousands) | 7,181 |
| 4,549 |
| 58 | % |
| | Average realized price ($/ounce) | $ | 13.38 |
| $ | 16.23 |
| (18 | )% |
| Other metals | | | |
| | Revenue (millions) | $ | 106 |
| $ | 37 |
| 186 | % |
| Total revenue (millions) | $ | 822 |
| $ | 753 |
| 9 | % |
| |
| (1) | Excludes attributable share of revenues from the Company's associates. |
Revenues increased by $69 million, or 9%, primarily due to increases in zinc and silver sales volumes of 98% and 58%, respectively, and a 22% increase in the average realized zinc price, partially offset by a lower average realized price for silver of 18%. The higher zinc and silver sales volumes were primarily due to higher production at Peñasquito due to higher grade ore as a result of mine sequencing in Phases 5 and 6, and higher mill throughput as the second quarter of 2016 included a prolonged period of planned and unplanned maintenance. Gold sales volumes for the three months ended June 30, 2017 were consistent with the same period in the prior year as an increase in Peñasquito's gold sales volume was offset by the impact of the sale of Los Filos in April 2017.
Second Quarter Report – 2017
(in United States dollars, tabular amounts in millions, except where noted)
Production Costs
Production costs decreased by $43 million, or 9%, primarily due to the divestiture of Los Filos in April 2017 ($51 million) and the closure of Marlin in the second quarter of 2017 ($24 million) when compared to the same period in the prior year. These decreases were partially offset by higher costs at Peñasquito ($26 million) due to higher fuel prices due to deregulation of the fuel markets, and higher costs at Cerro Negro as inflation in Argentina out-paced the devaluation of the Argentine peso. Production costs in 2016 were also lower comparatively due to a prolonged period of planned and unplanned maintenance at Peñasquito during the second quarter of 2016.
Depreciation and Depletion
|
| | | | | | | | |
| Three months ended June 30 | 2017 (1) | 2016 (1) | Change % |
| Depreciation and depletion (millions) | $ | 239 |
| $ | 232 |
| 3 | % |
| Sales ounces (thousands) | 497 |
| 504 |
| (1 | )% |
| Depreciation and Depletion per ounce | $ | 481 |
| $ | 460 |
| 5 | % |
| |
| (1) | Excludes attributable share of revenues from the Company's associates. |
Depreciation and depletion increased by $7 million, or 3%, mainly due to the impact of incremental depletion from the Hoyle Deep winze at Porcupine which finished construction during the second quarter of 2016.
Share of Net Earnings Related to Associates and Joint Venture
|
| | | | | | | | |
| Three months ended June 30 | 2017 | 2016 | Change % |
| Pueblo Viejo | $ | 40 |
| $ | 27 |
| 48 | % |
| Alumbrera | — |
| — |
| — | % |
| NuevaUnión | 1 |
| 1 |
| — | % |
| Share of net earnings related to associates and joint venture | $ | 41 |
| $ | 28 |
| 46 | % |
The Company’s share of earnings related to associates and joint venture increased by $13 million in the second quarter of 2017 compared to the same period in the prior year primarily due to an increase in net earnings from Pueblo Viejo due to higher tonnes milled and higher recoveries, offset by lower grades. With respect to Alumbrera, the Company has discontinued recognizing its share of earnings or losses of Alumbrera since impairing the investment to nil in 2015, and did not recognize its share of earnings of Alumbrera for the three months ended June 30, 2017 as future earnings will be recognized only after the Company's provision to fund its share of Alumbrera's reclamation costs is fully reversed. At June 30, 2017, the balance of the Company's provision to fund its share of Alumbrera's reclamation costs is $42 million.
Corporate Administration
Corporate administration expenses decreased by $14 million in the second quarter of 2017 compared to the same period in the prior year, primarily due to lower employee compensation expense as a result of the impact of cost savings initiatives undertaken in 2016 and the first quarter of 2017 to restructure and decentralize the Company's operating model.
Restructuring Costs
Restructuring costs were $2 million in the three months ended June 30, 2017 compared to $16 million in the second quarter of 2016. Restructuring costs in 2017 have been lower than 2016 as the majority of the workforce reductions from the decentralization initiative at several mine site and corporate offices were executed in 2016.
Other Income/Expense
Other income of $4 million for the three months ended June 30, 2017 was comprised primarily of gains on dispositions of securities and interest income on loans held with Pueblo Viejo, partially offset by foreign exchange losses arising primarily on value added tax receivables denominated in Argentine pesos and accounts payable denominated in Mexican pesos. Other income of $12 million for the three months ended June 30, 2016 related primarily to interest income on loans held with Pueblo Viejo and short-term money market investments and gains on dispositions of investments in securities, offset partially by foreign exchange losses arising primarily on value added tax receivables denominated in Mexican and Argentine pesos.
Second Quarter Report – 2017
(in United States dollars, tabular amounts in millions, except where noted)
Income Tax Recovery
Income tax recovery for the three months ended June 30, 2017 of $57 million represented a negative 73% rate (three months ended June 30, 2016 – income tax expense of $32 million representing a negative 70% rate) and was impacted by:
| |
| • | $3 million foreign exchange gains on the translation of deferred income tax assets and liabilities arising primarily from acquisitions, compared to $69 million foreign exchange losses for the three months ended June 30, 2016; and |
| |
| • | A lower effective tax rate in the second quarter of 2017 compared to the second quarter of 2016, after adjusting for the above noted item and non-deductible share-based compensation expense. The decrease in the effective tax rate in the second quarter of 2017 was primarily due to a larger amount of tax deductible Argentine Peso foreign exchange losses on US dollar denominated debt and a larger amount of after-tax income from associates that is not subject to further income tax, compared to the three months ended June 30, 2016. |
AISC
AISC were $800 per ounce (1) for the three months ended June 30, 2017, compared to $1,067 per ounce for the same period in the prior year. The decrease in AISC was primarily due to higher by-product production at Peñasquito and by-product prices ($170 per ounce), higher gold sales ($70 per ounce) and the impact the strengthening US dollar ($40 per ounce), partially offset by higher production costs ($20 per ounce).
| |
| (1) | AISC per ounce is a non-GAAP financial performance measure with no standardized definition under IFRS. For further information and detailed reconciliations, please see pages 33-39 of this report. |
Second Quarter Report – 2017
(in United States dollars, tabular amounts in millions, except where noted)
REVIEW OF SECOND QUARTER FINANCIAL RESULTS
Six months ended June 30, 2017 compared to the six months ended June 30, 2016
Net earnings for the six months ended June 30, 2017 were $305 million, or $0.36 per share, compared to net earnings of $2 million, or $0.00 per share, for the six months ended June 30, 2016. The increase in net earnings for the six months ended June 30, 2017 compared to the same period in 2016 was primarily due to an increase in revenues from higher gold, zinc and silver sales volumes and an increase in zinc realized prices, primarily at Peñasquito, lower corporate administration and restructuring costs, and a $33 million reduction in a provision to fund the Company's 37.5% share of Alumbrera's reclamation costs, partially offset by a decrease in earnings from mine operations due to the sale of Los Filos in April 2017.
Net earnings and earnings per share in the six months ended June 30, 2017 and 2016 were affected by, among other things, the following non-cash or other items that management believes are not reflective of the performance of the underlying operations (items are denoted as (increases)/decreases to net earnings and net earnings per share):
|
| | | | | | | | | | | | | | | | | | |
| | Six months ended June 30, 2017 | Six months ended June 30, 2016 |
| (in millions, except per share) | Pre-tax |
| After-tax |
| Per share ($/share) |
| Pre-tax | After-tax | Per share ($/share) |
Reduction in the Company's obligation to fund its share of Alumbrera's reclamation costs (1) | $ | (26 | ) | $ | (26 | ) | $ | (0.03 | ) | $ | — |
| $ | — |
| $ | — |
|
(Positive)/negative deferred tax effects of foreign exchange on tax assets and liabilities and losses (2) | $ | — |
| $ | (106 | ) | $ | (0.12 | ) | $ | — |
| $ | 20 |
| $ | 0.02 |
|
| Restructuring costs | $ | 3 |
| $ | 2 |
| $ | — |
| $ | 39 |
| $ | 27 |
| $ | 0.03 |
|
| Unrealized foreign exchange loss on Argentine peso denominated construction value-added tax receivable | $ | 3 |
| $ | 3 |
| $ | — |
| $ | 17 |
| $ | 17 |
| $ | 0.02 |
|
| |
| (1) | $7 million of the $33 million reduction in the Company's provision to fund its share of Alumbrera’s reclamation costs relates to Alumbrera's financial performance for the six months ended June 30, 2017 and is therefore considered reflective of the performance of the Company's underlying operations. |
| |
| (2) | Positive deferred tax effects of foreign exchange on tax assets and liabilities and losses of $106 million in the six months ended June 30, 2017 (six months ended June 30, 2016 – negative deferred tax effects of $20 million) is primarily composed of a foreign exchange gain on the translation of current and deferred income tax assets and liabilities, arising primarily from acquisitions and dispositions, of $81 million (six months ended June 30, 2016 – foreign exchange loss of $91 million) and Argentine tax deductible foreign exchange losses on US dollar denominated debt in local currency of $25 million (six months ended June 30, 2016 – $71 million). |
Revenues
|
| | | | | | | | | |
| Six months ended June 30 | 2017 (1) | 2016 (1) | Change % |
| Gold | | | |
| | Revenue (millions) | $ | 1,288 |
| $ | 1,432 |
| (10 | )% |
| | Ounces sold (thousands) | 1,036 |
| 1,162 |
| (11 | )% |
| | Average realized price | $ | 1,246 |
| $ | 1,234 |
| 1 | % |
| Silver | | | |
| | Revenue (millions) | $ | 192 |
| $ | 170 |
| 13 | % |
| | Ounces sold (thousands) | 13,950 |
| 12,170 |
| 15 | % |
| | Average realized price | $ | 14.39 |
| $ | 14.56 |
| (1 | )% |
| Other metals | | | |
| | Revenue (millions) | $ | 224 |
| $ | 95 |
| 136 | % |
| Total revenue (millions) | $ | 1,704 |
| $ | 1,697 |
| — | % |
| |
| (1) | Excludes attributable share of revenues from the Company's associates. |
Revenues increased moderately by $7 million primarily due to increases in zinc and silver sales volumes of 35% and 15%, respectively, and a 46% increase in the average realized price of zinc, partially offset by a decrease in gold sales volume of 11% mainly due to the divestiture of Los Filos and the closure of Marlin, partially offset by higher sales volumes at Peñasquito. The higher zinc and silver sales volumes were primarily due to higher production at Peñasquito due to higher grade ore as a result of mine sequencing in Phases 5 and 6, and higher mill throughput as the second quarter of 2016 included a prolonged period of planned and unplanned maintenance.
Second Quarter Report – 2017
(in United States dollars, tabular amounts in millions, except where noted)
Production Costs
Production costs decreased by $51 million, or 5%, when compared to the same period in the prior year, primarily due to the divestiture of Los Filos in April 2017, including the impact of lower production prior to its sale ($70 million), and the closure of Marlin in the second quarter of 2017 ($39 million). These decreases were partially offset by higher costs at Peñasquito ($47 million) due to higher fuel prices due to deregulation of the fuel markets, and a one-time $12 million charge to the oxide heap leach operation which was recognized in the first quarter of 2017, and higher costs at Cerro Negro as inflation in Argentina out-paced the devaluation of the Argentine peso and more than offset the cost reductions from employee and contractor reductions. Production costs in 2016 were also lower comparatively due to a prolonged period of planned and unplanned maintenance at Peñasquito during the second quarter of 2016.
Depreciation and Depletion
|
| | | | | | | | |
| Six months ended June 30 | 2017 (1) | 2016 (1) | Change % |
| Depreciation and depletion (millions) | $ | 485 |
| $ | 503 |
| (4 | )% |
| Sales ounces (thousands) | 1,036 |
| 1,162 |
| (11 | )% |
| Depreciation and Depletion per ounce | $ | 468 |
| $ | 433 |
| 8 | % |
| |
| (1) | Excludes attributable share of revenues from the Company's associates. |
Depreciation and depletion decreased by $18 million, or 4%, mainly due to lower sales volumes, offset partially by the impact of incremental depletion from the Hoyle Deep winze at Porcupine which finished construction in the second quarter of 2016. The lower sales volumes were primarily due to the impact of the sale of Los Filos in April 2017 and the closure of Marlin in the second quarter of 2017, offset partially by higher sales volumes at Peñasquito.
Share of Net Earnings Related to Associates and Joint Venture
|
| | | | | | | | |
| Six months ended June 30 | 2017 | 2016 | Change % |
| Pueblo Viejo | $ | 67 |
| $ | 62 |
| 8 | % |
| Alumbrera | 33 |
| — |
| – |
| NuevaUnión | 1 |
| 2 |
| (50 | )% |
| Share of net earnings related to associates and joint venture | $ | 101 |
| $ | 64 |
| 58 | % |
The Company’s share of earnings related to associates and joint venture increased by $37 million in the second quarter of 2017 compared to the same period in the prior year primarily due to a $33 million reduction in the Company's provision to fund its share of Alumbrera’s reclamation costs in the first quarter of 2017, which was classified as Share of Net Earnings Related to Associates and Joint Venture. The reduction in the provision for Alumbrera reflected the expectation that Alumbrera will be able to fund a greater portion of its reclamation costs than previously estimated due to improved financial results, primarily as a result of higher realized copper prices. At December 31, 2015, the Company recognized an impairment of its investment in Alumbrera, resulting in the carrying amount of its interest being reduced to zero, and recognized a $75 million provision to fund its share of Alumbrera's reclamation costs. Since then, the Company discontinued recognizing its share of losses of Alumbrera and did not recognize its share of earnings of Alumbrera for the six months ended June 30, 2017 as future earnings will be recognized only after the Company's provision to fund its share of Alumbrera's reclamation costs is fully reversed.
Impairment reversal/expense
The Company recorded a net impairment reversal of $3 million in the six months ended June 30, 2017. The net impairment reversal was comprised of a reversal of impairment at Cerro Blanco of $19 million, which was based on the expected proceeds from the sale to Bluestone being greater than the carrying value of the asset, partially offset by an impairment expense at Los Filos of $16 million, based on changes to the carrying value of the Los Filos assets being sold to Leagold.
Corporate Administration
Corporate administration expenses decreased by $35 million in the six months ended June 30, 2017 compared to the same period in the prior year, primarily due to lower employee compensation expense as a result of the impact of cost savings initiatives undertaken in 2016 and the first quarter of 2017 to restructure and decentralize the Company's operating model.
Second Quarter Report – 2017
(in United States dollars, tabular amounts in millions, except where noted)
Restructuring Costs
Restructuring costs were $3 million for the six months ended June 30, 2017 compared to $39 million for the six months ended June 30, 2016. The decrease in restructuring costs in the second quarter of 2017 related primarily to severance costs incurred in 2016 associated with involuntary and voluntary workforce reductions to increase efficiencies at mine sites and corporate offices.
Other Income/Expense
Other income of $23 million for the six months ended June 30, 2017 was comprised primarily interest income on loans held with Pueblo Viejo, foreign exchange gains arising primarily on value added tax receivables denominated in Mexican pesos and gains on dispositions of investments in securities. Other expense of $6 million for the six months ended June 30, 2016 was comprised of a $47 million foreign exchange loss arising primarily on value added tax receivables denominated in Argentine and Mexican pesos which was offset partially by interest income on loans held with Pueblo Viejo and short term money market investments and gains on dispositions of investments in securities.
Income Tax Expense/Recovery
Income tax recovery for the six months ended June 30, 2017 of $105 million represented a negative 53% rate (six months ended June 30, 2016 – income tax recovery of $8 million representing a 133% rate) and was impacted by:
| |
| • | $81 million foreign exchange gains on the translation of deferred income tax assets and liabilities arising primarily from acquisitions, compared to $91 million foreign exchange losses for the six months ended June 30, 2016; and |
| |
| • | A lower effective tax rate in the first half of 2017 compared to the first half of 2016, after adjusting for the above noted item and non-deductible share-based compensation expense. The decrease in the effective tax rate for the first half of 2017 was primarily due to a a larger amount after-tax income from associates that is not subject to further income tax compared to the six months ended June 30, 2016. |
AISC
AISC were $800 per ounce(1) for the six months ended June 30, 2017, compared to $936 per ounce for the six months ended June 30, 2016. The decrease in AISC was primarily due to the higher by-product production at Peñasquito and by-product prices ($130 per ounce), the impact the strengthening US dollar ($40 per ounce), lower General and Administration costs ($20 per ounce), and lower sustaining capital ($20 per ounce) partially offset by lower gold sales ($90 per ounce).
| |
| (1) | AISC per ounce is a non-GAAP financial performance measure with no standardized definition under IFRS. For further information and detailed reconciliations, please see pages 33-39 of this report. |
Second Quarter Report – 2017
(in United States dollars, tabular amounts in millions, except where noted)
FINANCIAL POSITION AND LIQUIDITY
The following table summarizes Goldcorp's cash flow activity:
|
| | | | | | | | | | | | |
| | Three Months Ended June 30 | Six Months Ended June 30 |
| | 2017 |
| 2016 |
| 2017 |
| 2016 |
|
| Cash flow | | | | |
| From continuing operations provided by operating activities | $ | 158 |
| $ | 234 |
| $ | 385 |
| $ | 293 |
|
| From continuing operations used in investing activities | (256 | ) | (140 | ) | (503 | ) | (325 | ) |
| From continuing operations (used) provided by financing activities | (33 | ) | (165 | ) | 21 |
| 34 |
|
| (Decrease) Increase in cash and cash equivalents | (131 | ) | (71 | ) | (97 | ) | 2 |
|
| Effect of exchange rate changes on cash and cash equivalents | — |
| (2 | ) | — |
| — |
|
| Cash and cash equivalents, beginning of period | 169 |
| 401 |
| 157 |
| 326 |
|
| Decrease in cash and cash equivalents reclassified as held for sale | 42 |
| — |
| 20 |
| — |
|
| Cash and cash equivalents, end of period | $ | 80 |
| $ | 328 |
| $ | 80 |
| $ | 328 |
|
Cash flow provided by operating activities for the three months ended June 30, 2017 decreased by $76 million compared to the same period in the prior year, primarily due to a net cash outflow from changes in working capital of $77 million in 2017 as compared to a net cash inflow of $89 million in 2016. The increase in the net cash outflow from changes in working capital related primarily to lower sale volumes at Peñasquito, due to a prolonged period of planned and unplanned maintenance at Peñasquito during the second quarter of 2016, and Cerro Negro in the second quarter of 2016 compared to the second quarter of 2017, resulting in lower accounts receivable balances at June 30, 2016.
The increase in cash flow provided from operating activities in the six months ended June 30, 2017 compared to the six months ended June 30, 2016 was primarily due to a decrease in by-product cash costs partially offset by a decrease in sales volumes.
The increase in cash flow used in investing activities for the three and six months ended June 30, 2017 compared to the same periods in the prior year was mainly due to $266 million, including transaction costs, paid to acquire Kinross' 25% interest in the Cerro Casale project and increases in expenditures on mining interests as noted below, offset partially by $242 million, net of transaction costs and cash disposed, received on the sale of Los Filos and Cerro Blanco.
The increase in cash flow used in investing activities for the six months ended June 30, 2017 compared to the same period in the prior year was also due to the purchase of a 4% gold stream on the El Morro deposit, part of the Company's NuevaUnión joint venture, from New Gold Inc. for $65 million. During the six months ended June 30, 2017, the Company received a principal repayment from Pueblo Viejo of $43 million, which partially offset purchases of securities and interest paid in the period of $55 million.
Expenditures on mining interests (including deposits on mining interest expenditures) were as follows:
|
| | | | | | | | | | | | |
| | Three Months Ended June 30 | Six Months Ended June 30 |
| | 2017 |
| 2016 |
| 2017 |
| 2016 |
|
| Peñasquito | $ | 80 |
| $ | 60 |
| $ | 153 |
| $ | 122 |
|
| Cerro Negro | 22 |
| 26 |
| 38 |
| 51 |
|
| Red Lake | 20 |
| 24 |
| 37 |
| 55 |
|
| Éléonore | 29 |
| 18 |
| 58 |
| 39 |
|
| Porcupine | 36 |
| 14 |
| 50 |
| 30 |
|
| Musselwhite | 14 |
| 7 |
| 25 |
| 12 |
|
| Other | 20 |
| 17 |
| 40 |
| 30 |
|
| Total | $ | 221 |
| $ | 166 |
| $ | 401 |
| $ | 339 |
|
The increase in expenditures on mining interests during the three and six months ended June 30, 2017 compared to the same periods in the prior year was due primarily to increases in expansionary capital of $63 million and $94 million, respectively, related to the construction of the Pyrite Leach Project at Peñasquito, the development ramp at Borden and the Material Handling Project at Musselwhite. These increases in expansionary capital were offset by decreases in sustaining capital expenditures of $8 million and $32 million for the three and six months ended June 30, 2017 compared to the same periods in the prior year, primarily attributable to decreases at Peñasquito.
Second Quarter Report – 2017
(in United States dollars, tabular amounts in millions, except where noted)
The decrease of $132 million in cash used in financing activities during the three months ended June 30, 2017 as compared to the three months ended June 30, 2016 was primarily due to a repayment of $16 million on the credit facility in the three months ended June 30, 2017, compared to $125 million in the three months ended June 30, 2016. The decrease of $13 million in cash provided by financing activities during the six months ended June 30, 2017 as compared to the same period in the prior year was primarily due to a $125 million draw on the credit facility in the six months ended June 30, 2016 compared to a draw of $54 million in the same period in the current year, offset partially by a $36 million decrease in dividends paid in the six months ended June 30, 2017 compared to the same period in 2016. Effective April 1, 2016, the Company’s Board of Directors reduced the annual dividend to $0.08 per share and amended the dividend payment schedule such that dividends were paid quarterly commencing in June 2016.
On June 22, 2017, the Company completed the extension of its $3.0 billion credit facility term by one year to June 22, 2022. The unsecured, floating-rate facility bears interest at LIBOR plus 150 points when drawn, based on Goldcorp's current bond ratings, and is intended to be used for liquidity and general corporate purposes.
At June 30, 2017, the Company had $3.0 billion of available liquidity held in $0.1 billion of cash and cash equivalents and short term investments, and $2.9 billion available on its $3.0 billion credit facility.
The Company may from time to time seek to retire or repurchase its outstanding debt in open market purchases, privately negotiated transactions or otherwise. Such repurchases, if any, will depend upon prevailing market conditions, the Company's liquidity requirements, contractual restrictions and other factors. The amount of debt retired or repurchased may be material.
Outstanding Share Data
As at July 26, 2017, there were 865 million common shares of the Company issued and outstanding and 8 million stock options outstanding, which are exercisable into common shares at exercise prices ranging between C$20.27 per share to C$35.66 per share, and 3 million restricted share units outstanding.
GUIDANCE (1)
2017 Guidance
Consistent with Goldcorp’s focus on profitable ounces and growing NAV per share, 2017 gold production is expected to be 2.5 million ounces (+/- 5%), in line with previous 2017 guidance. The Company's production profile is expected to be consistent over the year as declining grades at Peñasquito are offset by the ramp-up of production at Cerro Negro and Éléonore.
Due to the focus on capital management discipline as part of the Company's $250 million sustainable annual efficiency program, the Company now expects sustaining capital expenditures of $600 million for 2017 (+/- 5%), a reduction of $100 million compared to the Company's original guidance from capital reductions at our operating sites. Expansionary capital is also forecasted to be lower at $550 million (+/- 5%), a $50 million decrease compared to the Company's original guidance. Consequently, the Company's AISC guidance is reduced from $850 per ounce to $825 per ounce (+/- 5%). Total cash costs on a by-product basis are still expected to be $500 per ounce (+/- 5%) (2).
Company-wide exploration expenditures in 2017 are still expected to total $100 million, of which approximately 40% is expected to be expensed. Corporate administration expense is expected to be approximately $160 million, which includes share-based compensation of approximately $50 million. Depreciation and depletion expense is expected to be $435 per ounce. The effective tax rate on net income before share-based compensation is expected to be approximately 40%.
Five-Year Forecast
The Company’s five year outlook is focused on growing production by 20% to 3 million ounces, reducing AISC by 20% to $700 per ounce and growing gold reserves by 20% to 50 million ounces. Year-by-year gold production and AISC are forecast as follows:
|
| | |
| Year | Gold Production (oz) (3) (+/-5%) | AISC ($/oz) (2), (4) (+/-5%) |
| 2017 | 2,500,000 | $825 |
| 2018 | 2,500,000 | $800 |
| 2019 | 2,700,000 | $750 |
| 2020 | 3,000,000 | $700 |
| 2021 | 3,000,000 | $700 |
| |
| (1) | Guidance projections (“Guidance”) are considered “forward-looking statements” and represent management’s good faith estimates or expectations of future production results as of the date hereof. Guidance is based upon certain assumptions, including, but not limited to, metal prices, oil prices, certain exchange rates and other assumptions. Such assumptions may prove to be incorrect and actual results may differ materially from those anticipated. Consequently, Guidance cannot be guaranteed. As such, investors are cautioned not to place undue reliance upon Guidance and forward-looking statements as there can be no assurance that the plans, assumptions or expectations |
Second Quarter Report – 2017
(in United States dollars, tabular amounts in millions, except where noted)
upon which they are placed will occur.
| |
| (2) | The Company has presented the non-GAAP performance measures on an attributable (or Goldcorp's share) basis. AISC per ounce and cash costs: by-product are non-GAAP financial performance measures with no standardized definition under IFRS. For further information, please see pages 33-39 of this report. |
| |
| (3) | The assumptions below were used to forecast total cash costs and gold equivalent ounces: |
|
| | |
| | 2017 - 2018 | 2019 - 2021 |
| Gold (oz) | $1,250 | $1,250 |
| Silver (oz) | $19.00 | $19.00 |
| Copper (lb) | $2.25 | $2.25 |
| Zinc (lb) | $1.00 | $0.90 |
| Lead (lb) | $0.89 | $0.80 |
| Foreign exchange (respectively to the US$) | | |
| Canadian dollar | $1.30 | $1.30 |
| Mexican peso | 19.00 | 16.25 |
| |
| (4) | The Company’s projected AISC are not based on GAAP total production cash costs, which forms the basis of the Company’s cash costs: by-product. The projected range of AISC is anticipated to be adjusted to include sustaining capital expenditures, corporate administrative expense, mine-site exploration and evaluation costs and reclamation cost accretion and amortization, and exclude the effects of expansionary capital, non-sustaining expenditures, tax payments, dividends and financing costs. Projected GAAP total production cash costs for the full year would require inclusion of the projected impact of future included and excluded items, including items that are not currently determinable, but may be significant, such as sustaining capital expenditures, reclamation cost accretion and amortization and tax payments. Due to the uncertainty of the likelihood, amount and timing of any such items, the Company does not have information available to provide a quantitative reconciliation of projected AISC to a total production cash costs projection. |
OPERATIONAL REVIEW
The Company’s principal producing mining properties are comprised of the Peñasquito mine in Mexico; the Cerro Negro mine in Argentina; the Pueblo Viejo mine (40.0% interest) in the Dominican Republic and the Red Lake, Éléonore, Porcupine, and Musselwhite mines in Canada.
Operating results of operating segments are reviewed by the Company's chief operating decision maker ("CODM") to make decisions about resources to be allocated to the segments and to assess their performance. The Company considers each individual mine site as an operating segment for financial reporting purposes except as noted below.
Following the Company's acquisition and divestitures and the closure of the Marlin mine during the three months ended June 30, 2017, the Company reassessed its segments for financial reporting purposes. The Company concluded that Marlin and Los Filos are no longer operating segments and will be included in Other; they were previously included in the Other mines operating segment. The Company's 37.5% interest in Alumbrera, which was previously reported as Other associate, and the Company's interest in Leagold, will also be presented in Other, because their financial results do not meet the quantitative threshold required for segment disclosure purposes. Prior periods' results have been re-presented to reflect the current presentation.
The Company’s 100% interests in the Cochenour and Borden projects in Canada are included in the Red Lake and Porcupine reportable operating segments, respectively. The Company's interest in the Caspiche project and its 50% interests in the NuevaUnión and the Cerro Casale projects in Chile, and 100% interest in the Coffee project in the Yukon are included in Other.
The Company’s principal product is gold bullion which is sold primarily in the London spot market. Concentrate produced at Peñasquito and Alumbrera, containing both gold and by-product metals, is sold to third party smelters and traders.
Second Quarter Report – 2017
(in United States dollars, tabular amounts in millions, except where noted)
Segmented Financial and Operating Highlights
|
| | | | | | | | | | | |
| Three months ended June 30 | | Revenue ($ millions) |
| Gold produced (000's of ounces) |
| Gold sold (000's of ounces) |
| Total cash costs: by-product ($/oz) (1), (4) |
| AISC ($/oz) (3), (4) |
|
| Peñasquito | 2017 | 335 |
| 123 |
| 133 |
| 26 |
| 328 |
|
| | 2016 | 129 |
| 36 |
| 42 |
| 1,757 |
| 3,094 |
|
| Cerro Negro | 2017 | 149 |
| 112 |
| 107 |
| 484 |
| 694 |
|
| | 2016 | 121 |
| 86 |
| 85 |
| 529 |
| 808 |
|
Pueblo Viejo (4) | 2017 | 153 |
| 115 |
| 114 |
| 333 |
| 440 |
|
| | 2016 | 125 |
| 100 |
| 96 |
| 473 |
| 587 |
|
| Red Lake | 2017 | 74 |
| 58 |
| 58 |
| 828 |
| 1,120 |
|
| | 2016 | 91 |
| 73 |
| 71 |
| 675 |
| 958 |
|
| Éléonore | 2017 | 86 |
| 66 |
| 68 |
| 891 |
| 1,229 |
|
| | 2016 | 94 |
| 74 |
| 73 |
| 857 |
| 919 |
|
| Porcupine | 2017 | 76 |
| 60 |
| 60 |
| 777 |
| 1,052 |
|
| | 2016 | 93 |
| 73 |
| 73 |
| 655 |
| 844 |
|
| Musselwhite | 2017 | 69 |
| 57 |
| 55 |
| 658 |
| 826 |
|
| | 2016 | 77 |
| 59 |
| 61 |
| 585 |
| 721 |
|
Other mines (2) | 2017 | 108 |
| 44 |
| 54 |
| 859 |
| 917 |
|
| | 2016 | 191 |
| 112 |
| 115 |
| 781 |
| 924 |
|
Other (3) | 2017 | — |
| — |
| — |
| — |
| 68 |
|
| | 2016 | — |
| — |
| — |
| — |
| 88 |
|
Attributable segment total (4) | 2017 | 1,050 |
| 635 |
| 649 |
| 510 |
| 800 |
|
| | 2016 | 921 |
| 613 |
| 616 |
| 728 |
| 1,067 |
|
| Excluding attributable amounts from associates and joint ventures | 2017 | (228 | ) | (144 | ) | (152 | ) | (478 | ) | (574 | ) |
| | 2016 | (168 | ) | (120 | ) | (112 | ) | (505 | ) | (623 | ) |
| Total - Consolidated | 2017 | 822 |
| 491 |
| 497 |
| 520 |
| 868 |
|
| | 2016 | 753 |
| 493 |
| 504 |
| 777 |
| 1,165 |
|
Second Quarter Report – 2017
(in United States dollars, tabular amounts in millions, except where noted)
|
| | | | | | | | | | | |
| Six months ended June 30 | | Revenue ($ millions) |
| Gold produced (000's of ounces) |
| Gold sold (000's of ounces) |
| Total cash costs: by-product ($/oz) (1), (4) |
| AISC ($/oz) (3), (4) |
|
| Peñasquito | 2017 | 691 |
| 260 |
| 271 |
| 56 |
| 360 |
|
| | 2016 | 393 |
| 161 |
| 164 |
| 834 |
| 1,542 |
|
| Cerro Negro | 2017 | 270 |
| 207 |
| 195 |
| 473 |
| 675 |
|
| | 2016 | 295 |
| 201 |
| 213 |
| 440 |
| 624 |
|
Pueblo Viejo (4) | 2017 | 275 |
| 210 |
| 209 |
| 381 |
| 486 |
|
| | 2016 | 264 |
| 214 |
| 208 |
| 411 |
| 509 |
|
| Red Lake | 2017 | 140 |
| 107 |
| 112 |
| 844 |
| 1,134 |
|
| | 2016 | 190 |
| 152 |
| 155 |
| 605 |
| 895 |
|
| Éléonore | 2017 | 174 |
| 144 |
| 140 |
| 870 |
| 1,141 |
|
| | 2016 | 177 |
| 141 |
| 143 |
| 831 |
| 942 |
|
| Porcupine | 2017 | 152 |
| 121 |
| 122 |
| 810 |
| 1,031 |
|
| | 2016 | 182 |
| 147 |
| 148 |
| 639 |
| 840 |
|
| Musselwhite | 2017 | 138 |
| 111 |
| 111 |
| 686 |
| 848 |
|
| | 2016 | 155 |
| 127 |
| 128 |
| 513 |
| 633 |
|
Other mines (2) | 2017 | 254 |
| 130 |
| 135 |
| 758 |
| 831 |
|
| | 2016 | 421 |
| 254 |
| 256 |
| 797 |
| 923 |
|
Other (3) | 2017 | — |
| — |
| — |
| — |
| 66 |
|
| | 2016 | — |
| — |
| — |
| — |
| 83 |
|
Attributable segment total (4) | 2017 | 2,094 |
| 1,290 |
| 1,295 |
| 525 |
| 800 |
|
| | 2016 | 2,077 |
| 1,397 |
| 1,415 |
| 631 |
| 936 |
|
| Excluding attributable amounts from associates and joint ventures | 2017 | (390 | ) | (257 | ) | (259 | ) | (460 | ) | (564 | ) |
| | 2016 | (380 | ) | (260 | ) | (253 | ) | (502 | ) | (600 | ) |
| Total - Consolidated | 2017 | 1,704 |
| 1,033 |
| 1,036 |
| 541 |
| 858 |
|
| | 2016 | 1,697 |
| 1,137 |
| 1,162 |
| 659 |
| 1,010 |
|
| |
| (1) | Total cash costs: by-product, per ounce, is calculated net of Goldcorp’s share of by-product sales revenues (by-product copper sales revenues for Alumbrera; by-product silver sales revenues for Marlin and Pueblo Viejo; and by-product lead and zinc sales revenues and 75% of silver sales revenues for Peñasquito at market silver prices, and 25% of silver sales revenues for Peñasquito at $4.13 per silver ounce (2016 – $4.09 per silver ounce) sold to Silver Wheaton). If silver, copper, lead and zinc were treated as co-products, total cash costs for the three and six months ended June 30, 2017 would have been $644 and $672 per ounce of gold respectively (three and six months ended June 30, 2016 – $716 and $657 respectively). Production costs are allocated to each co-product based on the ratio of actual sales volumes multiplied by budget metal prices (see page 33). |
| |
| (2) | As described above, the Company's investments in Marlin, Alumbrera and Leagold are included in 'Other' for segment reporting purposes. They have been disclosed separately in these tables, in 'Other mines', along with Los Filos up to Los Filos' date of disposal on April 7, 2017, to provide visibility into the impact of the Company's corporate administration expense on AISC. |
| |
| (3) | For the purpose of calculating AISC, the Company includes corporate administration expense, capital expenditures incurred at the Company's regional and head office corporate offices and regional office exploration expense as corporate AISC in the "Other" category. These costs are not allocated to the individual mine sites as the Company measures its operations' performance on AISC directly incurred at the mine site. AISC for Other is calculated using total corporate expenditures and the Company's attributable gold sales ounces. |
| |
| (4) | The Company has included certain non-GAAP performance measures including the Company’s share of the applicable production, sales and financial information of Alumbrera, Pueblo Viejo, Leagold and NuevaUnión throughout this document. Total cash costs: by-product and AISC are non-GAAP performance measures with no standardized definition under IFRS. For further information and detailed reconciliations, please see pages 33-39 of this report. |
Second Quarter Report – 2017
(in United States dollars, tabular amounts in millions, except where noted)
OPERATIONAL REVIEW
Peñasquito, Mexico (100%-owned)
|
| | | | | | | | | | | | | | | | | |
| | Three months ended June 30 | | Six months ended June 30 |
| Operating Data | 2017 |
| 2016 |
| Change |
| | 2017 |
| 2016 |
| Change |
|
| Tonnes of ore mined (thousands) | 9,684 |
| 9,032 |
| 7 | % | | 19,153 |
| 19,899 |
| (4 | )% |
| Tonnes of ore milled (thousands) | 8,740 |
| 6,607 |
| 32 | % | | 18,250 |
| 15,840 |
| 15 | % |
| Mill head grade | | | | | | | |
| Gold grade (grams/tonne) | 0.73 |
| 0.39 |
| 87 | % | | 0.74 |
| 0.56 |
| 32 | % |
| Silver grade (grams/tonne) | 22.03 |
| 21.76 |
| 1 | % | | 21.59 |
| 22.21 |
| (3 | )% |
| Lead grade | 0.20 | % | 0.22 | % | (9 | )% | | 0.21 | % | 0.22 | % | (5 | )% |
| Zinc grade | 0.64 | % | 0.49 | % | 31 | % | | 0.60 | % | 0.51 | % | 18 | % |
| Mill Recovery Rate | | | | | | | |
| Gold recovery | 66 | % | 51 | % | 29 | % | | 66 | % | 60 | % | 10 | % |
| Silver recovery | 81 | % | 73 | % | 11 | % | | 82 | % | 77 | % | 6 | % |
| Lead recovery | 71 | % | 61 | % | 16 | % | | 74 | % | 66 | % | 12 | % |
| Zinc recovery | 81 | % | 72 | % | 13 | % | | 81 | % | 75 | % | 8 | % |
| Payable Metal Produced | | |
|
| | | | |
| Gold (thousands of ounces) | 123 |
| 36 |
| 242 | % | | 260 |
| 161 |
| 61 | % |
| Silver (thousands of ounces) | 5,331 |
| 3,117 |
| 71 | % | | 10,167 |
| 7,832 |
| 30 | % |
| Lead (thousands of pounds) | 26,100 |
| 17,100 |
| 53 | % | | 58,500 |
| 46,100 |
| 27 | % |
| Zinc (thousands of pounds) | 84,100 |
| 38,300 |
| 120 | % | | 164,800 |
| 109,400 |
| 51 | % |
Gold equivalent (thousands of ounces) (1) | 281 |
| 130 |
| 116 | % | | 571 |
| 411 |
| 39 | % |
| Payable Metal Sold | | | | | | | |
| Gold (thousands of ounces) | 133 |
| 42 |
| 217 | % | | 271 |
| 164 |
| 65 | % |
| Silver (thousands of ounces) | 5,676 |
| 2,551 |
| 123 | % | | 10,501 |
| 7,312 |
| 44 | % |
| Lead (thousands of pounds) | 27,300 |
| 13,300 |
| 105 | % | | 58,600 |
| 43,500 |
| 35 | % |
| Zinc (thousands of pounds) | 85,700 |
| 43,200 |
| 98 | % | | 174,200 |
| 116,300 |
| 50 | % |
| Total Cash Costs: By-product (per ounce) | $ | 26 |
| $ | 1,757 |
| (99 | )% | | $ | 56 |
| $ | 834 |
| (93 | )% |
| Total Cash Costs: Co-product (per ounce) | $ | 601 |
| $ | 1,304 |
| (54 | )% | | $ | 635 |
| $ | 894 |
| (29 | )% |
| AISC (per ounce) | $ | 328 |
| $ | 3,094 |
| (89 | )% | | $ | 360 |
| $ | 1,542 |
| (77 | )% |
| Financial Data (in millions) | | | | | | | |
Revenues (2) | $ | 335 |
| $ | 129 |
| 160 | % | | $ | 691 |
| $ | 393 |
| 76 | % |
| Production costs | $ | 172 |
| $ | 147 |
| 17 | % | | $ | 366 |
| $ | 319 |
| 15 | % |
| Depreciation and depletion | $ | 67 |
| $ | 38 |
| 76 | % | | $ | 139 |
| $ | 95 |
| 46 | % |
| Other | $ | 2 |
| $ | 2 |
| — | % | | $ | 2 |
| $ | 2 |
| — | % |
| Earnings from operations | $ | 94 |
| $ | (58 | ) | n/a |
| | $ | 184 |
| $ | (23 | ) | n/a |
|
| Expenditures on mining interests (cash basis) | $ | 81 |
| $ | 60 |
| 35 | % | | $ | 156 |
| $ | 122 |
| 28 | % |
| – Sustaining | $ | 37 |
| $ | 55 |
| (33 | )% | | $ | 77 |
| $ | 112 |
| (31 | )% |
| – Expansionary | $ | 44 |
| $ | 5 |
| 780 | % | | $ | 79 |
| $ | 10 |
| 690 | % |
| |
| (1) | Gold equivalent ounces are calculated using the following assumptions: $1,250 per ounce of gold; by-product metal prices of $19.00 per ounce of silver; $0.90 per pound of zinc; and $0.80 per pound of lead (2016 – $1,100; $16.50; $0.95; and $0.90 respectively). By-product metals are converted to gold equivalent ounces by multiplying by-product metal production with the associated by-product metal price and dividing it by the gold price. |
| |
| (2) | Includes 25% of silver ounces sold to Silver Wheaton at $4.13 per ounce (2016 – $4.09 ounce). The remaining 75% of silver ounces are sold at market rates. |
Second Quarter Report – 2017
(in United States dollars, tabular amounts in millions, except where noted)
Operating Highlights
Gold production for the three and six months ended June 30, 2017 was 242% and 61% higher, respectively, than the three and six months ended June 30, 2016, primarily due to higher grade ore as a result of mine sequencing in Phases 5 and 6, and higher mill throughput as the second quarter of 2016 included a prolonged period of planned and unplanned maintenance. The mined grade is expected to decline in the second half of the year, consistent with the Company's expectations for 2017. Starting late in the fourth quarter of 2017 and through 2018 the mill feed is expected to be fed a higher proportion of lower grade ore and stockpiled material. The feed will then revert back to higher grade ore in 2019 when the Phase 6 stripping program exposes higher grade ore in the Peñasco pit.
Productivity in the pit continues to improve leading to improved pit conditions with large and wide cut-backs and a continued focus on balancing truck haulage with available shovels. Pre-stripping of the Chile Colorado pit is ahead of schedule and mining is expected to start in 2018.
Financial Highlights
Earnings from operations were $94 million and $184 million in the three and six months ended June 30, 2017, respectively, compared to losses of $58 million and $23 million, respectively, in the three and six months ended June 30, 2016. Earnings increased due to higher gold and by-product production and higher by-product prices, partially offset by higher production costs. Production costs increased primarily due higher fuel prices due to deregulation of the fuel markets and a one-time $12 million charge related to the oxide heap leach operation which was recognized in the first quarter of 2017. Production costs in 2016 were also lower as a result of a prolonged period of planned and unplanned maintenance.
AISC for the three and six months ended June 30, 2017 were 89% and 77% lower, respectively, than the three and six months ended June 30, 2016 due to higher gold and by-product production, higher realized by-product prices and lower sustaining capital. Sustaining capital expenditures are expected to ramp up through 2017 as spending relating to Chile Colorado pre-stripping and the tailings dam raise increases.
Second Quarter Report – 2017
(in United States dollars, tabular amounts in millions, except where noted)
Cerro Negro, Argentina (100%-owned)
|
| | | | | | | | | | | | | | | | | |
| | Three months ended June 30 | | Six months ended June 30 |
| Operating Data | 2017 |
| 2016 |
| Change |
| | 2017 |
| 2016 |
| Change |
|
| Tonnes of ore mined (thousands) | 242 |
| 205 |
| 18 | % | | 479 |
| 466 |
| 3 | % |
| Tonnes of ore milled (thousands) | 268 |
| 205 |
| 31 | % | | 507 |
| 482 |
| 5 | % |
| Mill Gold grade (grams/tonne) | 13.42 |
| 14.36 |
| (7 | )% | | 13.04 |
| 13.34 |
| (2 | )% |
| Mill Silver grade (grams/tonne) | 119.6 |
| 116.3 |
| 3 | % | | 113.4 |
| 127.2 |
| (11 | )% |
| Gold recovery rate | 96 | % | 95 | % | 1 | % | | 96 | % | 95 | % | 1 | % |
| Silver recovery rate | 85 | % | 88 | % | (3 | )% | | 87 | % | 89 | % | (2 | )% |
| Gold Produced (thousands of ounces) | 112 |
| 86 |
| 30 | % | | 207 |
| 201 |
| 3 | % |
| Silver Produced (thousands of ounces) | 883 |
| 648 |
| 36 | % | | 1,589 |
| 1,804 |
| (12 | )% |
Gold equivalent ounces produced (thousands of ounces)(1) | 125 |
| 96 |
| 30 | % | | 231 |
| 229 |
| 1 | % |
| Gold Sold (thousands of ounces) | 107 |
| 85 |
| 26 | % | | 195 |
| 213 |
| (8 | )% |
| Silver Sold (thousands of ounces) | 815 |
| 678 |
| 20 | % | | 1,490 |
| 1,968 |
| (24 | )% |
| Total Cash Costs: By-product (per ounce) | $ | 484 |
| $ | 529 |
| (9 | )% | | $ | 473 |
| $ | 440 |
| 8 | % |
| Total Cash Costs: Co-product (per ounce) | $ | 547 |
| $ | 599 |
| (9 | )% | | $ | 539 |
| $ | 517 |
| 4 | % |
| AISC (per ounce) | $ | 694 |
| $ | 808 |
| (14 | )% | | $ | 675 |
| $ | 624 |
| 8 | % |
| Financial Data (in millions) | | | | | | | |
| Revenues | $ | 149 |
| $ | 121 |
| 23 | % | | $ | 270 |
| $ | 295 |
| (8 | )% |
| Production costs | $ | 66 |
| $ | 57 |
| 16 | % | | $ | 119 |
| $ | 125 |
| (5 | )% |
| Depreciation and depletion | $ | 64 |
| $ | 46 |
| 39 | % | | $ | 118 |
| $ | 113 |
| 4 | % |
| Other | $ | 4 |
| $ | 7 |
| (43 | )% | | $ | 4 |
| $ | 8 |
| (50 | )% |
| Earnings from operations | $ | 15 |
| $ | 11 |
| 36 | % | | $ | 29 |
| $ | 49 |
| (41 | )% |
| Expenditures on mining interests (cash basis) | $ | 22 |
| $ | 26 |
| (15 | )% | | $ | 38 |
| $ | 51 |
| (25 | )% |
| – Sustaining | $ | 20 |
| $ | 21 |
| (5 | )% | | $ | 34 |
| $ | 35 |
| (3 | )% |
| – Expansionary | $ | 2 |
| $ | 5 |
| (60 | )% | | $ | 4 |
| $ | 16 |
| (75 | )% |
| |
| (1) | Gold equivalent ounces are calculated using the following assumptions: $1,250 per ounce of gold and a by-product metal price of $19.00 per ounce of silver (2016 – $1,100 and $16.50, respectively). By-product metals are converted to gold equivalent ounces by multiplying by-product metal production with the associated by-product metal price and dividing it by the gold price. |
Operating Highlights
Gold production for the three and six months ended June 30, 2017 was 30% and 3% higher, respectively, than the three and six months ended June 30, 2016, primarily due to higher mined tonnes resulting from improved equipment availability, higher mine productivity, and the negative impact on the prior year's production from employee reductions during the second quarter of 2016. Mining operations have continued to improve since 2016 when labor disruptions tied to the workforce reduction program resulted in lower than expected operational performance. Mine performance has also been positively impacted with the implementation of a structured maintenance improvement program, supply chain process improvements, and an optimized mine development strategy.
Mariana Norte is expected to ramp up through 2017 with first ore from stopes expected in 2018. Development of the Emilia vein is expected to begin in the second half of 2017 in order to supplement declining production from Eureka in 2019. The production ramp-up to 4,000 tonnes per day is still expected to be achieved during the second half of 2018.
Financial Highlights
Earnings from operations were $15 million and $29 million, respectively, in the three and six months ended June 30, 2017, compared to earnings of $11 million and $49 million, respectively, in the three and six months ended June 30, 2016. Earnings were higher for the three months ended June 30, 2017, primarily due to 30% higher gold equivalent production, partially offset by higher production costs. Earnings were lower for the six months ended June 30, 2017 primarily due to lower gold and silver sales and higher production costs compared to the same period in 2016 which included sales of inventory from 2015 production. Due to inflation in Argentina out-pacing the devaluation of the Argentine Peso, Argentine peso denominated costs translated into US dollars increased when comparing the first six months of 2017 to the first six months of 2016.
Second Quarter Report – 2017
(in United States dollars, tabular amounts in millions, except where noted)
AISC for the three months ended June 30, 2017 were 14% lower than the three months ended June 30, 2016 due to higher gold and silver sales, partially offset by higher production costs associated with inflation. AISC for the six months ended June 30, 2017, were 8% higher than the six months ended June 30, 2016 due to lower gold and silver sales.
Second Quarter Report – 2017
(in United States dollars, tabular amounts in millions, except where noted)
Pueblo Viejo, Dominican Republic (40%-owned)
(tabular amounts below represent Goldcorp's proportionate 40% share)
|
| | | | | | | | | | | | | | | | | |
| | Three months ended June 30 | | Six months ended June 30 |
| Operating Data | 2017 |
| 2016 |
| Change |
| | 2017 |
| 2016 |
| Change |
|
| Tonnes of ore mined (thousands) | 2,201 |
| 1,672 |
| 32 | % | | 4,754 |
| 3,768 |
| 26 | % |
| Tonnes of ore milled (thousands) | 837 |
| 699 |
| 20 | % | | 1,567 |
| 1,464 |
| 7 | % |
| Mill head grade (grams/tonne) | 4.53 |
| 4.94 |
| (8 | )% | | 4.52 |
| 5.15 |
| (12 | )% |
| Recovery rate | 94 | % | 90 | % | 4 | % | | 92 | % | 89 | % | 3 | % |
| Gold Produced (thousands of ounces) | 115 |
| 100 |
| 15 | % | | 210 |
| 214 |
| (2 | )% |
| Gold Sold (thousands of ounces) | 114 |
| 96 |
| 19 | % | | 209 |
| 208 |
| — | % |
| Total Cash Costs: By-product (per ounce) | $ | 333 |
| $ | 473 |
| (30 | )% | | $ | 381 |
| $ | 411 |
| (7 | )% |
Total Cash Costs: Co-product (per ounce) | $ | 391 |
| $ | 499 |
| (22 | )% | | $ | 424 |
| $ | 438 |
| (3 | )% |
| AISC (per ounce) | $ | 440 |
| $ | 587 |
| (25 | )% | | $ | 486 |
| $ | 509 |
| (5 | )% |
Financial Data (in millions) (1) | | | | | | | |
| Revenues | $ | 153 |
| $ | 125 |
| 22 | % | | $ | 275 |
| $ | 264 |
| 4 | % |
| Production costs | $ | 48 |
| $ | 49 |
| (2 | )% | | $ | 95 |
| $ | 94 |
| 1 | % |
| Depreciation and depletion | $ | 11 |
| $ | 7 |
| 57 | % | | $ | 20 |
| $ | 20 |
| — | % |
| Earnings from operations | $ | 94 |
| $ | 69 |
| 36 | % | | $ | 160 |
| $ | 150 |
| 7 | % |
| Expenditures on mining interests (cash basis) | $ | 10 |
| $ | 10 |
| — | % | | $ | 19 |
| $ | 19 |
| — | % |
| – Sustaining | $ | 10 |
| $ | 10 |
| — | % | | $ | 19 |
| $ | 19 |
| — | % |
| – Expansionary | $ | — |
| $ | — |
| n/a |
| | $ | — |
| $ | — |
| n/a |
|
| |
| (1) | The Company’s 40% interest in Pueblo Viejo is classified as an investment in associate and is accounted for using the equity method with the Company’s share of net earnings and net assets separately disclosed in the Consolidated Statements of Earnings (Loss) and Consolidated Balance Sheets, respectively. The financial data disclosed in the table represents the financial data of Pueblo Viejo on a proportionate rather than equity basis. For the three and six months ended June 30, 2017, the Company's equity earnings from Pueblo Viejo were $40 million and $67 million, respectively (three and six months ended June 30, 2016 – equity earnings of $22 million and $58 million, respectively). |
Operating Highlights
Gold production for the three and six months ended June 30, 2017 was 15% higher and 2% lower, respectively, than the three and six months ended June 30, 2016, primarily due to higher tonnes milled and higher recoveries, offset by lower grades. Ore milled in the three and six months ended June 30, 2017 increased by 20% and 7%, respectively, in comparison with same periods in 2016 primarily due less planned maintenance shutdown time in 2017. Higher gold recovery in the first six months of 2017 was a result of processing ore with lower organic carbon content compared to the same period in 2016. The decrease in head grade was attributable to the mining sequence with higher grade ore deferred into the third and fourth quarters of 2017.
Financial Highlights
Earnings from operations were $94 million and $160 million, respectively, in the three and six months ended June 30, 2017 compared to $69 million and $150 million, respectively, in the three and six months ended June 30, 2016. Earnings for the three months ended June 30, 2017 increased compared to the same period in 2016 primarily due to higher gold production. Earnings for the six months ended June 30, 2017 were higher than the same period in 2016, primarily due to higher sales.
AISC for the three and six months ended June 30, 2017 were 25% and 5% lower, respectively, than the three and six months ended June 30, 2016 due to higher gold sales and higher by-product silver credits. Production costs in the three and six months ended June 30, 2017 remained consistent with the same periods in 2016 despite higher tonnes milled and gold sales.
Second Quarter Report – 2017
(in United States dollars, tabular amounts in millions, except where noted)
Red Lake, Canada (100%-owned)
|
| | | | | | | | | | | | | | | | | |
| | Three months ended June 30 | | Six months ended June 30 |
| Operating Data | 2017 |
| 2016 |
| Change |
| | 2017 |
| 2016 |
| Change |
|
| Tonnes of ore mined (thousands) | 150 |
| 142 |
| 6 | % | | 260 |
| 304 |
| (14 | )% |
| Tonnes of ore milled (thousands) | 150 |
| 142 |
| 6 | % | | 260 |
| 304 |
| (14 | )% |
| Mill head grade (grams/tonne) | 12.75 |
| 16.31 |
| (22 | )% | | 13.41 |
| 16.29 |
| (18 | )% |
| Recovery rate | 95 | % | 96 | % | (1 | )% | | 95 | % | 96 | % | (1 | )% |
| Gold Produced (thousands of ounces) | 58 |
| 73 |
| (21 | )% | | 107 |
| 152 |
| (30 | )% |
| Gold Sold (thousands of ounces) | 58 |
| 71 |
| (18 | )% | | 112 |
| 155 |
| (28 | )% |
| Total Cash Costs: By-product (per ounce) | $ | 828 |
| $ | 675 |
| 23 | % | | $ | 844 |
| $ | 605 |
| 40 | % |
| AISC (per ounce) | $ | 1,120 |
| $ | 958 |
| 17 | % | | $ | 1,134 |
| $ | 895 |
| 27 | % |
| Financial Data (in millions) | | | | | | | |
| Revenues | $ | 74 |
| $ | 91 |
| (19 | )% | | $ | 140 |
| $ | 190 |
| (26 | )% |
| Production costs | $ | 49 |
| $ | 48 |
| 2 | % | | $ | 95 |
| $ | 94 |
| 1 | % |
| Depreciation and depletion | $ | 23 |
| $ | 28 |
| (18 | )% | | $ | 44 |
| $ | 59 |
| (25 | )% |
| Other | $ | 2 |
| $ | 3 |
| (33 | )% | | $ | 4 |
| $ | 12 |
| (67 | )% |
| Earnings (loss) from operations | $ | — |
| $ | 12 |
| (100 | )% | | $ | (3 | ) | $ | 25 |
| n/a |
|
| Expenditures on mining interests (cash basis) | $ | 20 |
| $ | 24 |
| (17 | )% | | $ | 37 |
| $ | 55 |
| (33 | )% |
| – Sustaining | $ | 16 |
| $ | 17 |
| (6 | )% | | $ | 30 |
| $ | 38 |
| (21 | )% |
| – Expansionary | $ | 4 |
| $ | 7 |
| (43 | )% | | $ | 7 |
| $ | 17 |
| (59 | )% |
Operating Highlights
Gold production for the three and six months ended June 30, 2017 was 21% and 30% lower, respectively, than the three and six months ended June 30, 2016 due to lower grade from the High Grade Zone, and for the six month period, lower ore tonnes mined and milled. Red Lake has focused on accelerating development in the first half of 2017, which will continue into the third quarter of 2017, in order to provide higher tonnage and grade in the fourth quarter of 2017. Red Lake has achieved a development rate of 40 meters per day in the first six months of 2017 compared to 33 meters per day in the same period in the prior year.
The site is focused on realizing efficiencies through cost and productivity initiatives and the rationalization of site infrastructure. The Red Lake mill was placed on care and maintenance in the first quarter of 2017, while maintaining the flexibility to bring the mill back into service if additional milling capacity is required. Additional redundant infrastructure has been identified and is planned to be placed on care and maintenance in the second half of 2017.
Financial Highlights
Loss from operations were $nil and $3 million for the three and six months ended June 30, 2017, respectively, compared to earnings of $12 million and $25 million, respectively, in the three and six months ended June 30, 2016. Earnings decreased due to lower gold production and higher expensed development costs.
AISC for the three and six months ended June 30, 2017 were 17% and 27% higher, respectively, than the three and six months ended June 30, 2016 due to lower gold production, partially offset by lower sustaining capital. Milling costs have decreased as a result of the savings realized from the one mill strategy.
During the second quarter of 2017, Red Lake completed the process to identify areas to contribute to Goldcorp's overall $250 million target in annual sustainable efficiencies. The site has now transitioned into execution which is expected to improve results through cost reductions and production efficiencies.
Expansionary capital for the three and six months ended June 30, 2017 were 43% and 59%, lower, respectively, than the three and six months ended June 30, 2016, respectively, as project activities focused on planning and study work required for mining in the upper portion of Cochenour.
Second Quarter Report – 2017
(in United States dollars, tabular amounts in millions, except where noted)
Éléonore, Canada (100%-owned)
|
| | | | | | | | | | | | | | | | | |
| | Three months ended June 30 | | Six months ended June 30 |
| Operating Data | 2017 |
| 2016 |
| Change |
| | 2017 |
| 2016 |
| Change |
|
| Tonnes of ore mined (thousands) | 416 |
| 444 |
| (6 | )% | | 897 |
| 834 |
| 8 | % |
| Tonnes of ore milled (thousands) | 432 |
| 444 |
| (3 | )% | | 911 |
| 831 |
| 10 | % |
| Mill head grade (grams/tonne) | 5.15 |
| 5.60 |
| (8 | )% | | 5.26 |
| 5.62 |
| (6 | )% |
| Recovery rate | 91 | % | 90 | % | 1 | % | | 91 | % | 90 | % | 1 | % |
| Gold Produced (thousands of ounces) | 66 |
| 74 |
| (11 | )% | | 144 |
| 141 |
| 2 | % |
| Gold Sold (thousands of ounces) | 68 |
| 73 |
| (7 | )% | | 140 |
| 143 |
| (2 | )% |
| Total Cash Costs: By-product (per ounce) | $ | 891 |
| $ | 857 |
| 4 | % | | $ | 870 |
| $ | 831 |
| 5 | % |
| AISC (per ounce) | $ | 1,229 |
| $ | 919 |
| 34 | % | | $ | 1,141 |
| $ | 942 |
| 21 | % |
| Financial Data (in millions) | | | | | | | |
| Revenues | $ | 86 |
| $ | 94 |
| (9 | )% | | $ | 174 |
| $ | 177 |
| (2 | )% |
| Production costs | $ | 61 |
| $ | 63 |
| (3 | )% | | $ | 122 |
| $ | 119 |
| 3 | % |
| Depreciation and depletion | $ | 32 |
| $ | 37 |
| (14 | )% | | $ | 64 |
| $ | 73 |
| (12 | )% |
| Other | $ | — |
| $ | — |
| n/a |
| | $ | 1 |
| $ | — |
| n/a |
|
| Earnings (loss) from operations | $ | (7 | ) | $ | (6 | ) | 17 | % | | $ | (13 | ) | $ | (15 | ) | 13 | % |
| Expenditures on mining interests (cash basis) | $ | 29 |
| $ | 18 |
| 61 | % | | $ | 58 |
| $ | 39 |
| 49 | % |
| – Sustaining | $ | 22 |
| $ | 4 |
| 450 | % | | $ | 36 |
| $ | 15 |
| 140 | % |
| – Expansionary | $ | 7 |
| $ | 14 |
| (50 | )% | | $ | 22 |
| $ | 24 |
| (8 | )% |
Operating Highlights
Gold production for the three and six months ended June 30, 2017 was 11% lower and 2% higher, respectively, than the three and six months ended June 30, 2016. While the ramp up continues, the tonnes mined in the second quarter of 2017 were consistent with the prior year, as planned, as Éléonore focused on achieving additional development in order to support the longer term production rates. The mined grade is expected to increase in the second half of 2017 as a result of mine sequencing. Éléonore achieved a development rate of 51 meters per day in the first six months of 2017 compared to 47 meters per day in the first six months of 2016, which is designed to support the production ramp-up to 7,000 tonnes per day, expected to be achieved in late 2018 as planned.
Financial Highlights
The losses from operations were $7 million and $13 million, respectively, in the three and six months ended June 30, 2017 and were comparable to the losses of $6 million and $15 million, respectively, in the three and six months ended June 30, 2016.
AISC for the three and six months ended June 30, 2017 were and 34% and 21% higher, respectively, than the three and six months ended June 30, 2016 due to an increase in sustaining capital expenditures as a result of a planned increase in development rates. With significant fixed costs, including camp and transportation costs, Éléonore expects to see a reduction in AISC as mining rates continue to ramp-up. Expansionary capital expenditures decreased as the work on the water treatment plant progressed towards final commissioning.
Second Quarter Report – 2017
(in United States dollars, tabular amounts in millions, except where noted)
Porcupine, Canada (100%-owned)
|
| | | | | | | | | | | | | | | | | |
| | Three months ended June 30 | | Six months ended June 30 |
| Operating Data | 2017 |
| 2016 |
| Change |
| | 2017 |
| 2016 |
| Change |
|
| Tonnes of ore mined underground (thousands) | 188 |
| 205 |
| (8 | )% | | 345 |
| 424 |
| (19 | )% |
| Tonnes of ore mined open pit (thousands) | 594 |
| 473 |
| 26 | % | | 1,204 |
| 861 |
| 40 | % |
| Tonnes of ore milled (thousands) | 687 |
| 897 |
| (23 | )% | | 1,454 |
| 1,807 |
| (20 | )% |
| Mill head grade (grams/tonne) | 2.96 |
| 2.75 |
| 8 | % | | 2.80 |
| 2.69 |
| 4 | % |
| Recovery rate | 93 | % | 92 | % | 1 | % | | 92 | % | 91 | % | 1 | % |
| Gold Produced (thousands of ounces) | 60 |
| 73 |
| (18 | )% | | 121 |
| 147 |
| (18 | )% |
| Gold Sold (thousands of ounces) | 60 |
| 73 |
| (18 | )% | | 122 |
| 148 |
| (18 | )% |
| Total Cash Costs: By-product (per ounce) | $ | 777 |
| $ | 655 |
| 19 | % | | $ | 810 |
| $ | 639 |
| 27 | % |
| AISC (per ounce) | $ | 1,052 |
| $ | 844 |
| 25 | % | | $ | 1,031 |
| $ | 840 |
| 23 | % |
| Financial Data (in millions) | | | | | | | |
| Revenues | $ | 76 |
| $ | 93 |
| (18 | )% | | $ | 152 |
| $ | 182 |
| (16 | )% |
| Production costs | $ | 49 |
| $ | 48 |
| 2 | % | | $ | 101 |
| $ | 95 |
| 6 | % |
| Depreciation and depletion | $ | 27 |
| $ | 17 |
| 59 | % | | $ | 54 |
| $ | 35 |
| 54 | % |
| Other | $ | 2 |
| $ | (1 | ) | n/a |
| | $ | 5 |
| $ | 5 |
| — | % |
| Earnings (loss) from operations | $ | (2 | ) | $ | 29 |
| n/a |
| | $ | (8 | ) | $ | 47 |
| n/a |
|
| Expenditures on mining interests (cash basis) | $ | 36 |
| $ | 14 |
| 157 | % | | $ | 50 |
| $ | 30 |
| 67 | % |
| – Sustaining | $ | 14 |
| $ | 10 |
| 40 | % | | $ | 21 |
| $ | 22 |
| (5 | )% |
| – Expansionary | $ | 22 |
| $ | 3 |
| 633 | % | | $ | 29 |
| $ | 7 |
| 314 | % |
Operating Highlights
Gold production for the three and six months ended June 30, 2017 was 18% lower than both the three and six months ended June 30, 2016, primarily due to planned lower tonnes from both Dome underground and Hoyle Deep underground and the processing of low grade stockpile in the three and six months ended June 30, 2016, partially offset by higher production from the Hollinger open pit.
Higher development rates in the three and six months ended June 30, 2017 are expected to add capacity for higher mining rates at Hoyle Deep underground throughout the remainder of 2017. The increase in the mining rate at Hoyle Deep underground is also expected to positively impact grade.
Financial Highlights
The loss from operations was $2 million and $8 million, respectively, in the three and six months ended June 30, 2017 compared to earnings of $29 million and $47 million, respectively, in the three and six months ended June 30, 2016. The loss from operations was primarily due to lower production and higher depreciation and depletion. Depreciation and depletion increased as a result of incremental depletion from the Hoyle Deep winze which completed construction during the second quarter of 2016.
AISC for the three and six months ended June 30, 2017 were 25% and 23% higher, respectively, than the three and six months ended June 30, 2016 due to lower production, higher production costs and, for the three months ended June 30, 2017 compared to June 30, 2016, higher sustaining capital.
Second Quarter Report – 2017
(in United States dollars, tabular amounts in millions, except where noted)
Musselwhite, Canada (100%-owned)
|
| | | | | | | | | | | | | | | | | |
| | Three months ended June 30 | | Six months ended June 30 |
| Operating Data | 2017 |
| 2016 |
| Change |
| | 2017 |
| 2016 |
| Change |
|
| Tonnes of ore mined (thousands) | 284 |
| 287 |
| (1 | )% | | 581 |
| 562 |
| 3 | % |
| Tonnes of ore milled (thousands) | 278 |
| 283 |
| (2 | )% | | 581 |
| 572 |
| 2 | % |
| Average mill head grade (grams/tonne) | 6.52 |
| 6.80 |
| (4 | )% | | 6.10 |
| 7.23 |
| (16 | )% |
| Average recovery rate | 96 | % | 96 | % | — | % | | 96 | % | 96 | % | — | % |
| Gold Produced (thousands of ounces) | 57 |
| 59 |
| (3 | )% | | 111 |
| 127 |
| (13 | )% |
| Gold Sold (thousands of ounces) | 55 |
| 61 |
| (10 | )% | | 111 |
| 128 |
| (13 | )% |
| Total Cash Costs: By-product (per ounce) | $ | 658 |
| $ | 585 |
| 12 | % | | $ | 686 |
| $ | 513 |
| 34 | % |
| AISC (per ounce) | $ | 826 |
| $ | 721 |
| 15 | % | | $ | 848 |
| $ | 633 |
| 34 | % |
| Financial Data (in millions) | | | | | | | |
| Revenues | $ | 69 |
| $ | 77 |
| (10 | )% | | $ | 138 |
| $ | 155 |
| (11 | )% |
| Production costs | $ | 36 |
| $ | 36 |
| — | % | | $ | 76 |
| $ | 66 |
| 15 | % |
| Depreciation and depletion | $ | 10 |
| $ | 17 |
| (41 | )% | | $ | 20 |
| $ | 32 |
| (38 | )% |
| Other | $ | 2 |
| $ | 1 |
| 100 | % | | $ | 4 |
| $ | 3 |
| 33 | % |
| Earnings from operations | $ | 21 |
| $ | 23 |
| (9 | )% | | $ | 38 |
| $ | 54 |
| (30 | )% |
| Expenditures on mining interests (cash basis) | $ | 14 |
| $ | 7 |
| 100 | % | | $ | 25 |
| $ | 12 |
| 108 | % |
| – Sustaining | $ | 7 |
| $ | 7 |
| — | % | | $ | 14 |
| $ | 12 |
| 17 | % |
| – Expansionary | $ | 7 |
| $ | — |
| — |
| | $ | 11 |
| $ | — |
| — |
|
Operating Highlights
Gold production for the three and six months ended June 30, 2017 was 3% and 13% lower, respectively, than the three and six months ended June 30, 2016, primarily due to lower head grades. Lower grades in the first half of 2017 were the result of planned sequencing in the mine and higher than expected dilution in the first quarter of 2017 from larger stopes. In the second quarter of 2017, Musselwhite implemented revised stope designs and a review process to reduce future dilution that has positively impacted grades in the second quarter of 2017. The mine plan for the second half of 2017 contains higher planned grades than the first half of 2017.
Financial Highlights
Earnings from operations were $21 million and $38 million, respectively, in the three and six months ended June 30, 2017 compared to $23 million in the three months ended June 30, 2016, and lower than earnings of $54 million in the six months ended June 30, 2016.
AISC for the three and six months ended June 30, 2017 were 15% and 34% higher, respectively, than the three and six months ended June 30, 2016 due to lower gold production and higher production costs. Expansionary capital expenditures relate to the Materials Handling Project, which was approved in July 2016 and commenced in the third quarter of 2016.
Second Quarter Report – 2017
(in United States dollars, tabular amounts in millions, except where noted)
PROJECT PIPELINE
The Company has numerous projects underway and the current anticipated milestones for 2017 through 2021 are outlined below:
Expenditures relating to projects for the three and six months ended June 30, 2017 and 2016 were as follows (in millions):
|
| | | | | | | | | | | | | |
| | Three Months Ended June 30 | | Six Months Ended June 30 |
| Project | 2017 | 2016 | | 2017 | 2016 |
| Peñasquito – Pyrite Leach | $ | 43 |
| $ | 3 |
| | $ | 77 |
| $ | 6 |
|
| Musselwhite – Materials Handling | 7 |
| 1 |
| | 11 |
| 1 |
|
| Porcupine – Borden | 22 |
| 4 |
| | 29 |
| 7 |
|
| Coffee | 7 |
| — |
| | 9 |
| — |
|
| Red Lake – Cochenour | 4 |
| 6 |
| | 7 |
| 17 |
|
| Red Lake – HG Young | — |
| 3 |
| | 1 |
| 6 |
|
| Porcupine – Century | 4 |
| — |
| | 4 |
| — |
|
| NuevaUnión (50%) | 9 |
| 3 |
| | 14 |
| 8 |
|
Eleonore (1) | 7 |
| 14 |
| | 22 |
| 24 |
|
| Cerro Negro | 2 |
| 5 |
| | 4 |
| 16 |
|
| Other | 1 |
| 1 |
| | 2 |
| — |
|
| TOTAL | $ | 106 |
| $ | 40 |
| | $ | 180 |
| $ | 85 |
|
(1) Eleonore's 2017 expansionary capital relates primarily to the water treatment plant, which is expected to be commissioned in the third quarter of 2017.
Of the $106 million and $180 million of project expenditures for the three and six months ended June 30, 2017 (2016 - $40 million and $85 million for the three and six months ended June 30, 2016), $100 million and $173 million ($37 million and $79 million for the three and six months ended June 30, 2016) are included in expenditures on mining interests as expansionary capital. HG Young and certain Coffee expenditures have been expensed as exploration, and Century costs have been expensed as non-sustaining project costs.
Second Quarter Report – 2017
(in United States dollars, tabular amounts in millions, except where noted)
Peñasquito: Pyrite Leach Project
The Pyrite Leach Project (“PLP”) has an expected capital investment of approximately $420 million based on a feasibility study completed in December 2015. The PLP is expected to provide annual incremental production of 100,000-140,000 gold ounces and 4-6 million silver ounces, commencing in 2019. Project expenditures are included as expansionary capital in expenditures on mining interests in Peñasquito.
The PLP achieved construction progress of 14% and engineering progress of 94% by the end of the second quarter of 2017. Major procurement activities are nearing completion, material and equipment is arriving on site and major works contractors have mobilized to site. Earthwork activities are now complete, concrete works are underway, and mechanical works installation has commenced and is ramping up.
The Carbon Pre-flotation Project ("CPP") is also being constructed which will allow Peñasquito to process ore which was previously considered uneconomic, including significant amounts already in stockpiles. CPP earthworks are substantially complete and the concrete works are underway. The mechanical works contractor is mobilizing and will ramp up in the third quarter of 2017. The project remains on budget and on schedule.
Musselwhite: Materials Handling Project
The Materials Handling Project has an expected capital investment of approximately $90 million. The project will construct an underground winze and associated infrastructure which will result in reduced truck haulage and is expected to increase production by approximately 20% and reduce operating costs by approximately 10%. Completion of the project is expected in the first quarter of 2019. Project expenditures are included as expansionary capital in expenditures on mining interests in Musselwhite.
During the second quarter of 2017, the Material Handling Project achieved 31% completion and approximately 94% of the detailed engineering had been completed. Key underground development advanced on plan and all major components have been procured. The project remains on budget and on schedule.
Porcupine: Borden Project
The 100%-owned Borden Project is located near Chapleau in Ontario, approximately 160 kilometres west of the Company's Porcupine mine, and comprises 786 square kilometres of claims. Project expenditures are included as expansionary capital in expenditures on mining interests in Porcupine.
During the second quarter of 2017, ramp development commenced with 122 meters completed. The ramp design for the purpose of the bulk sample is expected to be sufficient for mining purposes. The underground platforms developed from the ramp access will further support exploration drilling of a deposit that remains open at depth and laterally. A final feasibility study is expected to be completed in the first quarter of 2019 after the completion of a bulk sample. With the expected ramp completion and minimal additional infrastructure required for full scale mining, the Company expects to reach commercial production six months following bulk sample extraction.
Coffee Project
The 100%-owned Coffee project is a structurally hosted hydrothermal deposit located approximately 130 kilometres south of the City of Dawson,Yukon. The Coffee land package, comprising over 60,000 hectares, demonstrates potential for near-mine discoveries with mineralization remaining open along strike and at depth and the potential for the discovery of a major new mineral system.
Following the submission of the Environmental Socioeconomic Assessment in the first quarter of 2017, Goldcorp and the Tr’ondëk Hwëch’in First Nation have made substantial progress on developing an Impact Benefits Agreement to ensure the Tr’ondëk Hwëch’in First Nation will benefit from the operation of the Coffee project.
In the second quarter of 2017, the review and optimization of the feasibility study and planning for upgrades to site infrastructure continued. The Company still expects permitting and construction to take approximately four years, with commercial production targeted for the first quarter of 2021.
Red Lake: Cochenour Project
The 100%-owned Cochenour project combines the existing workings of the historic Cochenour mine with the Bruce Channel gold discovery in the Red Lake camp. Cochenour is expected to provide an additional source of ore feed for the Red Lake Mine. Project expenditures are included as expansionary capital in expenditures on mining interests in Red Lake.
During the second quarter of 2017, the Company started development of additional drill platforms in the upper portion of the Cochenour deposit and commenced a pre-feasibility study with an updated block model. Completion of the pre-feasibility study relating to longer term and
Second Quarter Report – 2017
(in United States dollars, tabular amounts in millions, except where noted)
sustainable mining is expected by first half of 2018. The Company is assessing the opportunity to mine additional longhole stopes in 2017 which will provide further geological understanding and will be used to support mine planning.
The Company is undertaking the necessary work at Cochenour with the intention of converting a portion of the 0.29 million ounces (0.6 million tonnes at 15.03 grams per tonne) of indicated resources into a mineral reserve and expects to be able to include the estimate, along with an initial production profile, as part of the Company's September 30, 2017 results.
Red Lake: HG Young Project
The 100%-owned HG Young project is an exploration discovery in close proximity to the Company's 100%-owned Red Lake mine. Project expenditures are expensed as exploration in Red Lake.
During the second quarter of 2017, work focused on drilling, geological interpretation, block models and the concept study. The concept study will continue to evaluate alternative mining solutions, including accessing the deposit from existing underground workings or a decline from surface, to provide access to higher confidence areas for further exploration and bulk sampling in order to support a pre-feasibility study. The concept study is expected to be completed by the end of 2017, following which a pre-feasibility study is expected to commence.
Porcupine: Century Project
The 100%-owned Century Project is a potential large-scale, open pit mine and related processing facility at the Dome mine. The current mineral resource estimate in the Dome open pit is 4.5 million ounces (130.6 million tonnes at 1.07 grams per tonne) of measured and indicated resources and 0.9 million ounces (35 million tonnes at 0.81 grams per tonne) of inferred resources, with potential to further extend open pit mining well below the existing Dome open pit. Project expenditures are expensed as non-sustaining project costs and included in Porcupine's results.
In the second quarter of 2017, work continued on the pre-feasibility study. The base case pre-feasibility study is expected to complete necessary work at the Dome open pit to convert a portion of the measured and indicated mineral resources into an initial mineral reserve and the Company expects that the estimate will be included as part of the reserve and resource update to be released as part of the Company's September 30, 2017 results.
Following the completion of the base case, the pre-feasibility study will be optimized to improve the economics of the Dome open pit as well as the integration of additional potential mill feed including the Pamour open pit and the Pamour West open pit. The pre-feasibility is expected to be completed in the second half of 2018.
Cerro Casale / Caspiche Project
The 50%-owned Cerro Casale project is located in the Maricunga District of Chile. The joint venture will control more than 20,000 hectares of mineral properties in the Maricunga district with the Cerro Casale and Caspiche deposits. The Cerro Casale / Caspiche deposits contain 57.7 million gold ounces in reserves and resources (100% basis) (see table on page 47).
In June 2017, Goldcorp and Barrick formed a dedicated project team that will undertake 24 months of concept studies on the combined project. This will include analysis of synergies and the consolidation of infrastructure to reduce capital and operating costs as well as the environmental footprint and provide increased returns compared to two standalone projects. The project team is also engaged in community and broad stakeholder consultation.
NuevaUnión Project
The 50%-owned NuevaUnión Project comprises the La Fortuna gold/copper deposit and the Relincho copper/molybdenum deposit and is one of the largest undeveloped copper-gold-molybdenum projects in the Americas. A 2015 preliminary economic assessment contemplates ore from the La Fortuna deposit being conveyed to a concentrator at the Relincho deposit, resulting in a mine life of over 30 years.
During the second quarter of 2017, a drilling program to support the feasibility study continued. The project commenced a pre-feasibility study in October 2016 which is expected to be completed in the fourth quarter of 2017, following which a feasibility study is expected to commence. The Environmental Impact Assessment baseline studies and the consultation process with communities continues to progress.
Second Quarter Report – 2017
(in United States dollars, tabular amounts in millions, except where noted)
NON-GAAP FINANCIAL PERFORMANCE MEASURES
The Company has included certain non-GAAP performance measures throughout this document. These performance measures are employed by the Company to measure its operating and economic performance internally and to assist in business decision-making as well as providing key performance information to senior management. The Company believes that, in addition to conventional measures prepared in accordance with GAAP, certain investors and other stakeholders also use this information to evaluate the Company’s operating and financial performance; however, these non-GAAP performance measures do not have any standardized meaning. Accordingly, these performance measures are intended to provide additional information and should not be considered in isolation or as a substitute for measures of performance prepared in accordance with GAAP. The Company’s primary business is gold production and its future development and current operations focus are on maximizing returns from gold production, with other metal production being incidental to the gold production process. As a result, the Company's non-GAAP performance measures are disclosed on a per gold ounce basis.
The Company calculates its non-GAAP performance measures on an attributable basis. Attributable performance measures include the Company’s mining operations and projects, and the Company’s share of Pueblo Viejo, Alumbrera, Leagold and NuevaUnión. The inclusion of NuevaUnión in the Company's non-GAAP performance measures only impacts the Company's adjusted operating cash flow metric at this time as it is a development stage project. The Company believes that disclosing certain performance measures on an attributable basis provides useful information about the Company’s operating and financial performance, and reflects the Company’s view of its core mining operations.
Non-GAAP Measure - Total Cash Costs: by-product
Total cash costs: by-product incorporate Goldcorp’s share of all production costs, including adjustments to inventory carrying values, adjusted for changes in estimates in reclamation and closure costs at the Company’s closed mines which are non-cash in nature, and include Goldcorp’s share of by-product silver, lead, zinc and copper credits, and treatment and refining charges included within revenue. Additionally, cash costs are adjusted for realized gains and losses arising on the Company’s commodity and foreign currency contracts which the Company enters into to mitigate its exposure to fluctuations in by-product metal prices, heating oil prices and foreign exchange rates, which may impact the Company’s operating costs.
In addition to conventional measures, the Company assesses this per ounce measure in a manner that isolates the impacts of gold production volumes, the by-product credits, and operating costs fluctuations such that the non-controllable and controllable variability is independently addressed. The Company uses total cash costs: by-product per gold ounce to monitor its operating performance internally, including operating cash costs, as well as in its assessment of potential development projects and acquisition targets. The Company believes this measure provides investors and analysts with useful information about the Company’s underlying cash costs of operations and the impact of by-product credits on the Company’s cost structure and is a relevant metric used to understand the Company’s operating profitability and ability to generate cash flow. When deriving the production costs associated with an ounce of gold, the Company includes by-product credits as the Company considers that the cost to produce the gold is reduced as a result of the by-product sales incidental to the gold production process, thereby allowing the Company’s management and other stakeholders to assess the net costs of gold production.
The Company reports total cash costs: by-product on a gold ounces sold basis. In the gold mining industry, this is a common performance measure but does not have any standardized meaning. The Company follows the recommendations of the Gold Institute Production Cost Standard. The Gold Institute, which ceased operations in 2002, was a non-regulatory body and represented a global group of producers of gold and gold products. The production cost standard developed by the Gold Institute remains the generally accepted standard of reporting cash costs of production by gold mining companies.
The Company also reports total cash costs: co-product as a secondary metric to provide further information to the Company's stakeholders. Total cash costs: co-product, per gold ounce, are calculated by allocating Goldcorp‘s share of production costs to each co-product based on the ratio of actual sales volumes multiplied by budget metal prices, as compared to realized sales prices. The Company uses budget prices to eliminate price volatility and improve co-product cash cost reporting comparability between periods. The budget metal prices used in the calculation of total cash costs: co-product were as follows:
|
| | | | | | | | | |
| | 2017 |
| 2016 |
| 2015 |
|
| Gold (per ounce) | $ | 1,250 |
| $ | 1,100 |
| $ | 1,200 |
|
| Silver (per ounce) | $ | 19 |
| $ | 15 |
| $ | 18 |
|
| Copper (per pound) | $ | 2.25 |
| $ | 2.53 |
| $ | 3.00 |
|
| Lead (per pound) | $ | 0.89 |
| $ | 0.80 |
| $ | 0.95 |
|
| Zinc (per pound) | $ | 1.00 |
| $ | 0.80 |
| $ | 1.00 |
|
Second Quarter Report – 2017
(in United States dollars, tabular amounts in millions, except where noted)
The following tables provide a reconciliation of total cash costs: by-product per ounce to the consolidated financial statements:
Three months ended June 30, 2017:
|
| | | | | | | | | | | | | | | | | | | | |
| | Production Costs (1) | By-Product Credits | Treatment and Refining Charges on Concentrate Sales | Other | Total Cash Costs: by-product | Ounces (thousands) | Total Cash Costs: by-product per ounce (2), (3) |
| Peñasquito | $ | 172 |
| $ | (199 | ) | $ | 30 |
| $ | — |
| $ | 3 |
| 133 |
| $ | 26 |
|
| Cerro Negro | 66 |
| (14 | ) | — |
| (1 | ) | 51 |
| 107 |
| 484 |
|
| Pueblo Viejo | 48 |
| (10 | ) | — |
| — |
| 38 |
| 114 |
| 333 |
|
| Red Lake | 49 |
| — |
| — |
| — |
| 49 |
| 58 |
| 828 |
|
| Éléonore | 61 |
| — |
| — |
| — |
| 61 |
| 68 |
| 891 |
|
| Porcupine | 49 |
| — |
| — |
| (2 | ) | 47 |
| 60 |
| 777 |
|
| Musselwhite | 36 |
| — |
| — |
| — |
| 36 |
| 55 |
| 658 |
|
| Other mines | 86 |
| (43 | ) | 3 |
| 1 |
| 47 |
| 54 |
| 859 |
|
| Total - Attributable basis | $ | 567 |
| $ | (266 | ) | $ | 33 |
| $ | (2 | ) | $ | 332 |
| 649 |
| $ | 510 |
|
| Less associates and joint ventures | (111 | ) | 42 |
| (3 | ) | — |
| (72 | ) | (152 | ) | (478 | ) |
| TOTAL - Consolidated | $ | 456 |
| $ | (224 | ) | $ | 30 |
| $ | (2 | ) | $ | 260 |
| 497 |
| $ | 520 |
|
Three months ended June 30, 2016:
|
| | | | | | | | | | | | | | | | | |
| | Production Costs (1) | By-Product Credits | Treatment and Refining Charges on Concentrate Sales | Total Cash Costs: by-product | Ounces (thousands) | Total Cash Costs: by-product per ounce (2), (3) |
| Peñasquito | $ | 147 |
| $ | (92 | ) | $ | 20 |
| $ | 75 |
| 42 |
| $ | 1,757 |
|
| Cerro Negro | 57 |
| (12 | ) | — |
| 45 |
| 85 |
| 529 |
|
| Pueblo Viejo | 49 |
| (4 | ) | — |
| 45 |
| 96 |
| 473 |
|
| Red Lake | 48 |
| — |
| — |
| 48 |
| 71 |
| 675 |
|
| Éléonore | 63 |
| — |
| — |
| 63 |
| 73 |
| 857 |
|
| Porcupine | 48 |
| — |
| — |
| 48 |
| 73 |
| 655 |
|
| Musselwhite | 36 |
| — |
| — |
| 36 |
| 61 |
| 585 |
|
| Other mines | 132 |
| (48 | ) | 3 |
| 87 |
| 115 |
| 781 |
|
| Total - Attributable basis | $ | 580 |
| $ | (156 | ) | $ | 23 |
| $ | 447 |
| 616 |
| $ | 728 |
|
| Less associates and joint ventures | (81 | ) | 29 |
| (3 | ) | (55 | ) | (112 | ) | (505 | ) |
| TOTAL - Consolidated | $ | 499 |
| $ | (127 | ) | $ | 20 |
| $ | 392 |
| 504 |
| $ | 777 |
|
Second Quarter Report – 2017
(in United States dollars, tabular amounts in millions, except where noted)
Six months ended June 30, 2017:
|
| | | | | | | | | | | | | | | | | | | | |
| | Production Costs (1) | By-Product Credits | Treatment and Refining Charges on Concentrate Sales | Other | Total Cash Costs: by-product | Ounces (thousands) | Total Cash Costs: by-product per ounce (2), (3) |
| Peñasquito | $ | 366 |
| $ | (426 | ) | $ | 75 |
| $ | — |
| $ | 15 |
| 271 |
| $ | 56 |
|
| Cerro Negro | 119 |
| (26 | ) | — |
| (1 | ) | 92 |
| 195 |
| 473 |
|
| Pueblo Viejo | 95 |
| (15 | ) | — |
| — |
| 80 |
| 209 |
| 381 |
|
| Red Lake | 95 |
| — |
| — |
| — |
| 95 |
| 112 |
| 844 |
|
| Éléonore | 122 |
| — |
| — |
| — |
| 122 |
| 140 |
| 870 |
|
| Porcupine | 101 |
| — |
| — |
| (2 | ) | 99 |
| 122 |
| 810 |
|
| Musselwhite | 76 |
| — |
| — |
| — |
| 76 |
| 111 |
| 686 |
|
| Other mines | 189 |
| (94 | ) | 6 |
| 1 |
| 102 |
| 135 |
| 758 |
|
| Total - Attributable basis | $ | 1,163 |
| $ | (561 | ) | $ | 81 |
| $ | (2 | ) | $ | 681 |
| 1,295 |
| $ | 525 |
|
| Less associates and joint ventures | (187 | ) | 74 |
| (6 | ) | — |
| (119 | ) | (259 | ) | (460 | ) |
| TOTAL - Consolidated | $ | 976 |
| $ | (487 | ) | $ | 75 |
| $ | (2 | ) | $ | 562 |
| 1,036 |
| $ | 541 |
|
Six months ended June 30, 2016:
|
| | | | | | | | | | | | | | | | | |
| | Production Costs (1) | By-Product Credits | Treatment and Refining Charges on Concentrate Sales | Total Cash Costs: by-product | Ounces (thousands) | Total Cash Costs: by-product per ounce (2), (3) |
| Peñasquito | $ | 319 |
| $ | (234 | ) | $ | 51 |
| $ | 136 |
| 164 |
| $ | 834 |
|
| Cerro Negro | 125 |
| (31 | ) | — |
| 94 |
| 213 |
| 440 |
|
| Pueblo Viejo | 94 |
| (9 | ) | — |
| 85 |
| 208 |
| 411 |
|
| Red Lake | 94 |
| — |
| — |
| 94 |
| 155 |
| 605 |
|
| Éléonore | 119 |
| — |
| — |
| 119 |
| 143 |
| 831 |
|
| Porcupine | 95 |
| — |
| — |
| 95 |
| 148 |
| 639 |
|
| Musselwhite | 66 |
| — |
| — |
| 66 |
| 128 |
| 513 |
|
| Other mines | 307 |
| (112 | ) | 9 |
| 204 |
| 256 |
| 797 |
|
| Total - Attributable basis | $ | 1,219 |
| $ | (386 | ) | $ | 60 |
| $ | 893 |
| 1,415 |
| $ | 631 |
|
| Less associates and joint ventures | (192 | ) | 75 |
| (9 | ) | (126 | ) | (253 | ) | (502 | ) |
| TOTAL - Consolidated | $ | 1,027 |
| $ | (311 | ) | $ | 51 |
| $ | 767 |
| 1,162 |
| $ | 659 |
|
| |
| (1) | $18 million and $41 million in royalties are included in production costs for the three and six months ended June 30, 2017, respectively (three and six months ended June 30, 2016– $9 million and $26 million, respectively). |
| |
| (2) | Total cash costs: by-product per ounce may not calculate based on amounts presented in these tables due to rounding. |
| |
| (3) | If silver, lead, zinc and copper for Peñasquito, silver for Marlin, silver and copper for Pueblo Viejo, and copper for Alumbrera were treated as co-products, Goldcorp's share of total cash costs: co-product for the three and six months ended June 30, 2017, would be $644 and $672 per ounce of gold, $8.41 and $9.04 per ounce of silver, $2.08 and $2.01 per pound of copper, $0.62 and $0.71 per pound of zinc, and $0.81 and $0.88 per pound of lead, respectively (three and six months ended June 30, 2016 – $716 and $657 per ounce of gold, $14.17 and $10.77 per ounce of silver, $2.06 and $2.20 per pound of copper, $1.17 and $0.86 per pound of zinc, and $1.49 and $0.99 per pound of lead, respectively). |
Second Quarter Report – 2017
(in United States dollars, tabular amounts in millions, except where noted)
NON-GAAP MEASURE – AISC
AISC include total production cash costs incurred at the Company’s mining operations, which forms the basis of the Company’s by-product cash costs. Additionally, the Company includes sustaining capital expenditures, corporate administrative expense, mine-site exploration and evaluation costs, and reclamation cost accretion and amortization. The measure seeks to reflect the full cost of gold production from current operations, therefore expansionary capital and non-sustaining expenditures are excluded. Certain other cash expenditures, including tax payments, dividends and financing costs are also excluded.
The Company believes that this measure represents the total costs of producing gold from current operations, and provides the Company and other stakeholders of the Company with additional information of the Company’s operational performance and ability to generate cash flows. AISC, as a key performance measure, allows the Company to assess its ability to support capital expenditures and to sustain future production from the generation of operating cash flows. This information provides management with the ability to more actively manage capital programs and to make more prudent capital investment decisions.
The Company reports AISC on a gold ounces sold basis. This performance measure was adopted as a result of an initiative undertaken within the gold mining industry; however, this performance measure has no standardized meaning and should not be considered in isolation or as a substitute for measures of performance prepared in accordance with GAAP. The Company follows the guidance note released by the World Gold Council, which became effective January 1, 2014. The World Gold Council is a non-regulatory market development organization for the gold industry whose members comprise global senior gold mining companies.
As described above, AISC include total production cash costs incurred at the Company's mining operations, which forms the basis of the Company's cash costs: by-product and which are reconciled to reported production costs in the tables above. The following tables provide a reconciliation of AISC per ounce to the consolidated financial statements:
Three months ended June 30, 2017:
|
| | | | | | | | | | | | | | | | | | | | | | | |
| | Total cash costs: by-product | Corporate Administration | Exploration and evaluation costs | Reclamation cost accretion and amortization | Sustaining capital expenditures | Total AISC | Ounces (thousands) | Total AISC per ounce (1) |
| Peñasquito | $ | 3 |
| $ | — |
| $ | — |
| $ | 3 |
| $ | 37 |
| $ | 43 |
| 133 |
| $ | 328 |
|
| Cerro Negro | 51 |
| — |
| 1 |
| 2 |
| 20 |
| 74 |
| 107 |
| 694 |
|
| Pueblo Viejo | 38 |
| — |
| — |
| 2 |
| 10 |
| 50 |
| 114 |
| 440 |
|
| Red Lake | 49 |
| — |
| — |
| 1 |
| 16 |
| 66 |
| 58 |
| 1,120 |
|
| Éléonore | 61 |
| — |
| — |
| 1 |
| 22 |
| 84 |
| 68 |
| 1,229 |
|
| Porcupine | 47 |
| — |
| 1 |
| 2 |
| 14 |
| 64 |
| 60 |
| 1,052 |
|
| Musselwhite | 36 |
| — |
| 2 |
| — |
| 7 |
| 45 |
| 55 |
| 826 |
|
| Other mines | 47 |
| — |
| — |
| 2 |
| — |
| 49 |
| 54 |
| 917 |
|
Corporate (2) | — |
| 36 |
| 1 |
| — |
| 7 |
| 44 |
| — |
| 68 |
|
| Total - Attributable basis | $ | 332 |
| $ | 36 |
| $ | 5 |
| $ | 13 |
| $ | 133 |
| $ | 519 |
| 649 |
| $ | 800 |
|
| Less associates and joint ventures | (72 | ) | — |
| — |
| (4 | ) | (10 | ) | (86 | ) | (152 | ) | (574 | ) |
| TOTAL - Consolidated | $ | 260 |
| $ | 36 |
| $ | 5 |
| $ | 9 |
| $ | 123 |
| $ | 433 |
| 497 |
| $ | 868 |
|
Second Quarter Report – 2017
(in United States dollars, tabular amounts in millions, except where noted)
Three months ended June 30, 2016:
|
| | | | | | | | | | | | | | | | | | | | | | | |
| | Total cash costs: by-product | Corporate Administration | Exploration and evaluation costs | Reclamation cost accretion and amortization | Sustaining capital expenditures | Total AISC | Ounces (thousands) | Total AISC per ounce (1) |
| Peñasquito | $ | 75 |
| $ | — |
| $ | — |
| $ | 1 |
| $ | 55 |
| $ | 131 |
| 42 |
| $ | 3,094 |
|
| Cerro Negro | 45 |
| — |
| — |
| 2 |
| 21 |
| 68 |
| 85 |
| 808 |
|
| Pueblo Viejo | 45 |
| — |
| — |
| 1 |
| 10 |
| 56 |
| 96 |
| 587 |
|
| Red Lake | 48 |
| — |
| 3 |
| — |
| 17 |
| 68 |
| 71 |
| 958 |
|
| Éléonore | 63 |
| — |
| — |
| — |
| 4 |
| 67 |
| 73 |
| 919 |
|
| Porcupine | 48 |
| — |
| 1 |
| 3 |
| 10 |
| 62 |
| 73 |
| 844 |
|
| Musselwhite | 36 |
| — |
| 1 |
| — |
| 7 |
| 44 |
| 61 |
| 721 |
|
| Other mines | 87 |
| — |
| 3 |
| 6 |
| 8 |
| 104 |
| 115 |
| 924 |
|
Corporate (2) | — |
| 50 |
| (1 | ) | — |
| 8 |
| 57 |
| — |
| 88 |
|
| Total - Attributable basis | $ | 447 |
| $ | 50 |
| $ | 7 |
| $ | 13 |
| $ | 140 |
| $ | 657 |
| 616 |
| $ | 1,067 |
|
| Less associates and joint ventures | (55 | ) | — |
| — |
| (4 | ) | (10 | ) | (69 | ) | (112 | ) | (623 | ) |
| TOTAL - Consolidated | $ | 392 |
| $ | 50 |
| $ | 7 |
| $ | 9 |
| $ | 130 |
| $ | 588 |
| 504 |
| $ | 1,165 |
|
Six months ended June 30, 2017:
|
| | | | | | | | | | | | | | | | | | | | | | | |
| | Total cash costs: by-product | Corporate Administration | Exploration and evaluation costs | Reclamation cost accretion and amortization | Sustaining capital expenditures | Total AISC | Ounces (thousands) | Total AISC per ounce (1) |
| Peñasquito | $ | 15 |
| $ | — |
| $ | 1 |
| $ | 4 |
| $ | 77 |
| $ | 97 |
| 271 |
| $ | 360 |
|
| Cerro Negro | 92 |
| — |
| 2 |
| 4 |
| 34 |
| 132 |
| 195 |
| 675 |
|
| Pueblo Viejo | 80 |
| — |
| — |
| 2 |
| 19 |
| 101 |
| 209 |
| 486 |
|
| Red Lake | 95 |
| — |
| 1 |
| 1 |
| 30 |
| 127 |
| 112 |
| 1,134 |
|
| Éléonore | 122 |
| — |
| 1 |
| 1 |
| 36 |
| 160 |
| 140 |
| 1,141 |
|
| Porcupine | 99 |
| — |
| 1 |
| 5 |
| 21 |
| 126 |
| 122 |
| 1,031 |
|
| Musselwhite | 76 |
| — |
| 4 |
| — |
| 14 |
| 94 |
| 111 |
| 848 |
|
| Other mines | 102 |
| — |
| 1 |
| 7 |
| 2 |
| 112 |
| 135 |
| 831 |
|
Corporate (2) | — |
| 72 |
| 1 |
| — |
| 13 |
| 86 |
| — |
| 66 |
|
| Total - Attributable basis | $ | 681 |
| $ | 72 |
| $ | 12 |
| $ | 24 |
| $ | 246 |
| $ | 1,035 |
| 1,295 |
| $ | 800 |
|
| Less associates and joint ventures | (119 | ) | — |
| — |
| (7 | ) | (19 | ) | (145 | ) | (259 | ) | (564 | ) |
| TOTAL - Consolidated | $ | 562 |
| $ | 72 |
| $ | 12 |
| $ | 17 |
| $ | 227 |
| $ | 890 |
| 1,036 |
| $ | 858 |
|
Second Quarter Report – 2017
(in United States dollars, tabular amounts in millions, except where noted)
Six months ended June 30, 2016:
|
| | | | | | | | | | | | | | | | | | | | | | | |
| | Total cash costs: by-product | Corporate Administration | Exploration and evaluation costs | Reclamation cost accretion and amortization | Sustaining capital expenditures | Total AISC | Ounces (thousands) | Total AISC per ounce (1) |
| Peñasquito | $ | 136 |
| $ | — |
| $ | 1 |
| $ | 3 |
| $ | 112 |
| $ | 252 |
| 164 |
| $ | 1,542 |
|
| Cerro Negro | 94 |
| — |
| — |
| 4 |
| 35 |
| 133 |
| 213 |
| 624 |
|
| Pueblo Viejo | 85 |
| — |
| — |
| 2 |
| 19 |
| 106 |
| 208 |
| 509 |
|
| Red Lake | 94 |
| — |
| 6 |
| 1 |
| 38 |
| 139 |
| 155 |
| 895 |
|
| Éléonore | 119 |
| — |
| — |
| — |
| 15 |
| 134 |
| 143 |
| 942 |
|
| Porcupine | 95 |
| — |
| 1 |
| 6 |
| 22 |
| 124 |
| 148 |
| 840 |
|
| Musselwhite | 66 |
| — |
| 3 |
| — |
| 12 |
| 81 |
| 128 |
| 633 |
|
| Other mines | 204 |
| — |
| 5 |
| 12 |
| 15 |
| 236 |
| 256 |
| 923 |
|
Corporate (2) | — |
| 107 |
| 1 |
| — |
| 12 |
| 120 |
| — |
| 83 |
|
| Total - Attributable basis | $ | 893 |
| $ | 107 |
| $ | 17 |
| $ | 28 |
| $ | 280 |
| $ | 1,325 |
| 1,415 |
| $ | 936 |
|
| Less associates and joint ventures | (126 | ) | — |
| — |
| (7 | ) | (19 | ) | (152 | ) | (253 | ) | (600 | ) |
| TOTAL - Consolidated | $ | 767 |
| $ | 107 |
| $ | 17 |
| $ | 21 |
| $ | 261 |
| $ | 1,173 |
| 1,162 |
| $ | 1,010 |
|
| |
| (1) | AISC may not calculate based on amounts presented in these tables due to rounding. |
| |
| (2) | AISC for Corporate is calculated using total corporate expenditures and the Company's attributable gold sales ounces. |
Sustaining capital expenditures are defined as those expenditures which do not increase annual gold ounce production at a mine site and excludes all expenditures at the Company’s projects and certain expenditures at the Company’s operating sites which are deemed expansionary in nature. Sustaining capital expenditures can include, but is not limited to, capitalized stripping costs at open pit mines, underground mine development, mining and milling equipment and tailings dam raises. The following table reconciles sustaining capital expenditures to the Company’s total capital expenditures for continuing operations:
|
| | | | | | | | | | | | |
| | Three months ended June 30 | Six months ended June 30 |
| | 2017 |
| 2016 |
| 2017 |
| 2016 |
|
| Expenditures on mining interests per consolidated financial statements | $ | 221 |
| $ | 166 |
| $ | 401 |
| $ | 339 |
|
| Payment of finance lease obligations per consolidated financial statements | 1 |
| 1 |
| 3 |
| 2 |
|
Expenditures on mining interests by Alumbrera, Pueblo Viejo, Leagold and NuevaUnión (1) | 11 |
| 10 |
| 15 |
| 31 |
|
| Goldcorp’s share of expenditures on mining interests and deposits | $ | 233 |
| $ | 177 |
| $ | 419 |
| $ | 372 |
|
| Sustaining capital expenditures | $ | 133 |
| $ | 140 |
| $ | 246 |
| $ | 280 |
|
| Expansionary capital expenditures | 100 |
| 37 |
| 173 |
| 79 |
|
| | $ | 233 |
| $ | 177 |
| $ | 419 |
| $ | 359 |
|
| |
| (1) | Expenditures on mining interests by Alumbrera, Pueblo Viejo, Leagold and NuevaUnión represent mining interest expenditures, net of additional funding investments, which are included in expenditures on mining interests per the consolidated financial statements. |
Non-GAAP Measure - Adjusted Operating Cash Flows
Adjusted operating cash flows comprises Goldcorp’s share of operating cash flows before working capital changes, calculated on an attributable basis to include the Company's share of Pueblo Viejo, Alumbrera, Leagold and NuevaUnión's operating cash flows before working capital changes. The Company believes that, in addition to conventional measures prepared in accordance with GAAP, the Company and certain investors use this information to evaluate the Company’s performance and ability to operate without reliance on additional external funding or use of available cash.
Second Quarter Report – 2017
(in United States dollars, tabular amounts in millions, except where noted)
In prior periods, adjusted operating cash flows was presented on an attributable basis using operating cash flows as shown on the Company's statement of cash flows. In the current quarter, the Company revised its presentation of adjusted operating cash flows to present it on an attributable basis before working capital changes. The Company believes that this measure provides a better measure of the Company's performance of its core business operations as the Company can experience changes in working capital from one period to another which, at times, are not indicative of the performance of the Company’s business operations.
The following table provide a reconciliation of net cash provided by operating activities in the consolidated financial statements to Goldcorp’s share of adjusted operating cash flows:
|
| | | | | | | | | | | | |
| | Three months ended June 30 | Six months ended June 30 |
| | 2017 |
| 2016 |
| 2017 |
| 2016 |
|
| Net cash provided by operating activities of continuing operations | $ | 158 |
| $ | 234 |
| $ | 385 |
| $ | 293 |
|
| Change in working capital | 77 |
| (89 | ) | 100 |
| 117 |
|
| Adjusted operating cash flows provided by Pueblo Viejo, Alumbrera, Leagold and NuevaUnión | 85 |
| 59 |
| 150 |
| 124 |
|
| Goldcorp’s share of adjusted operating cash flows | $ | 320 |
| $ | 204 |
| $ | 635 |
| $ | 534 |
|
FINANCIAL INSTRUMENTS RISK EXPOSURE
The Company manages its exposures to financial risks, including credit risk, liquidity risk, currency risk, interest rate risk and price risk in accordance with its Finance Risk Management Policy. The Company's exposures to financial risks and how the Company manages each of those risks are described in note 27(e) to the Company's consolidated financial statements for the year ended December 31, 2016. There were no significant changes to those risks or to the Company's management of exposure to those risks during the six months ended June 30, 2017, except as noted below:
(i) Liquidity risk
During the three and six months ended June 30, 2017, the Company generated cash flows from operations, one of the Company's main sources of liquidity, of $158 million and $385 million, respectively (three and six months ended June 30, 2016 – $234 million and $293 million, respectively). At June 30, 2017, Goldcorp held cash and cash equivalents of $80 million (December 31, 2016 – $157 million), short-term investments of $43 million (December 31, 2016 – $43 million), and had working capital of $51 million (December 31, 2016 – $791 million), which the Company defines as current assets less current liabilities, nil of which was comprised of the Company's net assets held for sale (December 31, 2016 – $430 million).
During the second quarter of 2017, the Company extended the term of its $3.0 billion revolving credit facility to June 22, 2022. At June 30, 2017, the balance outstanding on the revolving credit facility was $84 million (December 31, 2016 – $30 million) with $2.92 billion available for the Company's use (December 31, 2016 – $2.97 billion). Certain of the Company's borrowings are subject to various financial and general covenants with which the Company was in compliance at June 30, 2017.
At June 30, 2017, the Company had letters of credit outstanding in the amount of $428 million (December 31, 2016 – $423 million) of which $311 million (December 31, 2016 – $303 million) represented guarantees for reclamation obligations. The Company's capital commitments for the next twelve months amounted to $423 million at June 30, 2017.
Second Quarter Report – 2017
(in United States dollars, tabular amounts in millions, except where noted)
(ii) Market risk
Currency risk
During the three and six months ended June 30, 2017, the Company recognized a net foreign exchange loss of $4 million and net gain of $17 million, respectively (three and six months ended June 30, 2016 – losses of $14 million and $47 million, respectively), and a net foreign exchange loss of $5 million and a net gain of $63 million, respectively in income tax expense on income taxes receivable (payable) and deferred income taxes (three and six months ended June 30, 2016 – loss of $66 million and $81 million ). Based on the Company’s net foreign currency exposures at June 30, 2017, depreciation or appreciation of applicable foreign currencies against the US dollar would have resulted in the following decrease or increase in the Company's net earnings:
|
| | | | | | | |
| At June 30, 2017 | Possible exposure (1)(2) | Impact on earnings excluding currency exposure related to taxes | Impact on earnings from foreign exchange exposure related to taxes |
| Canadian dollar | 10% | $ | 13 |
| $ | 98 |
|
| Mexican peso | 15% | 35 |
| 70 |
|
| Argentine peso | 15% | 17 |
| 84 |
|
(1) Calculated based on fluctuations of foreign exchange rates during the twelve months ended December 31, 2016.
(2) There is insignificant currency risk related to the Guatemalan quetzal due to the Company's minimal exposure to the currency.
OTHER RISKS AND UNCERTAINTIES
This section describes the principal risk and uncertainties that could have an adverse effect on the Company's business and financial results.
Acquisitions and Integration
As part of the Company’s business strategy, it has sought and will continue to seek new mining and development opportunities in the mining industry. In pursuit of such opportunities, the Company may fail to select appropriate acquisition targets or negotiate acceptable arrangements, including arrangements to finance acquisitions or integrate the acquired businesses and their workforce into Goldcorp. Ultimately, any acquisition is accompanied by risks, which could include:
| |
| • | a significant change in commodity prices after the Company has committed to complete the transaction and established the purchase price or exchange ratio; |
| |
| • | a material ore body could prove to be below expectations; |
| |
| • | difficulty in integrating and assimilating the operations and workforce of any acquired companies; |
| |
| • | realizing anticipated synergies and maximizing the financial and strategic position of the combined enterprise; |
| |
| • | maintaining uniform standards, policies and controls across the organization; |
| |
| • | disruption of the Company’s ongoing business and its relationships with employees, suppliers, contractors and other stakeholders as Goldcorp integrates the acquired business or assets; |
| |
| • | the acquired business or assets may have unknown liabilities that may be significant; |
| |
| • | delays because of regulatory approvals; and |
| |
| • | exposure to litigation (including actions commenced by shareholders) in connection with a transaction. |
Any material issues that the Company encounters in connection with an acquisition could have a material adverse effect on its business, results of operations and financial position.
Caspiche Transaction
The completion of the Caspiche Transaction is subject to several conditions precedent, certain of which, such as court approval, are outside the control of the Company. There can be no certainty, and the Company is not able to provide any assurance, that these conditions will be satisfied or, if satisfied, when they will be satisfied.
Second Quarter Report – 2017
(in United States dollars, tabular amounts in millions, except where noted)
Commodity Prices
The majority of the Company's revenues are derived from the sale of gold and silver, and to a lesser extent, copper, lead and zinc. The price of the Company’s Common Shares, its financial results and exploration, and its development and mining activities in the future may be materially adversely affected by declines in the price of gold, silver, copper, lead and zinc. Gold, silver, copper, lead and zinc prices fluctuate widely and are affected by numerous factors beyond the Company’s control, such as the sale or purchase of metals by various central banks and financial institutions, interest rates, exchange rates, inflation or deflation, fluctuation in the value of the United States dollar and foreign currencies, global and regional supply and demand, and the political and economic conditions of major metals-producing and metals-consuming countries throughout the world. The prices of gold, silver, copper, lead and zinc fluctuate widely, and future price declines could cause continued development of, and commercial production from, our properties to be uneconomic. Depending on the price of gold, silver, copper, lead and zinc, cash flow from mining operations may not be sufficient and the Company could be forced to discontinue production at, may lose its interest in, or may be forced to sell, some of its properties. Future production from the Company’s mining properties is dependent on the price of gold, silver, copper, lead and zinc that are adequate to make these properties economically viable.
Estimates of Future Production
The Company prepares estimates and projections of its future production. Any such information is forward-looking and no assurance can be given that such estimates will be achieved. These estimates are based on existing mine plans and other assumptions that change from time to time, including the availability, accessibility, sufficiency and quality of ore, the Company’s costs of production, its ability to sustain and increase production levels, the sufficiency of its infrastructure, the performance of its workforce and equipment, the ability to maintain and obtain mining interests and permits and the Company’s compliance with existing and future laws and regulations. The Company’s actual production may vary from estimates for a variety of reasons, including: actual ore mined varying from estimates of grade, tonnage, dilution and metallurgical and other characteristics; short-term operating factors relating to the ore reserves, such as the need for sequential development of orebodies and the processing of new or different ore grades; revisions to mine plans; unusual or unexpected orebody formations; risks and hazards associated with mining; natural phenomena, such as inclement weather conditions, water availability, floods, and earthquakes; and unexpected labor shortages, strikes, local community opposition or blockades. Failure to achieve the estimated forecasts could have an adverse impact on the Company’s future cash flows, business, results of operations and financial condition.
Foreign Operations
The majority of the Company’s foreign operations are conducted in Mexico, Argentina, the Dominican Republic, Chile and Guatemala, and as such the Company’s operations are exposed to various levels of political, economic and other risks and uncertainties. These risks and uncertainties vary from country to country and include, but are not limited to, terrorism; hostage taking; military repression; expropriation; extreme fluctuations in currency exchange rates; high rates of inflation; labour unrest; the risks of war, civil unrest or protests; renegotiation or nullification of existing concessions, licenses, permits and contracts; ability of governments to unilaterally alter agreements; government imposed supply laws, including laws establishing, among other things, profit margins, production quotas, maximum and minimum price levels and the ability to confiscate merchandise in certain circumstances; surface land access issues; illegal mining; changes in taxation policies; restrictions on foreign exchange and repatriation; and changing political conditions, currency controls and governmental regulations that favour or require the awarding of contracts to local contractors or require foreign contractors to employ citizens of, or purchase supplies from, a particular jurisdiction.
In addition, adverse changes in mining or investment policies or shifts in political attitude in Mexico, Argentina, the Dominican Republic, Chile and Guatemala may adversely affect the Company’s operations or profitability. Operations may be affected in varying degrees by government regulations with respect to, but not limited to, restrictions on production, price controls, export controls, import restrictions, such as restrictions applicable to, among other things, equipment, services and supplies, currency remittance, income taxes, expropriation of property, foreign investment, maintenance of claims, environmental legislation, land use, surface land access, land claims of local people, water use and mine safety.
Failure to comply strictly with applicable laws, regulations and local practices relating to mineral right applications and tenure, environmental requirements, land and water use, could result in loss, reduction or expropriation of entitlements, or the imposition of additional local or foreign parties as joint venture partners with carried or other interests. The occurrence of these various factors and uncertainties related to the economic and political risks of operating in foreign jurisdictions cannot be accurately predicted and could have a material adverse effect on the Company’s operations or profitability.
Government Regulation
The Company’s mining, processing, development and mineral exploration activities are subject to various laws governing prospecting, development, production, taxes, labour standards and occupational health, mine safety, toxic substances, land use, water use, land claims of local people and other matters. No assurance can be given that new rules and regulations will not be enacted or that existing rules and regulations will not be applied in a manner which could limit or curtail production or development. Amendments to current laws and regulations governing operations and activities of mining and milling or more stringent implementation thereof could have a material adverse impact on
Second Quarter Report – 2017
(in United States dollars, tabular amounts in millions, except where noted)
the operations and financial position of the Company. Changes to laws regarding mining royalties or taxes, or other elements of a country’s fiscal regime, may also adversely affect the Company’s costs of operations and financial results.
In addition, governments continue to struggle with deficits and concerns over the effects of depressed economies, which has resulted in the mining and metals sector being targeted to raise revenue. Governments are continually assessing the fiscal terms of the economic rent for a mining company to exploit resources in their countries. Numerous countries, including, but not limited to, Argentina, Australia, Brazil, Chile, the Dominican Republic, Guatemala, Honduras, Mexico and Venezuela, have implemented changes to their respective mining regimes that reflect increased government control or participation in the mining sector, including changes of law affecting foreign ownership and take-overs, mandatory government participation, taxation and royalties, working conditions, rates of exchange, exchange control, exploration licensing, export duties, repatriation of income or return of capital, environmental protection, as well as requirements for local goods, supplies and employment or other benefits to be provided to local residents.
The occurrence of mining regime changes in both developed and developing countries adds uncertainties that cannot be accurately predicted and any future adverse changes in government policies or legislation in the jurisdictions in which the Company operates that affect foreign ownership, mineral exploration, development or mining activities, may affect our viability and profitability.
In December 2016, the State of Zacatecas in Mexico approved new purported environmental taxes that became effective January 1, 2017. Certain operations at the Company’s Peñasquito mine may be subject to these taxes. The Company is not able to estimate the amount of the taxes with sufficient reliability. The Company disputes the legality and constitutionality of the taxes and has filed legal claims against the taxes before the Mexican courts but cannot provide assurance on whether its claims will be successfully resolved.
Environmental Regulation
The Company’s operations are subject to environmental regulation in the various jurisdictions in which it operates. These regulations mandate, among other things, the maintenance of air and water quality standards and land reclamation. They also set out limitations on the generation, transportation, storage and disposal of solid and hazardous waste. Environmental legislation is evolving in a manner that will likely, in the future, require stricter standards and enforcement, increased fines and penalties for non-compliance, more stringent environmental assessments of proposed projects and a heightened degree of responsibility for companies and their officers, directors and employees. Continuing issues with tailings dam failures at other companies operations may increase the likelihood that these stricter standards and enforcement mechanisms will be implemented in the future. We can provide no assurance that future changes in environmental regulation will not adversely affect our results of operations. Failure to comply with these laws, regulations and permitting requirements may result in enforcement actions, including orders issued by regulatory or judicial authorities causing operations to cease or be curtailed, and may include corrective measures requiring capital expenditures, installation of additional equipment, or remedial actions. Parties engaged in mining operations or in the exploration or development of mineral properties may also be required to compensate those suffering loss or damage due to the mining activities and may have civil or criminal fines or penalties imposed for violations of applicable laws or regulations. The occurrence of any environmental violation or enforcement action may have an adverse impact on the Company’s reputation and could adversely affect its results of operations. In addition, production at certain of the Company’s mines involves the use of sodium cyanide or other reagents and exposes rock material that could cause toxicity to the environment if released or not properly managed. Should sodium cyanide, other reagents, or contact water be improperly managed, leak or otherwise be discharged from the containment system, the Company may become subject to liability for clean-up work that may not be insured. In the event of any discharges of pollutants into the ground water and the environment, we may become subject to liability for hazards that we may not be insured against.
Other Risks
For further information regarding the Company’s operational risks, please refer to the section entitled “Description of the Business - Risk Factors” in the Company's most recent Annual Information Form available on SEDAR at www.sedar.com and on EDGAR at www.sec.gov.
ACCOUNTING MATTERS
Basis of Preparation
The Company’s unaudited condensed interim consolidated financial statements have been prepared in accordance with International Accounting Standard 34 – Interim Financial Reporting ("IAS 34") as issued by the IASB. Accordingly, certain disclosures included in annual financial statements prepared in accordance with IFRS as issued by the IASB have been condensed or omitted. These unaudited condensed interim consolidated financial statements should be read in conjunction with the Company’s audited consolidated financial statements for the year ended December 31, 2016.
Second Quarter Report – 2017
(in United States dollars, tabular amounts in millions, except where noted)
The accounting policies applied in the preparation of these unaudited condensed interim consolidated financial statements are consistent with those applied and disclosed in the Company’s audited consolidated financial statements for the year ended December 31, 2016, except for the following: the Company has adopted the narrow scope amendments to IFRS 12 - Disclosure of Interests in Other Entities, IAS 7 - Statement of Cash Flows and IAS 12 - Income Taxes which are effective for annual periods beginning on or after January 1, 2017. The amendments did not have an impact on the Company's unaudited condensed interim consolidated financial statements.
Critical Judgements and Estimates
The Company’s management makes judgements in its process of applying the Company’s accounting policies in the preparation of its unaudited condensed interim consolidated financial statements. In addition, the preparation of the financial data requires that the Company’s management make assumptions and estimates of the impacts of uncertain future events on the carrying amounts of the Company’s assets and liabilities at the end of the reporting period, and the reported amounts of revenues and expenses during the reporting period. Actual results may differ from those estimates as the estimation process is inherently uncertain. Estimates are reviewed on an ongoing basis based on historical experience and other factors that are considered to be relevant under the circumstances. Revisions to estimates and the resulting impacts on the carrying amounts of the Company’s assets and liabilities are accounted for prospectively.
The critical judgements and estimates applied in the preparation of the Company's unaudited condensed interim consolidated financial statements for the three and six months ended June 30, 2017 are consistent with those applied and disclosed in notes 5 and 6 of its audited consolidated financial statements for the year ended December 31, 2016 and the following critical judgments in applying accounting policies:
Business combinations
Determination of whether a set of assets acquired and liabilities assumed constitute the acquisition of a business or asset may require the Company to make certain judgements as to whether or not the assets acquired and liabilities assumed include the inputs, processes and outputs necessary to constitute a business as defined in IFRS 3 – Business Combinations. If an acquired set of assets and liabilities includes goodwill, the set is presumed to be a business. Based on an assessment of the relevant facts and circumstances, the Company concluded that the acquisition of its interests in Exeter and Cerro Casale on June 7, 2017 and June 9, 2017, respectively, did not meet the criteria of a business combination and the transactions have been accounted for as acquisitions of assets.
Determination of control of subsidiaries and joint arrangements
Judgement is required to determine when the Company has control of subsidiaries or joint control of joint arrangements. This requires an assessment of the relevant activities of the investee, being those activities that significantly affect the investee's returns, including operating and capital expenditure decision-making, financing of the investee, and the appointment, remuneration and termination of key management personnel; and when the decisions in relation to those activities are under the control of the Company or require unanimous consent from the investors. During the second quarter of 2017, the Company entered into the following transactions:
a. Acquisition of Exeter
Based on the fact that Goldcorp has a majority ownership interest of Exeter, the majority of the Exeter board of directors are Goldcorp nominees and Exeter's key management personnel is comprised of officers appointed by Goldcorp, the Company concluded that it has control over Exeter. Accordingly, Exeter met the criteria to be classified as a subsidiary. Commencing at the acquisition date of June 7, 2017, the financial results of Exeter were included in the results of the consolidated group and the portion of ownership interest that is not attributable to Goldcorp is accounted for as non-controlling interest as a separate component of equity.
b. Acquisition of 50% interest in Cerro Casale
Based on assessment of the relevant facts and circumstances, primarily, the requirement for unanimous agreement on management decisions relating to the development and operation of the arrangement, the Company concluded that the Cerro Casale project is a jointly controlled entity. Judgement is also required when determining the classification of a joint arrangement as a joint venture or a joint operation through an evaluation of the rights and obligations arising from the arrangement. Despite the fact that the joint venture is a limited liability company and the parties do not have rights and obligations to individual assets and liabilities, the Company concluded that the Cerro Casale project is a joint operation as the arrangement requires the owners to purchase the output on a pro rata basis, indicating that the entity has rights and obligations to the separate assets and liabilities of the joint entity. As such, the project has been proportionately consolidated with results of the consolidated group.
c. Acquisition of 25.3% interest in Leagold
As Goldcorp owns greater than 20% of Leagold, Goldcorp is considered to have significant influence over Leagold and therefore, is required to account for its interest in Leagold using the equity method.
Second Quarter Report – 2017
(in United States dollars, tabular amounts in millions, except where noted)
Income and value added taxes
The Company’s operations involve dealing with uncertainties and judgements in the application of complex tax regulations in multiple jurisdictions. The final income taxes paid and value added tax (“VAT”) refunds received are dependent upon many factors, including negotiations with taxing authorities in various jurisdictions and resolution of disputes arising from tax audits.
The Company recognizes potential liabilities and records tax liabilities for anticipated tax audit issues based on its judgement of whether, and the extent to which, additional taxes will be due. The Company adjusts these reserves in light of changing facts and circumstances; however, due to the complexity of some of these uncertainties, the ultimate resolution may result in a payment that is materially different from the Company’s current estimate of the tax liabilities. If the Company’s estimate of tax liabilities proves to be less than the ultimate assessment, an additional charge to expense would result. If the estimate of tax liabilities proves to be greater than the ultimate assessment, a tax benefit would result.
VAT receivables are generated on the purchase of supplies and services in several of the jurisdictions that the Company operates in. Timing and collection of VAT receivables is uncertain as VAT refund procedures in certain jurisdictions require a significant amount of information and follow-up. The Company is exposed to liquidity, credit and currency risk with respect to its VAT receivables if tax authorities are unwilling to make payments in a timely manner in accordance with the Company’s refund requests. The Company regularly monitors actual and projected collections of its VAT receivables to inform its assessment as to the collectability of the VAT receivables and classification as current and non-current assets.
In June 2017, the Mexican government’s tax authority indicated that it had experienced an increase in VAT refund requests and as a result had commenced more in-depth assessments of the requests. In light of this and the fact that the Company did not receive any VAT refunds from the Mexican government in the second quarter of 2017, the Company reassessed the collectability and classification of its Mexican VAT receivables and determined that no allowance was necessary. At June 30, 2017, the total VAT receivable due to the Company from Mexican tax authorities is $326 million, including the tax receivables retained on the sale of Los Filos, all of which is classified as current. If on review of the Company’s VAT refund requests, the Mexican tax authority disallows any portion of the Company’s VAT refund requests, an additional charge to expense would result.
Changes in Accounting Standards Not Yet Effective
Revenue recognition
In May 2014, the IASB issued IFRS 15 – Revenue from Contracts with Customers ("IFRS 15") which supersedes IAS 11 – Construction Contracts; IAS 18 – Revenue; IFRIC 13 – Customer Loyalty Programmes; IFRIC 15 – Agreements for the Construction of Real Estate; IFRIC 18 – Transfers of Assets from Customers; and SIC 31 – Revenue – Barter Transactions involving Advertising Services. IFRS 15 establishes a single five-step model framework for determining the nature, amount, timing and uncertainty of revenue and cash flows arising from a contract with a customer. The standard is effective for annual periods beginning on or after January 1, 2018, with early adoption permitted. The Company plans to apply IFRS 15 at the date it becomes effective.
The core principle of IFRS 15 is that revenue related to the transfer of promised goods or services should be recognized when the control of the goods or services passes to customers. The Company is currently evaluating the potential impact of applying IFRS 15, primarily analyzing its doré and concentrate sale agreements. The Company does not anticipate any changes in the gross amounts of revenue recognized but the timing of revenue recognized may differ under the new standard if the point of transfer of risk and reward of goods and services and transfer of control are different.
In addition, IFRS 15 requires entities to apportion revenue earned from contracts to individual promises or performance obligations, on a relative standalone selling price basis. In accordance with the terms of the Company's concentrate agreements, the seller must contract for and pay the shipping and insurance costs necessary to bring the goods to the named destination. Therefore, where material, a portion of the revenue earned under these contracts, representing the obligation to fulfill the shipping and insurance services, will be deferred and recognized over time as the obligations are fulfilled, along with the associated costs. Based on a preliminary assessment, the impact of this change on the amount of revenue recognized in a year is not expected to be significant.
Financial instruments
In July 2014, the IASB issued the final version of IFRS 9 – Financial Instruments ("IFRS 9") to replace IAS 39 – Financial Instruments: Recognition and Measurement. IFRS 9 provides a revised model for recognition and measurement of financial instruments and a single, forward-looking 'expected loss' impairment model. IFRS 9 also includes significant changes to hedge accounting. The standard is effective for annual periods beginning on or after January 1, 2018, with early adoption permitted. The Company plans to apply IFRS 9 at the date it becomes effective.
Second Quarter Report – 2017
(in United States dollars, tabular amounts in millions, except where noted)
The following summarizes the expected impact of IFRS 9 upon adoption:
| |
| • | The classification of financial assets and liabilities is expected to remain consistent under IFRS 9 with the possible exception of equity securities. Under IFRS 9, the Company will have the option to designate equity securities as financial assets at fair value through other comprehensive income, where they will be recorded initially at fair value with changes in fair value recognized in other comprehensive income which will not be subsequently transferred into earnings (loss). If the Company does not make this election, changes in fair value of the equity securities will be recognized in earnings (loss). |
| |
| • | The introduction of the new "expected credit loss" impairment model is not expected to have an impact on the Company, given the Company sells its products exclusively to large international financial institutions and other organizations with strong credit ratings, the negligible historical level of customer default, and the short term nature of the Company's receivables. |
| |
| • | The changes to hedge accounting are not expected to have a significant impact on the Company. Under the current standard, companies can elect to record basis adjustments against the carrying amount of the non-financial asset or in earnings at the same time the non-financial item affects earnings. Under IFRS 9, it is mandatory to record the basis adjustments against the carrying amount of the non-financial asset. As the Company's current policy aligns with the new requirement, this change has no impact on the Company. Additionally, supplementary documentation and on-going assessment of hedge effectiveness may be required under the new standard. However, these requirements are not expected to have a material impact on the hedging arrangements of the Company. |
Leases
In January 2016, the IASB issued IFRS 16 – Leases ("IFRS 16") which replaces IAS 17 – Leases and its associated interpretative guidance. IFRS 16 applies a control model to the identification of leases, distinguishing between a lease and a service contract on the basis of whether the customer controls the asset. For those assets determined to meet the definition of a lease, IFRS 16 introduces significant changes to the accounting by lessees, introducing a single, on-balance sheet accounting model that is similar to the current finance lease accounting, with limited exceptions for short-term leases or leases of low value assets. Lessor accounting remains similar to current accounting practice. The standard is effective for annual periods beginning on or after January 1, 2019, with early application permitted for entities that apply IFRS 15. The Company plans to apply IFRS 16 at the date it becomes effective.
Upon the adoption of IFRS 16, the Company anticipates it will record a material balance of lease assets and associated lease liabilities related to leases with a term of 12 months or more on the Consolidated Balance Sheet at January 1, 2019. Due to the recognition of additional lease assets and liabilities, a higher amount of depreciation expense and interest on lease liabilities will be recognized under IFRS 16 as compared to the current standard. Additionally, a reduction in production and/or corporate administrative costs is expected. Lastly, the Company expects a reduction in operating cash outflows with a corresponding increase in financing cash outflows under IFRS 16. The Company has not quantified these impacts at this time.
CONTROLS AND PROCEDURES
Disclosure Controls and Procedures
The Company’s management, with the participation of its President and Chief Executive Officer and Executive Vice President, Chief Financial Officer and Corporate Development, has evaluated the effectiveness of the Company’s disclosure controls and procedures. Based upon the results of that evaluation, the Company’s President and Chief Executive Officer and Executive Vice President, Chief Financial Officer and Corporate Development have concluded that, as of the end of the period covered by this report, the Company’s disclosure controls and procedures were effective to provide reasonable assurance that the information required to be disclosed by the Company in reports it files is recorded, processed, summarized and reported, within the appropriate time periods and is accumulated and communicated to management, including the President and Chief Executive Officer and Executive Vice President, Chief Financial Officer and Corporate Development, as appropriate to allow timely decisions regarding required disclosure.
Internal Control Over Financial Reporting
The Company’s management, with the participation of its President and Chief Executive Officer and Executive Vice President, Chief Financial Officer and Corporate Development, is responsible for establishing and maintaining adequate internal control over financial reporting. Under the supervision of the President and Chief Executive Officer and Executive Vice President, Chief Financial Officer and Corporate Development, the Company’s internal control over financial reporting is a process designed to provide reasonable assurance regarding the reliability of financial reporting and the preparation of financial statements for external purposes in accordance with IFRS. The Company’s internal control over financial reporting includes policies and procedures that:
| |
| • | pertain to the maintenance of records that accurately and fairly reflect, in reasonable detail, the transactions and dispositions of assets of the Company; |
Second Quarter Report – 2017
(in United States dollars, tabular amounts in millions, except where noted)
| |
| • | provide reasonable assurance that transactions are recorded as necessary to permit preparation of financial statements in accordance with IFRS and that the Company’s receipts and expenditures are made only in accordance with authorizations of management and the Company’s Directors; and |
| |
| • | provide reasonable assurance regarding prevention or timely detection of unauthorized acquisition, use, or disposition of the Company’s assets that could have a material effect on the Company’s consolidated financial statements. |
There has been no change in the Company’s internal control over financial reporting during the six months ended June 30, 2017 that has materially affected, or is reasonably likely to materially affect, the Company’s internal control over financial reporting.
Limitations of Controls and Procedures
The Company’s management, including the President and Chief Executive Officer and Executive Vice President, Chief Financial Officer and Corporate Development, believes that any disclosure controls and procedures or internal control over financial reporting, no matter how well conceived and operated, can provide only reasonable, not absolute, assurance that the objectives of the control system are met. Further, the design of a control system must reflect the fact that there are resource constraints, and the benefits of controls must be considered relative to their costs. Because of the inherent limitations in all control systems, they cannot provide absolute assurance that all control issues and instances of fraud, if any, within the Company have been prevented or detected. These inherent limitations include the realities that judgments in decision-making can be faulty, and that breakdowns can occur because of simple error or mistake. Additionally, controls can be circumvented by the individual acts of some persons, by collusion of two or more people, or by unauthorized override of the control. The design of any control system also is based in part upon certain assumptions about the likelihood of future events, and there can be no assurance that any design will succeed in achieving its stated goals under all potential future conditions. Accordingly, because of the inherent limitations in a cost effective control system, misstatements due to error or fraud may occur and not be detected.
Second Quarter Report – 2017
(in United States dollars, tabular amounts in millions, except where noted)
MINERAL RESERVES AND MINERAL RESOURCES
Cerro Casale and Caspiche currently report the following Mineral Reserves and Mineral Resources:
|
| | | | | | | |
Caspiche Sulphide (1) | | | | | | |
| 100% Basis | Tonnes | Au | Contained Au | Cu | Contained Cu | Ag | Contained Ag |
| | (Mt) | g/t | (Moz) | (%) | (Blbs) | (g/t) | (Moz) |
| Measured | 554.20 | 0.58 | 10.30 | 0.23 | 2.80 | 1.16 | 20.70 |
| Indicated | 727.90 | 0.48 | 11.20 | 0.18 | 2.90 | 1.17 | 27.40 |
| Measured & Indicated | 1,282.10 | 0.52 | 21.60 | 0.20 | 5.70 | 1.17 | 48.00 |
| | | | | | | | |
| Inferred | 195.60 | 0.29 | 1.80 | 0.12 | 0.50 | 0.91 | 5.70 |
| | | | | | | | |
Caspiche Oxide (1) | | | | | | |
| 100% Basis | Tonnes | Au | Contained Au | Ag | Contained Ag | | |
| | (Mt) | g/t | (Moz) | (g/t) | (Moz) | | |
| Measured | 65.90 | 0.46 | 1.00 | 1.55 | 3.30 | | |
| Indicated | 55.60 | 0.39 | 0.70 | 1.63 | 2.90 | | |
| Measured & Indicated | 121.50 | 0.43 | 1.70 | 1.59 | 6.20 | | |
| | | | | | | | |
| Inferred | 2.50 | 0.23 | — | 1.18 | 0.10 | | |
| | | | | | | | |
| | | | | | | | |
Cerro Casale (2) | | | | | | |
| 100% Basis | Tonnes | Au | Contained Au | Cu | Contained Cu | Ag | Contained Ag |
| | (Mt) | g/t | (Moz) | (%) | (Blbs) | (g/t) | (Moz) |
| Proven | 229.70 | 0.65 | 4.80 | 0.19 | 1.00 | 1.91 | 14.10 |
| Probable | 967.90 | 0.59 | 18.50 | 0.23 | 4.80 | 1.43 | 44.60 |
| Proven & Probable | 1,197.60 | 0.60 | 23.20 | 0.22 | 5.80 | 1.52 | 58.70 |
| | | | | | | | |
| Measured | 23.00 | 0.30 | 0.20 | 0.13 | 0.10 | 1.19 | 0.90 |
| Indicated | 273.70 | 0.36 | 3.10 | 0.16 | 1.00 | 1.06 | 9.30 |
| Measured & Indicated | 296.60 | 0.35 | 3.40 | 0.16 | 1.10 | 1.07 | 10.20 |
| Inferred | 495.40 | 0.38 | 6.00 | 0.19 | 2.10 | 1.04 | 16.50 |
Footnotes:
| |
| (1) | Mineral Resources for the Caspiche project are derived from information provided by Exeter Resource Corporation effective the June 7, 2017 transaction date. Refer to Exeter’s “Amended NI 43-101 Technical Report on the Caspiche Project Atacama Region, Chile dated 19 December 2014” as filed on SEDAR. |
| |
| (2) | Mineral Resources for Cerro Casale are reported exclusive of those Mineral Resources that were converted to Mineral Reserves. Refer to Barrick’s Annual Information Form for the year ended December 31, 2016 and dated March 24, 2017 for further information on Cerro Casale Mineral Reserves and Mineral Resources estimates. |