Table of Contents
UNITED STATES
SECURITIES AND EXCHANGE COMMISSION
Washington, D.C. 20549
FORM N-CSR
CERTIFIED SHAREHOLDER REPORT OF REGISTERED
MANAGEMENT INVESTMENT COMPANIES
Investment Company Act file number 811-8372
Travelers Series Fund Inc.
(Exact name of registrant as specified in charter)
| 125 Broad Street, New York, NY | 10004 | |
| (Address of principal executive offices) | (Zip code) | |
Robert I. Frenkel, Esq.
Smith Barney Fund Management LLC
300 First Stamford Place
Stamford, CT 06902
(Name and address of agent for service)
Registrant’s telephone number, including area code: (800) 451-2010
Date of fiscal year end: October 31
Date of reporting period: April 30, 2005
Table of Contents
ITEM 1. REPORT TO STOCKHOLDERS.
The Semi-Annual Report to Stockholders is filed herewith.
Table of Contents
TRAVELERS SERIES FUND INC.
MFS TOTAL RETURN
PORTFOLIO
TRAVELERS MANAGED
INCOME PORTFOLIO
SMITH BARNEY MONEY
MARKET PORTFOLIO
SEMI-ANNUAL REPORT | APRIL 30, 2005
NOT FDIC INSURED • NOT BANK GUARANTEED • MAY LOSE VALUE
Table of Contents
| 1 | ||
| 7 | ||
| 8 | ||
| 9 | ||
| 10 | ||
| 12 | ||
| 39 | ||
| 40 | ||
| 41 | ||
| 44 | ||
| 47 | ||
Table of Contents

R. JAY GERKEN, CFA
Chairman, President and
Chief Executive Officer
Dear Shareholder,
Despite rising interest rates, climbing oil prices, geopolitical concerns and uncertainties surrounding the Presidential election, the U.S. economy continued to expand during the period. Following a robust 4.0% gain in the third quarter of 2004, gross domestic product (“GDP”)i growth was 3.8% in the fourth quarter. After the end of the Funds’ reporting period, the advance first quarter GDP figure was revised up to 3.5% from 3.1%.
Given the overall strength of the economy, the Federal Reserve Board (“Fed”)ii continued to raise interest rates over the period in an attempt to ward off inflation. Following three rate hikes from June through September 2004, the Fed again increased its target for the federal funds rateiii in 0.25% increments four times during the reporting period. After the Fund’s reporting period had ended, at its May meeting, the Fed once again raised its fed funds target rate by 0.25% to 3.00%.
During the six months covered by this report, the U.S. stock market posted a modest gain, with the S&P 500 Indexiv returning 3.28%. The reporting period began on a bright note, as the equity markets rallied sharply in November and December 2004. Investors were drawn to stocks as the uncertainty of the Presidential election ended and oil prices fell from their record highs. Thus far in 2005, the equity markets have been volatile. Equities were weak in January, rose in February and again fell in March and April. The market’s recent troubles have been attributed to mixed economic data, continued high oil prices, and rising interest rates.
Looking at the reporting period as a whole, the trend of value-oriented stocks outperforming their growth counterparts continued. In addition, mid- and large-cap stocks generally outperformed small-cap stocks during the period.
During the first half of the reporting period, the fixed income market confounded many investors as short-term interest rates rose in concert with the Fed rate tightening, while longer-term rates, surprisingly, remained fairly steady. However, this began to change in late February 2005, as strong economic data and inflationary concerns caused longer-term rates to rise as well. This continued through March, before longer-term rates again declined on the back of mixed
1 Travelers Series Fund Inc. | 2005 Semi-Annual Report
Table of Contents
economic data. Looking at the six-month period as a whole, the overall municipal bond market outperformed the taxable bond market, as the Lehman Brothers Municipal Bond Indexv and Lehman Brothers Aggregate Bond Indexvi returned 1.93% and 0.98%, respectively.
Within this environment, the Funds performed as follows:vii
PERFORMANCE OF THE FUNDS
AS OF APRIL 30, 2005
(unaudited)
| 6 Months | |||
MFS Total Return Portfolio | 3.52 | % | |
S&P 500 Index | 3.28 | % | |
Lehman Brothers Aggregate Bond Index | 0.98 | % | |
Lipper Variable Balanced Funds Category Average | 2.82 | % | |
Travelers Managed Income Portfolio | 0.33 | % | |
Lehman Brothers Intermediate Government/Credit Bond Index | 0.03 | % | |
Lipper Variable Intermediate Investment Grade Debt Funds Category Average | 0.92 | % | |
Smith Barney Money Market Portfolio | 0.95 | % | |
90-Day U.S. Treasury Bill Index | 1.18 | % | |
Lipper Variable Money Market Funds Category Average | 0.90 | % |
The performance shown represents past performance. Past performance is no guarantee of future results and current performance may be higher or lower than the performance shown above. Principal value and investment returns will fluctuate and investors’ shares, when redeemed, may be worth more or less than their original cost.
Current reimbursements for Smith Barney Money Market Portfolio are voluntary and may be reduced or terminated at any time. Absent these reimbursements, performance would have been lower.
Fund returns assume the reinvestment of all distributions at net asset value and the deduction of all fund expenses.
Lipper, Inc. is a major independent mutual-fund tracking organization. Returns are based on the six-month period ended April 30, 2005 and include the reinvestment of dividends and capital gains distributions, if any. Returns were calculated among the 91 funds in the variable balanced funds category. Returns were calculated among the 47 funds in the variable intermediate investment grade debt funds category. Returns were calculated among the 110 funds in the variable money market funds category.
2 Travelers Series Fund Inc. | 2005 Semi-Annual Report
Table of Contents
MFS Total Return Portfolio
Special Shareholder Notice
At meetings held on March 24, 2005 and April 20, 2005, the Board of Directors approved a proposal to reorganize the MFS Total Return Portfolio (the “Acquired Fund”) of Travelers Series Fund Inc. (“TSF”) into a newly organized “shell” portfolio (the “Acquiring Fund”) of Travelers Series Trust (“TST”) (the “Reorganization”).
In connection with the Reorganization, the Board of Directors approved an Agreement and Plan of Reorganization (the “Plan”) between TSF, on behalf of the Acquired Fund, and TST, on behalf of the Acquiring Fund, under which the Acquiring Fund would acquire all of the assets of the Acquired Fund and assume all of the liabilities of the Acquired Fund. The Reorganization is being proposed to the Acquired Fund’s shareholders because Travelers Investment Adviser Inc., which serves as investment adviser to the Acquired Fund and is currently an indirect wholly owned subsidiary of Citigroup Inc. (“Citigroup”), will become an indirect wholly owned subsidiary of MetLife, Inc. (“MetLife”) as part of MetLife’s acquisition of Travelers Life & Annuity, the life insurance and annuity businesses of Citigroup.
A Special Meeting of Shareholders of the Acquired Fund has been called on June 29, 2005 for the purpose of submitting the Plan and such other matters as may properly come before the meeting to the stockholders of the Acquired Fund for approval. The close of business on April 15, 2005 has been fixed as the record date for the determination of stockholders of the Acquired Fund, who are entitled to notice of, and to vote at, the Special Meeting of Shareholders, including any adjournment or adjournments thereof.
Performance Updatevii
For the six months ended April 30, 2005, the MFS Total Return Portfolio returned 3.52%. The Fund outperformed its unmanaged benchmarks, the S&P 500 Indexiv and the Lehman Brothers Aggregate Bond Indexvi, which returned 3.28% and 0.98%, respectively, for the same period. It also outperformed the Lipper Variable Balanced Funds Category Average,1 which was 2.82% for the same time frame.
Travelers Managed Income Portfolio
Special Shareholder Notice
At meetings held on March 24, 2005 and April 20, 2005, the Board of Directors approved a proposal to reorganize the Travelers Managed Income Portfolio (the
| 1 | Lipper, Inc. is a major independent mutual-fund tracking organization. Returns are based on the 6-month period ended April 30, 2005, including the reinvestment of dividends and capital gains distributions, if any, calculated among the 91 funds in the Fund’s Lipper category. |
3 Travelers Series Fund Inc. | 2005 Semi-Annual Report
Table of Contents
“Acquired Fund”) of Travelers Series Fund Inc. (“TSF”) into a newly organized “shell” portfolio (the “Acquiring Fund”) of Travelers Series Trust (“TST”) (the “Reorganization”).
In connection with the Reorganization, the Board of Directors approved an Agreement and Plan of Reorganization (the “Plan”) between TSF, on behalf of the Acquired Fund, and TST, on behalf of the Acquiring Fund, under which the Acquiring Fund would acquire all of the assets of the Acquired Fund and assume all of the liabilities of the Acquired Fund. The Reorganization is being proposed to the Acquired Fund’s shareholders because Travelers Investment Adviser Inc., which serves as investment adviser to the Acquired Fund and is currently an indirect wholly owned subsidiary of Citigroup Inc. (“Citigroup”), will become an indirect wholly owned subsidiary of MetLife, Inc. (“MetLife”) as part of MetLife’s acquisition of Travelers Life & Annuity, the life insurance and annuity businesses of Citigroup.
A Special Meeting of Shareholders of the Acquired Fund has been called on June 29, 2005 for the purpose of submitting the Plan and such other matters as may properly come before the meeting to the stockholders of the Acquired Fund for approval. The close of business on April 15, 2005 has been fixed as the record date for the determination of stockholders of the Acquired Fund, who are entitled to notice of, and to vote at, the Special Meeting of Shareholders, including any adjournment or adjournments thereof.
Performance Updatevii
For the six months ended April 30, 2005, the Travelers Managed Income Portfolio returned 0.33%. The Fund outperformed its unmanaged benchmark, the Lehman Brothers Intermediate Government/Credit Bond Indexviii, which returned 0.03% for the same period. The Lipper Variable Intermediate Investment Grade Debt Funds Category Average2 was 0.92% for the same time frame.
Smith Barney Money Market Portfolio
Performance Updatevii
For the six months ended April 30, 2005, the Smith Barney Money Market Portfolio returned 0.95%. The Fund outperformed the Lipper Variable Money Market Funds Category Average,3 which was 0.90% for the same period. The Fund’s unmanaged benchmark, the 90-Day U.S. Treasury Bill Indexix, returned 1.18%.
| 2 | Lipper, Inc. is a major independent mutual-fund tracking organization. Returns are based on the 6-month period ended April 30, 2005, including the reinvestment of dividends and capital gains distributions, if any, calculated among the 47 funds in the Fund’s Lipper category. |
| 3 | Lipper, Inc. is a major independent mutual-fund tracking organization. Returns are based on the 6-month period ended April 30, 2005, including the reinvestment of dividends and capital gains distributions, if any, calculated among the 110 funds in the Fund’s Lipper category. |
4 Travelers Series Fund Inc. | 2005 Semi-Annual Report
Table of Contents
As of April 30, 2005, the seven-day current yield for the Smith Barney Money Market Portfolio was 2.40% and its seven-day effective yield, which reflects compounding, was 2.43%4.
In addition, your investment is neither insured nor guaranteed by the Federal Deposit Insurance Corporation (“FDIC”) or any other government agency. Although the fund seeks to preserve the value of your investment at $1.00 per share, it is possible to lose money by investing in the Fund.
Information About Your Fund
As you may be aware, several issues in the mutual fund industry have recently come under the scrutiny of federal and state regulators. The Funds’ Adviser and some of its affiliates have received requests for information from various government regulators regarding market timing, late trading, fees, and other mutual fund issues in connection with various investigations. The regulators appear to be examining, among other things, the Funds’ response to market timing and shareholder exchange activity, including compliance with prospectus disclosure related to these subjects. The Funds have been informed that the Adviser and its affiliates are responding to those information requests, but are not in a position to predict the outcome of these requests and investigations.
Important information concerning the Funds and its Adviser with regard to recent regulatory developments is contained in the “Additional Information” note in the Notes to the Financial Statements included in this report.
As always, thank you for your continued confidence in our stewardship of your assets. We look forward to helping you continue to meet your financial goals.
Sincerely,

R. Jay Gerken, CFA
Chairman, President and Chief Executive Officer
May 16, 2005
| 4 | The seven-day effective yield is calculated similarly to the seven-day current yield but, when annualized, the income earned by an investment in the Fund is assumed to be reinvested. The effective yield typically will be slightly higher than the current yield because of the compounding effect of the assumed reinvestment. |
5 Travelers Series Fund Inc. | 2005 Semi-Annual Report
Table of Contents
The information provided is not intended to be a forecast of future events, a guarantee of future results or investment advice. Views expressed may differ from those of the firm as a whole.
Portfolio holdings and breakdowns are as of April 30, 2005 and are subject to change. Please refer to pages 12 through 36 for a list and percentage breakdown of the Fund’s holdings.
RISKS:
MFS Total Return Portfolio: The Fund may invest in high yield bonds. High yield bonds involve greater credit and liquidity risks than investment grade bonds. The Fund may invest in foreign securities. Investing in foreign securities is subject to certain risks not associated with domestic investing, such as currency fluctuations, and changes in political and economic conditions. These risks are magnified in emerging or developing markets. The Fund may use derivatives, such as options and futures, which can be illiquid, may disproportionately increase losses and have a potentially large impact on fund performance. As interest rates rise, bond prices fall, reducing the value of the Fund’s share price. Please see the Fund’s prospectus for more information on these and other risks.
Travelers Managed Income Portfolio: The Fund may invest in high yield bonds. High yield bonds involve greater credit and liquidity risks than investment grade bonds. The Fund may invest in foreign securities. Investing in foreign securities is subject to certain risks not associated with domestic investing, such as currency fluctuations, and changes in political and economic conditions. These risks are magnified in emerging or developing markets. The Fund may use derivatives, such as options and futures, which can be illiquid, may disproportionately increase losses and have a potentially large impact of fund performance. As interest rates rise, bond prices fall, reducing the value of the Fund’s share price. Please see the Fund’s prospectus for more information on these and other risks.
Smith Barney Money Market Portfolio: An investment in a money market fund is neither insured nor guaranteed by the FDIC or any other government agency. Although the Fund seeks to preserve the value of your investment at one dollar per share, it is possible to lose money by investing in the Fund. Please see the Fund’s prospectus for more information on these and other risks.
All index performance reflects no deduction for fees, expenses or taxes. Please note that an investor cannot invest directly in an index.
| i | Gross domestic product is a market value of goods and services produced by labor and property in a given country. |
| ii | The Federal Reserve Board is responsible for the formulation of a policy designed to promote economic growth, full employment, stable prices, and a sustainable pattern of international trade and payments. |
| iii | The federal funds rate is the interest rate that banks with excess reserves at a Federal Reserve district bank charge other banks that need overnight loans. |
| iv | The S&P 500 Index is a market capitalization-weighted index of 500 widely held common stocks. |
| v | The Lehman Brothers Municipal Bond Index is a broad measure of the municipal bond market with maturities of at least one year. |
| vi | The Lehman Brothers Aggregate Bond Index is a broad-based bond index comprised of Government, Corporate, Mortgage and Asset-backed issues, rated investment grade or higher, and having at least one year to maturity. |
| vii | The Funds are underlying investment options of various variable annuity and variable life insurance products. The Funds’ performance returns do not reflect the deduction of initial sales charges and expenses imposed in connection with investing in variable annuity or variable life insurance contracts, such as administrative fees, account charges, and surrender charges which, if reflected, would reduce the performance of the Funds. Past performance is no guarantee of future results. |
| viii | The Lehman Brothers Intermediate Government/Credit Bond Index is a broad measure of bonds with maturities of up to ten years. |
| ix | The 90-day U.S. Treasury Bill Index is an unmanaged index that consists of one 90-day United States Treasury Bill whose return is tracked until its maturity. |
6 Travelers Series Fund Inc. | 2005 Semi-Annual Report
Table of Contents
7 Travelers Series Fund Inc. | 2005 Semi-Annual Report
Table of Contents
Travelers Managed Income Portfolio
Fund at a Glance (unaudited)
8 Travelers Series Fund Inc. | 2005 Semi-Annual Report
Table of Contents
Smith Barney Money Market Portfolio
Fund at a Glance (unaudited)
9 Travelers Series Fund Inc. | 2005 Semi-Annual Report
Table of Contents
Example
As a shareholder of the Fund, you may incur two types of costs: (1) transaction costs and (2) ongoing costs, including management fees; and other Fund expenses. This example is intended to help you understand your ongoing costs (in dollars) of investing in the Fund and to compare these costs with the ongoing costs of investing in other mutual funds.
This example is based on an investment of $1,000 invested on November 1, 2004 and held for the six months ended April 30, 2005.
Actual Expenses
The table below titled “Based on Actual Total Return” provides information about actual account values and actual expenses. You may use the information provided in this table, together with the amount you invested, to estimate the expenses that you paid over the period. To estimate the expenses you paid on your account, divide your ending account value by $1,000 (for example, an $8,600 ending account value divided by $1,000 = 8.6), then multiply the result by the number under the heading entitled “Expenses Paid During the Period”.
Based on Actual Total Return(1)
| Actual Total Return(2) | Beginning Account Value | Ending Account Value | Annualized Expense Ratio | Expenses Paid During the Period(3) | |||||||||||
MFS Total Return Portfolio | 3.52 | % | $ | 1,000.00 | $ | 1,035.20 | 0.79 | % | $ | 3.99 | |||||
Travelers Managed Income Portfolio | 0.33 | 1,000.00 | 1,003.30 | 0.68 | 3.38 | ||||||||||
Smith Barney Money Market Portfolio | 0.95 | 1,000.00 | 1,009.50 | 0.52 | 2.59 | ||||||||||
| (1) | For the six months ended April 30, 2005. |
| (2) | Assumes reinvestment of dividends and capital gains distributions, if any, at net asset value. Total return is not annualized, as it may not be representative of the total return for the year. Total returns do not reflect expenses associated with the separate account such as administrative fees, account charges and surrender charges, which, if reflected, would reduce the total returns. Performance figures may reflect fee waivers and/or expense reimbursements. Past performance is no guarantee of future results. In the absence of fee waivers and/or expense reimbursements, the total return would have been lower. |
| (3) | Expenses (net of voluntary expense reimbursements) are equal to each Fund’s respective annualized expense ratio multiplied by the average account value over the period, multiplied by the number of days in the most recent fiscal half-year, then divided by 365. |
10 Travelers Series Fund Inc. | 2005 Semi-Annual Report
Table of Contents
Fund Expenses (unaudited) (continued)
Hypothetical Example for Comparison Purposes
The table below titled “Based on Hypothetical Total Return” provides information about hypothetical account values and hypothetical expenses based on the actual expense ratio and an assumed rate of return of 5.00% per year before expenses, which is not the Fund’s actual return. The hypothetical account values and expenses may not be used to estimate the actual ending account balance or expenses you paid for the period. You may use the information provided in this table to compare the ongoing costs of investing in the Fund and other funds. To do so, compare the 5.00% hypothetical example relating to the Fund with the 5.00% hypothetical examples that appear in the shareholder reports of the other funds.
Please note that the expenses shown in the table below are meant to highlight your ongoing costs only and do not reflect any transactional costs. Therefore, the table is useful in comparing ongoing costs only, and will not help you determine the relative total costs of owning different funds. In addition, if these transaction costs were included, your costs would have been higher.
Based on Hypothetical Total Return(1)
| Hypothetical Annualized Total Return | Beginning Account Value | Ending Account Value | Annualized Expense Ratio | Expenses Paid During the Period(2) | |||||||||||
MFS Total Return | 5.00 | % | $ | 1,000.00 | $ | 1,020.88 | 0.79 | % | $ | 3.96 | |||||
Travelers Managed | 5.00 | 1,000.00 | 1,021.42 | 0.68 | 3.41 | ||||||||||
Smith Barney Money | 5.00 | 1,000.00 | 1,022.22 | 0.52 | 2.61 | ||||||||||
| (1) | For the six months ended April 30, 2005. |
| (2) | Expenses (net of voluntary expense reimbursements) are equal to each Fund’s respective annualized expense ratio multiplied by the average account value over the period, multiplied by the number of days in the most recent fiscal half-year, then divided by 365. |
11 Travelers Series Fund Inc. | 2005 Semi-Annual Report
Table of Contents
| Schedules of Investments (unaudited) | April 30, 2005 |
MFS TOTAL RETURN PORTFOLIO
| SHARES | SECURITY | VALUE | |||
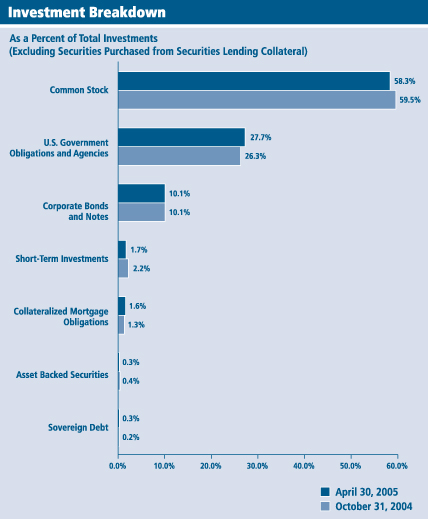
| COMMON STOCK — 58.2% | |||||
| CONSUMER DISCRETIONARY — 6.3% | |||||
Automobiles — 0.1% | |||||
| 40,000 | Toyota Motor Corp. | $ | 1,459,443 | ||
Hotels, Restaurants and Leisure — 0.1% | |||||
| 47,010 | McDonald’s Corp. | 1,377,863 | |||
Leisure Equipment and Products — 0.4% | |||||
| 45,600 | Hasbro, Inc. | 862,752 | |||
| 210,270 | Mattel, Inc. | 3,795,374 | |||
| 4,658,126 | |||||
Media — 3.6% | |||||
| 6,100 | Comcast Corp., Special Class A Shares (a) | 193,553 | |||
| 55,340 | Dex Media, Inc. | 1,211,946 | |||
| 532,800 | The Interpublic Group of Cos., Inc. (a)(b) | 6,851,808 | |||
| 398,370 | Reed Elsevier PLC | 3,905,856 | |||
| 218,790 | Time Warner Inc. (a) | 3,677,860 | |||
| 43,020 | Tribune Co. | 1,660,572 | |||
| 505,333 | Viacom Inc., Class B Shares | 17,494,628 | |||
| 356,920 | The Walt Disney Co. | 9,422,688 | |||
| 44,418,911 | |||||
Multi-Line Retail — 0.5% | |||||
| 54,730 | Family Dollar Stores, Inc. | 1,476,615 | |||
| 103,370 | Wal-Mart Stores, Inc. | 4,872,862 | |||
| 6,349,477 | |||||
Specialty Retail — 1.6% | |||||
| 148,800 | Circuit City Stores, Inc. | 2,351,040 | |||
| 424,330 | The Gap, Inc. | 9,059,446 | |||
| 25,800 | Lowe’s Cos., Inc. | 1,344,438 | |||
| 123,600 | OfficeMax Inc. | 4,014,528 | |||
| 158,960 | The TJX Cos., Inc. | 3,600,444 | |||
| 20,369,896 | |||||
| TOTAL CONSUMER DISCRETIONARY | 78,633,716 | ||||
| CONSUMER STAPLES — 3.8% | |||||
Beverages — 0.4% | |||||
| 75,770 | Diageo PLC | 1,124,582 | |||
| 74,310 | PepsiCo, Inc. | 4,134,608 | |||
| 5,259,190 | |||||
Food Products — 1.5% | |||||
| 123,450 | Archer-Daniels-Midland Co. | 2,220,865 | |||
| 113,030 | General Mills, Inc. | 5,583,682 | |||
See Notes to Financial Statements.
12 Travelers Series Fund Inc. | 2005 Semi-Annual Report
Table of Contents
| Schedules of Investments (unaudited) (continued) | April 30, 2005 |
MFS TOTAL RETURN PORTFOLIO
| SHARES | SECURITY | VALUE | |||
Food Products — 1.5% (continued) | |||||
| 102,430 | H.J. Heinz Co. | $ | 3,774,545 | ||
| 79,720 | Kellogg Co. | 3,583,414 | |||
| 4,424 | Nestle S.A. (b) | 1,166,872 | |||
| 88,500 | Sara Lee Corp. | 1,893,015 | |||
| 18,222,393 | |||||
Household Products — 0.4% | |||||
| 80,110 | Kimberly-Clark Corp. | 5,002,869 | |||
Personal Products — 0.5% | |||||
| 117,100 | The Gillette Co. | 6,047,044 | |||
Tobacco — 1.0% | |||||
| 200,360 | Altria Group, Inc. | 13,021,396 | |||
| TOTAL CONSUMER STAPLES | 47,552,892 | ||||
| ENERGY — 6.5% | |||||
Energy Equipment and Services — 2.1% | |||||
| 62,460 | BJ Services Co. | 3,044,925 | |||
| 93,760 | Cooper Cameron Corp. (a) | 5,151,174 | |||
| 239,730 | GlobalSantaFe Corp. | 8,054,928 | |||
| 191,980 | Noble Corp. | 9,771,782 | |||
| 26,022,809 | |||||
Oil and Gas — 4.4% | |||||
| 23,200 | Apache Corp. | 1,305,928 | |||
| 123,776 | BP PLC, Sponsored ADR | 7,537,958 | |||
| 57,800 | ConocoPhillips | 6,060,330 | |||
| 240,010 | Devon Energy Corp. | 10,841,252 | |||
| 35,410 | EnCana Corp. | 2,261,283 | |||
| 56,350 | EOG Resources, Inc. | 2,679,443 | |||
| 210,036 | Exxon Mobil Corp. | 11,978,353 | |||
| 78,270 | Total S.A., Sponsored ADR (b) | 8,680,926 | |||
| 67,450 | Unocal Corp. | 3,679,398 | |||
| 55,024,871 | |||||
| TOTAL ENERGY | 81,047,680 | ||||
| FINANCIALS — 14.7% | |||||
Banks — 5.7% | |||||
| 574,522 | Bank of America Corp. | 25,876,471 | |||
| 489,640 | Mellon Financial Corp. | 13,558,132 | |||
| 268,190 | The PNC Financial Services Group, Inc. | 14,275,754 | |||
| 118,630 | SunTrust Banks, Inc. | 8,639,823 | |||
| 63,666 | U.S. Bancorp | 1,776,281 | |||
| 46,620 | Wachovia Corp. | 2,386,012 | |||
| 80,790 | Wells Fargo & Co. | 4,842,553 | |||
| 71,355,026 | |||||
See Notes to Financial Statements.
13 Travelers Series Fund Inc. | 2005 Semi-Annual Report
Table of Contents
| Schedules of Investments (unaudited) (continued) | April 30, 2005 |
MFS TOTAL RETURN PORTFOLIO
| SHARES | SECURITY | VALUE | |||
Diversified Financials — 5.9% | |||||
| 149,190 | American Express Co. | $ | 7,862,313 | ||
| 59,090 | Countrywide Financial Corp. | 2,138,467 | |||
| 68,400 | Fannie Mae | 3,690,180 | |||
| 40,150 | Franklin Resources, Inc. | 2,757,502 | |||
| 124,550 | Freddie Mac | 7,662,316 | |||
| 68,960 | The Goldman Sachs Group, Inc. | 7,364,238 | |||
| 632,748 | JPMorgan Chase & Co. | 22,456,227 | |||
| 13,630 | Lehman Brothers Holdings Inc. | 1,250,144 | |||
| 115,360 | MBNA Corp. | 2,278,360 | |||
| 232,560 | Merrill Lynch & Co., Inc. | 12,541,961 | |||
| 64,240 | Morgan Stanley | 3,380,309 | |||
| 73,382,017 | |||||
Insurance — 3.1% | |||||
| 84,570 | AFLAC Inc. (c) | 3,437,771 | |||
| 241,540 | The Allstate Corp. | 13,564,886 | |||
| 15,130 | The Chubb Corp. | 1,237,331 | |||
| 310,560 | Conseco, Inc. (a)(b) | 5,975,174 | |||
| 69,780 | Genworth Financial, Inc., Class A Shares | 1,950,351 | |||
| 106,060 | The Hartford Financial Services Group, Inc. | 7,675,562 | |||
| 136,740 | MetLife, Inc. | 5,319,186 | |||
| 39,160,261 | |||||
| TOTAL FINANCIALS | 183,897,304 | ||||
| HEALTHCARE — 5.3% | |||||
Biotechnology — 0.4% | |||||
| 174,370 | MedImmune, Inc. (a) | 4,423,767 | |||
Healthcare Equipment and Supplies — 0.2% | |||||
| 33,720 | Baxter International Inc. | 1,251,012 | |||
| 36,360 | Boston Scientific Corp. (a) | 1,075,529 | |||
| 2,326,541 | |||||
Healthcare Providers and Services — 0.5% | |||||
| 538,810 | Tenet Healthcare Corp. (a) | 6,449,556 | |||
Pharmaceuticals — 4.2% | |||||
| 220,430 | Abbott Laboratories | 10,836,339 | |||
| 9,720 | Eli Lilly and Co. | 568,328 | |||
| 89,130 | Johnson & Johnson | 6,116,992 | |||
| 425,940 | Merck & Co. Inc. | 14,439,366 | |||
| 19,960 | Novartis AG | 975,606 | |||
| 29,660 | Pfizer Inc. | 805,862 | |||
| 13,770 | Roche Holding AG | 1,673,238 | |||
| 376,380 | Wyeth | 16,914,517 | |||
| 52,330,248 | |||||
| TOTAL HEALTHCARE | 65,530,112 | ||||
See Notes to Financial Statements.
14 Travelers Series Fund Inc. | 2005 Semi-Annual Report
Table of Contents
| Schedules of Investments (unaudited) (continued) | April 30, 2005 |
MFS TOTAL RETURN PORTFOLIO
| SHARES | SECURITY | VALUE | |||
| INDUSTRIALS — 6.4% | |||||
Aerospace and Defense — 1.7% | |||||
| 209,880 | Lockheed Martin Corp. | $ | 12,792,186 | ||
| 63,110 | Northrop Grumman Corp. | 3,460,952 | |||
| 28,070 | Precision Castparts Corp. | 2,067,636 | |||
| 29,210 | United Technologies Corp. | 2,971,241 | |||
| 21,292,015 | |||||
Air Freight and Couriers — 0.0% | |||||
| 10,580 | CNF Inc. | 452,295 | |||
Building Products — 0.9% | |||||
| 344,650 | Masco Corp. | 10,853,029 | |||
Commercial Services and Supplies — 0.3% | |||||
| 140,540 | Cendant Corp. | 2,798,151 | |||
| 30,590 | Fiserv, Inc. (a) | 1,293,957 | |||
| 4,092,108 | |||||
Electrical Equipment — 0.4% | |||||
| 22,140 | Cooper Industries, Ltd., Class A Shares | 1,409,432 | |||
| 37,130 | Emerson Electric Co. | 2,326,937 | |||
| 25,350 | Hubbell Inc., Class B Shares | 1,101,458 | |||
| 4,837,827 | |||||
Industrial Conglomerates — 1.9% | |||||
| 26,080 | 3M Co. | 1,994,338 | |||
| 266,580 | General Electric Co. | 9,650,196 | |||
| 359,850 | Tyco International Ltd. | 11,266,903 | |||
| 22,911,437 | |||||
Machinery — 1.0% | |||||
| 55,090 | Deere & Co. | 3,445,329 | |||
| 2,830 | Finning International Inc. | 75,543 | |||
| 25,530 | Illinois Tool Works Inc. | 2,139,925 | |||
| 15,900 | Ingersoll-Rand Co. Ltd., Class A Shares | 1,222,233 | |||
| 14,240 | ITT Industries, Inc. | 1,288,150 | |||
| 46,860 | Sandvik AB (b) | 1,843,379 | |||
| 69,900 | SPX Corp. (b) | 2,704,431 | |||
| 12,718,990 | |||||
Road and Rail — 0.2% | |||||
| 50,750 | Burlington Northern Santa Fe Corp. | 2,448,687 | |||
| TOTAL INDUSTRIALS | 79,606,388 | ||||
See Notes to Financial Statements.
15 Travelers Series Fund Inc. | 2005 Semi-Annual Report
Table of Contents
| Schedules of Investments (unaudited) (continued) | April 30, 2005 |
MFS TOTAL RETURN PORTFOLIO
| SHARES | SECURITY | VALUE | |||
| INFORMATION TECHNOLOGY — 4.4% | |||||
Communications Equipment — 1.6% | |||||
| 58,950 | Cisco Systems, Inc. (a) | $ | 1,018,656 | ||
| 576,640 | Nokia Corp., Sponsored ADR | 9,214,707 | |||
| 3,787,340 | Nortel Networks Corp. (a)(b) | 9,430,477 | |||
| 19,663,840 | |||||
Computers and Peripherals — 0.7% | |||||
| 34,870 | Dell, Inc. (a) | 1,214,522 | |||
| 45,710 | Hewlett-Packard Co. | 935,684 | |||
| 4,710 | International Business Machines Corp. | 359,750 | |||
| 1,757,760 | Sun Microsystems, Inc. (a) | 6,380,669 | |||
| 8,890,625 | |||||
IT Consulting and Services — 0.4% | |||||
| 236,710 | Accenture Ltd., Class A Shares (a) | 5,136,607 | |||
Office Electronics — 0.1% | |||||
| 120,480 | Xerox Corp. (a)(b) | 1,596,360 | |||
Semiconductor Equipment and Products — 0.2% | |||||
| 79,660 | Analog Devices, Inc. | 2,717,203 | |||
Software — 1.4% | |||||
| 457,400 | Compuware Corp. (a) | 2,721,530 | |||
| 58,400 | Microsoft Corp. | 1,477,520 | |||
| 148,300 | Oracle Corp. (a) | 1,714,348 | |||
| 615,250 | Symantec Corp. (a) | 11,554,395 | |||
| 17,467,793 | |||||
| TOTAL INFORMATION TECHNOLOGY | 55,472,428 | ||||
| MATERIALS — 3.7% | |||||
Chemicals — 1.7% | |||||
| 76,690 | Air Products and Chemicals, Inc. (c) | 4,504,004 | |||
| 84,460 | The Dow Chemical Co. | 3,879,248 | |||
| 62,760 | E.I. du Pont de Nemours and Co. | 2,956,624 | |||
| 16,140 | Monsanto Co. | 946,127 | |||
| 88,030 | PPG Industries, Inc. | 5,946,426 | |||
| 15,550 | Praxair, Inc. | 728,206 | |||
| 18,960 | Syngenta AG | 1,969,877 | |||
| 20,930,512 | |||||
Containers and Packaging — 1.0% | |||||
| 462,680 | Owens-Illinois, Inc. (a)(b) | 11,344,914 | |||
| 91,360 | Smurfit-Stone Container Corp. (a) | 1,197,730 | |||
| 12,542,644 | |||||
See Notes to Financial Statements.
16 Travelers Series Fund Inc. | 2005 Semi-Annual Report
Table of Contents
| Schedules of Investments (unaudited) (continued) | April 30, 2005 |
MFS TOTAL RETURN PORTFOLIO
| SHARES | SECURITY | VALUE | |||
Metals and Mining — 0.2% | |||||
| 171,420 | BHP Billiton PLC | $ | 2,094,627 | ||
Paper and Forest Products — 0.8% | |||||
| 169,360 | Bowater Inc. | 5,502,506 | |||
| 157,070 | International Paper Co. | 5,385,930 | |||
| 10,888,436 | |||||
| TOTAL MATERIALS | 46,456,219 | ||||
| TELECOMMUNICATION SERVICES — 4.5% | |||||
Diversified Telecommunication Services — 4.0% | |||||
| 148,014 | SBC Communications Inc. | 3,522,733 | |||
| 1,101,350 | Sprint Corp., Series 1, FON Shares | 24,516,051 | |||
| 599,944 | Verizon Communications Inc. | 21,477,995 | |||
| 49,516,779 | |||||
Wireless Telecommunication Services — 0.5% | |||||
| 255,449 | Vodafone Group PLC, Sponsored ADR (b) | 6,677,437 | |||
| TOTAL TELECOMMUNICATION SERVICES | 56,194,216 | ||||
| UTILITIES — 2.6% | |||||
Electric Utilities — 2.1% | |||||
| 1,570,980 | Calpine Corp. (a)(b) | 2,812,054 | |||
| 52,120 | Cinergy Corp. | 2,063,952 | |||
| 87,330 | Dominion Resources, Inc. | 6,584,682 | |||
| 70,500 | Entergy Corp. | 5,167,650 | |||
| 59,460 | Exelon Corp. | 2,943,270 | |||
| 9,460 | FPL Group, Inc. | 386,157 | |||
| 62,030 | PPL Corp. | 3,365,748 | |||
| 9,400 | Public Service Enterprise Group Inc. | 546,140 | |||
| 23,410 | TXU Corp. | 2,008,344 | |||
| 25,877,997 | |||||
Gas Utilities — 0.1% | |||||
| 53,130 | AGL Resources Inc. | 1,838,298 | |||
Multi-Utilities — 0.2% | |||||
| 80,614 | NiSource Inc. | 1,873,469 | |||
Water Utilities — 0.2% | |||||
| 128,160 | Nalco Holding Co. (a) | 2,306,880 | |||
| TOTAL UTILITIES | 31,896,644 | ||||
| TOTAL COMMON STOCK (Cost — $658,341,797) | 726,287,599 | ||||
See Notes to Financial Statements.
17 Travelers Series Fund Inc. | 2005 Semi-Annual Report
Table of Contents
| Schedules of Investments (unaudited) (continued) | April 30, 2005 |
MFS TOTAL RETURN PORTFOLIO
| FACE AMOUNT | SECURITY | VALUE | |||||
| U.S. GOVERNMENT OBLIGATIONS AND AGENCIES — 27.6% | |||||||
U.S. Treasury Obligations — 9.3% | |||||||
U.S. Treasury Bonds: | |||||||
| $ 884,000 | 10.375% due 11/15/12 | $ | 1,025,164 | ||||
| 17,909,000 | 6.250% due 8/15/23 (b) | 21,528,588 | |||||
| 4,168,000 | 5.375% due 2/15/31 (b) | 4,708,865 | |||||
U.S. Treasury Inflationary Index Bonds: | |||||||
| 4,300,428 | 4.250% due 1/15/10 (b) | 4,920,631 | |||||
| 5,339,099 | 3.000% due 7/15/12 | 5,940,378 | |||||
U.S. Treasury Notes: | |||||||
| 3,004,000 | 5.750% due 11/15/05 (b) | 3,045,188 | |||||
| 1,178,000 | 5.875% due 11/15/05 (b) | 1,194,981 | |||||
| 2,913,000 | 6.875% due 5/15/06 (b) | 3,015,526 | |||||
| 9,955,000 | 7.000% due 7/15/06 (b) | 10,366,818 | |||||
| 1,719,000 | 4.375% due 5/15/07 (b) | 1,743,779 | |||||
| 3,098,000 | 3.250% due 8/15/07 (b) | 3,071,016 | |||||
| 9,974,000 | 3.000% due 11/15/07 (b) | 9,811,145 | |||||
| 3,161,000 | 5.500% due 2/15/08 (b) | 3,311,397 | |||||
| 23,802,000 | 4.750% due 11/15/08 (b) | 24,560,713 | |||||
| 95,000 | 4.000% due 6/15/09 (b) | 95,616 | |||||
| 3,625,000 | 4.000% due 11/15/12 (b) | 3,623,021 | |||||
| 1,294,000 | 3.875% due 2/15/13 (b) | 1,277,118 | |||||
| 8,687,000 | 4.750% due 5/15/14 (b) | 9,058,239 | |||||
| 3,342,000 | 4.000% due 2/15/15 (b) | 3,288,869 | |||||
| Total U.S. Treasury Obligations | 115,587,052 | ||||||
| RATING(d) | ||||||
U.S. Government Agency Bonds and Notes — 4.1% | ||||||
Federal Home Loan Bank (FHLB): | ||||||
Bonds: | ||||||
| 6,120,000 | AAA | 3.750% due 9/28/06 | 6,109,529 | |||
| 740,000 | AAA | 3.900% due 2/25/08 | 737,527 | |||
| 1,985,000 | AAA | Notes, Series 1, 3.250% due 7/21/06 | 1,974,499 | |||
Federal Home Loan Mortgage Corp. (FHLMC): | ||||||
| 3,100,000 | AAA | Notes, 4.125% due 11/18/09 | 3,086,837 | |||
Reference Notes: | ||||||
| 10,656,000 | Aaa* | 7.000% due 7/15/05 | 10,737,582 | |||
| 2,663,000 | AAA | 2.875% due 12/15/06 | 2,624,248 | |||
Federal National Mortgage Association (FNMA), Benchmark Notes: | ||||||
| 3,000,000 | AAA | 3.250% due 7/31/06 | 2,983,566 | |||
| 1,533,000 | AAA | 3.000% due 3/2/07 | 1,510,235 | |||
| 7,765,000 | Aaa* | 6.625% due 9/15/09 to 11/15/10 | 8,596,535 | |||
| 4,498,000 | AAA | 6.000% due 5/15/08 to 5/15/11 | 4,782,747 | |||
See Notes to Financial Statements.
18 Travelers Series Fund Inc. | 2005 Semi-Annual Report
Table of Contents
| Schedules of Investments (unaudited) (continued) | April 30, 2005 |
MFS TOTAL RETURN PORTFOLIO
| FACE AMOUNT | RATING(d) | SECURITY | VALUE | ||||
U.S. Government Agency Bonds and Notes — 4.1% (continued) | |||||||
| $ 5,955,000 | AAA | 6.125% due 3/15/12 | $ | 6,559,272 | |||
| 1,447,000 | AAA | 4.625% due 10/15/14 (b) | 1,455,524 | ||||
| Total U.S. Government Agency Bonds and Notes | 51,158,101 | ||||||
U.S. Government Agency Pass-Throughs — 14.2% | |||||||
Federal Home Loan Mortgage Corp. (FHLMC): | |||||||
| 93,972 | 6.500% due 12/1/15 | 97,903 | |||||
| 2,746,841 | 5.000% due 5/1/18 to 6/1/19 | 2,770,886 | |||||
| 5,424,298 | 4.500% due 5/1/18 to 2/1/20 | 5,381,491 | |||||
| 4,060,773 | 6.000% due 4/1/16 to 2/1/23 | 4,198,906 | |||||
| 600,100 | 5.500% due 4/1/19 to 9/1/24 | 612,308 | |||||
| 6,277,638 | 5.000% due 9/1/33 to 4/1/34 | 6,233,214 | |||||
| 5,330,103 | 6.000% due 4/1/34 to 8/1/34 | 5,475,948 | |||||
| 2,642,904 | 6.500% due 5/1/34 to 10/1/34 | 2,751,184 | |||||
| 10,802,221 | 5.500% due 5/1/33 to 12/1/34 | 10,938,246 | |||||
Federal National Mortgage Association (FNMA): | |||||||
| 1,400,000 | 5.722% due 2/1/09 | 1,457,100 | |||||
| 189,210 | 6.330% due 3/1/11 | 203,968 | |||||
| 140,438 | 4.667% due 4/1/13 | 141,396 | |||||
| 113,866 | 4.010% due 8/1/13 | 109,690 | |||||
| 776,519 | 4.019% due 8/1/13 | 750,538 | |||||
| 281,967 | 4.630% due 4/1/14 | 281,870 | |||||
| 997,420 | 4.518% due 5/1/14 | 991,347 | |||||
| 586,939 | 4.846% due 8/1/14 | 595,714 | |||||
| 1,762,048 | 4.925% due 4/1/15 | 1,788,479 | |||||
| 5,984,594 | 6.000% due 7/1/16 to 7/1/17 | 6,207,301 | |||||
| 6,611,070 | 4.500% due 4/1/18 to 6/1/19 | 6,553,527 | |||||
| 11,263,517 | 5.000% due 11/1/17 to 9/1/19 | 11,364,036 | |||||
| 9,639,948 | 5.500% due 11/1/17 to 12/1/19 | 9,877,379 | |||||
| 1,012,893 | 7.500% due 10/1/29 to 2/1/32 | 1,086,016 | |||||
| 9,832,062 | 6.500% due 11/1/28 to 8/1/34 | 10,244,349 | |||||
| 3,502,633 | 5.000% due 3/1/34 to 9/1/34 | 3,471,904 | |||||
| 18,631,018 | 6.000% due 2/1/32 to 12/1/34 | 19,150,857 | |||||
| 47,914,580 | 5.500% due 2/1/33 to 2/1/35 | 48,425,269 | |||||
Government National Mortgage Association (GNMA): | |||||||
| 785,099 | 4.500% due 7/20/33 to 9/15/33 | 765,912 | |||||
| 799,325 | 6.500% due 3/15/28 to 7/15/34 | 838,111 | |||||
| 5,456,013 | 6.000% due 10/15/32 to 9/15/34 | 5,632,780 | |||||
| 1,238,083 | 5.000% due 3/15/34 to 12/15/34 | 1,237,754 | |||||
| 7,891,969 | 5.500% due 11/15/32 to 2/15/35 | 8,040,892 | |||||
| Total U.S. Government Agency Pass-Throughs | 177,676,275 | ||||||
| TOTAL U.S. GOVERNMENT OBLIGATIONS AND AGENCIES (Cost — $343,044,011) | 344,421,428 | ||||||
See Notes to Financial Statements.
19 Travelers Series Fund Inc. | 2005 Semi-Annual Report
Table of Contents
| Schedules of Investments (unaudited) (continued) | April 30, 2005 |
MFS TOTAL RETURN PORTFOLIO
| FACE AMOUNT | RATING(d) | SECURITY | VALUE | ||||
| COLLATERALIZED MORTGAGE OBLIGATIONS — 1.6% | |||||||
Bear Stearns Commercial Mortgage Securities: | |||||||
| $ 439,382 | Aaa* | Series 1999-WF2, Class A1, 6.800% due 7/15/31 | $ | 453,105 | |||
| 1,046,000 | Aaa* | Series 2005-PWR7, Class A3, 5.116% due 2/11/41 (e) | 1,066,551 | ||||
| 183,405 | BBB | Blackrock Capital Finance L.P., Series 1996-R1, Class B2, 7.750% due 9/25/26 (f) | 171,652 | ||||
Chase Commercial Mortgage Securities Corp.: | |||||||
| 1,167,000 | AAA | Series 1998-2, Class A2, 6.390% due 11/18/30 | 1,240,671 | ||||
| 249,671 | Aaa* | Series 2000-2, Class A1, 7.543% due 7/15/32 | 265,988 | ||||
CRIIMI MAE Commercial Mortgage Trust: | |||||||
| 420,000 | AAA | Series 1998-1, Class C, 6.701% due 6/20/30 (f) | 432,920 | ||||
| 2,150,000 | AAA | Series 1998-C1, Class A2, 7.000% due 6/2/33 (f) | 2,263,966 | ||||
| 550,000 | Aaa* | CS First Boston Mortgage Securities Corp., | 596,340 | ||||
| 1,060,752 | Aaa* | Deutsche Mortgage and Asset Receiving Corp., | 1,113,652 | ||||
| 480,762 | AAA | First Union-Lehman Brothers-Bank of America Commercial Mortgage Trust, Series 1998-C2, Class A2, | 507,412 | ||||
First Union-Lehman Brothers Commercial Mortgage Trust: | |||||||
| 288,623 | Aaa* | Series 1997-C1, Class A3, 7.380% due 4/18/29 | 302,389 | ||||
| 516,263 | AAA | Series 1997-C2, Class A3, 6.650% due 11/18/29 | 541,342 | ||||
| 1,200,000 | AAA | Greenwich Capital Commercial Funding Corp., | 1,242,054 | ||||
| 275,594 | AAA | GS Mortgage Securities Corp. II, Series 1998-C1, Class A1, | |||||
6.060% due 10/18/30 | 277,915 | ||||||
J.P. Morgan Chase Commercial Mortgage Securities Corp.: | |||||||
| 396,000 | AAA | Series 1998-C6, Class A3, 6.613% due 1/15/30 | 415,912 | ||||
| 1,200,000 | Aaa* | Series 2004-C2, Class A3, 5.384% due 5/15/41 (e) | 1,237,271 | ||||
| 333,817 | AAA | Merrill Lynch Mortgage Investors, Inc., Series 1998-C2, Class A2, 6.390% due 2/15/30 | 349,206 | ||||
| 34,493,448 | NR | Morgan Stanley Capital I, Inc., Series 1998-HF2, Class X, Interest Only 0.941% due 11/15/30 (e)(f) | 760,867 | ||||
| 1,406,662 | AAA | Mortgage Capital Funding, Inc., Series 1998-MC3, Class A2, 6.337% due 11/18/31 | 1,477,672 | ||||
| 283,301 | AAA | Multi-Family Capital Access One, Inc., Series 1, Class A, | |||||
6.650% due 1/15/24 | 304,905 | ||||||
| 548,000 | AAA | RAAC Series 2004-SP3 Trust, Class AI3, | 546,032 | ||||
| 2,048,293 | NR | Small Business Administration Participation Certificates, | |||||
Series 2003-20G, Class 1, 4.350% due 7/1/23 | 2,000,873 | ||||||
See Notes to Financial Statements.
20 Travelers Series Fund Inc. | 2005 Semi-Annual Report
Table of Contents
| Schedules of Investments (unaudited) (continued) | April 30, 2005 |
MFS TOTAL RETURN PORTFOLIO
| FACE AMOUNT | RATING(d) | SECURITY | VALUE | ||||
| COLLATERALIZED MORTGAGE OBLIGATIONS — 1.6% (continued) | |||||||
Wachovia Bank Commercial Mortgage Trust: | |||||||
| $ 1,775,000 | AAA | Series 2005-C16, 4.847% due 10/15/41 (e) | $ | 1,775,080 | |||
| 1,000,000 | AAA | Series 2005-C17, 5.083% due 3/15/42 (e) | 1,017,262 | ||||
| TOTAL COLLATERALIZED MORTGAGE OBLIGATIONS (Cost — $20,284,838) | 20,361,037 | ||||||
| ASSET-BACKED SECURITIES — 0.3% | |||||||
| 2,331,007 | AAA | Capital One Auto Finance Trust, Series 2002-A, Class A4, | |||||
4.790% due 1/15/09 | 2,344,266 | ||||||
| 310,889 | Aaa* | Falcon Franchise Loan LLC, Series 2000-1, Class A-1, | |||||
7.382% due 5/5/10 (f) | 329,557 | ||||||
| 500,000 | AAA | Providian Gateway Master Trust, Series 2000-B, Class A, | |||||
3.234% due 3/16/09 (e)(f) | 500,843 | ||||||
| 548,647 | AAA | Residential Asset Mortgage Products, Inc., | 547,345 | ||||
| TOTAL ASSET-BACKED SECURITIES (Cost — $3,722,323) | 3,722,011 | ||||||
| CORPORATE BONDS AND NOTES — 10.1% | |||||||
| CONSUMER DISCRETIONARY — 0.6% | |||||||
Automotive — 0.1% | |||||||
| 597,000 | BB+ | Ford Motor Co., Notes, 7.450% due 7/16/31 (b) | 491,825 | ||||
| 1,572,000 | BB | General Motors Corp., Sr. Debentures, | 1,199,219 | ||||
| 1,691,044 | |||||||
Hotels, Restaurants and Leisure — 0.1% | |||||||
| 486,000 | BBB- | Yum! Brands, Inc., Sr. Notes, 8.875% due 4/15/11 | 587,586 | ||||
Media — 0.4% | |||||||
| 998,000 | BBB- | Cox Communications, Inc., Notes, 4.625% due 6/1/13 | 951,333 | ||||
| 572,000 | BBB- | News America Holdings, Sr. Debentures, | 721,375 | ||||
| 923,000 | BBB- | News America Inc., Sr. Notes, 6.200% due 12/15/34 (b) | 934,383 | ||||
Time Warner Entertainment Co. L.P., Notes: | |||||||
| 484,000 | BBB+ | 10.150% due 5/1/12 | 625,309 | ||||
| 463,000 | BBB+ | 8.375% due 7/15/33 | 604,340 | ||||
The Walt Disney Co., Sr. Notes: | |||||||
| 811,000 | BBB+ | 6.375% due 3/1/12 (b) | 885,739 | ||||
| 370,000 | BBB+ | Series B, 6.750% due 3/30/06 | 379,623 | ||||
| 5,102,102 | |||||||
| TOTAL CONSUMER DISCRETIONARY | 7,380,732 | ||||||
See Notes to Financial Statements.
21 Travelers Series Fund Inc. | 2005 Semi-Annual Report
Table of Contents
| Schedules of Investments (unaudited) (continued) | April 30, 2005 |
MFS TOTAL RETURN PORTFOLIO
| FACE AMOUNT | RATING(d) | SECURITY | VALUE | ||||
| CONSUMER STAPLES — 0.5% | |||||||
Beverages — 0.1% | |||||||
| $ 1,641,000 | BBB+ | Miller Brewing Co., Notes, 5.500% due 8/15/13 (f) | $ | 1,690,893 | |||
Food Products — 0.4% | |||||||
| 1,585,000 | BBB | Cadbury Schweppes US Finance LLC, Notes, | 1,598,932 | ||||
| 903,000 | BBB+ | Kraft Foods Inc., Notes, 6.250% due 6/1/12 | 982,285 | ||||
| 1,557,000 | BBB | The Kroger Co., Sr. Notes, 6.750% due 4/15/12 (b) | 1,716,862 | ||||
| 4,298,079 | |||||||
| TOTAL CONSUMER STAPLES | 5,988,972 | ||||||
| ENERGY — 0.8% | |||||||
Energy Equipment and Services — 0.2% | |||||||
| 502,000 | BBB | CenterPoint Energy Resources Corp., Sr. Notes, Series B, | |||||
7.875% due 4/1/13 | 592,127 | ||||||
Kinder Morgan Energy Partners, L.P.: | |||||||
| 875,000 | BBB+ | Notes, 6.750% due 3/15/11 | 964,586 | ||||
| 985,000 | BBB+ | Sr. Bonds, 7.750% due 3/15/32 | 1,220,419 | ||||
| 2,777,132 | |||||||
Oil and Gas — 0.6% | |||||||
| 850,000 | BBB- | Amerada Hess Corp., Notes, 7.300% due 8/15/31 (b) | 974,641 | ||||
| 44,000 | BBB | Anderson Exploration Ltd., Notes, 6.750% due 3/15/11 (b) | 47,801 | ||||
| 988,000 | BBB | Devon Financing Corp., ULC, Notes, 6.875% due 9/30/11 | 1,098,685 | ||||
| 722,000 | BBB- | Duke Capital LLC, Sr. Notes, 8.000% due 10/1/19 | 883,180 | ||||
| 887,000 | A- | EnCana Holdings Finance Corp., Notes, | 939,332 | ||||
| 1,045,000 | BBB | Halliburton Co., Sr. Notes, 5.500% due 10/15/10 | 1,088,909 | ||||
| 598,000 | BB+ | Kerr-McGee Corp., Notes, 6.950% due 7/1/24 | 552,501 | ||||
| 520,000 | BBB | Ocean Energy Inc., Sr. Notes, 7.250% due 10/1/11 (b) | 582,600 | ||||
| 775,000 | BBB- | Pioneer Natural Resources Co., Sr. Notes, | 769,906 | ||||
| 6,937,555 | |||||||
| TOTAL ENERGY | 9,714,687 | ||||||
| FINANCIALS — 4.3% | |||||||
Banks — 1.0% | |||||||
Bank of America Corp.: | |||||||
| 840,000 | AA- | Sr. Notes, 5.375% due 6/15/14 (b) | 876,751 | ||||
| 2,663,000 | A+ | Sub. Notes, 7.400% due 1/15/11 | 3,033,045 | ||||
| 975,000 | A+ | Barclays Bank PLC, 6.860% Tier 1 Notes (e)(f) | 1,125,073 | ||||
| 568,000 | BBB+ | Mizuho Financial Group Cayman Ltd., Notes, | 588,631 | ||||
| 1,910,000 | BBB+ | Popular North America, Inc., Notes, 4.250% due 4/1/08 | 1,910,556 | ||||
See Notes to Financial Statements.
22 Travelers Series Fund Inc. | 2005 Semi-Annual Report
Table of Contents
| Schedules of Investments (unaudited) (continued) | April 30, 2005 |
MFS TOTAL RETURN PORTFOLIO
| FACE AMOUNT | RATING(d) | SECURITY | VALUE | ||||
Banks — 1.0% (continued) | |||||||
| $ 2,032,000 | A | Wachovia Corp., Sub. Notes, 5.250% due 8/1/14 | $ | 2,084,952 | |||
| 2,874,000 | AA- | Wells Fargo Bank N.A., Sub. Notes, 7.800% due 6/15/10 (e) | 2,888,157 | ||||
| 12,507,165 | |||||||
Diversified Financials — 2.4% | |||||||
| 801,000 | A- | Abbey National Capital Trust I, | 1,134,863 | ||||
| 2,500,000 | AA+ | AIG SunAmerica Global Financing II, Sr. Notes, | 2,511,753 | ||||
| 816,000 | AA+ | AIG SunAmerica Institutional Funding II, Medium-Term Notes, 5.750% due 2/16/09 | 858,221 | ||||
| 3,129,000 | A+ | CS First Boston (USA), Inc., Notes, 4.125% due 1/15/10 (b) | 3,073,507 | ||||
| 872,000 | A1* | DBS Capital Funding Corp., Series A, | 995,639 | ||||
Ford Motor Credit Co.: | |||||||
Global Landmark Securities: | |||||||
| 905,000 | BB+ | 7.375% due 10/28/09 | 871,415 | ||||
| 669,000 | BB+ | 7.375% due 2/1/11 (b) | 627,296 | ||||
| 465,000 | BB+ | Medium-Term Notes, 7.750% due 2/15/07 | 477,002 | ||||
GE Capital Corp.: | |||||||
Debentures: | |||||||
| 313,000 | AAA | 8.750% due 5/21/07 | 341,524 | ||||
| 553,000 | AAA | 8.500% due 7/24/08 | 620,408 | ||||
| 1,232,000 | AAA | Medium-Term Notes, Series A, 7.500% due 5/15/05 (b) | 1,233,635 | ||||
General Motors Acceptance Corp., Notes: | |||||||
| 920,000 | BB | 5.125% due 5/9/08 (b) | 858,129 | ||||
| 779,000 | BB | 7.250% due 3/2/11 | 699,496 | ||||
| 1,591,000 | A+ | The Goldman Sachs Group, Inc., Notes, | 1,670,491 | ||||
| 550,000 | A | HBOS Capital Funding LP, 6.071% Tier 1 Notes (b)(e)(f) | 583,350 | ||||
| 300,000 | NR | JET Equipment Trust, Notes, Series 95-D, | 0 | ||||
| 1,271,000 | A | JPMorgan Chase and Co., Sub. Notes, | 1,285,055 | ||||
| 771,000 | A | Lehman Brothers Holdings Inc., Sr. Notes, | 835,912 | ||||
| 1,235,000 | A+ | Merrill Lynch & Co., Inc. Medium-Term Notes, Series C, | 1,277,778 | ||||
| 599,000 | BBB+ | MidAmerican Funding LLC., Sr. Secured Bonds, | 698,126 | ||||
Morgan Stanley, Notes: | |||||||
| 864,000 | A+ | 6.750% due 4/15/11 | 955,488 | ||||
| 798,000 | A | 4.750% due 4/1/14 | 772,684 | ||||
See Notes to Financial Statements.
23 Travelers Series Fund Inc. | 2005 Semi-Annual Report
Table of Contents
| Schedules of Investments (unaudited) (continued) | April 30, 2005 |
MFS TOTAL RETURN PORTFOLIO
| FACE AMOUNT | RATING(d) | SECURITY | VALUE | ||||
Diversified Financials — 2.4% (continued) | |||||||
| $ 280,000 | A- | Natexis AMBS Co., LLC, Series A, | $ | 312,659 | |||
| 600,000 | AA- | Prudential Funding LLC, Notes, 6.600% due 5/15/08 (f) | 639,350 | ||||
| 2,000,000 | A | RBS Capital Trust II, 6.425% Trust Preferred Securities (b)(e) | 2,166,382 | ||||
SLM Corp., Medium-Term Notes, Series A: | |||||||
| 1,046,000 | A | 4.000% due 1/15/09 | 1,034,133 | ||||
| 934,000 | A | 5.375% due 1/15/13 | 983,085 | ||||
| 860,000 | BBB+ | UFJ Finance Aruba AEC, Notes, 6.750% due 7/15/13 | 949,471 | ||||
| 1,412,000 | A | UniCredito Italiano Capital Trust II, | 1,706,717 | ||||
| 30,173,569 | |||||||
Insurance — 0.3% | |||||||
| 795,000 | AA+ | American International Group, Inc., | 756,111 | ||||
| 630,000 | BBB- | Fund American Cos., Inc., Notes, 5.875% due 5/15/13 | 642,406 | ||||
| 600,000 | A | Genworth Financial, Inc., Notes, 5.750% due 6/15/14 | 634,030 | ||||
| 662,000 | A | MetLife, Inc., Sr. Notes, 6.500% due 12/15/32 | 755,005 | ||||
| 1,500,000 | A- | Prudential Financial, Inc., Medium-Term Notes, | 1,465,181 | ||||
| 4,252,733 | |||||||
Real Estate — 0.6% | |||||||
| 1,751,000 | BBB+ | EOP Operating, L.P., Notes, 6.800% due 1/15/09 | 1,877,433 | ||||
| 672,000 | BBB | HRPT Properties Trust, Sr. Notes, 6.250% due 8/15/16 | 719,881 | ||||
| 843,000 | BBB+ | Simon Property Group, L.P., Notes, 6.375% due 11/15/07 (b) | 881,448 | ||||
| 1,555,000 | A | SocGen Real Estate Co. LLC, Series A, | 1,671,218 | ||||
| 1,804,000 | BBB | Vornado Realty L.P., Sr. Notes, 5.625% due 6/15/07 | 1,855,948 | ||||
| 7,005,928 | |||||||
| TOTAL FINANCIALS | 53,939,395 | ||||||
| HEALTHCARE — 0.2% | |||||||
Healthcare Providers and Services — 0.1% | |||||||
HCA Inc.: | |||||||
| 828,000 | BB+ | Notes, 6.950% due 5/1/12 (b) | 867,270 | ||||
| 213,000 | BB+ | Sr. Notes, 8.750% due 9/1/10 | 240,760 | ||||
| 1,108,030 | |||||||
Pharmaceuticals — 0.1% | |||||||
| 879,000 | A | Wyeth, Notes, 5.500% due 3/15/13 (b) | 911,766 | ||||
| TOTAL HEALTHCARE | 2,019,796 | ||||||
See Notes to Financial Statements.
24 Travelers Series Fund Inc. | 2005 Semi-Annual Report
Table of Contents
| Schedules of Investments (unaudited) (continued) | April 30, 2005 |
MFS TOTAL RETURN PORTFOLIO
| FACE AMOUNT | RATING(d) | SECURITY | VALUE | ||||
| INDUSTRIALS — 1.2% | |||||||
Aerospace and Defense — 0.5% | |||||||
| $ 1,038,000 | BBB | BAE Systems Holdings Inc., Notes, 6.400% due 12/15/11 (f) | $ | 1,133,390 | |||
| 2,793,000 | A | Boeing Capital Corp., Notes, 6.500% due 2/15/12 (b) | 3,079,972 | ||||
| 1,395,000 | BBB | Northrop Grumman Corp., Sr. Debentures, | 1,813,658 | ||||
| 615,000 | BBB- | Raytheon Co., Sr. Notes, 6.150% due 11/1/08 | 645,034 | ||||
| 6,672,054 | |||||||
Airlines — 0.1% | |||||||
| 987,941 | BBB+ | Continental Airlines Inc., Series 981A, | 943,669 | ||||
Commercial Services and Supplies — 0.3% | |||||||
Cendant Corp., Sr. Notes: | |||||||
| 1,108,000 | BBB | 6.875% due 8/15/06 (b) | 1,145,959 | ||||
| 534,000 | BBB | 6.250% due 1/15/08 | 556,941 | ||||
Waste Management Inc., Sr. Notes: | |||||||
| 774,000 | BBB | 7.375% due 8/1/10 | 867,302 | ||||
| 1,268,000 | BBB | 7.000% due 7/15/28 | 1,449,039 | ||||
| 4,019,241 | |||||||
Industrial Conglomerates — 0.1% | |||||||
| 802,000 | BBB | Tyco International Group S.A., Notes, 6.750% due 2/15/11 | 881,542 | ||||
Machinery — 0.1% | |||||||
| 927,000 | BBB | Kennametal Inc., Sr. Notes, 7.200% due 6/15/12 | 1,032,624 | ||||
Road and Rail — 0.1% | |||||||
| 415,000 | BBB | CSX Corp., Notes, 6.750% due 3/15/11 | 458,830 | ||||
Union Pacific Corp., Notes: | |||||||
| 292,000 | BBB | 6.125% due 1/15/12 | 313,975 | ||||
| 763,000 | BBB | 5.375% due 5/1/14 | 787,698 | ||||
| 1,560,503 | |||||||
| TOTAL INDUSTRIALS | 15,109,633 | ||||||
| MATERIALS — 0.2% | |||||||
Chemicals — 0.0% | |||||||
| 659,000 | A- | The Dow Chemical Co., Notes, 5.750% due 12/15/08 | 689,653 | ||||
Paper and Forest Products — 0.2% | |||||||
| 441,000 | BBB | MeadWestvaco Corp., Debentures, 6.800% due 11/15/32 (b) | 466,945 | ||||
| 1,500,000 | BBB | Weyerhaeuser Co., Notes, 6.750% due 3/15/12 (b) | 1,603,512 | ||||
| 2,070,457 | |||||||
| TOTAL MATERIALS | 2,760,110 | ||||||
See Notes to Financial Statements.
25 Travelers Series Fund Inc. | 2005 Semi-Annual Report
Table of Contents
| Schedules of Investments (unaudited) (continued) | April 30, 2005 |
MFS TOTAL RETURN PORTFOLIO
| FACE AMOUNT | RATING(d) | SECURITY | VALUE | ||||
| TELECOMMUNICATION SERVICES — 1.3% | |||||||
Diversified Telecommunication Services — 1.1% | |||||||
| $ 852,000 | A | Bellsouth Corp., Notes, 6.550% due 6/15/34 | $ | 945,897 | |||
| 1,269,000 | A- | Deutsche Telekom International Finance BV, Bonds, | 1,705,561 | ||||
| 461,000 | A- | France Telecom S.A., Sr. Notes, 8.000% due 3/1/11 | 531,906 | ||||
| 737,000 | BBB | PCCW Capital II Ltd., Notes, 6.000% due 7/15/13 (f) | 773,722 | ||||
SBC Communications Inc., Global Notes: | |||||||
| 737,000 | A | 5.100% due 9/15/14 | 738,694 | ||||
| 442,000 | A | 6.150% due 9/15/34 (b) | 460,204 | ||||
| 824,000 | BBB- | Sprint Capital Corp., Notes, 6.875% due 11/15/28 | 921,639 | ||||
| 3,319,000 | BB+ | TCI Communications Inc., Preferred Securities, | 3,766,713 | ||||
Telecom Italia Capital S.A., Notes: | |||||||
| 545,000 | BBB+ | 5.250% due 11/15/13 | 546,922 | ||||
| 620,000 | BBB+ | 6.000% due 9/30/34 (f) | 616,228 | ||||
| 2,400,000 | A+ | Verizon New York Inc., Sr. Debentures, Series A, | |||||
6.875% due 4/1/12 (b) | 2,632,414 | ||||||
| 13,639,900 | |||||||
Wireless Telecommunications Services — 0.2% | |||||||
| 650,000 | A | Cingular Wireless LLC, Sr. Notes, 6.500% due 12/15/11 | 709,535 | ||||
New Cingular Wireless Services, Inc., Sr. Notes: | |||||||
| 410,000 | A | 7.350% due 3/1/06 (b) | 421,941 | ||||
| 785,000 | A | 8.750% due 3/1/31 | 1,073,817 | ||||
| 2,205,293 | |||||||
| TOTAL TELECOMMUNICATION SERVICES | 15,845,193 | ||||||
| UTILITIES — 1.0% | |||||||
Electric Utilities — 1.0% | |||||||
| 1,500,000 | BBB- | DTE Energy Co., Sr. Notes, 7.050% due 6/1/11 (b) | 1,673,610 | ||||
| 723,615 | BBB- | Entergy Louisiana, Inc., Waterford 3 Secured Lease Obligation Bonds, 8.090% due 1/2/17 | 797,743 | ||||
| 1,407,000 | A- | Exelon Generation Co., LLC, Sr. Notes, | 1,567,280 | ||||
| 934,000 | BB+ | FirstEnergy Corp., Sr. Notes, Series B, | 1,004,452 | ||||
| 1,250,000 | A+ | Hydro-Québec, Global Debentures, Series JL, | 1,367,413 | ||||
MidAmerican Energy Holdings Co., Sr. Notes: | |||||||
| 544,000 | BBB- | 3.500% due 5/15/08 | 527,469 | ||||
| 268,000 | BBB- | 5.875% due 10/1/12 | 282,729 | ||||
| 271,000 | A+ | Niagara Mohawk Power Corp., Secured Mortgage Bonds, | |||||
7.750% due 5/15/06 | 282,047 | ||||||
See Notes to Financial Statements.
26 Travelers Series Fund Inc. | 2005 Semi-Annual Report
Table of Contents
| Schedules of Investments (unaudited) (continued) | April 30, 2005 |
MFS TOTAL RETURN PORTFOLIO
| FACE AMOUNT | RATING(d) | SECURITY | VALUE | ||||
Electric Utilities — 1.0% (continued) | |||||||
| $ 204,766 | BBB | Northeast Utilities, Notes, Series A, 8.580% due 12/1/06 | $ | 210,310 | |||
| 1,171,000 | BBB- | Oncor Electric Delivery Co., Debentures, | 1,359,164 | ||||
| 1,500,000 | BBB | Pacific Gas & Electric Co., Mortgages, | 1,491,593 | ||||
PSEG Power LLC, Sr. Notes: | |||||||
| 405,000 | BBB | 6.950% due 6/1/12 (b) | 452,117 | ||||
| 533,000 | BBB | 8.625% due 4/15/31 (b) | 727,015 | ||||
| 674,172 | BBB | System Energy Resources Inc., Secured Lease Obligation Bonds, 5.129% due 1/15/14 (f) | 667,784 | ||||
| 587,000 | BBB | TXU Energy Co. LLC, Sr. Notes, 7.000% due 3/15/13 | 652,519 | ||||
| TOTAL UTILITIES | 13,063,245 | ||||||
| TOTAL CORPORATE BONDS AND NOTES (Cost — $122,801,195) | 125,821,763 | ||||||
| SOVEREIGN DEBT — 0.3% | |||||||
Italy — 0.1% | |||||||
| 1,500,000 | AA- | Republic of Italy, Notes, 4.625% due 6/15/05 | 1,503,219 | ||||
Mexico — 0.2% | |||||||
| 153,000 | BBB | Pemex Project Funding Master Trust, Bonds, | 177,480 | ||||
United Mexican States, Medium-Term Notes, Series A: | |||||||
| 1,334,000 | BBB | 6.625% due 3/3/15 | 1,414,707 | ||||
| 527,000 | BBB | 7.500% due 4/8/33 | 572,454 | ||||
| 2,164,641 | |||||||
| TOTAL SOVEREIGN DEBT (Cost — $3,696,134) | 3,667,860 | ||||||
| SUB-TOTAL INVESTMENTS (Cost — $1,151,890,298) | 1,224,281,698 | ||||||
| SHORT-TERM INVESTMENTS — 15.3% | |||||||
| SHARES | |||||||
| SECURITIES PURCHASED FROM SECURITIES LENDING COLLATERAL — 13.6% | |||||||
| 169,411,388 | State Street Navigator Securities Lending Trust Prime Portfolio (Cost — $169,411,388) | 169,411,388 | |||||
See Notes to Financial Statements.
27 Travelers Series Fund Inc. | 2005 Semi-Annual Report
Table of Contents
| Schedules of Investments (unaudited) (continued) | April 30, 2005 |
MFS TOTAL RETURN PORTFOLIO
| FACE AMOUNT | RATING(d) | SECURITY | VALUE | |||||
| COMMERCIAL PAPER — 1.7% | ||||||||
| $11,051,000 | A-1 | Merrill Lynch & Co., Inc., Discount Notes, due 5/2/05 | $ | 11,050,101 | ||||
| 9,586,000 | A-1+ | Wells Fargo & Co., Discount Notes, due 5/2/05 | 9,585,249 | |||||
| TOTAL COMMERCIAL PAPER (Cost — $20,635,350) | 20,635,350 | |||||||
| TOTAL SHORT-TERM INVESTMENTS (Cost — $190,046,738) | 190,046,738 | |||||||
| TOTAL INVESTMENTS — 113.4% (Cost — $1,341,937,036**) | 1,414,328,436 | |||||||
| Liabilities in Excess of Other Assets — (13.4)% | (166,973,364 | ) | ||||||
| TOTAL NET ASSETS — 100.0% | $ | 1,247,355,072 | ||||||
| (a) | Non-income producing security. |
| (b) | All or a portion of this security is on loan (See Notes 1 and 3). |
| (c) | All or a portion of this security is segregated for extended settlements. |
| (d) | All ratings are by Standard & Poor’s Rating Service, except for those identified by an asterisk (*), which are rated by Moody’s Investors Service. |
| (e) | Variable rate security. Rate shown is rate in effect on April 30, 2005. |
| (f) | Security is exempt from registration under Rule 144A of the Securities Act of 1933. This security may be resold in transactions that are exempt from registration, normally to qualified institutional buyers. This security has been deemed liquid pursuant to guidelines approved by the Board of Directors. |
| (g) | Security is currently in default. |
| (h) | Security is valued in good faith at fair value by or under the direction of the Board of Directors. |
| ** | Aggregate cost for federal income tax purposes is substantially the same. |
Abbreviation used in this schedule: | ||||
| ADR | — | American Depositary Receipt | ||
| See pages 37 and 38 for definitions of ratings. |
See Notes to Financial Statements.
28 Travelers Series Fund Inc. | 2005 Semi-Annual Report
Table of Contents
| Schedules of Investments (unaudited) (continued) | April 30, 2005 |
TRAVELERS MANAGED INCOME PORTFOLIO
FACE AMOUNT | SECURITY | VALUE | |||||
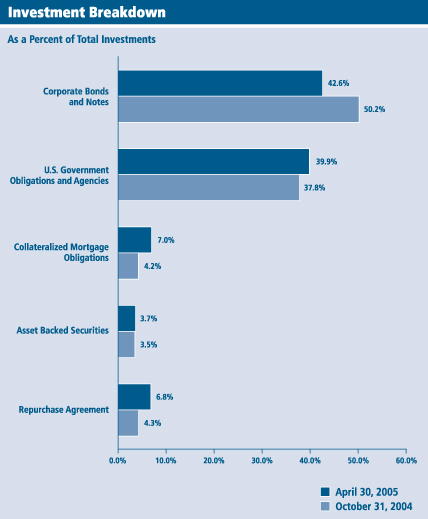
| U.S. GOVERNMENT OBLIGATIONS AND AGENCIES — 39.6% | |||||||
U.S. Treasury Notes: | |||||||
| $35,272,000 | 5.875% due 11/15/05 | $ | 35,780,446 | ||||
| 13,500,000 | 6.500% due 10/15/06 | 14,065,853 | |||||
| 4,000,000 | 2.750% due 8/15/07 | 3,920,940 | |||||
| 24,000,000 | 5.625% due 5/15/08 | 25,291,896 | |||||
| 1,140,000 | 3.625% due 1/15/10 | 1,127,621 | |||||
| 1,000,000 | 3.500% due 2/15/10 | 983,672 | |||||
| 2,000,000 | 4.000% due 3/15/10 | 2,009,688 | |||||
| 14,545,000 | 4.000% due 2/15/15 | 14,313,764 | |||||
| 1,000,000 | U.S. Treasury Strip, zero coupon due 11/15/09, Principal Only | 838,072 | |||||
| 1,500,000 | Federal Home Loan Mortgage Corp., Medium Term Notes, | 1,490,565 | |||||
Federal National Mortgage Association: | |||||||
Benchmark Notes: | |||||||
| 3,100,000 | 1.750% due 6/16/06 | 3,035,132 | |||||
| 4,900,000 | 6.000% due 5/15/11 | 5,322,914 | |||||
| 3,450,000 | Notes, 2.000% due 2/9/07 | 3,435,317 | |||||
| TOTAL U.S. GOVERNMENT OBLIGATIONS AND AGENCIES (Cost — $113,165,479) | 111,615,880 | ||||||
| RATING(a) | |||||||
| CORPORATE BONDS AND NOTES — 42.2% | |||||||
Aerospace/Defense — 0.6% | |||||||
| 1,600,000 | BBB | Northrop Grumman Corp., Remarketed Notes, | 1,599,994 | ||||
Automotive — 1.1% | |||||||
| 1,800,000 | BBB | DaimlerChrysler North America Holding Corp., Notes, | 1,930,572 | ||||
| 1,300,000 | BBB- | Lear Corp., Sr. Notes, Series B, 7.960% due 5/15/05 | 1,301,629 | ||||
| 3,232,201 | |||||||
Containers — 0.4% | |||||||
| 1,000,000 | A+ | Bottling Group LLC, Sr. Notes, Series B, | 1,000,352 | ||||
Energy — 1.4% | |||||||
| 800,000 | BBB+ | Anadarko Finance Co., Sr. Notes, Series B, | 890,719 | ||||
| 500,000 | BBB+ | Consolidated Natural Gas Co., Sr. Notes, | 498,927 | ||||
| 500,000 | A- | Cooper Cameron Corp., Sr. Notes, 2.650% due 4/15/07 | 484,071 | ||||
| 1,300,000 | BBB | Devon Financing Corp., ULC, Notes, 6.875% due 9/30/11 | 1,445,638 | ||||
| 500,000 | BBB+ | Kinder Morgan Energy Partners L.P., Notes, | 497,756 | ||||
| 3,817,111 | |||||||
See Notes to Financial Statements.
29 Travelers Series Fund Inc. | 2005 Semi-Annual Report
Table of Contents
| Schedules of Investments (unaudited) (continued) | April 30, 2005 |
TRAVELERS MANAGED INCOME PORTFOLIO
FACE AMOUNT | RATING(a) | SECURITY | VALUE | ||||
Entertainment/Media — 3.0% | |||||||
| $ 500,000 | BBB- | Clear Channel Communications, Inc., Sr. Notes, | $ | 464,120 | |||
| 1,000,000 | BBB | Comcast Cable Communications, Inc., Exchange Notes, | 1,326,428 | ||||
| 2,400,000 | BB+ | Liberty Media Corp., Sr. Notes, 4.510% due 9/17/06 (b) | 2,429,064 | ||||
| 4,000,000 | BBB+ | Time Warner Inc., Notes, 6.150% due 5/1/07 | 4,146,524 | ||||
| 8,366,136 | |||||||
Financial Services — 16.7% | |||||||
| 2,290,000 | AA- | ABN AMRO Bank, Sr. Notes, 2.834% due 5/11/07 (b) | 2,293,279 | ||||
| 1,400,000 | AA+ | AIG SunAmerica Global Financing, Sr. Notes, | 1,457,711 | ||||
| 2,500,000 | A+ | American General Finance Corp., Medium Term Notes, Series I, 3.875% due 10/1/09 | 2,428,230 | ||||
| 1,500,000 | AA- | Bank of America Corp., Sr. Notes, 5.375% due 6/15/14 | 1,565,626 | ||||
| 1,700,000 | BBB | Capital One Bank, Notes, 5.000% due 6/15/09 | 1,720,908 | ||||
| 2,200,000 | A | Caterpillar Financial Services Corp., Notes, | 2,210,551 | ||||
| 1,480,000 | A | Countrywide Home Loans, Inc., Medium Term Notes, Series L, 4.000% due 3/22/11 | 1,419,160 | ||||
Credit Suisse First Boston (USA), Inc., Notes: | |||||||
| 700,000 | A+ | 6.125% due 11/15/11 | 757,548 | ||||
| 2,000,000 | A+ | 4.875% due 1/15/15 | 1,984,110 | ||||
Ford Motor Credit Co.: | |||||||
Global Landmark Securities: | |||||||
| 2,000,000 | BBB- | 6.875% due 2/1/06 | 2,023,396 | ||||
| 1,200,000 | BBB- | 6.500% due 1/25/07 | 1,200,364 | ||||
| 300,000 | BBB- | 7.450% due 7/16/31 | 247,148 | ||||
| 300,000 | BBB- | Notes, 5.700% due 1/15/10 | 271,413 | ||||
General Motors Acceptance Corp., Notes: | |||||||
| 1,500,000 | BBB- | 7.250% due 3/2/11 | 1,346,911 | ||||
| 600,000 | BBB- | 6.875% due 9/15/11 | 526,321 | ||||
| 900,000 | BBB- | Glencore Funding LLC, Notes, 6.000% due 4/15/14 (c) | 853,907 | ||||
| 2,300,000 | A+ | The Goldman Sachs Group, Inc., Notes, | 2,336,282 | ||||
| 300,000 | BBB- | Greater Bay Bancorp, Sr. Notes, 5.125% due 4/15/10 (c) | 301,313 | ||||
| 3,400,000 | A | Household Finance Corp., Notes, 6.375% due 10/15/11 | 3,707,360 | ||||
| 1,200,000 | A+ | HSBC Bank (USA), Sub. Notes, 5.875% due 11/1/34 | 1,259,827 | ||||
| 1,000,000 | A- | Huntington National Bank, Sr. Notes, 4.650% due 6/30/09 | 1,009,129 | ||||
| 1,100,000 | A | JPMorgan Chase & Co., Sub. Notes, 5.250% due 5/1/15 | 1,125,325 | ||||
| 1,700,000 | A | Lehman Brothers Holdings Inc., Medium-Term Notes, Series G, 4.800% due 3/13/14 | 1,684,409 | ||||
Merrill Lynch & Co., Inc., Medium-Term Notes, Series C: | |||||||
| 1,000,000 | A+ | 4.125% due 9/10/09 | 989,068 | ||||
| 1,000,000 | A+ | 4.250% due 2/8/10 | 987,376 | ||||
See Notes to Financial Statements.
30 Travelers Series Fund Inc. | 2005 Semi-Annual Report
Table of Contents
| Schedules of Investments (unaudited) (continued) | April 30, 2005 |
TRAVELERS MANAGED INCOME PORTFOLIO
FACE AMOUNT | RATING(a) | SECURITY | VALUE | ||||
Financial Services — 16.7% (continued) | |||||||
| $ 1,000,000 | A+ | 5.000% due 1/15/15 | $ | 1,003,359 | |||
| 1,000,000 | A+ | Morgan Stanley, Notes, 6.600% due 4/1/12 | 1,096,630 | ||||
| 500,000 | AA | Rabobank Capital Funding Trust III, Sub. Notes, | 501,097 | ||||
| 1,700,000 | A+ | Royal Bank of Scotland Group PLC, Sub. Notes, | 1,725,871 | ||||
U.S. Bank, NA: | |||||||
| 2,000,000 | AA- | Notes, 2.870% due 2/1/07 | 1,967,528 | ||||
| 1,100,000 | A+ | Sub. Notes, 4.950% due 10/30/14 | 1,111,603 | ||||
Wachovia Bank NA, Sub. Notes: | |||||||
| 700,000 | A+ | 4.800% due 11/1/14 | 694,996 | ||||
| 2,000,000 | A+ | 3.130% due 11/3/14 (b) | 2,026,542 | ||||
| 1,300,000 | A- | Washington Mutual Bank, Sub. Notes, 5.125% due 1/15/15 | 1,296,834 | ||||
| 47,131,132 | |||||||
Food and Beverage — 1.4% | |||||||
| 2,000,000 | BBB | Fred Meyer, Inc., Sr. Notes, 7.450% due 3/1/08 | 2,149,676 | ||||
| 1,800,000 | A | PepsiAmericas Inc., Notes, 4.875% due 1/15/15 | 1,800,061 | ||||
| 3,949,737 | |||||||
Healthcare — 0.4% | |||||||
| 1,100,000 | BBB+ | Anthem, Inc., Bonds, 6.800% due 8/1/12 | 1,236,581 | ||||
Industrial Conglomerates — 2.1% | |||||||
| 3,500,000 | AAA | General Electric Co., Notes, 5.000% due 2/1/13 | 3,567,721 | ||||
| 2,300,000 | BBB | Tyco International Group SA, Notes, 6.125% due 11/1/08 | 2,422,006 | ||||
| 5,989,727 | |||||||
Insurance — 1.6% | |||||||
| 500,000 | BBB+ | GE Global Insurance Holding Corp., Notes, | 537,214 | ||||
| 1,800,000 | AAA | MassMutual Global Funding II, Notes, 2.550% due 7/15/08 (c) | 1,713,620 | ||||
| 2,100,000 | AA+ | New York Life Global Funding, Notes, Series 2003-1, | 2,193,985 | ||||
| 4,444,819 | |||||||
Metals and Mining — 0.3% | |||||||
| 800,000 | BBB | Phelps Dodge Corp., Sr. Notes, 8.750% due 6/1/11 | 961,946 | ||||
Paper and Forest Products — 0.2% | |||||||
| 600,000 | BBB | International Paper Co., Sr. Notes, 5.300% due 4/1/15 | 594,730 | ||||
Pharmaceuticals — 1.0% | |||||||
| 2,600,000 | A | Wyeth, Notes, 5.500% due 2/1/14 | 2,704,944 | ||||
Real Estate — 1.9% | |||||||
| 200,000 | BBB+ | AvalonBay Communities, Inc., Notes, 4.950% due 3/15/13 | 198,813 | ||||
| 700,000 | BBB- | Colonial Realty Limited Partnership, Notes, 4.750% due 2/1/10 | 690,799 | ||||
See Notes to Financial Statements.
31 Travelers Series Fund Inc. | 2005 Semi-Annual Report
Table of Contents
| Schedules of Investments (unaudited) (continued) | April 30, 2005 |
TRAVELERS MANAGED INCOME PORTFOLIO
FACE AMOUNT | RATING(a) | SECURITY | VALUE | ||||
Real Estate — 1.9% (continued) | |||||||
| $ 900,000 | BB+ | D.R. Horton, Inc., Sr. Notes, 5.250% due 2/15/15 | $ | 843,467 | |||
| 700,000 | BBB | HRPT Properties Trust, Sr. Notes, 6.250% due 8/15/16 | 749,876 | ||||
| 1,130,000 | BBB- | iStar Financial Inc., Sr. Notes, 6.000% due 12/15/10 | 1,165,075 | ||||
| 300,000 | A- | Kimco Realty Corp., Medium-Term Notes, Series C, | 300,432 | ||||
| 1,300,000 | BBB- | Pulte Homes Inc., Notes, 5.200% due 2/15/15 | 1,253,246 | ||||
| 5,201,708 | |||||||
Retail — 0.7% | |||||||
| 1,900,000 | BBB | Safeway Inc., Sr. Notes, 6.500% due 3/1/11 | 2,021,439 | ||||
Software — 0.7% | |||||||
| 1,900,000 | BBB- | Computer Associates International Inc., Sr. Notes, | 1,874,985 | ||||
Telecommunications — 3.4% | |||||||
| 2,300,000 | BBB- | Cox Communications Inc., Notes, 7.125% due 10/1/12 | 2,559,376 | ||||
Deutsche Telekom International Finance BV, Bonds: | |||||||
| 2,500,000 | A- | 7.750% due 6/15/05 (b) | 2,514,105 | ||||
| 1,100,000 | A- | 8.250% due 6/15/30 (b) | 1,478,422 | ||||
| 1,000,000 | A | SBC Communications Inc., Notes, 5.100% due 9/15/14 | 1,002,299 | ||||
Sprint Capital Corp., Notes: | |||||||
| 1,830,000 | BBB- | 6.125% due 11/15/08 | 1,924,765 | ||||
| 200,000 | BBB- | 8.375% due 3/15/12 | 237,157 | ||||
| 9,716,124 | |||||||
Tobacco — 0.7% | |||||||
| 2,000,000 | BBB | Altria Group, Inc., Notes, 5.625% due 11/4/08 | 2,073,910 | ||||
Utilities — 4.6% | |||||||
| 1,000,000 | BBB+ | Dominion Resources, Inc., Sr. Notes, Series F, | 1,017,520 | ||||
| 1,000,000 | BBB- | Duke Capital LLC, Remarketed Sr. Notes, | 1,002,301 | ||||
| 930,000 | BBB | Duke Energy Field Services, LLC, Notes, 7.500% due 8/16/05 | 940,554 | ||||
| 3,000,000 | BBB | Pepco Holdings, Inc., Notes, 5.500% due 8/15/07 | 3,065,874 | ||||
| 800,000 | BB- | PSE&G Energy Holdings Inc., Sr. Notes, 8.625% due 2/15/08 | 844,000 | ||||
| 900,000 | A+ | Southern California Gas Co., First Mortgage Bonds, Series II, 4.375% due 1/15/11 | 892,521 | ||||
| 2,000,000 | AA- | SP PowerAssets Ltd., Notes, 5.000% due 10/22/13 (c) | 2,031,282 | ||||
| 1,000,000 | BBB- | TransAlta Corp., Sr. Notes, 5.750% due 12/15/13 | 1,039,283 | ||||
| 2,300,000 | BBB- | Xcel Energy Inc., Sr. Notes, Series B, 3.400% due 7/1/08 | 2,230,466 | ||||
| 13,063,801 | |||||||
| TOTAL CORPORATE BONDS AND NOTES (Cost — $118,255,672) | 118,981,377 | ||||||
See Notes to Financial Statements.
32 Travelers Series Fund Inc. | 2005 Semi-Annual Report
Table of Contents
| Schedules of Investments (unaudited) (continued) | April 30, 2005 |
TRAVELERS MANAGED INCOME PORTFOLIO
FACE AMOUNT | RATING(a) | SECURITY | VALUE | ||||
| ASSET-BACKED SECURITIES — 3.6% | |||||||
| $ 2,000,000 | AAA | Bank One Issuance Trust, Series 2003-A3, Class A3, | $ | 2,005,853 | |||
| 913,883 | AAA | California Infrastructure PG&E-1, Series 1997-1, Class A7, 6.420% due 9/25/08 | 932,771 | ||||
| 1,000,000 | AAA | Capital One Multi-Asset Execution Trust, Series 2003-A7, | 1,005,073 | ||||
| 1,100,000 | AAA | Chase Funding Mortgage Loan Asset-Backed Certificates, | 1,134,237 | ||||
| 925,342 | AAA | DaimlerChrysler Auto Trust, Series 2001-C, Class A4, | 927,888 | ||||
| 2,000,000 | AAA | Discover Card Master Trust I, Series 1996-3, Class A, | 2,038,384 | ||||
| 1,800,740 | AAA | Ford Credit Auto Owner Trust, Series 2002-B, Class A4, | 1,807,340 | ||||
| 420,663 | AAA | Toyota Auto Receivables Owner Trust, Series 2002-C, Class A3, 2.650% due 11/15/06 | 420,391 | ||||
| TOTAL ASSET-BACKED SECURITIES (Cost — $10,628,382) | 10,271,937 | ||||||
| COLLATERALIZED MORTGAGE OBLIGATIONS — 7.0% | |||||||
| 4,250,000 | AAA | Banc of America Commercial Mortgage Inc., Series 2004-6, Class AJ, 4.870% due 12/10/42 | 4,234,174 | ||||
| 2,000,000 | AAA | Credit Suisse First Boston Mortgage Securities Corp., | 1,991,653 | ||||
| 3,000,000 | AAA | General Motors Acceptance Corp. Commercial Mortgage Securities Inc., Series 2004-C2, Class A3, | 3,071,461 | ||||
JPMorgan Chase Commercial Mortgage Securities Corp.: | |||||||
| 4,000,000 | AAA | Series 2004-C3, Class AJ, 4.922% due 1/15/42 | 3,996,359 | ||||
| 1,150,000 | AAA | Series 2005-LDP1, Class A4, 5.038% due 3/15/46 | 1,161,667 | ||||
LB-UBS Commercial Mortgage Trust: | |||||||
| 2,700,000 | AAA | Series 2005-C1, Class AJ, 4.806% due 2/15/40 | 2,676,094 | ||||
| 1,240,000 | AAA | Series 2002-C4, Class A5, 4.853% due 9/15/31 | 1,253,611 | ||||
| 1,290,000 | AAA | Morgan Stanley Capital I, Series 2005-IQ9, Class A4, | 1,276,589 | ||||
| TOTAL COLLATERALIZED MORTGAGE OBLIGATIONS (Cost—$19,735,922) | 19,661,608 | ||||||
See Notes to Financial Statements.
33 Travelers Series Fund Inc. | 2005 Semi-Annual Report
Table of Contents
| Schedules of Investments (unaudited) (continued) | April 30, 2005 |
TRAVELERS MANAGED INCOME PORTFOLIO
| WARRANTS | SECURITY | VALUE | |||||
| WARRANTS (d)(e) — 0.0% | |||||||
| 150 | Loral Orion Network Systems, Inc., Expires 1/15/07 (Cost — $105) | $ | 2 | ||||
| SUB-TOTAL INVESTMENTS (Cost — $261,785,560) | 260,530,804 | ||||||
| FACE AMOUNT | |||||||
| REPURCHASE AGREEMENT — 6.8% | |||||||
| $19,038,000 | State Street Bank and Trust Co. dated 4/29/05, 2.600% due 5/2/05 Proceeds at maturity — $19,042,125; (Fully collateralized by U.S. Treasury Bond, 8.125% due 8/15/19; Market value — $19,425,199) (Cost — $19,038,000) | 19,038,000 | |||||
| TOTAL INVESTMENTS — 99.2% (Cost — $280,823,560*) | 279,568,804 | ||||||
| Other Assets in Excess of Liabilities — 0.8% | 2,364,523 | ||||||
| TOTAL NET ASSETS — 100.0% | $ | 281,933,327 | |||||
| (a) | All ratings are by Standard & Poor’s Rating Service. |
| (b) | Variable rate security. Rate shown is rate in effect at April 30, 2005. |
| (c) | Security is exempt from registration under Rule 144A of the Securities Act 1933. This security may be sold in transactions that are exempt from registration, normally to qualified institutional buyers. This security has been deemed liquid pursuant to guidelines approved by the Board of Directors. |
| (d) | Non-income producing security. |
| (e) | Security is valued in good faith at fair value by or under the direction of the Board of Directors. |
| * | Aggregate cost for federal income tax purposes is substantially the same. |
| See pages 37 and 38 for definitions of ratings. |
See Notes to Financial Statements.
34 Travelers Series Fund Inc. | 2005 Semi-Annual Report
Table of Contents
| Schedules of Investments (unaudited) (continued) | April 30, 2005 |
SMITH BARNEY MONEY MARKET PORTFOLIO
| FACE AMOUNT | SECURITY | ANNUALIZED YIELD | VALUE | ||||
| COMMERCIAL PAPER — 37.6% | |||||||
| $16,165,000 | Abbey National North America LLC mature | 2.81% to 2.94% | $ | 16,154,608 | |||
| 7,000,000 | Bank America Corp. matures 10/3/05 | 3.31 | 6,901,747 | ||||
| 15,000,000 | Bank of Nova Scotia matures 5/5/05 | 2.81 | 14,995,333 | ||||
| 16,825,000 | Danske Corp. mature 5/2/05 to 5/9/05 | 2.73 to 2.80 | 16,817,491 | ||||
| 5,000,000 | Depfa Bank PLC matures 6/21/05 | 3.00 | 4,978,927 | ||||
| 5,000,000 | Dexia Delaware LLC matures 5/23/05 | 2.81 | 4,991,475 | ||||
| 17,000,000 | Galleon Capital LLC matures 5/2/05 | 2.98 | 16,998,593 | ||||
| 17,000,000 | General Electric Capital Corp. mature | 2.94 to 2.99 | 16,948,302 | ||||
| 10,000,000 | Goldman, Sachs & Co. matures 5/18/05 | 3.01 | 9,985,833 | ||||
| 9,800,000 | HBOS Treasury Services PLC mature | 2.77 to 2.90 | 9,780,862 | ||||
| 7,000,000 | ING US Funding LLC matures 5/31/05 | 2.93 | 6,982,996 | ||||
| 12,000,000 | Nordea North America Inc. mature 6/3/05 to 6/6/05 | 2.87 to 2.96 | 11,967,020 | ||||
| 17,100,000 | Rabobank USA Financial Corp. matures 5/10/05 | 2.85 | 17,087,859 | ||||
| 5,937,000 | Societe Generale North America mature | 2.70 to 2.79 | 5,935,966 | ||||
| 6,300,000 | Svenska Handelsbanken Inc. matures 7/7/05 | 3.06 | 6,264,356 | ||||
| 18,150,000 | UBS Finance Delaware LLC mature | 2.72 to 2.91 | 18,137,365 | ||||
| TOTAL COMMERCIAL PAPER (Cost — $184,928,733) | 184,928,733 | ||||||
| U.S. GOVERNMENT AGENCY DISCOUNT NOTES — 2.8% | |||||||
| 8,075,000 | Federal Home Loan Mortgage Corporation mature 5/3/05 to 9/28/05 | 2.75 to 3.22 | 8,008,490 | ||||
| 6,000,000 | Federal National Mortgage Association mature 6/22/05 to 9/14/05 | 3.00 to 3.20 | 5,936,007 | ||||
| TOTAL U.S. GOVERNMENT AGENCY DISCOUNT NOTES (Cost — $13,944,497) | 13,944,497 | ||||||
| CERTIFICATES OF DEPOSIT — 4.5% | |||||||
| 5,000,000 | Bank of America N.A. matures 5/5/05 | 2.68 | 5,000,000 | ||||
| 17,000,000 | Wells Fargo Bank N.A. mature 5/2/05 to 6/28/05 | 2.78 to 3.04 | 17,000,000 | ||||
| TOTAL CERTIFICATES OF DEPOSIT (Cost — $22,000,000) | 22,000,000 | ||||||
| FOREIGN CERTIFICATES OF DEPOSIT — 50.1% | |||||||
| 15,000,000 | Bank of Montreal matures 5/16/05 | 2.95 | 14,999,547 | ||||
| 16,500,000 | Barclays Bank PLC mature 5/18/05 to 9/19/05 | 2.81 to 3.19 | 16,500,000 | ||||
| 18,000,000 | BNP Paribas S.A. NY mature 5/2/05 to 6/29/05 | 2.68 to 3.04 | 17,999,668 | ||||
| 11,500,000 | Calyon NY matures 7/15/05 | 3.06 | 11,500,238 | ||||
See Notes to Financial Statements.
35 Travelers Series Fund Inc. | 2005 Semi-Annual Report
Table of Contents
| Schedules of Investments (unaudited) (continued) | April 30, 2005 |
SMITH BARNEY MONEY MARKET PORTFOLIO
| FACE AMOUNT | SECURITY | ANNUALIZED YIELD | VALUE | |||||
| FOREIGN CERTIFICATES OF DEPOSIT — 50.1% (continued) | ||||||||
| $17,000,000 | Canadian Imperial Bank of Commerce NY mature 6/2/05 to 6/10/05 | 2.76% to 2.96% | $ | 17,000,000 | ||||
| 17,000,000 | CS First Boston NY mature 5/4/05 to 5/13/05 | 2.81 to 2.89 | 17,000,000 | |||||
| 5,000,000 | DEPFA Bank PLC matures 8/2/05 | 2.90 | 5,000,000 | |||||
| 17,000,000 | Deutsche Bank NY matures 5/3/05 | 2.81 | 17,000,000 | |||||
| 7,000,000 | Dexia Bank NY matures 6/28/05 | 3.05 | 7,000,000 | |||||
| 3,000,000 | Fortis Bank NY matures 9/1/05 | 3.21 | 3,000,303 | |||||
| 5,000,000 | HBOS Treasury Services PLC NY matures 5/3/05 | 2.70 | 5,000,001 | |||||
| 7,000,000 | HSBC Bank USA matures 5/16/05 | 2.85 | 6,999,971 | |||||
| 18,000,000 | Lloyds TSB Bank PLC NY mature 5/12/05 to 5/25/05 | 2.87 to 2.97 | 18,000,033 | |||||
| 5,000,000 | Nordea Bank Finland NY matures 5/4/05 | 2.75 | 5,000,004 | |||||
| 10,000,000 | Royal Bank of Canada NY matures 5/6/05 | 2.81 | 10,000,011 | |||||
| 17,000,000 | Royal Bank of Scotland NY mature 5/6/05 to 6/7/05 | 2.81 to 2.96 | 17,000,020 | |||||
| 10,000,000 | Societe Generale NY mature 5/3/05 to 6/30/05 | 2.81 to 3.04 | 9,999,647 | |||||
| 5,000,000 | Suntrust Bank matures 10/12/05 | 3.33 | 5,000,000 | |||||
| 10,000,000 | Svenska Handelsbanken NY matures 5/19/05 | 2.95 | 9,999,739 | |||||
| 15,000,000 | Toronto Dominion Bank NY mature | 2.95 to 3.01 | 15,000,000 | |||||
| 18,000,000 | Unicredito Italiano S.p.A. mature 5/11/05 to 7/7/05 | 2.87 to 3.06 | 17,999,739 | |||||
| TOTAL FOREIGN CERTIFICATES OF DEPOSIT (Cost — $246,998,921) | 246,998,921 | |||||||
| TIME DEPOSITS — 5.1% | ||||||||
| 17,197,000 | JPMorgan Chase Bank matures 5/2/05 | 2.94 | 17,197,000 | |||||
| 8,000,000 | National Australia Bank matures 5/2/05 | 2.94 | 8,000,000 | |||||
| TOTAL TIME DEPOSITS (Cost — $25,197,000) | 25,197,000 | |||||||
| TOTAL INVESTMENTS — 100.1% (Cost — $493,069,151*) | 493,069,151 | |||||||
Liabilities is Excess of Other Assets — (0.1)% | (337,253 | ) | ||||||
| TOTAL NET ASSETS — 100.0% | $ | 492,731,898 | ||||||
| * | Aggregate cost for federal income tax purposes is substantially the same. |
See Notes to Financial Statements.
36 Travelers Series Fund Inc. | 2005 Semi-Annual Report
Table of Contents
Bond Ratings (unaudited)
The definitions of the applicable rating symbols are set forth below:
Standard & Poor’s Ratings Service (“Standard and Poor’s”) — Ratings from “AA” to “CCC” may be modified by the addition of a plus (+) or minus (-) sign to show relative standings within the major rating categories.
AAA | — Bonds rated “AAA” have the highest rating assigned by Standard & Poor’s. Capacity to pay interest and repay principal is extremely strong. | |
AA | — Bonds rated “AA” have a very strong capacity to pay interest and repay principal and differs from the highest rated issue only in a small degree. | |
A | — Bonds rated “A” have a strong capacity to pay interest and repay principal although it is somewhat more susceptible to the adverse effects of changes in circumstances and economic conditions than bonds in higher rated categories. | |
BBB | — Bonds rated “BBB” are regarded as having an adequate capacity to pay interest and repay principal. Whereas they normally exhibit adequate protection parameters, adverse economic conditions or changing circumstances are more likely to lead to a weakened capacity to pay interest and repay principal for bonds in this category than in higher rated categories. | |
| BB, B, CCC, CC and C | — Bonds rated “BB”, “B”, “CCC”, “CC” and “C” are regarded, on balance, as predominantly speculative with respect to capacity to pay interest and repay principal in accordance with the terms of the obligation. “BB” represents the lowest degree of speculation and “C” the highest degree of speculation. While such bonds will likely have some quality and protective characteristics, these are outweighed by large uncertainties or major risk exposures to adverse conditions. | |
D | — Bonds rated “D” are in default, and payment of interest and/or repayment of principal is in arrears. |
Moody’s Investors Service (“Moody’s”) — Numerical modifiers 1, 2 and 3 may be applied to each generic rating from “Aa” to “Caa,” where 1 is the highest and 3 the lowest rating within its generic category.
Aaa | — Bondsrated “Aaa” are judged to be of the best quality. They carry the smallest degree of investment risk and are generally referred to as “gilt edge.” Interest payments are protected by a large or by an exceptionally stable margin and principal is secure. While the various protective elements are likely to change, such changes as can be visualized are most unlikely to impair the fundamentally strong position of such issues. | |
Aa | — Bonds rated “Aa” are judged to be of high quality by all standards. Together with the “Aaa” group they comprise what are generally known as high grade bonds. They are rated lower than the best bonds because margins of protection may not be as large as in “Aaa” securities or fluctuation of protective elements may be of greater amplitude or there may be other elements present which make the long-term risks appear somewhat larger than in “Aaa” securities. | |
A | — Bonds rated “A” possess many favorable investment attributes and are to be considered as upper medium grade obligations. Factors giving security to principal and interest are considered adequate, but elements may be present that suggest a susceptibility to impairment some time in the future. | |
Baa | — Bonds rated “Baa” are considered to be medium grade obligations, i.e., they are neither highly protected nor poorly secured. Interest payment and principal security appear adequate for the present but certain protective elements may be lacking or may be characteristically unreliable over any great length of time. Such bonds lack outstanding investment characteristics and in fact have speculative characteristics as well. | |
Ba | — Bonds rated “Ba” are judged to have speculative elements; their future cannot be considered as well assured. Often the protection of interest and principal payments may be very moderate thereby not well safeguarded during both good and bad times over the future. Uncertainty of position characterizes bonds in this class. |
37 Travelers Series Fund Inc. | 2005 Semi-Annual Report
Table of Contents
Bond Ratings (unaudited) (continued)
B | — Bonds rated “B” generally lack characteristics of the desirable investments. Assurance of interest and principal payments or maintenance of other terms of the contract over any long period of time may be small. | |
Caa and Ca | — Bonds rated “Caa” and “Ca” are of poor standing. Such issues may be in default or present elements of danger with respect to principal or interest. | |
C | — Bonds rated “C” are the lowest rated class of bonds, and issues so rated can be regarded as having extremely poor prospects of ever attaining any real investment standing. | |
NR | — Indicates that the bond is not rated by Standard & Poor’s or Moody’s. | |
Short-Term Security Ratings (unaudited)
SP-1 | — Standard & Poor’s highest rating indicating very strong or strong capacity to pay principal and interest; those issues determined to possess overwhelming safety characteristics are denoted with a plus (+) sign. | |
SP-2 | — Standard & Poor’s rating indicating satisfactory capacity to pay principal and interest. | |
A-1 | — Standard & Poor’s highest commercial paper and variable-rate demand obligation (VRDO) rating indicating that the degree of safety regarding timely payment is either overwhelming or very strong; those issues determined to possess overwhelming characteristics are denoted with a plus (+) sign. | |
P-1 | — Moody’s highest rating for commercial paper and for VRDO prior to the advent of the VMIG 1 rating. |
38 Travelers Series Fund Inc. | 2005 Semi-Annual Report
Table of Contents
| April 30, 2005 |
| MFS Total Return Portfolio | Travelers Managed Income Portfolio | Smith Barney Money Market Portfolio | ||||||||
| ASSETS: | ||||||||||
Investments, at cost | $ | 1,341,937,036 | $ | 280,823,560 | $ | 493,069,151 | ||||
Foreign currency, at cost | 282 | — | — | |||||||
Investments, at value | 1,414,328,436 | 279,568,804 | 493,069,151 | |||||||
Foreign currency, at value | 282 | — | — | |||||||
Cash | 2,565 | 825 | 299 | |||||||
Dividends and interest receivable | 6,928,561 | 3,840,941 | 663,755 | |||||||
Receivable for securities sold | 4,072,974 | — | — | |||||||
Receivable for open forward foreign | 862 | — | — | |||||||
Receivable for Fund shares sold | 24 | 29,095 | 512,591 | |||||||
Prepaid expenses | 847 | — | 27 | |||||||
Total Assets | 1,425,334,551 | 283,439,665 | 494,245,823 | |||||||
| LIABILITIES: | ||||||||||
Payable for loaned securities collateral | 169,411,388 | — | — | |||||||
Payable for securities purchased | 7,034,947 | 1,323,245 | — | |||||||
Management fees payable | 772,708 | 150,203 | 201,708 | |||||||
Payable for Fund shares reacquired | 692,740 | 14,704 | 942,660 | |||||||
Dividends payable | — | — | 290,404 | |||||||
Directors’ fees payable | 920 | 350 | 637 | |||||||
Transfer agency services payable | 829 | 834 | 834 | |||||||
Accrued expenses | 65,947 | 17,002 | 77,682 | |||||||
Total Liabilities | 177,979,479 | 1,506,338 | 1,513,925 | |||||||
Total Net Assets | $ | 1,247,355,072 | $ | 281,933,327 | $ | 492,731,898 | ||||
| NET ASSETS: | ||||||||||
Par value of capital shares (Note 4) | $ | 739 | $ | 249 | $ | 4,927 | ||||
Capital paid in excess of par value | 1,149,094,925 | 288,570,866 | 492,726,455 | |||||||
Undistributed (overdistributed) net investment income | 6,019,064 | (1,230,878 | ) | 499 | ||||||
Accumulated net realized gain (loss) from investment transactions and foreign currency transactions | 19,848,400 | (4,152,154 | ) | 17 | ||||||
Net unrealized appreciation (depreciation) of investments and foreign currencies | 72,391,944 | (1,254,756 | ) | — | ||||||
Total Net Assets | $ | 1,247,355,072 | $ | 281,933,327 | $ | 492,731,898 | ||||
Shares Outstanding | 73,942,733 | 24,885,707 | 492,724,332 | |||||||
Net Asset Value | $ | 16.87 | $ | 11.33 | $ | 1.00 | ||||
See Notes to Financial Statements.
39 Travelers Series Fund Inc. | 2005 Semi-Annual Report
Table of Contents
For the Six Months Ended April 30, 2005
| MFS Total Return Portfolio | Travelers Managed Income Portfolio | Smith Barney Money Market Portfolio | ||||||||||
| INVESTMENT INCOME: | ||||||||||||
Interest | $ | 11,607,988 | $ | 5,244,878 | $ | 5,958,211 | ||||||
Dividends | 9,182,832 | — | — | |||||||||
Securities lending income | 79,634 | — | — | |||||||||
Less: Foreign withholding tax | (83,897 | ) | — | — | ||||||||
Total Investment Income | 20,786,557 | 5,244,878 | 5,958,211 | |||||||||
| EXPENSES: | ||||||||||||
Management fees (Note 2) | 4,692,229 | 903,193 | 1,229,447 | |||||||||
Custody | 63,249 | 14,122 | 22,045 | |||||||||
Shareholder communications | 31,820 | 6,474 | 21,013 | |||||||||
Audit and legal | 22,991 | 16,536 | 22,171 | |||||||||
Directors' fees | 13,908 | 4,463 | 6,927 | |||||||||
Transfer agency services (Note 2) | 2,498 | 2,482 | 2,614 | |||||||||
Other | 13,524 | 2,155 | 2,529 | |||||||||
Total Expenses | 4,840,219 | 949,425 | 1,306,746 | |||||||||
Less: Expense reimbursement (Note 2) | — | — | (27,581 | ) | ||||||||
Net Expenses | 4,840,219 | 949,425 | 1,279,165 | |||||||||
Net Investment Income | 15,946,338 | 4,295,453 | 4,679,046 | |||||||||
REALIZED AND UNREALIZED GAIN (LOSS) ON INVESTMENTS AND FOREIGN CURRENCIES (NOTES 1 AND 3): | ||||||||||||
Realized Gain (Loss) From: | ||||||||||||
Investment transactions | 27,885,148 | 1,177,247 | 17 | |||||||||
Foreign currency transactions | (5,051 | ) | — | — | ||||||||
Net Realized Gain | 27,880,097 | 1,177,247 | 17 | |||||||||
Net Change in Unrealized Appreciation/Depreciation From: | ||||||||||||
Investments | (3,384,405 | ) | (4,535,350 | ) | — | |||||||
Foreign currencies | 233 | — | — | |||||||||
Net Change in Unrealized Appreciation/Depreciation | (3,384,172 | ) | (4,535,350 | ) | — | |||||||
Net Gain (Loss) on Investments and Foreign Currencies | 24,495,925 | (3,358,103 | ) | 17 | ||||||||
Increase in Net Assets From Operations | $ | 40,442,263 | $ | 937,350 | $ | 4,679,063 | ||||||
See Notes to Financial Statements.
40 Travelers Series Fund Inc. | 2005 Semi-Annual Report
Table of Contents
Statements of Changes in Net Assets
For the Six Months Ended April 30, 2005 (unaudited) and the Year Ended October 31, 2004
| MFS Total Return Portfolio | 2005 | 2004 | ||||||
| OPERATIONS: | ||||||||
Net investment income | $ | 15,946,338 | $ | 24,511,979 | ||||
Net realized gain | 27,880,097 | 67,430,520 | ||||||
Net change in unrealized appreciation/depreciation | (3,384,172 | ) | 23,535,893 | |||||
Increase in Net Assets From Operations | 40,442,263 | 115,478,392 | ||||||
| DISTRIBUTIONS TO SHAREHOLDERS FROM: | ||||||||
Net investment income | (31,800,072 | ) | (22,438,758 | ) | ||||
Net realized gains | (32,429,912 | ) | — | |||||
Decrease in Net Assets From | (64,229,984 | ) | (22,438,758 | ) | ||||
| FUND SHARE TRANSACTIONS (NOTE 4): | ||||||||
Net proceeds from sale of shares | 69,926,337 | 86,033,895 | ||||||
Net asset value of shares issued for reinvestment of distributions | 64,229,984 | 22,438,758 | ||||||
Cost of shares reacquired | (23,169,882 | ) | (38,315,281 | ) | ||||
Increase in Net Assets From Fund Share Transactions | 110,986,439 | 70,157,372 | ||||||
Increase in Net Assets | 87,198,718 | 163,197,006 | ||||||
| NET ASSETS: | ||||||||
Beginning of period | 1,160,156,354 | 996,959,348 | ||||||
End of period* | $ | 1,247,355,072 | $ | 1,160,156,354 | ||||
* Includes undistributed net investment income of: | $6,019,064 | $21,872,798 | ||||||
See Notes to Financial Statements.
41 Travelers Series Fund Inc. | 2005 Semi-Annual Report
Table of Contents
Statements of Changes in Net Assets (continued)
For the Six Months Ended April 30, 2005 (unaudited) and the Year Ended October 31, 2004
| Travelers Managed Income Portfolio | 2005 | 2004 | ||||||
| OPERATIONS: | ||||||||
Net investment income | $ | 4,295,453 | $ | 8,271,956 | ||||
Net realized gain | 1,177,247 | 474,777 | ||||||
Net change in unrealized appreciation/depreciation | (4,535,350 | ) | 2,195,501 | |||||
Increase in Net Assets From Operations | 937,350 | 10,942,234 | ||||||
| DISTRIBUTIONS TO SHAREHOLDERS FROM: | ||||||||
Net investment income | (13,026,736 | ) | (10,421,800 | ) | ||||
Decrease in Net Assets From | (13,026,736 | ) | (10,421,800 | ) | ||||
| FUND SHARE TRANSACTIONS (NOTE 4): | ||||||||
Net proceeds from sale of shares | 16,270,146 | 40,399,247 | ||||||
Net asset value of shares issued for reinvestment of distributions | 13,026,736 | 10,421,800 | ||||||
Cost of shares reacquired | (13,347,977 | ) | (25,644,982 | ) | ||||
Increase in Net Assets From Fund Share Transactions | 15,948,905 | 25,176,065 | ||||||
Increase in Net Assets | 3,859,519 | 25,696,499 | ||||||
| NET ASSETS: | ||||||||
Beginning of period | 278,073,808 | 252,377,309 | ||||||
End of period* | $ | 281,933,327 | $ | 278,073,808 | ||||
* Includes undistributed (overdistributed) net investment income of: | $(1,230,878) | $7,500,405 | ||||||
See Notes to Financial Statements.
42 Travelers Series Fund Inc. | 2005 Semi-Annual Report
Table of Contents
Statements of Changes in Net Assets (continued)
For the Six Months Ended April 30, 2005 (unaudited) and the Year Ended October 31, 2004
| Smith Barney Money Market Portfolio | 2005 | 2004 | ||||||
| OPERATIONS: | ||||||||
Net investment income | $ | 4,679,046 | $ | 3,804,976 | ||||
Net realized gain | 17 | 455 | ||||||
Increase in Net Assets From Operations | 4,679,063 | 3,805,431 | ||||||
| DISTRIBUTIONS TO SHAREHOLDERS FROM: | ||||||||
Net investment income | (4,679,046 | ) | (3,804,976 | ) | ||||
Decrease in Net Assets From | (4,679,046 | ) | (3,804,976 | ) | ||||
| FUND SHARE TRANSACTIONS (NOTE 4): | ||||||||
Net proceeds from sale of shares | 76,154,271 | 128,585,681 | ||||||
Net asset value of shares issued for reinvestment of distributions | 4,572,427 | 3,756,423 | ||||||
Cost of shares reacquired | (98,534,081 | ) | (221,114,759 | ) | ||||
Decrease in Net Assets From Fund Share Transactions | (17,807,383 | ) | (88,772,655 | ) | ||||
Decrease in Net Assets | (17,807,366 | ) | (88,772,200 | ) | ||||
| NET ASSETS: | ||||||||
Beginning of period | 510,539,264 | 599,311,464 | ||||||
End of period* | $ | 492,731,898 | $ | 510,539,264 | ||||
* Includes undistributed net investment income of | $499 | $499 | ||||||
See Notes to Financial Statements.
43 Travelers Series Fund Inc. | 2005 Semi-Annual Report
Table of Contents
For a share of capital stock outstanding throughout each year or period ended October 31, unless otherwise noted:
| MFS Total Return Portfolio | 2005(1) | 2004 | 2003 | 2002 | 2001 | 2000 | ||||||||||||
Net Asset Value, Beginning of Period | $17.19 | $15.77 | $14.44 | $16.08 | $17.16 | $16.22 | ||||||||||||
Income (Loss) From Operations: | ||||||||||||||||||
Net investment income | 0.22 | 0.36 | 0.34 | 0.39 | (2) | 0.42 | 0.54 | |||||||||||
Net realized and unrealized gain (loss) | 0.39 | 1.41 | 1.49 | (0.98 | )(2) | (0.42 | ) | 1.43 | ||||||||||
Total Income (Loss) From Operations | 0.61 | 1.77 | 1.83 | (0.59 | ) | (0.00 | )* | 1.97 | ||||||||||
Less Distributions From: | ||||||||||||||||||
Net investment income | (0.46 | ) | (0.35 | ) | (0.50 | ) | (0.44 | ) | (0.48 | ) | (0.46 | ) | ||||||
Net realized gains | (0.47 | ) | — | — | (0.61 | ) | (0.60 | ) | (0.57 | ) | ||||||||
Total Distributions | (0.93 | ) | (0.35 | ) | (0.50 | ) | (1.05 | ) | (1.08 | ) | (1.03 | ) | ||||||
Net Asset Value, End of Period | $16.87 | $17.19 | $15.77 | $14.44 | $16.08 | $17.16 | ||||||||||||
Total Return(3) | 3.52 | %‡ | 11.36 | % | 13.05 | % | (3.59 | )% | (0.22 | )% | 12.77 | % | ||||||
Net Assets, End of Period (millions) | $1,247 | $1,160 | $997 | $830 | $804 | $697 | ||||||||||||
Ratios to Average Net Assets: | ||||||||||||||||||
Expenses(4) | 0.79 | %† | 0.82 | %(5) | 0.82 | % | 0.83 | % | 0.83 | % | 0.83 | % | ||||||
Net investment income | 2.62 | † | 2.25 | 2.37 | 2.81 | (2) | 3.08 | 3.42 | ||||||||||
Portfolio Turnover Rate | 26 | % | 66 | % | 49 | % | 81 | % | 88 | % | 108 | % | ||||||
| (1) | For the six months ended April 30, 2005 (unaudited). |
| (2) | Effective November 1, 2001, the Fund adopted a change in the accounting method that requires the Fund to amortize premiums and accrete all discounts. Without the adoption of this change, for the year ended October 31, 2002, those amounts would have been $0.40, $0.99 and 2.91% for net investment income, net realized and unrealized loss and the ratio of net investment income to average net assets, respectively. Per share information, ratios and supplemental data for the periods prior to November 1, 2001 have not been restated to reflect this change in presentation. |
| (3) | Total returns do not reflect expenses associated with the separate account such as administrative fees, account charges and surrender charges, which, if reflected, would reduce the total returns for all periods shown. Performance figures may reflect voluntary fee waivers and/or expense reimbursements. Past performance is no guarantee of future results. In the absence of voluntary fee waivers and/or expense reimbursements, the total return would have been lower. |
| (4) | As a result of a voluntary expense limitation, the ratio of expenses to average net assets will not exceed 1.25%. |
| (5) | The investment manager voluntarily waived a portion of its management fee for the year ended October 31, 2004. The expense ratio did not change due to these waivers. |
| * | Amount represents less than $0.01 per share. |
| ‡ | Total return is not annualized, as it may not be representative of the total return for the year. |
| † | Annualized. |
See Notes to Financial Statements.
44 Travelers Series Fund Inc. | 2005 Semi-Annual Report
Table of Contents
Financial Highlights (continued)
For a share of capital stock outstanding throughout each year or period ended October 31, unless otherwise noted:
| Travelers Managed Income Portfolio | 2005(1) | 2004 | 2003(2) | 2002(2) | 2001(2) | 2000(2) | ||||||||||||
Net Asset Value, Beginning of Period | $11.84 | $11.84 | $11.38 | $12.57 | $11.58 | $11.49 | ||||||||||||
Income (Loss) From Operations: | ||||||||||||||||||
Net investment income | 0.18 | 0.36 | 0.50 | 0.56 | (3) | 0.71 | 0.76 | |||||||||||
Net realized and unrealized gain (loss) | (0.14 | ) | 0.12 | 0.69 | (1.07 | )(3) | 0.83 | (0.24 | ) | |||||||||
Total Income (Loss) From Operations | 0.04 | 0.48 | 1.19 | (0.51 | ) | 1.54 | 0.52 | |||||||||||
Less Distributions From: | ||||||||||||||||||
Net investment income | (0.55 | ) | (0.48 | ) | (0.68 | ) | (0.63 | ) | (0.55 | ) | (0.43 | ) | ||||||
Net realized gains | — | — | (0.05 | ) | (0.05 | ) | — | — | ||||||||||
Total Distributions | (0.55 | ) | (0.48 | ) | (0.73 | ) | (0.68 | ) | (0.55 | ) | (0.43 | ) | ||||||
Net Asset Value, End of Period | $11.33 | $11.84 | $11.84 | $11.38 | $12.57 | $11.58 | ||||||||||||
Total Return(4) | 0.33 | %‡ | 4.19 | % | 10.85 | % | (4.06 | )% | 13.50 | % | 4.55 | % | ||||||
Net Assets, End of Period (millions) | $282 | $278 | $252 | $208 | $221 | $151 | ||||||||||||
Ratios to Average Net Assets: | ||||||||||||||||||
Expenses(5) | 0.68 | %† | 0.69 | %(6) | 0.68 | % | 0.69 | % | 0.68 | % | 0.69 | % | ||||||
Net investment income | 3.09 | † | 3.10 | 4.34 | 4.68 | (3) | 5.76 | 6.56 | ||||||||||
Portfolio Turnover Rate | 41 | % | 123 | % | 163 | % | 177 | % | 194 | % | 181 | % | ||||||
| (1) | For the six months ended April 30, 2005 (unaudited). |
| (2) | Per share amounts have been calculated using the monthly average shares method. |
| (3) | Effective November 1, 2001, the Fund adopted a change in the accounting method that requires the Fund to amortize premiums and accrete all discounts. Without the adoption of this change, for the year ended October 31, 2002, those amounts would have been $0.60, $1.11 and 5.02% for net investment income, net realized and unrealized loss and the ratio of net investment income to average net assets, respectively. Per share information, ratios and supplemental data for the periods prior to November 1, 2001 have not been restated to reflect this change in presentation. |
| (4) | Total returns do not reflect expenses associated with the separate account such as administrative fees, account charges and surrender charges, which, if reflected, would reduce the total returns for all periods shown. Performance figures may reflect voluntary fee waivers and/or expense reimbursements. Past performance is no guarantee of future results. In the absence of voluntary fee waivers and/or expense reimbursements, the total return would have been lower. |
| (5) | As a result of voluntary expense limitation, the ratio of expenses to average net assets will not exceed 1.25%. |
| (6) | The investment manager voluntarily waived a portion of its management fee for the year ended October 31, 2004. The expense ratio did not change due to these waivers. |
| ‡ | Total return is not annualized, as it may not be representative of the total return for the year. |
| † | Annualized. |
See Notes to Financial Statements.
45 Travelers Series Fund Inc. | 2005 Semi-Annual Report
Table of Contents
Financial Highlights (continued)
For a share of capital stock outstanding throughout each year or period ended October 31, unless otherwise noted:
| Smith Barney Money Market Portfolio | 2005(1)(2) | 2004(2) | 2003(2) | 2002 | 2001 | 2000 | ||||||||||||
Net Asset Value, Beginning of Period | $1.00 | $1.00 | $1.00 | $1.00 | $1.00 | $1.00 | ||||||||||||
Net investment income | 0.009 | 0.007 | 0.007 | 0.014 | 0.044 | 0.057 | ||||||||||||
Distributions from net investment income | (0.009 | ) | (0.007 | ) | (0.007 | ) | (0.014 | ) | (0.044 | ) | (0.057 | ) | ||||||
Net Asset Value, End of Period | $1.00 | $1.00 | $1.00 | $1.00 | $1.00 | $1.00 | ||||||||||||
Total Return(3) | 0.95 | %‡ | 0.71 | % | 0.74 | % | 1.40 | % | 4.46 | % | 5.88 | % | ||||||
Net Assets, End of Period (millions) | $493 | $511 | $599 | $733 | $605 | $319 | ||||||||||||
Ratios to Average Net Assets: | ||||||||||||||||||
Expenses | 0.52 | %(4)† | 0.53 | %(4) | 0.53 | % | 0.53 | % | 0.53 | % | 0.53 | % | ||||||
Net investment income | 1.90 | † | 0.71 | 0.75 | 1.38 | 4.17 | 5.75 | |||||||||||
| (1) | For the six months ended April 30, 2005 (unaudited). |
| (2) | Per share amounts have been calculated using the monthly average shares method. |
| (3) | Total returns do not reflect expenses associated with the separate account such as administrative fees, account charges and surrender charges, which, if reflected, would reduce the total returns for all periods shown. Performance figures may reflect voluntary fee waivers and/or expense reimbursements. Past performance is no guarantee of future results. In the absence of voluntary fee waivers and/or expense reimbursements, the total return would have been lower. |
| (4) | The investment manager voluntarily reimbursed expenses for the six months ended April 30, 2005 and voluntarily waived a portion of its management fees for the year ended October 31, 2004. If such expenses were not reimbursed the expense ratio for the six months ended April 30, 2005, would have been 0.53% (annualized). The expense ratio for the year ended October 31, 2004 did not change due to these waivers. |
| ‡ | Total return is not annualized, as it may not be representative of the total return for the year. |
| † | Annualized. |
See Notes to Financial Statements.
46 Travelers Series Fund Inc. | 2005 Semi-Annual Report
Table of Contents
Notes to Financial Statements (unaudited)
| 1. | Organization and Significant Accounting Policies |
The MFS Total Return Portfolio (“MFSTR”), Travelers Managed Income Portfolio (“TMI”) and Smith Barney Money Market Portfolio (“SBMM”) (“Fund(s)”) are separate diversified investment funds of the Travelers Series Fund Inc. (“Company”). The Company, a Maryland corporation, is registered under the Investment Company Act of 1940, as amended (the “1940 Act”), as an open-end management investment company.
The following are significant accounting policies consistently followed by the Funds and are in conformity with U.S. generally accepted accounting principles (“GAAP”). Estimates and assumptions are required to be made regarding assets, liabilities and changes in net assets resulting from operations when financial statements are prepared. Changes in the economic environment, financial markets and any other parameters used in determining these estimates could cause actual results to differ.
(a) Investment Valuation. Equity securities for which market quotations are available are valued at the last sale price or official closing price on the primary market or exchange on which they trade. Debt securities are valued at the mean between the bid and asked price provided by an independent pricing service that are based on transactions in debt obligations, quotations from bond dealers, market transactions in comparable securities and various relationships between securities. When prices are not readily available, or are determined not to reflect fair value, such as when the value of a security has been significantly affected by events after the close of the exchange or market on which the security is principally traded, but before the Funds calculate their net asset value, the Funds may value these investments at fair value as determined in accordance with the procedures approved by the Funds’ Board of Directors. For MFSTR and TMI, short-term obligations with maturities of 60 days or less are valued at amortized cost, which approximates market value. For SBMM, money market instruments are valued at amortized cost, in accordance with Rule 2a-7 under the 1940 Act, which approximates market value. This method involves valuing a portfolio security at its cost and thereafter assuming a constant amortization to maturity of any discount or premium. SBMM’s use of amortized cost is subject to its compliance with certain conditions as specified under Rule 2a-7 of the 1940 Act.
47 Travelers Series Fund Inc. | 2005 Semi-Annual Report
Table of Contents
Notes to Financial Statements (unaudited) (continued)
(b) Repurchase Agreements. When entering into repurchase agreements, it is the Funds’ policy that their custodian or a third party custodian take possession of the underlying collateral securities, the market value of which at least equals the principal amount of the repurchase transaction, including accrued interest. To the extent that any repurchase transaction exceeds one business day, the value of the collateral is marked-to-market to ensure the adequacy of the collateral. If the seller defaults, and the market value of the collateral declines or if bankruptcy proceedings are commenced with respect to the seller of the security, realization of the collateral by the Funds may be delayed or limited.
(c) Forward Foreign Currency Contracts. MFSTR may enter into forward foreign currency contracts to hedge against foreign currency exchange rate risk on its non-US dollar denominated securities or to facilitate settlement of foreign currency denominated portfolio transactions. A forward foreign currency contract is an agreement between two parties to buy and sell a currency at a set price on a future date. The contract is marked-to-market daily and the change in value is recorded by the Fund as an unrealized gain or loss. When a forward foreign currency contract is extinguished, through either delivery or offset by entering into another forward foreign currency contract, the Fund records a realized gain or loss equal to the difference between the value of the contract at the time it was opened and the value of the contract at the time it was extinguished.
Forward foreign currency contracts involve elements of market risk in excess of the amounts reflected in the Statements of Assets and Liabilities. The Fund bears the risk of an unfavorable change in the foreign exchange rate underlying the forward foreign currency contract. Risks may also arise upon entering into these contracts from the potential inability of the counterparties to meet the terms of their contracts.
(d) Lending of Portfolio Securities. MFSTR and TMI have an agreement with their custodian whereby the custodian may lend securities owned by the Fund to brokers, dealers and other financial organizations. In exchange for lending securities under the terms of the agreement with their custodian, the Funds receive a lender’s fee. Fees earned by the Funds on securities lending are recorded as securities lending income. Loans of securities by the Funds are collateralized by cash, U.S. government securities or high quality money market
48 Travelers Series Fund Inc. | 2005 Semi-Annual Report
Table of Contents
Notes to Financial Statements (unaudited) (continued)
instruments that are maintained at all times in an amount at least equal to the current market value of the loaned securities, plus a margin which varies depending on the type of securities loaned. The custodian establishes and maintains the collateral in a segregated account. The Funds have the right under the lending agreement to recover the securities from the borrower on demand.
The Funds maintain the risk of any loss on the securities on loan as well as the potential loss on investments purchased with cash collateral received from securities lending.
(e) Securities Traded on a To-Be-Announced Basis. MFSTR and TMI may trade securities on a to-be-announced (“TBA”) basis. In a TBA transaction, the Funds commit to purchasing or selling securities, which have not yet been issued by the issuer and for which specific information is not known, such as the face amount and maturity date and the underlying pool of investments in U.S. government agency mortgage pass-through transactions. Securities purchased on a TBA basis are not settled until they are delivered to the Funds, normally 15 to 45 days later. Beginning on the date the Funds enter into a TBA transaction, cash, U.S. government securities or other liquid high-grade debt obligations are segregated in an amount equal in value to the purchase price of the TBA security. These transactions are subject to market fluctuations and their current value is determined in the same manner as for other securities.
(f) Stripped Securities. MFSTR and TMI invest in ‘‘Stripped Securities,’’ a term used collectively for stripped fixed income securities. Stripped securities can be principal only securities (“PO”), which are debt obligations that have been stripped of unmatured interest coupons or interest only securities (“IO”), which are unmatured interest coupons that have been stripped from debt obligations. Stripped Securities do not make periodic payments of interest prior to maturity. As is the case with all securities, the market value of Stripped Securities will fluctuate in response to changes in economic conditions, interest rates and the market’s perception of the securities. However, fluctuations in response to interest rates may be greater in Stripped Securities than for debt obligations of comparable maturities that currently pay interest. The amount of fluctuation increases with a longer period of maturity.
The yield to maturity on IO’s is sensitive to the rate of principal repayments (including prepayments) on the related underlying debt obligation and principal
49 Travelers Series Fund Inc. | 2005 Semi-Annual Report
Table of Contents
Notes to Financial Statements (unaudited) (continued)
payments may have a material effect on yield to maturity. If the underlying debt obligation experiences greater than anticipated prepayments of principal, the Funds may not fully recoup its initial investment in IO’s.
(g) Credit and Market Risk. MFSTR and TMI may invest in high yield instruments that are subject to certain credit and market risks. The yields of high yield instruments reflect, among other things, perceived credit risk. The Fund’s investments in securities rated below investment grade typically involve risks not associated with higher rated securities including, among others, greater risk related to timely and ultimate payment of interest and principal, greater market price volatility and less liquid secondary market trading.
(h) Security Transactions and Investment Income. Security transactions are accounted for on a trade date basis. Interest income, adjusted for amortization of premium and accretion of discount, is recorded on the accrual basis. Dividend income is recorded on the ex-dividend date. Foreign dividend income is recorded on the ex-dividend date or as soon as practical after the Funds determine the existence of a dividend declaration after exercising reasonable due diligence. The cost of investments sold is determined by use of the specific identification method. To the extent any issuer defaults on an expected interest payment, the Funds’ policy is to generally halt any additional interest income accruals and consider the realizability of interest accrued up to the date of default.
(i) Foreign Currency Translation. Investment securities and other assets and liabilities denominated in foreign currencies are translated into U.S. dollar amounts based upon prevailing exchange rates on the date of valuation. Purchases and sales of investment securities and income and expense items denominated in foreign currencies are translated into U.S. dollar amounts based upon prevailing exchange rates on the respective dates of such transactions.
The Funds do not isolate that portion of the results of operations resulting from changes in foreign exchange rates on investments from the fluctuations arising from changes in market prices of securities held. Such fluctuations are included with the net realized and unrealized gain or loss on investments.
Net realized foreign exchange gains or losses arise from sales of foreign currencies, including gains and losses on forward foreign currency contracts, currency gains or losses realized between the trade and settlement dates on securities transactions and the difference between the amounts of dividends, interest and
50 Travelers Series Fund Inc. | 2005 Semi-Annual Report
Table of Contents
Notes to Financial Statements (unaudited) (continued)
foreign withholding taxes recorded on the Funds’ books and the U.S. dollar equivalent of the amounts actually received or paid. Net unrealized foreign exchange gains and losses arise from changes in the fair values of assets and liabilities, other than investments in securities, at the date of valuation, resulting from changes in exchange rates.
Foreign security and currency transactions may involve certain considerations and risks not typically associated with those of U.S. dollar denominated transactions as a result of, among other factors, the possibility of lower levels of governmental supervision and regulation of foreign securities markets and the possibility of political or economic instability.
(j) Distributions to Shareholders. For MFSTR and TMI, distributions from net investment income and distributions of net realized gains, if any, are declared at least annually. For SBMM, distributions from net investment income on the shares of the Fund are declared each business day to shareholders of record, and are paid monthly. Distributions of net realized gains, if any, are declared at least annually. Distributions to shareholders of the Funds are recorded on the ex-dividend date and are determined in accordance with income tax regulations, which may differ from GAAP.
(k) Federal and Other Taxes. It is the Funds’ policy to comply with the federal income and excise tax requirements of the Internal Revenue Code of 1986, as amended, applicable to regulated investment companies. Accordingly, the Funds intend to distribute substantially all of their taxable income and net realized gains on investments, if any, to shareholders each year. Therefore, no federal income tax provision is required in the Funds’ financial statements. Under the applicable foreign tax laws, a withholding tax may be imposed on interest, dividends and capital gains at various rates.
(l) Reclassifications. GAAP requires that certain components of net assets be adjusted to reflect permanent differences between financial and tax reporting. These reclassifications have no effect on net assets or net asset values per share.
| 2. | Management Agreement and Other Transactions with Affiliates |
Smith Barney Fund Management LLC (“SBFM”), an indirect wholly-owned subsidiary of Citigroup Inc. (“Citigroup”), acts as investment manager of SBMM. Travelers Investment Adviser, Inc. (“TIA”) and Travelers Asset
51 Travelers Series Fund Inc. | 2005 Semi-Annual Report
Table of Contents
Notes to Financial Statements (unaudited) (continued)
Management International Company, LLC (“TAMIC”), affiliates of SBFM, act as the investment managers of MFSTR and TMI, respectively. SBMM pays SBFM a management fee calculated at an annual rate of 0.50% of the average daily net assets of the SBMM. MFSTR pays TIA a management fee calculated at an annual rate of 0.800% of its average daily net assets up to $600 million, 0.775% of its average daily net assets in excess of $600 million an up to and including $900 million, 0.750% of its average daily net assets in excess of $900 million and up to and including $1.5 billion, 0.725% of its average daily net assets in excess of $1.5 billion and up to and including $2.5 billion and 0.675% of its average daily net assets in excess of $2.5 billion. Effective February 25, 2005, for purposes of meeting the various asset levels and determining an effective fee rate, the combined average daily net assets of the Fund and two other portfolios for which an affiliate of TIA is investment manager and MFS is subadviser are used in performing the calculation. TMI pays TAMIC a management fee calculated at an annual rate of 0.65% of the average daily net assets of TMI. These fees are calculated daily and paid monthly.
The Funds each have a voluntary expense limitation in place of 1.25%. During the six months ended April 30, 2005, SBFM reimbursed expenses in the amount of $27,581 for SBMM.
TIA has a sub-advisory agreement with Massachusetts Financial Services Company (“MFS”). Pursuant to the sub-advisory agreement, MFS is responsible for the day-to-day portfolio operations and investment decisions for MFSTR and is compensated by TIA for such services at an annual rate of 0.375% of its average daily net assets up to $600 million, 0.350% of its average daily net assets in excess of $600 million an up to and including $900 million, 0.325% of its average daily net assets in excess of $900 million and up to and including $1.5 billion, 0.300% of its average daily net assets in excess of $1.5 billion and up to and including $2.5 billion and 0.250% of its average daily net assets in excess of $2.5 billion.
TIA has entered into a Sub-Administrative Services Agreement with SBFM. TIA pays SBFM, as sub-administrator, a fee calculated at an annual rate of 0.10% of the average daily net assets of MFSTR.
Citicorp Trust Bank, fsb. (“CTB”), another subsidiary of Citigroup, acts as the Funds’ transfer agent. PFPC Inc. (“PFPC”) acts as the Funds’ sub-transfer agent. CTB receives account fees and asset-based fees that vary according to the size
52 Travelers Series Fund Inc. | 2005 Semi-Annual Report
Table of Contents
Notes to Financial Statements (unaudited) (continued)
and type of account. PFPC is responsible for shareholder recordkeeping and financial processing for all shareholder accounts and is paid by CTB. For the six months ended April 30, 2005, each Fund paid transfer agent fees of $2,083 to CTB.
Most of the officers and one Director of the Company are employees of Citigroup or its affiliates and do not receive compensation from the Company.
| 3. | Investments |
During the six months ended April 30, 2005, the aggregate cost of purchases and proceeds from sales of investments (excluding short-term investments) were as follows:
| MFSTR | TMI | |||||
Purchases | $ | 379,512,439 | $ | 111,416,232 | ||
Sales | 310,730,608 | 108,624,526 | ||||
At April 30, 2005, the aggregate gross unrealized appreciation and depreciation of investments for federal income tax purposes were substantially as follows:
| MFSTR | TMI | |||||||
Gross unrealized appreciation | $ | 99,784,148 | $ | 7,060,034 | ||||
Gross unrealized depreciation | (27,392,748 | ) | (8,314,790 | ) | ||||
Net unrealized appreciation (depreciation) | $ | 72,391,400 | $ | (1,254,756 | ) | |||
At April 30, 2005, MFSTR loaned securities having a market value of $165,537,120. MFSTR received cash collateral amounting to $169,411,388 which was invested in the State Street Navigator Securities Lending Trust Prime Portfolio, a Rule 2a-7 money market fund, under the 1940 Act.
At April 30, 2005, MFSTR had the following open forward foreign currency contracts. The unrealized gain on the contract reflected in the accompanying financial statements was as follows:
| Forward Foreign Currency Contracts | Local Currency | Market Value | Settlement Date | Unrealized Gain | ||||||
Contracts To Buy: | ||||||||||
Japanese Yen | 6,972,966 | $ | 66,634 | 5/2/05 | $ | 862 | ||||
53 Travelers Series Fund Inc. | 2005 Semi-Annual Report
Table of Contents
Notes to Financial Statements (unaudited) (continued)
| 4. | Capital Shares |
At April 30, 2005, the Company had six billion shares of capital stock authorized with a par value of $0.00001 per share. Each share of a Fund represents an identical interest in that Fund with each share of the same Fund and has an equal entitlement to any dividends and distributions made by the Fund.
Transactions in shares of each Fund were as follows:
| Six Months Ended April 30, 2005 | Year Ended October 31, 2004 | |||||
MFS Total Return Portfolio | ||||||
Shares sold | 4,047,705 | 5,224,464 | ||||
Shares issued on reinvestment | 3,751,751 | 1,385,108 | ||||
Shares reacquired | (1,345,405 | ) | (2,322,350 | ) | ||
Net Increase | 6,454,051 | 4,287,222 | ||||
Travelers Managed Income Portfolio | ||||||
Shares sold | 1,417,295 | 3,469,389 | ||||
Shares issued on reinvestment | 1,156,904 | 907,032 | ||||
Shares reacquired | (1,172,539 | ) | (2,206,167 | ) | ||
Net Increase | 1,401,660 | 2,170,254 | ||||
Smith Barney Money Market Portfolio | ||||||
Shares sold | 76,147,221 | 128,585,681 | ||||
Shares issued on reinvestment | 4,572,427 | 3,756,423 | ||||
Shares reacquired | (98,534,081 | ) | (221,114,759 | ) | ||
Net Decrease | (17,814,433 | ) | (88,772,655 | ) | ||
| 5. | Capital Loss Carryforward |
On October 31, 2004, TMI had a net capital loss carryforward of $5,329,401, of which $4,796,406 expires in 2011, and $532,995 expires in 2012. These amounts will be available to offset any future taxable capital gains.
| 6. | Additional Information |
On May 31, 2005, the U.S. Securities and Exchange Commission (“SEC”) issued an order in connection with the settlement of an administrative proceeding against Smith Barney Fund Management LLC (“SBFM”) and Citigroup Global Markets Inc. (“CGMI”) relating to the appointment of an affiliated transfer agent for the Smith Barney family of mutual funds (the “Funds”).
The SEC order finds that SBFM and CGMI willfully violated Section 206(1) of the Investment Advisers Act of 1940 (“Advisers Act”). Specifically, the order
54 Travelers Series Fund Inc. | 2005 Semi-Annual Report
Table of Contents
Notes to Financial Statements (unaudited) (continued)
finds that SBFM and CGMI knowingly or recklessly failed to disclose to the boards of the Funds in 1999 when proposing a new transfer agent arrangement with an affiliated transfer agent that: First Data Investors Services Group (“First Data”), the Funds’ then-existing transfer agent, had offered to continue as transfer agent and do the same work for substantially less money than before; and that Citigroup Asset Management (“CAM”), the Citigroup business unit that includes the fund’s investment manager and other investment advisory companies, had entered into a side letter with First Data under which CAM agreed to recommend the appointment of First Data as sub-transfer agent to the affiliated transfer agent in exchange, among other things, for a guarantee by First Data of specified amounts of asset management and investment banking fees to CAM and CGMI. The order also finds that SBFM and CGMI willfully violated Section 206(2) of the Advisers Act by virtue of the omissions discussed above and other misrepresentations and omissions in the materials provided to the Funds’ boards, including the failure to make clear that the affiliated transfer agent would earn a high profit for performing limited functions while First Data continued to perform almost all of the transfer agent functions, and the suggestion that the proposed arrangement was in the Funds’ best interests and that no viable alternatives existed. SBFM and CGMI do not admit or deny any wrongdoing or liability. The settlement does not establish wrongdoing or liability for purposes of any other proceeding.
The SEC censured SBFM and CGMI and ordered them to cease and desist from violations of Sections 206(1) and 206(2) of the Advisers Act. The order requires Citigroup to pay $208.1 million, including $109 million in disgorgement of profits, $19.1 million in interest, and a civil money penalty of $80 million. Approximately $24.4 million has already been paid to the Funds, primarily through fee waivers. The remaining $183.7 million, including the penalty, has been paid to the U.S. Treasury and will be distributed pursuant to a plan to be prepared by Citigroup and submitted within 90 days of the entry of the order for approval by the SEC. The order also requires that transfer agency fees received from the Funds since December 1, 2004 less certain expenses be placed in escrow and provides that a portion of such fees may be subsequently distributed in accordance with the terms of the order.
The order requires SBFM to recommend a new transfer agent contract to the Fund boards within 180 days of the entry of the order; if a Citigroup affiliate
55 Travelers Series Fund Inc. | 2005 Semi-Annual Report
Table of Contents
Notes to Financial Statements (unaudited) (continued)
submits a proposal to serve as transfer agent or sub-transfer agent, an independent monitor must be engaged at the expense of SBFM and CGMI to oversee a competitive bidding process. Under the order, Citigroup also must comply with an amended version of a vendor policy that Citigroup instituted in August 2004. That policy, as amended, among other things, requires that when requested by a Fund board, CAM will retain at its own expense an independent consulting expert to advise and assist the board on the selection of certain service providers affiliated with Citigroup.
At this time, there is no certainty as to how the proceeds of the settlement will be distributed, to whom such distributions will be made, the methodology by which such distributions will be allocated, and when such distributions will be made. Although there can be no assurance, Citigroup does not believe that this matter will have a material adverse effect on the Funds.
| 7. | Legal Matters |
Beginning in June, 2004, class action lawsuits alleging violations of the federal securities laws were filed against Citigroup Global Markets Inc. (the “Distributor”) and a number of its affiliates, including Smith Barney Fund Management LLC and Salomon Brothers Asset Management Inc (the “Advisers”), substantially all of the mutual funds managed by the Advisers, including the Funds (the “Funds”), and directors or trustees of the Funds (collectively, the “Defendants”). The complaints alleged, among other things, that the Distributor created various undisclosed incentives for its brokers to sell Smith Barney and Salomon Brothers funds. In addition, according to the complaints, the Advisers caused the Funds to pay excessive brokerage commissions to the Distributor for steering clients towards proprietary funds. The complaints also alleged that the defendants breached their fiduciary duty to the Funds by improperly charging Rule 12b-1 fees and by drawing on fund assets to make undisclosed payments of soft dollars and excessive brokerage commissions. The complaints also alleged that the Funds failed to adequately disclose certain of the allegedly wrongful conduct. The complaints sought injunctive relief and compensatory and punitive damages, rescission of the Funds’ contracts with the Advisers, recovery of all fees paid to the Advisers pursuant to such contracts and an award of attorneys’ fees and litigation expenses.
56 Travelers Series Fund Inc. | 2005 Semi-Annual Report
Table of Contents
Notes to Financial Statements (unaudited) (continued)
On December 15, 2004, a consolidated amended complaint (the “Complaint”) was filed alleging substantially similar causes of action. While the lawsuit is in its earliest stages, to the extent that the Complaint purports to state causes of action against the Funds, Citigroup Asset Management believes the Funds have significant defenses to such allegations, which the Funds intend to vigorously assert in responding to the Complaint.
Additional lawsuits arising out of these circumstances and presenting similar allegations and requests for relief may be filed against the defendants in the future.
As of the date of this report, Citigroup Asset Management and the Funds believe that the resolution of the pending lawsuit will not have a material effect on the financial position or results of operations of the Funds or the ability of the Advisers and their affiliates to continue to render services to the Funds under their respective contracts.
| 8. | Subsequent Events |
On January 31, 2005, Citigroup announced that it had reached an agreement with MetLife, Inc. (“MetLife”) to sell Citigroup’s life insurance and annuity businesses (“Travelers Life & Annuity”) to MetLife. As part of this transaction, TIA and TAMIC, both currently indirect wholly owned subsidiaries of Citigroup, would become indirect wholly owned subsidiaries of MetLife. TIA is the investment adviser to the MFS Total Return Portfolio and TAMIC is the investment adviser to the Travelers Managed Income Portfolio.
The transaction is subject to certain regulatory approvals, as well as other customary conditions to closing. The transaction is scheduled to close on June 30, 2005.
In connection with this transaction, at meetings held on March 24, 2005 and April 20, 2005, the Board of Directors approved a proposal to reorganize the MFS Total Return Portfolio and the Travelers Managed Income Portfolio (the “Acquired Funds”) of Travelers Series Fund Inc., into newly organized “shell” portfolios (the “Acquiring Funds”) of The Travelers Series Trust. In connection with the reorganization, the Acquiring Funds would acquire all of the assets and assume the liabilities of the Acquired Funds.
The proposed reorganization is subject to the fulfillment of certain conditions, including approval by the Acquired Funds shareholders. Proxy materials describing
57 Travelers Series Fund Inc. | 2005 Semi-Annual Report
Table of Contents
Notes to Financial Statements (unaudited) (continued)
the proposed reorganization were mailed on or about June 9, 2005, to the Acquired Funds shareholders of record on April 15, 2005, in anticipation of a meeting of shareholders scheduled to be held on June 29, 2005. If approved by the Acquired Funds shareholders, the reorganization will occur as soon as possible after the shareholder meeting.
On June 24, 2005, Citigroup announced that it has signed a definitive agreement under which Citigroup will sell substantially all of its worldwide asset management business to Legg Mason, Inc. (“Legg Mason”).
As part of this transaction, SBFM (the “Manager”), currently an indirect wholly owned subsidiary of Citigroup, would become an indirect wholly owned subsidiary of Legg Mason. The Manager is the investment adviser to SBMM.
The transaction is subject to certain regulatory approvals, as well as other customary conditions to closing. Subject to such approvals and the satisfaction of the other conditions, Citigroup expects the transaction to be completed later this year.
Under the Investment Company Act of 1940, consummation of the transaction will result in the automatic termination of the investment management contract between the SBMM and the Manager. Therefore, SBMM’s Board of Directors will be asked to approve a new investment management contract between SBMM and the Manager. If approved by the Board, the new investment management contract will be presented to the shareholders of SBMM for their approval.
58 Travelers Series Fund Inc. | 2005 Semi-Annual Report
Table of Contents
TRAVELERS SERIES
FUND INC.
DIRECTORS Robert A. Frankel Michael E. Gellert R. Jay Gerken, CFA Chairman Rainer Greeven Susan M. Heilbron
OFFICERS R. Jay Gerken, CFA Chairman, President and Chief Executive Officer
Andrew B. Shoup Senior Vice President and Chief Administrative Officer
James M. Giallanza Chief Financial Officer and Treasurer
Martin R. Hanley Vice President and Investment Officer
Gene C. Collins Senior Vice President and Investment Officer
Kurt Lin Vice President and Investment Officer
Brooks Taylor Investment Officer
Andrew Beagley
| OFFICERS (continued) Robert I. Frenkel Secretary and
INVESTMENT MANAGERS Smith Barney Fund Travelers Investment Travelers Asset Management
CUSTODIAN State Street Bank and Trust Company
ANNUITY ADMINISTRATION Travelers Annuity One Cityplace Hartford, CT 06103-3415
TRANSFER AGENT Citicorp Trust Bank, fsb. 125 Broad Street, 11th Floor New York, NY 10004
SUB-TRANSFER AGENT PFPC Inc. P.O. Box 9699 Providence, RI 02940-9699 |
Table of Contents
Travelers Series Fund Inc.
MFS Total Return Portfolio
Travelers Managed Income Portfolio
Smith Barney Money Market Portfolio
The Funds are separate investment funds of the Travelers Series Fund Inc., a Maryland corporation.
The Funds file their complete schedule of portfolio holdings with Securities and Exchange Commission for the first and third quarters of each fiscal year on Form N-Q. The Funds’ Forms N-Q are available on the Commission’s website at www.sec.gov. The Funds’ Forms N-Q may be reviewed and copied at the Commission’s Public Reference Room in Washington, D.C., and information on the operation of the Public Reference Room may be obtained by calling 1-800-SEC-0330. To obtain information on Form N-Q from the Funds, shareholders can call 1-800-451-2010.
Information on how the Funds voted proxies relating to portfolio securities during the 12-month period ended June 30, 2004 and a description of the policies and procedures that the Funds use to determine how to vote proxies relating to portfolio securities is available (1) without charge, upon request, by calling 1-800-451-2010, (2) on the Funds’ website at www.citigroupam.com and (3) on the SEC’s website at www.sec.gov.
This report is submitted for the general information of the shareholders of Travelers Series Fund Inc. — MFS Total Return Portfolio, Travelers Managed Income Portfolio and Smith Barney Money Market Portfolio.
TRAVELERS SERIES FUND INC.
125 Broad Street
10th Floor, MF-2
New York, New York 10004
IN0804 06/05
05-8639
Table of Contents
| ITEM 2. | CODE OF ETHICS. | |||
| Not Applicable. | ||||
| ITEM 3. | AUDIT COMMITTEE FINANCIAL EXPERT. | |||
| Not Applicable. | ||||
| ITEM 4. | PRINCIPAL ACCOUNTANT FEES AND SERVICES. | |||
| Not applicable. | ||||
| ITEM 5. | AUDIT COMMITTEE OF LISTED REGISTRANTS. | |||
| Not applicable. | ||||
| ITEM 6. | SCHEDULE OF INVESTMENTS. | |||
| Not applicable. | ||||
| ITEM 7. | DISCLOSURE OF PROXY VOTING POLICIES AND PROCEDURES FOR CLOSED-END MANAGEMENT INVESTMENT COMPANIES. | |||
| Not applicable. | ||||
| ITEM 8. | [RESERVED] | |||
| ITEM 9. | PURCHASES OF EQUITY SECURITIES BY CLOSED-END MANAGEMENT INVESTMENT COMPANY AND AFFILIATED PURCHASERS. | |||
| Not applicable. | ||||
| ITEM 10. | SUBMISSION OF MATTERS TO A VOTE OF SECURITY HOLDERS. | |||
| Not applicable. | ||||
| ITEM 11. | CONTROLS AND PROCEDURES. | |||
| (a) | The registrant’s principal executive officer and principal financial officer have concluded that the registrant’s disclosure controls and procedures (as defined in Rule 30a - 3(c) under the Investment Company Act of 1940, as amended (the “1940 Act”)) are effective as of a date within 90 days of the filing date of this report that includes the disclosure required by this paragraph, based on their evaluation of the disclosure controls and procedures required by Rule 30a-3(b) under the 1940 Act and 15d-15(b) under the Securities Exchange Act of 1934. | |||
| (b) | There were no changes in the registrant’s internal control over financial reporting (as defined in Rule 30a-3(d) under the 1940 Act) that occurred during the registrant’s last fiscal half-year (the registrant’s second fiscal half-year in the case of an annual report) that have materially affected, or are likely to materially affect the registrant’s internal control over financial reporting. | |||
Table of Contents
| ITEM 12. | EXHIBITS. | |||||
| (a) | Not applicable. | |||||
| (b) | Attached hereto. | |||||
| Exhibit 99.CERT | Certifications pursuant to section 302 of the Sarbanes-Oxley Act of 2002 | |||
| Exhibit 99.906CERT | Certifications pursuant to Section 906 of the Sarbanes-Oxley Act of 2002 | |||
Table of Contents
SIGNATURES
Pursuant to the requirements of the Securities Exchange Act of 1934 and the Investment Company Act of 1940, the registrant has duly caused this Report to be signed on its behalf by the undersigned, there unto duly authorized.
| Travelers Series Fund Inc. | ||
| By: | /s/ R. Jay Gerken | |
| R. Jay Gerken | ||
| Chief Executive Officer of | ||
| Travelers Series Fund Inc. | ||
| Date: | July 7, 2005 | |
Pursuant to the requirements of the Securities Exchange Act of 1934 and the Investment Company Act of 1940, this report has been signed below by the following persons on behalf of the registrant and in the capacities and on the dates indicated.
| By: | /s/ R. Jay Gerken | |
| R. Jay Gerken | ||
| Chief Executive Officer of | ||
| Travelers Series Fund Inc. | ||
| Date: | July 7, 2005 | |
| By: | /s/ James M. Giallanza | |
| James M. Giallanza | ||
| Chief Financial Officer of | ||
| Travelers Series Fund Inc. | ||
| Date: | July 7, 2005 | |