Table of Contents
UNITED STATES
SECURITIES AND EXCHANGE COMMISSION
Washington, D.C. 20549
FORM N-CSR
CERTIFIED SHAREHOLDER REPORT OF REGISTERED
MANAGEMENT INVESTMENT COMPANIES
Investment Company Act file number 811-08510
Matthews International Funds
(Exact name of registrant as specified in charter)
Four Embarcadero Center, Suite 550
San Francisco, CA 94111
(Address of principal executive offices) (Zip code)
James Cooper Abbott, President
Four Embarcadero Center, Suite 550
San Francisco, CA 94111
(Name and address of agent for service)
Registrant’s telephone number, including area code: 415-788-7553
Date of fiscal year end: December 31
Date of reporting period: December 31, 2022
Form N-CSR is to be used by management investment companies to file reports with the Commission not later than 10 days after the transmission to stockholders of any report that is required to be transmitted to stockholders under Rule 30e-1 under the Investment Company Act of 1940 (17 CFR 270.30e-1). The Commission may use the information provided on Form N-CSR in its regulatory, disclosure review, inspection, and policymaking roles.
A registrant is required to disclose the information specified by Form N-CSR, and the Commission will make this information public. A registrant is not required to respond to the collection of information contained in Form N-CSR unless the Form displays a currently valid Office of Management and Budget (“OMB”) control number. Please direct comments concerning the accuracy of the information collection burden estimate and any suggestions for reducing the burden to Secretary, Securities and Exchange Commission, 450 Fifth Street, NW, Washington, DC 20549-0609. The OMB has reviewed this collection of information under the clearance requirements of 44 U.S.C. § 3507.
Table of Contents
| Item 1. | Reports to Stockholders. |
| (a) | The Reports to Shareholders are attached herewith. |
Table of Contents
Matthews Asia Funds | Annual Report
December 31, 2022 | matthewsasia.com
GLOBAL EMERGING MARKETS STRATEGIES
Matthews Emerging Markets Equity Fund
Matthews Emerging Markets Sustainable Future Fund
Matthews Emerging Markets Small Companies Fund
ASIA GROWTH STRATEGIES
Matthews Asia Growth Fund
Matthews Pacific Tiger Fund
Matthews Asia Innovators Fund
Matthews China Fund
Matthews China Small Companies Fund
Matthews India Fund
Matthews Japan Fund
Matthews Korea Fund
ASIA GROWTH AND INCOME STRATEGIES
Matthews Asian Growth and Income Fund
Matthews Asia Dividend Fund
Matthews China Dividend Fund
ASIA FIXED INCOME STRATEGIES
Matthews Asia Total Return Bond Fund
Matthews Asia Credit Opportunities Fund

Paper copies of the Funds’ annual and semi-annual shareholder reports are no longer being sent by mail, unless you specifically request paper copies of the reports. Instead, the reports will be made available on the Funds’ website matthewsasia.com, and you will be notified by mail each time a report is posted and provided with a website link to access the report. You may elect to receive paper copies of shareholder reports and other communications from the Funds anytime by contacting your financial intermediary (such as a broker-dealer or bank) or, if you are a direct investor, by calling 800.789.ASIA (2742).
Your election to receive reports in paper will apply to all Funds held in your account if you invest through your financial intermediary or all Funds held directly with Matthews Asia Funds.

Table of Contents
Investor Class Performance and Expense Ratios (December 31, 2022) (unaudited)
|
| Average Annual Total Return† | Inception | 2022 Annual Operating Expense Ratios* | 2022 Annual Operating Expense Ratios after Fee Waiver and Expense Reim- bursement** | Prospectus Expense Ratios‡‡ | Prospectus Expense Ratios after Fee Waiver and Expense Reim- bursement‡‡ | ||||||||||||||||||||||||||||||
| Investor Class | 1 year | 5 years | 10 years | Since Inception | ||||||||||||||||||||||||||||||||
GLOBAL EMERGING MARKETS STRATEGIES | ||||||||||||||||||||||||||||||||||||
Emerging Markets Equity Fund (MEGMX) | -20.94% | n.a. | n.a. | 9.26% | 4/30/20 | 1.58% | 1.09% | 1 | 1.52% | 1.13% | 1 | |||||||||||||||||||||||||
Emerging Markets Sustainable Future Fund (MASGX)§ | -14.38% | 6.79% | n.a. | 7.15% | 4/30/15 | 1.24% | 1.30% | 3,4 | 1.35% | 1.35% | 3,4 | |||||||||||||||||||||||||
Emerging Markets Small Companies Fund (MSMLX) | -16.84% | 7.02% | 6.93% | 10.57% | 9/15/08 | 1.49% | 1.37% | 3 | 1.51% | 1.35% | 3 | |||||||||||||||||||||||||
ASIA GROWTH STRATEGIES | ||||||||||||||||||||||||||||||||||||
Asia Growth Fund (MPACX) | -33.12% | -2.41% | 4.19% | 6.76% | 10/31/03 | 1.13% | 1.13% | 1.07% | 1.07% | |||||||||||||||||||||||||||
Pacific Tiger Fund (MAPTX) | -20.73% | -0.80% | 4.38% | 7.46% | 9/12/94 | 1.10% | 1.09% | 2 | 1.06% | 1.03% | 2 | |||||||||||||||||||||||||
Asia Innovators Fund (MATFX) | -24.80% | 5.17% | 10.72% | 4.47% | 12/27/99 | 1.18% | 1.18% | 1.09% | 1.09% | |||||||||||||||||||||||||||
China Fund (MCHFX) | -24.40% | 0.07% | 4.72% | 8.45% | 2/19/98 | 1.12% | 1.12% | 1.06% | 1.06% | |||||||||||||||||||||||||||
China Small Companies Fund (MCSMX) | -31.26% | 6.16% | 10.14% | 6.38% | 5/31/11 | 1.55% | 1.41% | 3 | 1.48% | 1.43% | 3 | |||||||||||||||||||||||||
India Fund (MINDX) | -9.92% | 2.00% | 8.70% | 9.57% | 10/31/05 | 1.15% | 1.15% | 1.10% | 1.10% | |||||||||||||||||||||||||||
Japan Fund (MJFOX) | -27.85% | -1.56% | 6.90% | 5.05% | 12/31/98 | 1.05% | 1.05% | 0.95% | 0.95% | |||||||||||||||||||||||||||
Korea Fund (MAKOX) | -25.42% | -3.31% | 3.65% | 5.17% | 1/3/95 | 1.22% | 1.22% | 1.13% | 1.13% | |||||||||||||||||||||||||||
ASIA GROWTH AND INCOME STRATEGIES | ||||||||||||||||||||||||||||||||||||
Asian Growth and Income Fund (MACSX) | -18.43% | -0.23% | 1.96% | 7.76% | 9/12/94 | 1.13% | 1.13% | 1.07% | 1.07% | |||||||||||||||||||||||||||
Asia Dividend Fund (MAPIX) | -29.57% | -2.71% | 3.48% | 6.18% | �� | 10/31/06 | 1.10% | 1.10% | 1.03% | 1.02% | ||||||||||||||||||||||||||
China Dividend Fund (MCDFX) | -16.75% | 1.27% | 6.87% | 7.73% | 11/30/09 | 1.20% | 1.20% | 1.12% | 1.12% | |||||||||||||||||||||||||||
ASIA FIXED INCOME STRATEGIES | ||||||||||||||||||||||||||||||||||||
Asia Total Return Bond Fund (MAINX)5 | -10.25% | -0.33% | 1.74% | 2.70% | 11/30/11 | 1.23% | 1.08% | 1 | 1.05% | 1.05% | 1 | |||||||||||||||||||||||||
Asia Credit Opportunities Fund (MCRDX)5 | -13.28% | -1.87% | n.a. | 0.40% | 4/29/16 | 1.45% | 1.11% | 1 | 1.07% | 1.07% | 1 | |||||||||||||||||||||||||
| † | Annualized performance for periods of at least one year, otherwise cumulative. |
| * | Before fee waivers and expense reimbursement. |
| ** | Expense ratio represents the actual expense ratio a shareholder would have paid if they had been invested the entire year. |
| ‡‡ | These figures are from the Funds’ prospectus dated as of April 28, 2022, and may differ from the actual expense ratios for fiscal year 2022, as shown in the financial highlights section of this report. |
| § | The Fund’s name changed from Matthews Asia ESG Fund to Matthews Emerging Markets Sustainable Future Fund on July 29, 2022. |
| 1 | Matthews has contractually agreed (i) to waive fees and reimburse expenses to the extent needed to limit Total Annual Fund Operating Expenses (excluding Rule 12b-1 fees, taxes, interest, brokerage commissions, short sale dividend expenses, expenses incurred in connection with any merger or reorganization or extraordinary expenses such as litigation) of the Institutional Class to 0.90% first by waiving class specific expenses (i.e., shareholder service fees specific to a particular class) of the Institutional Class and then, to the extent necessary, by waiving non-class specific expenses (e.g., custody fees) of the Institutional Class, and (ii) if any Fund-wide expenses (i.e., expenses that apply to both the Institutional Class and the Investor Class) are waived for the Institutional Class to maintain the 0.90% expense limitation, to waive an equal amount (in annual percentage terms) of those same expenses for the Investor Class. The Total Annual Fund Operating Expenses After Fee Waiver and Expense Reimbursement for the Investor Class may vary from year to year and will in some years exceed 0.90%. Pursuant to this agreement, any amount waived for prior fiscal years with respect to the Matthews Asia Total Return Bond Fund and the Matthews Asia Credit Opportunities Fund is not subject to recoupment. For the Matthews Emerging Markets Equity Fund, if the operating expenses fall below the expense limitation within three years after Matthews has made a waiver or reimbursement, the Fund may reimburse Matthews up to an amount that does not cause the expenses for that year to exceed the lesser of (i) the expense limitation applicable at the time of that fee waiver and/or expense reimbursement or (ii) the expense limitation in effect at the time of recoupment. This agreement will remain in place until April 30, 2023 and may be terminated at any time by the Board of Trustees on behalf of the Fund on 60 days’ written notice to Matthews. Matthews may decline to renew this agreement by written notice to the Trust at least 30 days before its annual expiration date. |
| 2 | Matthews has contractually agreed to waive a portion of its advisory fee and administrative and shareholder services fee if the Fund’s average daily net assets are over $3 billion, as follows: for every $2.5 billion average daily net assets of the Fund that are over $3 billion, the advisory fee rate and the administrative and shareholder services fee rate for the Fund with respect to such excess average daily net assets will be each reduced by 0.01%, in each case without reducing such fee rate below 0.00%. Any amount waived by Matthews pursuant to this agreement may not be recouped by Matthews. This agreement will remain in place until April 30, 2023 and may be terminated (i) at any time by the Board of Trustees upon 60 days’ prior written notice to Matthews; or (ii) by Matthews at the annual expiration date of the agreement upon 60 days’ prior written notice to the Trust, in each case without payment of any penalty. |
| 3 | Matthews has contractually agreed (i) to waive fees and reimburse expenses to the extent needed to limit Total Annual Fund Operating Expenses (excluding Rule 12b-1 fees, taxes, interest, brokerage commissions, short sale dividend expenses, expenses incurred in connection with any merger or reorganization or extraordinary expenses such as litigation) of the Institutional Class to 1.20% (except for the Matthews Emerging Markets Sustainable Future Fund and the Matthews Emerging Markets Small Companies Fund, which have an expense limitation of 1.15% for the Institutional Class) first by waiving class specific expenses (i.e., shareholder service fees specific to a particular class) of the Institutional Class and then, to the extent necessary, by waiving non-class specific expenses (e.g., custody fees) of the Institutional Class, and (ii) if any Fund-wide expenses (i.e., expenses that apply to both the Institutional Class and the Investor Class) are waived for the Institutional Class to maintain the 1.20% expense limitation (or 1.15% for the Matthews Emerging Markets Sustainable Future Fund and the Matthews Emerging Markets Small Companies Fund), to waive an equal amount (in annual percentage terms) of those same expenses for the Investor Class. The Total Annual Fund Operating Expenses After Fee Waiver and Expense Reimbursement for the Investor Class may vary from year to year and will in some years exceed 1.20% (or 1.15% for the Matthews Emerging Markets Sustainable Future Fund and the Matthews Emerging Markets Small Companies Fund). If the operating expenses fall below the expense limitation within three years after Matthews has made a waiver or reimbursement, the Fund may reimburse Matthews up to an amount that does not cause the expenses for that year to exceed the lesser of (i) the expense limitation applicable at the time of that fee waiver and/or expense reimbursement or (ii) the expense limitation in effect at the time of recoupment. This agreement will remain in place until April 30, 2023 and may be terminated at any time by the Board of Trustees on behalf of the Fund on 60 days’ written notice to Matthews. Matthews may decline to renew this agreement by written notice to the Trust at least 30 days before its annual expiration date. |
| 4 | Expense ratios are from the Fund’s prospectus dated as of July 29, 2022. |
| 5 | Please refer to “Subsequent Events” in the Notes to the Financial Statements relating to the closure and liquidation of these Funds. |
| 2 | MATTHEWS ASIA FUNDS |
Table of Contents
Institutional Class Performance and Expense Ratios (December 31, 2022) (unaudited)
|
| Average Annual Total Return† |
| 2022 Annual Operating Expense Ratios* | 2022 Annual Operating Expense Ratios after Fee Waiver and Expense Reim- bursement** | Prospectus Expense Ratios‡‡ | Prospectus after Fee | ||||||||||||||||||||||||||||||
| Institutional Class | 1 year | 5 years | 10 years | Since Inception | Inception Date | |||||||||||||||||||||||||||||||
GLOBAL EMERGING MARKETS STRATEGIES | ||||||||||||||||||||||||||||||||||||
Emerging Markets Equity Fund (MIEFX) | -20.81% | n.a. | n.a. | 9.49% | 4/30/20 | 1.47% | 0.90% | 1 | 1.38% | 0.90% | 1 | |||||||||||||||||||||||||
Emerging Markets Sustainable Future Fund (MISFX)§ | -14.32% | 6.97% | n.a. | 7.36% | 4/30/15 | 1.11% | 1.17% | 3,4 | 1.15% | 1.15% | 3,4 | |||||||||||||||||||||||||
Emerging Markets Small Companies Fund (MISMX) | -16.66% | 7.24% | n.a. | 6.63% | 4/30/13 | 1.37% | 1.15% | 3 | 1.38% | 1.15% | 3 | |||||||||||||||||||||||||
ASIA GROWTH STRATEGIES | ||||||||||||||||||||||||||||||||||||
Asia Growth Fund (MIAPX) | -32.99% | -2.25% | 4.38% | 4.05% | 10/29/10 | 0.98% | 0.98% | 0.92% | 0.92% | |||||||||||||||||||||||||||
Pacific Tiger Fund (MIPTX) | -20.62% | -0.65% | 4.54% | 4.40% | 10/29/10 | 0.97% | 0.96% | 2 | 0.92% | 0.90% | 2 | |||||||||||||||||||||||||
Asia Innovators Fund (MITEX) | -24.73% | 5.33% | n.a. | 10.35% | 4/30/13 | 1.04% | 1.04% | 0.93% | 0.93% | |||||||||||||||||||||||||||
China Fund (MICFX) | -24.31% | 0.23% | 4.88% | 3.07% | 10/29/10 | 0.98% | 0.98% | 0.91% | 0.91% | |||||||||||||||||||||||||||
China Small Companies Fund (MICHX) | -31.08% | 6.40% | n.a. | 7.56% | 11/30/17 | 1.38% | 1.20% | 3 | 1.31% | 1.20% | 3 | |||||||||||||||||||||||||
India Fund (MIDNX)# | -9.83% | 2.15% | 8.88% | 5.52% | 10/29/10 | 1.01% | 1.01% | 0.96% | 0.96% | |||||||||||||||||||||||||||
Japan Fund (MIJFX) | -27.84% | -1.50% | 6.99% | 6.65% | 10/29/10 | 0.97% | 0.97% | 0.89% | 0.89% | |||||||||||||||||||||||||||
Korea Fund (MIKOX) | -25.39% | -3.22% | 3.76% | 5.09% | 10/29/10 | 1.08% | 1.08% | 0.98% | 0.98% | |||||||||||||||||||||||||||
ASIA GROWTH AND INCOME STRATEGIES | ||||||||||||||||||||||||||||||||||||
Asian Growth and Income Fund (MICSX) | -18.31% | -0.08% | 2.11% | 3.02% | 10/29/10 | 1.01% | 1.01% | 0.94% | 0.94% | |||||||||||||||||||||||||||
Asia Dividend Fund (MIPIX) | -29.55% | -2.62% | 3.60% | 3.97% | 10/29/10 | 0.99% | 0.99% | 0.92% | 0.91% | |||||||||||||||||||||||||||
China Dividend Fund (MICDX) | -16.59% | 1.42% | 7.05% | 6.90% | 10/29/10 | 1.06% | 1.06% | 0.97% | 0.97% | |||||||||||||||||||||||||||
ASIA FIXED INCOME STRATEGIES | ||||||||||||||||||||||||||||||||||||
Asia Total Return Bond Fund (MINCX)5 | -10.11% | -0.13% | 1.96% | 2.90% | 11/30/11 | 1.11% | 0.90% | 1 | 0.91% | 0.90% | 1 | |||||||||||||||||||||||||
Asia Credit Opportunities Fund (MICPX)5 | -13.02% | -1.65% | n.a. | 0.63% | 4/29/16 | 1.31% | 0.90% | 1 | 0.93% | 0.90% | 1 | |||||||||||||||||||||||||
| † | Annualized performance for periods of at least one year, otherwise cumulative. |
| ‡‡ | These figures are from the Funds’ prospectus dated as of April 28, 2022, and may differ from the actual expense ratios for fiscal year 2022, as shown in the financial highlights section of this report. |
| * | Before fee waivers and expense reimbursement. |
| ** | Expense ratio represents the actual expense ratio a shareholder would have paid if they had been invested the entire year. |
| § | The Fund’s name changed from Matthews Asia ESG Fund to Matthews Emerging Markets Sustainable Future Fund on July 29, 2022. |
| # | Performance results include adjustments made for financial reporting purposes in accordance with U.S. generally accepted accounting principles. |
| 1 | Matthews has contractually agreed to waive fees and reimburse expenses to the extent needed to limit Total Annual Fund Operating Expenses (excluding Rule 12b-1 fees, taxes, interest, brokerage commissions, short sale dividend expenses, expenses incurred in connection with any merger or reorganization or extraordinary expenses such as litigation) of the Institutional Class to 0.90%. Pursuant to this agreement, any amount waived for prior fiscal years with respect to the Matthews Asia Total Return Bond Fund and the Matthews Asia Credit Opportunities Fund is not subject to recoupment. For the Matthews Emerging Markets Equity Fund, if the operating expenses fall below the expense limitation within three years after Matthews has made a waiver or reimbursement, the Fund may reimburse Matthews up to an amount that does not cause the expenses for that year to exceed the lesser of (i) the expense limitation applicable at the time of that fee waiver and/or expense reimbursement or (ii) the expense limitation in effect at the time of recoupment. This agreement will remain in place until April 30, 2023 and may be terminated at any time by the Board of Trustees on behalf of the Fund on 60 days’ written notice to Matthews. Matthews may decline to renew this agreement by written notice to the Trust at least 30 days before its annual expiration date. |
| 2 | Matthews has contractually agreed to waive a portion of its advisory fee and administrative and shareholder services fee if the Fund’s average daily net assets are over $3 billion, as follows: for every $2.5 billion average daily net assets of the Fund that are over $3 billion, the advisory fee rate and the administrative and shareholder services fee rate for the Fund with respect to such excess average daily net assets will be each reduced by 0.01%, in each case without reducing such fee rate below 0.00%. Any amount waived by Matthews pursuant to this agreement may not be recouped by Matthews. This agreement will remain in place until April 30, 2023 and may be terminated (i) at any time by the Board of Trustees upon 60 days’ prior written notice to Matthews; or (ii) by Matthews at the annual expiration date of the agreement upon 60 days’ prior written notice to the Trust, in each case without payment of any penalty. |
| 3 | Matthews has contractually agreed to waive fees and reimburse expenses to the extent needed to limit Total Annual Fund Operating Expenses (excluding Rule 12b-1 fees, taxes, interest, brokerage commissions, short sale dividend expenses, expenses incurred in connection with any merger or reorganization or extraordinary expenses such as litigation) of the Institutional Class to 1.20% (except for the Matthews Emerging Markets Sustainable Future Fund and the Matthews Emerging Markets Small Companies Fund, which have an expense limitation of 1.15% for the Institutional Class). If the operating expenses fall below the expense limitation within three years after Matthews has made a waiver or reimbursement, the Fund may reimburse Matthews up to an amount that does not cause the expenses for that year to exceed the lesser of (i) the expense limitation applicable at the time of that fee waiver and/or expense reimbursement or (ii) the expense limitation in effect at the time of recoupment. This agreement will remain in place until April 30, 2023 and may be terminated at any time by the Board of Trustees on behalf of the Fund on 60 days’ written notice to Matthews. Matthews may decline to renew this agreement by written notice to the Trust at least 30 days before its annual expiration date. |
| 4 | Expense ratios are from the Fund’s prospectus dated as of July 29, 2022. |
| 5 | Please refer to “Subsequent Events” in the Notes to the Financial Statements relating to the closure and liquidation of these Funds. |
Past Performance: All performance quoted in this report is past performance and is no guarantee of future results. Investment return and principal value will fluctuate with changing market conditions so that when redeemed, shares may be worth more or less than their original cost. Current performance may be lower or higher than the returns quoted. If certain of the Funds’ fees and expenses had not been waived, returns would have been lower. For the Funds’ most recent month-end performance, please call 800.789.ASIA (2742) or visit matthewsasia.com.
| matthewsasia.com | 800.789.ASIA | 3 |
Table of Contents

Cover photo: Looking out to brighter and greener pastures (Chiang Mai, Thailand)
This report has been prepared for Matthews International Funds (d/b/a Matthews Asia Funds) shareholders. It is not authorized for distribution to prospective investors unless accompanied or preceded by a current Matthews Asia Funds prospectus, which contains more complete information about the Funds’ investment objectives, risks and expenses. Additional copies of the prospectus or summary prospectus may be obtained at matthewsasia.com. Please read the prospectus carefully before you invest or send money.
The views and opinions in this report were current as of December 31, 2022. They are not guarantees of performance or investment results and should not be taken as investment advice. Investment decisions reflect a variety of factors, and the managers reserve the right to change their views about individual stocks, sectors and the markets at any time. As a result, the views expressed should not be relied upon as a forecast of a Fund’s future investment intent. Current and future portfolio holdings are subject to risk.
Statements of fact are from sources considered reliable, but neither the Funds nor the Investment Advisor makes any representation or guarantee as to their completeness or accuracy.
| 4 | MATTHEWS ASIA FUNDS |
Table of Contents
* The Fund’s name changed from Matthews Asia ESG Fund to Matthews Emerging Markets Sustainable Future Fund on July 29, 2022.
† Please refer to “Subsequent Events” in the Notes to the Financial Statements relating to the closure and liquidation of these Funds.
Investment Risk: Mutual fund shares are not deposits or obligations of, or guaranteed by, any depositary institution. Shares are not insured by the FDIC, Federal Reserve Board or any government agency and are subject to investment risks, including possible loss of principal amount invested. Investing in international and emerging markets may involve additional risks, such as social and political instability, market illiquidity, exchange-rate fluctuations, a high level of volatility and limited regulation. Fixed income investments are subject to additional risks, including, but not limited to, interest rate, credit and inflation risks. In addition, single-country and sector funds may be subject to a higher degree of market risk than diversified funds because of a concentration in a specific industry, sector or geographic location. Investing in small and mid-size companies is more risky than investing in large companies as they may be more volatile and less liquid than larger companies. Please see the Funds’ Prospectuses and Statement of Additional Information for more risk disclosure.
| matthewsasia.com | 800.789.ASIA | 5 |
Table of Contents

Message to Shareholders from the President of Your Funds
Dear Fellow Shareholder,
I believe in the opportunity of Emerging Markets, Asia and China—and that these markets can offer investors important opportunity sets for return and diversification.
While 2022 was a volatile year for broad equity and fixed income markets around the world, the importance of Matthews as an experienced and trusted guide remained paramount. Inflation and weakening economic growth expectations were exacerbated by the war in Ukraine and China’s zero-COVID policy, while geopolitical ‘tensions’ between the U.S. and China negatively affected investor sentiment. Most investments suffered in this difficult environment, including Developed Market, Emerging Market and Asia Market equities. The short term was challenging, but Matthews’ longer-term performance and insights remain strong.
Emerging Markets & Sustainability
Emerging Markets and Asia represent a broad investment opportunity, and a unique one for Sustainable investing. Emerging Markets remain at the forefront tackling critical sustainability issues including reducing carbon emissions, alleviating poverty, providing access to affordable health care and housing, and facilitating greater financial inclusion. Emerging Markets—and we all—can benefit from companies that adopt more sustainable and responsible practices. We believe that it is critical for ESG (environmental, social, and governance) and sustainability-focused investors to gain exposure to Emerging Markets. With this in mind, we reorganized the Matthews Asia ESG Fund into the Matthews Emerging Markets Sustainable Future Fund, expanding the investment universe to provide more geographically diverse opportunities for the strategy.
Following this reorganization, we are pleased to offer three distinctive Emerging Markets strategies to help our shareholders gain exposure to this increasingly important parts of investment universe: Matthews Emerging Markets Equity Fund, Matthews Emerging Markets Sustainable Future Fund and Emerging Markets Small Companies Fund. Each of these is founded in fundamental investment research, including sustainability considerations to address risk and offer opportunities.
Matthews’ Active ETFs and the Power of Choice
Based on our history of providing investors with unique access to Emerging Markets, Asia and China, we have launched our first actively managed exchange-traded funds (ETFs) focused on these regions. These active, research-based new vehicles incorporate experienced insights and our deep research to offer a range of investment opportunity in a new way with the aim of building differentiated portfolios, providing investors the ‘power of choice’ for investing in these dynamic markets.
Privilege to Serve and Looking Forward
On a personal note, I am honored to have joined Matthews and to serve as the firm’s CEO, and as a Trustee and President of the Matthews Asia Funds in 2022. I have long admired the firm’s unique value proposition, with deep investment expertise in the Emerging Markets, strong fundamental research capabilities and commitment to delivering outstanding client service.
Looking forward, we will continue to maintain a thoughtful and opportunistic approach to identifying the most attractive long-term investment opportunities and we remain steadfast in our research-based investment approach.
We take seriously the stewardship of your assets and thank you for being a valued shareholder during what has been a tumultuous and challenging year. We look forward to the opportunities to come in the Lunar Year of the Rabbit.

Cooper Abbott, CFA
President, Matthews Asia Funds
Chief Executive Officer, Matthews International Capital Management, LLC
| 6 | MATTHEWS ASIA FUNDS |
Table of Contents
This page intentionally left blank.
| matthewsasia.com | 800.789.ASIA | 7 |
Table of Contents
Message to Shareholders from the
Investment Advisor
Dear Valued Shareholder,
2022 was the year of inflation. It seems like for a while it was all we talked about. Of course, there were other terrible things happening, like the war in Ukraine and China’s zero-COVID policy. And there was growing disagreement between the world’s two superpowers. Still, nothing screws up growth equity markets quite like a sudden burst of inflation, coupled with rising bond yields, and horror stories about the seventies and oil price shocks. Naturally, the hope is that 2023 will be the year when all these things get resolved and the markets spring back to rampant optimism. Hmmmmmm…. Maybe. But I’m a little more interested in the possibility of a real investment cycle and what that means for long-term sustainable demand.
And there are some good signs. The oil price shock, shockingly for the doomsayers, turned out to be a mere shocklet, barely an adolescent. Gas prices have retreated from highs and, outside of Europe, they were never that high in wage-adjusted terms. The war on Europe’s doorstep is likely to keep prices high there and push economies into a recession. The U.S. meanwhile seems impervious to a lot of these pressures. Core inflation is now by some measures, running at the Federal Reserve’s 2% target. There are more ways of calculating core inflation these days than there are of dressing a burger but by all accounts, the surge in inflation had a significant supply-side element. The Federal Reserve seems remarkably close to achieving a deceleration in inflation from 9% to 2% without provoking a recession.
Trade and reopening
Then we had China’s zero-COVID policy. The abandonment of the policy at the tail end of the year surprised me. I thought the government would wait out the winter. But popular protest was too much and so they made an about turn. That tells us a couple of things. Ultimately, the Chinese government is pragmatic. In addition, the rather simplistic division of the world into ‘democracy’ and ‘dictatorship’ is about as nuanced and thought-provoking as a sledgehammer. Some democracies can show a cavalier disregard for half their population; some authoritarian states can show a rapid response to popular opinion. Even in the sphere of U.S.—China relations there seems to be a hint of rapprochement—the kind of global warming we can all embrace.
For most of the year, of course, U.S.—China relations, like China’s zero-COVID policy, were also a negative on markets. Aside from Taiwan there were tensions over China’s role in global trade and that generated rhetoric over whether we would see China retreat from the global stage. We don’t believe this will happen and right now China’s share of world exports is higher than ever. Its domestic economy continues to grow and while exports as a share of its own economy may decrease that would only be natural in a country that is transitioning to a middle class and ultimately to higher value-added businesses, innovation, and ultimately higher incomes. It suggests neither lack of growth nor lack of productivity, and no desire to isolate from the world.
Staying on trade, in 2022 we heard a lot about ‘friend-shoring’ and the division of the world between multi-party and single-party states. But beneath it all, the process of building out supply chains and manufacturing bases in order to cut costs and raise productivity continues unabated. Undoubtedly, reorganizing supply chains on political grounds may entail extra costs. But someone’s extra cost might be another person’s extra income. Latin America, for example, could benefit from friend-shoring or, as it is sometimes called, near-shoring. Brazil and Mexico, particularly, could see inflows of capital from U.S. and, ironically, Chinese companies, seeking to avoid the political issues around trade and supply chains. I can see auto sectors, textiles, even pharmaceuticals, benefiting from these trends.
India would also seem to have similar opportunities. Here, the issue is that equity valuations are high. They are not perhaps as high as they have reached in the recent past, but they certainly seem quite expensive relative to other markets. But it is my experience that valuations play out only over the very long-term and while this may put a dampener on long-term returns other things can also create long-term tailwinds. The Indian government, for example, is targeting growth in the manufacturing export sector as this will raise both labor productivity and help the domestic economy to retain a high savings rate
| 8 | MATTHEWS ASIA FUNDS |
Table of Contents
to fuel further investment. It’s the virtuous circle of savings-productivity-exports-wage growth-savings that has helped propel some of the Asian tigers of the past. If India is successful, then valuations relative to history may be a poor indicator of relative cheapness.
The fears around inflation and Federal Reserve interest rate rises also sent shivers through the currency markets. The strength of the U.S. dollar was particularly noticeable against the yen, where the Japanese currency fell to levels with the potential to render some Japanese international businesses super competitive. It offers not only opportunities in Japan but also raises the potential for developing countries to upgrade their capital stocks and manufacturing processes, and perhaps an opportunity for Southeast Asia to try and build a manufacturing base.
Looking ahead, if a global recession were to take hold, then enthusiasm for export markets would be dampened. However, at the same time it may lower the cost of capital and make longer-term investments more profitable, particularly given the fact that international trade has in fact continued to grow. In addition, the diversification of supply chains due to economic tensions and an aging population and increased wages in China will also spur cross-border investments. Any global recession may also be mitigated by what appears to be a continually buoyant U.S. labor market and by a recovery in post-COVID China.
A new investment cycle
To put it all together, I think we are entering a world with a more realistic view of the cost of capital and consequently, returns on capital ought to be driven higher, too. I don’t see a return to rampant optimism. I think realism will be the watchword. And if this is the case it will undeniably be a good thing, at least for the way I think about emerging markets investing.
In recent years, I think we had an investment cycle that was abrupt, short-term and focused on listed securities. Real interest rates were driven so low that stocks began to trade on narratives of companies’ future values, on stories of what they might become. Track records, cash flows, dividends, all of the real things that companies produce for investors started to matter less and less. The far future became less anchored to any history of the company or any achievements in the present.
As we awake from our COVID slumber, emerging markets seem to have preconditions for a long-term, real, economic investment cycle. Not a financial cycle. Not a stock-market boom and bust. But countries and corporates cooperating to build more efficient and sustainable economic relationships given the new environment in which they find themselves. The logic of cross-border investments and rising productivity and wages continues.
In order to take advantage of a continued globalization as well as the increasing political tensions between the West and East, we believe in the need to focus on domestic businesses in the countries we invest in. Global trade increases efficiencies and this tends to raise wages at home. And while much of the supply chain is concentrated in businesses with fine margins and strong competitive pressures, domestic businesses can have more opportunities to shelter themselves from these pressures through attributes like brand, technological prowess, intellectual property, consumer tastes, logistical infrastructure, and owning of real estate. If political tensions increase and the world moves into more regional structures, domestic businesses are also likely to be somewhat protected.
And then there is also the fact that even as global trade grows, domestic economies may grow even faster. Twenty years ago or so, export businesses were the parts of economies that were considered modern. Now, services industries have caught up and become just as much areas of productivity gains as manufacturing sectors. Therefore, a lot of the innovation and growth that we see in emerging markets lies in sectors that are inherently more domestic in nature. Emerging market companies continue to be a good place to invest for the long term.
The economic and financial climate is undoubtedly difficult, but these are the times when opportunities arise. Our research-based investment team continues to comb our investment universe for these opportunities.

Robert Horrocks, PhD
Chief Investment Officer
Matthews International Capital Management, LLC
| matthewsasia.com | 800.789.ASIA | 9 |
Table of Contents

| PORTFOLIO MANAGERS | ||||
| John Paul Lech | ||||
Lead Manager | ||||
| Alex Zarechnak | ||||
Co-Manager | ||||
| FUND FACTS | ||||
| Investor | Institutional | |||
Ticker | MEGMX | MIEFX | ||
CUSIP | 577130651 | 577130644 | ||
Inception | 4/30/20 | 4/30/20 | ||
NAV | $11.14 | $11.13 | ||
Initial Investment | $2,500 | $100,000 | ||
Gross Expense Ratio1 | 1.58% | 1.47% | ||
After fee waiver and Reimbursement2 | 1.08% | 0.90% | ||
Portfolio Statistics | ||||
Total # of Positions | 59 | |||
Net Assets | $33.5 million | |||
Weighted Average Market Cap | $90.5 billion | |||
Portfolio Turnover3 | 63.25% | |||
Benchmark | ||||
MSCI Emerging Markets Index | ||||
OBJECTIVE
Long-term capital appreciation.
STRATEGY
Under normal circumstances, the Fund seeks to achieve its investment objective by investing at least 80% of its net assets, which include borrowings for investment purposes, in the common and preferred stocks of companies located in emerging market countries. Emerging market countries generally include every country in the world except the United States, Australia, Canada, Hong Kong, Israel, Japan, New Zealand, Singapore and most of the countries in Western Europe.
Matthews Emerging Markets Equity Fund
Portfolio Manager Commentary (unaudited)
For the year ending December 31, 2022, the Matthews Emerging Markets Equity Fund returned –20.94% (Investor Class) and –20.81% (Institutional Class), while its benchmark, the MSCI Emerging Markets Index, returned –19.74% over the same period. For the fourth quarter, the Fund returned 11.69% (Investor Class) and 11.66% (Institutional Class), while the benchmark returned 9.79%.
Market Environment
Markets around the world were weak in 2022. U.S. markets had their worst year since the global financial crisis of 2008 and their fourth-worst year since the 1930s. The MSCI Emerging Markets Index was also down more than in any year since 2008 and had its second-worst year since 2000. Many concerns contributed to the weakness in markets including: persistent inflation in many regions and rising interest rates; Russia’s invasion of Ukraine which contributed to both inflation and recession risks globally; rising tensions between China and the U.S.; and President Xi’s moves to consolidate political and economic power in China. In addition, high starting valuations and the post-pandemic normalization of consumer spending patterns contributed to dramatic declines in many high-growth stocks. Conversely, high raw material prices and strong company fundamentals helped many commodity stocks in 2022. Consequently, Latin American countries performed relatively well, with Brazil leading the pack.
In the fourth quarter, markets rebounded and emerging markets outperformed developed markets in December as investors worried about a hawkish U.S. Federal Reserve and inflation fell or stabilized in many emerging markets. By year end, the U.S. dollar had weakened from its peak in September. A weaker greenback often reflects optimism about global growth relative to the U.S. Markets also began to anticipate a re-opening of the Chinese economy after the abrupt abandonment of the zero-COVID policy.
Performance contributors and detractors
At the regional level, Russia was by far the biggest detractor to relative performance in 2022 as we held four Russian stocks at the time of the Ukraine invasion. We draw two lessons from the episode. One is to be wary of undemocratic regimes in which decision-makers aren’t constrained by civil society and the second is that a so-called “fortress balance sheet” at the country level can embolden aggressive leaders to make poor decisions. These conclusions inform our cautious approach to certain other markets, such as Saudi Arabia, even as we appreciate the social and market reforms being undertaken there. Our stock selection in India was another detractor from performance in 2022 as was our underweight in United Arab Emirates and our lack of exposure to Kuwait, Saudi Arabia and South Africa. On the other hand, our overweight in Mexico and Brazil were among the biggest contributors to performance. Our underweight and stock selection in South Korea, our underweight to Taiwan and our overweight to Vietnam were also top contributors.
At the sector level, real estate was the top contributor. Stock selection in information technology was the biggest contributor but was offset by our overweight position. Stock selection in materials and our underweight in communication services were
(continued)
| 1 | Actual 2022 expense ratios. |
| 2 | Matthews has contractually agreed (i) to waive fees and reimburse expenses to the extent needed to limit Total Annual Fund Operating Expenses (excluding Rule 12b-1 fees, taxes, interest, brokerage commissions, short sale dividend expenses, expenses incurred in connection with any merger or reorganization or extraordinary expenses such as litigation) of the Institutional Class to 0.90% first by waiving class specific expenses (i.e., shareholder service fees specific to a particular class) of the Institutional Class and then, to the extent necessary, by waiving non-class specific expenses (e.g., custody fees) of the Institutional Class, and (ii) if any Fund-wide expenses (i.e., expenses that apply to both the Institutional Class and the Investor Class) are waived for the Institutional Class to maintain the 0.90% expense limitation, to waive an equal amount (in annual percentage terms) of those same expenses for the Investor Class. The Total Annual Fund Operating Expenses After Fee Waiver and Expense Reimbursement for the Investor Class may vary from year to year and will in some years exceed 0.90%. If the operating expenses fall below the expense limitation within three years after Matthews has made a waiver or reimbursement, the Fund may reimburse Matthews up to an amount that does not cause the expenses for that year to exceed the lesser of (i) the expense limitation applicable at the time of that fee waiver and/or expense reimbursement or (ii) the expense limitation in effect at the time of recoupment. This agreement will remain in place until April 30, 2023 and may be terminated at any time by the Board of Trustees on behalf of the Fund on 60 days’ written notice to Matthews. Matthews may decline to renew this agreement by written notice to the Trust at least 30 days before its annual expiration date. |
| 3 | The lesser of fiscal year 2022 long-term purchase costs or sales proceeds divided by the average monthly market value of long-term securities. |
| 10 | MATTHEWS ASIA FUNDS |
Table of Contents
| PERFORMANCE AS OF DECEMBER 31, 2022 | ||||||||||||||||
| 3 Months | 1 Year | Since Inception | Inception date | |||||||||||||
| Investor Class (MEGMX) | 11.69% | -20.94% | 9.26% | 04/30/20 | ||||||||||||
| Institutional Class (MIEFX) | 11.66% | -20.81% | 9.49% | 04/30/20 | ||||||||||||
| MSCI Emerging Markets Index4 | 9.79% | -19.74% | 4.20% | |||||||||||||
Performance assumes reinvestment of all dividends and/or distributions before taxes. All performance quoted represents past performance and is no guarantee of future results. Investment return and principal value will fluctuate with market conditions so that when redeemed, shares may be worth more or less than their original cost. Current performance may be lower or higher than the return figures quoted. Returns would have been lower if certain of the Fund’s fees and expenses had not been waived. For the Fund’s most recent month-end performance visit matthewsasia.com.
GROWTH OF A HYPOTHETICAL $10,000 INVESTMENT SINCE INCEPTION—INVESTOR CLASS
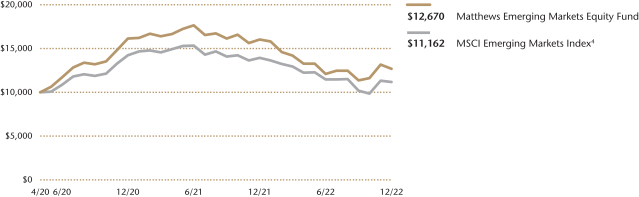
Plotted monthly. The performance data and graph do not reflect the deduction of taxes that a shareholder would pay on dividends, capital gains distributions or redemption of Fund shares. Values are in US$.
| 4 | It is not possible to invest directly in an index. Source: Index data from Morgan Stanley Capital International and Bloomberg; total return calculations performed by BNY Mellon Investment Servicing (US) Inc. Please see page 87 for index definition. |
| TOP TEN HOLDINGS5 | ||||||||
| Name | Sector | Country | % Net Assets | |||||
| Taiwan Semiconductor Manufacturing Co., Ltd. | Information Technology | Taiwan | 5.7% | |||||
| Samsung Electronics Co., Ltd., Pfd. | Information Technology | South Korea | 5.3% | |||||
| Tencent Holdings, Ltd. | Communication Services | China/Hong Kong | 4.8% | |||||
| FPT Corp. | Information Technology | Vietnam | 4.3% | |||||
| HDFC Bank, Ltd. | Financials | India | 3.4% | |||||
| Prudential PLC | Financials | United Kingdom | 2.8% | |||||
| Woodside Energy Group, Ltd. | Energy | Australia | 2.8% | |||||
| AIA Group, Ltd. | Financials | China/Hong Kong | 2.8% | |||||
| Prologis Property Mexico SA de CV REIT | Real Estate | Mexico | 2.8% | |||||
| ICICI Bank, Ltd. | Financials | India | 2.6% | |||||
| % OF ASSETS IN TOP 10 | 37.3% | |||||||
| 5 | Holdings may combine more than one security from same issuer and related depositary receipts. |
| matthewsasia.com | 800.789.ASIA | 11 |
Table of Contents
| COUNTRY ALLOCATION (%)6,7 | ||||
| China/Hong Kong | 19.6 | |||
| India | 14.0 | |||
| Mexico | 8.5 | |||
| Brazil | 8.4 | |||
| South Korea | 6.8 | |||
| Vietnam | 6.7 | |||
| Taiwan | 5.7 | |||
| Singapore | 3.3 | |||
| United States | 2.8 | |||
| United Kingdom | 2.8 | |||
| Australia | 2.8 | |||
| Indonesia | 2.7 | |||
| Canada | 2.6 | |||
| Philippines | 2.5 | |||
| France | 2.4 | |||
| Poland | 1.5 | |||
| Qatar | 1.4 | |||
| Argentina | 1.4 | |||
| Kazakhstan | 1.1 | |||
| United Arab Emirates | 1.0 | |||
| Turkey | 0.7 | |||
| Cash and Other Assets, Less Liabilities | 1.3 | |||
| SECTOR ALLOCATION (%)7 | ||||
| Financials | 25.4 | |||
| Information Technology | 22.0 | |||
| Consumer Discretionary | 10.5 | |||
| Materials | 9.8 | |||
| Industrials | 6.4 | |||
| Energy | 6.2 | |||
| Real Estate | 5.6 | |||
| Consumer Staples | 5.0 | |||
| Communication Services | 4.8 | |||
| Health Care | 2.9 | |||
| Cash and Other Assets, Less Liabilities | 1.3 | |||
| MARKET CAP EXPOSURE (%)7 | ||||
| Mega Cap (over $25B) | 50.4 | |||
| Large Cap ($10B-$25B) | 16.9 | |||
| Mid Cap ($3B-10B) | 18.1 | |||
| Small Cap (under $3B) | 13.3 | |||
| Cash and Other Assets, Less Liabilities | 1.3 | |||
| 6 | Not all countries where the Fund may invest are included in the benchmark index. |
| 7 | Source: FactSet Research Systems. Percentage values in data are rounded to the nearest tenth of one percent, so the values may not sum to 100% due to rounding. Country allocations and percentage values may be derived from different data sources and may not be consistent with other Fund literature. |
Matthews Emerging Markets Equity Fund
Portfolio Manager Commentary (unaudited) (continued)
also positive contributors. Conversely, stock selection in energy was the biggest detractor and financials and health care were also detractors.
At the holdings level, a number of Brazilian stocks were among the top contributors, including Petrobras, the oil and gas conglomerate, and Vale, the metals and mining group, which both benefited from high commodity prices. Banco BTG Pactual also performed well as the Brazilian economy strengthened. On the flip side, Russian stocks including energy companies Lukoil and Novatek, and banking financial group Sberbank, were among the worst performers as their values crashed after Russia’s invasion of Ukraine.
Notable portfolio changes
In the fourth quarter, we added a handful of stocks and exited a handful of positions leaving the name count unchanged at 59. After visiting Brazil in November following the election, we started a position in Weg, an industrial motors producer which has translated its success in Brazil to China and other countries. We also added two China-related companies—Hong Kong Exchanges and Clearing and CSPC Pharmaceutical Group—and increased the number of China/HK stocks in the portfolio to 11. We also added United Arab Emirates-based Fertiglobe, a fertilizer company which is a leader in managing costs—a key attribute for maintaining annual crop yields. In the semiconductor space, our sale of LAM Research to buy Applied Materials was driven by a desire to reduce exposure to memory in favor of foundry while also realizing a tax loss to minimize shareholder distributions.
Outlook
Looking to the year ahead we see two positive developments driving optimism about emerging markets. Firstly, inflation is falling in much of the world and secondly, China’s abandonment of its zero-COVID policy should quickly lead to a re-opening of its economy. Companies we speak to are aware of recession risks and are challenged by rising costs but few are noticing dramatic declines in demand for their products and services or facing meaningful financial or operating stresses.
Our focus remains on good companies—those which can succeed in a variety of macroeconomic and political environments. Many of our portfolio companies reacted rationally to the turbulent events of recent years by strengthening their balance sheets, reducing costs, and improving their competitive positions. Some commodity businesses, for example, have seen the disruption in energy and mining production, as well as the growing needs for certain materials in the energy transition, as reasons to move forward with important projects. Many companies we have exposure to have managed through a number of volatile cycles in the past and emerged stronger. As the world looks beyond the most disruptive consequences of the pandemic, we believe our holdings are positioned to emerge stronger still.
| 12 | MATTHEWS ASIA FUNDS |
Table of Contents
Matthews Emerging Markets Equity Fund
December 31, 2022
Schedule of Investmentsa
COMMON EQUITIES: 93.4%
| Shares | Value | |||||||
| CHINA/HONG KONG: 19.6% | ||||||||
Tencent Holdings, Ltd. | 37,600 | $1,594,254 | ||||||
AIA Group, Ltd. | 85,200 | 940,897 | ||||||
H World Group, Ltd. ADR | 14,627 | 620,477 | ||||||
JD.com, Inc. A Shares | 20,352 | 568,159 | ||||||
Yum China Holdings, Inc. | 10,084 | 551,091 | ||||||
Midea Group Co., Ltd. A Shares | 65,700 | 491,670 | ||||||
Hong Kong Exchanges & Clearing, Ltd. | 10,200 | 438,297 | ||||||
NARI Technology Co., Ltd. A Shares | 113,820 | 399,559 | ||||||
ESR Group, Ltd.b,c | 158,800 | 331,979 | ||||||
Techtronic Industries Co., Ltd. | 29,000 | 322,098 | ||||||
CSPC Pharmaceutical Group, Ltd. | 286,000 | 297,747 | ||||||
|
| |||||||
Total China/Hong Kong | 6,556,228 | |||||||
|
| |||||||
| INDIA: 14.0% | ||||||||
HDFC Bank, Ltd. ADR | 16,636 | 1,138,069 | ||||||
ICICI Bank, Ltd. ADR | 39,641 | 867,741 | ||||||
Infosys, Ltd. ADR | 45,361 | 816,952 | ||||||
Kotak Mahindra Bank, Ltd. | 24,793 | 545,478 | ||||||
Dabur India, Ltd. | 68,765 | 465,892 | ||||||
Restaurant Brands Asia, Ltd.d | 321,392 | 433,295 | ||||||
PI Industries, Ltd. | 9,767 | 403,366 | ||||||
|
| |||||||
Total India | 4,670,793 | |||||||
|
| |||||||
| MEXICO: 8.5% | ||||||||
Prologis Property Mexico SA de CV REIT | 322,698 | 924,549 | ||||||
Grupo Financiero Banorte SAB de CV Class O | 77,300 | 555,002 | ||||||
Grupo Aeroportuario del Sureste SAB de CV ADR | 2,109 | 491,376 | ||||||
Becle SAB de CV | 201,900 | 438,996 | ||||||
GCC SAB de CV | 64,000 | 428,276 | ||||||
|
| |||||||
Total Mexico | 2,838,199 | |||||||
|
| |||||||
| BRAZIL: 8.4% | ||||||||
Banco BTG Pactual SA | 134,600 | 608,858 | ||||||
Vinci Partners Investments, Ltd. Class A | 57,009 | 515,362 | ||||||
Vale SA ADR | 28,864 | 489,822 | ||||||
Hapvida Participacoes e Investimentos SAb,c,d | 367,400 | 354,039 | ||||||
Hypera SA | 37,500 | 321,554 | ||||||
Petroleo Brasileiro SA ADR | 25,363 | 270,116 | ||||||
WEG SA | 35,300 | 256,429 | ||||||
|
| |||||||
Total Brazil | 2,816,180 | |||||||
|
| |||||||
| VIETNAM: 6.7% | ||||||||
FPT Corp. | 443,017 | 1,443,069 | ||||||
Military Commercial Joint Stock Bankd | 464,376 | 336,696 | ||||||
Sai Gon Cargo Service Corp. | 98,695 | 313,814 | ||||||
HDBankd | 203,175 | 137,618 | ||||||
|
| |||||||
Total Vietnam | 2,231,197 | |||||||
|
| |||||||
| TAIWAN: 5.7% | ||||||||
Taiwan Semiconductor Manufacturing Co., Ltd. | 131,000 | 1,902,574 | ||||||
|
| |||||||
Total Taiwan | 1,902,574 | |||||||
|
| |||||||
| UNITED STATES: 4.2% | ||||||||
Applied Materials, Inc. | 4,987 | 485,634 | ||||||
Globant SAd | 2,793 | 469,671 | ||||||
Excelerate Energy, Inc. Class A | 18,007 | 451,075 | ||||||
|
| |||||||
Total United States | 1,406,380 | |||||||
|
| |||||||
| Shares | Value | |||||||
| SINGAPORE: 3.3% | ||||||||
Capitaland Investment, Ltd. | 223,200 | $616,856 | ||||||
TDCX, Inc. ADRd | 40,389 | 500,016 | ||||||
|
| |||||||
Total Singapore | 1,116,872 | |||||||
|
| |||||||
| UNITED KINGDOM: 2.8% | ||||||||
Prudential PLC | 69,369 | 945,867 | ||||||
|
| |||||||
Total United Kingdom | 945,867 | |||||||
|
| |||||||
| AUSTRALIA: 2.8% | ||||||||
Woodside Energy Group, Ltd. | 38,983 | 944,098 | ||||||
|
| |||||||
Total Australia | 944,098 | |||||||
|
| |||||||
| INDONESIA: 2.7% | ||||||||
PT Bank Rakyat Indonesia Persero Tbk | 2,028,900 | 643,263 | ||||||
PT Avia Avian Tbk | 6,602,800 | 267,208 | ||||||
|
| |||||||
Total Indonesia | 910,471 | |||||||
|
| |||||||
| ZAMBIA: 2.6% | ||||||||
First Quantum Minerals, Ltd. | 41,500 | 867,086 | ||||||
|
| |||||||
Total Zambia | 867,086 | |||||||
|
| |||||||
| PHILIPPINES: 2.5% | ||||||||
Wilcon Depot, Inc. | 895,800 | 474,887 | ||||||
Ayala Corp. | 29,360 | 367,503 | ||||||
|
| |||||||
Total Philippines | 842,390 | |||||||
|
| |||||||
| FRANCE: 2.4% | ||||||||
TotalEnergies SE ADR | 6,774 | 420,530 | ||||||
LVMH Moet Hennessy Louis Vuitton SE | 521 | 379,128 | ||||||
|
| |||||||
Total France | 799,658 | |||||||
|
| |||||||
| POLAND: 1.5% | ||||||||
Dino Polska SAb,c,d | 6,026 | 517,539 | ||||||
|
| |||||||
Total Poland | 517,539 | |||||||
|
| |||||||
| SOUTH KOREA: 1.5% | ||||||||
LG Chem Ltd. | 1,067 | 509,524 | ||||||
|
| |||||||
Total South Korea | 509,524 | |||||||
|
| |||||||
| QATAR: 1.4% | ||||||||
Qatar National Bank QPSC | 91,663 | 454,358 | ||||||
|
| |||||||
Total Qatar | 454,358 | |||||||
|
| |||||||
| KAZAKHSTAN: 1.1% | ||||||||
Kaspi.KZ JSC GDRc | 5,097 | 366,087 | ||||||
|
| |||||||
Total Kazakhstan | 366,087 | |||||||
|
| |||||||
| UNITED ARAB EMIRATES: 1.0% | ||||||||
Fertiglobe PLC | 278,189 | 319,765 | ||||||
|
| |||||||
Total United Arab Emirates | 319,765 | |||||||
|
| |||||||
| TURKEY: 0.7% | ||||||||
BIM Birlesik Magazalar AS | 33,543 | 245,127 | ||||||
|
| |||||||
Total Turkey | 245,127 | |||||||
|
| |||||||
| matthewsasia.com | 800.789.ASIA | 13 |
Table of Contents
Matthews Emerging Markets Equity Fund
December 31, 2022
Schedule of Investmentsa (continued)
COMMON EQUITIES (continued)
| Shares | Value | |||||||
| RUSSIA: 0.0% | ||||||||
Sberbank of Russia PJSCd,e | 128,308 | $1,740 | ||||||
LUKOIL PJSC ADRe | 18,010 | 360 | ||||||
TCS Group Holding PLC GDRc,d,e | 3,865 | 77 | ||||||
|
| |||||||
Total Russia | 2,177 | |||||||
|
| |||||||
| TOTAL COMMON EQUITIES | 31,262,570 | |||||||
|
| |||||||
(Cost $35,331,884) | ||||||||
PREFERRED EQUITIES: 5.3% | ||||||||
| SOUTH KOREA: 5.3% | ||||||||
Samsung Electronics Co., Ltd., Pfd. | 43,849 | 1,757,177 | ||||||
|
| |||||||
Total South Korea | 1,757,177 | |||||||
|
| |||||||
| TOTAL PREFERRED EQUITIES | 1,757,177 | |||||||
|
| |||||||
(Cost $2,545,709) | ||||||||
| TOTAL INVESTMENTS: 98.7% |
| 33,019,747 | ||||||
(Cost $37,877,593) | ||||||||
| CASH AND OTHER ASSETS, LESS LIABILITIES: 1.3% | 445,021 | |||||||
|
| |||||||
NET ASSETS: 100.0% |
| $33,464,768 | ||||||
|
| |||||||
| a | Certain securities were fair valued under the valuation policies approved by the Board of Trustees (Note 2-A). |
| b | Security exempt from registration under Rule 144A of the Securities Act of 1933, as amended. The security may be resold in transactions exempt from registration normally to qualified institutional buyers. The security has been determined to be liquid in accordance with procedures adopted by the Funds’ Board of Trustees. At December 31, 2022, the aggregate value is $1,203,557, which is 3.60% of net assets. |
| c | The securities may be resold to qualified foreign investors and foreign institutional buyers under Regulation S of the Securities Act of 1933. |
| d | Non-income producing security. |
| e | Security is valued using significant unobservable inputs and is classified as Level 3 in the fair value hierarchy. The aggregate value of Level 3 security is $2,177 and 0.01% of net assets. |
| ADR | American Depositary Receipt |
| GDR | Global Depositary Receipt |
| JSC | Joint Stock Co. |
| Pfd. | Preferred |
| PJSC | Public Joint Stock Co. |
| QPSC | Qatari Public Shareholding Co. |
| REIT | Real Estate Investment Trust |
See accompanying notes to financial statements.
| 14 | MATTHEWS ASIA FUNDS |
Table of Contents

| PORTFOLIO MANAGER | ||||
| Vivek Tanneeru | ||||
Lead Manager | ||||
| FUND FACTS | ||||
| Investor | Institutional | |||
Ticker | MASGX | MISFX | ||
CUSIP | 577130727 | 577130719 | ||
Inception | 4/30/15 | 4/30/15 | ||
NAV | $12.51 | $12.51 | ||
Initial Investment | $2,500 | $100,000 | ||
Gross Expense Ratio1 | 1.24% | 1.11% | ||
After Fee Waiver and Reimbursement2 | 1.30% | 1.17% | ||
Portfolio Statistics | ||||
Total # of Positions | 55 | |||
Net Assets | $172.3 million | |||
Weighted Average | $19.6 billion | |||
Portfolio Turnover3 | 31.53% | |||
Benchmark | ||||
MSCI Emerging Markets Index | ||||
OBJECTIVE
Long-term capital appreciation.
STRATEGY
Under normal circumstances, the Fund seeks to achieve its investment objective by investing at least 80% of its net assets, which include borrowings for investment purposes, in the common and preferred stocks of companies of any market capitalization located in emerging market countries that satisfy one or more of the Fund’s environmental, social and governance (“ESG”) standards. Emerging market countries generally include every country in the world except the United States, Australia, Canada, Hong Kong, Israel, Japan, New Zealand, Singapore and most of the countries in Western Europe.
Matthews Emerging Markets Sustainable Future Fund*
Portfolio Manager Commentary (unaudited)
For the year ending December 31, 2022, the Matthews Emerging Markets Sustainable Future Fund returned –14.38% (Investor Class) and –14.32% (Institutional Class), while its benchmark, the MSCI Emerging Markets Index, returned –19.74% over the same period. For the fourth quarter, the Fund returned 11.90% (Investor Class) and 11.87% (Institutional Class), while the benchmark returned 9.79%.
Market Environment
In 2022, the U.S. and many other parts of the developed world saw high rates of inflation that they hadn’t experienced since the 1980s. The U.S. Federal Reserve increased the Fed funds rate seven times last year after guiding for a transitory inflation for much of 2021. This led to strong U.S. dollar performance that peaked around the end of the third quarter. Inflation was less of a challenge in key emerging markets like China, partly because of suppressed economic activity resulting from China’s zero-COVID policy which was in place for much of 2022, and because where inflation was elevated, a number of central banks proactively addressed it by sharply increasing rates.
Nonetheless, emerging markets currencies were not completely immune to the impact of a very strong greenback. Among Latin American currencies, the Brazilian real, Mexican peso and Peruvian sol gained over 5% against the dollar in 2022, while the Argentine peso and Turkish lira were the worst performers as a result of runaway inflation. For perspective, some major developed market currencies, such as the Japanese yen, British pound and the euro, fared worse than some emerging-market currencies.
For the year, Turkey was the best performing emerging market, followed by Chile and Brazil. Asian markets like South Korea, Taiwan and China were among the worst-performing emerging markets alongside Eastern European markets including Hungary and Poland. Many of the poor performers for the full year turned in robust performances in the fourth quarter as markets in Asia particularly were aided by China’s lifting of its pandemic restrictions.
Performance Contributors and Detractors
On a country basis, our stock selection and overweight in both China and India were the biggest contributors to relative performance during the year, followed by our stock selection and underweight to Taiwan. On the other hand, our underweight to Brazil and stock selection in Indonesia detracted from performance.
From a sector perspective, stock selection in consumer discretionary was the biggest contributor to relative performance during the year. Our stock selection in health care and allocation to industrials also contributed positively. On the flip side, our stock selection in financials was the biggest detractor from relative performance.
At the stock level, as China’s zero-COVID policy was lifted toward the end of 2022, our Chinese portfolio holdings in general and holdings in JD Health and Full Truck Alliance, in particular, rebounded strongly and contributed positively to relative performance. JD Health, an internet health-care platform, was the top performer as it benefited from a surge in demand for health-care products and services during the latest wave of COVID and also on expectations of favorable
(continued)
| * | The Fund’s name changed from Matthews Asia ESG Fund to Matthews Emerging Markets Sustainable Future Fund on July 29, 2022. |
| 1 | Actual 2022 expense ratios. |
| 2 | Matthews has contractually agreed (i) to waive fees and reimburse expenses to the extent needed to limit Total Annual Fund Operating Expenses (excluding Rule 12b-1 fees, taxes, interest, brokerage commissions, short sale dividend expenses, expenses incurred in connection with any merger or reorganization or extraordinary expenses such as litigation) of the Institutional Class to 1.15% first by waiving class specific expenses (i.e., shareholder service fees specific to a particular class) of the Institutional Class and then, to the extent necessary, by waiving non-class specific expenses (e.g., custody fees) of the Institutional Class, and (ii) if any Fund-wide expenses (i.e., expenses that apply to both the Institutional Class and the Investor Class) are waived for the Institutional Class to maintain the 1.15% expense limitation, to waive an equal amount (in annual percentage terms) of those same expenses for the Investor Class. The Total Annual Fund Operating Expenses After Fee Waiver and Expense Reimbursement for the Investor Class may vary from year to year and will in some years exceed 1.15%. If the operating expenses fall below the expense limitation within three years after Matthews has made a waiver or reimbursement, the Fund may reimburse Matthews up to an amount that does not cause the expenses for that year to exceed the lesser of (i) the expense limitation applicable at the time of that fee waiver and/or expense reimbursement or (ii) the expense limitation in effect at the time of recoupment. This agreement will remain in place until April 30, 2023 and may be terminated at any time by the Board of Trustees on behalf of the Fund on 60 days’ written notice to Matthews. Matthews may decline to renew this agreement by written notice to the Trust at least 30 days before its annual expiration date. |
| 3 | The lesser of fiscal year 2022 long-term purchase costs or sales proceeds divided by the average monthly market value of long-term securities. |
| matthewsasia.com | 800.789.ASIA | 15 |
Table of Contents
| PERFORMANCE AS OF DECEMBER 31, 2022 | ||||||||||||||||||||||||
|
|
|
| Average Annual Total Returns |
| ||||||||||||||||||||
| 3 Months | 1 Year | 3 years | 5 years | Since Inception | Inception Date | |||||||||||||||||||
| Investor Class (MASGX)4 | 11.90% | -14.38% | 10.99% | 6.79% | 7.15% | 4/30/15 | ||||||||||||||||||
| Institutional Class (MISFX)4 | 11.87% | -14.32% | 11.15% | 6.97% | 7.36% | 4/30/15 | ||||||||||||||||||
| MSCI Emerging Markets Index5 | 9.79% | -19.74% | -2.34% | -1.03% | 1.63% | |||||||||||||||||||
| MSCI All Country Asia ex Japan Index5 | 11.43% | -19.36% | -1.15% | -0.34% | 2.36% | |||||||||||||||||||
Performance assumes reinvestment of all dividends and/or distributions before taxes. All performance quoted represents past performance and is no guarantee of future results. Investment return and principal value will fluctuate with market conditions so that when redeemed, shares may be worth more or less than their original cost. Current performance may be lower or higher than the return figures quoted. Returns would have been lower if certain of the Fund’s fees and expenses had not been waived. For the Fund’s most recent month-end performance visit matthewsasia.com.
GROWTH OF A HYPOTHETICAL $10,000 INVESTMENT SINCE INCEPTION—INVESTOR CLASS
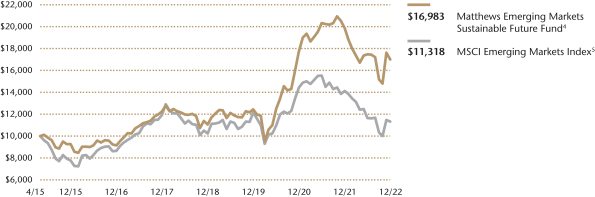
Plotted Monthly. The performance data and graph do not reflect the deduction of taxes that a shareholder would pay on dividends, capital gain distributions or redemption of Fund shares. Values are in US$.
| 4 | Before July 29, 2022, the Fund was managed with a slightly different investment strategy and may have achieved different performance results under its current investment strategy from the performance shown for periods before that date. |
| 5 | Effective July 29, 2022, in connection with changes to the Fund’s name and principal investment strategies, the primary benchmark changed from the MSCI All Country Asia ex Japan Index to the MSCI Emerging Markets Index. It is not possible to invest directly in an index. Source: Index data from Morgan Stanley Capital International; total return calculations performed by BNY Mellon Investment Servicing (US) Inc. Please see page 86 for index definition. |
| TOP TEN HOLDINGS6 | ||||||||
| Name | Sector | Country | % Net Assets | |||||
| Full Truck Alliance Co., Ltd. | Industrials | China/Hong Kong | 6.9% | |||||
| JD Health International, Inc. | Consumer Discretionary | China/Hong Kong | 6.0% | |||||
| Shriram Finance, Ltd. | Financials | India | 5.2% | |||||
| Legend Biotech Corp. | Health Care | United States | 5.0% | |||||
| Bandhan Bank, Ltd. | Financials | India | 4.9% | |||||
| Hong Kong Exchanges & Clearing, Ltd. | Financials | China/Hong Kong | 4.4% | |||||
| Samsung SDI Co., Ltd., Pfd. | Information Technology | South Korea | 3.9% | |||||
| Meituan | Consumer Discretionary | China/Hong Kong | 3.3% | |||||
| Phoenix Mills, Ltd. | Real Estate | India | 3.1% | |||||
| Marico, Ltd. | Consumer Staples | India | 2.9% | |||||
% OF ASSETS IN TOP 10 | 45.6% | |||||||
| 6 | Holdings may combine more than one security from same issuer and related depositary receipts. |
| 16 | MATTHEWS ASIA FUNDS |
Table of Contents
Matthews Emerging Markets Sustainable Future Fund
Portfolio Manager Commentary (unaudited) (continued)
regulatory changes. Full Truck Alliance, an online freight platform, gained as a result of China reopening expectations and a rebound in economic activity that would be beneficial to its revenue growth and also on expectations of movement restrictions that constrained the trucking industry being lifted. Our Indian holdings also benefited from the normalization of economic activity in the country. Phoenix Mills, a retail mall operator, and Lemon Tree Hotels were among top contributors amid stronger pricing and/or higher sales in these consumer segments compared with pre-pandemic levels. Conversely, electric vehicle (EV) supply-chain names underperformed toward the end of 2022 on worries about developed world economic growth potentially softening in 2023 at a time when the EV industry is rapidly increasing production capacity. South Korean EV component company Solus Advanced Materials, which has manufacturing operations in Europe, was one of the biggest detractors for the year amid concerns about its cost competitiveness given a significant increase in energy prices in Europe. We retain a positive view on the long-term demand trends for the EV industry and the competitiveness of Asian battery cell makers within it.
Notable Portfolio Changes
In 2022, we initiated a position in Brazilian education services and technology provider YDUQS. The company has higher-education offerings in an on-campus setting as well as digital learning. YDUQS is among leading players in the distance-learning programs in Brazil which makes education possible for students from lower-income households and students who work. YDUQS has strong governance, and a good track record of social and community engagement and environmental stewardship, in our view. It also stands to benefit if the Lula administration decides to support the education sector through increased funding. During the fourth quarter, we exited a position in MTR Corp., a Hong Kong mass transit operator, and redeployed the capital elsewhere.
Outlook
The Fed’s interest rate strategy and the market’s expectation of its evolution continue to be the most important variables impacting the near-term regional, sector and currency performance in emerging markets. We expect the impact of the Fed’s actions in 2023 to be less than it was in 2022 as the tightening cycle enters late stages. In addition, we are also wary of the cumulative impact of the Fed’s interest rate hikes on U.S. and developed world economic activity.
Our other key focus in 2022 was the evolution of China’s zero-COVID policy and its impact on economic activity in the country. This has largely been resolved given the unexpected lifting of most COVID restrictions in China in late 2022. Elsewhere, Russia’s invasion of Ukraine and its effect on energy prices—alongside OPEC’s efforts to keep the prices high—needs careful watching, especially as Chinese economic activity is likely to pick up as 2023 progresses.
Over the coming years, we expect the emerging markets gross domestic product (GDP) growth-differential with developed markets to improve from a 23-year low reached in 2022. This development, alongside relatively attractive valuations, should potentially lend support to better equity performance against developed markets compared with the last decade.
Companies that address critical challenges, such as climate change and inclusive development, will continue to thrive, in our view. And for investors interested in sustainability themes, including reducing carbon emissions, alleviating poverty and creating greater financial inclusion in the developing world, emerging markets remains a key investment destination. To tackle sustainable themes globally, we believe we need to include the world’s most populous economies, many of which lie in emerging markets. As the post-COVID global economic recovery matures and markets contend with macro headwinds and volatility, we believe there are attractive opportunities for alpha generation throughout our large, diverse, sustainable investment universe.
| COUNTRY ALLOCATION (%)7,8 | ||||
| China/Hong Kong | 40.3 | |||
| India | 22.1 | |||
| Taiwan | 7.6 | |||
| South Korea | 7.2 | |||
| United States | 6.3 | |||
| Brazil | 2.8 | |||
| Portugal | 2.1 | |||
| Indonesia | 2.0 | |||
| Netherlands | 1.6 | |||
| Vietnam | 1.6 | |||
| Saudi Arabia | 1.3 | |||
| Romania | 1.2 | |||
| United Kingdom | 1.1 | |||
| Bangladesh | 1.1 | |||
| Estonia | 0.8 | |||
| Cash and Other Assets, Less Liabilities | 1.0 | |||
| SECTOR ALLOCATION (%)8 | ||||
| Industrials | 25.0 | |||
| Financials | 20.4 | |||
| Consumer Discretionary | 16.4 | |||
| Information Technology | 12.3 | |||
| Health Care | 11.2 | |||
| Real Estate | 6.0 | |||
| Consumer Staples | 5.0 | |||
| Communication Services | 2.0 | |||
| Utilities | 0.8 | |||
| Cash and Other Assets, Less Liabilities | 1.0 | |||
| MARKET CAP EXPOSURE (%)8 | ||||
| Mega Cap (over $25B) | 22.9 | |||
| Large Cap ($10B-$25B) | 8.0 | |||
| Mid Cap ($3B-10B) | 48.6 | |||
| Small Cap (under $3B) | 19.5 | |||
| Cash and Other Assets, Less Liabilities | 1.0 | |||
| 7 | Not all countries are included in the benchmark index. |
| 8 | Source: FactSet Research Systems. Percentage values in data are rounded to the nearest tenth of one percent, so the values may not sum to 100% due to rounding. Country allocations and percentage values may be derived from different data sources and may not be consistent with other Fund literature. |
| matthewsasia.com | 800.789.ASIA | 17 |
Table of Contents
Matthews Emerging Markets Sustainable Future Fund
December 31, 2022
Schedule of Investmentsa
COMMON EQUITIES: 95.0%
| Shares | Value | |||||||
| CHINA/HONG KONG: 40.3% | ||||||||
Full Truck Alliance Co., Ltd. ADRb | 1,486,997 | $11,895,976 | ||||||
JD Health International, Inc.b,c,d | 1,143,700 | 10,327,670 | ||||||
Hong Kong Exchanges & Clearing, Ltd. | 177,700 | 7,635,814 | ||||||
Meituan B Sharesb,c,d | 259,900 | 5,758,302 | ||||||
Airtac International Group | 156,000 | 4,709,867 | ||||||
Contemporary Amperex Technology Co., Ltd. A Shares | 76,000 | 4,301,619 | ||||||
Ginlong Technologies Co., Ltd. A Sharesb | 153,300 | 3,992,488 | ||||||
Medlive Technology Co., Ltd.c,d | 2,189,500 | 2,375,043 | ||||||
China Conch Venture Holdings, Ltd. | 1,090,500 | 2,365,653 | ||||||
Centre Testing International Group Co., Ltd. A Shares | 655,100 | 2,114,513 | ||||||
Xinyi Glass Holdings, Ltd. | 1,099,000 | 2,030,485 | ||||||
Wuxi Biologics Cayman, Inc.b,c,d | 240,000 | 1,817,739 | ||||||
CSPC Pharmaceutical Group, Ltd. | 1,634,960 | 1,702,114 | ||||||
Flat Glass Group Co., Ltd. H Shares | 678,000 | 1,630,513 | ||||||
Innovent Biologics, Inc.b,c,d | 378,500 | 1,610,936 | ||||||
OPT Machine Vision Tech Co., Ltd. A Shares | 83,485 | 1,592,033 | ||||||
Hangzhou Tigermed Consulting Co., Ltd. A Shares | 88,476 | 1,335,398 | ||||||
Morimatsu International Holdings Co., Ltd.b,d | 1,084,000 | 1,196,807 | ||||||
Zhejiang HangKe Technology, Inc., Co. A Shares | 127,664 | 809,685 | ||||||
China Conch Environment Protection Holdings, Ltd.b | 733,500 | 295,371 | ||||||
|
| |||||||
Total China/Hong Kong | 69,498,026 | |||||||
|
| |||||||
| INDIA: 22.1% | ||||||||
Shriram Finance, Ltd. | 541,070 | 8,981,895 | ||||||
Bandhan Bank, Ltd.b,c,d | 2,982,606 | 8,417,741 | ||||||
Phoenix Mills, Ltd. | 308,254 | 5,294,086 | ||||||
Marico, Ltd. | 810,916 | 4,990,137 | ||||||
Mahindra & Mahindra, Ltd. | 238,338 | 3,588,116 | ||||||
Indus Towers, Ltd. | 1,224,949 | 2,812,489 | ||||||
Lemon Tree Hotels, Ltd.b,c,d | 2,420,831 | 2,503,496 | ||||||
UNO Minda, Ltd. | 136,156 | 856,628 | ||||||
NBCC India, Ltd. | 1,278,019 | 598,310 | ||||||
|
| |||||||
Total India | 38,042,898 | |||||||
|
| |||||||
| TAIWAN: 7.6% | ||||||||
Andes Technology Corp. | 281,000 | 4,522,281 | ||||||
Poya International Co., Ltd. | 237,477 | 3,844,934 | ||||||
M31 Technology Corp. | 153,000 | 2,267,388 | ||||||
Sporton International, Inc. | 233,448 | 1,590,967 | ||||||
Formosa Sumco Technology Corp. | 182,000 | 801,710 | ||||||
|
| |||||||
Total Taiwan | 13,027,280 | |||||||
|
| |||||||
| UNITED STATES: 6.2% | ||||||||
Legend Biotech Corp. ADRb | 172,279 | 8,600,168 | ||||||
Micron Technology, Inc. | 43,500 | 2,174,130 | ||||||
|
| |||||||
Total United States | 10,774,298 | |||||||
|
| |||||||
| POLAND: 3.7% | ||||||||
Jeronimo Martins SGPS SA | 163,702 | 3,541,775 | ||||||
InPost SAb | 334,507 | 2,826,170 | ||||||
|
| |||||||
Total Poland | 6,367,945 | |||||||
|
| |||||||
| Shares | Value | |||||||
| SOUTH KOREA: 3.3% | ||||||||
Ecopro BM Co., Ltd. | 51,493 | $3,766,973 | ||||||
Solus Advanced Materials Co., Ltd. | 48,107 | 1,149,055 | ||||||
LG Energy Solution, Ltd.b | 1,476 | 508,714 | ||||||
Samsung SDI Co., Ltd. | 422 | 198,147 | ||||||
|
| |||||||
Total South Korea | 5,622,889 | |||||||
|
| |||||||
| BRAZIL: 2.8% | ||||||||
B3 SA - Brasil Bolsa Balcao | 1,422,700 | 3,554,791 | ||||||
YDUQS Participacoes SA | 706,100 | 1,352,750 | ||||||
|
| |||||||
Total Brazil | 4,907,541 | |||||||
|
| |||||||
| INDONESIA: 1.9% | ||||||||
PT Summarecon Agung Tbk | 56,797,291 | 2,202,959 | ||||||
PT Bank Tabungan Negara Persero Tbk | 13,287,300 | 1,151,511 | ||||||
|
| |||||||
Total Indonesia | 3,354,470 | |||||||
|
| |||||||
| VIETNAM: 1.6% | ||||||||
Nam Long Investment Corp. | 2,121,939 | 2,783,035 | ||||||
|
| |||||||
Total Vietnam | 2,783,035 | |||||||
|
| |||||||
| SAUDI ARABIA: 1.3% | ||||||||
Saudi Tadawul Group Holding Co. | 45,385 | 2,197,629 | ||||||
|
| |||||||
Total Saudi Arabia | 2,197,629 | |||||||
|
| |||||||
| ROMANIA: 1.2% | ||||||||
Banca Transilvania SA | 464,087 | 1,996,963 | ||||||
|
| |||||||
Total Romania | 1,996,963 | |||||||
|
| |||||||
| JORDAN: 1.1% | ||||||||
Hikma Pharmaceuticals PLC | 102,164 | 1,903,918 | ||||||
|
| |||||||
Total Jordan | 1,903,918 | |||||||
|
| |||||||
| BANGLADESH: 1.1% | ||||||||
BRAC Bank, Ltd. | 3,402,700 | 1,150,031 | ||||||
GrameenPhone, Ltd. | 266,417 | 682,715 | ||||||
|
| |||||||
Total Bangladesh | 1,832,746 | |||||||
|
| |||||||
| ESTONIA: 0.8% | ||||||||
Enefit Green AS | 305,577 | 1,431,391 | ||||||
|
| |||||||
Total Estonia | 1,431,391 | |||||||
|
| |||||||
| TOTAL COMMON EQUITIES | 163,741,029 | |||||||
|
| |||||||
(Cost $163,215,225) | ||||||||
PREFERRED EQUITIES: 4.0% | ||||||||
| SOUTH KOREA: 4.0% | ||||||||
Samsung SDI Co., Ltd., Pfd. | 30,943 | 6,803,798 | ||||||
|
| |||||||
Total South Korea | 6,803,798 | |||||||
|
| |||||||
| TOTAL PREFERRED EQUITIES |
| 6,803,798 | ||||||
|
| |||||||
(Cost $8,641,059) | ||||||||
| 18 | MATTHEWS ASIA FUNDS |
Table of Contents
Matthews Emerging Markets Sustainable Future Fund
December 31, 2022
Schedule of Investmentsa (continued)
RIGHTS: 0.0%
| Shares | Value | |||||||
| INDONESIA: 0.0% | ||||||||
PT Bank Tabungan Negara Persero Tbk, | ||||||||
Rights, expires 01/13/23b | 4,321,753 | $39,699 | ||||||
|
| |||||||
Total Indonesia | 39,699 | |||||||
|
| |||||||
| TOTAL RIGHTS |
| 39,699 | ||||||
|
| |||||||
(Cost $0) | ||||||||
| TOTAL INVESTMENTS: 99.0% |
| 170,584,526 | ||||||
(Cost $171,856,284) | ||||||||
| CASH AND OTHER ASSETS, LESS LIABILITIES: 1.0% | 1,723,466 | |||||||
|
| |||||||
NET ASSETS: 100.0% | $172,307,992 | |||||||
|
| |||||||
| a | Certain securities were fair valued under the valuation policies approved by the Board of Trustees (Note 2-A). |
| b | Non-income producing security. |
| c | Security exempt from registration under Rule 144A of the Securities Act of 1933, as amended. The security may be resold in transactions exempt from registration normally to qualified institutional buyers. The security has been determined to be liquid in accordance with procedures adopted by the Funds’ Board of Trustees. At December 31, 2022, the aggregate value is $32,810,927, which is 19.04% of net assets. |
| d | The securities may be resold to qualified foreign investors and foreign institutional buyers under Regulation S of the Securities Act of 1933. |
| ADR | American Depositary Receipt |
| Pfd. | Preferred |
See accompanying notes to financial statements.
| matthewsasia.com | 800.789.ASIA | 19 |
Table of Contents
| PORTFOLIO MANAGERS | ||||
| Vivek Tanneeru | ||||
| Lead Manager | ||||
| Jeremy Sutch, CFA | ||||
Co-Manager | ||||
| FUND FACTS | ||||
| Investor | Institutional | |||
Ticker | MSMLX | MISMX | ||
CUSIP | 577125206 | 577125867 | ||
Inception | 9/15/08 | 4/30/13 | ||
NAV | $23.08 | $23.04 | ||
Initial Investment | $2,500 | $100,000 | ||
Gross Expense Ratio1 | 1.49% | 1.37% | ||
After Fee Waiver and Reimbursement2 | 1.37% | 1.15% | ||
Portfolio Statistics | ||||
Total # of Positions | 67 | |||
Net Assets | $369.4 million | |||
Weighted Average | $3.8 billion | |||
Portfolio Turnover3 | 27.85% | |||
Benchmark | ||||
MSCI Emerging Markets Small Cap Index | ||||
OBJECTIVE
Long-term capital appreciation.
STRATEGY
Under normal market conditions, the Fund seeks to achieve its investment objective by investing at least 80% of its net assets, which include borrowings for investment purposes, in the common and preferred stocks of Small Companies located in emerging market countries. Emerging market countries generally include every country in the world except the United States, Australia, Canada, Hong Kong, Israel, Japan, New Zealand, Singapore and most of the countries in Western Europe. The Fund defines Small Companies as companies with market capitalization no higher than the greater of $5 billion or the market capitalization of the largest company included in the Fund’s primary benchmark, the MSCI Emerging Markets Small Cap Index.
Matthews Emerging Markets Small Companies Fund
Portfolio Manager Commentary (unaudited)
For the year ending December 31, 2022, the Matthews Emerging Markets Small Companies Fund returned –16.84% (Investor Class) and –16.66% (Institutional Class), while its benchmark, the MSCI Emerging Markets Small Cap Index, returned –17.54% over the same period. For the fourth quarter, the Fund returned 9.08% (Investor Class) and 9.13% (Institutional Class), while the benchmark returned 8.33%.
Market Environment
In 2022, the U.S. and many other parts of the developed world saw high rates of inflation that they hadn’t experienced since the 1980s. The U.S. Federal Reserve increased the Fed funds rate seven times last year after guiding for a transitory inflation for much of 2021. This led to strong U.S. dollar performance that peaked around the end of the third quarter. Inflation was less of a challenge in key emerging markets like China, partly because of suppressed economic activity resulting from China’s zero COVID policy which was in place for much of 2022, and because where inflation was elevated, a number of central banks proactively addressed it by sharply increasing rates.
Nonetheless, emerging markets currencies were not completely immune to the impact of a very strong greenback. Among Latin American currencies, the Brazilian real, Mexican peso and Peruvian sol gained over 5% against the dollar in 2022 while the Argentine peso and Turkish lira were the worst performers as a result of runaway inflation. For perspective, some major developed market currencies, such as the Japanese yen, British pound and the euro, fared worse than some emerging-market currencies.
For the year, Turkey was the best performing small-cap emerging market, followed by Chile and Mexico. Columbia was the worst performer, followed by South Korea and Hungary. In Asia, China and Taiwan also performed poorly. During 2022, the MSCI Emerging Markets Small Cap Index comfortably outperformed the broader MSCI Emerging Markets Index.
Performance Contributors and Detractors
On a country basis, our stock selection in India was the biggest contributor to relative performance during the year, followed by stock selection in Indonesia and underweight allocation to Taiwan and South Korea. On the other hand, our overweight allocation to China as well as our stock selection in Russia detracted from performance. Our underweight to Turkey was also a detractor.
From a sector perspective, our stock selection and overweight in industrials was the biggest contributor to relative performance during the year. Stock selection in consumer discretionary, health care and real estate was also a top contributor. On the flip side, stock selection in information technology and financials were the biggest detractors from relative performance.
At the stock level, our Indian holdings benefited from the normalization of economic activity in the country. Lemon Tree Hotels and Phoenix Mills, a retail mall operator, were top contributors as they gained from higher sales and stronger pricing, respectively, compared with pre-pandemic levels. Shriram Finance, an Indian
(continued)
| 1 | Actual 2022 expense ratios. |
| 2 | Matthews has contractually agreed (i) to waive fees and reimburse expenses to the extent needed to limit Total Annual Fund Operating Expenses (excluding Rule 12b-1 fees, taxes, interest, brokerage commissions, short sale dividend expenses, expenses incurred in connection with any merger or reorganization or extraordinary expenses such as litigation) of the Institutional Class to 1.15% first by waiving class specific expenses (i.e., shareholder service fees specific to a particular class) of the Institutional Class and then, to the extent necessary, by waiving non-class specific expenses (e.g., custody fees) of the Institutional Class, and (ii) if any Fund-wide expenses (i.e., expenses that apply to both the Institutional Class and the Investor Class) are waived for the Institutional Class to maintain the 1.15% expense limitation, to waive an equal amount (in annual percentage terms) of those same expenses for the Investor Class. The Total Annual Fund Operating Expenses After Fee Waiver and Expense Reimbursement for the Investor Class may vary from year to year and will in some years exceed 1.15%. If the operating expenses fall below the expense limitation within three years after Matthews has made a waiver or reimbursement, the Fund may reimburse Matthews up to an amount that does not cause the expenses for that year to exceed the lesser of (i) the expense limitation applicable at the time of that fee waiver and/or expense reimbursement or (ii) the expense limitation in effect at the time of recoupment. This agreement will remain in place until April 30, 2023 and may be terminated at any time by the Board of Trustees on behalf of the Fund on 60 days’ written notice to Matthews. Matthews may decline to renew this agreement by written notice to the Trust at least 30 days before its annual expiration date. |
| 3 | The lesser of fiscal year 2022 long-term purchase costs or sales proceeds divided by the average monthly market value of long-term securities. |
| 20 | MATTHEWS ASIA FUNDS |
Table of Contents
| PERFORMANCE AS OF DECEMBER 31, 2022 | ||||||||||||||||||||||||||||
|
|
|
| Average Annual Total Returns |
| ||||||||||||||||||||||||
| 3 Months | 1 Year | 3 Years | 5 Years | 10 Years | Since Inception | Inception Date | ||||||||||||||||||||||
| Investor Class (MSMLX)4 | 9.08% | -16.84% | 13.43% | 7.02% | 6.93% | 10.57% | 09/15/08 | |||||||||||||||||||||
| Institutional Class (MISMX)4 | 9.13% | -16.66% | 13.65% | 7.24% | n.a. | 6.63% | 04/30/13 | |||||||||||||||||||||
| MSCI Emerging Markets Small Cap Index5 | 8.33% | -17.54% | 5.60% | 1.49% | 3.59% | 6.12% | 6 | |||||||||||||||||||||
Performance assumes reinvestment of all dividends and/or distributions before taxes. All performance quoted represents past performance and is no guarantee of future results. Investment return and principal value will fluctuate with market conditions so that when redeemed, shares may be worth more or less than their original cost. Current performance may be lower or higher than the return figures quoted. Returns would have been lower if certain of the Fund’s fees and expenses had not been waived. For the Fund’s most recent month-end performance, visit matthewsasia.com.
GROWTH OF A HYPOTHETICAL $10,000 INVESTMENT SINCE INCEPTION—INVESTOR CLASS
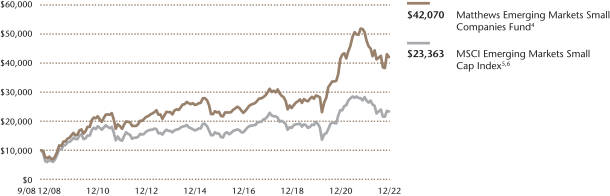
Plotted monthly. The performance data and graph do not reflect the deduction of taxes that a shareholder would pay on dividends, capital gains distributions or redemption of Fund shares. Values are in US$.
| 4 | Before April 30, 2021, the Fund was managed with a different investment strategy and may have achieved different performance results for periods before that date with its current investment strategy. |
| 5 | It is not possible to invest directly in an index. Source: Index data from Morgan Stanley Capital International and Bloomberg; total return calculations performed by BNY Mellon Investment Servicing (US) Inc. Please see page 87 for index definition. Effective April 30, 2021, in connection with changes to the Fund’s name and principal investment strategy, the primary benchmark changed from the MSCI All Country Asia ex Japan Small Cap Index to the MSCI Emerging Markets Small Cap Index. |
| 6 | Calculated from 9/15/08. |
| TOP TEN HOLDINGS7 | ||||||||
| Name | Sector | Country | % Net Assets | |||||
| Shriram Finance, Ltd. | Financials | India | 6.7% | |||||
| Bandhan Bank, Ltd. | Financials | India | 5.3% | |||||
| Legend Biotech Corp. | Health Care | United States | 4.5% | |||||
| Ecopro BM Co., Ltd. | Industrials | South Korea | 3.8% | |||||
| Phoenix Mills, Ltd. | Real Estate | India | 3.7% | |||||
| Ginlong Technologies Co., Ltd. | Industrials | China/Hong Kong | 3.6% | |||||
| Hugel, Inc. | Health Care | South Korea | 3.2% | |||||
| Silergy Corp. | Information Technology | China/Hong Kong | 3.1% | |||||
| Parque Arauco SA | Real Estate | Chile | 2.6% | |||||
| Andes Technology Corp. | Information Technology | Taiwan | 2.6% | |||||
| % OF ASSETS IN TOP 10 | 39.1% | |||||||
| 7 | Holdings may combine more than one security from same issuer and related depositary receipts. |
| matthewsasia.com | 800.789.ASIA | 21 |
Table of Contents
Matthews Emerging Markets Small Companies Fund
Portfolio Manager Commentary (unaudited) (continued)
non-banking financial company, also benefited from economic normalization and loan growth resumption. In Indonesia, as the economy as well as mall foot traffic normalized, Mitra Adiperkasa, a retailer with a broad exposure to discretionary consumer spending, was also a top performer. On the other hand, Taiwan technology holding Silergy was the largest detractor. Concerns over a post-COVID global consumer softening in demand for consumer appliances and communications products, in addition to general weakness in Chinese economic activity, proved to be a drag on stock performance. The broader build up in semiconductor inventory globally also contributed to negative sentiment toward the technology sector in general. We continue to like the long-term prospects of Silergy and its positioning in the analog semiconductor industry.
Notable Portfolio Changes
In the last quarter we initiated a new position in Tongcheng Travel Holdings, a Chinese online travel agency. We expect the company to benefit from a recovery in tourism as well as easing mobility restrictions in China. Higher savings and pent-up demand for travel after a long period of China’s zero-COVID policy should aid demand. The company has a strong lower-tier presence and China business. It has been making concerted efforts to increase its exposure to the international package travel area and while that is a relatively smaller proportion of its business, these efforts should aid further growth over the long term.
Outlook
The Fed’s interest rate strategy and the market’s expectation of its evolution continue to be the most important variables impacting the near-term regional, sector and currency performance in emerging markets. We expect the impact of the Fed’s actions in 2023 to be less than it was in 2022 as the tightening cycle enters late stages. In addition, we are also wary of the cumulative impact of the Fed’s interest rate hikes on U.S. and developed world economic activity.
Our other key focus in 2022 was the evolution of China’s zero-COVID policy and its impact on economic activity in the country. This has largely been resolved given the unexpected lifting of most COVID restrictions in China in late 2022. Elsewhere, Russia’s invasion of Ukraine and its effect on energy prices— alongside OPEC’s efforts to keep the prices high—needs careful watching, especially as Chinese economic activity is likely to pick up as 2023 progresses.
Over the coming years, we expect the emerging markets gross domestic product (GDP) growth-differential with developed markets to improve from a 23-year low reached in 2022. This development, alongside relatively attractive valuations, should potentially lend support to better equity performance against developed markets compared with the last decade.
As the global economy embarks on a likely tricky 2023, we believe small companies in emerging markets will continue to offer long-term growth opportunities given their innovation and domestic consumption orientation. There are also currently quality businesses at attractive valuations in this asset class.
| COUNTRY ALLOCATION (%)8,9 | ||||
| China/Hong Kong | 26.3 | |||
| India | 23.4 | |||
| Taiwan | 8.4 | |||
| South Korea | 7.9 | |||
| Vietnam | 6.1 | |||
| Brazil | 5.5 | |||
| Indonesia | 4.9 | |||
| United States | 4.5 | |||
| Chile | 3.0 | |||
| United Kingdom | 2.3 | |||
| Philippines | 1.9 | |||
| Netherlands | 1.5 | |||
| Mexico | 1.4 | |||
| Canada | 1.0 | |||
| Thailand | 0.9 | |||
| Turkey | 0.8 | |||
| Bangladesh | 0.8 | |||
| Liabilities in Excess of Cash and Other Assets | -0.5 | |||
| SECTOR ALLOCATION (%)9 | ||||
| Industrials | 27.2 | |||
| Financials | 19.1 | |||
| Information Technology | 15.9 | �� | ||
| Health Care | 12.9 | |||
| Consumer Discretionary | 12.1 | |||
| Real Estate | 10.0 | |||
| Consumer Staples | 1.2 | |||
| Communication Services | 1.2 | |||
| Materials | 1.0 | |||
| Liabilities in Excess of Cash and Other Assets | -0.5 | |||
| MARKET CAP EXPOSURE (%)9,10 | ||||
| Mega Cap (over $25B) | 0.0 | |||
| Large Cap ($10B-$25B) | 0.0 | |||
| Mid Cap ($3B-10B) | 51.6 | |||
| Small Cap (under $3B) | 48.9 | |||
| Liabilities in Excess of Cash and Other Assets | -0.5 | |||
| 8 | Not all countries where the Fund may invest are included in the benchmark index. |
| 9 | Source: FactSet Research Systems. Percentage values in data are rounded to the nearest tenth of one percent, so the values may not sum to 100% due to rounding. Country allocations and percentage values may be derived from different data sources and may not be consistent with other Fund literature. |
| 10 | The Fund defines Small Companies as companies with market capitalization no higher than the greater of $5 billion or the market capitalization of the largest company included in the Fund’s primary benchmark, the MSCI Emerging Markets Small Cap Index. |
| 22 | MATTHEWS ASIA FUNDS |
Table of Contents
Matthews Emerging Markets Small Companies Fund
December 31, 2022
Schedule of Investmentsa
COMMON EQUITIES: 99.4%
| Shares | Value | |||||||
| CHINA/HONG KONG: 26.4% | ||||||||
Silergy Corp. | 804,000 | $11,356,433 | ||||||
Ginlong Technologies Co., Ltd. A Sharesb | 367,406 | 9,568,584 | ||||||
Hainan Meilan International Airport Co., Ltd. H Sharesb | 2,913,000 | 8,818,848 | ||||||
Full Truck Alliance Co., Ltd. ADRb | 1,081,926 | 8,655,408 | ||||||
Airtac International Group | 240,431 | 7,258,963 | ||||||
Peijia Medical, Ltd.b,c,d | 4,587,000 | 5,592,608 | ||||||
AK Medical Holdings, Ltd.c,d | 3,816,000 | 4,777,004 | ||||||
Zhihu, Inc. ADRb | 3,498,839 | 4,548,491 | ||||||
CIFI Ever Sunshine Services Group, Ltd.d | 7,804,000 | 4,337,725 | ||||||
Medlive Technology Co., Ltd.c,d | 3,620,500 | 3,927,309 | ||||||
Xtep International Holdings, Ltd. | 3,372,500 | 3,732,422 | ||||||
Ginlong Technologies Co., Ltd. A Sharesb | 137,341 | 3,565,436 | ||||||
SITC International Holdings Co., Ltd. | 1,555,000 | 3,446,564 | ||||||
Innovent Biologics, Inc.b,c,d | 770,500 | 3,279,329 | ||||||
Morimatsu International Holdings Co., Ltd.b,d | 2,887,000 | 3,187,437 | ||||||
Flat Glass Group Co., Ltd. H Shares | 1,229,000 | 2,955,605 | ||||||
Centre Testing International Group Co., Ltd. A Shares | 865,974 | 2,786,256 | ||||||
OPT Machine Vision Tech Co., Ltd. A Shares | 117,095 | 2,232,965 | ||||||
Centre Testing International Group Co., Ltd. A Shares | 585,338 | 1,889,338 | ||||||
Tongcheng Travel Holdings, Ltd.b,d | 615,200 | 1,469,440 | ||||||
|
| |||||||
Total China/Hong Kong | 97,386,165 | |||||||
|
| |||||||
| INDIA: 23.4% | ||||||||
Shriram Finance, Ltd. | 1,490,182 | 24,737,388 | ||||||
Bandhan Bank, Ltd.b,c,d | 6,977,287 | 19,691,839 | ||||||
Phoenix Mills, Ltd. | 797,193 | 13,691,333 | ||||||
Finolex Cables, Ltd. | 1,191,546 | 7,877,626 | ||||||
Lemon Tree Hotels, Ltd.b,c,d | 4,583,142 | 4,739,645 | ||||||
Marico, Ltd. | 716,815 | 4,411,067 | ||||||
Ashok Leyland, Ltd. | 2,360,882 | 4,085,927 | ||||||
Barbeque Nation Hospitality, Ltd.b | 209,090 | 2,437,043 | ||||||
HEG, Ltd. | 161,884 | 2,011,338 | ||||||
Rainbow Children’s Medicare, Ltd. | 184,518 | 1,646,752 | ||||||
GMR Airports Infrastructure, Ltd.b | 2,225,709 | 1,067,500 | ||||||
|
| |||||||
Total India | 86,397,458 | |||||||
|
| |||||||
| TAIWAN: 8.4% | ||||||||
Andes Technology Corp. | 590,000 | 9,495,181 | ||||||
M31 Technology Corp. | 407,000 | 6,031,548 | ||||||
Poya International Co., Ltd. | 323,610 | 5,239,494 | ||||||
Yageo Corp. | 316,124 | 4,607,394 | ||||||
Formosa Sumco Technology Corp. | 565,000 | 2,488,824 | ||||||
Wiwynn Corp. | 69,000 | 1,784,714 | ||||||
ASPEED Technology, Inc. | 27,000 | 1,473,897 | ||||||
|
| |||||||
Total Taiwan | 31,121,052 | |||||||
|
| |||||||
| SOUTH KOREA: 7.9% | ||||||||
Ecopro BM Co., Ltd. | 192,606 | 14,090,101 | ||||||
Hugel, Inc.b | 109,576 | 11,703,809 | ||||||
Solus Advanced Materials Co., Ltd. | 139,346 | 3,328,337 | ||||||
|
| |||||||
Total South Korea | 29,122,247 | |||||||
|
| |||||||
| Shares | Value | |||||||
| VIETNAM: 6.1% | ||||||||
Mobile World Investment Corp. | 4,124,514 | $7,507,518 | ||||||
Military Commercial Joint Stock Bankb | 10,089,522 | 7,315,408 | ||||||
FPT Corp. | 1,471,488 | 4,793,177 | ||||||
Nam Long Investment Corp. | 2,168,432 | 2,844,013 | ||||||
|
| |||||||
Total Vietnam | 22,460,116 | |||||||
|
| |||||||
| INDONESIA: 4.8% | ||||||||
PT Mitra Adiperkasa Tbkb | 71,405,000 | 6,622,401 | ||||||
PT Summarecon Agung Tbk | 163,282,316 | 6,333,123 | ||||||
PT Bank Tabungan Negara Persero Tbk | 57,454,700 | 4,979,169 | ||||||
|
| |||||||
Total Indonesia | 17,934,693 | |||||||
|
| |||||||
| UNITED STATES: 4.5% | ||||||||
Legend Biotech Corp. ADRb | 333,451 | 16,645,874 | ||||||
|
| |||||||
Total United States | 16,645,874 | |||||||
|
| |||||||
| BRAZIL: 4.3% | ||||||||
Vamos Locacao de Caminhoes Maquinas e Equipamentos SA | 3,942,200 | 9,437,161 | ||||||
YDUQS Participacoes SA | 2,366,800 | 4,534,328 | ||||||
Vivara Participacoes SA | 500,100 | 2,121,252 | ||||||
|
| |||||||
Total Brazil | 16,092,741 | |||||||
|
| |||||||
| CHILE: 4.0% | ||||||||
Parque Arauco SA | 7,520,220 | 9,591,661 | ||||||
Lundin Mining Corp. | 589,400 | 3,617,366 | ||||||
Banco de Credito e Inversiones SA | 52,739 | 1,516,421 | ||||||
|
| |||||||
Total Chile | 14,725,448 | |||||||
|
| |||||||
| UNITED ARAB EMIRATES: 2.3% | ||||||||
Network International Holdings PLCb,c,d | 2,327,969 | 8,337,835 | ||||||
|
| |||||||
Total United Arab Emirates | 8,337,835 | |||||||
|
| |||||||
| PHILIPPINES: 1.9% | ||||||||
Cebu Air, Inc.b | 10,386,400 | 7,138,788 | ||||||
|
| |||||||
Total Philippines | 7,138,788 | |||||||
|
| |||||||
| POLAND: 1.5% | ||||||||
InPost SAb | 647,686 | 5,472,145 | ||||||
|
| |||||||
Total Poland | 5,472,145 | |||||||
|
| |||||||
| MEXICO: 1.4% | ||||||||
Banco del Bajio SAc,d | 1,622,500 | 5,124,823 | ||||||
|
| |||||||
Total Mexico | 5,124,823 | |||||||
|
| |||||||
| THAILAND: 0.9% | ||||||||
Siam Wellness Group Public Co., Ltd. F Sharesb | 9,456,600 | 3,214,669 | ||||||
|
| |||||||
Total Thailand | 3,214,669 | |||||||
|
| |||||||
| BANGLADESH: 0.8% | ||||||||
BRAC Bank, Ltd. | 8,836,192 | 2,986,421 | ||||||
|
| |||||||
Total Bangladesh | 2,986,421 | |||||||
|
| |||||||
| matthewsasia.com | 800.789.ASIA | 23 |
Table of Contents
Matthews Emerging Markets Small Companies Fund
December 31, 2022
Schedule of Investmentsa (continued)
COMMON EQUITIES (continued)
| Shares | Value | |||||||
| TURKEY: 0.8% | ||||||||
Ford Otomotiv Sanayi AS | 104,399 | $2,924,499 | ||||||
|
| |||||||
Total Turkey | 2,924,499 | |||||||
|
| |||||||
| RUSSIA: 0.0% | ||||||||
Moscow Exchange MICEX-RTS PJSCb,e | 2,101,250 | 28,492 | ||||||
TCS Group Holding PLC GDRb,d,e | 62,962 | 1,259 | ||||||
HeadHunter Group PLC ADRe | 15,800 | 316 | ||||||
|
| |||||||
Total Russia | 30,067 | |||||||
|
| |||||||
| TOTAL COMMON EQUITIES | 367,115,041 | |||||||
|
| |||||||
(Cost $365,056,958) | ||||||||
| PREFERRED EQUITIES: 1.1% | ||||||||
| BRAZIL: 1.1% | ||||||||
Banco Pan SA, Pfd. | 3,659,900 | 4,177,916 | ||||||
|
| |||||||
Total Brazil | 4,177,916 | |||||||
|
| |||||||
| TOTAL PREFERRED EQUITIES | 4,177,916 | |||||||
(Cost $6,594,264) | ||||||||
| RIGHTS: 0.0% | ||||||||
| INDONESIA: 0.0% | ||||||||
PT Bank Tabungan Negara Persero Tbk, Rights, expires 01/13/23b | 18,687,395 | 171,659 | ||||||
|
| |||||||
Total Indonesia | 171,659 | |||||||
|
| |||||||
| TOTAL RIGHTS | 171,659 | |||||||
(Cost $0) | ||||||||
| TOTAL INVESTMENTS: 100.5% | 371,464,616 | |||||||
(Cost $371,651,222) | ||||||||
| LIABILITIES IN EXCESS OF CASH AND OTHER ASSETS: (0.5%) | (2,017,068 | ) | ||||||
|
| |||||||
NET ASSETS: 100.0% |
| $369,447,548 | ||||||
|
| |||||||
| a | Certain securities were fair valued under the valuation policies approved by the Board of Trustees (Note 2-A). |
| b | Non-income producing security. |
| c | Security exempt from registration under Rule 144A of the Securities Act of 1933, as amended. The security may be resold in transactions exempt from registration normally to qualified institutional buyers. The security has been determined to be liquid in accordance with procedures adopted by the Funds’ Board of Trustees. At December 31, 2022, the aggregate value is $55,470,392, which is 15.01% of net assets. |
| d | The securities may be resold to qualified foreign investors and foreign institutional buyers under Regulation S of the Securities Act of 1933. |
| e | Security is valued using significant unobservable inputs and is classified as Level 3 in the fair value hierarchy. The aggregate value of Level 3 security is $30,067 and 0.01% of net assets. |
| ADR | American Depositary Receipt |
| GDR | Global Depositary Receipt |
| Pfd. | Preferred |
| PJSC | Public Joint Stock Co. |
See accompanying notes to financial statements.
| 24 | MATTHEWS ASIA FUNDS |
Table of Contents

| PORTFOLIO MANAGERS | ||||
| Taizo Ishida | ||||
Lead Manager | ||||
| Michael J. Oh, CFA | ||||
Co-Manager | ||||
| FUND FACTS | ||||
| Investor | Institutional | |||
Ticker | MPACX | MIAPX | ||
CUSIP | 577130867 | 577130776 | ||
Inception | 10/31/03 | 10/29/10 | ||
NAV | $20.84 | $21.11 | ||
Initial Investment | $2,500 | $100,000 | ||
Gross Expense Ratio1 | 1.13% | 0.98% | ||
Portfolio Statistics | ||||
Total # of Positions | 45 | |||
Net Assets | $632.1 million | |||
Weighted Average Market Cap | $61.3 billion | |||
Portfolio Turnover2 | 47.48% | |||
Benchmark | ||||
MSCI AC Asia Pacific Index | ||||
OBJECTIVE
Long-term capital appreciation.
STRATEGY
Under normal market conditions, the Fund seeks to achieve its investment objective by investing at least 80% of its net assets, which include borrowings for investment purposes, in the common and preferred stocks of companies located in Asia. Asia consists of all countries and markets in Asia, and includes developed, emerging and frontier countries and markets in the Asian region. The Fund may also invest in the convertible securities, of any duration or quality, of Asian companies.
Portfolio Manager Commentary (unaudited)
For the year ending December 31, 2022, the Matthews Asia Growth Fund returned –33.12% (Investor Class) and –32.99% (Institutional Class), while its benchmark, the MSCI All Country Asia Pacific Index, returned –16.92% over the same period. For the fourth quarter, the Fund returned 10.50% (Investor Class) and 10.58% (Institutional Class), while the benchmark returned 12.52%.
Market Environment
2022 was a difficult year for growth investors globally—though it played out differently in Asian markets versus the U.S. and elsewhere. As inflation concerns increased early in the year, value stocks staged a tremendous rally globally. But for the next two quarters this trend moderated in Asian markets where inflation remained relatively tamer. In the fourth quarter, we saw a modest rally in Asian growth stocks—particularly after the Chinese government’s announcement in December that it planned to dismantle its zero-COVID policy. However, this rally was insufficient to erase calendar-year losses.
Another major factor for Asian markets in 2022 was the Japanese yen, which weakened significantly as much of the developed world raised interest rates to fight inflation while the Bank of Japan maintained its highly accommodative stance. The weak yen weighed on Japanese markets, which fell 16% in the year.
Performance Contributors and Detractors
In one of the most challenging years we’ve experienced as investors, relative performance was significantly tested. At the country level, our stock selection in China/Hong Kong was the biggest detractor to performance in 2022 as our holdings encountered multiple simultaneous headwinds in the form of their growth orientation, technology focus and the negative sentiment resulting from ongoing political tensions between the U.S. and China. Stock selection in Japan was also a big detractor as low inflation persisted until late in the year and a weak yen weighed on both the economy and markets. Conversely, our lack of exposure in South Korea and underweight in Taiwan were top contributors to performance. The Fund also benefited from its overweight position and stock selection in Indonesia, which has been a relative bright spot in 2022 given its lower exposure to growth industries like information technology (IT) and communication services.
At the sector level, our stock selection in consumer discretionary was the biggest detractor while stock selection in IT and communication services also detracted from performance. Many of our holdings in these sectors—and in health care where allocation was a detractor as well as stock selection—were pressured not just by their growth orientation but also because many are Chinese.
At the holdings level, among the Fund’s bottom contributors were XPeng and Sea. Chinese electric vehicle (EV) maker XPeng was until recently one of only a few EV companies in China and serving the upper-middle segment of the market. However, 2022 saw a meaningful increase in competition which has pressured the company’s shares.
Singapore-based e-commerce and gaming platform Sea, operating mainly in Southeast Asia, experienced a decline in subscriptions as economies normalized in the wake of COVID which hurt the company’s revenues and weighed on shares. However, we remain constructive on the outlook given Sea’s dominant market share in its existing markets and growing share in new emerging markets like Brazil.
Among the Fund’s top individual contributors were Daiichi Sankyo and Bank Rakyat Indonesia. Japanese pharmaceutical Daiichi Sankyo produces Enhertu, one of the world’s leading breast cancer drugs. We are attracted to the company’s solid
(continued)
| 1 | Actual 2022 expense ratios. |
| 2 | The lesser of fiscal year 2022 long-term purchase costs or sales proceeds divided by the average monthly market value of long-term securities. |
| matthewsasia.com | 800.789.ASIA | 25 |
Table of Contents
| PERFORMANCE AS OF DECEMBER 31, 2022 | ||||||||||||||||||||||||||||
|
|
|
| Average Annual Total Returns |
| ||||||||||||||||||||||||
| 3 Months | 1 Year | 3 Years | 5 Years | 10 Years | Since Inception | Inception Date | ||||||||||||||||||||||
| Investor Class (MPACX) | 10.50% | -33.12% | -5.73% | -2.41% | 4.19% | 6.76% | 10/31/03 | |||||||||||||||||||||
| Institutional Class (MIAPX) | 10.58% | -32.99% | -5.58% | -2.25% | 4.38% | 4.05% | 10/29/10 | |||||||||||||||||||||
| MSCI AC Asia Pacific Index3 | 12.52% | -16.92% | -0.48% | 0.47% | 4.64% | 5.97% | 4 | |||||||||||||||||||||
Performance assumes reinvestment of all dividends and/or distributions before taxes. All performance quoted represents past performance and is no guarantee of future results. Investment return and principal value will fluctuate with market conditions so that when redeemed, shares may be worth more or less than their original cost. Current performance may be lower or higher than the return figures quoted. For the Fund’s most recent month-end performance, visit matthewsasia.com.
GROWTH OF A HYPOTHETICAL $10,000 INVESTMENT SINCE INCEPTION—INVESTOR CLASS
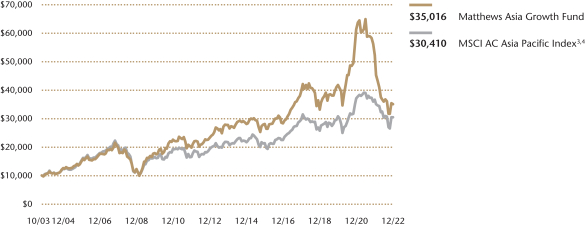
Plotted monthly. The performance data and graph do not reflect the deduction of taxes that a shareholder would pay on dividends, capital gains distributions or redemption of Fund shares. Values are in US$.
| 3 | It is not possible to invest directly in an index. Source: Index data from Morgan Stanley Capital International and Bloomberg; total return calculations performed by BNY Mellon Investment Servicing (US) Inc. Please see page 87 for index definition. |
| 4 | Calculated from 10/31/03. |
| TOP TEN HOLDINGS5 | ||||||||||
| Name | Sector | Country | % Net Assets | |||||||
| PT Bank Rakyat Indonesia Persero Tbk | Financials | Indonesia | 5.0% | |||||||
| HDFC Bank, Ltd. | Financials | India | 4.8% | |||||||
| BeiGene, Ltd. | Health Care | China/Hong Kong | 4.3% | |||||||
| Shenzhen Inovance Technology Co., Ltd. | Industrials | China/Hong Kong | 4.2% | |||||||
| Daiichi Sankyo Co., Ltd. | Health Care | Japan | 4.1% | |||||||
| Innovent Biologics, Inc. | Health Care | China/Hong Kong | 3.7% | |||||||
| Alibaba Group Holding, Ltd. | Consumer Discretionary | China/Hong Kong | 3.5% | |||||||
| Tencent Holdings, Ltd. | Communication Services | China/Hong Kong | 3.4% | |||||||
| Terumo Corp. | Health Care | Japan | 3.4% | |||||||
| Sony Group Corp. | Consumer Discretionary | Japan | 3.2% | |||||||
% OF ASSETS IN TOP 10 | 39.6% | |||||||||
| 5 | Holdings may combine more than one security from same issuer and related depositary receipts. |
| 26 | MATTHEWS ASIA FUNDS |
Table of Contents
| COUNTRY ALLOCATION (%)6,7 | ||||
| China/Hong Kong | 39.0 | |||
| Japan | 30.8 | |||
| India | 13.6 | |||
| Australia | 5.6 | |||
| Indonesia | 5.2 | |||
| United States | 3.5 | |||
| Vietnam | 1.2 | |||
| Singapore | 1.0 | |||
| Cash and Other Assets, Less Liabilities | 0.1 | |||
| SECTOR ALLOCATION (%)7 | ||||
| Health Care | 30.6 | |||
| Consumer Discretionary | 18.8 | |||
| Financials | 13.5 | |||
| Industrials | 9.5 | |||
| Communication Services | 9.4 | |||
| Information Technology | 8.9 | |||
| Consumer Staples | 4.5 | |||
| Energy | 2.6 | |||
| Materials | 2.0 | |||
| Cash and Other Assets, Less Liabilities | 0.1 | |||
| MARKET CAP EXPOSURE (%)7 | ||||
| Mega Cap (over $25B) | 57.9 | |||
| Large Cap ($10B-$25B) | 14.9 | |||
| Mid Cap ($3B-10B) | 19.0 | |||
| Small Cap (under $3B) | 8.1 | |||
| Cash and Other Assets, Less Liabilities | 0.1 | |||
| 6 | Not all countries where the Fund may invest are included in the benchmark index. |
| 7 | Source: FactSet Research Systems. Percentage values in data are rounded to the nearest tenth of one percent, so the values may not sum to 100% due to rounding. Country allocations and percentage values may be derived from different data sources and may not be consistent with other Fund literature. |
Matthews Asia Growth Fund
Portfolio Manager Commentary (unaudited) (continued)
fundamentals and the positive outlook for Enhertu. Bank Rakyat, one of the leading Asian banks, benefited from the interest rate environment in 2022. As a growth-oriented bank it has been a long-term holding in our portfolio and we maintain our conviction in the outlook.
Notable Portfolio Changes
In anticipation of a normalizing economic environment in a post-zero-COVID China, we shifted some capital in the fourth quarter to Chinese, growth-oriented names—including technology giants Alibaba and JD.com. We also introduced a position in Japanese commercial bank Sumitomo Mitsui as we anticipate the beginning of a potential rate-hike cycle in Japan. The bank’s fundamentals are solid and we capitalized on an attractive valuation to purchase shares.
We funded these purchases with several sales, including Bajaj Finance in India, which we trimmed as the position size had increased in our portfolio. We exited Ono Pharmaceutical in Japan, whose flagship cancer drug Opdivo has seen slowing sales as its growth matures. We also exited our position in XPeng given the increased competition it faces.
Outlook
As we enter 2023, we see reasons for optimism. The end of zero-COVID in China should reverse the relative economic and consumption malaise the country has faced in recent years. Increased economic activity in China could also prompt a bounce-back among growth stocks, whose valuations have decreased meaningfully thanks to the value rally in the first quarter of last year.
We think Japan could be worth watching too, as the country possibly finally starts to see signs of wage inflation which, in contrast to much of the world, would be an overall economic positive for a nation that has faced over two decades of economic stagnation and low inflation. We also anticipate moderately rising interest rates as the new Bank of Japan governor pivots toward a slightly more hawkish stance—which would in turn help stabilize the yen. Given overall solid fundamentals and still-cheap valuations, this could prove an attractive combination for investors in 2023.
India remains on solid economic footing—though nascent signs of inflation thanks to high oil prices could mean higher government deficits and pose an economic headwind. In our view, India’s economic outlook will hinge heavily on what happens with domestic interest rates. That said, for investors willing to be selective, India continues to offer compelling growth-oriented investing opportunities.
Though we have no way to forecast the outcome of major, ongoing global events such as the war in Ukraine, we believe the outlook for 2023 is relatively favorable. That said, it’s a rare year which doesn’t present investors with relatively meaningful surprises, and as ever, we will remain prepared to pivot accordingly.
| matthewsasia.com | 800.789.ASIA | 27 |
Table of Contents
Matthews Asia Growth Fund
December 31, 2022
Schedule of Investmentsa
COMMON EQUITIES: 99.9%
| Shares | Value | |||||||
| CHINA/HONG KONG: 39.0% | ||||||||
BeiGene, Ltd. ADRb | 123,127 | $27,080,553 | ||||||
Shenzhen Inovance Technology Co., Ltd. A Shares | 2,671,012 | 26,770,350 | ||||||
Innovent Biologics, Inc.b,c,d | 5,511,000 | 23,455,397 | ||||||
Alibaba Group Holding, Ltd.b | 2,031,900 | 22,295,863 | ||||||
Tencent Holdings, Ltd. | 501,600 | 21,268,023 | ||||||
H World Group, Ltd. | 4,371,700 | 18,638,474 | ||||||
Hangzhou Tigermed Consulting Co., Ltd. H Sharesc,d | 1,572,100 | 18,078,797 | ||||||
InnoCare Pharma, Ltd.b,c,d | 9,581,000 | 16,634,755 | ||||||
Pinduoduo, Inc. ADRb | 189,820 | 15,479,821 | ||||||
RemeGen Co., Ltd. H Sharesb,c,d | 1,990,000 | 14,681,583 | ||||||
JD.com, Inc. A Shares | 518,935 | 14,486,922 | ||||||
Silergy Corp. | 868,000 | 12,260,428 | ||||||
Medlive Technology Co., Ltd.c,d | 6,873,500 | 7,455,975 | ||||||
JD Health International, Inc.b,c,d | 707,650 | 6,390,116 | ||||||
Zhaoke Ophthalmology, Ltd.b,c,d | 3,303,633 | 1,271,803 | ||||||
|
| |||||||
Total China/Hong Kong | 246,248,860 | |||||||
|
| |||||||
| JAPAN: 30.8% | ||||||||
Daiichi Sankyo Co., Ltd. | 805,600 | 25,929,598 | ||||||
Terumo Corp. | 748,100 | 21,209,072 | ||||||
Sony Group Corp. | 263,900 | 20,114,886 | ||||||
Hitachi, Ltd. | 369,300 | 18,581,802 | ||||||
Keyence Corp. | 42,800 | 16,616,877 | ||||||
Japan Elevator Service Holdings Co., Ltd. | 1,194,100 | 14,843,885 | ||||||
Nintendo Co., Ltd. | 349,300 | 14,686,871 | ||||||
Shin-Etsu Chemical Co., Ltd. | 104,100 | 12,711,881 | ||||||
SoftBank Group Corp. | 239,400 | 10,124,935 | ||||||
Sumitomo Mitsui Financial Group, Inc. | 247,200 | 9,945,459 | ||||||
SHIFT, Inc.b | 52,100 | 9,171,096 | ||||||
OBIC Business Consultants Co., Ltd. | 246,100 | 8,011,460 | ||||||
giftee, Inc.b | 541,700 | 7,054,322 | ||||||
Kyoritsu Maintenance Co., Ltd. | 128,000 | 5,714,621 | ||||||
|
| |||||||
Total Japan | 194,716,765 | |||||||
|
| |||||||
| INDIA: 13.6% | ||||||||
HDFC Bank, Ltd. | 1,544,716 | 30,297,376 | ||||||
Bajaj Finance, Ltd. | 169,997 | 13,466,276 | ||||||
Avenue Supermarts, Ltd.b,c,d | 200,695 | 9,854,426 | ||||||
Dabur India, Ltd. | 1,386,252 | 9,392,033 | ||||||
Zomato, Ltd.b | 13,063,057 | 9,364,638 | ||||||
Reliance Industries, Ltd. | 222,159 | 6,820,417 | ||||||
Crompton Greaves Consumer Electricals, Ltd. | 1,632,979 | 6,635,908 | ||||||
|
| |||||||
Total India | 85,831,074 | |||||||
|
| |||||||
| INDONESIA: 5.2% | ||||||||
PT Bank Rakyat Indonesia Persero Tbk | 99,000,100 | 31,388,008 | ||||||
PT Mayora Indah Tbk | 10,007,500 | 1,610,230 | ||||||
|
| |||||||
Total Indonesia | 32,998,238 | |||||||
|
| |||||||
| Shares | Value | |||||||
| AUSTRALIA: 4.6% | ||||||||
CSL, Ltd. | 98,987 | $19,301,881 | ||||||
Woodside Energy Group, Ltd. | 397,612 | 9,629,450 | ||||||
|
| |||||||
Total Australia | 28,931,331 | |||||||
|
| |||||||
| UNITED STATES: 3.5% | ||||||||
Legend Biotech Corp. ADRb | 373,038 | 18,622,057 | ||||||
Atlassian Corp. Class Ab | 27,757 | 3,571,771 | ||||||
|
| |||||||
Total United States | 22,193,828 | |||||||
|
| |||||||
| VIETNAM: 1.2% | ||||||||
Vietnam Dairy Products JSC | 2,380,810 | 7,684,706 | ||||||
|
| |||||||
Total Vietnam | 7,684,706 | |||||||
|
| |||||||
| NEW ZEALAND: 1.0% | ||||||||
Xero, Ltd.b | 139,888 | 6,670,400 | ||||||
|
| |||||||
Total New Zealand | 6,670,400 | |||||||
|
| |||||||
| SINGAPORE: 1.0% | ||||||||
Sea, Ltd. ADRb | 120,393 | 6,264,048 | ||||||
|
| |||||||
Total Singapore | 6,264,048 | |||||||
|
| |||||||
| TOTAL INVESTMENTS: 99.9% | 631,539,250 | |||||||
(Cost $653,672,345) | ||||||||
| CASH AND OTHER ASSETS, LESS LIABILITIES: 0.1% | 538,776 | |||||||
|
| |||||||
NET ASSETS: 100.0% | $632,078,026 | |||||||
|
| |||||||
| a | Certain securities were fair valued under the valuation policies approved by the Board of Trustees (Note 2-A). |
| b | Non-income producing security. |
| c | Security exempt from registration under Rule 144A of the Securities Act of 1933, as amended. The security may be resold in transactions exempt from registration normally to qualified institutional buyers. The security has been determined to be liquid in accordance with procedures adopted by the Funds’ Board of Trustees. At December 31, 2022, the aggregate value is $97,822,852, which is 15.48% of net assets. |
| d | The securities may be resold to qualified foreign investors and foreign institutional buyers under Regulation S of the Securities Act of 1933. |
| ADR | American Depositary Receipt |
| JSC | Joint Stock Co. |
See accompanying notes to financial statements.
| 28 | MATTHEWS ASIA FUNDS |
Table of Contents
| PORTFOLIO MANAGERS | ||||
| Sharat Shroff, CFA | Inbok Song | |||
Lead Manager | Lead Manager | |||
| Winnie Chwang | Andrew Mattock, CFA | |||
Co-Manager | Co-Manager | |||
| FUND FACTS | ||||
| Investor | Institutional | |||
Ticker | MAPTX | MIPTX | ||
CUSIP | 577130107 | 577130834 | ||
Inception | 9/12/94 | 10/29/10 | ||
NAV | $20.16 | $20.16 | ||
Initial Investment | $2,500 | $100,000 | ||
Gross Expense Ratio1 | 1.10% | 0.97% | ||
After Fee Waiver and Reimbursement2 | 1.09% | 0.96% | ||
Portfolio Statistics | ||||
Total # of Positions | 52 | |||
Net Assets | $3.7 billion | |||
Weighted Average Market Cap | $105.1 billion | |||
Portfolio Turnover3 | 5.61% | |||
Benchmark | ||||
MSCI AC Asia ex Japan Index | ||||
OBJECTIVE
Long-term capital appreciation.
STRATEGY
Under normal market conditions, the Fund seeks to achieve its investment objective by investing at least 80% of its net assets, which include borrowings for investment purposes, in the common and preferred stocks of companies located in Asia ex Japan, which consists of all countries and markets in Asia excluding Japan, but including all other developed, emerging and frontier countries and markets in the Asian region.
Portfolio Manager Commentary (unaudited)
For the year ending December 31, 2022, the Matthews Pacific Tiger Fund returned –20.73% (Investor Class) and –20.62% (Institutional Class), while its benchmark, the MSCI All Country Asia ex Japan Index, returned –19.36% over the same period. For the fourth quarter, the Fund returned 9.48% (Investor Class) and 9.48% (Institutional Class), while the benchmark returned 11.43%.
Market Environment
2022 was a tough year for Asian equities, although the year ended on a positive note as the prospects of a post-COVID recovery in China started to gain traction. Chinese equities posted some of the strongest results within global markets with a rebound in sentiment stemming from the government’s statements and actions which support the easing of COVID-related restrictions in favor of ‘living with Covid’ policies. In addition, the Chinese authorities seem to be shifting their stance from risk-management (in areas like property) to reviving growth. In general, South Asia proved to be more resilient during the year given the domestic orientation of many of these economies and an outlook for gradual recovery in economic activity. Meanwhile, the more export-oriented countries such as Korea and Taiwan struggled in the first nine months but finished the year on a slight positive as investors seem to be anticipating a peak in U.S. interest rates. An expectation of a moderation in U.S. interest rates may also have been a driver of a partial recovery in Asian currencies in the fourth quarter.
Performance Contributors and Detractors
From the country perspective, stock selection within Taiwan, India and the Philippines contributed the most to the Fund’s relative performance for the year as domestic economic activities continued to recover in India and the Philippines and supply chain constraints eased in the case of Taiwan. On the other hand, stock selection in South Korea and Singapore as well as our zero exposure to Malaysia detracted from performance. Delays in the operational milestones in some of the portfolio’s South Korean holdings caused weaker earning results and accelerated derating of those companies. From a sector perspective, our allocation and stock selection within real estate and consumer discretionary contributed the most while our stock selection within materials and communication services detracted the most from relative performance.
Turning to individual securities, Central Pattana Public, Thailand’s largest retail property development and investment company, contributed the most to the portfolio’s absolute and relative performance during the year. While the company is classified under the real estate sector, the stock performed well as its underlying operations were driven by consumption recovery in the Southeast Asia region. Yum China, one of the leading restaurant chains in China, was another notable contributor. Amid a challenging external environment, the company was quick to adjust its operations toward delivery business and as a result the unit economics of its stores remained healthy. The company was also able to continue on the path toward its annual store expansion goal. In contrast, Hybe was one of the detractors. Hybe’s efforts to achieve operational leverage with a platform approach has been delayed while one of its key intellectual property assets is expected to contribute lower in the foreseeable future. Given the uncertainty combined with a still heightened valuation level, we exited our position during the fourth quarter.
(continued)
| 1 | Actual 2022 expense ratios. |
| 2 | Matthews has contractually agreed to waive a portion of its advisory fee and administrative and shareholder services fee if the Fund’s average daily net assets are over $3 billion, as follows: for every $2.5 billion average daily net assets of the Fund that are over $3 billion, the advisory fee rate and the administrative and shareholder services fee rate for the Fund with respect to such excess average daily net assets will be each reduced by 0.01%, in each case without reducing such fee rate below 0.00%. Any amount waived by Matthews pursuant to this agreement may not be recouped by Matthews. This agreement will remain in place until April 30, 2023 and may be terminated (i) at any time by the Board of Trustees upon 60 days’ prior written notice to Matthews; or (ii) by Matthews at the annual expiration date of the agreement upon 60 days’ prior written notice to the Trust, in each case without payment of any penalty. |
| 3 | The lesser of fiscal year 2022 long-term purchase costs or sales proceeds divided by the average monthly market value of long-term securities. |
| matthewsasia.com | 800.789.ASIA | 29 |
Table of Contents
| PERFORMANCE AS OF DECEMBER 31, 2022 | ||||||||||||||||||||||||||||
|
|
|
| Average Annual Total Returns |
| ||||||||||||||||||||||||
| 3 Months | 1 Year | 3 Years | 5 Years | 10 Years | Since Inception | Inception Date | ||||||||||||||||||||||
| Investor Class (MAPTX) | 9.48% | -20.73% | -0.80% | -0.80% | 4.38% | 7.46% | 9/12/94 | |||||||||||||||||||||
| Institutional Class (MIPTX) | 9.48% | -20.62% | -0.67% | -0.65% | 4.54% | 4.40% | 10/29/10 | |||||||||||||||||||||
| MSCI AC Asia ex Japan Index4 | 11.43% | -19.36% | -1.15% | -0.34% | 3.87% | 4.05% | 5 | |||||||||||||||||||||
Performance assumes reinvestment of all dividends and/or distributions before taxes. All performance quoted represents past performance and is no guarantee of future results. Investment return and principal value will fluctuate with market conditions so that when redeemed, shares may be worth more or less than their original cost. Current performance may be lower or higher than the return figures quoted. Returns would have been lower if certain of the Fund’s fees and expenses had not been waived. For the Fund’s most recent month-end performance, visit matthewsasia.com.
GROWTH OF A HYPOTHETICAL $10,000 INVESTMENT SINCE INCEPTION—INVESTOR CLASS
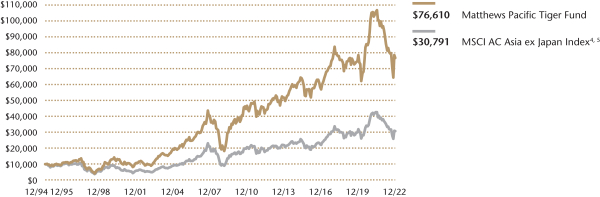
Plotted monthly. The performance data and graph do not reflect the deduction of taxes that a shareholder would pay on dividends, capital gains distributions or redemption of Fund shares. Values are in US$.
| 4 | It is not possible to invest directly in an index. Source: Index data from Morgan Stanley Capital International and Bloomberg; total return calculations performed by BNY Mellon Investment Servicing (US) Inc. Please see page 87 for index definition. |
| 5 | Calculated from 8/31/94. |
| TOP TEN HOLDINGS6 | ||||||||
| Name | Sector | Country | % Net Assets | |||||
| Taiwan Semiconductor Manufacturing Co., Ltd. | Information Technology | Taiwan | 5.7% | |||||
| Samsung Electronics Co., Ltd. | Information Technology | South Korea | 4.8% | |||||
| Tencent Holdings, Ltd. | Communication Services | China/Hong Kong | 4.6% | |||||
| Alibaba Group Holding, Ltd. | Consumer Discretionary | China/Hong Kong | 3.9% | |||||
| Meituan | Consumer Discretionary | China/Hong Kong | 3.7% | |||||
| ICICI Bank, Ltd. | Financials | India | 3.5% | |||||
| Central Pattana Public Co., Ltd. | Real Estate | Thailand | 3.2% | |||||
| China Tourism Group Duty Free Corp., Ltd. | Consumer Discretionary | China/Hong Kong | 2.9% | |||||
| Hong Kong Exchanges & Clearing, Ltd. | Financials | China/Hong Kong | 2.8% | |||||
| AIA Group, Ltd. | Financials | China/Hong Kong | 2.7% | |||||
| % OF ASSETS IN TOP 10 | 37.8% | |||||||
| 6 | Holdings may combine more than one security from same issuer and related depositary receipts. |
| 30 | MATTHEWS ASIA FUNDS |
Table of Contents
Matthews Pacific Tiger Fund
Portfolio Manager Commentary (unaudited) (continued)
HL Mando, a growing auto components company in South Korea had a negative performance contribution even though its earnings were resilient. Sentiment around uncertain auto demand and the lingering impact on supply chain constraints and subsequent cost pressure derated the company’s valuation.
Notable Portfolio Changes
We took advantage of market volatility throughout the year to rotate capital and make adjustments to the portfolio, finding opportunities in China given the potential for the country’s domestic consumption recovery. Platform-driven consumer discretionary companies such as Meituan showed strong cost control with decent revenue growth amid macroeconomic uncertainty. Additionally, valuations of these companies were at compelling levels from absolute and historical perspectives, with strong cash flow generation. These additions were funded by trimming positions in India as valuations became demanding given past strong performance. We also trimmed a couple of our information technology positions, Samsung Electronics in South Korea and Taiwan Semiconductor Manufacturing Co. (TSMC) in Taiwan. Although these companies have strong fundamentals, near-term earnings uncertainty risk has increased as both names are exposed to the slowing global demand environment.
Outlook
All eyes are squarely focused on economic recovery in China as the government has pared back all COVID-related constraints in an accelerated manner since November 2022. The surge in Chinese household deposits during the past two years may support a recovery in consumption which is emerging as the most important driver of economic activity for 2023. With the prospects for global growth in 2023 looking less inspiring, we believe the domestically-oriented economies in Asia may be better positioned to deliver growth. Furthermore, the competitive landscape has altered—somewhat dramatically in certain industries—in the post-COVID world and that is creating opportunities for growth through market share gains, new growth areas, and acceleration of certain trends that were slowly developing across the region. Examples include consolidation across many parts of retail sector in Asia, new and emerging sectors like solar/renewables, and a surge in the augmentation of manufacturing supply chains outside of China. All of these are areas that continue to be attractive.
| COUNTRY ALLOCATION (%)7,8 | ||||
| China/Hong Kong | 50.4 | |||
| India | 15.1 | |||
| Taiwan | 13.8 | |||
| South Korea | 8.7 | |||
| Thailand | 3.2 | |||
| Indonesia | 2.6 | |||
| Philippines | 2.6 | |||
| Vietnam | 1.6 | |||
| Singapore | 1.5 | |||
| Cash and Other Assets, Less Liabilities | 0.5 | |||
| SECTOR ALLOCATION (%)8 | ||||
| Consumer Discretionary | 21.5 | |||
| Information Technology | 19.9 | |||
| Financials | 18.1 | |||
| Consumer Staples | 9.4 | |||
| Real Estate | 9.2 | |||
| Industrials | 8.7 | |||
| Communication Services | 5.6 | |||
| Materials | 3.0 | |||
| Utilities | 2.1 | |||
| Health Care | 2.0 | |||
| Cash and Other Assets, Less Liabilities | 0.5 | |||
| MARKET CAP EXPOSURE (%)8 | ||||
| Mega Cap (over $25B) | 56.9 | |||
| Large Cap ($10B-$25B) | 24.6 | |||
| Mid Cap ($3B-10B) | 16.7 | |||
| Small Cap (under $3B) | 1.3 | |||
| Cash and Other Assets, Less Liabilities | 0.5 | |||
| 7 | Not all countries where the Fund may invest are included in the benchmark index. |
| 8 | Source: FactSet Research Systems. Percentage values in data are rounded to the nearest tenth of one percent, so the values may not sum to 100% due to rounding. Country allocations and percentage values may be derived from different data sources and may not be consistent with other Fund literature. |
| matthewsasia.com | 800.789.ASIA | 31 |
Table of Contents
Matthews Pacific Tiger Fund
December 31, 2022
Schedule of Investmentsa
COMMON EQUITIES: 99.5%
| Shares | Value | |||||||
| CHINA/HONG KONG: 50.3% | ||||||||
Tencent Holdings, Ltd. | 4,018,600 | $170,390,102 | ||||||
Meituan B Sharesb,c,d | 6,194,700 | 137,248,752 | ||||||
Alibaba Group Holding, Ltd.c | 11,916,000 | 130,753,236 | ||||||
China Tourism Group Duty Free Corp., Ltd. A Shares | 3,399,073 | 105,685,052 | ||||||
Hong Kong Exchanges & Clearing, Ltd. | 2,411,400 | 103,618,475 | ||||||
AIA Group, Ltd. | 9,161,000 | 101,168,511 | ||||||
China Resources Beer Holdings Co., Ltd. | 14,543,775 | 101,160,422 | ||||||
China Resources Mixc Lifestyle Services, Ltd.b,d | 19,936,630 | 100,989,722 | ||||||
Yum China Holdings, Inc. | 1,833,548 | 100,203,398 | ||||||
Kweichow Moutai Co., Ltd. A Shares | 400,273 | 99,461,526 | ||||||
JD.com, Inc. A Shares | 3,469,907 | 96,868,150 | ||||||
CITIC Securities Co., Ltd. H Shares | 45,848,600 | 92,338,274 | ||||||
Shenzhen Inovance Technology Co., Ltd. A Shares | 8,608,385 | 86,277,963 | ||||||
Pinduoduo, Inc. ADRc | 735,000 | 59,939,250 | ||||||
StarPower Semiconductor, Ltd. A Shares | 979,323 | 46,682,702 | ||||||
China Lesso Group Holdings, Ltd. | �� | 43,712,000 | 45,340,406 | |||||
ENN Energy Holdings, Ltd. | 2,981,400 | 41,644,347 | ||||||
Wuxi Biologics Cayman, Inc.b,c,d | 5,157,500 | 39,062,446 | ||||||
CSPC Pharmaceutical Group, Ltd. | 33,810,000 | 35,198,699 | ||||||
Shandong Sinocera Functional Material Co., Ltd. A Shares | 8,455,728 | 33,635,464 | ||||||
JD Logistics, Inc.b,c,d | 16,340,800 | 31,428,106 | ||||||
Sany Heavy Industry Co., Ltd. A Shares | 13,120,461 | 29,838,098 | ||||||
KE Holdings, Inc. ADRc | 1,625,000 | 22,685,000 | ||||||
Will Semiconductor Co., Ltd. Shanghai A Shares | 1,821,687 | 20,251,409 | ||||||
Alibaba Group Holding, Ltd. ADRc | 160,220 | 14,113,780 | ||||||
Contemporary Amperex Technology Co., Ltd. A Shares | 174,916 | 9,900,290 | ||||||
|
| |||||||
Total China/Hong Kong | 1,855,883,580 | |||||||
|
| |||||||
| INDIA: 15.1% | ||||||||
ICICI Bank, Ltd. | 12,042,014 | 129,521,218 | ||||||
Pidilite Industries, Ltd. | 2,523,498 | 77,629,153 | ||||||
Titan Co., Ltd. | 2,353,563 | 73,846,097 | ||||||
Housing Development Finance Corp., Ltd. | 2,109,831 | 67,073,562 | ||||||
Tata Consultancy Services, Ltd. | 1,552,939 | 61,072,616 | ||||||
Ashok Leyland, Ltd. | 34,526,160 | 59,753,678 | ||||||
Dabur India, Ltd. | 7,494,091 | 50,773,419 | ||||||
Tata Power Co., Ltd. | 15,019,464 | 37,633,936 | ||||||
|
| |||||||
Total India | 557,303,679 | |||||||
|
| |||||||
| TAIWAN: 13.9% | ||||||||
Taiwan Semiconductor Manufacturing Co., Ltd. | 14,425,000 | 209,500,958 | ||||||
Chailease Holding Co., Ltd. | 10,886,257 | 76,695,728 | ||||||
Delta Electronics, Inc. | 5,162,182 | 47,853,375 | ||||||
MediaTek, Inc. | 1,945,000 | 39,325,836 | ||||||
Uni-President Enterprises Corp. | 16,526,000 | 35,770,787 | ||||||
Accton Technology Corp. | 4,407,000 | 33,465,886 | ||||||
E Ink Holdings, Inc. | 5,431,000 | 28,440,602 | ||||||
Eclat Textile Co., Ltd. | 1,549,000 | 24,866,250 | ||||||
Yageo Corp. | 1,018,783 | 14,848,397 | ||||||
|
| |||||||
Total Taiwan | 510,767,819 | |||||||
|
| |||||||
| Shares | Value | |||||||
| SOUTH KOREA: 8.7% | ||||||||
Samsung Electronics Co., Ltd. | 4,028,966 | $176,844,385 | ||||||
Samsung Engineering Co., Ltd.c | 3,314,457 | 58,635,238 | ||||||
HL Mando Co., Ltd. | 1,504,094 | 48,000,110 | ||||||
NAVER Corp. | 266,658 | 37,924,383 | ||||||
|
| |||||||
Total South Korea | 321,404,116 | |||||||
|
| |||||||
| THAILAND: 3.2% | ||||||||
Central Pattana Public Co., Ltd. | 58,266,200 | 119,275,916 | ||||||
|
| |||||||
Total Thailand | 119,275,916 | |||||||
|
| |||||||
| INDONESIA: 2.6% | ||||||||
PT Bank Central Asia Tbk | 176,061,600 | 96,541,311 | ||||||
|
| |||||||
Total Indonesia | 96,541,311 | |||||||
|
| |||||||
| PHILIPPINES: 2.6% | ||||||||
SM Prime Holdings, Inc. | 150,947,171 | 96,305,747 | ||||||
|
| |||||||
Total Philippines | 96,305,747 | |||||||
|
| |||||||
| VIETNAM: 1.6% | ||||||||
Vietnam Dairy Products JSC | 18,369,028 | 59,290,994 | ||||||
|
| |||||||
Total Vietnam | 59,290,994 | |||||||
|
| |||||||
| SINGAPORE: 1.5% | ||||||||
Venture Corp., Ltd. | 4,257,900 | 54,271,984 | ||||||
|
| |||||||
Total Singapore | 54,271,984 | |||||||
|
| |||||||
| TOTAL INVESTMENTS: 99.5% | 3,671,045,146 | |||||||
(Cost $3,348,286,592) | ||||||||
| CASH AND OTHER ASSETS, LESS LIABILITIES: 0.5% | 17,738,886 | |||||||
|
| |||||||
NET ASSETS: 100.0% | $3,688,784,032 | |||||||
|
| |||||||
| a | Certain securities were fair valued under the valuation policies approved by the Board of Trustees (Note 2-A). |
| b | Security exempt from registration under Rule 144A of the Securities Act of 1933, as amended. The security may be resold in transactions exempt from registration normally to qualified institutional buyers. The security has been determined to be liquid in accordance with procedures adopted by the Funds’ Board of Trustees. At December 31, 2022, the aggregate value is $308,729,026, which is 8.37% of net assets. |
| c | Non-income producing security. |
| d | The securities may be resold to qualified foreign investors and foreign institutional buyers under Regulation S of the Securities Act of 1933. |
| ADR | American Depositary Receipt |
| JSC | Joint Stock Co. |
See accompanying notes to financial statements.
| 32 | MATTHEWS ASIA FUNDS |
Table of Contents
| PORTFOLIO MANAGERS | ||||
| Michael J. Oh, CFA | ||||
Lead Manager | ||||
| Taizo Ishida | ||||
Co-Manager | ||||
| FUND FACTS | ||||
| Investor | Institutional | |||
Ticker | MATFX | MITEX | ||
CUSIP | 577130883 | 577125859 | ||
Inception | 12/27/99 | 4/30/13 | ||
NAV | $11.31 | $11.49 | ||
Initial Investment | $2,500 | $100,000 | ||
Gross Expense Ratio1 | 1.18% | 1.04% | ||
Portfolio Statistics | ||||
Total # of Positions | 33 | |||
Net Assets | $472.3 million | |||
Weighted Average Market Cap | $104.4 billion | |||
Portfolio Turnover2 | 118.08% | |||
Benchmark | ||||
MSCI AC Asia ex Japan Index | ||||
OBJECTIVE
Long-term capital appreciation.
STRATEGY
Under normal market conditions, the Fund seeks to achieve its investment objective by investing at least 80% of its net assets, which include borrowings for investment purposes, in the common and preferred stocks of companies located in Asia that Matthews believes are innovators in their products, services, processes, business models, management, use of technology, or approach to creating, expanding or servicing their markets. Asia consists of all countries and markets in Asia, including developed, emerging, and frontier countries and markets in the Asian region.
Portfolio Manager Commentary (unaudited)
For the year ending December 31, 2022, the Matthews Asia Innovators Fund returned –24.80% (Investor Class) and –24.73% (Institutional Class), while its benchmark, the MSCI All Country Asia ex Japan Index, returned –19.36% over the same period. For the fourth quarter of the year, the fund returned 8.51% (Investor Class) and 8.48% (Institutional Class), while the MSCI All Country Asia ex Japan Index returned 11.43%.
Market Environment
2022 was another challenging year for Asian markets, particularly Taiwan, South Korea and China—the latter as the country’s zero-COVID policy materially impacted the domestic economy. Further pressuring China’s markets were ongoing concerns about the government’s regulatory interventions across sectors including technology and health care, as well as the challenges facing the country’s real estate sector. This combination weighed on investor sentiment and, in turn, market returns throughout the year.
Fortunately, starting in December, China’s government started to rapidly dismantle its zero-COVID policy and announced the reopening of its borders to international travel. We believe this will lift a major market—and economic—overhang as 2023 begins.
There were bright spots in 2022, including Indonesia’s and India’s markets, both of which were quite resilient given their relatively lower exposure to technology and lack of regulatory pressure. Investors seemed to view both markets as relatively stable havens, which helped deliver more moderate returns—4.23% for Indonesia and –7.49% for India.
Performance Contributors and Detractors
From a regional perspective, our stock selection in China/Hong Kong was the biggest detractor to performance during 2022 as China’s zero-COVID policy pressured business activity and consumer spending. Our underweight and stock selection in Singapore also detracted from performance. Conversely, the Fund’s overweight to India, as well as stock selection, was the biggest contributor to performance. Our underweight to technology-heavy Taiwan was also a positive contributor.
From a sector perspective, the Fund’s stock selection in communication services detracted the most from performance. Stock selection in health care was also a detractor as was stock selection in consumer discretionary, albeit mitigated by our allocation. On the other hand, the Fund’s underweight to information technology (IT) was a positive contributor, while the Fund’s stock selection in financials was the top contributor to performance as companies in the sector benefited from global interest-rate hikes. By the end of the year, both IT and communication services had experienced a rerating as many economies reopened and post-pandemic recoveries began.
At the holdings level, electronic vehicle (EV) maker XPeng was the biggest detractor as the company faced intensifying competitive pressures in a robustly growing industry. Singapore-based e-commerce platform Sea was another big detractor. It was a casualty of 2022’s technology downturn which especially punished companies without profits, like Sea. Long term, we maintain our conviction in Sea given its already dominant market share in Southeast Asia and its growing share in other emerging markets like Brazil. Conversely, Trip.com and Pinduoduo were among the top performers. Trip.com, a leading online travel agency in China, may be a major beneficiary as China lifts its pandemic restrictions policy. Chinese e-commerce platform Pinduoduo is similarly poised to benefit from China’s
(continued)
| 1 | Actual 2022 expense ratios. |
| 2 | The lesser of fiscal year 2022 long-term purchase costs or sales proceeds divided by the average monthly market value of long-term securities. |
| matthewsasia.com | 800.789.ASIA | 33 |
Table of Contents
| PERFORMANCE AS OF DECEMBER 31, 2022 | ||||||||||||||||||||||||||||||||
|
|
|
|
| Average Annual Total Returns |
|
| ||||||||||||||||||||||||||
| 3 Months | 1 Year | 3 Years | 5 Years | 10 Years | Since Inception | Inception Date | ||||||||||||||||||||||||||
| Investor Class (MATFX) | 8.51% | -24.80% | 6.86% | 5.17% | 10.72% | 4.47% | 12/27/99 | |||||||||||||||||||||||||
| Institutional Class (MITEX) | 8.48% | -24.73% | 7.00% | 5.33% | n.a. | 10.35% | 4/30/13 | |||||||||||||||||||||||||
| MSCI AC Asia ex Japan Index3 | 11.43% | -19.36% | -1.15% | -0.34% | 3.87% | 5.41% | 4 | |||||||||||||||||||||||||
Performance assumes reinvestment of all dividends and/or distributions before taxes. All performance quoted represents past performance and is no guarantee of future results. Investment return and principal value will fluctuate with market conditions so that when redeemed, shares may be worth more or less than their original cost. Current performance may be lower or higher than the return figures quoted. For the Fund’s most recent month-end performance, visit matthewsasia.com.
GROWTH OF A HYPOTHETICAL $10,000 INVESTMENT SINCE INCEPTION—INVESTOR CLASS
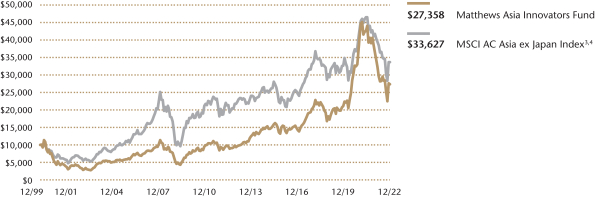
Plotted monthly. The performance data and graph do not reflect the deduction of taxes that a shareholder would pay on dividends, capital gains distributions or redemption of Fund shares. Values are in US$.
| 3 | It is not possible to invest directly in an index. Source: Index data from Morgan Stanley Capital International and Bloomberg; total return calculations performed by BNY Mellon Investment Servicing (US) Inc. Please see page 87 for index definition. |
| 4 | Calculated from 12/31/99. |
| TOP TEN HOLDINGS5 | ||||||||
| Name | Sector | Country | % Net Assets | |||||
| Tencent Holdings, Ltd. | Communication Services | China/Hong Kong | 6.4% | |||||
| Meituan | Consumer Discretionary | China/Hong Kong | 5.4% | |||||
| HDFC Bank, Ltd. | Financials | India | 5.3% | |||||
| Alibaba Group Holding, Ltd. | Consumer Discretionary | China/Hong Kong | 5.2% | |||||
| Pinduoduo, Inc. | Consumer Discretionary | China/Hong Kong | 4.9% | |||||
| Trip.com Group, Ltd. | Consumer Discretionary | China/Hong Kong | 4.9% | |||||
| Kuaishou Technology | Communication Services | China/Hong Kong | 4.7% | |||||
| H World Group, Ltd. | Consumer Discretionary | China/Hong Kong | 4.7% | |||||
| JD.com, Inc. | Consumer Discretionary | China/Hong Kong | 4.3% | |||||
| KE Holdings, Inc. | Real Estate | China/Hong Kong | 4.1% | |||||
% OF ASSETS IN TOP 10 | 49.9% | |||||||
| 5 | Holdings may combine more than one security from same issuer and related depositary receipts. |
| 34 | MATTHEWS ASIA FUNDS |
Table of Contents
| COUNTRY ALLOCATION (%)6,7 | ||||
| China/Hong Kong | 68.6 | |||
| India | 15.9 | |||
| South Korea | 5.7 | |||
| Singapore | 5.1 | |||
| Taiwan | 2.0 | |||
| Vietnam | 2.0 | |||
| Cash and Other Assets, Less Liabilities | 0.6 | |||
| SECTOR ALLOCATION (%)7 | ||||
| Consumer Discretionary | 35.3 | |||
| Communication Services | 18.0 | |||
| Financials | 14.5 | |||
| Information Technology | 9.6 | |||
| Consumer Staples | 8.9 | |||
| Industrials | 5.3 | |||
| Real Estate | 4.1 | |||
| Energy | 2.0 | |||
| Health Care | 1.6 | |||
| Cash and Other Assets, Less Liabilities | 0.6 | |||
| MARKET CAP EXPOSURE (%)7 | ||||
| Mega Cap (over $25B) | 62.6 | |||
| Large Cap ($10B-$25B) | 22.9 | |||
| Mid Cap ($3B-10B) | 10.5 | |||
| Small Cap (under $3B) | 3.3 | |||
| Cash and Other Assets, Less Liabilities | 0.6 | |||
| 6 | Not all countries are included in the benchmark index. |
| 7 | Source: FactSet Research Systems. Percentage values in data are rounded to the nearest tenth of one percent, so the values may not sum to 100% due to rounding. Country allocations and percentage values may be derived from different data sources and may not be consistent with other Fund literature. |
Matthews Asia Innovators Fund
Portfolio Manager Commentary (unaudited) (continued)
reopening. Having cut costs during the pandemic, Pinduoduo is well-positioned to expand margins and improve profitability as consumption rebounds, in our view.
Notable Portfolio Changes
Over the course of the year, we exited positions including XPeng given the growing headwinds facing the company. We also pared our exposure to Indian and Indonesian banks, such as ICICI Bank, Bajaj Finance, Bank Rakyat Indonesia and Bank Mandiri, where valuations have risen materially. We used this capital to increase our exposure to technology and semiconductor names, including Taiwan Semiconductor Manufacturing Co. (TSMC) and Samsung Electronics, where valuations became highly compelling amid the broad technology downturn.
The delisting risk to Chinese stocks trading on U.S. exchanges has materially decreased after the U.S. Public Company Accounting Oversight Board (PCAOB) last year gained full access to the audit books of these firms. Accordingly, we shifted some capital from China local shares to Chinese American Depositary Receipts (ADRs) given ADRs can be much more liquid.
Outlook
We are constructive on the broad outlook for 2023. As China shelves its zero-COVID policy, we expect consumption to pick up and overall sentiment to improve—though we expect bumps along the road to recovery. For example, normalization will pressure China’s health-care system as COVID rates rise.
We also believe the regulatory outlook has improved in China. Following several years of stringent crackdown, we are seeing positive signs the government is signaling its understanding of private companies’ important role—especially technology companies, which create many high-quality jobs, which China needs. Further, China seems to be making headway stabilizing its real estate market.
We are also increasingly seeing signs of a different interest-rate cycle in Asia, especially China. The U.S. faces a tougher inflation fight than China, which could result in lower interest rates and more stimulus in China and lead to some decoupling between the two economies in 2023.
The combination of relatively lower (and therefore, more compelling) valuations, improved investor sentiment and positive economic and regulatory outlooks give us relative optimism about the year ahead. That said, investing is hardly ever without its surprises—and we will remain ready to reposition the portfolio accordingly, should developments warrant it.
| matthewsasia.com | 800.789.ASIA | 35 |
Table of Contents
Matthews Asia Innovators Fund
December 31, 2022
Schedule of Investmentsa
COMMON EQUITIES: 99.4%
| Shares | Value | |||||||
| CHINA/HONG KONG: 68.6% | ||||||||
Tencent Holdings, Ltd. | 716,300 | $30,371,381 | ||||||
Meituan B Sharesb,c,d | 1,159,100 | 25,680,828 | ||||||
Alibaba Group Holding, Ltd.c | 2,233,200 | 24,504,710 | ||||||
Pinduoduo, Inc. ADRc | 284,711 | 23,218,182 | ||||||
Trip.com Group, Ltd. ADRc | 674,229 | 23,193,477 | ||||||
Kuaishou Technologyb,c,d | 2,489,800 | 22,381,485 | ||||||
H World Group, Ltd. ADR | 524,560 | 22,251,835 | ||||||
JD.com, Inc. A Shares | 734,173 | 20,495,644 | ||||||
KE Holdings, Inc. ADRc | 1,387,797 | 19,373,646 | ||||||
China Resources Beer Holdings Co., Ltd. | 2,358,000 | 16,401,263 | ||||||
Foshan Haitian Flavouring & Food Co., Ltd. A Shares | 1,274,076 | 14,620,430 | ||||||
Kanzhun, Ltd. ADRc | 677,924 | 13,809,312 | ||||||
Kweichow Moutai Co., Ltd. A Shares | 44,200 | 10,983,003 | ||||||
AIA Group, Ltd. | 937,000 | 10,347,658 | ||||||
Innovent Biologics, Inc.b,c,d | 1,781,500 | 7,582,252 | ||||||
Bilibili, Inc. ADRc | 314,074 | 7,440,413 | ||||||
Kingdee International Software Group Co., Ltd.c | 3,437,000 | 7,293,646 | ||||||
Shenzhen Inovance Technology Co., Ltd. A Shares | 630,070 | 6,314,908 | ||||||
Silergy Corp. | 429,000 | 6,059,589 | ||||||
OPT Machine Vision Tech Co., Ltd. A Shares | 314,570 | 5,998,751 | ||||||
Contemporary Amperex Technology Co., Ltd. A Shares | 100,600 | 5,693,986 | ||||||
|
| |||||||
Total China/Hong Kong | 324,016,399 | |||||||
|
| |||||||
| INDIA: 16.0% | ||||||||
HDFC Bank, Ltd. | 1,271,765 | 24,943,836 | ||||||
ICICI Bank, Ltd. | 1,785,648 | 19,206,032 | ||||||
IndusInd Bank, Ltd. | 961,612 | 14,135,647 | ||||||
Reliance Industries, Ltd. | 307,265 | 9,433,224 | ||||||
Zomato, Ltd.c | 10,616,094 | 7,610,460 | ||||||
|
| |||||||
Total India | 75,329,199 | |||||||
|
| |||||||
| SOUTH KOREA: 5.7% | ||||||||
Coupang, Inc.c | 710,078 | 10,445,247 | ||||||
Samsung Electronics Co., Ltd. | 214,769 | 9,426,908 | ||||||
Samsung SDI Co., Ltd. | 15,218 | 7,145,498 | ||||||
|
| |||||||
Total South Korea | 27,017,653 | |||||||
|
| |||||||
| Shares | Value | |||||||
| SINGAPORE: 5.1% | ||||||||
Grab Holdings, Ltd. Class Ac | 4,028,568 | $12,971,989 | ||||||
Sea, Ltd. ADRc | 214,007 | 11,134,784 | ||||||
|
| |||||||
Total Singapore | 24,106,773 | |||||||
|
| |||||||
| TAIWAN: 2.0% | ||||||||
Taiwan Semiconductor Manufacturing Co., Ltd. | 656,000 | 9,527,392 | ||||||
|
| |||||||
Total Taiwan | 9,527,392 | |||||||
|
| |||||||
| VIETNAM: 2.0% | ||||||||
Mobile World Investment Corp. | 5,200,248 | 9,465,590 | ||||||
|
| |||||||
Total Vietnam | 9,465,590 | |||||||
|
| |||||||
| TOTAL INVESTMENTS: 99.4% | 469,463,006 | |||||||
(Cost $471,075,233) | ||||||||
| CASH AND OTHER ASSETS, | ||||||||
| LESS LIABILITIES: 0.6% | 2,854,750 | |||||||
|
| |||||||
NET ASSETS: 100.0% | $472,317,756 | |||||||
|
| |||||||
| a | Certain securities were fair valued under the valuation policies approved by the Board of Trustees (Note 2-A). |
| b | Security exempt from registration under Rule 144A of the Securities Act of 1933, as amended. The security may be resold in transactions exempt from registration normally to qualified institutional buyers. The security has been determined to be liquid in accordance with procedures adopted by the Funds’ Board of Trustees. At December 31, 2022, the aggregate value is $55,644,565, which is 11.78% of net assets. |
| c | Non-income producing security. |
| d | The securities may be resold to qualified foreign investors and foreign institutional buyers under Regulation S of the Securities Act of 1933. |
| ADR | American Depositary Receipt |
See accompanying notes to financial statements.
| 36 | MATTHEWS ASIA FUNDS |
Table of Contents
| PORTFOLIO MANAGERS | ||||
| Andrew Mattock, CFA | ||||
Lead Manager | ||||
| Winnie Chwang | Sherwood Zhang, CFA | |||
Co-Manager | Co-Manager | |||
| FUND FACTS | ||||
| Investor | Institutional | |||
Ticker | MCHFX | MICFX | ||
CUSIP | 577130701 | 577130818 | ||
Inception | 2/19/98 | 10/29/10 | ||
NAV | $14.50 | $14.48 | ||
Initial Investment | $2,500 | $100,000 | ||
Gross Expense Ratio1 | 1.12% | 0.98% | ||
Portfolio Statistics | ||||
Total # of Positions | 64 | |||
Net Assets | $745.8 million | |||
Weighted Average | $79.6 billion | |||
Portfolio Turnover2 | 49.38% | |||
Benchmarks | ||||
MSCI China Index | ||||
MSCI China All Shares Index | ||||
OBJECTIVE
Long-term capital appreciation.
STRATEGY
Under normal market conditions, the Fund seeks to achieve its investment objective by investing at least 80% of its net assets, which include borrowings for investment purposes, in the common and preferred stocks of companies located in China. China includes its administrative and other districts, such as Hong Kong.
Portfolio Manager Commentary (unaudited)
For the year ending December 31, 2022, the Matthews China Fund returned –24.40% (Investor Class) and –24.31% (Institutional Class), while its benchmark, the MSCI China Index, returned –21.80% over the same period. For the fourth quarter, the Fund returned 16.98% (Investor Class) and 17.09% (Institutional Class), while the benchmark returned 13.53%.
Market Environment
Chinese equities were weak and choppy most of the year amid continued concern of an economic growth slowdown in the country, weighed down by COVID-19 and enforced lockdowns, ADR delisting pricing pressures and investor worries that Russia-like sanctions could be implemented upon select Chinese companies. Additionally, geopolitical headwinds combined with disappointing announcements post the 20th Party Congress impacted markets. China’s property market sentiment also continued to be negative. The real estate sector has been hit hard as potential buyers and local government casted doubts on whether some financially distressed developers can finish and deliver their pre-sold homes on time.
However, the last quarter of the year saw a reversal as Chinese equities posted some of the strongest results within global markets with a rebound in sentiment stemming from the government’s statements and actions which support the easing of COVID-related restrictions in favor of ‘living with Covid’ policies. The roll-back of COVID restrictions gained momentum during the quarter spurring speculation of a forthcoming increase in consumer discretionary activity and overall mobility.
Performance Contributors and Detractors
The portfolio’s allocation and stock selection within the consumer discretionary, consumer staples and health-care sectors contributed the most to the Fund’s relative performance for the full year. Among individual securities, Pinduoduo, one of China’s largest ecommerce platforms that started its businesses with a focus on lower-tier city, price sensitive consumers directly through its interactive shopping experience, was the largest contributor to both absolute and relative performance for the year. Pinduoduo’s stronger-than-expected earnings results contributed to its stock appreciation. The company’s platform has been growing faster than peers and has also experienced continued strong momentum of delivering monetization of the business model. Additionally, Pinduoduo continues to execute its cost cutting efforts. Opportunities in localization plays such as Shenzhen New Industries Biomedical Engineering, an in vitro diagnostics (IVD) equipment and reagent provider, also did well amid rising geopolitical tensions. The company’s products facilitate lab testing efforts in China’s hospitals and pharmaceutical industries.
On the other hand, holdings in the information technology and real estate sectors were among the top detractors to relative performance for the year. Technology holdings, including Naura Technology, detracted amid regulatory policies and harsher new technology export controls introduced by the U.S., which prohibit high-end equipment to be exported to China. The country’s technology-related companies may slow their CapEx* expansion and expenditures as they will not as easily move up the technology curve into more advanced processes. CIFI, a property developer focused on building houses near the outer perimeter of tier-one cities, was another detractor to performance. The stock fell amid deepening market concerns about the outlook of the overall property market in China. However, we remain constructive on CIFI’s long-term prospects as the company has an enviable nationwide footprint, giving it a strong base for future growth. On a long-term view, while we expect demand for real estate to moderate in growth, there is an opportunity for valuations to recover from current depressed levels.
| * | CapEx is an amount spent by a company to acquire or significantly improve the capacity or capabilities of a long-term asset such as equipment or buildings. |
(continued)
| 1 | Actual 2022 expense ratios. |
| 2 | The lesser of fiscal year 2022 long-term purchase costs or sales proceeds divided by the average monthly market value of long-term securities. |
| matthewsasia.com | 800.789.ASIA | 37 |
Table of Contents
| PERFORMANCE AS OF DECEMBER 31, 2022 | ||||||||||||||||||||||||||||
|
|
|
| Average Annual Total Returns |
| ||||||||||||||||||||||||
| 3 Months | 1 Year | 3 Years | 5 Years | 10 Years | Since Inception | Inception Date | ||||||||||||||||||||||
| Investor Class (MCHFX) | 16.98% | -24.40% | -1.74% | 0.07% | 4.72% | 8.45% | 2/19/98 | |||||||||||||||||||||
| Institutional Class (MICFX) | 17.09% | -24.31% | -1.58% | 0.23% | 4.88% | 3.07% | 10/29/10 | |||||||||||||||||||||
| MSCI China Index3 | 13.53% | -21.80% | -7.38% | -4.40% | 2.62% | 3.25% | 4 | |||||||||||||||||||||
| MSCI China All Shares Index3 | 9.12% | -23.47% | -3.75% | -2.61% | n.a. | n.a. | 5 | |||||||||||||||||||||
Performance assumes reinvestment of all dividends and/or distributions before taxes. All performance quoted represents past performance and is no guarantee of future results. Investment return and principal value will fluctuate with market conditions so that when redeemed, shares may be worth more or less than their original cost. Current performance may be lower or higher than the return figures quoted. For the Fund’s most recent month-end performance, visit matthewsasia.com.
GROWTH OF A HYPOTHETICAL $10,000 INVESTMENT SINCE INCEPTION—INVESTOR CLASS
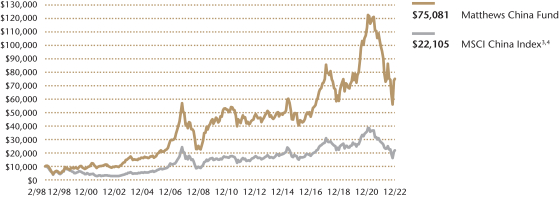
Plotted monthly. The performance data and graph do not reflect the deduction of taxes that a shareholder would pay on dividends, capital gains distributions or redemption of Fund shares. Values are in US$.
| 3 | It is not possible to invest directly in an index. Source: Index data from Morgan Stanley Capital International and Bloomberg; total return calculations performed by BNY Mellon Investment Servicing (US) Inc. Please see page 87 for index definition. |
| 4 | Calculated from 2/28/98. |
| 5 | Index performance data prior to 11/25/08 is not available. |
| TOP TEN HOLDINGS5 | ||||||||
| Name | Sector | % Net Assets | ||||||
| Pinduoduo, Inc. | Consumer Discretionary | 7.9% | ||||||
| Alibaba Group Holding, Ltd. | Consumer Discretionary | 7.3% | ||||||
| Meituan | Consumer Discretionary | 6.5% | ||||||
| JD.com, Inc. | Consumer Discretionary | 5.8% | ||||||
| China Merchants Bank Co., Ltd. | Financials | 4.4% | ||||||
| China International Capital Corp., Ltd. | Financials | 4.4% | ||||||
| Tencent Holdings, Ltd. | Communication Services | 4.3% | ||||||
| CITIC Securities Co., Ltd. | Financials | 3.0% | ||||||
| KE Holdings, Inc. | Real Estate | 3.0% | ||||||
| Focus Media Information Technology Co., Ltd. | Communication Services | 2.1% | ||||||
% OF ASSETS IN TOP 10 | 48.7% | |||||||
| 5 | Holdings may combine more than one security from same issuer and related depositary receipts. |
| 38 | MATTHEWS ASIA FUNDS |
Table of Contents
| COUNTRY ALLOCATION (%)6 | ||||
| China/Hong Kong | 99.6 | |||
| Cash and Other Assets, Less Liabilities | 0.3 | |||
| SECTOR ALLOCATION (%)6 | ||||
| Consumer Discretionary | 38.0 | |||
| Financials | 15.6 | |||
| Information Technology | 10.8 | |||
| Industrials | 8.8 | |||
| Communication Services | 8.1 | |||
| Real Estate | 7.9 | |||
| Health Care | 4.8 | |||
| Consumer Staples | 3.1 | |||
| Materials | 2.6 | |||
| Cash and Other Assets, Less Liabilities | 0.3 | |||
| MARKET CAP EXPOSURE (%)6 | ||||
| Mega Cap (over $25B) | 55.7 | |||
| Large Cap ($10B-$25B) | 24.1 | |||
| Mid Cap ($3B-10B) | 16.5 | |||
| Small Cap (under $3B) | 3.4 | |||
| Cash and Other Assets, Less Liabilities | 0.3 | |||
| 6 | Source: FactSet Research Systems. Percentage values in data are rounded to the nearest tenth of one percent, so the values may not sum to 100% due to rounding. Country allocations and percentage values may be derived from different data sources and may not be consistent with other Fund literature. |
Matthews China Fund
Portfolio Manager Commentary (unaudited) (continued)
Notable Portfolio Changes
During the quarter, we initiated new positions—as well as added to existing positions—within the consumer discretionary sector that have seen significant valuation compression given policy uncertainties, as well as to positions that we view will benefit from China’s reopening as the country continues to relax its COVID policies. We initiated positions in Galaxy Entertainment, a Macau casino operator, as we believe the company will benefit from the reopening. We also initiated positions in China Education Group, a vocational education provider in China, as it is becoming increasingly clear that the government is more supportive in the vocational education space and regulatory headwinds are easing.
Outlook
Looking ahead, China’s reopening will unfortunately be messy and the road to recovery will not be a smooth one. However, the overall direction of recovery remains clear, and we expect much of the COVID-related disruptions endured in 2022 to be behind us. The global economic outlook seems increasingly uncertain as the U.S. continues to slow, and Europe’s economic prospects continue to look fragile. In this environment, China will have to depend ever more on its internal growth engine for recovery. This could be a challenge pending more encouraging signs of recovery on the property, consumption and industrial output fronts, although we are cautiously optimistic that China will manage through these challenges given potential government support. Valuations wise, the Hong Kong market has rebounded, with positive stock performance in the fourth quarter of 2022, bolstered by end-of-COVID optimism. The A-share market, however, hasn’t reacted quite as much to the good news surrounding COVID relaxation. Coupled with valuations that are now more attractive, the A-share market stands to benefit from positive catalysts this year and, in our views, is well positioned for an improvement in 2023.
| matthewsasia.com | 800.789.ASIA | 39 |
Table of Contents
Matthews China Fund
December 31, 2022
Schedule of Investmentsa
COMMON EQUITIES: 99.7%
| Shares | Value | |||||||
| CONSUMER DISCRETIONARY: 38.0% |
| |||||||
Internet & Direct Marketing Retail: 27.5% |
| |||||||
Pinduoduo, Inc. ADRb | 719,350 | $58,662,993 | ||||||
Alibaba Group Holding, Ltd.b | 4,936,200 | 54,164,495 | ||||||
Meituan B Sharesb,c,d | 2,200,300 | 48,749,484 | ||||||
JD.com, Inc. A Shares | 1,562,013 | 43,606,157 | ||||||
|
| |||||||
| 205,183,129 | ||||||||
|
| |||||||
Hotels, Restaurants & Leisure: 2.8% |
| |||||||
Galaxy Entertainment Group, Ltd. | 1,756,000 | 11,545,096 | ||||||
H World Group, Ltd. ADR | 216,549 | 9,186,009 | ||||||
|
| |||||||
| 20,731,105 | ||||||||
|
| |||||||
Household Durables: 2.7% |
| |||||||
Midea Group Co., Ltd. A Shares | 1,471,552 | 10,969,738 | ||||||
Man Wah Holdings, Ltd. | 9,508,400 | 9,408,734 | ||||||
|
| |||||||
| 20,378,472 | ||||||||
|
| |||||||
Specialty Retail: 2.6% |
| |||||||
China Tourism Group Duty Free Corp., Ltd. A Shares | 377,190 | 11,727,711 | ||||||
Zhongsheng Group Holdings, Ltd. | 1,516,000 | 7,765,104 | ||||||
|
| |||||||
| 19,492,815 | ||||||||
|
| |||||||
Diversified Consumer Services: 1.3% |
| |||||||
China Education Group Holdings, Ltd.d | 7,581,000 | 9,748,348 | ||||||
|
| |||||||
Auto Components: 0.6% |
| |||||||
Zhejiang Shuanghuan Driveline Co., Ltd. A Shares | 1,093,417 | 4,015,679 | ||||||
|
| |||||||
Automobiles: 0.5% |
| |||||||
Yadea Group Holdings, Ltd.c,d | 2,344,000 | 3,902,713 | ||||||
|
| |||||||
Total Consumer Discretionary | 283,452,261 | |||||||
|
| |||||||
| FINANCIALS: 15.6% |
| |||||||
Capital Markets: 11.2% |
| |||||||
China International Capital Corp., Ltd. H Sharesc,d | 17,302,000 | 32,849,093 | ||||||
CITIC Securities Co., Ltd. H Shares | 11,256,925 | 22,671,249 | ||||||
China Merchants Securities Co., Ltd. H Sharesc,d | 11,745,800 | 11,502,424 | ||||||
Hong Kong Exchanges & Clearing, Ltd. | 212,400 | 9,126,882 | ||||||
East Money Information Co., Ltd. A Shares | 2,699,900 | 7,539,501 | ||||||
|
| |||||||
| 83,689,149 | ||||||||
|
| |||||||
Banks: 4.4% | ||||||||
China Merchants Bank Co., Ltd. A Shares | 6,141,523 | 32,893,677 | ||||||
|
| |||||||
Total Financials | 116,582,826 | |||||||
|
| |||||||
| INFORMATION TECHNOLOGY: 10.8% |
| |||||||
Semiconductors & Semiconductor Equipment: 4.8% |
| |||||||
Zhejiang Jingsheng Mechanical & Electrical Co., Ltd. A Shares | 790,658 | 7,253,639 | ||||||
LONGi Green Energy Technology Co., Ltd. A Shares | 1,146,112 | 6,971,236 | ||||||
NAURA Technology Group Co., Ltd. A Shares | 177,613 | 5,773,446 | ||||||
Will Semiconductor Co., Ltd. Shanghai A Shares | 388,410 | 4,317,893 | ||||||
GigaDevice Semiconductor, Inc. A Shares | 282,080 | 4,169,277 | ||||||
Beijing Huafeng Test & Control Technology Co., Ltd. A Shares | 82,303 | 3,284,094 | ||||||
Hangzhou Silan Microelectronics Co., Ltd. A Shares | 592,209 | 2,798,679 | ||||||
Cambricon Technologies Corp., Ltd. A Sharesb | 124,577 | 984,408 | ||||||
|
| |||||||
| 35,552,672 | ||||||||
|
| |||||||
| �� | Shares | Value | ||||||
| Software: 4.7% |
| |||||||
Shanghai Baosight Software Co., Ltd. A Shares | 1,688,144 | $10,906,470 | ||||||
Thunder Software Technology Co., Ltd. A Shares | 679,866 | 9,827,941 | ||||||
Beijing Kingsoft Office Software, Inc. A Shares | 189,291 | 7,210,360 | ||||||
Kingdee International Software Group Co., Ltd.b | 3,232,000 | 6,858,616 | ||||||
|
| |||||||
| 34,803,387 | ||||||||
|
| |||||||
Electronic Equipment, Instruments & Components: 1.3% |
| |||||||
Wingtech Technology Co., Ltd. A Shares | 1,001,317 | 7,577,471 | ||||||
Xiamen Faratronic Co., Ltd. A Shares | 107,609 | 2,482,926 | ||||||
|
| |||||||
| 10,060,397 | ||||||||
|
| |||||||
Total Information Technology | 80,416,456 | |||||||
|
| |||||||
| INDUSTRIALS: 8.8% |
| |||||||
Machinery: 4.5% |
| |||||||
Shenzhen Inovance Technology Co., Ltd. A Shares | 1,107,907 | 11,104,052 | ||||||
Estun Automation Co., Ltd. A Shares | 2,948,644 | 9,222,029 | ||||||
Wuxi Lead Intelligent Equipment Co., Ltd. A Shares | 1,438,716 | 8,337,216 | ||||||
Weichai Power Co., Ltd. A Shares | 2,446,161 | 3,586,598 | ||||||
Jiangsu Hengli Hydraulic Co., Ltd. A Shares | 133,100 | 1,212,330 | ||||||
|
| |||||||
| 33,462,225 | ||||||||
|
| |||||||
Electrical Equipment: 3.0% |
| |||||||
Sungrow Power Supply Co., Ltd. A Shares | 677,874 | 10,926,008 | ||||||
Contemporary Amperex Technology Co., Ltd. A Shares | 163,800 | 9,271,122 | ||||||
Gotion High-tech Co., Ltd. A Shares | 530,583 | 2,202,586 | ||||||
|
| |||||||
| 22,399,716 | ||||||||
|
| |||||||
Transportation Infrastructure: 1.3% |
| |||||||
Shanghai International Airport Co., Ltd. A Sharesb | 1,141,341 | 9,497,491 | ||||||
|
| |||||||
Total Industrials | 65,359,432 | |||||||
|
| |||||||
| COMMUNICATION SERVICES: 8.1% |
| |||||||
Interactive Media & Services: 4.3% |
| |||||||
Tencent Holdings, Ltd. | 749,800 | 31,791,793 | ||||||
|
| |||||||
Media: 2.0% |
| |||||||
Focus Media Information Technology Co., Ltd. A Shares | 15,941,057 | 15,332,942 | ||||||
|
| |||||||
Entertainment: 1.8% |
| |||||||
Bilibili, Inc. ADRb | 558,551 | 13,232,073 | ||||||
|
| |||||||
Total Communication Services | 60,356,808 | |||||||
|
| |||||||
| REAL ESTATE: 7.9% |
| |||||||
Real Estate Management & Development: 7.9% |
| |||||||
KE Holdings, Inc. ADRb | 1,615,735 | 22,555,660 | ||||||
CIFI Holdings Group Co., Ltd. | 108,129,520 | 15,013,552 | ||||||
Country Garden Services Holdings Co., Ltd. | 6,094,000 | 14,949,428 | ||||||
Times China Holdings, Ltd.b | 31,604,000 | 6,059,974 | ||||||
|
| |||||||
Total Real Estate | 58,578,614 | |||||||
|
| |||||||
| 40 | MATTHEWS ASIA FUNDS |
Table of Contents
Matthews China Fund
December 31, 2022
Schedule of Investmentsa (continued)
COMMON EQUITIES (continued)
| Shares | Value | |||||||
| HEALTH CARE: 4.8% | ||||||||
Life Sciences Tools & Services: 3.2% | ||||||||
Pharmaron Beijing Co., Ltd. H Sharesc,d | 1,803,600 | $12,393,144 | ||||||
Hangzhou Tigermed Consulting Co., Ltd. A Shares | 571,781 | 8,630,083 | ||||||
Wuxi Biologics Cayman, Inc.b,c,d | 379,500 | 2,874,300 | ||||||
|
| |||||||
| 23,897,527 | ||||||||
|
| |||||||
Health Care Equipment & Supplies: 1.4% | ||||||||
Shenzhen Mindray Bio-Medical Electronics Co., Ltd. A Shares | 152,573 | 6,949,838 | ||||||
Shenzhen New Industries Biomedical Engineering Co., Ltd. A Shares | 445,700 | 3,220,514 | ||||||
|
| |||||||
| 10,170,352 | ||||||||
|
| |||||||
Health Care Providers & Services: 0.1% | ||||||||
Topchoice Medical Corp. A Sharesb | 35,891 | 789,819 | ||||||
|
| |||||||
Pharmaceuticals: 0.1% | ||||||||
Jiangsu Hengrui Pharmaceuticals Co., Ltd. A Shares | 113,733 | 631,729 | ||||||
|
| |||||||
Total Health Care | 35,489,427 | |||||||
|
| |||||||
| CONSUMER STAPLES: 3.1% | ||||||||
Beverages: 2.9% | ||||||||
Wuliangye Yibin Co., Ltd. A Shares | 522,819 | 13,595,916 | ||||||
Shanxi Xinghuacun Fen Wine Factory Co., Ltd. A Shares | 203,822 | 8,366,233 | ||||||
|
| |||||||
| 21,962,149 | ||||||||
|
| |||||||
Food Products: 0.2% | ||||||||
Anjoy Foods Group Co., Ltd. A Shares | 63,723 | 1,489,764 | ||||||
|
| |||||||
Total Consumer Staples | 23,451,913 | |||||||
|
| |||||||
| MATERIALS: 2.6% | ||||||||
Chemicals: 2.5% | ||||||||
Shanghai Putailai New Energy Technology Co., Ltd. A Shares | 1,282,586 | 9,602,139 | ||||||
Skshu Paint Co., Ltd. A Sharesb | 232,726 | 3,814,836 | ||||||
Shandong Sinocera Functional Material Co., Ltd. A Shares | 920,224 | 3,660,496 | ||||||
Wanhua Chemical Group Co., Ltd. A Shares | 120,218 | 1,605,532 | ||||||
|
| |||||||
| 18,683,003 | ||||||||
|
| |||||||
Construction Materials: 0.1% | ||||||||
China Jushi Co., Ltd. A Shares | 423,389 | 836,888 | ||||||
|
| |||||||
Total Materials | 19,519,891 | |||||||
|
| |||||||
| TOTAL INVESTMENTS: 99.7% | 743,207,628 | |||||||
(Cost $917,249,871) | ||||||||
| CASH AND OTHER ASSETS, LESS LIABILITIES: 0.3% | 2,579,699 | |||||||
|
| |||||||
NET ASSETS: 100.0% | $745,787,327 | |||||||
|
| |||||||
| a | Certain securities were fair valued under the valuation policies approved by the Board of Trustees (Note 2-A). |
| b | Non-income producing security. |
| c | Security exempt from registration under Rule 144A of the Securities Act of 1933, as amended. The security may be resold in transactions exempt from registration normally to qualified institutional buyers. The security has been determined to be liquid in accordance with procedures adopted by the Funds’ Board of Trustees. At December 31, 2022, the aggregate value is $112,271,158, which is 15.05% of net assets. |
| d | The securities may be resold to qualified foreign investors and foreign institutional buyers under Regulation S of the Securities Act of 1933. |
| ADR | American Depositary Receipt |
See accompanying notes to financial statements.
| matthewsasia.com | 800.789.ASIA | 41 |
Table of Contents
| PORTFOLIO MANAGERS | ||||
| Winnie Chwang | Andrew Mattock, CFA | |||
Lead Manager | Lead Manager | |||
| FUND FACTS | ||||
| Investor | Institutional | |||
Ticker | MCSMX | MICHX | ||
CUSIP | 577125404 | 577125842 | ||
Inception | 5/31/11 | 11/30/17 | ||
NAV | $11.11 | $11.12 | ||
Initial Investment | $2,500 | $100,000 | ||
Gross Expense Ratio1 | 1.55% | 1.38% | ||
After Fee Waiver and Reimbursement2 | 1.41% | 1.20% | ||
Portfolio Statistics | ||||
Total # of Positions | 64 | |||
Net Assets | $154.8 million | |||
Weighted Average Market Cap | $5.0 billion | |||
Portfolio Turnover3 | 59.00% | |||
Benchmark | ||||
MSCI China Small Cap Index | ||||
OBJECTIVE
Long-term capital appreciation.
STRATEGY
Under normal market conditions, the Fund seeks to achieve its investment objective by investing at least 80% of its net assets, which include borrowings for investment purposes, in the common and preferred stocks of Small Companies located in China. China includes its administrative and other districts, such as Hong Kong. The Fund defines Small Companies as companies with market capitalization no higher than the greater of $5 billion or the market capitalization of the largest company included in the Fund’s primary benchmark, the MSCI China Small Cap Index.
Matthews China Small Companies Fund
Portfolio Manager Commentary (unaudited)
For the year ending December 31, 2022, the Matthews China Small Companies Fund returned –31.26% (Investor Class) and –31.08% (Institutional Class), while its benchmark, the MSCI China Small Cap Index, returned –24.77% over the same period. For the fourth quarter, the Fund returned 11.57% (Investor Class) and 11.61% (Institutional Class), while the benchmark returned 21.39%.
Market Environment
During 2022, China small caps lagged their large cap peers. Chinese equities were weak and choppy most of the year amid continued concern over an economic growth slowdown in the country, weighed down by COVID-19 and enforced lockdowns, ADR delisting pricing pressures and investor worries that Russia-like sanctions could be implemented upon select Chinese companies. Additionally, geopolitical headwinds combined with disappointing announcements post the 20th Party Congress impacted markets. China’s property market sentiment also continued to be negative. The real estate sector has been hit hard as potential buyers and local government casted doubts on whether some financially distressed developers can finish and deliver their pre-sold homes on time.
However, the last quarter of the year saw a reversal as Chinese equities posted some of the strongest results within global markets with a rebound in sentiment stemming from the government’s statements and actions which support the easing of COVID-related restrictions in favor of ‘living with Covid’ policies. The roll-back of COVID restrictions gained momentum during the quarter spurring speculation of a forthcoming increase in consumer discretionary activity and overall mobility.
Performance Contributors and Detractors
The portfolio’s stock selection within the industrials and utilities sectors as well as its under allocation to the real estate sector contributed the most to the Fund’s relative performance for the full year. Among individual holdings, Yangzijiang Shipbuilding, one of the few private shipbuilders remaining in China and a well-run and efficient operator, contributed the most to absolute and relative performance. The company outperformed on strong vessel orderbooks amid greater demand on higher freight rates, as well as environmentally driven upgrades which encourage an acceleration of scrapping of old vessels for the industry. China Overseas Property, a property management firm, whose sister company (China Overseas Land and Investment) is one of China’s largest state-owned property developers, was another top contributor to relative performance. In the current market consolidation phase of the real estate industry, state-owned enterprise (SOE) developers are favored as they have some of the strongest balance sheets in the market and have fewer liquidity concerns. China Overseas Property has an asset-light business model and is less subject to liquidity concerns. Further, its association with a SOE developer will continue to enable it to grow steadily while at the same time potentially benefit from M&A opportunities.
On the other hand, holdings in the information technology sector were among the top detractors to performance for the year. Technology holdings, including ACM Research, detracted amid regulatory policies and harsher new technology export controls introduced by the U.S. ACM Research is a semiconductor equipment company which provides a variety of equipment used in China’s foundries. With
(continued)
| 1 | Actual 2022 expense ratios. |
| 2 | Matthews has contractually agreed (i) to waive fees and reimburse expenses to the extent needed to limit Total Annual Fund Operating Expenses (excluding Rule 12b-1 fees, taxes, interest, brokerage commissions, short sale dividend expenses, expenses incurred in connection with any merger or reorganization or extraordinary expenses such as litigation) of the Institutional Class to 1.20% first by waiving class specific expenses (i.e., shareholder service fees specific to a particular class) of the Institutional Class and then, to the extent necessary, by waiving non-class specific expenses (e.g., custody fees) of the Institutional Class, and (ii) if any Fund-wide expenses (i.e., expenses that apply to both the Institutional Class and the Investor Class) are waived for the Institutional Class to maintain the 1.20% expense limitation, to waive an equal amount (in annual percentage terms) of those same expenses for the Investor Class. The Total Annual Fund Operating Expenses After Fee Waiver and Expense Reimbursement for the Investor Class may vary from year to year and will in some years exceed 1.20%. If the operating expenses fall below the expense limitation within three years after Matthews has made a waiver or reimbursement, the Fund may reimburse Matthews up to an amount that does not cause the expenses for that year to exceed the lesser of (i) the expense limitation applicable at the time of that fee waiver and/or expense reimbursement or (ii) the expense limitation in effect at the time of recoupment. This agreement will remain in place until April 30, 2023 and may be terminated at any time by the Board of Trustees on behalf of the Fund on 60 days’ written notice to Matthews. Matthews may decline to renew this agreement by written notice to the Trust at least 30 days before its annual expiration date. |
| 3 | The lesser of fiscal year 2022 long-term purchase costs or sales proceeds divided by the average monthly market value of long-term securities. |
| 42 | MATTHEWS ASIA FUNDS |
Table of Contents
| PERFORMANCE AS OF DECEMBER 31, 2022 | ||||||||||||||||||||||||||||
|
|
|
| Average Annual Total Returns |
| ||||||||||||||||||||||||
| 3 Months | 1 Year | 3 Years | 5 Years | 10 Years | Since Inception | Inception date | ||||||||||||||||||||||
| Investor Class (MCSMX) | 11.57% | -31.26% | 6.55% | 6.16% | 10.14% | 6.38% | 05/31/11 | |||||||||||||||||||||
| Institutional Class (MICHX) | 11.61% | -31.08% | 6.80% | 6.40% | n.a. | 7.56% | 11/30/17 | |||||||||||||||||||||
| MSCI China Small Cap Index4 | 21.39% | -24.77% | -3.55% | -5.10% | 1.00% | -1.07% | 5 | |||||||||||||||||||||
Performance assumes reinvestment of all dividends and/or distributions before taxes. All performance quoted represents past performance and is no guarantee of future results. Investment return and principal value will fluctuate with market conditions so that when redeemed, shares may be worth more or less than their original cost. Current performance may be lower or higher than the return figures quoted. Returns would have been lower if certain of the Fund’s fees and expenses had not been waived. For the Fund’s most recent month-end performance, visit matthewsasia.com.
GROWTH OF A HYPOTHETICAL $10,000 INVESTMENT SINCE INCEPTION—INVESTOR CLASS
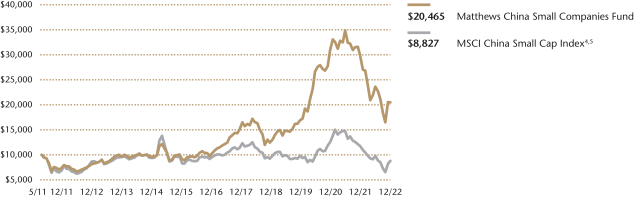
Plotted monthly. The performance data and graph do not reflect the deduction of taxes that a shareholder would pay on dividends, capital gains distributions or redemption of Fund shares. Values are in US$.
| 4 | It is not possible to invest directly in an index. Source: Index data from Morgan Stanley Capital International and Bloomberg; total return calculations performed by BNY Mellon Investment Servicing (US) Inc. Please see page 87 for index definition. |
| 5 | Calculated from 5/31/11 |
| TOP TEN HOLDINGS6 | ||||||||
| Name | Sector | % Net Assets | ||||||
| China Overseas Property Holdings, Ltd. | Real Estate | 3.6% | ||||||
| Hainan Meilan International Airport Co., Ltd. | Industrials | 3.3% | ||||||
| Pharmaron Beijing Co., Ltd. | Health Care | 3.0% | ||||||
| Yangzijiang Shipbuilding Holdings, Ltd. | Industrials | 3.0% | ||||||
| Morimatsu International Holdings Co., Ltd. | Industrials | 2.9% | ||||||
| ENN Natural Gas Co., Ltd. | Utilities | 2.5% | ||||||
| BOE Varitronix, Ltd. | Information Technology | 2.4% | ||||||
| Full Truck Alliance Co., Ltd. | Industrials | 2.4% | ||||||
| Xtep International Holdings, Ltd. | �� | Consumer Discretionary | 2.3% | |||||
| China State Construction International Holdings, Ltd. | Industrials | 2.2% | ||||||
| % OF ASSETS IN TOP 10 | 27.6% | |||||||
| 6 | Holdings may combine more than one security from same issuer and related depositary receipts. |
| matthewsasia.com | 800.789.ASIA | 43 |
Table of Contents
Matthews China Small Companies Fund
Portfolio Manager Commentary (unaudited) (continued)
the new technology export controls in place, which prohibit high end equipment to be exported to China, China’s foundries may slow their CapEx expansion and reduce semiconductor equipment expenditures as they will not as easily move up the technology curve into more advanced processes.
CIFI Ever Sunshine was another detractor to performance. The company is a property management company and shares a similar business model as China Overseas Property, but is associated with private developer, CIFI. Private developers saw a significant multiple de-rating over the quarter given market concerns about solvency. We continue to hold CIFI Ever Sunshine as we believe private developers will continue to see their liquidity conditions improve as contracted sales pick up with COVID restrictions easing.
Notable Portfolio Changes
During the quarter, we added AK Medical, one of China’s leading orthopedics joint manufacturers. We observed throughout the year that the overall attitude toward drug and medical devices price cuts has moderated and become less severe. This improves the overall predictability of future pricing impact and strengthens earnings visibility for the sector. AK Medical has also demonstrated its competitiveness under harsh pricing environments and has continued to gain market share. We like the orthopedic industry given its large addressable market. We see continued trends of orthopedic needs increasing given the demographic shifts in China. We exited China Yongda, a luxury and mass-market auto dealer in China. The company trades at very attractive valuations and we continued to hold onto the stock given potential customer traffic recovery post COVID. However, we eventually decided to sell out of the name due to limited portfolio exposure to the growing category of new energy vehicles (NEVs) and concerns that NEVs will require less service and maintenance and affect a sizable part of revenues and profits for the company.
Outlook
Looking ahead, China’s reopening will unfortunately be messy and the road to recovery will not be a smooth one. However, the overall direction of recovery remains clear, and we expect much of the COVID-related disruptions endured in 2022 to be behind us. The global economic outlook looks increasingly uncertain as the U.S. continues to slow, and Europe’s economic prospects continues to look fragile. In this environment, China will have to depend ever more on its internal growth engine for recovery. This could be a challenge pending more encouraging signs of recovery on the property, consumption and industrial output fronts, although we are cautiously optimistic that China will manage through these challenges given potential government support. Valuations wise, the Hong Kong market has rebounded, with positive stock performance in the fourth quarter of 2022, bolstered by end-of-COVID optimism. The A-share market, however, hasn’t reacted quite as much to the good news surrounding COVID relaxation. Coupled with valuations that are now more attractive, the A-share market stands to benefit from positive catalysts and, in our view, is well positioned for an improvement in 2023.
| COUNTRY ALLOCATION (%)7 | ||||
| China/Hong Kong | 91.3 | |||
| Taiwan | 5.4 | |||
| United States | 3.5 | |||
Liabilities in Excess of Cash and Other Assets | -0.2 | |||
| SECTOR ALLOCATION (%)7 | ||||
| Industrials | 28.2 | |||
| Consumer Discretionary | 16.1 | |||
| Information Technology | 15.9 | |||
| Health Care | 12.0 | |||
| Real Estate | 9.7 | |||
| Consumer Staples | 7.7 | |||
| Financials | 3.3 | |||
| Materials | 2.7 | |||
| Utilities | 2.5 | |||
| Communication Services | 2.1 | |||
| Liabilities in Excess of Cash and Other Assets | -0.2 | |||
| MARKET CAP EXPOSURE (%)7,8 | ||||
| Mega Cap (over $25B) | 0.0 | |||
| Large Cap ($10B-$25B) | 8.3 | |||
| Mid Cap ($3B-10B) | 51.9 | |||
| Small Cap (under $3B) | 40.0 | |||
| Liabilities in Excess of Cash and Other Assets | -0.2 | |||
| 7 | Source: FactSet Research Systems. Percentage values in data are rounded to the nearest tenth of one percent, so the values may not sum to 100% due to rounding. Country allocations and percentage values may be derived from different data sources and may not be consistent with other Fund literature. |
| 8 | The Fund defines Small Companies as companies with market capitalization no higher than the greater of $5 billion or the market capitalization of the largest company included in the Fund’s primary benchmark, the MSCI China Small Cap Index. |
| 44 | MATTHEWS ASIA FUNDS |
Table of Contents
Matthews China Small Companies Fund
December 31, 2022
Schedule of Investmentsa
COMMON EQUITIES: 100.2%
| Shares | Value | |||||||
| INDUSTRIALS: 28.2% | ||||||||
Machinery: 12.7% |
| |||||||
Yangzijiang Shipbuilding Holdings, Ltd. | 4,502,400 | $4,573,563 | ||||||
Morimatsu International Holdings Co., Ltd.b,c | 4,035,000 | 4,454,904 | ||||||
Zhuzhou Huarui Precision Cutting Tools Co., Ltd. A Shares | 140,266 | 3,265,842 | ||||||
Airtac International Group | 88,191 | 2,662,615 | ||||||
Zhuzhou CRRC Times Electric Co., Ltd. | 279,800 | 1,381,971 | ||||||
Luoyang Xinqianglian Slewing Bearing Co., Ltd. A Shares | 147,900 | 1,139,353 | ||||||
Estun Automation Co., Ltd. A Shares | 343,500 | 1,074,313 | ||||||
Leader Harmonious Drive Systems Co., Ltd. A Shares | 74,188 | 1,037,693 | ||||||
|
| |||||||
| 19,590,254 | ||||||||
|
| |||||||
Electrical Equipment: 4.5% |
| |||||||
Zhejiang HangKe Technology, Inc., Co. A Shares | 480,242 | 3,045,844 | ||||||
Ginlong Technologies Co., Ltd. A Sharesb | 86,655 | 2,256,810 | ||||||
Hongfa Technology Co., Ltd. A Shares | 351,557 | 1,692,233 | ||||||
|
| |||||||
| 6,994,887 | ||||||||
|
| |||||||
Transportation Infrastructure: 3.3% |
| |||||||
Hainan Meilan International Airport Co., Ltd. H Sharesb | 1,709,000 | 5,173,846 | ||||||
|
| |||||||
Road & Rail: 2.4% |
| |||||||
Full Truck Alliance Co., Ltd. ADRb | 463,034 | 3,704,272 | ||||||
|
| |||||||
Construction & Engineering: 2.3% |
| |||||||
China State Construction International | ||||||||
Holdings, Ltd. | 3,106,000 | 3,477,673 | ||||||
|
| |||||||
Air Freight & Logistics: 2.1% | ||||||||
Milkyway Chemical Supply Chain Service Co., Ltd. A Shares | 193,530 | 3,257,399 | ||||||
|
| |||||||
Marine: 0.9% | ||||||||
SITC International Holdings Co., Ltd. | 659,500 | 1,461,742 | ||||||
|
| |||||||
Total Industrials | 43,660,073 | |||||||
|
| |||||||
| CONSUMER DISCRETIONARY: 16.1% | ||||||||
Hotels, Restaurants & Leisure: 4.5% |
| |||||||
Melco International Development, Ltd.b | 2,236,000 | 2,415,374 | ||||||
BTG Hotels Group Co., Ltd. A Shares | 646,900 | 2,313,318 | ||||||
Helens International Holdings Co., Ltd.b | 1,220,500 | 2,305,027 | ||||||
|
| |||||||
| 7,033,719 | ||||||||
|
| |||||||
Textiles, Apparel & Luxury Goods: 4.1% |
| |||||||
Xtep International Holdings, Ltd. | 3,182,000 | 3,521,591 | ||||||
Samsonite International SAb,c,d | 1,104,300 | 2,899,568 | ||||||
|
| |||||||
| 6,421,159 | ||||||||
|
| |||||||
Automobiles: 2.0% |
| |||||||
Yadea Group Holdings, Ltd.c,d | 1,878,000 | 3,126,832 | ||||||
|
| |||||||
Auto Components: 2.0% | ||||||||
Zhejiang Shuanghuan Driveline Co., Ltd. A Shares | 819,303 | 3,018,594 | ||||||
|
| |||||||
Household Durables: 1.8% |
| |||||||
Jason Furniture Hangzhou Co., Ltd. A Shares | 455,200 | 2,796,622 | ||||||
|
| |||||||
Diversified Consumer Services: 1.7% |
| |||||||
China Education Group Holdings, Ltd.c | 1,998,000 | 2,569,213 | ||||||
|
| |||||||
Total Consumer Discretionary | 24,966,139 | |||||||
|
| |||||||
| Shares | Value | |||||||
| INFORMATION TECHNOLOGY: 15.9% | ||||||||
Semiconductors & Semiconductor Equipment: 7.9% |
| |||||||
Alchip Technologies, Ltd. | 115,000 | $2,921,032 | ||||||
ACM Research, Inc. Class Ab | 268,772 | 2,072,232 | ||||||
StarPower Semiconductor, Ltd. A Shares | 42,692 | 2,035,057 | ||||||
Beijing Huafeng Test & Control Technology Co., Ltd. A Shares | 41,017 | 1,636,680 | ||||||
Pan Jit International, Inc. | 787,000 | 1,475,255 | ||||||
Sino Wealth Electronic, Ltd. A Shares | 263,139 | 1,341,974 | ||||||
Silergy Corp. | 56,000 | 790,995 | ||||||
|
| |||||||
| 12,273,225 | ||||||||
|
| |||||||
Software: 4.0% | ||||||||
Kingdee International Software Group Co., Ltd.b | 1,507,000 | 3,198,000 | ||||||
Longshine Technology Group Co., Ltd. A Shares | 953,144 | 3,024,223 | ||||||
|
| |||||||
| 6,222,223 | ||||||||
|
| |||||||
Electronic Equipment, Instruments & Components: 4.0% |
| |||||||
BOE Varitronix, Ltd. | 1,997,000 | 3,775,332 | ||||||
Shenzhen Topband Co., Ltd. A Shares | 1,581,100 | 2,362,751 | ||||||
China High Precision Automation Group, Ltd.b,e | 195,000 | 250 | ||||||
|
| |||||||
| 6,138,333 | ||||||||
|
| |||||||
Total Information Technology | 24,633,781 | |||||||
|
| |||||||
| HEALTH CARE: 12.0% | ||||||||
Biotechnology: 4.8% | ||||||||
Legend Biotech Corp. ADRb | 67,419 | 3,365,557 | ||||||
RemeGen Co., Ltd. H Sharesb,c,d | 265,500 | 1,958,774 | ||||||
Akeso, Inc. B Sharesb,c,d | 218,000 | 1,191,630 | ||||||
Zai Lab, Ltd.b | 304,200 | 941,577 | ||||||
|
| |||||||
| 7,457,538 | ||||||||
|
| |||||||
Life Sciences Tools & Services: 4.0% | ||||||||
Pharmaron Beijing Co., Ltd. H Sharesc,d | 685,500 | 4,710,302 | ||||||
Joinn Laboratories China Co., Ltd. H Sharesc,d | 300,500 | 1,534,817 | ||||||
|
| |||||||
| 6,245,119 | ||||||||
|
| |||||||
Health Care Equipment & Supplies: 3.2% |
| |||||||
AK Medical Holdings, Ltd.c,d | 1,916,000 | 2,398,516 | ||||||
Shenzhen New Industries Biomedical Engineering Co., Ltd. A Shares | 217,765 | 1,578,776 | ||||||
Brighten Optix Corp. | 143,000 | 866,782 | ||||||
Qingdao Haier Biomedical Co., Ltd. A Shares | 6,467 | 59,113 | ||||||
|
| |||||||
| 4,903,187 | ||||||||
|
| |||||||
Total Health Care | 18,605,844 | |||||||
|
| |||||||
| REAL ESTATE: 9.7% | ||||||||
Real Estate Management & Development: 9.7% |
| |||||||
China Overseas Property Holdings, Ltd. | 5,430,000 | 5,625,354 | ||||||
KE Holdings, Inc. A Sharesb | 642,900 | 2,999,075 | ||||||
CIFI Ever Sunshine Services Group, Ltd.c | 5,152,000 | 2,863,654 | ||||||
China Jinmao Holdings Group, Ltd. | 7,398,000 | 1,582,775 | ||||||
Times China Holdings, Ltd.b | 5,630,000 | 1,079,536 | ||||||
KWG Group Holdings, Ltd.b | 3,414,500 | 806,115 | ||||||
|
| |||||||
Total Real Estate | 14,956,509 | |||||||
|
| |||||||
| matthewsasia.com | 800.789.ASIA | 45 |
Table of Contents
Matthews China Small Companies Fund
December 31, 2022
Schedule of Investmentsa (continued)
COMMON EQUITIES (continued)
| Shares | Value | |||||||
| CONSUMER STAPLES: 7.7% | ||||||||
Food Products: 5.7% | ||||||||
Jonjee Hi-Tech Industrial And Commercial | ||||||||
Holding Co., Ltd. A Shares | 473,032 | $2,514,876 | ||||||
Anjoy Foods Group Co., Ltd. A Shares | 104,347 | 2,439,502 | ||||||
Chacha Food Co., Ltd. A Shares | 330,400 | 2,381,887 | ||||||
Yantai China Pet Foods Co., Ltd. A Shares | 482,148 | 1,555,059 | ||||||
|
| |||||||
| 8,891,324 | ||||||||
|
| |||||||
Beverages: 2.0% | ||||||||
Anhui Yingjia Distillery Co., Ltd. A Shares | 339,200 | 3,067,815 | ||||||
|
| |||||||
Total Consumer Staples | 11,959,139 | |||||||
|
| |||||||
| FINANCIALS: 3.3% | ||||||||
Diversified Financial Services: 2.0% | ||||||||
Chailease Holding Co., Ltd. | 439,712 | 3,097,854 | ||||||
|
| |||||||
Capital Markets: 1.3% | ||||||||
China Merchants Securities Co., Ltd. H Sharesc,d | 2,044,000 | 2,001,648 | ||||||
|
| |||||||
Total Financials | 5,099,502 | |||||||
|
| |||||||
| MATERIALS: 2.7% | ||||||||
Chemicals: 1.4% | ||||||||
Jiangsu Cnano Technology Co., Ltd. A Shares | 190,297 | 2,120,924 | ||||||
|
| |||||||
Construction Materials: 1.3% | ||||||||
Keshun Waterproof Technologies Co., Ltd. A Sharesb | 1,100,080 | 1,992,574 | ||||||
|
| |||||||
Total Materials | 4,113,498 | |||||||
|
| |||||||
| UTILITIES: 2.5% | ||||||||
Gas Utilities: 2.5% | ||||||||
ENN Natural Gas Co., Ltd. A Shares | 1,643,242 | 3,812,617 | ||||||
|
| |||||||
Total Utilities | 3,812,617 | |||||||
|
| |||||||
| COMMUNICATION SERVICES: 2.1% | ||||||||
Entertainment: 2.1% | ||||||||
Bilibili, Inc. Class Zb | 134,720 | 3,193,406 | ||||||
|
| |||||||
Total Communication Services | 3,193,406 | |||||||
|
| |||||||
| TOTAL INVESTMENTS: 100.2% | 155,000,508 | |||||||
(Cost $188,656,504) | ||||||||
| LIABILITIES IN EXCESS OF CASH AND OTHER ASSETS: (0.2%) | (238,795 | ) | ||||||
|
| |||||||
NET ASSETS: 100.0% | $154,761,713 | |||||||
|
| |||||||
| a | Certain securities were fair valued under the valuation policies approved by the Board of Trustees (Note 2-A). |
| b | Non-income producing security. |
| c | The securities may be resold to qualified foreign investors and foreign institutional buyers under Regulation S of the Securities Act of 1933. |
| d | Security exempt from registration under Rule 144A of the Securities Act of 1933, as amended. The security may be resold in transactions exempt from registration normally to qualified institutional buyers. The security has been determined to be liquid in accordance with procedures adopted by the Funds’ Board of Trustees. At December 31, 2022, the aggregate value is $19,822,087, which is 12.81% of net assets. |
| e | Security is valued using significant unobservable inputs and is classified as Level 3 in the fair value hierarchy. The aggregate value of Level 3 security is $250 and 0.00% of net assets. |
| ADR | American Depositary Receipt |
See accompanying notes to financial statements.
| 46 | MATTHEWS ASIA FUNDS |
Table of Contents
| PORTFOLIO MANAGERS | ||||
| Peeyush Mittal,CFA | ||||
Lead Manager | ||||
| Sharat Shroff, CFA | ||||
Co-Manager | ||||
| FUND FACTS | ||||
| Investor | Institutional | |||
Ticker | MINDX | MIDNX | ||
CUSIP | 577130859 | 577130768 | ||
Inception | 10/31/05 | 10/29/10 | ||
NAV | $22.09 | $22.54 | ||
Initial Investment | $2,500 | $100,000 | ||
Gross Expense Ratio1 | 1.15% | 1.01% | ||
Portfolio Statistics | ||||
Total # of Positions | 48 | |||
Net Assets | $602.8 million | |||
Weighted Average Market Cap | $45.2 billion | |||
Portfolio Turnover2 | 41.35% | |||
Benchmark | ||||
S&P Bombay Stock Exchange 100 Index | ||||
OBJECTIVE
Long-term capital appreciation.
STRATEGY
Under normal market conditions, the Fund seeks to achieve its investment objective by investing at least 80% of its net assets, which include borrowings for investment purposes, in publicly traded common stocks, preferred stocks and convertible securities of companies located in India.
Portfolio Manager Commentary (unaudited)
For the year ending December 31, 2022, the Matthews India Fund returned –9.92% (Investor Class) and –9.83% (Institutional Class), while its benchmark, the S&P Bombay Stock Exchange 100 Index, returned –4.53% over the same period. For the fourth quarter, the Fund returned 0.58% (Investor Class) and 0.57% (Institutional Class), while the benchmark returned 3.40%.
Market Environment
Central banks maintained their war against inflation with higher interest rates globally during 2022. Even though inflation has generally subsided in the past few months, the pace of moderation has been behind the estimations of most. As a consequence, it’s expected that higher rates will be here for longer even as the pace of incremental rate hikes slows.
To complicate this dynamic, we’re also seeing China remove its entrenched zero-COVID restrictions. As activity in the world’s second-largest economic power starts to normalize it will help improve global gross domestic production (GDP) but it’s also likely to exert upward pressure on inflation. Hence, it’s reasonable to assume that central banks are unlikely to start to ease monetary policy anytime soon.
In India, the rupee continues to be range-bound but given the current interest rate policy it remains to be seen if that will stay the case. The differential between central bank rate policy in the U.S. and in India is at its lowest for the last 15 years, which suggests that outflow of dollar reserves from India will remain a risk in a near to medium term and the rupee will continue to be volatile.
Separately, consumption in India continues to moderate. Amid inflationary pressures, consumption is negatively impacted in lower-income sections of the economy. However, we are beginning to see some pick-up in nominal wage growth in rural India along with higher remittance which should help alleviate a cash crunch in non-urban areas of the country.
Performance Contributors and Detractors
At the sector level, our underweight in energy was the biggest contributor to relative performance in the year as oil marketing firm margins were negatively impacted by the high price of oil. Our overweight to industrials was also a positive contributor to performance as manufacturing activity in India continues to gather pace. On the other hand, our stock selection within consumer staples was the biggest detractor to performance. Stock selection within information technology, consumer discretionary and financials was also a detractor though the negative impact from financials was mitigated to a degree by our overweight position.
In the last quarter, our allocation and stock selection in consumer staples and communication services was the biggest contributor. On the flip side, allocation and stock selection in consumer discretionary was the biggest detractor, impacted by our holdings in the interest rate-sensitive autos segment.
At the holdings level, Lemon Tree Hotels and Cummins India were among the top contributors to performance for the year. Cummins is one of the largest manufacturers of engines globally and within India, it is a leading provider of back-up power generating units. A revival in infrastructure and real estate along with robust exports in India helped the company post robust revenue and earnings growth.
Conversely, Infosys and Tata Consultancy Services were among the biggest detractors and were hurt by softening demand from Western and international clients. Restaurant Brands Asia was also a detractor. While the company continues
(continued)
| 1 | Actual 2022 expense ratios. |
| 2 | The lesser of fiscal year 2022 long-term purchase costs or sales proceeds divided by the average monthly market value of long-term securities. |
| matthewsasia.com | 800.789.ASIA | 47 |
Table of Contents
| PERFORMANCE AS OF DECEMBER 31, 2022 | ||||||||||||||||||||||||||||
|
|
|
| Average Annual Total Returns |
| ||||||||||||||||||||||||
| 3 Months | 1 Year | 3 Years | 5 Years | 10 Years | Since Inception | Inception Date | ||||||||||||||||||||||
| Investor Class (MINDX) | 0.58% | -9.92% | 7.41% | 2.00% | 8.70% | 9.57% | 10/31/05 | |||||||||||||||||||||
| Institutional Class (MIDNX)* | 0.57% | -9.83% | 7.55% | 2.15% | 8.88% | 5.52% | 10/29/10 | |||||||||||||||||||||
| S&P Bombay Stock Exchange 100 Index3 | 3.40% | -4.53% | 10.51% | 6.60% | 8.88% | 10.13% | 4 | |||||||||||||||||||||
Performance assumes reinvestment of all dividends and/or distributions before taxes. All performance quoted represents past performance and is no guarantee of future results. Investment return and principal value will fluctuate with market conditions so that when redeemed, shares may be worth more or less than their original cost. Current performance may be lower or higher than the return figures quoted. For the Fund’s most recent month-end performance, visit matthewsasia.com.
| * | Performance results include adjustments made for financial reporting purposes in accordance with U.S. generally accepted accounting principles. |
GROWTH OF A HYPOTHETICAL $10,000 INVESTMENT SINCE INCEPTION—INVESTOR CLASS
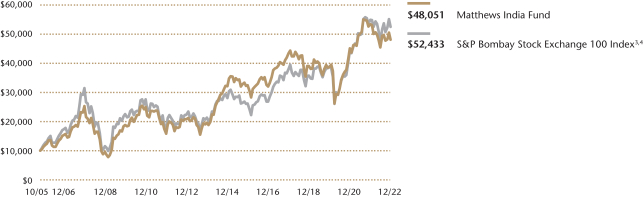
Plotted monthly. The performance data and graph do not reflect the deduction of taxes that a shareholder would pay on dividends, capital gains distributions or redemption of Fund shares. Values are in US$.
| 3 | It is not possible to invest directly in an index. Source: Index data from S&P BSE 100 Index and Bloomberg; total return calculations performed by BNY Mellon Investment Servicing (US) Inc. Please see page 87 for index definition. |
| 4 | Calculated from 10/31/05. |
| TOP TEN HOLDINGS5 | ||||||||
| Name | Sector | % Net Assets | ||||||
| HDFC Bank, Ltd. | Financials | 7.8% | ||||||
| ICICI Bank, Ltd. | Financials | 7.2% | ||||||
| Shriram Finance, Ltd. | Financials | 5.9% | ||||||
| Infosys, Ltd. | Information Technology | 5.2% | ||||||
| Bajaj Finance, Ltd. | Financials | 5.1% | ||||||
| Tata Consultancy Services, Ltd. | Information Technology | 4.3% | ||||||
| Axis Bank, Ltd. | Financials | 3.9% | ||||||
| Hindustan Unilever, Ltd. | Consumer Staples | 3.9% | ||||||
| Reliance Industries, Ltd. | Energy | 3.3% | ||||||
| Maruti Suzuki India, Ltd. | Consumer Discretionary | 3.2% | ||||||
| % OF ASSETS IN TOP 10 | 49.8% | |||||||
| 5 | Holdings may combine more than one security from same issuer and related depositary receipts. |
| 48 | MATTHEWS ASIA FUNDS |
Table of Contents
| COUNTRY ALLOCATION (%)6 | ||||
| India | 98.5 | |||
| Cash and Other Assets, Less Liabilities | 1.5 | |||
| SECTOR ALLOCATION (%)6 | ||||
| Financials | 41.3 | |||
| Consumer Discretionary | 12.6 | |||
| Information Technology | 12.4 | |||
| Consumer Staples | 9.1 | |||
| Materials | 6.9 | |||
| Industrials | 6.7 | |||
| Health Care | 5.7 | |||
| Energy | 3.3 | |||
| Communication Services | 0.5 | |||
| Cash and Other Assets, Less Liabilities | 1.5 | |||
| MARKET CAP EXPOSURE (%)6 | ||||
| Mega Cap (over $25B) | 51.9 | |||
| Large Cap ($10B-$25B) | 10.9 | |||
| Mid Cap ($3B-10B) | 23.1 | |||
| Small Cap (under $3B) | 12.6 | |||
| Cash and Other Assets, Less Liabilities | 1.5 | |||
| 6 | Source: FactSet Research Systems. Percentage values in data are rounded to the nearest tenth of one percent, so the values may not sum to 100% due to rounding. Country allocations and percentage values may be derived from different data sources and may not be consistent with other Fund literature. |
Matthews India Fund
Portfolio Manager Commentary (unaudited) (continued)
to grow well and execute on plans for network expansion, high inflation resulted in profit margin-performance being slightly behind investor expectation which negatively impacted performance.
Notable Portfolio Changes
We continued to consolidate the portfolio and reduce the number of holdings in the Fund in favor of companies which we think are more insulated from external headwinds and where growth expectations are reasonable. To this end, we exited Gujarat Fluorochemicals, a leading producer of fluoropolymers. The company has benefited from higher pricing for many of its manufactured products due to the pandemic restrictions in China but with China reopening we think some of those tailwinds will convert into headwinds. We also exited ABB India. The engineering and construction company continues to do well; however the valuation is very rich and with global GDP slowing down we believe it is prudent to exit.
We initiated a position in Syngene International, a contract research service (CRS) provider. Syngene continues to benefit from greater outsourcing of research projects by big pharma globally. The company also recently got certification from the U.S. Food and Drug Administration (FDA) to commence operations of its biologics manufacturing facility, which would mark the beginning of its custom development and manufacturing operations (CDMO). The CDMO business will help Syngene deliver higher growth and diversify its business model, in our view.
Outlook
We continue to remain cautious for the near-term outlook. While inflation has peaked and it seems like we are nearing the end of rate tightening globally, we expect rates are going to remain higher for longer and consequently it is going to have a negative impact on demand for goods and services globally. Reduced economic activity globally is going to have a negative impact on exports from India in the near to medium term. Amid low exports and higher rates in the developed world, the rupee may continue to have a depreciation bias unless oil prices decline.
Despite the external headwinds, we think the financial services sector in India continues to be in a very healthy state. Even if we have a slowdown, we don’t expect private and public sector banks to have credit quality challenges which would mean any slowdown would be short lived and would not lead to market panic. Banks, however, are increasing deposit rates and these are becoming attractive from an investment perspective. We think this is likely to pose the biggest risk to markets in India in the near term given the fact that current equity valuations leave little room to absorb negative surprises.
India’s government will also shortly be presenting its budget and since there are general elections next year this event will take on greater importance. There are widespread expectations that the government will announce an increase in spending at the grass roots and rural level where large chunks of the population live. While this would be helpful in improving consumption, a higher-than-normal fiscal deficit will only heighten existing inflationary challenges. Another cause of concern relates to expectations that the government is likely to raise long-term capital gains tax on equity investments from current 10% to 20%. If that were to happen it will likely create negative sentiment in the market at least in the interim.
| matthewsasia.com | 800.789.ASIA | 49 |
Table of Contents
Matthews India Fund
December 31, 2022
Schedule of Investmentsa
COMMON EQUITIES: 98.5%
| Shares | Value | |||||||
| FINANCIALS: 41.3% | ||||||||
Banks: 27.8% | ||||||||
HDFC Bank, Ltd. | 2,412,021 | $47,308,312 | ||||||
ICICI Bank, Ltd. | 4,055,302 | 43,617,924 | ||||||
Axis Bank, Ltd. | 2,095,146 | 23,578,026 | ||||||
IndusInd Bank, Ltd. | 1,280,081 | 18,817,125 | ||||||
Kotak Mahindra Bank, Ltd. | 852,919 | 18,765,329 | ||||||
Bandhan Bank, Ltd.b,c,d | 5,416,345 | 15,286,428 | ||||||
|
| |||||||
| 167,373,144 | ||||||||
|
| |||||||
Consumer Finance: 13.5% | ||||||||
Shriram Finance, Ltd. | 2,139,587 | 35,517,671 | ||||||
Bajaj Finance, Ltd. | 390,532 | 30,935,909 | ||||||
Cholamandalam Investment and Finance Co., Ltd. | 1,717,769 | 14,981,063 | ||||||
|
| |||||||
| 81,434,643 | ||||||||
|
| |||||||
Total Financials | 248,807,787 | |||||||
|
| |||||||
| CONSUMER DISCRETIONARY: 12.6% | ||||||||
Automobiles: 4.5% | ||||||||
Maruti Suzuki India, Ltd. | 189,585 | 19,179,458 | ||||||
TVS Motor Co., Ltd. | 590,874 | 7,737,984 | ||||||
|
| |||||||
| 26,917,442 | ||||||||
|
| |||||||
Hotels, Restaurants & Leisure: 2.9% | ||||||||
Lemon Tree Hotels, Ltd.b,c,d | 8,873,996 | 9,177,021 | ||||||
Restaurant Brands Asia, Ltd.c | 6,166,416 | 8,313,447 | ||||||
|
| |||||||
| 17,490,468 | ||||||||
|
| |||||||
Auto Components: 1.6% | ||||||||
Bosch, Ltd. | 45,447 | 9,465,642 | ||||||
|
| |||||||
Textiles, Apparel & Luxury Goods: 1.5% | ||||||||
Titan Co., Ltd. | 298,431 | 9,363,660 | ||||||
|
| |||||||
Household Durables: 1.1% | ||||||||
Crompton Greaves Consumer Electricals, Ltd. | 1,720,999 | 6,993,593 | ||||||
|
| |||||||
Internet & Direct Marketing Retail: 1.0% |
| |||||||
Zomato, Ltd.c | 5,184,481 | 3,716,648 | ||||||
FSN E-Commerce Ventures, Ltd.c | 1,171,860 | 2,186,166 | ||||||
|
| |||||||
| 5,902,814 | ||||||||
|
| |||||||
Total Consumer Discretionary | 76,133,619 | |||||||
|
| |||||||
| INFORMATION TECHNOLOGY: 12.4% |
| |||||||
IT Services: 12.4% | ||||||||
Infosys, Ltd. | 1,723,707 | 31,425,419 | ||||||
Tata Consultancy Services, Ltd. | 660,025 | 25,956,882 | ||||||
LTIMindtree, Ltd.b,d | 146,502 | 7,722,525 | ||||||
Persistent Systems, Ltd. | 129,521 | 6,055,074 | ||||||
HCL Technologies, Ltd. | 276,313 | 3,465,211 | ||||||
|
| |||||||
Total Information Technology | 74,625,111 | |||||||
|
| |||||||
| CONSUMER STAPLES: 9.1% | ||||||||
Personal Products: 6.9% | ||||||||
Hindustan Unilever, Ltd. | 751,405 | 23,213,494 | ||||||
Dabur India, Ltd. | 2,676,473 | 18,133,444 | ||||||
|
| |||||||
| 41,346,938 | ||||||||
|
| |||||||
| Shares | Value | |||||||
Food Products: 1.9% | ||||||||
Britannia Industries, Ltd. | 222,629 | $11,580,709 | ||||||
|
| |||||||
Tobacco: 0.3% | ||||||||
VST Industries, Ltd. | 44,526 | 1,779,260 | ||||||
|
| |||||||
Total Consumer Staples | 54,706,907 | |||||||
|
| |||||||
| MATERIALS: 6.9% | ||||||||
Chemicals: 4.7% | ||||||||
PI Industries, Ltd. | 229,069 | 9,460,294 | ||||||
Asian Paints, Ltd. | 229,725 | 8,540,297 | ||||||
Pidilite Industries, Ltd. | 195,765 | 6,022,224 | ||||||
Carborundum Universal, Ltd. | 427,452 | 4,510,912 | ||||||
|
| |||||||
| 28,533,727 | ||||||||
|
| |||||||
Metals & Mining: 1.6% | ||||||||
APL Apollo Tubes, Ltd. | 715,848 | 9,420,999 | ||||||
|
| |||||||
Construction Materials: 0.6% | ||||||||
Ramco Cements, Ltd. | 460,800 | 3,894,192 | ||||||
|
| |||||||
Total Materials | 41,848,918 | |||||||
|
| |||||||
| INDUSTRIALS: 6.7% | ||||||||
Machinery: 3.9% | ||||||||
Ashok Leyland, Ltd. | 6,374,760 | 11,032,659 | ||||||
Cummins India, Ltd. | 531,703 | 8,865,466 | ||||||
Greaves Cotton, Ltd. | 2,297,645 | 3,879,862 | ||||||
|
| |||||||
| 23,777,987 | ||||||||
|
| |||||||
Transportation Infrastructure: 1.2% | ||||||||
Gujarat Pipavav Port, Ltd. | 5,896,635 | 7,181,339 | ||||||
|
| |||||||
Industrial Conglomerates: 0.6% | ||||||||
Siemens, Ltd. | 105,263 | 3,589,055 | ||||||
|
| |||||||
Air Freight & Logistics: 0.5% | ||||||||
Delhivery, Ltd.c | 749,833 | 3,002,901 | ||||||
|
| |||||||
Electrical Equipment: 0.5% | ||||||||
Havells India, Ltd. | 220,160 | 2,921,241 | ||||||
|
| |||||||
Total Industrials | 40,472,523 | |||||||
|
| |||||||
| HEALTH CARE: 5.7% | ||||||||
Pharmaceuticals: 3.1% | ||||||||
Neuland Laboratories, Ltd. | 488,817 | 9,831,070 | ||||||
Sun Pharmaceutical Industries, Ltd. | 586,337 | 7,090,575 | ||||||
Laurus Labs, Ltd.b,d | 325,831 | 1,474,723 | ||||||
|
| |||||||
| 18,396,368 | ||||||||
|
| |||||||
Health Care Equipment & Supplies: 1.7% |
| |||||||
Poly Medicure, Ltd. | 959,928 | 10,388,495 | ||||||
|
| |||||||
Life Sciences Tools & Services: 0.9% | ||||||||
Syngene International, Ltd.b,d | 746,222 | 5,276,177 | ||||||
|
| |||||||
Total Health Care | 34,061,040 | |||||||
|
| |||||||
| ENERGY: 3.3% | ||||||||
Oil, Gas & Consumable Fuels: 3.3% | ||||||||
Reliance Industries, Ltd. | 656,080 | 20,142,059 | ||||||
|
| |||||||
Total Energy | 20,142,059 | |||||||
|
| |||||||
| 50 | MATTHEWS ASIA FUNDS |
Table of Contents
Matthews India Fund
December 31, 2022
Schedule of Investmentsa (continued)
COMMON EQUITIES (continued)
| Shares | Value | |||||||
| COMMUNICATION SERVICES: 0.5% | ||||||||
Interactive Media & Services: 0.5% | ||||||||
Info Edge India, Ltd. | 57,297 | $2,720,559 | ||||||
|
| |||||||
Total Communication Services | 2,720,559 | |||||||
|
| |||||||
| TOTAL COMMON EQUITIES | 593,518,523 | |||||||
|
| |||||||
(Cost $515,613,083) | ||||||||
NON-CONVERTIBLE CORPORATE BONDS: 0.0% |
| |||||||
| Face Amount | Value | |||||||
| CONSUMER STAPLES: 0.0% | ||||||||
Food Products: 0.0% | ||||||||
Britannia Industries, Ltd. 5.500%, 06/03/2024 | INR 1,996,476 | 23,434 | ||||||
|
| |||||||
Total Consumer Staples | 23,434 | |||||||
|
| |||||||
| TOTAL NON-CONVERTIBLE CORPORATE BONDS |
| 23,434 | ||||||
|
| |||||||
(Cost $27,435) | ||||||||
| TOTAL INVESTMENTS: 98.5% | 593,541,957 | |||||||
(Cost $515,640,518) | ||||||||
| CASH AND OTHER ASSETS, LESS LIABILITIES: 1.5% | 9,240,286 | |||||||
|
| |||||||
NET ASSETS: 100.0% | $602,782,243 | |||||||
|
| |||||||
| a | Certain securities were fair valued under the valuation policies approved by the Board of Trustees (Note 2-A). |
| b | Security exempt from registration under Rule 144A of the Securities Act of 1933, as amended. The security may be resold in transactions exempt from registration normally to qualified institutional buyers. The security has been determined to be liquid in accordance with procedures adopted by the Funds’ Board of Trustees. At December 31, 2022, the aggregate value is $38,936,874, which is 6.46% of net assets. |
| c | Non-income producing security. |
| d | The securities may be resold to qualified foreign investors and foreign institutional buyers under Regulation S of the Securities Act of 1933. |
| INR | Indian Rupee |
See accompanying notes to financial statements.
| matthewsasia.com | 800.789.ASIA | 51 |
Table of Contents
PORTFOLIO MANAGERS | ||||
| Taizo Ishida | Shuntaro Takeuchi | |||
Lead Manager | Lead Manager | |||
| FUND FACTS | ||||
| Investor | Institutional | |||
Ticker | MJFOX | MIJFX | ||
CUSIP | 577130800 | 577130792 | ||
Inception | 12/31/98 | 10/29/10 | ||
NAV | $14.90 | $14.93 | ||
Initial Investment | $2,500 | $100,000 | ||
Gross Expense Ratio1 | 1.05% | 0.97% | ||
Portfolio Statistics | ||||
Total # of Positions | 48 | |||
Net Assets | $622.1 million | |||
Weighted Average Market Cap | $34.7 billion | |||
Portfolio Turnover2 | 83.38% | |||
Benchmark | ||||
MSCI Japan Index | ||||
OBJECTIVE
Long-term capital appreciation.
STRATEGY
Under normal market conditions, the Fund seeks to achieve its investment objective by investing at least 80% of its net assets, which include borrowings for investment purposes, in the common and preferred stocks of companies located in Japan.
Portfolio Manager Commentary (unaudited)
For the year ending December 31, 2022, the Matthews Japan Fund returned –27.85% (Investor Class) and –27.84% (Institutional Class), while its benchmark, the MSCI Japan Index, returned –16.31% over the same period. For the fourth quarter, the Fund returned 10.76% (Investor Class) and 10.74% (Institutional Class), while the benchmark returned 13.26%.
Market Environment
Japan equity markets in 2022 delivered very different performances depending on the currency and style of investment used. Taking currency first, the Japanese yen weakened to 150 to the U.S. dollar in October, a level last seen in 1998. Multiple rate hikes by the U.S. Federal Reserve in tandem with the accommodative stance of the Bank of Japan resulted in the widening of the U.S.-Japan bond-yield spread. For investors, the yen’s decline meant that in local currency terms Japanese equities outperformed developed markets while in U.S. dollar terms they traded more in line. The other trend to have impacted Japanese equity markets was the continued significant spread between performance of value stocks and growth stocks. The one-year performance gap between value stocks and growth stocks in 2022 ended at 2,260 basis points (22.26%), the largest in international equity markets. The Matthews Japan Fund is a quality core growth portfolio and the widening of the growth-value spread has been a challenge.
Performance Contributors and Detractors
From a sector perspective, our stock selection in consumer staples was the largest contributor to relative performance in 2022. Stock selection in real estate was also a contributor though its impact was mitigated by our underweight in the sector. On the other hand, stock selection in industrials was the biggest detractor while our selections in financials, materials and information technology (IT) were also detractors.
At the holdings level, Daiichi Sankyo, a pharmaceutical company, was the largest contributor to the investment results. We view the company as evolving into a specialty pharma company focused on oncology and based on its proprietary antibody-drug conjugate (ADC) platform. The success of Daiichi Sankyo’s first ADC—Enhertu, an anticancer agent for breast cancer—coupled with a favorable court ruling in a dispute with a competitor regarding ADC technology in August drove the strong performance in the year.
P&C insurance company Tokio Marine Holdings was the second-largest contributor to performance. We regard the company as a prudent allocator of capital with a mid-teens dividend compound annual growth rate (CAGR) coupled with earnings-per-share (EPS) growth that is driven by both earnings and buybacks.
Game developer Capcom was also a positive contributor. Owner of key intellectual property (IP), such as “Monster Hunter” and “Resident Evil”, the company pledges to deliver stable and continuous double-digit growth. Given the uncertainty in macro situations, Capcom’s stable growth has resulted in equity outperformance.
Technology conglomerate Sony Group was the largest detractor last year. After approaching an all-time high in January, performance has struggled due to weakness in the mainstay PlayStation game business. While we remain constructive on Sony’s management capability and its competitive position in games, music and image sensors, the weakness in their highest return-on-invested-capital (ROIC) business segment makes it difficult for the share price to perform.
Recruit, a leading HR and media marketing solution provider was the second-largest detractor. The company benefited from the reopening of economic activity in 2021 with their crown jewel HR Tech segment but growth slowed due to the peaking out of global economic activity.
(continued)
| 1 | Actual 2022 expense ratios. |
| 2 | The lesser of fiscal year 2022 long-term purchase costs or sales proceeds divided by the average monthly market value of long-term securities. |
| 52 | MATTHEWS ASIA FUNDS |
Table of Contents
| PERFORMANCE AS OF DECEMBER 31, 2022 | ||||||||||||||||||||||||||||
|
|
|
|
| Average Annual Total Returns |
| |||||||||||||||||||||||
| 3 Months | 1 Year | 3 Years | 5 Years | 10 Years | Since Inception | Inception Date | ||||||||||||||||||||||
| Investor Class (MJFOX) | 10.76% | -27.85% | -2.79% | -1.56% | 6.90% | 5.05% | 12/31/98 | |||||||||||||||||||||
| Institutional Class (MIJFX) | 10.74% | -27.84% | -2.75% | -1.50% | 6.99% | 6.65% | 10/29/10 | |||||||||||||||||||||
| MSCI Japan Index3 | 13.26% | -16.31% | -0.63% | 0.60% | 5.90% | 3.24% | 4 | |||||||||||||||||||||
Performance assumes reinvestment of all dividends and/or distributions before taxes. All performance quoted represents past performance and is no guarantee of future results. Investment return and principal value will fluctuate with market conditions so that when redeemed, shares may be worth more or less than their original cost. Current performance may be lower or higher than the return figures quoted. For the Fund’s most recent month-end performance, visit matthewsasia.com.
GROWTH OF A HYPOTHETICAL $10,000 INVESTMENT SINCE INCEPTION—INVESTOR CLASS
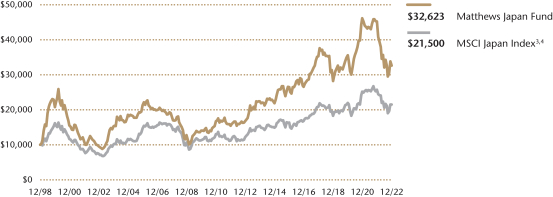
Plotted monthly. The performance data and graph do not reflect the deduction of taxes that a shareholder would pay on dividends, capital gains distributions or redemption of Fund shares. Values are in US$.
| 3 | It is not possible to invest directly in an index. Source: Index data from Morgan Stanley Capital International and Bloomberg; total return calculations performed by BNY Mellon Investment Servicing (US) Inc. Please see page 87 for index definitions. |
| 4 | Calculated from 12/31/98. |
| TOP TEN HOLDINGS5 | ||||||||||
| Name | Sector | % Net Assets | ||||||||
| Daiichi Sankyo Co., Ltd. | Health Care | 4.1% | ||||||||
| Tokio Marine Holdings, Inc. | Financials | 3.9% | ||||||||
| Hitachi, Ltd. | Industrials | 3.7% | ||||||||
| Shin-Etsu Chemical Co., Ltd. | Materials | 3.7% | ||||||||
| Keyence Corp. | Information Technology | 3.6% | ||||||||
| Nippon Telegraph & Telephone Corp. | Communication Services | 3.4% | ||||||||
| Sony Group Corp. | Consumer Discretionary | 3.4% | ||||||||
| Ajinomoto Co., Inc. | Consumer Staples | 3.3% | ||||||||
| Hoya Corp. | Health Care | 3.1% | ||||||||
| ITOCHU Corp. | Industrials | 2.9% | ||||||||
| % OF ASSETS IN TOP 10 | 35.1% | |||||||||
| 5 | Holdings may combine more than one security from same issuer and related depositary receipts. |
| matthewsasia.com | 800.789.ASIA | 53 |
Table of Contents
Matthews Japan Fund
Portfolio Manager Commentary (unaudited) (continued)
JSR, an electronic material manufacturer, was also a detractor. The company’s recent earnings were below expectations due to the slower-than-expected commercial production ramp of its highly-anticipated Contract Development and Manufacturing (CDMO) for bio-pharma products, as well as the weaker topline in display materials segment. Despite the near-term weakness, our conversation with the management suggests that the issues in the health-care businesses are transitory and the display business topline will bottom out. We still calculate that JSR trades below its intrinsic value and believe that a re-rating would accelerate as JSR’s health-care profit contribution increases in the later part of this fiscal year.
Notable Portfolio Changes
During the fourth quarter, we re-initiated furniture and household goods retailer Nitori Holdings. We exited the name in 2021 due to the negative impact from a weaker yen and tough year-on-year after COVID lockdowns had pushed up home fashion goods demand in 2020. After a year, both consensus earnings and valuation levels came down enough to warrant a review, especially as cost pressures and the weakness of the Japanese yen have started to peak out, in our view. The long-term thesis remains unchanged. Nitori is the last man standing in the furniture retail space in Japan and has achieved 35 consecutive years of earnings growth. The company’s track record in cost adjustment is also impressive.
We also initiated a position in Sumitomo Mitsui Financial Group in anticipation of potential changes in Japan’s monetary policy. The Bank of Japan revised its yield curve control (YCC) targets at its December 20 monetary policy meeting. While the move came as a surprise to the market including us, we had discussed the possibility of this happening. As current BoJ Governor Haruhiko Kuroda’s term expires in the Spring, increasing news flow around the upcoming change in leadership will drive expectations for a change in the bank’s negative interest rate policy and steps toward monetary policy normalization.
To fund these positions, we have exited Toyota Motor, Suntory Beverage and Food, SMC, Septeni Holdings, Roland, Ono Pharmaceutical, Mazda Motor, Kyoritsu Maintenance, Japan Steel Works, GMO Payment Gateway and Direct Marketing Mix.
Outlook
While the market seems ready for the Fed to pivot with its interest-rate policy and for inflation to peak out, we believe the Fed is hesitant to prematurely remove its hawkish policies to contain inflation. With this backdrop, we don’t see a reversal of growth underperformance in Japan anytime soon and are taking a more balanced approach toward multiple stages of growth and valuation levels. For the year of 2023, earnings growth and cash flow-generation ability will be ever more important as financial estimates for Japanese corporates have started to be revised down.
Looking long term, we continue to believe the earnings capability of Japanese companies has improved meaningfully over the past economic cycle. Last year, the Japanese equity market outperformed both developed markets (MSCI World) and emerging markets (MSCI Emerging Market) in U.S. dollar terms. With the yen at a near quarter-century-low to the dollar, Japanese companies are in good health and, importantly, the country is firmly open for tourism. We believe this is the time for investors to add a long-term exposure to the market.
Yield curve control (YCC) involves targeting a longer-term interest rate by a central bank, then buying or selling as many bonds as necessary to hit that rate target.
| COUNTRY ALLOCATION (%)6 | ||||
| Japan | 98.2 | |||
| Cash and Other Assets, Less Liabilities | 1.8 | |||
| SECTOR ALLOCATION (%)6 | ||||
| Industrials | 21.3 | |||
| Consumer Discretionary | 13.6 | |||
| Financials | 13.0 | |||
| Health Care | 13.0 | |||
| Information Technology | 12.4 | |||
| Communication Services | 11.2 | |||
| Consumer Staples | 6.6 | |||
| Materials | 6.1 | |||
| Real Estate | 1.0 | |||
| Cash and Other Assets, Less Liabilities | 1.8 | |||
| MARKET CAP EXPOSURE (%)6 | ||||
| Mega Cap (over $25B) | 48.6 | |||
| Large Cap ($10B-$25B) | 22.0 | |||
| Mid Cap ($3B-10B) | 16.6 | |||
| Small Cap (under $3B) | 11.1 | |||
| Cash and Other Assets, Less Liabilities | 1.8 | |||
| 6 | Source: FactSet Research Systems. Percentage values in data are rounded to the nearest tenth of one percent, so the values may not sum to 100% due to rounding. Country allocations and percentage values may be derived from different data sources and may not be consistent with other Fund literature. |
| 54 | MATTHEWS ASIA FUNDS |
Table of Contents
Matthews Japan Fund
December 31, 2022
Schedule of Investmentsa
COMMON EQUITIES: 98.2%
| Shares | Value | |||||||
| INDUSTRIALS: 21.3% | ||||||||
Industrial Conglomerates: 3.7% | ||||||||
Hitachi, Ltd. | 454,600 | $22,873,781 | ||||||
|
| |||||||
Professional Services: 3.3% | ||||||||
SMS Co., Ltd. | 570,000 | 14,418,032 | ||||||
Recruit Holdings Co., Ltd. | 189,700 | 5,937,985 | ||||||
|
| |||||||
| 20,356,017 | ||||||||
|
| |||||||
Trading Companies & Distributors: 2.9% | ||||||||
ITOCHU Corp. | 575,700 | 18,061,295 | ||||||
|
| |||||||
Building Products: 2.7% | ||||||||
Daikin Industries, Ltd. | 110,100 | 16,703,668 | ||||||
|
| |||||||
Machinery: 2.5% | ||||||||
Miura Co., Ltd. | 424,600 | 9,737,141 | ||||||
IHI Corp. | 210,600 | 6,100,742 | ||||||
|
| |||||||
| 15,837,883 | ||||||||
|
| |||||||
Road & Rail: 1.6% | ||||||||
West Japan Railway Co. | 228,400 | 9,916,976 | ||||||
|
| |||||||
Electrical Equipment: 1.5% | ||||||||
Ushio, Inc. | 773,500 | 9,484,464 | ||||||
|
| |||||||
Construction & Engineering: 1.2% | ||||||||
JGC Holdings Corp. | 581,000 | 7,364,744 | ||||||
|
| |||||||
Airlines: 1.1% | ||||||||
Skymark Airlines, Inc.b | 655,500 | 7,182,330 | ||||||
|
| |||||||
Commercial Services & Supplies: 0.8% | ||||||||
TOPPAN, Inc. | 325,400 | 4,805,343 | ||||||
|
| |||||||
Total Industrials | 132,586,501 | |||||||
|
| |||||||
| CONSUMER DISCRETIONARY: 13.6% | ||||||||
Specialty Retail: 4.2% |
| |||||||
Nitori Holdings Co., Ltd. | 112,600 | 14,712,601 | ||||||
Hikari Tsushin, Inc. | 81,200 | 11,429,245 | ||||||
|
| |||||||
| 26,141,846 | ||||||||
|
| |||||||
Household Durables: 3.4% |
| |||||||
Sony Group Corp. | 275,600 | 21,006,679 | ||||||
|
| |||||||
Textiles, Apparel & Luxury Goods: 2.6% | ||||||||
Asics Corp. | 720,600 | 15,839,437 | ||||||
|
| |||||||
Auto Components: 2.1% | ||||||||
Denso Corp. | 268,700 | 13,177,001 | ||||||
|
| |||||||
Leisure Products: 1.3% | ||||||||
Bandai Namco Holdings, Inc. | 131,900 | 8,267,417 | ||||||
|
| |||||||
Total Consumer Discretionary | 84,432,380 | |||||||
|
| |||||||
| HEALTH CARE: 13.0% | ||||||||
Health Care Equipment & Supplies: 7.1% | ||||||||
Hoya Corp. | 200,900 | 19,241,917 | ||||||
Olympus Corp. | 744,400 | 13,129,422 | ||||||
Terumo Corp. | 414,100 | 11,739,977 | ||||||
|
| |||||||
| 44,111,316 | ||||||||
|
| |||||||
| Shares | Value | |||||||
Pharmaceuticals: 5.9% | ||||||||
Daiichi Sankyo Co., Ltd. | 783,400 | $25,215,053 | ||||||
Takeda Pharmaceutical Co., Ltd. | 376,200 | 11,755,007 | ||||||
|
| |||||||
| 36,970,060 | ||||||||
|
| |||||||
Total Health Care | 81,081,376 | |||||||
|
| |||||||
| FINANCIALS: 13.0% | ||||||||
Banks: 4.8% | ||||||||
Sumitomo Mitsui Financial Group, Inc. | 435,300 | 17,513,180 | ||||||
Mitsubishi UFJ Financial Group, Inc. | 1,807,700 | 12,135,843 | ||||||
|
| |||||||
| 29,649,023 | ||||||||
|
| |||||||
Diversified Financial Services: 4.3% | ||||||||
eGuarantee, Inc. | 766,100 | 14,160,183 | ||||||
ORIX Corp. | 797,400 | 12,763,706 | ||||||
|
| |||||||
| 26,923,889 | ||||||||
|
| |||||||
Insurance: 3.9% | ||||||||
Tokio Marine Holdings, Inc. | 1,146,600 | 24,494,121 | ||||||
|
| |||||||
Total Financials | 81,067,033 | |||||||
|
| |||||||
| INFORMATION TECHNOLOGY: 12.4% | ||||||||
IT Services: 6.3% | ||||||||
OBIC Co., Ltd. | 107,100 | 15,723,251 | ||||||
Nomura Research Institute, Ltd. | 487,100 | 11,580,287 | ||||||
SHIFT, Inc.b | 51,500 | 9,065,479 | ||||||
Simplex Holdings, Inc. | 182,800 | 2,888,490 | ||||||
|
| |||||||
| 39,257,507 | ||||||||
|
| |||||||
Electronic Equipment, Instruments & Components: 3.6% |
| |||||||
Keyence Corp. | 58,300 | 22,634,671 | ||||||
|
| |||||||
Semiconductors & Semiconductor Equipment: 1.6% |
| |||||||
Renesas Electronics Corp.b | 1,093,000 | 9,660,223 | ||||||
|
| |||||||
Software: 0.9% | ||||||||
Appier Group, Inc.b | 530,400 | 5,426,440 | ||||||
|
| |||||||
Total Information Technology | 76,978,841 | |||||||
|
| |||||||
| COMMUNICATION SERVICES: 11.2% | ||||||||
Entertainment: 6.2% | ||||||||
Toho Co., Ltd. | 363,600 | 14,015,281 | ||||||
Nintendo Co., Ltd. | 300,500 | 12,634,998 | ||||||
Capcom Co., Ltd. | 370,200 | 11,816,968 | ||||||
|
| |||||||
| 38,467,247 | ||||||||
|
| |||||||
Diversified Telecommunication Services: 3.4% |
| |||||||
Nippon Telegraph & Telephone Corp. | 740,700 | 21,123,661 | ||||||
|
| |||||||
Interactive Media & Services: 1.1% | ||||||||
Kakaku.com, Inc. | 454,200 | 7,287,937 | ||||||
|
| |||||||
Wireless Telecommunication Services: 0.5% | ||||||||
SoftBank Group Corp. | 70,500 | 2,981,654 | ||||||
|
| |||||||
Total Communication Services | 69,860,499 | |||||||
|
| |||||||
| CONSUMER STAPLES: 6.6% | ||||||||
Food Products: 4.7% |
| |||||||
Ajinomoto Co., Inc. | 662,000 | 20,232,931 | ||||||
Kikkoman Corp. | 169,700 | 8,932,434 | ||||||
|
| |||||||
| 29,165,365 | ||||||||
|
| |||||||
| matthewsasia.com | 800.789.ASIA | 55 |
Table of Contents
Matthews Japan Fund
December 31, 2022
Schedule of Investmentsa (continued)
COMMON EQUITIES (continued)
| Shares | Value | |||||||
Food & Staples Retailing: 1.9% | ||||||||
Seven & i Holdings Co., Ltd. | 276,300 | $11,841,216 | ||||||
|
| |||||||
Total Consumer Staples | 41,006,581 | |||||||
|
| |||||||
| MATERIALS: 6.1% |
| |||||||
Chemicals: 6.1% |
| |||||||
Shin-Etsu Chemical Co., Ltd. | 186,500 | 22,773,927 | ||||||
Nissan Chemical Corp. | 190,900 | 8,324,615 | ||||||
JSR Corp. | 354,600 | 6,943,518 | ||||||
|
| |||||||
Total Materials | 38,042,060 | |||||||
|
| |||||||
| REAL ESTATE: 1.0% |
| |||||||
Real Estate Management & Development: 1.0% |
| |||||||
TKP Corp.b | 278,500 | 6,012,985 | ||||||
|
| |||||||
Total Real Estate | 6,012,985 | |||||||
|
| |||||||
| TOTAL INVESTMENTS: 98.2% |
| 611,068,256 | ||||||
(Cost $626,772,204) | ||||||||
CASH AND OTHER ASSETS, LESS LIABILITIES: 1.8% | 11,067,829 | |||||||
|
| |||||||
NET ASSETS: 100.0% | $622,136,085 | |||||||
|
| |||||||
| a | Certain securities were fair valued under the valuation policies approved by the Board of Trustees (Note 2-A). |
| b | Non-income producing security. |
See accompanying notes to financial statements.
| 56 | MATTHEWS ASIA FUNDS |
Table of Contents
| PORTFOLIO MANAGERS | ||||
| Michael J. Oh, CFA | Elli Lee | |||
Lead Manager | Lead Manager | |||
| Sojung Park | ||||
Co-Manager | ||||
| FUND FACTS | ||||
| Investor | Institutional | |||
Ticker | MAKOX | MIKOX | ||
CUSIP | 577130305 | 577130826 | ||
Inception | 1/3/95 | 10/29/10 | ||
NAV | $3.82 | $3.86 | ||
Initial Investment | $2,500 | $100,000 | ||
Gross Expense Ratio1 | 1.22% | 1.08% | ||
Portfolio Statistics | ||||
Total # of Positions | 34 | |||
Net Assets | $80.0 million | |||
Weighted Average | $79.9 billion | |||
Portfolio Turnover2 | 56.94% | |||
Benchmark | ||||
Korea Composite Stock Price Index | ||||
OBJECTIVE
Long-term capital appreciation.
STRATEGY
Under normal market conditions, the Fund seeks to achieve its investment objective by investing at least 80% of its net assets, which include borrowings for investment purposes, in the common and preferred stocks of companies located in South Korea.
Portfolio Manager Commentary (unaudited)
For the year ending December 31, 2022, the Matthews Korea Fund returned –25.42% (Investor Class) and –25.39% (Institutional Class), while its benchmark, the Korea Composite Stock Price Index (KOSPI), returned –28.64% over the same period. For the fourth quarter, the Fund returned 18.42% (Investor Class) and 18.19% (Institutional Class), while the benchmark returned 18.12%.
Market Environment
2022 was a volatile year for markets, with a healthy dose of uncertainty from quarter to quarter, tied partly to the unevenness with which countries reopened their economies. Though some reopened in early 2022, the notable exception was China which finally began reopening late last quarter. Though Korea was open much earlier in the year, its heavy economic reliance on exports posed a headwind throughout 2022 and weighed on sectors and individual stocks.
The prevailing uncertainty also resulted in an uneven year from a style-leadership perspective, with some quarters value-led and others (notably, the fourth quarter) growth and turnaround story-led.
From a headlines standpoint, inflation and monetary policy were among 2022’s dominant stories. Korea’s central bank largely followed the U.S. Federal Reserve, by increasing rates throughout the year. Banks in Korea were key beneficiaries of this approach and performed well, bolstered by low valuations. On the inflation front, we finally saw some companies able to increase prices—including auto parts and food and beverages companies. From here, the question will be the demand outlook.
Performance Contributors and Detractors
At the sector level, our stock selections in financials and consumer discretionary were the largest contributors to relative performance for the year. Among individual stocks, Shinhan Financial and Coupang were the biggest contributors to relative performance. In the first half of 2022, the Fund was overweight banks given the inflationary environment and the likelihood that Korea would follow the U.S. from a monetary perspective. Coupang—which can be thought of as the Amazon of Korea—was able to accelerate its market-share gains during COVID. We believe the company will be able to increase ad revenues while maintaining its discipline on promotions costs, ultimately turning free cash-flow positive and strengthening dominancy in the e-commerce industry.
Conversely, the Fund’s underweight to the materials sector detracted from relative results, though our individual holdings outperformed benchmark peers. We have maintained our below-benchmark exposure to materials as we have tended to find valuations—particularly among companies involved in the battery value chain in Korea—to be high, alongside high market expectations, making it challenging for us to increase our exposure and weighing on relative results. Given these high valuations, we have preferred to maintain exposure specifically through battery-cell makers, which tend to have more proven track records.
At the individual holdings level, Samsung Electronics preferred shares and SK Hynix were among the biggest detractors to relative performance. Samsung Electronics and SK Hynix faced headwinds amid high semiconductor inventory levels and weak demand. Looking forward, we find Samsung’s valuation and balance sheet attractive and believe expectations have largely been reset heading into 2023.
(continued)
| 1 | Actual 2022 expense ratios. |
| 2 | The lesser of fiscal year 2022 long-term purchase costs or sales proceeds divided by the average monthly market value of long-term securities. |
| matthewsasia.com | 800.789.ASIA | 57 |
Table of Contents
| PERFORMANCE AS OF DECEMBER 31, 2022 | ||||||||||||||||||||||||||||
|
|
|
| Average Annual Total Returns |
| ||||||||||||||||||||||||
| 3 Months | 1 Year | 3 Years | 5 Years | 10 Years | Since Inception | Inception Date | ||||||||||||||||||||||
| Investor Class (MAKOX) | 18.42% | -25.42% | 1.52% | -3.31% | 3.65% | 5.17% | 01/03/95 | |||||||||||||||||||||
| Institutional Class (MIKOX) | 18.19% | -25.39% | 1.59% | -3.22% | 3.76% | 5.09% | 10/29/10 | |||||||||||||||||||||
| Korea Composite Stock Price Index3 | 18.12% | -28.64% | -0.72% | -3.36% | 1.16% | 2.73% | 4 | |||||||||||||||||||||
Performance assumes reinvestment of all dividends and/or distributions before taxes. All performance quoted represents past performance and is no guarantee of future results. Investment return and principal value will fluctuate with market conditions so that when redeemed, shares may be worth more or less than their original cost. Current performance may be lower or higher than the return figures quoted. For the Fund’s most recent month-end performance, visit matthewsasia.com.
GROWTH OF A HYPOTHETICAL $10,000 INVESTMENT SINCE INCEPTION—INVESTOR CLASS
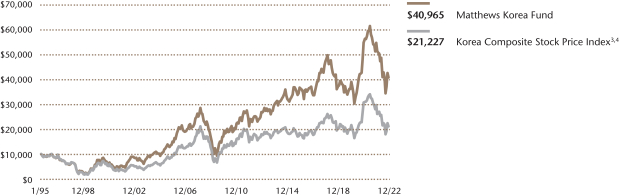
Plotted monthly. The performance data and graph do not reflect the deduction of taxes that a shareholder would pay on dividends, capital gains distributions or redemption of Fund shares. Values are in US$.
| 3 | Korea Composite Stock Price Index performance data may be readjusted periodically by the Korea Exchange due to certain factors, including the declaration of dividends. It is not possible to invest directly in an index. Source: Index data from Korea Composite Stock Price Index and Bloomberg; total return calculations performed by BNY Mellon Investment Servicing (US) Inc. Please see page 87 for index definition. |
| 4 | Calculated from 1/3/95. |
| TOP TEN HOLDINGS5 | ||||||||
| Name | Sector | % Net Assets | ||||||
| Samsung Electronics Co., Ltd., Pfd. | Information Technology | 16.8% | ||||||
| Samsung Electronics Co., Ltd. | Information Technology | 6.4% | ||||||
| SK Hynix, Inc. | Information Technology | 4.8% | ||||||
| Yuhan Corp. | Health Care | 3.9% | ||||||
| KT&G Corp. | Consumer Staples | 3.9% | ||||||
| S-Oil Corp. | Energy | 3.7% | ||||||
| LEENO Industrial, Inc. | Information Technology | 3.5% | ||||||
| DongKook Pharmaceutical Co., Ltd. | Health Care | 3.2% | ||||||
| LG Chem Ltd. | Materials | 3.0% | ||||||
| BGF Retail Co., Ltd. | Consumer Staples | 3.0% | ||||||
% OF ASSETS IN TOP 10 | 52.2% | |||||||
| 5 | Holdings may combine more than one security from same issuer and related depositary receipts. |
| 58 | MATTHEWS ASIA FUNDS |
Table of Contents
| COUNTRY ALLOCATION (%)6 | ||||
| South Korea | 98.1 | |||
| Cash and Other Assets, Less Liabilities | 1.9 | |||
| SECTOR ALLOCATION (%)6 | ||||
| Information Technology | 43.6 | |||
| Consumer Discretionary | 10.1 | |||
| Health Care | 9.7 | |||
| Consumer Staples | 9.0 | |||
| Communication Services | 7.7 | |||
| Industrials | 6.4 | |||
| Materials | 4.4 | |||
| Energy | 3.7 | |||
| Financials | 3.5 | |||
| Cash and Other Assets, Less Liabilities | 1.9 | |||
| MARKET CAP EXPOSURE (%)6 | ||||
| Mega Cap (over $25B) | 41.0 | |||
| Large Cap ($10B-$25B) | 10.5 | |||
| Mid Cap ($3B-10B) | 22.6 | |||
| Small Cap (under $3B) | 24.1 | |||
| Cash and Other Assets, Less Liabilities | 1.9 | |||
| 6 | Source: FactSet Research Systems. Percentage values in data are rounded to the nearest tenth of one percent, so the values may not sum to 100% due to rounding. Country allocations and percentage values may be derived from different data sources and may not be consistent with other Fund literature. |
Matthews Korea Fund
Portfolio Manager Commentary (unaudited) (continued)
Notable Portfolio Changes
We capitalized on the market’s rebound last quarter to make some portfolio adjustments—including introducing new positions in Orion and Hyundai Mobis while exiting our positions in Shinhan Financial Group and SK Innovation.
Orion is a leading confectionary company in the region. Its presence in Korea represents less than 35% of its business while China, Vietnam and Russa make up the balance. Orion has continued to build strong brand equities in each country by introducing new products and managing distribution channels efficiently.
Hyundai Mobis manufactures and sells automotive parts globally. The Fund has been overweight to Korean autos which we believe are doing well, however, we have lowered our weights in original equipment manufacturers (OEMs) in favor of companies like Hyundai Mobis, which are parts suppliers to innovative areas of the auto business, including autonomous vehicles. With the shares at an attractive valuation and the company paying a dividend, we chose to purchase the stock in the fourth quarter.
Conversely, we exited our position in Shinhan Financial as the valuation recovered. Regarding SK Innovation, it is one of the few battery-cell makers for electronic vehicles globally and certainly has room to take market share. However, we felt its capabilities relative to its competitors were inferior and that we have more attractive options to own some of its peers. We consequently chose to exit our position.
Outlook
We expect uncertainty in the markets to persist into 2023. Given Korea’s overall reliance on exports, we are attentive to the global demand outlook. We simultaneously remain intently focused on bottom-up, fundamental analysis, with attention on whether companies are staying innovative and taking share relative to their competitors.
From a research perspective, we are focused on finding new companies that can benefit from global innovation—the next generation of what are currently smaller-cap names that could potentially be mid cap (and maybe beyond).
| matthewsasia.com | 800.789.ASIA | 59 |
Table of Contents
Matthews Korea Fund
December 31, 2022
Schedule of Investmentsa
COMMON EQUITIES: 81.3%
| Shares | Value | |||||||
| INFORMATION TECHNOLOGY: 26.8% | ||||||||
Semiconductors & Semiconductor Equipment: 13.3% |
| |||||||
SK Hynix, Inc. | 64,641 | $3,856,744 | ||||||
LEENO Industrial, Inc. | 22,825 | 2,820,488 | ||||||
KoMiCo., Ltd. | 70,206 | 2,406,447 | ||||||
HPSP Co., Ltd. | 37,434 | 1,591,521 | ||||||
|
| |||||||
| 10,675,200 | ||||||||
|
| |||||||
Electronic Equipment, Instruments & Components: 7.1% |
| |||||||
Samsung SDI Co., Ltd. | 4,936 | 2,317,662 | ||||||
Park Systems Corp. | 18,997 | 1,721,348 | ||||||
Samsung Electro-Mechanics Co., Ltd. | 15,500 | 1,609,718 | ||||||
|
| |||||||
| 5,648,728 | ||||||||
|
| |||||||
Technology Hardware, Storage & Peripherals: 6.4% |
| |||||||
Samsung Electronics Co., Ltd. | 116,320 | 5,105,662 | ||||||
|
| |||||||
Total Information Technology | 21,429,590 | |||||||
|
| |||||||
| CONSUMER DISCRETIONARY: 10.1% | ||||||||
Auto Components: 4.2% | ||||||||
Hyundai Mobis Co., Ltd. | 13,867 | 2,199,560 | ||||||
HL Mando Co., Ltd. | 36,359 | 1,160,324 | ||||||
|
| |||||||
| 3,359,884 | ||||||||
|
| |||||||
Automobiles: 3.0% | ||||||||
Kia Corp. | 25,599 | 1,204,446 | ||||||
Hyundai Motor Co. | 10,046 | 1,202,325 | ||||||
|
| |||||||
| 2,406,771 | ||||||||
|
| |||||||
Internet & Direct Marketing Retail: 2.9% | ||||||||
Coupang, Inc.b | 158,446 | 2,330,741 | ||||||
|
| |||||||
Total Consumer Discretionary | 8,097,396 | |||||||
|
| |||||||
| HEALTH CARE: 9.7% | ||||||||
Pharmaceuticals: 7.1% | ||||||||
Yuhan Corp. | 69,672 | 3,151,140 | ||||||
DongKook Pharmaceutical Co., Ltd. | 192,135 | 2,521,883 | ||||||
|
| |||||||
| 5,673,023 | ||||||||
|
| |||||||
Life Sciences Tools & Services: 2.6% | ||||||||
Samsung Biologics Co., Ltd.b,c,d | 3,242 | 2,107,998 | ||||||
|
| |||||||
Total Health Care | 7,781,021 | |||||||
|
| |||||||
| CONSUMER STAPLES: 9.0% | ||||||||
Tobacco: 3.9% | ||||||||
KT&G Corp. | 43,127 | 3,117,113 | ||||||
|
| |||||||
Food & Staples Retailing: 3.1% | ||||||||
BGF Retail Co., Ltd. | 14,527 | 2,431,114 | ||||||
|
| |||||||
Food Products: 2.0% | ||||||||
Orion Corp. | 15,941 | 1,622,883 | ||||||
|
| |||||||
Total Consumer Staples | 7,171,110 | |||||||
|
| |||||||
| COMMUNICATION SERVICES: 7.7% | ||||||||
Interactive Media & Services: 3.7% | ||||||||
NAVER Corp. | 13,387 | 1,903,913 | ||||||
Kakao Corp. | 24,198 | 1,030,737 | ||||||
|
| |||||||
| 2,934,650 | ||||||||
|
| |||||||
| Shares | Value | |||||||
Entertainment: 1.6% | ||||||||
NCSoft Corp. | 3,606 | $1,288,149 | ||||||
|
| |||||||
Wireless Telecommunication Services: 1.5% |
| |||||||
SK Telecom Co., Ltd. | 33,265 | 1,247,898 | ||||||
|
| |||||||
Diversified Telecommunication Services: 0.9% |
| |||||||
KINX, Inc. | 16,129 | 696,432 | ||||||
|
| |||||||
Total Communication Services | 6,167,129 | |||||||
|
| |||||||
| INDUSTRIALS: 6.4% | ||||||||
Marine: 2.8% | ||||||||
Pan Ocean Co., Ltd. | 485,039 | 2,211,332 | ||||||
|
| |||||||
Machinery: 2.1% | ||||||||
Hyundai Mipo Dockyard Co., Ltd. | 25,285 | 1,693,088 | ||||||
|
| |||||||
Construction & Engineering: 1.5% | ||||||||
Samsung Engineering Co., Ltd.b | 69,643 | 1,232,037 | ||||||
|
| |||||||
Total Industrials | 5,136,457 | |||||||
|
| |||||||
| MATERIALS: 4.4% | ||||||||
Chemicals: 3.1% | ||||||||
LG Chem Ltd. | 5,109 | 2,439,697 | ||||||
|
| |||||||
Metals & Mining: 1.3% | ||||||||
POSCO Holdings, Inc. | 4,913 | 1,075,220 | ||||||
|
| |||||||
Total Materials | 3,514,917 | |||||||
|
| |||||||
| ENERGY: 3.7% | ||||||||
Oil, Gas & Consumable Fuels: 3.7% | ||||||||
S-Oil Corp. | 44,572 | 2,966,498 | ||||||
|
| |||||||
Total Energy | 2,966,498 | |||||||
|
| |||||||
| FINANCIALS: 3.5% | ||||||||
Banks: 1.3% | ||||||||
KB Financial Group, Inc. | 26,387 | 1,010,956 | ||||||
|
| |||||||
Capital Markets: 1.2% | ||||||||
Macquarie Korea Infrastructure Fund | 111,978 | 982,435 | ||||||
|
| |||||||
Insurance: 1.0% | ||||||||
Samsung Fire & Marine Insurance Co., Ltd. | 5,353 | 847,059 | ||||||
|
| |||||||
Total Financials | 2,840,450 | |||||||
|
| |||||||
| TOTAL COMMON EQUITIES | 65,104,568 | |||||||
|
| |||||||
(Cost $64,766,988) | ||||||||
| INFORMATION TECHNOLOGY: 16.8% |
| |||||||
Technology Hardware, Storage & Peripherals: 16.8% |
| |||||||
Samsung Electronics Co., Ltd., Pfd. | 335,322 | $13,437,479 | ||||||
|
| |||||||
Total Information Technology |
| 13,437,479 | ||||||
|
| |||||||
| TOTAL PREFERRED EQUITIES |
| 13,437,479 | ||||||
|
| |||||||
(Cost $ 9,794,292) | ||||||||
| 60 | MATTHEWS ASIA FUNDS |
Table of Contents
Matthews Korea Fund
December 31, 2022
Schedule of Investmentsa (continued)
PREFERRED EQUITIES: 16.8%
| Shares | Value | |||||||
| TOTAL INVESTMENTS: 98.1% |
| 78,542,047 | ||||||
(Cost $ 74,561,280) | ||||||||
| CASH AND OTHER ASSETS, LESS LIABILITIES: 1.9% | 1,480,709 | |||||||
|
| |||||||
NET ASSETS: 100.0% | $80,022,756 | |||||||
|
| |||||||
| a | Certain securities were fair valued under the valuation policies approved by the Board of Trustees (Note 2-A). |
| b | Non-income producing security. |
| c | Security exempt from registration under Rule 144A of the Securities Act of 1933, as amended. The security may be resold in transactions exempt from registration normally to qualified institutional buyers. The security has been determined to be liquid in accordance with procedures adopted by the Funds’ Board of Trustees. At December 31, 2022, the aggregate value is $2,107,998, which is 2.63% of net assets. |
| d | The securities may be resold to qualified foreign investors and foreign institutional buyers under Regulation S of the Securities Act of 1933. |
| Pfd. | Preferred |
See accompanying notes to financial statements.
| matthewsasia.com | 800.789.ASIA | 61 |
Table of Contents

| PORTFOLIO MANAGERS | ||||
| Robert J. Horrocks, PhD | Kenneth Lowe, CFA | |||
Lead Manager | Lead Manager | |||
| Satya Patel | Siddarth Bhargava | |||
Co-Manager | Co-Manager | |||
| FUND FACTS | ||||
| Investor | Institutional | |||
Ticker | MACSX | MICSX | ||
CUSIP | 577130206 | 577130842 | ||
Inception | 9/12/94 | 10/29/10 | ||
NAV | $12.50 | $12.48 | ||
Initial Investment | $2,500 | $100,000 | ||
Gross Expense Ratio1 | 1.13% | 1.01% | ||
Portfolio Statistics | ||||
Total # of Positions | 47 | |||
Net Assets | $610.0 million | |||
Weighted Average Market Cap | $98.1 billion | |||
Portfolio Turnover2 | 13.16% | |||
Benchmark | ||||
MSCI AC Asia ex Japan Index | ||||
OBJECTIVE
Long-term capital appreciation. The Fund also seeks to provide some current income.
STRATEGY
Under normal market conditions, the Fund seeks to achieve its investment objective by investing at least 80% of its net assets, which include borrowings for investment purposes, in dividend-paying common stock, preferred stock and other equity securities, and convertible securities as well as fixed-income securities, of any duration or quality, including high yield securities, of companies located in Asia, which consists of all countries and markets in Asia, including developed, emerging and frontier countries and markets in the Asian region.
Matthews Asian Growth and Income Fund
Portfolio Manager Commentary (unaudited)
For the year ending December 31, 2022, the Matthews Asian Growth and Income Fund returned –18.43% (Investor Class) and –18.31% (Institutional Class), while its benchmark, the MSCI All Country Asia ex Japan Index, returned –19.36% over the same period. For the fourth quarter of the year, the Fund returned 10.83% (Investor Class) and 10.89% (Institutional Class), while the benchmark
returned 11.43%.
Market environment
The last quarter of 2022 saw a regional rebound thanks mainly to China exiting its COVID restrictions. But Asian markets grappled with the COVID-related mobility restrictions for most of the year along with rising rates and inflation, geopolitical tensions and a weakening consumer. A cyclical correction in semiconductor inventories added to the headwinds for the technology-dependent markets of South Korea and Taiwan, which both fell over 20% in the year. China’s equity markets, with their own headwinds, fell almost 20%. Mobility restrictions impacted housing sales which, along with prior efforts to reduce leverage among property developers, prompted liquidity concerns for the sector. In Asia generally, higher global interest rates challenged lofty valuations for high-growth internet and electric vehicle (EV) stocks. The region also saw geopolitical tensions impact sentiment, particularly in China as the U.S. placed restrictions on its own exports of key technology to the country.
The second half of the year had more positives. Significant steps were made toward resolving the U.S.-China audit dispute concerning Chinese companies listed in the U.S., China eased up on regulation from online gaming to property development and the Chinese government took concrete steps to re-emerge from the pandemic. Indonesia and Singapore were among the few markets to post positive U.S. dollar-returns for 2022. Indonesia gained from rising commodity prices while Singapore benefited from reopening early in the year.
Performance Contributors and Detractors
From a country perspective, the portfolio’s overweight and stock selection in Singapore was the biggest contributor to relative performance. Our overweight and stock selection in China/Hong Kong was also a top contributor. In contrast, our stock selection in India was the biggest detractor to performance.
At the sector level, stock selection in information technology, communication services and financials were the biggest contributors to performance during the year. Financials benefited as businesses exposed to rate rises did well while China’s recovery helped all three sectors. On the other hand, stock selection in consumer staples and consumer discretionary were the biggest detractors.
At the stock level, AIA Group was the top contributor to performance in 2022. Faced with the challenges posed by China’s zero-COVID policy, the company focused on rationalizing costs and also announced its first stock buyback since its initial public offering (IPO) in 2010. With the scrapping of zero COVID, the company’s agency business has recovered to pre-pandemic levels. United Overseas Bank in Singapore also performed well, underpinned by rising interest margins in tandem with U.S. rate hikes. The bank’s technology investments reduced costs and there were no major asset quality issues. Yum China Holdings, operator of KFC and Pizza Hut brands in China, was a surprisingly strong performer. Management’s response to zero COVID was to share workers across locations that were open and expand digital sales. The company beat earnings expectations and its earnings multiple remained resilient. In contrast, Tencent Holdings was the biggest
(continued)
| 1 | Actual 2022 expense ratios. |
| 2 | The lesser of fiscal year 2022 long-term purchase costs or sales proceeds divided by the average monthly market value of long-term securities. |
| 62 | MATTHEWS ASIA FUNDS |
Table of Contents
| PERFORMANCE AS OF DECEMBER 31, 2022 | ||||||||||||||||||||||||||||
|
|
|
| Average Annual Total Returns |
| ||||||||||||||||||||||||
| 3 Months | 1 Year | 3 Years | 5 Years | 10 Years | Since Inception | Inception Date | ||||||||||||||||||||||
| Investor Class (MACSX) | 10.83% | -18.43% | -1.81% | -0.23% | 1.96% | 7.76% | 9/12/94 | |||||||||||||||||||||
| Institutional Class (MICSX) | 10.89% | -18.31% | -1.67% | -0.08% | 2.11% | 3.02% | 10/29/10 | |||||||||||||||||||||
| MSCI AC Asia ex Japan Index3 | 11.43% | -19.36% | -1.15% | -0.34% | 3.87% | 4.05% | 4 | |||||||||||||||||||||
Performance assumes reinvestment of all dividends and/or distributions before taxes. All performance quoted represents past performance and is no guarantee of future results. Investment return and principal value will fluctuate with market conditions so that when redeemed, shares may be worth more or less than their original cost. Current performance may be lower or higher than the return figures quoted. Returns would have been lower if certain of the Fund’s fees and expenses had not been waived. For the Fund’s most recent month-end performance, visit matthewsasia.com.
| INCOME DISTRIBUTION HISTORY | ||||||||||||||||||||||||||||
| 2022 | 2021 | |||||||||||||||||||||||||||
| June | December | Total | June | December | Total | |||||||||||||||||||||||
| Investor (MACSX) | $ | 0.08 | $ | 0.13 | $ | 0.21 | $ | 0.12 | $ | 0.07 | $ | 0.20 | ||||||||||||||||
| Inst’l (MICSX) | $ | 0.09 | $ | 0.14 | $ | 0.23 | $ | 0.14 | $ | 0.09 | $ | 0.23 | ||||||||||||||||
Note: This table does not include capital gains distributions. Totals may differ by $0.02 due to rounding. For income distribution history, visit matthewsasia.com.
30-DAY YIELD:
2.48% (Investor Class); 2.39% (Institutional Class)
The 30-Day Yield represents net investment income earned by the Fund over the 30-day period ended 12/31/22, expressed as an annual percentage rate based on the Fund’s share price at the end of the 30-day period. The 30-Day Yield should be regarded as an estimate of the Fund’s rate of investment income, and it may not equal the Fund’s actual income distribution rate.
Source: BNY Mellon Investment Servicing (US) Inc. | DIVIDEND YIELD: 3.31%
The dividend yield (trailing) for the portfolio is the weighted average sum of the dividends paid by each equity security held by the Fund over the 12 months ended 12/31/22 divided by the current price of each equity as of 12/31/22. The annualized dividend yield for the Fund is for the equity-only portion of the portfolio. Please note that this is based on gross equity portfolio holdings and does not reflect the actual yield an investor in the Fund would receive. Past yields are no guarantee of future yields.
Source: FactSet Research Systems, Bloomberg, MICM | |||
GROWTH OF A HYPOTHETICAL $10,000 INVESTMENT SINCE INCEPTION—INVESTOR CLASS
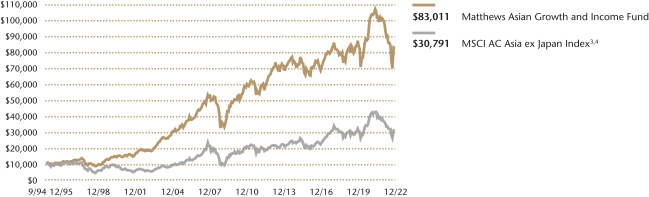
Plotted monthly. The performance data and graph do not reflect the deduction of taxes that a shareholder would pay on dividends, capital gains distributions or redemption of Fund shares. Values are in US$.
| 3 | It is not possible to invest directly in an index. Source: Index data from Morgan Stanley Capital International and Bloomberg; total return calculations performed by BNY Mellon Investment Servicing (US) Inc. Please see page 87 for index definition. |
| 4 | Calculated from 8/31/94. |
| TOP TEN HOLDINGS5 | ||||||||
| Name | Sector | Country | % Net Assets | |||||
| Taiwan Semiconductor Manufacturing Co., Ltd. | Information Technology | Taiwan | 7.5% | |||||
| Tencent Holdings, Ltd. | Communication Services | China/Hong Kong | 5.2% | |||||
| AIA Group, Ltd. | Financials | China/Hong Kong | 5.2% | |||||
| Samsung Electronics Co., Ltd. | Information Technology | South Korea | 3.6% | |||||
| Housing Development Finance Corp., Ltd. | Financials | India | 3.4% | |||||
| JD.com, Inc. | Consumer Discretionary | China/Hong Kong | 3.1% | |||||
| Macquarie Korea Infrastructure Fund | Financials | South Korea | 2.4% | |||||
| Pharmaron Beijing Co., Ltd., Cnv., 0.000%, 06/18/2026 | Health Care | China/Hong Kong | 2.2% | |||||
| ESR Group, Ltd., Cnv., 1.500%, 09/30/2025 | Real Estate | China/Hong Kong | 2.2% | |||||
| HKT Trust & HKT, Ltd. | Communication Services | China/Hong Kong | 2.1% | |||||
| % OF ASSETS IN TOP 10 | 36.9% | |||||||
| 5 | Holdings may combine more than one security from same issuer and related depositary receipts. |
| matthewsasia.com | 800.789.ASIA | 63 |
Table of Contents
Matthews Asian Growth and Income Fund
Portfolio Manager Commentary (unaudited) (continued)
detractor as Internet stocks corrected globally as central banks rapidly hiked interest rates. Additional challenges included weak consumer and ad spending and a regulatory stay on game approvals. The start of new approvals and the easing of pandemic restrictions signal better days ahead. Another detractor was Taiwan Semiconductor Manufacturing Co. (TSMC) as demand for PCs and smartphones slowed in 2022. Geopolitical concerns between China, Taiwan and the U.S. also weighed on the stock. Thanks to China’s removal of its COVID policy and with it, improved market sentiment, both Tencent and TSMC were top performers in the fourth quarter. Another large detractor for the full year was CIFI Ever Sunshine Services Group, a property management service provider in Hong Kong. The government crack-down on leverage in the real estate market prompted concerns over the liquidity of developers, including Ever Sunshine’s parent company CIFI Holdings Group.
Notable Portfolio Changes
The fund exited Topsports International, an athletic footwear and apparel retailer in China serving major global brands. Concerns remain over the long-term bargaining power of retailers as brands seek to go direct to consumers. Another exit in the consumer space was Coway, an appliance renter in South Korea. Slowing consumer demand in a saturated market with rising competition has impacted long-term prospects and the ability to execute meaningful dividend increases. Coway was replaced by SK Telecom. While SK Telecom operates in a low-growth market it offers a healthy yield of over 8% in addition to management’s commitment to sustain dividends going forward.
Outlook
Following China’s 20th Party Congress in October we have seen a return to more pragmatic policies. The major issues of supporting the property sector through its ongoing liquidity challenges, easing regulatory conflicts, attempting to improve bilateral relations with other countries, and engaging in economic reopening, have all made progress. The most pivotal of these has been the removal of the zero-COVID policy, albeit the transition to normalcy has been challenging as infection rates rise and economic activity is likely to take some time to fully resume.
Looking ahead, all these issues will likely continue to drive asset values in Asia. Importantly, a low base should allow for a return to double-digit earnings growth for China this year if the renewed policy regime remains in place. While this is a constructive argument for emerging markets, expectations for Asia as a whole are for a more muted 5% growth given a possible recession in the U.S. and a technology cycle that has slowed. Meanwhile, valuations are a reasonable, although not especially cheap, 13x P/E*. At a portfolio level, we continue to believe that this backdrop reinforces the importance of investing in quality companies that exhibit visible cash flow generation that is both sustainable and growing. When combined with a healthy income stream, it is our view that this can provide an attractive risk-adjusted return for our shareholders over a cycle.
| COUNTRY ALLOCATION (%)6,7 | ||||
| China/Hong Kong | 48.7 | |||
| India | 11.3 | |||
| Taiwan | 11.0 | |||
| South Korea | 8.8 | |||
| Singapore | 6.9 | |||
| France | 3.4 | |||
| United States | 2.0 | |||
| Thailand | 1.9 | |||
| Indonesia | 1.8 | |||
| Philippines | 1.5 | |||
| Australia | 1.4 | |||
| Cash and Other Assets, Less Liabilities | 1.3 | |||
| SECTOR ALLOCATION (%)7 | ||||
| Information Technology | 21.1 | |||
| Financials | 19.5 | |||
| Communication Services | 12.6 | |||
| Consumer Discretionary | 12.4 | |||
| Industrials | 10.0 | |||
| Real Estate | 7.3 | |||
| Health Care | 6.9 | |||
| Consumer Staples | 5.8 | |||
| Utilities | 3.2 | |||
| Cash and Other Assets, Less Liabilities | 1.3 | |||
| MARKET CAP EXPOSURE (%)7 | ||||
| Mega Cap (over $25B) | 48.1 | |||
| Large Cap ($10B-$25B) | 16.6 | |||
| Mid Cap ($3B-10B) | 26.8 | |||
| Small Cap (under $3B) | 7.2 | |||
| Cash and Other Assets, Less Liabilities | 1.3 | |||
| ASSET TYPE BREAKDOWN (%)7,8 | ||||
| Common Equities and ADRs | 90.9 | |||
| Convertible Corporate Bonds | 7.8 | |||
| Preferred Equities | 0.0 | |||
| Cash and Other Assets, Less Liabilities | 1.3 | |||
| 6 | Not all countries where the Fund may invest are included in the benchmark index. |
| 7 | Source: FactSet Research Systems. Percentage values in data are rounded to the nearest tenth of one percent, so the values may not sum to 100% due to rounding. Country allocations and percentage values may be derived from different data sources and may not be consistent with other Fund literature. |
| 8 | Bonds are not included in the MSCI All Country Asia ex Japan Index. |
| * | Price-to-Earnings Ratio (P/E Ratio) is a valuation ratio of a company’s current share price compared to its per-share earnings. |
| 64 | MATTHEWS ASIA FUNDS |
Table of Contents
Matthews Asian Growth and Income Fund
December 31, 2022
Schedule of Investmentsa
COMMON EQUITIES: 90.9%
| Shares | Value | |||||||
| CHINA/HONG KONG: 40.9% | ||||||||
Tencent Holdings, Ltd. | 747,400 | $31,690,032 | ||||||
AIA Group, Ltd. | 2,859,800 | 31,581,891 | ||||||
JD.com, Inc. A Shares | 671,202 | 18,737,706 | ||||||
HKT Trust & HKT, Ltd. | 10,652,000 | 13,039,368 | ||||||
NetEase, Inc. ADR | 167,322 | 12,152,597 | ||||||
Inner Mongolia Yili Industrial Group Co., Ltd. A Shares | 2,712,775 | 12,116,760 | ||||||
Techtronic Industries Co., Ltd. | 1,072,000 | 11,906,538 | ||||||
Wuliangye Yibin Co., Ltd. A Shares | 442,974 | 11,519,546 | ||||||
Yum China Holdings, Inc. | 202,534 | 11,068,483 | ||||||
Midea Group Co., Ltd. A Shares | 1,470,630 | 10,962,865 | ||||||
Guangdong Investment, Ltd. | 10,256,000 | 10,471,892 | ||||||
BOC Hong Kong Holdings, Ltd. | 2,942,000 | 9,987,492 | ||||||
NARI Technology Co., Ltd. A Shares | 2,809,309 | 9,861,918 | ||||||
Jiangsu Expressway Co., Ltd. H Shares | 10,724,000 | 9,762,071 | ||||||
CK Hutchison Holdings, Ltd. | 1,628,672 | 9,757,132 | ||||||
Link REIT | 1,294,400 | 9,471,565 | ||||||
Zhongsheng Group Holdings, Ltd. | 1,752,500 | 8,976,481 | ||||||
ENN Natural Gas Co., Ltd. A Shares | 3,785,877 | 8,783,916 | ||||||
Qingdao Haier Biomedical Co., Ltd. A Shares | 850,530 | 7,774,437 | ||||||
|
| |||||||
Total China/Hong Kong | 249,622,690 | |||||||
|
| |||||||
| INDIA: 11.3% | ||||||||
Housing Development Finance Corp., Ltd. | 644,027 | 20,474,240 | ||||||
Tata Consultancy Services, Ltd. | 308,439 | 12,130,017 | ||||||
Sanofi India, Ltd. | 145,394 | 10,283,875 | ||||||
Embassy Office Parks REIT | 2,212,102 | 8,975,437 | ||||||
Computer Age Management Services, Ltd. | 325,889 | 8,729,133 | ||||||
Crompton Greaves Consumer Electricals, Ltd. | 2,094,413 | 8,511,029 | ||||||
|
| |||||||
Total India | 69,103,731 | |||||||
|
| |||||||
| TAIWAN: 11.0% | ||||||||
Taiwan Semiconductor Manufacturing Co., Ltd. | 3,161,187 | 45,911,383 | ||||||
Chailease Holding Co., Ltd. | 1,611,160 | 11,350,925 | ||||||
Advantech Co., Ltd. | 911,884 | 9,763,947 | ||||||
|
| |||||||
Total Taiwan | 67,026,255 | |||||||
|
| |||||||
| SOUTH KOREA: 8.8% | ||||||||
Samsung Electronics Co., Ltd. | 503,633 | 22,106,086 | ||||||
Macquarie Korea Infrastructure Fund | 1,650,447 | 14,480,132 | ||||||
SK Telecom Co., Ltd. | 228,572 | 8,574,616 | ||||||
LEENO Industrial, Inc. | 68,872 | 8,510,521 | ||||||
|
| |||||||
Total South Korea | 53,671,355 | |||||||
|
| |||||||
| SINGAPORE: 6.9% | ||||||||
CapitaLand Ascendas REIT | 6,199,484 | 12,696,982 | ||||||
United Overseas Bank, Ltd. | 467,200 | 10,701,610 | ||||||
Venture Corp., Ltd. | 743,500 | 9,476,789 | ||||||
Singapore Technologies Engineering, Ltd. | 3,770,425 | 9,434,792 | ||||||
|
| |||||||
Total Singapore | 42,310,173 | |||||||
|
| |||||||
| Shares | Value | |||||||
| FRANCE: 3.4% | ||||||||
Pernod Ricard SA | 59,850 | 11,773,853 | ||||||
LVMH Moet Hennessy Louis Vuitton SE | 12,351 | 8,987,740 | ||||||
|
| |||||||
Total France | 20,761,593 | |||||||
|
| |||||||
| UNITED STATES: 2.0% | ||||||||
Broadcom, Inc. | 21,401 | $11,965,941 | ||||||
|
| |||||||
Total United States | 11,965,941 | |||||||
|
| |||||||
| THAILAND: 1.9% | ||||||||
Digital Telecommunications Infrastructure Fund F Shares | 29,740,800 | 11,334,735 | ||||||
|
| |||||||
Total Thailand | 11,334,735 | |||||||
|
| |||||||
| INDONESIA: 1.8% | ||||||||
PT Bank Rakyat Indonesia Persero Tbk | 34,433,672 | 10,917,205 | ||||||
|
| |||||||
Total Indonesia | 10,917,205 | |||||||
|
| |||||||
| PHILIPPINES: 1.5% | ||||||||
Bank of the Philippine Islands | 5,094,614 | 9,345,139 | ||||||
|
| |||||||
Total Philippines | 9,345,139 | |||||||
|
| |||||||
| AUSTRALIA: 1.4% | ||||||||
Aristocrat Leisure, Ltd. | 401,980 | 8,283,122 | ||||||
|
| |||||||
Total Australia | 8,283,122 | |||||||
|
| |||||||
| TOTAL COMMON EQUITIES | 554,341,939 | |||||||
|
| |||||||
(Cost $529,863,442) | ||||||||
CONVERTIBLE CORPORATE BONDS: 7.8% |
| |||||||
| Face Amount* | Value | |||||||
| CHINA/HONG KONG: 7.8% | ||||||||
Pharmaron Beijing Co., Ltd., Cnv. | 15,000,000 | 13,260,000 | ||||||
ESR Group, Ltd., Cnv. | 14,038,000 | 13,258,891 | ||||||
Hansoh Pharmaceutical Group Co., Ltd., Cnv. | 11,782,000 | 10,880,677 | ||||||
China Conch Venture Holdings International, Ltd., Cnv. | HKD 76,000,000 | 10,452,440 | ||||||
|
| |||||||
Total China/Hong Kong | 47,852,008 | |||||||
|
| |||||||
| TOTAL CONVERTIBLE CORPORATE BONDS |
| 47,852,008 | ||||||
|
| |||||||
(Cost $52,180,016) | ||||||||
| TOTAL INVESTMENTS: 98.7% | 602,193,947 | |||||||
|
| |||||||
(Cost $582,043,458) | ||||||||
| CASH AND OTHER ASSETS, LESS LIABILITIES: 1.3% | 7,820,959 | |||||||
|
| |||||||
NET ASSETS: 100.0% | $610,014,906 | |||||||
|
| |||||||
| matthewsasia.com | 800.789.ASIA | 65 |
Table of Contents
Matthews Asian Growth and Income Fund
December 31, 2022
Schedule of Investmentsa (continued)
| a | Certain securities were fair valued under the valuation policies approved by the Board of Trustees (Note 2-A). |
| b | The securities may be resold to qualified foreign investors and foreign institutional buyers under Regulation S of the Securities Act of 1933. |
| * | All Values in USD unless otherwise specified. |
| ADR | American Depositary Receipt |
| Cnv. | Convertible |
| HKD | Hong Kong Dollar |
| REIT | Real Estate Investment Trust |
| USD | U.S. Dollar |
See accompanying notes to financial statements.
| 66 | MATTHEWS ASIA FUNDS |
Table of Contents
| PORTFOLIO MANAGERS* | ||||
| Robert Horrocks, PhD | Kenneth Lowe, CFA | |||
Lead Manager | Lead Manager | |||
| Siddarth Bhargava | Winnie Chwang | |||
Co-Manager | Co-Manager | |||
| Elli Lee | ||||
Co-Manager | ||||
| FUND FACTS | ||||
| Investor | Institutional | |||
Ticker | MAPIX | MIPIX | ||
CUSIP | 577125107 | 577130750 | ||
Inception | 10/31/06 | 10/29/10 | ||
NAV | $13.24 | $13.23 | ||
Initial Investment | $2,500 | $100,000 | ||
Gross Expense Ratio1 | 1.10% | 0.99% | ||
Portfolio Statistics | ||||
Total # of Positions | 51 | |||
Net Assets | $1.9 billion | |||
Weighted Average Market Cap | $53.0 billion | |||
Portfolio Turnover2 | 50.75% | |||
Benchmark | ||||
MSCI AC Asia Pacific Index | ||||
OBJECTIVE
Total return with an emphasis on providing current income.
STRATEGY
Under normal market conditions, the Fund seeks to achieve its investment objective by investing at least 80% of its net assets, which include borrowings for investment purposes, in dividend-paying equity securities of companies located in Asia. Asia consists of all countries and markets in Asia, and includes developed, emerging and frontier countries and markets in the Asian region. The Fund may also invest in convertible debt and equity securities of companies located in Asia.
Portfolio Manager Commentary (unaudited)
For the year ending December 31, 2022, the Matthews Asia Dividend Fund returned –29.57% (Investor Class) and –29.55% (Institutional Class), while its benchmark, the MSCI All Country Asia Pacific Index, returned –16.92% over the same period. For the fourth quarter of the year, the Matthews Asia Dividend Fund returned 5.21% (Investor Class) and 5.21% (Institutional Class), while the benchmark returned 12.52%.
Market Environment
2022 was a painful year for investors in Asian equities due to a combination of the negative effects from rising inflation in the Western world and China’s continued restrictive zero-COVID policy. Earlier in the year, China’s equities received support amid indications Beijing was easing back on its regulatory interventions in the technology and consumer internet markets only for them to fall on concerns over an economic slowdown caused by the government’s implementation of its zero-COVID strategy.
In the last two quarters, the portfolio has been hurt by its exposure to the Vietnamese market. This was triggered by two events: firstly, rising U.S. interest rates have placed real pressure on the Vietnamese dong and secondly, and more significantly, the Vietnamese government launched an anti-corruption investigation into fraudulent corporate activities within the real estate sector. Both led to greater risk aversion in the marketplace.
India is a different story. While there are good quality businesses in the country, valuation multiples are among the highest in Asia which have led us to being more cautious and selective in our exposure. These different market dynamics within Asia have all been set against a macroeconomic backdrop where U.S. Fed policy has influenced not only Asian but global markets in general.
Performance Contributors and Detractors
From a country perspective, China/Hong Kong was a large detractor to performance during 2022. Chinese equities broadly have been hurt by the significant economic impact of the government’s zero-COVID policy. The negative impact of the zero-COVID approach on performance was mitigated in the fourth quarter when the government abruptly scrapped the policy. Ultimately, our stock selection in Japan was the biggest detractor in the year. Vietnam also detracted after the government-led probe into the real estate sector triggered a sharp selloff in the market. On the other hand, our underweight in South Korea was a positive contributor to performance, as was our stock selection in Singapore and Indonesia.
From a sector perspective, consumer discretionary-stock selection detracted the most from relative performance. Meanwhile, our allocation and stock selection in information technology was a contributor to relative performance.
At the holdings level, Hoa Phat Group, a Vietnamese materials company, was the biggest detractor to performance as the company’s profit margins were hurt by surging input material costs while the finished steel products’ selling price suffered from oversupply. On the other hand, Kyoritsu Maintenance, a Japanese consumer-discretionary stock, was a top contributor. The company operates one of the largest budget hotel chains in Japan and as the country has moved toward a full post-COVID re-opening the boom in inbound travelers bodes well for Kyoritsu’s recovery.
(continued)
| * | As of January 31, 2023 |
| 1 | Actual 2022 expense ratios. |
| 2 | The lesser of fiscal year 2022 long-term purchase costs or sales proceeds divided by the average monthly market value of long-term securities. |
| matthewsasia.com | 800.789.ASIA | 67 |
Table of Contents
| PERFORMANCE AS OF DECEMBER 31, 2022 | ||||||||||||||||||||||||||||
|
|
|
| Average Annual Total Returns |
| ||||||||||||||||||||||||
| 3 Months | 1 Year | 3 Years | 5 Years | 10 Years | Since Inception | Inception Date | ||||||||||||||||||||||
| Investor Class (MAPIX) | 5.21% | -29.57% | -3.52% | -2.71% | 3.48% | 6.18% | 10/31/06 | |||||||||||||||||||||
| Institutional Class (MIPIX) | 5.21% | -29.55% | -3.44% | -2.62% | 3.60% | 3.97% | 10/29/10 | |||||||||||||||||||||
| MSCI AC Asia Pacific Index3 | 12.52% | -16.92% | -0.48% | 0.47% | 4.64% | 3.72% | 4 | |||||||||||||||||||||
Performance assumes reinvestment of all dividends and/or distributions before taxes. All performance quoted represents past performance and is no guarantee of future results. Investment return and principal value will fluctuate with market conditions so that when redeemed, shares may be worth more or less than their original cost. Current performance may be lower or higher than the return figures quoted. Returns would have been lower if certain of the Fund’s fees and expenses had not been waived. For the Fund’s most recent month-end performance, visit matthewsasia.com.
| INCOME DISTRIBUTION HISTORY | ||||||||||||||||||||||||||||||||||||||||||||
| 2022
| 2021
| |||||||||||||||||||||||||||||||||||||||||||
| Q1 | Q2 | Q3 | Q4 | Total | Q1 | Q2 | Q3 | Q4 | Total | |||||||||||||||||||||||||||||||||||
| Investor (MAPIX) | $ | 0.05 | $ | 0.04 | $ | 0.02 | $ | 0.01 | $ | 0.11 | $ | 0.08 | $ | 0.04 | $ | 0.05 | $ | 0.02 | $ | 0.19 | ||||||||||||||||||||||||
| Inst’l (MIPIX) | $ | 0.06 | $ | 0.04 | $ | 0.02 | $ | 0.01 | $ | 0.13 | $ | 0.08 | $ | 0.05 | $ | 0.06 | $ | 0.02 | $ | 0.22 | ||||||||||||||||||||||||
Note: This table does not include capital gains distributions. Totals may differ by $0.02 due to rounding and a return of capital. For distribution history please visit matthewsasia.com.
30-DAY YIELD: Investor Class: 1.74% (1.74% excluding waivers) Institutional Class: 1.55% (1.55% excluding waivers)
The 30-Day Yield represents net investment income earned by the Fund over the 30-day period ended 12/31/22, expressed as an annual percentage rate based on the Fund’s share price at the end of the 30-day period. The 30-Day Yield should be regarded as an estimate of the Fund’s rate of investment income, and it may not equal the Fund’s actual income distribution rate.
Source: BNY Mellon Investment Servicing (US) Inc. | DIVIDEND YIELD: 1.93%
The dividend yield (trailing) for the portfolio is the weighted average sum of the dividends paid by each equity security held by the Fund over the 12 months ended 12/31/22 divided by the current price of each equity as of 12/31/22. The annualized dividend yield for the Fund is for the equity-only portion of the portfolio. Please note that this is based on gross equity portfolio holdings and does not reflect the actual yield an investor in the Fund would receive. Past yields are no guarantee of future yields.
Source: FactSet Research Systems, Bloomberg, MICM. | |||
GROWTH OF A HYPOTHETICAL $10,000 INVESTMENT SINCE INCEPTION—INVESTOR CLASS
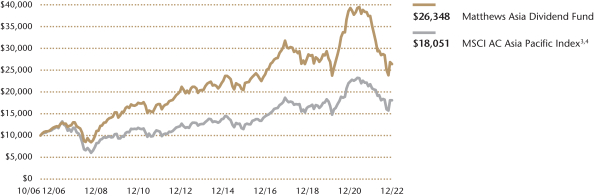
Plotted monthly. The performance data and graph do not reflect the deduction of taxes that a shareholder would pay on dividends, capital gains distributions or redemption of Fund shares. Values are in US$.
| 3 | It is not possible to invest directly in an index. Source: Index data from Morgan Stanley Capital International and Bloomberg; total return calculations performed by BNY Mellon Investment Servicing (US) Inc. Please see page 87 for index definition. |
| 4 | Calculated from 10/31/06. |
| TOP TEN HOLDINGS5 | ||||||||
| Name | Sector | Country | % Net Assets | |||||
| Minth Group, Ltd. | Consumer Discretionary | China/Hong Kong | 6.7% | |||||
| UNO Minda, Ltd. | Consumer Discretionary | India | 6.3% | |||||
| Tencent Holdings, Ltd. | Communication Services | China/Hong Kong | 3.9% | |||||
| FPT Corp. | Information Technology | Vietnam | 3.5% | |||||
| Asia Commercial Bank JSC | Financials | Vietnam | 3.4% | |||||
| KATITAS Co., Ltd. | Real Estate | Japan | 3.3% | |||||
| Taiwan Semiconductor Manufacturing Co., Ltd. | Information Technology | Taiwan | 3.3% | |||||
| Breville Group, Ltd. | Consumer Discretionary | Australia | 2.8% | |||||
| China Tourism Group Duty Free Corp., Ltd. | Consumer Discretionary | China/Hong Kong | 2.5% | |||||
| IDP Education, Ltd. | Consumer Discretionary | Australia | 2.5% | |||||
| % OF ASSETS IN TOP 10 | 38.2% | |||||||
| 5 | Holdings may combine more than one security from same issuer and related depositary receipts. |
| 68 | MATTHEWS ASIA FUNDS |
Table of Contents
| COUNTRY ALLOCATION (%)6,7 | ||||
| China/Hong Kong | 29.7 | |||
| Japan | 25.3 | |||
| Vietnam | 11.5 | |||
| Australia | 8.5 | |||
| India | 8.3 | |||
| Singapore | 3.9 | |||
| Taiwan | 3.3 | |||
| South Korea | 3.3 | |||
| Indonesia | 2.0 | |||
| Thailand | 1.9 | |||
| Philippines | 1.4 | |||
| Bangladesh | 1.1 | |||
| Liabilities in Excess of Cash and Other Assets | -0.3 | |||
| SECTOR ALLOCATION (%)7 | ||||
| Consumer Discretionary | 31.3 | |||
| Industrials | 13.4 | |||
| Information Technology | 12.8 | |||
| Communication Services | 9.8 | |||
| Financials | 8.7 | |||
| Real Estate | 7.6 | |||
| Health Care | 7.4 | |||
| Consumer Staples | 6.5 | |||
| Materials | 1.5 | |||
| Energy | 1.4 | |||
| Liabilities in Excess of Cash and Other Assets | -0.3 | |||
| MARKET CAP EXPOSURE (%)7 | ||||
| Mega Cap (over $25B) | 28.9 | |||
| Large Cap ($10B-$25B) | 14.8 | |||
| Mid Cap ($3B-10B) | 35.6 | |||
| Small Cap (under $3B) | 21.0 | |||
| Liabilities in Excess of Cash and Other Assets | -0.3 | |||
| 6 | Not all countries where the Fund may invest are included in the benchmark index. |
| 7 | Source: FactSet Research Systems. Percentage values in data are rounded to the nearest tenth of one percent, so the values may not sum to 100% due to rounding. Country allocations and percentage values may be derived from different data sources and may not be consistent with other Fund literature. |
Matthews Asia Dividend Fund
Portfolio Manager Commentary (unaudited) (continued)
Notable Portfolio Changes
In the last quarter, we initiated positions in Mingyue Optical Lens and Milkyway Chemical Supply, two China A-share stocks with strong earnings and dividend growth prospects, in our view. We also added a position in West Japan Railway, a Japanese transportation business which we see as well positioned to benefit from the potential tourism recovery. We reduced positions last year in areas such as financials and materials as inflation and rate-hike expectations started to show signs of peaking out and these have been key share-performance drivers for cyclical businesses in these sectors. We also increased exposure to so-called “re-opening” businesses across Asia as the region has decidedly moved toward living with COVID.
Outlook
China’s sudden abandonment of its zero-COVID policy is creating significant disruption to its growth in the near term but it is also setting up the Chinese economy to bounce back strongly once the surge in COVID rates starts to abate. Chinese equities remain quite attractively priced even after the recent market rally. In Japan, a potential change of the ultra-monetary easing policy could also yield significant investment implications including for interest-rate sensitive businesses and currency-sensitive businesses. Elsewhere, the Vietnam equity market has started to show early signs of stabilization as policymakers have started to address the short-term liquidity crunch in the property sector. The structural growth tailwind for the Vietnamese economy, in our view, remains intact.
Overall, we believe Asia remains an excellent growth market. With the growth outlook for developed economies remaining quite uncertain at this moment, the Asian economy and its equity markets could be a potential bright spot for 2023.
| matthewsasia.com | 800.789.ASIA | 69 |
Table of Contents
Matthews Asia Dividend Fund
December 31, 2022
Schedule of Investmentsa
COMMON EQUITIES: 98.8%
| Shares | Value | |||||||
| CHINA/HONG KONG: 29.8% | ||||||||
Minth Group, Ltd. | 46,091,000 | $124,408,204 | ||||||
Tencent Holdings, Ltd. | 1,696,300 | 71,923,737 | ||||||
China Tourism Group Duty Free Corp., Ltd. A Shares | 1,510,324 | 46,959,471 | ||||||
Alibaba Group Holding, Ltd.b | 3,908,500 | 42,887,632 | ||||||
JD.com, Inc. A Shares | 1,229,383 | 34,320,245 | ||||||
Baidu, Inc. A Sharesb | 2,254,950 | 32,157,253 | ||||||
Beijing-Shanghai High Speed Railway Co., Ltd. A Shares | 43,262,070 | 30,700,473 | ||||||
Pharmaron Beijing Co., Ltd. A Shares | 2,979,896 | 29,223,992 | ||||||
OPT Machine Vision Tech Co., Ltd. A Shares | 1,506,647 | 28,731,284 | ||||||
Yuexiu Transport Infrastructure, Ltd. | 51,388,000 | 27,912,306 | ||||||
Mingyue Optical Lens Co., Ltd. A Shares | 2,670,427 | 24,309,992 | ||||||
Milkyway Chemical Supply Chain Service Co., Ltd. A Shares | 1,395,574 | 23,489,593 | ||||||
Link REIT | 2,892,600 | 21,166,138 | ||||||
Pharmaron Beijing Co., Ltd. H Sharesc,d | 1,819,400 | 12,501,711 | ||||||
|
| |||||||
Total China/Hong Kong | 550,692,031 | |||||||
|
| |||||||
| JAPAN: 25.3% | ||||||||
KATITAS Co., Ltd. | 2,664,600 | 60,825,641 | ||||||
Olympus Corp. | 2,072,000 | 36,545,086 | ||||||
Kyoritsu Maintenance Co., Ltd. | 777,700 | 34,720,787 | ||||||
Ajinomoto Co., Inc. | 1,110,200 | 33,931,421 | ||||||
Oriental Land Co., Ltd. | 229,600 | 33,412,350 | ||||||
MISUMI Group, Inc. | 1,485,500 | 32,286,322 | ||||||
Disco Corp. | 107,700 | 30,696,769 | ||||||
West Japan Railway Co. | 692,400 | 30,063,546 | ||||||
Nintendo Co., Ltd. | 700,500 | 29,453,630 | ||||||
IHI Corp. | 916,900 | 26,561,113 | ||||||
Kotobuki Spirits Co., Ltd. | 409,100 | 23,952,445 | ||||||
Dai-ichi Life Holdings, Inc. | 1,030,000 | 23,260,875 | ||||||
Bandai Namco Holdings, Inc. | 344,500 | 21,593,064 | ||||||
Rakus Co., Ltd. | 1,625,300 | 19,479,042 | ||||||
Recruit Holdings Co., Ltd. | 582,800 | 18,242,793 | ||||||
Japan Steel Works, Ltd. | 704,900 | 13,847,318 | ||||||
|
| |||||||
Total Japan | 468,872,202 | |||||||
|
| |||||||
| VIETNAM: 11.5% | ||||||||
FPT Corp. | 19,699,840 | 64,169,613 | ||||||
Asia Commercial Bank JSCb | 67,461,087 | 62,611,380 | ||||||
Vinhomes JSCc,d | 15,841,910 | 32,203,398 | ||||||
KIDO Group Corp. | 9,979,200 | 27,514,231 | ||||||
Mobile World Investment Corp. | 14,328,600 | 26,081,188 | ||||||
|
| |||||||
Total Vietnam | 212,579,810 | |||||||
|
| |||||||
| AUSTRALIA: 8.5% | ||||||||
Breville Group, Ltd. | 4,151,924 | 51,556,028 | ||||||
IDP Education, Ltd. | 2,521,289 | 46,465,426 | ||||||
Treasury Wine Estates, Ltd. | 3,789,445 | 35,008,460 | ||||||
Worley, Ltd. | 2,456,590 | 25,058,356 | ||||||
|
| |||||||
Total Australia | 158,088,270 | |||||||
|
| |||||||
| INDIA: 8.3% | ||||||||
UNO Minda, Ltd. | 18,596,023 | 116,997,256 | ||||||
ICICI Bank, Ltd. | 3,431,410 | 36,907,481 | ||||||
|
| |||||||
Total India | 153,904,737 | |||||||
|
| |||||||
| Shares | Value | |||||||
| SINGAPORE: 3.9% | ||||||||
BOC Aviation, Ltd.c,d | 5,486,300 | $45,704,168 | ||||||
Capitaland India Trust | 32,318,500 | 27,260,488 | ||||||
|
| |||||||
Total Singapore | 72,964,656 | |||||||
|
| |||||||
| TAIWAN: 3.3% | ||||||||
Taiwan Semiconductor Manufacturing Co., Ltd. | 2,132,469 | 30,970,835 | ||||||
Taiwan Semiconductor Manufacturing Co., Ltd. ADR | 393,687 | 29,325,745 | ||||||
|
| |||||||
Total Taiwan | 60,296,580 | |||||||
|
| |||||||
| INDONESIA: 2.0% | ||||||||
PT Bank Rakyat Indonesia Persero Tbk | 118,182,684 | 37,469,851 | ||||||
|
| |||||||
Total Indonesia | 37,469,851 | |||||||
|
| |||||||
| THAILAND: 1.9% | ||||||||
Bangkok Dusit Medical Services Public Co., Ltd. F Shares | 41,091,300 | 34,363,032 | ||||||
|
| |||||||
Total Thailand | 34,363,032 | |||||||
|
| |||||||
| SOUTH KOREA: 1.8% | ||||||||
Samsung Electronics Co., Ltd. | 763,273 | 33,502,528 | ||||||
|
| |||||||
Total South Korea | 33,502,528 | |||||||
|
| |||||||
| PHILIPPINES: 1.4% | ||||||||
Globe Telecom, Inc. | 677,845 | 26,590,990 | ||||||
|
| |||||||
Total Philippines | 26,590,990 | |||||||
|
| |||||||
| BANGLADESH: 1.1% | ||||||||
GrameenPhone, Ltd. | 8,112,021 | 20,787,696 | ||||||
|
| |||||||
Total Bangladesh | 20,787,696 | |||||||
|
| |||||||
| TOTAL COMMON EQUITIES | 1,830,112,383 | |||||||
|
| |||||||
(Cost $1,828,823,402) | ||||||||
PREFERRED EQUITIES: 1.5% | ||||||||
| SOUTH KOREA: 1.5% | ||||||||
LG Chem, Ltd., Pfd. | 123,887 | 27,333,438 | ||||||
|
| |||||||
Total South Korea | 27,333,438 | |||||||
|
| |||||||
| TOTAL PREFERRED EQUITIES | 27,333,438 | |||||||
|
| |||||||
(Cost $19,014,294) | ||||||||
| TOTAL INVESTMENTS: 100.3% | 1,857,445,821 | |||||||
(Cost $1,847,837,696) | ||||||||
| LIABILITIES IN EXCESS OF CASH AND OTHER ASSETS: (0.3%) | (6,075,842 | ) | ||||||
|
| |||||||
NET ASSETS: 100.0% | $1,851,369,979 | |||||||
|
| |||||||
| 70 | MATTHEWS ASIA FUNDS |
Table of Contents
Matthews Asia Dividend Fund
December 31, 2022
Schedule of Investmentsa (continued)
| a | Certain securities were fair valued under the valuation policies approved by the Board of Trustees (Note 2-A). |
| b | Non-income producing security. |
| c | Security exempt from registration under Rule 144A of the Securities Act of 1933, as amended. The security may be resold in transactions exempt from registration normally to qualified institutional buyers. The security has been determined to be liquid in accordance with procedures adopted by the Funds’ Board of Trustees. At December 31, 2022, the aggregate value is $90,409,277, which is 4.88% of net assets. |
| d | The securities may be resold to qualified foreign investors and foreign institutional buyers under Regulation S of the Securities Act of 1933. |
| ADR | American Depositary Receipt |
| JSC | Joint Stock Co. |
| Pfd. | Preferred |
| REIT | Real Estate Investment Trust |
See accompanying notes to financial statements.
| matthewsasia.com | 800.789.ASIA | 71 |
Table of Contents
| PORTFOLIO MANAGERS | ||||
| Sherwood Zhang, CFA | Winnie Chwang* | |||
Lead Manager | Lead manager | |||
| Elli Lee* | Andrew Mattock, CFA* | |||
Co-Manager | Co-Manager | |||
| FUND FACTS | ||||
| Investor | Institutional | |||
Ticker | MCDFX | MICDX | ||
CUSIP | 577125305 | 577130735 | ||
Inception | 11/30/09 | 10/29/10 | ||
NAV | $14.00 | $14.00 | ||
Initial Investment | $2,500 | $100,000 | ||
Gross Expense Ratio1 | 1.20% | 1.06% | ||
Portfolio Statistics | ||||
Total # of Positions | 38 | |||
Net Assets | $221.3 million | |||
Weighted Average Market Cap | $85.0 billion | |||
Portfolio Turnover2 | 67.08% | |||
Benchmark | ||||
MSCI China Index | ||||
OBJECTIVE
Total return with an emphasis on providing current income.
STRATEGY
Under normal market conditions, the Fund seeks to achieve its investment objective by investing at least 80% of its net assets, which include borrowings for investment purposes, in dividend-paying equity securities of companies located in China. China includes its administrative and other districts, such as Hong Kong. The Fund may also invest in convertible debt and equity securities of companies located in China.
Portfolio Manager Commentary (unaudited)
For the year ending December 31, 2022, the Matthews China Dividend Fund returned –16.75% (Investor Class) and –16.59% (Institutional Class), while its benchmark, the MSCI China Index, returned –21.80% over the same period. For the fourth quarter of the year, the Fund returned 16.45% (Investor Class) and 16.55% (Institutional Class), while the benchmark returned 13.53%.
Market Environment
2022 will certainly be remembered as a year of volatility. Global equity markets reacted negatively to a series of events, including the Russian invasion of Ukraine, the spike in energy costs, aggressive rate rises by the U.S. Federal Reserve and other central banks, the lock down in Shanghai, tensions over Taiwan, and the Chinese Communist Party’s selection of a new leadership team for the next five years.
In November, Chinese equities markets hit their lowest point of the year. However, in that same month, China relaxed many of its COVID quarantine policies, signaling a change in policy direction in managing the virus and Chinese equities reacted favorably. Then, in early December, the government announced the scrapping of its zero-COVID policy and the removal of quarantine requirements for international visitors. Meanwhile, the U.S. Public Company Accounting Oversight Board (PCAOB) announced that it was able to fully inspect and investigate the audit workbooks of PCAOB-registered accounting firms working for Chinese companies listed on U.S. securities exchanges. This greatly reduced the risk of Chinese companies being forced to delist in the U.S. On the back of these positive developments, Chinese equities, especially those listed in the offshore market, began a strong rebound.
Performance Contributors and Detractors
During 2022, at the sector level, stock selection in industrials, consumer discretionary and information technology were the biggest contributors to performance. On the other hand, stock selection in the energy sector was the biggest detractor. In terms of market capitalization, small-cap holdings continued to outperform their large-cap peers.
Among individual holdings, Yangzijiang Shipbuilding was the top contributor. Having spun off its financial and investment business to focus on its core shipbuilding business, the company has grown its order book and last year secured the first contract for its LNG (Liquified Natural Gas) ship. It also benefited from a weakening Chinese currency and declining steel price. China Tourism Group Duty Free was the second-largest contributor as its business in Hainan Island and international airports in China may benefit significantly when Chinese tourism returns to normal. Pinduoduo, an online shopping platform, was also a top contributor as COVID-related lockdowns forced many consumers to shop online and its discount pricing also attracted more spending. However, we are very mindful that its recent push into the U.S. market might significantly reduce its short-term earnings and we will adjust our position accordingly.
Conversely, consumer internet giant Tencent was the largest detractor to performance. Given a challenging operating environment, management has been doing a good job increasing long-term investor returns by distributing its investments in companies in specie to shareholders. China Suntien Green Energy was the second-largest detractor as its gas pipeline suffered from lower utilization due to reduced industrial activity. Pharmaron Beijing, a leading Contract Research Organization (CRO), was also a large detractor. The company and the clinical trial services
(continued)
| * | As of January 31, 2023 |
| 1 | Actual 2022 expense ratios. |
| 2 | The lesser of fiscal year 2022 long-term purchase costs or sales proceeds divided by the average monthly market value of long-term securities. |
| 72 | MATTHEWS ASIA FUNDS |
Table of Contents
| PERFORMANCE AS OF DECEMBER 31, 2022 | ||||||||||||||||||||||||||||
|
|
|
| Average Annual Total Returns |
| ||||||||||||||||||||||||
| 3 Months | 1 Year | 3 Year | 5 Year | 10 Years | Since Inception | Inception Date | ||||||||||||||||||||||
| Investor Class (MCDFX) | 16.45% | -16.75% | 0.96% | 1.27% | 6.87% | 7.73% | 11/30/09 | |||||||||||||||||||||
| Institutional Class (MICDX) | 16.55% | -16.59% | 1.11% | 1.42% | 7.05% | 6.90% | 10/29/10 | |||||||||||||||||||||
| MSCI China Index3 | 13.53% | -21.80% | -7.38% | -4.40% | 2.62% | 2.45% | 4 | |||||||||||||||||||||
Performance assumes reinvestment of all dividends and/or distributions before taxes. All performance quoted represents past performance and is no guarantee of future results. Investment return and principal value will fluctuate with market conditions so that when redeemed, shares may be worth more or less than their original cost. Current performance may be lower or higher than the return figures quoted. For the Fund’s most recent month-end performance, visit matthewsasia.com.
| INCOME DISTRIBUTION HISTORY | ||||||||||||||||||||||||||||
| 2022 | 2021 | |||||||||||||||||||||||||||
| June | December | Total | June | December | Total | |||||||||||||||||||||||
| Investor (MCDFX) | $ | 0.42 | $ | 0.11 | $ | 0.52 | $ | 0.38 | $ | 0.11 | $ | 0.49 | ||||||||||||||||
| Inst’l (MICDX) | $ | 0.43 | $ | 0.12 | $ | 0.54 | $ | 0.39 | $ | 0.12 | $ | 0.52 | ||||||||||||||||
Note: This table does not include capital gains distributions. Totals may differ by $0.02 due to rounding. For income distribution history, visit matthewsasia.com.
30 DAY YIELD:
Investor Class: 1.17% (1.17% excluding waivers) Institutional Class: 1.26% (1.26% excluding waivers)
The 30-Day Yield represents net investment income earned by the Fund over the 30-day period ended 12/31/22, expressed as an annual percentage rate based on the Fund’s share price at the end of the 30-day period. The 30-Day Yield should be regarded as an estimate of the Fund’s rate of investment income, and it may not equal the Fund’s actual income distribution rate.
Source: BNY Mellon Investment Servicing (US) Inc. | DIVIDEND YIELD: 2.80%
The dividend yield (trailing) for the portfolio is the weighted average sum of the dividends paid by each equity security held by the Fund over the 12 months ended 12/31/22 divided by the current price of each equity as of 12/31/22. The annualized dividend yield for the Fund is for the equity-only portion of the portfolio. Please note that this is based on gross equity portfolio holdings and does not reflect the actual yield an investor in the Fund would receive. Past yields are no guarantee of future yields.
Source: FactSet Research Systems, Bloomberg, MICM. | |||
GROWTH OF A HYPOTHETICAL $10,000 INVESTMENT SINCE INCEPTION—INVESTOR CLASS
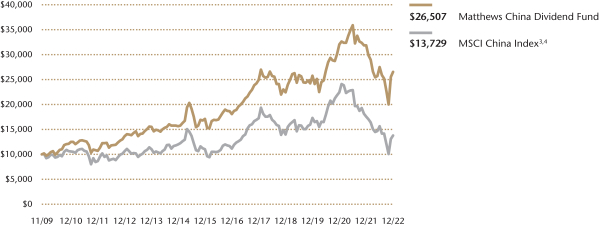
Plotted monthly. The performance data and graph do not reflect the deduction of taxes that a shareholder would pay on dividends, capital gains distributions or redemption of Fund shares. Values are in US$.
| 3 | It is not possible to invest directly in an index. Source: Index data from Morgan Stanley Capital International and Bloomberg; total return calculations performed by BNY Mellon Investment Servicing (US) Inc. Please see page 87 for index definition. |
| 4 | Calculated from 11/30/09. |
| TOP TEN HOLDINGS5 | ||||||||
| Name | Sector | % Net Assets | ||||||
| Tencent Holdings, Ltd. | Communication Services | 10.3% | ||||||
| Alibaba Group Holding, Ltd. | Consumer Discretionary | 5.3% | ||||||
| CITIC Telecom International Holdings, Ltd. | Communication Services | 5.1% | ||||||
| China Tourism Group Duty Free Corp., Ltd. | Consumer Discretionary | 3.1% | ||||||
| Tsingtao Brewery Co., Ltd. | Consumer Staples | 3.1% | ||||||
| China Merchants Bank Co., Ltd. | Financials | 3.1% | ||||||
| Ping An Insurance Group Co. of China, Ltd. | Financials | 3.1% | ||||||
| Postal Savings Bank of China Co., Ltd. | Financials | 3.0% | ||||||
| China Vanke Co., Ltd. | Real Estate | 2.9% | ||||||
| Meituan | Consumer Discretionary | 2.9% | ||||||
| % OF ASSETS IN TOP | 41.9% | |||||||
| 5 | Holdings may combine more than one security from same issuer and related depositary receipts. |
| matthewsasia.com | 800.789.ASIA | 73 |
Table of Contents
Matthews China Dividend Fund
Portfolio Manager Commentary (unaudited) (continued)
industry is increasingly facing risks tied to U.S.-China tensions and it may be pressed to build facilities outside China which we believe would be a drag on profitability.
Notable Portfolio Changes
During the year we added Ping An Insurance Group. While Ping An has been hampered by its exposure to the real estate sector and China’s zero-COVID policy, we believe its competitive advantage over state-owned insurance companies still exists. In addition, we added Wharf Real Estate Investment which owns some of the largest prime shopping centers in Hong Kong. We expect that the return of mainland Chinese consumers will increase retail sales of Wharf’s tenants and thus create drivers of higher rents down the road. We also added delivery company ZTO Express as we expect that a rebound of Chinese consumption growth in 2023 will create volume growth for the industry.
We exited BOC Hong Kong as we see limited credit-demand pickup while competition for deposits is driving up funding costs. We also exited Chongqing Changan Automobile as passenger car purchase-tax benefits are starting to be reduced and competitors will cut prices, in our view. We also exited battery-component maker Zhejiang Hangke Technology as changes to electric vehicles (EV) tax credits under the Inflation Reduction Act in the U.S. and slowing sales of EVs in China have created uncertainty for some of its key customers.
Outlook
We are glad to see the Chinese government finally change course on its zero-COVID policy. The uncertain regulation of internet platforms, draconian cooling measures for the property market and zero COVID have been the three main drags on the economy. But while policies are turning on all these areas there is still work to do. Many private entrepreneurs need to be incentivized to take risk and make investments and start hiring again while Chinese consumers who have stacked additional savings during the pandemic could also be helped with spending subsidies.
After the recent strong rally in Chinese equities we believe the next phase of the rebound will be driven by strong fundamentals. During this phase, high-quality companies with strong earnings and cash flow and healthy balance sheets could start to outperform. These companies have always been our focus. With their low valuations and strong growth potential we believe our portfolio could deliver an attractive total risk-adjusted return for shareholders.
| COUNTRY ALLOCATION (%)6,7 | ||||
| China/Hong Kong | 99.0 | |||
| Cash and Other Assets, Less Liabilities | 1.1 | |||
| SECTOR ALLOCATION (%)7 | ||||
| Consumer Discretionary | 29.5 | |||
| Communication Services | 15.4 | |||
| Financials | 11.4 | |||
| Consumer Staples | 9.0 | |||
| Real Estate | 7.4 | |||
| Industrials | 6.8 | |||
| Health Care | 6.6 | |||
| Materials | 6.0 | |||
| Information Technology | 5.2 | |||
| Energy | 1.7 | |||
| Cash and Other Assets, Less Liabilities | 1.1 | |||
| MARKET CAP EXPOSURE (%)7 | ||||
| Mega Cap (over $25B) | 45.4 | |||
| Large Cap ($10B-$25B) | 12.7 | |||
| Mid Cap ($3B-10B) | 24.0 | |||
| Small Cap (under $3B) | 16.8 | |||
| Cash and Other Assets, Less Liabilities | 1.1 | |||
| 6 | Not all countries where the Fund may invest are included in the benchmark index. |
| 7 | Source: FactSet Research Systems. Percentage values in data are rounded to the nearest tenth of one percent, so the values may not sum to 100% due to rounding. Country allocations and percentage values may be derived from different data sources and may not be consistent with other Fund literature. |
| 74 | MATTHEWS ASIA FUNDS |
Table of Contents
Matthews China Dividend Fund
December 31, 2022
Schedule of Investmentsa
COMMON EQUITIES: 98.9%
| Shares | Value | |||||||
| CONSUMER DISCRETIONARY: 29.4% |
| |||||||
Internet & Direct Marketing Retail: 10.0% |
| |||||||
Alibaba Group Holding, Ltd.b | 1,078,200 | $11,830,995 | ||||||
Meituan B Sharesb,c,d | 284,900 | 6,312,198 | ||||||
Pinduoduo, Inc. ADRb | 50,391 | 4,109,386 | ||||||
|
| |||||||
| 22,252,579 | ||||||||
|
| |||||||
Hotels, Restaurants & Leisure: 9.3% |
| |||||||
Yum China Holdings, Inc. | 114,774 | 6,272,399 | ||||||
Tam Jai International Co., Ltd. | 16,628,000 | 5,588,490 | ||||||
Shanghai Jinjiang International Hotels Co., Ltd. B Shares | 2,187,531 | 4,380,866 | ||||||
Melco Resorts & Entertainment, Ltd. ADRb | 371,740 | 4,275,010 | ||||||
|
| |||||||
| 20,516,765 | ||||||||
|
| |||||||
Specialty Retail: 3.1% |
| |||||||
China Tourism Group Duty Free Corp., Ltd. H Sharesb,c,d | 237,300 | 6,955,078 | ||||||
|
| |||||||
Household Durables: 2.5% |
| |||||||
Haier Smart Home Co., Ltd. D Shares | 4,692,403 | 5,494,033 | ||||||
|
| |||||||
Diversified Consumer Services: 2.3% |
| |||||||
China Education Group Holdings, Ltd.d | 3,940,000 | 5,066,415 | ||||||
|
| |||||||
Automobiles: 2.2% |
| |||||||
Yadea Group Holdings, Ltd.c,d | 2,936,000 | 4,888,381 | ||||||
|
| |||||||
Total Consumer Discretionary | 65,173,251 | |||||||
|
| |||||||
| COMMUNICATION SERVICES: 15.4% |
| |||||||
Interactive Media & Services: 10.3% |
| |||||||
Tencent Holdings, Ltd. | 537,200 | 22,777,476 | ||||||
|
| |||||||
Diversified Telecommunication Services: 5.1% |
| |||||||
CITIC Telecom International Holdings, Ltd. | 33,313,000 | 11,297,018 | ||||||
|
| |||||||
Total Communication Services | 34,074,494 | |||||||
|
| |||||||
| FINANCIALS: 11.4% |
| |||||||
Banks: 6.1% |
| |||||||
China Merchants Bank Co., Ltd. A Shares | 1,274,084 | 6,823,928 | ||||||
Postal Savings Bank of China Co., Ltd. H Sharesc,d | 10,745,000 | 6,649,176 | ||||||
|
| |||||||
| 13,473,104 | ||||||||
|
| |||||||
Insurance: 3.1% |
| |||||||
Ping An Insurance Group Co. of China, Ltd. H Shares | 1,035,000 | 6,799,686 | ||||||
|
| |||||||
Capital Markets: 2.2% |
| |||||||
Hong Kong Exchanges & Clearing, Ltd. | 114,000 | 4,898,609 | ||||||
|
| |||||||
Total Financials | 25,171,399 | |||||||
|
| |||||||
| CONSUMER STAPLES: 9.0% |
| |||||||
Beverages: 7.2% |
| |||||||
Tsingtao Brewery Co., Ltd. H Shares | 704,000 | 6,932,359 | ||||||
Wuliangye Yibin Co., Ltd. A Shares | 208,600 | 5,424,646 | ||||||
Yantai Changyu Pioneer Wine Co., Ltd. B Shares | 2,417,676 | 3,577,639 | ||||||
|
| |||||||
| 15,934,644 | ||||||||
|
| |||||||
| Shares | Value | |||||||
Food Products: 1.8% |
| |||||||
Inner Mongolia Yili Industrial Group Co., Ltd. A Shares | 885,600 | $3,955,582 | ||||||
|
| |||||||
Total Consumer Staples | 19,890,226 | |||||||
|
| |||||||
| REAL ESTATE: 7.4% |
| |||||||
Real Estate Management & Development: 7.4% |
| |||||||
China Vanke Co., Ltd. H Shares | 3,150,400 | 6,337,797 | ||||||
Wharf Real Estate Investment Co., Ltd. | 874,000 | 5,090,298 | ||||||
Onewo, Inc. H Sharesb | 782,730 | 4,921,827 | ||||||
|
| |||||||
Total Real Estate | 16,349,922 | |||||||
|
| |||||||
| INDUSTRIALS: 6.8% |
| |||||||
Machinery: 2.8% |
| |||||||
Yangzijiang Shipbuilding Holdings, Ltd. | 6,005,400 | 6,100,319 | ||||||
|
| |||||||
Transportation Infrastructure: 2.0% |
| |||||||
Hainan Meilan International Airport Co., Ltd. H Sharesb | 1,486,000 | 4,498,733 | ||||||
|
| |||||||
Air Freight & Logistics: 2.0% |
| |||||||
ZTO Express Cayman, Inc. ADR | 165,546 | 4,448,221 | ||||||
|
| |||||||
Total Industrials | 15,047,273 | |||||||
|
| |||||||
| HEALTH CARE: 6.6% |
| |||||||
Pharmaceuticals: 4.4% | ||||||||
CSPC Pharmaceutical Group, Ltd. | 5,076,000 | 5,284,490 | ||||||
Livzon Pharmaceutical Group, Inc. H Shares | 1,367,600 | 4,581,086 | ||||||
|
| |||||||
| 9,865,576 | ||||||||
|
| |||||||
Health Care Equipment & Supplies: 2.2% |
| |||||||
AK Medical Holdings, Ltd.c,d | 3,848,000 | 4,817,063 | ||||||
|
| |||||||
Total Health Care | 14,682,639 | |||||||
|
| |||||||
| MATERIALS: 6.0% |
| |||||||
Construction Materials: 4.2% |
| |||||||
China Jushi Co., Ltd. A Shares | 2,363,707 | 4,672,202 | ||||||
Huaxin Cement Co., Ltd. H Shares | 4,143,292 | 4,593,240 | ||||||
|
| |||||||
| 9,265,442 | ||||||||
|
| |||||||
Metals & Mining: 1.8% |
| |||||||
Tiangong International Co., Ltd. | 10,616,000 | 3,905,794 | ||||||
|
| |||||||
Total Materials | 13,171,236 | |||||||
|
| |||||||
| INFORMATION TECHNOLOGY: 5.2% |
| |||||||
Software: 2.8% |
| |||||||
Longshine Technology Group Co., Ltd. A Shares | 1,289,600 | 4,091,762 | ||||||
Shanghai Baosight Software Co., Ltd. B Shares | 712,213 | 2,201,428 | ||||||
|
| |||||||
| 6,293,190 | ||||||||
|
| |||||||
Electronic Equipment, Instruments & Components: 1.6% |
| |||||||
OPT Machine Vision Tech Co., Ltd. A Shares | 185,055 | 3,528,940 | ||||||
|
| |||||||
Semiconductors & Semiconductor Equipment: 0.8% |
| |||||||
Silergy Corp. | 121,000 | 1,709,115 | ||||||
|
| |||||||
Total Information Technology | 11,531,245 | |||||||
|
| |||||||
| matthewsasia.com | 800.789.ASIA | 75 |
Table of Contents
Matthews China Dividend Fund
December 31, 2022
Schedule of Investmentsa (continued)
COMMON EQUITIES (continued)
| Shares | Value | |||||||
| ENERGY: 1.7% | ||||||||
Oil, Gas & Consumable Fuels: 1.7% | ||||||||
China Suntien Green Energy Corp., Ltd. H Shares | 9,219,000 | $3,830,675 | ||||||
|
| |||||||
Total Energy | 3,830,675 | |||||||
|
| |||||||
| TOTAL INVESTMENTS: 98.9% | 218,922,360 | |||||||
(Cost $225,503,764) | ||||||||
| CASH AND OTHER ASSETS, LESS LIABILITIES: 1.1% | 2,363,307 | |||||||
|
| |||||||
NET ASSETS: 100.0% | $221,285,667 | |||||||
|
| |||||||
| a | Certain securities were fair valued under the valuation policies approved by the Board of Trustees (Note 2-A). |
| b | Non-income producing security. |
| c | Security exempt from registration under Rule 144A of the Securities Act of 1933, as amended. The security may be resold in transactions exempt from registration normally to qualified institutional buyers. The security has been determined to be liquid in accordance with procedures adopted by the Funds’ Board of Trustees. At December 31, 2022, the aggregate value is $29,621,896, which is 13.39% of net assets. |
| d | The securities may be resold to qualified foreign investors and foreign institutional buyers under Regulation S of the Securities Act of 1933. |
| ADR | American Depositary Receipt |
See accompanying notes to financial statements.
| 76 | MATTHEWS ASIA FUNDS |
Table of Contents

| PORTFOLIO MANAGERS | ||||
| Satya Patel* | ||||
Lead Manager | ||||
| Wei Zhang | ||||
Co-Manager | ||||
| FUND FACTS | ||||
| Investor | Institutional | |||
Ticker | MAINX | MINCX | ||
CUSIP | 577125503 | 577125602 | ||
Inception | 11/30/11 | 11/30/11 | ||
NAV | $8.89 | $8.89 | ||
Initial Investment | $2,500 | $100,000 | ||
Gross Expense Ratio1 | 1.23% | 1.11% | ||
After Fee Waiver and Reimbursement2 | 1.08% | 0.90% | ||
Portfolio Statistics | ||||
Total # of Positions | 25 | |||
Net Assets | $43.1 million | |||
Modified Duration3 | 2.2 | |||
Portfolio Turnover4 | 13.66% | |||
Benchmark | ||||
| 50% Markit iBoxx Asian Local Bond Index, 50% J.P. Morgan Asia Credit Index | ||||
OBJECTIVE
Total return over the long term with an emphasis on income.
STRATEGY
Under normal market conditions, the Fund seeks to achieve its investment objective by investing at least 80% of its net assets, which include borrowings for investment purposes, in debt and debt-related instruments issued by governments, quasi-governmental entities, supra-national institutions, and companies in Asia. Asia consists of all countries and markets in Asia, such as China and India, and includes developed, emerging, and frontier countries and markets in the Asian region. The Fund’s investments in debt securities may be denominated in any currency, may be of any quality or may be unrated, and may have no stated maturity or duration target.
Matthews Asia Total Return Bond Fund†
Portfolio Manager Commentary (unaudited)
For the year ending December 31, 2022, the Matthews Asia Total Return Bond Fund returned –10.25% (Investor Class) and –10.11% (Institutional Class), while its benchmark, the 50% Markit iBoxx Asian Local Bond Index, 50% J.P. Morgan Asia Credit Index, returned –9.19% over the same period. For the fourth quarter, the Fund returned 17.47% (Investor Class) and 17.48% (Institutional Class), while the benchmark returned 5.43%.
Market Environment
2022 has been a challenging year for Asia fixed income. The confluence of multiple global factors including higher U.S. interest rates, the unexpected start of armed conflict in Ukraine, tight liquidity in China’s property development sector and China’s zero-COVID policy, negatively affected markets and left Asia fixed income to suffer through a period of stress. The dynamic zero-COVID policies in China had the largest effect on the market due to the relatively large weight of China real estate in the Asia fixed income universe. The lack of ability to visit apartments put further strains on the China real estate developers whose business was already reeling from increased regulation in 2021. Despite various government policies aimed at supporting the sector, the challenging environment did not improve until November when China’s zero-COVID policy was finally relaxed. Market sentiment sharply improved in the last two months of the year. Despite the rapid recovery in the market towards year end, fundamental challenges such as increased deaths from COVID and a temporary shortage of labor caused by COVID remain. Longer-term challenges also remain with more persistent inflation and ongoing geopolitical uncertainties.
Performance Contributors and Detractors
During the year, our overweight and selection in China underperformed relative to the benchmark while Indonesia and Thailand outperformed on the back of better selection. The corporate bond portion of the portfolio underperformed the benchmark driven primarily by the challenging China real estate market. Within real estate, the worst performance was in residential real estate including Sino Ocean, CIFI Holdings Group and Times China Holdings. On the other hand, Chinese commercial mall owner and operator Wanda Properties International, Indonesian textile manufacturer PB International and Thai state-owned commercial bank offering various banking and financial services Krung Thai Bank were the top contributors.
Within convertible bonds, Luye Pharma, a China-based pharmaceutical company focused on orthopedics, neurology and gastroenterology, and Baozun, a Chinese online e-commerce platform primarily serving overseas clients, were among the biggest contributors to returns in 2022. Luye Pharma and Baozun were both busted convertible bonds that offered attractive yields to their put date, and we exercised our right to put both bonds. On the other hand, the top detractors were Chinese provider of cloud-based commerce and market solutions Weimob Investment, and Chinese online video platform Iqiyi Inc. Both convertible bonds sold off along with Chinese equities amid market concerns about the outlook for China and its road to recovery.
(continued)
| * | Effective July 31, 2022. |
| † | Please refer to “Subsequent Events” in the Notes to the Financial Statements relating to the closure and liquidation of this Fund. |
| 1 | Actual 2022 expense ratios. |
| 2 | Matthews has contractually agreed (i) to waive fees and reimburse expenses to the extent needed to limit Total Annual Fund Operating Expenses (excluding Rule 12b-1 fees, taxes, interest, brokerage commissions, short sale dividend expenses, expenses incurred in connection with any merger or reorganization or extraordinary expenses such as litigation) of the Institutional Class to 0.90% first by waiving class specific expenses (i.e., shareholder service fees specific to a particular class) of the Institutional Class and then, to the extent necessary, by waiving non-class specific expenses (e.g. custody fees) of the Institutional Class, and (ii) if any Fund-wide expenses (i.e., expenses that apply to both the Institutional Class and the Investor Class) are waived for the Institutional Class to maintain the 0.90% expense limitation, to waive an equal amount (in annual percentage terms) of those same expenses for the Investor Class. The Total Annual Fund Operating Expenses After Fee Waiver and Expense Reimbursement for the Investor Class may vary from year to year and will in some years exceed 0.90%. Pursuant to this agreement, any amount waived for prior fiscal years with respect to the Fund is not subject to recoupment. This agreement will remain in place until April 30, 2023 and may be terminated at any time by the Board of Trustees on behalf of the Fund on 60 days’ written notice to Matthews. Matthews may decline to renew this agreement by written notice to the Trust at least 30 days before its annual expiration date. |
| 3 | Modified duration measures the percent change in value of the fixed income portion of the portfolio in response to a 1% change in interest rates. In a multi-currency denominated portfolio with sensitivities to different interest rate regimes, modified duration will not accurately reflect the change in value of the overall portfolio from a change in any one interest rate regime. |
| 4 | The lesser of fiscal year 2022 long-term purchase costs or sales proceeds divided by the average monthly market value of long-term securities. |
| matthewsasia.com | 800.789.ASIA | 77 |
Table of Contents
| PERFORMANCE AS OF DECEMBER 31, 2022 | ||||||||||||||||||||||||||||
|
|
|
| Average Annual Total Returns |
|
| |||||||||||||||||||||||
| 3 Months | 1 Year | 3 Years | 5 Years | 10 Years | Since Inception | Inception Date | ||||||||||||||||||||||
| Investor Class (MAINX) | 17.47% | -10.25% | -3.19% | -0.33% | 1.74% | 2.70% | 11/30/11 | |||||||||||||||||||||
| Institutional Class (MINCX) | 17.48% | -10.11% | -3.01% | -0.13% | 1.96% | 2.90% | 11/30/11 | |||||||||||||||||||||
| 50% Markit iBoxx Asian Local Bond Index, 50% J.P. Morgan Asia Credit Index5 | 5.43% | -9.19% | -1.59% | 0.86% | 1.83% | 2.74% | ||||||||||||||||||||||
Performance assumes reinvestment of all dividends and/or distributions before taxes. All performance quoted represents past performance and is no guarantee of future results. Investment return and principal value will fluctuate with market conditions so that when redeemed, shares may be worth more or less than their original cost. Current performance may be lower or higher than the return figures quoted. Returns would have been lower if certain of the Fund’s fees and expenses had not been waived. For the Fund’s most recent month-end performance visit matthewsasia.com.
| INCOME DISTRIBUTION HISTORY | ||||||||||||||||||||||||||||||||||||||||||||||||||||
| 2022 | Jan. | Feb. | Mar. | Apr. | May | June | July | Aug. | Sept. | Oct. | Nov. | Dec. | Total | |||||||||||||||||||||||||||||||||||||||
| Investor (MAINX) | $ | 0.02 | $ | 0.04 | $ | 0.03 | $ | 0.04 | $ | 3.00 | $ | 0.04 | $ | 0.00 | $ | 0.02 | $ | 0.02 | $ | 0.00 | $ | 0.00 | $ | 0.03 | $ | 0.27 | ||||||||||||||||||||||||||
| Inst’l (MINCX) | $ | 0.02 | $ | 0.04 | $ | 0.04 | $ | 0.04 | $ | 0.04 | $ | 0.04 | $ | 0.00 | $ | 0.02 | $ | 0.02 | $ | 0.00 | $ | 0.00 | $ | 0.03 | $ | 0.28 | ||||||||||||||||||||||||||
| 2021 | ||||||||||||||||||||||||||||||||||||||||||||||||||||
| Investor (MAINX) | $ | 0.03 | $ | 0.02 | $ | 0.03 | $ | 0.04 | $ | 0.03 | $ | 0.04 | $ | 0.03 | $ | 0.03 | $ | 0.03 | $ | 0.04 | $ | 0.05 | $ | 0.08 | $ | 0.46 | ||||||||||||||||||||||||||
| Inst’l (MINCX) | $ | 0.03 | $ | 0.02 | $ | 0.03 | $ | 0.04 | $ | 0.04 | $ | 0.04 | $ | 0.03 | $ | 0.04 | $ | 0.03 | $ | 0.04 | $ | 0.05 | $ | 0.08 | $ | 0.47 | ||||||||||||||||||||||||||
Note: This table does not include capital gains distributions. Totals may differ by $0.02 due to rounding. For income distribution history, visit matthewsasia.com.
30-DAY YIELD:
Investor Class: 17.93% (17.55% excluding waivers) Institutional Class: 17.82% (17.70% excluding waivers)
The 30-Day Yield represents net investment income earned by the Fund over the 30-day period ended 12/31/22, expressed as an annual percentage rate based on the Fund’s share price at the end of the 30-day period. The 30 Day Yield excludes securities that trade without accrued interest. The 30-Day Yield should be regarded as an estimate of the Fund’s rate of investment income, and it may not equal the Fund’s actual income distribution rate.
Source: BNY Mellon Investment Servicing (US) Inc. | YIELD TO WORST: 20.73%
Yield to worst is the lowest yield that can be received on a bond assuming that the issuer does not default. It is calculated by utilizing the worst case assumptions for a bond with respect to certain income-reducing factors, including prepayment, call or sinking fund provisions. The yield to worst excludes securities that trade without accrued interest. It does not represent the yield that an investor should expect to receive. Past yields are no guarantee of future yields.
Source: FactSet Research Systems | |||
GROWTH OF A HYPOTHETICAL $10,000 INVESTMENT SINCE INCEPTION—INVESTOR CLASS
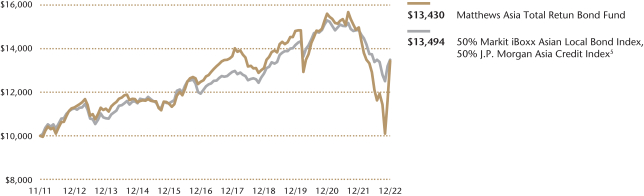
Plotted monthly. The performance data and graph do not reflect the deduction of taxes that a shareholder would pay on dividends, capital gains distributions or redemption of Fund shares. Values are in US$.
| 5 | It is not possible to invest directly in an index. Source: Index data from HSBC, Markit iBoxx and Bloomberg; total return calculations performed by BNY Mellon Investment Servicing (US) Inc. Please see page 87 for index definitions. The Markit iBoxx Asian Local Bond Index performance reflects the returns of the discontinued predecessor HSBC Asian Local Bond Index up to December 31, 2012 and the returns of the successor Markit iBoxx Asian Local Bond Index thereafter. |
| TOP TEN HOLDINGS | ||||||||
| Name | Sector | Currency | % Net Assets | |||||
| Wanda Properties International Co., Ltd., 7.250%, 01/29/2024 | Financial Institutions | U.S. Dollar | 11.0% | |||||
| Franshion Brilliant, Ltd., 6.000%, 02/08/2026 | Financial Institutions | U.S. Dollar | 8.6% | |||||
| ESR Group, Ltd., 5.650%, 09/02/2068 | Industrial | Singapore Dollar | 7.4% | |||||
| Standard Chartered PLC, 4.300%, 02/19/2068 | Financial Institutions | U.S. Dollar | 5.3% | |||||
| PB International BV, 7.625%, 12/31/2025 | Industrial | U.S. Dollar | 5.0% | |||||
| Krung Thai Bank Public Co., Ltd., 4.400%, 03/25/2026 | Financial Institutions | U.S. Dollar | 4.3% | |||||
| KWG Group Holdings, Ltd., 7.400%, 01/13/2027 | Financial Institutions | U.S. Dollar | 4.2% | |||||
| HSBC Holdings PLC, 4.000%, 03/09/2026 | Financial Institutions | U.S. Dollar | 4.2% | |||||
| HDFC Bank, Ltd., 3.700%, 02/25/2069 | Financial Institutions | U.S. Dollar | 4.2% | |||||
| Sino-Ocean Land Treasure III, Ltd., 6.876%, 03/21/2068 | Agency | U.S. Dollar | 4.1% | |||||
| % OF ASSETS IN TOP 10 | 58.3% | |||||||
| 78 | MATTHEWS ASIA FUNDS |
Table of Contents
| CURRENCY ALLOCATION (%)6,7 | ||||
| US Dollar | 74.6 | |||
| China Renminbi | 8.7 | |||
| Singapore Dollar | 6.0 | |||
| South Korean Won | 5.1 | |||
| Indonesian Rupiah | 3.0 | |||
| Thai Baht | 2.7 | |||
| COUNTRY ALLOCATION (%)6,7,8 | ||||
| China/Hong Kong | 60.4 | |||
| India | 11.4 | |||
| Thailand | 6.3 | |||
| Indonesia | 5.0 | |||
| New Zealand | 3.7 | |||
| Singapore | 3.1 | |||
| Cash and Other Assets, Less Liabilities | 10.1 | |||
| SECTOR ALLOCATION (%)6,7 | ||||
| Financial Institutions | 55.1 | |||
| Industrial | 30.7 | |||
| Agency | 4.1 | |||
| Cash and Other Assets, Less Liabilities | 10.1 | |||
| ASSET TYPE BREAKDOWN (%)6,7 | ||||
| Non-Convertible Corporate Bonds | 78.8 | |||
| Convertible Corporate Bonds | 11.1 | |||
| Government Bonds | 0.0 | |||
| Cash and Other Assets, Less Liabilities | 10.1 | |||
| 6 | Source: FactSet Research Systems. Percentage values in data are rounded to the nearest tenth of one percent, so the values may not sum to 100% due to rounding. Country allocations and percentage values may be derived from different data sources and may not be consistent with other Fund literature. |
| 7 | Cash and other assets may include forward currency exchange contracts and certain derivative instruments that have been marked-to-market. |
| 8 | Not all countries where the Fund may invest are included in the benchmark index. |
Matthews Asia Total Return Bond Fund
Portfolio Manager Commentary (unaudited) (continued)
Notable Portfolio Changes
During the fourth quarter, we reduced the portfolio’s local currency exposure due to the continued strong U.S. dollar environment. We believe the recent persistent inflation and geopolitical risk will continue to support a strong dollar. We exited our positions in rupiah-denominated Indonesian government bonds and also exited renminbi-denominated China Development Bank. We also reduced the portfolio’s holdings in convertible bonds where we believe the expected returns no longer justifies the risk, including for Weimob Investments and Iqiyi Inc. We added to our Chinese real estate exposure as the market sharply recovered in November. We added high-quality investment grade Chinese real estate bonds such as Vanke Real Estate and Longfor Holdings as these names were the first to recover and we believe most likely to be beneficiaries of China’s continued supportive policies.
Outlook
Looking ahead, we expect further easing policies to come from China. The current easing policies have for the most part only benefited the largest private firms while medium to smaller firms remain in a challenging environment. The Chinese real estate market remains very fragmented and relies on a long list of medium to smaller developers to fulfill demand. As such, we believe more easing is needed to support the sector. Additionally, how China manages its current COVID infection wave remains a key factor to watch. While infections, severe cases and deaths have risen higher, it is important that China’s ‘living with COVID’ policy does not revert back to a restrictive mode.
In the U.S., the Federal Reserve is expected to continue to aggressively respond to elevated inflation with larger than 25 basis-point (0.25%) hikes. Probabilities of recession will likely increase due to the longer and steeper rate hike cycle in our view. Labor supply and demand continues to be out of balance with more demand for labor than supply of labor. The persistent inflation is likely to result in higher short-term interest rates and more inverted term structure of interest rates.
With interest rates in the U.S. likely to stay high in the coming quarters and with sustained high energy prices, we do not believe the next few quarters to be favorable for Asian local currencies. In addition, global growth is expected to slow in 2023, with inflation is still higher than normal in much of the developed and emerging world, the war in Ukraine is continuing, and China’s recovery is still in its early stage. While Asian fixed income markets are normalizing, they are doing so in an environment where global macro factors are becoming more challenging, rather than more supportive, in the quarters to come.
| matthewsasia.com | 800.789.ASIA | 79 |
Table of Contents
Matthews Asia Total Return Bond Fund
December 31, 2022
Schedule of Investmentsa
NON-CONVERTIBLE CORPORATE BONDS: 78.8% | CONVERTIBLE CORPORATE BONDS: 11.1% |
| Face Amount* | Value | |||||||
| CHINA/HONG KONG: 56.1% | ||||||||
Wanda Properties International Co., Ltd. | ||||||||
7.250%, 01/29/24b | 5,300,000 | $4,760,407 | ||||||
Franshion Brilliant, Ltd. | ||||||||
6.000%c, 02/08/26b,d | 4,700,000 | 3,713,843 | ||||||
ESR Group, Ltd. | ||||||||
5.650%c, 03/02/26b,d | SGD 4,500,000 | 3,174,929 | ||||||
Standard Chartered PLC | ||||||||
4.300%c, 08/19/28b,d | 3,000,000 | 2,302,336 | ||||||
KWG Group Holdings, Ltd. | ||||||||
7.400%, 01/13/27b | 5,000,000 | 1,820,194 | ||||||
HSBC Holdings PLC | ||||||||
4.000%c, 03/09/26d | 2,100,000 | 1,816,403 | ||||||
Sino-Ocean Land Treasure III, Ltd. | ||||||||
6.876%c, 09/21/27b,d,e | 5,000,000 | 1,750,000 | ||||||
China SCE Group Holdings, Ltd. | ||||||||
7.000%, 05/02/25b,e | 4,000,000 | 1,660,000 | ||||||
Times China Holdings, Ltd. | ||||||||
6.200%, 03/22/26b,e | 3,900,000 | 585,000 | ||||||
CIFI Holdings Group Co., Ltd. | ||||||||
4.800%, 05/17/28b | 2,200,000 | 563,067 | ||||||
Logan Group Co., Ltd. | ||||||||
4.500%, 01/13/28b | 2,376,000 | 536,228 | ||||||
Sunac China Holdings, Ltd. | ||||||||
6.500%, 01/26/26b | 2,200,000 | 445,807 | ||||||
Powerlong Real Estate Holdings, Ltd. | ||||||||
4.900%, 05/13/26b | 1,500,000 | 419,400 | ||||||
Vanke Real Estate Hong Kong Co., Ltd. | ||||||||
3.150%, 05/12/25b | 200,000 | 182,109 | ||||||
Times China Holdings, Ltd. | ||||||||
6.750%, 07/08/25b,e | 1,100,000 | 165,000 | ||||||
Longfor Group Holdings, Ltd. | ||||||||
3.375%, 04/13/27b | 200,000 | 157,352 | ||||||
Times China Holdings, Ltd. | ||||||||
5.750%, 01/14/27b,e | 800,000 | 120,000 | ||||||
|
| |||||||
Total China/Hong Kong | 24,172,075 | |||||||
|
| |||||||
| INDIA: 11.4% | ||||||||
HDFC Bank, Ltd. | ||||||||
3.700%c, 08/25/26d,f | 2,100,000 | 1,801,800 | ||||||
Network i2i, Ltd. | ||||||||
5.650%c, 01/15/25d,f | 1,800,000 | 1,716,750 | ||||||
Periama Holdings LLC | ||||||||
5.950%, 04/19/26b | 1,500,000 | 1,395,840 | ||||||
|
| |||||||
Total India | 4,914,390 | |||||||
|
| |||||||
| THAILAND: 6.3% | ||||||||
Krung Thai Bank Public Co., Ltd. | ||||||||
4.400%c, 03/25/26b,d | 2,100,000 | 1,850,940 | ||||||
Bangkok Bank Public Co., Ltd. | ||||||||
5.000%c, 09/23/25b,d | 900,000 | 852,747 | ||||||
|
| |||||||
Total Thailand | 2,703,687 | |||||||
|
| |||||||
| INDONESIA: 5.0% | ||||||||
PB International BV | ||||||||
7.625%, 12/31/25b | 5,100,000 | 2,144,550 | ||||||
|
| |||||||
Total Indonesia | 2,144,550 | |||||||
|
| |||||||
| TOTAL NON-CONVERTIBLE CORPORATE BONDS |
| 33,934,702 | ||||||
|
| |||||||
(Cost $58,149,787) | ||||||||
| Face Amount* | Value | |||||||
| CHINA/HONG KONG: 4.4% |
| |||||||
NIO, Inc., Cnv. | ||||||||
0.500%, 02/01/27 | 1,400,000 | $1,048,320 | ||||||
Pinduoduo, Inc., Cnv. | ||||||||
0.000%, 12/01/25 | 900,000 | 834,750 | ||||||
|
| |||||||
Total China/Hong Kong |
| 1,883,070 | ||||||
|
| |||||||
| NEW ZEALAND: 3.7% | ||||||||
Xero Investments, Ltd., Cnv. | ||||||||
0.000%, 12/02/25b | 2,000,000 | 1,584,000 | ||||||
|
| |||||||
Total New Zealand |
| 1,584,000 | ||||||
|
| |||||||
| SINGAPORE: 3.0% | ||||||||
Sea, Ltd., Cnv. | ||||||||
0.250%, 09/15/26 | 1,800,000 | 1,318,500 | ||||||
|
| |||||||
Total Singapore |
| 1,318,500 | ||||||
|
| |||||||
| TOTAL CONVERTIBLE CORPORATE BONDS |
| 4,785,570 | ||||||
|
| |||||||
(Cost $5,396,851) | ||||||||
| TOTAL INVESTMENTS: 89.9% |
| 38,720,272 | ||||||
(Cost $63,546,638) | ||||||||
| CASH AND OTHER ASSETS, LESS LIABILITIES: 10.1% |
| 4,368,127 | ||||||
|
| |||||||
NET ASSETS: 100.0% |
| $43,088,399 | ||||||
|
| |||||||
| a | Certain securities were fair valued under the valuation policies approved by the Board of Trustees (Note 2-A). |
| b | The securities may be resold to qualified foreign investors and foreign institutional buyers under Regulation S of the Securities Act of 1933. |
| c | Security is a fix-to-float security, which carries a fixed coupon until a certain date, upon which it switches to a floating rate. Reference rate and spread are provided if the rate is currently floating. |
| d | Perpetual security with no stated maturity date. First call date is disclosed. |
| e | Security is valued using significant unobservable inputs and is classified as Level 3 in the fair value hierarchy. The aggregate value of Level 3 security is $4,280,000 and 9.93% of net assets. |
| f | Security exempt from registration under Rule 144A of the Securities Act of 1933, as amended. The security may be resold in transactions exempt from registration normally to qualified institutional buyers. The security has been determined to be liquid in accordance with procedures adopted by the Funds’ Board of Trustees. At December 31, 2022, the aggregate value is $3,518,550, which is 8.17% of net assets. |
| * | All Values in USD unless otherwise specified. |
| Cnv. | Convertible |
| CNY | Chinese Renminbi (Yuan) |
| IDR | Indonesian Rupiah |
| KRW | Korean Won |
| SGD | Singapore Dollar |
| THB | Thai Baht |
| USD | U.S. Dollar |
| 80 | MATTHEWS ASIA FUNDS |
Table of Contents
Matthews Asia Total Return Bond Fund
December 31, 2022
Schedule of Investmentsa (continued)
FORWARD FOREIGN CURRENCY EXCHANGE CONTRACTS
| Currency Purchased | Currency Sold | Counterparty | Settlement Date | Unrealized Appreciation (Depreciation) | ||||||||
CNY 24,034,500 | USD 3,500,000 | Bank of America, N.A. | 06/12/23 | $14,782 | ||||||||
CNY 1,997,955 | USD 290,000 | Bank of America, N.A. | 06/12/23 | 2,179 | ||||||||
IDR 20,188,500,000 | USD 1,290,000 | Bank of America, N.A. | 06/12/23 | 10,223 | ||||||||
KRW 2,793,528,000 | USD 2,160,000 | Bank of America, N.A. | 06/12/23 | 71,751 | ||||||||
THB 41,333,600 | USD 1,210,000 | Bank of America, N.A. | 06/12/23 | 2,351 | ||||||||
|
| |||||||||||
| 101,286 | ||||||||||||
|
| |||||||||||
| USD 630,000 | SGD 851,760 | Bank of America, N.A. | 06/12/23 | (8,088 | ) | |||||||
|
| |||||||||||
Net Unrealized Appreciation | $93,198 | |||||||||||
|
| |||||||||||
See accompanying notes to financial statements.
| matthewsasia.com | 800.789.ASIA | 81 |
Table of Contents
| PORTFOLIO MANAGERS | ||||
| Satya Patel | ||||
Lead Manager | ||||
| Wei Zhang* | ||||
Co-Manager | ||||
| FUND FACTS | ||||
| Investor | Institutional | |||
Ticker | MCRDX | MICPX | ||
CUSIP | 577130677 | 577130669 | ||
Inception | 4/29/16 | 4/29/16 | ||
NAV | $7.51 | $7.51 | ||
Initial Investment | $2,500 | $100,000 | ||
Gross Expense Ratio1 | 1.45% | 1.31% | ||
After Fee Waiver and Reimbursement2 | 1.11% | 0.90% | ||
Portfolio Statistics | ||||
Total # of Positions | 33 | |||
Net Assets | $29.2 million | |||
Modified Duration3 | 2.3 | |||
Portfolio Turnover4 | 26.73% | |||
Benchmark | ||||
J.P. Morgan Asia Credit Index | ||||
OBJECTIVE
Total return over the long term.
STRATEGY
Under normal market conditions, the Fund seeks to achieve its investment objective by investing at least 80% of its net assets, which include borrowings for investment purposes, in debt and debt-related instruments issued by companies as well as governments, quasi-governmental entities, and supra-national institutions in Asia. Debt and debt-related instruments typically include bonds, debentures, bills, securitized instruments (which are vehicles backed by pools of assets such as loans or other receivables), notes, certificates of deposit and other bank obligations, bank loans, senior secured bank debt, convertible debt securities, exchangeable bonds, credit-linked notes, inflation-linked instruments, repurchase agreements, payment-in-kind securities and derivative instruments with fixed income characteristics. Asia consists of all countries and markets in Asia, such as China and Indonesia, in addition to the developed, emerging, and frontier countries and markets in the Asian region.
Matthews Asia Credit Opportunities Fund†
Portfolio Manager Commentary (unaudited)
For the year ending December 31, 2022, the Matthews Asia Credit Opportunities Fund returned –13.28% (Investor Class) and –13.02% (Institutional Class), while its benchmark, the J.P. Morgan Asia Credit Index, returned –11.02% over the same period. For the fourth quarter, the Fund returned 8.58% (Investor Class) and 8.57% (Institutional Class), while the benchmark returned 3.31%.
Market Environment
Without a doubt, 2022 was one of the most challenging years in the history of the Asia credit market. The confluence of China’s zero-COVID policy, the tight liquidity in China’s property development sector and the global risk-off appetite led Asia credit to suffer through a period of stress that was worse than the Global Financial Crisis in 2008 or the initial COVID crisis in 2020. Asia high yield credit spreads were at 693 basis points (6.93%) coming into the year and trended wider over the first 10 months of 2022, peaking at 1,517 basis points (15.17%) on November 3. Until the U.S. Federal Reserve’s first 75 basis points (0.75%) rate hike in June the stress in Asia’s credit market was largely localized to issuers in the China property sector but once the Fed showed its commitment to raising rates in 75 basis points (0.75%) intervals if needed, the rest of Asia credit repriced dramatically lower as well.
In early November, though, Chinese policymakers embarked on series of easing measures aimed at supporting the economy overall, and the property sector specifically. The measures included optimizing zero-COVID policies to reduce severe testing and quarantine requirements, as well as a sweeping 16-point plan aimed at funneling liquidity to the real estate sector.
After months of watching companies struggle with slow sales and limited borrowing capabilities, markets responded well to the support from Chinese policymakers, and Asia high yield credit spreads rallied strongly to end the year at 886 basis points.
Performance Contributors and Detractors
Among the biggest contributors to returns in 2022 were convertible bond holdings in Luye Pharma, a China-based pharmaceutical company focused on orthopedics, neurology, and gastroenterology, and Baozun, a Chinese online e-commerce platform primarily serving overseas clients, as well as Country Garden, a Chinese property company. Luye Pharma and Baozun were both busted convertible bonds that offered attractive yields to their put date, and we exercised our right to put both bonds. Country Garden is a relatively high-quality property developer in China, and we bought the bonds in November when we expected the market to enter a recovery phase. Country Garden is one of the stronger privately-owned real estate companies, and with improving sentiment and liquidity, its bonds rallied to reflect a higher likelihood of survival.
Amongst the biggest detractors to returns in 2022 were high yield bonds issued by Chinese property companies including Logan Properties, Times Property Holdings and Sino Ocean. Logan Properties has entered into restructuring negotiations with onshore and offshore investors, while Times has announced that it expects to
(continued)
| * | Effective July 31, 2022. |
| † | Please refer to “Subsequent Events” in the Notes to the Financial Statements relating to the closure and liquidation of this Fund. |
| 1 | Actual 2022 expense ratios. |
| 2 | Matthews has contractually agreed (i) to waive fees and reimburse expenses to the extent needed to limit Total Annual Fund Operating Expenses (excluding Rule 12b-1 fees, taxes, interest, brokerage commissions, short sale dividend expenses, expenses incurred in connection with any merger or reorganization or extraordinary expenses such as litigation) of the Institutional Class to 0.90% first by waiving class specific expenses (i.e., shareholder service fees specific to a particular class) of the Institutional Class and then, to the extent necessary, by waiving non-class specific expenses (e.g., custody fees) of the Institutional Class, and (ii) if any Fund-wide expenses (i.e., expenses that apply to both the Institutional Class and the Investor Class) are waived for the Institutional Class to maintain the 0.90% expense limitation, to waive an equal amount (in annual percentage terms) of those same expenses for the Investor Class. The Total Annual Fund Operating Expenses After Fee Waiver and Expense Reimbursement for the Investor Class may vary from year to year and will in some years exceed 0.90%. Pursuant to this agreement, any amount waived for prior fiscal years with respect to the Fund is not subject to recoupment. This agreement will remain in place until April 30, 2023 and may be terminated at any time by the Board of Trustees on behalf of the Fund on 60 days’ written notice to Matthews. Matthews may decline to renew this agreement by written notice to the Trust at least 30 days before its annual expiration date. |
| 3 | Modified duration measures the percent change in value of the fixed income portion of the portfolio in response to a 1% change in interest rates. In a multi-currency denominated portfolio with sensitivities to different interest rate regimes, modified duration will not accurately reflect the change in value of the overall portfolio from a change in any one interest rate regime. |
| 4 | The lesser of fiscal year 2022 long-term purchase costs or sales proceeds divided by the average monthly market value of long-term securities. |
| 82 | MATTHEWS ASIA FUNDS |
Table of Contents
| PERFORMANCE AS OF DECEMBER 31, 2022 | ||||||||||||||||||||||||
|
|
|
| Average Annual Total Retuns |
|
| |||||||||||||||||||
| 3 Months | 1 Year | 3 Years | 5 Years | Since Inception | Inception Date | |||||||||||||||||||
| Investor Class (MCRDX) | 8.58% | -13.28% | -6.15% | -1.87% | 0.40% | 4/29/16 | ||||||||||||||||||
| Institutional Class (MICPX) | 8.57% | -13.02% | -5.94% | -1.65% | 0.63% | 4/29/16 | ||||||||||||||||||
| J.P. Morgan Asia Credit Index5 | 3.31% | -11.02% | -2.63% | 0.39% | 1.35% | |||||||||||||||||||
Performance assumes reinvestment of all dividends and/or distributions before taxes. All performance quoted represents past performance and is no guarantee of future results. Investment return and principal value will fluctuate with market conditions so that when redeemed, shares may be worth more or less than their original cost. Current performance may be lower or higher than the return figures quoted. Returns would have been lower if certain of the Fund’s fees and expenses had not been waived. For the Fund’s most recent month-end performance, visit matthewsasia.com.
| INCOME DISTRIBUTION HISTORY | ||||||||||||||||||||||||||||||||||||||||||||||||||||
| 2022 | Jan. | Feb. | Mar. | Apr. | May | June | July | Aug. | Sept. | Oct. | Nov. | Dec. | Total | |||||||||||||||||||||||||||||||||||||||
| Investor (MCRDX) | $ | 0.02 | $ | 0.03 | $ | 0.03 | $ | 0.04 | $ | 0.04 | $ | 0.04 | $ | 0.05 | $ | 0.03 | $ | 0.02 | $ | 0.04 | $ | 0.04 | $ | 0.05 | $ | 0.42 | ||||||||||||||||||||||||||
| Inst’l (MICPX) | $ | 0.02 | $ | 0.03 | $ | 0.03 | $ | 0.04 | $ | 0.04 | $ | 0.04 | $ | 0.05 | $ | 0.03 | $ | 0.02 | $ | 0.04 | $ | 0.04 | $ | 0.04 | $ | 0.43 | ||||||||||||||||||||||||||
| 2021 | ||||||||||||||||||||||||||||||||||||||||||||||||||||
| Investor (MCRDX) | $ | 0.05 | $ | 0.03 | $ | 0.04 | $ | 0.04 | $ | 0.03 | $ | 0.03 | $ | 0.03 | $ | 0.03 | $ | 0.03 | $ | 0.03 | $ | 0.07 | $ | 0.07 | $ | 0.47 | ||||||||||||||||||||||||||
| Inst’l (MICPX) | $ | 0.05 | $ | 0.03 | $ | 0.04 | $ | 0.04 | $ | 0.03 | $ | 0.03 | $ | 0.03 | $ | 0.03 | $ | 0.03 | $ | 0.04 | $ | 0.07 | $ | 0.07 | $ | 0.50 | ||||||||||||||||||||||||||
Note: This table does not include capital gains distributions. Totals may differ by $0.02 due to rounding. For income distribution history, visit matthewsasia.com.
30 DAY YIELD:
Investor Class: 15.39% (14.97% excluding waivers) Institutional Class: 14.87% (14.72% excluding waivers)
The 30-Day Yield represents net investment income earned by the Fund over the 30-day period ended 12/31/22, expressed as an annual percentage rate based on the Fund’s share price at the end of the 30-day period. The 30 Day Yield excludes securities that trade without accrued interest. The 30-Day Yield should be regarded as an estimate of the Fund’s rate of investment income, and it may not equal the Fund’s actual income distribution rate.
Source: BNY Mellon Investment Servicing (US) Inc. | YIELD TO WORST: 17.36%
Yield to worst is the lowest yield that can be received on a bond assuming that the issuer does not default. It is calculated by utilizing the worst case assumptions for a bond with respect to certain income-reducing factors, including prepayment, call or sinking fund provisions. The yield to worst excludes securities that trade without accrued interest. It does not represent the yield that an investor should expect to receive. Past yields are no guarantee of future yields.
Source: FactSet Research Systems | |||
GROWTH OF A HYPOTHETICAL $10,000 INVESTMENT SINCE INCEPTION—INVESTOR CLASS
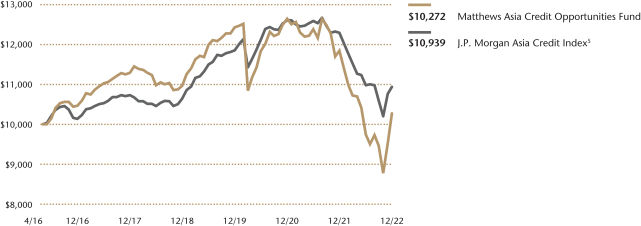
Plotted monthly. The performance data and graph do not reflect the deduction of taxes that a shareholder would pay on dividends, capital gains distributions, or redemption of Fund shares. Values are in US$.
| 5 | It is not possible to invest directly in an index. Source: Index data from J.P. Morgan and Bloomberg; total return calculations performed by BNY Mellon Investment Servicing (US) Inc. Please see page 87 for index definition. |
| TOP TEN HOLDINGS | ||||||||
| Name | Sector | Currency | % Net Assets | |||||
| PB International BV, 7.625%, 12/31/2025 | Industrial | U.S. Dollar | 7.6 | |||||
| Shriram Finance, Ltd., 4.400%, 03/13/2024 | Financial Institutions | U.S. Dollar | 4.3 | |||||
| Network i2i, Ltd., 5.650%, 04/15/2068 | Industrial | U.S. Dollar | 4.2 | |||||
| Socialist Republic of Vietnam, 5.500%, 03/12/2028 | Sovereign | U.S. Dollar | 4.0 | |||||
| Kasikornbank Public Co., Ltd., 5.275%, 04/14/2068 | Financial Institutions | U.S. Dollar | 3.8 | |||||
| Axis Bank, Ltd./Gift City, 4.100%, 09/08/2026 | Financial Institutions | U.S. Dollar | 3.8 | |||||
| Periama Holdings LLC, 5.950%, 04/19/2026 | Industrial | U.S. Dollar | 3.8 | |||||
| Wanda Properties International Co., Ltd., 7.250%, 01/29/2024 | Financial Institutions | U.S. Dollar | 3.4 | |||||
| Bank of East Asia, Ltd., 5.825%, 04/21/2069 | Financial Institutions | U.S. Dollar | 3.3 | |||||
| Theta Capital Pte, Ltd., 6.750%, 10/31/2026 | Financial Institutions | U.S. Dollar | 3.1 | |||||
% OF ASSETS IN TOP 10 | 41.3 | |||||||
| matthewsasia.com | 800.789.ASIA | 83 |
Table of Contents
| CURRENCY ALLOCATION (%)6,7 | ||||
| US Dollar | 100.0 | |||
| COUNTRY ALLOCATION (%)6,7,8 | ||||
China/Hong Kong | 41.1 | |||
India | 21.4 | |||
Indonesia | 14.0 | |||
Thailand | 8.8 | |||
Vietnam | 4.0 | |||
Singapore | 3.8 | |||
New Zealand | 2.2 | |||
| Cash and Other Assets, Less Liabilities | 4.6 | |||
| SECTOR ALLOCATION (%)6,7 | ||||
Financial Institutions | 52.9 | |||
Industrial | 33.4 | |||
| Agency | 5.1 | |||
| Sovereign | 4.0 | |||
| Cash and Other Assets, Less Liabilities | 4.6 | |||
| ASSET TYPE BREAKDOWN (%)6,7 | ||||
Corporate Bonds | 83.1 | |||
Convertible Bonds | 8.2 | |||
| Government Bonds | 4.0 | |||
| Cash and Other Assets, Less Liabilities | 4.6 | |||
| 6 | Source: FactSet Research Systems. Percentage values in data are rounded to the nearest tenth of one percent, so the values may not sum to 100% due to rounding. Country allocations and percentage values may be derived from different data sources and may not be consistent with other Fund literature. |
| 7 | Cash and other assets may include forward currency exchange contracts and certain derivative instruments that have been marked-to-market. |
| 8 | Not all countries where the Fund may invest are included in the benchmark index. |
Matthews Asia Credit Opportunities Fund
Portfolio Manager Commentary (unaudited) (continued)
suspend offshore debt repayments, signaling an upcoming default and/or restructuring. Sino Ocean faced tight liquidity throughout much of 2022 but bonds have recovered meaningfully from their lows as the company is more likely than others to navigate this environment and survive without a restructuring.
Notable Portfolio Changes
In 2022, the volatility in credit markets led to pockets of value, including in busted convertible and contingent convertible bonds. In the case of busted convertible bonds, we were able to take advantage of a drop in share prices as the post-COVID technology stock boom dissipated. While the fall in tech stock multiples led many convertible bonds to fall in price, the fundamental operations of many companies were unchanged, and low single digit yields became high single digit yields that compensated us well for the underlying credit risk. Xero Ltd., an online accounting and enterprise software company in Australia, was one example of this. We also bought the contingent convertible bonds of high-quality banks across the Asian region. The bonds of high-quality private banks headquartered in investment grade-rated countries fell along with the market, also leading to high single digit and low double-digit yields for much of the year. We bought the bonds of Bangkok Bank and Krung Thai Bank in Thailand, for instance, to take advantage of what we saw as attractive yields with limited volatility in the stressed market.
We also exited several holdings throughout the year. Many of these were convertible bond holdings, where we either exercised a put option (Luye Pharma, Baozun, Kakao) or sold because we thought the yield on the bond was unattractive relative to the risk we were taking (Hansoh, Meituan, United Microelectronics).
Outlook
As we enter 2023, investors in Asia credit should be optimistic about the market’s recovery. In the coming months and quarters, we expect the high yield market to continue to normalize, as it has been since November. This will likely include continued spread tightening, as well as a return to healthy levels of new issuance. The high yield market has largely been shut for bond issuance for the last 1.5 years, and companies have in many instances found new channels of liquidity to navigate the difficult environment. For those companies that survived both the COVID crisis and the difficult environment in 2022, the return of liquidity and a functioning high-yield market should provide a window to refinance upcoming bond maturities.
While the credit market’s recovery will no doubt provide a strong tailwind in the months to come, investors should be wary of the impact of ongoing global challenges. With interest rates in the U.S. likely to stay high in the coming quarters, corporate borrowing rates will be at higher levels than they have been in years. In addition, global growth is expected to slow in 2023, with inflation still higher than normal in much of the developed and emerging world, the war in Ukraine continuing, and China’s recovery still in its early stage. While Asian credit markets normalize, they are doing so in an environment where global macro factors are becoming more challenging, rather than more supportive, in the quarters to come.
| 84 | MATTHEWS ASIA FUNDS |
Table of Contents
Matthews Asia Credit Opportunities Fund
December 31, 2022
Schedule of Investmentsa
NON-CONVERTIBLE CORPORATE BONDS: 83.1%
| Face Amount* | Value | |||||||
| CHINA/HONG KONG: 36.7% | ||||||||
Wanda Properties International Co., Ltd. | 1,100,000 | $988,009 | ||||||
Bank of East Asia, Ltd. | 1,100,000 | 957,880 | ||||||
Sino-Ocean Land Treasure III, Ltd. | 2,500,000 | 875,000 | ||||||
Standard Chartered PLC | 1,000,000 | 767,445 | ||||||
Country Garden Holdings Co., Ltd. | 900,000 | 693,138 | ||||||
KWG Group Holdings, Ltd. | 1,800,000 | 655,270 | ||||||
Franshion Brilliant, Ltd. | 800,000 | 632,144 | ||||||
West China Cement, Ltd. | 750,000 | 626,437 | ||||||
Huarong Finance 2019 Co., Ltd. | 800,000 | 615,368 | ||||||
Vanke Real Estate Hong Kong Co., Ltd. | 650,000 | 591,856 | ||||||
Longfor Group Holdings, Ltd. | 700,000 | 550,733 | ||||||
Far East Horizon, Ltd. | 600,000 | 544,493 | ||||||
China SCE Group Holdings, Ltd. | 1,200,000 | 498,000 | ||||||
Weibo Corp. | 500,000 | 484,327 | ||||||
HSBC Holdings PLC | 500,000 | 432,477 | ||||||
Logan Group Co., Ltd. | 1,020,000 | 230,199 | ||||||
Times China Holdings, Ltd. | 1,500,000 | 225,000 | ||||||
Sunac China Holdings, Ltd. | 700,000 | 141,848 | ||||||
Powerlong Real Estate Holdings, Ltd. | 500,000 | 139,800 | ||||||
CIFI Holdings Group Co., Ltd. | 200,000 | 51,188 | ||||||
Times China Holdings, Ltd. | 250,000 | 37,500 | ||||||
|
| |||||||
Total China/Hong Kong | 10,738,112 | |||||||
|
| |||||||
| INDIA: 21.5% | ||||||||
Shriram Finance, Ltd. | 1,300,000 | 1,250,756 | ||||||
Network i2i, Ltd. | 1,300,000 | 1,239,875 | ||||||
Axis Bank, Ltd./Gift City, | 1,300,000 | 1,116,986 | ||||||
Periama Holdings LLC | 1,200,000 | 1,116,672 | ||||||
HDFC Bank, Ltd. | 1,000,000 | 858,000 | ||||||
Tata Motors, Ltd. 5.875%, 05/20/25b | 700,000 | 685,076 | ||||||
|
| |||||||
Total India | 6,267,365 | |||||||
|
| |||||||
| Face Amount* | Value | |||||||
| INDONESIA: 14.0% | ||||||||
PB International BV | 5,300,000 | $2,228,650 | ||||||
Theta Capital Pte, Ltd. | 1,400,000 | 896,140 | ||||||
Indika Energy Capital IV Pte, Ltd. | 500,000 | 492,849 | ||||||
PT Adaro Indonesia | 500,000 | 480,428 | ||||||
|
| |||||||
Total Indonesia | 4,098,067 | |||||||
|
| |||||||
| THAILAND: 8.8% | ||||||||
Kasikornbank Public Co., Ltd. | 1,200,000 | 1,125,000 | ||||||
Krung Thai Bank Public Co., Ltd. 4.400%c, 03/25/26b,d | 900,000 | 793,260 | ||||||
Bangkok Bank Public Co., Ltd. | 700,000 | 663,248 | ||||||
|
| |||||||
Total Thailand | 2,581,508 | |||||||
|
| |||||||
| SINGAPORE: 2.1% | ||||||||
GLP Pte, Ltd. | 1,200,000 | 607,680 | ||||||
|
| |||||||
Total Singapore | 607,680 | |||||||
|
| |||||||
| TOTAL NON-CONVERTIBLE CORPORATE BONDS |
| 24,292,732 | ||||||
|
| |||||||
(Cost $35,110,610) | ||||||||
CONVERTIBLE CORPORATE BONDS: 8.3% |
| |||||||
| CHINA/HONG KONG: 4.3% | ||||||||
NIO, Inc., Cnv. | 800,000 | 599,040 | ||||||
Weimob Investment, Ltd., Cnv. | 600,000 | 433,500 | ||||||
Pinduoduo, Inc., Cnv. | 250,000 | 231,875 | ||||||
|
| |||||||
Total China/Hong Kong | 1,264,415 | |||||||
|
| |||||||
| NEW ZEALAND: 2.2% | ||||||||
Xero Investments, Ltd., Cnv. | 800,000 | 633,600 | ||||||
|
| |||||||
Total New Zealand | 633,600 | |||||||
|
| |||||||
| SINGAPORE: 1.8% | ||||||||
Sea, Ltd., Cnv. | 700,000 | 512,750 | ||||||
|
| |||||||
Total Singapore | 512,750 | |||||||
|
| |||||||
| TOTAL CONVERTIBLE CORPORATE BONDS |
| 2,410,765 | ||||||
|
| |||||||
(Cost $2,826,876) | ||||||||
| matthewsasia.com | 800.789.ASIA | 85 |
Table of Contents
Matthews Asia Credit Opportunities Fund
December 31, 2022
Schedule of Investmentsa (continued)
FOREIGN GOVERNMENT OBLIGATIONS: 4.0%
| Face Amount* | Value | |||||||
| VIETNAM: 4.0% | ||||||||
Socialist Republic of Vietnam | 1,200,000 | $1,164,150 | ||||||
|
| |||||||
Total Vietnam | 1,164,150 | |||||||
|
| |||||||
| TOTAL FOREIGN GOVERNMENT OBLIGATIONS |
| 1,164,150 | ||||||
|
| |||||||
(Cost $1,200,000) | ||||||||
| TOTAL INVESTMENTS: 95.4% | 27,867,647 | |||||||
(Cost $39,137,486) | ||||||||
| CASH AND OTHER ASSETS, LESS LIABILITIES: 4.6% | 1,357,037 | |||||||
|
| |||||||
NET ASSETS: 100.0% | $29,224,684 | |||||||
|
| |||||||
| a | Certain securities were fair valued under the valuation policies approved by the Board of Trustees (Note 2-A). |
| b | The securities may be resold to qualified foreign investors and foreign institutional buyers under Regulation S of the Securities Act of 1933. |
| c | Security is a fix-to-float security, which carries a fixed coupon until a certain date, upon which it switches to a floating rate. Reference rate and spread are provided if the rate is currently floating. |
| d | Perpetual security with no stated maturity date. First call date is disclosed. |
| e | Security is valued using significant unobservable inputs and is classified as Level 3 in the fair value hierarchy. The aggregate value of Level 3 security is $1,635,500 and 5.60% of net assets. |
| f | Security exempt from registration under Rule 144A of the Securities Act of 1933, as amended. The security may be resold in transactions exempt from registration normally to qualified institutional buyers. The security has been determined to be liquid in accordance with procedures adopted by the Funds’ Board of Trustees. At December 31, 2022, the aggregate value is $2,097,875, which is 7.18% of net assets. |
| * | All Values in USD unless otherwise specified. |
| Cnv. | Convertible |
| USD | U.S. Dollar |
See accompanying notes to financial statements.
| 86 | MATTHEWS ASIA FUNDS |
Table of Contents
The MSCI Emerging Markets Index is a free float-adjusted market capitalization-weighted index of the stock markets of Argentina, Brazil, Chile, China, Colombia, Czech Republic, Egypt, Greece, Hungary, India, Indonesia, Kuwait, Malaysia, Mexico, Pakistan, Peru, Philippines, Poland, Qatar, Russia, Saudi Arabia, South Africa, South Korea, Taiwan, Thailand, Turkey and United Arab Emirates.
The MSCI Emerging Markets Small Cap Index is a free float-adjusted market capitalization-weighted small cap index of the stock markets of Argentina, Brazil, Chile, China, Colombia, Czech Republic, Egypt, Greece, Hungary, India, Indonesia, Kuwait, Malaysia, Mexico, Pakistan, Peru, Philippines, Poland, Qatar, Russia, Saudi Arabia, South Africa, South Korea, Taiwan, Thailand, Turkey and United Arab Emirates.
The MSCI All Country Asia ex Japan Small Cap Index is a free float–adjusted market capitalization-weighted small cap index of the stock markets of China, Hong Kong, India, Indonesia, Malaysia, Pakistan, Philippines, Singapore, South Korea, Taiwan and Thailand.
The MSCI All Country Asia Pacific Index is a free float–adjusted market capitalization–weighted index of the stock markets of Australia, China, Hong Kong, India, Indonesia, Japan, Malaysia, New Zealand, Pakistan, Philippines, Singapore, South Korea, Taiwan and Thailand.
The MSCI All Country Asia ex Japan Index is a free float–adjusted market capitalization–weighted index of the stock markets of China, Hong Kong, India, Indonesia, Malaysia, Pakistan, Philippines, Singapore, South Korea, Taiwan and Thailand.
The MSCI China Index is a free float–adjusted market capitalization-weighted index of Chinese equities that includes H shares listed on the Hong Kong exchange, B shares listed on the Shanghai and Shenzhen ex-exchanges, and Hong Kong-listed securities known as Red Chips (issued by entities owned by national or local governments in China) and P Chips (issued by companies controlled by individuals in China and deriving substantial revenues in China), and foreign listings (e.g., ADRs).
The MSCI China All Shares Index captures large and mid-cap representation across China A shares, B shares, H shares, Red Chips
(issued by entities owned by national or local governments in China), P Chips (issued by companies controlled by individuals in China and deriving substantial revenues in China), and foreign listings (e.g., ADRs). The index aims to reflect the opportunity set of China share classes listed in Hong Kong, Shanghai, Shenzhen and outside of China.
The MSCI China Small Cap Index is a free float–adjusted market capitalization-weighted small cap index of the Chinese equity securities markets, including H shares listed on the Hong Kong exchange, B shares listed on the Shanghai and Shenzhen exchanges, and Hong Kong-listed securities known as Red Chips (issued by entities owned by national or local governments in China) and P Chips (issued by companies controlled by individuals in China and deriving substantial revenues in China), and foreign listings (e.g., ADRs).
The S&P Bombay Stock Exchange (BSE) 100 Index is a free float–adjusted market capitalization-weighted index of the 100 stocks listed on the Bombay Stock Exchange.
The MSCI Japan Index is a free float–adjusted market capitalization-weighted index of Japanese equities listed in Japan.
The Korea Composite Stock Price Index (KOSPI) is a market capitalization–weighted index of all common stocks listed on the Korea Stock Exchange.
The Markit iBoxx Asian Local Bond Index (ALBI) tracks the total return performance of a bond portfolio consisting of local currency denominated, high quality and liquid bonds in Asia ex Japan. The ALBI includes bonds from the following countries: China, Hong Kong, India, Indonesia, Hong Kong, Malaysia, Philippines, Singapore, South Korea, Taiwan and Thailand.
The J.P. Morgan Asia Credit Index (JACI) tracks the total return performance of the Asia fixed-rate dollar bond market. JACI is a market capitalization-weighted index comprising sovereign, quasi-sovereign and corporate bonds and is partitioned by country, sector and credit rating. JACI includes bonds from the following countries: China, Hong Kong, India, Indonesia, Malaysia, Philippines, Singapore, South Korea and Thailand.
| matthewsasia.com | 800.789.ASIA | 87 |
Table of Contents
Fund Holdings: The Fund holdings shown in this report are as of December 31, 2022. Holdings are subject to change at any time, so holdings shown in this report may not reflect current Fund holdings. The Funds file complete schedules of portfolio holdings with the Securities and Exchange Commission (the “SEC”) for the first and third quarters of each fiscal year on Form N-PORT. The Funds’ Form N-PORTs are available on the SEC’s website at www.sec.gov. Complete schedules of investments are also available without charge, upon request, from the Funds by calling us at 800.789.ASIA (2742).
Proxy Voting Record: The Funds’ Statement of Additional Information containing a description of the policies and procedures that the Funds have used to vote proxies relating to portfolio securities, along with each Fund’s proxy voting record relating
to portfolio securities held during the most recent 12-month period ended June 30, is available upon request, at no charge, at the Funds’ website at matthewsasia.com or by calling 800.789.ASIA (2742), or on the SEC’s website at www.sec.gov.
Shareholder Reports and Prospectuses: To reduce the Funds’ expenses, we try to identify related shareholders in a household and send only one copy of the Funds’ prospectus and financial reports to that address. This process, called “householding,” will continue indefinitely unless you instruct us otherwise. At any time you may view the Funds’ current prospectus, summary prospectus and financial reports on our website. If you prefer to receive individual copies of the Funds’ prospectus or financial reports, please call us at 800.789.ASIA (2742).
| 88 | MATTHEWS ASIA FUNDS |
Table of Contents
Disclosure of Fund Expenses (unaudited)
We believe it is important for you to understand the impact of fees regarding your investment. All mutual funds have operating expenses. As a shareholder of a mutual fund, you incur ongoing costs, which include costs for portfolio management, administrative services, and shareholder reports (like this one), among others. Operating expenses, which are deducted from a fund’s gross income, directly reduce the investment return of the fund. A fund’s operating expenses are expressed as a percentage of its average net assets. This figure is known as the expense ratio. The following examples are intended to help you understand the ongoing fees (in dollars) of investing in your fund and to compare these costs with those of other mutual funds. The examples are based on an investment of $1,000 made at the beginning of the period shown and held for the entire period.
This table illustrates your fund’s costs in two ways:
Actual Fund Return: This section helps you to estimate the actual operating expenses, after any applicable fee waivers, that you paid over the period. The “Ending Account Value” shown is derived from the fund’s actual return for the past six month period, the “Expense Ratio” column shows the period’s annualized expense ratio, and the “Operating Expenses Paid During Period” column shows the dollar amount that would have been paid by an investor who started with $1,000 in the fund at the beginning of the period. You may use the information here, together with your account value, to estimate the expenses that you paid over the period. To do so, simply divide your account value by $1,000 (for example, an
$8,600 account value divided by $1,000 = 8.6), then multiply the result by the number given for your fund in the first line under the heading entitled “Operating Expenses Paid During Period.”
Hypothetical 5% Return: This section is intended to help you compare your fund’s costs with those of other mutual funds. It assumes that the fund had an annual return of 5% before operating expenses, but that the expense ratio is unchanged. In this case, because the return used is not the fund’s actual return, the results do not apply to your investment. This example is useful in making comparisons to other mutual funds because the Securities and Exchange Commission requires all mutual funds to calculate expenses based on an assumed 5% annual return. You can assess your fund’s costs by comparing this hypothetical example with the hypothetical examples that appear in shareholder reports of other funds.
Please note that the operating expenses shown in the table are meant to highlight and help you compare your ongoing costs only and do not reflect any transactional costs such as sales charges (loads), redemption fees, or exchange fees.
Matthews Asia Funds does not charge any sales loads, exchange fees, or 12b-1 fees, but these may be present in other funds to which you compare this data. Therefore, the hypothetical portions of the table are useful in comparing ongoing costs only, and will not help you determine the relative total costs of owning different funds.
| matthewsasia.com | 800.789.ASIA | 89 |
Table of Contents
December 31, 2022
Disclosure of Fund Expenses (unaudited) (continued)
| INVESTOR | INSTITUTIONAL | |||||||||||||||||||||||||||||||||||
| Beginning Account Value 7/1/22 | Ending Account Value 12/31/22 | Expense Ratio | Operating Expenses Paid During Period 7/1/22– 12/31/221 | Beginning Account Value 7/1/22 | Ending Account Value 12/31/22 | Expense Ratio | Operating Expenses Paid During Period 7/1/22– 12/31/221 | |||||||||||||||||||||||||||||
| GLOBAL EMERGING MARKETS STRATEGIES |
| |||||||||||||||||||||||||||||||||||
Matthews Emerging Markets Equity Fund |
| |||||||||||||||||||||||||||||||||||
Actual Fund Return | $1,000.00 | $1,049.70 | 1.02% | $5.27 | $1,000.00 | $1,049.60 | 0.91% | $4.70 | ||||||||||||||||||||||||||||
Hypothetical 5% Returns | $1,000.00 | $1,020.06 | 1.02% | $5.19 | $1,000.00 | $1,020.62 | 0.91% | $4.63 | ||||||||||||||||||||||||||||
Matthews Emerging Markets Sustainable Future Fund |
| |||||||||||||||||||||||||||||||||||
Actual Fund Return | $1,000.00 | $971.90 | 1.21% | $6.01 | $1,000.00 | $971.10 | 1.15% | $5.71 | ||||||||||||||||||||||||||||
Hypothetical 5% Returns | $1,000.00 | $1,019.11 | 1.21% | $6.16 | $1,000.00 | $1,019.41 | 1.15% | $5.85 | ||||||||||||||||||||||||||||
Matthews Emerging Markets Small Companies Fund |
| |||||||||||||||||||||||||||||||||||
Actual Fund Return | $1,000.00 | $1,018.10 | 1.35% | $6.87 | $1,000.00 | $1,019.00 | 1.16% | $5.90 | ||||||||||||||||||||||||||||
Hypothetical 5% Returns | $1,000.00 | $1,018.40 | 1.35% | $6.87 | $1,000.00 | $1,019.36 | 1.16% | $5.90 | ||||||||||||||||||||||||||||
| ASIA GROWTH STRATEGIES | ||||||||||||||||||||||||||||||||||||
Matthews Asia Growth Fund | ||||||||||||||||||||||||||||||||||||
Actual Fund Return | $1,000.00 | $973.30 | 1.11% | $5.52 | $1,000.00 | $974.50 | 0.95% | $4.73 | ||||||||||||||||||||||||||||
Hypothetical 5% Returns | $1,000.00 | $1,019.61 | 1.11% | $5.65 | $1,000.00 | $1,020.42 | 0.95% | $4.84 | ||||||||||||||||||||||||||||
Matthews Pacific Tiger Fund | ||||||||||||||||||||||||||||||||||||
Actual Fund Return | $1,000.00 | $954.50 | 1.07% | $5.27 | $1,000.00 | $955.40 | 0.94% | $4.63 | ||||||||||||||||||||||||||||
Hypothetical 5% Returns | $1,000.00 | $1,019.81 | 1.07% | $5.45 | $1,000.00 | $1,020.47 | 0.94% | $4.79 | ||||||||||||||||||||||||||||
Matthews Asia Innovators Fund | ||||||||||||||||||||||||||||||||||||
Actual Fund Return | $1,000.00 | $927.00 | 1.15% | $5.59 | $1,000.00 | $927.20 | 0.94% | $4.57 | ||||||||||||||||||||||||||||
Hypothetical 5% Returns | $1,000.00 | $1,019.41 | 1.15% | $5.85 | $1,000.00 | $1,020.47 | 0.94% | $4.79 | ||||||||||||||||||||||||||||
Matthews China Fund | ||||||||||||||||||||||||||||||||||||
Actual Fund Return | $1,000.00 | $870.60 | 1.10% | $5.19 | $1,000.00 | $871.50 | 1.00% | $4.72 | ||||||||||||||||||||||||||||
Hypothetical 5% Returns | $1,000.00 | $1,019.66 | 1.10% | $5.60 | $1,000.00 | $1,020.16 | 1.00% | $5.09 | ||||||||||||||||||||||||||||
Matthews China Small Companies Fund | ||||||||||||||||||||||||||||||||||||
Actual Fund Return | $1,000.00 | $867.40 | 1.37% | $6.45 | $1,000.00 | $868.50 | 1.21% | $5.70 | ||||||||||||||||||||||||||||
Hypothetical 5% Returns | $1,000.00 | $1,018.30 | 1.37% | $6.97 | $1,000.00 | $1,019.11 | 1.21% | $6.16 | ||||||||||||||||||||||||||||
Matthews India Fund | ||||||||||||||||||||||||||||||||||||
Actual Fund Return | $1,000.00 | $1,057.80 | 1.13% | $5.86 | $1,000.00 | $1,058.00 | 1.02% | $5.29 | ||||||||||||||||||||||||||||
Hypothetical 5% Returns | $1,000.00 | $1,019.51 | 1.13% | $5.75 | $1,000.00 | $1,020.06 | 1.02% | $5.19 | ||||||||||||||||||||||||||||
Matthews Japan Fund | ||||||||||||||||||||||||||||||||||||
Actual Fund Return | $1,000.00 | $1,018.40 | 1.02% | $5.19 | $1,000.00 | $1,017.80 | 1.02% | $5.19 | ||||||||||||||||||||||||||||
Hypothetical 5% Returns | $1,000.00 | $1,020.06 | 1.02% | $5.19 | $1,000.00 | $1,020.06 | 1.02% | $5.19 | ||||||||||||||||||||||||||||
Matthews Korea Fund | ||||||||||||||||||||||||||||||||||||
Actual Fund Return | $1,000.00 | $995.60 | 1.20% | $6.04 | $1,000.00 | $995.40 | 1.12% | $5.63 | ||||||||||||||||||||||||||||
Hypothetical 5% Returns | $1,000.00 | $1,019.16 | 1.20% | $6.11 | $1,000.00 | $1,019.56 | 1.12% | $5.70 | ||||||||||||||||||||||||||||
| ASIA GROWTH AND INCOME STRATEGIES |
| |||||||||||||||||||||||||||||||||||
Matthews Asian Growth and Income Fund |
| |||||||||||||||||||||||||||||||||||
Actual Fund Return | $1,000.00 | $959.10 | 1.11% | $5.48 | $1,000.00 | $960.00 | 1.02% | $5.04 | ||||||||||||||||||||||||||||
Hypothetical 5% Returns | $1,000.00 | $1,019.61 | 1.11% | $5.65 | $1,000.00 | $1,020.06 | 1.02% | $5.19 | ||||||||||||||||||||||||||||
Matthews Asia Dividend Fund | ||||||||||||||||||||||||||||||||||||
Actual Fund Return | $1,000.00 | $926.40 | 1.05% | $5.10 | $1,000.00 | $926.00 | 1.00% | $4.85 | ||||||||||||||||||||||||||||
Hypothetical 5% Returns | $1,000.00 | $1,019.91 | 1.05% | $5.35 | $1,000.00 | $1,020.16 | 1.00% | $5.09 | ||||||||||||||||||||||||||||
Matthews China Dividend Fund | ||||||||||||||||||||||||||||||||||||
Actual Fund Return | $1,000.00 | $965.60 | 1.20% | $5.95 | $1,000.00 | $966.40 | 1.05% | $5.20 | ||||||||||||||||||||||||||||
Hypothetical 5% Returns | $1,000.00 | $1,019.16 | 1.20% | $6.11 | $1,000.00 | $1,019.91 | 1.05% | $5.35 | ||||||||||||||||||||||||||||
| ASIA FIXED INCOME STRATEGIES | ||||||||||||||||||||||||||||||||||||
Matthews Asia Total Return Bond Fund | ||||||||||||||||||||||||||||||||||||
Actual Fund Return | $1,000.00 | $1,110.10 | 1.01% | $5.37 | $1,000.00 | $1,110.60 | 0.91% | $4.84 | ||||||||||||||||||||||||||||
Hypothetical 5% Returns | $1,000.00 | $1,020.11 | 1.01% | $5.14 | $1,000.00 | $1,020.62 | 0.91% | $4.63 | ||||||||||||||||||||||||||||
Matthews Asia Credit Opportunities Fund |
| |||||||||||||||||||||||||||||||||||
Actual Fund Return | $1,000.00 | $1,054.40 | 1.04% | $5.39 | $1,000.00 | $1,055.10 | 0.90% | $4.66 | ||||||||||||||||||||||||||||
Hypothetical 5% Returns | $1,000.00 | $1,019.96 | 1.04% | $5.30 | $1,000.00 | $1,020.67 | 0.90% | $4.58 | ||||||||||||||||||||||||||||
| 1 | Operating expenses are equal to the Fund’s annualized expense ratio multiplied by the average account value over the period, multiplied by 184 days, then divided by 365. |
| 90 | MATTHEWS ASIA FUNDS |
Table of Contents
| Statements of Assets and Liabilities | December 31, 2022 |
| Matthews Emerging Markets Equity Fund | Matthews Emerging Markets Sustainable Future Fund | Matthews Emerging Markets Small Companies Fund | ||||||||||
ASSETS: | ||||||||||||
Investments at value (A) (Note 2-A and 7): | ||||||||||||
Unaffiliated issuers | $33,019,747 | $170,584,526 | $371,464,616 | |||||||||
Cash | 358,441 | 3,811,095 | 1,964,709 | |||||||||
Segregated foreign currency at value | 725 | 5,914 | 611 | |||||||||
Foreign currency at value (B) | 28,886 | 838,862 | 1,546,340 | |||||||||
Dividends and interest receivable | 64,667 | 45,091 | 380,111 | |||||||||
Receivable for securities sold | — | — | 371 | |||||||||
Receivable for capital shares sold | 241,688 | 799,471 | 772,017 | |||||||||
Other receivable | — | 3,069 | 51,511 | |||||||||
Prepaid expenses | — | 40,098 | 7,901 | |||||||||
TOTAL ASSETS | 33,714,154 | 176,128,126 | 376,188,187 | |||||||||
LIABILITIES: | ||||||||||||
Payable for securities purchased | 23 | 1,974,361 | 2,633,394 | |||||||||
Payable for capital shares redeemed | 141,422 | 531,183 | 1,039,108 | |||||||||
Deferred foreign capital gains tax liability (Note 2-E) | — | 1,130,596 | 2,539,833 | |||||||||
Due to Advisor (Note 5) | 43,158 | 98,225 | 252,208 | |||||||||
Administration and accounting fees payable (Note 5) | 447 | 2,175 | 4,826 | |||||||||
Administration and shareholder servicing fees payable (Note 5) | 4,855 | 24,463 | 53,886 | |||||||||
Custodian fees payable | 29,898 | 22,131 | 77,120 | |||||||||
Intermediary service fees payable (Note 5) | 4,465 | 12,845 | 85,169 | |||||||||
Professional fees payable | 6,208 | 20,822 | 36,984 | |||||||||
Transfer agent fees payable | 9 | — | — | |||||||||
Accrued other expenses payable | 18,901 | 3,333 | 18,111 | |||||||||
TOTAL LIABILITIES | 249,386 | 3,820,134 | 6,740,639 | |||||||||
NET ASSETS | $33,464,768 | $172,307,992 | $369,447,548 | |||||||||
NET ASSETS: | ||||||||||||
Investor Class | $10,111,358 | $32,249,286 | $141,254,033 | |||||||||
Institutional Class | 23,353,410 | 140,058,706 | 228,193,515 | |||||||||
TOTAL | $33,464,768 | $172,307,992 | $369,447,548 | |||||||||
See accompanying notes to financial statements.
| matthewsasia.com | 800.789.ASIA | 91 |
Table of Contents
| Statements of Assets and Liabilities (continued) | December 31, 2022 | |||
| Matthews Emerging Markets Equity Fund | Matthews Emerging Markets Sustainable Future Fund | Matthews Emerging Markets Small Companies Fund | ||||||||||
SHARES OUTSTANDING: | ||||||||||||
(shares of beneficial interest issued and outstanding, respectively, unlimited number of shares authorized with a $0.001 par value) | ||||||||||||
Investor Class | 907,350 | 2,578,747 | 6,120,223 | |||||||||
Institutional Class | 2,097,452 | 11,192,372 | 9,902,590 | |||||||||
TOTAL | 3,004,802 | 13,771,119 | 16,022,813 | |||||||||
NET ASSET VALUE: | ||||||||||||
Investor Class, offering price and redemption price | $11.14 | $12.51 | $23.08 | |||||||||
Institutional Class, offering price and redemption price | $11.13 | $12.51 | $23.04 | |||||||||
NET ASSETS CONSISTS OF: | ||||||||||||
Capital paid-in | $43,420,650 | $177,675,183 | $443,952,834 | |||||||||
Total distributable earnings/(accumulated loss) | (9,955,882 | ) | (5,367,191 | ) | (74,505,286 | ) | ||||||
NET ASSETS | $33,464,768 | $172,307,992 | $369,447,548 | |||||||||
(A) Investments at cost: | ||||||||||||
Unaffiliated Issuers | $37,877,593 | $171,856,284 | $371,651,222 | |||||||||
(B) Foreign Currency at Cost | $28,879 | $839,760 | $1,546,330 | |||||||||
See accompanying notes to financial statements.
| 92 | MATTHEWS ASIA FUNDS |
Table of Contents
| Statements of Assets and Liabilities (continued) | December 31, 2022 | |||
| Matthews Asia Growth Fund | Matthews Pacific Tiger Fund | Matthews Asia Innovators Fund | ||||||||||
ASSETS: | ||||||||||||
Investments at value (A) (Note 2-A and 7): | ||||||||||||
Unaffiliated issuers | $631,539,250 | $3,671,045,146 | $469,463,006 | |||||||||
Cash | — | 50,636,362 | 4,343,332 | |||||||||
Segregated foreign currency at value | — | 16,750 | 1,610 | |||||||||
Foreign currency at value (B) | — | 6,839 | 636,852 | |||||||||
Dividends and interest receivable | 141,385 | 4,039,687 | 125,917 | |||||||||
Receivable for securities sold | 7,687,280 | 1,575,394 | 1,949,029 | |||||||||
Receivable for capital shares sold | 600,485 | 7,192,914 | 1,268,895 | |||||||||
Other receivable | 367,899 | 1,320,964 | 22,229 | |||||||||
Prepaid expenses | 29,693 | 39,822 | 26,603 | |||||||||
TOTAL ASSETS | 640,365,992 | 3,735,873,878 | 477,837,473 | |||||||||
LIABILITIES: | ||||||||||||
Cash overdraft | 4,804,746 | — | — | |||||||||
Foreign currency overdraft | 85 | — | — | |||||||||
Payable for securities purchased | 35,021 | — | 1,220,326 | |||||||||
Payable for capital shares redeemed | 1,665,177 | 19,242,263 | 2,346,202 | |||||||||
Deferred foreign capital gains tax liability (Note 2-E) | 794,669 | 22,739,292 | 1,131,750 | |||||||||
Due to Advisor (Note 5) | 391,835 | 2,201,847 | 291,779 | |||||||||
Administration and accounting fees payable (Note 5) | 9,371 | 53,922 | 6,860 | |||||||||
Administration and shareholder servicing fees payable (Note 5) | 96,925 | 552,698 | 71,962 | |||||||||
Custodian fees payable | 162,530 | 985,803 | 188,373 | |||||||||
Intermediary service fees payable (Note 5) | 96,331 | 584,950 | 96,968 | |||||||||
Professional fees payable | 52,744 | 25,760 | 41,084 | |||||||||
Transfer agent fees payable | 4,976 | 1,229 | 5,405 | |||||||||
Accrued other expenses payable | 173,556 | 702,082 | 119,008 | |||||||||
TOTAL LIABILITIES | 8,287,966 | 47,089,846 | 5,519,717 | |||||||||
NET ASSETS | $632,078,026 | $3,688,784,032 | $472,317,756 | |||||||||
NET ASSETS: | ||||||||||||
Investor Class | $225,922,927 | $1,081,347,055 | $272,949,728 | |||||||||
Institutional Class | 406,155,099 | 2,607,436,977 | 199,368,028 | |||||||||
TOTAL | $632,078,026 | $3,688,784,032 | $472,317,756 | |||||||||
| matthewsasia.com | 800.789.ASIA | 93 |
Table of Contents
| Statements of Assets and Liabilities (continued) | December 31, 2022 | |||
| Matthews Asia Growth Fund | Matthews Pacific Tiger Fund | Matthews Asia Innovators Fund | ||||||||||
SHARES OUTSTANDING: | ||||||||||||
(shares of beneficial interest issued and outstanding, respectively, unlimited number of shares authorized with a $0.001 par value) | ||||||||||||
Investor Class | 10,840,737 | 53,634,711 | 24,135,579 | |||||||||
Institutional Class | 19,244,315 | 129,332,493 | 17,345,632 | |||||||||
TOTAL | 30,085,052 | 182,967,204 | 41,481,211 | |||||||||
NET ASSET VALUE: | ||||||||||||
Investor Class, offering price and redemption price | $20.84 | $20.16 | $11.31 | |||||||||
Institutional Class, offering price and redemption price | $21.11 | $20.16 | $11.49 | |||||||||
NET ASSETS CONSISTS OF: | ||||||||||||
Capital paid-in | $806,901,065 | $3,417,073,966 | $842,932,665 | |||||||||
Total distributable earnings/(accumulated loss) | (174,823,039 | ) | 271,710,066 | (370,614,909 | ) | |||||||
NET ASSETS | $632,078,026 | $3,688,784,032 | $472,317,756 | |||||||||
(A) Investments at cost: | ||||||||||||
Unaffiliated Issuers | $653,672,345 | $3,348,286,592 | $471,075,233 | |||||||||
(B) Foreign Currency at Cost | $— | $6,774 | $631,308 | |||||||||
See accompanying notes to financial statements.
| 94 | MATTHEWS ASIA FUNDS |
Table of Contents
| Statements of Assets and Liabilities (continued) | December 31, 2022 | |||
| Matthews China Fund | Matthews China Small Companies Fund | Matthews India Fund | ||||||||||
ASSETS: | ||||||||||||
Investments at value (A) (Note 2-A and 7): | ||||||||||||
Unaffiliated issuers | $743,207,628 | $155,000,508 | $593,541,957 | |||||||||
Cash | 4,611,586 | — | 27,441,294 | |||||||||
Segregated foreign currency at value | 21,781 | 3,137 | — | |||||||||
Foreign currency at value (B) | 815 | 966,853 | 447,278 | |||||||||
Dividends and interest receivable | — | — | 738 | |||||||||
Receivable for securities sold | — | 739,054 | 951,869 | |||||||||
Receivable for capital shares sold | 1,752,503 | 217,457 | 404,513 | |||||||||
Other receivable | — | 1,263 | 15,336 | |||||||||
Prepaid expenses | 20,272 | 8,759 | 7,890 | |||||||||
TOTAL ASSETS | 749,614,585 | 156,937,031 | 622,810,875 | |||||||||
LIABILITIES: | ||||||||||||
Cash overdraft | — | 918,738 | — | |||||||||
Payable for securities purchased | — | 122,656 | — | |||||||||
Payable for capital shares redeemed | 2,681,919 | 795,703 | 2,211,810 | |||||||||
Deferred foreign capital gains tax liability (Note 2-E) | — | — | 16,887,698 | |||||||||
Due to Advisor (Note 5) | 445,544 | 116,528 | 376,297 | |||||||||
Administration and accounting fees payable (Note 5) | 9,920 | 2,152 | 8,455 | |||||||||
Administration and shareholder servicing fees payable (Note 5) | 110,429 | 23,514 | 89,670 | |||||||||
Custodian fees payable | 86,543 | 65,388 | 152,977 | |||||||||
Intermediary service fees payable (Note 5) | 129,917 | 34,441 | 99,419 | |||||||||
Professional fees payable | 39,332 | 37,973 | 58,147 | |||||||||
Transfer agent fees payable | 7,477 | 6,009 | 5,990 | |||||||||
Accrued other expenses payable | 316,177 | 52,216 | 138,169 | |||||||||
TOTAL LIABILITIES | 3,827,258 | 2,175,318 | 20,028,632 | |||||||||
NET ASSETS | $745,787,327 | $154,761,713 | $602,782,243 | |||||||||
NET ASSETS: | ||||||||||||
Investor Class | $448,622,823 | $114,440,124 | $505,764,234 | |||||||||
Institutional Class | 297,164,504 | 40,321,589 | 97,018,009 | |||||||||
TOTAL | $745,787,327 | $154,761,713 | $602,782,243 | |||||||||
See accompanying notes to financial statements.
| matthewsasia.com | 800.789.ASIA | 95 |
Table of Contents
| Statements of Assets and Liabilities (continued) | December 31, 2022 | |||
| Matthews China Fund | Matthews China Small Companies Fund | Matthews India Fund | ||||||||||
SHARES OUTSTANDING: | ||||||||||||
(shares of beneficial interest issued and outstanding, respectively, unlimited number of shares authorized with a $0.001 par value) | ||||||||||||
Investor Class | 30,939,613 | 10,298,124 | 22,899,036 | |||||||||
Institutional Class | 20,525,663 | 3,627,463 | 4,303,987 | |||||||||
TOTAL | 51,465,276 | 13,925,587 | 27,203,023 | |||||||||
NET ASSET VALUE: | ||||||||||||
Investor Class, offering price and redemption price | $14.50 | $11.11 | $22.09 | |||||||||
Institutional Class, offering price and redemption price | $14.48 | $11.12 | $22.54 | |||||||||
NET ASSETS CONSISTS OF: | ||||||||||||
Capital paid-in | $1,100,839,764 | $287,391,082 | $563,143,147 | |||||||||
Total distributable earnings/(accumulated loss) | (355,052,437 | ) | (132,629,369 | ) | 39,639,096 | |||||||
NET ASSETS | $745,787,327 | $154,761,713 | $602,782,243 | |||||||||
(A) Investments at cost: | ||||||||||||
Unaffiliated Issuers | $917,249,871 | $188,656,504 | $515,640,518 | |||||||||
(B) Foreign Currency at Cost | $809 | $957,417 | $446,873 | |||||||||
See accompanying notes to financial statements.
| 96 | MATTHEWS ASIA FUNDS |
Table of Contents
| Statements of Assets and Liabilities (continued) | December 31, 2022 | |||
| Matthews Japan Fund | Matthews Korea Fund | |||||||
ASSETS: | ||||||||
Investments at value (A) (Note 2-A and 7): | ||||||||
Unaffiliated issuers | $611,068,256 | $78,542,047 | ||||||
Cash | — | 323,623 | ||||||
Foreign currency at value (B) | — | 30,070 | ||||||
Dividends and interest receivable | 170,237 | 969,620 | ||||||
Receivable for securities sold | 17,555,677 | 1,187,037 | ||||||
Receivable for capital shares sold | 4,105,971 | 379 | ||||||
Other receivable | 1,568,254 | — | ||||||
Prepaid expenses | 34,288 | 15,421 | ||||||
TOTAL ASSETS | 634,502,683 | 81,068,197 | ||||||
LIABILITIES: | ||||||||
Cash overdraft | 4,819,336 | — | ||||||
Foreign currency overdraft | 532 | — | ||||||
Payable for securities purchased | 171,380 | 159,480 | ||||||
Payable for capital shares redeemed | 6,455,611 | 742,042 | ||||||
Due to Advisor (Note 5) | 398,712 | 49,339 | ||||||
Administration and accounting fees payable (Note 5) | 9,795 | 1,177 | ||||||
Administration and shareholder servicing fees payable (Note 5) | 98,871 | 12,256 | ||||||
Custodian fees payable | 54,236 | 11,807 | ||||||
Intermediary service fees payable (Note 5) | 46,595 | 12,225 | ||||||
Professional fees payable | 33,239 | 34,137 | ||||||
Transfer agent fees payable | 4,851 | 1,822 | ||||||
Accrued other expenses payable | 273,440 | 21,156 | ||||||
TOTAL LIABILITIES | 12,366,598 | 1,045,441 | ||||||
NET ASSETS | $622,136,085 | $80,022,756 | ||||||
NET ASSETS: | ||||||||
Investor Class | $208,329,143 | $70,857,002 | ||||||
Institutional Class | 413,806,942 | 9,165,754 | ||||||
TOTAL | $622,136,085 | $80,022,756 | ||||||
See accompanying notes to financial statements.
| matthewsasia.com | 800.789.ASIA | 97 |
Table of Contents
| Statements of Assets and Liabilities (continued) | December 31, 2022 | |||
| Matthews Japan Fund | Matthews Korea Fund | |||||||
SHARES OUTSTANDING: | ||||||||
(shares of beneficial interest issued and outstanding, respectively, unlimited number of shares authorized with a $0.001 par value) | ||||||||
Investor Class | 13,985,819 | 18,559,091 | ||||||
Institutional Class | 27,715,980 | 2,374,085 | ||||||
TOTAL | 41,701,799 | 20,933,176 | ||||||
NET ASSET VALUE: | ||||||||
Investor Class, offering price and redemption price | $14.90 | $3.82 | ||||||
Institutional Class, offering price and redemption price | $14.93 | $3.86 | ||||||
NET ASSETS CONSISTS OF: | ||||||||
Capital paid-in | $815,775,839 | $79,658,040 | ||||||
Total distributable earnings/(accumulated loss) | (193,639,754 | ) | 364,716 | |||||
NET ASSETS | $622,136,085 | $80,022,756 | ||||||
(A) Investments at cost: | ||||||||
Unaffiliated Issuers | $626,772,204 | $74,561,280 | ||||||
(B) Foreign Currency at Cost | $— | $30,070 | ||||||
See accompanying notes to financial statements.
| 98 | MATTHEWS ASIA FUNDS |
Table of Contents
| Statements of Assets and Liabilities (continued) | December 31, 2022 | |||
Matthews Asian Income Fund | Matthews Asia Dividend Fund | Matthews China Dividend Fund | ||||||||||
ASSETS: | ||||||||||||
Investments at value (A) (Note 2-A and 7): | ||||||||||||
Unaffiliated issuers | $602,193,947 | $1,857,445,821 | $218,922,360 | |||||||||
Cash | — | — | 1,609,779 | |||||||||
Segregated foreign currency at value | — | 26,945 | 4,507 | |||||||||
Foreign currency at value (B) | 2,099,189 | 7,442,773 | 2,201 | |||||||||
Dividends and interest receivable | 1,259,351 | 1,485,482 | — | |||||||||
Receivable for securities sold | 10,635,416 | 17,862,286 | 328,541 | |||||||||
Receivable for capital shares sold | 1,240,726 | 2,079,540 | 1,966,538 | |||||||||
Other receivable | 20,654 | 1,852,726 | — | |||||||||
Prepaid expenses | — | 26,031 | — | |||||||||
TOTAL ASSETS | 617,449,283 | 1,888,221,604 | 222,833,926 | |||||||||
LIABILITIES: | ||||||||||||
Cash overdraft | 2,734,547 | 15,220,216 | — | |||||||||
Payable for securities purchased | 8,961 | 172,351 | — | |||||||||
Payable for capital shares redeemed | 2,971,203 | 7,497,538 | 1,118,892 | |||||||||
Deferred foreign capital gains tax liability (Note 2-E) | 619,736 | 10,956,178 | — | |||||||||
Due to Advisor (Note 5) | 449,334 | 1,147,543 | 127,035 | |||||||||
Administration and accounting fees payable (Note 5) | 9,271 | 28,210 | 2,826 | |||||||||
Administration and shareholder servicing fees payable (Note 5) | 96,930 | 287,253 | 31,559 | |||||||||
Custodian fees payable | 91,060 | 612,264 | 64,752 | |||||||||
Intermediary service fees payable (Note 5) | 130,477 | 308,994 | 39,110 | |||||||||
Professional fees payable | 47,028 | 53,790 | 37,163 | |||||||||
Transfer agent fees payable | 4,573 | 4,824 | 1,113 | |||||||||
Accrued other expenses payable | 271,257 | 562,464 | 125,809 | |||||||||
TOTAL LIABILITIES | 7,434,377 | 36,851,625 | 1,548,259 | |||||||||
NET ASSETS | $610,014,906 | $1,851,369,979 | $221,285,667 | |||||||||
NET ASSETS: | ||||||||||||
Investor Class | $339,756,035 | $602,694,146 | $137,066,049 | |||||||||
Institutional Class | 270,258,871 | 1,248,675,833 | 84,219,618 | |||||||||
TOTAL | $610,014,906 | $1,851,369,979 | $221,285,667 | |||||||||
See accompanying notes to financial statements.
| matthewsasia.com | 800.789.ASIA | 99 |
Table of Contents
| Statements of Assets and Liabilities (continued) | December 31, 2022 | |||
| Matthews Asian Growth and Income Fund | Matthews Asia Dividend Fund | Matthews China Dividend Fund | ||||||||||
SHARES OUTSTANDING: | ||||||||||||
(shares of beneficial interest issued and outstanding, respectively, unlimited number of shares authorized with a $0.001 par value) | ||||||||||||
Investor Class | 27,171,505 | 45,526,978 | 9,790,064 | |||||||||
Institutional Class | 21,661,285 | 94,369,565 | 6,016,825 | |||||||||
TOTAL | 48,832,790 | 139,896,543 | 15,806,889 | |||||||||
NET ASSET VALUE: | ||||||||||||
Investor Class, offering price and redemption price | $12.50 | $13.24 | $14.00 | |||||||||
Institutional Class, offering price and redemption price | $12.48 | $13.23 | $14.00 | |||||||||
NET ASSETS CONSISTS OF: | ||||||||||||
Capital paid-in | $646,489,856 | $2,260,981,518 | $261,230,394 | |||||||||
Total distributable earnings/(accumulated loss) | (36,474,950 | ) | (409,611,539 | ) | (39,944,727 | ) | ||||||
NET ASSETS | $610,014,906 | $1,851,369,979 | $221,285,667 | |||||||||
(A) Investments at cost: | ||||||||||||
Unaffiliated Issuers | $582,043,458 | $1,847,837,696 | $225,503,764 | |||||||||
(B) Foreign Currency at Cost | $2,097,998 | $7,465,389 | $2,184 | |||||||||
See accompanying notes to financial statements.
| 100 | MATTHEWS ASIA FUNDS |
Table of Contents
| Statements of Assets and Liabilities (continued) | December 31, 2022 | |||
| Matthews Asia Total Return Bond Fund | Matthews Asia Credit Opportunities Fund | |||||||
ASSETS: | ||||||||
Investments at value (A) (Note 2-A and 7): | ||||||||
Unaffiliated issuers | $38,720,272 | $27,867,647 | ||||||
Cash | 4,341,985 | 1,457,024 | ||||||
Cash pledged collateral for forward foreign currency exchange contracts | 10,000 | — | ||||||
Segregated foreign currency at value | 9,841 | 3,244 | ||||||
Foreign currency at value (B) | 513 | 4,314 | ||||||
Dividends and interest receivable | 1,147,524 | 663,496 | ||||||
Receivable for capital shares sold | 6,800 | — | ||||||
Unrealized appreciation on forward foreign currency exchange contracts | 101,286 | — | ||||||
Prepaid expenses | 41,771 | 7,808 | ||||||
Deferred foreign capital gains tax refund (Note 2-E) | 55 | — | ||||||
TOTAL ASSETS | 44,380,047 | 30,003,533 | ||||||
LIABILITIES: | ||||||||
Payable for securities purchased | — | 565,784 | ||||||
Payable for capital shares redeemed | 1,189,026 | 132,096 | ||||||
Unrealized depreciation on forward foreign currency exchange contracts | 8,088 | — | ||||||
Due to Advisor (Note 5) | 11,767 | 9,055 | ||||||
Administration and accounting fees payable (Note 5) | 499 | 365 | ||||||
Administration and shareholder servicing fees payable (Note 5) | 5,843 | 4,122 | ||||||
Custodian fees payable | 14,778 | 1,382 | ||||||
Intermediary service fees payable (Note 5) | 9,225 | 852 | ||||||
Professional fees payable | 32,310 | 34,920 | ||||||
Transfer agent fees payable | 128 | — | ||||||
Accrued other expenses payable | 19,984 | 30,273 | ||||||
TOTAL LIABILITIES | 1,291,648 | 778,849 | ||||||
NET ASSETS | $43,088,399 | $29,224,684 | ||||||
NET ASSETS: | ||||||||
Investor Class | $17,053,118 | $3,562,002 | ||||||
Institutional Class | 26,035,281 | 25,662,682 | ||||||
TOTAL | $43,088,399 | $29,224,684 | ||||||
See accompanying notes to financial statements.
| matthewsasia.com | 800.789.ASIA | 101 |
Table of Contents
| Statements of Assets and Liabilities (continued) | December 31, 2022 | |||
| Matthews Asia Total Return Bond Fund | Matthews Asia Credit Opportunities Fund | |||||||
SHARES OUTSTANDING: | ||||||||
(shares of beneficial interest issued and outstanding, respectively, unlimited number of shares authorized with a $0.001 par value) | ||||||||
Investor Class | 1,917,196 | 474,384 | ||||||
Institutional Class | 2,927,785 | 3,419,181 | ||||||
TOTAL | 4,844,981 | 3,893,565 | ||||||
NET ASSET VALUE: | ||||||||
Investor Class, offering price and redemption price | $8.89 | $7.51 | ||||||
Institutional Class, offering price and redemption price | $8.89 | $7.51 | ||||||
NET ASSETS CONSISTS OF: | ||||||||
Capital paid-in | $71,572,999 | $48,906,355 | ||||||
Total distributable earnings/(accumulated loss) | (28,484,600 | ) | (19,681,671 | ) | ||||
NET ASSETS | $43,088,399 | $29,224,684 | ||||||
(A) Investments at cost: | ||||||||
Unaffiliated Issuers | $63,546,638 | $39,137,486 | ||||||
(B) Foreign Currency at Cost | $520 | $4,577 | ||||||
See accompanying notes to financial statements.
| 102 | MATTHEWS ASIA FUNDS |
Table of Contents
| Statements of Operations | Year Ended December 31, 2022 |
| Matthews Emerging Markets Equity Fund | Matthews Emerging Markets Sustainable Future Fund | Matthews Emerging Markets Small Companies Fund | ||||||||||
INVESTMENT INCOME: | ||||||||||||
Dividends—Unaffiliated Issuers | $1,123,348 | $1,369,856 | $4,690,359 | |||||||||
Interest | — | 487 | — | |||||||||
Foreign withholding tax | (80,117 | ) | (167,312 | ) | (578,706 | ) | ||||||
TOTAL INVESTMENT INCOME | 1,043,231 | 1,203,031 | 4,111,653 | |||||||||
EXPENSES: | ||||||||||||
Investment advisory fees (Note 5) | 270,426 | 912,375 | 3,600,841 | |||||||||
Administration and accounting fees (Note 5) | 3,224 | 10,861 | 28,807 | |||||||||
Administration and shareholder servicing fees (Note 5) | 62,995 | 214,648 | 566,547 | |||||||||
Accounting out-of-pocket fees | 42,099 | 30,211 | 38,909 | |||||||||
Custodian fees | 60,019 | 90,394 | 147,824 | |||||||||
Printing fees | 11,461 | 19,053 | 26,638 | |||||||||
Intermediary service fees (Note 5) | 44,799 | 154,021 | 520,440 | |||||||||
Professional fees | 47,023 | 54,184 | 75,610 | |||||||||
Registration fees | 31,160 | 33,613 | 38,989 | |||||||||
Transfer agent fees | 3,197 | 2,256 | 15,739 | |||||||||
Trustees fees | 2,234 | 4,668 | 13,176 | |||||||||
Other expenses | 25,865 | 23,356 | 34,785 | |||||||||
TOTAL EXPENSES | 604,502 | 1,549,640 | 5,108,305 | |||||||||
Advisory fees waived and expenses waived or reimbursed/repaid (Note 5) | (220,410 | ) | 81,420 | (647,978 | ) | |||||||
NET EXPENSES | 384,092 | 1,631,060 | 4,460,327 | |||||||||
NET INVESTMENT INCOME (LOSS) | 659,139 | (428,029 | ) | (348,674 | ) | |||||||
REALIZED AND UNREALIZED GAIN (LOSS) ON INVESTMENTS, FOREIGN CURRENCY RELATED TRANSACTIONS, AND FOREIGN CAPITAL GAINS TAXES: | ||||||||||||
Net realized gain (loss) on investments—Unaffiliated Issuers | (4,218,330 | ) | 4,195,267 | 35,767,423 | ||||||||
Net realized foreign capital gains tax | (24,223 | ) | (438,895 | ) | (1,877,039 | ) | ||||||
Net realized gain (loss) on foreign currency related transactions | (18,685 | ) | (80,056 | ) | (190,897 | ) | ||||||
Net change in unrealized appreciation/depreciation on investments—Unaffiliated Issuers | (7,970,011 | ) | (21,312,688 | ) | (103,103,316 | ) | ||||||
Net change in deferred foreign capital gains taxes on unrealized appreciation/depreciation | 62,033 | (6,668 | ) | 862,730 | ||||||||
Net change in unrealized appreciation/depreciation on foreign currency related translations | (180 | ) | (503 | ) | (9,921 | ) | ||||||
Net realized and unrealized gain (loss) on investments, foreign currency related transactions, and foreign capital gains taxes | (12,169,396 | ) | (17,643,543 | ) | (68,551,020 | ) | ||||||
NET INCREASE (DECREASE) IN NET ASSETS FROM OPERATIONS | ($11,510,257 | ) | ($18,071,572 | ) | ($68,899,694 | ) | ||||||
| matthewsasia.com | 800.789.ASIA | 103 |
Table of Contents
| Statements of Operations (continued) | Year Ended December 31, 2022 |
| Matthews Asia Growth Fund | Matthews Pacific Tiger Fund | Matthews Asia Innovators Fund | ||||||||||
INVESTMENT INCOME: | ||||||||||||
Dividends—Unaffiliated Issuers | $9,496,953 | $88,685,488 | $6,453,276 | |||||||||
Foreign withholding tax | (1,173,641 | ) | (9,796,157 | ) | (756,500 | ) | ||||||
TOTAL INVESTMENT INCOME | 8,323,312 | 78,889,331 | 5,696,776 | |||||||||
EXPENSES: | ||||||||||||
Investment advisory fees (Note 5) | 6,756,260 | 36,545,335 | 4,974,909 | |||||||||
Administration and accounting fees (Note 5) | 80,606 | 435,812 | 59,360 | |||||||||
Administration and shareholder servicing fees (Note 5) | 1,565,675 | 8,497,421 | 1,151,682 | |||||||||
Accounting out-of-pocket fees | 44,745 | 38,500 | 39,325 | |||||||||
Custodian fees | 347,344 | 2,126,948 | 475,460 | |||||||||
Printing fees | 153,435 | 508,909 | 132,736 | |||||||||
Intermediary service fees (Note 5) | 1,053,880 | 5,578,303 | 953,317 | |||||||||
Professional fees | 97,448 | 198,513 | 91,031 | |||||||||
Registration fees | 66,784 | 97,601 | 57,473 | |||||||||
Transfer agent fees | 37,537 | 84,720 | 35,102 | |||||||||
Trustees fees | 96,291 | 400,219 | 84,257 | |||||||||
Other expenses | 103,290 | 329,053 | 103,315 | |||||||||
TOTAL EXPENSES | 10,403,295 | 54,841,334 | 8,157,967 | |||||||||
Advisory fees waived and expenses waived or reimbursed (Note 5) | — | (283,697 | ) | — | ||||||||
Administration fees waived (Note 5) | — | (283,696 | ) | — | ||||||||
NET EXPENSES | 10,403,295 | 54,273,941 | 8,157,967 | |||||||||
NET INVESTMENT INCOME (LOSS) | (2,079,983 | ) | 24,615,390 | (2,461,191 | ) | |||||||
| REALIZED AND UNREALIZED GAIN (LOSS) ON INVESTMENTS, FOREIGN CURRENCY RELATED TRANSACTIONS, AND FOREIGN CAPITAL GAINS TAXES: | ||||||||||||
Net realized gain (loss) on investments—Unaffiliated Issuers | (139,977,133 | ) | (31,022,002 | ) | (281,920,046 | ) | ||||||
Net realized gain (loss) on investments—Affiliated Issuers | — | — | (11,660,276 | ) | ||||||||
Net realized foreign capital gains tax | (1,380,807 | ) | (17,707,832 | ) | (2,142,644 | ) | ||||||
Net realized gain (loss) on foreign currency related transactions | (1,681,036 | ) | (3,345,479 | ) | (692,127 | ) | ||||||
Net change in unrealized appreciation/depreciation on investments—Unaffiliated Issuers | (406,267,513 | ) | (1,497,066,102 | ) | (14,224,345 | ) | ||||||
Net change in unrealized appreciation/depreciation on investments—Affiliated Issuers | — | — | 3,379,210 | |||||||||
Net change in deferred foreign capital gains taxes on unrealized appreciation/depreciation | 5,625,551 | 16,309,323 | 2,819,303 | |||||||||
Net change in unrealized appreciation/depreciation on foreign currency related translations | (39,250 | ) | (168,769 | ) | 9,343 | |||||||
Net realized and unrealized gain (loss) on investments, foreign currency related transactions, and foreign capital gains taxes | (543,720,188 | ) | (1,533,000,861 | ) | (304,431,582 | ) | ||||||
NET INCREASE (DECREASE) IN NET ASSETS FROM OPERATIONS | ($545,800,171 | ) | ($1,508,385,471 | ) | ($306,892,773 | ) | ||||||
See accompanying notes to financial statements.
| 104 | MATTHEWS ASIA FUNDS |
Table of Contents
| Statements of Operations (continued) | Year Ended December 31, 2022 |
| Matthews China Fund | Matthews China Small Companies Fund | Matthews India Fund | ||||||||||
INVESTMENT INCOME: | ||||||||||||
Dividends—Unaffiliated Issuers | $11,215,630 | $4,198,697 | $6,071,371 | |||||||||
Interest | — | — | 1,398 | |||||||||
Foreign withholding tax | (842,198 | ) | (167,584 | ) | (1,412,146 | ) | ||||||
TOTAL INVESTMENT INCOME | 10,373,432 | 4,031,113 | 4,660,623 | |||||||||
EXPENSES: | ||||||||||||
Investment advisory fees (Note 5) | 6,451,300 | 2,494,569 | 4,461,594 | |||||||||
Administration and accounting fees (Note 5) | 76,936 | 19,957 | 53,160 | |||||||||
Administration and shareholder servicing fees (Note 5) | 1,499,439 | 387,891 | 1,043,262 | |||||||||
Accounting out-of-pocket fees | �� | 43,150 | 41,325 | 45,161 | ||||||||
Custodian fees | 289,615 | 154,784 | 284,472 | |||||||||
Printing fees | 116,355 | 54,498 | 72,967 | |||||||||
Intermediary service fees (Note 5) | 1,304,161 | 354,967 | 1,202,776 | |||||||||
Professional fees | 75,617 | 61,758 | 139,711 | |||||||||
Registration fees | 64,174 | 57,210 | 50,542 | |||||||||
Transfer agent fees | 71,007 | 20,936 | 59,583 | |||||||||
Trustees fees | 71,927 | 19,528 | 32,912 | |||||||||
Other expenses | 91,902 | 23,694 | 40,684 | |||||||||
TOTAL EXPENSES | 10,155,583 | 3,691,117 | 7,486,824 | |||||||||
Advisory fees waived and expenses waived or reimbursed (Note 5) | — | (388,736 | ) | — | ||||||||
NET EXPENSES | 10,155,583 | 3,302,381 | 7,486,824 | |||||||||
NET INVESTMENT INCOME (LOSS) | 217,849 | 728,732 | (2,826,201 | ) | ||||||||
| REALIZED AND UNREALIZED GAIN (LOSS) ON INVESTMENTS, FOREIGN CURRENCY RELATED TRANSACTIONS, AND FOREIGN CAPITAL GAINS TAXES: | ||||||||||||
Net realized gain (loss) on investments—Unaffiliated Issuers | (149,878,728 | ) | (88,899,039 | ) | 65,105,115 | |||||||
Net realized foreign capital gains tax | — | — | (9,785,052 | ) | ||||||||
Net realized gain (loss) on foreign currency related transactions | (189,397 | ) | (68,036 | ) | (594,283 | ) | ||||||
Net change in unrealized appreciation/depreciation on investments—Unaffiliated Issuers | (197,117,711 | ) | (31,872,662 | ) | (138,727,325 | ) | ||||||
Net change in deferred foreign capital gains taxes on unrealized appreciation/depreciation | — | — | 12,032,808 | |||||||||
Net change in unrealized appreciation/depreciation on foreign currency related translations | (5,335 | ) | 4,538 | 157,126 | ||||||||
Net realized and unrealized gain (loss) on investments, foreign currency related transactions, and foreign capital gains taxes | (347,191,171 | ) | (120,835,199 | ) | (71,811,611 | ) | ||||||
NET INCREASE (DECREASE) IN NET ASSETS FROM OPERATIONS | ($346,973,322 | ) | ($120,106,467 | ) | ($74,637,812 | ) | ||||||
| matthewsasia.com | 800.789.ASIA | 105 |
Table of Contents
| Statements of Operations (continued) | Year Ended December 31, 2022 |
| Matthews Japan Fund | Matthews Korea Fund | |||||||
INVESTMENT INCOME: | ||||||||
Dividends—Unaffiliated Issuers | $18,010,937 | $2,784,516 | ||||||
Foreign withholding tax | (2,336,550 | ) | (457,298 | ) | ||||
TOTAL INVESTMENT INCOME | 15,674,387 | 2,327,218 | ||||||
EXPENSES: | ||||||||
Investment advisory fees (Note 5) | 7,009,512 | 694,962 | ||||||
Administration and accounting fees (Note 5) | 83,612 | 8,285 | ||||||
Administration and shareholder servicing fees (Note 5) | 1,626,986 | 161,878 | ||||||
Accounting out-of-pocket fees | 43,085 | 40,500 | ||||||
Custodian fees | 123,120 | 29,140 | ||||||
Printing fees | 182,774 | 23,451 | ||||||
Intermediary service fees (Note 5) | 853,172 | 166,765 | ||||||
Professional fees | 74,701 | 54,137 | ||||||
Registration fees | 49,428 | 34,967 | ||||||
Transfer agent fees | 106,704 | 19,097 | ||||||
Trustees fees | 74,303 | 6,563 | ||||||
Other expenses | 74,041 | 7,406 | ||||||
TOTAL EXPENSES | 10,301,438 | 1,247,151 | ||||||
NET INVESTMENT INCOME (LOSS) | 5,372,949 | 1,080,067 | ||||||
| REALIZED AND UNREALIZED GAIN (LOSS) ON INVESTMENTS AND FOREIGN CURRENCY RELATED TRANSACTIONS: | ||||||||
Net realized gain (loss) on investments—Unaffiliated Issuers | (169,441,743 | ) | (3,260,405 | ) | ||||
Net realized gain (loss) on foreign currency related transactions | (555,985 | ) | (20,241 | ) | ||||
Net change in unrealized appreciation/depreciation on investments—Unaffiliated Issuers | (262,470,127 | ) | (31,176,174 | ) | ||||
Net change in unrealized appreciation/depreciation on foreign currency related translations | (206,284 | ) | 7,896 | |||||
Net realized and unrealized gain (loss) on investments and foreign currency related transactions | (432,674,139 | ) | (34,448,924 | ) | ||||
NET INCREASE (DECREASE) IN NET ASSETS FROM OPERATIONS | ($427,301,190 | ) | ($33,368,857 | ) | ||||
See accompanying notes to financial statements.
| 106 | MATTHEWS ASIA FUNDS |
Table of Contents
| Statements of Operations (continued) | Year Ended December 31, 2022 |
Matthews Asian Income Fund | Matthews Asia Dividend Fund | Matthews China Dividend Fund | ||||||||||
INVESTMENT INCOME: | ||||||||||||
Dividends—Unaffiliated Issuers | $24,822,908 | $56,763,398 | $8,913,424 | |||||||||
Dividends—Affiliated Issuers (Note 7) | — | 10,434,864 | — | |||||||||
Interest | 1,250,744 | — | — | |||||||||
Foreign withholding tax | (2,034,068 | ) | (5,900,622 | ) | (465,470 | ) | ||||||
TOTAL INVESTMENT INCOME | 24,039,584 | 61,297,640 | 8,447,954 | |||||||||
EXPENSES: | ||||||||||||
Investment advisory fees (Note 5) | 5,946,121 | 21,162,558 | 1,732,129 | |||||||||
Administration and accounting fees (Note 5) | 70,892 | 252,482 | 20,651 | |||||||||
Administration and shareholder servicing fees (Note 5) | 1,384,955 | 4,904,833 | 403,328 | |||||||||
Accounting out-of-pocket fees | 40,961 | 41,077 | 41,975 | |||||||||
Custodian fees | 222,711 | 1,592,923 | 129,836 | |||||||||
Printing fees | 167,878 | 438,748 | 32,452 | |||||||||
Intermediary service fees (Note 5) | 1,265,681 | 3,373,063 | 421,267 | |||||||||
Professional fees | 88,111 | 138,631 | 60,141 | |||||||||
Registration fees | 86,596 | 67,915 | 78,439 | |||||||||
Transfer agent fees | 41,902 | 66,485 | 11,465 | |||||||||
Trustees fees | 62,853 | 240,644 | 17,797 | |||||||||
Other expenses | 55,963 | 212,737 | 16,439 | |||||||||
TOTAL EXPENSES | 9,434,624 | 32,492,096 | 2,965,919 | |||||||||
Advisory fees waived and expenses waived or reimbursed (Note 5) | — | (41,494 | ) | — | ||||||||
Administration fees waived (Note 5) | — | (41,494 | ) | — | ||||||||
NET EXPENSES | 9,434,624 | 32,409,108 | 2,965,919 | |||||||||
NET INVESTMENT INCOME (LOSS) | 14,604,960 | 28,888,532 | 5,482,035 | |||||||||
| REALIZED AND UNREALIZED GAIN (LOSS) ON INVESTMENTS, FOREIGN CURRENCY RELATED TRANSACTIONS, AND FOREIGN CAPITAL GAINS TAXES: | ||||||||||||
Net realized gain (loss) on investments—Unaffiliated Issuers | (48,119,926 | ) | (286,430,072 | ) | (29,050,483 | ) | ||||||
Net realized gain (loss) on investments—Affiliated Issuers | — | 31,170,614 | — | |||||||||
Net realized foreign capital gains tax | (10,558 | ) | — | — | ||||||||
Net realized gain (loss) on foreign currency related transactions | (309,092 | ) | (5,941,770 | ) | (276,007 | ) | ||||||
Net change in unrealized appreciation/depreciation on investments—Unaffiliated Issuers | (169,293,900 | ) | (894,156,811 | ) | (39,956,404 | ) | ||||||
Net change in unrealized appreciation/depreciation on investments—Affiliated Issuers | — | (209,606,852 | ) | — | ||||||||
Net change in deferred foreign capital gains taxes on unrealized appreciation/depreciation | 662,900 | 595,392 | — | |||||||||
Net change in unrealized appreciation/depreciation on foreign currency related translations | 2,809 | (226,185 | ) | (15,935 | ) | |||||||
Net realized and unrealized gain (loss) on investments, foreign currency related transactions, and foreign capital gains taxes | (217,067,767 | ) | (1,364,595,684 | ) | (69,298,829 | ) | ||||||
NET INCREASE (DECREASE) IN NET ASSETS FROM OPERATIONS | ($202,462,807 | ) | ($1,335,707,152 | ) | ($63,816,794 | ) | ||||||
| matthewsasia.com | 800.789.ASIA | 107 |
Table of Contents
| Statements of Operations (continued) | Year Ended December 31, 2022 |
| Matthews Asia Total Return Bond Fund | Matthews Asia Credit Opportunities Fund | |||||||
INVESTMENT INCOME: | ||||||||
Dividends—Unaffiliated Issuers | $36,745 | $36,914 | ||||||
Interest | 4,292,124 | 2,124,219 | ||||||
Foreign withholding tax | (36,433 | ) | — | |||||
TOTAL INVESTMENT INCOME | 4,292,436 | 2,161,133 | ||||||
EXPENSES: | ||||||||
Investment advisory fees (Note 5) | 386,758 | 168,627 | ||||||
Administration and accounting fees (Note 5) | 5,625 | 2,453 | ||||||
Administration and shareholder servicing fees (Note 5) | 109,024 | 47,918 | ||||||
Accounting out-of-pocket fees | 40,657 | 30,711 | ||||||
Custodian fees | 35,886 | 7,738 | ||||||
Printing fees | 31,353 | 26,652 | ||||||
Intermediary service fees (Note 5) | 77,393 | 23,466 | ||||||
Professional fees | 51,571 | 52,724 | ||||||
Registration fees | 40,424 | 38,099 | ||||||
Transfer agent fees | 4,701 | 1,752 | ||||||
Trustees fees | 5,698 | 4,066 | ||||||
Interest expense | 359 | — | ||||||
Other expenses | 10,760 | 5,830 | ||||||
TOTAL EXPENSES | 800,209 | 410,036 | ||||||
Advisory fees waived and expenses waived or reimbursed (Note 5) | (130,734 | ) | (121,945 | ) | ||||
NET EXPENSES | 669,475 | 288,091 | ||||||
NET INVESTMENT INCOME (LOSS) | 3,622,961 | 1,873,042 | ||||||
| REALIZED AND UNREALIZED GAIN (LOSS) ON INVESTMENTS, FORWARD FOREIGN CURRENCY EXCHANGE CONTRACTS, FOREIGN CURRENCY RELATED TRANSACTIONS, SWAPS, AND FOREIGN CAPITAL GAINS TAXES: | ||||||||
Net realized gain (loss) on investments—Unaffiliated Issuers | (3,588,881 | ) | (391,314 | ) | ||||
Net realized gain (loss) on forward foreign currency exchange contracts | (1,233,772 | ) | — | |||||
Net realized gain (loss) on swaps | (4,480 | ) | — | |||||
Net realized gain (loss) on foreign currency related transactions | (80,981 | ) | (322 | ) | ||||
Net change in unrealized appreciation/depreciation on investments—Unaffiliated Issuers | (16,578,836 | ) | (6,781,360 | ) | ||||
Net change in unrealized appreciation/depreciation forward foreign currency exchange contracts | 707,457 | — | ||||||
Net change in unrealized appreciation/depreciation on swaps | (81,339 | ) | — | |||||
Net change in deferred foreign capital gains taxes on unrealized appreciation/depreciation | 41,124 | — | ||||||
Net change in unrealized appreciation/depreciation on foreign currency related translations | 17,628 | (371 | ) | |||||
Net realized and unrealized gain (loss) on investments, forward foreign currency exchange contracts, foreign currency related transactions, swaps, and foreign capital gains taxes | (20,802,080 | ) | (7,173,367 | ) | ||||
NET INCREASE (DECREASE) IN NET ASSETS FROM OPERATIONS | ($17,179,119 | ) | ($5,300,325 | ) | ||||
See accompanying notes to financial statements.
| 108 | MATTHEWS ASIA FUNDS |
Table of Contents
Statements of Changes in Net Assets
| MATTHEWS EMERGING MARKETS EQUITY FUND | Year Ended December 31, 2022 | Year Ended December 31, 2021 | ||||||
OPERATIONS: | ||||||||
Net investment income (loss) | $659,139 | $700,658 | ||||||
Net realized gain (loss) on investments and foreign currency related transactions | (4,261,238 | ) | 2,342,740 | |||||
Net change in unrealized appreciation/depreciation on investments and foreign currency related translations | (7,970,191 | ) | (3,861,061 | ) | ||||
Net change on foreign capital gains taxes on unrealized appreciation/depreciation | 62,033 | 11,495 | ||||||
Net increase (decrease) in net assets resulting from operations | (11,510,257 | ) | (806,168 | ) | ||||
DISTRIBUTIONS TO SHAREHOLDERS: | ||||||||
Investor Class | (171,815 | ) | (1,083,017 | ) | ||||
Institutional Class | (486,489 | ) | (3,260,692 | ) | ||||
Net decrease in net assets resulting from distributions | (658,304 | ) | (4,343,709 | ) | ||||
CAPITAL SHARE TRANSACTIONS (net) (Note 4) | (3,923,820 | ) | 9,914,929 | |||||
Total increase (decrease) in net assets | (16,092,381 | ) | 4,765,052 | |||||
NET ASSETS: | ||||||||
Beginning of year | 49,557,149 | 44,792,097 | ||||||
End of year | $33,464,768 | $49,557,149 | ||||||
| MATTHEWS EMERGING MARKETS SUSTAINABLE FUTURE FUND | Year Ended December 31, 2022 | Year Ended December 31, 2021 | ||||||
OPERATIONS: | ||||||||
Net investment income (loss) | ($428,029 | ) | ($367,490 | ) | ||||
Net realized gain (loss) on investments and foreign currency related transactions | 3,676,316 | 16,498,506 | ||||||
Net change in unrealized appreciation/depreciation on investments and foreign currency related translations | (21,313,191 | ) | (5,061,936 | ) | ||||
Net change on foreign capital gains taxes on unrealized appreciation/depreciation | (6,668 | ) | (654,383 | ) | ||||
Net increase (decrease) in net assets resulting from operations | (18,071,572 | ) | 10,414,697 | |||||
DISTRIBUTIONS TO SHAREHOLDERS: | ||||||||
Investor Class | (1,649,628 | ) | (3,181,901 | ) | ||||
Institutional Class | (7,058,005 | ) | (7,036,599 | ) | ||||
Net decrease in net assets resulting from distributions | (8,707,633 | ) | (10,218,500 | ) | ||||
CAPITAL SHARE TRANSACTIONS (net) (Note 4) | 72,234,041 | 38,630,119 | ||||||
Total increase (decrease) in net assets | 45,454,836 | 38,826,316 | ||||||
NET ASSETS: | ||||||||
Beginning of year | 126,853,156 | 88,026,840 | ||||||
End of year | $172,307,992 | $126,853,156 | ||||||
See accompanying notes to financial statements.
| matthewsasia.com | 800.789.ASIA | 109 |
Table of Contents
Statements of Changes in Net Assets (continued)
| MATTHEWS EMERGING MARKETS SMALL COMPANIES FUND | Year Ended December 31, 2022 | Year Ended December 31, 2021 | ||||||
OPERATIONS: | ||||||||
Net investment income (loss) | ($348,674 | ) | ($1,478,959 | ) | ||||
Net realized gain (loss) on investments and foreign currency related transactions | 33,699,487 | 46,739,287 | ||||||
Net change in unrealized appreciation/depreciation on investments and foreign currency related translations | (103,113,237 | ) | 20,513,242 | |||||
Net change on foreign capital gains taxes on unrealized appreciation/depreciation | 862,730 | (2,166,702 | ) | |||||
Net increase (decrease) in net assets resulting from operations | (68,899,694 | ) | 63,606,868 | |||||
DISTRIBUTIONS TO SHAREHOLDERS: | ||||||||
Investor Class | (10,642,526 | ) | (9,801,473 | ) | ||||
Institutional Class | (17,586,490 | ) | (12,694,236 | ) | ||||
Net decrease in net assets resulting from distributions | (28,229,016 | ) | (22,495,709 | ) | ||||
CAPITAL SHARE TRANSACTIONS (net) (Note 4) | 68,567,370 | 149,755,453 | ||||||
Total increase (decrease) in net assets | (28,561,340 | ) | 190,866,612 | |||||
NET ASSETS: | ||||||||
Beginning of year | 398,008,888 | 207,142,276 | ||||||
End of year | $369,447,548 | $398,008,888 | ||||||
| MATTHEWS ASIA GROWTH FUND | Year Ended December 31, 2022 | Year Ended December 31, 2021 | ||||||
OPERATIONS: | ||||||||
Net investment income (loss) | ($2,079,983 | ) | ($11,511,247 | ) | ||||
Net realized gain (loss) on investments and foreign currency related transactions | (143,038,976 | ) | 85,502,548 | |||||
Net change in unrealized appreciation/depreciation on investments and foreign currency related translations | (406,306,763 | ) | (413,024,484 | ) | ||||
Net change on foreign capital gains taxes on unrealized appreciation/depreciation | 5,625,551 | (5,345,430 | ) | |||||
Net increase (decrease) in net assets resulting from operations | (545,800,171 | ) | (344,378,613 | ) | ||||
DISTRIBUTIONS TO SHAREHOLDERS: | ||||||||
Investor Class | (6,372,932 | ) | (28,626,230 | ) | ||||
Institutional Class | (11,696,816 | ) | (61,109,835 | ) | ||||
Net decrease in net assets resulting from distributions | (18,069,748 | ) | (89,736,065 | ) | ||||
CAPITAL SHARE TRANSACTIONS (net) (Note 4) | (558,821,991 | ) | 135,096,963 | |||||
Total increase (decrease) in net assets | (1,122,691,910 | ) | (299,017,715 | ) | ||||
NET ASSETS: | ||||||||
Beginning of year | 1,754,769,936 | 2,053,787,651 | ||||||
End of year | $632,078,026 | $1,754,769,936 | ||||||
See accompanying notes to financial statements.
| 110 | MATTHEWS ASIA FUNDS |
Table of Contents
Statements of Changes in Net Assets (continued)
| MATTHEWS PACIFIC TIGER FUND | Year Ended December 31, 2022 | Year Ended December 31, 2021 | ||||||
OPERATIONS: | ||||||||
Net investment income (loss) | $24,615,390 | $24,387,817 | ||||||
Net realized gain (loss) on investments and foreign currency related transactions | (52,075,313 | ) | 1,488,400,469 | |||||
Net change in unrealized appreciation/depreciation on investments and foreign currency related translations | (1,497,234,871 | ) | (1,906,988,327 | ) | ||||
Net change on foreign capital gains taxes on unrealized appreciation/depreciation | 16,309,323 | (11,587,560 | ) | |||||
Net increase (decrease) in net assets resulting from operations | (1,508,385,471 | ) | (405,787,601 | ) | ||||
DISTRIBUTIONS TO SHAREHOLDERS: | ||||||||
Investor Class | (88,898,319 | ) | (343,295,997 | ) | ||||
Institutional Class | (213,752,096 | ) | (1,049,525,838 | ) | ||||
Net decrease in net assets resulting from distributions | (302,650,415 | ) | (1,392,821,835 | ) | ||||
CAPITAL SHARE TRANSACTIONS (net) (Note 4) | (1,692,644,474 | ) | 232,424,290 | |||||
Total increase (decrease) in net assets | (3,503,680,360 | ) | (1,566,185,146 | ) | ||||
NET ASSETS: | ||||||||
Beginning of year | 7,192,464,392 | 8,758,649,538 | ||||||
End of year | $3,688,784,032 | $7,192,464,392 | ||||||
| MATTHEWS ASIA INNOVATORS FUND | Year Ended December 31, 2022 | Year Ended December 31, 2021 | ||||||
OPERATIONS: | ||||||||
Net investment income (loss) | ($2,461,191 | ) | ($9,357,135 | ) | ||||
Net realized gain (loss) on investments and foreign currency related transactions | (296,415,093 | ) | 294,063,267 | |||||
Net change in unrealized appreciation/depreciation on investments and foreign currency related translations | (10,835,792 | ) | (580,855,771 | ) | ||||
Net change on foreign capital gains taxes on unrealized appreciation/depreciation | 2,819,303 | 2,164,474 | ||||||
Net increase (decrease) in net assets resulting from operations | (306,892,773 | ) | (293,985,165 | ) | ||||
DISTRIBUTIONS TO SHAREHOLDERS: | ||||||||
Investor Class | (60,056,072 | ) | (88,802,778 | ) | ||||
Institutional Class | (44,589,552 | ) | (187,598,026 | ) | ||||
Net decrease in net assets resulting from distributions | (104,645,624 | ) | (276,400,804 | ) | ||||
CAPITAL SHARE TRANSACTIONS (net) (Note 4) | (511,912,389 | ) | 240,697,526 | |||||
Total increase (decrease) in net assets | (923,450,786 | ) | (329,688,443 | ) | ||||
NET ASSETS: | ||||||||
Beginning of year | 1,395,768,542 | 1,725,456,985 | ||||||
End of year | $472,317,756 | $1,395,768,542 | ||||||
See accompanying notes to financial statements.
| matthewsasia.com | 800.789.ASIA | 111 |
Table of Contents
Statements of Changes in Net Assets (continued)
| MATTHEWS CHINA FUND | Year Ended December 31, 2022 | Year Ended December 31, 2021 | ||||||
OPERATIONS: | ||||||||
Net investment income (loss) | $217,849 | $3,844,991 | ||||||
Net realized gain (loss) on investments and foreign currency related transactions | (150,068,125 | ) | 204,568,096 | |||||
Net change in unrealized appreciation/depreciation on investments and foreign currency related translations | (197,123,046 | ) | (415,651,012 | ) | ||||
Net increase (decrease) in net assets resulting from operations | (346,973,322 | ) | (207,237,925 | ) | ||||
DISTRIBUTIONS TO SHAREHOLDERS: | ||||||||
Investor Class | (32,362,149 | ) | (99,354,820 | ) | ||||
Institutional Class | (21,837,281 | ) | (84,823,673 | ) | ||||
Net decrease in net assets resulting from distributions | (54,199,430 | ) | (184,178,493 | ) | ||||
CAPITAL SHARE TRANSACTIONS (net) (Note 4) | (194,850,178 | ) | 224,355,518 | |||||
Total increase (decrease) in net assets | (596,022,930 | ) | (167,060,900 | ) | ||||
NET ASSETS: | ||||||||
Beginning of year | 1,341,810,257 | 1,508,871,157 | ||||||
End of year | $745,787,327 | $1,341,810,257 | ||||||
| MATTHEWS CHINA SMALL COMPANIES FUND | Year Ended December 31, 2022 | Year Ended December 31, 2021 | ||||||
OPERATIONS: | ||||||||
Net investment income (loss) | $728,732 | $2,295,512 | ||||||
Net realized gain (loss) on investments and foreign currency related transactions | (88,967,075 | ) | 62,613,741 | |||||
Net change in unrealized appreciation/depreciation on investments and foreign currency related translations | (31,868,124 | ) | (90,887,223 | ) | ||||
Net increase (decrease) in net assets resulting from operations | (120,106,467 | ) | (25,977,970 | ) | ||||
DISTRIBUTIONS TO SHAREHOLDERS: | ||||||||
Investor Class | (2,034,204 | ) | (33,393,779 | ) | ||||
Institutional Class | (1,008,109 | ) | (24,008,699 | ) | ||||
Net decrease in net assets resulting from distributions | (3,042,313 | ) | (57,402,478 | ) | ||||
CAPITAL SHARE TRANSACTIONS (net) (Note 4) | (103,257,833 | ) | 80,779,555 | |||||
Total increase (decrease) in net assets | (226,406,613 | ) | (2,600,893 | ) | ||||
NET ASSETS: | ||||||||
Beginning of year | 381,168,326 | 383,769,219 | ||||||
End of year | $154,761,713 | $381,168,326 | ||||||
See accompanying notes to financial statements.
| 112 | MATTHEWS ASIA FUNDS |
Table of Contents
Statements of Changes in Net Assets (continued)
| MATTHEWS INDIA FUND | Year Ended December 31, 2022 | Year Ended December 31, 2021 | ||||||
OPERATIONS: | ||||||||
Net investment income (loss) | ($2,826,201 | ) | ($2,671,741 | ) | ||||
Net realized gain (loss) on investments and foreign currency related transactions | 54,725,780 | 111,630,393 | ||||||
Net change in unrealized appreciation/depreciation on investments and foreign currency related translations | (138,570,199 | ) | 22,196,110 | |||||
Net change on foreign capital gains taxes on unrealized appreciation/depreciation | 12,032,808 | (7,346,295 | ) | |||||
Net increase (decrease) in net assets resulting from operations | (74,637,812 | ) | 123,808,467 | |||||
DISTRIBUTIONS TO SHAREHOLDERS: | ||||||||
Investor Class | (69,440,851 | ) | (58,881,696 | ) | ||||
Institutional Class | (13,509,415 | ) | (11,871,666 | ) | ||||
Net decrease in net assets resulting from distributions | (82,950,266 | ) | (70,753,362 | ) | ||||
CAPITAL SHARE TRANSACTIONS (net) (Note 4) | (3,405,239 | ) | 2,759,175 | |||||
Total increase (decrease) in net assets | (160,993,317 | ) | 55,814,280 | |||||
NET ASSETS: | ||||||||
Beginning of year | 763,775,560 | 707,961,280 | ||||||
End of year | $602,782,243 | $763,775,560 | ||||||
| MATTHEWS JAPAN FUND | Year Ended December 31, 2022 | Year Ended December 31, 2021 | ||||||
OPERATIONS: | ||||||||
Net investment income (loss) | $5,372,949 | $4,627,985 | ||||||
Net realized gain (loss) on investments and foreign currency related transactions | (169,997,728 | ) | 208,077,658 | |||||
Net change in unrealized appreciation/depreciation on investments and foreign currency related translations | (262,676,411 | ) | (244,902,428 | ) | ||||
Net increase (decrease) in net assets resulting from operations | (427,301,190 | ) | (32,196,785 | ) | ||||
DISTRIBUTIONS TO SHAREHOLDERS: | ||||||||
Investor Class | (14,553,044 | ) | (42,947,580 | ) | ||||
Institutional Class | (31,813,438 | ) | (137,877,438 | ) | ||||
Net decrease in net assets resulting from distributions | (46,366,482 | ) | (180,825,018 | ) | ||||
CAPITAL SHARE TRANSACTIONS (net) (Note 4) | (448,315,849 | ) | 106,353,598 | |||||
Total increase (decrease) in net assets | (921,983,521 | ) | (106,668,205 | ) | ||||
NET ASSETS: | ||||||||
Beginning of year | 1,544,119,606 | 1,650,787,811 | ||||||
End of year | $622,136,085 | $1,544,119,606 | ||||||
See accompanying notes to financial statements.
| matthewsasia.com | 800.789.ASIA | 113 |
Table of Contents
Statements of Changes in Net Assets (continued)
| MATTHEWS KOREA FUND | Year Ended December 31, 2022 | Year Ended December 31, 2021 | ||||||
OPERATIONS: | ||||||||
Net investment income (loss) | $1,080,067 | $1,076,847 | ||||||
Net realized gain (loss) on investments and foreign currency related transactions | (3,280,646 | ) | 24,653,096 | |||||
Net change in unrealized appreciation/depreciation on investments and foreign currency related translations | (31,168,278 | ) | (25,481,947 | ) | ||||
Net increase (decrease) in net assets resulting from operations | (33,368,857 | ) | 247,996 | |||||
DISTRIBUTIONS TO SHAREHOLDERS: | ||||||||
Investor Class | (7,639,996 | ) | (7,903,643 | ) | ||||
Institutional Class | (968,596 | ) | (965,714 | ) | ||||
Net decrease in net assets resulting from distributions | (8,608,592 | ) | (8,869,357 | ) | ||||
CAPITAL SHARE TRANSACTIONS (net) (Note 4) | (10,938,083 | ) | (12,563,088 | ) | ||||
Total increase (decrease) in net assets | (52,915,532 | ) | (21,184,449 | ) | ||||
NET ASSETS: | ||||||||
Beginning of year | 132,938,288 | 154,122,737 | ||||||
End of year | $80,022,756 | $132,938,288 | ||||||
| MATTHEWS ASIAN GROWTH AND INCOME FUND | Year Ended December 31, 2022 | Year Ended December 31, 2021 | ||||||
OPERATIONS: | ||||||||
Net investment income (loss) | $14,604,960 | $13,961,338 | ||||||
Net realized gain (loss) on investments and foreign currency related transactions | (48,439,576 | ) | 180,269,695 | |||||
Net change in unrealized appreciation/depreciation on investments and foreign currency related translations | (169,291,091 | ) | (193,065,395 | ) | ||||
Net change on foreign capital gains taxes on unrealized appreciation/depreciation | 662,900 | 551,992 | ||||||
Net increase (decrease) in net assets resulting from operations | (202,462,807 | ) | 1,717,630 | |||||
DISTRIBUTIONS TO SHAREHOLDERS: | ||||||||
Investor Class | (17,020,543 | ) | (63,324,581 | ) | ||||
Institutional Class | (16,053,797 | ) | (67,936,667 | ) | ||||
Net decrease in net assets resulting from distributions | (33,074,340 | ) | (131,261,248 | ) | ||||
CAPITAL SHARE TRANSACTIONS (net) (Note 4) | (247,931,479 | ) | (272,727,754 | ) | ||||
Total increase (decrease) in net assets | (483,468,626 | ) | (402,271,372 | ) | ||||
NET ASSETS: | ||||||||
Beginning of year | 1,093,483,532 | 1,495,754,904 | ||||||
End of year | $610,014,906 | $1,093,483,532 | ||||||
See accompanying notes to financial statements.
| 114 | MATTHEWS ASIA FUNDS |
Table of Contents
Statements of Changes in Net Assets (continued)
| MATTHEWS ASIA DIVIDEND FUND | Year Ended December 31, 2022 | Year Ended December 31, 2021 | ||||||
OPERATIONS: | ||||||||
Net investment income (loss) | $28,888,532 | $47,989,553 | ||||||
Net realized gain (loss) on investments and foreign currency related transactions | (261,201,228 | ) | 590,052,083 | |||||
Net change in unrealized appreciation/depreciation on investments and foreign currency related translations | (1,103,989,848 | ) | (778,480,857 | ) | ||||
Net change on foreign capital gains taxes on unrealized appreciation/depreciation | 595,392 | (11,499,323 | ) | |||||
Net increase (decrease) in net assets resulting from operations | (1,335,707,152 | ) | (151,938,544 | ) | ||||
DISTRIBUTIONS TO SHAREHOLDERS: | ||||||||
Investor Class | (7,812,204 | ) | (236,307,308 | ) | ||||
Institutional Class | (18,595,761 | ) | (467,698,670 | ) | ||||
Net decrease in net assets resulting from distributions | (26,407,965 | ) | (704,005,978 | ) | ||||
CAPITAL SHARE TRANSACTIONS (net) (Note 4) | (1,527,382,129 | ) | 395,875,826 | |||||
Total increase (decrease) in net assets | (2,889,497,246 | ) | (460,068,696 | ) | ||||
NET ASSETS: | ||||||||
Beginning of year | 4,740,867,225 | 5,200,935,921 | ||||||
End of year | $1,851,369,979 | $4,740,867,225 | ||||||
| MATTHEWS CHINA DIVIDEND FUND | Year Ended December 31, 2022 | Year Ended December 31, 2021 | ||||||
OPERATIONS: | ||||||||
Net investment income (loss) | $5,482,035 | $9,178,392 | ||||||
Net realized gain (loss) on investments and foreign currency related transactions | (29,326,490 | ) | 38,504,136 | |||||
Net change in unrealized appreciation/depreciation on investments and foreign currency related translations | (39,972,339 | ) | (49,851,545 | ) | ||||
Net increase (decrease) in net assets resulting from operations | (63,816,794 | ) | (2,169,017 | ) | ||||
DISTRIBUTIONS TO SHAREHOLDERS: | ||||||||
Investor Class | (8,463,697 | ) | (21,726,106 | ) | ||||
Institutional Class | (4,778,140 | ) | (13,662,250 | ) | ||||
Net decrease in net assets resulting from distributions | (13,241,837 | ) | (35,388,356 | ) | ||||
CAPITAL SHARE TRANSACTIONS (net) (Note 4) | (51,816,442 | ) | 3,075,154 | |||||
Total increase (decrease) in net assets | (128,875,073 | ) | (34,482,219 | ) | ||||
NET ASSETS: | ||||||||
Beginning of year | 350,160,740 | 384,642,959 | ||||||
End of year | $221,285,667 | $350,160,740 | ||||||
See accompanying notes to financial statements.
| matthewsasia.com | 800.789.ASIA | 115 |
Table of Contents
Statements of Changes in Net Assets (continued)
| MATTHEWS ASIA TOTAL RETURN BOND FUND | Year Ended December 31, 2022 | Year Ended December 31, 2021 | ||||||
OPERATIONS: | ||||||||
Net investment income (loss) | $3,622,961 | $5,083,424 | ||||||
Net realized gain (loss) on investments and foreign currency related transactions | (4,908,114 | ) | 4,828,235 | |||||
Net change in unrealized appreciation/depreciation on investments, forward foreign currency exchange contracts,and foreign currency related translations | (15,853,751 | ) | (14,620,240 | ) | ||||
Net change on foreign capital gains taxes on unrealized appreciation/depreciation | 41,124 | 34,300 | ||||||
Net change in unrealized appreciation/depreciation on swaps | (81,339 | ) | (623,558 | ) | ||||
Net increase (decrease) in net assets resulting from operations | (17,179,119 | ) | (5,297,839 | ) | ||||
DISTRIBUTIONS TO SHAREHOLDERS: | ||||||||
Investor Class | (741,239 | ) | (1,530,622 | ) | ||||
Institutional Class | (2,167,913 | ) | (4,316,780 | ) | ||||
Net decrease in net assets resulting from distributions | (2,909,152 | ) | (5,847,402 | ) | ||||
CAPITAL SHARE TRANSACTIONS (net) (Note 4) | (50,683,470 | ) | 10,157,141 | |||||
Total increase (decrease) in net assets | (70,771,741 | ) | (988,100 | ) | ||||
NET ASSETS: | ||||||||
Beginning of year | 113,860,140 | 114,848,240 | ||||||
End of year | $43,088,399 | $113,860,140 | ||||||
| MATTHEWS ASIA CREDIT OPPORTUNITIES FUND | Year Ended December 31, 2022 | Year Ended December 31, 2021 | ||||||
OPERATIONS: | ||||||||
Net investment income (loss) | $1,873,042 | $3,707,314 | ||||||
Net realized gain (loss) on investments and foreign currency related transactions | (391,636 | ) | (5,615,978 | ) | ||||
Net change in unrealized appreciation/depreciation on investments and foreign currency related translations | (6,781,731 | ) | (5,166,380 | ) | ||||
Net increase (decrease) in net assets resulting from operations | (5,300,325 | ) | (7,075,044 | ) | ||||
DISTRIBUTIONS TO SHAREHOLDERS: | ||||||||
Investor Class | (292,196 | ) | (421,926 | ) | ||||
Institutional Class | (1,389,885 | ) | (3,602,496 | ) | ||||
Net decrease in net assets resulting from distributions | (1,682,081 | ) | (4,024,422 | ) | ||||
CAPITAL SHARE TRANSACTIONS (net) (Note 4) | (5,220,661 | ) | (38,580,219 | ) | ||||
Total increase (decrease) in net assets | (12,203,067 | ) | (49,679,685 | ) | ||||
NET ASSETS: | ||||||||
Beginning of year | 41,427,751 | 91,107,436 | ||||||
End of year | $29,224,684 | $41,427,751 | ||||||
See accompanying notes to financial statements.
| 116 | MATTHEWS ASIA FUNDS |
Table of Contents
Matthews Emerging Markets Equity Fund
The tables below set forth financial data for a share of beneficial interest outstanding throughout each period presented.
| INVESTOR CLASS | Year Ended Dec. 31, | Period Ended Dec. 31, 20201 | ||||||||||
| 2022 | 2021 | |||||||||||
Net Asset Value, beginning of period | $14.34 | $15.76 | $10.00 | |||||||||
INCOME (LOSS) FROM INVESTMENT OPERATIONS: | ||||||||||||
Net investment income (loss)2 | 0.20 | 0.19 | 0.04 | |||||||||
Net realized gain (loss) and unrealized appreciation/depreciation on investments, foreign currency related transactions and foreign capital gains taxes | (3.20 | ) | (0.31 | ) | 6.08 | |||||||
Total from investment operations | (3.00 | ) | (0.12 | ) | 6.12 | |||||||
LESS DISTRIBUTIONS FROM: | ||||||||||||
Net investment income | (0.20 | ) | (0.18 | ) | — | |||||||
Net realized gains on investments | — | (1.12 | ) | (0.36 | ) | |||||||
Total distributions | (0.20 | ) | (1.30 | ) | (0.36 | ) | ||||||
Net Asset Value, end of period | $11.14 | $14.34 | $15.76 | |||||||||
TOTAL RETURN | (20.94% | ) | (0.60% | ) | 61.23% | 3 | ||||||
RATIOS/SUPPLEMENTAL DATA | ||||||||||||
Net assets, end of period (in 000’s) | $10,111 | $13,317 | $9,851 | |||||||||
Ratio of expenses to average net assets before any reimbursement, waiver or recapture of expenses by Advisor and Administrator (Note 5) | 1.58% | 1.52% | 2.76% | 4 | ||||||||
Ratio of expenses to average net assets after any reimbursement, waiver or recapture of expenses by Advisor and Administrator | 1.08% | 1.13% | 1.08% | 4 | ||||||||
Ratio of net investment income (loss) to average net assets | 1.46% | 1.15% | 0.45% | 4 | ||||||||
Portfolio turnover5 | 63.08% | 88.45% | 62.30% | 3 | ||||||||
| INSTITUTIONAL CLASS | Year Ended Dec. 31, | Period Ended Dec. 31, 20201 | ||||||||||
| 2022 | 2021 | |||||||||||
Net Asset Value, beginning of period | $14.34 | $15.77 | $10.00 | |||||||||
INCOME (LOSS) FROM INVESTMENT OPERATIONS: | ||||||||||||
Net investment income (loss)2 | 0.23 | 0.22 | 0.04 | |||||||||
Net realized gain (loss) and unrealized appreciation/depreciation on investments, foreign currency related transactions and foreign capital gains taxes | (3.21 | ) | (0.31 | ) | 6.11 | |||||||
Total from investment operations | (2.98 | ) | (0.09 | ) | 6.15 | |||||||
LESS DISTRIBUTIONS FROM: | ||||||||||||
Net investment income | (0.23 | ) | (0.22 | ) | (0.02 | ) | ||||||
Net realized gains on investments | — | (1.12 | ) | (0.36 | ) | |||||||
Total distributions | (0.23 | ) | (1.34 | ) | (0.38 | ) | ||||||
Net Asset Value, end of period | $11.13 | $14.34 | $15.77 | |||||||||
TOTAL RETURN | (20.81% | ) | (0.43% | ) | 61.55% | 3 | ||||||
RATIOS/SUPPLEMENTAL DATA | ||||||||||||
Net assets, end of period (in 000’s) | $23,353 | $36,240 | $34,941 | |||||||||
Ratio of expenses to average net assets before any reimbursement, waiver or recapture of expenses by Advisor and Administrator (Note 5) | 1.47% | 1.38% | 2.65% | 4 | ||||||||
Ratio of expenses to average net assets after any reimbursement, waiver or recapture of expenses by Advisor and Administrator | 0.90% | 0.90% | 0.90% | 4 | ||||||||
Ratio of net investment income (loss) to average net assets | 1.70% | 1.33% | 0.44% | 4 | ||||||||
Portfolio turnover5 | 63.08% | 88.45% | 62.30% | 3 | ||||||||
| 1 | The Fund commenced operations on April 29, 2020. |
| 2 | Calculated using the average daily shares method. |
| 3 | Not annualized. |
| 4 | Annualized. |
| 5 | The portfolio turnover rate is calculated on the Fund as a whole without distinguishing between classes of shares issued. |
See accompanying notes to financial statements.
| matthewsasia.com | 800.789.ASIA | 117 |
Table of Contents
Financial Highlights (continued)
Matthews Emerging Markets Sustainable Future Fund
The tables below set forth financial data for a share of beneficial interest outstanding throughout each period presented.
| INVESTOR CLASS | Year Ended Dec. 31, | |||||||||||||||||||
| 2022 | 2021 | 2020 | 2019 | 2018 | ||||||||||||||||
Net Asset Value, beginning of year | $15.37 | $14.94 | $11.08 | $9.98 | $11.56 | |||||||||||||||
INCOME (LOSS) FROM INVESTMENT OPERATIONS: | ||||||||||||||||||||
Net investment income (loss)1 | (0.05 | ) | (0.07 | ) | (0.01 | ) | 0.04 | 0.03 | ||||||||||||
Net realized gain (loss) and unrealized appreciation/depreciation on investments, foreign currency related transactions and foreign capital gains taxes | (2.14 | ) | 1.85 | 4.72 | 1.21 | (1.16 | ) | |||||||||||||
Total from investment operations | (2.19 | ) | 1.78 | 4.71 | 1.25 | (1.13 | ) | |||||||||||||
LESS DISTRIBUTIONS FROM: | ||||||||||||||||||||
Net investment income | (0.04 | ) | — | (0.01 | ) | (0.03 | ) | (0.02 | ) | |||||||||||
Net realized gains on investments | (0.63 | ) | (1.35 | ) | (0.84 | ) | (0.12 | ) | (0.43 | ) | ||||||||||
Total distributions | (0.67 | ) | (1.35 | ) | (0.85 | ) | (0.15 | ) | (0.45 | ) | ||||||||||
Net Asset Value, end of year | $12.51 | $15.37 | $14.94 | $11.08 | $9.98 | |||||||||||||||
TOTAL RETURN | (14.38% | ) | 11.76% | 42.87% | 12.55% | (9.73% | ) | |||||||||||||
RATIOS/SUPPLEMENTAL DATA | ||||||||||||||||||||
Net assets, end of year (in 000’s) | $32,249 | $39,612 | $37,385 | $19,291 | $9,283 | |||||||||||||||
Ratio of expenses to average net assets before any reimbursement, waiver or recapture of expenses by Advisor and Administrator (Note 5) | 1.24% | 1.20% | 1.42% | 1.54% | 2.20% | |||||||||||||||
Ratio of expenses to average net assets after any reimbursement, waiver or recapture of expenses by Advisor and Administrator | 1.30% | 1.40% | 1.38% | 1.42% | 1.50% | |||||||||||||||
Ratio of net investment income (loss) to average net assets | (0.41% | ) | (0.41% | ) | (0.08% | ) | 0.41% | 0.27% | ||||||||||||
Portfolio turnover2 | 31.53% | 65.56% | 84.60% | 29.67% | 22.93% | |||||||||||||||
| INSTITUTIONAL CLASS | Year Ended Dec. 31, | |||||||||||||||||||
| 2022 | 2021 | 2020 | 2019 | 2018 | ||||||||||||||||
Net Asset Value, beginning of year | $15.38 | $14.92 | $11.06 | $9.96 | $11.50 | |||||||||||||||
INCOME (LOSS) FROM INVESTMENT OPERATIONS: | ||||||||||||||||||||
Net investment income (loss)1 | (0.04 | ) | (0.04 | ) | 0.01 | 0.06 | 0.06 | |||||||||||||
Net realized gain (loss) and unrealized appreciation/depreciation on investments, foreign currency related transactions and foreign capital gains taxes | (2.14 | ) | 1.85 | 4.72 | 1.21 | (1.16 | ) | |||||||||||||
Total from investment operations | (2.18 | ) | 1.81 | 4.73 | 1.27 | (1.10 | ) | |||||||||||||
LESS DISTRIBUTIONS FROM: | ||||||||||||||||||||
Net investment income | (0.06 | ) | — | (0.03 | ) | (0.05 | ) | (0.01 | ) | |||||||||||
Net realized gains on investments | (0.63 | ) | (1.35 | ) | (0.84 | ) | (0.12 | ) | (0.43 | ) | ||||||||||
Total distributions | (0.69 | ) | (1.35 | ) | (0.87 | ) | (0.17 | ) | (0.44 | ) | ||||||||||
Net Asset Value, end of year | $12.51 | $15.38 | $14.92 | $11.06 | $9.96 | |||||||||||||||
TOTAL RETURN | (14.32% | ) | 11.98% | 43.13% | 12.74% | (9.52% | ) | |||||||||||||
RATIOS/SUPPLEMENTAL DATA | ||||||||||||||||||||
Net assets, end of year (in 000’s) | $140,059 | $87,241 | $50,642 | $36,008 | $23,249 | |||||||||||||||
Ratio of expenses to average net assets before any reimbursement, waiver or recapture of expenses by Advisor and Administrator (Note 5) | 1.11% | 1.07% | 1.29% | 1.41% | 2.01% | |||||||||||||||
Ratio of expenses to average net assets after any reimbursement, waiver or recapture of expenses by Advisor and Administrator | 1.17% | 1.20% | 1.20% | 1.24% | 1.25% | |||||||||||||||
Ratio of net investment income (loss) to average net assets | (0.29% | ) | (0.25% | ) | 0.09% | 0.54% | 0.55% | |||||||||||||
Portfolio turnover2 | 31.53% | 65.56% | 84.60% | 29.67% | 22.93% | |||||||||||||||
| 1 | Calculated using the average daily shares method. |
| 2 | The portfolio turnover rate is calculated on the Fund as a whole without distinguishing between classes of shares issued. |
See accompanying notes to financial statements.
| 118 | MATTHEWS ASIA FUNDS |
Table of Contents
Financial Highlights (continued)
Matthews Emerging Markets Small Companies Fund
The tables below set forth financial data for a share of beneficial interest outstanding throughout each period presented.
| INVESTOR CLASS | Year Ended Dec. 31, | |||||||||||||||||||
| 2022 | 2021 | 2020 | 2019 | 2018 | ||||||||||||||||
Net Asset Value, beginning of year | $29.92 | $25.93 | $18.10 | $15.50 | $22.89 | |||||||||||||||
INCOME (LOSS) FROM INVESTMENT OPERATIONS: | ||||||||||||||||||||
Net investment income (loss)1 | (0.06 | ) | (0.17 | ) | (0.02 | ) | 0.12 | 0.12 | ||||||||||||
Net realized gain (loss) and unrealized appreciation/depreciation on investments, foreign currency related transactions and foreign capital gains taxes | (4.92 | ) | 5.90 | 7.92 | 2.57 | (4.20 | ) | |||||||||||||
Total from investment operations | (4.98 | ) | 5.73 | 7.90 | 2.69 | (4.08 | ) | |||||||||||||
LESS DISTRIBUTIONS FROM: | ||||||||||||||||||||
Net investment income | (0.09 | ) | — | (0.05 | ) | (0.09 | ) | (0.08 | ) | |||||||||||
Net realized gains on investments | (1.77 | ) | (1.74 | ) | (0.02 | ) | — | (3.23 | ) | |||||||||||
Total distributions | (1.86 | ) | (1.74 | ) | (0.07 | ) | (0.09 | ) | (3.31 | ) | ||||||||||
Paid-in capital from redemption fees (Note 4) | — | — | — | — | 3 | — | 2 | |||||||||||||
Net Asset Value, end of year | $23.08 | $29.92 | $25.93 | $18.10 | $15.50 | |||||||||||||||
TOTAL RETURN | (16.84% | ) | 22.14% | 43.68% | 17.38% | (18.05% | ) | |||||||||||||
RATIOS/SUPPLEMENTAL DATA | ||||||||||||||||||||
Net assets, end of year (in 000’s) | $141,254 | $176,723 | $99,573 | $96,229 | $111,456 | |||||||||||||||
Ratio of expenses to average net assets before any reimbursement, waiver or recapture of expenses by Advisor and Administrator (Note 5) | 1.49% | 1.51% | 1.57% | 1.60% | 1.51% | |||||||||||||||
Ratio of expenses to average net assets after any reimbursement, waiver or recapture of expenses by Advisor and Administrator | 1.37% | 1.36% | 1.39% | 1.45% | 1.46% | |||||||||||||||
Ratio of net investment income (loss) to average net assets | (0.24% | ) | (0.55% | ) | (0.11% | ) | 0.72% | 0.53% | ||||||||||||
Portfolio turnover4 | 27.85% | 50.82% | 111.87% | 59.10% | 69.79% | |||||||||||||||
| INSTITUTIONAL CLASS | Year Ended Dec. 31, | |||||||||||||||||||
| 2022 | 2021 | 2020 | 2019 | 2018 | ||||||||||||||||
Net Asset Value, beginning of year | $29.87 | $25.87 | $18.06 | $15.46 | $22.86 | |||||||||||||||
INCOME (LOSS) FROM INVESTMENT OPERATIONS: | ||||||||||||||||||||
Net investment income (loss)1 | — | 2 | (0.10 | ) | 0.01 | 0.15 | 0.16 | |||||||||||||
Net realized gain (loss) and unrealized appreciation/depreciation on investments, foreign currency related transactions and foreign capital gains taxes | (4.92 | ) | 5.88 | 7.91 | 2.58 | (4.19 | ) | |||||||||||||
Total from investment operations | (4.92 | ) | 5.78 | 7.92 | 2.73 | (4.03 | ) | |||||||||||||
LESS DISTRIBUTIONS FROM: | ||||||||||||||||||||
Net investment income | (0.14 | ) | (0.04 | ) | (0.09 | ) | (0.13 | ) | (0.14 | ) | ||||||||||
Net realized gains on investments | (1.77 | ) | (1.74 | ) | (0.02 | ) | — | (3.23 | ) | |||||||||||
Total distributions | (1.91 | ) | (1.78 | ) | (0.11 | ) | (0.13 | ) | (3.37 | ) | ||||||||||
Paid-in capital from redemption fees (Note 4) | — | — | — | — | 3 | — | 2 | |||||||||||||
Net Asset Value, end of year | $23.04 | $29.87 | $25.87 | $18.06 | $15.46 | |||||||||||||||
TOTAL RETURN | (16.66% | ) | 22.39% | 43.90% | 17.65% | (17.86% | ) | |||||||||||||
RATIOS/SUPPLEMENTAL DATA | ||||||||||||||||||||
Net assets, end of year (in 000’s) | $228,194 | $221,286 | $107,569 | $85,006 | $74,935 | |||||||||||||||
Ratio of expenses to average net assets before any reimbursement, waiver or recapture of expenses by Advisor and Administrator (Note 5) | 1.37% | 1.38% | 1.47% | 1.46% | 1.37% | |||||||||||||||
Ratio of expenses to average net assets after any reimbursement, waiver or recapture of expenses by Advisor and Administrator | 1.15% | 1.16% | 1.20% | 1.24% | 1.25% | |||||||||||||||
Ratio of net investment income (loss) to average net assets | (0.01% | ) | (0.34% | ) | 0.08% | 0.85% | 0.73% | |||||||||||||
Portfolio turnover4 | 27.85% | 50.82% | 111.87% | 59.10% | 69.79% | |||||||||||||||
| 1 | Calculated using the average daily shares method. |
| 2 | Less than $0.01 per share. |
| 3 | The Fund charged redemption fees through October 31, 2019. |
| 4 | The portfolio turnover rate is calculated on the Fund as a whole without distinguishing between classes of shares issued. |
See accompanying notes to financial statements.
| matthewsasia.com | 800.789.ASIA | 119 |
Table of Contents
Financial Highlights (continued)
Matthews Asia Growth Fund
The tables below set forth financial data for a share of beneficial interest outstanding throughout each period presented.
INVESTOR CLASS | Year Ended Dec. 31, | |||||||||||||||||||
| 2022 | 2021 | 2020 | 2019 | 2018 | ||||||||||||||||
Net Asset Value, beginning of year | $31.99 | $39.44 | $28.10 | $22.49 | $27.25 | |||||||||||||||
INCOME (LOSS) FROM INVESTMENT OPERATIONS: | ||||||||||||||||||||
Net investment income (loss)1 | (0.08 | ) | (0.24 | ) | (0.11 | ) | (0.03 | ) | — | 2 | ||||||||||
Net realized gain (loss) and unrealized appreciation/depreciation on investments, foreign currency related transactions and foreign capital gains taxes | (10.49 | ) | (5.56 | ) | 13.16 | 5.91 | (4.41 | ) | ||||||||||||
Total from investment operations | (10.57 | ) | (5.80 | ) | 13.05 | 5.88 | (4.41 | ) | ||||||||||||
LESS DISTRIBUTIONS FROM: | ||||||||||||||||||||
Net investment income | — | — | (0.15 | ) | — | (0.03 | ) | |||||||||||||
Net realized gains on investments | (0.58 | ) | (1.65 | ) | (1.56 | ) | (0.27 | ) | (0.32 | ) | ||||||||||
Total distributions | (0.58 | ) | (1.65 | ) | (1.71 | ) | (0.27 | ) | (0.35 | ) | ||||||||||
Net Asset Value, end of year | $20.84 | $31.99 | $39.44 | $28.10 | $22.49 | |||||||||||||||
TOTAL RETURN | (33.12% | ) | (14.65% | ) | 46.76% | 26.18% | (16.25% | ) | ||||||||||||
RATIOS/SUPPLEMENTAL DATA | ||||||||||||||||||||
Net assets, end of year (in 000’s) | $225,923 | $568,001 | $784,085 | $504,538 | $463,600 | |||||||||||||||
Ratio of expenses to average net assets | 1.13% | 1.07% | 1.08% | 1.09% | 1.10% | |||||||||||||||
Ratio of net investment income (loss) to average net assets | (0.32% | ) | (0.62% | ) | (0.35% | ) | (0.14% | ) | —% | 3 | ||||||||||
Portfolio turnover4 | 47.48% | 42.37% | 42.78% | 38.05% | 12.12% | |||||||||||||||
| INSTITUTIONAL CLASS | Year Ended Dec. 31, | |||||||||||||||||||
| 2022 | 2021 | 2020 | 2019 | 2018 | ||||||||||||||||
Net Asset Value, beginning of year | $32.33 | $39.82 | $28.34 | $22.65 | $27.45 | |||||||||||||||
INCOME (LOSS) FROM INVESTMENT OPERATIONS: | ||||||||||||||||||||
Net investment income (loss)1 | (0.04 | ) | (0.19 | ) | (0.07 | ) | — | 2 | 0.05 | |||||||||||
Net realized gain (loss) and unrealized appreciation/depreciation on investments, foreign currency related transactions and foreign capital gains taxes | (10.60 | ) | (5.63 | ) | 13.30 | 5.96 | (4.45 | ) | ||||||||||||
Total from investment operations | (10.64 | ) | (5.82 | ) | 13.23 | 5.96 | (4.40 | ) | ||||||||||||
LESS DISTRIBUTIONS FROM: | ||||||||||||||||||||
Net investment income | — | (0.02 | ) | (0.19 | ) | — | (0.08 | ) | ||||||||||||
Net realized gains on investments | (0.58 | ) | (1.65 | ) | (1.56 | ) | (0.27 | ) | (0.32 | ) | ||||||||||
Total distributions | (0.58 | ) | (1.67 | ) | (1.75 | ) | (0.27 | ) | (0.40 | ) | ||||||||||
Net Asset Value, end of year | $21.11 | $32.33 | $39.82 | $28.34 | $22.65 | |||||||||||||||
TOTAL RETURN | (32.99% | ) | (14.55% | ) | 47.01% | 26.34% | (16.10% | ) | ||||||||||||
RATIOS/SUPPLEMENTAL DATA | ||||||||||||||||||||
Net assets, end of year (in 000’s) | $406,155 | $1,186,769 | $1,269,702 | $698,797 | $466,733 | |||||||||||||||
Ratio of expenses to average net assets | 0.98% | 0.92% | 0.95% | 0.94% | 0.93% | |||||||||||||||
Ratio of net investment income (loss) to average net assets | (0.15% | ) | (0.47% | ) | (0.23% | ) | —% | 3 | 0.17% | |||||||||||
Portfolio turnover4 | 47.48% | 42.37% | 42.78% | 38.05% | 12.12% | |||||||||||||||
| 1 | Calculated using the average daily shares method. |
| 2 | Less than $0.01 per share. |
| 3 | Less than 0.01%. |
| 4 | The portfolio turnover rate is calculated on the Fund as a whole without distinguishing between classes of shares issued. |
See accompanying notes to financial statements.
| 120 | MATTHEWS ASIA FUNDS |
Table of Contents
Financial Highlights (continued)
Matthews Pacific Tiger Fund
The tables below set forth financial data for a share of beneficial interest outstanding throughout each period presented.
INVESTOR CLASS | Year Ended Dec. 31, | |||||||||||||||||||
| 2022 | 2021 | 2020 | 2019 | 2018 | ||||||||||||||||
Net Asset Value, beginning of year | $27.54 | $34.94 | $28.74 | $26.86 | $31.66 | |||||||||||||||
INCOME (LOSS) FROM INVESTMENT OPERATIONS: | ||||||||||||||||||||
Net investment income (loss)1 | 0.09 | 0.06 | 0.10 | 0.19 | 0.24 | |||||||||||||||
Net realized gain (loss) and unrealized appreciation/depreciation on investments, foreign currency related transactions and foreign capital gains taxes | (5.75 | ) | (1.60 | ) | 8.10 | 2.68 | (3.75 | ) | ||||||||||||
Total from investment operations | (5.66 | ) | (1.54 | ) | 8.20 | 2.87 | (3.51 | ) | ||||||||||||
LESS DISTRIBUTIONS FROM: | ||||||||||||||||||||
Net investment income | — | — | (0.08 | ) | (0.15 | ) | (0.21 | ) | ||||||||||||
Net realized gains on investments | (1.72 | ) | (5.86 | ) | (1.92 | ) | (0.84 | ) | (1.08 | ) | ||||||||||
Total distributions | (1.72 | ) | (5.86 | ) | (2.00 | ) | (0.99 | ) | (1.29 | ) | ||||||||||
Paid-in capital from redemption fees (Note 4) | — | — | — | — | 2 | — | ||||||||||||||
Net Asset Value, end of year | $20.16 | $27.54 | $34.94 | $28.74 | $26.86 | |||||||||||||||
TOTAL RETURN | (20.73% | ) | (4.41% | ) | 28.83% | 10.72% | (11.11% | ) | ||||||||||||
RATIOS/SUPPLEMENTAL DATA | ||||||||||||||||||||
Net assets, end of year (in 000’s) | $1,081,347 | $1,835,266 | $2,585,654 | $2,536,844 | $2,618,155 | |||||||||||||||
Ratio of expenses to average net assets before any reimbursement, waiver or recapture of expenses by Advisor and Administrator (Note 5) | 1.10% | 1.06% | 1.08% | 1.08% | 1.07% | |||||||||||||||
Ratio of expenses to average net assets after any reimbursement, waiver or recapture of expenses by Advisor and Administrator | 1.09% | 1.03% | 1.06% | 1.05% | 1.04% | |||||||||||||||
Ratio of net investment income (loss) to average net assets | 0.37% | 0.17% | 0.35% | 0.66% | 0.79% | |||||||||||||||
Portfolio turnover3 | 5.61% | 46.64% | 38.11% | 17.08% | 11.48% | |||||||||||||||
INSTITUTIONAL CLASS | Year Ended Dec. 31, | |||||||||||||||||||
| 2022 | 2021 | 2020 | 2019 | 2018 | ||||||||||||||||
Net Asset Value, beginning of year | $27.50 | $34.90 | $28.71 | $26.83 | $31.63 | |||||||||||||||
INCOME (LOSS) FROM INVESTMENT OPERATIONS: | ||||||||||||||||||||
Net investment income (loss)1 | 0.11 | 0.11 | 0.13 | 0.23 | 0.28 | |||||||||||||||
Net realized gain (loss) and unrealized appreciation/depreciation on investments, foreign currency related transactions and foreign capital gains taxes | (5.73 | ) | (1.60 | ) | 8.11 | 2.68 | (3.74 | ) | ||||||||||||
Total from investment operations | (5.62 | ) | (1.49 | ) | 8.24 | 2.91 | (3.46 | ) | ||||||||||||
LESS DISTRIBUTIONS FROM: | ||||||||||||||||||||
Net investment income | — | (0.05 | ) | (0.13 | ) | (0.19 | ) | (0.26 | ) | |||||||||||
Net realized gains on investments | (1.72 | ) | (5.86 | ) | (1.92 | ) | (0.84 | ) | (1.08 | ) | ||||||||||
Total distributions | (1.72 | ) | (5.91 | ) | (2.05 | ) | (1.03 | ) | (1.34 | ) | ||||||||||
Paid-in capital from redemption fees (Note 4) | — | — | — | — | 2 | — | ||||||||||||||
Net Asset Value, end of year | $20.16 | $27.50 | $34.90 | $28.71 | $26.83 | |||||||||||||||
TOTAL RETURN | (20.62% | ) | (4.29% | ) | 28.98% | 10.90% | (10.94% | ) | ||||||||||||
RATIOS/SUPPLEMENTAL DATA | ||||||||||||||||||||
Net assets, end of year (in 000’s) | $2,607,437 | $5,357,198 | $6,172,995 | $6,189,015 | $5,689,079 | |||||||||||||||
Ratio of expenses to average net assets before any reimbursement, waiver or recapture of expenses by Advisor and Administrator (Note 5) | 0.97% | 0.92% | 0.94% | 0.93% | 0.90% | |||||||||||||||
Ratio of expenses to average net assets after any reimbursement, waiver or recapture of expenses by Advisor and Administrator | 0.96% | 0.90% | 0.92% | 0.91% | 0.88% | |||||||||||||||
Ratio of net investment income (loss) to average net assets | 0.48% | 0.30% | 0.46% | 0.80% | 0.95% | |||||||||||||||
Portfolio turnover3 | 5.61% | 46.64% | 38.11% | 17.08% | 11.48% | |||||||||||||||
| 1 | Calculated using the average daily shares method. |
| 2 | Less than $0.01 per share. |
| 3 | The portfolio turnover rate is calculated on the Fund as a whole without distinguishing between classes of shares issued. |
See accompanying notes to financial statements.
| matthewsasia.com | 800.789.ASIA | 121 |
Table of Contents
Financial Highlights (continued)
Matthews Asia Innovators Fund
The tables below set forth financial data for a share of beneficial interest outstanding throughout each period presented.
| INVESTOR CLASS | Year Ended Dec. 31, | |||||||||||||||||||
| 2022 | 2021 | 2020 | 2019 | 2018 | ||||||||||||||||
Net Asset Value, beginning of year | $18.86 | $26.70 | $14.55 | $11.26 | $14.19 | |||||||||||||||
INCOME (LOSS) FROM INVESTMENT OPERATIONS: | ||||||||||||||||||||
Net investment income (loss)1 | (0.06 | ) | (0.16 | ) | (0.11 | ) | (0.01 | ) | (0.01 | ) | ||||||||||
Net realized gain (loss) and unrealized appreciation/depreciation on investments, foreign currency related transactions and foreign capital gains taxes | (4.49 | ) | (3.34 | ) | 12.71 | 3.34 | (2.62 | ) | ||||||||||||
Total from investment operations | (4.55 | ) | (3.50 | ) | 12.60 | 3.33 | (2.63 | ) | ||||||||||||
LESS DISTRIBUTIONS FROM: | ||||||||||||||||||||
Net investment income | — | — | — | — | (0.04 | ) | ||||||||||||||
Net realized gains on investments | (3.00 | ) | (4.34 | ) | (0.45 | ) | (0.04 | ) | (0.26 | ) | ||||||||||
Total distributions | (3.00 | ) | (4.34 | ) | (0.45 | ) | (0.04 | ) | (0.30 | ) | ||||||||||
Net Asset Value, end of year | $11.31 | $18.86 | $26.70 | $14.55 | $11.26 | |||||||||||||||
TOTAL RETURN | (24.80% | ) | (13.10% | ) | 86.72% | 29.60% | (18.62% | ) | ||||||||||||
RATIOS/SUPPLEMENTAL DATA | ||||||||||||||||||||
Net assets, end of year (in 000’s) | $272,950 | $465,207 | $631,101 | $177,639 | $152,449 | |||||||||||||||
Ratio of expenses to average net assets | 1.18% | 1.09% | 1.10% | 1.19% | 1.19% | |||||||||||||||
Ratio of net investment income (loss) to average net assets | (0.40% | ) | (0.59% | ) | (0.60% | ) | (0.04% | ) | (0.07% | ) | ||||||||||
Portfolio turnover2 | 118.08% | 220.45% | 119.81% | 80.10% | 85.73% | |||||||||||||||
| INSTITUTIONAL CLASS | Year Ended Dec. 31, | |||||||||||||||||||
| 2022 | 2021 | 2020 | 2019 | 2018 | ||||||||||||||||
Net Asset Value, beginning of year | $19.08 | $26.91 | $14.64 | $11.32 | $14.26 | |||||||||||||||
INCOME (LOSS) FROM INVESTMENT OPERATIONS: | ||||||||||||||||||||
Net investment income (loss)1 | (0.04 | ) | (0.11 | ) | (0.09 | ) | 0.01 | 0.01 | ||||||||||||
Net realized gain (loss) and unrealized appreciation/depreciation on investments, foreign currency related transactions and foreign capital gains taxes | (4.55 | ) | (3.38 | ) | 12.81 | 3.35 | (2.62 | ) | ||||||||||||
Total from investment operations | (4.59 | ) | (3.49 | ) | 12.72 | 3.36 | (2.61 | ) | ||||||||||||
LESS DISTRIBUTIONS FROM: | ||||||||||||||||||||
Net investment income | — | — | — | — | (0.07 | ) | ||||||||||||||
Net realized gains on investments | (3.00 | ) | (4.34 | ) | (0.45 | ) | (0.04 | ) | (0.26 | ) | ||||||||||
Total distributions | (3.00 | ) | (4.34 | ) | (0.45 | ) | (0.04 | ) | (0.33 | ) | ||||||||||
Net Asset Value, end of year | $11.49 | $19.08 | $26.91 | $14.64 | $11.32 | |||||||||||||||
TOTAL RETURN | (24.73% | ) | (12.97% | ) | 87.01% | 29.71% | (18.40% | ) | ||||||||||||
RATIOS/SUPPLEMENTAL DATA | ||||||||||||||||||||
Net assets, end of year (in 000’s) | $199,368 | $930,562 | $1,094,356 | $126,911 | $91,769 | |||||||||||||||
Ratio of expenses to average net assets | 1.04% | 0.93% | 0.95% | 1.05% | 1.02% | |||||||||||||||
Ratio of net investment income (loss) to average net assets | (0.27% | ) | (0.43% | ) | (0.44% | ) | 0.10% | 0.07% | ||||||||||||
Portfolio turnover2 | 118.08% | 220.45% | 119.81% | 80.10% | 85.73% | |||||||||||||||
| 1 | Calculated using the average daily shares method. |
| 2 | The portfolio turnover rate is calculated on the Fund as a whole without distinguishing between classes of shares issued. |
See accompanying notes to financial statements.
| 122 | MATTHEWS ASIA FUNDS |
Table of Contents
Financial Highlights (continued)
Matthews China Fund
The tables below set forth financial data for a share of beneficial interest outstanding throughout each period presented.
| INVESTOR CLASS | Year Ended Dec. 31, | |||||||||||||||||||
| 2022 | 2021 | 2020 | 2019 | 2018 | ||||||||||||||||
Net Asset Value, beginning of year | $20.58 | $27.00 | $19.12 | $14.37 | $22.20 | |||||||||||||||
INCOME (LOSS) FROM INVESTMENT OPERATIONS: | ||||||||||||||||||||
Net investment income (loss)1 | — | 2 | 0.03 | 0.05 | 0.16 | 0.21 | ||||||||||||||
Net realized gain (loss) and unrealized appreciation/depreciation on investments and foreign currency related transactions | (4.99 | ) | (3.25 | ) | 8.17 | 4.80 | (4.84 | ) | ||||||||||||
Total from investment operations | (4.99 | ) | (3.22 | ) | 8.22 | 4.96 | (4.63 | ) | ||||||||||||
LESS DISTRIBUTIONS FROM: | ||||||||||||||||||||
Net investment income | — | (0.05 | ) | (0.06 | ) | (0.21 | ) | (0.29 | ) | |||||||||||
Net realized gains on investments | (1.09 | ) | (3.15 | ) | (0.28 | ) | — | (2.91 | ) | |||||||||||
Total distributions | (1.09 | ) | (3.20 | ) | (0.34 | ) | (0.21 | ) | (3.20 | ) | ||||||||||
Net Asset Value, end of year | $14.50 | $20.58 | $27.00 | $19.12 | $14.37 | |||||||||||||||
TOTAL RETURN | (24.40% | ) | (12.26% | ) | 43.05% | 34.56% | (21.42% | ) | ||||||||||||
RATIOS/SUPPLEMENTAL DATA | ||||||||||||||||||||
Net assets, end of year (in 000’s) | $448,623 | $710,844 | $962,714 | $718,633 | $566,456 | |||||||||||||||
Ratio of expenses to average net assets | 1.12% | 1.06% | 1.09% | 1.09% | 1.10% | |||||||||||||||
Ratio of net investment income (loss) to average net assets | (0.01% | ) | 0.13% | 0.22% | 0.96% | 1.00% | ||||||||||||||
Portfolio turnover3 | 49.38% | 92.28% | 52.64% | 68.93% | 96.98% | |||||||||||||||
| INSTITUTIONAL CLASS | Year Ended Dec. 31, | |||||||||||||||||||
| 2022 | 2021 | 2020 | 2019 | 2018 | ||||||||||||||||
Net Asset Value, beginning of year | $20.53 | $26.94 | $19.08 | $14.33 | $22.17 | |||||||||||||||
INCOME (LOSS) FROM INVESTMENT OPERATIONS: | ||||||||||||||||||||
Net investment income (loss)1 | 0.01 | 0.10 | 0.09 | 0.20 | 0.33 | |||||||||||||||
Net realized gain (loss) and unrealized appreciation/depreciation on investments and foreign currency related transactions | (4.97 | ) | (3.26 | ) | 8.15 | 4.80 | (4.93 | ) | ||||||||||||
Total from investment operations | (4.96 | ) | (3.16 | ) | 8.24 | 5.00 | (4.60 | ) | ||||||||||||
LESS DISTRIBUTIONS FROM: | ||||||||||||||||||||
Net investment income | — | (0.10 | ) | (0.10 | ) | (0.25 | ) | (0.33 | ) | |||||||||||
Net realized gains on investments | (1.09 | ) | (3.15 | ) | (0.28 | ) | — | (2.91 | ) | |||||||||||
Total distributions | (1.09 | ) | (3.25 | ) | (0.38 | ) | (0.25 | ) | (3.24 | ) | ||||||||||
Net Asset Value, end of year | $14.48 | $20.53 | $26.94 | $19.08 | $14.33 | |||||||||||||||
TOTAL RETURN | (24.31% | ) | (12.07% | ) | 43.23% | 34.90% | (21.32% | ) | ||||||||||||
RATIOS/SUPPLEMENTAL DATA | ||||||||||||||||||||
Net assets, end of year (in 000’s) | $297,165 | $630,966 | $546,157 | $183,762 | $46,657 | |||||||||||||||
Ratio of expenses to average net assets | 0.98% | 0.91% | 0.93% | 0.91% | 0.91% | |||||||||||||||
Ratio of net investment income (loss) to average net assets | 0.07% | 0.38% | 0.40% | 1.17% | 1.53% | |||||||||||||||
Portfolio turnover3 | 49.38% | 92.28% | 52.64% | 68.93% | 96.98% | |||||||||||||||
| 1 | Calculated using the average daily shares method |
| 2 | Less than $0.01 per share. |
| 3 | The portfolio turnover rate is calculated on the Fund as a whole without distinguishing between classes of shares issued. |
See accompanying notes to financial statements.
| matthewsasia.com | 800.789.ASIA | 123 |
Table of Contents
Financial Highlights (continued)
Matthews China Small Companies Fund
The tables below set forth financial data for a share of beneficial interest outstanding throughout each period presented.
| INVESTOR CLASS | Year Ended Dec. 31, | |||||||||||||||||||
| 2022 | 2021 | 2020 | 2019 | 2018 | ||||||||||||||||
Net Asset Value, beginning of year | $16.44 | $19.86 | $12.84 | $9.58 | $11.89 | |||||||||||||||
INCOME (LOSS) FROM INVESTMENT OPERATIONS: | ||||||||||||||||||||
Net investment income (loss)1 | 0.02 | 0.09 | (0.03 | ) | 0.14 | 0.09 | ||||||||||||||
Net realized gain (loss) and unrealized appreciation/depreciation on investments and foreign currency related transactions | (5.15 | ) | (0.80 | ) | 10.42 | 3.24 | (2.23 | ) | ||||||||||||
Total from investment operations | (5.13 | ) | (0.71 | ) | 10.39 | 3.38 | (2.14 | ) | ||||||||||||
LESS DISTRIBUTIONS FROM: | ||||||||||||||||||||
Net investment income | (0.20 | ) | (0.12 | ) | (0.13 | ) | (0.13 | ) | (0.05 | ) | ||||||||||
Net realized gains on investments | — | (2.59 | ) | (3.24 | ) | — | (0.16 | ) | ||||||||||||
Total distributions | (0.20 | ) | (2.71 | ) | (3.37 | ) | (0.13 | ) | (0.21 | ) | ||||||||||
Paid-in capital from redemption fees (Note 4) | — | — | — | 0.01 | 2 | 0.04 | ||||||||||||||
Net Asset Value, end of year | $11.11 | $16.44 | $19.86 | $12.84 | $9.58 | |||||||||||||||
TOTAL RETURN | (31.26% | ) | (3.59% | ) | 82.52% | 35.41% | (17.68% | ) | ||||||||||||
RATIOS/SUPPLEMENTAL DATA | ||||||||||||||||||||
Net assets, end of year (in 000’s) | $114,440 | $218,398 | $285,717 | $63,432 | $41,740 | |||||||||||||||
Ratio of expenses to average net assets before any reimbursement, waiver or recapture of expenses by Advisor and Administrator (Note 5) | 1.55% | 1.48% | 1.52% | 1.62% | 1.97% | |||||||||||||||
Ratio of expenses to average net assets after any reimbursement, waiver or recapture of expenses by Advisor and Administrator | 1.41% | 1.43% | 1.43% | 1.42% | 1.50% | |||||||||||||||
Ratio of net investment income (loss) to average net assets | 0.17% | 0.44% | (0.14% | ) | 1.25% | 0.78% | ||||||||||||||
Portfolio turnover3 | 59.00% | 119.65% | 152.86% | 68.17% | 76.67% | |||||||||||||||
| INSTITUTIONAL CLASS | Year Ended Dec. 31, | |||||||||||||||||||
| 2022 | 2021 | 2020 | 2019 | 2018 | ||||||||||||||||
Net Asset Value, beginning of year | $16.47 | $19.90 | $12.86 | $9.59 | $11.87 | |||||||||||||||
INCOME (LOSS) FROM INVESTMENT OPERATIONS: | ||||||||||||||||||||
Net investment income (loss)1 | 0.06 | 0.13 | 0.04 | 0.15 | 0.11 | |||||||||||||||
Net realized gain (loss) and unrealized appreciation/depreciation on investments and foreign currency related transactions | (5.17 | ) | (0.80 | ) | 10.42 | 3.26 | (2.21 | ) | ||||||||||||
Total from investment operations | (5.11 | ) | (0.67 | ) | 10.46 | 3.41 | (2.10 | ) | ||||||||||||
LESS DISTRIBUTIONS FROM: | �� | |||||||||||||||||||
Net investment income | (0.24 | ) | (0.17 | ) | (0.18 | ) | (0.15 | ) | (0.05 | ) | ||||||||||
Net realized gains on investments | — | (2.59 | ) | (3.24 | ) | — | (0.16 | ) | ||||||||||||
Total distributions | (0.24 | ) | (2.76 | ) | (3.42 | ) | (0.15 | ) | (0.21 | ) | ||||||||||
Paid-in capital from redemption fees (Note 4) | — | — | — | 0.01 | 2 | 0.03 | ||||||||||||||
Net Asset Value, end of year | $11.12 | $16.47 | $19.90 | $12.86 | $9.59 | |||||||||||||||
TOTAL RETURN | (31.08% | ) | (3.35% | ) | 82.89% | 35.68% | (17.48% | ) | ||||||||||||
RATIOS/SUPPLEMENTAL DATA | ||||||||||||||||||||
Net assets, end of year (in 000’s) | $40,322 | $162,770 | $98,052 | $32,376 | $20,740 | |||||||||||||||
Ratio of expenses to average net assets before any reimbursement, waiver or recapture of expenses by Advisor and Administrator (Note 5) | 1.38% | 1.31% | 1.37% | 1.51% | 1.79% | |||||||||||||||
Ratio of expenses to average net assets after any reimbursement, waiver or recapture of expenses by Advisor and Administrator | 1.20% | 1.20% | 1.20% | 1.24% | 1.25% | |||||||||||||||
Ratio of net investment income (loss) to average net assets | 0.47% | 0.63% | 0.20% | 1.34% | 1.05% | |||||||||||||||
Portfolio turnover3 | 59.00% | 119.65% | 152.86% | 68.17% | 76.67% | |||||||||||||||
| 1 | Calculated using the average daily shares method. |
| 2 | The Fund charged redemption fees through October 31, 2019. |
| 3 | The portfolio turnover rate is calculated on the Fund as a whole without distinguishing between classes of shares issued. |
See accompanying notes to financial statements.
| 124 | MATTHEWS ASIA FUNDS |
Table of Contents
Financial Highlights (continued)
Matthews India Fund
The tables below set forth financial data for a share of beneficial interest outstanding throughout each period presented.
| INVESTOR CLASS | Year Ended Dec. 31, | |||||||||||||||||||
| 2022 | 2021 | 2020 | 2019 | 2018 | ||||||||||||||||
Net Asset Value, beginning of year | $28.17 | $26.29 | $23.27 | $26.32 | $34.31 | |||||||||||||||
INCOME (LOSS) FROM INVESTMENT OPERATIONS: | ||||||||||||||||||||
Net investment income (loss)1 | (0.12 | ) | (0.11 | ) | 0.01 | (0.01 | ) | (0.05 | ) | |||||||||||
Net realized gain (loss) and unrealized appreciation/depreciation on investments, foreign currency related transactions and foreign capital gains taxes | (2.58 | ) | 4.81 | 3.81 | (0.24 | ) | (3.60 | ) | ||||||||||||
Total from investment operations | (2.70 | ) | 4.70 | 3.82 | (0.25 | ) | (3.65 | ) | ||||||||||||
LESS DISTRIBUTIONS FROM: | ||||||||||||||||||||
Net realized gains on investments | (3.38 | ) | (2.82 | ) | (0.80 | ) | (2.80 | ) | (4.34 | ) | ||||||||||
Net Asset Value, end of year | $22.09 | $28.17 | $26.29 | $23.27 | $26.32 | |||||||||||||||
TOTAL RETURN | (9.92% | ) | 18.11% | 16.51% | (0.88% | ) | (10.09% | ) | ||||||||||||
RATIOS/SUPPLEMENTAL DATA | ||||||||||||||||||||
Net assets, end of year (in 000’s) | $505,764 | $635,067 | $617,908 | $786,881 | $1,077,990 | |||||||||||||||
Ratio of expenses to average net assets | 1.15% | 1.10% | 1.15% | 1.11% | 1.09% | |||||||||||||||
Ratio of net investment income (loss) to average net assets | (0.45% | ) | (0.38% | ) | 0.05% | (0.03% | ) | (0.16% | ) | |||||||||||
Portfolio turnover2 | 41.35% | 42.50% | 57.38% | 24.00% | 20.87% | |||||||||||||||
| INSTITUTIONAL CLASS | Year Ended Dec. 31, | |||||||||||||||||||
| 2022 | 2021 | 2020 | 2019 | 2018 | ||||||||||||||||
Net Asset Value, beginning of year | $28.64 | $26.65 | $23.55 | $26.56 | $34.51 | |||||||||||||||
INCOME (LOSS) FROM INVESTMENT OPERATIONS: | ||||||||||||||||||||
Net investment income (loss)1 | (0.08 | ) | (0.06 | ) | 0.05 | 0.02 | 0.01 | |||||||||||||
Net realized gain (loss) and unrealized appreciation/depreciation on investments, foreign currency related transactions and foreign capital gains taxes | (2.64 | ) | 4.87 | 3.85 | (0.23 | ) | (3.62 | ) | ||||||||||||
Total from investment operations | (2.72 | ) | 4.81 | 3.90 | (0.21 | ) | (3.61 | ) | ||||||||||||
LESS DISTRIBUTIONS FROM: | ||||||||||||||||||||
Net realized gains on investments | (3.38 | ) | (2.82 | ) | (0.80 | ) | (2.80 | ) | (4.34 | ) | ||||||||||
Net Asset Value, end of year | $22.54 | $28.64 | $26.65 | $23.55 | $26.56 | |||||||||||||||
TOTAL RETURN | (9.83% | ) | 18.28% | 16.65% | (0.76% | ) | (9.92% | ) | ||||||||||||
RATIOS/SUPPLEMENTAL DATA | ||||||||||||||||||||
Net assets, end of year (in 000’s) | $97,018 | $128,708 | $90,053 | $177,526 | $463,790 | |||||||||||||||
Ratio of expenses to average net assets | 1.01% | 0.96% | 1.03% | 0.94% | 0.90% | |||||||||||||||
Ratio of net investment income (loss) to average net assets | (0.31% | ) | (0.19% | ) | 0.24% | 0.09% | 0.02% | |||||||||||||
Portfolio turnover2 | 41.35% | 42.50% | 57.38% | 24.00% | 20.87% | |||||||||||||||
| 1 | Calculated using the average daily shares method. |
| 2 | The portfolio turnover rate is calculated on the Fund as a whole without distinguishing between classes of shares issued. |
See accompanying notes to financial statements.
| matthewsasia.com | 800.789.ASIA | 125 |
Table of Contents
Financial Highlights (continued)
Matthews Japan Fund
The tables below set forth financial data for a share of beneficial interest outstanding throughout each period presented.
| INVESTOR CLASS | Year Ended Dec. 31, | |||||||||||||||||||
| 2022 | 2021 | 2020 | 2019 | 2018 | ||||||||||||||||
Net Asset Value, beginning of year | $22.09 | $25.27 | $21.51 | $18.53 | $24.12 | |||||||||||||||
INCOME (LOSS) FROM INVESTMENT OPERATIONS: | ||||||||||||||||||||
Net investment income (loss)1 | 0.07 | 0.09 | 0.07 | 0.11 | 0.09 | |||||||||||||||
Net realized gain (loss) and unrealized appreciation/depreciation on investments and foreign currency related transactions | (6.19 | ) | (0.52 | ) | 6.25 | 4.73 | (4.91 | ) | ||||||||||||
Total from investment operations | (6.12 | ) | (0.43 | ) | 6.32 | 4.84 | (4.82 | ) | ||||||||||||
LESS DISTRIBUTIONS FROM: | ||||||||||||||||||||
Net investment income | — | (0.24 | ) | (0.13 | ) | (0.12 | ) | (0.06 | ) | |||||||||||
Net realized gains on investments | (1.07 | ) | (2.51 | ) | (2.43 | ) | (1.74 | ) | (0.71 | ) | ||||||||||
Total distributions | (1.07 | ) | (2.75 | ) | (2.56 | ) | (1.86 | ) | (0.77 | ) | ||||||||||
Net Asset Value, end of year | $14.90 | $22.09 | $25.27 | $21.51 | $18.53 | |||||||||||||||
TOTAL RETURN | (27.85% | ) | (1.92% | ) | 29.82% | 26.08% | (20.18% | ) | ||||||||||||
RATIOS/SUPPLEMENTAL DATA | ||||||||||||||||||||
Net assets, end of year (in 000’s) | $208,329 | $373,739 | $1,101,820 | $1,466,194 | $1,704,102 | |||||||||||||||
Ratio of expenses to average net assets before any reimbursement, waiver or recapture of expenses by Advisor and Administrator (Note 5) | 1.05% | 0.95% | 0.95% | 0.93% | 0.91% | |||||||||||||||
Ratio of expenses to average net assets after any reimbursement, waiver or recapture of expenses by Advisor and Administrator | 1.05% | 0.95% | 0.95% | 0.93% | 0.91% | |||||||||||||||
Ratio of net investment income (loss) to average net assets | 0.41% | 0.38% | 0.31% | 0.51% | 0.40% | |||||||||||||||
Portfolio turnover2 | 83.38% | 70.30% | 62.03% | 25.42% | 46.11% | |||||||||||||||
INSTITUTIONAL CLASS | Year Ended Dec. 31, | |||||||||||||||||||
| 2022 | 2021 | 2020 | 2019 | 2018 | ||||||||||||||||
Net Asset Value, beginning of year | $22.13 | $25.32 | $21.55 | $18.57 | $24.16 | |||||||||||||||
INCOME (LOSS) FROM INVESTMENT OPERATIONS: | ||||||||||||||||||||
Net investment income (loss)1 | 0.09 | 0.05 | 0.05 | 0.11 | 0.11 | |||||||||||||||
Net realized gain (loss) and unrealized appreciation/depreciation on investments and foreign currency related transactions | (6.22 | ) | (0.46 | ) | 6.29 | 4.74 | (4.91 | ) | ||||||||||||
Total from investment operations | (6.13 | ) | (0.41 | ) | 6.34 | 4.85 | (4.80 | ) | ||||||||||||
LESS DISTRIBUTIONS FROM: | ||||||||||||||||||||
Net investment income | — | (0.27 | ) | (0.14 | ) | (0.13 | ) | (0.08 | ) | |||||||||||
Net realized gains on investments | (1.07 | ) | (2.51 | ) | (2.43 | ) | (1.74 | ) | (0.71 | ) | ||||||||||
Total distributions | (1.07 | ) | (2.78 | ) | (2.57 | ) | (1.87 | ) | (0.79 | ) | ||||||||||
Net Asset Value, end of year | $14.93 | $22.13 | $25.32 | $21.55 | $18.57 | |||||||||||||||
TOTAL RETURN | (27.84% | ) | (1.83% | ) | 29.85% | 26.10% | (20.08% | ) | ||||||||||||
RATIOS/SUPPLEMENTAL DATA | ||||||||||||||||||||
Net assets, end of year (in 000’s) | $413,807 | $1,170,380 | $548,968 | $840,476 | $1,167,472 | |||||||||||||||
Ratio of expenses to average net assets before any reimbursement, waiver or recapture of expenses by Advisor and Administrator (Note 5) | 0.97% | 0.89% | 0.91% | 0.88% | 0.85% | |||||||||||||||
Ratio of expenses to average net assets after any reimbursement, waiver or recapture of expenses by Advisor and Administrator | 0.97% | 0.89% | 0.91% | 0.88% | 0.84% | |||||||||||||||
Ratio of net investment income (loss) to average net assets | 0.55% | 0.22% | 0.25% | 0.53% | 0.46% | |||||||||||||||
Portfolio turnover2 | 83.38% | 70.30% | 62.03% | 25.42% | 46.11% | |||||||||||||||
| 1 | Calculated using the average daily shares method. |
| 2 | The portfolio turnover rate is calculated on the Fund as a whole without distinguishing between classes of shares issued. |
See accompanying notes to financial statements.
| 126 | MATTHEWS ASIA FUNDS |
Table of Contents
Financial Highlights (continued)
Matthews Korea Fund
The tables below set forth financial data for a share of beneficial interest outstanding throughout each period presented.
INVESTOR CLASS | Year Ended Dec. 31, | |||||||||||||||||||
| 2022 | 2021 | 2020 | 2019 | 2018 | ||||||||||||||||
Net Asset Value, beginning of year | $5.70 | $6.12 | $4.38 | $4.58 | $6.91 | |||||||||||||||
INCOME (LOSS) FROM INVESTMENT OPERATIONS: | ||||||||||||||||||||
Net investment income (loss)1 | 0.05 | 0.04 | 0.02 | 0.01 | 0.06 | |||||||||||||||
Net realized gain (loss) and unrealized appreciation/depreciation on investments and foreign currency related transactions | (1.49 | ) | (0.06 | ) | 1.76 | 0.16 | (1.61 | ) | ||||||||||||
Total from investment operations | (1.44 | ) | (0.02 | ) | 1.78 | 0.17 | (1.55 | ) | ||||||||||||
LESS DISTRIBUTIONS FROM: | ||||||||||||||||||||
Net investment income | — | (0.10 | ) | (0.04 | ) | — | (0.13 | ) | ||||||||||||
Net realized gains on investments | (0.44 | ) | (0.30 | ) | — | (0.37 | ) | (0.65 | ) | |||||||||||
Total distributions | (0.44 | ) | (0.40 | ) | (0.04 | ) | (0.37 | ) | (0.78 | ) | ||||||||||
Net Asset Value, end of year | $3.82 | $5.70 | $6.12 | $4.38 | $4.58 | |||||||||||||||
TOTAL RETURN | (25.42% | ) | (0.33% | ) | 40.77% | 3.80% | (22.21% | ) | ||||||||||||
RATIOS/SUPPLEMENTAL DATA | �� | |||||||||||||||||||
Net assets, end of year (in 000’s) | $70,857 | $117,940 | $141,931 | $113,388 | $127,080 | |||||||||||||||
Ratio of expenses to average net assets | 1.22% | 1.13% | 1.19% | 1.15% | 1.14% | |||||||||||||||
Ratio of net investment income (loss) to average net assets | 1.02% | 0.70% | 0.50% | 0.28% | 1.01% | |||||||||||||||
Portfolio turnover2 | 56.94% | 40.18% | 39.62% | 36.63% | 35.60% | |||||||||||||||
INSTITUTIONAL CLASS | Year Ended Dec. 31, | |||||||||||||||||||
| 2022 | 2021 | 2020 | 2019 | 2018 | ||||||||||||||||
Net Asset Value, beginning of year | $5.75 | $6.17 | $4.42 | $4.61 | $6.95 | |||||||||||||||
INCOME (LOSS) FROM INVESTMENT OPERATIONS: | ||||||||||||||||||||
Net investment income (loss)1 | 0.06 | 0.06 | 0.01 | 0.01 | 0.04 | |||||||||||||||
Net realized gain (loss) and unrealized appreciation/depreciation on investments and foreign currency related transactions | (1.51 | ) | (0.07 | ) | 1.79 | 0.17 | (1.60 | ) | ||||||||||||
Total from investment operations | (1.45 | ) | (0.01 | ) | 1.80 | 0.18 | (1.56 | ) | ||||||||||||
LESS DISTRIBUTIONS FROM: | ||||||||||||||||||||
Net investment income | — | (0.11 | ) | (0.05 | ) | — | (0.13 | ) | ||||||||||||
Net realized gains on investments | (0.44 | ) | (0.30 | ) | — | (0.37 | ) | (0.65 | ) | |||||||||||
Total distributions | (0.44 | ) | (0.41 | ) | (0.05 | ) | (0.37 | ) | (0.78 | ) | ||||||||||
Net Asset Value, end of year | $3.86 | $5.75 | $6.17 | $4.42 | $4.61 | |||||||||||||||
TOTAL RETURN | (25.39% | ) | (0.16% | ) | 40.76% | 4.01% | (22.15% | ) | ||||||||||||
RATIOS/SUPPLEMENTAL DATA | ||||||||||||||||||||
Net assets, end of year (in 000’s) | $9,166 | $14,998 | $12,192 | $23,426 | $19,377 | |||||||||||||||
Ratio of expenses to average net assets | 1.08% | 0.98% | 1.05% | 1.05% | 1.02% | |||||||||||||||
Ratio of net investment income (loss) to average net assets | 1.20% | 0.93% | 0.28% | 0.29% | 0.67% | |||||||||||||||
Portfolio turnover2 | 56.94% | 40.18% | 39.62% | 36.63% | 35.60% | |||||||||||||||
| 1 | Calculated using the average daily shares method. |
| 2 | The portfolio turnover rate is calculated on the Fund as a whole without distinguishing between classes of shares issued. |
See accompanying notes to financial statements.
| matthewsasia.com | 800.789.ASIA | 127 |
Table of Contents
Financial Highlights (continued)
Matthews Asian Growth And Income Fund
The tables below set forth financial data for a share of beneficial interest outstanding throughout each period presented.
INVESTOR CLASS | Year Ended Dec. 31, | |||||||||||||||||||
| 2022 | 2021 | 2020 | 2019 | 2018 | ||||||||||||||||
Net Asset Value, beginning of year | $16.07 | $18.05 | $15.73 | $13.92 | $17.46 | |||||||||||||||
INCOME (LOSS) FROM INVESTMENT OPERATIONS: | ||||||||||||||||||||
Net investment income (loss)1 | 0.22 | 0.17 | 0.21 | 0.25 | 0.32 | |||||||||||||||
Net realized gain (loss) and unrealized appreciation/depreciation on investments, foreign currency related transactions and foreign capital gains taxes | (3.17 | ) | (0.17 | ) | 2.27 | 2.13 | (2.20 | ) | ||||||||||||
Total from investment operations | (2.95 | ) | — | 2.48 | 2.38 | (1.88 | ) | |||||||||||||
LESS DISTRIBUTIONS FROM: | ||||||||||||||||||||
Net investment income | (0.21 | ) | (0.20 | ) | (0.16 | ) | (0.35 | ) | (0.32 | ) | ||||||||||
Net realized gains on investments | (0.41 | ) | (1.78 | ) | — | 2 | (0.22 | ) | (1.34 | ) | ||||||||||
Total distributions | (0.62 | ) | (1.98 | ) | (0.16 | ) | (0.57 | ) | (1.66 | ) | ||||||||||
Net Asset Value, end of year | $12.50 | $16.07 | $18.05 | $15.73 | $13.92 | |||||||||||||||
TOTAL RETURN | (18.43% | ) | 0.04% | 16.00% | 17.26% | (10.96% | ) | |||||||||||||
RATIOS/SUPPLEMENTAL DATA | ||||||||||||||||||||
Net assets, end of year (in 000’s) | $339,756 | $541,744 | $673,576 | $723,815 | $799,328 | |||||||||||||||
Ratio of expenses to average net assets | 1.13% | 1.07% | 1.09% | 1.08% | 1.08% | |||||||||||||||
Ratio of net investment income (loss) to average net assets | 1.58% | 0.91% | 1.38% | 1.67% | 1.95% | |||||||||||||||
Portfolio turnover3 | 13.16% | 37.85% | 36.27% | 21.89% | 32.24% | |||||||||||||||
INSTITUTIONAL CLASS | Year Ended Dec. 31, | |||||||||||||||||||
| 2022 | 2021 | 2020 | 2019 | 2018 | ||||||||||||||||
Net Asset Value, beginning of year | $16.04 | $18.02 | $15.70 | $13.89 | $17.43 | |||||||||||||||
INCOME (LOSS) FROM INVESTMENT OPERATIONS: | ||||||||||||||||||||
Net investment income (loss)1 | 0.24 | 0.20 | 0.23 | 0.27 | 0.35 | |||||||||||||||
Net realized gain (loss) and unrealized appreciation/depreciation on investments, foreign currency related transactions and foreign capital gains taxes | (3.16 | ) | (0.17 | ) | 2.27 | 2.14 | (2.20 | ) | ||||||||||||
Total from investment operations | (2.92 | ) | 0.03 | 2.50 | 2.41 | (1.85 | ) | |||||||||||||
LESS DISTRIBUTIONS FROM: | ||||||||||||||||||||
Net investment income | (0.23 | ) | (0.23 | ) | (0.18 | ) | (0.38 | ) | (0.35 | ) | ||||||||||
Net realized gains on investments | (0.41 | ) | (1.78 | ) | — | 2 | (0.22 | ) | (1.34 | ) | ||||||||||
Total distributions | (0.64 | ) | (2.01 | ) | (0.18 | ) | (0.60 | ) | (1.69 | ) | ||||||||||
Net Asset Value, end of year | $12.48 | $16.04 | $18.02 | $15.70 | $13.89 | |||||||||||||||
TOTAL RETURN | (18.31% | ) | 0.18% | 16.18% | 17.46% | (10.84% | ) | |||||||||||||
RATIOS/SUPPLEMENTAL DATA | ||||||||||||||||||||
Net assets, end of year (in 000’s) | $270,259 | $551,740 | $822,179 | $743,951 | $596,364 | |||||||||||||||
Ratio of expenses to average net assets | 1.01% | 0.94% | 0.96% | 0.94% | 0.93% | |||||||||||||||
Ratio of net investment income (loss) to average net assets | 1.71% | 1.10% | 1.51% | 1.80% | 2.14% | |||||||||||||||
Portfolio turnover3 | 13.16% | 37.85% | 36.27% | 21.89% | 32.24% | |||||||||||||||
| 1 | Calculated using the average daily shares method. |
| 2 | Less than $0.01 per share. |
| 3 | The portfolio turnover rate is calculated on the Fund as a whole without distinguishing between classes of shares issued. |
See accompanying notes to financial statements.
| 128 | MATTHEWS ASIA FUNDS |
Table of Contents
Financial Highlights (continued)
Matthews Asia Dividend Fund
The tables below set forth financial data for a share of beneficial interest outstanding throughout each period presented.
| INVESTOR CLASS | Year Ended Dec. 31, | |||||||||||||||||||
| 2022 | 2021 | 2020 | 2019 | 2018 | ||||||||||||||||
Net Asset Value, beginning of year | $18.94 | $22.63 | $17.47 | $16.05 | $19.74 | |||||||||||||||
INCOME (LOSS) FROM INVESTMENT OPERATIONS: | ||||||||||||||||||||
Net investment income (loss)1 | 0.13 | 0.18 | 0.15 | 0.28 | 0.37 | |||||||||||||||
Net realized gain (loss) and unrealized appreciation/depreciation on investments, foreign currency related transactions and foreign capital gains taxes | (5.72 | ) | (0.81 | ) | 5.23 | 1.50 | (2.83 | ) | ||||||||||||
Total from investment operations | (5.59 | ) | (0.63 | ) | 5.38 | 1.78 | (2.46 | ) | ||||||||||||
LESS DISTRIBUTIONS FROM: | ||||||||||||||||||||
Net investment income | (0.11 | ) | (0.19 | ) | (0.22 | ) | (0.36 | ) | (0.31 | ) | ||||||||||
Net realized gains on investments | — | (2.87 | ) | — | — | (0.92 | ) | |||||||||||||
Total distributions | (0.11 | ) | (3.06 | ) | (0.22 | ) | (0.36 | ) | (1.23 | ) | ||||||||||
Net Asset Value, end of year | $13.24 | $18.94 | $22.63 | $17.47 | $16.05 | |||||||||||||||
TOTAL RETURN | (29.57% | ) | (2.83% | ) | 31.25% | 11.17% | (12.72% | ) | ||||||||||||
RATIOS/SUPPLEMENTAL DATA | ||||||||||||||||||||
Net assets, end of year (in 000’s) | $602,694 | $1,586,460 | $2,292,262 | $2,312,560 | $2,728,599 | |||||||||||||||
Ratio of expenses to average net assets before any reimbursement, waiver or recapture of expenses by Advisor and Administrator (Note 5) | 1.10% | 1.03% | 1.03% | 1.03% | 1.02% | |||||||||||||||
Ratio of expenses to average net assets after any reimbursement, waiver or recapture of expenses by Advisor and Administrator | 1.10% | 1.02% | 1.02% | 1.02% | 1.01% | |||||||||||||||
Ratio of net investment income (loss) to average net assets | 0.84% | 0.80% | 0.85% | 1.68% | 1.97% | |||||||||||||||
Portfolio turnover2 | 50.75% | 47.41% | 37.73% | 30.32% | 39.75% | |||||||||||||||
|
| Year Ended Dec. 31, | |||||||||||||||||||
| INSTITUTIONAL CLASS | 2022 | 2021 | 2020 | 2019 | 2018 | |||||||||||||||
Net Asset Value, beginning of year | $18.94 | $22.62 | $17.47 | $16.04 | $19.73 | |||||||||||||||
INCOME (LOSS) FROM INVESTMENT OPERATIONS: | ||||||||||||||||||||
Net investment income (loss)1 | 0.14 | 0.21 | 0.16 | 0.30 | 0.39 | |||||||||||||||
Net realized gain (loss) and unrealized appreciation/depreciation on investments, foreign currency related transactions and foreign capital gains taxes | (5.72 | ) | (0.80 | ) | 5.22 | 1.50 | (2.83 | ) | ||||||||||||
Total from investment operations | (5.58 | ) | (0.59 | ) | 5.38 | 1.80 | (2.44 | ) | ||||||||||||
LESS DISTRIBUTIONS FROM: | ||||||||||||||||||||
Net investment income | (0.13 | ) | (0.22 | ) | (0.23 | ) | (0.37 | ) | (0.33 | ) | ||||||||||
Net realized gains on investments | — | (2.87 | ) | — | — | (0.92 | ) | |||||||||||||
Total distributions | (0.13 | ) | (3.09 | ) | (0.23 | ) | (0.37 | ) | (1.25 | ) | ||||||||||
Net Asset Value, end of year | $13.23 | $18.94 | $22.62 | $17.47 | $16.04 | |||||||||||||||
TOTAL RETURN | (29.55% | ) | (2.67% | ) | 31.29% | 11.35% | (12.64% | ) | ||||||||||||
RATIOS/SUPPLEMENTAL DATA | ||||||||||||||||||||
Net assets, end of year (in 000’s) | $1,248,676 | $3,154,407 | $2,908,674 | $3,057,896 | $3,039,226 | |||||||||||||||
Ratio of expenses to average net assets before any reimbursement, waiver or recapture of expenses by Advisor and Administrator (Note 5) | 0.99% | 0.92% | 0.93% | 0.93% | 0.91% | |||||||||||||||
Ratio of expenses to average net assets after any reimbursement, waiver or recapture of expenses by Advisor and Administrator | 0.99% | 0.91% | 0.93% | 0.92% | 0.90% | |||||||||||||||
Ratio of net investment income (loss) to average net assets | 0.95% | 0.93% | 0.91% | 1.80% | 2.09% | |||||||||||||||
Portfolio turnover2 | 50.75% | 47.41% | 37.73% | 30.32% | 39.75% | |||||||||||||||
| 1 | Calculated using the average daily shares method. |
| 2 | The portfolio turnover rate is calculated on the Fund as a whole without distinguishing between classes of shares issued. |
See accompanying notes to financial statements.
| matthewsasia.com | 800.789.ASIA | 129 |
Table of Contents
Financial Highlights (continued)
Matthews China Dividend Fund
The tables below set forth financial data for a share of beneficial interest outstanding throughout each period presented.
INVESTOR CLASS | Year Ended Dec. 31, | |||||||||||||||||||
| 2022 | 2021 | 2020 | 2019 | 2018 | ||||||||||||||||
Net Asset Value, beginning of year | $17.73 | $19.64 | $16.20 | $14.32 | $17.61 | |||||||||||||||
INCOME (LOSS) FROM INVESTMENT OPERATIONS: | ||||||||||||||||||||
Net investment income (loss)1 | 0.31 | 0.41 | 0.30 | 0.34 | 0.41 | |||||||||||||||
Net realized gain (loss) and unrealized appreciation/depreciation on investments and foreign currency related transactions | (3.27 | ) | (0.48 | ) | 3.54 | 1.80 | (2.09 | ) | ||||||||||||
Total from investment operations | (2.96 | ) | (0.07 | ) | 3.84 | 2.14 | (1.68 | ) | ||||||||||||
LESS DISTRIBUTIONS FROM: | ||||||||||||||||||||
Net investment income | (0.52 | ) | (0.49 | ) | (0.40 | ) | (0.26 | ) | (0.40 | ) | ||||||||||
Net realized gains on investments | (0.25 | ) | (1.35 | ) | — | — | (1.21 | ) | ||||||||||||
Total distributions | (0.77 | ) | (1.84 | ) | (0.40 | ) | (0.26 | ) | (1.61 | ) | ||||||||||
Net Asset Value, end of year | $14.00 | $17.73 | $19.64 | $16.20 | $14.32 | |||||||||||||||
TOTAL RETURN | (16.75% | ) | (0.49% | ) | 24.22% | 15.00% | (9.98% | ) | ||||||||||||
RATIOS/SUPPLEMENTAL DATA | ||||||||||||||||||||
Net assets, end of year (in 000’s) | $137,066 | $218,766 | $269,192 | $258,111 | $196,626 | |||||||||||||||
Ratio of expenses to average net assets | 1.20% | 1.12% | 1.15% | 1.15% | 1.15% | |||||||||||||||
Ratio of net investment income (loss) to average net assets | 2.12% | 2.05% | 1.79% | 2.14% | 2.33% | |||||||||||||||
Portfolio turnover2 | 67.08% | 68.25% | 81.79% | 65.69% | 66.47% | |||||||||||||||
INSTITUTIONAL CLASS | Year Ended Dec. 31, | |||||||||||||||||||
| 2022 | 2021 | 2020 | 2019 | 2018 | ||||||||||||||||
Net Asset Value, beginning of year | $17.72 | $19.64 | $16.20 | $14.32 | $17.61 | |||||||||||||||
INCOME (LOSS) FROM INVESTMENT OPERATIONS: | ||||||||||||||||||||
Net investment income (loss)1 | 0.31 | 0.53 | 0.31 | 0.35 | 0.42 | |||||||||||||||
Net realized gain (loss) and unrealized appreciation/depreciation on investments and foreign currency related transactions | (3.24 | ) | (0.58 | ) | 3.55 | 1.81 | (2.07 | ) | ||||||||||||
Total from investment operations | (2.93 | ) | (0.05 | ) | 3.86 | 2.16 | (1.65 | ) | ||||||||||||
LESS DISTRIBUTIONS FROM: | ||||||||||||||||||||
Net investment income | (0.54 | ) | (0.52 | ) | (0.42 | ) | (0.28 | ) | (0.43 | ) | ||||||||||
Net realized gains on investments | (0.25 | ) | (1.35 | ) | — | — | (1.21 | ) | ||||||||||||
Total distributions | (0.79 | ) | (1.87 | ) | (0.42 | ) | (0.28 | ) | (1.64 | ) | ||||||||||
Net Asset Value, end of year | $14.00 | $17.72 | $19.64 | $16.20 | $14.32 | |||||||||||||||
TOTAL RETURN | (16.59% | ) | (0.38% | ) | 24.37% | 15.16% | (9.83% | ) | ||||||||||||
RATIOS/SUPPLEMENTAL DATA | ||||||||||||||||||||
Net assets, end of year (in 000’s) | $84,220 | $131,395 | $115,451 | $122,630 | $73,033 | |||||||||||||||
Ratio of expenses to average net assets | 1.06% | 0.97% | 1.02% | 1.01% | 1.01% | |||||||||||||||
Ratio of net investment income (loss) to average net assets | 2.12% | 2.65% | 1.85% | 2.25% | 2.44% | |||||||||||||||
Portfolio turnover2 | 67.08% | 68.25% | 81.79% | 65.69% | 66.47% | |||||||||||||||
| 1 | Calculated using the average daily shares method. |
| 2 | The portfolio turnover rate is calculated on the Fund as a whole without distinguishing between classes of shares issued. |
See accompanying notes to financial statements.
| 130 | MATTHEWS ASIA FUNDS |
Table of Contents
Financial Highlights (continued)
Matthews Asia Total Return Bond Fund
The tables below set forth financial data for a share of beneficial interest outstanding throughout each period presented.
| INVESTOR CLASS | Year Ended Dec. 31, | |||||||||||||||||||
| 2022 | 2021 | 2020 | 2019 | 2018 | ||||||||||||||||
Net Asset Value, beginning of year | $10.33 | $11.25 | $11.12 | $10.25 | $10.98 | |||||||||||||||
INCOME (LOSS) FROM INVESTMENT OPERATIONS: | ||||||||||||||||||||
Net investment income (loss)1 | 0.45 | 0.41 | 0.46 | 0.50 | 0.40 | |||||||||||||||
Net realized gain (loss) and unrealized appreciation/depreciation on investments, forward foreign currency exchange contracts, swaps, foreign currency related transactions, and foreign capital gains taxes | (1.52 | ) | (0.85 | ) | 0.11 | 0.81 | (0.84 | ) | ||||||||||||
Total from investment operations | (1.07 | ) | (0.44 | ) | 0.57 | 1.31 | (0.44 | ) | ||||||||||||
LESS DISTRIBUTIONS FROM: | ||||||||||||||||||||
Net investment income | (0.27 | ) | (0.46 | ) | (0.44 | ) | (0.44 | ) | (0.25 | ) | ||||||||||
Net realized gains on investments | (0.10 | ) | (0.02 | ) | — | — | — | |||||||||||||
Return of capital | — | — | — | — | (0.04 | ) | ||||||||||||||
Total distributions | (0.37 | ) | (0.48 | ) | (0.44 | ) | (0.44 | ) | (0.29 | ) | ||||||||||
Net Asset Value, end of year | $8.89 | $10.33 | $11.25 | $11.12 | $10.25 | |||||||||||||||
TOTAL RETURN | (10.25% | ) | (4.06% | ) | 5.36% | 13.00% | (4.05% | ) | ||||||||||||
RATIOS/SUPPLEMENTAL DATA | ||||||||||||||||||||
Net assets, end of year (in 000’s) | $17,053 | $28,166 | $40,422 | $39,485 | $40,698 | |||||||||||||||
Ratio of expenses to average net assets before any reimbursement, waiver or recapture of expenses by Advisor and Administrator (Note 5) | 1.23% | 1.05% | 1.15% | 1.08% | 1.23% | |||||||||||||||
Ratio of expenses to average net assets after any reimbursement, waiver or recapture of expenses by Advisor and Administrator | 1.08% | 1.05% | 1.12% | 1.07% | 1.15% | |||||||||||||||
Ratio of net investment income (loss) to average net assets | 5.18% | 3.76% | 4.32% | 4.61% | 3.76% | |||||||||||||||
Portfolio turnover2 | 13.66% | 62.17% | 39.71% | 84.38% | 82.32% | |||||||||||||||
| INSTITUTIONAL CLASS | Year Ended Dec. 31, | |||||||||||||||||||
| 2022 | 2021 | 2020 | 2019 | 2018 | ||||||||||||||||
Net Asset Value, beginning of year | $10.33 | $11.25 | $11.12 | $10.25 | $10.97 | |||||||||||||||
INCOME (LOSS) FROM INVESTMENT OPERATIONS: | ||||||||||||||||||||
Net investment income (loss)1 | 0.45 | 0.42 | 0.49 | 0.52 | 0.42 | |||||||||||||||
Net realized gain (loss) and unrealized appreciation/depreciation on investments, forward foreign currency exchange contracts, swaps, foreign currency related transactions, and foreign capital gains taxes | (1.51 | ) | (0.85 | ) | 0.10 | 0.81 | (0.83 | ) | ||||||||||||
Total from investment operations | (1.06 | ) | (0.43 | ) | 0.59 | 1.33 | (0.41 | ) | ||||||||||||
LESS DISTRIBUTIONS FROM: | ||||||||||||||||||||
Net investment income | (0.28 | ) | (0.47 | ) | (0.46 | ) | (0.46 | ) | (0.27 | ) | ||||||||||
Net realized gains on investments | (0.10 | ) | (0.02 | ) | — | — | — | |||||||||||||
Return of capital | — | — | — | — | (0.04 | ) | ||||||||||||||
Total distributions | (0.38 | ) | (0.49 | ) | (0.46 | ) | (0.46 | ) | (0.31 | ) | ||||||||||
Net Asset Value, end of year | $8.89 | $10.33 | $11.25 | $11.12 | $10.25 | |||||||||||||||
TOTAL RETURN | (10.11% | ) | (3.89% | ) | 5.60% | 13.20% | (3.78% | ) | ||||||||||||
RATIOS/SUPPLEMENTAL DATA | ||||||||||||||||||||
Net assets, end of year (in 000’s) | $26,035 | $85,694 | $74,426 | $77,228 | $60,017 | |||||||||||||||
Ratio of expenses to average net assets before any reimbursement, waiver or recapture of expenses by Advisor and Administrator (Note 5) | 1.11% | 0.91% | 1.00% | 0.97% | 1.04% | |||||||||||||||
Ratio of expenses to average net assets after any reimbursement, waiver or recapture of expenses by Advisor and Administrator | 0.90% | 0.90% | 0.90% | 0.90% | 0.90% | |||||||||||||||
Ratio of net investment income (loss) to average net assets | 5.14% | 3.93% | 4.56% | 4.81% | 4.03% | |||||||||||||||
Portfolio turnover2 | 13.66% | 62.17% | 39.71% | 84.38% | 82.32% | |||||||||||||||
| 1 | Calculated using the average daily shares method. |
| 2 | The portfolio turnover rate is calculated on the Fund as a whole without distinguishing between classes of shares issued. |
See accompanying notes to financial statements.
| matthewsasia.com | 800.789.ASIA | 131 |
Table of Contents
Financial Highlights (continued)
Matthews Asia Credit Opportunities Fund
The tables below set forth financial data for a share of beneficial interest outstanding throughout each period presented.
INVESTOR CLASS | Year Ended Dec. 31, | |||||||||||||||||||
| 2022 | 2021 | 2020 | 2019 | 2018 | ||||||||||||||||
Net Asset Value, beginning of year | $9.16 | $10.27 | $10.57 | $9.76 | $10.39 | |||||||||||||||
INCOME (LOSS) FROM INVESTMENT OPERATIONS: | ||||||||||||||||||||
Net investment income (loss)1 | 0.45 | 0.40 | 0.46 | 0.47 | 0.37 | |||||||||||||||
Net realized gain (loss) and unrealized appreciation/depreciation on investments, swaps, and foreign currency related transactions | (1.68 | ) | (1.04 | ) | (0.29 | ) | 0.82 | (0.67 | ) | |||||||||||
Total from investment operations | (1.23 | ) | (0.64 | ) | 0.17 | 1.29 | (0.30 | ) | ||||||||||||
LESS DISTRIBUTIONS FROM: | ||||||||||||||||||||
Net investment income | (0.42 | ) | (0.47 | ) | (0.44 | ) | (0.44 | ) | (0.33 | ) | ||||||||||
Net realized gains on investments | — | — | (0.03 | ) | (0.04 | ) | — | |||||||||||||
Total distributions | (0.42 | ) | (0.47 | ) | (0.47 | ) | (0.48 | ) | (0.33 | ) | ||||||||||
Net Asset Value, end of year | $7.51 | $9.16 | $10.27 | $10.57 | $9.76 | |||||||||||||||
TOTAL RETURN | (13.28% | ) | (6.35% | ) | 1.80% | 13.34% | (2.88% | ) | ||||||||||||
RATIOS/SUPPLEMENTAL DATA | ||||||||||||||||||||
Net assets, end of year (in 000’s) | $3,562 | $7,966 | $8,856 | $12,997 | $8,668 | |||||||||||||||
Ratio of expenses to average net assets before any reimbursement, waiver or recapture of expenses by Advisor and Administrator (Note 5) | 1.45% | 1.07% | 1.14% | 1.24% | 1.44% | |||||||||||||||
Ratio of expenses to average net assets after any reimbursement, waiver or recapture of expenses by Advisor and Administrator | 1.11% | 1.07% | 1.14% | 1.12% | 1.15% | |||||||||||||||
Ratio of net investment income (loss) to average net assets | 5.77% | 4.13% | 4.53% | 4.55% | 3.62% | |||||||||||||||
Portfolio turnover2 | 26.73% | 79.83% | 48.46% | 81.08% | 49.06% | |||||||||||||||
INSTITUTIONAL CLASS | Year Ended Dec. 31, | |||||||||||||||||||
| 2022 | 2021 | 2020 | 2019 | 2018 | ||||||||||||||||
Net Asset Value, beginning of year | $9.15 | $10.27 | $10.57 | $9.75 | $10.39 | |||||||||||||||
INCOME (LOSS) FROM INVESTMENT OPERATIONS: | ||||||||||||||||||||
Net investment income (loss)1 | 0.48 | 0.42 | 0.48 | 0.50 | 0.39 | |||||||||||||||
Net realized gain (loss) and unrealized appreciation/depreciation on investments, swaps, and foreign currency related transactions | (1.69 | ) | (1.04 | ) | (0.29 | ) | 0.82 | (0.67 | ) | |||||||||||
Total from investment operations | (1.21 | ) | (0.62 | ) | 0.19 | 1.32 | (0.28 | ) | ||||||||||||
LESS DISTRIBUTIONS FROM: | ||||||||||||||||||||
Net investment income | (0.43 | ) | (0.50 | ) | (0.46 | ) | (0.46 | ) | (0.36 | ) | ||||||||||
Net realized gains on investments | — | — | (0.03 | ) | (0.04 | ) | — | |||||||||||||
Total distributions | (0.43 | ) | (0.50 | ) | (0.49 | ) | (0.50 | ) | (0.36 | ) | ||||||||||
Net Asset Value, end of year | $7.51 | $9.15 | $10.27 | $10.57 | $9.75 | |||||||||||||||
TOTAL RETURN | (13.02% | ) | (6.24% | ) | 2.05% | 13.69% | (2.75% | ) | ||||||||||||
RATIOS/SUPPLEMENTAL DATA | ||||||||||||||||||||
Net assets, end of year (in 000’s) | $25,663 | $33,462 | $82,252 | $79,438 | $31,085 | |||||||||||||||
Ratio of expenses to average net assets before any reimbursement, waiver or recapture of expenses by Advisor and Administrator (Note 5) | 1.31% | 0.93% | 0.98% | 1.07% | 1.25% | |||||||||||||||
Ratio of expenses to average net assets after any reimbursement, waiver or recapture of expenses by Advisor and Administrator | 0.90% | 0.90% | 0.90% | 0.90% | 0.90% | |||||||||||||||
Ratio of net investment income (loss) to average net assets | 6.19% | 4.25% | 4.79% | 4.79% | 3.90% | |||||||||||||||
Portfolio turnover2 | 26.73% | 79.83% | 48.46% | 81.08% | 49.06% | |||||||||||||||
| 1 | Calculated using the average daily shares method. |
| 2 | The portfolio turnover rate is calculated on the Fund as a whole without distinguishing between classes of shares issued. |
See accompanying notes to financial statements.
| 132 | MATTHEWS ASIA FUNDS |
Table of Contents
| 1. | ORGANIZATION |
Matthews International Funds (d/b/a Matthews Asia Funds) (the “Trust”) is an open-end management investment company registered under the Investment Company Act of 1940, as amended (the “1940 Act”). As of December 31, 2022, the Trust issued nineteen separate series of shares. This shareholder report pertains to sixteen of those series (each a “Fund”, and collectively, the “Funds”): Matthews Emerging Markets Equity Fund, Matthews Emerging Markets Sustainable Future Fund (previously known as Matthews Asia ESG Fund), Matthews Emerging Markets Small Companies Fund, Matthews Asia Growth Fund, Matthews Pacific Tiger Fund, Matthews Asia Innovators Fund, Matthews China Fund, Matthews China Small Companies Fund, Matthews India Fund, Matthews Japan Fund, Matthews Korea Fund, Matthews Asian Growth and Income Fund, Matthews Asia Dividend Fund, Matthews China Dividend Fund, Matthews Asia Total Return Bond Fund and Matthews Asia Credit Opportunities Fund. Each Fund currently offers two classes of shares: Investor Class and Institutional Class. Each class of shares has identical voting, dividend, liquidation and other rights and the same terms and conditions, except each class may be subject to different class expenses as outlined in the relevant prospectus and each class has exclusive voting rights with respect to matters solely affecting such class. The other three separate series of the Trust are Exchange Traded Funds and are covered in a separate shareholder report.
| A. | Reorganization of Matthews Emerging Asia Fund into Matthews Asia Small Companies Fund and renaming of the combined Fund as Matthews Emerging Markets Small Companies Fund |
The Trust approved the reorganization of Matthews Emerging Asia Fund into Matthews Asia Small Companies Fund effective April 29, 2021, and the renaming of the combined Fund as Matthews Emerging Markets Small Companies Fund effective April 30, 2021. The Board of Trustees of the Trust had determined that the reorganization was in the best interests of each Fund given the factors referenced in the Combined Prospectus/Information Statement filed on March 31, 2021, that included the recognition that approximately 75% of the companies comprising the emerging markets small capitalization investment universe are located in Asia, the significant overlap in the investment mandates of the Matthews Emerging Asia Fund and the Matthews Asia Small Companies Fund, an additional 0.05% reduction from each Fund’s contractual expense cap to the contractual expense cap of the combined Matthews Emerging Markets Small Companies Fund’s Institutional Class shares (which would also result in a reduction in the expense cap for the Investor Class shares), and the benefit to the shareholders of each Fund from the exposure to a broader investment universe as well as from potential operating efficiencies and economies of scale that may be achieved by combining the two Funds’ assets through the reorganization.
For U.S. GAAP purposes, the transaction was treated as a merger. The merger took place after the close of business on April 29, 2021. For accounting and performance reporting purposes, the Matthews Emerging Markets Small Companies Fund is the survivor. The reorganization was accomplished by a tax-free exchange of shares of Matthews Emerging Markets Small Companies Fund in the following amount and at the following conversion ratio:
| Fund | Fund Share Class | Shares Prior to Reorganization | Conversion Ratio | Matthews Emerging Markets Small Companies Fund’s Share Class | Shares of Matthews Emerging Markets Small Companies Fund | |||||||||||||||
| Matthews Emerging Asia Fund | Investor | 4,222,800 | 0.418762136 | Investor | 1,768,348 | |||||||||||||||
| Matthews Emerging Asia Fund | Institutional | 5,778,167 | 0.421592128 | Institutional | 2,436,030 | |||||||||||||||
The exchange was based on values at the close of the New York Stock Exchange on the immediately preceding business day, April 29, 2021. The net assets of the acquired Fund at that date included unrealized appreciation of $15,929,918, securities of $58,327,177, cash of $36,124,254, foreign currency of $17,857,911, receivables and other assets of $5,309,401, payables of $944,907, unrealized foreign capital gains tax accrued of $91,283, capital paid-in of $191,310,932, total distributable earnings of ($74,728,379), and net assets of $116,582,553 that were combined with those of the acquiring Fund, resulting in aggregate net assets of $353,643,657 immediately after the acquisition. The assets and liabilities of Matthews Emerging Asia Fund were recorded at fair value; however, the cost basis of the investments received from the Matthews Emerging Asia Fund was carried forward to align ongoing reporting of the Matthews Emerging Markets Small Companies Fund’s realized and unrealized gains and losses with amounts distributable to shareholders for tax purposes. Pro forma results of operations of the combined entity for the year ended December 31, 2021, as though the acquisition had occurred as of the beginning of the year (rather that on the actual acquisition date), are as follows:
| * | Net investment loss: $(1,121,605) |
| * | Net realized gain on investments: $48,010,992 |
| * | Net change in unrealized gain/loss on investments: $20,080,367 |
| * | Net increase in the net assets resulting from operations: $66,969,754 |
| 2. | SIGNIFICANT ACCOUNTING POLICIES |
The following is a summary of significant accounting policies consistently followed by the Funds in preparation of their financial statements. Each Fund follows the investment company accounting and reporting guidance of the Financial Accounting Standards Board (FASB) Accounting Standard Codification Topic 946 Financial Services—Investment Companies. The accounting policies are in conformity with accounting principles generally accepted in the United States of America (“U.S. GAAP”).
| A. | SECURITY VALUATION: Pursuant to Rule 2a-5 under the 1940 Act, the Funds’ Board of Trustees (the “Board”) has designated authority to a Valuation Designee, Matthews International Capital Management, LLC (“Matthews”), the Funds’ investment adviser, to make fair valuation determinations under adopted procedures, subject to Board oversight. Matthews has formed a Valuation Committee (the “Valuation Committee”) to administer the pricing and valuation of portfolio securities and other assets and liabilities and to ensure that prices used for internal purposes or provided by third parties reasonably reflect fair value. The Valuation Designee may utilize independent pricing services, quotations from securities and financial instrument dealers and other market sources to determine fair value. The value of the Trust’s securities is based on market quotations for those securities, or on their fair value determined by the valuation policies approved by the Board. Market quotations and valuation information are provided by commercial pricing services or securities dealers that are independent of the Funds and Matthews in accordance with procedures established by the Valuation Designee. Foreign exchange-traded securities are valued as of the close of trading on the primary exchange on which they trade. Securities that trade in over-the-counter markets, including most debt securities (bonds), may be valued by other third-party vendors or by using indicative bid quotations from dealers or market makers, or other available market information. Market values for securities are determined based on quotations, market data or other information from the principal (or most advantageous) market on which the security is traded. Market quotations for equity securities used by the Funds include last reported sale prices, or, if such prices are not reported or available, bid and ask prices. Swap agreements are valued utilizing quotes received daily by the Funds’ pricing service or through brokers, which are derived using daily swap curves and models that incorporate a number of market data factors, such as discounted cash flows, trades and values of the underlying reference instruments. Foreign currency exchange contracts are valued at the mean between the bid and ask prices and are determined at the close of business on the New York Stock Exchange (“NYSE”). Interpolated values are derived when the settlement date of the contract is an interim date for which quotations are not available. The Funds may also utilize independent pricing services to assist them in determining a current market value for each security based on sources believed to be reliable. |
| matthewsasia.com | 800.789.ASIA | 133 |
Table of Contents
Notes to Financial Statements (continued)
When fair value pricing is employed, the prices of securities used by a Fund to calculate its Net Asset Value (“NAV”) may differ from any quoted or published prices for the same securities for that day. Events affecting the value of foreign investments may occur between the time at which they are determined and when the Funds calculate their NAV, which is normally the close of trading on the NYSE. If such events render market quotations unreliable, and the impact of such events can be reasonably determined, the investments will be valued at their fair value in accordance with pricing policies. The fair value of a security held by the Funds may be determined using the services of third-party pricing services to assist in this process.
The books and records of the Funds are maintained in U.S. dollars. Transactions, portfolio securities, and assets and liabilities denominated in a foreign currency are translated and recorded in U.S. dollars at the prevailing exchange rate as of the close of trading on the NYSE. The Fund does not isolate the effect of changes in foreign exchange rates from changes in market prices on securities held. Accordingly, such changes are included within Change in net unrealized appreciation/depreciation on investments on the Statement of Operations. Translation gains or losses resulting from changes in the exchange rate during the reporting period and realized gains and losses on the settlement of foreign currency transactions are reported in the results of operations for the current period. The Funds isolate that portion of gains and losses on investments in fixed income securities that is due to changes in foreign exchange rate from that which is due to changes in market prices of securities.
Foreign securities held by the Funds may be traded on days and at times when the NYSE is closed. Accordingly, the value of the Funds may be significantly affected on days when shareholders have no access to the Funds.
| B. | FAIR VALUE MEASUREMENTS: The Funds follow a fair value hierarchy that distinguishes between market data obtained from independent sources (observable inputs) and the Funds’ own market assumptions (unobservable inputs). These inputs are used in determining the value of the Funds’ financial instruments and are summarized in the following fair value hierarchy: |
Level 1: Unadjusted quoted prices in active markets for identical securities (foreign securities that are valued based on market quotations).
Level 2: Other significant observable inputs. Certain foreign securities may be fair valued by Matthews using information such as quoted prices for similar securities, interest rates, prepayment speeds, credit risk, and foreign exchange. Additionally, external pricing services are used when the Funds determine that events affecting the value of foreign securities which occur between the time at which they are determined and the close of trading on the NYSE render market quotations unreliable.
Level 3: Significant unobservable inputs. Level 3 securities are valued based on significant unobservable inputs as determined under the direction of the Board. Characterization of such securities as Level 3 securities are not necessarily an indication of their liquidity or the risk associated with investing in these securities. A significant change in the unobservable inputs could result in a significantly lower or higher value in such Level 3 securities and could impact overall Fund performance.
The input levels are not necessarily an indication of the risk or liquidity associated with financial instruments at that level.
| 134 | MATTHEWS ASIA FUNDS |
Table of Contents
Notes to Financial Statements (continued)
Levels for Multi-Country Funds (1 of 2):
Summary of inputs used to determine the fair valuation of multi-country Funds’ investments as of December 31, 2022.
| Matthews Emerging Markets Equity Fund | Matthews Emerging Markets | Matthews Emerging Markets | Matthews Asia Growth Fund | Matthews Pacific Tiger Fund | Matthews Asia Innovators Fund | |||||||||||||||||||
| Assets: | ||||||||||||||||||||||||
| Investments: | ||||||||||||||||||||||||
Level 1: Quoted Prices | ||||||||||||||||||||||||
Common Equities: | ||||||||||||||||||||||||
Brazil | $1,275,300 | $— | $— | $— | $— | $— | ||||||||||||||||||
Chile | — | — | 14,725,448 | — | — | — | ||||||||||||||||||
China/Hong Kong | 1,171,568 | 11,895,976 | 13,203,899 | 42,560,374 | 196,941,428 | 109,286,865 | ||||||||||||||||||
France | 420,530 | — | — | — | — | — | ||||||||||||||||||
India | 2,822,762 | — | — | — | — | — | ||||||||||||||||||
Indonesia | 267,208 | — | — | — | — | — | ||||||||||||||||||
Mexico | 2,838,199 | — | 5,124,823 | — | — | — | ||||||||||||||||||
Singapore | 500,016 | — | — | 6,264,048 | — | 24,106,773 | ||||||||||||||||||
South Korea | — | — | — | — | — | 10,445,247 | ||||||||||||||||||
United States | 1,406,380 | 10,774,298 | 16,645,874 | 22,193,828 | — | — | ||||||||||||||||||
Zambia | 867,086 | — | — | — | — | — | ||||||||||||||||||
Rights: | ||||||||||||||||||||||||
Indonesia | — | 39,699 | 171,659 | — | — | — | ||||||||||||||||||
Level 2: Other Significant Observable Inputs | ||||||||||||||||||||||||
Common Equities: | ||||||||||||||||||||||||
Australia | 944,098 | — | — | 28,931,331 | — | — | ||||||||||||||||||
Bangladesh | — | 1,832,746 | 2,986,421 | — | — | — | ||||||||||||||||||
Brazil | 1,540,880 | 4,907,541 | 16,092,741 | — | — | — | ||||||||||||||||||
China/Hong Kong | 5,384,660 | 57,602,050 | 84,182,266 | 203,688,486 | 1,658,942,152 | 214,729,534 | ||||||||||||||||||
Estonia | — | 1,431,391 | — | — | — | — | ||||||||||||||||||
France | 379,128 | — | — | — | — | — | ||||||||||||||||||
India | 1,848,031 | 38,042,898 | 86,397,458 | 85,831,074 | 557,303,679 | 75,329,199 | ||||||||||||||||||
Indonesia | 643,263 | 3,354,470 | 17,934,693 | 32,998,238 | 96,541,311 | — | ||||||||||||||||||
Kazakhstan | 366,087 | — | — | �� | — | — | — | |||||||||||||||||
Japan | — | — | — | 194,716,765 | — | — | ||||||||||||||||||
Jordan | — | 1,903,918 | — | — | — | — | ||||||||||||||||||
New Zealand | — | — | — | 6,670,400 | — | — | ||||||||||||||||||
Philippines | 842,390 | — | 7,138,788 | — | 96,305,747 | — | ||||||||||||||||||
Poland | 517,539 | 6,367,945 | 5,472,145 | — | — | — | ||||||||||||||||||
Qatar | 454,358 | — | — | — | — | — | ||||||||||||||||||
Romania | — | 1,996,963 | — | — | — | — | ||||||||||||||||||
Saudi Arabia | — | 2,197,629 | — | — | — | — | ||||||||||||||||||
Singapore | 616,856 | — | — | — | 54,271,984 | — | ||||||||||||||||||
South Korea | 509,524 | 5,622,889 | 29,122,247 | — | 321,404,116 | 16,572,406 | ||||||||||||||||||
Taiwan | 1,902,574 | 13,027,280 | 31,121,052 | — | 510,767,819 | 9,527,392 | ||||||||||||||||||
Thailand | — | — | 3,214,669 | — | 119,275,916 | — | ||||||||||||||||||
Turkey | 245,127 | — | 2,924,499 | — | — | — | ||||||||||||||||||
United Arab Emirates | 319,765 | — | 8,337,835 | — | — | — | ||||||||||||||||||
United Kingdom | 945,867 | — | — | — | — | — | ||||||||||||||||||
Vietnam | 2,231,197 | 2,783,035 | 22,460,116 | 7,684,706 | 59,290,994 | 9,465,590 | ||||||||||||||||||
Preferred Equities: | ||||||||||||||||||||||||
Brazil | — | — | 4,177,916 | — | — | — | ||||||||||||||||||
South Korea | 1,757,177 | 6,803,798 | — | — | — | — | ||||||||||||||||||
Level 3: Significant Unobservable Inputs | ||||||||||||||||||||||||
Common Equities: | ||||||||||||||||||||||||
Russia | 2,177 | — | 30,067 | — | — | — | ||||||||||||||||||
Total Market Value of Investments | $33,019,747 | $170,584,526 | $371,464,616 | $631,539,250 | $3,671,045,146 | $469,463,006 | ||||||||||||||||||
| matthewsasia.com | 800.789.ASIA | 135 |
Table of Contents
Notes to Financial Statements (continued)
Levels for Multi-Country Funds (2 of 2):
Summary of inputs used to determine the fair valuation of multi-country Funds’ investments as of December 31, 2022.
| Matthews Asian Growth and Income Fund | Matthews Asia Dividend Fund | Matthews Asia Total Return Bond Fund | Matthews Asia Credit Opportunities Fund | |||||||||||||
| Assets: | ||||||||||||||||
| Investments: | ||||||||||||||||
Level 1: Quoted Prices | ||||||||||||||||
Common Equities: | ||||||||||||||||
China/Hong Kong | $23,221,080 | $— | $— | $— | ||||||||||||
Taiwan | — | 29,325,745 | — | — | ||||||||||||
United States | 11,965,941 | — | — | — | ||||||||||||
Vietnam | — | 27,514,231 | — | — | ||||||||||||
Level 2: Other Significant Observable Inputs | ||||||||||||||||
Foreign Government Obligationsa | — | — | — | 1,164,150 | ||||||||||||
Non-Convertible Corporate Bondsa | — | — | 29,654,702 | 22,657,232 | ||||||||||||
Convertible Corporate Bondsa | 47,852,008 | — | 4,785,570 | 2,410,765 | ||||||||||||
Common Equities: | ||||||||||||||||
Australia | 8,283,122 | 158,088,270 | — | — | ||||||||||||
Bangladesh | — | 20,787,696 | — | — | ||||||||||||
China/Hong Kong | 226,401,610 | 550,692,031 | — | — | ||||||||||||
France | 20,761,593 | — | — | — | ||||||||||||
India | 69,103,731 | 153,904,737 | — | — | ||||||||||||
Indonesia | 10,917,205 | 37,469,851 | — | — | ||||||||||||
Japan | — | 468,872,202 | — | — | ||||||||||||
Philippines | 9,345,139 | 26,590,990 | — | — | ||||||||||||
Singapore | 42,310,173 | 72,964,656 | — | — | ||||||||||||
South Korea | 53,671,355 | 33,502,528 | — | — | ||||||||||||
Taiwan | 67,026,255 | 30,970,835 | — | — | ||||||||||||
Thailand | 11,334,735 | 34,363,032 | — | — | ||||||||||||
Vietnam | — | 185,065,579 | — | — | ||||||||||||
Preferred Equities: | ||||||||||||||||
South Korea | — | 27,333,438 | — | — | ||||||||||||
Level 3: Significant Unobservable Inputs | ||||||||||||||||
Non-Convertible Corporate Bondsa | — | — | 4,280,000 | 1,635,500 | ||||||||||||
Total Market Value of Investments | $602,193,947 | $1,857,445,821 | $38,720,272 | $27,867,647 | ||||||||||||
| a | Industry, countries, or security types are disclosed on the Schedule of Investments. |
| 136 | MATTHEWS ASIA FUNDS |
Table of Contents
Notes to Financial Statements (continued)
Levels for Single Country Funds:
Summary of inputs used to determine the fair valuation of the single country Funds’ investments as of December 31, 2022.
| Matthews China Fund | Matthews China Small Companies Fund | Matthews India Fund | Matthews Japan Fund | Matthews Korea Fund | Matthews China Dividend Fund | |||||||||||||||||||
| Assets: | ||||||||||||||||||||||||
| Investments: | ||||||||||||||||||||||||
Level 1: Quoted Prices | ||||||||||||||||||||||||
Common Equities: | ||||||||||||||||||||||||
Communication Services | $13,232,073 | $— | $— | $— | $— | $— | ||||||||||||||||||
Consumer Discretionary | 67,849,002 | — | — | — | 2,330,741 | 14,656,795 | ||||||||||||||||||
Health Care | — | 3,365,557 | — | — | — | — | ||||||||||||||||||
Industrials | — | 3,704,272 | — | 7,182,330 | — | 4,448,221 | ||||||||||||||||||
Information Technology | — | 2,072,232 | — | — | — | — | ||||||||||||||||||
Real Estate | 22,555,660 | — | — | — | — | — | ||||||||||||||||||
Level 2: Other Significant Observable Inputs | ||||||||||||||||||||||||
Common Equities: | ||||||||||||||||||||||||
Communication Services | 47,124,735 | 3,193,406 | 2,720,559 | 69,860,499 | 6,167,129 | 34,074,494 | ||||||||||||||||||
Consumer Discretionary | 215,603,259 | 24,966,139 | 76,133,619 | 84,432,380 | 5,766,655 | 50,516,456 | ||||||||||||||||||
Consumer Staples | 23,451,913 | 11,959,139 | 54,706,907 | 41,006,581 | 7,171,110 | 19,890,226 | ||||||||||||||||||
Energy | — | — | 20,142,059 | — | 2,966,498 | 3,830,675 | ||||||||||||||||||
Financials | 116,582,826 | 5,099,502 | 248,807,787 | 81,067,033 | 2,840,450 | 25,171,399 | ||||||||||||||||||
Health Care | 35,489,427 | 15,240,287 | 34,061,040 | 81,081,376 | 7,781,021 | 14,682,639 | ||||||||||||||||||
Industrials | 65,359,432 | 39,955,801 | 40,472,523 | 125,404,171 | 5,136,457 | 10,599,052 | ||||||||||||||||||
Information Technology | 80,416,456 | 22,561,299 | 74,625,111 | 76,978,841 | 21,429,590 | 11,531,245 | ||||||||||||||||||
Materials | 19,519,891 | 4,113,498 | 41,848,918 | 38,042,060 | 3,514,917 | 13,171,236 | ||||||||||||||||||
Real Estate | 36,022,954 | 14,956,509 | — | 6,012,985 | — | 16,349,922 | ||||||||||||||||||
Utilities | — | 3,812,617 | — | — | — | — | ||||||||||||||||||
Preferred Equities: | ||||||||||||||||||||||||
Information Technology | — | — | — | — | 13,437,479 | — | ||||||||||||||||||
Non Convertible Corporate Bonds: | ||||||||||||||||||||||||
Consumer Staples | — | — | 23,434 | — | — | — | ||||||||||||||||||
Level 3: Significant Unobservable Inputs | ||||||||||||||||||||||||
Common Equities: | ||||||||||||||||||||||||
Information Technology | — | 250 | — | — | — | — | ||||||||||||||||||
Total Market Value of Investments | $743,207,628 | $155,000,508 | $593,541,957 | $611,068,256 | $78,542,047 | $218,922,360 | ||||||||||||||||||
Levels for Derivatives Financial Instruments:
Summary of inputs used to determine the fair valuation of the Funds’ derivative financial instruments as of December 31, 2022.
| Matthews Asia Total Return Bond Fund | ||||
Derivative Financial Instruments1 | ||||
Assets | ||||
| Level 2: Other Significant Observable Inputs | ||||
Forward Foreign Currency Exchange Contracts | $101,286 | |||
|
| |||
Liabilities | ||||
| Level 2: Other Significant Observable Inputs | ||||
Forward Foreign Currency Exchange Contracts | ($8,088 | ) | ||
|
| |||
| 1 | Derivative financial instruments are forward foreign currency exchange contracts. Forward foreign currency exchange contracts are valued at the unrealized appreciation/depreciation on the instrument. |
| matthewsasia.com | 800.789.ASIA | 137 |
Table of Contents
Notes to Financial Statements (continued)
Changes in the Balances of Level 3 Securities:
The Funds’ policy is to recognize transfers in and transfers out of Level 3 as of the beginning of the reporting period.
Matthews Emerging Markets | Matthews Emerging Markets | Matthews China Small Companies | Matthews Asia Total Return Bond Fund | Matthews Asia Fund | ||||||||||||||||
Common Equities— Russia | Common Equities— Russia | Common Equities— Technology | Non Convertible Corporate Bonds— China/Hong Kong | Non Convertible Corporate Bonds— China/Hong Kong | ||||||||||||||||
| Balance as of 12/31/21 (market value) | $— | $— | $250 | $— | $— | |||||||||||||||
| Accrued discounts/premiums | — | — | — | 178 | (11,191 | ) | ||||||||||||||
| Realized gain/(loss) | (83,658 | ) | 82,479 | — | — | — | ||||||||||||||
| Change in unrealized appreciation/ (depreciation) | (2,318,437 | ) | (10,111,850 | ) | — | (6,952,137 | ) | (2,541,075 | ) | |||||||||||
| Purchases | 837,174 | 3,422,384 | — | — | — | |||||||||||||||
| Sales | (235,237 | ) | (1,376,811 | ) | — | — | — | |||||||||||||
| Transfers in to Level 3 | 1,802,335 | 8,013,865 | — | 11,231,959 | 4,187,766 | |||||||||||||||
| Transfer out of Level 3 | — | — | — | — | — | |||||||||||||||
| Balance as of 12/31/22 (market value)** | $2,177 | $30,067 | $250 | $4,280,000 | $1,635,500 | |||||||||||||||
| Net change in unrealized appreciation/depreciation on Level 3 investments held as of 12/31/22* | ($2,318,437 | ) | ($10,111,850 | ) | $— | ($6,952,137 | ) | ($2,541,075 | ) | |||||||||||
| * | Included in the related amounts on the Statements of Operations. |
| ** | Level three securities consist primarily of fixed income positions valued using broker quotes where the unobservable inputs were not readily available as well as the fair value of immaterial securities developed using various valuation techniques and unobservable inputs. |
| C. | RISKS ASSOCIATED WITH NON-U.S. COMPANIES: Investments by the Funds in the securities of non-U.S. companies may involve investment risks not typically associated with investments in U.S. issuers. These risks include possible political, economic, social and religious instability, inadequate investor protection; changes in laws or regulations of countries within the Asia Pacific region (including in countries where the Funds may invest, as well as in the broader region); international relations with other nations; natural disasters; corruption; and military activity. Foreign securities may be subject to greater fluctuations in price than securities of domestic corporations or the U.S. government. Foreign investing may also include the risk of expropriation or confiscatory taxation, limitation on the removal of funds or other assets, currency crises and exchange controls, the imposition of foreign withholding tax on the interest income payable on such instruments, the possible seizure or nationalization of foreign deposits or assets, or the adoption of other foreign government restrictions that might adversely affect the foreign securities held by the Funds. Additionally, Asia Pacific countries may utilize formal or informal currency exchange controls or “capital controls” that may limit the ability to repatriate investments or income or adversely affect the value of portfolio investments. The economies of many Asia Pacific countries differ from the economies of more developed countries in many respects, such as their rate of growth, inflation, capital reinvestment, resource self-sufficiency and dependence on other economies, financial system stability, the national balance of payments position and sensitivity to changes in global trade. |
Certain Asia Pacific countries are highly dependent upon and may be affected by developments in the economies of other countries. Non-U.S. companies are subject to different accounting, auditing, and financial reporting standards, practices, and requirements than U.S. companies. There is generally less government regulation of stock exchanges, brokers, and listed companies abroad than in the United States, which may result in less transparency with respect to a company’s operations, and make obtaining information about them more difficult (or such information may be unavailable).
Among other risks of investing in foreign markets are the variable quality and reliability of financial information and related audits of companies. In some cases, financial information and related audits can be unreliable and not subject to verification. Auditing firms in some of these markets are not subject to independent inspection or oversight of audit quality. For example, China does not allow the Public Company Accounting Oversight Board to inspect the work that auditors perform in China for Chinese companies that sell stock into U.S. markets. This can result in investment decisions being made based on flawed or misleading information.
Foreign stock markets may not be as developed or efficient as those in the United States, and the absence of negotiated brokerage commissions in certain countries may result in higher brokerage fees. The time between the trade and settlement dates of securities transactions on foreign exchanges ranges from one day to four weeks or longer and may result in higher custody charges. Custodial arrangements may be less well developed than in the United States. Foreign securities are generally denominated and pay distributions in foreign currencies, exposing the Funds to changes in foreign currency exchange rates. Investing in any country in the Asia Pacific region will also entail risks specific and unique to that country, and these risks can be significant and change rapidly.
Changes in interest rates in each of the countries in which the Funds may invest, as well as interest rates in more-developed countries, may cause a decline in the market value of an investment. Generally, fixed income securities will decrease in value when interest rates rise and can be expected to rise in value when interest rates decline. As interest rates decline, debt issuers may repay or refinance their loans or obligations earlier than anticipated. The issuers of fixed income securities may, therefore, repay principal in advance. This would force the Funds to reinvest the proceeds from the principal prepayments at lower rates, which reduces the Funds’ income.
The Funds may invest in certain operating companies in China through legal structures known as variable interest entities (“VIEs”). In China, ownership of companies in certain sectors by foreign individuals and entities (including U.S. persons and entities such as the Fund) is prohibited. In order to facilitate foreign investment in these businesses, many Chinese companies have created VIEs. In such an arrangement, a China-based operating company typically establishes an offshore shell company in another jurisdiction, such as the Cayman Islands. That shell company enters into service and other contracts with the China-based operating company, then issues shares on a foreign exchange, such as the New York Stock Exchange. Foreign investors hold stock in the shell company rather than directly in the China-based operating company. This arrangement allows U.S. investors to obtain economic exposure to the China-based company through contractual means rather than through formal equity ownership.
| 138 | MATTHEWS ASIA FUNDS |
Table of Contents
Notes to Financial Statements (continued)
VIEs are a longstanding industry practice and well known to officials and regulators in China; however, VIEs are not formally recognized under Chinese law. Recently, the government of China provided new guidance to and placed restrictions on China-based companies raising capital offshore, including through VIE structures. Investors face uncertainty about future actions by the government of China that could significantly affect an operating company’s financial performance and the enforceability of the shell company’s contractual arrangements. It is uncertain whether Chinese officials or regulators will withdraw their implicit acceptance of the VIE structure, or whether any new laws, rules or regulations relating to VIE structures will be adopted or, if adopted, what impact they would have on the interests of foreign shareholders. Under extreme circumstances, China might prohibit the existence of VIEs, or sever their ability to transmit economic and governance rights to foreign individuals and entities; if so, the market value of the Funds’ associated portfolio holdings would likely suffer significant, detrimental, and possibly permanent effects, which could result in substantial investment losses.
In February 2022, Russian forces entered Ukraine and commenced an armed conflict. Economic sanctions have since been imposed on Russia and certain of its citizens, including the exclusion of Russia from the SWIFT global payments network. As a result, Russian-related stocks and debt have since suffered significant declines in value. The ongoing conflict, together with growing turmoil from fluctuations in commodity prices and foreign exchange rates, has the potential to impact adversely global economies and has driven a sharp increase in volatility across markets. The duration of the Russian-Ukraine conflict and its effect on financial markets cannot be determined with certainty. The Funds’ performance could be negatively impacted if the value of a portfolio holding were harmed by these and such other events. Management is actively monitoring these events. As of December 31, 2022, the Russian positions held across the Matthews Asia Funds were valued near zero.
| D. | DISTRIBUTIONS TO SHAREHOLDERS: It is the policy of Matthews Asian Growth and Income Fund and Matthews China Dividend Fund to distribute net investment income on a semi-annual basis and capital gains, if any, annually. It is the policy of Matthews Asia Dividend Fund to distribute net investment income on a quarterly basis and capital gains, if any, annually. It is the policy of Matthews Asia Total Return Bond Fund and Matthews Asia Credit Opportunities Fund to distribute net investment income on a monthly basis and capital gains, if any, annually. Each of the other Funds distributes a net investment income and capital gains, if any, annually. Distributions to shareholders are recorded on the ex-dividend date. Income and capital gain distributions are determined in accordance with income tax regulations which may differ from U.S. GAAP. |
The tax character of distributions paid for the fiscal years ended December 31, 2022 and December 31, 2021 were as follows:
| YEAR ENDED DECEMBER 31, 2022 | Ordinary Income | Net Long-Term Capital Gains | Total Taxable Distributions | |||||||||
| Matthews Emerging Markets Equity Fund | $658,304 | $— | $658,304 | |||||||||
| Matthews Emerging Markets Sustainable Future Fund | 1,492,800 | 7,214,833 | 8,707,633 | |||||||||
| Matthews Emerging Markets Small Companies Fund | 3,923,578 | 24,305,438 | 28,229,016 | |||||||||
| Matthews Asia Growth Fund | 5 | 18,069,743 | 18,069,748 | |||||||||
| Matthews Pacific Tiger Fund | 16,179,343 | 286,471,072 | 302,650,415 | |||||||||
| Matthews Asia Innovators Fund | — | 104,645,624 | 104,645,624 | |||||||||
| Matthews China Fund | 240 | 54,199,190 | 54,199,430 | |||||||||
| Matthews China Small Companies Fund | 3,042,313 | — | 3,042,313 | |||||||||
| Matthews India Fund | 708,348 | 82,241,918 | 82,950,266 | |||||||||
| Matthews Japan Fund | — | 46,366,482 | 46,366,482 | |||||||||
| Matthews Korea Fund | 49 | 8,608,543 | 8,608,592 | |||||||||
| Matthews Asian Growth and Income Fund | 12,257,793 | 20,816,547 | 33,074,340 | |||||||||
| Matthews Asia Dividend Fund | 26,407,965 | — | 26,407,965 | |||||||||
| Matthews China Dividend Fund | 9,296,913 | 3,944,924 | 13,241,837 | |||||||||
| Matthews Asia Total Return Bond Fund | 2,446,133 | 463,019 | 2,909,152 | |||||||||
| Matthews Asia Credit Opportunities Fund | 1,682,081 | — | 1,682,081 | |||||||||
The tax character of distributions paid for the fiscal years ended December 31, 2022 and December 31, 2021 were as follows:
| YEAR ENDED DECEMBER 31, 2021 | Ordinary Income | Net Long-Term Capital Gains | Total Taxable Distributions | |||||||||
| Matthews Emerging Markets Equity Fund | $2,926,053 | $1,417,656 | $4,343,709 | |||||||||
| Matthews Emerging Markets Sustainable Future Fund | 5,343,494 | 4,875,006 | 10,218,500 | |||||||||
| Matthews Emerging Markets Small Companies Fund | 19,110,774 | 3,384,935 | 22,495,709 | |||||||||
| Matthews Asia Growth Fund | 26,665,170 | 63,070,895 | 89,736,065 | |||||||||
| Matthews Pacific Tiger Fund | 126,545,111 | 1,266,276,724 | 1,392,821,835 | |||||||||
| Matthews Asia Innovators Fund | 70,648,640 | 205,752,164 | 276,400,804 | |||||||||
| Matthews China Fund | 91,374,118 | 92,804,375 | 184,178,493 | |||||||||
| Matthews China Small Companies Fund | 40,331,721 | 17,070,757 | 57,402,478 | |||||||||
| Matthews India Fund | 6,626,844 | 64,126,518 | 70,753,362 | |||||||||
| Matthews Japan Fund | 36,167,888 | 144,657,130 | 180,825,018 | |||||||||
| Matthews Korea Fund | 3,049,995 | 5,819,362 | 8,869,357 | |||||||||
| Matthews Asian Growth and Income Fund | 42,341,878 | 88,919,370 | 131,261,248 | |||||||||
| Matthews Asia Dividend Fund | 176,600,715 | 527,405,263 | 704,005,978 | |||||||||
| Matthews China Dividend Fund | 12,319,487 | 23,068,869 | 35,388,356 | |||||||||
| Matthews Asia Total Return Bond Fund | 5,670,055 | 177,347 | 5,847,402 | |||||||||
| Matthews Asia Credit Opportunities Fund | 4,024,422 | — | 4,024,422 | |||||||||
| matthewsasia.com | 800.789.ASIA | 139 |
Table of Contents
Notes to Financial Statements (continued)
| E. | INVESTMENT TRANSACTIONS AND INCOME: Securities transactions are accounted for on the date the securities are purchased or sold or on the following business day. Financial statements reflect security transactions on trade date. Gains or losses on the sale of securities are determined on the identified cost basis. Interest income is recorded on the accrual basis. Interest income, including amortization and accretion of premiums and discounts on debt securities, is recognized daily on an accrual basis. Dividend income is generally recorded on the ex-dividend date net of any foreign taxes withheld at the source. Dividend income for certain issuers headquartered in countries which the Funds invest may not be recorded until approved by the shareholders (which may occur after the ex-dividend date) if, in the judgment of management, such dividends are not reasonably determined as of the ex-dividend date. Income and realized and unrealized gains or losses on investments are allocated to each class of shares based on its relative net assets. |
The Funds may be subject to foreign taxation related to income received, capital gains on the sale of securities and certain foreign currency transactions in the foreign jurisdictions in which they invest. Foreign taxes, if any, are recorded based on the tax regulations and rates that exist in the foreign markets in which the Funds invest. When a capital gain tax is determined to apply, the Funds may record an estimated deferred tax liability in an amount that may be payable if the securities were disposed of on the valuation date.
| F. | FUND EXPENSE ALLOCATIONS: The Funds account separately for the assets, liabilities and operations of each Fund. Estimated expenses are accrued daily. Direct expenses of each Fund or class are charged to that Fund or class while general expenses are allocated pro-rata among the Funds based on net assets or other appropriate methods. |
| G. | CASH, CASH OVERDRAFTS, AND FOREIGN CURRENCY: QFI accounts (i.e., the accounts through which the QFI quota is accessed) are required by the local market to maintain a cash reserve. The cash reserve is based upon a fixed ratio of the QFI’s approved investment quota, which is defined as the amount remitted into its special Renminbi (RMB) cash account. These amounts, if any, are included in “Segregated foreign currency at value” on the Statements of Assets and Liabilities. The fixed ratio is set at 0.08 percent for the Shanghai and 0.06 percent for the Shenzhen market. When any of the Funds’ cash balances are overdrawn, a Fund is charged an overdraft fee by the custodian of 1.00% above the 30-day LIBOR rate on outstanding balances. These amounts, if any, are included in “Other expenses” on the Statements of Operations. |
| H. | USE OF ESTIMATES: The preparation of financial statements in conformity with U.S. GAAP requires management to make estimates and assumptions that affect the amounts reported in the financial statements and accompanying notes. Actual results may differ from those estimates. |
| I. | RECENT ACCOUNTING GUIDANCE: The FASB issued Accounting Standards Update (ASU), ASU 2020-04, Reference Rate Reform (Topic 848)—Facilitation of the Effects of Reference Rate Reform on Financial Reporting in March 2020 and ASU 2021-01 in January 2021 which provided further amendments and clarifications to Topic 848. These ASUs provide optional, temporary relief with respect to the financial reporting of contracts subject to certain types of modifications due to the planned discontinuation of the London Interbank Offered Rate (LIBOR), and other interbank-offered based reference rates, through December 31, 2022. In December, 2022, FASB issued ASU 2022-06 which defers the sunset date of Topic 848 from December 31, 2022, to December 31, 2024, after which entities will no longer be permitted to apply the relief in Topic 848. Management intends to rely upon the relief provided under Topic 848, which is not expected to have a material impact on the fund’s financial statements. |
In June 2022, the FASB issued Accounting Standards Update (ASU), ASU 2022-03, Fair Value Measurement (Topic 820)—Fair Value Measurement of Equity Securities Subject to Contractual Sale Restrictions, which clarifies that a contractual restriction on the sale of an equity security is not considered part of the unit of account of the equity security and, therefore, is not considered in measuring fair value. The amendments under this ASU are effective for fiscal years beginning after December 15, 2023; however, early adoption is permitted.
Management is currently evaluating the impact, if any, of applying this ASU.
| 3. | DERIVATIVE FINANCIAL INSTRUMENTS |
Each of the Matthews Asia Total Return Bond Fund and the Matthews Asia Credit Opportunities Fund may engage in derivative transactions for a variety of purposes, including managing interest rate, currency and credit exposure. Derivative transactions in which each Fund may engage include financial futures contracts, swaps and/or forward foreign currency exchange contracts.
Certain derivative transactions may result in each Fund’s exposure to a currency to exceed the value of the Fund’s assets and the Fund could be exposed to currency risk whether or not it holds a bond or other instrument denominated in that currency. The gross notional value of derivative financial instruments and transactions could exceed the value of the Fund’s net assets, although the net market value of these instruments and transactions, on a marked-to-market basis, at most times, is expected to be substantially lower.
The primary risks associated with the use of derivative financial instruments are: (i) Matthews may not correctly predict the direction of currency exchange rates, interest rates, security prices, or other economic factors; (ii) Matthews may not correctly predict changes in the value of derivative financial instruments and related underlying instruments or assets, which may result in disproportionately increased losses and/or reduced opportunities for gains; (iii) imperfect correlation between the change in market value of the securities held by a Fund and the price of financial futures contracts and credit default swaps contracts; (iv) the lack of, or a reduction in the liquidity of, any secondary market for the instrument, and the resulting inability to close the position (or exit the position) when desired; (v) losses, which are potentially unlimited, due to unanticipated market movements; (vi) the value of the instrument may change unfavorably due to movements in the value of the referenced foreign currencies; (vii) a Fund may suffer disproportionately heavy losses relative to the amount invested; (viii) changes in the value of the derivatives may not match or fully offset changes in the value of hedged or related portfolio securities, thereby failing to achieve the hedging or investment purpose for the derivative transaction; and (ix) the other party to the instrument may fail to fulfill its obligation.
Forward Foreign Currency Exchange Contracts: The Matthews Asia Total Return Bond Fund and the Matthews Asia Credit Opportunities Fund may enter into forward foreign currency exchange contracts to gain or reduce exposure to foreign currency exchange rate risk. A forward foreign currency exchange contract is an agreement between two parties to buy and sell a currency at a set exchange rate on a future date. The contract is marked-to-market daily and the change in market value is recorded by the Fund as an unrealized gain or loss. When the contract is closed, the Fund records a realized gain or loss equal to the difference between the value at the time it was opened and the value at the time it was closed.
Swaps: The Matthews Asia Total Return Bond Fund and the Matthews Asia Credit Opportunities Fund may enter into swap contracts to manage exposure to issuers, markets and securities to reduce their risk exposure to defaults of corporate and/or sovereign issuers or to create exposure to corporate and/or sovereign issuers to which they are not otherwise exposed (credit risk). Such contracts are agreements between the Funds and a counterparty to make periodic net payments on a specified notional amount or a net payment upon termination. Swap agreements are privately negotiated in the OTC market and may be entered into as a bilateral contract (“OTC Swaps”) or centrally cleared (“centrally cleared swaps”).
For OTC swaps, any upfront premiums paid and any upfront fees received are shown as swap premiums paid and swap premiums received, respectively, in the Statements of Assets and Liabilities and amortized over the term of the contract. The daily fluctuation in market value is recorded as unrealized appreciation (depreciation) on OTC Swaps in the Statements of Assets and Liabilities. Payments received or paid are recorded in the Statements of Operations as realized gains or losses, respectively. When an OTC swap is terminated, a realized gain or loss is recorded in the Statements of Operations equal to the difference between the proceeds from (or cost of) the closing transaction and the Funds’ basis in the contract, if any. Generally, the basis of the contract is the amortized premium received or paid.
| 140 | MATTHEWS ASIA FUNDS |
Table of Contents
Notes to Financial Statements (continued)
The Funds may buy credit default swaps on single-name issuers (corporate or sovereign), a combination or basket of single-name issuers or traded indexes. Credit default swaps are agreements in which the protection buyer pays fixed periodic payments to the seller in consideration for a promise from the protection seller to make a specific payment should a negative credit event take place with respect to the referenced entity (e.g., bankruptcy, failure to pay, obligation acceleration, repudiation, moratorium or restructuring). As a buyer, if an underlying credit event occurs, the Funds will either (i) receive from the seller an amount equal to the notional amount of the swap and deliver the referenced security or underlying securities comprising the index, or (ii) receive a net settlement of cash equal to the notional amount of the swap less the recovery value of the security or underlying securities comprising the index.
The Funds may enter into interest rate swaps to gain or reduce exposure to interest rates or to manage duration, the yield curve or interest rate (interest rate risk).
Interest rate swaps are agreements to exchange cash flows based on the difference between specified interest rates applied to a notional principal amount for a specified period of time. Risks related to the use of interest rate swaps include the potential for unanticipated movements in interest or currency rates, the possible failure of a counterparty to perform in accordance with the terms of the swap agreements and potential government regulation that could adversely affect the Funds’ swap investments.
Counterparty Credit Risk: A derivative contract may suffer a mark to market loss if the value of the contract decreases due to an unfavorable change in the market rates or values of the underlying instrument. Losses can also occur if the counterparty does not perform under the contract.
A Fund’s risk of loss from counterparty credit risk on OTC derivatives is generally limited to the aggregate unrealized gain netted against any collateral held by such Fund.
With exchange traded futures and centrally cleared swaps, there is less counterparty credit risk to the Funds since the exchange or clearinghouse, as counterparty to such instruments, guarantees against a possible default. The clearinghouse stands between the buyer and the seller of the contract; therefore, the credit risk is limited to failure of the clearinghouse. While offset rights may exist under applicable law, a Fund does not have a contractual right of offset against a clearing broker or clearinghouse in the event of a default (including the bankruptcy or insolvency) of the clearingbroker or clearinghouse. Additionally, credit risk exists in exchange traded futures and centrally cleared swaps with respect to initial and variation margin that is held in a clearing broker’s customer accounts. While clearing brokers are required to segregate customer margin from their own assets, in the event that a clearing broker becomes insolvent or goes into bankruptcy and at that time there is a shortfall in the aggregate amount of margin held by the clearing broker for all its clients, typically the shortfall would be allocated on a pro rata basis across all the clearing broker’s customers, potentially resulting in losses to the Funds.
In order to better define its contractual rights and to secure rights that will help the Funds mitigate their counterparty risk, a Fund may enter into an International Swaps and Derivatives Association, Inc. Master Agreement (“ISDA Master Agreement”) or similar agreement with its derivative contract counterparties. An ISDA Master Agreement is a bilateral agreement between each Fund and a counterparty that governs OTC derivatives and typically contains, among other things, collateral posting terms and netting provisions in the event of a default and/or termination event. Under an ISDA Master Agreement, each Fund may, under certain circumstances, offset with the counterparty certain derivative financial instruments’ payables and/or receivables with collateral held and/or posted and create one single net payment. The provisions of the ISDA Master Agreement typically permit a single net payment in the event of default including the bankruptcy or insolvency of the counterparty. However, bankruptcy or insolvency laws of a particular jurisdiction may impose restrictions on or prohibitions against the right of offset in bankruptcy, insolvency or other events. In addition, certain ISDA Master Agreements allow counterparties to OTC derivatives to terminate derivative contracts prior to maturity in the event a Fund’s net assets decline by a stated percentage or the Fund fails to meet the terms of its ISDA Master Agreements, which would cause the Fund to accelerate payment of any net liability owed to the counterparty.
Collateral requirements: For derivatives traded under an ISDA Master Agreement, the collateral requirements are typically calculated by netting the mark to market amount for each transaction under such agreement and comparing that amount to the value of any collateral currently pledged by a Fund and the counterparty. Cash collateral that has been pledged to cover obligations of a Fund, if any, is reported separately on the Statements of Assets and Liabilities as cash pledged as collateral. Non-cash collateral pledged by a Fund, if any, is noted in the Schedules of Investments.
For financial reporting purposes, the Funds do not offset derivative assets and derivative liabilities that are subject to netting arrangements in the Statements of Assets and Liabilities.
The Funds have implemented the disclosure requirements pursuant to FASB Accounting Standards update No. 2011-11, Disclosures about Offsetting Assets and Liabilities, that requires disclosures to make financial statements that are prepared under U.S. GAAP more comparable to those prepared under International Financial Reporting Standards. Under this guidance the Funds disclose in the Statements of Assets and Liabilities both gross and net information about instruments and transactions eligible for offset such as instruments and transactions subject to an agreement similar to a master netting arrangement. In addition, the Funds disclose collateral received and posted in connection with master netting agreements or similar arrangements.
The following table presents the Matthews Asia Total Return Bond Fund’s net exposure to each counterparty for derivatives that are subject to enforceable master netting arrangements as of December 31, 2022.
| Gross Value on Statments of Assets and Liabilities | ||||||||||||||||
| Counterparty | Assets | Liablities | Cash Collateral Pledged/(Receivable)1 | Net Amount2 | ||||||||||||
Bank of America, N.A. | $101,286 | ($8,088 | ) | $10,000 | $103,198 | |||||||||||
| 1 | Cash collateral pledged/(received) in excess of derivative assets/liabilities is not presented in this table. The total cash collateral is presented on the Fund’s Statement of Assets and Liabilities. |
| 2 | Represents the net amount receivable from (payable to) the counterparty in the event of a default. |
For the fiscal year ended December 31, 2022, the effects of derivative financial instruments on the statement of Assets and Liabilities was as follows:
| Statements of Assets and Liabilities Location | Matthews Asia Total Return Bond | |||||||||
| Asset Derivatives | ||||||||||
| Unrealized appreciation on forward foreign | ||||||||||
| Forward foreign currency exchange contracts | currency exchange contracts | $101,286 | ||||||||
|
| |||||||||
| Liability Derivatives | ||||||||||
| Unrealized depreciation on forward foreign | ||||||||||
| currency exchange contracts | ($8,088 | ) | ||||||||
|
| |||||||||
| matthewsasia.com | 800.789.ASIA | 141 |
Table of Contents
Notes to Financial Statements (continued)
For the fiscal year ended December 31, 2022, the effects of derivative financial instruments on the Statements of Operations were as follows:
| Derivative type | Statements of Operations Location | Matthews Asia Total Return Bond | ||||||||
Net Realized Gain (Loss) | ||||||||||
| Foreign currency contracts: | ||||||||||
Forward foreign currency exchange contracts | Net realized gain (loss) on forward foreign | |||||||||
| currency exchange contracts | ($1,233,772 | ) | ||||||||
| Interest rate swaps: | ||||||||||
Interest rate contracts | Net realized gain (loss) on swaps | (4,480 | ) | |||||||
|
| |||||||||
| Total | ($1,238,252 | ) | ||||||||
|
| |||||||||
Net Change In Unrealized Appreciation (Depreciation) | ||||||||||
| Foreign currency contracts: | ||||||||||
Forward foreign currency exchange contracts | Net change in unrealized appreciation/ | |||||||||
| depreciation on forward foreign currency | ||||||||||
| exchange contracts | $707,457 | |||||||||
| Interest rate swaps: | ||||||||||
Interest rate contracts | Net change in unrealized appreciation/ | |||||||||
| depreciation on swaps | (81,339 | ) | ||||||||
|
| |||||||||
| Total | $626,118 | |||||||||
|
| |||||||||
In regards to the forward foreign currency exchange contracts entered into by the Matthews Asia Total Return Bond Fund, the average notional ending quarterly amounts purchased in USD were $5,595,737 and the average notional ending quarterly amounts sold in USD were $9,069,336. In regards to the interest rate swap contracts entered into by the Matthews Asia Total Return Bond Fund, where the Fund receives the fixed rate and pays the floating rate, the average notional ending quarterly amounts in USD was $1,578,947.
| 4. | CAPITAL SHARE TRANSACTIONS |
| Year Ended December 31, 2022 | Year Ended December 31, 2021 | |||||||||||||||
| Shares | Amount | Shares | Amount | |||||||||||||
MATTHEWS EMERGING MARKETS EQUITY FUND | ||||||||||||||||
Investor Class | ||||||||||||||||
Shares sold | 543,935 | $6,760,608 | 709,531 | $11,546,227 | ||||||||||||
Shares issued through reinvestment of distributions | 14,921 | 169,949 | 76,220 | 1,071,651 | ||||||||||||
Shares redeemed | (580,296 | ) | (6,968,303 | ) | (481,860 | ) | (7,728,667 | ) | ||||||||
Net increase (decrease) | (21,440 | ) | ($37,746 | ) | 303,891 | $4,889,211 | ||||||||||
Institutional Class | ||||||||||||||||
Shares sold | 538,021 | $6,550,963 | 497,556 | $8,187,275 | ||||||||||||
Shares issued through reinvestment of distributions | 32,061 | 364,856 | 184,073 | 2,588,076 | ||||||||||||
Shares redeemed | (999,790 | ) | (10,801,893 | ) | (370,525 | ) | (5,749,633 | ) | ||||||||
Net increase (decrease) | (429,708 | ) | ($3,886,074 | ) | 311,104 | $5,025,718 | ||||||||||
MATTHEWS EMERGING MARKETS SUSTAINABLE FUTURE FUND | ||||||||||||||||
Investor Class | ||||||||||||||||
Shares sold | 1,098,927 | $14,356,992 | 1,249,460 | $20,652,739 | ||||||||||||
Shares issued through reinvestment of distributions | 126,489 | 1,643,095 | 204,051 | 3,179,112 | ||||||||||||
Shares redeemed | (1,223,916 | ) | (16,262,366 | ) | (1,378,374 | ) | (23,248,889 | ) | ||||||||
Net increase (decrease) | 1,500 | ($262,279 | ) | 75,137 | $582,962 | |||||||||||
Institutional Class | ||||||||||||||||
Shares sold | 8,359,951 | $109,214,942 | 2,938,670 | $49,371,326 | ||||||||||||
Shares issued through reinvestment of distributions | 520,431 | 6,765,600 | 427,487 | 6,664,516 | ||||||||||||
Shares redeemed | (3,359,345 | ) | (43,484,222 | ) | (1,088,483 | ) | (17,988,685 | ) | ||||||||
Net increase | 5,521,037 | $72,496,320 | 2,277,674 | $38,047,157 | ||||||||||||
MATTHEWS EMERGING MARKETS SMALL COMPANIES FUND | ||||||||||||||||
Investor Class | ||||||||||||||||
Shares sold | 1,463,829 | $36,219,282 | 1,617,341 | $47,891,984 | ||||||||||||
Shares issued in reorganization1 | — | — | 1,768,348 | 49,082,409 | ||||||||||||
Shares issued through reinvestment of distributions | 435,633 | 10,354,992 | 320,642 | 9,555,131 | ||||||||||||
Shares redeemed | (1,685,415 | ) | (43,078,500 | ) | (1,640,812 | ) | (48,081,821 | ) | ||||||||
Net increase | 214,047 | $3,495,774 | 2,065,519 | $58,447,703 | ||||||||||||
Institutional Class | ||||||||||||||||
Shares sold | 4,719,237 | $119,349,047 | 2,286,207 | $65,576,613 | ||||||||||||
Shares issued in reorganization1 | — | — | 2,436,030 | 67,500,144 | ||||||||||||
Shares issued through reinvestment of distributions | 709,335 | 16,832,529 | 397,521 | 11,822,265 | ||||||||||||
Shares redeemed | (2,933,352 | ) | (71,109,980 | ) | (1,870,741 | ) | (53,591,272 | ) | ||||||||
Net increase | 2,495,220 | $65,071,596 | 3,249,017 | $91,307,750 | ||||||||||||
| 142 | MATTHEWS ASIA FUNDS |
Table of Contents
Notes to Financial Statements (continued)
| Year Ended December 31, 2022 | Year Ended December 31, 2021 | |||||||||||||||
| Shares | Amount | Shares | Amount | |||||||||||||
MATTHEWS ASIA GROWTH FUND | ||||||||||||||||
Investor Class | ||||||||||||||||
Shares sold | 2,196,500 | $53,440,225 | 7,423,313 | $304,032,957 | ||||||||||||
Shares issued through reinvestment of distributions | 280,586 | 6,105,563 | 874,009 | 27,662,376 | ||||||||||||
Shares redeemed | (9,394,517 | ) | (217,632,827 | ) | (10,417,644 | ) | (396,564,020 | ) | ||||||||
Net (decrease) | (6,917,431 | ) | ($158,087,039 | ) | (2,120,322 | ) | ($64,868,687 | ) | ||||||||
Institutional Class | ||||||||||||||||
Shares sold | 8,636,741 | $205,709,835 | 14,166,492 | $560,286,297 | ||||||||||||
Shares issued through reinvestment of distributions | 461,447 | 10,165,668 | 1,549,232 | 49,575,432 | ||||||||||||
Shares redeemed | (26,559,936 | ) | (616,610,455 | ) | (10,898,197 | ) | (409,896,079 | ) | ||||||||
Net increase (decrease) | (17,461,748 | ) | ($400,734,952 | ) | 4,817,527 | $199,965,650 | ||||||||||
MATTHEWS PACIFIC TIGER FUND | ||||||||||||||||
Investor Class | ||||||||||||||||
Shares sold | 6,112,939 | $142,892,124 | 8,893,329 | $321,350,881 | ||||||||||||
Shares issued through reinvestment of distributions | 4,149,003 | 86,008,839 | 11,959,980 | 329,497,448 | ||||||||||||
Shares redeemed | (23,272,445 | ) | (523,023,023 | ) | (28,205,661 | ) | (969,424,207 | ) | ||||||||
Net (decrease) | (13,010,503 | ) | ($294,122,060 | ) | (7,352,352 | ) | ($318,575,878 | ) | ||||||||
Institutional Class | ||||||||||||||||
Shares sold | 62,395,908 | $1,443,573,678 | 47,973,599 | $1,692,522,684 | ||||||||||||
Shares issued through reinvestment of distributions | 9,622,597 | 199,476,439 | 34,730,797 | 955,791,557 | ||||||||||||
Shares redeemed | (137,484,729 | ) | (3,041,572,531 | ) | (64,771,287 | ) | (2,097,314,073 | ) | ||||||||
Net increase (decrease) | (65,466,224 | ) | ($1,398,522,414 | ) | 17,933,109 | $551,000,168 | ||||||||||
MATTHEWS ASIA INNOVATORS FUND | ||||||||||||||||
Investor Class | ||||||||||||||||
Shares sold | 7,678,394 | $115,859,588 | 15,900,681 | $439,497,187 | ||||||||||||
Shares issued through reinvestment of distributions | 4,958,740 | 58,612,306 | 4,617,381 | 86,991,462 | ||||||||||||
Shares redeemed | (13,166,923 | ) | (190,724,602 | ) | (19,490,967 | ) | (507,912,649 | ) | ||||||||
Net increase (decrease) | (529,789 | ) | ($16,252,708 | ) | 1,027,095 | $18,576,000 | ||||||||||
Institutional Class | ||||||||||||||||
Shares sold | 9,489,396 | $148,205,928 | 24,802,456 | $692,154,752 | ||||||||||||
Shares issued through reinvestment of distributions | 3,693,765 | 44,362,122 | 7,868,062 | 149,965,265 | ||||||||||||
Shares redeemed | (44,606,226 | ) | (688,227,731 | ) | (24,573,373 | ) | (619,998,491 | ) | ||||||||
Net increase (decrease) | (31,423,065 | ) | ($495,659,681 | ) | 8,097,145 | $222,121,526 | ||||||||||
MATTHEWS CHINA FUND | ||||||||||||||||
Investor Class | ||||||||||||||||
Shares sold | 6,751,257 | $111,112,645 | 8,883,802 | $247,820,469 | ||||||||||||
Shares issued through reinvestment of distributions | 2,084,117 | 31,178,384 | 4,527,322 | 95,933,945 | ||||||||||||
Shares redeemed | (12,430,268 | ) | (194,631,328 | ) | (14,536,851 | ) | (384,500,174 | ) | ||||||||
Net (decrease) | (3,594,894 | ) | ($52,340,299 | ) | (1,125,727 | ) | ($40,745,760 | ) | ||||||||
Institutional Class | ||||||||||||||||
Shares sold | 15,868,949 | $265,191,549 | 20,456,030 | $528,285,590 | ||||||||||||
Shares issued through reinvestment of distributions | 1,343,972 | 20,078,939 | 3,583,944 | 75,728,747 | ||||||||||||
Shares redeemed | (27,424,340 | ) | (427,780,367 | ) | (13,572,392 | ) | (338,913,059 | ) | ||||||||
Net increase (decrease) | (10,211,419 | ) | ($142,509,879 | ) | 10,467,582 | $265,101,278 | ||||||||||
MATTHEWS CHINA SMALL COMPANIES FUND | ||||||||||||||||
Investor Class | ||||||||||||||||
Shares sold | 3,436,963 | $44,992,214 | 8,959,506 | $189,717,563 | ||||||||||||
Shares issued through reinvestment of distributions | 173,336 | 1,984,698 | 1,975,948 | 32,484,582 | ||||||||||||
Shares redeemed | (6,599,506 | ) | (82,835,265 | ) | (12,033,641 | ) | (241,573,249 | ) | ||||||||
Net (decrease) | (2,989,207 | ) | ($35,858,353 | ) | (1,098,187 | ) | ($19,371,104 | ) | ||||||||
Institutional Class | ||||||||||||||||
Shares sold | 2,927,129 | $38,281,777 | 6,605,771 | $137,241,251 | ||||||||||||
Shares issued through reinvestment of distributions | 78,949 | 904,757 | 1,402,207 | 23,094,348 | ||||||||||||
Shares redeemed | (9,263,348 | ) | (106,586,014 | ) | (3,049,880 | ) | (60,184,940 | ) | ||||||||
Net increase (decrease) | (6,257,270 | ) | ($67,399,480 | ) | 4,958,098 | $100,150,659 | ||||||||||
| matthewsasia.com | 800.789.ASIA | 143 |
Table of Contents
Notes to Financial Statements (continued)
| Year Ended December 31, 2022 | Year Ended December 31, 2021 | |||||||||||||||
| Shares | Amount | Shares | Amount | |||||||||||||
MATTHEWS INDIA FUND | ||||||||||||||||
Investor Class | ||||||||||||||||
Shares sold | 1,593,397 | $42,087,227 | 2,813,109 | $80,696,081 | ||||||||||||
Shares issued through reinvestment of distributions | 2,952,961 | 67,091,273 | 2,067,362 | 57,059,198 | ||||||||||||
Shares redeemed | (4,188,976 | ) | (106,860,935 | ) | (5,842,428 | ) | (166,461,095 | ) | ||||||||
Net increase (decrease) | 357,382 | $2,317,565 | (961,957 | ) | ($28,705,816 | ) | ||||||||||
Institutional Class | ||||||||||||||||
Shares sold | 894,519 | $22,947,980 | 1,816,167 | $52,199,270 | ||||||||||||
Shares issued through reinvestment of distributions | 456,719 | 10,591,311 | 314,464 | 8,820,713 | ||||||||||||
Shares redeemed | (1,541,629 | ) | (39,262,095 | ) | (1,015,833 | ) | (29,554,992 | ) | ||||||||
Net increase (decrease) | (190,391 | ) | ($5,722,804 | ) | 1,114,798 | $31,464,991 | ||||||||||
MATTHEWS JAPAN FUND | ||||||||||||||||
Investor Class | ||||||||||||||||
Shares sold | 1,890,537 | $31,931,773 | 6,743,366 | $166,680,993 | ||||||||||||
Shares issued through reinvestment of distributions | 877,175 | 13,482,177 | 1,755,976 | 39,527,030 | ||||||||||||
Shares redeemed | (5,698,655 | ) | (100,302,819 | ) | (35,183,485 | ) | (842,316,315 | ) | ||||||||
Net (decrease) | (2,930,943 | ) | ($54,888,869 | ) | (26,684,143 | ) | ($636,108,292 | ) | ||||||||
Institutional Class | ||||||||||||||||
Shares sold | 20,568,891 | $361,445,980 | 39,272,380 | $945,798,673 | ||||||||||||
Shares issued through reinvestment of distributions | 1,915,282 | 29,495,342 | 5,389,914 | 121,542,567 | ||||||||||||
Shares redeemed | (47,662,766 | ) | (784,368,302 | ) | (13,446,544 | ) | (324,879,350 | ) | ||||||||
Net increase (decrease) | (25,178,593 | ) | ($393,426,980 | ) | 31,215,750 | $742,461,890 | ||||||||||
MATTHEWS KOREA FUND | ||||||||||||||||
Investor Class | ||||||||||||||||
Shares sold | 1,794,314 | $7,344,868 | 2,166,787 | $14,093,494 | ||||||||||||
Shares issued through reinvestment of distributions | 1,920,486 | 7,451,487 | 1,365,820 | 7,771,518 | ||||||||||||
Shares redeemed | (5,847,971 | ) | (24,651,834 | ) | (6,041,095 | ) | (38,538,375 | ) | ||||||||
Net (decrease) | (2,133,171 | ) | ($9,855,479 | ) | (2,508,488 | ) | ($16,673,363 | ) | ||||||||
Institutional Class | ||||||||||||||||
Shares sold | 491,400 | $2,268,597 | 1,069,910 | $7,020,298 | ||||||||||||
Shares issued through reinvestment of distributions | 242,543 | 953,194 | 164,505 | 944,259 | ||||||||||||
Shares redeemed | (968,761 | ) | (4,304,395 | ) | (602,319 | ) | (3,854,282 | ) | ||||||||
Net increase (decrease) | (234,818 | ) | ($1,082,604 | ) | 632,096 | $4,110,275 | ||||||||||
MATTHEWS ASIAN GROWTH AND INCOME FUND | ||||||||||||||||
Investor Class | ||||||||||||||||
Shares sold | 2,072,697 | $28,836,381 | 2,726,234 | $50,277,256 | ||||||||||||
Shares issued through reinvestment of distributions | 1,292,489 | 16,634,895 | 3,842,976 | 62,138,570 | ||||||||||||
Shares redeemed | (9,901,120 | ) | (135,266,079 | ) | (10,174,874 | ) | (183,241,744 | ) | ||||||||
Net (decrease) | (6,535,934 | ) | ($89,794,803 | ) | (3,605,664 | ) | ($70,825,918 | ) | ||||||||
Institutional Class | ||||||||||||||||
Shares sold | 9,508,243 | $131,777,583 | 9,687,951 | $178,195,373 | ||||||||||||
Shares issued through reinvestment of distributions | 1,200,111 | 15,469,643 | 4,074,854 | 65,968,954 | ||||||||||||
Shares redeemed | (23,448,483 | ) | (305,383,902 | ) | (24,989,912 | ) | (446,066,163 | ) | ||||||||
Net (decrease) | (12,740,129 | ) | ($158,136,676 | ) | (11,227,107 | ) | ($201,901,836 | ) | ||||||||
MATTHEWS ASIA DIVIDEND FUND | ||||||||||||||||
Investor Class | ||||||||||||||||
Shares sold | 7,514,453 | $115,243,327 | 12,057,493 | $274,397,893 | ||||||||||||
Shares issued through reinvestment of distributions | 505,887 | 7,582,603 | 12,044,142 | 231,202,200 | ||||||||||||
Shares redeemed | (46,253,275 | ) | (662,868,059 | ) | (41,646,108 | ) | (927,390,236 | ) | ||||||||
Net (decrease) | (38,232,935 | ) | ($540,042,129 | ) | (17,544,473 | ) | ($421,790,143 | ) | ||||||||
Institutional Class | ||||||||||||||||
Shares sold | 39,426,296 | $582,376,055 | 53,859,272 | $1,217,283,482 | ||||||||||||
Shares issued through reinvestment of distributions | 1,155,172 | 17,289,211 | 22,772,158 | 436,803,502 | ||||||||||||
Shares redeemed | (112,802,946 | ) | (1,587,005,266 | ) | (38,600,689 | ) | (836,421,015 | ) | ||||||||
Net increase (decrease) | (72,221,478 | ) | ($987,340,000 | ) | 38,030,741 | $817,665,969 | ||||||||||
| 144 | MATTHEWS ASIA FUNDS |
Table of Contents
Notes to Financial Statements (continued)
| Year Ended December 31, 2022 | Year Ended December 31, 2021 | |||||||||||||||
| Shares | Amount | Shares | Amount | |||||||||||||
MATTHEWS CHINA DIVIDEND FUND | ||||||||||||||||
Investor Class | ||||||||||||||||
Shares sold | 2,997,704 | $43,780,103 | 3,142,125 | $63,677,062 | ||||||||||||
Shares issued through reinvestment of distributions | 563,832 | 8,208,582 | 1,155,183 | 21,089,762 | ||||||||||||
Shares redeemed | (6,111,791 | ) | (84,105,056 | ) | (5,663,768 | ) | (114,181,841 | ) | ||||||||
Net (decrease) | (2,550,255 | ) | ($32,116,371 | ) | (1,366,460 | ) | ($29,415,017 | ) | ||||||||
Institutional Class | ||||||||||||||||
Shares sold | 2,658,451 | $38,472,050 | 3,631,851 | $74,478,535 | ||||||||||||
Shares issued through reinvestment of distributions | 320,617 | 4,657,289 | 730,061 | 13,362,860 | ||||||||||||
Shares redeemed | (4,375,736 | ) | (62,829,410 | ) | (2,827,086 | ) | (55,351,224 | ) | ||||||||
Net increase (decrease) | (1,396,668 | ) | ($19,700,071 | ) | 1,534,826 | $32,490,171 | ||||||||||
MATTHEWS ASIA TOTAL RETURN BOND FUND | ||||||||||||||||
Investor Class | ||||||||||||||||
Shares sold | 478,009 | $4,167,133 | 1,180,628 | $12,970,119 | ||||||||||||
Shares issued through reinvestment of distributions | 82,551 | 729,766 | 140,376 | 1,506,992 | ||||||||||||
Shares redeemed | (1,370,345 | ) | (11,803,610 | ) | (2,187,511 | ) | (23,638,876 | ) | ||||||||
Net (decrease) | (809,785 | ) | ($6,906,711 | ) | (866,507 | ) | ($9,161,765 | ) | ||||||||
Institutional Class | ||||||||||||||||
Shares sold | 661,731 | $5,846,418 | 3,754,829 | $41,266,970 | ||||||||||||
Shares issued through reinvestment of distributions | 245,135 | 2,166,952 | 401,205 | 4,298,763 | ||||||||||||
Shares redeemed | (6,276,957 | ) | (51,790,129 | ) | (2,473,473 | ) | (26,246,827 | ) | ||||||||
Net increase (decrease) | (5,370,091 | ) | ($43,776,759 | ) | 1,682,561 | $19,318,906 | ||||||||||
MATTHEWS ASIA CREDIT OPPORTUNITIES FUND | ||||||||||||||||
Investor Class | ||||||||||||||||
Shares sold | 222,696 | $1,850,637 | 430,191 | $4,182,400 | ||||||||||||
Shares issued through reinvestment of distributions | 38,163 | 290,772 | 42,926 | 415,208 | ||||||||||||
Shares redeemed | (656,079 | ) | (4,968,936 | ) | (465,891 | ) | (4,464,027 | ) | ||||||||
Net increase (decrease) | (395,220 | ) | ($2,827,527 | ) | 7,226 | $133,581 | ||||||||||
Institutional Class | ||||||||||||||||
Shares sold | 1,307,613 | $9,649,143 | 2,341,111 | $22,982,610 | ||||||||||||
Shares issued through reinvestment of distributions | 184,077 | 1,373,878 | 349,347 | 3,411,004 | ||||||||||||
Shares redeemed | (1,727,959 | ) | (13,416,155 | ) | (7,045,662 | ) | (65,107,414 | ) | ||||||||
Net (decrease) | (236,269 | ) | ($2,393,134 | ) | (4,355,204 | ) | ($38,713,800 | ) | ||||||||
| 1 | See Note 1-A regarding the reorganization. |
| 5. | INVESTMENT ADVISORY FEES AND OTHER TRANSACTIONS WITH AFFILIATES |
Matthews, a registered investment advisor under the 1940 Act, provides the Funds with investment management services. Pursuant to the prior Investment Advisory Agreement dated August 13, 2004, as amended (the “Prior Advisory Agreement”) and the current Investment Advisory Agreement dated February 1, 2016, as amended (the “Current Advisory Agreement,” and together with the Prior Advisory Agreement, the “Advisory Agreement”), the Funds pay Matthews (i) for management and advisory services; and (ii) for certain administrative services, an annual fee as a percentage of average daily net assets. Under the Advisory Agreement each of the Funds, other than Matthews Emerging Markets Small Companies Fund, Matthews China Small Companies Fund, Matthews Asia Total Return Bond Fund and Matthews Asia Credit Opportunities Fund (the “Family-Priced Funds”), pays Matthews 0.75% of their aggregate average daily net assets up to $2 billion, 0.6834% of their aggregate average daily net assets over $2 billion up to $5 billion, 0.65% of their aggregate average daily net assets over $5 billion up to $25 billion, 0.64% of their aggregate average daily net assets over $25 billion up to $30 billion, 0.63% of their aggregate average daily net assets over $30 billion up to $35 billion, 0.62% of their aggregate average daily net assets over $35 billion up to $40 billion, 0.61% of their aggregate average daily net assets over $40 billion up to $45 billion, and 0.60% of their aggregate average daily net assets over $45 billion. Each of the Matthews Asia Total Return Bond Fund and Matthews Asia Credit Opportunities Fund pays Matthews an annual fee of 0.55% of such Fund’s annual average daily net assets pursuant to the Advisory Agreement. Each of the Matthews Emerging Markets Small Companies Fund and the Matthews China Small Companies Fund pays Matthews an annual fee of 1.00% of the average daily net assets of such Fund up to $1 billion and 0.95% of the average daily net assets of such Fund over $1 billion pursuant to the Advisory Agreement. Each Fund pays Matthews a monthly fee at the annual rate using the applicable management fee calculated based on the actual number of days of that month and based on the Fund’s average daily net asset value for the month.
Pursuant to a fee waiver letter agreement, effective as of September 1, 2014, between the Trust, on behalf of the Family-Priced Funds, and Matthews (as amended from time to time, the “Fee Waiver Agreement”), for each Family-Priced Fund, Matthews has agreed to waive a portion of the fee payable under the Advisory Agreement and a portion of the fee payable under the Administration and Shareholder Services Agreement, if any Family-Priced Fund’s average daily net assets are over $3 billion, as follows: for every $2.5 billion average daily net assets of a Family-Priced Fund that are over $3 billion, the fee rates that otherwise would be applied for calculating fees payable under the Advisory Agreement and the Administration and Shareholder Services Agreement for such Family-Priced Fund with respect to such excess average daily net assets will be each reduced by 0.01%, in each case without reducing such fee rate below 0.00%.
| matthewsasia.com | 800.789.ASIA | 145 |
Table of Contents
Notes to Financial Statements (continued)
Investment advisory fees charged, waived fees and reimbursed additional expenses for the year ended December 31, 2022, were as follows:
| Gross Advisory Fees | Advisory Fees Waived and Expenses Waived or Reimbursed in Excess of the Expense Limitation | Net Advisory Fee/ (Net Reimbursement) | ||||||||||
| Matthews Emerging Markets Equity Fund | $270,426 | ($220,410 | ) | $50,016 | ||||||||
| Matthews Emerging Markets Sustainable Future Fund | 912,375 | 81,420 | 993,795 | |||||||||
| Matthews Emerging Markets Small Companies Fund | 3,600,841 | (647,978 | ) | 2,952,863 | ||||||||
| Matthews Asia Growth Fund | 6,756,260 | — | 6,756,260 | |||||||||
| Matthews Pacific Tiger Fund | 36,545,335 | (283,697 | ) | 36,261,638 | ||||||||
| Matthews Asia Innovators Fund | 4,974,909 | — | 4,974,909 | |||||||||
| Matthews China Fund | 6,451,300 | — | 6,451,300 | |||||||||
| Matthews China Small Companies Fund | 2,494,569 | (388,736 | ) | 2,105,833 | ||||||||
| Matthews India Fund | 4,461,594 | — | 4,461,594 | |||||||||
| Matthews Japan Fund | 7,009,512 | — | 7,009,512 | |||||||||
| Matthews Korea Fund | 694,962 | — | 694,962 | |||||||||
| Matthews Asian Growth and Income Fund | 5,946,121 | — | 5,946,121 | |||||||||
| Matthews Asia Dividend Fund | 21,162,558 | (41,494 | ) | 21,121,064 | ||||||||
| Matthews China Dividend Fund | 1,732,129 | — | 1,732,129 | |||||||||
| Matthews Asia Total Return Bond Fund | 386,758 | (130,734 | ) | 256,024 | ||||||||
| Matthews Asia Credit Opportunities Fund | 168,627 | (121,945 | ) | 46,682 | ||||||||
Under a written agreement between the Funds and Matthews (the “Operating Expense Agreement”), Matthews agrees to waive fees and reimburse expenses to a Fund if its expense ratio exceeds a certain percentage level. For all Funds, except the Matthews Emerging Markets Equity Fund, the Matthews Emerging Markets Sustainable Future Fund, the Matthews Emerging Markets Small Companies Fund, the Matthews Asia Total Return Bond Fund and the Matthews Asia Credit Opportunities Fund, this level is 1.20% for the Institutional Class. For the Matthews Emerging Markets Equity Fund, the Matthews Asia Total Return Bond Fund and the Matthews Asia Credit Opportunities Fund, this level is 0.90% for the Institutional Class. Effective July 29, 2022, for the Matthews Emerging Markets Sustainable Future Fund, this level is 1.15% for the Institutional Class. For the Matthews Emerging Markets Small Companies Fund, this level is also 1.15% for the Institutional Class. Matthews agrees to reduce the expense ratio for the Investor Class by waiving an equal amount of non-class specific expenses (e.g., custody fees) as the Institutional Class. Because certain expenses of the Investor Class may be higher than those of the Institutional Class and because class specific expenses may be waived solely for the Institutional Class, total annual Fund expenses for the Investor Class may exceed 1.20% (or 0.90% for the Matthews Emerging Markets Equity Fund, the Matthews Asia Total Return Bond Fund and the Matthews Asia Credit Opportunities Fund, or 1.15% for the Matthews Emerging Markets Sustainable Future Fund and Matthews Emerging Markets Small Companies Fund). In turn, if the expenses of a Fund, other than the Matthews Asia Total Return Bond Fund and the Matthews Asia Credit Opportunities Fund, fall below the level noted within three years after Matthews has made such a reimbursement, the Fund may reimburse Matthews up to an amount of the recoupment available not to exceed the lesser of (i) the expense limitation applicable at the time of that fee waiver and/or expense reimbursement or (ii) the expense limitation in effect at the time of recoupment. For the Matthews Asia Total Return Bond Fund and the Matthews Asia Credit Opportunities Fund, any amount waived for prior fiscal years is not subject to recoupment. This agreement will continue through April 30, 2023, may be extended for additional periods not exceeding one year, and may be terminated at any time by the Board of Trustees on behalf of the Fund on 60 days’ written notice to Matthews. Matthews may decline to renew this agreement by written notice to the Trust at least 30 days before its annual expiration date.
Waived Fees Subject to Possible Future Recoupment:
On December 31, 2022, the amounts expired and subject to possible future recoupment under the expense limitation agreement are as follows:
| Expired December 31, | Expiring December 31, | |||||||||||||||||||
| 2022 | 2023 | 2024 | 2025 | |||||||||||||||||
| Matthews Emerging Markets Equity Fund | $— | $ | 231,409 | $ | 248,206 | $ | 263,291 | |||||||||||||
| Matthews Emerging Markets Small Companies Fund | 336,966 | 378,868 | 638,812 | 647,978 | ||||||||||||||||
| Matthews China Small Companies Fund | 167,178 | 362,019 | 309,590 | 388,736 | ||||||||||||||||
The Funds have an Administration and Shareholder Services Agreement dated August 13, 2004, as amended (the “Shareholder Services Agreement” or “Services Agreement”), in which the Funds pay an annual administration and shareholder servicing fee to Matthews, as a percentage of the average daily net assets of each Fund in aggregate, computed and prorated on a daily basis. Under the Shareholder Services Agreement, the Funds in the aggregate pay Matthews 0.25% of their aggregate average daily net assets up to $2 billion, 0.1834% of their aggregate average daily net assets over $2 billion up to $5 billion, 0.15% of their aggregate average daily net assets over $5 billion up to $7.5 billion, 0.125% of their aggregate average daily net assets over $7.5 billion up to $15 billion, 0.11% of their aggregate average daily net assets over $15 billion up to $22.5 billion, 0.10% of their aggregate average daily net assets over $22.5 billion up to $25 billion, 0.09% of their aggregate average daily net assets over $25 billion up to $30 billion, 0.08% of their aggregate average daily net assets over $30 billion up to $35 billion, 0.07% of their aggregate average daily net assets over $35 billion up to $40 billion, 0.06% of their aggregate average daily net assets over $40 billion up to $45 billion, and 0.05% of their aggregate average daily net assets over $45 billion.
| 146 | MATTHEWS ASIA FUNDS |
Table of Contents
Notes to Financial Statements (continued)
Administration and shareholder servicing fees charged, for the year ended December 31, 2022, were as follows:
| Gross Administration and Shareholder Servicing Fees | Administration and Shareholder Servicing Fees Waived in Excess of Expense Limitation | Net Administration and Shareholder Servicing Fees | ||||||||||
| Matthews Emerging Markets Equity Fund | $62,995 | $— | $62,995 | |||||||||
| Matthews Emerging Markets Sustainable Future Fund | 214,648 | — | 214,648 | |||||||||
| Matthews Emerging Markets Small Companies Fund | 566,547 | — | 566,547 | |||||||||
| Matthews Asia Growth Fund | 1,565,675 | — | 1,565,675 | |||||||||
| Matthews Pacific Tiger Fund | 8,497,421 | (283,696 | ) | 8,213,725 | ||||||||
| Matthews Asia Innovators Fund | 1,151,682 | — | 1,151,682 | |||||||||
| Matthews China Fund | 1,499,439 | — | 1,499,439 | |||||||||
| Matthews China Small Companies Fund | 387,891 | — | 387,891 | |||||||||
| Matthews India Fund | 1,043,262 | — | 1,043,262 | |||||||||
| Matthews Japan Fund | 1,626,986 | — | 1,626,986 | |||||||||
| Matthews Korea Fund | 161,878 | — | 161,878 | |||||||||
| Matthews Asian Growth and Income Fund | 1,384,955 | — | 1,384,955 | |||||||||
| Matthews Asia Dividend Fund | 4,904,833 | (41,494 | ) | 4,863,339 | ||||||||
| Matthews China Dividend Fund | 403,328 | — | 403,328 | |||||||||
| Matthews Asia Total Return Bond Fund | 109,024 | — | 109,024 | |||||||||
| Matthews Asia Credit Opportunities Fund | 47,918 | — | 47,918 | |||||||||
In addition to the fees paid to the Funds’ transfer agent, the Funds bear the cost of fees paid to certain service providers or intermediaries, including supermarkets, which provide transfer agency, record-keeping and shareholder servicing to certain shareholders. These fees are referred to as intermediary service fees on the Statements of Assets and Liabilities as well as the Statements of Operations. Additional information concerning these services and fees is contained in the Funds’ prospectuses.
BNY Mellon Investment Servicing (US) Inc. (“BNY Mellon”), an indirect wholly owned subsidiary of The Bank of New York Mellon Corporation, serves as the Funds’ administrator, and in that capacity, performs various administrative and accounting services for each Fund. BNY Mellon also serves as the Funds’ transfer agent, dividend disbursing agent and registrar. An officer of BNY Mellon serves as Assistant Treasurer to the Funds. Total fees accrued by the Funds for administration and accounting services for the year ended December 31, 2022 were as follows:
| Administration and Accounting fees | ||||
| Matthews Emerging Markets Equity Fund | $3,224 | |||
| Matthews Emerging Markets Sustainable Future Fund | 10,861 | |||
| Matthews Emerging Markets Small Companies Fund | 28,807 | |||
| Matthews Asia Growth Fund | 80,606 | |||
| Matthews Pacific Tiger Fund | 435,812 | |||
| Matthews Asia Innovators Fund | 59,360 | |||
| Matthews China Fund | 76,936 | |||
| Matthews China Small Companies Fund | 19,957 | |||
| Matthews India Fund | 53,160 | |||
| Matthews Japan Fund | 83,612 | |||
| Matthews Korea Fund | 8,285 | |||
| Matthews Asian Growth and Income Fund | 70,892 | |||
| Matthews Asia Dividend Fund | 252,482 | |||
| Matthews China Dividend Fund | 20,651 | |||
| Matthews Asia Total Return Bond Fund | 5,625 | |||
| Matthews Asia Credit Opportunities Fund | 2,453 | |||
As of December 31, 2022, Matthews and its affiliates held significant shares in the Funds as follows:
| Shares held by Matthews and its Affiliates | Percentage of Outstanding Shares | |||||||
| Matthews Emerging Markets Equity Fund | 636,891 | 21% | ||||||
| Matthews Asia Credit Opportunities Fund | 704,645 | 18% | ||||||
Certain officers and Trustees of the Funds are also officers and directors of Matthews. All officers serve without compensation from the Funds. The Funds paid the Independent Trustees $1,178,700 in aggregate for regular compensation during the year ended December 31, 2022.
| matthewsasia.com | 800.789.ASIA | 147 |
Table of Contents
Notes to Financial Statements (continued)
| 6. | INVESTMENTS |
The value of investment transactions made for affiliated and unaffiliated holdings for the year ended December 31, 2022 were as follows:
| Affiliated Purchases | Proceeds from Affiliated Sales | Unaffiliated Purchases | Proceeds from Unaffiliated Sales | |||||||||||||
| Matthews Emerging Markets Equity Fund | $— | $— | $24,649,325 | $26,979,784 | ||||||||||||
| Matthews Emerging Markets Sustainable Future Fund | — | — | 103,204,602 | 42,833,293 | ||||||||||||
| Matthews Emerging Markets Small Companies Fund | — | — | 142,677,443 | 101,279,778 | ||||||||||||
| Matthews Asia Growth Fund | — | — | 482,600,909 | 1,059,503,841 | ||||||||||||
| Matthews Pacific Tiger Fund | — | — | 300,908,570 | 2,339,374,110 | ||||||||||||
| Matthews Asia Innovators Fund | — | 7,399,241 | 895,443,531 | 1,508,217,537 | ||||||||||||
| Matthews China Fund | — | — | 476,107,630 | 710,986,663 | ||||||||||||
| Matthews China Small Companies Fund | — | — | 145,759,507 | 252,009,400 | ||||||||||||
| Matthews India Fund | — | — | 271,478,522 | 372,819,075 | ||||||||||||
| Matthews Japan Fund | — | — | 859,879,523 | 1,360,241,261 | ||||||||||||
| Matthews Korea Fund | — | — | 56,967,593 | 74,507,364 | ||||||||||||
| Matthews Asian Growth and Income Fund | — | — | 113,619,016 | 375,086,725 | ||||||||||||
| Matthews Asia Dividend Fund | — | 97,542,339 | 1,559,502,634 | 2,888,230,515 | ||||||||||||
| Matthews China Dividend Fund | — | — | 168,731,228 | 224,727,608 | ||||||||||||
| Matthews Asia Total Return Bond Fund | — | — | 9,287,927 | 61,805,911 | ||||||||||||
| Matthews Asia Credit Opportunities Fund | — | — | 7,751,815 | 13,499,405 | ||||||||||||
| 7. | HOLDINGS OF 5% VOTING SHARES OF PORTFOLIO COMPANIES |
The 1940 Act defines “affiliated companies” to include investments in portfolio companies in which a fund owns 5% or more of the outstanding voting shares. During the year ended December 31, 2022, the Funds below held 5% or more of the outstanding voting shares of the noted portfolio companies. During this period, other Funds in the Trust may also have held voting shares of the issuers at levels below 5%.
Investments in affiliates:
A summary of transactions in securities of issuers affiliated with a Fund for the year ended December 31, 2022 is as follows:
| Value at Dec. 31, 2021 | Purchases | Sales | Net Realized Gain (Loss) Jan. 1,2022- Dec. 31, 2022 | Net Change in Unrealized Appreciation (Depreciation) | Value at Dec. 31, 2022 | Shares Dec. 31, 2022 | Dividend Income Jan. 1,2022- Dec. 31, 2022 | |||||||||||||||||||||||||
| MATTHEWS ASIA INNOVATORS FUND |
| |||||||||||||||||||||||||||||||
| Name of Issuer: | ||||||||||||||||||||||||||||||||
MicroTech Medical Hangzhou Co., Ltd.† | $15,680,307 | $— | $7,399,241 | ($11,660,276 | ) | $3,379,210 | $— | — | $— | |||||||||||||||||||||||
| MATTHEWS ASIA DIVIDEND FUND |
| |||||||||||||||||||||||||||||||
| Name of Issuer: | ||||||||||||||||||||||||||||||||
KATITAS Co., Ltd.† | $161,151,617 | $— | $35,085,366 | $10,801,679 | ($76,042,289 | ) | $— | — | $1,029,049 | |||||||||||||||||||||||
Minth Group, Ltd.† | 272,336,759 | — | 38,934,904 | 19,666,281 | (128,659,932 | ) | — | — | 4,669,744 | |||||||||||||||||||||||
Yuexiu Transport Infrastructure, Ltd.† | 55,636,352 | — | 23,522,069 | 702,654 | (4,904,631 | ) | — | — | 4,736,071 | |||||||||||||||||||||||
Total Affiliates | $31,170,614 | ($209,606,852 | ) | $— | $10,434,864 | |||||||||||||||||||||||||||
| † | Issuer was not an affiliated company as of December 31, 2022. |
| 8. | INCOME TAX INFORMATION |
It is the policy of the Funds to comply with all requirements of the Internal Revenue Code of 1986, as amended (“the Code”), applicable to regulated investment companies and to distribute substantially all of their taxable income to their shareholders. The Funds have met the requirements of the Code applicable to regulated investment companies for the year ended December 31, 2022. Therefore, no federal income tax provision is required.
Management has analyzed the Funds’ tax positions taken on federal income tax returns for all open tax years (current and prior three tax years), and has concluded that no provision for federal income tax is required in the Funds’ financial statements. The Funds’ federal and state income and federal excise tax returns for tax years for which the applicable statutes of limitations have not expired are subject to examination by the Internal Revenue Service and state departments of revenue.
| 148 | MATTHEWS ASIA FUNDS |
Table of Contents
Notes to Financial Statements (continued)
As of December 31, 2022, the components of accumulated earnings/deficit on tax basis were as follows:
Undistributed Ordinary Income | Undistributed Long-Term Capital Gains | Capital Loss Carryforwards | ||||||||||
| Matthews Emerging Markets Equity Fund | $25,459 | — | ($4,382,141 | ) | ||||||||
| Matthews Emerging Markets Sustainable Future Fund | 974,336 | 479,771 | — | |||||||||
| Matthews Emerging Markets Small Companies Fund | 1,974,793 | 12,354,404 | (83,618,354 | ) | ||||||||
| Matthews Asia Growth Fund | 7,189,092 | — | (147,349,388 | ) | ||||||||
| Matthews Pacific Tiger Fund | 64,358,094 | — | (33,908,360 | ) | ||||||||
| Matthews Asia Innovators Fund | — | — | (271,526,248 | ) | ||||||||
| Matthews China Fund | 4,081,118 | — | (149,300,324 | ) | ||||||||
| Matthews China Small Companies Fund | 2,172,094 | — | (96,309,630 | ) | ||||||||
| Matthews India Fund | — | — | — | |||||||||
| Matthews Japan Fund | — | — | (168,385,781 | ) | ||||||||
| Matthews Korea Fund | 1,077,124 | — | (4,223,076 | ) | ||||||||
| Matthews Asian Growth and Income Fund | 6,994,429 | — | (50,558,564 | ) | ||||||||
| Matthews Asia Dividend Fund | 1,606,925 | — | (351,455,897 | ) | ||||||||
| Matthews China Dividend Fund | 2,970,404 | — | (31,862,741 | ) | ||||||||
| Matthews Asia Total Return Bond Fund | 226,957 | — | (3,588,928 | ) | ||||||||
| Matthews Asia Credit Opportunities Fund | 315,772 | — | (8,029,651 | ) | ||||||||
Late Year Losses* | Other Temporary Differences | Unrealized Appreciation (Depreciation)** | Total Accumulated Earnings/(Deficit) | |||||||||||||
| Matthews Emerging Markets Equity Fund | $— | $— | ($5,599,200 | ) | $(9,955,882 | ) | ||||||||||
| Matthews Emerging Markets Sustainable Future Fund | — | — | (6,821,298 | ) | (5,367,191 | ) | ||||||||||
| Matthews Emerging Markets Small Companies Fund | — | — | (5,216,129 | ) | (74,505,286 | ) | ||||||||||
| Matthews Asia Growth Fund | — | — | (34,662,743 | ) | (174,823,039 | ) | ||||||||||
| Matthews Pacific Tiger Fund | — | — | 241,260,332 | 271,710,066 | ||||||||||||
| Matthews Asia Innovators Fund | (1,695,641 | ) | — | (97,393,020 | ) | (370,614,909 | ) | |||||||||
| Matthews China Fund | — | — | (209,833,231 | ) | (355,052,437 | ) | ||||||||||
| Matthews China Small Companies Fund | — | — | (38,491,833 | ) | (132,629,369 | ) | ||||||||||
| Matthews India Fund | (4,306,898 | ) | — | 43,945,994 | 39,639,096 | |||||||||||
| Matthews Japan Fund | — | — | (25,253,973 | ) | (193,639,754 | ) | ||||||||||
| Matthews Korea Fund | — | — | 3,510,668 | 364,716 | ||||||||||||
| Matthews Asian Growth and Income Fund | — | — | 7,089,185 | (36,474,950 | ) | |||||||||||
| Matthews Asia Dividend Fund | — | — | (59,762,567 | ) | (409,611,539 | ) | ||||||||||
| Matthews China Dividend Fund | — | — | (11,052,390 | ) | (39,944,727 | ) | ||||||||||
| Matthews Asia Total Return Bond Fund | (25,122,629 | ) | (28,484,600 | ) | ||||||||||||
| Matthews Asia Credit Opportunities Fund | — | — | (11,967,792 | ) | (19,681,671 | ) | ||||||||||
| * | The Funds have elected to defer certain qualified late-year losses and recognize such losses in the next fiscal year. |
| ** | The differences between book-basis and tax-basis unrealized appreciation/depreciation is attributable primarily to the tax deferral of losses on wash sales and passive foreign investment company (PFIC) mark to market adjustments. |
| matthewsasia.com | 800.789.ASIA | 149 |
Table of Contents
Notes to Financial Statements (continued)
As of December 31, 2022, the Funds have capital loss carryforwards available to offset future realized capital gains through the indicated expiration dates as follows:
| Amount With No Expiration | ||||||||||||
| Short-term Losses | Long-term Losses | Total | ||||||||||
| Matthews Emerging Markets Equity Fund | $3,392,560 | $989,581 | $4,382,141 | |||||||||
| Matthews Emerging Markets Small Companies Fund | — | 83,618,354 | 83,618,354 | |||||||||
| Matthews Asia Growth Fund | 124,610,849 | 22,738,539 | 147,349,388 | |||||||||
| Matthews Pacific Tiger Fund | 33,908,360 | — | 33,908,360 | |||||||||
| Matthews Asia Innovators Fund | 179,655,785 | 91,870,463 | 271,526,248 | |||||||||
| Matthews China Fund | 102,659,675 | 46,640,649 | 149,300,324 | |||||||||
| Matthews China Small Companies Fund | 41,071,139 | 55,238,491 | 96,309,630 | |||||||||
| Matthews Japan Fund | 152,505,812 | 15,879,969 | 168,385,781 | |||||||||
| Matthews Korea Fund | 3,269,836 | 953,240 | 4,223,076 | |||||||||
| Matthews Asian Growth and Income Fund | 11,747,132 | 38,811,432 | 50,558,564 | |||||||||
| Matthews Asia Dividend Fund | 351,455,897 | — | 351,455,897 | |||||||||
| Matthews China Dividend Fund | 22,983,416 | 8,879,325 | 31,862,741 | |||||||||
| Matthews Asia Total Return Bond Fund | 1,654,532 | 1,934,396 | 3,588,928 | |||||||||
| Matthews Asia Credit Opportunities Fund | 7,166,373 | 863,278 | 8,029,651 | |||||||||
The following Funds utilized capital loss carryforwards in the current year:
| Utilized Capital Loss Carryforwards | ||||
| Matthews Emerging Markets Small Companies Fund | $1,760,397 | |||
Under the Regulated Investment Company Modernization Act of 2010, the Funds are permitted to carry forward capital losses incurred in taxable years beginning after December 22, 2010 for an unlimited period. However, any losses incurred during those future taxable years will be required to be utilized prior to any losses incurred in pre-enactment taxable years, which generally expire after eight years from when they are incurred. Additionally, post-enactment capital losses that are carried forward will retain their character as either short-term or long-term capital losses rather than being considered all short-term as under previous law.
U.S. GAAP requires that certain components of net assets be reclassified between financial and tax reporting. These reclassifications have no effect on net assets or NAV. The permanent differences are primarily attributable to investments in PFICs, non-deductible expenses, foreign currency reclassification, NOL (net operating loss) adjustments, capital gains tax, distributions in excess of current earnings and profits, re-characterization of distributions, investment in swaps, adjustments on distributions related to taxable spinoffs and the utilization of accumulated earnings and profits distributed to shareholders on redemptions of shares as part of the dividends paid deduction for income tax purposes. For the year ended December 31, 2022, permanent differences in book and tax accounting have been reclassified to paid-in capital, undistributed net investment income (loss) and accumulated realized gain (loss) as follows:
| Increase/ (Decrease) Capital paid-in | Increase/(Decrease) Total Distributable Earnings/(Accumulated Loss) | |||||||
| Matthews Emerging Markets Equity Fund | $— | $— | ||||||
| Matthews Emerging Markets Sustainable Future Fund | 430,325 | (430,325 | ) | |||||
| Matthews Emerging Markets Small Companies Fund | 2,664,932 | (2,664,932 | ) | |||||
| Matthews Asia Growth Fund | — | — | ||||||
| Matthews Pacific Tiger Fund | — | — | ||||||
| Matthews Asia Innovators Fund | (1,077,436 | ) | 1,077,436 | |||||
| Matthews China Fund | — | — | ||||||
| Matthews China Small Companies Fund | — | — | ||||||
| Matthews India Fund | (5,061,879 | ) | 5,061,879 | |||||
| Matthews Japan Fund | (6,918,324 | ) | 6,918,324 | |||||
| Matthews Korea Fund | — | — | ||||||
| Matthews Asian Growth and Income Fund | — | — | ||||||
| Matthews Asia Dividend Fund | — | — | ||||||
| Matthews China Dividend Fund | — | — | ||||||
| Matthews Asia Total Return Bond Fund | — | — | ||||||
| Matthews Asia Credit Opportunities Fund | — | — | ||||||
| 150 | MATTHEWS ASIA FUNDS |
Table of Contents
Notes to Financial Statements (continued)
As of December 31, 2022, the tax cost of investments, including derivatives, and the related net unrealized appreciation and depreciation were as follows:
| Tax Cost | Gross Unrealized Appreciation | Gross Unrealized Depreciation | Net Unrealized Appreciation (Depreciation) | |||||||||||||
| Matthews Emerging Markets Equity Fund | $38,623,758 | $2,256,563 | ($7,860,574 | ) | ($5,604,011 | ) | ||||||||||
| Matthews Emerging Markets Sustainable Future Fund | 176,274,381 | 21,861,501 | (27,551,356 | ) | (5,689,855 | ) | ||||||||||
| Matthews Emerging Markets Small Companies Fund | 374,099,874 | 69,363,854 | (71,999,112 | ) | (2,635,258 | ) | ||||||||||
| Matthews Asia Growth Fund | 665,346,903 | 82,326,796 | (116,134,449 | ) | (33,807,653 | ) | ||||||||||
| Matthews Pacific Tiger Fund | 3,407,086,813 | 903,490,162 | (639,531,829 | ) | 263,958,333 | |||||||||||
| Matthews Asia Innovators Fund | 565,732,911 | 47,684,162 | (143,954,067 | ) | (96,269,905 | ) | ||||||||||
| Matthews China Fund | 953,040,362 | 64,796,089 | (274,628,823 | ) | (209,832,734 | ) | ||||||||||
| Matthews China Small Companies Fund | 193,505,015 | 8,565,807 | (47,070,314 | ) | (38,504,507 | ) | ||||||||||
| Matthews India Fund | 532,704,627 | 105,132,877 | (44,295,547 | ) | 60,837,330 | |||||||||||
| Matthews Japan Fund | 636,060,859 | 38,260,261 | (63,252,864 | ) | (24,992,603 | ) | ||||||||||
| Matthews Korea Fund | 75,037,517 | 10,413,634 | (6,909,104 | ) | 3,504,530 | |||||||||||
| Matthews Asian Growth and Income Fund | 594,185,070 | 98,416,551 | (90,407,674 | ) | 8,008,877 | |||||||||||
| Matthews Asia Dividend Fund | 1,905,938,058 | 260,029,320 | (308,521,557 | ) | (48,492,237 | ) | ||||||||||
| Matthews China Dividend Fund | 229,974,974 | 22,366,701 | (33,419,315 | ) | (11,052,614 | ) | ||||||||||
| Matthews Asia Total Return Bond Fund | 63,894,814 | 147,797 | (25,322,339 | ) | (25,174,542 | ) | ||||||||||
| Matthews Asia Credit Opportunities Fund | 39,827,730 | 298,585 | (12,258,668 | ) | (11,960,083 | ) | ||||||||||
| 9. | PUBLIC HEALTH EMERGENCY RISKS |
Pandemics and other public health emergencies, including outbreaks of infectious diseases such as the current outbreak of the novel coronavirus (“COVID-19”), can result, and in the case of COVID-19 is resulting, in market volatility and disruption, and materially and adversely impact economic conditions in ways that cannot be predicted, all of which could result in substantial investment losses. Containment efforts and related restrictive actions by governments and businesses have significantly diminished and disrupted global economic activity across many industries. Less developed countries and their health systems may be more vulnerable to these impacts. The ultimate impact of COVID-19 or other health emergencies on global economic conditions and businesses is impossible to predict accurately. Ongoing and potential additional material adverse economic effects of indeterminate duration and severity are possible. The resulting adverse impact on the value of investment in the Funds could be significant and prolonged.
| 10. | SUBSEQUENT EVENTS |
On January 12, 2023, the Board of Trustees of the Matthews International Funds (d/b/a Matthews Asia Funds) approved a proposal to close both the Matthews Asia Total Return Bond Fund and the Matthews Asia Credit Opportunities Fund to purchases and thereafter to liquidate the Matthews Asia Total Return Bond Fund and the Matthews Asia Credit Opportunities Fund. Accordingly, effective on January 16, 2023, the Matthews Asia Total Return Bond Fund and the Matthews Asia Credit Opportunities Fund will no longer accept purchase orders. On or about March 15, 2023 (the “Liquidation Date”), all of the assets of the Matthews Asia Total Return Bond Fund and the Matthews Asia Credit Opportunities Fund will each then be terminated, the shares of any interest holders on the Liquidation Date will be redeemed at the NAV per share and the Matthews Asia Total Return Bond Fund and the Matthews Asia Credit Opportunities Fund will each then be terminated as a series of the Trust.
On February 23, 2023, the Board approved the reorganization of the Matthews Korea Fund into a newly created ETF to be designated the Matthews Korea Active ETF, which will be a series of the Trust. Matthews estimates that the reorganization will occur in 2023.
| matthewsasia.com | 800.789.ASIA | 151 |
Table of Contents
Report of Independent Registered Public Accounting Firm
To the Board of Trustees of Matthews International Funds and Shareholders of Matthews Emerging Markets Equity Fund, Matthews Asia Total Return Bond Fund, Matthews Asia Credit Opportunities Fund, Matthews Asian Growth and Income Fund, Matthews Asia Dividend Fund, Matthews China Dividend Fund, Matthews Asia Growth Fund, Matthews Pacific Tiger Fund, Matthews Emerging Markets Sustainable Future Fund, Matthews Asia Innovators Fund, Matthews China Fund, Matthews India Fund, Matthews Japan Fund, Matthews Korea Fund, Matthews Emerging Markets Small Companies Fund
and Matthews China Small Companies Fund
Opinions on the Financial Statements
We have audited the accompanying statements of assets and liabilities, including the schedules of investments, of Matthews Emerging Markets Equity Fund, Matthews Asia Total Return Bond Fund, Matthews Asia Credit Opportunities Fund, Matthews Asian Growth and Income Fund, Matthews Asia Dividend Fund, Matthews China Dividend Fund, Matthews Asia Growth Fund, Matthews Pacific Tiger Fund, Matthews Emerging Markets Sustainable Future Fund, Matthews Asia Innovators Fund, Matthews China Fund, Matthews India Fund, Matthews Japan Fund, Matthews Korea Fund, Matthews Emerging Markets Small Companies Fund and Matthews China Small Companies Fund (sixteen of the funds constituting Matthews International Funds, hereafter collectively referred to as the “Funds”) as of December 31, 2022, the related statements of operations for the year ended December 31, 2022, the statements of changes in net assets for each of the two years in the period ended December 31, 2022, including the related notes, and the financial highlights for each of the periods indicated therein (collectively referred to as the “financial statements”). In our opinion, the financial statements present fairly, in all material respects, the financial position of each of the Funds as of December 31, 2022, the results of each of their operations for the year then ended, the changes in each of their net assets for each of the two years in the period ended December 31, 2022 and each of the financial highlights for each of the periods indicated therein in conformity with accounting principles generally accepted in the United States of America.
Basis for Opinions
These financial statements are the responsibility of the Funds’ management. Our responsibility is to express an opinion on the Funds’ financial statements based on our audits. We are a public accounting firm registered with the Public Company Accounting Oversight Board (United States) (PCAOB) and are required to be independent with respect to the Funds in accordance with the U.S. federal securities laws and the applicable rules and regulations of the Securities and Exchange Commission and the PCAOB.
We conducted our audits of these financial statements in accordance with the standards of the PCAOB. Those standards require that we plan and perform the audit to obtain reasonable assurance about whether the financial statements are free of material misstatement, whether due to error or fraud.
Our audits included performing procedures to assess the risks of material misstatement of the financial statements, whether due to error or fraud, and performing procedures that respond to those risks. Such procedures included examining, on a test basis, evidence regarding the amounts and disclosures in the financial statements. Our audits also included evaluating the accounting principles used and significant estimates made by management, as well as evaluating the overall presentation of the financial statements. Our procedures included confirmation of securities owned as of December 31, 2022 by correspondence with the custodian and brokers; when replies were not received from brokers, we performed other auditing procedures. We believe that our audits provide a reasonable basis for our opinions.
PricewaterhouseCoopers LLP
San Francisco, CA
February 24, 2023
We have served as the auditor of one or more investment companies in Matthews International Funds since 2007.
| 152 | MATTHEWS ASIA FUNDS |
Table of Contents
For shareholders who do not have a December 31, 2022 tax year-end, this notice is for informational purposes. For the period January 1, 2022 to December 31, 2022, the Funds report the following items with regard to distributions paid during the period. All reports are based on financial information available as of the date of this annual report and, accordingly, are subject to change. For each item, it is the intention of each Fund to report the maximum amount permitted under the Internal Revenue Code and the regulations thereunder.
1. Qualified Dividend Income
The Funds report a portion of the ordinary income distributed during the year ended December 31, 2022 as Qualified Dividend Income (“QDI”) as defined in the Internal Revenue code as follows:
| QDI Portion | ||||
| Matthews Emerging Markets Equity Fund | 100.00% | |||
| Matthews Emerging Markets Sustainable Future Fund | 17.88% | |||
| Matthews Emerging Markets Small Companies Fund | 33.54% | |||
| Matthews Asia Growth Fund | 100.00% | |||
| Matthews Pacific Tiger Fund | 39.48% | |||
| Matthews Asia Innovators Fund | 0.00% | |||
| Matthews China Fund | 0.00% | |||
| Matthews China Small Companies Fund | 18.06% | |||
| Matthews India Fund | 61.54% | |||
| Matthews Japan Fund | 0.00% | |||
| Matthews Korea Fund | 100.00% | |||
| Matthews Asian Growth and Income Fund | 44.56% | |||
| Matthews Asia Dividend Fund | 72.08% | |||
| Matthews China Dividend Fund | 75.85% | |||
| Matthews Asia Total Return Bond Fund | 0.00% | |||
| Matthews Asia Credit Opportunities Fund | 0.00% | |||
2. Dividends Received Deduction
The Funds report a Dividend Received Deduction pursuant to Section 854 of the Internal Revenue Code for the year ended December 31, 2022 as follows:
| Matthews Emerging Markets Equity Fund | 1.29% | |||
| Matthews Emerging Markets Sustainable Future Fund | 0.06% | |||
| Matthews Emerging Markets Small Companies Fund | 0.00% | |||
| Matthews Asia Growth Fund | 0.00% | |||
| Matthews Pacific Tiger Fund | 0.98% | |||
| Matthews Asia Innovators Fund | 0.00% | |||
| Matthews China Fund | 0.00% | |||
| Matthews China Small Companies Fund | 0.00% | |||
| Matthews India Fund | 0.00% | |||
| Matthews Japan Fund | 0.00% | |||
| Matthews Korea Fund | 0.00% | |||
| Matthews Asian Growth and Income Fund | 3.00% | |||
| Matthews Asia Dividend Fund | 0.00% | |||
| Matthews China Dividend Fund | 0.51% | |||
| Matthews Asia Total Return Bond Fund | 0.00% | |||
| Matthews Asia Credit Opportunities Fund | 0.00% |
| matthewsasia.com | 800.789.ASIA | 153 |
Table of Contents
Tax Information (unaudited) (continued)
3. Long-Term Capital Gain Distributions
The Funds report Long-Term Capital Gain distributions pursuant to Section 852(b)(3) of the Internal Revenue Code for the year ended December 31, 2022 as follows:
| Long-Term Capital Gains | ||||
| Matthews Emerging Markets Equity Fund | $— | |||
| Matthews Emerging Markets Sustainable Future Fund | 7,214,833 | |||
| Matthews Emerging Markets Small Companies Fund | 24,305,438 | |||
| Matthews Asia Growth Fund | 18,069,743 | |||
| Matthews Pacific Tiger Fund | 286,471,072 | |||
| Matthews Asia Innovators Fund | 104,645,624 | |||
| Matthews China Fund | 54,199,190 | |||
| Matthews China Small Companies Fund | — | |||
| Matthews India Fund | 82,241,918 | |||
| Matthews Japan Fund | 46,366,482 | |||
| Matthews Korea Fund | 8,608,543 | |||
| Matthews Asian Growth and Income Fund | 20,816,547 | |||
| Matthews Asia Dividend Fund | — | |||
| Matthews China Dividend Fund | 3,944,924 | |||
| Matthews Asia Total Return Bond Fund | 463,019 | |||
| Matthews Asia Credit Opportunities Fund | — | |||
4. Foreign Taxes Paid
The Funds have elected to pass through to their shareholders the foreign taxes paid for year ended December 31, 2022 as follows:
| Foreign Source Income | Foreign Taxes Paid/(Credit) | |||||||
| Matthews Emerging Markets Equity Fund | $1,145,110 | $69,849 | ||||||
| Matthews Emerging Markets Sustainable Future Fund | 1,732,241 | 167,312 | ||||||
| Matthews Emerging Markets Small Companies Fund | 5,168,565 | 502,003 | ||||||
| Matthews Asia Growth Fund | — | — | ||||||
| Matthews Pacific Tiger Fund | 97,480,172 | 9,796,157 | ||||||
| Matthews Asia Innovators Fund | — | — | ||||||
| Matthews China Fund | — | — | ||||||
| Matthews China Small Companies Fund | 4,188,343 | 167,584 | ||||||
| Matthews India Fund | — | — | ||||||
| Matthews Japan Fund | — | — | ||||||
| Matthews Korea Fund | — | — | ||||||
| Matthews Asian Growth and Income Fund | 25,039,303 | 2,000,035 | ||||||
| Matthews Asia Dividend Fund | 69,455,031 | 5,797,316 | ||||||
| Matthews China Dividend Fund | 14,046,999 | 465,470 | ||||||
| Matthews Asia Total Return Bond Fund | 4,349,870 | 19,160 | ||||||
| Matthews Asia Credit Opportunities Fund | — | — | ||||||
| 154 | MATTHEWS ASIA FUNDS |
Table of Contents
Tax Information (unaudited) (continued)
5. Qualified Interest Income
The Funds report a portion of the net income dividends distributed during the year ended December 31, 2022, as Qualified Interest Income (QII), as defined in the Internal Revenue Code as follows:
| QII Portion | ||||
| Matthews Emerging Markets Equity Fund | 0.64% | |||
| Matthews Emerging Markets Sustainable Future Fund | 0.92% | |||
| Matthews Emerging Markets Small Companies Fund | 0.15% | |||
| Matthews Asia Growth Fund | 0.18% | |||
| Matthews Pacific Tiger Fund | 0.59% | |||
| Matthews Asia Innovators Fund | 0.00% | |||
| Matthews China Fund | 0.12% | |||
| Matthews China Small Companies Fund | 0.14% | |||
| Matthews India Fund | 0.00% | |||
| Matthews Japan Fund | 0.00% | |||
| Matthews Korea Fund | 1.62% | |||
| Matthews Asian Growth and Income Fund | 0.61% | |||
| Matthews Asia Dividend Fund | 0.70% | |||
| Matthews China Dividend Fund | 0.51% | |||
| Matthews Asia Total Return Bond Fund | 1.92% | |||
| Matthews Asia Credit Opportunities Fund | 4.20% | |||
6. Qualified Short-Term Capital Gain Dividends
The Funds designate a portion of the short term capital gain dividends distributed during the year ended December 31, 2022, as Qualified Short Term Gain, as defined in the Internal Revenue Code as follows:
| Short-Term Gains | ||||
| Matthews Emerging Markets Equity Fund | 0.00% | |||
| Matthews Emerging Markets Sustainable Future Fund | 100.00% | |||
| Matthews Emerging Markets Small Companies Fund | 100.00% | |||
| Matthews Asia Growth Fund | 0.00% | |||
| Matthews Pacific Tiger Fund | 100.00% | |||
| Matthews Asia Innovators Fund | 0.00% | |||
| Matthews China Fund | 0.00% | |||
| Matthews China Small Companies Fund | 0.00% | |||
| Matthews India Fund | 100.00% | |||
| Matthews Japan Fund | 0.00% | |||
| Matthews Korea Fund | 0.00% | |||
| Matthews Asian Growth and Income Fund | 0.00% | |||
| Matthews Asia Dividend Fund | 100.00% | |||
| Matthews China Dividend Fund | 0.00% | |||
| Matthews Asia Total Return Bond Fund | 0.00% | |||
| Matthews Asia Credit Opportunities Fund | 0.00% | |||
| matthewsasia.com | 800.789.ASIA | 155 |
Table of Contents
Approval of Investment Advisory Agreement (unaudited)
The Funds, which are series of the Trust, have retained Matthews International Capital Management, LLC (“Matthews”) to manage their assets pursuant to an Investment Advisory Agreement dated as of February 1, 2016, as amended (the “Advisory Agreement”), which has been approved by the Board of Trustees of the Trust, including all of the Trustees who are not “interested persons” (“Independent Trustees”), within the meaning of the Investment Company Act of 1940, as amended (the “1940 Act”), as well as by the shareholders of each Fund in accordance with the requirements of the 1940 Act. Following an initial two-year term with respect to each Fund, the Advisory Agreement continues in effect from year-to-year provided that the continuance is specifically approved at least annually by the vote of the holders of at least a majority of the outstanding shares of the Funds, or by the Board of Trustees, and, in either event, by a majority of the Independent Trustees of the Trust casting votes in person at a meeting called for that purpose (the “Annual 15(c) Process”).
At a meeting held on August 24-25, 2022 (the “Meeting”), the Board, including all of the Independent Trustees, approved the continuation of the Advisory Agreement for an additional one-year term beginning February 1, 2023 with respect to each Fund.
At the Meeting and at a prior meeting of the Independent Trustees on August 15, 2022, the Board received and considered information (both written and oral) provided to assist it in the review of the Advisory Agreement and made assessments with respect to each Fund individually. The Independent Trustees were advised by independent legal counsel with respect to these matters. Prior to the August 15, 2022 meeting, a working group of Independent Trustees and independent legal counsel had met with representatives of Matthews on August 3, 2022 to review relevant information in connection with the Annual 15(c) Process. After the August 3, 2022 and August 15, 2022 meetings, the Independent Trustees asked Matthews to provide certain additional information and to respond to certain additional questions at the Meeting. The Independent Trustees then reviewed this supplemental information, which was provided prior to and at the Meeting. The Independent Trustees discussed the renewal of the Advisory Agreement with representatives of Matthews and among themselves in private sessions on various occasions at which no representatives of Matthews were present.
In addition, the Board received presentations about the Funds throughout the year from management. Among the information considered by the Board were responses to a detailed information request sent on behalf of the Independent Trustees by their independent legal counsel. Matthews furnished extensive information in response to this request with respect to many subjects relating to the Advisory Agreement and addressed many of the factors discussed below, including, but not limited to, information about the services provided by Matthews, its structure, organization, operations and personnel, the financial condition of
Matthews and the profitability to Matthews from the Advisory Agreement, compliance procedures and resources, investment performance of the Funds, expenses of the Funds, brokerage and portfolio transactions, distribution and marketing of the Funds, shareholder services and relationships with intermediaries, and other information considered relevant.
In considering information relating to management fee levels, which the Board considers to be the advisory and administrative fees both separately and on a combined basis, the Board considered, among other things, information provided by Matthews as to Fund management services and fees as compared to advisory services and fees charged by Matthews to its institutional clients and pooled vehicles organized outside of the United States. The Trustees also considered information provided by an independent data provider, Broadridge, comparing the investment performance and the fee and expense levels of each Fund to appropriate peer groups of mutual funds, as well as performance data provided by Matthews with respect to unmanaged benchmarks and pooled vehicles or other accounts managed by Matthews with similar investment objectives and/or strategies to the Funds, as applicable.
The Independent Trustees also considered that they had engaged an independent data provider, Broadridge, to assist them in their Annual 15(c) Process. The Independent Trustees considered the work and analysis performed by the independent data provider in selecting appropriate peer groups for the Funds. Furthermore, throughout the course of the year, the Board received a wide variety of materials relating to the services provided by Matthews, including reports on each Fund’s investment results, portfolio composition, portfolio trading practices, shareholder services, and other information relating to the nature, extent, and quality of services provided by Matthews to the Funds. The Board also considered that, under the Administration and Shareholder Services Agreement, Matthews provides additional services to the Funds that are essential to the operation of the Funds and that, although Matthews is separately compensated under that agreement, these additional services are provided in connection with Matthews’ advisory relationship with the Funds.
In addition to the information furnished by Matthews, the Trustees were provided with a legal memorandum from their independent legal counsel discussing their fiduciary duties related to their approval of the continuation of the Advisory Agreement and discussed these matters with their counsel. The Board’s consideration of all this information, both at the Meeting and throughout the year, is part of a systematic process that it has used, and continues to use with regard to the Annual 15(c) Process.
The Trustees’ determinations at the Meeting were made on the basis of each Trustee’s business judgment after consideration of all the information presented. In deciding to recommend the renewal of the Advisory Agreement with respect to each Fund, the Independent Trustees did not
| 156 | MATTHEWS ASIA FUNDS |
Table of Contents
Approval of Investment Advisory Agreement (unaudited) (continued)
identify any single factor or particular piece of information that, in isolation, was controlling. Each Independent Trustee may also have weighed factors differently. This summary describes the most important, but not all, of the factors considered by the Board and the Independent Trustees.
| 1. | The nature, extent and quality of the services provided by Matthews under the Advisory Agreement. |
The Trustees considered the overall financial strength and long-term stability of Matthews and its ability to continue to provide a high level and high quality of services to the Funds. The Trustees considered that despite recent challenging conditions with respect to revenues and profitability of the organization, which have been caused by contracting revenues and assets under management, a difficult geopolitical environment and market volatility, Matthews has continued to provide high quality services to the Funds. They noted that past periods of volatile and challenging securities markets had not resulted in a diminution of services and that Matthews has always demonstrated a commitment to employ the resources necessary to maintain the high level of quality and services to the Funds. The Trustees positively viewed Matthews’ emphasis on preserving and enhancing portfolio management team resources, and careful business planning and management.
The Trustees considered the experience and qualifications of the executive and portfolio management personnel at Matthews who are responsible for providing services to the Funds and who are responsible for the daily management of the Funds’ portfolios. The Trustees noted that Matthews has expanded its professional staff at both senior and junior levels over the past several years, but noted that Matthews had recently experienced some turnover at the senior executive and professional staff levels. In this regard, the Trustees considered that Matthews had recently completed the transition for each of the Chief Executive Officer and General Counsel. They met with the new Chief Executive Officer of Matthews and reviewed with him the current state of Matthews and his initial thoughts regarding future plans. They also reviewed with Matthews the potential impact of recent employee turnover and efforts undertaken to replace staff where appropriate and to otherwise minimize its impact on the Funds. They also reviewed Matthews’ retention strategies and recent personnel developments relevant to certain of the Funds. They discussed efforts by Matthews to provide appropriate support to the Funds, including, but not limited to, appropriate back-up support for each Fund such as, but not limited to, ensuring that the portfolio management teams are fully staffed, and succession plans are put in place. In this regard they discussed with Matthews its efforts to develop and promote the use of knowledge platforms to help provide additional resources to portfolio managers. Among the improved capabilities noted by the Independent Trustees over the past several years are enhanced risk analytical resources and related professionals, including the appointment of a Global Head of Risk and Compliance (“Global CCO”) and ongoing enhancements to compliance, risk management, technology,
business infrastructure, operations, marketing and client service, as well as enhancements to financial intermediary oversight and valuation practices.
As in past years, the Trustees considered the technical capabilities of Matthews, including the design and implementation of its disaster recovery and business continuity infrastructure. The Trustees also considered the Chief Compliance Officer’s (“CCO”) report regarding Matthews’ compliance resources, risk assessment and other compliance initiatives and programs. The Trustees also noted that they had received regular updates with regard to management’s search for a new CCO following the resignation of the current CCO and appointed the Global CCO as interim CCO of the Trust. The Trustees concluded that Matthews has implemented a robust and diligent compliance process, and demonstrates a strong commitment to a culture of compliance. The Independent Trustees took into consideration Matthews’ description of its supervision of the activities of the Funds’ various service providers, as well as supporting the Independent Trustees’ responsibilities and requests and its responsiveness to questions and/or concerns raised by the Trustees throughout the year.
The Trustees noted the significant role played by Matthews with respect to the valuation of portfolio securities, including research and analysis related to fair valued securities and due diligence and oversight of pricing vendors.
The Trustees concluded that Matthews had the quality of personnel and other investment resources essential to performing its duties under the Advisory Agreement, and that the nature, overall quality, cost and extent of such management services are satisfactory.
| 2. | The investment performance of the Funds. |
The Trustees reviewed the short-term and long-term performance of each Fund on both an absolute basis and in comparison to appropriate peer funds, benchmark indices and to the extent they exist, Matthews’ similarly managed accounts, all for various periods ending June 30, 2022. The Trustees considered investment results in light of each Fund’s objective, strategies and market conditions, noting periods during which there were challenging investment conditions in various Asian markets. The Independent Trustees reviewed information as to peer group selections presented by Broadridge. In doing so, the Trustees recognized and took into account that the specialized nature of the Funds made it sometimes difficult to fairly benchmark performance against peers and also took into account that certain funds had a very limited universe of peers. The Board also considered that many of the Funds had investment objectives, goals and strategies that were very different from non-managed broad-based benchmarks, which rendered performance comparisons against such broad-based benchmarks of lesser utility. In this regard, the Board took into account that the Funds are not designed to perform like broad-based indices and therefore that most investors in the Funds likely are not seeking to achieve benchmark-like returns.
| matthewsasia.com | 800.789.ASIA | 157 |
Table of Contents
Approval of Investment Advisory Agreement (unaudited) (continued)
The Trustees reviewed each Fund’s performance on a case-by-case basis and noted that some Funds had outperformed their Performance Universe over certain periods and/or exceeded the return of their respective benchmark while others underperformed their Performance Universe over certain periods and/or trailed the return of their respective benchmark. In considering each Fund’s investment results, the Board placed greater emphasis on each Fund’s long-term performance track record rather than shorter-term performance. The Board also took into account that each Fund’s track record was measured as of a specific ending date, and that track records can vary as of different measurement dates. Therefore, in reviewing a Fund that is currently underperforming, the Trustees also considered the broader perspective of the Fund’s performance over varying time periods, the market conditions experienced during the periods under review, as well as the outlook for the Fund going forward in light of expected future market conditions.
The Trustees discussed with Matthews the fact that certain periods of underperformance may be transitory while other periods of underperformance may be caused by factors that warrant further consideration. To the extent of any concerns about performance with respect to any particular period for a Fund, the Trustees noted that Matthews had provided an explanation for that performance and explained its reasons for maintaining a consistent investment philosophy. In addition, the Trustees recognized actions taken by Matthews from time to time in response to performance concerns, such as changes to members of a portfolio management team or changes in the investment process and strategies of certain Funds. A summary of each Fund’s performance track record is provided below.
For Matthews Pacific Tiger Fund, the Trustees noted that there were not enough funds in the peer universe to assign quintile performance for the ten-year and since-inception periods, but that the Fund’s performance ranked in the third quintile for the one-year period, the fifth quintile for the three-year period and the fourth quintile for the five-year period. The Trustees also noted that the Fund performed at the median of its peer group for the one-year, ten-year and since-inception periods and below that median for the three-year and five-year periods. The Trustees took into account, however, that because the peer universe for the Fund was small over the longer time periods, with only a few comparable funds, relative peer performance was of less use for those periods than if the peer universe were larger. The Board considered Matthews’ discussion regarding the factors contributing to the periods of underperformance and took into account changes implemented in the portfolio by Matthews to address that underperformance.
For Matthews Asian Growth and Income Fund, the Trustees noted that the Fund has experienced periods of difficult performance although there has been recent improvement due, in part, to changes implemented in the portfolio. The Trustees noted the Fund ranked in the first quintile for the one-year period, ranked in the fifth quintile for the three-year, five-year
and ten-year period and ranked in the third quintile for the since-inception period. The Trustees also noted that the Fund performed above the median of its peer group for the one-year period and performed below the median for each of the three-year, five-year, ten-year and since-inception periods. The Trustees considered Matthews’ view as to reasons for the Fund’s longer-term underperformance, including discussing with management the diverse nature of the funds in the peer group.
For Matthews Korea Fund, the Trustees noted that there were not enough funds in the peer universe to assign quintile performance for any time period; however, the Trustees noted that the Fund performed above the median of its peer group for the one-year, three-year, five-year, ten-year and since-inception periods. The Trustees took into account, however, that the peer universe for the Fund was very small, with only a few comparable funds and that, therefore, relative peer performance was less useful than if the peer universe were larger.
For Matthews China Fund, the Trustees noted that the Fund’s performance had ranked in the third quintile for the one-year period, first quintile for the three-year, five-year and ten-year periods, and second quintile for the since-inception period. The Trustees also noted that the Fund outperformed the median of its peer funds over each of those periods.
For Matthews Japan Fund, the Trustees noted that the Fund’s performance had ranked in the fifth quintile for the one-year period, in the third quintile for the three-year period and in the second quintile for the five-year, ten-year and since-inception periods. The Trustees also noted that the Fund underperformed the median of its peer funds over the one-year period and outperformed the median over the three-year, five-year, ten-year and since inception periods. The Trustees took into consideration Matthews’ discussions regarding the factors that had contributed to the Fund’s short-term underperformance.
For Matthews Asia Innovators Fund, the Trustees noted that there were not enough funds in the peer universe to assign quintile performance for the since-inception period, but that the Fund’s performance ranked in the fifth quintile for the one-year period and the first quintile for the three-year and five-year periods. The Trustees also noted that the Fund underperformed the median of its peer funds over the one-year period and outperformed the median over the three-year and five-year periods. The Trustees took into account, however, that because the peer universe for the Fund was small over the longer time periods, with only a few comparable funds, relative peer performance was of less use for those periods than if the peer universe were larger. The Trustees took into consideration Matthews’ discussions regarding the factors that had contributed to the Fund’s short-term underperformance.
For Matthews Asia Growth Fund, the Trustees noted that there were not enough funds in the peer universe to assign quintile performance for any period. The Trustees further
| 158 | MATTHEWS ASIA FUNDS |
Table of Contents
Approval of Investment Advisory Agreement (unaudited) (continued)
noted that the Fund underperformed the median of its peer group for the one-year and three-year periods, performed at the median for the five-year period and outperformed the median for the ten-year and since-inception periods. The Trustees took into account, however, that because the peer universe for the Fund was small, relative peer performance was of less use for those periods than if the peer universe were larger. The Trustees also took into consideration Matthews’ discussions regarding the factors that had contributed to the Fund’s underperformance as well as efforts undertaken to improve performance.
For Matthews India Fund, the Trustees noted that the Fund ranked in the fourth quintile for the one-year period, fifth quintile for the three- and five-year periods and first quintile for the ten-year and since-inception periods. The Trustees further noted that the Fund underperformed the median of its peer group for the one-year, three-year and five-year periods and outperformed the median for the ten-year and since-inception periods. The Trustees also took into consideration Matthews’ discussions regarding the factors that had contributed to the Fund’s underperformance as well as efforts undertaken to improve performance.
For Matthews Asia Dividend Fund, the Trustees noted that the Fund ranked in the fourth quintile for the one-year and five-year periods, the third quintile for the three-year period, the second quintile for the ten-year period and the first quintile for the since-inception period. The Trustees further noted that the Fund underperformed the median of its peer group for the one-year, three-year and five-year periods and outperformed the median for the ten-year and since inception periods. The Trustees took into account, however, that the peer universe for the Fund was small, with only a few comparable funds and that, therefore, relative peer performance was of less use than if the peer universe were larger.
For Matthews Emerging Markets Small Companies Fund (formerly the Matthews Asia Small Companies Fund), the Trustees noted that the Fund ranked in the first quintile of its peer group for the one-year, three-year, five-year and since-inception periods. The Trustees further noted that the Fund had outperformed the median of its peer group for each of those periods. The Trustees also considered that the Fund’s name and principal investment strategy had changed effective April 30, 2021, and that the Matthews Emerging Asia Fund was reorganized into the Fund at that time.
For Matthews China Dividend Fund, the Trustees noted that the Fund ranked in the second quintile of its peer group over the one-year and five-year periods, the third quintile for the three-year period and first quintile for the ten-year and since-inception periods. The Trustees also noted that the Fund had outperformed its peer group median for the one-year, five-year, ten-year and since inceptions periods and underperformed its peer group median for the three-year period.
For Matthews China Small Companies Fund, the Trustees noted that there were not enough funds in the peer universe to assign quintile performance for any time period; however,
the Trustees noted that the Fund’s performance was below the median of its peer group for the one-year period and above the median for the three-year and since-inception periods. The Trustees took into account, however, the very small size of the peer group, with only two funds in the peer group and that, therefore, relative peer performance was less useful than if the peer universe were larger.
For Matthews Asia Total Return Bond Fund, the Trustees noted that the Fund’s performance had ranked in the fourth quintile for the one-year, three-year and since inception periods and in the third quintile for the five-year and ten-year periods. The Trustees noted that the Fund had underperformed the median of its peer group for all of those time periods. The Trustees recognized that the peer groups included mostly broader emerging market hard currency debt funds not focused on Asia, making the peer group less useful in comparing relative performance than if their principal investment strategies were more closely aligned with the Fund’s investment focus. The Trustees also considered that the Fund’s name and principal investment strategy had changed effective January 31, 2020 and that there has been a change in the portfolio manager for the Fund. The Trustees also took into account Matthews’ continuing review of the Fund and continued efforts to address performance concerns.
For Matthews Emerging Markets Sustainable Future Fund (formerly the Matthews Asia ESG Fund), the Trustees noted that there were not enough funds in the peer universe to assign quintile performance for any time period. The Trustees further noted that the Fund had outperformed its peer group median for the one-year, three-year, five-year and since inception periods. The Trustees noted that the peer group funds did not have a similar ESG strategy as the Fund. The Trustees also considered that the Fund’s name and principal investment strategy had changed effective July 29, 2022.
For Matthews Asia Credit Opportunities Fund, the Trustees noted that there were not enough funds in the peer universe to assign quintile performance for any time period. The Trustees also noted that the Fund had underperformed the peer group median for the one-year, three-year, five-year and since-inception periods. The Trustees took into consideration Matthews’ discussions regarding the factors that had contributed to the underperformance and that there has been a change in the portfolio manager for the Fund. The Trustees took into account, however, that the peer universe for the Fund was small, with only a few comparable funds, and that, therefore, relative peer performance was of less use than if the peer universe were larger. The Trustees also took into account Matthews’ continuing review of the Fund and continued efforts to address performance concerns.
For Matthews Emerging Markets Equity Fund, the Trustees noted that the Fund’s performance ranked in the fourth quintile for the one-year period and in the second quintile for the since-inception period. The Trustees also noted that the Fund had underperformed the peer group median for the one-year period and had outperformed the median for the since inception period. The Trustees took into consideration
| matthewsasia.com | 800.789.ASIA | 159 |
Table of Contents
Approval of Investment Advisory Agreement (unaudited) (continued)
Matthews’ discussions regarding the factors that had contributed to the Fund’s short-term underperformance.
After review, the Trustees concluded that each Fund’s overall performance was satisfactory or was being addressed as needed. The Trustees also reviewed Matthews’ trading policies and efforts to obtain best overall execution for the Funds in the various markets in which the Funds trade securities. The Trustees noted the relatively low turnover rates in many of the equity Funds and Matthews’ consistent adherence to its long-standing investment approach, which emphasizes fundamental bottom-up driven investment selection in light of its view of regional economic conditions.
| 3. | The extent to which Matthews realizes economies of scale as the Funds grow larger and whether Fund investors benefit from any economies of scale. |
The Trustees first noted the substantial work done over the years between the Board and Matthews to establish fee structures for both the Advisory Agreement and other agreements that recognize the sharing of economies of scale that can arise as assets in the Funds grow through the use of breakpoints. In particular, they noted that the management fee structure contains breakpoints for the group-priced Funds as well as for certain individually priced Funds. That structure enhances the ability of the Funds and their shareholders to benefit from past and potential future economies of scale. They discussed the structure and level of these breakpoints and concluded that they continue to be appropriate given the sizes of the Funds. The Trustees further noted that as the Funds’ assets have decreased in recent periods, there were no additional economies to share at present, however, should the Funds grow additional economies of scale will continue to be shared with shareholders of the Funds through fee waivers and/or expense reimbursements pursuant to the Operating Expenses Agreement, fee waivers pursuant to the Fee Waiver Agreement, and the breakpoints in the fees payable under the Services Agreement. As another example of economies of scale, the Trustees noted that Matthews was successful in negotiating lower fees with the Funds’ custodian, first in 2014 and again in 2020, resulting in additional savings to the Funds.
The Trustees next discussed Matthews’ ongoing investment in its technology, systems, staffing and other aspects of its business that can benefit the Funds, noting that all these endeavors are a means by which Matthews is sharing economies of scale with the Funds and their shareholders through reinvestment in products and services that are designed to benefit the Funds and their shareholders. The Trustees considered the new personnel hired over recent years, as well as planned hiring, and the extent to which that hiring could be expected to benefit shareholders. The Trustees also recognize that the Funds’ total assets have fluctuated, especially in certain strategies. Those fluctuations affect any economies of scale that could be enjoyed. As a result, the Trustees remain satisfied about the extent to which economies of scale have been and will continue to be shared with the Funds and their shareholders.
| 4. | The costs of the services provided by Matthews and others. |
The Trustees considered the management fees and total fees and expenses of each Fund in comparison to the management and advisory fees and other fees and expenses of other funds in each Fund’s relevant peer group. The Trustees reviewed information developed by Broadridge as to appropriate peer groups for each Fund for these purposes. The Board placed greater emphasis on management fees, which include both advisory and administrative fees, as the basis of comparison rather than advisory fees alone.
The Trustees considered both the gross management fee rates charged by Matthews, as well as the effective management fee rates after taking into consideration the fees waived and expenses reimbursed pursuant to the Operating Expenses Agreement and the Fee Waiver Agreement. The Trustees considered that the contractual advisory rates (excluding administrative services) for the Funds were generally very competitive and often lower than those of the relevant peer group averages. The Trustees also considered that the total expense ratios paid by shareholders of the Funds, which are most representative of a shareholder’s net investment results, were also generally competitive. The Trustees noted that Matthews’ continued efforts in recent years had resulted in, for many of the Funds, reduced expenses over time. The Trustees also noted that, as an example of those efforts, in 2019 the Advisor had agreed to lower the level of the expense cap for the Institutional Class of each Fund (other than the Matthews Asia Total Return Bond Fund and Matthews Asia Credit Opportunities Fund) by 5 basis points to 1.20%, thereby effectively lowering the expenses for the Investor Class of those Funds by the same amount. The Trustees also noted that all Funds, except for the Emerging Markets Equity Fund, Emerging Markets Small Companies Fund, China Small Companies Fund, Asia Total Return Bond Fund, and Asia Credit Opportunities Fund, are running below their existing caps, but that they have downside protection in the event that their assets decrease. The Trustees further noted that the Advisor had further lowered the expense cap for the Institutional Class of the Matthews Emerging Markets Small Companies Fund by an additional 5 basis points to 1.15% effective April 30, 2021 and had lowered the expense cap for the Institutional Class of the Matthews Emerging Markets Sustainable Future Fund to 1.15% effective July 29, 2022.
The Trustees also compared Matthews’ advisory fees with those of Matthews’ separate accounts and other investment products, noting that the Funds’ advisory expenses were not disadvantageous (not being substantially higher than the separate accounts’ rates). The Trustees agreed that advisory fees for the Funds appeared to be appropriate in comparison and taking into account the differences in services between these products and the Funds, including the differences in the frequency of net asset value calculations and other operational and compliance activities.
The Trustees’ overall assessment with respect to each Fund was that, taking into account the considerations noted below, the contractual advisory fee rates, the total expense ratio, and the effective or net advisory fee rates were fair and reasonable.
| 160 | MATTHEWS ASIA FUNDS |
Table of Contents
Approval of Investment Advisory Agreement (unaudited) (continued)
For the Matthews Pacific Tiger Fund, the actual management fee was below the peer group median and the contractual management fee was above the peer group median. The actual total expenses (excluding 12b-1 fees) were below the peer group median.
For the Matthews Asian Growth and Income Fund and the Matthews Asia Growth Fund, the actual management fee was above the peer group median and the contractual management fee was below the peer group median. The actual total expenses (excluding 12b-1 fees) were above the peer group median.
For the Matthews Korea Fund and Matthews Emerging Markets Sustainable Future Fund, the actual management fee was above the peer group median and the contractual management fee was below the peer group median. The actual total expenses (excluding 12b-1 fees) were above the peer group median.
For the Matthews China Fund, Matthews India Fund and Matthews China Dividend Fund, the actual management fee was below the peer group median and the contractual management fee was below the peer group median. The actual total expenses (excluding 12b-1 fees) were below the peer group median.
For the Matthews Japan Fund, the actual management fee was above the peer group median and the contractual management fee was above the peer group median. The actual total expenses (excluding 12b-1 fees) were below the peer group median.
For the Matthews Asia Innovators Fund, the actual management fee was below the peer group median and the contractual management fee was below the peer group median. The actual total expenses (excluding 12b-1 fees) were above the peer group median.
For the Matthews Asia Dividend Fund, the actual management fee was above the peer group median and the contractual management fee was above the peer group median. The actual total expenses (excluding 12b-1 fees) were above the peer group median.
For the Matthews Emerging Markets Small Companies Fund and Matthews China Small Companies Fund, the actual management fee was above the peer group median and the contractual management fee was above the peer group median. The actual total expenses (excluding 12b-1 fees) were above the peer group median. The Trustees considered that these Funds each had breakpoints in its management fee schedule and noted that in 2019 the Advisor had recommended, and the Trustees agreed, to remove redemption fees from the Matthews Emerging Markets Small Companies Fund and Matthews China Small Companies Fund in order to promote asset growth and realize economies of scale.
For the Matthews Asia Total Return Bond Fund and the Matthews Asia Credit Opportunities Fund, the actual management fee was above the peer group median and the contractual management fee was below the peer group median.
The actual total expenses (excluding 12b-1 fees) were above the median. The Trustees noted that in 2018 Matthews had agreed to a reduction in its advisory fee rate from 0.65% to 0.55% and to forego recovery of any fees waived prior to that reduction.
For the Matthews Emerging Markets Equity Fund, the actual management fee was above the peer group median and the contractual management fee was below the peer group median. The actual total expenses (excluding 12b-1 fees) were below the peer group median.
| 5. | The profits to be realized by Matthews and its affiliates from the relationships with the Funds. |
The Trustees reviewed information provided by Matthews regarding the costs of sponsoring and operating the Funds and information regarding the profitability to Matthews of the Advisory Agreement both on a fund-by-fund basis and overall for the family of Funds. In considering profitability, the Trustees discussed and considered the methodology employed by Matthews in calculating profit margins but also considered other elements relevant to discussions of profitability, such as the entrepreneurial risk undertaken by Matthews in sponsoring and maintaining the Funds and risks associated with commitments to maintain Fund expense ratios. The Trustees also reviewed information provided regarding the structure and manner in which Matthews’ investment professionals were compensated and their respective views of the relationship of such compensation to the attraction and retention of quality personnel. The Trustees considered Matthews’ willingness to invest in technology, infrastructure and professional staff to reinforce and offer services and to accommodate changing regulatory requirements and industry practices.
The Trustees noted that Matthews appeared to be sufficiently profitable to operate as a viable investment management firm, able to honor its obligations as a sponsor of the Funds, including the Funds that did not generate a profit for Matthews, without earning excessive profits from any particular Fund or from the overall relationship with the Funds. The Trustees noted that, with fluctuations in asset levels in some prior years, volatility in revenues and profitability could be expected from time to time in the future, but they also noted the continued expenditures on personnel and other resources. The Board also considered information relating to the profitability of a limited number of publicly traded investment advisers, although the Board noted that this information was of limited utility because it was comprised of a limited universe of advisers, did not provide any information as to how profitability was determined and did not limit profitability analysis to the performance of advisory services to registered investment companies. The Board further noted that these advisers differed significantly from Matthews because they were not solely dedicated to investment in the Asian markets.
Based on information received, the Trustees noted that Matthews’ overall profitability from the Advisory Agreement appeared not to be excessive at the current time, whether considered inclusive or exclusive of distribution costs.
| matthewsasia.com | 800.789.ASIA | 161 |
Table of Contents
Approval of Investment Advisory Agreement (unaudited) (continued)
| 6. | Ancillary benefits. |
The Trustees requested and received from Matthews information concerning other benefits received by Matthews as a result of its respective relationship with the Funds, including various service arrangements with Matthews. These potential benefits included, among other things, the use of soft dollars as well as potential benefits resulting from the structure of compensation arrangements between the Trust, the Adviser and financial intermediaries in the areas of shareholder servicing and sub-transfer agency services. The Board concluded that such benefits were consistent with those generally derived by investment advisers to mutual funds or were otherwise not unusual.
| 7. | Conclusions. |
Based on their review, including their consideration of each of the factors referred to above, and assisted by the advice of independent counsel to the Independent Trustees, the Board, including the Independent Trustees, concluded that the Advisory Agreement was fair and reasonable with respect to each Fund and its shareholders, and that the renewal of the Advisory Agreement would be in the best interests of each Fund and its shareholders. The Board did not indicate that any single factor was determinative of its decision to approve the Advisory Agreement, but indicated that the Board based its determination on the total mix of information available to it.
| 162 | MATTHEWS ASIA FUNDS |
Table of Contents
Statement Regarding Liquidity Risk Management Program
The Securities and Exchange Commission adopted Rule 22e-4 under the Investment Company Act of 1940, as amended (the “Liquidity Rule”) to promote effective liquidity risk management throughout the open-end investment company industry.
The Board of Trustees (the “Board”) of the Matthews International Funds, (the “Funds”) met on November 15-16, 2022 (the “Meeting”) to review the Liquidity Risk Management Program (the “Program”) of the Funds, in accordance with the requirements of the Liquidity Rule. The Board has appointed the Liquidity Risk Management Committee (“LRMC”), a sub-committee of the Enterprise Risk Management Committee of Matthews International Capital Management, LLC, as Program Administrator.
At the Meeting, the LRMC provided the Board with a report that addressed the operation of the Program and assessed its adequacy and effectiveness of implementation, including the operation of each Fund’s Highly Liquid Investment Minimum (“HLIM”) where applicable, and any material changes to the Program (the “Report”). The Report covered the period from October 1, 2021 through October 31, 2022 (the “Program Reporting Period”).
The Report included a Portfolio Liquidity Profile of each Fund as of October 31, 2022. The Report also discussed the factors and assumptions considered in establishing a Fund’s HLIM and Reasonably Anticipated Trading Size (“RATS”) and noted that the LRMC is not proposing any changes to the current HLIM or RATS for each Fund.
There were no material changes to the Program during the Program Reporting Period. The Report provided to the Board stated that the LRMC concluded that based on the operation of the functions, as described in the Report, the Program is adequately designed and implemented and is operating effectively pursuant to the requirements of the Liquidity Rule.
| matthewsasia.com | 800.789.ASIA | 163 |
Table of Contents
Trustees and Officers of the Funds (unaudited)
The operations of each Fund are under the direction of the Board of Trustees. The Board of Trustees establishes each Fund’s policies and oversees and reviews the management of each Fund. The Board meets regularly to review the activities of the officers, who are responsible for the day-to-day operations of the Funds. The Statement of Additional Information, which includes additional information about Fund Trustees, is available without charge by calling 800.789.2742 or by visiting the Funds’ website, matthewsasia.com. The Trustees and executive officers of the Funds, their year of birth, business address, principal occupations during the past five years and other trusteeships/directorships are set forth below:
Name, Year of Birth, Address and Position(s) Held with Trust | Term of Office and Length of Time Served1 | Principal Occupation(s) During Past 5 Years | Number of Portfolios in Fund Complex Overseen by Trustee | Other Trusteeships/Directorships (number of portfolios) Held by Trustee | ||||
| INDEPENDENT TRUSTEES | ||||||||
GALE K. CARUSO Born 1957 Four Embarcadero Center Suite 550 San Francisco, CA 94111 Chair of the Board of Trustees and Trustee | Trustee since 2015, Vice Chair (2021), and Chair of the Board since 2022 | Formerly President and Chief Executive Officer (1999–2003), Zurich Kemper Life (life insurance and annuities); Chairman, President and Chief Executive Officer (1994–1999), Scudder Canada Investor Services, Ltd. (investment management); Managing Director (1986–1999), Scudder Kemper Investments, Inc. (investment management). | 19 | Trustee (since 2006), Pacific Select Fund (57 Portfolios) and Pacific Funds Series Trust (39 Portfolios); Director (2005–2012), Make-A-Wish Foundation of Maine; Director (2005–2009), LandAmerica Financial Group, Inc. | ||||
TOSHI SHIBANO Born 1950 Four Embarcadero Center Suite 550 San Francisco, CA 94111 Trustee | Since 2003 | President (since 1995), Executive Financial Literacy, Inc. (financial executive development programs); Faculty (2000–2020), General Electric’s John F. Welch Leadership Center; Faculty Director and Executive Education Lecturer (1995–2016), Center for Executive Education, Haas School of Business, UC Berkeley; Adjunct Professor (2000–2011), Columbia Graduate School of Business; Associate Professor (2001–2005), Thunderbird School of Global Management; Visiting Assistant Professor (2000), Stanford Graduate School of Business; Assistant Professor (1995–2000), University of Chicago Graduate School of Business; Assistant Professor (1988–1995), Haas School of Business, UC Berkeley. | 19 | |||||
RHODA ROSSMAN Born 1958 Four Embarcadero Center Suite 550 San Francisco, CA 94111 Trustee | Since 2006 | Council Member (since 2019), California Catastrophe Response Council; Vice President, Corporate Investment Officer (2007–2010), Senior Vice President and Treasurer (2003–2007), The PMI Group, Inc. (mortgage insurer). | 19 | |||||
JONATHAN F. ZESCHIN Born 1953 Four Embarcadero Center Suite 550 San Francisco, CA 94111 Trustee | Trustee since 2007 and Chair of the Board (2014–2021) | Partner (since 2009), Essential Investment Partners, LLC (investment advisory and wealth management). | 19 | Trustee (2019), Russell Investment Funds (9 portfolios) and Russell Investment Company (32 portfolios). | ||||
RICHARD K. LYONS Born 1961 Four Embarcadero Center Suite 550 San Francisco, CA 94111 Trustee | Since 2010 | Chief Innovation and Entrepreneurship Officer (since 2020), UC Berkeley; Dean (2008–2018), Haas School of Business, UC Berkeley; Chief Learning Officer (2006–2008), Goldman Sachs (investment banking and investment management). | 19 | Trustee (since 2018), Syntax ETF Trust; Trustee (2001–2006), Barclays Global Investor Funds and Master Investment Portfolios (15 Portfolios); Trustee (2000–2006), iShares, Inc. (24 Portfolios) and iShares Trust (over 70 Portfolios); Trustee (1994–2006) and Chairman of the Board (2000–2006), Matthews Asia Funds (9 Portfolios). | ||||
| 1 | Each Trustee serves for an indefinite term, until retirement age or until his/her successor is elected. Officers serve at the pleasure of the Board of Trustees. |
| 164 | MATTHEWS ASIA FUNDS |
Table of Contents
Name, Year of Birth, Address and Position(s) Held with Trust | Term of Office and Length of Time Served1 | Principal Occupation(s) During Past 5 Years | Number of Portfolios in Fund Complex Overseen by Trustee | Other Trusteeships/Directorships (number of portfolios) Held by Trustee | ||||
| INDEPENDENT TRUSTEES | ||||||||
CHRISTOPHER LEE Born 1967 Four Embarcadero Center Suite 550 San Francisco, CA 94111 Trustee | Since 2015 | Consultant and Associate Professor (since 2017), Hong Kong University of Science and Technology; Lecturer (part-time) (2013–2019), The Chinese University of Hong Kong; Private Investor and Partner (since 2012), FAA Investments (financial holding company); Managing Director, Asia Region, and Head of Global Markets Investment Products & db-X (2010–2012), Deutsche Bank AG (financial services); Managing Director, Equity Risk Management Products, and Head of Intermediary Business (2002–2010), UBS AG (financial services); Vice President, Global Markets & Investment Bank (2000–2002), Vice President, International Private Clients Group (1997–2000), Associate, Debt and Equity Markets Group (1995–1997), Merrill Lynch & Co., Inc. (brokerage and investment management). | 19 | Director (since 2017), Hong Kong Securities and Investment Institute; Director (2013–2018), Asian Master Funds (Australia) (1 Portfolio); Trustee (since 2013), African Wildlife Foundation; Trustee (2010–2016), Oakland Museum of California. | ||||
Name, Year of Birth, Address and Position(s) Held with Trust | Term of Office and Length of Time Served1 | Principal Occupation(s) During Past 5 Years | Number of Portfolios in Fund Complex Overseen by Trustee | Other Trusteeships/Directorships (number of portfolios) Held by Trustee | ||||
| INTERESTED TRUSTEES2 | ||||||||
JAMES COOPER ABBOTT Born 1969 Four Embarcadero Center Suite 550 San Francisco, CA 94111 Trustee and President | Trustee and President since 2022 | Director and Chief Executive Officer (since 2022), Matthews (investment management); Chairman and Chief Executive Officer/President (2009–2022), Carillon Tower Advisers, Inc. and Affiliates (asset management); Chief Executive Officer/President (2009–2022), Eagle Asset Management, Inc. (asset management); President (2003–021), Carillon Family of Funds (mutual fund company); President (2008–2019) Eagle Boston Investment Management, Inc. (asset management); Managing Member (2010–2022) Alternative Strategy Partnerships (asset management). | 19 | Trustee (2017–2021), Carillon Family of Funds (12 Portfolios). | ||||
ROBERT J. HORROCKS, PhD Born 1968 Four Embarcadero Center Suite 550 San Francisco, CA 94111 Trustee and Vice President | Vice President since 2009 and Trustee since 2018 | Chief Investment Officer (since 2009), Director of Research (2008–2009), Matthews (investment management); Head of Research (2006–2008), Mirae Asset Management (investment management); Chief Investment Officer (2003–2006), Everbright Pramerica (investment management). | 19 | None | ||||
| 1 | Each trustee serves for an indefinite term, until retirement age or until his/her successor is elected. Officers serve at the pleasure of the Board of Trustees. |
| 2 | A trustee is considered an “interested person” of the Trust as defined under the 1940 Act because of an ownership interest in the Advisor or an office held with the Trust or the Advisor. |
| matthewsasia.com | 800.789.ASIA | 165 |
Table of Contents
Name, Year of Birth, Address and Position(s) Held with Trust | Term of Office and Length of Time Served | Principal Occupation(s) During Past 5 Years | Other Trusteeships/ Directorships (number of portfolios) Held by Officer | |||
| OFFICERS WHO ARE NOT TRUSTEES | ||||||
JOHN P. McGOWAN Born 1964 Four Embarcadero Center Suite 550 San Francisco, CA 94111 Vice President and Secretary | Since 2005 | Head of Fund Administration (since 2009), Chief Administrative Officer (2007–2008), Chief Operating Officer (2004–2007), Matthews (investment management); Vice President and Secretary (2013–2017), Matthews A Share Selections Fund, LLC (registered investment company); Director (since 2010), Matthews Asia Funds SICAV (Luxembourg) (investments); Director (2010–2020), Matthews Global Investors S.à r.l. (Luxembourg) (investment management); Director (since 2004), Matthews Asian Selections Funds, PLC (Ireland) (investments). | Director, Matthews Asian Selections Funds Plc (1 Portfolio); Director, Matthews Asia Funds SICAV (Luxembourg) (12 Portfolios). | |||
SHAI A. MALKA Born 1973 Four Embarcadero Center Suite 550 San Francisco, CA 94111 Treasurer | Since 2005 | Vice President of Fund Accounting and Operations (since 2010), Senior Manager of Fund Accounting and Operations (2004–2009), Matthews (investment management); Treasurer (2013–2017), Matthews A Share Selections Fund, LLC (registered investment company). | None | |||
DEEPA DAMRE SMITH Born 1975 Four Embarcadero Center Suite 550 San Francisco, CA 94111 Vice President | Since 2022 | General Counsel (since 2022), Matthews (investment management); Managing Director (2014–2022), Director (2009–2013), BlackRock (investment management); Principal (2004–2009), Barclays Global Investors (investment management). | None | |||
J. DAVID KAST Born 1966 Four Embarcadero Center Suite 550 San Francisco, CA 94111 Chief Compliance Officer and Anti-Money Laundering Officer | Since 2018 | Chief Compliance Officer and Anti-Money Laundering Officer (since 2018), Global Head of Risk and Compliance (since 2017), Matthews (investment management); Managing Director (2009–2017), Goldman Sachs (investment management). | None | |||
| 166 | MATTHEWS ASIA FUNDS |
Table of Contents
| Matthews Asia Funds | ||||
INVESTMENT ADVISOR Matthews International Capital Management, LLC Four Embarcadero Center, Suite 550 San Francisco, CA 94111 800.789.ASIA
CUSTODIAN Brown Brothers Harriman & Co. 50 Post Office Square Boston, MA 02110 | ACCOUNT SERVICES Matthews Asia Funds P.O. Box 534475 Pittsburgh, PA 15253-4475 800.789.ASIA
LEGAL COUNSEL Paul Hastings LLP 101 California Street, 48th Floor San Francisco, CA 94111 | ADMINISTRATOR & TRANSFER AGENT BNY Mellon 301 Bellevue Parkway Wilmington, DE 19809 | ||

P.O. Box 534475 | Pittsburgh, PA 15253-4475 | matthewsasia.com | 800.789.ASIA (2742)
Matthews Asia Funds are distributed in the United States by Foreside Funds Distributors LLC, Portland, Maine
Matthews Asia Funds are distributed in Latin America by Picton S. A.

AR-1222
Table of Contents
Matthews Asia Active ETFs | Annual Report
December 31, 2022 | matthewsasia.com
GLOBAL EMERGING MARKETS STRATEGY
Matthews Emerging Markets Equity Active ETF (MEM)
ASIA GROWTH STRATEGIES
Matthews Asia Innovators Active ETF (MINV)
Matthews China Active ETF (MCH)

Listed on the NYSE Arca

Table of Contents

Matthews Asia Active Exchange-Traded Funds (ETFs) are actively managed and do not seek to replicate a specific index. ETFs are bought and sold through an exchange at the then current market price, not net asset value (NAV), and are not individually redeemed from the fund. Shares may trade at a premium or discount to their NAV when traded on an exchange. Brokerage commissions will reduce returns. There can be no guarantee that an active market for ETFs will develop or be maintained, or that the ETF’s listing will continue or remain unchanged.
ETF market price returns since inception are calculated using NAV for the period until market price became available (generally a few days after inception).
Investments are not FDIC-insured, nor are they deposits of or guaranteed by a bank or any other entity, so they may lose value.
Cover photo: Looking out to brighter and greener pastures (Chiang Mai, Thailand)
This report has been prepared for Matthews International Funds (d/b/a Matthews Asia Funds) shareholders. It is not authorized for distribution to prospective investors unless accompanied or preceded by a current Matthews Asia Funds prospectus, which contains more complete information about the Funds’ investment objectives, risks and expenses. Additional copies of the prospectus or summary prospectus may be obtained at matthewsasia.com. Please read the prospectus carefully before you invest or send money.
The views and opinions in this report were current as of December 31, 2022. They are not guarantees of performance or investment results and should not be taken as investment advice. Investment decisions reflect a variety of factors, and the managers reserve the right to change their views about individual stocks, sectors and the markets at any time. As a result, the views expressed should not be relied upon as a forecast of a Fund’s future investment intent. Current and future portfolio holdings are subject to risk.
Statements of fact are from sources considered reliable, but neither the Funds nor the Investment Advisor makes any representation or guarantee as to their completeness or accuracy.
| 2 | MATTHEWS ASIA FUNDS |
Table of Contents
| Message to Shareholders from the President of Matthews Asia Funds | 4 | |||
| 5 | ||||
Fund Characteristics and Schedules of Investments: | ||||
GLOBAL EMERGING MARKETS STRATEGY | ||||
| 6 | ||||
ASIA GROWTH STRATEGIES | ||||
| 9 | ||||
| 11 | ||||
| Index Definitions | 14 | |||
| Disclosures | 15 | |||
| Disclosure of Fund Expenses | 16 | |||
| Statements of Assets and Liabilities | 18 | |||
| Statements of Operations | 19 | |||
| Statements of Changes in Net Assets | 20 | |||
| Financial Highlights | 21 | |||
| Notes to Financial Statements | 24 | |||
| 1. Organization | 24 | |||
| 2. Significant Accounting Policies | 24 | |||
| 3. Capital Shares Transactions | 27 | |||
| 4. Investment Advisory Fees and Other Transactions with Affiliates | 27 | |||
| 5. Investments | 28 | |||
| 6. Income Tax Information | 28 | |||
| 7. Public Health Emergency Risks | 29 | |||
| 8. Subsequent Events | 29 | |||
| 9. Report of Independent Registered Public Accounting Firm | 30 | |||
| 10. Tax Information | 31 | |||
| 11. Approval of Investment Management Agreement | 32 | |||
| 12. Statement Regarding Liquidity Risk Management Program | 34 | |||
| 13. Trustees and Officers of the Funds | 35 | |||
Investment Risk: Exchange-Traded Fund shares are not deposits or obligations of, or guaranteed by, any depositary institution. Shares are not insured by the FDIC, Federal Reserve Board or any government agency and are subject to investment risks, including possible loss of principal amount invested. Investing in international and emerging markets may involve additional risks, such as social and political instability, market illiquidity, exchange-rate fluctuations, a high level of volatility and limited regulation. Fixed income investments are subject to additional risks, including, but not limited to, interest rate, credit and inflation risks. In addition, single-country and sector funds may be subject to a higher degree of market risk than diversified funds because of a concentration in a specific industry, sector or geographic location. Investing in small and mid-size companies is more risky than investing in large companies as they may be more volatile and less liquid than larger companies. Please see the Funds’ Prospectus and Statement of Additional Information for more risk disclosure.
| matthewsasia.com | 800.789.ASIA | 3 |
Table of Contents

Message to Shareholders from the
President of Your ETFs
Dear Fellow Shareholder,
I am pleased to offer this inaugural Annual Report letter about our Active Exchange-Traded Funds (ETFs) to you.
Matthews’ Active ETFs and the Power of Choice
Based on our history of providing investors with unique access to Emerging Markets, Asia and China, we have launched our first actively managed ETFs focused on these regions. These active, research-based new vehicles incorporate experienced insights and our deep research to offer a range of investment opportunity in a new way with the aim of building differentiated portfolios, providing investors the `power of choice’ for investing in these dynamic markets.
The Matthews Emerging Markets Active ETF (MEM), Matthews Asia Innovators Active ETF (MINV) and Matthews China Active ETF (MCH) (as well as the newly launched Matthews Emerging Markets ex China Active ETF (MEMX)) provide investors access to our deep expertise, fundamental research, and active management backed by over 30 years of active investment experience.
Privilege to Serve and Looking Forward
On a personal note, I am honored to have joined Matthews and to serve as the firm’s CEO, and as a Trustee and President of the Matthews Funds in 2022. I have long admired the firm’s unique value proposition, with deep investment expertise in the Emerging Markets, strong fundamental research capabilities and commitment to delivering outstanding client service.
Looking forward, we will continue to maintain a thoughtful and opportunistic approach to identifying the most attractive long-term investment opportunities and we remain steadfast in our research-based investment approach.
We take seriously the stewardship of your assets and thank you for being a valued shareholder during what has been a tumultuous and challenging year. We look forward to the opportunities to come in the Lunar Year of the Rabbit.

Cooper Abbott, CFA
President, Matthews Asia Funds
Chief Executive Officer, Matthews International Capital Management, LLC
| 4 | MATTHEWS ASIA FUNDS |
Table of Contents
Message to Shareholders from the Investment Advisor
Dear Valued Shareholder,
2022 was a momentous year. The markets endured some formidable headwinds, including U.S.—China tensions, China’s zero-COVID policy and the difficulties posed by inflation and rising interest rates. Taiwan was challenged due to the global slowdown, which affected its semiconductor industry, as was export-dependent Korea. India on the other hand was a different story. Capital spending in the economy continued to strengthen, consumption remained robust and its equity markets significantly outperformed much of Asia. As for Latin America, the domestic markets of Brazil and Mexico were relatively stable.
By the end of September, much of our universe seemed to have severe price dislocations, that is to say prices that were significantly delinked from what we believed to be fundamental long-term earnings power. Thankfully, there was respite during the remainder of 2022. The abrupt abandonment of China’s COVID policy at the tail end of the year paved the way for economic recovery in the world’s second-biggest economy and equity markets in China and its emerging markets-trading partners surged as a result. The fight against inflation also gained ground with the steepest Fed rate rises now seemingly behind us.
The power of choice in challenging times
2022 was also a momentous year for the firm. At Matthews Asia, we have a history of offering new strategies when we believe there are attractive long-term opportunities for our clients. The Matthews Emerging Markets Equity Active ETF (MEM), the Matthews Asia Innovators Active ETF (MINV) and the Matthews China Active ETF (MCH) were all launched in July, offering an additional vehicle for investing in three key asset classes—Emerging Markets, Innovation and China. The suite combines the benefits of our active investment approach and stock-picking heritage with the transparency, daily trading and potential tax efficiency of ETFs.
As we look ahead, many emerging markets are proving themselves to be remarkably resilient. The process of building out supply chains and manufacturing bases in order to cut costs and raise productivity continues unabated. Brazil and Mexico, particularly, could see inflows of capital from the U.S. and, ironically, Chinese companies, seeking to avoid the political issues around trade and supply chains. India would also seem to have similar opportunities. Here, the issue is that equity valuations seem quite expensive relative to other markets.
Of course, the specter of recession still hangs over the world, particularly in Europe where the war in Ukraine is likely to keep prices high. If a global recession were to take hold then enthusiasm for export markets would be dampened. At the same time it may lower the cost of capital and make longer-term investments more profitable, particularly given the fact that international trade has in fact continued to grow. Any global recession may also be mitigated by what appears to be a continually buoyant U.S. labor market and by a recovery in post-COVID China.
Active strategies for a real investment cycle
In recent years, I think we have had an investment cycle that was abrupt, short-term and focused on listed securities. Real interest rates were driven so low that stocks began to trade on narratives of companies’ future values, on stories of what they might become. Track records, cash flows, dividends, all of the real things that companies produce for investors started to matter less and less. The far future became less anchored to any history of the company or any achievements in the present.
As we awake from our COVID slumber, emerging markets seems to have preconditions for a long-term, real, economic investment cycle. Not a financial cycle. Not a stock-market boom and bust. But countries and corporates cooperating to build more efficient and sustainable economic relationships given the new environment in which they find themselves. The logic of cross-border investments and rising productivity and wages continues.
In order to take advantage of a continued globalization as well as the increasing political tensions between the West and East, we believe in the need to focus on domestic businesses in the countries we invest in. While much of the supply chain is concentrated in businesses with fine margins and strong competitive pressures, domestic businesses can have more opportunities to shelter themselves from these pressures through attributes like brand, technological prowess, intellectual property, consumer tastes, logistical infrastructure, and owning of real estate.
To put it all together, I think we are entering a world with a more realistic view of the cost of capital and consequently, returns on capital ought to be driven higher, too. I don’t see a return to rampant optimism. I think realism will be the watchword. In January 2023, we launched the Matthews Emerging Markets ex China Active ETF (MEMX), designed to give investors more control over how they allocate to China in their portfolios. To navigate emerging markets in the months and years ahead we think the power of choice and the power of active management will be key elements in the toolkits of investors.
The economic and financial climate is undoubtedly difficult, but these are the times when opportunities arise. Our research-based investment team continues to comb our investment universe for these opportunities.

Robert Horrocks, PhD
Chief Investment Officer
Matthews International Capital Management, LLC
| matthewsasia.com | 800.789.ASIA | 5 |
Table of Contents

| PORTFOLIO MANAGERS | ||
| John Paul Lech | ||
Lead Manager | ||
| Alex Zarechnak | ||
Co-Manager | ||
| FUND FACTS | ||
| Ticker | MEM | |
CUSIP | 577125818 | |
Inception Date | 07/13/22 | |
Gross Expense Ratio | 0.79% | |
NAV (as of 12/31/22) | $26.27 | |
Market Price (as of 12/31/22) | $26.44 | |
# of Positions | 56 | |
Net Assets | $6.3 million | |
Portfolio Turnover | 15.47% | |
Weight Average Market Cap | $93.4 billion | |
Benchmark | ||
MSCI Emerging Markets Index | ||
OBJECTIVE
Long-term capital appreciation.
STRATEGY
Under normal circumstances, the Fund seeks to achieve its investment objective by investing at least 80% of its net assets, which include borrowings for investment purposes, in the common and preferred stocks of companies located in emerging market countries. Emerging market countries generally include every country in the world except the United States, Australia, Canada, Hong Kong, Israel, Japan, New Zealand, Singapore and most of the countries in Western Europe.
| 2 | Holdings may combine more than one security from same issuer and related depositary receipts. |
| 3 | Not all countries where the Fund may invest are included in the benchmark index. |
| 4 | Source: FactSet Research Systems. Percentage values in data are rounded to the nearest tenth of one percent, so the values may not sum to 100% due to rounding. Country allocations and percentage values may be derived from different data sources and may not be consistent with other Fund literature. |
Matthews Emerging Markets Equity Active ETF (unaudited)
| PERFORMANCE AS OF DECEMBER 31, 2022 | ||||||||||||
|
|
| Actual Return, Not Annualized | ||||||||||
| 3 Months | Since Inception | Inception date | ||||||||||
| Emerging Markets Equity Active ETF (NAV) | 10.44% | 5.63% | 07/13/22 | |||||||||
| Emerging Markets Equity Active ETF (market price) | 11.48% | 6.31% | ||||||||||
| MSCI Emerging Markets Index1 | 9.79% | -0.07% | ||||||||||
| 1 | It is not possible to invest directly in an index. Source: Index data from Morgan Stanley Capital International and Bloomberg; total return calculations performed by BNY Mellon Investment Servicing (US) Inc. Please see page 14 for index definition. |
Performance assumes reinvestment of all dividends and/or distributions before taxes. All performance quoted represents past performance and is no guarantee of future results. Investment return and principal value will fluctuate with market conditions so that when sold, shares may be worth more or less than their original cost. For the Fund’s most recent month-end performance visit matthewsasia.com.
| TOP TEN HOLDINGS2 | ||||||
| Country | % of Net Assets | |||||
Taiwan Semiconductor Manufacturing Co., Ltd. | Taiwan | 5.8% | ||||
Samsung Electronics Co., Ltd., Pfd. | South Korea | 5.4% | ||||
Tencent Holdings, Ltd. | China | 4.8% | ||||
HDFC Bank, Ltd. | India | 3.4% | ||||
AIA Group, Ltd. | Hong Kong | 2.9% | ||||
Prudential PLC | United Kingdom | 2.8% | ||||
Woodside Energy Group, Ltd. | Australia | 2.8% | ||||
Prologis Property Mexico SA de CV REIT | Mexico | 2.8% | ||||
ICICI Bank, Ltd. | India | 2.6% | ||||
First Quantum Minerals, Ltd. | Zambia | 2.6% | ||||
% OF ASSETS IN TOP 10 | 35.9% | |||||
COUNTRY ALLOCATION3,4 | ||||
| China/Hong Kong | 19.9 | |||
India | 14.1 | |||
Mexico | 8.5 | |||
Brazil | 8.4 | |||
South Korea | 6.9 | |||
Taiwan | 5.8 | |||
Vietnam | 4.6 | |||
Singapore | 3.3 | |||
Indonesia | 2.8 | |||
United Kingdom | 2.8 | |||
Australia | 2.8 | |||
| United States | 2.8 | |||
Canada | 2.6 | |||
Philippines | 2.5 | |||
France | 2.5 | |||
Poland | 1.5 | |||
Qatar | 1.4 | |||
Argentina | 1.4 | |||
Kazakhstan | 1.1 | |||
United Arab Emirates | 1.0 | |||
Turkey | 0.7 | |||
Cash and Other Assets, Less Liabilities | 2.6 | |||
SECTOR ALLOCATION4 | ||||
Financials | 25.5 | |||
Information Technology | 20.5 | |||
Consumer Discretionary | 10.7 | |||
Materials | 9.8 | |||
Industrials | 6.4 | |||
Energy | 6.2 | |||
Real Estate | 5.6 | |||
Consumer Staples | 5.0 | |||
Communication Services | 4.8 | |||
Health Care | 2.9 | |||
Cash and Other Assets, Less Liabilities | 2.6 | |||
MARKET CAP EXPOSURE4 | ||||
Mega Cap (over $25B) | 51.1 | |||
Large Cap ($10B-$25B) | 17.0 | |||
Mid Cap ($3B-10B) | 16.1 | |||
Small Cap (under $3B) | 13.3 | |||
Cash and Other Assets, Less Liabilities | 2.6 | |||
| 6 | MATTHEWS ASIA FUNDS |
Table of Contents
Matthews Emerging Markets Equity Active ETF
December 31, 2022
Schedule of Investments
COMMON EQUITIES: 92.0%
| Shares | Value | |||||||
| CHINA/HONG KONG: 19.9% | ||||||||
Tencent Holdings, Ltd. | 7,100 | $303,833 | ||||||
AIA Group, Ltd. | 16,200 | 180,163 | ||||||
H World Group, Ltd. ADR | 2,767 | 117,376 | ||||||
JD.com, Inc. A Shares | 3,800 | 107,209 | ||||||
Yum China Holdings, Inc. | 1,883 | 102,906 | ||||||
Midea Group Co., Ltd. A Shares | 12,400 | 93,109 | ||||||
Hong Kong Exchanges & Clearing, Ltd. | 2,000 | 86,407 | ||||||
NARI Technology Co., Ltd. A Shares | 21,600 | 76,174 | ||||||
Techtronic Industries Co., Ltd. | 6,000 | 66,957 | ||||||
ESR Group, Ltd.a,b | 30,000 | 62,960 | ||||||
CSPC Pharmaceutical Group, Ltd. | 52,000 | 54,632 | ||||||
|
| |||||||
Total China/Hong Kong | 1,251,726 | |||||||
|
| |||||||
| INDIA: 14.1% | ||||||||
HDFC Bank, Ltd. ADR | 3,144 | 215,081 | ||||||
ICICI Bank, Ltd. ADR | 7,500 | 164,175 | ||||||
Infosys, Ltd. ADR | 8,605 | 154,976 | ||||||
Kotak Mahindra Bank, Ltd. | 4,704 | 103,897 | ||||||
Dabur India, Ltd. | 13,053 | 88,585 | ||||||
Restaurant Brands Asia, Ltd.c | 61,389 | 82,923 | ||||||
PI Industries, Ltd. | 1,863 | 77,013 | ||||||
|
| |||||||
Total India | 886,650 | |||||||
|
| |||||||
| MEXICO: 8.5% | ||||||||
Prologis Property Mexico SA de CV REIT | 60,900 | 174,475 | ||||||
Grupo Financiero Banorte SAB de CV Class O | 14,400 | 103,386 | ||||||
Grupo Aeroportuario del Sureste SAB de CV ADR | 395 | 92,031 | ||||||
Becle SAB de CV | 38,300 | 83,273 | ||||||
GCC SAB de CV | 12,000 | 80,299 | ||||||
|
| |||||||
Total Mexico | 533,464 | |||||||
|
| |||||||
| BRAZIL: 8.4% | ||||||||
Banco BTG Pactual SA | 25,200 | 114,264 | ||||||
Vinci Partners Investments, Ltd. Class A | 10,669 | 96,448 | ||||||
Vale SA ADR | 5,540 | 94,014 | ||||||
Hapvida Participacoes e Investimentos SAa,b,c | 68,700 | 66,101 | ||||||
Hypera SA | 7,000 | 59,927 | ||||||
Petroleo Brasileiro SA ADR | 4,799 | 51,109 | ||||||
WEG SA | 6,400 | 46,681 | ||||||
|
| |||||||
Total Brazil | 528,544 | |||||||
|
| |||||||
| TAIWAN: 5.8% | ||||||||
Taiwan Semiconductor Manufacturing Co., Ltd. | 25,000 | 364,806 | ||||||
|
| |||||||
Total Taiwan | 364,806 | |||||||
|
| |||||||
| VIETNAM: 4.6% | ||||||||
FPT Corp. | 46,900 | 152,984 | ||||||
Military Commercial Joint Stock Bankc | 73,500 | 53,313 | ||||||
Sai Gon Cargo Service Corp. | 16,670 | 53,033 | ||||||
HDBankc | 46,625 | 31,545 | ||||||
|
| |||||||
Total Vietnam | 290,875 | |||||||
|
| |||||||
| Shares | Value | |||||||
| UNITED STATES: 4.2% | ||||||||
Applied Materials, Inc. | 939 | $91,440 | ||||||
Globant SAc | 536 | 90,134 | ||||||
Excelerate Energy, Inc. Class A | 3,395 | 85,044 | ||||||
|
| |||||||
Total United States | 266,618 | |||||||
|
| |||||||
| SINGAPORE: 3.3% | ||||||||
Capitaland Investment, Ltd. | 41,800 | 115,315 | ||||||
TDCX, Inc. ADRc | 7,599 | 94,075 | ||||||
|
| |||||||
Total Singapore | 209,390 | |||||||
|
| |||||||
| UNITED KINGDOM: 2.8% | ||||||||
Prudential PLC | 13,245 | 179,638 | ||||||
|
| |||||||
Total United Kingdom | 179,638 | |||||||
|
| |||||||
| AUSTRALIA: 2.8% | ||||||||
Woodside Energy Group, Ltd. | 7,406 | 177,993 | ||||||
|
| |||||||
Total Australia | 177,993 | |||||||
|
| |||||||
| INDONESIA: 2.8% | ||||||||
PT Bank Rakyat Indonesia Persero Tbk | 390,000 | 123,758 | ||||||
PT Avia Avian Tbk | 1,254,000 | 50,748 | ||||||
|
| |||||||
Total Indonesia | 174,506 | |||||||
|
| |||||||
| ZAMBIA: 2.6% | ||||||||
First Quantum Minerals, Ltd. | 7,700 | 160,768 | ||||||
|
| |||||||
Total Zambia | 160,768 | |||||||
|
| |||||||
| PHILIPPINES: 2.5% | ||||||||
Wilcon Depot, Inc. | 170,400 | 90,203 | ||||||
Ayala Corp. | 5,620 | 70,090 | ||||||
|
| |||||||
Total Philippines | 160,293 | |||||||
|
| |||||||
| FRANCE: 2.5% | ||||||||
TotalEnergies SE ADR | 1,283 | 79,649 | ||||||
LVMH Moet Hennessy Louis Vuitton SE | 108 | 78,367 | ||||||
|
| |||||||
Total France | 158,016 | |||||||
|
| |||||||
| POLAND: 1.5% | ||||||||
Dino Polska SAa,b,c | 1,139 | 97,456 | ||||||
|
| |||||||
Total Poland | 97,456 | |||||||
|
| |||||||
| SOUTH KOREA: 1.5% | ||||||||
LG Chem Ltd. | 202 | 95,848 | ||||||
|
| |||||||
Total South Korea | 95,848 | |||||||
|
| |||||||
| QATAR: 1.4% | ||||||||
Qatar National Bank QPSC | 17,243 | 85,227 | ||||||
|
| |||||||
Total Qatar | 85,227 | |||||||
|
| |||||||
| KAZAKHSTAN: 1.1% | ||||||||
Kaspi.KZ JSC GDRb | 972 | 69,498 | ||||||
|
| |||||||
Total Kazakhstan | 69,498 | |||||||
|
| |||||||
| matthewsasia.com | 800.789.ASIA | 7 |
Table of Contents
Matthews Emerging Markets Equity Active ETF
December 31, 2022
Schedule of Investments (continued)
COMMON EQUITIES (continued)
| Shares | Value | |||||||
| UNITED ARAB EMIRATES: 1.0% | ||||||||
Fertiglobe PLC | 52,287 | $60,222 | ||||||
|
| |||||||
Total United Arab Emirates | 60,222 | |||||||
|
| |||||||
| TURKEY: 0.7% | ||||||||
BIM Birlesik Magazalar AS | 6,371 | 46,593 | ||||||
|
| |||||||
Total Turkey | 46,593 | |||||||
|
| |||||||
| TOTAL COMMON EQUITIES | 5,798,131 | |||||||
|
| |||||||
(Cost $5,758,376) | ||||||||
PREFERRED EQUITIES: 5.4% | ||||||||
| SOUTH KOREA: 5.4% | ||||||||
Samsung Electronics Co., Ltd., Pfd. | 8,556 | 341,699 | ||||||
|
| |||||||
Total South Korea | 341,699 | |||||||
|
| |||||||
| TOTAL PREFERRED EQUITIES | 341,699 | |||||||
|
| |||||||
(Cost $357,486) | ||||||||
SHORT-TERM INVESTMENT: 1.6% | ||||||||
| MONEY MARKET FUNDS: 1.6% | ||||||||
JPMorgan U.S. Government Money Market Fund, Capital Shares, 4.11%d | 98,331 | 98,331 | ||||||
|
| |||||||
(Cost $98,331) | ||||||||
| TOTAL INVESTMENTS: 99.0% |
| 6,238,161 | ||||||
(Cost $6,214,193) | ||||||||
| CASH AND OTHER ASSETS, LESS LIABILITIES: 1.0% | 65,725 | |||||||
|
| |||||||
NET ASSETS: 100.0% |
| $6,303,886 | ||||||
|
| |||||||
| a | Security exempt from registration under Rule 144A of the Securities Act of 1933, as amended. The security may be resold in transactions exempt from registration normally to qualified institutional buyers. The security has been determined to be liquid in accordance with procedures adopted by the Funds’ Board of Trustees. At December 31, 2022, the aggregate value is $226,517, which is 3.59% of net assets. |
| b | The securities may be resold to qualified foreign investors and foreign institutional buyers under Regulation S of the Securities Act of 1933. |
| c | Non-income producing security. |
| d | Rate shown is the current yield as of December 31, 2022. |
| ADR | American Depositary Receipt |
| GDR | Global Depositary Receipt |
| JSC | Joint Stock Co. |
| Pfd. | Preferred |
| QPSC | Qatari Public Shareholding Co. |
| REIT | Real Estate Investment Trust |
See accompanying notes to financial statements.
| 8 | MATTHEWS ASIA FUNDS |
Table of Contents

| PORTFOLIO MANAGERS | ||
Michael J. Oh, CFA | ||
Lead Manager | ||
| Taizo Ishida | ||
Co-Manager | ||
| FUND FACTS | ||
| Ticker | MINV | |
CUSIP | 577125826 | |
Inception Date | 07/13/22 | |
Gross Expense Ratio | 0.79% | |
NAV (as of 12/31/22) | $24.24 | |
Market Price (as of 12/31/22) | $24.29 | |
# of Positions | 33 | |
Net Assets | $105.4 million | |
Portfolio Turnover | 72.56% | |
Weight Average Market Cap | $105.7 billion | |
Benchmark | ||
MSCI AC Asia ex Japan Index | ||
OBJECTIVE
Long-term capital appreciation.
STRATEGY
Under normal circumstances, the Fund seeks to achieve its investment objective by investing at least 80% of its net assets, which include borrowings for investment purposes, in the common and preferred stocks of companies located in Asia that Matthews believes are innovators in their products, services, processes, business models, management, use of technology, or approach to creating, expanding or servicing their markets. Asia consists of all countries and markets in Asia, including developed, emerging, and frontier countries and markets in the Asia region.
| 2 | Holdings may combine more than one security from same issuer and related depositary receipts. |
| 3 | Not all countries where the Fund may invest are included in the benchmark index. |
| 4 | Source: FactSet Research Systems. Percentage values in data are rounded to the nearest tenth of one percent, so the values may not sum to 100% due to rounding. Country allocations and percentage values may be derived from different data sources and may not be consistent with other Fund literature. |
Matthews Asia Innovators Active ETF (unaudited)
| PERFORMANCE AS OF DECEMBER 31, 2022 | ||||||||||||
|
|
| Actual Return, Not Annualized | ||||||||||
| 3 Months | Since Inception | Inception date | ||||||||||
| Asia Innovators Active ETF (NAV) | 8.31% | -3.04% | 07/13/22 | |||||||||
| Asia Innovators Active ETF (market price) | 8.78% | -2.84% | ||||||||||
| MSCI AC Asia ex Japan Index1 | 11.43% | -1.44% | ||||||||||
| 1 | It is not possible to invest directly in an index. Source: Index data from Morgan Stanley Capital International and Bloomberg; total return calculations performed by BNY Mellon Investment Servicing (US) Inc. Please see page 14 for index definition. |
Performance assumes reinvestment of all dividends and/or distributions before taxes. All performance quoted represents past performance and is no guarantee of future results. Investment return and principal value will fluctuate with market conditions so that when sold, shares may be worth more or less than their original cost. For the Fund’s most recent month-end performance visit matthewsasia.com.
| TOP TEN HOLDINGS2 | ||||||
| Name | Country | % Net Assets | ||||
Tencent Holdings, Ltd. | China | 6.4% | ||||
Meituan B Shares | China | 5.5% | ||||
HDFC Bank, Ltd. | India | 5.2% | ||||
Alibaba Group Holding, Ltd. ADR | China | 5.0% | ||||
Pinduoduo, Inc. ADR | China | 4.9% | ||||
Trip.com Group, Ltd. ADR | China | 4.9% | ||||
H World Group, Ltd. ADR | China | 4.7% | ||||
Kuaishou Technology | China | 4.7% | ||||
JD.com, Inc. ADR | China | 4.3% | ||||
KE Holdings, Inc. ADR | China | 4.1% | ||||
| % OF ASSETS IN TOP 10 | 49.7% | |||||
COUNTRY ALLOCATION3,4 | ||||
China/Hong Kong | 68.2 | |||
India | 15.6 | |||
South Korea | 5.6 | |||
Singapore | 5.0 | |||
Taiwan | 2.0 | |||
Vietnam | 0.8 | |||
Cash and Other Assets, Less Liabilities | 2.7 | |||
SECTOR ALLOCATION4 | ||||
Consumer Discretionary | 33.9 | |||
Communication Services | 18.0 | |||
Financials | 14.2 | |||
Information Technology | 9.5 | |||
Consumer Staples | 8.8 | |||
Industrials | 5.2 | |||
Real Estate | 4.1 | |||
Energy | 2.0 | |||
Health Care | 1.6 | |||
Cash and Other Assets, Less Liabilities | 2.7 | |||
MARKET CAP EXPOSURE4 | ||||
Mega Cap (over $25B) | 62.1 | |||
Large Cap ($10B-$25B) | 22.7 | |||
Mid Cap ($3B-10B) | 10.5 | |||
Small Cap (under $3B) | 2.1 | |||
Cash and Other Assets, Less Liabilities | 2.7 | |||
| matthewsasia.com | 800.789.ASIA | 9 |
Table of Contents
Matthews Asia Innovators Active ETF
December 31, 2022
Schedule of Investments
COMMON EQUITIES: 97.3%
| Shares | Value | |||||||
| CHINA/HONG KONG: 68.2% | ||||||||
Tencent Holdings, Ltd. | 158,200 | $6,769,909 | ||||||
Meituan B Sharesa,b,c | 257,000 | 5,752,490 | ||||||
Alibaba Group Holding, Ltd. ADRb | 60,362 | 5,317,289 | ||||||
Pinduoduo, Inc. ADRb | 63,339 | 5,165,295 | ||||||
Trip.com Group, Ltd. ADRb | 149,615 | 5,146,756 | ||||||
H World Group, Ltd. ADR | 117,726 | 4,993,937 | ||||||
Kuaishou Technologya,b,c | 548,500 | 4,993,104 | ||||||
JD.com, Inc. ADR | 80,201 | 4,501,682 | ||||||
KE Holdings, Inc. ADRb | 307,122 | 4,287,423 | ||||||
China Resources Beer Holdings Co., Ltd. | 524,000 | 3,662,317 | ||||||
Foshan Haitian Flavouring & Food Co., Ltd. A Shares | 279,796 | 3,218,998 | ||||||
Kanzhun, Ltd. ADRb | 149,985 | 3,055,194 | ||||||
Kweichow Moutai Co., Ltd. A Shares | 9,800 | 2,446,158 | ||||||
AIA Group, Ltd. | 208,000 | 2,313,199 | ||||||
Innovent Biologics, Inc.a,b,c | 394,500 | 1,693,252 | ||||||
Bilibili, Inc. ADRb | 69,597 | 1,648,753 | ||||||
Kingdee International Software Group Co., Ltd.b | 768,000 | 1,647,201 | ||||||
Shenzhen Inovance Technology Co., Ltd. A Shares | 140,200 | 1,408,312 | ||||||
Silergy Corp. | 95,000 | 1,349,173 | ||||||
OPT Machine Vision Tech Co., Ltd. A Shares | 67,515 | 1,291,853 | ||||||
Contemporary Amperex Technology Co., Ltd. A Shares | 22,000 | 1,250,965 | ||||||
|
| |||||||
Total China/Hong Kong | 71,913,260 | |||||||
|
| |||||||
| INDIA: 15.6% | ||||||||
HDFC Bank, Ltd. | 277,049 | 5,452,403 | ||||||
ICICI Bank, Ltd. | 395,797 | 4,262,006 | ||||||
IndusInd Bank, Ltd. | 201,720 | 2,974,962 | ||||||
Reliance Industries, Ltd. | 67,923 | 2,091,303 | ||||||
Zomato, Ltd.b | 2,356,843 | 1,689,360 | ||||||
|
| |||||||
Total India | 16,470,034 | |||||||
|
| |||||||
| SOUTH KOREA: 5.6% | ||||||||
Coupang, Inc.b | 157,085 | 2,310,720 | ||||||
Samsung Electronics Co., Ltd. | 47,413 | 2,073,499 | ||||||
Samsung SDI Co., Ltd. | 3,307 | 1,545,620 | ||||||
|
| |||||||
Total South Korea | 5,929,839 | |||||||
|
| |||||||
| SINGAPORE: 5.0% | ||||||||
Grab Holdings, Ltd. Class Ab | 879,692 | 2,832,608 | ||||||
Sea, Ltd. ADRb | 47,491 | 2,470,957 | ||||||
|
| |||||||
Total Singapore | 5,303,565 | |||||||
|
| |||||||
| TAIWAN: 2.0% | ||||||||
Taiwan Semiconductor Manufacturing Co., Ltd. | 145,000 | 2,115,876 | ||||||
|
| |||||||
Total Taiwan | 2,115,876 | |||||||
|
| |||||||
| Shares | Value | |||||||
| VIETNAM: 0.9% | ||||||||
Mobile World Investment Corp. | 481,200 | $875,652 | ||||||
|
| |||||||
Total Vietnam | 875,652 | |||||||
|
| |||||||
| TOTAL COMMON EQUITIES | 102,608,226 | |||||||
|
| |||||||
(Cost $100,314,660) | ||||||||
SHORT-TERM INVESTMENT: 2.5% | ||||||||
| MONEY MARKET FUNDS: 2.5% | ||||||||
JPMorgan U.S. Government Money Market Fund, Capital Shares, 4.11%d | 2,653,401 | 2,653,401 | ||||||
|
| |||||||
(Cost $2,653,401) | ||||||||
| TOTAL INVESTMENTS: 99.8% |
| 105,261,627 | ||||||
(Cost $102,968,061) | ||||||||
| CASH AND OTHER ASSETS, LESS LIABILITIES: 0.2% | 177,400 | |||||||
|
| |||||||
NET ASSETS: 100.0% |
| $105,439,027 | ||||||
|
| |||||||
| a | Security exempt from registration under Rule 144A of the Securities Act of 1933, as amended. The security may be resold in transactions exempt from registration normally to qualified institutional buyers. The security has been determined to be liquid in accordance with procedures adopted by the Funds’ Board of Trustees. At December 31, 2022, the aggregate value is $12,438,846, which is 11.80% of net assets. |
| b | Non-income producing security. |
| c | The securities may be resold to qualified foreign investors and foreign institutional buyers under Regulation S of the Securities Act of 1933. |
| d | Rate shown is the current yield as of December 31, 2022. |
| ADR | American Depositary Receipt |
See accompanying notes to financial statements.
| 10 | MATTHEWS ASIA FUNDS |
Table of Contents
| PORTFOLIO MANAGERS | ||||
| Andrew Mattock, CFA | ||||
Lead Manager | ||||
| Winnie Chwang | Sherwood Zhang, CFA | |||
Co-Manager | Co-Manager | |||
| FUND FACTS | ||||
| Ticker | MCH | |||
CUSIP | 577125834 | |||
Inception Date | 07/13/22 | |||
Gross Expense Ratio | 0.79% | |||
NAV (as of 12/31/22) | $24.04 | |||
Market Price (as of 12/31/22) | $24.16 | |||
# of Positions | 63 | |||
Net Assets | $10.1 million | |||
Portfolio Turnover | 12.48% | |||
Weight Average Market Cap | $75.9 billion | |||
Benchmark | ||||
MSCI China Index | ||||
MSCI China All Shares Index | ||||
OBJECTIVE
Long-term capital appreciation.
STRATEGY
Under normal circumstances, the Fund seeks to achieve its investment objective by investing at least 80% of its net assets, which include borrowings for investment purposes, in the common and preferred stocks of companies located in China. China includes its administrative and other districts, such as Hong Kong.
| 2 | Holdings may combine more than one security from same issuer and related depositary receipts. |
| 3 | Not all countries where the Fund may invest are included in the benchmark index. |
| 4 | Source: FactSet Research Systems. Percentage values in data are rounded to the nearest tenth of one percent, so the values may not sum to 100% due to rounding. Country allocations and percentage values may be derived from different data sources and may not be consistent with other Fund literature. |
Matthews China Active ETF (unaudited)
| PERFORMANCE AS OF DECEMBER 31, 2022 | ||||||||||||
|
|
| Actual Return, Not Annualized | ||||||||||
| 3 Months | Since Inception | Inception date | ||||||||||
| China Active ETF (NAV) | 17.84% | -3.84% | 07/13/22 | |||||||||
| China Active ETF (market price) | 17.56% | -3.32% | ||||||||||
| MSCI China Index1 | 13.53% | -7.60% | ||||||||||
| MSCI China All Shares Index1 | 9.12% | -9.46% | ||||||||||
| 1 | It is not possible to invest directly in an index. Source: Index data from Morgan Stanley Capital International and Bloomberg; total return calculations performed by BNY Mellon Investment Servicing (US) Inc. Please see page 14 for index definition. |
Performance assumes reinvestment of all dividends and/or distributions before taxes. All performance quoted represents past performance and is no guarantee of future results. Investment return and principal value will fluctuate with market conditions so that when sold, shares may be worth more or less than their original cost. For the Fund’s most recent month-end performance visit matthewsasia.com.
| TOP TEN HOLDINGS2 | ||||||
| Name | Country | % Net Assets | ||||
Alibaba Group Holding, Ltd. | China | 6.0% | ||||
Pinduoduo, Inc. ADR | China | 5.9% | ||||
JD.com, Inc. A Shares | China | 5.8% | ||||
Meituan B Shares | China | 5.7% | ||||
China Merchants Bank Co., Ltd. A Shares | China | 4.6% | ||||
CITIC Securities Co., Ltd. H Shares | China | 4.3% | ||||
China International Capital Corp., Ltd. H Shares | China | 4.3% | ||||
Tencent Holdings, Ltd. | China | 4.3% | ||||
KE Holdings, Inc. ADR | China | 3.2% | ||||
Bilibili, Inc. ADR | China | 2.2% | ||||
| % OF ASSETS IN TOP 10 | 46.3% | |||||
COUNTRY ALLOCATION3,4 | ||||
China/Hong Kong | 98.3 | |||
Cash and Other Assets, Less Liabilities | 1.7 | |||
SECTOR ALLOCATION4 | ||||
Consumer Discretionary | 34.7 | |||
Financials | 15.9 | |||
Information Technology | 10.4 | |||
Industrials | 9.3 | |||
Communication Services | 8.7 | |||
Real Estate | 7.8 | |||
Health Care | 5.7 | |||
Consumer Staples | 3.4 | |||
Materials | 2.4 | |||
Cash and Other Assets, Less Liabilities | 1.7 | |||
MARKET CAP EXPOSURE4 | ||||
Mega Cap (over $25B) | 54.5 | |||
Large Cap ($10B-$25B) | 23.6 | |||
Mid Cap ($3B-10B) | 17.0 | |||
Small Cap (under $3B) | 3.2 | |||
Cash and Other Assets, Less Liabilities | 1.7 | |||
| matthewsasia.com | 800.789.ASIA | 11 |
Table of Contents
Matthews China Active ETF
December 31, 2022
Schedule of Investments
COMMON EQUITIES: 98.3%
| Shares | Value | |||||||
| CONSUMER DISCRETIONARY: 34.7% |
| |||||||
Internet & Direct Marketing Retail: 23.3% |
| |||||||
Alibaba Group Holding, Ltd.a | 54,500 | $602,262 | ||||||
Pinduoduo, Inc. ADRa | 7,284 | 594,010 | ||||||
JD.com, Inc. A Shares | 20,650 | 582,596 | ||||||
Meituan B Sharesa,b,c | 25,700 | 575,249 | ||||||
|
| |||||||
| 2,354,117 | ||||||||
|
| |||||||
Hotels, Restaurants & Leisure: 3.0% | ||||||||
Galaxy Entertainment Group, Ltd. | 24,000 | 158,669 | ||||||
H World Group, Ltd. ADR | 3,526 | 149,573 | ||||||
|
| |||||||
| 308,242 | ||||||||
|
| |||||||
Specialty Retail: 3.0% | ||||||||
China Tourism Group Duty Free Corp., Ltd. A Shares | 6,100 | 190,463 | ||||||
Zhongsheng Group Holdings, Ltd. | 21,500 | 110,599 | ||||||
|
| |||||||
| 301,062 | ||||||||
|
| |||||||
Household Durables: 2.7% | ||||||||
Midea Group Co., Ltd. A Shares | 18,800 | 140,752 | ||||||
Man Wah Holdings, Ltd. | 134,800 | 134,196 | ||||||
|
| |||||||
| 274,948 | ||||||||
|
| |||||||
Diversified Consumer Services: 1.2% | ||||||||
China Education Group Holdings, Ltd.c | 92,000 | 119,053 | ||||||
|
| |||||||
Automobiles: 0.9% | ||||||||
Yadea Group Holdings, Ltd.b,c | 52,000 | 87,011 | ||||||
|
| |||||||
Auto Components: 0.6% | ||||||||
Zhejiang Shuanghuan Driveline Co., Ltd. A Shares | 15,300 | 56,279 | ||||||
|
| |||||||
Total Consumer Discretionary | 3,500,712 | |||||||
|
| |||||||
| FINANCIALS: 15.9% | ||||||||
Capital Markets: 11.3% | ||||||||
CITIC Securities Co., Ltd. H Shares | 215,000 | 434,686 | ||||||
China International Capital Corp., Ltd. H Sharesb,c | 227,600 | 434,499 | ||||||
Hong Kong Exchanges & Clearing, Ltd. | 3,900 | 168,493 | ||||||
East Money Information Co., Ltd. A Shares | 38,000 | 106,549 | ||||||
|
| |||||||
| 1,144,227 | ||||||||
|
| |||||||
Banks: 4.6% | ||||||||
China Merchants Bank Co., Ltd. A Shares | 85,800 | 462,058 | ||||||
|
| |||||||
Total Financials | 1,606,285 | |||||||
|
| |||||||
| INFORMATION TECHNOLOGY: 10.4% | ||||||||
Software: 4.7% | ||||||||
Shanghai Baosight Software Co., Ltd. A Shares | 25,180 | 163,042 | ||||||
Thunder Software Technology Co., Ltd. A Shares | 8,800 | 127,570 | ||||||
Beijing Kingsoft Office Software, Inc. A Shares | 2,601 | 99,430 | ||||||
Kingdee International Software Group Co., Ltd.a | 41,000 | 87,936 | ||||||
|
| |||||||
| 477,978 | ||||||||
|
| |||||||
Semiconductors & Semiconductor Equipment: 4.3% |
| |||||||
Zhejiang Jingsheng Mechanical & Electrical Co., Ltd. A Shares | 12,400 | 113,912 | ||||||
LONGi Green Energy Technology Co., Ltd. A Shares | 14,800 | 90,398 | ||||||
NAURA Technology Group Co., Ltd. A Shares | 2,300 | 74,895 | ||||||
| Shares | Value | |||||||
GigaDevice Semiconductor, Inc. A Shares | 4,000 | $59,241 | ||||||
Hangzhou Silan Microelectronics Co., Ltd. A Shares | 8,300 | 39,336 | ||||||
Will Semiconductor Co., Ltd. Shanghai A Shares | 2,205 | 24,568 | ||||||
Beijing Huafeng Test & Control Technology Co., Ltd. A Shares | 509 | 20,339 | ||||||
Cambricon Technologies Corp., Ltd. A Sharesa | 1,100 | 8,700 | ||||||
|
| |||||||
| 431,389 | ||||||||
|
| |||||||
Electronic Equipment, Instruments & Components: 1.4% |
| |||||||
Wingtech Technology Co., Ltd. A Shares | 12,600 | 95,754 | ||||||
Xiamen Faratronic Co., Ltd. A Shares | 2,100 | 48,527 | ||||||
|
| |||||||
| 144,281 | ||||||||
|
| |||||||
Total Information Technology | 1,053,648 | |||||||
|
| |||||||
| INDUSTRIALS: 9.3% | ||||||||
Machinery: 5.0% |
| |||||||
Shenzhen Inovance Technology Co., Ltd. A Shares | 16,400 | 164,738 | ||||||
Wuxi Lead Intelligent Equipment Co., Ltd. A Shares | 18,900 | 109,950 | ||||||
Estun Automation Co., Ltd. A Shares | 33,600 | 105,285 | ||||||
Weichai Power Co., Ltd. A Shares | 46,200 | 67,976 | ||||||
Jiangsu Hengli Hydraulic Co., Ltd. A Shares | 6,500 | 59,327 | ||||||
|
| |||||||
| 507,276 | ||||||||
|
| |||||||
Electrical Equipment: 2.9% | ||||||||
Sungrow Power Supply Co., Ltd. A Shares | 8,300 | 134,118 | ||||||
Contemporary Amperex Technology Co., Ltd. A Shares | 2,200 | 125,097 | ||||||
Gotion High-tech Co., Ltd. A Shares | 8,200 | 34,168 | ||||||
|
| |||||||
| 293,383 | ||||||||
|
| |||||||
Transportation Infrastructure: 1.4% | ||||||||
Shanghai International Airport Co., Ltd. A Sharesa | 16,600 | 138,460 | ||||||
|
| |||||||
Total Industrials | 939,119 | |||||||
|
| |||||||
| COMMUNICATION SERVICES: 8.7% | ||||||||
Interactive Media & Services: 4.3% | ||||||||
Tencent Holdings, Ltd. | 10,100 | 432,213 | ||||||
|
| |||||||
Entertainment: 2.2% | ||||||||
Bilibili, Inc. ADRa | 9,579 | 226,926 | ||||||
|
| |||||||
Media: 2.2% | ||||||||
Focus Media Information Technology Co., Ltd. A Shares | 231,100 | 223,122 | ||||||
|
| |||||||
Total Communication Services | 882,261 | |||||||
|
| |||||||
| REAL ESTATE: 7.8% | ||||||||
Real Estate Management & Development: 7.8% |
| |||||||
KE Holdings, Inc. ADRa | 23,102 | 322,504 | ||||||
Country Garden Services Holdings Co., Ltd. | 80,000 | 199,258 | ||||||
CIFI Holdings Group Co., Ltd. | 1,332,000 | 187,727 | ||||||
Times China Holdings, Ltd.a | 394,000 | 76,226 | ||||||
|
| |||||||
Total Real Estate | 785,715 | |||||||
|
| |||||||
| 12 | MATTHEWS ASIA FUNDS |
Table of Contents
Matthews China Active ETF
December 31, 2022
Schedule of Investments (continued)
COMMON EQUITIES (continued)
| Shares | Value | |||||||
| HEALTH CARE: 5.7% | ||||||||
Life Sciences Tools & Services: 3.8% | ||||||||
Pharmaron Beijing Co., Ltd. H Sharesb,c | 24,900 | $172,754 | ||||||
Hangzhou Tigermed Consulting Co., Ltd. A Shares | 8,700 | 131,779 | ||||||
Wuxi Biologics Cayman, Inc.a,b,c | 10,500 | 80,516 | ||||||
|
| |||||||
| 385,049 | ||||||||
|
| |||||||
Health Care Equipment & Supplies: 1.4% | ||||||||
Shenzhen Mindray Bio-Medical Electronics Co., Ltd. A Shares | 2,000 | 91,336 | ||||||
Shenzhen New Industries Biomedical Engineering Co., Ltd. A Shares | 6,900 | 50,003 | ||||||
|
| |||||||
| 141,339 | ||||||||
|
| |||||||
Health Care Providers & Services: 0.4% | ||||||||
Topchoice Medical Corp. A Sharesa | 1,500 | 33,168 | ||||||
|
| |||||||
Pharmaceuticals: 0.1% | ||||||||
Jiangsu Hengrui Pharmaceuticals Co., Ltd. A Shares | 2,100 | 11,695 | ||||||
|
| |||||||
Total Health Care | 571,251 | |||||||
|
| |||||||
| CONSUMER STAPLES: 3.4% | ||||||||
Beverages: 3.0% | ||||||||
Wuliangye Yibin Co., Ltd. A Shares | 7,900 | 206,313 | ||||||
Shanxi Xinghuacun Fen Wine Factory Co., Ltd. A Shares | 2,400 | 98,857 | ||||||
|
| |||||||
| 305,170 | ||||||||
|
| |||||||
Food Products: 0.4% | ||||||||
Anjoy Foods Group Co., Ltd. A Shares | 1,500 | 35,096 | ||||||
|
| |||||||
Total Consumer Staples | 340,266 | |||||||
|
| |||||||
| MATERIALS: 2.4% | ||||||||
Chemicals: 2.3% | ||||||||
Shanghai Putailai New Energy Technology Co., Ltd. A Shares | 16,800 | 125,997 | ||||||
Shandong Sinocera Functional Material Co., Ltd. A Shares | 12,100 | 48,216 | ||||||
Skshu Paint Co., Ltd. A Sharesa | 2,100 | 34,549 | ||||||
Wanhua Chemical Group Co., Ltd. A Shares | 1,700 | 22,764 | ||||||
|
| |||||||
| 231,526 | ||||||||
|
| |||||||
Construction Materials: 0.1% | ||||||||
China Jushi Co., Ltd. A Shares | 6,300 | 12,484 | ||||||
|
| |||||||
Total Materials | 244,010 | |||||||
|
| |||||||
| TOTAL COMMON EQUITIES | 9,923,267 | |||||||
|
| |||||||
(Cost $9,477,263) | ||||||||
SHORT-TERM INVESTMENT: 1.3% | ||||||||
| MONEY MARKET FUNDS: 1.3% | ||||||||
JPMorgan U.S. Government Money Market Fund, Capital Shares, 4.11%d | 134,996 | 134,996 | ||||||
|
| |||||||
(Cost $134,996) | ||||||||
| Value | ||||||||
| TOTAL INVESTMENTS: 99.6% | 10,058,263 | |||||||
(Cost $9,612,259) | ||||||||
| CASH AND OTHER ASSETS, LESS LIABILITIES: 0.4% | 40,617 | |||||||
|
| |||||||
NET ASSETS: 100.0% | $10,098,880 | |||||||
|
| |||||||
| a | Non-income producing security. |
| b | Security exempt from registration under Rule 144A of the Securities Act of 1933, as amended. The security may be resold in transactions exempt from registration normally to qualified institutional buyers. The security has been determined to be liquid in accordance with procedures adopted by the Funds’ Board of Trustees. At December 31, 2022, the aggregate value is $1,350,029, which is 13.37% of net assets. |
| c | The securities may be resold to qualified foreign investors and foreign institutional buyers under Regulation S of the Securities Act of 1933. |
| d | Rate shown is the current yield as of December 31, 2022. |
| ADR | American Depositary Receipt |
See accompanying notes to financial statements.
| matthewsasia.com | 800.789.ASIA | 13 |
Table of Contents
The MSCI All Country Asia ex Japan Small Cap Index is a free float–adjusted market capitalization-weighted small cap index of the stock markets of China, Hong Kong, India, Indonesia, Malaysia, Pakistan, Philippines, Singapore, South Korea, Taiwan and Thailand.
The MSCI China All Shares Index captures large and mid-cap representation across China A shares, B shares, H shares, Red Chips (issued by entities owned by national or local governments in China), P Chips (issued by companies controlled by individuals in China and deriving substantial revenues in China), and foreign listings (e.g., ADRs). The index aims to reflect the opportunity set of China share classes listed in Hong Kong, Shanghai, Shenzhen and outside of China.
The MSCI China Index is a free float–adjusted market capitalization-weighted index of Chinese equities that includes H
shares listed on the Hong Kong exchange, B shares listed on the Shanghai and Shenzhen ex-exchanges, and Hong Kong-listed securities known as Red Chips (issued by entities owned by national or local governments in China) and P Chips (issued by companies controlled by individuals in China and deriving substantial revenues in China), and foreign listings (e.g., ADRs).
The MSCI Emerging Markets Index is a free float-adjusted market capitalization-weighted index of the stock markets of Argentina, Brazil, Chile, China, Colombia, Czech Republic, Egypt, Greece, Hungary, India, Indonesia, Kuwait, Malaysia, Mexico, Pakistan, Peru, Philippines, Poland, Qatar, Russia, Saudi Arabia, South Africa, South Korea, Taiwan, Thailand, Turkey and United Arab Emirates.
| 14 | MATTHEWS ASIA FUNDS |
Table of Contents
Fund Holdings: The Fund holdings shown in this report are as of December 31, 2022. Holdings are subject to change at any time, so holdings shown in this report may not reflect current Fund holdings. The Funds file complete schedules of portfolio holdings with the Securities and Exchange Commission (the “SEC”) for the first and third quarters of each fiscal year on Form N-PORT. The Funds’ Form N-PORTs are available on the SEC’s website at www.sec.gov. Complete schedules of investments are also available without charge, upon request, from the Funds by calling us at 800.789.ASIA (2742).
Proxy Voting Record: The Funds’ Statement of Additional Information containing a description of the policies and procedures that the Funds have used to vote proxies relating to
portfolio securities, along with each Fund’s proxy voting record relating to portfolio securities held during the most recent 12-month period ended June 30, is available upon request, at no charge, at the Funds’ website at matthewsasia.com or by calling 800.789.ASIA (2742), or on the SEC’s website at www.sec.gov.
Shareholder Reports and Prospectuses: To reduce expenses, it is intended that only one copy of the Funds’ prospectus and each annual and semi-annual report or notice of availability will be mailed to those addresses shared by two or more accounts. If you wish to receive individual copies of these documents, please contact the financial intermediary through which you hold your shares.
| matthewsasia.com | 800.789.ASIA | 15 |
Table of Contents
Disclosure of Fund Expenses (unaudited)
We believe it is important for you to understand the impact of fees regarding your investment. All ETFs have operating expenses. As a shareholder of an ETF, you incur ongoing costs, which include costs for portfolio management, administrative services, and shareholder reports (like this one), among others. Operating expenses, which are deducted from a fund’s gross income, directly reduce the investment return of the fund. A fund’s operating expenses are expressed as a percentage of its average net assets. This figure is known as the expense ratio. The following examples are intended to help you understand the ongoing fees (in dollars) of investing in your fund and to compare these costs with those of other ETFs. The examples are based on an investment of $1,000 made at the beginning of the period shown and held for the entire period.
This table illustrates your fund’s costs in two ways:
Actual Fund Return: This section helps you to estimate the actual operating expenses, after any applicable fee waivers, that you paid over the period. The “Ending Account Value” shown is derived from the fund’s actual return for the past six month period, the “Expense Ratio” column shows the period’s annualized expense ratio, and the “Operating Expenses Paid During Period” column shows the dollar amount that would have been paid by an investor who started with $1,000 in the fund at the beginning of the period. You may use the information here, together with your account value, to estimate the expenses that you paid over the period. To do so, simply divide your account value
by $1,000 (for example, an $8,600 account value divided by $1,000 = 8.6), then multiply the result by the number given for your fund in the first line under the heading entitled “Operating Expenses Paid During Period.”
Hypothetical 5% Return: This section is intended to help you compare your fund’s costs with those of other ETFs. It assumes that the fund had an annual return of 5% before operating expenses, but that the expense ratio is unchanged. In this case, because the return used is not the fund’s actual return, the results do not apply to your investment. This example is useful in making comparisons to other ETFs because the Securities and Exchange Commission requires all registered funds to calculate expenses based on an assumed 5% annual return. You can assess your fund’s costs by comparing this hypothetical example with the hypothetical examples that appear in shareholder reports of other funds.
Please note that the operating expenses shown in the table are meant to highlight and help you compare your ongoing costs only and do not reflect any transactional costs. You may pay brokerage commissions on your purchases and sales of fund shares, which are not reflected in the table.
Matthews Asia Funds does not charge any sales loads, exchange fees, or 12b-1 fees, but these may be present in other funds to which you compare this data. Therefore, the hypothetical portions of the table are useful in comparing ongoing costs only, and will not help you determine the relative total costs of owning different funds.
| 16 | MATTHEWS ASIA FUNDS |
Table of Contents
Disclosure of Fund Expenses (unaudited) (continued)
| ||||||||||||||||
| Beginning Account Value 7/13/22 | Ending Account Value 12/31/22 | Expense Ratio1 | Operating | |||||||||||||
Matthews Emerging Markets Equity Active ETF | ||||||||||||||||
Actual Fund Return | $1,000.00 | $1,063.10 | 0.79% | $3.82 | ||||||||||||
Hypothetical 5% Returns | $1,000.00 | $1,021.22 | 0.79% | $4.02 | ||||||||||||
Matthews Asia Innovators Active ETF |
| |||||||||||||||
Actual Fund Return | $1,000.00 | $971.60 | 0.79% | $3.65 | ||||||||||||
Hypothetical 5% Returns | $1,000.00 | $1,021.22 | 0.79% | $4.02 | ||||||||||||
Matthews China Active ETF | ||||||||||||||||
Actual Fund Return | $1,000.00 | $966.80 | 0.79% | $3.64 | ||||||||||||
Hypothetical 5% Returns | $1,000.00 | $1,021.22 | 0.79% | $4.02 | ||||||||||||
| 1 | Annualized from Fund’s inception, July 13, 2022. |
| 2 | The Fund commenced operations on July 13, 2022. Operating expenses are equal to the Fund’s annualized expense ratio multiplied by the average account value over the period, multiplied by 171 days, then divided by 365. The hypothetical expense example is based on the half-year period beginning July 1, 2022, as required by the SEC. |
| matthewsasia.com | 800.789.ASIA | 17 |
Table of Contents
| Statements of Assets and Liabilities | December 31, 2022 |
| Matthews Emerging Markets Equity Active ETF | Matthews Asia Innovators Active ETF | Matthews China Active ETF | ||||||||||
ASSETS: | ||||||||||||
Investments at value (A) (Note 2-A): | ||||||||||||
Unaffiliated issuers | $6,238,161 | $105,261,627 | $10,058,263 | |||||||||
Cash | 52,291 | 1,287,488 | 11 | |||||||||
Segregated foreign currency at value | 6,766 | 71,149 | 43,450 | |||||||||
Dividends and interest receivable | 10,413 | 36,589 | 2,627 | |||||||||
Receivable for securities sold | — | 1,170,283 | — | |||||||||
Receivable for capital shares sold | 11,194 | 2,076 | — | |||||||||
Other receivable | — | 3,986 | — | |||||||||
TOTAL ASSETS | 6,318,825 | 107,833,198 | 10,104,351 | |||||||||
LIABILITIES: | ||||||||||||
Payable for securities purchased | 11,194 | 2,338,679 | — | |||||||||
Deferred foreign capital gains tax liability (Note 2-E) | 173 | — | — | |||||||||
Due to Advisor (Note 4) | 3,572 | 55,492 | 5,471 | |||||||||
TOTAL LIABILITIES | 14,939 | 2,394,171 | 5,471 | |||||||||
NET ASSETS | $6,303,886 | $105,439,027 | $10,098,880 | |||||||||
SHARES OUTSTANDING: | ||||||||||||
(shares of beneficial interest issued and outstanding, respectively, unlimited number of shares authorized with a $0.001 par value) | 240,000 | 4,350,000 | 420,000 | |||||||||
Net asset value, offering price and redemption price | 26.27 | 24.24 | 24.04 | |||||||||
NET ASSETS CONSISTS OF: | ||||||||||||
Capital paid-in | $6,323,916 | $104,516,743 | $9,699,534 | |||||||||
Total distributable earnings/(accumulated loss) | (20,030 | ) | 922,284 | 399,346 | ||||||||
NET ASSETS | $6,303,886 | $105,439,027 | $10,098,880 | |||||||||
(A) Investments at cost: | ||||||||||||
Unaffiliated Issuers | $6,214,193 | $102,968,061 | $9,612,259 | |||||||||
See accompanying notes to financial statements.
| 18 | MATTHEWS ASIA FUNDS |
Table of Contents
| Statements of Operations | Period Ended December 31, 2022 |
| Matthews Emerging Markets Equity Active ETF1 | Matthews Asia Innovators Active ETF1 | Matthews China Active ETF1 | ||||||||||
INVESTMENT INCOME: | ||||||||||||
Dividends—Unaffiliated Issuers | $48,127 | $46,899 | $6,207 | |||||||||
Interest | 298 | 10,224 | 4,556 | |||||||||
Foreign withholding tax | (3,614 | ) | (10,037 | ) | (425 | ) | ||||||
TOTAL INVESTMENT INCOME | 44,811 | 47,086 | 10,338 | |||||||||
EXPENSES: | ||||||||||||
Investment advisory fees (Note 4) | 13,019 | 81,437 | 14,981 | |||||||||
NET INVESTMENT INCOME (LOSS) | 31,792 | (34,351 | ) | (4,643 | ) | |||||||
| REALIZED AND UNREALIZED GAIN (LOSS) ON INVESTMENTS, FOREIGN CURRENCY RELATED TRANSACTIONS, AND FOREIGN CAPITAL GAINS TAXES: | ||||||||||||
Net realized gain (loss) on investments—Unaffiliated Issuers | (49,732 | ) | (1,268,597 | ) | (47,210 | ) | ||||||
Net realized gain (loss) on foreign currency related transactions | 2,209 | (124,001 | ) | (521 | ) | |||||||
Net change in unrealized appreciation/depreciation on investments—Unaffiliated Issuers | 23,968 | 2,293,566 | 446,004 | |||||||||
Net change in deferred foreign capital gains taxes on unrealized appreciation/depreciation | (173 | ) | — | — | ||||||||
Net change in unrealized appreciation/depreciation on foreign currency related translations | (4 | ) | 8 | 552 | ||||||||
Net realized and unrealized gain (loss) on investments, foreign currency related transactions, and foreign capital gains taxes | (23,732 | ) | 900,976 | 398,825 | ||||||||
NET INCREASE (DECREASE) IN NET ASSETS FROM OPERATIONS | $8,060 | $866,625 | $394,182 | |||||||||
| 1 | The Funds commenced operations on July 13, 2022. |
See accompanying notes to financial statements.
| matthewsasia.com | 800.789.ASIA | 19 |
Table of Contents
Statements of Changes in Net Assets
| MATTHEWS EMERGING MARKETS EQUITY ACTIVE ETF | For the Period Ended December 31, 20221 | |||
OPERATIONS: | ||||
Net investment income (loss) | $31,792 | |||
Net realized gain (loss) on investments and foreign currency related transactions | (47,523 | ) | ||
Net change in unrealized appreciation/depreciation on investments and foreign currency related translations | 23,964 | |||
Net change on foreign capital gains taxes on unrealized appreciation/depreciation | (173 | ) | ||
Net increase (decrease) in net assets resulting from operations | 8,060 | |||
DISTRIBUTIONS TO SHAREHOLDERS: | ||||
Net decrease in net assets resulting from distributions | (28,090 | ) | ||
CAPITAL SHARE TRANSACTIONS (net) (Note 3) | 6,323,916 | |||
Total increase (decrease) in net assets | 6,303,886 | |||
NET ASSETS: | ||||
Beginning of period | — | |||
End of period | $6,303,886 | |||
1 The Fund commenced operations on July 13, 2022. | ||||
| MATTHEWS ASIA INNOVATORS ACTIVE ETF | For the Period Ended December 31, 20221 | |||
OPERATIONS: | ||||
Net investment income (loss) | ($34,351 | ) | ||
Net realized gain (loss) on investments and foreign currency related transactions | (1,392,598 | ) | ||
Net change in unrealized appreciation/depreciation on investments and foreign currency related translations | 2,293,574 | |||
Net increase (decrease) in net assets resulting from operations | 866,625 | |||
CAPITAL SHARE TRANSACTIONS (net) (Note 3) | 104,572,402 | |||
Total increase (decrease) in net assets | 105,439,027 | |||
NET ASSETS: | ||||
Beginning of period | — | |||
End of period | $105,439,027 | |||
1 The Fund commenced operations on July 13, 2022. | ||||
| MATTHEWS CHINA ACTIVE ETF | For the Period Ended December 31, 20221 | |||
OPERATIONS: | ||||
Net investment income (loss) | ($4,643 | ) | ||
Net realized gain (loss) on investments and foreign currency related transactions | (47,731 | ) | ||
Net change in unrealized appreciation/depreciation on investments and foreign currency related translations | 446,556 | |||
Net increase (decrease) in net assets resulting from operations | 394,182 | |||
CAPITAL SHARE TRANSACTIONS (net) (Note 3) | 9,704,698 | |||
Total increase (decrease) in net assets | 10,098,880 | |||
NET ASSETS: | ||||
Beginning of period | — | |||
End of period | $10,098,880 | |||
| 1 | The Fund commenced operations on July 13, 2022. |
See accompanying notes to financial statements.
| 20 | MATTHEWS ASIA FUNDS |
Table of Contents
Matthews Emerging Markets Equity Active ETF
The tables below set forth financial data for a share of beneficial interest outstanding throughout each period presented.
Period Ended | ||||
Net Asset Value, beginning of Period | $25.00 | |||
INCOME (LOSS) FROM INVESTMENT OPERATIONS: | ||||
Net investment income (loss)2 | 0.23 | |||
Net realized gain (loss) and unrealized appreciation/depreciation on investments, foreign currency related transactions and foreign capital gains taxes | 1.18 | |||
Total from investment operations | 1.41 | |||
LESS DISTRIBUTIONS FROM: | ||||
Net investment income | (0.14 | ) | ||
Net Asset Value, end of Period | $26.27 | |||
TOTAL RETURN | 5.63% | 3 | ||
RATIOS/SUPPLEMENTAL DATA | ||||
Net assets, end of Period (in 000’s) | $6,304 | |||
Ratio of expenses to average net assets (Note 4) | 0.79% | 4 | ||
Ratio of net investment income (loss) to average net assets | 1.93% | 4 | ||
Portfolio turnover | | 15.47% | 3 | |
| 1 | The Fund commenced operations on July 13, 2022. |
| 2 | Calculated using the average daily shares method. |
| 3 | Not annualized. |
| 4 | Annualized. |
See accompanying notes to financial statements.
| matthewsasia.com | 800.789.ASIA | 21 |
Table of Contents
Financial Highlights (continued)
Matthews Asia Innovators Active ETF
The tables below set forth financial data for a share of beneficial interest outstanding throughout each period presented.
Period Ended | ||||
Net Asset Value, beginning of Period | $25.00 | |||
INCOME (LOSS) FROM INVESTMENT OPERATIONS: | ||||
Net investment income (loss)2 | (0.04 | ) | ||
Net realized gain (loss) and unrealized appreciation/depreciation on investments and foreign currency related transactions | (0 72 | ) | ||
Total from investment operations | (0.76 | ) | ||
Net Asset Value, end of Period | $24.24 | |||
TOTAL RETURN | | (3.04% | )3 | |
RATIOS/SUPPLEMENTAL DATA | ||||
Net assets, end of Period (in 000’s) | $105,439 | |||
Ratio of expenses to average net assets (Note 4) | 0.79% | 4 | ||
Ratio of net investment income (loss) to average net assets | (0.33% | )4 | ||
Portfolio turnover | 72.56% | 3 | ||
| 1 | The Fund commenced operations on July 13, 2022. |
| 2 | Calculated using the average daily shares method. |
| 3 | Not annualized. |
| 4 | Annualized. |
See accompanying notes to financial statements.
| 22 | MATTHEWS ASIA FUNDS |
Table of Contents
Financial Highlights (continued)
Matthews China Active ETF
The tables below set forth financial data for a share of beneficial interest outstanding throughout each period presented.
Period Ended | ||||
Net Asset Value, beginning of Period | $25.00 | |||
INCOME (LOSS) FROM INVESTMENT OPERATIONS: | ||||
Net investment income (loss)2 | (0.03 | ) | ||
Net realized gain (loss) and unrealized appreciation/depreciation on investments and foreign currency related transactions | (0 93 | ) | ||
Total from investment operations | (0.96 | ) | ||
Net Asset Value, end of Period | $24.04 | |||
TOTAL RETURN | | (3.84% | )3 | |
RATIOS/SUPPLEMENTAL DATA | ||||
Net assets, end of Period (in 000’s) | $10,099 | |||
Ratio of expenses to average net assets (Note 4) | 0.79% | 4 | ||
Ratio of net investment income (loss) to average net assets | | (0.24% | )4 | |
Portfolio turnover | | 12.48% | 3 | |
| 1 | The Fund commenced operations on July 13, 2022. |
| 2 | Calculated using the average daily shares method. |
| 3 | Not annualized. |
| 4 | Annualized. |
See accompanying notes to financial statements.
| matthewsasia.com | 800.789.ASIA | 23 |
Table of Contents
| 1. | ORGANIZATION |
Matthews International Funds (d/b/a Matthews Asia Funds) (the “Trust”) is an open-end management investment company registered under the Investment Company Act of 1940, as amended (the “1940 Act”). The Trust currently issues nineteen separate series of shares. This shareholder report pertains to three of those series (each a “Fund”, and collectively, the “Funds”): Matthews Emerging Markets Equity Active ETF, Matthews Innovators Active ETF and Matthews China Active ETF. All three Funds are considered diversified. The other sixteen separate series of the Trust are mutual funds and are covered in a separate shareholder report.
The Funds issue and redeem shares at their net asset value per share (NAV) only in large blocks of shares (Creation Units). These transactions are usually in exchange for a basket of securities and/or an amount of cash. As a practical matter, only institutional investors who have entered into an authorized participant agreement may purchase or redeem Creation Units. Except when aggregated in Creation Units, shares of the Funds are not redeemable securities.
Individual shares of the Funds trade on national securities exchanges and elsewhere during the trading day and can only be bought and sold at market prices throughout the trading day through a broker-dealer. Because fund shares trade at market prices rather than NAV, shares may trade at a price greater than NAV (premium) or less than NAV (discount). A chart showing the frequency at which each fund’s daily closing market price was at a discount or premium to each fund’s NAV can be found at www.MatthewsAsia.com.
| 2. | SIGNIFICANT ACCOUNTING POLICIES |
The following is a summary of significant accounting policies consistently followed by the Funds in preparation of their financial statements. Each Fund follows the investment company accounting and reporting guidance of the Financial Accounting Standards Board (FASB) Accounting Standard Codification Topic 946 Financial Services—Investment Companies. The accounting policies are in conformity with accounting principles generally accepted in the United States of America (“U.S. GAAP”).
| A. | SECURITY VALUATION: Pursuant to Rule 2a-5 under the 1940 Act, the Funds’ Board of Trustees (the “Board”) has designated authority to a Valuation Designee, Matthews International Capital Management, LLC (“Matthews”), the Funds’ investment adviser, to make fair valuation determinations under adopted procedures subject to Board oversight. Matthews has formed a Valuation Committee (the “Valuation Committee”) to administer the pricing and valuation of portfolio securities and other assets and liabilities and to ensure that prices used for internal purposes or provided by third parties reasonably reflect fair value. The Valuation Designee may utilize independent pricing services, quotations from securities and financial instrument dealers and other market sources to determine fair value. The value of the Trust’s securities is based on market quotations for those securities, or on their fair value determined by the valuation policies approved by the Board. Market quotations and valuation information are provided by commercial pricing services or securities dealers that are independent of the Funds and Matthews, in accordance with procedures established by the Valuation Designee. Foreign exchange-traded securities are valued as of the close of trading on the primary exchange on which they trade. Securities that trade in over-the-counter markets, including most debt securities (bonds), may be valued by other third-party vendors or by using indicative bid quotations from dealers or market makers, or other available market information. Market values for securities are determined based on quotations, market data or other information from the principal (or most advantageous) market on which the security is traded. Market quotations for equity securities used by the Funds include last reported sale prices, or, if such prices are not reported or available, bid and ask prices. Foreign currency exchange contracts are valued at the mean between the bid and ask prices and are determined at the close of business on the New York Stock Exchange (“NYSE”). Interpolated values are derived when the settlement date of the contract is an interim date for which quotations are not available. The Funds may also utilize independent pricing services to assist them in determining a current market value for each security based on sources believed to be reliable. When fair value pricing is employed, the prices of securities used by a Fund to calculate its Net Asset Value (“NAV”) may differ from any quoted or published prices for the same securities for that day. |
The books and records of the Funds are maintained in U.S. dollars. Transactions, portfolio securities, and assets and liabilities denominated in a foreign currency are translated and recorded in U.S. dollars at the prevailing exchange rate as of the close of trading on the NYSE. The Fund does not isolate the effect of changes in foreign exchange rates from changes in market prices on securities held. Accordingly, such changes are included within Change in net unrealized appreciation/depreciation on investments on the Statement of Operations. Translation gains or losses resulting from changes in the exchange rate during the reporting period and realized gains and losses on the settlement of foreign currency transactions are reported in the results of operations for the current period. The Funds isolate that portion of gains and losses on investments in fixed income securities that is due to changes in foreign exchange rate from that which is due to changes in market prices of securities.
Foreign securities held by the Funds may be traded on days and at times when the NYSE is closed. Accordingly, the value of the Funds may be significantly affected on days when shareholders have no access to the Funds.
| B. | FAIR VALUE MEASUREMENTS: The Funds follow a fair value hierarchy that distinguishes between market data obtained from independent sources (observable inputs) and the Funds’ own market assumptions (unobservable inputs). These inputs are used in determining the value of the Funds’ financial instruments and are summarized in the following fair value hierarchy: |
Level 1: Unadjusted quoted prices in active markets for identical securities (foreign securities that are valued based on market quotations).
Level 2: Other significant observable inputs. Certain foreign securities may be fair valued by Matthews using information such as quoted prices for similar securities, interest rates, prepayment speeds, credit risk, and foreign exchange.
Level 3: Significant unobservable inputs. Level 3 securities are valued based on significant unobservable inputs as determined under the direction of the Board. Characterization of such securities as Level 3 securities are not necessarily an indication of their liquidity or the risk associated with investing in these securities. A significant change in the unobservable inputs could result in a significantly lower or higher value in such Level 3 securities and could impact overall Fund performance.
The input levels are not necessarily an indication of the risk or liquidity associated with financial instruments at that level.
| 24 | MATTHEWS ASIA FUNDS |
Table of Contents
Notes to Financial Statements (continued)
Levels for Multi-Country Funds :
Summary of inputs used to determine the fair valuation of multi-country Funds’ investments as of December 31, 2022.
| Matthews Emerging Markets Equity Active ETF | Matthews Asia Innovators Active ETF | |||||||
| Assets: | ||||||||
| Investments: | ||||||||
Level 1: Quoted Prices | ||||||||
Common Equities: | ||||||||
Australia | $177,993 | $— | ||||||
Brazil | 528,544 | — | ||||||
China/Hong Kong | 1,251,726 | 71,913,260 | ||||||
France | 158,016 | — | ||||||
India | 886,650 | 16,470,034 | ||||||
Indonesia | 174,506 | — | ||||||
Kazakhstan | 69,498 | — | ||||||
Mexico | 533,464 | — | ||||||
Philippines | 160,293 | — | ||||||
Poland | 97,456 | — | ||||||
Qatar | 85,227 | — | ||||||
Singapore | 209,390 | 5,303,565 | ||||||
South Korea | 95,848 | 5,929,839 | ||||||
Taiwan | 364,806 | 2,115,876 | ||||||
Turkey | 46,593 | — | ||||||
United Arab Emirates | 60,222 | — | ||||||
United Kingdom | 179,638 | — | ||||||
United States | 266,618 | — | ||||||
Vietnam | 290,875 | 875,652 | ||||||
Zambia | 160,768 | — | ||||||
Preferred Equities: | ||||||||
South Korea | 341,699 | — | ||||||
Short-Term Investments | 98,331 | 2,653,401 | ||||||
Total Market Value of Investments | $6,238,161 | $105,261,627 | ||||||
Levels for Single Country Funds:
Summary of inputs used to determine the fair valuation of the single country Fund’s investments as of December 31, 2022.
| Matthews China Active ETF | ||||
| Assets: | ||||
| Investments: | ||||
Level 1: Quoted Prices | ||||
Common Equities: | ||||
Communication Services | $882,261 | |||
Consumer Discretionary | 3,500,712 | |||
Consumer Staples | 340,266 | |||
Financials | 1,606,285 | |||
Health Care | 571,251 | |||
Industrials | 939,119 | |||
Information Technology | 1,053,648 | |||
Materials | 244,010 | |||
Real Estate | 785,715 | |||
Short-Term Investments | 134,996 | |||
Total Market Value of Investments | $10,058,263 | |||
| C. | RISKS ASSOCIATED WITH NON-U.S. COMPANIES: Investments by the Funds in the securities of non-U.S. companies may involve investment risks not typically associated with investments in U.S. issuers. These risks include possible political, economic, social and religious instability, inadequate investor protection; changes in laws or regulations of countries within the Asia Pacific region (including in countries where the Funds may invest, as well as in the broader region); international relations with other nations; natural disasters; corruption; and military activity. Foreign securities may be subject to greater fluctuations in price than securities of domestic corporations or the U.S. government. Foreign investing may also include the risk of expropriation or confiscatory taxation, limitation on the removal of funds or other assets, currency crises and exchange controls, the imposition of foreign withholding tax on the interest income payable on such instruments, the possible seizure or nationalization of foreign deposits or assets, or the adoption of other foreign government restrictions that might adversely affect the foreign securities held by the Funds. Additionally, Asia Pacific countries may utilize formal or informal currency exchange controls or “capital controls” that may limit the ability to repatriate investments or income or adversely affect the value of portfolio investments. The economies of many Asia Pacific countries differ from the economies of more |
| matthewsasia.com | 800.789.ASIA | 25 |
Table of Contents
Notes to Financial Statements (continued)
| developed countries in many respects, such as their rate of growth, inflation, capital reinvestment, resource self-sufficiency and dependence on other economies, financial system stability, the national balance of payments position and sensitivity to changes in global trade. |
Certain Asia Pacific countries are highly dependent upon and may be affected by developments in the economies of other countries. There is generally less government regulation of stock exchanges, brokers, and listed companies abroad than in the United States, which may result in less transparency with respect to a company’s operations, and make obtaining information about them more difficult (or such information may be unavailable).
Among other risks of investing in foreign markets are the variable quality and reliability of financial information and related audits of companies. Non-U.S. companies are subject to different accounting, auditing, and financial reporting standards, practices, and requirements than U.S. companies. In some cases, financial information and related audits can be unreliable and not subject to verification. Auditing firms in some of these markets are not subject to independent inspection or oversight of audit quality.
Foreign stock markets may not be as developed or efficient as those in the United States, and the absence of negotiated brokerage commissions in certain countries may result in higher brokerage fees. The time between the trade and settlement dates of securities transactions on foreign exchanges ranges from one day to four weeks or longer and may result in higher custody charges. Custodial arrangements may be less well developed than in the United States. Foreign securities are generally denominated and pay distributions in foreign currencies, exposing the Funds to changes in foreign currency exchange rates. Investing in any country in the Asia Pacific region will also entail risks specific and unique to that country, and these risks can be significant and change rapidly.
Changes in interest rates in each of the countries in which the Funds may invest, as well as interest rates in more-developed countries, may cause a decline in the market value of an investment. Generally, fixed income securities will decrease in value when interest rates rise and can be expected to rise in value when interest rates decline. As interest rates decline, debt issuers may repay or refinance their loans or obligations earlier than anticipated. The issuers of fixed income securities may, therefore, repay principal in advance. This would force the Funds to reinvest the proceeds from the principal prepayments at lower rates, which reduces the Funds’ income.
The Funds may invest in certain operating companies in China through legal structures known as variable interest entities (“VIEs”). In China, ownership of companies in certain sectors by foreign individuals and entities (including U.S. persons and entities such as the Fund) is prohibited. In order to facilitate foreign investment in these businesses, many Chinese companies have created VIEs. In such an arrangement, a China-based operating company typically establishes an offshore shell company in another jurisdiction, such as the Cayman Islands. That shell company enters into service and other contracts with the China-based operating company, then issues shares on a foreign exchange, such as the New York Stock Exchange. Foreign investors hold stock in the shell company rather than directly in the China-based operating company. This arrangement allows U.S. investors to obtain economic exposure to the China-based company through contractual means rather than through formal equity ownership.
VIEs are a longstanding industry practice and well known to officials and regulators in China; however, VIEs are not formally recognized under Chinese law. Recently, the government of China provided new guidance to and placed restrictions on China-based companies raising capital offshore, including through VIE structures. Investors face uncertainty about future actions by the government of China that could significantly affect an operating company’s financial performance and the enforceability of the shell company’s contractual arrangements. It is uncertain whether Chinese officials or regulators will withdraw their implicit acceptance of the VIE structure, or whether any new laws, rules or regulations relating to VIE structures will be adopted or, if adopted, what impact they would have on the interests of foreign shareholders. Under extreme circumstances, China might prohibit the existence of VIEs, or sever their ability to transmit economic and governance rights to foreign individuals and entities; if so, the market value of the Funds’ associated portfolio holdings would likely suffer significant, detrimental, and possibly permanent effects, which could result in substantial investment losses.
In February 2022, Russian forces entered Ukraine and commenced an armed conflict. Economic sanctions have since been imposed on Russia and certain of its citizens, including the exclusion of Russia from the SWIFT global payments network. As a result, Russian-related stocks and debt have since suffered significant declines in value. The ongoing conflict, together with growing turmoil from fluctuations in commodity prices and foreign exchange rates, has the potential to impact adversely global economies and has driven a sharp increase in volatility across markets. The duration of the Russian-Ukraine conflict and its effect on financial markets cannot be determined with certainty. The Funds’ performance could be negatively impacted if the value of a portfolio holding were harmed by these and such other events. Management is actively monitoring these events. As of December 31, 2022, the Funds did not hold any Russian securities.
| D. | DISTRIBUTIONS TO SHAREHOLDERS: |
The Funds generally distribute their net investment income once annually in December. Any net realized gain from the sale of portfolio securities and net realized gains from foreign currency transactions are distributed at least once each year unless they are used to offset losses carried forward from prior years. The Funds will declare and pay income and capital gain distributions in cash. Distributions in cash may be reinvested automatically in additional whole shares of the Funds only if the broker through whom you purchased your shares makes such option available. Your broker is responsible for distributing the income and capital gain distributions to you. Distributions are treated the same for tax purposes whether received in cash or reinvested. If you buy shares when a Fund has realized but not yet distributed ordinary income or capital gains, you will be “buying a dividend” by paying the full price of the shares and then receiving a portion of the price back in the form of a taxable dividend.
The tax character of distributions paid for the period ended December 31, 2022 were as follows:
| Ordinary Income | ||||
| Matthews Emerging Markets Equity Active ETF | $28,090 | |||
| E. | INVESTMENT TRANSACTIONS AND INCOME: Securities transactions are accounted for on the date the securities are purchased or sold or on the following business day. Financial statements reflect security transactions on trade date. Gains or losses on the sale of securities are determined on the identified cost basis. Interest income is recorded on the accrual basis. Interest income, including amortization and accretion of premiums and discounts on debt securities, is recognized daily on an accrual basis. Dividend income is generally recorded on the ex-dividend date net of any foreign taxes withheld at the source. Dividend income for certain issuers headquartered in countries which the Funds invest may not be recorded until approved by the shareholders (which may occur after the ex-dividend date) if, in the judgment of management, such dividends are not reasonably determined as of the ex-dividend date. Income and realized and unrealized gains or losses on investments are allocated to each class of shares based on its relative net assets. |
The Funds may be subject to foreign taxation related to income received, capital gains on the sale of securities and certain foreign currency transactions in the foreign jurisdictions in which they invest. Foreign taxes, if any, are recorded based on the tax regulations and rates that exist in
| 26 | MATTHEWS ASIA FUNDS |
Table of Contents
Notes to Financial Statements (continued)
the foreign markets in which the Funds invest. When a capital gain tax is determined to apply, the Funds may record an estimated deferred tax liability in an amount that may be payable if the securities were disposed of on the valuation date.
| F. | CASH, CASH OVERDRAFTS, AND FOREIGN CURRENCY: QFI accounts (i.e., the accounts through which the QFI quota is accessed) are required by the local market to maintain a cash reserve. The cash reserve is based upon a fixed ratio of the QFI’s approved investment quota, which is defined as the amount remitted into its special Renminbi (RMB) cash account. These amounts, if any, are included in “Segregated foreign currency at value” on the Statements of Assets and Liabilities. The fixed ratio is set at 0.08 percent for the Shanghai and 0.06 percent for the Shenzhen market. When any of the Funds’ cash balances are overdrawn, a Fund is charged an overdraft fee by the custodian of 1.00% above the 30-day LIBOR rate on outstanding balances. These amounts, if any, are included in “Other expenses” on the Statements of Operations. |
| G. | USE OF ESTIMATES: The preparation of financial statements in conformity with U.S. GAAP requires management to make estimates and assumptions that affect the amounts reported in the financial statements and accompanying notes. Actual results may differ from those estimates. |
| H. | RECENT ACCOUNTING GUIDANCE: The FASB issued Accounting Standards Update (ASU), ASU 2020-04, Reference Rate Reform (Topic 848)—Facilitation of the Effects of Reference Rate Reform on Financial Reporting in March 2020 and ASU 2021-01 in January 2021 which provided further amendments and clarifications to Topic 848. These ASUs provide optional, temporary relief with respect to the financial reporting of contracts subject to certain types of modifications due to the planned discontinuation of the London Interbank Offered Rate (LIBOR), and other interbank-offered based reference rates, through December 31, 2022. In December, 2022, FASB issued ASU 2022-06 which defers the sunset date of Topic 848 from December 31, 2022, to December 31, 2024, after which entities will no longer be permitted to apply the relief in Topic 848. Management intends to rely upon the relief provided under Topic 848, which is not expected to have a material impact on the fund’s financial statements. |
In June 2022, the FASB issued Accounting Standards Update (ASU), ASU 2022-03, Fair Value Measurement (Topic 820)—Fair Value Measurement of Equity Securities Subject to Contractual Sale Restrictions, which clarifies that a contractual restriction on the sale of an equity security is not considered part of the unit of account of the equity security and, therefore, is not considered in measuring fair value. The amendments under this ASU are effective for fiscal years beginning after December 15, 2023; however, early adoption is permitted. Management is currently evaluating the impact, if any, of applying this ASU.
| 3. | CAPITAL SHARE TRANSACTIONS |
Capital shares are issued and redeemed by the Fund only in aggregations of a specified number of shares or multiples thereof (Creation Units) at NAV, in return for securities, other instruments, and/or cash (the Basket). Except when aggregated in Creation Units, shares of the Fund are not redeemable. Transactions in capital shares for the Fund are disclosed in detail in the Statement of Changes in Net Assets. Purchasers and redeemers of Creation Units are charged a transaction fee to cover the estimated cost to the Fund of processing the purchase or redemption, including costs charged to it by the NSCC (National Securities Clearing Corporation) or DTC (Depository Trust Company), and the estimated transaction costs, e.g., brokerage commissions, bid-ask spread, and market impact trading costs, \ incurred in converting the Basket to or from the desired portfolio composition. The transaction fee is determined daily and will be limited to amounts approved by the Board and determined by the Adviser to be appropriate to defray the expenses that the Fund incurs in connection with the purchase or redemption. The purpose of transaction fees is to protect the Fund’s existing shareholders from the dilutive costs associated with the purchase and redemption of Creation Units. The amount of transaction fees will differ depending on the estimated trading costs for portfolio positions and Basket processing costs and other considerations. Transaction fees may include fixed amounts per creation or redemption transactions, amounts varying with the number of Creation Units purchased or redeemed, and varying amounts based on the time an order is placed. The Fund may impose higher transaction fees when cash is substituted for Basket instruments. Higher transaction fees may apply to purchases and redemptions through the DTC than through the NSCC.
| For the Period Ended December 31, 20221 | ||||||||
| Shares | Amount | |||||||
MATTHEWS EMERGING MARKETS EQUITY ACTIVE ETF | ||||||||
Shares sold | 240,000 | $6,323,916 | ||||||
Shares redeemed | — | — | ||||||
Net increase | 240,000 | $6,323,916 | ||||||
MATTHEWS ASIA INNOVATORS ACTIVE ETF | ||||||||
Shares sold | 4,350,000 | $104,572,402 | ||||||
Shares redeemed | — | — | ||||||
Net increase | 4,350,000 | $104,572,402 | ||||||
MATTHEWS CHINA ACTIVE ETF | ||||||||
Shares sold | 420,000 | $9,704,698 | ||||||
Shares redeemed | — | — | ||||||
Net increase | 420,000 | $9,704,698 | ||||||
| 1 | The Funds commenced operations on July 13, 2022. |
| 4. | INVESTMENT MANAGEMENT FEES |
Pursuant to the Investment Management Agreement, as amended, between Matthews and the Trust, Matthews will pay substantially all the expenses of each Fund excluding management fees, interest expenses, taxes, brokerage fees, securities lending fees, payments under a Fund’s 12b-1 plan (if any), acquired fund fees, litigation expenses and any extraordinary expenses. The investment management fee, accrued daily and paid monthly by the Funds based on the average daily net assets of each Fund, are as follows:
| Matthews Emerging Markets Equity Active ETF | 0.79 | % | ||
| Matthews Asia Innovators Active ETF | 0.79 | % | ||
| Matthews China Active ETF | 0.79 | % |
| matthewsasia.com | 800.789.ASIA | 27 |
Table of Contents
Notes to Financial Statements (continued)
| 5. | INVESTMENTS |
For the period ended December 31, 2022, the cost of investments purchased and proceeds from sale of investments (excluding in-kind transactions and short-term investments) were as follows:
| Purchases | Sales | |||||||
| Matthews Emerging Markets Equity Active ETF | $4,185,488 | $574,641 | ||||||
| Matthews Asia Innovators Active ETF | 101,445,338 | 18,961,088 | ||||||
| Matthews China Active ETF | 9,420,295 | 557,117 | ||||||
For the period ended December 31, 2022, the cost of in-kind purchases and proceeds from in-kind sales were as follows:
| Purchases | Sales | |||||||
| Matthews Emerging Markets Equity Active ETF | $2,554,737 | $— | ||||||
| Matthews Asia Innovators Active ETF | 19,098,549 | — | ||||||
| Matthews China Active ETF | 661,294 | — | ||||||
| 6. | INCOME TAX INFORMATION |
It is the policy of the Funds to comply with all requirements of the Internal Revenue Code of 1986, as amended (“the Code”), applicable to regulated investment companies and to distribute substantially all of their taxable income to their shareholders. The Funds have met the requirements of the Code applicable to regulated investment companies for the period ended December 31, 2022. Therefore, no federal income tax provision is required.
Management has analyzed the Funds’ tax positions taken on federal income tax returns.
As of December 31, 2022, the components of accumulated earnings/deficit on tax basis were as follows:
| Undistributed Ordinary Income | Capital Loss Carryforwards | Late Year Losses* | Unrealized Appreciation/ (Depreciation)** | Total Accumulated Earnings/(Deficit) | ||||||||||||||||
| Matthews Emerging Markets Equity Active ETF | $5,911 | $(43,128 | ) | $— | $17,187 | $(20,030 | ) | |||||||||||||
| Matthews Asia Innovators Active ETF | — | (549,621 | ) | (101,402 | ) | 1,573,307 | 922,284 | |||||||||||||
| Matthews China Active ETF | — | (3,277 | ) | — | 402,623 | 399,346 | ||||||||||||||
| * | The Funds have elected to defer certain qualified late-year losses and recognize such losses in the next fiscal year. |
| ** | The differences between book-basis and tax-basis unrealized appreciation/depreciation is attributable primarily to the tax deferral of losses on wash sales and passive foreign investment company (PFIC) mark to market adjustments. |
As of December 31, 2022, the Funds have capital loss carryforwards available to offset future realized capital gains through the indicated expiration dates as follows:
| Amount With No Expiration | ||||
| Short-term Losses | ||||
| Matthews Emerging Markets Equity Active ETF | $43,128 | |||
| Matthews Asia Innovators Active ETF | 549,621 | |||
| Matthews China Active ETF | 3,277 | |||
Under the Regulated Investment Company Modernization Act of 2010, the Funds are permitted to carry forward capital losses incurred in taxable years beginning after December 22, 2010 for an unlimited period. However, any losses incurred during those future taxable years will be required to be utilized prior to any losses incurred in pre-enactment taxable years, which generally expire after eight years from when they are incurred. Additionally, post-enactment capital losses that are carried forward will retain their character as either short-term or long-term capital losses rather than being considered all short-term as under previous law.
U.S. GAAP requires that certain components of net assets be reclassified between financial and tax reporting. These reclassifications have no effect on net assets or NAV. The permanent differences are primarily attributable to investments in PFICs, foreign currency reclassification, and net operating loss adjustments. For the period ended December 31, 2022, permanent differences in book and tax accounting have been reclassified to paid-in capital, undistributed net investment income (loss) and accumulated realized gain (loss) as follows:
| Decrease Paid-in-Capital | Increase/(Decrease) Undistributed Net Investment Income | Increase/(Decrease) Accumulated Realized Gain/(Loss) | ||||||||||
| Matthews Emerging Markets Equity Active ETF | $— | $2,209 | $(2,209 | ) | ||||||||
| Matthews Asia Innovators Active ETF | (55,659 | ) | (67,051 | ) | 122,710 | |||||||
| Matthews China Active ETF | (5,164 | ) | 4,643 | 521 | ||||||||
| 28 | MATTHEWS ASIA FUNDS |
Table of Contents
Notes to Financial Statements (continued)
As of December 31, 2022, the tax cost of investments and the related net unrealized appreciation and depreciation were as follows:
| Tax Cost | Gross Unrealized Appreciation | Gross Unrealized Depreciation | Net Unrealized Appreciation/ (Depreciation) | |||||||||||||
| Matthews Emerging Markets Equity Active ETF | $6,220,797 | $301,818 | $(284,454 | ) | $17,364 | |||||||||||
| Matthews Asia Innovators Active ETF | 103,688,328 | 5,443,278 | (3,869,979 | ) | 1,573,299 | |||||||||||
| Matthews China Active ETF | 9,656,192 | 881,687 | (479,616 | ) | 402,071 | |||||||||||
| 7. | PUBLIC HEALTH EMERGENCY RISKS |
Pandemics and other public health emergencies, including outbreaks of infectious diseases such as the current outbreak of the novel coronavirus (“COVID-19”), can result, and in the case of COVID-19 is resulting, in market volatility and disruption, and materially and adversely impact economic conditions in ways that cannot be predicted, all of which could result in substantial investment losses. Containment efforts and related restrictive actions by governments and businesses have significantly diminished and disrupted global economic activity across many industries. Less developed countries and their health systems may be more vulnerable to these impacts. The ultimate impact of COVID-19 or other health emergencies on global economic conditions and businesses is impossible to predict accurately. Ongoing and potential additional material adverse economic effects of indeterminate duration and severity are possible. The resulting adverse impact on the value of investment in the Funds could be significant and prolonged.
| 8. | SUBSEQUENT EVENTS |
On January 11, 2023, the Matthews Emerging Markets ex China Active ETF, a new series of the Trust, was launched. On February 23, 2023, the Board approved the reorganization of the Matthews Korea Fund into a newly created ETF to be designated the Matthews Korea Active ETF, which will be a series of the Trust. Matthews estimates that the reorganization will occur in 2023.
| matthewsasia.com | 800.789.ASIA | 29 |
Table of Contents
Report of Independent Registered Public Accounting Firm
To the Board of Trustees of Matthews International Funds and Shareholders of Matthews Emerging Markets Equity Active ETF, Matthews Asia Innovators Active ETF, and Matthews China Active ETF
Opinion on the Financial Statements
We have audited the accompanying statements of assets and liabilities, including the schedules of investments, of Matthews Emerging Markets Equity Active ETF, Matthews Asia Innovators Active ETF, and Matthews China Active ETF (three of the funds constituting Matthews International Funds, hereafter collectively referred to as the “Funds”) as of December 31, 2022, the related statements of operations and changes in net assets, including the related notes, and the financial highlights for the period July 13, 2022 (commencement of operations) through December 31, 2022 (collectively referred to as the “financial statements”). In our opinion, the financial statements present fairly, in all material respects, the financial position of the Funds as of December 31, 2022, and the results of their operations, changes in their net assets and the financial highlights for the period July 13, 2022 (commencement of operations) through December 31, 2022 in conformity with accounting principles generally accepted in the United States of America.
Basis for Opinion
These financial statements are the responsibility of the Funds’ management. Our responsibility is to express an opinion on the Funds’ financial statements based on our audit. We are a public accounting firm registered with the Public Company Accounting Oversight Board (United States) (PCAOB) and are required to be independent with respect to the Funds in accordance with the U.S. federal securities laws and the applicable rules and regulations of the Securities and Exchange Commission and the PCAOB.
We conducted our audit of these financial statements in accordance with the standards of the PCAOB. Those standards require that we plan and perform the audit to obtain reasonable assurance about whether the financial statements are free of material misstatement, whether due to error or fraud.
Our audit included performing procedures to assess the risks of material misstatement of the financial statements, whether due to error or fraud, and performing procedures that respond to those risks. Such procedures included examining, on a test basis, evidence regarding the amounts and disclosures in the financial statements. Our audit also included evaluating the accounting principles used and significant estimates made by management, as well as evaluating the overall presentation of the financial statements. Our procedures included confirmation of securities owned as of December 31, 2022 by correspondence with the custodian and brokers; when replies were not received from brokers, we performed other auditing procedures. We believe that our audit provides a reasonable basis for our opinion.
PricewaterhouseCoopers LLP
February 24, 2023
We have served as the auditor of one or more investment companies in Matthews International Funds since 2007.
| 30 | MATTHEWS ASIA FUNDS |
Table of Contents
For shareholders who do not have a December 31, 2022 tax year-end, this notice is for informational purposes. For the period July 13, 2022 to December 31, 2022, the Funds report the following items with regard to distributions paid during the period. All reports are based on financial information available as of the date of this annual report and, accordingly, are subject to change. For each item, it is the intention of each Fund to report the maximum amount permitted under the Internal Revenue Code and the regulations thereunder.
1. Qualified Dividend Income
The Funds report a portion of the ordinary income distributed during the the period ended December 31, 2022 as Qualified Dividend Income (“QDI”) as defined in the Internal Revenue code as follows:
| QDI Portion | ||||
| Matthews Emerging Markets Equity Active ETF | 100% | |||
2. Dividends Received Deduction
The Funds report a Dividend Received Deduction pursuant to Section 854 of the Internal Revenue Code for the period ended December 31, 2022 as follows:
| Matthews Emerging Markets Equity Active ETF | 7.86% |
3. Qualified Interest Income
The Funds report a portion of the net income dividends distributed during the period ended December 31, 2022, as Qualified Interest Income (QII), as defined in the Internal Revenue Code as follows:
| QII Portion | ||||
| Matthews Emerging Markets Equity Active ETF | 0.27% | |||
| matthewsasia.com | 800.789.ASIA | 31 |
Table of Contents
Approval of Investment Management Agreement (unaudited)
The Matthews Emerging Markets Equity Active ETF, Matthews Asia Innovators Active ETF and Matthews China Active ETF (each, a “Fund” and together, the “Funds”), which are new series of the Trust, each has retained Matthews International Capital Management, LLC (“Matthews”) to manage its assets pursuant to the Management Agreement, which has been approved by the Board of Trustees of the Trust, including the Independent Trustees.
At a meeting held on May 17-18, 2022, the Board, including the Independent Trustees of the Trust, approved the Management Agreement, with respect to each Fund, for an initial term of two years. Following the initial term with respect to each Fund upon its commencement of operations, the Management Agreement continues in effect from year-to-year provided that the continuance is specifically approved at least annually by the vote of the holders of at least a majority of the outstanding shares of the Fund, or by the Board of Trustees, and, in either event, by a majority of the Independent Trustees of the Trust casting votes in person at a meeting called for that purpose.
The Independent Trustees reviewed and discussed the information provided by Matthews at that and prior meetings. The Independent Trustees were assisted in their deliberations by their independent legal counsel. Below is a summary of the factors considered by the Board in approving the Management Agreement with respect to each Fund.
| ● | The nature, extent and quality of the services to be provided by Matthews under the Management Agreement. The Trustees considered the services provided to the other series of the Trust pursuant to the Investment Advisory Agreement between the Trust, on behalf of each existing series, and Matthews. The Trustees further considered the experience and qualifications of the personnel at Matthews who would be responsible for providing services to each Fund and would be responsible for the daily management of the Fund’s portfolio. The Trustees noted Matthews’ on-going commitment to governance, compliance, risk and valuation practices. The Trustees viewed Matthews as well positioned to provide high quality services to each Fund under various market conditions, as demonstrated by the past volatile and challenging securities markets that have caused either contracting revenues or rapidly expanding assets at different times. The Trustees concluded that Matthews has the quality of personnel and other investment resources essential to performing its duties under the Management Agreement, and that the nature, overall quality and extent of such management services are expected to be satisfactory and reliable. |
| ● | The investment performance of Matthews. The Trustees are familiar with the short-term and long-term performance of other series of the Trust on both an absolute basis and in comparison to peer funds and benchmark indices. The Trustees noted that each Fund is a new Fund without any prior performance, but that each Fund will be managed with substantially similar investment strategies as a corresponding series in the Trust that is operated as a mutual |
| fund. The Board considered the investment performance of those corresponding series. The Trustees also emphasized longer-term performance goals, which they believe are more important than short isolated periods for purposes of evaluating Matthews’s success in meeting Fund and shareholder objectives. The Trustees concluded that Matthews has the potential to generate acceptable long-term performance for the Fund. |
| ● | The extent to which Matthews will realize economies of scale as each Fund grows larger and whether Fund investors will benefit from any economies of scale. Because the Funds are new, they are not expected to recognize economies of scale for some time. The Trustees expect to monitor each Fund’s growth and evaluate economies of scale at future renewals of the Management Agreement in effect at that time. They expect that each Fund will benefit from existing economies of scale through relatively low fee rates established at inception, as well as through additional investment in the Trust’s business and the provision of improved or additional infrastructure and services to the Funds and their shareholders. As a result, the Trustees were satisfied about the extent to which economies of scale would be shared with each Fund and its shareholders. |
| ● | The costs of the services to be provided by Matthews and others. The Trustees considered the management fees and expenses of the Funds in comparison to the advisory fees and other fees and expenses of other existing series of the Trust, noting that, as compared to the other series of the Trust that are operated as mutual funds, the Funds have a unitary management fee structure which will cover most of the ordinary operating expenses of the Funds. The Trustees noted that because Matthews would be assuming many of the operating expenses of the Funds, the total expense ratio for each Fund is substantially lower than that of the corresponding mutual fund series of the Trust. The Trustees also considered the fees and expenses of the competitive universe of actively- and passively-managed exchange-traded funds, noting that there were a limited number of actively-managed funds in the competitive universe for each of the Funds. The Trustees considered that the total expense ratio to be paid by investors in the Fund, which is most representative of an investor’s net experience, would be reasonable. |
| ● | The profits to be realized by Matthews and its affiliates from the relationships with the Funds. The Trustees recognized that, as new funds with a unitary fee structure, it is unlikely that a Fund will generate profits for Matthews initially and may not do so until the Fund has experienced some significant growth. The Trustees also considered that the additional benefits expected to be derived by Matthews from its relationship with the Fund are limited, and largely consist of research benefits received in exchange for “soft dollars.” |
No single factor was determinative of the Board’s decision to approve the Management Agreement, but rather the Trustees based their determination on the total mix of information available to them. After considering the factors described
| 32 | MATTHEWS ASIA FUNDS |
Table of Contents
above, the Board concluded that the terms of the management arrangements would be fair and reasonable to the Fund in light of the services that Matthews is expected to provide, and that each Fund’s shareholders are expected to receive reasonable value in return for the management fees paid. For these reasons, the approval of the Management Agreement with respect to each Fund would be in the best interests of the Fund and its shareholders.
The Management Agreement may be terminated by the Trustees on behalf of a Fund or by Matthews upon 60 days’ prior written notice without penalty. The Management Agreement will also terminate automatically in the event of its assignment, as defined in the 1940 Act.
| matthewsasia.com | 800.789.ASIA | 33 |
Table of Contents
Statement Regarding Liquidity Risk Management Program
The Securities and Exchange Commission adopted Rule 22e-4 under the Investment Company Act of 1940, as amended (the “Liquidity Rule”) to promote effective liquidity risk management throughout the open-end investment company industry.
The Board of Trustees (the “Board”) of the Matthews International Funds, (the “Funds”) met on November 15-16, 2022 (the “Meeting”) to review the Liquidity Risk Management Program (the “Program”) of the Funds, in accordance with the requirements of the Liquidity Rule. The Board has appointed the Liquidity Risk Management Committee (“LRMC”), a sub-committee of the Enterprise Risk Management Committee of Matthews International Capital Management, LLC, as Program Administrator.
At the Meeting, the LRMC provided the Board with a report that addressed the operation of the Program and assessed its adequacy and effectiveness of implementation, including the operation of each Fund’s Highly Liquid Investment Minimum (“HLIM”) where applicable, and any material changes to the Program (the “Report”). The Report covered the period from October 1, 2021 through October 31, 2022 (the “Program Reporting Period”).
The Report included a Portfolio Liquidity Profile of each Fund as of October 31, 2022. The Report also discussed the factors and assumptions considered in establishing a Fund’s HLIM and Reasonably Anticipated Trading Size (“RATS”) and noted that the LRMC is not proposing any changes to the current HLIM or RATS for each Fund.
There were no material changes to the Program during the Program Reporting Period. The Report provided to the Board stated that the LRMC concluded that based on the operation of the functions, as described in the Report, the Program is adequately designed and implemented and is operating effectively pursuant to the requirements of the Liquidity Rule.
| 34 | MATTHEWS ASIA FUNDS |
Table of Contents
Trustees and Officers of the Funds (unaudited)
The operations of each Fund are under the direction of the Board of Trustees. The Board of Trustees establishes each Fund’s policies and oversees and reviews the management of each Fund. The Board meets regularly to review the activities of the officers, who are responsible for the day-to-day operations of the Funds. The Statement of Additional Information, which includes additional information about Fund Trustees, is available without charge by calling 800.789.2742 or by visiting the Funds’ website, matthewsasia.com. The Trustees and executive officers of the Funds, their year of birth, business address, principal occupations during the past five years and other trusteeships/directorships are set forth below:
Name, Year of Birth, Address and Position(s) Held with Trust | Term of Office and Length of Time Served1 | Principal Occupation(s) During Past 5 Years | Number of Portfolios in Fund Complex Overseen by Trustee | Other Trusteeships/Directorships (number of portfolios) Held by Trustee | ||||
| INDEPENDENT TRUSTEES | ||||||||
GALE K. CARUSO Born 1957 Four Embarcadero Center Suite 550 San Francisco, CA 94111 Chair of the Board of Trustees and Trustee | Trustee since 2015, Vice Chair (2021), and Chair of the Board since 2022 | Formerly President and Chief Executive Officer (1999–2003), Zurich Kemper Life (life insurance and annuities); Chairman, President and Chief Executive Officer (1994–1999), Scudder Canada Investor Services, Ltd. (investment management); Managing Director (1986–1999), Scudder Kemper Investments, Inc. (investment management). | 19 | Trustee (since 2006), Pacific Select Fund (57 Portfolios) and Pacific Funds Series Trust (39 Portfolios); Director (2005–2012), Make-A-Wish Foundation of Maine; Director (2005–2009), LandAmerica Financial Group, Inc. | ||||
TOSHI SHIBANO Born 1950 Four Embarcadero Center Suite 550 San Francisco, CA 94111 Trustee | Since 2003 | President (since 1995), Executive Financial Literacy, Inc. (financial executive development programs); Faculty (2000–2020), General Electric’s John F. Welch Leadership Center; Faculty Director and Executive Education Lecturer (1995–2016), Center for Executive Education, Haas School of Business, UC Berkeley; Adjunct Professor (2000–2011), Columbia Graduate School of Business; Associate Professor (2001–2005), Thunderbird School of Global Management; Visiting Assistant Professor (2000), Stanford Graduate School of Business; Assistant Professor (1995–2000), University of Chicago Graduate School of Business; Assistant Professor (1988–1995), Haas School of Business, UC Berkeley. | 19 | |||||
RHODA ROSSMAN Born 1958 Four Embarcadero Center Suite 550 San Francisco, CA 94111 Trustee | Since 2006 | Council Member (since 2019), California Catastrophe Response Council; Vice President, Corporate Investment Officer (2007–2010), Senior Vice President and Treasurer (2003–2007), The PMI Group, Inc. (mortgage insurer). | 19 | |||||
JONATHAN F. ZESCHIN Born 1953 Four Embarcadero Center Suite 550 San Francisco, CA 94111 Trustee | Trustee since 2007 and Chair of the Board (2014-2021) | Partner (since 2009), Essential Investment Partners, LLC (investment advisory and wealth management). | 19 | Trustee (2019), Russell Investment Funds (9 portfolios) and Russell Investment Company (32 portfolios). | ||||
RICHARD K. LYONS Born 1961 Four Embarcadero Center Suite 550 San Francisco, CA 94111 Trustee | Since 2010 | Chief Innovation and Entrepreneurship Officer (since 2020), UC Berkeley; Dean (2008–2018), Haas School of Business, UC Berkeley; Chief Learning Officer (2006–2008), Goldman Sachs (investment banking and investment management). | 19 | Trustee (since 2018), Syntax ETF Trust; Trustee (2001–2006), Barclays Global Investor Funds and Master Investment Portfolios (15 Portfolios); Trustee (2000–2006), iShares, Inc. (24 Portfolios) and iShares Trust (over 70 Portfolios); Trustee (1994–2006) and Chairman of the Board (2000–2006), Matthews Asia Funds (9 Portfolios). | ||||
| 1 | Each Trustee serves for an indefinite term, until retirement age or until his/her successor is elected. Officers serve at the pleasure of the Board of Trustees. |
| matthewsasia.com | 800.789.ASIA | 35 |
Table of Contents
Name, Year of Birth, Address and Position(s) Held with Trust | Term of Office and Length of Time Served1 | Principal Occupation(s) During Past 5 Years | Number of Portfolios in Fund Complex Overseen by Trustee | Other Trusteeships/Directorships (number of portfolios) Held by Trustee | ||||
| INDEPENDENT TRUSTEES | ||||||||
CHRISTOPHER LEE Born 1967 Four Embarcadero Center Suite 550 San Francisco, CA 94111 Trustee | Since 2015 | Consultant and Associate Professor (since 2017), Hong Kong University of Science and Technology; Lecturer (part-time) (2013–2019), The Chinese University of Hong Kong; Private Investor and Partner (since 2012), FAA Investments (financial holding company); Managing Director, Asia Region, and Head of Global Markets Investment Products & db-X (2010–2012), Deutsche Bank AG (financial services); Managing Director, Equity Risk Management Products, and Head of Intermediary Business (2002–2010), UBS AG (financial services); Vice President, Global Markets & Investment Bank (2000–2002), Vice President, International Private Clients Group (1997–2000), Associate, Debt and Equity Markets Group (1995–1997), Merrill Lynch & Co., Inc. (brokerage and investment management). | 19 | Director (since 2017), Hong Kong Securities and Investment Institute; Director (2013–2018), Asian Master Funds (Australia) (1 Portfolio); Trustee (since 2013), African Wildlife Foundation; Trustee (2010–2016), Oakland Museum of California. | ||||
Name, Year of Birth, Address and Position(s) Held with Trust | Term of Office and Length of Time Served1 | Principal Occupation(s) During Past 5 Years | Number of Portfolios in Fund Complex Overseen by Trustee | Other Trusteeships/Directorships (number of portfolios) Held by Trustee | ||||
| INTERESTED TRUSTEES2 | ||||||||
JAMES COOPER ABBOTT Born 1969 Four Embarcadero Center Suite 550 San Francisco, CA 94111 Trustee and President | Trustee and President since 2022 | Director and Chief Executive Officer (since 2022), Matthews (investment management); Chairman and Chief Executive Officer/President (2009–2022), Carillon Tower Advisers, Inc. and Affiliates (asset management); Chief Executive Officer/President (2009–2022), Eagle Asset Management, Inc. (asset management); President (2003–2021), Carillon Family of Funds (mutual fund company); President (2008–2019) Eagle Boston Investment Management, Inc. (asset management); Managing Member (2010–2022) Alternative Strategy Partnerships (asset management). | 19 | Trustee (2017–2021), Carillon Family of Funds (12 Portfolios). | ||||
ROBERT J. HORROCKS, PhD Born 1968 Four Embarcadero Center Suite 550 San Francisco, CA 94111 Trustee and Vice President | Vice President since 2009 and Trustee since 2018 | Chief Investment Officer (since 2009), Director of Research (2008–2009), Matthews (investment management); Head of Research (2006–2008), Mirae Asset Management (investment management); Chief Investment Officer (2003–2006), Everbright Pramerica (investment management). | 19 | None | ||||
| 1 | Each trustee serves for an indefinite term, until retirement age or until his/her successor is elected. Officers serve at the pleasure of the Board of Trustees. |
| 2 | A trustee is considered an “interested person” of the Trust as defined under the 1940 Act because of an ownership interest in the Advisor or an office held with the Trust or the Advisor. |
| 36 | MATTHEWS ASIA FUNDS |
Table of Contents
Name, Year of Birth, Address and Position(s) Held with Trust | Term of Office and Length of Time Served | Principal Occupation(s) During Past 5 Years | Other Trusteeships/ Directorships (number of portfolios) Held by Officer | |||
| OFFICERS WHO ARE NOT TRUSTEES | ||||||
JOHN P. McGOWAN Born 1964 Four Embarcadero Center Suite 550 San Francisco, CA 94111 Vice President and Secretary | Since 2005 | Head of Fund Administration (since 2009), Chief Administrative Officer (2007–2008), Chief Operating Officer (2004–2007), Matthews (investment management); Vice President and Secretary (2013–2017), Matthews A Share Selections Fund, LLC (registered investment company); Director (since 2010), Matthews Asia Funds SICAV (Luxembourg) (investments); Director (2010–2020), Matthews Global Investors S.à r.l. (Luxembourg) (investment management); Director (since 2004), Matthews Asian Selections Funds, PLC (Ireland) (investments). | Director, Matthews Asian Selections Funds Plc (1 Portfolio); Director, Matthews Asia Funds SICAV (Luxembourg) (12 Portfolios). | |||
SHAI A. MALKA Born 1973 Four Embarcadero Center Suite 550 San Francisco, CA 94111 Treasurer | Since 2005 | Vice President of Fund Accounting and Operations (since 2010), Senior Manager of Fund Accounting and Operations (2004–2009), Matthews (investment management); Treasurer (2013–2017), Matthews A Share Selections Fund, LLC (registered investment company). | None | |||
DEEPA DAMRE SMITH Born 1975 Four Embarcadero Center Suite 550 San Francisco, CA 94111 Vice President | Since 2022 | General Counsel (since 2022), Matthews (investment management); Managing Director (2014–2022), Director (2009–2013), BlackRock (investment management); Principal (2004–2009), Barclays Global Investors (investment management). | None | |||
J. DAVID KAST Born 1966 Four Embarcadero Center Suite 550 San Francisco, CA 94111 Chief Compliance Officer and Anti-Money Laundering Officer | Since 2018 | Chief Compliance Officer and Anti-Money Laundering Officer (since 2018), Global Head of Risk and Compliance (since 2017), Matthews (investment management); Managing Director (2009–2017), Goldman Sachs (investment management). | None | |||
| matthewsasia.com | 800.789.ASIA | 37 |
Table of Contents
| Matthews Asia Funds | ||||
INVESTMENT ADVISOR Matthews International Capital Management, LLC Four Embarcadero Center, Suite 550 San Francisco, CA 94111 800.789.ASIA
| ADMINISTRATOR, CUSTODIAN & TRANSFER AGENT BNY Mellon 240 Greenwich St. New York, NY 10007
| LEGAL COUNSEL Paul Hastings LLP 101 California Street, 48th Floor San Francisco, CA 94111 | ||

P.O. Box 9791 | Providence, RI 02940 | matthewsasia.com | 800.789.ASIA (2742)
Matthews Asia Funds are distributed in the United States by Foreside Funds Distributors LLC, Portland, Maine
Matthews Asia Funds are distributed in Latin America by Picton S. A.

AR-ETF-1222
Table of Contents
| (b) | Not applicable. |
Table of Contents
| Item 2. | Code of Ethics. |
| (a) | The registrant, as of the end of the period covered by this report, has adopted a code of ethics that applies to the registrant’s principal executive officer, principal financial officer, principal accounting officer or controller, or persons performing similar functions, regardless of whether these individuals are employed by the registrant or a third party. |
| (c) | There have been no amendments, during the period covered by this report, to a provision of the code of ethics that applies to the registrant’s principal executive officer, principal financial officer, principal accounting officer or controller, or persons performing similar functions, regardless of whether these individuals are employed by the registrant or a third party, and that relates to any element of the code of ethics description. |
| (d) | The registrant has not granted any waivers, including an implicit waiver, from a provision of the code of ethics that applies to the registrant’s principal executive officer, principal financial officer, principal accounting officer or controller, or persons performing similar functions, regardless of whether these individuals are employed by the registrant or a third party, that relates to one or more of the items set forth in paragraph (b) of this item’s instructions. |
| Item 3. | Audit Committee Financial Expert. |
| (a)(1) | The registrant’s board of directors has determined that the registrant has four audit committee financial experts serving on its audit committee. |
| (a)(2) | The audit committee financial experts are Christopher F. Lee, Toshi Shibano, Jonathan F. Zeschin, and Richard K. Lyons, each of whom is “independent.” |
| (b) | Mr. Lee is an associate professor (part-time) of science practice in financial mathematics at the Hong Kong University of Science & Technology where he teaches courses in capital markets and risk management. In addition, Mr. Lee was the chairman and currently is a member of the Audit Committee of Hong Kong Securities and Investment Institute (HKSI). HKSI conducts all the licensing examinations and professional development of securities professionals in Hong Kong. Since HKSI receives funding from the Securities and Futures Commission and the Financial Services & Treasury Bureau of Hong Kong, the Audit Committee must provide the oversight in selecting professional auditing firms and preparing annual financial reports that are in compliance with government rules and regulations. Furthermore, Mr. Lee has served as a member of the Audit Committee at other large organizations such as the Oakland Museum of California and the Washington DC based African Wildlife Foundation. Mr. Lee was designated as Chair of the Audit Committee of Matthews International Funds on November 19, 2020. |
Prof. Shibano has served on business school faculties at Columbia Graduate School of Business, Stanford Graduate School of Business, the University of Chicago School of Business, and the Haas School of Business at University of California, Berkeley. Prof. Shibano has extensive experience in executive education worldwide (Hong Kong, Taiwan, Singapore, Japan, Thailand, India, Brazil, Finland, England, France, Italy, Belgium, Dubai, and Mexico) and has developed innovative new programs in financial analysis, management control systems and strategy implementation. He served at the UC Berkeley Center for Executive Education as a Faculty Director and Executive Education Instructor. He also served as a member of the Faculty of the General Electric Corporate Leadership Development Center. He is President of Executive Financial Literacy, Inc., providing financial education to worldwide corporations.
Prof. Shibano has published in the Journal of Accounting Research, the Journal of Accounting and Economics, the Rand Journal of Economics, and the Journal of Applied Corporate Finance, on the topics of strategic audit risk, accounting standard setting, international accounting standards, tax minimization, foreign currency risk management, and organizational structure. He has reviewed current research in accounting at the Journal of Accounting Research, Journal of Accounting and Economics, and other academic journals both for use in instruction of courses and for internal faculty evaluation. He has experience analyzing and evaluating financial statements at the appropriate level of complexity through his professional activities on the educational faculties referenced above. Prof. Shibano received his PhD at the Stanford Graduate School of Business and his MBA from the Haas School at UC Berkeley, earning the highest academic honors in both programs. Prof. Shibano has gained additional accounting expertise as a member and former Chair of the Audit Committee of Matthews International Funds.
Mr. Zeschin is Partner of Essential Investment Partners, LLC, a wealth management and investment advisory firm. He is also the portfolio manager for that firm’s Essential Growth Portfolio. Essential Investment Partners, LLC succeeded to the business of Essential Advisers, Inc. Prior to forming Essential Advisers, Inc., Mr. Zeschin held senior executive positions with Founders Asset Management, Inc., Invesco Funds Group, and Stein Roe & Farnham, Inc. Mr. Zeschin holds a Masters of Management from the Kellogg School at Northwestern University, with majors in Finance and Marketing, and a Bachelor in Business Administration in Accounting with distinction from the University of Michigan. He holds a Certified Public Accountant license from the state of Colorado and is a Certified Financial Planner certificant. Mr. Zeschin is a former chair of the ICI’s Accounting Treasurer’s Committee and a former member of the AICPA Investment Companies committee. Mr. Zeschin was previously the chairman of the Board of Trustees of two NYSE listed closed-end funds. He has served on the audit committees of mutual fund boards since 2002. He has experience analyzing and evaluating financial statements at the appropriate level of complexity through his professional activities referenced above. Mr. Zeschin has gained additional accounting expertise as a member of the Audit Committee of Matthews International Funds.
Mr. Lyons is a Professor of Finance and Economics at the Haas School of Business at the University of California, Berkeley, and has served as the university’s Chief Innovation and Entrepreneurship Officer since 2020. Mr. Lyons oversaw the accounting and finance functions at the Haas School of Business when he served as Dean from 2008 to 2018. From 2006 to 2008 Mr. Lyons was on leave from UC Berkeley to serve as Chief Learning Officer at Goldman Sachs. In that role he interacted regularly with the leadership of the Securities Division, which oversees all Sales and Trading at Goldman Sachs. His teaching is primarily in International Finance and Currency Markets in both the MBA and Master’s in Financial Engineering programs. These courses include content on international accounting standards. His research for over two decades has been on the functioning of currency markets and, more recently, on the functioning of cryptocurrency markets.
Table of Contents
| Item 4. | Principal Accountant Fees and Services. |
Audit Fees
| (a) | The aggregate fees billed for each of the last two fiscal years for professional services rendered by the principal accountant for the audit of the registrant’s annual financial statements or services that are normally provided by the accountant in connection with statutory and regulatory filings or engagements for those fiscal years are $563,120 in 2021 and $651,600 in 2022. |
Audit-Related Fees
| (b) | The aggregate fees billed in each of the last two fiscal years for assurance and related services by the principal accountant that are reasonably related to the performance of the audit of the registrant’s financial statements and are not reported under paragraph (a) of this Item are $0 in 2021 and $0 in 2022. |
Tax Fees
| (c) | The aggregate fees billed in each of the last two fiscal years for professional services rendered by the principal accountant for tax compliance, tax advice, and tax planning are $140,800 in 2021 and $170,400 in 2022. Tax fees include services provided by the principal accountant for tax return preparations. |
All Other Fees
| (d) | The aggregate fees billed in each of the last two fiscal years for products and services provided by the principal accountant, other than the services reported in paragraphs (a) through (c) of this Item are $0 in 2021 and $0 in 2022. |
| (e)(1) | Disclose the audit committee’s pre-approval policies and procedures described in paragraph (c)(7) of Rule 2-01 of Regulation S-X. |
Pre-Approval of Auditor Services.
Pre-Approval Requirements. Before the Auditor is engaged by the Trust to render audit related or permissible non-audit services, either:
| (i) | The Audit Committee shall pre-approve all audit related services and permissible non-audit services (e.g., tax services) to be provided to the Trust; or |
| (ii) | The Audit Committee shall establish policies and procedures governing the Auditor’s engagement. Any such policies and procedures must (1) be detailed as to the particular service and (2) not involve any delegation of the Audit Committee’s |
Table of Contents
responsibilities to the Adviser. The Audit Committee may delegate to one or more of its members the authority to grant pre-approvals. The pre-approval policies and procedures shall include the requirement that the decisions of any member to whom authority is delegated under this Section 4(e) shall be presented to the full Audit Committee at its next scheduled meeting. |
De Minimis Exceptions to Pre-Approval Requirements. Pre-approval for a service provided to the Trust other than audit, review or attest services is not required if: (1) the aggregate amount of all such non-audit services provided to the Trust constitutes not more than 5 percent of the total amount of revenues paid by the Trust to the Auditor during the fiscal year in which the non-audit services are provided; (2) such services were not recognized by the Trust at the time of the engagement to be non-audit services; and (3) such services are promptly brought to the attention of the Audit Committee and are approved by the Audit Committee or by one or more members of the Audit Committee to whom authority to grant such approvals has been delegated by the Audit Committee.
Pre-Approval of Non-Audit Services Provided to the Adviser and Certain Control Persons. With respect to services that have a direct impact on the operations or financial reporting of the Trust, the Audit Committee shall pre-approve all such non-audit services proposed to be provided by the Auditor to (i) the Adviser and (ii) any entity controlling, controlled by, or under common control with the Adviser that provides ongoing services to the Trust.
Application of De Minimis Exception: The de minimis exceptions set forth above under Section 4(e)(ii) apply to pre-approvals under this Section 4(e)(iii) as well, except that the “total amount of revenues” calculation for Section 4(e)(iii) services is based on the total amount of revenues paid to the Auditor by the Trust and any other entity that has its services approved under this Section (i.e., the Adviser or any control person).
| (e)(2) | The percentage of services described in each of paragraphs (b) through (d) of this Item that were approved by the audit committee pursuant to paragraph (c)(7)(i)(C) of Rule 2-01 of Regulation S-X are as follows: |
(b) Not Applicable.
(c) Not Applicable.
(d) Not Applicable.
| (f) | The percentage of hours expended on the principal accountant’s engagement to audit the registrant’s financial statements for the most recent fiscal year that were attributed to work performed by persons other than the principal accountant’s full-time, permanent employees was 0%. |
Table of Contents
| (g) | The aggregate non-audit fees billed by the registrant’s accountant for services rendered to the registrant, and rendered to the registrant’s investment adviser (not including any sub-adviser whose role is primarily portfolio management and is subcontracted with or overseen by another investment adviser), and any entity controlling, controlled by, or under common control with the adviser that provides ongoing services to the registrant for each of the last two fiscal years of the registrant was $574,638 in 2021 and $277,237 in 2022. |
| (h) | The registrant’s audit committee of the board of directors has considered whether the provision of non-audit services that were rendered to the registrant’s investment adviser (not including any sub-adviser whose role is primarily portfolio management and is subcontracted with or overseen by another investment adviser), and any entity controlling, controlled by, or under common control with the investment adviser that provides ongoing services to the registrant that were not pre-approved pursuant to paragraph (c)(7)(ii) of Rule 2-01 of Regulation S-X is compatible with maintaining the principal accountant’s independence. |
| (i) | Not applicable. |
| (j) | Not applicable. |
| Item 5. | Audit Committee of Listed Registrants. |
Not applicable.
| Item 6. | Investments. |
| (a) | Schedule of Investments in securities of unaffiliated issuers as of the close of the reporting period is included as part of the report to shareholders filed under Item 1(a) of this form. |
| (b) | Not applicable. |
| Item 7. | Disclosure of Proxy Voting Policies and Procedures for Closed-End Management Investment Companies. |
Not applicable.
| Item 8. | Portfolio Managers of Closed-End Management Investment Companies. |
Not applicable.
| Item 9. | Purchases of Equity Securities by Closed-End Management Investment Company and Affiliated Purchasers. |
Not applicable.
Table of Contents
| Item 10. | Submission of Matters to a Vote of Security Holders. |
There have been no material changes to the procedures by which the shareholders may recommend nominees to the registrant’s board of directors, where those changes were implemented after the registrant last provided disclosure in response to the requirements of Item 407(c)(2)(iv) of Regulation S-K (17 CFR 229.407) (as required by Item 22(b)(15) of Schedule 14A (17 CFR 240.14a-101)), or this Item.
| Item 11. | Controls and Procedures. |
| (a) | The registrant’s principal executive and principal financial officers, or persons performing similar functions, have concluded that the registrant’s disclosure controls and procedures (as defined in Rule 30a-3(c) under the Investment Company Act of 1940, as amended (the “1940 Act”) (17 CFR 270.30a-3(c))) are effective, as of a date within 90 days of the filing date of the report that includes the disclosure required by this paragraph, based on their evaluation of these controls and procedures required by Rule 30a-3(b) under the 1940 Act (17 CFR 270.30a-3(b)) and Rules 13a- 15(b) or 15d-15(b) under the Securities Exchange Act of 1934, as amended (17 CFR 240.13a- 15(b) or 240.15d-15(b)). |
| (b) | There were no changes in the registrant’s internal control over financial reporting (as defined in Rule 30a-3(d) under the 1940 Act (17 CFR 270.30a-3(d))) that occurred during the period covered by this report that has materially affected, or is reasonably likely to materially affect, the registrant’s internal control over financial reporting. |
| Item 12. | Disclosure of Securities Lending Activities for Closed-End Management Investment Companies. |
Not applicable.
| Item 13. | Exhibits. |
(a)(1) | ||
(a)(2) | ||
(a)(2)(1) | Not applicable. | |
(a)(2)(2) | Not applicable. | |
(b) | ||
Table of Contents
SIGNATURES
Pursuant to the requirements of the Securities Exchange Act of 1934 and the Investment Company Act of 1940, the registrant has duly caused this report to be signed on its behalf by the undersigned, thereunto duly authorized.
(Registrant) | Matthews International Funds | |
By (Signature and Title)* | /s/ James Cooper Abbott | |
| James Cooper Abbott, President | ||
| (principal executive officer) | ||
Date | March 8, 2023 | |
Pursuant to the requirements of the Securities Exchange Act of 1934 and the Investment Company Act of 1940, this report has been signed below by the following persons on behalf of the registrant and in the capacities and on the dates indicated.
| By (Signature and Title)* | /s/ James Cooper Abbott | |
| James Cooper Abbott, President | ||
| (principal executive officer) | ||
| Date | March 8, 2023 | |
| By (Signature and Title)* | /s/ Shai Malka | |
| Shai Malka, Treasurer | ||
| (principal financial officer) | ||
| Date | March 8, 2023 | |
| * | Print the name and title of each signing officer under his or her signature. |