UNITED STATES
SECURITIES AND EXCHANGE COMMISSION
WASHINGTON, D.C. 20549
FORM 6-K
REPORT OF FOREIGN ISSUER
PURSUANT TO RULE 13a-16 OR 15b-16 OF
THE SECURITIES EXCHANGE ACT OF 1934
October 2022
Date of Report (Date of Earliest Event Reported)
Embotelladora Andina S.A.
(Exact name of registrant as specified in its charter)
Andina Bottling Company, Inc.
(Translation of Registrant´s name into English)
Avda. Miraflores 9153
Renca
Santiago, Chile
(Address of principal executive office)
Indicate by check mark whether the registrant files or will file annual reports under cover Form 20-F or Form 40-F.
Form 20-F x Form 40-F ¨
Indicate by check mark if the Registrant is submitting this Form 6-K in paper as permitted by Regulation S-T Rule 101(b)(1):
Yes ¨ No x
Indicate by check mark if the Registrant is submitting this Form 6-K in paper as permitted by Regulation S-T Rule 101(b)(7):
Yes ¨ No x
Indicate by check mark whether the registrant by furnishing the information contained in this Form 6-K is also thereby furnishing the information to the Commission pursuant to Rule 12g3-2(b) under the Securities Exchange Act of 1934
Yes ¨ No x

EXECUTIVE SUMMARY
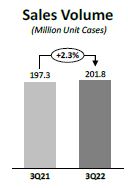
 | The quarter closed with Consolidated Sales Volume of 201.8 million unit cases*, increasing by 2.3% against the same quarter of the previous year. Accumulated consolidated Sales Volume reached 622.6 million unit cases, representing an increase of 5.9% over the previous year. Excluding the volume of wines in Chile, which we began commercializing in November 2021, volume increased by 5.3% in the period. | |
| | Company figures reported are the following: |
| · | Consolidated Net Sales reached CLP 653,498 million in the quarter, a 21.5% increase against the same quarter of the previous year. Accumulated consolidated Net Sales reached CLP 1,932,681 million, representing an increase of 26.3% over the previous year. |
| · | Consolidated Operating Income* reached CLP 68,765 million in the quarter, which represents a 16.3% increase against the same quarter of the previous year. Accumulated consolidated Operating Income reached CLP 239,392 million, an increase of 26.9% over the previous year. |
| · | Consolidated Adjusted EBITDA* increased by 17.2% against the same quarter of the previous year, reaching CLP 99,290 million in the quarter. Adjusted EBITDA Margin reached 15.2%, a 55-basis point contraction against the same quarter of the previous year. Accumulated consolidated Adjusted EBITDA reached CLP 328,880 million, representing a 24.8% increase over the previous year. Adjusted EBITDA Margin for the period reached 17.0%, a 21-basis point contraction over the previous year. |
| · | Net Income attributable to the owners of the controller for the quarter reached CLP 33,999 million, representing a 13.6% decrease regarding the same quarter of the previous year. Accumulated Net Income attributable to the owners of the controller was CLP 90,185 million, which represents an increase of 8.5% over the previous year. |
SUMMARY OF RESULTS THIRD QUARTER AND NINE MONTHS AS OF SEPTEMBER 30, 2022
| (Figures in million CLP) | 3Q21 | 3Q22 | Var % | 9M21 | 9M22 | Var % | ||||||||||||||||||
Sales Volume (Million Unit Cases) | 197.3 | 201.8 | 2.3 | % | 588.2 | 622.6 | 5.9 | % | ||||||||||||||||
| Net Sales | 538,023 | 653,498 | 21.5 | % | 1,530,097 | 1,932,681 | 26.3 | % | ||||||||||||||||
| Operating Income* | 59,151 | 68,765 | 16.3 | % | 188,600 | 239,392 | 26.9 | % | ||||||||||||||||
| Adjusted EBITDA* | 84,692 | 99,290 | 17.2 | % | 263,568 | 328,880 | 24.8 | % | ||||||||||||||||
| Net income attributable to the owners of the controller | 39,353 | 33,999 | -13.6 | % | 83,135 | 90,185 | 8.5 | % |
Comment of the Chief Executive Officer, Mr. Miguel Ángel Peirano
“Positive financial results were achieved in the third quarter, with consolidated Adjusted EBITDA increasing by 17.2% compared to the same quarter in the previous year. This increase was driven by results from Argentina, Brazil, and Paraguay, as well as a favorable effect in the translation of figures into Chilean pesos. A higher average revenue per unit case sold, as well as increases in NARTDS volumes in Argentina, Brazil, and Paraguay, and the previously mentioned positive translation effect, explain the 21.5% growth in Consolidated Sales. In the case of Chile, sales volumes were primarily affected by a high comparison base, which was influenced by the favorable impact of government subsidies distributed to families last year, which had a positive impact on consumption. In all the countries where we operate, we have implemented an active pricing strategy, with targeted price increases, seeking to overcome the scenario of high cost inflation.
In addition, we continue to make steady progress in our digital transformation; in our customer relationships, we are scaling our B2B solution that provides an omnichannel experience of our entire portfolio; in Chile, nearly 30% of our customers interact with us via our digital platforms; and in Paraguay (and soon in Brazil), we are executing an ambitious scaling program. Regarding consumers, Micoca-cola.cl (D2C Chile) continues to generate traction and growth, and we achieved outstanding results at the Cyber event in October. Na Sua Casa (D2C Brazil) continues to expand (albeit on a small basis) by double digits every month. We continue to automate repetitive back-office and call center tasks in our internal processes and generate data-driven decisions through our data analytics initiatives. Our focus on capturing, developing, and training digital talent has allowed us to accomplish the aforementioned.
Finally, in Chile, we received for the first time the Kaizen Awards Chile|2021/22, which annually recognizes public and private organizations, large and medium-sized businesses, that stand out in operational excellence practices, achieving first place in the Food and Beverage industry. In Paraguay, for the eleventh consecutive year, we have been recognized as the brand that Paraguayans remember the most, receiving the Top of Mind award. This award measures the positioning of the most important brands in the public's mind.”
*Definitions used are contained in the Glossary on page 16 of this document.
| COCA-COLA ANDINA |
| 3Q22 EARNINGS RELEASE |
| www.koandina.com |
| -2- |
BASIS OF PRESENTATION
Figures in the following analysis are set according to IFRS, in nominal Chilean pesos, for consolidated results as well as for the results of each of our operations. All variations regarding 2021 are nominal.
Since Argentina has been classified as a Hyperinflationary economy, pursuant to IAS 29, translation of figures from local to reporting currency was performed using the closing exchange rate for the translation to Chilean pesos. The local currency figures for both 2022 and 2021 referred to in the Argentina sections are all expressed in September 2022 currency.
Finally, a devaluation of local currencies regarding the U.S. dollar has a negative impact on our dollarized costs and a devaluation of local currencies regarding the Chilean peso has a negative impact upon consolidating figures.
When we refer to "Argentina", we mean our subsidiaries Embotelladora del Atlántico S.A. and Empaques Argentina S.A. When we refer to "Chile", we mean our subsidiaries Embotelladora Andina S.A., VJ S.A., Vital Aguas S.A. and Envases Central S.A.
CONSOLIDATED RESULTS: 3rd Quarter 2022 vs. 3rd Quarter 2021
| (Figures in million CLP) | 3Q21 | 3Q22 | Var % | |||||||||
| Net Sales | 538,023 | 653,498 | 21.5 | % | ||||||||
| Operating Income | 59,151 | 68,765 | 16.3 | % | ||||||||
| Adjusted EBITDA | 84,692 | 99,290 | 17.2 | % | ||||||||
| Net income attributable to the owners of the controller | 39,353 | 33,999 | -13.6 | % |
Consolidated Sales Volume during the quarter was 201.8 million unit cases, which represented an increase of 2.3% compared to the same period of 2021, explained by the increase in volume of the operations in Argentina, Brazil and Paraguay, partially offset by the volume decrease of the operation in Chile. The Non-Alcoholic Beverages Segment represented 94.6% of consolidated Sales Volume and grew 5.4%, explained by the growth of the Segment in Brazil, Argentina and Paraguay, partially offset by the decrease in Chile. The Alcoholic Beverages Segment represented 5.4% of total volume and decreased by 32.5%, which was mainly explained by the reduction of the Segment's volume in the Brazilian operation as a consequence of the change in the portfolio of Heineken brands that we commercialize. Transactions reached 1,131.3 million in the quarter, which represents an increase of 1.5% compared to the same quarter of the previous year.
Consolidated Net Sales reached CLP 653,498 million, an increase of 21.5%, explained by the revenue growth in the four countries where we operate and by the effect of translating figures.
Consolidated Costs of Sales increased by 17.3%, mainly explained by (i) the greater volume sold of products carrying a higher unit cost in Chile and Paraguay, (ii) the devaluation of the Argentine peso and the Chilean peso over dollarized costs, (iii) a higher cost of PET resin in the four operations, and (iv) the effect of translating figures to Chilean pesos. The aforementioned was offset by a decrease in the cost of beer in Brazil as a result of declining sales volume.
Consolidated Distribution Costs and Administrative Expenses increased by 34.9%, which is mainly explained by (i) greater distribution expenses due to higher tariffs in Brazil, Chile and Paraguay, (ii) greater labor expenses, (iii) greater marketing expenses in Argentina, and (iv) the effect of translating figures to Chilean pesos.
The above mentioned effects led to a consolidated Operating Income of CLP 68,765 million, a 16.3% increase. Operating Margin was 10.5%.
Consolidated Adjusted EBITDA reached CLP 99,290 million, increasing by 17.2%. Adjusted EBITDA Margin was 15.2%, a 55-basis point contraction.
Net Income attributable to the owners of the controller for the quarter was CLP 33,999 million, a decrease of 13.6% and Net Margin reached 5.2%, a 211-basis point contraction.
*Definitions used are contained in the Glossary on page 16 of this document.
| COCA-COLA ANDINA |
| 3Q22 EARNINGS RELEASE |
| www.koandina.com |
| -3- |
ARGENTINA: 3rd Quarter 2022 vs. 3rd Quarter 2021
| 3Q21 | 3Q22 | Var % | 3Q21 | 3Q22 | Var % | |||||||||||||||||||
| (Figures in million CLP) | (Figures in million ARS of September 2022) | |||||||||||||||||||||||
| Net Sales | 112,668 | 178,437 | 58.4 | % | 25,121 | 27,376 | 9.0 | % | ||||||||||||||||
| Operating Income | 9,075 | 17,921 | 97.5 | % | 2,023 | 2,750 | 35.9 | % | ||||||||||||||||
| Adjusted EBITDA | 16,437 | 26,985 | 64.2 | % | 3,665 | 4,140 | 13.0 | % | ||||||||||||||||
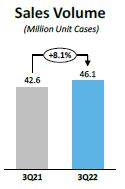
Sales Volume for the quarter increased by 8.1%, reaching 46.1 million unit cases, explained by a volume increase in all categories. Transactions reached 221.4 million, representing an increase of 15.4%, due to the recovery of immediate consumption packaging.
Net Sales amounted to CLP 178,437 million, an increase of 58.4%. In local currency, they increased by 9.0%, which was mainly explained by the aforementioned increase in volume, and to a lesser extent by the increase in the average revenue per unit case sold, as a result of the price increases implemented, and by the recovery of immediate consumption packaging sales.
Cost of Sales increased by 54.2%, while in local currency it increased by 6.1%, which is mainly explained by (i) the increase in volume sold, (ii) the negative effect of the devaluation of the Argentine peso on our dollarized costs, and (iii) a higher cost of PET resin. The previous was partially offset by (i) lower depreciation charges, and (ii) lower labor costs.
Distribution Costs and Administrative Expenses increased by 56.2% in the reporting currency, while in local currency they increased by 7.5%, which is mainly explained by (i) higher marketing expenses, and (ii) higher labor expenses.
The aforementioned effects led to an Operating Income of CLP 17,921 million, an increase of 97.5% compared to the same period of the previous year. Operating Margin was 10.0%. In local currency, Operating Income increased by 35.9%.
Adjusted EBITDA amounted to CLP 26,985 million, an increase of 64.2%. Adjusted EBITDA Margin was 15.1%, a 53-basis point expansion. Adjusted EBITDA in local currency increased by 13.0%.
BRAZIL: 3rd Quarter 2022 vs. 3rd Quarter 2021
| 3Q21 | 3Q22 | Var % | 3Q21 | 3Q22 | Var % | |||||||||||||||||||
| (Figures in million CLP) | (Figures in million BRL) | |||||||||||||||||||||||
| Net Sales | 142,953 | 162,292 | 13.5 | % | 968 | 919 | -5.0 | % | ||||||||||||||||
| Operating Income | 13,836 | 17,084 | 23.5 | % | 94 | 97 | 3.3 | % | ||||||||||||||||
| Adjusted EBITDA | 19,853 | 24,880 | 25.3 | % | 134 | 141 | 4.9 | % | ||||||||||||||||
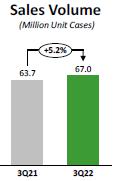
Sales Volume for the quarter reached 67.0 million unit cases, an increase of 5.2%, explained by the increase in the Soft Drinks, Waters and Juices and Other Non-Alcoholic beverages categories, partially offset by the volume decrease in the Beer category. The Non-Alcoholic Beverages Segment represented 98.2% of total sales volume, and grew 15.0%, which was explained by the growth of all the Segment's categories. The Alcoholic Beverages Segment represented 1.8% of total volume and decreased 81.4%, which is explained by the new agreement with Heineken, under which, as of October 2021, we no longer distribute the Heineken and Amstel brands. Transactions reached 376.0 million, representing a decrease of 6.0%, which was explained by an increase in the mix of multi-serve packaging consumption, explained in part by the reduction of beer sales volume, which has a higher immediate consumption mix.
Net Sales amounted to CLP 162,292 million, an increase of 13.5%. In local currency, Net Sales decreased 5.0%, which was mainly explained by the decrease in the average revenue per unit case sold in the beer sales volume since we no longer commercialize the Amstel and Heineken brands, which was partially offset by the already mentioned volume increase. Net Sales of the Non-Alcoholic Beverages segment increased 36.0% in local currency, representing 95.2% of total sales. Net Sales of the Alcoholic Beverages segment decreased 86.4% in local currency, representing 4.8% of total sales.
*Definitions used are contained in the Glossary on page 16 of this document.
| COCA-COLA ANDINA |
| 3Q22 EARNINGS RELEASE |
| www.koandina.com |
| -4- |
Cost of sales increased by 3.9%, while in local currency it decreased by 13.1%, which is mainly explained by the decrease in beer volumes, which has a high unit cost. This effect was partially offset by (i) higher raw material costs, such as sugar, resin and aluminum, and (ii) higher cost of concentrate given the implementation of price increases.
Distribution Costs and Administrative Expenses increased by 42.5% in the reporting currency. In local currency, they increased by 19.3%, which is mainly explained by (i) greater labor expenses, and (ii) increased distribution expenses, due to both higher volumes and higher tariffs.
The aforementioned effects led to an Operating Income of CLP 17,084 million, an increase of 23.5%. Operating Margin was 10.5%. In local currency, Operating Income increased by 3.3%.
Adjusted EBITDA was CLP 24,880 million, an increase of 25.3% compared to the previous year. Adjusted EBITDA Margin was 15.3%, a 144-basis point expansion. In local currency, Adjusted EBITDA increased by 4.9%.
CHILE: 3rd Quarter 2022 vs. 3rd Quarter 2021
| 3Q21 | 3Q22 | Var % | ||||||||||
| (Figures in million CLP) | ||||||||||||
| Net Sales | 243,880 | 261,897 | 7.4 | % | ||||||||
| Operating Income | 28,659 | 25,088 | -12.5 | % | ||||||||
| Adjusted EBITDA | 38,230 | 35,020 | -8.4 | % | ||||||||
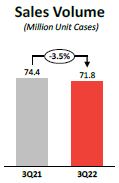
Sales Volume during the quarter, reached 71.8 million unit cases, representing a 3.5% decrease, explained by the volume decrease in the Soft Drinks, Water, Juices and other non-alcoholic beverages categories. Transactions reached 427.0 million, representing a decrease of 0.3%, explained by an increase in the mix of single-serve beverages, which was leveraged by an improvement in the on-premise sales channel. Sales Volume excluding the Wine category, which was not present in the previous year, declined by 5.2%. The Non-Alcoholic Beverages Segment represented 86.4% of total sales volume, and declined by 3.9%, which was explained by the reduction of all categories. The Alcoholic Beverages Segment represented 13.6% of total Sales Volume, without variation regarding the same quarter of the previous year, explained by the incorporation of wines to the Segment. Excluding wines, the Alcoholic Beverages Segment decreased 13.3%.
Net Sales reached CLP 261,897 million, a 7.4% growth, which is mainly explained by the increase in the average revenue per unit case sold, by the implementation of price increases, partially offset by the already mentioned decrease in volumes. Net Sales excluding the wine category, which was not present in the previous year, increased 3.7%. Net Sales of the Non-Alcoholic Beverages segment increased 8.7%, representing 74.3% of total sales. Net Sales of the Alcoholic Beverages Segment grew 3.7%, representing 25.7% of total sales. Excluding wine, sales of the Alcoholic Beverages Segment decreased 10.3%.
Cost of Sales increased by 8.6%, which is mainly explained by (i) the increase in sales of the Beer and spirits category, which have a high cost per unit case, (ii) the increase in the cost of certain raw materials, especially resin and sugar, and (iii) the devaluation of the exchange rate, which has a negative effect on dollarized costs.
Distribution Costs and Administrative Expenses increased by 14.5%, which is mainly explained by (i) higher distribution and hauling expenses, as a consequence of higher tariffs, and (ii) higher labor costs and services provided third parties.
The aforementioned effects led to an Operating Income of CLP 25,088 million, 12.5% lower when compared to the previous year. Operating Margin was 9.6%.
Adjusted EBITDA reached CLP 35,020 million, a decrease of 8.4%. Adjusted EBITDA Margin was 13.4%, a 230-basis point contraction.
*Definitions used are contained in the Glossary on page 16 of this document.
| COCA-COLA ANDINA |
| 3Q22 EARNINGS RELEASE |
| www.koandina.com |
| -5- |
PARAGUAY: 3rd Quarter 2022 vs. 3rd Quarter 2021
| 3Q21 | 3Q22 | Var % | 3Q21 | 3Q22 | Var % | |||||||||||||||||||
| (Figures in million CLP) | (Figures in million PGY) | |||||||||||||||||||||||
| Net Sales | 39,314 | 52,574 | 33.7 | % | 350,517 | 392,064 | 11.9 | % | ||||||||||||||||
| Operating Income | 9,066 | 10,551 | 16.4 | % | 80,798 | 78,747 | -2.5 | % | ||||||||||||||||
| Adjusted EBITDA | 11,655 | 14,285 | 22.6 | % | 103,903 | 106,549 | 2.5 | % | ||||||||||||||||
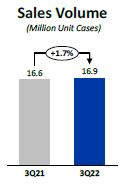
During the quarter, Sales Volume reached 16.9 million unit cases, an increase of 1.7%, explained by the increase in volume of the Water, Juices and other non-alcoholic beverages categories. Transactions reached 106.9 million, which represents an increase of 12.7%, explained by a greater mix of single-serve consumption.
Net Sales amounted to CLP 52,574 million, an increase of 33.7%. In local currency, Net Sales increased by 11.9%, which was mainly explained by a higher average revenue per unit case sold, and to a lesser extent by the aforementioned increase in volume.
Cost of Sales in the reporting currency increased by 38.8%. In local currency, it increased by 16.1%, which is mainly explained by (i) a change in the mix towards higher unit cost products, (ii) higher PET resin cost, and (iii) higher depreciation charges.
Distribution Costs and Administrative Expenses increased by 39.2%, and in local currency they increased by 16.4%. This is mainly explained by (i) higher distribution expenses, mainly due to higher tariffs, and (ii) greater labor costs and services provided by third parties.
The aforementioned effects led to an Operating Income of CLP 10,551 million, 16.4% higher when compared to the previous year. Operating Margin reached 20.1%. In local currency, Operating Income decreased by 2.5%.
Adjusted EBITDA reached CLP 14,285 million, an increase of 22.6%, and Adjusted EBITDA Margin was 27.2%, a 248-basis point contraction. In local currency Adjusted EBITDA increased by 2.5%.
ACCUMULATED RESULTS: Nine months ended September 30, 2022 vs. Nine months ended September 30, 2021
Consolidated Results
| (Figures in million CLP) | 9M21 | 9M22 | Var % | |||||||||
| Net Sales | 1,530,097 | 1,932,681 | 26.3 | % | ||||||||
| Operating Income | 188,600 | 239,392 | 26.9 | % | ||||||||
| Adjusted EBITDA | 263,568 | 328,880 | 24.8 | % | ||||||||
| Net income attributable to the owners of the controller | 83,135 | 90,185 | 8.5 | % |
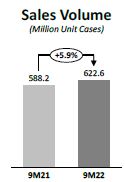
Consolidated Sales Volume was 622.6 million unit cases, which represented an increase of 5.9% compared to the same period of 2021, explained by volume growth in all the countries in which we operate. The Non-Alcoholic Beverages Segment represented 94.6% of consolidated Sales Volume and grew 8.9%, explained by the growth of the Segment in all the countries in which we operate. The Alcoholic Beverages Segment represented 5.4% of total volume and decreased 28.8%, which was mainly explained by the reduction of the Segment's volume in the Brazilian operation, which was partially offset by the growth of the Segment in the Chilean operation. Transactions reached 3,432.8 million, representing an increase of 6.2%. Consolidated Net Sales reached CLP 1,932,681 million, an increase of 26.3%.
*Definitions used are contained in the Glossary on page 16 of this document.
| COCA-COLA ANDINA |
| 3Q22 EARNINGS RELEASE |
| www.koandina.com |
| -6- |
![]()
Consolidated Cost of Sales increased 22.9%, which is mainly explained by (i) higher volume sold in Argentina and Chile, (ii) a higher cost of PET resin in the four operations, (iii) a higher cost of sugar in Brazil and Chile, (iv) the negative effect of the devaluation of the Argentine peso and Chilean peso on dollarized costs, and (v) the effect of translating figures to Chilean pesos. The previous was offset by (i) a lower cost of sales in Brazil, as a result of the reduction in beer sales, and (ii) the positive effect on dollarized costs of the appreciation of the Brazilian real.
Consolidated Distribution Costs and Administrative Expenses increased by 34.7%, which is mainly explained by (i) greater distribution expenses, (ii) greater labor expenses, and (ii) the effect of translating figures to Chilean pesos.
The above mentioned effects led to a consolidated Operating Income of CLP 239,392 million, a 26.9% increase. Operating Margin was 12.4%.
Consolidated Adjusted EBITDA reached CLP 328,880 million, increasing by 24.8%. Adjusted EBITDA Margin was 17.0%, a 21-basis point contraction.
Net Income attributable to the owners of the controller was CLP 90,185 million, an increase of 8.5% and Net Margin reached 4.7%.
Argentina

| 9M21 | 9M22 | Var % | 9M21 | 9M22 | Var % | |||||||||||||||||||
| (Figures in million CLP) | (Figures in million ARS of September 2022) | |||||||||||||||||||||||
| Net Sales | 335,352 | 552,479 | 64.7 | % | 74,772 | 84,761 | 13.4 | % | ||||||||||||||||
| Operating Income | 32,765 | 75,923 | 131.7 | % | 7,305 | 11,648 | 59.4 | % | ||||||||||||||||
| Adjusted EBITDA | 54,465 | 103,781 | 90.5 | % | 12,144 | 15,922 | 31.1 | % | ||||||||||||||||
Sales Volume increased by 11.6%, reaching 143.0 million unit cases, explained by a volume increase in all categories. Transactions reached 670.5 million, representing an increase of 18.5%, explained by a higher mix of immediate consumption.
Net Sales amounted to CLP 552,479 million, an increase of 64.7%, while in local currency, Net Sales increased by 13.4%, which was mainly explained by the aforementioned increase in volume, and to a lesser extent by the increase in the average revenue per unit case sold.
Cost of Sales increased by 60.7%. In local currency it increased by 10.6%, which is mainly explained by (i) the increase in volume sold, (ii) the negative effect of the devaluation of the Argentine peso on our dollarized costs, and (iii) a higher cost of PET resin.
Distribution Costs and Administrative Expenses increased by 52.5% in the reporting currency. In local currency they increased by 4.9%, which is mainly explained by (i) higher freight expenses due to higher sales volumes and (ii) greater labor expenses. This was partially offset by higher other operating income, which is classified under this item.
The aforementioned effects led to an Operating Income of CLP 75,923 million, an increase of 131.7%. Operating Margin was 13.7%. In local currency, Operating Income increased by 59.4%.
Adjusted EBITDA amounted to CLP 103,781 million, an increase of 90.5%. Adjusted EBITDA Margin was 18.8%, a 254-basis point expansion. Adjusted EBITDA in local currency increased by 31.1%.
*Definitions used are contained in the Glossary on page 16 of this document.
| COCA-COLA ANDINA | |
| 3Q22 EARNINGS RELEASE | |
| www.koandina.com | |
| -7- | |
![]()
Brazil
| 9M21 | 9M22 | Var % | 9M21 | 9M22 | Var % | |||||||||||||||||||
| (Figures in million CLP) | (Figures in million BRL) | |||||||||||||||||||||||
| Net Sales | 408,657 | 444,024 | 8.7 | % | 2,952 | 2,641 | -10.5 | % | ||||||||||||||||
| Operating Income | 45,493 | 50,743 | 11.5 | % | 331 | 302 | -8.7 | % | ||||||||||||||||
| Adjusted EBITDA | 62,849 | 73,537 | 17.0 | % | 456 | 438 | -4.0 | % | ||||||||||||||||
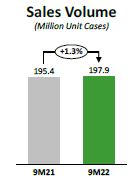
Sales Volume increased 1.3%, reaching 197.9 million unit cases, explained by the increase in the Soft Drinks, Water and Juices and Other non-alcoholic beverages categories, which was partially offset by the volume decrease in the Beer category. The Non-Alcoholic Beverages Segment represented 98.2% of total sales volume, and grew 10.8%, which was explained by the growth of all the Segment's categories. The Alcoholic Beverages Segment represented 1.8% of total volume and decreased 82.3%, which is explained by the new agreement with Heineken, under which, as of October 2021, we no longer distribute the Heineken and Amstel brands. Transactions reached 1,089.2 million, representing a decrease of 8.8%.
Net Sales reached CLP 444,024 million, an increase of 8.7%, driven by the positive effect of the translation of figures into Chilean pesos. In local currency, Net Sales decreased 10.5%, due to a lower average price resulting from the decrease in beer sales, partially offset by the already mentioned volume increase. Net Sales of the Non-Alcoholic Beverages segment increased 27.9% in local currency, representing 94.9% of total sales. Net Sales of the Alcoholic Beverages Segment decreased 86.4% in local currency, representing 5.1% of total sales.
Cost of sales decreased 0.3%, while in local currency it decreased 17.8%, which is mainly explained by (i) the decrease in beer volumes, which has a high unit cost, and (ii) the positive effect of the appreciation of the real on our dollarized costs. These effects were partially offset by (i) higher concentrate costs because of the implementation of price increases, and (ii) higher raw material costs, such as sugar, resin and aluminum.
Distribution Costs and Administrative Expenses increased by 38.9% in the reporting currency, and in local currency, they increased by 14.4%, which is mainly explained by (i) higher distribution and hauling expenses, and (ii) greater labor expenses.
The aforementioned effects led to an Operating Income of CLP 50,743 million, an increase of 11.5%. Operating Margin was 11.4%. In local currency, Operating Income decreased by 8.7%.
Adjusted EBITDA was CLP 73,537 million, an increase of 17.0% compared to the previous year. Adjusted EBITDA Margin was 16.6%, a 118-basis point expansion. In local currency, Adjusted EBITDA decreased by 4.0%.
Chile

| 9M21 | 9M22 | Var % | ||||||||||
| (Figures in million CLP) | ||||||||||||
| Net Sales | 675,867 | 790,999 | 17.0 | % | ||||||||
| Operating Income | 87,197 | 83,508 | -4.2 | % | ||||||||
| Adjusted EBITDA | 115,770 | 112,697 | -2.7 | % | ||||||||
Sales Volume reached 229.1 million unit cases, an increase of 6.2%, explained by the increase in volume in the Water, Juices and Other Non-Alcoholic Beverages and Beers and Spirits categories, partially offset by the volume decrease in the Soft Drinks category. Transactions reached 1,354.8 million, an increase of 13.0%. Sales volume excluding the Wines category, which was not present in the previous year, grew by 4.7%. The Non-Alcoholic Beverages Segment represented 86.9% of total sales volume, and grew by 5.6%, which was explained by the growth of the Water, Juices and Other Non-Alcoholic Beverages categories, partially offset by the volume decrease in the Soft Drinks category. The Alcoholic Beverages Segment represented 13.1% of total Sales Volume and grew 10.5%, explained by the growth of the Spirits and Wine categories, partially offset by the decrease in the Beer category. Excluding wines, the Alcoholic Beverages Segment declined by 1.2%.
*Definitions used are contained in the Glossary on page 16 of this document.
| COCA-COLA ANDINA | |
| 3Q22 EARNINGS RELEASE | |
| www.koandina.com | |
| -8- | |
![]()
Net Sales amounted to CLP 790,999 million, an increase of 17.0%, which is explained by a higher average price for the period and the increase in Sales Volume already mentioned. The higher average price for the period is mainly explained by a higher average price in the non-alcoholic categories. Net Sales of the Non-Alcoholic Beverages segment increased 18.0%, representing 75.6% of total sales. Net Sales of the Alcoholic Beverages Segment grew 14.3%, representing 24.4% of total sales. Excluding wines, sales of the Alcoholic Beverages Segment grew 1.2%.
Cost of sales increased 20.3%, which is mainly explained by (i) higher volume sold, (ii) the incorporation of the Wine category, which have a high cost per unit case, (iii) the increase in the cost of certain raw materials, particularly resin and sugar, and (iv) the devaluation of the exchange rate, which has a negative effect on dollarized costs.
Distribution Costs and Administrative Expenses increased by 19.7%, which is mainly explained by (i) higher distribution and hauling expenses, as a consequence of the higher volume sold and higher tariffs, and (ii) higher labor costs and services provided third parties.
The aforementioned effects led to an Operating Income of CLP 83,508 million, 4.2% lower when compared to the previous year. Operating Margin was 10.6%.
Adjusted EBITDA reached CLP 112,697 million, a decrease of 2.7%. Adjusted EBITDA Margin was 14.2%, a 288-basis point contraction.
Paraguay
| 9M21 | 9M22 | Var % | 9M21 | 9M22 | Var % | |||||||||||||||||||
| (Figures in million CLP) | (Figures in million PGY) | |||||||||||||||||||||||
| Net Sales | 112,742 | 148,921 | 32.1 | % | 1,030,783 | 1,202,836 | 16.7 | % | ||||||||||||||||
| Operating Income | 27,501 | 34,245 | 24.5 | % | 251,538 | 279,075 | 10.9 | % | ||||||||||||||||
| Adjusted EBITDA | 34,839 | 43,892 | 26.0 | % | 318,667 | 356,415 | 11.8 | % | ||||||||||||||||
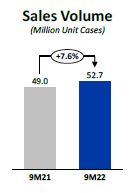
Sales Volume reached 52.7 million unit cases, an increase of 7.6%, mainly explained by the increase in volume in all categories. Transactions amounted to 318.3 million, an increase of 16.2%.
Net sales amounted to CLP 148,921 million, an increase of 32.1%. In local currency, Net Sales increased 16.7%, which is explained by a higher average price as well as by the already mentioned increase in Sales Volume.
Cost of Sales increased 35.9% and in local currency it increased 19.9%, which is mainly explained by (i) a shift in the mix towards products with higher unit cost, and (ii) a greater cost of PET resin.
Distribution Costs and Administrative Expenses increased 31.1% in the reporting currency. In local currency, they increased 15.3%, which is mainly explained by (i) higher distribution expenses, due to higher volume sold, (ii) higher labor expenses and services provided by third parties, and (iii) higher advertising expenses.
The aforementioned effects led to an Operating Income of CLP 34,245 million, 24.5% higher when compared to the previous year. Operating Margin reached 23.0%. In local currency, Operating Income increased 10.9%.
Adjusted EBITDA reached CLP 43,892 million, 26.0% higher when compared to the previous year, and Adjusted EBITDA Margin was 29.5%, a 143-basis point contraction. In local currency, Adjusted EBITDA increased 11.8 %.
*Definitions used are contained in the Glossary on page 16 of this document.
| COCA-COLA ANDINA | |
| 3Q22 EARNINGS RELEASE | |
| www.koandina.com | |
| -9- | |
![]()
NON-OPERATING RESULTS FOR THE QUARTER
Net Financial Income and Expenses account recorded an expense CLP 9,935 million, which compares to an expense of CLP 13,097 million in the same quarter of the previous year, mainly as a result of higher financial income from investments held in portfolio management.
Share of Profit or Loss of Investments Accounted for using the Equity Method account went from an CLP 538 million profit to a CLP 252 million profit, which is mainly explained by a lower net profit of the Sorocaba equity investee.
Other Income and Expenses account recorded a CLP 1,613 million profit, compared with a CLP 3,706 million loss in the same quarter of the previous year, which is mainly explained by lower contingencies in Brazil.
Results by Adjustment Units and Exchange Rate Differences account went from a CLP 974 million loss to an CLP 11,583 million loss. This loss is mainly explained by the higher inflation recorded this quarter (3.54%) compared to the same quarter of the previous year (1.27%), which has a negative impact on restating the debt that the Company holds in UF.
Income Tax went from CLP -2,005 million to CLP -14,577 million, a variation that is mainly explained by (i) the higher income before taxes, (ii) the negative tax effect of the variation in the exchange rate in Chile, and (iii) the negative tax effect of the higher inflation in Chile.
SUSTAINABILITY
Coca-Cola Andina is constantly on the lookout for opportunities that will allow us to provide strategic, financial, operational, and management information to our stakeholders in a timely and transparent manner.
In this way and with a view to beginning our 2022 Integrated Report, we updated our Materiality Matrix, a process for defining the pertinent issues for each of the Company's stakeholders in Environmental, Social, and Governance (ESG) matters. We incorporated a variety of sources for this analysis, including Coca-Cola Andina's 2021 Materiality, international standards, industry benchmarks, and stakeholder interviews.
The analysis of the Sustainability Accounting Standard Board (SASB) and Dow Jones Sustainability Index (DJSI) was incorporated for the beverage and non-alcoholic beverage industries in the scenario of international standards of ESG information disclosure, and for the industry as a whole, we benchmarked the material issues reported by Coca-Cola Femsa, Arca, Coca-Cola Hellenic, Embonor, Solar, Coca-Cola Company, CCU, Nestlé, AbInbev, and Carozzi, among others. The opinions of Andina's main executives on issues relevant to the company are added to all of the aforementioned, allowing for the integration of the organization's perspective with its environment.
The robustness of the operation and its efficiency in the use of natural resources, the implementation of circular processes, where returnability and recycling acquire a greater preponderance, as well as the diversity and breadth of the portfolio to meet the needs of customers and consumers, as well as the importance of having innovative and diverse teams within the organization, are some areas that require a greater focus this year, even though our previous matrix had already incorporated these issues as those most relevant to our stakeholders.
In addition to the foregoing, and in order to comply with our principles of transparency, duty of care and diligence in the information we share with the Company's various stakeholders, we continue to participate in a number of indexes that evaluate our performance in terms of indicators, goals and compliance.
One of these, in which we participate voluntarily, is the Dow Jones Sustainability Index of Chile and the Dow Jones Sustainability MILA Pacific Alliance, which highlights the best companies in meeting a variety of sustainability management criteria. This index ranks the Company among the top 5 most highly regarded companies in its industry.
The Company is also constantly evaluated by other indicators such as FTSE4Good Index, MSCI, Morningstar Sustainalitics and VE from Moody's ESG Solutions, where it has obtained results that support its ongoing management in the areas of environmental, social and governance, among others.
*Definitions used are contained in the Glossary on page 16 of this document.
| COCA-COLA ANDINA | |
| 3Q22 EARNINGS RELEASE | |
| www.koandina.com | |
| -10- | |
![]()
CONSOLIDATED BALANCE
The following are the balances of Assets and Liabilities at the closing dates of these financial statements:
| 12.31.2021 | 09.30.2022 | Variation | ||||||||||
| million CLP | million CLP | million CLP | ||||||||||
| Assets | ||||||||||||
| Current assets | 990,986 | 912,567 | -78,419 | |||||||||
| Non-current assets | 1,955,121 | 2,140,181 | 185,060 | |||||||||
| Total Assets | 2,946,107 | 3,052,748 | 106,641 | |||||||||
| 12.31.2021 | 09.30.2022 | Variation | ||||||||||
| million CLP | million CLP | million CLP | ||||||||||
| Liabilities | ||||||||||||
| Current liabilities | 529,567 | 555,892 | 26,325 | |||||||||
| Non-current liabilities | 1,315,126 | 1,494,582 | 179,456 | |||||||||
| Total Liabilities | 1,844,693 | 2,050,474 | 205,781 |
| 12.31.2021 | 09.30.2022 | Variation | ||||||||||
| million CLP | million CLP | million CLP | ||||||||||
| Equity | ||||||||||||
| Non-controlling interests | 25,270 | 28,252 | 2,982 | |||||||||
| Equity attributable to the owners of the controller | 1,076,144 | 974,021 | -102,123 | |||||||||
| Total Equity | 1,101,414 | 1,002,273 | -99,140 |
At the end of September, with respect to the end of 2021, the Argentine peso depreciated by 26.2% against the Chilean peso, which generated a decrease in the assets, liabilities and equity accounts, due to the effect of the translation of figures. On the other hand, at the end of September, with respect to the end of 2021, the Brazilian real and Paraguayan guarani appreciated against the Chilean peso by 14.8% and 9.4%, respectively, which generated an increase in assets, liabilities and equity accounts, due to the effect of translation of figures.
Assets
Total assets increased by CLP 106,641 million, 3.6% compared to December 2021.
Current assets decreased by CLP 78,419 million, 7.9% compared to December 2021, which is mainly explained by the decrease in Other current financial assets (CLP -101,916 million) added to the decrease in Cash and cash equivalents (CLP -60,675 million) mainly due to the payment of extraordinary dividends in April. The foregoing decreases were partially offset by the increase in Inventories (CLP 50,887 million), mainly of raw materials and finished products in Chile (alcoholic products), added to the increase in Current tax assets (CLP 30,687 million) mainly due to higher provisional payments in the Chilean operation.
Non-current assets increased by CLP 185,060 million, 9.5% compared to December 2021, mainly due to the increase in Property, plant and equipment (CLP 115,335 million), which is explained by the investments made (CLP 118,420 million) mainly in production, as well as in packaging and cold equipment, added to the positive effect of translating figures and IAS 29 restatements and partially offset by the Depreciation account. In addition to the above increase, there was an increase in Intangible assets other than goodwill (CLP 52,848 million), mainly explained by the positive effect of the translation of figures of our foreign subsidiaries.
Liability and Equity
Total liabilities increased by CLP 205,781 million, 11.2% compared to December 2021.
Current liabilities increased by CLP 26,325 million, 5.0% compared to December 2021, mainly due to the increase in Current accounts payable to related entities (CLP 21,384 million) mainly due to higher accounts payable to The Coca-Cola Company. In addition to Other current financial liabilities (CLP 15,248 million) and Trade and other current accounts payable (CLP 7,963 million). The foregoing effects were partially offset by the decrease in Current tax liabilities (CLP -20,609 million) which is explained by lower income taxes in Chile because of the derivative mark-to-market derivative balance.
On the other hand, non-current liabilities increased by CLP 179,456 million, 13.6% compared to December 2021, mainly due to the increase in Other non-current financial liabilities (CLP 168,996 million) explained by the increase in bond debt because of the depreciation of the Chilean peso against the U.S. dollar and the increase of the UF, in addition to the increase in liabilities from the mark to market of the cross currency swaps of the bond placed in the US market in January 2020. The foregoing increase was partially offset by the decrease of Other non-current provisions (CLP -4,875 million).
Equity decreased by CLP 99,140 million, 9.0% compared to December 2021, explained by the decrease in Accumulated earnings from the payment of dividends (CLP -245,492 million), which were partially offset by the restatement of equity balances in our subsidiary in Argentina, in accordance with IAS 29 (CLP 99,274 million) and by the profits obtained in the period (CLP 90,185 million). In addition to the decrease in Accumulated earnings, there was a decrease in Other reserves (CLP -46,090 million), which decreased mainly due to the recognition of hedging derivatives, partially offset by the positive effect of translation of figures from our foreign subsidiaries.
*Definitions used are contained in the Glossary on page 16 of this document.
| COCA-COLA ANDINA | |
| 3Q22 EARNINGS RELEASE | |
| www.koandina.com | |
| -11- | |
FINANCIAL ASSETS AND LIABILITIES
| CONSOLIDATED NET FINANCIAL DEBT | (USD million) | |||
| Total Financial Assets | 582 | |||
| Cash and Cash Equivalent (1) | 254 | |||
| Other current financial assets (1) | 93 | |||
| Valuation of Hedge Derivatives | 235 | |||
| Financial Debt | 1,246 | |||
| Bonds on the international market | 663 | |||
| Bonds on the local market (Chile) | 540 | |||
| Bank Debt and Others | 43 | |||
| Net Financial Debt | 663 | |||
(1) Financial Assets corresponding to Cash and Cash Equivalents and Other current financial assets are held invested in low-risk instruments such as time deposits, short-term fixed-income mutual funds and others.
| CURRENCY EXPOSURE (%) | ||||||||
| Total Financial Assets | Financial Debt (2) | |||||||
| CLP (Chile) | 36 | % | 27 | % | ||||
Unidad de Fomento (CLP indexed to inflation) | 5 | % | 56 | % | ||||
| BRL (Brazil) | 48 | % | 17 | % | ||||
| PGY (Paraguay) | 9 | % | 0 | % | ||||
| ARS (Argentina) | 1 | % | 0 | % | ||||
| USD (United States) | 2 | % | 1 | % | ||||
| Total | 100 | % | 100 | % | ||||
(2) Includes the effects of Cross Currency Swaps.
| RISK RATINGS | ||||
| Local rating agencies | Rating | |||
| ICR | AA+ | |||
| Fitch Chile | AA+ | |||
| International rating agencies | Rating | |||
| Standard & Poors | BBB | |||
| Fitch Ratings, Inc. | BBB+ |
DEBT AMORTIZATION PROFILE

CASH FLOW
| 09.30.2021 | 09.30.2022 | Variation | ||||||||||||||
| million CLP | million CLP | million CLP | % | |||||||||||||
| Cash flow | ||||||||||||||||
| Operating | 172,088 | 243,275 | 71,188 | 41.4 | % | |||||||||||
| Investment | -119,595 | -29,311 | 90,284 | -75.5 | % | |||||||||||
| Financing | -84,578 | -248,459 | -163,881 | 193.8 | % | |||||||||||
| Net Cash Flow for the period | -32,085 | -34,495 | -2,410 | 7.5 | % | |||||||||||
During the current period, the Company generated a negative net cash flow of CLP 34,495 million, which is explained as follows:
Operating activities generated a positive net cash flow of CLP 243,275 million, higher than the CLP 172,088 million recorded in the same period of 2021, which is mainly due to higher collections from the greater variety of products offered, partially offset by higher payments to suppliers and tax payments.
Investing activities generated a negative cash flow of CLP 29,311 million, with a positive variation of CLP 90,284 million compared to the previous year, which is mainly explained by the purchase of financial instruments for CLP 56,511 million in 2021, not present in 2022, added to the fact that in the current period an amount of CLP 104,325 million has been redeemed, increasing the movement of cash and cash equivalents. This is partially offset by an increase in Capex.
Financing activities generated a negative cash flow of CLP 248,459 million, with a negative variation of CLP 163,881 million with respect to the previous year, which is mainly explained by the payment of extraordinary dividends.
*Definitions used are contained in the Glossary on page 16 of this document.
| COCA-COLA ANDINA | |
| 3Q22 EARNINGS RELEASE | |
| www.koandina.com | |
| -12- | |
MAIN INDICATORS
| INDICATOR | Definition | Unit | Sep 22 | Dec 21 | Sep 21 | Sep 22 vs Dec 21 | Sep 22 vs Sep 21 | |||||||||||||||||
| LIQUIDITY | ||||||||||||||||||||||||
| Current liquidity | Current Asset Current Liability | Times | 1.6 | 1.9 | 1.9 | -12.3 | % | -15.0 | % | |||||||||||||||
| Acid ratio | Current Asset – Inventory Current Liability | Times | 1.2 | 1.5 | 1.6 | -20.1 | % | -23.4 | % | |||||||||||||||
| ACTIVITY | ||||||||||||||||||||||||
| Investment | Million CLP | 118,420 | 141,952 | 80,488 | -16.6 | % | 47.1 | % | ||||||||||||||||
| Inventory turnover | Cost of Sales Average Inventory | Times | 5.5 | 8.6 | 6.7 | -36.7 | % | -18.1 | % | |||||||||||||||
| INDEBTEDNESS | ||||||||||||||||||||||||
| Indebtedness ratio | Net Financial Debt* Total Equity* | Times | 0.6 | 0.3 | 0.2 | 137.9 | % | 185.8 | % | |||||||||||||||
| Financial exp. coverage | Adjusted EBITDA (12M) Financial Expenses* (12M) – Financial Income* (12M) | Times | 19.7 | 8.2 | 7.8 | 140.4 | % | 151.3 | % | |||||||||||||||
| Net financial debt / Adjusted EBITDA | Net Financial Debt Adjusted EBITDA (12M) | Times | 1.4 | 0.7 | 0.6 | 85.9 | % | 135.3 | % | |||||||||||||||
| PROFITABILITY | ||||||||||||||||||||||||
| On Equity | Net Income Fiscal Year (12M) Average Equity | % | 15.8 | % | 16.4 | % | 14.1 | % | (0.6 | pp) | 1.7 | pp | ||||||||||||
| On Total Assets | Net Income Fiscal Year (12M) Average Equity | % | 5.4 | % | 5.7 | % | 5.0 | % | (0.3 | pp) | 0.4 | pp | ||||||||||||
Liquidity
Current Liquidity showed a negative variation of 12.3% with respect to December 2021, explained by the decrease in current assets by 7.9% previously explained, in addition to the 5.0% increase in current liabilities.
The Acid Ratio showed a decrease of 20.1% compared to December 2021, for the reasons explained above, added to the increase in inventories (26.6%) in the period, due to higher inventories of raw materials and finished products. Excluding inventories, current assets decreased by 16.2% compared to December 2021.
Activity
At the end of September 2022, investments reached CLP 118,420 million, which corresponds to an increase of 47.1% compared to the same period of 2021, explained by higher productive investments, in addition to investments in cold equipment and packaging.
Inventory turnover reached 5.5 times, showing a decrease of 18.1% compared to the same period of 2021, mainly explained by the increase in average inventory by 50.1% compared to the same period of 2021 mentioned above, which was higher than the increase in cost of sales (22.9%).
Indebtedness
Indebtedness ratio reached 0.6 times at the end of September 2022, which is equivalent to an increase of 137.9% compared to the end of December 2021. This is due to the increase in net debt by 116.4%, added to the decrease in total equity by 9.0%.
The Financial Expense Coverage indicator shows an increase of 140.4% when compared to December 2021, reaching 19.7 times. This is explained by the 51.6% decrease in net financial expenses (rolling 12 months), added to the 16.4% increase in Adjusted EBITDA for the period.
Net financial debt/Adjusted EBITDA was 1.4 times, which represents an increase of 85.9% versus December 2021. The foregoing is due to the 116.4% increase in Net Financial Debt, which was higher than the 16.4% increase in Adjusted EBITDA for the period.
*Definitions used are contained in the Glossary on page 16 of this document.
| COCA-COLA ANDINA | |
| 3Q22 EARNINGS RELEASE | |
| www.koandina.com | |
| -13- | |
Profitability
Return on equity reached 15.8%, 0.6 percentage points lower than the indicator measured in December 2021. The result is due to the increase in average Equity (8.6%), which was higher than the increase in Net Income for the rolling 12-month period (4.6%).
Meanwhile, Return on Total Assets was 5.4%, 0.3 percentage points lower regarding the indicator as of December 2021, due to the increase in Average Asset (11.2%) which was higher than the mentioned increase in Net Income for the 12 rolling months.
MACROECONOMIC INFORMATION
INFLATION
| Accumulated 9M22 | LTM | ||||||||
| Argentina* | 66.18 | % | 82.99 | % | |||||
| Brazil | 4.09 | % | 7.17 | % | |||||
| Chile | 10.89 | % | 13.70 | % | |||||
| Paraguay | 7.08 | % | 9.35 | % | |||||
*Official inflation reported by the National Institute of Statistics and Censuses of Argentina (INDEC). It should be mentioned that the inflation used to express Argentina's figures in accordance with IAS 29 corresponds to inflation estimated by the Central Bank of the Argentine Republic (in its Survey of Market Expectations report), which is also adjusted for the difference between the estimate (by the Central Bank) and the actual inflation of the previous month (INDEC).
| EXCHANGE | Local currency/USD | CLP/local currency | ||||||||||||||
| RATES | (Average exchange rate) | (Average exchange rate*) | ||||||||||||||
| USED | 3Q21 | 3Q22 | 3Q21 | 3Q22 | ||||||||||||
| Argentina | 98.7 | 147.3 | 8.2 | 6.5 | ||||||||||||
| Brazil | 5.23 | 5.25 | 147.75 | 176.56 | ||||||||||||
| Chile | 773 | 927 | N.A | N.A | ||||||||||||
| Paraguay | 6,895 | 6,911 | 0.11 | 0.13 | ||||||||||||
*Except Argentina, where the closing exchange rate is used, in accordance with IAS 29.
| EXCHANGE | Local currency/USD | CLP/local currency | ||||||||||||||
| RATES | (Average exchange rate) | (Average exchange rate*) | ||||||||||||||
| USED | 9M21 | 9M22 | 9M21 | 9M22 | ||||||||||||
| Argentina | 98.7 | 147.3 | 8.2 | 6.5 | ||||||||||||
| Brazil | 5.33 | 5.13 | 138.31 | 167.41 | ||||||||||||
| Chile | 738 | 860 | N.A | N.A | ||||||||||||
| Paraguay | 6,750 | 6,915 | 0.11 | 0.12 | ||||||||||||
*Except Argentina, where the closing exchange rate is used, in accordance with IAS 29.
MARKET RISK ANALYSIS
The Company’s risk management is the responsibility of the office of the Chief Executive Officer, (through the areas of Corporate Management Control, Sustainability and Risks, which depends on the office of the Chief Financial Officer), as well as each of the management areas of Coca-Cola Andina. The main risks that the Company has identified and that could possibly affect the business are as follows:
Relationship with The Coca-Cola Company
A large part of the Company’s sales derives from the sale of products whose trademarks are owned by The Coca-Cola Company, which has the ability to exert an important influence on the business through its rights under the Licensing or Bottling Agreements. In addition, we depend on The Coca-Cola Company to renew these Bottling Agreements.
Non-alcoholic beverage business environment
Consumers, public health officials, and government officials in our markets are increasingly concerned about the public health consequences associated with obesity, which can affect demand for our products, especially those containing sugar.
The Company has developed a large portfolio of sugar-free products and has also made reformulations to some of its sugary products, significantly reducing sugar contents of its products.
Raw material prices and exchange rate
Many raw materials are used in the production of beverages and packaging, including sugar and PET resin, the prices of which may present great volatility. In the case of sugar, the Company sets the price of a part of the volume that it consumes with some anticipation, in order to avoid having large fluctuations of cost that cannot be anticipated.
In addition, these raw materials are traded in dollars; the Company has a policy of hedging in the futures market a portion of the dollars it uses to buy raw materials.
* Definitions used are contained in the Glossary on page 16 of this document.
| COCA-COLA ANDINA | |
| 3Q22 EARNINGS RELEASE | |
| www.koandina.com | |
| -14- | |
Instability in the supply of utilities and raw materials
In the countries in which we operate, our operations depend on a stable supply of utilities, fuel and raw materials. Power outages or water shut offs as well as the lack of raw materials may result in interruptions of our production. The Company has mitigation plans to reduce the effects of eventual interruptions in the supply of utilities and raw materials.
Economic conditions of the countries where we operate
The Company maintains operations in Argentina, Brazil, Chile and Paraguay. The demand for our products largely depends on the economic situation of these countries. Moreover, economic instability can cause depreciation of the currencies of these countries, as well as inflation, which may eventually affect the Company’s financial situation.
New tax laws or modifications to tax incentives
We cannot ensure that any government authority in any of the countries in which we operate will not impose new taxes or increase existing taxes on our raw materials, products or containers. Likewise, we cannot assure that these authorities are going to uphold and/or renew tax incentives that currently benefit some of our operations.
A devaluation of the currencies of the countries where we have our operations, regarding the Chilean peso, can negatively affect the results reported by the Company in Chilean pesos
The Company reports its results in Chilean pesos, while a large part of its revenues and Adjusted EBITDA comes from countries that use other currencies. Should currencies devaluate regarding the Chilean peso, this would have a negative effect on the results of the Company, upon the translation of results into Chilean pesos.
The imposition of exchange controls could restrict the entry and exit of funds to and from the countries in which we operate, which could significantly limit our financial capacity
The imposition of exchange controls in the countries in which we operate could affect our ability to repatriate profits, which could significantly limit our ability to pay dividends to our shareholders. Additionally, it may limit the ability of our foreign subsidiaries to finance payments of U.S. dollar denominated liabilities required by foreign creditors.
Civil unrest in Chile could have a material adverse effect on general economic conditions in Chile and our business and financial condition
Since October 18, 2019, there have been protests and demonstrations in Chile, seeking to reduce inequality, including claims about better pensions, improvement in health plans and reduced health care costs, reduction in the cost of public transportation, better wages, among others. Sometimes demonstrations have been violent, causing damage to public and private property.
We cannot predict the extent to which the Chilean economy will be affected by the civil unrest, nor can we predict if government policies enacted as a response to the civil unrest will have a negative impact on the Chilean economy and our business. Neither can we assure that demonstrations and vandalism will not cause damage to our logistics and production infrastructure. So far, the Company has not been affected in any material respect.
Our business is subject to risks arising from the COVID-19 pandemic
The COVID-19 pandemic has resulted in the countries where we operate taking extraordinary measures to contain the spread of COVID-19, including travel restrictions, closing borders, restrictions or bans on social gathering events, instructions to citizens to practice social distancing, non-essential business closure, quarantine implementation, and other similar actions. The impact of this pandemic has substantially increased uncertainty regarding the development of economies and is most likely to cause a global recession. We cannot predict how long this pandemic will last, or how long the restrictions imposed by the countries where we operate will last.
Since the impact of COVID-19 is very uncertain, we cannot accurately predict the extent of impact this pandemic will have on our business and our operations. There is a risk that our collaborators, contractors and suppliers may be restricted or prevented from carrying out their activities for an indefinite period of time, due to shutdowns mandated by the authorities. Although our operations have not been materially disrupted to date, eventually the pandemic and the measures taken by governments to contain the virus could affect the continuity of our operations. In addition, some measures taken by governments have negatively affected some of our sales channels, especially the closing of restaurants and bars, as well as the prohibition of social gathering events, which affects our sales volumes to these channels. We cannot predict the effect that the pandemic and these measures will have on our sales to these channels, nor whether these channels will recover once the pandemic is over. Nor can we predict how long our consumers will change their consumer spending pattern as a result of the pandemic.
Additionally, a possible outbreak of other epidemics in the future, such as SARS, Zika or the Ebola virus, could also result in a similar impact on our business than COVID-19.
A more detailed analysis of business risks is available in the Company’s 20-F and Annual Report, available on our website.
* Definitions used are contained in the Glossary on page 16 of this document.
| COCA-COLA ANDINA | |
| 3Q22 EARNINGS RELEASE | |
| www.koandina.com | |
| -15- | |
RECENT EVENTS
Interim Dividend 222
On August 26, 2022, the company paid Interim Dividend 222: CLP 29.0 for each Series A share; and CLP 31.9 per each Series B share.
Interim Dividend 223
On October 28, 2022, the company will pay Interim Dividend 223: CLP 29.0 for each Series A share; and CLP 31.9 per each Series B share.
GLOSSARY
Adjusted EBITDA: includes Revenue, Costs of Sales, Distribution Costs and Administrative Expenses, included in the Financial Statements submitted to Chile’s Financial Market Commission and determined in accordance with IFRS, plus Depreciation.
Currency-neutral of a quarter q for a Q year is calculated using the same ratio of local currencies to the Chilean peso as the q quarter of the Q-1 year. In the case of Argentina, given that it is a hyperinflationary economy, the result of the q quarter is also deflated by inflation of the last 12 months.
Financial Expenses: correspond to interest generated by the Company’s financial debt.
Financial Income: corresponds to the interest generated by the Company's cash.
Net Financial Debt: considers the consolidated financial liability that accrues interest, i.e.: (i) other current financial liabilities, plus (ii) other non-current financial liabilities, less (iii) the sum of cash and cash equivalent; plus other current financial assets; plus other non-current financial assets (to the extent that they correspond to the balances of assets for derivative financial instruments, taken to cover exchange rate risk and/or interest rate of financial liabilities).
Operating Income: includes Revenue, Costs of Sales, Distribution Costs and Administrative Expenses, included in the Financial Statements submitted to Chile Financial Market Commission and determined in accordance with IFRS.
Total Equity: corresponds to the equity attributable to the owners of the controller plus non-controlling interests.
Transactions: refers to the number of units sold, regardless of size.
Volume: expressed in Unit Cases (UCs), which is the conventional measurement used to measure sales volume in the Coca-Cola System worldwide.
ADDITIONAL INFORMATION
| STOCK EXCHANGES WE TRADE ON | |||
ANDINA-A ANDINA-B
|
AKO/A AKO/B
| ||
| ESG INDICES IN WHICH WE PARTICIPATE | |||
Dow Jones Sustainability Index Chile Dow Jones Sustainability MILA Pacific Alliance Index. |
|
|
|
| NUMBER OF SHARES | |||
| TOTAL: 946,570,604 | SERIES A: 473,289,301 | SERIES B: 473,281,303 | SHARES PER ADR: 6 |


*Definitions used are contained in the Glossary on page 16 of this document.
| COCA-COLA ANDINA | |
| 3Q22 EARNINGS RELEASE | |
| www.koandina.com | |
| -16- | |
ABOUT COCA-COLA ANDINA
Coca-Cola Andina is among the three largest Coca-Cola bottlers in Latin America, servicing franchised territories with almost 55.3 million people, delivering 828.3 million unit cases or 4,703 million liters of soft drinks, juices, bottled water, beer and other alcoholic beverages during 2021. Coca-Cola Andina has the franchise to produce and commercialize Coca-Cola products in certain territories in Argentina (through Embotelladora del Atlántico), in Brazil (through Rio de Janeiro Refrescos), in Chile, (through Embotelladora Andina) and in all of Paraguay (through Paraguay Refrescos). The Chadwick Claro, Garcés Silva, Said Handal and Said Somavía families control Coca-Cola Andina in equal parts. The Company's value generation proposal is to become a Total Beverage Company, using existing resources efficiently and sustainably, developing a relationship of excellence with consumers of its products, as well as with its collaborators, customers, suppliers, the community in which it operates and with its strategic partner The Coca-Cola Company, in order to increase ROIC for shareholders in the long term. For more company information visit www.koandina.com.
This document may contain projections reflecting Coca-Cola Andina’s good faith expectation and are based on currently available information. However, the results that are finally obtained are subject to diverse variables, many of which are beyond the Company's control, and which could materially impact the current performance. Among the factors that could change the performance are the political and economic conditions on mass consumption, pricing pressures resulting from competitive discounts of other bottlers, weather conditions in the Southern Cone and other risk factors that would be applicable from time to time, and which are periodically informed in reports filed before the appropriate regulatory authorities, and which are available on our website.
*Definitions used are contained in the Glossary on page 16 of this document.
| COCA-COLA ANDINA | |
| 3Q22 EARNINGS RELEASE | |
| www.koandina.com | |
| -17- | |
Embotelladora Andina S.A.
Third Quarter Results for the period ended September 30, 2022. Reported figures, IFRS GAAP.
(In nominal million Chilean pesos, except per share)
| July-September 2022 | July-September 2021 | ||||||||||||||||||||||||||||||||
| Chilean Operations | Brazilian Operations | Argentine Operations | Paraguay Operations | Total (1) | Chilean Operations | Brazilian Operations | Argentine Operations | Paraguay Operations | Total (1) | % Ch. | |||||||||||||||||||||||
| Volume total beverages (Million UC) | 71.8 | 67.0 | 46.1 | 16.9 | 201.8 | 74.4 | 63.7 | 42.6 | 16.6 | 197.3 | 2.3 | % | |||||||||||||||||||||
| Transactions (Million) | 427.0 | 376.0 | 221.4 | 106.9 | 1,131.3 | 428.3 | 399.9 | 191.9 | 94.9 | 1,115.0 | 1.5 | % | |||||||||||||||||||||
| Net sales | 261,897 | 162,292 | 178,437 | 52,574 | 653,498 | 243,880 | 142,953 | 112,668 | 39,314 | 538,023 | 21.5 | % | |||||||||||||||||||||
| Cost of sales | (175,732 | ) | (104,554 | ) | (98,554 | ) | (30,000 | ) | (407,138 | ) | (161,865 | ) | (100,591 | ) | (63,923 | ) | (21,614 | ) | (347,201 | ) | 17.3 | % | |||||||||||
| Gross profit | 86,165 | 57,738 | 79,884 | 22,574 | 246,361 | 82,014 | 42,362 | 48,745 | 17,701 | 190,822 | 29.1 | % | |||||||||||||||||||||
| Gross margin | 32.9 | % | 35.6 | % | 44.8 | % | 42.9 | % | 37.7 | % | 33.6 | % | 29.6 | % | 43.3 | % | 45.0 | % | 35.5 | % | |||||||||||||
| Distribution and administrative expenses | (61,077 | ) | (40,654 | ) | (61,962 | ) | (12,024 | ) | (175,716 | ) | (53,355 | ) | (28,526 | ) | (39,670 | ) | (8,635 | ) | (130,186 | ) | 35.0 | % | |||||||||||
| Corporate expenses (2) | (1,879 | ) | (1,484 | ) | 26.6 | % | |||||||||||||||||||||||||||
| Operating income (3) | 25,088 | 17,084 | 17,921 | 10,551 | 68,765 | 28,659 | 13,836 | 9,075 | 9,066 | 59,151 | 16.3 | % | |||||||||||||||||||||
| Operating margin | 9.6 | % | 10.5 | % | 10.0 | % | 20.1 | % | 10.5 | % | 11.8 | % | 9.7 | % | 8.1 | % | 23.1 | % | 11.0 | % | |||||||||||||
| Adjusted EBITDA (4) | 35,020 | 24,880 | 26,985 | 14,285 | 99,290 | 38,230 | 19,853 | 16,437 | 11,655 | 84,692 | 17.2 | % | |||||||||||||||||||||
| Adjusted EBITDA margin | 13.4 | % | 15.3 | % | 15.1 | % | 27.2 | % | 15.2 | % | 15.7 | % | 13.9 | % | 14.6 | % | 29.6 | % | 15.7 | % | |||||||||||||
| Financial (expenses) income (net) | (9,935 | ) | (13,097 | ) | -24.1 | % | |||||||||||||||||||||||||||
| Share of (loss) profit of investments accounted for using the equity method | 252 | 538 | -53.2 | % | |||||||||||||||||||||||||||||
| Other income (expenses) (5) | 1,613 | (3,706 | ) | -143.5 | % | ||||||||||||||||||||||||||||
| Results by readjustement unit and exchange rate difference | (11,583 | ) | (974 | ) | 1089.1 | % | |||||||||||||||||||||||||||
| Net income before income taxes | 49,112 | 41,912 | 17.2 | % | |||||||||||||||||||||||||||||
| Income tax expense | (14,577 | ) | (2,005 | ) | 626.9 | % | |||||||||||||||||||||||||||
| Net income | 34,535 | 39,907 | -13.5 | % | |||||||||||||||||||||||||||||
| Net income attributable to non-controlling interests | (536 | ) | (554 | ) | -3.3 | % | |||||||||||||||||||||||||||
| Net income attributable to equity holders of the parent | 33,999 | 39,353 | -13.6 | % | |||||||||||||||||||||||||||||
| Net margin | 5.2 | % | 7.3 | % | |||||||||||||||||||||||||||||
| WEIGHTED AVERAGE SHARES OUTSTANDING | 946.6 | 946.6 | |||||||||||||||||||||||||||||||
| EARNINGS PER SHARE | 35.9 | 41.6 | |||||||||||||||||||||||||||||||
| EARNINGS PER ADS | 215.5 | 249.4 | -13.6 | % | |||||||||||||||||||||||||||||
(1) Total may be different from the addition of the four countries because of intercountry eliminations.
(2) Corporate expenses partially reclassified to the operations.
(3) Operating Income considers Net Sales, Cost of Sales, Distribution Costs, and Administrative Expenses included in the Financial Statements filed with the Chilean Financial Market Comission and determined in accordance to IFRS.
(4) Adjusted EBITDA considers Net Sales, Cost of Sales, Distribution Costs, and Administrative Expenses included in the Financial Statements filed with the Chilean Financial Market Comission and determined in accordance to IFRS, plus Depreciation.
(5) Other income (expenses) includes the following lines of the income statement by function included in the published financial statements in the Financial Market Comission: “Other income”, “Other expenses” and “Other (loss) gains”.
| -18- |
Embotelladora Andina S.A.
Nine Months Results for the period ended September 30, 2022. Reported figures, IFRS GAAP.
(In nominal million Chilean pesos, except per share)
| January-September 2022 | January-September 2021 | ||||||||||||||||||||||||||||||||
| Chilean Operations | Brazilian Operations | Argentine Operations | Paraguay Operations | Total (1) | Chilean Operations | Brazilian Operations | Argentine Operations | Paraguay Operations | Total (1) | % Ch. | |||||||||||||||||||||||
| Volume total beverages (Million UC) | 229.1 | 197.9 | 143.0 | 52.7 | 622.6 | 215.7 | 195.4 | 128.1 | 49.0 | 588.2 | 5.9 | % | |||||||||||||||||||||
| Transactions (Million) | 1,354.8 | 1,089.2 | 670.5 | 318.3 | 3,432.8 | 1,198.8 | 1,194.9 | 565.8 | 273.9 | 3,233.3 | 6.2 | % | |||||||||||||||||||||
| Net sales | 790,999 | 444,024 | 552,479 | 148,921 | 1,932,681 | 675,867 | 408,657 | 335,352 | 112,742 | 1,530,097 | 26.3 | % | |||||||||||||||||||||
| Cost of sales | (524,653 | ) | (283,188 | ) | (295,768 | ) | (82,272 | ) | (1,182,138 | ) | (435,979 | ) | (283,910 | ) | (184,024 | ) | (60,521 | ) | (961,913 | ) | 22.9 | % | |||||||||||
| Gross profit | 266,347 | 160,836 | 256,711 | 66,650 | 750,543 | 239,888 | 124,747 | 151,328 | 52,221 | 568,184 | 32.1 | % | |||||||||||||||||||||
| Gross margin | 33.7 | % | 36.2 | % | 46.5 | % | 44.8 | % | 38.8 | % | 35.5 | % | 30.5 | % | 45.1 | % | 46.3 | % | 37.1 | % | |||||||||||||
| Distribution and administrative expenses | (182,839 | ) | (110,093 | ) | (180,788 | ) | (32,404 | ) | (506,124 | ) | (152,691 | ) | (79,254 | ) | (118,563 | ) | (24,720 | ) | (375,228 | ) | 34.9 | % | |||||||||||
| Corporate expenses (2) | (5,027 | ) | (4,356 | ) | 15.4 | % | |||||||||||||||||||||||||||
| Operating income (3) | 83,508 | 50,743 | 75,923 | 34,245 | 239,392 | 87,197 | 45,493 | 32,765 | 27,501 | 188,600 | 26.9 | % | |||||||||||||||||||||
| Operating margin | 10.6 | % | 11.4 | % | 13.7 | % | 23.0 | % | 12.4 | % | 12.9 | % | 11.1 | % | 9.8 | % | 24.4 | % | 12.3 | % | |||||||||||||
| Adjusted EBITDA (4) | 112,697 | 73,537 | 103,781 | 43,892 | 328,880 | 115,770 | 62,849 | 54,465 | 34,839 | 263,568 | 24.8 | % | |||||||||||||||||||||
| Adjusted EBITDA margin | 14.2 | % | 16.6 | % | 18.8 | % | 29.5 | % | 17.0 | % | 17.1 | % | 15.4 | % | 16.2 | % | 30.9 | % | 17.2 | % | |||||||||||||
| Financial (expenses) income (net) | (12,440 | ) | (38,103 | ) | -67.4 | % | |||||||||||||||||||||||||||
| Share of (loss) profit of investments accounted for using the equity method | 285 | 1,525 | -81.3 | % | |||||||||||||||||||||||||||||
| Other income (expenses) (5) | (18,851 | ) | (8,956 | ) | 110.5 | % | |||||||||||||||||||||||||||
| Results by readjustement unit and exchange rate difference | (50,797 | ) | (20,544 | ) | 147.3 | % | |||||||||||||||||||||||||||
| Net income before income taxes | 157,588 | 122,521 | 28.6 | % | |||||||||||||||||||||||||||||
| Income tax expense | (66,039 | ) | (37,327 | ) | 76.9 | % | |||||||||||||||||||||||||||
| Net income | 91,549 | 85,194 | 7.5 | % | |||||||||||||||||||||||||||||
| Net income attributable to non-controlling interests | (1,363 | ) | (2,059 | ) | -33.8 | % | |||||||||||||||||||||||||||
| Net income attributable to equity holders of the parent | 90,185 | 83,135 | 8.5 | % | |||||||||||||||||||||||||||||
| Net margin | 4.7 | % | 5.4 | % | |||||||||||||||||||||||||||||
| WEIGHTED AVERAGE SHARES OUTSTANDING | 946.6 | 946.6 | |||||||||||||||||||||||||||||||
| EARNINGS PER SHARE | 95.3 | 87.8 | |||||||||||||||||||||||||||||||
| EARNINGS PER ADS | 571.7 | 527.0 | 8.5 | % | |||||||||||||||||||||||||||||
(1) Total may be different from the addition of the four countries because of intercountry eliminations.
(2) Corporate expenses partially reclassified to the operations.
(3) Operating Income considers Net Sales, Cost of Sales, Distribution Costs, and Administrative Expenses included in the Financial Statements filed with the Chilean Financial Market Comission and determined in accordance to IFRS.
(4) Adjusted EBITDA considers Net Sales, Cost of Sales, Distribution Costs, and Administrative Expenses included in the Financial Statements filed with the Chilean Financial Market Comission and determined in accordance to IFRS, plus Depreciation.
(5) Other income (expenses) includes the following lines of the income statement by function included in the published financial statements in the Financial Market Comission: “Other income”, “Other expenses” and “Other (loss) gains”.
| -19- |
Embotelladora Andina S.A.
Third Quarter Results for the period ended September 30, 2022.
(In local nominal currency of each period, except Argentina (3))
| July-September 2022 | July-September 2021 | |||||||||||||||||||||||||||||||
| Chile Million Ch$ | Brazil Million R$ | Argentina (3) Million AR$ | Paraguay Million G$ | Chile Million Ch$ | Brazil Million R$ | Argentina (3) Million AR$ | Paraguay Million G$ | |||||||||||||||||||||||||
| Nominal | Nominal | IAS29 | Nominal | Nominal | Nominal | IAS 29 | Nominal | |||||||||||||||||||||||||
| Total beverages volume (Million UC) | 71.8 | 67.0 | 46.1 | 16.9 | 74.4 | 63.7 | 42.6 | 16.6 | ||||||||||||||||||||||||
| Transactions (Million) | 427.0 | 376.0 | 221.4 | 106.9 | 428.3 | 399.9 | 191.9 | 94.9 | ||||||||||||||||||||||||
| Net sales | 261,897 | 919.3 | 27,375.9 | 392,064 | 243,880 | 968.1 | 25,121.2 | 350,517 | ||||||||||||||||||||||||
| Cost of sales | (175,732 | ) | (592.3 | ) | (15,120.1 | ) | (223,636 | ) | (161,865 | ) | (681.4 | ) | (14,252.7 | ) | (192,697 | ) | ||||||||||||||||
| Gross profit | 86,165 | 327.1 | 12,255.7 | 168,428 | 82,014 | 286.8 | 10,868.5 | 157,820 | ||||||||||||||||||||||||
| Gross margin | 32.9 | % | 35.6 | % | 44.8 | % | 43.0 | % | 33.6 | % | 29.6 | % | 43.3 | % | 45.0 | % | ||||||||||||||||
| Distribution and administrative expenses | (61,077 | ) | (230.3 | ) | (9,506.2 | ) | (89,681 | ) | (53,355 | ) | (193.1 | ) | (8,845.1 | ) | (77,022 | ) | ||||||||||||||||
| Operating income (1) | 25,088 | 96.8 | 2,749.5 | 78,747 | 28,659 | 93.7 | 2,023.4 | 80,798 | ||||||||||||||||||||||||
| Operating margin | 9.6 | % | 10.5 | % | 10.0 | % | 20.1 | % | 11.8 | % | 9.7 | % | 8.1 | % | 23.1 | % | ||||||||||||||||
| Adjusted EBITDA (2) | 35,020 | 141.0 | 4,140.0 | 106,549 | 38,230 | 134.4 | 3,665.0 | 103,903 | ||||||||||||||||||||||||
| Adjusted EBITDA margin | 13.4 | % | 15.3 | % | 15.1 | % | 27.2 | % | 15.7 | % | 13.9 | % | 14.6 | % | 29.6 | % | ||||||||||||||||
(1) Operating Income considers Net Sales, Cost of Sales, Distribution Costs, and Administrative Expenses included in the Financial Statements filed with the Chilean Financial Market Comission and determined in accordance to IFRS.
(2) Adjusted EBITDA considers Net Sales, Cost of Sales, Distribution Costs, and Administrative Expenses included in the Financial Statements filed with the Chilean Financial Market Comission and determined in accordance to IFRS, plus Depreciation.
(3) Argentina 2022 figures are presented in accordance to IAS 29, in September 2022 currency. 2021 figures are also presented in accordance to IAS 29, in September 2022 currency.
-20-
Embotelladora Andina S.A.
Nine Months Results for the period ended September 30, 2022.
(In local nominal currency of each period, except Argentina (3))
| January-September 2022 | January-September 2021 | |||||||||||||||||||||||||||||||
| Chile Million Ch$ | Brazil Million R$ | Argentina (3) Million AR$ | Paraguay Million G$ | Chile Million Ch$ | Brazil Million R$ | Argentina (3) Million AR$ | Paraguay Million G$ | |||||||||||||||||||||||||
| Nominal | Nominal | IAS29 | Nominal | Nominal | Nominal | IAS 29 | Nominal | |||||||||||||||||||||||||
| Total beverages volume (Million UC) | 229.1 | 197.9 | 143.0 | 52.7 | 215.7 | 195.4 | 128.1 | 49.0 | ||||||||||||||||||||||||
| Transactions (Million) | 1,354.8 | 1,089.2 | 670.5 | 318.3 | 1,198.8 | 1,194.9 | 565.8 | 273.9 | ||||||||||||||||||||||||
| Net sales | 790,999 | 2,641.0 | 84,761.3 | 1,202,836 | 675,867 | 2,952.1 | 74,772.2 | 1,030,783 | ||||||||||||||||||||||||
| Cost of sales | (524,653 | ) | (1,683.9 | ) | (45,376.8 | ) | (663,187 | ) | (435,979 | ) | (2,048.6 | ) | (41,031.2 | ) | (553,207 | ) | ||||||||||||||||
| Gross profit | 266,347 | 957.1 | 39,384.5 | 539,650 | 239,888 | 903.5 | 33,741.0 | 477,576 | ||||||||||||||||||||||||
| Gross margin | 33.7 | % | 36.2 | % | 46.5 | % | 44.9 | % | 35.5 | % | 30.6 | % | 45.1 | % | 46.3 | % | ||||||||||||||||
| Distribution and administrative expenses | (182,839 | ) | (655.1 | ) | (27,736.5 | ) | (260,575 | ) | (152,691 | ) | (572.7 | ) | (26,435.6 | ) | (226,038 | ) | ||||||||||||||||
| Operating income (1) | 83,508 | 302.0 | 11,648.0 | 279,075 | 87,197 | 330.7 | 7,305.4 | 251,538 | ||||||||||||||||||||||||
| Operating margin | 10.6 | % | 11.4 | % | 13.7 | % | 23.2 | % | 12.9 | % | 11.2 | % | 9.8 | % | 24.4 | % | ||||||||||||||||
| Adjusted EBITDA (2) | 112,697 | 437.6 | 15,922.1 | 356,415 | 115,770 | 455.9 | 12,143.9 | 318,667 | ||||||||||||||||||||||||
| Adjusted EBITDA margin | 14.2 | % | 16.6 | % | 18.8 | % | 29.6 | % | 17.1 | % | 15.4 | % | 16.2 | % | 30.9 | % | ||||||||||||||||
(1) Operating Income considers Net Sales, Cost of Sales, Distribution Costs, and Administrative Expenses included in the Financial Statements filed with the Chilean
Financial Market Comission and determined in accordance to IFRS.
(2) Adjusted EBITDA considers Net Sales, Cost of Sales, Distribution Costs, and Administrative Expenses included in the Financial Statements filed with the Chilean
Financial Market Comission and determined in accordance to IFRS, plus Depreciation.
(3) Argentina 2022 figures are presented in accordance to IAS 29, in September 2022 currency. 2021 figures are also presented in accordance to IAS 29, in September 2022 currency.
-21-
Embotelladora Andina S.A.
Consolidated Balance Sheet
(In million Chilean pesos)
| Variation % | ||||||||||||||||||||
| ASSETS | 09-30-2022 | 12-31-2021 | 09-30-2021 | 12-31-2021 | 09-30-2021 | |||||||||||||||
| Cash + Time deposits + market. Securit. | 337,192 | 499,783 | 476,885 | -32.5 | % | -29.3 | % | |||||||||||||
| Account receivables (net) | 255,757 | 274,910 | 200,635 | -7.0 | % | 27.5 | % | |||||||||||||
| Inventories | 242,237 | 191,350 | 160,813 | 26.6 | % | 50.6 | % | |||||||||||||
| Other current assets | 77,381 | 24,943 | 29,882 | 210.2 | % | 159.0 | % | |||||||||||||
| Total Current Assets | 912,567 | 990,986 | 868,214 | -7.9 | % | 5.1 | % | |||||||||||||
| Property, plant and equipment | 1,996,762 | 1,677,828 | 1,599,668 | 19.0 | % | 24.8 | % | |||||||||||||
| Depreciation | (1,165,048 | ) | (961,449 | ) | (931,091 | ) | 21.2 | % | 25.1 | % | ||||||||||
| Total Property, Plant, and Equipment | 831,714 | 716,379 | 668,577 | 16.1 | % | 24.4 | % | |||||||||||||
| Investment in related companies | 98,819 | 91,489 | 91,332 | 8.0 | % | 8.2 | % | |||||||||||||
| Goodwill | 141,963 | 118,043 | 113,051 | 20.3 | % | 25.6 | % | |||||||||||||
| Other long term assets | 1,067,684 | 1,029,209 | 1,059,691 | 3.7 | % | 0.8 | % | |||||||||||||
| Total Other Assets | 1,308,466 | 1,238,741 | 1,264,074 | 5.6 | % | 3.5 | % | |||||||||||||
| TOTAL ASSETS | 3,052,748 | 2,946,107 | 2,800,865 | 3.6 | % | 9.0 | % | |||||||||||||
| Variation % | ||||||||||||||||||||
| LIABILITIES & SHAREHOLDERS' EQUITY | 09-30-2022 | 12-31-2021 | 09-30-2021 | 12-31-2021 | 09-30-2021 | |||||||||||||||
| Short term bank liabilities | 5,044 | 27 | 404 | 18850.8 | % | 1149.3 | % | |||||||||||||
| Current portion of bonds payable | 17,727 | 25,383 | 15,170 | -30.2 | % | 16.9 | % | |||||||||||||
| Other financial liabilities | 22,141 | 22,353 | 22,165 | -0.9 | % | -0.1 | % | |||||||||||||
| Trade accounts payable and notes payable | 412,860 | 383,513 | 307,654 | 7.7 | % | 34.2 | % | |||||||||||||
| Other liabilities | 98,120 | 98,292 | 104,263 | -0.2 | % | -5.9 | % | |||||||||||||
| Total Current Liabilities | 555,892 | 529,567 | 449,656 | 5.0 | % | 23.6 | % | |||||||||||||
| Long term bank liabilities | 13,441 | 4,000 | 4,000 | 236.0 | % | 236.0 | % | |||||||||||||
| Bonds payable | 1,137,067 | 1,020,662 | 989,651 | 11.4 | % | 14.9 | % | |||||||||||||
| Other financial liabilities | 59,538 | 16,387 | 14,672 | 263.3 | % | 305.8 | % | |||||||||||||
| Other long term liabilities | 284,537 | 274,077 | 274,986 | 3.8 | % | 3.5 | % | |||||||||||||
| Total Long Term Liabilities | 1,494,582 | 1,315,126 | 1,283,309 | 13.6 | % | 16.5 | % | |||||||||||||
| Minority interest | 28,252 | 25,270 | 25,168 | 11.8 | % | 12.3 | % | |||||||||||||
| Stockholders' Equity | 974,021 | 1,076,144 | 1,042,732 | -9.5 | % | -6.6 | % | |||||||||||||
| TOTAL LIABILITIES & SHAREHOLDERS' EQUITY | 3,052,748 | 2,946,107 | 2,800,865 | 3.6 | % | 9.0 | % | |||||||||||||
Financial Highlights
(In million Chilean pesos)
| Accumulated | ||||||||||||
| ADDITIONS TO FIXED ASSETS | 09-30-2022 | 12-31-2021 | 09-30-2021 | |||||||||
| Chile | 46,172 | 57,245 | 28,518 | |||||||||
| Brazil | 30,783 | 30,882 | 16,107 | |||||||||
| Argentina | 29,874 | 31,723 | 24,302 | |||||||||
| Paraguay | 11,590 | 22,102 | 11,561 | |||||||||
| Total | 118,420 | 141,952 | 80,488 | |||||||||
| -22- |
SIGNATURES
Pursuant to the requirements of the Securities Exchange Act of 1934, the registrant has duly caused this report to be signed on its behalf by the undersigned, thereunto duly authorized, in the city of Santiago, Chile.
| EMBOTELLADORA ANDINA S.A. | ||
| By: | /s/ Andrés Wainer | |
| Name: | Andrés Wainer | |
| Title: | Chief Financial Officer | |
Santiago, October 25, 2022