UNITED STATES
SECURITIES AND EXCHANGE COMMISSION
Washington, D.C. 20549
FORMN-CSR
CERTIFIED SHAREHOLDER REPORT OF REGISTERED MANAGEMENT
INVESTMENT COMPANIES
Investment Company Act file number 811-08560
Gabelli International Growth Fund, Inc. (formerly GAMCO International Growth Fund, Inc.)
(Exact name of registrant as specified in charter)
One Corporate Center
Rye, New York 10580-1422
(Address of principal executive offices) (Zip code)
Bruce N. Alpert
Gabelli Funds, LLC
One Corporate Center
Rye, New York 10580-1422
(Name and address of agent for service)
Registrant’s telephone number, including area code: 1-800-422-3554
Date of fiscal year end: December 31
Date of reporting period: December 31, 2019
FormN-CSR is to be used by management investment companies to file reports with the Commission not later than 10 days after the transmission to stockholders of any report that is required to be transmitted to stockholders under Rule30e-1 under the Investment Company Act of 1940 (17 CFR270.30e-1). The Commission may use the information provided on FormN-CSR in its regulatory, disclosure review, inspection, and policymaking roles.
A registrant is required to disclose the information specified by FormN-CSR, and the Commission will make this information public. A registrant is not required to respond to the collection of information contained in FormN-CSR unless the Form displays a currently valid Office of Management and Budget (“OMB”) control number. Please direct comments concerning the accuracy of the information collection burden estimate and any suggestions for reducing the burden to Secretary, Securities and Exchange Commission, 450 Fifth Street, NW, Washington, DC 20549-0609. The OMB has reviewed this collection of information under the clearance requirements of 44 U.S.C. § 3507.
Item 1. Reports to Stockholders.
The Report to Shareholders is attached herewith.
GAMCO International Growth Fund, Inc. Annual Report — December 31, 2019 |  | |
Caesar M. P. Bryan Portfolio Manager |
To Our Shareholders,
For the year ended December 31, 2019, the net asset value (NAV) per Class AAA Share of the GAMCO International Growth Fund, Inc. increased 24.5% compared with an increase of 22.0% for the Morgan Stanley Capital International (MSCI) Europe, Australasia, and the Far East (EAFE) Index. Other classes of shares are available. See page 4 for performance information for all classes of shares.
Enclosed are the financial statements, including the schedule of investments, as of December 31, 2019.
Performance Discussion (Unaudited)
The Fund’s investment objective is to provide investors with long term capital appreciation. The Fund’s investment strategy is to invest at least 65% of its total assets in equity securities of foreign issuers located in at least three countries outside the United States that Gabelli Funds, LLC (the Adviser) believes are likely to have rapid growth in revenues and earnings and potential for above-average capital appreciation. The Fund invests in companies that have the potential to grow faster than other companies in their respective equity markets and are priced at attractive valuation levels. The Fund intends to diversify its investments across different countries. The percentage of Fund assets invested in particular countries or regions will change from time to time based on the Adviser’s judgment. The Fund intends to invest in the securities of companies located in developed countries and, to a lesser extent, those located in emerging markets. The Adviser pays close attention to a company’s market position, management, and balance sheet, with a particular emphasis on the ability of the company to finance growth. Generally, the Adviser values a company relative to its local market, but where appropriate, we will attempt to benefit from valuation discrepancies between markets. Our primary focus is on security selection and not country allocation, but the Fund will remain diversified by sector and geography. Country allocation is likely to reflect broad economic, financial, and currency trends, as well as relative size of the market.
Beginning on January 1, 2021, as permitted by regulations adopted by the Securities and Exchange Commission, paper copies of the Fund’s annual and semiannual shareholder reports will no longer be sent by mail, unless you specifically request paper copies of the reports. Instead, the reports will be made available on the Fund’s website (www.gabelli.com), and you will be notified by mail each time a report is posted and provided with a website link to access the report. If you already elected to receive shareholder reports electronically, you will not be affected by this change and you need not take any action. To elect to receive all future reports on paper free of charge, please contact your financial intermediary, or, if you invest directly with the Fund, you may call800-422-3554 or send an email request to info@gabelli.com.
Last year global equities as measured by MSCI rose by 24.1% which was the fourth best calendar year return since the index began in 1987. All global markets that MSCI follow showed gains for the year. Among major markets the U.S. led the way with the S&P gaining more than 30.0%. This compares with a gain of 20.0% for Europe and 17.1% for Japan.
With equites marching higher during the due to an improved outlook for growth it was no surprise that bond yields rallied. For example, the ten year U.S. government bond yield rose from 1.66% at the end of September to 1.92% by the end of the year. In Europe, the bell weather German ten year government bond yield rose from negative 0.57% to negative 0.18% during the quarter. Also the dollar declined. The DXY index that measures the dollar relative to the leading foreign currencies fell by 3.0%. The yen, however, reflecting its status as a safe haven currency actually fell slightly relative to the dollar. The decline in the dollar helps returns from overseas markets for U.S. based investors.
On a global basis both the semiconductor and technology hardware sectors rose by about 20% and software by 9.1%. Less economically sensitive sectors with the exception of healthcare underperformed. For example, consumer staple stocks gained 2.1%, telecom 2.5% and utilities 1.8%. Healthcare stocks rallied by 13.5%.
Easier monetary policy was the main driver for the powerful performance of equity markets during the fourth quarter as there was very modest, if any, corporate earnings growth. After two rate cuts totaling 50 basis points, the Federal Reserve ( Fed ) cut short term interest rates by a further 25 basis points in October. This was accompanied by a massive increase in their balance sheet.
Inmid-September, the repo market broke down and rates in this important overnight money market shot up to about 10% way above the policy rate. Many reasons have been given for this but observers suggest that there was a surplus of collateral and a shortage of cash. In stepped the Fed who purchased billions of dollars of short term Treasury Bills in exchange for cash. The Fed insists that this operation was not Quantitative Easing (QE) as there was no intent to influence longer term interest rates Rather the Fed was managing the “financial plumbing” of the financial system . The Fed’s balance sheet has increased by over $400 billion in just over three months. This represents a major reversal as the Fed had been intent on contracting or normalizing its balance sheet. Whether this program is QE or not is beside the point as the equity market rallied coincident with the Fed’s injection of cash.
Two other factors likely helped propel equities. First, it became apparent that the U.S. administration was close to a trade agreement with China. Uncertainties about the future trade relationship with China and the imposition of tariffs had resulted in a meaningful cutback in capital investments. Second, there was some evidence of a recovery in manufacturing. Meanwhile employment remained strong and wages picked up, albeit by small amounts. The growth in consumer spending ,while solidly positive , was a little disappointing.
The slowdown in global manufacturing had a greater impact on the European and Japanese economies than the U.S. largely because the former are more open economies with trade representing a greater share of the economy. Neither the European Central Bank (ECB) nor the Bank of Japan followed the Fed in raising rates during 2017 and 2018. Indeed, the ECB lowered rates further into negative territory in September. Under its new President, Christine Lagarde, the bank conducted a review of its policies, something that has not happened since 2003. Japan recently announced a government spending plan worth about $120 billion while in the EU there is plenty of scope for fiscal reflation, the German authorities have been reluctant to open the fiscal purse.
Conclusion:
In the U.S., there has been hardly any earnings growth so the advance last year for global equities was mostly due to rising multiples. Due to its outperformance the U.S. equities are trading at the high end relative to its
2
history. Overseas market, by comparison, are much less expensive relative to their history. It should be noted that the S&P has risen by 120.0% since the end of 2007, prior to the Global Financial Crisis. In that time the EFFE index has fallen by 9.6%. On a total return basis the S&P has compounded by 9.1% compared with 2.6% for the EAFE index since 2001. This rate of outperformance is most unusual
Top contributors to performance in 2019 included Sony Corp. (1.8% of net assets as of December 31, 2019), a conglomerate based in Tokyo, Japan focusing ondirect-to-consumer entertainment products supported by the company’s technology. Sony is the #1 integrated global gaming company and has announced the launch of PlayStation 5 for 2020. Sony Music Recording commands #2 and Music Publishing #1 global share. Sony also operates the Sony/Columbia film studio, is an image sensor leader with over 50% global revenue share, and is the dominant supplier to Apple iPhone. Sony’s Electronics business is a globally diversified cash cow. It also holds majority ownership of Sony Financial Services.
Keyence (5.3%) designs factory automation equipment including code readers, laser markers, machine vision systems, and sensors, all of which are manufactured by subcontractors. Crucially, Keyence is also an automation consultant, dispatching engineers to client factories to suggest and then implement labor-saving methods, using the company’s products. Today, Keyence serves over 200,000 customers in 70 countries around the world.
Weaker holdings in 2019 included Millicom International Cellular S.A. (0.9%), a wireless carrier serving over 48 million mobile B2C customers in eight countries in Latin America and Africa, primarily under the brand name Tigo. It also operates cable and fixed-broadband businesses with 7.9 million revenue generating units (RGUs) in Latin America. In January 2019, Millicom was approached by Liberty Latin America (LiLAC) with a “preliminary highly conditionalnon-binding proposal” in relation to an offer for all shares of TIGO. However, later that month, the companies terminated conversations about a potential transaction without an offer being made. This outcome was not particularly surprising, as it appeared that LiLAC’s approach was mistimed, given its smaller size (about half of Millicom’s market cap at that time) and elevated leverage (over 4x). The companies could revisit a potential combination at a more opportune time, possibly when Millicom fully exits Africa and makes further progress in cable expansion and if LiLAC’s equity currency is stronger and its leverage is lower. On February 20, 2019, Millicom agreed to acquire Telefonica’s mobile operations in Panama, Costa Rica, and Nicaragua for $1.65 billion. The deal (a) makes TIGO convergent (cable and wireless operator) in all 9 markets in Latin America, (b) further diversifies and balances 8 the company’s geographic footprint and sources of cash flow, and (c) improves its B2B position. This transaction values acquired operations at 5.8x TEV/EBITDA (post-synergies). Millicom is purchasing leading mobile players (#2 of 3 in Costa Rica, #1 of 4 in Panama, and #1 of 2 in Nicaragua) with strong spectrum positions in their respective markets.
Chr. Hansen Holding A/S (1.1%) based in Denmark, develops and produces cultures, enzymes, probiotics, and natural colors utilized by customers in the food, beverage, pharmaceutical, and agricultural industries. CHR estimates that it has over 45% market share of the cultures and enzymes global market, which are used to enhance production processes, yields, and quality of dairy, meat, and wine products. Through its expertise in microbial solutions, the company develops natural solutions for human health, including dietary supplements, as well as animal health and plant protection. Chr. Hansen targets long term annual organic revenue growth of8%-10%, particularly in emerging markets.
Thank you for your investment in the GAMCO International Growth Fund.
We appreciate your confidence and trust.
3
Comparative Results
| Average Annual Returns through December 31, 2019 (a) (Unaudited) | Since | |||||||||||||||||||||||
| 1 Year | 5 Year | 10 Year | 15 Year | 20 Year | Inception (6/30/95) | |||||||||||||||||||
Class AAA (GIGRX) | 24.50 | % | 6.29 | % | 6.11 | % | 5.09 | % | 3.09 | % | 6.55 | % | ||||||||||||
MSCI EAFE Index | 22.01 | 5.67 | 5.50 | 4.84 | 3.32 | 5.15 | ||||||||||||||||||
Lipper InternationalLarge-Cap Growth Fund Classification | 26.74 | 6.39 | 5.74 | 5.74 | 3.90 | 6.34 | ||||||||||||||||||
Lipper InternationalMulti-Cap Growth Fund Classification | 26.59 | 6.39 | 6.13 | 4.99 | 3.60 | 6.10 | ||||||||||||||||||
Class A (GAIGX) | 23.02 | 5.88 | 5.92 | 4.99 | 3.08 | 6.55 | ||||||||||||||||||
With sales charge (b) | 15.95 | 4.63 | 5.29 | 4.57 | 2.78 | 6.29 | ||||||||||||||||||
Class C (GCIGX) | 22.11 | 5.09 | 5.13 | 4.19 | 2.23 | 5.82 | ||||||||||||||||||
With contingent deferred sales charge (c) | 21.11 | 5.09 | 5.13 | 4.19 | 2.23 | 5.82 | ||||||||||||||||||
Class I (GIIGX) | 24.80 | 7.18 | 6.74 | 5.54 | 3.42 | 6.83 | ||||||||||||||||||
In the current prospectuses dated April 30, 2019, the gross expense ratios for Class AAA, A, C, and I Shares are 2.38%, 2.38%, 3.13%, and 2.13%, respectively, and the net expense ratios for these share classes after contractual reimbursements by Gabelli Funds, LLC, (the “Adviser”) are 1.25%, 2.38%, 3.13%, and 1.00%, respectively. See page 12 for the expense ratios for the year ended December 31, 2019. The contractual reimbursements for Class AAA and Class I Shares are in effect through April 30, 2020. Class AAA and Class I Shares do not have a sales charge. The maximum sales charge for Class A Shares and Class C Shares is 5.75% and 1.00%, respectively.
| (a) | Returns represent past performance and do not guarantee future results. Total returns and average annual returns reflect changes in share price, reinvestment of distributions, and are net of expenses. Investment returns and the principal value of an investment will fluctuate. When shares are redeemed, they may be worth more or less than their original cost. Current performance may be lower or higher than the performance data presented. Visit www.gabelli.com for performance information as of the most recent month end. Returns for Class I Shares would have been lower had the Adviser not reimbursed certain expenses. The Fund imposes a 2% redemption fee on shares sold or exchanged within seven days of purchase. Investors should carefully consider the investment objectives, risks, charges, and expenses of the Fund before investing. The prospectuses contain information about these and other matters and should be read carefully before investing. To obtain a prospectus, please visit our website at www.gabelli.com. Investing in foreign securities involves risks not ordinarily associated with investments in domestic issues, including currency fluctuation, economic, and political risks. The Class AAA Share NAVs are used to calculate performance for the periods prior to the issuance of Class A Shares, Class C Shares, and Class I Shares on July 25, 2001, December 17, 2000, and January 11, 2008, respectively. The actual performance of the Class A Shares and Class C Shares would have been lower due to the additional fees and expenses associated with these classes of shares. The actual performance of the Class I Shares would have been higher due to lower expenses related to this class of shares. The MSCI EAFE Index is an unmanaged indicator of international stock market performance, while the Lipper InternationalLarge-Cap Growth Fund Classification and the Lipper InternationalMulti-Cap Growth Fund Classification reflect the average performance of mutual funds classified in these particular categories. Dividends are considered reinvested. You cannot invest directly in an index. |
| (b) | Performance results include the effect of the maximum 5.75% sales charge at the beginning of the period. |
| (c) | Assuming payment of the 1% maximum contingent deferred sales charge imposed on redemptions made within one year of purchase. |
4
COMPARISON OF CHANGE IN VALUE OF A $10,000 INVESTMENT IN
GAMCO INTERNATIONAL GROWTH FUND (CLASS AAA SHARES)
AND MSCI EAFE INDEX (Unaudited)
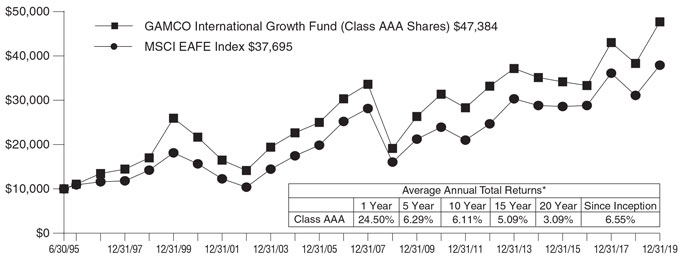
| * | Past performance is not predictive of future results. The performance tables and graph do not reflect the deduction of taxes that a shareholder would pay on fund distributions or the redemption of fund shares. |
5
| GAMCO International Growth Fund, Inc. | ||
Disclosure of Fund Expenses (Unaudited) | ||
For the Six Month Period from July 1, 2019 through December 31, 2019 | Expense Table |
We believe it is important for you to understand the impact of fees and expenses regarding your investment. All mutual funds have operating expenses. As a shareholder of a fund, you incur ongoing costs, which include costs for portfolio management, administrative services, and shareholder reports (like this one), among others. Operating expenses, which are deducted from a fund’s gross income, directly reduce the investment return of a fund. When a fund’s expenses are expressed as a percentage of its average net assets, this figure is known as the expense ratio. The following examples are intended to help you understand the ongoing costs (in dollars) of investing in your Fund and to compare these costs with those of other mutual funds. The examples are based on an investment of $1,000 made at the beginning of the period shown and held for the entire period.
The Expense Table below illustrates your Fund’s costs in two ways:
Actual Fund Return:This section provides informationabout actual account values and actual expenses. You may use this section to help you to estimate the actual expenses that you paid over the period after any fee waivers and expense reimbursements. The “Ending Account Value” shown is derived from the Fund’sactualreturn during the past six months, and the“Expenses Paid During Period” shows the dollar amount that would have been paid by an investor who started with $1,000 in the Fund. You may use this information, together with the amount you invested, to estimate the expenses that you paid over the period.
To do so, simply divide your account value by $1,000 (for example, an $8,600 account value divided by $1,000 = 8.6), then multiply the result by the number given for your Fund under the heading “Expenses Paid During Period” to estimate the expenses you paid during this period.
Hypothetical 5% Return:This section providesinformation about hypothetical account values and hypothetical expenses based on the Fund’s actual
expense ratio. It assumes a hypothetical annualized return of 5% before expenses during the period shown. In this case – because the hypothetical return used isnot the Fund’s actual return – the results do not apply to your investment and you cannot use the hypothetical account value and expense to estimate the actual ending account balance or expenses you paid for the period. This example is useful in making comparisons of the ongoing costs of investing in the Fund and other funds. To do so, compare this 5% hypothetical example with the 5% hypothetical examples that appear in shareholder reports of other funds.
Please note that the expenses shown in the table are meant to highlight your ongoing costs only and do not reflect any transactional costs such as sales charges (loads), redemption fees, or exchange fees, if any, which are described in the Prospectus. If these costs were applied to your account, your costs would be higher. Therefore, the 5% hypothetical return is useful in comparing ongoing costs only, and will not help you determine the relative total costs of owning different funds. The “Annualized Expense Ratio” represents the actual expenses for the last six months and may be different from the expense ratio in the Financial Highlights which is for the year ended December 31, 2019.
| Beginning Account Value 07/01/19 | Ending Account Value 12/31/19 | Annualized Expense Ratio | Expenses Paid During Period* | |||||||||||||
GAMCO International Growth Fund, Inc. |
| |||||||||||||||
Actual Fund Return |
| |||||||||||||||
Class AAA | $1,000.00 | $1,060.60 | 1.25% | $ 6.49 | ||||||||||||
Class A | $1,000.00 | $1,054.40 | 2.39% | $12.38 | ||||||||||||
Class C | $1,000.00 | $1,050.40 | 3.10% | $16.02 | ||||||||||||
Class I | $1,000.00 | $1,061.70 | 1.00% | $ 5.20 | ||||||||||||
Hypothetical 5% Return |
| |||||||||||||||
Class AAA | $1,000.00 | $1,018.90 | 1.25% | $ 6.36 | ||||||||||||
Class A | $1,000.00 | $1,013.16 | 2.39% | $12.13 | ||||||||||||
Class C | $1,000.00 | $1,009.58 | 3.10% | $15.70 | ||||||||||||
Class I | $1,000.00 | $1,020.16 | 1.00% | $ 5.09 | ||||||||||||
| * | Expenses are equal to the Fund’s annualized expense ratio for the last six months multiplied by the average account value over the period, multiplied by the number of days in the most recent fiscal half year (184 days), then divided by 365. |
| 6 |
Summary of Portfolio Holdings (Unaudited)
The following table presents portfolio holdings as a percent of net assets as of December 31, 2019:
GAMCO International Growth Fund, Inc.
Consumer Discretionary | 20.5 | % | ||
Consumer Staples - Food, Beverage, and Tobacco | 16.9 | % | ||
Health Care | 16.4 | % | ||
Industrials | 12.6 | % | ||
Materials | 8.9 | % | ||
Information Technology | 8.0 | % | ||
Consumer Staples - Household and Personal Products | 7.9 | % |
Financials | 5.8 | % | ||
Communication Services | 2.1 | % | ||
Business Services | 0.6 | % | ||
Energy | 0.5 | % | ||
Other Assets and Liabilities (Net) | (0.2 | )% | ||
|
| |||
| 100.0 | % | |||
|
|
The Fund files a complete schedule of portfolio holdings with the Securities and Exchange Commission (the SEC) for the first and third quarters of each fiscal year on FormN-PORT. Shareholders may obtain this information at www.gabelli.com or by calling the Fund at800-GABELLI(800-422-3554). The Fund’s FormN-PORT is available on the SEC’s website at www.sec.gov and may also be reviewed and copied at the SEC’s Public Reference Room in Washington, DC. Information on the operation of the Public Reference Room may be obtained by calling800-SEC-0330.
Proxy Voting
The Fund files FormN-PX with its complete proxy voting record for the twelve months ended June 30, no later than August 31 of each year. A description of the Fund’s proxy voting policies, procedures, and how the Fund voted proxies relating to portfolio securities is available without charge, upon request, by (i) calling800-GABELLI(800-422-3554); (ii) writing to The Gabelli Funds at One Corporate Center, Rye, NY 10580-1422; or (iii) visiting the SEC website at www.sec.gov.
7
GAMCO International Growth Fund, Inc.
Schedule of Investments — December 31, 2019
| Market | ||||||||||||
Shares | Cost | Value | ||||||||||
| COMMON STOCKS — 100.2% |
| |||||||||||
| CONSUMER DISCRETIONARY — 20.5% |
| |||||||||||
| 500 | adidas AG | $ | 155,796 | $ | 162,535 | |||||||
| 3,000 | ASX Ltd. | 137,640 | 165,072 | |||||||||
| 1,800 | Christian Dior SE | 149,827 | 922,311 | |||||||||
| 7,150 | Cie Financiere Richemont SA | 174,477 | 561,923 | |||||||||
| 700 | Fast Retailing Co. Ltd. | 137,571 | 418,757 | |||||||||
| 13,000 | GVC Holdings plc | 110,453 | 152,258 | |||||||||
| 725 | Hermes International | 258,037 | 541,778 | |||||||||
| 135,000 | NagaCorp. Ltd. | 133,313 | 235,617 | |||||||||
| 3,150 | Naspers Ltd., Cl. N | 379,977 | 515,207 | |||||||||
| 3,150 | Prosus NV† | 264,297 | 235,075 | |||||||||
| 1,000 | Shimano Inc. | 135,354 | 163,545 | |||||||||
| 5,600 | Sony Corp. | 145,489 | 381,442 | |||||||||
|
|
|
| |||||||||
| 2,182,231 | 4,455,520 | |||||||||||
|
|
|
| |||||||||
CONSUMER STAPLES - FOOD, BEVERAGE, AND TOBACCO — 16.9% |
| |||||||||||
| 6,200 | Associated British Foods plc | 224,690 | 213,363 | |||||||||
| 5,750 | British American Tobacco plc | 188,385 | 246,127 | |||||||||
| 5,000 | Danone SA | 330,378 | 414,470 | |||||||||
| 15,000 | Diageo plc | 235,723 | 635,911 | |||||||||
| 4,000 | Heineken NV | 222,976 | 425,889 | |||||||||
| 4,000 | Kameda Seika Co. Ltd. | 160,162 | 183,517 | |||||||||
| 4,000 | Kobe Bussan Co. Ltd. | 107,832 | 138,052 | |||||||||
| 8,600 | Nestlé SA | 485,960 | 931,089 | |||||||||
| 2,750 | Pernod Ricard SA | 184,782 | 491,699 | |||||||||
|
|
|
| |||||||||
| 2,140,888 | 3,680,117 | |||||||||||
|
|
|
| |||||||||
| HEALTH CARE — 16.4% |
| |||||||||||
| 5,500 | AstraZeneca plc | 384,666 | 554,196 | |||||||||
| 2,600 | Coloplast A/S, Cl. B | 205,267 | 322,529 | |||||||||
| 1,500 | EssilorLuxottica SA | 192,211 | 228,491 | |||||||||
| 10,000 | GlaxoSmithKline plc | 206,108 | 235,648 | |||||||||
| 7,250 | Novartis AG | 317,787 | 688,443 | |||||||||
| 6,000 | Novo Nordisk A/S, Cl. B | 258,851 | 348,237 | |||||||||
| 2,200 | Roche Holding AG, Genusschein | 350,806 | 713,784 | |||||||||
| 19,400 | Smith & Nephew plc | 223,802 | 470,905 | |||||||||
|
|
|
| |||||||||
| 2,139,498 | 3,562,233 | |||||||||||
|
|
|
| |||||||||
| INDUSTRIALS — 12.6% |
| |||||||||||
| 1,150 | Airbus SE | 151,288 | 168,314 | |||||||||
| 15,000 | Epiroc AB, Cl. B | 164,076 | 177,844 | |||||||||
| 2,400 | FANUC Corp. | 292,105 | 449,054 | |||||||||
| 2,500 | IHS Markit Ltd.† | 138,470 | 188,375 | |||||||||
| 8,600 | Jardine Matheson Holdings Ltd. | 430,577 | 478,160 | |||||||||
| 8,000 | Komatsu Ltd. | 198,456 | 194,524 | |||||||||
| 1,800 | Nidec Corp. | 165,807 | 248,576 | |||||||||
| 6,000 | Park24 Co. Ltd. | 109,641 | 147,384 | |||||||||
| 1,500 | SMC Corp. | 258,607 | 694,262 | |||||||||
|
|
|
| |||||||||
| 1,909,027 | 2,746,493 | |||||||||||
|
|
|
| |||||||||
| MATERIALS — 8.9% |
| |||||||||||
| 7,000 | Agnico Eagle Mines Ltd. | 300,641 | 431,270 | |||||||||
| 2,218 | Air Liquide SA | 223,718 | 313,978 | |||||||||
| Market | ||||||||||||
Shares | Cost | Value | ||||||||||
| 24,512 | Barrick Gold Corp. | $ | 288,918 | $ | 455,678 | |||||||
| 3,000 | Chr. Hansen Holding A/S | 117,565 | 238,402 | |||||||||
| 8,125 | Rio Tinto plc | 308,704 | 484,633 | |||||||||
|
|
|
| |||||||||
| 1,239,546 | 1,923,961 | |||||||||||
|
|
|
| |||||||||
| INFORMATION TECHNOLOGY — 8.0% |
| |||||||||||
| 3,280 | Keyence Corp. | 204,194 | 1,161,909 | |||||||||
| 6,800 | Murata Manufacturing Co. Ltd. | 262,311 | 422,188 | |||||||||
| 15,000 | The Sage Group plc | 128,174 | 148,820 | |||||||||
|
|
|
| |||||||||
| 594,679 | 1,732,917 | |||||||||||
|
|
|
| |||||||||
CONSUMER STAPLES - HOUSEHOLD AND PERSONAL PRODUCTS — 7.9% |
| |||||||||||
| 2,300 | Henkel AG & Co. KGaA | 229,448 | 216,713 | |||||||||
| 2,300 | L’Oreal SA | 246,959 | 681,099 | |||||||||
| 1,300 | Reckitt Benckiser Group plc | 119,384 | 105,541 | |||||||||
| 6,000 | Shiseido Co. Ltd. | 93,798 | 429,727 | |||||||||
| 5,000 | Unilever NV | 229,896 | 287,325 | |||||||||
|
|
|
| |||||||||
| 919,485 | 1,720,405 | |||||||||||
|
|
|
| |||||||||
| FINANCIALS — 5.8% | ||||||||||||
| 30,000 | AIA Group Ltd. | 238,736 | 314,926 | |||||||||
| 8,000 | Investor AB, Cl. B | 286,619 | 436,627 | |||||||||
| 10,000 | Kinnevik AB, Cl. B | 252,114 | 244,492 | |||||||||
| 11,700 | M&G plc† | 39,615 | 36,761 | |||||||||
| 11,700 | Prudential plc | 238,321 | 224,565 | |||||||||
|
|
|
| |||||||||
| 1,055,405 | 1,257,371 | |||||||||||
|
|
|
| |||||||||
| COMMUNICATION SERVICES — 2.1% |
| |||||||||||
| 3,872 | Millicom International Cellular SA, SDR | 192,036 | 185,449 | |||||||||
| 3,000 | MonotaRO Co. Ltd. | 78,924 | 80,705 | |||||||||
| 3,976 | Nordic Entertainment Group AB, Cl. B | 92,858 | 128,538 | |||||||||
| 1,000 | Ubisoft Entertainment SA† | 111,551 | 69,075 | |||||||||
|
|
|
| |||||||||
| 475,369 | 463,767 | |||||||||||
|
|
|
| |||||||||
| BUSINESS SERVICES — 0.6% |
| |||||||||||
| 2,500 | Edenred | 131,365 | 129,277 | |||||||||
|
|
|
| |||||||||
| ENERGY — 0.5% |
| |||||||||||
| 2,500 | Schlumberger Ltd. | 191,135 | 100,500 | |||||||||
|
|
|
| |||||||||
TOTAL COMMON STOCKS | 12,978,628 | 21,772,561 | ||||||||||
|
|
|
| |||||||||
| TOTAL INVESTMENTS —100.2% | $ | 12,978,628 | 21,772,561 | |||||||||
|
| |||||||||||
Other Assets and Liabilities (Net) — (0.2)% |
| (53,470 | ) | |||||||||
|
| |||||||||||
| NET ASSETS — 100.0% |
| $ | 21,719,091 | |||||||||
|
| |||||||||||
† Non-income producing security.
SDR Swedish Depositary Receipt
| See accompanying notes to financial statements. |
| 8 |
GAMCO International Growth Fund, Inc.
Schedule of Investments (Continued) — December 31, 2019
Geographic Diversification | % of | Market | ||||||
Europe | 64.1 | % | $ | 13,962,489 | ||||
Japan | 23.5 | 5,113,641 | ||||||
North America | 4.5 | 987,448 | ||||||
Asia/Pacific | 4.4 | 958,159 | ||||||
South Africa | 2.4 | 515,207 | ||||||
Latin America | 1.1 | 235,617 | ||||||
|
|
|
| |||||
| 100.0 | % | $ | 21,772,561 | |||||
|
|
|
| |||||
| See accompanying notes to financial statements. |
| 9 |
GAMCO International Growth Fund, Inc.
Statement of Assets and Liabilities
December 31, 2019
Assets: | ||||
Investments, at value (cost $12,978,628) | $ | 21,772,561 | ||
Foreign currency, at value (cost $89) | 90 | |||
Cash | 263 | |||
Receivable for investments sold | 55,631 | |||
Receivable for Fund shares sold | 13,521 | |||
Receivable from Adviser | 37,100 | |||
Dividends receivable | 84,619 | |||
Prepaid expenses | 25,210 | |||
|
| |||
Total Assets | 21,988,995 | |||
|
| |||
Liabilities: | ||||
Payable for Fund shares redeemed | 4,276 | |||
Payable for investment advisory fees | 35,869 | |||
Payable for distribution fees | 3,458 | |||
Line of credit payable | 142,000 | |||
Payable for legal and audit fees | 40,002 | |||
Payable for shareholder communications expenses | 22,746 | |||
Other accrued expenses | 21,553 | |||
|
| |||
Total Liabilities | 269,904 | |||
|
| |||
Net Assets | ||||
(applicable to 947,919 shares outstanding) | $ | 21,719,091 | ||
|
| |||
Net Assets Consist of: | ||||
Paid-in capital | $ | 13,082,110 | ||
Total distributable earnings | 8,636,981 | |||
|
| |||
Net Assets | $ | 21,719,091 | ||
|
| |||
Shares of Capital Stock, each at $0.001 par value: |
| |||
Class AAA: | ||||
Net Asset Value, offering, and redemption price per share ($15,021,160 ÷ 657,340 shares outstanding; 375,000,000 shares authorized) | $22.85 | |||
Class A: | ||||
Net Asset Value and redemption price per share ($513,317 ÷ 22,046 shares outstanding; 250,000,000 shares authorized) | $23.28 | |||
Maximum offering price per share (NAV ÷ 0.9425, based on maximum sales charge of 5.75% of the offering price) | $24.70 | |||
Class C: | ||||
Net Asset Value and offering price per share ($237,522 ÷ 11,752 shares outstanding; 125,000,000 shares authorized) | $20.21 | (a) | ||
Class I: | ||||
Net Asset Value, offering, and redemption price per share ($5,947,092 ÷ 256,781 shares outstanding; 125,000,000 shares authorized) | $23.16 | |||
| (a) | Redemption price varies based on the length of time held. |
Statement of Operations
For the Year Ended December 31, 2019
Investment Income: | ||||
Dividends (net of foreign withholding taxes of $55,989) | $ | 489,256 | ||
Income fromnon-cash dividends | 344,841 | |||
Interest | 411 | |||
|
| |||
Total Investment Income | 834,508 | |||
|
| |||
Expenses: | ||||
Investment advisory fees | 209,571 | |||
Distribution fees - Class AAA | 37,402 | |||
Distribution fees - Class A | 1,226 | |||
Distribution fees - Class C | 3,193 | |||
Legal and audit fees | 64,247 | |||
Registration expenses | 49,294 | |||
Shareholder communications expenses | 40,589 | |||
Shareholder services fees | 18,278 | |||
Directors’ fees | 17,000 | |||
Custodian fees | 12,112 | |||
Interest expense | 1,846 | |||
Miscellaneous expenses | 42,948 | |||
|
| |||
Total Expenses | 497,706 | |||
|
| |||
Less: | ||||
Expense reimbursements (See Note 3) | (235,021 | ) | ||
|
| |||
Net Expenses | 262,685 | |||
|
| |||
Net Investment Income | 571,823 | |||
|
| |||
Net Realized and Unrealized Gain/(Loss) on Investments and |
| |||
Net realized gain on investments | 811,639 | |||
Net realized loss on foreign currency transactions | (3,708 | ) | ||
|
| |||
Net realized gain on investments and foreign currency transactions | 807,931 | |||
|
| |||
Net change in unrealized appreciation/depreciation: | ||||
on investments | 3,177,206 | |||
on foreign currency translations | 2,475 | |||
|
| |||
Net change in unrealized appreciation/depreciation on investments and foreign currency translations | 3,179,681 | |||
|
| |||
Net Realized and Unrealized Gain/(Loss) on Investments and Foreign Currency | 3,987,612 | |||
|
| |||
Net Increase in Net Assets Resulting from Operations | $ | 4,559,435 | ||
|
| |||
| See accompanying notes to financial statements. |
| 10 |
GAMCO International Growth Fund, Inc.
Statement of Changes in Net Assets
| Year Ended December 31, 2019 | Year Ended December 31, 2018 | |||||||||||||||||||||||
Operations: | ||||||||||||||||||||||||
Net investment income | $ | 571,823 | $ | 135,738 | ||||||||||||||||||||
Net realized gain on investments and foreign currency transactions | 807,931 | 1,572,733 | ||||||||||||||||||||||
Net change in unrealized appreciation/depreciation on investments and foreign currency translations | 3,179,681 | (4,296,882 | ) | |||||||||||||||||||||
|
|
|
| |||||||||||||||||||||
Net Increase/(Decrease) in Net Assets Resulting from Operations | 4,559,435 | (2,588,411 | ) | |||||||||||||||||||||
|
|
|
| |||||||||||||||||||||
Distributions to Shareholders: | ||||||||||||||||||||||||
Accumulated earnings | ||||||||||||||||||||||||
Class AAA | (1,010,900 | ) | (1,197,401 | ) | ||||||||||||||||||||
Class A | (29,026 | ) | (38,761 | ) | ||||||||||||||||||||
Class C | (12,678 | ) | (38,461 | ) | ||||||||||||||||||||
Class I | (408,210 | ) | (402,747 | ) | ||||||||||||||||||||
|
|
|
| |||||||||||||||||||||
Total Distributions to Shareholders | (1,460,814 | ) | (1,677,370 | ) | ||||||||||||||||||||
|
|
|
| |||||||||||||||||||||
Capital Share Transactions: | ||||||||||||||||||||||||
Class AAA | (1,439,611 | ) | (175,450 | ) | ||||||||||||||||||||
Class A | (38,565 | ) | 5,079 | |||||||||||||||||||||
Class C | (247,303 | ) | 251,681 | |||||||||||||||||||||
Class I | 885,879 | (1,626,349 | ) | |||||||||||||||||||||
|
|
|
| |||||||||||||||||||||
Net Decrease in Net Assets from Capital Share Transactions | (839,600 | ) | (1,545,039 | ) | ||||||||||||||||||||
|
|
|
| |||||||||||||||||||||
Redemption Fees | 14 | — | ||||||||||||||||||||||
|
|
|
| |||||||||||||||||||||
Net Increase/(Decrease) in Net Assets | 2,259,035 | (5,810,820 | ) | |||||||||||||||||||||
Net Assets: | ||||||||||||||||||||||||
Beginning of year | 19,460,056 | 25,270,876 | ||||||||||||||||||||||
|
|
|
| |||||||||||||||||||||
End of year | $ | 21,719,091 | $ | 19,460,056 | ||||||||||||||||||||
|
|
|
| |||||||||||||||||||||
| See accompanying notes to financial statements. |
| 11 |
GAMCO International Growth Fund, Inc.
Financial Highlights
Selected data for a share of capital stock outstanding throughout each year:
| Income (Loss) from Investment Operations | Distributions | Ratios to Average Net Assets/ Supplemental Data | ||||||||||||||||||||||||||||||||||||||||||||||||||||||||||
| Year Ended December 31 | Net Asset Value, Beginning of Year | Net Investment Income (Loss)(a) | Net Realized and Unrealized Gain (Loss) on Investments | Total from Investment Operations | Net Investment Income | Net Realized Gain on Investments | Total Distributions | Redemption Fees(a)(b) | Net Asset Value, End of Year | Total Return† | Net Assets End of Year (in 000’s) | Net Investment Income (Loss) | Operating Expenses Before Reimburse- ments(c) | Operating Expenses Net of Reimbrse- ments(c) | Portfolio Turnover Rate | |||||||||||||||||||||||||||||||||||||||||||||
Class AAA | ||||||||||||||||||||||||||||||||||||||||||||||||||||||||||||
2019 | $19.67 | $ 0.60 | (d) | $ 4.23 | $ 4.83 | $(0.75 | ) | $(0.90) | $(1.65 | ) | $0.00 | $22.85 | 24.5 | % | $15,021 | 2.68 | %(d) | 2.43 | % | 1.26 | %(e) | 6 | % | |||||||||||||||||||||||||||||||||||||
2018 | 24.15 | 0.11 | (2.79 | ) | (2.68 | ) | (0.09 | ) | (1.71 | ) | (1.80 | ) | — | 19.67 | (11.0 | ) | 14,223 | 0.47 | 2.39 | 1.63 | (e)(f) | 5 | ||||||||||||||||||||||||||||||||||||||
2017 | 19.57 | (0.05 | ) | 5.78 | 5.73 | (0.03 | ) | (1.12 | ) | (1.15 | ) | 0.00 | 24.15 | 29.3 | 17,556 | (0.20 | ) | 2.14 | 2.14 | (g) | 4 | |||||||||||||||||||||||||||||||||||||||
2016 | 20.43 | 0.29 | (0.79 | ) | (0.50 | ) | (0.33 | ) | (0.03 | ) | (0.36 | ) | 0.00 | 19.57 | (2.4 | ) | 16,112 | 1.44 | 2.07 | 2.07 | (g) | 9 | ||||||||||||||||||||||||||||||||||||||
2015 | 21.07 | 0.00 | (b) | (0.62 | ) | (0.62 | ) | (0.00 | )(b) | (0.02 | ) | (0.02 | ) | 0.00 | 20.43 | (2.9 | ) | 18,762 | 0.01 | 2.12 | 2.12 | (f)(h) | 15 | |||||||||||||||||||||||||||||||||||||
Class A | ||||||||||||||||||||||||||||||||||||||||||||||||||||||||||||
2019 | $20.03 | $ 0.35 | (d) | $ 4.27 | $ 4.62 | $(0.47 | ) | $(0.90) | $(1.37 | ) | $0.00 | $23.28 | 23.0 | % | $ 513 | 1.56 | %(d) | 2.43 | % | 2.43 | % | 6 | % | |||||||||||||||||||||||||||||||||||||
2018 | 24.65 | (0.09 | ) | (2.82 | ) | (2.91 | ) | — | (1.71 | ) | (1.71 | ) | — | 20.03 | (11.7 | ) | 482 | (0.39 | ) | 2.39 | 2.39 | (f) | 5 | |||||||||||||||||||||||||||||||||||||
2017 | 19.95 | (0.05 | ) | 5.90 | 5.85 | (0.03 | ) | (1.12 | ) | (1.15 | ) | 0.00 | 24.65 | 29.3 | 594 | (0.20 | ) | 2.14 | 2.14 | (g) | 4 | |||||||||||||||||||||||||||||||||||||||
2016 | 20.81 | 0.33 | (0.84 | ) | (0.51 | ) | (0.32 | ) | (0.03 | ) | (0.35 | ) | 0.00 | 19.95 | (2.4 | ) | 603 | 1.60 | 2.07 | 2.07 | (g) | 9 | ||||||||||||||||||||||||||||||||||||||
2015 | 21.47 | (0.02 | ) | (0.61 | ) | (0.63 | ) | (0.01 | ) | (0.02 | ) | (0.03 | ) | 0.00 | 20.81 | (2.9 | ) | 761 | (0.08 | ) | 2.12 | 2.12 | (f)(h) | 15 | ||||||||||||||||||||||||||||||||||||
Class C | ||||||||||||||||||||||||||||||||||||||||||||||||||||||||||||
2019 | $17.48 | $ 0.13 | (d) | $ 3.74 | $ 3.87 | $(0.24 | ) | $(0.90) | $(1.14 | ) | $0.00 | $20.21 | 22.1 | % | $ 238 | 0.66 | %(d) | 3.18 | % | 3.18 | % | 6 | % | |||||||||||||||||||||||||||||||||||||
2018 | 21.92 | (0.25 | ) | (2.48 | ) | (2.73 | ) | — | (1.71 | ) | (1.71 | ) | — | 17.48 | (12.4 | ) | 429 | (1.21 | ) | 3.14 | 3.14 | (f) | 5 | |||||||||||||||||||||||||||||||||||||
2017 | 17.95 | (0.21 | ) | 5.30 | 5.09 | — | (1.12 | ) | (1.12 | ) | 0.00 | 21.92 | 28.4 | 279 | (0.99 | ) | 2.89 | 2.89 | (g) | 4 | ||||||||||||||||||||||||||||||||||||||||
2016 | 18.73 | 0.12 | (0.71 | ) | (0.59 | ) | (0.16 | ) | (0.03 | ) | (0.19 | ) | 0.00 | 17.95 | (3.1 | ) | 226 | 0.64 | 2.82 | 2.82 | (g) | 9 | ||||||||||||||||||||||||||||||||||||||
2015 | 19.47 | (0.16 | ) | (0.56 | ) | (0.72 | ) | (0.00 | )(b) | (0.02 | ) | (0.02 | ) | 0.00 | 18.73 | (3.7 | ) | 366 | (0.80 | ) | 2.87 | 2.87 | (f)(h) | 15 | ||||||||||||||||||||||||||||||||||||
Class I | ||||||||||||||||||||||||||||||||||||||||||||||||||||||||||||
2019 | $19.89 | $ 0.70 | (d) | $ 4.24 | $ 4.94 | $(0.77 | ) | $(0.90) | $(1.67 | ) | $0.00 | $23.16 | 24.8 | % | $ 5,947 | 3.11 | %(d) | 2.18 | % | 1.01 | %(e) | 6 | % | |||||||||||||||||||||||||||||||||||||
2018 | 24.45 | 0.27 | (2.86 | ) | (2.59 | ) | (0.26 | ) | (1.71 | ) | (1.97 | ) | — | 19.89 | (10.5 | ) | 4,326 | 1.11 | 2.14 | 1.01 | (e)(f) | 5 | ||||||||||||||||||||||||||||||||||||||
2017 | 19.81 | 0.24 | 5.85 | 6.09 | (0.33 | ) | (1.12 | ) | (1.45 | ) | 0.00 | 24.45 | 30.8 | 6,842 | 1.03 | 1.89 | 1.00 | (g) | 4 | |||||||||||||||||||||||||||||||||||||||||
2016 | 20.69 | 0.53 | (0.82 | ) | (0.29 | ) | (0.56 | ) | (0.03 | ) | (0.59 | ) | 0.00 | 19.81 | (1.4 | ) | 7,183 | 2.58 | 1.82 | 1.00 | (e)(g) | 9 | ||||||||||||||||||||||||||||||||||||||
2015 | 21.31 | 0.18 | (0.57 | ) | (0.39 | ) | (0.21 | ) | (0.02 | ) | (0.23 | ) | 0.00 | 20.69 | (1.9 | ) | 7,410 | 0.83 | 1.87 | 1.01 | (f)(h) | 15 | ||||||||||||||||||||||||||||||||||||||
| † | Total return represents aggregate total return of a hypothetical $1,000 investment at the beginning of the year and sold at the end of the year including reinvestment of distributions and does not reflect the applicable sales charges. |
| (a) | Per share amounts have been calculated using the average shares outstanding method. |
| (b) | Amount represents less than $0.005 per share. |
| (c) | The Fund incurred interest expense during the years ended December 31, 2019, 2018, 2017, 2016, and 2015. For the years ended December 31, 2019 and 2018 if interest expense had not been incurred, the ratios of operating expenses to average net assets would have been 1.25%, 1.62% (Class AAA), 2.42%, 2.38% (Class A), 3.17%, 3.13% (Class C), and 1.00%, 1.00% (Class I), respectively. For the years ended December 31, 2017, 2016, and 2015, there was no impact on the expense ratios. |
| (d) | Includes income resulting from special dividends. Without these dividends, the per share income (loss) amounts would have been 0.23 (Class AAA), (0.02) (Class A), (0.19) (Class C), and 0.33 (Class I), respectively, and the net investment income (loss) ratio would have been 1.04% (Class AAA), (0.09)% (Class A), (0.99)% (Class C), and 1.46% (Class I), respectively. |
| (e) | Under an expense reimbursement agreement with the Adviser, for the years ended December 31, 2019 and 2018 the Adviser reimbursed $174,521 and $131,548 in certain Class AAA expenses and $60,500 and $62,410 in certain Class I expenses to the Fund, respectively. For the years ended December 31, 2017, and 2016, the Fund reimbursed Class I expenses to the Fund of $63,160, and $64,752, respectively. |
| (f) | The Fund received credits from a designated broker who agreed to pay certain Fund operating expenses. Had such payments not been made, the expense ratios for the year ended December 31, 2015 would have been 2.11% (Class AAA and Class A), 2.86% (Class C), and 1.01% (Class I). The 2018 reimbursement has no impact on the expense ratio. |
| (g) | During the years ended December 31, 2017 and 2016, the Fund received reimbursements of custody expenses paid in prior years. Had such reimbursement (allocated by relative net asset values of the Fund’s share classes) been included in the 2016 calculation, the annualized expense ratios would have been 0.79% (Class AAA), 0.63% (Class A), 1.61% (Class C), and (0.31)% (Class I), respectively. The 2017 reimbursement had no effect on the expense ratio. |
| (h) | The Fund incurred tax expense during the year ended December 31, 2015. If the tax expense had not incurred, the ratios of operating expenses to average net assets would have been 2.11% (Class AAA and Class A), 2.86% (Class C), and 1.00% (Class I). |
| See accompanying notes to financial statements. |
| 12 |
GAMCO International Growth Fund, Inc.
Notes to Financial Statements
1. Organization.GAMCO International Growth Fund, Inc. was incorporated on May 25, 1994 in Maryland andcommenced investment operations on June 30, 1995. The Fund is a diversifiedopen-end management investment company registered under the Investment Company Act of 1940, as amended (the 1940 Act). The Fund’s primary objective is long term capital appreciation.
2. Significant Accounting Policies.As an investment company, the Fund follows the investment companyaccounting and reporting guidance, which is part of U.S. generally accepted accounting principles (GAAP) that may require the use of management estimates and assumptions in the preparation of its financial statements. Actual results could differ from those estimates. The following is a summary of significant accounting policies followed by the Fund in the preparation of its financial statements.
New Accounting Pronouncements.To improve the effectiveness of fair value disclosure requirements, theFinancial Accounting Standards Board recently issued Accounting Standard Update (ASU)2018-13, Fair Value Measurement Disclosure Framework – Changes to the Disclosure Requirements for Fair Value Measurement (ASU2018-13), which adds, removes, and modifies certain aspects relating to fair value disclosure. ASU2018-13 is effective for interim and annual reporting periods beginning after December 15, 2019; early adoption of the additions relating to ASU2018-13 is not required, even if early adoption is elected for the removals and modifications under ASU2018-13. Management has early adopted the removals and modifications set forth in ASU2018-13 in these financial statements and has not early adopted the additions set forth in ASU2018-13.
Security Valuation.Portfolio securities listed or traded on a nationally recognized securities exchange or tradedin the U.S.over-the-counter market for which market quotations are readily available are valued at the last quoted sale price or a market’s official closing price as of the close of business on the day the securities are being valued. If there were no sales that day, the security is valued at the average of the closing bid and asked prices or, if there were no asked prices quoted on that day, then the security is valued at the closing bid price on that day. If no bid or asked prices are quoted on such day, the security is valued at the most recently available price or, if the Board of Directors (the Board) so determines, by such other method as the Board shall determine in good faith to reflect its fair market value. Portfolio securities traded on more than one national securities exchange or market are valued according to the broadest and most representative market, as determined by Gabelli Funds, LLC (the Adviser).
Portfolio securities primarily traded on a foreign market are generally valued at the preceding closing values of such securities on the relevant market, but may be fair valued pursuant to procedures established by the Board if market conditions change significantly after the close of the foreign market, but prior to the close of business on the day the securities are being valued. Debt obligations for which market quotations are readily available are valued at the average of the latest bid and asked prices. If there were no asked prices quoted on such day, the security is valued using the closing bid price, unless the Board determines such amount does not reflect the securities’ fair value, in which case these securities will be fair valued as determined by the Board. Certain securities are valued principally using dealer quotations. Futures contracts are valued at the closing settlement price of the exchange or board of trade on which the applicable contract is traded. OTC futures and options on futures for which market quotations are readily available will be valued by quotations received from a pricing service or, if no quotations are available from a pricing service, by quotations obtained from one or more dealers in the instrument in question by the Adviser.
13
GAMCO International Growth Fund, Inc.
Notes to Financial Statements (Continued)
Securities and assets for which market quotations are not readily available are fair valued as determined by the Board. Fair valuation methodologies and procedures may include, but are not limited to: analysis and review of available financial andnon-financial information about the company; comparisons with the valuation and changes in valuation of similar securities, including a comparison of foreign securities with the equivalent U.S. dollar value American Depositary Receipt securities at the close of the U.S. exchange; and evaluation of any other information that could be indicative of the value of the security.
The Fund employs a fair value model to adjust prices to reflect events affecting the values of certain portfolio securities, which occur between the close of trading on the principal market for such securities (foreign exchanges andover-the-counter markets) at the time when net asset values of the Fund are determined. If the Fund’s valuation committee believes that a particular event would materially affect net asset value, further adjustment is considered.
The inputs and valuation techniques used to measure fair value of the Fund’s investments are summarized into three levels as described in the hierarchy below:
| ● | Level 1 – quoted prices in active markets for identical securities; |
| ● | Level 2 – other significant observable inputs (including quoted prices for similar securities, interest rates, prepayment speeds, credit risk, etc.); and |
| ● | Level 3 – significant unobservable inputs (including the Board’s determinations as to the fair value of investments). |
A financial instrument’s level within the fair value hierarchy is based on the lowest level of any input both individually and in the aggregate that is significant to the fair value measurement. The inputs or methodology used for valuing securities are not necessarily an indication of the risk associated with investing in those securities. The closing price is adjusted from the local close, therefore, such securities are classified as Level 2 in the fair value hierarchy presented below. The summary of the Fund’s investments in securities by inputs used to value the Fund’s investments as of December 31, 2019 is as follows:
| Valuation Inputs | ||||||||
| Level 1 Quoted Prices | Total Market Value at 12/31/19 | |||||||
INVESTMENTS IN SECURITIES: | ||||||||
ASSETS (Market Value): | ||||||||
Common Stocks (a) | $21,772,561 | $21,772,561 | ||||||
TOTAL INVESTMENTS IN SECURITIES – ASSETS | $21,772,561 | $21,772,561 | ||||||
| (a) | Please refer to the Schedule of Investments for the industry classifications of these portfolio holdings. |
There were no Level 3 investments held at December 31, 2019 or December 31, 2018.
14
GAMCO International Growth Fund, Inc.
Notes to Financial Statements (Continued)
Additional Information to Evaluate Qualitative Information.
General.The Fund uses recognized industry pricing services – approved by the Board and unaffiliated withthe Adviser – to value most of its securities, and uses broker quotes provided by market makers of securities not valued by these and other recognized pricing sources. Several different pricing feeds are received to value domestic equity securities, international equity securities, preferred equity securities, and fixed income securities. The data within these feeds are ultimately sourced from major stock exchanges and trading systems where these securities trade. The prices supplied by external sources are checked by obtaining quotations or actual transaction prices from market participants. If a price obtained from the pricing source is deemed unreliable, prices will be sought from another pricing service or from a broker/dealer that trades that security or similar securities.
Fair Valuation.Fair valued securities may be common or preferred equities, warrants, options, rights, orfixed income obligations. Where appropriate, Level 3 securities are those for which market quotations are not available, such as securities not traded for several days, or for which current bids are not available, or which are restricted as to transfer. Among the factors to be considered to fair value a security are recent prices of comparable securities that are publicly traded, reliable prices of securities not publicly traded, the use of valuation models, current analyst reports, valuing the income or cash flow of the issuer, or cost if the preceding factors do not apply. A significant change in the unobservable inputs could result in a lower or higher value in Level 3 securities. The circumstances of Level 3 securities are frequently monitored to determine if fair valuation measures continue to apply.
The Adviser reports quarterly to the Board the results of the application of fair valuation policies and procedures. These may include back testing the prices realized in subsequent trades of these fair valued securities to fair values previously recognized.
Foreign Currency Translations.The books and records of the Fund are maintained in U.S. dollars. Foreigncurrencies, investments, and other assets and liabilities are translated into U.S. dollars at current exchange rates. Purchases and sales of investment securities, income, and expenses are translated at the exchange rate prevailing on the respective dates of such transactions. Unrealized gains and losses that result from changes in foreign exchange rates and/or changes in market prices of securities have been included in unrealized appreciation/depreciation on investments and foreign currency translations. Net realized foreign currency gains and losses resulting from changes in exchange rates include foreign currency gains and losses between trade date and settlement date on investment securities transactions, foreign currency transactions, and the difference between the amounts of interest and dividends recorded on the books of the Fund and the amounts actually received. The portion of foreign currency gains and losses related to fluctuation in exchange rates between the initial purchase trade date and subsequent sale trade date is included in realized gain/(loss) on investments.
Foreign Securities.The Fund may directly purchase securities of foreign issuers. Investing in securities offoreign issuers involves special risks not typically associated with investing in securities of U.S. issuers. The risks include possible revaluation of currencies, the inability to repatriate funds, less complete financial information about companies, and possible future adverse political and economic developments. Moreover, securities of many foreign issuers and their markets may be less liquid and their prices more volatile than securities of comparable U.S. issuers.
15
GAMCO International Growth Fund, Inc.
Notes to Financial Statements (Continued)
Foreign Taxes.The Fund may be subject to foreign taxes on income, gains on investments, or currency repatriation,a portion of which may be recoverable. The Fund will accrue such taxes and recoveries as applicable, based upon its current interpretation of tax rules and regulations that exist in the markets in which it invests.
Securities Transactions and Investment Income.Securities transactions are accounted for on the trade datewith realized gain/(loss) on investments determined by using the identified cost method. Interest income (including amortization of premium and accretion of discount) is recorded on an accrual basis. Premiums and discounts on debt securities are amortized using the effective yield to maturity method. Dividend income is recorded on theex-dividend date, except for certain dividends from foreign securities that are recorded as soon after theex-dividend date as the Fund becomes aware of such dividends.
Determination of Net Asset Value and Calculation of Expenses.Certain administrative expenses are commonto, and allocated among, various affiliated funds. Such allocations are made on the basis of each fund’s average net assets or other criteria directly affecting the expenses as determined by the Adviser pursuant to procedures established by the Board.
In calculating the NAV per share of each class, investment income, realized and unrealized gains and losses, redemption fees, and expenses other than class specific expenses are allocated daily to each class of shares based upon the proportion of net assets of each class at the beginning of each day. Distribution expenses are borne solely by the class incurring the expense.
Distributions to Shareholders.Distributions to shareholders are recorded on theex-dividend date. Distributionsto shareholders are based on income and capital gains as determined in accordance with federal income tax regulations, which may differ from income and capital gains as determined under GAAP. These differences are primarily due to differing treatments of income and gains on various investment securities and foreign currency transactions held by the Fund, timing differences, and differing characterizations of distributions made by the Fund. Distributions from net investment income for federal income tax purposes include net realized gains on foreign currency transactions. These book/tax differences are either temporary or permanent in nature. To the extent these differences are permanent, adjustments are made to the appropriate capital accounts in the period when the differences arise. Permanent differences were primarily due to the sale of securities no longer considered passive foreign investment companies and the tax treatment of currency gains and losses. These reclassifications have no impact on the NAV of the Fund.
The tax character of distributions paid during the year ended December 31, 2019 and 2018 was as follows:
| Year Ended December 31, 2019 | Year Ended December 31, 2018 | |||||||
Distributions paid from: | ||||||||
Ordinary income (inclusive of short term capital gains) | $ | 671,525 | $ | 109,748 | ||||
Net long term capital gains | 789,289 | 1,567,622 | ||||||
|
|
|
| |||||
Total distributions paid | $ | 1,460,814 | * | $ | 1,677,370 | |||
|
|
|
| |||||
| * | Includes Deemed Distributions from Utilization of Equalization. |
Provision for Income Taxes.The Fund intends to continue to qualify as a regulated investment companyunder Subchapter M of the Internal Revenue Code of 1986, as amended (the Code). It is the policy of the Fund to comply with the requirements of the Code applicable to regulated investment companies and to distribute
16
GAMCO International Growth Fund, Inc.
Notes to Financial Statements (Continued)
substantially all of its net investment company taxable income and net capital gains. Therefore, no provision for federal income taxes is required.
As of December 31, 2019, the components of accumulated earnings/losses on a tax basis were as follows:
Undistributed ordinary income | $ | 5,445 | ||
Undistributed long term capital gains | 6,114 | |||
Net unrealized appreciation on investments and foreign currency translations | 8,625,422 | |||
|
| |||
Total | $ | 8,636,981 | ||
|
|
The Fund is permitted to carry capital losses forward for an unlimited period. Capital losses that are carried forward will retain their character as either short term or long term capital losses.
At December 31, 2019, the temporary differences between book basis and tax basis net unrealized appreciation were primarily due tomark-to market adjustments on investments in passive foreign investment companies.
The following summarizes the tax cost of investments and the related net unrealized appreciation at December 31, 2019:
| Cost | Gross Unrealized Appreciation | Gross Unrealized Depreciation | Net Unrealized Appreciation | |||||||||||||
Investments | $ | 13,147,971 | $9,370,739 | $(746,149) | $8,624,590 | |||||||||||
The Fund is required to evaluate tax positions taken or expected to be taken in the course of preparing the Fund’s tax returns to determine whether the tax positions are“more-likely-than-not” of being sustained by the applicable tax authority. Income tax and related interest and penalties would be recognized by the Fund as tax expense in the Statement of Operations if the tax positions were deemed not to meet themore-likely-than-not threshold. For the year ended December 31, 2019, the Fund did not incur any income tax, interest, or penalties. As of December 31, 2019, the Adviser has reviewed all open tax years and concluded that there was no impact to the Fund’s net assets or results of operations. The Fund’s federal and state tax returns for the prior three fiscal years remain open, subject to examination. On an ongoing basis, the Adviser will monitor the Fund’s tax positions to determine if adjustments to this conclusion are necessary.
3. Investment Advisory Agreement and Other Transactions.The Fund has entered into an investmentadvisory agreement (the Advisory Agreement) with the Adviser which provides that the Fund will pay the Adviser a fee, computed daily and paid monthly, at the annual rate of 1.00% of the value of its average daily net assets. In accordance with the Advisory Agreement, the Adviser provides a continuous investment program for the Fund’s portfolio, oversees the administration of all aspects of the Fund’s business and affairs, and pays the compensation of all Officers and Directors of the Fund who are affiliated persons of the Adviser.
The Adviser has contractually agreed to waive its investment advisory fee and/or reimburse expenses of Class AAA Shares and Class I Shares to the extent necessary to maintain the total operating expenses (excluding brokerage, acquired fund fees and expenses, interest, taxes, and extraordinary expenses) until at least April 30, 2020 at no more than 1.25% and 1.00% of the value of its average daily net assets, respectively. For the year ended December 31, 2019, the Adviser reimbursed the Fund in the amount of $235,021. In addition, the Fund has agreed, during the three year period following any waiver or reimbursement by the Adviser, to repay such amount to the extent, that after giving the effect to the repayment, such adjusted annualized total operating expenses of the Fund would not exceed 1.25% and 1.00% of the Fund’s average daily net assets for Class AAA
17
GAMCO International Growth Fund, Inc.
Notes to Financial Statements (Continued)
and Class I, respectively. The agreement is renewable annually. At December 31, 2019, the cumulative amount which the Fund may repay the Advisor, subject to the terms above, is $492,139.
For the year ended December 31, 2017, expiring December 31, 2020 | $ | 63,160 | ||
For the year ended December 31, 2018, expiring December 31, 2021 | 193,958 | |||
For the year ended December 31, 2019, expiring December 31, 2022 | 235,021 | |||
|
| |||
| $ | 492,139 | |||
|
|
The Fund pays each Director who is not considered to be an affiliated person an annual retainer of $1,000 plus $500 for each Board meeting attended and they are reimbursed for any out of pocket expenses incurred in attending meetings. All Board committee members receive $500 per meeting attended. The Chairman of the Audit Committee and the Lead Director each receive an annual fee of $1,000. A Director may receive a single meeting fee, allocated among the participating funds, for attending certain meetings held on behalf of multiple funds. Directors who are directors or employees of the Adviser or an affiliated company receive no compensation or expense reimbursement from the Fund.
4.Distribution Plan.The Fund’s Board has adopted a distribution plan (the Plan) for each class of shares,except for Class I Shares, pursuant to Rule12b-1 under the 1940 Act. Under the Class AAA, Class A, and Class C Share Plans, payments are authorized to G.distributors, LLC (the Distributor), an affiliate of the Adviser, at annual rates of 0.25%, 0.25%, and 1.00%, respectively, of the average daily net assets of those classes, the annual limitations under each Plan. Such payments are accrued daily and paid monthly.
5.Portfolio Securities.Purchases and sales of securities during the year ended December 31, 2019, otherthan short term securities and U.S. Government obligations, aggregated $1,285,972 and $3,060,647, respectively.
6.Transactions with Affiliates and Other Arrangements.During the year ended December 31, 2019, theDistributor retained a total of $76 from investors representing commissions (sales charges and underwriting fees) on sales and redemptions of Fund shares.
The cost of calculating the Fund’s NAV per share is a Fund expense pursuant to the Advisory Agreement. Under thesub-administration agreement with Bank of New York Mellon, the fees paid include the cost of calculating the Fund’s NAV. The Fund reimburses the Adviser for this service. The Adviser did not seek a reimbursement during the year ended December 31, 2019.
7. Line of Credit.The Fund participates in an unsecured line of credit, which expires on March 4, 2020 andmay be renewed annually, of up to $75,000,000 under which it may borrow up to 10% of its net assets from the custodian for temporary borrowing purposes. Borrowings under this arrangement bear interest at a floating rate equal to the higher of the overnight Federal Funds rate plus 125 basis points or the 30 day ICE LIBOR plus 125 basis points in effect on that day. This amount, if any, would be included in “Interest expense” in the Statement of Operations. At December 31, 2019, there was $142,000 outstanding under the line of credit.
The average daily amount of borrowings outstanding under the line of credit during the year ended December 31, 2019 was $26,778, with a weighted average interest rate of 3.68%. The maximum amount borrowed at any time during the year ended was $324,000.
18
GAMCO International Growth Fund, Inc.
Notes to Financial Statements (Continued)
8. Capital Stock.The Fund offers four classes of shares – Class AAA Shares, Class A Shares, Class C Shares,and Class I Shares. Class AAA and Class I Shares are offered without a sales charge. Class A Shares are subject to a maximumfront-end sales charge of 5.75%, and Class C Shares are subject to a 1.00% contingent deferred sales charge for one year after purchase.
The Fund imposes a redemption fee of 2.00% on all classes of shares that are redeemed or exchanged on or before the seventh day after the date of a purchase. The redemption fee is deducted from the proceeds otherwise payable to the redeeming shareholders and is retained by the Fund as an increase inpaid-in capital. The redemption fees retained by the Fund during the year ended December 31, 2019 and the year ended December 31, 2018, if any, can be found in the Statement of Changes in Net Assets under Redemption Fees.
Transactions in shares of capital stock were as follows:
| Year Ended December 31, 2019 | Year Ended December 31, 2018 | |||||||||||||||
| Shares | Amount | Shares | Amount | |||||||||||||
Class AAA | ||||||||||||||||
Shares sold | 16,866 | $ | 383,502 | 72,256 | $ | 1,797,251 | ||||||||||
Shares issued upon reinvestment of distributions | 42,638 | 978,106 | 59,732 | 1,161,198 | ||||||||||||
Shares redeemed | (125,115 | ) | (2,801,219 | ) | (135,872 | ) | (3,133,899 | ) | ||||||||
|
|
|
|
|
|
|
| |||||||||
Net decrease | (65,611 | ) | $ | (1,439,611 | ) | (3,884 | ) | $ | (175,450 | ) | ||||||
|
|
|
|
|
|
|
| |||||||||
Class A | ||||||||||||||||
Shares sold | 1,828 | $ | 42,120 | 13,327 | $ | 334,517 | ||||||||||
Shares issued upon reinvestment of distributions | 1,138 | 26,595 | 1,803 | 35,706 | ||||||||||||
Shares redeemed | (5,002 | ) | (107,280 | ) | (15,136 | ) | (365,144 | ) | ||||||||
|
|
|
|
|
|
|
| |||||||||
Net increase/(decrease) | (2,036 | ) | $ | (38,565 | ) | (6 | ) | $ | 5,079 | |||||||
|
|
|
|
|
|
|
| |||||||||
Class C | ||||||||||||||||
Shares sold | 39 | $ | 742 | 17,574 | $ | 381,289 | ||||||||||
Shares issued upon reinvestment of distributions | 625 | 12,678 | 2,226 | 38,461 | ||||||||||||
Shares redeemed | (13,446 | ) | (260,723 | ) | (8,019 | ) | (168,069 | ) | ||||||||
|
|
|
|
|
|
|
| |||||||||
Net increase/(decrease) | (12,782 | ) | $ | (247,303 | ) | 11,781 | $ | 251,681 | ||||||||
|
|
|
|
|
|
|
| |||||||||
Class I | ||||||||||||||||
Shares sold | 46,428 | $ | 1,034,547 | 16,519 | $ | 404,480 | ||||||||||
Shares issued upon reinvestment of distributions | 12,385 | 287,950 | 13,262 | 260,727 | ||||||||||||
Shares redeemed | (19,496 | ) | (436,618 | ) | (92,192 | ) | (2,291,556 | ) | ||||||||
|
|
|
|
|
|
|
| |||||||||
Net increase/(decrease) | 39,317 | $ | 885,879 | (62,411 | ) | $ | (1,626,349 | ) | ||||||||
|
|
|
|
|
|
|
| |||||||||
9.Indemnifications.The Fund enters into contracts that contain a variety of indemnifications. The Fund’smaximum exposure under these arrangements is unknown. However, the Fund has not had prior claims or losses pursuant to these contracts. Management has reviewed the Fund’s existing contracts and expects the risk of loss to be remote.
10.Subsequent Events.Effective February 11, 2020, the GAMCO International Growth Fund changed itsname to the Gabelli International Growth Fund.
Management has evaluated the impact on the Fund of all other subsequent events occurring through the date the financial statements were issued and has determined that there were no other subsequent events requiring recognition or disclosure in the financial statements.
19
GAMCO International Growth Fund, Inc.
Report of Independent Registered Public Accounting Firm
To the Shareholders and the Board of Directors of
GAMCO International Growth Fund, Inc.
Opinion on the Financial Statements
We have audited the accompanying statement of assets and liabilities of GAMCO International Growth Fund, Inc. (the “Fund”), including the schedule of investments, as of December 31, 2019, and the related statement of operations for the year then ended, the statements of changes in net assets for each of the two years in the period then ended, the financial highlights for each of the five years in the period then ended and the related notes (collectively referred to as the “financial statements”). In our opinion, the financial statements present fairly, in all material respects, the financial position of the Fund at December 31, 2019, the results of its operations for the year then ended, the changes in its net assets for each of the two years in the period then ended and its financial highlights for each of the five years in the period then ended, in conformity with U.S. generally accepted accounting principles.
Basis for Opinion
These financial statements are the responsibility of the Fund’s management. Our responsibility is to express an opinion on the Fund’s financial statements based on our audits. We are a public accounting firm registered with the Public Company Accounting Oversight Board (United States) (“PCAOB”) and are required to be independent with respect to the Fund in accordance with the U.S. federal securities laws and the applicable rules and regulations of the Securities and Exchange Commission and the PCAOB.
We conducted our audits in accordance with the standards of the PCAOB. Those standards require that we plan and perform the audit to obtain reasonable assurance about whether the financial statements are free of material misstatement, whether due to error or fraud. The Fund is not required to have, nor were we engaged to perform, an audit of the Fund’s internal control over financial reporting. As part of our audits we are required to obtain an understanding of internal control over financial reporting but not for the purpose of expressing an opinion on the effectiveness of the Fund’s internal control over financial reporting. Accordingly, we express no such opinion.
Our audits included performing procedures to assess the risks of material misstatement of the financial statements, whether due to error or fraud, and performing procedures that respond to those risks. Such procedures included examining, on a test basis, evidence regarding the amounts and disclosures in the financial statements. Our procedures included confirmation of securities owned as of December 31, 2019, by correspondence with the custodian. Our audits also included evaluating the accounting principles used and significant estimates made by management, as well as evaluating the overall presentation of the financial statements. We believe that our audits provide a reasonable basis for our opinion.

We have served as the auditor of one or more Gabelli/GAMCO Funds investment companies since 1992.
Philadelphia, Pennsylvania
February 27, 2020
20
GAMCO International Growth Fund, Inc.
Additional Fund Information (Unaudited)
The business and affairs of the Fund are managed under the direction of the Fund’s Board of Directors. Information pertaining to the Directors and officers of the Fund is set forth below. The Fund’s Statement of Additional Information includes additional information about the Fund’s Directors and is available without charge, upon request, by calling800-GABELLI(800-422-3554) or by writing to the GAMCO International Growth Fund, Inc. at One Corporate Center, Rye, NY 10580-1422.
| Name, Position(s) Address1 and Age | Term of Office | Number of Funds | Principal Occupation(s) | Other Directorships | ||||
INTERESTED DIRECTORS4: | ||||||||
Mario J. Gabelli, CFA Director and Chief Investment Officer Age: 77 | Since 1994 | 33 | Chairman, Chief Executive Officer, and Chief Investment Officer – Value Portfolios of GAMCO Investors, Inc. and Chief Investment Officer – Value Portfolios of Gabelli Funds, LLC and GAMCO Asset Management Inc.; Director/ Trustee or Chief Investment Officer of other registered investment companies within the Gabelli/GAMCO Fund Complex; Chief Executive Officer of GGCP, Inc.; Executive Chairman of Associated Capital Group, Inc. | Director of Morgan Group Holdings, Inc. (holding company) (2001-2019); Chairman of the Board and Chief Executive Officer of LICT Corp. (multimedia and communication services company); Director of CIBL, Inc. (broadcasting and wireless communications); Director of ICTC Group Inc. (communications) (2013-2018) | ||||
INDEPENDENT DIRECTORS5: | ||||||||
Anthony J. Colavita6 Director Age: 84 | Since 1994 | 20 | President of the law firm of Anthony J. Colavita, P.C. | — | ||||
Werner J. Roeder Director Age: 79 | Since 1994 | 21 | Retired physician; Former Vice President of Medical Affairs (Medical Director) of New York Presbyterian/Lawrence Hospital (1999-2014) | — | ||||
Anthonie C. van Ekris6 Director Age: 85 | Since 1994 | 23 | Chairman and Chief Executive Officer of BALMAC International, Inc. (global import/ export company) | — | ||||
Salvatore J. Zizza6,7 Director Age: 74 | Since 2004 | 31 | President of Zizza & Associates Corp. (private holding company); President of Bergen Cove Realty Inc.; Chairman of Harbor Diversified, Inc. (pharmaceuticals) (2009-2018); Chairman of BAM (semiconductor and aerospace manufacturing) (2000-2018); Chairman of Metropolitan Paper Recycling Inc. (recycling) (2005-2014) | Director and Chairman of Trans- Lux Corporation (business services); Director and Chairman of Harbor Diversified Inc. (pharmaceuticals) (2009-2018) | ||||
21
GAMCO International Growth Fund, Inc.
Additional Fund Information (Continued) (Unaudited)
Name, Position(s) Address1 and Age | Term of Office and Length of Time Served2 | Principal Occupation(s) During Past Five Years | ||||
OFFICERS: | ||||||
Bruce N. Alpert President Age: 68 | Since 1995 | Executive Vice President and Chief Operating Officer of Gabelli Funds, LLC since 1988; Officer of registered investment companies within the Gabelli/GAMCO Fund Complex; Senior Vice President of GAMCO Investors, Inc. since 2008 | ||||
John C. Ball Treasurer Age: 43 |
Since 2017 |
Treasurer of funds within the Gabelli/GAMCO Fund Complex since 2017; Vice President and Assistant Treasurer of AMG Funds, 2014-2017; Vice President of State Street Corporation, 2007-2014 | ||||
Agnes Mullady Vice President Age: 61 |
Since 2006 |
Officer of registered investment companies within the Gabelli/GAMCO Fund Complex since 2006; President and Chief Operating Officer of the Fund Division of Gabelli Funds, LLC since 2015; Chief Executive Officer of G.distributors, LLC since 2010; Senior Vice President of GAMCO Investors, Inc. since 2009; Vice President of Gabelli Funds, LLC since 2007; Executive Vice President of Associated Capital Group, Inc. since 2016 | ||||
Andrea R. Mango Secretary Age: 47 |
Since 2013 |
Vice President of GAMCO Investors, Inc. since 2016; Counsel of Gabelli Funds, LLC since 2013; Secretary of registered investment companies within the Gabelli/GAMCO Fund Complex since 2013; Vice President ofclosed-end funds within the Gabelli/GAMCO Fund Complex since 2014 | ||||
Richard J. Walz Chief Compliance Officer Age: 60 |
Since 2013 |
Chief Compliance Officer of registered investment companies within the Gabelli/GAMCO Fund Complex since 2013 | ||||
| 1 | Address: One Corporate Center, Rye, NY 10580-1422, unless otherwise noted. |
| 2 | Each Director will hold office for an indefinite term until the earliest of (i) the next meeting of shareholders, if any, called for the purpose of considering the election orre-election of such Director and until the election and qualification of his or her successor, if any, elected at such meeting, or (ii) the date a Director resigns or retires, or a Director is removed by the Board of Directors or shareholders, in accordance with the Fund’sBy-Laws and Articles of Incorporation. Each officer will hold office for an indefinite term until the date he or she resigns or retires or until his or her successor is elected and qualified. For Officers, includes time served in other officer roles with the Fund. |
| 3 | This column includes only directorships of companies required to report to the SEC under the Securities Exchange Act of 1934, as amended, i.e., public companies, or other investment companies registered under the 1940 Act. |
| 4 | “Interested person” of the Fund as defined in the 1940 Act. Mr. Gabelli is considered an “interested person” because of his affiliation with Gabelli Funds, LLC which acts as the Fund’s investment adviser. |
| 5 | Directors who are not interested persons are considered “Independent” Directors. |
| 6 | Mr. Colavita’s son, Anthony S. Colavita, serves as director of other funds in the Fund complex. Mr. van Ekris is an independent director of Gabelli International Ltd., Gabelli Fund LDC, Gama Capital Opportunities Master Ltd., and GAMCO International SICAV, all of which may be deemed to be controlled by Mario J. Gabelli and/or affiliates and, in that event, would be deemed to be under common control with the Fund’s Adviser. Mr. Zizza is an independent director of Gabelli International Ltd., which may be deemed to be under common control with the Advier. |
| 7 | On September 9, 2015, Mr. Zizza entered into a settlement with the SEC to resolve an inquiry relating to an alleged violation regarding the making of false statements or omissions to the accountants of a company concerning a related party transaction. The company in question is not an affiliate of, nor has any connection to, the Fund. Under the terms of the settlement, Mr. Zizza, without admitting or denying the SEC’s findings and allegation, paid $150,000 and agreed to cease and desist committing or causing any future violations of Rule13b2-2 of the Securities Exchange Act of 1934, as amended (the 1934 Act). The Board has discussed this matter and has determined that it does not disqualify Mr. Zizza from serving as an Independent Trustee. |
22
GAMCO INTERNATIONAL GROWTH FUND, INC.
One Corporate Center
Rye, NY 10580-1422
Portfolio Manager Biography
Caesar M. P. Bryanjoined GAMCO Asset Management in 1994. He is a member of the global investment teamof Gabelli Funds, LLC and portfolio manager of several funds within the Gabelli/GAMCO Fund Complex. Prior to joining Gabelli, Mr. Bryan was a portfolio manager at Lexington Management. He began his investment career at Samuel Montagu Company, the London based merchant bank. Mr. Bryan graduated from the University of Southampton in England with a Bachelor of Law and is a member of the English Bar.
2019 TAX NOTICE TO SHAREHOLDERS(Unaudited)
For the year ended December 31, 2019, the Fund paid to shareholders ordinary income distributions (comprised of net investment income and short term capital gains) totaling $0.7599, $0.4819, $0.2529, and $0.7843 per share for Class AAA, Class A, Class C, and Class I Shares, respectively, and long term capital gains totaling $789,289, or the maximum allowable. The distribution of long term capital gains has been designated as a capital gain dividend by the Fund’s Board of Directors. The Fund designates 70.39% of the ordinary income distribution as qualified dividend income pursuant to the Jobs and Growth Tax Relief Reconciliation Act of 2003. The Fund designates 0.03% of the ordinary income distribution as qualified interest income pursuant to the Tax Relief, Unemployment Reauthorization, and Job Creation Act of 2010. The Fund designates 100% of the ordinary income distribution as qualified short term gain pursuant to the American Jobs Creation Act of 2004. Also for the year ended 2019, the Fund passed through foreign tax credits of $0.033, $0.033, $0.033, and $0.033 per share to Class AAA, Class A, Class C, and Class I Shares, respectively.
U.S. Government Income
The percentage of the ordinary income distribution paid by the Fund during 2019 which was derived from U.S. Treasury securities was 0.03%.
All designations are based on financial information available as of the date of this annual report and, accordingly, are subject to change. For each item, it is the intention of the Fund to designate the maximum amount permitted under the Internal Revenue Code and the regulations thereunder.
We have separated the portfolio manager’s commentary from the financial statements and investment portfolio due to corporate governance regulations stipulated by the Sarbanes-Oxley Act of 2002. We have done this to ensure that the content of the portfolio manager’s commentary is unrestricted. Both the commentary and the financial statements, including the portfolio of investments, will be available on our website at www.gabelli.com.
| GAMCO INTERNATIONAL GROWTH FUND, INC. | ||
One Corporate Center | ||
| Rye, New York 10580-1422 | ||
| t 800-GABELLI(800-422-3554) | ||
| f 914-921-5118 | ||
| e info@gabelli.com | ||
| GABELLI.COM | ||
Net Asset Value per share available daily by calling800-GABELLI after 7:00 P.M. | ||
BOARD OF DIRECTORS
Mario J. Gabelli, CFA Chairman and Chief Executive Officer, GAMCO Investors, Inc. Executive Chairman, Associated Capital Group Inc.
Anthony J. Colavita President, Anthony J. Colavita, P.C.
Werner J. Roeder Former Medical Director, Lawrence Hospital
Anthonie C. van Ekris Chairman, BALMAC International, Inc.
Salvatore J. Zizza Chairman, Zizza & Associates Corp. | OFFICERS
Bruce N. Alpert President
John C. Ball Treasurer
Agnes Mullady Vice President
Andrea R. Mango Secretary
Richard J. Walz Chief Compliance Officer
DISTRIBUTOR
G.distributors, LLC
CUSTODIAN
State Street Bank and Trust Company
TRANSFER AGENT AND DIVIDEND DISBURSING AGENT
DST Asset Manager Solutions, Inc.
LEGAL COUNSEL
Paul Hastings LLP
| |
This report is submitted for the general information of the shareholders of the GAMCO International Growth Fund, Inc. It is not authorized for distribution to prospective investors unless preceded or accompanied by an effective prospectus.
| ||
| GAB009Q419AR | ||
Item 2. Code of Ethics.
| (a) | The registrant, as of the end of the period covered by this report, has adopted a code of ethics that applies to the registrant’s principal executive officer, principal financial officer, principal accounting officer or controller, or persons performing similar functions, regardless of whether these individuals are employed by the registrant or a third party. |
| (c) | There have been no amendments, during the period covered by this report, to a provision of the code of ethics that applies to the registrant’s principal executive officer, principal financial officer, principal accounting officer or controller, or persons performing similar functions, regardless of whether these individuals are employed by the registrant or a third party, and that relates to any element of the code of ethics description. |
| (d) | The registrant has not granted any waivers, including an implicit waiver, from a provision of the code of ethics that applies to the registrant’s principal executive officer, principal financial officer, principal accounting officer or controller, or persons performing similar functions, regardless of whether these individuals are employed by the registrant or a third party, that relates to one or more of the items set forth in paragraph (b) of this item’s instructions. |
Item 3. Audit Committee Financial Expert.
As of the end of the period covered by the report, the registrant’s Board of Directors has determined that Salvatore J. Zizza is qualified to serve as an audit committee financial expert serving on its audit committee and that he is “independent,” as defined by Item 3 of FormN-CSR.
Item 4. Principal Accountant Fees and Services.
Audit Fees
| (a) | The aggregate fees billed for each of the last two fiscal years for professional services rendered by the principal accountant for the audit of the registrant’s annual financial statements or services that are normally provided by the accountant in connection with statutory and regulatory filings or engagements for those fiscal years are $32,200 for 2018 and $32,200 for 2019. |
Audit-Related Fees
| (b) | The aggregate fees billed in each of the last two fiscal years for assurance and related services by the principal accountant that are reasonably related to the performance of the audit of the registrant’s financial statements and are not reported under paragraph (a) of this Item are $0 for 2018 and $0 for 2019. |
Tax Fees
| (c) | The aggregate fees billed in each of the last two fiscal years for professional services rendered by the principal accountant for tax compliance, tax advice, and tax planning are $3,800 for 2018 and $3,800 for 2019. Tax fees represent tax compliance services provided in connection with the review of the Registrant’s tax returns. |
All Other Fees
| (d) | The aggregate fees billed in each of the last two fiscal years for products and services provided by the principal accountant, other than the services reported in paragraphs (a) through (c) of this Item are $565 for 2018 and $681 for 2019. The fees relate to Passive Foreign Investment Company identification database subscription fees billed on an annual basis. |
| (e)(1) | Disclose the audit committee’spre-approval policies and procedures described in paragraph (c)(7) of Rule2-01 of RegulationS-X. |
Pre-Approval Policies and Procedures. The Audit Committee (“Committee”) of the registrant is responsible forpre-approving (i) all audit and permissiblenon-audit services to be provided by the independent registered public accounting firm to the registrant and (ii) all permissiblenon-audit services to be provided by the independent registered public accounting firm to the Adviser, Gabelli Funds, LLC, and any affiliate of Gabelli Funds, LLC (“Gabelli”) that provides services to the registrant (a “Covered Services Provider”) if the independent registered public accounting firm’s engagement related directly to the operations and financial reporting of the registrant. The Committee may delegate its responsibility topre-approve any such audit and permissiblenon-audit services to the Chairperson of the Committee, and the Chairperson must report to the Committee, at its next regularly scheduled meeting after the Chairperson’spre-approval of such services, his or her decision(s). The Committee may also establish detailedpre-approval policies and procedures forpre-approval of such services in accordance with applicable laws, including the delegation of some or all of the Committee’spre-approval responsibilities to the other persons (other than Gabelli or the registrant’s officers).Pre-approval by the Committee of any permissiblenon-audit services is not required so long as: (i) the permissiblenon-audit services were not recognized by the registrant at the time of the engagement to benon-audit services; and (ii) such services are promptly brought to the attention of the Committee and approved by the Committee or Chairperson prior to the completion of the audit.
| (e)(2) | The percentage of services described in each of paragraphs (b) through (d) of this Item that were approved by the audit committee pursuant to paragraph (c)(7)(i)(C) of Rule2-01 of RegulationS-X are as follows: |
(b) N/A
(c) 0%
(d) 0%
| (f) | The percentage of hours expended on the principal accountant’s engagement to audit the registrant’s financial statements for the most recent fiscal year that were attributed to work |
performed by persons other than the principal accountant’s full-time, permanent employees was less than fifty percent. |
| (g) | The aggregatenon-audit fees billed by the registrant’s accountant for services rendered to the registrant, and rendered to the registrant’s investment adviser (not including anysub-adviser whose role is primarily portfolio management and is subcontracted with or overseen by another investment adviser), and any entity controlling, controlled by, or under common control with the adviser that provides ongoing services to the registrant for each of the last two fiscal years of the registrant was $43,421 for 2018 and $53,598 for 2019. |
| (h) | The registrant’s audit committee of the board of directors has considered whether the provision ofnon-audit services that were rendered to the registrant’s investment adviser (not including anysub-adviser whose role is primarily portfolio management and is subcontracted with or overseen by another investment adviser), and any entity controlling, controlled by, or under common control with the investment adviser that provides ongoing services to the registrant that were notpre-approved pursuant to paragraph (c)(7)(ii) of Rule2-01 of RegulationS-X is compatible with maintaining the principal accountant’s independence. |
Item 5. Audit Committee of Listed Registrants.
Not applicable.
Item 6. Investments.
| (a) | Schedule of Investments in securities of unaffiliated issuers as of the close of the reporting period is included as part of the report to shareholders filed under Item 1 of this form. |
| (b) | Not applicable due to no such divestments during the semi-annual period covered since the previous FormN-CSR filing. |
| Item 7. | Disclosure of Proxy Voting Policies and Procedures forClosed-End Management Investment Companies. |
Not applicable.
Item 8. Portfolio Managers ofClosed-End Management Investment Companies.
Not applicable.
| Item 9. | Purchases of Equity Securities byClosed-End Management Investment Company and Affiliated Purchasers. |
Not applicable.
Item 10. Submission of Matters to a Vote of Security Holders.
There have been no material changes to the procedures by which the shareholders may recommend nominees to the registrant’s Board of Directors, where those changes were implemented after the registrant last provided disclosure in response to the requirements of Item 407(c)(2)(iv) of RegulationS-K (17 CFR 229.407) (as required by Item 22(b)(15) of Schedule 14A (17 CFR240.14a-101)), or this Item.
Item 11. Controls and Procedures.
| (a) | The registrant’s principal executive and principal financial officers, or persons performing similar functions, have concluded that the registrant’s disclosure controls and procedures (as defined in Rule30a-3(c) under the Investment Company Act of 1940, as amended (the “1940 Act”) (17 CFR270.30a-3(c))) are effective, as of a date within 90 days of the filing date of the report that includes the disclosure required by this paragraph, based on their evaluation of these controls and procedures required by Rule30a-3(b) under the 1940 Act (17 CFR270.30a-3(b)) and Rules13a-15(b) or15d-15(b) under the Securities Exchange Act of 1934, as amended (17 CFR240.13a-15(b) or240.15d-15(b)). |
| (b) | There were no changes in the registrant’s internal control over financial reporting (as defined in Rule30a-3(d) under the 1940 Act (17 CFR270.30a-3(d))) that occurred during the period covered by this report that has materially affected, or is reasonably likely to materially affect, the registrant’s internal control over financial reporting. |
Item 12. Disclosure of Securities Lending Activities forClosed-End Management Investment Companies.
Not applicable.
Item 13. Exhibits.
| (a)(1) | Code of ethics, or any amendment thereto, that is the subject of disclosure required by Item 2 is attached hereto. |
| (a)(2) | Certifications pursuant to Rule30a-2(a) under the 1940 Act and Section 302 of the Sarbanes-Oxley Act of 2002 are attached hereto. |
| (a)(3) | Not applicable. |
| (a)(4) | Not applicable. |
| (b) | Certifications pursuant to Rule30a-2(b) under the 1940 Act and Section 906 of the Sarbanes- Oxley Act of 2002 are attached hereto. |
SIGNATURES
Pursuant to the requirements of the Securities Exchange Act of 1934 and the Investment Company Act of 1940, the registrant has duly caused this report to be signed on its behalf by the undersigned, thereunto duly authorized.
(Registrant) Gabelli International Growth Fund, Inc. | ||
By (Signature and Title)* /s/ Bruce N. Alpert | ||
Bruce N. Alpert, Principal Executive Officer | ||
Date March 6, 2020 | ||
Pursuant to the requirements of the Securities Exchange Act of 1934 and the Investment Company Act of 1940, this report has been signed below by the following persons on behalf of the registrant and in the capacities and on the dates indicated.
By (Signature and Title)* /s/ Bruce N. Alpert | ||
Bruce N. Alpert, Principal Executive Officer | ||
Date March 6, 2020 | ||
By (Signature and Title)* /s/ John C. Ball | ||
John C. Ball, Principal Financial Officer and Treasurer | ||
Date March 6, 2020 | ||
* Print the name and title of each signing officer under his or her signature.