UNITED STATES
SECURITIES AND EXCHANGE COMMISSION
Washington, D.C. 20549
Form 6-K
Report of Foreign Issuer
Pursuant to Rule 13a-16 or 15d-16 under
the Securities Exchange Act of 1934
For the Month of January 2023
Commission File Number: 001-32294
TATA MOTORS LIMITED
(Translation of registrant’s name into English)
BOMBAY HOUSE
24, HOMI MODY STREET,
MUMBAI 400 001, MAHARASHTRA, INDIA
Telephone # 91 22 6665 8282
(Address of principal executive office)
Indicate by check mark whether the registrant files or will file annual reports under cover Form 20-F or Form 40-F.
Form 20-F ☒ Form 40-F ☐
Indicate by check mark if the registrant is submitting the Form 6-K in paper as permitted by Regulation S-T Rule 101(b)(1):
Yes ☐ No ☒
Indicate by check mark if the registrant is submitting the Form 6-K in paper as permitted by Regulation S-T Rule 101(b)(7):
Yes ☐ No ☒
SIGNATURE
Pursuant to the requirements of the Securities Exchange Act of 1934, the registrant has duly caused this report to be signed on its behalf by the undersigned, thereunto duly authorised.
|
Tata Motors Limited By: /s/ Maloy Kumar Gupta Name: Maloy Kumar Gupta Title: Company Secretary
Dated: January 25, 2023 |
TATA MOTORS LIMITED
Bombay House
24, Homi Mody Street,
Mumbai 400 001, Maharashtra, India
| News Release - 1 | January 25, 2023 |
Intimation of outcome of Board Meeting under Regulations 30, 33, 52 and 54 of the SEBI (Listing Obligations and Disclosure Requirements) Regulations 2015 (“SEBI Listing Regulations”)
Mumbai, January 25, 2023: We hereby inform you that the Board of Directors of Tata Motors Limited (‘the Company’) at its Meeting held today, i.e., January 25, 2023 has, inter alia, approved the Audited Standalone Financial Results along with Auditor’s Report and the Unaudited Consolidated Financial Results along with Limited Review Report, for the third quarter and nine months ended December 31, 2022. The said Financial Results and the Reports together with Security Cover Certificate are attached herewith. Also enclosed herewith a copy of the Press Release with regard to the said Financial Results for the third quarter and nine months ended December 31, 2022.
The above information is also made available on the Company’s website at www.tatamotors.com.
The Board Meeting commenced at 11 a.m. (IST) and concluded at 4 p.m. (IST).
| News Release – 2 | January 25, 2023 |
CONTENTS OF THE PRESS RELEASE
Tata Motors Group Results Q3 FY23 | January 25, 2023 |

Tata Motors Consolidated Q3 FY23 Results:
Revenue ₹ 88.5KCr, EBITDA at ₹ 9.9KCr, PBT (bei) ₹ 3.2KCr, Auto FCF ₹ 5.3 KCr
| • | Consolidated Revenue ₹ 88.5KCr, up 22.5%, EBITDA at 11.1% (+ 90 bps), EBIT at 4.4% ( +270 bps) |
| • | JLR Revenue £ 6.0b, up 28%, EBITDA at 11.9% (-10 bps), EBIT at 3.7% (+230 bps) |
| • | Tata CV Revenue ₹ 16.9KCr, up 22.5%, EBITDA at 8.4% (+580 bps), EBIT at 5.9% (+650 bps) |
| • | Tata PV Revenue ₹ 11.7 KCr, up 37.4%, EBITDA at 6.9% (+370 bps), EBIT at 1.5% (+510 bps) |
Mumbai, January 25, 2023: Tata Motors Ltd announced its results for quarter ending December 31, 2022. The results represent the details on consolidated segment level.
Consolidated (₹ Cr Ind AS) | Jaguar Land Rover (£m, IFRS) | Tata Commercial Vehicles (₹Cr, Ind AS) | Tata Passenger Vehicles (₹Cr, Ind AS) | |||||||||||||||||||||||||||||||
| FY23 | Vs. PY | FY23 | Vs. PY | FY23 | Vs. PY | FY23 | Vs. PY | |||||||||||||||||||||||||||
| Q3 FY23 | Revenue | 88,489 | 22.5 | % | 6,041 | 28.1 | % | 16,886 | 22.5 | % | 11,671 | 37.4 | % | |||||||||||||||||||||
| EBITDA (%) | 11.1 | 90 | bps | 11.9 | (10) | bps | 8.4 | 580 | bps | 6.9 | 370 | bps | ||||||||||||||||||||||
| EBIT (%) | 4.4 | 270 | bps | 3.7 | 230 | bps | 5.9 | 650 | bps | 1.5 | 510 | bps | ||||||||||||||||||||||
| PBT (bei) | 3,203 | ₹ | 3,901 | crs | 265 | £ | 274 | m | 938 | ₹ | 1,093 | crs | 321 | ₹ | 650 | crs | ||||||||||||||||||
| YTD FY 23 | Revenue | 240,035 | 20.0 | % | 15,707 | 15.9 | % | 49,576 | 46.9 | % | 35,775 | 70.2 | % | |||||||||||||||||||||
| EBITDA (%) | 9.5 | 50 | bps | 9.8 | 20 | bps | 6.3 | 380 | bps | 6.1 | 170 | bps | ||||||||||||||||||||||
| EBIT (%) | 2.2 | 250 | bps | 0.5 | 170 | bps | 3.7 | 500 | bps | 0.9 | 460 | bps | ||||||||||||||||||||||
| PBT (bei) | (3,533) | ₹ | 3,214 | crs | (432) | £ | (11) | m | 1,531 | ₹ | 2,271 | crs | 503 | ₹ | 1,401 | crs | ||||||||||||||||||
Jaguar Land Rover (JLR): JLR delivered on its plans and achieved positive free cash flow and profitability in the quarter as supplies improved. Revenues were £6.0 billion, up 28% vs. Q3 FY22 and up 15% sequentially reflecting better supplies, strong model mix and pricing. Profit before tax in the quarter was £265 million, up from a loss of £(9) million a year ago with a positive EBIT margin of 3.7%, up from 1.4% in Q3 FY22. The higher profitability reflects increased wholesale volumes with favourable mix, pricing and foreign exchange offset partially by higher inflation and supplier claims largely related to constrained volumes. Free cash flow was £490 million in Q3 FY22.
Tata Commercial Vehicles (Tata CV): Tata CV revenues in Q3 FY23 were up 22.5% vs. Q3 FY22 at ₹ 16.9KCr. Q3 FY23 EBITDA margins were 8.4% (+580 bps yoy) and EBIT margins were at 5.9% (+ 650 bps y-o-y) led by better mix, higher realisations, cost savings and softened commodity prices. The business was PBT (bei) positive at ₹ 0.9K Cr as compared to loss of ₹ 0.2K Cr in Q3 FY22.
Tata Passenger Vehicles (Tata PV): Tata PV revenues were up 37% vs Q3 FY22 at ₹ 11.7K Cr reflecting higher volumes and realizations. EBITDA margins were 6.9% (+370 bps yoy) and EBIT margins were at 1.5% (+510 bps) yoy driven by improved volumes and mix, higher realizations, softening commodities and certain one offs. The business was PBT (bei) positive at ₹ 0.3K Cr as compared to loss of ₹ 0.3K Cr in Q3 FY22.
Outlook: We remain cautiously optimistic on the demand situation despite global uncertainties. We will remain vigilant on demand and our continued focus on profitable growth, improving semiconductor supplies and stable commodity prices will aid revenue growth, margin improvement and positive cash delivery in Q4 FY23.
Page 1 of 5
Tata Motors Group Results Q3 FY23 | January 25, 2023 |
JAGUAR LAND ROVER (JLR)
HIGHLIGHTS
| • | Revenues in Q3 FY23 of £6.0 billion, up 28% vs. Q3 FY22 and up 15% vs. Q2 FY23 |
| • | Free cash flow in Q3 FY23 of £490 million with EBIT margin of 3.7% and profit before tax of £265 million, up from a loss before tax of £(9) million in Q3 FY22 |
| • | Wholesale volumes of 80k, the highest level since Q1 FY22 when the semiconductor shortages began and up 15% vs. Q3 FY22 |
| • | The production ramp up of New Range Rover and New Range Rover Sport continued with 27k units wholesaled in the quarter, up from 14k in Q2 |
| • | Liquidity remained strong at the end of the quarter with £3.9 billion of cash |
| • | Undrawn £1.5 billion unsecured revolving credit facility extended to April 2026 and extension to £0.6 billion equivalent China bank loan maturing June 2023 signed |
REIMAGINE TRANSFORMATION CONTINUES
| • | Strong demand continues – 85k cars delivered to retail clients in Q3 while taking 95k net new orders with the total number of orders increasing to a new record of 215k units |
| • | Three most profitable models, the New Range Rover, New Range Rover Sport and Defender account for over 74% of the order book |
| • | Modern luxury Range Rover SV is the fastest ever selling Special Vehicle Operations model, with more than 5,000 orders since launch in October 2021 at average pricing above £180,000 |
| • | Refocus transformation programme delivered £850 million year to date and on track to deliver £1 billion of savings this financial year |
| • | Reimagined pure-electric Jaguar models, launching in 2025, will be built in Solihull alongside BEV Range Rovers, heralding an exciting new era of electric car production in the UK |
LOOKINGAHEAD
The Company continues to see strong demand for its vehicles. Wholesales in China during the quarter were impacted by lockdowns leading to dealer closures followed by high rates of staff absence as Covid-19 restrictions were relaxed. The situation is expected to recover in the fourth quarter with our dealers open and staff absence closer to normal levels in January. The Refocus transformation programme is on track to deliver a target of £1 billion plus improvements in the year to help mitigate the impact of inflation.
Although there continues to be supply chain and other macro risks, our guidance for the full year remains unchanged. Positive EBIT margin and free cashflow in Q4 FY23 on wholesales of 80,000 or more are expected to achieve breakeven free cashflow and a positive EBIT margin for the full year.
Adrian Mardell, Jaguar Land Rover’s Interim Chief Executive Officer, said:
“JLR has returned to profit as chip shortages eased in the quarter and production and wholesales increased. These improved results are testament to the hard work and dedication of our people across the business who have delivered a further increase in production of our New Range Rover and Range Rover Sport models.
We remain committed to our Reimagine strategy which will transform JLR into an all-electric modern luxury business, whilst delivering our SBTi climate goals and striving to exceed our clients’ expectations.”
Page 2 of 5
Tata Motors Group Results Q3 FY23 | January 25, 2023 |
TATA COMMERCIAL VEHICLES (TATA CV)
HIGHLIGHTS
| • | Q3 revenue at ₹ 16.9KCr, (+22.5%), EBITDA 8.4% (+580 bps), EBIT 5.9% (+650 bps), PBT (bei) ₹ 0.9 K Cr. |
| • | Q3 Tata CV global wholesales stood at 97.1K units (-6% yoy), primarily because of weaker international business volumes. |
| • | Q3 CV domestic wholesales at 90.8 K units (flat yoy), domestic retails at 97.7K units (+5%). |
| • | Domestic CV market share (based on Vahan) at 42.1% in YTD FY23 (-260 bps vs FY22), although improving month on month in Q3. |
| • | Commenced deliveries of ACE EV, marking a significant leap forward in offering sustainable mobility solutions. |
| • | Smart city mobility business continues to witness strong growth; signed definitive agreement for operating 1,500 buses in Delhi, 921 buses in Bengaluru and 200 buses in Jammu & Kashmir. |
| • | Comprehensive range of green and zero emission mobility solutions showcased at Auto Expo. |
FINANCIALS
The commercial vehicles industry witnessed a robust recovery in Q3 FY23 led by strong demand in MHCV and passenger carrier segment. Improving fleet utilizations, pick up in road construction projects and increase in cement consumption catalyzed the demand recovery for MHCVs. CV exports, however, remained subdued due to the prevailing economic situation in most of our overseas markets. Domestic wholesales were at 90.8k units (flat yoy), domestic retails at 97.7k units (+5%). Our continued focus on retail during the quarter resulted in retail sales surpassing wholesale by 6.3% in Q3 FY23, and reducing system inventory as we transition towards BSVI phase-2 norms.
Revenues at ₹ 16.9KCr was up 22.5% yoy despite wholesales being down 6%, reflecting improved mix and better market operating price. Q3 FY23 EBITDA margins were 8.4% (+580 bps yoy) and EBIT margins were at 5.9% (+ 650 bps yoy) led by sustained pricing improvement, cost actions and softening commodity prices. The business was PBT (bei) positive at ₹ 0.9K Cr as compared to loss of ₹ 0.2K Cr in Q3 FY22.
LOOKINGAHEAD
The CV industry is poised for growth on the back of increased infrastructure activity, demand for last mile mobility and strong recovery in bus segment. Going forward, we expect a good replacement demand, especially in MHCVs in Q4 FY23, as we also maintain a close watch on the evolving geopolitical situation, inflation and interest rate risks on both the supply and demand. The recent exciting launches of the new range of smart trucks in MHCV and ILCV, and best-in-class pickups will help us serve our customers better. We exhibited most comprehensive range of greener and zero emission mobility solutions at Auto Expo, across cargo and passenger segments, powered by natural gas, electric and hydrogen. Focus will continue to remain on registration market share improvement with demand-pull strategy, innovation intensity, restoring double-digit EBITDA margins and successfully delivering on new business models.
Girish Wagh, Executive Director Tata Motors Ltd said:
“In Q3 FY23, the CV industry witnessed a steady, overall demand. Our focus on creating ‘’Demand Pull’ from customers and sustained emphasis on retail in Q3 FY23 resulted in retail sales surpassing wholesale by 6.3%, thereby enabling reduction in inventory as we transition towards BS VI phase-2 norms. Led by realization improvement, revenue growth was higher than volume growth. Realization improvement coupled with commodity softening and cost control resulted in improved margins. Going forward, we will maintain our agility and keep a close watch on the evolving geopolitical, inflation and interest rate risks on both supply and demand. We will also continue to drive the business with strong customer connect, product and service innovations to improve customer affinity for our brands, step-up registration market shares sustainably, and improve realisations and profitability.”
Page 3 of 5
Tata Motors Group Results Q3 FY23 | January 25, 2023 |
TATA PASSENGER VEHICLES (TATA PV)
HIGHLIGHTS
| • | Q3 revenue at ₹ 11.7KCr, (+37%), EBITDA 6.9% (+370 bps), EBIT 1.5% (+510 bps), PBT (bei) ₹ 0.3 K Cr. |
| • | Q3 PV domestic wholesales at 131.3 K units (+33%), domestic retails at 138.9K units (+ 27%), highest quarterly retails |
| • | Q3 EV volumes highest at 12.6 K units (+116%). YTD FY23 EV volumes at 32.4K units. |
| • | EV penetration at 8%, CNG penetration at 9% in YTD FY23. |
| • | Domestic PV market share strengthened further by 200 bps to 14.1% in YTD FY23. |
| • | Deliveries of Tiago.ev commenced, strong 20K+ order book. |
| • | Signed MOUs / secured orders for 7000 XPRES-T EVs. |
| • | Acquisition of Ford India’s Sanand plant complete; would unlock capacity of 300k vehicles p.a., scalable to 420k vehicles p.a. |
| • | Drawdown notice for Tranche 2 of ₹ 3,750 Cr from TPG Rise Climate issued and funds expected to be received by end January. |
FINANCIALS
Tata PV business continued its strong momentum in Q3 FY23. Wholesales grew 33% yoy to 132.3k vehicles driven by strong demand for Nexon, Nexon EV, Punch, Tiago and Tigor CNG. Retails grew 27% yoy. The business witnessed highest ever retails at 139K. The revenues grew 37% yoy to ₹ 11.7K Cr reflecting higher volumes and realizations. EBITDA margins were 6.9% (+370 bps yoy) and EBIT margins were at 1.5% (+510 bps yoy) driven by improved volumes & mix, realizations, softening commodities and certain one off’s. The business was PBT (bei) positive at ₹ 0.3K Cr as compared to loss of ₹ 0.3K Cr in Q3 FY22. Market share improved to 14.1% in YTD FY23.
LOOKINGAHEAD
While in Q3 FY23 the industry witnessed some moderation in demand post festive season, we expect the PV industry to continue witnessing robust demand in the next quarter. We expect the growth momentum for EVs to remain strong with their rising popularity and the announcement of progressive policies by several states. The Company has commenced deliveries of Tiago.ev in January 2023 and strong 20K+ order book will support growth. The Company unveiled range of exciting new offerings at auto expo, including Avinya, Harrier EV, Sierra EV, ICE Curvv, Punch and Altroz with twin iCNG technology which received an overwhelming response. The Company will continue to deliver market-beating growth, improve profitability and cash flows.
Shailesh Chandra, Managing Director Tata Motors Passenger Vehicles Ltd & Tata Passenger Electric Mobility Limited said:
“Q3 FY23 was one of the best quarters for the PV industry with strong retails from new launches, robust festive demand, and adequate supply of vehicles. Tata Motors posted its highest ever quarterly retails in Q3 FY23 and crossed the 50,000 units of monthly retail for the first time. Wholesales of 131,297 units recorded in Q3 FY23 (+32.6% vs Q3 FY22) resulted in the business comfortably crossing the distinctive landmark of 500,000 annual units to post wholesale of 526,798 units in CY22. EVs too posted their highest ever sales in Q3 FY23 at 12,596 units (+ 116.2% vs Q3 FY22) and crossed the cumulative sales milestone of 50,000 units. Going forward, we remain vigilant about the evolving demand and supply situation and will stay nimble to take necessary actions swiftly whilst focusing on improving profitability further.”
Page 4 of 5
Tata Motors Group Results Q3 FY23 | �� | January 25, 2023 |
ADDITIONAL COMMENTARY ON FINANCIAL STATEMENTS
(CONSOLIDATED NUMBERS, IND AS)
FINANCE COSTS
Finance costs increased by ₹275 Cr to ₹2,676 Cr during Q3 FY23 as compared to ₹2,401 Cr in Q3 FY22 due to higher gross borrowings.
JOINTVENTURES, ASSOCIATESAND OTHERINCOME
For the quarter, net profit from joint ventures and associates amounted to ₹103Cr compared with a loss of ₹113Cr in Q3 FY 22. Other income (excluding grants) was ₹455Cr in Q3 FY23 versus ₹197Cr in Q3 FY22.
FREE CASH FLOWS
Free cash flow (automotive) in the quarter, was positive at ₹5.3K Cr (as compared to ₹4.0K Cr in Q3 FY 22) owing to improvement in cash profits and working capital.
REPORTING FORMAT
The press release represents the details on consolidated segment level. The operating segment comprise of automotive segment and others.
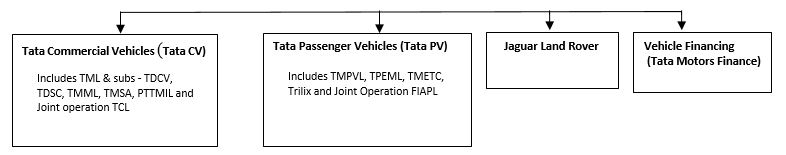
In automotive segment, results have been presented for entities basis four reportable sub-segments as below
TML Group Automotive business
For further information contact
Corporate Communications, Tata Motors Limited
Phone: 00 91 22 6665 7289; www.tatamotors.com
Page 5 of 5
News Release – 3 | January 25, 2023 |
Independent Auditors Report (Standalone)
| B S R & Co. LLP | ||
Chartered Accountants
8th floor, Business Plaza, | Telephone: +91 20 6747 7300 | |
Westin Hotel Campus, | Fax: +91 20 6747 7310 | |
36/3-B, Koregaon Park Annex, | ||
Mundhwa Road, Ghorpadi, | ||
Pune - 411001, India |
Independent Auditor’s Report
To the Board of Directors of Tata Motors Limited
Report on the audit of the Standalone Financial Results
Opinion
We have audited the accompanying standalone quarterly financial results of Tata Motors Limited (“the Company”) for the quarter ended 31 December 2022 and the year-to-date results for the period from 1 April 2022 to 31 December 2022, (in which are included interim financial statements of a joint operation) attached herewith, being submitted by the Company pursuant to the requirement of Regulation 33 and Regulation 52(4) read with Regulation 63 of the Securities and Exchange Board of India (Listing Obligations and Disclosure Requirements) Regulations, 2015, as amended (“Listing Regulations”).
In our opinion and to the best of our information and according to the explanations given to us, these standalone financial results:
| a. | are presented in accordance with the requirements of Regulation 33 and Regulation 52(4) read with Regulation 63 of the Listing Regulations in this regard; and |
| b. | give a true and fair view in conformity with the recognition and measurement principles laid down in the applicable accounting standards, and other accounting principles generally accepted in India, of the net profit and other comprehensive income and other financial information for the quarter ended 31 December 2022 as well as net profit and other comprehensive loss and other financial information for the year to date results for the period from 1 April 2022 to 31 December 2022. |
Basis for Opinion
We conducted our audit in accordance with the Standards on Auditing (“SAs”) specified under section 143(10) of the Companies Act, 2013 (“the Act”). Our responsibilities under those SAs are further described in the Auditor’s Responsibilities for the Audit of the Standalone Financial Results section of our report. We are independent of the Company, in accordance with the Code of Ethics issued by the Institute of Chartered Accountants of India together with the ethical requirements that are relevant to our audit of the financial statements under the provisions of the Act, and the Rules thereunder, and we have fulfilled our other ethical responsibilities in accordance with these requirements and the Code of Ethics. We believe that the audit evidence we have obtained, is sufficient and appropriate to provide a basis for our opinion.
Management’s and Board of Directors’ Responsibilities for the Standalone Financial Results
These quarterly financial results as well as the year to date standalone financial results have been prepared on the basis of the interim financial statements.
The Company’s Management and the Board of Directors are responsible for the preparation of these standalone financial results that give a true and fair view of the net profit/ loss and other comprehensive income and other financial information in accordance with the recognition and measurement principles laid down in Indian Accounting Standard 34, ‘Interim Financial Reporting’ prescribed under Section 133 of the Act and other accounting principles generally accepted in India and in compliance with Regulation 33 and Regulation 52(4) read with Regulation 63 of the Listing Regulations. The respective Management and Board of Directors of the Company and its joint operation are responsible for maintenance of adequate accounting records in accordance with the provisions of the Act for safeguarding of the assets of each company and for preventing and detecting frauds and other irregularities; selection and application of appropriate accounting policies; making judgments and estimates that are reasonable and prudent; and the design, implementation and maintenance of adequate internal financial controls, that were operating effectively for ensuring accuracy and completeness of the accounting records, relevant to the preparation and presentation of the standalone financial results that give a true and fair view and are free from material misstatement, whether due to fraud or error.
| B S R & Co. (a partnership firm with Registration No. BA61223) converted into B S R & Co. LLP (a Limited Liability Partnership with LLP Registration No. AAB-8181) with effect from October 14, 2013 | Registered Office:
14th Floor, Central B Wing and North C Wing, Nesco IT Park 4, Nesco Center, Western Express Highway, Goregaon (East), Mumbai - 400063 |
B S R & Co. LLP
Independent Auditor’s Report (Continued)
Tata Motors Limited
In preparing the standalone financial results, the respective Management and the Board of Directors are responsible for assessing each company’s ability to continue as a going concern, disclosing, as applicable, matters related to going concern and using the going concern basis of accounting unless the respective Board of Directors either intends to liquidate the company or to cease operations, or has no realistic alternative but to do so.
The respective Board of Directors are also responsible for overseeing the financial reporting process of each company.
Auditor’s Responsibilities for the Audit of the Standalone Financial Results
Our objectives are to obtain reasonable assurance about whether the standalone financial results as a whole are free from material misstatement, whether due to fraud or error, and to issue an auditor’s report that includes our opinion. Reasonable assurance is a high level of assurance, but is not a guarantee that an audit conducted in accordance with SAs will always detect a material misstatement when it exists. Misstatements can arise from fraud or error and are considered material if, individually or in the aggregate, they could reasonably be expected to influence the economic decisions of users taken on the basis of these standalone financial results.
As part of an audit in accordance with SAs, we exercise professional judgment and maintain professional skepticism throughout the audit. We also:
| • | Identify and assess the risks of material misstatement of the standalone financial results, whether due to fraud or error, design and perform audit procedures responsive to those risks, and obtain audit evidence that is sufficient and appropriate to provide a basis for our opinion. The risk of not detecting a material misstatement resulting from fraud is higher than for one resulting from error, as fraud may involve collusion, forgery, intentional omissions, misrepresentations, or the override of internal control. |
| • | Obtain an understanding of internal control relevant to the audit in order to design audit procedures that are appropriate in the circumstances, but not for the purpose of expressing an opinion on the effectiveness of the company’s internal control. |
| • | Evaluate the appropriateness of accounting policies used and the reasonableness of accounting estimates and related disclosures in the standalone financial results made by the Management and Board of Directors. |
| • | Conclude on the appropriateness of the Management and Board of Directors’ use of the going concern basis of accounting and, based on the audit evidence obtained, whether a material uncertainty exists related to events or conditions that may cast significant doubt on the Company’s ability to continue as a going concern. If we conclude that a material uncertainty exists, we are required to draw attention in our auditor’s report to the related disclosures in the standalone financial results or, if such disclosures are inadequate, to modify our opinion. Our conclusions are based on the audit evidence obtained up to the date of our auditor’s report. However, future events or conditions may cause the Company to cease to continue as a going concern. |
| • | Evaluate the overall presentation, structure and content of the standalone financial results, including the disclosures, and whether the standalone financial results represent the underlying transactions and events in a manner that achieves fair presentation. |
We communicate with those charged with governance of the Company and such other entity included in standalone financial results of which we are the independent auditors regarding, among other matters, the planned scope and timing of the audit and significant audit findings, including any significant deficiencies in internal control that we identify during our audit.
B S R & Co. LLP
Independent Auditor’s Report (Continued)
Tata Motors Limited
We also provide those charged with governance with a statement that we have complied with relevant ethical requirements regarding independence, and to communicate with them all relationships and other matters that may reasonably be thought to bear on our independence, and where applicable, related safeguards.
| For B S R & Co. LLP | ||
| Chartered Accountants | ||
| Firm’s Registration No.:101248W/W-100022 | ||
| Shiraz Vastani | ||
| Partner | ||
| Mumbai | Membership No.: 103334 | |
| 25 January 2023 | UDIN:23103334BGYMQW2763 | |
| News Release – 4 | January 25, 2023 |
Audited Standalone Financial Results

TATA MOTORS LIMITED
Regd.Office : Bombay House, 24, Homi Mody Street, Mumbai 400 001.
CIN L28920MH1945PLC004520
(₹ in crores)
STATEMENT OF STANDALONE AUDITED FINANCIAL RESULTS FOR THE QUARTER AND NINE MONTHS ENDED DECEMBER 31, 2022
| Quarter ended | Nine months ended | Year ended | ||||||||||||||||||||||||
| December 31, | September 30, | December 31, | December 31, | December 31, | March 31, | |||||||||||||||||||||
Particulars | 2022 | 2022 | 2021 | 2022 | 2021 | 2022 | ||||||||||||||||||||
| I. | Revenue from operations | Audited | ||||||||||||||||||||||||
(a) Revenue | 15,693.14 | 14,850.97 | 12,259.02 | 45,337.23 | 29,656.36 | 46,880.97 | ||||||||||||||||||||
(b) Other operating revenue | 100.84 | 95.81 | 93.76 | 277.97 | 269.05 | 382.71 | ||||||||||||||||||||
| Total revenue from operations (a)+(b) | 15,793.98 | 14,946.78 | 12,352.78 | 45,615.20 | 29,925.41 | 47,263.68 | ||||||||||||||||||||
| II. | Other income (includes Government incentives) | 173.18 | 195.06 | 138.74 | 579.01 | 464.59 | 659.91 | |||||||||||||||||||
| III. | Total Income (I+II) | 15,967.16 | 15,141.84 | 12,491.52 | 46,194.21 | 30,390.00 | 47,923.59 | |||||||||||||||||||
| IV. | Expenses | |||||||||||||||||||||||||
(a) Cost of materials consumed | 10,115.98 | 9,674.40 | 8,499.61 | 30,316.23 | 20,656.65 | 31,693.11 | ||||||||||||||||||||
(b) Purchases of products for sale | 1,583.00 | 1,513.01 | 1,342.76 | 4,751.96 | 3,424.20 | 5,030.00 | ||||||||||||||||||||
(c) Changes in inventories of finished goods, work-in-progress and products for sale | (65.25 | ) | 349.83 | (188.35 | ) | (634.65 | ) | (1,274.30 | ) | (403.87 | ) | |||||||||||||||
(d) Employee benefits expense | 972.28 | 964.43 | 918.10 | 2,999.56 | 2,725.91 | 3,601.51 | ||||||||||||||||||||
(e) Finance costs | 503.43 | 549.35 | 535.55 | 1,581.58 | 1,629.98 | 2,121.73 | ||||||||||||||||||||
(f) Foreign exchange (gain)/loss (net) | 66.68 | 98.42 | 33.80 | 254.16 | 87.01 | 136.81 | ||||||||||||||||||||
(g) Depreciation and amortisation expense | 430.18 | 446.13 | 452.15 | 1,299.29 | 1,302.71 | 1,760.57 | ||||||||||||||||||||
(h) Product development/engineering expenses | 214.83 | 200.19 | 122.83 | 592.69 | 331.27 | 593.90 | ||||||||||||||||||||
(i) Other expenses | 1,842.19 | 1,846.41 | 1,589.72 | 5,612.00 | 4,186.14 | 6,018.71 | ||||||||||||||||||||
(j) Amount transferred to capital and other accounts | (256.49 | ) | (252.78 | ) | (233.09 | ) | �� | (753.14 | ) | (643.57 | ) | (905.42 | ) | |||||||||||||
| Total expenses (IV) | 15,406.83 | 15,389.39 | 13,073.08 | 46,019.68 | 32,426.00 | 49,647.05 | ||||||||||||||||||||
| V. | Profit/(loss) before exceptional items and tax (III-IV) | 560.33 | (247.55 | ) | (581.56 | ) | 174.53 | (2,036.00 | ) | (1,723.46 | ) | |||||||||||||||
| VI. | Exceptional Items | |||||||||||||||||||||||||
(a) Employee separation cost | — | — | 0.09 | 1.36 | 6.48 | 8.35 | ||||||||||||||||||||
(b) Cost of slump sale of Passenger Vehicle (PV) undertaking | — | — | — | — | — | 50.00 | ||||||||||||||||||||
(c) Provision/(reversal) for loan given to/investment in/cost of closure of subsidiary companies | 0.11 | 4.04 | — | 4.22 | 54.18 | (139.24 | ) | |||||||||||||||||||
(d) Others | — | — | — | — | (2.52 | ) | (2.52 | ) | ||||||||||||||||||
| VII. | Profit/(loss) before tax from continuing operations (V-VI) | 560.22 | (251.59 | ) | (581.65 | ) | 168.95 | (2,094.14 | ) | (1,640.05 | ) | |||||||||||||||
| VIII. | Tax expense/(credit) (net) of continuing operations | |||||||||||||||||||||||||
(a) Currrent tax | 29.86 | 13.94 | 11.10 | 59.49 | 28.74 | 51.18 | ||||||||||||||||||||
(b) Deferred tax | 24.17 | 27.06 | 42.74 | 76.89 | 29.70 | 48.00 | ||||||||||||||||||||
| Total tax expense (net) | 54.03 | 41.00 | 53.84 | 136.38 | 58.44 | 99.18 | ||||||||||||||||||||
| IX. | Profit/(loss) for the period after tax from continuing operations (VII-VIII) | 506.19 | (292.59 | ) | (635.49 | ) | 32.57 | (2,152.58 | ) | (1,739.23 | ) | |||||||||||||||
| X. | Profit/(loss) before tax for the period from discontinued operations | — | — | 834.77 | — | 392.51 | 392.51 | |||||||||||||||||||
| XI. | Tax expense/(credit) (net) of discontinued operations | |||||||||||||||||||||||||
(a) Currrent tax | — | — | 23.43 | — | 44.14 | 44.14 | ||||||||||||||||||||
(b) Deferred tax | — | — | — | — | — | — | ||||||||||||||||||||
| Total tax expense | — | — | 23.43 | — | 44.14 | 44.14 | ||||||||||||||||||||
| XII. | Profit/(loss) for the period after tax from discontinued operations (X-XI) | — | — | 811.34 | — | 348.37 | 348.37 | |||||||||||||||||||
| XIII. | Profit/(loss) for the period (IX+XII) | 506.19 | (292.59 | ) | 175.85 | 32.57 | (1,804.21 | ) | (1,390.86 | ) | ||||||||||||||||
| XIV. | Other comprehensive income/(loss) | |||||||||||||||||||||||||
| (A) (i) Items that will not be reclassified to profit and loss | 58.14 | 78.83 | (128.19 | ) | (100.60 | ) | 181.37 | 313.63 | ||||||||||||||||||
(ii) Income tax (expense)/credit relating to items that will not be reclassified to profit and loss | 1.99 | 8.61 | 22.91 | 21.19 | (12.92 | ) | (32.33 | ) | ||||||||||||||||||
| (B) (i) Items that will be reclassified to profit and loss | (13.96 | ) | (27.90 | ) | 14.24 | (165.17 | ) | (8.09 | ) | 1.62 | ||||||||||||||||
| (ii) Income tax (expense)/credit relating to items that will be reclassified to profit and loss | 3.52 | 7.02 | (4.97 | ) | 26.41 | 2.83 | (0.57 | ) | ||||||||||||||||||
| Total other comprehensive income/(loss), net of taxes | 49.69 | 66.56 | (96.01 | ) | (218.17 | ) | 163.19 | 282.35 | ||||||||||||||||||
| XV. | Total comprehensive income/(loss) for the period (XIII+XIV) | 555.88 | (226.03 | ) | 79.84 | (185.60 | ) | (1,641.02 | ) | (1,108.51 | ) | |||||||||||||||
| XVI. | Paid-up equity share capital (face value of ₹2 each) | 766.01 | 765.98 | 765.86 | 766.01 | 765.86 | 765.88 | |||||||||||||||||||
| XVII. | Reserves excluding revaluation reserve (as per balance sheet of previous accounting year) | 19,178.27 | ||||||||||||||||||||||||
| XVIII. | Earnings/(loss) per share (EPS) | |||||||||||||||||||||||||
| Earnings/(loss) per share from continuing operations (EPS) | ||||||||||||||||||||||||||
(a) Ordinary shares (face value of ₹ 2 each) | ||||||||||||||||||||||||||
(i) Basic | ₹ | 1.31 | (0.76 | ) | (1.66 | ) | 0.07 | (5.62 | ) | (4.54 | ) | |||||||||||||||
(ii) Diluted | ₹ | 1.31 | (0.76 | ) | (1.66 | ) | 0.07 | (5.62 | ) | (4.54 | ) | |||||||||||||||
(b) ‘A’ Ordinary shares (face value of ₹2 each) | ||||||||||||||||||||||||||
(i) Basic | ₹ | 1.41 | (0.76 | ) | (1.66 | ) | 0.17 | (5.62 | ) | (4.54 | ) | |||||||||||||||
(ii) Diluted | ₹ | 1.41 | (0.76 | ) | (1.66 | ) | 0.17 | (5.62 | ) | (4.54 | ) | |||||||||||||||
| Earnings/(loss) per share from discontinued operations (EPS) | ||||||||||||||||||||||||||
(a) Ordinary shares (face value of ₹ 2 each) | ||||||||||||||||||||||||||
(i) Basic | ₹ | — | — | 2.11 | — | 0.90 | 0.90 | |||||||||||||||||||
(ii) Diluted | ₹ | — | — | 2.10 | — | 0.90 | 0.90 | |||||||||||||||||||
(b) ‘A’ Ordinary shares (face value of ₹2 each) | ||||||||||||||||||||||||||
(i) Basic | ₹ | — | — | 2.21 | — | 1.00 | 1.00 | |||||||||||||||||||
(ii) Diluted | ₹ | — | — | 2.20 | — | 1.00 | 1.00 | |||||||||||||||||||
| Earnings/(loss) per share from continuing and discontinued operations (EPS) | ||||||||||||||||||||||||||
(a) Ordinary shares (face value of ₹ 2 each) | ||||||||||||||||||||||||||
(i) Basic | ₹ | 1.31 | (0.76 | ) | 0.45 | 0.07 | (4.72 | ) | (3.63 | ) | ||||||||||||||||
(ii) Diluted | ₹ | 1.31 | (0.76 | ) | 0.44 | 0.07 | (4.72 | ) | (3.63 | ) | ||||||||||||||||
(b) ‘A’ Ordinary shares (face value of ₹2 each) | ||||||||||||||||||||||||||
(i) Basic | ₹ | 1.41 | (0.76 | ) | 0.55 | 0.17 | (4.62 | ) | (3.63 | ) | ||||||||||||||||
(ii) Diluted | ₹ | 1.41 | (0.76 | ) | 0.54 | 0.17 | (4.62 | ) | (3.63 | ) | ||||||||||||||||
| Not annualised | ||||||||||||||||||||||||||
Notes:
| 1) | The above results were reviewed and recommended by the Audit Committee on January 24, 2023 and approved by the Board of Directors at its meeting held on January 25, 2023. |
| 2) | The above results include the Company’s proportionate share of income and expenditure in its Joint Operation, namely Tata Cummins Private Limited. A Scheme of Arrangement, between Tata Motors Limited and Tata Motors Passenger Vehicles Limited (formerly known as TML Business Analytics Services Limited) (Transferee Company) for transfer of the PV Undertaking of the Company to the Transferee Company, was effective from January 1, 2022. Post transfer of PV Undertaking, the arrangement with Fiat India Automobiles Private Limited (FIAPL) is considered to be a Joint Venture of the Company. |
Accordingly, the results of PV undertaking along with joint operation Fiat India Automobiles Private Limited (FIAPL) has been disclosed as discontinued operations in the Statement of Profit and Loss for the quarter and nine months ended December 31, 2021 and year ended March 31, 2022.
Below are supplementary details of Tata Motors Limited on standalone basis excluding interest in the aforesaid Joint Operations:
| (₹ in crores) | ||||||||||||||||||||||||||
Particulars | Quarter ended | Nine months ended | Year ended | |||||||||||||||||||||||
| December 31, | September 30, | December 31, | December 31, | December 31, | March 31, | |||||||||||||||||||||
| 2022 | 2022 | 2021 | 2022 | 2021 | 2022 | |||||||||||||||||||||
1 | Revenue from operations | 15,599.50 | 14,762.93 | 12,197.46 | 45,071.21 | 29,476.85 | 46,668.92 | |||||||||||||||||||
2 | Profit/(loss) before tax from continuing operations | 468.92 | (311.08 | ) | (627.21 | ) | 67.15 | (2,162.50 | ) | (1,795.39 | ) | |||||||||||||||
3 | Profit/(loss) after tax from continuing operations | 455.02 | (326.22 | ) | (645.18 | ) | 11.04 | (2,152.44 | ) | (1,763.34 | ) | |||||||||||||||
4 | Profit/(loss) before tax from discontinued operations | — | — | 705.36 | — | 143.81 | 143.81 | |||||||||||||||||||
5 | Profit/(loss) after tax from discontinued operations | — | — | 705.36 | — | 143.81 | 143.81 | |||||||||||||||||||
| 3) | Additional Information pursuant to requirement of Regulation 52(4) and Regulation 54(2) of the Securities and Exchange Board of India (Listing Obligations and Disclosure Requirements) Regulation 2015 as amended and as at nine months ended December 31, 2022: |
Sr | Particulars | Quarter ended | Nine months ended | Year ended | ||||||||||||||||||||||
| December 31, | September 30, | December 31, | December 31, | December 31, | March 31, | |||||||||||||||||||||
| 2022 | 2022 | 2021 | 2022 | 2021 | 2022 | |||||||||||||||||||||
| Audited | ||||||||||||||||||||||||||
| a) | Debt Equity Ratio (number of times) [Total Debt(i)/ Equity(ii)] | 1.09 | 1.18 | 1.38 | 1.09 | 1.38 | 1.16 | |||||||||||||||||||
| b) | Debt Service Coverage Ratio (number of times) (not annualised) [(Profit/(loss) before exceptional items and tax+Interest on Borrowings)/(Interest on Borrowings + Repayment of Borrowings(iii))] | 0.56 | 0.31 | (0.06 | ) | 0.40 | (1.51 | ) | 0.01 | |||||||||||||||||
| c) | Interest Service Coverage Ratio (number of times) (not annualised) [(Profit/(loss) before exceptional items and tax+Interest on Borrowings)/Interest on Borrowings] | 2.44 | 0.44 | (0.41 | ) | 1.14 | (0.54 | ) | 0.01 | |||||||||||||||||
| d) | Capital redemption reserve (₹ In crores) | 2.28 | 2.28 | 2.28 | 2.28 | 2.28 | 2.28 | |||||||||||||||||||
| e) | Debenture redemption reserve (₹ In crores) | 411.14 | 411.14 | 904.44 | 411.14 | 904.44 | 411.14 | |||||||||||||||||||
| f) | Net worth (₹ In crores)(iv) | 19,795.89 | 19,230.39 | 17,436.77 | 19,795.89 | 17,436.77 | 19,944.15 | |||||||||||||||||||
| g) | Net profit/(loss) after tax from continuing operations (₹ In crores) | 506.19 | (292.59 | ) | (635.49 | ) | 32.57 | (2,152.58 | ) | (1,739.23 | ) | |||||||||||||||
| h) | Net profit/(loss) after tax from discontinued operations (₹ In crores) | — | — | 811.34 | — | 348.37 | 348.37 | |||||||||||||||||||
| i) | Net profit/(loss) for the period (₹ In crores) | 506.19 | (292.59 | ) | 175.85 | 32.57 | (1,804.21 | ) | (1,390.86 | ) | ||||||||||||||||
| j) | Earnings/(loss) per share (EPS) | |||||||||||||||||||||||||
| Earnings/(loss) per share from continuing operations (EPS) | ||||||||||||||||||||||||||
(a) Ordinary shares (face value of ₹ 2 each) | ||||||||||||||||||||||||||
(i) Basic (₹) | 1.31 | (0.76 | ) | (1.66 | ) | 0.07 | (5.62 | ) | (4.54 | ) | ||||||||||||||||
(ii) Diluted (₹) | 1.31 | (0.76 | ) | (1.66 | ) | 0.07 | (5.62 | ) | (4.54 | ) | ||||||||||||||||
(b) ‘A’ Ordinary shares (face value of ₹2 each) | ||||||||||||||||||||||||||
(i) Basic (₹) | 1.41 | (0.76 | ) | (1.66 | ) | 0.17 | (5.62 | ) | (4.54 | ) | ||||||||||||||||
(ii) Diluted (₹) | 1.41 | (0.76 | ) | (1.66 | ) | 0.17 | (5.62 | ) | (4.54 | ) | ||||||||||||||||
| Earnings/(loss) per share from discontinued operations (EPS) | ||||||||||||||||||||||||||
(a) Ordinary shares (face value of ₹ 2 each) | ||||||||||||||||||||||||||
(i) Basic (₹) | — | — | 2.11 | — | 0.90 | 0.90 | ||||||||||||||||||||
(ii) Diluted (₹) | — | — | 2.10 | — | 0.90 | 0.90 | ||||||||||||||||||||
(b) ‘A’ Ordinary shares (face value of ₹2 each) | ||||||||||||||||||||||||||
(i) Basic (₹) | — | — | 2.21 | — | 1.00 | 1.00 | ||||||||||||||||||||
(ii) Diluted (₹) | — | — | 2.20 | — | 1.00 | 1.00 | ||||||||||||||||||||
| Earnings/(loss) per share from continuing and discontinued operations (EPS) | ||||||||||||||||||||||||||
(a) Ordinary shares (face value of ₹ 2 each) | ||||||||||||||||||||||||||
(i) Basic (₹) | 1.31 | (0.76 | ) | 0.45 | 0.07 | (4.72 | ) | (3.63 | ) | |||||||||||||||||
(ii) Diluted (₹) | 1.31 | (0.76 | ) | 0.44 | 0.07 | (4.72 | ) | (3.63 | ) | |||||||||||||||||
(b) ‘A’ Ordinary shares (face value of ₹2 each) | ||||||||||||||||||||||||||
(i) Basic (₹) | 1.41 | (0.76 | ) | 0.55 | 0.17 | (4.62 | ) | (3.63 | ) | |||||||||||||||||
(ii) Diluted (₹) | 1.41 | (0.76 | ) | 0.54 | 0.17 | (4.62 | ) | (3.63 | ) | |||||||||||||||||
| Not annualised | ||||||||||||||||||||||||||
| k) | Current ratio (number of times) [Current assets/ Current liabilities] | 0.45 | 0.48 | 0.58 | 0.45 | 0.58 | 0.58 | |||||||||||||||||||
| l) | Long term debt to working capital (number of times) [Long Term Borrowings(v)/Working capital(vi)] | (1.20 | ) | (1.53 | ) | (2.78 | ) | (1.20 | ) | (2.78 | ) | (2.18 | ) | |||||||||||||
| m) | Bad debts to Account receivable ratio (%) [Bad Debts(vii) / Average of Trade and Other Receivables(viii)] | — | — | 0.01 | % | (0.07 | %) | 1.23 | % | 1.72 | % | |||||||||||||||
| n) | Current liability ratio (number of times) [Current liabilities (excluding current maturities of Iong term debt and interest accrued on borrowings) / (Total liabilities)] | 0.58 | 0.54 | 0.41 | 0.58 | 0.41 | 0.54 | |||||||||||||||||||
| o) | Total debts to total assets (number of times) [(Non current borrowings + Current borrowings) / Total assets] | 0.36 | 0.38 | 0.36 | 0.36 | 0.36 | 0.36 | |||||||||||||||||||
| p) | Debtors turnover (number of times) (not annualised) [Revenue from operations / Average Trade receivables] | 6.11 | 5.32 | 5.75 | 19.96 | 15.44 | 25.88 | |||||||||||||||||||
| q) | Inventory turnover (number of times) (not annualised) [Raw material consumed(ix) / Average Inventory(x)] | 2.69 | 2.52 | 2.20 | 8.63 | 5.92 | 10.60 | |||||||||||||||||||
| r) | Operating margin (%) [(Profit/(loss) before tax from continuing operations +/(-) Exceptional Items + Net Finance Charges + Depreciation and amortisation - Other Income (excluding incentives)) / Revenue from operations] | 9.20 | % | 4.83 | % | 2.80 | % | 6.43 | % | 2.12 | % | 3.85 | % | |||||||||||||
| s) | Net profit margin (%) [Net profit after tax / Revenue from continuing operations] | 3.20 | % | (1.96 | %) | 1.42 | % | 0.07 | % | (6.03 | %) | (2.94 | %) | |||||||||||||
| t) | Security cover ratio (number of times)1 [Secured Assets(xi) / Secured Borrowings(xii)] | 3.63 | 1.74 | 1.34 | 3.63 | 1.34 | 1.38 | |||||||||||||||||||
| 1 | As at December 31, 2022, 8.80% non-convertible debentures of face value of ₹ 1,000 crores are secured by creating a pari passu charge on certain tangible fixed assets, right of use assets and capital work-in-progress. |
| 2 | As at December 31, 2021, assets and liabilties were recomputed excluding PV undertaking and Fiat India Automobiles Private Limited (refer note 2) to make the ratios comparable with current periods. |
Notes:
| i | Total debts includes non current and current borrowings |
| ii | Equity = Equity share capital + Other equity |
| iii | Repayment of borrowings includes repayment of long-term borrowings, proceeds from short-term borrowings, repayment of short-term borrowings and net change in other short-term borrowings (with maturity up to three months). |
| iv | Net Worth has been computed on the basis as stated in Clause 2 of the Securities and Exchange Board of India (Listing Obligations and Disclosure Requirements) Regulations, 2015 i.e. Net worth as defined in sub-section (57) of section 2 of the Companies Act, 2013. |
| v | Long term borrowings (including current portion of long term borrowings). |
| vi | Working capital = Current assets - Current liabilities (excluding current maturities of Iong term debt and interest accrued on borrowings). |
| vii | Bad debts includes written off on trade and other receivables. |
| viii | Trade and other receivables includes Trade receivables, current and non-current Loans and advances and other current and non-current assets. |
| ix | Raw material consumed includes Cost of materials consumed, Purchases of products for sale and Changes in inventories of finished goods, work-in-progress and products for sale. |
| x | Inventory includes Raw materials and components, Work-in-progress, Finished goods, Stores and spare parts, Consumable tools and Goods-in-transit - Raw materials and components. |
| xi | Secured assets include written down value of secured assets and fixed deposits under lien. |
| xii | Secured borrowings include 8.80% non-convertible debentures and term loans from financial institutions. |
| 4) | The Company primarily operates in the automotive business. The automotive business comprises two reportable segments i.e. commercial vehicles and passenger vehicles (Upto December 31, 2021 - refer note 2). Post transfer of net assets of PV undertaking, the Company operates in a single segment of commercial vehicles. The Company has opted for an exemption as per para 4 of Ind AS 108. Segment information is thus given in the consolidated financial statements of the Company. |
| 5) | On November 4, 2022, the Supreme Court of India passed a judgment thereby upholding the validity of the 2014 amendment to the Employees’ Pension Scheme 1995. The Judgment has interalia upheld the exercise of joint option by certain categories of employees for contributing into the pension fund an amount over and above the statutory limit. Subsequently, the Employees Provident Fund Organization (EPFO) issued a circular on December 29, 2022 calling upon eligible pensioners whose exercise of joint options were rejected earlier by EPFO authorities to apply online for exercising their options afresh. In case of Tata Motors Limited, joint option has never been exercised in the past, and contributions have always been made only on the statutory ceiling amount. As on December 31, 2022 also no such intimation has been made or options exercised by such pensioners and the Company jointly. As regards the exempted establishments under the Pension Scheme, the Judgment in paragraph 37 states that the cases of the members of such category were not being addressed in the Judgement. The Company being an exempted establishment is in consultation with EPFO for the further course of action, if any. Consequently, there is no impact on the Financial Results for the quarter and nine months ended December 31, 2022. |
| 6) | The Statutory Auditors have carried an audit of the above results for the quarter and nine months ended December 31, 2022 and have issued an unmodified opinion on the same. |
| Tata Motors Limited | ||
| Girish Wagh | ||
| Mumbai, January 25, 2023 | Executive Director | |
News Release – 5 | January 25, 2023 |
Independent Auditors Limited Review Report (Unaudited Consolidated)
B S R & Co. LLP Chartered Accountants
8th floor, Business Plaza, Westin Hotel Campus, 36/3-B, Koregaon Park Annex, Mundhwa Road, Ghorpadi, Pune - 411001, India |
Telephone: +91 20 6747 7300 Fax: +91 20 6747 7310 |
Limited Review Report on unaudited consolidated financial results of Tata Motors Limited for the quarter ended 31 December 2022 and year to date results for the period from 1 April 2022 to 31 December 2022 pursuant to Regulation 33 and Regulation 52(4) read with Regulation 63 of Securities and Exchange Board of India (Listing Obligations and Disclosure Requirements) Regulations, 2015, as amended
To the Board of Directors of Tata Motors Limited
| 1. | We have reviewed the accompanying Statement of unaudited consolidated financial results of Tata Motors Limited (hereinafter referred to as “the Parent”), and its subsidiaries (the Parent and its subsidiaries together referred to as “the Group”) and its share of the net profit after tax (net) and total comprehensive income (net) of its associates and joint ventures for the quarter ended 31 December 2022 and year to date results for the period from 1 April 2022 to 31 December 2022 (“the Statement”) (in which are included interim financial statements from 2 of joint operations), being submitted by the Parent pursuant to the requirements of Regulation 33 and Regulation 52(4) read with Regulation 63 of the Securities and Exchange Board of India (Listing Obligations and Disclosure Requirements) Regulations, 2015, as amended (“Listing Regulations”). |
| 2. | This Statement, which is the responsibility of the Parent’s management and approved by the Parent’s Board of Directors, has been prepared in accordance with the recognition and measurement principles laid down in Indian Accounting Standard 34 “Interim Financial Reporting” (“Ind AS 34”), prescribed under Section 133 of the Companies Act, 2013, and other accounting principles generally accepted in India and in compliance with Regulation 33 and Regulation 52(4) read with Regulation 63 of the Listing Regulations. Our responsibility is to express a conclusion on the Statement based on our review. |
| 3. | We conducted our review of the Statement in accordance with the Standard on Review Engagements (SRE) 2410 “Review of Interim Financial Information Performed by the Independent Auditor of the Entity”, issued by the Institute of Chartered Accountants of India. A review of interim financial information consists of making inquiries, primarily of persons responsible for financial and accounting matters, and applying analytical and other review procedures. A review is substantially less in scope than an audit conducted in accordance with Standards on Auditing and consequently does not enable us to obtain assurance that we would become aware of all significant matters that might be identified in an audit. Accordingly, we do not express an audit opinion. |
We also performed procedures in accordance with the circular issued by the Securities and Exchange Board of India under Regulation 33(8) of the Listing Regulations, to the extent applicable.
| 4. | The Statement includes the results of the entities mentioned in Annexure I: |
| 5. | Based on our review conducted and procedures performed as stated in paragraph 3 above and based on the consideration of the review reports of the other auditors referred to in paragraph 6 and 8 below, nothing has come to our attention that causes us to believe that the accompanying Statement, prepared in accordance with the recognition and measurement principles laid down in the aforesaid Indian Accounting Standard and other accounting principles generally accepted in India, has not disclosed the information required to be disclosed in terms of Regulation 33 and Regulation 52(4) read with Regulation 63 of the Listing Regulations, including the manner in which it is to be disclosed, or that it contains any material misstatement. |
| B S R & Co. (a partnership firm with Registration No. BA61223) converted into B S R & Co. LLP (a Limited Liability Partnership with LLP Registration No. AAB-8181) with effect from October 14, 2013 | Registered Office:
14th Floor, Central B Wing and North C Wing, Nesco IT Park 4, Nesco Center, Western Express Highway, Goregaon (East), Mumbai - 400063 |
Page 1 of 10
B S R & Co. LLP
Limited Review Report (Continued)
Tata Motors Limited
| 6. | We did not review the interim financial statements /financial information/ financial results of two Subsidiaries and 56 Step-down subsidiaries included in the Statement, whose interim financial statements /financial information/ financial results reflects total revenues (before consolidation adjustments) of Rs. 60,712.81 crores and Rs. 1,57,680.37 crores, total net profit / (loss) after tax (before consolidation adjustments) of Rs. 2,156.54 crores and (Rs. 3,500.67 crores) and total comprehensive income / (loss) (before consolidation adjustments) of Rs. 8,274.61 crores and Rs. (8,130.64 crores), for the quarter ended 31 December 2022 and for the period from 1 April 2022 to 31 December 2022 respectively, as considered in the Statement. The Statement also include the Group’s share of net profit after tax (net) of Rs. 43.73 crores and Rs. 109.71 crores and total comprehensive income (net) of Rs. 43.73 crores and Rs. 109.71 crores, for the quarter ended 31 December 2022 and for the period from 1 April 2022 to 31 December 2022 respectively as considered in the Statement, in respect of six associates and two joint ventures, whose interim financial statements / interim financial information/ interim financial results have not been reviewed by us. These interim financial statements /financial information/interim financial results have been reviewed by other auditors whose reports have been furnished to us by the Parent’s management and our conclusion on the Statement, in so far as it relates to the amounts and disclosures included in respect of these subsidiaries/step-down subsidiaries/associates/joint ventures, is based solely on the reports of the other auditors and the procedures performed by us as stated in paragraph 3 above. |
Two of these step-down subsidiaries are located outside India whose interim financial statements/financial information/financial results have been prepared in accordance with accounting principles generally accepted in their respective countries and which have been reviewed by other auditors under generally accepted auditing standards applicable in their respective countries. The Parent’s management has converted the interim financial statements/financial information/financial results of such step-down subsidiaries located outside India from accounting principles generally accepted in their respective countries to accounting principles generally accepted in India. We have reviewed these conversion adjustments made by the Parent’s management. Our conclusion in so far as it relates to the balances and affairs of such step-down subsidiaries located outside India is based on the reports of other auditors and the conversion adjustments prepared by the management of the Parent and reviewed by us.
Our conclusion is not modified in respect of this matter.
| 7. | The Statement includes the interim financial statements /financial information/ financial results of eight subsidiaries and nine step-down subsidiaries which have not been reviewed, whose interim financial statements /financial information/ financial results reflects total revenues (before consolidation adjustments) of Rs. 139.96 crores and Rs. 553.75 crores, total net loss after tax (before consolidation adjustments) (net) of Rs. 2.97 crores and Rs. 10.07 crores and total comprehensive loss (before consolidation adjustments) (net) of Rs. 2.69 crores and Rs. 8.99 crores, for the quarter ended 31 December 2022 and for the period from 1 April 2022 to 31 December 2022 respectively, as considered in the Statement. The Statement also includes the Group’s share of net profit after tax (net) of Rs. 57.70 crores and Rs. 127.25 crores and total comprehensive income (net) of Rs. 57.70 crores and Rs. 127.25 crores, for the quarter ended 31 December 2022 and for the period from 1 April 2022 to 31 December 2022 respectively as considered in the Statement, in respect of four associates and two joint ventures, based on their interim financial statements /financial information/ financial results which have not been reviewed. According to the information and explanations given to us by the Parent’s management, these interim financial statements /financial information/ financial results are not material to the Group. |
Our conclusion is not modified in respect of this matter.
Page 2 of 10
B S R & Co. LLP
Limited Review Report (Continued)
Tata Motors Limited
| 8. | We did not review the interim financial statement/financial information/financial results of one joint operation included in the Statement, whose interim financial statement/financial information/financial results reflects total revenue (before consolidation adjustments) of Rs. 4,938.19 crores and Rs. 15,279.95 crores, total net profit after tax (before consolidation adjustments) of Rs. 181.09 crores and Rs. 478.24 crores, total comprehensive income (before consolidation adjustments) of Rs. 181.24 crores and Rs. 478.62 crores, for the quarter ended 31 December 2022 and for the period from 1 April 2022 to 31 December 2022 respectively, as considered in the Statement. The interim financial statement/financial information/financial results of this joint operation has been been reviewed by other auditor whose report has been fursnished to us by the Parent’s management and our conclusion on the Statement, in so far as it relates to the amounts and disclosures included in respect of this joint operation, is based solely on the report of such other auditor and the procedures performed by us as stated in paragraph 3 above. |
Our conclusion is not modified in respect of this matter.
| For B S R & Co. LLP | ||
| Chartered Accountants | ||
| Firm’s Registration No.:101248W/W-100022 | ||
| Shiraz Vastani | ||
| Partner | ||
| Mumbai | Membership No.: 103334 | |
| 25 January 2023 | UDIN:23103334BGYMQX6918 | |
Page 3 of 10
B S R & Co. LLP
Limited Review Report (Continued)
Tata Motors Limited
Annexure I
List of entities included in unaudited consolidated financial results.
| Sr. No | Name of component | Relationship | ||
| 1 | TML Business Services Limited | Subsidiary | ||
| 2 | Tata Technologies Limited | Subsidiary | ||
| 3 | Tata Motors Body Solutions Limited (Name changed from Tata Morcopolo Motors Limited with effect from 30 December 2022) | Subsidiary | ||
| 4 | TMF Holding Limited | Subsidiary | ||
| 5 | Tata Motors Insurance Broking and Advisory Services Limited | Subsidiary | ||
| 6 | Jaguar Land Rover Technology and Business Services India Private Limited (Name changed from JT Special Vehicles Pvt. Limited with effect from April 12, 2022) | Subsidiary | ||
| 7 | Tata Hispano Motors Carrocera S.A | Subsidiary | ||
| 8 | TML Holdings Pte, Ltd; Singapore | Subsidiary | ||
| 9 | Tata Precision Industries Pte Ltd | Subsidiary | ||
| 10 | Tata Hispano Motors Carrocerries Maghreb SA | Subsidiary | ||
| 11 | Brabo Robotics and Automation Limited | Subsidiary | ||
| 12 | Tata Motors Passenger Vehicles Limited (Name changed from TML Business Analytics Services Limited with effect from September 17, 2021) | Subsidiary | ||
Page 4 of 10
B S R & Co. LLP
Limited Review Report (Continued)
Tata Motors Limited
| 13 | TML CV Mobility Solutions Limited | Subsidiary | ||
| 14 | Tata Passenger Electric Mobility Ltd. (Incorporated on December 21, 2021) | Subsidiary | ||
| 15 | TML Smart City Mobility Solutions Limited | Subsidiary | ||
| 16 | Trilix S.R.L | Step down Subsidiary | ||
| 17 | Jaguar Land Rover India Limited | Step down subsidiary | ||
| 18 | Tata Motors Finance Solutions Limited | Step down subsidiary | ||
| 19 | Tata Daewoo Commercial Vehicle Co Ltd | Step down subsidiary | ||
| 20 | Tata Daewoo Commercial Vehicle Sales and Distribution Company Limited | Step down subsidiary | ||
| 21 | Tata Motors (Thailand) Ltd | Step down subsidiary | ||
| 22 | Tata Motors (SA) (Propreitary) Ltd | Step down subsidiary | ||
| 23 | P.T. Tata Motors Indonesia | Step down subsidiary | ||
| 24 | Jaguar Land Rover Automotive PLC | Step down subsidiary | ||
| 25 | PT Tata Motors Distribusi Indonesia | Step down subsidiary | ||
| 26 | Jaguar Land Rover France SAS | Step down subsidiary | ||
| 27 | Jaguar Land Rover Italia SPA | Step down subsidiary | ||
| 28 | Jaguar Land Rover Portugal Veiculos e Pecas Lda | Step down subsidiary | ||
| 29 | Jaguar Land Rover Espana SL | Step down subsidiary | ||
Page 5 of 10
B S R & Co. LLP
Limited Review Report (Continued)
Tata Motors Limited
| 30 | Jaguar Land Rover Deustcheland GmbH | Step down subsidiary | ||
| 31 | Jaguar Land Rover Austria GmbH | Step down subsidiary | ||
| 32 | Jaguar Land Rover Australia Pty Limited | Step down subsidiary | ||
| 33 | Jaguar Land Rover Japan Limited | Step down subsidiary | ||
| 34 | Jaguar Land Rover Canada ULC | Step down subsidiary | ||
| 35 | Jaguar Land Rover Belux NV (Following the merger of Jaguar Belux and Land Rover) | Step down subsidiary | ||
| 36 | Jaguar Land Rover Nederland BV | Step down subsidiary | ||
| 37 | Jaguar Land Rover (South Africa) (Pty) Ltd | Step down subsidiary | ||
| 38 | JLR Nominee Company Limited | Step down subsidiary | ||
| 39 | Jaguar Land Rover (South Africa) Holdings Limited | Step down subsidiary | ||
| 40 | Jaguar Cars Limited | Step down subsidiary | ||
| 41 | Jaguar Cars (South Africa) (Pty) Ltd | Step down subsidiary | ||
| 42 | S S Cars Limited | Step down subsidiary | ||
| 43 | Daimler Transport Vehicles Limited | Step down subsidiary | ||
| 44 | Jaguar Land Rover North America LLC | Step down subsidiary | ||
| 45 | Jaguar Land Rover Holdings Limited | Step down subsidiary | ||
Page 6 of 10
B S R & Co. LLP
Limited Review Report (Continued)
Tata Motors Limited
| 46 | Jaguar Land Rover Limited | Step down subsidiary | ||
| 47 | Land Rover Exports Limited ( Business Transferred to Jaguar Land Rover Exports Limited) | Step down subsidiary | ||
| 48 | The Lanchester Motor Company Limited | Step down subsidiary | ||
| 49 | The Daimler Motor Company Limited | Step down subsidiary | ||
| 50 | Jaguar Land Rover Korea Company Limited | Step down subsidiary | ||
| 51 | Jaguar land rover (China) Investment Co. Limited | Step down subsidiary | ||
| 52 | Jaguar e Land rover Brasil Industria e Comercio de veiculos LTDA | Step down subsidiary | ||
| 53 | Limited Liability Company “Jaguar land rover” (Russia) | Step down subsidiary | ||
| 54 | Land Rover Ireland Limited | Step down subsidiary | ||
| 55 | Shanghai Jaguar Land Rover Automotive Services Company Limited | Step down subsidiary | ||
| 56 | Jaguar Land Rover Pension Trustees Limited | Step down subsidiary | ||
| 57 | Jaguar Land Rover Slovakia S.R.O | Step down subsidiary | ||
| 58 | Jaguar Land Rover Singapore Pte. Ltd. | Step down subsidiary | ||
| 59 | Jaguar Racing Limited | Step down subsidiary | ||
| 60 | Inmotion Ventures Limited | Step down subsidiary | ||
| 61 | Inmotion Ventures 2 Limited | Step down subsidiary | ||
Page 7 of 10
B S R & Co. LLP
Limited Review Report (Continued)
Tata Motors Limited
| 62 | Inmotion Ventures 3 Limited | Step down subsidiary | ||
| 63 | Jaguar Land Rover Columbia S.A.S | Step down subsidiary | ||
| 64 | Tata Technologies Inc. | Step down subsidiary | ||
| 65 | Tata Technologies De Mexico, S.A. de C.V. | Step down subsidiary | ||
| 66 | Tata Technologies Pte Limited | Step down subsidiary | ||
| 67 | Tata Technologies (Thailand) Limited | Step down subsidiary | ||
| 68 | Tata Technologies Europe limited | Step down subsidiary | ||
| 69 | Incat International PLC | Step down subsidiary | ||
| 70 | Tata Technologies GmBH | Step down subsidiary | ||
| 71 | Cambric Limited | Step down subsidiary | ||
| 72 | Tata Technlogies SRL Romania | Step down subsidiary | ||
| 73 | Tata Manufacturing Technologies (Shanghai) Limited | Step down subsidiary | ||
| 74 | Tata Technologies Nordics AB | Step down subsidiary | ||
| 75 | Tata Motors Finance Limited | Step down subsidiary | ||
| 76 | Tata Motors European Technical Centre PLC (Changed from a direct subsidiary of TML to a WOS of TPEM w.e.f. March 10, 2022) | Step down subsidiary | ||
| 77 | Jaguar Land Rover Ireland (Services) Limited | Step down subsidiary | ||
| 78 | Jaguar Land Rover Mexico, SAPi de CV - Mexico | Step down subsidiary | ||
Page 8 of 10
B S R & Co. LLP
Limited Review Report (Continued)
Tata Motors Limited
| 79 | Jaguar Land Rover Servicios Mexico, S.A. de C.V. - Mexico | Step down subsidiary | ||
| 80 | Jaguar Land Rover Taiwan Company LTD | Step down subsidiary | ||
| 81 | Jaguar Land Rover Hungary KFT | Step down subsidiary | ||
| 82 | Jaguar Land Rover Classic USA LLC | Step down subsidiary | ||
| 83 | Jaguar Land Rover Classic Deutschland GmbH | Step down subsidiary | ||
| 84 | Jaguar Land Rover Ventures Ltd | Step down subsidiary | ||
| 85 | Jaguar Land Rover (Ningbo) Trading Co. Limited | Step down subsidiary | ||
| 86 | Bowler Motors Limited | Step down subsidiary | ||
| 87 | In-Car Ventures Limited | Step down subsidiary | ||
| 88 | Tata Cumins Private Limited | Joint Operation | ||
| 89 | Fiat India Automobiles Private Limited | Joint Operation | ||
| 90 | Nita Company Ltd | Associate | ||
| 91 | Jaguar Cars Finance Limited | Associate | ||
| 92 | Synaptiv Limited | Associate | ||
| 93 | Cloud Car Inc | Associate | ||
| 94 | Automobile Corporation of Goa Limited | Associate | ||
| 95 | Tata Hitachi Construction Machinery Company Private Limited | Associate | ||
Page 9 of 10
B S R & Co. LLP
Limited Review Report (Continued)
Tata Motors Limited
| 96 | Tata Precision Industries (India) Limited | Associate | ||
| 97 | Tata Autocomp Systems Limited | Associate | ||
| 98 | Drive Club Service Pte Ltd | Associate | ||
| 99 | Inchcape JLR Europe Limited | Associate | ||
| 100 | Chery Jaguar Land Rover Automotive Company Ltd | Joint Venture | ||
| 101 | Tata HAL Technologies Limited | Joint Venture | ||
| 102 | Loginomic Tech Solutions Limited | Joint Venture | ||
| 103 | Jaguar Land Rover Schweiz AG | Joint Venture | ||
| 104 | Sertec Corporation | Associate | ||
| 105 | TML Smart City Mobility Solutions (J&K) Private Limited (Incorporated with effect from 13 October 2022) | Step down subsidiary | ||
| 106 | Incat International PLC 2000 Trust (UK ESOP Trust) | Step down subsidiary | ||
| 107 | Tata Technologies Limited- Employee Stock Option Trust (TTL ESOP Trust) | Step down subsidiary | ||
Page 10 of 10
| News Release – 6 | January 25, 2023 |
Unaudited Consolidated Financial Results

TATA MOTORS LIMITED
Regd.Office : Bombay House, 24, Homi Mody Street, Mumbai 400 001.
CIN L28920MH1945PLC004520
(₹ in crores)
STATEMENT OF CONSOLIDATED UNAUDITED FINANCIAL RESULTS FOR THE QUARTER AND NINE MONTHS ENDED DECEMBER 31, 2022
| Quarter ended | Nine months ended | Year ended | ||||||||||||||||||||||||
| December 31, | September 30, | December 31, | December 31 | March 31, | ||||||||||||||||||||||
| 2022 | 2022 | 2021 | 2022 | 2021 | 2022 | |||||||||||||||||||||
Particulars | Unaudited | Audited | ||||||||||||||||||||||||
I. | Revenue from operations | |||||||||||||||||||||||||
(a) Revenue | 87,783.21 | 78,846.92 | 71,406.77 | 237,857.89 | 197,378.07 | 275,235.23 | ||||||||||||||||||||
(b) Other operating revenues | 705.38 | 764.45 | 822.52 | 2,176.73 | 2,636.49 | 3,218.39 | ||||||||||||||||||||
| Total revenue from operations (a)+(b) | 88,488.59 | 79,611.37 | 72,229.29 | 240,034.62 | 200,014.56 | 278,453.62 | ||||||||||||||||||||
II. | Other income | 1,130.38 | 1,038.51 | 702.57 | 3,056.25 | 2,151.08 | 3,053.63 | |||||||||||||||||||
III. | Total Income (I + II) | 89,618.97 | 80,649.88 | 72,931.86 | 243,090.87 | 202,165.64 | 281,507.25 | |||||||||||||||||||
IV. | Expenses | |||||||||||||||||||||||||
(a) Cost of materials consumed | ||||||||||||||||||||||||||
(i) Cost of materials consumed | 53,268.92 | 47,721.91 | 41,616.79 | 147,914.54 | 112,008.05 | 159,598.06 | ||||||||||||||||||||
(ii) Basis adjustment on hedge accounted derivatives | 86.95 | 318.29 | 352.58 | 817.83 | 943.36 | 1,322.50 | ||||||||||||||||||||
(b) Purchase of products for sale | 5,471.30 | 5,324.32 | 4,874.09 | 16,059.26 | 13,023.83 | 18,374.77 | ||||||||||||||||||||
(c) Changes in inventories of finished goods, work-in-progress and products for sale | (1,368.63 | ) | (769.53 | ) | (794.71 | ) | (6,516.37 | ) | 3,714.15 | 1,590.49 | ||||||||||||||||
(d) Employee benefits expense | 8,592.90 | 7,897.92 | 7,651.04 | 24,277.18 | 22,779.10 | 30,808.52 | ||||||||||||||||||||
(e) Finance costs | 2,675.83 | 2,487.26 | 2,400.74 | 7,583.81 | 6,931.34 | 9,311.86 | ||||||||||||||||||||
(f) Compulsorily convertible preference share measured at fair value | — | — | — | — | — | 14.45 | ||||||||||||||||||||
(g) Foreign exchange (gain)/loss (net) | (1,177.27 | ) | 623.93 | (313.78 | ) | 214.44 | (365.65 | ) | 78.68 | |||||||||||||||||
(h) Depreciation and amortisation expense | 6,071.78 | 5,897.34 | 6,078.13 | 17,810.16 | 18,403.58 | 24,835.69 | ||||||||||||||||||||
(i) Product development/engineering expenses | 2,636.63 | 2,521.57 | 2,292.60 | 7,850.10 | 6,457.03 | 9,209.50 | ||||||||||||||||||||
(j) Other expenses | 14,979.83 | 14,541.73 | 12,935.01 | 43,355.41 | 35,493.29 | 47,133.85 | ||||||||||||||||||||
(k) Amount transferred to capital and other accounts | (4,822.28 | ) | (4,141.08 | ) | (3,462.35 | ) | (12,743.05 | ) | (10,475.90 | ) | (14,397.29 | ) | ||||||||||||||
| Total expenses (IV) | 86,415.96 | 82,423.66 | 73,630.14 | 246,623.31 | 208,912.18 | 287,881.08 | ||||||||||||||||||||
V. | Profit/(loss) before exceptional items and tax (III - IV) | 3,203.01 | (1,773.78 | ) | (698.28 | ) | (3,532.44 | ) | (6,746.54 | ) | (6,373.83 | ) | ||||||||||||||
VI. | Exceptional Items | |||||||||||||||||||||||||
(a) Defined benefit pension plan amendment past service credit (refer note 2) | — | — | — �� | (1,495.07 | ) | — | — | |||||||||||||||||||
(b) Employee separation cost | — | — | 0.10 | 1.45 | 7.87 | 9.83 | ||||||||||||||||||||
(c) Write off/provision (reversal) for tangible/intangible assets (including under development) | — | (46.95 | ) | — | (46.95 | ) | — | — | ||||||||||||||||||
(d) Reversal for onerous contracts and related supplier claims | — | (61.03 | ) | — | (61.03 | ) | — | — | ||||||||||||||||||
(e) Reversal for cost of closure of operation of a subsidiary | — | — | — | — | (3.32 | ) | (21.47 | ) | ||||||||||||||||||
(f) Reversal of Impairment in subsidiaries (refer note 3) | — | (214.39 | ) | (86.26 | ) | (214.39 | ) | (86.26 | ) | (86.26 | ) | |||||||||||||||
(g) Cost of slump sale of passenger vehicle undertaking | — | 9.00 | — | 9.00 | — | 301.34 | ||||||||||||||||||||
(h) Provision for Russia market (refer note 4) | — | — | — | — | — | 428.66 | ||||||||||||||||||||
(i) Others | 0.40 | 0.74 | — | 1.14 | (2.52 | ) | (2.52 | ) | ||||||||||||||||||
VII. | Profit/(loss) before tax from continuing operations (V - VI) | 3,202.61 | (1,461.15 | ) | (612.12 | ) | (1,726.59 | ) | (6,662.31 | ) | (7,003.41 | ) | ||||||||||||||
VIII. | Tax expense/(credit) (net) of continuing operations | |||||||||||||||||||||||||
(a) Current tax | 826.13 | 716.19 | 616.33 | 2,141.58 | 1,744.16 | 2,669.98 | ||||||||||||||||||||
(b) Deferred tax | (563.30 | ) | (1,173.27 | ) | 109.72 | (816.87 | ) | 1,728.91 | 1,561.31 | |||||||||||||||||
| Total tax expense/(credit) (net) | 262.83 | (457.08 | ) | 726.05 | 1,324.71 | 3,473.07 | 4,231.29 | |||||||||||||||||||
IX. | Profit/(Loss) for the period from continuing operations (VII - VIII) | 2,939.78 | (1,004.07 | ) | (1,338.17 | ) | (3,051.30 | ) | (10,135.38 | ) | (11,234.70 | ) | ||||||||||||||
X. | Share of profit/(loss) of joint ventures and associates (net) | 103.37 | 105.72 | (112.88 | ) | 245.13 | (181.33 | ) | (74.06 | ) | ||||||||||||||||
XI. | Profit/(Loss) for the period (IX + X) | 3,043.15 | (898.35 | ) | (1,451.05 | ) | (2,806.17 | ) | (10,316.71 | ) | (11,308.76 | ) | ||||||||||||||
| Attributable to: | ||||||||||||||||||||||||||
(a) Shareholders of the Company | 2,957.71 | (944.61 | ) | (1,516.14 | ) | (2,993.50 | ) | (10,408.63 | ) | (11,441.47 | ) | |||||||||||||||
(b) Non-controlling interests | 85.44 | 46.26 | 65.09 | 187.33 | 91.92 | 132.71 | ||||||||||||||||||||
XII. | Other comprehensive income/(loss) | |||||||||||||||||||||||||
(A) (i) Items that will not be reclassified to profit or loss | (3,377.38 | ) | 584.12 | 1,467.85 | 621.60 | 1,160.12 | 7,480.70 | |||||||||||||||||||
(ii) Income tax(expense)/credit relating to items that will not be reclassified to profit or loss | 862.87 | (112.61 | ) | (383.25 | ) | (158.69 | ) | 609.00 | (963.79 | ) | ||||||||||||||||
(B) (i) Items that will be reclassified to profit or loss | 11,803.97 | (8,463.96 | ) | (876.75 | ) | (4,101.54 | ) | (4,546.00 | ) | (9,002.90 | ) | |||||||||||||||
(ii) Income tax (expense)/credit relating to items that will be reclassified to profit or loss | (1,259.35 | ) | (1,407.18 | ) | 215.74 | (1,094.98 | ) | 997.01 | 2,030.80 | |||||||||||||||||
| Total other comprehensive income/(loss), net of taxes | 8,030.11 | (9,399.63 | ) | 423.59 | (4,733.61 | ) | (1,779.87 | ) | (455.19 | ) | ||||||||||||||||
XIII. | Total comprehensive income/(loss) for the period (XI + XII) | 11,073.26 | (10,297.98 | ) | (1,027.46 | ) | (7,539.78 | ) | (12,096.58 | ) | (11,763.95 | ) | ||||||||||||||
| Attributable to: | ||||||||||||||||||||||||||
(a) Shareholders of the Company | 10,960.22 | (10,335.77 | ) | (1,092.09 | ) | (7,743.04 | ) | (12,188.61 | ) | (11,897.28 | ) | |||||||||||||||
(b) Non-controlling interests | 113.04 | 37.79 | 64.63 | 203.26 | 92.03 | 133.33 | ||||||||||||||||||||
XIV. | Paid-up equity share capital (face value of ₹2 each) | 766.01 | 765.98 | 765.86 | 766.01 | 765.86 | 765.88 | |||||||||||||||||||
XV. | Reserves excluding revaluation reserves | 43,795.36 | ||||||||||||||||||||||||
XVI. | Earnings/(loss) per share (EPS) | |||||||||||||||||||||||||
(a) Ordinary shares (face value of ₹2 each) | ||||||||||||||||||||||||||
(i) Basic | ₹ | 7.71 | (2.47 | ) | (3.96 | ) | (7.82 | ) | (27.18 | ) | (29.88 | ) | ||||||||||||||
(ii) Diluted | ₹ | 7.71 | (2.47 | ) | (3.96 | ) | (7.82 | ) | (27.18 | ) | (29.88 | ) | ||||||||||||||
(b) ‘A’ Ordinary shares (face value of ₹2 each) | ||||||||||||||||||||||||||
(i) Basic | ₹ | 7.81 | (2.47 | ) | (3.96 | ) | (7.82 | ) | (27.18 | ) | (29.88 | ) | ||||||||||||||
(ii) Diluted | ₹ | 7.81 | (2.47 | ) | (3.96 | ) | (7.82 | ) | (27.18 | ) | (29.88 | ) | ||||||||||||||
| Not annualised | ||||||||||||||||||||||||||
Segment wise Revenue, Results, Assets and Liabilities
The Company primarily operates in the automotive business. The automotive business includes all activities relating to development, design, manufacture, assembly and sale of vehicles including financing thereof, as well as sale of related parts, accessories and services. The Company provides financing for vehicles sold by dealers in India. The vehicle financing is intended to drive sale of vehicles by providing financing to the dealers’ customers and as such is an integral part of automotive business. The operating results for Vehicle Financing has been adjusted only for finance cost for the borrowings sourced by this segment.
Operating segments consist of :
| a) | Automotive: The Automotive segment consists of four reportable sub-segments: Tata Commercial Vehicles, Tata Passenger Vehicles, Jaguar Land Rover and Vehicle Financing. |
| b) | Others: Others consist of IT services and Insurance Broking services. |
Other operating segments do not meet the quantitative thresholds for disclosure and have been aggregated.
This segment information is provided to and reviewed by Chief Operating Decision Maker (CODM).
(₹ in crores)
| Quarter ended | Nine months ended | Year ended | ||||||||||||||||||||||||
| December 31, | September 30, | December 31, | December 31, | March 31, | ||||||||||||||||||||||
| 2022 | 2022 | 2021 | 2022 | 2021 | 2022 | |||||||||||||||||||||
Particulars | Unaudited | Audited | ||||||||||||||||||||||||
A. | Segment Revenue : | |||||||||||||||||||||||||
| Revenue from operations | ||||||||||||||||||||||||||
I. | Automotive and related activity | |||||||||||||||||||||||||
- Tata and other brands vehicles | ||||||||||||||||||||||||||
(a) Commercial Vehicle | 16,885.74 | 16,420.40 | 13,785.60 | 49,575.95 | 33,758.43 | 52,287.30 | ||||||||||||||||||||
(b) Passenger Vehicle | 11,671.12 | 12,547.27 | 8,492.60 | 35,774.71 | 21,023.58 | 31,514.90 | ||||||||||||||||||||
(c) Corporate/Unallocable | 81.60 | 48.38 | 42.73 | 247.72 | 130.20 | 314.35 | ||||||||||||||||||||
- Vehicle Financing | 1,142.94 | 1,286.26 | 1,181.62 | 3,526.88 | 3,499.54 | 4,584.58 | ||||||||||||||||||||
- Jaguar and Land Rover | 58,862.97 | 49,477.39 | 47,915.13 | 151,396.66 | 139,674.17 | 187,696.74 | ||||||||||||||||||||
| Less: Intra segment eliminations | (1,002.86 | ) | (917.97 | ) | (23.42 | ) | (2,752.01 | ) | (71.96 | ) | (618.20 | ) | ||||||||||||||
|
|
|
|
|
|
|
|
|
|
|
| |||||||||||||||
| -Total | 87,641.51 | 78,861.73 | 71,394.26 | 237,769.91 | 198,013.96 | 275,779.67 | ||||||||||||||||||||
II. | Others | 1,230.37 | 1,102.52 | 1,114.15 | 3,303.88 | 2,822.00 | 3,809.13 | |||||||||||||||||||
|
|
|
|
|
|
|
|
|
|
|
| |||||||||||||||
| Total Segment Revenue | 88,871.88 | 79,964.25 | 72,508.41 | 241,073.79 | 200,835.96 | 279,588.80 | ||||||||||||||||||||
Less: Inter segment revenue | (383.29 | ) | (352.88 | ) | (279.12 | ) | (1,039.17 | ) | (821.40 | ) | (1,135.18 | ) | ||||||||||||||
|
|
|
|
|
|
|
|
|
|
|
| |||||||||||||||
Revenue from Operations | 88,488.59 | 79,611.37 | 72,229.29 | 240,034.62 | 200,014.56 | 278,453.62 | ||||||||||||||||||||
|
|
|
|
|
|
|
|
|
|
|
| |||||||||||||||
| B. | Segment results before other income (excluding government incentives), finance costs, foreign exchange gain/(loss) (net), exceptional items and tax: | |||||||||||||||||||||||||
I. | Automotive and related activity | |||||||||||||||||||||||||
- Tata and other brands vehicles | ||||||||||||||||||||||||||
(a) Commercial Vehicle | 1,055.51 | 402.26 | (62.14 | ) | 1,853.18 | (463.16 | ) | 210.21 | ||||||||||||||||||
(b) Passenger Vehicle | 194.04 | 119.40 | (297.13 | ) | 385.97 | (800.85 | ) | (660.13 | ) | |||||||||||||||||
(c) Corporate/Unallocable | (92.28 | ) | (36.33 | ) | 16.05 | (123.11 | ) | (108.70 | ) | (62.47 | ) | |||||||||||||||
- Vehicle Financing (net off finance costs pertaining to borrowings sourced by the segment) | (535.92 | ) | (257.37 | ) | (49.52 | ) | (794.04 | ) | (212.03 | ) | (253.19 | ) | ||||||||||||||
- Jaguar and Land Rover | 2,683.74 | (167.32 | ) | 699.86 | (914.57 | ) | (1,853.67 | ) | (439.39 | ) | ||||||||||||||||
Less: Intra segment eliminations | 35.30 | (64.49 | ) | — | (46.46 | ) | — | (90.20 | ) | |||||||||||||||||
|
|
|
|
|
|
|
|
|
|
|
| |||||||||||||||
-Total | 3,340.39 | (3.85 | ) | 307.12 | 360.97 | (3,438.41 | ) | (1,295.17 | ) | |||||||||||||||||
II. | Others | 195.44 | 189.11 | 198.69 | 561.13 | 453.75 | 624.73 | |||||||||||||||||||
|
|
|
|
|
|
|
|
|
|
|
| |||||||||||||||
Total Segment results | 3,535.83 | 185.26 | 505.81 | 922.10 | (2,984.66 | ) | (670.44 | ) | ||||||||||||||||||
Less: Inter segment eliminations | (30.60 | ) | 20.09 | 26.07 | (2.81 | ) | 65.88 | 53.75 | ||||||||||||||||||
|
|
|
|
|
|
|
|
|
|
|
| |||||||||||||||
Net Segment results | 3,505.23 | 205.35 | 531.88 | 919.29 | (2,918.78 | ) | (616.69 | ) | ||||||||||||||||||
| Add/(Less) : Other income (excluding Government Incentives) | 455.14 | 392.99 | 196.96 | 1,188.11 | 686.50 | 928.92 | ||||||||||||||||||||
| Add/(Less) : Finance costs (excluding pertaining to borrowings sourced by the vehicle finance segment) | (1,934.63 | ) | (1,748.19 | ) | (1,740.90 | ) | (5,425.40 | ) | (4,879.91 | ) | (6,607.38 | ) | ||||||||||||||
| Add/(Less) : Foreign exchange gain/(loss) (net) | 1,177.27 | (623.93 | ) | 313.78 | (214.44 | ) | 365.65 | (78.68 | ) | |||||||||||||||||
| Add/(Less) : Exceptional items | ||||||||||||||||||||||||||
| - Tata and other brands vehicles | ||||||||||||||||||||||||||
(a) Commercial Vehicle | — | — | (0.61 | ) | (1.36 | ) | 3.06 | (52.50 | ) | |||||||||||||||||
(b) Passenger Vehicle | — | 313.37 | 86.26 | 313.37 | 85.98 | (147.21 | ) | |||||||||||||||||||
(c) Corporate/Unallocable | — | — | 0.51 | (0.09 | ) | (3.70 | ) | (0.10 | ) | |||||||||||||||||
- Jaguar and Land Rover | (0.40 | ) | (0.74 | ) | — | 1,493.93 | — | (428.66 | ) | |||||||||||||||||
- Others | — | — | — | — | (1.11 | ) | (1.11 | ) | ||||||||||||||||||
|
|
|
|
|
|
|
|
|
|
|
| |||||||||||||||
Total Profit/(loss) before tax | 3,202.61 | (1,461.15 | ) | (612.12 | ) | (1,726.59 | ) | (6,662.31 | ) | (7,003.41 | ) | |||||||||||||||
|
|
|
|
|
|
|
|
|
|
|
| |||||||||||||||
| As at September 30, | As at December 31, | As at March 31, | ||||||||||||||||||||||||
| 2022 | 2022 | 2021 | 2022 | |||||||||||||||||||||||
| Unaudited | Unaudited | Audited | ||||||||||||||||||||||||
C. | Segment Assets | |||||||||||||||||||||||||
I. | Automotive and related activity | |||||||||||||||||||||||||
| - Tata and other brands vehicles | ||||||||||||||||||||||||||
(a) Commercial Vehicle | 30,470.37 | 31,220.79 | 28,628.67 | 30,407.96 | ||||||||||||||||||||||
(b) Passenger Vehicle | 16,575.49 | 16,139.25 | 19,506.96 | 15,877.08 | ||||||||||||||||||||||
(c) Corporate/Unallocable - (including assets classified as held for sale) | 2,110.66 | 2,019.47 | 795.43 | 856.80 | ||||||||||||||||||||||
- Vehicle Financing (including assets classified as held for sale) | 39,116.60 | 37,243.92 | 36,924.86 | 38,994.57 | ||||||||||||||||||||||
- Jaguar and Land Rover (including assets classified as held for sale) | 167,144.62 | 179,876.23 | 170,271.77 | 172,273.81 | ||||||||||||||||||||||
Less: Intra segment eliminations | (61.92 | ) | (1,296.24 | ) | — | — | ||||||||||||||||||||
|
|
|
|
|
|
|
| |||||||||||||||||||
-Total | 255,355.82 | 265,203.42 | 256,127.69 | 258,410.22 | ||||||||||||||||||||||
II. | (a) Others | 3,159.83 | 3,562.72 | 3,327.93 | 3,465.00 | |||||||||||||||||||||
|
|
|
|
|
|
|
| |||||||||||||||||||
Total Segment Assets | 258,515.65 | 268,766.14 | 259,455.62 | 261,875.22 | ||||||||||||||||||||||
Less: Inter segment eliminations | (1,199.52 | ) | (1,262.41 | ) | (1,222.00 | ) | (1,129.43 | ) | ||||||||||||||||||
|
|
|
|
|
|
|
| |||||||||||||||||||
Net Segment Assets | 257,316.13 | 267,503.73 | 258,233.62 | 260,745.79 | ||||||||||||||||||||||
| Investment in equity accounted investees | ||||||||||||||||||||||||||
- Tata and other brands vehicles - Corporate/Unallocable | 607.77 | 657.84 | 485.63 | 554.25 | ||||||||||||||||||||||
- Jaguar and Land Rover | 3,143.70 | 3,287.53 | 3,092.42 | 3,192.99 | ||||||||||||||||||||||
- Others | 596.80 | 606.62 | 590.81 | 602.15 | ||||||||||||||||||||||
Add : Unallocable assets | 53,975.32 | 57,457.56 | 63,310.44 | 65,524.75 | ||||||||||||||||||||||
|
|
|
|
|
|
|
| |||||||||||||||||||
Total Assets | 315,639.72 | 329,513.28 | 325,712.92 | 330,619.93 | ||||||||||||||||||||||
|
|
|
|
|
|
|
| |||||||||||||||||||
| D. | Segment Liabilities | |||||||||||||||||||||||||
I. | Automotive and related activity | |||||||||||||||||||||||||
| - Tata and other brands vehicles | ||||||||||||||||||||||||||
(a) Commercial Vehicle | 18,255.11 | 19,412.27 | 18,434.01 | 21,230.50 | ||||||||||||||||||||||
(b) Passenger Vehicle | 12,731.79 | 11,721.27 | 8,288.98 | 10,932.34 | ||||||||||||||||||||||
(c) Corporate/Unallocable (including liabilities for assets classified as held for sale) | 872.88 | 892.44 | 1,171.46 | 209.55 | ||||||||||||||||||||||
- Vehicle Financing | 282.50 | 1,086.15 | 1,105.33 | 966.20 | ||||||||||||||||||||||
- Jaguar and Land Rover (including liabilities for assets classified as held for sale) | 89,391.73 | 100,492.00 | 93,062.35 | 94,698.42 | ||||||||||||||||||||||
Less: Intra segment eliminations | (61.12 | ) | (1,149.77 | ) | — | (88.60 | ) | |||||||||||||||||||
|
|
|
|
|
|
|
| |||||||||||||||||||
-Total | 121,472.89 | 132,454.36 | 122,062.13 | 127,948.41 | ||||||||||||||||||||||
II. | (a) Others | 1,760.52 | 1,960.23 | 1,708.29 | 2,020.15 | |||||||||||||||||||||
|
|
|
|
|
|
|
| |||||||||||||||||||
Total Segment Liabilities | 123,233.41 | 134,414.59 | 123,770.42 | 129,968.56 | ||||||||||||||||||||||
Less: Inter segment eliminations | (289.95 | ) | (324.55 | ) | (283.64 | ) | (269.78 | ) | ||||||||||||||||||
|
|
|
|
|
|
|
| |||||||||||||||||||
Net Segment Liabilities | 122,943.46 | 134,090.04 | 123,486.78 | 129,698.78 | ||||||||||||||||||||||
Add : Unallocable liabilities | 161,832.00 | 153,619.17 | 156,342.66 | 152,088.85 | ||||||||||||||||||||||
|
|
|
|
|
|
|
| |||||||||||||||||||
Total Liabilities | 284,775.46 | 287,709.21 | 279,829.44 | 281,787.63 | ||||||||||||||||||||||
|
|
|
|
|
|
|
| |||||||||||||||||||
Notes:
| 1) | The above results were reviewed and recommended by the Audit Committee on January 24, 2023 and approved by the Board of Directors at its meeting held on January 25, 2023. |
| 2) | During the nine months ended December 31, 2022 Jaguar Land Rover has recognized a pension past service credit of ₹1,495.07 crores (£155 million) due to change in inflation index from RPI to CPI. |
| 3) | During the nine months ended December 31, 2022 the Company reassessed the recoverable value of assets belonging to Tata Motors European Technical Centre PLC (TMETC) and accordingly provision for impairment towards the assets is reversed amounting to ₹214.39 crores (£23.57 million). |
| 4) | During the year ended March 31, 2022, Jaguar Land Rover has created a provision of ₹428.66 crores (£43.00 million) in relation to customer liabilities arising from sanctions imposed against Russia by many countries, preventing the shipment of vehicles and certain parts to the market. |
| 5) | On November 4, 2022, the Supreme Court of India passed a judgment thereby upholding the validity of the 2014 amendment to the Employees’ Pension Scheme 1995. The Judgment has interalia upheld the exercise of joint option by certain categories of employees for contributing into the pension fund an amount over and above the statutory limit. Subsequently, the Employees Provident Fund Organization (EPFO) issued a circular on December 29, 2022 calling upon eligible pensioners whose exercise of joint options were rejected earlier by EPFO authorities to apply online for exercising their options afresh. In case of Tata Motors Limited, joint option has never been exercised in the past, and contributions have always been made only on the statutory ceiling amount. As on December 31, 2022 also no such intimation has been made or options exercised by such pensioners and the Company jointly. As regards the exempted establishments under the Pension Scheme, the Judgment in paragraph 37 states that the cases of the members of such category were not being addressed in the Judgement. The Company being an exempted establishment is in consultation with EPFO for the further course of action, if any. Consequently, there is no impact on the consolidated financial results for the quarter and nine months ended December 31, 2022. |
| 6) | On January 10, 2023, pursuant to the fulfilment of the condition precedents, including receipt of relevant government and regulatory approvals, Tata Passenger Electric Mobility Limited (TPEML), Ford India Private Limited (“FIPL”) have completed the transaction of acquisition of FIPL’s Sanand plant for a consideration of ₹725.70 crores. The transaction will be accounted as purchase of Land, Building and Plant & Machinery in the quarter ending March 31, 2023. |
| 7) | Additional Information pursuant to requirement of Regulation 52(4) and Regulation 54(2) of the Securities and Exchange Board of India (Listing Obligations and Disclosure Requirements) Regulation 2015 as amended and as at nine month ended December 31, 2022: |
| Quarter ended | Nine months ended | Year ended | ||||||||||||||||||||||||
| December 31, | September 30, | December 31, | December 31, | March 31, | ||||||||||||||||||||||
| Sr | 2022 | 2022 | 2021 | 2022 | 2021 | 2022 | ||||||||||||||||||||
No | Particulars | Unaudited | Audited | |||||||||||||||||||||||
a) | Debt Equity Ratio (number of times) [Total Debt(i)/Equity(ii)] | 3.68 | 5.21 | 3.33 | 3.68 | 3.33 | 3.13 | |||||||||||||||||||
b) | Debt Service Coverage Ratio (number of times) (not annualised) [(Profit/ (loss) before exceptional items and tax + Interest on Borrowings) / (Interest on Borrowings + Repayment of Borrowings)(iii)] | 0.46 | 0.04 | 0.21 | 0.10 | (0.04 | ) | 0.04 | ||||||||||||||||||
c) | Interest Service Coverage Ratio (number of times) (not annualised) [(Profit/ (loss) before exceptional items and tax + Interest on Borrowings) / Interest on Borrowings] | 2.42 | 0.15 | 0.66 | 0.45 | (0.15 | ) | 0.19 | ||||||||||||||||||
d) | Capital redemption reserve (₹ In crores) | 2.28 | 2.28 | 2.28 | 2.28 | 2.28 | 2.28 | |||||||||||||||||||
e) | Debenture redemption reserve (₹ In crores) | 411.14 | 411.14 | 904.44 | 411.14 | 904.44 | 411.14 | |||||||||||||||||||
f) | Net worth(iv) (₹ In crores) [Equity share capital + Other equity] | 37,052.82 | 26,174.56 | 43,901.74 | 37,052.82 | 43,901.74 | 44,561.24 | |||||||||||||||||||
g) | Profit/(Loss) for the period (₹ In crores) | 3,043.15 | (898.35 | ) | (1,451.05 | ) | (2,806.17 | ) | (10,316.71 | ) | (11,308.76 | ) | ||||||||||||||
h) | Earnings/(loss) per share (EPS) * | |||||||||||||||||||||||||
| A. Ordinary shares (face value of ₹2 each) | ||||||||||||||||||||||||||
| (i) Basic (₹) | 7.71 | (2.47 | ) | (3.96 | ) | (7.82 | ) | (27.18 | ) | (29.88 | ) | |||||||||||||||
| (ii) Diluted (₹) | 7.71 | (2.47 | ) | (3.96 | ) | (7.82 | ) | (27.18 | ) | (29.88 | ) | |||||||||||||||
| B. ‘A’ Ordinary shares (face value of ₹2 each) | ||||||||||||||||||||||||||
| (i) Basic (₹) | 7.81 | (2.47 | ) | (3.96 | ) | (7.82 | ) | (27.18 | ) | (29.88 | ) | |||||||||||||||
| (ii) Diluted (₹) | 7.81 | (2.47 | ) | (3.96 | ) | (7.82 | ) | (27.18 | ) | (29.88 | ) | |||||||||||||||
| Not annualised | ||||||||||||||||||||||||||
i) | Current ratio (number of times) [Current assets / Current liabilities] | 0.96 | 0.93 | 0.98 | 0.96 | 0.98 | 0.98 | |||||||||||||||||||
j) | Long term debt to working capital (number of times) [Long Term Borrowings(v) / Working capital(vi)] | 5.48 | 6.12 | 6.35 | 5.48 | 6.35 | 5.42 | |||||||||||||||||||
k) | Bad debts to Account receivable ratio (%) [Bad Debts(vii) / Average of Trade and Other Receivables(viii)] | 0.01 | % | 0.35 | % | 0.03 | % | 0.39 | % | 0.79 | % | 1.01 | % | |||||||||||||
l) | Current liability ratio (number of times) [Current Liabilities (excluding current maturities of long term debt and interest accrued on borrowings) / (Total liabilities)] | 0.43 | 0.42 | 0.43 | 0.43 | 0.43 | 0.44 | |||||||||||||||||||
m) | Total debts to total assets (number of times) [(Non current borrowings + Current borrowings) / Total assets] | 0.41 | 0.43 | 0.45 | 0.41 | 0.45 | 0.42 | |||||||||||||||||||
n) | Debtors turnover (number of times) (not annualised) [Revenue from operations (excluding finance revenue) / Average Trade Receivables] | 6.20 | 5.83 | 6.72 | 17.31 | 16.27 | 21.84 | |||||||||||||||||||
o) | Inventory turnover (number of times) (not annualised) [Raw material consumed (ix)/ Average Inventory(x) ] | 1.44 | 1.37 | 1.41 | 4.11 | 3.75 | 5.07 | |||||||||||||||||||
p) | Operating margin (%) [(Profit/ (loss) before exceptional items and tax + Finance costs (excluding finance costs pertaining to borrowings sourced by vehicle financing segment) + Foreign exchange (gain)/loss (net)+ Depreciation and amortisation expense - Other Income (excluding incentives)) / Revenue from operations] | 10.82 | % | 7.67 | % | 9.15 | % | 7.80 | % | 7.74 | % | 8.70 | % | |||||||||||||
q) | Net profit margin (%) [Profit/(loss) for the period / Revenue from operations] | 3.44 | % | (1.13 | %) | (2.01 | %) | (1.17 | %) | (5.16 | %) | (4.06 | %) | |||||||||||||
Notes:
| (i) | Total debt includes non-current and current borrowings. |
| (ii) | Equity = equity attributable to owners of Tata Motors Limited |
| (iii) | Repayment of borrowing includes repayment of long-term borrowings, proceeds from short-term borrowings, repayment of short-term borrowings and net change in other short-term borrowings (with maturity up to three months). |
| (iv) | Net worth has been computed on the basis as stated in Clause 2 of the Securities and Exchange Board of India (Listing Obligations and Disclosure Requirements) Regulations, 2015 i.e. Net worth as defined in sub-section (57) of section 2 of the Companies Act, 2013. |
| (v) | Long term borrowings (including current portion of long term borrowings) |
| (vi) | Working capital = current assets - current liabilities (excluding current maturities of Iong term debt and interest accrued on borrowings) |
| (vii) | Bad debts includes written off on trade and other receivables. |
| (viii) | Average of trade and other receivables includes trade receivables, non-current and current loans and advances, non-current and current other assets. |
| (ix) | Raw material consumed includes cost of materials consumed, purchase of products for sale and changes in inventories of finished goods, work-in-progress and products for sale. |
| (x) | Inventory includes raw materials and components, work-in-progress, finished goods, stores and spare parts, consumable tools and goods-in-transit - raw materials and components. |
| 8) | The Statutory Auditors have carried out a limited review of the consolidated financial results for the quarter and nine months ended December 31, 2022. |
| Tata Motors Limited | ||
| GIRISH WAGH | ||
| Mumbai, January 25, 2023 | Executive Director | |
| News Release – 7 | January 25, 2023 |
Statement of Certificate on Security Cover Ratio as on December 31, 2022
B S R & Co. LLP
Private and confidential
To,
The Board of Directors
Tata Motors Limited
Bombay House,
24, Homi Mody Street,
Mumbai 400 001
25 January 2023
Independent Auditor’s report on Statement of a certificate on Security Cover Ratio as on 31 December 2022.
| 1. | This certificate is issued in accordance with the terms of our engagement letter dated 5 July 2022 read with an addendum dated 27 July 2022 with Tata Motors Limited (‘the Company’). |
| 2. | We B S R & Co. LLP, Chartered Accountants, the statutory auditors of the Company have been requested by the management of the Company to certify the following accompanying Statement containing: - |
| a. | Security Coverage Ratio for Secured Debt Securities as on 31 December 2022 (‘the SCR for Secured Debt Securities’) in Annexure – I, prepared by the Company, pursuant to the requirements in terms of Regulation 54 read with 56(1)(d) of Securities and Exchange Board of India (Listing Obligations and Disclosure Requirements) Regulation, 2015 (as amended) (referred to as ‘the Regulations’) as mentioned in the Debenture Trust Deed entered between the Company and Vistra ITCL (India) Limited (‘the Debenture Trustee’) on 22 August 2020 (‘the Debenture Trust Deed’); and |
| b. | Compliance with the covenants as specified in clause 32 of the Debenture Trust Deed dated 22 August 2020 between the Company and Vistra ITCL (India) Limited. |
The aforesaid Statement has been prepared by the management of the Company for onward submission to the Vistra ITCL (India) Limited and signed by us for identification purposes only.
Management’s Responsibility
| 3. | The management of the Company is responsible for the preparation of the said Statement including the preparation and maintenance of all accounting and other relevant supporting records and documents. This responsibility includes design, implementation, and maintenance of internal controls relevant to the preparation and presentation of the said Annexures and applying an appropriate basis of preparation and making estimates that are reasonable in the circumstances. The management of the Company is also responsible to comply with the Regulations. |
| 4. | The management responsibility includes: |
| • | With respect to the SCR for Secured Debt Securities: - |
| a. | ensuring that the calculation of Security Coverage Ratio for Secured Debt Securities is mathematically correct. |
| b. | ensuring that the Company complies with the applicable requirements of the Debenture Trust Deed from time to time, including legal representation of the aforesaid requirements and providing all relevant information to the Debenture Trustees and to us in this regard. |
| c. | ensuring that the assets offered as security are accurately identified and are in agreement with the books of account including Fixed Assets Register and the book values are correct. |
| d. | ensuring compliance with all the covenants of Debenture Trust Deed dated 22 August 2020 between the Company and Vistra ITCL (India) Limited. |
| e. | Ensuring preparation of the annexure I to the statement in a specified format prescribed by the SEBI and complies with all the requirements of the SEBI. |
| B S R & Co. (a partnership firm with Registration No. BA61223) converted into B S R & Co. LLP (a Limited Liability Partnership with LLP Registration No. AAB-8181) with effect from October 14, 2013 | Principal Office:
14th Floor, Central B Wing and North C Wing, Nesco IT Park 4, Nesco Center, Western Express Highway, Goregaon (East), Mumbai - 400063 |
B S R & Co. LLP
Auditors’ Responsibility
| 5. | It is our responsibility as statutory auditors to provide a reasonable assurance whether: |
| i. | the Company has complied with the covenants as specified in clause 32 of the Debenture Trust Deed dated 22 August 2020 between the Company and Vistra ITCL (India) Limited. |
| ii. | the particulars (book value of the assets, secured debts, and coverage ratio) contained in column F of Annexure I in the Statement are in agreement with the audited books of accounts for the period ended 31 December 2022 and other relevant records and documents maintained by the Company. |
| iii. | the calculation of the Security Coverage Ratio (cover on book value) for Secured Debt Securities given in Annexure I in the Statement is mathematically correct. |
| 6. | The standalone financial statements of the Company for the period ended 31 December 2022 have been audited by us, on which we issued an unmodified audit opinion dated 25 January 2023. Our audit of these financial statements was conducted in accordance with the Standards on Auditing and other applicable authoritative pronouncements issued by the Institute of Chartered Accountants of India (the “ICAI”). Those Standards require that we plan and perform the audit to obtain reasonable assurance about whether the financial statements are free of material misstatement. Our audits were not planned and performed in connection with any transactions to identify matters that may be of potential interest to third parties. |
| 7. | We have examined the attached Statement, with reference to the following records, documents, and audited books of accounts: |
| • | with respect to the SCR for Secured Debt Securities: - |
| a. | Audited standalone financial statements for the period ended 31 December 2022 including Fixed Assets Register as on 31 December 2022 and other relevant records and documents, as applicable, maintained by the Company to agree with the book value of Assets as specified in the Statement. |
| b. | Register of Charges maintained by the Company pursuant to section 85 sub-rule (1) of rule 10 of the Companies (Registration of Charges) Rules, 2014. |
| c. | Appropriate representations from the Company’s management. |
| • | Management representation for compliance with all the covenants as per the Debenture Trust Deed dated 22 August 2020 between the Company and Vistra ITCL (India) Limited. |
| 8. | We conducted our examination in accordance with the ‘Guidance Note on Reports or Certificates for Special Purposes’ (Revised 2016) issued by the ICAI. This requires that we comply with the ethical requirements of the Code of Ethics issued by the ICAI. |
| 9. | We have complied with the relevant applicable requirements of the Standard on Quality Control (SQC) 1, Quality Control for Firms that Perform Audits and Reviews of Historical Financial Information, and Other Assurance and Related Services Engagements. |
Opinion
| 10. | Based on our examination, as above, and according to the information and explanations and other documents made available to us by the Company, and representations given to us, we are of the opinion that: |
| i. | the Company has complied with the covenants as specified in clause 32 of the Debenture Trust Deed dated 22 August 2020 between the Company and Vistra ITCL (India) Limited. |
| ii. | the amounts furnished in the column F of Statement in Annexure—I containing Security Coverage Ratio for Secured Debt Securities (cover on book value), read with notes thereon, are in agreement with the audited books of account for the period ended 31 December 2022, and other relevant records and documents maintained by the Company; and |
B S R & Co. LLP
| iii. | the calculation of the Security Coverage Ratio (cover on book value) for Secured Debt Securities specified Annexure - I, of the Statement, is mathematically correct. |
Other matters
| 11. | As specified in Note 1 to Annexure - I, the Company entered into Mortgage deed on 08 January 2021 supplemental to debenture trust deed dated 22 August 2020 with Vistra ITCL (India) Limited to create a first ranking mortgage on the mortgaged property as an additional charge to secure the payment obligations of the Company in respect of the Debentures. By way of Indenture of Mortgage dated March 2, 2021 pari passu charge has been created in favour of Housing Development Finance Corporation Limited in respect of a secured loan facility availed by the Company aggregating ₹ 3,000 crores. The amount of loan outstanding as on 31 December 2022 is ₹ 273 crores. |
| 12. | As specified in Note 2 to Annexure – I, the Leasehold Land at Pimpri Industrial Area proposed to be offered as security by way of a pari passu charge in favour of Vistra ITCL (India) Limited and Housing Development Finance Corporation Limited, and a charge has been created by way of Indenture of Mortgage dated March 2, 2021. |
| 13. | As specified in Note 3 to Annexure – I, as per clause 10.3 of SEBI circular dated May 19, 2022 valuation report for assets offered as security is required once in three years. The Company had done valuation at inception of loan i.e. 26 May 2020. Accordingly details of market value of assets offered as security as required in column K to O is not disclosed by the management of the Company. |
| 14. | A report dated 25 January 2023 is issued by us on the Statement of Security Coverage Ratio (Cover on book value) as on 31 December 2022 prepared by the Company pursuant to the requirement as per para 15.8 of Facility Agreement entered between the Company and Housing Development Finance Corporation Limited on 29 June 2020. |
Our opinion is not modified in respect of the above matters.
Restriction on Use
| 15. | This certificate is being solely issued at the request of the management of the Company for onward submission to Vistra ITCL (India) Limited. Our certificate is not suited for any other purpose and should not be used by any other person or for any other purpose. Accordingly, we do not accept or assume any liability or any duty of care for any other purpose or to any other person to whom this certificate is shown or into whose hands it may come without our prior written consent. |
For B S R & Co. LLP
Chartered Accountants
Firm’s Registration No: 101248W/W100022
| Shiraz Vastani | ||
| Partner | ||
Membership No: 103334 ICAI UDIN: 2310333BGYMQZ9407 | ||
| Place : Mumbai | ||
| Date: 25 January 2023 |
Statement of Certificate on Security Cover Ratio as on December 31, 2022
To,
Vistra ITCL (India) Limited
Debenture Trustee of Tata Motors Limited
We hereby certify that:
| a) | The Company has vide its Board Resolution and information memorandum/ offer document and under Debenture Trust Deed, has issued the following listed debt securities and outstanding as on December 31, 2022: |
₹ in crores
S.No. | ISIN | Series | Private Placement / Public Issue | Secured/ | Sanctioned amount | |||||||
| 1 | INE155A08191 | E26-B | Private Placement | Unsecured | 300 | |||||||
| 2 | INE155A08209 | E26-C | Private Placement | Unsecured | 200 | |||||||
| 3 | INE155A08241 | E26-F | Private Placement | Unsecured | 400 | |||||||
| 4 | INE155A08381 | E28-A (Tr I) | Private Placement | Unsecured | 200 | |||||||
| 5 | INE155A08373 | E28-A (Tr II) | Private Placement | Unsecured | 200 | |||||||
| 6 | INE155A08399 | E28-A (Tr III1) | Private Placement | Unsecured | 100 | |||||||
| 7 | INE155A08407 | E28-B (Tr I) | Private Placement | Unsecured | 250 | |||||||
| 8 | INE155A08415 | E28-B (Tr II) | Private Placement | Unsecured | 250 | |||||||
| 9 | INE155A07284 | E29-A | Private Placement | Secured | 1,000 | |||||||
| 10 | INE155A08423 | E30-A | Private Placement | Unsecured | 500 | |||||||
| 11 | INE155A08431 | E30-B | Private Placement | Unsecured | 500 | |||||||
| b) | Security Cover for listed debt securities: |
| 1) | The financial information as on December 31, 2022 has been extracted from the audited books of accounts for the period ended December 31, 2022 and other relevant records of the listed entity. |
| 2) | The assets (cover on book value) of the listed entity provide coverage of 3.63 times of the principal amount, which is in accordance with the terms of issue/ debenture trust deed (calculation as per the statement of security cover ratio for the Secured debt securities – Annexure - I) |
ISIN wise details (Secured)
S. No | ISIN | Facility | Type of charge | Sanctioned amount (₹ in crores) | Outstanding amount as on December 30,2022 (₹ in crores) | Cover Required | Assets Required | |||||||||||
| 1. | INE155A07284 | Non-convertible Debt Securities | Pari-passu | 1,000 | 1,000 | Yes | Yes | |||||||||||
| c) | Compliance with Covenants of Debenture Trust Deed |
The Company has complied with all the covenants as specified in clause 32 of the Debenture Trust Deed dated August 22, 2020 between the Company and Vistra ITCL (India) Limited.
| For Tata Motors Limited | Signed for identification purpose only | |
| For B S R & Co. LLP | ||
| Chartered Accountants | ||
| Firm’s Registration No: 101248W/W-100022 | ||
| Smriti Goyal | Shiraz Vastani | |
| Senior General Manager – Group Controlling | Partner | |
| Place: Mumbai | Membership No: 103334 | |
| Date: January 25, 2023 | Place: Mumbai | |
| Dated: January 25, 2023 | ||
Annexure I - Security Coverage Ratio for Secured Debt Securities
Column A | Column B | Column C | Column D | Column E | Column F | Column G | Column H | Column I | Column J | Column K | Column L | Column M | Column N | Column O | ||||||||||||||||||||||||||||||||||||||
Particulars | Description of | Exclusive Charge | Exclusive Charge | Pari- Passu Charge | Pari- Passu Charge | Pari- Passu Charge | Elimination (amount in negative ) | Related to only those items covered by this certificate | ||||||||||||||||||||||||||||||||||||||||||||
| Debt for which this certificate being issued | Other Secured Debt | Debt for which this certificate being issued | Assets shared by pari passu debt holder (includes debt for which this certificate is issued & other debt with pari - passu charge) | Other assets on which there is pari-Passu charge (excluding items covered in column F) | Assets not offered as Security | debt amount considered more than once (due to exclusive plus pari passu charge) | (Total C to H) (₹ in crore) | Market Value for Assets charged on Exclusive basis | Carrying /book value for exclusive charge assets where market value is not ascertainable or applicable (For E.g. Bank Balance, DSRA market value is not applicable) | Market Value for Pari passu charge Assets Relating to Column F | Carrying value/book value for pari passu charge assets where market value is not ascertainable or applicable (For E.g. Bank Balance, DSRA market value is not applicable) | Total Value = (K+L+M+ N) | ||||||||||||||||||||||||||||||||||||||||
| Book Value (₹ in crore) | Book Value (₹ in crore) | Yes/ No | Book Value (₹ in crore) | Book Value (₹ in crore) | Book Value (₹ in crore) | |||||||||||||||||||||||||||||||||||||||||||||||
ASSETS | ||||||||||||||||||||||||||||||||||||||||||||||||||||
Property, Plant and Equipment | Property, plant and equipment and Capital Work in progress situated at Pimpri and Pantnagar location | — | — | Yes | 4,446 | — | 6,683 | — | 11,128.87 | |||||||||||||||||||||||||||||||||||||||||||
Capital Work-in- Progress | — | — | Yes | 175 | — | 264 | — | 438.34 | ||||||||||||||||||||||||||||||||||||||||||||
Right of Use Assets | — | — | No | — | — | 398 | — | 397.58 | ||||||||||||||||||||||||||||||||||||||||||||
Intangible Assets | — | — | No | — | — | 1,683 | — | 1,682.62 | ||||||||||||||||||||||||||||||||||||||||||||
Intangible Assets under Development | — | — | No | — | — | 1,218 | — | 1,217.82 | ||||||||||||||||||||||||||||||||||||||||||||
Investments | — | — | No | — | — | 30,827 | — | 30,827.11 | ||||||||||||||||||||||||||||||||||||||||||||
Loans | — | — | No | — | — | 221 | — | 221.14 | ||||||||||||||||||||||||||||||||||||||||||||
Inventories | — | — | No | — | — | 3,983 | — | 3,982.66 | ||||||||||||||||||||||||||||||||||||||||||||
Trade Receivables | — | — | No | — | — | 2,309 | — | 2,308.51 | ||||||||||||||||||||||||||||||||||||||||||||
Cash and Cash Equivalents | — | — | No | — | — | 854 | — | 853.53 | ||||||||||||||||||||||||||||||||||||||||||||
Bank Balances other than Cash and Cash Equivalents | — | — | No | — | — | 21 | — | 21.20 | ||||||||||||||||||||||||||||||||||||||||||||
Others | — | — | No | — | — | 5,394 | — | 5,393.75 | ||||||||||||||||||||||||||||||||||||||||||||
Total | — | — | 4,621 | — | 53,852 | — | 58,473.13 | |||||||||||||||||||||||||||||||||||||||||||||
LIABILITIES | Refer Note no. 3 below | |||||||||||||||||||||||||||||||||||||||||||||||||||
Debt securities to which this certificate pertains | Rated, Listed, 8.80% Redeemable, Non-Convertible Debentures (privately placed) of a face value of INR 1,000,000/-each | — | — | Yes | 1,000 | — | 1,000.00 | |||||||||||||||||||||||||||||||||||||||||||||
Other debt sharing pari-passu charge with above debt | Term loan from Housing Development Finance Corporation Limited taken on June 29, 2020 | — | Yes | 273 | — | 272.73 | ||||||||||||||||||||||||||||||||||||||||||||||
Borrowings | — | — | No | — | 20,220 | 20,219.90 | ||||||||||||||||||||||||||||||||||||||||||||||
Trade payables | — | — | No | — | 5,804 | 5,804.01 | ||||||||||||||||||||||||||||||||||||||||||||||
Lease Liabilities | — | — | No | — | 377 | 376.85 | ||||||||||||||||||||||||||||||||||||||||||||||
Provisions | — | — | No | — | 2,011 | 2,010.71 | ||||||||||||||||||||||||||||||||||||||||||||||
Others | — | — | No | — | 10,306 | 10,305.61 | ||||||||||||||||||||||||||||||||||||||||||||||
Total | — | — | No | 1,273 | 38,717 | 39,989.81 | ||||||||||||||||||||||||||||||||||||||||||||||
Cover on Book value (Refer Note 4 below) | — | — | 3.63 | |||||||||||||||||||||||||||||||||||||||||||||||||
Cover on Market value (Refer Note 3 below) | ||||||||||||||||||||||||||||||||||||||||||||||||||||
| | Exclusive Security Cover Ratio | | | Pari-Passu Security Cover Ratio | | |||||||||||||||||||||||||||||||||||||||||||||||
Notes
| 1. | The Company has entered into Mortgage deed on January 8, 2021 supplemental to debenture trust deed dated August 22, 2020 with Vistra ITCL (India) Limited to create a first ranking mortgage on the mortgaged property as an additional charge to secure the payment obligations of the Company in respect of the Debentures. By way of Indenture of Mortgage dated March 2, 2021 pari passu charge has been created in favour of Housing Development Finance Corporation Limited in respect of a secured loan facility availed by the Company aggregating ₹ 3,000 crores. The amount of the loan outstanding as on 31 December 2022 is ₹ 272.73 crores |
| 2. | The Leasehold Land at Pimpri Industrial Area offered as security by way of a pari passu charge in favour of Housing Development Finance Corporation Limited and charge has been created by way of Indenture of Mortgage dated March 2, 2021 |
| 3. | As per clause 10.3 of SEBI circular dated May 19, 2022 valuation report for assets offered as security is required once in three years. Company had done valuation at inception of loan i.e. 26 May 2020. Accordingly details of market value of assets offered as security as required in column K to O is not disclosed above. |
| 4. | The statutory auditor is only responsible to certify security coverage ratio calculated based on the book value of assets mentioned in column F above is in agreement with the audited books of accounts as at 31 December 2022 and other relevant records and documents maintained by the Company. |
Media Contact Information
Tata Motors Corporate Communications E-mail: indiacorpcomm@tatamotors.com
Tel: +91 22-66657613 www.tatamotors.com
All statements contained herein that are not statements of historical fact constitute “forward-looking statements”. All statements regarding our expected financial condition and results of operations, business, plans and prospects are forward-looking statements. These forward-looking statements include but are no limited to statements as to our business strategy, our revenue and profitability, planned projects and other matters discussed herein regarding matters that are not historical fact. These forward-looking statements and any other projections (whether made by us or any third party) involve known and unknown risks, uncertainties and other factors that may cause our actual results, performance or achievements to be materially different from any future results, performance or achievements expressed or implied by these forward-looking statements or other projections. Additional risks that could affect our future operating results are more fully described in our filings with the United States Securities and Exchange Commission. These filings are available at www.sec.gov. We may, from time to time, make additional written and oral forward-looking statements, including statements contained in our filings with the Securities and Exchange Commission and our reports to shareholders. We do not undertake to update any forward-looking statement that may be made from time to time by or on our behalf.